quantifying the uncertainties of transpiration calculations with the penman–monteith equation...
TRANSCRIPT

Agricultural and Forest Meteorology 149 (2009) 1063–1072
Contents lists available at ScienceDirect
Agricultural and Forest Meteorology
journal homepage: www.e lsev ier .com/ locate /agr formet
,
t
l
l
t
-
t
.
l
)
r
t
.
Quantifying the uncertainties of transpiration calculations with the Penman–Monteith equation under different climate and optimum water supply conditions
Matthias Langensiepen a,*, Marcel Fuchs b, Homero Bergamaschi c, Samuel Moreshet b, Yehezkel Cohen b
Peter Wolff d, Samuel C. Jutzi e, Shabtai Cohen b, Luis Mauro G. Rosa c, Yan Li f, Thomas Fricke g
a Modelling Plant Systems, Institute of Crop Science, Faculty of Agriculture and Horticulture, Humboldt-University of Berlin, Invalidenstrasse 42, 10115 Berlin, Germanyb Department of Environmental Physics and Irrigation, Institute of Soil, Water and Environmental Sciences Agricultural Research Organization, The Volcani Centre, P.O. Box 6, Be
Dagan 50250, Israelc Department of Forage Plants and Agricultural Meteorology, Federal University of Rio Grande do Sul, Faculty of Agronomy, Caixa Postal 776, CEP 91501-970, Porto Alegre - RS, Brazid Heiligenstadter Weg 5, 37213 Witzenhausen, Germanye FAO Headquarters, Animal Production and Health Division, Viale delle Terme di Caracalla, Rome 00100, Italyf Xinjiang Institute of Ecology and Geography, CAS, 40-3 South Beijing Road, Urumqi, Xinjiang 830011, PR Chinag Department of Grassland Science and Renewable Plant Resources, Faculty of Organic Agricultural Sciences, University of Kassel, Steinstrasse 19, 37213 Witzenhausen, Germany
A R T I C L E I N F O
Article history:
Received 26 June 2008
Received in revised form 22 December 2008
Accepted 6 January 2009
Keywords:
Transpiration
Penman–Monteith
Uncertainty analysis
Climates
Plant–water relations
A B S T R A C T
The uncertainties of transpiration calculations with the Penman–Monteith equation were quantified
under different climate conditions of Brazil, Germany and Israel using maize as a common crop type. Al
experiments were carried out under non-limiting growing conditions. Canopy resistance was
determined by scaling to canopy level specific relations between in situ measurements of inciden
radiation and stomatal conductance using a light penetration model. The model was tested against heat
pulse measured sap flow in plant stems. The root mean square error (RMSE) of daily calculated
transpiration minus measured sap flow was 0.4 mm/day. It was dominated by its variance componen
(variance = 0.2 {mm/day}2; bias = 0.0 mm/day). Calculated transpiration closely matched the measured
trends at the three locations. No significant differences were found between seasons and locations
Uncertainties of canopy conductance parameterizations led to errors of up to 2.1 mm/day. The mode
responded most sensitively to a 30% change of net radiation (absolute bias error = 1.6 mm/day), followed
by corresponding alterations of canopy resistances (0.8 mm/day), vapour pressure deficits (0.5 mm/day
and aerodynamic resistances (0.34 mm/day). Measured and calculated 30-min or hourly averaged
transpiration rates are highly correlated (r2 = 0.95; n = 10634), and the slope of the regression line is
close to unity. The overall RMSE of calculated transpiration minus measured sap flow was 0.08 mm/h
and was dominated by its variance component (0.005 {mm/h}2). Measured sap flow consistently lagged
behind calculated transpiration, because plant hydraulic capacitance delays the change of leaf wate
potential that drives water uptake. Calculated transpiration significantly overestimated sap flow during
morning hours (mean = 0.068 mm/h, n = 321) and underestimated it during afternoon hours
(mean = �0.065 mm/h; n = 316). The Penman–Monteith approach as implemented in the presen
study is sufficiently sensitive to detect small differences between transpiration and water uptake and
provides a robust tool to manage plant water supply under unstressed conditions.
� 2009 Elsevier B.V. All rights reserved
1. Introduction
Crop transpiration is the main process depleting water from thesoil. It affects the sustainability of water resource and conditionsthe rate of plant growth. The Penman–Monteith equation is widelyused to evaluate crop canopies transpiration rates (Burman, 2003;Allen et al., 1998). It combines supply of energy and transport of
* Corresponding author.
E-mail address: [email protected] (M. Langensiepen).
0168-1923/$ – see front matter � 2009 Elsevier B.V. All rights reserved.
doi:10.1016/j.agrformet.2009.01.001
water vapour from the canopy. The effect of plant physiology istaken into account by introducing a stomatal conductance. Toresolve the energy balance equation the slope of the saturationvapour-pressure function in the vicinity of air temperature is usedto eliminate surface temperature. The steady state assumptionimplied in the model has been criticized, but the associatedcalculation error is insignificant because the volumetric heatcapacity of plant leaves is very small (Monteith and Unsworth,1990; McArthur, 1990; Milly, 1991).
Net radiation, air humidity, air temperature and wind speed arethe required input variables of the equation. Soil heat flux is also

Nomenclature
Ah solar radiation absorptivity
c cloudless portion of the sky
d displacement height in m
e vapour pressure in Pa (subscripts s = saturation,
a = actual)
g stomatal conductance in m s�1 (subscripts s = sun-
lit, sh = shaded, x = leaf fraction)
E transpiration in W m�2 (subscripts p = potential,
a = actual, x = leaf fraction)
G orthogonal projection of a unit leaf area in the
direction of an incident ray
L latent heat of vaporization in J g�1
P0 probability for a incident ray to meet a gap in the
foliage
r resistance in s m�1 (subscripts u = aerodynamic,
c = canopy, b = leaf boundary layer, x = leaf fraction)
R radiation flux density in J m�2 s�1 (subscripts
n = net, S = solar, L = longwave (terrestrial), dir = -
direct, diff = diffuse, x = leaf fractions, s = sunlit,
sh = shaded, PAR = Photosynthetically Active Radia-
tion in mmol m�2 s�1)
s slope of the saturation vapour pressure curve in
Pa K�1
T temperature in K (subscripts a = air, x = leaf frac-
tion, s = sunlit, sh = shaded)
u0 wind speed at the canopy top in m s�1
z height or roughness length in meter (subscripts
o = momentum, E = vapour)
Z solar zenith angle in radian
g psychrometric constant in Pa K�1
ea emissivity of the atmosphere at air temperature in K
rcp volumetric heat capacity of the air in J m�3 K�1
x hemispherical integral of ray interception prob-
ability
L leaf area index in m2 m�2 (subscripts s = sunlit,
sh = shaded)
M. Langensiepen et al. / Agricultural and Forest Meteorology 149 (2009) 1063–10721064
required as input, but decreases exponentially from 50 to 5% of netradiation as the surface advances from bare to full vegetation(Choudhury et al., 1987; Baldocchi et al., 1991; Sauer and Horton,2005). It can thus be neglected when a plant canopy is fully closed.
The equation has been parameterized with various degrees ofcomplexity, for time scales ranging from minutes to days, andtested by a variety of methods, including micrometeorological,lysimetric, soil moisture-based and sap-flow measurements oftranspiration. Efforts to standardise its application to manageirrigation have lead to formulations compromising betweenscientific accuracy and practical convenience (Allen et al., 1998).Transpiring plant leaves are usually dry even when wateravailability in the root zone is unlimited. The surface resistanceto water vapour flow of the dry layer separating the atmospherefrom the liquid water in the plant tissues has a crucial influence onthe magnitude of transpiration. Determining and modelling thisresistance remains a partially resolved issue (Brutsaert, 2005).
A large number of validation studies have been carried out withlysimeters, which have known technical limitations and confoundplant transpiration and soil evaporation (Allen and Howell, 1991).The purpose of this study was thus to quantify the uncertainties oftranspiration computations with the Penman–Monteith equation
under contrasting climate conditions using identical parameter-ization and validation methodologies. The model computationswere compared against sap flow measurements that extent andintegrate over a period of between 5 and 10 min (Cohen et al.,1988; Cohen and Li, 1996).
Aiming for a practical application of the model, a simpleapproach to determine the surface resistance was chosen for closedcanopy conditions when the soil is a negligible source of heat andvapour. It is based on an empirical determination of stomatal lightresponse and scaling to the canopy level using a frequently usedprocedure to estimate incident canopy radiation in uniformcanopies (Fuchs et al., 1987; Sinoquet et al., 1993). Sensitivity,parameter uncertainty and validation analyses were carried outunder the contrasting climate conditions of Brazil, Germany andIsrael using maize as a common experimental crop type.
Previous sensitivity analyses have focussed on the scientificaspects of aerodynamic and canopy resistance parameterizations(Beven, 1979; Saxton, 1975; Verhoef and Allen, 1998; Rana andKaterji, 1998). The complexity of the required experimental setupconfined these studies to particular geographical locations.Theoretical studies have dealt with quantifications of stomatalresponses to the environment (Eamus and Shanahan, 2002), theirscaling to the canopy level (Baldocchi et al., 1991) and comparisonof different competitive model theories (Coleman, 1976). Thepurpose of this study was to provide experimental evidence for theuniversal validity of the Penman–Monteith theory under con-trasting climate and non-limiting water supply conditions.
2. Model
Transpiration rates from the sunlit and shaded leaf fractions arecalculated separately to account for their different contributions tototal transpiration (Fuchs et al., 1987; Petersen et al., 1992).Potential transpiration was estimated with (Penman, 1948):
E p;x ¼1
sþ gs Rn;x þ rc p
½esðTaÞ � ea�ru;x
� �(1)
where Ep,x is the transpiration from each leaf fraction x (subscriptsp = potential, s = sunlit leaf fraction, sh = shaded leaf fraction) inW m�2, s the slope of the saturation vapour pressure curve in Pa K�1,g the psychrometric constant in Pa K�1, Rn the net radiation fluxdensity at the sunlit or shaded canopy surfaces x in J m�2 s�1, rcp thevolumetric heat capacity of the air in J m�3 K�1, es(Ta) and ea thesaturation and actual vapour pressures in the air at temperature Ta inPa, and ru,x is the aerodynamic resistance in s m�1.
The actual transpiration from each leaf fraction Ea,x in W m�2
(subscript a = actual) was then calculated with (Monteith, 1965):
Ea;x ¼E p;x
1þ ðg=ðsþ gÞÞðrc;x=ru;xÞ(2)
where rc,x is the canopy resistances of the sunlit or shaded leaffractions in s m�1. Ep,x and Ea,x were converted to mass flux rates bydividing their values by the air temperature dependent latent heatof vaporization of water in J kg�1(Cambpell and Norman, 1998).
Direct radiation penetrates the canopy through gaps in thefoliage. The probability P0 that a ray meets a gap is calculated withthe Beer–Lambert law (Sinoquet et al., 1993):
P0 ¼ exp�G�L=cos Z (3)
where L is the measured leaf area index and Z the solar zenithangle which is determined with a Fourier series (Spencer, 1971).Assuming a spherical leaf angle distribution G, the orthogonalprojection of a unit leaf area in the direction of an incident rayequals 0.5. The probability of diffuse incident radiation penetration
M. Langensiepen et al. / Agricultural and Forest Meteorology 149 (2009) 1063–1072 1065
into the canopy was computed by numerically integrating thedirectional gap probabilities over 18 zenith angle classes.
The sunlit leaf area index Ls was determined by dividing thefraction of intercepted light by the shadow by a unit leaf area on ahorizontal plane:
Ls ¼1� P0
G=cos Z(4)
The shaded leaf area index Lsh is then L minus Ls.Agricultural crop leaves typically have a solar absorptivity Ah of
0.55 (Gates, 1980; Cambpell and Norman, 1998). Using this valueand assuming that they receive direct radiation plus a singlescatter, net shortwave radiation per unit sunlit leaf area index RS,n,s
in W m�2 was calculated with (Fuchs et al., 1987, Bugler, 1977):
RS;n;s ¼ A0:5h
RS;dir0:5
cos Z þ RS;diff
� �(5)
where RS,dir and RS,diff are the estimated direct and diffusecomponents of global radiation (subscripts n = net; dir = direct;diff = diffuse; S = Solar).
As shaded leaves exchange radiation more than once, the modelassumes that 95% of diffuse solar radiation is eventually absorbedamongst them when the canopy is closed
RS;n;sh ¼ 0:95RS;diff (6)
Significant net terrestrial radiation exchange is assumed to takeplace only between sunlit leaves and the cloudless portion of thesky c from which shaded leaves are sheltered. The net terrestrialradiation RL,n,s exchange in W m�2 of this fraction is (subscriptL = longwave, terrestrial):
RL;n;s ¼ 5:67� 10�8cxð1� eaÞT4a (7)
where the numeric coefficient is the Boltzmann constant inW m�2 K�4, ea the emissivity of the atmosphere at air temperatureTa in Kelvin (Brutasert, 1982), and x is the hemisphericalinterception probability solved by numerically integrating rayinterception probability over 18 zenith angle classes. RL,n,s is alsoused to determine the maximum rate of dew formation, Ep in g m�2
(subscript p = potential) during nighttimes when solar radiationand vapour pressure deficits are zero (Garrat and Segal, 1988)
E p ¼sRL;n;s
Lðsþ gÞ (8)
where L is the latent heat of vaporization. If negative net radiationcools the top canopy layer below dewpoint temperature watercondenses there, but in dense canopies heat supply from the soilprevents dew in the lower foliage (Jacobs et al., 1996). Eq. (1)estimates evaporation of the dew until its depletion.
The net radiation balances of the sunlit and shaded canopyfractions are
Rn;s ¼ RS;n;s � RL;n;s (9)Rn;sh ¼ RS;n;sh (10)
Stomatal responses to photosynthetically active radiation werecalculated using an empirical function with two fitting parameters,a and b, determined under non-limiting soil water supplyconditions (Petersen et al., 1992):
gs;x ¼ affiffiffiffiffiffiffiffiffiRPAR
pþ b� RPAR (11)
where gs,x is the stomatal conductance in m s�1 and RPAR thephotosynthetically active radiation in mmol m�2 s�1 (subscriptPAR = photosynthetic active radiation). The model scales leaf
resistance to the sunlit and shaded canopy levels using
rc;X ¼1
gS;XLX(11a)
It computes their solar radiation loads and converts them to thephotosynthetic active spectrum (Rochette et al., 1991) assuming aconstant proportionality factor of 2.04 between measured solarradiation and photosynthetically active radiation (Ross, 1981).
The characteristic width of sunlit and shaded maize leaves wasset to 0.1 m and their boundary layer resistance rb,x was calculatedwith (Cambpell and Norman, 1998):
rb;x ¼ 300
ffiffiffiffiffiffiffi0:1
u0
s(12)
where u0 is the wind speed at the canopy top in m s�1 extrapolatedby the logarithm profile law, which was also used to calculate theturbulent resistance ra:
ra ¼lnð½z� d�=z0Þlnð½z� d�=zEÞ
k2u(13)
where u is the wind speed at height z, k the von Karman constant(0.4), d the displacement height taken as 66% of the corn canopyheight h in meter, z0 the moment roughness length (0.13 h) and zE
is the roughness length for vapour transport (0.2 � z0).The total aerodynamic resistance is finally calculated by
coupling the turbulent and boundary layer resistances in series:
ru;x ¼ ra þrb;x
Lx: (14)
3. Materials and methods
The studies were carried out during the 1995 and 1996vegetation seasons under the contrasting climate conditions ofBrazil, Germany, and Israel. Corn was chosen as a commonexperimental crop for this study. The experiment at Brazil waslocated at Eldorado do Sul (Latitude 30860S, longitude 518410W,altitude 40 m above sea level) which has a subtropical climate withhot summers and high rainfall during most of the year exceptduring peak summer. The climate at Hebenshausen in Germany(Latitude 518230N, longitude 98550E, altitude 250 m above sealevel) is humid temperate with occasional frosts during winter andan even rainfall distribution throughout the rest of the year. Theexperiment at Israel was carried out in Bet Dagan (328010N,348500E, 25 m above sea level) in a typical semi-arid climate zonewith hot and dry summers and warm winters with infrequentrainfall.
3.1. Agronomic details
The plot at the Brazilian site had a size of 0.54 ha (62 m � 87 m).Its soil is a well-drained humic sandy loam. Maize (cv. Pioneer3230) was sown with a density of 6.7 plants m�2 at the end ofOctober. Row spacing was 0.7 m. The surrounding fields were alsocultivated with crops. A line-source sprinkler system was installedto maintain the water content of its adjacent soils at field capacity.The corresponding irrigation amounts were calculated from dailyevapotranspiration measurements which were carried out with aweighing lysimeter located in the field center (surface 5.1 m2,depth 0.9 m).
The soil at the German site region is classified as a humic loesstype with slight stagnic conditions at 1.2 m depth. Maize (cv. Helix,KWS) was sown with a density of 11 plants m�2 at the end of April1995 and 1996 on commercial farm fields of 2.7 ha (150 m� 180 m)sizes; row spacing was 0.7 m. The fields were surrounded by

Fig. 2. Correlation between air vapour pressure deficits measured above grass and
maize canopy surfaces during the main growing periods in 1995 and 1996 at the
German field sites.
Fig. 1. Leaf area index (LAI), plant height (h), and computation periods (dotted lines) at the three experimental sites.
M. Langensiepen et al. / Agricultural and Forest Meteorology 149 (2009) 1063–10721066
agricultural crops. The crops did not experience extended droughtperiods due to frequent summer rains during both years.
The experiment at Israel was carried out on a 0.42 ha(65 m � 65 m) plot located in a large field crop research area. Itssoil is a sandy loam. Sweet corn (cv. Jubilee) was hand-sown in Juneat a density of 8 plants/m2; row spacing was 0.95 m. Soil moisturewas allowed to drop to 80% of field capacity level and thenreplenished to full retention using drip irrigation.
Fertilizer dosages, pest and disease control were appliedaccording to standard agronomic practice in all experiments.
3.2. Model parameterization and input data collection
Leaf vapour conductance and photosynthetically active radia-tion were measured with steady state porometers (L1600 M, Licor,Lincoln, NE, USA). Conductance readings were taken from theabaxial and adaxial leaf sides. The measurement locations weresampled at random in the sunlit and shaded canopy portions.Frequent dewfall and ensuing canopy surface drying preventedporometer measurements before 10 a.m. in the German trial.Furthermore morning and afternoon readings of stomatal lightresponses may differ (Li et al., 2004). Only noon observations werechosen for model parameterization to avoid artefacts fromstomatal acclimation to steep changes of physical air states andthe light environment during mornings and afternoons.
Leaf area growth was monitored at all locations by destructiveand indirect methods (LI-3100C Area Meter, LI-2000 Fisheye, Licor,Lincoln, NE, USA; SUNLINK, Decagon Devices, Inc., Pullman, WA,USA). Plant heights were measured with rulers. Seasonal data andperiods during which computations were carried out are shown inFig. 1. The model was exclusively applied under closed canopyconditions when leaf area index was above 2.5.
Solar radiation, wind-speed, air temperature and humiditywere monitored at 2 m height above grass surfaces and averagedover 30-min intervals using standard automatic weather stationsoperated in close vicinity of the experiments (Campbell ScientificInc., Logan, UT, USA; Thies Clima, Gottingen, Germany). This is atypical procedure to obtain and use weather data for modelapplications under practical agronomic conditions which was thusalso applied in this study. Since the structural properties of grassand maize canopies could have potentially influenced the
temperature and humidity characteristics of the surface boundarylayer, we examined the validity of this approach. Additionalmeteorological towers were installed above the maize canopies forthis purpose. The heights of the sensors were adjusted weekly to0.66 �maize height + 3 m.
Differences in data outputs from the meteorological stationpairs were small in the cases of the relatively small plots in Braziland Israel. Strong air mixing with the surrounding atmosphereprevented a build-up of a new boundary layer. Fetch requirementswere only met in the cases of the larger fields in Germany and thusallowed for a testing of the chosen approach. Temperature andhumidity fluctuations measured with both stations were almostidentical in 1995 and 1996. The calculated vapour pressure deficitsabove the grass and maize surfaces are thus highly correlated(Fig. 2). At low vapour pressure deficit, humidity over the maizecanopy is higher than over grass. During nighttime temperatureinversion more dew can be stored on the larger surface of themaize canopy above which stable atmosphere promotes vapouraccumulation. The overall difference of 2% is small enough to allowfor a usage of both station outputs interchangeably.
M. Langensiepen et al. / Agricultural and Forest Meteorology 149 (2009) 1063–1072 1067
3.3. Validation, sensitivity and uncertainty analyses
The sap flow of eight randomly selected plants with same stemdiameters was determined in each field experiment with thecalibrated heat pulse method (Cohen et al., 1988). The temperaturedrift between the upstream and downstream sensors wasmonitored for 2 min before each measurement and subtractedfrom the flow dependent temperature change measured over aperiod of between 5 and 10 min. A constant calibration factor of 1.6(Cohen and Li, 1996) was used in all corn. Each set of diurnal sapflow measurements was filtered to remove data inconsistenciesgenerally due to improper installation. Group average was used toattenuate noise at extremely low sap flow rates. Mean sap fluxesand their standard deviations were used in the validation,sensitivity and uncertainty analyses. We emphasize that the heatpulse measures sap flow and not transpiration. The comparison ofthe measurements with the model calculations entails theassumption that plant hydraulic capacitance is small.
Model calculation accuracies were measured with severalstatistical methods (Zar, 1999): Sap flow versus calculatedtranspiration regression and correlation analyses were carriedout to determine the overall agreement between both independentmethods. The root mean square error (RMSE) of calculatedtranspiration minus sap flow was additionally determined anddecomposed into bias and variance components to trace thedifferent error sources. Daily calculated transpiration minus sapflow data were also used in a sensitivity analysis to check theinteractive influences of altered net radiation and vapour pressureinputs on computation bias errors. Seasonal and characteristicdaily trends of calculated transpiration and sap flow providedinformation about the dynamic changes of both independentmethods. The effects of uncertainties of stomatal conductancemeasurements on model bias and variance errors were finallyanalysed within the 95% range of predictions bands of the fittedstomatal light response function. All analyses were carried outwith the statistical software R (R Development Core Team, 2006).
4. Results
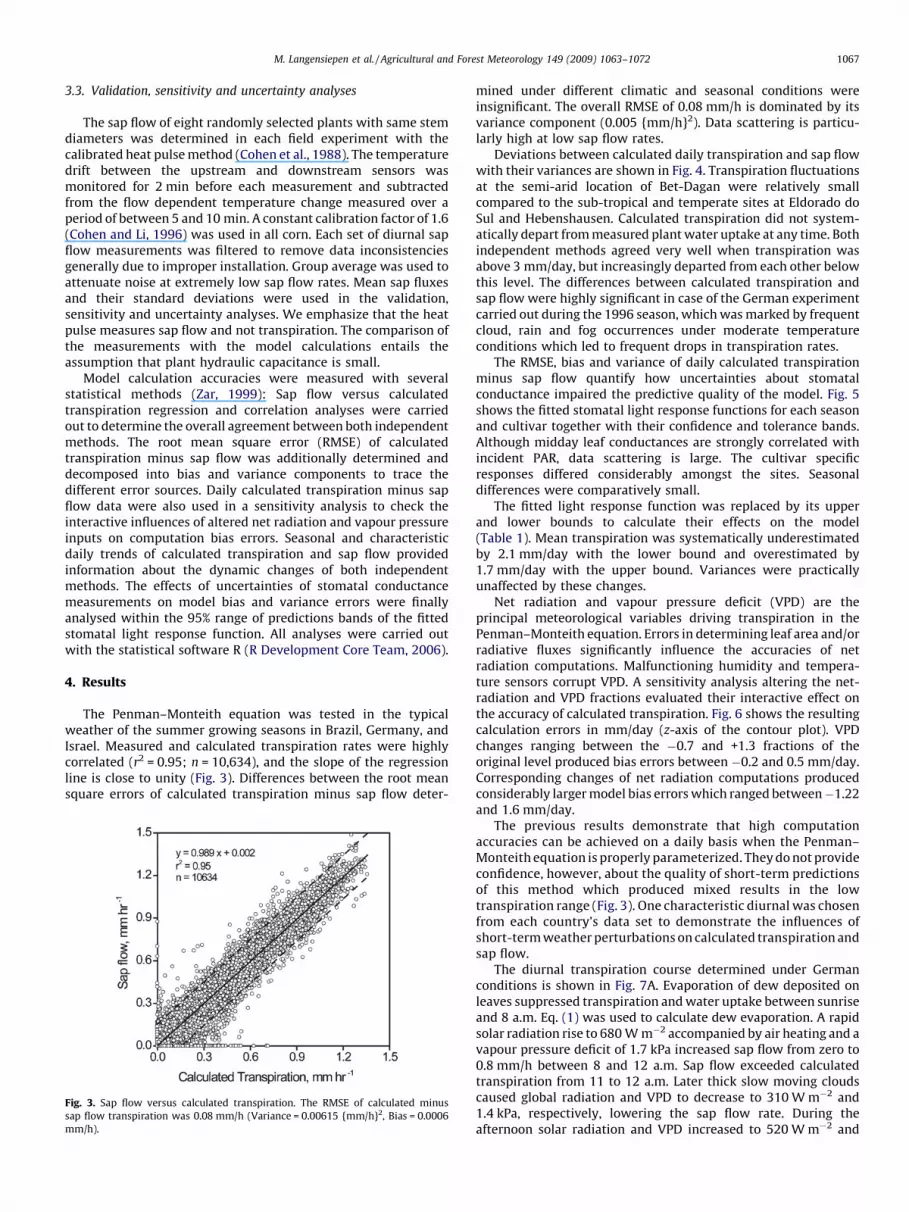
The Penman–Monteith equation was tested in the typicalweather of the summer growing seasons in Brazil, Germany, andIsrael. Measured and calculated transpiration rates were highlycorrelated (r2 = 0.95; n = 10,634), and the slope of the regressionline is close to unity (Fig. 3). Differences between the root meansquare errors of calculated transpiration minus sap flow deter-
Fig. 3. Sap flow versus calculated transpiration. The RMSE of calculated minus
sap flow transpiration was 0.08 mm/h (Variance = 0.00615 {mm/h}2, Bias = 0.0006
mm/h).
mined under different climatic and seasonal conditions wereinsignificant. The overall RMSE of 0.08 mm/h is dominated by itsvariance component (0.005 {mm/h}2). Data scattering is particu-larly high at low sap flow rates.
Deviations between calculated daily transpiration and sap flowwith their variances are shown in Fig. 4. Transpiration fluctuationsat the semi-arid location of Bet-Dagan were relatively smallcompared to the sub-tropical and temperate sites at Eldorado doSul and Hebenshausen. Calculated transpiration did not system-atically depart from measured plant water uptake at any time. Bothindependent methods agreed very well when transpiration wasabove 3 mm/day, but increasingly departed from each other belowthis level. The differences between calculated transpiration andsap flow were highly significant in case of the German experimentcarried out during the 1996 season, which was marked by frequentcloud, rain and fog occurrences under moderate temperatureconditions which led to frequent drops in transpiration rates.
The RMSE, bias and variance of daily calculated transpirationminus sap flow quantify how uncertainties about stomatalconductance impaired the predictive quality of the model. Fig. 5shows the fitted stomatal light response functions for each seasonand cultivar together with their confidence and tolerance bands.Although midday leaf conductances are strongly correlated withincident PAR, data scattering is large. The cultivar specificresponses differed considerably amongst the sites. Seasonaldifferences were comparatively small.
The fitted light response function was replaced by its upperand lower bounds to calculate their effects on the model(Table 1). Mean transpiration was systematically underestimatedby 2.1 mm/day with the lower bound and overestimated by1.7 mm/day with the upper bound. Variances were practicallyunaffected by these changes.
Net radiation and vapour pressure deficit (VPD) are theprincipal meteorological variables driving transpiration in thePenman–Monteith equation. Errors in determining leaf area and/orradiative fluxes significantly influence the accuracies of netradiation computations. Malfunctioning humidity and tempera-ture sensors corrupt VPD. A sensitivity analysis altering the net-radiation and VPD fractions evaluated their interactive effect onthe accuracy of calculated transpiration. Fig. 6 shows the resultingcalculation errors in mm/day (z-axis of the contour plot). VPDchanges ranging between the �0.7 and +1.3 fractions of theoriginal level produced bias errors between �0.2 and 0.5 mm/day.Corresponding changes of net radiation computations producedconsiderably larger model bias errors which ranged between�1.22and 1.6 mm/day.
The previous results demonstrate that high computationaccuracies can be achieved on a daily basis when the Penman–Monteith equation is properly parameterized. They do not provideconfidence, however, about the quality of short-term predictionsof this method which produced mixed results in the lowtranspiration range (Fig. 3). One characteristic diurnal was chosenfrom each country’s data set to demonstrate the influences ofshort-term weather perturbations on calculated transpiration andsap flow.
The diurnal transpiration course determined under Germanconditions is shown in Fig. 7A. Evaporation of dew deposited onleaves suppressed transpiration and water uptake between sunriseand 8 a.m. Eq. (1) was used to calculate dew evaporation. A rapidsolar radiation rise to 680 W m�2 accompanied by air heating and avapour pressure deficit of 1.7 kPa increased sap flow from zero to0.8 mm/h between 8 and 12 a.m. Sap flow exceeded calculatedtranspiration from 11 to 12 a.m. Later thick slow moving cloudscaused global radiation and VPD to decrease to 310 W m�2 and1.4 kPa, respectively, lowering the sap flow rate. During theafternoon solar radiation and VPD increased to 520 W m�2 and

Fig. 4. Seasonal courses of sap flow and calculated transpiration under the contrasting climatic conditions of Germany (top), Israel (middle), and Brazil (bottom).
M. Langensiepen et al. / Agricultural and Forest Meteorology 149 (2009) 1063–10721068
1.9 kPa to which sap flow responded by elevating its rate. Incontrast with observations in Brazil and Israel calculatedtranspiration lagged behind the measured sap flow.
Maize transpiration was determined with a higher timeresolution of 15 min in the Brazilian experiment allowing acloser analysis of short-term phenomena (Fig. 7B). Low windspeeds and vapour pressure deficits prevented a strong rise incalculated transpiration during the first two morning hours,respectively. Global radiation and VPD rose to 980 W m�2 and3.1 kPa during the subsequent four morning hours. Measuredsap flow increased during this period but lagged behindcalculated transpiration. Rapid fluctuations of radiation andVPD after 12 a.m. resulted in corresponding fluctuations ofcalculated transpiration and measured sap flow that droppedfrom 1.2 to 0.2 mm/h. The weather conditions varied consider-ably during the subsequent 2 h. Weather conditions normalizedafterwards. Global radiation reached a high value of 820 W m�2
again and VPD increased to 1.7 kPa. Weather conditions duringthe remaining daylight hours were characterized by smoothtransitions in global radiation and VPD at an average wind speedof 3 m s�1. Calculated transpiration consistently lagged behindsap flow transpiration during this time.
The semi-arid climate at Bet-Dagan site provided an opportu-nity to analyse the discrepancies between calculated transpirationand sap flow courses under continuous hot and dry weatherconditions. Any amount of dew would have quickly evaporatedshortly after sunrise due to a rapid increase of air vapour pressuredeficit. Measured sap flow continuously lagged behind calculatedtranspiration before and after noon when solar radiation and VPDreached peak values of 980 W m�2 and 1.8 kPa, respectively(Fig. 7C). This effect was repeatedly observed with very fewexceptions during the two growing seasons.
In summary, these results suggest that calculated transpira-tion consistently overestimates the measured sap flow rateduring morning hours and underestimates it during the after-noon. In order to quantify this observation, all validation pairscollected during 9 and 10 a.m. were compared against thoseobtained between 4 and 5 p.m. (Fig. 8). Sap flow was also set to alower threshold level of 0.33 mm/h to exclude cloudy dayswith strong weather fluctuations that would have introduceda considerable degree of noise in this comparison. Sap flowwas significantly overestimated in the morning (mean = 0.068mm/h, n = 321) and underestimated in the afternoon (mean =�0.065 mm/h; n = 316).
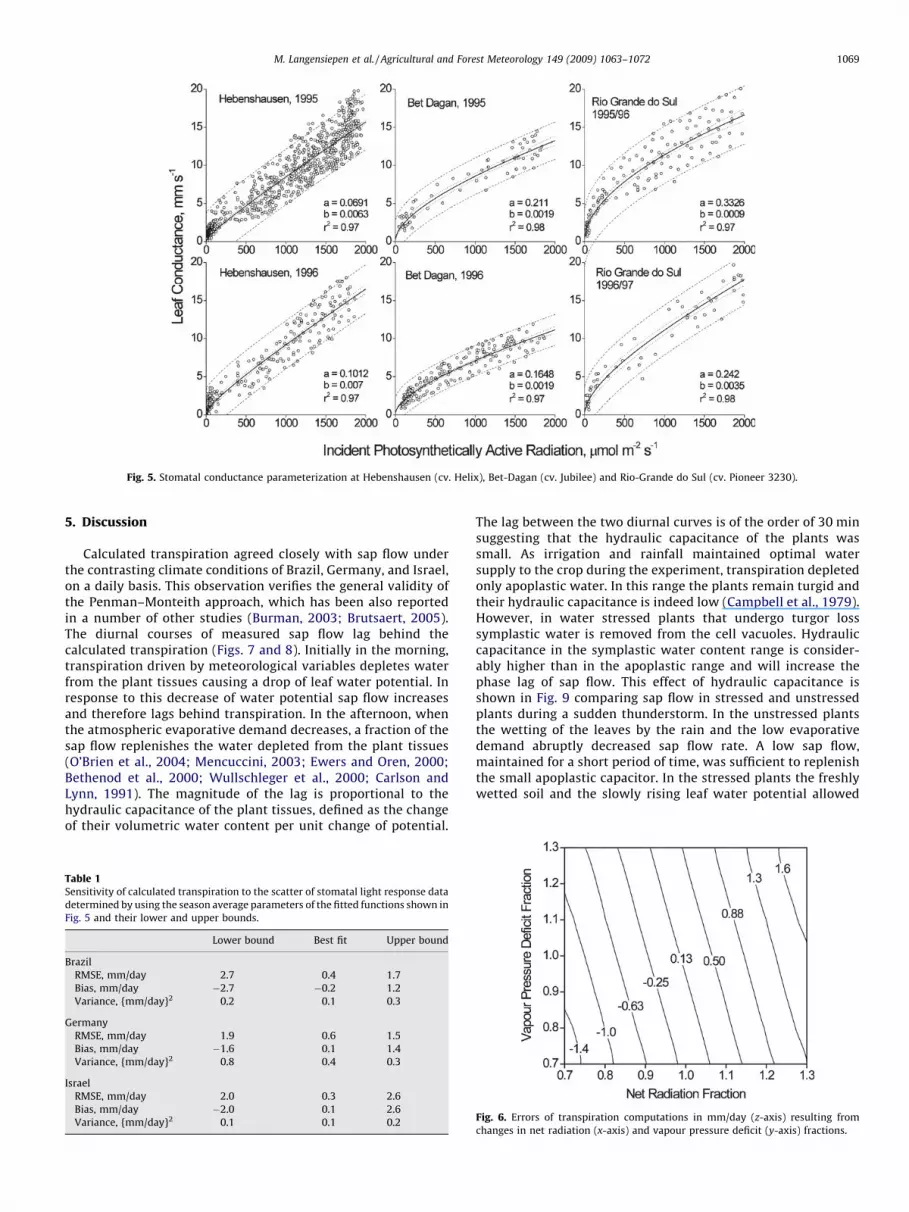
Fig. 5. Stomatal conductance parameterization at Hebenshausen (cv. Helix), Bet-Dagan (cv. Jubilee) and Rio-Grande do Sul (cv. Pioneer 3230).
M. Langensiepen et al. / Agricultural and Forest Meteorology 149 (2009) 1063–1072 1069
5. Discussion
Calculated transpiration agreed closely with sap flow underthe contrasting climate conditions of Brazil, Germany, and Israel,on a daily basis. This observation verifies the general validity ofthe Penman–Monteith approach, which has been also reportedin a number of other studies (Burman, 2003; Brutsaert, 2005).The diurnal courses of measured sap flow lag behind thecalculated transpiration (Figs. 7 and 8). Initially in the morning,transpiration driven by meteorological variables depletes waterfrom the plant tissues causing a drop of leaf water potential. Inresponse to this decrease of water potential sap flow increasesand therefore lags behind transpiration. In the afternoon, whenthe atmospheric evaporative demand decreases, a fraction of thesap flow replenishes the water depleted from the plant tissues(O’Brien et al., 2004; Mencuccini, 2003; Ewers and Oren, 2000;Bethenod et al., 2000; Wullschleger et al., 2000; Carlson andLynn, 1991). The magnitude of the lag is proportional to thehydraulic capacitance of the plant tissues, defined as the changeof their volumetric water content per unit change of potential.
Table 1Sensitivity of calculated transpiration to the scatter of stomatal light response data
determined by using the season average parameters of the fitted functions shown in
Fig. 5 and their lower and upper bounds.
Lower bound Best fit Upper bound
Brazil
RMSE, mm/day 2.7 0.4 1.7
Bias, mm/day �2.7 �0.2 1.2
Variance, {mm/day}2 0.2 0.1 0.3
Germany
RMSE, mm/day 1.9 0.6 1.5
Bias, mm/day �1.6 0.1 1.4
Variance, {mm/day}2 0.8 0.4 0.3
Israel
RMSE, mm/day 2.0 0.3 2.6
Bias, mm/day �2.0 0.1 2.6
Variance, {mm/day}2 0.1 0.1 0.2
The lag between the two diurnal curves is of the order of 30 minsuggesting that the hydraulic capacitance of the plants wassmall. As irrigation and rainfall maintained optimal watersupply to the crop during the experiment, transpiration depletedonly apoplastic water. In this range the plants remain turgid andtheir hydraulic capacitance is indeed low (Campbell et al., 1979).However, in water stressed plants that undergo turgor losssymplastic water is removed from the cell vacuoles. Hydrauliccapacitance in the symplastic water content range is consider-ably higher than in the apoplastic range and will increase thephase lag of sap flow. This effect of hydraulic capacitance isshown in Fig. 9 comparing sap flow in stressed and unstressedplants during a sudden thunderstorm. In the unstressed plantsthe wetting of the leaves by the rain and the low evaporativedemand abruptly decreased sap flow rate. A low sap flow,maintained for a short period of time, was sufficient to replenishthe small apoplastic capacitor. In the stressed plants the freshlywetted soil and the slowly rising leaf water potential allowed
Fig. 6. Errors of transpiration computations in mm/day (z-axis) resulting from
changes in net radiation (x-axis) and vapour pressure deficit (y-axis) fractions.

Fig. 7. Typical daily courses of calculated transpiration (closed symbols) and measured sap flow (open symbols): (A) Hebenshausen, Germany (10.8.1996), (B) Eldorado do Sul,
Brazil (31.12.1996) and (C) Bet-Dagan, Israel (9.8.1996). Values of relevant global radiation and vapour pressure deficit data are given.
M. Langensiepen et al. / Agricultural and Forest Meteorology 149 (2009) 1063–10721070
the prolonged sap flow rate needed to recharge the largesymplastic capacitor despite transpiration suppression byevaporation from the wetted leaves and the drop of evaporativedemand.
Evaporation of dew retained on the leaf surfaces couldexplain that the Penman–Monteith equation overestimateswater uptake during early morning hours, particularly underthe calm and humid weather conditions of Germany (Herbstet al., 1996). If this had been the case calculated transpirationwould have matched the diurnal course of plant–water uptakeno later than about 2 h after sunrise, because the maximumamount of dew evaporation in maize canopies is typically below0.2 mm (Jacobs et al., 1996; Fuchs et al., 1989). This behaviourwas not detected during the entire experiment. Therefore, dewretention is not responsible for the phase shift between the sapflow and calculated transpiration.
The Penman–Monteith equation is most significantly applied inwater balance studies where short-term phenomena play acomparatively minor role. However, it matches also closely thediurnal course of plant water uptake. It precedes systematicallysap flow measurements. The phase shift amounts to around30 min, which are also the time step of the calculations and themeasurements. Hydraulic capacitance of the plants accounts easilyfor the small discrepancy.
The most important goal of this study was to quantify theeffects of uncertainties of canopy resistance, faulty net-radiationand vapour pressure deficit on daily transpiration. Canopy
Fig. 8. Morning–afternoon segregation of the comparison between calculated
transpiration and measured sap flow rate.
resistance was determined with a simple methodology using anempirical stomatal light response curve that was scaled up tothe whole canopy by means of a light interception model. Thisapproach facilitates a simple application of the Penman–Monteith under practical conditions (Baldocchi et al., 1991),such as irrigation scheduling or regional hydrological studies.The maximum computation error introduced by the statisticaluncertainties of stomatal resistance parameterizations (Fig. 5)was 2.7 mm/day under the conditions of this study, which isquite significant (Table 1). Altering the relation between PARand stomatal conductance measurements by leaf twisting,insufficient chamber acclimation and drying of desiccants areusually the major sources of this uncertainty (Turner, 1991).Physiological reasons could also be made responsible for theseuncertainties. Li et al. (2004) detected different stomatal lightresponses in maize during mornings and afternoons, slightunder unstressed and more severe under stressed conditions,suggesting environmental control of stomatal opening that wasnot considered in this model. Diurnal changes of temperature,humidity and soil matric potential may cause additionalvariations of stomatal conductance. Based on a comprehensivecomputation exercise, Tuzet et al. (2003) came to the conclusionthat stomatal conductance cannot be modelled using leaf-levelprocesses alone, but the effect of environmental factors is smallwhen soil water supply is optimal. For this reason the simplescaling methodology based on sole canopy architectonic andlight information applied in the present study remains valid and
Fig. 9. Measured sap-flow rates under optimum and severe water stress on a day
with a sudden thunderstorm (Rio Grande do Sul, Brazil, 13.1.1997). Vapour pressure
deficit (VPD) and global radiation (Rglob) conditions are shown for the noon (12
a.m.–3 p.m.) and after-thunderstorm periods (4–9 p.m.).
M. Langensiepen et al. / Agricultural and Forest Meteorology 149 (2009) 1063–1072 1071
is corroborated by the experiments. The study also shows thatthe shape of the stomatal light response is cultivar dependentand cannot be generalized.
Canopy architecture and measured solar irradiance alsodetermine the magnitude of the net-radiation term of thePenman–Monteith equation. Changing its value by 30% led tomaximum computation errors of 1.6 mm/day in this study,which were high compared to corresponding changes in vapourpressure deficit which produced errors of up to 0.5 mm/day(Fig. 6). These observations confirm results of other studiesdemonstrating the effects of both variables on the Penman–Monteith calculations (Yoder et al., 2005). Leaf area develop-ment and meteorological data must thus be accuratelydetermined to ensure good results.
6. Conclusion
The results of this study confirm that the Penman–Monteithequation is a robust tool for daily and diurnal computations ofplant transpiration under different climate conditions. Its relia-bility is primarily influenced by canopy resistance parameteriza-tion and accuracy of input variables which determine themagnitude of net-radiation. The diurnal course of measuredsap-flow consistently lagged behind calculated transpiration, dueto plant hydraulic capacitance.
Acknowledgements
We thank family Wentrot at Hebenshausen for their friendlysupport and providing access to their maize fields at no costs.Tobias Gabele and Tobias Wilhelm assisted during field work.Rainer Braukmann, Dr. Dorothea von Renesse and MarinaHethke-Wesche from the Department of Tropical and SubtropicalField Crop Production at the University of Kassel providedtechnical support. Renate Curdt and Hans Heman administeredthe project.
The field experiments in Bet Dagan were conducted with thetechnical help of Yefet Cohen.
We also thank UFRGS (Universidade Federal do Rio Grande doSul), CNPq (Conselho Nacional de Desenvolvimento Cientıfico eTecnologico) and Fundacao CAPES for sponsoring great part of theBrazilian staff and materials for the cooperative researchactivities.
This study was financed by the German Ministry of EconomicCooperation through the German-Israel Agricultural ResearchAgreement for the Benefit of Third-World Countries (GIARA). Wegratefully acknowledge the support from Dr. S. Gura and Mr. R.Korntheuer.
References
Allen, R.G., Howell, T.A., 1991. Lysimeters for evapotranspiration and environmen-tal measurements. In: Proceedings of the International Symposium on Lysi-metry. American Society of Civil Engineers, Reston.
Allen, R.G., Pereira, L.S., Smith, M., 1998. Crop evapotranspiration: guidelines forcomputing crop water requirements. FAO Irrigation and Drainage Papers 56:Food and Agriculture Organisation of the United Nations, Viale delle Terme diCaracalla, Rome 00100, Italy.
Baldocchi, D.A., Luxmoore, R.J., Hatfield, J.L., 1991. Discerning the forest from thetrees: an essay on scaling canopy conductance. Agric. For. Meteorol. 54, 197–226.
Bethenod, O., Katerji, N., Goujet, R., Bertolini, J.M., Rana, G., 2000. Determination andvalidation of corn transpiration by sap flow measurement under field condi-tions. Theor. Appl. Climatol. 67, 153–160.
Beven, K., 1979. A sensitivity analysis of the Penman–Monteith actual evapotran-spiration estimates. J. Hydrol. 44, 169–190.
Brutasert, W.R., 1982. Evaporation into the Atmosphere. Kluwer, Dordrecht, Nether-lands.
Brutsaert, W., 2005. Hydrology. Cambridge University Press, United Kingdom.
Bugler, J.W., 1977. The determination of hourly insulation on an inclined planeusing a diffuse irradiance model based on hourly measured global horizontalradiation. Solar Energy 19, 477–491.
Burman, R.D., 2003. Evapotranspiration formulars. In: Stewart, B.A., Howell, T.A.(Eds.), Encyclopedia of Water Science. Marcel Dekker, Inc., New York, pp.253–257.
Cambpell, G.S., Norman, J.M., 1998. An Introduction to Environmental Biophysics,2nd ed. Springer Verlag, New York, Berlin, Heidelberg.
Campbell, G.S., Papendick, R.I., Rabie, E., Shayo-Ngowi, A.J., 1979. A comparison ofosmotic potential, elastic modulus, and apoplastic water in leaves of drylandwinter wheat. Agron. J. 71, 31–36.
Carlson, T.N., Lynn, B., 1991. The effects of plant water storage on transpiration andradiometric surface temperature. Agric. For. Meteorol. 57, 171–186.
Choudhury, B.J., Idso, S.B., Reginato, R.J., 1987. Analysis of an empirical model forsoil heat flux under a growing wheat crop for estimating evaporation by aninfrared-temperature based energy balance equation. Agric. For. Meteorol. 39,283–297.
Cohen, Y., Fuchs, M., Falkenflug, V., Moreshet, S., 1988. A calibrated heat pulsemethod for determining water uptake in cotton. Agron. J. 80, 398–402.
Cohen, Y., Li, Y., 1996. Validating sap flow measurement in field-grown sunflowerand corn. J. Exp. Bot. 47, 1699–1707.
Coleman, G., 1976. Sensitivity and model variance analysis applied to some eva-poration and evapotranspiration models. Water Resour. Res. 12, 873–879.
Eamus, D., Shanahan, S.T., 2002. A rate equation model of stomatal responses tovapour pressure deficit and drought. http://www.biomedcentral.com/1472-6785/2/8.
Ewers, B.E., Oren, R., 2000. Analysis of assumptions and errors in the calculation ofstomatal conductance from sap flux measurements. Tree Physiol. 20, 579–589.
Fuchs, M., Cohen, Y., Moreshet, S., 1987. Determining transpiration from meteor-ological and crop characteristics for irrigation management. Irrigation Sci. 8,91–99.
Fuchs, M., Cohen, Y., Moreshet, S., Cohen, Y., 1989. Experimental verification of ameteorological transpiration model. Agronomie 9, 827–832.
Garrat, J.R., Segal, M., 1988. On the contribution to dew formation. Boundary LayerMeteorol. 45, 209–236.
Gates, D.M., 1980. Biophysical Ecology. Springer, New York.Herbst, M., Kappen, L., Thamm, F., Vanselow, R., 1996. Simultaneous measurements
of transpiration, soil evaporation and total evaporation in a maize field innorthern Germany. J. Exp. Bot. 47, 1957–1962.
Jacobs, A.F.G., van Boxel, J.H., Nieveen, J., 1996. Nighttime exchange processes nearthe soil surface of a maize canopy. Agric. For. Meteorol. 82, 155–169.
Li, Y., Cohen, Y., Wallach, R., Cohen, S., Fuchs, M., 2004. On quantifying soil waterdeficit of a partially wetted root zone by the response of canopy or leafconductance. Agric. Water Manage. 65, 21–38.
McArthur, A.J., 1990. An accurate solution to the Penman equation. Agric. For.Meteorol. 51, 87–92.
Mencuccini, M., 2003. The ecological significance of long-distance water transport:short-term regulation, long-term acclimation and the hydraulic costs of statureacross plant life forms. Plant Cell Environ. 26, 163–182.
Milly, P.C.D., 1991. A refinement of the combination equations for evaporation.Surv. Geophys. 12, 145–154.
Monteith, J.L., 1965. Evaporation and the environment. In: The state and movementof water in living organisms. Proc. 19th Symp. Soc. Exp. Biol.. CambridgeUniversity Press, England.
Monteith, J.L., Unsworth, M., 1990. Principles of Environmental Physics, 2nd ed.Arnold, London.
O’Brien, J.J., Oberbauer, S., Clark, D.B., 2004. Whole tree xylem sap flow responses tomultiple environmental variables in a wet tropical forest. Plant Cell Environ. 27,551–567.
Penman, H.L., 1948. Natural evaporation from open water, bare soil and grass. Proc.Roy. Soc. Ser. A 193, 120.
Petersen, K.L., Fuchs, M., Moreshet, S., Cohen, Y., Sinoquet, H., 1992. Computingtranspiration of sunlit and shaded cotton foliage under variable water stress.Agron. J. 84, 91–97.
R Development Core Team, 2006. R: A Language and Environment for StatisticalComputing. R Foundation for Statistical Computing, Vienna, Austria, ISBN: 3-900051-07-0.
Rana, A., Katerji, N., 1998. Measurement based sensitivity analysis of the Penman–Monteith actual evapotranspiration model for crops of different height and incontrasting water status. Theor. Appl. Climatol. 60, 141–149.
Rochette, P., Pattey, E., Desjardins, R.L., Dwyer, L.M., Stewart, D.W., Dube, P.A., 1991.Estimation of maize (Zea mays L.) canopy conductance by scaling leaf stomatalconductance. Agric. For. Meteorol. 54, 241–261.
Ross, J., 1981. The Radiation Regime and Architecture of Plant Stands. Dr. W. JunkPublishers, The Hague-Boston-London.
Sauer, T.J., Horton, R., 2005. Soil heat flux. In: Hatfield, J.L., Baker, J.M. (Eds.),Micrometeorology in agricultural systems. Agronomy Monograph No. 47.American Society of Agronomy, Crop Science Society of America, Soil ScienceSociety of America, USA, pp. 131–154.
Saxton, K.E., 1975. Sensitivity analyses of the combination evapotranspirationequation. Agric. For. Meteorol. 15, 343–353.
Sinoquet, H., Varlet-Grancher, C., Bonhomme, R., 1993. Modelling radiative transferwithin homogeneous canopies: basic concepts. In: Varlet-Grancher, C., Bon-homme, R., Sinoquet, H. (Eds.), Crop Structure and Light Microclimate. INRAEditions, France, pp. 207–228.

M. Langensiepen et al. / Agricultural and Forest Meteorology 149 (2009) 1063–10721072
Spencer, J., 1971. Fourier series representation of the position of the Sun. Search 2(5), 172.
Turner, N.C., 1991. Measurement and influence of environmental and plant factorson stomatal conductance in the field. Agric. For. Meteorol. 54, 137–154.
Tuzet, A., Perrier, A., Leuning, R., 2003. A coupled model of stomatal conductance,photosynthesis and transpiration. Plant Cell Environ. 26, 1097–1116.
Verhoef, A., Allen, S.J., 1998. The relative importance of surface and aerodynamicresistances in a multi-source energy-CO2 model. Phys. Chem. Earth 23, 459–463.
Wullschleger, S.D., Wilson, K.B., Hanson, P.J., 2000. Environmental controlof whole-plant transpiration, canopy conductance and estimates of thedecoupling coefficient for large maple trees. Agric. For. Meteorol. 104,157–168.
Yoder, R.E., Odhiambo, L.O., Wright, W.C., 2005. Effects of vapor-pressure deficit andnet-radiation calculation methods on accuracy of standardized equation in ahumid climate. J. Irrig. Drain. Eng. 131, 228–237.
Zar, J.H., 1999. Biostatistical Analysis. Prentice Hall, Upper Saddle River, NJ, USA.