dew deposition suppresses transpiration and carbon uptake
TRANSCRIPT
Contents lists available at ScienceDirect
Agricultural and Forest Meteorology
journal homepage: www.elsevier.com/locate/agrformet
Dew deposition suppresses transpiration and carbon uptake in leaves
Cynthia Gerlein-Safdia,⁎, Michael C. Koohafkanb,c, Michaella Chungc, Fulton E. Rockwelld,Sally Thompsonc, Kelly K. Caylora,e,f
a Department of Civil and Environmental Engineering, Princeton University, Princeton, NJ 08544, USAbHydrologic Sciences Graduate Group, University of California Davis, Davis, CA 95616, USAc Department of Civil and Environmental Engineering, University of California Berkeley, Berkeley, CA 94720, USAd Department of Organismic and Evolutionary Biology, Harvard University, Cambridge, MA 02138, USAe Department of Geography, University of California Santa Barbara, Santa Barbara, CA 93106, USAf Bren School of Environmental Science and Management, UC Santa Barbara, Santa Barbara, CA 93106, USA
A R T I C L E I N F O
Keywords:Carbon assimilationDewFogLeaf energy balanceLeaf wetnessTranspiration suppression
A B S T R A C T
Dew deposition occurs in ecosystems worldwide, even in the driest deserts and in times of drought. Althoughsome species absorb dew water directly via foliar uptake, a ubiquitous effect of dew on plant water balance is theinterference of dew droplets with the leaf energy balance, which increases leaf albedo and emissivity and de-creases leaf temperature through dew evaporation. Dew deposition frequency and amount are expected to beaffected by changing environmental conditions, with unknown consequences for plant water stress and eco-system carbon, water and energy fluxes. Here we present a simple leaf energy balance that characterizes theeffect of deposition and the evaporation of dew on leaf energy balance, transpiration, and carbon uptake. Themodel is driven by five common meteorological variables and shows very good agreement with leaf wetnesssensor data from the Blue Oak Ranch Reserve in California. We explore the tradeoffs between energy, water, andcarbon balances for leaves of different sizes across a range of relative humidity, wind speed, and air temperatureconditions. Our results show significant water savings from transpiration suppression up to 25% for leaf char-acteristic lengths of 50 cm. CO2 assimilation is decreased by up to 12% by the presence of dew, except for biggerleaves in windspeed conditions below 1m s−1 when an increase in assimilation is expected.
1. Introduction
Non-meteoric water (dew or fog) is an often-overlooked componentof surface water balance for many landscapes. Dew in particular canoccur in virtually every climate and ecosystem worldwide, from thearid Negev Desert of Israel (Zangvil, 1996; Hill et al., 2015), to floodedrice paddies of China (Xu et al., 2015), semi-arid costal steppes of Spain(Uclés et al., 2013), American wheat fields (Pinter, 1986), lushNorthern European lawns (Monteith, 1957; Jacobs et al., 2006), andtropical forests (Clus et al., 2008; Lakatos et al., 2012). Non-meteoricwater can affect the water balance of plants directly through foliaruptake (Yates and Hutley, 1995; Andrade, 2003; Lakatos et al., 2012;Berkelhammer et al., 2013), and can act as a major water source forvegetation where fresh water is scarce (Agam and Berliner, 2006; Cluset al., 2008). Some species that lack access to soil water – includingepiphytic bromeliads (Andrade, 2003; Gotsch et al., 2015; Pan andWang, 2014) and lichens (Lakatos et al., 2012) – have physical featuresallowing them to collect dew water. Most plant species, however, have
water-repellent leaves (Neinhuis and Barthlott, 1997) that are adaptedto shed water rather than trapping and imbibing it. Non-meteoric waterdeposition can impose risk on plants: in cold climates it may freeze,damaging leaf tissue (Jordan and Smith, 1994), and in warm environ-ments it may cause rotting and facilitate pathogen infection (Evanset al., 1992). As a response, many species have developed waxy, hy-drophobic cuticles (Holloway, 1994) that force water droplets to beadup and roll off the leaf. However, the capacity for droplets to drain offthe leaf can be very small (Gao and McCarthy, 2006), in spite of highcontact angles between droplet and leaf surface (Holder, 2012b).Therefore, during dew events, micro-droplets of water may sometimesform on the surface of even hydrophobic leaves (Holder, 2012b;Aparecido et al., 2017).
The accumulation of dew droplets on leaf surfaces directly affectsleaf energy balance through evaporative cooling, changes in albedo,and changes in emissivity. These factors – and their interactions – leadto transpiration suppression – a collective term that describes reduc-tions in leaf-level transpiration (Tolk et al., 1995; Gerlein-Safdi et al.,
https://doi.org/10.1016/j.agrformet.2018.05.015Received 2 August 2017; Received in revised form 10 May 2018; Accepted 21 May 2018
⁎ Corresponding author at: University of Michigan, Department of Climate and Space Sciences and Engineering, 2517C SRB, 2455 Hayward Street, Ann Arbor, MI 48109, USA.E-mail address: [email protected] (C. Gerlein-Safdi).
Agricultural and Forest Meteorology 259 (2018) 305–316
Available online 28 May 20180168-1923/ © 2018 Elsevier B.V. All rights reserved.
T
2018). There is growing interest in transpiration suppression duringinteractions between leaves and non-meteoric water (Barradas andGlez-Medellín, 1999; Alvarado-Barrientos et al., 2014), but the im-portance of transpiration suppression to leaf water status and the spe-cific manner by which dew deposition affects leaf energy, water, andcarbon balances and the magnitude of these effects are still poorly re-solved.
The leaf energy balance is often considered at steady state, a con-dition when energy inputs due to net shortwave radiation, K (Wm−2),and incoming longwave radiation, Lin (Wm−2), are balanced by theenergy losses due to outgoing longwave radiation, Lout (Wm−2), sen-sible heat transfers due to convection, H (Wm−2), and latent energytransfers associated with the exothermic evaporation of liquid waterwithin the leaf, λE (Wm−2), where λ is the latent heat of vaporizationof water (J kg−1) (Gates, 1980; Vogel, 2012). The steady state energybalance can be expressed as (Campbell and Norman, 1998):
+ = + +K L λE H Lin out (1)
which can be simplified to:
= +R λE H,n (2)
where Rn = K + Lin− Lout is the net radiation (Wm−2). Because theleaf energy loss processes are temperature-dependent, a steady stateenergy balance implies a steady state leaf temperature. In naturalecosystems, this leaf temperature is generally warmer than surroundingair, due to the high radiative fluxes leaves experience, and their lowthermal mass (Li et al., 2013). Smaller leaves tend to be at a tem-perature closer to the ambient air, because their boundary layer isthinner, facilitating convective heat exchange (Givnish, 1987; Scoffoniet al., 2011). For this reason, and because high leaf temperatures canimpede photosynthesis or even result in leaf mortality, sun-exposedleaves are often smaller than shaded leaves (Gates, 1980).
The λE term in Eq. (1) couples steady-state leaf energy balance tosteady-state plant water balance, because evaporating water in leavesmust be replaced by transport of water to the leaf via the xylem. Indeed,plants open their stomata to allow CO2 to diffuse in, with an inevitableloss of water as water vapor diffuses out. This water loss leads to eva-porative cooling, which plays an important role in balancing solar ra-diative forcing (Pieruschka et al., 2010). When plant available water isinsufficient to meet lead water demand under ambient environmentalconditions, leaf transpiration rates are reduced through stomatal clo-sure, which leads to a new steady-state energy balance with a higherleaf temperature. Thus, drought conditions, which restrict leaf watersupply, elevate leaf temperature, causing a trade-off between waterconservation and temperature management (Rodriguez-Dominguezet al., 2016). Non-meteoric water on a leaf surface, however, increases -and externalizes – the water supply available for evaporative cooling(Chu et al., 2012), potentially alleviating this tradeoff. In the presenceof non-meteoric leaf water, the leaf energy balance equation is mod-ified:
= + +R λE H E ,n dew (3)
and evaporation of the dew (Edew) provides an additional leaf energysink. Applying this estimate to typical dew deposition volumes(0.5 mm/day (Monteith, 1963; Clus et al., 2008), with peak values of0.8 mm/day reported in some tropical forests (Andrade, 2003; Lakatoset al., 2012)) suggests that dew evaporation could satiate ≈1/6 ofpotential transpiration in tropical areas, less in arid climates (Monteith,1963). These estimates, however, neglect two additional impacts ofdew deposition on leaves: (1) wet leaves have higher albedos, whichreduces K (Pinter, 1986); and (2) wet leave have a lower temperature,because of the cooling provided by dew evaporation which lowersfluxes of water (λE, Edew) and energy (H) from the leaf. Because dewformed before dawn can persist for up to 6 h after sunrise (Abtew andMelesse, 2012; Monteith, 1957) and dew may also form in the lateafternoon before sunset (Wilson et al., 1999; Kabela et al., 2009),
albedo and evaporative cooling effects can last for a considerable por-tion of the day (Aparecido et al., 2017), shortening the duration ofwater stress experienced by plants.
Dew deposition events are spatially extensive, and may occur si-multaneously over areas of thousands of squared kilometers (de Jeuet al., 2005). Even small changes in leaf energy, water, and carbonbalances on such scales can imply large landscape-scale impacts. Theubiquity of dew events across ecosystems and climates, includingduring drought events, points to potentially important implications oftranspiration suppression from dew for drought survival (Yang et al.,2017) and plant community composition (Gauslaa, 2014; McLaughlinet al., 2017). Indeed, transpiration suppression by dew can help plantsmaintain healthy leaf water status during soil droughts (Madeira et al.,2002; Proctor, 2012). Key drivers of dew deposition, however, espe-cially air temperature and relative humidity, are expected to changerapidly with climate change (Cook et al., 2014), especially in tropicalforests (Malhi and Wright, 2004; Nepstad et al., 2008), and will likelycause changes in the frequency and amount of dew deposition(Vuollekoski et al., 2015; Tomaszkiewicz et al., 2016). For example,reduced dew formation was a key feature of the 2005 mega-drought inthe Amazon (Frolking et al., 2011). Non-climate drivers of globalchange such as deforestation also impact dew and fog formation byraising temperatures and lowering humidity (Moreira et al., 1997; Rayet al., 2006). The ecological impact of such changes in dew formationregimes is unclear. Although dew formation is included in many globalclimate models (Rosenzweig and Abramopoulos, 1997), its interactionwith vegetation carbon, energy, and water balance is not usuallyevaluated, which represents a missing climate-ecosystem feedback inevaluations of global change. However, including the interaction ofvegetation with non-meteoric water in global climate models requiresthe development and testing of biophysical models of dew deposition,dew evaporation, and the consequences for leaf level carbon, energyand water balance.
Some important components of such a model have been developedin different contexts: (i) informing the design of dew collection systemsto supplement water supply; and (ii) modeling effects of dew on agri-cultural disease risks. Independently, these efforts have provided de-tailed energy balance descriptions of synthetic condenser systems(Nikolayev et al., 1996; Jacobs et al., 2002; Richards, 2009; Maestre-Valero et al., 2012; Beysens, 2016) and the duration of leaf wetness onplant leaves (Janssen and Römer, 1991; Evans et al., 1992; Sentelhaset al., 2008; Schmitz and Grant, 2009; Bregaglio et al., 2010; Kim et al.,2010). The aim of this study is to link insight from these models to eachother in order to develop a representation of the leaf carbon, energy,and water balance that provides a framework for interrogating the leaf-level physiological implications of dew deposition. To this end, wepropose a new leaf energy balance model that incorporates both thedeposition and the evaporation of dew. The energy balance model iscoupled to a dynamic stomatal conductance and leaf carbon assimila-tion model that tracks the effect of the presence of dew on leaf tem-perature, transpiration, and CO2 uptake. To test the model, we firstlypresent the results of a calibration experiment that relates the voltagereading on commercially available capacitance leaf wetness sensors tothe mass of water accumulated on the surfaces of plant leaves exposedto the same conditions of humidity and temperature. The resultingcalibration relationship is then used to infer the mass of dew stored on anetwork of similar leaf wetness sensors deployed across a range ofelevation, vegetation, and topographic settings at Blue Oak Ranch Re-serve, near San Jose California. Web camera images are used to identifya set of dew and low-density fog events, and leaf wetness sensor outputis used to test model predictions based on locally observed temperatureand humidity during these events. The model is then applied to quantifytranspiration suppression and changes in CO2 assimilation rates fromdew deposition.
C. Gerlein-Safdi et al. Agricultural and Forest Meteorology 259 (2018) 305–316
306
2. Materials and methods
2.1. Modeling the effects of dew on a leaf
2.1.1. Energy balanceHere, we present a process-based model of dew deposition on the
adaxial surface of the leaf and dew evaporation, and its effect on leaftemperature, transpiration, and CO2 uptake by coupling the heatequation to a dew mass balance equation (Richards, 2009; Vuollekoskiet al., 2015). The heat equation describes the energy balance in terms ofits effects on plant leaf temperature, as follows:
+ = + − −T C m C m S R P S H S λEddt
( ) ,leafl l d d l n lat l l (4)
where Tleaf, Cl, and ml are the leaf temperature in °C, leaf specific heatcapacity in J kg−1 K−1, and leaf mass in kg, respectively. Cd, and md arethe specific heat capacity and mass of dew accumulated on the leaf. Sl isthe surface area of the leaf in m2, and Rn, H, and λE are in Wm−2, andPlat is Edew (Eq. (3)) expressed in W.
The net radiation Rn is described as:
=
⎧
⎨
⎪⎪⎪⎪
⎩
⎪⎪⎪⎪
− +
+ + −
+ +
>
− +
+ +
− +
=R
α R
σ T
σ T
m
α R
σ T
σ T
m
(1 ) (ϵ ϵ
ϵ ϵ ) ( 273.2) (ϵ
ϵ ) ( 273.2) ,
if 0
(1 ) ϵ (ϵ
ϵ ) ( 273.2)
2 ϵ ( 273.2) ,
if 0n
dew sw w atm
l surr air4
l
w leaf4
d
dry sw l atm
surr air4
l leaf4
d
(5)
where the first term on the right hand side is the incoming shortwaveradiation K, the second is the incoming longwave radiation Lin, and thethird term is the outgoing longwave radiation Lout. ϵw (no units) is theeffective emissivity of dew water, ϵl (no units) is the effective emissivityof the dry leaf, ϵatm (no units) is the effective emissivity of the atmo-sphere defined as (Kustas et al., 1527):
= +e T Tϵ 0.642( ( )/( 273.2))atm c air air1/7, and ϵsurr (no units) is the effective
emissivity of the surroundings as seen by the abaxial side of the leaf andis here taken to be equal to ϵl. αdew and αdry are the albedo of a wet anda dry leaf (no units), respectively, σ is the Stefan-Boltzman constant inWm−2 K−4, and Tair is the temperature of the air in °C. For simplicity,the difference in albedo between wet and dry leaves is treated cate-gorically rather than a function of dew amount. A list of parameters isavailable in Table 1.
Using the Penman–Monteith equation, the evaporative cooling fromtranspiration is described as (Rodriguez-Iturbe and Porporato, 2004):
= −λE ρ g λ e T e TP
0.622 ( ) ( ) ,air v vsat leaf c air
(6)
where ρair is the density of air in kgm−3, P is the atmospheric pressurein Pa, esat is the saturation vapor pressure in Pa, ec is the vapor pressurein Pa, λv is the latent heat of vaporization in J kg−1 defined as afunction of temperature (in °C) as (Dingman, 2002): λv = 106 ×(2.5–2.36 × 10⁻³ × T), and gv is the total conductance defined as:
=+
gg g
g g,v
h s
h s (7)
with gs the stomatal conductance and gh the conductance of theboundary layer to water vapor, all three expressed in m s−1. The con-ductance of the boundary layer can be described as a function of theheat transfer coefficient, hc (Incropera et al., 2007; Schymanski et al.,2013):
=g hρ C Nh
c
air a Le2/3 (8)
with Ca is the heat capacity of air, equal to 1010 J kg−1 K−1. NLe is thedimensionless Lewis number, defined as the ratio of thermal diffusivityto mass diffusivity: =N ,α
DLeava
with αa the thermal diffusivity of air(m2 s−1) depending on the boundary layer temperature Tb =(Tair + Tleaf)/2 as: αa = (Tb+ 273.2) 1.32 × 10⁻⁷ − 1.73 × 10⁻⁵ andDva is the diffusivity of water vapor in air (m2 s−1): Dva = (Tb+ 273.2)1.49 × 10⁻⁷ − 1.96 × 10⁻⁵. The heat transfer coefficient hc(W K−1 m−2) can be described as:
Table 1List of parameters used in Section 2.
Parameter Value Unit Description Relevant equations
αdew 0.1 Albedo of a wet leaf (5)αdry 0.5 Albedo of a dry leaf (5)ϵw 0.97 Emissivity of water (5)ϵl 0.95 Emissivity of a dry leaf (5)γ0 34.6× 10⁻⁶ mol mol−1 CO2 compensation point at T0 (15)γ1 0.0451 K−1 (15)γ2 0.000347 K−2 (15)ρair 1.225 kgm−3 Density of air (6), (8), (18)σ 5.670373×10⁻⁸ Wm− K−4 Stefan–Boltzman constant (5)cair 400× 10−6 mol mol−1 CO2 concentration of air (12), (20)Ca 1005 J kg−1 K−1 Heat capacity of air (8)Cl 3750 J kg−1 K−1 Leaf heat capacity (4)Cd 4181.3 J kg−1 K−1 Heat capacity of liquid water (4)Hkc 59 430 Jmol−1 Activation energy for Kc (27)Hko 36,000 Jmol−1 Activation energy for Ko (27)Hvv 116,300 Jmol−1 Activation energy for Vc,max (26)Hdv 202,900 Jmol−1 Deactivation energy for Vc,max (26)Hvj 79,500 Jmol−1 Activation energy for Jmax (29)Hdj 201,000 Jmol−1 Deactivation energy for Jmax (29)Jmax,0 17.6 J m−2 Electron transport capacity at T0 (29)Kc,0 302× 10−6 mol mol−1 Michaelis–Menten coefficients for CO2 at T0 (27)Ko,0 256× 10−3 mol mol−1 Michaelis–Menten coefficients for O2 at T0 (27)MH2O 0.0182 kgmol−1 Molar mass of water (19)NPr 0.71 Prandtl number for air (10)Oc 0.21 mol mol−1 Oxygen mole fraction in chloroplast (23)R 8.314 Jmol−1 K−1 Ideal gas constant (13), (21), (25)Sv 650 Jmol−1 Entropy term (26), (29)T0 293.2 K Reference temperature (15), (26)Vc,max,0 50×10−6 mol m−2 s−1 Maximum carboxylation rate at T0 (25), (26)
C. Gerlein-Safdi et al. Agricultural and Forest Meteorology 259 (2018) 305–316
307
=h k NL
,c aNu
l (9)
where ka is the thermal conductivity of air in the boundary layer inWK−1 m−1 described as (Schymanski et al., 2013): ka = (T+273.2)× 6.84 × 10−5 + 5.62 × 10⁻³, Ll is the characteristic length of theleaf in m, taken to be equal to the leaf width (Schymanski and Or,2016), and NNu is the dimensionless Nusselt number, the ratio of con-vective to conductive heat transfer across the boundary layer:
=N N N0.664 ,Nu Re1/2
Pr1/3 (10)
with NPr the dimensionless Prandtl number, equal to 0.71 for air, andNRe is the Reynolds number, defined as the ratio of inertial forces toviscous forces within a fluid:
=N u Lν
,Rel
air (11)
with u the wind velocity in m s−1, and νair is the kinetic viscosity of theair in m s−1, here taken to be a function of temperature using theempirical relation (Schymanski et al., 2013): νair = (T+273.2) × 9 ×10−8 − 1.13 × 10⁻⁵
For the description of the stomatal conductance, we use an opti-mized expression of gs. Optimized stomatal conductance models aim atreflecting the conflict between increased carbon uptake and limitedwater losses in plants (Wolf et al., 2016). In these models, stomatalconductance is usually described as a function of carbon assimilation,An, atmospheric CO2 concentration, cair, and water vapor deficit (VPD),D as a function of A
c Dn
air(Vico et al., 2013; Medlyn et al., 2011). Al-
though fairly new, these models have been overall very performant indescribing stomatal response to environmental conditions during theday (Lloyd and Farquhar, 1994; Dewar et al., 2017). Here, we choose(Vico et al., 2013) expressions for optimized stomatal aperture, gs,mol
(expressed in mol m−2 s−1) under rubisco and RuBP regeneration lim-itations:
=
⎧
⎨
⎪⎪
⎩⎪⎪
> >
× > >g
D A
D A
, if 0 and 0, under rubisco limitation
3 , if 0 and 0, under RuBP regeneration limitation
0, otherwise
Ac D
cλ
Ac D λ
s,mol
nair
air1.6 m
n
nair
1.6 Γ*m n
(12)
Stomatal conductance in mol m−2 s−1 can then be transformed tom s−1 as:
=gR T
Pgs
leaf,Ks,mol (13)
In this expression, An is expressed in mol m−2 s−1 and described later inEq. (31), cair is the CO2 concentration of air, set here to400×10−6 mol mol−1, and λm is the marginal water use efficiencytaken to be: =λ λ c
cm m,0air
air,0with cair,0 = 380×10−6 mol mol−1 and
λm,0= 400 × 10−6 mol mol−1 (Vico et al., 2013). D (no unit) is de-fined as:
= ⎛⎝
− ⎞⎠
D e T e TP
max 0, ( ) ( )sat leaf c air
(14)
with P, esat, and ec as described above. Finally, Γ* is the CO2 compen-sation point (mol mol−1) calculated as a function of leaf temperatureTleaf,K in K as:
= + − + −γ γ T T γ T TΓ* [1 ( ) ( ) ].0 1 leaf,K 0 2 leaf,K 02 (15)
The sensible heat flux in and out of the leaf is described as:
= −H h T T2 ( ),c leaf air (16)
which is positive (energy flux out of the leaf) when the leaf is hotterthan the ambient air, and negative (flux into the leaf) when the leaf iscooler than the air. Finally, when dew is present, the latent energydissipated from evaporating dew or accumulated from condensing dew
is:
=⎧⎨⎩
>
<P
λ T
λ T
( ) , if 0
( ) , if 0
mt
mt
mt
mt
latv leaf
dd
dd
c leafd
dd
d
d d
d d(17)
with md the dew mass (kg) and λc the latent heat of condensation(J kg−1) and is equal to λv. The dew mass balance can be written asfollows:
= ⎡⎣
− ⎤⎦
m S ρ g e T e TP
ddt
0.622 ( ) ( ) ,dl air h
c air sat leaf
(18)
Note that in Eq. (18), the esat and the ec have opposite signs compared tothe expression of transpiration (Eq. (6)) because we are counting dewcondensation positively and evaporation negatively.
2.1.2. Modeling net assimilationWater use efficiency (WUE) is the ratio of CO2 flux into the leaf over
the water vapor flux out of the leaf:
= AE
WUE ,n
mol (19)
where Emol is the transpiration flux expressed in mol m−2 s−1 andwhich is easily calculated from λE as described in Eq. (6):
=E λEλ Mmol v H2O
, with MH O2 the molar mass of water equal to0.0182 kgmol−1. For An, the net flux of CO2 (mol m−2 s−1) we use themodel described in (Rodriguez-Iturbe and Porporato, 2004):
= −A g c c( ),n sba air i (20)
where ci is the intercellular CO2 concentration within the leaf(mol mol−1), and gsba (mol m−2 s−1) is the equivalent conductancecorresponding to the stomatal (gs), boundary layer (gh), and mesophyll(gm) conductances to CO2 put in series:
=+ +
g 1R Tg P
R Tg P g
sba 1.6 1.37 1leaf,K
s
leaf,K
h m (21)
with atmospheric pressure P in Pa, Tleaf,K the leaf temperature in K, andgh and gs the boundary layer and stomatal conductances to water vaporexpressed in m s−1 and as described in Eqs. (8) and (13), respectively.The mesophyll conductance to CO2 can be described as a function ofleaf temperature using the following empirical relation (Buckley et al.,2014):
= ⎡⎣⎢
⎛⎝
⎞⎠
⎤⎦⎥
g T0.18 exp 0.71027 ln36.75m
leaf2
(22)
with Tleaf in oC and gm in mol m−2 s−1. In addition, An can also bedescribed as the minimum of the rubisco-limited and the light-limitedassimilation rates. The rubisco limitation can be described as(Rodriguez-Iturbe and Porporato, 2004):
= −+ +
−A V cc K O K
RΓ*(1 / )
,n,c c,maxi
i c c ol (23)
and the RuBP regeneration limitation caused by light limitation:
= −+
−A J cc
RΓ*4 ( 2Γ*)
,n,qi
il (24)
Γ* is the CO2 compensation point (mol mol−1) calculated as a functionof leaf temperature as described in Eq. (15). Rl (mol m−2 s−1) is thenon-photorespiratory CO2 release in the light and is calculated as afunction of leaf temperature following the expression (Schymanski andOr, 2016):
= ⎡⎣⎢
− ⎤⎦⎥
−R VR T
0.0089 exp 18.72 46.3910l c,max,0 3
leaf,K (25)
Vc,max is the maximum carboxylation rate (mol m−2 s−1) described as:
C. Gerlein-Safdi et al. Agricultural and Forest Meteorology 259 (2018) 305–316
308
=⎡⎣
− ⎤⎦
+ ⎡⎣
⎤⎦
−
( )V V
exp 1
1 exp,
H TT
S T HR T
c,max c,max,0RT
vv0
0leaf,K
v leaf,K dv
leaf,K (26)
Kc and Ko are the Michaelis–Menten coefficients (mol mol−1) for CO2
and O2, respectively and are described as (where x is either c or o):
⎜ ⎟= ⎡
⎣⎢
⎛⎝
− ⎞⎠
⎤
⎦⎥K K
H TT
expRT
1 .x x,0k
0
0
leaf,K
x
(27)
J is the electron transport rate given by the lower root of the quadraticequation:
− + + =κ J κ Q J J κ Q J( ) 0,12
2 max 2 max (28)
= =κ κwith 0.95, 0.25 and,1 2
=⎡⎣
− ⎤⎦
+ ⎡⎣
⎤⎦
−
( )J J
exp 1
1 exp,
H TT
S T HR T
max max,0RT
vj
00
leaf,K
v leaf,K dj
leaf,K (29)
and Q (mol photons m−2 s−1) the absorbed photon irradiance, whichcan be calculated from incoming shortwave radiation as (Buckley et al.,2014; Schymanski and Or, 2016): = ×− −Q 10 α R6 (1 )
0.5666sw , with α taken
to be either αdew or αdry depending on whether dew is present or not.To calculate An, we replace ci in Eqs. (23) and (24) by its expression
derived from Eq. (20). Isolating An, we obtain two expressions for An,c
and An,q (Schymanski and Or, 2016)
⎜ ⎟ ⎜
⎟
= ⎛⎝
+ + ⎞⎠
− +
− ⎛⎝
⎛⎝
+ + ⎞⎠
+ ⎞⎠
− ⎛⎝
⎛⎝
− + − ⎞⎠
+ − ⎞⎠
= + − +
− + + − − + −
( )( ) ( )
A c K
c K g R c K g
R V V
A c
c g R c g R J J
1
1 2 1 2Γ*
2
( 2Γ*)
16(( 2Γ*) ) (8 ( 4Γ*) 8 )
OK
g R V
OK
OK
g R J
n,c air cco
sba2
l2
c,max2
12 air c
co sba l
2air c
co sba
l c,max c,max
n,q airsba2
l2 8
18 air sba l 2 air sba l
(30)
and
=A A Amin( , )n n,c n,q (31)
2.2. Model testing
To test the dew deposition and evaporation components of the de-rived model, we considered a suite of data collected on a leaf wetnesssensor network deployed at the Blue Oak Ranch Reserve near San Jose,California. Leaf wetness sensors were originally developed to identifyrisks of plant foliar disease under wet leaf conditions (Chungu et al.,2001; Dalla Marta et al., 2005, 2007; Rossi et al., 2008; Gil et al., 2011).Contemporary leaf wetness sensors mimic key thermodynamic and
surface properties of leaves such as hydrophobicity and total heat ca-pacity. They have a dielectric constant that is altered by the presence ofwater on the sensor surface (Letts and Mulligan, 2005; Gil et al., 2011;Berkelhammer et al., 2013). The dielectric constant can be calibratedagainst the mass of water on the sensor surface for a given excitationvoltage, providing quantitative information about water inputs andleaf-level storage (Cobos, 2013). What remains unclear is the robustnessof the relationships between the sensor output, the evolution of thewater mass on the sensor surface, and the water mass present on plantleaves under the same conditions. Thus, before interpreting the leafwetness sensor network outputs in terms of masses of water accumu-lating on the sensors – and thus potentially surrounding plant leaves – acalibration experiment is necessary.
2.2.1. Field dataAn array of over 57 wireless sensor nodes is deployed at the Blue
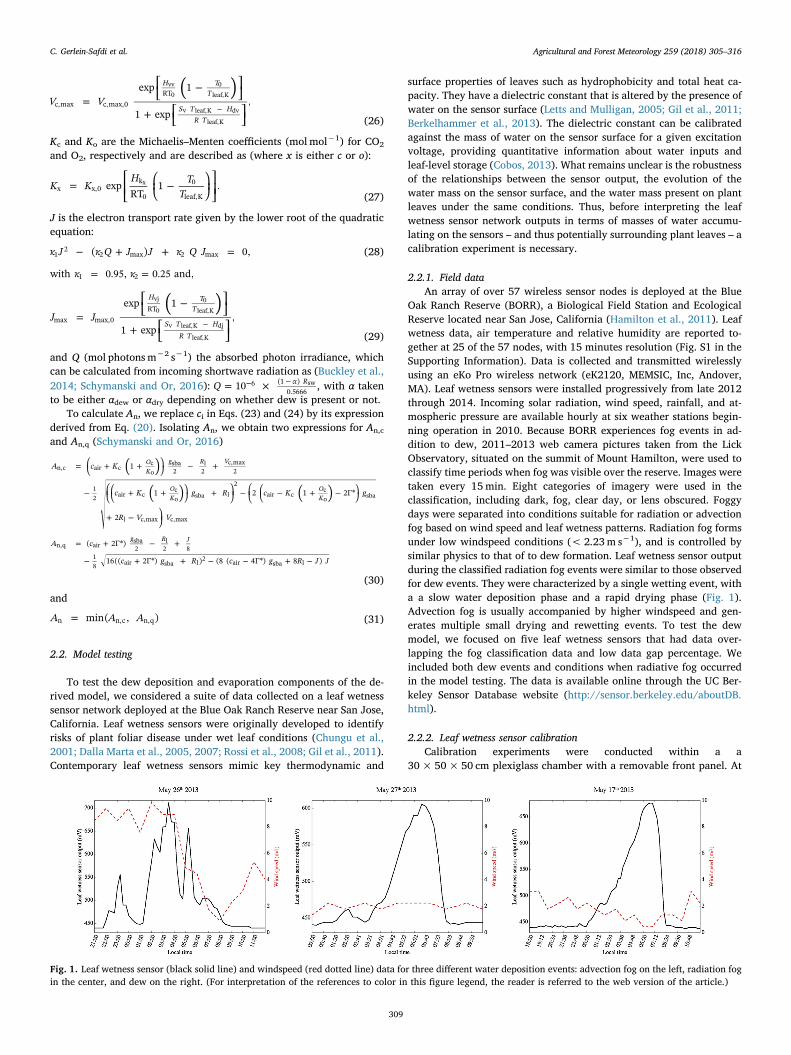
Oak Ranch Reserve (BORR), a Biological Field Station and EcologicalReserve located near San Jose, California (Hamilton et al., 2011). Leafwetness data, air temperature and relative humidity are reported to-gether at 25 of the 57 nodes, with 15 minutes resolution (Fig. S1 in theSupporting Information). Data is collected and transmitted wirelesslyusing an eKo Pro wireless network (eK2120, MEMSIC, Inc, Andover,MA). Leaf wetness sensors were installed progressively from late 2012through 2014. Incoming solar radiation, wind speed, rainfall, and at-mospheric pressure are available hourly at six weather stations begin-ning operation in 2010. Because BORR experiences fog events in ad-dition to dew, 2011–2013 web camera pictures taken from the LickObservatory, situated on the summit of Mount Hamilton, were used toclassify time periods when fog was visible over the reserve. Images weretaken every 15min. Eight categories of imagery were used in theclassification, including dark, fog, clear day, or lens obscured. Foggydays were separated into conditions suitable for radiation or advectionfog based on wind speed and leaf wetness patterns. Radiation fog formsunder low windspeed conditions (< 2.23m s−1), and is controlled bysimilar physics to that of to dew formation. Leaf wetness sensor outputduring the classified radiation fog events were similar to those observedfor dew events. They were characterized by a single wetting event, witha a slow water deposition phase and a rapid drying phase (Fig. 1).Advection fog is usually accompanied by higher windspeed and gen-erates multiple small drying and rewetting events. To test the dewmodel, we focused on five leaf wetness sensors that had data over-lapping the fog classification data and low data gap percentage. Weincluded both dew events and conditions when radiative fog occurredin the model testing. The data is available online through the UC Ber-keley Sensor Database website (http://sensor.berkeley.edu/aboutDB.html).
2.2.2. Leaf wetness sensor calibrationCalibration experiments were conducted within a a
30× 50×50 cm plexiglass chamber with a removable front panel. At
Fig. 1. Leaf wetness sensor (black solid line) and windspeed (red dotted line) data for three different water deposition events: advection fog on the left, radiation fogin the center, and dew on the right. (For interpretation of the references to color in this figure legend, the reader is referred to the web version of the article.)
C. Gerlein-Safdi et al. Agricultural and Forest Meteorology 259 (2018) 305–316
309
the bottom of the panel, an ultrasonic mist generator (NHKR, M-011)with> 300mL/h capacity was floated in a water reservoir, and coveredwith a wire screen to prevent water splashing from the reservoir intothe chamber. Mist generated at the bottom of the chamber was dis-persed using a waterproof fan (JSarci, Scenario 120). A dielectric leafwetness sensor (Decagon, 40020) was mounted horizontally 30 cmabove the floor of the chamber (c. 27 cm above the reservoir watersurface), run using an excitation voltage of 3000mV, and reportedcontinuously to a datalogger (Campbell CR1000).
Leaves of Quercus douglasii (blue oak) and Quercus lobata (valleyoak) were placed horizontally one at a time within the wire cradle in adry chamber. These two species were chosen because they are com-monly found at the BORR research station. The wire cradle was sus-pended at the same level as the leaf wetness sensor. The cradle wassuspended from a load cell (Measurement Specialties, Inc., FN3280)located outside the chamber. Mass readings from the load cell werecontinuously logged throughout the experiment, and the load cell wascalibrated at the beginning and end of each experimental run. Once theload cell readings stabilized, the ultrasonic mist generator and fan werestarted, the chamber was sealed, and the load cell and wetness sensorreadings logged over 45min. Visually, the chamber reached a homo-geneously ‘foggy’ condition within 45 s of starting the experiment.While the experiment ran, we measured the dry weight of a polyvinylalcohol cloth. At the conclusion of the experiment, we swabbed bothsurfaces of the leaf wetness sensor with the cloth and weighed the clothto estimate the mass of water accumulated on the sensor.
We measured the surface area of the tested leaves as follows: theleaves were firstly flattened and fastened to a white background with aone cm2 reference square marked on it in black. The sheets werescanned in an optical scanner, converted to a binary (black and whiteimage) and the black pixel count associated with the leaf used to esti-mate the surface area. Seven and eight different leaves were tested forfor Q. douglasii and Q. lobata, respectively. Control runs were also madewith no leaf in place to allow the mass change associated with fogdeposition on the cradle to be determined. The mass changes in theabsence of leaves were negligible, suggesting that no significant de-position of water on the wire cradle occurred.
The logged data were subjected to a series of quality assurancesteps. The mass calibration performed at the beginning and end of eachtrial was used to correct for sensor drift during the trial by imposing alinear drift term that was subtracted from the measured data. 95%confidence intervals on the load cell measurements were made based on
repeat measures, and propagated into all subsequent computationsusing the R qpcR package. Where the total mass of water accumulatedon the leaf surface during the experimental trial fell within the 95%confidence interval for the leaf dry mass (i.e. a low signal to noise ratio,primarily occurring on leaves with a small surface area), the data wasexcluded from subsequent analysis.
2.3. Model experiments
We first look at the influence of leaf size and dew deposition amounton transpiration and CO2 assimilation. Meteorological data for a typicalday at BORR were chosen (Fig. S2 in the Supporting Information) andthe model was run for different characteristic leaf lengths, Ll (Eq. (9)).We vary the dew deposition amount at dawn and model transpirationand assimilation during a full diurnal cycle. We compare these results tothe transpiration and assimilation of a dry leaf in the same environ-mental conditions.
We then explore the effects of a changing climate by varying re-lative humidity, wind speed and air temperature. We use the diurnaltime series of air temperature, pressure, and solar radiation presentedabove (Fig. S2 in the Supporting Information) and run the model for aset of wind speeds from 0.1 to 5m s−1 and relative humidities from 1 to100%. Relative humidity and windspeed are kept constant for the entirediurnal cycle. We set the dew deposition amount at dawn to 0.4 kg/m2
and calculate the decrease in transpiration and CO2 assimilation asso-ciated with the presence of dew, compared to diurnal transpiration andassimilation levels of a dry leaf. We also record leaf wetness duration.To reproduce the warming expected in the Tropics by the end of the21st century (Cook et al., 2014), we repeat the experiment with an airtemperature 5 °C higher than recorded air temperature. The experimentis conducted for leaf characteristic lengths Ll (Eq. (9)) of 1 and 50 cm.
3. Results and discussion
3.1. Laboratory leaf wetness measurements
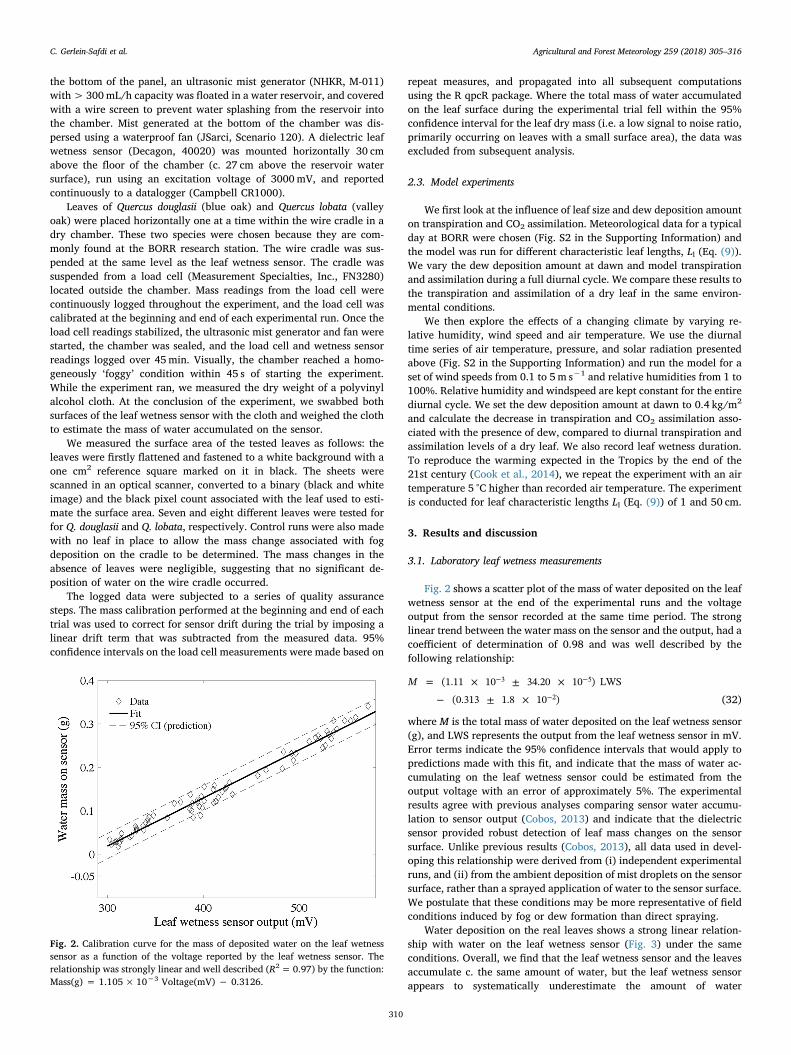
Fig. 2 shows a scatter plot of the mass of water deposited on the leafwetness sensor at the end of the experimental runs and the voltageoutput from the sensor recorded at the same time period. The stronglinear trend between the water mass on the sensor and the output, had acoefficient of determination of 0.98 and was well described by thefollowing relationship:
= × ± ×
− ± ×
− −
−
M (1.11 10 34.20 10 ) LWS
(0.313 1.8 10 )
3 5
2 (32)
where M is the total mass of water deposited on the leaf wetness sensor(g), and LWS represents the output from the leaf wetness sensor in mV.Error terms indicate the 95% confidence intervals that would apply topredictions made with this fit, and indicate that the mass of water ac-cumulating on the leaf wetness sensor could be estimated from theoutput voltage with an error of approximately 5%. The experimentalresults agree with previous analyses comparing sensor water accumu-lation to sensor output (Cobos, 2013) and indicate that the dielectricsensor provided robust detection of leaf mass changes on the sensorsurface. Unlike previous results (Cobos, 2013), all data used in devel-oping this relationship were derived from (i) independent experimentalruns, and (ii) from the ambient deposition of mist droplets on the sensorsurface, rather than a sprayed application of water to the sensor surface.We postulate that these conditions may be more representative of fieldconditions induced by fog or dew formation than direct spraying.
Water deposition on the real leaves shows a strong linear relation-ship with water on the leaf wetness sensor (Fig. 3) under the sameconditions. Overall, we find that the leaf wetness sensor and the leavesaccumulate c. the same amount of water, but the leaf wetness sensorappears to systematically underestimate the amount of water
Fig. 2. Calibration curve for the mass of deposited water on the leaf wetnesssensor as a function of the voltage reported by the leaf wetness sensor. Therelationship was strongly linear and well described (R2= 0.97) by the function:Mass(g) = 1.105× 10⁻³ Voltage(mV) − 0.3126.
C. Gerlein-Safdi et al. Agricultural and Forest Meteorology 259 (2018) 305–316
310
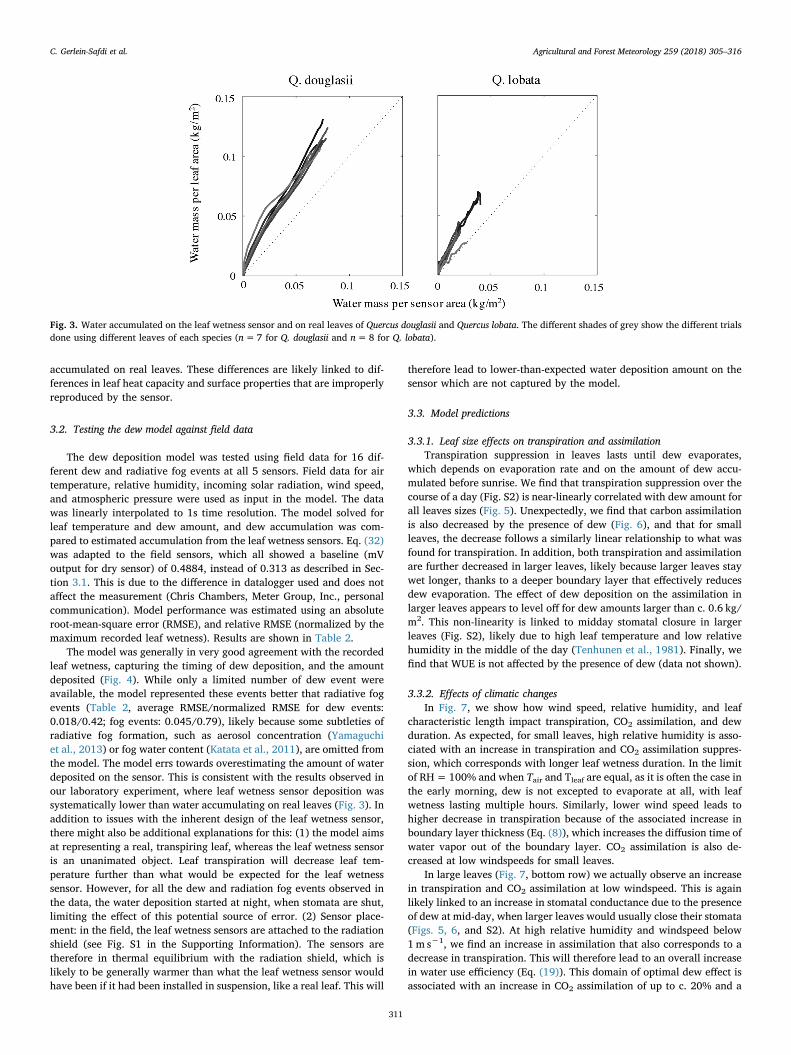
accumulated on real leaves. These differences are likely linked to dif-ferences in leaf heat capacity and surface properties that are improperlyreproduced by the sensor.
3.2. Testing the dew model against field data
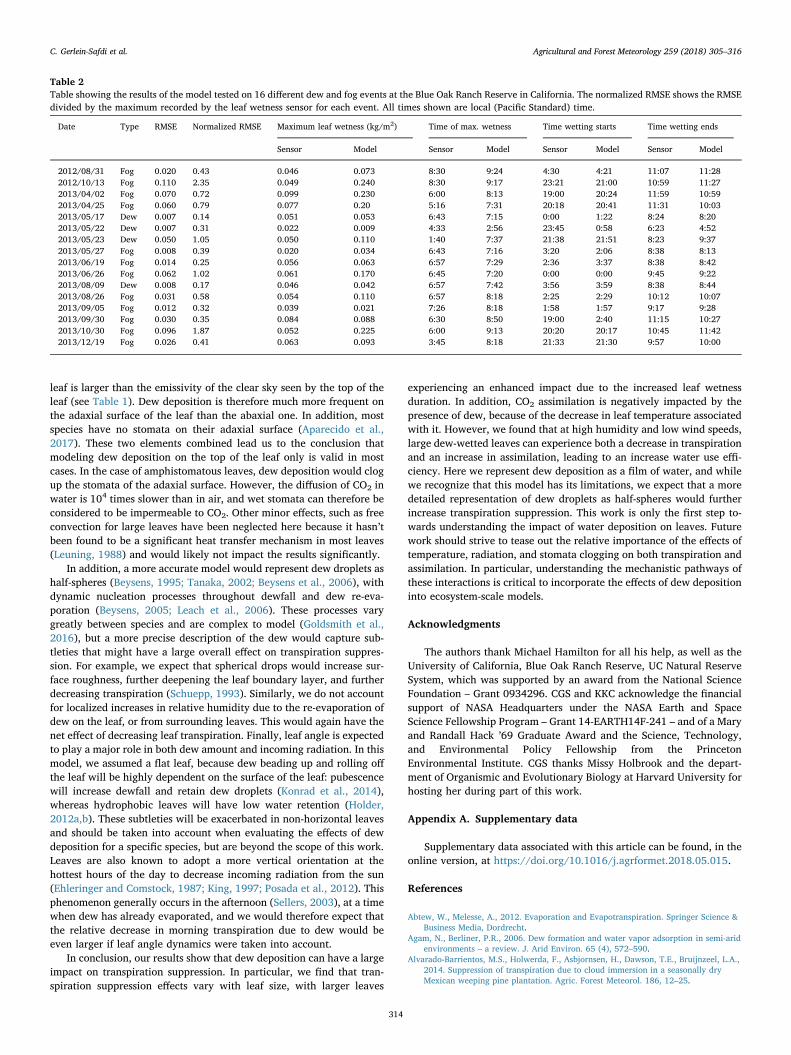
The dew deposition model was tested using field data for 16 dif-ferent dew and radiative fog events at all 5 sensors. Field data for airtemperature, relative humidity, incoming solar radiation, wind speed,and atmospheric pressure were used as input in the model. The datawas linearly interpolated to 1s time resolution. The model solved forleaf temperature and dew amount, and dew accumulation was com-pared to estimated accumulation from the leaf wetness sensors. Eq. (32)was adapted to the field sensors, which all showed a baseline (mVoutput for dry sensor) of 0.4884, instead of 0.313 as described in Sec-tion 3.1. This is due to the difference in datalogger used and does notaffect the measurement (Chris Chambers, Meter Group, Inc., personalcommunication). Model performance was estimated using an absoluteroot-mean-square error (RMSE), and relative RMSE (normalized by themaximum recorded leaf wetness). Results are shown in Table 2.
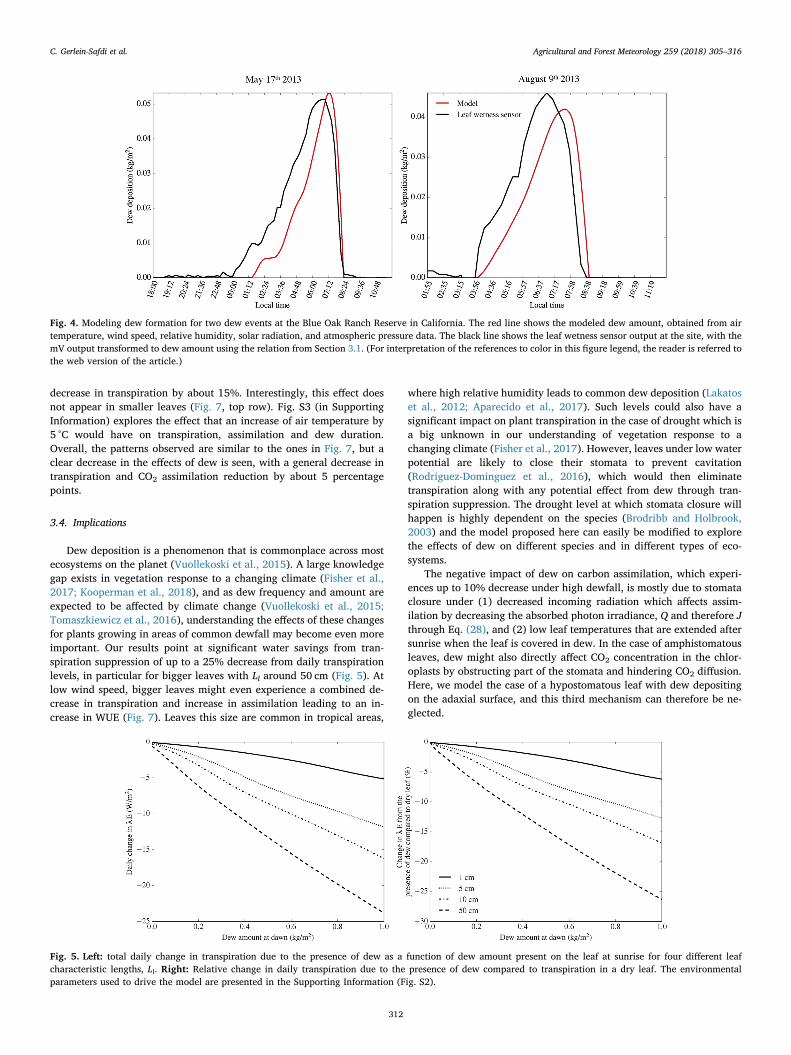
The model was generally in very good agreement with the recordedleaf wetness, capturing the timing of dew deposition, and the amountdeposited (Fig. 4). While only a limited number of dew event wereavailable, the model represented these events better that radiative fogevents (Table 2, average RMSE/normalized RMSE for dew events:0.018/0.42; fog events: 0.045/0.79), likely because some subtleties ofradiative fog formation, such as aerosol concentration (Yamaguchiet al., 2013) or fog water content (Katata et al., 2011), are omitted fromthe model. The model errs towards overestimating the amount of waterdeposited on the sensor. This is consistent with the results observed inour laboratory experiment, where leaf wetness sensor deposition wassystematically lower than water accumulating on real leaves (Fig. 3). Inaddition to issues with the inherent design of the leaf wetness sensor,there might also be additional explanations for this: (1) the model aimsat representing a real, transpiring leaf, whereas the leaf wetness sensoris an unanimated object. Leaf transpiration will decrease leaf tem-perature further than what would be expected for the leaf wetnesssensor. However, for all the dew and radiation fog events observed inthe data, the water deposition started at night, when stomata are shut,limiting the effect of this potential source of error. (2) Sensor place-ment: in the field, the leaf wetness sensors are attached to the radiationshield (see Fig. S1 in the Supporting Information). The sensors aretherefore in thermal equilibrium with the radiation shield, which islikely to be generally warmer than what the leaf wetness sensor wouldhave been if it had been installed in suspension, like a real leaf. This will
therefore lead to lower-than-expected water deposition amount on thesensor which are not captured by the model.
3.3. Model predictions
3.3.1. Leaf size effects on transpiration and assimilationTranspiration suppression in leaves lasts until dew evaporates,
which depends on evaporation rate and on the amount of dew accu-mulated before sunrise. We find that transpiration suppression over thecourse of a day (Fig. S2) is near-linearly correlated with dew amount forall leaves sizes (Fig. 5). Unexpectedly, we find that carbon assimilationis also decreased by the presence of dew (Fig. 6), and that for smallleaves, the decrease follows a similarly linear relationship to what wasfound for transpiration. In addition, both transpiration and assimilationare further decreased in larger leaves, likely because larger leaves staywet longer, thanks to a deeper boundary layer that effectively reducesdew evaporation. The effect of dew deposition on the assimilation inlarger leaves appears to level off for dew amounts larger than c. 0.6 kg/m2. This non-linearity is linked to midday stomatal closure in largerleaves (Fig. S2), likely due to high leaf temperature and low relativehumidity in the middle of the day (Tenhunen et al., 1981). Finally, wefind that WUE is not affected by the presence of dew (data not shown).
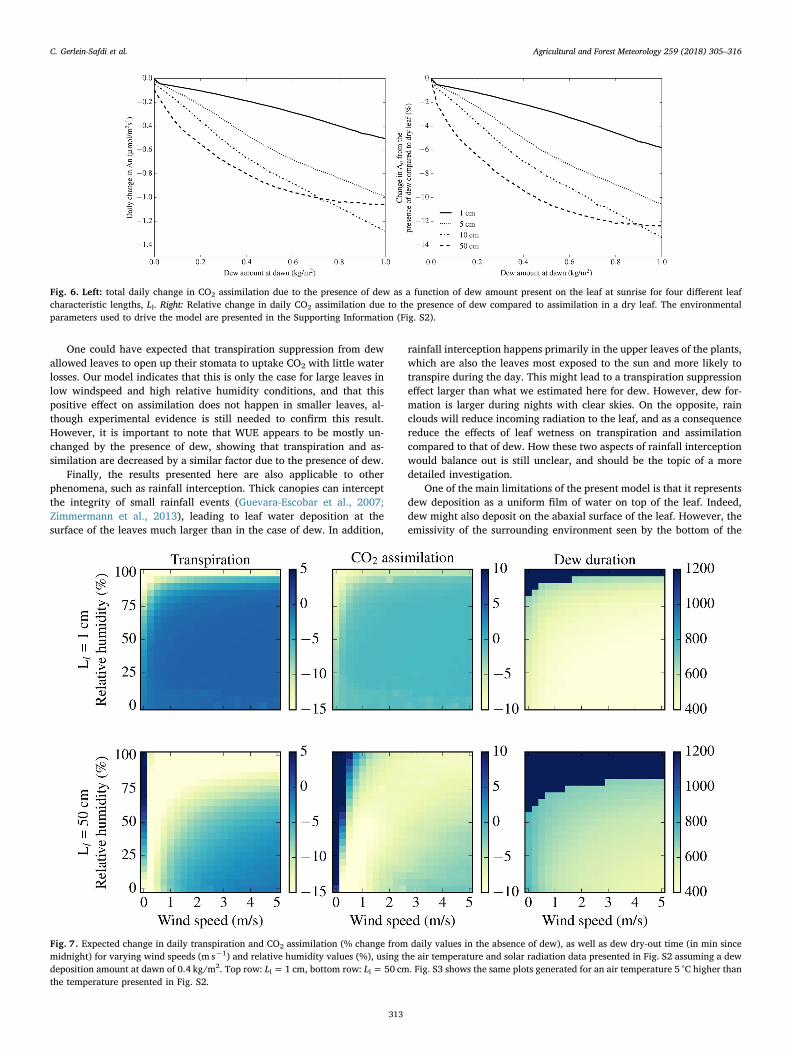
3.3.2. Effects of climatic changesIn Fig. 7, we show how wind speed, relative humidity, and leaf
characteristic length impact transpiration, CO2 assimilation, and dewduration. As expected, for small leaves, high relative humidity is asso-ciated with an increase in transpiration and CO2 assimilation suppres-sion, which corresponds with longer leaf wetness duration. In the limitof RH=100% and when Tair and Tleaf are equal, as it is often the case inthe early morning, dew is not excepted to evaporate at all, with leafwetness lasting multiple hours. Similarly, lower wind speed leads tohigher decrease in transpiration because of the associated increase inboundary layer thickness (Eq. (8)), which increases the diffusion time ofwater vapor out of the boundary layer. CO2 assimilation is also de-creased at low windspeeds for small leaves.
In large leaves (Fig. 7, bottom row) we actually observe an increasein transpiration and CO2 assimilation at low windspeed. This is againlikely linked to an increase in stomatal conductance due to the presenceof dew at mid-day, when larger leaves would usually close their stomata(Figs. 5, 6, and S2). At high relative humidity and windspeed below1m s−1, we find an increase in assimilation that also corresponds to adecrease in transpiration. This will therefore lead to an overall increasein water use efficiency (Eq. (19)). This domain of optimal dew effect isassociated with an increase in CO2 assimilation of up to c. 20% and a
Fig. 3. Water accumulated on the leaf wetness sensor and on real leaves of Quercus douglasii and Quercus lobata. The different shades of grey show the different trialsdone using different leaves of each species (n=7 for Q. douglasii and n=8 for Q. lobata).
C. Gerlein-Safdi et al. Agricultural and Forest Meteorology 259 (2018) 305–316
311
decrease in transpiration by about 15%. Interestingly, this effect doesnot appear in smaller leaves (Fig. 7, top row). Fig. S3 (in SupportingInformation) explores the effect that an increase of air temperature by5 °C would have on transpiration, assimilation and dew duration.Overall, the patterns observed are similar to the ones in Fig. 7, but aclear decrease in the effects of dew is seen, with a general decrease intranspiration and CO2 assimilation reduction by about 5 percentagepoints.
3.4. Implications
Dew deposition is a phenomenon that is commonplace across mostecosystems on the planet (Vuollekoski et al., 2015). A large knowledgegap exists in vegetation response to a changing climate (Fisher et al.,2017; Kooperman et al., 2018), and as dew frequency and amount areexpected to be affected by climate change (Vuollekoski et al., 2015;Tomaszkiewicz et al., 2016), understanding the effects of these changesfor plants growing in areas of common dewfall may become even moreimportant. Our results point at significant water savings from tran-spiration suppression of up to a 25% decrease from daily transpirationlevels, in particular for bigger leaves with Ll around 50 cm (Fig. 5). Atlow wind speed, bigger leaves might even experience a combined de-crease in transpiration and increase in assimilation leading to an in-crease in WUE (Fig. 7). Leaves this size are common in tropical areas,
where high relative humidity leads to common dew deposition (Lakatoset al., 2012; Aparecido et al., 2017). Such levels could also have asignificant impact on plant transpiration in the case of drought which isa big unknown in our understanding of vegetation response to achanging climate (Fisher et al., 2017). However, leaves under low waterpotential are likely to close their stomata to prevent cavitation(Rodriguez-Dominguez et al., 2016), which would then eliminatetranspiration along with any potential effect from dew through tran-spiration suppression. The drought level at which stomata closure willhappen is highly dependent on the species (Brodribb and Holbrook,2003) and the model proposed here can easily be modified to explorethe effects of dew on different species and in different types of eco-systems.
The negative impact of dew on carbon assimilation, which experi-ences up to 10% decrease under high dewfall, is mostly due to stomataclosure under (1) decreased incoming radiation which affects assim-ilation by decreasing the absorbed photon irradiance, Q and therefore Jthrough Eq. (28), and (2) low leaf temperatures that are extended aftersunrise when the leaf is covered in dew. In the case of amphistomatousleaves, dew might also directly affect CO2 concentration in the chlor-oplasts by obstructing part of the stomata and hindering CO2 diffusion.Here, we model the case of a hypostomatous leaf with dew depositingon the adaxial surface, and this third mechanism can therefore be ne-glected.
Fig. 4. Modeling dew formation for two dew events at the Blue Oak Ranch Reserve in California. The red line shows the modeled dew amount, obtained from airtemperature, wind speed, relative humidity, solar radiation, and atmospheric pressure data. The black line shows the leaf wetness sensor output at the site, with themV output transformed to dew amount using the relation from Section 3.1. (For interpretation of the references to color in this figure legend, the reader is referred tothe web version of the article.)
Fig. 5. Left: total daily change in transpiration due to the presence of dew as a function of dew amount present on the leaf at sunrise for four different leafcharacteristic lengths, Ll. Right: Relative change in daily transpiration due to the presence of dew compared to transpiration in a dry leaf. The environmentalparameters used to drive the model are presented in the Supporting Information (Fig. S2).
C. Gerlein-Safdi et al. Agricultural and Forest Meteorology 259 (2018) 305–316
312
One could have expected that transpiration suppression from dewallowed leaves to open up their stomata to uptake CO2 with little waterlosses. Our model indicates that this is only the case for large leaves inlow windspeed and high relative humidity conditions, and that thispositive effect on assimilation does not happen in smaller leaves, al-though experimental evidence is still needed to confirm this result.However, it is important to note that WUE appears to be mostly un-changed by the presence of dew, showing that transpiration and as-similation are decreased by a similar factor due to the presence of dew.
Finally, the results presented here are also applicable to otherphenomena, such as rainfall interception. Thick canopies can interceptthe integrity of small rainfall events (Guevara-Escobar et al., 2007;Zimmermann et al., 2013), leading to leaf water deposition at thesurface of the leaves much larger than in the case of dew. In addition,
rainfall interception happens primarily in the upper leaves of the plants,which are also the leaves most exposed to the sun and more likely totranspire during the day. This might lead to a transpiration suppressioneffect larger than what we estimated here for dew. However, dew for-mation is larger during nights with clear skies. On the opposite, rainclouds will reduce incoming radiation to the leaf, and as a consequencereduce the effects of leaf wetness on transpiration and assimilationcompared to that of dew. How these two aspects of rainfall interceptionwould balance out is still unclear, and should be the topic of a moredetailed investigation.
One of the main limitations of the present model is that it representsdew deposition as a uniform film of water on top of the leaf. Indeed,dew might also deposit on the abaxial surface of the leaf. However, theemissivity of the surrounding environment seen by the bottom of the
Fig. 6. Left: total daily change in CO2 assimilation due to the presence of dew as a function of dew amount present on the leaf at sunrise for four different leafcharacteristic lengths, Ll. Right: Relative change in daily CO2 assimilation due to the presence of dew compared to assimilation in a dry leaf. The environmentalparameters used to drive the model are presented in the Supporting Information (Fig. S2).
Fig. 7. Expected change in daily transpiration and CO2 assimilation (% change from daily values in the absence of dew), as well as dew dry-out time (in min sincemidnight) for varying wind speeds (m s−1) and relative humidity values (%), using the air temperature and solar radiation data presented in Fig. S2 assuming a dewdeposition amount at dawn of 0.4 kg/m2. Top row: Ll = 1 cm, bottom row: Ll = 50 cm. Fig. S3 shows the same plots generated for an air temperature 5 °C higher thanthe temperature presented in Fig. S2.
C. Gerlein-Safdi et al. Agricultural and Forest Meteorology 259 (2018) 305–316
313
leaf is larger than the emissivity of the clear sky seen by the top of theleaf (see Table 1). Dew deposition is therefore much more frequent onthe adaxial surface of the leaf than the abaxial one. In addition, mostspecies have no stomata on their adaxial surface (Aparecido et al.,2017). These two elements combined lead us to the conclusion thatmodeling dew deposition on the top of the leaf only is valid in mostcases. In the case of amphistomatous leaves, dew deposition would clogup the stomata of the adaxial surface. However, the diffusion of CO2 inwater is 104 times slower than in air, and wet stomata can therefore beconsidered to be impermeable to CO2. Other minor effects, such as freeconvection for large leaves have been neglected here because it hasn’tbeen found to be a significant heat transfer mechanism in most leaves(Leuning, 1988) and would likely not impact the results significantly.
In addition, a more accurate model would represent dew droplets ashalf-spheres (Beysens, 1995; Tanaka, 2002; Beysens et al., 2006), withdynamic nucleation processes throughout dewfall and dew re-eva-poration (Beysens, 2005; Leach et al., 2006). These processes varygreatly between species and are complex to model (Goldsmith et al.,2016), but a more precise description of the dew would capture sub-tleties that might have a large overall effect on transpiration suppres-sion. For example, we expect that spherical drops would increase sur-face roughness, further deepening the leaf boundary layer, and furtherdecreasing transpiration (Schuepp, 1993). Similarly, we do not accountfor localized increases in relative humidity due to the re-evaporation ofdew on the leaf, or from surrounding leaves. This would again have thenet effect of decreasing leaf transpiration. Finally, leaf angle is expectedto play a major role in both dew amount and incoming radiation. In thismodel, we assumed a flat leaf, because dew beading up and rolling offthe leaf will be highly dependent on the surface of the leaf: pubescencewill increase dewfall and retain dew droplets (Konrad et al., 2014),whereas hydrophobic leaves will have low water retention (Holder,2012a,b). These subtleties will be exacerbated in non-horizontal leavesand should be taken into account when evaluating the effects of dewdeposition for a specific species, but are beyond the scope of this work.Leaves are also known to adopt a more vertical orientation at thehottest hours of the day to decrease incoming radiation from the sun(Ehleringer and Comstock, 1987; King, 1997; Posada et al., 2012). Thisphenomenon generally occurs in the afternoon (Sellers, 2003), at a timewhen dew has already evaporated, and we would therefore expect thatthe relative decrease in morning transpiration due to dew would beeven larger if leaf angle dynamics were taken into account.
In conclusion, our results show that dew deposition can have a largeimpact on transpiration suppression. In particular, we find that tran-spiration suppression effects vary with leaf size, with larger leaves
experiencing an enhanced impact due to the increased leaf wetnessduration. In addition, CO2 assimilation is negatively impacted by thepresence of dew, because of the decrease in leaf temperature associatedwith it. However, we found that at high humidity and low wind speeds,large dew-wetted leaves can experience both a decrease in transpirationand an increase in assimilation, leading to an increase water use effi-ciency. Here we represent dew deposition as a film of water, and whilewe recognize that this model has its limitations, we expect that a moredetailed representation of dew droplets as half-spheres would furtherincrease transpiration suppression. This work is only the first step to-wards understanding the impact of water deposition on leaves. Futurework should strive to tease out the relative importance of the effects oftemperature, radiation, and stomata clogging on both transpiration andassimilation. In particular, understanding the mechanistic pathways ofthese interactions is critical to incorporate the effects of dew depositioninto ecosystem-scale models.
Acknowledgments
The authors thank Michael Hamilton for all his help, as well as theUniversity of California, Blue Oak Ranch Reserve, UC Natural ReserveSystem, which was supported by an award from the National ScienceFoundation – Grant 0934296. CGS and KKC acknowledge the financialsupport of NASA Headquarters under the NASA Earth and SpaceScience Fellowship Program – Grant 14-EARTH14F-241 – and of a Maryand Randall Hack ’69 Graduate Award and the Science, Technology,and Environmental Policy Fellowship from the PrincetonEnvironmental Institute. CGS thanks Missy Holbrook and the depart-ment of Organismic and Evolutionary Biology at Harvard University forhosting her during part of this work.
Appendix A. Supplementary data
Supplementary data associated with this article can be found, in theonline version, at https://doi.org/10.1016/j.agrformet.2018.05.015.
References
Abtew, W., Melesse, A., 2012. Evaporation and Evapotranspiration. Springer Science &Business Media, Dordrecht.
Agam, N., Berliner, P.R., 2006. Dew formation and water vapor adsorption in semi-aridenvironments – a review. J. Arid Environ. 65 (4), 572–590.
Alvarado-Barrientos, M.S., Holwerda, F., Asbjornsen, H., Dawson, T.E., Bruijnzeel, L.A.,2014. Suppression of transpiration due to cloud immersion in a seasonally dryMexican weeping pine plantation. Agric. Forest Meteorol. 186, 12–25.
Table 2Table showing the results of the model tested on 16 different dew and fog events at the Blue Oak Ranch Reserve in California. The normalized RMSE shows the RMSEdivided by the maximum recorded by the leaf wetness sensor for each event. All times shown are local (Pacific Standard) time.
Date Type RMSE Normalized RMSE Maximum leaf wetness (kg/m2) Time of max. wetness Time wetting starts Time wetting ends
Sensor Model Sensor Model Sensor Model Sensor Model
2012/08/31 Fog 0.020 0.43 0.046 0.073 8:30 9:24 4:30 4:21 11:07 11:282012/10/13 Fog 0.110 2.35 0.049 0.240 8:30 9:17 23:21 21:00 10:59 11:272013/04/02 Fog 0.070 0.72 0.099 0.230 6:00 8:13 19:00 20:24 11:59 10:592013/04/25 Fog 0.060 0.79 0.077 0.20 5:16 7:31 20:18 20:41 11:31 10:032013/05/17 Dew 0.007 0.14 0.051 0.053 6:43 7:15 0:00 1:22 8:24 8:202013/05/22 Dew 0.007 0.31 0.022 0.009 4:33 2:56 23:45 0:58 6:23 4:522013/05/23 Dew 0.050 1.05 0.050 0.110 1:40 7:37 21:38 21:51 8:23 9:372013/05/27 Fog 0.008 0.39 0.020 0.034 6:43 7:16 3:20 2:06 8:38 8:132013/06/19 Fog 0.014 0.25 0.056 0.063 6:57 7:29 2:36 3:37 8:38 8:422013/06/26 Fog 0.062 1.02 0.061 0.170 6:45 7:20 0:00 0:00 9:45 9:222013/08/09 Dew 0.008 0.17 0.046 0.042 6:57 7:42 3:56 3:59 8:38 8:442013/08/26 Fog 0.031 0.58 0.054 0.110 6:57 8:18 2:25 2:29 10:12 10:072013/09/05 Fog 0.012 0.32 0.039 0.021 7:26 8:18 1:58 1:57 9:17 9:282013/09/30 Fog 0.030 0.35 0.084 0.088 6:30 8:50 19:00 2:40 11:15 10:272013/10/30 Fog 0.096 1.87 0.052 0.225 6:00 9:13 20:20 20:17 10:45 11:422013/12/19 Fog 0.026 0.41 0.063 0.093 3:45 8:18 21:33 21:30 9:57 10:00
C. Gerlein-Safdi et al. Agricultural and Forest Meteorology 259 (2018) 305–316
314
Andrade, J.L., 2003. Dew deposition on epiphytic bromeliad leaves: an important event ina Mexican tropical dry deciduous forest. J. Trop. Ecol. 19 (5), 479–488.
Aparecido, L.M.T., Miller, G.R., Cahill, A.T., Moore, G.W., 2017. Leaf surface traits andwater storage retention affect photosynthetic responses to leaf surface wetness amongwet tropical forest and semiarid savanna plants. Tree Physiol. 37 (10), 1285–1300.
Barradas, V.L., Glez-Medellín, M.G., 1999. Dew and its effect on two heliophile under-storey species of a tropical dry deciduous forest in Mexico. Int. J. Biometeorol. 43(1), 1–7.
Berkelhammer, M., Hu, J., Bailey, A., Noone, D.C., Still, C.J., Barnard, H., Gochis, D.,Hsiao, G.S., Rahn, T., Turnipseed, A., 2013. The nocturnal water cycle in an open-canopy forest. J. Geophys. Res.: Atmosp. 118 (1), 10225.
Beysens, D., 1995. The formation of dew. Atmosp. Res. 39 (1), 215–237.Beysens, D., 2005. Dew nucleation and growth. Comptes Rendus Phys. 7 (9), 1082–1100.Beysens, D., 2016. Estimating dew yield worldwide from a few meteo data. Atmosp. Res.
167 (C), 146–155.Beysens, D., Steyer, A., Guenoun, P., Fritter, D., Knobler, C.M., 2006. How does dew
form? Phase Trans. 31 (1–4), 219–246.Bregaglio, S., Donatelli, M., Confalonieri, R., Acutis, M., Orlandini, S., 2010. Multi metric
evaluation of leaf wetness models for large-area application of plant disease models.Agric. Forest Meteorol. 151 (9), 1163–1172.
Brodribb, T., Holbrook, N., 2003. Stomatal closure during leaf dehydration, correlationwith other leaf physiological traits. Plant Physiol. 132 (4), 2166–2173.
Buckley, T.N., Martorell, S., Diaz-Espejo, A., Tomas, M., Medrano, H., 2014. Is stomatalconductance optimized over both time and space in plant crowns? A field test ingrapevine (Vitis vinifera). Plant Cell Environ. 37 (12), 2707–2721.
Campbell, G.S., Norman, J.M., 1998. An Introduction to Environmental Biophysics.Springer New York, New York, NY.
Chu, H.-S., Chang, S.-C., Klemm, O., Lai, C.-W., Lin, Y.-Z., Wu, C.-C., Lin, J.Y., Jiang, J.Y.,Chen, J., Gottgens, J.F., Hsia, Y.-J., 2012. Does canopy wetness matter?Evapotranspiration from a subtropical montane cloud forest in Taiwan. Hydrol.Process. 28 (3), 1190–1214.
Chungu, C., Gilbert, J., Townley-Smith, F., 2001. Septoria tritici blotch development asaffected by temperature, duration of leaf wetness, inoculum concentration, and host.Plant Dis. 85 (4), 430–435.
Clus, O., Ortega, P., Muselli, M., Milimouk, I., Beysens, D., 2008. Study of dew watercollection in humid tropical islands. J. Hydrol. 361 (1), 159–171.
Cobos, D.R., 2013. Predicting the Amount of Water on the Surface of the LWS DielectricLeaf Wetness Sensor. Decagon Devices, Inc. Application Note 509-332-5600.
Cook, B.I., Smerdon, J.E., Seager, R., Coats, S., 2014. Global warming and 21st centurydrying. Climate Dyn. 43 (9–10), 2607–2627.
Dalla Marta, A., Magarey, R.D., Martinelli, L., Orlandini, S., 2007. Leaf wetness durationin sunflower (Helianthus annuus): analysis of observations, measurements and simu-lations. Eur. J. Agron. 26 (3), 310–316.
Dalla Marta, A., Magarey, R.D., Orlandini, S., 2005. Modelling leaf wetness duration anddowny mildew simulation on grapevine in Italy. Agric. Forest Meteorol. 132 (1–2),84–95.
de Jeu, R.A.M., Holmes, T.R.H., Owe, M., 2005. Determination of the effect of dew onpassive microwave observations from space. Rem. Sens. Agric. 5976, 51–59.
Dewar, R., Mauranen, A., M“akel”a, A., H“oltt”a, T., Medlyn,B., Vesala, T., 2017. New insights into the covariation of stomatal, mesophyll andhydraulic conductances from optimization models incorporating nonstomatal lim-itations to photosynthesis. New Phytol. 217 (October (2)), 571–585.
Dingman, S.L., 2002. Physical Hydrology, 2nd ed. Waveland Press, Inc.Ehleringer, J.R., Comstock, J., 1987. Leaf absorptance and leaf angle: mechanisms for
stress avoidance. In: Tenhunen, J.D., Catarino, F.M., Lange, O.L., Oechel, W.C. (Eds.),Plant Response to Stress: Functional Analysis in Mediterranean Ecosystems. SpringerBerlin Heidelberg, Berlin, Heidelberg, pp. 55–76. http://dx.doi.org/10.1007/978-3-642-70868-8_3.
Evans, K.J., Nyquist, W.E., Latin, R.X., 1992. A model based on temperature and leafwetness duration for establishment of alternaria leaf-blight of muskmelon.Phytopathology 82 (8), 890–895.
Fisher, J.B., Melton, F., Middleton, E., Hain, C., Anderson, M., Allen, R., McCabe, M.F.,Hook, S., Baldocchi, D., Townsend, P.A., Kilic, A., Tu, K., Miralles, D.D., Perret, J.,Lagouarde, J.-P., Waliser, D., Purdy, A.J., French, A., Schimel, D., Famiglietti, J.S.,Stephens, G., Wood, E.F., 2017. The future of evapotranspiration: global require-ments for ecosystem functioning, carbon and climate feedbacks, agricultural man-agement, and water resources. Water Resour. Res. 53 (4), 2618–2626.
Frolking, S., Milliman, T., Palace, M., Wisser, D., Lammers, R., Fahnestock, M., 2011.Tropical forest backscatter anomaly evident in SeaWinds scatterometer morningoverpass data during 2005 drought in Amazonia. Rem. Sens. Environ. 115 (3),897–907.
Gao, L., McCarthy, T.J., 2006. Contact angle hysteresis explained. Langmuir 22 (14),6234–6237.
Gates, D., 1980. Biophysical Ecology. Springer-Verlag New York.Gauslaa, Y., 2014. Rain, dew, and humid air as drivers of morphology, function and
spatial distribution in epiphytic lichens. Lichenologist 46 (01), 1–16.Gerlein-Safdi, C., Gauthier, P.P.G., Caylor, K.K., 2018. Dew-induced transpiration sup-
pression impacts the water and isotope balances of Colocasia leaves. Oecologia.Gil, R., Bojaca, C.R., Schrevens, E., 2011. Suitability evaluation of four methods to esti-
mate leaf wetness duration in a greenhouse rose crop. Acta Horticult. 797–804.Givnish, T.J., 1987. Comparative studies of leaf form: assessing the relative roles of se-
lective pressures and phylogenetic constraints. New Phytol. 106 (S1), 131–160.Goldsmith, G.R., Bentley, L.P., Shenkin, A., Salinas, N., Blonder, B., Martin, R.E., Castro-
Ccossco, R., Chambi-Porroa, P., Diaz, S., Enquist, B.J., Asner, G.P., Malhi, Y., 2016.Variation in leaf wettability traits along a tropical montane elevation gradient. NewPhytol. 214 (3), 989–1001.
Gotsch, S.G., Nadkarni, N., Darby, A., Glunk, A., Mackenzie, D., Davidson, K., Dawson,T.E., 2015. Life in the treetops: ecophysiological strategies of canopy epiphytes in atropical montane cloud forest. Ecol. Monogr. 85 (3), 393–412.
Guevara-Escobar, A., González-Sosa, E., Véliz-Chávez, C., Ventura-Ramos, E., Ramos-Salinas, M., 2007. Rainfall interception and distribution patterns of gross precipita-tion around an isolated Ficus benjamina tree in an urban area. J. Hydrol. 333 (2–4),532–541.
Hamilton, M.P., Dawson, T.E., Thompson, S.E., 2011. The very large ecological array.AGU Fall Meeting Abstracts, Abstract B14A-08.
Hill, A.J., Dawson, T.E., Shelef, O., Rachmilevitch, S., 2015. The role of dew in NegevDesert plants. Oecologia 178 (2), 317–327.
Holder, C.D., 2012a. Effects of leaf hydrophobicity and water droplet retention on canopystorage capacity. Ecohydrology 6 (3), 483–490.
Holder, C.D., 2012b. The relationship between leaf hydrophobicity, water droplet re-tention, and leaf angle of common species in a semi-arid region of the western UnitedStates. Agric. Forest Meteorol. 152, 11–16.
Holloway, P.J., 1994. chap. Plant cuticles: physiochemical characteristics and biosynth-esis. In: Percy, K., Cape, C.N., Jagels, R., Simpson, C.J. (Eds.), Air Pollutants and theLeaf Cuticle. Springer, Heidelberg, Germany.
Incropera, F.P., DeWitt, D.P., Bergman, T.L., Lavine, A.S., 2007. Fundamentals of Heatand Mass Transfer, 6th ed. John Wiley, Hoboken, NJ.
Jacobs, A.F.G., Heusinkveld, B.G., Berkowicz, S.M., 2002. A simple model for potentialdewfall in an arid region. Atmosp. Res. 64 (1), 285–295.
Jacobs, A.F.G., Heusinkveld, B.G., Wichink Kruit, R.J., Berkowicz, S.M., 2006.Contribution of dew to the water budget of a grassland area in the Netherlands. WaterResour. Res. 42 (3).
Janssen, L.H.J.M., Römer, F.G., 1991. The frequency and duration of dew occurrence overa year: model results compared with measurements. Tellus B 43 (5), 408.
Jordan, D.N., Smith, W.K., 1994. Energy balance analysis of nighttime leaf temperaturesand frost formation in a subalpine environment. Agric. Forest Meteorol. 71 (3),359–372.
Kabela, E.D., Hornbuckle, B.K., Cosh, M.H., Anderson, M.C., Gleason, M.L., 2009. Dewfrequency, duration, amount, and distribution in corn and soybean during SMEX05.Agric. Forest Meteorol. 149 (1), 11–24.
Katata, G., Kajino, M., Hiraki, T., Aikawa, M., 2011. A method for simple and accurateestimation of fog deposition in a mountain forest using a meteorological model. J.Geophys. Res. 116 (20), D20102.
Kim, K.S., Taylor, S.E., Gleason, M.L., Nutter Jr., F.W., Coop, L.B., Pfender, W.F., Seem,R.C., Sentelhas, P.C., Gillespie, T.J., Marta, A.D., Orlandini, S., Dalla Marta, A., 2010.Spatial portability of numerical models of leaf wetness duration based on empiricalapproaches. Agric. Forest Meteorol. 150 (7–8), 871–880.
King, D.A., 1997. The functional significance of leaf angle in Eucalyptus. Aust. J. Bot. 45(4), 619–639.
Konrad, W., Burkhardt, J., Ebner, M., Roth-Nebelsick, A., 2014. Leaf pubescence as apossibility to increase water use efficiency by promoting condensation. Ecohydrology8 (3), 480–492.
Kooperman, G.J., Chen, Y., Hoffman, F.M., Koven, C.D., Lindsay, K., Pritchard, M.S.,Swann, A.L.S., Randerson, J.T., 2018. Forest response to rising CO2 drives zonallyasymmetric rainfall change over tropical land. Nat. Climate Change 8 (April (5)),434–440.
Kustas, W.P., Rango, A., Uijlenhoet, R., 1994. A simple energy budget algorithm for thesnowmelt runoff model. Water Resour. Res. 30 (May (5)), 1515–1527.
Lakatos, M., Obregón, A., B”udel, B., Bendix, J., 2012. Midday dew – an over-looked factor enhancing photosynthetic activity of corticolous epiphytes in a wettropical rain forest. New Phytol. 194 (1), 245–253.
Leach, R.N., Stevens, F., Langford, S.C., Dickinson, J.T., 2006. Dropwise condensation:experiments and simulations of nucleation and growth of water drops in a coolingsystem. Langmuir 22 (21), 8864–8872.
Letts, M.G., Mulligan, M., 2005. The impact of light quality and leaf wetness on photo-synthesis in north-west Andean tropical montane cloud forest. J. Trop. Ecol. 21 (05),549–557.
Leuning, R., 1988. Leaf temperatures during radiation frost Part II. A steady state theory.Agric. Forest Meteorol. 42 (2), 135–155.
Li, S., Zhang, Y.-J., Sack, L., Scoffoni, C., Ishida, A., Chen, Y.-J., Cao, K.-F., 2013. Theheterogeneity and spatial patterning of structure and physiology across the leafsurface in giant leaves of Alocasia macrorrhiza. PLoS ONE 8 (6), e66016.
Lloyd, J., Farquhar, G.D., 1994. 13C discrimination during CO2 assimilation by the ter-restrial biosphere. Oecologia 99 (3–4), 201–215.
Madeira, A.C., Kim, K.S., Taylor, S.E., Gleason, M.L., 2002. A simple cloud-based energybalance model to estimate dew. Agric. Forest Meteorol. 111 (1), 55–63.
Maestre-Valero, J.F., Ragab, R., Martínez-Alvarez, V., Baille, A., 2012. Estimation of dewyield from radiative condensers by means of an energy balance model. J. Hydrol.460–461 (C), 103–109.
Malhi, Y., Wright, J., 2004. Spatial patterns and recent trends in the climate of tropicalrainforest regions. Philos. Trans. R. Soc. B: Biol. Sci. 359 (1443), 311–329.
McLaughlin, B.C., Ackerly, D.D., Klos, P.Z., Natali, J., Dawson, T.E., Thompson, S.E.,2017. Hydrologic refugia, plants, and climate change. Global Change Biol. 66,107–121.
Medlyn, B.E., Duursma, R.A., Eamus, D., Ellsworth, D.S., Prentice, I.C., Barton, C.V.M.,Crous, K.Y., De Angelis, P., Freeman, M., Wingate, L., 2011. Reconciling the optimaland empirical approaches to modelling stomatal conductance. Global Change Biol. 17(6), 2134–2144.
Monteith, J.L., 1957. Dew. Q. J. R. Meteorol. Soc. 83, 322–341.Monteith, J.L., 1963. In: Rutter, A.J., Whitehead, F.H. (Eds.), The Water Relations of
Plants. Blackwell Scientific, New York, pp. 37–56.Moreira, M., Sternberg, L., Martinelli, L., Victoria, R., Barbosa, E., Bonates, L., Nepstad,
C. Gerlein-Safdi et al. Agricultural and Forest Meteorology 259 (2018) 305–316
315
D., 1997. Contribution of transpiration to forest ambient vapour based on isotopicmeasurements. Global Change Biol. 3 (5), 439–450.
Neinhuis, C., Barthlott, W., 1997. Characterization and distribution of water-repellent,self-cleaning plant surfaces. Ann. Bot. 79 (6), 667–677.
Nepstad, D.C., Stickler, C.M., Soares-Filho, B., Merry, F., 2008. Interactions amongAmazon land use, forests and climate: prospects for a near-term forest tipping point.Philos. Trans. R. Soc. B: Biol. Sci. 363 (1498), 1737–1746.
Nikolayev, V.S., Beysens, D., Gioda, A., Milimouka, I., Katiushin, E., Morel, J.P., 1996.Water recovery from dew. J. Hydrol. 182 (1), 19–35.
Pan, Y., Wang, X., 2014. Effects of shrub species and microhabitats on dew formation in arevegetationstabilized desert ecosystem in Shapotou, northern China. J. Arid Land 6(4), 389–399.
Pieruschka, R., Huber, G., Berry, J.A., 2010. Control of transpiration by radiation. Proc.Natl. Acad. Sci. U. S. A. 107 (30), 13372–13377.
Pinter Jr., P.J., 1986. Effect of dew on canopy reflectance and temperature. Rem. Sens.Environ. 19 (2).
Posada, J.M., Siev“anen, R., Messier, C., Perttunen, J., Nikinmaa, E., Lechowicz,M.J., 2012. Contributions of leaf photosynthetic capacity, leaf angle and self-shadingto the maximization of net photosynthesis in Acer saccharum: a modelling assess-ment. Ann. Bot. 110 (3), 731–741.
Proctor, M.C.F., 2012. Dew, where and when? ’There are more things in heaven andearth, Horatio, than are dreamt of in your philosophy’. New Phytol. 194 (1), 10–11.
Ray, D.K., Nair, U.S., Lawton, R.O., Welch, R.M., Pielke, R.A., 2006. Impact of land use onCosta Rican tropical montane cloud forests: sensitivity of orographic cloud formationto deforestation in the plains. J. Geophys. Res.: Atmosp. 111 (D), D02108.
Richards, K., 2009. Adaptation of a leaf wetness model to estimate dewfall amount on aroof surface. Agric. Forest Meteorol. 149 (8), 1377–1383.
Rodriguez-Dominguez, C.M., Buckley, T.N., Egea, G., de Cires, A., Hernandez-Santana, V.,Martorell, S., Diaz-Espejo, A., 2016. Most stomatal closure in woody species undermoderate drought can be explained by stomatal responses to leaf turgor. Plant CellEnviron. 39 (9), 2014–2026.
Rodriguez-Iturbe, I., Porporato, A., 2004. Ecohydrology of Water-Controlled Ecosystems.Cambridge University Press, New York.
Rosenzweig, C., Abramopoulos, F., 1997. Land-surface model development for the GISSGCM. J. Climate 10 (8), 2040–2054.
Rossi, V., Caffi, T., Giosu, S., Bugiani, R., 2008. A mechanistic model simulating primaryinfections of downy mildew in grapevine. Ecol. Modell. 212 (3–4), 480–491.
Schmitz, H.F., Grant, R.H., 2009. Precipitation and dew in a soybean canopy: spatialvariations in leaf wetness and implications for Phakopsora pachyrhizi infection. Agric.Forest Meteorol. 149 (10), 1621–1627.
Schuepp, P.H., 1993. Leaf Boundary Layers: Tansley Review no. 59 (Vol. 125). NewPhytologist.
Schymanski, S.J., Or, D., 2016. Wind increases leaf water use efficiency. Plant CellEnviron. 39 (7), 1448–1459.
Schymanski, S.J., Or, D., Zwieniecki, M., 2013. Stomatal control and leaf thermal andhydraulic capacitances under rapid environmental fluctuations. PLoS ONE 8 (1),e54231.
Scoffoni, C., Rawls, M., McKown, A., Cochard, H., Sack, L., 2011. Decline of leaf hydraulicconductance with dehydration: relationship to leaf size and venation architecture.Plant Physiol. 156 (2), 832–843.
Sellers, B., 2003. Diurnal fluctuations and leaf angle reduce glufosinate efficacy. WeedTechnol. 17 (2), 302–306.
Sentelhas, P.C., Dalla Marta, A., Orlandini, S., Santos, E.A., Gillespie, T.J., Gleason, M.L.,2008. Suitability of relative humidity as an estimator of leaf wetness duration. Agric.Forest Meteorol. 148 (3), 392–400.
Tanaka, K., 2002. Multi-layer model of CO2 exchange in a plant community coupled withthe water budget of leaf surfaces. Ecol. Modell. 147 (1), 85–104.
Tenhunen, J.D., Lange, O.L., Braun, M., 1981. Midday stomatal closure in Mediterraneantype sclerophylls under simulated habitat conditions in an environmental chamber –II. Effect of the complex of leaf temperature and air humidity on gas exchange ofArbutus unedo and Quercus ilex. Oecologia 50 (August (1)), 5–11.
Tolk, J.A., Howell, T.A., Steiner, J.L., Krieg, D.R., Schneider, A.D., 1995. Role of tran-spiration suppression by evaporation of intercepted water in improving irrigationefficiency. Irrig. Sci. 16 (2), 89–95.
Tomaszkiewicz, M., Najm, M.A., Beysens, D., Alameddine, I., Zeid, E.B., El-Fadel, M.,2016. Projected climate change impacts upon dew yield in the Mediterranean basin.Sci. Total Environ. 566–567, 1339–1348.
Uclés, O., Villagarcía, L., Moro, M.J., Canton, Y., Domingo, F., 2013. Role of dewfall in thewater balance of a semiarid coastal steppe ecosystem. Hydrol. Process. 28 (4),2271–2280.
Vico, G., Manzoni, S., Palmroth, S., Weih, M., Katul, G., 2013, December. A perspective onoptimal leaf stomatal conductance under CO2 and light co-limitations. Agric. ForestMeteorol. 182–183, 191–199.
Vogel, S., 2012. The Life of a Leaf. The University of Chicago Press.Vuollekoski, H., Vogt, M., Sinclair, V.A., Duplissy, J., J”arvinen, H., Kyrö, E.-M.,
Makkonen, R., Petäjä, T., Prisle1, N.L., Räisänen, P., Sipilä, M., Ylhäisi, J., Kulmala,M., 2015. Estimates of global dew collection potential on artificial surfaces. Hydrol.Earth Syst. Sci. 19 (1), 601–613.
Wilson, T.B., Bland, W.L., Norman, J.M., 1999. Measurement and simulation of dew ac-cumulation and drying in a potato canopy. Agric. Forest Meteorol. 93 (2), 111–119.
Wolf, A., Anderegg, W.R.L., Pacala, S.W., 2016. Optimal stomatal behavior with com-petition for water and risk of hydraulic impairment. PNAS 113 (46), E7222–E7230.
Xu, Y., Yan, B., Tang, J., 2015. The effect of climate change on variations in dew amountin a paddy ecosystem of the Sanjiang Plain, China. Adv. Meteorol. 2015 (2), 1–9.
Yamaguchi, T., Noguchi, I., Watanabe, Y., Katata, G., Sato, H., Hara, H., 2013. Aerosoldeposition and behavior on leaves in cool-temperate deciduous forests. Part 2:characteristics of fog water chemistry and fog deposition in Northern Japan. Asian J.Atmosp. Environ. 7 (1), 8–16.
Yang, X.-D., Lv, G.-H., Ali, A., Ran, Q.-Y., Gong, X.-W., Wang, F., Liu, Z.-D., Qin, L., Liu,W.-G., 2017. Experimental variations in functional and demographic traits of Lappulasemiglabra among dew amount treatments in an arid region. Ecohydrology 10 (6),e1858.
Yates, D.J., Hutley, L.B., 1995. Foliar uptake of water by wet leaves of Sloanea woollsii, anAustralian subtropical rainforest tree. Aust. J. Bot. 43 (2), 157–167.
Zangvil, A., 1996. Six years of dew observations in the Negev Desert, Israel. J. AridEnviron. 32 (4), 361–371.
Zimmermann, B., Zimmermann, A., Scheckenbach, H.L., Schmid, T., Hall, J.S., vanBreugel, M., 2013. Changes in rainfall interception along a secondary forest succes-sion gradient in lowland Panama. Hydrol. Earth Syst. Sci. 17 (11), 4659–4670.
C. Gerlein-Safdi et al. Agricultural and Forest Meteorology 259 (2018) 305–316
316