quantifying the geometry, displacements, and subresolution deformation in thrust-ramp anticlines...
TRANSCRIPT

Dear Author, Please, note that changes made to the HTML content will be added to the article before publication, but are not reflected in this PDF. Note also that this file should not be used for submitting corrections.

Our reference: SG 3099 P-authorquery-v9
AUTHOR QUERY FORM
Journal: SG
Article Number: 3099
Please e-mail or fax your responses and any corrections to:
E-mail: [email protected]
Fax: +31204852789
Dear Author,
Please check your proof carefully and mark all corrections at the appropriate place in the proof (e.g., by using on-screen
annotation in the PDF file) or compile them in a separate list. Note: if you opt to annotate the file with software other than
Adobe Reader then please also highlight the appropriate place in the PDF file. To ensure fast publication of your paper please
return your corrections within 48 hours.
For correction or revision of any artwork, please consult http://www.elsevier.com/artworkinstructions.
Any queries or remarks that have arisen during the processing of your manuscript are listed below and highlighted by flags in
the proof.
Location
in articleQuery / Remark: Click on the Q link to find the query’s location in text
Please insert your reply or correction at the corresponding line in the proof
Q1 Please confirm that given names and surnames have been identified correctly.
Please check this box or indicate
your approval if you have no
corrections to make to the PDF file ,
Thank you for your assistance.

Highlights
� We apply area-depth-strain (ADS) method to ramp anticlines with growth and erosion.� ADS accurately predicts boundary displacements and depth to basal detachment.� Growth and eroded beds have similar ADS plots but differ from pre-deformation beds.� Sand models have up to 17% layer-parallel shortening (LPS) and 3% dilation.� For thrust ramp from Niger Delta, LPS and fault offset are inversely related.
Contents lists available at ScienceDirect
Journal of Structural Geology
journal homepage: www.elsevier .com/locate/ jsg
http://dx.doi.org/10.1016/j.jsg.2014.07.0120191-8141/© 2014 Published by Elsevier Ltd.
Journal of Structural Geology xxx (2014) 1
1234
56789
1011121314151617
SG3099_grabs ■ 30 July 2014 ■ 1/1
Please cite this article in press as: Schlische, R.W., et al., Quantifying the geometry, displacements, and subresolution deformation in thrust-ramp anticlines with growth and erosion: From models to seismic-reflection profile, Journal of Structural Geology (2014), http://dx.doi.org/10.1016/j.jsg.2014.07.012
Quantifying the geometry, displacements, and subresolutiondeformation in thrust-ramp anticlines with growth and erosion: Frommodels to seismic-reflection profile
Q1 Roy W. Schlische a, *, Richard H. Groshong Jr. b, Martha Oliver Withjack a,Triyani N. Hidayah a
a Department of Earth & Planetary Sciences, Rutgers University, 610 Taylor Road, Piscataway, NJ 08854, USAb Consulting Structural Geologist and Professor Emeritus, The University of Alabama, 2504 Twain Drive, Tallahassee, FL 32311, USA
Keywords:Ramp anticlineGrowth bedsUnconformitiesArea-depth-strain relationshipSubresolution deformation
a b s t r a c t
We quantify the evolution of thrust-ramp anticlines exhibiting growth and/or erosion using the area-depth-strain (ADS) method. We illustrate, validate, and explore the limitations of the ADS method fora series of kinematic models and experimental sand (analog) models. We then apply the method to aseismically imaged thrust-ramp anticline from the deep-water Niger Delta. The ADS method allowsdetermination of the boundary displacements, displacement rates, and layer-parallel strains using theexcess areas (areas of marker beds above their regional level) of multiple horizons. The kinematic andexperimental models demonstrate that excess areas for pre-deformation units lie on a straight line on anareaedepth graph, the inverse slope of which is the boundary displacement and the intercept is theelevation of the basal detachment. For growth strata, the line connecting an area-depth value to the valuerepresenting the basal detachment gives the displacement after deposition of that horizon. For partiallyeroded markers, the calculated displacements are less than the actual displacements; however, originallyplanar unconformities yield the displacements that accrued after the formation of the unconformities.The experimental sand models show substantial layer-parallel shortening in the anticlines, displace-ments on the main thrust ramp that are only half the displacement on the basal detachment, and smalltectonic dilations. The seismic example is an area-balanced ramp anticline with clearly defined pre-deformation and growth sequences. Fault separation at the center of the ramp in the pre-deformationinterval is approximately equal to the total boundary displacement but decreases both upward anddownward. The layer-parallel strains have the opposite pattern, with the lowest values at the center ofthe ramp and increasing values both upward and downward.
© 2014 Published by Elsevier Ltd.
1. Introduction
Thrust-ramp anticlines are common structures in regions withdetached shortening, including many deep-water sedimentarybasins (e.g., offshore Nigeria, Fig. 1). In such settings, most thrust-ramp anticlines are growth structures with deposition and/orerosion occurring during the deformation process. Althoughseismic-reflection data provide valuable information about thegeometries of these structures, critical questions remain. Is thestructure, as interpreted, balanced? What is the depth of the
detachment? What is the boundary displacement? What is thegrowth history of the structure? Does the displacement rate changethrough time? How significant is subresolution deformation (e.g.,deformation below seismic resolution), and does it vary withdepth?
In this paper, we conduct a quantitative analysis of growingthrust-ramp anticlines (i.e., structures that have undergone depo-sition and/or erosion during deformation) using the area-depth-strain (ADS) method. The method, a mass-balance technique, al-lows analysis without assuming a specific kinematic or mechanicalmodel (e.g., no assumption that bed length and thickness remainconstant during deformation) (Epard and Groshong, 1993;Groshong and Epard, 1994; Groshong, 2006). The analysis isbased on a graph of excess area of a marker horizon above itsregional level, plotted against the depth of the regional level
* Corresponding author.E-mail addresses: [email protected] (R.W. Schlische), [email protected]
(R.H. Groshong), [email protected] (M.O. Withjack), [email protected](T.N. Hidayah).
Contents lists available at ScienceDirect
Journal of Structural Geology
journal homepage: www.elsevier .com/locate/ jsg
http://dx.doi.org/10.1016/j.jsg.2014.07.0120191-8141/© 2014 Published by Elsevier Ltd.
Journal of Structural Geology xxx (2014) 1e16
123456789101112131415161718192021222324252627282930313233343536373839404142434445464748495051525354
555657585960616263646566676869707172737475767778798081828384858687888990919293949596979899
100101102103104105106107108109110111112113114115116117118119
SG3099_proof ■ 30 July 2014 ■ 1/16
Please cite this article in press as: Schlische, R.W., et al., Quantifying the geometry, displacements, and subresolution deformation in thrust-ramp anticlines with growth and erosion: From models to seismic-reflection profile, Journal of Structural Geology (2014), http://dx.doi.org/10.1016/j.jsg.2014.07.012

relative to a reference level. The ADS method can help verifywhether a structural interpretation is balanced and provides in-dependent information about the detachment depth, the boundarydisplacement, displacement rates, and average layer-parallelstrains (predictors of subresolution deformation and strain parti-tioning). Previous workers have applied the method to detachmentfolds (Epard and Groshong, 1993; Groshong and Epard, 1994;Gonzalez-Mieres and Suppe, 2006, 2011) and fault-bend folds(Groshong et al., 2012; Wiltschko and Groshong, 2012).
In this paper, we apply the ADS method to examples of growingthrust-ramp anticlines that exhibit increasing levels of complexityand uncertainty: 1) kinematic models, 2) experimental (analog)sand models, and 3) a seismically imaged structure from the deep-water Niger Delta (Fig. 1). The kinematic models (involving growthand/or erosion) maintain constant bed length and thickness duringdeformation. The experimental sand models have known boundaryconditions and generally well-constrained bedding and fault ge-ometries. Our analysis shows that bed lengths and thickness are notconserved, some layers exhibit substantial layer-parallel strain, andthe models have undergone small tectonic dilations. The boundarydisplacement is unknown for the seismic example. Our analysisindicates that the profile is area balanced (although not bed-lengthconstant), and that the calculated layer-parallel strains are highestfor those horizons that exhibit the smallest fault separation alongthe thrust ramp.
2. Kinematic models and overview of the ADS method
The kinematic (geometric) models (constructed with the aid ofFaultFold5.4 of Allmendinger, 2006) illustrate different scenarioswith deposition and erosion and provide an overview of the area-depth-strain (ADS) method. Additionally, the kinematic modelsallow us to test the reliability of the method in predicting detach-ment depth and boundary displacement. The fault in the kinematicmodels has a flat-ramp geometry with a ramp dip of 30�. Kink-stylefault-bend folding results from displacement on the non-planarfault. The layers maintain constant bed length and thickness (BLT)during deformation. However, as noted above, constant BLTdeformation is not a prerequisite to using the ADS method.
In the following models, we subdivide the stratigraphy into pre-deformation beds and growth beds. We use the latter term in a broadsense to refer to those layers that accumulate after the onset ofdeformation, including layers that accumulate between periods offault displacement.Markers are the boundaries between beds; they
increase in number from bottom to top; the basal detachment ismarker 0.
2.1. Kinematic model with incremental deformation and deposition
2.1.1. Model setup and evolutionThe first kinematic model (Fig. 2) simulates incremental defor-
mation and deposition. It involves six identical deformation epi-sodes, each with a boundary displacement of 0.25 km; after eachincrement, sedimentation occurs, simulating growth beds havingthe geometry originally described by Suppe et al. (1992). Thegrowth beds are continuous across the section and thin on the crestof the ramp anticline. Pre-deformation layers have undergone atotal boundary displacement of 1.5 km. Each growth bed has un-dergone 0.25 km less boundary displacement than the underlyingbed. Marker 9, the top horizon, has undergone no displacement.The backlimb synclinal axial trace is fixed to the bend between thebasal flat and the ramp. The backlimb anticlinal axial trace migratesup the ramp with increasing displacement; this axial trace is par-allel to the backlimb synclinal hinge in the pre-deformation layers;it has a shallower inclination in the growth beds (Fig. 2bed),forming a growth triangle on the backlimb of the anticline.
2.1.2. Areaedepth relationshipThe ADS method utilizes measurements of excess area (S) of a
marker horizon versus the depth (h) of its regional (the level of theundeformed marker) below the reference level (parameters illus-trated in Fig. 2e) for multiple horizons. Pre-deformation markersyield a straight line (black solid line in Fig. 2) on a graph of areaversus depth:
h ¼ ð1=DÞSþ H (1)
where 1/D is the slope of the line, D is the boundary displacement,and H (the y-intercept of the straight line) is the depth of the basaldetachment below the reference level. The slope of the area-depthline decreases with increasing deformation; therefore, the inverseslope (the boundary displacement) increases with increasingdeformation. For all values of the boundary displacement, the linefor the pre-deformation markers has a y-intercept equal to thedepth of the basal detachment below the reference level, ~2.25 km.
Each growth bed has undergone a different magnitude ofboundary displacement; therefore, each growth bed has an area-depth value that lies along a line with an inverse slope equal to
Fig. 1. Seismic profile showing thrust-ramp anticline from deep-water Niger Delta. Seismic profile is from 3D data set provided by CGG Veritas to the Virtual Seismic Atlas (Butler,2008; Torvela, 2009). No vertical exaggeration assuming an average velocity of 3 km/s.
R.W. Schlische et al. / Journal of Structural Geology xxx (2014) 1e162
1234567891011121314151617181920212223242526272829303132333435363738394041424344454647484950515253545556575859606162636465
66676869707172737475767778798081828384858687888990919293949596979899
100101102103104105106107108109110111112113114115116117118119120121122123124125126127128129130
SG3099_proof ■ 30 July 2014 ■ 2/16
Please cite this article in press as: Schlische, R.W., et al., Quantifying the geometry, displacements, and subresolution deformation in thrust-ramp anticlines with growth and erosion: From models to seismic-reflection profile, Journal of Structural Geology (2014), http://dx.doi.org/10.1016/j.jsg.2014.07.012

the boundary displacement for that marker (for details, see thecaption for Fig. 2). Note that all of the area-depth lines for growthbeds have steeper slopes than the area-depth line for the pre-deformation markers; all lines also intersect the y-axis at thedepth of the basal detachment. Table 1 compares the parametersfor the best-fit lines in Fig. 2d to the actual model parameters. Thebest-fit line for the pre-deformationmarkers does not include area-depth values for marker 0; therefore, the y-intercept of the best-fitline for the pre-deformation markers independently determinesthe detachment depth. This calculated depth is then used with thearea-depth values for the growth markers to calculate their inverseslope (boundary displacement). The calculated and model param-eters differ by only very small amounts (Table 1), reflecting thecumulative effect of small drafting and measurement errors.
2.2. Kinematic model with episodic displacement followed bydeposition
2.2.1. Model setup and evolutionThis kinematic model (Fig. 3) simulates the development of a
ramp anticline with episodic deformation followed by deposition.The model has three distinct deformation episodes, each with aboundary displacement of 0.5 km. The layers deposited immedi-ately after each episode (3e4, 6e7, and 9e10) fill the model to thecrest of the uplift. The next layers are entirely aggradational (4e6,7e9, 10e11). To better illustrate the stratal geometries, we haveadded internal stratigraphic markers within these layers (gray linesin Fig. 3; note the onlap of these markers onto the dipping back-limb). For Stage 3 (Fig. 3c), pre-deformation layers 0-3 have un-dergone a total boundary displacement of 1.5 km; layers 3e6 haveundergone 1.0 km of boundary displacement; layers 6e9 haveundergone 0.5 km of boundary displacement; layers 9e11 haveundergone no boundary displacement. The backlimb anticlinalaxial trace has multiple segments that correspond to the three in-crements of displacement and deposition.
2.2.2. Areaedepth relationshipGroups of markers that have undergone the same displacement
lie along straight lines with inverse slopes equal to the displace-ment for that group of markers (for details, see the caption forFig. 3). The y-intercept for all lines is the depth of the basaldetachment below the reference level, ~2.5 km. As the displace-ment for a group of markers increases, the slope of the area-depthline decreases (i.e., the inverse slope increases). The area-depthlines for pre-deformation layers, therefore, have gentler slopes(greater inverse slopes) than those for layers deposited during thedeformation process. Table 2 compares the parameters for the best-fit lines in Stage 3 (Fig. 3c) to the actual model parameters. Ingenerating the best-fit lines, we omitted area-depth values for thedetachment itself; thus, the y-intercept serves to predict thedetachment depth. The best-fit lines for groups of growth markersalso independently predict the detachment depth. The calculatedand model parameters differ by only small amounts (Table 2),reflecting small drafting and measurement errors.
2.3. Kinematic model with erosion and subsequent displacement
2.3.1. Model setup and evolutionThis kinematic model (Fig. 4) simulates the development of a
ramp anticline with an initial phase of deformation, followed byerosion, followed by renewed deformation. The model initiallyundergoes 0.75 km of boundary displacement (Fig. 4a) followed byerosion of the deformed strata down to the original top level of thesection (Fig. 4b). This produces an angular unconformity, which iscorrelative with the undeformed parts of marker 3. The model then
undergoes an additional boundary displacement of 0.75 km(Fig. 4c). Thus, the unconformity has undergone a boundarydisplacement of 0.75 km. All other markers have undergone aboundary displacement of 1.5 km.
2.3.2. Areaedepth relationshipPrior to erosion (Fig. 4a), all pre-deformationmarkers have area-
depth values that lie along a line with D ¼ 0.75 km. Followingerosion (Fig. 4b), all markers except 1A and 1 undergo partial tocomplete erosion, thus shifting the area-depth values of mostmarkers leftward. After the final increment of boundary displace-ment (Fig. 4c), only uneroded markers 1A and 1 have area-depthvalues that lie on a line with D ¼ 1.5 km. Marker 3, which in-cludes the angular unconformity, has an area-depth value that lieson a line D ¼ 0.75 km, which is the correct total displacement forthat marker. Other markers have area-depth values that lie alonglines with 0.75 km < D < 1.5 km. These apparent displacements(“D”) are less than the actual total boundary displacement (Fig. 4c).Table 3 shows that the imposed and predicted displacements anddetachment depths are nearly identical for the uneroded markers1A and 1 and the unconformity (marker 3). Because the best-fitlines are all based on only two data points, the correlation coeffi-cient (R2) is not a meaningful measure of the goodness-of-fit.
2.4. Layer-parallel strains and measurement error
Because the area-depth graph yields an estimate of boundarydisplacement independent of bed lengths, we can calculate averagelayer-parallel strains using.
e ¼ ðL=ðW þ DÞÞ � 1; (2)
where L is the observed (deformed) bed length and W is the widthof the structure at regional (Fig. 2e illustrates these parameters).Calculated layer-parallel strains for the three kinematic modelsshown in Figs. 2e4 range from �0.88% to þ0.46% (Tables 4e6). Inthe case of erosion (marker 3 in Fig. 4c and Table 6), part of themeasured “bed” length is along the unconformity; thus, the strainrepresents deformation of the preserved marker and its correlativeunconformity. Strain measurements for partially eroded markersare not valid because erosion has removed part of the deformed bedlength.
The layer-parallel strains provide a method for judging thequality of the measurements for the kinematic models with con-stant bed-length and thickness. All values should be zero. Thecomputed values are less than 1% but not zero. Thus, even withcareful drafting and measurement, errors can lead to calculatedstrains of up to 1%. Hence, the strain values have an error of ±1%.
3. Experimental sand models
We next analyze two experimental models with thrust-rampanticlines (Figs. 5 and 6) (Hidayah, 2010). Both models consist ofhomogeneous dry sand with differently colored, but otherwiseidentical, layers. Model A has five episodes of deposition duringdeformation, whereas model B has one episode of erosion duringdeformation. Amaster thrust fault and an associated ramp anticlinedevelop in both models. In model A, the ramp dip is ~40�, slightlysteeper than expected from the angle of internal friction (e.g.,Eisenstadt and Sims, 2005). In model B, the ramp dip is ~30�. Inboth models, backlimbs are characterized by relatively uniformlyspaced, asymmetric shear zones. The shear zones form at the baseof the ramp and move up the ramp as displacement increases. Theshear zones resemble the hanging-wall backthrusts observed by
R.W. Schlische et al. / Journal of Structural Geology xxx (2014) 1e16 3
1234567891011121314151617181920212223242526272829303132333435363738394041424344454647484950515253545556575859606162636465
66676869707172737475767778798081828384858687888990919293949596979899
100101102103104105106107108109110111112113114115116117118119120121122123124125126127128129130
SG3099_proof ■ 30 July 2014 ■ 3/16
Please cite this article in press as: Schlische, R.W., et al., Quantifying the geometry, displacements, and subresolution deformation in thrust-ramp anticlines with growth and erosion: From models to seismic-reflection profile, Journal of Structural Geology (2014), http://dx.doi.org/10.1016/j.jsg.2014.07.012

R.W. Schlische et al. / Journal of Structural Geology xxx (2014) 1e164
1234567891011121314151617181920212223242526272829303132333435363738394041424344454647484950515253545556575859606162636465
66676869707172737475767778798081828384858687888990919293949596979899
100101102103104105106107108109110111112113114115116117118119120121122123124125126127128129130
SG3099_proof ■ 30 July 2014 ■ 4/16
Please cite this article in press as: Schlische, R.W., et al., Quantifying the geometry, displacements, and subresolution deformation in thrust-ramp anticlines with growth and erosion: From models to seismic-reflection profile, Journal of Structural Geology (2014), http://dx.doi.org/10.1016/j.jsg.2014.07.012

Serra (1977) in field exposures. Hidayah (2010) provides additionaldetails about the sand models.
3.1. Model A: growth
In model A (Fig. 7a), markers 1e8 are the pre-deformationstratigraphy, whereas markers 9e12 are growth units added dur-ing deformation (i.e., after every 2 cm of displacement (Fig. 5b)).The growth units filled the accommodation space and thinlycovered the crest of the ramp anticline. A slight amount of erosionof growth units 8e9, 9e10, and 10e11 occurred near the anticlinalcrest during the deposition of growth unit 11e12. Markers 11 and12 are continuous across the anticline, and their excess areas aremeasured in the same way as for the pre-deformation markers. Incontrast, markers 9 and 10 are contiguous with an originally hori-zontal erosion surface. The trace of these markers follows the un-conformity where the marker itself is missing; their excess areasare measured the sameway as in the kinematic model with erosion(Fig. 4c).
3.1.1. Boundary displacements and detachment depthThe area-depth graph (Fig. 7b) resembles that for the kinematic
model in Fig. 2: pre-deformation points (1e8) all have the samedisplacement, and growth-stratigraphic points (9e12) all havedifferent displacements. The pre-deformation strata fall on astraight line (Fig. 7b; Table 7) indicating structural area-balance.The actual depth of the basal detachment for the hanging wallis �7.49 cm; the calculated value (the y-intercept of the best-fitregression line) is �7.68 cm, a difference of 0.19 cm.
The imposed and the calculated total boundary displacementsare very similar (Fig. 7b, Table 7). The calculated displacements andthe detachment depth are all slightly larger than the imposedvalues, most likely the result of positive dilation caused by defor-mation (Section 3.1.2). The measured fault displacement on theramp of the deepest pre-deformation unit (marker 1) is 5.75 cmand of the shallowest pre-deformation unit (marker 8) is 4.21 cm, asignificant decrease in fault displacement up-dip. The maximummeasured fault displacement of 5.75 cm is equal to only 58% of theimposed boundary displacement. This is in strong contrast to theconstant BLT kinematic models (e.g., Fig. 2) for which the pre-deformation interval carries 100% of the boundary displacement
up the ramp. The critical difference between the kinematic modeland the experimental model is that the sand layers shorten andthicken, whereas the layers in the kinematic model do not.
3.1.2. DilationDilation is computed from the expected excess area of a marker,
as determined from the imposed boundary displacement,compared to the measured excess area (Groshong et al., 2012).
D ¼ ðSm � SeÞ=ðSe þ BÞ (3)
where D ¼ dilation (an increase is positive), Sm ¼ measured excessarea (Fig. 8a), Se ¼ expected-value excess area (Fig. 8b), and B ¼ allof the deformed area below the regional of the selected marker(Fig. 8a). The expected-value excess area is given by the imposedboundary-displacement area-depth line (dashed lines in Fig. 8b).The sum (Se þ B) is assumed to be approximately the original area,which was subsequently deformed. The calculation gives the cu-mulative dilation, which is the dilation of the entire region belowthe selected marker horizon.
For model A, the cumulative dilations are small for all units,ranging from þ1% to þ4% area increase in the growth stratigraphyand þ3% for the pre-deformation stratigraphy (Table 8). Becausepositive dilation shifts the measured area-depth line (solid line) tothe right, the calculated detachment depth (the zero-area y-inter-cept) is slightly deeper than the actual detachment depth (see alsoTable 7). The calculated dilations are small but likely physicallysignificant. All of the calculated dilations are positive. If the di-lations were entirely the result of random measurement errors, wewould expect both positive and negative values.
3.1.3. Layer-parallel strainThe layer-parallel strain (LPS) for eachmarker is calculated using
Equation (2) and the imposed experimental value of the boundarydisplacement. Values range from þ3 to �17%, with negative valuesindicating layer-parallel shortening (Table 9). The bed lengths forgrowth markers 9, 10 and 11 include a distance along the uncon-formity surface; thus, the calculated strain values are approximate.Nonetheless, the true magnitudes are likely not very different fromthe approximate values because the amount of erosion was verysmall. The strains in the pre-deformation strata are all relatively
Fig. 2. Kinematic model with small displacement increments and deposition with sedimentation rate exceeding uplift rate. Growth beds are added after every 0.25 km ofdisplacement; cross sections are shown after addition of two growth beds. a. Pre-deformation geometry; markers 1e3 exhibit no excess areas; area-depth values plot along the y-axis. b. At D ¼ 0.5 km, pre-deformation markers 1e3 have area-depth values that lie along a line with a slope of 2/km; the inverse slope is D ¼ 0.5 km. Marker 4 has undergone0.25 km of displacement since deposition of this growth bed; its area-depth value lies along a line with an inverse slope of 0.25 km; marker 5 has not yet undergone anydisplacement. c. At D ¼ 1.0 km, pre-deformation markers have area-depth values that lie along a line with an inverse slope of D ¼ 1 km; markers 4, 5, 6, 7 have area-depth valuesthat lie along lines with inverse slopes of 0.75 km, 0.5 km, 0.25 km, and 0 km, respectively. d. At D ¼ 1.5 km, pre-deformation markers have area-depth values that lie along a linewith an inverse slope of D ¼ 1.5 km; markers 4, 5, 6, 7, 8, and 9 have area-depth values that lie along lines with inverse slopes of 1.25 km, 1.0 km, 0.75 km, 0.5 km, 0.25 km, and 0 km,respectively. e. Enlargement of part of kinematic model in (c), showing parameters for area-depth-strain measurements for markers 2 and 5. Regional is the undeformed level of amarker; h is the depth of the regional below the reference level; H is the depth of the basal detachment below the reference level; S is the excess area, the deformed area of a markerabove the regional; L is the deformed bed length; W is the width of the deformed marker at the regional.
Table 1Area-depth data for kinematic model in Fig. 2d. R2 is the correlation coefficient of the best-fit straight line.
Markers Model parameters Calculated results
Displacement (km) Detachment depth (km) Slope (1/km) Intercept (km) R2 Displacement (km) (1/slope)
8 0.25 �2.251 4.191 �2.253a 1b 0.2397 0.50 �2.251 1.997 �2.253a 1b 0.5016 0.75 �2.251 1.355 �2.253a 1b 0.7385 1.00 �2.251 1.007 �2.253a 1b 0.9934 1.25 �2.251 0.819 �2.253a 1b 1.2211e3 1.50 �2.251 0.671 �2.253 1.0000 1.490
a Value based on intercept for pre-deformation markers.b Best-fit line has only two data points.
R.W. Schlische et al. / Journal of Structural Geology xxx (2014) 1e16 5
1234567891011121314151617181920212223242526272829303132333435363738394041424344454647484950515253545556575859606162636465
66676869707172737475767778798081828384858687888990919293949596979899
100101102103104105106107108109110111112113114115116117118119120121122123124125126127128129130
SG3099_proof ■ 30 July 2014 ■ 5/16
Please cite this article in press as: Schlische, R.W., et al., Quantifying the geometry, displacements, and subresolution deformation in thrust-ramp anticlines with growth and erosion: From models to seismic-reflection profile, Journal of Structural Geology (2014), http://dx.doi.org/10.1016/j.jsg.2014.07.012

Fig. 3. Kinematic model of episodic displacement, deposition, and aggradationwith associated area-depth graphs. Di is the incremental displacement; Dt is the total displacement. a.Stage 1. The area-depth graph for the pre-deformation markers is a straight line with a slope of 2/km, the inverse of the boundary displacement of 0.5 km; layers 4e6 have not yetundergone any displacement, and, therefore, plot along the y-axis (zero excess area). b. Stage 2. The area-depth graph for the pre-deformation markers is a straight line with a slopeof 1/km, the inverse of the boundary displacement of 1 km; layers 4e6 have undergone an incremental displacement of 0.5 km, and, therefore, fall along a line with a slope of 2/km;layers 7-9 have not yet undergone any displacement, and, therefore, plot along the y-axis. c. Stage 3. The area-depth graph for the pre-deformation markers is a straight line with aslope of 0.67/km, the inverse of the boundary displacement of 1.5 km; layers 4-6 have undergone a total displacement of 1 km, and, therefore, fall along a line with a slope of 1/km;layers 7e9 have undergone a displacement of 0.5 km, and, therefore, plot along a line with a slope of 2/km; layers 10-11 have not yet undergone any displacement, and, therefore,plot along the y-axis. All lines have a y-intercept equal to the depth of the basal detachment below the reference level, �2.486 km.
Table 2Area-depth data for kinematic model in Fig. 3c. R2 is the correlation coefficient of the best-fit straight line.
Markers Model parameters Calculated results
Displacement (km) Detachment depth (km) Slope (1/km) Intercept (km) R2 Displacement (km) (1/slope)
7e9 0.50 �2.486 1.974 �2.460 0.99998 0.5074e6 1.00 �2.486 0.979 �2.460 0.99992 1.0211e3 1.50 �2.486 0.665 �2.481 1.0000 1.503
R.W. Schlische et al. / Journal of Structural Geology xxx (2014) 1e166
1234567891011121314151617181920212223242526272829303132333435363738394041424344454647484950515253545556575859606162636465
66676869707172737475767778798081828384858687888990919293949596979899
100101102103104105106107108109110111112113114115116117118119120121122123124125126127128129130
SG3099_proof ■ 30 July 2014 ■ 6/16
Please cite this article in press as: Schlische, R.W., et al., Quantifying the geometry, displacements, and subresolution deformation in thrust-ramp anticlines with growth and erosion: From models to seismic-reflection profile, Journal of Structural Geology (2014), http://dx.doi.org/10.1016/j.jsg.2014.07.012

large (Table 9, markers 8 to 1). Because the differences between theimposed experimental displacement and the calculated displace-ment are small (see Tables 7 and 9), determining the strainwith thecalculated displacement leads to changes in computed strains of nomore than three percentage points (Table 9).
The calculated strainmagnitudes are sensitive to the interpretedstructural style. For example, Fig. 9a shows an overturned-bedinterpretation for marker 9 near the main thrust-fault zone. Thecalculated strain is 0%. Fig. 9b shows an alternative interpretation
with marker 9 offset by the main thrust-fault zone. With thealternative interpretation, the measured bed length of marker 9 issmaller, and the calculated strain has a higher magnitude, �11%.These differences in interpretation do not affect measured excessareas and, therefore, do not affect calculated boundary displace-ments and detachment depths.
3.2. Model B: erosion
In model B (Fig. 7c), 5 cm of boundary displacement was fol-lowed by erosion down to the original level of the model, creating aflat surface, which was then deformed during an additional 5 cm ofdisplacement. Markers 1e3 are pre-deformation units untouchedby erosion. During thrusting and anticlinal growth following theerosional truncation, sand in interval 3e4 cascaded down the frontof the anticline, thinning the interval to zero in the upper forelimband accumulating at the front of the structure. The excess-areavalue indicates that no loss of area occurred in this process.
Fig. 4. Kinematic model with erosion and associated area-depth graphs. To better define the effects of erosion, this figure includes additional pre-deformation markers (1A, 2A, 3A).The lack of growth beds results in an upper flat along the top of marker 3. Gray shading shows excess area for marker 2. a. Model after 0.75 km of boundary displacement and priorto erosion. b. Model after 0.75 km of boundary displacement and after erosion down to the regional level of marker 3, which consists of an angular unconformity (wavy line) and itscorrelative conformity. c. Model after 1.5 km of boundary displacement. Only markers 1A & 1 and marker 3 have area-depth values that yield displacement lines with the correctslope. “D” is an apparent displacement that is less than the actual displacement.
Table 3Area-depth data for kinematic model in Fig. 4c. R2 is the correlation coefficient of thebest-fit straight line.
Markers Model parameters Calculated results
Displacement(km)
Detachmentdepth (km)
Slope(1/km)
Intercept(km)
R2 Displacement(km) (1/slope)
3 0.75 �1.500 1.3396 �1.500a 1b 0.7463A 1.50 �1.500 1.0169 �1.500a 1b 0.983c
2 1.50 �1.500 0.8429 �1.500a 1b 1.186c
2A 1.50 �1.500 0.7019 �1.500a 1b 1.425c
1A, 1 1.50 �1.500 0.6684 �1.500 1b 1.496
a Value based on intercept for pre-deformation markers.b Best-fit line has only two data points.c Apparent displacement (less than the actual displacement) because of partial
erosion.
Table 4Layer-parallel strain for kinematic model in Fig. 2d calculated from areaedepthrelationship; shortening is negative.
Marker 1 2 3 4 5 6 7 8
Strain (%) �0.15 þ0.04 �0.07 �0.68 �0.14 �0.27 0.00 �0.31
R.W. Schlische et al. / Journal of Structural Geology xxx (2014) 1e16 7
1234567891011121314151617181920212223242526272829303132333435363738394041424344454647484950515253545556575859606162636465
66676869707172737475767778798081828384858687888990919293949596979899
100101102103104105106107108109110111112113114115116117118119120121122123124125126127128129130
SG3099_proof ■ 30 July 2014 ■ 7/16
Please cite this article in press as: Schlische, R.W., et al., Quantifying the geometry, displacements, and subresolution deformation in thrust-ramp anticlines with growth and erosion: From models to seismic-reflection profile, Journal of Structural Geology (2014), http://dx.doi.org/10.1016/j.jsg.2014.07.012

Markers 4e7 represent eroded pre-deformation units. The majorityof marker 8 over the anticline is an erosional angular unconformity,which was horizontal before the second increment ofdisplacement.
3.2.1. Boundary displacements and detachment depthThe area-depth graph (Fig. 7d), which resembles that for the
kinematic model in Fig. 4c, has two distinct parts corresponding tothe uneroded pre-deformation interval (markers 1e3) and theeroded pre-deformation markers (4e8). The uneroded pre-deformation strata are well fit by a straight line (Table 10), indi-cating excellent structural balance. Although photographs indicatethat layer 3e4 underwent erosion (Fig. 6d), its area-depth valuefalls very close to the best-fit uneroded pre-deformation line,indicating that the magnitude of erosion was very small. Thecalculated depth of the basal detachment for the hanging wall
Table 6Layer-parallel strain for kinematic model in Fig. 4c calculated from areaedepthrelationship; shortening is negative.
Marker 1A 1 2A 2 3A 3
Strain (%) 0.00 �0.05 �2.52a �11.91a �18.38a þ0.46
a Value is not valid due to erosion.
Fig. 5. Experimental sand model A of ramp anticline with growth (model S3s of Hidayah, 2010). a. Boundary conditions in map view; arrow indicates displacement direction oflower rigid plate relative to upper rigid plate. b. Sketch of boundary conditions in cross-section view; growth beds are added after every 2 cm of boundary displacement c. Crosssection (CS30 of Hidayah, 2010) through model at location shown in (e). Black box shows area enlarged in (d). d. Photo of central part of cross section in (c) showing the main thrust-fault zone and backlimb shear zones; the numbers show the order of backlimb shear-zone formation (1 is oldest). e. Photos of map views showing anticline bounded by mainthrust-fault zone and backlimb shear zones; inactive shear zones are shown in white; the numbers show the order of backlimb shear-zone formation (1 is oldest). The solid lineshows location of cross section in (c). Left photo shows geometry after 5 cm of boundary displacement; 1 cm of displacement has accrued since addition of 2nd growth bed. Rightphoto shows geometry after 10 cm of boundary displacement; 2 cm of displacement has accrued since addition of 4th growth bed; the 5th growth layer was added after this photowas taken.
Table 5Layer-parallel strain for kinematic model in Fig. 3c calculated from areaedepth relationship; shortening is negative.
Marker 1 2 3 4 5 6 7 8 9
Strain (%) �0.21 �0.05 þ0.06 �0.88 �0.78 �0.62 �0.07 �0.38 �0.17
R.W. Schlische et al. / Journal of Structural Geology xxx (2014) 1e168
1234567891011121314151617181920212223242526272829303132333435363738394041424344454647484950515253545556575859606162636465
66676869707172737475767778798081828384858687888990919293949596979899
100101102103104105106107108109110111112113114115116117118119120121122123124125126127128129130
SG3099_proof ■ 30 July 2014 ■ 8/16
Please cite this article in press as: Schlische, R.W., et al., Quantifying the geometry, displacements, and subresolution deformation in thrust-ramp anticlines with growth and erosion: From models to seismic-reflection profile, Journal of Structural Geology (2014), http://dx.doi.org/10.1016/j.jsg.2014.07.012

is �7.58 cm, 0.09 cm deeper than the actual value of �7.49 cm. Thetotal boundary displacement calculated from the uneroded pre-deformation units is 10.42 cm, slightly greater than the imposedexperimental boundary displacement of 10 cm (Table 10). Both ofthese small differences are attributed to a positive dilation (seeSection 3.2.2.). The fault displacement measured from the offset ofmarker 1 on the ramp is 5.07 cm, equal to only 51% of the imposedboundary displacement of 10 cm.
Of the five eroded markers, only marker 8 yields a validdisplacement. After the first 5 cm of displacement and subsequenterosion, marker 8 and its correlative angular unconformity werehorizontal. The composite surface then underwent 5 cm of addi-tional boundary displacement, and its excess area is the appro-priate amount for that displacement. Markers 4e7 consist ofsegments of the angular unconformity and segments from theuneroded backlimb and forelimb. Therefore, the marker 4e7 sur-faces were not horizontal in their entirety prior to the final 5 cm ofdisplacement and do not result in excess areas that give valid dis-placements. Prior to erosion, the excess areas for markers 4e8would all have fallen on the pre-deformation line (similar to thekinematic model in Fig. 4a). The reductions in their areas reflect themagnitude of the uplift and the subsequent depth of erosion.
3.2.2. DilationOnly two horizons yield relevant values of dilation, markers 3
and 8. From Equation (3), the cumulative dilation of the uneroded
pre-deformation interval (marker 3) is 4%, and of the completestructure below the unconformity (marker 8) is 2%. Both values arepositive, indicating a slight increase in area.
3.2.3. Layer-parallel strainThe computed strains (Table 11) indicate layer-parallel short-
ening for uneroded markers 1e3; the strains range from �11to �15%. If the strains are calculated based on the computedboundary displacement of 10.41 cm, the strain magnitudes rangefrom �13 to �17%. The only other valid strain value is for marker 8(þ3%), a marker that includes the length of both the bed and theunconformity. The measured length is valid because this total linelength was present, and horizontal, prior to the second incrementof displacement, which took place after erosion. This strainmagnitude represents a small amount of lengthening, consistentwith the presence of normal faults cutting the anticlinal crest(Fig. 6d). Because eroded markers 4 and 5 are only slightly trun-cated, the calculated strain magnitudes should be reasonably closeto the actual values. The values for markers 6 and 7 are not validbecause erosion causes their preserved bed lengths to be too smalland the calculated shortening to be too large; using the calculatedboundary displacements (which are also incorrect because oferosion) produces a large discrepancy between the calculatedstrain magnitudes (Table 11). The unconformity lengths included aspart of the bed-length measurements fail to compensate for theeroded bed lengths.
Fig. 6. Experimental sand model B of ramp anticline with erosion followed by additional displacement (model S2 of Hidayah, 2010). a. Sketch of boundary conditions in cross-section view. Following 5 cm of displacement, the anticline is eroded down to the original top of the model. The basal boundary conditions are the same as in Fig. 5a. b. Crosssection (CS30 of Hidayah, 2010) through model at location shown in (d). Black box shows area enlarged in (c). At the end of the experiment, the thick, uppermost unit was added topreserve the topography. c. Photo of central part of cross section in (b) showing the main thrust-fault zone and backlimb shear zones; the numbers show the order of backlimbshear-zone formation (1 is oldest). d. Photos of map views showing anticline bounded by main thrust-fault zone and backlimb shear zones; inactive shear zones are shown inwhite;the numbers show the order of backlimb shear-zone formation (1 is oldest). The solid line shows location of cross section in (b). Left photo shows geometry after 5 cm of boundarydisplacement but before erosion; middle photo shows model after erosion; right photo shows geometry at end of experiment after 10 cm of boundary displacement.
R.W. Schlische et al. / Journal of Structural Geology xxx (2014) 1e16 9
1234567891011121314151617181920212223242526272829303132333435363738394041424344454647484950515253545556575859606162636465
66676869707172737475767778798081828384858687888990919293949596979899
100101102103104105106107108109110111112113114115116117118119120121122123124125126127128129130
SG3099_proof ■ 30 July 2014 ■ 9/16
Please cite this article in press as: Schlische, R.W., et al., Quantifying the geometry, displacements, and subresolution deformation in thrust-ramp anticlines with growth and erosion: From models to seismic-reflection profile, Journal of Structural Geology (2014), http://dx.doi.org/10.1016/j.jsg.2014.07.012

4. Seismic-reflection profile from deep-water Niger Delta
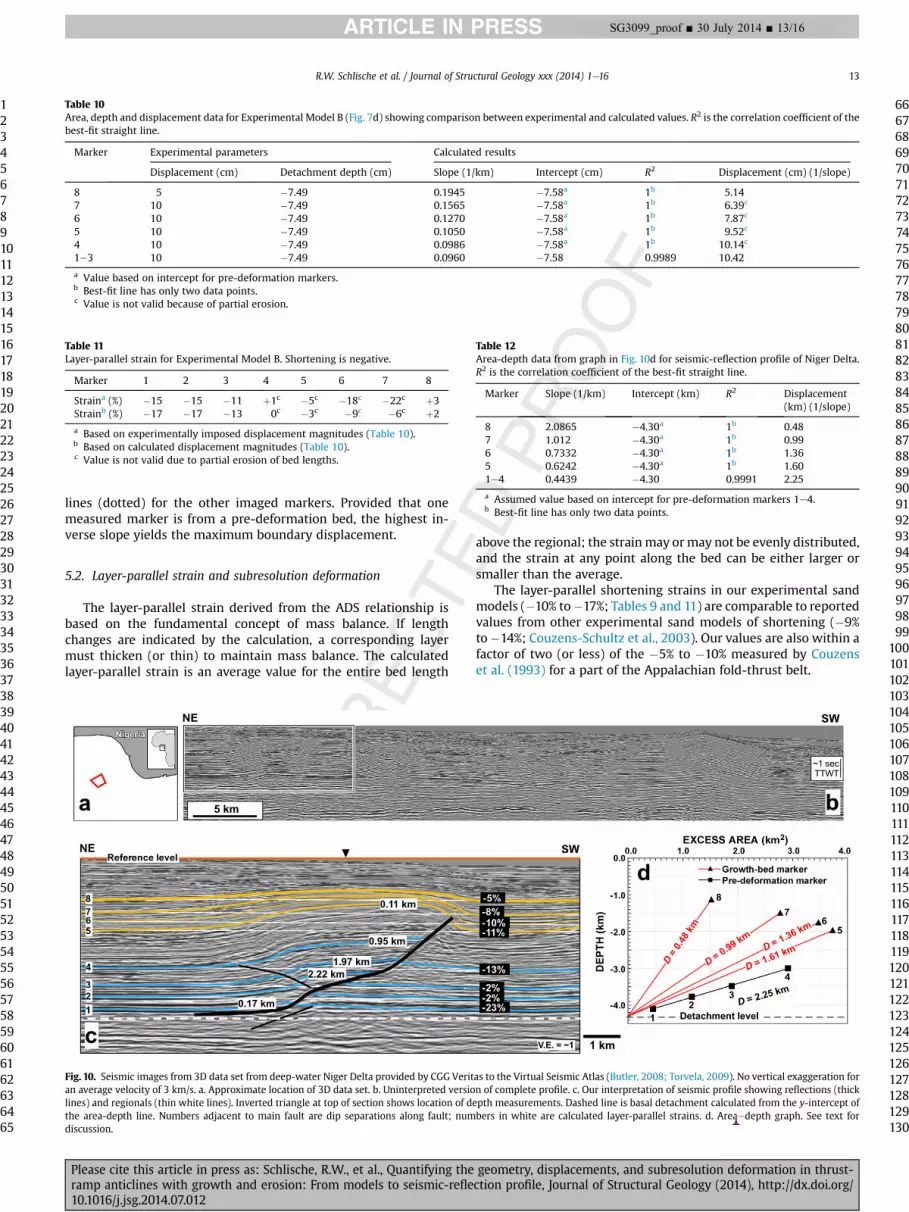
We now apply the ADS method to a seismically imaged rampanticline from the deep-water Niger Delta (Fig. 10; see Fig. 1 for theuninterpreted line). The seismic profile, available in the VirtualSeismic Atlas (Butler, 2008), is from a 3D seismic survey acquired byCGG Veritas (VERNG-99 3D). The exact location of the seismicprofile is confidential; however, the 3D survey is in thewestern partof the deep-water Niger Delta in the outer fold-and-thrust belt asdefined by Corredor et al. (2005) (Fig. 10a). The profile is orientedNEeSW, subperpendicular to fault/fold trends and, therefore, islikely subparallel to the transport direction. It is part of a longerseismic line (Fig. 10b) with additional structures. Both the longseismic line and the short profile are displayed with approximatelyno vertical exaggeration assuming an average velocity of 3 km/s(Butler, 2008).
We interpreted the seismic profile by identifying the mainthrust fault and then correlating its hanging-wall and footwall re-flections. With our correlation, the hanging-wall and footwall re-flections have the same regional elevations on opposite sides of themain thrust fault. Our interpretation (Fig. 10c) differs slightly fromthe interpretation of Butler (2008) in which regional elevations ofsome of the hanging-wall and footwall reflections differ. As dis-cussed below, the high quality of the resulting area-depth graph(Fig. 10d) supports our revised interpretation.
4.1. Boundary displacements and detachment depth
On the area-depth graph (Fig. 10d) for our revised interpreta-tion, markers 1e4 lie on straight line (R2 ¼ 0.9991, Table 12) thattrends downward toward zero excess area. The straight area-depthline indicates that markers 1e4 represent pre-deformation units (a
Fig. 7. Area-depth analyses of experimental sand models with growth (a, b) and erosion (c, d). In (a) and (c), the reference levels are at the same height above the basal detachment;inverted triangles show where depths were measured. a. Section of model A with growth; see Fig. 5ced for location. b. Area-depth graph for model A. D ¼ computed displacementsin cm; numbers in parentheses are experimentally imposed displacements. c. Section of model B with erosion; see Fig. 6b and c for location. d. Area-depth graph for model B.D ¼ valid displacement values in cm (numbers in parentheses are experimentally imposed displacement), “D” ¼ invalid displacement values due to partial erosion.
Table 7Area-depth and displacement data for Experimental Model A (Fig. 7b) showing comparison between experimental and calculated values. R2 is the correlation coefficient of thebest-fit straight line.
Marker Experimental parameters Calculated results
Displacement (cm) Detachment depth (cm) Slope Intercept (cm) R2 Displacement (cm) (1/slope)
12 2 �7.49 0.475 �7.68a 1b 2.1411 4 �7.49 0.228 �7.68a 1b 4.1810 6 �7.49 0.158 �7.68a 1b 6.059 8 �7.49 0.118 �7.68a 1b 8.461e8 10 �7.49 0.099 �7.68 0.9966 10.14
a Assumed value based on intercept for pre-deformation markers 1e8.b Best-fit line has only two data points.
R.W. Schlische et al. / Journal of Structural Geology xxx (2014) 1e1610
1234567891011121314151617181920212223242526272829303132333435363738394041424344454647484950515253545556575859606162636465
66676869707172737475767778798081828384858687888990919293949596979899
100101102103104105106107108109110111112113114115116117118119120121122123124125126127128129130
SG3099_proof ■ 30 July 2014 ■ 10/16
Please cite this article in press as: Schlische, R.W., et al., Quantifying the geometry, displacements, and subresolution deformation in thrust-ramp anticlines with growth and erosion: From models to seismic-reflection profile, Journal of Structural Geology (2014), http://dx.doi.org/10.1016/j.jsg.2014.07.012

result supported by the relatively constant thicknesses of the in-tervals between the marker horizons) and that the detachmentdepth of the structure is �4.30 km, a result consistent with theseismic data (dashed white line in Fig. 10c). The straight area-depthline also indicates that the section is area balanced with a totalboundary displacement of 2.25 km for pre-deformation markers1e4.
Markers 5e8 show a steady decrease in displacement upward(Fig. 10d, Table 12), as expected for growth units. The thicknesses ofthe intervals between these marker horizons vary across thestructure, supporting the interpretation of coeval deformation anddeposition. Our confidence in the interpreted displacements forgrowth markers 5-8 derives from a key result of the kinematic andexperimental modeling: namely, any surface that was planar beforedeformation will give a valid area-depth point. Growth-bedmarkers 5-8 appear to be depositional surfaces that were sub-horizontal before deformation.
We refer to all of the fault offsets (Fig. 10c) measured on theseismic profile as separations because the slip direction, althoughpresumably in the profile direction, is unknown. The ramp has itsmaximum separation in the center and decreases both upward anddownward along the fault. Briggs et al. (2006) observed similarseparation profiles in the deep-water Niger Delta. The maximumseparation, at marker 2 (2.22 km) is very close to the total boundarydisplacement calculated from the area-depth line (2.25 km).Although separation varies in the pre-deformation horizons, thetotal boundary displacement must be identical for pre-deformationmarkers 1e4. Any decrease in total boundary displacement withdepth for markers 1e4 would yield a downward-steepening ADSgraph (Epard and Groshong, 1993; Groshong, 2006). Corredor et al.(2005) proposed that some folds in the deep-water Niger Delta aresimple-shear fault-bend folds. With this type of fault-bend fold, abasal detachment zone undergoes bedding parallel simple shear,and the total boundary displacement decreases with depth withinthe detachment zone. For our seismic example (Fig. 10d), we cannotrule out that the total boundary displacement decreases with depthbeneath marker 1 (the deepest marker that falls along the straightarea-depth line).
4.2. Layer-parallel strain
Strain magnitudes (Fig. 10c) increase downward from the shal-lowest to the deepest marker, with the significant exception of the
two very low values in markers 2 and 3. Layer 2e3 is, therefore,nearly constant in length and thickness, whereas substantialshortening and thickening is implied for the other layers. The layerbetween the basal detachment and marker 1 has the highest strainvalue. Because it is in or near the detachment zone, high ductilityand a large strain magnitude are expected. Within the faultedsection (markers 1e5), strain magnitude and fault separation areinversely related (Fig. 10c); the separation is greatest in layer 2e3.
These relationships allow several alternative interpretations. (1)The interpretation of the seismic profile is correct, the mechanicalstratigraphy is homogeneous, and the strain-displacement parti-tioning on the fault reflects a fault that initiated near layer 2e3,where displacement is greatest, and propagated up and downsection. (2) The interpretation of the seismic profile is correct, themechanical stratigraphy is heterogeneous (i.e., more brittle wherestrains are smallest), and the strain-displacement partitioning re-flects a fault that propagated upward from the lower detachmentwith slip inversely proportional to ductility while dying out up-ward. (3) The interpretation of the seismic profile is not correct,producing an unusually large strain for marker 4. Seismic-reflectionprofiles (even high-quality 3D data) rarely image steeply dippingbeds. For example, drilling of the nearby Alpha structure in theNiger Delta (Kostenko et al., 2008) showed that an upper horizon,originally interpreted as faulted, was actually a fold with a verticallimb. As discussed previously for the experimental models (Section3.1.3; Fig. 9), the added bed length of a vertical limb reduces thecalculated strain, perhaps to the lower values calculated formarkers 2 and 3. Thus, the strain versus fault displacement rela-tionship for an area-balanced cross section leads to multipleworking hypotheses, each of which have potentially large theo-retical and/or economic importance.
5. Discussion
5.1. Summary of areaedepth relationships
This section summarizes the properties of area-depth graphs forramp anticlines with growth and/or erosion. In addition, we showhow to use area-depth graphs to calculate displacement rates anddiscuss how stratigraphic resolution affects these relationships.
5.1.1. Growth and erosionThe ADS graphs for the kinematic models (where bed lengths
and thicknesses remain constant), the experimental models (wherebeds shorten and thicken significantly), and the seismic examplepresented here share many characteristics. Uneroded pre-deformation markers have area-depth values that lie on a straightline; the inverse slope of the best-fit line gives the boundary
Table 8Cumulative dilations for Experimental Model A (Fig. 8).
Marker 1e8 9 10 11 12
D (%) þ3 þ4 þ2 þ2 þ1
Fig. 8. Data for cumulative dilation calculation illustrated for marker 8 in model A (Fig. 5d). a. Cross section showing measured areas; Sm ¼measured excess area above the regional,B ¼ deformed area below the regional. b. Area-depth graph showing Sm and Se (expected value for excess area).
R.W. Schlische et al. / Journal of Structural Geology xxx (2014) 1e16 11
1234567891011121314151617181920212223242526272829303132333435363738394041424344454647484950515253545556575859606162636465
66676869707172737475767778798081828384858687888990919293949596979899
100101102103104105106107108109110111112113114115116117118119120121122123124125126127128129130
SG3099_proof ■ 30 July 2014 ■ 11/16
Please cite this article in press as: Schlische, R.W., et al., Quantifying the geometry, displacements, and subresolution deformation in thrust-ramp anticlines with growth and erosion: From models to seismic-reflection profile, Journal of Structural Geology (2014), http://dx.doi.org/10.1016/j.jsg.2014.07.012

displacement. Projecting the best-fit lines to the y-axis (dashedblack lines in Fig. 11a and b) yields the depth of the basal detach-ment below the reference level.
Growth beds (Fig. 11a and b), eroded pre-deformation beds (seeFig. 4) and eroded growth beds (Fig.11c) exhibit decreasing excessareas with decreasing depth below the reference level. The area-depth line for a growth bed yields the boundary displacementthat accrued since the layer accumulated. For aggradational growth(Figs. 3 and 11b), multiple markers have area-depth values that liealong the same area-depth line; consequently, the y-intercept ofthe best-fit line provides an independent estimate of the detach-ment depth. The area-depth line for a partially eroded bed yields anapparent displacement that, due to erosion, is less than the actualdisplacement. However, the area-depth line for an originally planarunconformity (e.g., marker 5, Fig. 11c) yields the correct displace-ment that accrued after the formation of the unconformity.
The geometry of area-depth lines for growth beds (Fig. 11a) andpartially eroded beds (Fig. 11c) are similar. Consequently, the ADSrelationship, by itself, is not able to distinguish between growthand erosion. Geologic criteria such as onlap and truncation arenecessary to distinguish between growth and erosion. If the erosiondepth is deep enough (at or below the top of the highest pre-deformation beds), then the cross-sectional geometry of thelayers is also insufficient for distinguishing between pre-deformation beds and growth beds.
5.1.2. Displacement ratesThe area-depth graph allows calculation of average displace-
ment rates if the depositional ages of key markers are known(Fig. 11b). The displacement rate is:
DD=Dt ¼ ðDb � DaÞ=ðtb � taÞ (4)
where DD ¼ displacement increment, Dt ¼ time increment,Da ¼ displacement of older beds, Db ¼ displacement of younger
beds, ta ¼ age of youngest marker with displacement Da, tb ¼ age ofoldest marker with displacement Db. For example, for the youngestnon-zero constant-displacement interval from Fig. 11b, thedisplacement increment is the difference in displacement betweenmarkers 7e9 and 4e6, or 0.5 km ¼ DD2. If the time interval be-tween each marker (Dt) represents, say, 0.4 million years with thedifferent thicknesses representing different rates of deposition,then the average displacement rate for DD2 is 0.5 km/0.4 my, or1.25 km/my. All incremental displacement rates are determined thesame way. The calculated displacement rate will always be theminimum value. The short-term displacement rate could be higherif, for example, the displacement accumulated during multipleepisodes of rapid seismic slip.
5.1.3. Effect of stratigraphic resolutionThe detail and accuracy of results obtained with the ADS
method depend on the stratigraphic resolution (e.g., seismic-reflection profiling may not image layer boundaries in intervalsthat lack significant impedance contrasts). For example, Fig. 11dshows the same section as Fig. 11a but without the odd-numberedmarkers. In this case, where only one pre-deformation marker isimaged, no two area-depth values lie along a valid area-depthstraight line. Consequently, the boundary displacement and thedetachment depth are uncertain. Some interpreters might errone-ously draw a straight line between markers 2 and 4 (Fig. 11d). Thisline, which incorrectly connects the area-depth values of a pre-deformation marker (3) and a growth marker (4), reveals theproblem: the detachment depth is too deep and the calculatedboundary displacement is too low. The section in Fig. 11e (based onthe section in Fig. 11b) has the same number of imaged markers asFig. 11d. Two of the markers (7 and 8), however, accumulated be-tween episodes of faulting and underwent the same boundarydisplacement. With these two markers, it is possible to define abest-fit straight line (solid) and extrapolate this line (dashed) toconstrain the detachment depth. This, in turn, fixes the area-depth
Table 9Layer-parallel strain for Experimental Model A. Shortening is negative.
Marker 1 2 3 4 5 6 7 8 9 10 11 12
Straina,c (%) �11 �15 �12 �11 �8 �9 �13 �11 �11 �11 �5 þ3Strainb,c (%) �12 �15 �13 �12 �9 �9 �14 �11 �12 �11 �6 þ3Straina,d (%) �16 �17 �14 �11 �12 �9 �12 �12 0 �3 �5 þ2Strainb,d (%) �17 �17 �15 �11 �13 �9 �13 �13 �3 �3 �6 þ1
a Based on boundary displacement magnitude (Table 7).b Based on calculated displacement magnitude (Table 7).c Strain values based on forelimb fault interpretation (see Fig. 9b).d Strain values based on forelimb fold interpretation (see Fig. 9a).
Fig. 9. Alternative interpretations for marker 9 (see Fig. 7a) in experimental model A and influence on calculated layer-parallel strain (e). L9 is deformed bed length; W9 is the widthof deformed marker at the regional level. a. Interpretation with overturned bed adjacent to the main deformation zone. b. Interpretation with wide shear zone offsetting bedding inthe main deformation zone.
R.W. Schlische et al. / Journal of Structural Geology xxx (2014) 1e1612
1234567891011121314151617181920212223242526272829303132333435363738394041424344454647484950515253545556575859606162636465
66676869707172737475767778798081828384858687888990919293949596979899
100101102103104105106107108109110111112113114115116117118119120121122123124125126127128129130
SG3099_proof ■ 30 July 2014 ■ 12/16
Please cite this article in press as: Schlische, R.W., et al., Quantifying the geometry, displacements, and subresolution deformation in thrust-ramp anticlines with growth and erosion: From models to seismic-reflection profile, Journal of Structural Geology (2014), http://dx.doi.org/10.1016/j.jsg.2014.07.012
lines (dotted) for the other imaged markers. Provided that onemeasured marker is from a pre-deformation bed, the highest in-verse slope yields the maximum boundary displacement.
5.2. Layer-parallel strain and subresolution deformation
The layer-parallel strain derived from the ADS relationship isbased on the fundamental concept of mass balance. If lengthchanges are indicated by the calculation, a corresponding layermust thicken (or thin) to maintain mass balance. The calculatedlayer-parallel strain is an average value for the entire bed length
above the regional; the strainmay ormay not be evenly distributed,and the strain at any point along the bed can be either larger orsmaller than the average.
The layer-parallel shortening strains in our experimental sandmodels (�10% to�17%; Tables 9 and 11) are comparable to reportedvalues from other experimental sand models of shortening (�9%to �14%; Couzens-Schultz et al., 2003). Our values are also within afactor of two (or less) of the �5% to �10% measured by Couzenset al. (1993) for a part of the Appalachian fold-thrust belt.
Table 10Area, depth and displacement data for Experimental Model B (Fig. 7d) showing comparison between experimental and calculated values. R2 is the correlation coefficient of thebest-fit straight line.
Marker Experimental parameters Calculated results
Displacement (cm) Detachment depth (cm) Slope (1/km) Intercept (cm) R2 Displacement (cm) (1/slope)
8 5 �7.49 0.1945 �7.58a 1b 5.147 10 �7.49 0.1565 �7.58a 1b 6.39c
6 10 �7.49 0.1270 �7.58a 1b 7.87c
5 10 �7.49 0.1050 �7.58a 1b 9.52c
4 10 �7.49 0.0986 �7.58a 1b 10.14c
1e3 10 �7.49 0.0960 �7.58 0.9989 10.42
a Value based on intercept for pre-deformation markers.b Best-fit line has only two data points.c Value is not valid because of partial erosion.
Table 11Layer-parallel strain for Experimental Model B. Shortening is negative.
Marker 1 2 3 4 5 6 7 8
Straina (%) �15 �15 �11 þ1c �5c �18c �22c þ3Strainb (%) �17 �17 �13 0c �3c �9c �6c þ2
a Based on experimentally imposed displacement magnitudes (Table 10).b Based on calculated displacement magnitudes (Table 10).c Value is not valid due to partial erosion of bed lengths.
Fig. 10. Seismic images from 3D data set from deep-water Niger Delta provided by CGG Veritas to the Virtual Seismic Atlas (Butler, 2008; Torvela, 2009). No vertical exaggeration foran average velocity of 3 km/s. a. Approximate location of 3D data set. b. Uninterpreted version of complete profile. c. Our interpretation of seismic profile showing reflections (thicklines) and regionals (thin white lines). Inverted triangle at top of section shows location of depth measurements. Dashed line is basal detachment calculated from the y-intercept ofthe area-depth line. Numbers adjacent to main fault are dip separations along fault; numbers in white are calculated layer-parallel strains. d. Areaedepth graph. See text fordiscussion.
Table 12Area-depth data from graph in Fig. 10d for seismic-reflection profile of Niger Delta.R2 is the correlation coefficient of the best-fit straight line.
Marker Slope (1/km) Intercept (km) R2 Displacement(km) (1/slope)
8 2.0865 �4.30a 1b 0.487 1.012 �4.30a 1b 0.996 0.7332 �4.30a 1b 1.365 0.6242 �4.30a 1b 1.601e4 0.4439 �4.30 0.9991 2.25
a Assumed value based on intercept for pre-deformation markers 1e4.b Best-fit line has only two data points.
R.W. Schlische et al. / Journal of Structural Geology xxx (2014) 1e16 13
1234567891011121314151617181920212223242526272829303132333435363738394041424344454647484950515253545556575859606162636465
66676869707172737475767778798081828384858687888990919293949596979899
100101102103104105106107108109110111112113114115116117118119120121122123124125126127128129130
SG3099_proof ■ 30 July 2014 ■ 13/16
Please cite this article in press as: Schlische, R.W., et al., Quantifying the geometry, displacements, and subresolution deformation in thrust-ramp anticlines with growth and erosion: From models to seismic-reflection profile, Journal of Structural Geology (2014), http://dx.doi.org/10.1016/j.jsg.2014.07.012

R.W. Schlische et al. / Journal of Structural Geology xxx (2014) 1e1614
1234567891011121314151617181920212223242526272829303132333435363738394041424344454647484950515253545556575859606162636465
66676869707172737475767778798081828384858687888990919293949596979899
100101102103104105106107108109110111112113114115116117118119120121122123124125126127128129130
SG3099_proof ■ 30 July 2014 ■ 14/16
Please cite this article in press as: Schlische, R.W., et al., Quantifying the geometry, displacements, and subresolution deformation in thrust-ramp anticlines with growth and erosion: From models to seismic-reflection profile, Journal of Structural Geology (2014), http://dx.doi.org/10.1016/j.jsg.2014.07.012

Amajor value of the layer-parallel strain calculation is to providean estimate of the potential relative magnitude of subresolutiondeformation at different levels in the structure.Where beds shortenand thicken during deformation and, consequently, have largelayer-parallel strains, the fault separations may be much less thanthe boundary displacement. The measured fault displacements onthe thrust ramps of the sand models are only 51e58% of theboundary displacements. For the seismic example from the NigerDelta (Fig. 10), the measured separations are 8e100% of theboundary displacement calculated using the ADS method. A layerwith an anomalously high shortening strain may be very ductile;alternatively, the deformed horizon may not exhibit fault offset butrather is part of a fold with a very steep limb (see Fig. 9). Sub-resolution deformation could substantially affect reservoir conti-nuity and bulk fluid transmissivity.
5.3. Dilation
Sand can shorten and thicken while simultaneously dilating(Mead, 1925). When unconsolidated sand of relatively uniformgrain size undergoes deformation, the packing arrangement mustloosen slightly (dilate) so that the grains can move around and pastone another. A small permanent increase in area is characteristic ofthe sand models for which it has been directly measured (Collettaet al., 1991; Moretti and Callot, 2012; Groshong et al., 2012; thispaper). The dilation is probably larger in shear zones and less in therest of the model (Colletta et al., 1991). In our models, both theshortening and the dilation contribute to layer-normal thickeningand thereby increase the excess areas.
5.4. Assessing the quality of an interpreted section
The ADS relationship provides three separate quantitative pa-rameters for judging the quality of an interpretation. (i) A good fit ofarea-depth values for pre-deformation markers to a straight lineindicates that the cross section is area balanced. (ii) Agreementbetween the interpreted basal detachment and the predicted basaldetachment (based on the ADS method) confirms the areaedepthrelationship and area balance. (iii) A balanced interpretation shouldhave layer-parallel strains (given by Equation (2) utilizing theboundary displacements derived from the areaedepth graph) thatare realistic for the structural style. For the contractional structuresin the experimental models and the seismic-reflection profile fromthe Niger Delta, we determined mostly layer-parallel shortening. Acalculated strain that is extensional or very different from themagnitudes in adjacent horizons is an indication of a problem orspecial circumstance requiring further investigation. An example ofa special circumstance is the small extensional strain for the up-permost marker in the experimental sand models; this layer-parallel extension is consistent with the observed formation ofnormal faults on the crest of the ramp anticline (Fig. 6d). Anotherexample is the seismic profile from the Niger Delta. The strainmagnitudes vary significantly, suggesting multiple hypotheses to
test regarding fault propagation, mechanical stratigraphy, andfolding versus faulting.
6. Conclusions
In this paper, we present a quantitative interpretation of dis-placements, displacement rates, and strains for growing and/orpartly eroded thrust-ramp anticlines using the area-depth-strain(ADS) relationship. We validated the methodology using kine-matic models and experimental sand models, and then applied it toa seismically imaged structure from the deep-water fold-thrust beltof the Niger Delta. From these examples, we draw the followingconclusions:
1) The plot of excess area versus depth provides a clear distinctionbetween pre-deformation units and growth/eroded beds. Pointsfrom pre-deformation units fall on a straight line that trendstoward zero area downward at the elevation of the basaldetachment; growth beds and eroded strata exhibit decreasingexcess areas for younger units. Because the area-depth graphsfor growth strata and eroded strata are similar, the distinctiondepends on geological criteria such as onlap versus truncation.
2) The inverse slope of the area-depth line is the boundarydisplacement. For pre-deformation strata, this is the totalboundary displacement of the structure. For growth strata, theinverse slope of this line is the total displacement of the struc-ture since the unit accumulated. If beds have undergone erosion,their area-depth lines yield boundary displacements that are toosmall. However, the area-depth value of an originally planarunconformity yields a valid post-unconformity displacement.The experimental sand models show that the boundary dis-placements calculated from pre-deformation and growth strataare accurate, even if bed lengths are not constant.
3) The minimum displacement rate for a growth unit is the ADS-derived displacement increment between markers at the topand base of the interval divided by the difference in age betweenthe markers.
4) Layer-parallel strains are derived from observed bed lengths andthe calculated boundary displacements. These data provideinsight into the deformation mechanisms and/or the validity ofthe interpretation. Small strains indicate near-constant bedlength deformation, whereas large strains may indicate a ductileinterval, substantial subresolution deformation, and/or inter-pretation errors. For seismic-reflection data, subresolutiondeformation might be represented by second-order folds orsmall faults that would be observable in outcrop.
5) For the constant bed-length kinematic models, the calculatedlayer-parallel strains are approximately zero. The experimentalsand models have layer-parallel strains that increase downwardfrom 0% to 3% extension at the surface to �17% shortening closeto the basal detachment. As a result of this internal strain, themeasured fault separations are only about half of the totalboundary displacement.
Fig. 11. Summary of the effects of sedimentation, aggradation, erosion, and stratigraphic resolution on area-depth graphs. a. Cross section of kinematic model with small incrementsof displacement and growth from Fig. 2d. Area-depth graph shows that pre-deformation markers define a straight line (solid) that predicts the boundary displacement and thedetachment depth (intersection of dashed line with the y-axis). Lines (dotted) connecting the predicted detachment depth to area-depth values for growth beds determine theboundary displacement that accrued after accumulation of the growth bed. b. Cross section of kinematic model with episodic displacement, sedimentation, and aggradation fromFig. 3c. Area-depth graph shows that the detachment depth can be constrained from both pre-deformation markers and groups of growth/aggradation beds (solid lines and dashedextensions). Area-depth graph also illustrates parameters for calculating displacement rates (see text for discussion). c. Cross section from (a) modified by erosion. Area-depth graphresembles that in (a); however, area-depth lines for markers 3e5 yield inverse slopes that represent apparent displacements, which are less than the actual boundary displace-ments. Note that, at this level of erosion, the preserved growth beds and the pre-deformation beds have the same geometry. d. Same section as (a), except every other marker ismissing. In this case, no groups of markers define a straight line necessary to accurately predict the detachment depth. See text for further discussion. e. Same section as (b), exceptgroups of markers are missing. In this case, markers 7 and 8 lie on the same displacement line (solid and dashed), which predicts the correct detachment depth and which can beused to determine the area-depth lines (dotted) for the other markers.
R.W. Schlische et al. / Journal of Structural Geology xxx (2014) 1e16 15
1234567891011121314151617181920212223242526272829303132333435363738394041424344454647484950515253545556575859606162636465
66676869707172737475767778798081828384858687888990919293949596979899
100101102103104105106107108109110111112113114115116117118119120121122123124125126127128129130
SG3099_proof ■ 30 July 2014 ■ 15/16
Please cite this article in press as: Schlische, R.W., et al., Quantifying the geometry, displacements, and subresolution deformation in thrust-ramp anticlines with growth and erosion: From models to seismic-reflection profile, Journal of Structural Geology (2014), http://dx.doi.org/10.1016/j.jsg.2014.07.012

6) For the ramp anticline from the Niger Delta, an inverse rela-tionship exists between the fault separation and the layer-parallel shortening. Possible causes for this inverse relation-ship include ductility differences, fault nucleation on the rampwith upward and downward propagation, or the misinterpre-tation of a steep fold limb as a fault.
Acknowledgments
We greatly appreciate S. Naruk for bringing the Niger Deltaexample to our attention and CGG Veritas for making the seismicdata available to the Virtual Seismic Atlas. K. Bemis, M. Ferencz, M.Flite, M. Needle, C. Sequeira, N. Stier, and K. Warrell helped improvean earlier draft of the manuscript. We thank F. Dula, S. Naruk, and B.Couzens-Schultz for their helpful reviews. RWS, MOW, and TNHthank the National Science Foundation (grants EAR-0838462 andEAR-0408878), Husky Energy Inc., and Petrobras S.A. for theirsupport of the Experimental Modeling Laboratory at Rutgers Uni-versity. TNH thanks ExxonMobil Corporation for its support of herthesis work.
References
Allmendinger, R.W., 2006. FaultFold5, Version 5.4 for Mac OSX available at: http://www.geo.cornell.edu/geology/faculty/RWA/programs.html.
Briggs, S.E., Davies, R.J., Cartwright, J.A., Morgan, R., 2006. Multiple detachmentlevels and their control on fold styles in the compressional domain of thedeepwater west Niger Delta. Basin Res. 18, 435e450.
Butler, R., 2008. Deep Water Niger Delta Seismic Profile. http://see-atlas.leeds.ac.uk:8080/homePages/regionalProject.jsp?resourceId¼090000648000f208.
Colletta, B., Letouzey, J., Pinedo, R., Ballard, J.F., Bal�e, P., 1991. Computerized X-raytomography analysis of sandbox models: examples of thin-skinned thrustsystems. Geology 33, 1063e1067.
Corredor, F., Shaw, J.H., Bilotti, F., 2005. Structural styles in the deep-water fold-and-thrust belts of the Niger Delta. AAPG Bull. 89, 753e780.
Couzens, B.A., Dunne, W.M., Onasch, C.M., Glass, R., 1993. Strain variations andthree-dimensional strain factorization at the transition from the southern tothe central Appalachians. J. Struct. Geol. 15, 451e464.
Couzens-Schultz, B.A., Vendeville, B.C., Wiltschko, D.V., 2003. Duplex style andtriangle zone formation: insights from physical models. J. Struct. Geol. 25,1623e1644.
Eisenstadt, G., Sims, D., 2005. Evaluating sand and clay models: do rheologicaldifferences matter? J. Struct. Geol. 27, 1399e1412.
Epard, J.-L., Groshong Jr., R.H., 1993. Excess area and depth to detachment. AAPGBull. 77, 1291e1302.
Gonzalez-Mieres, R., Suppe, J., 2006. Relief and shortening in detachment folds.J. Struct. Geol. 28, 1785e1807.
Gonzalez-Mieres, R., Suppe, J., 2011. Shortening histories in active detachment foldsbased on area-of-relief methods. In: McClay, K., Shaw, J., Suppe, J. (Eds.), Thrust-fault Related Folding. AAPG Memoir, vol. 94, pp. 39e67.
Groshong Jr., R.H., 2006. 3-D Structural Geology, second ed. Springer, Heidelberg.Groshong Jr., R.H., Epard, J.-L., 1994. The role of strain in area-constant detachment
folding. J. Struct. Geol. 16, 613e618.Groshong Jr., R.H., Withjack, M.O., Schlische, R.W., Hidayah, T.N., 2012. Bed length
does not remain constant during deformation: recognition and why it matters.J. Struct. Geol. 41, 86e97.
Hidayah, T.N., 2010. Experimental Modeling of Focused Shortening: Understandingthe Structural Development of Reverse Fault Zones. Rutgers University. M.S.thesis.
Kostenko, O.V., Naruk, S.J., Hack, W., Poupon, M., Hans-Jurg Meyer, H.-J., Mora-Glukstad, M., Anowai, C., Mordi, M., 2008. Structural evaluation of column-height controls at a toe-thrust discovery, deep-water Niger Delta. AAPG Bull.92, 1615e1638.
Mead, W.J., 1925. The geologic role of dilatancy. J. Geol. 33, 685e698.Moretti, I., Callot, J.-P., 2012. Area, length and thickness conservation: dogma or
reality? J. Struct. Geol. 41, 64e75.Serra, S., 1977. Styles of deformation in ramp regions of overthrust faults. In:
Wyoming Geological Association, 29th Annual Field Conference Guidebook,pp. 487e498.
Suppe, J., Chou, G.T., Hook, S.C., 1992. Rates of folding and faulting determined fromgrowth strata. In: McClay, K.R. (Ed.), Thrust Tectonics. Chapman and Hall,London, pp. 105e121.
Torvela, T., 2009. Scene 3 e Niger Delta Fold and Thrust Belt. http://see-atlas.leeds.ac.uk:8080/homePages/generic.jsp?resourceId¼0900006480014291.
Wiltschko, D.V., Groshong Jr., R.H., 2012. Why did Chamberlin go wrong? Contextand contribution of Chamberlin (1910). J. Struct. Geol. 41, 7e23.
R.W. Schlische et al. / Journal of Structural Geology xxx (2014) 1e1616
12345678910111213141516171819202122232425262728293031323334
35363738394041424344454647484950515253545556575859606162636465666768
SG3099_proof ■ 30 July 2014 ■ 16/16
Please cite this article in press as: Schlische, R.W., et al., Quantifying the geometry, displacements, and subresolution deformation in thrust-ramp anticlines with growth and erosion: From models to seismic-reflection profile, Journal of Structural Geology (2014), http://dx.doi.org/10.1016/j.jsg.2014.07.012