quantifying morphological alteration of rbc 1 population from light scattering data
TRANSCRIPT
Unc
orre
cted
Aut
hor P
roof
Clinical Hemorheology and Microcirculation xx (20xx) x–xxDOI:10.3233/CH-131726IOS Press
1
Quantifying morphological alteration of RBC1
population from light scattering data2
Raghwendra Mishraa,b, Debasish Sarkarc, Sourav Bhattacharyaa, Sanjaya Mallickd,e,Mousumi Chakrabortya, Debarati Mukherjeea,b, Manoj Karb and Roshnara Mishraa,∗
3
4
aDepartment of Physiology, University of Calcutta, Kolkata, India5
bDepartment of Biochemistry, NRS Medical College, Kolkata, India6
cDepartment of Chemical Engineering, University of Calcutta, Kolkata, India7
dCU BD Centre of Excellence for Nanobiotechnology, University of Calcutta, Kolkata, India8
eBD Biosciences, India9
Abstract. Studies of RBC morphological alterations, despite their potential clinical and experimental application, are com-10
promised due to lack of simple and rapid techniques. As a complementary approach toward quantitative microscopy, we have11
reconstituted morphological information from light scattering data obtained from flow cytometer. Normal and poikilocytic agent12
treated samples were analyzed by microscopy and respective morphological index (MI) was calculated from the morphology13
based scores assigned to RBC. The samples were simultaneously analyzed by flowcytometer and the scatter data were obtained.14
Accordingly, the best correlated parameters of both forward scatter and side scatter were chosen to formulate a suitable regression15
model with MI as response. Flow cytometry data was also verified with another instrument (BD FACS Verse) and the equation16
obtained was validated with separate set of samples. The multivariate regression analysis yields a quadratic model with MI as17
response (R2 = 0.96, p < 0.001). The flow cytometric data from both instruments were in good agreement (Intra class correla-18
tion 0.9, p < 0.001). The model was found to simulate the sample MI with high accuracy (R2 = 0.97, p < 0.001). This proposed19
method was verified to be simple, rapid, quantitative and cost effective for the measurement of morphological alteration of RBC.20
Keywords: Red blood cell, morphological alteration, morphological index, light scattering, flow cytometry21
Abbreviations21
RBC red blood cellMI morphological indexMS morphological scoreFSC forward scatterSSC Side scatterE5M eosin-5-maleimiderCV robust co-efficient of variance%CV co-efficient of variance
∗Corresponding author: Roshnara Mishra, Assistant Professor, Department of Physiology, University of Calcutta, 92, A.P.C.Road, Kolkata-700009, India. Tel.: +91 33 23508386/6387/6396/1397 (Extn: 226); Fax: +91 33 2351 9755/2241 3288; E-mail:[email protected].
1386-0291/13/$27.50 © 2013 – IOS Press and the authors. All rights reserved
Unc
orre
cted
Aut
hor P
roof
2 R. Mishra et al. / Quantifying morphological alteration of RBC
Radj adjusted RICC Intraclass correlationAFM atomic force microscopy.
1. Introduction22
Red blood cell (RBC) also referred sometime as discocyte for its discoid shape, are the most populous23
cell species of blood. RBC morphology and its alteration, under physiological, pathological or experi-24
mental condition are fascinatingly different from any other cell types and thus a challenge on its own.25
In physiological condition it assumes a biconcave disc structure, the discocyte, which in pathological or26
experimental conditions can transform to spherocyte through a series of poikilocyte conversions. Poik-27
ilocytosis is a major deviation from the normal shape of erythrocytes that is associated with an increased28
rate of erythrocyte destruction [7, 9, 29, 35]. Morphological alteration of RBC, unlike other RBC indices,29
may be regarded as a pathological index of several diseases viz. hemoglobinopathies, membranopathies,30
and infectious, inflammatory and congenital diseases, as well as in neonatology, cytoskeletal and mem-31
brane composition studies, in drug interactions studies for research, clinical and screening purpose, RBC32
morphology study is unavoidable [1, 31]. Poikilocytosis is also associated with a certain decrease in33
deformability of the cells (e.g. in sickled cells, echinocytosis) [7, 21, 27], which may lead to a decrease34
in capillary perfusion (microcirculatory disorder) [16, 33]. Recent articles vouch for the need of the35
morphological studies of RBC in routine clinical analysis and awareness about importance of presence of36
poikilocytes in clinical samples [12]. One of the major obstacles in this path is dependence on time and37
labour intensive microscopic studies. Morphological Index (MI), a number fraction weighted average38
of morphological score (MS) (MI = ∑xi.MSi, where xi be the number fraction of ith derivative), is a39
quantitative approach to assess morphological alteration of RBC microscopically [4], which is laborious40
and affected by observer’s personalized bias, and thus the quantitative deviation of the calculated MI41
from its true value is always probable. This has limited the clinical and experimental significance of RBC42
morphological information. Need for automation has taken up the indirect approach to RBC morphol-43
ogy by quantifying size or rheological characters in automated cell counters or laser diffractometers,44
ektacytometer, Rayligh scattering, and other methods [6, 8, 14, 28, 32].45
Light scattering of particles is a standard technique to extract information regarding their shape and46
size. Flow cytometry has become a powerful quantitative alternative of microscopy for large scale, high47
throughput analysis of cell populations. Generally, the size dependent small angle or forward scatter (FSC)48
and the shape and surface granularity dependent orthogonal or side scatter (SSC) data readily obtainable49
from a flow cytometer are largely centered on particles spherical in nature and sphere perturbed derivative50
shapes of a model RBC [19], which may be regarded as an oversimplified version of the actual topology.51
Study of nonspherical cells or particles by flow cytometry has staged difficulties in interpreting the findings52
and to monitor the cellular size/shape etc. The major concern around such sort of effort is the difference53
in orientation of the nonspherical cells/particles with respect to the angle of incident light and the angle of54
signal collection. Most of the cytometric investigations with non-spherical particles, reported so far deal55
with RBC and sperm cells. A comparison indicates that the former presents wide spectrum morphological56
variations and hence is largely unattended from a quantitative point of view. Due to its discoid shape57
and presence of central pallor, scattering from RBC varies largely and is hard to interpret. Under shear58
flow RBC elongates and assumes a variety of orientation, each differing from other in some aspect [2].59
Unc
orre
cted
Aut
hor P
roof
R. Mishra et al. / Quantifying morphological alteration of RBC 3
Both elongation and orientation property of RBC in shear flow contributes to the greater variability in60
the scattering pattern. Moreover, the biconcave disc structure, discocyte, can transform to spherocyte61
through budding off of membrane either externally or internally from spike containing echinocytes or62
invaginated stomatocytes respectively in pathological and experimental conditions [1, 34].63
While RBC shape has been rigorously modeled mathematically for its atypical shape and scattering64
properties [10, 22], morphology study by scattering shows uncertainty in selecting parameters to represent65
the changes. Though the observations based studies by Piagnerelli et al. [28] and Bratosin et al. [6]66
showed uncertainty in selecting flowcytometric parameters as a function of morphology, these attempts67
had clearly depicted association between the corresponding parameters and morphology. The present68
investigation has been undertaken in an attempt to develop a functional relation between scattering data69
of flowcytometry and the MI of a RBC population.70
2. Materials and methods71
2.1. Sample preparation72
We have generated mixed populations of poikilocytic and normal cells by treating whole blood73
sample from normal healthy volunteers (Male-6, female-4; Age-28.9 ± 2.73 years; body weight-74
68.8 ± 11.68 Kg; resting heart rate- 74.6 ± 4.45 beats/minute; Systolic pressure- 125.8 ± 4.57 mmHg75
and diastolic pressure- 84.2 ± 3.33 mmHg; data represented as mean ± standard deviation) with differ-76
ent poikilocytic agents in different doses randomly (n = 30). Blood was collected from antecubital vein77
after overnight fasting and appropriate rest between 9–10 am in a quiet environment and ambient room78
temperature (25 ± 0.5◦C) following the new guidelines for hemorheological laboratory techniques [3] in79
a heparinised vial (15 U/ml). Eosin-5-maelimide [13] (E5M; 1–3 �g/�l packed cell) and Naja kaouthia80
snake venom [36] (0.5–2 �g/ml whole blood) were used to induce echinocytosis and stomatocytosis81
respectively. The samples were analyzed by flow cytometry and microscopy simultaneously. To avoid82
observers’ bias the experiments were double blinded with respect to both microscopy and flowcytometry83
analysis. Additionally a different set, including both control and patient and poikilocyte agent treated84
samples were prepared for model validation (n = 10).85
2.2. Flow cytometry86
Flow cytometry data were generated using a BD FACS Aria III with a 488 nm blue laser and a total of87
30,000 events were recorded for each sample. The FSC data were collected on a linear scale, whereas for88
SSC data log scale was used. The height, width and area parameter of the voltage pulse of both FSC and89
SSC were recorded. On the BD FACS Aria III a 70 �m nozzle was used and the custom sheath pressure90
was set at 15 psi with a minimum sample flow rate of 1. Additionally, we have also used BD FACS Verse91
in order to check the instrumental bias of the generated data using both the standard mode (low flow rate)92
and high sensitivity mode of the instrument. Intraclass correlation coefficients (ICC) were calculated for93
these two data sets with the respective FACS Aria III data.94
2.3. Fluorescence labelling of RBC samples95
Washed RBC samples including treated, untreated and patients’ blood, were labelled with E5M dye,96
which reacts covalently with lysine-430 on the extracellular domain of band 3 protein of RBC membrane97
Unc
orre
cted
Aut
hor P
roof
4 R. Mishra et al. / Quantifying morphological alteration of RBC
according to the method of king et al. [18]. Briefly, 25 �l of packed RBC, after washing with 10 mM98
phosphate buffer saline (PBS) (pH = 7.4), from healthy control were incubated with graded dose of E5M99
(5 �l, 10 �l and 15 �l of 5 mg/ml solution of E5M) for 1 hour in dark at room temperature. After incubation100
the sample was washed with 10 mM PBS containing 0.5% BSA thrice to remove the unbound dye and101
then diluted to appropriate number in 10 mM PBS and used for microscopic study.102
2.4. Microscopy imaging103
For imaging BD Pathway 855 instrument was used. The RBCs (both E5M labeled and unlabeled) were104
seeded into a 96 well bioimaging plate and incubated on the stage for 15 min to allow the cells to settle105
and Nipkow spinning disc based confocal images were captured by a CCD Camera in transmission mode106
as well as using excitation and emission filter for FITC (for fluorescence imaging of E5M labeled RBC).107
A 3 × 3 confocal stacked montage image was captured for each well and as mentioned MI was evaluated108
by manual counting all cells in the field. Based on the classification and scoring system of Besis [4]109
we have chosen the MS range to be [−1, +1], with MS = 0 for discocyte, MS = +1 for spherocyte via110
echinocytic pathway, MS = −1 for spherocyte via stomatocytic pathway, as both pathways are mutually111
exclusive. To reduce the complexity in gathered information from the transitional RBC morphological112
species, intermediate population in both pathways were assigned with MS = ±0.5.113
2.5. Atomic force microscopy114
Immediately after treatment a thin layer of heparinized blood was drawn on a glass cover slide to prepare115
a film. Then the films were air dried and were ready for AFM analysis. AFM study was performed with116
VEECO Multimode system having Nanoscope IIIa controller. All the images were taken using taping117
mode in air (at room temperature, 75% humidity) with RTESP tip silicon probes at resonant frequency118
302.87 kHz. 200 �m J scanner was used. The cover slip carrying the blood sample was mounted on XY119
stage of Scanner. The images obtained were analyzed by Nanoscope Software version 5.12 in offline120
mode.121
2.6. Statistical analysis122
Flow cytometry data, in term of (i) area, (ii) height and (iii) width distribution of both FSC and SSC123
were extracted from the raw experimental data of all events with the help of FlowDiva software (version124
6.1.3). Software output also includes basic statistics (mean, median, standard deviation, coefficient of125
variance, etc.) of the respective distribution. The analysis of the obtained statistics was done with statistical126
program packages SPSS (SPSS Version 16 for Windows; SPSS Inc., Chicago, USA). In order to pick the127
best correlated parameters of all the six distributions with the corresponding MI, the univariate curve fit128
estimation was carried out. Accordingly, the best correlated parameters of both FSC and SSC were chosen129
to formulate a suitable regression model with MI as response using the standard Design-Expert (Version130
8.0) package. Internal validation of the model was carried out using residual analysis and appropriate131
statistics. The model was further validated using a new experimental data set, exclusive to the same used132
in model formulation.133
Unc
orre
cted
Aut
hor P
roof
R. Mishra et al. / Quantifying morphological alteration of RBC 5
3. Results134
3.1. Microscopic imaging of RBC morphology135
E5M labeled and unlabeled samples of both control and poikilocytic agent treated sample were pho-136
tomicrographed using BD Pathway 855. The unlabeled RBC sample of control sample contains discocyte137
as the major population (>95%), whereas echinocytogenic and stomatocytogenic agent treated samples138
shows prevalence of respective poikilocytes along with spherocytes in varying percentage (Fig. 1 subset139
Ia, IIa and IIIa), the figure in the inset are the AFM images of the major population of each respective140
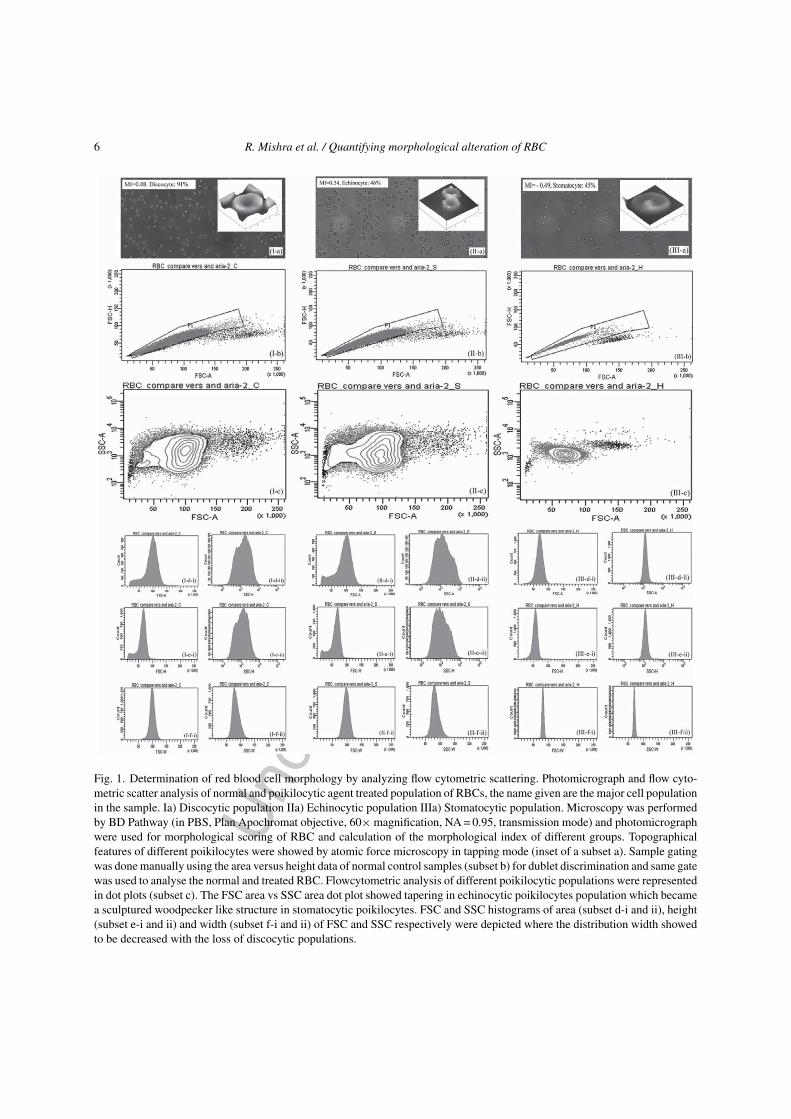
group. E5M treated sample (at all doses) shows prevalence of echinocytes (Fig. 2) thus limited its use141
to identify the different morphological alteration and hence not used for the calculation of MI of control142
and treated samples. The morphological scoring was done with the photomicrograph of samples taken in143
transmission mode in PBS.144
3.2. Morphological index145
Based on the scoring system adopted and customized for the present work, the MI was calculated146
based on the standard formula. The MI of samples ranged from −0.64 to +0.57, where the sign implies147
the presence of stomatocyte and echinocyte respectively and the numerical value indicates the extent148
of damage. The range covers a wide span and comprises of system which either fall in echinocyte or149
stomatocyte group. In order to check the precision of obtained MI related to number of cells counted, we150
have calculated the MI for 50, 100, 200 and >200 cells for each sample (n = 40). It was found that the MI for151
each set does not varies significantly (One way ANOVA, F = 0.057, p = 0.996). The %CV value of 50.93,152
49.83, 50.25 and 49.15 were obtained for calculated MI for 50, 100, 200 and >200 cells respectively.153
3.3. Flow cytometry analysis154
All the three distribution pattern viz. area, height and width of each sample both control and treated155
were acquired and analysed with FlowDiva software (version 6.1.3). The measures of central tendencies156
(mean & median) and dispersion statistics (standard deviation, robust coefficient of variance and Pearson157
coefficient of dissymmetry) of each sample was then calculated. The scatter plots and histrogram of flow158
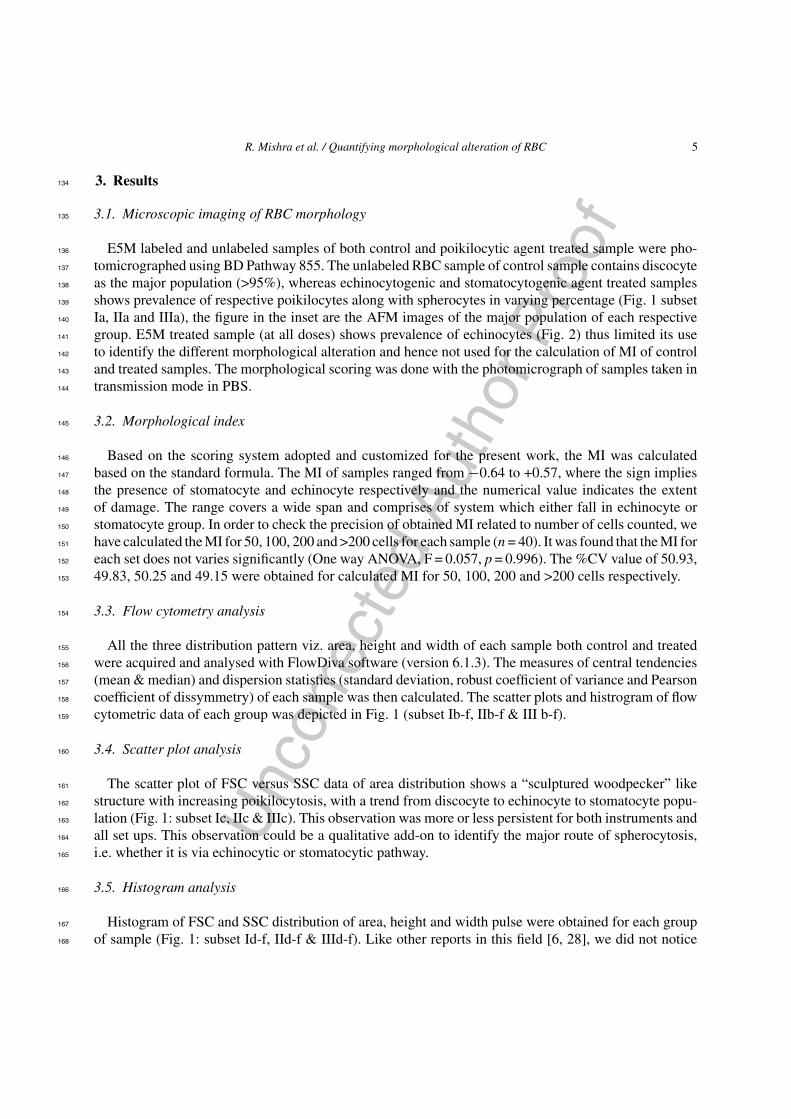
cytometric data of each group was depicted in Fig. 1 (subset Ib-f, IIb-f & III b-f).159
3.4. Scatter plot analysis160
The scatter plot of FSC versus SSC data of area distribution shows a “sculptured woodpecker” like161
structure with increasing poikilocytosis, with a trend from discocyte to echinocyte to stomatocyte popu-162
lation (Fig. 1: subset Ic, IIc & IIIc). This observation was more or less persistent for both instruments and163
all set ups. This observation could be a qualitative add-on to identify the major route of spherocytosis,164
i.e. whether it is via echinocytic or stomatocytic pathway.165
3.5. Histogram analysis166
Histogram of FSC and SSC distribution of area, height and width pulse were obtained for each group167
of sample (Fig. 1: subset Id-f, IId-f & IIId-f). Like other reports in this field [6, 28], we did not notice168
Unc
orre
cted
Aut
hor P
roof
6 R. Mishra et al. / Quantifying morphological alteration of RBC
Fig. 1. Determination of red blood cell morphology by analyzing flow cytometric scattering. Photomicrograph and flow cyto-metric scatter analysis of normal and poikilocytic agent treated population of RBCs, the name given are the major cell populationin the sample. Ia) Discocytic population IIa) Echinocytic population IIIa) Stomatocytic population. Microscopy was performedby BD Pathway (in PBS, Plan Apochromat objective, 60× magnification, NA = 0.95, transmission mode) and photomicrographwere used for morphological scoring of RBC and calculation of the morphological index of different groups. Topographicalfeatures of different poikilocytes were showed by atomic force microscopy in tapping mode (inset of a subset a). Sample gatingwas done manually using the area versus height data of normal control samples (subset b) for dublet discrimination and same gatewas used to analyse the normal and treated RBC. Flowcytometric analysis of different poikilocytic populations were representedin dot plots (subset c). The FSC area vs SSC area dot plot showed tapering in echinocytic poikilocytes population which becamea sculptured woodpecker like structure in stomatocytic poikilocytes. FSC and SSC histograms of area (subset d-i and ii), height(subset e-i and ii) and width (subset f-i and ii) of FSC and SSC respectively were depicted where the distribution width showedto be decreased with the loss of discocytic populations.
Unc
orre
cted
Aut
hor P
roof
R. Mishra et al. / Quantifying morphological alteration of RBC 7
(Ia) (IIa) (IIIa)
(Ib) (IIb) (IIIb)
Fig. 2. Photomicrograph of E5M stained control RBC showing echinocytosis in a dose dependent manner. Panel (a) representsthe fluorescence image of E5M labeled RBC using excitation and emission filter for FITC and panel (b) represents the pho-tomicrograph in transmission mode of the same field, microscopy was performed by BD Pathway (in PBS, Plan Apochromatobjective, 60× magnification, NA = 0.95). Subset I: 1 �g E5M/ �l packed RBC, subset II: 2 �g E5M/ �l packed RBC and subsetIII: 3 �g E5M/ �l packed RBC.
a prominent bimodal distribution even for the discocyte population, instead a shouldering was noticed169
in FSC area and height histogram on FASCAria III limiting its usability for the prediction of shape170
alteration. The SSC area and height histogram shows somewhat more prominent bimodality in case of171
discocyte population. On the contrary bimodality was noticed in discocyte population when samples are172
run on FACS Verse for validation on both modes. The width distribution in all cases and both instruments173
shows a unimodal distribution. All distribution histogram gradually tappers with poikilocytosis with a174
maximum tapering in stomatocytic population.175
3.6. Regression model using response surface methodology176
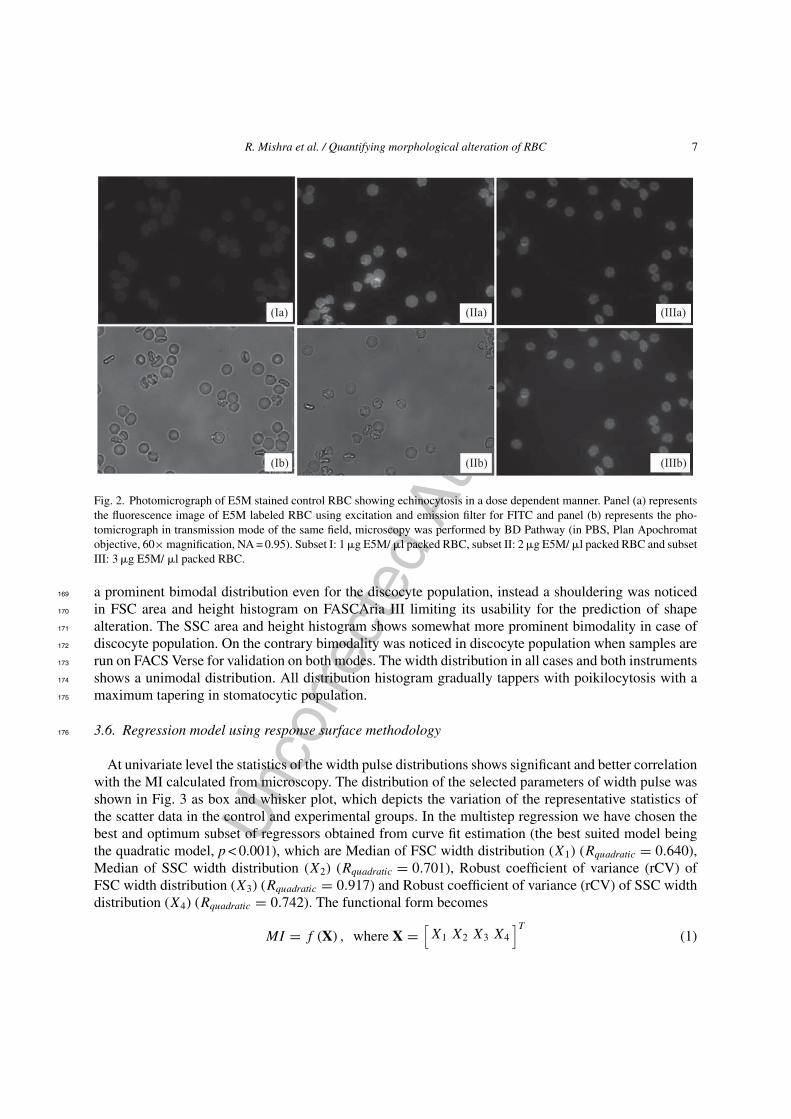
At univariate level the statistics of the width pulse distributions shows significant and better correlationwith the MI calculated from microscopy. The distribution of the selected parameters of width pulse wasshown in Fig. 3 as box and whisker plot, which depicts the variation of the representative statistics ofthe scatter data in the control and experimental groups. In the multistep regression we have chosen thebest and optimum subset of regressors obtained from curve fit estimation (the best suited model beingthe quadratic model, p < 0.001), which are Median of FSC width distribution (X1) (Rquadratic = 0.640),Median of SSC width distribution (X2) (Rquadratic = 0.701), Robust coefficient of variance (rCV) ofFSC width distribution (X3) (Rquadratic = 0.917) and Robust coefficient of variance (rCV) of SSC widthdistribution (X4) (Rquadratic = 0.742). The functional form becomes
MI = f (X) , where X =[X1 X2 X3 X4
]T
(1)
Unc
orre
cted
Aut
hor P
roof
8 R. Mishra et al. / Quantifying morphological alteration of RBC
60000.00
FS
CM
edia
n
FS
CrC
V
SS
CrC
VS
SC
Med
ian
Control
(a) (b)
(c) (d)
Echinocyte Stomatocyte
Control Echinocyte Stomatocyte Control Echinocyte Stomatocyte
Control Echinocyte Stomatocyte
12.00
10.0015.00
10.00
5.00
8.00
6.00
4.00
2.00
65000.00
70000.00
75000.00
80000.00
85000.00
90000.00
70000.00
80000.00
90000.00
100000.00
110000.00
Fig. 3. Box and whisker plot showing the distribution pattern of the predictors in each group used to formulate the regressionmodel with MI as response: (a) FSC Median, (b) SSC Median, (c) FSC rCV and (d) SSC rCV.
As {Xi}i=1, 4 cannot be precisely adjusted by changing the dose of the poikilocytic agent, the set of177
data used in the study may be regarded as random historical data, distributed over a wide spectrum of178
MI ⇒ [−0.64, + 0.57].179
Initially we have tried to fit a linear multivariable regression model of the form
MI = β0 +4∑
i=1
βiXi (2)
where {βi}i=0, 4 are constants parameters. However, the statistical analysis indicates a poor fit as reflectedby the correlation coefficient (both R2 and R2
adj) and % CV. For linear regression model we have foundR2 = 0.87, R2
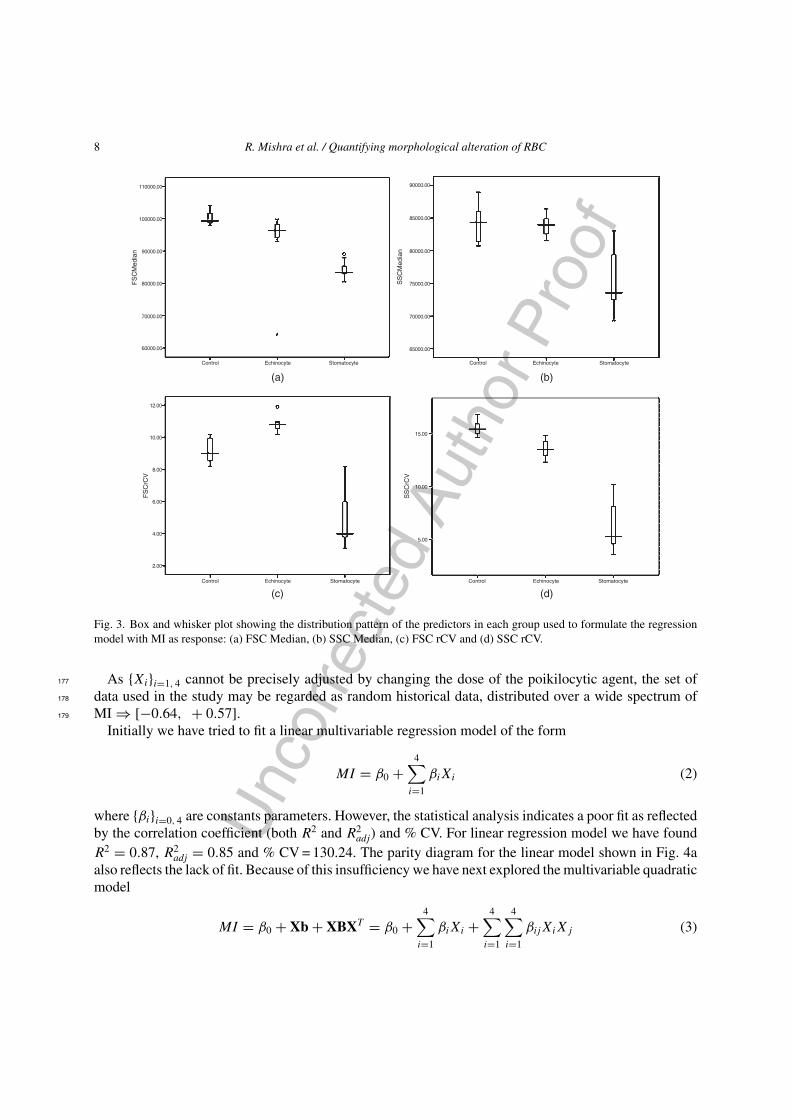
adj = 0.85 and % CV = 130.24. The parity diagram for the linear model shown in Fig. 4aalso reflects the lack of fit. Because of this insufficiency we have next explored the multivariable quadraticmodel
MI = β0 + Xb + XBXT = β0 +4∑
i=1
βiXi +4∑
i=1
4∑i=1
βijXiXj (3)
Unc
orre
cted
Aut
hor P
roof
R. Mishra et al. / Quantifying morphological alteration of RBC 9
where {βi}i=0, 4 and{βij
}i=0, 4;j=1, 4 are constant model parameters and X =
[X1 X2 X3 X4
]T
, b =180
[β1 β2 β3 β4
]T
and B =
⎡⎢⎢⎢⎢⎢⎣
β11β122
β132
β142
β22β232
β242
β33β342
sym. β44
⎤⎥⎥⎥⎥⎥⎦
T
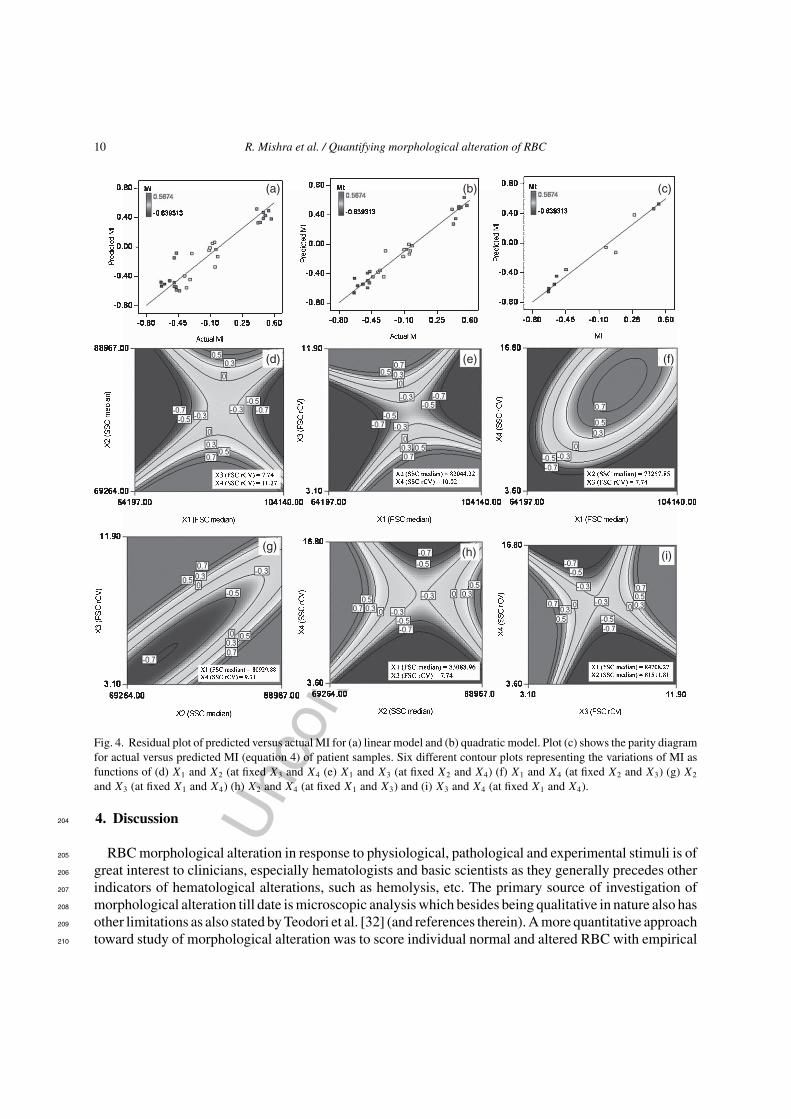
. For the quadratic model we have found R2 = 0.96,181
R2adj = 0.92 and %CV = 92.12 indicating general usefulness. The model has been also validated by F182
test. F value of 26.26 (p < 0.0001) implies that the model is significant and there is only a 0.01% chance183
that a model F value this large could occur due to noise. The parity diagram of the quadratic regression184
model is shown in Fig. 4b. We have also tested the cubic regression model to fit the experimental data,185
though the cubic model does not significantly improve the test parameters (R2, R2adj and %CV) over186
the quadratic one, at the same time the regression equation became too complicated to use. So the final187
working equation of MI as a function of X =[X1 X2 X3 X4
]T
becomes188
MI = 43.70338 + 5.61906 × 10−4X1 − 2.25751 × 10−3X2 + 6.49537X3 − 0.615890X4189
+2.10773 × 10−9X1X2 − 2.64946 × 10−5X1X3 + 1.23169 × 10−5X1X4190
−8.54377 × 10−5X2X3 − 3.16989 × 10−6X2X4 + 0.08X3X4 − 3.80161 × 10−9X21191
+1.71499 × 10−8X22 + 0.12437X2
3 − 0.032371X24 (4)192
Six different contour plots representing the variations of MI as functions of set of two predictors(keeping other two constant) are shown in Fig. 4d–i. Out of the six different contours, four representsaddle, while the rest of the two are centers. Complete characterization of the response surface cannot bedone only with the contour plots; a more formal canonical analysis may be useful. The stationary point(XS) of the response surface can be located as
XS = −1
2B−1b (5)
The stationary point for the present quadratic model was found to be XS =[− 5.7305 × 10⁴
193
5.8632 × 10⁴ 3 27]T
. The result indicates that the stationary point is far outside the region of explo-194
ration for fitting the regression model. The nature of the response surface can be further analyzed from the195
signs and magnitudes of the eigenvalues {λi}i=1, 4 of matrix B, which are λ =[− 0.042 0 0 0.134
]T
.196
This indicates that the present response surface is a rising ridge type [26].197
3.7. Validation198
The proposed model was also validated using a new set of experimental data distributed over MI ⇒199
[−0.63, 0.52], exclusive to model formulation. The corresponding parity diagram is shown in Fig. 4c.200
The correlation coefficient of the data set with respect to the 45◦ line was found to be 0.97 (p < 0.001).201
High intraclass correlation (ranging from 0.879–0.990, p < 0.001) among the predictors used on different202
instrument setup for same sample shows instrument independency of current method.203
Unc
orre
cted
Aut
hor P
roof
10 R. Mishra et al. / Quantifying morphological alteration of RBC
(a) (b) (c)
(d)
(g) (h) (i)
(e) (f)
Fig. 4. Residual plot of predicted versus actual MI for (a) linear model and (b) quadratic model. Plot (c) shows the parity diagramfor actual versus predicted MI (equation 4) of patient samples. Six different contour plots representing the variations of MI asfunctions of (d) X1 and X2 (at fixed X3 and X4 (e) X1 and X3 (at fixed X2 and X4) (f) X1 and X4 (at fixed X2 and X3) (g) X2
and X3 (at fixed X1 and X4) (h) X2 and X4 (at fixed X1 and X3) and (i) X3 and X4 (at fixed X1 and X4).
4. Discussion204
RBC morphological alteration in response to physiological, pathological and experimental stimuli is of205
great interest to clinicians, especially hematologists and basic scientists as they generally precedes other206
indicators of hematological alterations, such as hemolysis, etc. The primary source of investigation of207
morphological alteration till date is microscopic analysis which besides being qualitative in nature also has208
other limitations as also stated by Teodori et al. [32] (and references therein). A more quantitative approach209
toward study of morphological alteration was to score individual normal and altered RBC with empirical210
Unc
orre
cted
Aut
hor P
roof
R. Mishra et al. / Quantifying morphological alteration of RBC 11
scoring and thereby to calculate the morphological index of the RBC population. This system, though211
give quantitative information, is a representative of small population consisting of 100–200 RBC [4, 11,212
17, 27] and can be affected by field selection and observers bias to precisely score the individual stage of213
morphological responses. The conventional scoring of morphologically altered RBC was based on light214
microscopy according nomenclature of Bessis [4], later modified by Ferrell et al. [11] and personalized215
[17] for particular works. Discocyte has the score of zero. Species with spiculation has positive values216
ascertained to them, whereas species with invagination has negative values according to deviation from217
normal. The highest scores, positive as well as negative, were assigned to the spherocytic RBC population218
obtained through either via echinocytosis or stomatocytosis respectively. Reported literatures [5, 23] also219
indicates that stomatocytosis and echinocytosis are mutually exclusive because a particular poikilocytic220
agent could induce either spiculation or invagination. This universal “main sequence” of shapes and221
their order of appearance is not influenced by specific echinocytogenic or stomatocytogenic agent though222
shapes outside this sequence can be found as some special cases [23]. Based on this knowledge we chose223
poikilocytic (echinocytogenic or stomatocytogenic) agents at random and generated different population224
of RBC morphological species in whole blood aliquots. Thereafter MI values of control and poikilocytic225
agent treated samples were calculated from Z stacked images from BD Pathway 855 (transmission mode).226
The use of fluorescence dye to label RBC was limited due to two reasons i) the fluorescence dye itself or227
fluorescently labelled agglutinins may themselves alter RBC shape as also suggested by Piagnerelli et al.228
[28] and ii) the buffer which was used to wash the unbound dye to reduce the background noise for proper229
fluorescence microscopy generally contains albumin a known stomatocytic agent [24, 34]. We have used230
E5M for fluorescence labelling of RBC in this experiment, which shows echinocytosis at all doses used231
and is in accordance with other studies [13, 20]. PBS-BSA washing does not inhibit or help to recover232
the echinocyte induced due to E5M labeling as reported by Lee et al. [20]. Another problem associated233
with this shape recovery procedure is that the recovered shape may vary from the original shaped RBC234
in membrane property [30] and thus could affect the scattering behavior and also the extent of recovery235
is undetermined. As the glass effect also leads to echinocytosis [24] we have used unlabelled RBCs in236
PBS medium for imaging as it does not induces any shape transition [25].237
With increasing awareness of the clinical and experimental usability of RBC morphological alterations238
in recent time [1, 12], several attempts were taken for the automation and rapid quantification of RBC239
morphological alterations using different instrument and techniques, of which automated cytometric240
analysis has its greater share. The recent trend has its major focus in the use of scattering techniques241
and includes both simulation and wet lab experiments. Use of scattering property to identify the RBC242
morphological alteration could be traced back to Hoffman [14], who has used the variability of the243
Rayleigh scattering of light from a stirred suspension to describe the shape alteration in RBC. He has244
shown that as RBC approaches sphericity, the noise (i.e. the variability) diminishes and the scattering245
becomes somewhat more uniform, but information of individual RBC was lost. Piagnerelli et al. [28]246
and Bratison et al. [6] used a more refined approach regarding scattering property of RBC to describe247
its shape alteration. They have used the FSC height data of flow cytometry, which provides information248
at unit level. Both have shown with shape alteration the bimodality of FSC height data was lost and249
with increasing sphericity uniform scattering pattern was observed with low dispersed data compared to250
discocyte. Piagnerelli et al. [28] also tries to approach the problem in a more quantitative way by defining251
M2:M1 ratio (i.e. is the median value of the two modes) and Pearson dissymmetry coefficient to calculate252
the degree of sphericity. In both the studies SSC scattering data, known to contain information about253
the shape and granularity was completely overlooked, as in scatter based automated cell counters. None254
of the distributions shows a clear bimodality on BD FACSAria III for any sample as reported by others255
Unc
orre
cted
Aut
hor P
roof
12 R. Mishra et al. / Quantifying morphological alteration of RBC
[6, 28] thus limiting its use. In order to generate a more robust method to use the scattering information256
from normal and morphologically altered RBCs, we first identified the better representative scattering257
distribution pattern. Out of the three parameters, width distribution was chosen in order to formulate258
suitable regression model, with MI as response. The reason behind this selection is threefold:259
i. width parameters are independent of many factors that affects light scattering [15]260
ii. unimodality of distribution (which requires only two statistical parameters; one representing central261
tendency whereas another represents dispersion statistics) and262
iii. the width distribution statistics showed highest correlation with MI263
Afterward, the best correlated model and parameters were identified using the curve fit estimate at264
univariate level. Based on these information a quadratic regression model was established using the265
representative of statistics of both FSC and SSC width distribution. The model was validated for other266
instrument and fresh sample indicates the usability of the developed model for the rapid quantification267
of MI.268
5. Conclusion269
It may be concluded that the information about RBC morphology could be reconstructed from FSC270
and SSC distribution statistics. The proposed quadratic model can efficiently predict the MI value of271
a blood sample from the rapidly generable flow cytometric data with reasonable accuracy and avoids272
the microscopic analysis, which is laborious and prone to personalised bias. In a more generalized way273
it could be said that the current method suggests a new approach toward the use of scatter data from274
unadulterated sample to get the qualitative and quantitative information about RBC morphology.275
Acknowledgments276
We are grateful to Centre for Research in Nanoscience and Nanotechnology (CRNN), University of277
Calcutta. This work was funded by Department of Science & Technology, Government of West Bengal278
[Ref No: 371/ST/P/S&T/9G-7/2009].279
Author contributions280
R.M., R.M., and S.B. conceived the project, R.M., S.B., S.M., M.C., and D.M. performed experiments,281
R.M., D.S. and S.M. analysed the data, R.M., R.M., D.S., S.B., and M.K. wrote the manuscript.282
References283
[1] B.J. Bain, Morphology in the diagnosis of red cell disorders, Hematology 10 (2005), 178–181.284
[2] R. Bayer, S. Caglayan and B. Gunther, Discrimination between orientation and elongation of RBC in laminar flow by285
means of laser diffraction, Proc SPIE 2136 (1994), 105–113.286
[3] O.K. Baskurt, M. Boynard, G.C. Cokelet, P. Connes, B.M. Cooke, S. Forconi, F. Liao, M.R. Hardeman, F. Jung, H.J.287
Meiselman, G. Nash, N. Nemeth, B. Neu, B. Sandhagen, S. Shin, G. Thurston and J.L. Wautier, International expert288
panel for standardization of hemorheological methods. New guidelines for hemorheological laboratory techniques, Clin289
Hemorheol Microcirc 42 (2009), 75–97.290
Unc
orre
cted
Aut
hor P
roof
R. Mishra et al. / Quantifying morphological alteration of RBC 13
[4] M. Bessis, in: Red Cell Shape, M. Bessis, R.I. Weed, P.F. Leblond, eds., Springer-Verlag, New York, 1973, pp. 1–25.291
[5] T. Betz, U. Bakowsky, M.R. Muller, C.M. Lehr and I. Bernhardt, Conformational change of membrane proteins leads to292
shape changes of red blood cells, Bioelectrochemistry 70 (2007), 122–126.293
[6] D. Bratosin, J.-P. Tissier, H. Lapillonne, O. Hermine, T.B. de Villemeur, C. Cotoraci, J. Montreuil and C. Migno, A294
cytometric study of the red blood cells in gaucher disease reveals their abnormal shape that may be involved in increased295
erythrophagocytosis, Cytometry Part B (Clinical Cytometry) 80B (2011), 28–37.296
[7] A. Chabanel, W. Reinhart and S. Chien, Increased resistance to membrane deformation of shape-transformed human red297
blood cells, Blood 69 (1987), 739–743.298
[8] B.T. Constantino, The red cell histogram and the dimorphic red cell population, Labmedicine 42 (2011), 300–308.299
[9] Dacie and Lewis Practical Haematology, 10 ed., S.M. Lewis, B.J. Bain, I. Bates, eds., Churchill Livingstone, An Imprint300
of Elsevier, 2006.301
[10] O. Ergul, O., A. Arslan-Ergul and L. Gurel, Computational study of scattering from healthy and diseased red blood cells,302
J Biomed Opt 15 (2010), 045004.303
[11] J.E. Ferrell Jr., K.-J. Lee and W.H. Huestis, Membrane bilayer balance and erythrocyte shape: a quantitative assessment,304
Biochemistry 24 (1985), 2849–2857.305
[12] J.C. Ford, R. Milner and D.B. Dix, Red blood cell morphology reporting how much is a waste of time?, J Pediatr Hematol306
Oncol 33 (2011), 10–14.307
[13] H. Hagerstrand, M. Danieluk, M. Bobrowska –Hagerstrand, T. Holmstrom, V. Kralj-Iglic, C. Lindqvist and M. Nikin-308
maa, The lamprey (Lampetra fluviatilis) erythrocyte; morphology, ultrastructure, major plasma membrane proteins and309
phospholipids, and cytoskeletal organization, Mol Membr Biol 16 (1999), 195–204.310
[14] J.F. Hoffman, On the mechanism and measurement of shape transformations of constant volume of human red blood cells,311
Blood Cells 12 (1987), 565–588.312
[15] R.A. Hoffman, Pulse width for particle sizing, Curr Protoc Cytom Chapter 1:Unit 1.23, 2009.313
[16] F. Jung, From hemorheology to microcirculation and regenerative medicine: Fahraeus Lecture 2009, Clin Hemorheol314
Microcirc 45 (2010), 79–99.315
[17] B.S. Karon, C.M. van Buskirk, E.A. Jaben, J.D. Hoyer and D.D. Thomas, Temporal sequence of major biochemical events316
during Blood Bank storage of packed red blood cells, Blood Transfus 10 (2012), 453–461.317
[18] M.J. King, J.S. Smythe and R. Mushens, Eosin-5’- maleimide binding to band 3 and Rh-related proteins forms the basis318
of a screening test for hereditary spherocytosis, Br J Haematol 124 (2004), 106–113.319
[19] M. Kinnunen, A. Kauppila, A. Karmenyan and R. Myllyla, Effect of the size and shape of a red blood cell on elastic light320
scattering properties at the single-cell level, Biomed Opt Express 2 (2011), 1803–1814.321
[20] J.C.-M. Lee, J.A. Gimm, A.J. Lo, M.J. Koury, S.W. Krauss, N. Mohandas and J.A. Chasis, Mechanism of protein sorting322
during erythroblast enucleation: Role of cytoskeletal connectivity, Blood 103 (2004), 1912–1919.323
[21] Y. Lamarre, M.D. Hardy-Dessources, M. Romana, M.L. Lalanne-Mistrih, X. Waltz, M. Petras, L. Doumdo, A. Blanchet-324
Deverly, J. Martino, B. Tressieres, F. Maillard, V. Tarer, M. Etienne-Julan and P. Connes, Relationships between systemic325
vascular resistance, blood rheology and nitric oxide in children with sickle cell anemia or sickle cell-hemoglobin C disease,326
Clin Hemorheol Microcirc (2013), DOI: 10.3233/CH-121661327
[22] J. Lim, H. Ding, M. Mir, R. Zhu, K. Tangella and G. Popescu, Born approximation model for light scattering by red blood328
cells, Biomed Opt Express 2 (2011), 2784–2791.329
[23] H.W.G. Lim, M. Wortis and R. Mukhopadhyay, Stomatocyte-discocyte-echinocyte sequence of the human red blood cell:330
Evidence for the bilayer- couple hypothesis from membrane mechanics, Proc Natl Acad Sci U S A 99 (2002), 16766–16769.331
[24] N.G. Mehta, Role of membrane integral proteins in the modulation of red cell shape by albumin, dinitrophenol and the332
glass effect, Biochim Biophys Acta 651 (1983), 9–18.333
[25] N. Mohandas and J.A. Chasis, Red blood cell deformability, membrane material properties and shape: Regulation by334
transmembrane, skeletal and cytosolic proteins and lipids, Semin Hematol 30 (1993), 171–192.335
[26] D.G. Montgomery, Desiagn and Analysis of Experiments, 5 ed., Wiley, NewYork, 2001.336
[27] C. Mrowietz, R.P. Franke and F. Jung, Influence of different radiographic contrast media on the echinocyte formation of337
human erythrocytes, Clin Hemorheol Microcirc 50 (2012), 35–47.338
[28] M. Piagnerelli, K.Z. Boudjeltia, D. Brohee, A. Vereerstraeten, P. Piro and J.-L. Vincent and M. Vanhaeverbeek, Assessment339
of erythrocyte shape by flow cytometry techniques, J Clin Pathol 60 (2007), 549–554.340
[29] W.H. Reinhart, Peculiar red cell shapes: Fahraeus Lecture, Clin Hemorheol Microcirc 49 (2011), 11–27.341
[30] S.V. Rodenko, Erythrocyte morphological states, phases, transitions and trajectories, Biochim Biophys Acta 1798 (2010),342
1767–1778.343
Unc
orre
cted
Aut
hor P
roof
14 R. Mishra et al. / Quantifying morphological alteration of RBC
[31] P. Ruef, J. Gehm, L. Gehm and J. Poschl, Shear stress and force required for tether formation of neonatal and adult344
erythrocytes, Clin Hemorheol Microcirc 48 (2011), 119–128.345
[32] L. Teodori, A. Accorsi, F. Uguccioni, M.B.L. Rocchi, F. Baldoni, E. Piatti and M.C. Albertini, Erythrocyte, morphology346
automated analysis: Proposal for a new prediction tool of essential hypertension diagnosis, Cytometry Part B (Clinical347
Cytometry) 72B (2007), 211–214.348
[33] I.A. Tikhomirova, A.O. Oslyakova and S.G. Mikhailova, Microcirculation and blood rheology in patients with cerebrovas-349
cular disorders, Clin Hemorheol Microcirc 49 (2011), 295–305.350
[34] P. Wong, A basis of echinocytosis and stomatocytosis in the disc-sphere transformations of the erythrocyte, J Theor Biol351
196 (1999), 343–361.352
[35] Wintrobe’s Clinical Hematology, 11 ed., J.P. Greer, J. Foerster, J.N. Lukens, ed., Lippincott Williams & Wilkins Publishers,353
London, 2003.354
[36] T.W. Yau, R.P. Kuchel, J.M. Koh, D. Szekely, P.J. Mirtschin and P.W. Kuchel, Cytoskeletal rearrangements in human red355
blood cells induced by snake venoms: Light microscopy of shapes and NMR studies of membrane function, Cell Biol Int356
36 (2012), 87–97.357