quality of life in jasper, alberta
TRANSCRIPT
BRUNO D. ZUMBO and ALEX C. MICHALOS
QUALITY OF LIFE IN JASPER, ALBERTA
(Accepted May, 1998)
ABSTRACT. This paper describes and explains citizen beliefs and attitudes aboutthe quality of life in Jasper, Alberta in the summer of 1997. We report on 447survey respondents’ satisfaction with a wide variety of aspects of their commu-nity and their lives, the best and worst things about living in Jasper, and thethings they would change first to improve the quality of their lives. There was notmuch enthusiasm for use-fees or the value received from tax dollars. Fifteen newindices of satisfaction with fundamental aspects of people’s lives were created.Happiness, life satisfaction and overall satisfaction with the quality of life wereexplained from a limited set of 14 variables, providing comparisons with resultsfrom seven other surveys taken over nearly 20 years. Finally, we used a simplelinear model to account for 63% of the variance in life satisfaction scores, 44% ofthe variance in satisfaction with the quality of life scores and 37% of the variancein happiness scores.
1. INTRODUCTION
In this essay, we report on the results of a survey of citizen beliefsand attitudes about the quality of life in Jasper, Alberta, Canada inthe summer of 1997. The town of Jasper is inside Jasper NationalPark, which is one of Canada’s most beautiful and famous parkareas. At the time of the survey, the town was governed by the JasperImprovement District Council and there was considerable debateabout moving to self-government. The District does not have all thepowers that a municipal government would have. It has the authorityand responsibility for taxation, culture and recreation, family andcommunity support services, library services and protective services(e.g., ambulance). Parks Canada has the authority for municipalservices such as water, streets, protective services (e.g., fire depart-ment), bylaws and bylaw enforcement, sewage and development(e.g., building permits, business licences).
It seemed to be a perfect time to obtain a broad-based assessmentof the perceived quality of life of permanent residents of the town, as
Social Indicators Research49: 121–145, 2000.© 2000Kluwer Academic Publishers. Printed in the Netherlands.

122 BRUNO D. ZUMBO AND ALEX C. MICHALOS
well as an assessment of views about the future development of thetown and the likely impact of self-government. Some comparisonsmade with similar surveys taken in other communities were alsomade (e.g., Michalos, 1996).
The structure of the essay is as follows. In the next section (2),we describe our sampling technique and questionnaire. Then wemove to a description of our sample (3) and descriptive statisticsregarding satisfaction levels for a variety of public services andother aspects of life (4). Section (5) summarizes responses to ouropen-ended questions about the best and worst things about livingin Jasper, and things to change to improve the quality of life there.This is followed by a section (6) in which we review respondents’attitudes toward user-fees and the value received from tax dollars.In the next section (7), we discuss the most salient responses to aset of 21 statements about which we asked respondents to expressagreement or disagreement. We then (8) create 15 indices out ofthe 93 satisfaction items reviewed in section (4), which we use tohelp explain our three global dependent variable scores in section(10). In section (9), we explain the three global dependent variablescores from a limited set of 14 variables, which allows us to compareour Jasper results with results from seven other surveys taken overnearly 20 years. In section (11) we apply a new statistical methodfor ordering the predictor variables from the regressions reported insections (9) and (10) in terms of their relative importance in eachregression model (Thomas, Hughes and Zumbo, 1998). The finalsection (12) is a brief conclusion.
2. SAMPLING TECHNIQUE AND QUESTIONNAIRE
Questionnaires were hand-delivered by volunteers to 1200 hous-ing units in Jasper in June and July 1997, covering all of thetown’s 1669 households. Respondents were given a plastic bag inwhich to deposit their completed questionnaires, which were laterpicked up or dropped off in some boxes conveniently located in thecommunity.
The first three pages of the questionnaire listed 95 “services andother things affecting people today”, including such things as familysupport services, snow removal, the cost of local housing, family

QUALITY OF LIFE IN JASPER, ALBERTA 123
relations, health, jobs and so on. The extent to which people weresatisfied with these things was measured on a 7-point Likert scalewith response categories ranging from “very dissatisfied=1 point”,through “an even balance = 4”, to “very satisfied = 7 ”.
Following these questions, there was a 7-point question designedto measure the extent to which people were happy with their lives asa whole, ranging from “very unhappy = 1 point”, through “an evenbalance = 4”, to “very happy = 7”.
These were followed by a page containing a general questiondesigned to measure the extent to which respondents felt that 26particular public services should be controlled more or less byParks Canada rather than by the local Jasper Improvement DistrictCouncil. The response categories were “less = 1”, “same = 2” and“more = 3”.
The next two pages of the questionnaire had 21 statements aboutwhich respondents were asked to indicate the extent of their agree-ment, with five response categories ranging from “strongly disagree= 1 point”, through “don’t know = 3”, to “strongly agree = 5”.
This was followed by two open-ended questions asking respond-ents, first, to describe the “best thing about living in thiscommunity”, and then “the worst thing”. Respondents were thenasked, “If you could change anything about this community toimprove the quality of life here, what would that change be?”
We then raised the question: “Do you think that more publicservices should be supported by user-fees instead of by generaltaxes?” The response options were simply “yes” or “no”.
Finally, we asked respondents to tell us whether they thought theygot poor or good value for their tax dollars from federal, provincialand District governments. The options for each sort of governmentwere “poor value = 1”, “average value = 2” and “good value = 3”.
3. SAMPLE CHARACTERISTICS
By the end of July, 447 (37%) useable questionnaires were returned,which form the working data-set for the survey. Respondentsincluded 241 (55%) females and 197 (45%) males. Two-hundredand sixty-six (61%) were now married and living with their spouse.The average age was 44, with a range from 17–82. Two hundred

124 BRUNO D. ZUMBO AND ALEX C. MICHALOS
and eighty-nine (67%) owned or were in the process of buying theirhome. One hundred and sixty-five (37%) had some university educa-tion, with 95 (21%) holding a university degree. The first languageof 375 (84%) respondents was English. Two hundred and thirty-nine (54%) were employed full-time and 78 (17%) part-time. Onehundred and forty-seven (35%) had total family incomes of from$40 000 to $69 999 CDN.
According to the 1996 census, which is the last official fullpopulation count available from Statistics Canada, there were 1669private households in the Improvement District (mostly living inJasper) and 48% (1511) of the Improvement District’s permanentadult residents aged 15 years or older were female. Unfortunately,no other figures from that census are available. However, from the1991 census we know that there were also 48% female, 38% weremarried and living with their spouse, 22% had some universityeducation, 8% held a university degree, 49% owned or were inthe process of buying their home, 43% were employed full-timeand 42% were employed part-time, 30% had total family incomesof from $40 000 to $69 999 CDN, and 87% had English as theirfirst language. Broadly speaking, then, it is likely that our work-ing sample has a few more females, married people, home owners,university educated and full-time employed people than the totalpopulation from which it was drawn.
4. SATISFACTION
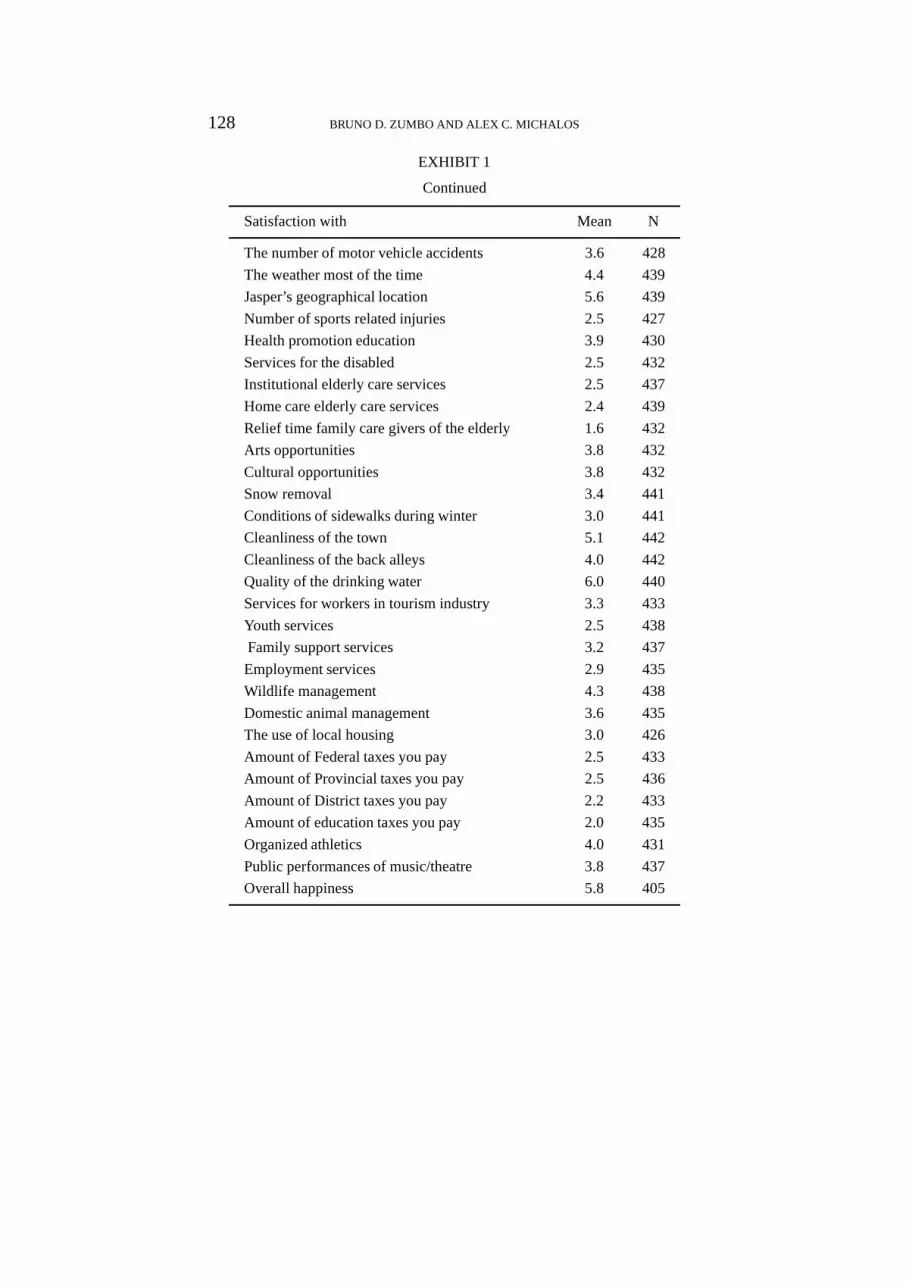
Exhibit 1 lists the mean scores for the 95 satisfaction items and theone happiness item. The most satisfying aspects of people’s liveswere satisfaction with the physical beauty of Jasper (mean= 6.6),friendships, recreation activities and the quality of drinking water(6.0), Jasper as a place to live, life as a whole and the overall qualityof life (5.9), family relations, personal health and self-esteem (5.8).The mean score for happiness with life as a whole was also 5.8.
The mean score for satisfaction with the physical beauty of Jasperis remarkable because it is so much higher than the usual meanscores of roughly 6 points for satisfaction items and because itso clearly dominates family and living partner satisfaction whichusually dominate such lists (Michalos, 1991a). Clearly, the spectac-

QUALITY OF LIFE IN JASPER, ALBERTA 125
ular beauty of the area is deeply appreciated by its permanentresidents.
Highest levels of dissatisfaction were expressed for infantcommunity operated child care (0.9), infant home-based operatedchild care and school-age home-based child care (1.0), pre-schoolhome-based child care (1.2), school-age community operated childcare (1.4), relief time family caregivers of the elderly (1.6), and pre-school community operated child care (1.9). The fact that 47% ofthe sampled households had at least one child under 17 years of ageliving at home does not help us understand why so much dissatisfac-tion surrounded the issue of child care. Presumably, there are manyfamilies in need of such care.
5. BEST THINGS, WORST THINGS AND THINGS TO CHANGE
For our respondents, the most frequently mentioned “best thingabout living in Jasper” was a physical collage described by thephrases “the beauty of the surroundings”, “the scenery”, “the moun-tains”, “the environment” and “being in a national park”. Onehundred and ninety-five (44%) of our respondents mentioned suchthings. Second, 96 (21%) mentioned the“friendly people” which,as a matter of fact, seems to be what most people in most citiesaround the world regard as the best thing about living in them(Michalos, 1993). Following these responses, the people in oursample mentioned the town’s outdoor opportunities (20%) and itssmall town atmosphere (19%).
The most frequently mentioned “worst thing about living inJasper” was “the high cost of living”. One hundred and sixty-one(36%) of respondents mentioned this feature. Second, 73 (16%) saidthey “did not like park management”. Following these things, 36(8%) felt that there was a lack of shopping facilities “for everydayneeds” and that taxes were too high.
Having determined the things about life in Jasper that wereespecially good and especially bad, we wanted to find out whatrespondents “would change to improve the quality of life” there.First, 81 (18%) respondents said they would lower their cost ofliving, and following that, 65 (15%) said they would move towardself-government. After these things, 53 (12%) said they would slow

126 BRUNO D. ZUMBO AND ALEX C. MICHALOS
EXHIBIT 1
Mean satisfaction and happiness levels
Satisfaction with Mean N
Your house, apartment or mobile home 5.7 440
Your neighbourhood as a place to live 5.7 441
Jasper as a place to live 5.9 439
Your family relations, generally 5.8 441
Your living partner 5.4 435
Your job 4.6 435
Your pay level 4.3 433
Your work schedule 4.6 434
Your friendships 6.0 443
Your health 5.8 441
Your religion or spiritual fulfilment 4.5 441
Your overall standard of living 5.7 441
Your financial security 4.9 440
The physical beauty of Jasper 6.6 443
Your recreation opportunities 6.0 441
What you are accomplishing in life 5.4 439
Your self-esteem 5.8 439
How you feel about life as a whole 5.9 439
Police protection services 5.5 443
Public transportation services 2.8 434
Public highways, streets and roads 4.0 441
Street lighting 4.9 443
Play areas for children 4.2 441
Elementary education 3.2 438
Junior/senior high school education 2.2 436
Availability of post-secondary education 2.2 435
Y.R.E.C. 2.9 408
Seton General Hospital 4.7 439
Clinics 5.1 442
Counselling services 2.5 436
Maternity public health services 2.0 439
School public health services 2.4 436
Availability of local housing 2.5 426

QUALITY OF LIFE IN JASPER, ALBERTA 127
EXHIBIT 1
Continued
Satisfaction with Mean N
Cost of local housing 2.1 432
Density of local housing 2.9 431
The friendliness of neighbours 5.5 442
Ambulance service 4.6 436
Parks Canada officials 3.5 438
I.D. staff and councillors 3.5 428
Federal M.P. 3.0 434
Provincial M.L.A. 3.0 426
Local parks and recreation facilities 5.4 434
Grocery shopping facilities 3.8 440
Clothing shopping facilities 2.4 440
Household supplies shopping facilities 2.8 436
The amount of taxes you pay 2.1 436
Recycling 5.2 438
Domestic animal control and enforcement 3.6 438
Pre-school community operated child care 1.9 434
Pre-school home-based child care 1.2 431
School-age community operated child care 1.4 432
School-age home-based child care 1.0 431
Infant community operated child care 0.9 429
Infant home-based operated child care 1.0 426
The library 5.4 436
Your overall quality of life 5.9 441
Job opportunities 3.6 435
Traffic congestion 3.5 432
Sewage system 4.2 426
Garbage system 5.2 438
Sidewalks and pedestrian walkways 4.6 436
Planning and zoning regulations 2.6 432
Correctional services 2.0 428
Judicial services 2.7 426
Noise levels here 4.4 436
Drug and alcohol abuse 2.6 429
128 BRUNO D. ZUMBO AND ALEX C. MICHALOS
EXHIBIT 1
Continued
Satisfaction with Mean N
The number of motor vehicle accidents 3.6 428
The weather most of the time 4.4 439
Jasper’s geographical location 5.6 439
Number of sports related injuries 2.5 427
Health promotion education 3.9 430
Services for the disabled 2.5 432
Institutional elderly care services 2.5 437
Home care elderly care services 2.4 439
Relief time family care givers of the elderly 1.6 432
Arts opportunities 3.8 432
Cultural opportunities 3.8 432
Snow removal 3.4 441
Conditions of sidewalks during winter 3.0 441
Cleanliness of the town 5.1 442
Cleanliness of the back alleys 4.0 442
Quality of the drinking water 6.0 440
Services for workers in tourism industry 3.3 433
Youth services 2.5 438
Family support services 3.2 437
Employment services 2.9 435
Wildlife management 4.3 438
Domestic animal management 3.6 435
The use of local housing 3.0 426
Amount of Federal taxes you pay 2.5 433
Amount of Provincial taxes you pay 2.5 436
Amount of District taxes you pay 2.2 433
Amount of education taxes you pay 2.0 435
Organized athletics 4.0 431
Public performances of music/theatre 3.8 437
Overall happiness 5.8 405

QUALITY OF LIFE IN JASPER, ALBERTA 129
down development of the town, 30 (7%) would reduce taxes, 26(6%) would increase the number of stores with “everyday needs”,and 16 (4%) would “get rid of the elk in the townsite”.
6. USER-FEES AND GOVERNMENT VALUE FOR TAX DOLLARS
Regarding user-fees, of 427 people who answered the question, 162(36%) claimed that the town should, 179 (40%) claimed that thetown should not raise more money from this source and 78 (17%)had no opinion. Assuming the sampling error margins were about5 percentage points for our survey results, the support for user-feesmight be as low as 31% and the opposition might be as high as45%. Since our sample had a disproportionate number of propertyowners in it, one might assume some bias in favour of user-fees.So, it is probably fair to say that in the whole community there ismore opposition than support for the idea of increasing the use ofuser-fees as a source of public revenue.
Exhibit 2 gives the percents of people indicating that they gotpoor, average or good value for their tax dollars from each ofthe three levels of government. Ten percent asserted that they gotgood value from the District government, compared to only 3%from the provincial government and 7% from the federal govern-ment. On the other hand, 47% thought they got poor value fromthe federal government, 46% thought they got poor value fromthe provincial government, but only 30% thought they got poorvalue from the District government. These figures are of coursecompletely consistent with respondents’ reported preferences forself-government.
In the light of the figures reported in the previous paragraph, onemight have expected to find some significant correlation betweenrespondents’ reported levels of agreement with the statement “Ibelieve this community would be best served by having its ownmunicipal government” and their reported levels of satisfaction withlife as a whole and their overall quality of life, or with their overallhappiness. In fact, there is no significant correlation at all betweenthe former and the latter scores.

130 BRUNO D. ZUMBO AND ALEX C. MICHALOS
EXHIBIT 2
Percent saying they get poor, average or good value for their tax dollars
Poor value Average value Good value Don’t know
Spent by the N % N % N % N %
Federal Government 200 47 155 37 29 7 39 9
Provincial Government 196 46 165 39 14 3 47 11
District Government 126 30 176 42 43 10 71 17
7. AGREEMENTS AND DISAGREEMENTS
Exhibit 3 lists the percentages of people indicating disagreement orstrong disagreement versus agreement or strong agreement with aset of 21 statements about various aspects of their community andtheir lives. The statement receiving the greatest support (96%) wasthe one affirming that “Good communities require high levels ofco-operation”. This was contrasted with 34% affirming that “Goodcommunities require high levels of competition”. Given the pastdecade of bombardment with right-wing propaganda about the needfor and virtues of competition (Michalos, 1995) and the traditionalAlbertan support for relatively conservative governments, it wasinteresting to see that the co-operative spirit was relatively strong inJasper. In fact, 79% supported the statement that “This communityneeds more co-operative planning for development”.
The statement receiving the second highest level of support(89%) was the one affirming that the “Cost of living is a seriousproblem in this community”. Immediately following this one, therewere two statements indicating social support. The statements were“I know someone in this community who sincerely cares about mywell-being” (85%) and “There is someone in this community I canalways count on for good advice” (82%).
The statement receiving the greatest disagreement (79%) was theone affirming that “This community needs more business develop-ment”. That was followed by “My home needs some major repairs”,with 67% disagreeing and “I would leave this community if I hadthe opportunity”, with 61% disagreeing.

QUALITY OF LIFE IN JASPER, ALBERTA 131
While 72% affirmed that “I don’t think Parks Canada officialscare much about what I think”, 74% felt that way about “provincialpublic officials” and 51% felt that way about “local public officials”.Responses to these three items are also consistent with the generalsupport for self-government. Fifty percent agreed with the statement“I believe this community would be best served by having its ownmunicipal government”.
8. REDUCTION OF SATISFACTION ITEMS TO INDICES
Given 93 satisfaction items, it seemed reasonable to undertakesome data-reduction strategies in order to get a more manageableset of variables to explain and predict our three global indicatorscores (life satisfaction, satisfaction with overall quality of life, andhappiness). After several attempts to cluster items using variousfactor-analytic techniques produced largely incoherent factors, webecame convinced that such techniques were simply not useful forconstructing indices from the great number and variety of availableitems. Instead, we proceeded to conceptually analyze our items, sortthem into clusters and then create coherent indices on the basisof acceptable Cronbach alpha values. The 15 indices with theirconstituent items resulting from these exercises are listed in Exhibit4.
Briefly, we created indices for general satisfaction with taxes(alpha = 0.89), child care services (0.89), elderly and disabledcare services (0.91), health, hospitals and clinics (0.88), recre-ation opportunities (0.85), human services (0.84), shopping facilities(0.80), personal worth (0.79), sanitation and waste removal services(0.78), finances (0.76), house and neighbourhood (0.74), job (0.73),government (0.71), educational opportunities (0.68), and interper-sonal relations (0.67). Since these indices pertain to fundamentalaspects of people’s lives, we think other researchers will find theseespecially useful.

132 BRUNO D. ZUMBO AND ALEX C. MICHALOS
EXHIBIT 3
Aspects about the community and life with which people disagree or disagreestrongly versus agree or agree strongly (N = 431)
Disagree or Agree or
Statement strongly disagree strongly agree No opinion
Too many people in this community areover-qualified for the jobs they have.
26 30 44
We need more full time and fewer part-time jobs.
21 57 22
Unemployment is a serious problem inthis community.
57 23 21
I don’t think local public officials caremuch about what I think.
32 51 1
This community needs more co-opera-tive planning for development.
12 79 10
I would rate my current physical healthas excellent.
17 75 8
I don’t think provincial officials caremuch about what I think.
10 74 17
Good communities require high levelsof co-operation.
1 96 3
My home needs some major repairs. 67 26 6
There is someone in this community Ican always count on for good advice.
12 82 17
This community needs more businessdevelopment.
79 16 7
I would leave this community if I hadthe opportunity.
61 20 19
I don’t think Parks Canada officials caremuch about what I think.
16 72 12
Good communities require high levelsof competition.
45 34 20
I know someone in this community whosincerely cares about my well-being.
3 85 11
I believe this community is a betterplace to live than it was five years ago.
54 22 23
Continued growth will hurt the qualityof life in this community.
25 64 12
I believe this community will be a betterplace to live five years from now than itis today.
37 15 48

QUALITY OF LIFE IN JASPER, ALBERTA 133
EXHIBIT 3
Continued
Disagree or Agree or
Statement strongly disagree strongly agree No opinion
Downsizing is a serious problem in thiscommunity.
32 37 31
Cost of living is a serious problem in thiscommunity.
9 89 3
I believe this community would be bestserved by having its own municipalgovernment.
22 50 29
9. EXPLAINING LIFE SATISFACTION, HAPPINESS AND OVERALLSATISFACTION WITH THE QUALITY OF LIFE FROM SELECTED
DOMAIN SATISFACTION ITEMS
Exhibit 5 provides some comparative figures resulting from regress-ing mean life satisfaction scores on mean scores for satisfaction withvarious domains of life. The simple linear model used to obtainthese figures was one of the first models applied by social indic-ators researchers and it is still one of the most frequently usedmodels (Michalos, 1991). Since the model merely explains overalllife (global) satisfaction in terms of the (domain) satisfaction onegets from one’s job, family relations and so on, it is not usefulfor explaining satisfaction in the generic sense. For the latter, onewould require something other than satisfaction to do the explan-atory work. For example, in multiple discrepancies theory (MDT)satisfaction is posited as the effect of such things as the perceiveddiscrepancies between what one has and wants, between what onehas and others have, and so on (Michalos, 1985, 1991). Neverthe-less, although the simple linear model does not explain satisfactionin the generic sense, it does allow one to measure the impact ofsatisfaction with various domains of life on one’s perceived overallsatisfaction with life. In this section we will also apply the modelto explain happiness with life as a whole and satisfaction with theoverall quality of life.
On average, for the eight samples represented in Exhibit 5, wewere able to explain 56% of the variance in reported life satisfaction

134 BRUNO D. ZUMBO AND ALEX C. MICHALOS
EXHIBIT 4
Items in satisfaction indices, with alpha values
Satisfaction with elderly/disabled care: Alpha = 0.91
Services for the disabled
Institutional elderly care services
Home care elderly care services
Relief time family care givers of the elderly
Satisfaction with taxes: A = 0.89
Amount of Federal taxes you pay
Amount of Provincial taxes you pay
Amount of District taxes you pay
Amount of education taxes you pay
The amount of taxes you pay
Satisfaction with child care: A = 0.89
Pre-school community operated child care
Pre-school home-based child care
School-age community operated child care
School-age home-based child care
Infant community operated child care
Infant home-based operated child care
Satisfaction with health/hospitals: A = 0.88
Seton General Hospital
Clinics
Counselling services
Maternity public health services
School public health services
Ambulance service
Satisfaction with recreation: A = 0.85
Your recreation activities
Play areas for children
Y.R.E.C.
Local parks and recreation facilities
The library
Arts opportunities
Cultural opportunities
Organized athletics
Public performances of music/theatre

QUALITY OF LIFE IN JASPER, ALBERTA 135
EXHIBIT 4
Continued
Satisfaction with human services: A = 0.84
Services for workers in tourism industry
Youth services
Family support services
Employment services
Satisfaction with shopping: A = 0.80
Grocery shopping facilities
Clothing shopping facilities
Household supplies shopping facilities
Satisfaction with personal worth: A = 0.79
What you are accomplishing in life
Your self-esteem
Satisfaction with sanitation/waste management: A = 0.78
Snow removal
Conditions of sidewalks during winter
Cleanliness of the town
Cleanliness of the back alleys
Wildlife management
Domestic animal management
Satisfaction with finances: A = 0.76
Your overall standard of living
Your financial security
Satisfaction with house/neighborhood: A = 0.74
Your house, apartment or mobile home
Your neighbourhood as a place to live
Availability of local housing
Cost of local housing
Density of local housing
Use of local housing
Satisfaction with your job: A = 0.73
Your job
Your pay level
Your work schedule
Satisfaction with government: A = 0.71
Parks Canada officials

136 BRUNO D. ZUMBO AND ALEX C. MICHALOS
EXHIBIT 4
Continued
I.D. staff and councillors
Federal M.P.
Provincial M.L.A.
Satisfaction with educational opportunities: A = 0.68
Elementary education
Junior/senior high school education
Availability of post-secondary education
Satisfaction with interpersonal relations: A = 0.67
Your family relations generally
Your living partner
Your friendships
from some subset of the 14 predictor variables listed in the exhibit.Our best success came from the Jasper sample in 1997 (columnH), at 65%. When all variables are standardized to have meansof zero and standard deviations of one, the standardized regres-sion coefficients (Betas) measure the percent of movement in thedependent variable when a predictor variable moves one full unitand every other predictor in the set is held constant. For example,under column H one finds that the Beta value for self-esteem isB =0.57, which means that for every full standard deviation increasein satisfaction with one’s own self-esteem, one’s life satisfactionincreases a bit over half a standard deviation. Inspection of the otherfigures in that column reveals that satisfaction in no other domainhad as great an impact on overall life satisfaction for the 229 Jasperrespondents.
It should be noted that the presence of correlation among thepredictor variables affects the magnitude of the standardized regres-sion coefficients. Therefore, it is not recommended that standardizedregression coefficients be interpreted as reflecting the importanceof the predictor. Thus far in this essay we are not interpreting theimportance of the predictors, per se, but rather we use the standard-ized regression coefficients, in part, to help us make comparisonsacross samples. In section (11) we will come back to these regres-

QUALITY OF LIFE IN JASPER, ALBERTA 137
EXHIBIT 5
Comparison of life satisfaction regressions from 8 surveys
1979 1981 1982 1984 1985/86 1994 1997 1997
Aa B C D E F G H
Percent of variance explained 57 49 53 53 49 60 64 65
in life satisfaction
Predictors satisfaction with: Standardized regression coefficients
Health 0.11 0.18 0.17 0.12 0.11 b b 0.17
Financial security 0.15−0.01 0.24 0.11 0.16 b 0.09 b
Family relations 0.35 0.10 0.10 0.13 0.06 b 0.09 0.16
Job 0.10 c b 0.09 b 0.08 0.08 0.11
Friendships 0.20 0.08 0.07 0.17 0.08 0.13 0.07 b
Housing −0.05 0.21 0.10 0.12 0.12 0.14 b b
Area lived in b 0.01 0.13 b c b b b
Recreation activity 0.08 0.08 0.05 0.12 0.13 b b b
Religion c 0.13 0.07 b b b b b
Self-esteem 0.13 0.17 0.19 0.31 0.19 0.50 0.57 0.57
Transportation 0.09 0.05 0.06 b 0.05 b b c
Gov. services c 0.13 0.04 c c 0.13 b b
Living partner c 0.06 c c 0.15 0.09 0.13 b
Education −0.03 c c 0.16 0.19 b c c
P < 0.01, a: A = Clerical staff (N = 312), B = Seniors (N = 273), C = East.northerners (N = 328), D = Guelph students (N = 296), E = world students (N =5107), F = Prince George residents in 1994 (N = 430), G = Prince George residentsin 1997 (N = 512), H = Jasper residents in 1997 (N = 229). b: Significance leveltoo low to enter equation. c: Not in questionnaire.
sion models and consider the relative importance of the predictorvariables.
Reading across the row to the left from 0.57, one sees that satis-faction with one’s own self-esteem was also the strongest predictorof life satisfaction for the 512 Prince George residents in the 1997sample (column G,B = 0.57), for the 430 residents in the 1994Prince George sample (column F,B = 0.50) and for the sample of296 University of Guelph students (column D), atB = 0.31. ThatGuelph sample was part of the global student sample whose resultsare listed in column E. Inspection of that column shows that satis-faction with one’s own self-esteem tied with satisfaction with one’s

138 BRUNO D. ZUMBO AND ALEX C. MICHALOS
university education as the strongest predictors of life satisfactionfor the 5107 students in the global sample.
For the other three samples, satisfaction with one’s self-esteemwas not as powerful a predictor as (had less explanatory power than)satisfaction with one or more other domains. For the 312 sampledmembers of the office, clerical and technical staff of the Universityof Guelph (column A), satisfaction with one’s family relations hadthe greatest explanatory power (B = 0.35). For the 273 sampled ruralseniors (column B), satisfaction with their housing had the strongestpredictive strength (B = 0.21) and for the 328 eastern northerners(column C), satisfaction with their financial security had the greatestexplanatory power (B = 0.24).
The figures just reviewed clearly illustrate the fact that differ-ent groups of people with different life circumstances, resourcesand constraints use different mixtures of ingredients to determinetheir life satisfaction. The explanatory model used here allowed thegroups represented in Exhibit 5 to draw satisfaction from roughlythe same set of 14 domains. Analytically speaking, some groupsused more and some used fewer of these domains to build theirlife satisfaction. The Jasper group used only 4 of the 12 possib-ilities open to them. Besides making use of only 4 domains alltogether, they drew more overall life satisfaction from satisfac-tion with their own self-esteem than they did from the other threedomains combined, i.e., satisfaction with their health (B = 0.17),family relations (B = 0.16) and job (B = 0.11).
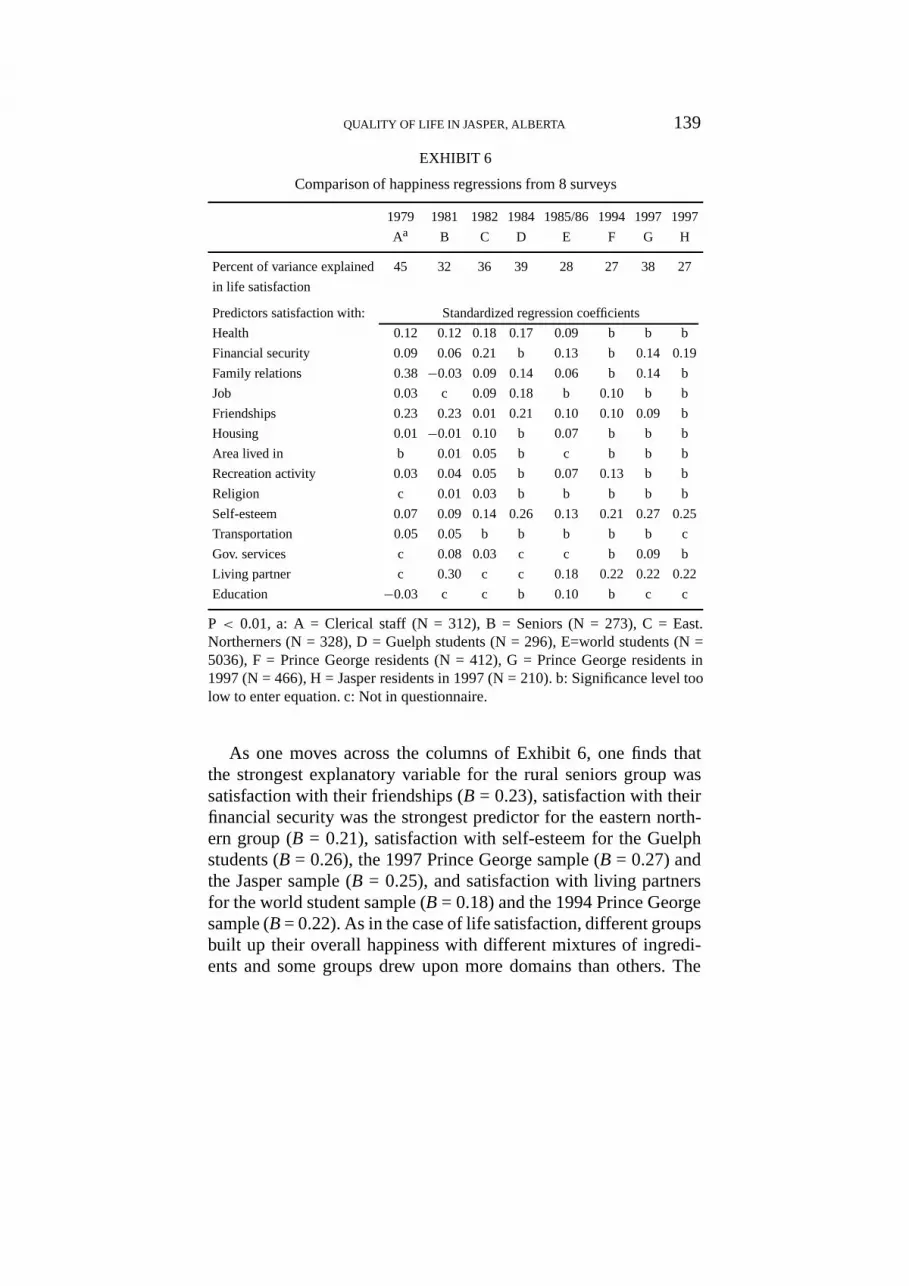
Exhibit 6 provides some comparative figures resulting fromregressing mean happiness scores on mean scores for satisfactionwith various domains of life. On average, for the eight samplesrepresented in this exhibit, we were able to explain 34% of thevariance in reported happiness with life as a whole from somesubset of the 14 predictor variables listed in the exhibit. Our bestsuccess came from the clerical staff sample from the Universityof Guelph (column A), at 45%. The strongest explanatory variablefor that sample was satisfaction with family relations, which had aBeta value ofB = 0.38. Thus, figuratively speaking, for every full-step increase in satisfaction with their family relations, the overallhappiness of these respondents increased 38% of a step.
QUALITY OF LIFE IN JASPER, ALBERTA 139
EXHIBIT 6
Comparison of happiness regressions from 8 surveys
1979 1981 1982 1984 1985/86 1994 1997 1997
Aa B C D E F G H
Percent of variance explained 45 32 36 39 28 27 38 27
in life satisfaction
Predictors satisfaction with: Standardized regression coefficients
Health 0.12 0.12 0.18 0.17 0.09 b b b
Financial security 0.09 0.06 0.21 b 0.13 b 0.14 0.19
Family relations 0.38−0.03 0.09 0.14 0.06 b 0.14 b
Job 0.03 c 0.09 0.18 b 0.10 b b
Friendships 0.23 0.23 0.01 0.21 0.10 0.10 0.09 b
Housing 0.01−0.01 0.10 b 0.07 b b b
Area lived in b 0.01 0.05 b c b b b
Recreation activity 0.03 0.04 0.05 b 0.07 0.13 b b
Religion c 0.01 0.03 b b b b b
Self-esteem 0.07 0.09 0.14 0.26 0.13 0.21 0.27 0.25
Transportation 0.05 0.05 b b b b b c
Gov. services c 0.08 0.03 c c b 0.09 b
Living partner c 0.30 c c 0.18 0.22 0.22 0.22
Education −0.03 c c b 0.10 b c c
P < 0.01, a: A = Clerical staff (N = 312), B = Seniors (N = 273), C = East.Northerners (N = 328), D = Guelph students (N = 296), E=world students (N =5036), F = Prince George residents (N = 412), G = Prince George residents in1997 (N = 466), H = Jasper residents in 1997 (N = 210). b: Significance level toolow to enter equation. c: Not in questionnaire.
As one moves across the columns of Exhibit 6, one finds thatthe strongest explanatory variable for the rural seniors group wassatisfaction with their friendships (B = 0.23), satisfaction with theirfinancial security was the strongest predictor for the eastern north-ern group (B = 0.21), satisfaction with self-esteem for the Guelphstudents (B = 0.26), the 1997 Prince George sample (B = 0.27) andthe Jasper sample (B = 0.25), and satisfaction with living partnersfor the world student sample (B = 0.18) and the 1994 Prince Georgesample (B = 0.22). As in the case of life satisfaction, different groupsbuilt up their overall happiness with different mixtures of ingredi-ents and some groups drew upon more domains than others. The

140 BRUNO D. ZUMBO AND ALEX C. MICHALOS
Jasper sample used only 3 of the 12 possibilities open to them, withsatisfaction with living partners (B = 0.22) and financial security(B = 0.19) having almost as much influence as satisfaction withself-esteem.
When we examined the impact of the same domain satisfac-tion scores on satisfaction with the overall quality of life in Jasper,we found that there were five statistically significant predictorswhich collectively accounted for 44% of the variation in the globalindicator scores (N = 229). Again, satisfaction with one’s own self-esteem was the strongest predictor (B = 0.30). Following that, therewas a cluster containing satisfaction with local recreation opportun-ities (B = 0.18), Jasper as a place to live (B = 0.18), religion (B =0.17) and financial security (B = 0.16). The most interesting thingabout the cluster was that three of the items had no significant impacton life satisfaction or happiness. Clearly, respondents are conceptu-alizing their overall quality of life in a way that distinguishes it tosome extent from overall life satisfaction and happiness.
10. EXPLAINING LIFE SATISFACTION, HAPPINESS ANDSATISFACTION WITH THE QUALITY OF LIFE FROM SELECTED
SATISFACTION ITEMS AND INDICES
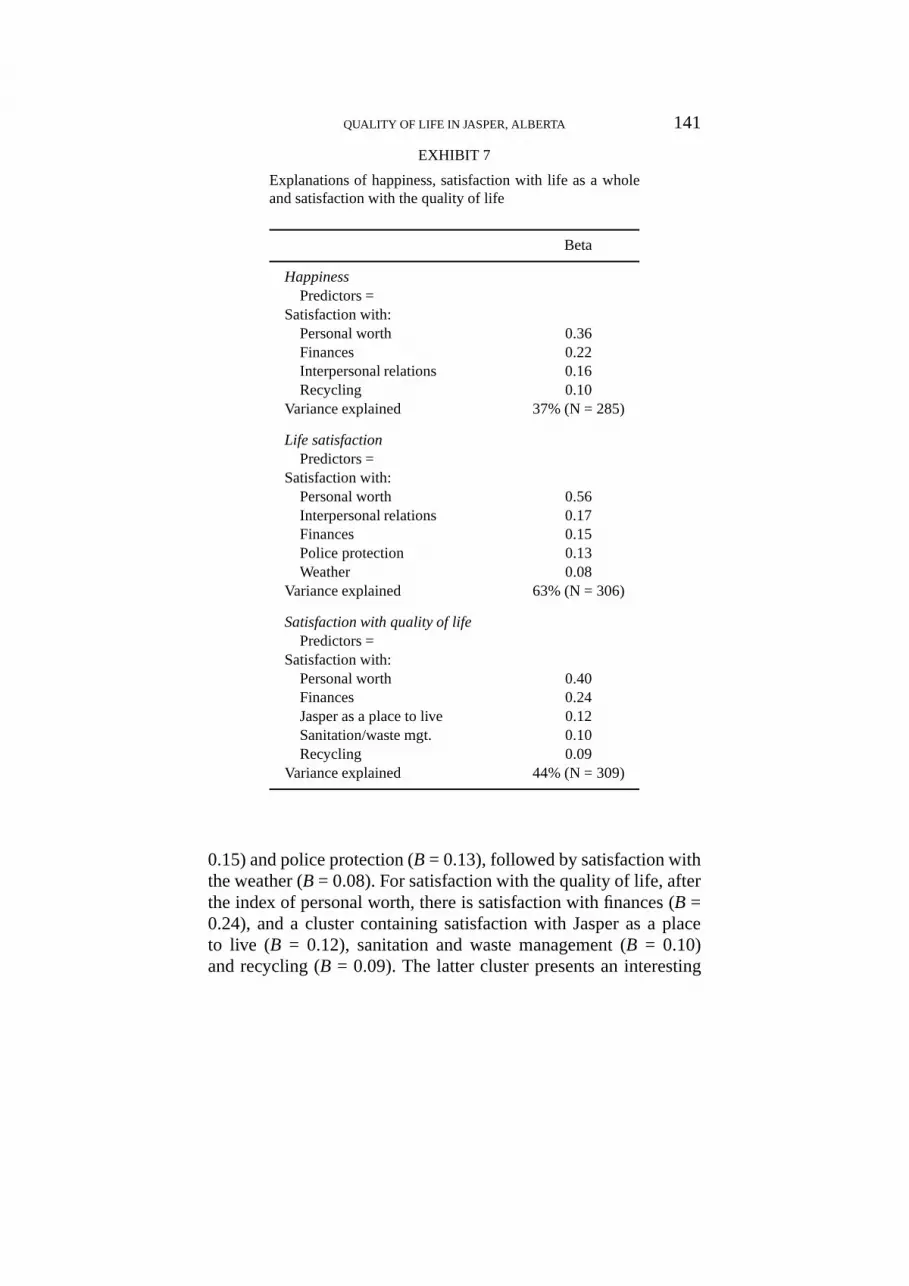
Exhibit 7 gives the results of regressing the three dependent globalvariables on the 15 indices plus some individual items. We were ableto explain 37% of the variance in reported overall happiness, 63% ofthe variance in reported satisfaction with life as a whole and 44% ofthe variance in reported satisfaction with the overall quality of life.
Perhaps the most interesting discovery from these regressions isthe fact that only the indices of personal worth and finances havea role to play in explaining all three dependent variables. Regard-ing happiness (B = 0.36), satisfaction with life as a whole (B =0.56) and with the overall quality of life (B = 0.40), the index ofpersonal worth is more influential than any of the other predictors.For overall happiness, after the index of personal worth, there issatisfaction with one’s finances (B = 0.22), interpersonal relations(B = 0.16) and recycling (B = 0.10). For satisfaction with life as awhole, after the index of personal worth, there is a cluster containingsatisfaction with interpersonal relations (B = 0.17), finances (B =
QUALITY OF LIFE IN JASPER, ALBERTA 141
EXHIBIT 7
Explanations of happiness, satisfaction with life as a wholeand satisfaction with the quality of life
Beta
HappinessPredictors =
Satisfaction with:Personal worth 0.36Finances 0.22Interpersonal relations 0.16Recycling 0.10
Variance explained 37% (N = 285)
Life satisfactionPredictors =
Satisfaction with:Personal worth 0.56Interpersonal relations 0.17Finances 0.15Police protection 0.13Weather 0.08
Variance explained 63% (N = 306)
Satisfaction with quality of lifePredictors =
Satisfaction with:Personal worth 0.40Finances 0.24Jasper as a place to live 0.12Sanitation/waste mgt. 0.10Recycling 0.09
Variance explained 44% (N = 309)
0.15) and police protection (B = 0.13), followed by satisfaction withthe weather (B = 0.08). For satisfaction with the quality of life, afterthe index of personal worth, there is satisfaction with finances (B =0.24), and a cluster containing satisfaction with Jasper as a placeto live (B = 0.12), sanitation and waste management (B = 0.10)and recycling (B = 0.09). The latter cluster presents an interesting

142 BRUNO D. ZUMBO AND ALEX C. MICHALOS
set of quality-of-life predictors for respondents living in a beautifulnational park.
Given the great number and variety of items and indices availablein these regressions, it seems remarkable to us that satisfaction withrecycling emerged as a modest but statistically significant predictorof happiness and satisfaction with the overall quality of life inJasper.
11. RELATIVE IMPORTANCE OF THE PREDICTOR VARIABLES
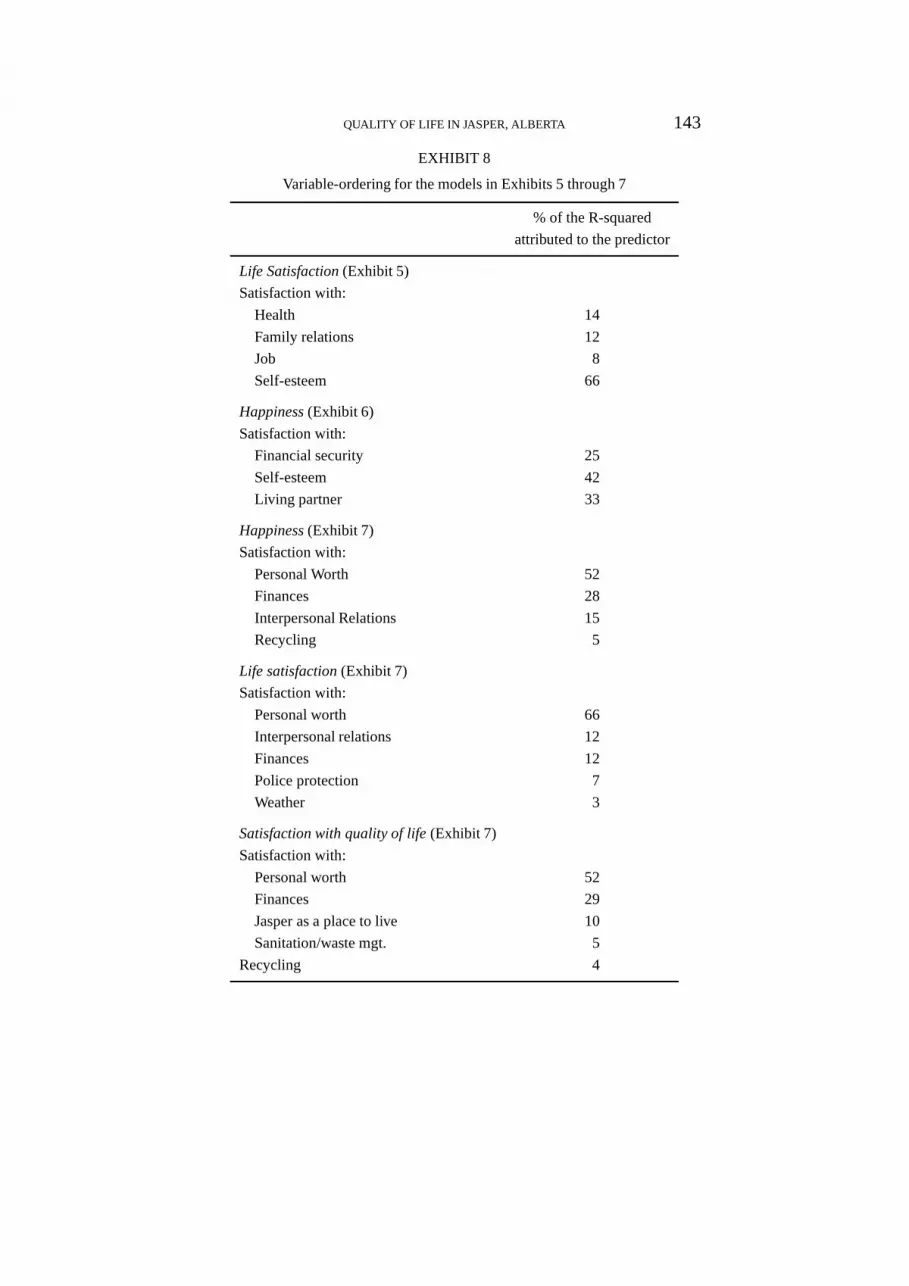
Keeping in mind the caveat we provided in section (9) about inter-preting the relative importance of predictor variables based on themagnitude of the Beta coefficient, Thomas, Hughes, and Zumbo(1998) presented a new statistical method for ordering predictorvariables in a linear model in terms of their importance in themodel. The Thomas, Hughes, and Zumbo method proceeds bydefining importance as the relative proportion (percentage) of theresultant model R-squared that can be attributed to each predictorvariable. Said another way, their method additively partitions theR-squared value so that one can attribute a certain proportion ofthe R-squared to each predictor variable. The computation of thisnew statistic is straightforward: multiply the Beta coefficient by thesimple correlation of the predictor and dependent variable, and thendivide this quantity by the model R-squared. One simply performsthese computations for each predictor variable in a model.
Exhibit 8 lists the results for each of the linear regression modelsreported in this essay. As an example of how to interpret these newmethods let us focus on the Jasper model reported in Exhibit 5.From Exhibit 8 we can see that 66% of the explained variationin life satisfaction is attributable to satisfaction with self-esteemwhereas 26% of the explained variation is attributable to health andfamily relations together, and the remaining 8% to job satisfaction.This sort of analysis is possible because of additive properties ofthe Thomas-Hughes-Zumbo method. Furthermore, self-esteem isclearly the most important predictor in that model whereas healthand family relations are tied for second most important and jobsatisfaction the least important.
QUALITY OF LIFE IN JASPER, ALBERTA 143
EXHIBIT 8
Variable-ordering for the models in Exhibits 5 through 7
% of the R-squared
attributed to the predictor
Life Satisfaction(Exhibit 5)
Satisfaction with:
Health 14
Family relations 12
Job 8
Self-esteem 66
Happiness(Exhibit 6)
Satisfaction with:
Financial security 25
Self-esteem 42
Living partner 33
Happiness(Exhibit 7)
Satisfaction with:
Personal Worth 52
Finances 28
Interpersonal Relations 15
Recycling 5
Life satisfaction(Exhibit 7)
Satisfaction with:
Personal worth 66
Interpersonal relations 12
Finances 12
Police protection 7
Weather 3
Satisfaction with quality of life(Exhibit 7)
Satisfaction with:
Personal worth 52
Finances 29
Jasper as a place to live 10
Sanitation/waste mgt. 5
Recycling 4
144 BRUNO D. ZUMBO AND ALEX C. MICHALOS
Some noteworthy findings in Exhibit 8 are: (a) 75% of theexplained variation in happiness (Exhibit 6) is attributable tosatisfaction with self-esteem and satisfaction with living partnertogether, (b) with reference to the regressions reported in Exhibit 7,satisfaction with personal worth is not only clearly the most import-ant predictor, but for each model over 50% of the explained variationis attributable to satisfaction with personal worth.
12. CONCLUSION
The main aim of this research was to discover and explain citizenbeliefs and attitudes about the quality of life in Jasper, Albertain the summer of 1997. We explored people’s satisfaction with awide variety of aspects of their community and their lives. In therespondents’ own words, we discovered the best and worst thingsabout living in Jasper, and the things they would change first toimprove the quality of their lives. We found relatively less supportfor increasing the use of use-fees than one might have expected androughly just what one would have expected about citizen views ofthe value received from tax dollars. We created 15 indices of satis-faction with fundamental aspects of people’s lives, which should bevery useful to other researchers. Then we explained happiness, lifesatisfaction and overall satisfaction with the quality of life from alimited set of 14 variables, which allowed us to compare our Jasperresults with results from seven other surveys taken over nearly 20years. Finally, we used a simple linear model to account for 63%of the variance in life satisfaction scores, 44% of the variance insatisfaction with the quality of life scores and 37% of the variancein happiness scores.
ACKNOWLEDGMENTS
The authors would like to express their appreciation to Toni Fletcher,George Krefting, Wendy Marks, Joanne Matthews, Shelley Rennickand Kathleen Waxer for the help they gave us in the development,administration, analysis and reporting of the survey.

QUALITY OF LIFE IN JASPER, ALBERTA 145
REFERENCES
Michalos, A. C.: 1985, ‘Multiple discrepancies theory (MDT)’, Social IndicatorsResearch 16, pp. 347–413.
Michalos, A. C.: 1991, Global Report on Student Well-Being, Volume 1: LifeSatisfaction and Happiness (Springer-Verlag, New York).
Michalos, A. C.: 1991a, Global Report on Student Well-Being, Volume 2: Family,Friends, Living Partner and Self-Esteem (Springer-Verlag, New York).
Michalos, A. C.: 1993, Global Report on Student Well-Being, Volume 3: Employ-ment, Finances, Housing and Transportation (Springer-Verlag, New York).
Michalos, A. C.: 1995, A Pragmatic Approach to Business Ethics (Sage Publica-tions, Thousand Oaks).
Michalos, A. C.: 1996, ‘Aspects of the quality of life in Prince George: A casestudyin Canada’, South Asian Journal of Psychology 1, pp. 45–70.
Michalos, A. C. and B. D. Zumbo: 1999, ‘Public services and the quality of life’,Social Indicators Research (in press).
Thomas, D. R., E. Hughes and B. D. Zumbo: 1998, ‘On variable importance inlinear regression’, Social Indicators Research (in press).
College of Arts, Social and Health SciencesUniversity of Northern British ColumbiaPrince George, B.C.E-mail: [email protected]
BRUNO D. ZUMBO and ALEX C. MICHALOS
