university of alberta - era
TRANSCRIPT

University of Alberta
Regulation of clavam metabolite production in Streptomyces clavuligerus
by
Thomas Kwong
A thesis submitted to the Faculty of Graduate Studies and Research in partial fulfillment of the requirements for the degree of
Doctor of Philosophy in
Microbiology and Biotechnbology
Department of Biological Sciences
©Kwong Ngai Yeung, Thomas Spring, 2011
Edmonton, Alberta
Permission is hereby granted to the University of Alberta Libraries to reproduce single copies of this thesis and to lend or sell such copies for private, scholarly or scientific research purposes only. Where the thesis is
converted to, or otherwise made available in digital form, the University of Alberta will advise potential users of the thesis of these terms.
The author reserves all other publication and other rights in association with the copyright in the thesis and,
except as herein before provided, neither the thesis nor any substantial portion thereof may be printed or otherwise reproduced in any material form whatsoever without the author's prior written permission.
Abstract
Streptomyces clavuligerus is capable of producing various secondary
metabolites including clavulanic acid. The biosynthetic pathway of clavulanic
acid is partially shared with other structurally related 5S clavams. The first
reaction involved in clavam biosynthesis is catalyzed by carboxyethylarginine
synthase (CeaS), which is encoded by two paralogous genes, ceaS1 and ceaS2.
However, ceaS2 mutant was severely compromised in clavam biosynthesis when
grown in liquid medium. This mutation was shown to affect ceaS1 transcription,
as reverse transcriptase-polymerase chain reaction (RT-PCR) and Western blot
protein analyses showed that transcription of ceaS1, and CeaS1 production, were
abolished in ceaS2 mutants. Interestingly, clavam biosynthesis was restored when
ceaS2 mutants were grown on solid medium.
Production of 5S clavams in S. clavuligerus is controlled by a pathway
specific transcriptional regulator, C7P, and an unusual two-component system that
is composed of a sensor kinase, Snk, and two response regulators, Res1 and Res2.
Null mutations in snk or res2 completely abolished production of 5S clavams. In
contrast, res1 mutants overproduce 2-hydroxymethylclavam and alanylclavam.
Phosphorylation sites of each protein involved in this two-component system
were identified by changing the conserved histidine residues of Snk (H-365) and
the asparatate residues of Res1 (D-65) and Res2 (D-52) to alanine residues. These
mutations prevented auto-phosphorylation of Snk and transfer of phosphate
molecules from phosphorylated Snk to response regulators as shown by in vitro
phosphorylation assays. The phosphorylation dynamics between Res1 and Res2
were also analyzed. Phospho-transfer assays suggested that Res1 is capable of
transferring its phosphate molecule to Res2, and dephosphorylation assays
showed that Res1 may possess phosphatase activity.
The transcriptional regulator C7P is encoded by the c7p gene. RT-PCR
analyses showed that transcription of cvm1 and cvm5, which encode essential
biosynthetic enzymes involved in 5S clavam production, ceased in c7p mutants. In
addition, c7p transcription was severely reduced in a snk or res2 mutant.
Electrophoretic mobility shift assays showed that Res2 binds to the putative
promoter region of c7p, and C7P binds to the intergenic region between cvm1 and
cas1. This suggests that the two-component system controls transcription of c7p,
and C7P promotes transcription of clavam genes through direct binding.

Acknowledgements
First of all, I would like to express my sincere gratitude to my Ph.D
supervisor, Dr. Susan Jensen, for giving me the opportunity to work in her lab as a
graduate student. Without her support, encouragement and guidance over the last
five years, this thesis would not have been possible.
I am grateful to my many student colleagues, Jingru Li, Nathan Zelyas,
Mohamad Shaheen and Sarah Goomeshi Nobary, for providing a fun and
supportive environment in which to grow and learn. I appreciate their help and
sound advices throughout my study and introducing many valuable laboratory
techniques to me. I would like to thank Annie Wong for her work and technical
support, which contributed greatly to my thesis. I would also like to thank Troy
Locke from MBSU for his help with the FPLC.
Lastly and most importantly, I wish to thank my family, especially my
parents, and friends for their love and support through the good and difficult times.
Without their caring and encouragement, this study would not have been
completed. To them, I dedicate this thesis.
Table of Contents
1. Introduction .......................................................................................................... 1
1.1 Streptomyces ....................................................................................................... 2
1.2 β-lactam metabolites .......................................................................................... 4
1.3 Biosynthesis of clavulanic acid and 5S clavams ................................................ 9
1.3.1 “Early” steps in clavam production .......................................................... 10
1.3.2 Gene clusters involved in clavam production ........................................... 13
1.3.3 “Late” genes in clavulanic acid production .............................................. 24
1.3.4 “Late” genes in 5S clavam production ...................................................... 29
1.4 Regulation of antibiotic production .................................................................. 35
1.4.1 SARPS ...................................................................................................... 35
1.4.2 Other pathway specific transcriptional regulators .................................... 38
1.4.3 Bald (bld) genes ........................................................................................ 39
1.4.4 γ-butyrolactone regulators......................................................................... 40
1.4.5 The stringent response .............................................................................. 41
1.4.6 Two-component regulatory systems ......................................................... 42
1.5 Thesis objective ................................................................................................ 45
2. Materials and Methods ...................................................................................... 47
2.1 Materials ........................................................................................................... 48
2.2 Bacterial strains and plasmids .......................................................................... 49
2.3 Centrifugation and culture harvesting .............................................................. 49
2.4 E. coli procedures ............................................................................................. 49
2.4.1 Culture media and growth conditions for E. coli ...................................... 49
2.4.2 Storage of E. coli strains ........................................................................... 58
2.4.3 Isolation of E. coli plasmid DNA.............................................................. 58
2.4.4 Electroporation of DNA into electrocompetent E. coli............................. 58
2.5 Streptomyces procedures .................................................................................. 59
2.5.1 Culture media and growth conditions for S. clavuligerus ......................... 59
2.5.2 Storage of S. clavuligerus strains .............................................................. 59
2.5.3 Introduction of DNA into S. clavuligerus ................................................. 60
2.5.4 Fermentation of S. clavuligerus ................................................................ 61
2.5.5 RNA isolation ........................................................................................... 61
2.5.6 Cell-free extract preparation ..................................................................... 64
2.6 Determination of antibiotic production ............................................................ 64
2.6.1 Clavulanic acid bioassay ........................................................................... 64
2.6.2 High performance liquid chromatography ................................................ 65
2.7 DNA methods ................................................................................................... 66
2.7.1 DNA quantification ................................................................................... 66
2.7.2 Digestion and ligation reactions ................................................................ 66
2.7.3 Polymerase chain reaction ........................................................................ 67
2.7.4 Agarose gel electrophoresis ...................................................................... 68
2.7.5 DNA purification from agarose gels ......................................................... 75
2.7.6 Polyacrylamide gel electrophoresis .......................................................... 75
2.7.7 DNA purification from polyacrylamide gels ............................................ 75
2.7.8 DNA labelling ........................................................................................... 76
2.7.9 DNA sequencing ....................................................................................... 76
2.8 RNA methods ................................................................................................... 77
2.8.1 RNA quantification ................................................................................... 77
2.8.2 Reverse transcriptase-polymerase chain reaction..................................... 77
2.9 Protein methods ................................................................................................ 78
2.9.1 Protein quantification ................................................................................ 78
2.9.2 SDS-Polyacrylamide gel electrophoresis .................................................. 78
2.9.3 Overproduction of CeaS1 and CeaS2 ....................................................... 79
2.9.4 Overproduction of Snk-His7 and Res2-His7.............................................. 80
2.9.5 Overproduction of His10-Res1, His10-Res1-SD and His10-C7P ................ 80
2.9.6 Overproduction of MBP-Res1 and MBP-Res2 ......................................... 81
2.9.7 Purification of His-tagged proteins ........................................................... 81
2.9.8 Purification of MBP fusion protein ........................................................... 82
2.9.9 In vitro phosphorylation assays ................................................................ 84
2.9.10 Phospho-transfer assays ............................................................................ 84
2.9.11 In vitro dephosphorylation assays ............................................................. 86
2.9.12 Western analysis ....................................................................................... 86
2.10 DNA-Protein interactions ................................................................................. 87
2.10.1 Electrophoretic mobility shift assays ........................................................ 87
2.11 Confocal Microscopy ....................................................................................... 88
2.12 Software and web sources used for analysis .................................................... 89
3. Results ................................................................................................................. 90
3.1 Analysis of the regulation of ceaS involved in clavam biosynthesis ............... 91
3.1.1 Overproduction of CeaS1 and CeaS2 ....................................................... 92
3.1.2 Cross reaction of anti-CeaS2 antibody with CeaS1 protein ...................... 94
3.1.3 Western analyses to detect CeaS1 and CeaS2 production ........................ 99
3.1.4 Western analyses to detect Bls1 and Bls2 production ............................ 110
3.1.5 Reverse transcriptase-PCR analysis ........................................................ 116
1. Effect of ΔceaS2-IF mutation on ceaS1 and bls2 transcription .......... 116
2. Investigation of transcription of other clavam biosynthetic genes _______ in the ΔceaS2-IF mutant by RT-PCR ................................................. 120
3.1.6 Promoter activity analysis by use of egfp ............................................... 121
3.1.7 Clavulanic acid production revisited....................................................... 128
3.2 Analysis of the regulation of the late steps of 5S clavam biosynthesis .......... 133
3.2.1 Phenotype of Δsnk-IF, Δres1::apra Δres2::apra Δc7p::apra mutants ..... 133
3.2.2 Transcript analysis by RT-PCR .............................................................. 134
3.2.3 Protein overproduction and purification ................................................. 137
1. Res2-His7 overproduction and purification ........................................ 145
2. Construction of a C7P overexpression vector ..................................... 148
3. His10-C7P overproduction and purification ........................................ 155
3.2.4 Protein-DNA interactions ....................................................................... 160
1. Analysis of Res2-DNA interactions by EMSA .................................. 160
2. Analysis of C7P-DNA interaction by EMSA ..................................... 163
3.3 Analysis of proteins involved in the two-component system ........................ 173
3.3.1 Overproduction and purification of wild type proteins of the two- component regulatory system ................................................................. 173
3.3.2 Sequence comparison .............................................................................. 179
3.3.3 Site-directed mutagenesis of phosphorylation site of Snk, Res1 and Res2 ......................................................................................................... 179
3.3.4 Overproduction and purification of two-component regulatory proteins with altered phosphorylation sites ............................................. 184
3.3.5 In vitro phosphorylation assays .............................................................. 189
3.3.6 Phosphorylation dynamics between Res1 and Res2 ............................... 196
1. Construction of MBP fusion protein overproduction vector .............. 196
2. Purification of phosphorylated MBP-Res1 and MBP-Res2 ............... 200
3. In vitro dephosphorylation assays ....................................................... 207
4. Phospho-transfer assays ...................................................................... 210
4. Discussion .......................................................................................................... 213
4.1 Polar effect exerted on transcription of downstream genes ........................... 214
4.2 ceaS1 and ceaS2 regulation ............................................................................ 217
4.3 Atypical two-component system and C7P on 5S clavam metabolite
biosynthesis .................................................................................................... 221
4.4 Conclusions .................................................................................................... 229
5. References ......................................................................................................... 231
List of Tables
Chapter 1
1.1 Production of clavulanic acid and 5S clavams by mutants with defects in genes encoding enzymes involved in the early steps of clavam metabolite biosynthesis in S. clavuligerus......................................19
Chapter 2
2.1 Escherichia coli strains used in this study.................................................. 50
2.2 Streptomyces strains used in this study....................................................... 51
2.3 Escherichia coli and Streptomyces plasmids used in this study................. 53
2.4 Oligionucleotides primers used in this study.............................................. 69
Chapter 3
3.1 Bioassay detection of clavulanic acid production by various S. clavuligerus mutants after 48 hours of growth in Soy and SA media.......................................................................................................... 93
3.2 Transcription profile of various S. clavuligerus strains as determined by RT-PCR............................................................................................... 144
List of Figures Chapter 1 1.1. Chemical structure of various secondary metabolites produced by
S. clavuligerus ........................................................................................................ 5 1.2. “Early” steps involved in biosynthesis of clavaminic acid, the branch point
intermediate leading to production of clavulanic acid and 5S clavams................. 11 1.3. The β-lactam supercluster of S. clavuligerus .......................................................... 14 1.4. The clavam gene cluster of S. clavuligerus ............................................................. 17 1.5. The paralogue gene cluster of S. clavuligerus. ....................................................... 21 1.6. Proposed “late” steps involved in biosynthesis of clavulanic acid and 5S
clavams .................................................................................................................. 26 1.7. Proposed steps involved in alanylclavam biosynthesis ......................................... 32 Chapter 3 3.1.1. Overproduction of CeaS1 and CeaS2 from E. coli BL21(DE3) carrying
pET9c-ceaS1 and pET24a-ceaS2 ......................................................................... 95 3.1.2. Western analysis of CeaS1 and CeaS2 ................................................................... 97 3.1.3. Western analysis of CeaS using cell-free extracts isolated from wild type S.
clavuligerus grown either in liquid complex soy (Soy) or defined starch asparagine (SA) medium ..................................................................................... 101
3.1.4. Western analysis of CeaS in ceaS2 mutant strains and ceaS1/ceaS2 double
mutant ...................................................................................................................103 3.1.5. Western analysis of CeaS in ceaS1 mutant strains .................................................105 3.1.6. Western analysis of CeaS in complemented ceaS2 mutants ..................................108 3.1.7. Western analysis of Bls in wild type S. clavuligerus and bls mutants. ..................111
3.1.8. Western analysis of Bls in ceaS2 mutants ............................................................. 114 3.1.9. Assessment of ceas1, ceas2, bls1, bls2 and hrdB transcript levels in wild type
S. clavuligerus, ΔceaS2-IF and ΔceaS1::apra mutants by RT-PCR .....................118 3.1.10. Assessment of cvm5, c7p, c6p and hrdB transcript levels in wild type S.
clavuligerus, ΔceaS2-IF, Δres2::apra and Δres1::apra mutants by RT-PCR ........122 3.1.11. Assessment of cas1, cvm1, res1 and res2 transcript levels in wild type S.
clavuligerus, ΔceaS2-IF, Δres2::apra and Δres1::apra mutants by RT-PCR ........ 124 3.1.12. Assessment of orfA, ceaS1, ceaS2 and snk transcript levels in wild type S.
clavuligerus, ΔceaS2-IF, Δres2::apra and Δres1::apra mutants by RT-PCR ........ 126 3.1.13. Detection of ceaS1 promoter activity in wild type and ΔceaS2 mutant strains
of S. clavuligerus by using EGFP as a reporter .................................................... 129 3.1.14. Clavam metabolites produced by wild type S. clavuligerus and ΔceaS2-IF
mutants grown on solid Soy medium ................................................................... 131 3.2.1. Clavam metabolites produced by Δsnk-IF, Δres2::apra, Δc7p::apra and
Δres1::apra mutants grown on solid Soy medium ............................................... 135 3.2.2. Assessment of cas1, cvm5, cvm1 and hrdB transcript levels in ΔceaS1::apra,
Δc7p::apra and Δsnk-IF mutants by RT-PCR ....................................................... 138 3.2.3. Assessment of res1, res2, snk and orfA transcript levels in ΔceaS1::apra,
Δc7p::apra and Δsnk-IF mutants by RT-PCR ....................................................... 140 3.2.4. Assessment of ceaS1, ceaS2, c6p and c7p transcript levels in ΔceaS1::apra,
Δc7p::apra and Δsnk-IF mutants by RT-PCR. ...................................................... 142 3.2.5. Purification of Res2-His7 from E. coli BL21(DE3) carrying pT7-7His-res2 ........ 146 3.2.6. Schematic of the process leading to the construction of pET-19b-c7p .................. 149

3.2.7. DNA fragments used to construct the c7p expression vector ................................ 153 3.2.8. Restriction analysis of pET-19b-c7p protein expression vector ............................ 156 3.2.9. Purification of His10-C7P from E. coli BL21(DE3) carrying pET-19b-c7p .......... 158 3.2.10. DNA probes for electrophoretic mobility shift assays of various targets
identified by RT-PCR ........................................................................................... 161 3.2.11. Analysis of binding of Res2-His7 to promoter regions of genes in the
clavam and paralogue gene clusters. .................................................................... 164 3.2.12. Analysis of binding of His10-C7P to promoter regions of genes in the
clavam and paralogue gene clusters. .................................................................... 166 3.2.13. Electrophoretic mobility shift of a 454 bp DNA fragment spanning the
intergenic region between cvm1 and cas1 when bound by His10-C7P ................. 169 3.2.14. Specificity of His10-C7P binding to a 454 bp DNA fragment spanning the
intergenic region between cvm1 and cas1 ........................................................... 171 3.3.1. Purification of Snk-His7 from E. coli BL21(DE3) carrying pT7-7His-snk ............ 175 3.3.2. Purification of His10-Res1 from E. coli BL21(DE3) carrying pET-19b-res1 ........ 177 3.3.3. In vitro phosphorylation of Snk-His7, His10-Res1 and Res2-His7.......................... 180 3.3.4. Sequence comparison through BLAST analyses of the proteins of the
two-component regulatory system .......................................................................182 3.3.5. Schematic representation of the two-step site-directed mutagenesis used to
change the phosphorylation site of Snk, Res1 and Res2 to an alanine residue. ... 185 3.3.6. Purification of Snk-SD-His7 from E. coli BL21(DE3) carrying
pT7-7His-snk-SD. ................................................................................................ 190

3.3.7. Purification of His10-Res1-SD and Res2-SD- His7 from E. coli BL21(DE3) carrying pET-19b-res1-SD and pT7-7His-res2-SD ............................................. 192
3.3.8. In vitro phosphorylation of Snk-His7, His10-Res1 and Res2-His7 and
Snk-SD-His7, His10-Res1-SD and Res2-SD-His7 ............................................... 194 3.3.9. Purification of MBP-Res1 and MBP-Res2 from E. coli BL21(DE3) carrying
pMal-res1 and pMal-res2 .....................................................................................198 3.3.10. Phosphorylation of MBP-tagged response regulators .......................................... 201 3.3.11. Anion exchange chromatography of MBP fusion protein .................................... 203 3.3.12. Schematic diagram of the process leading to the purification of
phosphorylated MBP-Res1 and MBP-Res2. ........................................................ 205 3.3.13. In vitro dephosphorylation assays ........................................................................ 208 3.3.14. Phospho-transfer activity between phosphorylated Res1 and Res2-His7............. 211 Chapter 4 4.1. The proposed mechanism for regulation of ceaS1 transcription by ceaS2
of S. clavuligerus. ................................................................................................. 222 4.2. The proposed mechanism between the Snk/Res1/Res2 atypical two-component
system and transcriptional regulator C7P of S. clavuligerus................................ 227
List of Abbreviations
α Alpha
β Beta
Δ Delta or deletion
γ Gamma
g Gravity
λ Lambda bacteriophage
µ Micro
Ω Omega
σ Sigma factor
ARE Autoregulatory element
ATP Adenosine triphosphate
BLAST Basic Local Alignment Search Tool
bp Base pair
BSA Bovine serum albumin
C- Carboxy
CDA Calcium-dependent-antibiotic
cDNA Complementary DNA
CFE Cell free extract
Ci Curie
D Aspartate
Da Dalton
DMSO Dimethyl sulfoxide
DNA Deoxyribonucleic acid
DNase Deoxyribonuclease
dNTP Deoxynucleoside triphosphate
DTT Dithiothreitol
EBP Enhancer binding protein
ECL Enhanced chemiluminescence
EDTA Ethylenediaminetetraacetic acid
EGFP Enhanced Green Fluorescent Protein
EMSA Electrophoretic mobility shift assay
F Farad
FPLC Fast protein liquid chromatography
GAF cGMP-specific and -stimulated phosphodiesterases, adenylate cyclases and FhlA
H Histidine
HPLC High performance liquid chromatography
IAA Isoamyl alcohol
IPTG Isopropyl-β-D-thiogalactopyranoside
ISP-4 International Streptomyces project medium
kb Kilobase
kDa KiloDalton
LB Lennox broth
LBA LB agar
M Molar
m milli
Mb Megabase
MBP Maltose binding protein
mol mole
MOPS 3-[N-morpholino]propanesulfonic acid
MYM Maltose yeast extract malt extract medium
N- Amino
ng nanogram
NiNTA Nickel-Nitrilotriacetate

OD Optical density
PAG Polyacrylamide gel
PAGE Polyacrylamide gel electrophoresis
PCR Polymerase chain reaction
pmol Picomole
RNA Ribonucleic acid
RNase Ribonuclease
rpm Revolutions per minute
RT-PCR Reverse-transcriptase-PCR
SARP Streptomyces Antibiotic Regulatory Protein
SD Site-directed mutagenesis
SDS Sodium dodecyl sulfate
TAE Tris-acetate-EDTA buffer
TBE Tris-borate-EDTA buffer
TCS Two-component regulatory system
TE Tris-EDTA buffer
U Unit
UV Ultraviolet
V Volt
v/v volume/volume
w/v weight/volume
X-gal 5-bromo-4-chloro-3-β-D-galactopyranoside

Chapter 1
Introduction
1
1. Introduction
1.1 Streptomyces
Streptomycetes are Gram-positive, aerobic, filamentous, spore-forming
bacteria that commonly inhabit soil and give it its characteristic smell. The genus
Streptomyces was first proposed in 1943 by Waksman and Henrici (1943).
Streptomycetes have a complex life cycle that is similar to fungi and the life cycle
begins as the spore germinates. On solid substrates, growth then occurs at hyphal
tips, and with frequent branching, develops into a network called the vegetative or
substrate mycelium. During this vegetative growth phase, DNA replicates without
cellular division. This results in the characteristic multinucleoid and filamentous
structure of the bacterial cells (Chater, 1993). As nutrients begin to be depleted in
its surrounding environment, morphological differentiation takes place, which
leads to the formation of reproductive aerial hyphae that grow vertically and away
from the surface. At the same time, secondary metabolite production begins.
Many of these compounds have important medical value including various
antibiotics, antitumor agents and immunosuppressants (Chater, 1993; Demain,
2000). The aerial hyphae obtain necessary nutrients for growth and further
differentiation by lysing the substrate mycelium underneath (Mendez et al., 1985).
Septation begins to occur between individual nucleoids along the aerial hyphae
leading to development of uninucleoid spores (Hardisson and Manzanal, 1976;
Wildermuth, 1970). Once sporulation is complete, the mature spores can then
disperse and start the cycle again.
2

Streptomycetes chromosomes are typically 8-9 Mb in size and are among the
largest found in prokaryotes; they are linear and have a high G+C content (69-
78%). Due to their saprotrophic nature, Streptomyces species are capable of
utilizing different carbon sources by producing a range of extracellular enzymes
(McCarthy and Williams, 1992). This metabolic diversity is reflected in their
extremely large genome. Determination of its complete genome sequence showed
that the chromosome of Streptomyces coelicolor is about 8.7 Mb in length and
contains 7,825 genes, where as in Streptomyces avermitilis and Streptomyces
griseus, the chromosomes contain 7,574 and 7,138 genes and are 9.0 Mb and 8.5
Mb in length, respectively (Bentley et al., 2002; Ikeda et al., 2003; Ohnishi et al.,
2008). A comparative analysis between these strains also revealed that the genes
on the chromosomes are organized in a way such that a highly conserved core
region, which carries most of the essential genes, can be found in the middle of
the chromosome in all three organisms. However, the outer arms of the
chromosomes are less conserved and contain genes with non-essential functions,
such as secondary metabolite production (Bentley et al., 2002; Ikeda et al., 2003;
Ohnishi et al., 2008). In Streptomyces spp., including S. clavuligerus, genes
involved in secondary metabolite production tend to be grouped together as gene
clusters, which are shown to be highly abundant. More than twenty gene clusters
related to known or predicted secondary metabolite production were identified in
S. avermitilis, S. coelicolor and S. griseus (Bentley et al., 2002; Chater and Bibb,
1997; Ikeda et al., 2003; Ohnishi et al., 2008). This clustering characteristic has
3
proven useful as a genetic tool for researchers to identify novel genes that may be
involved in antibiotic biosynthetic pathways.
1.2 β-lactam metabolites
Since the discovery of penicillin by Alexander Fleming in 1928, intensive
research has been undertaken to discover new antibiotics for treating infections.
The β-lactam metabolites have different ring structures fused to the four-
membered azetidinione ring (also known as the β-lactam ring) (Figure1.1), which
contributes to their biological activity (Skatrud et al., 1997). The β-lactam ring
acts as an analog of acyl-D-alanyl-D-alanine and binds to the transpeptidase
enzyme that catalyzes the cross-linking reaction of the peptidoglycan network
(Tipper and Strominger, 1965; Wise and Park, 1965). This weakens the
peptidoglycan, which normally provides the structural support and rigidity to
bacterial cells, and eventually leads to cell death as the cells are no longer
protected from osmotic pressure. To date, β-lactam antibiotics are still one of the
most important groups of chemotherapeutic agents, accounting for over 65% of
antibiotics used worldwide (Elander, 2003; Paradkar et al., 1997). However, it
was not until 1962 that researchers started to realize that, besides fungi, bacteria
such as Streptomycetes were also capable of producing β-lactam antibiotics
(Miller et al., 1962). Streptomyces clavuligerus NRRL 3585 was isolated from a
South American soil sample in 1971 by Higgens and Kastner (1971). Subsequent
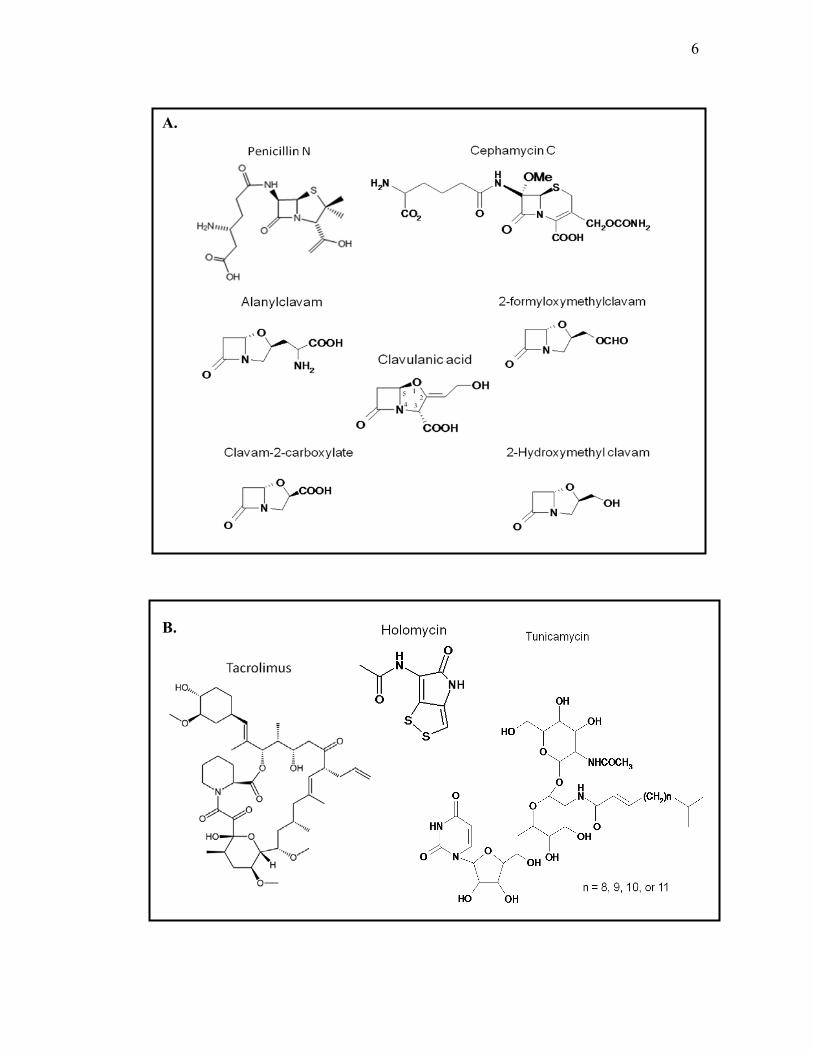
analysis showed that this strain could produce penicillin N and cephamycin C
(Nagarajan et al., 1971; Figure 1.1). In addition to the antibiotics mentioned
above, five other clavam-type-β-lactam metabolites, including clavulanic acid, as
4

Figure 1.1. Chemical structure of various secondary metabolites produced by S.
clavuligerus. A. β-lactam metabolites. B. other types of metabolites.
5
B.
A.
6
well as non-β-lactam compounds including holomycin and tunicamycin were
found to be produced by this strain (Kenig and Reading, 1979; Nagarajan et al.,
1971; Figure1.1). The five clavam compounds have an oxygen-containing
oxazolidine ring instead of the sulfur-containing thiazolidine ring found in
penicillin or the six-membered dihydrothiazine ring found in cephamycin C
(Demain and Elander, 1999; Figure 1.1). Another S. clavuligerus strain, CKD119,
newly isolated from a south Korea soil sample, was shown to produce tacrolimus
(FK-506), which has high clinical value because of its immunosuppressant
activity (Kim and Park, 2008; Figure 1.1). Recently, sequencing of the S.
clavuligerus genome has been completed. Although its chromosome is only 6.8
Mb in length, 48 secondary metabolite gene clusters have been identified that are
distributed between the chromosome and a newly identified 1.8 Mb linear plasmid
(pSCL4) (Medema et al., 2010). This suggests that S. clavuligerus is capable of
producing a large number of yet unidentified secondary metabolites.
Unfortunately, improper and over usage of antibiotics has led to the
development of β-lactam antibiotic resistance in many organisms. One of the
resistance mechanisms employed by these organisms is the production of β-
lactamase, which hydrolyzes the β-lactam ring structure and therefore inactivates
its function. The four recognized classes of β-lactamases produced by various
bacteria can be arranged into two groups, in which class A, C, and D enzymes are
serine hydrolases while class B β-lactamases are metalloenzymes with zinc being
the common co-factor (Ambler, 1980).
7
The spread of β-lactamase encoding genes to pathogenic organisms led to
large scale screening for β-lactam antibiotics that are resistant to β-lactamase
hydrolysis, and alternatively, for compounds that are capable of inhibiting the
reaction catalyzed by β-lactamases. This latter approach led to the identification
of clavulanic acid. Although clavulanic acid itself is a weak antibiotic, it is a
potent β-lactamase inhibitor (Brown et al., 1976), which binds by acting as a
structural analogue of penicillin and therefore inhibits a wide range of β-
lactamases that belong to classes A and D (Walsh, 2003). Beside the carboxyl
group that is present at the C3 position, clavulanic acid also has a 5R
stereochemistry compared to the 5S stereochemistry of the other four clavams
(Figure 1.1), which are therefore referred to as the 5S clavams. Although
clavulanic acid and the 5S clavams are very similar in structure, only clavulanic
acid is capable of inhibiting β-lactamase. Thus, it is believed that this unique
stereochemistry confers the β-lactamase inhibitory activity (Baggaley et al.,
1997). Despite the fact that the 5S clavams are not β-lactamase inhibitors, they
still possess biological activity. Clavam-2-carboxylate, 2-hydroxymethylclavam
and 2-formyloxymethylclavam were shown to be antifungal (Brown et al., 1979),
and alanylclavam was found to be bacteriostatic for certain organisms by
inhibiting methionine biosynthesis (Pruess and Kellett, 1983).
Since the discovery of this β-lactamase inhibitory activity, clavulanic acid
has been used in combination with β-lactam antibiotics to treat infections caused
by β-lactamase-producing pathogenic bacteria (Jensen and Paradkar, 1999).
AugmentinTM, a commercial product that contains clavulanic acid and
8

amoxicillin, was the second largest selling antibacterial with a world sales value
of ~$1.3 billion (US) in 1995 (Elander, 2003). As the emergence of antibiotic
resistant strains increased rapidly and in view of the great difficulty in identifying
new functional antibiotics, the need for clavulanic acid has increased
dramatically. Since S. clavuligerus is the only organism used to produce
clavulanic acid through industrial fermentation (Jensen, personal communication),
the biosynthetic pathway and its regulation has become a point of great interest. It
is now known that clavulanic acid and the 5S clavams share a common
biosynthetic pathway up to the intermediate called clavaminic acid and then the
pathway branches off leading to the production of clavulanic acid on the one
hand, or the various 5S clavams on the other hand (Egan et al., 1997). However,
the biosynthetic pathway has not been completely elucidated and it is still unclear
how clavaminic acid proceeds to clavulanic acid or the 5S clavams.
1.3 Biosynthesis of clavulanic acid and 5S clavams
Similar to the biosynthetic pathway for cephamycin C, which has been
well studied in S. clavuligerus, the biosynthetic pathway for clavulanic acid and
the 5S clavams can be divided into two parts that are commonly referred to as the
“early” and “late” steps. The “early” steps are shared between clavulanic acid and
5S clavam biosynthesis up to the branch point intermediate called clavaminic acid
(Egan et al., 1997; Figure 1.2). The “late” steps are specific and either lead to the
formation of clavulanic acid or 5S clavams from clavaminic acid. Even though the
pathway leading to clavaminic acid production has been well characterized
(Jensen and Paradkar, 1999), steps beyond clavaminic acid are uncertain.
9
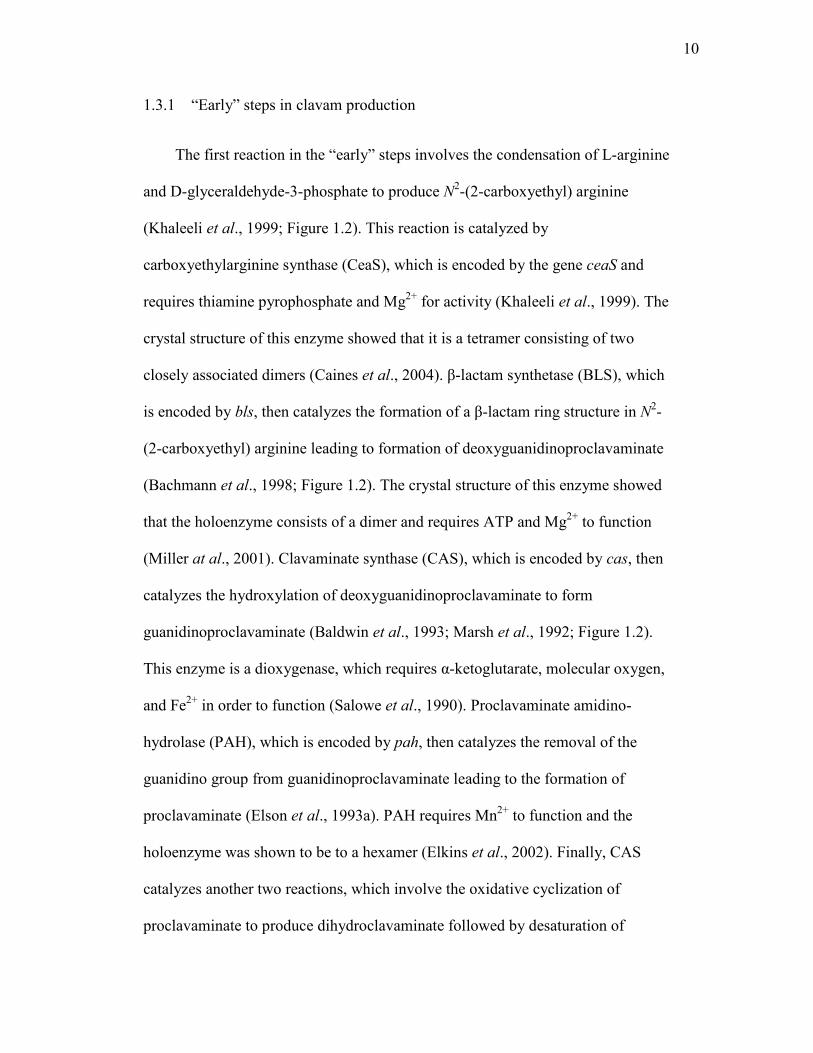
1.3.1 “Early” steps in clavam production
The first reaction in the “early” steps involves the condensation of L-arginine
and D-glyceraldehyde-3-phosphate to produce N2-(2-carboxyethyl) arginine
(Khaleeli et al., 1999; Figure 1.2). This reaction is catalyzed by
carboxyethylarginine synthase (CeaS), which is encoded by the gene ceaS and
requires thiamine pyrophosphate and Mg2+ for activity (Khaleeli et al., 1999). The
crystal structure of this enzyme showed that it is a tetramer consisting of two
closely associated dimers (Caines et al., 2004). β-lactam synthetase (BLS), which
is encoded by bls, then catalyzes the formation of a β-lactam ring structure in N2-
(2-carboxyethyl) arginine leading to formation of deoxyguanidinoproclavaminate
(Bachmann et al., 1998; Figure 1.2). The crystal structure of this enzyme showed
that the holoenzyme consists of a dimer and requires ATP and Mg2+ to function
(Miller at al., 2001). Clavaminate synthase (CAS), which is encoded by cas, then
catalyzes the hydroxylation of deoxyguanidinoproclavaminate to form
guanidinoproclavaminate (Baldwin et al., 1993; Marsh et al., 1992; Figure 1.2).
This enzyme is a dioxygenase, which requires α-ketoglutarate, molecular oxygen,
and Fe2+ in order to function (Salowe et al., 1990). Proclavaminate amidino-
hydrolase (PAH), which is encoded by pah, then catalyzes the removal of the
guanidino group from guanidinoproclavaminate leading to the formation of
proclavaminate (Elson et al., 1993a). PAH requires Mn2+ to function and the
holoenzyme was shown to be to a hexamer (Elkins et al., 2002). Finally, CAS
catalyzes another two reactions, which involve the oxidative cyclization of
proclavaminate to produce dihydroclavaminate followed by desaturation of
10

Figure 1.2. “Early” steps involved in biosynthesis of clavaminic acid, the branch
point intermediate leading to production of clavulanic acid and 5S clavams. Gene
designations are shown in italics.
11
12

dihydroclavaminate leading to the formation of clavaminic acid (Salowe et al.,
1991; Figure 1.2).
1.3.2 Gene clusters involved in clavam production
When CAS was purified from S. clavuligerus, two active forms of the
enzyme, which have slightly different kinetic constants and molecular weights,
were observed (Salowe et al., 1990). Subsequent analysis revealed that the two
CAS isozymes were encoded by two different genes, that shared 82% identity and
87% similarity at the amino acid level, and therefore the two genes were named
cas1 and cas2 (Marsh et al., 1992). cas2, along with ceaS, bls, pah and oat (later
called ceaS2, bls2, pah2 and oat2), are located downstream of the cephamycin C
gene cluster (Jensen et al., 2000; Figure 1.3). It is now known that genes specific
for clavulanic acid production are also located in this region of the chromosome.
As a result, this region is now referred to as the clavulanic acid gene cluster
(Figure 1.3). For organisms, such as Streptomyces jumonjinensis and S.
clavuligerus, that can produce clavulanic acid and cephamycin C, it is common
for both gene clusters to reside adjacent to each other (Ward and Hodgson, 1993).
Therefore, these two clusters together are also referred to as the β-lactam
supercluster.
In contrast, cas1 is located on another part of the S. clavuligerus
chromosome. Investigation of the region surrounding cas1 showed that it also
formed a separate cluster with genes that are only involved in the 5S clavam
biosynthesis and therefore, this cluster was named the clavam gene cluster
13
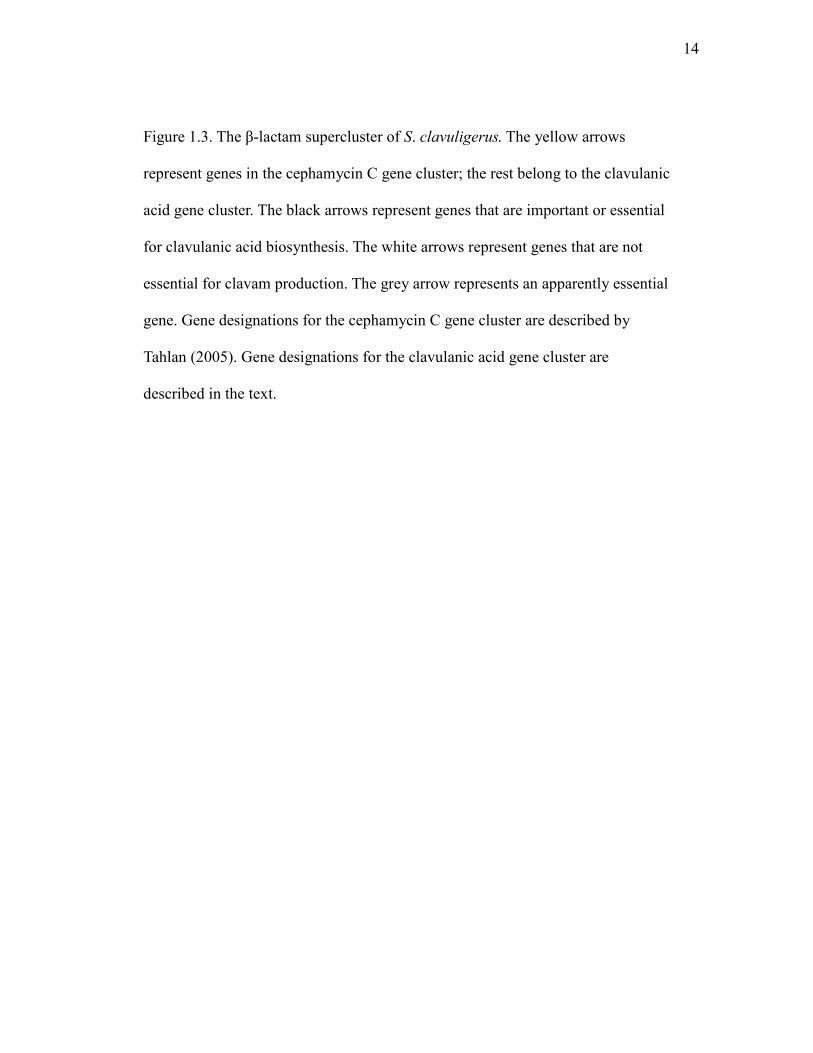
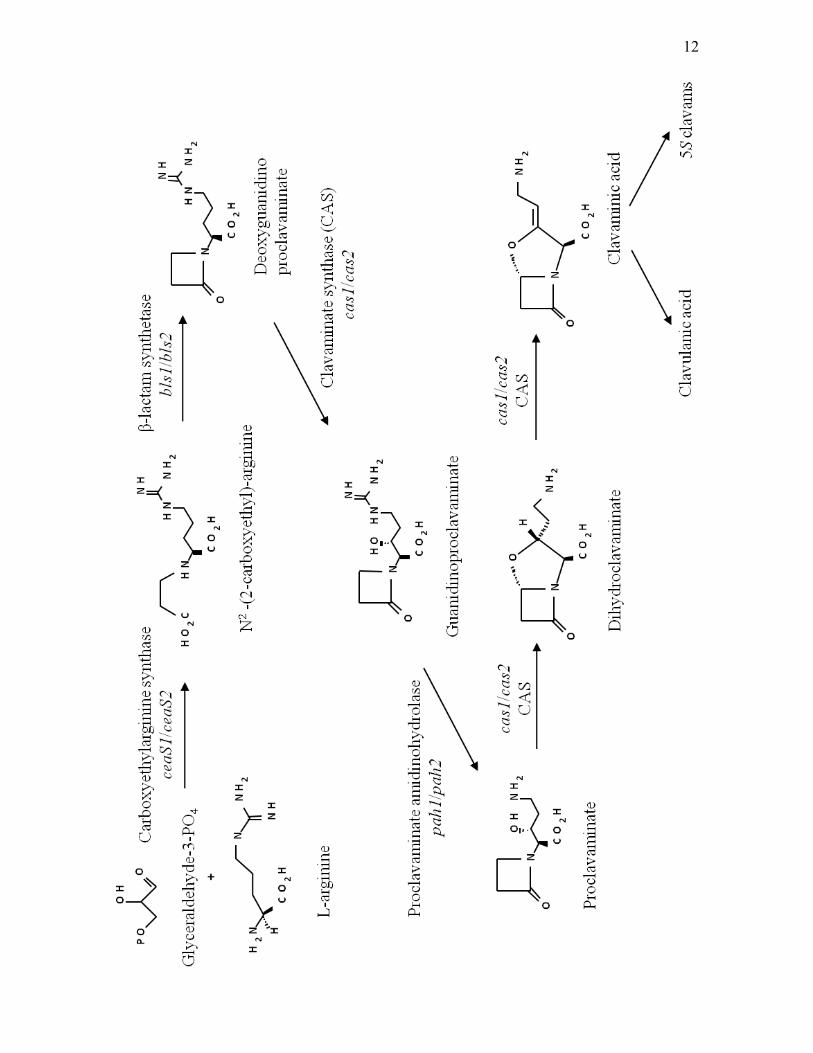
Figure 1.3. The β-lactam supercluster of S. clavuligerus. The yellow arrows
represent genes in the cephamycin C gene cluster; the rest belong to the clavulanic
acid gene cluster. The black arrows represent genes that are important or essential
for clavulanic acid biosynthesis. The white arrows represent genes that are not
essential for clavam production. The grey arrow represents an apparently essential
gene. Gene designations for the cephamycin C gene cluster are described by
Tahlan (2005). Gene designations for the clavulanic acid gene cluster are
described in the text.
14
15
(Mosher et al., 1999; Figure 1.4). Mutational analysis showed that a cas2 null
mutant was capable of producing clavulanic acid and 5S clavams but at a reduced
level compared to wild type S. clavuligerus in complex soy (Soy) medium (Table
1.1). However, production of all clavam compounds was abolished in defined
starch asparagine (SA) medium (Paradkar and Jensen, 1995). Mutational analysis
showed that a cas1 null mutant exhibited a phenotype similar to the cas2 mutant
when grown in Soy medium, but it could still produce clavulanic acid when
grown in SA medium (Mosher et al., 1999). Transcriptional analysis showed that
cas1 and cas2 are subjected to different nutritional regulation, where cas1 is only
expressed in Soy medium, while cas2 can be expressed in both media (Paradkar
and Jensen, 1995). A cas1/cas2 double mutant cannot produce any clavam
metabolites when growing either in Soy or SA media (Table 1.1). This result
excluded the possibility that a third copy of cas is present in S. clavuligerus. All
of these data together indicated that CAS1 and CAS2 are functionally equivalent
enzymes and both are involved in clavulanic acid production when the organism
is grown in Soy medium while CAS2 is solely responsible for the production of
clavulanic acid when grown in SA medium.
When separate mutations were made in the ceaS, bls and pah genes that lie
upstream of cas2 in S. clavuligerus, phenotypes similar to that seen in the cas2
mutant were observed (Table 1.1). Only partial loss of production of clavams was
seen, although the severity of the defect in production was far more prominent in
ceaS and bls mutants. These mutants were still capable of producing at least some
clavulanic acid and 5S clavams in Soy medium but clavam production was
16

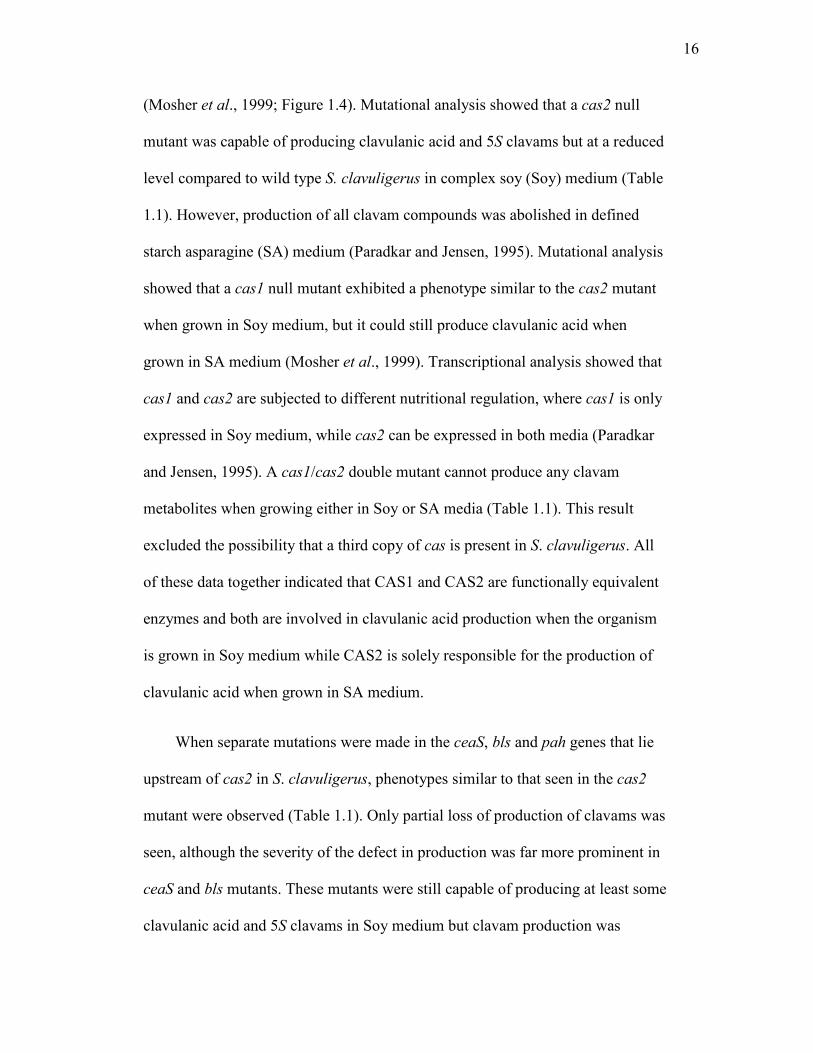
Figure 1.4. The clavam gene cluster of S. clavuligerus. The grey arrows represent
genes that are essential or important for clavam biosynthesis. The white arrows
represent genes that are not essential for clavam production. The black arrows
represent genes whose importance in clavam biosynthesis has not been examined.
Gene designations for the clavam gene cluster are described in the text.
17
18
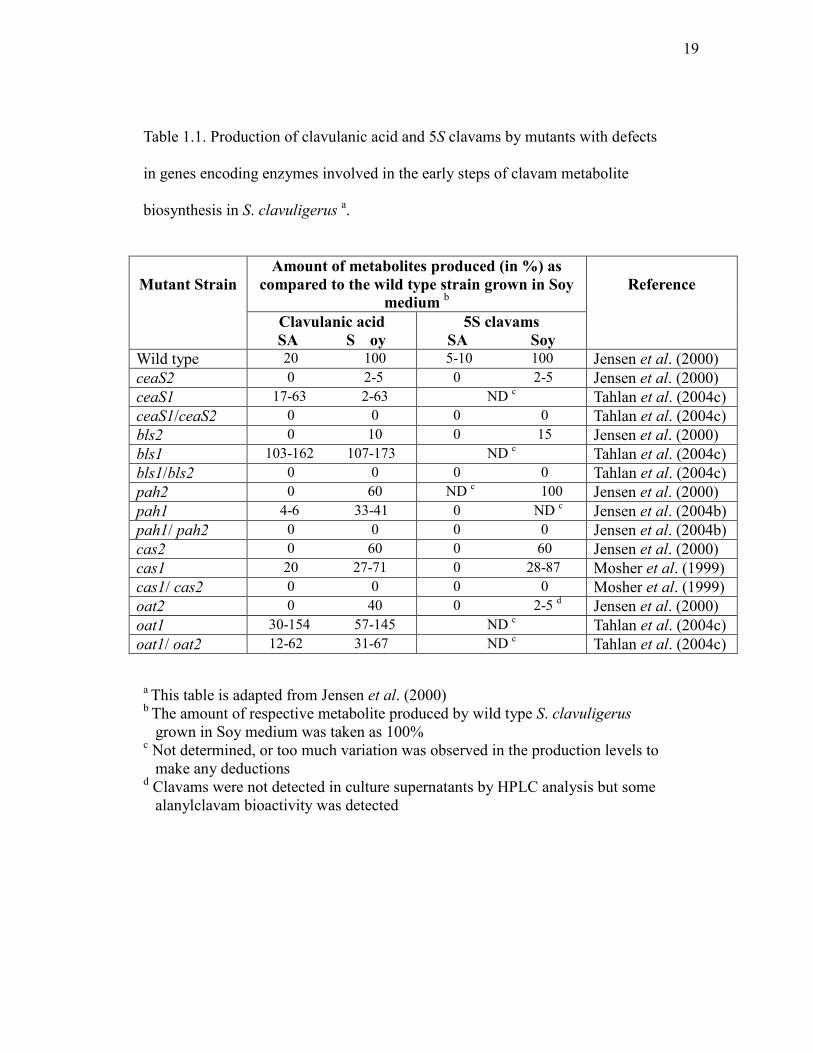
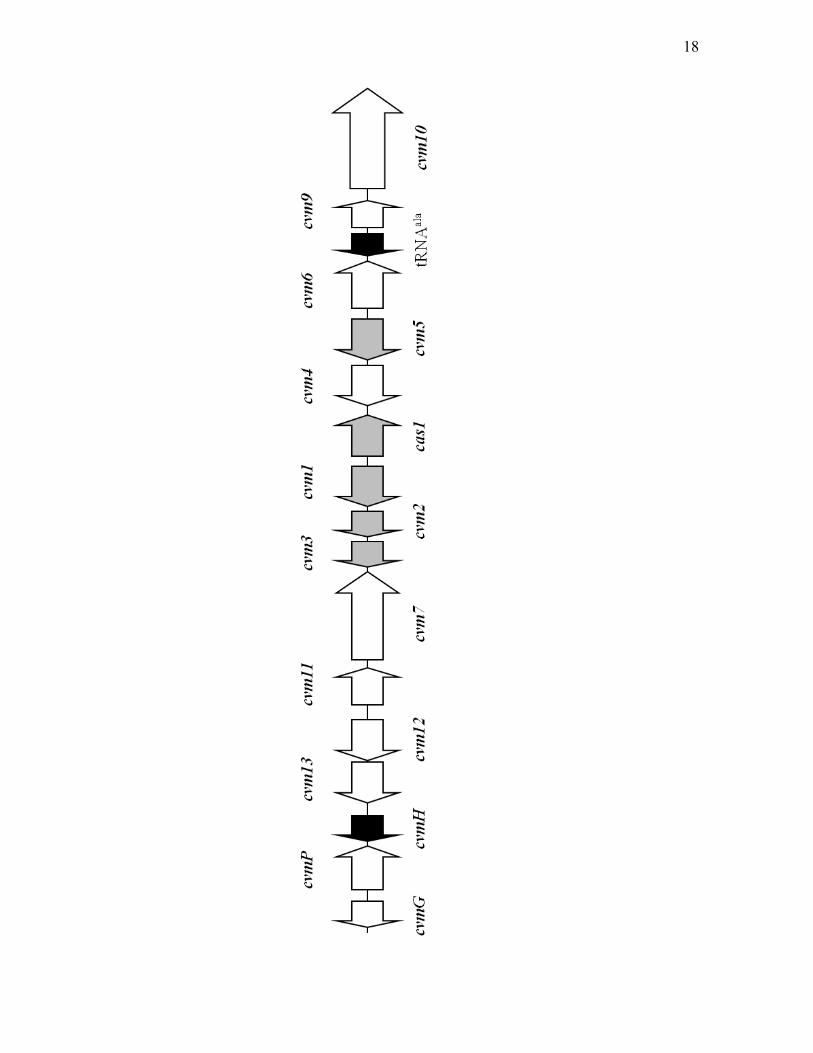
Table 1.1. Production of clavulanic acid and 5S clavams by mutants with defects
in genes encoding enzymes involved in the early steps of clavam metabolite
biosynthesis in S. clavuligerus a.
Mutant Strain
Amount of metabolites produced (in %) as compared to the wild type strain grown in Soy
medium b
Reference
Clavulanic acid SA S oy
5S clavams SA Soy
Wild type 20 100 5-10 100 Jensen et al. (2000) ceaS2 0 2-5 0 2-5 Jensen et al. (2000) ceaS1 17-63 2-63 ND c Tahlan et al. (2004c) ceaS1/ceaS2 0 0 0 0 Tahlan et al. (2004c) bls2 0 10 0 15 Jensen et al. (2000) bls1 103-162 107-173 ND c Tahlan et al. (2004c) bls1/bls2 0 0 0 0 Tahlan et al. (2004c) pah2 0 60 ND c 100 Jensen et al. (2000) pah1 4-6 33-41 0 ND c Jensen et al. (2004b) pah1/ pah2 0 0 0 0 Jensen et al. (2004b) cas2 0 60 0 60 Jensen et al. (2000) cas1 20 27-71 0 28-87 Mosher et al. (1999) cas1/ cas2 0 0 0 0 Mosher et al. (1999) oat2 0 40 0 2-5 d Jensen et al. (2000) oat1 30-154 57-145 ND c Tahlan et al. (2004c) oat1/ oat2 12-62 31-67 ND c Tahlan et al. (2004c)
a This table is adapted from Jensen et al. (2000) b The amount of respective metabolite produced by wild type S. clavuligerus grown in Soy medium was taken as 100% c Not determined, or too much variation was observed in the production levels to make any deductions d Clavams were not detected in culture supernatants by HPLC analysis but some alanylclavam bioactivity was detected
19

abolished in SA medium. This suggested that, just as was seen for the cas genes,
another copy of each of these other early genes may also exist in S. clavuligerus
(Jensen et al., 2000). Indeed, a paralogue of pah, which is called pah1 in order to
differentiate it from the pah gene located in the clavulanic acid cluster (now called
pah2), was found by Southern analysis and the two PAH isozymes they encode
shared 71% identity at the amino acid level (Jensen et al., 2004b). Although
clavam production was not greatly affected in a pah1 mutant, a pah1/pah2 double
mutant was incapable of producing clavam metabolites. The region surrounding
pah1 was then sequenced and subsequent analysis revealed three more genes that
showed significant similarity to the “early” genes in the clavulanic acid gene
cluster (Tahlan et al., 2004a). This region is therefore called the paralogue gene
cluster (Figure 1.5). All of the “early” genes located in the clavulanic acid cluster
are therefore renamed to become ceaS2, bls2, pah2 and oat2 in order to
differentiate them from their respective paralogous copies. ceaS1 encodes a
protein that has 66% identity to CeaS2 at the amino acid level. It was proposed
that these two genes may also be under different regulation, as was seen in cas1
and cas2. Indeed, transcriptional analysis indicated that ceaS1 and ceaS2 are
nutritionally regulated in different ways, where ceaS2 was expressed in Soy and
SA media while ceaS1 was only expressed in Soy medium (Tahlan et al., 2004a).
The same study also revealed that ceaS2 but not ceaS1 was under the regulation
of the transcriptional regulator CcaR, where in a ccaR deletion mutant, ceaS2
expression was completely abolished but ceaS1 expression was retained (Tahlan
et al., 2004a).
20

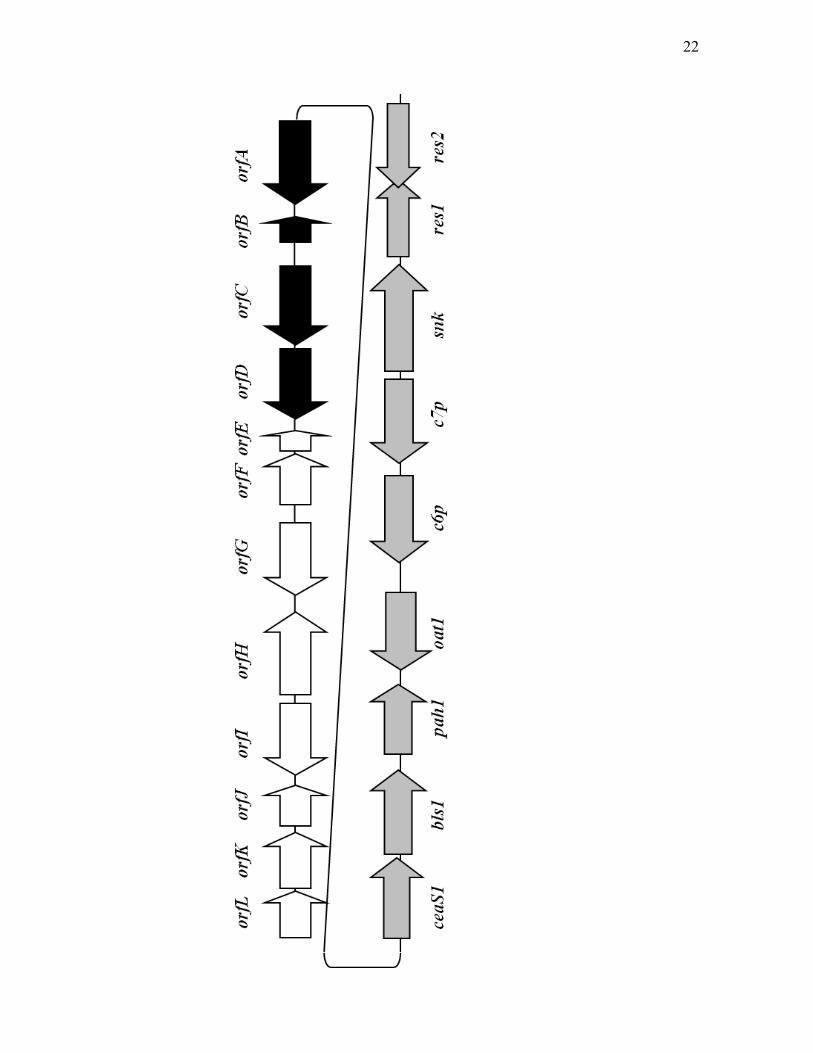
Figure 1.5. The paralogue gene cluster of S. clavuligerus. The grey arrows
represent genes that are essential or important for clavam biosynthesis. The black
arrows represent genes that are specifically involved in alanylclavam biosynthesis.
The white arrows represent genes that are not essential for 5S clavam biosynthesis.
Gene designations for the paralogue gene cluster are described in the text.
21
22

Despite the presence of the ceaS1 gene encoding a CeaS enzyme functionally
equivalent to CeaS2, ceaS2 mutants were severely impaired in clavulanic acid
production even in Soy medium (Table 1.1). This suggested that, in addition to
being under different nutritional regulation, some kind of cross regulation is
taking place between ceaS1 and ceaS2, which prevents the expression of ceaS1 in
the ceaS2 mutants.
bls1, which encodes a protein that shares 49% identity to BLS2 at the amino
acid level, is located downstream of ceaS1. The next gene found in the cluster is
pah1. Further downstream of pah1 is oat1, encoding an ornithine
acetyltransferase enzyme (OAT1), which shares 47% identity with OAT2 at the
amino acid level. While clavulanic acid production was shown to be reduced in a
ceaS1 mutant, mutating either bls1 or oat1 had no apparent effect on clavam
production when grown in Soy medium. Not surprisingly, ceaS1/ceaS2 and
bls1/bls2 double mutants were incapable of producing clavams, indicating that
third copies of these genes do not exist (Tahlan et al., 2004a; Table 1.1). OAT,
encoded by oat1 and oat2, is believed to play a non-essential role in clavam
production by increasing arginine production and channelling it towards the
biosynthesis of clavam metabolites (Kershaw et al., 2002). This suggestion is
supported by data showing that oat1/oat2 double mutants are still capable of
producing clavams although at a reduced level (Jensen et al., 2000; Table 1.1).
To date, there are three gene clusters that comprise genes involved in the
biosynthesis of identified clavam metabolites in S. clavuligerus. They are the
clavulanic acid (Jensen and Paradkar, 1999), paralogue (Tahlan, 2005) and the
23
clavam (Mosher et al., 1999) gene clusters. These gene clusters are not physically
linked as was originally shown by chromosome walking (Tahlan, 2004b) and the
paralogue gene cluster has recently been found through genome sequencing to be
located on the pSCL4 giant linear plasmid whereas the other two are located on
the chromosome (Medema et al., 2010). As antibiotic biosynthetic genes are
always grouped together, the discovery of these clusters provided a useful handle
in order to identify genes that may play a role in clavam production. Long before
the genome sequence of S. clavuligerus become available, sequence analyses of
the regions surrounding the known “early” genes within the gene clusters revealed
the presence of a large number of open reading frames (ORFs) that have been
shown to be involved specifically in the “late” steps of the biosynthetic pathway.
Some of these ORFs are also involved in regulating clavam production.
1.3.3 “Late” genes in clavulanic acid production
Extensive investigation through sequencing and mutational analyses has
expanded the clavulanic acid gene cluster further. It is composed of all the “early”
genes as well as genes involved specifically in clavulanic acid biosynthesis.
Downstream of oat2 resides oppA1, which has significant similarity to oppA2
(encoded proteins show 48% identity at the amino acid level), located further
downstream in the clavulanic acid gene cluster (Hodgson et al., 1995; Jensen et
al., 2000; Lorenzana et al., 2004; Mellado et al., 2002; Figure 1.3). Both genes
were predicted to encode oligopeptide binding proteins and contain a conserved
domain found in bacterial extracellular solute-binding proteins (Mellado et al.,
2002). Analysis of oppA1 and oppA2 mutants indicated that these genes are
24

involved in peptide transport, and disrupting either of these two genes separately
impaired or eliminated clavulanic acid production (Jensen et al., 2000; Jensen et
al., 2004a; Lorenzana et al., 2004). It is believed that OppA1 and OppA2 function
to bind and transport arginine and arginine-containing peptides into S.
clavuligerus for clavam biosynthesis (Mackenzie et al., 2010).
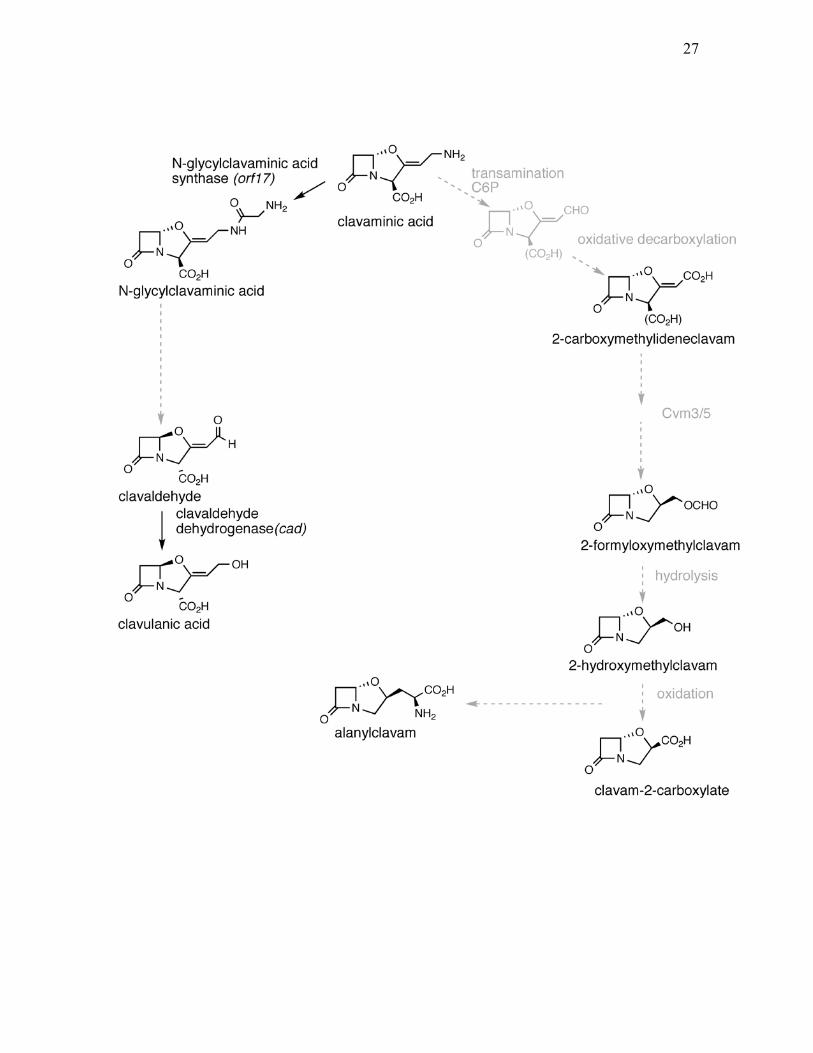
claR and cad, which are located downstream of oppA1, are another two
genes in the clavulanic acid cluster that have well defined roles. claR encodes the
pathway-specific transcriptional regulator for clavulanic acid biosynthesis
(Paradkar et al., 1998) and cad encodes clavaldehyde dehydrogenase (CAD).
CAD catalyzes the final step in clavulanic acid biosynthesis by reducing
clavaldehyde, which is a known intermediate between clavaminic acid and
clavulanic acid, to clavulanic acid (Nicholson et al., 1994; Figure 1.6). The crystal
structure of CAD has been solved recently and was shown to be a tetramer that
requires NADPH as a cofactor to function (MacKenzie et al., 2007). Clavulanic
acid production was blocked when cad was mutated, while over-expressing cad
increased clavulanic acid production (Jensen et al., 2000; Perez-Redondo et al.,
1998). cyp, fd, orf12, orf13 and orf14 are located beside cad and were shown to be
important for clavulanic acid production since disrupting any of these genes
severely compromised the ability of S. clavuligerus to produce clavulanic acid
(Jensen et al., 2000; Jensen et al., 2004a). Proteins encoded by cyp and fd showed
homologies to P-450 cytochromes and ferredoxin proteins, respectively, and as a
pair, they were proposed to participate in the oxidative deamination of clavaminic
acid to clavaldehyde (Jensen et al., 2000; Li et al., 2000). However, this remains
25
Figure 1.6. Proposed “late” steps involved in biosynthesis of clavulanic acid and
5S clavams. Known processes are shown as solid black arrows. Hypothetical
enzymes and chemical structures are shown in grey. (adapted from Tahlan et al.
2007).
26
27

elusive as the reaction has not been demonstrated experimentally. Based on
sequence analysis, orf12, orf13 and orf14 encode proteins showing some
similarity to β-lactamases, efflux pump proteins and acetyltransferases,
respectively (Jensen et al., 2004a; Li et al., 2000). Despite their obvious influence
on clavulanic acid biosynthesis, the exact roles of these gene products remain
unclear.
Similar to oppA2, disrupting orf16 abolished clavulanic acid production
and led to the accumulation of two novel intermediates that are proposed to lie
between clavaminic acid and clavaldehyde, N-glycyl-clavaminic acid and N-
acetyl-glycyl-clavaminic acid (Jensen et al., 2004a). Disrupting orf17 also
blocked clavulanic acid production, again indicating its essential role in the
biosynthetic pathway (Jensen et al., 2004a). Recently, a new step in the process to
produce clavulanic acid from clavaminic acid was proposed. Arulanantham et al.
(2006) showed that ORF17 is an N-glycyl-clavaminic acid synthetase (GCAS),
which belongs to the ATP-grasp fold superfamily and catalyzes a carboxylate-
amine ligation reaction using ATP and glycine in the presence of Mg2+ and K+. In
vitro analysis confirmed that clavaminic acid was converted by ORF17 to N-
glycylclavaminic acid, which is another novel intermediate that lies between
clavaminic acid and clavaldehyde (Arulanantham et al., 2006; Figure 1.6). Based
on these results, an acetyltransferase encoded by orf14 mentioned above, was
proposed to catalyze acetylation of N-glycylclavaminic acid, leading to N-acetyl-
glycyl-clavaminic acid, which is another proposed intermediate in the “late” part
of the pathway.
28

orf 18 and orf19 encode proteins with high similarity to penicillin-binding
proteins (PBPs) in S. coelicolor and S. avermitilis, respectively. While mutations
in orf19, and in orf20, which encodes a putative cytochrome P-450, showed no
effect on clavulanic acid production, the effect of disrupting orf18 could not be
assessed as no orf18 mutants could be isolated, suggesting orf18 may be an
essential gene. Recently three more ORFs named orf21, orf22 and orf23, which
encode a putative sigma factor, a sensor kinase and a response regulator,
respectively, were identified downstream of orf 20 (Song et al., 2009). Although
the effects were subtle, cephamycin C production was reduced in orf21 mutants
while both cephamycin C and clavulanic acid production were reduced in orf22
mutants. A more prominent effect was observed in an orf23 mutant, where both
morphological differentiation and antibiotic production were retarded (Song et al.,
2009).
Interestingly, the gene that encodes an enzyme to carry out the
stereochemical inversion of the 3S, 5S stereochemistry in clavaminic acid to the
3R, 5R stereochemistry, believed to confer its β-lactamase inhibitory activity, in
clavulanic acid, has not been identified as yet.
1.3.4 “Late” genes in 5S clavam production
Initial sequencing around the cas1 gene in the clavam gene cluster
revealed seven open reading frames termed cvm1 to cvm7 (Figure 1.4), of which
some are involved in the “late” steps for 5S clavam biosynthesis, as determined by
mutational studies (Mosher et al., 1999). Predicted amino acid sequence of cvm1
29
showed similarity to aldo-keto reductases. Mutation of cvm1 blocked 5S clavam
production but clavulanic acid production was unaffected in S. clavuligerus
(Mosher et al., 1999). A similar phenotype was observed in a cvm4/cvm5 double
mutant (Mosher et al., 1999). Since mutations in cvm4 have no apparent effect on
clavam biosynthesis, this indicated the essential role of cvm5 in 5S clavam
production. cvm5 was predicted to encode a mono-oxygenase and mutants with
defects in cvm5 accumulated a novel intermediate called 2-
carboxymethylideneclavam (Tahlan et al., 2007). Based on limited data, a series
of “late” steps were proposed for 5S clavam biosynthesis in which Cvm5 is
believed to carry out a Baeyer-Villiger oxidation to convert 2-
carboxymethylideneclavam to 2-formyloxymethylclavam (Tahlan et al., 2007;
Zelyas, 2007; Figure 1.6). cvm3 encodes a putative flavin reductase, which is
believed to supply the reduced flavin that is required for the Cvm5 mono-
oxygenase to function (Tahlan et al., 2007; Mosher et al., 1999). However,
mutants in cvm3 produced normal level of 5S clavams, thus suggesting Cvm3 can
be functionally substituted by other flavin reductases encoded by S. clavuligerus
(Tahlan et al., 2007).
The predicted amino acid sequence of the protein encoded by cvm2
showed similarity to isomerases (Mosher et al., 1999). Although its function is
uncertain, 5S clavam production was severely depressed in cvm2 mutants (Tahlan
et al., 2007). Conversely, mutations in cvm6 and cvm7 showed no effect on
clavam biosynthesis, despite the fact that cvm7 encodes a putative protein that
belongs to the Streptomyces antibiotic regulatory proteins (SARPs) (Tahlan et al.,
30
2007). A number of genes, named cvm9, cvm10, cvm11, cvm12, cvm13, cvmH,
cvmP, and cvmG, were also identified in the clavam gene cluster (Tahlan et al.,
2007; Figure 1.4). Disruption of these genes, except cvmH, showed that they are
not involved in clavam production (Tahlan et al., 2007). Since mutants in cvmH
could not be isolated, its role in clavam biosynthesis is not known.
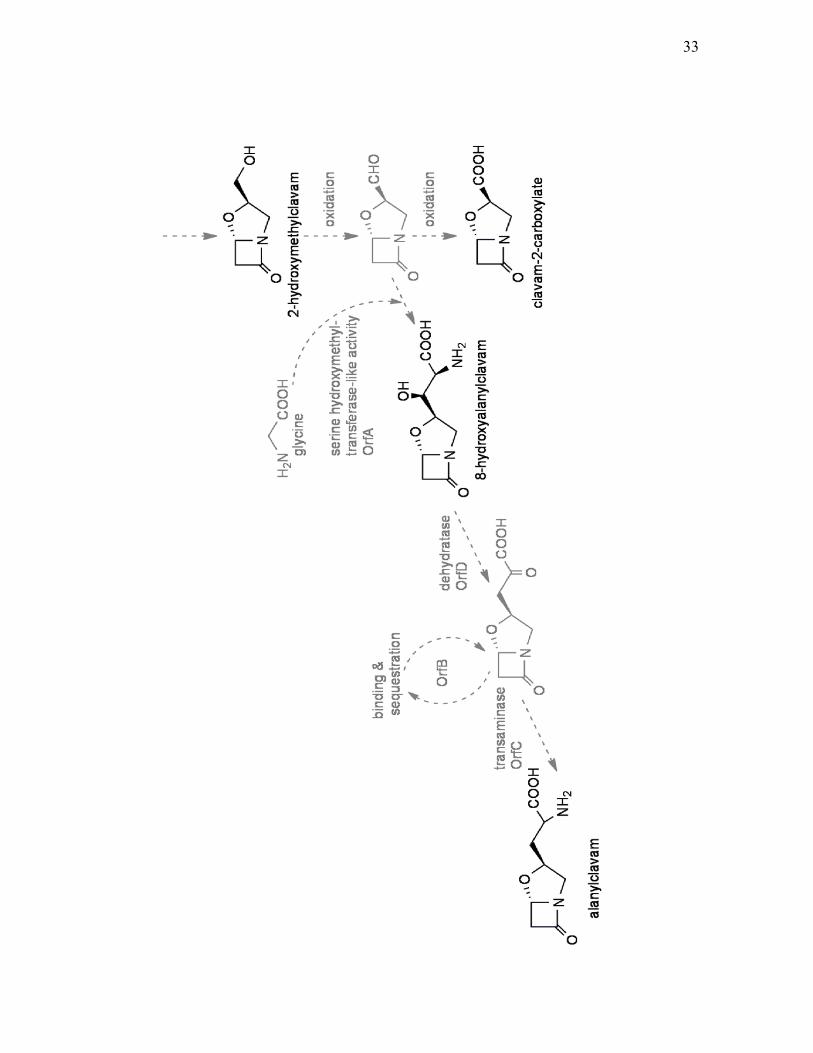
Since the initial discovery of the paralogue gene cluster, it has been
expanded considerably with the identification of additional open reading frames
that flank the paralogous copies of the early genes (Figure 1.5). orfA-L are located
upstream of ceaS1 (Cai, 2003). Mutants of orfA, orfB, orfC or orfD are incapable
of producing alanylclavam while production of other clavams is unaffected. This
indicated that they are specifically involved in alanylclavam production.
Disruption of the remaining ORFs (E through L) had no apparent effect on clavam
biosynthesis (Zelyas et al., 2008). orfA is predicted to encode a protein similar to
glycine/serine hydroxymethyltransferase while orfB encodes a
YjgF/YER057c/UK114 family protein (Cai, 2003). orfC and orfD are predicted to
encode aminotransferase and threonine dehydratase type enzymes, respectively,
and mutations in these two genes abolished alanylclavam production and led to
accumulation of a novel clavam metabolite, 8-hydroxyalanylclavam (Zelyas et al.,
2008). Based on the predicted function of these proteins, a mechanism for
alanylclavam biosynthesis was proposed, although this has not been proved
experimentally (Zelyas et al., 2008; Figure 1.7). On the other side of the
paralogue gene cluster, c6p, c7p, snk, res1 and res2 reside upstream of oat1
(Figure 1.5). Mutants of c6p and c7p, which are paralogues of cvm6 and cvm7
31

Figure 1.7. Proposed steps involved in alanylclavam biosynthesis. Hypothetical
steps are showed in grey. (adapted from Zelyas et al. 2008).
32
33
from the clavam gene cluster, were blocked in 5S clavam production while
clavulanic acid production was unaffected (Tahlan, 2007). Since c7p, like cvm7,
belongs to a class of antibiotic regulatory proteins that has an N-terminal SARP-
like domain and a C-terminal ATPase domain, it was proposed to act as a
pathway-specific transcriptional activator for 5S clavam production in S.
clavuligerus (Tahlan, 2007). snk encodes a product with similarity to sensor
kinases from two-component systems in S. avermitilis and S. coelicolor (Tahlan,
2005). A mutant disrupted in snk was incapable of producing 5S clavams but
clavulanic acid production was unaffected (Tahlan, 2005). Sequence analysis
suggested that Snk is a soluble sensor kinase with two tandem GAF (cGMP-
specific and -stimulated phosphodiesterases, adenylate cyclases and FhlA)
domains, which may be involved in substrate binding, located at its N-terminus
(Tahlan, 2005). res1 and res2 both encode response regulators and mutation in
res1 caused overproduction of 2-hydroxymethylclavam and alanylclavam. On the
other hand, mutants in res2 were unable to produce 5S clavams (Zelyas, 2007).
Sequence analysis of Res2 suggested the presence of an N-terminal
phosphorylation pocket and a C-terminal DNA-binding domain, which are
characteristics of response regulators from different bacteria. In contrast, Res1
retained the phosphorylation pocket but lacked the DNA-binding domain (Zelyas,
2007). The reason for employing two response regulators is not clear at this point.
Nonetheless, both C7P and the atypical two-component system were shown to be
involved specifically in 5S clavam production. With the identification of various
34
enzymatic and regulatory genes, attention also turned to how the clavam
biosynthetic pathway is being regulated.
1.4 Regulation of antibiotic production
In streptomycetes, secondary metabolite production is linked to growth
phase and usually starts when entering stationary phase. Furthermore, it is often
coordinated with morphological differentiation (Demain, 2000) and is subject to
different levels of regulation, which are organized in a hierarchical manner
(Chater and Bibb, 1997). Pathway-specific regulators that control the production
of one or a small number of closely related secondary metabolites define the
bottom of this hierarchy. The genes that encode these pathway-specific regulators
are often located within or close to the antibiotic gene clusters that they regulate
(Chater and Bibb, 1997). The next level is the global regulators that control both
morphological development and secondary metabolite production. In S.
clavuligerus, mechanisms that are involved in either level of regulation are not
completely understood. On top of this regulatory hierarchy are different kinds of
signalling molecules, such as γ-butyrolactones, which serve to monitor both the
environment and physiology of the cells, so that appropriate responses can be
exerted.
1.4.1 SARPS
The Streptomyces Antibiotic Regulatory Proteins (SARPs) are pathway-
specific regulators that control the biosynthesis of various antibiotics. The N-
terminal end of SARPs resemble a DNA binding domain similar to the “winged
35
helix-turn-helix” DNA binding domain found in transcriptional regulators that
belong to the OmpR family (Wietzorrek and Bibb, 1997). Since members of the
OmpR family regulate transcription by binding to direct DNA repeats located in
the promoter region, it was proposed that SARPs also control gene expression by
binding to direct heptameric repeats located in the promoter region of the genes
they regulate (Martinez-Hackert and Stock, 1997; Wietzorrek and Bibb, 1997).
The ActII-ORF4 protein is a well characterized SARP that positively regulates the
biosynthesis of actinorhodin (Act), an antibiotic produced by S. coelicolor
(Fernandez-Moreno et al., 1991). Fernandez-Moreno et al. (1991) observed that
Act was over-produced when extra copies of actII-ORF4 were introduced into S.
coelicolor while Act production was abolished in an actII-ORF4 mutant.
Electrophoretic Mobility Shift Assays (EMSA) and DNase I footprinting also
showed that ActII-ORF4 was capable of binding specifically to imperfect
repeated sequences found in the -35 region of the promoters of Act biosynthetic
genes including actIII, actVI-ORF1 and actVI-ORFA (Arias et al., 1999). CdaR,
encoded by cdaR is also a SARP homologue that was shown to activate calcium-
dependent-antibiotic (CDA) production in S. coelicolor (Ryding et al., 2002).
Similarly, StrR, a SARP homologue encoded by strR in S. griseus, activated
streptomycin production specifically (Retzlaff and Distler, 1995). This confirmed
the role of SARPs in general as pathway-specific positive transcriptional
regulators on antibiotic production in Streptomyces species.
The ccaR (Cephamycin and Clavulanic Acid Regulator) gene from the
cephamycin C gene cluster of S. clavuligerus encodes a SARP called CcaR. It
36

regulates both the biosynthesis of cephamycin C and clavulanic acid as shown by
Perez-Llarena et al. (1997a) who found that a S. clavuligerus ccaR mutant was
incapable of producing any cephamycin C or clavulanic acid (Alexander and
Jensen 1998; Perez-Llarena et al., 1997a). Perez-Llarena et al. (1997a) also
observed that cephamycin C and clavulanic acid were over-produced when extra
copies of ccaR on a plasmid were introduced into S. clavuligerus. Western
analysis of the cell free extracts (CFEs) from a S. clavuligerus ccaR mutant
showed that lysine 6-aminotransferase (LAT), isopenicillin N synthase (IPNS)
and desacetoxycephalosporin C synthase (DAOCS), which are key enzymes
involved in cephamycin C production, and CcaR were not produced (Alexander
and Jensen, 1998). As a result, it was proposed that CcaR is an autoregulator that
controls its own expression as well as controlling the transcription of the
cephamycin C biosynthetic genes. Since cefE, encoding DAOCS, is transcribed as
a polycistronic transcript with cefD, CcaR may regulate the upstream cefD
promoter (Figure 1.3). This was proved as EMSA showed that CcaR can bind to
the divergent cefD-cmcI and ccaR promoters (Santamarta et al., 2002). On the
other hand, it is still unclear if CcaR directly regulates the lat promoter, which is
responsible for for the expression of lat (encoding LAT), because contradictory
results were reported from two different research groups. Kyung et al., (2001)
showed that His-tagged CcaR from recombinant E. coli could bind to the -35
region of the lat promoter, by carrying out EMSA and DNase I footprinting
analysis. However, Santamarata et al. (2002) showed that purified CcaR protein
from S. clavuligerus was unable to bind to the lat promoter. Despite the unclear
37

role of CcaR in regulating the lat promoter, it is obvious that CcaR positively
regulates cephamycin C biosynthesis by directly binding to at least some
biosynthetic genes and controlling their transcription.
1.4.2 Other pathway specific transcriptional regulators
CcaR also controls clavulanic acid biosynthesis by direct binding to
control the expression of another pathway-specific transcriptional regulator called
ClaR (Clavulanic Acid Regulator), encoded by claR (Paradkar et al., 1998; Figure
1.3). Transcriptional analysis showed that claR was not transcribed in a S.
clavuligerus ccaR mutant (Perez-Redondo et al., 1998). ClaR belongs to the LysR
family and contains two helix-turn-helix DNA binding domains at both the amino
and carboxyl termini. A S. clavuligerus claR mutant was incapable of producing
clavulanic acid while it retained the ability to produce cephamycin C and 5S
clavams. Also, clavulanic acid production was increased by three-fold when
multicopy plasmids carrying claR were introduced into S. clavuligerus (Perez-
Redondo et al., 1998). This suggested that ClaR regulates the “late” steps
responsible for clavulanic acid biosynthesis. This hypothesis was supported by the
fact that expression of oppA1, cad and cyp, which are genes involved in
converting clavaminic acid to clavulanic acid (Arulanantham et al., 2006; Jensen
et al., 2004), was significantly reduced in the S. clavuligerus claR mutant (Perez-
Redondo et al., 1998).
It is interesting that CcaR co-regulates both the biosynthesis of
cephamycin C (β-lactam antibiotic) and clavulanic acid (β-lactamase inhibitor). It
38

was proposed that this type of regulation may actually reflect an evolutionary
event that allows S. clavuligerus to adapt to the highly competitive environment in
the soil (Ward and Hodgson, 1993).
1.4.3 Bald (bld) genes
Regulation mediated by pleiotropic regulators, which regulate both the
morphological differentiation and secondary metabolite production, comes next in
the hierarchy. The best characterized pleiotropic regulator gene is the bldA gene
from S. coelicolor. A S. coelicolor bldA mutant was unable to form aerial mycelia
or antibiotics (Merrick, 1976). bldA regulates both aerial mycelium formation and
antibiotic production by encoding the only leucyl tRNA capable of translating the
rare TTA codons. TTA codons are mainly found in genes that are involved in
aerial mycelium formation and antibiotic production, including ccaR (Chater and
Chandra, 2008; Leskiw et al., 1991; Trepanier et al., 2002). Although disrupting
bldA in S. clavuligerus blocked aerial mycelium formation, surprisingly, it had no
effect on β-lactam production (Trepanier et al., 2002). Trepanier et al. (2002)
proposed that the TTA codon context has an important effect on regulation as all
bldA dependent targets that resulted in a null phenotype were shown to contain
TTA codons in the context of TTAC or TTAT. It was further proposed that ccaR,
which carries a TTA codon in TTAG context, is not under bldA regulation and
instead CcaR is mistranslated giving rise to functional protein in bldA mutants
(Trepanier et al., 2002).
39
A S. clavuligerus bldG mutant was also unable to produce β-lactams and
aerial mycelia (Bignell et al., 2005). Since BldG shows similarity to anti-anti-
sigma factor proteins found in various Bacillus spp., bldG in S. clavuligerus is
thought to encode an anti-anti-sigma factor that interacts with an anti-sigma factor
that in turn regulates various sigma factors that control morphological
development and secondary metabolite biosynthesis. The function of BldG was
shown to be activated by phosphorylation (Bignell et al., 2003). In addition, ccaR
transcription was blocked in a S. clavuligerus bldG mutant (Bignell et al., 2005).
Therefore, it is apparent that BldG regulates β-lactam biosynthesis through CcaR.
However, it is still unclear how BldG controls transcription of ccaR, whether
directly or indirectly.
1.4.4 γ-butyrolactone regulators
Many Streptomyces species were shown to produce γ-butyrolactones,
which are diffusible low molecular weight signalling compounds (Kholkov et al.,
1967). γ-butyrolactones control gene expression by binding to their cognate
receptor proteins, which in the absence of the γ-butyrolactones act as DNA-
binding repressors that bind to conserved palindromic inverted repeats called
autoregulatory elements (AREs) (Kinoshita et al., 1999). Once a γ-butyrolactone
binds to the receptor protein, the complex is released from the DNA. Thus, gene
expression occurs. γ-butyrolactones serve as Streptomyces hormones to regulate
morphological differentiation and antibiotic production (Horinouchi and Beppu,
1992). A γ-butyrolactone receptor protein called ScaR (S. clavuligerus
autoregulator receptor), which is encoded by scaR, was found in S. clavuligerus
40

(Kim et al., 2004). Sequence analysis of the upstream region of ccaR and scaR
revealed the presence of ARE sequences. EMSAs showed that ScaR was capable
of binding specifically to these two ARE sequences. This suggested ScaR
autoregulates its own expression as well as controlling ccaR expression.
Moreover, in a scaR mutant, the production of both clavulanic acid and
cephamycin C increased significantly compared to the wild type. This indicated
that ScaR is a repressor and exerts it effect by binding to the ARE sequence and
preventing gene transcription (Santamarta et al., 2005). The same study also
found a novel protein that is capable of binding to ARE sequences as shown by
EMSA. Recently, this protein was isolated from S. clavuligerus and named AreB
(Santamarta et al., 2007). AreB, which is encoded by areB, was identified as a
regulatory protein of the IclR family. It was shown to autoregulate its own
expression and is also involved in leucine biosynthesis and fatty acid catabolism.
areB mutants show elevated cephamycin C and clavulanic acid production and
more interestingly, binding of AreB to the ARE of ccaR requires an unknown
small molecule other than γ-butyrolactone (Santamarta et al., 2007). As a result,
AreB controls primary metabolism and when induced by some as yet unidentified
signals, regulates secondary metabolite production, simultaneously.
1.4.5 The stringent response
The “stringent response” is another system that was shown to be involved
in controlling morphological differentiation and secondary metabolite production
in Streptomyces species. Under amino acid starvation conditions, cellular levels of
highly phosphorylated guanine nucleotide (p)ppGpp increase. Accumulation of
41
(p)ppGpp was shown to initiate morphological differentiation and antibiotic
production in Streptomyces sp. MA406-A-1 (Ochi, 1986). Similarly, when relA,
which encodes the ppGpp synthetase in S. coelicolor, was knocked out, the
mutant was delayed in morphological differentiation and incapable of producing
actinorhodin and undecylprodigiosin (Chakraburtty and Bibb, 1997). It was
further demonstrated that (p)ppGpp induced transcription of actII-ORF4 (Hesketh
et al., 2007). Two homologues of relA (relA and rhs) were isolated from S.
clavuligerus and mutants of relA were unable to synthesize (p)ppGpp (Jin et al.,
2004). Although mutations in relA impaired aerial mycelium formation and
sporulation, contradicting results were obtained in regard to antibiotic production,
where Jin et al. (2004) showed relA mutants were unable to produce either
cephamycin C or clavulanic acid but Gomez-Escribano et al. (2008) showed
overproduction of these compounds. As a result, it is still unclear at this point
about the role of “stringent response” in S. clavuligerus antibiotic production.
1.4.6 Two-component regulatory systems
Two-component regulatory systems (TCSs) have been identified in a wide
range of organisms. In its simplest form, the system involves one sensor kinase
and one response regulator. Sensor kinases sense and respond to stimuli by
undergoing autophosphorylation at a conserved histidine residue. The phosphate
is then transferred to a conserved aspartate residue of the response regulator,
which can then activate transcription of target genes. The complete genome
sequence of S. coelicolor revealed a large number of TCSs, as 84 genes encoding
sensor kinases and 79 genes encoding response regulators were identified. Most
42

of the sensor kinase genes are located beside a response regulator gene,
presumably forming a cognate pair (Bentley et al., 2002; Hutchings et al., 2004).
Although the majority of these systems have not been studied and the stimuli
recognized by these systems remain largely unknown (Hutchings et al., 2004),
this still reflected the complexity of the regulatory networks in S. coelicolor and
presumably in other Streptomyces spp., which are essential for survival in the
drastically changeable soil environment.
Among the TCSs that are present in S. coelicolor, the AbsA1/A2 system is
the most studied. The absA locus, which encodes the sensor kinase AbsA1 and the
response regulator AbsA2, is located within the CDA biosynthetic cluster and was
shown to be pleotropic in that it controls not only the biosynthesis of CDA, but
also actinorhodin, undecylprodigiosin and methylenomycin, the four well-studied
antibiotics produced by S. coelicolor (Adamidis et al., 1990; Brain et al., 1996).
Transcript analysis showed that disrupting absA2 led to higher transcript levels of
actII-ORF4 and redD, which encode the pathway-specific activators in
undecylprodigiosin biosynthesis (Aceti and Champness, 1998). Recent work
further indicated that AbsA2 binds specifically to the promoter regions of actII-
ORF4, cdaR and redZ (a transcriptional activator of redD) and binding was
enhanced when AbsA2 was phosphorylated (McKenzie and Nodwell 2007).
Although the signal recognized by AbsA1 is not known, the AbsA two-
component system negatively regulates antibiotic biosynthesis by repressing
transcription of pathway-specific activators.
43
It is well known that the presence of inorganic phosphate in the environment
represses secondary metabolite production in a wide range of bacteria. In S.
lividans and S. coelicolor, this regulation is mediated through the PhoR/PhoP two-
component system. Deletion mutants of S. lividans lacking either PhoP (the
response regulator) or both PhoR (the sensor kinase) and PhoP, overproduced
actinorhodin and undecylprodigiosin while production of PhoA, an extracellular
alkaline phosphatase encoded by phoA, was depressed (Sola-Landa et al., 2003).
This indicated that PhoP positively regulates PhoA production while it negatively
controls antibiotic production. It was proposed that under phosphate starvation,
PhoR undergoes autophosphorylation and then transfers its phosphate molecule to
PhoP. Phosphorylated PhoP can then exert its regulation, and this was confirmed
as phosphorylated PhoP induced expression of phoA (Martin, 2004). In the E. coli
and B. subtilis PhoR/PhoP system, PhoP~P activates transcription of target genes
by binding to consensus phosphate boxes (PHO boxes) located in the promoter
regions (Martin, 2004). Recent work revealed that PhoP~P represses afsS
transcription by binding to the PHO box located in its promoter region. AfsS,
encoded by afsS, was shown to induce actinorhodin and undecylprodigiosin
production (Floriano and Bibb, 1996; Martin and Liras, 2010; Santos-Beneit et
al., 2009; Vogtli et al., 1994). Interestingly, although actinorhodin and
undecylprodigiosin are under phosphate control in S. coelicolor, overproduction
of these antibiotics was not observed in a deletion mutant in phoP (Santos-Beneit
et al., 2009). This again reflected the idea that production of antibiotics is under
the control of extensive inter-connected regulatory networks.
44
As mentioned before, the snk/res1/res2 atypical two-component system is
located in the paralogue gene cluster of S. clavuligerus, and was shown to affect
5S clavam biosynthesis (Zelyas, 2007; Figure 1.7). It is hypothesized that this
TCS controls 5S clavam biosynthesis through controlling transcription of c7p,
which encodes a putative pathway-specific transcriptional activator.
The regulatory systems described above form part of the complex regulatory
network controlling antibiotic production, but many more regulators and systems
may well be involved that have not yet been identified. With more information
being collected, a complete picture of how various regulatory circuits, which
govern morphological differentiation, secondary metabolite production and
nutrient utilization, are inter-connected to ensure proper timing of gene expression
will be revealed.
1.5 Thesis objective
Although two copies of ceaS genes, ceaS1 and ceaS2, exist in S.
clavuligerus, mutants in ceaS2 are severely impaired, and in some cases unable, to
produce clavulanic acid and 5S clavams (Tahlan et al., 2004a). This drastic effect
from disrupting ceaS2 suggested that cross regulation may exist between ceaS2
and ceaS1. Therefore, one main objective of this thesis was to characterize the
relationship between these two genes. In addition, the close proximity of the
enzymatic genes and regulatory genes (snk/res1/res2 two-component system and
c7p that encodes a transcriptional regulator) in the paralogue gene cluster (Figure
1.5) and their apparent effect on 5S clavam production suggested that the
45

regulatory proteins they encode control expression of genes that are involved in
the “late” steps of 5S clavam biosynthesis. Studies were carried out to identify the
genes that are regulated by C7P and/or the two-component system. Identified
genes were further examined to assess if they are directly controlled by these
regulatory proteins. Finally, each component of the two-component system was
further characterized and the phosphorelay mechanism between these proteins
was analyzed.
46
Chapter 2
Materials and Methods
47
2. Materials and Methods
2.1 Materials
Restriction endonucleases were purchased from Roche (Laval, QC) or
New England Biolabs Ltd. (NEB) (Mississauga, ON). Oligonucleotide primers
used were synthesized by Integrated DNA Technologies, Inc. (IDT) (Coralville,
IA).
Ampicillin (amp), kanamycin (kan), chloramphenicol (cam), penicillin G
(PenG) and thiostrepton (tsr) were purchased from Sigma-Aldrich Ltd. (Oakville,
ON). Apramycin (apr) was purchased from Provel Division Eli Lilly Canada Inc.
(Scarborough, ON). Dimethylsulfoxide (DMSO), lysozyme, isopropyl-β-D-
thiogalactopyranoside (IPTG) and 5-bromo-4-chloro-3-β-D-galactopyranoside
(X-gal) were purchased from Sigma-Aldrich. [γ-32P] ATP was purchased from
PerkinElmer, Inc. (Waltham, MA).
BactoTM agar, BactoTM yeast extract, BactoTM tryptone, soluble starch,
ISP-4 medium, Trypticase Soy Broth (TSB) and malt extract were all purchased
from Difco Laboratories (Detroit, MI). All other chemicals used in this study were
of reagent grade.
PCR tubes (0.2 ml and 0.5 ml) and microcentrifuge tubes (1.5 ml) were
purchased from Axygen Inc. (Union city, CA). Aerosol Resistant Tips (ART®10,
20, 100 and 1000) were purchased from Molecular BioProducts, San Diego, CA.
48
All electrophoresis equipment was purchased from Bio-Rad laboratories
Ltd. (Mississauga, ON). Other materials and enzymes used in this study are
described along with their use in corresponding sections.
2.2 Bacterial strains and plasmids
Escherichia coli and Streptomyces clavuligerus strains used in this study
are listed in Table 2.1 and 2.2 respectively. Plasmid vectors used are listed in
Table 2.3.
2.3 Centrifugation and culture harvesting
All large scale centrifugations were carried out at 4oC with a Beckman
Model J2-21 centrifuge. E. coli cultures were harvested at 5,000 rpm with a JA-20
rotor when culture volume was 2-50 ml; otherwise, a JA-14 rotor was used for
large volumes. A Clinical centrifuge (International Equipment, Needham, MA) at
speed setting 7 was used to harvest S. clavuligerus cultures in 15 ml screw cap
polypropylene tubes (Corning Lifesciences, Lowell, MA). Microcentrifugations
were typically carried out at 14,000 rpm at 21oC with an Eppendorf 5415 C
microcentrifuge (Brinkmann Instruments Inc., Mississauga, ON). Exceptions are
stated in corresponding sections.
2.4 E. coli procedures
2.4.1 Culture media and growth conditions for E. coli
E. coli strains were grown in Lennox broth (LB) [1% (w/v) tryptone, 0.5%
(w/v) yeast extract, and 0.5% (w/v) NaCl; in some cases, 0.1% (w/v) glucose was
49
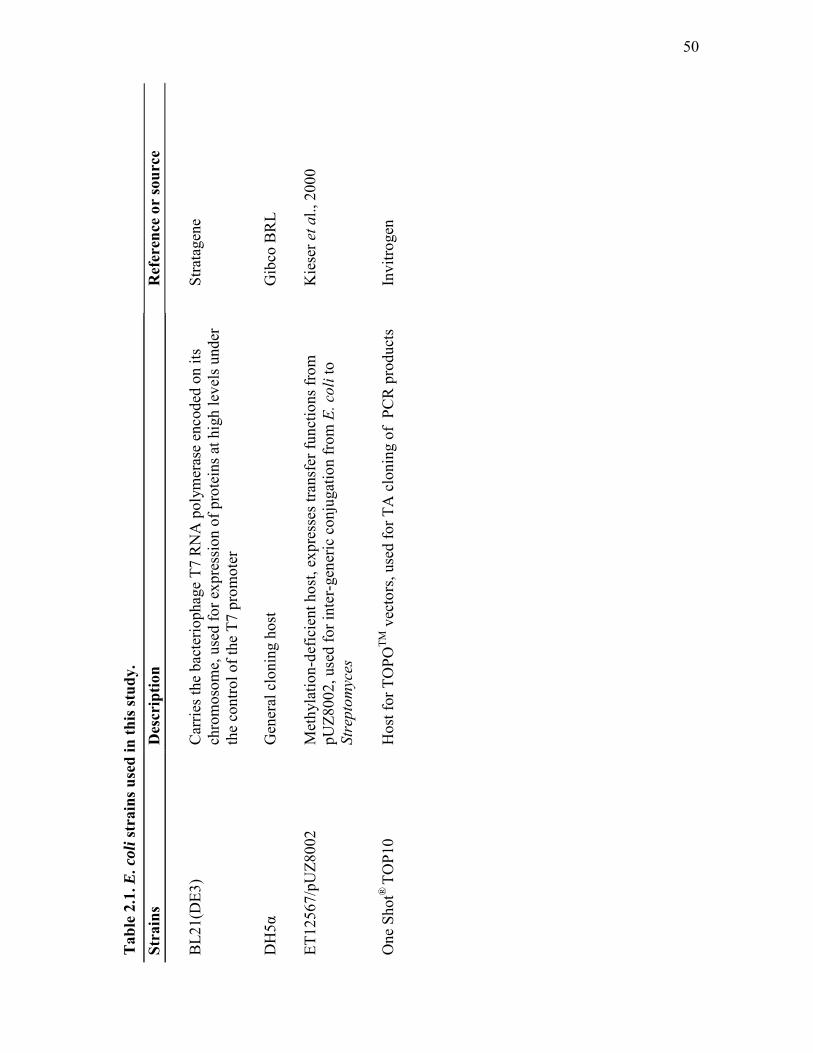
Tab
le 2
.1. E
. col
i str
ains
use
d in
this
stud
y.
Stra
ins
Des
crip
tion
Ref
eren
ce o
r so
urce
BL2
1(D
E3)
Car
ries t
he b
acte
rioph
age
T7 R
NA
pol
ymer
ase
enco
ded
on it
s ch
rom
osom
e, u
sed
for e
xpre
ssio
n of
pro
tein
s at h
igh
leve
ls u
nder
th
e co
ntro
l of t
he T
7 pr
omot
er
Stra
tage
ne
D
H5α
G
ener
al c
loni
ng h
ost
Gib
co B
RL
ET
1256
7/pU
Z800
2 M
ethy
latio
n-de
ficie
nt h
ost,
expr
esse
s tra
nsfe
r fun
ctio
ns fr
om
pUZ8
002,
use
d fo
r int
er-g
ener
ic c
onju
gatio
n fr
om E
. col
i to
Stre
ptom
yces
Kie
ser e
t al.,
200
0
O
ne S
hot®
TOP1
0 H
ost f
or T
OPO
TM v
ecto
rs, u
sed
for T
A c
loni
ng o
f PC
R p
rodu
cts
Invi
troge
n
50

Tab
le 2
.2. S
. cla
vulig
erus
stra
ins u
sed
in th
is st
udy.
Stra
in
Des
crip
tion
Ref
eren
ce o
r So
urce
NR
RL
3585
W
ild ty
pe st
rain
cap
able
of p
rodu
cing
cep
ham
ycin
C,
clav
ulan
ic a
cid
and
5S c
lava
ms
Nor
ther
n R
egio
nal R
esea
rch
Labo
rato
ry, P
eoria
, Ill.
USA
bls1
::tsr
bl
s1 in
serti
onal
dis
rupt
ion
mut
ant
Tahl
an, 2
004
bl
s1::t
sr/b
ls2:
:apr
a bl
s1/b
ls2
doub
le m
utan
t
Tahl
an, 2
004
bl
s2::a
pra
bls2
inse
rtion
al d
isru
ptio
n m
utan
t Je
nsen
, 200
0
ceaS
2::a
pra
ceaS
2 in
serti
onal
dis
rupt
ion
mut
ant
Jens
en e
t al.,
200
0
ceaS
2-Fs
ce
aS2
fram
e sh
ift m
utan
t Ta
hlan
, 200
4
Δc7p
::apr
a M
utan
t stra
in w
ith c
7p re
plac
ed b
y a
RED
IREC
T©-a
pra
cass
ette
Ta
hlan
, 200
7
Δc
eaS1
::apr
a M
utan
t stra
in w
ith c
eaS1
repl
aced
by
a R
EDIR
ECT©
-apr
a ca
sset
te
Tahl
an, 2
004
Δc
eaS1
::apr
a/ce
aS2-
Fs
ceaS
1/ce
aS2
doub
le m
utan
t Ta
hlan
, 200
4
Δcea
S2-I
F ce
aS2
in fr
ame
dele
tion
mut
ant
Tahl
an, 2
005
1
51
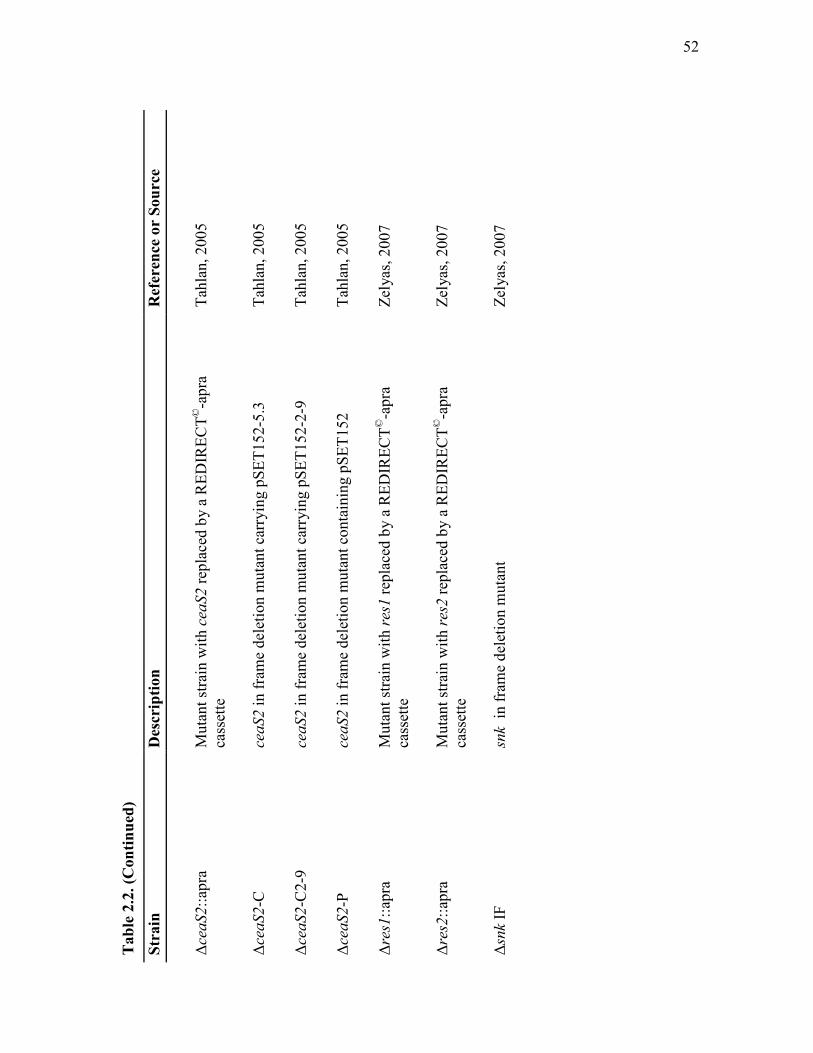
Tab
le 2
.2. (
Con
tinue
d)
Stra
in
Des
crip
tion
Ref
eren
ce o
r So
urce
Δcea
S2::a
pra
Mut
ant s
train
with
cea
S2 re
plac
ed b
y a
RED
IREC
T©-a
pra
cass
ette
Ta
hlan
, 200
5
Δc
eaS2
-C
ceaS
2 in
fram
e de
letio
n m
utan
t car
ryin
g pS
ET15
2-5.
3 Ta
hlan
, 200
5
Δcea
S2-C
2-9
ceaS
2 in
fram
e de
letio
n m
utan
t car
ryin
g pS
ET15
2-2-
9 Ta
hlan
, 200
5
Δcea
S2-P
ce
aS2
in fr
ame
dele
tion
mut
ant c
onta
inin
g pS
ET15
2 Ta
hlan
, 200
5
Δres
1::a
pra
Mut
ant s
train
with
res1
repl
aced
by
a R
EDIR
ECT©
-apr
a ca
sset
te
Zely
as, 2
007
Δr
es2:
:apr
a M
utan
t stra
in w
ith re
s2 re
plac
ed b
y a
RED
IREC
T©-a
pra
cass
ette
Ze
lyas
, 200
7
Δs
nk IF
sn
k in
fram
e de
letio
n m
utan
t Ze
lyas
, 200
7
1
52

Tab
le.2
.3. E
. col
i and
Stre
ptom
yces
pla
smid
s use
d in
this
stud
y.
Plas
mid
A
ntib
iotic
Mar
ker
Des
crip
tion
Ref
eren
ce o
r So
urce
E
. col
i pla
smid
s
pCR
®2.
1-TO
PO®
A
mpi
cilli
n,
Kan
amyc
in
Phag
emid
for T
A-c
loni
ng o
f PC
R p
rodu
cts
Invi
troge
n
pDA
504
Am
pici
llin
E. c
oli c
loni
ng v
ecto
r, pS
L118
0 de
rivat
ive
with
a 1
.1 k
b Bc
lI fr
agm
ent c
arry
ing
tsr
inse
rted
Ale
xand
er, 1
998
pUC
119
Am
pici
llin
Phag
emid
clo
ning
vec
tor
Vie
ira &
Mes
sing
, 198
7
pU
C11
9-sn
k-c7
p pU
C11
9-c7
p-co
mpl
ete
Am
pici
llin
Am
pici
llin
pUC
119
deriv
ativ
e w
ith c
7p a
nd u
pstre
am
regi
on in
clud
ing
3’ e
nd o
f snk
inse
rted
pUC
119
deriv
ativ
e w
ith c
7p in
serte
d
This
stud
y Th
is st
udy
pET-
9c-c
eaS1
K
anam
ycin
Pr
otei
n ex
pres
sion
vec
tor,
pET-
9c
deriv
ativ
e w
ith c
eaS1
inse
rted
S.
Jens
en, U
nive
rsity
of
Alb
erta
pE
T-24
a-ce
aS2
Kan
amyc
in
Prot
ein
expr
essi
on v
ecto
r, pE
T-9c
de
rivat
ive
with
cea
S2 in
serte
d
C. S
chof
ield
, Oxf
ord
univ
ersi
ty
pET-
19b
Am
pici
llin,
C
hlor
amph
enic
ol
Prot
ein
expr
essi
on v
ecto
r con
ferr
ing
an N
-te
rmin
al 1
0X H
is-ta
g N
ovag
en
x
53

Tab
le.2
.3. (
Con
tinue
d).
Plas
mid
A
ntib
iotic
Mar
ker
Des
crip
tion
Ref
eren
ce o
r So
urce
pE
T-19
b-c7
p A
mpi
cilli
n,
Chl
oram
phen
icol
pE
T-19
b de
rivat
ive
with
c7p
inse
rted
as a
n N
deI/H
indI
II fr
agm
ent
This
stud
y
pET-
19b-
res1
A
mpi
cilli
n,
Chl
oram
phen
icol
pE
T-19
b de
rivat
ive
with
res1
inse
rted
as a
n N
deI/B
amH
I fra
gmen
t Ze
lyas
, 200
7
pET-
19b-
res1
-SD
A
mpi
cilli
n,
Chl
oram
phen
icol
pE
T-19
b de
rivat
ive
with
mut
ated
ver
sion
of
res1
inse
rted
as a
n N
deI/B
amH
I fra
gmen
t Th
is st
udy
pMA
L-C
5X
Am
pici
llin
Prot
ein
expr
essi
on v
ecto
r, ex
pres
ses
mal
tose
-bin
ding
pro
tein
fusi
on p
rote
ins
New
Eng
land
Bio
labs
pMA
L-sn
k A
mpi
cilli
n pM
AL-
C5X
der
ivat
ive
with
snk
inse
rted
as
a N
deI/B
amH
I fra
gmen
t Th
is st
udy
pMA
L-re
s1
Am
pici
llin
pMA
L-C
5X d
eriv
ativ
e w
ith re
s1 in
serte
d as
a
Nde
I/Bam
HI f
ragm
ent
This
stud
y
pMA
L-re
s2
Am
pici
llin
pMA
L-C
5X d
eriv
ativ
e w
ith re
s2 in
serte
d as
a
Nde
I/Bam
HI f
ragm
ent
This
stud
y
pT7-
7His
A
mpi
cilli
n Pr
otei
n ex
pres
sion
vec
tor,
pT7-
7 de
rivat
ive
conf
errin
g a
C-te
rmin
al 7
x H
is-ta
g J.
Man
chak
, Uni
vers
ity
of A
lber
ta
54

Tab
le.2
.3. (
Con
tinue
d).
Plas
mid
A
ntib
iotic
Mar
ker
Des
crip
tion
Ref
eren
ce o
r So
urce
pT
7-7H
is-r
es2
Am
pici
llin
pT7-
7His
der
ivat
ive
with
res2
inse
rted
as a
n
Nde
I/Bam
HI f
ragm
ent f
rom
TO
PO-r
es2
Zely
as, 2
007
pT7-
7His
-res
2-SD
A
mpi
cilli
n pT
7-7H
is d
eriv
ativ
e w
ith m
utat
ed v
ersi
on o
f re
s2 in
serte
d as
an
Nde
I/Bam
HI f
ragm
ent
from
TO
PO-r
es2-
SD
This
stud
y
pT7-
7His
-snk
A
mpi
cilli
n pT
7-7H
is d
eriv
ativ
e w
ith sn
k in
serte
d as
an
Nde
I/Bam
HI f
ragm
ent f
rom
TO
PO-s
nk
Zely
as, 2
007
pT7-
7His
-snk
-SD
A
mpi
cilli
n pT
7-7H
is d
eriv
ativ
e w
ith m
utat
ed v
ersi
on o
f sn
k in
serte
d as
an
Nde
I/Bam
HI f
ragm
ent
from
TO
PO-s
nk-S
D
This
stud
y
TOPO
-c7p
A
mpi
cilli
n,
Kan
amyc
in
pCR
®2.
1-TO
PO® d
eriv
ativ
e w
ith 5
85 b
p 5'
en
d of
c7p
inse
rted
S. Je
nsen
, Uni
vers
ity o
f A
lber
ta
TOPO
-res
1-SD
A
mpi
cilli
n,
Kan
amyc
in
pCR
®2.
1-TO
PO® d
eriv
ativ
e w
ith m
utat
ed
vers
ion
of re
s1 in
serte
d, a
mpl
ified
by
two
step
site
-dire
cted
mut
agen
esis
This
stud
y
x
55
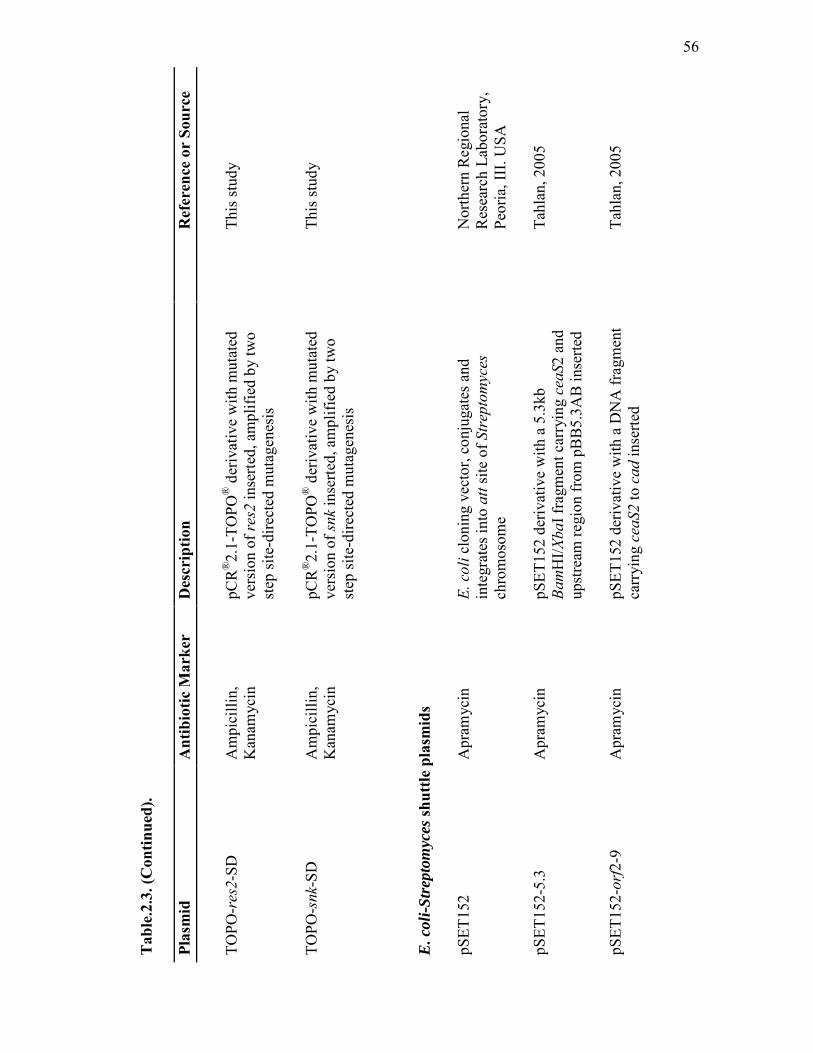
Tab
le.2
.3. (
Con
tinue
d).
Plas
mid
A
ntib
iotic
Mar
ker
Des
crip
tion
Ref
eren
ce o
r So
urce
TO
PO-r
es2-
SD
Am
pici
llin,
K
anam
ycin
pC
R®2.
1-TO
PO® d
eriv
ativ
e w
ith m
utat
ed
vers
ion
of re
s2 in
serte
d, a
mpl
ified
by
two
step
site
-dire
cted
mut
agen
esis
This
stud
y
TOPO
-snk
-SD
A
mpi
cilli
n,
Kan
amyc
in
pCR
®2.
1-TO
PO® d
eriv
ativ
e w
ith m
utat
ed
vers
ion
of sn
k in
serte
d, a
mpl
ified
by
two
step
site
-dire
cted
mut
agen
esis
This
stud
y
E
. col
i-Str
epto
myc
es sh
uttle
pla
smid
s
pSET
152
Apr
amyc
in
E. c
oli c
loni
ng v
ecto
r, co
njug
ates
and
in
tegr
ates
into
att
site
of S
trep
tom
yces
ch
rom
osom
e
Nor
ther
n R
egio
nal
Res
earc
h La
bora
tory
, Pe
oria
, III.
USA
pS
ET15
2-5.
3 A
pram
ycin
pS
ET15
2 de
rivat
ive
with
a 5
.3kb
Ba
mH
I/Xba
I fra
gmen
t car
ryin
g ce
aS2
and
upst
ream
regi
on fr
om p
BB
5.3A
B in
serte
d
Tahl
an, 2
005
pSET
152-
orf2
-9
Apr
amyc
in
pSET
152
deriv
ativ
e w
ith a
DN
A fr
agm
ent
carr
ying
cea
S2 to
cad
inse
rted
Tahl
an, 2
005
x
56
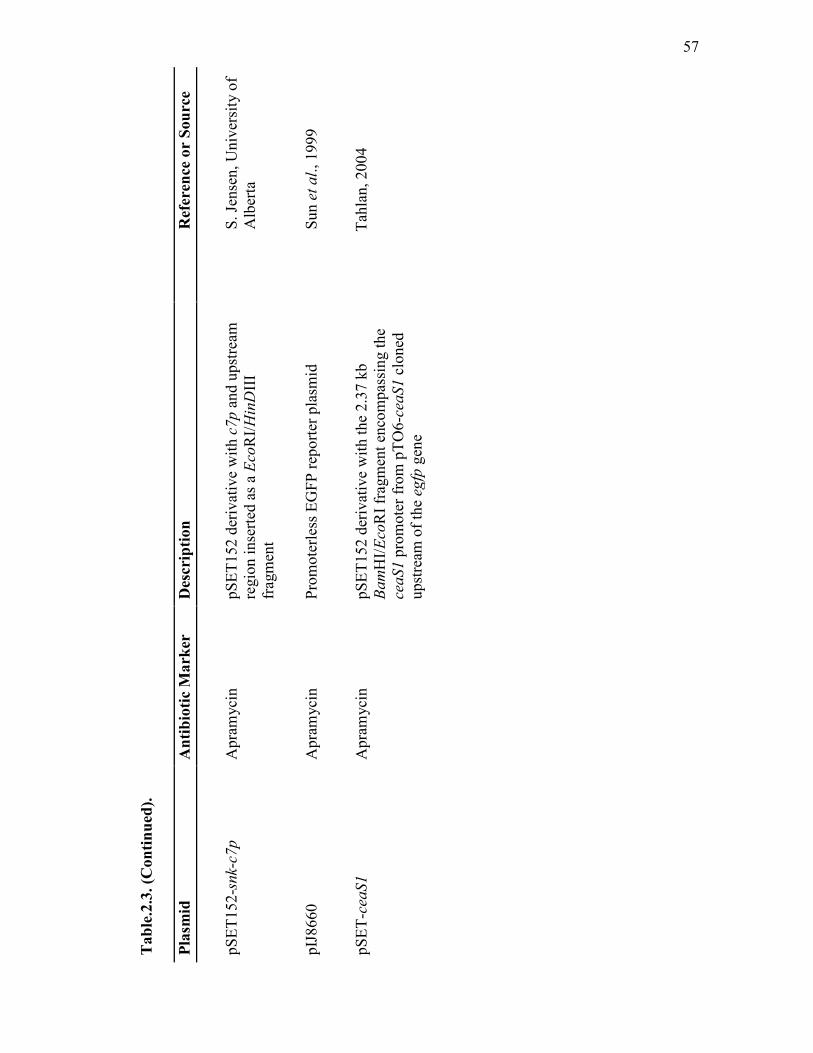
Tab
le.2
.3. (
Con
tinue
d).
Plas
mid
A
ntib
iotic
Mar
ker
Des
crip
tion
Ref
eren
ce o
r So
urce
pS
ET15
2-sn
k-c7
p A
pram
ycin
pS
ET15
2 de
rivat
ive
with
c7p
and
ups
tream
re
gion
inse
rted
as a
Eco
RI/H
inD
III
frag
men
t
S. Je
nsen
, Uni
vers
ity o
f A
lber
ta
pIJ8
660
Apr
amyc
in
Prom
oter
less
EG
FP re
porte
r pla
smid
Su
n et
al.,
199
9
pS
ET-c
eaS1
A
pram
ycin
pS
ET15
2 de
rivat
ive
with
the
2.37
kb
Bam
HI/E
coR
I fra
gmen
t enc
ompa
ssin
g th
e ce
aS1
prom
oter
from
pTO
6-ce
aS1
clon
ed
upst
ream
of t
he e
gfp
gene
T
ahla
n, 2
004
57
added] at 37ºC on a Cell Production Roller Drum (Bellco Biotechnology,
Vineland, NJ) or a G-24 Environmental incubator shaker (New Brunswick
Scientific Co., Edison, NJ). Solid LB medium with 1.5% agar (LBA) was used to
maintain plate cultures. Antibiotic-resistant strains of E. coli were grown in LB or
LBA supplemented with ampicillin (100 μg/ml), kanamycin (50 μg/ml),
apramycin (50 μg/ml), or chloramphenicol (25 μg/ml).
2.4.2 Storage of E. coli strains
All E. coli strains were maintained as frozen glycerol stocks. One milliliter
amounts of E. coli cultures that were grown for 16 hours in LB were harvested by
microcentrifugation. Supernatants were removed by aspiration and cell pellets
were then resuspended in 500 µl of sterile 20% glycerol and stored at -80oC.
2.4.3 Isolation of E. coli plasmid DNA
Plasmid DNA was primarily isolated from E. coli by using the alkaline
lysis method as described by Sambrook et al. (1989). Occasionally, a QIAprep
Spin Miniprep Kit was used to purify plasmid DNA by following the
manufacturer’s protocol (Qiagen, Mississauga, ON).
2.4.4 Electroporation of DNA into electrocompetent E. coli
All electrocompetent cells used in this study were prepared by previous
graduate students and were stored at -80oC (Zelyas, 2007). Prior to
electroporation, competent cells (40 µl) were slowly thawed on ice, after which
0.5 to 5 µl of DNA were added. Electroporation was carried out by placing the
58
mixture in a 4oC 2 mm gap Disposable Electroporation Cuvette (Molecular
BioProducts) and pulsed using the Bio-Rad GenePulser II device set to 200 Ω, 25
μF and 2.5 kV. Immediately after the pulsing, 955 µl of 4oC LB was added and
the cell suspension was transferred to a 1.5 ml microcentrifuge tube and incubated
at 37ºC for one hour for cell recovery. Aliquots of 100 µl and 900 µl (reduced to a
smaller volume by removing most of the supernatant after microcentrifugation)
were plated onto LB agar. If blue/white screening was used to detect insert
containing clones, 100 mM of IPTG and 40 μg/ml of X-gal were added along with
appropriate antibiotics to the agar plates.
2.5 Streptomyces procedures
2.5.1 Culture media and growth conditions for S. clavuligerus
S. clavuligerus strains were grown on MYM [0.4% (w/v) maltose, 0.4%
(w/v) yeast extract, 1% (w/v) malt extract, and 1.8% (w/v) agar] (Stuttard, 1982)
or ISP-4 plates at 28ºC. Antibiotic-resistant strains of S. clavuligerus were grown
in media supplemented with apramycin (25 μg/ml), kanamycin (50 μg/ml), or
thiostrepton (5 μg/ml).
2.5.2 Storage of S. clavuligerus strains
All S. clavuligerus strains used in this study were maintained as frozen
spore stocks. Various strains were grown on ISP-4 medium for 7-14 days. Cell
biomass on plates was then scraped and transferred into 1 ml of 20% sterile
glycerol. Spore and mycelia mixtures were then placed into a Branasonic 42-
sonication bath (Branson cleaning equipment Co., Shelton, CN) for 1 minute to
59
resuspend spores into the solution. Mixtures were then filtered through sterile
non-absorbent cotton wool to remove mycelia and stored at -80oC.
2.5.3 Introduction of DNA into S. clavuligerus
Plasmid DNA was introduced into S. clavuligerus by inter-generic
conjugation following the procedure as described by Kieser et al. (2000). E. coli
ET12567/pUZ8002 carrying the plasmid DNA to be transferred was grown for 16
hours in LB at 37ºC. One hundred microliters of the culture was used to inoculate
10 ml of LB. This larger culture was grown at 37ºC until it reached an OD600 of
~0.4 - 0.6. Cells were then harvested, washed twice with 10 ml of 1/2 strength LB
to remove antibiotics added in the culture medium and resuspended in ~600 µl of
residual LB. S. clavuligerus spores (100 µl) were harvested in a microcentrifuge
and then resuspended in 500 µl of LB and heat-shocked at 50ºC for 10 minutes.
After cooling to room temperature, heat-shocked spores were combined with 500
µl of the washed E. coli cell suspension. The mixture was microcentrifuged again
and most of the supernatant was removed. The pellet of the spore and E. coli cell
mixture was resuspended in the residual fluid and spread onto AS-1 medium
plates [0.1% (w/v) yeast extract, 0.02% (w/v) L-alanine, 0.02% (w/v) L-arginine,
0.05% (w/v) L-asparagine, 0.5% (w/v) soluble starch, 0.25% (w/v) NaCl, 1%
(w/v) Na2SO4, and 2% (w/v) agar (pH 7.5)] (Baltz, 1980) supplemented with 10
mM MgCl2 and incubated at 28ºC for 16-20 hours. The plates were then overlaid
with 1 ml of water containing appropriate antibiotics to select for the transferred
plasmid and 0.5 mg of nalidixic acid (to obtain a final concentration of 20 μg/ml
in the plate). After 7-10 days of growth at 28ºC, S. clavuligerus exconjugant
60
colonies that appeared were patched onto MYM plates (Stuttard, 1982) containing
appropriate antibiotics for further growth.
2.5.4 Fermentation of S. clavuligerus
S. clavuligerus strains were grown in production media to determine
clavulanic acid and 5S clavam production. Twenty microliters (~108 spores) of
spore stocks were used to inoculate 25 ml of TSBS seed medium [3% (w/v)
trypticase soy broth and 1% (w/v) soluble starch] and incubated at 28ºC and ~250
rpm in a Model G-25 rotary shaker (New Brunswick Scientific Co.). After 40
hours of growth, TSBS seed cultures (at 2% v/v) were used to inoculate 100 ml of
complex Soy medium [15 g/l soy flour, 47 g/l soluble starch, 0.1 g/l KH2PO4, and
0.2 g/l FeSO4·7H2O, pH6.8] (Salowe et al. 1990) or defined starch asparagine
(SA) medium [10 g/l soluble starch, 2 g/l asparagine, 21 g/l MOPS, 0.6 g/l
MgSO4.7H2O, 4.4 g/l K2HPO4 and 1 ml of trace element solution (0.13%
CaCl2.3H2O, 0.1% FeSO4.7H2O, 0.1% MnCl2.4H2O and 0.1% ZnSO4.7H2O), pH
6.8] (Salowe et al., 1990). Cultures were harvested after 48, 72 and 96 hours of
growth by centrifugation and the culture supernatants obtained were used for
antibiotic production analysis. Cells pellets were used for RNA isolation (section
2.5.5) or cell-free extract preparations as described in section 2.5.6.
2.5.5 RNA isolation
S. clavuligerus RNA used in this study was initially isolated by using the
modified version of the Kirby et al. (1967) method as described by Kieser et al.
(2000). RNeasy Protect Bacteria Midi kit (Qiagen) was later used for RNA
61
isolation as one of the chemicals used in the Kirby’s mix was no longer available.
Liquid cultures from section 2.5.4 were harvested by filtering through a Whatman
#1 filter paper. For solid media, cultures were harvested by scraping mycelia that
had grown on cellophane discs placed on the surface of agar plates. When using
the modified Kirby method, cultures harvested were transferred into 4oC universal
bottles containing ~14 g of glass beads and 5 ml of double strength Kirby’s mix
[2% (w/v) sodium tri-isopropyl naphthalene sulphonate, 12% (w/v) sodium 4-
amino salicylate and 12% (v/v) neutral phenol buffered in Tris-HCl (pH8.0)].
The bottles were vortexed vigorously for a total of 2 minutes, interchanging
between 30 seconds on ice and 30 seconds of vortexing to keep the cultures’
temperature at 4oC. Five milliliters of phenol/chloroform/IAA was added and
vortexed for another 1 minute as described above. Samples were then stored
frozen at -20oC until all samples were harvested and ready for downstream
processing.
Culture slurries were transferred to 10 ml polypropylene tubes and
centrifuged at 8,000 rpm for 5 minutes at 4oC. The aqueous layer was transferred
to a fresh 10 ml polypropylene tube containing 5 ml of phenol/chloroform/IAA.
Samples were then vortexed for 30 seconds and centrifuged at 8,000 rpm for 5
minutes at 4oC. Phenol/chloroform extraction was repeated until there was no
visible material at the interface. Total nucleic acids were precipitated by adding
1/10 volume of 3M NaOAC and 1 volume of isopropanol and stored at -80oC for
16 hours. Samples were centrifuged at 8,000 rpm for 10 minutes and pellets
obtained were rinsed with 98% ethanol, air dried and dissolved in 450 µl of H20.
62
Chromosomal DNA present in the samples was removed by adding 7.5 µl of
RNase-free DNase I (Roche) and 1/10 volume of 10 x DNase buffer provided
[400 mM Tris-HCl (Ph 7.9), 100 mM NaCl, 60 mM MgCl2, 10 mM CaCl2] and
incubated at 21oC for 30 minutes. The samples were then extracted with
phenol/chloroform and precipitated with 3M NaOAC and isopropanol as
described above, for 1 hour. Pellets were washed with 80% ethanol, air dried and
redissolved in 450 µl of H2O. The entire DNaseI digestion procedure was repeated
to ensure chromosomal DNA was removed. Finally, the samples were extracted
twice with phenol/chloroform/IAA, followed by one chloroform extraction and
then precipitated with 3M NaOAC and isopropanol as described above. The
pellets were rinsed with 100 µl of 80% ethanol, air dried and redissolved in 100 µl
of H2O.
When using the RNeasy protect Bacteria midi kit, 5 ml of cultures were
first added to 10 ml of RNAprotect bacteria reagent to stabilize RNA inside the
cells. RNA was then isolated by following the manufacturer’s protocol (Qiagen).
Before eluting RNA from the spin column, on-column DNase digestion was
carried out by adding 160 µl of DNase I diluted in RDD buffer supplied (Qiagen)
to the column and incubated at 21oC for 15 minutes. Columns were then washed
twice with RPE buffer provided and RNA was eluted with 150 µl of H2O.
Before the RNA preparations were precipitated in isopropanol for storage
at -80oC, two samples were taken in order to determine the RNA quality and
quantity.
63
2.5.6 Cell-free extract preparation
Cell-free extracts of various S. clavuligerus strains were prepared for
Western analysis. Five milliliters of S. clavuligerus cultures that were grown in
liquid Soy and SA media for 48 and 72 hours were harvested by centrifugation
and resuspended in 1 ml of lysis buffer [50 mM Tris-HCl (pH 7.4), 2 mM EDTA,
0.1% Triton X-100, 0.15 mg/ml lysozyme]. Cell suspensions were incubated at
37oC for 20 minutes and then sonicated 5 times for 15 seconds each time on a
setting of 15% with a 1/8” (3.175 mm) diameter microtip connected to the Model
500 Dismembrator (Fisher Scientific, Ottawa, ON). Cell debris was separated
from the soluble protein fraction by microcentrifugation for 10 minutes at 4oC.
Resulting supernatants were then aliquoted into 100 µl fractions and stored at -
80oC for future analysis.
2.6 Determination of antibiotic production
2.6.1 Clavulanic acid bioassay
A disc diffusion assay using Klebsiella pneumoniae ATCC 15380 as the
indicator organism was used to detect the presence of clavulanic acid in culture
supernatants from various S. clavuligerus strains (Mosher et al. 1999). For each
assay, two bioassay plates containing 150 ml TSB agar were inoculated with 250
μl of glycerol stock of the indicator organism. One of the two plates also
contained 6 µg/ml of penicillin G. Paper discs were placed onto the TSB agar
surface and 20 μl of S. clavuligerus culture supernatants were dispensed onto the
discs. Plates were then incubated for 16 hours at 37ºC and the diameter of the
64

inhibition zones produced was measured and compared between the two plates.
Inhibition zones formed on plates with penicillin G were attributed to the presence
of clavulanic acid while the inhibition zones of the same sample formed on the
plate without penicillin G were due to factors other than clavulanic acid.
2.6.2 High performance liquid chromatography
High performance liquid chromatography (HPLC) was used to determine
and quantify the amounts of clavulanic acid and 5S clavams present in S.
clavuligerus culture filtrates (Foulstone and Reading, 1982; Paradkar and Jensen,
1995). Culture supernatants were microcentrifuged for 5 minutes to remove
mycelia and insoluble material. For each culture supernatant, two 20 µl aliquots
were taken and transferred to fresh microcentrifuge tubes and diluted with 80 µl
of milliQ water. One of the two aliquots was imidazole-derivatized by adding 25
μl of 25% (w/v) imidazole (pH 6.8). For the other set, 25 μl of MilliQ water was
added. These underivatized samples served as a control to subtract background
absorbance that was not related to clavam compounds. Samples were then
incubated at 21oC for 15 minutes and microcentrifuged for 5 minutes to sediment
any insoluble material. For each sample, 100 μl was transferred to polypropylene
spring inserts (Fisher Scientific) which were then placed into HPLC screw neck
vials.
Fifty microliters of each sample was injected into a Phenomenex®
Bondclone 10μ C18 (100 x 800 mm 10 micron) column (Phenomenex, Torrance,
CA) by using an automated Waters 2690 Separations Module. Absorbance
65

spectrum was determined with a Waters 996 Photodiode Array Detector (Waters,
Milford, MA). Samples were analyzed by isocratic elution at a flow rate of 2
ml/minute. The mobile phase was composed of 100 mM NaH2PO4 (pH 3.68,
adjusted with glacial acetic acid) + 6% (v/v) methanol. Each run was 15 minutes
in length and derivatized clavam compounds were detected by measuring the
absorbance at 311 nm. Data obtained were processed and analyzed with the
Waters Millenium32 Software (version 3.20; Waters, Milford, MA).
2.7 DNA methods
2.7.1 DNA quantification
Purified DNA was quantified by using the NanoDrop® ND-1000
Spectrophotometer (NanoDrop Technologies, Inc., Wilmington, DE.). In addition
to concentration, A260:A280 ratio of each sample was also provided by the machine
and was used to assess the purity of DNA samples. Oligonucleotide primers were
quantified by measuring A260 with the UNICAM UV/Vis Spectrophotometer UV3
(ATI Unicam, Cambridge, UK).
2.7.2 Digestion and ligation reactions
Restriction digests were carried out according to manufacturer’s
recommendations (NEB and Roche). For standard subcloning, DNA was digested
with appropriate restriction enzymes for 2 hours. To prevent self-annealing,
vector DNA digested with a single restriction enzyme was 5’ end
dephosphorylated after restriction digestion. Two units of shrimp alkaline
phosphatase (SAP) (NEB) was added to the reaction and incubated at 37oC for 15
66

minutes. SAP was then inactivated by heating at 65oC for 15 minutes. Restriction
enzymes were then inactivated by phenol/chloroform extraction and DNA was
recovered either by ethanol precipitation or purified from agarose gels after
fractionation by electrophoresis (Section 2.3.5). Ligation reactions were set up
according to manufacturer’s suggestions. In general, reactions were 10 to 30 µl in
volume with up to 1 µg of digested DNA, and 20 U of T4 ligase prepared in the
ligation buffer provided (NEB). The entire mixture was incubated at 16oC for 16
hours before electroporating (section 2.4.4) into appropriate host strains.
Typically, an insert to vector molar ratio of 3:1 was used when vector DNA and
insert DNA were similar in length, otherwise, a molar ratio of 1:1 was used.
PCR products were cloned using pCR®2.1-TOPO® kits according to the
manufacturer’s instructions (Invitrogen Inc., Burlington, ON). Briefly, 4 µl of
PCR product was mixed with 1 µl of the salt solution provided and 1µl of
pCR®2.1-TOPO® vector. The mixture was incubated at 21oC for 5 minutes. Two
microliters of the cloning reaction mixture was then mixed into a vial of thawed
One Shot® TOP10 E. coli chemically competent cells and incubated on ice for 5
minutes. Cells were heat-shocked for 30 seconds at 42oC followed by addition of
250 µl of SOC medium. Cells were then recovered and plated as described in
section 2.4.4.
2.7.3 Polymerase chain reaction
DNA fragments used for cloning and used as DNA probes for
electrophoretic mobility shift assays (EMSA) were produced by polymerase chain
67

reaction (PCR). PCRs were carried out using the Expand high fidelity PCR
system when the accuracy of the PCR product amplified was important. Reactions
were set up based on manufacturer’s recommendation (Roche). Each reaction was
50 µl in volume and contained 100-500 ng of plasmid DNA as template, 200 µM
of each dNTP, 5-15 pmol of each primer, 5% DMSO, 2.6 U of enzyme and 1/10
volume of 10 x buffer with 1.5 mM MgCl2 supplied. In cases where fidelity of the
enzyme was less of a concern, 2.5 U of Taq DNA polymerase (supplied by the
Fermentation Service Unit, Department of Biological Sciences, University of
Alberta) and 1 x Taq buffer [50 mM Tris (pH9.0), 1.5 mM MgCl2, 0.4 mM β-
mercaptoethanol, 0.1 mg/ml BSA, 10 mM NH2SO4 and 0.2 mM of each dNTP]
were used. Reactions were carried out in thin-walled 0.2 ml PCR tubes in a
TGradient thermocycler (Biometra, Goettingen, Germany), equipped with a
heated lid. The following cycling conditions were used: an initial denaturation
step for 2 minute at 96ºC, followed by 25-30 cycles of 96ºC for 30-60 seconds,
55-65ºC for 30 seconds, and 72ºC for 45 seconds-120 seconds. A final elongation
step was carried out at 72ºC for 5 minutes. All oligonucleotides primers used in
this study are listed in Table 2.4.
2.7.4 Agarose gel electrophoresis
DNA fragments were subjected to electrophoresis on 0.8, 1 or 1.5 % (w/v)
agarose gels in 1 x TAE buffer system [40 mM Tris-Acetate and 1 mM EDTA
(pH 8.0)]. All gels were stained in ~2.0 µg/ml ethidium bromide in distilled water
for 15 minutes before they were exposed to UV light and photographed. DNA
samples were combined with 5 x loading buffer [60% (w/v) sucrose, 100 mM
68

T
able
2.4
. Olig
onuc
leot
ide
prim
ers u
sed
in th
is st
udy.
Pr
imer
Se
quen
ce (5
'-3')
a U
se
A
NW
48
GG
GG
CA
GG
AC
CG
GG
TGG
AA
C
Forw
ard
prim
er to
am
plify
pro
mot
er
regi
on o
f c6p
for E
MSA
AN
W 4
9 G
CC
CG
TGTC
CC
GTT
CC
TCC
G
Rev
erse
prim
er to
am
plify
pro
mot
er
regi
on o
f c6p
for E
MSA
AN
W 5
0 C
GC
CC
AG
AC
AG
CC
CA
GG
AC
GG
Fo
rwar
d pr
imer
to a
mpl
ify in
terg
enic
re
gion
bet
wee
n c7
p an
d sn
k fo
r EM
SA
A
NW
51
CTG
GG
AA
GTG
CG
TCG
CG
GA
GA
GTC
R
ever
se p
rimer
to a
mpl
ify in
terg
enic
re
gion
bet
wee
n c7
p an
d sn
k fo
r EM
SA
A
NW
52
CC
GTG
GA
GA
AC
CC
GC
AG
CG
TC
Forw
ard
prim
er to
am
plify
inte
rgen
ic
regi
on b
etw
een
c7p
and
snk
for E
MSA
AN
W 5
3 C
CG
CC
CG
CTC
CTC
GA
CG
ATC
T R
ever
se p
rimer
to a
mpl
ify in
terg
enic
re
gion
bet
wee
n c7
p an
d sn
k fo
r EM
SA
A
NW
54
TCG
GG
CG
GA
GA
GC
GG
GA
CA
TA
Forw
ard
prim
er to
am
plify
inte
rgen
ic
regi
on b
etw
een
cas1
and
cvm
1 fo
r EM
SA
A
NW
55
TGG
AA
AG
GG
CG
GC
GG
TGTT
GG
R
ever
se p
rimer
to a
mpl
ify in
terg
enic
re
gion
bet
wee
n ca
s1 a
nd c
vm1
for E
MSA
69

T
able
2.4
. (C
ontin
ued)
. Pr
imer
Se
quen
ce (5
'-3')
a U
se
A
NW
56
TCC
GC
CG
TTC
TCC
CC
CG
TTC
C
Forw
ard
prim
er to
am
plify
inte
rgen
ic
regi
on b
etw
een
cas1
and
cvm
1 fo
r EM
SA
A
NW
57
CG
CG
CA
GC
TCG
GG
GC
CG
TAC
R
ever
se p
rimer
to a
mpl
ify in
terg
enic
re
gion
bet
wee
n ca
s1 a
nd c
vm1
for E
MSA
AN
W 5
8 C
GA
CC
GTT
GG
CA
GA
TAG
AA
GA
GA
A
Forw
ard
prim
er to
am
plify
inte
rgen
ic
regi
on b
etw
een
cvm
5 an
d cv
m6
for E
MSA
AN
W 5
9 G
TCG
GG
AG
CG
CG
CG
GA
GA
TTG
R
ever
se p
rimer
to a
mpl
ify in
terg
enic
re
gion
bet
wee
n cv
m5
and
cvm
6 fo
r EM
SA
bl
s1 fo
rwar
d TC
CTG
AA
CG
GA
CG
GTT
CG
C
Forw
ard
prim
er fo
r bls
1 R
T-PC
R
bl
s1 re
vers
e
AG
GG
CA
GTT
CC
CTG
AC
GA
GTT
R
ever
se p
rimer
for b
ls1
RT-
PCR
CA
N16
9 C
GG
CTG
CTG
GA
AC
GC
TATG
AC
CT
Forw
ard
prim
er fo
r bls
2 R
T-PC
R
C
AN
170
CC
GC
CG
GA
GA
GC
AC
CA
CC
AA
R
ever
se p
rimer
for b
ls2
RT-
PCR
c7p
RT-
forw
ard
GG
TGA
TCA
TGC
TGG
AG
GA
CA
TGG
A
Forw
ard
prim
er fo
r c7p
RT-
PCR
c7p
RT-
reve
rse
ATC
AC
AC
GC
CG
TTC
GC
AA
CT
Rev
erse
prim
er fo
r c7p
RT-
PCR
ceaS
1-R
T-Fo
r G
CG
CA
GTC
CG
AG
TCG
TAC
Fo
rwar
d pr
imer
for c
eaS1
RT-
PCR
70
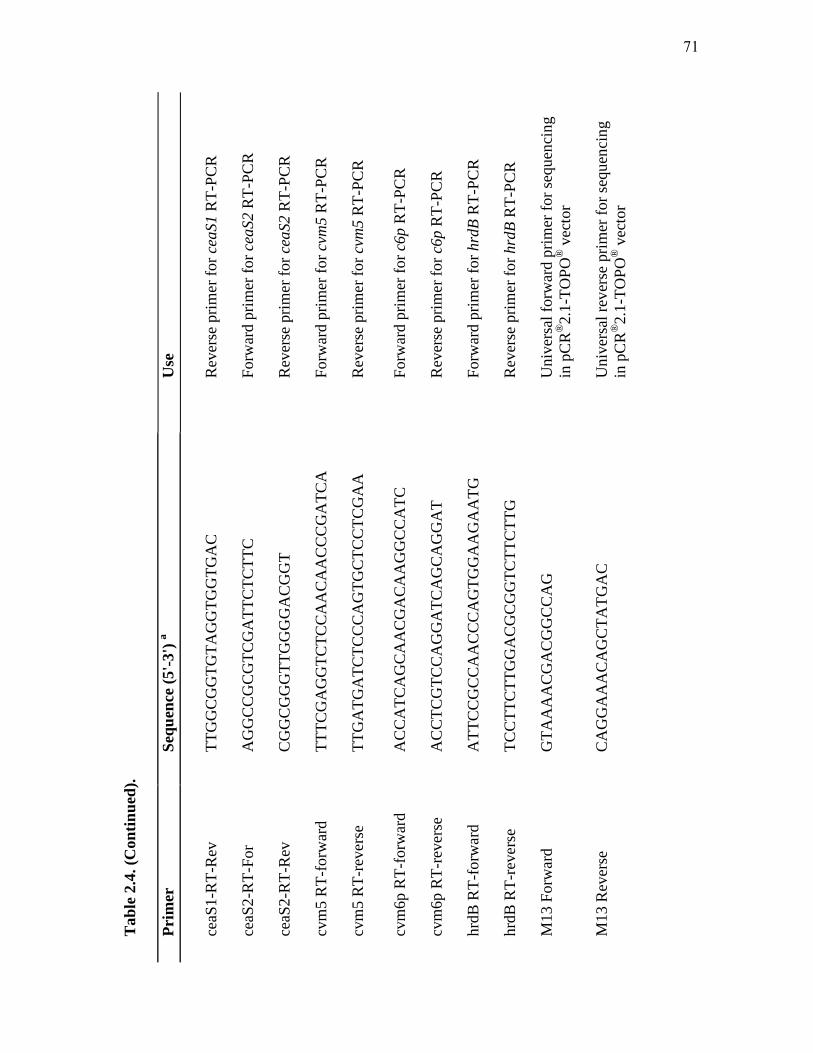
T
able
2.4
. (C
ontin
ued)
. Pr
imer
Se
quen
ce (5
'-3')
a U
se
ce
aS1-
RT-
Rev
TT
GG
CG
GTG
TAG
GTG
GTG
AC
R
ever
se p
rimer
for c
eaS1
RT-
PCR
ceaS
2-R
T-Fo
r A
GG
CC
GC
GTC
GA
TTC
TCTT
C
Forw
ard
prim
er fo
r cea
S2 R
T-PC
R
ce
aS2-
RT-
Rev
C
GG
CG
GG
TTG
GG
GA
CG
GT
Rev
erse
prim
er fo
r cea
S2 R
T-PC
R
cv
m5
RT-
forw
ard
TTTC
GA
GG
TCTC
CA
AC
AA
CC
CG
ATC
A
Forw
ard
prim
er fo
r cvm
5 R
T-PC
R
cv
m5
RT-
reve
rse
TTG
ATG
ATC
TCC
CA
GTG
CTC
CTC
GA
A
Rev
erse
prim
er fo
r cvm
5 R
T-PC
R
cv
m6p
RT-
forw
ard
AC
CA
TCA
GC
AA
CG
AC
AA
GG
CC
ATC
Fo
rwar
d pr
imer
for c
6p R
T-PC
R
cv
m6p
RT-
reve
rse
AC
CTC
GTC
CA
GG
ATC
AG
CA
GG
AT
Rev
erse
prim
er fo
r c6p
RT-
PCR
hrdB
RT-
forw
ard
ATT
CC
GC
CA
AC
CC
AG
TGG
AA
GA
ATG
Fo
rwar
d pr
imer
for h
rdB
RT-
PCR
hrdB
RT-
reve
rse
TCC
TTC
TTG
GA
CG
CG
GTC
TTC
TTG
R
ever
se p
rimer
for h
rdB
RT-
PCR
M13
For
war
d G
TAA
AA
CG
AC
GG
CC
AG
U
nive
rsal
forw
ard
prim
er fo
r seq
uenc
ing
in p
CR
®2.
1-TO
PO® v
ecto
r
M13
Rev
erse
C
AG
GA
AA
CA
GC
TATG
AC
U
nive
rsal
reve
rse
prim
er fo
r seq
uenc
ing
in p
CR
®2.
1-TO
PO® v
ecto
r
71
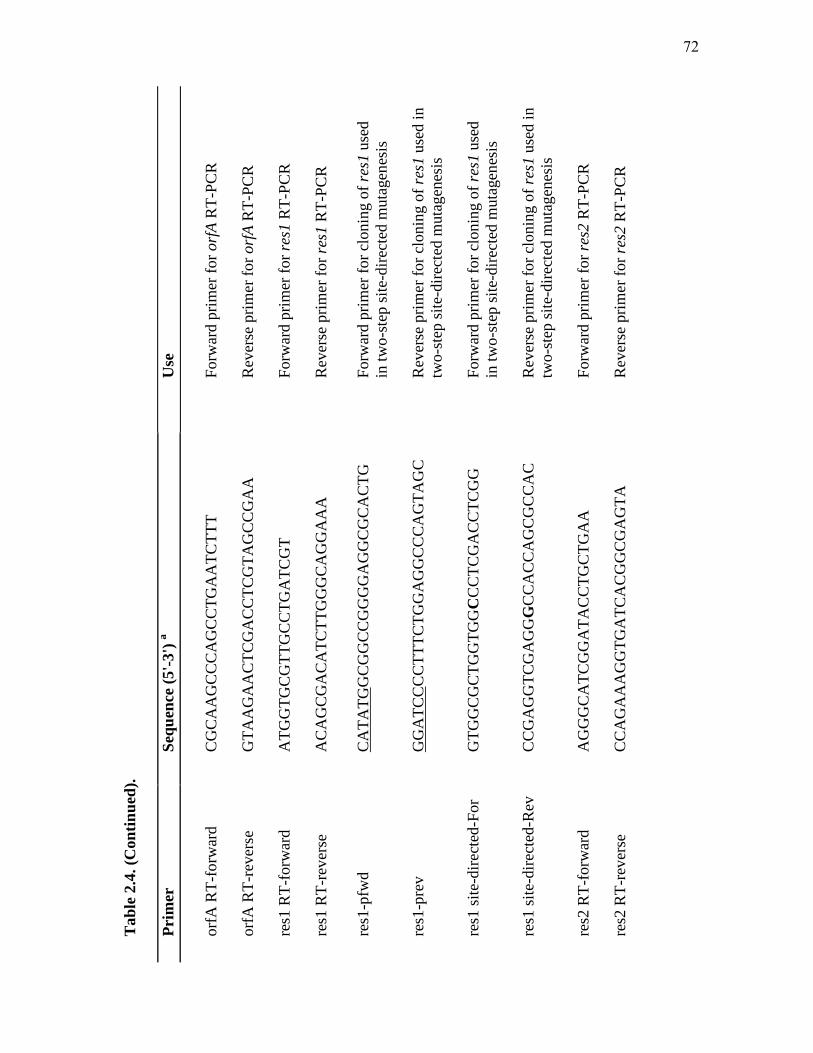
T
able
2.4
. (C
ontin
ued)
. Pr
imer
Se
quen
ce (5
'-3')
a U
se
or
fA R
T-fo
rwar
d C
GC
AA
GC
CC
AG
CC
TGA
ATC
TTT
Forw
ard
prim
er fo
r orf
A R
T-PC
R
or
fA R
T-re
vers
e
GTA
AG
AA
CTC
GA
CC
TCG
TAG
CC
GA
A
Rev
erse
prim
er fo
r orf
A R
T-PC
R
re
s1 R
T-fo
rwar
d A
TGG
TGC
GTT
GC
CTG
ATC
GT
Forw
ard
prim
er fo
r res
1 R
T-PC
R
re
s1 R
T-re
vers
e A
CA
GC
GA
CA
TCTT
GG
GC
AG
GA
AA
R
ever
se p
rimer
for r
es1
RT-
PCR
res1
-pfw
d C
ATA
TGG
CG
GC
CG
GG
GA
GG
CG
CA
CTG
Fo
rwar
d pr
imer
for c
loni
ng o
f res
1 us
ed
in tw
o-st
ep si
te-d
irect
ed m
utag
enes
is
re
s1-p
rev
GG
ATC
CC
CTT
TCTG
GA
GG
CC
CA
GTA
GC
R
ever
se p
rimer
for c
loni
ng o
f res
1 us
ed in
tw
o-st
ep si
te-d
irect
ed m
utag
enes
is
re
s1 si
te-d
irect
ed-F
or
GTG
GC
GC
TGG
TGG
CC
CTC
GA
CC
TCG
G
Forw
ard
prim
er fo
r clo
ning
of r
es1
used
in
two-
step
site
-dire
cted
mut
agen
esis
res1
site
-dire
cted
-Rev
C
CG
AG
GTC
GA
GG
GC
CA
CC
AG
CG
CC
AC
R
ever
se p
rimer
for c
loni
ng o
f res
1 us
ed in
tw
o-st
ep si
te-d
irect
ed m
utag
enes
is
re
s2 R
T-fo
rwar
d A
GG
GC
ATC
GG
ATA
CC
TGC
TGA
A
Forw
ard
prim
er fo
r res
2 R
T-PC
R
re
s2 R
T-re
vers
e C
CA
GA
AA
GG
TGA
TCA
CG
GC
GA
GTA
R
ever
se p
rimer
for r
es2
RT-
PCR
72
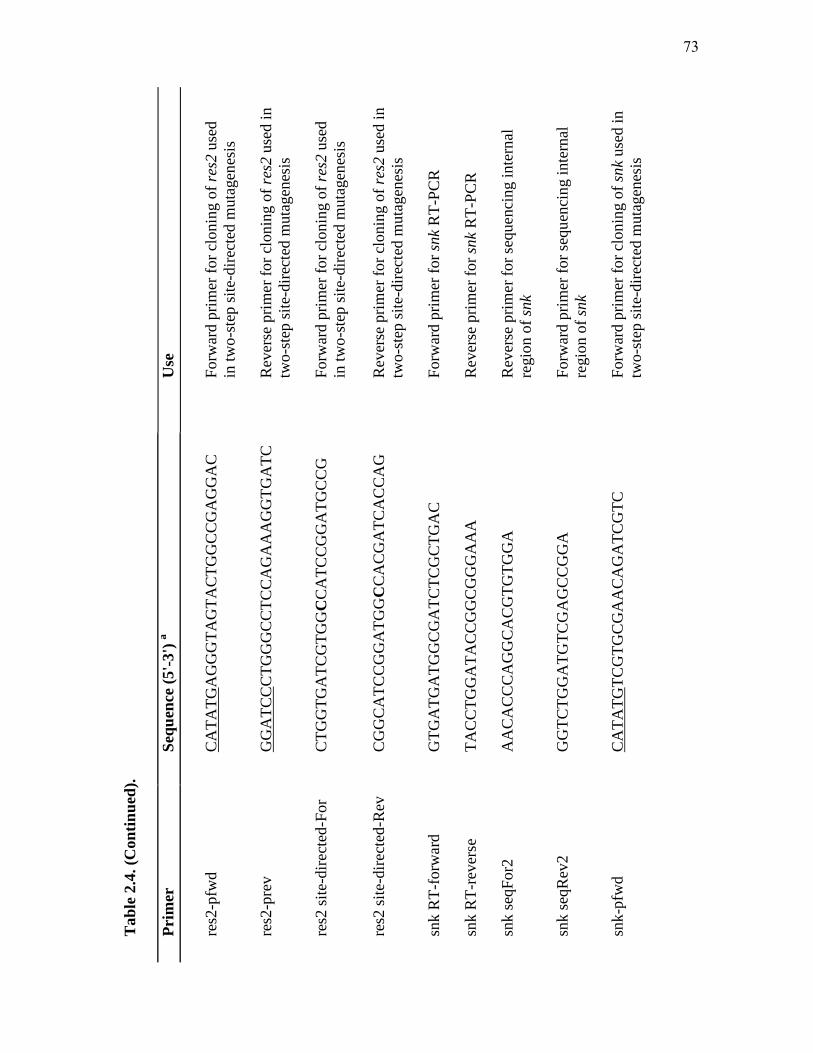
T
able
2.4
. (C
ontin
ued)
. Pr
imer
Se
quen
ce (5
'-3')
a U
se
re
s2-p
fwd
C
ATA
TGA
GG
GTA
GTA
CTG
GC
CG
AG
GA
C
Forw
ard
prim
er fo
r clo
ning
of r
es2
used
in
two-
step
site
-dire
cted
mut
agen
esis
res2
-pre
v G
GA
TCC
CTG
GG
CC
TCC
AG
AA
AG
GTG
ATC
R
ever
se p
rimer
for c
loni
ng o
f res
2 us
ed in
tw
o-st
ep si
te-d
irect
ed m
utag
enes
is
re
s2 si
te-d
irect
ed-F
or
CTG
GTG
ATC
GTG
GC
CA
TCC
GG
ATG
CC
G
Forw
ard
prim
er fo
r clo
ning
of r
es2
used
in
two-
step
site
-dire
cted
mut
agen
esis
res2
site
-dire
cted
-Rev
C
GG
CA
TCC
GG
ATG
GC
CA
CG
ATC
AC
CA
G
Rev
erse
prim
er fo
r clo
ning
of r
es2
used
in
two-
step
site
-dire
cted
mut
agen
esis
snk
RT-
forw
ard
GTG
ATG
ATG
GC
GA
TCTC
GC
TGA
C
Forw
ard
prim
er fo
r snk
RT-
PCR
snk
RT-
reve
rse
TAC
CTG
GA
TAC
CG
GC
GG
GA
AA
R
ever
se p
rimer
for s
nk R
T-PC
R
sn
k se
qFor
2 A
AC
AC
CC
AG
GC
AC
GTG
TGG
A
Rev
erse
prim
er fo
r seq
uenc
ing
inte
rnal
re
gion
of s
nk
sn
k se
qRev
2 G
GTC
TGG
ATG
TCG
AG
CC
GG
A
Forw
ard
prim
er fo
r seq
uenc
ing
inte
rnal
re
gion
of s
nk
sn
k-pf
wd
CA
TATG
TCG
TGC
GA
AC
AG
ATC
GTC
Fo
rwar
d pr
imer
for c
loni
ng o
f snk
use
d in
tw
o-st
ep si
te-d
irect
ed m
utag
enes
is
73
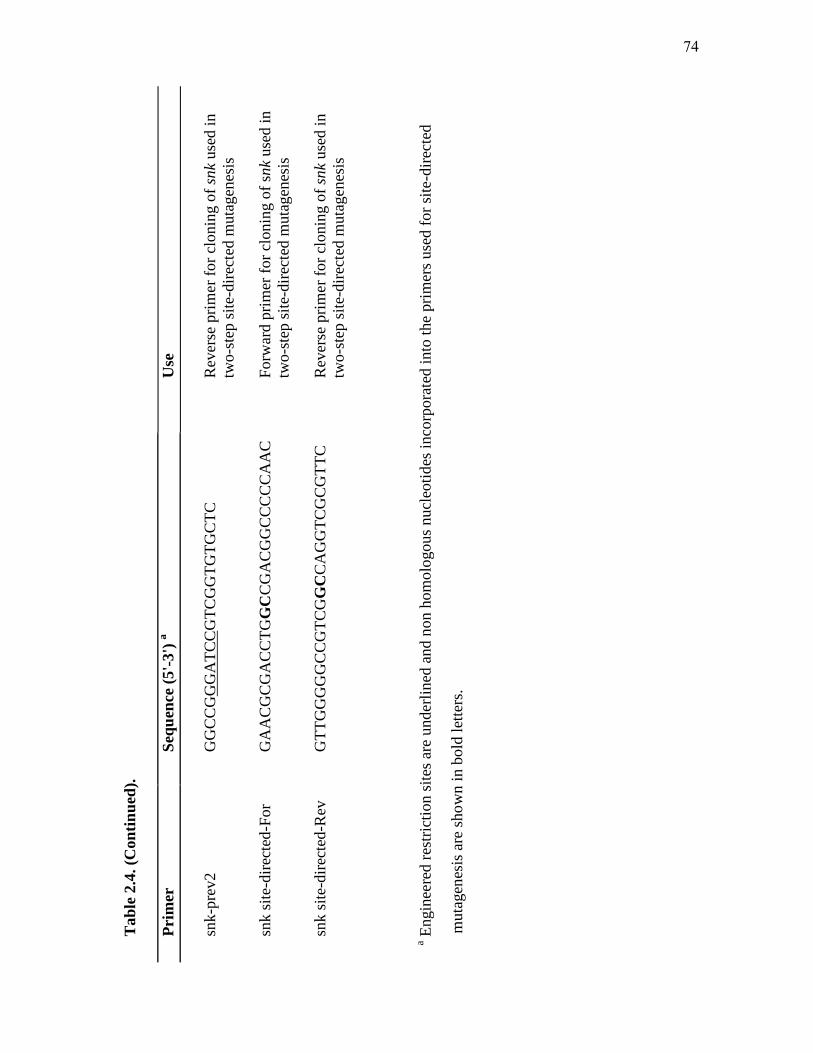
T
able
2.4
. (C
ontin
ued)
. Pr
imer
Se
quen
ce (5
'-3')
a U
se
sn
k-pr
ev2
GG
CC
GG
GA
TCC
GTC
GG
TGTG
CTC
R
ever
se p
rimer
for c
loni
ng o
f snk
use
d in
tw
o-st
ep si
te-d
irect
ed m
utag
enes
is
sn
k si
te-d
irect
ed-F
or
GA
AC
GC
GA
CC
TGG
CC
GA
CG
GC
CC
CC
AA
C
Forw
ard
prim
er fo
r clo
ning
of s
nk u
sed
in
two-
step
site
-dire
cted
mut
agen
esis
snk
site
-dire
cted
-Rev
G
TTG
GG
GG
CC
GTC
GG
CC
AG
GTC
GC
GTT
C
Rev
erse
prim
er fo
r clo
ning
of s
nk u
sed
in
two-
step
site
-dire
cted
mut
agen
esis
a Eng
inee
red
rest
rictio
n si
tes a
re u
nder
lined
and
non
hom
olog
ous n
ucle
otid
es in
corp
orat
ed in
to th
e pr
imer
s use
d fo
r site
-dire
cted
m
utag
enes
is a
re sh
own
in b
old
lette
rs.
74
EDTA, 0.25% (w/v) bromophenol blue, 0.25% (w/v) ficoll orange, and 0.25%
(w/v) xylene cyanol] to aid in loading and to visualize migration of DNA in the
gel. Lambda phage DNA digested with BstII or PstI was used as the molecular
weight marker. When size of the DNA fragment was crucial, GeneRuler 100 bp or
1 kb DNA ladder were used (Ferrnentas, Burlington, ON).
2.7.5 DNA purification from agarose gels
DNA fragments generated by PCR or restriction digestions were separated
on agarose gels. After electrophoresis, gels were stained with ethidium bromide
and DNA bands were visualized by exposing to UV light. A small block of
agarose gel containing the desired fragment of DNA was excised with a razor and
transferred into a 1.5 ml microcentrifuge tube. DNA was then purified from the
agarose gel by using the QIAquick Gel Extraction Kit (Qiagen).
2.7.6 Polyacrylamide gel electrophoresis
Polyacrylamide gel electrophoresis was used to examine DNA fragments
of less than 500 bp. DNA samples were combined with loading buffer and
electrophoresed on 6% polyacrylamide gels (37.5:1, acrylamide:N,N’-methylene
bisacrylamide), at 100Vfor 1.5 hours, using a 1 x TBE buffer system [10.8 g/l Tris
base, 5.5 g/l boric acid and 2 mM EDTA (pH 8.0)]. GeneRuler 1 kb DNA ladder
(Fermentas) and λ-PstI were used as molecular weight standards. Gels were then
stained with ethidium bromide and DNA bands were visualized by exposing to
UV light.
2.7.7 DNA purification from polyacrylamide gels
75
DNA fragments used for EMSA were purified from polyacrylamide gels
by using the “Crush and Soak” method as described in Sambrook et al. (1989).
Samples were electrophoresed and visualized as described in section 2.7.6. The
desired DNA band was excised and transferred to a 1.5 ml microcentrifuge tube,
crushed with a small pestle and soaked in elution buffer [0.5M ammonium
acetate, 10 mM magnesium acetate, 1 mM EDTA (pH8.0) and 0.1% (w/v) SDS]
for 16 hours at 37oC. The solution was then filtered to remove any residual
polyacrylamide. DNA was ethanol precipitated twice, washed in 70% ethanol and
resuspened in 10 µl H2O.
2.7.8 DNA labelling
PCR probes for EMSA were 5’ end-labelled by using T4 polynucleotide
kinase (Roche). Fifty pmol or 200 ng of DNA was combined with 5 µl of [γ-32P]
ATP, 20 U of kinase enzyme and 1 µl of 10 x kinase buffer [0.5 M Tris-HCl (pH
9.5), 1 mM spermidine, 100 mM MgCl2, 1 mM EDTA and 50 mM DTT) in a total
volume of 10 µl. Reaction mixtures were incubated at 37oC for 30 minutes (15
minutes after each 1 µl of kinase enzyme was added). Once the reaction was
complete, labelled DNA was separated from unincorporated labelled nucleotides
by ethanol precipitation and resuspended in 10 µl of 1/5 diluted TE buffer.
2.7.9 DNA sequencing
DNA sequencing was carried out by using the BigDye Terminator v3.1
Cycle Sequencing Kit (Applied Biosystems, Foster city, USA). Each reaction
mixture (20 µl) contained 100-200 ng of PCR products or 400 ng of plasmid DNA
76
as the template DNA. Five picomoles of primer, 2 µl of BigDye premix and 6 µl
of dilution buffer [200 mM Tris (pH9.0) and 5 mM MgCl2] along with DMSO to
give a final concentration of 5% were added to the reaction tube and subjected to
the following cycling conditions: 30 cycles of 96 ºC for 30 seconds and 60 ºC for
2 minutes. Once the cycling was complete, the entire contents was transferred to a
fresh 1.5 ml microcentrifuge tube with 2 μl of sodium acetate/EDTA buffer
added. After mixing, 80 μl of 95% (v/v) ethanol was added. The tube was
vortexed and incubated on ice for 15 minutes and then microcentrifuged for 15
minutes. DNA pellets were washed with 500 μl of 70% ethanol, air dried for 5
minutes and then sent to the Molecular Biology Service Unit (Department of
Biological Sciences, University of Alberta), where the sequence information was
determined.
2.8 RNA methods
2.8.1 RNA quantification
Purified RNA was quantified by using the NanoDrop® ND-1000
Spectrophotometer. Quality of RNA samples was determined by the A260:A280
ratio provided by the machine as well as agarose gel electrophoresis (section
2.7.4).
2.8.2 Reverse transcriptase polymerase chain reaction
Reverse transcriptase-polymerase chain reaction (RT-PCR) was carried
out to determine transcription profiles of various S. clavuligerus strains. First
strand cDNA synthesis in two-step RT-PCR was carried out by using Superscript
77
III (SSIII) reverse transcriptase (Invitrogen). Reactions were set up according to
manufacturer’s suggestions with the following changes: 1 µg of total RNA, 5%
DMSO and 0.5µl of SSIII (200 U/µl) were used in all RT reactions. The second
step PCR reactions were set up as described in section 2.7.3 except that 10 µl of
RT product from above and 25 pmol of each primer were used. When all
components were added to the reaction tube, the mixture was aliquoted into two
25 µl volumes; one was subjected to 25 cycles of amplification and the other one
subjected to 30 cycles of amplification. Negative control reactions were set up by
repeating the experiment with the same RNA preparations but without carrying
out the RT step, to confirm that the results obtained were not due to chromosomal
DNA contamination. Amplification of the RT product of hrdB, which encodes a
constitutively expressed sigma factor, was also carried out to assess the quality
and quantity of each RNA preparation.
2.9 Protein methods
2.9.1 Protein quantification
Protein concentration of each sample used in this study was measured by
using the Bio-Rad protein assay (Bio-Rad), which is based on the protein-dye
binding assay as described by Bradford (1976). A standard curve was constructed
with bovine gamma globulin and A595 of each sample was determined by using
the UNICAM UV/Vis Spectrophotometer UV3.
2.9.2 SDS-Polyacrylamide gel electrophoresis
78

Protein samples were analyzed through discontinuous SDS-
polyacrylamide gels except for EMSAs, for which non-denaturing continuous gels
were used. Gels were cast by using the Mini-PROTEAN 3 apparatus (Bio-Rad)
and the stacking gels were composed of 4% (v/v) acrylamide:N,N’-methylene
bisacrylamide (37.5:1), 125 mM Tris-HCl (pH 6.8), 0.1% (w/v) SDS, 0.1% (v/v)
TEMED, and 0.05% (w/v) ammonium persulfate. Resolving gels were composed
of 8-15% (v/v) acrylamide:N,N’-methylene bisacrylamide (37.5:1), 375 mM Tris-
HCl (pH 8.8), 0.1% (w/v) SDS, 0.05% (v/v) TEMED, and 0.5% (w/v) ammonium
persulfate. Gels were run in 1 x running buffer (14.34 g/l glycine, 3.03 g/l Tris
base and 1 g/l SDS) at 200 V for 1 hour at 4oC. Protein samples were combined
with 5 x sample buffer [62.5 mM Tris-HCl (pH 6.8), 10% (v/v) glycerol, 2 %
(w/v) SDS, 720 mM β-mercaptoethanol, and 0.00125% (w/v) bromophenol blue]
and heated at 95ºC for 4 minutes before loading.
After electrophoresis, gels were stained with Phast Coomassie stain [0.1%
(w/v) PhastGel Blue R Stain, 30% (v/v) methanol, and 10% (v/v) glacial acetic
acid] for at least one hour and then destained overnight in 30% (v/v) methanol and
10% (v/v) glacial acetic acid. After destaining, gels were soaked in 10% (v/v)
glacial acetic acid and 5% (v/v) glycerol and then preserved in
BioDesignGelWrap (BioDesign Inc., Carmel, NY).
2.9.3 Overproduction of CeaS1 and CeaS2
E. coli BL21 (DE3) carrying pET-9c-ceaS1 or pET-24a-ceaS2 was used to
inoculate 2.5 ml of LB medium. Cultures were incubated at 37oC for 16 hours and
79
0.5 ml was used to inoculate 25 ml of LB. These larger cultures were incubated at
37oC until OD600 reached ~0.6. At this point, 0.5 mM IPTG was added and
cultures were further incubated at 37oC for 4 hours to induce protein expression.
Cells were then harvested and disrupted as described in section 2.5.6. Since
proteins were insoluble and present as inclusion bodies, samples were
microcentrifuged and supernatant was decanted. Pellets were resuspended in 1 ml
of 50 mM Tris (pH 8.0) and stored at -80oC and were used as protein standards for
Western analysis.
2.9.4 Overproduction of Snk-His7 and Res2-His7
E. coli BL21 (DE3) carrying pT7-7His-snk or pT7-7His-res2 plasmid was
grown for 16 hours in 10 ml of LB medium at 37oC. The entire culture was used
to inoculate 200 ml of LB and then incubated at 37oC until OD600 reached ~0.6.
At this point, 0.4 mM of IPTG was added and further incubated at 37oC for ~5
hours to induce protein expression. Cultures were harvested by centrifugation at
5,000 rpm for 20 minutes. Culture supernatants were poured off and cell pellets
were stored for 16 hours at -20oC.
The same procedure described above was used to over express the mutated
version of Snk-His7 and Res2-His7 except that E. coli BL21 (DE3) carrying pT7-
7His-snk-SD or pT7-7His-res2-SD was used.
2.9.5 Overproduction of His10-Res1, His10-Res1-SD and His10-C7P
A similar procedure as described above was used to over express His10-
Res1, His10-Res1-SD and His10-C7P by E. coli BL21 (DE3) carrying pET-19B-
80
res1, pET-19B-res1-SD and pET-19B-c7p respectively, but with the following
changes. To induce protein expression, 1 mM IPTG was added to the medium
once the culture OD600 reached ~0.6. During induction, these cultures were
incubated at 21oC for ~7 hours and harvested by centrifugation at 5,000 rpm for
20 minutes. Cell pellets were stored overnight at -20oC.
2.9.6 Overproduction of MBP-Res1 and MBP-Res2
MBP-Res1 and MBP-Res2 fusion protein were over expressed using a
similar procedure as described above with E. coli BL21 (DE3) carrying pMal-res1
or pMal-res2. LB medium was supplemented with glucose (2 g/l) to inhibit
amylase production by the E. coli host strain to prevent degradation of the
amylose resin that was used in downstream process to purify fusion proteins
(NEB). To induce protein expression, 0.3 mM of IPTG was added to the medium
once the culture OD600 reached ~0.5. These cultures were further incubated at
37oC for 2 hours and harvested by centrifugation at 5,000 rpm for 20 minutes.
Cell pellets were resuspended in 5 ml of column buffer [20 mM Tris-HCL
(pH7.4), 200 mM NaCl, 1 mM EDTA and 1 mM DTT] and stored overnight at
-20oC.
2.9.7 Purification of His-tagged proteins
To purify the His-tagged proteins from E. coli cells, pellets were first
thawed on ice for 10 minutes and resuspended in 5 ml of lysis buffer (50 mM
NaH2PO4, 300 mM NaCl, 10 mM imidazole, pH8.0) supplemented with 1 mg/ml
of lysozyme. Cell suspensions were incubated on ice for 30 minutes and then
81
sonicated 6 x 15 seconds on setting of 25% with a ¼” (6.35 mm) diameter
microtip. Samples were centrifuged at 9,000 rpm for 20 minutes to remove
insoluble cell debris and clarified cell lysates were transferred to 15 ml
polypropylene tubes.
One milliliter of 50% nickel-nitrilotriacetic acid (Ni-NTA) resin slurry
(Qiagen) was added to the supernatants and incubated on ice on a rotary shaker
for 60 minutes to facilitate the binding of His-tagged proteins to the resin. The
mixture was then loaded into a column, which was made by filling a 5 ml syringe
with non-absorbent cotton wool. The mixture was washed twice with 4 ml of
wash buffer [50 mM NaH2PO4, 300 mM NaCl, and 20 mM imidazole (pH 8.0)].
Bound His-tagged proteins were eluted from the resin with 0.5 ml fractions of
elution buffer (50 mM NaH2PO4, 300 mM NaCl, 50-250 mM imidazole, pH8.0).
Fractions collected were analyzed by SDS-PAGE (Section 2.9.2) and those
carrying the desired protein were pooled and concentrated down to ~50 µl by
centrifugation with Amicon® Centricon®-10 concentrators (Millipore, Billerica,
MA) at 6,500 rpm at 4ºC. The concentrated solution was adjusted to ~500 µl with
protein storage buffer [10 mM Tris-HCl (pH 8.0), 0.1% CHAPS, 0.1 mM DTT,
0.1 mM EDTA, 0.3 M NaCl, and 30% glycerol] and aliquoted into 50 µl fractions
and stored at -80oC.
2.9.8 Purification of MBP fusion protein
Cell suspensions stored at -20oC (Section 2.9.6) were thawed on ice for 10
minutes and then sonicated 6 times for 15 seconds on a setting of 25% with a ¼”
82

(6.35 mm) diameter microtip. Crude cell lysates were centrifuged at 9,000 rpm for
20 minutes to remove insoluble materials. MBP fusion proteins were then purified
according to the manufacturer’s recommendations (NEB). Clarified cell lysates
were diluted 1:6 with column buffer (as described in section 2.9.6) and loaded
onto columns. Prior to loading, 1 ml of amylose resin (NEB) was poured into a
column (set up as described above) and washed with 5 ml of column buffer. After
loading, resin was washed with 12 ml of column buffer to remove unbound
proteins. Bound MBP fusion protein was eluted with column buffer supplemented
with 10 mM maltose. Ten 1 ml fractions were collected and analysed by SDS-
PAGE. Identified fractions that contained the desired protein were pooled together
and subjected to the same treatment as described above and stored at -80oC for
future analysis.
Maltose present in the elution buffer must be removed in order to carry out
some of the assays performed in this study. For those procedures, the desired
protein was further purified by FPLC through an anion exchange column.
Fractions identified from above were first pooled and diluted 1:3 with buffer [20
mM Tris-HCl (pH 7.8) and 10% glycerol] then loaded onto a HiLoad 26/10 Q
Sepharose High Performance column (GE healthcare Bio-Sciences, Uppsala,
Sweden). The column was washed with 1 column volume of washing buffer [20
mM Tris-HCl (pH 7.8), 50 mM NaCl, 0.1 mM DTT and 10% glycerol] and eluted
with elution buffer (washing buffer with increasing concentration of NaCl, up to
2M). A280 of collected fractions was monitored to follow protein elution and
fractions that might contain the desired protein were analyzed by SDS-PAGE.
83

Identified fractions were pooled and subjected to the same treatment as described
in section 2.9.7 and stored at -80oC for future analysis.
2.9.9 In vitro phosphorylation assays
In vitro phosphorylation assays were carried out to determine the
phosphorylation status of various proteins. Each reaction mixture composed of 2
µM of Snk-His7 protein and 6 µM of His10-Res1 or Res2-His7 protein. However,
when all 3 proteins were present in the same reaction mixture, only 3 µM of
His10-Res1 and Res2-His7 were used. In addition to appropriate protein amounts,
each 20 µl reaction also contained 4 µl of 5 x kinase buffer [50 mM Tris-HCl (pH
8.0), 2 mM DTT, 50 mM KCl, 0.1 mM MgCl2 and 10% (v/v) glycerol], 60 μM
ATP and 2 μCi [γ-32P] ATP. Kinase reactions were carried out at 30ºC for 30
minutes. Reactions were stopped by placing the reaction tubes on ice and adding 5
µl of 5 x SDS-PAGE sample buffer. The entire mixtures were then run into 15%
polyacrylamide gels. The resulting gels were dried with a Model 583 Gel Dryer
(Bio-Rad) for 45 minutes at 80oC and exposed to a BAS cassette 4043 phosphor
screen (Fujifilm, Tokyo, Japan) for 16 hours. The image was developed in an
Image Reader FLA-5000 phosphorimager (Fujiflim, Tokyo, Japan).
2.9.10 Phospho-transfer assays
MBP-Res1 was first phosphorylated with Snk-His7 as described above in a
500 µl reaction mixture. A total of 450 µl of amylose resin resuspended in 1 x
kinase buffer was then added to the reaction tube and incubated on ice. After 15
minutes, reaction tubes were microcentrifuged for 2 minutes. Supernatant was
84
decanted and pelleted resins were washed 4 times with 800 µl 1 x kinase buffer.
Bound phosphorylated MBP-Res1 was then eluted from the resin by adding 150
µl of kinase buffer supplemented with 1 mM maltose and incubated on ice for 15
minutes. The mixture was then subjected to microcentrifugation and supernatant
containing phosphorylated MBP-Res1 was transferred to a fresh 1.5 ml
microcentrifuge tube. Kinase reactions were then set up by mixing 15 µl of
phosphorylated MBP-Res1 with Res2-His7 (final concentration, 6 µM; volume
adjusted to 20 µl with 1 x kinase buffer) and incubated at 30oC for 30 minutes.
MBP-Res2 was phosphorylated with Snk-His7 as described above in a 250
µl reaction mixture. A total of 250 µl (two 125 µl volumes) of Ni-NTA resin
slurry resuspended in 1 x kinase buffer was added. After each addition, the
reaction tube was incubated at 4 oC for 10 minutes and then microcentrifuged for
1 minute to sediment the Ni-NTA resin, whereupon the supernatant containing
phosphorylated MBP-Res2 was transferred to a fresh 1.5 ml microcentrifuge tube.
Kinase reactions were then set up by mixing 15 µl of phosphorylated MBP-Res2
with His10-Res1 (final concentration, 6 µM; volume adjusted to 20 µl with 1 x
kinase buffer) and incubated at 30oC for 30 minutes.
Once the kinase reactions from above were complete, reaction tubes were
placed on ice and combined with 5 µl of SDS-PAGE sample buffer. The entire
reaction mixtures were loaded onto 12% polyacrylamide gels. Resulting gels were
dried and exposed for 16 hours to a phosphor screen. Images were developed as
described above.
85

2.9.11 In vitro dephosphorylation assays
Twelve microliters of the supernatant containing phosphorylated MBP-
Res2 purified from section 2.9.10 was added to His10-Res1 (final concentration, 6
μM; adjusted to 20 µl with kinase buffer). The 20 μl reaction mixture was
incubated at 30°C for 1, 5, 20, 60, or 300 minutes, and the reaction was stopped
by adding 5 µl of SDS-PAGE sample buffer. The reaction products were resolved
on a 12% polyacrylamide gel. Resulting gels were dried and images were
obtained as described in section 2.9.9.
2.9.12 Western analysis
Ten micrograms of cell-free extract protein from each test strain was
subjected to Western analysis. Each sample was combined with SDS-PAGE
sample buffer and heated at 95oC for 4 minutes and subjected to SDS-PAGE
(section 2.9.2). After electrophoresis, separated proteins were transferred to
Hybond-P PVDF membranes (Amersham) at 4 oC in transfer buffer composed of
25 mM Tris (pH8.3), 192 mM glycine and 20% methanol. Transfers were carried
out at 30V for 16 hours by using the mini-Trans-Blot apparatus (Bio-Rad). PVDF
membranes were first pre-wetted by soaking in methanol and then equilibrating in
transfer buffer for at least 15 minutes. Gels with the separated proteins were also
equilibrated in transfer buffer for 15 minutes prior to transfer.
Protocols and reagents from the ECL Western blotting analysis system
were used to detect proteins of interest (Amersham BioSciences, Uppsala,
Sweden) with minor changes as stated below. Membranes were rinsed with wash
86
buffer [0.02 M Tris-HCl (pH 7.6), 0.14 M NaCl and 0.1% Tween 20] and blocked
overnight at 4oC with blocking buffer (10% non-fat dried milk in wash buffer).
Primary antibody was added at a dilution of 1/5,000 to 1/15,000 in 25ml of
blocking buffer and incubated at 21oC for 1 hour on an orbital shaker. Primary
polyclonal antibodies were obtained from rabbits injected with proteins purified
by SDS-PAGE, using standard methods as described by Sambrook et al. (1989).
Horseradish peroxidise-linked anti-rabbit IgG isolated from donkey, as provided
in the kit was added at a dilution of 1/10,000 to 1/15,000 in 25 ml blocking buffer
and incubated at 21oC for 1 hour. The blot was rinsed and washed 1 x 15 minutes
and 3 x 5 minutes with wash buffer after incubation with each antibody.
Six milliliters of the supplied detection reagent was dispensed onto the
blot and incubated at 21oC for 1 minute. Excess reagent was drained off and the
blot was wrapped in Saran wrap and exposed to Kodak BioMax light X-ray film
(GE Healthcare) for 10 to 20 minutes. Films were then developed by using the
Fuji RGII X-ray film processor (Fuji Photo Film Co., Tokyo).
2.10 DNA-Protein interactions
2.10.1 Electrophoretic mobility shift assays
Electrophoretic mobility shift assays were carried out to determine the
ability of Res2 or C7P to bind DNA. DNA fragments of potential targets as
determined by RT-PCR were generated by PCR, purified from polyacrylamide
gels by the “crush and soak” method and 32P end-labelled (section 2.8.2, 2.7.3,
2.7.6, 2.7.7 and 2.7.8, respectively). Reactions were set up in a total volume of 20
87

µl by mixing 20 fmol of each labelled fragment with 0-100 pmol of purified
protein in a buffer containing 10 mM Tris-HCl (pH 8.0), 1 mM DTT, 10%
glycerol, 150 mM NaCl and 1 µg of poly d(I-C). Binding reactions were carried
out at 21oC for ~25 minutes. Reaction products were then separated on 1.5%
glycerol containing 6-10% non-denaturing polyacrylamide gels (37.5:1
acrylamide:N,N’-methylene bisacrylamide) in 1 x Tris-glycine buffer system
(3.03 g/l Tris base, 14.3 g/l glycine, 0.39 g/l EDTA, pH 8.3). Before the samples
were loaded, gels were pre-run at 200V for ~1 hour. Electrophoresis was then
carried out at 120-150V for ~30 minutes at 4oC to separate bound and free DNA
probes. Gels were then dried for 45 minutes, placed on phosphor screen and
exposed for 16 hours. The images were developed in an Image Reader FLA-5000
phosphorimager.
Control reactions were also carried out by setting up reaction mixtures as
described above, but with 5 and 50 x molar excess of unlabelled DNA probe
added to the binding reactions for specific competition. For non-specific
competition, 5 and 50 x molar excess of unlabeled non-specific DNA (a 350 bp
hrdB fragment amplified by using primers hrdB RT-forward and hrdB RT-reverse
and S. clavuligerus genomic DNA as the template) were added to the binding
reactions.
2.11 Confocal Microscopy
S. clavuligerus strains carrying the egfp reporter construct were grown in
TSBS for 40 hours and 500 µl of the resulting cultures were then used to inoculate
88
25 ml of Soy medium. After 48 h of growth, 1ml of the cultures were harvested
by microcentrifugation, and then washed once with an equal volume of
acetonitrile and twice with dH2O. The washed cells were resuspended in 500 µl of
40% glycerol and 10 µl amounts were loaded onto a microscope slide and
mounted with a microscope cover slip. The edges of the cover slips were sealed
with clear nail polish before observation.
Confocal microscopy was carried out using a Leica DM IRB Inverted
microscope. An argon laser with 50-52% attenuation was used to provide
excitation at 488 nm and EGFP excitation was detected between 500 nm to 520
nm. Corresponding Differential Interference Contrast (DIC) images were also
obtained.
2.12 Software and web sources used for analysis
GeneTools version 2.0 (BioTools Inc., Edmonton, AB) was used to
identify restriction sites within DNA sequences. Lasergene version 7.1
(DNASTAR Inc., Madison, WI) was used for sequence editing, alignment and to
locate restriction sites. It was also used to calculate the molecular weight of
various proteins. Similarity searches were performed by using the BLAST
program (Altschul et al. 1990; Gish and States, 1993) available at the National
Institute for Biotechnology Information (http://www.ncbi.nlm.nih.gov/BLAST/).
OligoAnalyzer version 3.1 (IDT) was used to design and analyze oligonucleotide
primers.
89

Chapter 3
Results
90

3. Results
3.1 Analysis of the regulation of ceaS involved in clavam biosynthesis
Carboxyethylarginine synthase (CeaS), which is encoded by ceaS1 and
ceaS2, catalyzes the first reaction involved in clavam production. Since first
enzymes of biosynthetic pathways are typically subjected to tight regulation, CeaS
is a likely control point for regulating production of clavulanic acid and 5S
clavams in S. clavuligerus.
In a previous study, a ceaS2 mutant constructed by inserting an apramycin
resistance gene cassette into ceaS2 (ceaS2::apra) was found to be severely
compromised in clavam biosynthesis (Jensen et al., 2000). As ceaS2, bls2 and
pah2 are transcribed together as a polycistronic transcript (Paradkar and Jensen,
1995), it was initially proposed that the severe phenotype was due to the insertion
of the apr gene cassette, which could have polar effects on transcription of the
downstream genes. As a result, a new ceaS2 mutant was prepared by replacing the
apr gene cassette in ceaS2::apra with a frame shift mutation (ceaS2-Fs) to
alleviate polar effects (Tahlan, 2005). However, a similar phenotype was observed
and so it was proposed that, either polarity still remains an issue, or that the
truncated form of CeaS2 produced may interfere with other biosynthetic enzymes,
thus affecting production of clavam metabolites. Therefore, ΔceaS2::apra was
constructed by replacing the entire ceaS2 gene with the apr gene cassette to
eliminate the possibility of production of truncated CeaS2 protein. In view of the
fact that the apr gene cassette may still exert polar effects on downstream genes,
91
ΔceaS2 in-frame (IF) was also prepared by removing the gene cassette and thus
leaving just an unmarked in-frame deletion. This ΔceaS2-IF mutant was expected
to have the least potential to cause polar effects on expression of downstream bls2
and pah2. Nonetheless, all four ceaS2 mutants: ΔceaS2-IF, ΔceaS2::apra, ceaS2-
Fs and ceaS2::apra were still severely compromised or incapable of producing
clavulanic acid (Table 3.1) or 5S clavams (data not shown). This is unexpected
because both CeaS1 and CeaS2 catalyze the same reaction and disruption of
ceaS2 would be expected to leave the functional copy of ceaS1 to support S.
clavuligerus to continue synthesizing clavulanic acid. Moreover, since ceaS2,
pah2 and cas2 are genes involved in the early steps of clavam biosynthesis, by
disrupting ceaS2, we would expect ceaS2 mutants to have a phenotype similar to
those of pah2 or cas2 mutants, where reduced levels but not a complete loss of
clavulanic acid production, was observed (Jensen et al., 2000).
This much more severe phenotype of the ceaS2 mutants suggested that cross
regulation is taking place between ceaS1 and ceaS2. As a first step in
understanding how ceaS may regulate clavam biosynthesis, a study was
undertaken to investigate the potential cross regulation between ceaS1 and ceaS2
and to determine if disrupting ceaS2 caused a polar effect and influenced
transcription of downstream genes.
3.1.1 Overproduction of CeaS1 and CeaS2
CeaS1 and CeaS2 proteins were required for use as protein markers for
subsequent Western analyses and were over produced as described in section
92
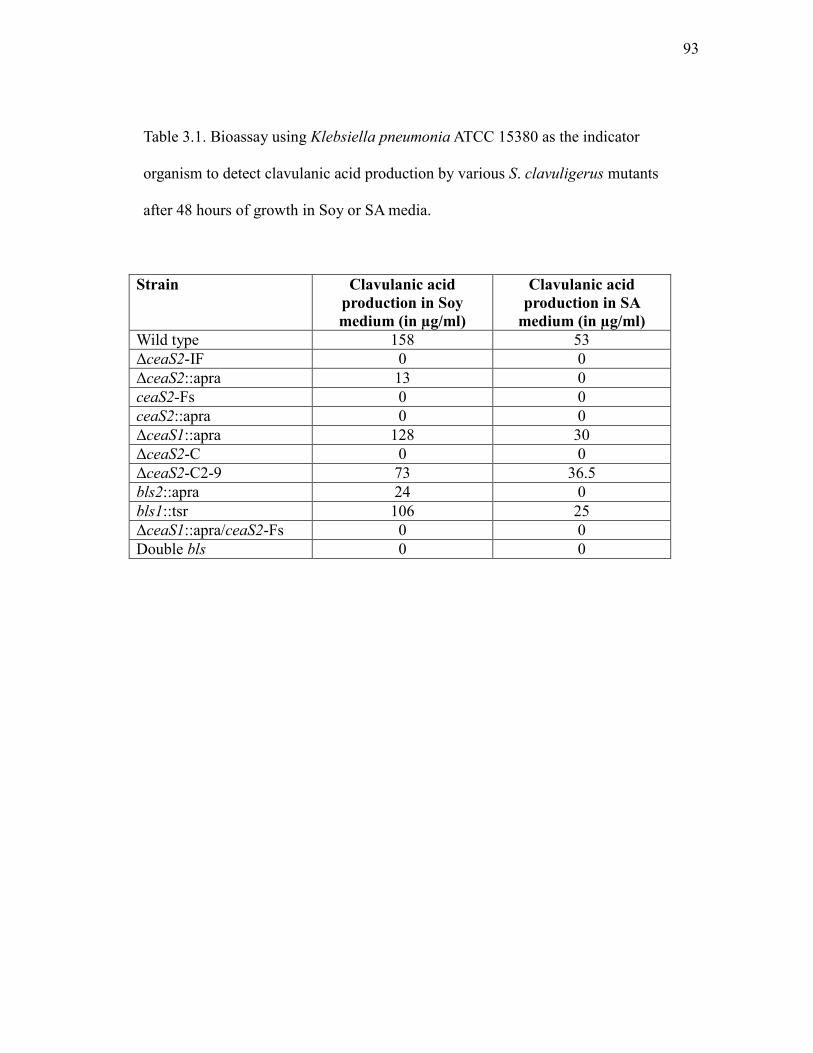
Table 3.1. Bioassay using Klebsiella pneumonia ATCC 15380 as the indicator
organism to detect clavulanic acid production by various S. clavuligerus mutants
after 48 hours of growth in Soy or SA media.
Strain Clavulanic acid production in Soy medium (in µg/ml)
Clavulanic acid production in SA
medium (in µg/ml) Wild type 158 53 ΔceaS2-IF 0 0 ΔceaS2::apra 13 0 ceaS2-Fs 0 0 ceaS2::apra 0 0 ΔceaS1::apra 128 30 ΔceaS2-C 0 0 ΔceaS2-C2-9 73 36.5 bls2::apra 24 0 bls1::tsr 106 25 ΔceaS1::apra/ceaS2-Fs 0 0 Double bls 0 0
93
2.9.3. Sixteen hour cultures of E. coli BL21(DE3) carrying pET-9c-ceaS1 or
pET-24a-ceaS2 (Table 2.3) were used to inoculate 25 ml of TSBS medium.
Once the culture OD600 reached ~0.6, expression of ceaS1 and ceaS2, as driven
by a T7 promoter, was initiated by adding 0.5 mM IPTG to the cultures to
induce production of T7 RNA polymerase, and incubating at 37oC for 4-6
hours. After induction, cells were harvested, frozen overnight, lysed with
lysozyme and sonicated to release the overproduced protein. Crude lysates
were centrifuged to sediment insoluble cell matter. Since induction of wild
type CeaS proteins resulted in the production of insoluble inclusion bodies
localized in the cytoplasm (Figure 3.1.1 and observation under microscope,
data not shown), the insoluble protein fraction was stored at -80oC and used for
later studies.
3.1.2 Cross reaction of anti-CeaS2 antibody with CeaS1 protein
As mentioned in Section 3.1.1, CeaS1 and CeaS2 obtained through high
level expression in E. coli were insoluble. The optimum amount used for each
Western analysis was therefore determined empirically. In addition, only anti-
CeaS2 antibody was available for use in these studies. As sequence comparison
revealed a high similarity between CeaS1 and CeaS2 (67% identity, 80%
similarity) (Tahlan, 2005), Western analysis was carried out to determine if anti-
CeaS2 antibody can cross react with CeaS1 protein. Single protein bands
corresponding to CeaS2 and CeaS1 (Figure 3.1.2) were observed on the
developed x-ray film in the most diluted samples when cell-free extracts (CFEs)
from the CeaS2 and CeaS1 overproducing E. coli strains were examined. This
94

Figure 3.1.1. Overproduction of CeaS1 and CeaS2 from E. coli BL21(DE3)
carrying pET9c-ceaS1 and pET24a-ceaS2, respectively. Samples were analyzed
by SDS-PAGE with the use of precast PhastGel Gradient 8-25% and proteins
were visualized by staining with Coomassie blue. (A) soluble protein fractions. (B)
insoluble cell matter.
95
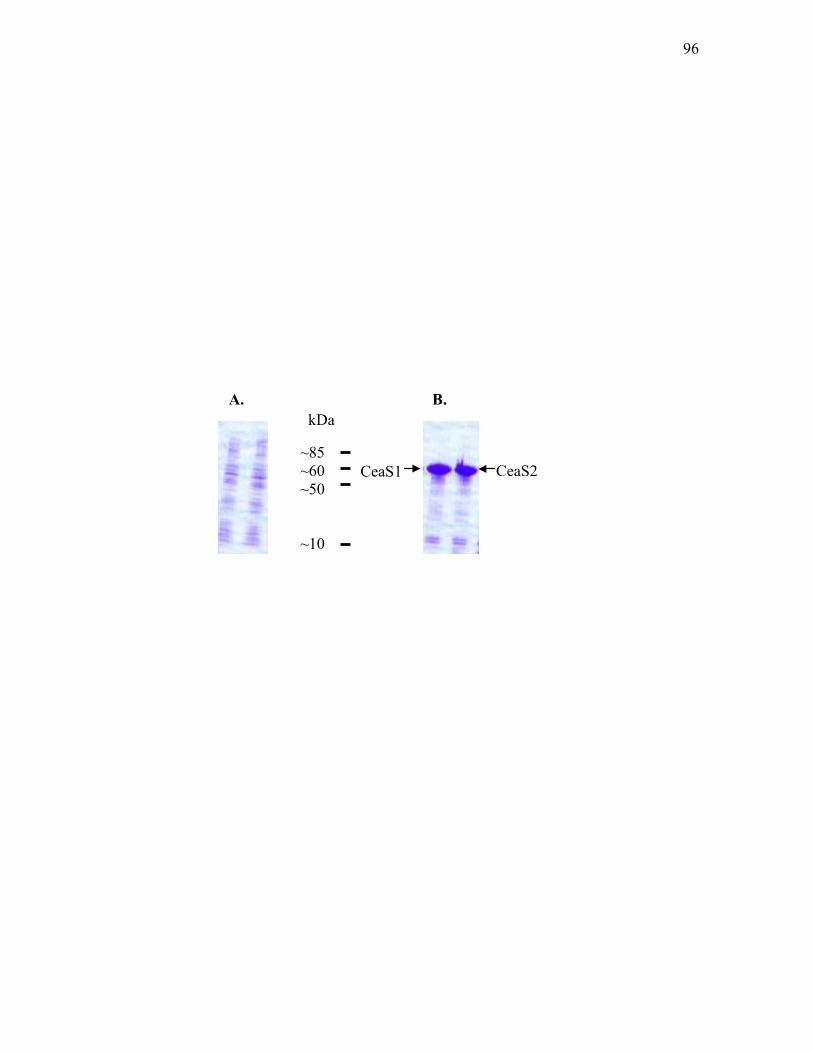
CeaS1
~10
kDa
~85 ~60 ~50
A. B.
CeaS2
96

Figure 3.1.2. Western analysis of CeaS1 and CeaS2. Cell-free extracts were
isolated from E. coli BL21(DE3) carrying (A) pET-24a-ceaS2 or (B) pET-9c-
ceaS1. Series of dilutions of CFE were electrophoresed on 8% SDS-PAG to
determine the optimal amount to use as a protein standard for subsequent Western
analyses. Samples were separated on 8% SDS-PAG and transferred to PVDF
membranes. Membranes were then incubated with rabbit anti-CeaS2 polyclonal
antibodies, followed by incubation with horseradish peroxidase-conjugated,
donkey anti-rabbit secondary antibodies. The membranes were exposed to x-ray
film for 5-10 minutes after treatment with enhanced chemiluminescence reagents.
97

A. B. CeaS2 C eaS1
1:50 1:100 1:200 1:50 1:100 1:200
98

indicated that both proteins can be detected by anti-CeaS2 antibody. For
subsequent Western analyses, 5 µl of the appropriately diluted CFEs were used as
the protein standard. In addition, under the electrophoresis conditions used, when
the gels were electrophoresed until the bromophenol blue indicator present in the
SDS-PAGE sample buffer ran completely off the gel, CeaS1 could be resolved
from CeaS2, despite the fact that they are very similar in molecular weight (59
and 61 kDA, respectively).
3.1.3 Western analyses to detect CeaS1 and CeaS2 production
To investigate the unexpected observation that ceaS2 mutants
cannot produce clavam metabolites, Western analyses using CeaS-specific
polyclonal antibodies were carried out to examine CeaS1 production in
these mutants. CFEs from wild type S. clavuligerus, ΔceaS2-IF,
ΔceaS2::apra, ceaS2-Fs, ceaS2::apra, ΔceaS1::apra and
ΔceaS1::apra/ceaS2-Fs mutants (Table 2.2) were obtained after growth for
48 and 72 hours in Soy and SA media. Proteins were then separated on 8%
SDS-PAG and transferred to PVDF membranes.
After overnight transfer, the membranes were first incubated with rabbit
anti-CeaS antibody at 1:15,000 dilution and then incubated with 1:15,000 diluted
horseradish peroxidase-conjugated, donkey anti-rabbit secondary antibodies. The
membranes were exposed to x-ray film for 5-10 minutes after treatment with
enhanced chemiluminescence reagents.
99
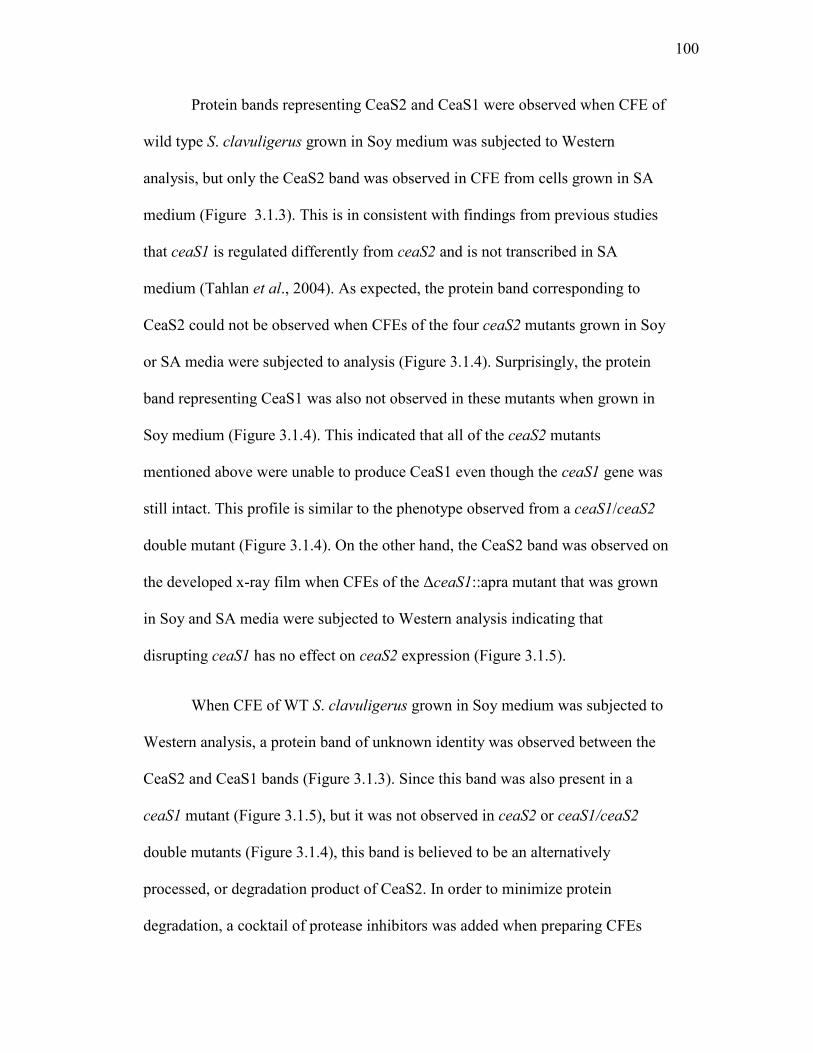
Protein bands representing CeaS2 and CeaS1 were observed when CFE of
wild type S. clavuligerus grown in Soy medium was subjected to Western
analysis, but only the CeaS2 band was observed in CFE from cells grown in SA
medium (Figure 3.1.3). This is in consistent with findings from previous studies
that ceaS1 is regulated differently from ceaS2 and is not transcribed in SA
medium (Tahlan et al., 2004). As expected, the protein band corresponding to
CeaS2 could not be observed when CFEs of the four ceaS2 mutants grown in Soy
or SA media were subjected to analysis (Figure 3.1.4). Surprisingly, the protein
band representing CeaS1 was also not observed in these mutants when grown in
Soy medium (Figure 3.1.4). This indicated that all of the ceaS2 mutants
mentioned above were unable to produce CeaS1 even though the ceaS1 gene was
still intact. This profile is similar to the phenotype observed from a ceaS1/ceaS2
double mutant (Figure 3.1.4). On the other hand, the CeaS2 band was observed on
the developed x-ray film when CFEs of the ΔceaS1::apra mutant that was grown
in Soy and SA media were subjected to Western analysis indicating that
disrupting ceaS1 has no effect on ceaS2 expression (Figure 3.1.5).
When CFE of WT S. clavuligerus grown in Soy medium was subjected to
Western analysis, a protein band of unknown identity was observed between the
CeaS2 and CeaS1 bands (Figure 3.1.3). Since this band was also present in a
ceaS1 mutant (Figure 3.1.5), but it was not observed in ceaS2 or ceaS1/ceaS2
double mutants (Figure 3.1.4), this band is believed to be an alternatively
processed, or degradation product of CeaS2. In order to minimize protein
degradation, a cocktail of protease inhibitors was added when preparing CFEs
100

Figure 3.1.3. Western analysis of CeaS using cell-free extracts isolated from wild
type S. clavuligerus grown either in liquid complex soy (Soy) or defined starch
asparagine (SA) medium. Ten microgram amounts of total cellular protein were
separated on 8% SDS-PAG and transferred to PVDF membranes. Equal volume
(5 µl) of diluted CeaS1 and CeaS2 overproducing E. coli CFEs were mixed and
used as the protein standard. Membranes were then incubated with rabbit anti-
CeaS2 polyclonal antibodies, followed by incubation with horseradish peroxidase-
conjugated, donkey anti-rabbit secondary antibodies. The membranes were
exposed to x-ray film for 5-10 minutes after treatment with enhanced
chemiluminescence reagents.
101
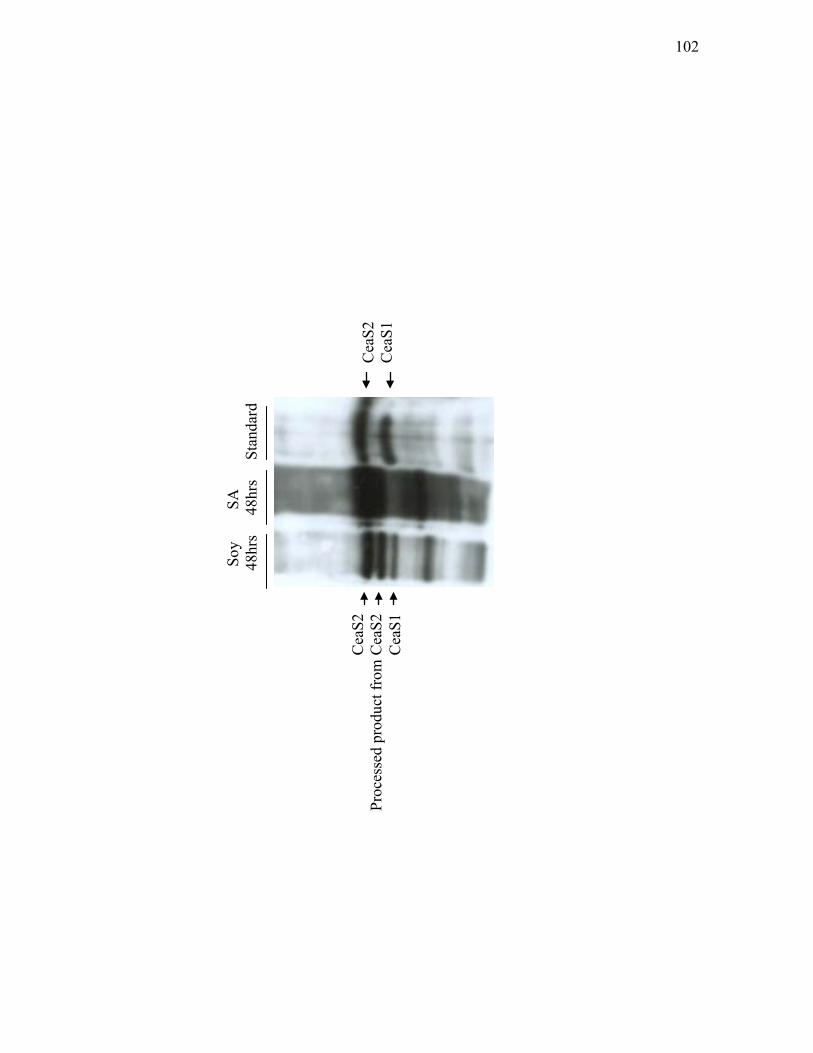
Soy
SA
48
hrs
48
hrs
St
anda
rd
Cea
S2
Cea
S1
Cea
S2
Proc
esse
d pr
oduc
t fro
m C
eaS2
C
eaS1
102

Figure 3.1.4. Western analysis of CeaS in ceaS2 mutant strains and ceaS1/ceaS2
double mutant. Cell-free extracts were isolated from Soy or SA grown cultures of
(A) ΔceaS2-IF, (B) ΔceaS2::apra, (C) ceaS2-Fs, (D) ceaS2::apra and (E)
ΔceaS1::apra/ceaS2-Fs. Ten microgram amounts of total cellular protein were
separated on 8% SDS-PAG and transferred to PVDF membranes. Membranes
were then incubated with anti-CeaS2 polyclonal antibodies from rabbit, followed
by incubation with horseradish peroxidase-conjugated, donkey anti-rabbit
secondary antibodies. The membranes were exposed to x-ray film for 5-10
minutes after treatment with enhanced chemiluminescence reagents.
103
So
y
SA
St
anda
rd
4
8
72
hrs
48
72 h
rs
S
oy
S
A
Stan
dard
4
8
72
hrs
48
72 h
rs
So
y
SA
St
anda
rd
4
8
72
hrs
48
72 h
rs
So
y
SA
St
anda
rd
4
8
72
hrs
48
72 h
rs
A.
B.
C.
D.
Cea
S2
Cea
S1
Cea
S2
Cea
S1
Cea
S2
Cea
S1
Cea
S2
Cea
S1
E.
Cea
S2
Cea
S1
So
y
SA
St
anda
rd
4
8
72
hrs
48
72 h
rs
104
Figure 3.1.5. Western analysis of CeaS in ceaS1 mutant strains. Cell-free extracts
were isolated from Soy or defined SA grown cultures of ΔceaS1::apra. Ten
microgram amounts of total cellular protein were separated on 8% SDS-PAG and
transferred to PVDF membranes. Membranes were incubated with anti-CeaS2
polyclonal antibodies obtained from rabbit, followed by incubation with
horseradish peroxidise-conjugated, donkey anti-rabbit secondary antibodies. After
being treated with enhanced chemiluminescence reagents, membrane was exposed
to x-ray film for 5-10 minutes.
105
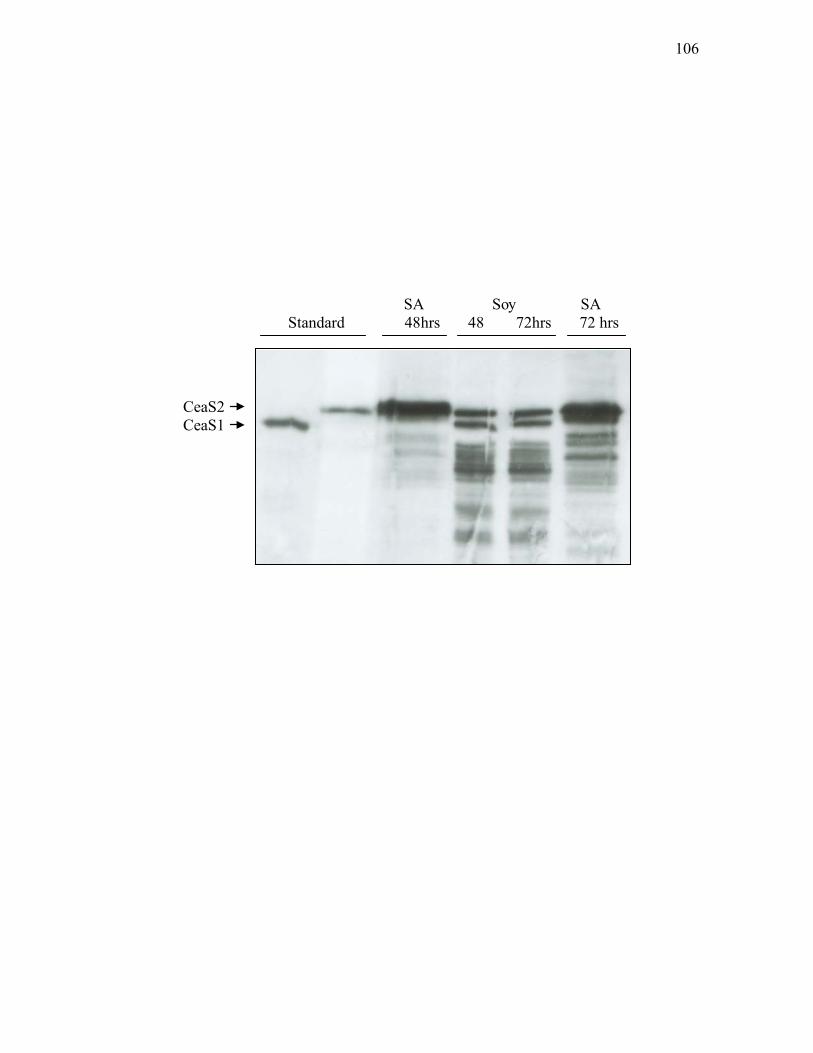
CeaS2 CeaS1
SA Soy SA Standard 48hrs 48 72hrs 72 hrs
106
from the various strains. However, no significant improvement was found. As
mentioned before, CeaS catalyzes the first reaction in the clavam production
pathway, and first enzymes are typical control points for biosynthetic pathways, it
might have an intrinsically high turn-over rate. As a result, degraded CeaS may
already be present in the cells when samples were taken at 48 and 72 hours post
inoculation into the production media.
Overall, the results obtained from Western analyses correspond with the
observation that clavulanic acid production was abolished, as determined by
clavulanic acid bioassay (Table.3.1), in all of the various ceaS2 mutants, as
neither CeaS1 nor CeaS2, which catalyze the first reaction involved in clavam
biosynthesis, were produced.
To examine this effect further, cell free extracts from ΔceaS2-C and
ΔceaS2-C2-9 (Table 2.2), which represent the ΔceaS2-IF mutant carrying a copy
of ceaS2 alone or an ~11kb DNA fragment carrying all of the early genes required
for clavulanic acid biosynthesis including ceaS2 and flanking regions,
respectively, were subjected to Western analysis using the same conditions as
described above. Although the protein band corresponding to CeaS2 could now be
observed in both complemented strains growing either in Soy or SA medium, the
CeaS1 protein band was still missing (Figure 3.1.6). Furthermore, clavulanic acid
bioassays indicated that only the latter construct (the ~11kb DNA fragment)
restored clavulanic acid production despite the restoration of CeaS2 production in
both strains (Table 3.1).
107
Figure 3.1.6. Western analysis of CeaS in complemented ceaS2 mutants. Cell-free
extracts were isolated from Soy or SA grown cultures of (A) ΔceaS2-C and (B)
ΔceaS2-C2-9. Ten microgram amounts of total cellular protein were separated by
electrophoresis on 8% SDS-PAG and transferred to PVDF membrane. Membranes
were incubated with rabbit anti-CeaS2 polyclonal antibodies and then incubated
with horseradish peroxidase-conjugated, donkey anti-rabbit secondary antibodies.
After being treated with enhanced chemiluminescence reagents, membranes were
exposed to x-ray film for 5-10 minutes.
108
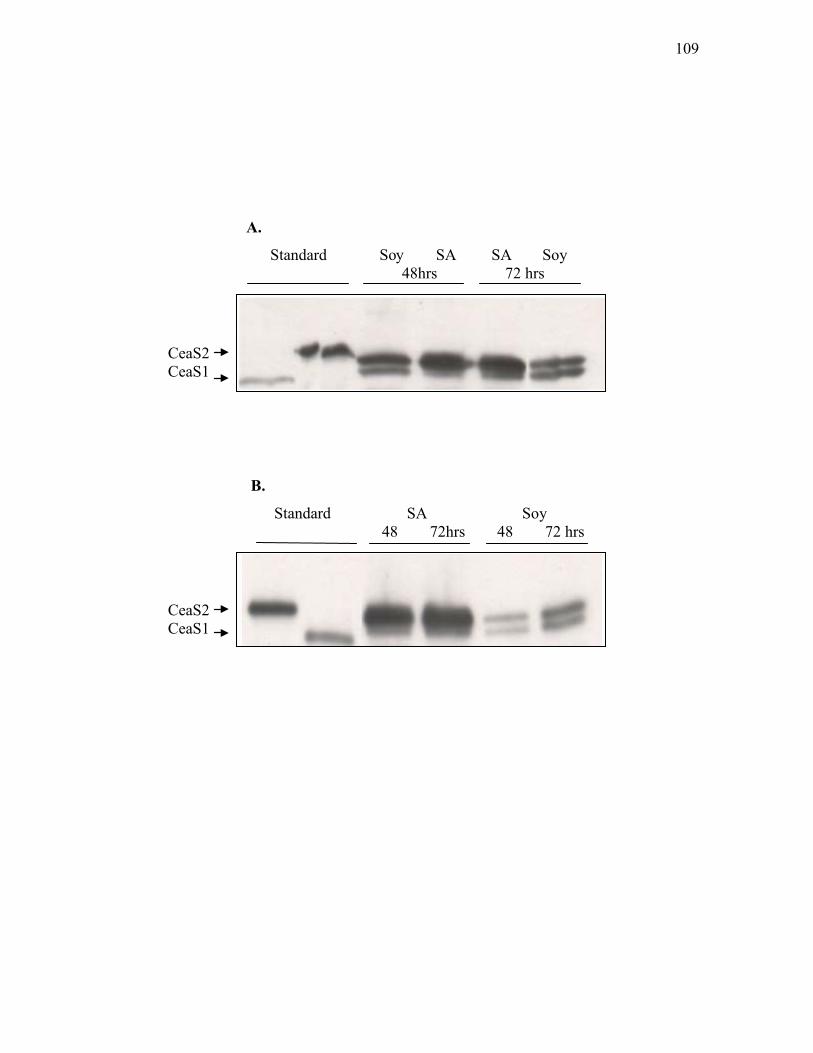
Standard SA Soy 48 72hrs 48 72 hrs
Standard Soy SA SA Soy 48hrs 72 hrs
CeaS2 CeaS1
CeaS2 CeaS1
A.
B.
109
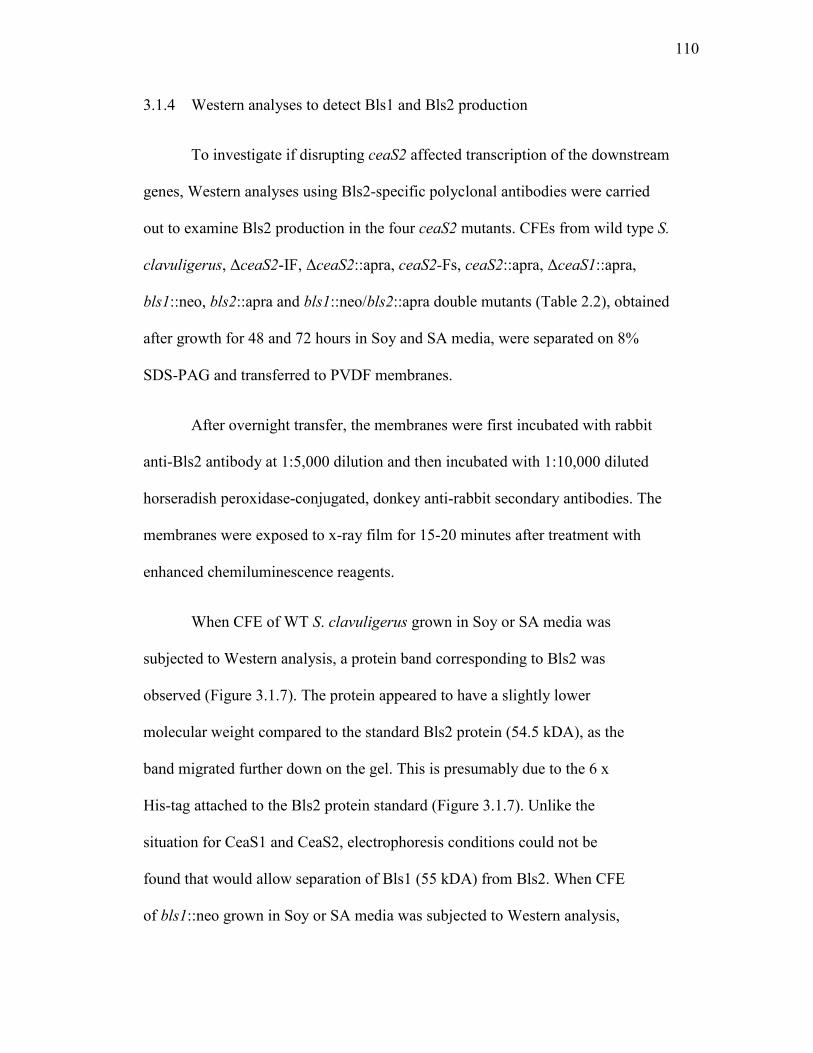
3.1.4 Western analyses to detect Bls1 and Bls2 production
To investigate if disrupting ceaS2 affected transcription of the downstream
genes, Western analyses using Bls2-specific polyclonal antibodies were carried
out to examine Bls2 production in the four ceaS2 mutants. CFEs from wild type S.
clavuligerus, ΔceaS2-IF, ΔceaS2::apra, ceaS2-Fs, ceaS2::apra, ΔceaS1::apra,
bls1::neo, bls2::apra and bls1::neo/bls2::apra double mutants (Table 2.2), obtained
after growth for 48 and 72 hours in Soy and SA media, were separated on 8%
SDS-PAG and transferred to PVDF membranes.
After overnight transfer, the membranes were first incubated with rabbit
anti-Bls2 antibody at 1:5,000 dilution and then incubated with 1:10,000 diluted
horseradish peroxidase-conjugated, donkey anti-rabbit secondary antibodies. The
membranes were exposed to x-ray film for 15-20 minutes after treatment with
enhanced chemiluminescence reagents.
When CFE of WT S. clavuligerus grown in Soy or SA media was
subjected to Western analysis, a protein band corresponding to Bls2 was
observed (Figure 3.1.7). The protein appeared to have a slightly lower
molecular weight compared to the standard Bls2 protein (54.5 kDA), as the
band migrated further down on the gel. This is presumably due to the 6 x
His-tag attached to the Bls2 protein standard (Figure 3.1.7). Unlike the
situation for CeaS1 and CeaS2, electrophoresis conditions could not be
found that would allow separation of Bls1 (55 kDA) from Bls2. When CFE
of bls1::neo grown in Soy or SA media was subjected to Western analysis,
110
Figure 3.1.7. Western analysis of Bls in wild type S. clavuligerus and bls mutants.
Cell-free extracts were isolated from Soy or SA grown cultures of (A) WT S.
clavuligerus, (B) bls1::neo, (C) bls1::tsr/bls2::apra and (D) bls2::apra mutants.
Ten microgram amounts of total cellular protein were separated by electrophoresis
on 8% SDS-PAG and transferred to PVDF membranes. Twenty nanograms of
purified His-tagged Bls2 was used as the protein standard. Membranes were
incubated with rabbit anti-Bls2 polyclonal antibodies and then incubated with
horseradish peroxidase-conjugated, donkey anti-rabbit secondary antibodies. After
being treated with enhanced chemiluminescence reagents, membranes were
exposed to x-ray film for 15-20 minutes.
111
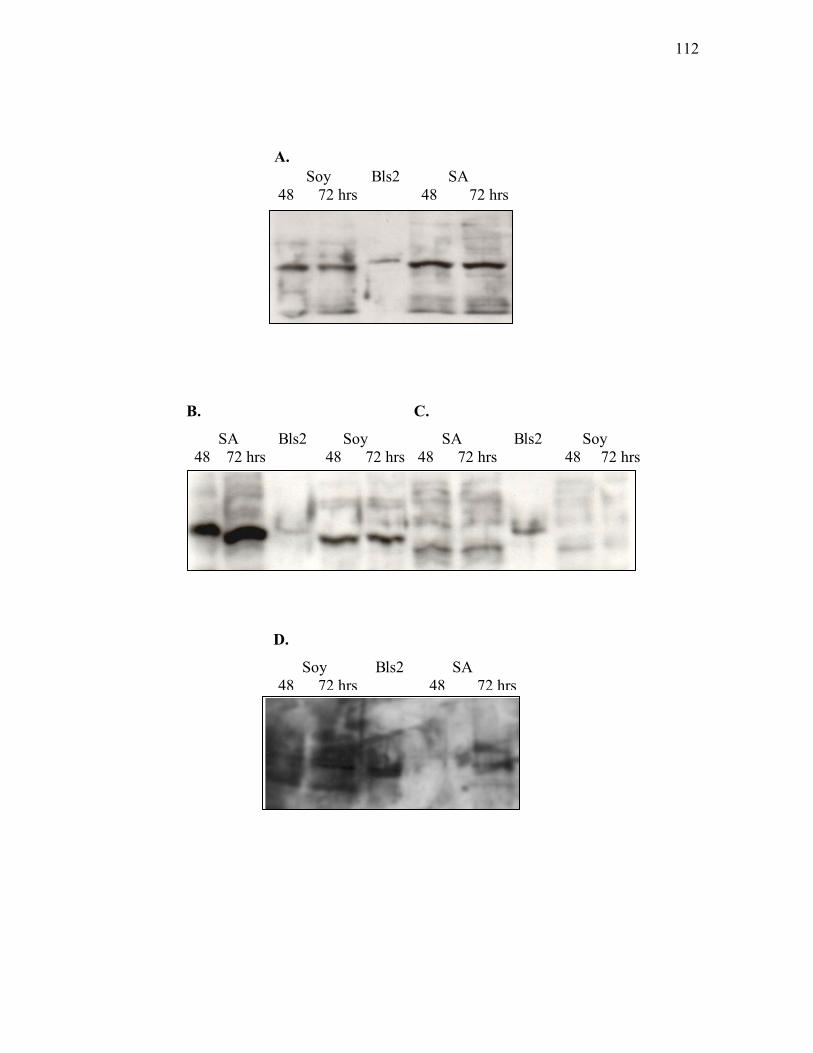
A. Soy Bls2 SA 48 72 hrs 48 72 hrs
C. B.
SA Bls2 Soy 48 72 hrs 48 72 hrs
SA Bls2 Soy 48 72 hrs 48 72 hrs
D.
Soy Bls2 SA 48 72 hrs 48 72 hrs
112

the protein band corresponding to Bls2 was also observed (Figure 3.1.7).
However, when CFE of the bls2::apra, grown in Soy or SA media, was
subjected to Western analysis using the same conditions, no band
corresponding to Bls1 was observed, and gels resembled those seen when
CFE from bls1/bls2 double mutants were analyzed. Only minor amounts of
common cross reacting bands were observed from these two strains (Figure
3.1.7). Unfortunately, no Bls1 protein was available for use as a protein
standard. These results were interpreted to mean that the Bls2-specific
antibody did not recognize Bls1, although the possibility that mutation of
bls2 somehow blocked the expression of bls1 could not be ruled out as
Bls1 and Bls2 proteins show 49% identity, 59% similarity.
When CFEs of ΔceaS2-IF, ΔceaS2::apra, ceaS2-Fs and ceaS2::apra
mutants, grown for 48 and 72 hours in Soy and SA media, were subjected to
Western analysis, signals corresponding to Bls2 protein were not observed,
indicating Bls2 was not produced in any of these mutants (Figure 3.1.8). In
contrast, a protein band corresponding to Bls2 was observed when CFEs of the
ΔceaS1::apra mutant, grown in Soy or SA media, were subjected to analysis
(Figure 3.1.8).
In addition to the inability to separate Bls1 from Bls2 and the uncertainty
about whether the Bls2 antibodies were recognizing Bls1, Western analyses for
Bls were also severely hampered by the quality of the anti-Bls antibodies
available. The anti-Bls2 antibody generated a much weaker signal with high
background noise compared to the anti-CeaS2 antibody. Although approaches
113
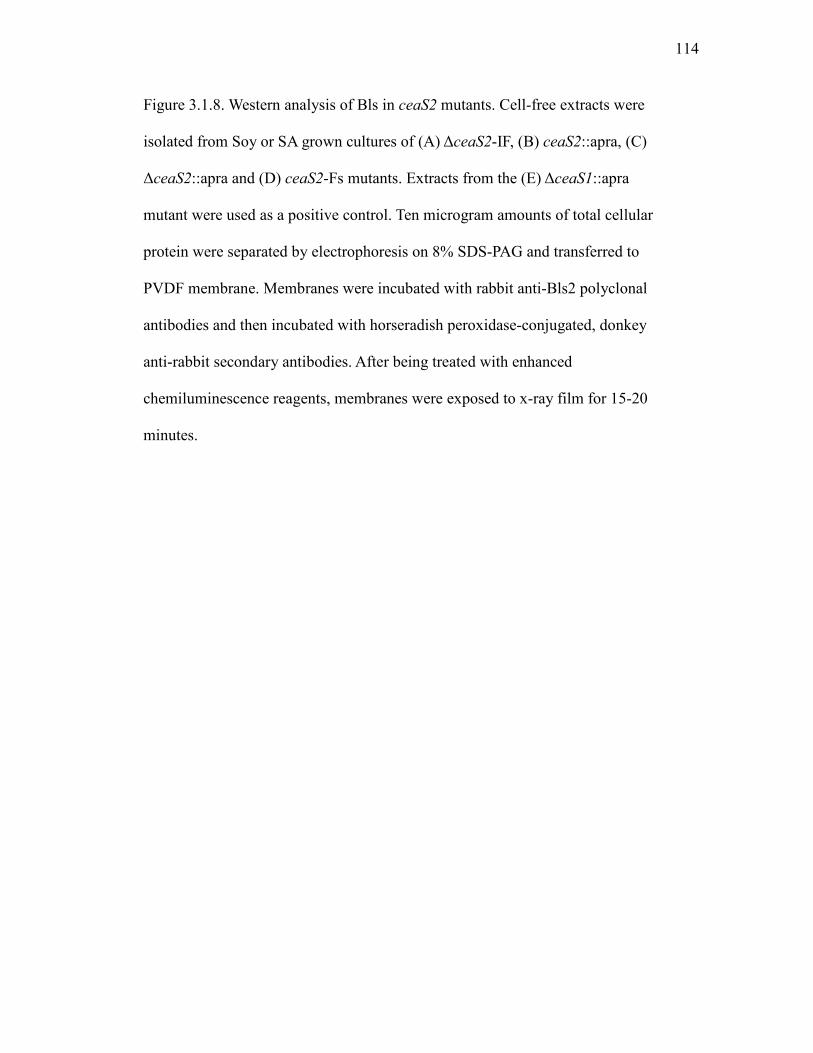
Figure 3.1.8. Western analysis of Bls in ceaS2 mutants. Cell-free extracts were
isolated from Soy or SA grown cultures of (A) ΔceaS2-IF, (B) ceaS2::apra, (C)
ΔceaS2::apra and (D) ceaS2-Fs mutants. Extracts from the (E) ΔceaS1::apra
mutant were used as a positive control. Ten microgram amounts of total cellular
protein were separated by electrophoresis on 8% SDS-PAG and transferred to
PVDF membrane. Membranes were incubated with rabbit anti-Bls2 polyclonal
antibodies and then incubated with horseradish peroxidase-conjugated, donkey
anti-rabbit secondary antibodies. After being treated with enhanced
chemiluminescence reagents, membranes were exposed to x-ray film for 15-20
minutes.
114
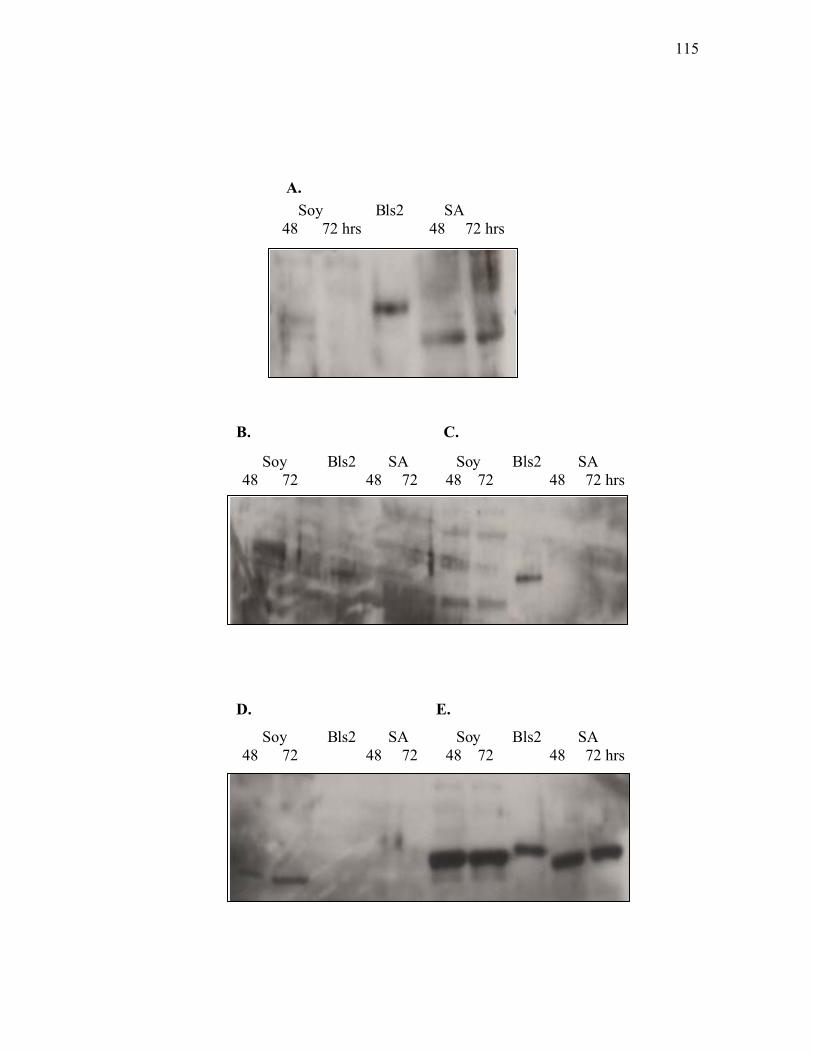
C.
D.
B.
A.
E.
Soy Bls2 SA Soy Bls2 SA 48 72 48 72 48 72 48 72 hrs
Soy Bls2 SA 48 72 hrs 48 72 hrs
Soy Bls2 SA Soy Bls2 SA 48 72 48 72 48 72 48 72 hrs
115

were undertaken to clean up the antiserum in order to reduce background noise
and cross-reacting bands, none of these gave consistently improved quality.
Similarly, different conditions (amounts of blocking agent and antibodies) were
tested when developing the Western blot procedure, but again, no significant
improvement was observed. The anti-Bls2 antibodies used were from a previous
study in which they were prepared using purified Bls2 protein provided by C.
Schofield, Oxford University. No expression constructs were available to prepare
Bls1 or additional Bls2 protein or new anti-Bls antibodies, and so this aspect of
the project was abandoned in favour of a RT-PCR approach.
3.1.5 Reverse transcriptase-PCR analysis
3.1.5.1 Effect of ΔceaS2-IF mutation on ceaS1 and bls2 transcription
Reverse transcriptase PCR (RT-PCR) was carried out to investigate further
if the impairment of CeaS1 production in the ΔceaS2-IF mutant occurred at the
transcriptional or translational level. It was also used to investigate whether
polarity due to the 81-bp scar left by using the REDIRECT PCR targeting system
to remove the ceaS2 gene is still an issue in the ΔceaS2-IF mutant, as determined
by analyzing bls2 transcript levels.
Total RNAs were isolated from WT S. clavuligerus, ΔceaS1::apra and
ΔceaS2-IF mutants after growing for 48 hours in Soy liquid medium. Reverse
primers (Table 2.4) were used to generate cDNA and then specific primer pairs
(Table 2.4) were used to determine if the genes of interest were being transcribed
in the mutant strains. The primer pairs ceaS1-RT-For/ceaS1-RT-Rev, ceaS2-RT-
116

For/ceaS2-RT-Rev, bls1 forward/bls1 reverse, CAN169/CAN170 (bls2 specific
primers) and hrdB RT-forward/hrdB RT-reverse were used for PCR amplification
of 433-bp ceaS1, 452-bp ceaS2, 600-bp bls1, 443-bp bls2 and 350-bp hrdB RT-
PCR products, respectively. PCR reactions were carried out for 28 cycles and
signal intensities were compared to WT S. clavuligerus. The hrdB gene encodes a
constitutively expressed sigma factor in Streptomyces and its transcription level
served as a control for RNA quality from different strains.
When RNA of WT S. clavuligerus isolated from Soy grown cultures was
subjected to RT-PCR, DNA bands of the expected size representing ceaS1, ceaS2,
bls1 and bls2 were observed (Figure 3.1.9). This indicated ceaS1, ceaS2, bls1 and
bls2 were transcribed normally in the WT strain. When RNA of ΔceaS1::apra was
subjected to RT-PCR using the same conditions, only ceaS2 and bls2 transcripts
were observed (Figure 3.1.9), thus indicating ceaS1 and bls1 were not transcribed
in a ceaS1 mutant. This was expected as previous studies showed that these two
genes are transcribed together as a polycistronic transcript. Therefore, insertion of
the apr gene cassette to disrupt ceaS1 was expected to have a polar effect on the
transcription of the bls1 gene. Similarly, when RNA of the ΔceaS2-IF mutant was
analyzed by RT-PCR, signals from ceaS2 were not detected, but nor were
transcripts for bls2 and bls1, and only a faint band corresponding to ceaS1 was
observed (Figure 3.1.9). This indicated that transcription of bls2 was blocked in
the ΔceaS2-IF mutant despite its supposedly non-polar character. Furthermore,
transcription of ceaS1 and bls1 was severely impaired or absent in the ceaS2
mutant. On the other hand, all tested samples showed a similar level of hrdB
117

Figure 3.1.9. Assessment of transcript levels by RT-PCR. Transcripts examined
were: ceaS1 (lanes 1, 8 and 14), ceaS2 (lanes 2, 9 and 15), hrdB (lanes 3, 10 and
16), bls1 (lanes 4, 11 and 17) and bls2 (lanes 5, 12 and 18). RNA from wild type
(WT) S.clavuligerus, ΔceaS2-IF and ΔceaS1::apra mutants grown on liquid Soy
medium for 48 hours were used as the template. PCR reactions were carried out
for 28 cycles. Lane M, GeneRuler 100bp DNA ladder. Lanes 6, 13 and 19
represent negative controls for each RNA sample used; no reverse transcriptase
was added.
118
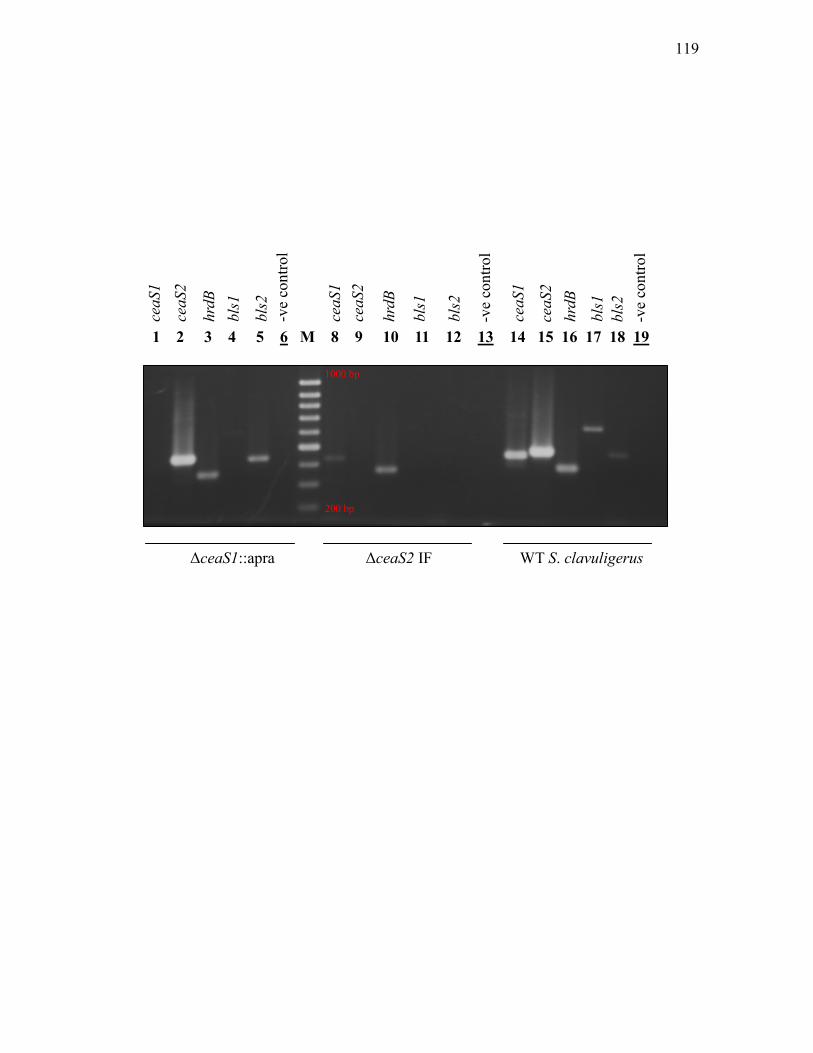
ΔceaS1::apra ΔceaS2 IF WT S. clavuligerus
1 2 3 4 5 6 M 8 9 10 11 12 13 14 15 16 17 18 19
200 bp
1000 bp
ceaS
1 ce
aS2
ceaS
2 ce
aS1
ceaS
1
hrdB
bl
s1
bls2
bls1
hrdB
bls2
bls1
hrdB
ceaS
2
-ve
cont
rol
bls2
-ve
cont
rol
-ve
cont
rol
119
transcripts (Figure 3.1.9). RT-PCR analysis was repeated multiple times, and
representative results are shown in Figure 3.1.9. The identities of the amplified
PCR products, aside from product size, were also confirmed by sequencing and
then compared to the known sequences of the corresponding genes (data not
shown).
3.1.5.2 Investigation of transcription of other clavam biosynthetic genes in the
ΔceaS2-IF mutant by RT-PCR
Tight regulation of secondary metabolism is advantageous to the cell by
conserving limited resources for other essential cell processes. Since ceaS1
transcription was severely impaired and essentially all clavam production was
abolished in a ΔceaS2-IF mutant (Table 1.1 and 3.1), it was postulated that other
5S clavam-related biosynthetic genes in addition to ceaS1 and its downstream
genes, might also be regulated in a similar manner in the ΔceaS2-IF mutant.
Therefore, RT-PCR was undertaken to examine transcription of cas1, cvm1, cvm5
from the clavam gene cluster (Figure 1.4) and c6p, c7p, snk, res1, res2 and orfA
from the paralogue gene cluster (Figure 1.5).
RNA used in this study was isolated from wild type S. clavuligerus and
the ∆ceaS2-IF mutant after growing for 96 hours, in which 5S clavam production
was at the maximal level, in Soy liquid medium. cDNA was first generated by
using the reverse primers listed in Table 2.4. The primer pairs c7p RT-
forward/c7p RT-reverse, ceaS1-RT-For/ceaS1-RT-Rev, ceaS2-RT-For/ceaS2-RT-
Rev, cvm5 RT-forward/cvm5 RT-reverse, cvm6p RT-forward/cvm6p RT-reverse,
120
hrdB RT-forward/hrdB RT-reverse, orfA RT-forward/orfA RT-reverse, res1 RT-
forward/res1 RT-reverse, res2 RT-forward/res2 RT-reverse and snk RT-
forward/snk RT-reverse were then used for PCR amplification of 485-bp c7p,
433-bp ceaS1, 452-bp ceaS2, 303-bp cvm5, 512-bp c6p, 350-bp hrdB, 354-bp
orfA, 312-bp res1, 339-bp res2 and 339-bp snk RT-PCR products, respectively.
PCR reactions were carried out for 25 and 30 cycles as a semi-quantitative
measure to determine if transcription was completely blocked or changed to an
altered level compared to WT S. clavuligerus. The hrdB transcription was again
monitored as a quality control.
Bands corresponding to cvm5, c6p and cas1 could not be observed in the
∆ceaS2-IF mutant (Figure 3.1.10 and 3.1.11). In contrast, transcripts of orfA, snk,
res1, res2 and c7p were detected (Figure 3.1.10, 3.1.11 and 3.1.12). Transcripts of
all of these genes could be detected in WT S. clavuligerus (Figure 3.1.10, 3.1.11
and 3.1.12). This indicated that, in addition to ceaS1, the transcription of some
other early (cas1) and late (cvm5 and c6p) clavam biosynthetic genes is regulated
by a common but as yet unknown mechanism, such that their transcription is
blocked in ceaS2 mutants. In contrast, transcription of the alanylclavam-specific
gene, orfA, the elements of the two-component regulatory system, snk, res1 and
res2, and the pathway specific transcriptional regulator, c7p, are not controlled by
this mechanism.
3.1.6 Promoter activity analysis by use of egfp
121

Figure 3.1.10. Assessment of cvm5, c7p, c6p and hrdB transcript levels by RT-
PCR. For each gene under investigation, RNA from wild type (WT) S.
clavuligerus (lanes 1, 6, 11 and 16), ΔceaS2-IF (lanes 2, 7, 12 and 17), Δres2::apra
(lanes 3, 8, 13 and 18) and Δres1::apra (lanes 4, 9, 14 and 19) mutants grown on
liquid Soy medium for 96 hours were used as the template, respectively. (A) PCR
reactions carried out for 25 cycles. (B) PCR reactions carried out for 30 cycles.
Lane M, GeneRuler 100 bp DNA ladder.
122
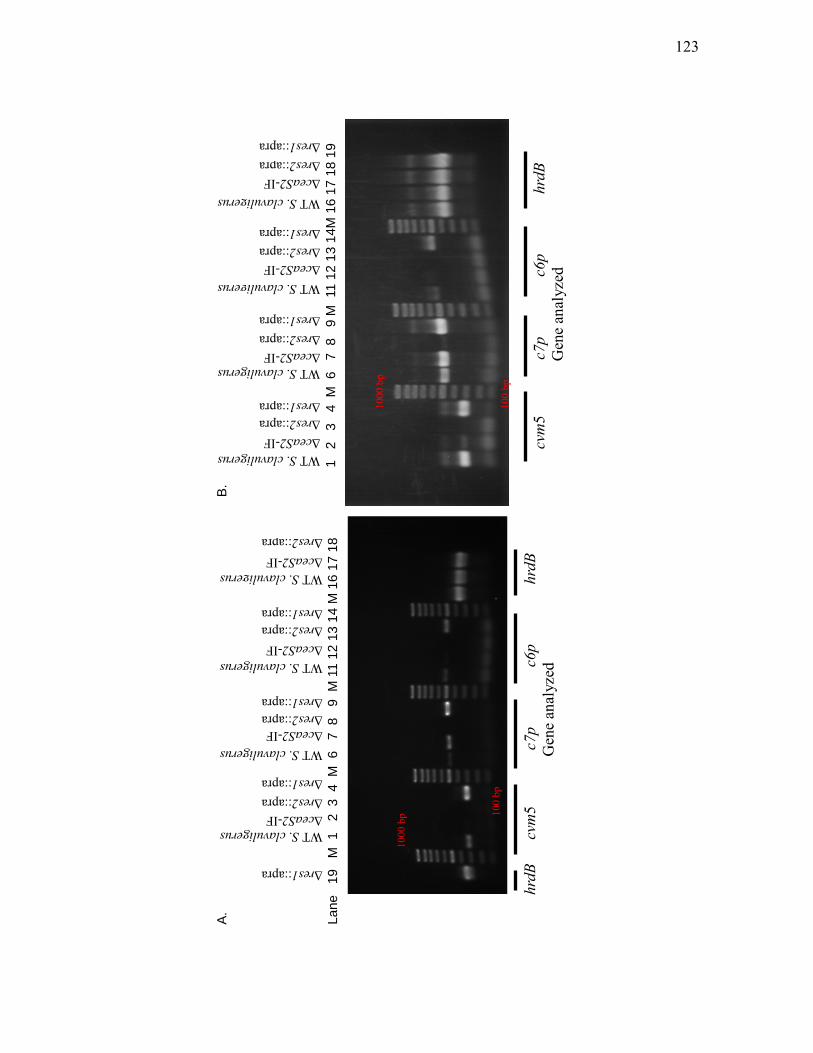
1
2 3
4
M 6
7
8
9 M
11
12 1
3 14
M 1
6 17
18
19
hrd
B
cvm
5
c
7p
c6p
hrd
B G
ene
anal
yzed
cv
m5
c7p
c6
p
h
rdB
Gen
e an
alyz
ed
1000
bp
1000
bp
100
bp
100
bp
WT S. clavuligerus
WT S. clavuligerus
WT S. clavuligerus
WT S. clavuligerus
Lane
19
M
1
2 3
4 M
6
7 8
9
M 1
1 12
13
14 M
16
17 1
8
ΔceaS2-IF
ΔceaS2-IF
ΔceaS2-IF
ΔceaS2-IF
Δres2::apra
Δres2::apra
Δres2::apra
Δres2::apra
Δres1::apra
Δres1::apra
Δres1::apra
Δres1::apra
WT S. clavuligerus
WT S. clavuligerus
WT S. clavuligerus
ΔceaS2-IF
ΔceaS2-IF
ΔceaS2-IF
Δres2::apra
Δres2::apra
Δres2::apra
Δres1::apra
Δres1::apra
Δres1::apra
Δres2::apra
Δres1::apra
WT S. clavuligerus
ΔceaS2-IF
A.
B.
123
Figure 3.1.11. Assessment of cas1, cvm1, res1 and res2 transcript levels by RT-
PCR. For each gene under investigation, RNA from WT S. clavuligerus (lanes 1, 6,
11 and 16), ΔceaS2-IF (lanes 2, 7, 12 and 17), Δres2::apra (lanes 3, 8, 13 and 18)
and Δres1::apra (lanes 4, 9, 14 and 19) mutants grown on liquid Soy medium for
96 hours were used as the template, respectively. (A) PCR reactions carried out
for 25 cycles. (B) PCR reactions carried out for 30 cycles. Lane M, GeneRuler
100bp DNA ladder.
124

Lane
1
2 3
4 M
6 7
8
9 M
11
12 1
3 14
M 1
6 17
18
19
1
2
3
4 M
6 7
8
9 M
11 1
2 13
14M
16
17 1
8 19
cas
1
cv
m1
r
es1
res2
G
ene
anal
yzed
c
as1
cvm
1
res
1
re
s2
Gen
e an
alyz
ed
1000
bp
1000
bp
100
bp
100
bp
WT S. clavuligerus
WT S. clavuligerus
ΔceaS2-IF
ΔceaS2-IF
ΔceaS2-IF
Δres2::apra
Δres2::apra
Δres2::apra
Δres1::apra
Δres1::apra
Δres1::apra
Δres2::apra
Δres1::apra
WT S. clavuligerus
ΔceaS2-IF
B.
WT S. clavuligerus
WT S. clavuligerus
ΔceaS2-IF
ΔceaS2-IF
ΔceaS2-IF
Δres2::apra
Δres2::apra
Δres2::apra
Δres1::apra
Δres1::apra
Δres1::apra
Δres2::apra
Δres1::apra
WT S. clavuligerus
ΔceaS2-IF
A.
WT S. clavuligerus
WT S. clavuligerus
125
Figure 3.1.12. Assessment of orfA, ceaS1, ceaS2 and snk transcript levels by RT-
PCR. For each gene under investigation, RNA from WT S. clavuligerus (lanes 1, 6,
11 and 16), ΔceaS2-IF (lanes 2, 7, 12 and17), Δres2::apra (lanes 3, 8, 13 and 18)
and Δres1::apra (lanes 4, 9, 14 and 19) mutants grown on liquid Soy medium for
96 hours were used as the template, respectively. Lanes 21 to 24 represent
negative controls for each RNA sample being used where no reverse transcriptase
was added. (A) PCR reactions carried out for 25 cycles. (B) PCR reactions carried
out for 30 cycles. Lane M, GeneRuler 100bp DNA ladder.
126
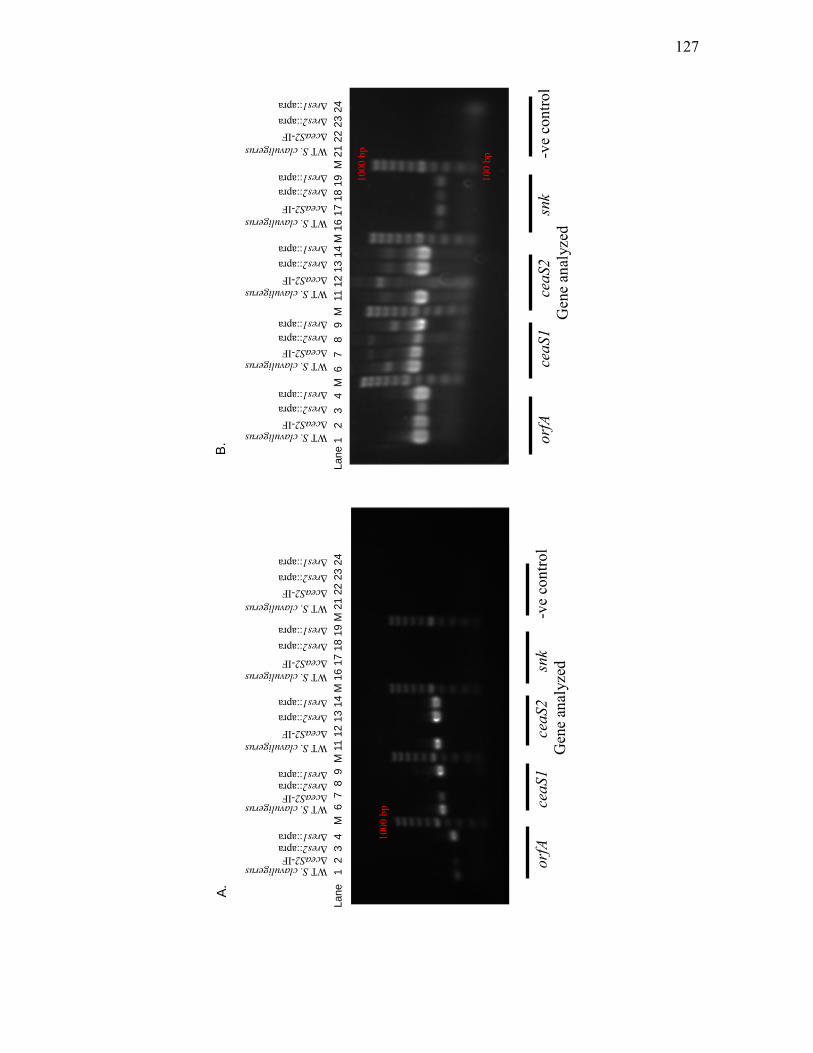
Lan
e 1
2 3
4
M 6
7 8
9 M
11
12 1
3 14
M 1
6 17
18
19 M
21
22 2
3 24
La
ne 1
2
3
4 M
6
7 8
9
M 1
1 12
13
14 M
16
17 1
8 19
M 2
1 22
23
24
orfA
cea
S1
c
eaS2
snk
-ve
cont
rol
Gen
e an
alyz
ed
orfA
ceaS
1
c
eaS2
s
nk
-ve
cont
rol
Gen
e an
alyz
ed
1000
bp
100
bp
1000
bp
ΔceaS2-IF Δres2::apra Δres1::apra
WT S. clavuligerus
ΔceaS2-IF Δres2::apra Δres1::apra
WT S. clavuligerus
ΔceaS2-IF Δres2::apra Δres1::apra
WT S. clavuligerus
ΔceaS2-IF Δres2::apra Δres1::apra
WT S. clavuligerus
ΔceaS2-IF Δres2::apra Δres1::apra
WT S. clavuligerus
ΔceaS2-IF Δres2::apra Δres1::apra
WT S. clavuligerus
ΔceaS2-IF Δres2::apra Δres1::apra
WT S. clavuligerus
ΔceaS2-IF Δres2::apra Δres1::apra
WT S. clavuligerus
ΔceaS2-IF Δres2::apra Δres1::apra
WT S. clavuligerus
ΔceaS2-IF Δres2::apra Δres1::apra
WT S. clavuligerus
A.
B.
127
To confirm the original results obtained from RT-PCR that ceaS1 was not
transcribed efficiently in a ∆ceaS2-IF mutant, promoter activity of ceaS1 was
examined by using enhanced green fluorescence protein (EGFP) as a reporter.
pSET-ceaS1 carrying the promoter region of ceaS1 coupled to a promoterless egfp
gene previously constructed in the lab by K. Tahlan, was conjugated into the
ΔceaS2-IF mutant and WT S. clavuligerus strain, and integrated at the attB site on
the chromosome. The resulting S. clavuligerus reporter strains were grown in
liquid Soy medium for 48 hours. Mycelia were then harvested and analyzed by
confocal microscopy to determine promoter activity by examining fluorescence
due to EGFP production and excitation. Duplicates were setup for each reporter
strain and fluorescence was observed when samples of WT S. clavuligerus
carrying pSET-ceaS1 were examined, but no fluorescence was observed from the
ΔceaS2-IF reporter strains (Figure 3.1.13). This indicated that the ceaS1 promoter
is not active in the ΔceaS2-IF mutant.
3.1.7 Clavulanic acid production revisited
The studies described above employed cultures of S. clavuligerus strains
grown in liquid Soy medium and showed that mutation of the ceaS2 gene affected
transcription of a large number of clavam biosynthesis related genes. However,
when culture extracts of ΔceaS2-IF mutants grown on solid Soy medium were
obtained by the freeze and squeeze procedure and analyzed by HPLC, peaks
corresponding to clavulanic acid and 5S clavams were detected and production of
clavulanic acid was seen to be taking place at or near wild type levels (Figure
3.1.14). This unexpected production of clavam metabolites on solid medium when
128

Figure 3.1.13. Detection of ceaS1 promoter activity in wild type and ΔceaS2
mutant strains of S. clavuligerus by using EGFP as a reporter. (A) Mycelia of WT
S. clavuligerus carrying pSET-ceaS1 reporter. (B) Mycelia of ΔceaS2-IF carrying
pSET-ceaS1 reporter. Both reporter strains were grown in liquid Soy medium for
48 hours and then analyzed by confocal microscopy. Fluorescence images are
shown in section 1. Differential interference contrast (DIC) images are shown in
section 2.
129
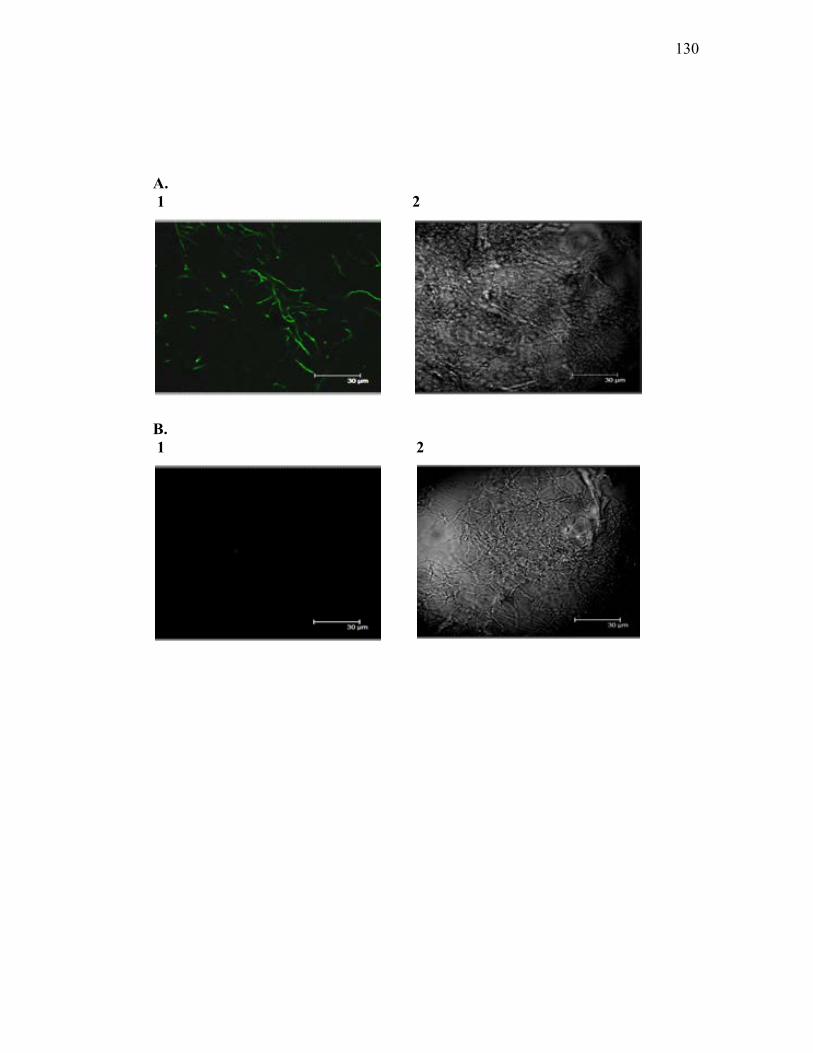
A. 1 2
B. 1 2
130
Figure 3.1.14. Clavam metabolites produced by S. clavuligerus and ΔceaS2-IF
mutants grown on solid Soy medium. Culture supernatants obtained by the freeze
and squeeze procedure were diluted (1/5) and analyzed via HPLC. The peaks are
as follows: AC: alanylclavam; C2C: clavam-2-carboxylate; 2HMC: 2-
hydroxymethylclavam; CA: clavulanic acid.
131

AC
2HMC
CA
C2C
2HMC
CA C2C AC
Wild Type
ΔceaS2-IF
Retention Time (minutes)
Retention Time (minutes)
Abs
orba
nce
Uni
t A
bsor
banc
e U
nit
132
no production was seen on liquid medium suggested that the already complicated
cross regulation between ceaS2 and genes involved in clavam biosynthesis must
require some additional unknown factors that are involved in sensing the physical
nature of the surrounding environment. Under this scenario, it would be difficult
to resolve and identify the factor(s) that may be involved. Therefore, the focus of
this study was switched to investigate the regulatory elements that control the late
steps of the 5S clavam biosynthetic pathway.
3.2 Analysis of the regulation of the late steps of 5S clavam biosynthesis
Previous studies have shown that a number of genes, including cvm1,
cvm2, cvm5 and c6p, encoding apparent biosynthetic enzymes, are specifically
required for 5S clavam biosynthesis but not for clavulanic acid production (Tahlan
et al., 2007; Zelyas, 2007). Furthermore, it has also been shown that disruption of
res2, snk or c7p, encoding apparent regulatory proteins, abolished 5S clavam
production (Zelyas, 2007). Due to the close proximity of these regulatory genes to
5S clavam biosynthetic enzyme genes (Figure 1.5), it was suspected that they may
play a role in regulating expression of the genes responsible for 5S clavam
production. Studies were therefore initiated to investigate how the transcriptional
regulator, C7P, and the two-component system control 5S clavam production.
3.2.1 Phenotype of Δsnk-IF, Δres1::apra, Δres2::apra and Δc7p::apra mutants
In view of the observation that growth medium type (solid agar plate
versus liquid) had a tremendous and unanticipated effect on ΔceaS2-IF mutant
phenotype as described in section 3.1.8, it was first essential to examine the
133

clavam production profiles of Δsnk-IF, Δc7p::apra, Δres2::apra and Δres1::apra
mutant strains to ensure that their phenotypes did not depend on the physical form
of the medium. Various mutant strains were grown on solid Soy medium for 7 to
10 days and culture extracts were obtained by using the freeze and squeeze
procedure and analyzed by HPLC. Clavulanic acid was detected in the culture
extracts from all of these mutants (Figure 3.2.1). Alanylclavam, clavam-2-
carboxylate, 2-hydroxymethylclavam and 2-formyloxymethylclavam were not
detected in extracts from Δsnk-IF, Δres2::apra and Δc7p::apra mutants while
Δres1::apra mutants still capable of producing clavam metabolites (Figure 3.1.14
and 3.2.1). Each of these mutants was shown to have the same phenotype as was
observed previously when grown in liquid medium (Zelyas, 2007).
3.2.2 Transcript analysis by RT-PCR
Since Res2 and C7P, encoded by res2 and c7p respectively, are apparent
regulatory proteins, it was postulated that these two proteins may control the
transcription of genes involved in 5S clavam production. RT-PCR was carried out
to investigate this hypothesis. Analysis was carried out multiple times and
representative results are shown in the following figures.
RNA used in this study was isolated from wild type S. clavuligerus, ∆snk-
IF, ∆c7p::apra, ∆res1::apra and ∆res2::apra mutants after growing for 96 hours in
Soy liquid medium. The reverse primers (Table 2.4) used to generate cDNA and
specific primer pairs used to amplify RT-products were described previously
3.1.6.2, and listed in Table 2.4. PCR reactions were carried out for 25 and 30
134
Figure 3.2.1. Clavam metabolites produced by Δsnk-IF, Δres2::apra, Δc7p::apra
and Δres1::apra mutants grown on solid Soy medium. Culture supernatants
obtained by the freeze and squeeze procedure were diluted (1/5) and analyzed via
HPLC. The peaks are as follows: AC: alanylclavam; C2C: clavam-2-carboxylate;
2HMC: 2-hydroxymethylclavam; CA: clavulanic acid.
135
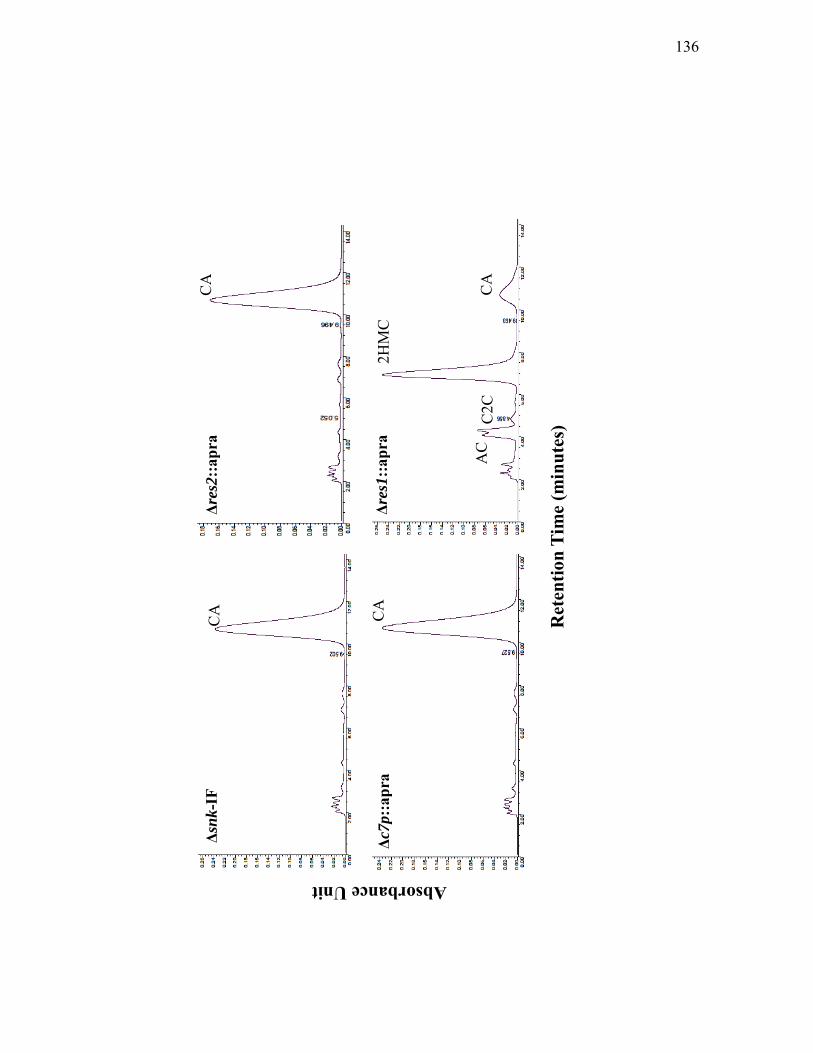
Δsnk
-IF
Δres
2::a
pra
Δc7p
::apr
a Δr
es1:
:apr
a
CA
CA
CA
CA
2HM
C
C2C
A
C
Ret
entio
n Ti
me
(min
utes
)
Absorbance Unit
136
cycles as a semi-quantitative measure to determine if transcription was blocked or
genes were transcribed at an altered level compared to WT S. clavuligerus. The
hrdB transcription again served as a control.
Transcripts of cvm1, cvm5, c7p and c6p, which are all essential for 5S
clavam biosynthesis, could not be detected, or were transcribed at greatly reduced
levels, in Δsnk-IF or Δres2::apra mutants as determined by RT-PCR (Figure
3.1.10, 3.1.11, 3.2.2 and 3.2.4). Interestingly, cas1 transcripts were not detected in
these mutants, suggesting that this two-component system also controls
transcription of some of the early genes (Figure 3.1.11 and 3.2.2). Similarly,
transcripts of cvm1, cvm5 and cas1 were not detected when RNA isolated from a
∆c7p::apra mutant was subjected RT-PCR (Figure 3.2.2). Transcription of c7p
was abolished or reduced in res2 and snk mutants, respectively, but transcription
of snk, res1 and res2, the genes of the two-component system, was not affected in
a c7p mutant (Figure 3.1.10, 3.2.3 and 3.2.4). This indicated that the two-
component system operates at a higher level in the regulatory hierarchy than C7P.
cvm1 and orfA transcripts were detected at elevated levels in a ∆res1::apra mutant
(Figure 3.1.11 and 3.1.12). Despite the differences in transcription profiles from
various strains, hrdB transcripts were detected at similar levels in all samples
tested, thus validating the results obtained (Figure 3.1.10 and 3.2.2). Transcription
profiles of various strains being tested in this study are summarized in Table 3.2.
3.2.3 Protein overproduction and purification
137
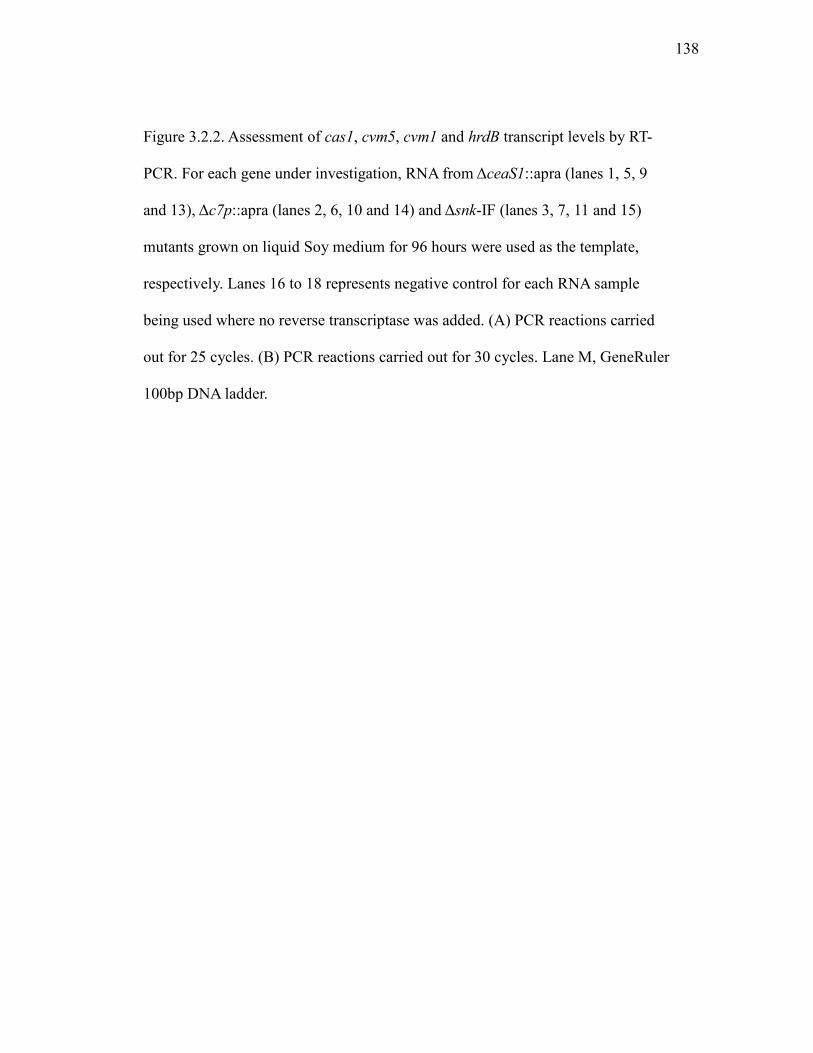
Figure 3.2.2. Assessment of cas1, cvm5, cvm1 and hrdB transcript levels by RT-
PCR. For each gene under investigation, RNA from ΔceaS1::apra (lanes 1, 5, 9
and 13), Δc7p::apra (lanes 2, 6, 10 and 14) and Δsnk-IF (lanes 3, 7, 11 and 15)
mutants grown on liquid Soy medium for 96 hours were used as the template,
respectively. Lanes 16 to 18 represents negative control for each RNA sample
being used where no reverse transcriptase was added. (A) PCR reactions carried
out for 25 cycles. (B) PCR reactions carried out for 30 cycles. Lane M, GeneRuler
100bp DNA ladder.
138
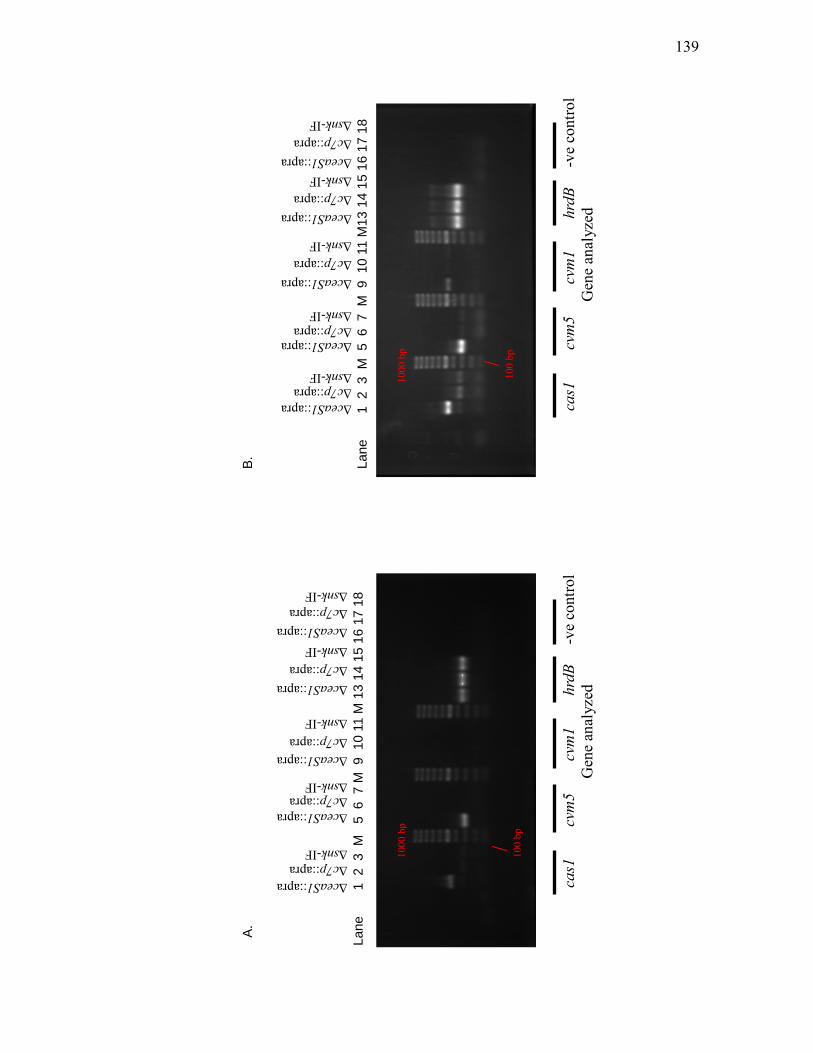
La
ne
1
2 3
M
5 6
7 M
9 1
0 11
M 1
3 14
15
16 1
7 18
La
ne
1
2 3
M 5
6 7
M 9
10
11 M
13 1
4 15
16
17 1
8
cas
1
c
vm5
cvm
1
h
rdB
-v
e co
ntro
l G
ene
anal
yzed
c
as1
cvm
5
c
vm1
hrd
B
-ve
cont
rol
Gen
e an
alyz
ed
1000
bp
1000
bp
100
bp
100
bp
ΔceaS1::apra
ΔceaS1::apra
ΔceaS1::apra
Δc7p::apra
Δc7p::apra
Δsnk-IF
Δsnk-IF
Δc7p::apra
Δsnk-IF
ΔceaS1::apra Δc7p::apra Δsnk-IF ΔceaS1::apra Δc7p::apra Δsnk-IF
ΔceaS1::apra Δc7p::apra Δsnk-IF
ΔceaS1::apra Δc7p::apra Δsnk-IF
ΔceaS1::apra Δc7p::apra Δsnk-IF
ΔceaS1::apra Δc7p::apra Δsnk-IF
ΔceaS1::apra Δc7p::apra Δsnk-IF
A.
B.
139

Figure 3.2.3. Assessment of res1, res2, snk and orfA transcript levels by RT-PCR.
For each gene under investigation, RNA from ΔceaS1::apra (lanes 1, 5, 9 and 13),
Δc7p::apra (lanes 2, 6, 10 and 14) and Δsnk-IF (lanes 3, 7, 11 and 15) mutants
grown on liquid Soy medium for 96 hours were used as the template, respectively.
(A) PCR reactions carried out for 25 cycles. (B) PCR reactions carried out for 30
cycles. Lane M, GeneRuler 100bp DNA ladder.
140
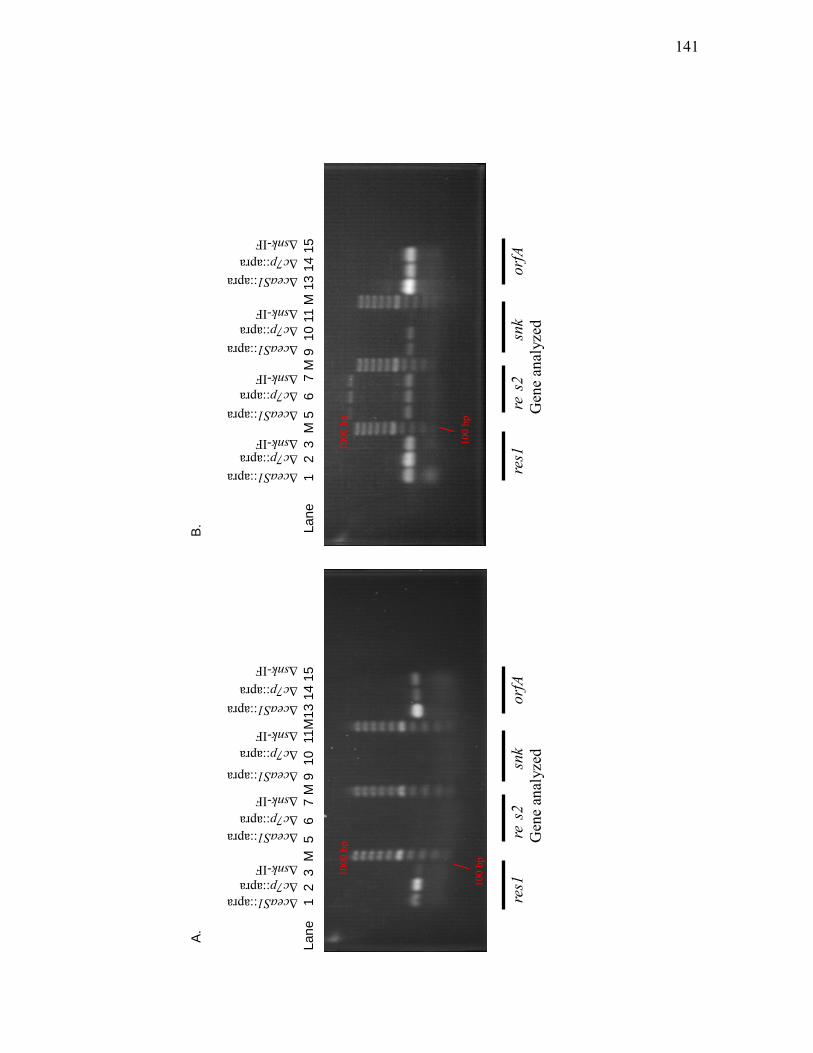
L
ane
1
2 3
M 5
6
7 M
9 1
0 1
1M13
14
15
Lan
e
1
2 3
M 5
6
7 M
9 1
0 11
M 1
3 14
15
re
s1
res2
sn
k
orf
A
Gen
e an
alyz
ed
re
s1
res2
sn
k
orf
A
Gen
e an
alyz
ed
1000
bp
1000
bp
100
bp
100
bp
ΔceaS1::apra
ΔceaS1::apra
ΔceaS1::apra
Δc7p::apra
Δc7p::apra
Δsnk-IF
Δsnk-IF
Δc7p::apra
Δsnk-IF
ΔceaS1::apra Δc7p::apra Δsnk-IF
ΔceaS1::apra
ΔceaS1::apra
ΔceaS1::apra
Δc7p::apra
Δc7p::apra
Δsnk-IF
Δsnk-IF
Δc7p::apra
Δsnk-IF
ΔceaS1::apra Δc7p::apra Δsnk-IF
B.
A.
141
Figure 3.2.4. Assessment of ceaS1, ceaS2, c6p and c7p transcript levels by RT-
PCR. For each gene under investigation, RNA from ΔceaS1::apra (lanes 1, 5, 9
and 13), Δc7p::apra (lanes 2, 6, 10 and 14) and Δsnk-IF (lanes 3, 7, 11 and 15)
mutants grown on liquid Soy medium for 96 hours were used as the template,
respectively. (A) PCR reactions carried out for 25 cycles. (B) PCR reactions
carried out for 30 cycles. Lane M, GeneRuler 100bp DNA ladder.
142
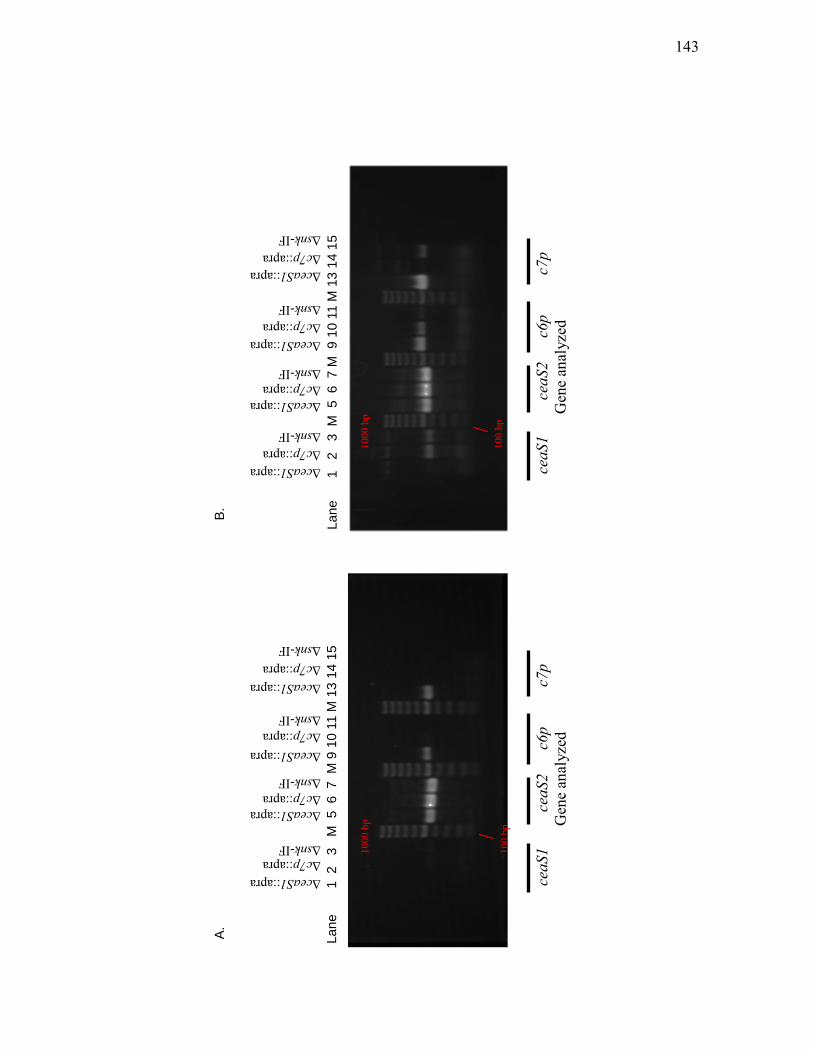
Lane
1 2
3
M 5
6 7
M 9
10
11 M
13
14 1
5 La
ne
1
2
3 M
5 6
7 M
9 1
0 11
M 1
3 14
15
c
eaS1
ce
aS2
c
6p
c7p
G
ene
anal
yzed
cea
S1
ceaS
2
c6p
c
7p
Gen
e an
alyz
ed
1000
bp
1000
bp
100
bp
100
bp
ΔceaS1::apra
ΔceaS1::apra
ΔceaS1::apra
Δc7p::apra
Δc7p::apra
Δsnk-IF
Δsnk-IF
Δc7p::apra
Δsnk-IF
ΔceaS1::apra Δc7p::apra Δsnk-IF
ΔceaS1::apra
ΔceaS1::apra
ΔceaS1::apra
Δc7p::apra
Δc7p::apra
Δsnk-IF
Δsnk-IF
Δc7p::apra
Δsnk-IF
ΔceaS1::apra Δc7p::apra Δsnk-IF
A.
B.
143
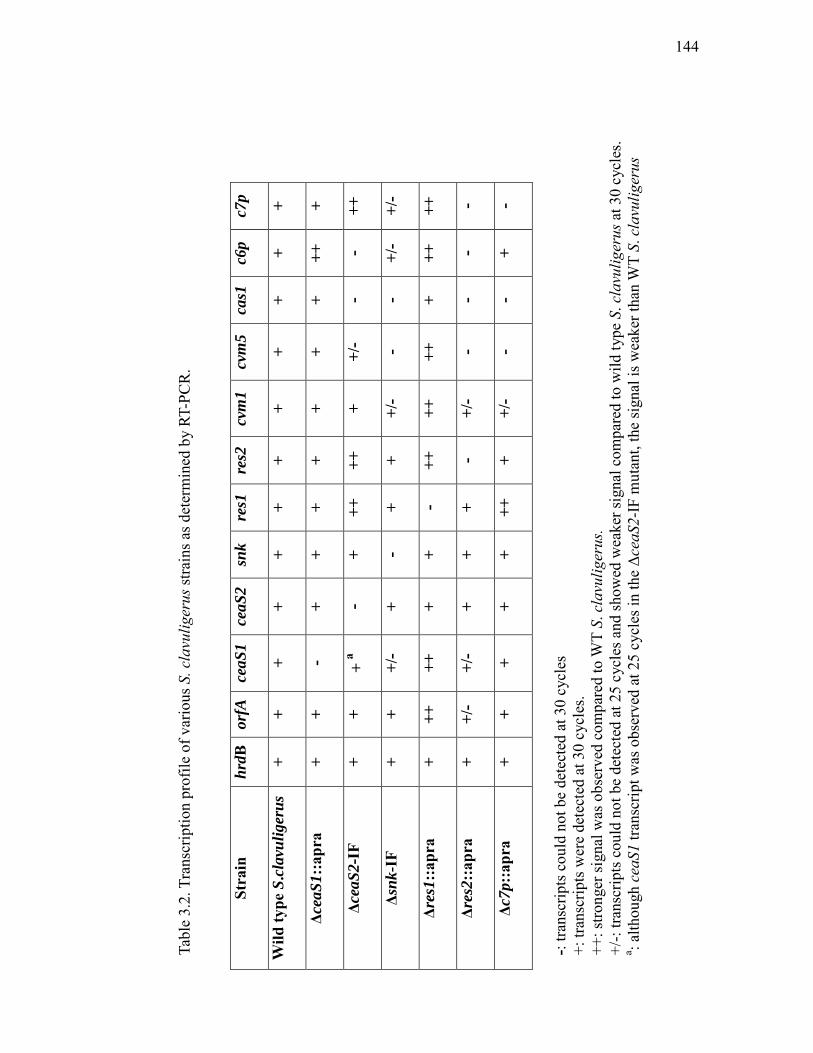
Tabl
e 3.
2. T
rans
crip
tion
prof
ile o
f var
ious
S. c
lavu
liger
us st
rain
s as d
eter
min
ed b
y RT
-PC
R.
St
rain
hr
dB
orfA
ce
aS1
ceaS
2 sn
k re
s1
res2
cv
m1
cvm
5 ca
s1
c6p
c7p
Wild
type
S.c
lavu
liger
us
+ +
+ +
+ +
+ +
+ +
+ +
Δcea
S1::a
pra
+ +
- +
+ +
+ +
+ +
++
+
Δcea
S2-I
F +
+ +
a -
+ ++
++
+
+/-
- -
++
Δsnk
-IF
+ +
+/-
+ -
+ +
+/-
- -
+/-
+/-
Δres
1::a
pra
+ ++
++
+
+ -
++
++
++
+ ++
++
Δres
2::a
pra
+ +/
- +/
- +
+ +
- +/
- -
- -
-
Δc7p
::apr
a +
+ +
+ +
++
+ +/
- -
- +
-
-:
trans
crip
ts c
ould
not
be
dete
cted
at 3
0 cy
cles
+:
tran
scrip
ts w
ere
dete
cted
at 3
0 cy
cles
. ++
: stro
nger
sign
al w
as o
bser
ved
com
pare
d to
WT
S. c
lavu
liger
us.
+/-:
trans
crip
ts c
ould
not
be
dete
cted
at 2
5 cy
cles
and
show
ed w
eake
r sig
nal c
ompa
red
to w
ild ty
pe S
. cla
vulig
erus
at 3
0 cy
cles
. a : a
lthou
gh c
eaS1
tran
scrip
t was
obs
erve
d at
25
cycl
es in
the
Δcea
S2-I
F m
utan
t, th
e si
gnal
is w
eake
r tha
n W
T S.
cla
vulig
erus
144
BLAST analysis of the C7P and Res2 amino acid sequences predicted the
presence of a DNA binding domain within each protein (data not shown). In order
to carry out in vitro protein assays to examine if these two proteins bind DNA, it
was necessary to obtain large quantities of Res2 and C7P proteins.
3.2.3.1 Res2-His7 overproduction and purification
To obtain purified Res2, the res2 coding sequence was cloned (by N.
Zelyas) as an NdeI/BamHI fragment upstream of a 7 x histidine tag in the E. coli
protein expression plasmid, pT7-7His. Production of Res2-His7 was driven by a
T7 promoter and was induced by addition of 0.4 mM IPTG to activate expression
of a T7 RNA polymerase-encoding gene, followed by incubation at 37oC for 5
hours. Cells were harvested by centrifugation, stored frozen overnight and then
treated with lysozyme and sonicated to release overproduced protein. The lysate
was then centrifuged to remove cell debris and Res2-His7 was purified from the
soluble protein fraction.
Since overproduced Res2 carried a 7 x His-tag at the C-terminus, it was
purified by combining the soluble protein fraction obtained from above with Ni-
NTA resin under conditions where His-tagged protein binds to the resin and can
thus be separated from the bulk proteins in the lysate. The entire mixture was
incubated for one hour at 4ºC and after washing away unbound proteins, bound
protein was eluted by using a gradient of imidazole. Each collected fraction was
electrophoresed on a 12% SDS-PAG to identify fractions that contained the
desired protein, which has an expected molecular weight of about 25 kDa (Figure
145
Figure 3.2.5. Purification of Res2-His7 from E. coli BL21(DE3) carrying pT7-
7His-res2. Protein samples were taken at different stages of the overproduction
and purification processes and analyzed by SDS-PAGE. Proteins were visualized
by staining with Coomassie blue. Lane M, PageRuler™ prestained Protein Ladder
Plus molecular weight marker. Lane NI, non-induced total protein sample. Lane I,
induced total protein sample. Lane CL, cleared lysate. Lane WT, wash-through.
Numbers above lanes indicate the concentration of imidazole (in mM) used to
elute the protein samples.
146
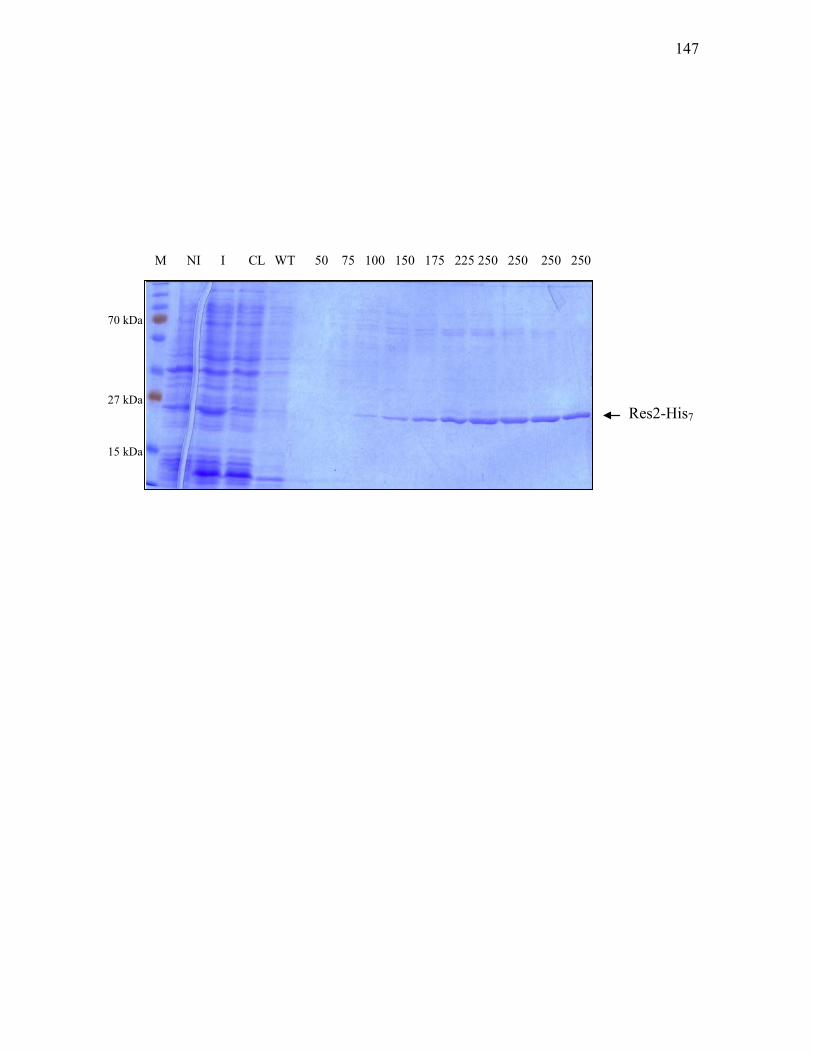
Res2-His7
M NI I CL WT 50 75 100 150 175 225 250 250 250 250
27 kDa
70 kDa
15 kDa
147

3.2.5). Fractions identified as containing Res2-His7 were then pooled and
concentrated using centrifugal concentrators with a molecular weight cutoff of 10
kDA, resuspended in protein storage buffer and stored at -80oC.
3.2.3.2 Construction of a C7P overexpression vector
An E. coli strain expressing c7p was prepared in order to obtain C7P
protein to assess C7P-DNA interactions. The strategy using plasmid pSET152-
snk-c7p and TOPO-c7p (Table 2.3) to prepare this strain is outlined in Figure
3.2.6. pSET152-snk-c7p was originally constructed as a S. clavuligerus
integrative plasmid used to complement c7p mutants. In order to clone the c7p
gene into the protein expression vector pET19b as an NdeI/HindIII fragment, a
585 bp fragment encompassing the 5’ end of c7p with a NdeI restriction site
engineered at the start codon was amplified by PCR and cloned into pCR®2.1-
TOPO® to obtain TOPO-c7p (by S. E. Jensen). pSET152-snk-c7p was digested
with EcoRI and XbaI and the desired snk-c7p fragment was cloned into
pUC119 to obtain pUC119-snk-c7p (by S. E. Jensen). TOPO-c7p was digested
with EcoRI and BstXI and the DNA fragment corresponding to the 5’ end of
c7p with the engineered NdeI site was gel purified after electrophoresis on 1%
agarose gel (Figure 3.2.7). The desired fragment was then ligated with gel
purified pUC119-snk-c7p after EcoRI/BstXI double digestion (Figure 3.2.7) to
obtain pUC119-c7p-complete. The entire coding sequence of c7p was then
cloned into the E. coli protein expression plasmid pET-19b as an NdeI/HindIII
fragment, resulting in the construction of pET-19b-c7p. The insertion and
ligation of the correct fragment was confirmed by using restriction analysis.
148

Figure 3.2.6. Schematic of the process leading to the construction of pET-19b-c7p.
Restriction sites utilized in the process are shown in the diagrams.
149
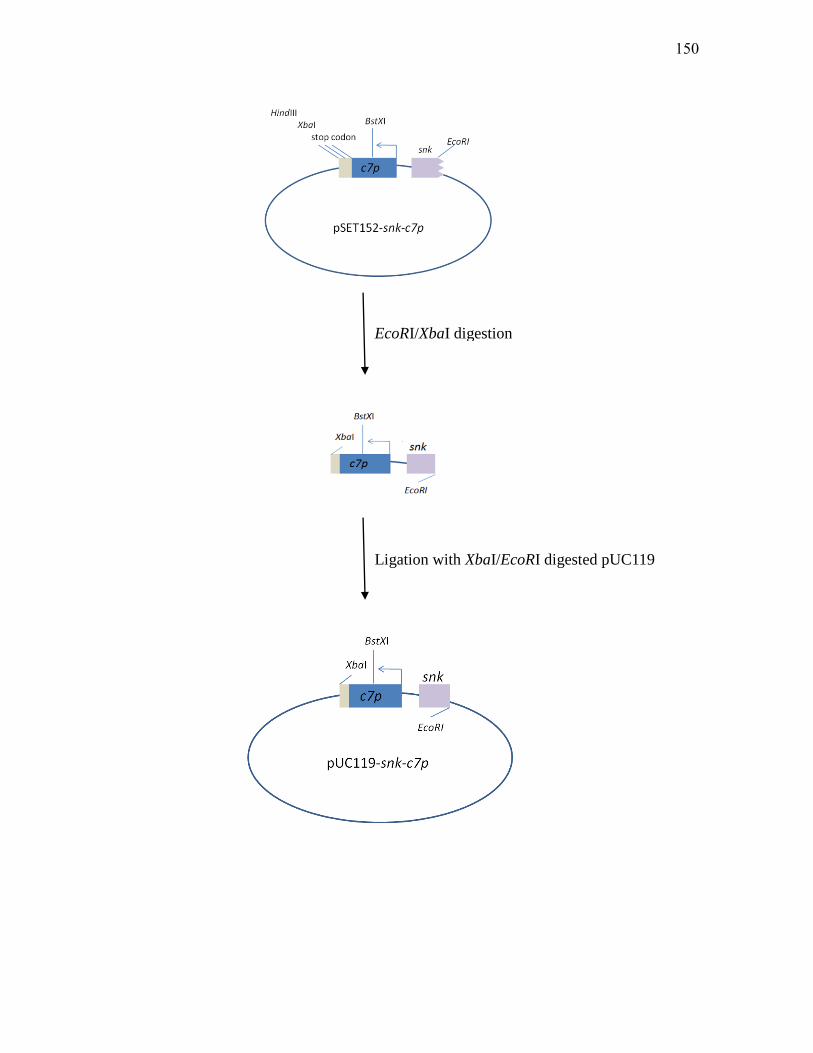
EcoRI/XbaI digestion
Ligation with XbaI/EcoRI digested pUC119
150

Figure 3.2.6. (Continued). Schematic of the process leading to the construction of
pET-19b-c7p. Restriction sites utilized in the process are shown in the diagrams.
151

Ligation
BstXI/EcoRI digestion
Cloned into pET19b as NdeI/HindIII fragment to
obtain pET-19b-c7p
152

Figure 3.2.7. DNA fragments used to construct the c7p expression vector. Lane M,
λ BstEII DNA marker. Lane 1, uncut pUC119-snk-c7p. Lane 2, pUC119-snk-c7p
digested with BstXI. Lane 3, pUC119-snk-c7p digested with EcoRI and BstXI.
Lane 4, purified ~585bp fragment encompassing the 5’ end of c7p.
153

M 1 2 3 4
1,264 1,371
702
1,929 2,323
4,822
bp
7,242 8,454
~585bp c7p fragment
154

DNA fragments corresponding to the ~2.45 kb c7p gene and the ~5.72 kb
pET-19b plasmid vector were observed after NdeI/HindIII restriction digestion
(Figure 3.2.8). This plasmid was then transformed into E. coli DH5α for long
term storage and subsequently into BL21(DE3) for expression.
3.2.3.3 His10-C7P overproduction and purification
The c7p coding sequence was positioned in-frame downstream of a 10 x
histidine tag in pET-19b. Production of His10-C7P was driven by a T7 promoter
and was initiated by addition of 1 mM IPTG, which induced production of T7
RNA polymerase, followed by incubation for 7 hours at 21oC. Cells were
harvested, frozen overnight and then treated to release overproduced protein as
described in Section 2.9.5. The lysate was then centrifuged to remove cell debris
and His10-C7P was purified from the soluble protein fraction.
His10-C7P was purified by combining the soluble protein fraction with Ni-
NTA resin and incubated for an hour at 4ºC. Protein was eluted from the washed
resin by using a gradient of imidazole and each collected fraction was
electrophoresed on 8% SDS-PAG to identify fractions that contained the desired
protein. A high purity preparation of His10-C7P could not be obtained as multiple
protein bands, beside the expected 89 kDa protein band, were observed on the gel
when stained with Coomassie Blue (Figure 3.2.9). This indicated that the
conditions used were not optimal for C7P production. Despite various attempts to
improve C7P production, which included changing the expression temperature
from 21oC to 15oC or 37oC, changing the amount of IPTG added (from 1 mM to
155
Figure 3.2.8. Restriction analysis of pET-19b-c7p protein expression vector. Lane
M, λ BstEII DNA marker. Lane 1, uncut pET-19b-c7p. Lane 2, pET-19b-c7p
digested with NdeI/HindIII.
156

Expected ~2.45 kb c7p
1 2 M
1,929
2,323
3,675
bp
5,686 - -
- -
4,822 - Expected ~5.72 kb pET-19b
157
Figure 3.2.9. Purification of His10-C7P from E. coli BL21(DE3) carrying pET-
19b-c7p. Protein samples were taken at different stages of the overexpression and
purification processes and analyzed by SDS-PAGE. Proteins were visualized by
staining with Coomassie blue. Lane M, PageRuler™ prestained Protein Ladder
Plus molecular weight marker. Lane I, induced total protein sample. Lane CL,
cleared lysate. Lane WT, wash-through. The number above each lane indicates the
concentration of imidazole (in mM) used to elute the protein samples.
158
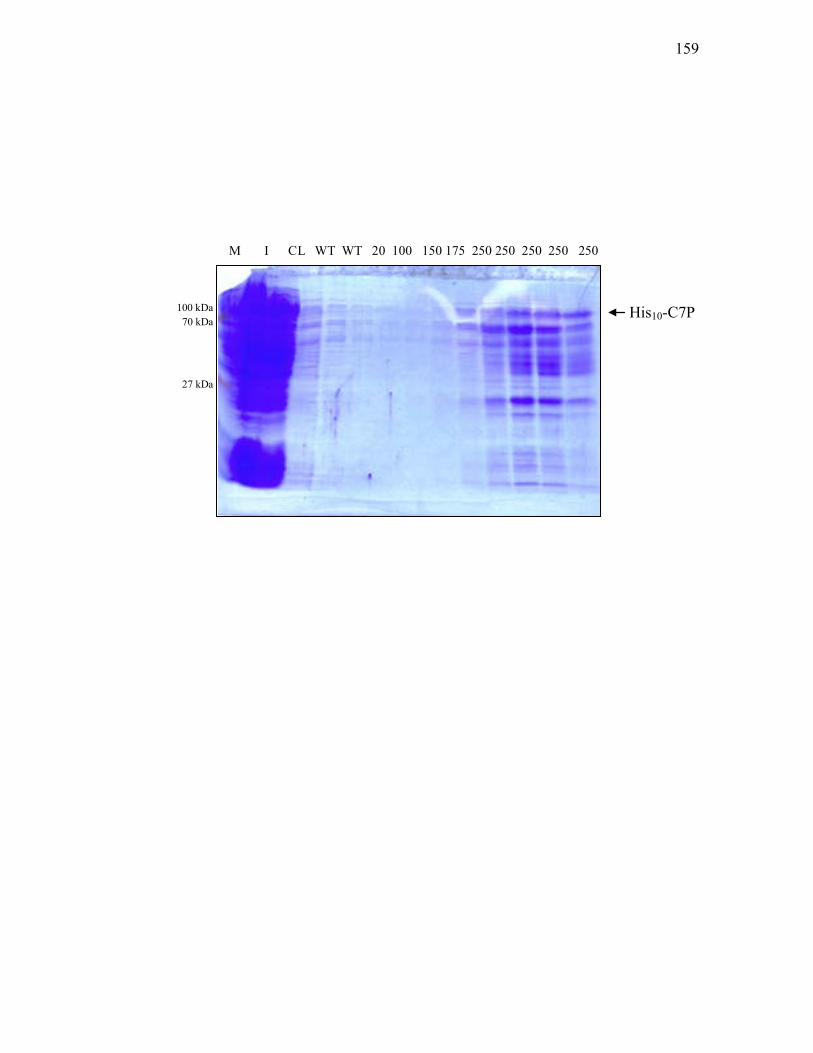
M I CL WT WT 20 100 150 175 250 250 250 250 250
70 kDa
27 kDa
100 kDa His10-C7P
159

0.4 mM) to induce protein production and addition of protease inhibitors to inhibit
protein degradation, similar expression patterns were observed (data not shown).
It is possible that C7P, as a transcriptional regulator, is not stable and has a high
turnover rate to ensure a dynamic response. C7P might have started to degrade
once produced in BL21(DE3) even before lysis of the cells. Therefore, fractions
containing the desired protein from the initial expression were concentrated using
centrifugal concentrators to give a preparation enriched in His10-C7P, and stored
at -80oC for future use after resuspending in protein storage buffer.
3.2.4 Protein-DNA interactions
Protein-sequence analysis of C7P and Res2 indicated that these two
proteins have DNA-binding domains, which suggests they may exert their effects
by binding to promoter regions of their targets. Electrophoretic mobility shift
assays (EMSAs) were carried out to investigate this hypothesis. All EMSA work
described below was carried out multiple times with various condition changes
and the best results are shown in the following figures.
3.2.4.1 Analysis of Res2-DNA interactions by EMSA
Once Res2-His7 was purified (Section 3.2.3.1), EMSAs were carried out to
determine the ability of Res2 to bind to putative promoter regions of genes
identified as potential targets from RT-PCR analyses (Section 3.2.2). Since the
promoter regions of the potential targets have not been identified, a variety of
DNA fragments, which covered the entire intergenic region between these genes
as illustrated in Figure 3.2.10, were used to assess binding ability of Res2.
160
Figure 3.2.10. DNA probes for electrophoretic mobility shift assays of various
targets identified by RT-PCR. Primer pairs used to generate each probe are listed
to the right of its name along with the probe size in bp. Figures not drawn to scale.
161

Prob
es fo
r E
lect
roph
oret
ic M
obili
ty S
hift
Ass
ays
c
vm1
cas
1
cvm
4 c
vm5
cvm
6 Pr
imer
s
S
ize
(bp)
PC
R4
A
NW
58/
59
347
PCR
5
AN
W 5
4/55
2
45
PCR
6
AN
W 5
6/57
4
54
c6p
c
7p
snk
Pr
imer
s
S
ize
(bp)
PC
R1
A
NW
48/
49
408
PCR
2
AN
W 5
0/51
3
19
PCR
3
AN
W 5
2/53
4
06
162
Purified Res2-His7 (100 pmol) was incubated with each 32P end-labeled DNA
probe, which had been amplified by PCR using cosmid pCEC018, pEC020 or
p5N14E10 as the template, and purified by the “crush and soak” method (Section
2.7.7). Reactions were carried out in the presence of excess poly d(I-C) as non-
specific DNA competitor. The reaction mixtures were electrophoresed on 8%
non-denaturing PAG to determine whether or not there were DNA-protein
complexes. Except for the samples containing PCR3, which is a region upstream
of both of c7p and snk, shifting of the probes was not observed in other samples
(Figure 3.2.11). This indicated a possible Res2-DNA complex formation with
DNA fragment PCR 3 and suggested that Res2 binds and controls transcription of
c7p and/or snk. Although the probe was clearly shifted, the protein-DNA complex
was trapped in the loading well suggesting that either a very large protein-DNA
complex was formed or the conditions used were not optimal for Res2 binding.
Attempts were made to improve the shifting quality. This included varying the
protein and DNA concentrations, changing the buffer and running conditions.
However, none of the changes helped significantly to resolve the situation.
3.2.4.2 Analysis of C7P-DNA interaction by EMSA
C7P was also subjected to EMSA to determine its ability to bind to the
DNA fragments described previously (Figure 3.2.10). The binding reaction
mixtures were electrophoresed on a 6% non-denaturing PAG to determine the
presence of a DNA-protein complex. A shifted band was observed when DNA
fragment PCR 6, which is the region upstream of cvm1 and cas1 (Fig 3.2.12), was
incubated with His10-C7P in the binding reaction. Moreover, addition of 50-fold
163
Figure 3.2.11. Analysis of binding of Res2-His7 to promoter regions of genes in
the clavam and paralogue gene clusters. DNA probe used corresponds to
intergenic regions between c7p and c6p (PCR1), snk and c7p (PCR2, 3), cvm5 and
cvm6 (PCR4), and cvm1 and cas1 (PCR5 and 6). Reactions were set up in a total
volume of 20 µl by mixing 20 fmol of each 32P end- labeled fragment with 100
pmol of purified Res2-His7 protein in binding buffer containing 10 mM Tris-HCl
(pH 8.0), 1 mM DTT, 10% glycerol, 150 mM NaCl and 1 µg of poly d(I-C).
Binding reactions were carried out at 21oC for 25 minutes. Samples were
separated on 1.5% glycerol-containing 8% non-denaturing PAG in 1X Tris-
glycine buffer. Gels were dried for 45 minutes, placed on a phosphor screen and
exposed for 16 hours. Data in these figures were obtained by Annie Wong.
164
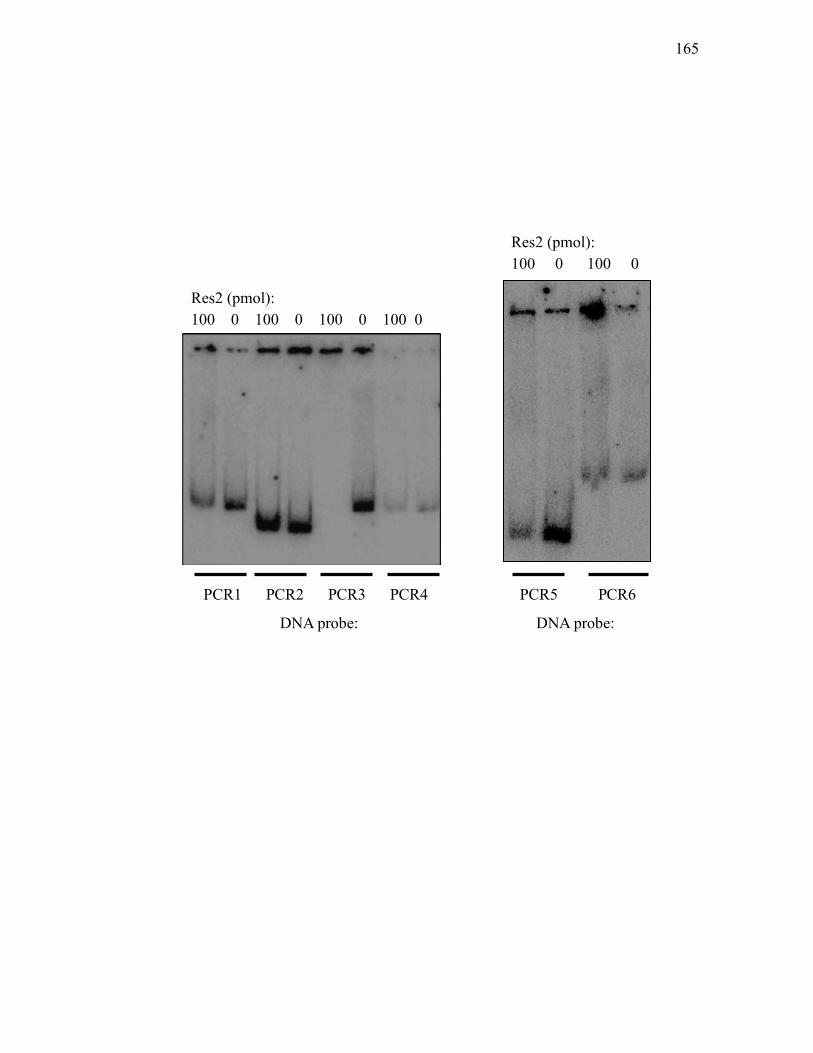
100 0 100 0 100 0 100 0
100 0 100 0
Res2 (pmol):
Res2 (pmol):
DNA probe:
PCR1 PCR2 PCR3 PCR4 PCR5 PCR6
DNA probe:
165
Figure 3.2.12. Analysis of binding of His10-C7P to promoter regions of genes in
the clavam and paralogue gene clusters. DNA probe used corresponds to
intergenic regions between snk and c7p (PCR2, 3), cvm5 and cvm6 (PCR4), and
cvm1 and cas1 (PCR5 and 6). Reactions were prepared in a total volume of 20 µl
by mixing 20 fmol of each 32P end- labeled fragment with 100 pmol of enriched
His10-C7P protein preparation in binding buffer containing 10 mM Tris-HCl (pH
8.0), 1 mM DTT, 10% glycerol, 150 mM NaCl and 1 µg of poly d(I-C). Binding
reactions were carried out at 21oC for 25 minutes. Samples were separated on
1.5% glycerol containing 6% non-denaturing polyacrylamide gels in 1X Tris-
glycine buffer. Gels were dried for 45 minutes, placed on a phosphor screen and
exposed for 16 hours. Data in these figures were obtained by Annie Wong.
166
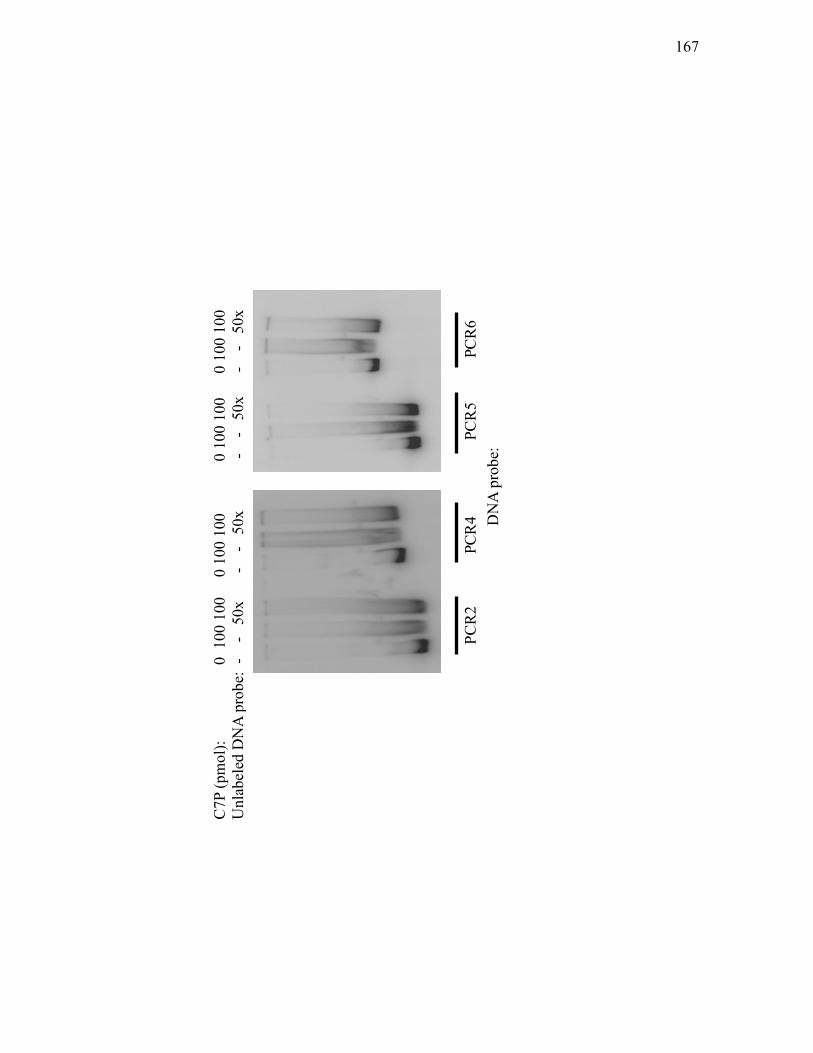
PC
R2
PCR
4
PC
R5
P
CR
6
C7P
(pm
ol):
0 1
00 1
00
0 1
00 1
00
0
100
100
0 10
0 10
0 U
nlab
eled
DN
A p
robe
: -
-
50x
- -
50
x
-
-
50x
-
-
50x
DN
A p
robe
:
167
excess unlabeled probe (PCR6) to the binding reactions reduced protein binding
to the labeled fragment (Figure 3.2.12). With the same conditions used, C7P also
showed at least some ability to bind PCR 2, 4 and 5 (Fig 3.2.12), which are the
regions upstream of c7p, cvm5 and cvm6, and cvm1, respectively (Figure 3.2.12).
This suggested that C7P regulates 5S clavam production by binding to these
biosynthetic genes, and also that transcription of c7p may be under auto regulation
by C7P binding to its own promoter. However, instead of distinct bands, the
shifted DNA appeared as smears, suggesting that the conditions used were not
optimal for C7P binding. Therefore, attempts were made to improve the shifting
quality including the changes as described in section 3.2.4.1. However, none of
the changes helped significantly to resolve the problem and so the evidence for
interaction between C7P and c7p, cvm5, cvm6 and cvm1 remains inconclusive.
Among the targets that appeared to be bound by C7P, the region between
the divergently oriented cvm1 and cas1 genes (PCR 6) was chosen for a more
detailed study as it showed the most promising result (Figure 3.2.12). PCR 6 was
mixed with His10-C7P (0-100 pmol) in the presence of excess poly d(I-C) as non-
specific DNA competitor. As expected, as the amount of protein added to the
binding reaction increased, more DNA probe was shifted (Figure 3.2.13).
Competition mobility shift assays were then carried out to demonstrate the
specificity of C7P binding. C7P binding to labeled probe was reduced when 50-
fold excess of unlabeled probe (PCR 6) was added to the EMSA reaction (Figure
3.2.14). In contrast, excess unlabeled nonspecific DNA (internal region of hrdB,
amplified by hrdB RT-forward and hrdB RT-reverse primers) did not affect C7P
168

Figure 3.2.13. Electrophoretic mobility shift of a 454 bp DNA fragment spanning
the intergenic region between cvm1 and cas1 (PCR6) when bound by His10-C7P.
Reactions were prepared in a total volume of 20 µl by mixing 20 fmol of 32P end-
labeled fragment with 0-100 pmol of purified His10-C7P protein in binding buffer.
Reactions were incubated at 21oC for 25 minutes. Samples were separated on
1.5% glycerol-containing 8% non-denaturing PAG 1X Tris-glycine buffer. Gels
were dried, placed in contact with a phosphor screen and exposed for 16 hours.
Data in these figures were obtained by Annie Wong.
169
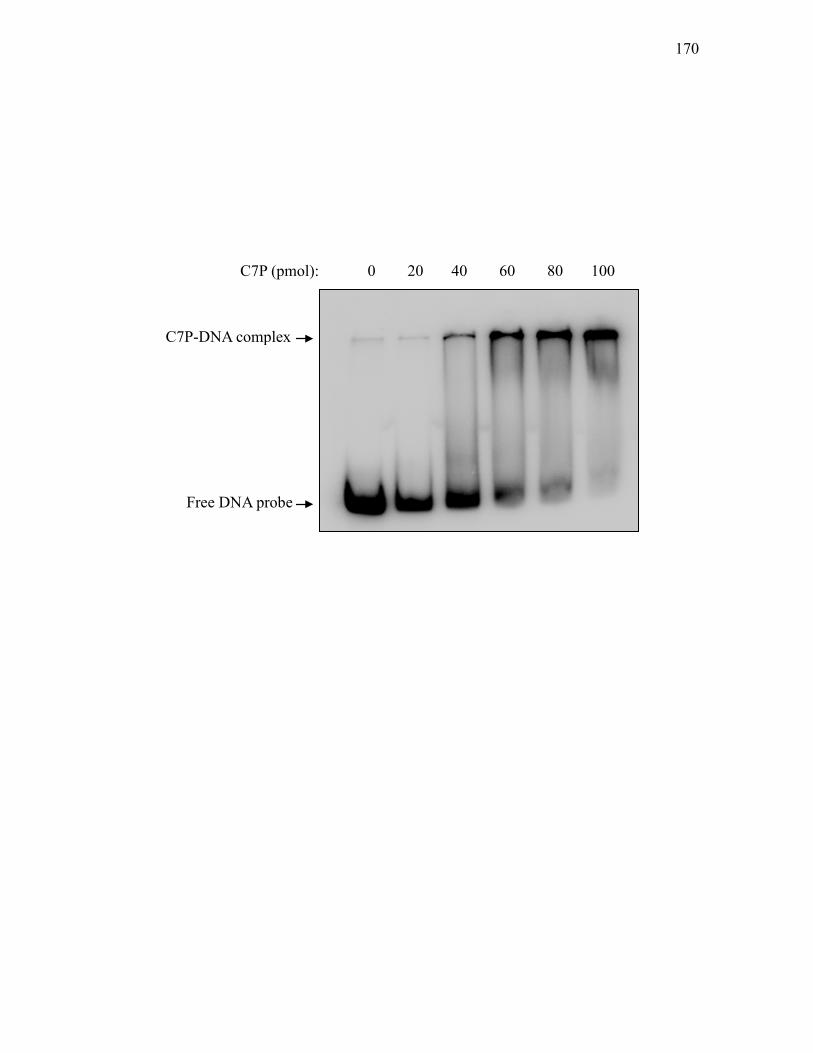
0 20 40 60 80 100
C7P-DNA complex
Free DNA probe
C7P (pmol):
170
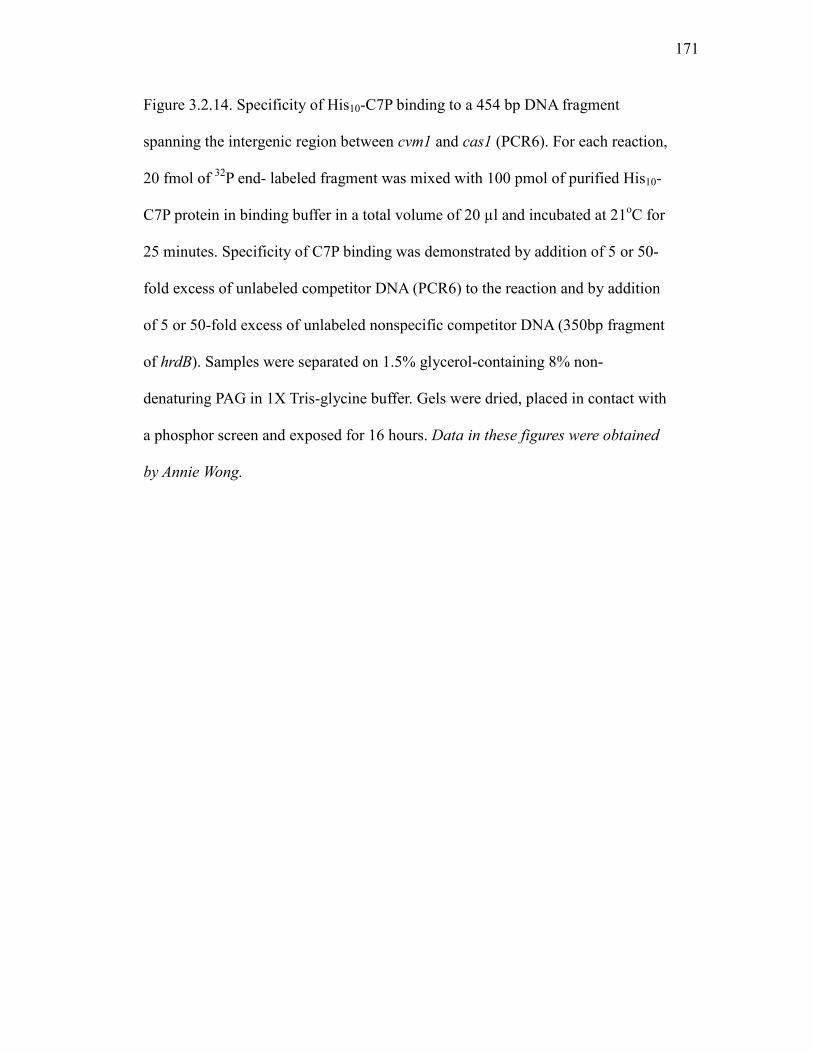
Figure 3.2.14. Specificity of His10-C7P binding to a 454 bp DNA fragment
spanning the intergenic region between cvm1 and cas1 (PCR6). For each reaction,
20 fmol of 32P end- labeled fragment was mixed with 100 pmol of purified His10-
C7P protein in binding buffer in a total volume of 20 µl and incubated at 21oC for
25 minutes. Specificity of C7P binding was demonstrated by addition of 5 or 50-
fold excess of unlabeled competitor DNA (PCR6) to the reaction and by addition
of 5 or 50-fold excess of unlabeled nonspecific competitor DNA (350bp fragment
of hrdB). Samples were separated on 1.5% glycerol-containing 8% non-
denaturing PAG in 1X Tris-glycine buffer. Gels were dried, placed in contact with
a phosphor screen and exposed for 16 hours. Data in these figures were obtained
by Annie Wong.
171
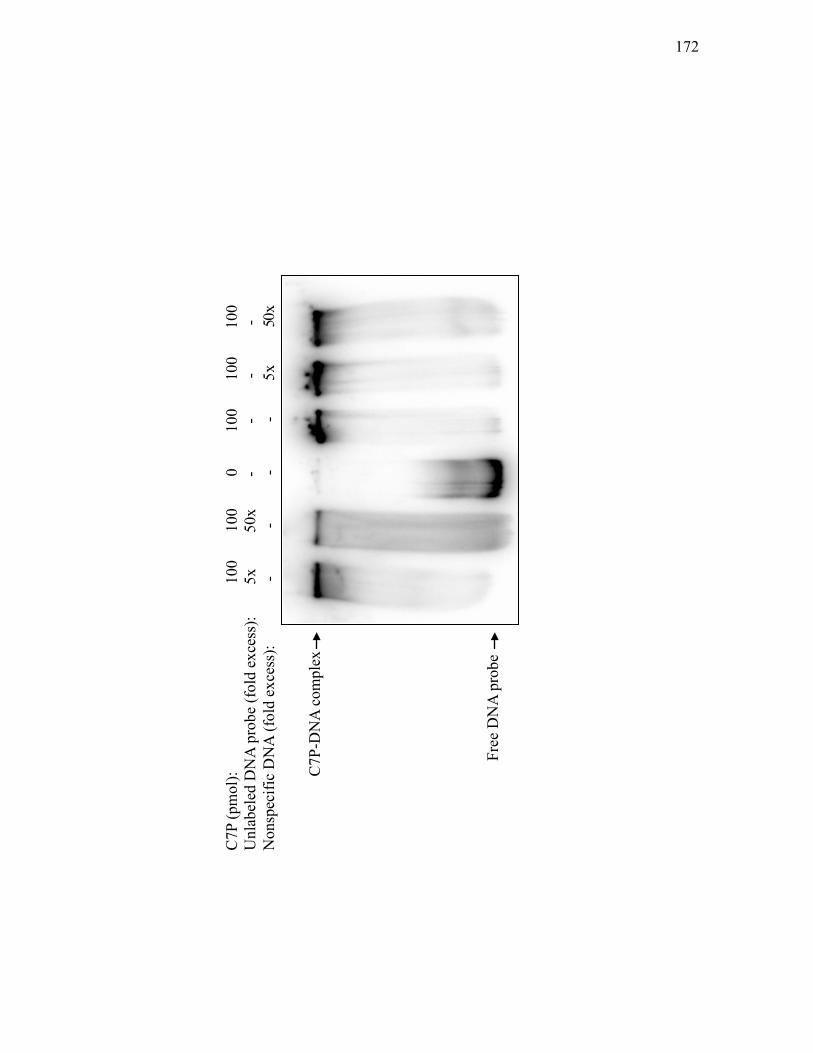
Free
DN
A p
robe
C7P
-DN
A c
ompl
ex
C7P
(pm
ol):
1
00
1
00
0
10
0
10
0
10
0 U
nlab
eled
DN
A p
robe
(fol
d ex
cess
):
5
x
5
0x
-
-
-
- N
onsp
ecifi
c D
NA
(fol
d ex
cess
):
-
-
-
-
5x
50x
172
binding when added to the EMSA reaction (Figure 3.2.14). Taken together these
results suggested that C7P was able to bind and shift the mobility of the labeled
PCR 6 fragment.
3.3 Analysis of proteins involved in the two-component system
Typical two-component regulatory systems involve one sensor kinase
protein and one response regulator protein. However, atypical two-component
systems with more than two components have also been described. In particular,
systems with components similar to RocS1 (a sensor kinase), RocA1 (a typical
response regulator), and RocR (a response regulator without a DNA-binding
domain) from Pseudomonas aeruginosa (this system is further described in
Section 4.3), have also been identified in several different organisms. Even
though S. clavuligerus has been shown to carry such an atypical two-component
system, experimental characterization of the system has not yet been done.
Furthermore, the reason for carrying two response regulators is not clear. It is also
not apparent if these response regulators interact only with the sensor kinase or
also with each other once they are phosphorylated by the sensor kinase.
Therefore, studies were initiated to investigate the phosphorylation dynamics
between these proteins.
3.3.1 Overproduction and purification of wild type proteins of the two-
component regulatory system
Expression vectors for overproducing Snk and Res1 were available from a
previous study (prepared by N. Zelyas). Res2 was obtained previously as
173
described in Section 3.2.3.1 (Figure 3.2.5). Proteins were overproduced as
described in Section 2.9.4, and 2.9.5. Since overproduced proteins carried a His-
tag either at the N or C-terminus, they were purified by combining the cell lysates
with Ni-NTA resin under conditions where His-tagged protein binds to the resin
and can thus be separated from the bulk proteins in the lysate. The entire mixture
was incubated for one hour at 4ºC and after washing away unbound proteins,
bound protein was eluted by using a gradient of imidazole. For Snk-His7, each
collected fraction was electrophoresed on 8% SDS-PAG to identify fractions that
contained the desired protein, which has an expected molecular weight of about
59 kDa (Figure 3.3.1.). Similarly, samples collected during the His10-Res1
purification process were visualized by electrophoresing on 12% SDS-PAG and
appeared to run at the expected molecular weight of about 16 kDa (Figure 3.3.2).
Fractions identified as containing the desired proteins were then concentrated
using centrifugal concentrators with a molecular weight cutoff of 10 kDA,
resuspended in protein storage buffer and stored at -80oC.
In vitro phosphorylation assays were carried out with wild type proteins to
optimize conditions used for subsequent assays and to determine if the expression
and purification processes used had yielded active proteins. Different
combinations of Snk-His7, His10-Res1 and Res2-His7 were incubated together for
30 minutes at 30ºC with excess [γ-32P] ATP as the phosphate donor. Each reaction
was done in duplicate. After incubation, reaction mixtures were electrophoresed
on SDS-PAG to separate the proteins and the dried gels were exposed to a
phosphor screen to detect signals from the radioactive γ-phosphate. In all reaction
174

Figure 3.3.1. Purification of Snk-His7 from E. coli BL21(DE3) carrying pT7-7His-
snk. Protein samples were taken at different stages of the overexpression and
purification processes and analyzed by SDS-PAGE. Proteins were visualized by
staining with Coomassie blue. Lane M, PageRuler™ prestained Protein Ladder
Plus molecular weight marker. Lane I, induced total protein sample. Lane CL,
cleared lysate. Lane WT, wash-through. Numbers above lanes indicate the
concentration of imidazole (in mM) used to elute the protein samples.
175

M I CL WT WT 50 75 100 150 175 225 250 250 250 250
70 kDa
27 kDa
55 kDa
35 kDa
Snk-His7
176
Figure 3.3.2. Purification of His10-Res1 from E. coli BL21(DE3) carrying pET-
19b-res1. Protein samples were taken during different stages of the
overexpression and purification processes and analyzed by SDS-PAGE. Proteins
were visualized by staining with Coomassie blue. Lane M, PageRuler™ Protein
Ladder Plus molecular weight marker. Lane I, induced total protein sample. Lane
CL, cleared lysate. Lane WT, wash-through. Numbers above lanes indicate the
concentration of imidazole (in mM) used to elute the protein samples.
177
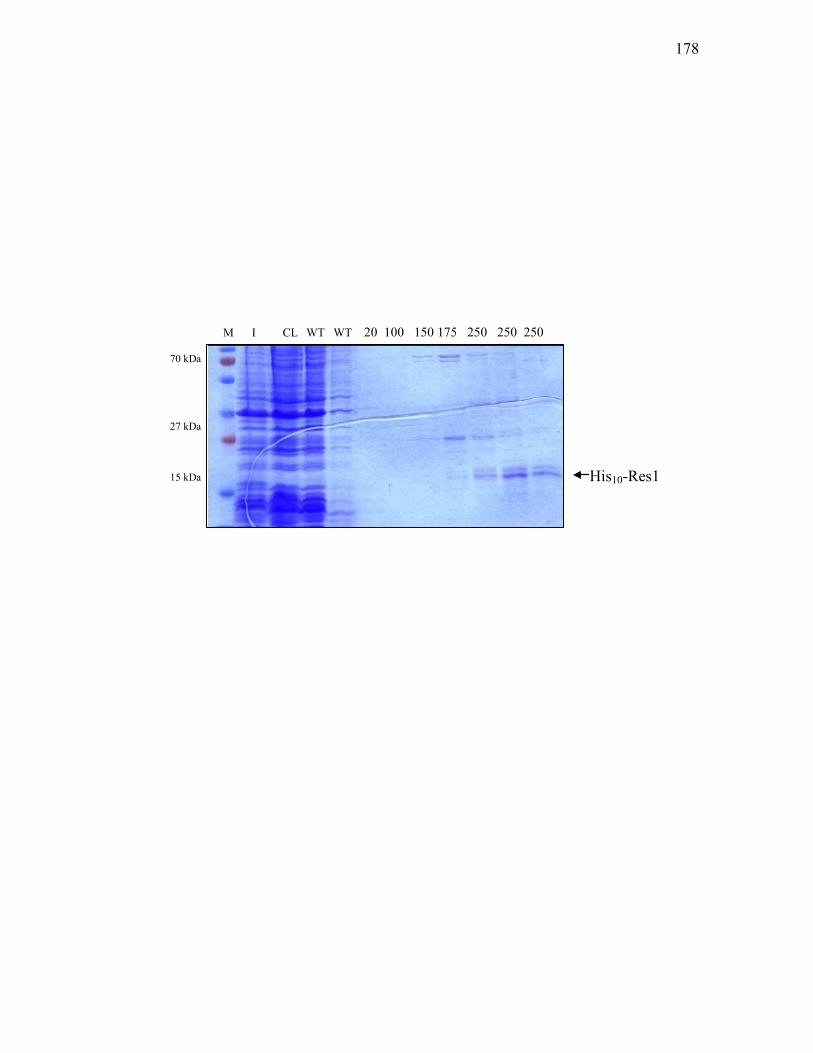
M I CL WT WT 20 100 150 175 250 250 250
70 kDa
15 kDa
27 kDa
His10-Res1
178
mixtures that contained Snk-His7, signals corresponding to Snk were detected as
shown on the image obtained from the phosphorimager (Figure 3.3.3).
Radioactive signals were not observed from Res1 or Res2 when Snk was not
present in the reaction mixtures but phosphorylated Res1 and Res2 were detected
when either protein, or both proteins, was incubated with Snk in the reaction
mixture (Figure 3.3.3). This indicated Snk-His7 is capable of autophosphorylation
and is also able to transfer phosphate to His10-Res1 and Res2-His7.
3.3.2 Sequence comparison
To further understand the role of Snk, Res1 and Res2 in the two-
component system, the protein sequence of each member was first compared to
other known sequences in GenBank. Through BLAST analysis, the conserved
histidine residue, which is involved in auto-phosphorylation of the sensor kinase
in two-component systems from other bacteria, was identified in Snk (H-365)
(Figure 3.3.4). Similarly, the conserved asparatic acid residue, which acts as the
phosphate acceptor site in response regulators from other bacteria, was also
identified in Res1 (D-65) and Res2 (D-52) (Figure 3.3.4).
3.3.3 Site-directed mutagenesis of phosphorylation site of Snk, Res1 and Res2
To investigate if the residues identified from Section 3.3.2 are involved in
phosphorylation, site-directed mutagenesis was employed to change the histidine
or aspartic acid residue from the sensor kinase or response regulators,
respectively, to an alanine residue. Initially, QuickChange® II-E Site-Directed
Mutagenesis kit (Stratagene) was used to generate such mutations. However, for
179

Figure 3.3.3. In vitro phosphorylation of Snk-His7, His10-Res1 and Res2-His7.
Reaction mixtures were incubated at 30oC for 30 minutes with excess [γ-32P] ATP.
Reactions were stopped by cooling on ice and addition of 5x SDS-PAGE loading
buffer. Samples were electrophoresed on a 15% SDS-PAG, dried and then
exposed for 16 hours to a phosphor screen. Labels above each lane indicate the
protein or proteins included in the reaction mixture.
180

Snk +Res1 +Res2
Res1 +Res2
Snk +Res2
Snk +Res1 Snk Res1 Res2
Snk
Res2
Res1
181
Figure 3.3.4. Sequence comparison through BLAST analyses of the proteins of
the two-component regulatory system. (A) Alignment of the amino acid sequence
of Snk with sensor kinases from various bacteria. Conserved histidine residues
involved in auto-phosphorylation are shown in bold. (B) Alignment of the amino
acid sequences of Res1 and Res2 with response regulators from various bacteria.
Conserved asparatic acid residues involved in phosphorylation are shown in bold.
Numbers refer to the amino acid positions within the protein.
182
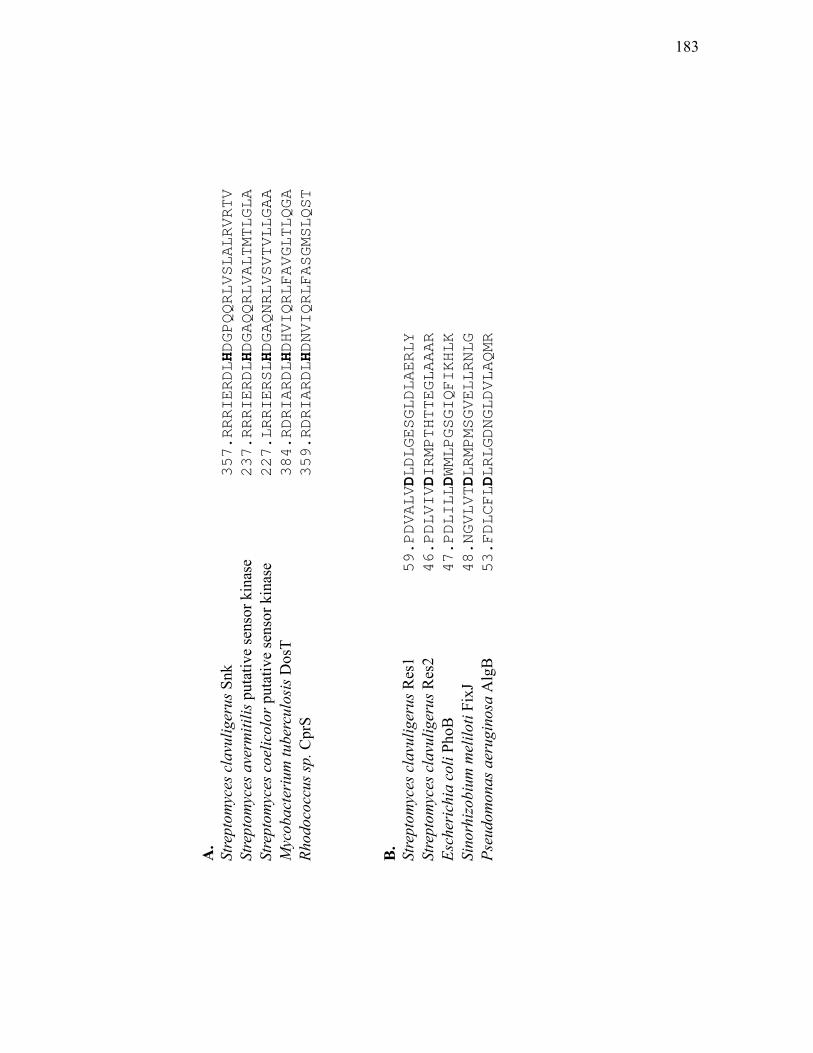
A.
Stre
ptom
yces
cla
vulig
erus
Snk
357.RRRIERDLHDGPQQRLVSLALRVRTV
Stre
ptom
yces
ave
rmiti
lis p
utat
ive
sens
or k
inas
e
237.RRRIERDLHDGAQQRLVALTMTLGLA
Stre
ptom
yces
coe
licol
or p
utat
ive
sens
or k
inas
e
227.LRRIERSLHDGAQNRLVSVTVLLGAA
Myc
obac
teri
um tu
berc
ulos
is D
osT
384.RDRIARDLHDHVIQRLFAVGLTLQGA
Rhod
ococ
cus s
p. C
prS
359.RDRIARDLHDNVIQRLFASGMSLQST
B.
Stre
ptom
yces
cla
vulig
erus
Res
1
59.PDVALVDLDLGESGLDLAERLY
Stre
ptom
yces
cla
vulig
erus
Res
2
46.PDLVIVDIRMPTHTTEGLAAAR
Esch
eric
hia
coli
PhoB
47.PDLILLDWMLPGSGIQFIKHLK
Sino
rhiz
obiu
m m
elilo
ti Fi
xJ
48.NGVLVTDLRMPMSGVELLRNLG
Pseu
dom
onas
aer
ugin
osa
Alg
B
53.FDLCFLDLRLGDNGLDVLAQMR
183
unknown reasons, it was not possible to transform competent cells with the
plasmids that carry the mutated versions of snk, res1 or res2. As a result, two-step
site-directed mutagenesis, which required two separate PCR reactions to generate
the mutations, was used (Thai et al., 2001). The procedure is illustrated in Figure
3.3.5. Although this method was relatively more laborious, the mutations were
successfully introduced into the genes of interest as confirmed by sequencing
(data not shown). Similar to the res2 overexpression construct described
previously, each of the forward primers used for amplification had an engineered
5’ NdeI site and the reverse primers contained a 5’ BamHI site (Figure 3.3.5). This
allowed the amplified genes to be cloned into expression vectors easily as
NdeI/BamHI fragments and in this way pET-19b-res1-SD, pT7-7His-res2-SD and
pT7-7His-snk-SD were constructed (Table 2.3).
3.3.4 Two-component regulatory system protein overproduction and
purification
pET-19b-res1-SD, pT7-7His-res2-SD and pT7-7His-snk-SD were
transformed into E. coli BL21(DE3) to overproduce the two-component
regulatory proteins with altered putative phosphorylation sites, hereafter referred
as His10-Res1-SD, Res2-SD-His7 and Snk-SD-His7, respectively. Snk-SD-His7,
and Res2-SD-His7 were overproduced with the same conditions as described
earlier for Res2-His7 (Section 2.9.4). Conditions similar to those used to obtain
His10-C7P were used for His10-Res1-SD overproduction (Section 2.9.5).
184

Figure 3.3.5. Schematic representation of the first PCR reaction of the two step
site-directed mutagenesis used to change the phosphorylation site of Snk, Res1
and Res2 to an alanine residue.
185

• Fo
rwar
d pr
imer
with
eng
inee
red
Nde
I res
trict
ion
site
s -
res1
-pfw
d -
res2
-pfw
d -
snk-
pfw
d
• R
ever
se p
rimer
with
eng
inee
red
Bam
HI r
estri
ctio
n si
te
- re
s1-p
rev
- re
s2-p
rev
-
snk-
prev
2
• Fo
rwar
d or
Rev
erse
prim
er w
ith si
te d
irect
ed m
utat
ion
to a
lani
ne c
odon
-
res1
site
-dire
cted
-For
-
res1
site
-dire
cted
-Rev
-
res2
site
-dire
cted
-For
-
res2
site
-dire
cted
-Rev
-
snk
site
-dire
cted
-For
-
snk
site
-dire
cted
-Rev
Firs
t ste
p PC
R a
mpl
ifica
tion
186

Figure 3.3.5. (Continued). Schematic representation of the second PCR reaction
of the two step site-directed mutagenesis used to obtain complete gene products
with engineered terminal restriction sites and site specific mutation.
187
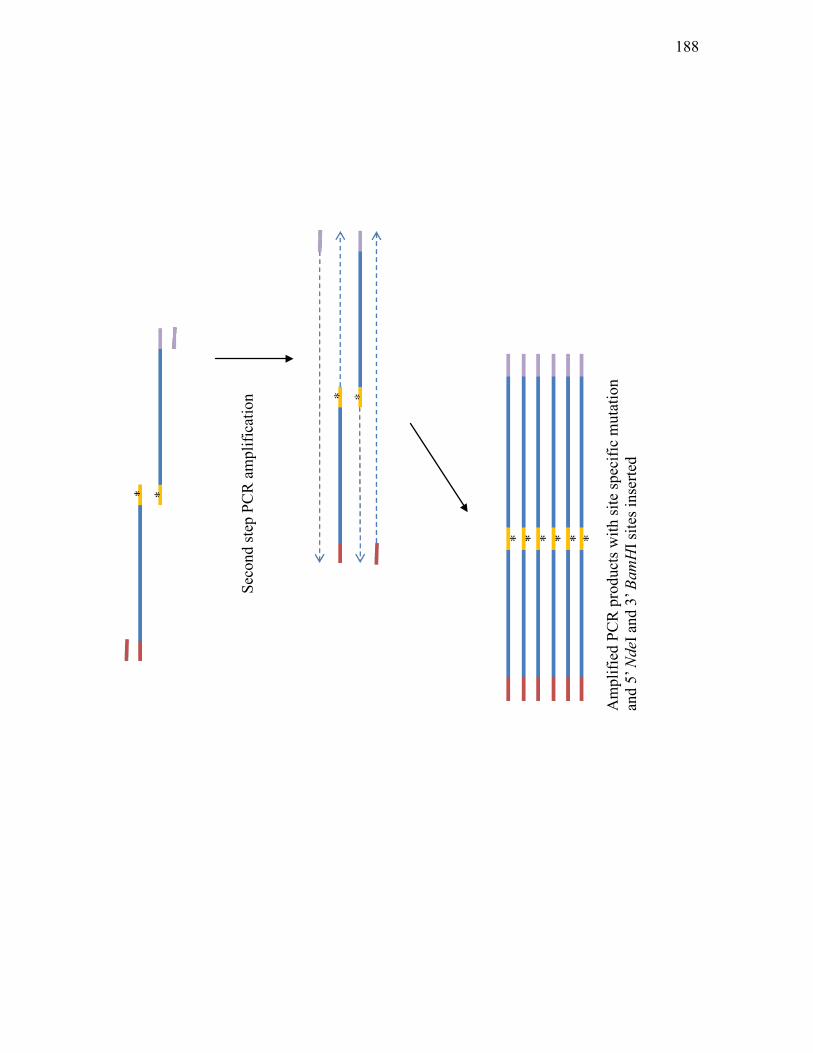
Seco
nd st
ep P
CR
am
plifi
catio
n
Am
plifi
ed P
CR
pro
duct
s with
site
spec
ific
mut
atio
n an
d 5’
Nde
I and
3’ B
amH
I site
s ins
erte
d
188
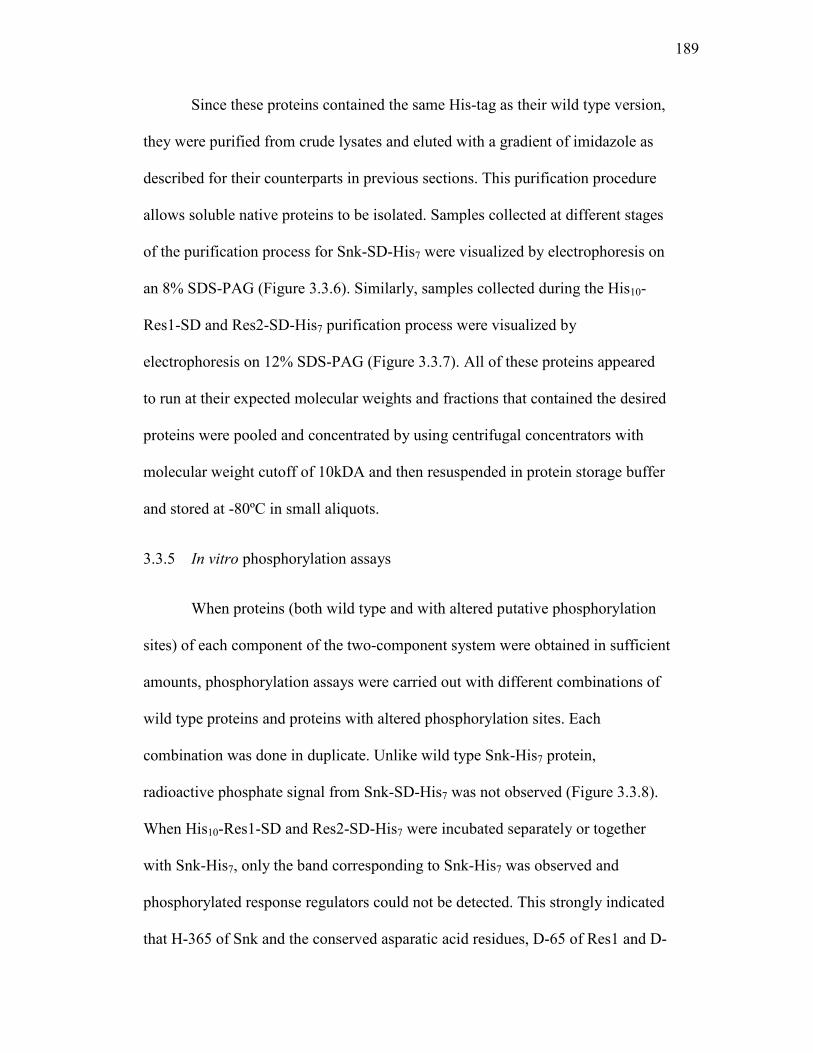
Since these proteins contained the same His-tag as their wild type version,
they were purified from crude lysates and eluted with a gradient of imidazole as
described for their counterparts in previous sections. This purification procedure
allows soluble native proteins to be isolated. Samples collected at different stages
of the purification process for Snk-SD-His7 were visualized by electrophoresis on
an 8% SDS-PAG (Figure 3.3.6). Similarly, samples collected during the His10-
Res1-SD and Res2-SD-His7 purification process were visualized by
electrophoresis on 12% SDS-PAG (Figure 3.3.7). All of these proteins appeared
to run at their expected molecular weights and fractions that contained the desired
proteins were pooled and concentrated by using centrifugal concentrators with
molecular weight cutoff of 10kDA and then resuspended in protein storage buffer
and stored at -80ºC in small aliquots.
3.3.5 In vitro phosphorylation assays
When proteins (both wild type and with altered putative phosphorylation
sites) of each component of the two-component system were obtained in sufficient
amounts, phosphorylation assays were carried out with different combinations of
wild type proteins and proteins with altered phosphorylation sites. Each
combination was done in duplicate. Unlike wild type Snk-His7 protein,
radioactive phosphate signal from Snk-SD-His7 was not observed (Figure 3.3.8).
When His10-Res1-SD and Res2-SD-His7 were incubated separately or together
with Snk-His7, only the band corresponding to Snk-His7 was observed and
phosphorylated response regulators could not be detected. This strongly indicated
that H-365 of Snk and the conserved asparatic acid residues, D-65 of Res1 and D-
189

Figure 3.3.6. Purification of Snk-SD-His7 from E. coli BL21(DE3) carrying pT7-
7His-snk-SD. Protein samples were taken at different stages of the overexpression
and purification processes and analyzed by SDS-PAGE. Proteins were visualized
by staining with Coomassie blue. Lane M, PageRuler™ prestained Protein Ladder
Plus molecular weight marker. Lane I, induced total protein sample. Lane CL,
cleared lysate. Lane WT, wash-through. Numbers above lanes indicate the
concentration of imidazole (in mM) used to elute the protein samples.
190
M I CL WT WT 50 75 100 150 175 225 250 250 250 250
Snk-SD-His7 70 kDa
55 kDa
191
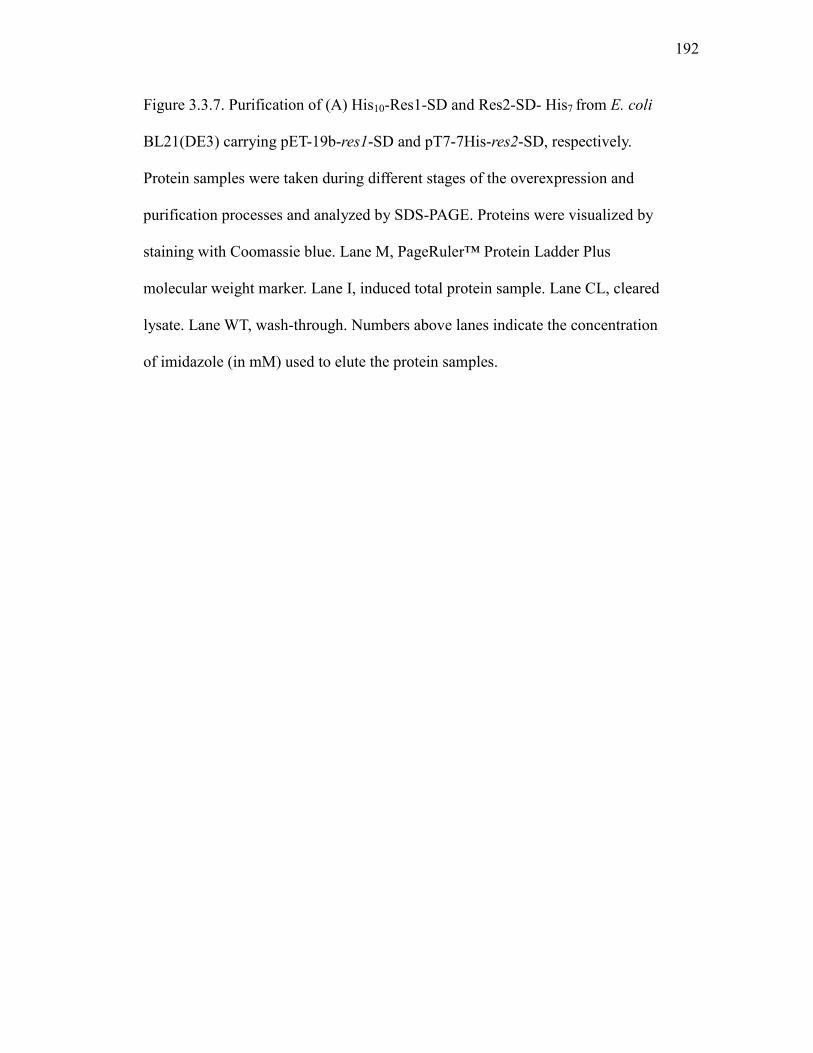
Figure 3.3.7. Purification of (A) His10-Res1-SD and Res2-SD- His7 from E. coli
BL21(DE3) carrying pET-19b-res1-SD and pT7-7His-res2-SD, respectively.
Protein samples were taken during different stages of the overexpression and
purification processes and analyzed by SDS-PAGE. Proteins were visualized by
staining with Coomassie blue. Lane M, PageRuler™ Protein Ladder Plus
molecular weight marker. Lane I, induced total protein sample. Lane CL, cleared
lysate. Lane WT, wash-through. Numbers above lanes indicate the concentration
of imidazole (in mM) used to elute the protein samples.
192
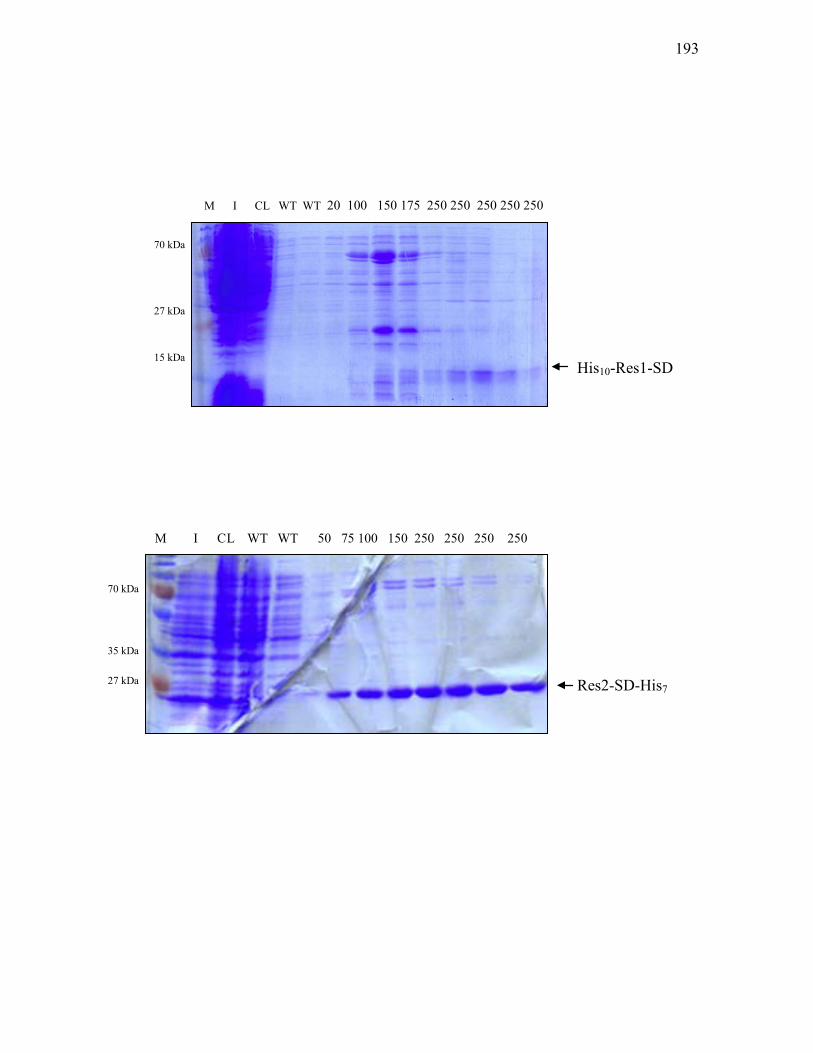
M I CL WT WT 50 75 100 150 250 250 250 250
Res2-SD-His7
70 kDa
27 kDa
35 kDa
M I CL WT WT 20 100 150 175 250 250 250 250 250
27 kDa
15 kDa
70 kDa
His10-Res1-SD
193
Figure 3.3.8. In vitro phosphorylation of Snk-His7, His10-Res1 and Res2-His7 and
Snk-SD-His7, His10-Res1-SD and Res2-SD-His7. Reactions were incubated at
30oC for 30 minutes with excess [γ-32P] ATP. Reactions were stopped by cooling
on ice and addition of 5x SDS-PAGE loading buffer. Samples were
electrophoresed on a 15% SDS-PAG, dried and then exposed for 16 hours to a
phosphor screen. Labels above each lane indicate the protein or proteins included
in the reaction mixture.
SD = site-directed mutant versions of the corresponding proteins.
194
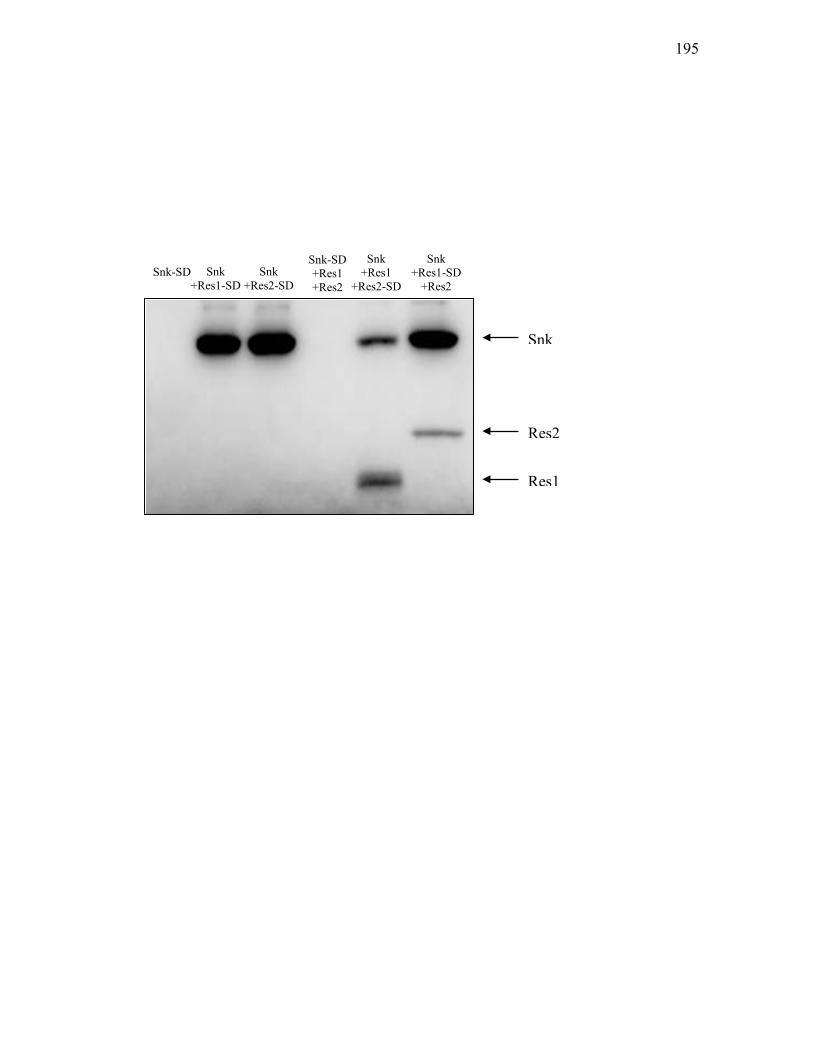
Snk-SD Snk +Res1-SD
Snk +Res2-SD
Snk +Res1
+Res2-SD
Snk +Res1-SD
+Res2
Snk-SD +Res1 +Res2
Snk
Res2
Res1
195
52 of Res2 identified previously were the actual phosphorylation sites, since
changing these residues to alanines prevented Snk autophosphorylation and
abolished the ability of Res1 and Res2 to undergo phosphorylation by receiving
phosphate molecules.
3.3.6 Phosphorylation dynamics between Res1 and Res2
One interesting finding when carrying out phosphorylation assays as
described above, was that whenever His10-Res1 was present in the reaction
mixtures, the signal intensity of either labelled Snk-His7 or Res2-His7 dropped
significantly (Figure 3.3.3 and 3.3.8). Since γ-P32-ATP was always used in excess,
one possible explanation was that Res1 might possess phosphatase activity that
constantly removes phosphate from these two proteins; another possible
explanation is that Res1 can interact with and induce conformational change on
Snk, thus revealing its phosphatase domain, which could in turn cause phosphate
to be removed from these proteins. Studies were carried out to investigate this
observation.
3.3.6.1 Construction of MBP fusion protein overproduction vector
The presence of Snk in reaction mixtures is necessary to initiate the
phospho-relay, but its continued presence would then interfere with studies to
examine possible reactions between Res1 and Res2. Since all three of snk, res1
or res2 expression systems use His-tags for protein purification, removal of
Snk specifically from reaction mixtures was not possible. Therefore, to carry
out in vitro dephosphorylation and phospho transfer assays, a new Snk protein
196
producing strain first had to be constructed. pMAL-snk, which upon induction
will produce a maltose binding protein (MBP) fusion protein, was prepared.
This would allow phosphorylated His10-Res1 or Res2-His7 to be separated
from MBP-Snk after in vitro phosphorylation. snk from pT7-7-snk was cloned
downstream of malE, which encodes MBP, in the pMAL-C5X expression
vector as an NdeI/BamHI fragment. pMAL-snk was then transformed into
BL21(DE3) for high level protein production. MBP-Snk was produced and
purified successfully by following the protocol provided by the manufacturer
(NEB) (data not shown). However, in vitro phosphorylation assays indicated
that MBP-Snk was unable to phosphorylate His10-Res1 and Res2-His7 (data
not shown). This may be due to the presence of the large MBP tag (~42 kDa),
which physically blocked the interaction between Snk and the response
regulators, thus inhibiting the transfer of the phosphate molecules. As a result,
the coding sequences of res1 and res2 from pET-19b-res1 and pT7-7-res2,
respectively, were cloned into the pMAL-C5X expression vector with the same
strategy as described above to obtain pMAL-res1 and pMal-res2 and
transformed into BL21(DE3). MBP-Res1 and MBP-Res2 were produced and
purified successfully by using the protocol as described in 2.9.6. Samples
collected during the purification process were visualized by electrophoresing
on 8% SDS-PAG. MBP-Res1 and MBP-Res2 appeared to run at their expected
molecular weights of about 58 kDa and 67 kDa, respectively (Figure 3.3.9).
After purification, phosphorylation assays were first carried out to
determine if the proteins were still intact and could undergo phosphorylation by
197

Figure 3.3.9. Purification of (A) MBP-Res1 and (B) MBP-Res2 from E. coli
BL21(DE3) carrying pMal-res1 and pMal-res2, respectively. Protein samples
were taken during different stages of the overexpression and purification
processes and analyzed by SDS-PAGE. Proteins were visualized by staining with
Coomassie blue. Lane M, PageRuler™ Protein Ladder Plus molecular weight
marker. Lane I, induced total protein sample. Lane CL, cleared lysate. Lane WT,
wash-through. Numbers above lanes represent fractions eluted from the amylose
affinity column with column buffer supplemented with 10 mM maltose.
198
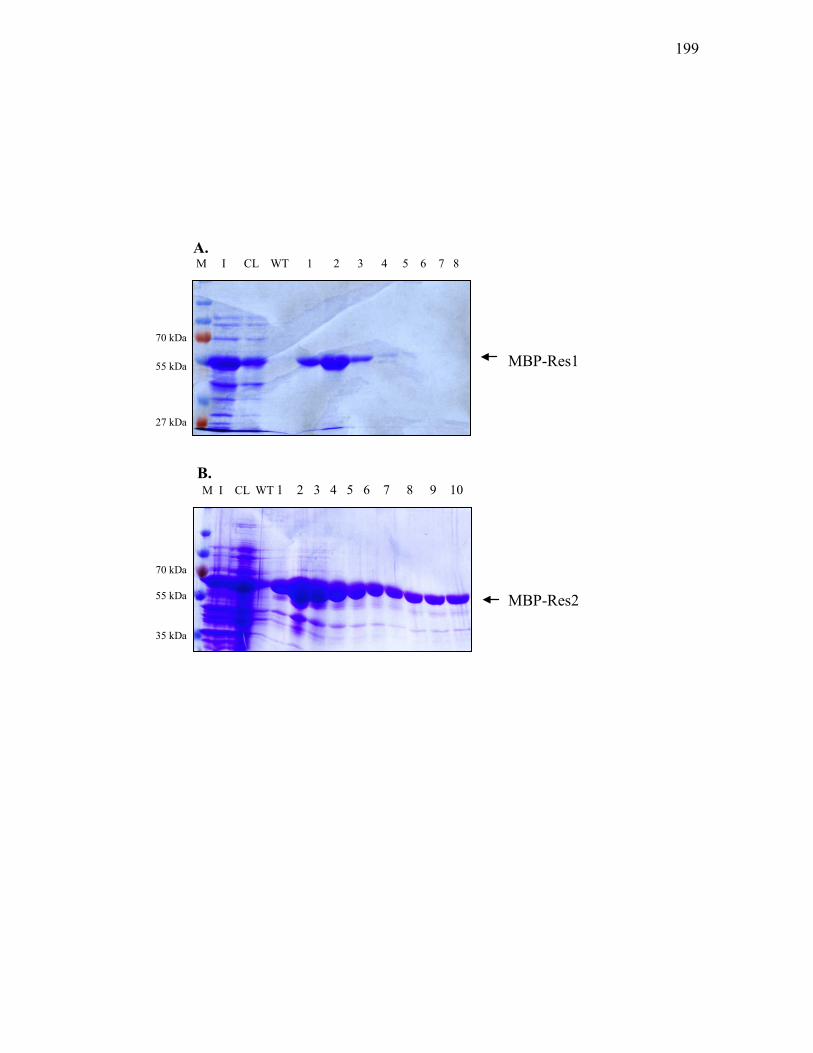
A. M I CL WT 1 2 3 4 5 6 7 8
B. M I CL WT 1 2 3 4 5 6 7 8 9 10
70 kDa
70 kDa
27 kDa
35 kDa
55 kDa
55 kDa
MBP-Res1
MBP-Res2
199
WT Snk-His7. Despite the presence of the large MBP tag, both MBP-Res1 and
MBP-Res2 were confirmed to undergo phosphorylation in the presence of Snk-
His7 (Figure 3.3.10). After confirmation that both MBP fusion proteins could be
phosphorylated by Snk, MBP-Res1 and MBP-Res2 were further purified by
running through a HiLoad 26/10 Q Sepharose High Performance anion exchange
column to remove maltose that was present in the elution buffer. The presence of
maltose would otherwise inhibit MBP fusion proteins from re-binding to amylose
resin, which is a crucial step as described in the next section. Proteins were eluted
from the anion exchange column with a gradient of NaCl and fractions were
monitored by measuring absorbance at 280 nm. Identity of the protein was
confirmed by SDS-PAGE. Fractions that contained the desired proteins were
pooled, concentrated and stored as described previously (Section 2.9.8; Figure
3.3.11).
3.3.6.2 Purification of phosphorylated MBP-Res1 and MBP-Res2
Pure phosphorylated MBP-Res1 and MBP-Res2 were obtained by using
the procedures illustrated in Figure 3.3.12. In vitro phosphorylation assays were
first carried out between purified MBP-Res1 or MBP-Res2 and Snk-His7 protein
in the presence of excess [γ-32P] ATP. Once the reactions were complete,
phosphorylated MBP-Res1 and MBP-Res2 were separated from Snk-His7 by
combining the reaction mixtures with amylose resin and incubating on ice for 15
minutes. After incubation, the resins were washed extensively with kinase buffer
at 4oC to remove unbound proteins and small molecular weight components
including ATP. Phosphorylated MBP-Res1 and MBP-Res2 were isolated
200

Figure 3.3.10. Phosphorylation of MBP-tagged response regulators. (A) In vitro
phosphorylation of wild type Snk-His7 and MBP-Res2. Lane C, control reaction
mixture, contained Snk-His7 only. Lane 1, both wild type Snk-His7 and MBP-
Res2 were added to the reaction mixture. (B) In vitro phosphorylation of wild
type Snk-His7 and MBP-Res1. Reactions were incubated at 30oC for 30 minutes
with excess [γ-32P] ATP. Reactions were stopped by cooling on ice and addition of
5x SDS-PAGE loading buffer. Samples were electrophoresed on a 12% SDS-PAG,
dried and then exposed for 16 hours to a phosphor screen.
201
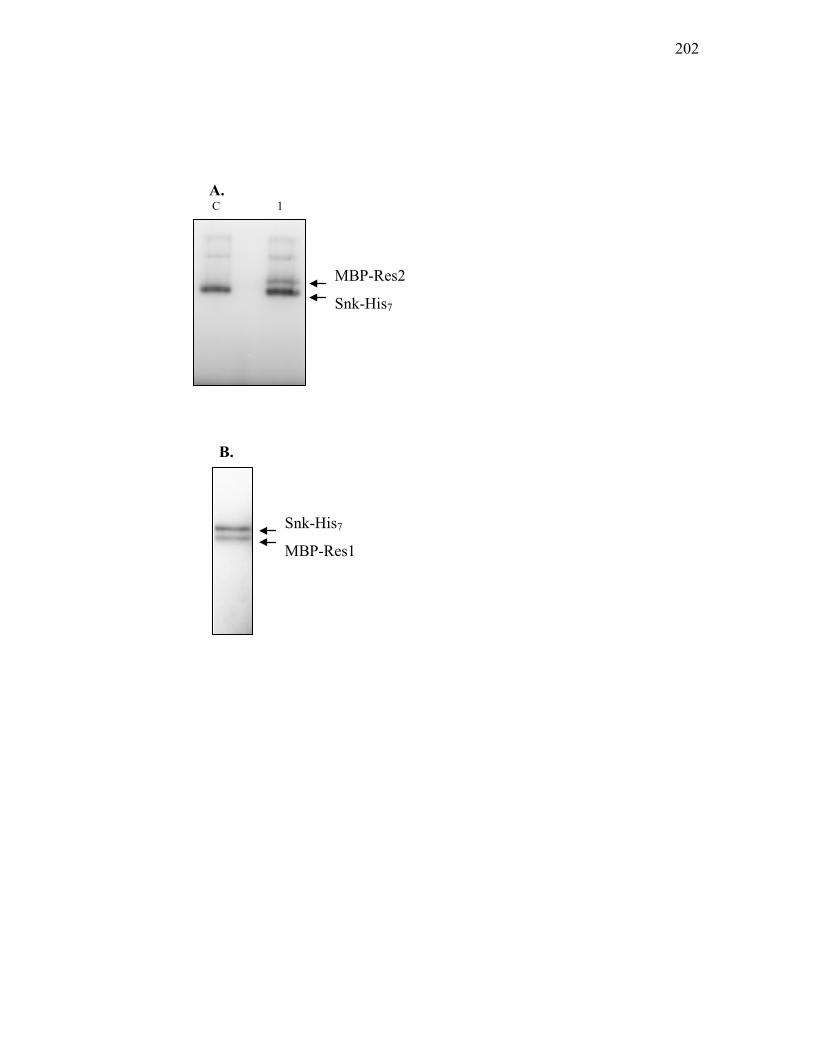
A. C 1
B.
MBP-Res1
MBP-Res2
Snk-His7
Snk-His7
202
Figure 3.3.11. Anion exchange chromatography of MBP fusion proteins.
Recovery of (A) MBP-Res1 and (B) MBP-Res2 after purification with the HiLoad
26/10 Q Sepharose High Performance anion exchange column. Proteins were
eluted from the column by increasing concentration of NaCl. Protein-containing
fractions, identified by measuring A280, were analyzed by SDS-PAGE and
visualized by staining with Coomassive blue. Lane M, PageRuler™ Protein
Ladder Plus molecular weight marker.
203
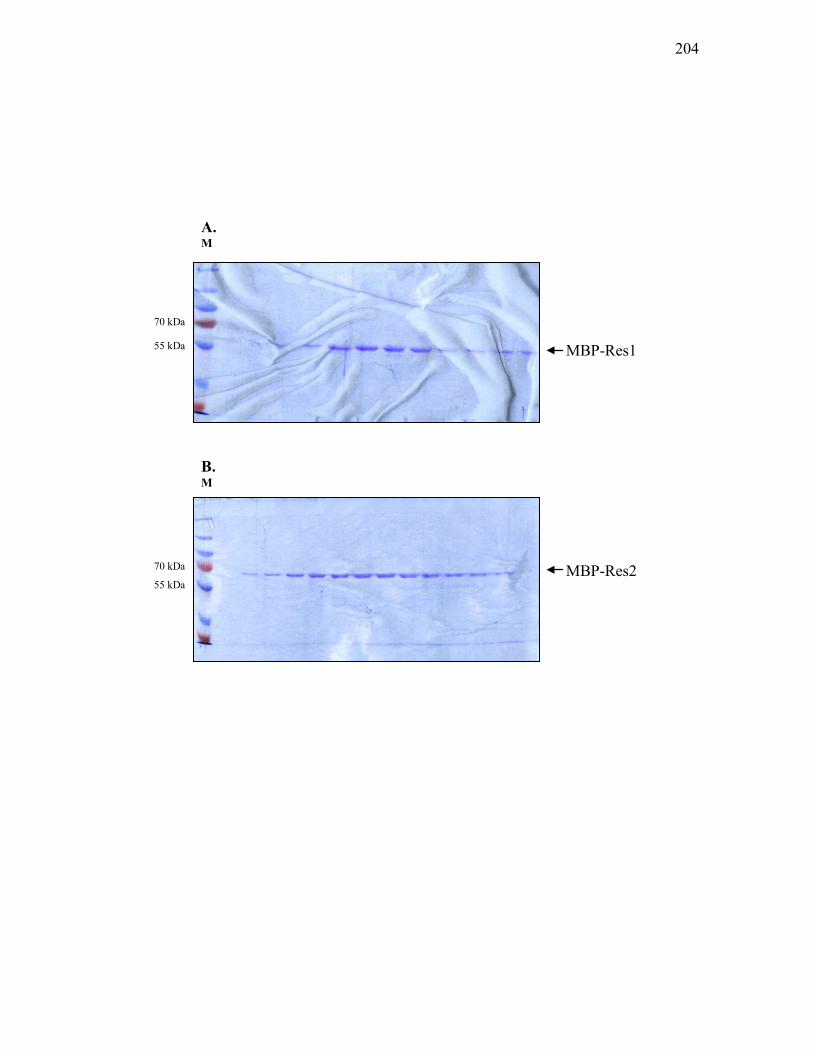
A. M
B. M
MBP-Res1
MBP-Res2
70 kDa
70 kDa
55 kDa
55 kDa
204

Figure 3.3.12. Schematic diagram of the process leading to the purification of
phosphorylated MBP-Res1 and MBP-Res2.
205
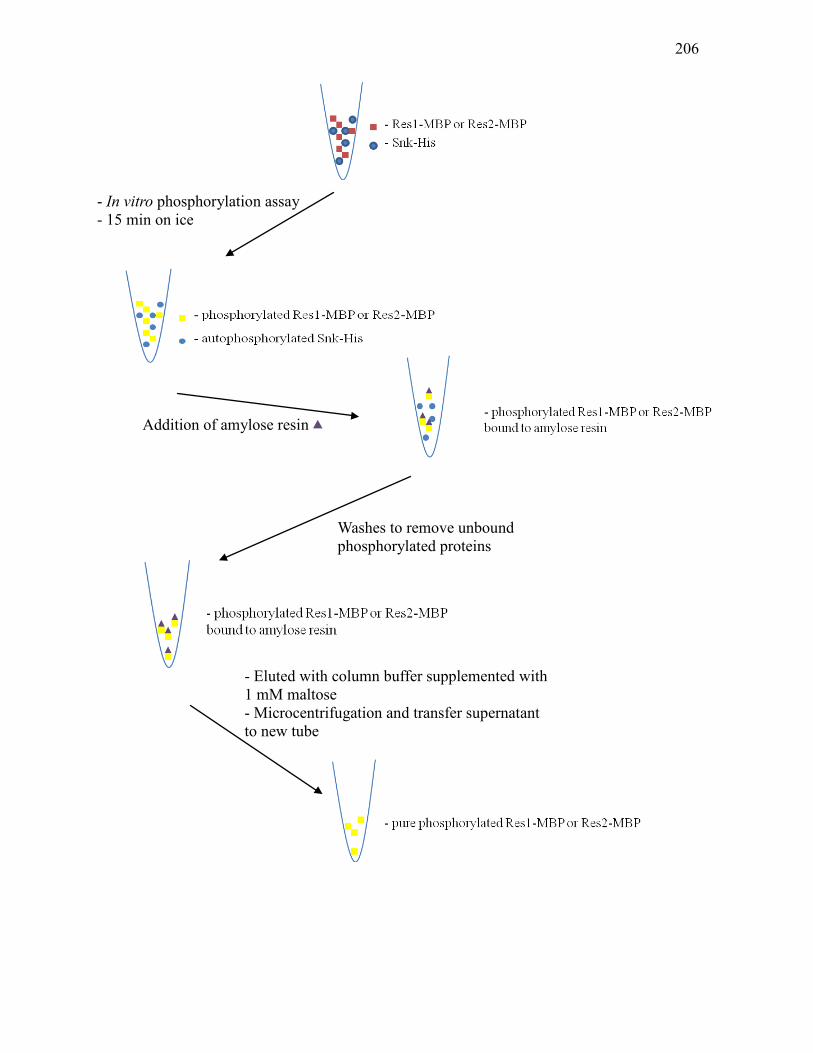
Addition of amylose resin
- In vitro phosphorylation assay - 15 min on ice
Washes to remove unbound phosphorylated proteins
- Eluted with column buffer supplemented with 1 mM maltose - Microcentrifugation and transfer supernatant to new tube
206

successfully, for use in the following in vitro protein assays, by eluting bound
proteins from the resin with kinase buffer supplemented with 1 mM maltose (data
not shown). Nonradioactive trial experiments were also carried out to confirm that
Snk-His7 was efficiently removed and no detectable amount was present in the
eluate, as determined by running samples collected at different stages by SDS-
PAGE and visualizing proteins by staining with Coomassie brilliant blue (data not
shown).
3.3.6.3 In vitro dephosphorylation assays
Once phosphorylated MBP-Res2 was isolated (Section 3.3.5.2), in vitro
dephosphorylation assays were carried out. Phosphorylated MPB-Res2 was mixed
with His10-Res1 and incubated at 30oC. Samples were then taken at different time
points to a maximum of 5 hours. Reactions were stopped by addition of SDS-
PAGE sample buffer and placed at 4oC. All collected samples were then
electrophoresed on 10% SDS-PAG to separate the proteins and the dried gel was
exposed to a phosphor screen. This experiment was carried out multiple times
with minor condition changes and the best data are shown in Figure 3.3.13. In the
control reactions that contained phosphorylated Res2-MPB alone, some
spontaneous dephosphorylation was observed (Figure 3.3.13). When
phosphorylated MBP-Res2 was incubated with His10-Res1, a much more rapid
rate of dephosphorylation of Res2 was observed (Figure 3.3.13). This suggested
that Res1 may possess phosphatase activity or enhance autophosphatase activity
of Res2.
207
Figure 3.3.13. In vitro dephosphorylation assays. (A) Phosphorylated MBP-Res2
was incubated at 30oC alone for the times indicated. (B) Phosphorylated MBP-
Res2 was incubated with His10-Res1 at 30oC for the times indicated. Reactions
were stopped by cooling on ice and addition of 5x SDS-PAGE sample buffer.
Samples were electrophoresed on 12% SDS-PAG. Gels were dried and then
exposed overnight to a phosphor screen.
208
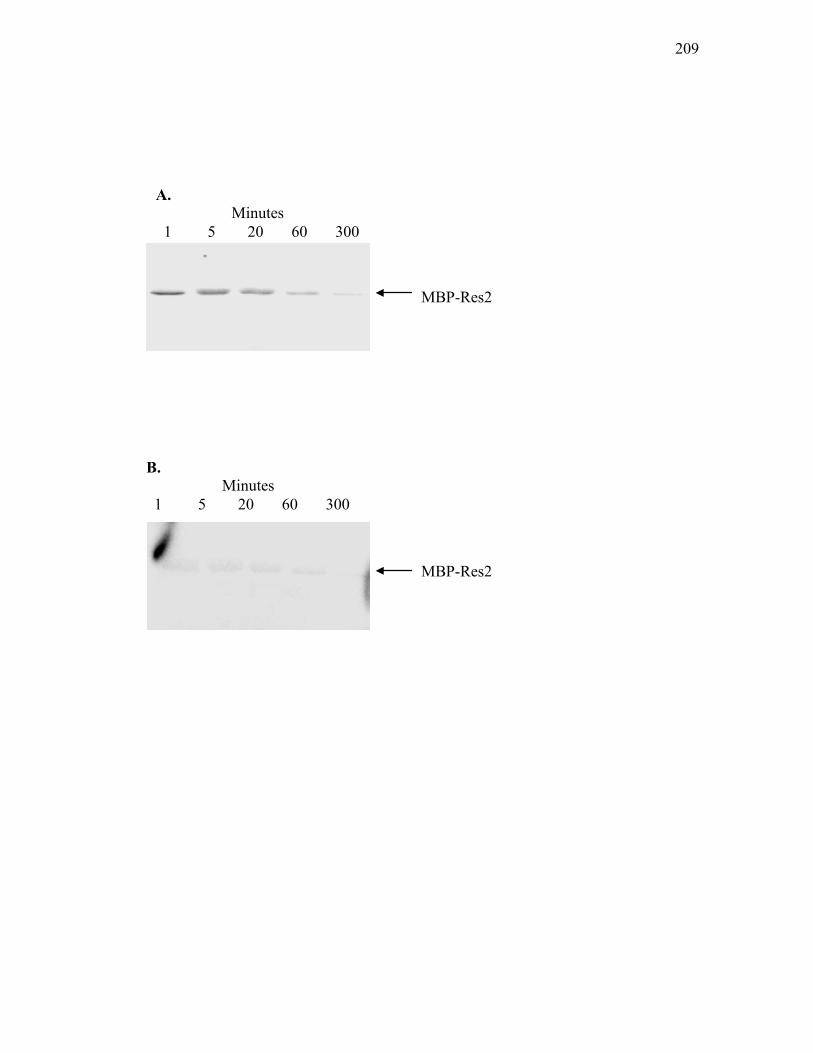
A. Minutes 1 5 20 60 300
MBP-Res2
B. Minutes 1 5 20 60 300
MBP-Res2
209
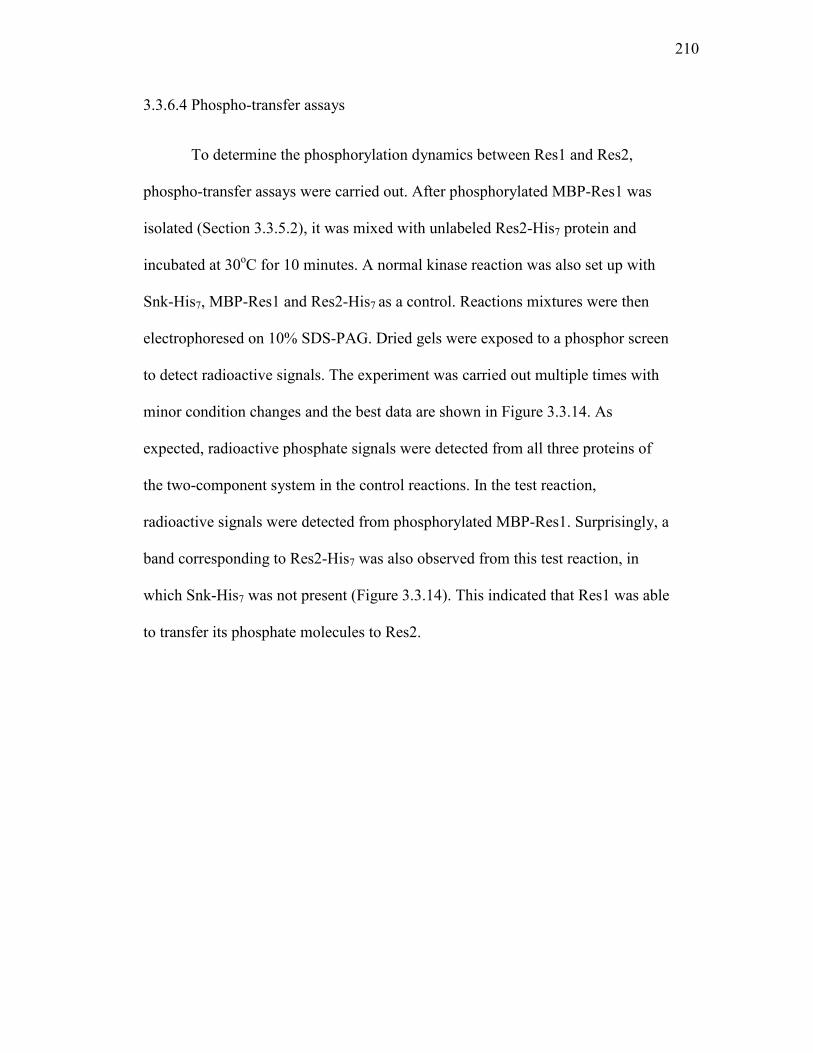
3.3.6.4 Phospho-transfer assays
To determine the phosphorylation dynamics between Res1 and Res2,
phospho-transfer assays were carried out. After phosphorylated MBP-Res1 was
isolated (Section 3.3.5.2), it was mixed with unlabeled Res2-His7 protein and
incubated at 30oC for 10 minutes. A normal kinase reaction was also set up with
Snk-His7, MBP-Res1 and Res2-His7 as a control. Reactions mixtures were then
electrophoresed on 10% SDS-PAG. Dried gels were exposed to a phosphor screen
to detect radioactive signals. The experiment was carried out multiple times with
minor condition changes and the best data are shown in Figure 3.3.14. As
expected, radioactive phosphate signals were detected from all three proteins of
the two-component system in the control reactions. In the test reaction,
radioactive signals were detected from phosphorylated MBP-Res1. Surprisingly, a
band corresponding to Res2-His7 was also observed from this test reaction, in
which Snk-His7 was not present (Figure 3.3.14). This indicated that Res1 was able
to transfer its phosphate molecules to Res2.
210
Figure 3.3.14. Phosphotransfer activity between phosphorylated Res1 and Res2.
Lane C, standard phosphorylation assay with Snk-His7, MBP-Res1 and Res2-His7
present in the reaction mixture; lane 1, phosphotransfer between phosphorylated
MBP-Res1 and Res2-His7, where Snk-His7 was not added to the reaction mixture.
Phosphorylated MBP-Res1 was mixed with Res2-His7 and incubated at 30oC for
15 minutes. Reaction mixtures were cooled on ice and combined with 5x SDS-
PAGE loading buffer. Both samples were electrophoresed on a 12% SDS-PAG,
dried and exposed 16 hours to a phosphor screen.
211
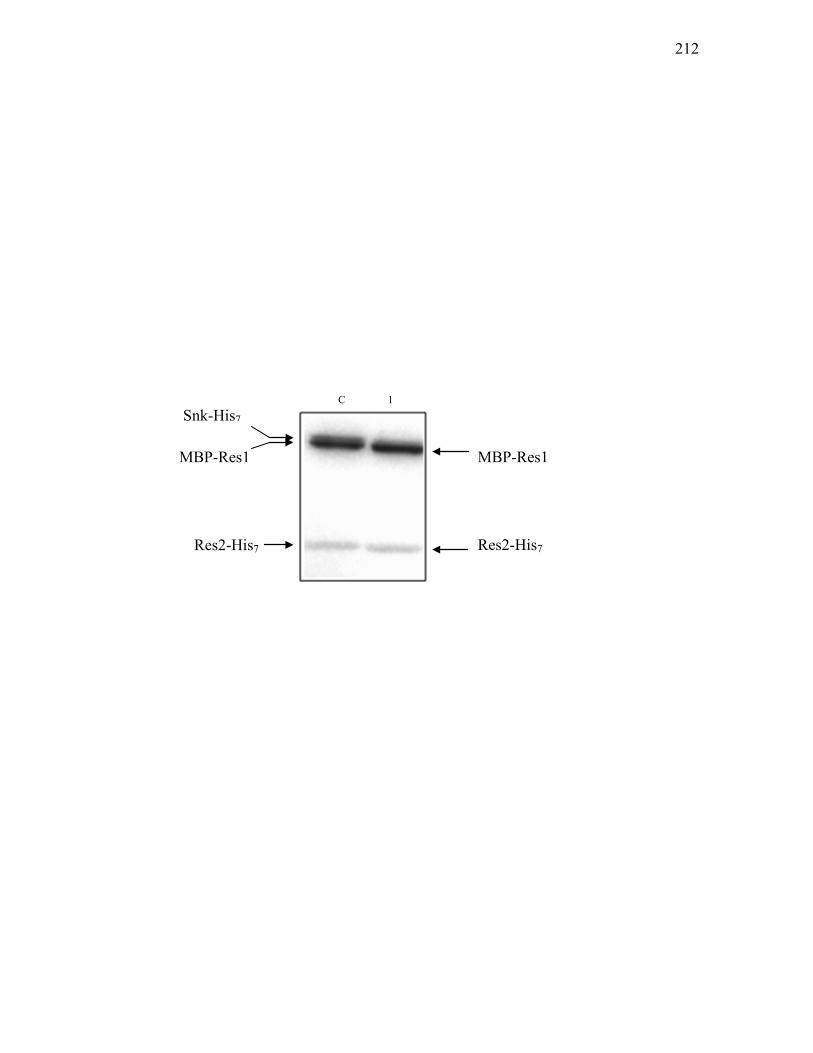
C 1
MBP-Res1
Res2-His7
Snk-His7
Res2-His7
MBP-Res1
212

Chapter 4
Discussion
213
4. Discussion
The main objective of this thesis was to investigate the regulation of
clavam biosynthesis in S. clavuligerus. The first approach taken was to
characterize the unexpected severity of the defect in clavam biosynthesis in ceaS2
mutants and explore the relationship between ceaS1 and ceaS2. In subsequent
studies, the regulation of 5S clavam biosynthesis by the snk/res1/res2 atypical
two-component system, and the pathway specific transcriptional regulator, C7P,
was also investigated. Each component, and the phosphorelay mechanism of the
two-component system were further characterized. Compiling the results from
this thesis and other studies, the major findings will be discussed in the following
sections.
4.1 Polar effect exerted on transcription of downstream genes
When the ΔceaS2-IF mutant prepared by Tahlan (2005) was first
analyzed, it was found that this mutant was still severely compromised in clavam
biosynthesis, a phenotype similar to that seen in ceaS2::apra, ceaS2-Fs and
ΔceaS2::apra mutants constructed previously. A complementation test with a copy
of ceaS2 did not restore clavam production (Tahlan, 2005). In contrast, by
complementing these mutants with a large fragment of DNA, which included the
ceaS2 to the cad genes from the clavulanic acid gene cluster (Figure 1.3),
clavulanic acid production was restored (Table 3.1). Since ceaS2, bls2 and pah2
are transcribed together as a polycistronic transcript, this suggested that a polar
effect still affected transcription of the downstream genes in ΔceaS2-IF. To
214
examine this hypothesis, RT-PCR and Western analyses were carried out to assess
bls transcription and Bls production, respectively. On analysis, it was found that
all ceaS2 mutants were incapable of producing Bls protein (Section 3.1.4) and bls
transcripts were not detected in ΔceaS2-IF (Section 3.1.6). This indicated that
although ΔceaS2-IF was expected to have little or no effect on transcription of
downstream genes, polarity still prevented transcription of the downstream genes
that encode proteins involved in catalyzing the early steps of the clavam
biosynthetic pathway.
The ΔceaS2-IF mutant was prepared by using the REDIRECT methodTM
(Gust et al. 2003). A gene cassette, which contains an origin of transfer (oriT) and
an antibiotic resistance gene, flanked by two FRT (FLP recombinase target) sites
in the same orientation was amplified by PCR with specially designed primers.
These primers were designed so that one end of each primer is homologous to the
gene cassette and the other end is homologous to the appropriate region on a
cosmid that carries the target gene to be disrupted. The amplified cassette was
then introduced into an E. coli strain already carrying the λ RED recombination
genes as well as the target cosmid. Homologous recombination allowed the
amplified cassette to replace the target gene, therefore disrupting the target gene
on the cosmid. Finally, the mutated cosmid was conjugated into Streptomyces
cells, and through a double cross-over recombination, the desired gene(s) in the
Streptomyces' chromosome was replaced by the disruption cassette. To generate
an unmarked and in-frame mutant, presumed to be non-polar, another plasmid
carrying the flp gene, which encodes FLP recombinase and catalyzes
215
recombination between the two FRT sites, was transiently introduced into S.
clavuligerus. Expression of Flp would excise the intervening DNA between the
FRT sites of the gene cassette on the chromosome and leave just the start and stop
codons of the original target gene and an 81-bp scar sequence.
A close inspection of the scar sequence revealed the presence of a rare
CTA codon. Codon usage has been shown to be highly biased in Streptomyces
spp. because of the high G+C content of Streptomyces DNA. TTA codons and the
bldA gene, which encodes the tRNA for this rare leucine codon have been shown
to be involved in regulating secondary metabolism in S. coelicolor and various
Streptomyces spp. (Chater and Chandra, 2008). A S. coelicolor bldA mutant is
unable to produce actinorhodin, undecylprodigiosin and methylenomycin and
TTA codons have been identified in actII-ORF4, redZ, mmfL and mmyB that
encode pathway-specific transcriptional regulators, which control the biosynthesis
of previously mentioned secondary metabolites, respectively (Chater and
Chandra, 2008). A bldA mutant of S. avermitilis was found to be incapable of
producing avermectin, which is an important macrocyclic polyketide widely used
as an anthelmintic agent and has a high value in the medical, veterinary, and
agricultural fields (Tao et al. 2007). The pathway-specific regulator AveR, which
positively controls avermectin production by direct binding to promoter region of
regulated genes, also contains a TTA codon (Guo et al., 2010).
Both studies indicated that ribosome stalling at the TTA codon could lead
to transcriptional polarity. Based on these results, although the scar sequence
mentioned above is small, in-frame and a TTA codon is not present, the presence
216
of a rare CTA codon in this sequence in the ΔceaS2-IF mutant, might still exert a
polar effect on transcription of genes downstream from ceaS2. In such a situation,
the CTA codon could lead to pre-mature termination of transcription by stalling
the ribosome at that point, therefore bls2 would not be transcribed and Bls2 would
not be produced. It may also be possible that the CTA codon context can
influence the severity of the phenotype in a way similar to that proposed for TTA
codons (Trepanier et al., 2002).
Although the REDIRECT methodTM provides a relatively simple and
effective way to generate in-frame deletion mutants and has been widely used in
different laboratories, as co-transcription is a common phenomenon to save
resources by co-regulating genes that belong to the same gene cluster, caution
should be taken to ensure that the phenotype observed is not still due to a polarity
effect on downstream genes. Similar to the egfp gene, in which the codon usage of
the original version has been modified to facilitate expression in high G+C
Streptomyces DNA, the CTA codon could be substituted with alternative leucine
codon such as CTC or CTG, which is commonly used in Streptomyces, to
alleviate possible polarity. However, as the CTA codon is located within the FRT
site, it is not certain that such changes would not interfere with FLP recognization
and excision of the intervening DNA.
4.2 ceaS1 and ceaS2 regulation
Even though polarity still persists in these mutants, this alone still does not
explain why clavam production was so severely affected in the various ceaS2
217
mutants, as ceaS1 and ceaS2 encode proteins that both catalyze the same reaction.
Even if disrupting ceaS2 led to polarity, a reduced level of clavam biosynthesis
instead of a total loss of production should be observed because ceaS1 was still
intact. Since the crystal structure of CeaS2 was shown to be a tetramer (dimer of
dimers) (Caines et al. 2004), it was initially considered that for CeaS1 to function,
it may need to form heterodimers with CeaS2, or that CeaS1 does not have the
same activity as CeaS2. However, since production of clavam metabolites was
restored when ΔceaS2-IF was grown on solid medium, this indicated that ceaS1
was transcribed and the encoded protein was functional in the absence of any
CeaS2 protein (Section 3.1.8). Therefore, this leads to an altenative hypothesis
that cross regulation must be taking place between ceaS1 and ceaS2. This
regulation is possibly at the transcription level because the bacterium could be at a
disadvantage due to the high energy cost to regulate at the post-transcription level
(transcribe or translate a gene that will not function). This was addressed by
determining ceaS1 transcription and CeaS1 production in various ceaS2 mutants.
On analysis, all ceaS2 mutants were shown to be incapable of producing
CeaS1protein (Section 3.1.3) and ceaS1 transcripts were at much lower
abundance, or absent, in ΔceaS2-IF compared to wild type S. clavuligerus
(Section 3.1.6). These results provided evidence that ceaS1 and ceaS2 are cross
regulated through an unknown mechanism. Previous studies have shown that the
two different copies of ceaS gene are under different regulation, where ceaS1 and
ceaS2 are both expressed in complex Soy medium but only ceaS2 is expressed in
defined starch asparagine medium (Tahlan et al. 2004). This study, however,
218
clearly indicated that an additional regulatory mechanism governing transcription
of ceaS1 and ceaS2 must exist such that transcription of the two genes is
interconnected, at least in liquid medium. Interestingly, complementation studies
as described in Section 3.1.3 showed that CeaS1production was not restored, even
though clavulanic acid production was restored in the complemented strains. This
suggested that the integrity of the ceaS2 in its native chromosomal position is
required for efficient transcription of ceaS1 and downstream genes. The
mechanism employed by Myxococcus xanthus to control the formation of
multicellular fruiting bodies might be able to explain this observation.
Under nutrient limitation conditions, M. xanthus undergoes morphological
differentiation and develops into fruiting bodies, which contains spores. Many of
these developmental genes were shown to be expressed from σ54-dependent
promoters. To activate transcription from these promoters, additional activator
proteins are also required to bind to DNA sequences, which are similar to
enhancer sequences from eukaryotes, thus, these regulatory proteins are referred
to as enhancer-binding proteins (EBPs) (Ghosh et al., 2010; Jelsbak et al., 2005).
DNA looping allows bound EBPs to interact with RNA polymerase, forming an
open complex and activating transcription (Ghosh et al., 2010). Although these
enhancer elements are typically located 70-150 bp upstream of transcription start
site (Buck et al., 2000), regulatory elements located >400 bp have been identified
in M. xanthus (Viswanathan et al., 2007).
Although S.coelicolor (and presumably also S. clavuligerus) does not
encode recognizable EBPs or σ54, that does not rule out the possibility that an
219
analogous system may exist in Streptomyces spp. Based on the data obtained, it
might be possible that an enhancer-type element is located in close proximity or
within ceaS2. Therefore, disrupting ceaS2 by inserting an antibiotic resistance
gene or introducing a frame shift mutation, or deleting ceaS2 would either alter
the relative location of the enhancer element or prevented binding of EBP. This
would then interrupt the interaction between EBP bound at the enhancer element
and the RNA polymerase. As a result, transcription would not be initiated. Since
the paralogue gene cluster is located on the pSCL4 plasmid (Medema et al.,
2010), this also suggested a possible interaction between the chromosome and
plasmid.
EBPs have N-terminal domains that can respond to environmental stimuli
and some of these resemble the two-component response regulator receiver
domain (Studholme and Dixon, 2003). A few EBPs identified from M. xanthus
contained a forkhead-associated (FHA) sensory domain. Since the FHA domain
specifically recognizes phosphothreonine residues and Ser/Thr protein kinases
(STPK) are highly abundant in this organism (Kroos, 2005), it was proposed that
Thr of the STPK undergoes autophosphorylation in response to environmental
signals and the FHA domain of EBPs recognizes and interacts with the
phosphorylated STPK. Transfer of phosphate from the STPK to the EBP activates
and promotes interaction with RNA polymerase, and activates transcription
(Jelsbak et al., 2005).
As complete genome sequencing revealed that two-component systems are
highly abundant in Streptomyces spp., and cognate response regulators have not
220
been identified for some of these sensor kinases, it is possible that sensor kinases
autophosphorylate in response to an environmental signal and then phosphorylate
EBP-type-regulatory proteins, which in turn control transcription of ceaS1 (Figure
4.1). Such a system, if it exists, would have to be active only when S. clavuligerus
was grown in liquid medium to explain the discrepancy between liquid and solid
medium. Since S. clavuligerus cannot sporulate in liquid medium, the sensor
kinases involved could be sensing osmolarity difference or recognizing some
other signals that regulate sporulation. However, at this point, the mechanism
controlling ceaS1 transcription remains elusive.
4.3 Effect of the atypical two-component system and C7P on 5S clavam
metabolite biosynthesis
Previous studies have shown that the Snk/Res1/Res2 two-component
system and the pathway-specific transcriptional regulator, C7P, are important for
5S clavam biosynthesis (Tahlan, 2005; Zelyas, 2007; Figure 3.2.1). Therefore,
studies were initiated to further characterize how this system and C7P regulate
production of 5S clavams. RT-PCR was carried out to determine genes that might
be controlled by these proteins. Besides biosynthetic genes that are specifically
involved in late steps for 5S clavam production, c7p transcription was also shown
to be affected in a snk and res2 mutants, but not the opposite (Table 3.2). This
indicated that this two-component system operates at a higher level in the
regulatory hierarchy controlling 5S clavam production in S. clavuligerus. EMSA
further indicated that Res2 binds to the putative promoter region of c7p, and the
encoded C7P protein binds to promoter regions of some tested late biosynthetic
221

Figure 4.1. A proposed mechanism for regulation of ceaS1 transcription by ceaS2
of S. clavuligerus.
222

223
genes (Section 3.2.4.1 and 3.2.4.2). This suggested Res2 controls transcription of
c7p, which in turns controls transcription of biosynthetic genes.
Snk is a soluble sensor kinase and contains two tandem GAF domains at
the N-terminus (Tahlan, 2005). Although the exact stimulus detected by Snk is
not known, GAF domains have been shown to be involved in binding small
molecules such as cyclic nucleotides (cGMP and cAMP), heme, 2-ketoglutarate,
formate, and Na+ (Cann 2007; Ho et al. 2000; Hopper and Bock 1995; Little and
Dixon 2003; Sardiwal et al., 2005). Therefore, it was proposed that binding of
some type of these small molecules would stimulate Snk autophosphorylation.
Both Res1 and Res2 showed similarity to response regulators. Although
Res2 contains both an N-terminal phosphorylation receiver domain and a C-
terminal DNA binding domain, typical of a response regulator, Res1 only contains
the N-terminal phosphorylation domain (Zelyas, 2007). In order to characterize
the phosphorylation dynamics between these three proteins, they were
overproduced and purified as His-tagged proteins (Section 3.2.3). In vitro
phosphorylation assays demonstrated that, with the conditions used, Snk is
capable of autophosphorylation and both Res1 and Res2 can be phosphorylated by
Snk (Section 3.3.1). The conserved histidine residue, H-365 of Snk and the
conserved asparatic acid residues, D-65 of Res1 and D-52 of Res2, are the actual
phosphorylation sites, as changing these residues to alanines prevented Snk
autophosphorylation and blocked the ability of Res1 and Res2 to receive the
phosphate molecules from Snk (Section 3.3.2 and 3.3.4). To further characterize
the phosphorelay mechanism between Res1 and Res2, in vitro protein assays were
224

carried out. The results not only indicated that Res1 possesses phosphatase
activity (Section 3.3.5.3), but also strongly suggested that it is capable of
transferring phosphate molecules to Res2 (Section 3.3.5.4).
Although three-component systems have been identified in different
bacteria, the mechanism governing their regulation remains largely unknown
(Buelow and Raivio, 2010). These systems have been shown to play a key role in
regulating a wide variety of activities. One of these is the RocSAR system from
Pseudomonas aeruginosa that is involved in biofilm formation and maturation
(Kuchma et al., 2005; Kulasekara et al., 2005). This system contains a sensor
kinase, RocS1, and two response regulators, RocA1 and RocR. Similar to Res2,
RocA1contains a response regulator domain and a DNA-binding domain.
Although RocR also contains a response regulator domain, it is linked to an
glutamate-alanine-leucine (EAL) domain instead of a DNA-binding domain
(Kulasekara et al. 2005). Disrupting rocS1, rocA1, or rocR resulted in immature
biofilm formation (Kuchma et al. 2005). Since bacterial two-hybrid systems
showed that RocS1 can interact with both RocA1 and RocR, it was proposed that
an environmental signal will induce RocS1 autophosphorylation, which can then
phosphorylate RocA1 and RocR (Kulasekara et al. 2005). Phosphorylated RocA1
can then control transcription of target genes by direct binding to promoter region
through its DNA-binding domain. In contrast, RocR is believed to regulate gene
expression indirectly by controlling the intracellular concentration of cyclic di-
GMP, as its EAL domain is associated with degradation of cyclic di-GMP to
GMP, which serves as a signalling molecule to control biofilm formation, surface
225
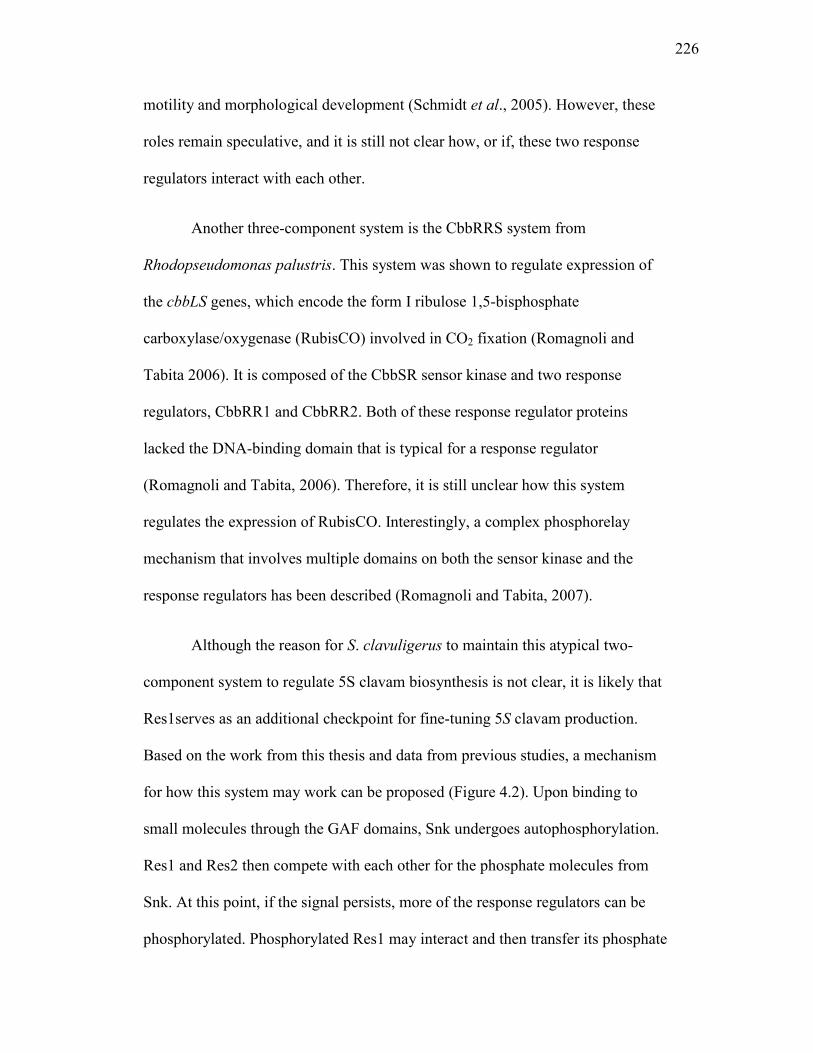
motility and morphological development (Schmidt et al., 2005). However, these
roles remain speculative, and it is still not clear how, or if, these two response
regulators interact with each other.
Another three-component system is the CbbRRS system from
Rhodopseudomonas palustris. This system was shown to regulate expression of
the cbbLS genes, which encode the form I ribulose 1,5-bisphosphate
carboxylase/oxygenase (RubisCO) involved in CO2 fixation (Romagnoli and
Tabita 2006). It is composed of the CbbSR sensor kinase and two response
regulators, CbbRR1 and CbbRR2. Both of these response regulator proteins
lacked the DNA-binding domain that is typical for a response regulator
(Romagnoli and Tabita, 2006). Therefore, it is still unclear how this system
regulates the expression of RubisCO. Interestingly, a complex phosphorelay
mechanism that involves multiple domains on both the sensor kinase and the
response regulators has been described (Romagnoli and Tabita, 2007).
Although the reason for S. clavuligerus to maintain this atypical two-
component system to regulate 5S clavam biosynthesis is not clear, it is likely that
Res1serves as an additional checkpoint for fine-tuning 5S clavam production.
Based on the work from this thesis and data from previous studies, a mechanism
for how this system may work can be proposed (Figure 4.2). Upon binding to
small molecules through the GAF domains, Snk undergoes autophosphorylation.
Res1 and Res2 then compete with each other for the phosphate molecules from
Snk. At this point, if the signal persists, more of the response regulators can be
phosphorylated. Phosphorylated Res1 may interact and then transfer its phosphate
226

Figure 4.2. A proposed mechanism for interaction between the Snk/Res1/Res2
atypical two-component system and the transcriptional regulator C7P of S.
clavuligerus. Speculative steps that have not been verified experimentally are
shown in broken arrows.
227
228
molecules to Res2, which further enhances the amount of phosphorylated Res2.
As a result, 5S clavam biosynthesis is up-regulated as Res2~P activates c7p
transcription by binding to its own promoter and the encoded C7P protein
activates transcription of 5S clavam biosynthetic genes. On the other hand, if the
signal diminishes, phosphatase activity of Res1 will desphosphorylate Res2~P,
therefore, resetting the system and reducing the amount of 5S clavams being
produced. Obviously, additional work is required to confirm this mechanism.
Another possibility is that Res1 may actually form a heterodimer with Res2 and
modulate Res2 activity. To investigate this hypothesis, a bacterial two-hybrid
system can be employed to test whether or not Res1 and Res2 interact.
4.4 Conclusions
Despite the work discussed here, the exact mechanism of regulation of 5S
clavam biosynthesis in S. clavuligerus remains elusive. Since sequencing of the S.
clavuligerus genome sequence, at least in draft form, has just been completed
(Medema et al., 2010), future studies could include microarray analyses
comparing a ΔceaS2-IF mutant grown in liquid and solid medium to provide some
insight of how ceaS1 is being affected by ceaS2. In addition, because RT-PCR
pointed out that, besides the late genes, some of the early genes of clavam
biosynthesis are also affected in a res2 mutant (Table 3.2), it is likely that this
complex regulatory network would control a much larger number of genes.
Therefore, S. clavuligerus genomic DNA microarrays can also help to provide a
more comprehensive list of genes being regulated by this two-component system.
Continued examination of the Snk/Res1/Res2 system will provide a better
229

understanding of the regulatory circuits of clavam biosynthesis. This may lead to
higher clavulanic acid production at the industrial level through strain
improvement by directing more resources from 5S clavam to the clavulanic acid
biosynthetic pathway.
230
Chapter 5
References
231

5. References
Aceti, D.J., and Champness, W.C. 1998. Transcriptional regulation of Streptomyces coelicolor pathway-specific antibiotic regulators by the absA and absB loci. J. Bacteriol. 180:3100-3106.
Adamidis, T., Riggle, P., and Champness, W. 1990. Mutations in a new Streptomyces coelicolor locus which globally block antibiotic biosynthesis but not sporulation. J. Bacteriol. 172:2962-2969.
Alexander, D.C., and Jensen, S.E. 1998. Investigation of the Streptomyces clavuligerus cephamycin C gene cluster and its regulation by the CcaR protein. J. Bacteriol. 180:4068-4079.
Ambler, R.P. 1980. The structure of β-lactamases. Phil. Trans. R. Sec. Lond. B 289:321-331.
Arias, P., Fernandez-Moreno, M.A., and Malpartida, F. 1999. Characterization of the pathway-specific positive transcriptional regulator for actinorhodin biosynthesis in Streptomyces coelicolor A3(2) as a DNA-binding protein. J. Bacteriol. 181:6958-6968.
Arulanantham, H., Kershaw, N.J., Hewitson, K.S., Hughes, C.E., Thirkettele, J.E., and Schofield, C.J. 2006. Orf17 from the clavulanic acid biosynthesis gene cluster catalyzes the ATP-dependent formation of N-glycyl-clavaminic acid. J. Biol. Chem. 281:279-287.
Bachmann, B.O., Li, R., and Townsend, C.A. 1998. β-lactam synthetase: a new biosynthetic enzyme. Proc. Natl. Acad. Sci. USA. 95:9082-9086.
Baggaley, K.H., Brown, A.G., and Schofield, C.J. 1997. Chemistry and biosynthesis of clavulanic acid and other clavams. Nat. Prod. Rep. 14:309-333.
Baldwin, J.E., Lloyd, M.D., Wha-Shon, B., Schofield, C.J., Elson, S.W., Baggaley, K.H., Nicholson, N.H. 1993. A substrate analogue study on clavaminic acid synthase: possible clues to the biosynthetic origin of proclavaminic acid. J. Chem. Soc. Chem. Commun. 500-502.
Baltz, R.H. 1980. Genetic recombination by protoplast fusion in Streptomyces. Dev. Ind. Microbiol. 21:43-54.
Bentley, S.D., Brown, S., Murphy, L.D., Harris, D.E., Quail, M.A., Parkhill, J., Barrell, B.G., McCormick, J.R., Santamaria, R.I., Losick, R., Yamasaki, M., Kinashi, H., Chen, C.W., Chandra, G., Jakimowicz, D., Kieser, H.M., Kieser, T., and Chater, K.F. 2004. SCP1, a 356 023 bp linear plasmid adapted to the
232
ecology and developmental biology of its host, Streptomyces coelicolor A3(2). Mol. Microbiol. 51(6): 1615-1628.
Bentley, S.D., Chater, K.F., Cerdeño-Tárraga, A.-., Challis, G.L., Thomson, N.R., James, K.D., Harris, D.E., Quail, M.A., Kieser, H., Harper, D., Bateman, A., Brown, S., Chandra, G., Chen, C.W., Collins, M., Cronin, A., Fraser, A., Goble, A., Hidalgo, J., Hornsby, T., Howarth, S., Huang, C.-., Kieser, T., Larke, L., Murphy, L., Oliver, K., O'Neil, S., Rabbinowitsch, E., Rajandream, M.-., Rutherford, K., Rutter, S., Seeger, K., Saunders, D., Sharp, S., Squares, R., Squares, S., Taylor, K., Warren, T., Wietzorrek, A., Woodward, J., Barrell, B.G., Parkhill, J., and Hopwood, D.A. 2002. Complete genome sequence of the model actinomycete Streptomyces coelicolor A3 (2). Nature 417:141-147.
Bignell, A.G., Lau, L.H., Colvin, K.R., and Leskiw, B.K. 2003. The putative anti-anti-sigma factor BldG is post-translationally modified by phosphorylation in Streptomyces coelicolor. FEMS Microbiol. Lett. 25:93-99.
Bignell, D.R.D., Tahlan, K., Colvin, K.R., Jensen, S.E., and Leskiw, B.K. 2005. Expression of ccaR, encoding the positive activator of cephamycin C and clavulanic acid production in Streptomyces clavuligerus, is dependent on bldG. Antimicrob. Agents Chemother. 49:1529-1541.
Brian, P., Riggle, P.J., Santos, R.A., and Champness, W.C. 1996. Global negative regulation of Streptomyces coelicolor antibiotic synthesis mediated by an absA-encoded putative signal transduction system. J. Bacteriol. 178:3221-3231.
Brown, A.G., Butterworth, G., Cole, M., Hanscombe, G., Hood, J.D., Reading, C., and Robinson, G.N. 1976. Naturally occurring β-lactamase inhibitors with antibacterial activity. J. Antibiot. 29:668-669.
Brown, K.L., Evans, J.R., and Fletton, R.A. 1979. Structures of three novel β-lactams isolated from three Streptomyces clavuligerus. J. Chem. Soc. Chem. Commun. 1979:282-283.
Buck, M., Gallegos, M.T., Studholme, D.J., Guo, Y.L., and Gralla, J.D. 2000. The bacterial enhancer-dependent sigma(54) (sigma(N)) transcription factor. J. Bacteriol. 182(15): 4129-4136.
Buelow, D.R., and Raivio, T.L. 2010. Three (and more) component regulatory systems - auxiliary regulators of bacterial histidine kinases. Mol. Microbiol. 75(3):547-566.
Cai, H. 2003. Transposon mutagenesis and characterization of clavam biosynthetic genes in Streptomyces clavuligerus. M.Sc. Thesis, University of Alberta, Edmonton, Alta.
233
Caines, M.E.C., Elkins, J.M., Hewitson, K.S., and Schofield, C.J. 2004. Crystal structure and mechanistic implications of N 2-(2-Carboxyethyl) arginine synthase, the first enzyme in the clavulanic acid biosynthesis pathway. J. Biol. Chem. 279:5685-5692.
Cann, M. 2007. A subset of GAF domains are evolutionarily conserved sodium sensors. Mol. Microbiol. 64:461-472.
Chakraburtty, R., and Bibb, M.J. 1997. The ppGpp synthase gene (relA) of Streptomyces coelicolor A3(2) plays a conditional role in antibiotic production and morphological differentiation. J. Bacteriol. 179:5854-5861.
Chater, K.F. 1993. Genetics of differentiation in Streptomyces. Annu. Rev. Microbiol. 47:685-713.
Chater, K.F., and Bibb, M.J. 1997. Regulation of bacterial antibiotic production. In Biotechnology. Edited by H. Kleinkauf and H. von Döhren. VCH, Weinheim, Germany. pp. 57-105.
Chater, K.F., and Chandra, G. 2008. The use of the rare UUA codon to define "expression space" for genes involved in secondary metabolism, development and environmental adaptation in Streptomyces. J. Microbiol. 46(1): 1-11.
Demain, A.L. 2000. Small bugs, big business: the economic power of the microbe. Biotechnol. Adv. 18:499-514.
Demain, A.L., and Elander, R.P. 1999. The β-lactam antibiotics: Past, present, and future. Antonie van Leeuwenhoek 75:5-19.
Egan, L.A., Busby, R.W., Iwata-Reuyl, D., and Townsend, C.A. 1997. Probable role of clavaminic acid as the terminal intermediate in the common pathway to clavulanic acid and the antipodal clavam metabolites. J. Am. Chem. Soc. 119:2348-2355.
Elander, R.P. 2003. Industrial production of β-lactam antibiotics. Appl. Microbiol. Biotechnol. 61:385-392.
Elkins, J.M., Clifton, I.J., Hernandez, H., Doan, L.X., Robinson, C.V., Schofield, C.J., and Hewitson, K.S. 2002. Oligomeric structure of proclavaminic acid amidino hydrolase: evolution of a hydrolytic enzyme in clavulanic acid biosynthesis. Biochem. J. 366:423-434.
Elson, S.W., Baggaley, K.H., Davison, M., Fulston, M., Nicholson, N.H., Risbridger, G.D., and Tyler, J.W. 1993a. The identification of three new biosynthetic intermediates and one further biosynthetic enzyme in the clavulanic acid pathway. J. Chem. Soc. Chem. Commun. 1993:1212-1214.
234
Fernandez-Moreno, M.A., Caballero, J.L., Hopwood, D.A., and Malpartida, F. 1991. The act cluster contains regulatory and antibiotic export genes, direct targets for translational control by the bldA tRNA gene of Streptomyces. Cell 66:769-780.
Floriano, B., and Bibb, M. 1996. afsR is a pleiotropic but conditionally required regulatory gene for antibiotic production in Streptomyces coelicolor A3(2). Mol. Microbiol. 21(2): 385-396.
Foulstone, M. and Reading, C. 1982. Assay of amoxicillin and clavulanic acid, the components of Augmentin, in biological fluids with high-performance liquid chromatography. Antimicrob. Agents Chemother. 22:753-762.
Ghosh, T., Bose, D., and Zhang, X. 2010. Mechanisms for activating bacterial RNA polymerase. FEMS Microbiol. Rev. 34(5): 611-627.
Gomez-Escribano, J.P., Martin, J.F., Hesketh, A., Bibb, M.J., and Liras, P. 2008. Streptomyces clavuligerus reIA-null mutants overproduce clavulanic acid and cephamycin C: negative regulation of secondary metabolism by (p)ppGpp. Microbiol. Sgm 154: 744-755.
Guo, J., Zhao, J., Li, L., Chen, Z., Wen, Y., and Li, J. 2010. The pathway-specific regulator AveR from Streptomyces avermitilis positively regulates avermectin production while it negatively affects oligomycin biosynthesis. Mol. Genet. Genomics 283(2): 123-133.
Gust, B., Challis, G.L., Fowler, K., Kieser, T. and Chater, K.F. 2003. PCR-targeted Streptomyces gene replacement identifies a protein domain needed for biosynthesis of the sesquiterpene soil odor geosmin. Proc. Natl. Acad. Sci USA. 100:1541-1546.
Hardisson, C., and Manzanal, M.B. 1976. Ultrastructural studies of sporulation in Streptomyces. J. Bacteriol. 127:1443-1454.
Hesketh, A., Chen, W.J., Ryding, J., Chang, S., and Bibb, M. 2007. The global role of ppGpp synthesis in morphological differentiation and antibiotic production in Streptomyces coelicolor A3(2). Genome Biol. 8(8): R161.
Higgens, C.F., and Kastnar, R.E. 1971. Streptomyces clavuligerus sp. nov. a β-lactam antibiotic producer. Int. J. Syst. Bacteriol. 21:326-331.
Ho, Y.S.J., Burden, L.M., and Hurley, J.H. 2000. Structure of the GAF domain, a ubiquitous signaling motif and a new class of cyclic GMP receptor. EMBO J. 19:5288-5299.
235
Hodgson, J.E., Fosberry, A.P., Rawlinson, N.S., Ross, H.N.M., Neal, R.J., Arnell, J.C., Earl, A.J., and Lawlor, E.J. 1995. Clavulanic acid biosynthesis in Streptomyces clavuligerus: gene cloning and characterization. Gene 166:49-55.
Hopper, S., and Bock, A. 1995. Effector-mediated stimulation of ATPase activity by the sigma 54-dependent transcriptional activator FHLA from Escherichia coli. J. Bacteriol. 177:2798-27803.
Horinouchi, S., and Beppu, T. 1992. Autoregulatory factors and communication in Actinomycetes. Annu. Rev. Microbiol. 46:377-398.
Howarth, T.T., Brown, A.G., and King, T. 1976. Clavulanic acid, a novel β-lactam from Streptomyces clavuligerus; X-ray crystal structure and analysis. J. Chem. Soc. Commun.: 266-267.
Hutchings, M.I., Hoskisson, P.A., Chandra, G., and Buttner, M.J. 2004. Sensing and responding to diverse extracellular signals? Analysis of the sensor kinases and response regulators of Streptomyces coelicolor A3(2). Microbiology 150:2795-2806.
Ikeda, H., Ishikawa, J., Hanamoto, A., Shinose, M., Kikuchi, H., Shiba, T., Sakaki, Y., Hattori, M., and Omura, S. 2003. Complete genome sequence and comparative analysis of the industrial microorganism Streptomyces avermitilis. Nat. Biotechnol. 21:526-531.
Jelsbak, L., Givskov, M., and Kaiser, D. 2005. Enhancer-binding proteins with a forkhead-associated domain and the sigma(54) regulon in Myxococcus xanthus fruiting body development. Proc. Natl. Acad. Sci. USA. 102(8): 3010-3015.
Jensen, S.E., and Paradkar, A.S. 1999. Biosynthesis and molecular genetics of clavulanic acid. Antonie van Leeuwenhoek 75:125-133.
Jensen, S.E., Elder, K.J., Aidoo, K.A., and Paradkar, A.S. 2000. Enzymes catalyzing the early steps of clavulanic acid biosynthesis are encoded by two sets of paralogous genes in Streptomyces clavuligerus. Antimicrob. Agents Chemother. 44:720-726.
Jensen, S.E., Paradkar, A.S., Mosher, R.H., Anders, C., Beatty, P.H., Brumlik, M.J., Griffin, A., and Barton, B. 2004a. Five additional genes are involved in clavulanic acid biosynthesis in Streptomyces clavuligerus. Antimicrob. Agents Chemother. 48:192-202.
Jensen, S.E., Wong, A., Griffin, A., and Barton, B. 2004b. Streptomyces clavuligerus has a second copy of the proclavaminate amidinohydrolase gene. Antimicrob. Agents Chemother. 48:514-520.
236
Jin, W., Ryu, Y., Kang, S.G., Kim, S.K., Saito, N., Ochi, K., Lee, S.H., and Lee, K.J. 2004. Two relA/spoT homologous genes are involved in the morphological and physiological differentiation of Streptomyces clavuligerus. Microbiology 150:1485-1493.
Kenig, M., and Reading, C. 1979. Holomycin and an antibiotic (MM 19290) related to tunicamycin, metabolites of Streptomyces clavuligerus. J. Antibiot. 32:549-554
Kershaw, N.J., McNaughton, H.J., Hewitson, K.S., Hernandez, H., Griffin, J., Hughes, C, Greaves, P., Barton, B., Robinson, C.V., and Schofield, C.J. 2002. ORF6 from the clavulanic acid gene cluster of Streptomyces clavuligerus has ornithine acetyltransferase activity. Eur. J. Biochem. 269:2052-2059.
Khaleeli, N., Li, R., and Townsend, C.A. 1999. Origin of the β-lactam carbons in clavulanic acid from an unusual thiamine pyrophosphate-mediated reaction. J. Am. Chem. Soc. 121:9223-9224.
Khokhlov, A.S., Tovarova, I.L., Borisova, L.N., Pliner, S.A., Schevchenko, I.L., Kornitskaka, E.Y., Ivkina, N.S., and Rapoport, I.A. 1967. A-factor responsible for the production of streptomycin by a mutant strain of Actinomyces streptomycini. Dokl. Akad. SSSR 177:232-235.
Kieser, T., Bibb, M.J., Buttner, M.J., Charter, K.F., and Hopwood, D.A. 2000. Practical Streptomyces genetics. John Innes Foundation, Norwich, England.
Kim, H.S., and Park, Y.I. 2008. Isolation and identification of a novel microorganism producing the immunosuppressant tacrolimus. J. Biosci. Bioeng. 105(4): 418-421.
Kim, H.S., Lee, Y.J., Lee, C.K., Choi, S.U., Yeo, S.H., Hwang, Y.I., Yu, T.S., Kinoshita, H., and Nihira, T. 2004. Cloning and characterization of a gene encoding the γ-butyrolactone autoregulator receptor from Streptomyces clavuligerus. Arch. Microbiol. 182:44-50.
Kinoshita, H., Tsuji, T., Ipposhi, H., Nihira, T., and Yamada, Y. 1999. Characterization of binding sequences for butyrolactone autoregulator receptors in Streptomycetes. J. Bacteriol. 181:5075-5080.
Kirby, K. S., Fox-Carter, E., and Guest, M. 1967. Isolation of deoxyribonucleic acid and ribosomal ribonucleic acid from bacteria. Biochem. J. 104:258-262.
Kroos, L. 2005. Eukaryotic-like signaling and gene regulation in a prokaryote that undergoes multicellular development. Proc. Natl. Acad. Sci. USA. 102(8): 2681-2682.
237
Kuchma, S.L., Connolly, J.P., and O’Toole, G.A. 2005. A three-component regulatory system regulates biofilm maturation and type III secretion in Pseudomonas aeruginosa. J. Bacteriol. 187:1441-1454.
Kulasekara, H.D., Ventre, I., Kulasekara, B.R., Lazdunski, A., Filloux, A., and Lory, S. 2005. A novel two-component system controls the expression of Pseudomonas aeruginosa fimbrial cup genes. Mol. Microbiol. 55:368-380.
Kyung, Y.S., Hu, W.S., and Sherman, D.H. 2001. Analysis of temporal and spatial expression of the CcaR regulatory element in the cephamycin C biosynthetic pathway using green fluorescent protein. Mol. Microbiol. 40(3): 530-541.
Leskiw, B.K., Bibb, M.J., and Chater, K.F. 1991. The use of a rare codon specifically during development. Mol. Microbiol. 5:2861-2867.
Li, R., Khaleeli, N., and Townsend, C.A. 2000. Expansion of the clavulanic acid gene cluster: identification and in vivo functional analysis of three new genes required for biosynthesis of clavulanic acid by Streptomyces clavuligerus. J. Bacteriol. 182:4087-4095.
Little, R., and Dixon, R. 2003. The amino-terminal GAF domain of Azotobacter vinelandii NifA binds 2-oxoglutarate to resist inhibition of NifL under nitrogen-limiting conditions. J. Biol. Chem. 278:28711-28718.
Lorenzana, L.M., Perez-Redondo, R., Santamarta, I., Martin, J.F., and Liras, P. 2004. Two oligopeptide-permease-encoding genes in the clavulanic acid cluster of Streptomyces clavuligerus are essential for production of the β-lactamase inhibitor. J. Bacteriol. 186:3431-3438.
MacKenzie, A.K., Kershaw, N.J., Hernandez, H., Robinson, C.V., Schofield, C.J., and Andersson, I. 2007. Clavulanic acid dehydrogenase: Structural and biochemical analysis of the final step in the biosynthesis of the beta-lactamase inhibitor clavulanic acid. Biochemistry 46(6): 1523-1533.
Mackenzie, A.K., Valegard, K., Iqbal, A., Caines, M.E.C., Kershaw, N.J., Jensen, S.E., Schofield, C.J., and Andersson, I. 2010. Crystal structures of an oligopeptide-binding protein from the biosynthetic pathway of the beta-lactamase inhibitor clavulanic acid. J. Mol. Biol. 396(2): 332-344.
Marsh, E.N., Chang, M.D., and Townsend, C.A. 1992. Two isozymes of clavaminate synthase central to clavulanic acid formation: cloning and sequencing of both genes from Streptomyces clavuligerus. Biochemistry 31:12648-12657.
238
Martin, J., and Liras, P. 2010. Engineering of regulatory cascades and networks controlling antibiotic biosynthesis in Streptomyces. Curr. Opin. Microbiol. 13(3): 263-273.
Martin, J.F. 2004. Phosphate control of the biosynthesis of antibiotics and other secondary metabolites is mediated by the PhoR-PhoP system: an unfinished story. J. Bacteriol. 186(16): 5197-5201.
Martinez-Hackert, E., and Stock, A. M. 1997. The DNA-binding domain of OmpR: crystal structures of a winged helix transcription factor. Structure 5:109-124.
McCarthy, A.J., and Williams, S.T. 1992. Actinomeycetes as agents of biodegradation in the environment-a review. Gene 115:189-192.
McKenzie, N.L., and Nodwell, J.R. 2007. Phosphorylated AbsA2 negatively regulates antibiotic production in Streptomyces coelicolor through interactions with pathway-specific regulatory gene promoters. J. Bacteriol. 189:5284-5292.
Medema, M.H., Trefzer, A., Kovalchuk, A., van den Berg, M., Muller, U., Heijne, W., Wu, L., Alam, M.T., Ronning, C.M., Nierman, W.C., Bovenberg, R.A.L., Breitling, R., and Takano, E. 2010. The sequence of a 1.8-Mb bacterial linear plasmid reveals a rich evolutionary reservoir of secondary metabolic pathways. Genome Biol. Evol. 2: 212-224.
Mellado, E., Lorenzana, L.M., Rodriguez-Saiz, M., Diez, B., Liras, P., and Barredo, J.L. 2002. The clavulanic acid biosynthetic cluster of Streptomyces clavuligerus: genetic organization of the region upstream of the car gene. Microbiology 148:1427-1438.
Mendez, C., Brana, A.F., Manzanal, M.B., and Hardisson, C. 1985. Role of substrate mycelium in colony development in Streptomyces. Can. J. Microbiol. 31:446-450.
Merrick, M.J. 1976. A morphological and genetic mapping study of bald colony mutants of Streptomyces coelicolor. J. Gen. Microbiol. 96:299-315.
Miller, L.M., Stapley, E.O., and Chailet, L. 1962. Production of synnemantin B by the member of the genus Streptomyces. Bacteriol. Proc. 49:32.
Miller, M.T., Bachmann, B.O., Townsend, C.A., and Rosenzweig, A.C. 2001. Structure of β-lactam synthetase reveals how to synthesize antibiotics instead of asparagine. Nat. Struct. Biol. 8:684-689.
239

Mosher, R.H., Paradkar, A.S., Anders, C., Barton, B., and Jensen, S.E. 1999. Genes specific for the biosynthesis of clavam metabolites antipodal to clavulanic acid are clustered with the gene for clavaminate synthase 1 in Streptomyces clavuligerus. Antimicrob. Agents Chemother. 43:1215-1224.
Nagarajan, R., Boeck, L.D., Gorman, M., Hamill, R.L., Higgens, C.E., Hoehn, M.M., Stark, W.M., and Whitney, J.G. 1971. Beta-lactam antibiotics from Streptomyces. J. Am. Chem. Soc. 93:2308-2310.
Nicholson, N.H., Baggaley, K.H., Cassels, R., Davison, M., Elson, S.W., Fulston, M., Tyler, J.W., and Woroniecki, S.R. 1994. Evidence that the immediate biosynthetic precursor of clavulanic acid is its N-aldehyde analogue. J. Chem. Soc. Chem. Commun. 1994:1281-1282.
Ochi, K. 1986. Occurrence of the stringent response in Streptomyces sp. and its significance for the initiation of morphological and physiological differentiation. J. Gen. Microbiol. 132:2621-2631.
Ohnishi, Y., Ishikawa, J., Hara, H., Suzuki, H., Ikenoya, M., Ikeda, H., Yamashita, A., Hattori, M., and Horinouchi, S. 2008. Genome sequence of the streptomycin-producing microorganism Streptomyces griseus IFO 13350. J. Bacteriol. 190(11): 4050-4060.
Paradkar, A.S., Aidoo, K.A., and Jensen, S.E. 1998. A pathway-specifictranscriptional activator regulates late steps of clavulanic acid biosynthesis in Streptomyces clavuligerus. Mol. Microbiol. 27:831-843.
Paradkar, A.S., and Jensen, S.E. 1995. Functional analysis of the gene encoding the clavaminate synthase 2 isoenzyme involved in clavulanic acid biosynthesis in Streptomyces clavuligerus. J. Bacteriol. 177:1307-1314.
Paradkar, A.S., Jensen, S.E., and Mosher, R.H. 1997. Comparative genetics and molecular biology of β-lactam biosynthesis. In Biotechnology of antibiotics. Edited by W.J. Strohl. Marcel Dekker, Inc., New York. Pp. 241-277.
Pérez-Llarena, F.J., Liras, P., Rodríguez-García, A., and Martin, J.F. 1997. A regulatory gene (ccaR) required for cephamycin and clavulanic acid production in Streptomyces clavuligerus: Amplification results in overproduction of both β-lactam compounds. J. Bacteriol. 179:2053-2059.
Pérez-Redondo, R., Rodríguez-García, A., Martín, J.F., and Liras, P. 1998. The claR gene of Streptomyces clavuligerus, encoding a LysR-type regulatory protein controlling clavulanic acid biosynthesis, is linked to the clavulanate-9-aldehyde reductase (car) gene. Gene 211:311-321.
240
Pruess, D.L., and Kellett, M. 1983. Ro 22-5417, a new clavam antibiotic from Streptomyces clavuligerus. I. Discovery and biological activity. J. Antibiot. 36:208-212.
Retzlaff, L., and Distler, J. 1995. The regulator of streptomycin gene expression, StrR, of Streptomyces griseus is a DNA binding activator protein with multiple recognition sites. Mol. Microbiol. 18:151-162.
Romagnoli, S., and Tabita, F.R. 2006. A novel three-protein two-component system provides a regulatory twist on an established circuit to moculate expression of the cbbI region Rhodopseudomonas palustris CGA010. J. Bacteriol. 188:2780-2791.
Romagnoli, S., and Tabita, F.R. 2007. Phosphotransfer reactions of the CbbRRS three-protein two-component system from Rhodopseudomonas palustris CGA010 appear to be controlled by an internal molecular switch on the sensor kinase. J. Bacteriol. 189(2): 325-335.
Ryding, N.J., Anderson, T.B., and Champness, W.C. 2002. Regulation of the Streptomyces coelicolor calcium-dependent antibiotic by absA, encoding a cluster-linked two-component system. J. Bacteriol. 184(3): 794-805.
Salowe, S.P., Krol, W.J., Iwata-Reuyl, D., and Townsend, C.A. 1991. Elucidation of the order of oxidations and identification of an intermediate in the multistep clavaminate synthase reaction. Biochemistry 30:2281-2292.
Salowe, S.P., Marsh, E.N., and Townsend, C.A. 1990. Purification and characterization of clavaminate synthase from Streptomyces clavuligerus: an unusual oxidative enzyme in natural product biosynthesis. Biochemistry 29:6499-6508.
Sambrook, J., Fritsch, E.F., and Maniatas, T. 1989. Molecular cloning: a laboratory manual. 2nd ed. Cold Spring Harbor Laboratory Press, Cold Spring Harbor, N.Y.
Santamarta, I., Pérez-Redondo, R., Lorenzana, L.M., Martín, J.F., and Liras, P. 2005. Different proteins bind to the butyrolactone receptor protein ARE sequence located upstream of the regulatory ccaR gene of Streptomyces clavuligerus. Mol. Microbiol. 56:824-835.
Santamarta, I., Rodríguez-García, A., Pérez-Redondo, R., Martín, J.F., and Liras, P. 2002. CcaR is an autoregulatory protein that binds to the ccaR and cefD-cmcI promoters of the cephamycin C-clavulanic acid cluster in Streptomyces clavuligerus. J. Bacteriol. 184:3106-3113.
Santos-Beneit, F., Rodriguez-Garcia, A., Sola-Landa, A., and Martin, J.F. 2009. Cross-talk between two global regulators in Streptomyces: PhoP and AfsR
241
interact in the control of afsS, pstS and phoRP transcription. Mol. Microbiol. 72(1): 53-68.
Sardiwal, S., Kendall, S.L., Movahedzadeh, F., Rison, S.C.G., Stoker, N.G., and Djordjevic, S. 2005. A GAF domain in the hypoxia/NO-inducible Mycobacterium tuberculosis DosS protein binds haem. J. Mol. Biol. 353:929-936.
Schmidt, A.J., Ryjenkov, D.A., and Gomelsky, M. 2005. The ubiquitous protein domain EAL is a cyclic diguanylate-specific phosphodiesterase: Enzymatically active and inactive EAL domains. J. Bacteriol. 187(14): 4774-4781.
Skatrud, P.L., Schwecke, T., Liempt, H.V., and Tobin, M.B. 1997. Advances in the molecular genetics of β-lactam antibiotic biosynthesis. In Biotechnology. Edited by H. Kleinkauf and H. von Döhren. VCH, Weinheim, Germany. pp. 247-270.
Sola-Landa, A., Moura, R.S., and Martin, J.F. 2003. The two-component PhoR-PhoP system controls both primary metabolism and secondary metabolite biosynthesis in Streptomyces lividans. Proc. Natl. Acad. Sci. USA. 100:6133-6138.
Song, J.Y., Kim, E.S., Kim, D.W., Jensen, S.E., and Lee, K.J. 2009. A gene located downstream of the clavulanic acid gene cluster in Streptomyces clavuligerus ATCC 27064 encodes a putative response regulator that affects clavulanic acid production. J. Ind. Microbiol. Biotechnol. 36(2): 301-311.
Studholme, D.J., and Dixon, R. 2003. Domain architectures of sigma(54)-dependent transcriptional activators. J. Bacteriol. 185(6): 1757-1767.
Stuttard, C. 1982. Temperate phages of Streptomyces venezuelae: lysogeny and host specificity shown by phages SV1 and SV2. J. Gen. Microbiol. 128:115-121.
Tahlan, K. 2005. Characterization of the carboxyethylarginine synthase genes involved in clavulanic acid and 5S clavam metabolite biosynthesis in Streptomyces clavuligerus. Ph.D. thesis, University of Alberta, Edmonton, Alta.
Tahlan, K., Anders, C., and Jensen, S.E. 2004a. The paralogous pairs of genes involved in clavulanic acid and clavam metabolite biosynthesis are differently regulated in Streptomyces clavuligerus. J. Bacteriol. 186:6286-6297.
242
Tahlan, K., Park, H.U., and Jensen, S.E. 2004b. Three unlinked gene clusters are involved in clavam metabolite biosynthesis in Streptomyces clavuligerus. Can. J. Microbiol. 50:803-810.
Tahlan, K., Park, H.U., Wong, A., Beatty, P.H., and Jensen, S.E. 2004c. Two sets of paralogous genes encode the enzymes involved in the early stages of clavulanic acid and clavam metabolite biosynthesis in Streptomyces clavuligerus. Antimicrob. Agents Chemother. 48:903-939.
Tahlan, K., Anders, C., Wong, A., Mosher, R.H., Beatty, P.H., Brumlik, M.J., Griffin, A., Hughes, C., Griffin, J., Barton, B., and Jensen, S.E. 2007. 5S clavam biosynthetic genes are located in both the clavam and paralog gene clusters in Streptomyces clavuligerus. Chem. Biol. 14(2): 131-142.
Thai, W., Paradkar, A.S. and Jensen, S.E. 2001. Construction and analysus of β-lactamase-inhibitory protein (BLIP) non-producer mutants of Streptomyces clavuligerus. Microbiology 147:325-335.
Tipper, D.J., and Strominger, J.L. 1965. Mechanism of action of penicillins: a proposal based on their structural similarity to acyl-D-alanyl-D-alanine. Proc. Natl. Acad. Sci. USA. 54:1133-1141.
Trepanier, N.K., Jensen, S.E., Alexander, D.C., and Leskiw, B.K. 2002. The positive activator of cephamycin C and clavulanic acid production in Streptomyces clavuligerus is mistranslated in a bldA mutant. Microbiology 148:643-656.
Viswanathan, P., Ueki, T., Inouye, S., and Kroos, L. 2007. Combinatorial regulation of genes essential for Myxococcus xanthus development involves a response regulator and a LysR-type regulator. Proc. Natl. Acad. Sci. USA. 104(19): 7969-7974.
Vogtli, M., Chang, P.C., and Cohen, S.N. 1994. Afsr2 - a previously undetected gene encoding a 63-amino-acid protein that stimulates antibiotic production in Streptomyces lividans. Mol. Microbiol. 14(4): 643-653.
Waksman, S.A., and Henrici, A.T. 1943. The nomenclature and classification of the actinomycetes. J. Bacteriol. 46:337-341.
Walsh, C. 2003. Antibiotics. American Society for Micriobiology Press, Washington, DC.
Ward, J.M., and Hodgson, J.E. 1993. The biosynthetic genes for clavulanic acid and cephamycin production occur as a 'super-cluster' in three Streptomyces. FEMS Microbiol. Lett. 110:239-242.
243
Wietzorrek, A., and Bibb, M. 1997. A novel family of proteins that regulates antibiotic production in Streptomycetes appears to contain an OmpR-like DNA-binding fold. Mol. Microbiol. 25:1181-1184.
Wildermuth, H. 1970. Development and organization of the aerial mycelium in Streptomyces coelicolor. J. Gen. Microbiol. 60:43-50.
Wise, E.M., and Park, J.T. 1965. Penicillin: its basic site of action as an inhibitor of a peptide cross-linking reaction in cell wall mucopeptide synthesis. Proc. Natl. Acad. Sci. USA. 54:75-81.
Zelyas, N. 2007. Identification and analysis of genes involved in 5S clavam biosynthesis in Streptomyces clavuligerus. M.Sc. thesis, University of Alberta, Edmonton, Alta.
Zelyas, N.J., Cai, H., Kwong, T., and Jensen, S.E. 2008. Alanylclavam biosynthetic genes are clustered together with one group of clavulanic acid biosynthetic genes in Streptomyces clavuligerus. J. Bacteriol. 190(24): 7957-7965.
244