qtl identification of the insensitive response to photoperiod and temperature in soybean by...
TRANSCRIPT
Journal of Integrative Agriculture2013, 12(8): 1423-1430 August 2013
© 2013, CAAS. All rights reserved. Published by Elsevier Ltd.
doi:10.1016/S2095-3119(13)60554-7
RESEARCH ARTICLE
QTL Identification of the Insensitive Response to Photoperiod and Temperaturein Soybean by Association Mapping
ZUO Qiao-mei, WEN Zi-xiang, ZHANG Shu-yun, HOU Jin-feng, GAI Jun-yi, YU De-yue and XING Han
Key Laboratory of Biology and Genetic Improvement of Soybean, Ministry of Agriculture/National Key Laboratory of Crop Genetics and
Germplasm Enhancement/ , Nanjing Agricultural University, Nanjing 210095, P.R.China
Abstract
The insensitive response to photoperiod and temperature is an important quantitative trait for soybean in wide adaptation
breeding. The natural variation in response to photoperiod and temperature was detected using 275 accessions of
soybean [Glycine max (L.) Merrill] from China. Genome-wide association mapping, based on population structure
analysis, was carried out using 118 SSR markers by the TASSEL GLM (general linear model) program. Nine SSR markers
(P<0.01) were associated with the value of the response to photoperiod and temperature (VRPT) caused by days to
flowering (DF), among which, Satt308 (LG M), Satt150 (LG M) and Satt440 (LG I), were identified in both 2006 and 2007.
Twelve SSR markers (P<0.01) were associated with VRPT caused by days to maturity (DM), among which three markers,
Satt387 (LG N), Satt307 (LG C2) and AW310961 (LG J), were detected in both 2006 and 2007. In addition, a total of 20 elite
alleles were screened out over 2006 and 2007 for being associated with an insensitive response to photoperiod and temperature
(IRPT) caused by DF and a total of seven different elite alleles were screened out for being associated with IRPT caused by
DM. Among these elite alleles, five alleles, Satt150-244, Satt308-164, Satt308-206, Satt440-176, and Satt440-206, were associated
with IRPT caused by DF and were identified in both years, but only one allele, Satt307-170, was identified as being associated
with an IRPT caused by DM. Based on these elite alleles, a set of typical accessions were screened out. The result about the
genetic basis of IRPT is meaningful for soybean wide adaption breeding.
Key words: QTL, association mapping, soybean, insensitive response, photoperiod and temperature
INTRODUCTION
Soybean [Glycine max (L.) Merrill] is sensitive to pho-toperiod and temperature. For this reason, the plantingregion for each cultivar is restricted to a narrow rangeof latitudes, although the overall latitude range overwhich soybean can be cultivated is wide (50°N-35°S).Therefore, the study of the insensitive response to pho-toperiod and temperature is one of the most importanttopics for wide adaptation breeding in soybean. Todate, nine genes, E1 and E2 (Bernard 1971), E3 (Buzzell
1971), E4 (Buzzell and Voldeng 1980), E5 (McBlainand Bernard 1987), E6 (Bonato and Vello 1999), E7(Cober and Voldeng 2001), E8 (Cober et al. 2010) andJ (Malo et al. 1995), have been reported to affect flow-ering time and maturity. Besides E6 and J, the rest ofthe genes are involved in the control of plant insensitiv-ity especially in long-day (LD) conditions (Buzzell 1971;Buzzell and Voldeng 1980; Cober et al. 1996; Coberand Voldeng 2001; Cober et al. 2010). Many QTLscontrolling days to flowering (DF), days to maturity(DM) and response to photoperiod and temperature havebeen reported by previous researchers (Kabelka et al.
Received 17 September, 2012 Accepted 19 November, 2012
Correspondence XING Han, Tel/Fax: +86-25-84399526, E-mail: [email protected]
1424 ZUO Qiao-mei et al.
© 2013, CAAS. All rights reserved. Published by Elsevier Ltd.
2004; Zhang et al. 2004; Reinprecht et al. 2006; Githiriet al. 2007; Liu and Abe 2010).
Association mapping (AM), also known as associa-tion analysis or linkage disequilibrium (LD) mapping, isan alternative technique for the identification of QTLs.It detects and locates QTLs based on the strength of thecorrelation between mapped genetic markers and traits(Mackay and Powell 2007). In contrast to traditionalbiparental population-based linkage analysis, AM proce-dures can effectively compare a greater portion of thevariation within a species and has the power to simulta-neously evaluate the varying effects of many alleles (Luet al. 2010). In soybean, association analysis had beenused to determine markers associated with iron deficiencychlorosis (Wang et al. 2008), protein content (Jun et al.2008) and soybean quality traits (Hou et al. 2011).
The goal of this study was to identify the QTLs andelite alleles associated with the insensitive response tophotoperiod and temperature (IRPT) using the AMmethod. A soybean landrace population, consisting of275 individuals and 118 SSR markers, was used forgenome-wide association mapping by the TASSEL GLMprogram based on the population structure analysisundertaken as part of this study. The genetic basis forIRPT demonstrated in this study is applicable to wideadaptation breeding in soybean.
RESULTS
Analysis of variation
In this study, accessions selected from China weregrown at Jiangpu Experimental Station, Nanjing Agri-
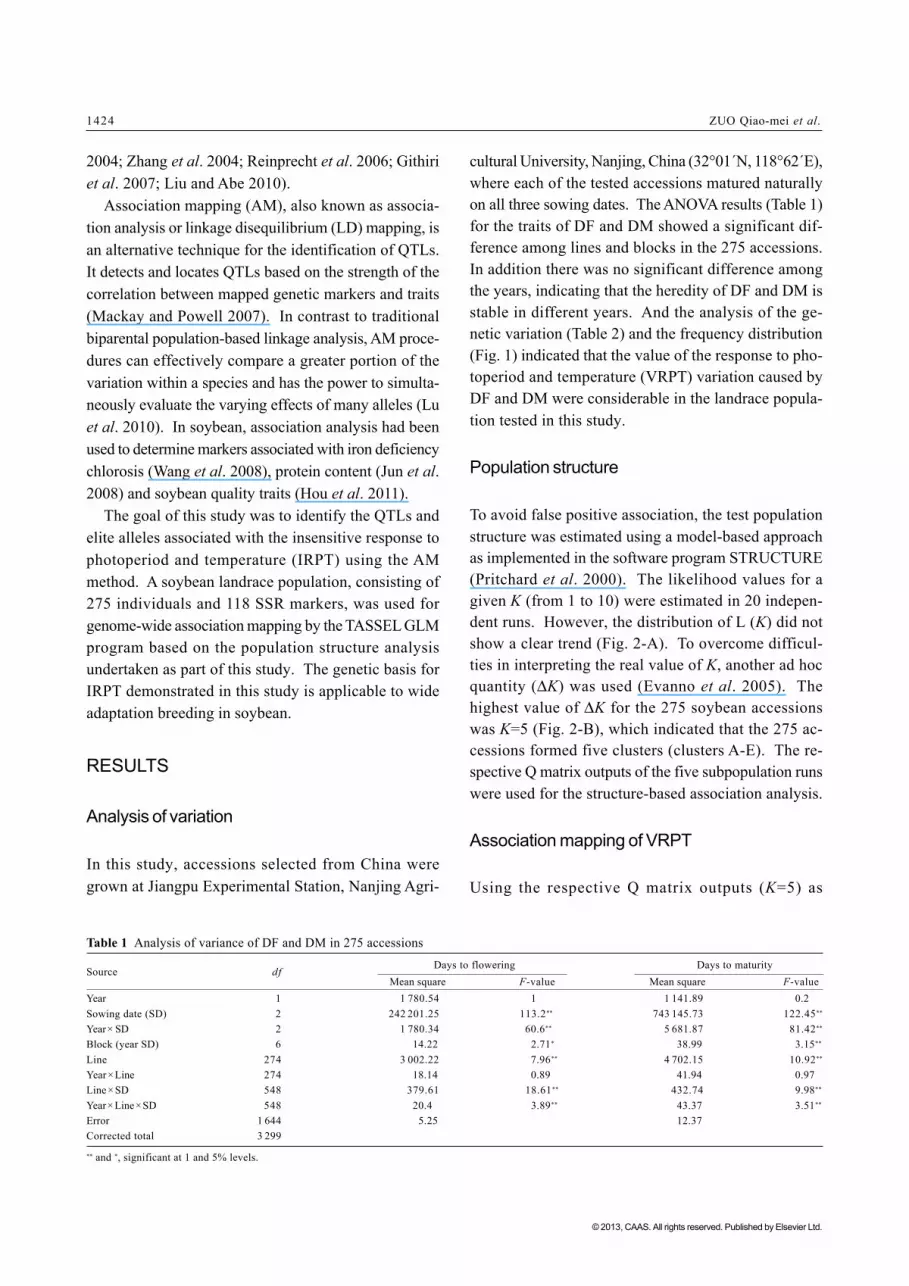
cultural University, Nanjing, China (32°01´N, 118°62´E),where each of the tested accessions matured naturallyon all three sowing dates. The ANOVA results (Table 1)for the traits of DF and DM showed a significant dif-ference among lines and blocks in the 275 accessions.In addition there was no significant difference amongthe years, indicating that the heredity of DF and DM isstable in different years. And the analysis of the ge-netic variation (Table 2) and the frequency distribution(Fig. 1) indicated that the value of the response to pho-toperiod and temperature (VRPT) variation caused byDF and DM were considerable in the landrace popula-tion tested in this study.
Population structure
To avoid false positive association, the test populationstructure was estimated using a model-based approachas implemented in the software program STRUCTURE(Pritchard et al. 2000). The likelihood values for agiven K (from 1 to 10) were estimated in 20 indepen-dent runs. However, the distribution of L (K) did notshow a clear trend (Fig. 2-A). To overcome difficul-ties in interpreting the real value of K, another ad hocquantity (ΔK) was used (Evanno et al. 2005). Thehighest value of ΔK for the 275 soybean accessionswas K=5 (Fig. 2-B), which indicated that the 275 ac-cessions formed five clusters (clusters A-E). The re-spective Q matrix outputs of the five subpopulation runswere used for the structure-based association analysis.
Association mapping of VRPT
Using the respective Q matrix outputs (K=5) as
Table 1 Analysis of variance of DF and DM in 275 accessions
Source dfDays to flowering Days to maturity
Mean square F-value Mean square F-value
Year 1 1 780.54 1 1 141.89 0.2
Sowing date (SD) 2 242 201.25 113.2** 743 145.73 122.45**
Year × SD 2 1 780.34 60.6** 5 681.87 81.42**
Block (year SD) 6 14.22 2.71* 38.99 3.15**
Line 274 3 002.22 7.96** 4 702.15 10.92**
Year × Line 274 18.14 0.89 41.94 0.97
Line × SD 548 379.61 18.61** 432.74 9.98**
Year × Line × SD 548 20.4 3.89** 43.37 3.51**
Error 1 644 5.25 12.37
Corrected total 3 299
** and *, significant at 1 and 5% levels.

QTL Identification of the Insensitive Response to Photoperiod and Temperature in Soybean by Association Mapping 1425
© 2013, CAAS. All rights reserved. Published by Elsevier Ltd.
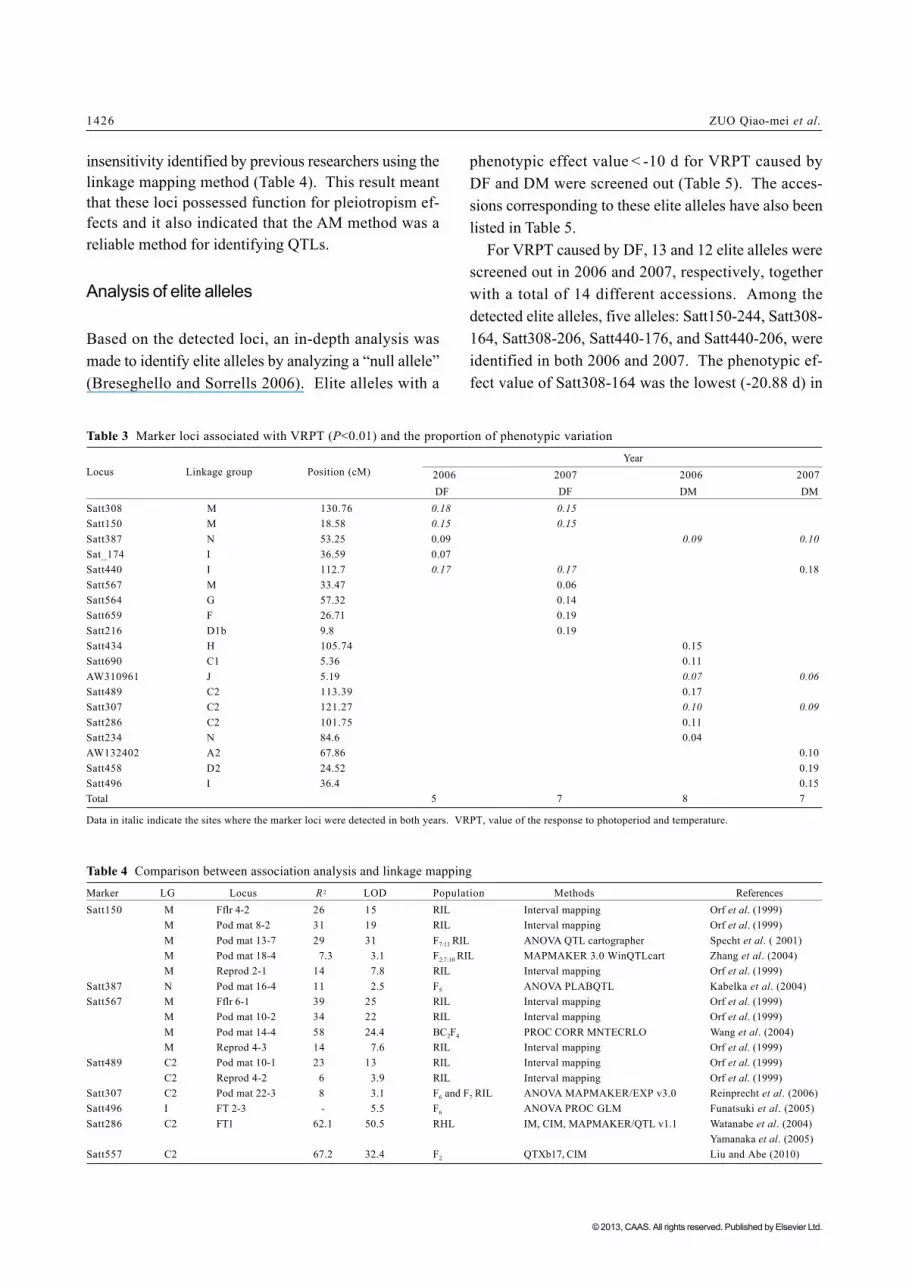
covariates, association analysis between 118 SSR mark-ers and VRPT was undertaken for DF and DM usingthe GLM analyses in the TASSEL software (ver. 2.0).The results obtained from AM in this study are shownin Table 3.
A total of 27 marker-trait associations were identi-fied with 19 different SSR markers (P<0.01) and thephenotypic variation of the marker-trait associationsranged from 4-19%. Among the marker-traitassociations, 12 associations, five in 2006 and sevenin 2007, were for VRPT caused by DF, with a range
from 6-19% for phenotypic variation. Three markers,Satt308 (LG M), Satt150 (LG M) and Satt440 (LG I),were identified in both the 2006 and 2007 sample yearsand the phenotypic variation for each loci was over15% for each marker-trait association. Fifteenassociations, eight in 2006 and seven in 2007, werefor VRPT caused by DM, with a range from 4-19%for phenotypic variation. Three markers, Satt387(LG N), Satt307 (LG C2) and AW310961 (LG J), weredetected in both years. This analysis also showedthat some loci, such as Satt387 (LG N) and Satt440(LG I), were associated with VRPT caused by DFand DM simultaneously. Satt387 (LG N) was associ-ated with VRPT caused by DM in both the 2006 and2007 and by DF in 2006. Satt440 (LG I), was asso-ciated with VRPT caused by DF in both years, and byDM in 2007.
Among the 19 detected markers, seven markers wereassociated with growth period traits or photoperiod
Fig. 1 Frequency distribution for VRPT caused by DF and DM in 2006 and 2007. DF, days to flowering; DM, days to maturity; VRPT, valueof the response to photoperiod and temperature.
Fig. 2 Plot of the log-likelihood value (A) and ΔK (B) for the number of subgroups (K). K was the number of the inferred subpopulations.ΔK calculated as ΔK=m(|L(K+1)-2L(K)+L(K-1)|)/s[L(K)]. LnP(D) was the value of the posterior probability of the data for a given K.
Table 2 The VRPT (value of the response to photoperiod andtemperature) for DF and DM in 2006 and 2007
Trait1) Year Range (d) Mean (d) CV
DF 2006 43.63 51.40
2007 9.36-52.93 32.78 31.24
DM 2006 10.5-86.38 38.34 39.93
2007 3.08-55.16 27.34 36.14
1) DF, days to flowering; DM, days to maturity. The same as below.
6.01-103.39
1426 ZUO Qiao-mei et al.
© 2013, CAAS. All rights reserved. Published by Elsevier Ltd.
insensitivity identified by previous researchers using thelinkage mapping method (Table 4). This result meantthat these loci possessed function for pleiotropism ef-fects and it also indicated that the AM method was areliable method for identifying QTLs.
Analysis of elite alleles
Based on the detected loci, an in-depth analysis wasmade to identify elite alleles by analyzing a “null allele”(Breseghello and Sorrells 2006). Elite alleles with a
phenotypic effect value < -10 d for VRPT caused byDF and DM were screened out (Table 5). The acces-sions corresponding to these elite alleles have also beenlisted in Table 5.
For VRPT caused by DF, 13 and 12 elite alleles werescreened out in 2006 and 2007, respectively, togetherwith a total of 14 different accessions. Among thedetected elite alleles, five alleles: Satt150-244, Satt308-164, Satt308-206, Satt440-176, and Satt440-206, wereidentified in both 2006 and 2007. The phenotypic ef-fect value of Satt308-164 was the lowest (-20.88 d) in
Table 4 Comparison between association analysis and linkage mapping
Marker LG Locus R2 LOD Population Methods References
Satt150 M Fflr 4-2 26 15 RIL Interval mapping Orf et al. (1999)
M Pod mat 8-2 31 19 RIL Interval mapping Orf et al. (1999)
M Pod mat 13-7 29 31 F7:11 RIL ANOVA QTL cartographer Specht et al. ( 2001)
M Pod mat 18-4 7.3 3.1 F2:7:10 RIL MAPMAKER 3.0 WinQTLcart Zhang et al. (2004)
M Reprod 2-1 14 7.8 RIL Interval mapping Orf et al. (1999)
Satt387 N Pod mat 16-4 11 2.5 F5 ANOVA PLABQTL Kabelka et al. (2004)
Satt567 M Fflr 6-1 39 25 RIL Interval mapping Orf et al. (1999)
M Pod mat 10-2 34 22 RIL Interval mapping Orf et al. (1999)
M Pod mat 14-4 58 24.4 BC2F4 PROC CORR MNTECRLO Wang et al. (2004)
M Reprod 4-3 14 7.6 RIL Interval mapping Orf et al. (1999)
Satt489 C2 Pod mat 10-1 23 13 RIL Interval mapping Orf et al. (1999)
C2 Reprod 4-2 6 3.9 RIL Interval mapping Orf et al. (1999)
Satt307 C2 Pod mat 22-3 8 3.1 F6 and F7 RIL ANOVA MAPMAKER/EXP v3.0 Reinprecht et al. (2006)
Satt496 I FT 2-3 - 5.5 F6 ANOVA PROC GLM Funatsuki et al. (2005)
Satt286 C2 FT1 62.1 50.5 RHL IM, CIM, MAPMAKER/QTL v1.1 Watanabe et al. (2004)
Yamanaka et al. (2005)
Satt557 C2 67.2 32.4 F2 QTXb17, CIM Liu and Abe (2010)
Table 3 Marker loci associated with VRPT (P<0.01) and the proportion of phenotypic variation
Locus Linkage group Position (cM)Year
2006 2007 2006 2007
DF DF DM DM
Satt308 M 130.76 0.18 0.15
Satt150 M 18.58 0.15 0.15
Satt387 N 53.25 0.09 0.09 0.10
Sat_174 I 36.59 0.07
Satt440 I 112.7 0.17 0.17 0.18
Satt567 M 33.47 0.06
Satt564 G 57.32 0.14
Satt659 F 26.71 0.19
Satt216 D1b 9.8 0.19
Satt434 H 105.74 0.15
Satt690 C1 5.36 0.11
AW310961 J 5.19 0.07 0.06
Satt489 C2 113.39 0.17
Satt307 C2 121.27 0.10 0.09
Satt286 C2 101.75 0.11
Satt234 N 84.6 0.04
AW132402 A2 67.86 0.10
Satt458 D2 24.52 0.19
Satt496 I 36.4 0.15
Total 5 7 8 7
Data in italic indicate the sites where the marker loci were detected in both years. VRPT, value of the response to photoperiod and temperature.

QTL Identification of the Insensitive Response to Photoperiod and Temperature in Soybean by Association Mapping 1427
© 2013, CAAS. All rights reserved. Published by Elsevier Ltd.
2006, but Satt567-119 was the lowest (-17.34 d) in2007. Of the 14 different accessions, some possessedtwo or more elite alleles simultaneously. For example,N24606 (Linheidou) carried Satt_174-239, Satt150-244,and Satt308-164. The accessions that possess severalelite alleles could be useful in wide adaption breeding insoybean.
For the VRPT caused by DM, five and three elitealleles were screened out in 2006 and 2007, respectively,together with a total of five different accessions. Amongthe detected elite alleles, Satt307-170 was the only onethat was identified in both years. Furthermore, the typi-cal material corresponding to it was the same accession,N24268, in both 2006 and 2007. The lowest pheno-typic effect value in 2006 (-16.14 d) was explained bySatt234-221, and the accession corresponding to it wasN24276 (Chifengxiaoqingdou). The lowest phenotypiceffect value in 2007 (-13.35 d) and was explained bySatt440-206. The accession corresponding to it wasN24281 (Xiaolihei).
DISCUSSION
Loci associated with the comprehensiveresponse to photoperiod and temperature
The comprehensive response to photoperiod and tem-perature (CRPT) is a typical complex quantitative traitin soybean. In this paper, a total of 27 marker-trait
associations were detected using 19 different SSRmarkers (P<0.01) by the association mapping method.Among the 19 detected markers for the CRPT by DM,three markers, Satt286 (101.75 cM), Satt489 (113.39 cM)and Satt307 (121.27 cM), were located on LG C2. TheSatt307 marker was detected in both years. The re-gion they were mapped in was also located with the E1gene and other QTLs for soybean development traitsthat had been identified using the linkage mappingmethod by previous researchers. FT1, which is con-sidered to correspond to E1, was fine mapped betweenSatt365 and GM169, at distances of approximately 0.1and 0.4 cM, respectively (Watanabe et al. 2004;Yamanaka et al. 2005). Using the same linkage map,FT1 was located at distances of approximately 0.9 cMto Satt365 and 0.5 cM GM169, respectively (Yamanakaet al. 2005). Satt489 was detected, with an explainedproportion of 0.17 for the CRPT caused by DM, in 2006using the AM method. Whether the QTL associated withSatt489, which was identified as being responsible forthe CRPT caused by DM in this study was the allele ofFT1 needed further study. Liu and Abe (2010) also de-tected a major QTL associated with photoperiod insensi-tivity in proximity to Satt557, which lay between Satt286(LG C2l, 101.75 cM) and Satt307 (LG C2, 121.27 cM).Moreover, Tasma et al. (2001) showed that Satt286 wasassociated with photoperiod insensitivity in the IX136population. The difference between the results obtainedin this paper and that of previous studies suggested thatAM was a good method for QTL identification and also
Table 5 Phenotypic effect value of SSR elite alleles associated with the VRPT caused by DF and DM
Trait2006 2007
Locus-allele ai (d) Accessions Locus-allele ai (d) Typical material
DF Sat_174-239 -12.75 N24606 Satt150-244 -10.25 N24606
Sat_174-242 -10.07 N23663 Satt216-155 -10.34 N23538
Satt150-238 -11.31 N24278 Satt216-176 -16.39 N24152
Satt150-244 -11.69 N24606 Satt216-203 -12.96 N21029
Satt150-250 -17.71 N24281 Satt216-212 -12.46 N23529
Satt150-265 -11.29 N24276 Satt216-215 -11.39 N24278
Satt308-164 -20.88 N24606 Satt216-221 -11.2 N5477
Satt308-206 -15.51 N23538 Satt308-164 -12.72 N24046
Satt387-206 -11.09 N24046 Satt308-206 -11.24 N23529
Satt387-227 -10.84 N24278 Satt440-176 -10.07 N24046
Satt387-230 -19.08 N23737 Satt440-206 -10.56 N24281
Satt440-176 -14.43 N23538 Satt567-119 -17.34 N24606
Satt440-206 -17.21 N24281
DM Satt234-221 -16.14 N24276 Satt307-170 -11.32 N24268
Satt307-170 -12.83 N24268 Satt440-206 -13.35 N24281
Satt434-349 -11.82 N00134 Satt496-411 -12.2 N24268
Satt489-258 -11.14 N00134
Satt489-324 -13.43 N23529

1428 ZUO Qiao-mei et al.
© 2013, CAAS. All rights reserved. Published by Elsevier Ltd.
indicated that VRPT was a reliable measure for the com-prehensive response to photoperiod and temperature insoybean, especially for larger populations.
AM is a powerful method for analyzingquantitative traits
Over the 2 yr of this study, a total of 20 different eliteloci alleles were identified as being responsible for theinsensitive response to photoperiod and temperature(IRPT) caused by DF and a total of seven differentelite loci alleles were detected for DM. The large num-ber of elite loci alleles detected was due to the associa-tion mapping method used in this study. Conventionalmethods often utilize a population (F
2, backcross, re-
combinant inbred, etc.) which is limited to samplingonly two or a little alleles in any given QTL identifica-tion of a target trait (Flint-Garcia et al. 2005). In asso-ciation mapping, however, a natural population was usedto detect linked QTLs accounting for specified propor-tions of the phenotypic variation. As for naturalpopulation, it contained a large number of alleles perlocus and could be surveyed simultaneously (Flint-Garcia et al. 2005; Mackay and Powell 2007).Furthermore, QTLs detected in the germplasm were ofdirect relevance to the accession (Mackay and Powell2007). So the accessions corresponding to the eliteloci alleles could be screened out directly and utilized asmaterial for wide adaptation breeding. In this paper,besides the elite alleles, we also reported a set of corre-sponding accessions to them. However, the numberof SSR markers used in this paper was still less forgenome-wide association mapping. For the linked locidetected in the paper, intensive scanning for the frag-ment in which they are located was worthwhile.
CONCLUSION
The association mapping results suggested that VRPTwas a reliable measure for the insensitive response tophotoperiod and temperature in soybean. A total of 27marker-trait associations were identified with 19 dif-ferent SSR markers (P<0.01) by this study. Amongthese associations, 12 were associated with the VRPTcaused by DF and 15 were associated with the VRPT
caused by DM. In addition, a total of 20 different eliteloci alleles were detected over the 2 yr for the insensi-tive response to photoperiod and temperature causedby DF, and a total of seven different elite loci alleleswere detected for DM. Accessions corresponding tothese elite loci alleles, were screened out. The resultsof this paper could provide an applicable genetic basisfor soybean wide adaption breeding by design.
MATERIALS AND METHODS
In this study, 275 soybean accessions representing thefull geographic range in China were selected for QTL iden-tification of insensitive responses to photoperiod and tem-perature by the AM method. The 275 typical accessionswere the landraces sampled from 23 provinces/regions,Anhui (17), Fujian (4), Gansu (17), Guangdong (7), Guangxi(16), Guizhou (13), Hebei (2), Henan (11), Heilongjiang (27),Hubei (23), Hunan(3), Jilin (14), Jiangsu (15), Jiangxi (8),Liaoning (22), Inner Mongolia (10), Shandong (1), Shanxi(14), Shaanxi (16), Shanghai (12), Sichuan (3),Yunnan (14),and Zhejiang (6). The accessions were sown in small plotsof six plants on three sowing dates (SD): April (SD Apr.),June (SD June) and July (SD July). The distance betweenrows was 0.7 (SD Apr), 0.6 (SD June) and 0.5 m (SD July)and the distance between each small plot of six plants was0.6 (SD Apr), 0.5 (SD June) and 0.4 m (SD July). The experi-mental design was a randomized complete-block designwith two replications and was carried out at Jiangpu Ex-perimental Station, Nanjing Agricultural University,Nanjing, China (32°01´N, 118°62´E) in 2006 and 2007.
Phenotyping
The VRPT was considered as a measure of the comprehen-sive response to photoperiod and temperature in soybean.VRPT was the coefficient of variation (CV) for the days ofgrowth period trait among the different sowing dates andwas calculated using the formula:
Where, S indicates the standard deviation for the daysof growth period trait on the different sowing dates and indicates the average for the days of growth period trait onthe different sowing dates. For soybean, the lower theVRPT of an accession, then the more insensitive the re-sponse to photoperiod and temperature by that accession,and vis versa. Based on this criterion, alleles with lowerVRPTs were considered elite alleles in this study. Thegrowth period traits, DF and DM, were measured with thegrowth stage criteria used by Fehr et al. (1971).

QTL Identification of the Insensitive Response to Photoperiod and Temperature in Soybean by Association Mapping 1429
© 2013, CAAS. All rights reserved. Published by Elsevier Ltd.
DNA isolation and SSR genotyping
DNA was extracted individually from leaves of soybeanseedlings using the method described by Doyle (1990). Aset of 118 genome-wide distributed pairs of SSR primerswere used to genotype the 275 soybean accessions. Theinformation on the SSR primers is available at http://bldg6.arsusda.gov/~pooley/soy/cregan/soy_map1.html. Theamplified products were separated by electrophoresis us-ing 8% non-denaturing polyacrylamide gels and then vi-sualized through silver staining. The stained bands wereanalyzed by Quantity One v.4.4.0 software (Bio-Rad,Hercules, CA, USA) based on their migration distance rela-tive to the phage and plasmid DNA marker (SM0221;Fermentas, Burlington, Ontario, Canada).
Population structure analysis
In this study, the tested population was analyzed for pos-sible population structure with the STRUCTURE program(Pritchard et al. 2000) using the admixture model and thenon origin-base model. Twenty-nine selected SSR loci, thedistance between which was >50 cM located over the 20linkage groups, were used for population structure analysis.In order to detect an accurate number (K) of the inferredsubpopulations, 20 independent runs were performed at Klevels ranging from K=1 to K=10. Then an ad hoc statistic,ΔK (Evanno et al. 2005), was calculated, which was basedon the rate of change in the log probability of data be-tween successive K-values. The K and Q values corre-sponding to the highest ΔK were adopted for the associa-tion mapping.
AM and exploration of elite alleles
The AM was performed using the general linear model(GLM) function in the TASSEL 2.0 software (Bradburyet al. 2007), which included population structure data. Thepopulation structure consisted of a Q matrix that describedthe subpopulation parentage for each line in the analysis.These percentages were then implemented into STRUC-TURE software (Pritchard et al. 2000). The SSR genotypedata from 118 SSR markers were also used in the analysis.
Specific loci alleles, which were significantly associatedwith the traits, and their contribution to the phenotypicvalue, were identified by analyzing a ‘null allele’(Breseghello and Sorrells 2006). The contribution valuefor an al le le was calculated using the formula:
, Where, ai indicates the contribution value
of the ith allele, xij
indicates the phenotypic value of the jthsamples that carry the ith allele, n
i is the number of samples
that carry the ith allele, Nk is the phenotypic value of the
kth samples and nk is the total number of samples. An
allele has positive or negative effect when ai>0 and a
i<0,
respectively.
AcknowledgementsThe project was supported by the National Basic ResearchProgram of China (2009CB118400) and the Earmarked Fundfor Modern Agro-Industry Technology Research System,China (nycytx-004).
ReferencesBernard R L. 1971. Two major genes for time of flowering
and maturity in soybeans. Crop Science, 11, 242-244.Bonato E R, Vello N A. 1999. E6, a dominant gene
conditioning early flowering and maturity in soybeans.Genetics and Molecular Biology, 22, 229-232.
Bradbury P J, Zhang Z, Kroon D E, Casstevens T M,Ramdoss Y, Buckler E S. 2007. TASSEL: software forassociation mapping of complex traits in diversesamples. Bioinformatics, 23, 2633-2635.
Breseghello F, Sorrells M E. 2006. Association mapping ofkernel size and milling quality in wheat (Triticumaestivum L.) cultivars. Genetics, 172, 1165-1177.
Buzzell R. 1971. Inheritance of a soybean flowering responseto fluorescent-daylength conditions. Canadian Journalof Genetics and Cytology, 13, 703-707.
Buzzell R I, Voldeng H D. 1980. Inheritance of insensitivityto long daylength. Soybean Genetics Newsletter, 7,26-29.
Cober E, Tanner J, Voldeng H. 1996. Soybean photoperiod-sensitivity loci respond differentially to light quality.Crop Science, 36, 606-610.
Cober E R, Charette M, Voldeng H D, Molnar S J. 2010. Anew locus for early maturity in soybean. Crop Science,50, 524-527.
Cober E R, Voldeng H D. 2001. A new soybean maturity andphotoperiod-sensitivity locus linked to E1 and T. CropScience, 41, 698-701.
Doyle J J. 1990. Isolation of plant DNA from fresh tissue.Focus, 12, 13-15.
Evanno G, Regnaut S, Goudet J. 2005. Detecting the numberof clusters of individuals using the softwareSTRUCTURE: a simulation study. Molecular Ecology,14, 2611-2620.
Fehr W R, Caviness C E, Burmood D T, Pennington J S.1971. Stage of development descriptions for soybeans,Glycine max (L.) Merrill. Crop Science, 11, 929-931.
Flint-Garcia S A, Thuillet A C, Yu J, Pressoir G, Romero S M,Mitchell S E, Doebley J, Kresovich S, Goodman M M,Buckler E S. 2005. Maize association population: a high-resolution platform for quantitative trait locusdissection. The Plant Journal, 44, 1054-1064.
Funatsuki H, Kawaguchi K, Matsuba S, Sato Y, IshimotoM. 2005. Mapping of QTL associated with chillingtolerance during reproductive growth in soybean.Theoretical and Applied Genetics, 111, 851-861.
Githiri S M, Yang D, Khan N A, Xu D, Komatsuda T,

1430 ZUO Qiao-mei et al.
© 2013, CAAS. All rights reserved. Published by Elsevier Ltd.
Takahashi R. 2007. QTL analysis of low temperature-induced browning in soybean seed coats. Journal ofHeredity, 98, 360-366.
Hou J F, Wang C L, Hong X J, Zhao J M, Xue C C, Guo N,Gai J Y, Xing H. 2011. Association analysis of vegetablesoybean quality traits with SSR markers. PlantBreeding, 130, 444-449.
Jun T H, Van K, Kim M Y, Lee S H, Walker D R. 2008.Association analysis using SSR markers to find QTLfor seed protein content in soybean. Euphytica, 162,179-191.
Kabelka E, Diers B, Fehr W, LeRoy A, Baianu I, You T,Neece D, Nelson R. 2004. Putative alleles for increasedyield from soybean plant introductions. Crop Science,44, 784-791.
Liu B, Abe J. 2010. QTL mapping for photoperiodinsensi t ivi ty of a Japanese soybean landraceSakamotowase. Journal of Heredity, 101, 251-256.
Lu Y, Zhang S, Shah T, Xie C, Hao Z, Li X, Farkhari M,Ribaut J M, Cao M, Rong T. 2010. Joint linkage-linkagedisequilibrium mapping is a powerful approach todetecting quantitative trait loci underlying droughttolerance in maize. Proceedings of the NationalAcademy of Sciences of the United States of America,107, 19585-19590.
Mackay I, Powell W. 2007. Methods for l inkagedisequilibrium mapping in crops. Trends Plant Science,12, 57-63.
Malo M F, Hinson K, Ray J D, Mankono J. 1995. Geneticcontrol of a long-juvenile trait in soybean. Crop Science,35, 1001-1006.
McBlain B A, Bernard R L. 1987. A new gene affecting thetime of flowering and maturity in soybeans. Journal ofHeredity, 78, 160-162.
Orf J H, Chase K, Jarvik T, Mansur L M, Cregan P B, AdlerF R, Lark K G. 1999. Genetics of soybean agronomictraits: I. Comparison of three related recombinant inbred
populations. Crop Science, 39, 1642-1651.Pritchard J K, Stephens M, Donnelly P. 2000. Inference of
population structure using multilocus genotype data.Genetics, 155, 945-959.
Reinprecht Y, Poysa V W, Yu K, Rajcan I, Ablett G R, PaulsK P. 2006. Seed and agronomic QTL in low linolenicacid, lipoxygenase-free soybean (Glycine max (L.)Merrill) germplasm. Genome, 49, 1510-1527.
Specht J, Chase K, Markwell J, Germann M, Lark K, GraefG, Macrander M, Orf J, Chung J. 2001. Soybean responseto water. Crop Science, 41, 493-509.
Tasma I M, Lorenzen L L, Green D E, Shoemaker R C. 2001.Mapping genetic loci for flowering time, maturity, andphotoperiod insensitivity in soybean. MolecularBreeding, 8, 25-35.
Wang D, Graef G L, Procopiuk A M, Diers W B. 2004.Identification of putative QTL that underlie yield ininterspecif ic soybean backcross populat ions .Theoretical and Applied Genetics, 108, 458-467.
Wang J, McClean P E, Lee R, Goos R J, Helms T. 2008.Association mapping of iron deficiency chlorosis lociin soybean (Glycine max L. Merr.) advanced breedinglines. Theoretical and Applied Genetics, 116, 777-787.
Watanabe S, Tajuddin T, Yamanaka N, Hayashi M, HaradaK. 2004. Analysis of QTLs for reproductive developmentand seed quality traits in soybean using recombinantinbred lines. Breeding Science, 54, 399-407.
Yamanaka N, Watanabe S, Toda K, Hayashi M, FuchigamiH, Takahashi R, Harada K. 2005. Fine mapping of theFT1 locus for soybean flowering time using a residualheterozygous line derived from a recombinant inbredline. Theoretical and Applied Genetics, 110, 634-639.
Zhang W K, Wang Y J, Luo G Z, Zhang J S, He C Y, Wu XL, Gai J Y, Chen S Y. 2004. QTL mapping of tenagronomic traits on the soybean (Glycine max L. Merr.)genetic map and their association with EST markers.Theoretical and Applied Genetics, 108, 1131-1139.
(Managing editor WANG Ning)