qos-aware health monitoring system using cloud-based wbans
TRANSCRIPT

AUTHOR'S PROOF JrnlID 10916 ArtID 0121 Proof#1 - 03/08/2014
UNCORRECTEDPROOF
J Med Syst (2014) 38:121DOI 10.1007/s10916-014-0121-2
SYSTEMS-LEVEL QUALITY IMPROVEMENT1
QoS-Aware Health Monitoring System Using Cloud-BasedWBANs
2
3
Ghada Almashaqbeh · Thaier Hayajneh ·Athanasios V. Vasilakos · Bassam J. Mohd
4
5
Received: 14 May 2014 / Accepted: 28 July 20146© Springer Science+Business Media New York 20147
Abstract Wireless Body Area Networks (WBANs) are8
amongst the best options for remote health monitoring.9
However, as standalone systems WBANs have many limi-10
tations due to the large amount of processed data, mobility11
of monitored users, and the network coverage area. Inte-12
grating WBANs with cloud computing provides effective13
solutions to these problems and promotes the performance14
of WBANs based systems. Accordingly, in this paper we15
propose a cloud-based real-time remote health monitoring16
system for tracking the health status of non-hospitalized17
patients while practicing their daily activities. Compared18
with existing cloud-based WBAN frameworks, we divide19
the cloud into local one, that includes the monitored users20
and local medical staff, and a global one that includes the21
This article is part of the Topical Collection on Systems-LevelQuality Improvement
G. Almashaqbeh (�)Department of Computer Science and Engineering,University of Notre Dame, Notre Dame, IN, USAe-mail: [email protected]
T. HayajnehSchool of Engineering and Computing Sciences,New York Institute of Technology, New York, NY, USAe-mail: [email protected]
A. V. VasilakosComputer Science Department, Kuwait University,Kuwait City, Kuwaite-mail: [email protected]
B. J. MohdComputer Engineering Department, The Hashemite University,Zarqa, Jordane-mail: [email protected]
outer world. The performance of the proposed framework
Q1
22
is optimized by reducing congestion, interference, and data
Q2
23
delivery delay while supporting users’ mobility. Several 24
novel techniques and algorithms are proposed to accom- 25
plish our objective. First, the concept of data classification 26
and aggregation is utilized to avoid clogging the network 27
with unnecessary data traffic. Second, a dynamic channel 28
assignment policy is developed to distribute the WBANs 29
associated with the users on the available frequency chan- 30
nels to manage interference. Third, a delay-aware routing 31
metric is proposed to be used by the local cloud in its multi- 32
hop communication to speed up the reporting process of 33
the health-related data. Fourth, the delay-aware metric is 34
further utilized by the association protocols used by the 35
WBANs to connect with the local cloud. Finally, the system 36
with all the proposed techniques and algorithms is evaluated 37
using extensive ns-2 simulations. The simulation results 38
show superior performance of the proposed architecture 39
in optimizing the end-to-end delay, handling the increased 40
interference levels, maximizing the network capacity, and 41
tracking user’s mobility. 42
Keywords E-Health · Body area networks · Cloud 43
computing ·Medical sensors ·Multi-radio 44
Introduction 45
Given that being hospitalized is usually costly, inconve- 46
nient, and commonly unfavorable by the patients, dis- 47
tance health monitoring becomes inevitable. People prefer 48
to stay home rather than being hospitalized and attached 49
to medical equipment, devices, or escorts that usually 50
restrict their functional mobility and daily activities. 51
The recent advances in computers, electronic devices, 52
and telecommunications made such preferences possible. 53

AUTHOR'S PROOF JrnlID 10916 ArtID 0121 Proof#1 - 03/08/2014
UNCORRECTEDPROOF
121, Page 2 of 20 J Med Syst (2014) 38:121
WBANs [33, 46] are pioneering technology that provide54
convenient distance health monitoring.55
In WBANs, electronic sensors are attached in, on, or56
around the human body while constantly reporting infor-57
mation on vital biological signs. Typically, these data are58
transferred to medical units for processing and utilized59
for medical decision making. One major limitation of this60
approach is that the collected data are usually processed and61
stored at local medical units which makes extended acces-62
sibility to such data highly restricted to the surrounding63
community [30]. Moreover, these centralized telemedicine64
data require a complicated hardware and dedicated network65
for data collection and processing which makes the interpre-66
tation of this technology incomprehensible to the average67
user.68
Cloud computing is a new promising model that has the69
potential to help in storing, processing, analyzing, deliver-70
ing, distributing, and securing critical data [16, 24, 45]. It71
provides a promising solution to address big data storage72
and analysis due to the cloud abundant resources. Bioin-73
formatics clouds are classified into four sources: data as74
a service, software as a service, platform as a service,75
and infrastructure as a service [18]. Hence, combining76
cloud computing with WBANs has become an innovative77
approach and has recently received extensive attention [6,78
21]. Figure 1 presents a general architecture of a cloud-79
based WBAN. As shown in the figure, the monitored80
patients are at their homes while being continuously mon-81
itored by the medical staff through the Internet cloud. The82
cloud is referred to as the “global cloud” which is accessed83
by intended Internet users for the various applications they84
run. It is also considered the bridge connecting the WBANs85
users with one or multiple hospitals and medical centers per86
the user needs.87
Merging WBANs with cloud computing will have poten-88
tially numerous advantages. Using clouds may imply that89
organizations are less likely to need their own servers or90
software which will eventually save energy, physical space,91
and technical staff [48]. Moreover, [6] showed that a cloud92
computing-based mobile health monitoring is almost 2093
times faster and 10 times more energy-efficient compared94
to a standalone mobile health monitoring application.95
On the other hand, several challenging unresolved issues96
may hinder the success of the marriage between these tech-97
nologies [26, 38, 49]. Some of these issues are related98
to the communication standard in WBANs, the integration99
between WBANs with hybrid clouds, and the authoriza-100
tion of social networks. The integration of cloud computing101
with mobile services is another challenging issue including102
the mobile cloud computing architecture, applications, and103
approaches [22, 40]. Healthcare applications is one impor-104
tant area that can benefit from mobile cloud computing,105
but with two concomitant challenges: QoS and security.106
Examples of such applications include [22]: complete health 107
monitoring system, smart emergency management system, 108
health-aware mobile devices, pervasive access to healthcare 109
information, seamless connection to cloud storage, patient 110
health record management, and image viewing support. 111
Accordingly, in this paper we propose a cloud-based real- 112
time remote health monitoring system (CHMS) for tracking 113
the health status of non-hospitalized patients while per- 114
forming their daily activities. In this system, we aim to 115
provide high QoS and focus on connectivity-related issues 116
between the patients and the global cloud. The literature on 117
most cloud-enabled WBAN systems, e.g. [6, 49], assumed 118
that the patients are connected to the global cloud using 119
a gateway that eventually reaches the medical staff. How- 120
ever, we expand this concept by having a local cloud for 121
WBANs, i.e. monitored users and local medical, staff that 122
is also connected to the global cloud itself. For example, 123
if we are conducting the system in a university campus 124
we may have students who are monitored using WBANs 125
that are connected to the campus medical center. Hence, 126
the reported data is available to the local medical staff 127
using the university network that contains multiple routers 128
to cover the whole campus. Simultaneously, the students can 129
be connected, if necessary, to other hospitals since the uni- 130
versity local network, which we refer to it as local cloud, is 131
connected with the global cloud. 132
Particularly, we present an architecture and prototype of 133
the local cloud along with its detailed operation. The objec- 134
tive is to optimize its performance by reducing congestion, 135
interference, and data delivery delay while supporting the 136
mobility of the users. We employed several novel techniques 137
and algorithms in CHMS to accomplish its objectives. First, 138
we utilize the concept of data classification and aggre- 139
gation to reduce the flow of data traffic in the network. 140
The reported health-related data by the WBANs are clas- 141
sified into urgent and non-urgent data. The former is sent 142
instantly to the medical staff while the latter is aggregated 143
and sent less frequently. Second, we propose a dynamic 144
channel assignment policy to distribute the WBANs among 145
the available frequency channels with the objective of reduc- 146
ing mutual interference. Third, we propose a delay-aware 147
routing metric that is used by the local cloud in its multi- 148
hop communication to reach the medical staff. The goal is 149
to find routes with low end-to-end delay as the speed of 150
reporting health related data is a critical issue in health mon- 151
itoring systems. Fourth, a delay-aware association protocol 152
is developed to connect the users with the routers in the local 153
cloud. The association protocols are required to track users’ 154
mobility where the router with which the WBAN is associ- 155
ated may change based on the new location of the mobile 156
user. 157
The aforementioned techniques contribute to maximiz- 158
ing the capacity of the local cloud to withstand the 159

AUTHOR'S PROOF JrnlID 10916 ArtID 0121 Proof#1 - 03/08/2014
UNCORRECTEDPROOF
J Med Syst (2014) 38:121 Page 3 of 20, 121
Fig. 1 General architecture of a cloud-based WBAN
largest possible number of monitored patients without sig-160
nificant degradation in performance. Finally, the perfor-161
mance of CHMS is evaluated using extensive simulation162
experiments under various conditions. The efficiency of163
CHMS is tested against several factors that affect wireless164
networks in general and remote health monitoring systems165
in particular. We studied the effect of mutual interference,166
users’ mobility, cloud density, and WBANs’ traffic gener-167
ation pattern. We used ns-2 simulator after adding all the168
required modules to support CHMS’s local cloud design.169
The results are reported in terms of packet delivery rate,170
end-to-end delay, and the average routing overhead.171
Motivation172
WBANs are argued to be the most effective solution for173
remote health monitoring systems that enable the tracking174
of non-hospitalized patients. However, using WBANs have175
many limitations such as: energy, capabilities to run compli-176
cated software, storing and processing large amount of data,177
... etc. Merging WBANs with cloud computing is a promis-178
ing solution to overcome these limitations. The resulted179
WBAN cloud-based system may be restricted by two main180
issues. The first issue is to provide good QoS level that can181
guarantee a real-time response of the system. The second is182
providing adequate security for the communicated data. In183
this paper, we address the first issue and propose an archi-184
tecture for a WBAN cloud-based health monitoring system185
that is optimized to provide high performance delivery of 186
the critical health-related data. 187
Major contributions 188
The main contributions provided in this paper can be sum- 189
marized as follows: 1) proposed an architecture of a cloud- 190
based distributed health monitoring system which utilizes 191
the concept of local cloud and global Internet cloud. 2) opti- 192
mized the design of the WBANs by assigning new roles 193
to the master nodes and the personal digital devices. 3) 194
managed the congestion of the local cloud traffic by data 195
aggregation and classification. 4) proposed a novel delay- 196
aware routing metric to optimize the routing process and the 197
data delivery delay. 5) developed an interference mitigation 198
solution that includes a layered and dynamic channel assign- 199
ment policy for the local cloud and theWBANs. 6) proposed 200
a delay-aware association protocol to connect the WBANs 201
with the local cloud which handles the mobility of the users. 202
7) performed extensive simulations using ns-2 with several 203
real-life scenarios to evaluate the impact of interference, 204
congestion, mobility, traffic pattern, and network topology 205
on the proposed system. 206
The rest of the paper is organized as follows. Section 207
“Related work” gives a brief overview of the related work 208
found in the literature. Section “CHMS system model” 209
presents CHMS model and its architecture while the details 210
of its operation and modules are introduced in section 211

AUTHOR'S PROOF JrnlID 10916 ArtID 0121 Proof#1 - 03/08/2014
UNCORRECTEDPROOF
121, Page 4 of 20 J Med Syst (2014) 38:121
“CHMS operation”. The simulation experiments setup and212
the results are discussed thoroughly in section “Performance213
evaluation”. Finally, section “Conclusions” concludes the214
paper.215
Related work216
As mentioned earlier, building efficient remote health moni-217
toring systems was investigated by the research community.218
Many solutions and techniques were proposed to solve the219
main design challenges associated with these systems. In220
this section, a brief overview of the research efforts in this221
field is presented.222
A cloud-based framework for Wireless Sensor Net-223
works (WSNs) was proposed in [5], mainly, to improve224
the data transfer process from the WSN using cloud com-225
puting. A similar attempt was presented in [37] in which226
the cloud acts as a virtual sink for the sensed data from227
the WSN. A survey of Sensor-Cloud infrastructure was228
summarized in [7] which discussed the definition, archi-229
tecture and applications of these platforms. In [49] the230
researchers presented a cloud-enabled WBANs design that231
can support several types of scenarios for home, hospi-232
tal, and outdoor environments. Another system to sup-233
port effective health monitoring for in-home users with234
a Web-based graphical interface was presented in [23].235
Jacob et al. in [30] proposed a low-cost remote patient236
monitoring system based on a reduced platform computer237
technology.238
The researchers in [6] proposed mHealthMon which is239
a cloud computing-based energy-efficient and distributed240
mobile health monitoring. The idea is to run some parts241
of the application components, possibly in a parallel man-242
ner, on the cloud to avoid draining the batteries of the243
mobile devices. Karthikeyan et al. in [31] presented a sys-244
tem for electronic medical profiles storage and retrieval245
including medical images using a cloud based Palm vein246
recognition. Another electronic health record cloud-based247
sharing system was introduced in [17] where the authors248
considered the security and privacy issues of the shared249
profiles. Lin et al. in [35] utilized WLANs and the tele-250
vision cable network to build a system to monitor the251
health status of patients at homes and public places to252
create electronic profiles. The authors in [36] presented a253
study of the main criteria needed to evaluate cloud-based254
hospital systems. A survey of health monitoring systems255
that defines the main design challenges and open research256
issues is found in [10].257
Patients’ health status prioritization, QoS sup-258
port, multi-interface design, and multi-hop routing in259
WBANs systems had been considered in many research260
works [9, 11, 14, 27, 34, 39, 48]. A cloud-based261
service-oriented architecture that is capable to han- 262
dle emergency care service was proposed in [39]. The 263
developed system can identify patients emergency 264
information, guide the medical personnel to the most 265
appropriate management of the emergency case, prioritize 266
the emergency case, and identify the most appropri- 267
ate ambulance and healthcare settings. A priority based 268
and interference aware patients’ health monitoring 269
and tracking system was introduced in [14]. The sys- 270
tem schedules the transmissions of the vital signs of 271
patients based on their current health status and the 272
network current conditions in terms of congestion, inter- 273
ference, multi-channel availability, and offered delay. 274
The proposed work in [11] and [34] had investigated 275
multi-hop routing and crosslayer design in WBANs based 276
systems. 277
To mitigate fading and shadowing effects in health mon- 278
itoring systems, the researchers in [9] proposed a multi- 279
radio/multi-channel communication framework for WBAN 280
devices. The objective is to increase the data rates to support 281
multimedia information and to improve the overall network 282
throughput. In [48] the authors presented the design of an 283
e-Health cloud platform with QoS guarantees. The cloud 284
platform system is modeled as an M/M/m queue and is com- 285
posed of two parts: Front-end which consists of the software 286
components and Back-end which includes the servers with 287
their database system. 288
To support patients’ mobility a handoff protocol for 289
WBANs was proposed in [27]. The health monitoring sys- 290
tem is divided into multiple tiers where each patient is 291
served by two APs: basic and temporary one. The designed 292
protocol relied on monitoring the signal strength from the 293
basic AP, in case of receiving a week signal the operation is 294
switched to the temporary AP to avoid disconnection. 295
Compared to the previously presented studies, our 296
proposed CHMS system presents a framework that 297
integrates WBAN with cloud computing. However, the 298
main objective is to address QoS support in a light 299
weight manner which is one of the most challenging 300
issues in such integration. Particularly, CHMS optimizes 301
the operation of the local cloud and WBANs by propos- 302
ing a delay-aware routing metric and association protocols 303
to support real time response. In addition, CHMS presents 304
a dynamic channel assignment policy to mitigate mutual 305
interference between nearby patients. These techniques con- 306
tribute to promote QoS support and enhance the system 307
scalability. 308
CHMS system model 309
In this section, the components of CHMS and the rela- 310
tions between them are described in details. As dis- 311

AUTHOR'S PROOF JrnlID 10916 ArtID 0121 Proof#1 - 03/08/2014
UNCORRECTEDPROOF
J Med Syst (2014) 38:121 Page 5 of 20, 121
Fig. 2 CHMS design
cussed earlier, the core idea of CHMS is to have a dis-312
tributed, flexible, reliable, and real-time health monitor-313
ing system for subject categories including: healthy peo-314
ple, athletes, people with chronic conditions, or recovered315
patients.316
The general design of CHMS architecture (depicted in317
Fig. 2) includes four basic components: the wireless routers,318
the gateways, the users’ WBANs, and the medical staff.319
The wireless routers, referred to as local routers through-320
out this paper, represent the infrastructure of the local321
cloud. They are responsible of the routing process by con-322
structing multi-hop routes to deliver the WBANs’ reported323
data to the gateways. The number of local routers and324
their underlying wireless standard specifications determine325
the coverage area of the local cloud and the number of326
supported users.327
The gateways are a subset of the local routers with the328
privilege of having a connection, possibly wired, with the329
global cloud. Thus, they represent the connection points330
through which the medical staff is reached. As shown in331
Fig. 2, few gateways are used, compared to the number of332
local routers, and they serve the entire local cloud. There- 333
fore, load balancing and efficient routing are required to 334
guarantee high performance level in terms of delay and 335
packet delivery rate. 336
Each user in CHMS is represented by his/her own 337
WBAN referred to as local WBAN. The local WBAN con- 338
tains the health monitoring units which are sensor nodes 339
used to measure the vital signs of the body health sta- 340
tus. These units are under the control of a special node 341
called the master node. A magnified view of these local 342
WBANs is provided in Fig. 3. Examples of the moni- 343
tored body health indicators include: the electrical activity 344
of the heart (ECG), the electrical activity of the brain 345
(EEG), the heart beat rate [32], ... etc. The user’s, or 346
the patient, health state determines the required types 347
of sensors. 348
In addition to the traditional WBAN design, CHMS 349
assumes the existence of another node that supports 350
the operation of the master node. This node is a 351
digital device which is used by the patient on regular basis 352
such as a tablet, a laptop, or a smart phone. This device 353
AUTHOR'S PROOF JrnlID 10916 ArtID 0121 Proof#1 - 03/08/2014
UNCORRECTEDPROOF
121, Page 6 of 20 J Med Syst (2014) 38:121
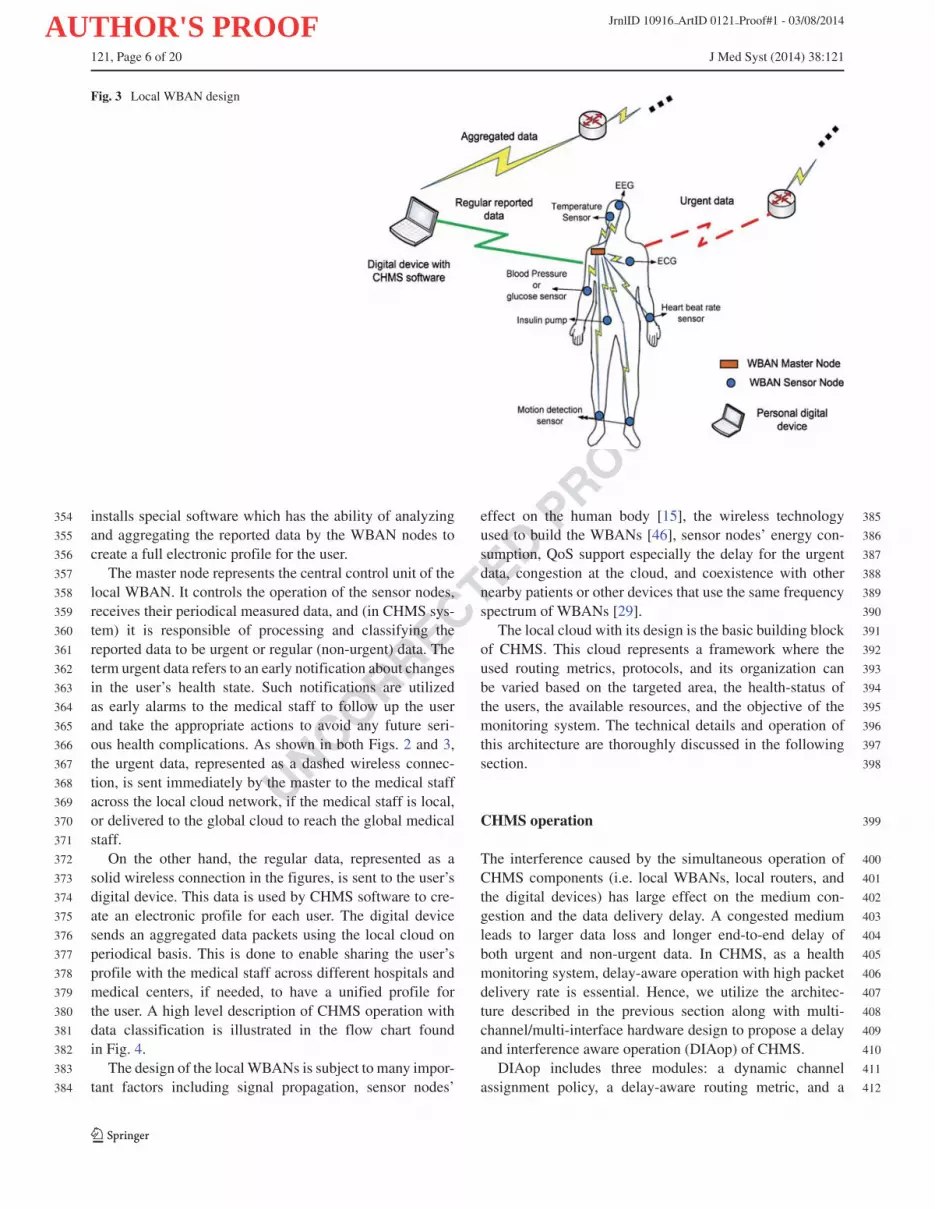
Fig. 3 Local WBAN design
installs special software which has the ability of analyzing354
and aggregating the reported data by the WBAN nodes to355
create a full electronic profile for the user.356
The master node represents the central control unit of the357
local WBAN. It controls the operation of the sensor nodes,358
receives their periodical measured data, and (in CHMS sys-359
tem) it is responsible of processing and classifying the360
reported data to be urgent or regular (non-urgent) data. The361
term urgent data refers to an early notification about changes362
in the user’s health state. Such notifications are utilized363
as early alarms to the medical staff to follow up the user364
and take the appropriate actions to avoid any future seri-365
ous health complications. As shown in both Figs. 2 and 3,366
the urgent data, represented as a dashed wireless connec-367
tion, is sent immediately by the master to the medical staff368
across the local cloud network, if the medical staff is local,369
or delivered to the global cloud to reach the global medical370
staff.371
On the other hand, the regular data, represented as a372
solid wireless connection in the figures, is sent to the user’s373
digital device. This data is used by CHMS software to cre-374
ate an electronic profile for each user. The digital device375
sends an aggregated data packets using the local cloud on376
periodical basis. This is done to enable sharing the user’s377
profile with the medical staff across different hospitals and378
medical centers, if needed, to have a unified profile for379
the user. A high level description of CHMS operation with380
data classification is illustrated in the flow chart found381
in Fig. 4.382
The design of the localWBANs is subject to many impor-383
tant factors including signal propagation, sensor nodes’384
effect on the human body [15], the wireless technology 385
used to build the WBANs [46], sensor nodes’ energy con- 386
sumption, QoS support especially the delay for the urgent 387
data, congestion at the cloud, and coexistence with other 388
nearby patients or other devices that use the same frequency 389
spectrum of WBANs [29]. 390
The local cloud with its design is the basic building block 391
of CHMS. This cloud represents a framework where the 392
used routing metrics, protocols, and its organization can 393
be varied based on the targeted area, the health-status of 394
the users, the available resources, and the objective of the 395
monitoring system. The technical details and operation of 396
this architecture are thoroughly discussed in the following 397
section. 398
CHMS operation 399
The interference caused by the simultaneous operation of 400
CHMS components (i.e. local WBANs, local routers, and 401
the digital devices) has large effect on the medium con- 402
gestion and the data delivery delay. A congested medium 403
leads to larger data loss and longer end-to-end delay of 404
both urgent and non-urgent data. In CHMS, as a health 405
monitoring system, delay-aware operation with high packet 406
delivery rate is essential. Hence, we utilize the architec- 407
ture described in the previous section along with multi- 408
channel/multi-interface hardware design to propose a delay 409
and interference aware operation (DIAop) of CHMS. 410
DIAop includes three modules: a dynamic channel 411
assignment policy, a delay-aware routing metric, and a 412

AUTHOR'S PROOF JrnlID 10916 ArtID 0121 Proof#1 - 03/08/2014
UNCORRECTEDPROOF
J Med Syst (2014) 38:121 Page 7 of 20, 121
Fig. 4 CHMS basic operation
delay-aware association protocol. The dynamic channel413
assignment policy distributes the co-located local WBANs414
among the available frequency channels. Hence, the assign-415
ment policy balances the load among the channels and416
reduces congestion effects by separating the collision417
domains. The delay-aware routing metric is utilized in con-418
structing reliable routes toward the gateways that offer low419
data delivery delay. In addition, this metric is adopted by420
the association protocol that is used by the master nodes to421
associate with the most suitable local router. The operation422
of these modules is described in details in this section. The423
notations and terminologies that are used in DIAop modules424
are summarized in Table 1.425
Dynamic channel assignment policy426
DIAop divides the components and devices found in the427
local cloud of CHMS according to the operating frequency428
channel into two layers, as illustrated in Fig. 5. Layer 1429
includes the digital devices, the local routers, and the gate-430
ways while Layer 2 includes the sensor nodes of the local431
WBANs. The connection points between the two layers are432
the master nodes. Therefore, DIAop assumes that the master433
nodes are equipped with two radio interfaces, one for each434
layer.435
The objective of having different layers is to distribute 436
the available frequency channels among the incorporated 437
devices to reduce interference. DIAop assigns a single chan- 438
nel for Layer 1. On the other hand, layer 2 uses the rest of 439
the available channels for the local WBANs. For the con- 440
nection points, i.e. the master nodes, the first radio interface 441
is assigned to the same channel used by layer 1, where the 442
second one is assigned to the same channel used by its local 443
WBAN. The multi-radio master node design supports stan- 444
dards diversity in CHMS operation. In other words, if the 445
WBANs implement a different networking standard from 446
the one used by the infrastructure the master nodes will be 447
equipped with two different radios according to the used 448
standards. This feature allows interoperability without any 449
degradation in the system performance where the hybrid 450
communication between the two radio interfaces is carried 451
out by the master node itself. 452
The master node is responsible of finding the most 453
suitable channel for its local WBAN. It uses the deliv- 454
ery delay of the health status related data packets to 455
decide if switching to a new channel is needed. The 456
flowchart found in Fig. 6 gives a high level descrip- 457
tion of the channel selection and switching policy imple- 458
mented by the master nodes while the details are found in 459
Algorithm 1. 460

AUTHOR'S PROOF JrnlID 10916 ArtID 0121 Proof#1 - 03/08/2014
UNCORRECTEDPROOF
121, Page 8 of 20 J Med Syst (2014) 38:121
Algorithm 1 Dynamic channel assignment policy
When a new WBAN is constructed, i.e. a new user461
decides to use CHMS, it is assigned a channel randomly462
from the available set of channels in Layer 2. The master463
node monitors the delay of all packets received from every464
node in its local WBAN over a specific time window Tw.465
The delay of each packet includes the queuing delay, the466
time needed to reserve the medium by the WBAN node, and467
the packet transmission time. For this purpose, we added468
an additional field in the data packet header to be used by469
the WBAN node to store the sum of the queuing delay and470
medium reservation time experienced by the packet. The471
master node extracts this data and adds the transmission472
time to compute the final delay value.473
At the end of each monitoring period an average delay474
value is computed for all packets. If the computed average is475
found to be greater than a threshold value then the channel476
selection phase starts. The threshold value is the multiplica-477
tion of Pdstd by a factor of α, where Pdstd is the minimum478
delay needed for a packet to be sent from the sensor node479
towards its master according to the used WBAN standard.480
During the channel selection phase the master node checks481
the rest of the available channels at Layer 2 including its482
current channel to find a lightly loaded one. This is done by483
Table 1 DIAop Q3notations t1.1
t1.2Notation Meaning
t1.3WBANi The ith local WBAN in CHMS.
t1.4Si The number of sensor nodes in the ith local WBAN.
t1.5CL1 The frequency channel assigned to Layer 1.
t1.6Ci The frequency channel assigned to the ith local
t1.7WBAN.
t1.8Pdk The end-to-end delay of the kth data packet.
t1.9Pi Total number of periodic packets received at the
t1.10master from the ith local WBAN.
t1.11Tw Measurement time window for channel switching
t1.12policy.
t1.13WBANidelay Average end-to-end delay of the ith local WBAN.
t1.14Pdstd Standard value of packets end-to-end delay.
t1.15α, β Multipliers where β > α > 1
t1.16a, b Weighting factors where a + b = 1
t1.17CountCr Total number of WBANs on the rth channel.
t1.18avgDelayCr Average packet delay for all WBANs on the
t1.19rth channel.
t1.20WCr Weight value assigned to the rth channel.
t1.21Tm Measurement time window for recording end-to-end
t1.22delay of data packets exchange at the MAC layer.
t1.23Li,j The link between nodes i and j .
t1.24ET Xi.j ETX metric [20] of the link between nodes i and j .
t1.25P icount Total number of data packets sent by node i.
t1.26Tetx Measurement time window for ETX metric.
t1.27τ Periodic time of sending ETX probes.
t1.28PDR Packet delivery rate.
t1.29R Set of discovered local routers around a master node.
t1.30Tassoc Periodic time of the association process.
t1.31RSSRi Received signal strength of the ith local router.
t1.32DARRi Total delay-aware routing metric value of the
t1.33best route of the ith local router.
t1.34NRSSRi Normalized RSS value of the ith local router.
t1.35NDARRi Normalized DAR value of the ith local router.
t1.36WRi Weight value assigned to the ith local router.
t1.37γ, θ Weighting factors where γ + θ = 1
t1.38δ Urgent data packets percentage.
broadcasting a WBAN DISCOVER control packet on the 484
interface that uses the common channel of Layer 1. All close 485
master nodes, i.e. one-hop neighbors, respond by sending a 486
WBAN DISCOVER REP control packet that includes the 487
channel ID used by the neighbor’s local WBAN, and the last 488
recorded average packet delay on that channel. 489
Next, the master node which initiated the channel selec- 490
tion process assigns to each channel a weight value WCr . 491
This weight is based on the number of WBANs that are 492
currently using the channel and the delay reported by their 493

AUTHOR'S PROOF JrnlID 10916 ArtID 0121 Proof#1 - 03/08/2014
UNCORRECTEDPROOF
J Med Syst (2014) 38:121 Page 9 of 20, 121
Fig. 5 Frequency channelslayers in CHMS
master nodes. The aim is to have an estimation of the chan-494
nel congestion, represented by the number of WBANs, and495
the channel quality, represented by the measured delay.496
Initially, the average delay of channel Cr is computed as497
follows:498
avgDelayCr =∑CountCr
k=1 WBANkdelay
CountCr
(1)
WCr is based on combining avgDelayCr and CountCr499
with each other. Therefore, the normalized values of these500
quantities are used and combined by weighting factors a and501
b using the following equation:502
WCr = a ∗ avgDelayCr
max∀ravgDelayCr
+ b ∗ CountCr
max∀rCountCr
(2)
The newly selected channel is the one with the minimum503
weight value. After the new channel is selected the mas-504
ter decides whether to switch to the new channel or not. If505
the value of the monitored average delay on the used chan-506
nel increases to be larger than Pdstd by a factor of β, then507
the master node informs its local WBAN nodes to switch508
to the new channel. This is done by broadcasting a CHAN-509
NEL SET control packet. Upon the reception of this packet510
all WBAN nodes switch to operate on the new channel. In511
this paper, we assume that the channel switching process at512
the nodes can be performed instantly and reliably. In other513
words, we assume that all WBAN nodes receive the CHAN-514
NEL SET without any loss and the channel switching delay515
is negligible.516
Delay-aware routing517
Health monitoring systems with urgent data or notifica-518
tions require real-time operation. Hence, delay optimization519
while routing is needed to guarantee fast response. More- 520
over, finding routes with good quality is essential to reduce 521
data loss and deliver to the medical staff a complete profile 522
for the user. For this purpose, CHMS implements a novel 523
delay-aware routing metric, referred to as DAR, that can be 524
integrated in any routing protocol to construct the needed 525
routes. 526
The proposed metric depends on the cross interaction 527
between the medium access layer (MAC) and the rout- 528
ing layer, i.e. cross-layer design. The MAC layer records 529
the total delay of sending a packet to a specific neigh- 530
bor. It monitors the delay for both successfully delivered 531
packets and unsuccessful ones. The former corresponds to 532
packets with received ACK, while the latter corresponds 533
to the dropped packets after exceeding the packet retrans- 534
missions limit. The recorded delay includes the time of 535
reserving the medium, transmitting the packet, and receiv- 536
ing the ACK. High congestion level means that longer time 537
is required to reserve the medium. The packets transmis- 538
sion time captures the effect of the packet size and the 539
used data rate. Exceeding the retransmission counter at 540
the MAC layer leads to high packet error rate and pack- 541
ets collision. Thus, DAR tries to capture the effect of 542
all these factors. 543
The MAC layer is able to record delay values only 544
for used links. In other words, packets must be trans- 545
mitted on a link to record the delay values. Conse- 546
quently, there is a need for a metric to evaluate the delay 547
of the unused links. Moreover, the recorded delay depends 548
on the packet size. Large delay value implies poor chan- 549
nel quality for small data packets, however, it may indi- 550
cate good channel quality and successful transmission 551
from the first attempt for large packets. This is 552
due to the difference in the transmission time in 553
both cases. Hence, monitored delay for different pack- 554

AUTHOR'S PROOF JrnlID 10916 ArtID 0121 Proof#1 - 03/08/2014
UNCORRECTEDPROOF
121, Page 10 of 20 J Med Syst (2014) 38:121
Fig. 6 Dynamic channelassignment policy basicoperation
ets sizes has to be recorded separately. In CHMS555
urgent data packets have higher priority than non-556
urgent ones, thus, only the delay of urgent packets557
is monitored.558
DAR is computed in two different approaches; one559
for recently used links and one for the links that have560
not been used during the last time period Tm. However,561
both approaches report the expected delay for exchang-562
ing packets on the links. For a link Li,j between local563
routers i and j , DAR is computed based on the following 564
equation: 565
DARi,j =
⎧⎪⎨⎪⎩
∑Pcountk=1 Pdi
k
P icount
, P icount �= 0
ET Xi.j ∗ Pdstd , P icount = 0
(3)
566
Where ET Xi.j is the expected number of retransmis- 567
sions metric [20] measured over Li,j . It is computed by 568

AUTHOR'S PROOF JrnlID 10916 ArtID 0121 Proof#1 - 03/08/2014
UNCORRECTEDPROOF
J Med Syst (2014) 38:121 Page 11 of 20, 121
measuring the packet delivery rate of both directions on569
a link, i.e. forward direction over which the data packets570
are sent and the reverse direction over which the ACKs571
are received. Each local router broadcasts small pack-572
ets, called probes, periodically at a rate of one probe573
every τ second. The number of received probes dur-574
ing a time window Tetx is recorded by each router and575
is used to compute PDR according to the following576
equation:577
PDR = count (t − Tetx, t)
Tetx/τ(4)
PDR is computed on both directions of a link. To com-578
pute the forward direction PDR, denoted as PDRf , a router579
needs to know how many probes its neighbors have heard.580
ETX probes are used to exchange the recorded counters581
between neighbors to allow them to compute PDRf . On582
the other hand, the counters recorded by the router itself583
about the probes from its neighbors are used to compute584
PDR on the reverse direction denoted as PDRr . Finally, the585
link’s ETX value is computed by combining PDR on both586
directions using the following equation [20]:587
ET X = 1
PDRf ∗ PDRr
(5)
As a result, the DAR value for the used links is the aver-588
age delivery delay experienced during the last measurement589
period. On other hand, for unused links DAR is the expected590
delay to be experienced. DAR is used by the underlying591
routing protocol implemented by the local cloud for the592
route construction toward the gateways. The route weight is593
the sum of DAR for all links that belong to this route. The594
route with the minimum total DAR value is designated as595
the best route that offers the lowest end-to-end delay based596
on the current medium conditions.597
The selection of the routing protocol depends on many598
factors such as the coverage area of the local cloud, the num-599
ber of nodes, the available resources, the health status of the600
monitored users, ... etc. Basically two options are available:601
– Static routing: Where each router maintains one route602
toward each gateway. These routes are configured dur-603
ing the network setup phase and is fixed during the604
network operation. This option is suitable for small size605
and sparse networks with limited number of alternative606
routes.607
– Dynamic routing: Here the routes are constructed608
when needed and they change during the network oper-609
ation time. Any dynamic routing protocol can be used610
in this case such as AODV [19] and DSR [12]. Instead611
of using the hop-count metric, which is the basic metric612
for most of these protocols, the DAR metric is used to613
assign weights for the network links.614
Association protocols 615
To connect with the local cloud in CHMS the master nodes 616
and the digital devices have to run an association protocol 617
to find the best local router to associate with. The mas- 618
ter nodes communicate with the local router whenever an 619
urgent data packet is received. For this purpose, two fac- 620
tors must be considered by the master nodes while selecting 621
the best router to associate with: distance to the router and 622
route quality toward the gateway. Due to users’ mobility, the 623
best local router to associate with may change over time. 624
As a result, in CHMS mobility tracking is a task handled by 625
the association protocols. Algorithm 2 describes the associ- 626
ation protocol that is used by the master nodes, which is a 627
modified version of the protocol found in [8]. 628
Algorithm 2Master nodes’ association protocol
In what follows a detailed description of Algorithm 2 is 629
presented. The master starts by discovering the local routers 630
around it by broadcasting a DISCOVER control packet. 631
Each local router, that exists around, replies by a DIS- 632
COVER REP packet that contains the total DAR value for 633
the best route it has toward any gateway. From these replies 634
the master extracts the IP address of the router, the RSS 635
value of the received reply, and the DAR value. For all dis- 636
covered routers found in router set R, the master computes 637
the normalized RSS and DAR values. WRi is computed 638
by combining these normalized values using the weighting 639
factors γ and θ . 640

AUTHOR'S PROOF JrnlID 10916 ArtID 0121 Proof#1 - 03/08/2014
UNCORRECTEDPROOF
121, Page 12 of 20 J Med Syst (2014) 38:121
The master selects the router that has the maximum641
weight and sends a REGISTER control packet to register.642
The selected router sends a REGISTER REP packet as a643
response after which the association process is considered644
complete. If no reply is received then the master tries to645
register again. After a specified retries limit is reached the646
master looks for another router in R and tries to register647
with. If R is found empty then the master initiates the dis-648
covery process again. The association process is repeated649
periodically every Tassoc to track any location change due to650
human mobility.651
To reduce the overhead of the association process, the652
master nodes utilize the ETX probes broadcasted by the653
local routers instead of sending DISCOVER packets. As654
mentioned previously, these probes are broadcasted period-655
ically and can be used to extract the needed information656
about the local routers. However, if the DAR metric is not657
adopted in the implementation of the local cloud of CHMS658
we return to the original association protocol described in659
Algorithm 2.660
The digital devices run the same association protocol661
of the master nodes with the difference in the quantities662
used for computing WRi . The digital devices need the local663
routers to deliver regular data packets which are not critical664
as urgent packets sent by the master nodes. For this purpose,665
and to privilege urgent data over regular one, the digital666
devices select the local router with the highest RSS value667
only to associate with. Similar to the master nodes, the dig-668
ital devices need to run the association process periodically669
every Tassoc to assure connectivity.670
Performance evaluation671
In this section, we evaluate the performance of CHMS using672
extensive simulation experiments under various conditions.673
We used ns-2 to implement the simulation scenarios after674
adding the required modifications and design details of675
CHMS. The simulation setup, the tested factors, the perfor-676
mance measures, and the obtained results are presented in677
the following subsections.678
Simulation setup679
We have modified the original distribution of ns-2 by adding680
several modules needed to support the design of CHMS.681
Some modules are related to the wireless medium operation,682
while others are related to WBANs’ networking standard,683
traffic generation, patients’ mobility, and the local cloud684
design in CHMS.685
The Multi-interface/multi-channel design is imple-686
mented based on [1]. The multi-rate transmission operation,687
Ricean fading propagation model, and realistic channel688
behavior based on empirical bit error rate and signal to 689
noise ratio (BER vs. SNR) curves for IEEE 802.11b are 690
added based on the patch found in [2]. Finally, we have 691
added a common database between the MAC and the 692
network layers to support cross-layer design. Both layers 693
have full access to this database for storing and retrieving 694
the needed data and parameters required to compute the 695
DAR metric. 696
For the Local WBANs design, as elaborated earlier, these 697
WBANs are based on the usage of low power wireless 698
technologies. Many options are available such as Zigbee 699
[3], IEEE 802.15.6 [4], and more recently the IP-based 700
sensors which implement a low-power version of IEEE 701
802.11 standard [25, 44]. We assume the usage of one 702
standard for all devices incorporated in CHMS. There- 703
fore, the implemented WBANs are based on IEEE 802.11b 704
but with special settings. We followed the same specifi- 705
cations of IP-based sensors found in [25, 44] for the low 706
power operation. 707
In CHMS only the local WBANs are allowed to move 708
throughout the network where each local WBAN moves 709
as one entity, i.e. represents a patient or user in the sys- 710
tem. In addition, we assume that the user holds the digital 711
device wherever he/she goes. As a result, all the nodes that 712
belong to the same local WBAN move at the same speed 713
toward the same destination at the same time. For this pur- 714
pose, we modified the mobility generation script found in 715
ns-2 to enable all nodes associated with the same user to 716
move as one object. Figure 7 shows the design of the user’s 717
local WBAN used in CHMS simulation. The number and 718
locations of the nodes on the human body are arbitrary. As 719
shown in the figure, the selected local WBAN design con- 720
sists of seven nodes: five monitoring nodes, one master, and 721
one digital device. 722
Fig. 7 Simulated local WBAN design

AUTHOR'S PROOF JrnlID 10916 ArtID 0121 Proof#1 - 03/08/2014
UNCORRECTEDPROOF
J Med Syst (2014) 38:121 Page 13 of 20, 121
Another important issue related to local WBANs opera-723
tion is the data traffic generation. Mainly, WBANs applica-724
tions are characterized by periodic generation of small data725
packets. In CHMS the monitoring (sensor) nodes generate726
small data packets regularly and send them to the master727
node. Also, the digital devices generate periodic large pack-728
ets that contain aggregated data less frequently. According729
to the nature of the monitored body health indicators, the730
sensor nodes may be heavy traffic sensors such as EEG and731
ECG with a rate of approximately 10 pps (packet per sec-732
ond), or lower loaded ones such as the heart beat rate and733
blood pressure sensors with a rate of 1 pps, or even lightly734
loaded nodes such as temperature sensors which generate735
on average 1 packet per 5 seconds [43, 50]. To represent736
a realistic and fair load we selected sensors from all types.737
Specifically, each local WBAN in CHMS consists of the738
following: two sensors with a rate of 10 pps, two sensors739
with a rate of 1 pps, and one sensor with a rate of 0.2740
pps. The packet size is selected to be 128 byte for these741
sensors. For the digital devices the following settings are742
used: a rate of 1 packet per 5 seconds with a packet size743
of 1500 byte.744
Another important aspect that is related to sensor nodes745
traffic generation is the percentage value, δ, of the generated746
packets that will be considered as urgent. Practically, this747
value should be very small most of the time since CHMS748
is targeting people with fair health condition who practice749
their normal life at home, work, sporting, ...etc. However, to 750
analyze the performance of CHMS under heavy load condi- 751
tions we selected large value for δ in most of the conducted 752
experiments which reaches 30 % of the total generated data 753
packets. 754
As for the local cloud of CHMS, the simulated local 755
cloud topology, which is depicted in Fig. 8, consists of 36 756
local routers distributed in a 6×6 grid within an area of 757
1200×1200 m. The separation distance between the local 758
routers in the grid is set to 150 m. Wired connections to the 759
Internet were added to two local routers to set up the gate- 760
ways. The combination of wired and wireless environments 761
in ns-2 is called wired-cum-wireless where wired hosts can 762
be added and they are able to communicate with the wire- 763
less nodes. We have added one wired host that represents 764
the medical staff in CHMS as shown in Fig. 8. The local 765
WBANs were distributed and allowed to move in the sec- 766
ond half of the network located far away from the gateways, 767
i.e. the lower 500×1200 m region. 768
For the multi-hop wireless routing protocol needed by the 769
local cloud we selected AODV protocol [19]. The original 770
implementation of this protocol in ns-2 is for single-radio 771
ad hoc networks with the hop-count as its routing metric. 772
At first, we modified AODV module to support multi- 773
interface/multi-channel operation based on [1]. Then, we 774
added the ability of routing in wired-cum-wireless scenarios 775
based on the work found in [28]. Finally, we implemented 776
Fig. 8 Simulated local cloudtopology

AUTHOR'S PROOF JrnlID 10916 ArtID 0121 Proof#1 - 03/08/2014
UNCORRECTEDPROOF
121, Page 14 of 20 J Med Syst (2014) 38:121
our DAR routing metric to be used instead of the hop-count777
metric for the route construction process.778
The values of the used simulation parameters for each779
simulation run, unless different settings are specified, are780
summarized in Table 2. Each simulation scenario has been781
repeated 25 times for statistical validation.782
Performance metrics783
In the simulations we adopted the following metrics to784
measure the performance of CHMS:785
– Packet delivery ratio (PDR): is the total number of786
successfully received data packets with respect to the787
total number of generated packets during simulation.788
CHMS involves two types of packets with different789
characteristics, i.e. urgent and regular data packets.790
For this purpose, we reported PDR for each data type791
separately.792
– Average end-to-end delay: is the average time needed793
by the data packets to reach their ultimate destination794
which is the medical staff. This metric is also reported795
separately for urgent and non-urgent data.796
Table 2 Simulation parameterst2.1
t2.2 MAC protocol IEEE 802.11b with RTS/CTS disabled.
t2.3 Number of channels 3 (one assigned for Layer 1 and two available
t2.4 for Layer 2).
t2.5 Propagation model Two ray ground reflection for large-scale path
t2.6 loss, and Ricean fading for small-scale fading.
t2.7 Mobility model Random way-point [13] (1 m/s minimum speed,
t2.8 5 m/s maximum speed, and 5 s pause time).
t2.9 Transmission range 250 m (routers, master nodes, and digital
t2.10 devices). 50 m (WBANs sensor nodes).
t2.11 Interference range 500 m (routers, master nodes, and digital
t2.12 devices). 100 m (WBANs sensor nodes).
t2.13 Transmission power 30 mW (routers, master nodes, and digital
t2.14 devices). 8 mW (WBANs sensor nodes).
t2.15 Transmission rate 1, 2, 5.5, 11 Mbps (routers, master nodes,
t2.16 and digital devices). 1 Mbps (WBANs
t2.17 sensor nodes).
t2.18 Traffic type CBR over UDP.
t2.19 Packet size 1500 byte (digital devices). 128 byte (WBANs
t2.20 sensor nodes).
t2.21 Interface queue 50 packets.
t2.22 length
t2.23 Pdstd 2 ms
t2.24 α, β, a, b, γ, θ, δ 2, 3, 0.5, 0.5, 0.5, 0.5, 0.3
t2.25 Tw, Tm, Tassoc, 5, 1, 10, 10, 1 s.
t2.26 Tetx , τ
t2.27 Simulation time 900 s.
– Routing overhead ratio (ROR): is the ratio of the 797
total overhead required for the local cloud operation 798
with respect to number of delivered data packets. The 799
overhead includes the association, routing metric com- 800
putation, and routes construction overhead. ROR is 801
computed according to the following equation where 802
the received data packets include both urgent and non- 803
urgent data packets: 804
ROR =∑
ControlP ackets∑ReceivedDataPackets
(6)
The conducted experiments include studying the effect of 805
several factors that are considered crucial to the operation of 806
remote health monitoring systems in general. These factors 807
include the following: 808
– Mutual interference: This factor studies the effect of 809
increasing the number of coexisting WBANs within the 810
local cloud of CHMS. More WBANs implies that more 811
interference is introduced causing a more congested 812
medium, more collisions between simultaneous trans- 813
missions, and more waiting time to reserve the medium. 814
For this purpose, we evaluate the ability of CHMS in 815
utilizing the availability of multiple channels to reduce 816
the effect of mutual interference. 817
– Human mobility: Continuous monitoring of users’ 818
health is a very important requirement that is essen- 819
tial in health monitoring systems. Human mobility 820
affects mutual interference since moving to a new 821
location, especially crowded one, triggers the dynamic 822
channel switching module in CHMS. In addition, 823
the association protocols used by both master nodes 824
and digital devices play a crucial rule in tracking 825
users’ mobility by periodically looking for new local 826
routers to associate with. For this purpose, we study 827
this factor based on different mobility patterns and 828
scenarios. 829
– Cloud density: The cloud density represents the dis- 830
tance separation between the local routers that form 831
the local cloud of CHMS. Closer routers means larger 832
density, i.e. greater number of one hop neighbors, and 833
higher level of mutual interference. However, large 834
density has an advantage of having larger number of 835
alternative routes toward the gateway which promotes 836
the reliability of the network. Thus, we study the per- 837
formance of CHMS under different network topologies 838
with various cloud densities. 839
– Urgent data percentage: The amount of urgent data 840
generated by the local WBANs highly affects the per- 841
formance of the entire system. More urgent data implies 842
more data to be routed by the local cloud toward the 843
gateways. Hence, CHMS is evaluated under different 844
urgent traffic loads to measure its ability to route the 845

AUTHOR'S PROOF JrnlID 10916 ArtID 0121 Proof#1 - 03/08/2014
UNCORRECTEDPROOF
J Med Syst (2014) 38:121 Page 15 of 20, 121
data on various routes while maintaining acceptable846
end-to-end delay and data delivery rate.847
Simulation results848
In this subsection, the results of the simulation experiments849
for each of the aforementioned factors are presented and850
discussed.851
Impact of mutual interference852
In this experiment, the number of local WBANs is increased853
from 6 to 18 with a step of 2 WBANs. Each additional854
WBAN means that seven nodes are added. Consequently,855
the total number of nodes in this experiment is in the856
range from 42 to 126 nodes. We evaluated the perfor-857
mance of CHMS design with and without DIAop module858
to examine the effect of DIAop in interference mitigation.859
In the exhibited figures we refer to the first configura-860
tion as DIAop while the second one, i.e. without DIAop,861
is referred to as Hop-SR since the used routing metric862
is the hop-count metric with single-radio/single-channel863
design.864
As shown in Fig. 9a, DIAop achieved higher packet865
delivery rate for both urgent and non-urgent data which866
is around twice the rate reached by Hop-SR. For exam-867
ple, at network size of 70 WBAN nodes, DIAop had a868
PDR of around 80 % while Hop-SR reached only 50 %.869
Moreover, as the network size grows larger than 70 nodes,870
Hop-SR had much lower PDR for urgent data than non-871
urgent one. This is due to the fact that the hop-count872
metric does not distinguish between the two types of873
reported data. DIAop, on the other hand, reduced the874
effect of interference between nearby WBANs using the875
dynamic channel assignment policy and the layered channel876
distribution.877
Figure 9b proves that DIAop succeeded in its main objec- 878
tive by reducing the data delivery delay of the urgent data. 879
As depicted in the figure, DIAop had lower delay for urgent 880
data as compared to non-urgent one. This is due to two 881
main reasons. The first one is the usage of DAR met- 882
ric which is based on monitoring the urgent data delay. 883
While the second one is the implemented association pro- 884
tocol by the master nodes. The figure also shows that 885
DIAop had lower delay for both types of data com- 886
pared to the Hop-SR for approximately all cases of 887
increased number of WBAN nodes. On the other hand, 888
Hop-SR experienced a severe degradation in its perfor- 889
mance beyond 70 nodes especially for the urgent data 890
packets. 891
Finally, ROR of both DIAop and hop-SR is shown in 892
Fig. 10. DIAop has the constant overhead of broadcast- 893
ing ETX probe control packets which is part of the DAR 894
metric. Additional overhead is introduced as the network 895
size and traffic load increase, as depicted in the figure. 896
However, DIAop has lower ROR compared to Hop-SR. 897
This means that DIAop is more efficient in utilizing the 898
introduced operation overhead with respect to the obtained 899
PDR. Hop-SR degraded in performance as the interference 900
increases where the routes experience frequent breakage 901
and increased number of collisions. As a result, more 902
overhead is needed to construct alternative routes and 903
retransmit the data. 904
Impact of human mobility 905
As discussed earlier, the users in CHMS might be patients 906
in the recovery period, i.e. moving slowly, or healthy 907
people who experienced some irregularities in their vital 908
signs, i.e. moderate speed while moving, or athletes, 909
i.e. moving at high speed. The mobility pattern of the 910
users affects the topology of the network where some 911
locations experience congestion due to the existence of 912
Fig. 9 Mutual interference: (a) Packet delivery ratio, (b) Average end-to-end delay

AUTHOR'S PROOF JrnlID 10916 ArtID 0121 Proof#1 - 03/08/2014
UNCORRECTEDPROOF
121, Page 16 of 20 J Med Syst (2014) 38:121
Fig. 10 Mutual interference: routing overhead ratio
multiple users around each other. Furthermore, mobil-913
ity affects the association of the master nodes and the914
digital devices with the local routers. Excessive data915
packets loss may occur as a result of being disassoci-916
ated due to high mobility. Hence, the objective is to917
examine the response of CHMS to different mobility918
patterns.919
The random way-point mobility model [13] found in ns-920
2 was used to generate the mobility scenarios by varying the921
average nodes speed and the pause time parameters of this922
model. In this experiment the number of WBAN nodes is set923
to 56 and six mobility scenarios were generated as shown in924
Table 3.925
As shown in Fig. 11a, CHMS exhibited a stable per-926
formance under different mobility patterns where PDR927
is almost the same for both types of data. This is928
because of the operation of the dynamic channel assign-929
ment policy. It distributes the WBANs among the avail-930
able channels and separates their collision domains even931
in crowded regions formed by users moving toward932
the same destination. Moreover, the association pro-933
tocols repeat the discovery process periodically which934
allows tracking the new locations of the master nodes935
Table 3 Tested mobility patterns3.1
t3.2 Pattern name Speed range (m/s) Pause time (s)
t3.3 s5p0 [1, 5] 0
t3.4 s5p5 [1, 5] 5
t3.5 s10p0 [1, 10] 0
t3.6 s10p5 [1, 10] 5
t3.7 s15p0 [1, 15] 0
t3.8 s15p5 [1, 15] 5
and the digital devices and reconnect them with the 936
local cloud. 937
The end-to-end delay, found in Fig. 11b, exhibited a 938
different trend compared to PDR where it is affected by 939
mobility. The urgent data delay increased slightly in the 940
range of 140 ms and reached around 180 ms at the high- 941
est speed. However, the non-urgent data delay varied in a 942
larger range. It had the lowest delay for the most stable 943
mobility pattern s5p5 with a value of around 340 ms, and 944
reached around 590 ms for high mobility ones. As men- 945
tioned previously, the optimization of urgent data delay 946
is a result of the core operation of CHMS association 947
protocols and DAR metric. On the other hand, the main 948
concern with non-urgent data is to be delivered with high 949
PDR even with larger delays. As shown in Fig. 11a, this 950
goal has been achieved where the non-urgent data PDR 951
remained approximately constant regardless of the applied 952
mobility pattern. 953
In terms of ROR, Fig. 12 proves another advantage of 954
CHMS by having approximately constant overhead against 955
the different mobility patterns. One reason is the stable 956
PDR for all the tested mobility scenarios which means 957
that the routes are stable and not experiencing additional 958
link failure due to mobility. Moreover, the association pro- 959
tocols are based on monitoring the ETX probe packets 960
where they are broadcasted periodically every 1 s. As a 961
result, the discovery process period Tassoc can be modi- 962
fied to guarantee continuous coverage by the local routers 963
with no cost. 964
Impact of cloud density 965
In this experiment, we vary the distance between the local 966
routers to change the density of the local cloud infrastruc- 967
ture. Similar to the previous experiment, the reported results 968
here are for 56 WBAN nodes scenario. The distance separa- 969
tion had been varied from 100 m to 200 m with a step of 25 970
m. Distance larger than 200 m is not studied to avoid discon- 971
nections in the network since the used transmission range is 972
250 m. 973
As shown in Fig. 13a, CHMS with DIAop module 974
achieved a PDR close to 98 % for both urgent and non- 975
urgent data in dense clouds. Hence, the interference-aware 976
part of DIAop succeeded in mitigating the interference 977
effect. The same trend is depicted for the end-to-end delay in 978
Fig. 13b where the delay is minimal for dense clouds espe- 979
cially for urgent data (around 100 ms). In dense clouds there 980
are more routes toward the gateway among which the DAR 981
metric is used to pick the best one. On the other hand, the 982
sparse clouds have limited number of routes and the one- 983
hop distance traversed by the packet is larger which leads 984
to larger signal attenuation. This is reflected on both PDR 985
and the end-to-end delay which have degraded in sparse 986

AUTHOR'S PROOF JrnlID 10916 ArtID 0121 Proof#1 - 03/08/2014
UNCORRECTEDPROOF
J Med Syst (2014) 38:121 Page 17 of 20, 121
Fig. 11 Human mobility: (a) Packet delivery ratio, (b) Average end-to-end delay
clouds. However, CHMS still has the ability to favor urgent987
data even when resources are scarce. Based on the afore-988
mentioned results, one can deduce that critical patients or989
users need to be located in dense cloud-based monitor-990
ing systems to provide real time tracking of their health991
status. Whereas, normal users can be located in sparse992
clouds where no need for the extra cost of deploying more993
local routers.994
For the routing overhead, as shown in Fig. 13,995
sparse clouds had the highest overhead ratio due to996
the decreased number of delivered data packets. On997
the other hand, smaller fixed ratio values are obtained998
for large to moderate density. As shown, moderate999
density, e.g. 150 m distance separation, can be a1000
good compromise between overhead, delay, and PDR1001
(Fig. 14).
Q4
1002
Fig. 12 Human mobility: routing overhead ratio
Impact of urgent data percentage 1003
Finally, we varied the percentage of urgent data with respect 1004
to the total reported data by the sensor nodes in each local 1005
WBAN. The tested percentage values started with 5 % till 1006
50 % with a step of 5 %. Again the reported results are for 1007
56 WBAN nodes with the default cloud density of 150 m. 1008
Figure 15a shows that CHMS provided a PDR of 1009
around 92 %for urgent percentage of 30 % which is con- 1010
sidered heavy load. PDR degraded after 30 % where it 1011
reached around 65 % for both urgent and non-urgent data 1012
at 50 % load. The regular reported data by the digital 1013
devices is also affected by the increase in urgent data per- 1014
centage. This is due to the fact that heavier cloud load 1015
affects the delivery of all packets regardless of their type. 1016
The same situation is depicted for the end-to-end delay 1017
in Fig. 15b, where it shows a value of approximately 1018
100 ms for a load up to 30 % urgent data. After that 1019
the delay was degraded noticeably due to the increased 1020
congestion. 1021
Finally, ROR was found to be larger for small percent- 1022
age, less than 15 %, as shown in Fig. 16. The reason is 1023
the constant overhead needed by CHMS to compute ETX 1024
which is independent of the network load. However, as the 1025
load increases the number of delivered packets increases and 1026
ROR decreases. As shown in the figure, ROR is optimum for 1027
loads between 25 % and 35 %, while it is slightly increased 1028
for larger loads. 1029
CHMS limitations and open research issues 1030
Since CHMS requires additional computational and com- 1031
munication overhead while WBAN nodes have limited 1032
energy source, in our future research we plan to ana- 1033
lyze the cost of CHMS operation (e.g., energy consump- 1034
tion) and optimize its algorithms accordingly. Moreover, 1035

AUTHOR'S PROOF JrnlID 10916 ArtID 0121 Proof#1 - 03/08/2014
UNCORRECTEDPROOF
121, Page 18 of 20 J Med Syst (2014) 38:121
Fig. 13 Cloud density: (a) Packet delivery ratio, (b) Average end-to-end delay
the complexity of the system due to the large amount1036
of processed data needs to be studied especially for1037
large scale systems. In addition, the data aggregation1038
and classification algorithms used by the digital devices1039
and the master nodes need further investigation to be1040
defined and optimized.1041
Another limitation in our system is that we assumed1042
that the dynamic channel switching process is performed1043
instantly without delay. Besides, the control packets1044
announced by the master nodes to switch the channels1045
operation may be lost due to congestion or bad chan-1046
nel quality. As a result, some WBAN nodes may oper-1047
ate on a different channel than the announced one and1048
fail to deliver the reported data. Hence, future research1049
tackling the cost of channel switching (both energy and1050
delay) and reliable communication of control packets is1051
needed. Furthermore, the performance of heterogeneous1052
systems (i.e. have WBANs use different wireless standard1053
other than the one adopted by the local cloud) has to1054
Fig. 14 Cloud density: routing overhead ratio
be studied to understand its impact on the entire system 1055
performance. 1056
An important issue that requires further analysis is 1057
related to the mobility of the human body organs (i.e. mov- 1058
ing the arms, legs, and chest, ...etc) which may affect the 1059
operation of the WBAN nodes and their connectivity with 1060
the master node, the digital device, and the local cloud. 1061
Moreover, the mobility model for the patients (or local 1062
WBANs) needs to be explored. We used the random way- 1063
point model in our simulations as mentioned previously. 1064
However, this mobility model has been proved to be unable 1065
to capture the behavior of humans [47]. More accurate 1066
models are needed for patients that are residing at hospi- 1067
tals or recovering at home that consider their health status 1068
which has a direct effect on the mobility speed, track, and 1069
frequency. 1070
Security is another critical factor in health monitoring 1071
systems where securing the transmitted data, authenticat- 1072
ing the users’ WBANs, detecting and avoiding jammers 1073
are essential in these systems [41, 42]. In our future 1074
work, we plan to consider extending the CHMS sys- 1075
tem architecture to include securing its operation while 1076
maintaining an acceptable data delivery delay and over- 1077
head to minimize potential degradation in the system 1078
performance. 1079
Conclusions 1080
Existing design challenging issues encountered byWBANs- 1081
based health monitoring systems include: the coverage area, 1082
the health-status of the monitored patients, network con- 1083
gestion, mutual interference, real time response, in addition 1084
to mobility tracking of the users. Integrating WBANs with 1085
cloud computing provides promising solutions to overcome 1086
these limitations and make cloud-based health monitoring 1087

AUTHOR'S PROOF JrnlID 10916 ArtID 0121 Proof#1 - 03/08/2014
UNCORRECTEDPROOF
J Med Syst (2014) 38:121 Page 19 of 20, 121
Fig. 15 Urgent percentage: (a) Packet delivery ratio, (b) Average end-to-end delay
systems more viable. In this paper, a cloud-based real-time1088
remote health monitoring system (CHMS) for tracking the1089
health status of individuals while practicing their daily activ-1090
ities is proposed. The system divides the cloud into local and1091
global clouds and optimizes the operation of the local cloud1092
to enhance the systemQoS level. Many techniques and algo-1093
rithms were proposed in this paper to promote the perfor-1094
mance of CHMS including a dynamic channel assignment1095
policy, a delay-aware routing metric, and association proto-1096
cols for the WBANs to connect with the local and global1097
clouds. Moreover, data classification and aggregation are1098
used to enable tracking the patients’ status while minimizing1099
the traffic flow in the entire network to manage congestion1100
and interference. CHMS with all the proposed techniques1101
and modules has been evaluated against traditional solu-1102
tions using extensive ns-2 simulations. Simulation results1103
Fig. 16 Urgent percentage: routing overhead ratio
proved the efficiency of CHMS in supporting larger number 1104
of users while maintaining a high performance level in terms 1105
of packet delivery rate, end-to-end delay, and the operation 1106
overhead. 1107
References 1108
1. Multi-interface support for ns-2. http://personales.unican.es/ 1109aguerocr/files/ucMultiIfacesSupport.pdf 1110
2. Wireless update patch for ns-2. http://www.telematica.polito.it/ 1111fiore/ 1112
3. Ieee std 802.15.4-2006. http://standards.ieee.org/findstds/ 1113standard/802.15.4-2006.html, 2006. 1114
4. Ieee std 802.15.6-2012. http://standards.ieee.org/findstds/ 1115standard/802.15.6-2012.html, 2012. 1116
5. Ahmed, K., and Gregory, M.: Integrating wireless sensor networks 1117with cloud computing. In: Seventh International Conference on 1118Mobile Ad-hoc and Sensor Networks (MSN), 2011, pp. 364–366. 1119IEEE, 2011. 1120
6. Ahnn, J.H., and Potkonjak, M., mhealthmon: Toward energy- 1121efficient and distributed mobile health monitoring using parallel 1122offloading. J. Med. Syst. 37(5):1–11, 2013. 1123
7. Alamri, A., and et al., A survey on sensor-cloud: Architecture, 1124applications, and approaches. Int. J. Distrib. Sensor Networks 11252013, 2013. 1126
8. Al-Mashaqbeh, G.A., Al-Karaki, J.N., Bataineh, S.M., Clear: 1127A cross-layer enhanced and adaptive routing framework for 1128wireless mesh networks. Wirel. Pers. Commun. 51(3):449–482, 11292009. 1130
9. Alrajeh, N.A., Khan, S., Campbell, C.E., Shams, B., Multi- 1131channel framework for body area network in health monitoring. 1132Appl. Math. 7(5):1743–1747, 2013. 1133
10. Baig, M., and Gholamhosseini, H., Smart health monitoring sys- 1134tems: An overview of design and modeling. J. Med. Syst. 37(2), 11352013. 1136
11. Braem, B., Latre, B., Moerman, I., Blondia, C., Demeester, P.: The 1137wireless autonomous spanning tree protocol for multihop wireless 1138body area networks. In: Third Annual International Conference 1139on Mobile and Ubiquitous Systems: Networking & Services, 2006, 1140pp. 1–8. IEEE, 2006. 1141

AUTHOR'S PROOF JrnlID 10916 ArtID 0121 Proof#1 - 03/08/2014
UNCORRECTEDPROOF
121, Page 20 of 20 J Med Syst (2014) 38:121
12. Broch, J., Johnson, D.B., Maltz, D.A.: The dynamic source routing1142protocol for mobile ad hoc networks. Internet-Draft, draft-ietf-1143manet-dsr-00.txt, 1998.1144
13. Camp, T., Boleng, J., Davies, V., A survey of mobility mod-1145els for ad hoc network research. Wirel. Commun. Mob. Comput.11462(5):483–502, 2002.1147
14. Chen, B., and Pompili, D., Transmission of patient vital signs1148using wireless body area networks. Mob. Netw. Appl. 16(6):663–1149682, 2011.1150
15. Chen, M., Gonzalez, S., Vasilakos, A., Cao, H., Leung, V.C., Body1151area networks: A survey.Mob. Netw. Appl. 16(2):171–193, 2011.1152
16. Chen, M., Mao, S., Liu, Y., Big data: A survey. Mob. Netw. Appl.115319(2):171–209, 2014.1154
17. Chen, Y.Y., Lu, J.C., Jan, J.K., A secure ehr system based on1155hybrid clouds. J. Med. Syst. 36(5):3375–3384, 2012.1156
18. Dai, L., Gao, X., Guo, Y., Xiao, J., Zhang, Z., et al., Bioinformatics1157clouds for big data manipulation. Biol. Direct 7(1):43, 2012.1158
19. Das, S.R., Belding-Royer, E.M., Perkins, C.E., Ad hoc on-demand1159distance vector (aodv) routing. IETF RFC, 3561, 2003.1160
20. De Couto, D.S., Aguayo, D., Bicket, J., Morris, R., A high-1161throughput path metric for multi-hop wireless routing.Wirel. Netw116211(4):419–434, 2005.1163
21. Diallo, O., Rodrigues, J.J., Sene, M., Niu, J.: Real-time query pro-1164cessing optimization for cloud-based wireless body area networks.1165Information Sciences, 2014.1166
22. Dinh, H.T., Lee, C., Niyato, D., Wang, P.: A survey of mobile1167cloud computing: architecture, applications, and approaches.1168Wireless Communications and Mobile Computing, 2011.1169
23. Doherty, S.T., and Oh, P., A multi-sensor monitoring system1170of human physiology and daily activities. Telemed. e-Health117118(3):185–192, 2012.1172
24. F. Costa, J., Rodrigues, J., Simes, T., Lloret, J., Exploring social1173networks and improving hypertext results for cloud solutions.1174Mob. Netw. Appl. 1–7, 2014.1175
25. Folea, S., and Ghercioiu, M.: Ultra-low power wi-fi tag for wire-1176less sensing. In: IEEE International Conference on Automation,1177Quality and Testing, Robotics, 2008. AQTR 2008. Vol. 3, pp.1178247–252. IEEE, 2008.1179
26. Fortino, G., Di Fatta, G., Pathan, M., Vasilakos, A.V., Cloud-1180assisted body area networks: state-of-the-art and future challenges.1181Wirel. Netw, 1–14, 2014.1182
27. Gonzalez-Valenzuela, S., Chen, M., Leung, V.C., Mobility sup-1183port for health monitoring at home using wearable sensors. IEEE1184Trans. Inf. Technol. Biomed. 15(4):539–549, 2011.1185
28. Hamidian, A. A study of internet connectivity for mobile ad hoc1186networks in ns-2. Sweden: Lund Institute of Technology, 2003.1187
29. Hayajneh, T., Almashaqbeh, G., Ullah, S., Vasilakos, A., A survey1188of wireless technologies coexistence in wban: analysis and open1189research issues. Wirel. Netw, 1–35, 2014.1190
30. Jacob, N.A., Pillai, V., Nair, S., Harrell, D.T., Delhommer, R.,1191Chen, B., Sanchez, I., Almstrum, V., Gopalan, S., Low-cost remote1192patient monitoring system based on reduced platform computer1193technology. Telemed. e-Health 17(7):536–545, 2011.1194
31. Karthikeyan, N., and Sukanesh, R., Cloud based emergency health1195care information service in india. J. Med. Syst. 36(6):4031–4036,11962012.1197
32. Lai, X., Liu, Q., Wei, X., Wang, W., Zhou, G., Han, G., A survey1198of body sensor networks. Sensors 13(5):5406–5447, 2013.1199
33. Latre, B., Braem, B., Moerman, I., Blondia, C., Demeester, P., A 1200survey on wireless body area networks. Wirel. Netw 17(1):1–18, 12012011. 1202
34. Latre, B., Braem, B., Moerman, I., Blondia, C., Reusens, E., 1203Joseph, W., Demeester, P.: A low-delay protocol for multihop 1204wireless body area networks. In: Fourth Annual International 1205Conference on Mobile and Ubiquitous Systems: Networking & 1206Services, 2007. MobiQuitous 2007. pp. 1–8. IEEE, 2007. 1207
35. Lin, C.C., Lee, R.G., Hsiao, C.C., A pervasive health monitoring 1208service system based on ubiquitous network technology. Int. J. 1209Med. Inform. 77(7):461–469, 2008. 1210
36. Low, C., and Hsueh Chen, Y., Criteria for the evaluation of a 1211cloud-based hospital information system outsourcing provider. J. 1212Med. Syst. 36(6):3543–3553, 2012. 1213
37. Peng Zhang Hanlin Sun, Z.Y.: A novel architecture based on 1214cloud computing for wireless sensor network. In: International 1215Conference on Computer Science and Electronics Engineering 1216(ICCSEE), pp. 472–475, 2013. 1217
38. Postema, T., Peeters, J., Friele, R., Key factors influencing the 1218implementation success of a home telecare application. Int. J. 1219Med. Inform. 81(6):415–423, 2012. 1220
39. Poulymenopoulou, M., Malamateniou, F., Vassilacopoulos, G., 1221Emergency healthcare process automation using mobile comput- 1222ing and cloud services. J. Med. Syst. 36(5):3233–3241, 2012. 1223
40. Rahimi, M., Ren, J., Liu, C., Vasilakos, A., Venkatasubramanian, 1224N., Mobile cloud computing: A survey, state of art and future 1225directions. Mob. Netw. Appl. 19(2):133–143, 2014. 1226
41. Rodrigues, J.J., de la Torre, I., Fernandez, G., Lopez-Coronado, 1227M., Analysis of the security and privacy requirements of cloud- 1228based electronic health records systems. J. Med. Internet Res. 122915(8), 2013. 1230
42. Siddiqui, Z., Abdullah, A., Khan, M., Alghamdi, A., Smart envi- 1231ronment as a service: Three factor cloud based user authentication 1232for telecare medical information system. J. Med. Syst. 38(1), 2013. 1233
43. Touati, F., and Tabish, R., U-healthcare system: State-of-the-art 1234review and challenges. J. Med. Syst. 37(3):1–20, 2013. 1235
44. Tozlu, S., Senel, M., Mao, W., Keshavarzian, A., Wi-fi enabled 1236sensors for internet of things: A practical approach. IEEE Com- 1237mun. Mag. 50(6):134–143, 2012. 1238
45. Tsai, C.W., and Rodrigues, J., Metaheuristic scheduling for cloud: 1239A survey. IEEE Syst. J. 8(1):279–291, 2014. 1240
46. Ullah, S., Higgins, H., Braem, B., Latre, B., Blondia, C., Moer- 1241man, I., Saleem, S., Rahman, Z., Kwak, K.S., A comprehensive 1242survey of wireless body area networks. J. Med. Syst. 36(3):1065– 12431094, 2012. 1244
47. Vastardis, N., and Yang, K., An enhanced community-based 1245mobility model for distributed mobile social networks. J. Ambient 1246Intell. Humanized Comput. 5(1):65–75, 2014. 1247
48. Vilaplana, J., Solsona, F., Abella, F., Filgueira, R., Torrento, J.R., 1248The cloud paradigm applied to e-health. BMC Med. Inf. Decis. 1249Mak. 13:35, 2013. 1250
49. Wan, J., Zou, C., Ullah, S., Lai, C.F., Zhou, M., Wang, X., Cloud- 1251enabled wireless body area networks for pervasive healthcare. 1252IEEE Netw. 27(5):56–61, 2013. 1253
50. Wang, Y., Wang, Q., Zeng, Z., Zheng, G., Zheng, R.: Wicop: Engi- 1254neering wifi temporal white-spaces for safe operations of wireless 1255body area networks in medical applications. In: Real-Time Systems 1256Symposium (RTSS), 2011 IEEE 32nd. pp. 170–179. IEEE, 2011. 1257