qcc-v2 copy - abu dhabi quality and conformity council
TRANSCRIPT

Second EditionJULY 2020
(WA-726-1)
STORMWATER & SUBSOILDRAINAGE SYSTEMS
VOLUME IDESIGN MANUAL
QCC-V2
COPY

DOCUMENT AMENDMENT PAGE
EDITION
NO. REVISION
NO. DATE PAGE NO. AMENDMENTS NOTES
01 00 DEC 2016
02 01 JULY 2020 WA-726-1: 2.3 (PAGE-5)
Modify as below: Structure (With Reinforcement) - 50 years. Structure (Without Reinforcement) -60 years
02 01 JULY 2020 WA-726-1: 3.4.1 (PAGE-20)
Add the following statement: “Recommended type of curve to be used for hydraulic modelling should be SCS Type II Cumulative type curve, unless otherwise specified by DMT”.
02 01 JULY 2020 WA-726-1: 3.4.2 (PAGE-23)
Modify as below: The hydraulic model CIVILSTORM (for ADM), SewerGEMS, INFOWORKS (for AACM) or shape file exports are to be submitted to DMT for input by DMT into their hydraulic model to verify the results and extend the overall Abu Dhabi hydraulic models. Section 8 details DMT’s requirements for the submission of model files.
02 01 JULY 2020 WA-726-1: 4.3.4 (PAGE -31)
To be added as follows: All Materials bearing the AD QCC Trust Mark are preferable and recommended.
02 01 JULY 2020 WA-726-1: 4.3.1 (PAGE-29)
Modify as below: HDPE Pipes (plain and corrugated)
02 01 JULY 2020 WA-726-1: 4.3.4 (PAGE-31)
Modify as below: Structured Wall / Corrugated HDPE Pipes (SWPP)
02 01 JULY 2020 WA-726-1: 4.3.4 (PAGE-31)
Modify as below: As all these materials have acceptable properties, subject to correct design and allowable deflection and ovalization as per specifications, the choice will be determined by bedding and construction cost and size availability. Other pipe materials may be considered, subject to approval of DMT
02 01 JULY 2020 WA-726-1: 4.3.4 (PAGE-31)
Add this part in the comments column: Any stormwater pipe under the road shall comply with DIN 8061/8062 or ISO 4422 (2.5)
QCC-V2
COPY
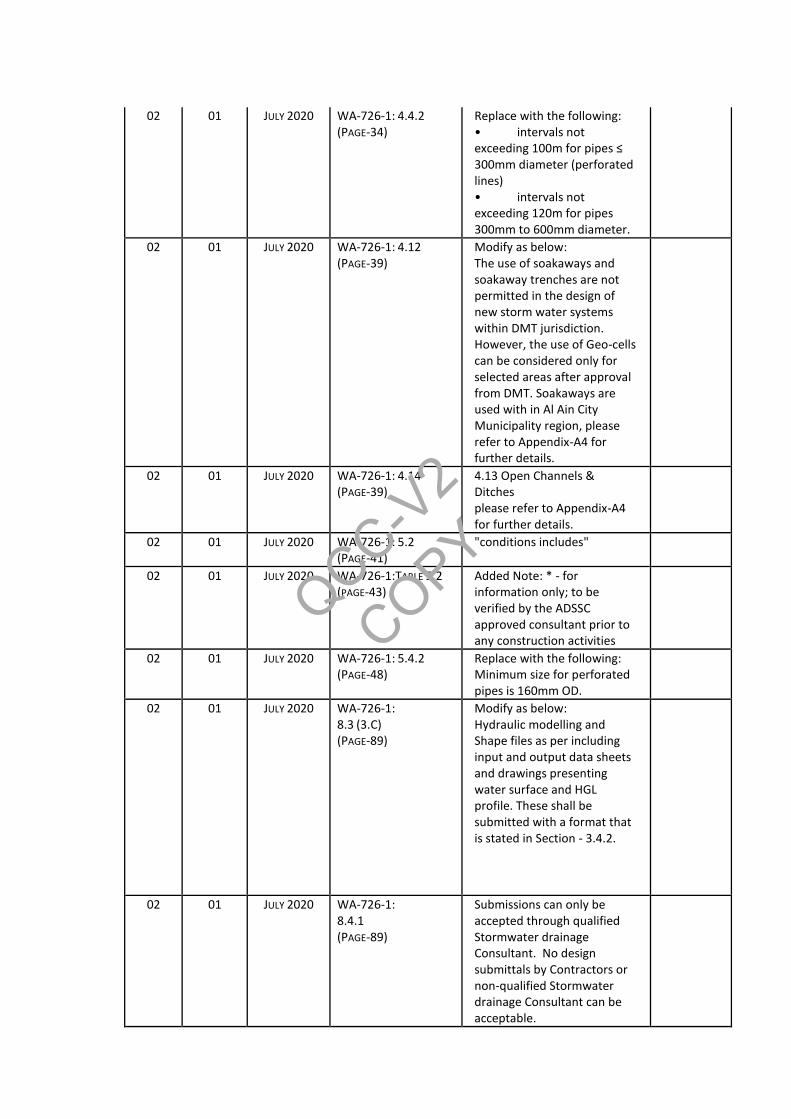
02 01 JULY 2020 WA-726-1: 4.4.2 (PAGE-34)
Replace with the following: • intervals not exceeding 100m for pipes ≤ 300mm diameter (perforated lines) • intervals not exceeding 120m for pipes 300mm to 600mm diameter.
02 01 JULY 2020 WA-726-1: 4.12 (PAGE-39)
Modify as below: The use of soakaways and soakaway trenches are not permitted in the design of new storm water systems within DMT jurisdiction. However, the use of Geo-cells can be considered only for selected areas after approval from DMT. Soakaways are used with in Al Ain City Municipality region, please refer to Appendix-A4 for further details.
02 01 JULY 2020 WA-726-1: 4.14 (PAGE-39)
4.13 Open Channels & Ditches please refer to Appendix-A4 for further details.
02 01 JULY 2020 WA-726-1: 5.2 (PAGE-41)
"conditions includes"
02 01 JULY 2020 WA-726-1:TABLE 5.2 (PAGE-43)
Added Note: * - for information only; to be verified by the ADSSC approved consultant prior to any construction activities
02 01 JULY 2020 WA-726-1: 5.4.2 (PAGE-48)
Replace with the following: Minimum size for perforated pipes is 160mm OD.
02 01 JULY 2020 WA-726-1: 8.3 (3.C) (PAGE-89)
Modify as below: Hydraulic modelling and Shape files as per including input and output data sheets and drawings presenting water surface and HGL profile. These shall be submitted with a format that is stated in Section - 3.4.2.
02 01 JULY 2020 WA-726-1: 8.4.1 (PAGE-89)
Submissions can only be accepted through qualified Stormwater drainage Consultant. No design submittals by Contractors or non-qualified Stormwater drainage Consultant can be acceptable.
QCC-V2
COPY

02 01 JULY 2020 WA-726-1: 8.4.2.E 8.4.2.P 8.4.3 K (PAGE-90&91 &91)
AutoCad and Excel Justification Justification
02 01 JULY 2020 WA-726-1: 8.7 (#4) (PAGE-94)
Modify as below: One soft copy of the Hydraulic modelling Shape files that is compatible with a format that is stated in Section - 3.4.2.
02 01 JULY 2020 WA-726-1: REFERENCE (PAGE-101)
28. Abu Dhabi SewerageServices Company (ADSSC) Design Guidelines, Specification & Drawings
Department of Municipalities and Transport PO Box 20
Abu Dhabi, United Arab Emirates
© Copyright 2020, by the Department of Municipalities and Transport. All Rights Reserved. This manual, or parts thereof, may not be reproduced in any form without
written permission of the publisher
QCC-V2
COPY

STORMWATER & SUBSOIL DRAINAGE SYSTEMS VOLUME I- DESIGN MANUAL
PAGE I TOC SECOND EDITION – JULY 2020
TABLE OF CONTENTS
FOREWORD .......................................................................................................................................... vi
GLOSSARY ........................................................................................................................................... vii
1. OBJECTIVES ............................................................................................................................... 1
1.1. Introduction ........................................................................................................................................... 1 1.2. Approvals Process ................................................................................................................................ 1 1.3. Permanent Works ................................................................................................................................. 2 1.4. Inspection, Testing and Commissioning ............................................................................................... 3 1.5. Innovation ............................................................................................................................................. 3 1.6. Copyright............................................................................................................................................... 3 1.7. Updates ................................................................................................................................................. 3
2. DESIGN CONSIDERATIONS ...................................................................................................... 4
2.1. Network Integration ............................................................................................................................... 4 2.2. Design Philosophy ................................................................................................................................ 4 2.3. Design Life ............................................................................................................................................ 5 2.4. Investigations ........................................................................................................................................ 5 2.5. Environmental Impact ........................................................................................................................... 5
2.5.1. Environmental Legislation ............................................................................................................. 5 2.5.2. Cultural Heritage Permitting Requirements .................................................................................. 5
2.6. Health and Safety in Design .............................................................................................................. 6 2.7. Value Management and Value Engineering ......................................................................................... 6 2.8. Options Appraisal ................................................................................................................................. 7
2.8.1. Capital Cost (CAPEX) ................................................................................................................... 7 2.8.2. Operational and Maintenance Cost (OPEX) ................................................................................. 7 2.8.3. Economic Appraisal of Options ..................................................................................................... 7
2.9. Drawings ............................................................................................................................................... 8 2.9.1. Standard Drawings ....................................................................................................................... 8 2.9.2. Typical Drawings........................................................................................................................... 8
2.10. Materials Selection ........................................................................................................................... 8
3. RAINFALL AND RUNOFF ........................................................................................................... 9
3.1. Introduction ........................................................................................................................................... 9 3.2. Design Storms ...................................................................................................................................... 9
3.2.1. Design Return Period ................................................................................................................... 9 3.2.2. Duration of Rainfall ..................................................................................................................... 10 3.2.3. Design storm duration ................................................................................................................. 10 3.2.4. Rainfall Intensity Duration Frequency (IDF) ........................................................................... 13
3.3. Rational Method .................................................................................................................................. 16 3.3.1. Runoff Coefficient ....................................................................................................................... 17 3.3.2. Flow calculation .......................................................................................................................... 19
3.4. Soil Conservation Service (SCS) Method ........................................................................................... 19 3.4.1. Curve Number............................................................................................................................. 19 3.4.2. Flow calculation .......................................................................................................................... 22
3.5. Special considerations for mixed catchments .................................................................................... 23 3.6. Flood volume calculations .................................................................................................................. 23
4. STORM WATER SYSTEM DESIGN .......................................................................................... 25
4.1. System Planning ................................................................................................................................. 25 4.1.1. Commencing Design .................................................................................................................. 25 4.1.2. System Performance and Recommended Design Return Period .............................................. 26 4.1.3. Surface Flooding ......................................................................................................................... 26 4.1.4. Pipes Located Near to Structures and Buildings ........................................................................ 26
4.2. Flow Attenuation ................................................................................................................................. 27 4.3. Design Parameters for Gravity Pipelines ............................................................................................ 28
4.3.1. Pipe Hydraulic Formulae ............................................................................................................ 28 4.3.2. Pipe Hydraulic Design ................................................................................................................ 30 4.3.3. Minor Friction Losses .................................................................................................................. 30
QCC-V2
COPY
STORMWATER & SUBSOIL DRAINAGE SYSTEMS VOLUME I- DESIGN MANUAL
PAGE II TOC SECOND EDITION – JULY 2020
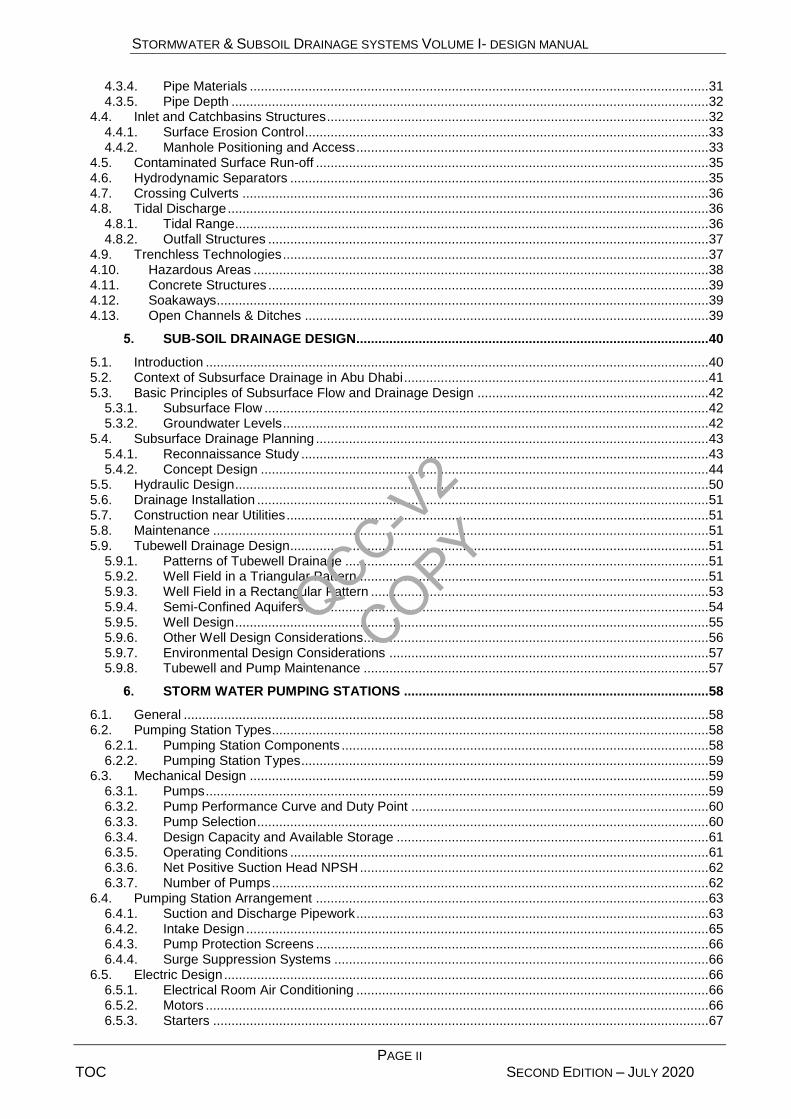
4.3.4. Pipe Materials ............................................................................................................................. 31 4.3.5. Pipe Depth .................................................................................................................................. 32
4.4. Inlet and Catchbasins Structures ........................................................................................................ 32 4.4.1. Surface Erosion Control .............................................................................................................. 33 4.4.2. Manhole Positioning and Access ................................................................................................ 33
4.5. Contaminated Surface Run-off ........................................................................................................... 35 4.6. Hydrodynamic Separators .................................................................................................................. 35 4.7. Crossing Culverts ............................................................................................................................... 36 4.8. Tidal Discharge ................................................................................................................................... 36
4.8.1. Tidal Range ................................................................................................................................. 36 4.8.2. Outfall Structures ........................................................................................................................ 37
4.9. Trenchless Technologies .................................................................................................................... 37 4.10. Hazardous Areas ............................................................................................................................ 38 4.11. Concrete Structures ........................................................................................................................ 39 4.12. Soakaways ...................................................................................................................................... 39 4.13. Open Channels & Ditches .............................................................................................................. 39
5. SUB-SOIL DRAINAGE DESIGN................................................................................................ 40
5.1. Introduction ......................................................................................................................................... 40 5.2. Context of Subsurface Drainage in Abu Dhabi ................................................................................... 41 5.3. Basic Principles of Subsurface Flow and Drainage Design ............................................................... 42
5.3.1. Subsurface Flow ......................................................................................................................... 42 5.3.2. Groundwater Levels .................................................................................................................... 42
5.4. Subsurface Drainage Planning ........................................................................................................... 43 5.4.1. Reconnaissance Study ............................................................................................................... 43 5.4.2. Concept Design .......................................................................................................................... 44
5.5. Hydraulic Design ................................................................................................................................. 50 5.6. Drainage Installation ........................................................................................................................... 51 5.7. Construction near Utilities ................................................................................................................... 51 5.8. Maintenance ....................................................................................................................................... 51 5.9. Tubewell Drainage Design .................................................................................................................. 51
5.9.1. Patterns of Tubewell Drainage ................................................................................................... 51 5.9.2. Well Field in a Triangular Pattern ............................................................................................... 51 5.9.3. Well Field in a Rectangular Pattern ............................................................................................ 53 5.9.4. Semi-Confined Aquifers .............................................................................................................. 54 5.9.5. Well Design ................................................................................................................................. 55 5.9.6. Other Well Design Considerations.............................................................................................. 56 5.9.7. Environmental Design Considerations ....................................................................................... 57 5.9.8. Tubewell and Pump Maintenance .............................................................................................. 57
6. STORM WATER PUMPING STATIONS ................................................................................... 58
6.1. General ............................................................................................................................................... 58 6.2. Pumping Station Types ....................................................................................................................... 58
6.2.1. Pumping Station Components .................................................................................................... 58 6.2.2. Pumping Station Types ............................................................................................................... 59
6.3. Mechanical Design ............................................................................................................................. 59 6.3.1. Pumps ......................................................................................................................................... 59 6.3.2. Pump Performance Curve and Duty Point ................................................................................. 60 6.3.3. Pump Selection ........................................................................................................................... 60 6.3.4. Design Capacity and Available Storage ..................................................................................... 61 6.3.5. Operating Conditions .................................................................................................................. 61 6.3.6. Net Positive Suction Head NPSH ............................................................................................... 62 6.3.7. Number of Pumps ....................................................................................................................... 62
6.4. Pumping Station Arrangement ........................................................................................................... 63 6.4.1. Suction and Discharge Pipework ................................................................................................ 63 6.4.2. Intake Design .............................................................................................................................. 65 6.4.3. Pump Protection Screens ........................................................................................................... 66 6.4.4. Surge Suppression Systems ...................................................................................................... 66
6.5. Electric Design .................................................................................................................................... 66 6.5.1. Electrical Room Air Conditioning ................................................................................................ 66 6.5.2. Motors ......................................................................................................................................... 66 6.5.3. Starters ....................................................................................................................................... 67
QCC-V2
COPY
STORMWATER & SUBSOIL DRAINAGE SYSTEMS VOLUME I- DESIGN MANUAL
PAGE III TOC SECOND EDITION – JULY 2020
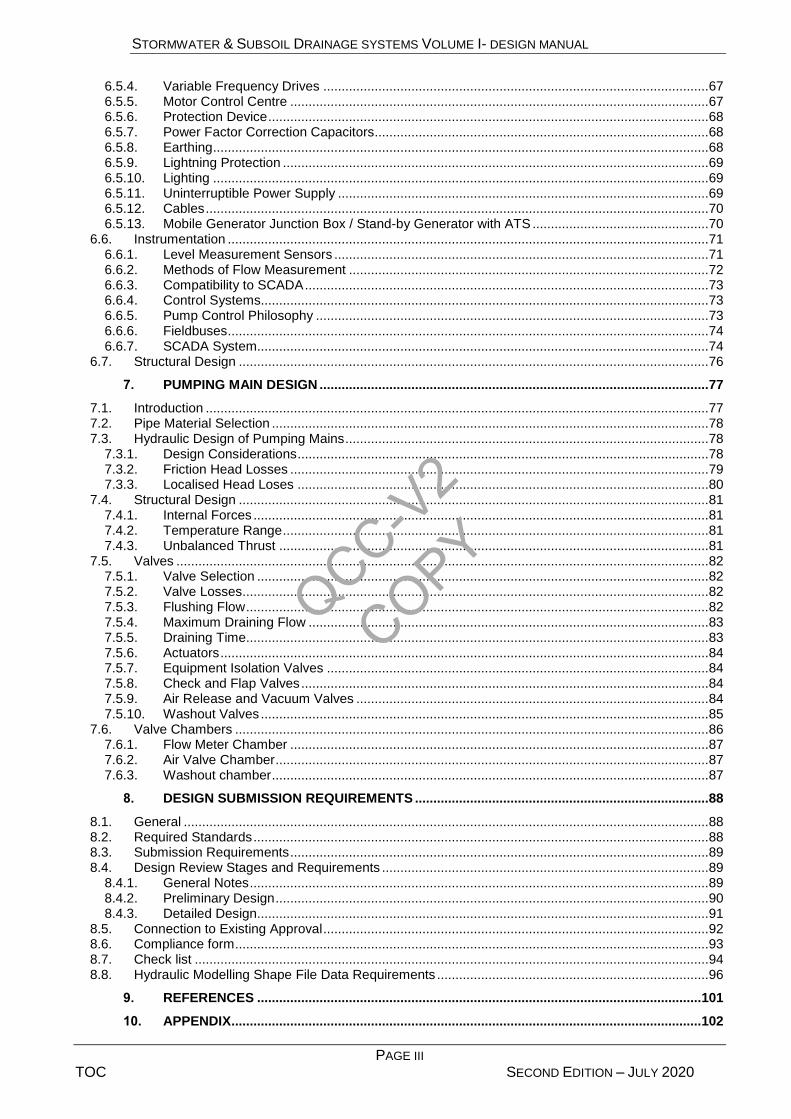
6.5.4. Variable Frequency Drives ......................................................................................................... 67 6.5.5. Motor Control Centre .................................................................................................................. 67 6.5.6. Protection Device ........................................................................................................................ 68 6.5.7. Power Factor Correction Capacitors........................................................................................... 68 6.5.8. Earthing ....................................................................................................................................... 68 6.5.9. Lightning Protection .................................................................................................................... 69 6.5.10. Lighting ....................................................................................................................................... 69 6.5.11. Uninterruptible Power Supply ..................................................................................................... 69 6.5.12. Cables ......................................................................................................................................... 70 6.5.13. Mobile Generator Junction Box / Stand-by Generator with ATS ................................................ 70
6.6. Instrumentation ................................................................................................................................... 71 6.6.1. Level Measurement Sensors ...................................................................................................... 71 6.6.2. Methods of Flow Measurement .................................................................................................. 72 6.6.3. Compatibility to SCADA .............................................................................................................. 73 6.6.4. Control Systems.......................................................................................................................... 73 6.6.5. Pump Control Philosophy ........................................................................................................... 73 6.6.6. Fieldbuses ................................................................................................................................... 74 6.6.7. SCADA System........................................................................................................................... 74
6.7. Structural Design ................................................................................................................................ 76
7. PUMPING MAIN DESIGN .......................................................................................................... 77
7.1. Introduction ......................................................................................................................................... 77 7.2. Pipe Material Selection ....................................................................................................................... 78 7.3. Hydraulic Design of Pumping Mains ................................................................................................... 78
7.3.1. Design Considerations ................................................................................................................ 78 7.3.2. Friction Head Losses .................................................................................................................. 79 7.3.3. Localised Head Loses ................................................................................................................ 80
7.4. Structural Design ................................................................................................................................ 81 7.4.1. Internal Forces ............................................................................................................................ 81 7.4.2. Temperature Range .................................................................................................................... 81 7.4.3. Unbalanced Thrust ..................................................................................................................... 81
7.5. Valves ................................................................................................................................................. 82 7.5.1. Valve Selection ........................................................................................................................... 82 7.5.2. Valve Losses............................................................................................................................... 82 7.5.3. Flushing Flow .............................................................................................................................. 82 7.5.4. Maximum Draining Flow ............................................................................................................. 83 7.5.5. Draining Time.............................................................................................................................. 83 7.5.6. Actuators ..................................................................................................................................... 84 7.5.7. Equipment Isolation Valves ........................................................................................................ 84 7.5.8. Check and Flap Valves ............................................................................................................... 84 7.5.9. Air Release and Vacuum Valves ................................................................................................ 84 7.5.10. Washout Valves .......................................................................................................................... 85
7.6. Valve Chambers ................................................................................................................................. 86 7.6.1. Flow Meter Chamber .................................................................................................................. 87 7.6.2. Air Valve Chamber ...................................................................................................................... 87 7.6.3. Washout chamber ....................................................................................................................... 87
8. DESIGN SUBMISSION REQUIREMENTS ................................................................................ 88
8.1. General ............................................................................................................................................... 88 8.2. Required Standards ............................................................................................................................ 88 8.3. Submission Requirements .................................................................................................................. 89 8.4. Design Review Stages and Requirements ......................................................................................... 89
8.4.1. General Notes ............................................................................................................................. 89 8.4.2. Preliminary Design ...................................................................................................................... 90 8.4.3. Detailed Design........................................................................................................................... 91
8.5. Connection to Existing Approval ......................................................................................................... 92 8.6. Compliance form ................................................................................................................................. 93 8.7. Check list ............................................................................................................................................ 94 8.8. Hydraulic Modelling Shape File Data Requirements .......................................................................... 96
9. REFERENCES ......................................................................................................................... 101
10. APPENDIX ................................................................................................................................ 102
QCC-V2
COPY
STORMWATER & SUBSOIL DRAINAGE SYSTEMS VOLUME I- DESIGN MANUAL
PAGE IV TOC SECOND EDITION – JULY 2020
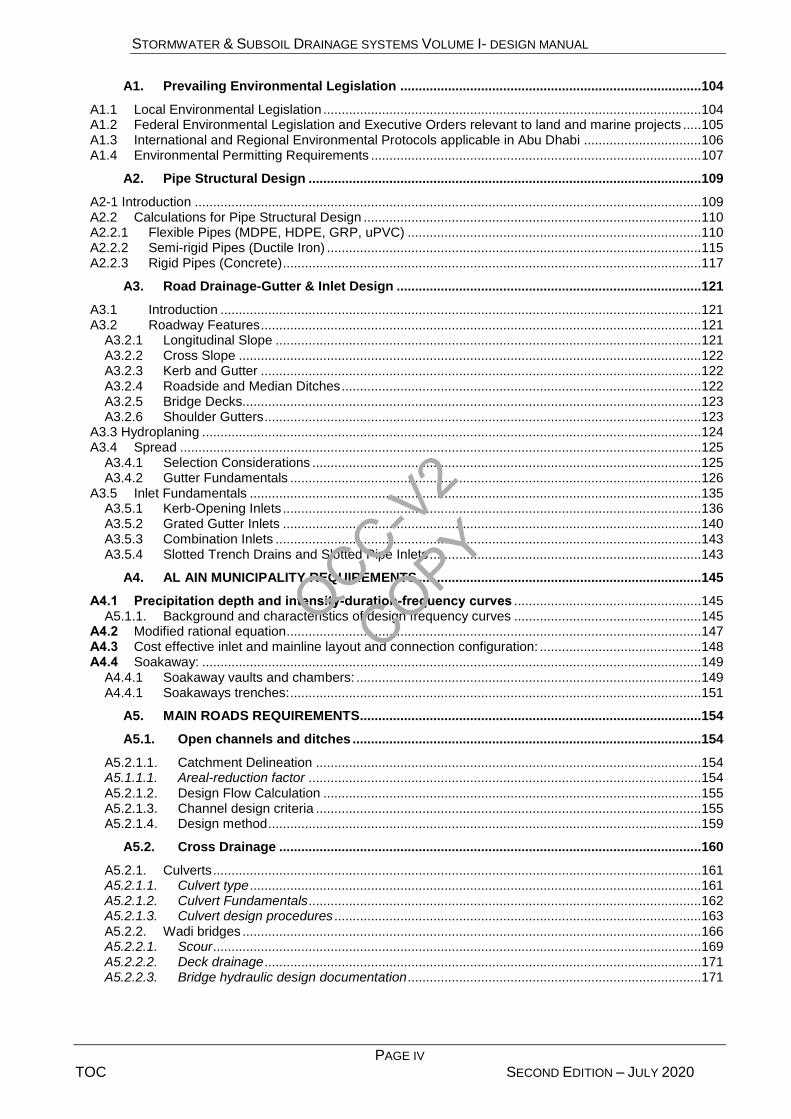
A1. Prevailing Environmental Legislation .................................................................................. 104
A1.1 Local Environmental Legislation ....................................................................................................... 104 A1.2 Federal Environmental Legislation and Executive Orders relevant to land and marine projects ..... 105 A1.3 International and Regional Environmental Protocols applicable in Abu Dhabi ................................ 106 A1.4 Environmental Permitting Requirements .......................................................................................... 107
A2. Pipe Structural Design ........................................................................................................... 109
A2-1 Introduction .......................................................................................................................................... 109 A2.2 Calculations for Pipe Structural Design ............................................................................................ 110 A2.2.1 Flexible Pipes (MDPE, HDPE, GRP, uPVC) ................................................................................ 110 A2.2.2 Semi-rigid Pipes (Ductile Iron) ...................................................................................................... 115 A2.2.3 Rigid Pipes (Concrete) .................................................................................................................. 117
A3. Road Drainage-Gutter & Inlet Design ................................................................................... 121
A3.1 Introduction ................................................................................................................................... 121 A3.2 Roadway Features ........................................................................................................................ 121
A3.2.1 Longitudinal Slope .................................................................................................................... 121 A3.2.2 Cross Slope .............................................................................................................................. 122 A3.2.3 Kerb and Gutter ........................................................................................................................ 122 A3.2.4 Roadside and Median Ditches .................................................................................................. 122 A3.2.5 Bridge Decks............................................................................................................................. 123 A3.2.6 Shoulder Gutters ....................................................................................................................... 123
A3.3 Hydroplaning ........................................................................................................................................ 124 A3.4 Spread .............................................................................................................................................. 125
A3.4.1 Selection Considerations .......................................................................................................... 125 A3.4.2 Gutter Fundamentals ................................................................................................................ 126
A3.5 Inlet Fundamentals ........................................................................................................................... 135 A3.5.1 Kerb-Opening Inlets .................................................................................................................. 136 A3.5.2 Grated Gutter Inlets .................................................................................................................. 140 A3.5.3 Combination Inlets .................................................................................................................... 143 A3.5.4 Slotted Trench Drains and Slotted Pipe Inlets .......................................................................... 143
A4. AL AIN MUNICIPALITY REQUIREMENTS ............................................................................. 145
A4.1 Precipitation depth and intensity-duration-frequency curves ................................................... 145 A5.1.1. Background and characteristics of design frequency curves ................................................... 145
A4.2 Modified rational equation ................................................................................................................. 147 A4.3 Cost effective inlet and mainline layout and connection configuration: ............................................ 148 A4.4 Soakaway: ........................................................................................................................................ 149
A4.4.1 Soakaway vaults and chambers: .............................................................................................. 149 A4.4.1 Soakaways trenches: ................................................................................................................ 151
A5. MAIN ROADS REQUIREMENTS ............................................................................................. 154
A5.1. Open channels and ditches ............................................................................................... 154
A5.2.1.1. Catchment Delineation ......................................................................................................... 154 A5.1.1.1. Areal-reduction factor ........................................................................................................... 154 A5.2.1.2. Design Flow Calculation ....................................................................................................... 155 A5.2.1.3. Channel design criteria ......................................................................................................... 155 A5.2.1.4. Design method ...................................................................................................................... 159
A5.2. Cross Drainage ................................................................................................................... 160
A5.2.1. Culverts ..................................................................................................................................... 161 A5.2.1.1. Culvert type ........................................................................................................................... 161 A5.2.1.2. Culvert Fundamentals ........................................................................................................... 162 A5.2.1.3. Culvert design procedures .................................................................................................... 163 A5.2.2. Wadi bridges ............................................................................................................................. 166 A5.2.2.1. Scour ..................................................................................................................................... 169 A5.2.2.2. Deck drainage ....................................................................................................................... 171 A5.2.2.3. Bridge hydraulic design documentation ................................................................................ 171
QCC-V2
COPY

STORMWATER & SUBSOIL DRAINAGE SYSTEMS VOLUME I- DESIGN MANUAL
PAGE V TOC SECOND EDITION – JULY 2020
LIST OF TABLES
Table 2-1 – Design Life......................................................................................................................................... 5 Table 3-1 - Summary of rainfall-runoff methods ................................................................................................... 9 Table 3-2 – Design storm standard for various facilities .................................................................................... 10 Table 3-3 – Priorities and time of concentration multipliers used to determine design storm durations ............ 10 Table 3-4 - Recommended IDF table for use in DMAT ...................................................................................... 15 Table 3-5 – Recommended IDF equations for use in DMAT ............................................................................. 15 Table 3-6 - Typical Urban Run-Off Coefficients.................................................................................................. 17 Table 3-7 - Typical Rural Run-Off Coefficients ................................................................................................... 18 Table 3-8 - Soil characteristics and hydrological soil groups ............................................................................. 20 Table 3-9 - Curve numbers for hydrological soil groups and cover complexes ................................................. 21
Table 4-1 - Roughness Coefficients ................................................................................................................... 29 Table 4-2 - Approved Pipe Materials for Gravity Pipelines ................................................................................. 31 Table 4-3 - Use of Inlets and Catchbasins ......................................................................................................... 33 Table 4-4 - Manhole Cover Levels ..................................................................................................................... 34 Table 4-5 - Tide Levels ....................................................................................................................................... 36 Table 4-6 - Potential Hazards in a Storm Water Network .................................................................................. 38 Table 5-1 – Typical Soil Permeability ................................................................................................................. 42 Table 5-2 - Guideline Depths of Infrastructure and Minimum Groundwater Levels ........................................... 43 Table 5-3 – Phases of Subsurface Drainage Project Design ............................................................................. 43 Table 5-4 – Reconnaissance Data ..................................................................................................................... 44 Table 5-5 – Soil Properties and Pipe Spacing .................................................................................................... 46 Table 5-6 - Approved Drainage Pipe parameters ............................................................................................... 48 Table 5-7 – Design Criteria for Gravel Envelopes .............................................................................................. 50
Table 5-8 – Well Screen Materials ..................................................................................................................... 55 Table 5-9 – Other Well Design Considerations .................................................................................................. 56 Table 5-10 – Autonomous and Design Factors Affecting Design Discharge Rates ........................................... 57 Table 6-1 – Commonly used types of pumping stations in DMAT jurisdiction ................................................... 59 Table 6-2 – Pump types and applications .......................................................................................................... 60 Table 6-3 - Suction Piping Design Considerations ............................................................................................. 63
Table 6-4 – Discharge Line Design Considerations ........................................................................................... 64 Table 6-5 – Motor Specification .......................................................................................................................... 66
Table 6-6 – Motor Control Centre Specification ................................................................................................. 68 Table 6-7 – Lighting Design ................................................................................................................................ 69
Table 6-8 - Level Sensor Application .................................................................................................................. 71 Table 6-9 – Methods of Flow Measurement ....................................................................................................... 72 Table 6-11 – Pump Protection Measures: .......................................................................................................... 74
Table 6-12 – Minimum PLC and RTU Requirements ......................................................................................... 75 Table 7-1 - Pumping Main Design Factors ......................................................................................................... 77
Table 7-2 – Hazen Williams C Coefficients for Types of Pipe ............................................................................ 79 Table 7-3 –Ks Coefficients for velocity of flow .................................................................................................... 80 Table 7-4 – K Values for Type of Fittings ........................................................................................................... 81 Table 7-5 – Minimum Thrust Safety Factors ...................................................................................................... 81 Table 7-6 – Manual vs Power Operated Valves ................................................................................................. 84
Table 7-7 - Air Valve Nominal Sizes v Main (DN) .............................................................................................. 85 Table 7-8 – Washout Nominal Sizes vs Main (DN) ............................................................................................ 85 Table 7-9 – Valve Chamber Design Criteria ....................................................................................................... 86
QCC-V2
COPY
STORMWATER & SUBSOIL DRAINAGE SYSTEMS VOLUME I- DESIGN MANUAL
PAGE VI FORWARD SECOND EDITION – JULY 2020
FOREWORD
This Storm water and Sub-soil Drainage Systems Design Manual covers the key technical requirements for designing storm water and sub-soil drainage systems within the jurisdiction of Abu Dhabi Emirate.
Principal guidance is contained in the main body of the manual which includes references to established and recognised documents. These documents include national and international standards. Supporting detail such as formulae, information and methodologies are given in the Appendices.
The safety of construction and maintenance workers and of the general public is an important factor for projects in Abu Dhabi and it is essential that safety is considered throughout the design of each project. The reader’s attention is drawn to various safety considerations identified by red text.
The Manual is intended to be used by experienced, professional drainage engineers, qualified professionals with specialised knowledge of geology and the application of soil mechanics and other suitably qualified and experienced professionals.
QCC-V2
COPY
STORMWATER & SUBSOIL DRAINAGE SYSTEMS VOLUME I- DESIGN MANUAL
PAGE VII GLOSSARY SECOND EDITION – JULY 2020
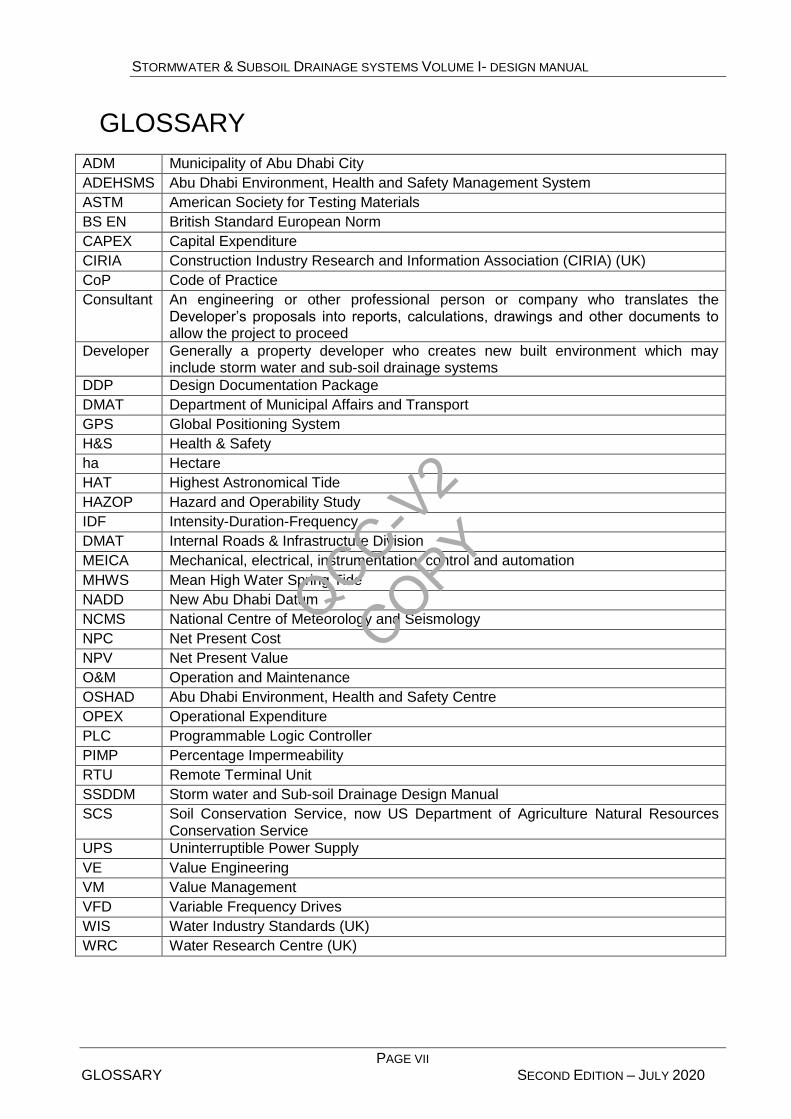
GLOSSARY
ADM Municipality of Abu Dhabi City
ADEHSMS Abu Dhabi Environment, Health and Safety Management System
ASTM American Society for Testing Materials
BS EN British Standard European Norm
CAPEX Capital Expenditure
CIRIA Construction Industry Research and Information Association (CIRIA) (UK)
CoP Code of Practice
Consultant An engineering or other professional person or company who translates the Developer’s proposals into reports, calculations, drawings and other documents to allow the project to proceed
Developer Generally a property developer who creates new built environment which may include storm water and sub-soil drainage systems
DDP Design Documentation Package
DMAT Department of Municipal Affairs and Transport
GPS Global Positioning System
H&S Health & Safety
ha Hectare
HAT Highest Astronomical Tide
HAZOP Hazard and Operability Study
IDF Intensity-Duration-Frequency
DMAT Internal Roads & Infrastructure Division
MEICA Mechanical, electrical, instrumentation, control and automation
MHWS Mean High Water Spring Tide
NADD New Abu Dhabi Datum
NCMS National Centre of Meteorology and Seismology
NPC Net Present Cost
NPV Net Present Value
O&M Operation and Maintenance
OSHAD Abu Dhabi Environment, Health and Safety Centre
OPEX Operational Expenditure
PLC Programmable Logic Controller
PIMP Percentage Impermeability
RTU Remote Terminal Unit
SSDDM Storm water and Sub-soil Drainage Design Manual
SCS Soil Conservation Service, now US Department of Agriculture Natural Resources Conservation Service
UPS Uninterruptible Power Supply
VE Value Engineering
VM Value Management
VFD Variable Frequency Drives
WIS Water Industry Standards (UK)
WRC Water Research Centre (UK)
QCC-V2
COPY

STORMWATER & SUBSOIL DRAINAGE SYSTEMS VOLUME I- DESIGN MANUAL
PAGE 1 01-OBJECTIVE SECOND EDITION – JULY 2020
1. OBJECTIVES
1.1. Introduction
The purpose of this Design Manual is to identify the requirements for the design of storm water and sub-soil drainage projects arising from municipal development in Emirate of Abu Dhabi.
The Manual limits the use of detailed design theories and methods of calculation and requires that users refer to other documents as necessary. A list of principle reference documents is shown at the end of the Manual.
In addition to rain water run-off from developed areas, including side roads and paved areas and overland flow from open areas, the municipal storm water network may also receive run-off from main highways.
This Manual is one of four volumes relating to the design, construction, operation and maintenance of storm water and sub-soil drainage systems for Municipal controlled roads and developments in Emirate of Abu Dhabi:
Volume 1 – Design Manual
Volume 2 –Standard Drawings
Volume 3 – Operation and Maintenance Manual
Volume 4 – Standard Specifications
These documents are interdependent and shall be read and applied as a single entity.
Engineers and other disciplines using this Manual must be experienced and appropriately qualified professionals who are familiar with the planning, design, construction, operation and maintenance of drainage networks.
Compliance with the Manual does not absolve users of their professional and contractual responsibilities.
Where a Developer or other party believes that a change to the Manual may be advantageous for a particular project, the written approval of DMAT shall be sought. Supporting documentation shall be submitted to DMAT in sufficient detail to allow the proposal to be appraised. A copy of DMAT’s approval letter to be part of any submittal.
Where reference is made to the ‘Developer’ this also includes all his professional advisers.
It should be noted that the design of foul sewer systems is not covered by this Manual.
1.2. Approvals Process
Any design submittal shall be by a qualified Consultant. The Consultant shall submit his proposals for the site layout and associated surface water and sub-soil drainage to DMAT in the stages and level of detail set out in Section 8. This section also describes the requirements for the submission of reports, calculations, drawings and other documents for approval.
The Developer shall note that following completion of construction there are further stages to be completed to the satisfaction of DMAT before the new works can be accepted by DMAT and ultimately taken over. It should be noted that DMAT design approval does not guarantee taking over of assets
QCC-V2
COPY
STORMWATER & SUBSOIL DRAINAGE SYSTEMS VOLUME I- DESIGN MANUAL
PAGE 2 01-OBJECTIVE SECOND EDITION – JULY 2020
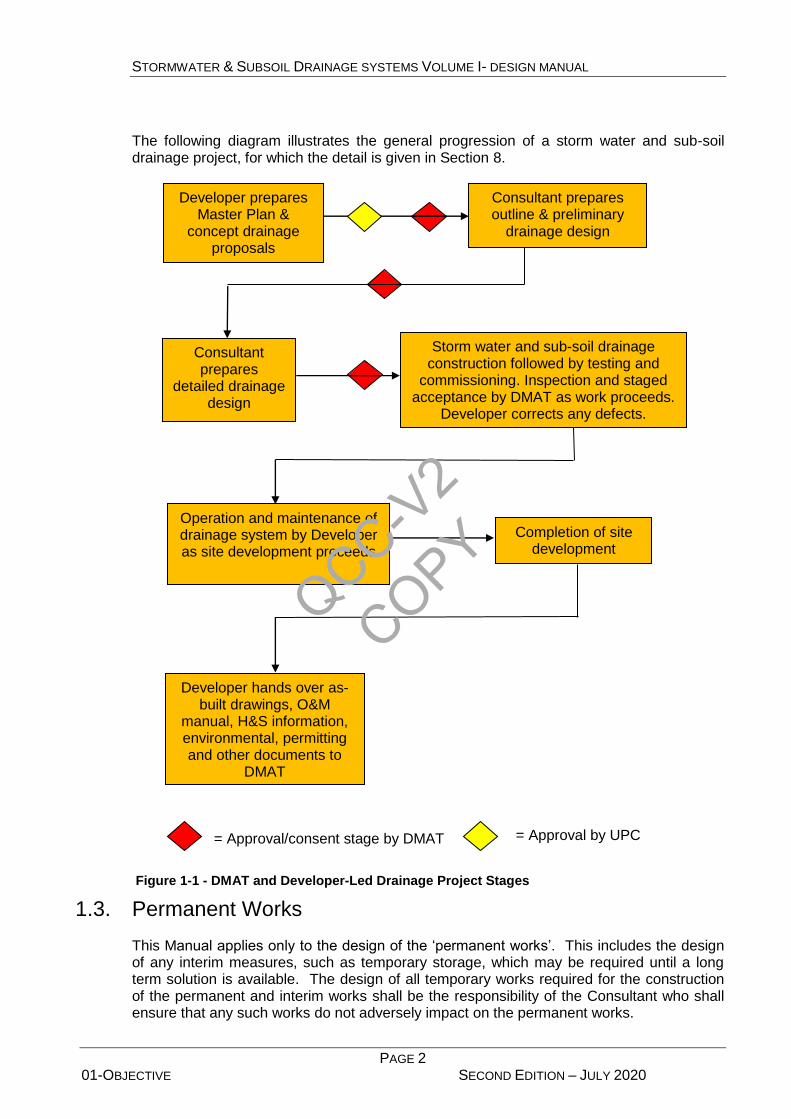
The following diagram illustrates the general progression of a storm water and sub-soil drainage project, for which the detail is given in Section 8.
Figure 1-1 - DMAT and Developer-Led Drainage Project Stages
1.3. Permanent Works
This Manual applies only to the design of the ‘permanent works’. This includes the design of any interim measures, such as temporary storage, which may be required until a long term solution is available. The design of all temporary works required for the construction of the permanent and interim works shall be the responsibility of the Consultant who shall ensure that any such works do not adversely impact on the permanent works.
Developer prepares Master Plan &
concept drainage proposals
Consultant prepares outline & preliminary
drainage design
Consultant prepares
detailed drainage design
Storm water and sub-soil drainage construction followed by testing and
commissioning. Inspection and staged acceptance by DMAT as work proceeds.
Developer corrects any defects.
Operation and maintenance of drainage system by Developer as site development proceeds
Completion of site development
Developer hands over as-built drawings, O&M
manual, H&S information, environmental, permitting and other documents to
DMAT
= Approval/consent stage by DMAT = Approval by UPC
QCC-V2
COPY

STORMWATER & SUBSOIL DRAINAGE SYSTEMS VOLUME I- DESIGN MANUAL
PAGE 3 01-OBJECTIVE SECOND EDITION – JULY 2020
1.4. Inspection, Testing and Commissioning
The requirements for inspection, testing and commissioning of the works are given in Volume 4: Standard Specifications.
1.5. Innovation
The Developer shall encourage the parties involved in the planning, design and construction of a storm water and sub-soil drainage system to devise innovative solutions and challenge conventional thinking where this could be beneficial to the project and DMAT.
Documentation in support of this shall be submitted to DMAT in sufficient detail to allow the proposal to be appraised.
1.6. Copyright
Copyright of the Design Manual, Specification, Standard Drawings and Operation and Maintenance Manual is the property of DMAT.
1.7. Updates
This manual will be revised by DMAT from time to time to keep up to date with technical developments and improved practices. It is the responsibility of the user to ensure that they are working to the latest issue.
Any errors that are found or recommendations for improvement should be notified to DMAT.
QCC-V2
COPY
STORMWATER & SUBSOIL DRAINAGE SYSTEMS VOLUME I- DESIGN MANUAL
PAGE 4 02-DESIGN CONSIDERATION SECOND EDITION – JULY 2020
2. DESIGN CONSIDERATIONS
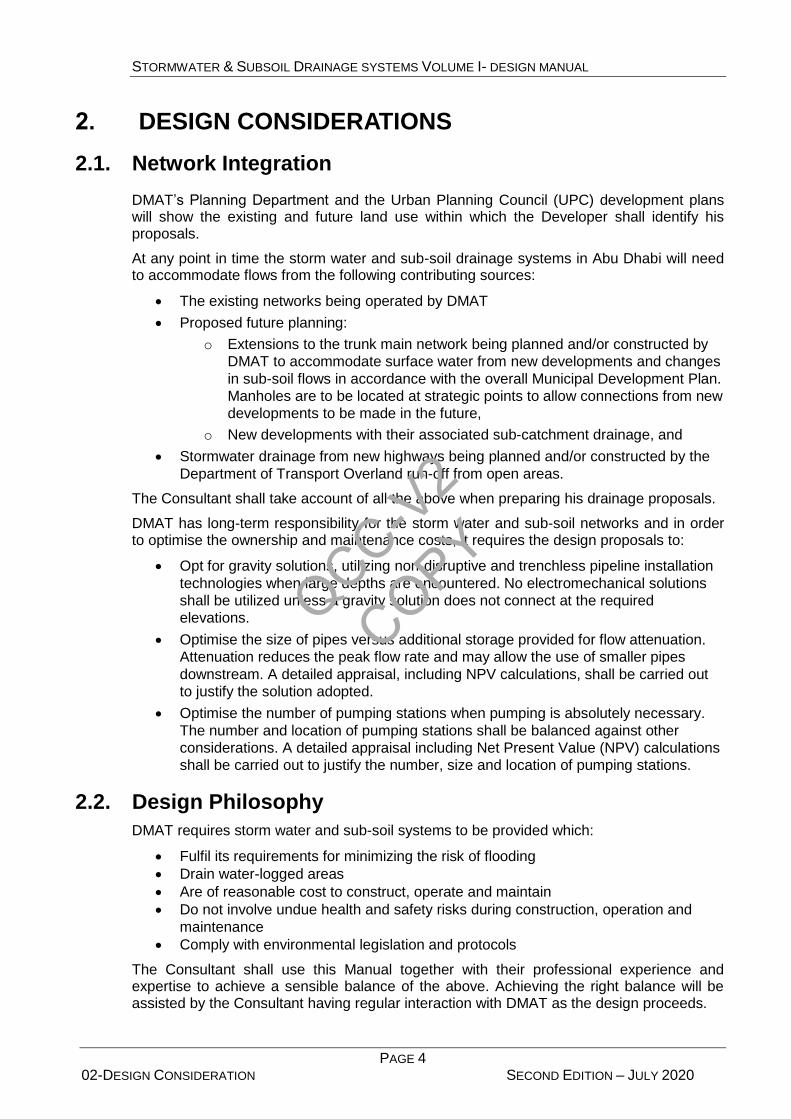
2.1. Network Integration
DMAT’s Planning Department and the Urban Planning Council (UPC) development plans will show the existing and future land use within which the Developer shall identify his proposals.
At any point in time the storm water and sub-soil drainage systems in Abu Dhabi will need to accommodate flows from the following contributing sources:
The existing networks being operated by DMAT
Proposed future planning:
o Extensions to the trunk main network being planned and/or constructed by
DMAT to accommodate surface water from new developments and changes
in sub-soil flows in accordance with the overall Municipal Development Plan.
Manholes are to be located at strategic points to allow connections from new
developments to be made in the future,
o New developments with their associated sub-catchment drainage, and
Stormwater drainage from new highways being planned and/or constructed by the
Department of Transport Overland run-off from open areas.
The Consultant shall take account of all the above when preparing his drainage proposals.
DMAT has long-term responsibility for the storm water and sub-soil networks and in order to optimise the ownership and maintenance costs, it requires the design proposals to:
Opt for gravity solutions, utilizing non-disruptive and trenchless pipeline installation
technologies when large depths are encountered. No electromechanical solutions
shall be utilized unless a gravity solution does not connect at the required
elevations.
Optimise the size of pipes versus additional storage provided for flow attenuation.
Attenuation reduces the peak flow rate and may allow the use of smaller pipes
downstream. A detailed appraisal, including NPV calculations, shall be carried out
to justify the solution adopted.
Optimise the number of pumping stations when pumping is absolutely necessary.
The number and location of pumping stations shall be balanced against other
considerations. A detailed appraisal including Net Present Value (NPV) calculations
shall be carried out to justify the number, size and location of pumping stations.
2.2. Design Philosophy
DMAT requires storm water and sub-soil systems to be provided which:
Fulfil its requirements for minimizing the risk of flooding
Drain water-logged areas
Are of reasonable cost to construct, operate and maintain
Do not involve undue health and safety risks during construction, operation and
maintenance
Comply with environmental legislation and protocols
The Consultant shall use this Manual together with their professional experience and expertise to achieve a sensible balance of the above. Achieving the right balance will be assisted by the Consultant having regular interaction with DMAT as the design proceeds.
QCC-V2
COPY

STORMWATER & SUBSOIL DRAINAGE SYSTEMS VOLUME I- DESIGN MANUAL
PAGE 5 02-DESIGN CONSIDERATION SECOND EDITION – JULY 2020
2.3. Design Life
The minimum periods of time for new assets to last before replacement are shown in Table 2-1.
Asset type Minimum Design Life (years)
Pipelines 60
Structure (With Reinforcement) Structure (Without Reinforcement)
50
60
Mechanical and Electrical Equipment 15
Instrumentation, computer hardware & sensors 5
Table 2-1 – Design Life
It is recognised that maintenance, repairs and in the case of MEICA equipment, parts replacement, will be required during the above periods. A planned maintenance schedule and spare parts list shall form part of the design submission documentation.
The design life given in Table 2-1 is to be used in the NPV calculations for asset replacement.
2.4. Investigations
The Consultant shall note that he may need to carry out site surveys and investigations during the design process which may take a significant amount of time to complete. These may include:
Environmental studies, e.g. hydrodynamic modelling
Marine studies
Ecological studies
Traffic studies
Geotechnical and groundwater investigations
2.5. Environmental Impact
2.5.1. Environmental Legislation
The Consultant’s drainage proposals shall comply with all relevant local and regional legislation and international conventions and protocols to which Abu Dhabi is a signatory.
The relevant requirements are given in Appendix A1.
The Consultant shall note that no project can commence prior to securing the appropriate approval in accordance with the regulations determined by the Competent Authority.
The Consultant shall comply with the Standard Operating Procedures and Technical Guidelines produced by the Environment Agency Abu Dhabi.
Where there is any conflict between the legislation or standards a decision shall be sought from DMAT on the correct application.
2.5.2. Cultural Heritage Permitting Requirements
It is the responsibility of the Consultant to ensure that all current requirements relating to cultural heritage permitting are complied with during the project.
QCC-V2
COPY

STORMWATER & SUBSOIL DRAINAGE SYSTEMS VOLUME I- DESIGN MANUAL
PAGE 6 02-DESIGN CONSIDERATION SECOND EDITION – JULY 2020
2.6. Health and Safety in Design
The Consultant shall be aware of his statutory Health and Safety (H&S) responsibilities in carrying out a drainage project. Those responsibilities start at the inception of a project and continue until the asset is adopted by DMAT.
The Consultant shall ensure that other parties to the project are aware of their statutory H&S responsibilities.
All parties shall adhere to the Abu Dhabi Environment, Health and Safety Management System (ADEHSMS) published by OSHAD and the associated Codes of Practice, which together form the framework under which H&S is managed. Consultants should in particular take account of Code of Practice No 20 – ‘Safety in Design’.
The key requirements for Consultants are to:
ensure they are sufficiently competent and adequately resourced to address H&S
issues during design
minimise foreseeable risks and hazards to people and property directly or indirectly
involved or affected by construction work and the future use of the asset
provide a record of all H&S considerations during the design process
include information on the drawings of any significant risks that could be present
during construction
provide information for inclusion in the O&M Manual on design-related matters that
could impact on the safety of operation and maintenance
coordinate with others to ensure that risks are comprehensively managed
promote a learning environment in H&S matters
2.7. Value Management and Value Engineering
Value Management (VM) is a means of maximizing the value of a project through the structured examination of decisions about benefits, risks and costs. The VM process requires a high degree of challenge to standard solutions and depends on a clear understanding of the problems to be solved. Maximum benefit from VM occurs in the early stages of a project.
Value Engineering (VE) is a structured process which examines the functionality of a project element and assesses whether it fulfils the required function at best value.
VM and VE are carried out through formal workshops, as well as being an integral part of the day to day design development. Formal workshops are to be run by a trained facilitator and include all relevant stakeholders.
VM reviews should be carried out throughout the project life cycle, as set out in the value management plan, and the number required will depend on the project complexity. The reviews should generally follow the following sequence:
i. VM1 Project definition.
ii. VM2 Concept design.
iii. VE1 Preliminary design and engineering.
iv. VE2 a,b,c Detailed design.
v. VM3 Procurement and contract strategy.
vi. VM4 Post project feedback.
QCC-V2
COPY

STORMWATER & SUBSOIL DRAINAGE SYSTEMS VOLUME I- DESIGN MANUAL
PAGE 7 02-DESIGN CONSIDERATION SECOND EDITION – JULY 2020
The Consultant shall prepare and submit report at the end of each review summarising the scope of the review, the process adopted, the changes made and the ensuring benefits.
A formal VM and VE approach involves significant time and cost. The Consultant shall carry out a preliminary assessment to determine whether such an approach would be beneficial to a particular project. DMAT has a major interest in optimising the content of drainage projects and the Consultant shall obtain DMAT’s agreement where he considers that formal VM and VE are not justified.
2.8. Options Appraisal
In many cases of storm water and sub-soil drainage design there will be several layout options.
DMAT’s approval of the Developer’s proposals requires that there is a cost-effective balance between initial capital cost and ongoing operational and maintenance costs. To support this evaluation the Consultant shall carry out an options appraisal exercise based on the layout options agreed with DMAT. The optimum balance will normally be given by the lowest NPV based on capital and annual costs. However, other factors such as construction risk, programme risk, health and safety risk and environmental impact shall also be considered.
In the case of a simple drainage network with a clear solution the Developer may request DMAT’s approval to not carrying out an options appraisal exercise.
2.8.1. Capital Cost (CAPEX)
The capital cost of each option shall be estimated using the latest market rates, preferably obtained from DMAT tenders. The estimating method will depend on the stage of the project; unit rates will be adequate for the Master Plan stage with increasing accuracy and detail through to the final estimate at detailed design which is to be based on a detailed bill of quantities. The estimating method is to be approved by DMAT before commencing the stage.
2.8.2. Operational and Maintenance Cost (OPEX)
The operating and maintenance costs of each option shall be estimated taking advice from DMAT as the long-term owner. Costs will include:
Labour
Vehicles and plant
Power
Parts and consumables
Chemicals
O&M management
For each option the Consultant shall prepare a spreadsheet of estimated daily, weekly, monthly and annual operating and maintenance quantities to which DMAT will add its unit costs to give annual estimates of OPEX. These values shall be used by the Consultant in appraising the options.
2.8.3. Economic Appraisal of Options
At various points in the Manual reference is made to NPV (Net Present Value) calculations. This is the means of making an economic comparison of the whole life cost of competing
QCC-V2
COPY

STORMWATER & SUBSOIL DRAINAGE SYSTEMS VOLUME I- DESIGN MANUAL
PAGE 8 02-DESIGN CONSIDERATION SECOND EDITION – JULY 2020
options. The option with the lowest NPV gives the most economically advantageous solution.
NPV costs shall be calculated from the time of construction commencement and all costs are to be at the current price base.
DMAT will provide the evaluation period to be used in the financial appraisal, and the Consultant will decide on the discount rate in coordination with DMAT. A sensitivity check with higher and lower discount rates may also be requested by DMAT.
In addition to the NPV whole life costing, the capital and O & M costs used in the evaluation have to be clearly set out all at current price base.
2.9. Drawings
2.9.1. Standard Drawings
Standard drawings are included in Volume 2: Standard Drawings. Where these are used they shall not be altered except where indicated.
2.9.2. Typical Drawings
Typical drawings are included in Volume 2: Standard Drawings. These drawings are for guidance and may be adapted to suit the particular requirements of the project.
2.10. Materials Selection
All materials shall comply with the Volume 4: Standard Specifications and shall be approved by the Materials Section of DMAT.
QCC-V2
COPY

STORMWATER & SUBSOIL DRAINAGE SYSTEMS VOLUME I- DESIGN MANUAL
PAGE 9 03-RAINFALL AND RUNOFF SECOND EDITION – JULY 2020
3. RAINFALL AND RUNOFF
3.1. Introduction
This section provides information about key rainfall parameters, catchment characteristics and modelling methods to be used in storm water design in Emirate of Abu Dhabi. The methods should be used when an estimate of flow from an urban, non-urban or mixed catchment in response to storm rainfall is required. The method that should be used is summarised in Table 3-1, and described in detail in the rest of this chapter. If flood volumes are also required, the recommended approach for calculating these is given in Section 3.6.
Summary of rainfall runoff methods
1 Select required design standard. In case the rational method will be used, select the time of concentration multiplier.
2 Calculate time of concentration tc, as appropriate to the rural or urban nature of the catchment
3 Calculate rainfall depth and intensity from IDF relationships
Rational Method
For catchment areas < 80 ha and / or tc < 30 mins and no significant retention and / or back water effects, the rational
method will be used.
SCS Method
For catchment areas > 80 ha and / or tc >30 mins, the SCS method is
recommended for use in the design of new networks. However, the SCS method can be used in the design and analysis of
networks for all sizes of catchments.
4 Estimate runoff coefficients based on land use.
Estimate curve number based on land use. Check runoff and replace with coefficient of runoff estimate if necessary.
5 Apply rational equation for network calculations for sub-catchments.
Apply SCS unit hydrograph method. Use hydrodynamic model for network calculations.
6 Calculate runoff volumes if necessary. Calculate runoff volumes.
Table 3-1 - Summary of rainfall-runoff methods
3.2. Design Storms
3.2.1. Design Return Period
The first step in generating the design rainfall is to determine the required design standard. These should be taken as:
Event Area
1 in 5 Years Storm This is the design standard for all areas served by storm water networks, with the exceptions highlighted in the rows below.
1 in 10 Years Storm Major roads, airports, seaports, palaces and other critical areas, as approved by DMAT.
1 in 25 Years Storm Culverts on minor roads (check for 1 in 50 years storm); lagoons that do not have an outlet and where overtopping may lead to flooding of properties*
1 in 50 Year Storm Underpasses and underground car parks (Ramps); Culverts on major roads (check for 1 in 100 years storm)
QCC-V2
COPY

STORMWATER & SUBSOIL DRAINAGE SYSTEMS VOLUME I- DESIGN MANUAL
PAGE 10 03-RAINFALL AND RUNOFF SECOND EDITION – JULY 2020
Event Area
* Lagoons that have an outlet or overland flow track to sea that does not cause disruption to properties or road users will be sized for the next higher event in the above table. For example, a lagoon serving an area which is generally a 1 in 5 year catchment type shall be sized for a 1 in 10 year storm before overflow occurs
Table 3-2 – Design storm standard for various facilities
3.2.2. Duration of Rainfall
To determine the storm duration, the multipliers given in Table 3-3 should be applied to the time of concentration, according to the catchment type. This means longer storms, and therefore lower rainfall intensities are used for lower priority sites; design flows for these catchments will therefore be lower. The recommended methods for calculation of time of concentration are described in the following sections.
Priority Catchment type Tc Multiplier
M
1 Major Roads; expressways; arterials; underpasses; road crossings and culverts; underground car parks (Ramps)
Tc
2 High density sectors (≥ 50% impermeable area) 2 x Tc
3 Low density sectors (≤ 50% impermeable area) 3 x Tc
4 Industrial sectors* 5 x Tc
5 Open areas, parks and areas of infrequent use and not subject to building flooding
12 x Tc
* If the Industrial sectors are more than 50% impervious, then they should be treated as Low density sectors.
Table 3-3 – Priorities and time of concentration multipliers used to determine design storm
durations
Please note that the above is applicable only to calculations done using the rational method.
3.2.3. Design storm duration
Design storm duration and a specified design return period are required to determine design rainfall intensity, i (mm/hr) from IDF relationships as given in the following section.
For storm water networks and drainage design the time of concentration tc, along with the multipliers of Table 3-3, should be taken as the design storm duration. Time of concentration is defined as the interval in time from the beginning of the rainfall to the time when water from the furthest point in the catchment reaches the point under consideration. It is one of the key characteristics of a catchment and care is required in its calculation.
The response times of urban and rural catchments can be very different, and different methods are required for each. Dealing with mixed urban/rural catchments is discussed in Section 3.5.
QCC-V2
COPY

STORMWATER & SUBSOIL DRAINAGE SYSTEMS VOLUME I- DESIGN MANUAL
PAGE 11 03-RAINFALL AND RUNOFF SECOND EDITION – JULY 2020
Rural (undeveloped) catchments
The following formula for tc is based on kinematic flow assumptions and should be used for rural catchments:
4.03.0
6.06.012.0
iS
Lntc
Where:
tc = time of concentration (hours)
n = Manning’s roughness coefficient
L = length of flow from furthest point (meters)
S = average slope (meters/meters)
i = average rainfall intensity (mm/hr)
The rainfall intensity i is related to the storm duration by a relationship of the form:
ti
The values of α and β for this equation for each return period are given in Table 3-5.
Because the required storm duration is equal to the time of concentration, combining these equations gives:
4.01
1
4.03.0
6.06.012.0
S
Lntc
This equation should be used to calculate time of concentration. The appropriate multiplier given in Table 3-3 is then applied to give the design storm duration for the storm water network.
It is recommended that an appropriate ‘n’ value to use for undeveloped areas of Abu Dhabi lies between 0.020 and 0.035. This range has been established using a method for developing Manning’s ‘n’ values for floodplains. Where catchment response is expected to be dominated by channel flow, then an appropriate value of Manning’s n based on the channel type should be used.
Urban (developed) catchments
Time of concentration for urban catchments is made up of two chief components:
Time taken for water to enter the storm water drainage network (entry time)
Time taken for water to pass through the storm water drainage network (travel time)
The total time of concentration is the sum of these.
For calculation of entry time, use
Figure 3-1 and an average value for catchments slope to calculate the flow velocity, then use this with the average distance water must travel to reach the storm water network to calculate the entry time. A minimum value of 10 minutes should be used for impervious catchments.
QCC-V2
COPY

STORMWATER & SUBSOIL DRAINAGE SYSTEMS VOLUME I- DESIGN MANUAL
PAGE 12 03-RAINFALL AND RUNOFF SECOND EDITION – JULY 2020
Figure 3-1 - Overland flow velocities for various land types
QCC-V2
COPY
STORMWATER & SUBSOIL DRAINAGE SYSTEMS VOLUME I- DESIGN MANUAL
PAGE 13 03-RAINFALL AND RUNOFF SECOND EDITION – JULY 2020
To calculate the time taken to pass through the storm water system, use the following method:
1. Prepare a preliminary layout of storm water network, taking account of the available discharge points. Mark pipe numbers on plan in accordance with numbering convention
2. Estimate the approximate gradients and pipe diameters for each pipe.
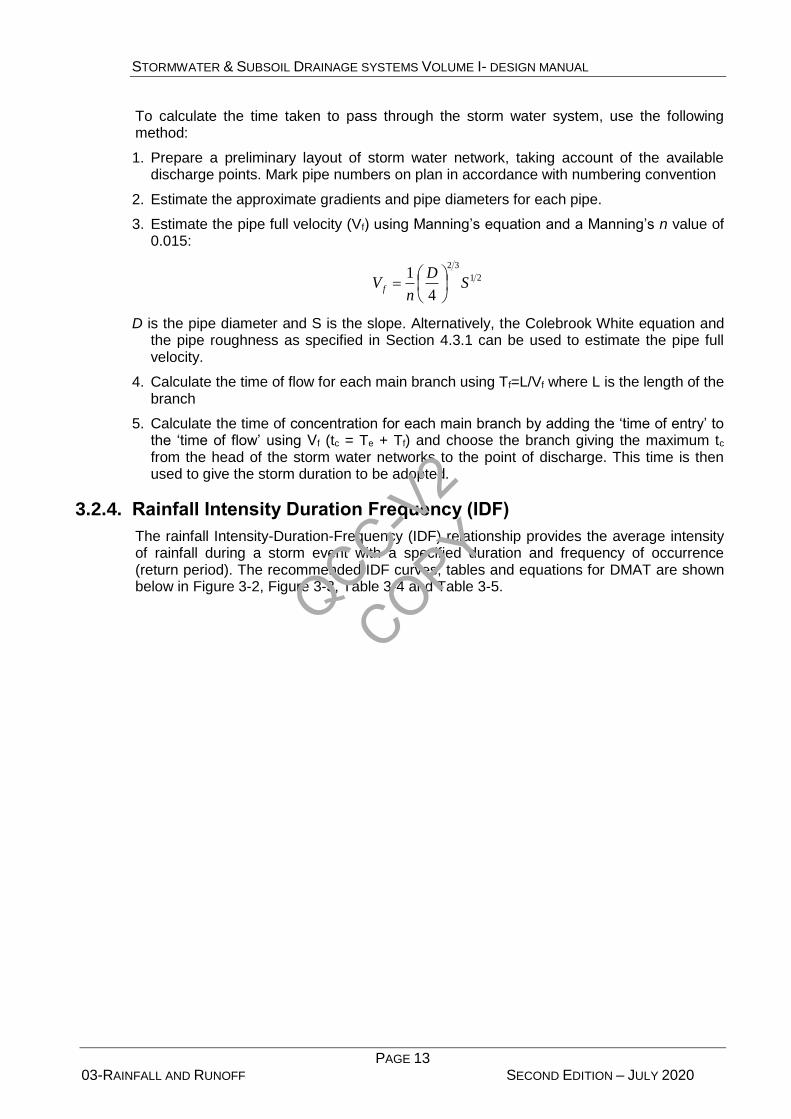
3. Estimate the pipe full velocity (Vf) using Manning’s equation and a Manning’s n value of 0.015:
21
32
4
1S
D
nV f
D is the pipe diameter and S is the slope. Alternatively, the Colebrook White equation and the pipe roughness as specified in Section 4.3.1 can be used to estimate the pipe full velocity.
4. Calculate the time of flow for each main branch using Tf=L/Vf where L is the length of the branch
5. Calculate the time of concentration for each main branch by adding the ‘time of entry’ to the ‘time of flow’ using Vf (tc = Te + Tf) and choose the branch giving the maximum tc from the head of the storm water networks to the point of discharge. This time is then used to give the storm duration to be adopted.
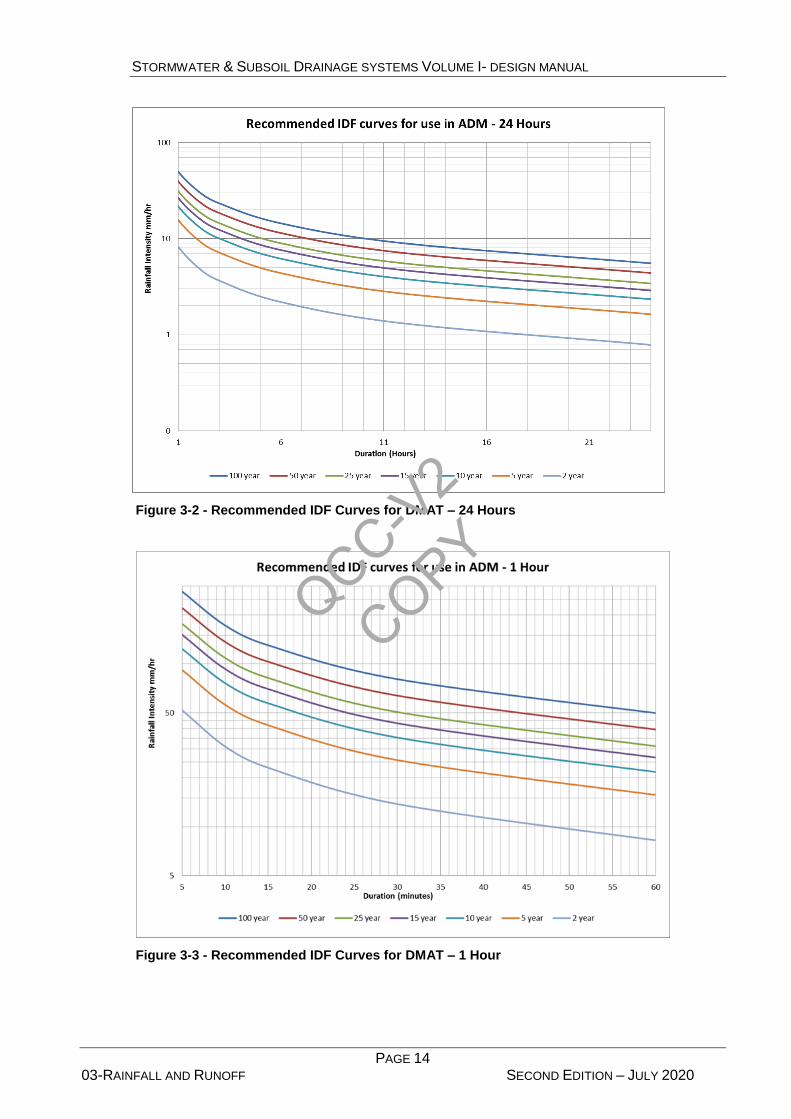
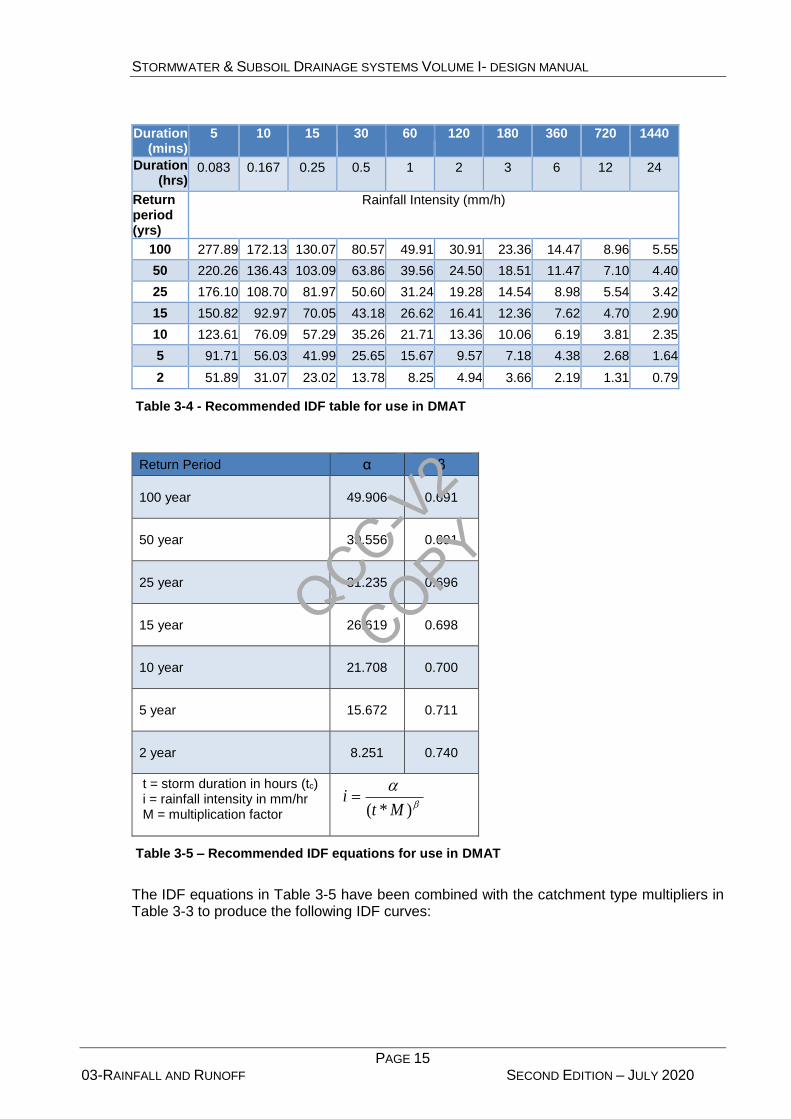
3.2.4. Rainfall Intensity Duration Frequency (IDF)
The rainfall Intensity-Duration-Frequency (IDF) relationship provides the average intensity of rainfall during a storm event with a specified duration and frequency of occurrence (return period). The recommended IDF curves, tables and equations for DMAT are shown below in Figure 3-2, Figure 3-3, Table 3-4 and Table 3-5.
QCC-V2
COPY
STORMWATER & SUBSOIL DRAINAGE SYSTEMS VOLUME I- DESIGN MANUAL
PAGE 14 03-RAINFALL AND RUNOFF SECOND EDITION – JULY 2020
Figure 3-2 - Recommended IDF Curves for DMAT – 24 Hours
Figure 3-3 - Recommended IDF Curves for DMAT – 1 Hour
QCC-V2
COPY
STORMWATER & SUBSOIL DRAINAGE SYSTEMS VOLUME I- DESIGN MANUAL
PAGE 15 03-RAINFALL AND RUNOFF SECOND EDITION – JULY 2020
Duration
(mins) 5 10 15 30 60 120 180 360 720 1440
Duration (hrs)
0.083 0.167 0.25 0.5 1 2 3 6 12 24
Return period (yrs)
Rainfall Intensity (mm/h)
100 277.89 172.13 130.07 80.57 49.91 30.91 23.36 14.47 8.96 5.55
50 220.26 136.43 103.09 63.86 39.56 24.50 18.51 11.47 7.10 4.40
25 176.10 108.70 81.97 50.60 31.24 19.28 14.54 8.98 5.54 3.42
15 150.82 92.97 70.05 43.18 26.62 16.41 12.36 7.62 4.70 2.90
10 123.61 76.09 57.29 35.26 21.71 13.36 10.06 6.19 3.81 2.35
5 91.71 56.03 41.99 25.65 15.67 9.57 7.18 4.38 2.68 1.64
2 51.89 31.07 23.02 13.78 8.25 4.94 3.66 2.19 1.31 0.79
Table 3-4 - Recommended IDF table for use in DMAT
Return Period α β
100 year 49.906 0.691
50 year 39.556 0.691
25 year 31.235 0.696
15 year 26.619 0.698
10 year 21.708 0.700
5 year 15.672 0.711
2 year 8.251 0.740
t = storm duration in hours (tc) i = rainfall intensity in mm/hr M = multiplication factor
)*( Mti
Table 3-5 – Recommended IDF equations for use in DMAT
The IDF equations in Table 3-5 have been combined with the catchment type multipliers in Table 3-3 to produce the following IDF curves:
QCC-V2
COPY

STORMWATER & SUBSOIL DRAINAGE SYSTEMS VOLUME I- DESIGN MANUAL
PAGE 16 03-RAINFALL AND RUNOFF SECOND EDITION – JULY 2020
Figure 3-4 – IDF Curves by Development Type; Storm Duration < 3 Hours
Figure 3-5 – IDF Curves by Development Type; Storm Duration 1 – 24 Hours
For Al Ain Municipality refer to appendix A4 for IDF Curves and other related information.
3.3. Rational Method
The Rational Method is based on assumptions that the rainfall intensity is uniform across the catchment and for the duration of the storm, and that the time of concentration is less than or equal to the storm duration. These assumptions mean that the catchment reaches a steady state toward the end of the storm, and therefore the flow out of the catchment depends only on the area, rainfall intensity and runoff coefficient. The rational method
QCC-V2
COPY
STORMWATER & SUBSOIL DRAINAGE SYSTEMS VOLUME I- DESIGN MANUAL
PAGE 17 03-RAINFALL AND RUNOFF SECOND EDITION – JULY 2020
should only be used when the catchment being modelled is less than 80 ha in area or the time of concentration is <30 minutes.
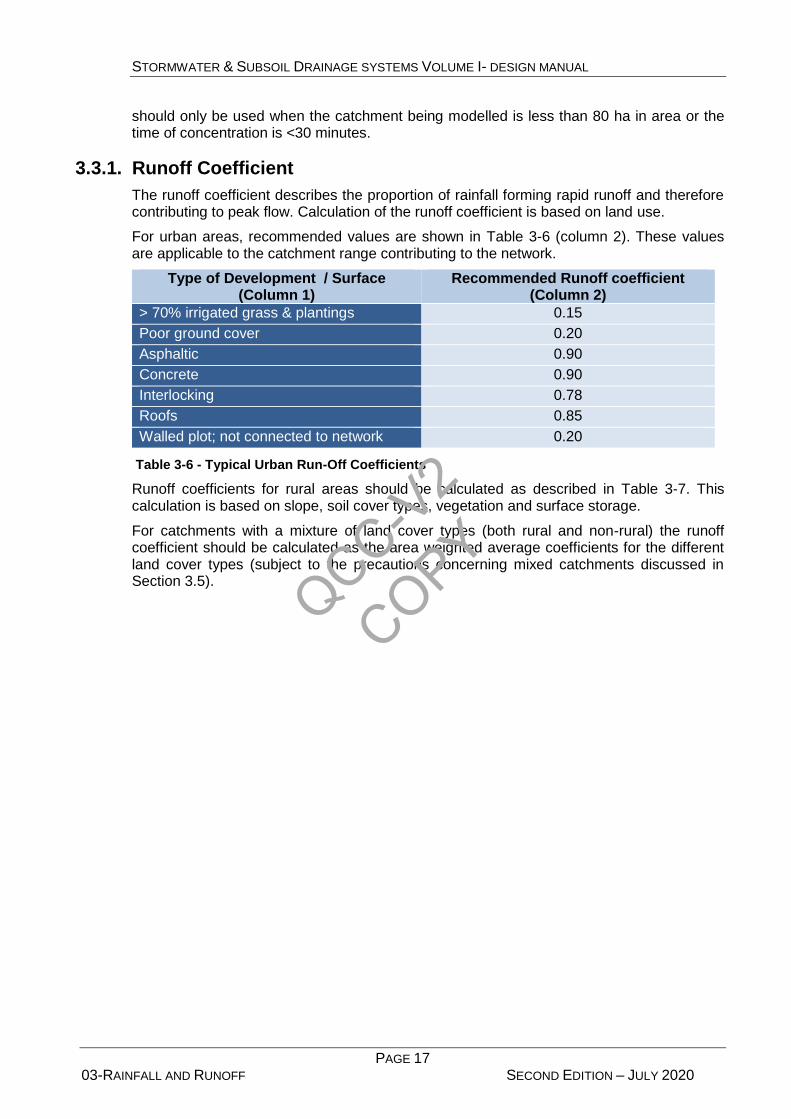
3.3.1. Runoff Coefficient
The runoff coefficient describes the proportion of rainfall forming rapid runoff and therefore contributing to peak flow. Calculation of the runoff coefficient is based on land use.
For urban areas, recommended values are shown in Table 3-6 (column 2). These values are applicable to the catchment range contributing to the network.
Type of Development / Surface (Column 1)
Recommended Runoff coefficient (Column 2)
> 70% irrigated grass & plantings 0.15
Poor ground cover 0.20
Asphaltic 0.90
Concrete 0.90
Interlocking 0.78
Roofs 0.85
Walled plot; not connected to network 0.20
Table 3-6 - Typical Urban Run-Off Coefficients
Runoff coefficients for rural areas should be calculated as described in Table 3-7. This calculation is based on slope, soil cover types, vegetation and surface storage.
For catchments with a mixture of land cover types (both rural and non-rural) the runoff coefficient should be calculated as the area weighted average coefficients for the different land cover types (subject to the precautions concerning mixed catchments discussed in Section 3.5).
QCC-V2
COPY
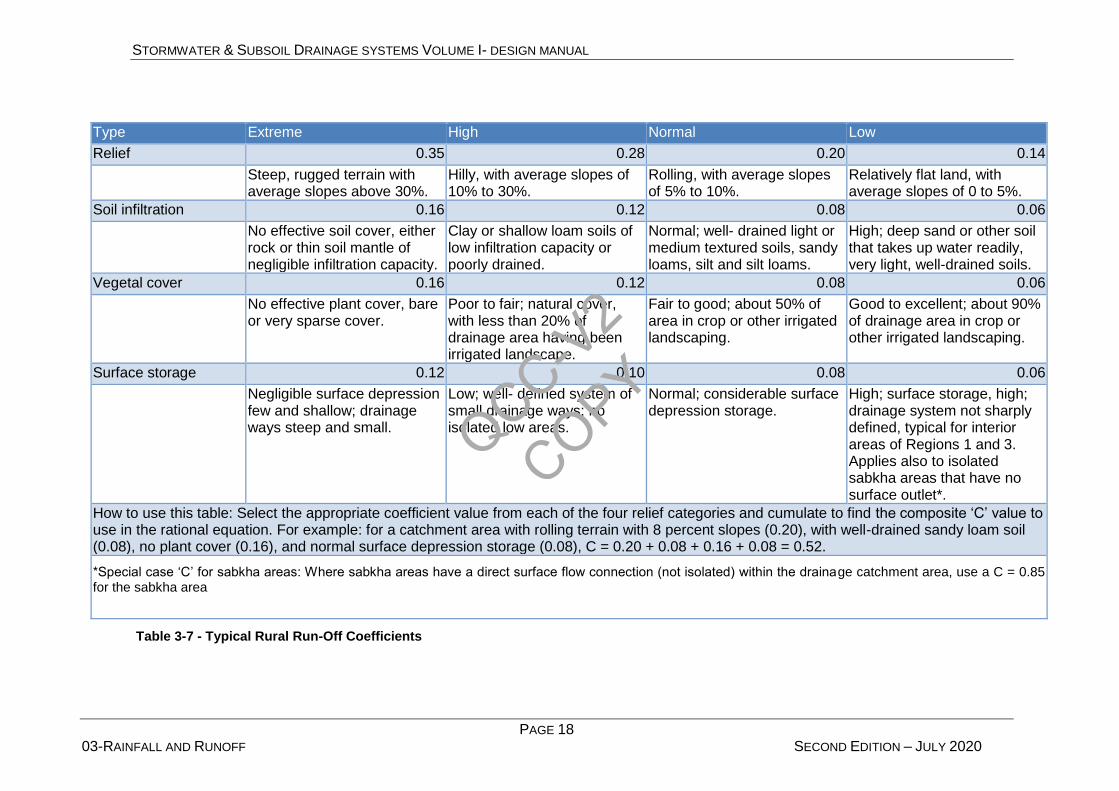
STORMWATER & SUBSOIL DRAINAGE SYSTEMS VOLUME I- DESIGN MANUAL
PAGE 18 03-RAINFALL AND RUNOFF SECOND EDITION – JULY 2020
Type Extreme High Normal Low
Relief 0.35 0.28 0.20 0.14
Steep, rugged terrain with average slopes above 30%.
Hilly, with average slopes of 10% to 30%.
Rolling, with average slopes of 5% to 10%.
Relatively flat land, with average slopes of 0 to 5%.
Soil infiltration 0.16 0.12 0.08 0.06
No effective soil cover, either rock or thin soil mantle of negligible infiltration capacity.
Clay or shallow loam soils of low infiltration capacity or poorly drained.
Normal; well- drained light or medium textured soils, sandy loams, silt and silt loams.
High; deep sand or other soil that takes up water readily, very light, well-drained soils.
Vegetal cover 0.16 0.12 0.08 0.06
No effective plant cover, bare or very sparse cover.
Poor to fair; natural cover, with less than 20% of drainage area having been irrigated landscape.
Fair to good; about 50% of area in crop or other irrigated landscaping.
Good to excellent; about 90% of drainage area in crop or other irrigated landscaping.
Surface storage 0.12 0.10 0.08 0.06
Negligible surface depression few and shallow; drainage ways steep and small.
Low; well- defined system of small drainage ways; no isolated low areas.
Normal; considerable surface depression storage.
High; surface storage, high; drainage system not sharply defined, typical for interior areas of Regions 1 and 3. Applies also to isolated sabkha areas that have no surface outlet*.
How to use this table: Select the appropriate coefficient value from each of the four relief categories and cumulate to find the composite ‘C’ value to use in the rational equation. For example: for a catchment area with rolling terrain with 8 percent slopes (0.20), with well-drained sandy loam soil (0.08), no plant cover (0.16), and normal surface depression storage (0.08), C = 0.20 + 0.08 + 0.16 + 0.08 = 0.52.
*Special case ‘C’ for sabkha areas: Where sabkha areas have a direct surface flow connection (not isolated) within the drainage catchment area, use a C = 0.85 for the sabkha area
Table 3-7 - Typical Rural Run-Off Coefficients
QCC-V2
COPY
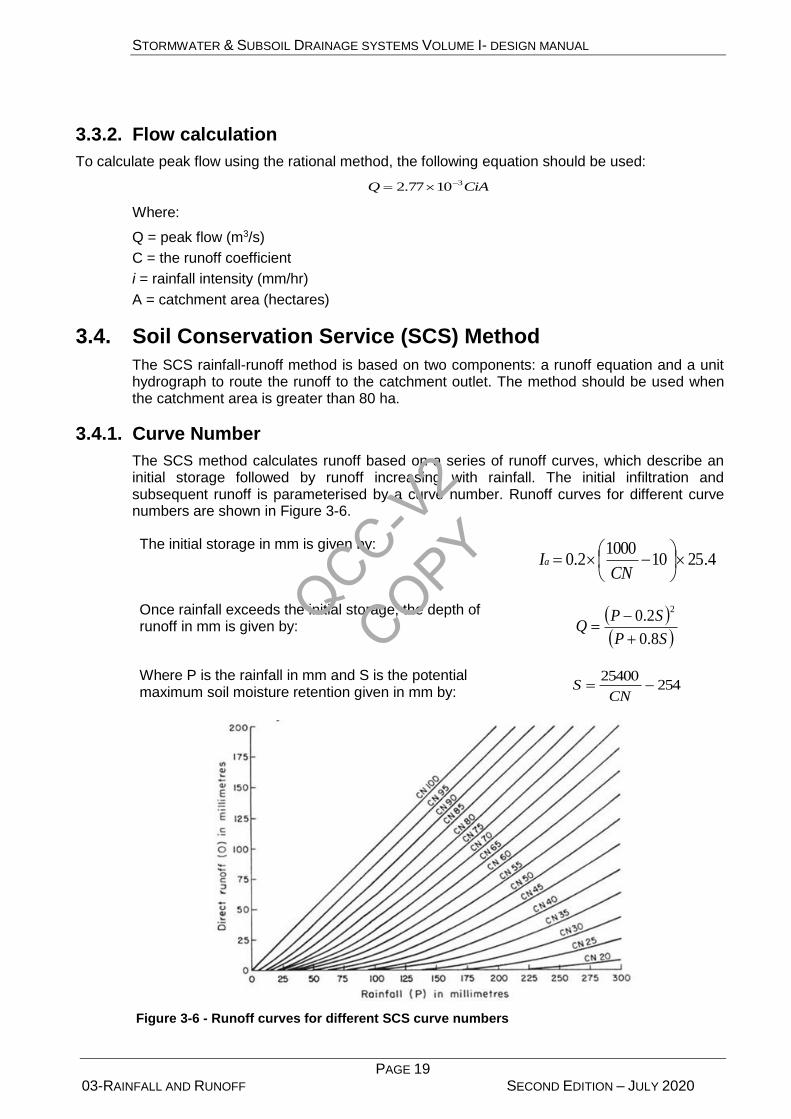
STORMWATER & SUBSOIL DRAINAGE SYSTEMS VOLUME I- DESIGN MANUAL
PAGE 19 03-RAINFALL AND RUNOFF SECOND EDITION – JULY 2020
3.3.2. Flow calculation
To calculate peak flow using the rational method, the following equation should be used:
CiAQ 31077.2
Where:
Q = peak flow (m3/s)
C = the runoff coefficient
i = rainfall intensity (mm/hr)
A = catchment area (hectares)
3.4. Soil Conservation Service (SCS) Method
The SCS rainfall-runoff method is based on two components: a runoff equation and a unit hydrograph to route the runoff to the catchment outlet. The method should be used when the catchment area is greater than 80 ha.
3.4.1. Curve Number
The SCS method calculates runoff based on a series of runoff curves, which describe an initial storage followed by runoff increasing with rainfall. The initial infiltration and subsequent runoff is parameterised by a curve number. Runoff curves for different curve numbers are shown in Figure 3-6.
The initial storage in mm is given by: 4.2510
10002.0
CNIa
Once rainfall exceeds the initial storage, the depth of runoff in mm is given by:
SP
SPQ
8.0
2.02
Where P is the rainfall in mm and S is the potential maximum soil moisture retention given in mm by:
25425400
CN
S
Figure 3-6 - Runoff curves for different SCS curve numbers
QCC-V2
COPY
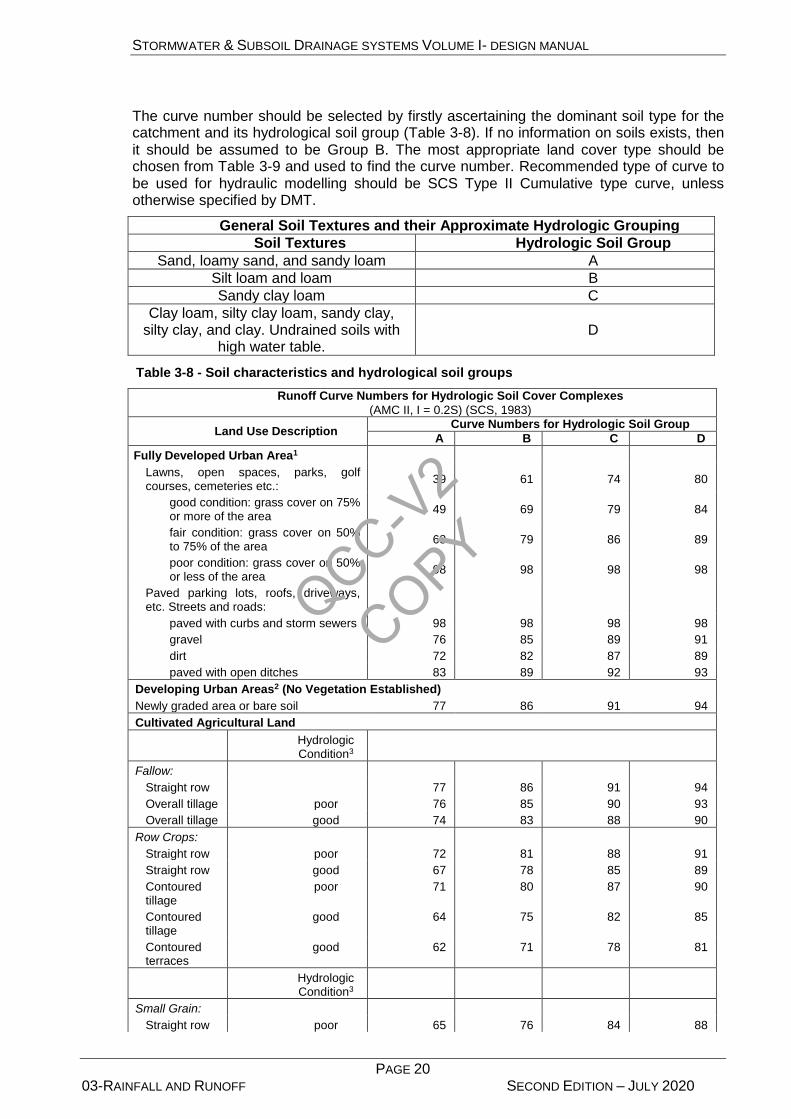
STORMWATER & SUBSOIL DRAINAGE SYSTEMS VOLUME I- DESIGN MANUAL
PAGE 20 03-RAINFALL AND RUNOFF SECOND EDITION – JULY 2020
The curve number should be selected by firstly ascertaining the dominant soil type for the catchment and its hydrological soil group (Table 3-8). If no information on soils exists, then it should be assumed to be Group B. The most appropriate land cover type should be chosen from Table 3-9 and used to find the curve number. Recommended type of curve to be used for hydraulic modelling should be SCS Type II Cumulative type curve, unless otherwise specified by DMT.
General Soil Textures and their Approximate Hydrologic Grouping
Soil Textures Hydrologic Soil Group
Sand, loamy sand, and sandy loam A
Silt loam and loam B
Sandy clay loam C
Clay loam, silty clay loam, sandy clay, silty clay, and clay. Undrained soils with
high water table. D
Table 3-8 - Soil characteristics and hydrological soil groups
Runoff Curve Numbers for Hydrologic Soil Cover Complexes
(AMC II, I = 0.2S) (SCS, 1983)
Land Use Description Curve Numbers for Hydrologic Soil Group
A B C D
Fully Developed Urban Area1
Lawns, open spaces, parks, golf courses, cemeteries etc.:
39 61 74 80
good condition: grass cover on 75% or more of the area
49 69 79 84
fair condition: grass cover on 50% to 75% of the area
68 79 86 89
poor condition: grass cover on 50% or less of the area
98 98 98 98
Paved parking lots, roofs, driveways, etc. Streets and roads:
paved with curbs and storm sewers 98 98 98 98
gravel 76 85 89 91
dirt 72 82 87 89
paved with open ditches 83 89 92 93
Developing Urban Areas2 (No Vegetation Established)
Newly graded area or bare soil 77 86 91 94
Cultivated Agricultural Land
Hydrologic Condition3
Fallow:
Straight row 77 86 91 94
Overall tillage poor 76 85 90 93
Overall tillage good 74 83 88 90
Row Crops:
Straight row poor 72 81 88 91
Straight row good 67 78 85 89
Contoured tillage
poor 71 80 87 90
Contoured tillage
good 64 75 82 85
Contoured terraces
good 62 71 78 81
Hydrologic Condition3
Small Grain:
Straight row poor 65 76 84 88
QCC-V2
COPY

STORMWATER & SUBSOIL DRAINAGE SYSTEMS VOLUME I- DESIGN MANUAL
PAGE 21 03-RAINFALL AND RUNOFF SECOND EDITION – JULY 2020
Runoff Curve Numbers for Hydrologic Soil Cover Complexes
(AMC II, I = 0.2S) (SCS, 1983)
Land Use Description Curve Numbers for Hydrologic Soil Group
A B C D
Straight row good 63 75 83 87
Contoured tillage
poor 64 75 83 86
Contoured tillage
good 60 72 80 84
Close-seed Hay or Rotation Pasture4:
Straight row poor 66 77 85 89
Straight row good 58 72 81 85
Contoured tillage
poor 64 75 83 85
Contoured tillage
good 55 69 78 83
Desert Range5:
poor 55 73 82 86
fair 44 65 76 82
good 32 58 72 79
Forest Land (irrigated by drip systems) (no sprinkler irrigation of secondary growth)6
poor 55 73 82 86
fair 44 65 76 82
good 32 58 72 79
(Table taken from the DMAT Road Drainage Manual)
1 For land uses with pervious areas, curve numbers are computed assuming that 100% of runoff from previous areas is directly connected to the drainage system. Pervious areas (lawn) are considered to be equivalent to lawns in good condition and the impervious areas have a CN of 98.
2 Use for the design of temporary measures during grading and construction.
3 For contoured tillage poor hydrologic conditions, 5 to 20 percent of the surface is covered with residue. For contoured tillage good hydrologic condition, more than 20 percent of the surface is covered with residue.
4 Close-drilled or broadcast.
5 Poor hydrologic condition has less than 25 percent ground cover density. Fair hydrologic condition has between 25 and 50 percent ground cover density. Good hydrologic condition has more than 50 percent ground cover density.
6 Poor hydrologic condition has less than 30 percent ground cover density. Fair hydrologic condition has between 30 and 70 percent ground cover density. Good hydrologic condition has more than 70 percent ground cover density.
Table 3-9 - Curve numbers for hydrological soil groups and cover complexes
If modelling an urban catchment, and the appropriate Average Percent Impervious area is not listed in Table 3-9, or the pervious areas are not best described as “lawns in good condition”, then an alternative approach should be used:
i. Estimate the curve number for the pervious area
ii. Estimate the curve number for the impervious area
iii. Estimate the runoff from each separately then summate for downstream runoff.
QCC-V2
COPY
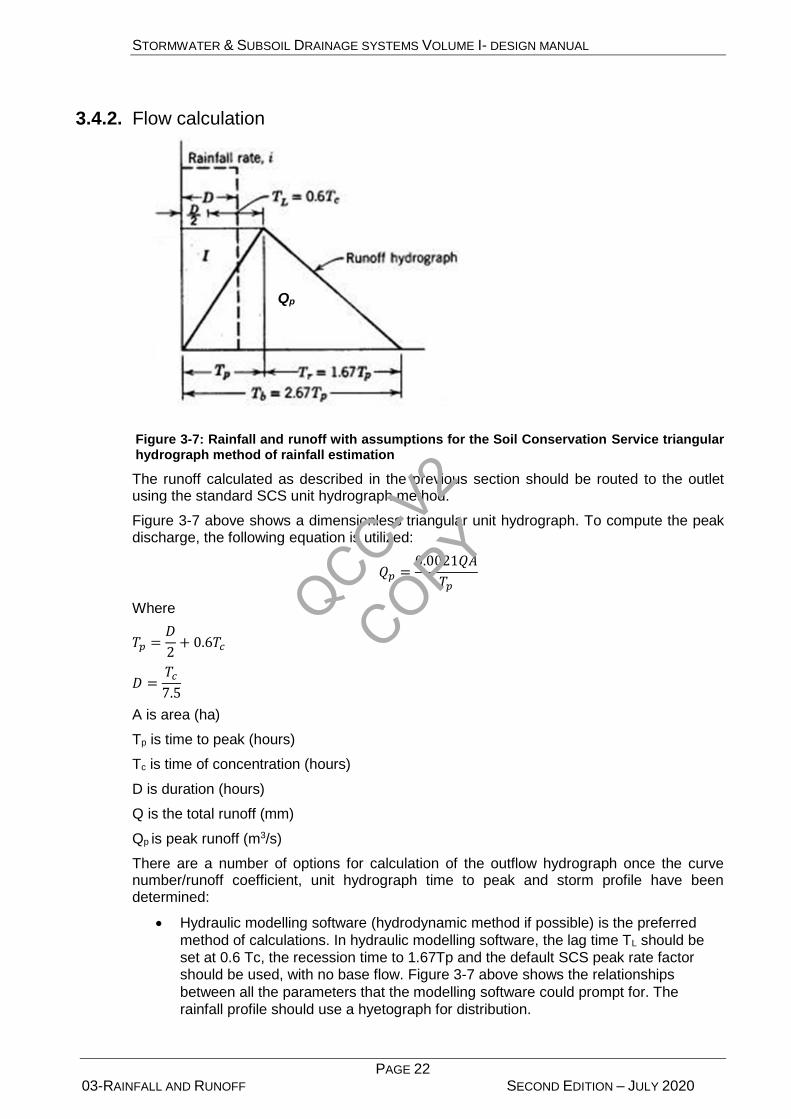
STORMWATER & SUBSOIL DRAINAGE SYSTEMS VOLUME I- DESIGN MANUAL
PAGE 22 03-RAINFALL AND RUNOFF SECOND EDITION – JULY 2020
3.4.2. Flow calculation
Figure 3-7: Rainfall and runoff with assumptions for the Soil Conservation Service triangular hydrograph method of rainfall estimation
The runoff calculated as described in the previous section should be routed to the outlet using the standard SCS unit hydrograph method.
Figure 3-7 above shows a dimensionless triangular unit hydrograph. To compute the peak discharge, the following equation is utilized:
𝑄𝑝 =0.0021𝑄𝐴
𝑇𝑝
Where
𝑇𝑝 =𝐷
2+ 0.6𝑇𝑐
𝐷 =𝑇𝑐
7.5
A is area (ha)
Tp is time to peak (hours)
Tc is time of concentration (hours)
D is duration (hours)
Q is the total runoff (mm)
Qp is peak runoff (m3/s)
There are a number of options for calculation of the outflow hydrograph once the curve number/runoff coefficient, unit hydrograph time to peak and storm profile have been determined:
Hydraulic modelling software (hydrodynamic method if possible) is the preferred
method of calculations. In hydraulic modelling software, the lag time TL should be
set at 0.6 Tc, the recession time to 1.67Tp and the default SCS peak rate factor should be used, with no base flow. Figure 3-7 above shows the relationships
between all the parameters that the modelling software could prompt for. The
rainfall profile should use a hyetograph for distribution.
Qp
QCC-V2
COPY
STORMWATER & SUBSOIL DRAINAGE SYSTEMS VOLUME I- DESIGN MANUAL
PAGE 23 03-RAINFALL AND RUNOFF SECOND EDITION – JULY 2020
For small catchments (A<80 ha and tc<30 min) an Excel spreadsheet system can
be used (based on the rational equation)
Where the system contains the following, hydraulic modelling is to be used:
Retention / detention tanks with significant volumes are used
Retention in the network needs to be considered
Backwater condition (e.g. from tide cycle) needs to be considered
Flow restricting options need to be applied
Whichever method is used, the total runoff must be checked against a manual calculation to verify the magnitude of the runoff is correct.
The hydraulic model CIVILSTORM (for ADM), SewerGEMS, INFOWORKS (for AACM) or shape file exports are to be submitted to DMT for input by DMT into their hydraulic model to verify the results and extend the overall Abu Dhabi hydraulic models. Section 8 details DMT’s requirements for the submission of model files.
3.5. Special considerations for mixed catchments
The method described above assumes that the catchment behaves as a reasonably homogeneous hydrological unit. In this case, a single representative time of concentration and coefficient of runoff/curve number can be derived and will give reliable results.
Where one part of a catchment could dominate runoff, this may need to be treated independently. A typical example is where an urban sub-catchment, with high runoff coefficient and short time of concentration, dominates storm water runoff, and the rest of the catchment does not contribute significantly to runoff.
Where a catchment includes areas of very different hydrological characteristics, the analysis should be performed for the sub area or areas which may dominate the hydrological response. Where the flow from this sub catchment is greater than the flow predicted from the catchment when considered as a whole, the higher value from the sub-catchment should be used. Where the remainder of the catchment could contribute significant addition flow, this should also be modelled separately and the flows added together to give the total flow estimate. Section 8 details DMAT’s requirements for the submission of model files.
3.6. Flood volume calculations
Some applications will require calculation of flood volumes, as well as peak flows. Examples include the design of retention basins and lagoons, sub-surface storm water storage tanks etc. This requires an estimate of the volume of storage required to reduce the outflow downstream of the storage device to a manageable flow rate. Two methods are recommended: the method for flood volumes and the hydrodynamic / SCS method. The design standard should be as for flow calculations (see Section 3.2.1); no time of concentration multipliers should be applied.
The rational method for flood volumes should be used only for initial sizing of retention basins etc, for catchments where the rational method is valid for estimation of peak flows. The rational method for flood volumes estimates peak flow in exactly the same way as the rational method, but in addition assumes the catchment outflow hydrograph (i.e. the flow entering the storage structure) is trapezoidal and symmetrical in form (see Figure 3-8). The rise/fall time of the outflow hydrograph is taken as the catchment time of concentration. The procedure is illustrated in Figure 3-8.
For a trial storm duration (not necessarily equal to the time of concentration) and the design return period, the rational method is used to estimate peak flow, and the hydrograph determined. In the example below, the area between the hydrograph and the line
QCC-V2
COPY

STORMWATER & SUBSOIL DRAINAGE SYSTEMS VOLUME I- DESIGN MANUAL
PAGE 24 03-RAINFALL AND RUNOFF SECOND EDITION – JULY 2020
representing the maximum design outflow (i.e. the design flow capacity of the storm water system downstream of the storage structure) is the retention volume required to store enough water to attenuate the hydrograph sufficiently. The calculation should be repeated for a range of storm durations and the maximum volume used as the retention volume.
Figure 3-8 - Use of rational method for flood volumes for sizing of retention basins etc
For detailed design, and for catchments where the rational method is not appropriate, the SCS method should be used to estimate storage. The SCS method produces flood hydrographs as part of the calculation, and these should be used in a process similar to that for the rational method for flood volumes:
For initial sizing, the retention volume represented as the area between the
hydrograph and maximum design outflow should be calculated as for the rational method for flood volumes, but using the SCS hydrograph output (see Figure 3-9).
This should be repeated for a range of storm durations, and the maximum volume
required used as the design retention volume.
For detailed design, the hydraulics of the retention structure, outflow control weirs
etc should be represented in a modelling software package and the peak outflow
and retention volume calculated for a range of storm durations for the design return
period. Each potential set of design characteristics (retention volume, outflow weir
design etc.) should be tested to verify that the storage volume is not exceeded and
that the outflow from the storage structure is below the acceptable maximum.
Figure 3-9 - Use of SCS method for sizing of retention basins
When designing a pond or lagoon for areas that are not connected to a stormwater network with a final outfall to sea (no downstream network), the minimum retention volume of the pond or lagoon will be represented by the entire area under the graph.
Flo
w
Time
Maximum design outflow
tc
Critical storm duration for flow
Retention volumes required for different storm durations
Flo
w
Time
Maximum design outflow
tc
Critical storm duration for flow
Retention volumes required for different storm durations
QCC-V2
COPY

STORMWATER & SUBSOIL DRAINAGE SYSTEMS VOLUME I- DESIGN MANUAL
PAGE 25 04-STORMWATER SYSTEM DESIGN SECOND EDITION – JULY 2020
4. STORM WATER SYSTEM DESIGN
4.1. System Planning
Storm water drainage in municipal areas has the primary purpose of receiving and disposing of rainfall run-off in order to reduce the risk of surface water flooding. It also serves as a collection network for sub-soil drainage systems.
Storm water drainage systems in new development areas shall discharge to the existing storm water drainage system, to evaporation lagoons or direct to the sea. Uncontaminated rainfall run-off must only connect to the storm water system, and domestic sewage flow must only connect to the foul sewer system.
The design of a new storm water system shall take account of the hydraulic constraints imposed by the receiving network or the point of outfall.
DMAT will identify the constraints on the design of new connections to its storm water system. These will take the form of permitted points of connection, the maximum water levels in the existing system and the maximum permitted discharge rates from the new development.
For networks serving areas up to 80ha and / or ‘times of concentration’ up to 30 minutes the “Rational Method” shall be used for system design, supported by the use of proprietary network design software as appropriate. For larger catchments or where the ‘time of concentration’ is greater than 30 minutes the SCS method shall be used, again supported by proprietary network design software as appropriate. Descriptions of the Rational and SCS methods are given in Section 3.
Models must be submitted with the draft and final preliminary and detailed design reports. Section 8 details DMAT’s requirements for the Database File (DBF) and Shapefile (SHP) data files exported from the modelling software.
4.1.1. Commencing Design
The design of a new network will progress in stages. Initially the pipeline gradient available for the longest branch should be estimated and initial inputs of flow provided along its length. If the pipe gradients available for gravity flow do not give the required minimum cleansing velocities given in Section 4.3.2 then they shall be steepened and intermediate pumping stations introduced where necessary, and will be subject to DMAT approval.
Once the profile of the longest branch has been established the initial design of the other branches can proceed.
Greater refinement is then progressively achieved by inputting the flows in more detail and by considering flooding constraints. The final sizes of pipes and their gradients may result from either flow velocity or flooding constraints. A minimum pipe diameter of 300mm is recommended for surface water pipes.
Service reservations are allocated by UPC and finally approved by DMAT, and details of these shall be obtained at the earliest time in the design process. The location of existing and planned utilities shall be obtained from the relevant utility provider.
Service reservation widths shall comply with the current requirements of the UPC’s Utility Corridor Design Manual (UCDM).
QCC-V2
COPY

STORMWATER & SUBSOIL DRAINAGE SYSTEMS VOLUME I- DESIGN MANUAL
PAGE 26 04-STORMWATER SYSTEM DESIGN SECOND EDITION – JULY 2020
4.1.2. System Performance and Recommended Design Return Period
Refer to Section 3 for rainfall characteristics and run-off parameters.
The storm water system hydraulic performance shall relate to the importance of the catchment area and the consequences of flooding. Areas shall be classified into the groups in accordance with Table 3-2 (Design storm standards for various facilities) to establish the level of performance required.
It may be necessary to test several storm types to arrive at the worst-case conditions to take account of the various types of contributing surfaces and area priorities.
Lagoons (detention ponds) that do not have an outlet and where overtopping may lead to flooding of properties shall be designed to hold the run-off from a 1 in 25 year storm. Lagoons that have an outlet or overland flow track to sea that does not cause disruption to properties or road users, the lagoon is to be sized for the next higher event in Table 3-2 (e.g. a lagoon serving an area which is generally a 1 in 5 year catchment type shall be sized for a 1 in 10 years storm before an overflow occurs).
The amenity value of detention ponds located in urban areas or areas close to residential developments is to be considered. In these areas consideration should be given to landscaping the area as park land and utilising the pond as a shallow open water feature, or wetland with reed beds or other plant life, to encourage wildlife. The increased depth following a storm should be lowered to the amenity level within one week.
The presence of a mechanical aerator, such as a fountain in the middle of the lagoon, often makes the site more attractive, deters the growth of unwanted vegetation and reduces the possibilities of mosquitoes using the lagoon as a breeding site.
Detention ponds in rural areas should be dry and facilities installed to empty the pond within one week installed unless DMAT approval is obtained to an evaporative lagoon.
4.1.3. Surface Flooding
No surface flooding will be allowed unless agreed with DMAT, along with the necessary checks at the appropriate design storms and return periods.
4.1.4. Pipes Located Near to Structures and Buildings
Pipelines shall be designed with a clear width on each side shown Figure 4-1 to allow for future maintenance/repair access and to avoid additional forces from structures and buildings.
QCC-V2
COPY
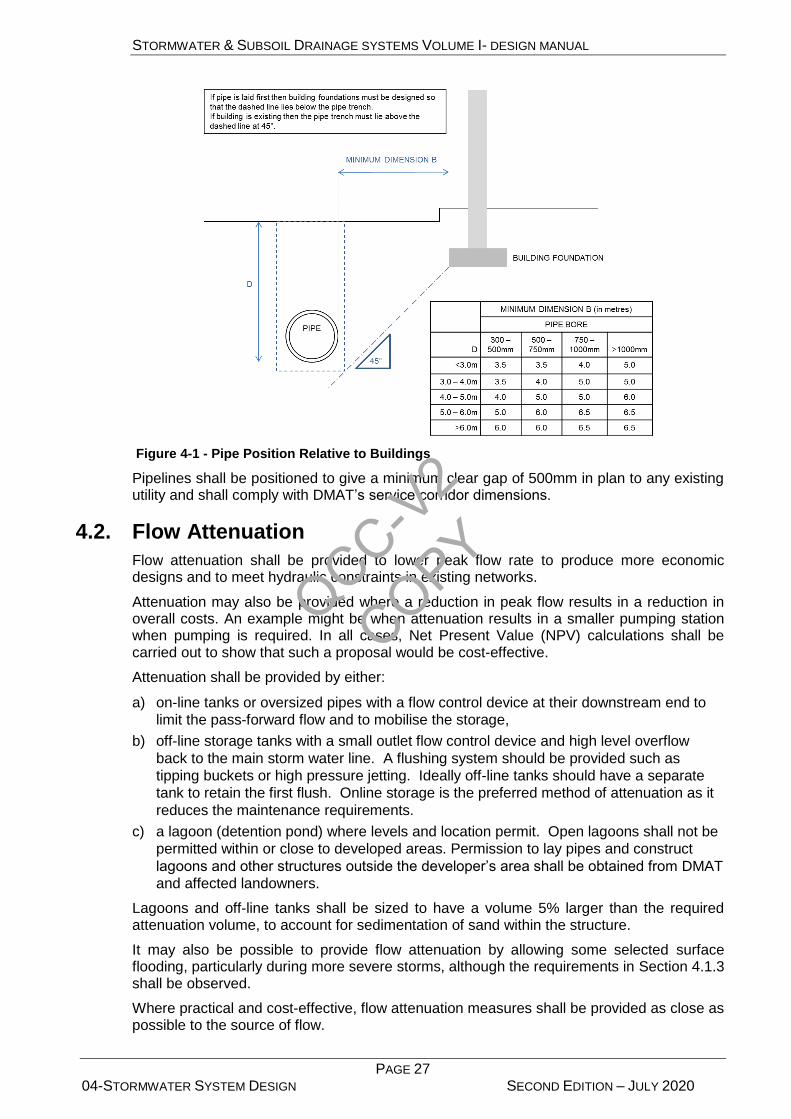
STORMWATER & SUBSOIL DRAINAGE SYSTEMS VOLUME I- DESIGN MANUAL
PAGE 27 04-STORMWATER SYSTEM DESIGN SECOND EDITION – JULY 2020
Figure 4-1 - Pipe Position Relative to Buildings
Pipelines shall be positioned to give a minimum clear gap of 500mm in plan to any existing utility and shall comply with DMAT’s service corridor dimensions.
4.2. Flow Attenuation
Flow attenuation shall be provided to lower peak flow rate to produce more economic designs and to meet hydraulic constraints in existing networks.
Attenuation may also be provided where a reduction in peak flow results in a reduction in overall costs. An example might be when attenuation results in a smaller pumping station when pumping is required. In all cases, Net Present Value (NPV) calculations shall be carried out to show that such a proposal would be cost-effective.
Attenuation shall be provided by either:
a) on-line tanks or oversized pipes with a flow control device at their downstream end to
limit the pass-forward flow and to mobilise the storage,
b) off-line storage tanks with a small outlet flow control device and high level overflow
back to the main storm water line. A flushing system should be provided such as
tipping buckets or high pressure jetting. Ideally off-line tanks should have a separate
tank to retain the first flush. Online storage is the preferred method of attenuation as it
reduces the maintenance requirements.
c) a lagoon (detention pond) where levels and location permit. Open lagoons shall not be
permitted within or close to developed areas. Permission to lay pipes and construct
lagoons and other structures outside the developer’s area shall be obtained from DMAT
and affected landowners.
Lagoons and off-line tanks shall be sized to have a volume 5% larger than the required attenuation volume, to account for sedimentation of sand within the structure.
It may also be possible to provide flow attenuation by allowing some selected surface flooding, particularly during more severe storms, although the requirements in Section 4.1.3 shall be observed.
Where practical and cost-effective, flow attenuation measures shall be provided as close as possible to the source of flow.
QCC-V2
COPY
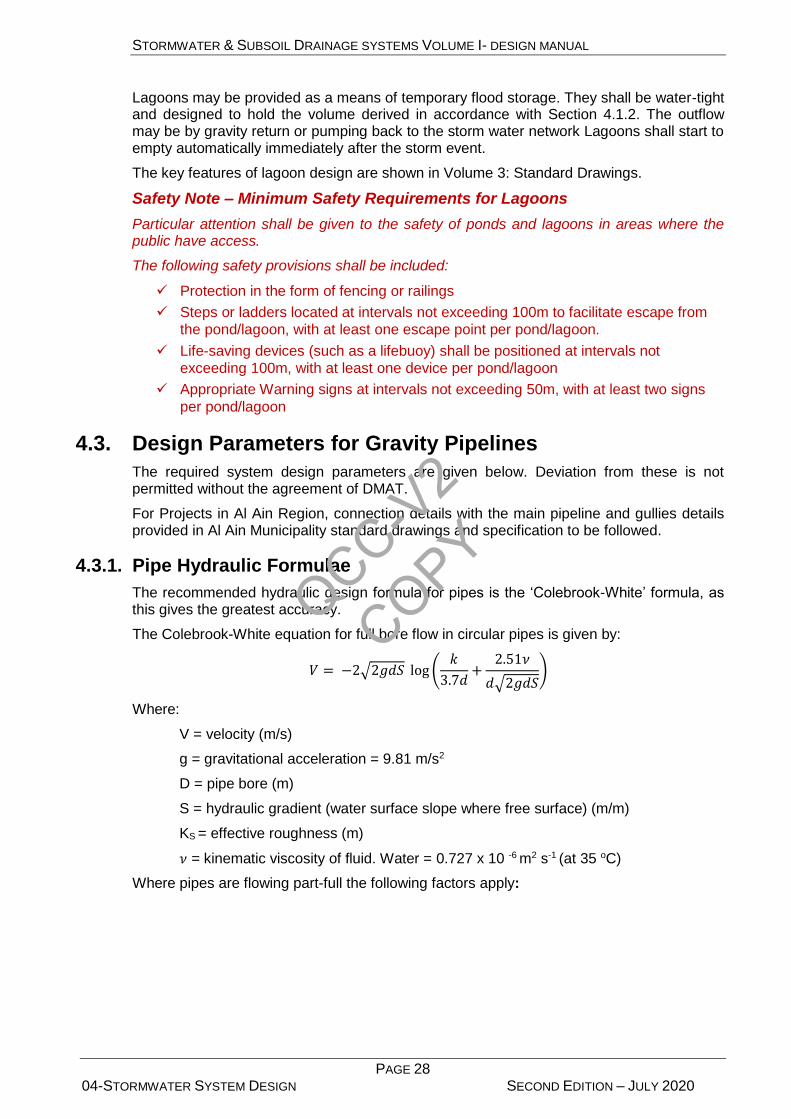
STORMWATER & SUBSOIL DRAINAGE SYSTEMS VOLUME I- DESIGN MANUAL
PAGE 28 04-STORMWATER SYSTEM DESIGN SECOND EDITION – JULY 2020
Lagoons may be provided as a means of temporary flood storage. They shall be water-tight and designed to hold the volume derived in accordance with Section 4.1.2. The outflow may be by gravity return or pumping back to the storm water network Lagoons shall start to empty automatically immediately after the storm event.
The key features of lagoon design are shown in Volume 3: Standard Drawings.
Safety Note – Minimum Safety Requirements for Lagoons
Particular attention shall be given to the safety of ponds and lagoons in areas where the public have access.
The following safety provisions shall be included:
Protection in the form of fencing or railings
Steps or ladders located at intervals not exceeding 100m to facilitate escape from
the pond/lagoon, with at least one escape point per pond/lagoon.
Life-saving devices (such as a lifebuoy) shall be positioned at intervals not
exceeding 100m, with at least one device per pond/lagoon
Appropriate Warning signs at intervals not exceeding 50m, with at least two signs
per pond/lagoon
4.3. Design Parameters for Gravity Pipelines
The required system design parameters are given below. Deviation from these is not permitted without the agreement of DMAT.
For Projects in Al Ain Region, connection details with the main pipeline and gullies details provided in Al Ain Municipality standard drawings and specification to be followed.
4.3.1. Pipe Hydraulic Formulae
The recommended hydraulic design formula for pipes is the ‘Colebrook-White’ formula, as this gives the greatest accuracy.
The Colebrook-White equation for full bore flow in circular pipes is given by:
𝑉 = −2√2𝑔𝑑𝑆 log (𝑘
3.7𝑑+
2.51𝜈
𝑑√2𝑔𝑑𝑆)
Where:
V = velocity (m/s)
g = gravitational acceleration = 9.81 m/s2
D = pipe bore (m)
S = hydraulic gradient (water surface slope where free surface) (m/m)
KS = effective roughness (m)
𝜈 = kinematic viscosity of fluid. Water = 0.727 x 10 -6 m2 s-1 (at 35 oC)
Where pipes are flowing part-full the following factors apply:
QCC-V2
COPY
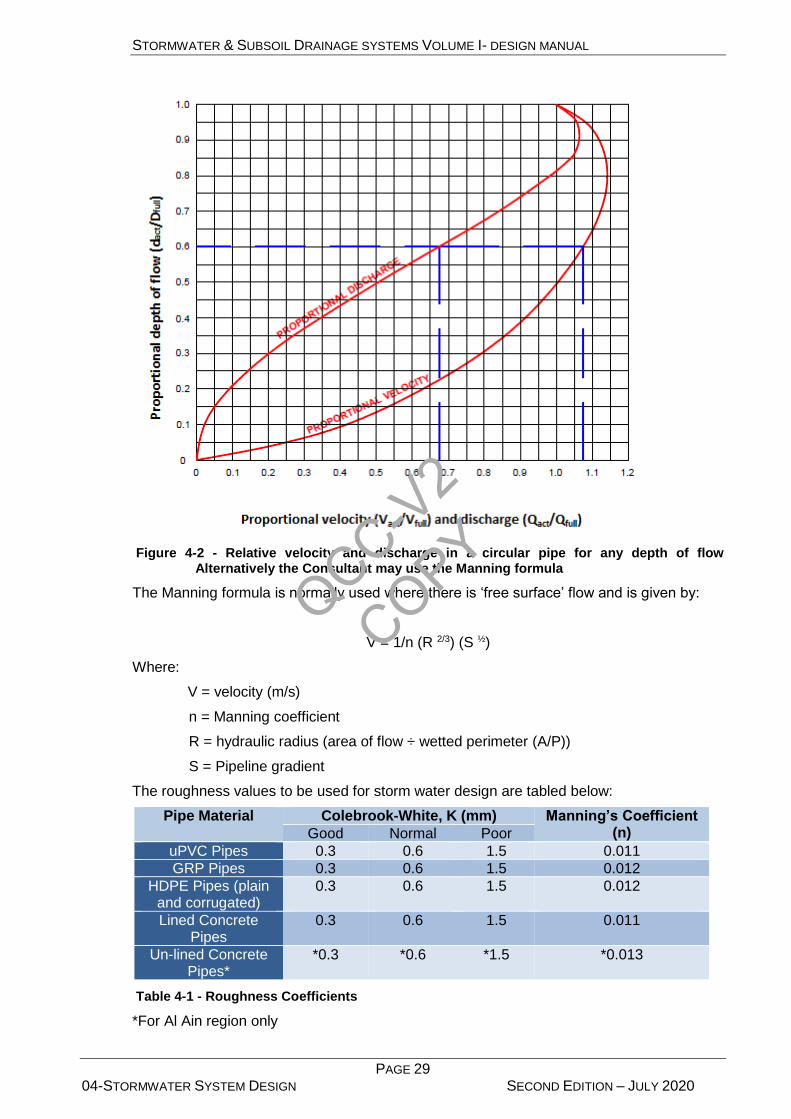
STORMWATER & SUBSOIL DRAINAGE SYSTEMS VOLUME I- DESIGN MANUAL
PAGE 29 04-STORMWATER SYSTEM DESIGN SECOND EDITION – JULY 2020
Figure 4-2 - Relative velocity and discharge in a circular pipe for any depth of flow Alternatively the Consultant may use the Manning formula
The Manning formula is normally used where there is ‘free surface’ flow and is given by:
V = 1/n (R 2/3) (S ½)
Where:
V = velocity (m/s)
n = Manning coefficient
R = hydraulic radius (area of flow ÷ wetted perimeter (A/P))
S = Pipeline gradient
The roughness values to be used for storm water design are tabled below:
Pipe Material Colebrook-White, K (mm) Manning’s Coefficient (n) Good Normal Poor
uPVC Pipes 0.3 0.6 1.5 0.011
GRP Pipes 0.3 0.6 1.5 0.012
HDPE Pipes (plain and corrugated)
0.3 0.6 1.5 0.012
Lined Concrete Pipes
0.3 0.6 1.5 0.011
Un-lined Concrete Pipes*
*0.3 *0.6 *1.5 *0.013
Table 4-1 - Roughness Coefficients
*For Al Ain region only
QCC-V2
COPY
STORMWATER & SUBSOIL DRAINAGE SYSTEMS VOLUME I- DESIGN MANUAL
PAGE 30 04-STORMWATER SYSTEM DESIGN SECOND EDITION – JULY 2020
4.3.2. Pipe Hydraulic Design
To provide a self-cleansing regime within gravity storm water pipes, the minimum velocity shall be above 0.75 m/s at peak flow. Less velocity may be accepted only at the early upstream of the storm water network after discussions with DMAT Engineers.
The maximum flow velocity shall not exceed 2.5m/s to minimise energy dissipation problems. Where system levels would result in higher velocities then the use of backdrop manholes for energy dissipation is not recommended. Specialist advice should be obtained if this occurs.
Where a scheme is to be developed in phases over several years, calculations shall be carried out to show the flow velocities at the end of each phase. Depending on the network and the nature of the development it may be necessary to increase the pipe gradients to give the required velocities from the lower flows during the early years of operation. This shall be by agreement with DMAT.
4.3.3. Minor Friction Losses
Calculations of the hydraulic grade line (HGL) for typical storm water systems usually ignore minor pipe losses. These include losses that occur in manholes (a summation of entrance, exit and bend losses), as well as losses that occur in pipes (at pipe to pipe junctions, bends, contractions, enlargement and transitions).
These minor losses, when cumulated, can cause substantial differences in the estimated HGL for the storm drain. In some cases (such as when profile slopes are minimal and velocities slow), design calculations need to allow for the additional head losses that will occur in manholes, chambers and pipes. This is necessary to avoid restricting the capacity of the drain system by not accounting for them in design.
When using proprietary network design software these losses can be calculated. For details on how to calculate minor losses manually, refer to the relevant literature.
QCC-V2
COPY
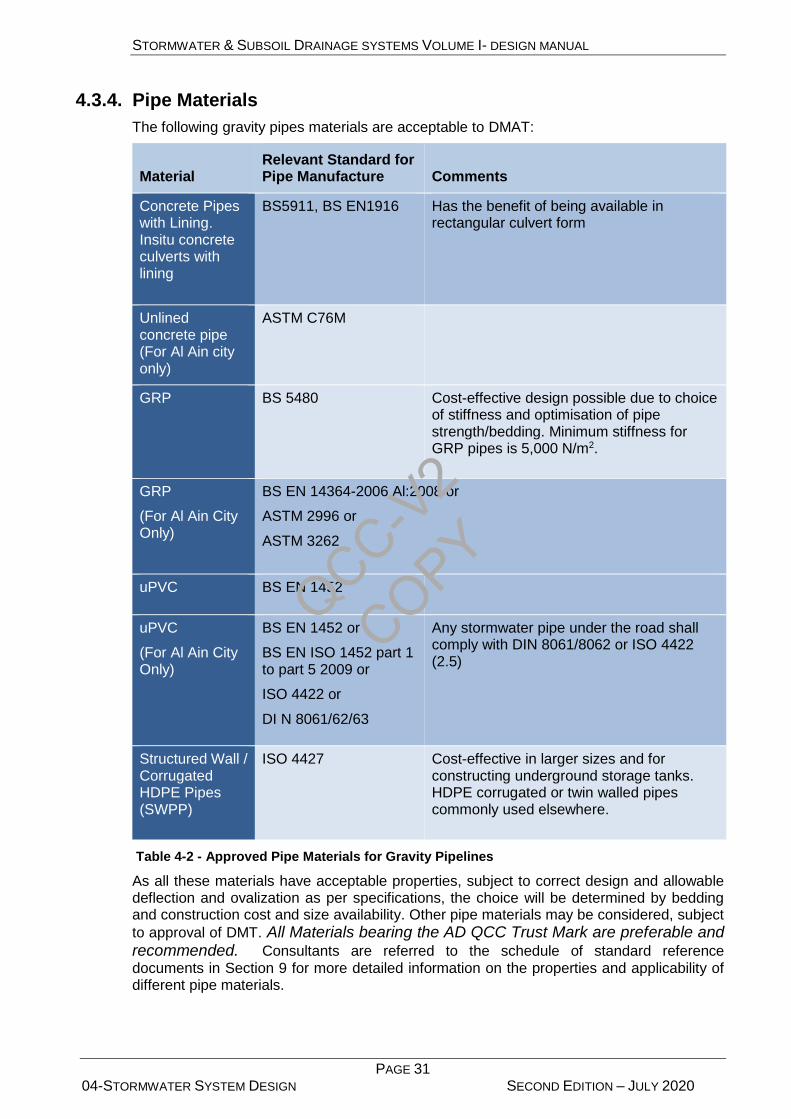
STORMWATER & SUBSOIL DRAINAGE SYSTEMS VOLUME I- DESIGN MANUAL
PAGE 31 04-STORMWATER SYSTEM DESIGN SECOND EDITION – JULY 2020
4.3.4. Pipe Materials
The following gravity pipes materials are acceptable to DMAT:
Material Relevant Standard for Pipe Manufacture Comments
Concrete Pipes with Lining. Insitu concrete culverts with lining
BS5911, BS EN1916 Has the benefit of being available in rectangular culvert form
Unlined concrete pipe (For Al Ain city only)
ASTM C76M
GRP BS 5480 Cost-effective design possible due to choice of stiffness and optimisation of pipe strength/bedding. Minimum stiffness for GRP pipes is 5,000 N/m2.
GRP
(For Al Ain City Only)
BS EN 14364-2006 Al:2008 or
ASTM 2996 or
ASTM 3262
uPVC BS EN 1452
uPVC
(For Al Ain City Only)
BS EN 1452 or
BS EN ISO 1452 part 1 to part 5 2009 or
ISO 4422 or
DI N 8061/62/63
Any stormwater pipe under the road shall comply with DIN 8061/8062 or ISO 4422 (2.5)
Structured Wall / Corrugated HDPE Pipes (SWPP)
ISO 4427 Cost-effective in larger sizes and for constructing underground storage tanks. HDPE corrugated or twin walled pipes commonly used elsewhere.
Table 4-2 - Approved Pipe Materials for Gravity Pipelines
As all these materials have acceptable properties, subject to correct design and allowable deflection and ovalization as per specifications, the choice will be determined by bedding and construction cost and size availability. Other pipe materials may be considered, subject
to approval of DMT. All Materials bearing the AD QCC Trust Mark are preferable and recommended. Consultants are referred to the schedule of standard reference
documents in Section 9 for more detailed information on the properties and applicability of different pipe materials.
QCC-V2
COPY

STORMWATER & SUBSOIL DRAINAGE SYSTEMS VOLUME I- DESIGN MANUAL
PAGE 32 04-STORMWATER SYSTEM DESIGN SECOND EDITION – JULY 2020
4.3.5. Pipe Depth
The minimum cover to pipes without additional protection shall be 1200mm. In special conditions structural calculations in line with Appendix A2 may show that protection is required at greater depth for particular loading cases.
Where it is not cost-effective to have the head of the system starting with 1200mm cover then additional protection shall be provided to the pipes. Additional protection will usually take the form of concrete bed and surround or protection slabs.
When designing the pipeline, the corresponding cover depths, the pipe material and bedding, the Consultant shall consider if and by how much existing ground levels and imposed surface loads may change as a result of:
a) temporary conditions during construction
b) re-profiling of the ground as part of the site development
c) possible future changes to ground levels
Safety Note – Trenchless Solutions
Where the trench depth is greater than 10m or where difficult ground conditions exist or there is an obstacle to be passed, the Consultant shall consider whether a trenchless construction technique would be safer than open cut trenching. See also Section 4.10.
Safety Note – Pipe Flotation
During construction it may be possible for the pipe trench to contain fluid concrete or standing water. If the pipes are sealed and empty and have little or no backfill they can become buoyant with a risk of injury to personnel and damage to the pipeline and adjoining works. A similar risk is present after backfilling if the surrounding material can become fluid (as quicksand). If this can occur the buoyancy forces are greater due to the higher density of the material.
The Consultant shall carry out calculations to demonstrate that there is a Factor of Safety of at least 1.1 against pipe flotation under all practical circumstances. If the pipe self-weight is not sufficient then additional weight shall be provided by means of concrete saddles, or similar.
4.4. Inlet and Catchbasins Structures
Surface water run-off areas will accumulate windblown sand and measures shall be taken to prevent or significantly reduce the amount of sand getting into the storm water network. Surface water collection inlets shall include a sump to trap sand as shown on the Standard Drawings. Each inlet shall be connected to a rider pipe of maximum length 50m which at its end shall connect to a catchbasin. Each catchbasin shall connect to a manhole by as short a pipe as possible. Catch basins shall be specified at junctions of two or more lateral pipes, and at the upstream of manholes.
MH
Inlets
Catchbasins
Rider Pipe
Storm water pipe
QCC-V2
COPY
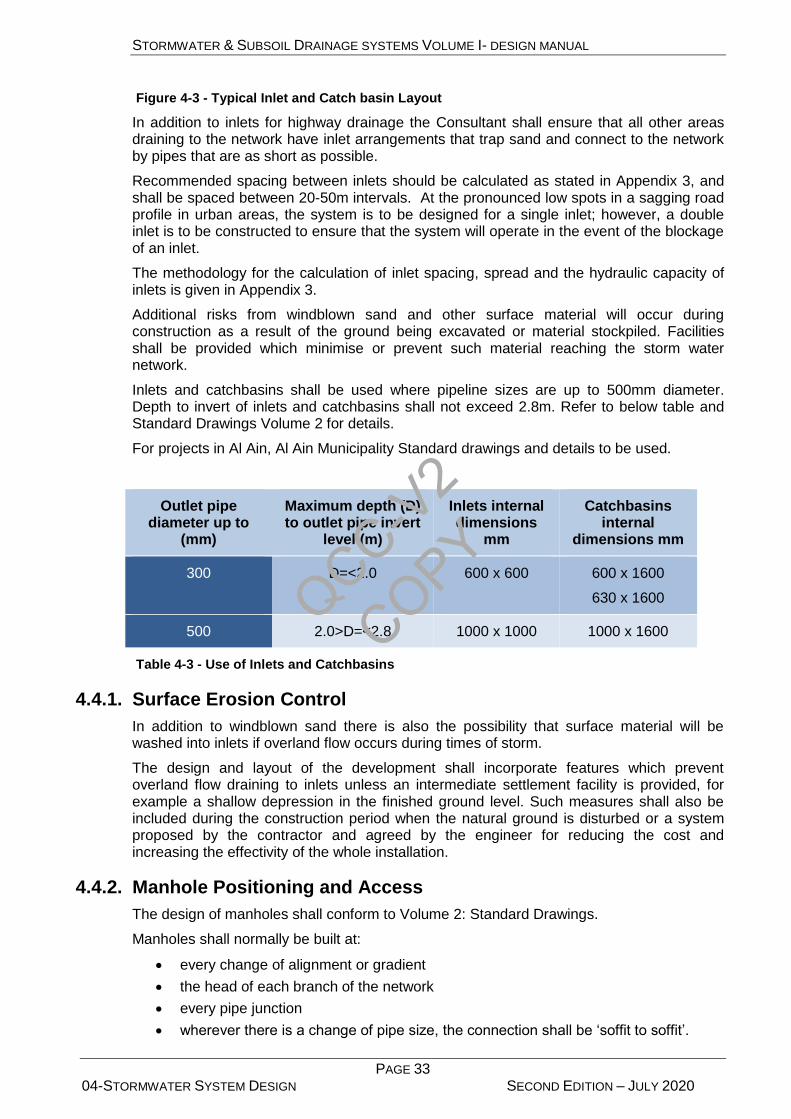
STORMWATER & SUBSOIL DRAINAGE SYSTEMS VOLUME I- DESIGN MANUAL
PAGE 33 04-STORMWATER SYSTEM DESIGN SECOND EDITION – JULY 2020
Figure 4-3 - Typical Inlet and Catch basin Layout
In addition to inlets for highway drainage the Consultant shall ensure that all other areas draining to the network have inlet arrangements that trap sand and connect to the network by pipes that are as short as possible.
Recommended spacing between inlets should be calculated as stated in Appendix 3, and shall be spaced between 20-50m intervals. At the pronounced low spots in a sagging road profile in urban areas, the system is to be designed for a single inlet; however, a double inlet is to be constructed to ensure that the system will operate in the event of the blockage of an inlet.
The methodology for the calculation of inlet spacing, spread and the hydraulic capacity of inlets is given in Appendix 3.
Additional risks from windblown sand and other surface material will occur during construction as a result of the ground being excavated or material stockpiled. Facilities shall be provided which minimise or prevent such material reaching the storm water network.
Inlets and catchbasins shall be used where pipeline sizes are up to 500mm diameter. Depth to invert of inlets and catchbasins shall not exceed 2.8m. Refer to below table and Standard Drawings Volume 2 for details.
For projects in Al Ain, Al Ain Municipality Standard drawings and details to be used.
Outlet pipe diameter up to
(mm)
Maximum depth (D) to outlet pipe invert
level (m)
Inlets internal dimensions
mm
Catchbasins internal
dimensions mm
300 D=<2.0 600 x 600 600 x 1600
630 x 1600
500 2.0>D=<2.8 1000 x 1000 1000 x 1600
Table 4-3 - Use of Inlets and Catchbasins
4.4.1. Surface Erosion Control
In addition to windblown sand there is also the possibility that surface material will be washed into inlets if overland flow occurs during times of storm.
The design and layout of the development shall incorporate features which prevent overland flow draining to inlets unless an intermediate settlement facility is provided, for example a shallow depression in the finished ground level. Such measures shall also be included during the construction period when the natural ground is disturbed or a system proposed by the contractor and agreed by the engineer for reducing the cost and increasing the effectivity of the whole installation.
4.4.2. Manhole Positioning and Access
The design of manholes shall conform to Volume 2: Standard Drawings.
Manholes shall normally be built at:
every change of alignment or gradient
the head of each branch of the network
every pipe junction
wherever there is a change of pipe size, the connection shall be ‘soffit to soffit’.
QCC-V2
COPY

STORMWATER & SUBSOIL DRAINAGE SYSTEMS VOLUME I- DESIGN MANUAL
PAGE 34 04-STORMWATER SYSTEM DESIGN SECOND EDITION – JULY 2020
intervals not exceeding 100m for pipes ≤ 300mm diameter (perforated lines)
intervals not exceeding 120m for pipes 300mm to 600mm diameter.
intervals not exceeding 160m for pipes 700mm & 800mm diameter
intervals not exceeding 200m for pipes from 900mm to 1100mm diameter
for pipe diameters ≥ 1200mm interval may reach 300m, subject to DMAT approval
at any additional locations designated by DMAT
The above mentioned spacing values are based on typical installation conditions and shall only be taken as indicative. The Consultant shall undertake design calculations and site investigation to determine manholes spaces to suit the site conditions / layout.
Manholes shall be located to provide safe access for maintenance but also to minimise disruption to the general public and property owners during maintenance. The positioning of manholes should consider the size of the excavation required to construct the chamber and the impact this may have on adjacent utilities.
Particular features to note are:
All manholes shall be provided with access ladders.
Manhole covers shall be sized to allow for access for maintenance equipment, man-
entry with breathing equipment and removal of a casualty by stretcher. In particular,
means for direct access from the surface shall be provided for all installations
requiring regular maintenance, such as penstocks.
Blanked-off stub pipes shall be incorporated in manholes where necessary to allow
system extension and future connections
Manhole cover levels shall conform to the cover levels in Table 4-4
Location Cover Level
Paved areas final paved level.
Landscaped areas final ground level +0.1m
Open, unpaved areas final ground level +0.25m.
Table 4-4 - Manhole Cover Levels
In exceptional cases and where agreed with DMAT the manhole may have a recessed cover, in which case the location shall be precisely identified in relation to adjoining permanent features and shown on the record drawings.
The spacing of shafts for trenchless construction shall be as agreed with DMAT.
Safety Note – Manholes
Pipes of 900mm diameter or greater shall be fitted with stainless steel safety chains
at the manhole upstream openings.
In the layout and location of manholes, particular attention shall be paid to providing
safe conditions for inspection and maintenance work and for dealing with
emergencies and man-rescue.
Where covers with a lift weight greater than 25kg are used then portable lifting
mechanism for ease of lifting and no damages to the coating of covers shall be
used.
Where covers are in public areas or where the depth of the manhole or chamber is
greater than 2m, provision shall be included for locking the covers. Provision for
locking the covers should be considered for both vandalism and road safety, and
that should in agreement with DMAT.
QCC-V2
COPY

STORMWATER & SUBSOIL DRAINAGE SYSTEMS VOLUME I- DESIGN MANUAL
PAGE 35 04-STORMWATER SYSTEM DESIGN SECOND EDITION – JULY 2020
4.5. Contaminated Surface Run-off
Where there is the potential for surface water run-off to be contaminated then appropriate measures shall be included to prevent contamination reaching the network and the receiving body of water. Areas that might produce such run-off are car parks, petrol station forecourts and leaking storage tanks, landfill sites, airports and overland run-off from industrial areas.
For car parks and petrol station forecourts the risk arises from run-off being contaminated with hydrocarbons and petrol/oil interceptors shall be provided.
Interceptors shall be located to give good access for the removal of contaminated material. Interceptors shall be installed in areas with good natural ventilation and shall not be installed in enclosed areas.
Interceptors shall be of a multi-compartment design as shown in Volume 2: Standard Drawings or a proprietary multi-compartment design. They shall include the following features:
ventilation
Secure, non-flammable covers
Uniform flow through the separation compartment
The capacity of petrol/oil interceptors shall be based on the following:
Size of separator shall be based on double the maximum contaminated water flow.
For light liquids the retention time shall be a minimum of 3 minutes up to a design
flow of 20 l/s. For higher flows an additional minute shall be added per 10 l/s
increase.
The width to length ratio shall be 1:1.8
Alternatively, in case of mechanical oil separators, the manufacturer’s
recommended flow rates with a factor of safety of 2.
Domestic wastewater shall not be connected to an interceptor.
Where a pumping station is required in the vicinity it shall be located downstream of an interceptor.
Areas that regularly have contaminated surfaces or regularly produce contaminated run-off such as vehicle washing plants shall have site specific measures installed to limit the contamination entering the storm water network (e.g. oil separators shall be installed prior connection of the drainage lines from contaminated areas to the DMAT main stormwater network).
4.6. Hydrodynamic Separators
In addition to the sumps in inlets, catchbasins and manholes, consideration should be given to the use of hydrodynamic separators to remove settleable solids and floating debris, particularly in networks that have pumped discharges or discharge to public amenity areas.
These are normally proprietary designs and are most effective where the materials to be removed from run-off are heavy particles, such as sand and gravel, which can be settled or floatables which can be captured rather than solids with poor settlability or dissolved pollutants. These can also be located in potential “hotspots” where there is a high likelihood of high sediment loads or debris entering the network.
The separators should be located in areas with safe access for the operators to “dip” the central shaft to measure the depth of accumulated sediment and safe off-road parking for the suction tanker for emptying.
QCC-V2
COPY
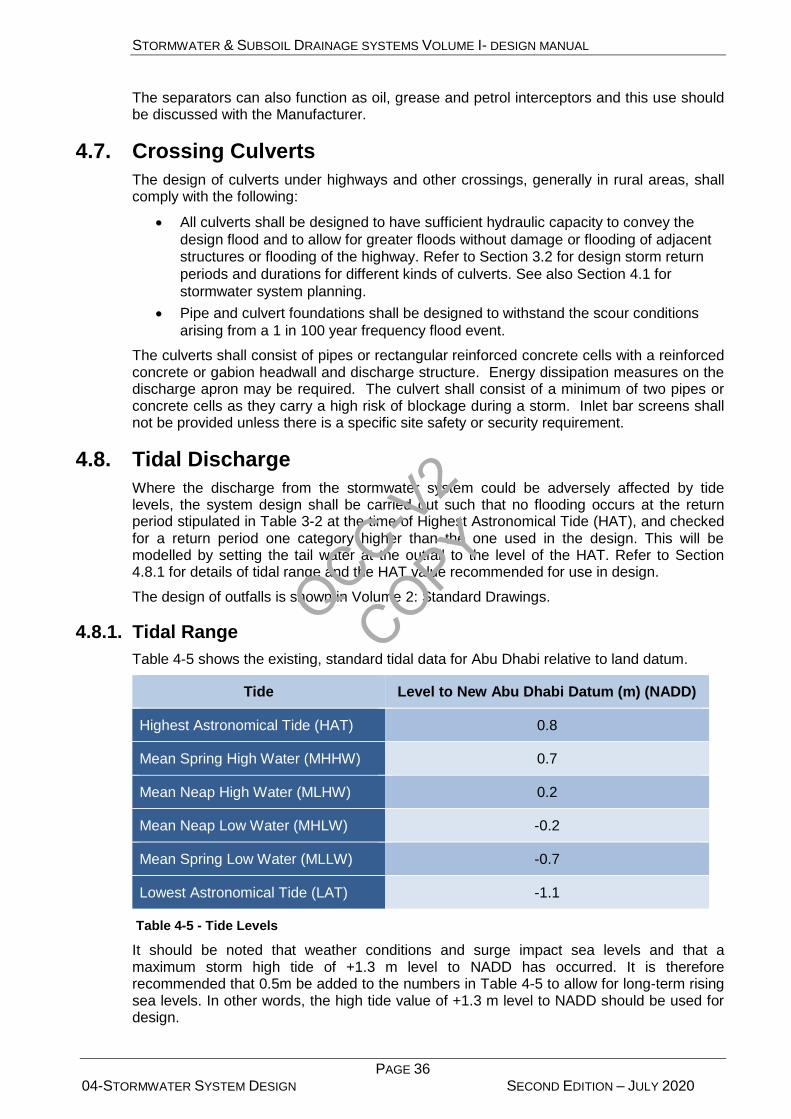
STORMWATER & SUBSOIL DRAINAGE SYSTEMS VOLUME I- DESIGN MANUAL
PAGE 36 04-STORMWATER SYSTEM DESIGN SECOND EDITION – JULY 2020
The separators can also function as oil, grease and petrol interceptors and this use should be discussed with the Manufacturer.
4.7. Crossing Culverts
The design of culverts under highways and other crossings, generally in rural areas, shall comply with the following:
All culverts shall be designed to have sufficient hydraulic capacity to convey the
design flood and to allow for greater floods without damage or flooding of adjacent structures or flooding of the highway. Refer to Section 3.2 for design storm return
periods and durations for different kinds of culverts. See also Section 4.1 for
stormwater system planning.
Pipe and culvert foundations shall be designed to withstand the scour conditions
arising from a 1 in 100 year frequency flood event.
The culverts shall consist of pipes or rectangular reinforced concrete cells with a reinforced concrete or gabion headwall and discharge structure. Energy dissipation measures on the discharge apron may be required. The culvert shall consist of a minimum of two pipes or concrete cells as they carry a high risk of blockage during a storm. Inlet bar screens shall not be provided unless there is a specific site safety or security requirement.
4.8. Tidal Discharge
Where the discharge from the stormwater system could be adversely affected by tide levels, the system design shall be carried out such that no flooding occurs at the return period stipulated in Table 3-2 at the time of Highest Astronomical Tide (HAT), and checked for a return period one category higher than the one used in the design. This will be modelled by setting the tail water at the outfall to the level of the HAT. Refer to Section 4.8.1 for details of tidal range and the HAT value recommended for use in design.
The design of outfalls is shown in Volume 2: Standard Drawings.
4.8.1. Tidal Range
Table 4-5 shows the existing, standard tidal data for Abu Dhabi relative to land datum.
Tide Level to New Abu Dhabi Datum (m) (NADD)
Highest Astronomical Tide (HAT) 0.8
Mean Spring High Water (MHHW) 0.7
Mean Neap High Water (MLHW) 0.2
Mean Neap Low Water (MHLW) -0.2
Mean Spring Low Water (MLLW) -0.7
Lowest Astronomical Tide (LAT) -1.1
Table 4-5 - Tide Levels
It should be noted that weather conditions and surge impact sea levels and that a maximum storm high tide of +1.3 m level to NADD has occurred. It is therefore recommended that 0.5m be added to the numbers in Table 4-5 to allow for long-term rising sea levels. In other words, the high tide value of +1.3 m level to NADD should be used for design.
QCC-V2
COPY
STORMWATER & SUBSOIL DRAINAGE SYSTEMS VOLUME I- DESIGN MANUAL
PAGE 37 04-STORMWATER SYSTEM DESIGN SECOND EDITION – JULY 2020
4.8.2. Outfall Structures
The soffit of all outfall pipes shall lie below Mean Spring Low Water tide level.
The layout of outfall structures is shown in Volume 2: Standard Drawings.
A chamber shall be located on the pipe upstream of the outfall with cover level at a point above HAT (i.e above 0.8m – Level to New Abu Dhabi Datum (m) NADD) and shall include non-return valve, such that the network or pumping station is protected by non-return valve against seawater ingress. Such valves shall be a double hinged flap valve or a flexible duck-bill or cone type of valve. The valves shall close under a minimum of head difference and shall prevent any backflow into the network. This chamber shall also include a trash screen with vertical bars at 100mm spacing. The chamber shall be located to give good access for maintenance purposes, including the removal of trash.
All materials that could come into contact with sea water or diluted sea water shall be specified for the appropriate corrosion resistance.
Safety Note – Outfall Safety Grill
Every outfall structure shall incorporate a safety grill to prevent unauthorised access into the outfall pipe. The grill shall be fabricated from 20mm diameter stainless steel bars and the maximum spacing of bars shall be 150mm. Refer to the Standard Drawings and Specifications for details.
For projects in Al Ain region, galvanized bars with the size 20mmx10mm or 15mmx10mm or 10mmx10mm to be used. Refer to the Al Ain Municipality Standard
Drawings and Specifications for details.
4.9. Trenchless Technologies
The Consultant should be aware of the different technologies available for trenchless construction and the benefits these can bring to cost, safety and environmental impact. Such construction may be beneficial where:
An open cut trench would be unacceptably deep for the particular location
The ground conditions are unsuitable for open trenches
A road, railway, powerlines or body of water crossing is required
The primary methods for trenchless construction are:
Tunnel boring machine (TBM) with segmental rings for larger diameters.
Pipe jacking - diameter 900mm to 2400mm and above
Micro-tunnelling - diameter range 300mm to 900mm
Auger boring – diameters up to 1000mm
Directional drilling - diameter range 300mm to 1500mm
Note that significant areas are required for working shafts/pits at each end of a trenchless technique and possibly at intermediate points depending on length and conditions. The shafts/pits can be large in order to allow the insertion and removal of the tunnelling equipment.
Trenchless construction can provide safety, environmental and cost benefits where used appropriately. The successful use of trenchless construction relies heavily on:
comprehensive knowledge of the ground conditions and buried obstacles from a
detailed ground investigation
the advice of an experienced geotechnical engineer
QCC-V2
COPY

STORMWATER & SUBSOIL DRAINAGE SYSTEMS VOLUME I- DESIGN MANUAL
PAGE 38 04-STORMWATER SYSTEM DESIGN SECOND EDITION – JULY 2020
the use of experienced, specialist contractors who can advise on the merits of the
different techniques. It is important that construction advice is sought at an early
stage in the design process
The assessment of preferred method shall consider:
availability of contractor expertise
construction safety
ground conditions
area of land required for the permanent works and construction working areas
environmental impact, including impact on the public and property owners/occupiers
construction cost
construction duration
4.10. Hazardous Areas
Although a storm water network provides an inherently less dangerous environment than a foul sewer system, it is still important to consider the hazards that can arise and to address these in the design.
Hazard Possible Design Solution
The accumulation of explosive or poisonous gases in the pipe network, chambers and pumping stations. Methane for example could arise from the decomposition of organic matter contained in run-off or by diffusion from the natural ground. Explosive gases are normally lighter than air and thus accumulate at high spots.
Vent stacks to be provided.
Avoid specifying materials that could generate sparks from static electricity.
Check the geological reports for the presence of natural gases or organic material in the ground and identify this risk in the residual hazards document.
The displacement of oxygen by other gases such that the air in the pipe network, chambers and pumping stations becomes irrespirable for maintenance/repair workers.
Ensure that there are no foul or contaminated area connections to the storm water network.
Check the geological reports for the presence of natural gases or organic material in the ground and identify this risk in the residual hazards document.
The release of gases through disturbing pipe sediment during maintenance or repair activities
Ensure that the minimum pipe gradients are provided to minimise sediment accumulation.
The accidental discharge of toxic or explosive chemicals in a part of the catchment which then finds its way into the storm water network.
Ensure that there are no foul or contaminated area connections to the storm water network.
Deep manholes Provide intermediate landings or staircases Provide space for lift of unconscious person from base of manhole to ground level
Table 4-6 - Potential Hazards in a Storm Water Network
QCC-V2
COPY
STORMWATER & SUBSOIL DRAINAGE SYSTEMS VOLUME I- DESIGN MANUAL
PAGE 39 04-STORMWATER SYSTEM DESIGN SECOND EDITION – JULY 2020
In all cases careful consideration shall be given to the need for natural or forced ventilation of the network to remove any undesirable gases and before man-entry is made for maintenance purposes. In many instances residual hazards will remain and these shall be notified to DMAT through the Health and Safety records and on the as-constructed drawings.
4.11. Concrete Structures
All concrete structures shall be designed to comply with:
DMAT publication “Building Regulations & Recommendations for Structural Design
& Concrete Practices”
User Guide for the International Building Codes in the Emirate of Abu Dhabi
4.12. Soakaways
The use of soakaways and soakaway trenches are not permitted in the design of new storm water systems within DMT jurisdiction. However, the use of Geo-cells can be considered only for selected areas after approval from DMT. Soakaways are used with in Al Ain City Municipality region, please refer to Appendix-A4 for further details.
4.13. Open Channels & Ditches
Constructed open channels and ditches in urban areas are not permitted in the design of new storm water systems within DMAT jurisdiction. However open channels and ditches are used with in Al Ain City Municipality region, please refer to Attendix-A4 for further details.
QCC-V2
COPY
STORMWATER & SUBSOIL DRAINAGE SYSTEMS VOLUME I- DESIGN MANUAL
PAGE 40 05-SUB SOIL DRAINAGE DESIGN SECOND EDITION – JULY 2020
5. SUB-SOIL DRAINAGE DESIGN
5.1. Introduction
The purpose of subsurface drainage is to control groundwater level to a desired maximum level by removing excess subsurface water, where a desired maximum level is exceeded. Elevated groundwater may be caused by excess precipitation or irrigation, leakage from water and irrigation mains, high tides, trapped (perched) water due to impermeable soil and rock layers, or underground flows from upland areas. Under such situations groundwater control is required principally to protect underground structures and buried services, maintain plant growth (landscaping) conditions, to provide increased storage capacity during periods of excess surface free water (e.g. during rainfall events), and to prevent groundwater flooding.
Groundwater control systems are best when combined with the surface water system, so that combined flows are directed to common attenuation tanks, pumping stations and outfalls. These shared arrangements help minimise land use and environmental impacts of separate systems. A shared system can also operate all year round when taking groundwater flow contributions, thus maximizing reliability to deal with much larger flows from infrequent rainfall events.
The three most common techniques used to drain excess subsurface water are: surface drainage, subsurface drainage, and tubewell drainage.
Surface drainage removes surplus water by means of open drains. They are typically adopted where the land is flat, the sub-soil is heavy, and infiltration rates are low, and used to eliminate ponding and to prevent prolonged saturation. They may be used alone or supplemented with subsurface drainage.
Subsurface drains are used to intercept and remove saturated water from natural and made ground. Subsurface drainage consists of perforated pipes and collector systems installed underground that allow flow under gravity to an open or closed collector drain. The marked advantage of subsurface drains over surface drains is that they can be placed where needed without sub-dividing land development plots.
Tubewell drainage controls water table elevation by adoption of a group of wells to control the water table at all points in an area. These systems are best suited to soils of high transmissivity, reducing the number of wells required. Some of the advantages of tubewell drainage include less earthwork and better handling of topographical and construction limitations. Similar to surface and subsurface drains, a collector system is required to convey water to a disposal/re-use site.
Depending on the location characteristics, it is recommended that subsurface drainage should be viewed as the ultimate solution in the planner’s arsenal when considering groundwater control. Ideally, planning should address the problem of excess subsurface free water by using designs and technologies that reduce the scale of the problem at source and restrict flows that closely mimic the natural environment.
QCC-V2
COPY
STORMWATER & SUBSOIL DRAINAGE SYSTEMS VOLUME I- DESIGN MANUAL
PAGE 41 05-SUB SOIL DRAINAGE DESIGN SECOND EDITION – JULY 2020
5.2. Context of Subsurface Drainage in Abu Dhabi
The application of subsurface drainage is highly dependent on the unique set of variables relating to the physical and human environment of the Emirate of Abu Dhabi. A summary of the most important conditions includes:
Topography – largely flat landscape with characteristic sand dunes rising gradually
from the coastal plain inland, and with hilly/mountainous areas to the east and south
of Al Ain;
Climate – low annual rainfall of high intensity and high evaporation rates;
Hydrogeology – shallow water table at the coast and more than 150 m below
ground level far inland, low groundwater recharge rate and very poor groundwater
quality; and
Hydrology – generally there are few hydrological features, with exception around
the Al Ain area.
Appropriate responses to the two general waterlogging situations in Abu Dhabi include:
shallow and saline water table renders the (Sabkha) soils unproductive as a result of deposition of migrating salts on the surface. Soils are heavy and flocculated as a result of the presence of Sodium.
subsurface drainage
soils of good quality overlay a heavy and confining layer that causes ponding of water in topographical lows.
subsurface drainage
Importantly though, each situation should be examined on a site by site basis, including existing utility services, and decisions made on the most appropriate drainage system for the local conditions encountered.
Where alternative responses to subsurface drainage are proposed, the Consultant shall discuss and agree with DMAT the justification.
QCC-V2
COPY
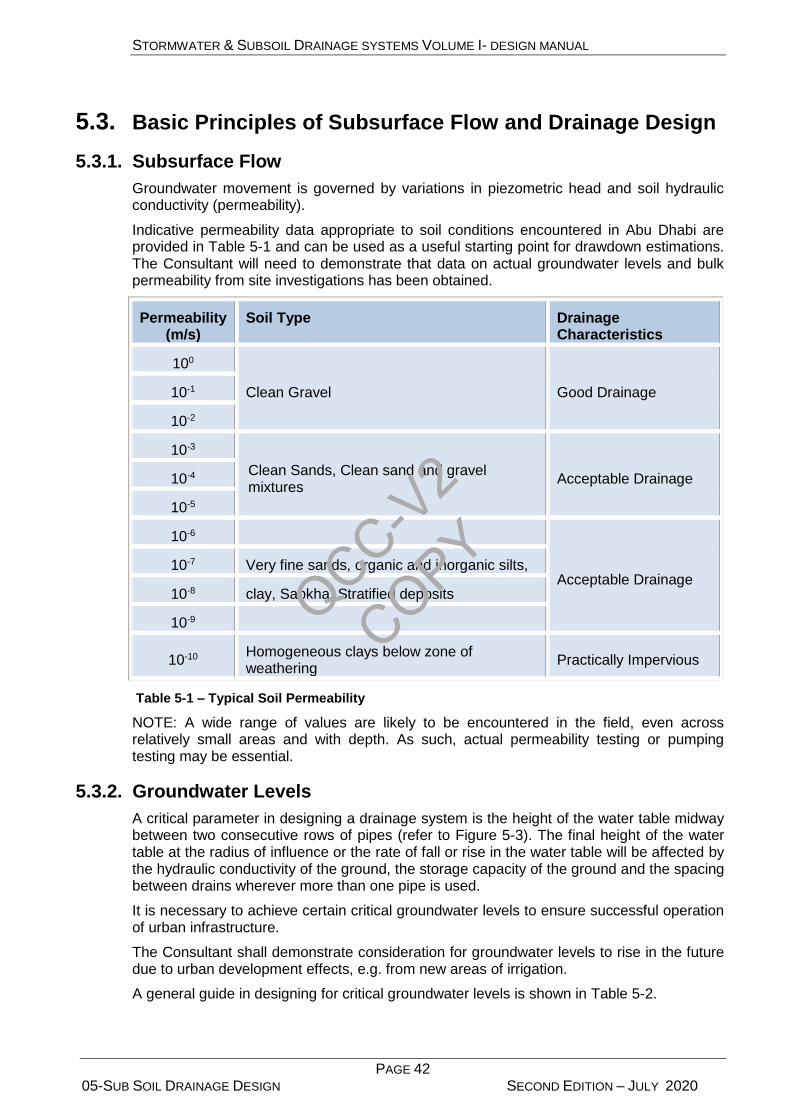
STORMWATER & SUBSOIL DRAINAGE SYSTEMS VOLUME I- DESIGN MANUAL
PAGE 42 05-SUB SOIL DRAINAGE DESIGN SECOND EDITION – JULY 2020
5.3. Basic Principles of Subsurface Flow and Drainage Design
5.3.1. Subsurface Flow
Groundwater movement is governed by variations in piezometric head and soil hydraulic conductivity (permeability).
Indicative permeability data appropriate to soil conditions encountered in Abu Dhabi are provided in Table 5-1 and can be used as a useful starting point for drawdown estimations. The Consultant will need to demonstrate that data on actual groundwater levels and bulk permeability from site investigations has been obtained.
Permeability (m/s)
Soil Type Drainage Characteristics
100
Clean Gravel Good Drainage 10-1
10-2
10-3
Clean Sands, Clean sand and gravel mixtures
Acceptable Drainage 10-4
10-5
10-6
Acceptable Drainage 10-7 Very fine sands, organic and inorganic silts,
10-8 clay, Sabkha, Stratified deposits
10-9
10-10 Homogeneous clays below zone of weathering
Practically Impervious
Table 5-1 – Typical Soil Permeability
NOTE: A wide range of values are likely to be encountered in the field, even across relatively small areas and with depth. As such, actual permeability testing or pumping testing may be essential.
5.3.2. Groundwater Levels
A critical parameter in designing a drainage system is the height of the water table midway between two consecutive rows of pipes (refer to Figure 5-3). The final height of the water table at the radius of influence or the rate of fall or rise in the water table will be affected by the hydraulic conductivity of the ground, the storage capacity of the ground and the spacing between drains wherever more than one pipe is used.
It is necessary to achieve certain critical groundwater levels to ensure successful operation of urban infrastructure.
The Consultant shall demonstrate consideration for groundwater levels to rise in the future due to urban development effects, e.g. from new areas of irrigation.
A general guide in designing for critical groundwater levels is shown in Table 5-2.
QCC-V2
COPY
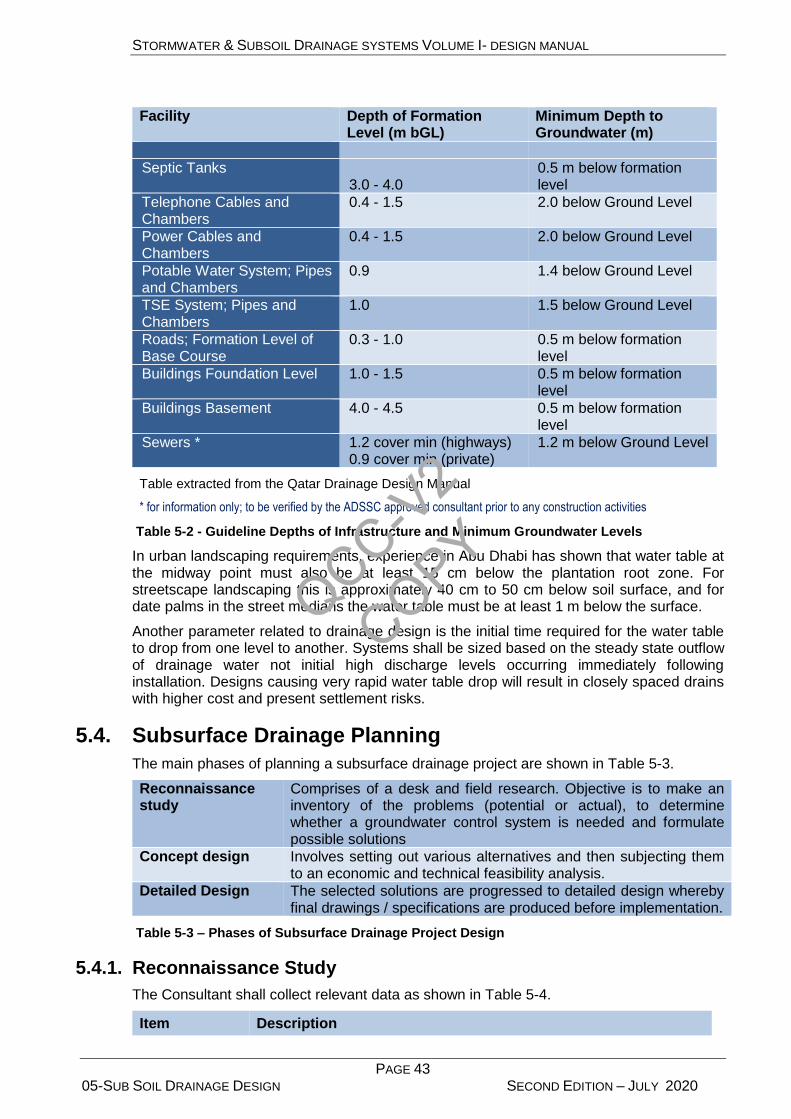
STORMWATER & SUBSOIL DRAINAGE SYSTEMS VOLUME I- DESIGN MANUAL
PAGE 43 05-SUB SOIL DRAINAGE DESIGN SECOND EDITION – JULY 2020
Facility Depth of Formation Level (m bGL)
Minimum Depth to Groundwater (m)
Septic Tanks 3.0 - 4.0
0.5 m below formation level
Telephone Cables and Chambers
0.4 - 1.5 2.0 below Ground Level
Power Cables and Chambers
0.4 - 1.5 2.0 below Ground Level
Potable Water System; Pipes and Chambers
0.9 1.4 below Ground Level
TSE System; Pipes and Chambers
1.0 1.5 below Ground Level
Roads; Formation Level of Base Course
0.3 - 1.0 0.5 m below formation level
Buildings Foundation Level 1.0 - 1.5 0.5 m below formation level
Buildings Basement 4.0 - 4.5 0.5 m below formation level
Sewers * 1.2 cover min (highways) 0.9 cover min (private)
1.2 m below Ground Level
Table extracted from the Qatar Drainage Design Manual
* for information only; to be verified by the ADSSC approved consultant prior to any construction activities
Table 5-2 - Guideline Depths of Infrastructure and Minimum Groundwater Levels
In urban landscaping requirements, experience in Abu Dhabi has shown that water table at the midway point must also be at least 15 cm below the plantation root zone. For streetscape landscaping this is approximately 40 cm to 50 cm below soil surface, and for date palms in the street medians the water table must be at least 1 m below the surface.
Another parameter related to drainage design is the initial time required for the water table to drop from one level to another. Systems shall be sized based on the steady state outflow of drainage water not initial high discharge levels occurring immediately following installation. Designs causing very rapid water table drop will result in closely spaced drains with higher cost and present settlement risks.
5.4. Subsurface Drainage Planning
The main phases of planning a subsurface drainage project are shown in Table 5-3.
Reconnaissance study
Comprises of a desk and field research. Objective is to make an inventory of the problems (potential or actual), to determine whether a groundwater control system is needed and formulate possible solutions
Concept design Involves setting out various alternatives and then subjecting them to an economic and technical feasibility analysis.
Detailed Design The selected solutions are progressed to detailed design whereby final drawings / specifications are produced before implementation.
Table 5-3 – Phases of Subsurface Drainage Project Design
5.4.1. Reconnaissance Study
The Consultant shall collect relevant data as shown in Table 5-4.
Item Description
QCC-V2
COPY

STORMWATER & SUBSOIL DRAINAGE SYSTEMS VOLUME I- DESIGN MANUAL
PAGE 44 05-SUB SOIL DRAINAGE DESIGN SECOND EDITION – JULY 2020
Item Description
Topography and Land Use
topography and land use maps on a scale between 1: 50,000
and 1:100,000 showing contour lines of the land surface
alignment and slope of main sewer lines, laterals and drains
selection of the drainage outlet
the direction of natural drainage
the concentration points of flow
actual and proposed land use
Where topography and land use maps are not readily available, a simple GPS survey coupled with field observations should be undertaken. Actual and proposed land use determines the degree of drainage required, the type of drainage system and individual drain alignment.
Hydrogeology Groundwater and surface hydrology considered concurrently
rainfall
evapotranspiration
water elevation
water quality
As a minimum sufficient data should be collected to derive piezometric contours maps and subsequently groundwater flow patterns at sufficient scale for the size of the project.
Geology geological map of the region
cross sections showing the lithological sequence
borehole data
For reasons of economy and efficiency, bores of 5-10 meters generally provide adequate information on the soil profile and depth-to-water status. The actual depth of investigation will be dependent on the target depth of subsurface drainage requirements. For selected bores a pumping test will be required to measure soil permeability of the shallow substratum (1.5 to 5.0 m)
Soils soil map at a scale between 1:50,000 and 1:100,000
data on soil stratification of the shallow substratum (1.5 to 5.0
m)
Table 5-4 – Reconnaissance Data
5.4.2. Concept Design
Data collected during the reconnaissance phase are analysed and the results used as background for the concept design.
The Consultant shall determine
general alignment of field drains, collectors and main line from the prevailing
topography.
spacing of field drains in a trial and error procedure whereby the time required to
control the water table is evaluated in relation to pipe spacing and depth.
calculate system capacity and pipe discharge.
QCC-V2
COPY
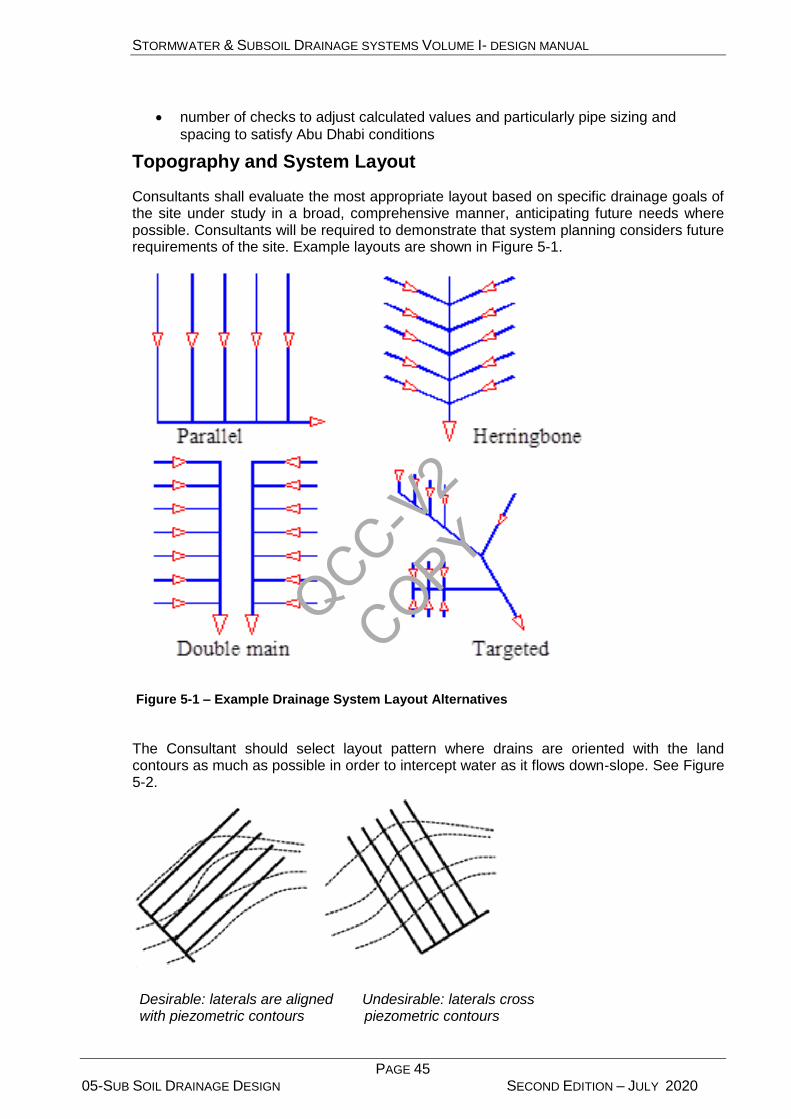
STORMWATER & SUBSOIL DRAINAGE SYSTEMS VOLUME I- DESIGN MANUAL
PAGE 45 05-SUB SOIL DRAINAGE DESIGN SECOND EDITION – JULY 2020
number of checks to adjust calculated values and particularly pipe sizing and
spacing to satisfy Abu Dhabi conditions
Topography and System Layout
Consultants shall evaluate the most appropriate layout based on specific drainage goals of the site under study in a broad, comprehensive manner, anticipating future needs where possible. Consultants will be required to demonstrate that system planning considers future requirements of the site. Example layouts are shown in Figure 5-1.
Figure 5-1 – Example Drainage System Layout Alternatives
The Consultant should select layout pattern where drains are oriented with the land contours as much as possible in order to intercept water as it flows down-slope. See Figure 5-2.
Desirable: laterals are aligned with piezometric contours
Undesirable: laterals cross piezometric contours
QCC-V2
COPY
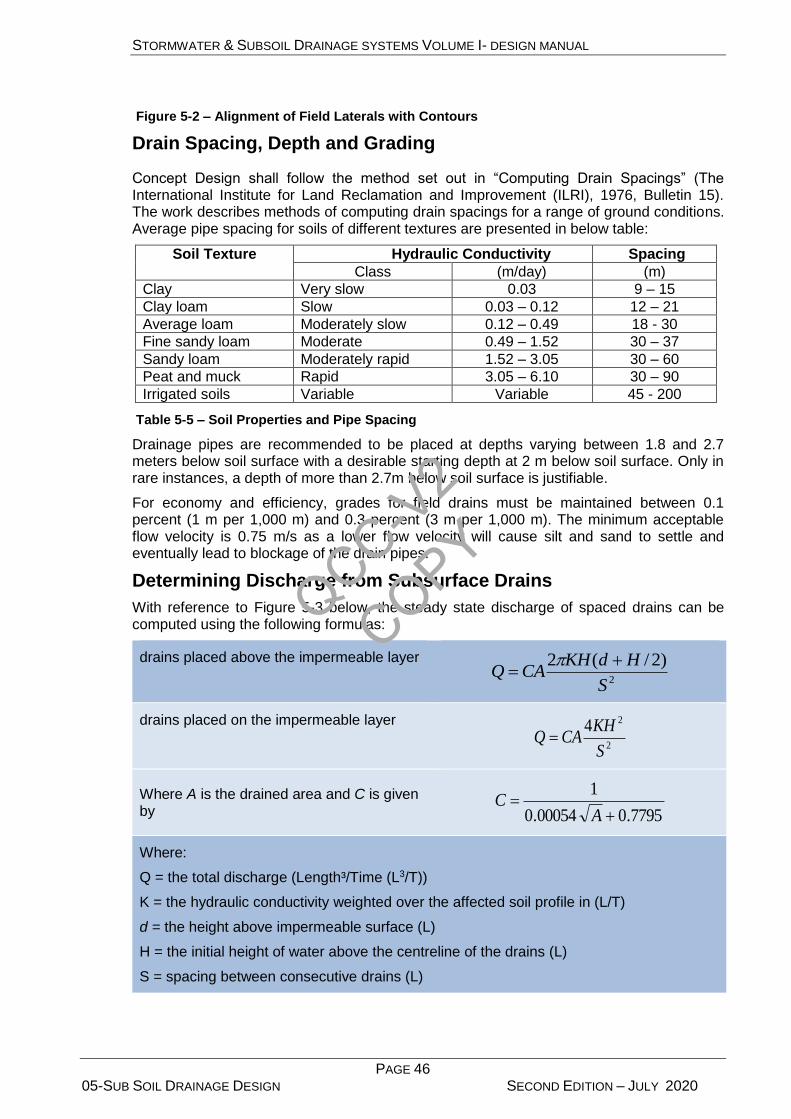
STORMWATER & SUBSOIL DRAINAGE SYSTEMS VOLUME I- DESIGN MANUAL
PAGE 46 05-SUB SOIL DRAINAGE DESIGN SECOND EDITION – JULY 2020
Figure 5-2 – Alignment of Field Laterals with Contours
Drain Spacing, Depth and Grading
Concept Design shall follow the method set out in “Computing Drain Spacings” (The International Institute for Land Reclamation and Improvement (ILRI), 1976, Bulletin 15). The work describes methods of computing drain spacings for a range of ground conditions. Average pipe spacing for soils of different textures are presented in below table:
Soil Texture Hydraulic Conductivity Spacing
Class (m/day) (m)
Clay Very slow 0.03 9 – 15
Clay loam Slow 0.03 – 0.12 12 – 21
Average loam Moderately slow 0.12 – 0.49 18 - 30
Fine sandy loam Moderate 0.49 – 1.52 30 – 37
Sandy loam Moderately rapid 1.52 – 3.05 30 – 60
Peat and muck Rapid 3.05 – 6.10 30 – 90
Irrigated soils Variable Variable 45 - 200
Table 5-5 – Soil Properties and Pipe Spacing
Drainage pipes are recommended to be placed at depths varying between 1.8 and 2.7 meters below soil surface with a desirable starting depth at 2 m below soil surface. Only in rare instances, a depth of more than 2.7m below soil surface is justifiable.
For economy and efficiency, grades for field drains must be maintained between 0.1 percent (1 m per 1,000 m) and 0.3 percent (3 m per 1,000 m). The minimum acceptable flow velocity is 0.75 m/s as a lower flow velocity will cause silt and sand to settle and eventually lead to blockage of the drain pipes.
Determining Discharge from Subsurface Drains
With reference to Figure 5-3 below, the steady state discharge of spaced drains can be computed using the following formulas:
drains placed above the impermeable layer
2
)2/(2
S
HdKHCAQ
drains placed on the impermeable layer
2
24
S
KHCAQ
Where A is the drained area and C is given by 7795.000054.0
1
AC
Where:
Q = the total discharge (Length³/Time (L3/T))
K = the hydraulic conductivity weighted over the affected soil profile in (L/T)
d = the height above impermeable surface (L)
H = the initial height of water above the centreline of the drains (L)
S = spacing between consecutive drains (L)
QCC-V2
COPY
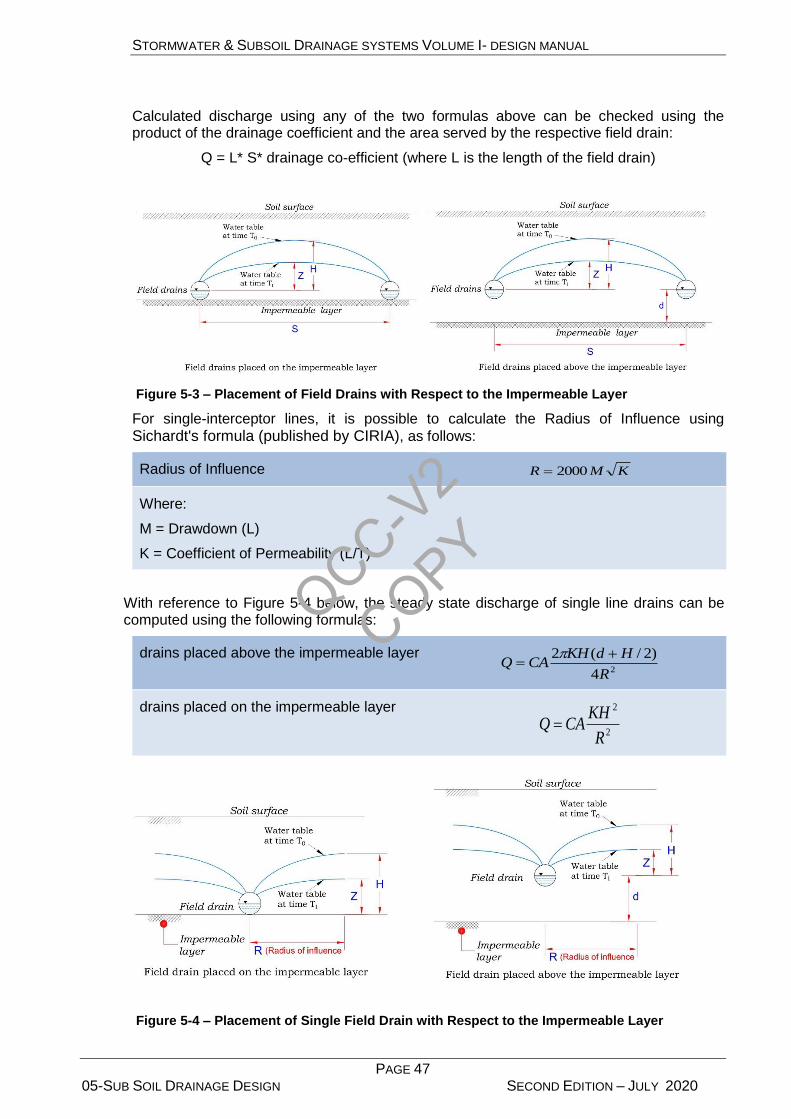
STORMWATER & SUBSOIL DRAINAGE SYSTEMS VOLUME I- DESIGN MANUAL
PAGE 47 05-SUB SOIL DRAINAGE DESIGN SECOND EDITION – JULY 2020
Calculated discharge using any of the two formulas above can be checked using the product of the drainage coefficient and the area served by the respective field drain:
Q = L* S* drainage co-efficient (where L is the length of the field drain)
Figure 5-3 – Placement of Field Drains with Respect to the Impermeable Layer
For single-interceptor lines, it is possible to calculate the Radius of Influence using
Sichardt's formula (published by CIRIA), as follows:
Radius of Influence KMR 2000
Where:
M = Drawdown (L)
K = Coefficient of Permeability (L/T)
With reference to Figure 5-4 below, the steady state discharge of single line drains can be computed using the following formulas:
drains placed above the impermeable layer 24
)2/(2
R
HdKHCAQ
drains placed on the impermeable layer
2
2
R
KHCAQ
Figure 5-4 – Placement of Single Field Drain with Respect to the Impermeable Layer
QCC-V2
COPY
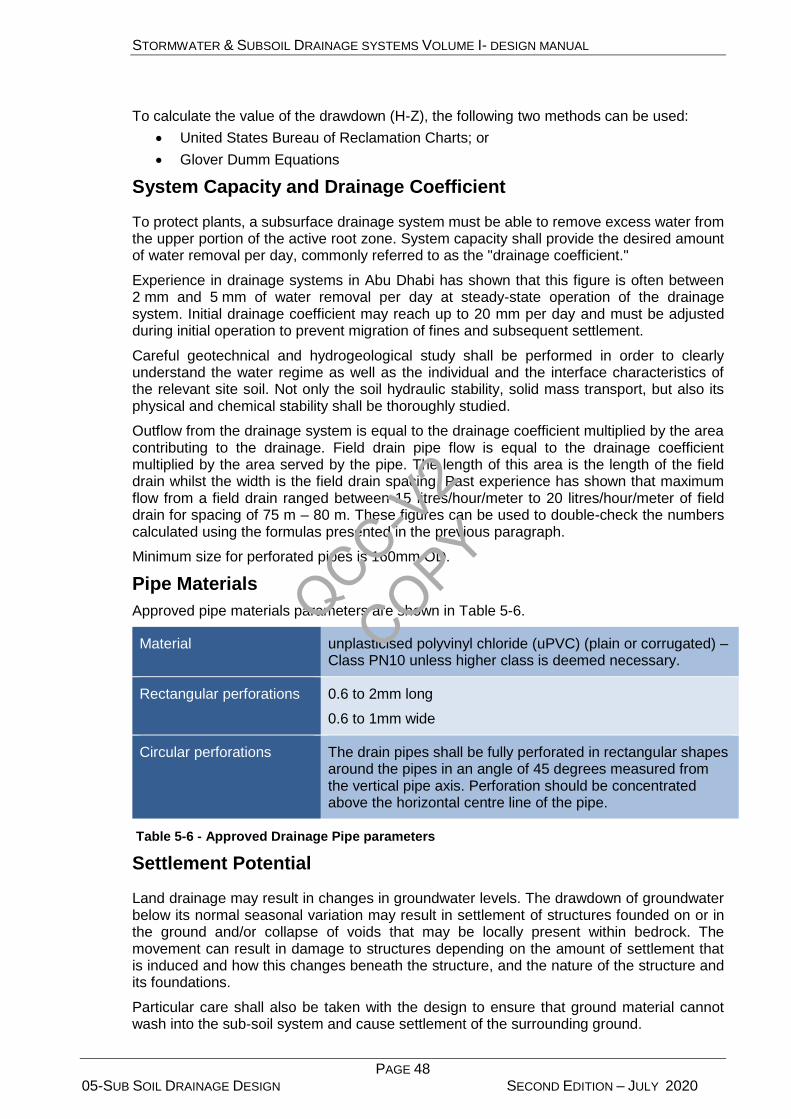
STORMWATER & SUBSOIL DRAINAGE SYSTEMS VOLUME I- DESIGN MANUAL
PAGE 48 05-SUB SOIL DRAINAGE DESIGN SECOND EDITION – JULY 2020
To calculate the value of the drawdown (H-Z), the following two methods can be used:
United States Bureau of Reclamation Charts; or
Glover Dumm Equations
System Capacity and Drainage Coefficient
To protect plants, a subsurface drainage system must be able to remove excess water from the upper portion of the active root zone. System capacity shall provide the desired amount of water removal per day, commonly referred to as the "drainage coefficient."
Experience in drainage systems in Abu Dhabi has shown that this figure is often between 2 mm and 5 mm of water removal per day at steady-state operation of the drainage system. Initial drainage coefficient may reach up to 20 mm per day and must be adjusted during initial operation to prevent migration of fines and subsequent settlement.
Careful geotechnical and hydrogeological study shall be performed in order to clearly understand the water regime as well as the individual and the interface characteristics of the relevant site soil. Not only the soil hydraulic stability, solid mass transport, but also its physical and chemical stability shall be thoroughly studied.
Outflow from the drainage system is equal to the drainage coefficient multiplied by the area contributing to the drainage. Field drain pipe flow is equal to the drainage coefficient multiplied by the area served by the pipe. The length of this area is the length of the field drain whilst the width is the field drain spacing. Past experience has shown that maximum flow from a field drain ranged between 15 litres/hour/meter to 20 litres/hour/meter of field drain for spacing of 75 m – 80 m. These figures can be used to double-check the numbers calculated using the formulas presented in the previous paragraph.
Minimum size for perforated pipes is 160mm OD.
Pipe Materials
Approved pipe materials parameters are shown in Table 5-6.
Material unplasticised polyvinyl chloride (uPVC) (plain or corrugated) – Class PN10 unless higher class is deemed necessary.
Rectangular perforations 0.6 to 2mm long
0.6 to 1mm wide
Circular perforations The drain pipes shall be fully perforated in rectangular shapes around the pipes in an angle of 45 degrees measured from the vertical pipe axis. Perforation should be concentrated above the horizontal centre line of the pipe.
Table 5-6 - Approved Drainage Pipe parameters
Settlement Potential
Land drainage may result in changes in groundwater levels. The drawdown of groundwater below its normal seasonal variation may result in settlement of structures founded on or in the ground and/or collapse of voids that may be locally present within bedrock. The movement can result in damage to structures depending on the amount of settlement that is induced and how this changes beneath the structure, and the nature of the structure and its foundations.
Particular care shall also be taken with the design to ensure that ground material cannot wash into the sub-soil system and cause settlement of the surrounding ground.
QCC-V2
COPY
STORMWATER & SUBSOIL DRAINAGE SYSTEMS VOLUME I- DESIGN MANUAL
PAGE 49 05-SUB SOIL DRAINAGE DESIGN SECOND EDITION – JULY 2020
The Consultant shall make an assessment of these impacts and report findings to DMAT for review. Design shall not proceed until the agreement of DMAT Dewatering Section has been given.
Water quality
The drainage assessment shall consider the chemical properties of water that will be drawn into the drainage system. This is because it may cause migration of existing contamination and/or affect the structural integrity of below ground infrastructure (e.g. foundations, piles, pipelines). In particular, where drainage systems are installed within or adjacent to areas of potential contamination, or have the potential to draw water from areas that may have different chemical properties to the native groundwater (e.g. close to the sea, natural and artificial wetlands), a risk assessment shall be provided and appropriate mitigation measures adopted by the Developer. The risk assessment shall consider the potential for all relevant risks including but not necessarily limited to:
Changes to aquifer properties (e.g. dissolution or precipitation)
Changes to groundwater chemistry
Mobilisation of contamination
Saline intrusion
Detrimental effects on the drainage network (e.g. corrosion of pipes)
Detrimental effects on infrastructure (e.g. corrosion of existing foundations / piles).
Pipe Bed and Surround
All pipes shall be laid with bed and surround in order to:
prevent or restrict soil particles from entering the pipe
provide good drainage permeability
assist with accurate laying of the pipe
provide structural support to the pipe
The pipe trench shall be 150mm wider than the pipe on each side for open trench installation with minimum pipe trench width of 600mm to allow sufficient bedding to support the pipe.
For Projects in Al Ain Region, pipe bedding and surround details provided in Al Ain Municipality standard drawings and specification to be used.
Gravel Bed and Surround
Where gravel bed and surround is provided, the depth beneath the pipe shall be a minimum of 100mm, and above the pipe shall be a minimum of 180mm. However, the depth of gravel above the pipe shall be increased where necessary to connect with permeable ground.
Where required, well-graded gravel shall be used for bed and surround. The measures of grading are given by the coefficients of uniformity and curvature from the following formulae:
Coefficient of uniformity 10
60
D
DCu
Coefficient of curvature
6010
2
30
DD
DCc
QCC-V2
COPY
STORMWATER & SUBSOIL DRAINAGE SYSTEMS VOLUME I- DESIGN MANUAL
PAGE 50 05-SUB SOIL DRAINAGE DESIGN SECOND EDITION – JULY 2020
Where D60, D30 and D10 are the respective diameters corresponding to 60%, 30%, and 10 % finer particles in the particle-size distribution curve.
A well graded material shall have a coefficient of uniformity greater than 4 for gravel and greater than 6 for sands. In addition, the coefficient of curvature shall be between 1 and 3 for both gravel and sand.
Table 5-7 below shows the gradation relationship between the base material and gravel envelope for most soils. These relationships have been found to work satisfactorily under low-head conditions
Base soil
limits for
d60 (mm)
Lower limits (mm) Upper limits (mm)
Percentage passing Percentage passing
100 60 30 10 5 0 100 60 30 10 5 0
0.020-0.050 9.52 2.0 0.81 0.33 0.3 0.074 38.1 10.0 8.7 2.5 - 0.59
0.050-0.100 9.52 3.0 1.07 0.38 0.3 0.074 38.1 12.0 10.0 3.0 - 0.59
0.100-0.250 9.52 4.0 1.30 0.40 0.3 0.074 38.1 15.0 13.1 3.8 - 0.59
0.250-1.000 9.52 5.0 1.45 0.42 0.3 0.074 38.1 20.0 17.3 5.0 - 0.59
Table 5-7 – Design Criteria for Gravel Envelopes
Pipe Connections
Pipe connections will be achieved using manholes.
In urban areas, the groundwater lowering pipework will generally be laid in the same trench as the storm water pipes (as long as not under road asphalt) and connect to manholes for ease of cleaning.
5.5. Hydraulic Design
The flow from a sub-soil system shall be determined by using the highest value from the following methods:
multiplying the drainage coefficient ( ranging from 2 to 5 mm/day for Abu Dhabi), by
the drainage area
using the formulae in Section 5.4.2, “Determining Discharge from Subsurface
Drains”
where irrigation is the only source of recharge to estimate the drainage rate as a
fraction of the irrigation rate. This fraction is commonly taken as 10 percent.
The sizing of field drains shall be carried out using the modified version of the Manning equation:
Where:
d = pipe diameter in mm
q = flow in litres per second
S = pipe slope in m/m
n = pipe roughness coefficient
8/32/1/*116 Sqnd
QCC-V2
COPY

STORMWATER & SUBSOIL DRAINAGE SYSTEMS VOLUME I- DESIGN MANUAL
PAGE 51 05-SUB SOIL DRAINAGE DESIGN SECOND EDITION – JULY 2020
For example: if a PVC field drain has a total length of 360 m, pipe roughness coefficient of 0.011, calculated flow of 1.7 l/s and a slope of 0.2 percent, the pipe internal diameter is calculated at 84 mm.
Pumping station design shall be carried out in accordance with Section 6.
5.6. Drainage Installation
Pipes shall be laid in accordance with Volume 4: Standard Specifications.
Manufacturer should be obliged to study the soil condition with the Contractor and the supervising Consultant in order to ensure the suitability of the pipe geometrical and material characteristics, including the joints, for installation in the given soil condition, may need to be added.
5.7. Construction near Utilities
Information shall be obtained by the Consultant on existing and proposed utilities.
As far as possible, drain lines shall not be installed across buried cables, pipelines and other facilities.
5.8. Maintenance
Maintenance of sub-soil drainage systems shall be carried out in accordance with the requirements of Volume 3: Operation and Maintenance.
5.9. Tubewell Drainage Design
Tubewell drainage consists of pumping from a series of wells an amount of groundwater equal to the drainage surplus. The pumped water is then discharged into a pipe or open surface drain network.
Tubewell drainage is not a substitute for subsurface drainage and shall be used only in combination with near surface drainage options to minimise the extent of subsurface drainage requirements over wider areas.
5.9.1. Patterns of Tubewell Drainage
Lowering of the water table sufficiently and uniformly requires considered placement of each well. Two regular configured tubewell patterns are permitted:
Triangular pattern is hydraulically the most favourable well-field configuration, with a maximum area to be drained by one well and with no extra drawdown induced by neighbouring wells.
Rectangular pattern in which wells are placed along parallel collector drains. For this well field configuration, a reduced length of collector drains is required when compared to a triangular configuration.
Alternate patterns are permitted only upon the approval of DMAT.
5.9.2. Well Field in a Triangular Pattern
A triangular well field pattern is shown in Figure 5-5. Limited overlap of individual radii of influence occur when the wells are placed in a triangular pattern. A simplifying assumption infers that drawdown and discharge of each well will not be affected by neighbouring wells, and therefore, the theory of a single well can be used.
QCC-V2
COPY

STORMWATER & SUBSOIL DRAINAGE SYSTEMS VOLUME I- DESIGN MANUAL
PAGE 52 05-SUB SOIL DRAINAGE DESIGN SECOND EDITION – JULY 2020
Figure 5-5 – Wells Located in a Pattern of Equilateral Triangles (Well Spacing L=re √3)
In a drainage well-field, there is a direct relationship between the discharge rate of the well, the recharge rate of the aquifer by percolation, and the area affected by pumping. The decline of the water level due to pumping is determined by the discharge rate of the well and the permeability and thickness of the aquifer. The discharge rate and the drawdown in the well are important factors in calculating the pumping costs of well drainage. In an unconfined aquifer, the steady-state flow through an arbitrary cylinder at a distance r (Qr) from the well is given by:
𝑄𝑟 = 𝜋(𝑟𝑒2 − 𝑟2)𝑅
Where:
re: radius of influence of the well (m)
r ∶ distance r from the well (m)
R ∶ recharge rate of the aquifer per unit surface area (m/d)
According to Darcy’s law, Qr equals to algebraic product of the cylindrical area of flow and the flow velocity. Hence, the discharge at distance r from the well can also be expressed by:
𝑄𝑟 = 2𝜋𝑟ℎ𝐾𝛿ℎ
𝛿𝑟
Where:
K ∶ hydraulic conductivity of the aquifer (m/d)
δh
δr: hydraulic gradient in the aquifer at distance r (-)
r ∶ distance r from the well (m)
h : height of water above the well at distance r
To calculate the drawdown in a well field when the wells are placed in a triangular pattern following equation can be utilized. From the Figure 5.5, it can be seen that the distance L
between the wells is equal to re√3 .
QCC-V2
COPY
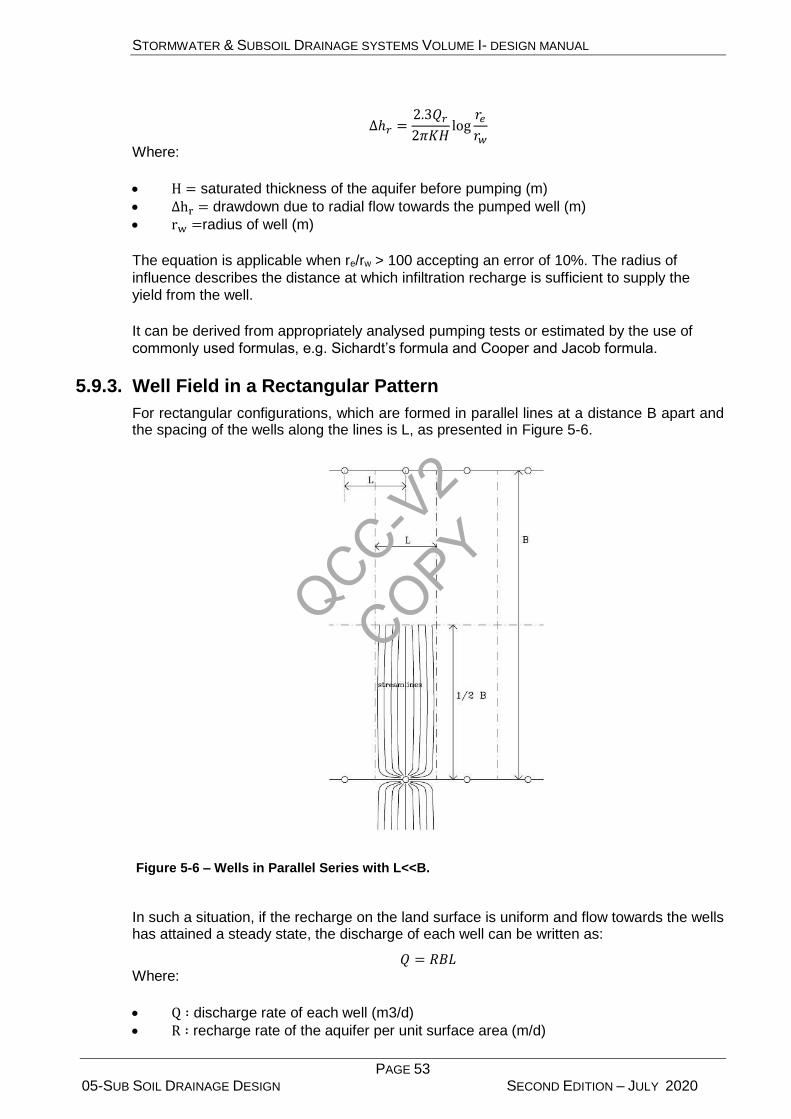
STORMWATER & SUBSOIL DRAINAGE SYSTEMS VOLUME I- DESIGN MANUAL
PAGE 53 05-SUB SOIL DRAINAGE DESIGN SECOND EDITION – JULY 2020
∆ℎ𝑟 =2.3𝑄𝑟
2𝜋𝐾𝐻log
𝑟𝑒
𝑟𝑤
Where:
H = saturated thickness of the aquifer before pumping (m)
∆hr = drawdown due to radial flow towards the pumped well (m)
rw =radius of well (m)
The equation is applicable when re/rw > 100 accepting an error of 10%. The radius of
influence describes the distance at which infiltration recharge is sufficient to supply the
yield from the well.
It can be derived from appropriately analysed pumping tests or estimated by the use of
commonly used formulas, e.g. Sichardt’s formula and Cooper and Jacob formula.
5.9.3. Well Field in a Rectangular Pattern
For rectangular configurations, which are formed in parallel lines at a distance B apart and the spacing of the wells along the lines is L, as presented in Figure 5-6.
Figure 5-6 – Wells in Parallel Series with L<<B.
In such a situation, if the recharge on the land surface is uniform and flow towards the wells has attained a steady state, the discharge of each well can be written as:
𝑄 = 𝑅𝐵𝐿 Where:
Q ∶ discharge rate of each well (m3/d)
R ∶ recharge rate of the aquifer per unit surface area (m/d)
QCC-V2
COPY
STORMWATER & SUBSOIL DRAINAGE SYSTEMS VOLUME I- DESIGN MANUAL
PAGE 54 05-SUB SOIL DRAINAGE DESIGN SECOND EDITION – JULY 2020
B ∶distance between the parallel lines (m)
L ∶ spacing of the wells along the lines (m)
For radial flow the drawdown is expressed as:
∆ℎ =𝑅𝐵2
8𝐾𝐻+
2.3𝑄
2𝜋𝐾𝐻𝑙𝑜𝑔
𝐿
𝜋𝑟𝑤
Where Q, R, B and L are as above, and:
K = hydraulic conductivity of the aquifer (m/d)
H = saturated thickness of the aquifer before pumping (m)
Δh = drawdown due to flow towards the pumped well (m)
rw = radius of well (m)
The equation can be used to calculate the head loss in a well field when the wells form a rectangular pattern. Such a pattern is recommended when surface drains running in parallel lines are proposed or already exist in the drainage area.
5.9.4. Semi-Confined Aquifers
A semi-confined aquifer, whose overlying layer is an aquitard, is replenished by percolating rain or excess irrigation water. Depending on the recharge rate and the hydraulic resistance of the aquitard, a difference in head between the free water table in the aquitard and the piezometric level of the aquifer will develop.
Equations for both triangular and rectangular pattern placement may be used to calculate the head loss in a well field.
Well Distance Calculation Procedure
An operating factor (the number of hours of tubewell operation in a 24 hour period) and the discharge rate determine how much water will be pumped by one tubewell. In combination with the drainable surplus (the annual discharge required to maintain the design water-level criteria), they determine the drainage area per tubewell and thus also the number of tube wells required for the total drainage area. This can be expressed in the following equation:
𝐴𝑤 =0.1𝑄𝑡𝑤
𝑞
Where:
Aw = drainage area per well (ha)
Q = discharge rate of the well (m3/d)
q = drainable surplus (mm/d)
tw = tubewell operating factor (-)
The total number of wells required can then be found by dividing the total drainage area per tubewell.
Well Field Configuration
For a triangular well field configuration, the distance between the wells for a selected discharge rate can be calculated by:
QCC-V2
COPY

STORMWATER & SUBSOIL DRAINAGE SYSTEMS VOLUME I- DESIGN MANUAL
PAGE 55 05-SUB SOIL DRAINAGE DESIGN SECOND EDITION – JULY 2020
𝐿 = 100√3𝐴𝑤
𝜋
For a rectangular well field configuration with wells placed along the parallel main drains is:
𝐿 = 10,000𝐴𝑤
𝐵
Where;
L = the distance between the wells (m)
B = the distance between the lines of wells (m)
5.9.5. Well Design
The Consultant shall demonstrate how the following objectives are met:
Pump water at the lowest cost
Pump water that is free of sand
Operate with minimum operation and maintenance costs
Operate with a long and economic lifetime
Materials used in well construction shall be selected without compromising long-term performance. Established international standards and guides such as BS, ISO, ASTM, WIS, and WRc shall be followed in the selection of and specification of construction materials.
In particular, screen material shall be resistant to chemical and microbiological corrosion, and degradation in contaminated and uncontaminated waters. The screen shall be durable enough to withstand installation and well development and last for the entire designed operation period. The screen material shall conform to ASTM Standard D5092 or other similar international standard.
PVC and stainless steel are the most commonly used well screen materials. However, in some situations, other materials, such as Teflon® may meet project objectives.
PVC screens, casings, and fittings Schedule 40 or 80
conform to ASTM Standards F480 or D1785 or other similar international standard
Stainless steel well screens Type 316
flush threaded joints
sealing “O” rings
conform to ASTM Standard A312/A312M or other similar international standard
Teflon® well screen flush threaded joints
sealing Teflon® “O” rings
conform to ASTM Standard D4894 or D4895 or other similar international standard
chemically inert as technically practical with respect to the site environment
Table 5-8 – Well Screen Materials
QCC-V2
COPY
STORMWATER & SUBSOIL DRAINAGE SYSTEMS VOLUME I- DESIGN MANUAL
PAGE 56 05-SUB SOIL DRAINAGE DESIGN SECOND EDITION – JULY 2020
5.9.6. Other Well Design Considerations
The Consultant shall demonstrate consideration of other well design factors:
Design Discharge Rate of Tubewells
The design discharge rate depends on autonomous and design factors shown in Table 5-10.
Tubewell Operating Factor
The tubewell operating factor is the number of actual operating hours of the well per 24 hours, expressed as a fraction. The tubewell operating factor largely depends on autonomous factors, but also on a design factor like the peak drainage requirement. It will not be possible to operate all wells continuously over an extended period. Time will be lost during maintenance, inspection, and repairs, stoppage due to power failures, etc. Social factors like the presence or absence of a pump operator will also influence the possible operating factor of the wells.
Annual Drainable Surplus
The annual drainable surplus of an area is the annual discharge, in mm/day, required to maintain the design water-level criteria. It depends on many factors and one of the essential factors is the depth at which the water table is to be controlled.
Peak Drainage Requirement
To maintain a stabilised water table in tube well drainage, the system should be based on the maximum expected recharge. This, however, would result in excessive investment costs. If the system were to be based on a continuous discharge to drain the annual drainable surplus at a constant rate, the water table would fluctuate throughout the year. This variation can be reduced by adjusting the monthly tubewell operating factor. This means higher operating factors during the periods with higher recharges and lower operating factors during the periods with lower recharges.
Table 5-9 – Other Well Design Considerations
Autonomous Factors Design factors
Design should be based on the most economic pump capacity. If larger pumps are installed, fewer pumps will be required, which generally results in lower investment costs. On the other hand, larger capacity pumps result in higher drawdowns and thus higher energy costs. Determining pump capacities on a purely economic basis could lead to very high pumping rates. There are, however, several practical constraints to these high pump capacities.
The annual drainable surplus and the peak requirements. The maximum tubewell capacity will influence the distance between the wells or the maximum spacing in the well field. Hence, for a given operating factor, the drainable surplus would be the determining factor for the discharge rate of the well.
Selection of pumps and engines should be based on their availability on the local market; spare parts, especially, should be locally available.
The horizontal and vertical hydraulic conductivity and the thickness of the aquifer, and the vertical resistance of the aquitard, determine the drawdown for a given discharge rate and the expansion of the cone of depression.
A policy of reducing the number of different
pump sizes may be another major constraint on
the choice of the pump capacity.
Screen and casing specifications,
together with the discharge rate,
determine the entrance velocity of
water flowing through the screen,
QCC-V2
COPY

STORMWATER & SUBSOIL DRAINAGE SYSTEMS VOLUME I- DESIGN MANUAL
PAGE 57 05-SUB SOIL DRAINAGE DESIGN SECOND EDITION – JULY 2020
Autonomous Factors Design factors
which has a maximum value in order
to ensure a maximum lifetime for the
well.
A well with a very high pump capacity may
serve a very large area that exceeds the
spacing determined by other factors. If such a
well were to be out of order for a prolonged
period, the neighbouring wells would be
overburdened, and proper drainage of the area
would be impossible.
Table 5-10 – Autonomous and Design Factors Affecting Design Discharge Rates
5.9.7. Environmental Design Considerations
This Section provides guidance on tubewell design and the potential for impact on the environment. Environmental considerations include:
Aquifer pollution prevention – design and construction of suitable tubewell housing to prevent unauthorised access.
Management of poor quality discharge water – tubewell drainage may draw in contaminants from off-site or newly introduced on-site sources. Poor quality water may require treatment prior to its disposal into the reticulation network.
Environmental design considerations should be included as part of the reconnaissance and concept design stages of drainage design development. These considerations shall follow guidance provided in CIRIA document ‘Control of water pollution from linear construction projects: technical guidance, Publication C648, 2006’.
5.9.8. Tubewell and Pump Maintenance
To determine any loss in performance some reference mark will be needed and an effective maintenance program established prior to implementation of the drainage design.
To evaluate the performance of a well, the following checklist shall be performed on commissioning each well:
The static water level in the well.
The pumping rate and the water level expressed as specific capacity and the ratio of the pumping rate and the drawdown after a specified period of pumping.
The sand content of the pumped water.
The total depth of the well.
The original specific capacity of the well.
The normal pumping rate and how many hours per day it is operated.
Significant changes in well yield, energy demand, or energy consumption indicate that the well, or the pump, requires maintenance measures.
It is important that the tubewell is designed to allow easy access for monitoring, and maintenance should it be required. Thus design shall follow guidance provided in CIRIA document ‘Monitoring, maintenance and rehabilitation of water supply boreholes, Report R 137, 2003’.
QCC-V2
COPY
STORMWATER & SUBSOIL DRAINAGE SYSTEMS VOLUME I- DESIGN MANUAL
PAGE 58 06-STORMWATER PUMPING STATIONS SECOND EDITION – JULY 2020
6. STORM WATER PUMPING STATIONS
6.1. General
Pumping stations are required for the removal of the storm water from locations where gravity drainage is impossible or for maintenance purpose. However, pumping stations are expensive to construct, operate and maintain, contain additional health and safety risks over gravity systems and have number potential problems that must be considered. They also represent a weak-link in the operation of the system compared to gravity systems.
As such, pumping stations should only be incorporated in the system where they are essential for correct hydraulic functioning.
6.2. Pumping Station Types
6.2.1. Pumping Station Components
Following major pumping station components shall be considered as minimum during the design process:
Inlet Chamber
Pump house
Discharge Chamber
Inlet chamber shall be design to accommodate following items:
o Penstock
o Screening
o Sand Trap
o Oil separator
Pump house arrangements shall mostly depend on the pumping station type.
However, each pump house shall be designed to accommodate following items:
o Suction piping (wet well installation)
o Pumps
o Discharge piping including required isolation valves, check valve, associated
piping, etc.
Discharge chamber shall be design to accommodate
o Flowmeter
o Line Valve
o Surge vessel (if required)
MCC room
Lifting Equipment
Ventilation/ HVAC system
QCC-V2
COPY

STORMWATER & SUBSOIL DRAINAGE SYSTEMS VOLUME I- DESIGN MANUAL
PAGE 59 06-STORMWATER PUMPING STATIONS SECOND EDITION – JULY 2020
6.2.2. Pumping Station Types
Commonly used types of pumping stations in DMAT jurisdiction are shown in the table below:
Pumping Station Type Wet Well Dry Well
outfall
pedestrian underpasses
traffic underpasses
sub-soil drainage
lifting stations
pumping station of the general purpose
Table 6-1 – Commonly used types of pumping stations in DMAT jurisdiction
Wet Well Pumping Stations
Circular wet wells shall be used for pumps with individual flows up to 180 l/s. Rectangular wet wells shall be designed for large pumps with individual flows greater than 180 l/s.
For minimum active volume calculation following equation shall be used:
V=0.25QT
Q – Pump capacity
T – Minimum cycle time specified by pump manufacturer
Dry Well Pumping Stations
Comprising two main chambers: a dry well and a wet well. The minimum active volume of the wet well shall be calculated using equation in Wet Well Pumping Stations section.
For the dry well sizing following shall be considered as minimum:
Equipment and piping requirement
Sufficient space for installation of the equipment and piping
Adequate access for personnel
Civil Defence requirements
6.3. Mechanical Design
6.3.1. Pumps
Centrifugal pumps shall be used for all storm water pumping applications as follows:
Pump Type Wet Well Dry Well
Submersible direct coupled pumps
Submersible axial (propeller)
QCC-V2
COPY
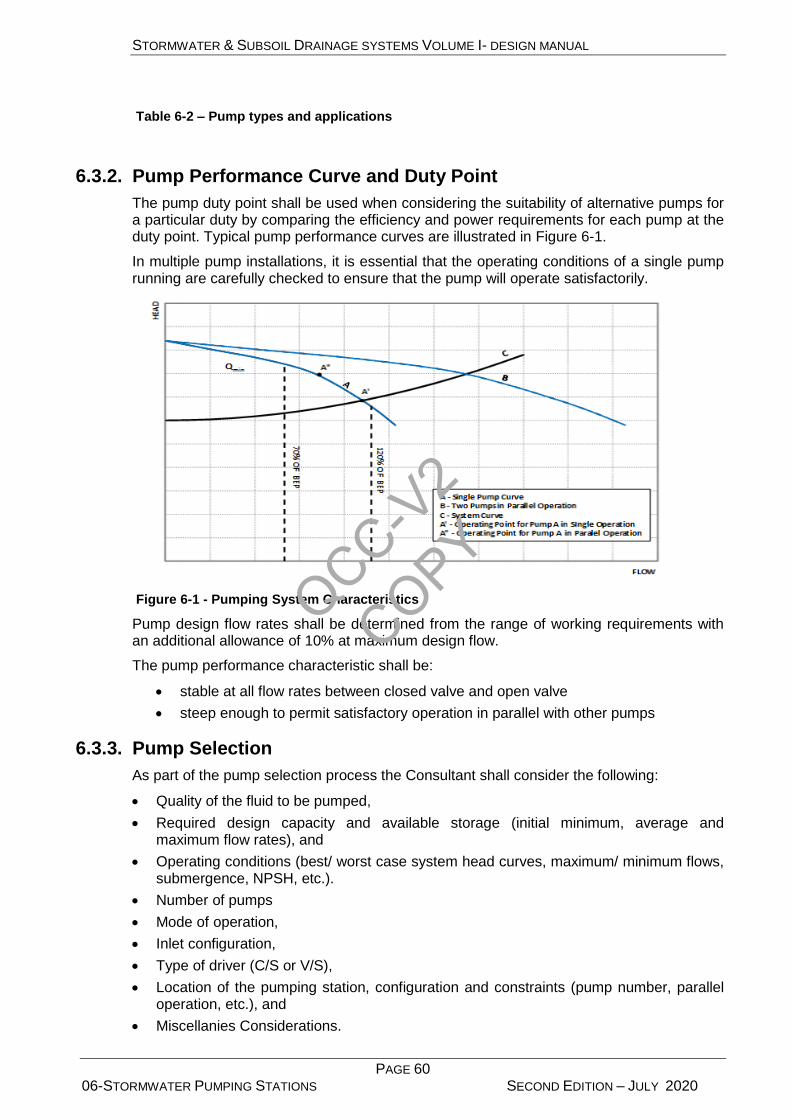
STORMWATER & SUBSOIL DRAINAGE SYSTEMS VOLUME I- DESIGN MANUAL
PAGE 60 06-STORMWATER PUMPING STATIONS SECOND EDITION – JULY 2020
Table 6-2 – Pump types and applications
6.3.2. Pump Performance Curve and Duty Point
The pump duty point shall be used when considering the suitability of alternative pumps for a particular duty by comparing the efficiency and power requirements for each pump at the duty point. Typical pump performance curves are illustrated in Figure 6-1.
In multiple pump installations, it is essential that the operating conditions of a single pump running are carefully checked to ensure that the pump will operate satisfactorily.
Figure 6-1 - Pumping System Characteristics
Pump design flow rates shall be determined from the range of working requirements with an additional allowance of 10% at maximum design flow.
The pump performance characteristic shall be:
stable at all flow rates between closed valve and open valve
steep enough to permit satisfactory operation in parallel with other pumps
6.3.3. Pump Selection
As part of the pump selection process the Consultant shall consider the following:
Quality of the fluid to be pumped,
Required design capacity and available storage (initial minimum, average and maximum flow rates), and
Operating conditions (best/ worst case system head curves, maximum/ minimum flows, submergence, NPSH, etc.).
Number of pumps
Mode of operation,
Inlet configuration,
Type of driver (C/S or V/S),
Location of the pumping station, configuration and constraints (pump number, parallel operation, etc.), and
Miscellanies Considerations.
QCC-V2
COPY
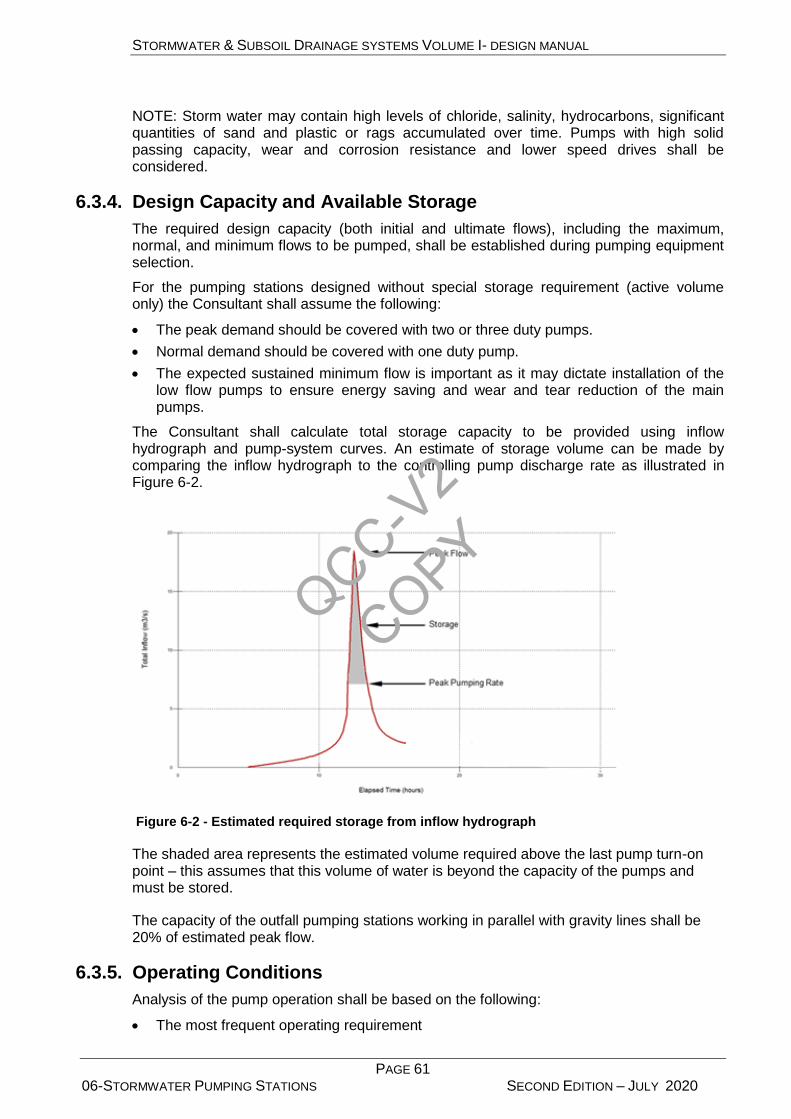
STORMWATER & SUBSOIL DRAINAGE SYSTEMS VOLUME I- DESIGN MANUAL
PAGE 61 06-STORMWATER PUMPING STATIONS SECOND EDITION – JULY 2020
NOTE: Storm water may contain high levels of chloride, salinity, hydrocarbons, significant quantities of sand and plastic or rags accumulated over time. Pumps with high solid passing capacity, wear and corrosion resistance and lower speed drives shall be considered.
6.3.4. Design Capacity and Available Storage
The required design capacity (both initial and ultimate flows), including the maximum, normal, and minimum flows to be pumped, shall be established during pumping equipment selection.
For the pumping stations designed without special storage requirement (active volume only) the Consultant shall assume the following:
The peak demand should be covered with two or three duty pumps.
Normal demand should be covered with one duty pump.
The expected sustained minimum flow is important as it may dictate installation of the low flow pumps to ensure energy saving and wear and tear reduction of the main pumps.
The Consultant shall calculate total storage capacity to be provided using inflow hydrograph and pump-system curves. An estimate of storage volume can be made by comparing the inflow hydrograph to the controlling pump discharge rate as illustrated in Figure 6-2.
Figure 6-2 - Estimated required storage from inflow hydrograph
The shaded area represents the estimated volume required above the last pump turn-on point – this assumes that this volume of water is beyond the capacity of the pumps and must be stored.
The capacity of the outfall pumping stations working in parallel with gravity lines shall be 20% of estimated peak flow.
6.3.5. Operating Conditions
Analysis of the pump operation shall be based on the following:
The most frequent operating requirement
QCC-V2
COPY
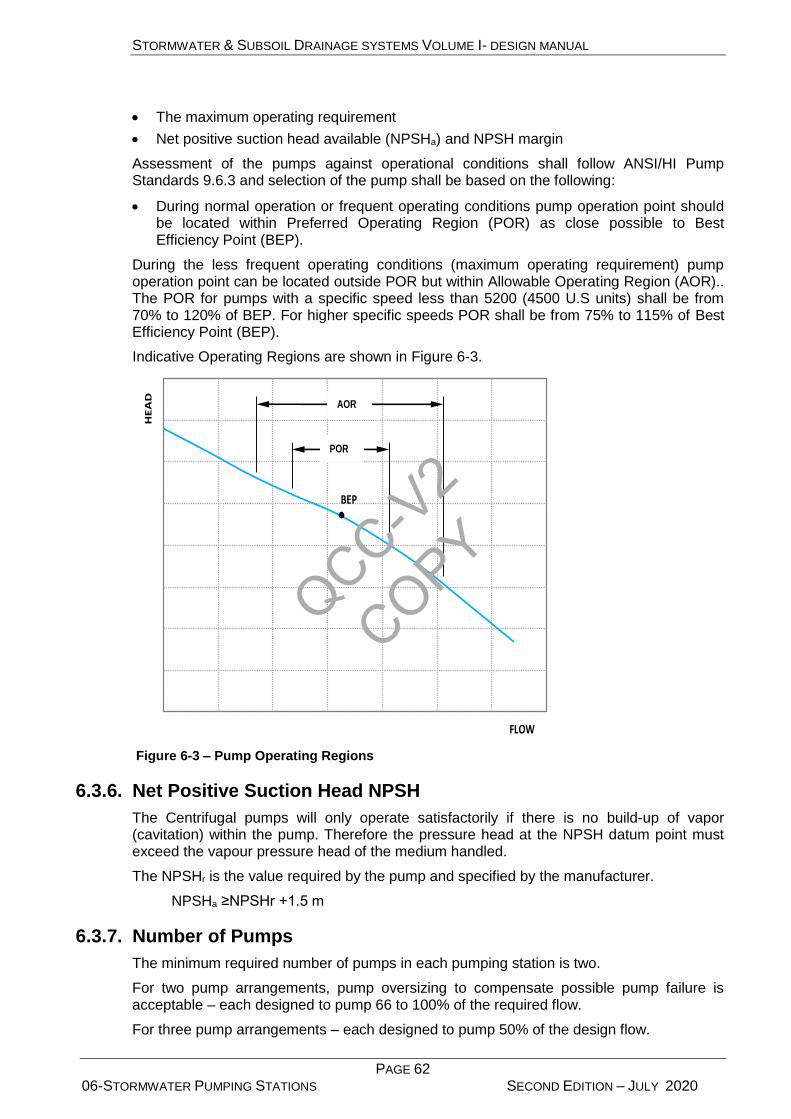
STORMWATER & SUBSOIL DRAINAGE SYSTEMS VOLUME I- DESIGN MANUAL
PAGE 62 06-STORMWATER PUMPING STATIONS SECOND EDITION – JULY 2020
The maximum operating requirement
Net positive suction head available (NPSHa) and NPSH margin
Assessment of the pumps against operational conditions shall follow ANSI/HI Pump Standards 9.6.3 and selection of the pump shall be based on the following:
During normal operation or frequent operating conditions pump operation point should be located within Preferred Operating Region (POR) as close possible to Best Efficiency Point (BEP).
During the less frequent operating conditions (maximum operating requirement) pump operation point can be located outside POR but within Allowable Operating Region (AOR).. The POR for pumps with a specific speed less than 5200 (4500 U.S units) shall be from 70% to 120% of BEP. For higher specific speeds POR shall be from 75% to 115% of Best Efficiency Point (BEP).
Indicative Operating Regions are shown in Figure 6-3.
Figure 6-3 – Pump Operating Regions
6.3.6. Net Positive Suction Head NPSH
The Centrifugal pumps will only operate satisfactorily if there is no build-up of vapor (cavitation) within the pump. Therefore the pressure head at the NPSH datum point must exceed the vapour pressure head of the medium handled.
The NPSHr is the value required by the pump and specified by the manufacturer.
NPSHa ≥NPSHr +1.5 m
6.3.7. Number of Pumps
The minimum required number of pumps in each pumping station is two.
For two pump arrangements, pump oversizing to compensate possible pump failure is acceptable – each designed to pump 66 to 100% of the required flow.
For three pump arrangements – each designed to pump 50% of the design flow.
BEP
FLOW
HEAD
POR
AOR
QCC-V2
COPY
STORMWATER & SUBSOIL DRAINAGE SYSTEMS VOLUME I- DESIGN MANUAL
PAGE 63 06-STORMWATER PUMPING STATIONS SECOND EDITION – JULY 2020
Each main pump shall have equal capacity and be of the same make and type.
Low capacity pump should be used as the first to switch on when using a small number of large capacity pumps. This pump is not part of the sequencing that follows.
6.4. Pumping Station Arrangement
6.4.1. Suction and Discharge Pipework
Design of the suction piping shall follow ANSI/HI 9.8 Pump Intake Design standard and selected pump manufacturer recommendations.
In addition the following suction piping recommendations shall be considered by the Consultant:
Design Element Consideration
Direct connection of the pipe fittings to pump nozzle shall be avoided since.
Pipe fitting cause uneven flow patterns
The short radius elbows shall be avoided Always use long radius elbows where possible
Suction piping approaching to pump should be straight with length from 5D to 10D
Ideally, length of the suction pipe should be 10D. (10D rule is not always applicable due to construction / economic limitations)
Pump inlet piping shall be designed and installed to provide smooth and even flow
Introduction of the suction bell is recommended. Suction bell shall reduce frictional losses and approach mean velocity
The eccentric reducer in flat to the top position should be used when a pipe size transition is required
Connection of the large pipe to pump suction
Installation of foot valves shall be avoided
Gate valves shall be used as shut off valves
Minimum pumping velocity shall be sufficient to avoid clogging of the suction line due to presence of the solids in the water
Anchorage of the suction piping should be near to the pumps and in the same time piping arrangement should ensure easy removal of the pump
Misalignment of the suction piping can cause excessive loads at pump nozzle. The contraction/ expansion of the suction piping should be reduced on the acceptable level
The suction line size shall never be smaller than suction nozzle size
Table 6-3 - Suction Piping Design Considerations
QCC-V2
COPY
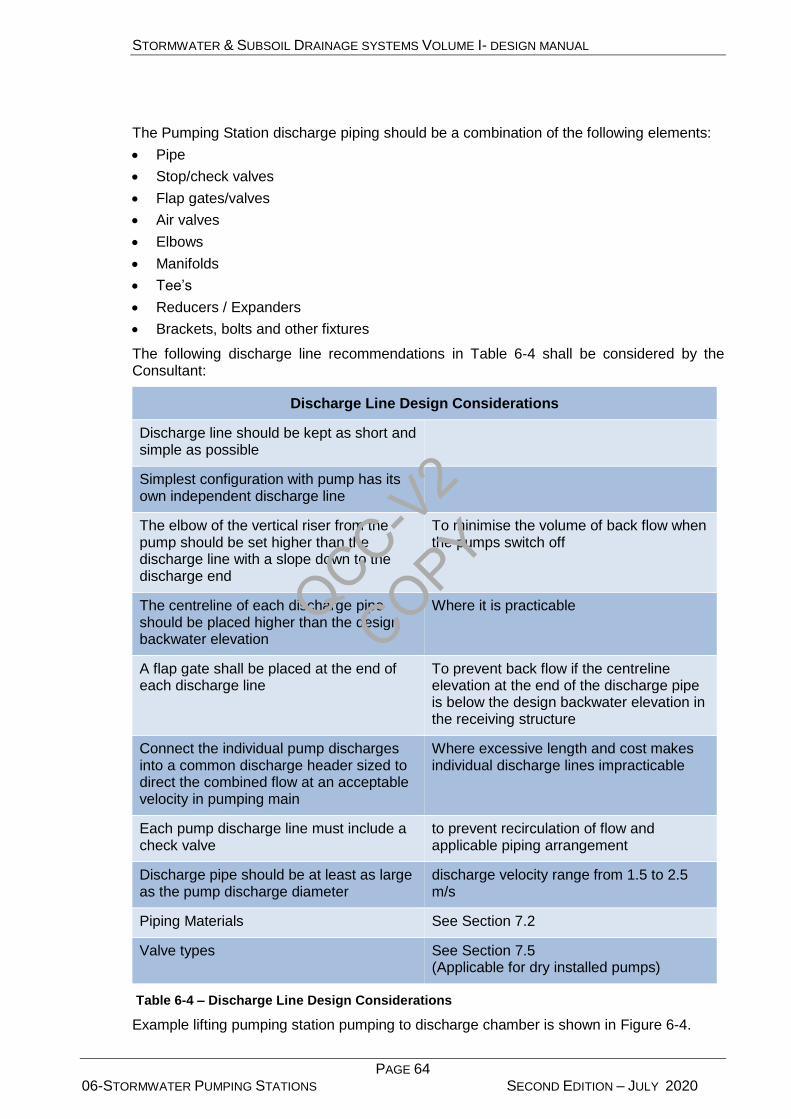
STORMWATER & SUBSOIL DRAINAGE SYSTEMS VOLUME I- DESIGN MANUAL
PAGE 64 06-STORMWATER PUMPING STATIONS SECOND EDITION – JULY 2020
The Pumping Station discharge piping should be a combination of the following elements:
Pipe
Stop/check valves
Flap gates/valves
Air valves
Elbows
Manifolds
Tee’s
Reducers / Expanders
Brackets, bolts and other fixtures
The following discharge line recommendations in Table 6-4 shall be considered by the Consultant:
Discharge Line Design Considerations
Discharge line should be kept as short and simple as possible
Simplest configuration with pump has its own independent discharge line
The elbow of the vertical riser from the pump should be set higher than the discharge line with a slope down to the discharge end
To minimise the volume of back flow when the pumps switch off
The centreline of each discharge pipe should be placed higher than the design backwater elevation
Where it is practicable
A flap gate shall be placed at the end of each discharge line
To prevent back flow if the centreline elevation at the end of the discharge pipe is below the design backwater elevation in the receiving structure
Connect the individual pump discharges into a common discharge header sized to direct the combined flow at an acceptable velocity in pumping main
Where excessive length and cost makes individual discharge lines impracticable
Each pump discharge line must include a check valve
to prevent recirculation of flow and applicable piping arrangement
Discharge pipe should be at least as large as the pump discharge diameter
discharge velocity range from 1.5 to 2.5 m/s
Piping Materials See Section 7.2
Valve types See Section 7.5 (Applicable for dry installed pumps)
Table 6-4 – Discharge Line Design Considerations
Example lifting pumping station pumping to discharge chamber is shown in Figure 6-4.
QCC-V2
COPY

STORMWATER & SUBSOIL DRAINAGE SYSTEMS VOLUME I- DESIGN MANUAL
PAGE 65 06-STORMWATER PUMPING STATIONS SECOND EDITION – JULY 2020
6.4.2. Intake Design
The intake structure shall be designed to supply an even distribution of flow to the pumps.
Since pump performance is dependent on conditions at the pump intake the following conditions should be avoided during design:
Poor velocity distribution at the pump entrance
Excessive swirling in the piping
Air entrainment
Inadequate NPSHA
Unstable approach conditions during multiple as well as single pump operation
Vortices
The pump intake shall be designed according to the latest version Hydraulic Institute standard ANSI/HI 9.8 Pump Intake Design and as per manufacturer recommendations. Example configurations are shown in Figure 6-4.
Figure 6-4 – Typical Pump station intake configurations
QCC-V2
COPY
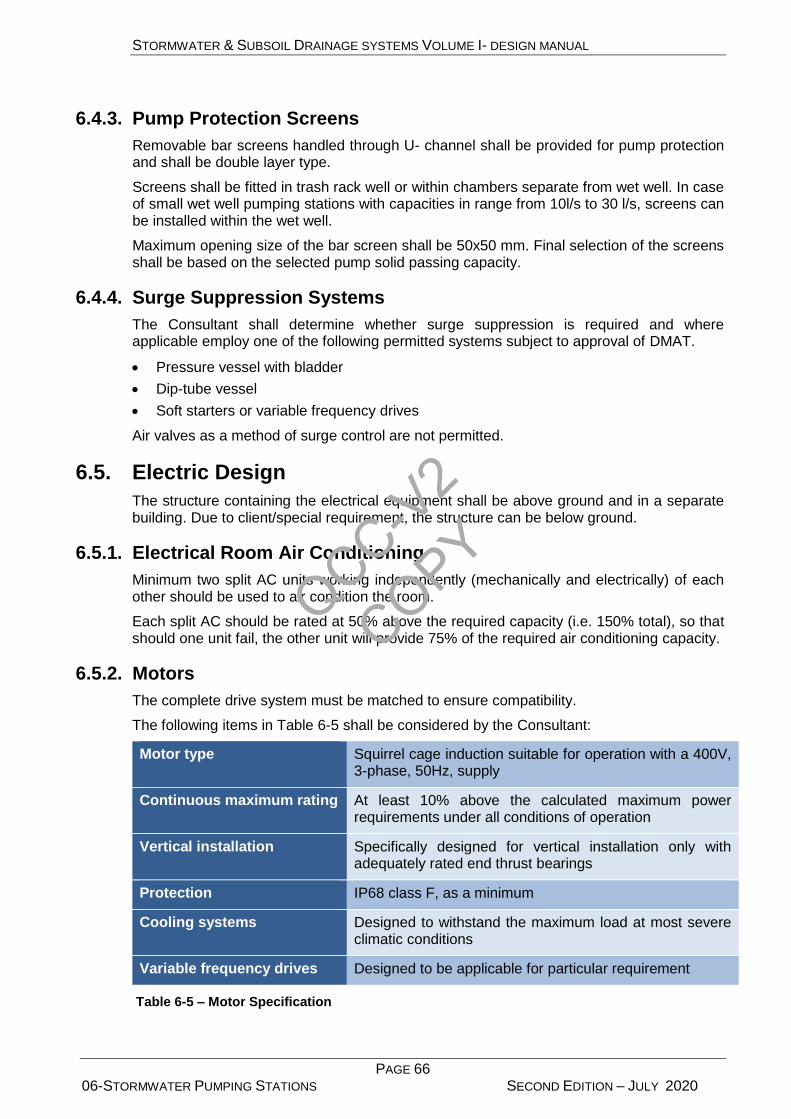
STORMWATER & SUBSOIL DRAINAGE SYSTEMS VOLUME I- DESIGN MANUAL
PAGE 66 06-STORMWATER PUMPING STATIONS SECOND EDITION – JULY 2020
6.4.3. Pump Protection Screens
Removable bar screens handled through U- channel shall be provided for pump protection and shall be double layer type.
Screens shall be fitted in trash rack well or within chambers separate from wet well. In case of small wet well pumping stations with capacities in range from 10l/s to 30 l/s, screens can be installed within the wet well.
Maximum opening size of the bar screen shall be 50x50 mm. Final selection of the screens shall be based on the selected pump solid passing capacity.
6.4.4. Surge Suppression Systems
The Consultant shall determine whether surge suppression is required and where applicable employ one of the following permitted systems subject to approval of DMAT.
Pressure vessel with bladder
Dip-tube vessel
Soft starters or variable frequency drives
Air valves as a method of surge control are not permitted.
6.5. Electric Design
The structure containing the electrical equipment shall be above ground and in a separate building. Due to client/special requirement, the structure can be below ground.
6.5.1. Electrical Room Air Conditioning
Minimum two split AC units working independently (mechanically and electrically) of each other should be used to air condition the room.
Each split AC should be rated at 50% above the required capacity (i.e. 150% total), so that should one unit fail, the other unit will provide 75% of the required air conditioning capacity.
6.5.2. Motors
The complete drive system must be matched to ensure compatibility.
The following items in Table 6-5 shall be considered by the Consultant:
Motor type Squirrel cage induction suitable for operation with a 400V, 3-phase, 50Hz, supply
Continuous maximum rating At least 10% above the calculated maximum power requirements under all conditions of operation
Vertical installation Specifically designed for vertical installation only with adequately rated end thrust bearings
Protection IP68 class F, as a minimum
Cooling systems Designed to withstand the maximum load at most severe climatic conditions
Variable frequency drives Designed to be applicable for particular requirement
Table 6-5 – Motor Specification
QCC-V2
COPY
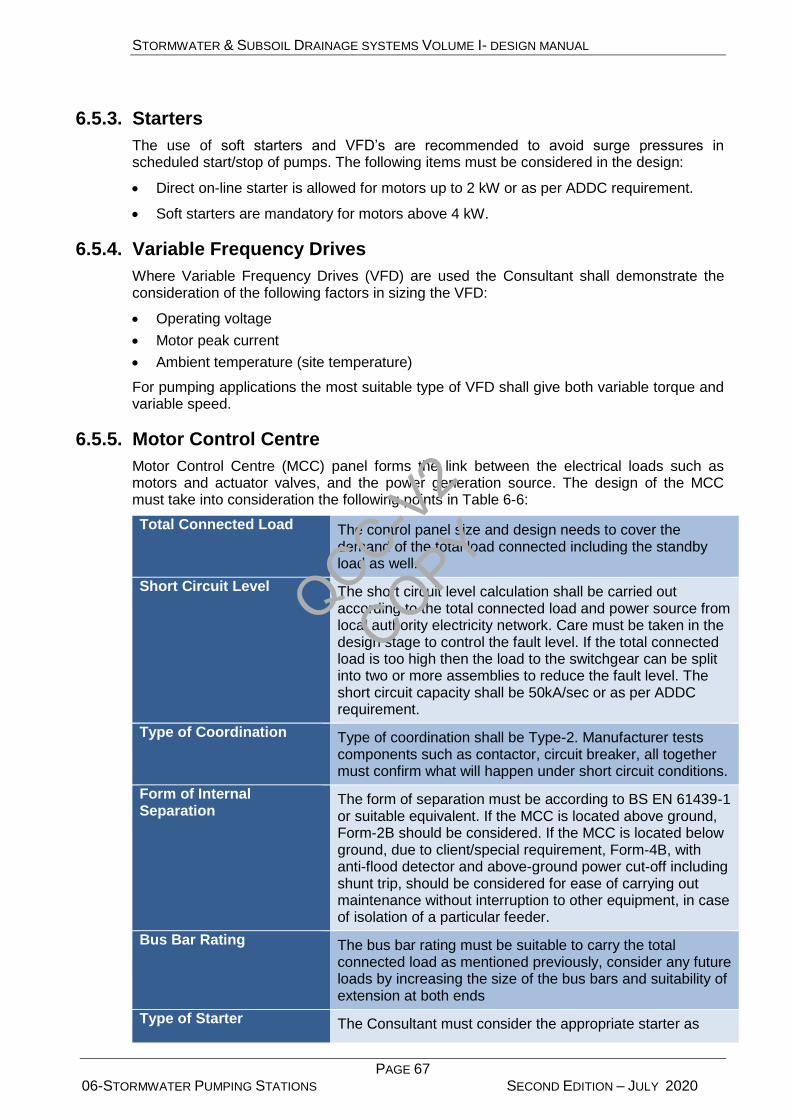
STORMWATER & SUBSOIL DRAINAGE SYSTEMS VOLUME I- DESIGN MANUAL
PAGE 67 06-STORMWATER PUMPING STATIONS SECOND EDITION – JULY 2020
6.5.3. Starters
The use of soft starters and VFD’s are recommended to avoid surge pressures in scheduled start/stop of pumps. The following items must be considered in the design:
Direct on-line starter is allowed for motors up to 2 kW or as per ADDC requirement.
Soft starters are mandatory for motors above 4 kW.
6.5.4. Variable Frequency Drives
Where Variable Frequency Drives (VFD) are used the Consultant shall demonstrate the consideration of the following factors in sizing the VFD:
Operating voltage
Motor peak current
Ambient temperature (site temperature)
For pumping applications the most suitable type of VFD shall give both variable torque and variable speed.
6.5.5. Motor Control Centre
Motor Control Centre (MCC) panel forms the link between the electrical loads such as motors and actuator valves, and the power generation source. The design of the MCC must take into consideration the following points in Table 6-6:
Total Connected Load The control panel size and design needs to cover the demand of the total load connected including the standby load as well.
Short Circuit Level The short circuit level calculation shall be carried out according to the total connected load and power source from local authority electricity network. Care must be taken in the design stage to control the fault level. If the total connected load is too high then the load to the switchgear can be split into two or more assemblies to reduce the fault level. The short circuit capacity shall be 50kA/sec or as per ADDC requirement.
Type of Coordination Type of coordination shall be Type-2. Manufacturer tests components such as contactor, circuit breaker, all together must confirm what will happen under short circuit conditions.
Form of Internal Separation
The form of separation must be according to BS EN 61439-1 or suitable equivalent. If the MCC is located above ground, Form-2B should be considered. If the MCC is located below ground, due to client/special requirement, Form-4B, with anti-flood detector and above-ground power cut-off including shunt trip, should be considered for ease of carrying out maintenance without interruption to other equipment, in case of isolation of a particular feeder.
Bus Bar Rating The bus bar rating must be suitable to carry the total connected load as mentioned previously, consider any future loads by increasing the size of the bus bars and suitability of extension at both ends
Type of Starter The Consultant must consider the appropriate starter as
QCC-V2
COPY

STORMWATER & SUBSOIL DRAINAGE SYSTEMS VOLUME I- DESIGN MANUAL
PAGE 68 06-STORMWATER PUMPING STATIONS SECOND EDITION – JULY 2020
mentioned in Section 6.5.3 and 6.5.4
Table 6-6 – Motor Control Centre Specification
The MCC, Main Distribution Board (MDB) and Distribution Board (DB) shall comply with the latest ADDC requirements.
6.5.6. Protection Device
The Consultant shall categorise the entire load connected to the switchgear according to its critical status in the process and its effect on operator safety.
Permitted protection types are as follows:
Short circuit protection
Overload protection
Under/over voltage protection
Phase losses/phase miss reversal protection
Earth leakage protection
Motor protection relay (electronic relay)
Interlocking facility where required
6.5.7. Power Factor Correction Capacitors
The Consultant shall demonstrate consideration of following items in the design of Power Factor Correction Capacitors:
PFCC shall improve the overall power factor of the plant/equipment to 0.93 lagging (or better)
PFCC shall be designed for automatic centralised operation for site-wide Power Factor compensation by employing multiple steps
The enclosure shall be of equal height of the associated MCC and located adjacent to it or at other suitable location within the MCC room
The PFCC enclosure shall be fitted with forced ventilation fan and louvers as necessary. The IP rating when fitted with forced ventilation must be at least IP43
The PFCC enclosure shall be sized to accommodate an additional spare step of equal rating for future use
The design of the PFCC shall take into account any harmonic filter installations connected to the same power distribution system so as to avoid any LC resonance with these and any upstream transformer reactance.
6.5.8. Earthing
All the metallic parts shall be earthed.
The Consultant shall specify appropriate earth connection between metallic parts separated by rubber joints.
Earthing shall be designed in accordance with ADDC regulations and achieve the following objectives:
To maintain high operational availability of electrical installation
To eliminate the problems often caused by undesired potential difference between different parts of an installation leading to malfunctioning, damage to installation and human lives
To provide segregated earthing system as follows:
QCC-V2
COPY
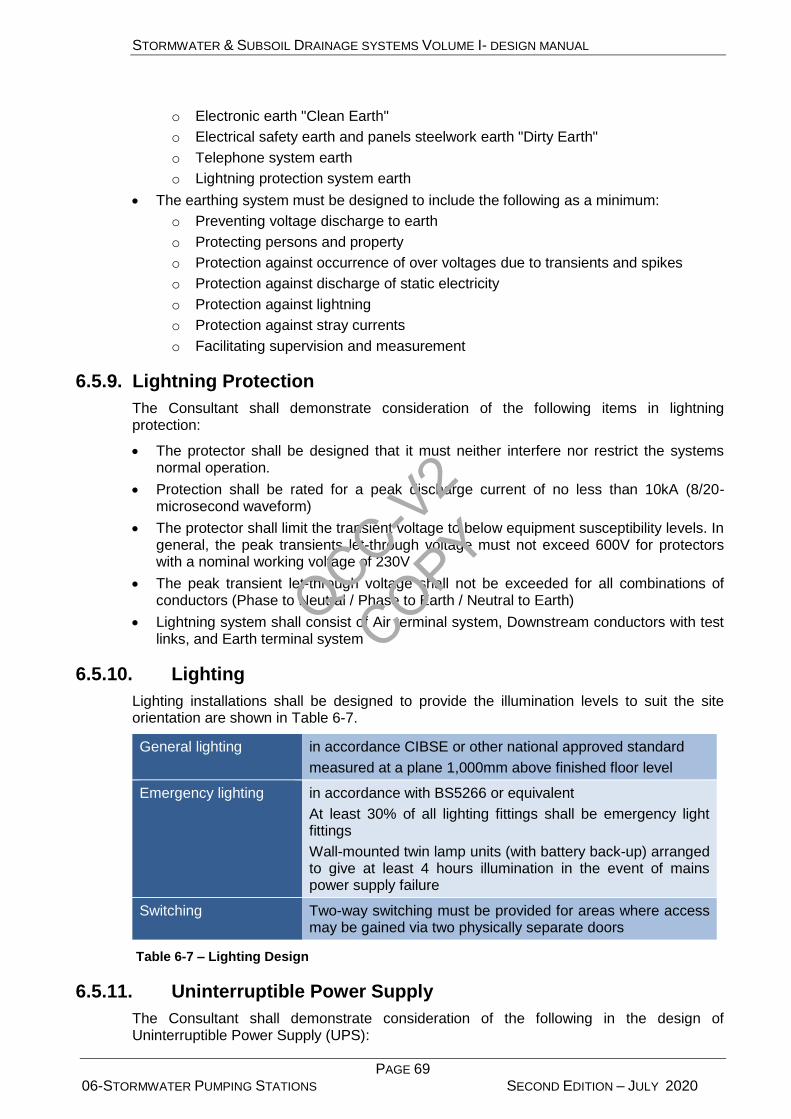
STORMWATER & SUBSOIL DRAINAGE SYSTEMS VOLUME I- DESIGN MANUAL
PAGE 69 06-STORMWATER PUMPING STATIONS SECOND EDITION – JULY 2020
o Electronic earth "Clean Earth"
o Electrical safety earth and panels steelwork earth "Dirty Earth"
o Telephone system earth
o Lightning protection system earth
The earthing system must be designed to include the following as a minimum:
o Preventing voltage discharge to earth
o Protecting persons and property
o Protection against occurrence of over voltages due to transients and spikes
o Protection against discharge of static electricity
o Protection against lightning
o Protection against stray currents
o Facilitating supervision and measurement
6.5.9. Lightning Protection
The Consultant shall demonstrate consideration of the following items in lightning protection:
The protector shall be designed that it must neither interfere nor restrict the systems normal operation.
Protection shall be rated for a peak discharge current of no less than 10kA (8/20-microsecond waveform)
The protector shall limit the transient voltage to below equipment susceptibility levels. In general, the peak transients let-through voltage must not exceed 600V for protectors with a nominal working voltage of 230V
The peak transient let-through voltage shall not be exceeded for all combinations of conductors (Phase to Neutral / Phase to Earth / Neutral to Earth)
Lightning system shall consist of Air terminal system, Downstream conductors with test links, and Earth terminal system
6.5.10. Lighting
Lighting installations shall be designed to provide the illumination levels to suit the site orientation are shown in Table 6-7.
General lighting in accordance CIBSE or other national approved standard
measured at a plane 1,000mm above finished floor level
Emergency lighting in accordance with BS5266 or equivalent
At least 30% of all lighting fittings shall be emergency light fittings
Wall-mounted twin lamp units (with battery back-up) arranged to give at least 4 hours illumination in the event of mains power supply failure
Switching Two-way switching must be provided for areas where access may be gained via two physically separate doors
Table 6-7 – Lighting Design
6.5.11. Uninterruptible Power Supply
The Consultant shall demonstrate consideration of the following in the design of Uninterruptible Power Supply (UPS):
QCC-V2
COPY

STORMWATER & SUBSOIL DRAINAGE SYSTEMS VOLUME I- DESIGN MANUAL
PAGE 70 06-STORMWATER PUMPING STATIONS SECOND EDITION – JULY 2020
The UPS shall be designed and manufactured “standalone” for automatic operation
The UPS shall be designed to supply clean, uninterrupted power to the loads
The design of UPS shall take account of continuous load capacity, de-rating for non-linear loads and ambient temperature conditions
The UPS shall be sized to supply all instrumentation and control equipment, including but not limited to, control and computer room hardware, mimic, annunciation, telecommunication systems and emergency lighting etc., where applicable.
6.5.12. Cables
The Consultant shall demonstrate consideration of the following items in the design of cables:
All LV cables shall be 600/1000V-grade copper single/multi cores
Where required a neutral conductor shall be in the form of a core of the same section as the other cores - separate neutral cables are not permitted
Each cable is of sufficient rating for its normal and fault conditions
Cables shall be sized considering following:
o Laid in ground/air/duct
o Depth of laying for cables laid direct in the ground/duct
o Temperature of the ground/air
o Group rating factors
o Thermal resistivity of soil (for cable laid direct in ground/duct)
o Allowable voltage drop
Earthing conductor shall be of adequate cross sectional area and be either one core of a multicore cable or a separately run single-core cable. The use of conduit and water pipes in any part of the earth continuity conductor is not permitted.
General routing of cables shall be indicated on the drawings and the final routes and duct locations agreed with DMAT.
6.5.13. Mobile Generator Junction Box / Stand-by Generator with ATS
A mobile generator junction box shall be provided for mobile generator connection in case of mains power supply failure.
A stationary generator shall be provided for tunnel lifting pumping station.
QCC-V2
COPY
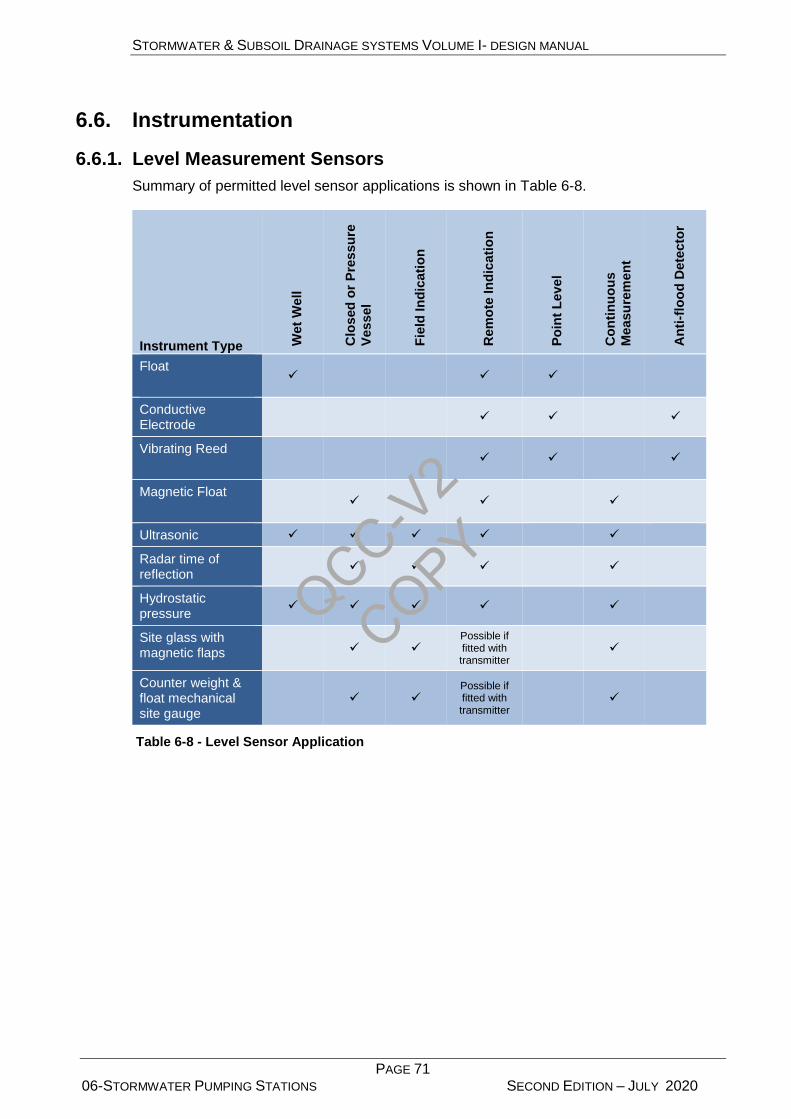
STORMWATER & SUBSOIL DRAINAGE SYSTEMS VOLUME I- DESIGN MANUAL
PAGE 71 06-STORMWATER PUMPING STATIONS SECOND EDITION – JULY 2020
6.6. Instrumentation
6.6.1. Level Measurement Sensors
Summary of permitted level sensor applications is shown in Table 6-8.
Instrument Type Wet
Well
Clo
sed
or
Pre
ssu
re
Ves
sel
Fie
ld In
dic
ati
on
Rem
ote
In
dic
ati
on
Po
int
Leve
l
Co
nti
nu
ou
s
Measu
rem
en
t
An
ti-f
loo
d D
ete
cto
r
Float
Conductive Electrode
Vibrating Reed
Magnetic Float
Ultrasonic
Radar time of reflection
Hydrostatic pressure
Site glass with magnetic flaps
Possible if fitted with transmitter
Counter weight & float mechanical site gauge
Possible if fitted with transmitter
Table 6-8 - Level Sensor Application
QCC-V2
COPY
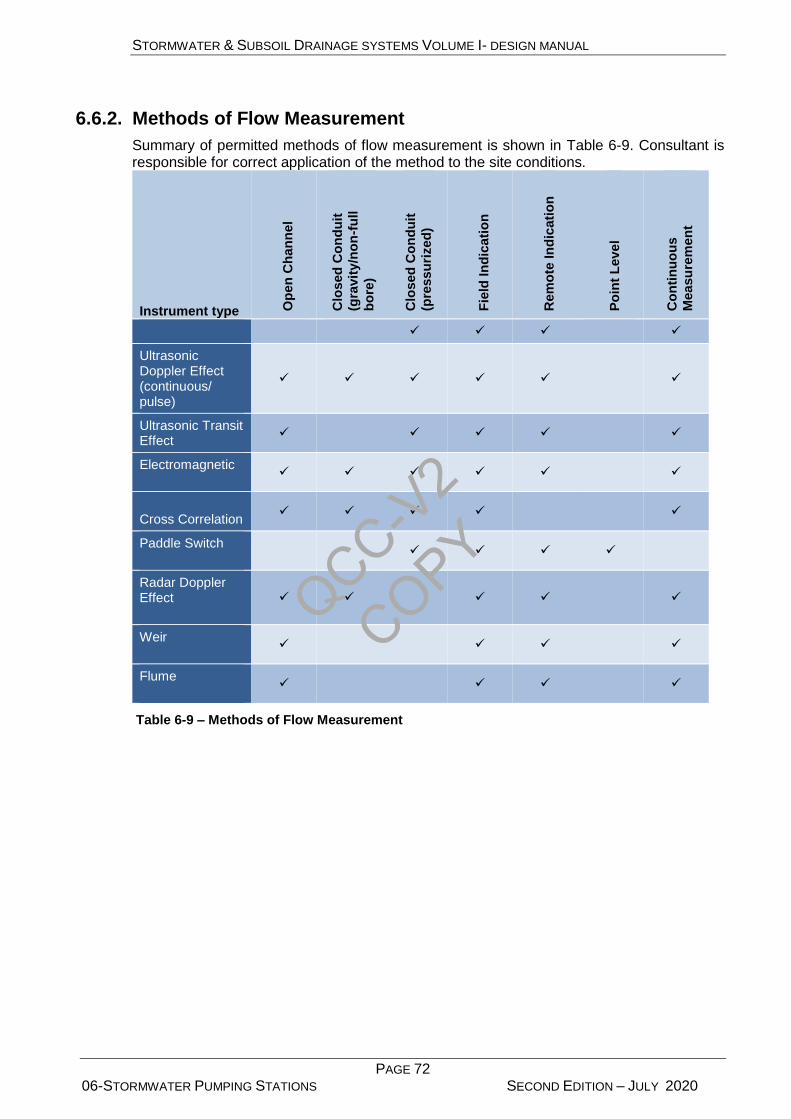
STORMWATER & SUBSOIL DRAINAGE SYSTEMS VOLUME I- DESIGN MANUAL
PAGE 72 06-STORMWATER PUMPING STATIONS SECOND EDITION – JULY 2020
6.6.2. Methods of Flow Measurement
Summary of permitted methods of flow measurement is shown in Table 6-9. Consultant is responsible for correct application of the method to the site conditions.
Instrument type Op
en
Ch
an
nel
Clo
sed
Co
nd
uit
(gra
vit
y/n
on
-fu
ll
bo
re)
Clo
sed
Co
nd
uit
(pre
ssu
rized
)
Fie
ld In
dic
ati
on
Rem
ote
In
dic
ati
on
Po
int
Leve
l
Co
nti
nu
ou
s
Measu
rem
en
t
Ultrasonic Doppler Effect (continuous/ pulse)
Ultrasonic Transit Effect
Electromagnetic
Cross Correlation
Paddle Switch
Radar Doppler Effect
Weir
Flume
Table 6-9 – Methods of Flow Measurement
QCC-V2
COPY
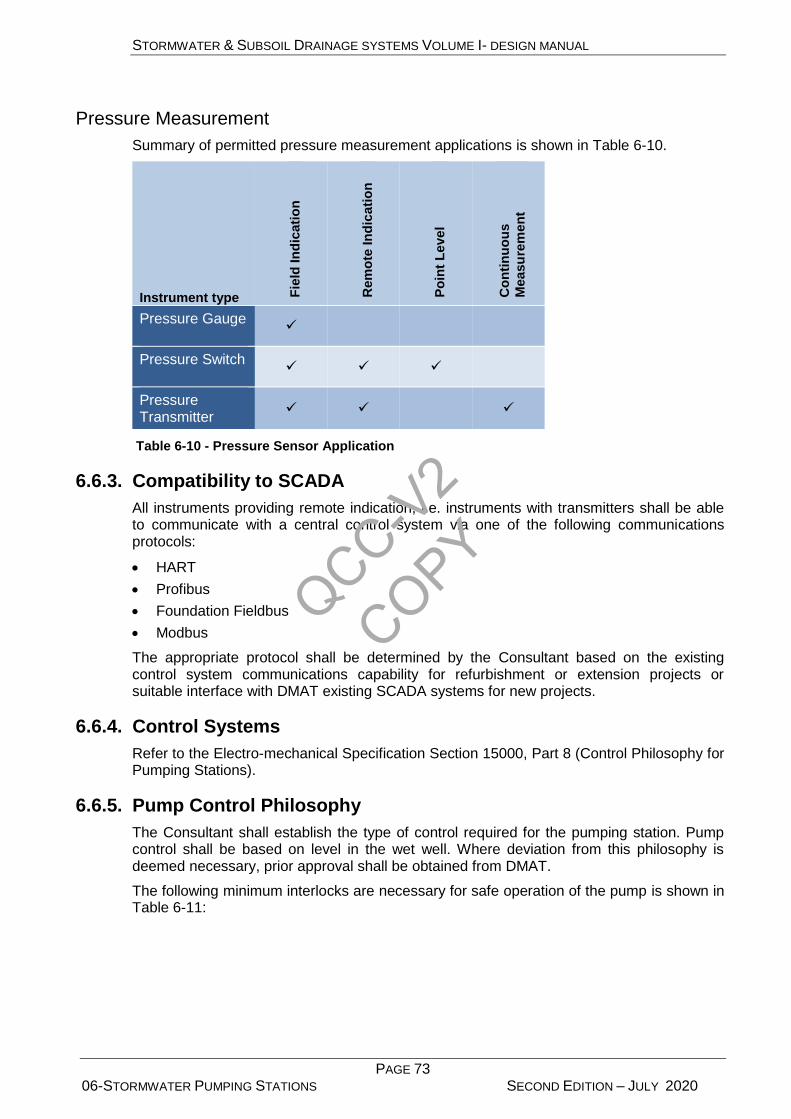
STORMWATER & SUBSOIL DRAINAGE SYSTEMS VOLUME I- DESIGN MANUAL
PAGE 73 06-STORMWATER PUMPING STATIONS SECOND EDITION – JULY 2020
Pressure Measurement
Summary of permitted pressure measurement applications is shown in Table 6-10.
Instrument type Fie
ld In
dic
ati
on
Rem
ote
In
dic
ati
on
Po
int
Leve
l
Co
nti
nu
ou
s
Measu
rem
en
t
Pressure Gauge
Pressure Switch
Pressure Transmitter
Table 6-10 - Pressure Sensor Application
6.6.3. Compatibility to SCADA
All instruments providing remote indication, i.e. instruments with transmitters shall be able to communicate with a central control system via one of the following communications protocols:
HART
Profibus
Foundation Fieldbus
Modbus
The appropriate protocol shall be determined by the Consultant based on the existing control system communications capability for refurbishment or extension projects or suitable interface with DMAT existing SCADA systems for new projects.
6.6.4. Control Systems
Refer to the Electro-mechanical Specification Section 15000, Part 8 (Control Philosophy for Pumping Stations).
6.6.5. Pump Control Philosophy
The Consultant shall establish the type of control required for the pumping station. Pump control shall be based on level in the wet well. Where deviation from this philosophy is deemed necessary, prior approval shall be obtained from DMAT.
The following minimum interlocks are necessary for safe operation of the pump is shown in Table 6-11:
QCC-V2
COPY
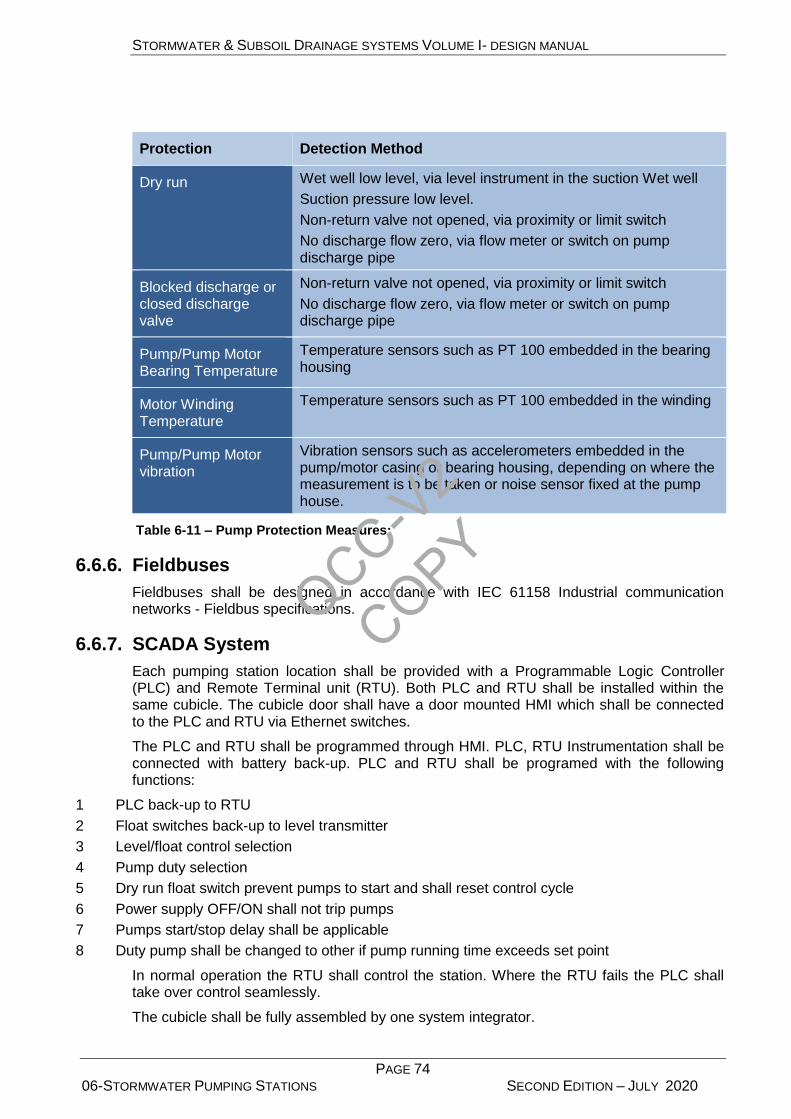
STORMWATER & SUBSOIL DRAINAGE SYSTEMS VOLUME I- DESIGN MANUAL
PAGE 74 06-STORMWATER PUMPING STATIONS SECOND EDITION – JULY 2020
Protection Detection Method
Dry run Wet well low level, via level instrument in the suction Wet well
Suction pressure low level.
Non-return valve not opened, via proximity or limit switch
No discharge flow zero, via flow meter or switch on pump discharge pipe
Blocked discharge or closed discharge valve
Non-return valve not opened, via proximity or limit switch
No discharge flow zero, via flow meter or switch on pump discharge pipe
Pump/Pump Motor Bearing Temperature
Temperature sensors such as PT 100 embedded in the bearing housing
Motor Winding Temperature
Temperature sensors such as PT 100 embedded in the winding
Pump/Pump Motor vibration
Vibration sensors such as accelerometers embedded in the pump/motor casing or bearing housing, depending on where the measurement is to be taken or noise sensor fixed at the pump house.
Table 6-11 – Pump Protection Measures:
6.6.6. Fieldbuses
Fieldbuses shall be designed in accordance with IEC 61158 Industrial communication networks - Fieldbus specifications.
6.6.7. SCADA System
Each pumping station location shall be provided with a Programmable Logic Controller (PLC) and Remote Terminal unit (RTU). Both PLC and RTU shall be installed within the same cubicle. The cubicle door shall have a door mounted HMI which shall be connected to the PLC and RTU via Ethernet switches.
The PLC and RTU shall be programmed through HMI. PLC, RTU Instrumentation shall be connected with battery back-up. PLC and RTU shall be programed with the following functions:
1 PLC back-up to RTU
2 Float switches back-up to level transmitter
3 Level/float control selection
4 Pump duty selection
5 Dry run float switch prevent pumps to start and shall reset control cycle
6 Power supply OFF/ON shall not trip pumps
7 Pumps start/stop delay shall be applicable
8 Duty pump shall be changed to other if pump running time exceeds set point
In normal operation the RTU shall control the station. Where the RTU fails the PLC shall take over control seamlessly.
The cubicle shall be fully assembled by one system integrator.
QCC-V2
COPY
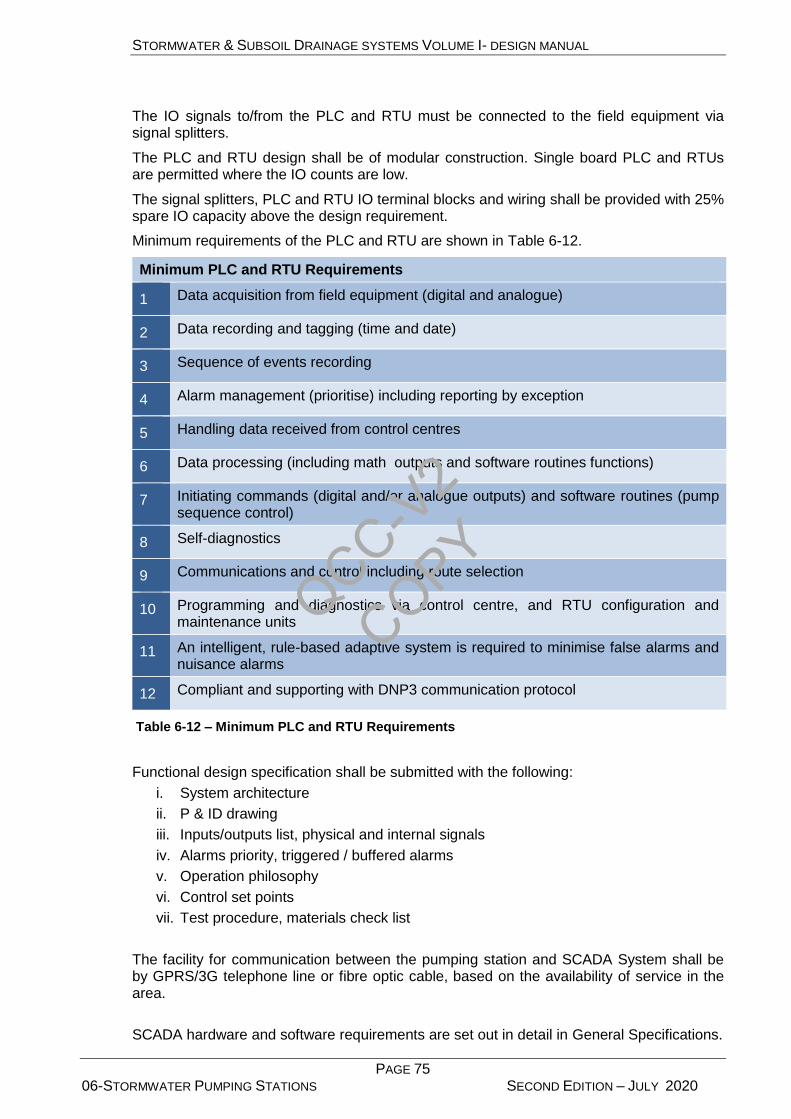
STORMWATER & SUBSOIL DRAINAGE SYSTEMS VOLUME I- DESIGN MANUAL
PAGE 75 06-STORMWATER PUMPING STATIONS SECOND EDITION – JULY 2020
The IO signals to/from the PLC and RTU must be connected to the field equipment via signal splitters.
The PLC and RTU design shall be of modular construction. Single board PLC and RTUs are permitted where the IO counts are low.
The signal splitters, PLC and RTU IO terminal blocks and wiring shall be provided with 25% spare IO capacity above the design requirement.
Minimum requirements of the PLC and RTU are shown in Table 6-12.
Minimum PLC and RTU Requirements
1 Data acquisition from field equipment (digital and analogue)
2 Data recording and tagging (time and date)
3 Sequence of events recording
4 Alarm management (prioritise) including reporting by exception
5 Handling data received from control centres
6 Data processing (including math outputs and software routines functions)
7 Initiating commands (digital and/or analogue outputs) and software routines (pump sequence control)
8 Self-diagnostics
9 Communications and control including route selection
10 Programming and diagnostics via control centre, and RTU configuration and maintenance units
11 An intelligent, rule-based adaptive system is required to minimise false alarms and nuisance alarms
12 Compliant and supporting with DNP3 communication protocol
Table 6-12 – Minimum PLC and RTU Requirements
Functional design specification shall be submitted with the following:
i. System architecture
ii. P & ID drawing
iii. Inputs/outputs list, physical and internal signals
iv. Alarms priority, triggered / buffered alarms
v. Operation philosophy
vi. Control set points
vii. Test procedure, materials check list
The facility for communication between the pumping station and SCADA System shall be by GPRS/3G telephone line or fibre optic cable, based on the availability of service in the area.
SCADA hardware and software requirements are set out in detail in General Specifications.
QCC-V2
COPY

STORMWATER & SUBSOIL DRAINAGE SYSTEMS VOLUME I- DESIGN MANUAL
PAGE 76 06-STORMWATER PUMPING STATIONS SECOND EDITION – JULY 2020
6.7. Structural Design
All structures shall be designed to the required standards of ACI 318 – “Building Code Requirements for Structural Concrete” or equivalent.
QCC-V2
COPY
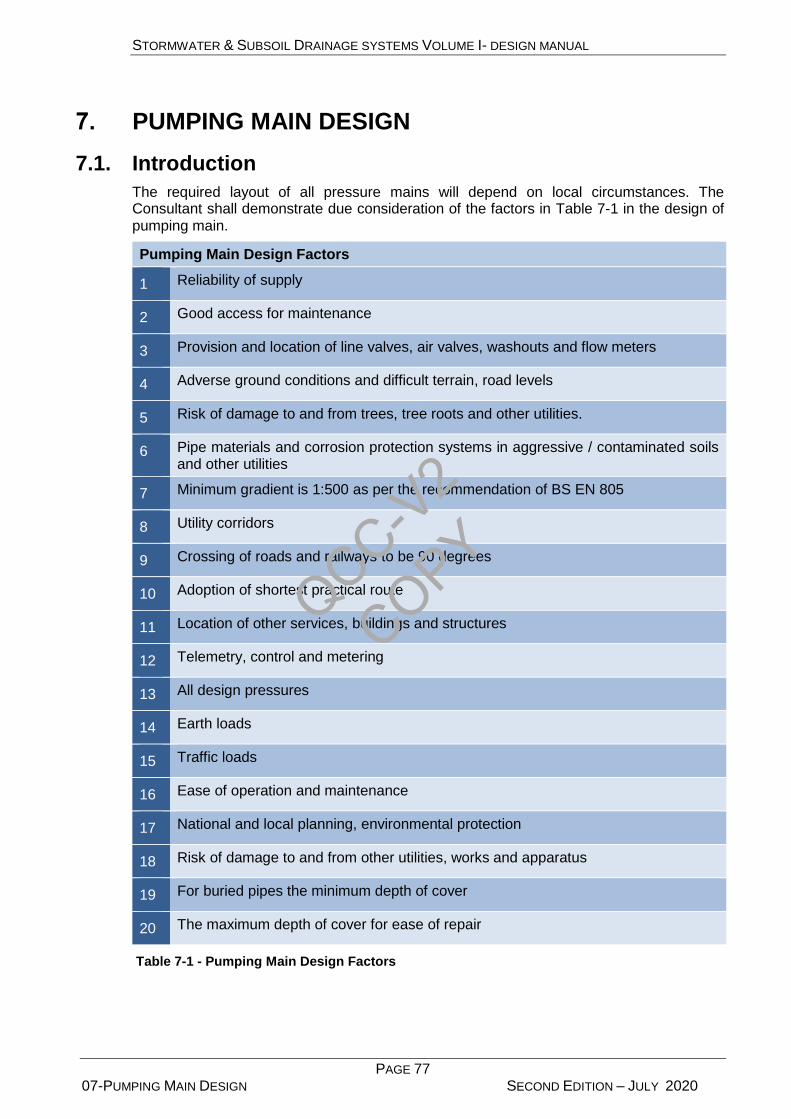
STORMWATER & SUBSOIL DRAINAGE SYSTEMS VOLUME I- DESIGN MANUAL
PAGE 77 07-PUMPING MAIN DESIGN SECOND EDITION – JULY 2020
7. PUMPING MAIN DESIGN
7.1. Introduction
The required layout of all pressure mains will depend on local circumstances. The Consultant shall demonstrate due consideration of the factors in Table 7-1 in the design of pumping main.
Pumping Main Design Factors
1 Reliability of supply
2 Good access for maintenance
3 Provision and location of line valves, air valves, washouts and flow meters
4 Adverse ground conditions and difficult terrain, road levels
5 Risk of damage to and from trees, tree roots and other utilities.
6 Pipe materials and corrosion protection systems in aggressive / contaminated soils and other utilities
7 Minimum gradient is 1:500 as per the recommendation of BS EN 805
8 Utility corridors
9 Crossing of roads and railways to be 90 degrees
10 Adoption of shortest practical route
11 Location of other services, buildings and structures
12 Telemetry, control and metering
13 All design pressures
14 Earth loads
15 Traffic loads
16 Ease of operation and maintenance
17 National and local planning, environmental protection
18 Risk of damage to and from other utilities, works and apparatus
19 For buried pipes the minimum depth of cover
20 The maximum depth of cover for ease of repair
Table 7-1 - Pumping Main Design Factors
QCC-V2
COPY
STORMWATER & SUBSOIL DRAINAGE SYSTEMS VOLUME I- DESIGN MANUAL
PAGE 78 07-PUMPING MAIN DESIGN SECOND EDITION – JULY 2020
7.2. Pipe Material Selection
Piping for storm water pumping mains shall be ductile iron, GRP or HDPE and the pipework within valve chambers and pumping stations is to be ductile iron. The selection of the material is to be based on consideration of the:
operating pressure
surge pressure alleviation
economics
delivery time
resilience
In addition to above for Projects in Al Ain Region, uPVC pipe materials can also be considered as an alternate material.
7.3. Hydraulic Design of Pumping Mains
7.3.1. Design Considerations
The Consultant shall perform hydraulic calculations in order to demonstrate that the system will:
Deliver the required flow
Operate at the accepted velocities defined below
Operate within the required pressure range of the pipes and fittings
In addition, the design pressure and the maximum design pressure must be established at appropriate points in the system.
Pipe diameter shall be such that velocity will be in the range of 1 m/s at minimum flow and 2.0 m/s under peak flow. A maximum velocity of 2.5 m/s in emergency scenarios, for example, to avoid flooding where additional standby pumps are brought on line.
Single pump discharge pipes shall be sized such that the discharge velocities in these pipes will be in the range of 1.5 to 2.5 m/s and suction headers shall be sized to achieve a velocity in the range of 0.8 to 1.5 m/s.
The use of twin mains should be considered on a case by case basis. The main factors for consideration include design elements, the risk assessment and cost benefit analysis.
Consideration for design elements comprise the:
rate of build-up of flow
range of flow conditions
range of velocities in mains
availability of land for twin mains and associated chambers
added complexity in pumping operation
O&M requirements and confirmation.
A thorough risk assessment should be carried out, which should include the likelihood of a main bursting, the consequences of failure, areas affected, sensitive receivers affected and the feasibility of temporary diversions.
The cost benefit analysis should include all tangible factors (such as cost of pipework, land costs, energy cost) and intangible factors (such as nuisance).
QCC-V2
COPY
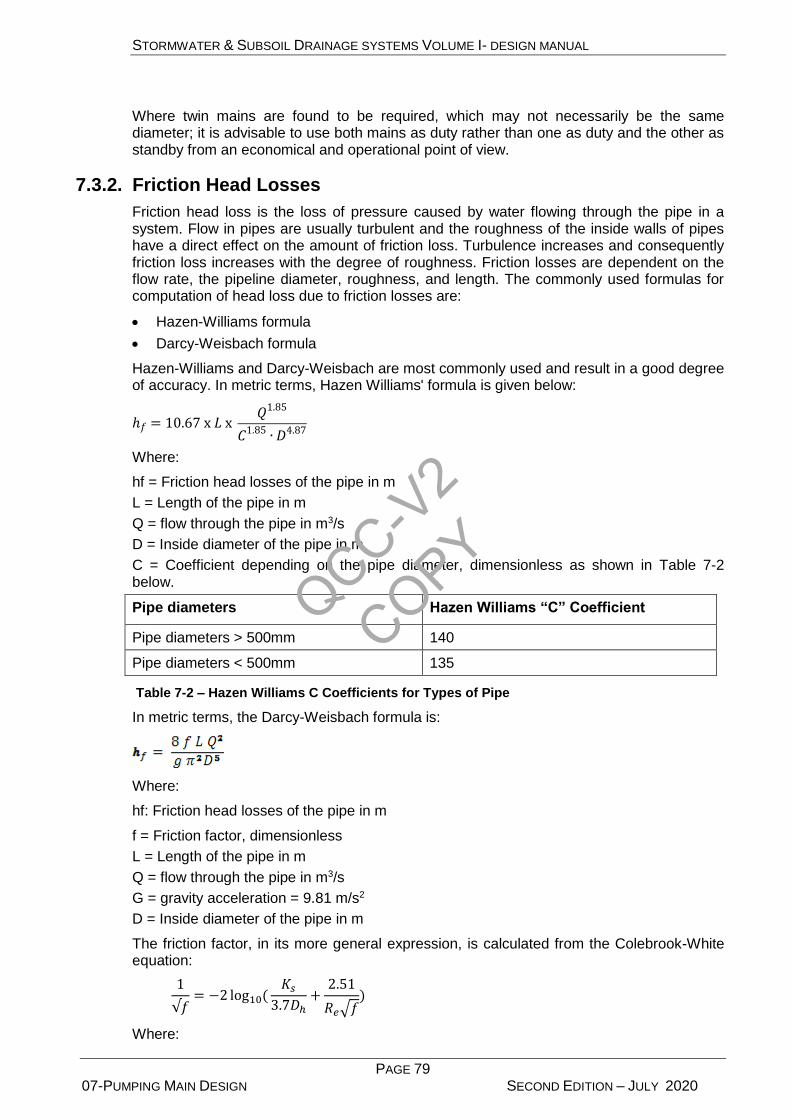
STORMWATER & SUBSOIL DRAINAGE SYSTEMS VOLUME I- DESIGN MANUAL
PAGE 79 07-PUMPING MAIN DESIGN SECOND EDITION – JULY 2020
Where twin mains are found to be required, which may not necessarily be the same diameter; it is advisable to use both mains as duty rather than one as duty and the other as standby from an economical and operational point of view.
7.3.2. Friction Head Losses
Friction head loss is the loss of pressure caused by water flowing through the pipe in a system. Flow in pipes are usually turbulent and the roughness of the inside walls of pipes have a direct effect on the amount of friction loss. Turbulence increases and consequently friction loss increases with the degree of roughness. Friction losses are dependent on the flow rate, the pipeline diameter, roughness, and length. The commonly used formulas for computation of head loss due to friction losses are:
Hazen-Williams formula
Darcy-Weisbach formula
Hazen-Williams and Darcy-Weisbach are most commonly used and result in a good degree of accuracy. In metric terms, Hazen Williams' formula is given below:
ℎ𝑓 = 10.67 x 𝐿 x 𝑄1.85
𝐶1.85 ∙ 𝐷4.87
Where:
hf = Friction head losses of the pipe in m
L = Length of the pipe in m
Q = flow through the pipe in m3/s
D = Inside diameter of the pipe in m
C = Coefficient depending on the pipe diameter, dimensionless as shown in Table 7-2 below.
Pipe diameters Hazen Williams “C” Coefficient
Pipe diameters > 500mm 140
Pipe diameters < 500mm 135
Table 7-2 – Hazen Williams C Coefficients for Types of Pipe
In metric terms, the Darcy-Weisbach formula is:
Where:
hf: Friction head losses of the pipe in m
f = Friction factor, dimensionless
L = Length of the pipe in m
Q = flow through the pipe in m3/s
G = gravity acceleration = 9.81 m/s2
D = Inside diameter of the pipe in m
The friction factor, in its more general expression, is calculated from the Colebrook-White equation:
1
√𝑓= −2 log10(
𝐾𝑠
3.7𝐷ℎ+
2.51
𝑅𝑒√𝑓)
Where:
QCC-V2
COPY
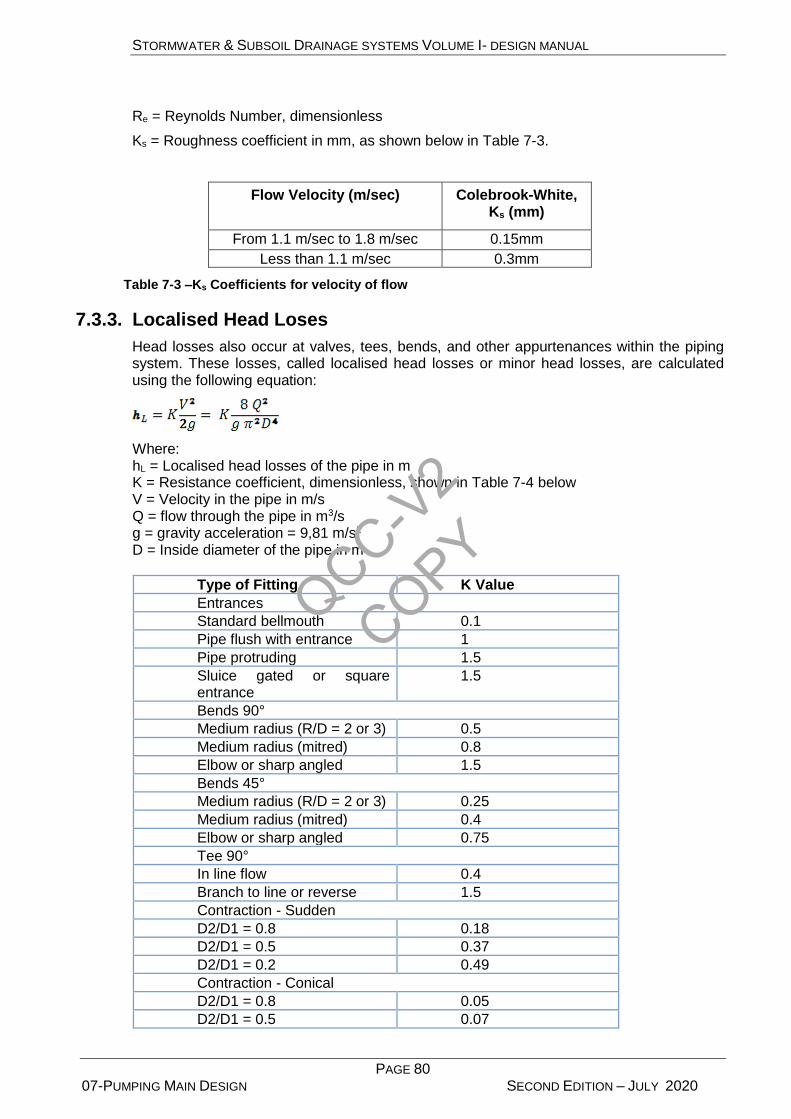
STORMWATER & SUBSOIL DRAINAGE SYSTEMS VOLUME I- DESIGN MANUAL
PAGE 80 07-PUMPING MAIN DESIGN SECOND EDITION – JULY 2020
Re = Reynolds Number, dimensionless
Ks = Roughness coefficient in mm, as shown below in Table 7-3.
Flow Velocity (m/sec) Colebrook-White, Ks (mm)
From 1.1 m/sec to 1.8 m/sec 0.15mm
Less than 1.1 m/sec 0.3mm
Table 7-3 –Ks Coefficients for velocity of flow
7.3.3. Localised Head Loses
Head losses also occur at valves, tees, bends, and other appurtenances within the piping system. These losses, called localised head losses or minor head losses, are calculated using the following equation:
Where: hL = Localised head losses of the pipe in m K = Resistance coefficient, dimensionless, shown in Table 7-4 below V = Velocity in the pipe in m/s Q = flow through the pipe in m3/s g = gravity acceleration = 9,81 m/s2 D = Inside diameter of the pipe in m
Type of Fitting K Value
Entrances
Standard bellmouth 0.1
Pipe flush with entrance 1
Pipe protruding 1.5
Sluice gated or square entrance
1.5
Bends 90°
Medium radius (R/D = 2 or 3) 0.5
Medium radius (mitred) 0.8
Elbow or sharp angled 1.5
Bends 45°
Medium radius (R/D = 2 or 3) 0.25
Medium radius (mitred) 0.4
Elbow or sharp angled 0.75
Tee 90°
In line flow 0.4
Branch to line or reverse 1.5
Contraction - Sudden
D2/D1 = 0.8 0.18
D2/D1 = 0.5 0.37
D2/D1 = 0.2 0.49
Contraction - Conical
D2/D1 = 0.8 0.05
D2/D1 = 0.5 0.07
QCC-V2
COPY

STORMWATER & SUBSOIL DRAINAGE SYSTEMS VOLUME I- DESIGN MANUAL
PAGE 81 07-PUMPING MAIN DESIGN SECOND EDITION – JULY 2020
Type of Fitting K Value
D2/D1 = 0.2 0.08
Expansion - Sudden
D2/D1 = 0.8 0.16
D2/D1 = 0.5 0.57
D2/D1 = 0.2 0.92
Expansion - Conical
D2/D1 = 0.8 0.03
D2/D1 = 0.5 0.08
D2/D1 = 0.2 0.13
Valves
Gate valve fully open 0.25
Gate valve ¾ open 1
Gate valve ½ open 5.6
Gate valve ¼ open 24
Check valve fully open 4.3
Note that for valves it is advisable to obtain manufacturers data on head losses. System head calculations would normally be carried out using valve open figures
Table 7-4 – K Values for Type of Fittings
7.4. Structural Design
7.4.1. Internal Forces
In accordance to BS EN 805 standard, pipelines shall be designed to withstand a transient pressure of 80 kPa below atmospheric pressure (approximately 20 kPa absolute pressure).
7.4.2. Temperature Range
Pressure mains shall be designed for continuous operation over the anticipated temperature range of 10 – 50°C. Note that de-rating factors will need to be applied to flexible pipes for the high temperature.
7.4.3. Unbalanced Thrust
Unbalanced forces (forces at valves, changes in direction, etc.) shall be compensated by an adequate number of restrained joints, thrust blocks or other anchorages. Where thrust blocks are to bear against the soil the safe bearing pressure shall be determined.
Blocks shall take the form of a cradle wedged against the undisturbed trench side and design based on the safe bearing pressure of the ground. Minimum safety factors are shown in Table 7-5.
minimum friction safety factor 1.5
minimum sliding safety factor 2.0
minimum overturning safety factor 2.0
Table 7-5 – Minimum Thrust Safety Factors
QCC-V2
COPY
STORMWATER & SUBSOIL DRAINAGE SYSTEMS VOLUME I- DESIGN MANUAL
PAGE 82 07-PUMPING MAIN DESIGN SECOND EDITION – JULY 2020
7.5. Valves
7.5.1. Valve Selection
Manufacturer data must be considered when selecting and sizing valves. The following general items must be considered in selecting valves:
Temperature: The valve bodies, trim, and operating parts must be capable of withstanding the highest temperature expected during sustained normal and transient operating conditions
Pressure: The valve must be rated for the highest transient pressure that might be expected
Shutoff: The degree of allowable shutoff must be known. No leakage must be allowed.
Valve operation: It must be determined whether the valve be used only for ON/OFF use or for throttling
Pressure drop: Allowable pressure drop must be established and the size selected
Velocity: The velocity of the fluid through the valve must be considered to avoid cavitation in any operating condition
7.5.2. Valve Losses
There may be occasions where precise determination of the pressure drop through valve (check valve or flap valve) shall be required. This is done by using the standard measure of valve flow, the coefficients Kv or Cv. These coefficients are determined by the valve manufacturer using actual flow tests. With the Kv or Cv known, the pressure differential can be found.
Kv value is defined as the rate of flow of water in m3/hr in temperature range from 5°C to 30°C at a pressure drop of 1 bar across the valve. Thus for a given Kv and Q the pressure drop across a valve is calculated as:
Where:
Kv = valve coefficient
Q = flow through the valve in m3/h
ΔP = pressure drop in bar
Cv value is defined as the rate of flow of water in US gallons per Minute at 15°C at a pressure drop of 1 psi across the equipment. Thus for a given Cv, the Kv value is calculated as:
Kv = 0.86488 Cv
7.5.3. Flushing Flow
The flushing flow (qf) for scouring and cleaning can be calculated by the following formula:
QCC-V2
COPY
STORMWATER & SUBSOIL DRAINAGE SYSTEMS VOLUME I- DESIGN MANUAL
PAGE 83 07-PUMPING MAIN DESIGN SECOND EDITION – JULY 2020
Where:
qf = flushing flow, in m3/h
d = inside diameter of drainage pipe, in mm
MDP = maximum design pressure, in bar
K = Sum of individual K-factors for the components of the drainage pipework, dimensionless
7.5.4. Maximum Draining Flow
The maximum draining flow (qdr), which must be used to size air valves for pipeline draining, can be calculated by the following formula:
Where:
qdr : maximum draining flow, in m3/h
d = inside diameter of drainage pipe, in mm
h1 = head of water above drain pipe at start of discharge, in m
h2 = head of water above drain pipe at end of discharge, in m
ΔP = differential pressure, in bar
K = Sum of individual K-factors for the components of the drainage pipework, dimensionless
7.5.5. Draining Time
Sufficient washouts must be provided to limit the draining time of the section affected to a maximum of 4 h (14,400 s). The draining time can be obtained applying the Torricelli’s formula as follows=
Where:
t = draining time, in s
A = Surface area of the water in the pipeline, in m2
K = Sum of individual K-factors for the components of the pipework, dimensionless
a = Cross sectional area of the drainage pipework, in m2
g = gravity constant = 9.81 m/s2
h1 = head of water above drain pipe at start of discharge, in m
h2 = head of water above drain pipe at end of discharge, in m
ΔP = differential pressure, in bar
The water surface takes the form of an ellipse during draining, which minor axis is equal to pipe diameter. The pipe slope affects the major axis. The surface area (A) is computed as
QCC-V2
COPY
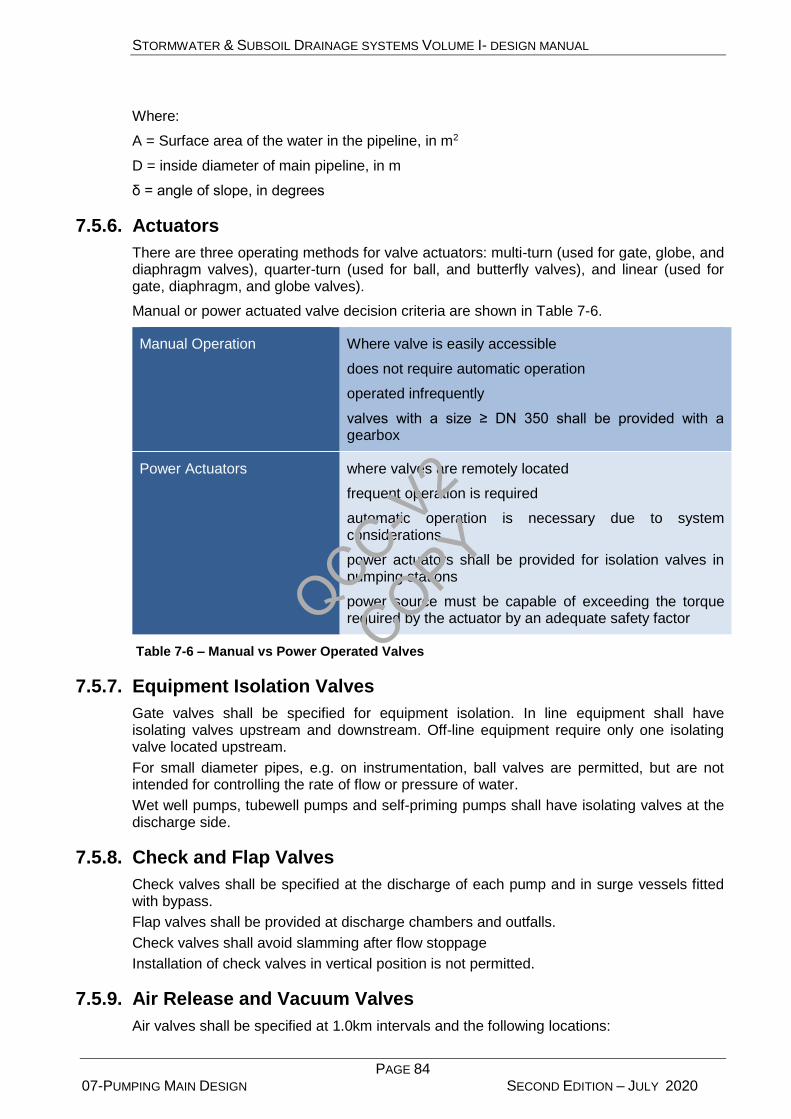
STORMWATER & SUBSOIL DRAINAGE SYSTEMS VOLUME I- DESIGN MANUAL
PAGE 84 07-PUMPING MAIN DESIGN SECOND EDITION – JULY 2020
Where:
A = Surface area of the water in the pipeline, in m2
D = inside diameter of main pipeline, in m
δ = angle of slope, in degrees
7.5.6. Actuators
There are three operating methods for valve actuators: multi-turn (used for gate, globe, and diaphragm valves), quarter-turn (used for ball, and butterfly valves), and linear (used for gate, diaphragm, and globe valves).
Manual or power actuated valve decision criteria are shown in Table 7-6.
Manual Operation
Where valve is easily accessible
does not require automatic operation
operated infrequently
valves with a size ≥ DN 350 shall be provided with a gearbox
Power Actuators
where valves are remotely located
frequent operation is required
automatic operation is necessary due to system considerations
power actuators shall be provided for isolation valves in pumping stations
power source must be capable of exceeding the torque required by the actuator by an adequate safety factor
Table 7-6 – Manual vs Power Operated Valves
7.5.7. Equipment Isolation Valves
Gate valves shall be specified for equipment isolation. In line equipment shall have isolating valves upstream and downstream. Off-line equipment require only one isolating valve located upstream.
For small diameter pipes, e.g. on instrumentation, ball valves are permitted, but are not intended for controlling the rate of flow or pressure of water.
Wet well pumps, tubewell pumps and self-priming pumps shall have isolating valves at the discharge side.
7.5.8. Check and Flap Valves
Check valves shall be specified at the discharge of each pump and in surge vessels fitted with bypass.
Flap valves shall be provided at discharge chambers and outfalls.
Check valves shall avoid slamming after flow stoppage
Installation of check valves in vertical position is not permitted.
7.5.9. Air Release and Vacuum Valves
Air valves shall be specified at 1.0km intervals and the following locations:
QCC-V2
COPY
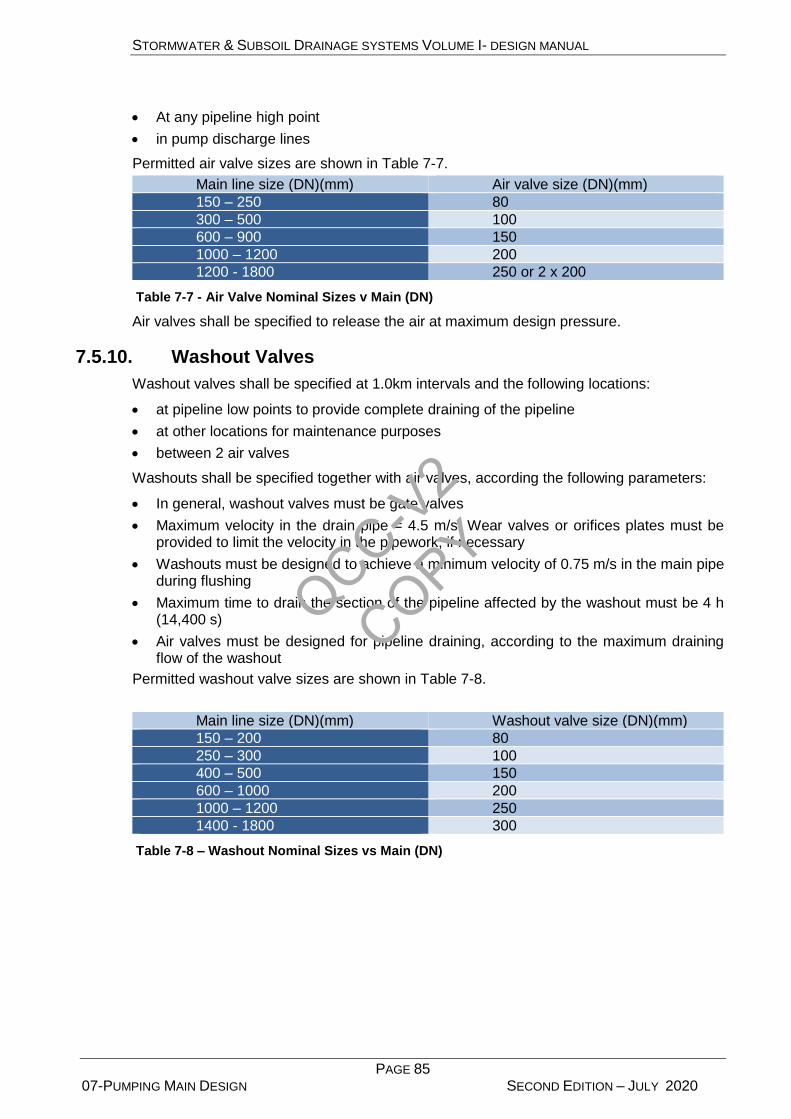
STORMWATER & SUBSOIL DRAINAGE SYSTEMS VOLUME I- DESIGN MANUAL
PAGE 85 07-PUMPING MAIN DESIGN SECOND EDITION – JULY 2020
At any pipeline high point
in pump discharge lines
Permitted air valve sizes are shown in Table 7-7.
Main line size (DN)(mm) Air valve size (DN)(mm)
150 – 250 80
300 – 500 100
600 – 900 150
1000 – 1200 200
1200 - 1800 250 or 2 x 200
Table 7-7 - Air Valve Nominal Sizes v Main (DN)
Air valves shall be specified to release the air at maximum design pressure.
7.5.10. Washout Valves
Washout valves shall be specified at 1.0km intervals and the following locations:
at pipeline low points to provide complete draining of the pipeline
at other locations for maintenance purposes
between 2 air valves
Washouts shall be specified together with air valves, according the following parameters:
In general, washout valves must be gate valves
Maximum velocity in the drain pipe = 4.5 m/s. Wear valves or orifices plates must be provided to limit the velocity in the pipework, if necessary
Washouts must be designed to achieve a minimum velocity of 0.75 m/s in the main pipe during flushing
Maximum time to drain the section of the pipeline affected by the washout must be 4 h (14,400 s)
Air valves must be designed for pipeline draining, according to the maximum draining flow of the washout
Permitted washout valve sizes are shown in Table 7-8.
Main line size (DN)(mm) Washout valve size (DN)(mm)
150 – 200 80
250 – 300 100
400 – 500 150
600 – 1000 200
1000 – 1200 250
1400 - 1800 300
Table 7-8 – Washout Nominal Sizes vs Main (DN)
QCC-V2
COPY
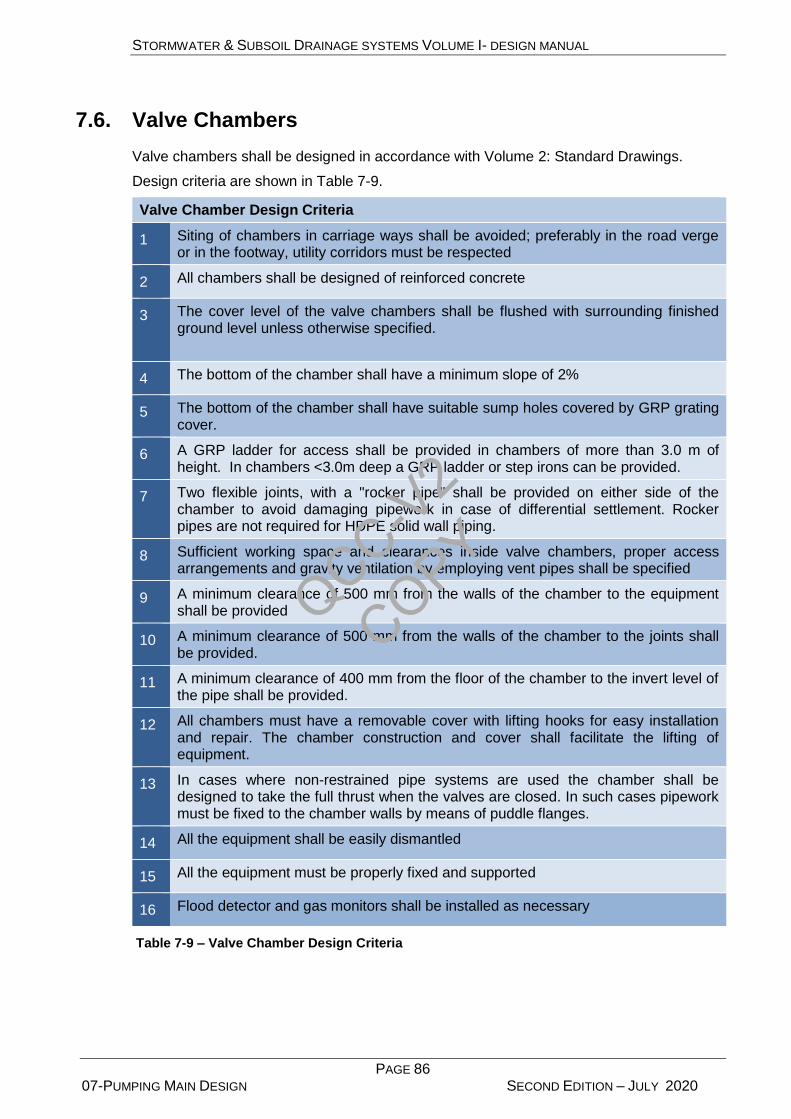
STORMWATER & SUBSOIL DRAINAGE SYSTEMS VOLUME I- DESIGN MANUAL
PAGE 86 07-PUMPING MAIN DESIGN SECOND EDITION – JULY 2020
7.6. Valve Chambers
Valve chambers shall be designed in accordance with Volume 2: Standard Drawings.
Design criteria are shown in Table 7-9.
Valve Chamber Design Criteria
1 Siting of chambers in carriage ways shall be avoided; preferably in the road verge or in the footway, utility corridors must be respected
2 All chambers shall be designed of reinforced concrete
3 The cover level of the valve chambers shall be flushed with surrounding finished ground level unless otherwise specified.
4 The bottom of the chamber shall have a minimum slope of 2%
5 The bottom of the chamber shall have suitable sump holes covered by GRP grating cover.
6 A GRP ladder for access shall be provided in chambers of more than 3.0 m of height. In chambers <3.0m deep a GRP ladder or step irons can be provided.
7 Two flexible joints, with a "rocker pipe" shall be provided on either side of the chamber to avoid damaging pipework in case of differential settlement. Rocker pipes are not required for HDPE solid wall piping.
8 Sufficient working space and clearances inside valve chambers, proper access arrangements and gravity ventilation by employing vent pipes shall be specified
9 A minimum clearance of 500 mm from the walls of the chamber to the equipment shall be provided
10 A minimum clearance of 500 mm from the walls of the chamber to the joints shall be provided.
11 A minimum clearance of 400 mm from the floor of the chamber to the invert level of the pipe shall be provided.
12 All chambers must have a removable cover with lifting hooks for easy installation and repair. The chamber construction and cover shall facilitate the lifting of equipment.
13 In cases where non-restrained pipe systems are used the chamber shall be designed to take the full thrust when the valves are closed. In such cases pipework must be fixed to the chamber walls by means of puddle flanges.
14 All the equipment shall be easily dismantled
15 All the equipment must be properly fixed and supported
16 Flood detector and gas monitors shall be installed as necessary
Table 7-9 – Valve Chamber Design Criteria
QCC-V2
COPY
STORMWATER & SUBSOIL DRAINAGE SYSTEMS VOLUME I- DESIGN MANUAL
PAGE 87 07-PUMPING MAIN DESIGN SECOND EDITION – JULY 2020
7.6.1. Flow Meter Chamber
Equipment that may create flow disturbances, such as isolation valves or reducers, shall not be placed next to flow meters.
Sufficient strait run downstream and upstream of flowmeter shall be designed in accordance to manufacturer recommendations. For typical piping arrangement and details refer to flow meter chamber standard drawings.
7.6.2. Air Valve Chamber
Air valve chambers shall be composed by a gate valve double function air valve with automatic air release and pipework.
The gate valve shall incorporate mitre gearing and vertical extension to suit below cover level so as to allow operation from ground level. For typical piping arrangement and details refer to air valve chamber standard drawings.
7.6.3. Washout chamber
The washout concrete chamber shall consist of dry and wet chamber.
The drain pipe with blind flange shall terminate in the wet chamber. For typical piping arrangement and details refer to washout valve chamber standard drawings.
QCC-V2
COPY

STORMWATER & SUBSOIL DRAINAGE SYSTEMS VOLUME I- DESIGN MANUAL
PAGE 88 08-DESIGN SUBMISSION REQUIREMENTS SECOND EDITION – JULY 2020
8. DESIGN SUBMISSION REQUIREMENTS
8.1. General
These submission requirements are related to Stormwater and Subsurface Drainage Designs and it also covers the connection to existing DMAT stormwater network submission. This document supersedes “Appendix-C” in the “Consultant Procedure Manual (Version 2.0 November 2014) Consultants are required to follow these requirements for any design approval required from DMAT. For Stormwater and subsurface drainage projects owned by developers, DMAT design approval does not guarantee the acceptance of the DMAT for taking over the Stormwater and Subsurface Drainage assets for Operation and Maintenance after construction. This will also require a MOU between the developer and Management of Emirate of Abu Dhabi.
8.2. Required Standards
All stormwater and subsurface drainage designs must comply with the latest Abu Dhabi Emirate Drainage Design Manual and Standards, Technical Specifications and Standard Drawings. Attention is drawn to the following documents in particular and it is up to the consultant to ensure that they understand the requirements of these documents: “STORMWATER & SUB-SOIL DRAINAGE SYSTEMS DESIGN Manual, - Emirate of Abu Dhabi It should be noted that the above mentioned Manual is under continuous updating to ensure their compatibility with the latest UAE and international standards. It is the responsibility of the Design Consultant to confirm obtaining the latest version of the Manual prior to start any design works. All stormwater and subsurface drainage designs and connection to existing submittals must be addressed with an Arabic cover letter to:
المهندس/ ........................... ،،السيد
مدير إدارة الطرق والبنية التحتية
دائرة الشؤون البلدية
بلدية مدينة أبوظبي
263ص.ب
أبو ظبي ، دولة االمارات العربية المتحدة
QCC-V2
COPY

STORMWATER & SUBSOIL DRAINAGE SYSTEMS VOLUME I- DESIGN MANUAL
PAGE 89 08-DESIGN SUBMISSION REQUIREMENTS SECOND EDITION – JULY 2020
8.3. Submission Requirements
The following requirements are applicable to the preliminary design and the detailed design submission: 1. Check list as per section 7 below must be submitted. Any submittal not containing the
relevant check list will be returned back to the consultant.
2. One complete set – Hard Copies (If requested only) - of the design package produced
in sufficient details and readable scale to facilitate a comprehensive and prompt review
(A4 for Report and A3 size for drawings is preferred).
3. One soft copy of:
o Report and Drawings. MS word and PDF/CAD (if requested) format or compatible.
o Technical design calculation sheets with visible formulas. MS Excel format or
compatible.
o Hydraulic modelling and Shape files as per including input and output data sheets
and drawings presenting water surface and HGL profile. These shall be submitted
with a format that is stated in Section - 3.4.2.
4. A presentation to DMAT might be required during the review process to address
particular issues. MS PowerPoint format or compatible to it.
8.4. Design Review Stages and Requirements
8.4.1. General Notes
1. Submissions can only be accepted through qualified Stormwater drainage Consultant.
No design submittals by Contractors or non-qualified Stormwater drainage Consultant
can be acceptable.
2. Master Plans and/or Concept Designs approval shall be obtained from the Abu Dhabi
Urban Planning Council (UPC). DMAT may comment on Master Plans and Concept
Designs as part of the UPC review process and the response will be coordinated by
UPC.
3. Environment Agency - Abu Dhabi (EAD) approval shall be obtained to confirm that
designs meet the allowable discharge limits as set out in the EAD “Technical
Guidance Document”.
4. The applicant shall not incorporate in his designs any technology which has not been
approved in advance by DMAT.
5. All Drawings must be in PDF / CAD (if requested) -based at readable scale with the
Key Plan and Legend.
6. Approvals of Preliminary Designs cannot be granted on a conditional basis pending
the fulfillment of certain requirements.
7. All submittals must be complete and self-explanatory and must not be based on a
submittal previously commented and/or rejected by DMAT. Approvals of Detailed
Designs are always conditional to the implementation of complete DMAT
specifications and approved materials list during execution.
8. DMAT shall be alerted before making any changes to the approved designs. An
approval of these changes must be obtained from DMAT.
QCC-V2
COPY

STORMWATER & SUBSOIL DRAINAGE SYSTEMS VOLUME I- DESIGN MANUAL
PAGE 90 08-DESIGN SUBMISSION REQUIREMENTS SECOND EDITION – JULY 2020
8.4.2. Preliminary Design
The Preliminary Design Package shall include but not limited to the following: a. Copies of:
i. Assignment Letter of the Client.
ii. Approval of UPC of the Master Plans and Concept Design.
iii. Environment Agency - Abu Dhabi (EAD) approval
iv. Approval of connection from DMAT Operation and Maintenance Section refer to
section 5 of this document.
b. Project Vision Statement.
c. Project site location plan showing existing site boundary, access roads and primary
infrastructure facilities serving the site.
d. Site survey and site context including existing utilities / services, access and
connectivity, surrounding land use.
e. Topography survey to be submitted in digital (X, Y, Z) AutoCad and Excel format.
f. Geotechnical investigations report/results (soil, rock, water tests and groundwater
conditions).
g. Site analysis to identify opportunities as well as – technical and design constraints.
h. Full and detailed description of design criteria adopted.
i. Designs including the following:
a. Proposed site plans and grading plans.
b. Proposed network layouts. Layouts containing stormwater and subsoil drainage
should be presented separately.
c. Proposed catchment area plan highlighting sub catchments and any
catchments contributing or expected to contribute to the proposed network.
d. Proposed infrastructure layouts showing pump stations, storage ponds (if
applicable).
e. Electromechanical concept design including pump curves, pump selection and
details of any ancillary works (if applicable).
f. Hydraulic Design calculations and technical calculation sheets (MS Excel
format.
g. ) must contain as a minimum pipe diameters, levels, slopes, and catchment
area with respective coefficients, time of concentration, intensities, full and
partial pipe flows and velocities. Hydraulic calculations shall be prepared based
on Storm events as specified in the Design Manual (refer to section 2 above).
h. Electromechanical Design to include System Curve for Parallel Operation
Scenarios and Sump operation levels as well. and surge analysis for pumps
operation
i. Hydraulic modelling for the proposed network as specified (refer to section 3
above).
j. Subsoil drainage calculation shall be based on soil parameters and
groundwater conditions. The calculations must contain as a minimum pipe
diameters, levels, slopes, and radius of influence (if applicable), drainage
coefficients, pipe flows and velocities. Hydraulic calculations shall be prepared
with reference to the Design Manual (refer to section 2 above).
k. Full and detailed design calculation of each element of the works.
l. Sizing design calculations for any proposed structures.
j. Sections showing ROW with all details of all services corridor. Project implementation
plan.
QCC-V2
COPY

STORMWATER & SUBSOIL DRAINAGE SYSTEMS VOLUME I- DESIGN MANUAL
PAGE 91 08-DESIGN SUBMISSION REQUIREMENTS SECOND EDITION – JULY 2020
k. Operations and Maintenance strategy.
l. Cost assumption breakdown for Operation and Maintenance.
m. Construction cost estimation breakdown.
n. Detailed calculation of Net Present Value, NPV, for all proposed Design alternatives
and/ or Options.
o. Statement of status of all Authority Approvals including any pending NOI / NOC.
p. Compliance Form to be signed and stamped by the Consultant stating full compliance
in his submittal to the latest DMAT manuals, specifications and standards and noting
any non‐conforming elements with justification.(refer to section 6 of this document).
q. Other details as applicable and requested by DMAT.
8.4.3. Detailed Design
The submitted Detailed Design Package shall include the following: a. Copies of:
a. Approvals of all authorities related to the project scope including DMAT
Preliminary Design approval.
b. Statements: the status of all pending NOI / NOC (if any).
c. Approval of Service Reservation for Stormwater pipeline from the Town
Planning Department.
b. Detailed Design Report with full and detailed design updated calculations for all
products, materials, plant, and equipment in accordance with the scope of work. Final
hydraulic model shall also be included. To be submitted as described in section 3
above.
c. All applicable design drawings including:
i. Drawings list.
ii. Project location Plan.
iii. General site layout.
iv. Detailed layout Plans showing all stormwater and subsurface drainage
systems.
v. Detailed profile drawings.
vi. Structural layouts and details for the stormwater pumping station including site
layout, approved site plan from UPC and Town Planning department.
vii. Electro‐mechanical layouts and details.
viii. Standard drawings.
d. All applicable standard specifications.
e. All particular specifications.
f. Bill of Quantities for the works.
g. Detailed breakdown of the estimated construction cost.
h. Detailed Operation & Maintenance strategy with associated programme of activities /
tasks.
i. Operations and Maintenance budget estimate and breakdown covering 10-year period
from final handover (FAC / Final TOC).
j. All other necessary details as applicable.
k. Compliance Form to be signed and stamped by the Consultant stating full compliance
in his submittal to the latest DMAT manuals, specifications and standards and noting
any non‐conforming elements with justification.(refer to section 6 of this document).
QCC-V2
COPY

STORMWATER & SUBSOIL DRAINAGE SYSTEMS VOLUME I- DESIGN MANUAL
PAGE 92 08-DESIGN SUBMISSION REQUIREMENTS SECOND EDITION – JULY 2020
8.5. Connection to Existing Approval
The following requirements are applicable to the connection to DMAT existing network submission: a. Two complete sets – Hard Copies - of the concept design package (as approved by
UPC) produced in sufficient details and readable scale to check the possibility to
connect to the proposed connection point (exiting DMAT Manhole). This package
shall include:
i. General catchment area with the proposed layouts.
ii. Description of criteria adopted to calculate flows produced from the project
catchments.
iii. Calculated flows at the connection point/(s). Flow calculation should be based
on methods provided in Design Manual, and it should also show peak flow for
desired return period.
iv. General hydraulic calculation to confirm the possibility of the gravity network to
connect at the invert level of the existing manholes.
v. Any other details can facilitate the review and approval of the connection to
existing.
vi. Shape file for the catchment
b. A presentation to DMAT might be required as well as coordination with DMAT
Operation and Maintenance section during the review process to address particular
issues.
c. DMAT approval for the connection to existing is always conditional to the submission
of the preliminary and detailed design and obtains DMAT approval on the submittals.
QCC-V2
COPY

STORMWATER & SUBSOIL DRAINAGE SYSTEMS VOLUME I- DESIGN MANUAL
PAGE 93 08-DESIGN SUBMISSION REQUIREMENTS SECOND EDITION – JULY 2020
8.6. Compliance form
DETAILS OF THE CONSUTANT MAKING THE APPLICATION:
NAME OF CONSULTANT: ……………..………..…...………………………………………………….…
FULL ADRESS: ……………..………..…...………………………………………………….………………
TELEPHONE NO: ……………………………………………………………………………………………
DETAILS OF THE PROJECT:
PROJECT TITLE: ………………………………………………….…………………………………………
PROJECT OWNER……………………………………………………………………….……………………
SUBMISSION STAGE: ……………………………………………………………………………………….
WE HEREBY CERTIFY THAT THE STATEMENTS AND INFORMATION IN ALL
FORMS, REPORTS, DOCUMENTS, AND ATTACHMENTS SUBMITTED TO
DMAT ARE TRUE, ACCURATE AND COMPLETE. WE ALSO CERTIFY THAT
ALL SUBMITTED DESIGNS ARE FULLY COMPLYING WITH DMAT
MANUALS, SPECIFICATIONS AND STANDARDS.
WE NOTE THAT THE FOLLOWING LISTED ELEMENTS AND ITEMS ARE
NON‐CONFORMING DMAT MANUALS, SPECIFICATIONS AND STANDARDS
WITH JUSTIFICATION:
…………………………………………………………………………………………………………………………………………………………………………………………………………………………………………………………………………………………………………………………………………………………………………………………………………………………………………………………………………………… (IF SPACE NOT SUITABLE CAN ATTACH AUTHENTICATED DOCUMENT) NAME OF REPRESENTATIVE:
…………………………………………………………………………………………….…….
POSITION IN THE COMPANY: …………………………………………………………….………………
MOBILE NO: ………………………………………………………………………………………………..
SIGNATURE: ……………………………………………………………………………………………………
CONSULTANT STAMP:
QCC-V2
COPY

STORMWATER & SUBSOIL DRAINAGE SYSTEMS VOLUME I- DESIGN MANUAL
PAGE 94 08-DESIGN SUBMISSION REQUIREMENTS SECOND EDITION – JULY 2020
8.7. Check list
8.7.1 PRELIMINARY DESIGN CHECK LIST
# Description Yes No NA Clarifications
1 One complete set – Hard Copy (If Requested) - of the full design package.
2 One soft copy of the Report and Drawings.
3 One soft copy of the Technical calculation sheets with visible formulas. MS Excel format or compatible to it.
4 One soft copy of the Hydraulic modelling Shape files that is compatible with a format that is stated in Section - 3.4.2.
5 Copy of Assignment Letter of the Client.
6 Copy of UPC approval on the Master Plans and Concept Design.
7 Copy of Environment Agency - Abu Dhabi (EAD) approval
8 Copy of connection approval from DMAT Operation and Maintenance Section.
9 Project Vision Statement and full and detailed description of design criteria adopted.
10 Project site location plan.
11 Site survey and site context including existing utilities / services.
12 Digital topography survey (X, Y, Z).
13 Geotechnical investigations report/results.
14 Proposed site plans and grading plans.
15 Proposed network layouts.
16 Proposed catchment area plan
17 Proposed infrastructure layouts showing pump stations, storage ponds (if applicable).
18 Electromechanical concept design (if applicable).
19 Sizing design calculations for any proposed structures.
20 Sections showing ROW with all details of all services corridor.
21 Project implementation plan.
22 Operations and Maintenance strategy.
23 Cost assumption breakdown for Operation and Maintenance.
24 Construction cost estimation breakdown.
25 Statement of status of all Authority Approvals including any pending NOI / NOC.
26 Compliance Form.
QCC-V2
COPY
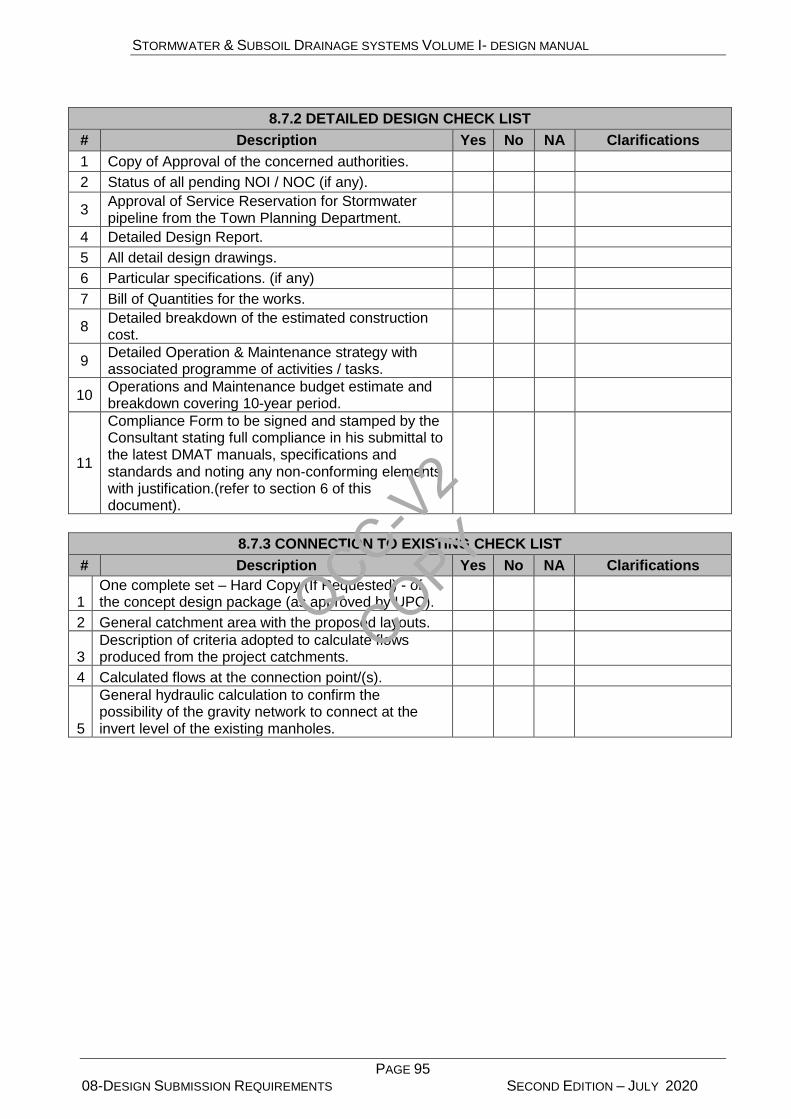
STORMWATER & SUBSOIL DRAINAGE SYSTEMS VOLUME I- DESIGN MANUAL
PAGE 95 08-DESIGN SUBMISSION REQUIREMENTS SECOND EDITION – JULY 2020
8.7.2 DETAILED DESIGN CHECK LIST
# Description Yes No NA Clarifications
1 Copy of Approval of the concerned authorities.
2 Status of all pending NOI / NOC (if any).
3 Approval of Service Reservation for Stormwater pipeline from the Town Planning Department.
4 Detailed Design Report.
5 All detail design drawings.
6 Particular specifications. (if any)
7 Bill of Quantities for the works.
8 Detailed breakdown of the estimated construction cost.
9 Detailed Operation & Maintenance strategy with associated programme of activities / tasks.
10 Operations and Maintenance budget estimate and breakdown covering 10-year period.
11
Compliance Form to be signed and stamped by the Consultant stating full compliance in his submittal to the latest DMAT manuals, specifications and standards and noting any non‐conforming elements with justification.(refer to section 6 of this document).
8.7.3 CONNECTION TO EXISTING CHECK LIST
# Description Yes No NA Clarifications
1 One complete set – Hard Copy (If Requested) - of the concept design package (as approved by UPC).
2 General catchment area with the proposed layouts.
3 Description of criteria adopted to calculate flows produced from the project catchments.
4 Calculated flows at the connection point/(s).
5
General hydraulic calculation to confirm the possibility of the gravity network to connect at the invert level of the existing manholes.
QCC-V2
COPY

STORMWATER & SUBSOIL DRAINAGE SYSTEMS VOLUME I- DESIGN MANUAL
PAGE 96 08-DESIGN SUBMISSION REQUIREMENTS SECOND EDITION – JULY 2020
8.8. Hydraulic Modelling Shape File Data Requirements
Layer
Fea
ture
cla
ss
No
.
Para
mete
r
nam
e
Fie
ld n
am
e
Un
it M
eth
od
Decim
al
Pla
ces (
Fie
ld
Scale
)
Fie
ld t
yp
e
Data
typ
e
Ap
ply
to
Su
bso
il
Rem
ark
s
NO
DE
S
Po
ints
1 Label Label text
RM
&H
D
- string I/O Yes
2 Diameter Dia m 3
double
I
3 B size (if rectangular)
B m 4
4 W size (if rectangular)
W m 5
5 Elevation (Ground)
elev_grd m
3
Yes
6 Elevation (Invert) elev_inv m
7 Elevation (Rim) elev_rim m
8 External inflow (e.g. from exist. net.)
inflow m3/s 4
9 Hydraulic Grade Line (In)
HGL_in m
RM
3 O
10 Hydraulic Grade Line (Out)
HGL_out
m
11 Type (manhole/ catch basin/inlet…)
Type text
RM
&H
D
10 string I
12 Is Flooded? Is_flood 0,1 1
integer
O
0=No, 1=Yes
13 Flood volume flood_vl m3
HD
double 14 Head(HGL) Head m 3
Yes
15 Existing? Existing 0,1
RM
&H
D
1 integer I
Does it exist? 0=No, 1=Yes
16 Upgrade? Upgrade 0,1 Is it upgraded? 0=No, 1=Yes
17 Phase Phase - - string
PIP
ES
Lin
es
1 Label Label text
RM
&H
D
-
string
I/O
Yes
2 Start Node (Label)
Up_nod text -
I
3 Stop Node (Label)
Dn_nod text -
4 Diameter (Internal)
Dia m 3 double
5 cross-section shape
Shape text 10 string
optional 6
Cross-section height
CH m 3 double
7 Cross-section width
CW m
8 Number of barrels
barrel - 1 integer Yes
QCC-V2
COPY
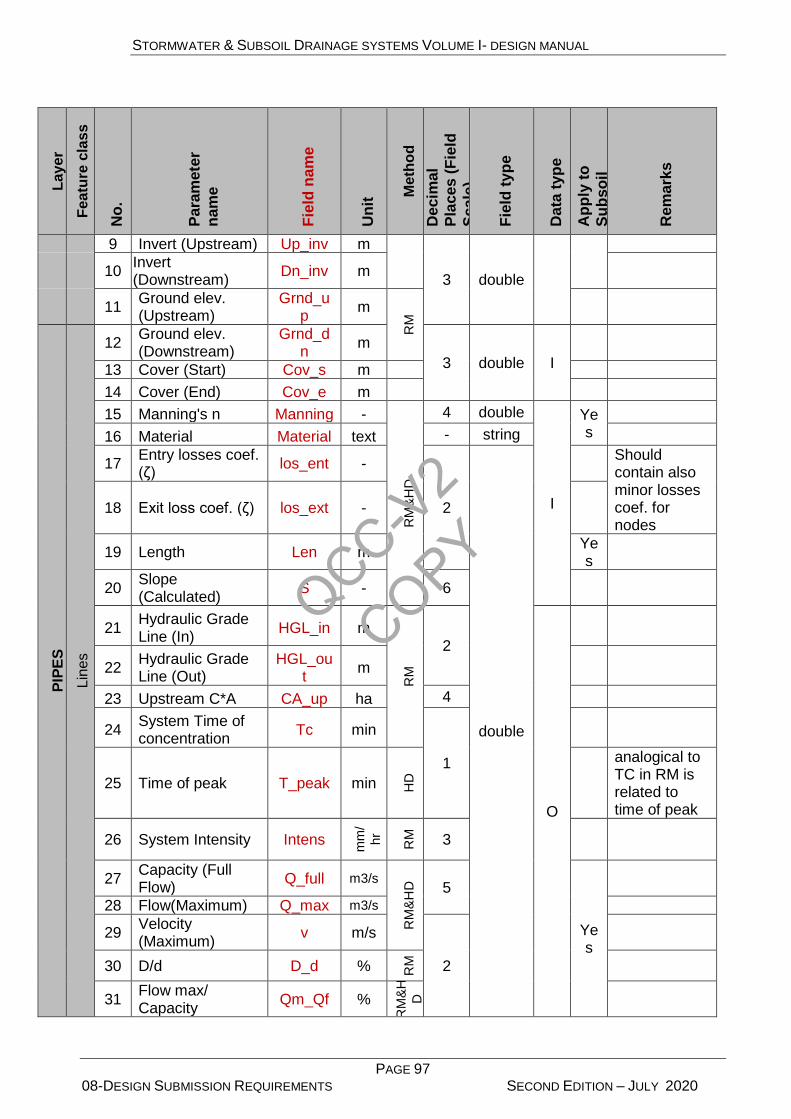
STORMWATER & SUBSOIL DRAINAGE SYSTEMS VOLUME I- DESIGN MANUAL
PAGE 97 08-DESIGN SUBMISSION REQUIREMENTS SECOND EDITION – JULY 2020
Layer
Fea
ture
cla
ss
No
.
Para
mete
r
nam
e
Fie
ld n
am
e
Un
it M
eth
od
Decim
al
Pla
ces (
Fie
ld
Scale
)
Fie
ld t
yp
e
Data
typ
e
Ap
ply
to
Su
bso
il
Rem
ark
s
9 Invert (Upstream) Up_inv m
3 double
10 Invert (Downstream)
Dn_inv m
11 Ground elev. (Upstream)
Grnd_up
m
RM
PIP
ES
Lin
es
12 Ground elev. (Downstream)
Grnd_dn
m
3 double I
13 Cover (Start) Cov_s m
14 Cover (End) Cov_e m
15 Manning's n Manning - R
M&
HD
4 double
I
Yes
16 Material Material text - string
17 Entry losses coef. (ζ)
los_ent -
2
double
Should contain also minor losses coef. for nodes
18 Exit loss coef. (ζ) los_ext -
19 Length Len m Yes
20 Slope (Calculated)
S - 6
21 Hydraulic Grade Line (In)
HGL_in m
RM
2
O
22 Hydraulic Grade Line (Out)
HGL_out
m
23 Upstream C*A CA_up ha 4
24 System Time of concentration
Tc min
1
25 Time of peak T_peak min HD
analogical to TC in RM is related to time of peak
26 System Intensity Intens
mm
/
hr
RM
3
27 Capacity (Full Flow)
Q_full m3/s
RM
&H
D
5
Yes
28 Flow(Maximum) Q_max m3/s
29 Velocity (Maximum)
v m/s
2
30 D/d D_d % RM
31 Flow max/ Capacity
Qm_Qf %
RM
&H
D
QCC-V2
COPY
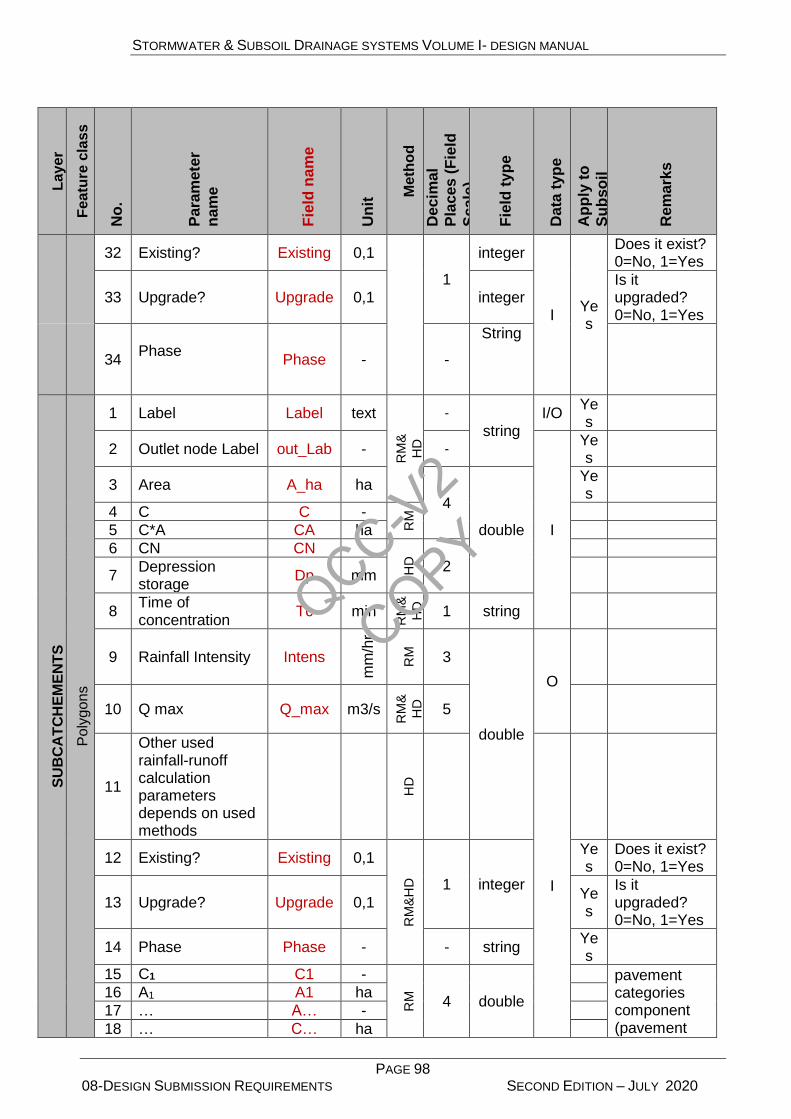
STORMWATER & SUBSOIL DRAINAGE SYSTEMS VOLUME I- DESIGN MANUAL
PAGE 98 08-DESIGN SUBMISSION REQUIREMENTS SECOND EDITION – JULY 2020
Layer
Fea
ture
cla
ss
No
.
Para
mete
r
nam
e
Fie
ld n
am
e
Un
it M
eth
od
Decim
al
Pla
ces (
Fie
ld
Scale
)
Fie
ld t
yp
e
Data
typ
e
Ap
ply
to
Su
bso
il
Rem
ark
s
32 Existing? Existing 0,1
1
integer
I Yes
Does it exist? 0=No, 1=Yes
33 Upgrade? Upgrade 0,1 integer Is it upgraded? 0=No, 1=Yes
34 Phase
Phase - -
String
SU
BC
AT
CH
EM
EN
TS
Po
lyg
on
s
1 Label Label text R
M&
HD
-
string I/O
Yes
2 Outlet node Label out_Lab - -
I
Yes
3 Area A_ha ha
4
double
Yes
4 C C -
RM
5 C*A CA ha
6 CN CN -
HD
2
7 Depression storage
Dp mm
8 Time of concentration
Tc min
RM
&
HD
1 string
9 Rainfall Intensity Intens
mm
/hr
RM
3
double
O
10 Q max Q_max m3/s
RM
&
HD
5
11
Other used rainfall-runoff calculation parameters depends on used methods
HD
I
12 Existing? Existing 0,1
RM
&H
D
1 integer
Yes
Does it exist? 0=No, 1=Yes
13 Upgrade? Upgrade 0,1 Yes
Is it upgraded? 0=No, 1=Yes
14 Phase Phase - - string Yes
15 C1 C1 -
RM
4 double
pavement categories component (pavement
16 A1 A1 ha
17 … A… -
18 … C… ha
QCC-V2
COPY

STORMWATER & SUBSOIL DRAINAGE SYSTEMS VOLUME I- DESIGN MANUAL
PAGE 99 08-DESIGN SUBMISSION REQUIREMENTS SECOND EDITION – JULY 2020
Layer
Fea
ture
cla
ss
No
.
Para
mete
r
nam
e
Fie
ld n
am
e
Un
it M
eth
od
Decim
al
Pla
ces (
Fie
ld
Scale
)
Fie
ld t
yp
e
Data
typ
e
Ap
ply
to
Su
bso
il
Rem
ark
s
19 Cn Cn -
categories need to be explained in attached file e.g. txt/docx)
20 An An ha
OU
TF
AL
LS
Po
ints
1 Label Label text
RM
&H
D
- string I/O Yes
2 Diameter Dia m
3 double
I
3 Fixed Tide Elevation
Stage m
4 Flap gate Fl_gate 0,1 1 integer
5 Elevation (Ground)
elev_grd m 3 double
Yes
6 Elevation (Invert) elev_inv m
7 Existing? Existing 0,1 1 integer
Yes
8 Upgrade? Upgrade 0,1
9 Phase
Phase - - string
PU
MP
ING
ST
AT
ION
S
Po
ints
1 Label Label text
RM
&H
D
- string I/O
Yes
2 Diameter Dia m
3 double
I
3 Elevation (Ground)
elev_grd m
4 Elevation (inlet Invert)
e_in_inv m
5 Wet well invert elevation
elev_inv m 4
6 Wet well shape Shape text - string
7 Wet well size W W m
2 double
8 Wet well size B B m
9 MAX level max_lev m
10 MIN level min_lev m
11 max capacity Q_max m3/s 5
12 Existing? Existing 0,1
1 integer
Does it exist? 0=No, 1=Yes
13 Upgrade? Upgrade 0,1 Is it upgraded? 0=No, 1=Yes
14 Phase Phase - - string
Sto
rag
e
ele
me
nt
Po
ints
/Po
lyg
on
s
1 Label Label text
RM
&H
D
- string
I/O
Yes
2 Maximum Volume
Vol m3 4
I
3 Elevation (Ground)
elev_grd m 3 double
4 Elevation (Invert) elev_inv m
QCC-V2
COPY
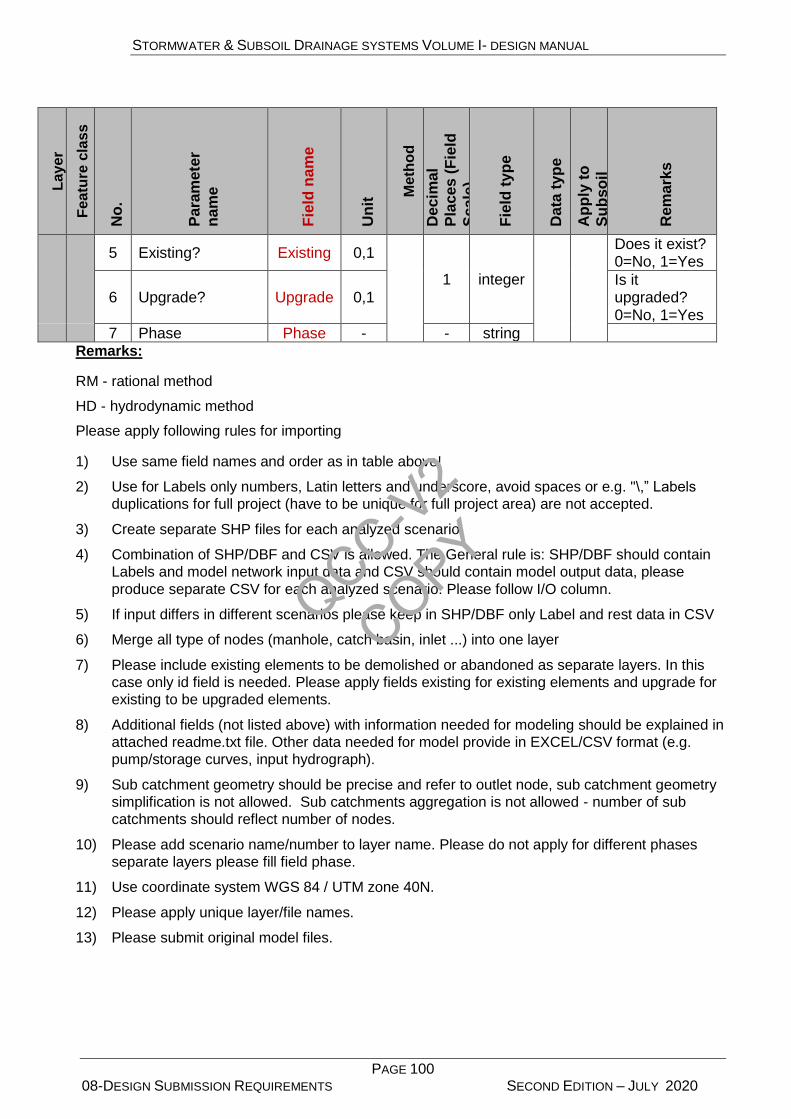
STORMWATER & SUBSOIL DRAINAGE SYSTEMS VOLUME I- DESIGN MANUAL
PAGE 100 08-DESIGN SUBMISSION REQUIREMENTS SECOND EDITION – JULY 2020
Layer
Fea
ture
cla
ss
No
.
Para
mete
r
nam
e
Fie
ld n
am
e
Un
it M
eth
od
Decim
al
Pla
ces (
Fie
ld
Scale
)
Fie
ld t
yp
e
Data
typ
e
Ap
ply
to
Su
bso
il
Rem
ark
s
5 Existing? Existing 0,1
1 integer
Does it exist? 0=No, 1=Yes
6 Upgrade? Upgrade 0,1 Is it upgraded? 0=No, 1=Yes
7 Phase Phase - - string
Remarks:
RM - rational method
HD - hydrodynamic method
Please apply following rules for importing
1) Use same field names and order as in table above!
2) Use for Labels only numbers, Latin letters and underscore, avoid spaces or e.g. "\,” Labels
duplications for full project (have to be unique for full project area) are not accepted.
3) Create separate SHP files for each analyzed scenario.
4) Combination of SHP/DBF and CSV is allowed. The General rule is: SHP/DBF should contain
Labels and model network input data and CSV should contain model output data, please
produce separate CSV for each analyzed scenario. Please follow I/O column.
5) If input differs in different scenarios please keep in SHP/DBF only Label and rest data in CSV
6) Merge all type of nodes (manhole, catch basin, inlet ...) into one layer
7) Please include existing elements to be demolished or abandoned as separate layers. In this
case only id field is needed. Please apply fields existing for existing elements and upgrade for
existing to be upgraded elements.
8) Additional fields (not listed above) with information needed for modeling should be explained in
attached readme.txt file. Other data needed for model provide in EXCEL/CSV format (e.g.
pump/storage curves, input hydrograph).
9) Sub catchment geometry should be precise and refer to outlet node, sub catchment geometry
simplification is not allowed. Sub catchments aggregation is not allowed - number of sub
catchments should reflect number of nodes.
10) Please add scenario name/number to layer name. Please do not apply for different phases
separate layers please fill field phase.
11) Use coordinate system WGS 84 / UTM zone 40N.
12) Please apply unique layer/file names.
13) Please submit original model files.
QCC-V2
COPY
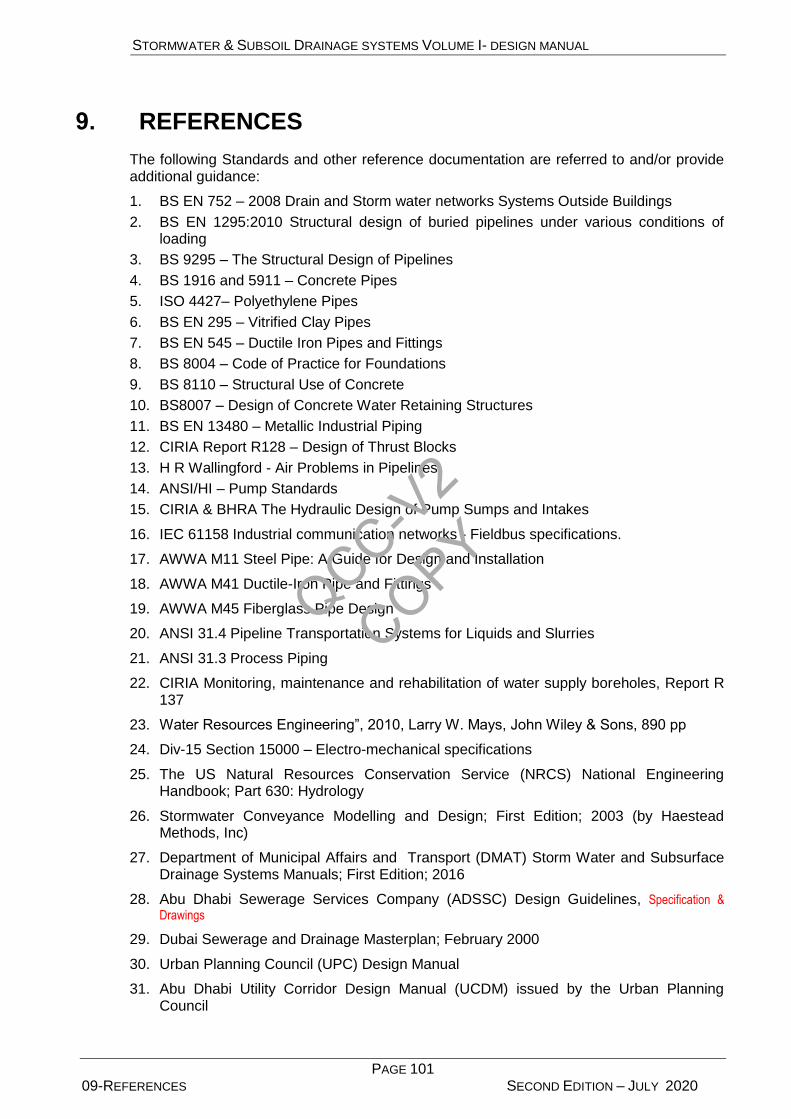
STORMWATER & SUBSOIL DRAINAGE SYSTEMS VOLUME I- DESIGN MANUAL
PAGE 101 09-REFERENCES SECOND EDITION – JULY 2020
9. REFERENCES
The following Standards and other reference documentation are referred to and/or provide additional guidance:
1. BS EN 752 – 2008 Drain and Storm water networks Systems Outside Buildings
2. BS EN 1295:2010 Structural design of buried pipelines under various conditions of loading
3. BS 9295 – The Structural Design of Pipelines
4. BS 1916 and 5911 – Concrete Pipes
5. ISO 4427– Polyethylene Pipes
6. BS EN 295 – Vitrified Clay Pipes
7. BS EN 545 – Ductile Iron Pipes and Fittings
8. BS 8004 – Code of Practice for Foundations
9. BS 8110 – Structural Use of Concrete
10. BS8007 – Design of Concrete Water Retaining Structures
11. BS EN 13480 – Metallic Industrial Piping
12. CIRIA Report R128 – Design of Thrust Blocks
13. H R Wallingford - Air Problems in Pipelines
14. ANSI/HI – Pump Standards
15. CIRIA & BHRA The Hydraulic Design of Pump Sumps and Intakes
16. IEC 61158 Industrial communication networks - Fieldbus specifications.
17. AWWA M11 Steel Pipe: A Guide for Design and Installation
18. AWWA M41 Ductile-Iron Pipe and Fittings
19. AWWA M45 Fiberglass Pipe Design
20. ANSI 31.4 Pipeline Transportation Systems for Liquids and Slurries
21. ANSI 31.3 Process Piping
22. CIRIA Monitoring, maintenance and rehabilitation of water supply boreholes, Report R 137
23. Water Resources Engineering”, 2010, Larry W. Mays, John Wiley & Sons, 890 pp
24. Div-15 Section 15000 – Electro-mechanical specifications
25. The US Natural Resources Conservation Service (NRCS) National Engineering Handbook; Part 630: Hydrology
26. Stormwater Conveyance Modelling and Design; First Edition; 2003 (by Haestead Methods, Inc)
27. Department of Municipal Affairs and Transport (DMAT) Storm Water and Subsurface Drainage Systems Manuals; First Edition; 2016
28. Abu Dhabi Sewerage Services Company (ADSSC) Design Guidelines, Specification & Drawings
29. Dubai Sewerage and Drainage Masterplan; February 2000
30. Urban Planning Council (UPC) Design Manual
31. Abu Dhabi Utility Corridor Design Manual (UCDM) issued by the Urban Planning Council
QCC-V2
COPY

STORMWATER & SUBSOIL DRAINAGE SYSTEMS VOLUME I- DESIGN MANUAL
PAGE 102 APPENDIX SECOND EDITION – JULY 2020
10. APPENDIX
Appendix A1– Prevailing Environmental Legislation
Appendix A2 – Pipe Structural Design
Appendix A3 – Road Drainage – Gutter and Inlet Design
Appendix A4 – Al Ain Municipality Requirements
Appendix A5 –Main Roads Requirements
QCC-V2
COPY
STORMWATER & SUBSOIL DRAINAGE SYSTEMS VOLUME I- DESIGN MANUAL
PAGE 103 APPENDIX-A1 SECOND EDITION – JULY 2020
Appendix A1– Prevailing Environmental Legislation
QCC-V
2
COPY
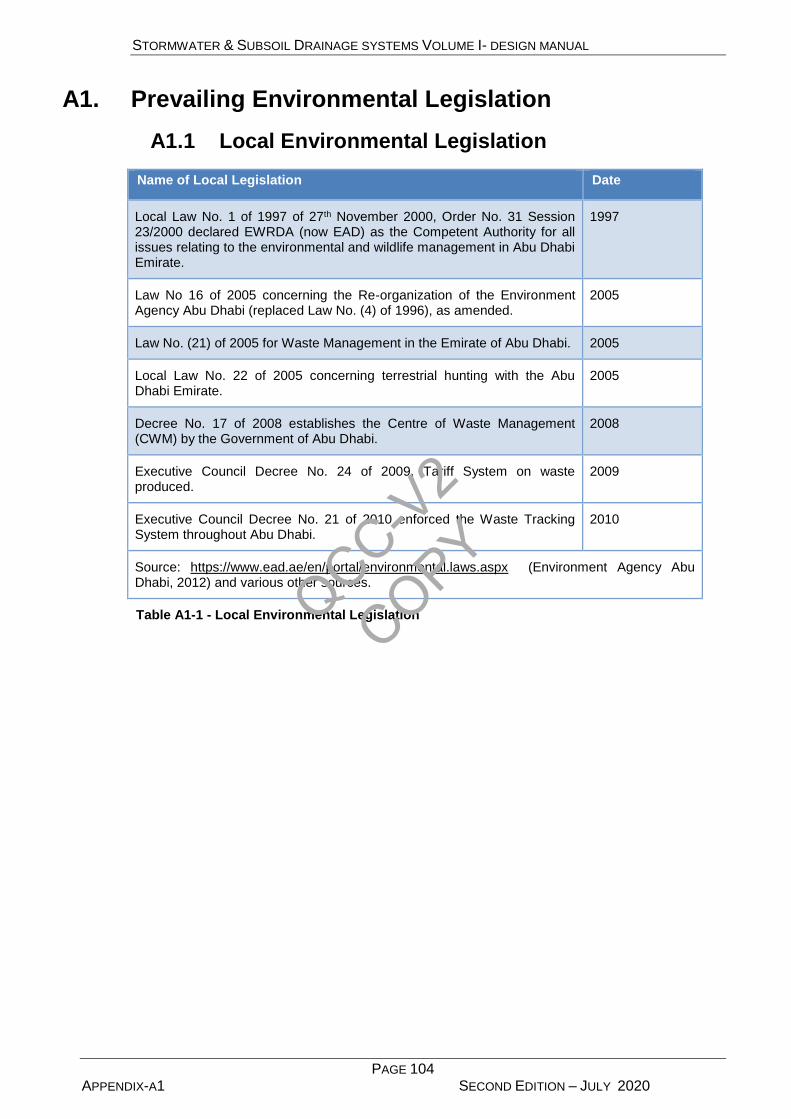
STORMWATER & SUBSOIL DRAINAGE SYSTEMS VOLUME I- DESIGN MANUAL
PAGE 104 APPENDIX-A1 SECOND EDITION – JULY 2020
A1. Prevailing Environmental Legislation
A1.1 Local Environmental Legislation
Name of Local Legislation Date
Local Law No. 1 of 1997 of 27th November 2000, Order No. 31 Session 23/2000 declared EWRDA (now EAD) as the Competent Authority for all issues relating to the environmental and wildlife management in Abu Dhabi Emirate.
1997
Law No 16 of 2005 concerning the Re-organization of the Environment Agency Abu Dhabi (replaced Law No. (4) of 1996), as amended.
2005
Law No. (21) of 2005 for Waste Management in the Emirate of Abu Dhabi. 2005
Local Law No. 22 of 2005 concerning terrestrial hunting with the Abu Dhabi Emirate.
2005
Decree No. 17 of 2008 establishes the Centre of Waste Management (CWM) by the Government of Abu Dhabi.
2008
Executive Council Decree No. 24 of 2009, Tariff System on waste produced.
2009
Executive Council Decree No. 21 of 2010 enforced the Waste Tracking System throughout Abu Dhabi.
2010
Source: https://www.ead.ae/en/portal/environmental.laws.aspx (Environment Agency Abu Dhabi, 2012) and various other sources.
Table A1-1 - Local Environmental Legislation
QCC-V2
COPY
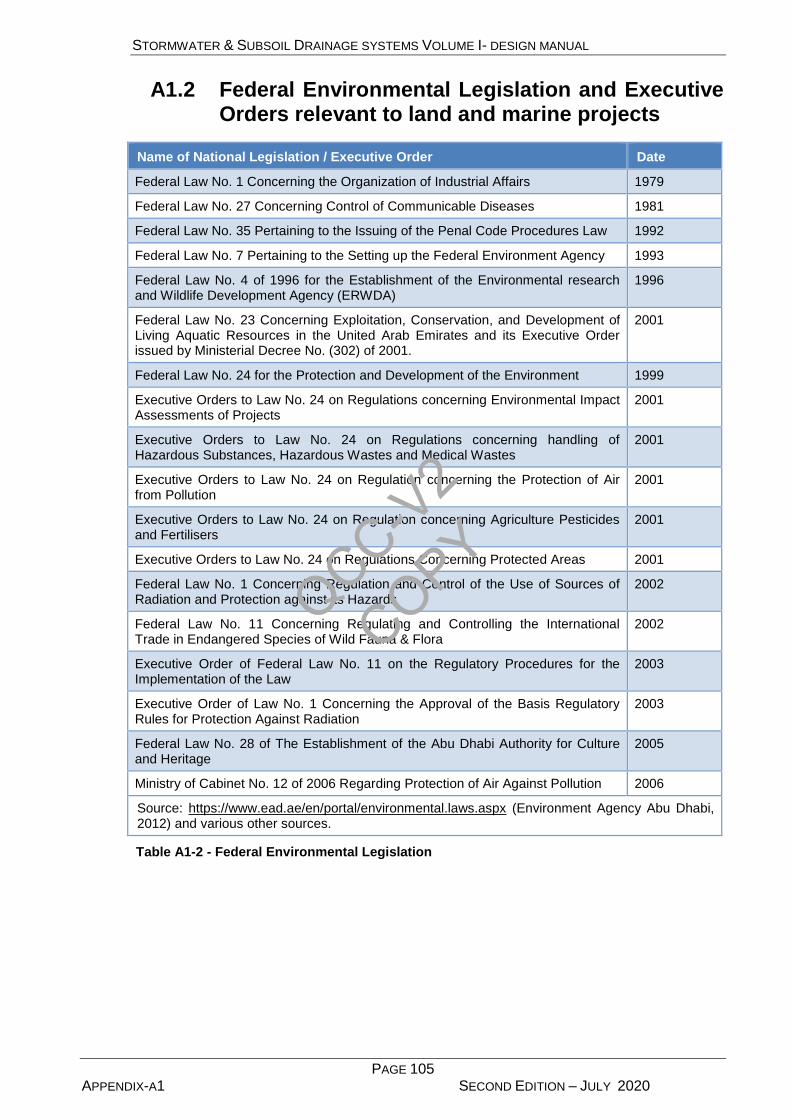
STORMWATER & SUBSOIL DRAINAGE SYSTEMS VOLUME I- DESIGN MANUAL
PAGE 105 APPENDIX-A1 SECOND EDITION – JULY 2020
A1.2 Federal Environmental Legislation and Executive Orders relevant to land and marine projects
Name of National Legislation / Executive Order Date
Federal Law No. 1 Concerning the Organization of Industrial Affairs 1979
Federal Law No. 27 Concerning Control of Communicable Diseases 1981
Federal Law No. 35 Pertaining to the Issuing of the Penal Code Procedures Law 1992
Federal Law No. 7 Pertaining to the Setting up the Federal Environment Agency 1993
Federal Law No. 4 of 1996 for the Establishment of the Environmental research and Wildlife Development Agency (ERWDA)
1996
Federal Law No. 23 Concerning Exploitation, Conservation, and Development of Living Aquatic Resources in the United Arab Emirates and its Executive Order issued by Ministerial Decree No. (302) of 2001.
2001
Federal Law No. 24 for the Protection and Development of the Environment 1999
Executive Orders to Law No. 24 on Regulations concerning Environmental Impact Assessments of Projects
2001
Executive Orders to Law No. 24 on Regulations concerning handling of Hazardous Substances, Hazardous Wastes and Medical Wastes
2001
Executive Orders to Law No. 24 on Regulation concerning the Protection of Air from Pollution
2001
Executive Orders to Law No. 24 on Regulation concerning Agriculture Pesticides and Fertilisers
2001
Executive Orders to Law No. 24 on Regulations Concerning Protected Areas 2001
Federal Law No. 1 Concerning Regulation and Control of the Use of Sources of Radiation and Protection against its Hazards
2002
Federal Law No. 11 Concerning Regulating and Controlling the International Trade in Endangered Species of Wild Fauna & Flora
2002
Executive Order of Federal Law No. 11 on the Regulatory Procedures for the Implementation of the Law
2003
Executive Order of Law No. 1 Concerning the Approval of the Basis Regulatory Rules for Protection Against Radiation
2003
Federal Law No. 28 of The Establishment of the Abu Dhabi Authority for Culture and Heritage
2005
Ministry of Cabinet No. 12 of 2006 Regarding Protection of Air Against Pollution 2006
Source: https://www.ead.ae/en/portal/environmental.laws.aspx (Environment Agency Abu Dhabi, 2012) and various other sources.
Table A1-2 - Federal Environmental Legislation
QCC-V2
COPY

STORMWATER & SUBSOIL DRAINAGE SYSTEMS VOLUME I- DESIGN MANUAL
PAGE 106 APPENDIX-A1 SECOND EDITION – JULY 2020
A1.3 International and Regional Environmental Protocols applicable in Abu Dhabi
Name of International and Regional Protocol/Convention Date of Ratification
Convention on the Prevention of Marine Pollution by Dumping of Wastes and Other Matter (LDC),1972.
1974
Kuwait Regional Convention for cooperation on the protection of the marine environment from pollution, 1978.
1979
International Convention for the Safety of Life at Sea (SOLAS), 1974. 1983
International Convention for the Prevention of Pollution of the Sea by Oil, 1954 and its amendments.
1983
International Convention Relating to Intervention on the High Seas in Cases of Oil Pollution Casualties (INTERVENTION), 1969.
1983
International Convention on Civil Liability for Oil Pollution Damage (CLC), 1969. 1983
Vienna Convention for the Protection of the Ozone Layer of 1985. 1989
Montreal Protocol on Substances that Deplete the Ozone Layer of 1987. 1989
Protocol concerning Marine Pollution resulting from Exploration and Exploitation of the Continental Shelf, 1989.
1990
Convention on International Trade in Endangered Species of Wild Fauna and Flora (CITES) 1973.
1990
Basel Convention on the Control of Transboundary Movements of Hazardous Wastes and their disposal, 1989.
1990
UN Framework Convention on Climate Change for the year 1992. 1995
1992 Protocol Concerning Amendments on International Convention on Civil Liability for Oil Pollution Damage (CLC), 1969 and International Convention on the Establishment of an International Fund for Compensation for Oil Pollution Damage, 1971.
1997
Convention on Limitation of Liability for Maritime Claims (LLMC), 1976. 1997
United Nations Convention to Combat Desertification for the Year 1994. 1998
Convention on Biological Diversity for the Year 1992. 1999
Stockholm Convention on Persistent Organic Pollutants (POPS), 2001. 2002
Rotterdam Convention on Prior Informed Consent Procedure for Certain Hazardous Chemicals and Pesticides in International Trade (PIC Convention),1998.
2002
Convention on Conservation of Wildlife and its Natural Habitats in the GCC Countries, 2001.
2003
Montreal Amendments (London 1990, Copenhagen 1992, Montreal 1997, Beijing 1999).
2005
Kyoto Protocol, 1997. 2005
Protocol on the Control of Marine Transboundary Movements and Disposal of Hazardous Wastes and Other Wastes, 1998.
2005
Source: https://www.ead.ae/en/portal/environmental.laws.aspx (Environment Agency Abu Dhabi, 2012)
Table A1-3 - International and Regional Environmental Protocols and Conventions
QCC-V2
COPY

STORMWATER & SUBSOIL DRAINAGE SYSTEMS VOLUME I- DESIGN MANUAL
PAGE 107 APPENDIX-A1 SECOND EDITION – JULY 2020
A1.4 Environmental Permitting Requirements
In accordance with Article 4 of Federal Law No. 24, ‘…No project or establishment is permitted to commence works prior to securing the appropriate license in accordance with the regulations determined by the Competent Authority...’
In accordance with Article 1 of Federal Law No. 24 the Competent Authority is the ‘Local Authorities in each Emirate of the United Arab Emirates’. Local Law No 16 identifies the Environment Agency Abu Dhabi as, ‘…the agency concerned with environmental affairs in the Emirate of Abu Dhabi...’
In accordance with Federal Law No. 24, industrial, commercial facilities and development projects require an environmental permit or No Objection Certificate prior to the commencement of site activities. In addition, certain environmental studies may be required by the Environment Agency Abu Dhabi in order to process the permit.
It is the responsibility of the Design Team / Contractor to ensure that all the Environment Agency Abu Dhabi requirements related to storm water and sub-surface drainage projects are fulfilled either as part of their own storm water and sub-surface drainage design or as part of a larger project. All current and applicable standard operating procedures and technical guidance should be complied with during all stages of the project execution. Standard Operating Procedures and Technical Guidelines are produced by the Environment Agency Abu Dhabi (Environment Agency Abu Dhabi, 2012).
The EAD Standard Operating Procedures are defined in the following:
Standard Operating Procedures for Permitting of Development and Infrastructure Projects in Abu Dhabi.
Standard Operating Procedures for Permitting of Industrial, Commercial, and Light Industrial Projects in Abu Dhabi.
Standard Operating Procedures for Permitting of Chemicals and Hazardous Materials in Abu Dhabi.
Standard Operating Procedures for Registration of Environmental Consultancy Offices in Abu Dhabi.
The EAD Technical Guidelines are defined in the following:
Technical Guidance Document for Preliminary Environmental Review (PER).
Technical Guidance Document for Environmental Impact Assessment (EIA).
Technical Guidance Document for Strategic Environmental Assessment (SEA).
Technical Guidance Document for Terms of Reference (TOR).
Technical Guidance Document for Construction Environmental Management Plan (CEMP).
Technical Guidance Document for Operation Environmental Management Plan (OEMP).
Technical Guidance Document for Decommissioning Environmental Management Plan (DEMP).
Technical Guidance Document for Environmental Action Plan (EAP).
Technical Guidance Document for Submission of Environmental Permit Applications and Environmental Studies.
Standard Operating Procedure (SOP) for Compliance Monitoring Using Continuous Emissions Monitoring Systems (CEMS).
Air Quality Modelling Guidance.
Technical Guidance Document for Environmental Audit Reports.
Technical Guidance Document for Wastewater and Marine Water Quality Monitoring.
QCC-V2
COPY
STORMWATER & SUBSOIL DRAINAGE SYSTEMS VOLUME I- DESIGN MANUAL
PAGE 108 APPENDIX-A2 SECOND EDITION – JULY 2020
Appendix A2 – Pipe Structural Design
QCC-V2
COPY
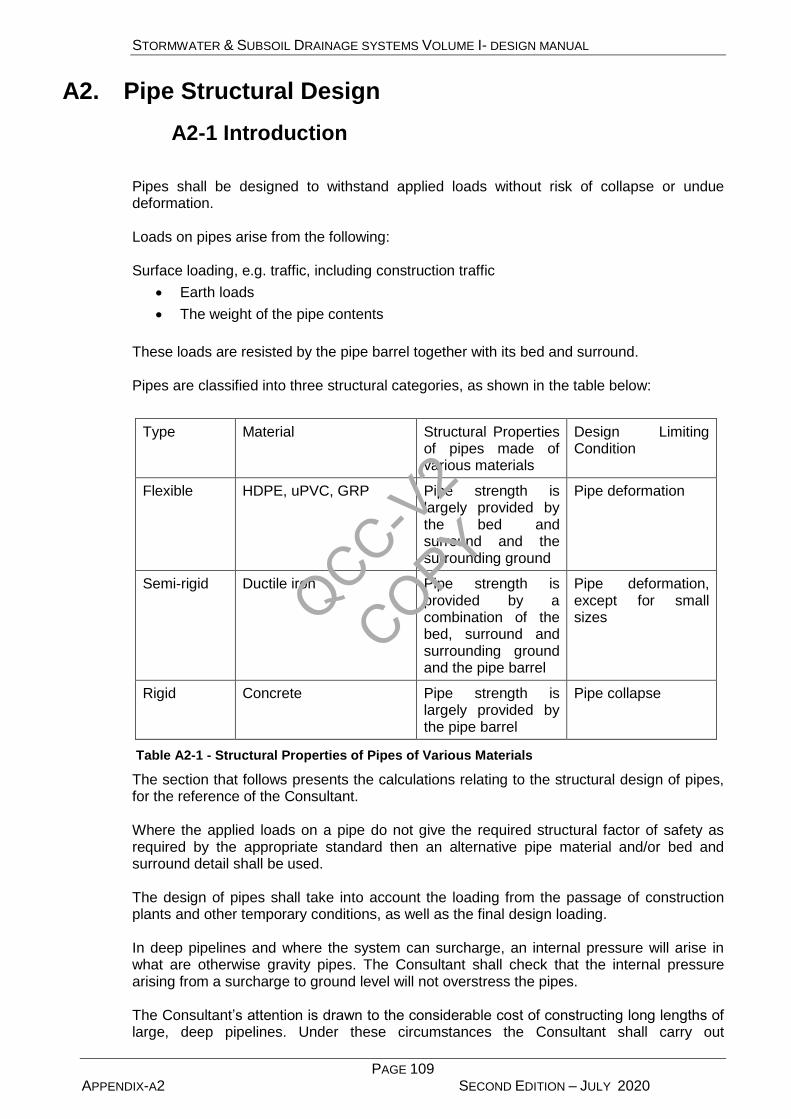
STORMWATER & SUBSOIL DRAINAGE SYSTEMS VOLUME I- DESIGN MANUAL
PAGE 109 APPENDIX-A2 SECOND EDITION – JULY 2020
A2. Pipe Structural Design
A2-1 Introduction
Pipes shall be designed to withstand applied loads without risk of collapse or undue deformation. Loads on pipes arise from the following: Surface loading, e.g. traffic, including construction traffic
Earth loads
The weight of the pipe contents
These loads are resisted by the pipe barrel together with its bed and surround. Pipes are classified into three structural categories, as shown in the table below:
Type Material Structural Properties of pipes made of various materials
Design Limiting Condition
Flexible HDPE, uPVC, GRP Pipe strength is largely provided by the bed and surround and the surrounding ground
Pipe deformation
Semi-rigid Ductile iron Pipe strength is provided by a combination of the bed, surround and surrounding ground and the pipe barrel
Pipe deformation, except for small sizes
Rigid Concrete Pipe strength is largely provided by the pipe barrel
Pipe collapse
Table A2-1 - Structural Properties of Pipes of Various Materials
The section that follows presents the calculations relating to the structural design of pipes, for the reference of the Consultant. Where the applied loads on a pipe do not give the required structural factor of safety as required by the appropriate standard then an alternative pipe material and/or bed and surround detail shall be used. The design of pipes shall take into account the loading from the passage of construction plants and other temporary conditions, as well as the final design loading. In deep pipelines and where the system can surcharge, an internal pressure will arise in what are otherwise gravity pipes. The Consultant shall check that the internal pressure arising from a surcharge to ground level will not overstress the pipes. The Consultant’s attention is drawn to the considerable cost of constructing long lengths of large, deep pipelines. Under these circumstances the Consultant shall carry out
QCC-V2
COPY
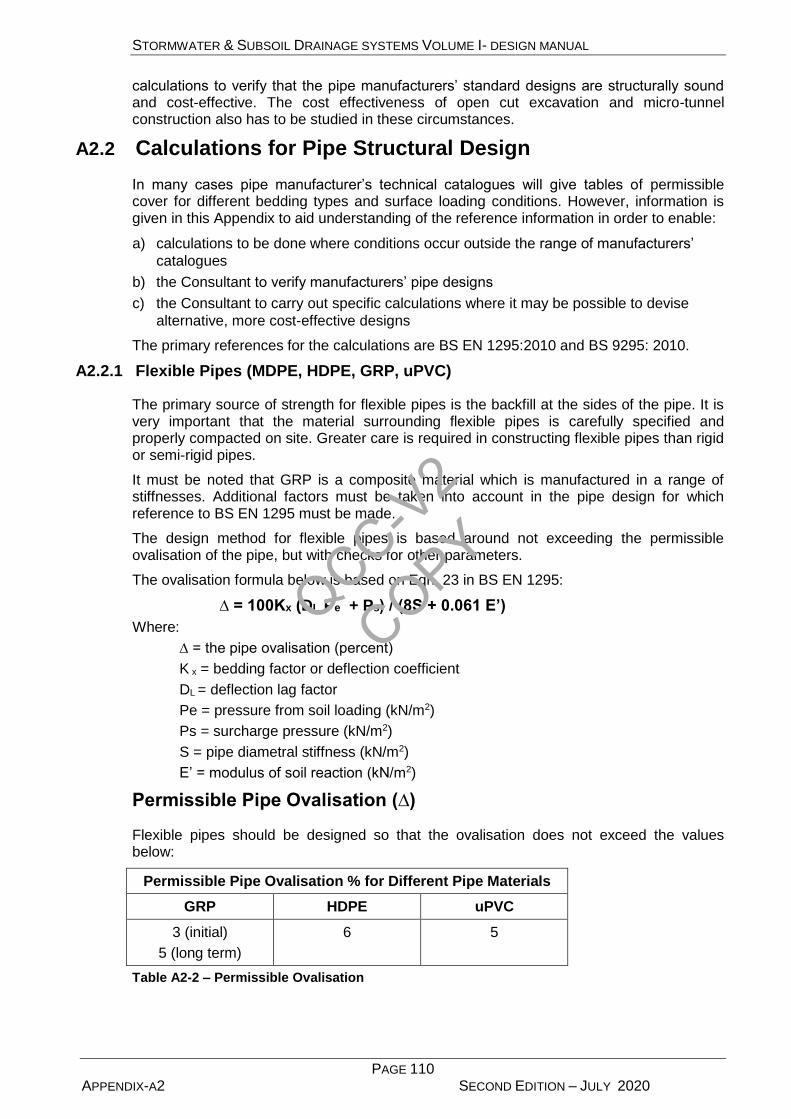
STORMWATER & SUBSOIL DRAINAGE SYSTEMS VOLUME I- DESIGN MANUAL
PAGE 110 APPENDIX-A2 SECOND EDITION – JULY 2020
calculations to verify that the pipe manufacturers’ standard designs are structurally sound and cost-effective. The cost effectiveness of open cut excavation and micro-tunnel construction also has to be studied in these circumstances.
A2.2 Calculations for Pipe Structural Design
In many cases pipe manufacturer’s technical catalogues will give tables of permissible cover for different bedding types and surface loading conditions. However, information is given in this Appendix to aid understanding of the reference information in order to enable:
a) calculations to be done where conditions occur outside the range of manufacturers’
catalogues
b) the Consultant to verify manufacturers’ pipe designs
c) the Consultant to carry out specific calculations where it may be possible to devise
alternative, more cost-effective designs
The primary references for the calculations are BS EN 1295:2010 and BS 9295: 2010.
A2.2.1 Flexible Pipes (MDPE, HDPE, GRP, uPVC)
The primary source of strength for flexible pipes is the backfill at the sides of the pipe. It is very important that the material surrounding flexible pipes is carefully specified and properly compacted on site. Greater care is required in constructing flexible pipes than rigid or semi-rigid pipes.
It must be noted that GRP is a composite material which is manufactured in a range of stiffnesses. Additional factors must be taken into account in the pipe design for which reference to BS EN 1295 must be made.
The design method for flexible pipes is based around not exceeding the permissible ovalisation of the pipe, but with checks for other parameters.
The ovalisation formula below is based on Eqn. 23 in BS EN 1295:
∆ = 100Kx (DL Pe + Ps) / (8S + 0.061 E’)
Where:
∆ = the pipe ovalisation (percent)
K x = bedding factor or deflection coefficient
DL = deflection lag factor
Pe = pressure from soil loading (kN/m2)
Ps = surcharge pressure (kN/m2)
S = pipe diametral stiffness (kN/m2)
E’ = modulus of soil reaction (kN/m2)
Permissible Pipe Ovalisation (∆)
Flexible pipes should be designed so that the ovalisation does not exceed the values below:
Permissible Pipe Ovalisation % for Different Pipe Materials
GRP HDPE uPVC
3 (initial)
5 (long term)
6 5
Table A2-2 – Permissible Ovalisation
QCC-V2
COPY

STORMWATER & SUBSOIL DRAINAGE SYSTEMS VOLUME I- DESIGN MANUAL
PAGE 111 APPENDIX-A2 SECOND EDITION – JULY 2020
Bedding Factor or Deflection Coefficient (Kx)
The bedding factor depends on the soil pressure distribution at the top and bottom of the pipe.
Figure A2-1 shows the different bed and surround details and the corresponding Kx values. In summary these are:
Bedding Type Bedding Factor K x
S1, S2 0.083
S3 – S5 0.10
B1, B2 0.083
Table A2-3 – Bedding Factors for Different Bedding Types
QCC-V2
COPY
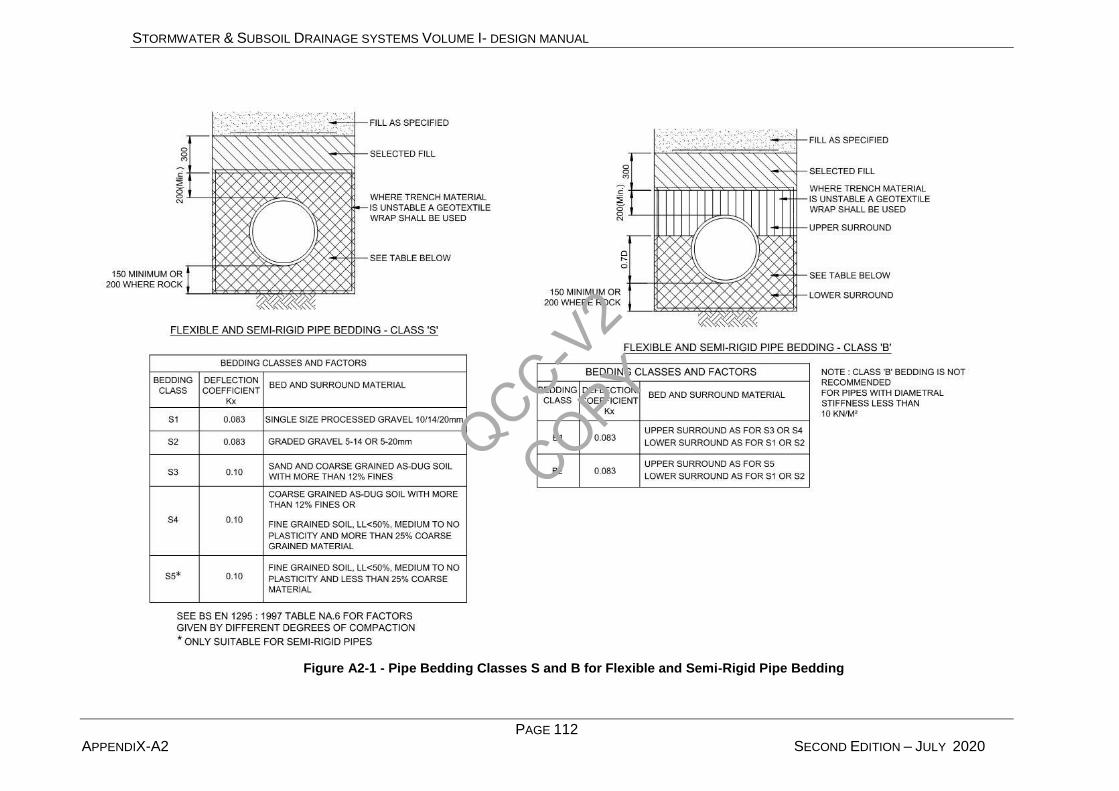
STORMWATER & SUBSOIL DRAINAGE SYSTEMS VOLUME I- DESIGN MANUAL
PAGE 112 APPENDIX-A2 SECOND EDITION – JULY 2020
Figure A2-1 - Pipe Bedding Classes S and B for Flexible and Semi-Rigid Pipe Bedding
QCC-V2
COPY
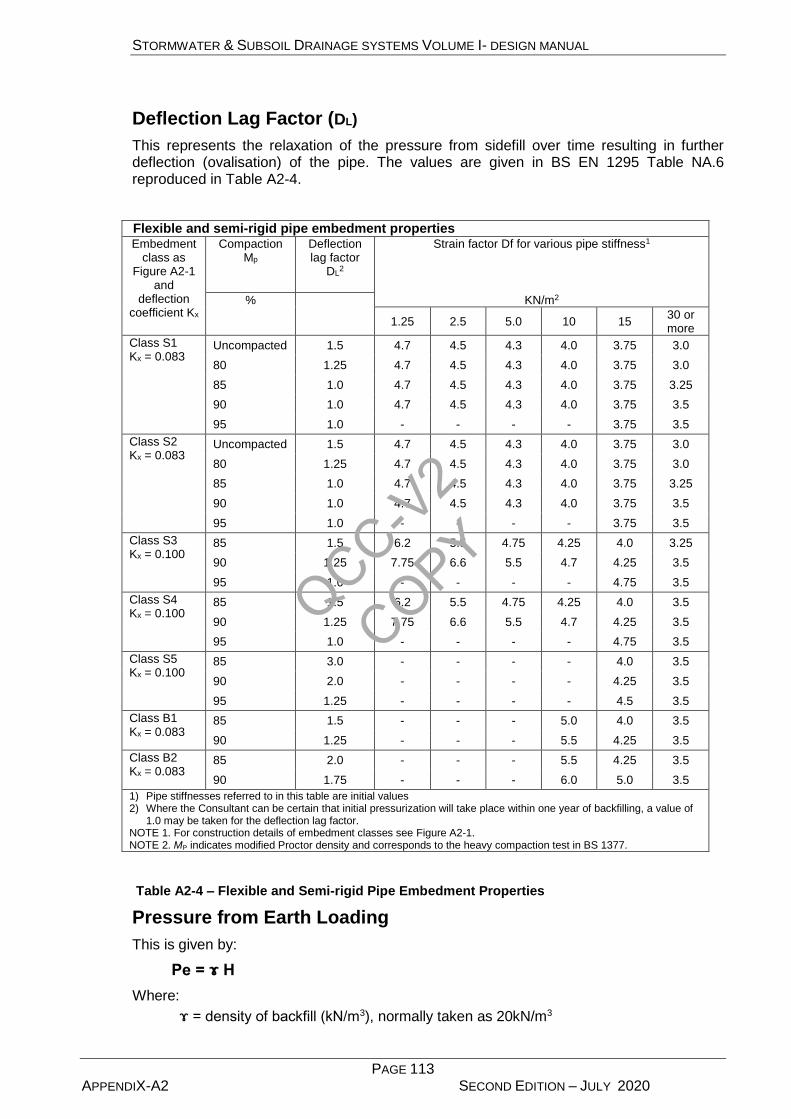
STORMWATER & SUBSOIL DRAINAGE SYSTEMS VOLUME I- DESIGN MANUAL
PAGE 113 APPENDIX-A2 SECOND EDITION – JULY 2020
Deflection Lag Factor (DL)
This represents the relaxation of the pressure from sidefill over time resulting in further deflection (ovalisation) of the pipe. The values are given in BS EN 1295 Table NA.6 reproduced in Table A2-4.
Flexible and semi-rigid pipe embedment properties Embedment
class as Figure A2-1
and deflection
coefficient Kx
Compaction Mp
Deflection lag factor
DL2
Strain factor Df for various pipe stiffness1
% KN/m2
1.25 2.5 5.0 10 15
30 or more
Class S1 Kx = 0.083
Uncompacted 1.5 4.7 4.5 4.3 4.0 3.75 3.0
80 1.25 4.7 4.5 4.3 4.0 3.75 3.0
85 1.0 4.7 4.5 4.3 4.0 3.75 3.25
90 1.0 4.7 4.5 4.3 4.0 3.75 3.5
95 1.0 - - - - 3.75 3.5
Class S2 Kx = 0.083
Uncompacted 1.5 4.7 4.5 4.3 4.0 3.75 3.0
80 1.25 4.7 4.5 4.3 4.0 3.75 3.0
85 1.0 4.7 4.5 4.3 4.0 3.75 3.25
90 1.0 4.7 4.5 4.3 4.0 3.75 3.5
95 1.0 - - - - 3.75 3.5
Class S3 Kx = 0.100
85 1.5 6.2 5.5 4.75 4.25 4.0 3.25
90 1.25 7.75 6.6 5.5 4.7 4.25 3.5
95 1.0 - - - - 4.75 3.5
Class S4 Kx = 0.100
85 1.5 6.2 5.5 4.75 4.25 4.0 3.5
90 1.25 7.75 6.6 5.5 4.7 4.25 3.5
95 1.0 - - - - 4.75 3.5
Class S5 Kx = 0.100
85 3.0 - - - - 4.0 3.5
90 2.0 - - - - 4.25 3.5
95 1.25 - - - - 4.5 3.5
Class B1 Kx = 0.083
85 1.5 - - - 5.0 4.0 3.5
90 1.25 - - - 5.5 4.25 3.5
Class B2 Kx = 0.083
85 2.0 - - - 5.5 4.25 3.5
90 1.75 - - - 6.0 5.0 3.5
1) Pipe stiffnesses referred to in this table are initial values 2) Where the Consultant can be certain that initial pressurization will take place within one year of backfilling, a value of
1.0 may be taken for the deflection lag factor. NOTE 1. For construction details of embedment classes see Figure A2-1. NOTE 2. MP indicates modified Proctor density and corresponds to the heavy compaction test in BS 1377.
Table A2-4 – Flexible and Semi-rigid Pipe Embedment Properties
Pressure from Earth Loading
This is given by:
Pe = ɤ H
Where:
ɤ = density of backfill (kN/m3), normally taken as 20kN/m3
QCC-V2
COPY
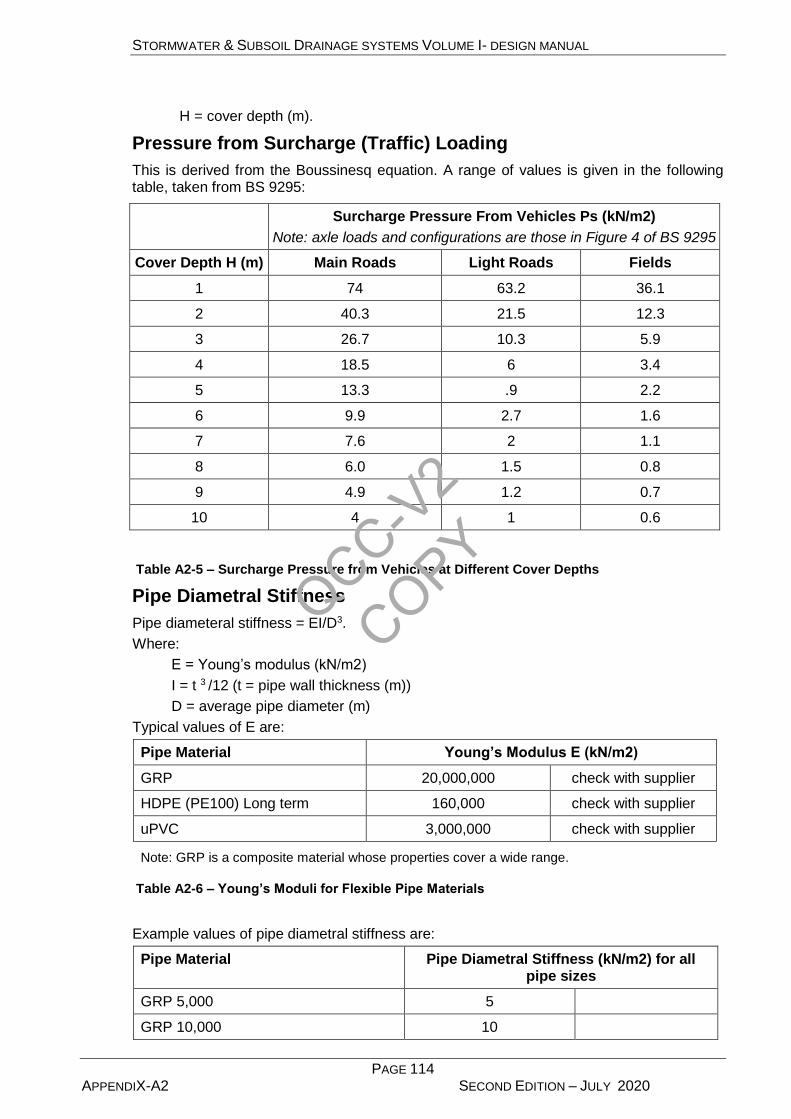
STORMWATER & SUBSOIL DRAINAGE SYSTEMS VOLUME I- DESIGN MANUAL
PAGE 114 APPENDIX-A2 SECOND EDITION – JULY 2020
H = cover depth (m).
Pressure from Surcharge (Traffic) Loading
This is derived from the Boussinesq equation. A range of values is given in the following table, taken from BS 9295:
Surcharge Pressure From Vehicles Ps (kN/m2)
Note: axle loads and configurations are those in Figure 4 of BS 9295
Cover Depth H (m) Main Roads Light Roads Fields
1 74 63.2 36.1
2 40.3 21.5 12.3
3 26.7 10.3 5.9
4 18.5 6 3.4
5 13.3 .9 2.2
6 9.9 2.7 1.6
7 7.6 2 1.1
8 6.0 1.5 0.8
9 4.9 1.2 0.7
10 4 1 0.6
Table A2-5 – Surcharge Pressure from Vehicles at Different Cover Depths
Pipe Diametral Stiffness
Pipe diameteral stiffness = EI/D3.
Where:
E = Young’s modulus (kN/m2)
I = t 3 /12 (t = pipe wall thickness (m))
D = average pipe diameter (m)
Typical values of E are:
Pipe Material Young’s Modulus E (kN/m2)
GRP 20,000,000 check with supplier
HDPE (PE100) Long term 160,000 check with supplier
uPVC 3,000,000 check with supplier
Note: GRP is a composite material whose properties cover a wide range.
Table A2-6 – Young’s Moduli for Flexible Pipe Materials
Example values of pipe diametral stiffness are:
Pipe Material Pipe Diametral Stiffness (kN/m2) for all pipe sizes
GRP 5,000 5
GRP 10,000 10
QCC-V2
COPY
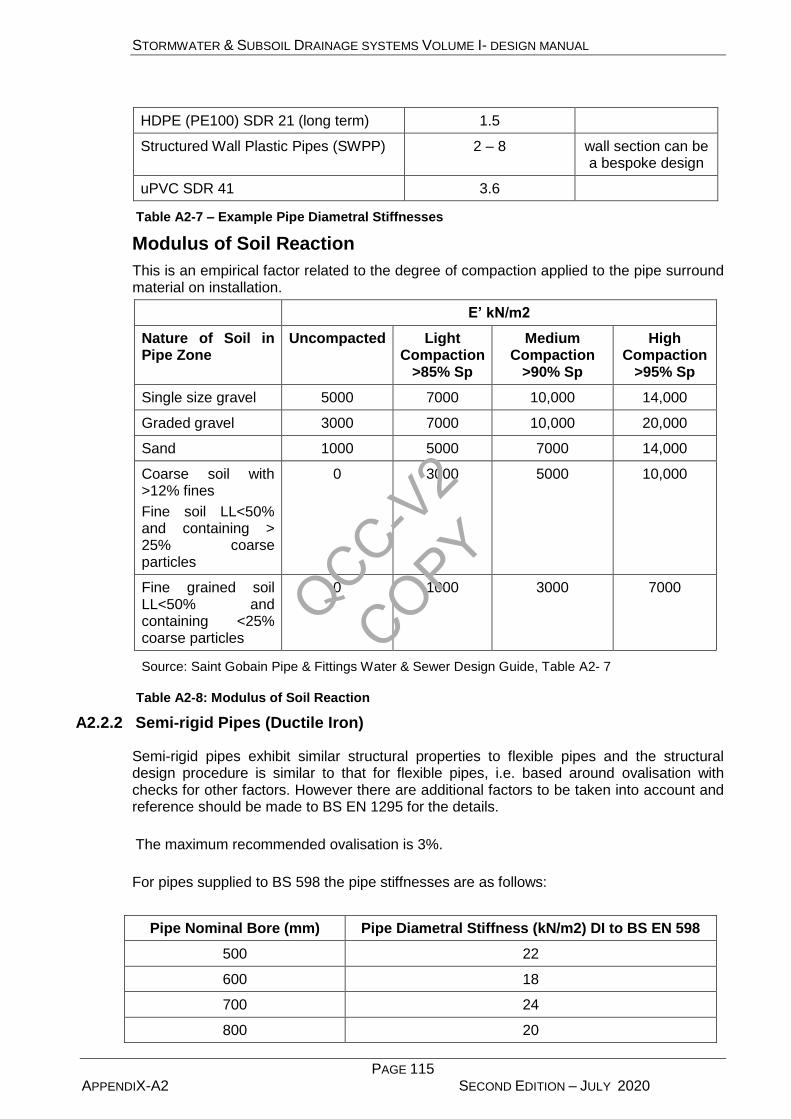
STORMWATER & SUBSOIL DRAINAGE SYSTEMS VOLUME I- DESIGN MANUAL
PAGE 115 APPENDIX-A2 SECOND EDITION – JULY 2020
HDPE (PE100) SDR 21 (long term) 1.5
Structured Wall Plastic Pipes (SWPP) 2 – 8 wall section can be a bespoke design
uPVC SDR 41 3.6
Table A2-7 – Example Pipe Diametral Stiffnesses
Modulus of Soil Reaction
This is an empirical factor related to the degree of compaction applied to the pipe surround material on installation.
E’ kN/m2
Nature of Soil in Pipe Zone
Uncompacted Light Compaction
>85% Sp
Medium Compaction
>90% Sp
High Compaction
>95% Sp
Single size gravel 5000 7000 10,000 14,000
Graded gravel 3000 7000 10,000 20,000
Sand 1000 5000 7000 14,000
Coarse soil with >12% fines
Fine soil LL<50% and containing > 25% coarse particles
0 3000 5000 10,000
Fine grained soil LL<50% and containing <25% coarse particles
0 1000 3000 7000
Source: Saint Gobain Pipe & Fittings Water & Sewer Design Guide, Table A2- 7
Table A2-8: Modulus of Soil Reaction
A2.2.2 Semi-rigid Pipes (Ductile Iron)
Semi-rigid pipes exhibit similar structural properties to flexible pipes and the structural design procedure is similar to that for flexible pipes, i.e. based around ovalisation with checks for other factors. However there are additional factors to be taken into account and reference should be made to BS EN 1295 for the details.
The maximum recommended ovalisation is 3%.
For pipes supplied to BS 598 the pipe stiffnesses are as follows:
Pipe Nominal Bore (mm) Pipe Diametral Stiffness (kN/m2) DI to BS EN 598
500 22
600 18
700 24
800 20
QCC-V2
COPY
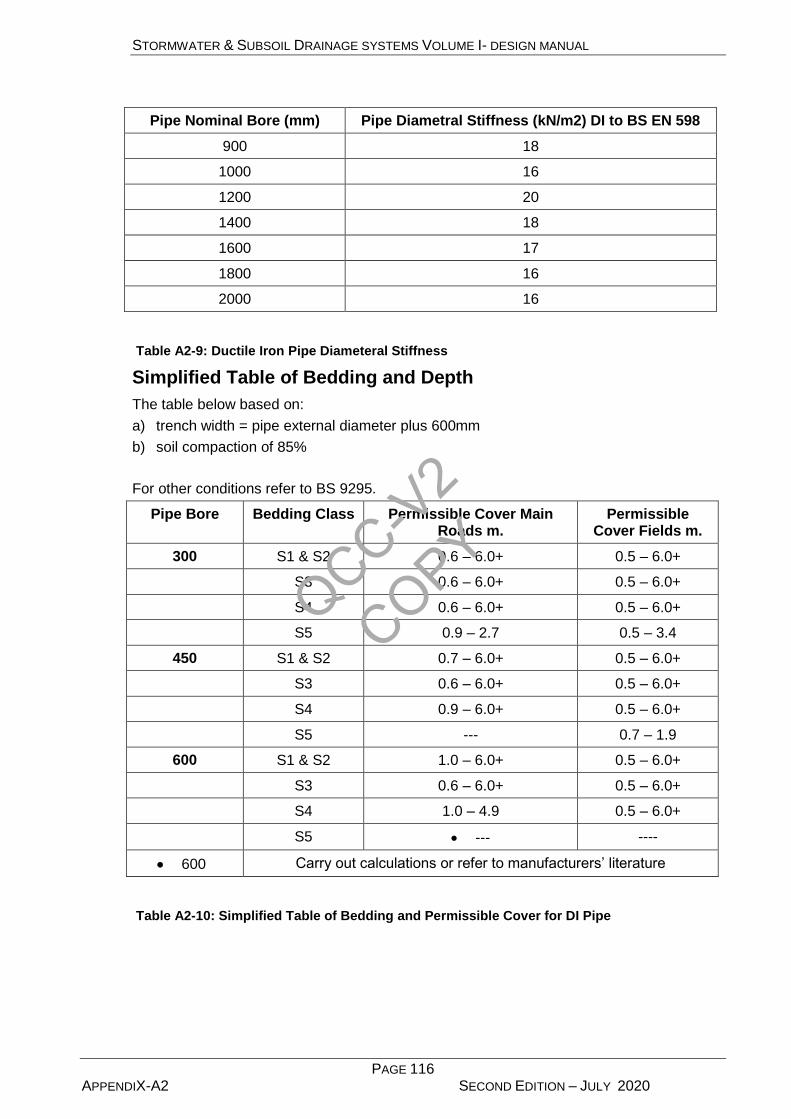
STORMWATER & SUBSOIL DRAINAGE SYSTEMS VOLUME I- DESIGN MANUAL
PAGE 116 APPENDIX-A2 SECOND EDITION – JULY 2020
Pipe Nominal Bore (mm) Pipe Diametral Stiffness (kN/m2) DI to BS EN 598
900 18
1000 16
1200 20
1400 18
1600 17
1800 16
2000 16
Table A2-9: Ductile Iron Pipe Diameteral Stiffness
Simplified Table of Bedding and Depth
The table below based on:
a) trench width = pipe external diameter plus 600mm
b) soil compaction of 85%
For other conditions refer to BS 9295.
Pipe Bore Bedding Class Permissible Cover Main Roads m.
Permissible Cover Fields m.
300 S1 & S2 0.6 – 6.0+ 0.5 – 6.0+
S3 0.6 – 6.0+ 0.5 – 6.0+
S4 0.6 – 6.0+ 0.5 – 6.0+
S5 0.9 – 2.7 0.5 – 3.4
450 S1 & S2 0.7 – 6.0+ 0.5 – 6.0+
S3 0.6 – 6.0+ 0.5 – 6.0+
S4 0.9 – 6.0+ 0.5 – 6.0+
S5 --- 0.7 – 1.9
600 S1 & S2 1.0 – 6.0+ 0.5 – 6.0+
S3 0.6 – 6.0+ 0.5 – 6.0+
S4 1.0 – 4.9 0.5 – 6.0+
S5 --- ----
600 Carry out calculations or refer to manufacturers’ literature
Table A2-10: Simplified Table of Bedding and Permissible Cover for DI Pipe
QCC-V2
COPY
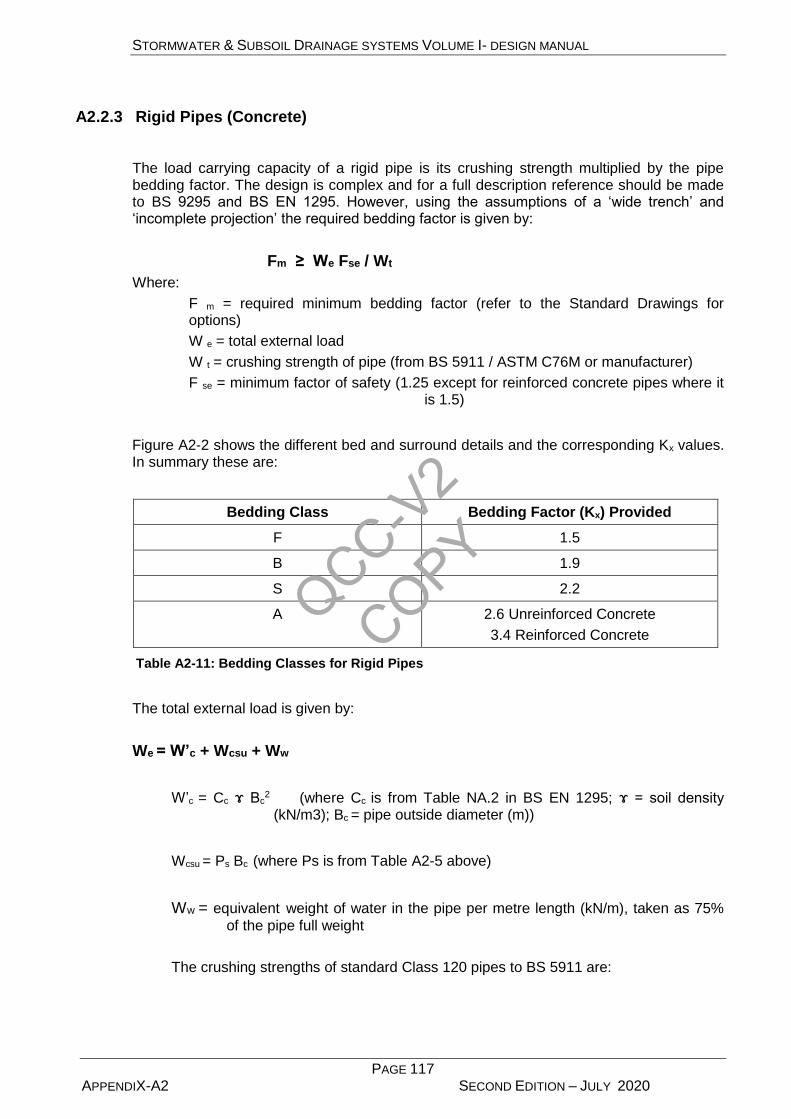
STORMWATER & SUBSOIL DRAINAGE SYSTEMS VOLUME I- DESIGN MANUAL
PAGE 117 APPENDIX-A2 SECOND EDITION – JULY 2020
A2.2.3 Rigid Pipes (Concrete)
The load carrying capacity of a rigid pipe is its crushing strength multiplied by the pipe bedding factor. The design is complex and for a full description reference should be made to BS 9295 and BS EN 1295. However, using the assumptions of a ‘wide trench’ and ‘incomplete projection’ the required bedding factor is given by:
Fm ≥ We Fse / Wt
Where:
F m = required minimum bedding factor (refer to the Standard Drawings for options)
W e = total external load
W t = crushing strength of pipe (from BS 5911 / ASTM C76M or manufacturer)
F se = minimum factor of safety (1.25 except for reinforced concrete pipes where it is 1.5)
Figure A2-2 shows the different bed and surround details and the corresponding Kx values. In summary these are:
Bedding Class Bedding Factor (Kx) Provided
F 1.5
B 1.9
S 2.2
A 2.6 Unreinforced Concrete
3.4 Reinforced Concrete
Table A2-11: Bedding Classes for Rigid Pipes
The total external load is given by:
We = W’c + Wcsu + Ww
W’c = Cc ɤ Bc2 (where Cc is from Table NA.2 in BS EN 1295; ɤ = soil density
(kN/m3); Bc = pipe outside diameter (m))
Wcsu = Ps Bc (where Ps is from Table A2-5 above)
Ww = equivalent weight of water in the pipe per metre length (kN/m), taken as 75%
of the pipe full weight
The crushing strengths of standard Class 120 pipes to BS 5911 are:
QCC-V2
COPY
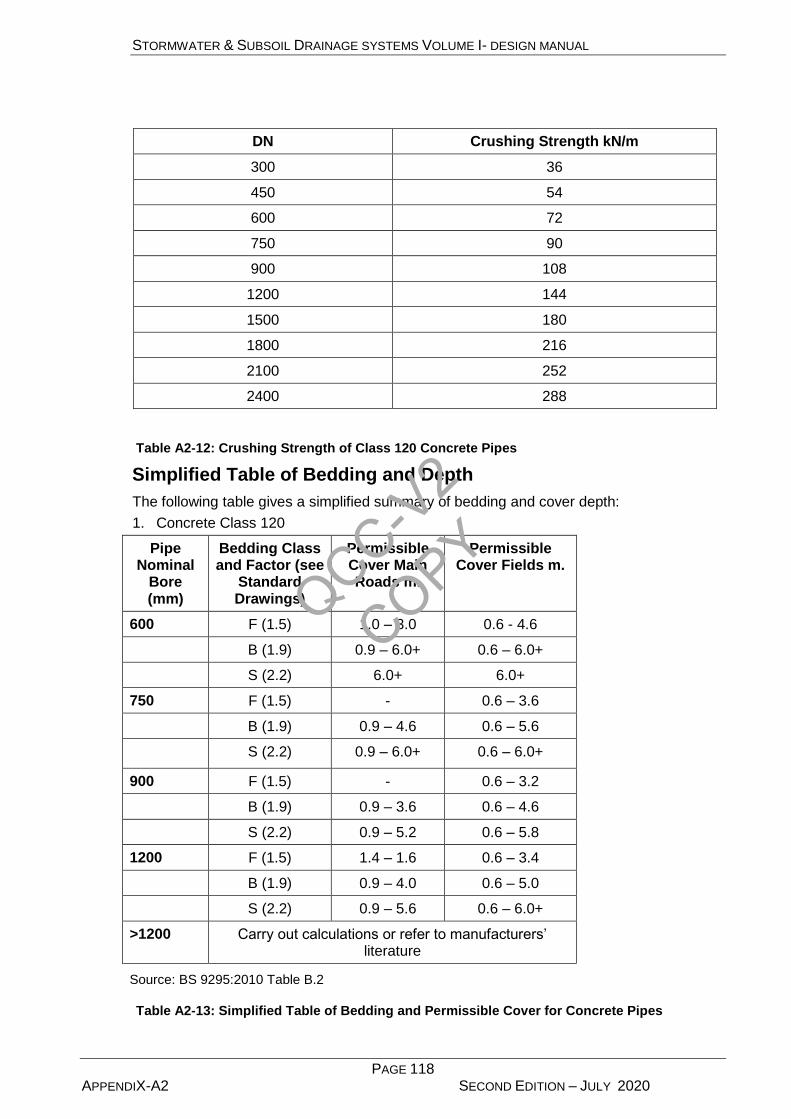
STORMWATER & SUBSOIL DRAINAGE SYSTEMS VOLUME I- DESIGN MANUAL
PAGE 118 APPENDIX-A2 SECOND EDITION – JULY 2020
DN Crushing Strength kN/m
300 36
450 54
600 72
750 90
900 108
1200 144
1500 180
1800 216
2100 252
2400 288
Table A2-12: Crushing Strength of Class 120 Concrete Pipes
Simplified Table of Bedding and Depth
The following table gives a simplified summary of bedding and cover depth:
1. Concrete Class 120
Pipe Nominal
Bore (mm)
Bedding Class and Factor (see
Standard Drawings)
Permissible Cover Main Roads m.
Permissible Cover Fields m.
600 F (1.5) 1.0 – 3.0 0.6 - 4.6
B (1.9) 0.9 – 6.0+ 0.6 – 6.0+
S (2.2) 6.0+ 6.0+
750 F (1.5) - 0.6 – 3.6
B (1.9) 0.9 – 4.6 0.6 – 5.6
S (2.2) 0.9 – 6.0+ 0.6 – 6.0+
900 F (1.5) - 0.6 – 3.2
B (1.9) 0.9 – 3.6 0.6 – 4.6
S (2.2) 0.9 – 5.2 0.6 – 5.8
1200 F (1.5) 1.4 – 1.6 0.6 – 3.4
B (1.9) 0.9 – 4.0 0.6 – 5.0
S (2.2) 0.9 – 5.6 0.6 – 6.0+
>1200 Carry out calculations or refer to manufacturers’ literature
Source: BS 9295:2010 Table B.2
Table A2-13: Simplified Table of Bedding and Permissible Cover for Concrete Pipes
QCC-V2
COPY

STORMWATER & SUBSOIL DRAINAGE SYSTEMS VOLUME I- DESIGN MANUAL
PAGE 119 APPENDIX-A2 SECOND EDITION – JULY 200
Figure A2-2: Pipe Bedding Classes F, B, S and A for Rigid Pipes
QCC-V2
COPY

STORMWATER & SUBSOIL DRAINAGE SYSTEMS VOLUME I- DESIGN MANUAL
PAGE 120 APPENDIX-A3 SECOND EDITION – JULY 2020
Appendix A3 – Road Drainage – Gutter and Inlet Design
QCC-V2
COPY

STORMWATER & SUBSOIL DRAINAGE SYSTEMS VOLUME I- DESIGN MANUAL
PAGE 121 APPENDIX-A3 SECOND EDITION – JULY 2020
A3. Road Drainage-Gutter & Inlet Design
Note: This appendix was reproduced from the Roadway Design Manual – Drainage, Section 400: Roadway Drainage (Gutter, Inlet, and Pavement Hydraulics)
A3.1 Introduction
Variables of major concern for pavement drainage evaluations include depth of gutter flow and pavement spread. These variables and roadway features such as cross slope, longitudinal slope, and gutter sections can affect the size, type, and spacing of inlets. This section provides fundamentals of gutter flow, inlet interception capacity, and bridge deck drainage, and an evaluation of the potential for hydroplaning. The level of service of facilities that provide drainage of roadway surfaces should be consistent with the level of service being provided by the roadway. Guidelines are given for evaluating roadway features as they relate to pavement drainage, and for selecting an appropriate design frequency. The potential for hydroplaning, which can occur at design speeds greater than 75 km per hour when there is water on the pavement, is discussed. Procedures for performing gutter flow calculations are based on a modification of Manning’s Equation. Inlet capacity calculations for kerb opening inlets, grated gutter inlets, combination inlets, slotted pipe and trench drain inlets, and bridge deck drainage features are discussed.
A3.2 Roadway Features
Roadway features considered during gutter, inlet, and pavement drainage calculations include:
Longitudinal slope
Cross slope
kerb and gutter sections
Ditches
Bridge decks
Shoulder gutters
A3.2.1 Longitudinal Slope
A minimum longitudinal gradient is important for a kerbed pavement, since it is susceptible to stormwater spread. Flat gradients on unkerbed pavements can lead to a spread problem if vegetation is allowed to build up along the pavement edge. Desirable gutter grades should not be less than 0.3 percent for kerbed pavements, and not less than 0.2 percent in very flat terrain. Minimum grades can be maintained in very flat terrain by use of a saw-tooth or rolling profile. To provide adequate drainage in sag vertical curves, a minimum slope of 0.3 percent should be maintained within 50 feet of the level point in the curve. This is accomplished where the length of the curve (L) divided by the algebraic difference in grades (A) is equal to or less than 167 (L/A < 167). Special gutter profiles should be developed to maintain a minimum slope of 0.2 percent up to the inlet. Although ponding is not usually a problem at crest vertical curves, on extremely flat curves a similar minimum gradient should be provided to facilitate drainage.
QCC-V2
COPY
STORMWATER & SUBSOIL DRAINAGE SYSTEMS VOLUME I- DESIGN MANUAL
PAGE 122 APPENDIX-A3 SECOND EDITION – JULY 2020
A3.2.2 Cross Slope
The AASHTO policy on geometric design (Green Book, 1984) is standard practice and should be consulted for more details than those presented in this section. The design of pavement cross slope is often a compromise between the need for reasonably steep cross slopes for drainage and relatively flat cross slopes for driver comfort. The USDOT, FHWA (FHWA-RD-79-30, 31, 1979) reports that cross slopes of 2 percent have little effect on driver effort in steering, especially with power steering, or on friction demand for vehicle stability. Use of a cross slope steeper than 2 percent on pavements with a central crown line is not desirable. In areas of longitudinal flat slopes and slower traffic speeds (less than 75 kph), a somewhat steeper cross slope may be necessary to facilitate drainage. In such areas, the cross slope may be increased to 2.5 percent. When three or more lanes are inclined in the same direction on multi-lane pavements, it is desirable that each successive pair of lanes, or the portion thereof outward from the first two lanes from the crown line, have an increased slope. The two lanes adjacent to the crown line should be pitched at the normal slope, and successive outward lane pairs, or portions thereof, should be increased by about 0.5 percent. Where three or more lanes are provided in each direction, the maximum outside lane pavement cross slope should be limited to 3 percent. It is desirable to provide a break in cross slope at two lanes, with three lanes the upper limit. Although not widely encouraged, inside lanes can be sloped toward the median. This should not be used unless four continuous lanes or some physical constraint on the roadway elevations occurs, since inside lanes are used for high speed traffic and the allowable water depth is lower. Median areas should not be drained across travelled lanes. A careful check should be made of designs to minimize the number and length of flat pavement sections in cross slope transition areas, and consideration should be given to increasing cross slopes in sag vertical curves, crest vertical curves, and in sections of flat longitudinal grades. Where kerbs are used, depressed gutter sections can be effective at increasing gutter capacity and reducing spread on the pavement. Shoulders should generally be sloped to drain away from the pavement, except with raised, narrow medians.
A3.2.3 Kerb and Gutter
Kerbing at the outside edge of pavements is normal practice for low-speed, urban roadway facilities. Where formed gutters are used, they are generally 0.5 to 1 metres wide. Formed gutters (either asphalt or portland cement concrete) are on the same cross slope as the pavement on the high side and depressed with a steeper cross slope on the low side, usually at 8%. Typical practice is to place kerbs at the outside edge of the travelway, the shoulders, or the parking lanes on low speed facilities. The gutter width is included as a part of the pavement width.
A3.2.4 Roadside and Median Ditches
Roadside ditches are commonly used with unkerbed roadway sections to convey runoff from the highway pavement and from areas which drain toward the highway. Due to access and right-of-way limitations, roadside ditches cannot be used on most urban areas. They can be used in cut sections, depressed sections, and other locations where sufficient right-of-way is available and driveways or intersections are infrequent. Kerbed highway sections are relatively inefficient at conveying water, and the area tributary to the gutter section should be kept to a minimum to reduce the hazard of water on the pavement. Where practicable, the flow from major areas draining toward kerbed highway pavements should be intercepted by ditches or other pipe/inlet systems, as appropriate.
QCC-V2
COPY
STORMWATER & SUBSOIL DRAINAGE SYSTEMS VOLUME I- DESIGN MANUAL
PAGE 123 APPENDIX-A3 SECOND EDITION – JULY 2020
It is preferable to slope median areas and inside shoulders to a centre swale, to prevent drainage from the median area running across the pavement. This is particularly important for high-speed facilities and for facilities with more than two lanes of traffic in each direction. In some cases, detention can be included in shallow medians to reduce the size of runoff facilities, but this must be carefully engineered to handle higher intensity rainfall.
A3.2.5 Bridge Decks
Drainage of bridge decks is similar to other kerbed roadway sections. It is often less efficient, because cross slopes are flatter, parapets collect large amounts of debris, and small drainage inlets or scuppers have a higher potential for becoming clogged by debris. Bridge deck constructability usually requires a constant cross slope, so the guidelines in Section A3.2.2 do not apply. Because of the difficulties in providing and maintaining adequate deck drainage systems, gutter flow from roadways should be intercepted before it reaches a bridge. In many cases, deck drainage must be carried several spans to the bridge end for disposal. Zero gradients and sag vertical curves should be avoided on bridges. The minimum desirable longitudinal slope for bridge deck drainage should be 0.2 percent. When bridges are placed on a vertical curve and the longitudinal slope is less than 0.2 percent, the gutter spread should be checked to ensure a safe, reasonable design. Piped and grated scupper type inlets are the recommended method of deck drainage because they can reduce the problems of transporting a relatively large concentration of runoff in an area of generally limited right-of-way. They also have a low initial cost and are relatively easy to maintain. However, the use of scuppers should be evaluated for site-specific concerns, and scuppers should always be piped in down drains to stable and erosion protected runoff points. Runoff collected and transported to the end of the bridge should generally be collected by inlets and down drains, although paved flumes may be used for extremely minor flows in some areas.
A3.2.6 Shoulder Gutters
Shoulder gutters are used to protect fill slopes from erosion caused by water from the roadway pavement. Shoulder gutters are required on all fill slopes higher than 3 metres in areas where permanent vegetation cannot be established. An inspection of the existing/proposed site conditions and contact with the Agriculture Section shall be made by the Consultant to determine the likelihood that vegetation will survive. Shoulder gutters are also required at bridge ends where concentrated flow from the bridge deck would otherwise run down the slope or over a retaining wall/abutment. This section of gutter should be long enough to include the transitions necessary. Shoulder gutters are not required on the high side of super-elevated sections or adjacent to barrier walls on high fills. Shoulder gutter ditch bottom type inlet spacing shall be based on consideration of future additional median lanes. Bypass should not exceed 25 percent for intermediate inlets. The terminal inlet must be assured of intercepting 100 percent of the flow coming to it, including bypass from intermediate inlets. The maximum flow allowed at the terminal inlet should be 0.043 cubic metres per second for grades steeper than 1.4 percent. For grades flatter than 1.4 percent, the flow shall not exceed 80% of the maximum 100% intercept width of the gutter inlet. In any case, the distance from the last intermediate inlet to the terminal inlet should not exceed 70 metres.
QCC-V2
COPY

STORMWATER & SUBSOIL DRAINAGE SYSTEMS VOLUME I- DESIGN MANUAL
PAGE 124 APPENDIX-A3 SECOND EDITION – JULY 2020
A3.3 Hydroplaning
Hydroplaning occurs when a tire is separated from the road surface by a layer of fluid. Major variables influencing hydroplaning conditions include:
Pavement texture depth (TXD), in millimetres
Cross slope of pavement (Sx), in m/m
Pavement width (W), in m
Rainfall intensity (i), in mm/hour
Tire tread depth (TD), in mm
Tire pressure (P), in psi
Vehicle speeds, in kph
Water depth (WD), in millimetres
Only the first three variables are design parameters that can be controlled by the engineer, with typical values as follows:
Pavement texture depth, 0.25 to 1.5 millimetres
Cross slope of pavement, 0.01 to 0.03 m/m (can be higher for super-elevated
sections)
Pavement width, 3 to 15 metres
An evaluation of the potential for hydroplaning requires selection of design variables that minimize the pavement water depth. An empirical equation for computing water film depth, based on experimental studies conducted at Texas A&M University for the USDOT, FHWA, and presented in the two volume report FHWA-RD-79-30 and 31 (1979), can be used for this evaluation. Knowing the water film depth and various operational parameters, the vehicle speed at which hydroplaning occurs can be estimated using a second empirical equation. Both equations are presented below: The equation for estimating the vehicle speed at which hydroplaning occurs is expressed as: v = 1.609[SD0.04P0.3 (.039TD + 1) 0.06A]
(Eq. A3-1) where: v = vehicle speed at which hydroplaning occurs, in kph
SD = 100 [(Wd - WW) / Wd] = spindown percent (10 percent spindown is used as an
indicator of hydroplaning)
Wd = rotational velocity of a rolling wheel on a dry surface
WW = rotational velocity of a wheel after spinning down due to contact with a flooded
pavement
P = tire pressure, in pounds per square inch (use 24 psi for design)
TD = tire tread depth, in millimetres (use 1.59 mm for design)
A = the greater of (10.409 /.039WD) + 3.507 or [(28.952/(.039WD0.06)) -
7.817](.039TXD0.14)
WD = water depth, in mm (see Equation A3-2)
TXD = pavement texture depth in millimetres (use 0.51 mm for design)
QCC-V2
COPY
STORMWATER & SUBSOIL DRAINAGE SYSTEMS VOLUME I- DESIGN MANUAL
PAGE 125 APPENDIX-A3 SECOND EDITION – JULY 2020
An equation for evaluating the depth of stormwater on pavement is expressed as: WD = 25.4 {0.00338 [(0.039TXD0.110.305L0.430.039i0.59) / Sx0.42] - 0.039TXD}
(Eq. A3-2) where: L = pavement width, in metres
I = rainfall intensity, in millimetres/hr
Sx = pavement cross slope, in m/m
The following guidelines for pavement drainage can help reduce the potential for hydroplaning problems:
A permeable surface course or a high macrotexture surface course appears to have
the highest potential for reducing hydroplaning accidents. This has been
accomplished using friction courses.
Pavement cross slope is the dominant factor in removing water from the pavement
surface. A minimum cross slope of 1.5 percent is recommended.
As a guideline, a wheel path depression in excess of 5 millimetres should be
considered as a threshold to indicate the need for resurfacing to reduce the potential
for pavement drainage problems on dense asphaltic concrete or portland cement
concrete pavements. The potential for hydroplaning is greater from wheel path
settlement and wear depressions than from sheet flow depth. This is also true for
most multi-lane facilities.
Surface drains located parallel to the lane lines will probably not solve potential
drainage problems caused by the creation of wheel path depressions.
Transverse surface drains located on the pavement surface would probably result in a
rough pavement, increase maintenance costs, and increase potential for ponding
water, and are not recommended for general use.
Grooving may be considered as a corrective measure for severe localized
hydroplaning problems.
A3.4 Spread
The design storm frequency for pavement drainage should be consistent with the frequency selected for other components of the drainage system.
A3.4.1 Selection Considerations
The major considerations for selecting a design frequency and spread are:
Highway classification, because it defines and reflects public expectations for finding
water on the pavement surface. Ponding should be minimized on the traffic lanes of
high-speed, high-volume highways, where it is not expected to occur.
Highway speed, because at speeds greater than 75 kilometres per hour, even a
shallow depth of water on the pavement can cause hydroplaning. Design speed is
recommended for use in evaluating hydroplaning potential. When the design speed
is selected, consideration should be given to the likelihood that legal posted speeds
may be exceeded. It is clearly unreasonable to provide the same level of pavement
drainage for low speed facilities as for high speed facilities.
QCC-V2
COPY
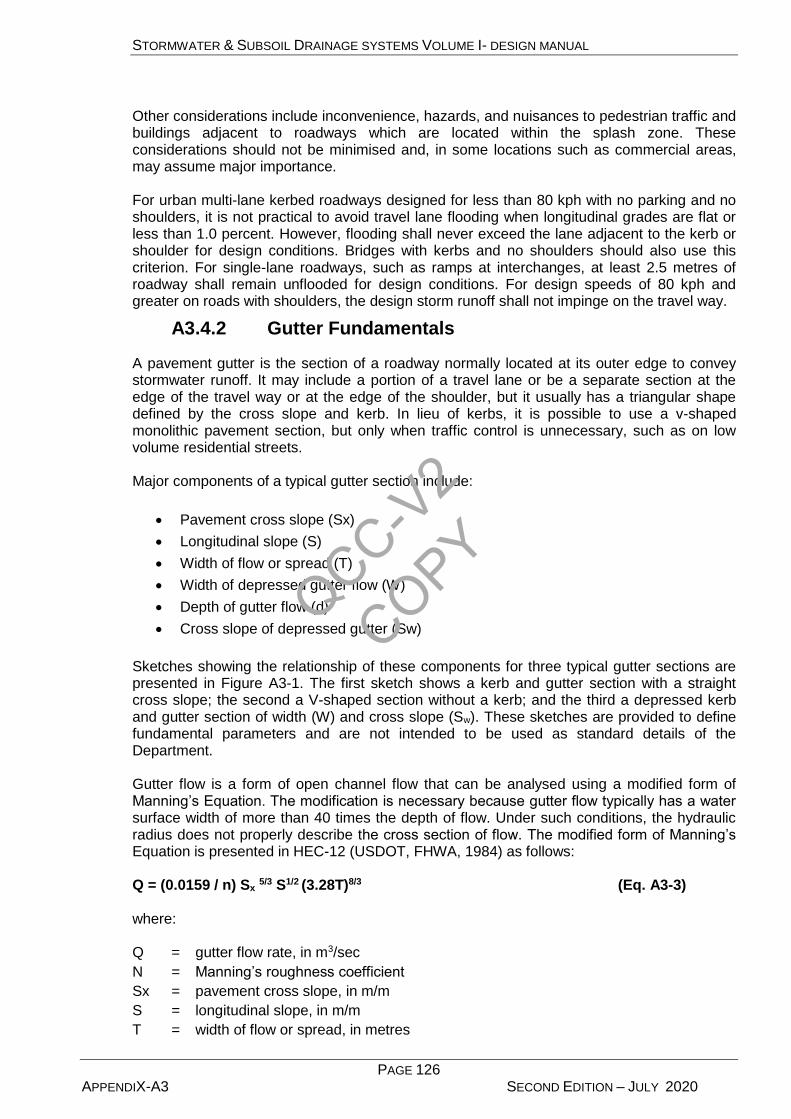
STORMWATER & SUBSOIL DRAINAGE SYSTEMS VOLUME I- DESIGN MANUAL
PAGE 126 APPENDIX-A3 SECOND EDITION – JULY 2020
Other considerations include inconvenience, hazards, and nuisances to pedestrian traffic and buildings adjacent to roadways which are located within the splash zone. These considerations should not be minimised and, in some locations such as commercial areas, may assume major importance. For urban multi-lane kerbed roadways designed for less than 80 kph with no parking and no shoulders, it is not practical to avoid travel lane flooding when longitudinal grades are flat or less than 1.0 percent. However, flooding shall never exceed the lane adjacent to the kerb or shoulder for design conditions. Bridges with kerbs and no shoulders should also use this criterion. For single-lane roadways, such as ramps at interchanges, at least 2.5 metres of roadway shall remain unflooded for design conditions. For design speeds of 80 kph and greater on roads with shoulders, the design storm runoff shall not impinge on the travel way.
A3.4.2 Gutter Fundamentals
A pavement gutter is the section of a roadway normally located at its outer edge to convey stormwater runoff. It may include a portion of a travel lane or be a separate section at the edge of the travel way or at the edge of the shoulder, but it usually has a triangular shape defined by the cross slope and kerb. In lieu of kerbs, it is possible to use a v-shaped monolithic pavement section, but only when traffic control is unnecessary, such as on low volume residential streets. Major components of a typical gutter section include:
Pavement cross slope (Sx)
Longitudinal slope (S)
Width of flow or spread (T)
Width of depressed gutter flow (W)
Depth of gutter flow (d)
Cross slope of depressed gutter (Sw)
Sketches showing the relationship of these components for three typical gutter sections are presented in Figure A3-1. The first sketch shows a kerb and gutter section with a straight cross slope; the second a V-shaped section without a kerb; and the third a depressed kerb and gutter section of width (W) and cross slope (Sw). These sketches are provided to define fundamental parameters and are not intended to be used as standard details of the Department. Gutter flow is a form of open channel flow that can be analysed using a modified form of Manning’s Equation. The modification is necessary because gutter flow typically has a water surface width of more than 40 times the depth of flow. Under such conditions, the hydraulic radius does not properly describe the cross section of flow. The modified form of Manning’s Equation is presented in HEC-12 (USDOT, FHWA, 1984) as follows: Q = (0.0159 / n) Sx 5/3 S1/2 (3.28T)8/3 (Eq. A3-3)
where: Q = gutter flow rate, in m3/sec
N = Manning’s roughness coefficient
Sx = pavement cross slope, in m/m
S = longitudinal slope, in m/m
T = width of flow or spread, in metres
QCC-V2
COPY

STORMWATER & SUBSOIL DRAINAGE SYSTEMS VOLUME I- DESIGN MANUAL
PAGE 127 APPENDIX-A3 SECOND EDITION – JULY 2020
Depth of gutter flow and pavement spread are parameters which must be evaluated to properly establish the size, type, bypass, and spacing of inlets. The depth of flow and pavement spread are related as follows: d = TSx (Eq. A3-4) where: d = depth of gutter flow, in metres
T = width of spread, in metres
Sx = pavement cross slope, in m/m
QCC-V2
COPY
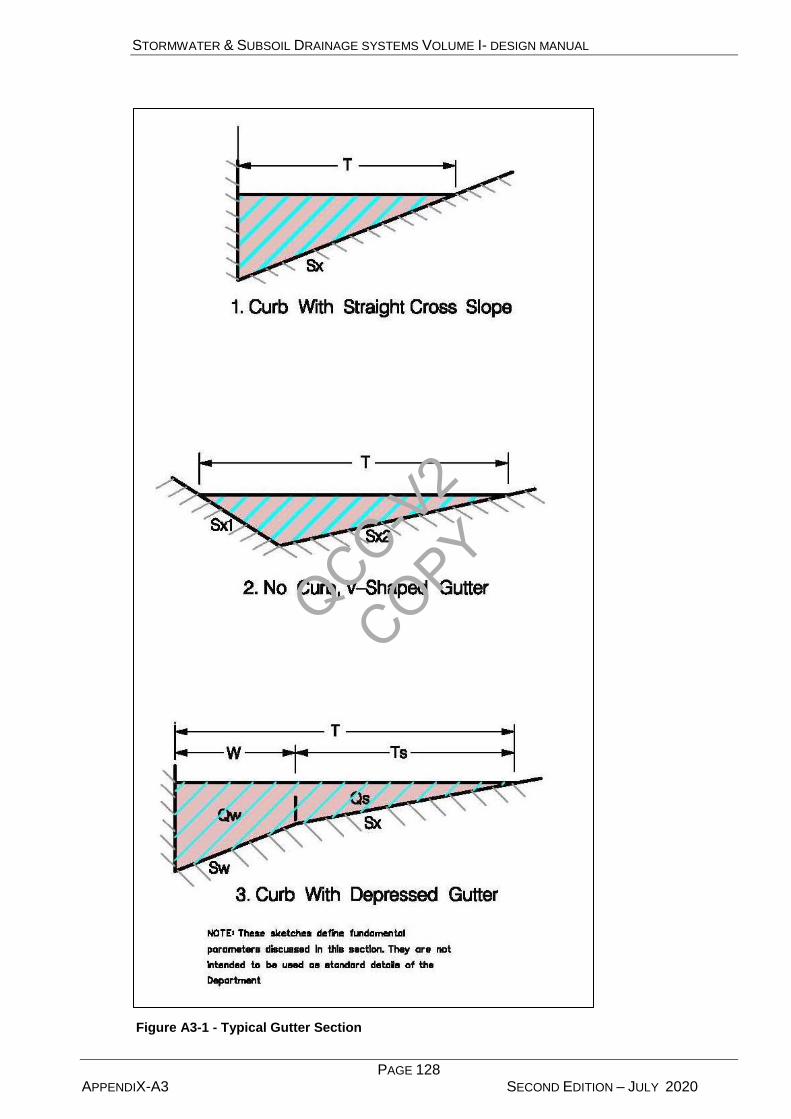
STORMWATER & SUBSOIL DRAINAGE SYSTEMS VOLUME I- DESIGN MANUAL
PAGE 128 APPENDIX-A3 SECOND EDITION – JULY 2020
Figure A3-1 - Typical Gutter Section
QCC-V2
COPY
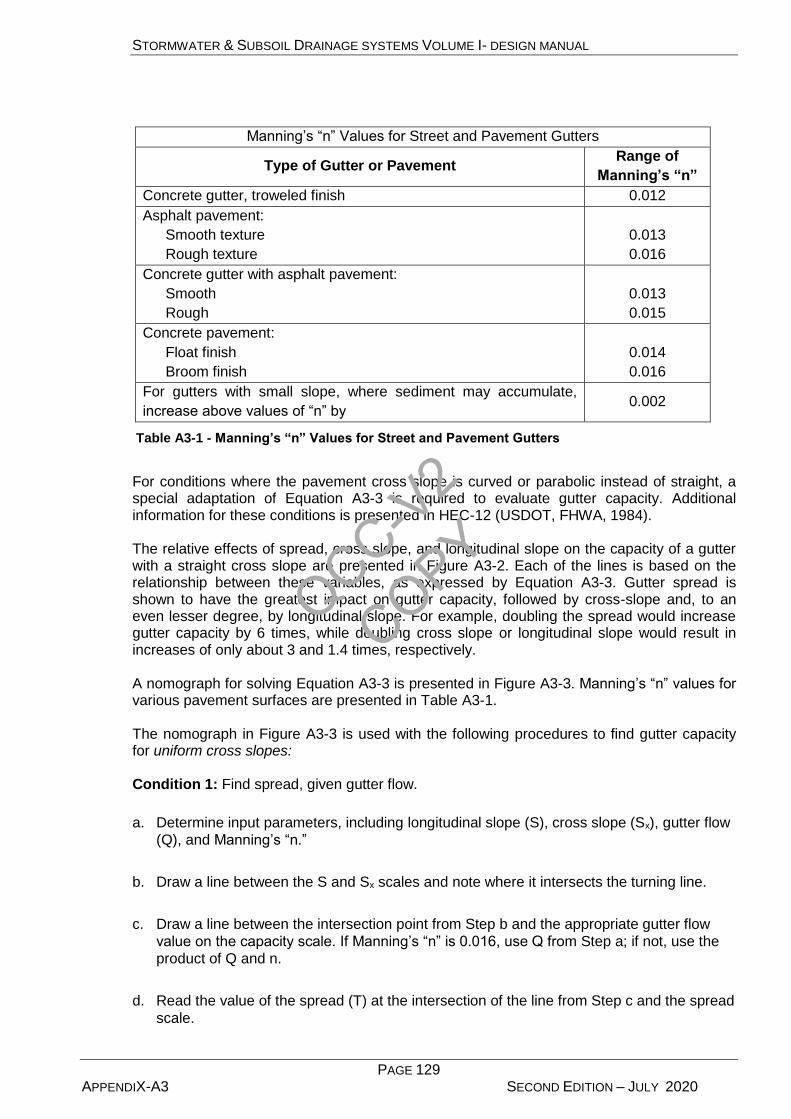
STORMWATER & SUBSOIL DRAINAGE SYSTEMS VOLUME I- DESIGN MANUAL
PAGE 129 APPENDIX-A3 SECOND EDITION – JULY 2020
Manning’s “n” Values for Street and Pavement Gutters
Type of Gutter or Pavement Range of
Manning’s “n”
Concrete gutter, troweled finish 0.012
Asphalt pavement:
Smooth texture
Rough texture
0.013
0.016
Concrete gutter with asphalt pavement:
Smooth
Rough
0.013
0.015
Concrete pavement:
Float finish
Broom finish
0.014
0.016
For gutters with small slope, where sediment may accumulate,
increase above values of “n” by 0.002
Table A3-1 - Manning’s “n” Values for Street and Pavement Gutters
For conditions where the pavement cross slope is curved or parabolic instead of straight, a special adaptation of Equation A3-3 is required to evaluate gutter capacity. Additional information for these conditions is presented in HEC-12 (USDOT, FHWA, 1984). The relative effects of spread, cross slope, and longitudinal slope on the capacity of a gutter with a straight cross slope are presented in Figure A3-2. Each of the lines is based on the relationship between these variables, as expressed by Equation A3-3. Gutter spread is shown to have the greatest impact on gutter capacity, followed by cross-slope and, to an even lesser degree, by longitudinal slope. For example, doubling the spread would increase gutter capacity by 6 times, while doubling cross slope or longitudinal slope would result in increases of only about 3 and 1.4 times, respectively. A nomograph for solving Equation A3-3 is presented in Figure A3-3. Manning’s “n” values for various pavement surfaces are presented in Table A3-1. The nomograph in Figure A3-3 is used with the following procedures to find gutter capacity for uniform cross slopes: Condition 1: Find spread, given gutter flow.
a. Determine input parameters, including longitudinal slope (S), cross slope (Sx), gutter flow
(Q), and Manning’s “n.”
b. Draw a line between the S and Sx scales and note where it intersects the turning line.
c. Draw a line between the intersection point from Step b and the appropriate gutter flow
value on the capacity scale. If Manning’s “n” is 0.016, use Q from Step a; if not, use the
product of Q and n.
d. Read the value of the spread (T) at the intersection of the line from Step c and the spread
scale.
QCC-V2
COPY

STORMWATER & SUBSOIL DRAINAGE SYSTEMS VOLUME I- DESIGN MANUAL
PAGE 130 APPENDIX-A3 SECOND EDITION – JULY 2020
Condition 2: Find gutter flow, given spread.
a. Determine input parameters, including longitudinal slope (S), cross slope (Sx), spread (T),
and Manning’s “n.”
b. Draw a line between the S and Sx scales and note where it intersects the turning line.
c. Draw a line between the intersection point from Step b and the appropriate value on the T
scale. Read the value of Q or Qn from the intersection of that line on the capacity scale.
d. For Manning’s “n” values of 0.016, the gutter capacity (Q) from Step c is selected. For
other Manning’s “n” values, the gutter capacity times n (Qn) is selected from Step c and
divided by the appropriate n value to give the gutter capacity.
Figure A3-3 can be used to find the flow in a gutter of width (W) less than the total spread (T). Such calculations are generally used for evaluating composite gutter sections or frontal flow for grate inlets. The following steps are used to evaluate composite gutter sections: Condition 1: Find spread, given gutter flow.
a. Determine input parameters, including longitudinal slope (S), cross slope (Sx), depressed
section slope (Sw), depressed section width (W), Manning’s “n,” gutter flow (Q), and a
trial value of the gutter capacity above the depressed section (QS).
b. Calculate the gutter flow in W (Qw), using the equation:
Qw = Q - Qs (Eq. A3-5)
c. Calculate the ratios Qw/Q and Sw/Sx and use Figure A3-4 to find an appropriate value of
W/T.
d. Calculate the spread (T) by dividing the depressed section width (W) by the value of W/T
from Step c.
e. Find the spread above the depressed section (Ts) by subtracting W from the value of T
obtained in Step d.
f. Use the value of Ts from Step e along with Manning’s “n,” S, and Sx to find the actual
value of Qs from Figure A3-3.
g. Compare the value of Qs from Step f to the trial value from Step a. If values are not
comparable, select a new value of Qs and return to Step a.
Condition 2: Find gutter flow, given spread.
a. Determine input parameters, including spread (T), spread above the depressed section
(Ts), cross slope (Sx), longitudinal slope (S), depressed section slope (Sw), depressed
section width (W), Manning’s “n,” and depth of gutter flow (d).
QCC-V2
COPY

STORMWATER & SUBSOIL DRAINAGE SYSTEMS VOLUME I- DESIGN MANUAL
PAGE 131 APPENDIX-A3 SECOND EDITION – JULY 2020
b. Use Figure A3-3 to determine the capacity of the gutter section above the depressed
section (Qs). Use the procedure for non-composite gutter sections, Condition 2,
substituting Ts for T.
c. Calculate the ratios W/T and Sw/Sx, and, from Figure A3-4, find the appropriate ratio of Eo
(the ratio of Qw/Q).
d. Calculate the total gutter flow using the equation:
Q = Qs (1 - Eo) (Eq. A3-6)
where: Q - gutter flow rate, in m3/sec Qs = flow capacity of the gutter section above the depressed section, in m3/sec Eo - ratio of frontal flow to total gutter flow, Qw/Q
e. Calculate the gutter flow in width (W), using Equation A3-5.
QCC-V2
COPY

STORMWATER & SUBSOIL DRAINAGE SYSTEMS VOLUME I- DESIGN MANUAL
PAGE 132 APPENDIX-A3 SECOND EDITION – JULY 2020
Figure A3-2: Relative Effects of Spread, Cross Slope and Longitudinal Slope on Gutter Flow Capacity
QCC-V2
COPY
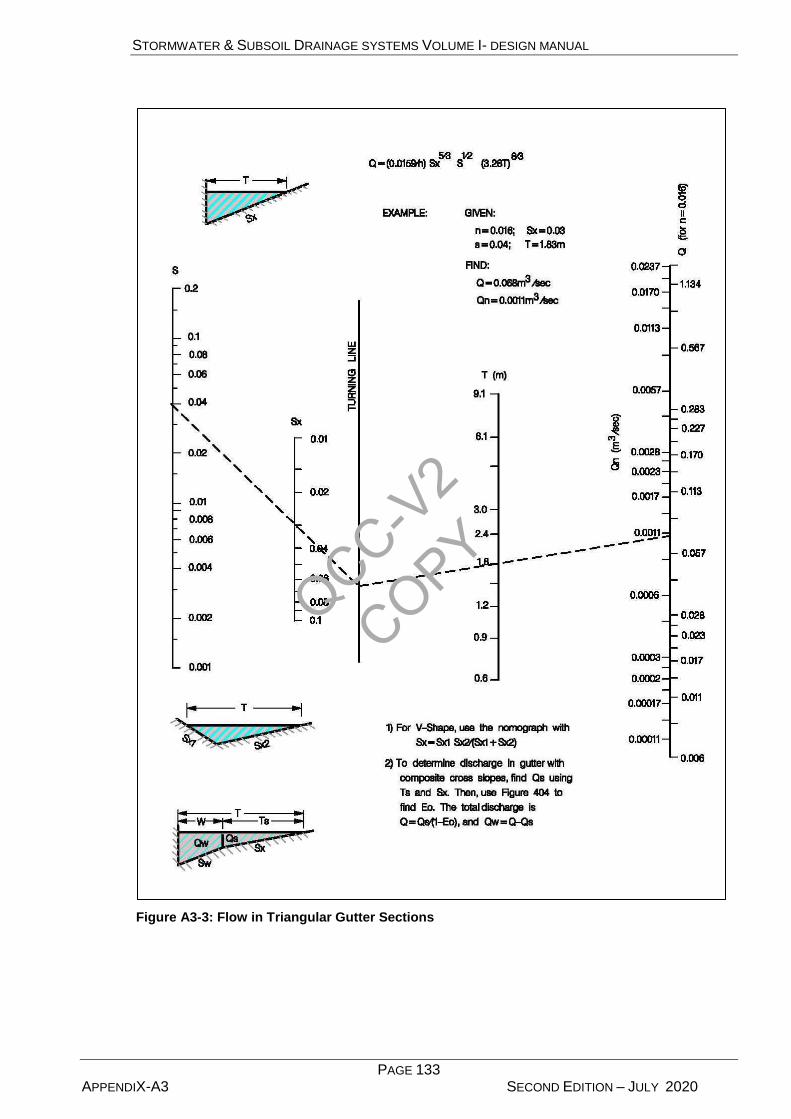
STORMWATER & SUBSOIL DRAINAGE SYSTEMS VOLUME I- DESIGN MANUAL
PAGE 133 APPENDIX-A3 SECOND EDITION – JULY 2020
Figure A3-3: Flow in Triangular Gutter Sections
QCC-V2
COPY

STORMWATER & SUBSOIL DRAINAGE SYSTEMS VOLUME I- DESIGN MANUAL
PAGE 134 APPENDIX-A3 SECOND EDITION – JULY 2020
Figure A3-4: Ratio of Frontal Flow to Total Gutter Flow
QCC-V2
COPY
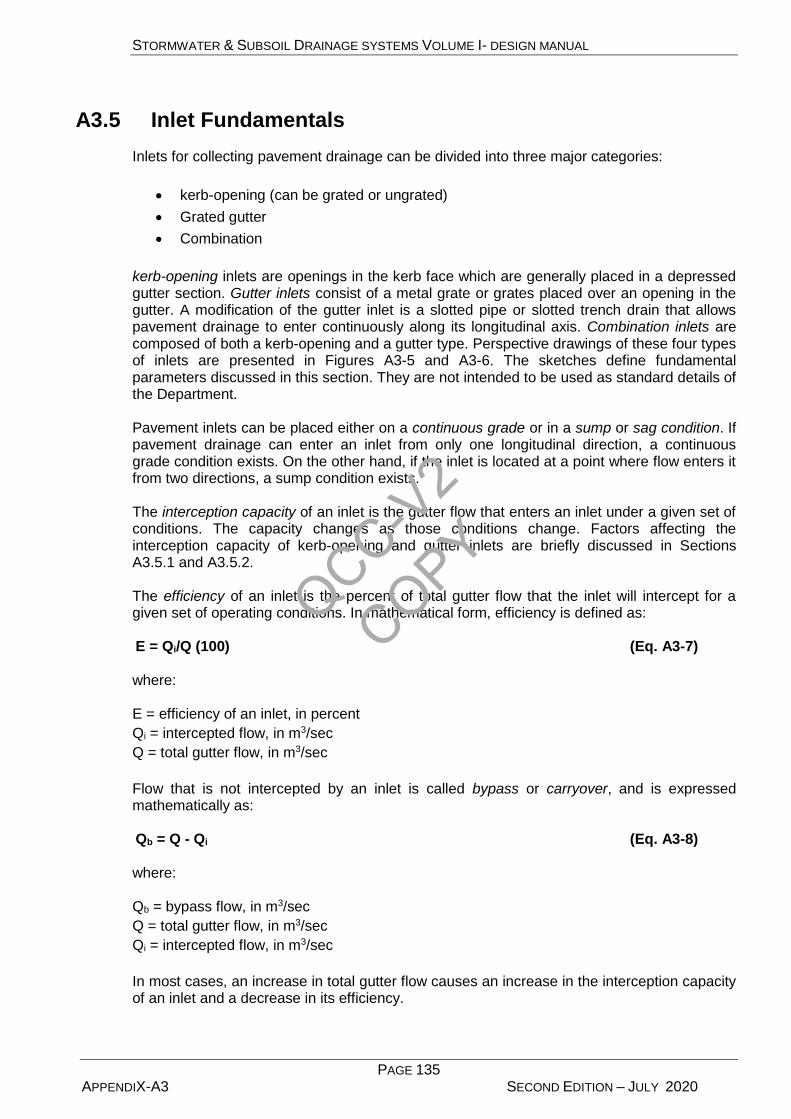
STORMWATER & SUBSOIL DRAINAGE SYSTEMS VOLUME I- DESIGN MANUAL
PAGE 135 APPENDIX-A3 SECOND EDITION – JULY 2020
A3.5 Inlet Fundamentals
Inlets for collecting pavement drainage can be divided into three major categories:
kerb-opening (can be grated or ungrated)
Grated gutter
Combination
kerb-opening inlets are openings in the kerb face which are generally placed in a depressed gutter section. Gutter inlets consist of a metal grate or grates placed over an opening in the gutter. A modification of the gutter inlet is a slotted pipe or slotted trench drain that allows pavement drainage to enter continuously along its longitudinal axis. Combination inlets are composed of both a kerb-opening and a gutter type. Perspective drawings of these four types of inlets are presented in Figures A3-5 and A3-6. The sketches define fundamental parameters discussed in this section. They are not intended to be used as standard details of the Department. Pavement inlets can be placed either on a continuous grade or in a sump or sag condition. If pavement drainage can enter an inlet from only one longitudinal direction, a continuous grade condition exists. On the other hand, if the inlet is located at a point where flow enters it from two directions, a sump condition exists. The interception capacity of an inlet is the gutter flow that enters an inlet under a given set of conditions. The capacity changes as those conditions change. Factors affecting the interception capacity of kerb-opening and gutter inlets are briefly discussed in Sections A3.5.1 and A3.5.2. The efficiency of an inlet is the percent of total gutter flow that the inlet will intercept for a given set of operating conditions. In mathematical form, efficiency is defined as: E = Qi/Q (100) (Eq. A3-7) where: E = efficiency of an inlet, in percent
Qi = intercepted flow, in m3/sec
Q = total gutter flow, in m3/sec
Flow that is not intercepted by an inlet is called bypass or carryover, and is expressed mathematically as: Qb = Q - Qi (Eq. A3-8) where: Qb = bypass flow, in m3/sec
Q = total gutter flow, in m3/sec
Qi = intercepted flow, in m3/sec
In most cases, an increase in total gutter flow causes an increase in the interception capacity of an inlet and a decrease in its efficiency.
QCC-V2
COPY

STORMWATER & SUBSOIL DRAINAGE SYSTEMS VOLUME I- DESIGN MANUAL
PAGE 136 APPENDIX-A3 SECOND EDITION – JULY 2020
Pavement inlets do not provide an efficient method for collecting large quantities of stormwater. Therefore, non-pavement drainage should be collected upstream of the pavement where possible. The use of capacity charts as presented by specific inlet grate manufactures and for the more general case in USDOT, FHWA, HEC-12 (1984) should be utilized to evaluate interception capacity of inlets, evaluated empirically by physical testing.
A3.5.1 Kerb-Opening Inlets
The advantages of ungrated kerb-opening inlets are that they are less susceptible to clogging and less hazardous to pedestrians and bicyclists than grated gutter inlets. However, they are usually not as efficient. Grated kerb-opening inlets are subject to the same clogging inefficiencies
QCC-V2
COPY
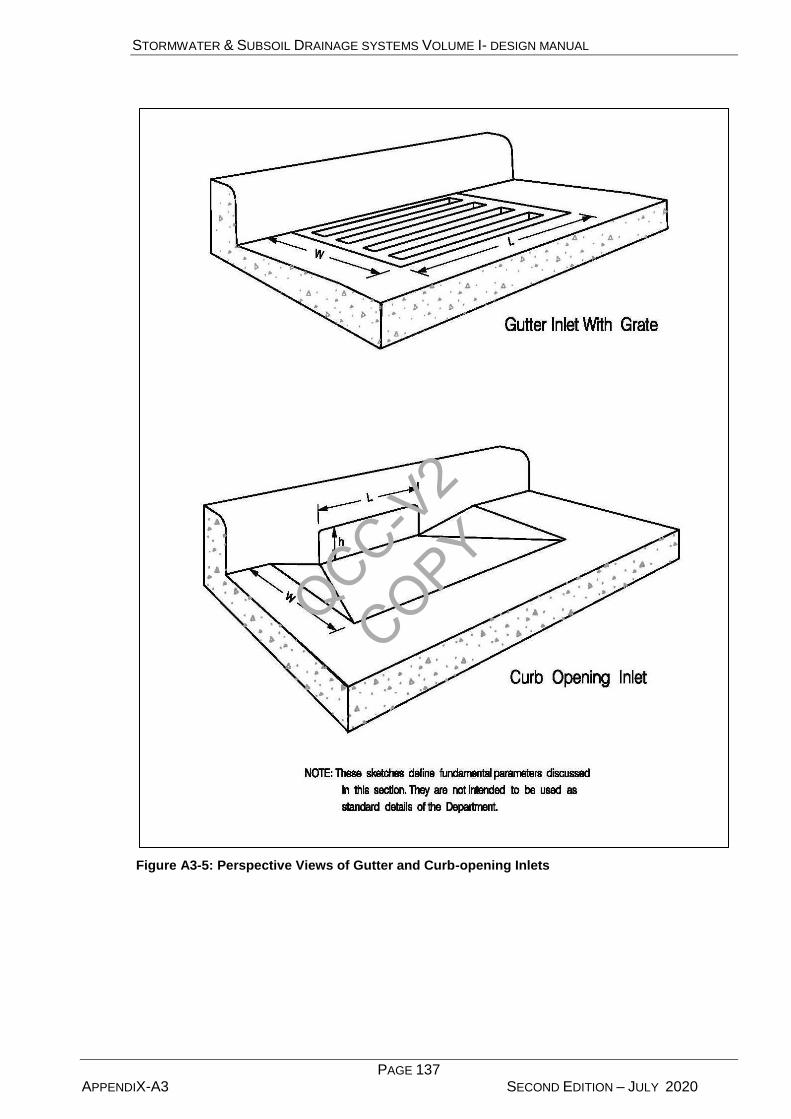
STORMWATER & SUBSOIL DRAINAGE SYSTEMS VOLUME I- DESIGN MANUAL
PAGE 137 APPENDIX-A3 SECOND EDITION – JULY 2020
Figure A3-5: Perspective Views of Gutter and Curb-opening Inlets
QCC-V2
COPY
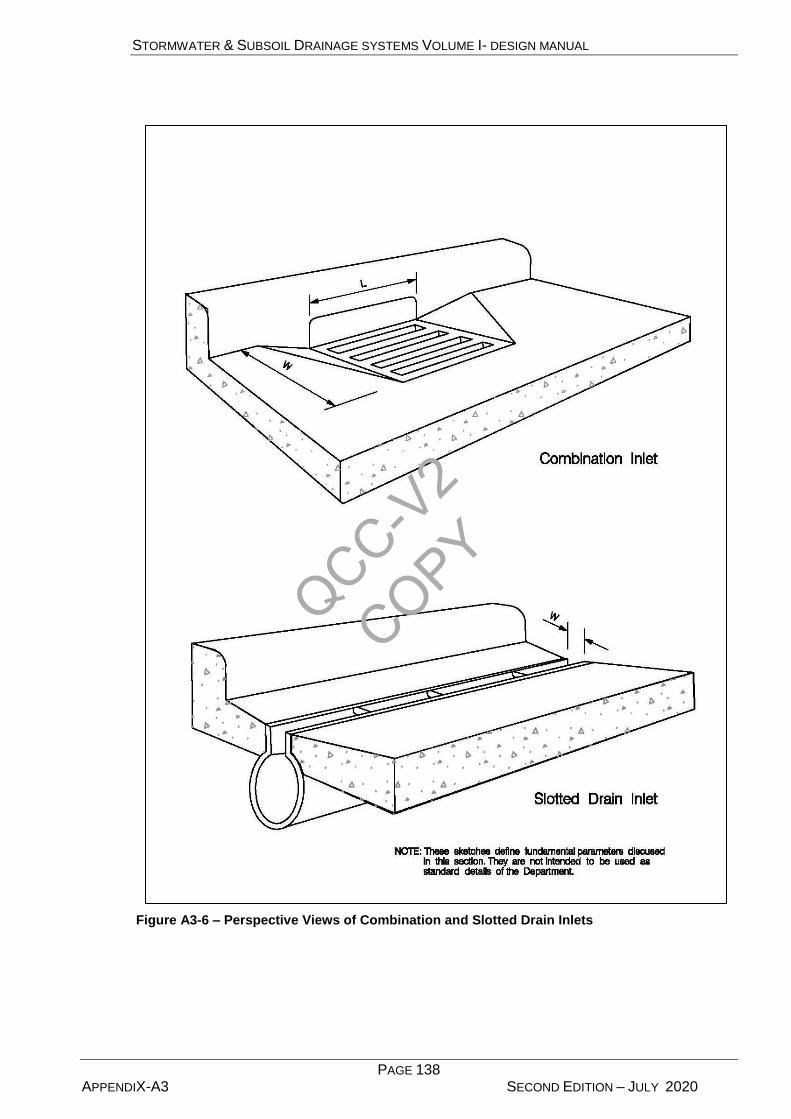
STORMWATER & SUBSOIL DRAINAGE SYSTEMS VOLUME I- DESIGN MANUAL
PAGE 138 APPENDIX-A3 SECOND EDITION – JULY 2020
Figure A3-6 – Perspective Views of Combination and Slotted Drain Inlets
QCC-V2
COPY
STORMWATER & SUBSOIL DRAINAGE SYSTEMS VOLUME I- DESIGN MANUAL
PAGE 139 APPENDIX-A3 SECOND EDITION – JULY 2020
Continuous Grade
A kerb-opening inlet located on a continuous grade functions as a falling head weir, the efficiency of which is affected by cross slope, longitudinal slope, total gutter flow, and weir length. The interception capacity of the inlet depends primarily on the flow depth at the kerb and the kerb-opening geometry. If the kerb opening can be depressed several inches below the gutter elevation, the interception capacity of the inlet can be increased. This can be done as part of a continuous gutter depression or as a local depression at the inlet. kerb inlets with grates are subject to clogging and the allowable design capacity should never be more than 50% - 60 % of the capacity calculated by the following formula (Various storm drainage grate manufacturers have published capacity charts based on actual testing under various conditions. These references should be obtained and compared to the theoretical capacities calculated via the formulae contained herein): Q = 0.0015 d L (10.76g d)1/2 (Eq. A3-9) or Q = .093L {1.87 i0.579 [35.29Qo / (s / n)1/2]0.563} (Eq. A3-10) Assuming a gutter of wedge shaped cross-section, where: Qo = flow in the gutter in cubic metres per second I = pavement or gutter cross-slope, m/m S = hydraulic gradient of gutter, m/m N = Manning’s coefficient of roughness of pavement or gutter Q = discharge into inlets in cubic metres per second L = length of inlet opening in metres D = depth of flow in gutter in metres
Sump Locations
kerb-opening inlets in sump locations operate as weirs up to a depth equal to the opening height. At depths above 1.4 times the opening height, the inlet operates as an orifice, and between these depths, a transition from weir to orifice flow occurs. The weir flow equation for a depressed kerb-opening inlet is expressed as: Qi = 0.065 (3.28L + 5.904W)(3.28d)1.5 (Eq. A3-11) where: Qi = interception capacity of a depressed kerb-opening inlet operating as a weir and
located at a sump, in m3/sec L = length of kerb-opening, in m W = lateral width of depression, in m D = depth of flow at kerb, measured from the normal cross slope, in metres Equation A3-11 is applicable for flow depths less than or equal to the kerb-opening height plus the depth of the depression. This limitation is expressed mathematically as:
QCC-V2
COPY
STORMWATER & SUBSOIL DRAINAGE SYSTEMS VOLUME I- DESIGN MANUAL
PAGE 140 APPENDIX-A3 SECOND EDITION – JULY 2020
d < h + a (Eq. A3-12) where: d = depth of flow at kerb, measured from the normal cross-slope, in metres h = height of kerb-opening inlet, in metres a = depth of depression, in metres Since Equation A3-11 is based on a local depression, it will give conservative capacity estimates for inlets with a continuously depressed gutter. The weir flow equation for kerb-opening inlets without a depressed gutter is expressed as: Qi = 0.214 L (3.28d)1.5 (Eq. A3-13) where: Qi = interception capacity of a non-depressed kerb-opening inlet operating as a weir and
located at a sump, in m3/sec L = length of kerb-opening, in m D = depth at kerb, measured from the normal cross-slope, in m The depth limitation for weir flow represented by Equation A3-13 is expressed as: d < h (Eq. A3-14) where: d = depth at kerb, measured from the normal cross slope, in m h = height of kerb-opening, in m The orifice flow equation for evaluating the capacity of a submerged kerb-opening inlet is expressed as: Qi = 0.204 A [6.56 g (3.28di - 1.64h)]0.5 (Eq. A3-15) where: Qi = interception capacity of a kerb-opening inlet operating as an orifice and located at a
sump, in m3/sec A = clear area of the inlet opening, in m2 G = acceleration due to gravity, 9.806 metres/sec2 H = height of kerb opening, including the depression height (a) if appropriate, in m D = depth of flow at lip of kerb opening, in m Equation A3-15 is applicable to depressed and undepressed kerb-opening inlets, and the height of the kerb opening includes the depression height, if appropriate.
A3.5.2 Grated Gutter Inlets
Gutter inlets usually have one or more metal grates covering an opening in the gutter. Because debris carried by stormwater can clog the grates, effective operation may not be possible where the potential for debris transport exists. In any case, the efficiency used should be only 50% - 60% of the calculated capacity. The Consultant should also be aware of what happens to the bypass flows, and take care of them accordingly.
QCC-V2
COPY
STORMWATER & SUBSOIL DRAINAGE SYSTEMS VOLUME I- DESIGN MANUAL
PAGE 141 APPENDIX-A3 SECOND EDITION – JULY 2020
Continuous Grades
The water flowing in the section of a gutter inlet occupied by the grate is called frontal flow. When the gutter flow velocity is low enough, the grate inlet intercepts all of the frontal flow and a small portion of the side flow, which occurs along the length of the grate. As the gutter flow velocity increases, water may begin to skip, or splash over, the grate and the efficiency of the inlet may be reduced. If splash-over does not occur, the capacity and efficiency of a gutter inlet will increase with an increase of the longitudinal slope (the reverse of the effect on kerb-opening and slotted inlets). The ratio of frontal flow to total gutter flow for a straight cross slope (see Figure A3-1) is expressed as: Eo = Qw / Q = 1 - (1 - W/T)2.67 (Eq. A3-16) where: Eo = ratio of frontal flow to total gutter flow Qw = frontal flow in width (W), in m3/sec Q = total gutter flow, in m3/sec W = width of gutter inlet or grate (see Figure A3-5), in m T = total spread of water in the gutter (see Figure A3-1) in m The ratio of side flow to total gutter flow is expressed as: Qs/Q = 1 - Qw/Q = 1 - Eo (Eq. A3-17) where: Qs = side flow intercepted by gutter inlet, in m3/sec Q = total gutter flow, in m3/sec Qw = frontal flow in width (W), in m3/sec Eo = ratio of frontal flow to total gutter flow (see Equation A3-16) The ratio of intercepted frontal flow to total frontal flow is expressed as: Rf = 1 - 0.09 (v - vo) (Eq. A3-18) where: Rf = ratio of intercepted frontal flow to total frontal flow v = average velocity of gutter flow, in m/sec vo = average gutter velocity where splash-over first occurs, in m/sec The ratio of intercepted side flow to total side flow is expressed as: Rs = 1 / {1 + [(0.15 (3.28v)1.8) / (Sx (3.28L)2.3)]} (Eq. A3-19) where: Rs = ratio of intercepted side flow to total side flow v = average velocity of gutter flow, in m/sec Sx = cross slope of gutter, in m/m L = length of grate, in m
QCC-V2
COPY
STORMWATER & SUBSOIL DRAINAGE SYSTEMS VOLUME I- DESIGN MANUAL
PAGE 142 APPENDIX-A3 SECOND EDITION – JULY 2020
The operating efficiency of a gutter inlet with a grate located on a continuous grade is expressed as:
E = Rf Eo + Rs (1 - Eo) (Eq. A3-20)
where: E = efficiency of the gutter inlet on a continuous grade Rf = ratio of intercepted frontal flow to total frontal flow (see Equation A3-18) Eo = ratio of frontal flow to total gutter flow (see Equation A3-16) Rs = ratio of intercepted side flow to total side flow (see Equation A3-19) The interception capacity of a gutter inlet with a grate located on a continuous grade is equal to the efficiency of the inlet multiplied by the total gutter flow, which can be expressed as:
Qi = EQ = Q [Rf Eo + Rs (1 - Eo)] (Eq. A3-21)
where: Qi = interception capacity of the gutter inlet on a continuous grade, in m3/sec E = efficiency of the gutter inlet on a continuous grade (see Equation A3-20)
Sump Locations
Gutter inlets in sump locations operate as weirs up to depths that are dependent on grate size and configuration, and as orifices at greater depths. A transition occurs between weir and orifice flow depths. In this transition, the capacity is ill-defined and may fluctuate between weir and orifice control. The efficiency of inlets in passing debris is critical in sump locations. If the inlet plugs, hazardous ponding conditions can result. Since gutter inlets with grates tend to clog, it is generally beneficial to place an ungrated kerb opening inlet behind each grate. This is known as a combination inlet. However, because of the potential for clogging, it is usually appropriate to assume not more than 50% - 60% efficiency for the grated inlet portion. The interception capacity of a gutter inlet with a grate operating as a weir in a sump location is expressed as: Qi = 0.085 (3.28P) (3.28d)1.5 (Eq. A3-22) where: Qi = interception capacity of a sump gutter inlet operating as a weir, in m3/sec P = perimeter of the grate, disregarding bars and the kerb side, in m D = depth of water above the top of the grate, in m The interception capacity of a gutter inlet with a grate operating as an orifice in a sump location is expressed as: Qi = 0.204 A (21.52g d)0.5 (Eq. A3-23) where: Qi = interception capacity of a sump grated gutter inlet operating as an orifice, in m3/sec A = clear opening area of the grate, in m2 G = acceleration due to gravity, 9.806 metres/sec2 D = depth of water above the top of the grate, in m The transition zone from weir flow to orifice flow for gutter inlets in sump locations is typically between a depth of about 120mm to 430mm. However, this transition zone is known to vary depending on perimeter and clear opening area. This transition zone should be evaluated by
QCC-V2
COPY

STORMWATER & SUBSOIL DRAINAGE SYSTEMS VOLUME I- DESIGN MANUAL
PAGE 143 APPENDIX-A3 SECOND EDITION – JULY 2020
empirical methods and further information can be found from specific storm drainage grate manufacturer’s test data.
A3.5.3 Combination Inlets
Continuous Grade
On a continuous grade, the capacity of an unclogged combination inlet with the kerb opening located adjacent to the grate is approximately equal to the capacity of the grated gutter inlet alone due to the inefficiencies of the kerb inlet. The appropriate efficiency level is a function of the location and associated debris potential.
Sump Locations
All debris carried by stormwater runoff that is not intercepted by upstream inlets will be concentrated at the inlet located at the low point, or sump. Since this will increase the probability of clogging for grated inlets, it is appropriate to delete the grate from the kerb inlet and assume a combination inlet at a sump will be limited by the kerb-opening capacity.
A3.5.4 Slotted Trench Drains and Slotted Pipe Inlets
A slotted trench drain is a version of the grated gutter inlet but is more susceptible to clogging. This inlet should not be used for main highway drainage but as an interceptor of sheet surface flow or for isolated low areas that are on flat grades and need an exceptionally long intercept length. The capacity for slotted trench drains can be calculated the same as for grated gutter inlets.
Slotted pipe is a version of the gutter inlet that allows pavement drainage to enter the pipe continuously along its longitudinal axis. Slotted pipes can be used on kerbed or unkerbed pavement and present minimal interference to traffic and pedestrians; however, they are susceptible to clogging. The interception capacity of slotted pipe inlets on a continuous grade has been found to be hydraulically similar to that of a kerb-opening inlet. Both inlets function as falling head weirs, with the flow subjected to lateral acceleration caused by the pavement cross slope. The analysis of test data collected by the USDOT, FHWA for slot widths greater than 45 millimetres indicates that the length of inlet required for complete interception of gutter flow can be computed using an equation developed for kerb-opening inlets. This equation is expressed as:
LT = 6.46 Q0.42 s0.3 (1 / (n Sx))0.6 (Eq. A3-24)
where: L T = length required to intercept 100 percent of gutter flow on a continuous grade, in m Q = total gutter flow, in m3/sec S = longitudinal slope of gutter, in m/m N = Manning’s roughness coefficient for gutter pavement Sx = cross slope of pavement, in m/m
The efficiency of a slotted inlet on a continuous grade with a length shorter than that required for total interception can be computed using another equation developed for kerb-opening inlets, expressed as:
E = 1 - (1 - L/LT)1.8 (Eq. A3-25) where: E = efficiency of the inlet on a continuous grade, as a decimal L = slotted inlet, or kerb-opening length, in m LT = length required to intercept 100 percent of gutter flow on a continuous grade (see
Equation A3-24), in metres
QCC-V2
COPY

STORMWATER & SUBSOIL DRAINAGE SYSTEMS VOLUME I- DESIGN MANUAL
PAGE 144 APPENDIX-A4 SECOND EDITION – JULY 2020
Appendix A4 – Al Ain Municipality Requirements
QCC-V2
COPY
STORMWATER & SUBSOIL DRAINAGE SYSTEMS VOLUME I- DESIGN MANUAL
PAGE 145 APPENDIX-A4 SECOND EDITION – JULY 2020
A4. AL AIN MUNICIPALITY REQUIREMENTS
A4.1 Precipitation depth and intensity-duration-frequency curves
Twenty-four-hour intensity-duration-frequency (IDF) curves for the design storm frequencies are shown in Figure A-4.1. Total design precipitation depths, measured in millimetres, for different statistical recurrence intervals for the 24-hour duration storm graphs are shown in Figure A-4.2. The estimation of runoff discharges shall utilize the precipitation frequency and intensity values shown on the following graphs. These 24-hour precipitation-frequency and frequency-intensity-duration curves have been prepared utilizing precipitation records from the Al Ain International Airport. Until such time as more regional precipitation or runoff values are developed, the curves noted the curves noted for the Al Ain area Figure A-2 shall be used for Al Ain Region 2 and W2. The graphs have been prepared using probability statistics to define the storm size and appropriate precipitation intensities for various future occurrence events from which discharge rates can be calculated for design of the structures and pipes required to handle the runoff. The total precipitation graphs show the total rainfall in millimetres in a 24-hour period for the “n-year flood” (return period). The precipitation intensity graphs show the design intensity in millimetres per hour for the various “n-year” storms that are to be used for the calculation of peak discharge. It is noted that from observations and records that the typical storm events in this locale area of high intensity short duration type storms, wherein most of the 24-hour total precipitation will occur within the first 2 hours of the event. When designing systems utilizing on-line or off-line storage where the discharge structures and pipes are sized smaller than that required for the peak runoff volumes, consideration should be given to what will happen if back-to-back storms occur. TableA-1: IDF equations for Al Ain Region 2 and W2 are provided for various storm reoccurrence intervals. Intensity can be calculated directly for the Al Ain Region and the interior areas of the Western Region 2.
A4.1.1. Background and characteristics of design frequency curves
Regions 1 (Abu Dhabi) and W1 (coastal area of Western Region) show similar hydrological characteristics in terms of having low-lying plains with mild to flat terrain gradients dominated by salt marshes and wetland areas just a few metres above sea level along the coast. These regions also have similar meteorological characteristics of rainfall and evaporation and thus have been grouped together for the purpose of developing the design storm frequency curves. Regions 2 and W2 are heavily influenced by their higher elevations and proximity to the Al Hajar (Omani) Mountains, which vary in elevation from 500 m to 900 m, with some peaks as high as 2,000 m. Thus, Regions 2 and W2 are significantly different meteorologically from the other two regions, and a separate set of design storm frequency curves have been provided. Additional information on the emirate’s climate conditions can be found in Volume 4, Section 3.1.2, of these standard specifications.
QCC-V2
COPY
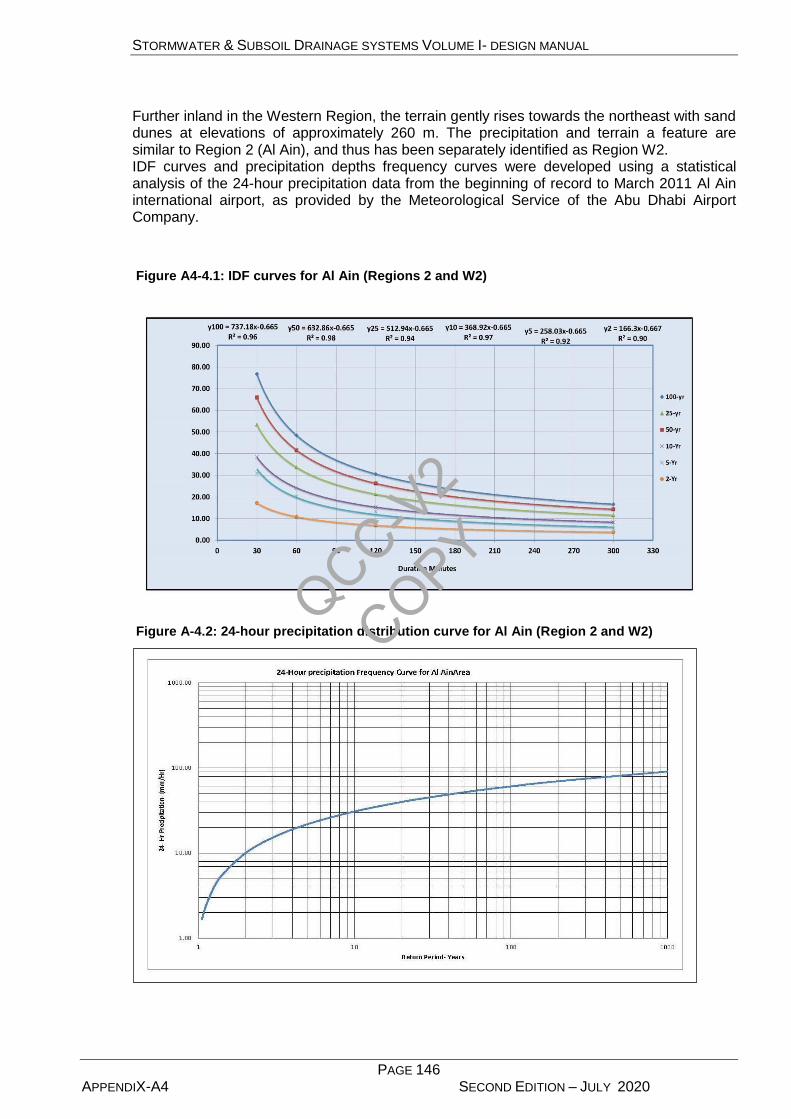
STORMWATER & SUBSOIL DRAINAGE SYSTEMS VOLUME I- DESIGN MANUAL
PAGE 146 APPENDIX-A4 SECOND EDITION – JULY 2020
Further inland in the Western Region, the terrain gently rises towards the northeast with sand dunes at elevations of approximately 260 m. The precipitation and terrain a feature are similar to Region 2 (Al Ain), and thus has been separately identified as Region W2. IDF curves and precipitation depths frequency curves were developed using a statistical analysis of the 24-hour precipitation data from the beginning of record to March 2011 Al Ain international airport, as provided by the Meteorological Service of the Abu Dhabi Airport Company.
Figure A4-4.1: IDF curves for Al Ain (Regions 2 and W2)
Figure A-4.2: 24-hour precipitation distribution curve for Al Ain (Region 2 and W2)
QCC-V2
COPY
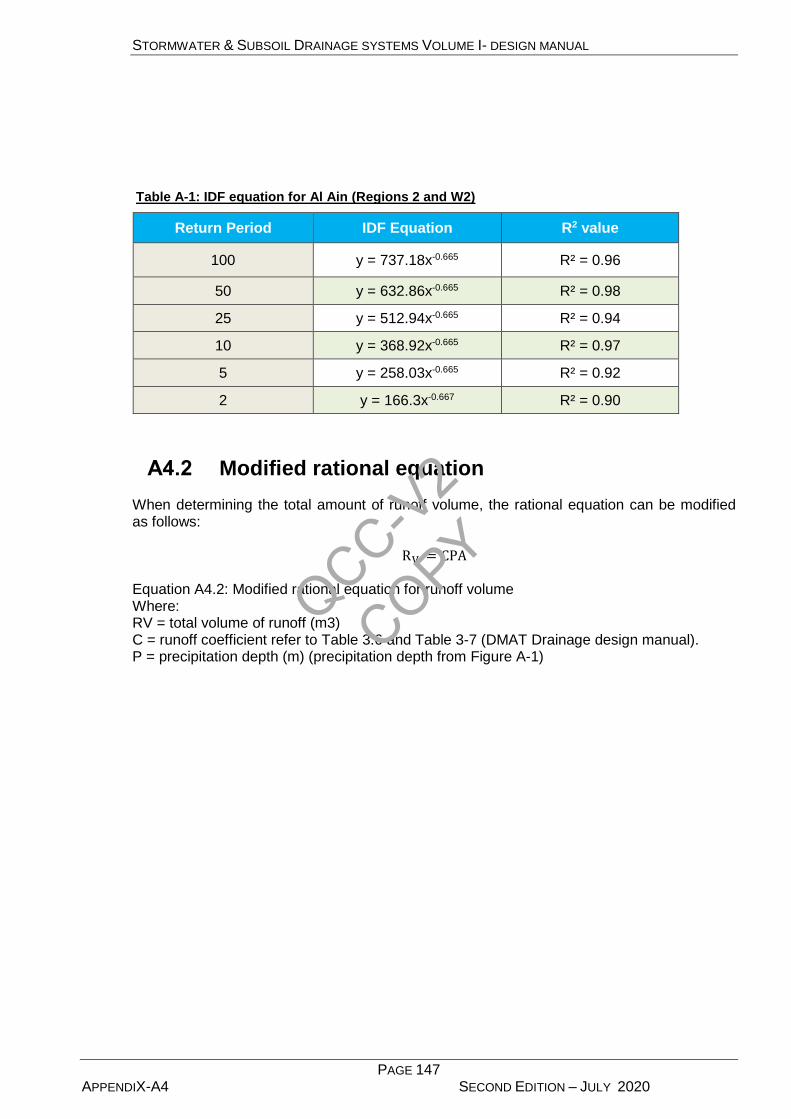
STORMWATER & SUBSOIL DRAINAGE SYSTEMS VOLUME I- DESIGN MANUAL
PAGE 147 APPENDIX-A4 SECOND EDITION – JULY 2020
Table A-1: IDF equation for Al Ain (Regions 2 and W2)
Return Period IDF Equation R2 value
100 y = 737.18x-0.665 R² = 0.96
50 y = 632.86x-0.665 R² = 0.98
25 y = 512.94x-0.665 R² = 0.94
10 y = 368.92x-0.665 R² = 0.97
5 y = 258.03x-0.665 R² = 0.92
2 y = 166.3x-0.667 R² = 0.90
A4.2 Modified rational equation
When determining the total amount of runoff volume, the rational equation can be modified as follows:
RV = CPA Equation A4.2: Modified rational equation for runoff volume Where: RV = total volume of runoff (m3) C = runoff coefficient refer to Table 3.6 and Table 3-7 (DMAT Drainage design manual). P = precipitation depth (m) (precipitation depth from Figure A-1)
QCC-V2
COPY
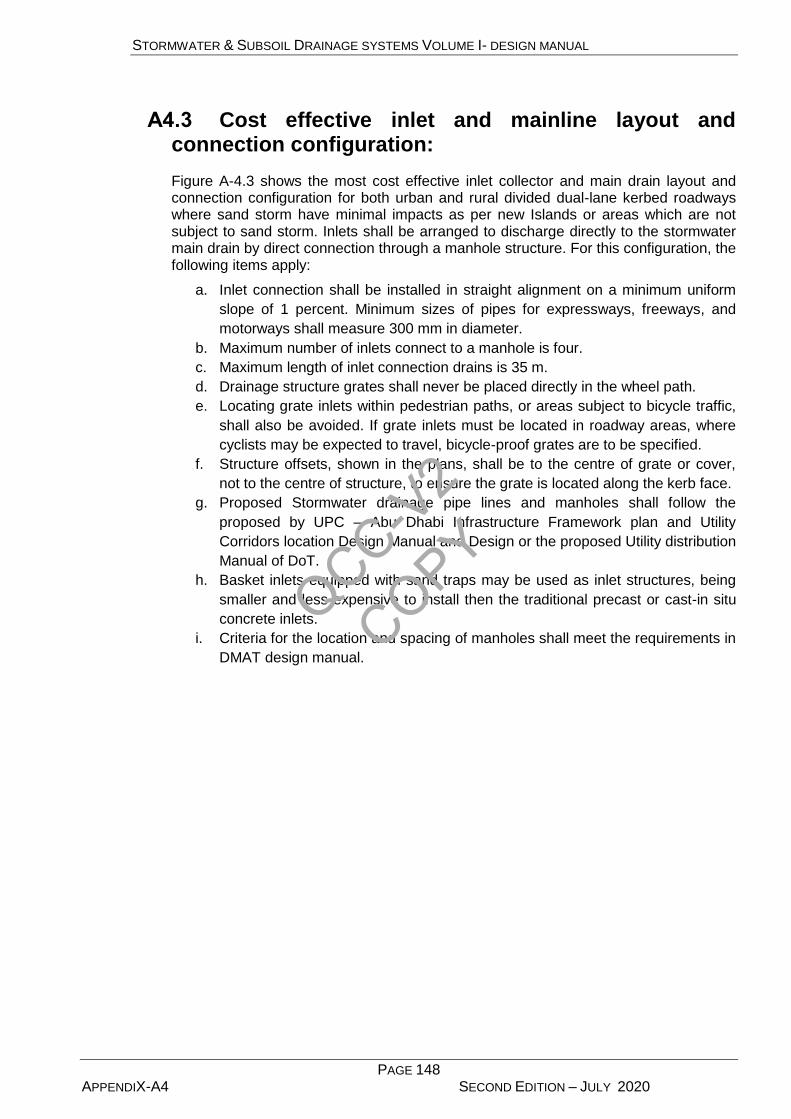
STORMWATER & SUBSOIL DRAINAGE SYSTEMS VOLUME I- DESIGN MANUAL
PAGE 148 APPENDIX-A4 SECOND EDITION – JULY 2020
A4.3 Cost effective inlet and mainline layout and connection configuration:
Figure A-4.3 shows the most cost effective inlet collector and main drain layout and connection configuration for both urban and rural divided dual-lane kerbed roadways where sand storm have minimal impacts as per new Islands or areas which are not subject to sand storm. Inlets shall be arranged to discharge directly to the stormwater main drain by direct connection through a manhole structure. For this configuration, the following items apply:
a. Inlet connection shall be installed in straight alignment on a minimum uniform
slope of 1 percent. Minimum sizes of pipes for expressways, freeways, and
motorways shall measure 300 mm in diameter.
b. Maximum number of inlets connect to a manhole is four.
c. Maximum length of inlet connection drains is 35 m.
d. Drainage structure grates shall never be placed directly in the wheel path.
e. Locating grate inlets within pedestrian paths, or areas subject to bicycle traffic,
shall also be avoided. If grate inlets must be located in roadway areas, where
cyclists may be expected to travel, bicycle-proof grates are to be specified.
f. Structure offsets, shown in the plans, shall be to the centre of grate or cover,
not to the centre of structure, to ensure the grate is located along the kerb face.
g. Proposed Stormwater drainage pipe lines and manholes shall follow the
proposed by UPC – Abu Dhabi Infrastructure Framework plan and Utility
Corridors location Design Manual and Design or the proposed Utility distribution
Manual of DoT.
h. Basket inlets equipped with sand traps may be used as inlet structures, being
smaller and less expensive to install then the traditional precast or cast-in situ
concrete inlets.
i. Criteria for the location and spacing of manholes shall meet the requirements in
DMAT design manual.
QCC-V2
COPY

STORMWATER & SUBSOIL DRAINAGE SYSTEMS VOLUME I- DESIGN MANUAL
PAGE 149 APPENDIX-A4 SECOND EDITION – JULY 2020
Figure A-4.3-: Inlet to Main Drain Connection Configuration – Preferred Method
This inlet layout method is preferable from a construction cost and hydraulic performance point of view; however, the selected arrangement and configuration shall be approved by the Al Ain City Municipality during early design phases, according to Project conditions.
A4.4 Soakaway:
Individual Soakaway systems shall be sized for infiltrating the runoff volume for paved/unpaved areas with a storage volume that accommodates the detention of the design return period 24-hour stormwater flow to be infiltrated (volume emptied) within a 24-hour period after the end of the storm. Generally, it is better to use multiple systems with smaller catchment areas to simplify the size and complexity of the Soakaway for both cost and maintenance purposes. It is also preferable, from a soil permeability and Soakaway interaction standpoint, to spread the individual infiltration areas apart, according to road structure, safety, and geotechnical requirements. Several types of soakaways, appropriate for use throughout the emirate, are described below:
A4.4.1 Soakaway vaults and chambers:
Structural-type chambers can be constructed of larger diameter pipe; precast perforated concrete ring units and rectangular section( Bricks), sometimes called an infiltration well; concrete vaults; and proprietary preformed chamber systems, such as plastic cells having a 90 percent void ratio to overall volume. In all cases, the structure will have a backfill surround of a uniformly graded aggregate wrapped in a Geotextile filter fabric. Structure sizes are based on providing storage for the design storm runoff volume minus the volume lost due to infiltration during the storm period. Infiltration interface areas, or the outer areas of gravel backfill, must be sufficient to provide an infiltration flow that empties the storage volume within 24 hours after the storm event. Bottom surfaces are assumed to be blocked by sediment, thus the infiltration interface surface is based on the sides only. Design is based on the following procedure:
QCC-V2
COPY
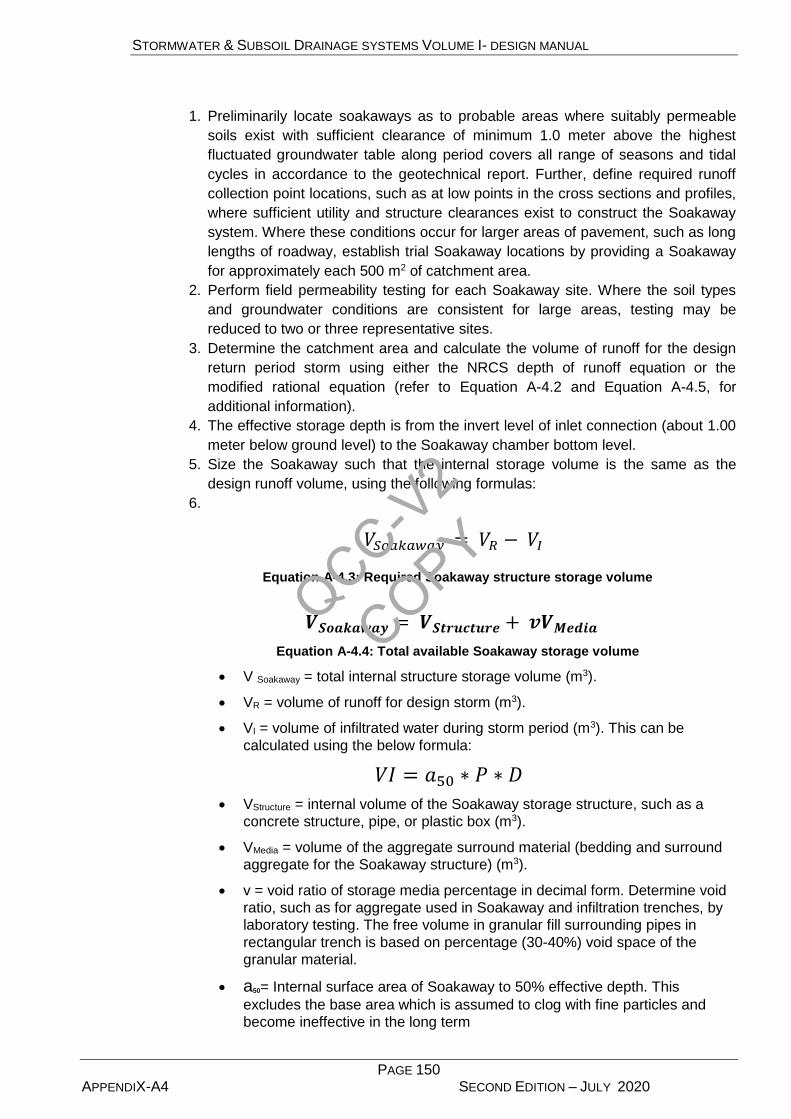
STORMWATER & SUBSOIL DRAINAGE SYSTEMS VOLUME I- DESIGN MANUAL
PAGE 150 APPENDIX-A4 SECOND EDITION – JULY 2020
1. Preliminarily locate soakaways as to probable areas where suitably permeable
soils exist with sufficient clearance of minimum 1.0 meter above the highest
fluctuated groundwater table along period covers all range of seasons and tidal
cycles in accordance to the geotechnical report. Further, define required runoff
collection point locations, such as at low points in the cross sections and profiles,
where sufficient utility and structure clearances exist to construct the Soakaway
system. Where these conditions occur for larger areas of pavement, such as long
lengths of roadway, establish trial Soakaway locations by providing a Soakaway
for approximately each 500 m2 of catchment area.
2. Perform field permeability testing for each Soakaway site. Where the soil types
and groundwater conditions are consistent for large areas, testing may be
reduced to two or three representative sites.
3. Determine the catchment area and calculate the volume of runoff for the design
return period storm using either the NRCS depth of runoff equation or the
modified rational equation (refer to Equation A-4.2 and Equation A-4.5, for
additional information).
4. The effective storage depth is from the invert level of inlet connection (about 1.00
meter below ground level) to the Soakaway chamber bottom level.
5. Size the Soakaway such that the internal storage volume is the same as the
design runoff volume, using the following formulas:
6.
𝑉𝑆𝑜𝑎𝑘𝑎𝑤𝑎𝑦 = 𝑉𝑅 − 𝑉𝐼
Equation A-4.3: Required Soakaway structure storage volume
𝑽𝑺𝒐𝒂𝒌𝒂𝒘𝒂𝒚 = 𝑽𝑺𝒕𝒓𝒖𝒄𝒕𝒖𝒓𝒆 + 𝒗𝑽𝑴𝒆𝒅𝒊𝒂
Equation A-4.4: Total available Soakaway storage volume
V Soakaway = total internal structure storage volume (m3).
VR = volume of runoff for design storm (m3).
VI = volume of infiltrated water during storm period (m3). This can be
calculated using the below formula:
𝑉𝐼 = 𝑎50 ∗ 𝑃 ∗ 𝐷
VStructure = internal volume of the Soakaway storage structure, such as a
concrete structure, pipe, or plastic box (m3).
VMedia = volume of the aggregate surround material (bedding and surround
aggregate for the Soakaway structure) (m3).
v = void ratio of storage media percentage in decimal form. Determine void
ratio, such as for aggregate used in Soakaway and infiltration trenches, by
laboratory testing. The free volume in granular fill surrounding pipes in
rectangular trench is based on percentage (30-40%) void space of the
granular material.
a50= Internal surface area of Soakaway to 50% effective depth. This
excludes the base area which is assumed to clog with fine particles and
become ineffective in the long term
QCC-V2
COPY
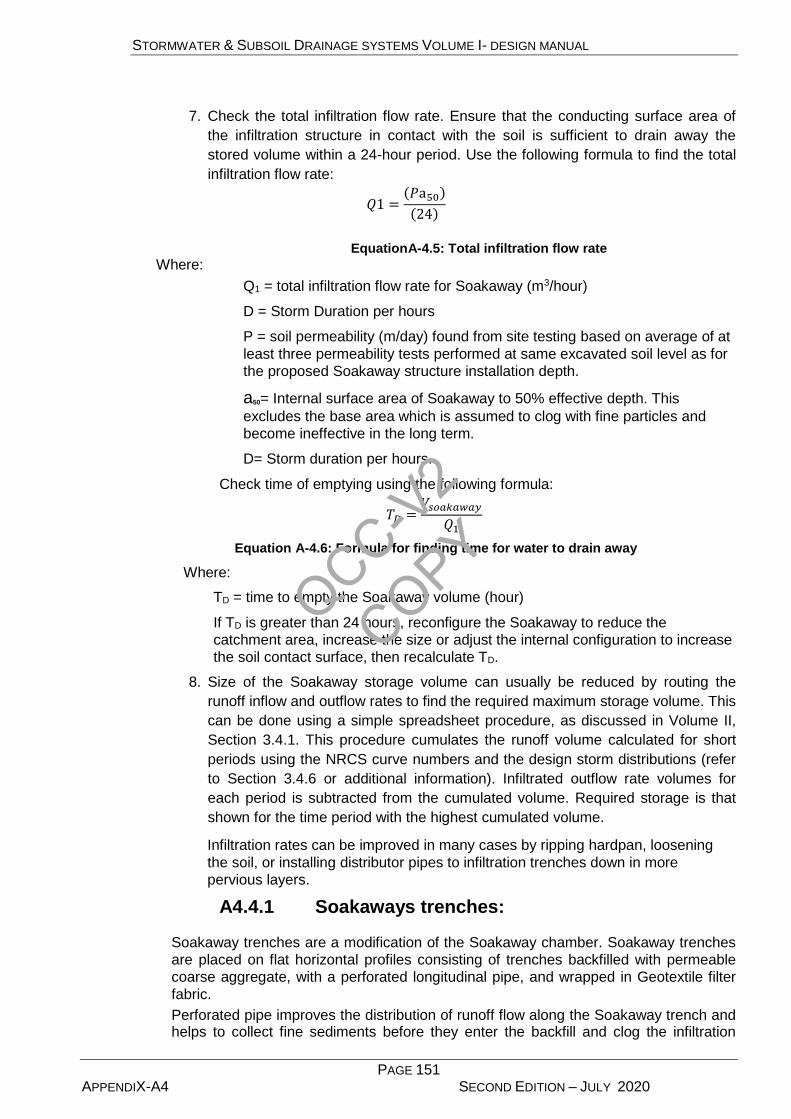
STORMWATER & SUBSOIL DRAINAGE SYSTEMS VOLUME I- DESIGN MANUAL
PAGE 151 APPENDIX-A4 SECOND EDITION – JULY 2020
7. Check the total infiltration flow rate. Ensure that the conducting surface area of
the infiltration structure in contact with the soil is sufficient to drain away the
stored volume within a 24-hour period. Use the following formula to find the total
infiltration flow rate:
𝑄1 =(𝑃a50)
(24)
EquationA-4.5: Total infiltration flow rate
Where:
Q1 = total infiltration flow rate for Soakaway (m3/hour)
D = Storm Duration per hours
P = soil permeability (m/day) found from site testing based on average of at
least three permeability tests performed at same excavated soil level as for
the proposed Soakaway structure installation depth.
a50= Internal surface area of Soakaway to 50% effective depth. This
excludes the base area which is assumed to clog with fine particles and
become ineffective in the long term.
D= Storm duration per hours.
Check time of emptying using the following formula:
𝑇𝐷 =𝑉𝑠𝑜𝑎𝑘𝑎𝑤𝑎𝑦
𝑄1
Equation A-4.6: Formula for finding time for water to drain away
Where:
TD = time to empty the Soakaway volume (hour)
If TD is greater than 24 hours, reconfigure the Soakaway to reduce the
catchment area, increase the size or adjust the internal configuration to increase
the soil contact surface, then recalculate TD.
8. Size of the Soakaway storage volume can usually be reduced by routing the
runoff inflow and outflow rates to find the required maximum storage volume. This
can be done using a simple spreadsheet procedure, as discussed in Volume II,
Section 3.4.1. This procedure cumulates the runoff volume calculated for short
periods using the NRCS curve numbers and the design storm distributions (refer
to Section 3.4.6 or additional information). Infiltrated outflow rate volumes for
each period is subtracted from the cumulated volume. Required storage is that
shown for the time period with the highest cumulated volume.
Infiltration rates can be improved in many cases by ripping hardpan, loosening
the soil, or installing distributor pipes to infiltration trenches down in more
pervious layers.
A4.4.1 Soakaways trenches:
Soakaway trenches are a modification of the Soakaway chamber. Soakaway trenches
are placed on flat horizontal profiles consisting of trenches backfilled with permeable
coarse aggregate, with a perforated longitudinal pipe, and wrapped in Geotextile filter
fabric.
Perforated pipe improves the distribution of runoff flow along the Soakaway trench and helps to collect fine sediments before they enter the backfill and clog the infiltration
QCC-V2
COPY
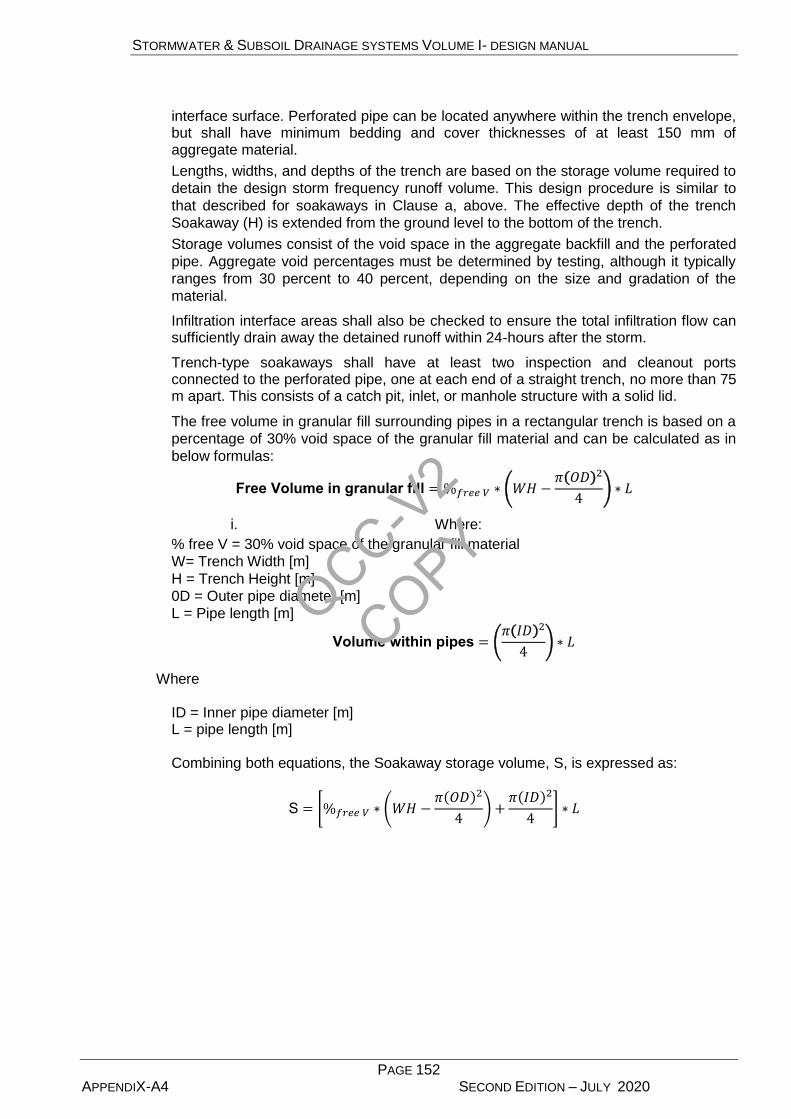
STORMWATER & SUBSOIL DRAINAGE SYSTEMS VOLUME I- DESIGN MANUAL
PAGE 152 APPENDIX-A4 SECOND EDITION – JULY 2020
interface surface. Perforated pipe can be located anywhere within the trench envelope, but shall have minimum bedding and cover thicknesses of at least 150 mm of aggregate material.
Lengths, widths, and depths of the trench are based on the storage volume required to
detain the design storm frequency runoff volume. This design procedure is similar to
that described for soakaways in Clause a, above. The effective depth of the trench
Soakaway (H) is extended from the ground level to the bottom of the trench.
Storage volumes consist of the void space in the aggregate backfill and the perforated
pipe. Aggregate void percentages must be determined by testing, although it typically
ranges from 30 percent to 40 percent, depending on the size and gradation of the
material.
Infiltration interface areas shall also be checked to ensure the total infiltration flow can sufficiently drain away the detained runoff within 24-hours after the storm.
Trench-type soakaways shall have at least two inspection and cleanout ports connected to the perforated pipe, one at each end of a straight trench, no more than 75 m apart. This consists of a catch pit, inlet, or manhole structure with a solid lid.
The free volume in granular fill surrounding pipes in a rectangular trench is based on a
percentage of 30% void space of the granular fill material and can be calculated as in
below formulas:
Free Volume in granular fill = %𝑓𝑟𝑒𝑒 𝑉 ∗ (𝑊𝐻 −𝜋(𝑂𝐷)2
4) ∗ 𝐿
i. Where:
% free V = 30% void space of the granular fill material
W= Trench Width [m]
H = Trench Height [m]
0D = Outer pipe diameter [m]
L = Pipe length [m]
Volume within pipes = (𝜋(𝐼𝐷)2
4) ∗ 𝐿
Where ID = Inner pipe diameter [m] L = pipe length [m] Combining both equations, the Soakaway storage volume, S, is expressed as:
S = [%𝑓𝑟𝑒𝑒 𝑉 ∗ (𝑊𝐻 −𝜋(𝑂𝐷)2
4) +
𝜋(𝐼𝐷)2
4] ∗ 𝐿
QCC-V2
COPY

STORMWATER & SUBSOIL DRAINAGE SYSTEMS VOLUME I- DESIGN MANUAL
PAGE 153 APPENDIX-A5 SECOND EDITION – JULY 2020
Appendix A5 –Main Roads Requirements
QCC-V2
COPY

STORMWATER & SUBSOIL DRAINAGE SYSTEMS VOLUME I- DESIGN MANUAL
PAGE 154 APPENDIX-A5 SECOND EDITION – JULY 2020
A5. MAIN ROADS REQUIREMENTS
A5.1. Open channels and ditches
Open channels are a drainage feature in which water flows with a free surface. Open channels are generally classified as those that occur naturally, are manmade, or improved natural channels. Manmade channels, or artificial channels, used on most roadway projects, include Interceptor ditch, diversion channel, wadi channelization, roadside or median ditch, outfall ditch or canal and Low-flow ditch
This section provides specific requirements and criteria related to channel design analysis procedures and documentation. For a more complete discussion of practical channel hydraulics for road projects, refer to Chapter 4 of the FHWA publication HDS 4. For designs of larger outfall channels, the Design Engineer shall refer to the FHWA publication HDS No. 6 or the American Association of State Highway Transportation Officials (AASHTO) Highway Drainage Guidelines.
A5.1.1 Catchment Delineation
Determining the size of the drainage area that contributes to the flow at the site of the drainage structure is a basic step in a hydrologic analysis, regardless of the method used to evaluate design flows. Drainage area, expressed in hectares or square kilometres, is frequently determined from field surveys, topographic maps, or aerial photographs. Catchment areas include all of the area that will contribute runoff to the point of interest such as open channel or cross drains and are delineated on a drainage map to support the design calculations as part of a design review submittal for all development phases of a project . Drainage maps shall include the following items:
Drainage basin and sub-basin (catchment areas) identification;
Discharge area delineations indicating flow paths and outfalls to receiving waters;
Metrologic features of the catchments;
Basin and catchment area size determinations;
Existing drainage facilities, such as storm drains, inlets, cross culverts, and outfalls;
Environmentally sensitive areas;
Proposed solutions and alternatives layout plans; and
Tentative details for main drain facilities.
A5.1.1.1. Areal-reduction factor
Over a drainage catchment area, the point rainfall will vary and the magnitude of this variation depends on the size of the catchment area due to variations in the storm as it moves through the area. Predicting this average rainfall depth for the whole area from the point rainfall is done by means of applying an Arf. This factor is multiplied by the point rainfall depth or intensity when determining the runoff volume or flow rate. Arf are determined using a statistical analysis of long-term precipitation records and comparing results between the various recording stations within the region. When the Engineer lacks longer term precipitation data for the emirate’s interior recording stations to make this determination, an estimated Arf based on storm rainfall records and statistical calculations for East Africa (refer to Transport and Road Research Laboratory Report 623, Prediction of storm rainfall in East Africa ) can be used as follows:
QCC-V2
COPY
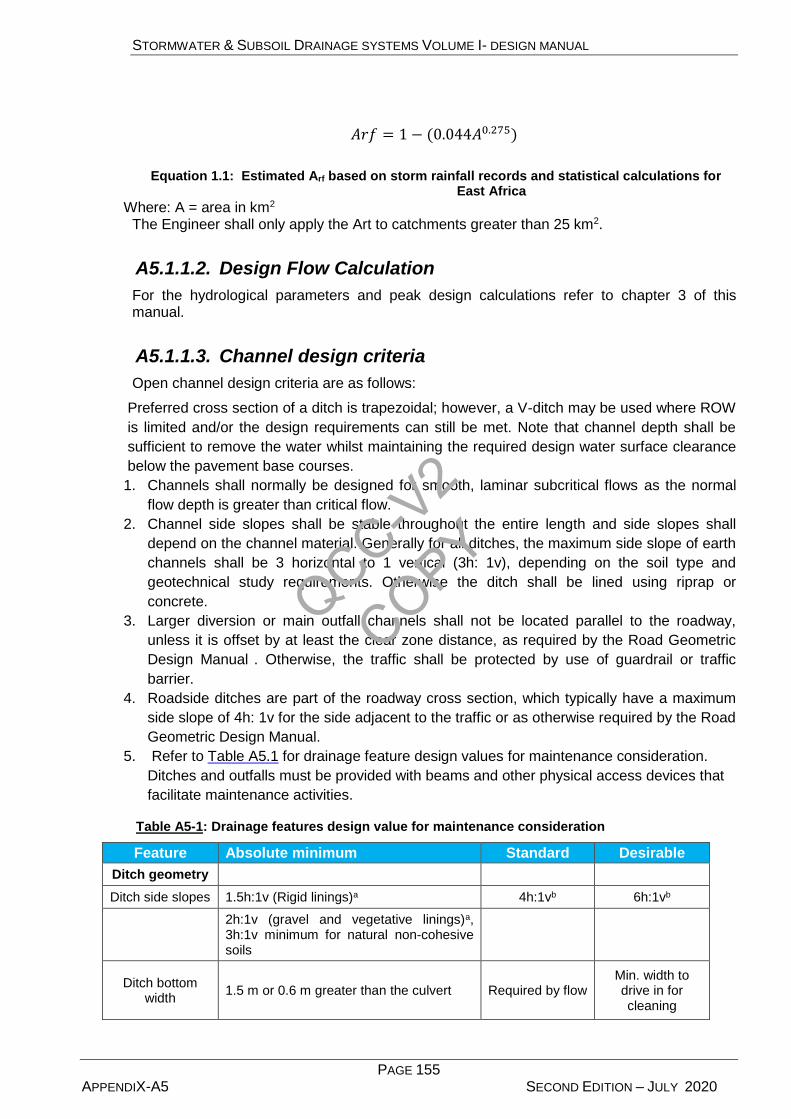
STORMWATER & SUBSOIL DRAINAGE SYSTEMS VOLUME I- DESIGN MANUAL
PAGE 155 APPENDIX-A5 SECOND EDITION – JULY 2020
𝐴𝑟𝑓 = 1 − (0.044𝐴0.275)
Equation 1.1: Estimated Arf based on storm rainfall records and statistical calculations for East Africa
Where: A = area in km2 The Engineer shall only apply the Art to catchments greater than 25 km2.
A5.1.1.2. Design Flow Calculation
For the hydrological parameters and peak design calculations refer to chapter 3 of this manual.
A5.1.1.3. Channel design criteria
Open channel design criteria are as follows:
Preferred cross section of a ditch is trapezoidal; however, a V-ditch may be used where ROW
is limited and/or the design requirements can still be met. Note that channel depth shall be
sufficient to remove the water whilst maintaining the required design water surface clearance
below the pavement base courses.
1. Channels shall normally be designed for smooth, laminar subcritical flows as the normal
flow depth is greater than critical flow.
2. Channel side slopes shall be stable throughout the entire length and side slopes shall
depend on the channel material. Generally for all ditches, the maximum side slope of earth
channels shall be 3 horizontal to 1 vertical (3h: 1v), depending on the soil type and
geotechnical study requirements. Otherwise the ditch shall be lined using riprap or
concrete.
3. Larger diversion or main outfall channels shall not be located parallel to the roadway,
unless it is offset by at least the clear zone distance, as required by the Road Geometric
Design Manual . Otherwise, the traffic shall be protected by use of guardrail or traffic
barrier.
4. Roadside ditches are part of the roadway cross section, which typically have a maximum
side slope of 4h: 1v for the side adjacent to the traffic or as otherwise required by the Road
Geometric Design Manual.
5. Refer to Table A5.1 for drainage feature design values for maintenance consideration.
Ditches and outfalls must be provided with beams and other physical access devices that
facilitate maintenance activities.
Table A5-1: Drainage features design value for maintenance consideration
Feature Absolute minimum Standard Desirable
Ditch geometry
Ditch side slopes 1.5h:1v (Rigid linings)a 4h:1vb 6h:1vb
2h:1v (gravel and vegetative linings)a, 3h:1v minimum for natural non-cohesive soils
Ditch bottom width
1.5 m or 0.6 m greater than the culvert Required by flow Min. width to drive in for cleaning
QCC-V2
COPY
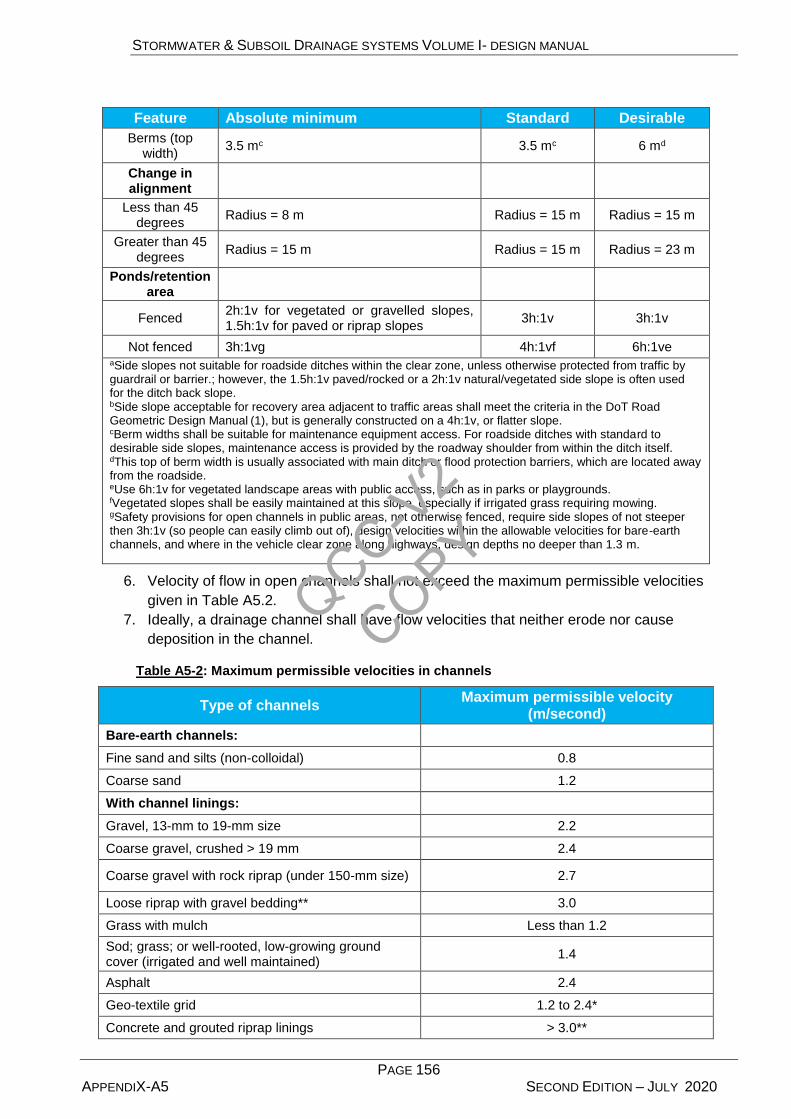
STORMWATER & SUBSOIL DRAINAGE SYSTEMS VOLUME I- DESIGN MANUAL
PAGE 156 APPENDIX-A5 SECOND EDITION – JULY 2020
Feature Absolute minimum Standard Desirable
Berms (top width)
3.5 mc 3.5 mc 6 md
Change in alignment
Less than 45 degrees
Radius = 8 m Radius = 15 m Radius = 15 m
Greater than 45 degrees
Radius = 15 m Radius = 15 m Radius = 23 m
Ponds/retention area
Fenced 2h:1v for vegetated or gravelled slopes, 1.5h:1v for paved or riprap slopes
3h:1v 3h:1v
Not fenced 3h:1vg 4h:1vf 6h:1ve aSide slopes not suitable for roadside ditches within the clear zone, unless otherwise protected from traffic by guardrail or barrier.; however, the 1.5h:1v paved/rocked or a 2h:1v natural/vegetated side slope is often used for the ditch back slope. bSide slope acceptable for recovery area adjacent to traffic areas shall meet the criteria in the DoT Road Geometric Design Manual (1), but is generally constructed on a 4h:1v, or flatter slope. cBerm widths shall be suitable for maintenance equipment access. For roadside ditches with standard to desirable side slopes, maintenance access is provided by the roadway shoulder from within the ditch itself. dThis top of berm width is usually associated with main ditch or flood protection barriers, which are located away from the roadside. eUse 6h:1v for vegetated landscape areas with public access, such as in parks or playgrounds. fVegetated slopes shall be easily maintained at this slope, especially if irrigated grass requiring mowing. gSafety provisions for open channels in public areas, not otherwise fenced, require side slopes of not steeper then 3h:1v (so people can easily climb out of), design velocities within the allowable velocities for bare-earth channels, and where in the vehicle clear zone along highways, design depths no deeper than 1.3 m.
6. Velocity of flow in open channels shall not exceed the maximum permissible velocities
given in Table A5.2.
7. Ideally, a drainage channel shall have flow velocities that neither erode nor cause
deposition in the channel.
Table A5-2: Maximum permissible velocities in channels
Type of channels Maximum permissible velocity
(m/second)
Bare-earth channels:
Fine sand and silts (non-colloidal) 0.8
Coarse sand 1.2
With channel linings:
Gravel, 13-mm to 19-mm size 2.2
Coarse gravel, crushed > 19 mm 2.4
Coarse gravel with rock riprap (under 150-mm size) 2.7
Loose riprap with gravel bedding** 3.0
Grass with mulch Less than 1.2
Sod; grass; or well-rooted, low-growing ground cover (irrigated and well maintained)
1.4
Asphalt 2.4
Geo-textile grid 1.2 to 2.4*
Concrete and grouted riprap linings > 3.0**
QCC-V2
COPY
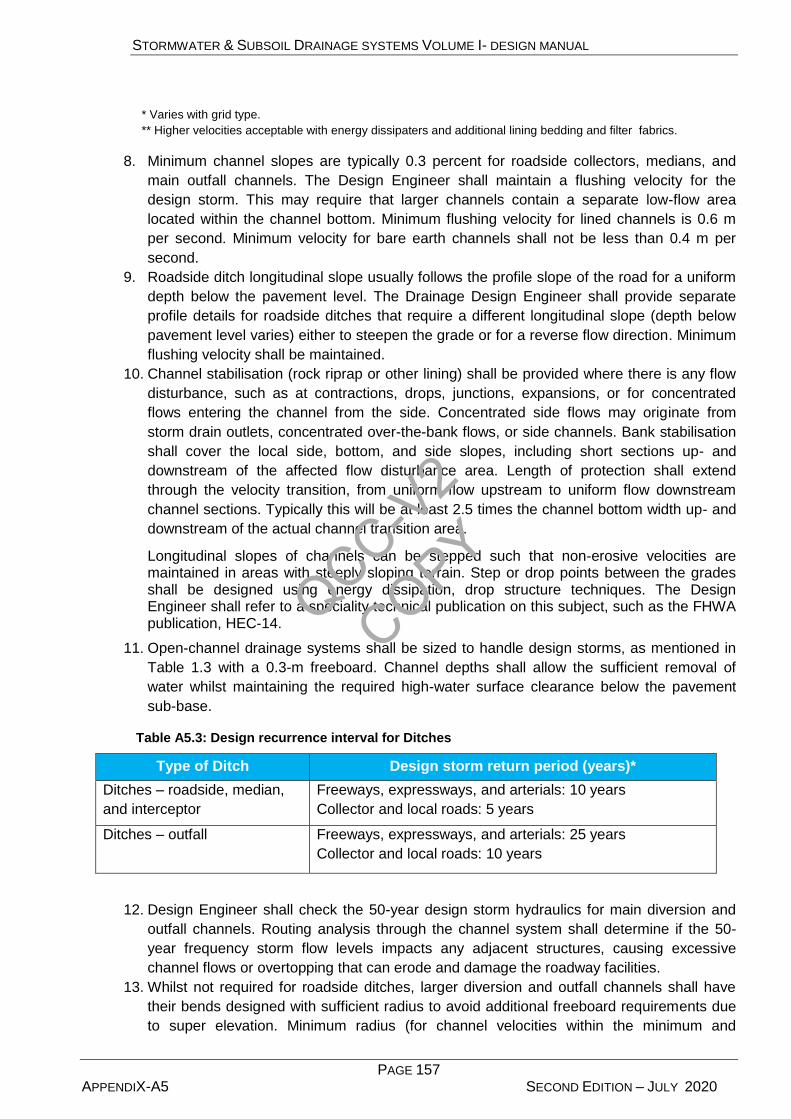
STORMWATER & SUBSOIL DRAINAGE SYSTEMS VOLUME I- DESIGN MANUAL
PAGE 157 APPENDIX-A5 SECOND EDITION – JULY 2020
* Varies with grid type.
** Higher velocities acceptable with energy dissipaters and additional lining bedding and filter fabrics.
8. Minimum channel slopes are typically 0.3 percent for roadside collectors, medians, and
main outfall channels. The Design Engineer shall maintain a flushing velocity for the
design storm. This may require that larger channels contain a separate low-flow area
located within the channel bottom. Minimum flushing velocity for lined channels is 0.6 m
per second. Minimum velocity for bare earth channels shall not be less than 0.4 m per
second.
9. Roadside ditch longitudinal slope usually follows the profile slope of the road for a uniform
depth below the pavement level. The Drainage Design Engineer shall provide separate
profile details for roadside ditches that require a different longitudinal slope (depth below
pavement level varies) either to steepen the grade or for a reverse flow direction. Minimum
flushing velocity shall be maintained.
10. Channel stabilisation (rock riprap or other lining) shall be provided where there is any flow
disturbance, such as at contractions, drops, junctions, expansions, or for concentrated
flows entering the channel from the side. Concentrated side flows may originate from
storm drain outlets, concentrated over-the-bank flows, or side channels. Bank stabilisation
shall cover the local side, bottom, and side slopes, including short sections up- and
downstream of the affected flow disturbance area. Length of protection shall extend
through the velocity transition, from uniform flow upstream to uniform flow downstream
channel sections. Typically this will be at least 2.5 times the channel bottom width up- and
downstream of the actual channel transition area.
Longitudinal slopes of channels can be stepped such that non-erosive velocities are maintained in areas with steeply sloping terrain. Step or drop points between the grades shall be designed using energy dissipation, drop structure techniques. The Design Engineer shall refer to a speciality technical publication on this subject, such as the FHWA publication, HEC-14.
11. Open-channel drainage systems shall be sized to handle design storms, as mentioned in
Table 1.3 with a 0.3-m freeboard. Channel depths shall allow the sufficient removal of
water whilst maintaining the required high-water surface clearance below the pavement
sub-base.
Table A5.3: Design recurrence interval for Ditches
Type of Ditch Design storm return period (years)*
Ditches – roadside, median,
and interceptor
Freeways, expressways, and arterials: 10 years
Collector and local roads: 5 years
Ditches – outfall Freeways, expressways, and arterials: 25 years
Collector and local roads: 10 years
12. Design Engineer shall check the 50-year design storm hydraulics for main diversion and
outfall channels. Routing analysis through the channel system shall determine if the 50-
year frequency storm flow levels impacts any adjacent structures, causing excessive
channel flows or overtopping that can erode and damage the roadway facilities.
13. Whilst not required for roadside ditches, larger diversion and outfall channels shall have
their bends designed with sufficient radius to avoid additional freeboard requirements due
to super elevation. Minimum radius (for channel velocities within the minimum and
QCC-V2
COPY
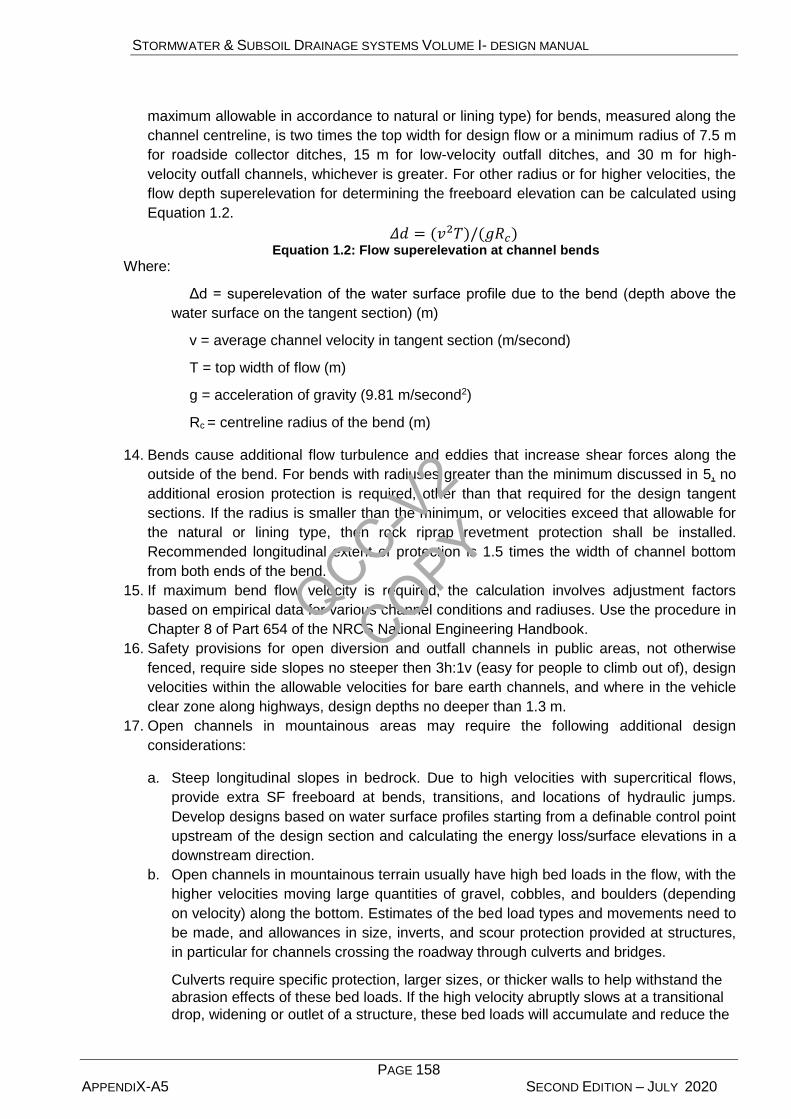
STORMWATER & SUBSOIL DRAINAGE SYSTEMS VOLUME I- DESIGN MANUAL
PAGE 158 APPENDIX-A5 SECOND EDITION – JULY 2020
maximum allowable in accordance to natural or lining type) for bends, measured along the
channel centreline, is two times the top width for design flow or a minimum radius of 7.5 m
for roadside collector ditches, 15 m for low-velocity outfall ditches, and 30 m for high-
velocity outfall channels, whichever is greater. For other radius or for higher velocities, the
flow depth superelevation for determining the freeboard elevation can be calculated using
Equation 1.2.
𝛥𝑑 = (𝑣2𝑇)/(𝑔𝑅𝑐) Equation 1.2: Flow superelevation at channel bends
Where:
Δd = superelevation of the water surface profile due to the bend (depth above the
water surface on the tangent section) (m)
v = average channel velocity in tangent section (m/second)
T = top width of flow (m)
g = acceleration of gravity (9.81 m/second2)
Rc = centreline radius of the bend (m)
14. Bends cause additional flow turbulence and eddies that increase shear forces along the
outside of the bend. For bends with radiuses greater than the minimum discussed in 5, no
additional erosion protection is required, other than that required for the design tangent
sections. If the radius is smaller than the minimum, or velocities exceed that allowable for
the natural or lining type, then rock riprap revetment protection shall be installed.
Recommended longitudinal extent of protection is 1.5 times the width of channel bottom
from both ends of the bend.
15. If maximum bend flow velocity is required, the calculation involves adjustment factors
based on empirical data for various channel conditions and radiuses. Use the procedure in
Chapter 8 of Part 654 of the NRCS National Engineering Handbook.
16. Safety provisions for open diversion and outfall channels in public areas, not otherwise
fenced, require side slopes no steeper then 3h:1v (easy for people to climb out of), design
velocities within the allowable velocities for bare earth channels, and where in the vehicle
clear zone along highways, design depths no deeper than 1.3 m.
17. Open channels in mountainous areas may require the following additional design
considerations:
a. Steep longitudinal slopes in bedrock. Due to high velocities with supercritical flows,
provide extra SF freeboard at bends, transitions, and locations of hydraulic jumps.
Develop designs based on water surface profiles starting from a definable control point
upstream of the design section and calculating the energy loss/surface elevations in a
downstream direction.
b. Open channels in mountainous terrain usually have high bed loads in the flow, with the
higher velocities moving large quantities of gravel, cobbles, and boulders (depending
on velocity) along the bottom. Estimates of the bed load types and movements need to
be made, and allowances in size, inverts, and scour protection provided at structures,
in particular for channels crossing the roadway through culverts and bridges.
Culverts require specific protection, larger sizes, or thicker walls to help withstand the
abrasion effects of these bed loads. If the high velocity abruptly slows at a transitional
drop, widening or outlet of a structure, these bed loads will accumulate and reduce the
QCC-V2
COPY

STORMWATER & SUBSOIL DRAINAGE SYSTEMS VOLUME I- DESIGN MANUAL
PAGE 159 APPENDIX-A5 SECOND EDITION – JULY 2020
capacity of the channel. Provide maintenance access to the culvert inlet to assist with
removal of this material by maintenance crews.
c. Mountainous roads in the cut section, with roadside waterfalls, need to be provided
with large inlet structures designed with barriers, such that high-flow volumes, debris,
and bed loads will not affect the traffic area, but be contained by the inlet, to flush
through the culvert to the downstream side of the roadway.
d. Energy dissipaters may be required to slow high-velocity flows to acceptable velocities
before transitioning to a side of roadway channel, or where the channel is discharging
from a rock-lined channel to an earth channel.
e. The Design Engineer shall refer to a speciality reference for additional design details
and considerations, such as the FHWA publications HEC-15 and HEC-20 .
18. For evaluating the capacity of natural channels and wadis, geometric elements are usually
not well defined. Irregular channel cross sections (i.e., those with a narrow deep main
channel and a wide shallow overbank channel) must be subdivided into segments so flow
can be computed separately from the main channel and for overbank portions. This same
process of subdivision may be used when different parts of the channel cross section have
different roughness coefficients.
a. When computing the hydraulic radius of the subsections, the water depth common
to the two adjacent subsections is not counted as a wetted perimeter.
b. Use of surveyed cross sections and a channel modelling programme, such as the
U.S. Army Corps of Engineers’ (USACE) hydrologic engineering centre’s River
Analysis System Programme (HEC-RAS), will help to facilitate the analysis.
A5.1.1.4. Design method
Channel design is a trial-and-error process using the following general steps:
1. Determine the catchment area and the existing ground level/ topography conditions and
calculate the design storm peak runoff flow rate.
2. Select a trial channel cross section and longitudinal slope. Typically these will be
assumptions based on the Design Engineer’s experience that best fits the existing or
proposed terrain and the required roadway cross-sections and ROW.
3. Calculate the flow capacity of the trial channel using Manning’s equation 1.3 and compare
calculated capacity against the design flows. If the channel capacity is less than the
required design flows, increase the bottom slope or increase the cross-section dimensions
and recalculate.
4. Calculate the design velocity. Compare to the allowable velocities in Table A5-2 Adjust
channel geometry and longitudinal slopes as necessary to reduce velocity to less than
allowable. If this is not possible, then provide the necessary channel erosion protection at
the bottom and side slope armouring or lining.
5. Check and provide calculations for additional criteria items, such as freeboard, clearance
of design water surface below pavement, and critical depth.
Before finalising a channel design, the Design Engineer must verify that the normal depth of a channel is either greater or less than the critical depth. Generally, open channels shall be designed with greater than critical depths for laminar, uniform flows. Designs within this flow regime will help assure that the channels and ditches are stable and non-erosive.
Hydraulic principles of open-channel flow are based on steady state uniform flow conditions. Though these conditions are rarely achieved in the field, generally the variation in channel
QCC-V2
COPY
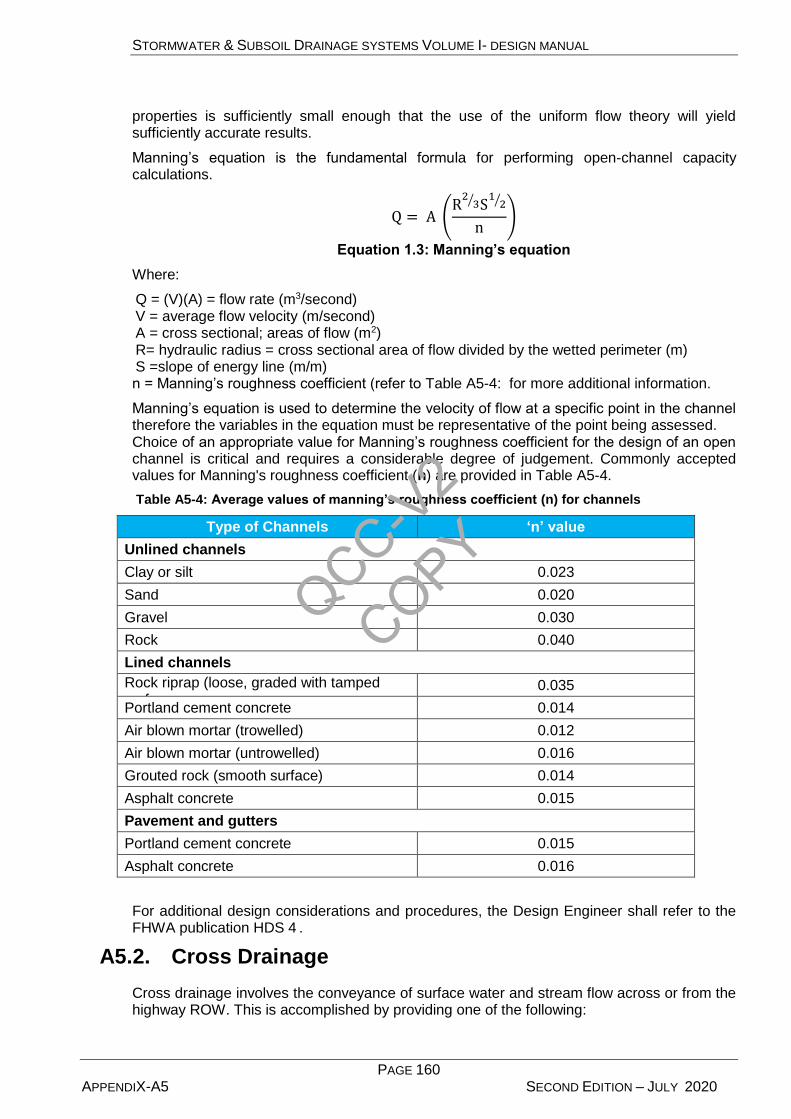
STORMWATER & SUBSOIL DRAINAGE SYSTEMS VOLUME I- DESIGN MANUAL
PAGE 160 APPENDIX-A5 SECOND EDITION – JULY 2020
properties is sufficiently small enough that the use of the uniform flow theory will yield sufficiently accurate results.
Manning’s equation is the fundamental formula for performing open-channel capacity calculations.
Q = A (R
23⁄ S
12⁄
n)
Equation 1.3: Manning’s equation
Where:
Q = (V)(A) = flow rate (m3/second) V = average flow velocity (m/second) A = cross sectional; areas of flow (m2) R= hydraulic radius = cross sectional area of flow divided by the wetted perimeter (m) S =slope of energy line (m/m) n = Manning’s roughness coefficient (refer to Table A5-4: for more additional information.
Manning’s equation is used to determine the velocity of flow at a specific point in the channel therefore the variables in the equation must be representative of the point being assessed. Choice of an appropriate value for Manning’s roughness coefficient for the design of an open channel is critical and requires a considerable degree of judgement. Commonly accepted values for Manning's roughness coefficient (n) are provided in Table A5-4.
Table A5-4: Average values of manning’s roughness coefficient (n) for channels
Type of Channels ‘n’ value
Unlined channels
Clay or silt 0.023
Sand 0.020
Gravel 0.030
Rock 0.040
Lined channels
Rock riprap (loose, graded with tamped surface
0.035
Portland cement concrete 0.014
Air blown mortar (trowelled) 0.012
Air blown mortar (untrowelled) 0.016
Grouted rock (smooth surface) 0.014
Asphalt concrete 0.015
Pavement and gutters
Portland cement concrete 0.015
Asphalt concrete 0.016
For additional design considerations and procedures, the Design Engineer shall refer to the FHWA publication HDS 4 .
A5.2. Cross Drainage
Cross drainage involves the conveyance of surface water and stream flow across or from the highway ROW. This is accomplished by providing one of the following:
QCC-V2
COPY
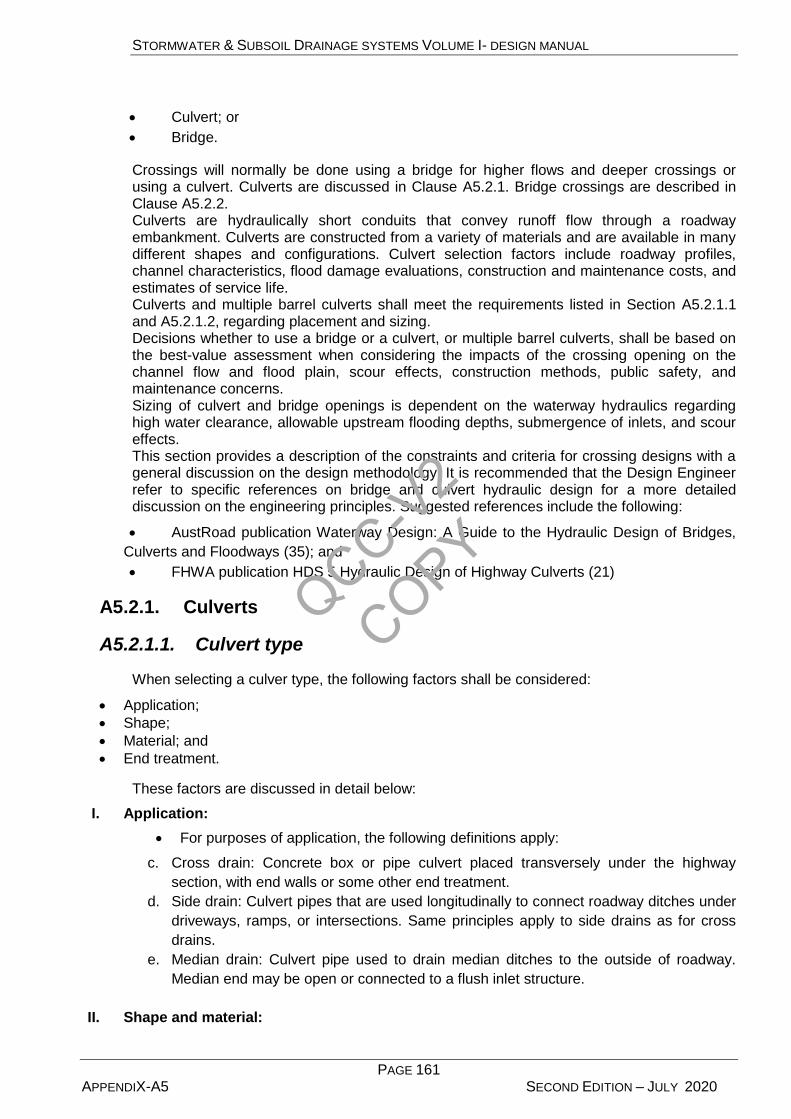
STORMWATER & SUBSOIL DRAINAGE SYSTEMS VOLUME I- DESIGN MANUAL
PAGE 161 APPENDIX-A5 SECOND EDITION – JULY 2020
Culvert; or
Bridge.
Crossings will normally be done using a bridge for higher flows and deeper crossings or using a culvert. Culverts are discussed in Clause A5.2.1. Bridge crossings are described in Clause A5.2.2. Culverts are hydraulically short conduits that convey runoff flow through a roadway embankment. Culverts are constructed from a variety of materials and are available in many different shapes and configurations. Culvert selection factors include roadway profiles, channel characteristics, flood damage evaluations, construction and maintenance costs, and estimates of service life. Culverts and multiple barrel culverts shall meet the requirements listed in Section A5.2.1.1 and A5.2.1.2, regarding placement and sizing. Decisions whether to use a bridge or a culvert, or multiple barrel culverts, shall be based on the best-value assessment when considering the impacts of the crossing opening on the channel flow and flood plain, scour effects, construction methods, public safety, and maintenance concerns. Sizing of culvert and bridge openings is dependent on the waterway hydraulics regarding high water clearance, allowable upstream flooding depths, submergence of inlets, and scour effects. This section provides a description of the constraints and criteria for crossing designs with a general discussion on the design methodology. It is recommended that the Design Engineer refer to specific references on bridge and culvert hydraulic design for a more detailed discussion on the engineering principles. Suggested references include the following:
AustRoad publication Waterway Design: A Guide to the Hydraulic Design of Bridges,
Culverts and Floodways (35); and
FHWA publication HDS 5 Hydraulic Design of Highway Culverts (21)
A5.2.1. Culverts
A5.2.1.1. Culvert type
When selecting a culver type, the following factors shall be considered:
Application;
Shape;
Material; and
End treatment.
These factors are discussed in detail below:
I. Application:
For purposes of application, the following definitions apply:
c. Cross drain: Concrete box or pipe culvert placed transversely under the highway
section, with end walls or some other end treatment.
d. Side drain: Culvert pipes that are used longitudinally to connect roadway ditches under
driveways, ramps, or intersections. Same principles apply to side drains as for cross
drains.
e. Median drain: Culvert pipe used to drain median ditches to the outside of roadway.
Median end may be open or connected to a flush inlet structure.
II. Shape and material:
QCC-V2
COPY

STORMWATER & SUBSOIL DRAINAGE SYSTEMS VOLUME I- DESIGN MANUAL
PAGE 162 APPENDIX-A5 SECOND EDITION – JULY 2020
Cross drain pipes used throughout Abu Dhabi shall be circular pipes and shall meet the material selection limitations.
Concrete box culverts shall be structurally designed to withstand all live and dead
loads for both the construction and permanent conditions in accordance to the
requirements within the DoT Road Structures Design Manual (30).
III. Concrete box culverts shall also meet the pipe durability, service life, corrosion protection, and
abrasion resistance for concrete pipe as per manufacturers requirement.
IV. Size:
Minimum culvert sizes shall meet the requirements of Table A5-5.
Table A5-5: Minimum culvert sizes
Culvert type Minimum size (mm diameter)
Cross drain** 600
Median drain 500*
Side drain 500*
Box culvert 900 by 900 precast
1,200 by 1,200 cast-in situ
Drains from inlets on high fills (e.g., gutter drain) 300*
*When debris control is provided by grates and sand trap facilities use a 300-mm-dia.
minimum.
**Size of cross drains shall also be agreed with the O&M department, according to site
conditions.
V. End treatment:
Selection of end treatment facilities must be consistent with hydraulic requirements,
maintenance concerns, and provide vehicle collision safety where culvert ends
terminate within the roadway clear zone.
A5.2.1.2. Culvert Fundamentals
1. Flow control:
Culverts can operate either under inlet control, where the barrel has a greater hydraulic
capacity than the inlet; or, under outlet control, where the inlet has a greater hydraulic capacity
than the barrel.
When a culvert is operating under inlet control, the barrel will flow partially full (i.e., the culvert
is capable of carrying more flow than the inlet will accept). Culverts flowing in inlet control have
a shallow, high-velocity flow categorized as supercritical. For supercritical flow, the control
section is at the upstream end of the barrel, or the inlet. When an outlet is submerged under
inlet control, a hydraulic jump will occur inside the barrel.
When a culvert is operating under outlet control, the barrel is intended to flow full for design
conditions (i.e., the culvert barrel is not capable of conveying as much flow as the inlet will
accept). Culverts flowing in outlet control will have relatively deep, lower velocity flow —
termed subcritical flow.
QCC-V2
COPY

STORMWATER & SUBSOIL DRAINAGE SYSTEMS VOLUME I- DESIGN MANUAL
PAGE 163 APPENDIX-A5 SECOND EDITION – JULY 2020
For each type of control, different factors and formulas are used to compute the hydraulic
capacity of a culvert. Under inlet control, the cross sectional area of the culvert, inlet geometry,
and HW elevations at the entrance are of primary importance. Outlet control involves the
additional consideration of the outlet channel TW elevations and the slope, roughness, and the
length of the culvert barrel.
Discussions of these two types of control, and charts for selecting a culvert size for a given set of conditions, are included in the FHWA publication HDS 5 .
2. Headwater:
HW is the depth of the upstream water surface measured from the invert of the culvert
entrance.
It is not always economical or practical to use all of the available HW, especially where debris
must pass through the culvert or where the natural gradient is steep and high outlet velocities
are objectionable.
3. Tailwater:
Tailwater (TW) depth is either critical depth at the culvert outlet or the downstream channel
flow depth, whichever is higher.
A5.2.1.3. Culvert design procedures
General procedure to follow when designing a culvert is summarised in the steps below. Design Engineer shall refer to a detailed reference on culvert theory and design methods, such as the FHWA publication HDS 5. Culvert spans more than 6 m, or a width paralleling the roadway centreline, may be subject to additional performance measures, as described in Section A5.2.1.
a) Calculate the culvert design flows:
The crossing culvert are designed for 50 years storm return intervals for freeways,
expressways, and arterials and check the 100-year design for upstream flooding or
overtopping. For collector and local roads, 25-year design storm return intervals is
recommended for design and 50 – year for check the upstream flooding or
overtopping.
b) Determine the allowable headwater (HW) elevation:
Circular and box culverts shall be designed such that the ratio of the HW to diameter
(D) during the design flow event is less than or equal to 1.25 (HW i/D ≤ 1.25). HWi/D
ratios larger than 1.25 are permitted, provided that existing site conditions, such as
available ponding areas on deeper fills warrant a larger ratio. The maximum allowable
HWi/D ratio shall never exceed 3.
c) Determine the TWL elevation at the design flow:
Hydraulic conditions downstream of the culvert site shall be evaluated to determine a
TWL depth for the design discharge. For culvert outlets operating under free-fall
conditions, such as a cantilevered pipe; critical depth and equivalent hydraulic grade
line are determined using procedures as discussed below.
For culverts discharging to an open channel, normal depth of flow in the channel shall
be evaluated using procedures presented in Section A5.1.1.3
QCC-V2
COPY
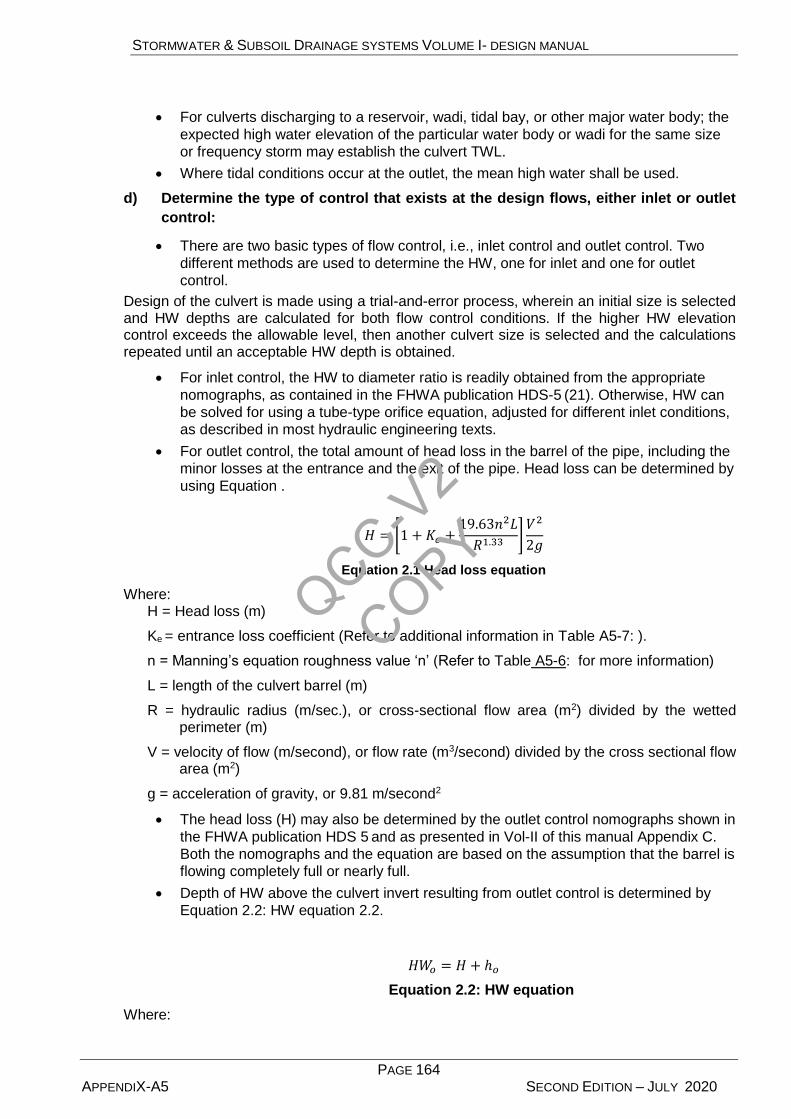
STORMWATER & SUBSOIL DRAINAGE SYSTEMS VOLUME I- DESIGN MANUAL
PAGE 164 APPENDIX-A5 SECOND EDITION – JULY 2020
For culverts discharging to a reservoir, wadi, tidal bay, or other major water body; the
expected high water elevation of the particular water body or wadi for the same size
or frequency storm may establish the culvert TWL.
Where tidal conditions occur at the outlet, the mean high water shall be used.
d) Determine the type of control that exists at the design flows, either inlet or outlet
control:
There are two basic types of flow control, i.e., inlet control and outlet control. Two
different methods are used to determine the HW, one for inlet and one for outlet
control.
Design of the culvert is made using a trial-and-error process, wherein an initial size is selected and HW depths are calculated for both flow control conditions. If the higher HW elevation control exceeds the allowable level, then another culvert size is selected and the calculations repeated until an acceptable HW depth is obtained.
For inlet control, the HW to diameter ratio is readily obtained from the appropriate
nomographs, as contained in the FHWA publication HDS-5 (21). Otherwise, HW can
be solved for using a tube-type orifice equation, adjusted for different inlet conditions,
as described in most hydraulic engineering texts.
For outlet control, the total amount of head loss in the barrel of the pipe, including the
minor losses at the entrance and the exit of the pipe. Head loss can be determined by
using Equation .
𝐻 = [1 + 𝐾𝑒 +19.63𝑛2𝐿
𝑅1.33]
𝑉2
2𝑔
Equation 2.1 Head loss equation
Where: H = Head loss (m)
Ke = entrance loss coefficient (Refer to additional information in Table A5-7: ).
n = Manning’s equation roughness value ‘n’ (Refer to Table A5-6: for more information)
L = length of the culvert barrel (m)
R = hydraulic radius (m/sec.), or cross-sectional flow area (m2) divided by the wetted perimeter (m)
V = velocity of flow (m/second), or flow rate (m3/second) divided by the cross sectional flow area (m2)
g = acceleration of gravity, or 9.81 m/second2
The head loss (H) may also be determined by the outlet control nomographs shown in
the FHWA publication HDS 5 and as presented in Vol-II of this manual Appendix C.
Both the nomographs and the equation are based on the assumption that the barrel is
flowing completely full or nearly full.
Depth of HW above the culvert invert resulting from outlet control is determined by
Equation 2.2: HW equation 2.2.
𝐻𝑊𝑜 = 𝐻 + ℎ𝑜
Equation 2.2: HW equation
Where:
QCC-V2
COPY
STORMWATER & SUBSOIL DRAINAGE SYSTEMS VOLUME I- DESIGN MANUAL
PAGE 165 APPENDIX-A5 SECOND EDITION – JULY 2020
ho = actual TWL depth above the culvert invert or the term (dc + D)/2, whichever is greater.
Table A5-6: Manning’s equation roughness coefficient (n) for culverts
Culvert Material “n” value
Concrete pipe or box (non-lined) 0.015
Concrete pipe (PVC-lined) 0.011
Vitrified clay pipe 0.013
Corrugated metal pipe 0.022 – 0.027*
68 mm by 13 mm – annular or helical 0.025
76 mm by 25 mm – annular or helical 0.028
125 mm by 25 mm – annular or helical 0.026
152 mm by 51 mm – annular or helical 0.035
229 mm by 64 mm – annular or helical 0.035
Spiral rib metal pipe:
19 mm (W) x 25 mm (D) @ 292 mm o/c 0.013
19 mm (W) x 19 mm (D) @ 191 mm o/c 0.013
19 mm (W) x 25 mm (D) @ 213 mm o/c 0.013
Corrugated polyethylene – smooth 0.009 – 0.015*
Corrugated polyethylene – corrugated 0.018 – 0.025*
PVC – smooth 0.009 – 0.011*
Composite steel spiral rib pipe 0.012
*Refer to pipe manufacture’s data sheets
Table A5-7: Culvert entrance loss coefficients
Culvert end treatment Ke
Pipe concrete
Projecting from fill, socket end (groove-end) 0.2
Projecting from fill, square cut end 0.5
Headwall or headwall and wing walls
Socket end of pipe (groove-end 0.2
Square-edge 0.5
Rounded (radius = D/12 0.2
Mitred to conform to fill slope 0.7
*End-section conforming to fill slope 0.5
Bevelled edges, 33.7°or 45° bevels 0.2
Side- or slope-tapered inlet 0.2
Pipe or pipe-arch corrugated metal
Projecting from fill (no headwall) 0.9
Mitred to conform to fill slope, paved or unpaved slope 0.7
QCC-V2
COPY
STORMWATER & SUBSOIL DRAINAGE SYSTEMS VOLUME I- DESIGN MANUAL
PAGE 166 APPENDIX-A5 SECOND EDITION – JULY 2020
Culvert end treatment Ke
Box, reinforced concrete Headwall parallel to embankment (no wing walls)
Square-edged on three edges 0.5
Rounded on three edges to radius of D/12 or B/12, or bevelled edges on three sides 0.2
Wing walls at 30° to 75° to barrel
Square-edged at crown 0.4
Crown edge rounded to radius of D/12 or bevelled top edge 0.2
Wing walls at 10°to 25° to barrel
Square-edged at crown 0.5
Wing walls parallel (extension of sides)
Square-edged at crown 0.7
Side- or slope-tapered inlet 0.2
*Note: "End sections conforming to fill slope," made of either metal or concrete, are the sections commonly available. From limited hydraulic tests they are equivalent in operation to a headwall in both inlet and outlet control. Some end sections, incorporating a closed taper in their design, have a superior hydraulic performance. These latter sections can be designed using the information given for the bevelled inlet.
e) Calculate outlet velocities:
a. If the controlling HW is based on inlet control, determine the normal depth and
velocity in the culvert barrel. Velocities at normal depths are assumed to be the
outlet velocity. This can be calculated by using Manning’s equation.
b. If the controlling HW is in outlet control, the outlet velocity is the flow rate divided by
the cross-sectional flow area. Determine the area of flow at the outlet based on the
barrel geometry and the following:
i. Critical depth, if the TWL is below critical depth;
ii. TWL depth, if the TWL is between critical depth and the top of the barrel;
and
iii. Height of the barrel, if the TWL is above the top of the barrel.
c. Outlet flows shall closely match the velocity of the existing channel. If they do not,
an alternate culvert design that reduces the outlet velocity or uses energy
dissipaters shall be considered
f) Provide embankment slope protection at inlet and outlet of culvert:
a. Install rock riprap on inlet slope to a height equal to the design HW and width of 2D
on each side of the culvert opening.
b. Install rock riprap on outlet slope to a height equal to 5D above the top of the
culvert and width of 1D on each side of the culver opening.
g) Provide channel erosion protection at the inlet and outlet of culvert, if required.
A5.2.2. Wadi bridges
Bridge opening hydraulics will be used to design larger box culverts and bridges across Wadi’s in (Al Ain). Bridges shall be considered when design flow is large and using multiple barrel culverts is not effective, or where located in channels with high-velocity flows with
QCC-V2
COPY
STORMWATER & SUBSOIL DRAINAGE SYSTEMS VOLUME I- DESIGN MANUAL
PAGE 167 APPENDIX-A5 SECOND EDITION – JULY 2020
debris or heavy bed loads. Hydraulic designs that size bridge or large culvert openings shall meet the following hydraulic criteria:
I. Bridges and large culverts shall be designed to have sufficient hydraulic capacity to convey the
required design storm frequency channel flows without damage to the structure and to
approach embankments.
II. Design of all structure openings shall be analysed for the peak design storm frequency flow of
100 years design return period maintaining 1 m clear between high water and bridge deck for
freeways, expressways, and arterials and 50 years design return period for collector and local
roads.
III. Backwater Effects: bridges have an effect on the flow of the watercourse over which they are
located. This is because part of the bridge structure is usually located within the channel of the
river or stream, and causes an obstruction of water flow. Bridges which cross a river in more
than one span have piers located in the watercourse, which force water to flow around them.
The abutments of bridges also generally protrude into the watercourse, causing obstacles at
either side of the channel. Even if under normal flow conditions no part of the bridge is
obstructing flow, in flood conditions, where the water level is significantly raised, parts of the
bridge superstructure may cause an obstruction to flow.
IV. As water flowing in the channel approaches a bridge structure that restricts its flow area, the
flow is forced to contract, in order to pass through the bridge, before expanding once again to
the full channel width. As the constricted flow passes through the obstruction of the bridge, it
accelerates, causing a depression in level of water surface. As the flow expands once more to
the full channel width, so the water level recovers, to its downstream boundary condition level.
The successive contraction and expansion results in a local head loss, which is compensated
by an increase in water level upstream of the bridge. This phenomenon is known as afflux, or
the backwater effect. Water levels upstream are raised by ∆y with respect to downstream
levels, (refer to Figure 2-1), where ∆y is equal to the head loss caused by the contraction and
expansion of flow at the bridge.
V. Design flows shall be determined in accordance to the procedures in Chapter 3. Hydraulic
conditions for the design and overtopping flows shall be determined using an open channel-
type modelling program, Modelling of backwater flow effects with HEC-RAS HEC-RAS can be
used to model the effects of a bridge crossing a watercourse, and to examine backwater
effects). In particular, modelling shall be done for both the existing channel and the proposed
crossing conditions and differences compared.
VI. Bridge crossings of sea channels, inlets, and bays with tidal flows shall be analysed using an
engineering approach suitable for the given site and shall consider flow due to normal tidal
exchange, storm surge, and wave attack.
VII. Design of the bridge flow openings shall be such that the proposed water surface is not
increased more than 0.3m at a distance of 50 m upstream of the bridge — above the existing
water surface in the channel during the peak design storm frequency flow.
VIII. Low chords of the structure shall provide at least a 1-m clearance above the peak design
storm frequency water surface or, in areas with tidal influence, of 1-m above the mean high
tide level.
IX. Economical approach for crossings of wide wadi floodplains will usually require a bridge
structure over the main flow channel. This bridge opening is sized for the maximum flow
occurring within the wadi channel banks, but does not overtop the channel banks.
QCC-V2
COPY

STORMWATER & SUBSOIL DRAINAGE SYSTEMS VOLUME I- DESIGN MANUAL
PAGE 168 APPENDIX-A5 SECOND EDITION – JULY 2020
Figure 2-1 Schematic of backwater effect cause by bridge pier
Larger storms, that overtop the banks and spread out across the floodplain, require additional openings under the roadway. These are called relief crossings and can consist of additional bridge spans or large culverts and shall be placed at locations that match the low points in the floodplain terrain. Relief crossings will generally be at higher levels than the main channel. An example of this is shown in Figure 2-2, where the bridge’s main span is sized for the main channel area, with additional spans acting as flood relief. Although this picture shows the relief crossings using additional spans, they can also be provided through the roadway fill using large culverts. Bridge hydraulic design programs, such as HEC-RAS, will perform modelling of the design flows through both the main and secondary relief openings. Total opening areas are sized to meet the design requirements noted above.
Figure 2-2: Wadi bridge crossing with floodplain relief spans
QCC-V2
COPY
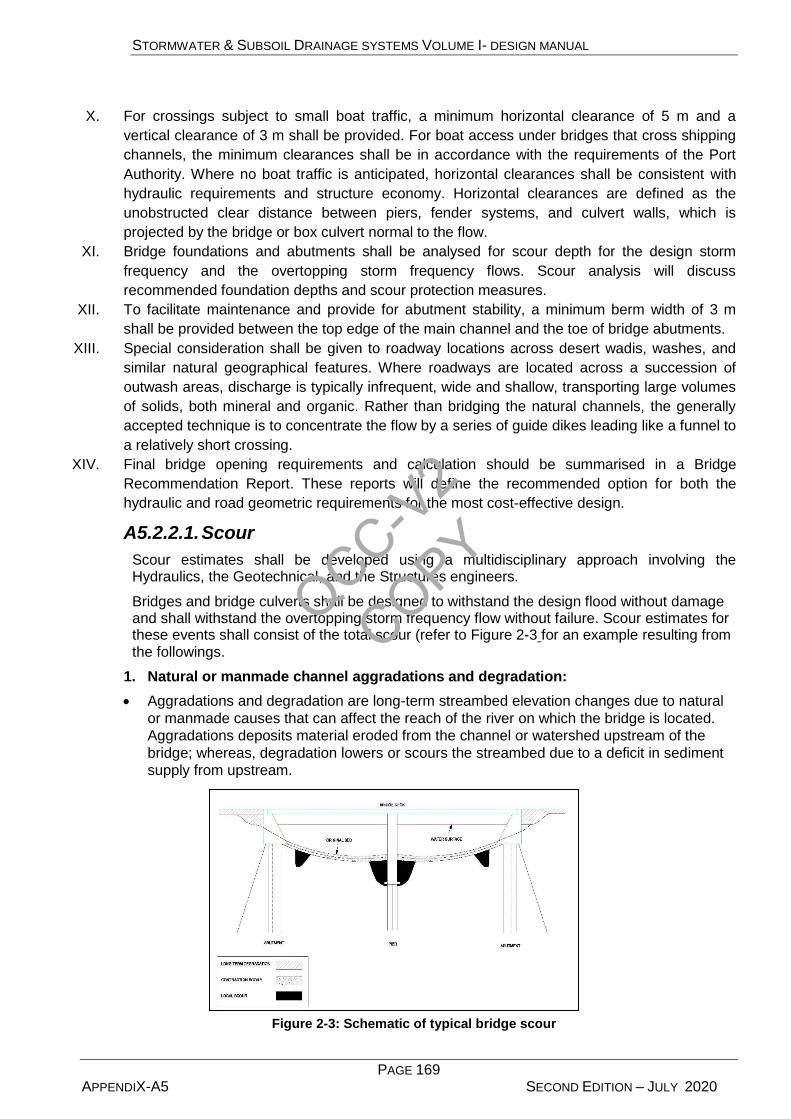
STORMWATER & SUBSOIL DRAINAGE SYSTEMS VOLUME I- DESIGN MANUAL
PAGE 169 APPENDIX-A5 SECOND EDITION – JULY 2020
X. For crossings subject to small boat traffic, a minimum horizontal clearance of 5 m and a
vertical clearance of 3 m shall be provided. For boat access under bridges that cross shipping
channels, the minimum clearances shall be in accordance with the requirements of the Port
Authority. Where no boat traffic is anticipated, horizontal clearances shall be consistent with
hydraulic requirements and structure economy. Horizontal clearances are defined as the
unobstructed clear distance between piers, fender systems, and culvert walls, which is
projected by the bridge or box culvert normal to the flow.
XI. Bridge foundations and abutments shall be analysed for scour depth for the design storm
frequency and the overtopping storm frequency flows. Scour analysis will discuss
recommended foundation depths and scour protection measures.
XII. To facilitate maintenance and provide for abutment stability, a minimum berm width of 3 m
shall be provided between the top edge of the main channel and the toe of bridge abutments.
XIII. Special consideration shall be given to roadway locations across desert wadis, washes, and
similar natural geographical features. Where roadways are located across a succession of
outwash areas, discharge is typically infrequent, wide and shallow, transporting large volumes
of solids, both mineral and organic. Rather than bridging the natural channels, the generally
accepted technique is to concentrate the flow by a series of guide dikes leading like a funnel to
a relatively short crossing.
XIV. Final bridge opening requirements and calculation should be summarised in a Bridge
Recommendation Report. These reports will define the recommended option for both the
hydraulic and road geometric requirements for the most cost-effective design.
A5.2.2.1. Scour
Scour estimates shall be developed using a multidisciplinary approach involving the Hydraulics, the Geotechnical, and the Structures engineers.
Bridges and bridge culverts shall be designed to withstand the design flood without damage and shall withstand the overtopping storm frequency flow without failure. Scour estimates for these events shall consist of the total scour (refer to Figure 2-3 for an example resulting from the followings.
1. Natural or manmade channel aggradations and degradation:
Aggradations and degradation are long-term streambed elevation changes due to natural
or manmade causes that can affect the reach of the river on which the bridge is located.
Aggradations deposits material eroded from the channel or watershed upstream of the
bridge; whereas, degradation lowers or scours the streambed due to a deficit in sediment
supply from upstream.
Figure 2-3: Schematic of typical bridge scour
QCC-V2
COPY
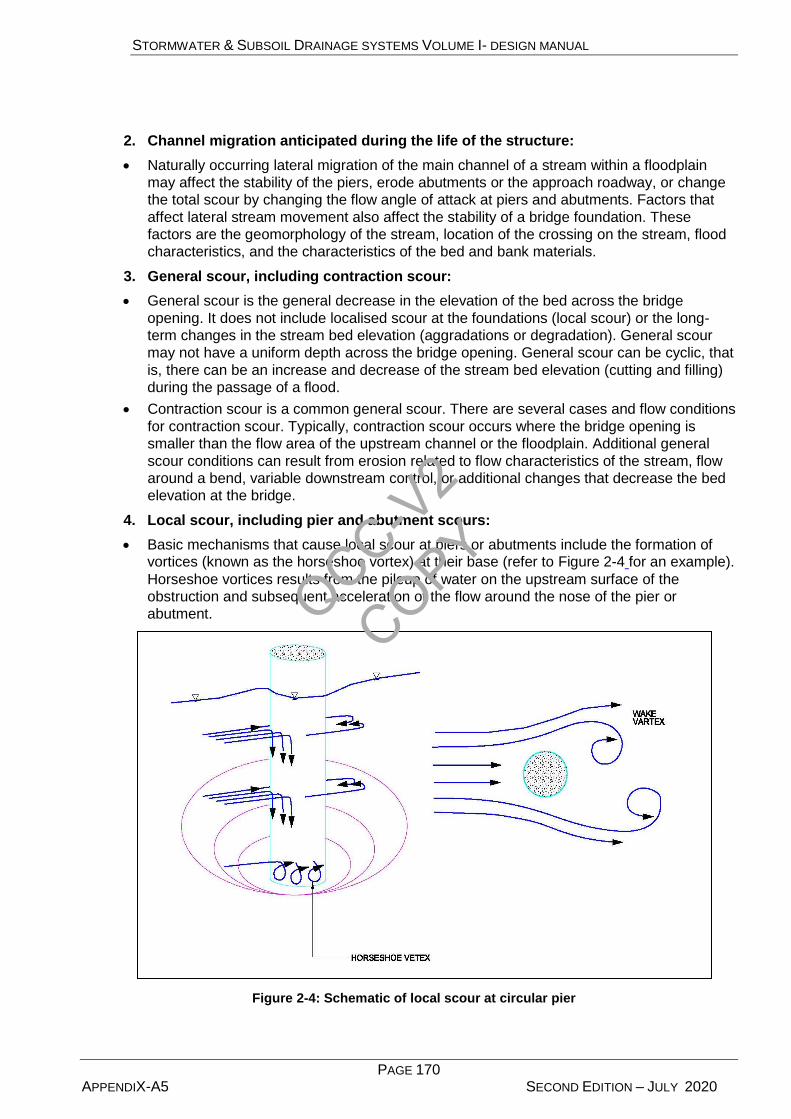
STORMWATER & SUBSOIL DRAINAGE SYSTEMS VOLUME I- DESIGN MANUAL
PAGE 170 APPENDIX-A5 SECOND EDITION – JULY 2020
2. Channel migration anticipated during the life of the structure:
Naturally occurring lateral migration of the main channel of a stream within a floodplain
may affect the stability of the piers, erode abutments or the approach roadway, or change
the total scour by changing the flow angle of attack at piers and abutments. Factors that
affect lateral stream movement also affect the stability of a bridge foundation. These
factors are the geomorphology of the stream, location of the crossing on the stream, flood
characteristics, and the characteristics of the bed and bank materials.
3. General scour, including contraction scour:
General scour is the general decrease in the elevation of the bed across the bridge
opening. It does not include localised scour at the foundations (local scour) or the long-
term changes in the stream bed elevation (aggradations or degradation). General scour
may not have a uniform depth across the bridge opening. General scour can be cyclic, that
is, there can be an increase and decrease of the stream bed elevation (cutting and filling)
during the passage of a flood.
Contraction scour is a common general scour. There are several cases and flow conditions
for contraction scour. Typically, contraction scour occurs where the bridge opening is
smaller than the flow area of the upstream channel or the floodplain. Additional general
scour conditions can result from erosion related to flow characteristics of the stream, flow
around a bend, variable downstream control, or additional changes that decrease the bed
elevation at the bridge.
4. Local scour, including pier and abutment scours:
Basic mechanisms that cause local scour at piers or abutments include the formation of vortices (known as the horseshoe vortex) at their base (refer to Figure 2-4 for an example).
Horseshoe vortices results from the pileup of water on the upstream surface of the
obstruction and subsequent acceleration of the flow around the nose of the pier or
abutment.
Figure 2-4: Schematic of local scour at circular pier
QCC-V2
COPY

STORMWATER & SUBSOIL DRAINAGE SYSTEMS VOLUME I- DESIGN MANUAL
PAGE 171 APPENDIX-A5 SECOND EDITION – JULY 2020
Action of the vortex removes bed material from around the base of the obstruction. Transport rates of sediment away from the base region are greater than the transport rate into the region, and, consequently, a scour hole develops. As the depth of scour increases, the strength of the horseshoe vortex is reduced, thereby reducing the transport rate from the base region. Eventually, for live-bed local scour, equilibrium is re-established between bed material inflow and outflow and scouring ceases. Scour depth is a basis for design of the abutment and pier protection. For design of piers and supporting piles, the total of the predicted scour depths is used as the maximum vertical unsupported pier length for reinforcement design. Pier support pile caps will typically be placed at this elevation. Even where piles require less depth for structural loading, the depth of the piling must extend beyond this depth to act as a SF against undermining by the flow. Scour predictions will also have a large effect on the type of abutment support, whether pile-supported or using spread footings. Use of spread footings require suitable erosion protection, such as heavy riprap with concrete wing walls or flow deflection dikes to protect both the supports and the backfill from flow erosion. It may be more economical to provide a positive scour protection, such as concrete slab on the channel bottom, than construct the additional pier and abutment protection structures that will otherwise be required.
A5.2.2.2. Deck drainage
Design of deck drainage shall meet the minimum spread and inlet spacing requirements as stipulated in Section A3.2.5, for kerbed roadways.
A5.2.2.3. Bridge hydraulic design documentation
Bridge hydraulic designs shall be documented in a Bridge Hydraulic Report. Documentation shall be provided in detail, commensurate with the complexity of the Project. Documentation shall be sufficient enough so that an independent Engineer with expertise in bridge hydraulics, but not involved with the Project design, can fully interpret, follow, and understand the logic, methods, computations, analysis, and considerations used to develop the final design.
1. Documentation for bridge designs shall include, at a minimum, the following:
a. Hydrologic analysis, including sources of data and methodology.
b. Alternative analysis or evaluation of structure sizes, including length and
vertical height or clearance. This evaluation shall include the following
considerations:
i. Cost;
ii. Design standards;
iii. Structure hydraulic performance, including backwater, velocity, and scour; and
iv. Impacts of the structure on the adjacent property.
2. Alternative analysis shall include the reasons for selecting the recommended
structure and a clear explanation as to why it is the most economical structure for the
site in question. At a minimum, the following structure sizes shall be evaluated:
a. Minimum structure size required to meet hydraulic standards for vertical and
horizontal clearance, scour, and backwater.
b. Existing structure size, if applicable.
c. Recommended structure size, if different from the above.
3. Design recommendations for bridges shall include the following:
a. Bridge length and justification for the length, including locations (stations) of
abutments;
QCC-V2
COPY

STORMWATER & SUBSOIL DRAINAGE SYSTEMS VOLUME I- DESIGN MANUAL
PAGE 172 APPENDIX-A5 SECOND EDITION – JULY 2020
b. Channel excavation requirements;
c. Minimum vertical clearance;
d. Minimum horizontal clearance;
e. Abutment type and orientation;
f. Pier orientation;
g. Scour depths for the design storm return period flows, 100-year flows, and
maximum overtopping flows — if needed for main or major roadways;
h. Scour protection requirements for abutments, piers, and channels;
i. Deck drainage.
4. Documentation of hydraulic designs of culverts, including larger culverts with bridge
design characteristics, shall include recommendations for the following:
a. Culvert size and justification for the size, barrel length, and location;
b. Up- and downstream invert elevations;
c. End wall type for entrance and outlet, including the need for an improved inlet;
d. Skew;
e. Inlet and outlet ends scour protection requirements; and,
f. Final Project plans shall show the peak stages, peak discharges, peak
velocities, and peak scour predictions for the design flows, and the greatest
flow or overtopping flow that can be expected at the structure.
g. Many computer programs are available for computation of backwater curves.
The most general and widely used program, HEC-2 was developed by the U.S
Army corps of Engineers and it’s recommended for floodwater profile
computations. This program can be used to computer water surfaces profiles
for both natural and artificial channels and culverts.
QCC-V
2
COPY