pycnoporus sanguineus - universidad veracruzana
TRANSCRIPT
1
UNIVERSIDAD VERACRUZANA
INSTITUTO DE BIOTECNOLOGÍA
Y ECOLOGÍA APLICADA
INDUCCIÓN DE LACASAS Y CELULASAS PARA
UTILIZARSE EN LA PRODUCCIÓN DE BIOETANOL CELULÓSICO
Tesis
Para obtener el grado de
Doctor en Ciencias en Ecología y Biotecnología
QUE PRESENTA:
BIOL. CHRISTIAN ARTURO HERNÁNDEZ HERNÁNDEZ
DIRECTOR
Dr. Enrique Alarcón Gutiérrez
XALAPA, VER. MAYO 2016
2
INDUCCIÓN DE LACASAS Y CELULASAS PARA
UTILIZARSE EN LA PRODUCCIÓN DE BIOETANOL CELULÓSICO
El presente trabajo se ha realizado dentro del Cuerpo Académico Estructura y
Funcionamiento de los Ecosistemas Forestales CA-UVER-324, línea de
generación y aplicación del conocimiento Ecología Microbiana e
interacciones biogeoquímicas planta-suelo-microorganismos, bajo la
dirección del Dr. Enrique Alarcón Gutiérrez y subvencionado por el proyecto
ECOS-NORD Mexique M13A02
Asímismo, el autor agradece al Centro de Biotecnologia, Escola de
Engenharia de Lorena de la Universidade de São Paulo; al Centro de Estudios
Multidisciplinarios en Biotecnología de la Universidad Michoacana de San
Nicolás de Hidalgo; al Institut Méditerranéen de Biodiversité et d’Ecologie
Marine et Continentale, y al Spectropole de la Aix Marseille Université; al
Instituto Tecnológico Superior de Tierra Blanca, por contribuír al desarrollo
de la presente tesis.
Se agradece también al comité tutoral, integrado por el Dr. Enrique Alarcón
Gutiérrez, la Dra. Beatríz Gutiérrez Rivera, el Dr. Sergio Martínez
Hernández, y el Dr. Ángel Trigos Landa, por su consejo y revisión de la
presente tesis.
El autor agradece al Consejo Nacional de Ciencia y Tecnología de México
(CONACyT), por la beca de manutención otorgada para realizar los estudios
doctorales. A la Red de Macrouniversidades de América Latina, al gupo
financiero Santander, al CONACyT y al Gobierno Francés, por las becas para
realizar estancias de investigación y movilidad internacional.
Atentamente
Christian A. Hernández Hernández
Xalapa Veracruz, 27 de mayo de 2016
3
Este trabajo lo dedico para mis padres y hermano,
gracias por llenar mi vida de alegrías y compartir conmigo esta pasión por la ciencia
(porque yo sé que también la sienten)
Descubrir que lo extraordinario,
Lo monstruosamente anormal
Es esta breve cosa que llamamos… vida
(Jaime Sabines, Otros poemas sueltos)
4
Agradecimientos
Durante la realización de esta tesis, he contado con el apoyo sincero y desinteresado de
muchas personas, a las que quisiera agradecer, pues mucho de este logro, lo debo a
ustedes: Primeramente, a mi director el Dr. Enrique Alarcón, por guiar durante los últimos
7 años mi formación científica, por el ánimo, consejo, la confianza y las grandes
enseñanzas, por ser más que un tutor, un amigo; siempre te estaré agradecido. A mis
compañeros de generación, por los ánimos y las experiencias, gracias por dejarme
aprender de ustedes. A mis amigos, los ¡inbio power!, Leo, Lucho y Luis J. ustedes saben
por qué (jaja), a todo el equipo del CMEB-Morelia, por su apoyo durante mi estancia para
la identificación de mis cepas de hongos, especialmente al Dr. Gerardo, Dra Saila y a mi
amiga Heidi. A la Dra. Adriane Milagres por recibirme en su laboratorio en Brasil, a mis
compañeros de laboratorio y a mis roomies de la RepSemNome (Catra, Du e Lumbriga),
obrigado sempre!. Al equipo francés que me recibió en Marsella, a la Dra. Isabelle Gaime,
por tanta hospitalidad, a la Dra. Anne Marie Farnet y al Dr. Fabio Ziarelli por su apoyo, a
Carolina, Bubú, Mary, Quentin et Sonia, merci beaucoup!. Al equipo de Tierra Blanca,
especialmente a la Dra. Beatríz y a la técnico Lucero, por su apoyo con los análisis de
HPLC.
A mis compañeros de laboratorio que hicieron los días de trabajo tan amenos, a Darcy (la
capitana), Vico (por las pláticas eternas), Gera, Miriam, Marycruz (cuñis) y Evelin, y
especialmente a Gabi y a Norma, por apoyarme en mi etapa de experimentación. A Anahí,
por todo tu cariño y paciencia durante el cierre de esta etapa tan importante, gracias. A mis
amigas, las más creativas y artistas de todas, Isabela, Arely, Faby y Griss, que me han
acompañado durante este viaje. A Heidi.Co, Adri y Karla, por su amistad cuando apenas
iniciaba el doctorado; así como a César, Chucho, Yeye (del rock!), Angie, Clau, a Paulina y
Eli, Don Ale (brasileiro), Paty, Fer (Pollita) y Ricardo, por su constante y apreciable
amistad, y por los momentos compartidos.
A todos aquellos que han contribuído a esta historia… mis más sinceros agradecimientos,
sin ustedes, estos sería un cuento vacío.
Christian

5
6
Índice
Resumen
Lista de publicaciones
Lista de asistencia a congresos
Lista de estancias de investigación
Lista de figuras
Lista de tablas
I. Introducción general
1.1 El bioetanol celulósico
1.2 El proceso de producción de bioetanol celulósico
1.3 El bagazo de caña de azúcar como materia prima para la producción de bioetanol
II. Estado del arte
2.1 Métodos de pretratamiento para lignocelulosa
2.1.1 Pretratamientos fisicoquímicos
2.1.2 Pretratamientos biológicos
2.1.3 Las lacasas
2.2 Las celulasas
2.2.1 Organismos productores de celulasas
2.2.2 Métodos de producción de celulasas
2.3 La hidrolisis y fermentación
2.3.1 La hidrólisis enzimática
2.3.2 Fermentación alcoholica
2.4 Planteamiento del problema
III. Preguntas de investigación
3.1 Deslignificación biológica de bagazo de caña de azúcar
3.2 Optimización de la producción de celulasas para procesos de fermentación-sacarificación
simultánea
IV. Hipótesis
4.1 Deslignificación biológica de bagazo de caña de azúcar
4.2 Optimización de la producción de celulasas para procesos de fermentación-sacarificación
simultánea
7
V. Objetivos
5.1 Objetivo general
5.2 Inducción de lacasas
5.3 Optimización de la producción de celulasas para procesos de fermentación-sacarificación
simultánea
VI Metodología general
6.1 Etapas del proyecto
6.2 Etapa 1. Deslignificación biológica de bagazo de caña de azúcar
6.2.1 Efecto de la exposición a luz sobre la producción de lacasa
6.2.2 Efecto del etanol, la fuente y concentración de nitrógeno sobre la producción de lacasa.
6.2.3 Evaluacion de colorantes fenólicos como inductores de actividad lacasa
6.3 Etapa 2. Optimización de la producción de celulasas para procesos de fermentación-
sacarificación simultánea
6.3.1 Bioprospección de cepas de hongos productoras de celulasas de mantillo de bosques
veracruzanos
6.3.2 Efecto de la interacción de diferentes cepas de hongos sobre el perfil de celulasas producido.
6.3.3 Bioprospección de hongos productores de celulasas del Parque Nacional Pico de Orizaba.
6.4 Etapa 3. Digestibilidad enzimática de BCA sometido a diferentes pretratamientos
VII. Resultados
7.1 Capítulo 1. Deslignificación biológica de bagazo de caña de azúcar
7.1.1 Light-induced inhibition of laccase in Pycnoporus sanguineus
7.1.2 Ethanol induction of laccase depends on nitrogen conditions of Pycnoporus sanguineus
7.1.3 Laccase induction by synthetic dyes in Pycnoporus sanguineus (L.), and their use for sugar
cane bagasse delignification
7.2 Capítulo 2. Optimización de la producción de celulasas para procesos de fermentación-
sacarificación simultánea.
7.2.1 Cellulases and xylanases production with different fungi (Ascomycota) mixed cultures in
liquid media.
7.2.2 Cellulases produced from Pico de Orizaba’s cold-ecosystem fungi, hydrolyze at lower
temperature than cellulase from Trichoderma reesei?
7.3 Capítulo 3. Digestibilidad enzimática de BCA sometido a diferentes pretratamientos
7.3.1 Sugar cane bagasse pretreatments analysed through solid-state 13
C CPMAS NMR:
implications for enzymatic hydrolysis and fermentation
8
VIII. Discusión general
IX. Conclusiones generales
X. Referencias
XI. Anexos
11.1 Curva de calibración para estimar actividad xilanasa
11.2 Curva de calibración para estimar actividad endoglucanase
11.3 Curva de calibración para estimar actividad exoglucanasa
11.4 Curva de calibración para estimar poteína total por el método de Bradford
11.5 Curva de calibración semilogaritmica para estimar peso molecular de isoformas proteicas en
gel de poliacrilamida (SDS-PAGE).
11.6 Protocolo para evaluar la concentración de azúcares reductores en solución
11.7 Protocolo para evaluar la actividad lacasa en cultivos liquidos
11.8 Protocolo para estimar la cantidad de proteína en solución por el método de Bradford (1969)
11.9 Modelos de regresión lineal para estimar la concentración de colorantes en solución líquida
11.10 Protocolo para extracción de ADN
11.11 Curvas de calibración utilizadas para el calculo de actividad celulasa por FPU
9
Resumen
La búsqueda de nuevas fuentes energéticas, alternativas a los derivados de petróleo, ha señalado al
bioetanol como una opción viable en el corto y mediano plazo; este alcohol es producido a partir de la
fermentación de azúcares con levaduras o bacterias. Sin embargo, el uso de materias primas ricas en
almidones, como los cereales (maíz, trigo), o ricos en sacarosa (jugos o azúcar de caña) para la
producción de alcohol, puede no ser conveniente en economías en vías de desarrollo. Es por ello, que la
transformación de polímeros estructurales vegetales, como la celulosa o la hemicelulosa, hasta sus
monómeros de azúcar, podría suplir la demanda de azúcares necesarios para la producción de bioetanol.
Este biocombustible de segunda generación, llamado bioetanol celulósico, enfrenta diversas
problemáticas para que su producción pueda ser escalada a nivel industrial, debido a la recalcitrancia de
la lignocelulosa. Las dos principales son la de optimizar un pretratamiento que aumente la digestibilidad
de la lignocelulosa y la de diseñar un complejo de celulasa que cumpla los requerimientos necesarios
para lograr una hidrólisis completa de celulosa hasta glucosa. Su principal ventaja es que la materia
prima existe en abundancia y es de bajo costo; pues podrían utilizarse residuos de la agroindustria, como
el bagazo de caña de azúcar.
Para aumentar la digestibilidad de la lignocelulosa, el pretratamiento debe ser de bajo costo, debe
depolimerizar la mayor cantidad de lignina, disminuír el índice de cristalinidad de la celulosa y evitar la
formación de compuestos inhibitorios de celulasas u organismos fermentadores. Por otro lado, las
celulasas (y en algunos casos xilanasas) utilizadas para la hidrólisis de holocelulosa, deben ser de alta
capacidad catalítica, tener un balance entre actividades exo, endo y β-glucosidasa, y es deseable que el
complejo hidrolítico sea rico en isoformas, pues esto contribuye a una mejor hidrólisis del sustrato. Las
características intrínsecas de las enzimas, como su temperatura óptima de reacción y su actividad
específica son muy importantes cuando se les desea proponer para procesos de producción de bioetanol.
El presente proyecto, busca generar conocimiento en el campo de la inducción de enzimas estratégicas
para utilizarse en las fases de pretratamiento e hidrólisis del proceso de producción de bioetanol
celulósico.
El primer objetivo fue optimizar un pretratamiento biológico para bagazo de caña de azúcar, utilizando
el hongo Pycnoporus sanguineus; para esto, se evaluaron diversas variables fisicoquímicas para
aumentar la producción de la enzima lacasa en este hongo. La lacasa es la enzima responsable de
depolimerizar la lignina y contribuir en el conocimiento sobre la regulación de su producción es un paso
fundamental para poder utilizar hongos basidiomicetos para deslignificar material lignocelulósico.
Encontramos que la lacasa en P. sanguineus, puede regularse mediante señales lumínicas; la presencia
de luz blanca –en el espectro de luz visible- inhibe casi completamente la producción de esta enzima,
mientras que, en condiciones de oscuridad, es producida. Al fraccionar la luz blanca en luz azul, verde y
roja, encontramos que la inhibición es mayor cuando P. sanguineus está expuesto a longitudes de onda
corta, ya que longitudes de onda larga solo inhiben parcialmente su producción. En la sección de
Resultados 1.1, se discute esta inhibición lumínica de la producción de lacasa.
Además, probamos que la producción de lacasa en P. sanguineus responde al tipo y concentración de
nitrógeno en el medio; asimismo, esta regulación condiciona el efecto de inductores oxidantes, como el
etanol. Nuestros resultados indican que la presencia de fuentes de nitrógeno simples (i.e. urea) reprimen
la producción de lacasa, mientras que fuentes complejas (i.e. extracto de levadura) la inducen
(Resultados 1.2). Atribuímos este resultado al mecanismo de represión catabólica del nitrógeno. Se
10
probó también el uso de azo-colorantes y colorantes antraquinónicos (ambos producidos y desechados
por la industria textil) como posibles inductores de lacasa en medio líquido. Encontramos que el ácido
carmínico y el amarillo de alizarina, pueden fungir como potentes inductores en medio líquido
(Resultados 1.3); además, esta inducción es acompañada por la degradación de colorantes, via oxidación
enzimática.
Las condiciones de oscuridad, fuente de nitrógeno orgánico y presencia de inductor antraquinónico, nos
permitieron obtener una hiperproducción de lacasa en medio líquido (700% más que en controles); por
lo que el siguiente paso, fue evaluar el efecto de dichas condiciones en cultivos sólidos de P. sanguineus,
utilizando bagazo de caña de azúcar como sustrato. Se observó que la inducción de lacasa persiste en
medio sólido, aunque en menor medida que en medio líquido; se observó también una ligera represión
en la producción de celulasas y biomasa fúngica, cuando el ácido carmínico es usado como inductor
(Resultados 1.3). La transformación de la lignocelulosa por el hongo fue seguida mediante Resonancia
Magética Nuclear en fase sólida del carbono 13 (13
C CPMAS NMR); y observamos que los tratamientos
con P. sanguineus remueven más del 50% de la lignina contenida en el bagazo, superando a tratamientos
con soluciones alcalinas de NaOH y Ca(OH)2 al 5%. Asímismo, P. sanguineus disminuyó un 40% el
banco de carbohidratos, pero incrementó significativamente la cantidad de proteína y lípidos en el
bagazo. El rendimiento de hidrólisis enzimática y la producción de glucosa del bagazo de caña
pretratado, tanto con P. sanguineus como con soluciones alcalinas, fue relacionado a la composición
química obtenida por los pretratamientos, mediante estadística multivariada. Encontramos que el
pretratamiento con P. sanguineus, tiene una producción de glucosa y un rendimiento de hidrólisis
mayores que los demás pretratamientos; además, el hidrolizado obtenido tiene mayor rendimiento de
producción de etanol que los hidrolizados obtenidos de bagazo pretratado con soluciones químicas. En
conclusión, las condiciones de inducción de lacasa en medio líquido y medio sólido, permiten utilizar a
P. sanguineus como pretratamiento biológico que deslignifique bagazo de caña de azúcar y lo enriquezca
de proteína y lípidos; lo que promovió un mayor rendimiento de hidrólisis y de producción de etanol
(Resultados 3.1).
El segundo objetivo fue la producción de celulasas, con características que las hicieran elegibles para ser
utilizadas en la etapa de hidrólisis de lignocelulosa. Para esto, se realizaron diversas prospecciones en
mantillo de bosques veracruzanos, obteniéndose diferentes cepas de hongos productores de celulasas; las
cuales fueron identificadas mediante secuenciación de la región ITS. Cuatro de estas cepas fueron
utilizadas para evaluar el efecto de utilizar cultivos mixtos sobre el perfil de celulasas (exo, endo y β-
glucosidasas), xilanasas e isoformas proteicas en medio líquido. Nuestros resultados señalan que, con
excepción del cocultivo Aspergillus niger-Fusarium oxysporum, el uso de cultivos mixtos tiende a
disminuir las actividades enzimáticas, afectando principalmente a las xilanasas. De la misma manera, se
observó una disminución en la producción de isoformas proteicas, por lo que concluímos que el uso de
cultivos mixtos, con las condiciones aquí descritas, generan estrés biótico a las cepas, lo que afecta
negativamente su producción enzimática (Resultados 2.1). Se realizaron diversas recomendaciones para
mejorar el sistema de producción enzimática.
Se realizó una segunda prospección en el volcán Pico de Orizaba, con el fin de aislar cepas adaptadas a
degradar lignocelulosa en temperaturas frías. La producción de endoglucanasas y β-glucosidasas se
evaluó con diferentes fuentes de carbono, y determinamos que la lactosa –un azúcar reductor- propició
mejor producción enzimática. Los extractos crudos fueron dializados y a la enzima concentrada se le
evaluó su temperatura óptima de reacción (TOR). Encontramos que las celulasas de hongos habitantes
del Pico de Orizaba, producen celulasas con TOR generalmente mesófila (cercana a 30° C), a diferencia
11
de cepas de Trichoderma, las cuales producen celulasas con TOR de 50° C. Las celulasas mesófilas,
producidas por una cepa que pertenece a la familia Pleosporaceae, podrían utilizarse en procesos de
fermentación-sacarificación simultánea, pues poseen alta actividad enzimática a la temperatura (30° C),
requerida para la fermentación (Resultados 2.2). En conclusión, el uso de prospecciones de hongos de
mantillo es una importante actividad para el descrubrimiento de nuevas cepas productoras de xilanasas y
celulasas, las cuales poseen características diferentes a las de Trichoderma o Aspergillus. Se requiere de
más esfuerzo en este campo, sobre todo en ecosistemas con condiciones extremas, puesto que son
fuentes potenciales de organismos extremófilos, que podrían aportar nuevas enzimas con aplicaciones
bitoecnológicas.
La producción de bioetanol celulósico es una importante alternativa para suplir las necesidades
energéticas actuales y futuras. Las enzimas microbianas (como lacasa, celulasa y xilanasa) tienen y
tendrán un rol primordial en el proceso de producción de bioetanol, por lo que entender los mecanismos
de regulación/expresión de estas enzimas, es de gran importancia científica.
12
Lista de publicaciones
Articulos publicados
Hernández CA, Sandoval N, Mallerman J, García-Pérez JA, Farnet AM, Perraud-Gaime I, Alarcón E.
2015. Ethanol induction of laccase depends on nitrogen conditions of Pycnoporus sanguineus.
Electronic Journal of Biotechnology 18(2015): 327-332 http://dx.doi.org/10.1016/j.ejbt.2015.05.008
Hernández CA, Perroni Y, García JA, Gutiérrez B, Alarcón E. 2015. Light-induced inhibition of
laccase in Pycnoporus sanguineus. Folia Microbiológica DOI 10.1007/s12223-015-0418-7
Christian Hernández, Anne-Marie Farnet Da Silva, Fabio Ziarelli , Isabelle Perraud-Gaime, Beatriz
Gutiérrez-Rivera, José Antonio García-Pérez, Enrique Alarcón. 2016. Laccase induction by synthetic
dyes in Pycnoporus sanguineus and their use for sugar cane bagasse delignification. Applied
Microbiology and Biotechnology (Aceptado).
Hernández C. 2012. Apuesta biotecnológica: etanol de segunda generación. La Ciencia y el Hombre
XXVI(1).
Articulos sometidos
Hernández C, Milagres A, Vázquez-Marrufo G, Alarcón E. 2016. Cellulase and xylanase production
from different Ascomycota in mixed cultures of liquid media. Enzyme and Microbial Technology
(Sometido el 26 de mayo de 2016).
Lista de participación en congresos
Internacionales
Hernández-Hernández CA, Alarcón-Gutiérrez E, Perroni Ventura Y. 2013. Laccase is inhibited by
white light in Pycnoporus sanguineus. 9 Congreso internacional de biotecnología vegetal, Ciego de
Ávila, Cuba. ORAL
Hernández C, Milagres A, Alarcón E, Gaime I, Farnet AM, Espinoza V, Gutiérrez B. 2014. Production
of fungal cellulases and xylanases in mixed cultures. XVI International biodeterioration and
biodegradation symposium, Lodz, Polonia. POSTER
Nacionales
Hernández C, Milagres A, Alarcón E. 2014. Prospección de hongos productores de celulasas en
mantillo de bosques veracruzanos. V Simposio: Ecología, manejo y conservación de los ecosistemas
de montaña en México, Xalapa, México. POSTER
13
Hernández C, Alarcón E. 2015. Uso de colorantes aromáticos para la inducción de lacasa en
Pycnoporus sanguineus. XI Congreso Nacional de Micología. Mérida, Mexico. ORAL
Hernández C, Ziarelli F, Farnet Da Silva AM, Gaime I, Alarcón E. 2015. Uso de resonancia magnética
nuclear (RMN 13
C CPMAS) para evaluar la deslignificación biológica de bagazo de caña de azúcar. II
Reunión de la Red Temática de Bioenergía. Ixtapa, México. POSTER
14
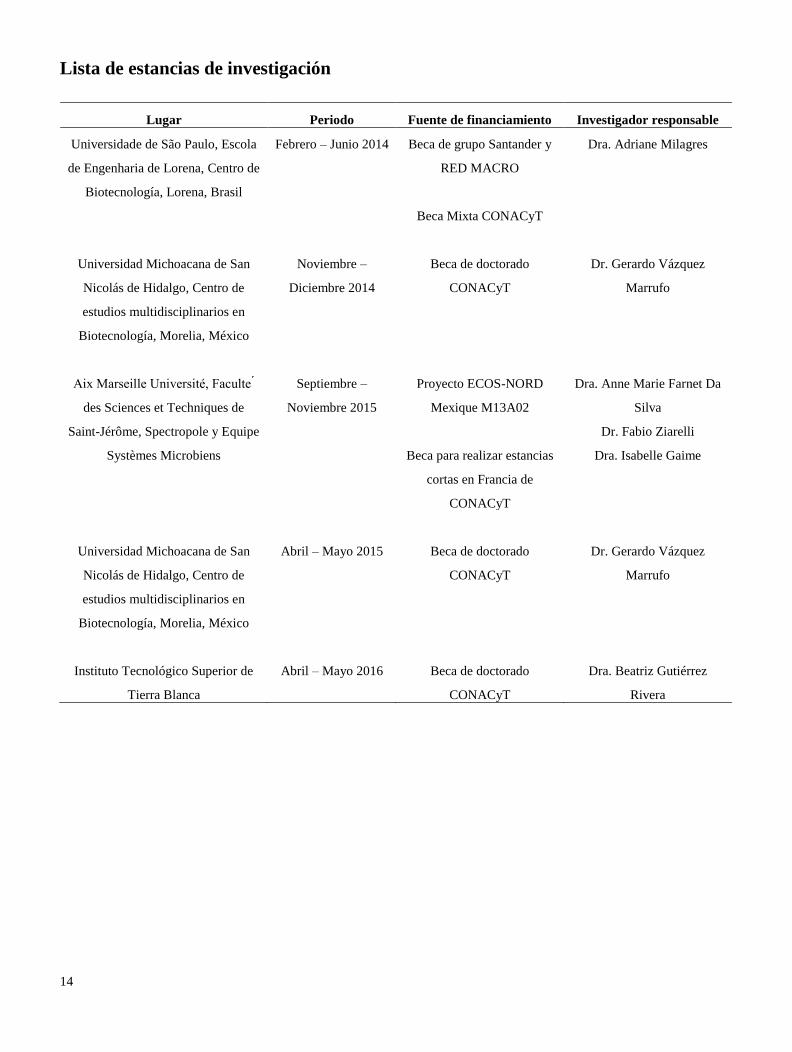
Lista de estancias de investigación
Lugar Periodo Fuente de financiamiento Investigador responsable
Universidade de São Paulo, Escola
de Engenharia de Lorena, Centro de
Biotecnología, Lorena, Brasil
Febrero – Junio 2014 Beca de grupo Santander y
RED MACRO
Beca Mixta CONACyT
Dra. Adriane Milagres
Universidad Michoacana de San
Nicolás de Hidalgo, Centro de
estudios multidisciplinarios en
Biotecnología, Morelia, México
Noviembre –
Diciembre 2014
Beca de doctorado
CONACyT
Dr. Gerardo Vázquez
Marrufo
Aix Marseille Université, Faculte ́
des Sciences et Techniques de
Saint-Jérôme, Spectropole y Equipe
Systèmes Microbiens
Septiembre –
Noviembre 2015
Proyecto ECOS-NORD
Mexique M13A02
Beca para realizar estancias
cortas en Francia de
CONACyT
Dra. Anne Marie Farnet Da
Silva
Dr. Fabio Ziarelli
Dra. Isabelle Gaime
Universidad Michoacana de San
Nicolás de Hidalgo, Centro de
estudios multidisciplinarios en
Biotecnología, Morelia, México
Abril – Mayo 2015
Beca de doctorado
CONACyT
Dr. Gerardo Vázquez
Marrufo
Instituto Tecnológico Superior de
Tierra Blanca
Abril – Mayo 2016
Beca de doctorado
CONACyT
Dra. Beatriz Gutiérrez
Rivera
15
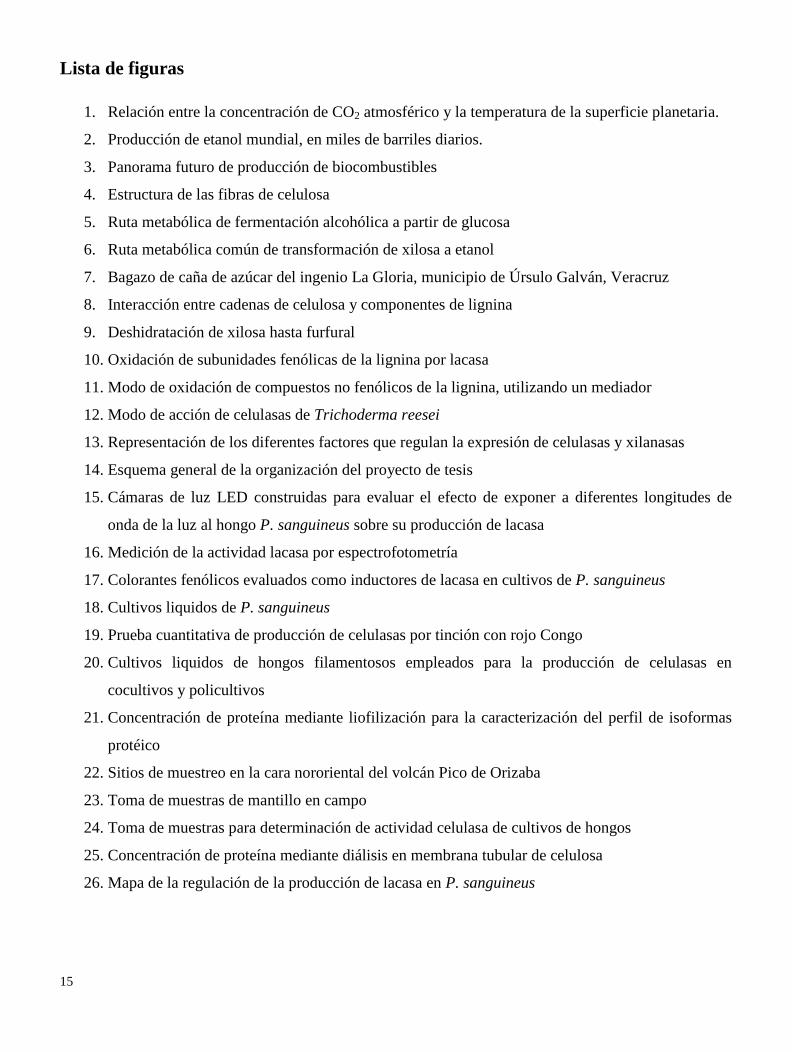
Lista de figuras
1. Relación entre la concentración de CO2 atmosférico y la temperatura de la superficie planetaria.
2. Producción de etanol mundial, en miles de barriles diarios.
3. Panorama futuro de producción de biocombustibles
4. Estructura de las fibras de celulosa
5. Ruta metabólica de fermentación alcohólica a partir de glucosa
6. Ruta metabólica común de transformación de xilosa a etanol
7. Bagazo de caña de azúcar del ingenio La Gloria, municipio de Úrsulo Galván, Veracruz
8. Interacción entre cadenas de celulosa y componentes de lignina
9. Deshidratación de xilosa hasta furfural
10. Oxidación de subunidades fenólicas de la lignina por lacasa
11. Modo de oxidación de compuestos no fenólicos de la lignina, utilizando un mediador
12. Modo de acción de celulasas de Trichoderma reesei
13. Representación de los diferentes factores que regulan la expresión de celulasas y xilanasas
14. Esquema general de la organización del proyecto de tesis
15. Cámaras de luz LED construidas para evaluar el efecto de exponer a diferentes longitudes de
onda de la luz al hongo P. sanguineus sobre su producción de lacasa
16. Medición de la actividad lacasa por espectrofotometría
17. Colorantes fenólicos evaluados como inductores de lacasa en cultivos de P. sanguineus
18. Cultivos liquidos de P. sanguineus
19. Prueba cuantitativa de producción de celulasas por tinción con rojo Congo
20. Cultivos liquidos de hongos filamentosos empleados para la producción de celulasas en
cocultivos y policultivos
21. Concentración de proteína mediante liofilización para la caracterización del perfil de isoformas
protéico
22. Sitios de muestreo en la cara nororiental del volcán Pico de Orizaba
23. Toma de muestras de mantillo en campo
24. Toma de muestras para determinación de actividad celulasa de cultivos de hongos
25. Concentración de proteína mediante diálisis en membrana tubular de celulosa
26. Mapa de la regulación de la producción de lacasa en P. sanguineus
16
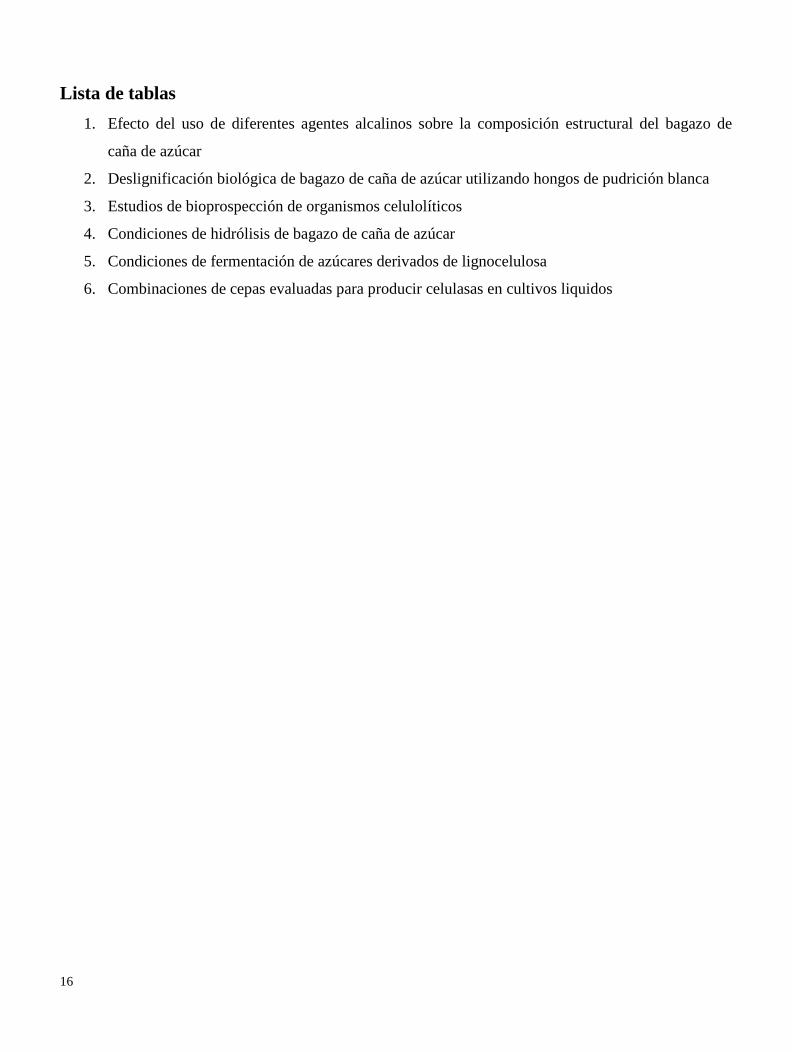
Lista de tablas
1. Efecto del uso de diferentes agentes alcalinos sobre la composición estructural del bagazo de
caña de azúcar
2. Deslignificación biológica de bagazo de caña de azúcar utilizando hongos de pudrición blanca
3. Estudios de bioprospección de organismos celulolíticos
4. Condiciones de hidrólisis de bagazo de caña de azúcar
5. Condiciones de fermentación de azúcares derivados de lignocelulosa
6. Combinaciones de cepas evaluadas para producir celulasas en cultivos liquidos

17
1. Introducción general
________________________________________
18
1.1 El bioetanol celulósico
El bioetanol (CH3CH2OH) o etil alcohol, es un líquido sin color, volátil y flamable con un peso
molecular de 46.07 g y una densidad de 789 kg/m3 a 294 K (Baeyens et al., 2015). Puede utilizarse
como combustible alterativo a la gasolina y es considerado de emisiones de carbono neutras debido
a que se produce a partir de la fermentación de azúcares simples (generalmente hexosas). Dichos
azúcares derivan del proceso de fotosíntesis que utiliza el CO2 ambiental para su producción, a
diferencia de los combustibles fósiles, los cuales utilizan carbón subterráneo que al quemarse se
libera a la atmósfera, y contribuye a un aumento del CO2 ambiental. Este aumento causa, entre otros
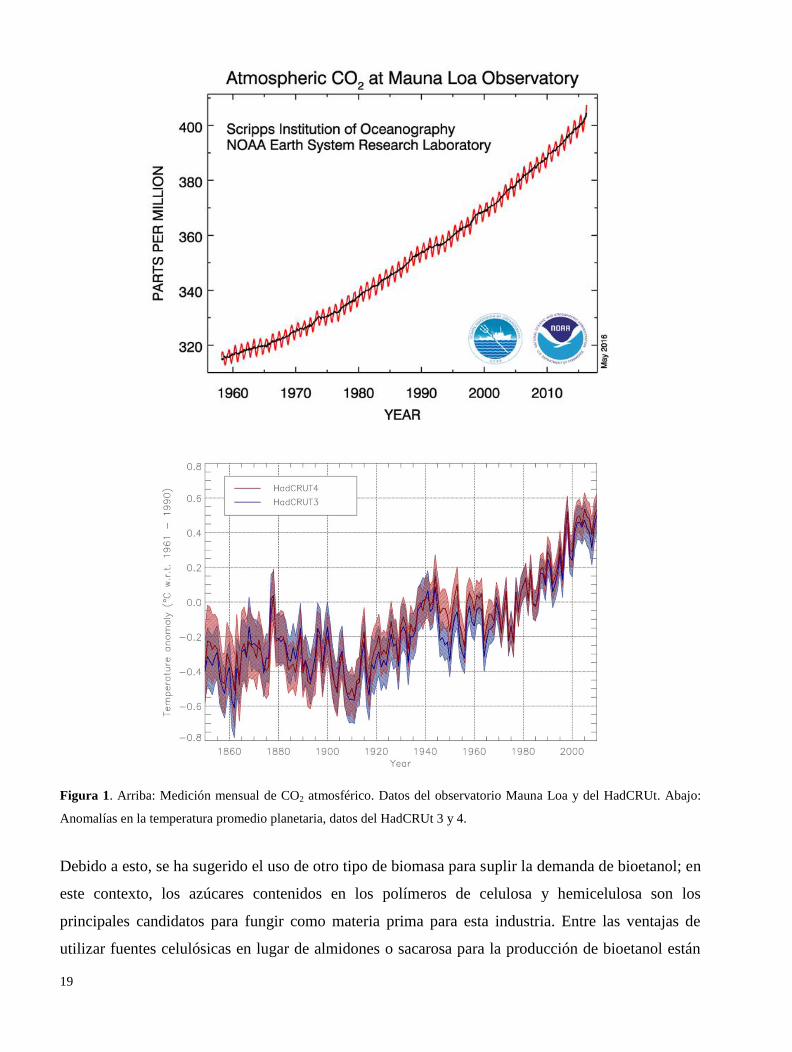
problemas, un aumento en la temperatura atmosférica llamado calentamiento global (Figura 1);
(Hausfather, 2009).
El bioetanol puede utilizarse de manera pura en motores de combustión interna; sin embargo, para
la mayoría de los automóviles se requieren adecuaciones para funcionar con bioetanol puro. Esto se
debe a que el etanol posee un octanaje mayor que la gasolina (i.e. 113 octanos para etanol, 87
octanos para gasolina Magna PEMEX), lo cual requiere modificación del sistema de carburación;
pero a la vez, mayor octanaje brinda mayor potencia al motor, gracias a que la capacidad de
compresión aumenta, disminuyendo con esto el uso de combustible.
El bioetanol también puede utilizarse como aditivo de gasolina hasta en una proporción de 30% sin
necesidad de modificaciones mecánicas. Las mezclas más comunes utilizadas son el E5, E10 y el
E85. El etanol, al ser una molécula oxidante, puede reemplazar el uso de Metil-terbutil éter (MTBE)
como oxigenante de gasolinas; el MTBE es una molécula contaminante que puede causar estragos
en la salud humana y al ecosistema (Peyster y Mihaich, 2014; Rakshit et al., 2013).
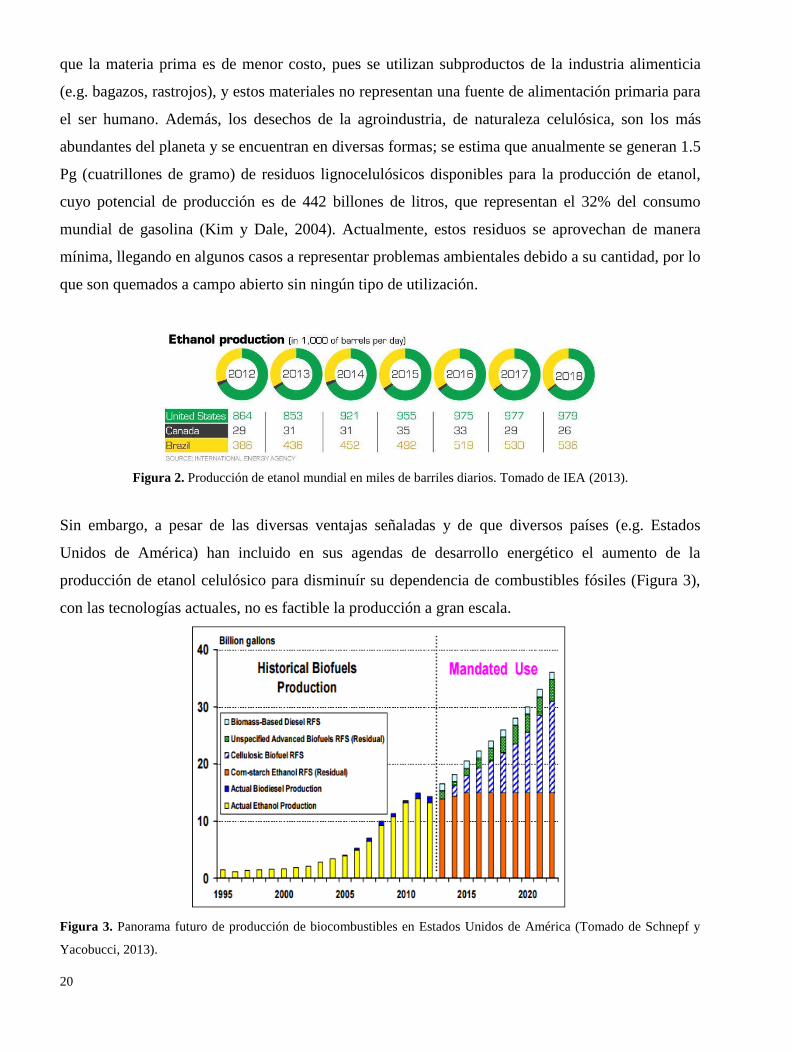
La demanda mundial de bioetanol y su respectiva producción ha aumentado significativamente los
últimos 20 años (Figura 2), siendo los principales productores Brasil, que lo produce a partir de jugo
de caña de azúcar, y Estados Unidos, que lo produce en su mayoría a partir de almidón de maíz.
Este tipo de etanol es conocido como bioetanol de primera generación, esta categoría engloba a la
producción de bioetanol que derivada de fuentes alimenticias para el ser humano (e.g. azúcar de
caña, maíz, remolacha azucarera) y, a pesar de haberse constituído como una industria millonaria y
en constante crecimiento, se recomienda que en economías en desarrollo se utilicen materias primas
no comestibles para la producción de este combustible (Baeyens et al., 2015); además, su balance
energético no arroja emisiones de carbono neutras, pues se requiere de energía fósil para producir
las plantas que terminan siendo materia prima para la industria.
19
Figura 1. Arriba: Medición mensual de CO2 atmosférico. Datos del observatorio Mauna Loa y del HadCRUt. Abajo:
Anomalías en la temperatura promedio planetaria, datos del HadCRUt 3 y 4.
Debido a esto, se ha sugerido el uso de otro tipo de biomasa para suplir la demanda de bioetanol; en
este contexto, los azúcares contenidos en los polímeros de celulosa y hemicelulosa son los
principales candidatos para fungir como materia prima para esta industria. Entre las ventajas de
utilizar fuentes celulósicas en lugar de almidones o sacarosa para la producción de bioetanol están
20
que la materia prima es de menor costo, pues se utilizan subproductos de la industria alimenticia
(e.g. bagazos, rastrojos), y estos materiales no representan una fuente de alimentación primaria para
el ser humano. Además, los desechos de la agroindustria, de naturaleza celulósica, son los más
abundantes del planeta y se encuentran en diversas formas; se estima que anualmente se generan 1.5
Pg (cuatrillones de gramo) de residuos lignocelulósicos disponibles para la producción de etanol,
cuyo potencial de producción es de 442 billones de litros, que representan el 32% del consumo
mundial de gasolina (Kim y Dale, 2004). Actualmente, estos residuos se aprovechan de manera
mínima, llegando en algunos casos a representar problemas ambientales debido a su cantidad, por lo
que son quemados a campo abierto sin ningún tipo de utilización.
Figura 2. Producción de etanol mundial en miles de barriles diarios. Tomado de IEA (2013).
Sin embargo, a pesar de las diversas ventajas señaladas y de que diversos países (e.g. Estados
Unidos de América) han incluido en sus agendas de desarrollo energético el aumento de la
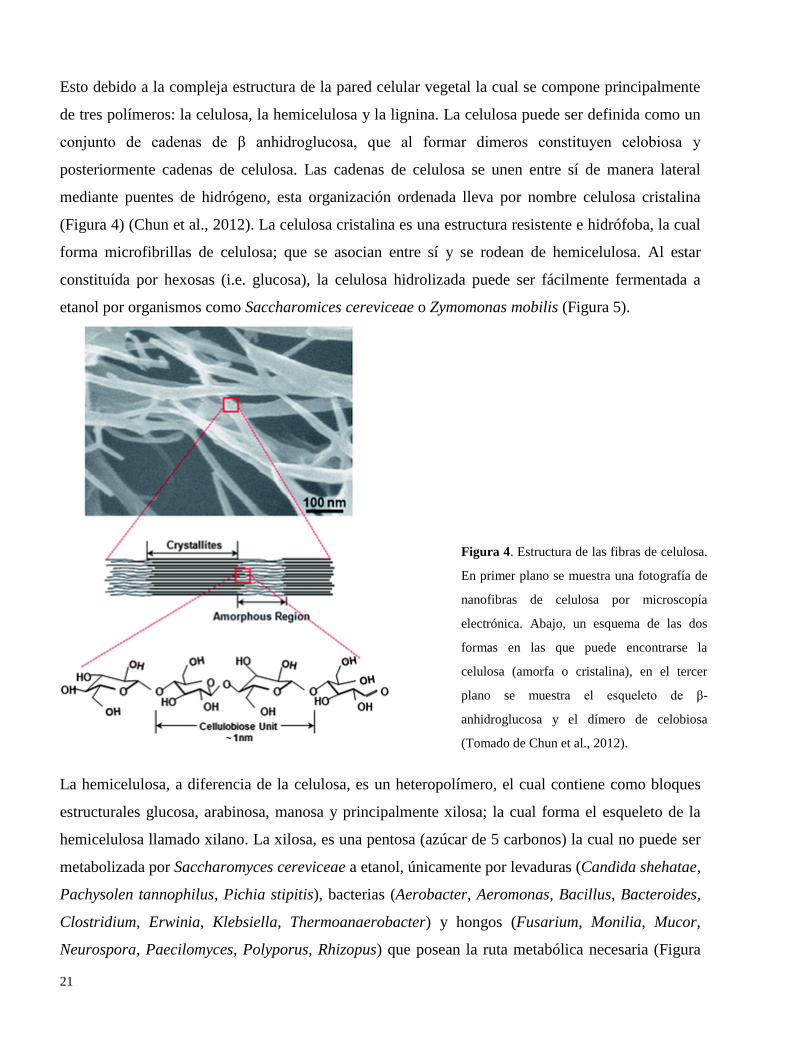
producción de etanol celulósico para disminuír su dependencia de combustibles fósiles (Figura 3),
con las tecnologías actuales, no es factible la producción a gran escala.
Figura 3. Panorama futuro de producción de biocombustibles en Estados Unidos de América (Tomado de Schnepf y
Yacobucci, 2013).
21
Esto debido a la compleja estructura de la pared celular vegetal la cual se compone principalmente
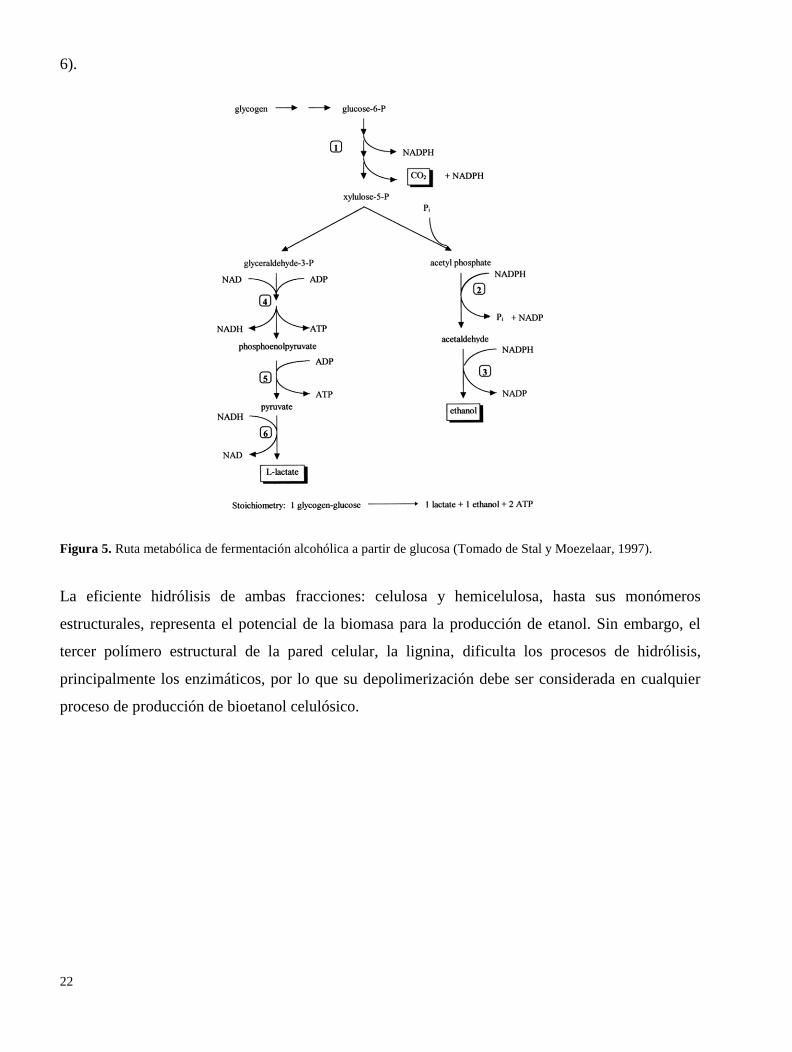
de tres polímeros: la celulosa, la hemicelulosa y la lignina. La celulosa puede ser definida como un
conjunto de cadenas de β anhidroglucosa, que al formar dimeros constituyen celobiosa y
posteriormente cadenas de celulosa. Las cadenas de celulosa se unen entre sí de manera lateral
mediante puentes de hidrógeno, esta organización ordenada lleva por nombre celulosa cristalina
(Figura 4) (Chun et al., 2012). La celulosa cristalina es una estructura resistente e hidrófoba, la cual
forma microfibrillas de celulosa; que se asocian entre sí y se rodean de hemicelulosa. Al estar
constituída por hexosas (i.e. glucosa), la celulosa hidrolizada puede ser fácilmente fermentada a
etanol por organismos como Saccharomices cereviceae o Zymomonas mobilis (Figura 5).
La hemicelulosa, a diferencia de la celulosa, es un heteropolímero, el cual contiene como bloques
estructurales glucosa, arabinosa, manosa y principalmente xilosa; la cual forma el esqueleto de la
hemicelulosa llamado xilano. La xilosa, es una pentosa (azúcar de 5 carbonos) la cual no puede ser
metabolizada por Saccharomyces cereviceae a etanol, únicamente por levaduras (Candida shehatae,
Pachysolen tannophilus, Pichia stipitis), bacterias (Aerobacter, Aeromonas, Bacillus, Bacteroides,
Clostridium, Erwinia, Klebsiella, Thermoanaerobacter) y hongos (Fusarium, Monilia, Mucor,
Neurospora, Paecilomyces, Polyporus, Rhizopus) que posean la ruta metabólica necesaria (Figura
Figura 4. Estructura de las fibras de celulosa.
En primer plano se muestra una fotografía de
nanofibras de celulosa por microscopía
electrónica. Abajo, un esquema de las dos
formas en las que puede encontrarse la
celulosa (amorfa o cristalina), en el tercer
plano se muestra el esqueleto de β-
anhidroglucosa y el dímero de celobiosa
(Tomado de Chun et al., 2012).
22
6).
Figura 5. Ruta metabólica de fermentación alcohólica a partir de glucosa (Tomado de Stal y Moezelaar, 1997).
La eficiente hidrólisis de ambas fracciones: celulosa y hemicelulosa, hasta sus monómeros
estructurales, representa el potencial de la biomasa para la producción de etanol. Sin embargo, el
tercer polímero estructural de la pared celular, la lignina, dificulta los procesos de hidrólisis,
principalmente los enzimáticos, por lo que su depolimerización debe ser considerada en cualquier
proceso de producción de bioetanol celulósico.
23
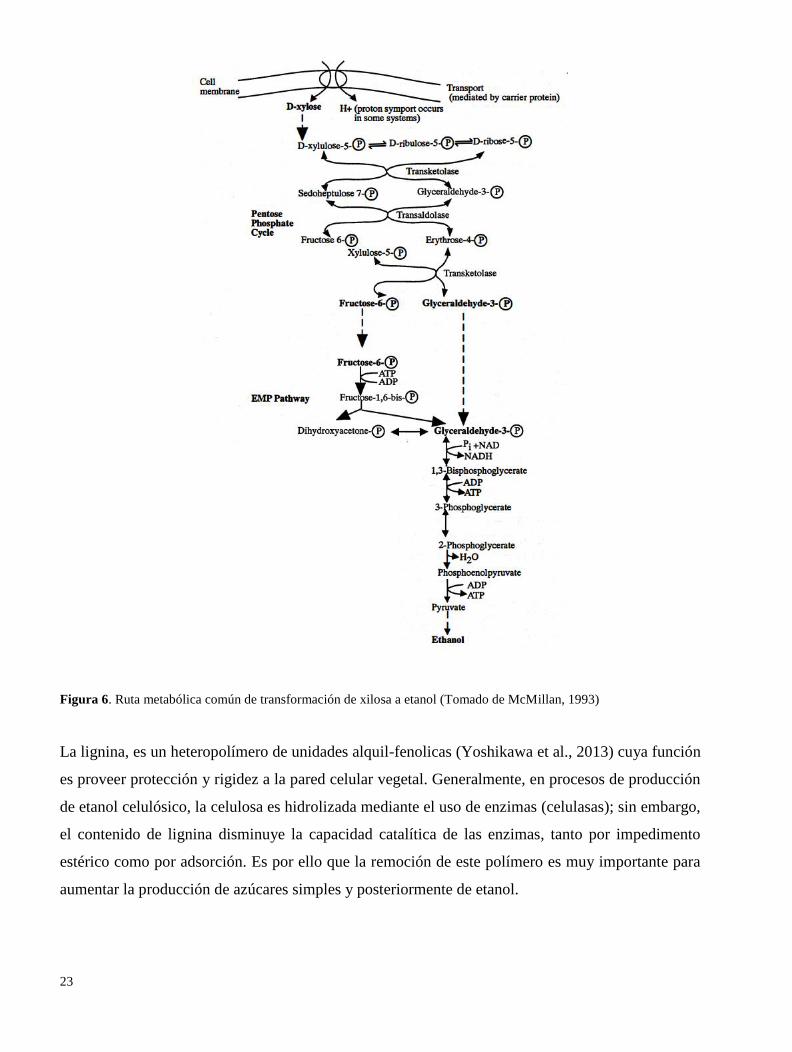
Figura 6. Ruta metabólica común de transformación de xilosa a etanol (Tomado de McMillan, 1993)
La lignina, es un heteropolímero de unidades alquil-fenolicas (Yoshikawa et al., 2013) cuya función
es proveer protección y rigidez a la pared celular vegetal. Generalmente, en procesos de producción
de etanol celulósico, la celulosa es hidrolizada mediante el uso de enzimas (celulasas); sin embargo,
el contenido de lignina disminuye la capacidad catalítica de las enzimas, tanto por impedimento
estérico como por adsorción. Es por ello que la remoción de este polímero es muy importante para
aumentar la producción de azúcares simples y posteriormente de etanol.
24
1.2 El proceso de producción de etanol celulósico
Para poder transformar la compleja estructura de la lignocelulosa a etanol, se utilizan generalmente
tres etapas bien identificadas: la primera es un pretratamiento a la biomasa, con el fin de disminuír
la cantidad de lignina, la cristalinidad de la celulosa e incluso de hemicelulosa (cuando no se
requiere para etapas de fermentación). El resultado de esta etapa debe ser una biomasa constituída
principalmente por celulosa en estado amorfo, que sea propicia para la hidrólisis enzimática.
Existen diversos métodos para pretratar biomasa lignocelulósica, que pueden ser físicos, químicos,
biológicos o una combinación de los anteriores. Entre las características que debe poseer un
pretratamiento para ser considerado viable se encuentran i) que sea de bajo costo, ii) que remueva la
mayor cantidad de lignina y/o hemicelulosa, iii) que disminuya la cristalinidad de la celulosa y iv)
que no decremente significativamente la cantidad de celulosa disponible para etapas subsecuentes.
La descripción de estos procesos de pretratamiento, también llamados procesos de deslignificación
se abordará a fondo en la sección de – estado del arte -.
Debido a la gran importancia de esta etapa, el presente proyecto de tesis dedidca su primer
capítulo a a la optimización de un sistema biológico de pretratamiento de bagazo de caña de azúcar
(BCA). Se optó por utilizar un sistema biológico debido a que podría disminuír los costos de esta
etapa del proceso.
La segunda etapa del proceso de producción es la hidrólisis o sacarificación de la biomasa. El
objetivo es producir la mayor cantidad posible de azúcares simples (principalmente glucosa) a partir
de la biomasa pretratada; esto se realiza generalmente utilizando enzimas (celulasas) que a partir de
la sinergia de tres enzimas i.e. endoglucanasa, exoglucanasa y β-glucosidasa son capaces de
hidrolizar la celulosa hasta sus monómeros de glucosa.
La capacidad catalítica y el costo de las enzimas utilizadas en esta etapa es determinante para la
viabilidad total del proceso. Usualmente, en plantas piloto de producción de etanol celulósico, se
utilizan enzimas comerciales de Novozymes como celluclast®; sin embargo, estas enzimas
obtenidas a partir del hongo filamentoso Trichoderma reesei poseen ciertas limitantes, como poca
actividad β-glucosidasa y un temperatura óptima de reacción de 50°C, lo cual aumenta el costo
energético del proceso. Además, Celluclast tiene un costo aproximado de $1,695.00 por 1.5 L de
solución acuosa con ≥ 700 U.g (cotización de Sigma Aldrich, 2015), lo que representa un alto costo
para la producción de etanol. La optimización de procesos de producción de celulasas es crucial
para la viabilidad de los sistemas de transformación de lignocelulosa a etanol. Este proyecto de
tesis, en su segundo capítulo, tiene como objetivo el generar conocimiento en el campo de la
25
producción de celulasas a nivel de bioreactor; así como descubrir nuevas cepas productoras de este
tipo de enzimas con la realización de bioprospecciones.
La tercera etapa es la fermentación, aquí se utilizarán los azúcares simples generados en la etapa de
hidrólisis para ser transformados a etanol. Los azúcares pueden ser glucosa o una mezcla de hexosas
(e.g. glucosa, manosa) + pentosas (e.g. xilosa, arabinosa). En el primer caso, la glucosa es
fácilmente transformada a etanol utilizando Saccharomyces cereviceae o Zymomonas mobilis, así
como tecnologías convencionales. Cuando también se hidroliza la hemicelulosa y se enriquece la
mezcla de azúcares con pentosas, es necesario utilizar organismos (e.g. Pichia stipitis) que tengan la
maquinaria matabólica para transformar pentosas a etanol.
Una opción alternativa es realizar la etapa de hidrólisis (sacarificación) y la de fermentación de
manera simultánea, esto debido a que las celulasas inhiben su capacidad catalítica a altas
concentraciones de glucosa o celobiosa (inhibición por producto). Fermentar los azúcares liberados
por las enzimas de manera simultánea evita su acumulación, y con esto se evita la inhibición de las
celulasas.
Este proceso es conocido como – Fermentación-sacarificación simultánea (FSS) -, sin embargo,
diversos factores actúan como limitantes para que este proceso alcance altos rendimientos,
principalmente la diferencia de temperaturas entre las etapas de hidrólisis (50°C) y la de
fermentación (30°C). Por lo tanto, esta tesis (Capítulo 2.2) se enfocó en evaluar la producción de
celulasas con una temperatura óptima de reacción cercana a los 30°C (derivado de los procesos de
bioprospección).
El Capítulo 3 del proyecto de tesis fue dedicado a la evaluación de la producción de etanol a
partir de bagazo de caña de azúcar, pretratado con compuestos alcalinos (Ca(OH)2 y NaOH) y con
P. sanguineus, utilizando las mejores condiciones para la producción de lacasa, obtenidas en el
capítulo 1.
1.3. El bagazo de caña de azúcar como materia prima para la producción de
bioetanol
México es uno de los principales productores de azúcar de caña en el mundo, posee 54 ingenios, la
industria genera 450 000 empleos directos, de los cuales 164 000 están registrados como
productores; en 2012 la producción de caña de azúcar fue de 52 495 311 ton, de las cuales Veracruz
produjo el 37%, manteniendo el liderato nacional de producción de azúcar (SAGARPA, 2015).
El bagazo de caña de azúcar (Figura 7) representa entre el 25 y el 40% del total de la materia
procesada (Pernalete et al., 2008); el cúal tiene una composición aproximada de 50% de celulosa,
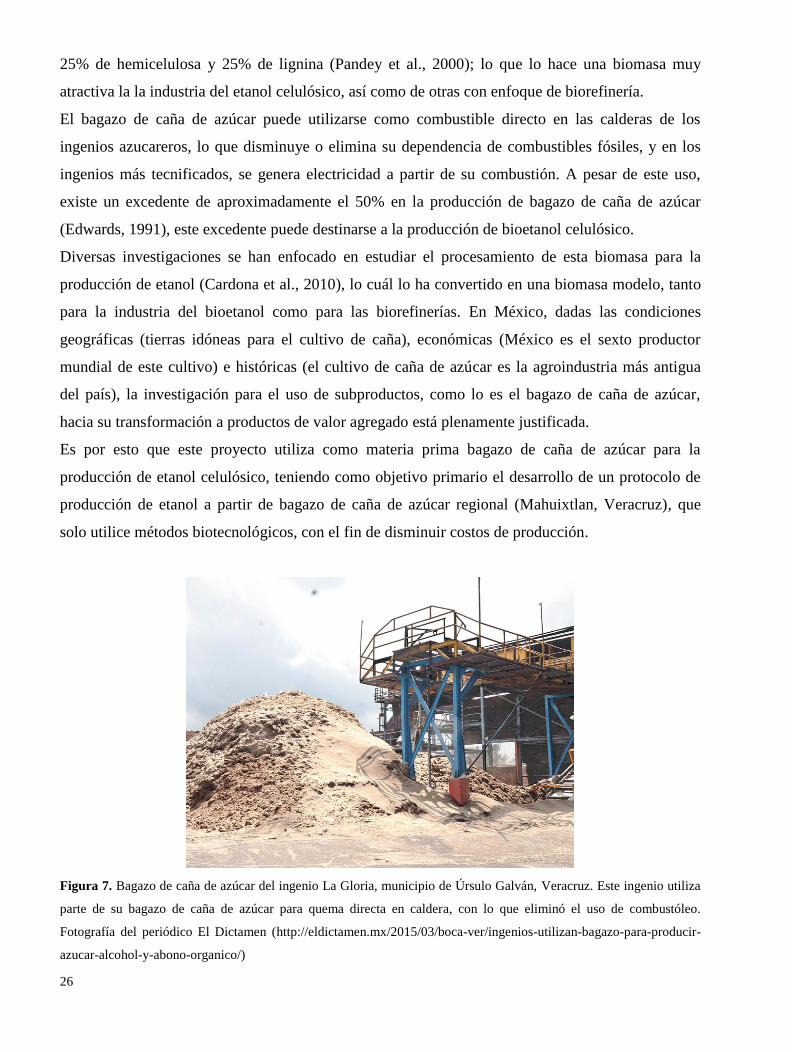
26
25% de hemicelulosa y 25% de lignina (Pandey et al., 2000); lo que lo hace una biomasa muy
atractiva la la industria del etanol celulósico, así como de otras con enfoque de biorefinería.
El bagazo de caña de azúcar puede utilizarse como combustible directo en las calderas de los
ingenios azucareros, lo que disminuye o elimina su dependencia de combustibles fósiles, y en los
ingenios más tecnificados, se genera electricidad a partir de su combustión. A pesar de este uso,
existe un excedente de aproximadamente el 50% en la producción de bagazo de caña de azúcar
(Edwards, 1991), este excedente puede destinarse a la producción de bioetanol celulósico.
Diversas investigaciones se han enfocado en estudiar el procesamiento de esta biomasa para la
producción de etanol (Cardona et al., 2010), lo cuál lo ha convertido en una biomasa modelo, tanto
para la industria del bioetanol como para las biorefinerías. En México, dadas las condiciones
geográficas (tierras idóneas para el cultivo de caña), económicas (México es el sexto productor
mundial de este cultivo) e históricas (el cultivo de caña de azúcar es la agroindustria más antigua
del país), la investigación para el uso de subproductos, como lo es el bagazo de caña de azúcar,
hacia su transformación a productos de valor agregado está plenamente justificada.
Es por esto que este proyecto utiliza como materia prima bagazo de caña de azúcar para la
producción de etanol celulósico, teniendo como objetivo primario el desarrollo de un protocolo de
producción de etanol a partir de bagazo de caña de azúcar regional (Mahuixtlan, Veracruz), que
solo utilice métodos biotecnológicos, con el fin de disminuir costos de producción.
Figura 7. Bagazo de caña de azúcar del ingenio La Gloria, municipio de Úrsulo Galván, Veracruz. Este ingenio utiliza
parte de su bagazo de caña de azúcar para quema directa en caldera, con lo que eliminó el uso de combustóleo.
Fotografía del periódico El Dictamen (http://eldictamen.mx/2015/03/boca-ver/ingenios-utilizan-bagazo-para-producir-
azucar-alcohol-y-abono-organico/)
27
2. Estado del arte
__________________________________
28
2.1 Métodos de pretratamiento para lignocelulosa
2.1.1 Pretratamientos fisicoquímicos
La lignocelulosa es una estructura estable y resistente a la hidrólisis, esto se debe principalmente al
entrecruzamiento entre polisacáridos (celulosa y hemicelulosa) con la lignina, mediante enlaces éster o
éter (Figura 8). Las fibras de celulosa y hemicelulosa son densamente cubiertas por capas de lignina, lo
que da protección contra hidrólisis enzimática (Verma et al., 2011).
Figura 8. Interacción entre cadenas de celulosa y componentes de lignina. Se observa los enlaces tipo éster y éter (Tomado de
Zhou et al., 2010).
Como se mencionó anteriormente, el objetivo de un pretratamiento es aumentar la digestibilidad
enzimática de la lignocelulosa por medio de: i) disminuír la cantidad de lignina, ii) disminuír la cantidad
de celulosa cristalina y aumentar su estado amorfo y iii) disminuír la cantidad de hemicelulosa (cuando
no se requiere para los procesos de hidrólisis y fermentación). Existen diversos métodos fisicoquímicos,
los cuales al ser utilizados como pretratamiento aumentan el rendimiento de hidrólisis enzimática de la
lignocelulosa, entre ellos se encuentran tratamientos alcalinos, ácidos, explosión con vapor, explosión
con dióxido de azufre, explosión de fibras con amonio, uso de liquidos ionicos, entre otros (Behera et al.,
2014).
Generalmente, los tratamientos con agentes alcalinos y ácidos conllevan el uso de altas temperaturas
(~120°C) y presión (~15 lb), lo cual permite obtener altos rendimientos de deslignificación y/o remoción
de hemicelulosa en cortos periodos de tiempo (5 a 30 min). Entre los agentes alcalinos más utilizados
para remover lignina, se encuentran el NaOH, el Ca(OH)2 y el KOH (Maryana et al., 2014), algunos de
29
los resultados reportados para estos álcali se resumen en la Tabla 1. El efecto deslignificador de los
agentes alcalinos se atribuye a su capacidad para saponificar los enlaces ester contenidos entre la
celulosa y la hemicelulosa con la lignina (Figura 8) (Sun y Cheng, 2002). Asimismo, se sabe que los
álcali reaccionan con las fibras de celulosa, y pueden generar celulosa alcalina, mediante intercambio
iónico (Bahar et al., 2009). La reacción simplificada se muestra a continuación:
Cellulosa-OH + NaOH → Cellulosa-O-Na+ + H2O
Esto puede afectar procesos subsecuentes como la hidrólisis o la fermentación.
Tabla 1. Efecto del uso de diferentes agentes alcalinos sobre la composición estructural del bagazo de caña de azúcar.
Agente químico Condiciones Resultado obtenido Referencia
NaOH 1 N 100 °C
12 L
Reducción de lignina
de 17.52 a 7.16%
Maryana et al. (2014)
NaOH 0.5 M 80 °C, 2 horas en
agitación
Reducción de lignina
de 25.03 a 8.26%
Liu et al. (2016)
KOH 2.5% 120 °C, 45 min Deslignificación del
70.7%
Irfan et al. (2011)
KOH 10% 121 °C, 35 min Deslignificación del
74%
Paixão et al. (2016)
Ca(OH)2 10% 120 °C, 60 min Deslignificación del
30%
Grimaldi et al. (2015)
NaOH 10 % +
Ca(OH)2 8% (w/w)
Temperatura
ambiente
156 h
Deslignificación
41.2%
Ahmadi et al. (2016)
Por otro lado, el uso de ácidos diluidos (concentración menor a 10%) contribuye a la remoción de la
hemicelulosa, lo cual es importante ya que las celulasas se inhiben en presencia de xilosa, xilano y xilo-
oligosacáridos (Negahdar et al., 2016). Los ácidos que mayormente han sido utilizados para hidrolizar
hemicelulosa son el ácido sulfúrico, el ácido clorhídrico, el ácido nítrico y el ácido fosfórico (Kumar et
al., 2015). Cuando la reacción ocurre a pH 2 o menor, únicamente importa la cantidad de protones (H+)
liberados, y no la naturaleza del ácido empleado (Kim et al., 2013). Asimismo, las cadenas laterales de la
hemicelulosa tienden a hidrolizarse más rápidamente que el esqueleto de xilano, esto debido a que las
unidades de arabinogalactano y galactoglucomanano se encuentran más accesibles que el xilano, y a que
en ellas predominan enlaces tipo α; más fácilmente hidrolizables que los enlaces β del xilano (Negahdar
et al., 2014). Entre las desventajas de utilizar ácidos diluidos, se encuentra que al interactuar con la
xilosa liberada de la hemicelulosa pueden producir furfurales e hidroximetil-fufurales (Yemis y Mazza,
2011), estos compuestos, junto con el ácido acético, son fuertes inhibidores de la fermentación con
30
levaduras (Palmqvist et al., 1999). Los furfurales se producen cuando las pentosas (principalmente la
xilosa) se deshidratan por la acción de ácidos a un intermediario (xilosa 2,5-anhidro) y, posteriormente,
una segunda deshidratación produce furfural por la perdida de 3 moléculas de agua (Antal et al., 1991;
NimLos et al., 2006; Yang et al., 2012), (Figura 9).
Figura 9. Deshidratación de xilosa hasta furfural (tomado de Yang et al., 2012)
La formación de furfurales puede evitarse disminuyendo la temperatura de reacción a un máximo de 90
°C; sin embargo, esto aumenta el tiempo de reacción hasta por 24 h (Negahdar et al., 2014). Tanto
tratamientos ácidos como alcalinos requieren una posterior neutralización de su pH, para propiciar las
condiciones de hidrólisis y/o fermentación. Esto, aunado al gasto energético, hace que su uso más allá de
escalas piloto se considere inviable, hasta la fecha.
De manera similar, las reacciónes de explosión con vapor, o explosiones de vapor-amonio, a pesar de ser
métodos altamente efectivos para romper la estructura de la lignocelulosa, conllevan un alto gasto
energético. Estos métodos consisten en elevar la temperatura hasta 220 °C por un corto periodo de
tiempo y posteriormente disminuírla súbitamente a temperatura ambiente, con esto se generan
condiciones de explosión, al interior de la lignocelulosa, que remueven lignina y hemicelulosa (Sun y
Cheng, 2002). Los métodos de explosión aumentan significativamente el rendimiento de hidrólisis
enzimática; sin embargo, generan compuestos inhibidores de la fermentación, por lo que se requiere de
lavados subsecuentes para eliminar dichos compuestos, lo que a su vez provoca la pérdida de
monosacáridos liberados de la hemicelulosa y celulosa (McMillan, 1994), además de contaminación de
agua.
31
2.1.2 Pretratamientos biológicos
A diferencia de los pretratamientos fisicoquímicos, los pretratamientos biológicos involucran el uso de
organismos vivos (hongos, bacterias) o sus derivados (enzimas) para modificar la estructura de la
lignocelulosa y aumentar su digestibilidad enzimática. Entre las características deseables de un
pretratamiento biológico se encuentran: i) que contribuya a disminuír la cantidad de lignina, ii) que
utilice condiciones de bajo costo económico, iii) que evite la pérdida de carbohidratos del sustrato y, iv)
que utilice tiempos de retención cortos.
Generalmente, el decremento en la cantidad de lignina se logra gracias a la exposición del sustrato a
diversas enzimas del grupo de las oxidoreductasas, las cuales oxidan los anillos aromáticos de la lignina
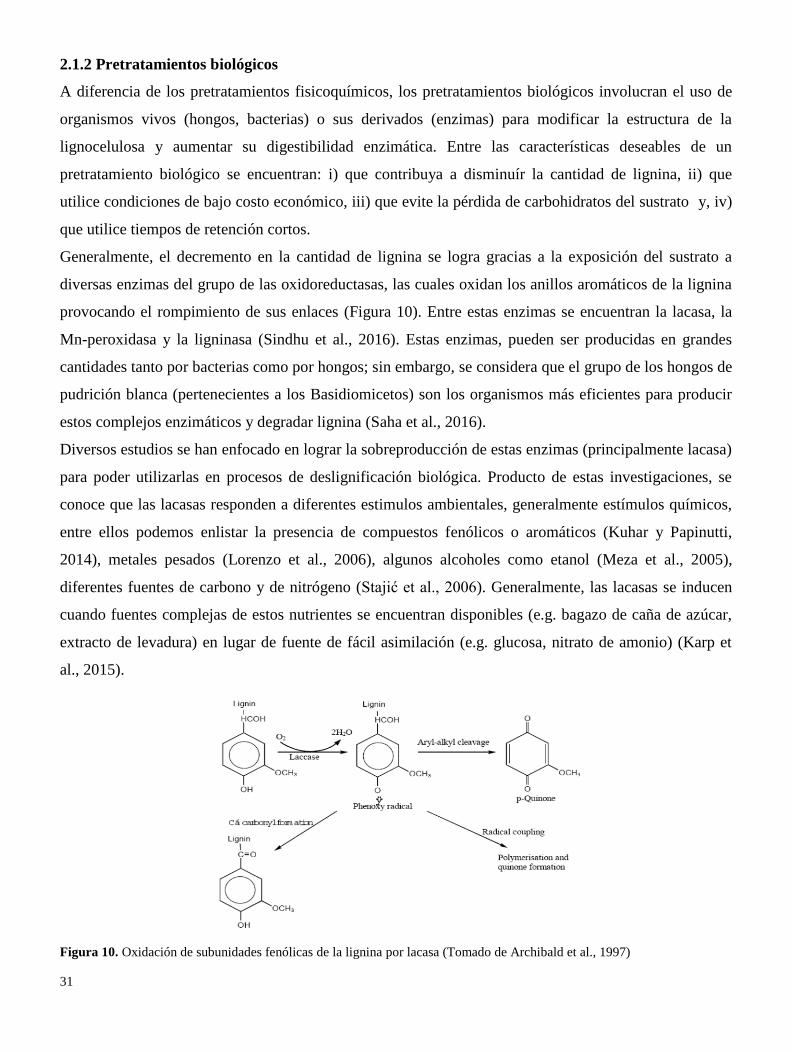
provocando el rompimiento de sus enlaces (Figura 10). Entre estas enzimas se encuentran la lacasa, la
Mn-peroxidasa y la ligninasa (Sindhu et al., 2016). Estas enzimas, pueden ser producidas en grandes
cantidades tanto por bacterias como por hongos; sin embargo, se considera que el grupo de los hongos de
pudrición blanca (pertenecientes a los Basidiomicetos) son los organismos más eficientes para producir
estos complejos enzimáticos y degradar lignina (Saha et al., 2016).
Diversos estudios se han enfocado en lograr la sobreproducción de estas enzimas (principalmente lacasa)
para poder utilizarlas en procesos de deslignificación biológica. Producto de estas investigaciones, se
conoce que las lacasas responden a diferentes estimulos ambientales, generalmente estímulos químicos,
entre ellos podemos enlistar la presencia de compuestos fenólicos o aromáticos (Kuhar y Papinutti,
2014), metales pesados (Lorenzo et al., 2006), algunos alcoholes como etanol (Meza et al., 2005),
diferentes fuentes de carbono y de nitrógeno (Stajić et al., 2006). Generalmente, las lacasas se inducen
cuando fuentes complejas de estos nutrientes se encuentran disponibles (e.g. bagazo de caña de azúcar,
extracto de levadura) en lugar de fuente de fácil asimilación (e.g. glucosa, nitrato de amonio) (Karp et
al., 2015).
Figura 10. Oxidación de subunidades fenólicas de la lignina por lacasa (Tomado de Archibald et al., 1997)
32
2.1.3 Las lacasas
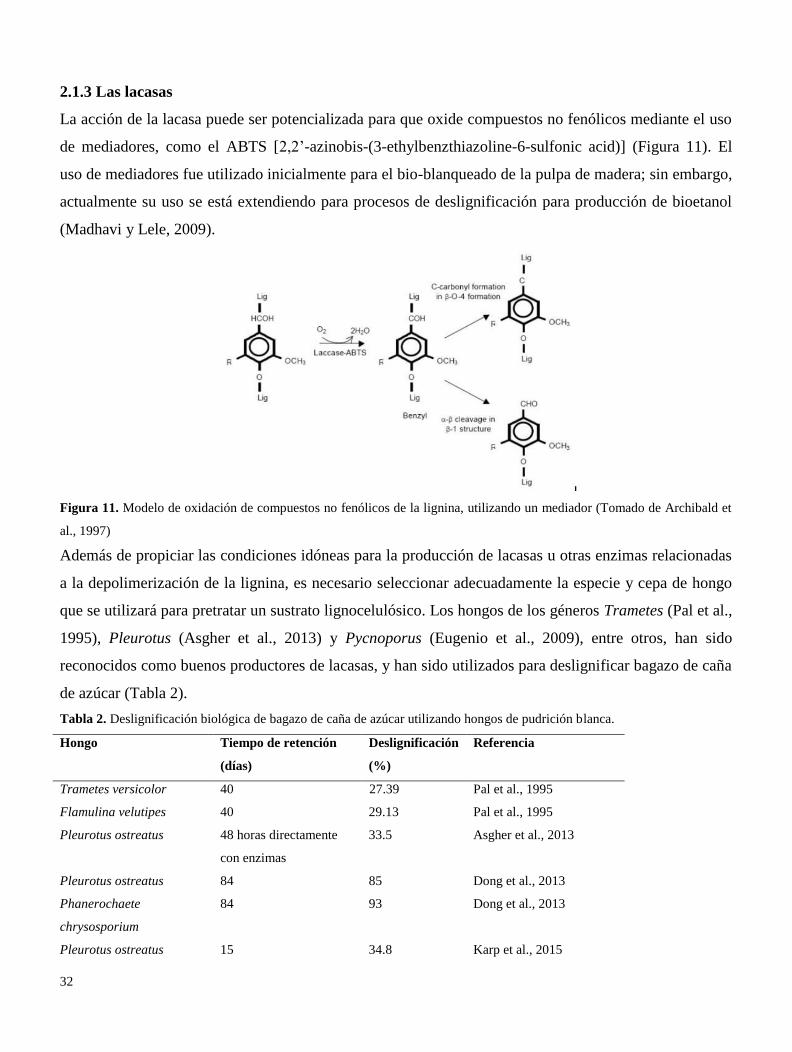
La acción de la lacasa puede ser potencializada para que oxide compuestos no fenólicos mediante el uso
de mediadores, como el ABTS [2,2’-azinobis-(3-ethylbenzthiazoline-6-sulfonic acid)] (Figura 11). El
uso de mediadores fue utilizado inicialmente para el bio-blanqueado de la pulpa de madera; sin embargo,
actualmente su uso se está extendiendo para procesos de deslignificación para producción de bioetanol
(Madhavi y Lele, 2009).
Figura 11. Modelo de oxidación de compuestos no fenólicos de la lignina, utilizando un mediador (Tomado de Archibald et
al., 1997)
Además de propiciar las condiciones idóneas para la producción de lacasas u otras enzimas relacionadas
a la depolimerización de la lignina, es necesario seleccionar adecuadamente la especie y cepa de hongo
que se utilizará para pretratar un sustrato lignocelulósico. Los hongos de los géneros Trametes (Pal et al.,
1995), Pleurotus (Asgher et al., 2013) y Pycnoporus (Eugenio et al., 2009), entre otros, han sido
reconocidos como buenos productores de lacasas, y han sido utilizados para deslignificar bagazo de caña
de azúcar (Tabla 2).
Tabla 2. Deslignificación biológica de bagazo de caña de azúcar utilizando hongos de pudrición blanca.
Hongo Tiempo de retención
(días)
Deslignificación
(%)
Referencia
Trametes versicolor 40 27.39 Pal et al., 1995
Flamulina velutipes 40 29.13 Pal et al., 1995
Pleurotus ostreatus 48 horas directamente
con enzimas
33.5 Asgher et al., 2013
Pleurotus ostreatus 84 85 Dong et al., 2013
Phanerochaete
chrysosporium
84 93 Dong et al., 2013
Pleurotus ostreatus 15 34.8 Karp et al., 2015
33
Pycnoporus sanguineus 14 días para alcanzar la
máxima producción de
lacasa en bagazo de caña
de azúcar
ND* Meza et al., 2005
* ND. No determinada
Como se observa en la Tabla 2, los tiempos de retención son sustancialmente mayores a los utilizados en
pretratamientos fisicoquímicos, por lo tanto, se requiere mayor investigación para lograr obtener altos
índices de deslignificación en el menor tiempo posible. Para esto, se deben optimizar las condiciones de
cultivo de acuerdo a la cepa que se desee emplear, manipulando las variables fisicoqúimicas que más
afecten la producción de lacasa u otras enzimas oxidoreductasas (e.g. fuente y concentración de
nitrógeno, temperatura, presencia de inductores, grado de exposición a luz, etc.).
El presente proyecto de tesis evalúa la deslignificación biológica de bagazo de caña de azúcar utilizando
al hongo Pycnoporus sanguineus, esto con base en reportes (Meza et al., 2005) que lo señalan como un
potencial productor de lacasas y a que podría ser utilizado para deslignificar selectivamente sustratos
lignocelulósicos.
2.2 Las celulasas
Las celulasas son un grupo de enzimas hidrolíticas capaces de degradar la celulosa hasta sus monómeros
de glucosa. Estas enzimas generalmente se clasifican de acuerdo a la actividad que presentan dentro de la
cadena de celulosa: las endoglucanasas cortan aleatoriamente en las regiones de celulosa amorfa
generando oligosacáridos (cadenas cortas de celulosa); las exoglucanasas actúan en las cadenas
terminales de las cadenas de celulosa (incluso en estado cristalino) y liberan celobiosa; por último, las β-
glucosidasas cortan la celobiosa y liberan dos moléculas de glucosa. La sinergia entre estas actividades
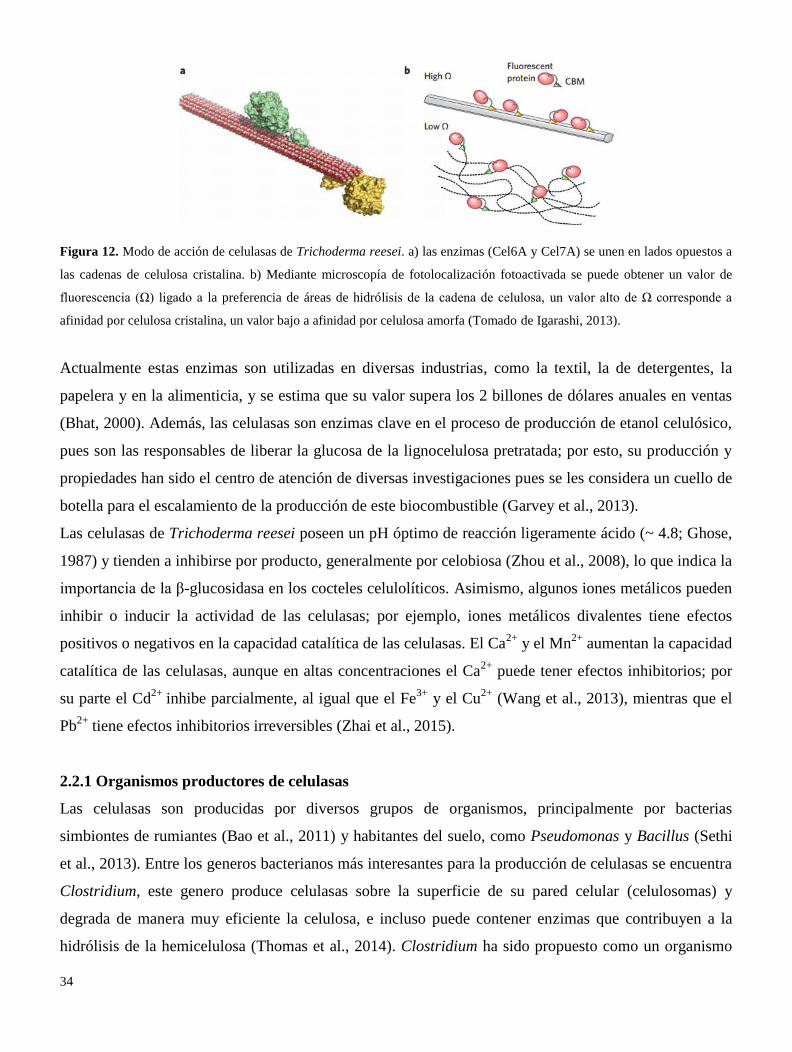
determina la eficiencia de hidrólisis de la celulosa (Igarashi, 2013); sin embargo, se conoce poco sobre la
manera en la que interactúan entre ellas, aunque se han propuesto algunos modelos (Figura 12).
34
Figura 12. Modo de acción de celulasas de Trichoderma reesei. a) las enzimas (Cel6A y Cel7A) se unen en lados opuestos a
las cadenas de celulosa cristalina. b) Mediante microscopía de fotolocalización fotoactivada se puede obtener un valor de
fluorescencia (Ω) ligado a la preferencia de áreas de hidrólisis de la cadena de celulosa, un valor alto de Ω corresponde a
afinidad por celulosa cristalina, un valor bajo a afinidad por celulosa amorfa (Tomado de Igarashi, 2013).
Actualmente estas enzimas son utilizadas en diversas industrias, como la textil, la de detergentes, la
papelera y en la alimenticia, y se estima que su valor supera los 2 billones de dólares anuales en ventas
(Bhat, 2000). Además, las celulasas son enzimas clave en el proceso de producción de etanol celulósico,
pues son las responsables de liberar la glucosa de la lignocelulosa pretratada; por esto, su producción y
propiedades han sido el centro de atención de diversas investigaciones pues se les considera un cuello de
botella para el escalamiento de la producción de este biocombustible (Garvey et al., 2013).
Las celulasas de Trichoderma reesei poseen un pH óptimo de reacción ligeramente ácido (~ 4.8; Ghose,
1987) y tienden a inhibirse por producto, generalmente por celobiosa (Zhou et al., 2008), lo que indica la
importancia de la β-glucosidasa en los cocteles celulolíticos. Asimismo, algunos iones metálicos pueden
inhibir o inducir la actividad de las celulasas; por ejemplo, iones metálicos divalentes tiene efectos
positivos o negativos en la capacidad catalítica de las celulasas. El Ca2+
y el Mn2+
aumentan la capacidad
catalítica de las celulasas, aunque en altas concentraciones el Ca2+
puede tener efectos inhibitorios; por
su parte el Cd2+
inhibe parcialmente, al igual que el Fe3+
y el Cu2+
(Wang et al., 2013), mientras que el
Pb2+
tiene efectos inhibitorios irreversibles (Zhai et al., 2015).
2.2.1 Organismos productores de celulasas
Las celulasas son producidas por diversos grupos de organismos, principalmente por bacterias
simbiontes de rumiantes (Bao et al., 2011) y habitantes del suelo, como Pseudomonas y Bacillus (Sethi
et al., 2013). Entre los generos bacterianos más interesantes para la producción de celulasas se encuentra
Clostridium, este genero produce celulasas sobre la superficie de su pared celular (celulosomas) y
degrada de manera muy eficiente la celulosa, e incluso puede contener enzimas que contribuyen a la
hidrólisis de la hemicelulosa (Thomas et al., 2014). Clostridium ha sido propuesto como un organismo
35
que puede ser utilizado en los procesos de transformación de lignocelulosa a etanol y butanol (Pfromm et
al., 2010).
A pesar del gran potencial de los grupos bacterianos para la producción de celulasas, son los hongos
filamentosos (Ascomycota) quienes dominan la producción industrial de celulasas. Esto debido a que
son organismos resistentes y con gran plasticidad para crecer en diferentes sustratos y adaptarse a
diversas condiciones ambientales. Entre los generos más utilizados para producir celulasas, se
encuentran Trichoderma (Callow et al., 2016) y Aspergillus (Bansal et al., 2012), pero otros generos
como Penicillium (dos Reis et al., 2013) y Fusarium (Yuan et al., 2012) también son considerados
buenos productores de celulasas.
Para que un hongo sea candidato para producir celulasas que puedan ser utilizadas a nivel industrial,
debe cumplir ciertas características, tanto fisiológicas (plasticidad, rápido crecimiento, alta producción
enzimática) como enzimáticas (enzimas con alta capacidad catalítica, resistentes a la desnaturalización).
Generalmente, las enzimas producidas por una sola especie de hongo, poseen ciertas carencias en alguno
de los requerimientos mencionados. Por ejemplo, las enzimas producidas por el género Trichoderma,
tienden a ser deficientes en actividad β-glucosidasa (Treebupachatsakul et al., 2016); además, poseen
una temperatura óptima de reacción de 50° C, lo cual tiende a ser una limitante en procesos de
fermentación-sacarificación simultánea (Ballesteros et al., 2004). A pesar de estas limitantes,
Trichoderma es el hongo más utilizado para la producción de celulasas, gracias a su gran producción
enzimática, su resistencia y plasticidad, y a su excelente producción de exoglucanasas (Esterbauer et al.,
1991).
Para suplir las deficiencias de las celulasas de Trichoderma, se han generado estrategias para aumentar el
rendimiento de hidrólisis de lignocelulosa; como: i) suplementar las enzimas de Trichoderma con β-
glucosidasas de Aspergillus (Fortes et al., 2010), ii) modificar genéticamente cepas de Trichoderma
(Chandra et al., 2009), iii) producir celulasas mediante consorcios de hongos. Generalmente, el binomio
Trichoderma-Aspergillus es el más utilizado para producir cocteles celulolíticos para la hidrólisis de
lignocelulosa (Ahamed y Vermette, 2008); sin embargo, existe una gran variedad de combinaciones
posibles que pueden ser evaluadas para producir una mezcla de celulasas con características deseadas.
Además de los organismos conocidos, existe una amplia diversidad de biota celulolítica con potencial
para ser utilizada como fuente de enzimas para la industria del bioetanol. Los estudios de
bioprospecciones contribuyen a conocer la diversidad de organismos y enzimas de interés industrial, sin
embargo, pocos estudios de este tipo se han realizado para descubrir nuevas fuentes de celulasas (Tabla
3).
36
Tabla 3. Estudios de bioprospección de organismos celulolíticos
Área muestreada Organismo aislado Características de las celulasas Referencia
Océano Atlántico sur, mar
profundo
Bacillis stratosphericus,
Bacillus aerophilus,
Bacillus pumilus
Celulasas con temperaturas
óptimas de reacción mesófilas
(28 °C)
Odisi et al., 2012
Distintas áreas geográficas
de India
Bacillus simplex,
Arthrobactercitreus,
Bacillus subtilis, Bacillus
endophyticus, Bacillus
amylololiquefaciens,
Bacillus megaterium
Celulasas con temperaturas
óptimas de reacción psicrofilas,
mesófilas y termófilas
Venkatachalam et al.,
2014
Odisha, India Bacterias halófilas Celulasas con potencial para ser
utilizadas en hidrólisis de
biomasa algal
Indira et al., 2014
Bosque tropical, Perú Aspergillus sp, Penicillium
sp
Celulasas alcalinas Vega et al., 2012
India Aspergillus terreus Sin características sobresalientes Saritha et al., 2015
2.2.2 Métodos de producción de celulasas
Las celulasas fúngicas pueden ser producidas por diversos métodos, los cuales se clasifican
generalmente en dos grandes grupos: fermentación sumergida y fermentación en estado sólido. La
primera se refiere, a aquellos cultivos en los cuales el hongo productor se encuentra totalmente inmerso
en el medio de cultivo, el cual es líquido. Este tipo de cultivos suelen llevarse a cabo en biorreactores, en
condiciones controladas. Entre los parámetros que se pueden controlar en la fermentación sumergida, se
encuentran el pH, la oxigenación, temperatura, agitación, cantidad de nutrientes (uso de medios
definidos), concentración de inductores (e.g. lactosa) y luminosidad; además, se facilita la recuperación
de las enzimas producidas. La desventaja que tiene el uso de este tipo de cultivos, es el grado de
tecnificación que se requiere, sobre todo cuando se desea una producción industrial, además dadas las
condiciones benéficas para el desarrollo de microorganismos, el riesgo de contaminación suele ser alto.
Por otro lado, la fermentación en estado sólido, asemeja las condiciones naturales en las cuales se
desarrollan la mayoría de los hongos filamentosos; i.e. humedad alta, ventilación, crecimiento directo
sobre sustrato. Este tipo de cultivos propician el desarrollo de los hongos sobre el de las bacterias,
requieren un nivel de tecnificación bajo y permite el uso de diversos residuos agroindustriales como
sustratos para la producción de celulasas (Subramaniyam y Vimala, 2012). No obstante, también posee
desventajas, entre las que se encuentran una menor interacción entre hongo-inductor (cuando se utiliza) y
una recuperación enzimática más costosa.
37
El método de producción enzimática debe ser cuidadosamente seleccionado, puesto que se conoce que
un mismo hongo (e.g. Aspergillus niger) puede variar su metabolismo dependiendo del tipo de cultivo
que se utilice (Maghsoodi y Yaghmaei, 2010). Aunque, independientemente del método a utilizar,
existen ciertas variables reconocidas que afectan la producción de celulasas.
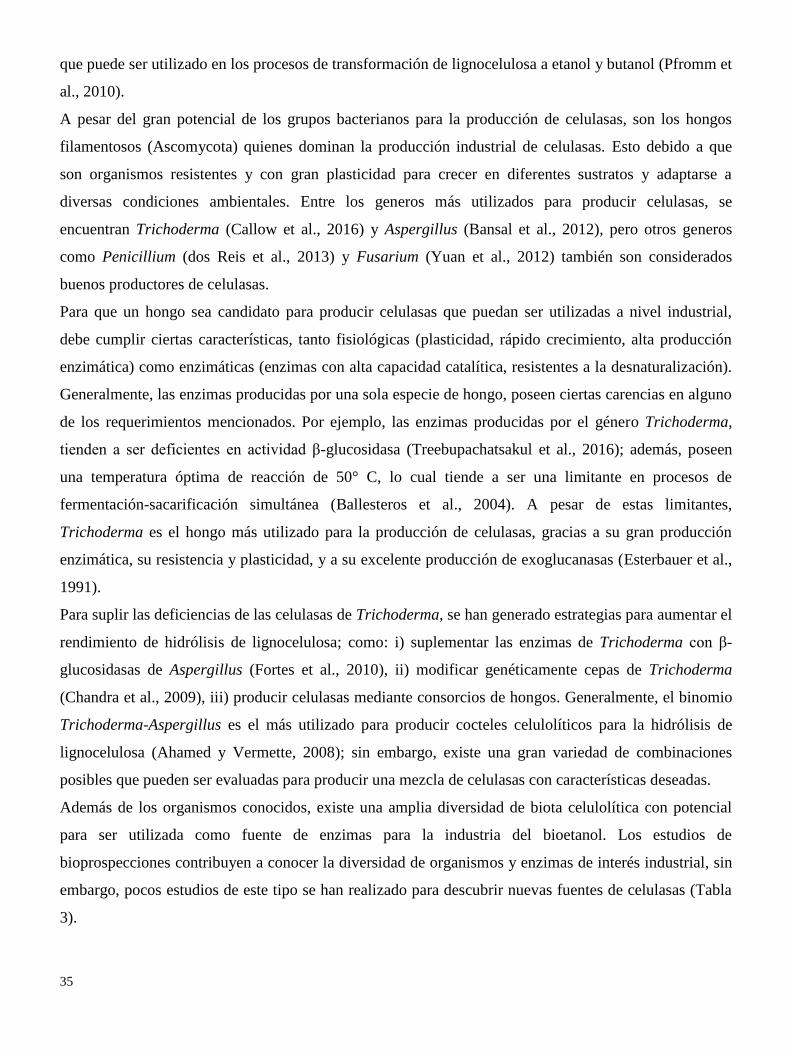
Las celulasas son generalmente, enzimas controladas por la represión catabólica del carbono. De esta
manera, se acepta que cuando existen carbohidratos simples abundantemente, como la glucosa y la
celobiosa, en el medio de cultivo, la producción de las celulasas es reprimida (Aro et al., 2005). Esta
regulación tipo operón se ha localizado en diversos hongos filamentosos, los cuales producen de manera
constitutiva pequeñas cantidades de celulasas, las cuales liberan pequeñas cantidades de glúcidos de la
celulosa, mismos que activan la transcripción de celulasas. Empero, cuando la cantidad de glucosa se
encuentra en altas concentraciones la transcripción se inhibe mediante la acción de proteínas Cre (Aro et
al., 2005). Todo esto ocurre gracias a la presencia de receptores en la membrana celular de las hifas
(Figura 13).
Entre los disacáridos conocidos que más inducen la producción de celulasas se encuentran la soforosa y
la lactosa (Sternberg y Mandels, 1980; Lo et al., 2010), así como algunos derivados de la hemicelulosa.
Estos azúcares han sido utilizados ampliamente como inductores de celulasas, principalmente en
fermentación sumergida.
Figura 13. Representación de los diferentes factores que regulan la expresión de celulasas y xilanasas. CRE es el represor
catabólico del carbono, PacC el regulador asociado a pH, AreA es el regulador ligado a las condiciones de nitrógeno del
medio. Tomado de Aro et al. (2005).
38
El pH es otro importante factor que afecta la producción de celulasas, generalmente estas enzimas se
producen a pH ligeramente ácido; en cambio, pequeñas variaciones en el pH pueden afectar el tipo de
celulasa que se produce. En este sentido, se ha reportado que el pH óptimo para producir β-glucosidasas
con T. reesei es 6, mientras que esta misma especie puede producir altas concentraciones de
endoglucanasa y exoglucanasa en pH de 4 a 6 (Prasetyo et al., 2010). El efecto del pH puede ser especie-
específico o cepa-específico, puesto que Hendy et al., (1984) reportan que producir celulasas con T.
reesei a un pH mayor de 5 resulta en una pérdida de rendimiento. Se ha sugerido que cada componente
del complejo celulolítico de T. reesei posee un pH óptimo para ser producido, y que la sincronización de
los cambios en el pH del medio de cultivo con la fase de crecimiento del hongo puede aumentar los
rendimientos de producción enzimáticos (Li et al., 2013).
La fuente de nitrógeno per se no afecta la producción de celulasas, pero si puede alterar el pH
(Rodriguez-Gomez y Hobley, 2013); lo cual, como ya se enunció, tiene fuertes efectos en la producción
enzimática.
Cuando se utiliza fermentación en estado sólido para la producción de celulasas, el sustrato puede ser
pretratado para aumentar su colonización por parte de las hifas, y evitar los efectos negativos de la
lignina. Si bien, como se mencionó anteriormente, posterior a un pretratamiento químico, el pH debe ser
regulado para permitir la producción de celulasas (Li et al., 2013); y dependiendo el tipo de agente
químico utilizado, serán las características del sustrato obtenido. Se recomienda no utilizar ácido diluído
para remover la hemicelulosa, puesto que los derivados del xilano son potentes inductores de celulasas
(Sørensen et al., 2014); además, el uso de NaOH puede producir sustancias inhibitorias que disminuyen
el rendimiento de producción de celulasas (Xin y Geng, 2010).
Pretratamientos que aumenten el índice de cristalinidad de la celulasa, como el uso de NaOH, pueden
afectar la producción de celulasas, porque esto limita el acceso de las celulasas a la celulosa (Ojumu et
al., 2003). Asímismo, el tipo de álcali utilizado para pretratar la lignocelulosa puede ser determinante no
solo desde el punto de vista estructural, si no por el tipo de celulosa alcalina resultante (Bahar et al.,
2009). Por ejemplo, mientras que el NaOH puede provocar sustancias inhibitorias, el Ca(OH)2 podría
resultar benéfico puesto que el Ca2+
puede actuar como cofactor e inductor de endoglucanasas (Van
Lieshout et al., 2012; Eckert et al., 2002).
2.3 La hidrólisis y la fermentación
2.3.1 La hidrólisis enzimática
La hidrólisis enzimática de la lignocelulosa es el proceso por el cual se liberan los azúcares contenidos
en las fibras de celulosa (principalmente) y en la matriz de hemicelulosa. Entre las ventajas de la
39
hidrólisis enzimática se encuentran su potencial alto rendimiento, su alta especificidad, su bajo
requerimiento energético, y que no se requieren contenedores especiales como en el caso de la hidrólisis
química (Yang et al., 2011). Existen dos enfoques para realizar este proceso: i) un enfoque donde una
mezcla de celulasas y xilanasas se agregan para hidrolizar conjuntamente celulosa y xilano, y ii) donde
únicamente se agregan celulasas, pues se pretende obtener únicamente glucosa como producto de
hidrólisis.
La mezcla de enzimas que se utilizarán para el proceso de hidrólisis depende tanto de la naturaleza del
sustrato (contenido de celulosa, accesibilidad, grado de polimerización, grado de cristalinidad, contenido
de hemicelulosa) (Yang et al., 2011), como del producto que se desea obtener. Cuando se utiliza una
mezcla de celulasas y xilanasas, el producto obtenido será una mezcla de azúcares, tanto pentosas (D-
xilosa y L-arabinosa) como hexosas (D-glucosa, D-manosa y D-galactosa) (Cuervo et al., 2009). Esto es
muy importante ya que, dependiendo la concentración y el tipo de azúcares obtenidos, se elegirá una
estrategia de fermentación.
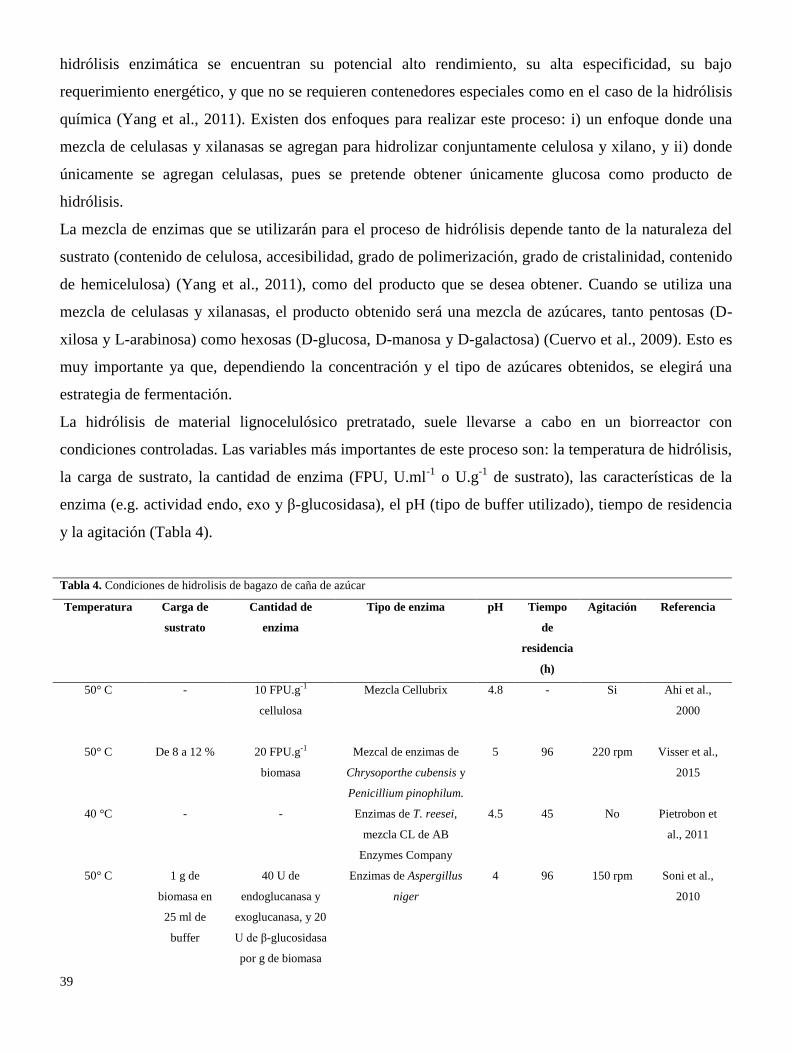
La hidrólisis de material lignocelulósico pretratado, suele llevarse a cabo en un biorreactor con
condiciones controladas. Las variables más importantes de este proceso son: la temperatura de hidrólisis,
la carga de sustrato, la cantidad de enzima (FPU, U.ml-1
o U.g-1
de sustrato), las características de la
enzima (e.g. actividad endo, exo y β-glucosidasa), el pH (tipo de buffer utilizado), tiempo de residencia
y la agitación (Tabla 4).
Tabla 4. Condiciones de hidrolisis de bagazo de caña de azúcar
Temperatura Carga de
sustrato
Cantidad de
enzima
Tipo de enzima pH Tiempo
de
residencia
(h)
Agitación Referencia
50° C - 10 FPU.g-1
cellulosa
Mezcla Cellubrix 4.8 - Si Ahi et al.,
2000
50° C
De 8 a 12 %
20 FPU.g-1
biomasa
Mezcal de enzimas de
Chrysoporthe cubensis y
Penicillium pinophilum.
5
96
220 rpm
Visser et al.,
2015
40 °C - - Enzimas de T. reesei,
mezcla CL de AB
Enzymes Company
4.5 45 No Pietrobon et
al., 2011
50° C 1 g de
biomasa en
25 ml de
buffer
40 U de
endoglucanasa y
exoglucanasa, y 20
U de β-glucosidasa
por g de biomasa
Enzimas de Aspergillus
niger
4 96 150 rpm Soni et al.,
2010
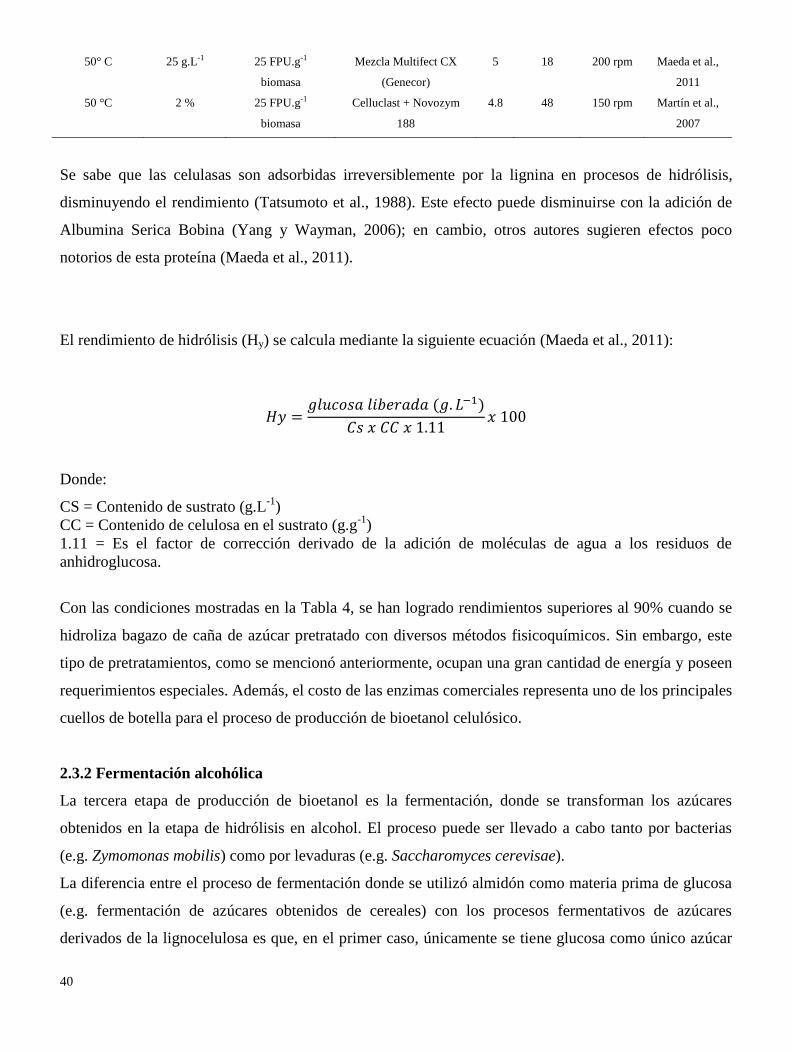
40
50° C 25 g.L-1 25 FPU.g-1
biomasa
Mezcla Multifect CX
(Genecor)
5 18 200 rpm Maeda et al.,
2011
50 °C 2 % 25 FPU.g-1
biomasa
Celluclast + Novozym
188
4.8 48 150 rpm Martín et al.,
2007
Se sabe que las celulasas son adsorbidas irreversiblemente por la lignina en procesos de hidrólisis,
disminuyendo el rendimiento (Tatsumoto et al., 1988). Este efecto puede disminuirse con la adición de
Albumina Serica Bobina (Yang y Wayman, 2006); en cambio, otros autores sugieren efectos poco
notorios de esta proteína (Maeda et al., 2011).
El rendimiento de hidrólisis (Hy) se calcula mediante la siguiente ecuación (Maeda et al., 2011):
𝐻𝑦 =𝑔𝑙𝑢𝑐𝑜𝑠𝑎 𝑙𝑖𝑏𝑒𝑟𝑎𝑑𝑎 (𝑔. 𝐿−1)
𝐶𝑠 𝑥 𝐶𝐶 𝑥 1.11𝑥 100
Donde:
CS = Contenido de sustrato (g.L-1
)
CC = Contenido de celulosa en el sustrato (g.g-1
)
1.11 = Es el factor de corrección derivado de la adición de moléculas de agua a los residuos de
anhidroglucosa.
Con las condiciones mostradas en la Tabla 4, se han logrado rendimientos superiores al 90% cuando se
hidroliza bagazo de caña de azúcar pretratado con diversos métodos fisicoquímicos. Sin embargo, este
tipo de pretratamientos, como se mencionó anteriormente, ocupan una gran cantidad de energía y poseen
requerimientos especiales. Además, el costo de las enzimas comerciales representa uno de los principales
cuellos de botella para el proceso de producción de bioetanol celulósico.
2.3.2 Fermentación alcohólica
La tercera etapa de producción de bioetanol es la fermentación, donde se transforman los azúcares
obtenidos en la etapa de hidrólisis en alcohol. El proceso puede ser llevado a cabo tanto por bacterias
(e.g. Zymomonas mobilis) como por levaduras (e.g. Saccharomyces cerevisae).
La diferencia entre el proceso de fermentación donde se utilizó almidón como materia prima de glucosa
(e.g. fermentación de azúcares obtenidos de cereales) con los procesos fermentativos de azúcares
derivados de la lignocelulosa es que, en el primer caso, únicamente se tiene glucosa como único azúcar
41
fermentable. Además, el proceso de hidrólisis de almidón mediante amilasas no genera compuestos que
puedan ser tóxicos para las levaduras.
Por otro lado, al hidrolizar lignocelulosa se obtiene una mezcla de azúcares (hexosas + pentosas) las
cuales pueden requerir de una mezcla de microorganismos para poder ser fermentados. Además, cuando
se utilizan pretratamientos con ácidos y elevadas temperaturas, se genera la aparición de furfurales,
hidroximetil furfurales y ácido acético que son potentes inhibidores de la fermentación (Palmqvist et al.,
1999).
En este contexto, se han propuesto diversas estrategias para lograr un alto rendimiento de producción de
etanol a partir de los azúcares simples obtenidos de la lignocelulosa. Entre ellas se encuentran i) Utilizar
una mezcla de levaduras que puedan metabolizar hexosas y pentosas a etanol, ii) Mejorar genéticamente
Saccharomyces cerevisiae para que pueda metabolizar pentosas, iii) Detoxificar la mezcla de hidrólisis
para evitar inhibición de las levaduras, iv) Transformar las pentosas en productos de valor agregado, v)
Realizar la hidrólisis y la fermentación en una sola etapa para evitar la acumulación de glucosa.
La eficiencia de la fermentación se calcula mediante la siguiente ecuación (Yadav et al., 2011):
𝐸𝑓𝑖𝑐𝑖𝑒𝑛𝑐𝑖𝑎 𝑑𝑒 𝑙𝑎 𝑓𝑒𝑟𝑚𝑒𝑛𝑡𝑎𝑐𝑖ó𝑛 =𝑅𝑒𝑛𝑑𝑖𝑚𝑖𝑒𝑛𝑡𝑜 𝑝𝑟á𝑐𝑡𝑖𝑐𝑜
𝑅𝑒𝑛𝑑𝑖𝑚𝑖𝑒𝑛𝑡𝑜 𝑡𝑒ó𝑟𝑖𝑐𝑜𝑥 100
Donde: Rendimiento práctico = Etanol producido
Rendimiento teórico = 0.511 por gramo de azúcar consumido
La fermentación suele llevarse a cabo en biorreactores, donde se deposita el hidrolizado de lignocelulosa
enriquecido con alguna o varias fuentes de nitrógeno (e.g. extracto de levadura, peptona, nitrato de
amonio) y minerales (Fe, Mn, Mg, Ca, Zn) para el correcto metabolismo de las levaduras, sin los cuales
el rendimiento decae significativamente (Slininger et al., 2006; Yadav et al., 2011). Además, el uso de
vitaminas (e.g. biotina, ácido pantotéico) tiene efectos positivos sobre el rendimiento de etanol
producido por S. cerevisiae (Alfenore et al., 2002).
Entre los consorcios de levaduras más utilizados para fermentar una mezcla de pentosas y hexosas se
encuentra el binomio S. cerevisiae y Pichia stipitis (Yadav et al., 2011). Aunque algunos autores
sugieren que es preferible fermentar inicialmente la glucosa con S. cerevisiae o Zymomonas mobilis y
posteriormente fermentar las pentosas con P. stipitis o Candida shehatae, previa inactivación de S.
cerevisiae (Li, et al., 2011; Delgenes et al., 1996). Las condiciones de fermentación más utilizadas se
presentan en la tabla 5. Por otro lado, algunos estudios se han concentrado en modificar genéticamente a
S. cerevisiae para lograr que pueda fermentar tanto glucosa como xilosa adicionando un gen para que
42
pueda expresar xilosa isomerasa (EC 5.3.1.5) (Kuyper et al., 2004). Esta enzima habilita a S. cerevisiae a
producir etanol a partir de xilosa con rendimientos similares a los obtenidos con glucosa.
Cuando el hidrolizado proviene de un proceso de hidrólisis ácida o de un pretratamiento ácido, se
requiere de un proceso de detoxificiación para evitar la inhibición de las levaduras por furfurales. Entre
los procesos de detoxificación de hidrolizado se encuentra el uso de Ca(OH)2, el proceso involucra un
encalado hasta llevar el pH del hidrolizado a 10, posteriormente una centrifugación, filtrado, y reajuste
de pH a 6 mediante la adición de H2SO4. Posteriormente se agrega carbón activado y se repite el proceso
de centrifugación y filtrado (Yadav et al., 2011). Este proceso reduce la cantidad de furanos y
compuestos fenólicos; sin embargo, aumenta el costo y la tecnificación total del proceso.
Por otro lado, cuando se utiliza un pretratamiento biológico y una hidrólisis enzimática, no hay
necesidad de una detoxificación o de un ajuste de pH, pues el utilizado en procesos de hidrólisis
enzimática es muy similar al utilizado en procesos de fermentación (Tablas 4 y 5). Asimismo, las
pentosas pueden ser fermentadas a etanol con mezclas de levaduras (como se mencionó anteriormente),
o pueden ser transformadas en productos de alto valor agregado a posteriori del proceso de
fermentación.
Esta última opción ha llamado mucho la atención en los últimos años, debido al creciente interés por los
productos derivados de la xilosa y la arabinosa, los cuales podrían tener más valor que el etanol derivado
de pentosas. Lo cual, desde un punto de vista de biorefinería, aumentaría la viabilidad global del
proceso. Entre los productos que se pueden obtener a partir de la xilosa (posterior a la destilación
alcohólica) se encuentran los furfurales, los cuales como ya se enunció, se obtienen a partir de la
deshidratación de la xilosa en presencia de un ácido y a elevadas temperaturas (Yang et al., 2012; Figura
9).
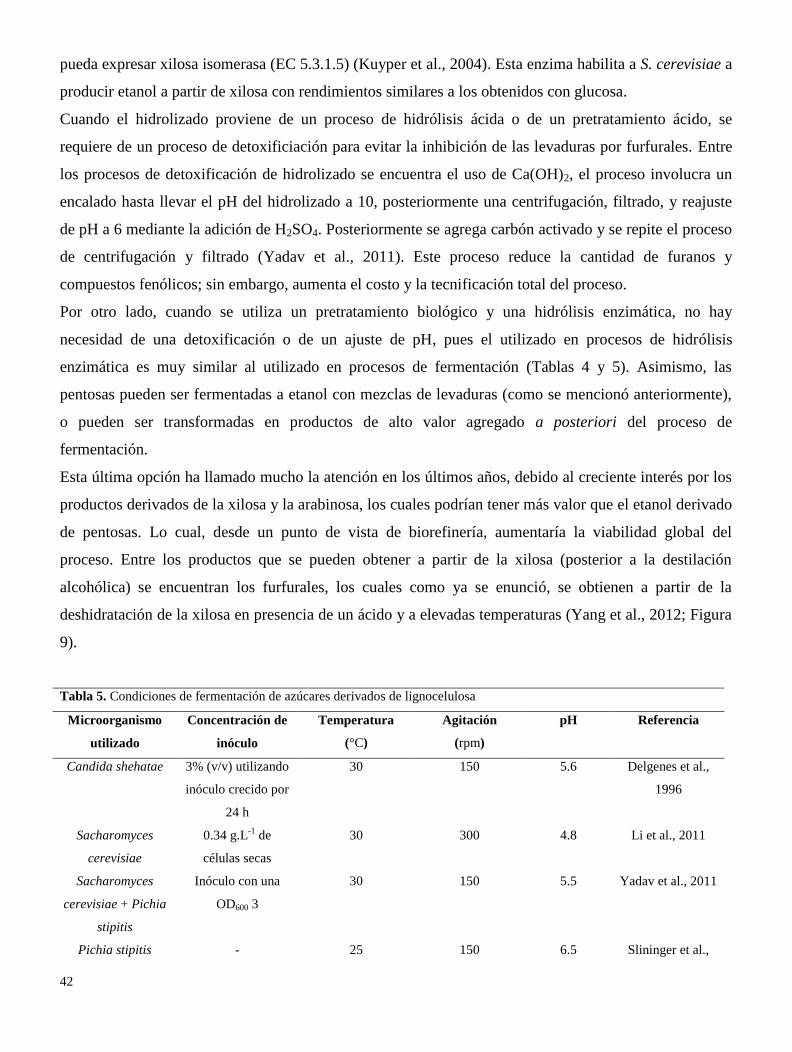
Tabla 5. Condiciones de fermentación de azúcares derivados de lignocelulosa
Microorganismo
utilizado
Concentración de
inóculo
Temperatura
(°C)
Agitación
(rpm)
pH Referencia
Candida shehatae 3% (v/v) utilizando
inóculo crecido por
24 h
30 150 5.6 Delgenes et al.,
1996
Sacharomyces
cerevisiae
0.34 g.L-1
de
células secas
30 300 4.8 Li et al., 2011
Sacharomyces
cerevisiae + Pichia
stipitis
Inóculo con una
OD600 3
30 150 5.5 Yadav et al., 2011
Pichia stipitis - 25 150 6.5 Slininger et al.,
43
2006
Pichia stipitis 0.4 g.L-1
30 100 6 Chen et al., 2012
Saccharomyces
cerevisiae
- 30 400 4 Alfenore et al.,
2002
Los furfurales y sus derivados son utilizados en la industria de plásticos, farmacéutica y agroquímica.
Los productos obtenidos a partir de estos compuestos van desde solventes (e.g. di-hidropirano, metil-
tetra-hidrofurano, tetra-hidrofurano), fungicidas y nematicidas, aditivos de gasolinas, resinas,
lubricantes, mezclas de turbosina, insecticidas, bio-plásticos, potenciadores de sabor de alimentos y
bebidas, entre otros (Eseyin y Steele, 2015). Debido a sus diversas aplicaciones, la fermentación de
pentosas a etanol podría no ser conveniente desde un punto de vista económico e incluso ambiental, pues
la producción de furfurales de pentosas podría ser una opción para el desarrollo de productos químicos
sustentables.
Dadas las características de las pentosas, la producción de etanol debería derivar preferentamente de la
fermentación de hexosas, derivadas principalmente de la hidrólisis con celulasas. Como se mencionó
anteriormente, las celulasas se inhiben en presencia de altas concentraciones de celobiosa y glucosa
(Ballesteros et al., 2004), una estrategia que busca evitar este inconveniente es el uso de la fermentación
al mismo tiempo que ocurre la hidrólisis. En este proceso, las levaduras consumen los azúcares liberados
de la lignocelulosa por las celulasas, evitando así su acumulación y con ello, la inhibición de las
enzimas. Otra de las ventajas es que la presencia de etanol en el medio disminuye el riesgo de
contaminación por organismos indeseables (Ferreira et al., 2009).
Dentro de los inconvenientes de utilizar esta técnica se encuentran la diferencia de temperaturas entre el
proceso de hidrólisis con enzimas de T. reesei (50 °C) y fermentación con levaduras (30 °C) (Zhou et al.,
2008). Para sobrepasar esta limitante, se ha propuesto el uso de levaduras termotolerantes que sean
capaces de fermentar a 50 °C, como Blastobotrys adeninivorans, la cual obtuvo un rendimiento de 46.87
% de acuerdo al valor teórico (Antil et al., 2014), Kluyveromyces sp, con rendimiento de 8.14% (Narra et
al., 2015) e incluso algunas cepas de Saccharomyces cerevisiae (Huang et al., 2015). El uso de
organismos termotolerantes también ha sido utilizado para producir otros productos derivados de
azúcares de lignocelulosa, en fermentación-sacarificación simultánea, como el ácido láctico con una
cepa de Bacillus sp (Patel et al., 2005).
Por otro lado, el uso de enzimas celulasas con temperatura óptima de reacción mesófila ha sido menos
estudiado, a pesar de que diversos estudios de bioprospección (Tabla 3) han aportado organismos
capaces de producir celulasas con estas características. Optimizar un proceso de fermentación y
sacarificación simultánea a 30 °C podría resultar más eficiente que un proceso a 50 °C, desde un punto
44
de vista energético; por esto, el capítulo 2 de esta tesis tuvo como objetivo estudiar la producción de
celulasas que pudiesen ser utilizadas en procesos de fermentación y sacarificación simultánea, en
condiciones de temperatura mesófila.
2.4 Planteamiento del problema
Como se expuso anteriormente, las enzimas lacasas y celulasas son piezas clave en el el pretratamiento e
hidrólisis biológicos de la lignocelulosa. No obstante, a pesar del avance en el entendimiento de estos
procesos y en el rol que cumplen dichas enzimas en la depolimerización de la lignina y celulosa, aun se
requiere de investigación en el área de inducción de lacasas y celulasas en hongos. Esto con el propósito
de lograr una hiperproducción enzimática, en el caso de las lacasas, y para lograr una alta
deslignificación selectiva; y un complejo celulasa/xilanasa que cumpla los requerimientos necesarios
para realizar una hidrólisis completa de la celulosa/hemicelulosa hasta sus monómeros estructurales.
Aunado a esto, es necesaria la búsqueda de nuevas cepas de hongos con potencial productor de celulasas,
que posean características para ser utilizadas en procesos de hidrólisis y fermentación separada y/o
simultánea.
Es por ello que la presente tesis se enfoca en identificar el efecto de distintas variables fisicoquímicas en
la producción de lacasa en P. sanguineus, con el objetivo de generar una producción enzimática que
pueda utilizarse en el pretratamiento de bagazo de caña de azúcar. Asímismo, se estudió el efecto de la
producción de celulasas y xilanasas a partir de cepas de hongos aisladas de distintos bosques del estado
de Veracruz, tanto en monocultivos como en policultivos.
45
3. Preguntas de investigación
Derivado de la revisión bibliográfica del estado del arte sobre producción de etanol celulósico, a partir de
bagazo de caña de azúcar, se estructuraron las siguientes preguntas de investigación, las cuales se
dividen en dos grupos:
3.1 Deslignificación biológica de bagazo de caña de azúcar
En el conocimiento de que la enzima lacasa es una de las principales oxidoreductasas involucradas en la
depolimerización de la lignina y que su producción en hongos de pudrición blanca es afectada por
diversas variables fisicoquímicas ¿Qué condiciones de luminosidad, disponibilidad de nitrógeno y
presencia de inductores químicos aumentarán su producción en el hongo Pycnoporus sanguineus? ¿El
cultivo de P. sanguineus sobre bagazo de caña de azúcar en estado sólido, utilizando las mejores
condiciones para la producción de lacasa, realizará una deslignificación selectiva de la estructura
química del bagazo de caña de acuerdo a los requerimientos para la hidrólisis enzimática?
3.2 Optimización de la producción de celulasas para procesos de fermentación-sacarificación
simultánea
En el conocimiento de que el uso de celulasas puras de Trichoderma reesei posee limitaciones en la
etapa de hidrólisis de celulosa, entre las que se encuentran inhibición por producto, baja actividad β-
glucosidasa y alta temperatura óptima de reacción, y que estas limitantes pueden ser resueltas mediante
la combinación de diversas fuentes enzimáticas, ¿Cómo afectará la interacción resultante de policultivos
de hongos filamentosos (nativos del estado de Veracruz) el perfil de celulasas (endoglucanasa,
exoglucanasa, β-glucosidasa, cantidad de isoformas) y xilanasas producido?; y ¿Las celulasas producidas
por hongos habitantes de climas frios (Parque Nacional Pico de Orizaba) tendrán una temperatura óptima
de reacción mesófila, que las haga elejibles para procesos de fermentación-sacarificación simultánea?
46
4. Hipótesis
4.1 Deslignificación biológica de bagazo de caña de azúcar
Si la enzima lacasa es la principal responsable de la deslignificación biológica llevada a cabo por
Pycnoporus sanguineus, entonces;
H0: Mejorar las condiciones de producción de esta enzima (i.e. fuente de nitrógeno, luminosidad,
presencia y cantidad de inductor) no permitirá deslignificar selectivamente bagazo de caña de azúcar con
este hongo.
H1: Mejorar las condiciones de producción de esta enzima (i.e. fuente de nitrógeno, luminosidad,
presencia y cantidad de inductor) permitirá deslignificar selectivamente bagazo de caña de azúcar con
este hongo.
4.2 Optimización de la producción de celulasas para procesos de fermentación-sacarificación
simultánea
Si la descomposición de la lignocelulosa es llevada a cabo de manera natural, por consorcios
microbianos, entonces;
H0: La interacción de diversas especies de hongos filamentosos en un bioreactor no promoverá la
producción de un pool enzimático de mayor actividad celulasa y mayor riqueza de isoformas que los
monocultivos.
H2: La interacción de diversas especies de hongos filamentosos en un bioreactor promoverá la
producción de un pool enzimático de mayor actividad celulasa y mayor riqueza de isoformas que los
monocultivos.
Si los organismos adaptan sus requerimientos metabólicos por medio de presiones ambientales
selectivas, entonces;
H0: Las celulasas producidas por hongos provenientes de climas fríos (Parque Nacional Pico de Orizaba)
no poseerán temperaturas óptimas de reacción más bajas que aquellas provenientes de hongos tropicales
(i.e. Trichoderma reesei), y no podrán ser utilizadas en procesos de fermentación-sacarificación
simultánea.
H3: Las celulasas producidas por hongos provenientes de climas fríos (Parque Nacional Pico de Orizaba)
poseerán temperaturas óptimas de reacción más bajas que aquellas provenientes de hongos tropicales
(i.e. Trichoderma reesei), y podrán ser utilizadas en procesos de fermentación-sacarificación simultánea.
47
5. Objetivos
5.1 Objetivo general
Desarrollar un proceso de producción de lacasas y celulasas, basado en conocimientos de ecología
microbiana, con el fin de utilizar dichas enzimas en el proceso de pretratamiento e hidrólisis de bagazo
de caña de azúcar, para la producción de bioetanol celulósico.
Específicos:
5.2 Inducción de lacasas
i) Optimizar las condiciones de luminosidad, fuente de nitrógeno y fuente de inductor de lacasa que
promuevan mayor actividad enzimática lacasa, para disminuír la cantidad de lignina y la cristalinidad de
la celulosa de bagazo de caña de azúcar, en cultivos solidos de Pycnoporus sanguineus; para obtener un
bagazo de caña de azúcar que sea más digerible para las celulasas.
5.3 Optimización de la producción de celulasas para procesos de hidrólisis e hidrólisis y
fermentación simultánea
i) Obtener a partir de cultivos mixtos de hongos filamentosos, un complejo celulasa con un balance entre
actividades endoglucanasa, exoglucanasa y β-glucosidasa, y que posea riqueza de isoformas (robustez).
ii) Obtener al menos 1 cepa de hongo que produzca celulasas con temperatura óptima de reacción de
30°C (o cercada a ella), mediante la realización de una bioprospección en ecosistemas fríos (bosque de
coníferas y páramo de altura del Parque Nacional Pico de Orizaba).

48
6. Metodología general
___________________________________
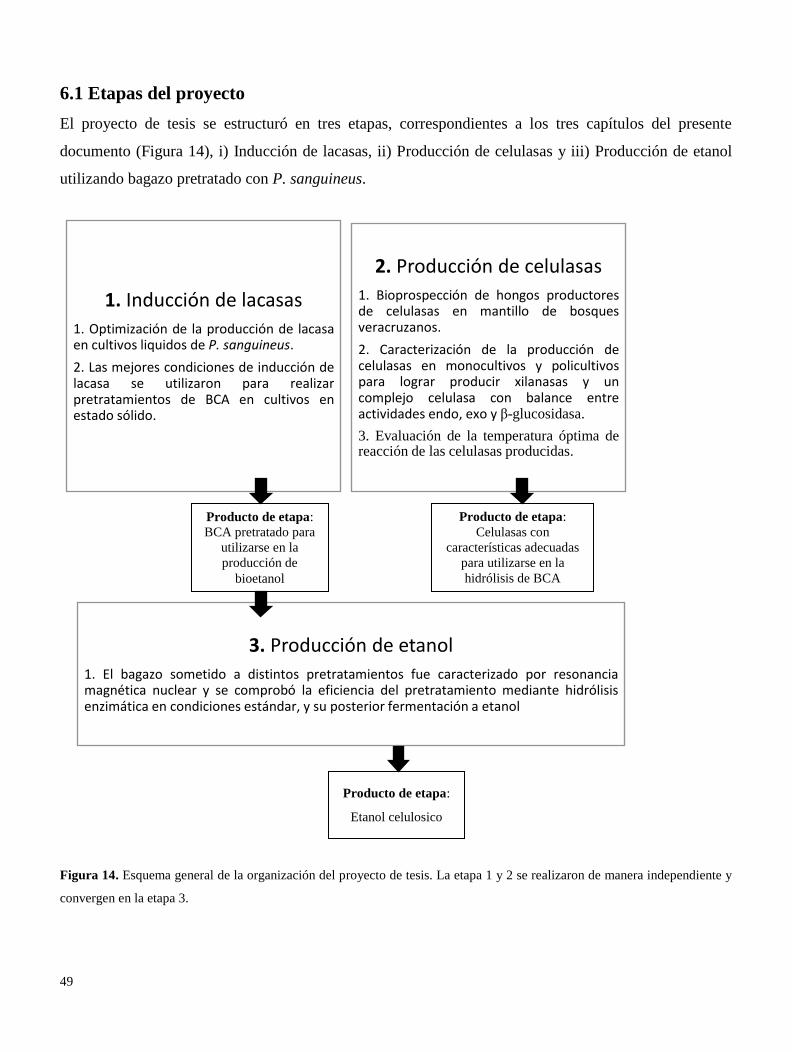
49
6.1 Etapas del proyecto
El proyecto de tesis se estructuró en tres etapas, correspondientes a los tres capítulos del presente
documento (Figura 14), i) Inducción de lacasas, ii) Producción de celulasas y iii) Producción de etanol
utilizando bagazo pretratado con P. sanguineus.
Figura 14. Esquema general de la organización del proyecto de tesis. La etapa 1 y 2 se realizaron de manera independiente y
convergen en la etapa 3.
1. Inducción de lacasas
1. Optimización de la producción de lacasa en cultivos liquidos de P. sanguineus.
2. Las mejores condiciones de inducción de lacasa se utilizaron para realizar pretratamientos de BCA en cultivos en estado sólido.
2. Producción de celulasas
1. Bioprospección de hongos productores de celulasas en mantillo de bosques veracruzanos.
2. Caracterización de la producción de celulasas en monocultivos y policultivos para lograr producir xilanasas y un complejo celulasa con balance entre actividades endo, exo y β-glucosidasa.
3. Evaluación de la temperatura óptima de reacción de las celulasas producidas.
3. Producción de etanol
1. El bagazo sometido a distintos pretratamientos fue caracterizado por resonancia magnética nuclear y se comprobó la eficiencia del pretratamiento mediante hidrólisis enzimática en condiciones estándar, y su posterior fermentación a etanol
Producto de etapa:
BCA pretratado para
utilizarse en la
producción de
bioetanol
Producto de etapa:
Celulasas con
características adecuadas
para utilizarse en la
hidrólisis de BCA
Producto de etapa:
Etanol celulosico
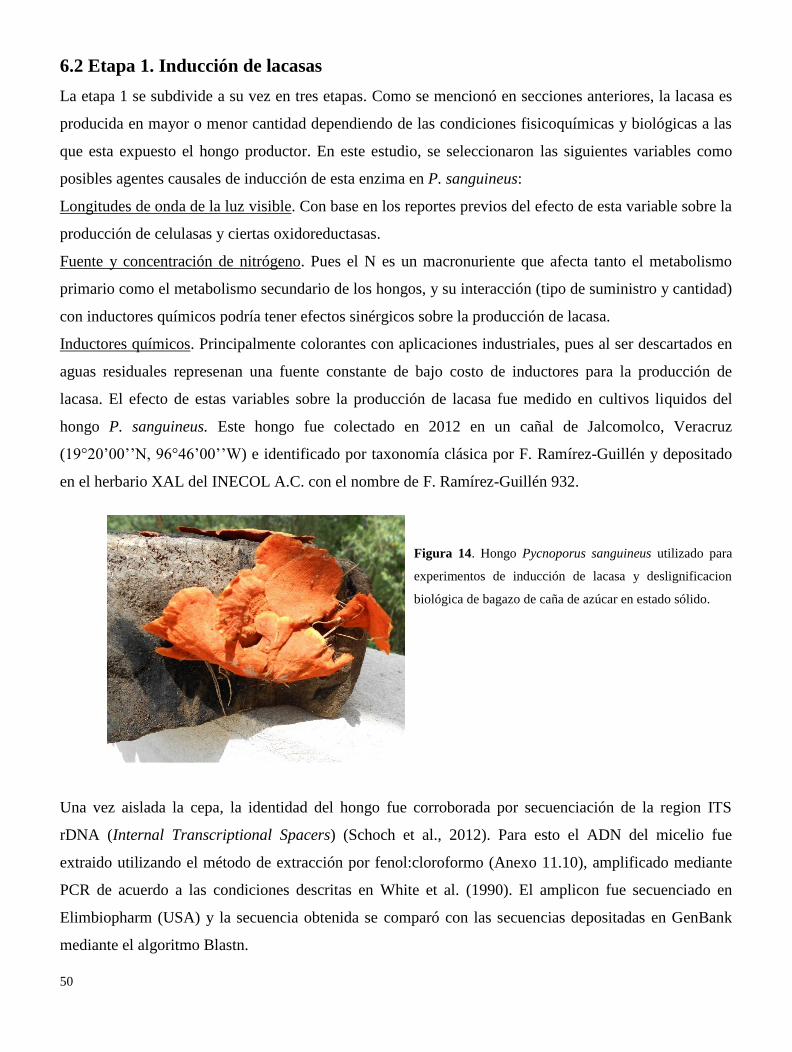
50
6.2 Etapa 1. Inducción de lacasas
La etapa 1 se subdivide a su vez en tres etapas. Como se mencionó en secciones anteriores, la lacasa es
producida en mayor o menor cantidad dependiendo de las condiciones fisicoquímicas y biológicas a las
que esta expuesto el hongo productor. En este estudio, se seleccionaron las siguientes variables como
posibles agentes causales de inducción de esta enzima en P. sanguineus:
Longitudes de onda de la luz visible. Con base en los reportes previos del efecto de esta variable sobre la
producción de celulasas y ciertas oxidoreductasas.
Fuente y concentración de nitrógeno. Pues el N es un macronuriente que afecta tanto el metabolismo
primario como el metabolismo secundario de los hongos, y su interacción (tipo de suministro y cantidad)
con inductores químicos podría tener efectos sinérgicos sobre la producción de lacasa.
Inductores químicos. Principalmente colorantes con aplicaciones industriales, pues al ser descartados en
aguas residuales represenan una fuente constante de bajo costo de inductores para la producción de
lacasa. El efecto de estas variables sobre la producción de lacasa fue medido en cultivos liquidos del
hongo P. sanguineus. Este hongo fue colectado en 2012 en un cañal de Jalcomolco, Veracruz
(19°20’00’’N, 96°46’00’’W) e identificado por taxonomía clásica por F. Ramírez-Guillén y depositado
en el herbario XAL del INECOL A.C. con el nombre de F. Ramírez-Guillén 932.
Figura 14. Hongo Pycnoporus sanguineus utilizado para
experimentos de inducción de lacasa y deslignificacion
biológica de bagazo de caña de azúcar en estado sólido.
Una vez aislada la cepa, la identidad del hongo fue corroborada por secuenciación de la region ITS
rDNA (Internal Transcriptional Spacers) (Schoch et al., 2012). Para esto el ADN del micelio fue
extraido utilizando el método de extracción por fenol:cloroformo (Anexo 11.10), amplificado mediante
PCR de acuerdo a las condiciones descritas en White et al. (1990). El amplicon fue secuenciado en
Elimbiopharm (USA) y la secuencia obtenida se comparó con las secuencias depositadas en GenBank
mediante el algoritmo Blastn.

51
La cepa de P. sanguineus se mantuvo en refrigeracion a 4°C en medio Papa Dextrosa Agar (PDA) hasta
ser requerida para experimentacion. A continuación se describen los diseños de los experimentos
realizados para evaluar el efecto de: 1) exposición a diferentes longitudes de onda de la luz ; 2) el efecto
del etanol y de la fuente y concentración de nitrógeno y 3) el efecto de diferentes colorantes fenólicos
sobre la producción de lacasa en cultivos liquidos de P. sanguineus.
6.2.1 Efecto de la exposición a luz sobre la producción de lacasa
Para evaluar el efecto de la exposición de P. sanguineus a distintas longitudes de onda de la luz, sobre su
producción de lacasa, proteína extracelular y biomasa, se construyeron cámaras de luz LED (Light
emiting diodes) que ofrecieran un ambiente de luz controlada, constante y de 360° (Figura 15). Los
cultivos liquidos inoculados con un cuadro (0.25 cm2) de PDA con micelio reactivado (6 dias de
crecimiento) se depositaron dentro de las cámaras, se cubrieron con cartulina negra opaca para evitar
otras interferencias de luz y se depositaron dentro de una camara ambiental Binder con emperatura
controlada de 30°C.
Figura 15. Camaras de luz LED construidas para
evaluar el efecto de exponer a diferentes
longitudes de onda de luz al hongo P. sanguineus
sobre su producción de lacasa.
Cuatro diferentes longitudes de onda fueron evaluadas: luz blanca (combinación de 460 y 560 nm; 750
lx), luz verde (525 nm; 675 lx), luz azul (460 nm; 22.66 lx) y luz roja (660 nm; 183.5 lx) y como
controles se utilizaron cultivos en oscuridad. Los datos de longitud de onda fueron obtenidos del
fabricante y los de luminosidad mediante un luxómetro (Fisher Scientific).
Los cultivos liquidos consistieron en frascos de vidrio de 250 mL que contenían 150 mL de medio
mínimo (Kyi 2011), con la siguiente composición: 5 % de una solución base de sales compuesta de 6 g
de NaNO3, 0.52 g de KCl, 0.52 g de MgSO4, y 0.82 g de KH2PO4 por litro, y 0.02 % de una solución
Hutner de elementos traza compuesta de 0.22 g de ZnSO4, 0.11 g de H3BO3, 0.05 g de MnCl2, 0.05 g
de FeSO4, 0.016 g de CoCl2, 0.016 g de CuSO4, y 0.011 g de (NH4) 6MO7O24 por 100 ml y 1 g/L de
glucosa como fuente de carbono.
La actividad lacasa y la cantidad de glucosa consumida fueron cuantificadas cada 4 días en un periodo de
20 días. La actividad lacasa fue determinada de acuerdo a Criquet (1999) (Anexo 11.7), mientras que la
52
cantidad de glucosa consumida se estimó midiendo la cantidad de azúcares reductores, presentes en el
medio de cultivo, de acuerdo a Miller (1959) y modificado por Durán y Muñóz (2003) (Anexo 11.6). La
producción de biomasa se determinó al final del experimento mediante gravimetría de masa seca1.
Al término del experimento, para conocer si había diferencias entre los tratramientos, los datos fueron
analizados estadísticamente mediante análisis de varianza (ANDEVA) de una via, y cuando el
ANDEVA fue significativo (P < 0.05), se realizaron pruebas post hoc de Fisher LSD. Además, para
conocer si existió relación entre la producción de lacasa y la cantidad de luxes y/o la longitud de onda a
la que el hongo fue expuesto, se realizaron correlaciones múltiples de Pearson. Todos estos análisis se
realizaron en el programa estadístico STATISTICA 7 (StatSoft, 2004). Los resultados experimentales
arrojaron que la luz ejerce un efecto negativo en la producción de lacasa (Resultados, capítulo 1.1), por
lo que se seleccionó la oscuridad como ambiente para efectuar la deslignificación biológica de BCA.
6.2.2 Efecto del etanol, la fuente y concentración de nitrógeno sobre la producción de lacasa.
Una vez determinado el efecto de la exposición al efecto de luz visible sobre la producción de lacasa, se
procedió a evaluar el efecto de la fuente y concentración de nitrógeno, así como la adición o no de etanol
sobre la producción de esta enzima.
Como se mencionó en la revisión del estado del arte, la lacasa está regulada en algunos hongos por el
mecanismo llamado regulación catabólica del nitrógeno; por lo tanto, la disponibilidad de fuentes
orgánicas (polímeros complejos) o de fuentes minerales (simples) podría afectar la producción de lacasa.
Por su parte, algunos reportes previos indican que el etanol puede o no inducir la producción de lacasa;
con base en estos antecedentes, diseñamos un experimento trifactorial, tomando como variables
explicativas la presencia (3 g.L-1
) o ausencia de etanol (0 g.L-1
), el tipo de nitrógeno agregado al medio
de cultivo (mineral u orgánico), y la concentración de la fuente de nitrógeno en el medio (1, 2 y 3 g.L-1
).
Como fuente de nitrógeno orgánico se seleccionó el extracto de levadura, y como fuente de nitrógeno
mineral se seleccionó urea. Como variables de respuesta se midieron la actividad lacasa (Criquet, 1999)
(Figura 16), la cantidad de proteína extracelular de acuerdo a Bradford (1969) (Anexo 11.8) y la cantidad
de azúcares liberados (Miller, 1959) a partir del BCA utilizado como fuente de carbono. Para saber si
existían efectos combinados entre la concentración y la presencia y ausencia de etanol, en ambos tipos de
fuentes de nitrógeno (i.e. organico y mineral), los datos fueron analizados mediante modelos de
superficie de respuesta; a su vez, para conocer si existían efectos de las variables explicativas sobre las
de respuesta, se realizaron pruebas de ANDEVA. Los análisis de este experimento se realizaron en el
programa STATISTICA 7 (StatSoft, 2004) (Resultados, capítulo 1.2). 1 Las variables glucosa consumida y biomasa producida se midieron con el propósito de descartar efectos nocivos de la
exposición a diferentes fuentes lumínicas, sobre el crecimiento de P. sanguineus
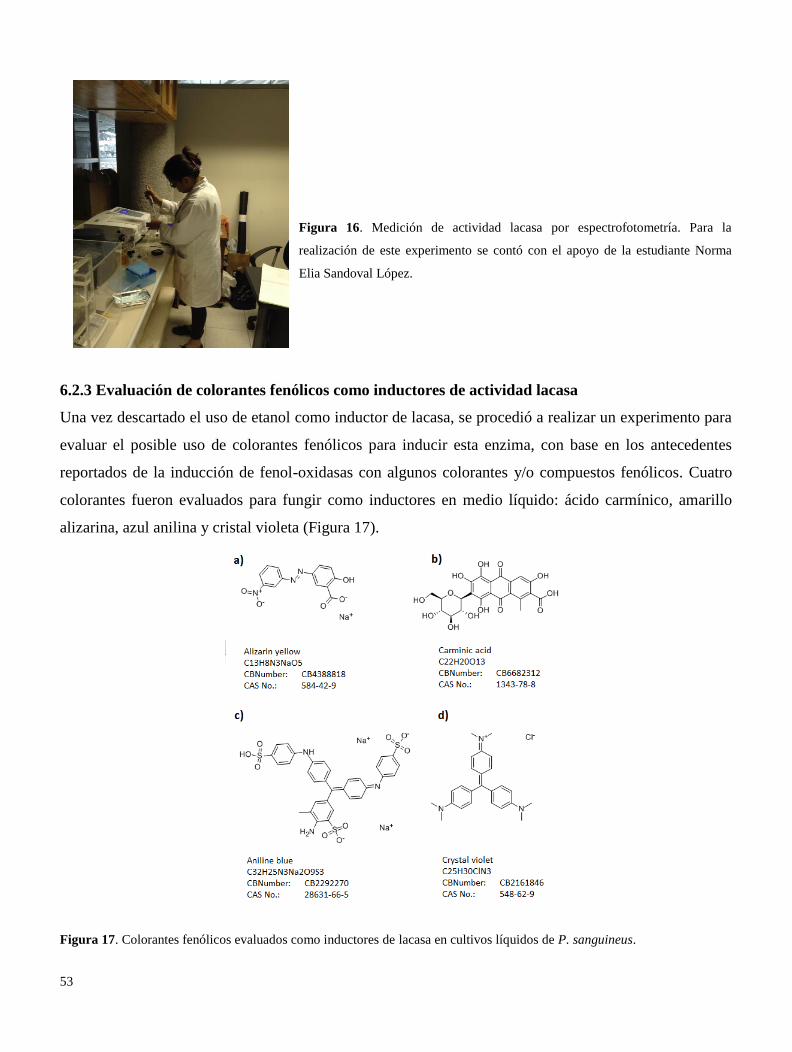
53
Figura 16. Medición de actividad lacasa por espectrofotometría. Para la
realización de este experimento se contó con el apoyo de la estudiante Norma
Elia Sandoval López.
6.2.3 Evaluación de colorantes fenólicos como inductores de actividad lacasa
Una vez descartado el uso de etanol como inductor de lacasa, se procedió a realizar un experimento para
evaluar el posible uso de colorantes fenólicos para inducir esta enzima, con base en los antecedentes
reportados de la inducción de fenol-oxidasas con algunos colorantes y/o compuestos fenólicos. Cuatro
colorantes fueron evaluados para fungir como inductores en medio líquido: ácido carmínico, amarillo
alizarina, azul anilina y cristal violeta (Figura 17).
Figura 17. Colorantes fenólicos evaluados como inductores de lacasa en cultivos líquidos de P. sanguineus.
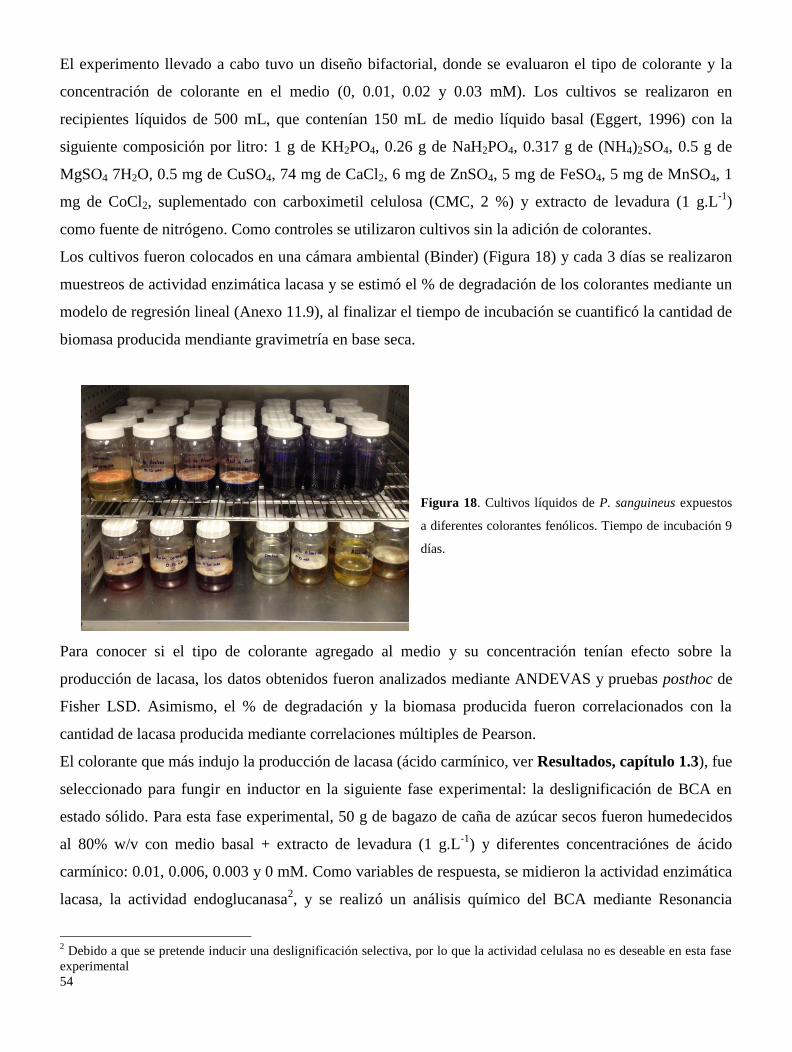
54
El experimento llevado a cabo tuvo un diseño bifactorial, donde se evaluaron el tipo de colorante y la
concentración de colorante en el medio (0, 0.01, 0.02 y 0.03 mM). Los cultivos se realizaron en
recipientes líquidos de 500 mL, que contenían 150 mL de medio líquido basal (Eggert, 1996) con la
siguiente composición por litro: 1 g de KH2PO4, 0.26 g de NaH2PO4, 0.317 g de (NH4)2SO4, 0.5 g de
MgSO4 7H2O, 0.5 mg de CuSO4, 74 mg de CaCl2, 6 mg de ZnSO4, 5 mg de FeSO4, 5 mg de MnSO4, 1
mg de CoCl2, suplementado con carboximetil celulosa (CMC, 2 %) y extracto de levadura (1 g.L-1
)
como fuente de nitrógeno. Como controles se utilizaron cultivos sin la adición de colorantes.
Los cultivos fueron colocados en una cámara ambiental (Binder) (Figura 18) y cada 3 días se realizaron
muestreos de actividad enzimática lacasa y se estimó el % de degradación de los colorantes mediante un
modelo de regresión lineal (Anexo 11.9), al finalizar el tiempo de incubación se cuantificó la cantidad de
biomasa producida mendiante gravimetría en base seca.
Figura 18. Cultivos líquidos de P. sanguineus expuestos
a diferentes colorantes fenólicos. Tiempo de incubación 9
días.
Para conocer si el tipo de colorante agregado al medio y su concentración tenían efecto sobre la
producción de lacasa, los datos obtenidos fueron analizados mediante ANDEVAS y pruebas posthoc de
Fisher LSD. Asimismo, el % de degradación y la biomasa producida fueron correlacionados con la
cantidad de lacasa producida mediante correlaciones múltiples de Pearson.
El colorante que más indujo la producción de lacasa (ácido carmínico, ver Resultados, capítulo 1.3), fue
seleccionado para fungir en inductor en la siguiente fase experimental: la deslignificación de BCA en
estado sólido. Para esta fase experimental, 50 g de bagazo de caña de azúcar secos fueron humedecidos
al 80% w/v con medio basal + extracto de levadura (1 g.L-1
) y diferentes concentraciónes de ácido
carmínico: 0.01, 0.006, 0.003 y 0 mM. Como variables de respuesta, se midieron la actividad enzimática
lacasa, la actividad endoglucanasa2, y se realizó un análisis químico del BCA mediante Resonancia
2 Debido a que se pretende inducir una deslignificación selectiva, por lo que la actividad celulasa no es deseable en esta fase
experimental
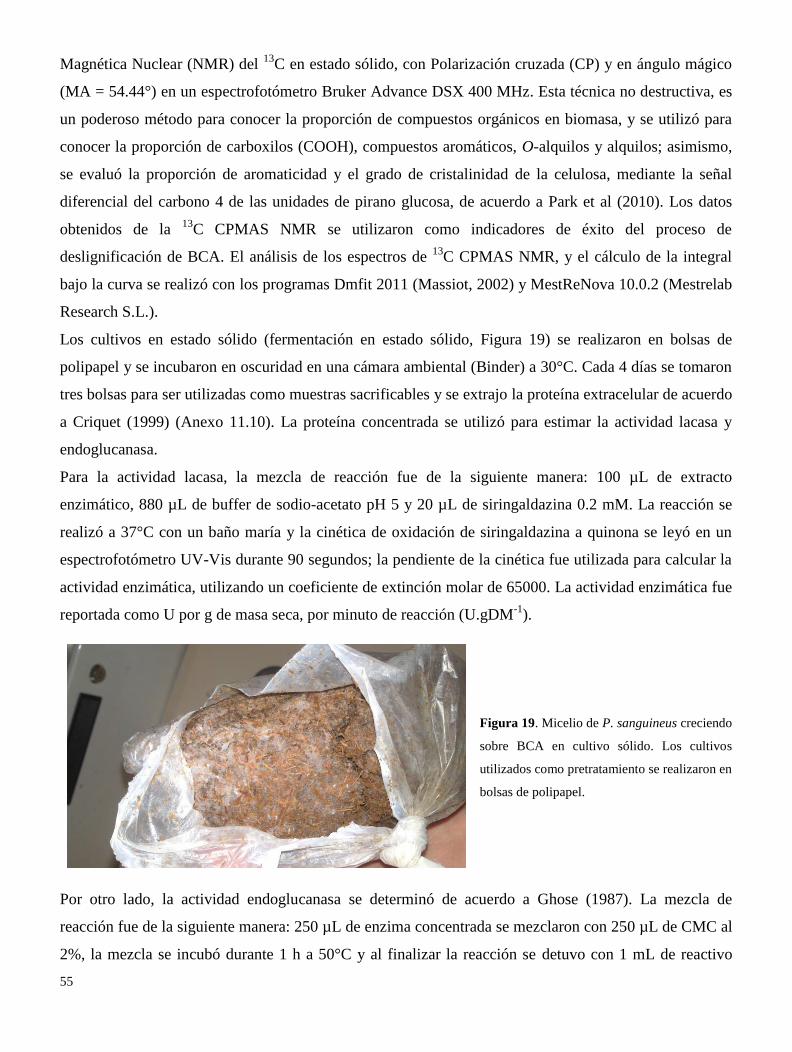
55
Magnética Nuclear (NMR) del 13
C en estado sólido, con Polarización cruzada (CP) y en ángulo mágico
(MA = 54.44°) en un espectrofotómetro Bruker Advance DSX 400 MHz. Esta técnica no destructiva, es
un poderoso método para conocer la proporción de compuestos orgánicos en biomasa, y se utilizó para
conocer la proporción de carboxilos (COOH), compuestos aromáticos, O-alquilos y alquilos; asimismo,
se evaluó la proporción de aromaticidad y el grado de cristalinidad de la celulosa, mediante la señal
diferencial del carbono 4 de las unidades de pirano glucosa, de acuerdo a Park et al (2010). Los datos
obtenidos de la 13
C CPMAS NMR se utilizaron como indicadores de éxito del proceso de
deslignificación de BCA. El análisis de los espectros de 13
C CPMAS NMR, y el cálculo de la integral
bajo la curva se realizó con los programas Dmfit 2011 (Massiot, 2002) y MestReNova 10.0.2 (Mestrelab
Research S.L.).
Los cultivos en estado sólido (fermentación en estado sólido, Figura 19) se realizaron en bolsas de
polipapel y se incubaron en oscuridad en una cámara ambiental (Binder) a 30°C. Cada 4 días se tomaron
tres bolsas para ser utilizadas como muestras sacrificables y se extrajo la proteína extracelular de acuerdo
a Criquet (1999) (Anexo 11.10). La proteína concentrada se utilizó para estimar la actividad lacasa y
endoglucanasa.
Para la actividad lacasa, la mezcla de reacción fue de la siguiente manera: 100 µL de extracto
enzimático, 880 µL de buffer de sodio-acetato pH 5 y 20 µL de siringaldazina 0.2 mM. La reacción se
realizó a 37°C con un baño maría y la cinética de oxidación de siringaldazina a quinona se leyó en un
espectrofotómetro UV-Vis durante 90 segundos; la pendiente de la cinética fue utilizada para calcular la
actividad enzimática, utilizando un coeficiente de extinción molar de 65000. La actividad enzimática fue
reportada como U por g de masa seca, por minuto de reacción (U.gDM-1
).
Figura 19. Micelio de P. sanguineus creciendo
sobre BCA en cultivo sólido. Los cultivos
utilizados como pretratamiento se realizaron en
bolsas de polipapel.
Por otro lado, la actividad endoglucanasa se determinó de acuerdo a Ghose (1987). La mezcla de
reacción fue de la siguiente manera: 250 µL de enzima concentrada se mezclaron con 250 µL de CMC al
2%, la mezcla se incubó durante 1 h a 50°C y al finalizar la reacción se detuvo con 1 mL de reactivo
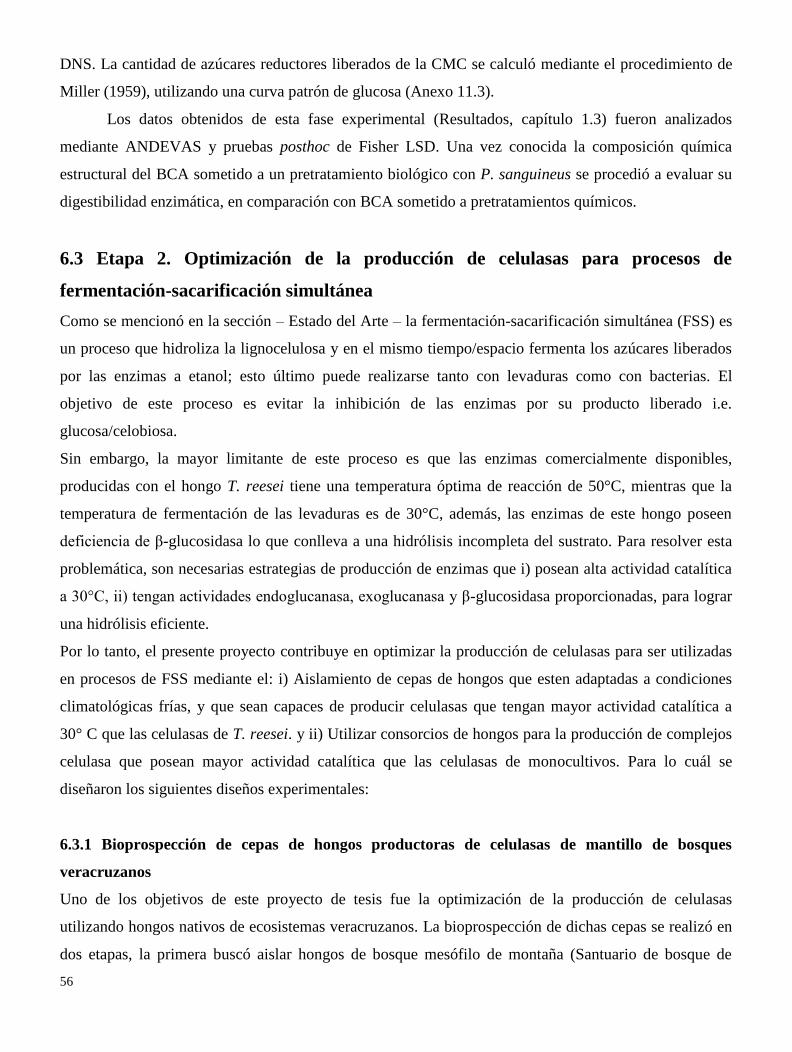
56
DNS. La cantidad de azúcares reductores liberados de la CMC se calculó mediante el procedimiento de
Miller (1959), utilizando una curva patrón de glucosa (Anexo 11.3).
Los datos obtenidos de esta fase experimental (Resultados, capítulo 1.3) fueron analizados
mediante ANDEVAS y pruebas posthoc de Fisher LSD. Una vez conocida la composición química
estructural del BCA sometido a un pretratamiento biológico con P. sanguineus se procedió a evaluar su
digestibilidad enzimática, en comparación con BCA sometido a pretratamientos químicos.
6.3 Etapa 2. Optimización de la producción de celulasas para procesos de
fermentación-sacarificación simultánea
Como se mencionó en la sección – Estado del Arte – la fermentación-sacarificación simultánea (FSS) es
un proceso que hidroliza la lignocelulosa y en el mismo tiempo/espacio fermenta los azúcares liberados
por las enzimas a etanol; esto último puede realizarse tanto con levaduras como con bacterias. El
objetivo de este proceso es evitar la inhibición de las enzimas por su producto liberado i.e.
glucosa/celobiosa.
Sin embargo, la mayor limitante de este proceso es que las enzimas comercialmente disponibles,
producidas con el hongo T. reesei tiene una temperatura óptima de reacción de 50°C, mientras que la
temperatura de fermentación de las levaduras es de 30°C, además, las enzimas de este hongo poseen
deficiencia de β-glucosidasa lo que conlleva a una hidrólisis incompleta del sustrato. Para resolver esta
problemática, son necesarias estrategias de producción de enzimas que i) posean alta actividad catalítica
a 30°C, ii) tengan actividades endoglucanasa, exoglucanasa y β-glucosidasa proporcionadas, para lograr
una hidrólisis eficiente.
Por lo tanto, el presente proyecto contribuye en optimizar la producción de celulasas para ser utilizadas
en procesos de FSS mediante el: i) Aislamiento de cepas de hongos que esten adaptadas a condiciones
climatológicas frías, y que sean capaces de producir celulasas que tengan mayor actividad catalítica a
30° C que las celulasas de T. reesei. y ii) Utilizar consorcios de hongos para la producción de complejos
celulasa que posean mayor actividad catalítica que las celulasas de monocultivos. Para lo cuál se
diseñaron los siguientes diseños experimentales:
6.3.1 Bioprospección de cepas de hongos productoras de celulasas de mantillo de bosques
veracruzanos
Uno de los objetivos de este proyecto de tesis fue la optimización de la producción de celulasas
utilizando hongos nativos de ecosistemas veracruzanos. La bioprospección de dichas cepas se realizó en
dos etapas, la primera buscó aislar hongos de bosque mesófilo de montaña (Santuario de bosque de
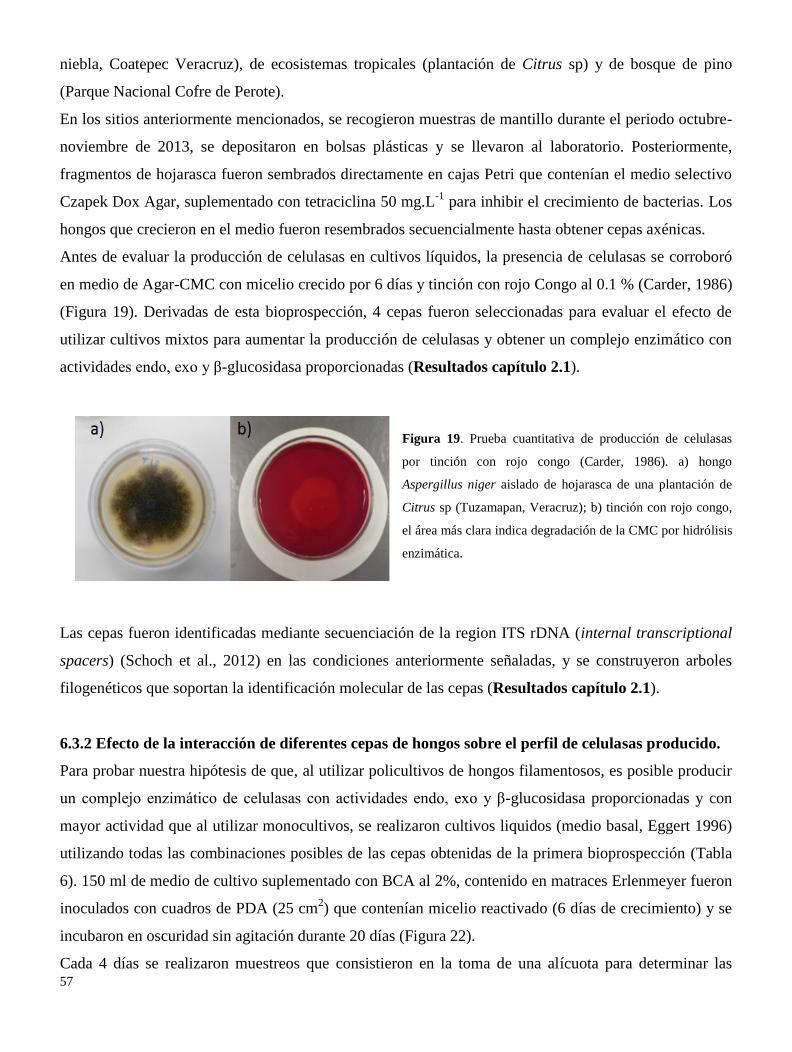
57
niebla, Coatepec Veracruz), de ecosistemas tropicales (plantación de Citrus sp) y de bosque de pino
(Parque Nacional Cofre de Perote).
En los sitios anteriormente mencionados, se recogieron muestras de mantillo durante el periodo octubre-
noviembre de 2013, se depositaron en bolsas plásticas y se llevaron al laboratorio. Posteriormente,
fragmentos de hojarasca fueron sembrados directamente en cajas Petri que contenían el medio selectivo
Czapek Dox Agar, suplementado con tetraciclina 50 mg.L-1
para inhibir el crecimiento de bacterias. Los
hongos que crecieron en el medio fueron resembrados secuencialmente hasta obtener cepas axénicas.
Antes de evaluar la producción de celulasas en cultivos líquidos, la presencia de celulasas se corroboró
en medio de Agar-CMC con micelio crecido por 6 días y tinción con rojo Congo al 0.1 % (Carder, 1986)
(Figura 19). Derivadas de esta bioprospección, 4 cepas fueron seleccionadas para evaluar el efecto de
utilizar cultivos mixtos para aumentar la producción de celulasas y obtener un complejo enzimático con
actividades endo, exo y β-glucosidasa proporcionadas (Resultados capítulo 2.1).
Figura 19. Prueba cuantitativa de producción de celulasas
por tinción con rojo congo (Carder, 1986). a) hongo
Aspergillus niger aislado de hojarasca de una plantación de
Citrus sp (Tuzamapan, Veracruz); b) tinción con rojo congo,
el área más clara indica degradación de la CMC por hidrólisis
enzimática.
Las cepas fueron identificadas mediante secuenciación de la region ITS rDNA (internal transcriptional
spacers) (Schoch et al., 2012) en las condiciones anteriormente señaladas, y se construyeron arboles
filogenéticos que soportan la identificación molecular de las cepas (Resultados capítulo 2.1).
6.3.2 Efecto de la interacción de diferentes cepas de hongos sobre el perfil de celulasas producido.
Para probar nuestra hipótesis de que, al utilizar policultivos de hongos filamentosos, es posible producir
un complejo enzimático de celulasas con actividades endo, exo y β-glucosidasa proporcionadas y con
mayor actividad que al utilizar monocultivos, se realizaron cultivos liquidos (medio basal, Eggert 1996)
utilizando todas las combinaciones posibles de las cepas obtenidas de la primera bioprospección (Tabla
6). 150 ml de medio de cultivo suplementado con BCA al 2%, contenido en matraces Erlenmeyer fueron
inoculados con cuadros de PDA (25 cm2) que contenían micelio reactivado (6 días de crecimiento) y se
incubaron en oscuridad sin agitación durante 20 días (Figura 22).
Cada 4 días se realizaron muestreos que consistieron en la toma de una alícuota para determinar las
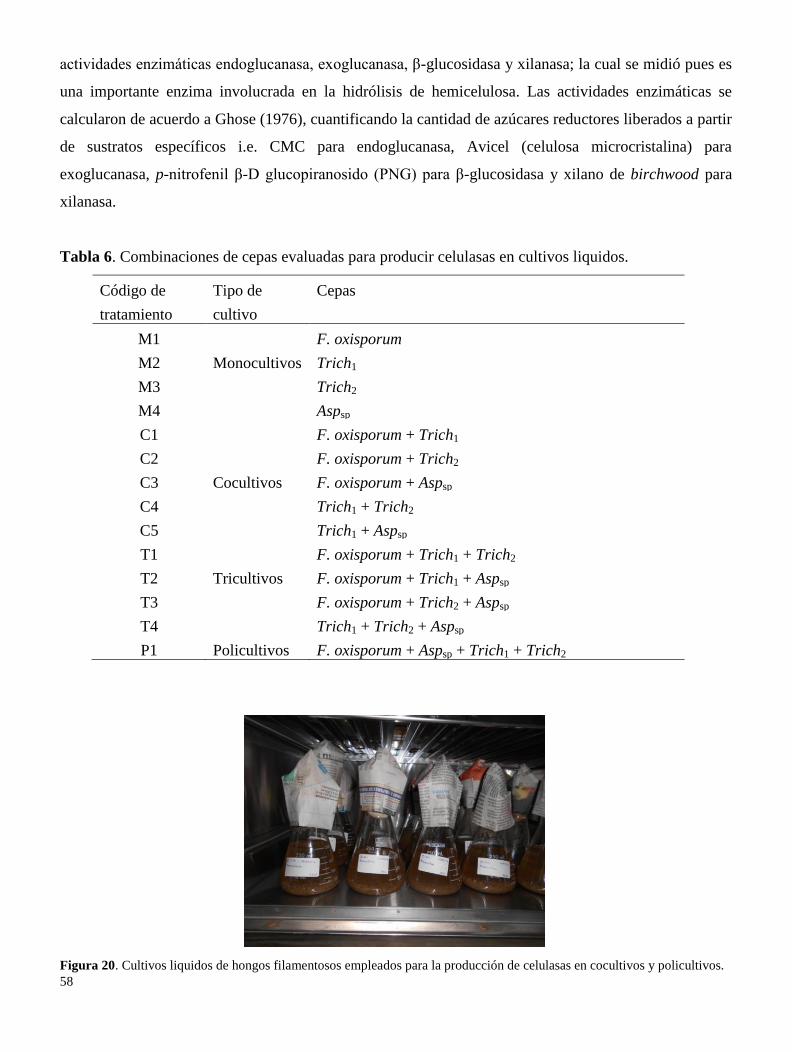
58
actividades enzimáticas endoglucanasa, exoglucanasa, β-glucosidasa y xilanasa; la cual se midió pues es
una importante enzima involucrada en la hidrólisis de hemicelulosa. Las actividades enzimáticas se
calcularon de acuerdo a Ghose (1976), cuantificando la cantidad de azúcares reductores liberados a partir
de sustratos específicos i.e. CMC para endoglucanasa, Avicel (celulosa microcristalina) para
exoglucanasa, p-nitrofenil β-D glucopiranosido (PNG) para β-glucosidasa y xilano de birchwood para
xilanasa.
Tabla 6. Combinaciones de cepas evaluadas para producir celulasas en cultivos liquidos.
Código de
tratamiento
Tipo de
cultivo
Cepas
M1
Monocultivos
F. oxisporum
M2 Trich1
M3 Trich2
M4 Aspsp
C1
Cocultivos
F. oxisporum + Trich1
C2 F. oxisporum + Trich2
C3 F. oxisporum + Aspsp
C4 Trich1 + Trich2
C5 Trich1 + Aspsp
T1
Tricultivos
F. oxisporum + Trich1 + Trich2
T2 F. oxisporum + Trich1 + Aspsp
T3 F. oxisporum + Trich2 + Aspsp
T4 Trich1 + Trich2 + Aspsp
P1 Policultivos F. oxisporum + Aspsp + Trich1 + Trich2
Figura 20. Cultivos liquidos de hongos filamentosos empleados para la producción de celulasas en cocultivos y policultivos.
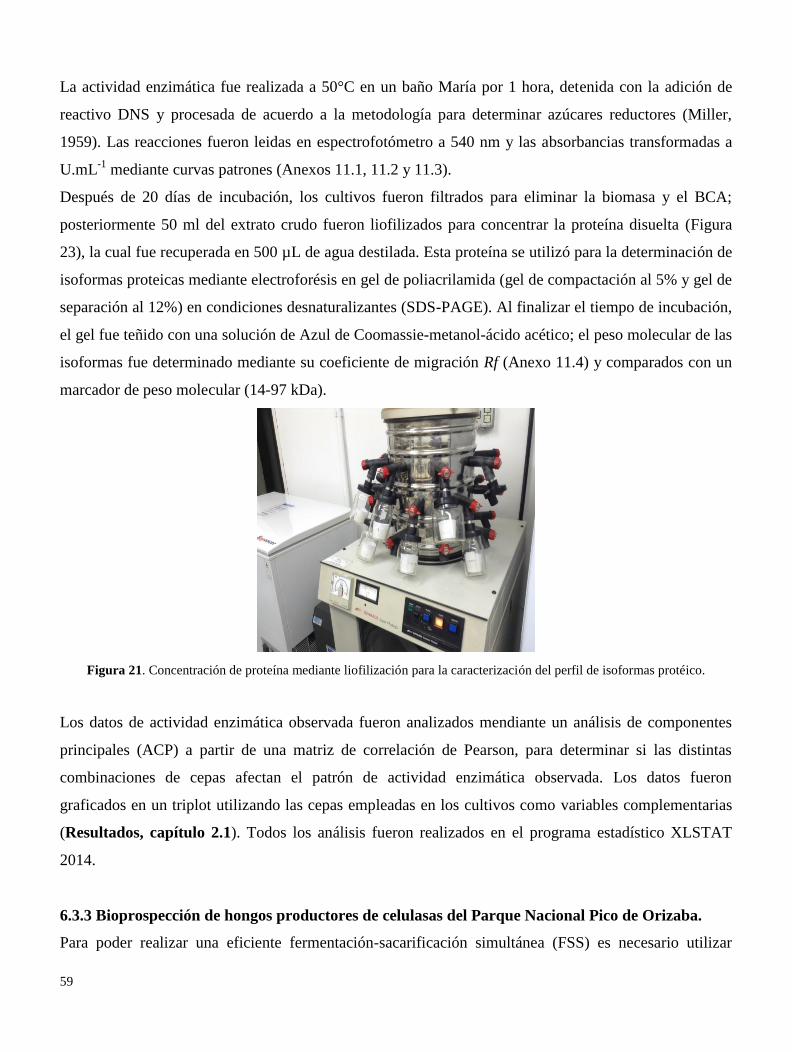
59
La actividad enzimática fue realizada a 50°C en un baño María por 1 hora, detenida con la adición de
reactivo DNS y procesada de acuerdo a la metodología para determinar azúcares reductores (Miller,
1959). Las reacciones fueron leidas en espectrofotómetro a 540 nm y las absorbancias transformadas a
U.mL-1
mediante curvas patrones (Anexos 11.1, 11.2 y 11.3).
Después de 20 días de incubación, los cultivos fueron filtrados para eliminar la biomasa y el BCA;
posteriormente 50 ml del extrato crudo fueron liofilizados para concentrar la proteína disuelta (Figura
23), la cual fue recuperada en 500 µL de agua destilada. Esta proteína se utilizó para la determinación de
isoformas proteicas mediante electroforésis en gel de poliacrilamida (gel de compactación al 5% y gel de
separación al 12%) en condiciones desnaturalizantes (SDS-PAGE). Al finalizar el tiempo de incubación,
el gel fue teñido con una solución de Azul de Coomassie-metanol-ácido acético; el peso molecular de las
isoformas fue determinado mediante su coeficiente de migración Rf (Anexo 11.4) y comparados con un
marcador de peso molecular (14-97 kDa).
Figura 21. Concentración de proteína mediante liofilización para la caracterización del perfil de isoformas protéico.
Los datos de actividad enzimática observada fueron analizados mendiante un análisis de componentes
principales (ACP) a partir de una matriz de correlación de Pearson, para determinar si las distintas
combinaciones de cepas afectan el patrón de actividad enzimática observada. Los datos fueron
graficados en un triplot utilizando las cepas empleadas en los cultivos como variables complementarias
(Resultados, capítulo 2.1). Todos los análisis fueron realizados en el programa estadístico XLSTAT
2014.
6.3.3 Bioprospección de hongos productores de celulasas del Parque Nacional Pico de Orizaba.
Para poder realizar una eficiente fermentación-sacarificación simultánea (FSS) es necesario utilizar
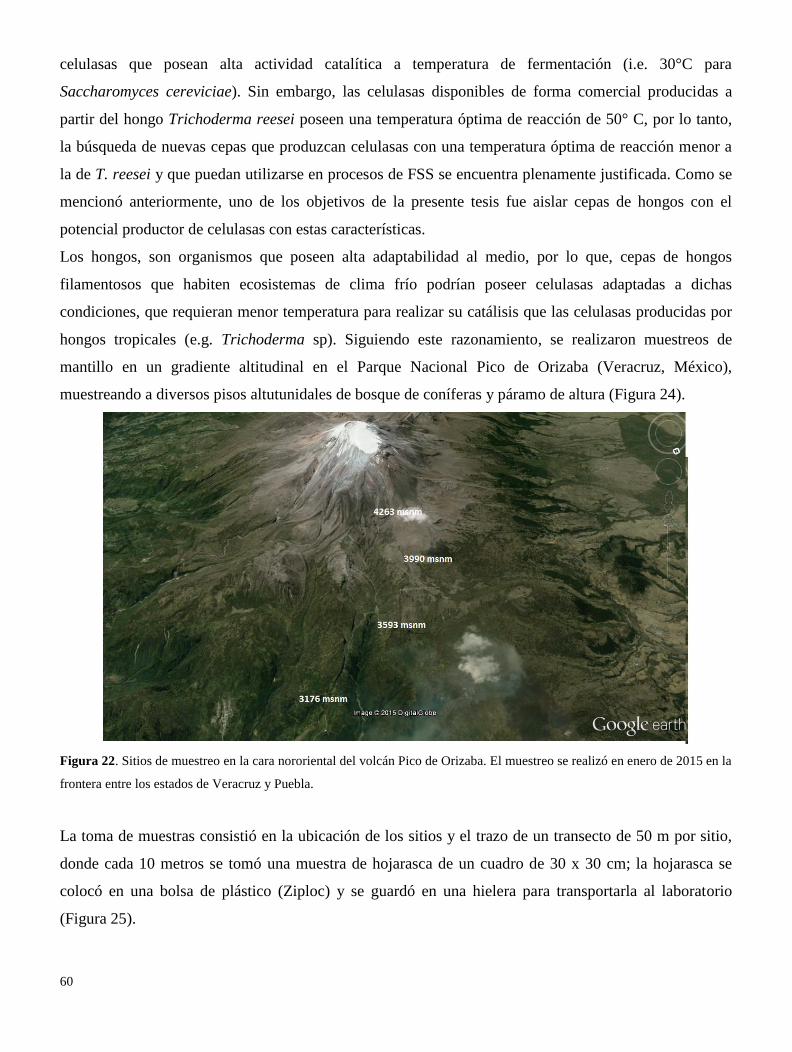
60
celulasas que posean alta actividad catalítica a temperatura de fermentación (i.e. 30°C para
Saccharomyces cereviciae). Sin embargo, las celulasas disponibles de forma comercial producidas a
partir del hongo Trichoderma reesei poseen una temperatura óptima de reacción de 50° C, por lo tanto,
la búsqueda de nuevas cepas que produzcan celulasas con una temperatura óptima de reacción menor a
la de T. reesei y que puedan utilizarse en procesos de FSS se encuentra plenamente justificada. Como se
mencionó anteriormente, uno de los objetivos de la presente tesis fue aislar cepas de hongos con el
potencial productor de celulasas con estas características.
Los hongos, son organismos que poseen alta adaptabilidad al medio, por lo que, cepas de hongos
filamentosos que habiten ecosistemas de clima frío podrían poseer celulasas adaptadas a dichas
condiciones, que requieran menor temperatura para realizar su catálisis que las celulasas producidas por
hongos tropicales (e.g. Trichoderma sp). Siguiendo este razonamiento, se realizaron muestreos de
mantillo en un gradiente altitudinal en el Parque Nacional Pico de Orizaba (Veracruz, México),
muestreando a diversos pisos altutunidales de bosque de coníferas y páramo de altura (Figura 24).
Figura 22. Sitios de muestreo en la cara nororiental del volcán Pico de Orizaba. El muestreo se realizó en enero de 2015 en la
frontera entre los estados de Veracruz y Puebla.
La toma de muestras consistió en la ubicación de los sitios y el trazo de un transecto de 50 m por sitio,
donde cada 10 metros se tomó una muestra de hojarasca de un cuadro de 30 x 30 cm; la hojarasca se
colocó en una bolsa de plástico (Ziploc) y se guardó en una hielera para transportarla al laboratorio
(Figura 25).
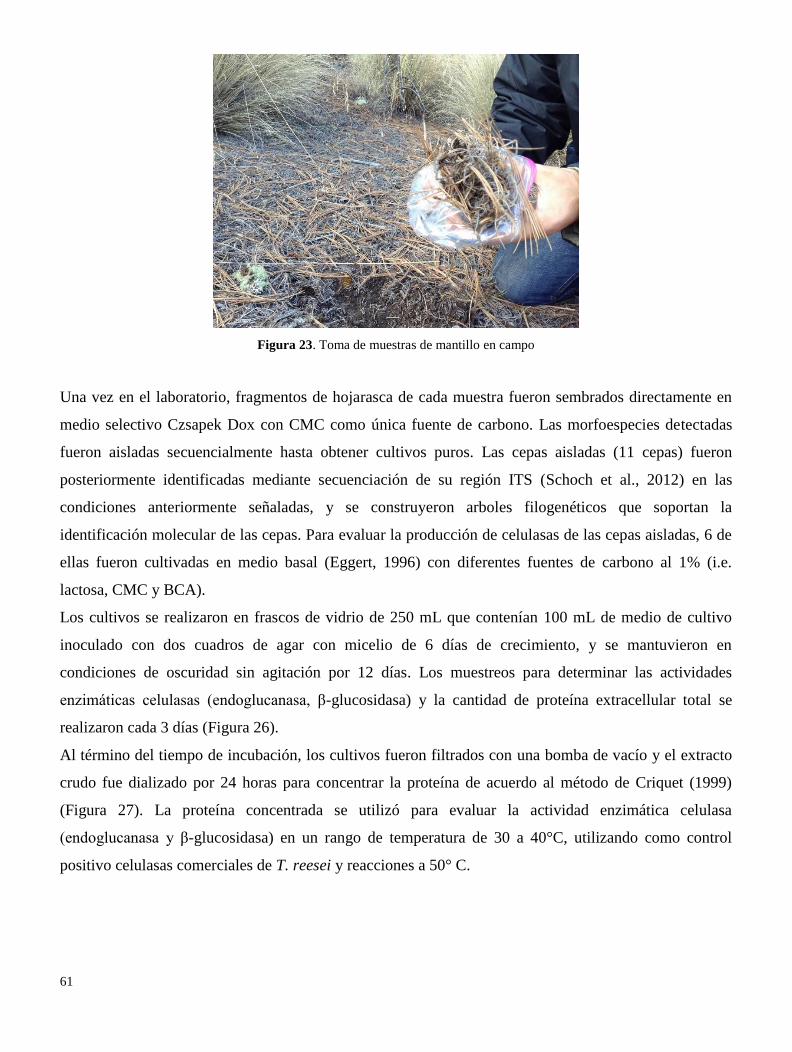
61
Figura 23. Toma de muestras de mantillo en campo
Una vez en el laboratorio, fragmentos de hojarasca de cada muestra fueron sembrados directamente en
medio selectivo Czsapek Dox con CMC como única fuente de carbono. Las morfoespecies detectadas
fueron aisladas secuencialmente hasta obtener cultivos puros. Las cepas aisladas (11 cepas) fueron
posteriormente identificadas mediante secuenciación de su región ITS (Schoch et al., 2012) en las
condiciones anteriormente señaladas, y se construyeron arboles filogenéticos que soportan la
identificación molecular de las cepas. Para evaluar la producción de celulasas de las cepas aisladas, 6 de
ellas fueron cultivadas en medio basal (Eggert, 1996) con diferentes fuentes de carbono al 1% (i.e.
lactosa, CMC y BCA).
Los cultivos se realizaron en frascos de vidrio de 250 mL que contenían 100 mL de medio de cultivo
inoculado con dos cuadros de agar con micelio de 6 días de crecimiento, y se mantuvieron en
condiciones de oscuridad sin agitación por 12 días. Los muestreos para determinar las actividades
enzimáticas celulasas (endoglucanasa, β-glucosidasa) y la cantidad de proteína extracellular total se
realizaron cada 3 días (Figura 26).
Al término del tiempo de incubación, los cultivos fueron filtrados con una bomba de vacío y el extracto
crudo fue dializado por 24 horas para concentrar la proteína de acuerdo al método de Criquet (1999)
(Figura 27). La proteína concentrada se utilizó para evaluar la actividad enzimática celulasa
(endoglucanasa y β-glucosidasa) en un rango de temperatura de 30 a 40°C, utilizando como control
positivo celulasas comerciales de T. reesei y reacciones a 50° C.
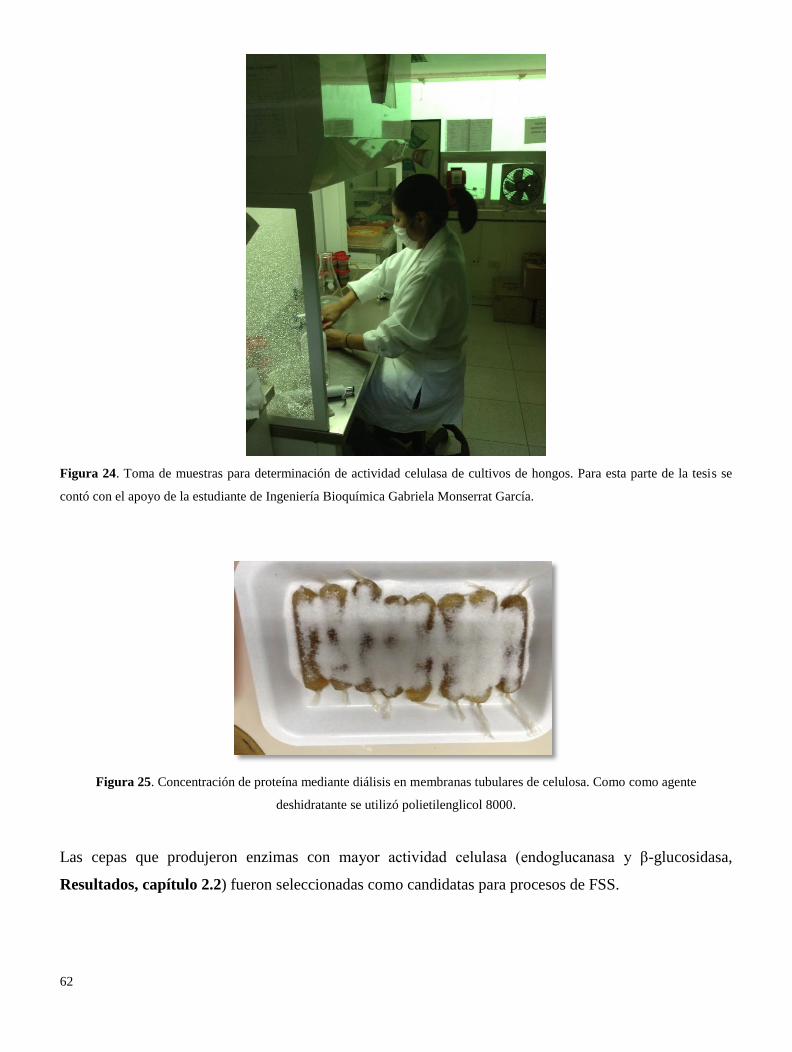
62
Figura 24. Toma de muestras para determinación de actividad celulasa de cultivos de hongos. Para esta parte de la tesis se
contó con el apoyo de la estudiante de Ingeniería Bioquímica Gabriela Monserrat García.
Figura 25. Concentración de proteína mediante diálisis en membranas tubulares de celulosa. Como como agente
deshidratante se utilizó polietilenglicol 8000.
Las cepas que produjeron enzimas con mayor actividad celulasa (endoglucanasa y β-glucosidasa,
Resultados, capítulo 2.2) fueron seleccionadas como candidatas para procesos de FSS.
63
6.4 Etapa 3. Digestibilidad enzimática de BCA sometido a diferentes
pretratamientos
Una vez realizados los diferentes pretratamientos biológicos (Resultados, capítulo 3.1) y conocida la
estructura química del BCA obtenido después de un proceso de deslignificación en estado sólido, se
evaluó su digestibilidad enzimática (con celulasas comerciales de Aspergillus niger, marca USB) y se
comparó con la digestibilidad de BCA sometidos a pretratamientos químicos con NaOH y Ca(OH)2 al
5%.
Se realizó un experimento multifactorial, donde las variables explicativas fueron la proporción de
COOH, C-aromático, O-alquilos y alquilos, así como el índice de cristalinidad, la cantidad de
aminoácidos, ergosterol, quitina, y el C4 de la xilosa; del BCA pretratado con P. sanguineus, NaOH y
Ca(OH)2; estas variables fueron medidas mediante 13
C CPMAS NMR. Las variables de respuesta fueron
la cantidad de azúcares liberados i.e. glucosa, xilosa, arabinosa y celobiosa, en función del tiempo. La
actividad celulasa también fue evaluada y se reporta como FPU.mL-1
.
Las condiciones de hidrólisis enzimática utilizadas fueron aquellas definidas por Borges et al (2014), con
algunas modificaciones. La hidrólisis se realizó a un volumen de carga del 2%, en buffer acetato de
sodio 50 mM pH 4.8 (25 ml), con una carga de celulasas para obtener una actividad de 3.5 FPU.g de
BCA-1
, en agitación constante de 150 rpm (De Souza et al., 2014). Los muestreos se realizaron cada 24
horas durante 96 horas (Pereira et al., 2015; De Souza et al., 2014; Borges et al., 2014), mediante la toma
de alícuotas a las cuales se les determinaron las concentraciones de glucosa, xilosa, celobiosa y arabinosa
mediante cromatografía de líquidos de alta resolución (HPLC, Waters); a su vez, la actividad enzimática
celulasa total (FPU) fue estimada de acuerdo a Ghose (1987).
Para conocer la forma en que la estructura química del BCA resultante de distintos pretratamientos
(químicos y biológicos) afecta su hidrólisis con celulasas y la cantidad de productos de reacción, los
datos obtenidos se analizaron mediante un análisis de componentes principales (ACP). Para conocer si
existieron diferencias entre los rendimientos de hidrólisis dependientes del material parental, se
realizaron ANDEVAS con pruebas posthoc de Fisher LSD. Estos análisis se realizaron en el programa
estadístico XLSTAT 2014 y Statistica 7 (StatSoft, 2004).
Posteriormente, los productos de hidrólisis fueron fermentados mediante la adición del equivalente a 0.4
g.l-1
de células secas de Saccharomyces cerevisae (Li et al., 2011). Los muestreos se realizaron cada 24
horas durante 96 horas (Pereira et al., 2015; De Souza et al., 2014; Borges et al., 2014), mediante la toma
de alícuotas a las cuales se les determinaron las concentraciones de glucosa, xilosa, celobiosa, ácido
acético, ácido láctico, arabinosa y etanol mediante cromatografía de líquidos de alta resolución (HPLC).

64
La biomasa de Saccharomyces cerevisae fue estimada mediante conteo directo en cámara de Neubauer,
cada 20 h.
65
Resultados
Capítulo 1
Deslignificación biológica de bagazo de caña de azúcar
__________________________________
66
1.1 Light-induced inhibition of laccase in Pycnoporus sanguineus
Artículo publicado en Folia Microbiológica (Springer)
Publicado en línea el 2 de agosto de 2015
El artículo reporta los resultados obtenidos del capítulo 1. Efecto de la luminosidad sobre la producción
de la enzima lacasa en Pycnoporus sanguineus.
______________________________________
67
DOI 10.1007/s12223-015-0418-7
Light-induced inhibition of laccase in Pycnoporus sanguineus
Christian A. Hernández 1
& Yareni Perroni 1
& José Antonio García Pérez2
&
Beatriz Gutiérrez Rivera3
& Enrique Alarcón1
Received: 22 April 2015 / Accepted: 15 July 2015 # Institute of Microbiology, Academy of Sciences of the Czech Republic, v.v.i. 2015
Abstract The aim was to determine which specific regions of
the visible light spectrum were responsible for the induction or
inhibition of laccase in Pycnoporus sanguineus. Cultures were
exposed to various bandwidth lights: blue (460 nm), green
(525 nm), white (a combination of 460 and 560 nm), red
(660 nm), and darkness. The results indicate that short wave-
lengths strongly inhibit the production of laccase: green (3.76
±1.12 U/L), blue (1.94±0.36 U/L), and white (1.05±0.21 U/
L) in proportions of 85.8, 92.6, and 96.0 %, respectively;
whereas long wavelengths inhibit laccase production only par-
tially i.e., red light (14.05 ± 4.79 U/L) in a proportion of
46.8 %. Maximum activity was induced in absence of visible
light (30 °C, darkness), i.e., 30.76±4.0 U/L. It is concluded
that the production of laccase in P. sanguineus responds to
light stimuli [measured as wavelengths and lx] and that it does
so inversely. This can be explained as an ecological mecha-
nism of environmental recognition, given that P. sanguineus
develops inside lignocellulose structures in conditions of dark-
ness. The presence of short wavelength light (460–510 nm)
would indicate that the organism finds itself in an external
environment, unprovided of lignin, and that it is therefore
unnecessary to secrete laccase. This possible new regulation
in the laccase production in P. sanguineus has important bio-
technological implications, for it would be possible to control
the production of laccase using light stimuli.
Introduction
It is known that the production of some extracellular enzymes
* Enrique Alarcón
Christian A. Hernández
Yareni Perroni
José Antonio García Pérez
Beatriz Gutiérrez Rivera [email protected]
1 Institute of Biotechnology and Applied Ecology (INBIOTECA),
Universidad Veracruzana, Av. Culturas Veracruzanas 101, Col.
Emiliano Zapata, Xalapa, Veracruz 91090, Mexico
2 Faculty of Biology, Universidad Veracruzana, Cto. Gonzalo Aguirre
Beltrán s/n, Col. Emiliano Zapata, Xalapa, Veracruz 91090, Mexico
3 Instituto Tecnológico Superior de Tierra Blanca, Av. Veracruz S/N
Esq. Héroes de Puebla, Colonia Pemex, Tierra
Blanca, Veracruz 95180, Mexico
involved in the degradation of lignocellulose by certain fungi
is differentially affected by the various wavelengths of the
visible light spectrum (Schmoll et al. 2005; 2012). However,
in spite of the fact that light has been associated to the regu-
latory processes in the production of exoenzymes, little is
known about the mechanisms of the perception of light and
the transduction of signals ( Rodríguez-Romero et al. 2010).
From the adaptive viewpoint, changes in the detection of light
furnishes fungi with information on orientation as well as
exposition to external environments (Herrera-Estrella and
Horwitz 2007; Corrochano 2011), allowing them to adjust
their metabolism to the prevailing conditions for optimal use
of the resources at hand. Pycnoporus sanguineus
(Polyporaceae) is a basidiomycete fungus that, as a saprobe,
produces extracellular enzymes that allow it to decompose
organic polymers and consume its monomers. These fungi
are of special interest because they produce enzymes of the
laccase group that decompose mainly lignin. Laccases are
enzymes with a wide specificity of substratum involved in
68
the white decay of wood (lignin oxidation), and the biotech-
nological knowledge of their production mechanisms has im-
portant industrial and environmental applications. Some of
their applications are the pretreatment of wood for biofuel
production and the recycling or transformation of toxic waste
and other pollutants such as polycyclic aromatic hydrocar-
bons, pesticides, and industrial dyes (Kunamneni et al. 2007;
Jong-Rok and Yoon-Seok 2013; Meng-Juan et al. 2013). It is
known that the production of laccases is affected by chemical
signals; for example, a high abundance of simple carbonated
forms (mainly glucose) leads to a genetic transcriptional inhi-
bition of laccase. This is attributed to the carbon catabolic
repression transcription factors (CreaA; Janusz et al.
2012), which respond to an epigenetic regulation via
G/AMPc/proteins kinase, regulating gene clusters related to
secondary metabolism. Such transcription regulators have
been characterized in the laccase gene (LAC1)- promoting
region of basidiomycete fungi (Janusz et al. 2013; Xiao et
al. 2006).
However, in spite of the fact that light has been associ- ated
with regulation in the production of exoenzymes and with
various bioprocesses in fungi such as sporulation and
regulation of circadian rhythms (Saha et al. 2008), practi-
cally nothing is known of its effects on the regulation in the
laccase production of P. sanguineus. This study sets out to
identify a possible regulation in the production of laccase by
stimuli from changes in the visible light spectrum sur-
rounding P. sanguineus. We therefore set out to find evi-
dence of enzymatic regulation, measured as inhibition,
resulting from wavelength changes within the visible light
spectrum. This may open up new avenues for a better un-
derstanding of the interaction processes between organisms
and their environment, as well as those regulation mecha-
nisms of extracellular enzymes that are mediated by visible
light.
Materials and methods
Strain and inoculum
The strain of P. sanguineus used was isolated from a wild
mushroom found in the cane fields of Jalcomulco,
Veracruz, México (19°20′00″N, 96°46′00″W), registered as
F. Ramírez-Guillén 932 in the Herbarium Xal
(INECOL, A.C.) and identified by ITS 1, 4 amplification
(GenBank accession KR013138). The strain was preserved
in a potato dextrose agar medium (PDA) at 4 °C and
reactivated in Petri dishes with PDA at 30 °C for 7 days
prior to the experiment. As inoculum, during the experi-
mental phase, agar squares 0.25 cm2
in size with reactivated
mycelium were used.
Experimental design
A single-factor design was used to determine the effect of
exposition to different types of visible light on the production
of laccase in P. sanguineus. The mushroom was exposed to
different light wavelengths within the visible light spectrum:
blue (460 nm), green (525 nm), white (combination of 460
and 560 nm), and red (660 nm), using light-emitting diodes
(LEDs). As a means of control, cultivars kept in conditions of
darkness were used. Illuminance (lux=lm/m2) of each treat-
ment, replicated four times, was measured with a lux meter
(Fisher Scientific), corresponding to 22.66 lx (for blue light),
183.5 lx (red), 675 lx (green), and 750 lx (white). In order to
rule out a possible adverse effect of light on the growth of
P. sanguineus, which might affect the production of laccase,
the glucose consumption kinetics and the final biomass pro-
duction were also quantified. Samples for the determination of
laccase and glucose were taken periodically over 20 days.
At the end of the experiment, the significant effects of the
treatments were determined by the one-way variance analysis
protocol [ANOVA; (Zar 1999)] and the Fisher LSD (Least
significant difference) post hoc test. Also, in order to know if
the laccase activity was affected by light wavelength (nm),
and its correspondent lx values, correlations and linear regres-
sion analysis were done. The analyses were carried out on the
STATISTICA 7 software (StatSoft 2004).
Cultivar medium and conditions
The experimental units consisted of glass containers with
150 mL of minimal medium (Kyi 2011), which was composed
of 5 % of a salt solution base composed of 6 g of NaNO3,
0.52 g of KCl, 0.52 g of MgSO4, and 0.82 g of KH2PO4 per
liter, and 0.02 % of a Hutner solution of trace elements com-
posed of 0.22 g of ZnSO4, 0.11g of H3BO3, 0.05 g of MnCl2,
0.05 g of FeSO4, 0.016 g of CoCl2, 0.016 g of CuSO4, and
0.011 g of (NH4) 6MO7O24 per 100 mL and 1 g/L of glucose
as a source of carbon. Cultivars were kept steady and under
constant temperature conditions (30 °C) in an environmental
chamber (Binder, Germany).
Analytic methods
Laccase activities were estimated using syringaldazine as a
substrate, according to Leonowicz and Grzywnowicz (1981)
and modified by Criquet (1999). To 990 μL of cultivar sam-
ple, 10 μL of a solution of syringaldazine at 5 mM were
added. The oxidation kinetics from syringaldazine to quinone
was followed at 525 nm (ε=65,000 M–1
cm–1
) at 37 °C. The
activity was expressed as μmol of quinone formed from
syringaldazine per min (U) per one L of cultivar (U.L–1
).
The consumption of sugars was determined through the spec-
trophotometric method of dinitrosalicylic acid (DNS; Miller,
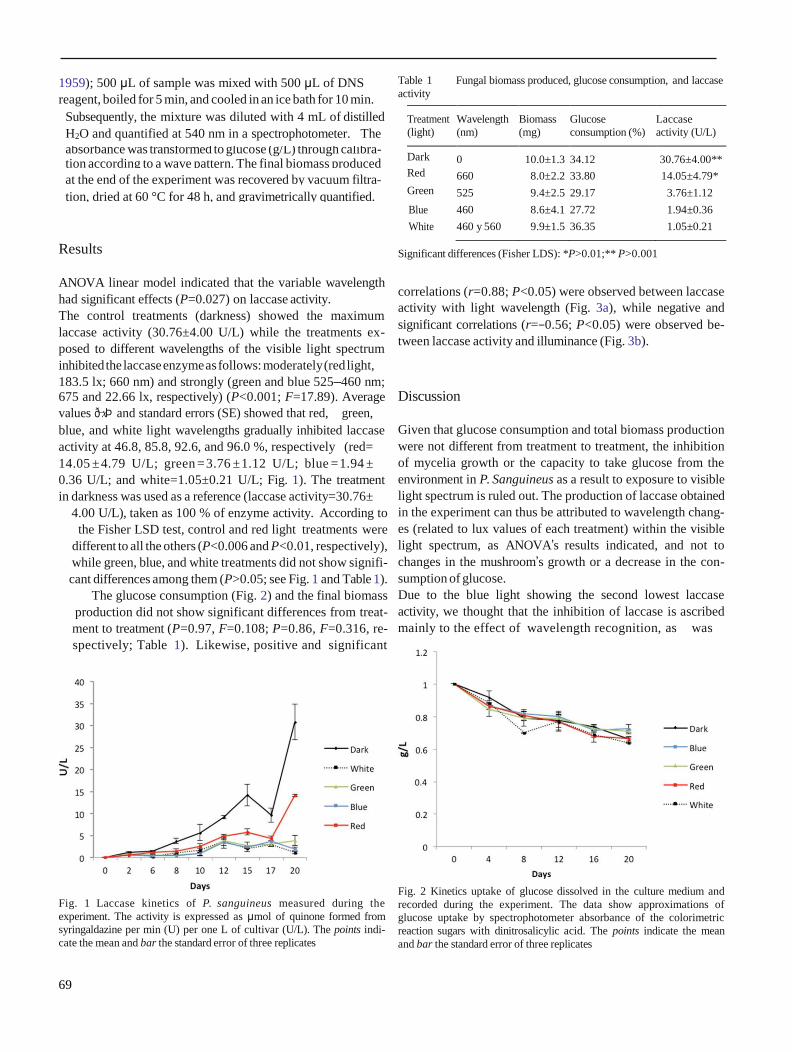
69
1959); 500 μL of sample was mixed with 500 μL of DNS
reagent, boiled for 5 min, and cooled in an ice bath for 10 min.
Table 1 Fungal biomass produced, glucose consumption, and laccase
activity
Results
ANOVA linear model indicated that the variable wavelength
had significant effects (P=0.027) on laccase activity.
The control treatments (darkness) showed the maximum
laccase activity (30.76±4.00 U/L) while the treatments ex-
posed to different wavelengths of the visible light spectrum
inhibited the laccase enzyme as follows: moderately (red light,
183.5 lx; 660 nm) and strongly (green and blue 525–460 nm; 675 and 22.66 lx, respectively) (P<0.001; F=17.89). Average
values ð-xÞ and standard errors (SE) showed that red, green,
blue, and white light wavelengths gradually inhibited laccase
activity at 46.8, 85.8, 92.6, and 96.0 %, respectively (red=
14.05 ± 4.79 U/L; green = 3.76 ± 1.12 U/L; blue = 1.94 ±
0.36 U/L; and white=1.05±0.21 U/L; Fig. 1). The treatment
in darkness was used as a reference (laccase activity=30.76±
4.00 U/L), taken as 100 % of enzyme activity. According to
the Fisher LSD test, control and red light treatments were
different to all the others (P<0.006 and P<0.01, respectively),
while green, blue, and white treatments did not show signifi-
cant differences among them (P>0.05; see Fig. 1 and Table 1).
The glucose consumption (Fig. 2) and the final biomass
production did not show significant differences from treat-
ment to treatment (P=0.97, F=0.108; P=0.86, F=0.316, re-
spectively; Table 1). Likewise, positive and significant
Fig. 1 Laccase kinetics of P. sanguineus measured during the
experiment. The activity is expressed as μmol of quinone formed from
syringaldazine per min (U) per one L of cultivar (U/L). The points indi-
cate the mean and bar the standard error of three replicates
Significant differences (Fisher LDS): *P>0.01;** P>0.001
correlations (r=0.88; P<0.05) were observed between laccase
activity with light wavelength (Fig. 3a), while negative and
significant correlations (r=−0.56; P<0.05) were observed be-
tween laccase activity and illuminance (Fig. 3b).
Discussion
Given that glucose consumption and total biomass production
were not different from treatment to treatment, the inhibition
of mycelia growth or the capacity to take glucose from the
environment in P. Sanguineus as a result to exposure to visible
light spectrum is ruled out. The production of laccase obtained
in the experiment can thus be attributed to wavelength chang-
es (related to lux values of each treatment) within the visible
light spectrum, as ANOVA’s results indicated, and not to
changes in the mushroom’s growth or a decrease in the con-
sumption of glucose.
Due to the blue light showing the second lowest laccase
activity, we thought that the inhibition of laccase is ascribed
mainly to the effect of wavelength recognition, as was
Fig. 2 Kinetics uptake of glucose dissolved in the culture medium and
recorded during the experiment. The data show approximations of
glucose uptake by spectrophotometer absorbance of the colorimetric
reaction sugars with dinitrosalicylic acid. The points indicate the mean
and bar the standard error of three replicates
Subsequently, the mixture was diluted with 4 mL of distilled
H2O and quantified at 540 nm in a spectrophotometer. The Treatment
(light)
Wavelength
(nm)
Biomass
(mg)
Glucose
consumption (%)
Laccase
activity (U/L)
absorbance was transformed to glucose (g/L) through calibra- tion according to a wave pattern. The final biomass produced
Dark 0 10.0±1.3 34.12 30.76±4.00**
at the end of the experiment was recovered by vacuum filtra- Red
660 8.0±2.2 33.80 14.05±4.79*
tion, dried at 60 °C for 48 h, and gravimetrically quantified. Green
525 9.4±2.5 29.17 3.76±1.12
Blue 460 8.6±4.1 27.72 1.94±0.36
White 460 y 560 9.9±1.5 36.35 1.05±0.21
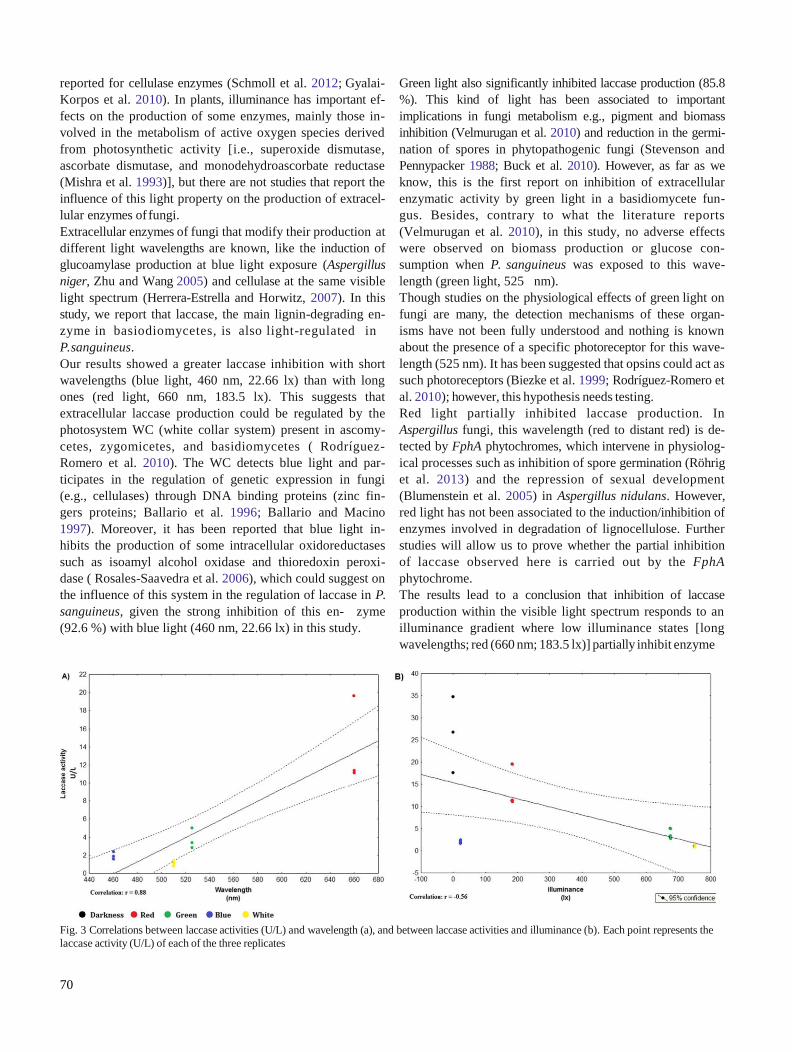
70
reported for cellulase enzymes (Schmoll et al. 2012; Gyalai-
Korpos et al. 2010). In plants, illuminance has important ef-
fects on the production of some enzymes, mainly those in-
volved in the metabolism of active oxygen species derived
from photosynthetic activity [i.e., superoxide dismutase,
ascorbate dismutase, and monodehydroascorbate reductase
(Mishra et al. 1993)], but there are not studies that report the
influence of this light property on the production of extracel-
lular enzymes of fungi.
Extracellular enzymes of fungi that modify their production at
different light wavelengths are known, like the induction of
glucoamylase production at blue light exposure (Aspergillus
niger, Zhu and Wang 2005) and cellulase at the same visible
light spectrum (Herrera-Estrella and Horwitz, 2007). In this
study, we report that laccase, the main lignin-degrading en-
zyme in basiodiomycetes, is also light-regulated in
P. sanguineus.
Our results showed a greater laccase inhibition with short
wavelengths (blue light, 460 nm, 22.66 lx) than with long
ones (red light, 660 nm, 183.5 lx). This suggests that
extracellular laccase production could be regulated by the
photosystem WC (white collar system) present in ascomy-
cetes, zygomicetes, and basidiomycetes ( Rodríguez-
Romero et al. 2010). The WC detects blue light and par-
ticipates in the regulation of genetic expression in fungi
(e.g., cellulases) through DNA binding proteins (zinc fin-
gers proteins; Ballario et al. 1996; Ballario and Macino
1997). Moreover, it has been reported that blue light in-
hibits the production of some intracellular oxidoreductases
such as isoamyl alcohol oxidase and thioredoxin peroxi-
dase ( Rosales-Saavedra et al. 2006), which could suggest on
the influence of this system in the regulation of laccase in P.
sanguineus, given the strong inhibition of this en- zyme
(92.6 %) with blue light (460 nm, 22.66 lx) in this study.
Green light also significantly inhibited laccase production (85.8
%). This kind of light has been associated to important
implications in fungi metabolism e.g., pigment and biomass
inhibition (Velmurugan et al. 2010) and reduction in the germi-
nation of spores in phytopathogenic fungi (Stevenson and
Pennypacker 1988; Buck et al. 2010). However, as far as we
know, this is the first report on inhibition of extracellular
enzymatic activity by green light in a basidiomycete fun-
gus. Besides, contrary to what the literature reports
(Velmurugan et al. 2010), in this study, no adverse effects
were observed on biomass production or glucose con-
sumption when P. sanguineus was exposed to this wave-
length (green light, 525 nm).
Though studies on the physiological effects of green light on
fungi are many, the detection mechanisms of these organ-
isms have not been fully understood and nothing is known
about the presence of a specific photoreceptor for this wave-
length (525 nm). It has been suggested that opsins could act as
such photoreceptors (Biezke et al. 1999; Rodríguez-Romero et
al. 2010); however, this hypothesis needs testing.
Red light partially inhibited laccase production. In
Aspergillus fungi, this wavelength (red to distant red) is de-
tected by FphA phytochromes, which intervene in physiolog-
ical processes such as inhibition of spore germination (Röhrig
et al. 2013) and the repression of sexual development
(Blumenstein et al. 2005) in Aspergillus nidulans. However,
red light has not been associated to the induction/inhibition of
enzymes involved in degradation of lignocellulose. Further
studies will allow us to prove whether the partial inhibition
of laccase observed here is carried out by the FphA
phytochrome.
The results lead to a conclusion that inhibition of laccase
production within the visible light spectrum responds to an
illuminance gradient where low illuminance states [long
wavelengths; red (660 nm; 183.5 lx)] partially inhibit enzyme
Fig. 3 Correlations between laccase activities (U/L) and wavelength (a), and between laccase activities and illuminance (b). Each point represents the
laccase activity (U/L) of each of the three replicates
71
production, whereas high illuminance states [short wave-
lengths; green (525 nm) and blue (460 nm), corresponding
to 675 lx and 22.66 lx, respectively] strongly inhibit it.
Likewise, white light (a combination of 460 and 560 nm, cor-
responding to 750 lx) almost completely inhibits laccase ac-
tivity, whereas the highest activity values were obtained under
conditions of darkness (0 lx).
The ecological implications of this finding contribute to the
understanding of the relationship between fungi and their en-
vironment. Due to the fact that P. sanguineus is a fungus
whose mycelium develops within the lignocellulose (e.g.,
decaying wood) and that it forms its reproductive structures
externally, it can be said that the presence or absence of light is
an important source of information for an energy-saving met-
abolic regulation, as has been proposed before (Tisch and
Schmoll 2010). Following this avenue of thought, we can hy-
pothesize that within the lignocellulose structure (in conditions
of darkness), the fungus must produce laccases in order to
degrade lignin and be able to obtain energy from polymers such
as cellulose and hemicellulose. The presence of light would
indicate that the fungus finds itself in an external environment,
unprovided of lignocellulose, and therefore interprets it as a
regulation signal that laccase production is unnecessary.
The inhibition of laccase production, specifically in the
presence of blue light, could result from the fact that lignin
(a natural laccase substrate) absorbs short light wavelengths,
mainly between 200 and 230 nm and 260 to 280 nm, corre-
sponding to ultraviolet (UV) light (Jahan and Mun 2007), and
that the absorbance of products derived from the oxidation of
lignocellulose (furans, pyrans) is close to the visible light
spectrum (blue, 320 nm). Therefore, the absence of these
wavelengths, due to their absorption by organic polymers, in
combination with the known chemical inductors (phenolic),
would indicate P. sanguineus’ location in a potentially lignin-
rich place, and that laccase production would bring a positive
trade-off, since it would mean access to energy-rich polymers
(cellulose, hemicellulose). Conversely, the presence of short
wavelengths would indicate that there is no need to produce
laccase.
Further molecular studies on the expression of the gen LAC in
real time in cultivars exposed to different wavelengths of the
visible light spectrum could bring suitable information that
enrich the data showed here. We think it is important to exper-
iment with the inhibition of specialized trans-membrane pho-
toreceptors in photonic detection (rhodopsins, opsins, etc.) so
as to identify those that are involved in the transduction of
inhibitory signals in laccase production in P. sanguineus and
other basidiomycetes.
We conclude that extracellular laccase production in
P. sanguineus responds to light stimuli, whereby short wave-
lengths within the visible light spectrum (460–525 nm) are
strongly inhibited; long wavelengths (660 nm) are inhibited
only partially, and darkness activates it.
Acknowledgments The authors are grateful to the National Council of
Science and Technology (Conacyt) of Mexico, for the doctoral scholar-
ship (261027) of Hernández Christian, to the PROMEP program of the
National Education Secretary (SEP), and to ECOS-ANUIES-CONACYT
Program through the ECOS project M13A02, for financial support. The
authors are grateful to Biologist Ramírez-Guillén F., from INECOL A.C.,
Xalapa, Mexico, for the taxonomical identification of the fungus. The
authors are also grateful to the Institute of Biotechnology and Applied
Ecology (INBIOTECA), and to the UVCA324 research group from
Universidad Veracruzana, Mexico, for facilities support.
Conflict of interest The authors declare that they have no competing
interests.
References
Ballario P, Macino G (1997) White collar proteins: PAS sing the light
signal in Neurospora crassa. Trends Microbiol 5:458–462
Ballario P, Vittorioso P, Magrelli A, Talora C et al (1996) White collar-1, a
central regulator of blue light responses in Neurospora, is a zinc finger
protein. EMBO J 15(7):1650–1657
Biezke JA, Braun EL, Bean LE, Kang S et al (1999) The nop-1 gene of
Neurospora crassa encodes a seven transmembrane helix retinal-
binding protein homologous to archeal rhodopsins. Proc Natl Acad Sci
U S A 96:8034–8039
Blumenstein A, Vienken K, Tasler R, Purschwitz J et al (2005) The
Aspergillus nidulans phytocrome FphA represses sexual develop- ment in
red light. Curr Biol 15:1833–1838
Buck JW, Dong W, Mueller DS (2010) Effect of light exposure on in vitro
germination and germ tube growth of eight species of rust fungi.
Mycologia 102(5):1134–1140
Corrochano LM (2011) Fungal photobiology: a synopsis. IMA Fungus 2:
25–28
Criquet S (1999) La litière de chênevert (Quercus ilex L.). Aspects
méthodologiques, microorganismes, enzymes et facteurs
environnementaux. Paul Cézanne Aix-Marseille III University,
Marseille, France
Gyalai-Korpos M, Nagy G, Mareczky Z, Schuster A, Réczey K, Schmoll
M (2010) Relevance of the light signaling machinery for cellulase
expression in trichoderma reesei (hypocrea jecorina). BMC Res Notes
3:330
Herrera-Estrella A, Horwitz BA (2007) Looking through the eyes of
fungi: molecular genetics of photoreception. Mol Microbiol 64:5–15 Jahan
MS, Mun SP (2007) Characteristics of dioxanelignins isolated at
different ages of Nalita wood (Tremaorientalis). J Wood Chem
Technol 27(2):83–98
Janusz G, Kucharzyk KH, Pawlik A, Staszczak M, Paszczynski AJ
(2013) Fungal laccase, manganese peroxidase and lignin peroxi- dase:
gene expression and regulation. Enzyme Microb Technol 52: 1–12
Janusz G, Mazur A, Checinsks A, Malek W et al (2012) Cloning and
characterization of a laccase gene from biotechnologically important
basidiomycete Carrena unicolor. J Fac Agr Kyushu U 57:41–49
Jong-Rok J, Yoon-Seok C (2013) Laccase-mediated oxidation of small
organics: bifunctional roles for versatile applications. Trends
Biotechnol 31(6):335–341
Kunamneni A, Ballesteros A, Plou FJ, Alcalde M (2007) Fungal
laccase—a versatile enzyme for biotechnological applications. In:
Méndez-Vilas A (ed) Communicating current research and educa- tional
topics and trends in applied microbiology. Microbiology se- ries vol 1.
Formatex, Badajoz, Spain, pp 233–245
Kyi TS (2011) Screening of potential lignin-degrading microorganisms
and evaluating their optimal enzyme producing culture conditions.
72
Master in Science thesis, Chalmers University of Technology,
Göteborg, Sweden
Leonowicz A, Grzywnowicz K (1981) Quantitative estimation of
laccase forms in some white rot-fungi using syringaldazine as a
substrate. Enzym Microb Technol 3(1):55–58
Meng-Juan Z, Fang D, Guo-Qing Z, He-Xiang W, Tzi-Bin N (2013)
Purification a laccase exhibiting dye decolorizing ability from an
edible mushroom Russula virescens. Int. Biodeterioration
Biodegrad 82:33–39
Miller GL (1959) Use of Dinitrosalicylic acid reagent for determination
of reducing sugar. Anal Chem 31(3):426–428
Mishra NP, Mishra RK, Singhal GS (1993) Changes in the activities of
anti-oxidant enzymes during exposure of intact wheat leaves to
strong visible light at different temperatures in the presence of pro-
tein synthesis inhibitors. Plant Physiol 102:903–910
Rodríguez-Romero J, Hedtke M, Kastner C, Müller S, Fischer R
(2010) Fungi, hidden in soil or up in the air: light makes a difference.
Annu Rev Microbiol 64:585–610
Röhrig J, Kastner C, Fischer R (2013) Light inhibits spore
germination through phytocrome in Aspergillus nidulans. Curr Genet
59:55–62 Rosales-Saavedra T, Esquivel-Naranjo EU, Casas-Flores
S, Martínez- Hernández P et al (2006) Novel light-regulated
genes in
Trichoderma atroviridae: a dissection by cDNA microarrays.
Microbiol 152:3305–3317
Saha A, Mandal P, Dasgupta S, Saha D (2008) Influence of culture
media and environmental factors on mycelia growth and sporulation
of Lasiodiplodia theobromae (Pat.) Griffon and Maubl. J Environ
Biol 29(3):407–410
Schmoll M, Franchi L, Kubicek CP (2005) Envoy, a PAS/LOV
domain protein of Hypocreaje corina (Anamorph Trichoderma reesei),
mod- ulates cellulase gene transcription in response to light. Eukaryot
Cell 4(12):1998–2007
Schmoll M, Tian C, Sun J, Tisch D, Glass NL (2012) Unravelling
the molecular basis for light modulated cellulase gene expression—the role of photoreceptors in Neurosporacrassa. BMC Genomics
13:127
StatSoft Inc. (2004) STATISTICA (Data analysis software
system).
Version 7
Stevenson RE, Pennypacker SP (1988) Effect of radiation,
temperature, and moisture on conidial germination of
Alternariasolanum. Phytopathology 78(7):926–930
Tisch D, Schmoll M (2010) Light regulation of metabolic pathways
in fungi. Appl Microbiol Biotechnol 85:1259–1277. doi:10.1007/
s00253-009-2320-1
Velmurugan P, Hoon Y, Kulandaisamy C, Lakshmanaperumalsamy
P et al (2010) Effect of light on growth, intracellular and extracellular
pigment production by five pigment-producing filamentous fungi in
synthetic medium. J Biosci Bioeng 109(4):346–50
Xiao YZ, Hong YZ, Li JF, Hang J et al (2006) Cloning of novel
laccase isozyme genes from Trametes sp. AH28-2 analysis of their
differ- ential expression. Appl Microbiol Biotechnol 71(4):493–501
Zar JH (1999) Biostatistical Analysis, Prentice Hall (Ed.), New
Jersey, EE.UU.
Zhu JC, Wang XJ (2005) Effect of blue light on conidiation
development and glucoamylase enhancement in Aspergillus niger. Wei
Sheng Wu Xue Bao 45(2):275–8
73
1.2 Ethanol induction of laccase depends on nitrogen conditions of Pycnoporus sanguineus
Artículo publicado en Electronic Journal of Biotechnology (Elsevier).
Publicado en línea el 27 de junio de 2015
El artículo reporta los resultados obtenidos del capítulo 1. Efecto de diversas fuentes de nitrógeno y de
la presencia/ausencia de etanol en la producción de la enzima lacasa en Pycnoporus sanguineus.
______________________________________
74
Electronic Journal of Biotechnology 18 (2015) 327–332
Ethanol induction of laccase depends on nitrogen conditions of
Pycnoporus sanguineus
Christian A. Hernández a, Norma Sandoval a, Julieta Mallerman b, José Antonio García-Pérez c,
Anne-Marie Farnet d, Isabelle Perraud-Gaime e, Enrique Alarcón a,⁎ a Instituto de Biotecnología y Ecología Aplicada (INBIOTECA), Universidad Veracruzana, Xalapa, Veracruz, Mexico b Universidad de Buenos Aires (UBA), Buenos Aires, Argentina c Facultad de Biología, Universidad Veracruzana, Xalapa, Veracruz, Mexico d Equipe Systèmes Microbiens IMBE, UMR CNRS 7263, IRD 237, Faculté des Sciences Techniques de St. Jérôme, Aix Marseille Université, Marseille, France e Equipe Ecotechnologies et Bioremediation, IMBE, UMR CNRS 7263, IRD 237, Faculté des Sciences et Techniques de St. Jérôme, Aix Marseille Université, Marseille, France
a r t i c l e i n f o Article history:
Received 30 December 2014
Accepted 2 May 2015
Available online 27 June 2015
Keywords:
Enzyme production
Fungal metabolism
Phenoloxidases Urea
Yeast extract
a b s t r a c t
Background: Ethanol has been pointed out as a laccase inducer. However, there are controversial reports about its
efficiency with some fungi. In this study, we hypothesized that ethanol laccase induced in Pycnoporus sanguineus
depends on nitrogen nutriment conditions. To prove this, we assessed laccase production in submerged cultures of
P. sanguineus, with different nitrogen concentrations and with, or without ethanol added in a factorial designed
experiment.
Results: In order to analyze the effects of factors on the response variables, a factorial ANOVA, and response-
surface models were performed. It was found that the nitrogen source was the main factor that affected
laccase production in P. sanguineus. The treatments with yeast extract (2 g/L) and ethanol (3 g/L) induced the
highest laccase activity (31.01 ± 4.9 U/L), while the treatments with urea reached the lowest activity (less
than 1.6 U/L). Ethanol had positive and synergic effects on laccase production, in accordance with the surface
response model, as long as simple nitrogen sources (urea) were not available.
Conclusions: We suggest that laccase in P. sanguineus is regulated by a catabolic nitrogen repression mechanism;
laccase activity is strongly inhibited by urea used as nitrogen source and it decreases when the amount of urea
increases; contrarily, a synergic positive effect was observed between yeast extract and ethanol on laccase
production.
© 2015 Pontificia Universidad Católica de Valparaíso. Production and hosting by Elsevier B.V. All rights reserved.
1. Introduction
It is well known that nitrogen is one of the main nutrients for microbial metabolism because it is an essential component of proteins and nucleic acids, as well as carbon. Its concentration in the medium and type of
source (e.g. mineral or organic) can affect enzyme production in
submerged fungal cultures [1,2,3]. In fungi, the nitrogen catabolite repression, homologous to the economic theory of microbial metabolism
for carbon sets that, simple sources of nitrogen (e.g. ammonium) are
preferred and consumed before complex sources (e.g. organic complex
sources, such as yeast extract), with the objective of saving resources. For some enzymes linked to secondary metabolism,
e.g. proteases, L-asparaginase and laccase, it is well known that this
mechanism drives their extracellular production [4,5,6,7]; thus, for
fungal laccases, for example, some studies pointed that this enzyme is
* Corresponding author.
E-mail address: [email protected] (E. Alarcón).
Peer review under responsibility of Pontificia Universidad Católica de Valparaíso.
regulated by the nitrogen catabolite repression system [8] and besides,
their production, it responds differentially to diverse nitrogen sources
in the culture medium. Thus, it is assumed that fungal laccases are
activated when carbon and nitrogen are limited [9,10]. Thereby, it has
been observed that laccase production in submerged cultures is
performed in the presence of nitrogen as a simple mineral source (such
as ammonium nitrate and ammonium sulfate [11]), or complex organic
supplies (e.g. a mixture of amino acids, peptone, and yeast extract,
[12,13,14]). In this sense, high laccase yields have been reported, when
complex organic nitrogen was added to the medium,
in contrast with a simple mineral nitrogen source, for Agaricus bisporius
[15], Pleurotus ostreatus [3], Trametes hirsuta [16] and
Trametes pubescens [17]. Besides, the effect of the nitrogen source could
be species and strain specific and varies with culture conditions (e.g.
carbon source, C/N ratio, micro-nutriments content, presence of inducers). Hence, not only the source, but also the concentration of nitrogen in the medium, influences laccase production [10,18].
Other factors also affect laccase production, like the type of inducer:
metal ions (e.g. copper and manganese) [19,20,21]; phenolic
http://dx.doi.org/10.1016/j.ejbt.2015.05.008
0717-3458/© 2015 Pontificia Universidad Católica de Valparaíso. Production and hosting by Elsevier B.V. All rights reserved.
Contents lists available at ScienceDirect
Electronic Journal of Biotechnology
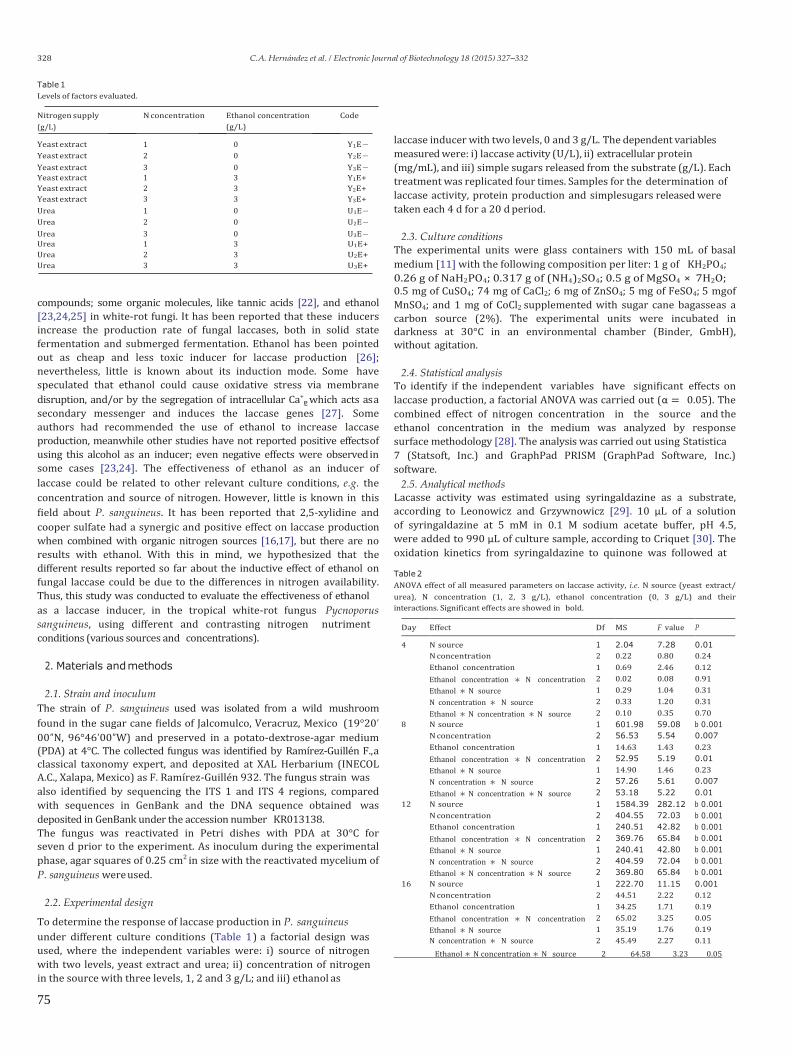
75
2
328 C.A. Hernández et al. / Electronic Journal of Biotechnology 18 (2015) 327–332
Table 1
Levels of factors evaluated.
Nitrogen supply N concentration
(g/L)
Ethanol concentration
(g/L)
Code
Yeast extract 1 0 Y1E−
Yeast extract 2 0 Y2E−
Yeast extract 3 0 Y3E−
Yeast extract 1 3 Y1E+
Yeast extract 2 3 Y2E+
Yeast extract 3 3 Y3E+
Urea 1 0 U1E−
Urea 2 0 U2E−
Urea 3 0 U3E−
Urea 1 3 U1E+
Urea 2 3 U2E+
Urea 3 3 U3E+
compounds; some organic molecules, like tannic acids [22], and ethanol
[23,24,25] in white-rot fungi. It has been reported that these inducers
increase the production rate of fungal laccases, both in solid state
fermentation and submerged fermentation. Ethanol has been pointed
out as cheap and less toxic inducer for laccase production [26];
nevertheless, little is known about its induction mode. Some have
speculated that ethanol could cause oxidative stress via membrane
disruption, and/or by the segregation of intracellular Ca+, which acts as a
secondary messenger and induces the laccase genes [27]. Some
authors had recommended the use of ethanol to increase laccase
production, meanwhile other studies have not reported positive effects of
using this alcohol as an inducer; even negative effects were observed in
some cases [23,24]. The effectiveness of ethanol as an inducer of
laccase could be related to other relevant culture conditions, e.g. the
concentration and source of nitrogen. However, little is known in this
field about P. sanguineus. It has been reported that 2,5-xylidine and
cooper sulfate had a synergic and positive effect on laccase production
when combined with organic nitrogen sources [16,17], but there are no
results with ethanol. With this in mind, we hypothesized that the
different results reported so far about the inductive effect of ethanol on
fungal laccase could be due to the differences in nitrogen availability.
Thus, this study was conducted to evaluate the effectiveness of ethanol
as a laccase inducer, in the tropical white-rot fungus Pycnoporus
sanguineus, using different and contrasting nitrogen nutriment
conditions (various sources and concentrations).
2. Materials and methods
2.1. Strain and inoculum
The strain of P. sanguineus used was isolated from a wild mushroom
found in the sugar cane fields of Jalcomulco, Veracruz, Mexico (19°20′
00″N, 96°46′00″W) and preserved in a potato-dextrose-agar medium (PDA) at 4°C. The collected fungus was identified by Ramírez-Guillén F., a classical taxonomy expert, and deposited at XAL Herbarium (INECOL A.C., Xalapa, Mexico) as F. Ramírez-Guillén 932. The fungus strain was
also identified by sequencing the ITS 1 and ITS 4 regions, compared
with sequences in GenBank and the DNA sequence obtained was
deposited in GenBank under the accession number KR013138.
The fungus was reactivated in Petri dishes with PDA at 30°C for seven d prior to the experiment. As inoculum during the experimental
phase, agar squares of 0.25 cm2 in size with the reactivated mycelium of
P. sanguineus were used.
2.2. Experimental design
To determine the response of laccase production in P. sanguineus
under different culture conditions (Table 1) a factorial design was
used, where the independent variables were: i) source of nitrogen
with two levels, yeast extract and urea; ii) concentration of nitrogen
in the source with three levels, 1, 2 and 3 g/L; and iii) ethanol as
laccase inducer with two levels, 0 and 3 g/L. The dependent variables
measured were: i) laccase activity (U/L), ii) extracellular protein
(mg/mL), and iii) simple sugars released from the substrate (g/L). Each
treatment was replicated four times. Samples for the determination of
laccase activity, protein production and simple sugars released were
taken each 4 d for a 20 d period.
2.3. Culture conditions The experimental units were glass containers with 150 mL of basal
medium [11] with the following composition per liter: 1 g of KH2PO4;
0.26 g of NaH2PO4; 0.317 g of (NH4)2SO4; 0.5 g of MgSO4 × 7H2O; 0.5 mg of CuSO4; 74 mg of CaCl2; 6 mg of ZnSO4; 5 mg of FeSO4; 5 mg of
MnSO4; and 1 mg of CoCl2 supplemented with sugar cane bagasse as a
carbon source (2%). The experimental units were incubated in darkness at 30°C in an environmental chamber (Binder, GmbH), without agitation.
2.4. Statistical analysis
To identify if the independent variables have significant effects on
laccase production, a factorial ANOVA was carried out (α = 0.05). The
combined effect of nitrogen concentration in the source and the
ethanol concentration in the medium was analyzed by response
surface methodology [28]. The analysis was carried out using Statistica
7 (Statsoft, Inc.) and GraphPad PRISM (GraphPad Software, Inc.)
software.
2.5. Analytical methods Lacasse activity was estimated using syringaldazine as a substrate,
according to Leonowicz and Grzywnowicz [29]. 10 μL of a solution
of syringaldazine at 5 mM in 0.1 M sodium acetate buffer, pH 4.5,
were added to 990 μL of culture sample, according to Criquet [30]. The
oxidation kinetics from syringaldazine to quinone was followed at
Table 2
ANOVA effect of all measured parameters on laccase activity, i.e. N source (yeast extract/
urea), N concentration (1, 2, 3 g/L), ethanol concentration (0, 3 g/L) and their
interactions. Significant effects are showed in bold.
Day Effect Df MS F value P
4 N source 1 2.04 7.28 0.01
N concentration 2 0.22 0.80 0.24
Ethanol concentration 1 0.69 2.46 0.12
Ethanol concentration ∗ N concentration 2 0.02 0.08 0.91
Ethanol ∗ N source 1 0.29 1.04 0.31
N concentration ∗ N source 2 0.33 1.20 0.31
Ethanol ∗ N concentration ∗ N source 2 0.10 0.35 0.70
8 N source 1 601.98 59.08 b 0.001
N concentration 2 56.53 5.54 0.007
Ethanol concentration 1 14.63 1.43 0.23
Ethanol concentration ∗ N concentration 2 52.95 5.19 0.01
Ethanol ∗ N source 1 14.90 1.46 0.23
N concentration ∗ N source 2 57.26 5.61 0.007
Ethanol ∗ N concentration ∗ N source 2 53.18 5.22 0.01
12 N source 1 1584.39 282.12 b 0.001
N concentration 2 404.55 72.03 b 0.001
Ethanol concentration 1 240.51 42.82 b 0.001
Ethanol concentration ∗ N concentration 2 369.76 65.84 b 0.001
Ethanol ∗ N source 1 240.41 42.80 b 0.001
N concentration ∗ N source 2 404.59 72.04 b 0.001
Ethanol ∗ N concentration ∗ N source 2 369.80 65.84 b 0.001
16 N source 1 222.70 11.15 0.001
N concentration 2 44.51 2.22 0.12
Ethanol concentration 1 34.25 1.71 0.19
Ethanol concentration ∗ N concentration 2 65.02 3.25 0.05
Ethanol ∗ N source 1 35.19 1.76 0.19
N concentration ∗ N source 2 45.49 2.27 0.11
Ethanol ∗ N concentration ∗ N source 2 64.58 3.23 0.05
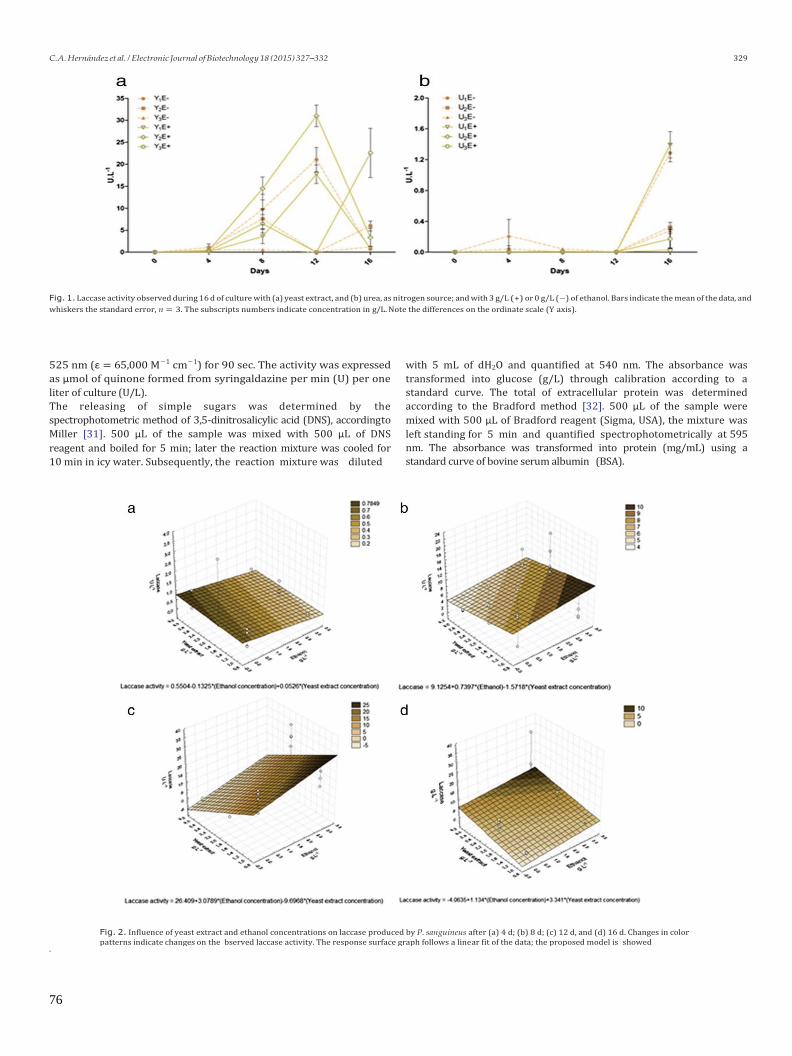
76
C.A. Hernández et al. / Electronic Journal of Biotechnology 18 (2015) 327–332 329
Fig. 1. Laccase activity observed during 16 d of culture with (a) yeast extract, and (b) urea, as nitrogen source; and with 3 g/L (+) or 0 g/L (−) of ethanol. Bars indicate the mean of the data, and
whiskers the standard error, n = 3. The subscripts numbers indicate concentration in g/L. Note the differences on the ordinate scale (Y axis).
525 nm (ε = 65,000 M−1 cm−1) for 90 sec. The activity was expressed
as μmol of quinone formed from syringaldazine per min (U) per one
liter of culture (U/L).
The releasing of simple sugars was determined by the
spectrophotometric method of 3,5-dinitrosalicylic acid (DNS), according to
Miller [31]. 500 μL of the sample was mixed with 500 μL of DNS
reagent and boiled for 5 min; later the reaction mixture was cooled for
10 min in icy water. Subsequently, the reaction mixture was diluted
with 5 mL of dH2O and quantified at 540 nm. The absorbance was
transformed into glucose (g/L) through calibration according to a
standard curve. The total of extracellular protein was determined
according to the Bradford method [32]. 500 μL of the sample were
mixed with 500 μL of Bradford reagent (Sigma, USA), the mixture was
left standing for 5 min and quantified spectrophotometrically at 595
nm. The absorbance was transformed into protein (mg/mL) using a
standard curve of bovine serum albumin (BSA).
.
Fig. 2. Influence of yeast extract and ethanol concentrations on laccase produced by P. sanguineus after (a) 4 d; (b) 8 d; (c) 12 d, and (d) 16 d. Changes in color patterns indicate changes on the bserved laccase activity. The response surface graph follows a linear fit of the data; the proposed model is showed
77
330 C.A. Hernández et al. / Electronic Journal of Biotechnology 18 (2015) 327–332
3. Results
Laccase production was highly dependent on nitrogen supply conditions (P b 0.05, Table 2). In cultures with yeast extract as
nitrogen supply (Fig. 1a), the highest activity was observed (31.01 ±
4.9 U/L) after 12 d in a culture treated with 2 g/L of yeast extract as a
nitrogen source and 3 g/L of ethanol (Y2E+). Meanwhile, in all
treatments with urea as nitrogen supply (Fig. 1b) laccase activity was
lower than 1.6 U/L.
Nitrogen concentration and ethanol had significant effects on laccase production only at certain moments. Nitrogen concentration
had significant effects after 8 d (F = 5.54; P = 0.007) and 12 d
(F = 72.03; P b 0.001) of culture (when laccase expressed high activity), and ethanol concentration had significant effects only at d 12 (F = 42.82; P b 0.001). Combined effects of ethanol and
nitrogen supply/nitrogen concentration were found at d 8 and 12, and
as well as between nitrogen supply and nitrogen concentration
(Table 2). The surface response analysis showed combined effects of
ethanol and nitrogen concentration on laccase production when yeast
extract was supplied (Fig. 2); ethanol showed positive effects after 8
(m = 0.73; Fig. 2b), 12 (m = 3.07 Fig. 2c) and 16 d (m = 1.13). At d 4,
non-synergic effects were observed between ethanol and nitrogen
concentrations (nitrogen concentration did not show effect, Fig. 2a).
However, at d 8 and 12 the highest laccase activities were observed in
treatments with 3 g/L of ethanol and low nitrogen concentration (Fig.
2b, Fig. 2c).
In cultures with urea, non-effects were observed when ethanol was
added (Fig. 3), and urea concentration only showed an effect after 16 d
of culture (Fig. 3d). When urea was used, the highest laccase activities
were observed at d 16 on treatments with 1 g/L (Fig. 3d).
Extracellular protein production was slightly higher in treatments with
yeast extract than those with urea (Fig. 4a and Fig. 4b). However, no
effects of ethanol addition or nitrogen concentration were observed.
The sugar content in cultures with urea was slightly higher than those
with yeast extract (Fig. 5), but no significant effect was observed.
4. Discussion
In accordance with previous reports for other fungi [3] such as P.
ostreatus, our ANOVA results indicate that the source of nitrogen is the
most significant source of variation in laccase activity, and that the yeast extract (an organic complex source) promotes more laccase production in a submerged culture than urea (a mineral simple source).
Some studies have reported better laccase production with mineral
sources of nitrogen than with organic ones [21], for several species of
Pleurotus. However, it is accepted that inorganic sources lead to lower
laccase yields than organic sources, although both of them promote
good fungal (biomass) development [33]. However, the source of
nitrogen added to the medium and its consequent effect on laccase
activity is species and strain specific, as determined by Mikiashvili et
al. [3]. In this study, we observed that P. sanguineus preferred a
Fig. 3. Influence of urea and ethanol concentrations on laccase produced by P. sanguineus (a) after 4 d; (b) 8 d; (c) 12 d, and (d) 16 d. Changes in color patterns indicate changes on the
observed laccase activity. The response surface graph follows a linear fit of the data; the proposed model is showed.
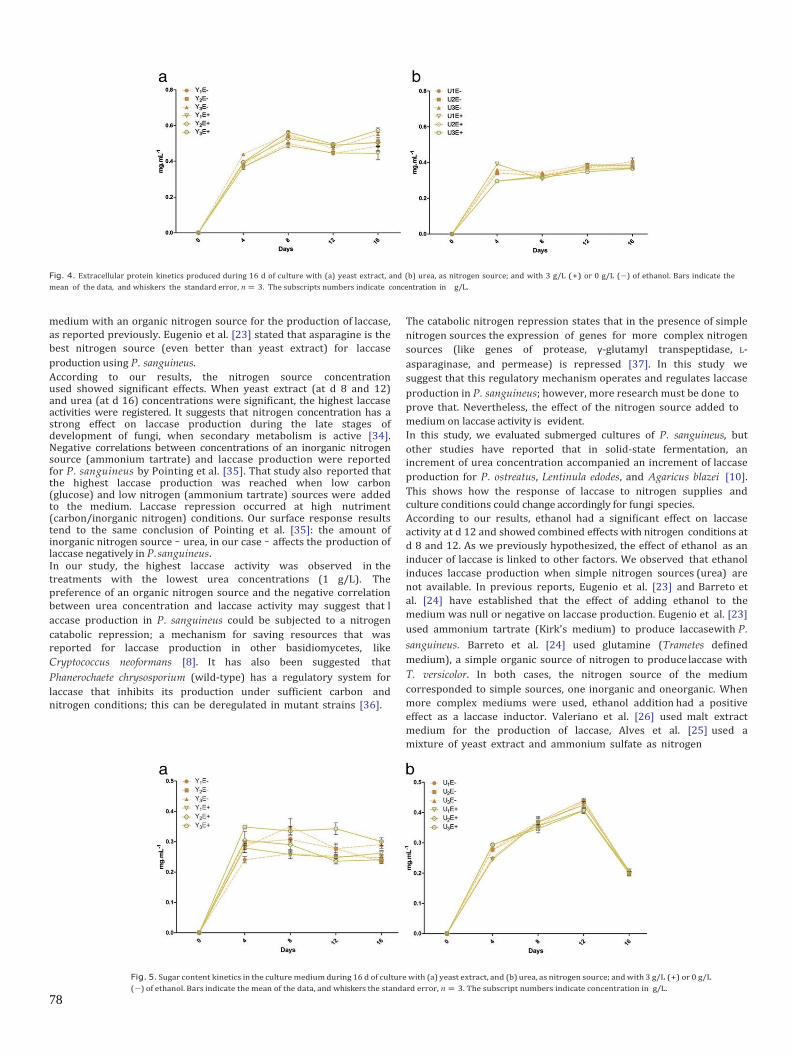
78
Fig. 4. Extracellular protein kinetics produced during 16 d of culture with (a) yeast extract, and (b) urea, as nitrogen source; and with 3 g/L (+) or 0 g/L (−) of ethanol. Bars indicate the
mean of the data, and whiskers the standard error, n = 3. The subscripts numbers indicate concentration in g/L.
medium with an organic nitrogen source for the production of laccase,
as reported previously. Eugenio et al. [23] stated that asparagine is the
best nitrogen source (even better than yeast extract) for laccase
production using P. sanguineus.
According to our results, the nitrogen source concentration used showed significant effects. When yeast extract (at d 8 and 12) and urea (at d 16) concentrations were significant, the highest laccase activities were registered. It suggests that nitrogen concentration has a strong effect on laccase production during the late stages of development of fungi, when secondary metabolism is active [34]. Negative correlations between concentrations of an inorganic nitrogen source (ammonium tartrate) and laccase production were reported for P. sanguineus by Pointing et al. [35]. That study also reported that the highest laccase production was reached when low carbon (glucose) and low nitrogen (ammonium tartrate) sources were added to the medium. Laccase repression occurred at high nutriment (carbon/inorganic nitrogen) conditions. Our surface response results tend to the same conclusion of Pointing et al. [35]: the amount of inorganic nitrogen source – urea, in our case – affects the production of laccase negatively in P. sanguineus. In our study, the highest laccase activity was observed in the treatments with the lowest urea concentrations (1 g/L). The
preference of an organic nitrogen source and the negative correlation between urea concentration and laccase activity may suggest that l
accase production in P. sanguineus could be subjected to a nitrogen
catabolic repression; a mechanism for saving resources that was reported for laccase production in other basidiomycetes, like
Cryptococcus neoformans [8]. It has also been suggested that
Phanerochaete chrysosporium (wild-type) has a regulatory system for
laccase that inhibits its production under sufficient carbon and nitrogen conditions; this can be deregulated in mutant strains [36].
The catabolic nitrogen repression states that in the presence of simple
nitrogen sources the expression of genes for more complex nitrogen
sources (like genes of protease, γ-glutamyl transpeptidase, L-
asparaginase, and permease) is repressed [37]. In this study we
suggest that this regulatory mechanism operates and regulates laccase
production in P. sanguineus; however, more research must be done to
prove that. Nevertheless, the effect of the nitrogen source added to
medium on laccase activity is evident.
In this study, we evaluated submerged cultures of P. sanguineus, but
other studies have reported that in solid-state fermentation, an increment of urea concentration accompanied an increment of laccase
production for P. ostreatus, Lentinula edodes, and Agaricus blazei [10].
This shows how the response of laccase to nitrogen supplies and culture conditions could change accordingly for fungi species.
According to our results, ethanol had a significant effect on laccase
activity at d 12 and showed combined effects with nitrogen conditions at
d 8 and 12. As we previously hypothesized, the effect of ethanol as an
inducer of laccase is linked to other factors. We observed that ethanol
induces laccase production when simple nitrogen sources (urea) are
not available. In previous reports, Eugenio et al. [23] and Barreto et
al. [24] have established that the effect of adding ethanol to the
medium was null or negative on laccase production. Eugenio et al. [23]
used ammonium tartrate (Kirk's medium) to produce laccase with P.
sanguineus. Barreto et al. [24] used glutamine (Trametes defined
medium), a simple organic source of nitrogen to produce laccase with
T. versicolor. In both cases, the nitrogen source of the medium
corresponded to simple sources, one inorganic and one organic. When
more complex mediums were used, ethanol addition had a positive
effect as a laccase inductor. Valeriano et al. [26] used malt extract
medium for the production of laccase, Alves et al. [25] used a
mixture of yeast extract and ammonium sulfate as nitrogen
Fig. 5. Sugar content kinetics in the culture medium during 16 d of culture with (a) yeast extract, and (b) urea, as nitrogen source; and with 3 g/L (+) or 0 g/L
(−) of ethanol. Bars indicate the mean of the data, and whiskers the standard error, n = 3. The subscript numbers indicate concentration in g/L.
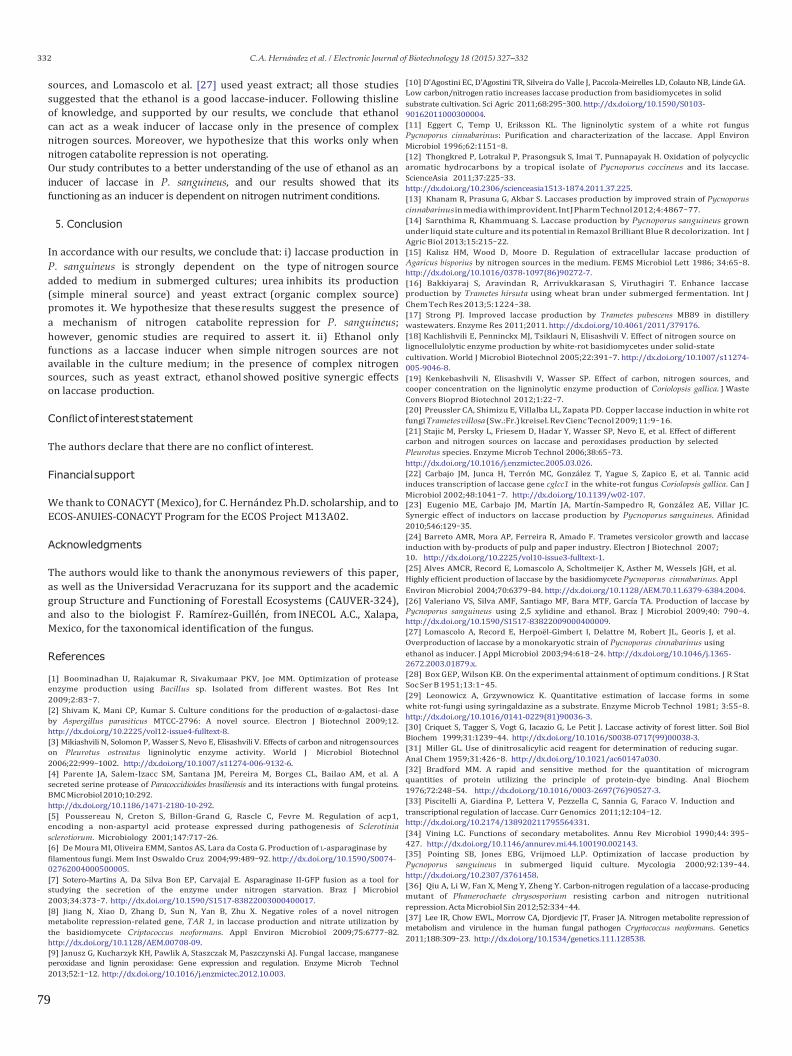
79
332 C.A. Hernández et al. / Electronic Journal of Biotechnology 18 (2015) 327–332
sources, and Lomascolo et al. [27] used yeast extract; all those studies
suggested that the ethanol is a good laccase-inducer. Following this line
of knowledge, and supported by our results, we conclude that ethanol
can act as a weak inducer of laccase only in the presence of complex
nitrogen sources. Moreover, we hypothesize that this works only when
nitrogen catabolite repression is not operating.
Our study contributes to a better understanding of the use of ethanol as an
inducer of laccase in P. sanguineus, and our results showed that its
functioning as an inducer is dependent on nitrogen nutriment conditions.
5. Conclusion
In accordance with our results, we conclude that: i) laccase production in
P. sanguineus is strongly dependent on the type of nitrogen source
added to medium in submerged cultures; urea inhibits its production
(simple mineral source) and yeast extract (organic complex source)
promotes it. We hypothesize that these results suggest the presence of
a mechanism of nitrogen catabolite repression for P. sanguineus;
however, genomic studies are required to assert it. ii) Ethanol only
functions as a laccase inducer when simple nitrogen sources are not
available in the culture medium; in the presence of complex nitrogen
sources, such as yeast extract, ethanol showed positive synergic effects
on laccase production.
Conflict of interest statement
The authors declare that there are no conflict of interest.
Financial support
We thank to CONACYT (Mexico), for C. Hernández Ph.D. scholarship, and to
ECOS-ANUIES-CONACYT Program for the ECOS Project M13A02.
Acknowledgments
The authors would like to thank the anonymous reviewers of this paper,
as well as the Universidad Veracruzana for its support and the academic
group Structure and Functioning of Forestall Ecosystems (CAUVER-324),
and also to the biologist F. Ramírez-Guillén, from INECOL A.C., Xalapa,
Mexico, for the taxonomical identification of the fungus.
References [1] Boominadhan U, Rajakumar R, Sivakumaar PKV, Joe MM. Optimization of protease
enzyme production using Bacillus sp. Isolated from different wastes. Bot Res Int
2009;2:83–7.
[2] Shivam K, Mani CP, Kumar S. Culture conditions for the production of α-galactosi- dase
by Aspergillus parasiticus MTCC-2796: A novel source. Electron J Biotechnol 2009;12.
http://dx.doi.org/10.2225/vol12-issue4-fulltext-8.
[3] Mikiashvili N, Solomon P, Wasser S, Nevo E, Elisashvili V. Effects of carbon and nitrogen sources
on Pleurotus ostreatus ligninolytic enzyme activity. World J Microbiol Biotechnol
2006;22:999–1002. http://dx.doi.org/10.1007/s11274-006-9132-6.
[4] Parente JA, Salem-Izacc SM, Santana JM, Pereira M, Borges CL, Bailao AM, et al. A
secreted serine protease of Paracoccidioides brasiliensis and its interactions with fungal proteins.
BMC Microbiol 2010;10:292.
http://dx.doi.org/10.1186/1471-2180-10-292.
[5] Poussereau N, Creton S, Billon-Grand G, Rascle C, Fevre M. Regulation of acp1,
encoding a non-aspartyl acid protease expressed during pathogenesis of Sclerotinia
sclerotiorum. Microbiology 2001;147:717–26.
[6] De Moura MI, Oliveira EMM, Santos AS, Lara da Costa G. Production of L-asparaginase by
filamentous fungi. Mem Inst Oswaldo Cruz 2004;99:489–92. http://dx.doi.org/10.1590/S0074-
02762004000500005.
[7] Sotero-Martins A, Da Silva Bon EP, Carvajal E. Asparaginase II-GFP fusion as a tool for
studying the secretion of the enzyme under nitrogen starvation. Braz J Microbiol
2003;34:373–7. http://dx.doi.org/10.1590/S1517-83822003000400017.
[8] Jiang N, Xiao D, Zhang D, Sun N, Yan B, Zhu X. Negative roles of a novel nitrogen
metabolite repression-related gene, TAR 1, in laccase production and nitrate utilization by
the basidiomycete Criptococcus neoformans. Appl Environ Microbiol 2009;75:6777–82.
http://dx.doi.org/10.1128/AEM.00708-09.
[9] Janusz G, Kucharzyk KH, Pawlik A, Staszczak M, Paszczynski AJ. Fungal laccase, manganese
peroxidase and lignin peroxidase: Gene expression and regulation. Enzyme Microb Technol
2013;52:1–12. http://dx.doi.org/10.1016/j.enzmictec.2012.10.003.
[10] D'Agostini EC, D'Agostini TR, Silveira do Valle J, Paccola-Meirelles LD, Colauto NB, Linde GA.
Low carbon/nitrogen ratio increases laccase production from basidiomycetes in solid
substrate cultivation. Sci Agric 2011;68:295–300. http://dx.doi.org/10.1590/S0103-
90162011000300004.
[11] Eggert C, Temp U, Eriksson KL. The ligninolytic system of a white rot fungus
Pycnoporus cinnabarinus: Purification and characterization of the laccase. Appl Environ
Microbiol 1996;62:1151–8.
[12] Thongkred P, Lotrakul P, Prasongsuk S, Imai T, Punnapayak H. Oxidation of polycyclic
aromatic hydrocarbons by a tropical isolate of Pycnoporus coccineus and its laccase.
ScienceAsia 2011;37:225–33.
http://dx.doi.org/10.2306/scienceasia1513-1874.2011.37.225.
[13] Khanam R, Prasuna G, Akbar S. Laccases production by improved strain of Pycnoporus
cinnabarinus in media with improvident. Int J Pharm Technol 2012;4:4867–77.
[14] Sarnthima R, Khammuang S. Laccase production by Pycnoporus sanguineus grown
under liquid state culture and its potential in Remazol Brilliant Blue R decolorization. Int J
Agric Biol 2013;15:215–22.
[15] Kalisz HM, Wood D, Moore D. Regulation of extracellular laccase production of
Agaricus bisporius by nitrogen sources in the medium. FEMS Microbiol Lett 1986; 34:65–8.
http://dx.doi.org/10.1016/0378-1097(86)90272-7.
[16] Bakkiyaraj S, Aravindan R, Arrivukkarasan S, Viruthagiri T. Enhance laccase
production by Trametes hirsuta using wheat bran under submerged fermentation. Int J
Chem Tech Res 2013;5:1224–38.
[17] Strong PJ. Improved laccase production by Trametes pubescens MB89 in distillery
wastewaters. Enzyme Res 2011;2011. http://dx.doi.org/10.4061/2011/379176.
[18] Kachlishvili E, Penninckx MJ, Tsiklauri N, Elisashvili V. Effect of nitrogen source on
lignocellulolytic enzyme production by white-rot basidiomycetes under solid-state
cultivation. World J Microbiol Biotechnol 2005;22:391–7. http://dx.doi.org/10.1007/s11274-
005-9046-8.
[19] Kenkebashvili N, Elisashvili V, Wasser SP. Effect of carbon, nitrogen sources, and
cooper concentration on the ligninolytic enzyme production of Coriolopsis gallica. J Waste
Convers Bioprod Biotechnol 2012;1:22–7.
[20] Preussler CA, Shimizu E, Villalba LL, Zapata PD. Copper laccase induction in white rot
fungi Trametes villosa (Sw.:Fr.) kreisel. Rev Cienc Tecnol 2009;11:9–16.
[21] Stajic M, Persky L, Friesem D, Hadar Y, Wasser SP, Nevo E, et al. Effect of different
carbon and nitrogen sources on laccase and peroxidases production by selected
Pleurotus species. Enzyme Microb Technol 2006;38:65–73.
http://dx.doi.org/10.1016/j.enzmictec.2005.03.026.
[22] Carbajo JM, Junca H, Terrón MC, González T, Yague S, Zapico E, et al. Tannic acid
induces transcription of laccase gene cglcc1 in the white-rot fungus Coriolopsis gallica. Can J
Microbiol 2002;48:1041–7. http://dx.doi.org/10.1139/w02-107. [23] Eugenio ME, Carbajo JM, Martín JA, Martín-Sampedro R, González AE, Villar JC.
Synergic effect of inductors on laccase production by Pycnoporus sanguineus. Afinidad
2010;546:129–35.
[24] Barreto AMR, Mora AP, Ferreira R, Amado F. Trametes versicolor growth and laccase
induction with by-products of pulp and paper industry. Electron J Biotechnol 2007;
10. http://dx.doi.org/10.2225/vol10-issue3-fulltext-1.
[25] Alves AMCR, Record E, Lomascolo A, Scholtmeijer K, Asther M, Wessels JGH, et al.
Highly efficient production of laccase by the basidiomycete Pycnoporus cinnabarinus. Appl
Environ Microbiol 2004;70:6379–84. http://dx.doi.org/10.1128/AEM.70.11.6379-6384.2004.
[26] Valeriano VS, Silva AMF, Santiago MF, Bara MTF, García TA. Production of laccase by
Pycnoporus sanguineus using 2,5 xylidine and ethanol. Braz J Microbiol 2009;40: 790–4.
http://dx.doi.org/10.1590/S1517-83822009000400009.
[27] Lomascolo A, Record E, Herpoël-Gimbert I, Delattre M, Robert JL, Georis J, et al.
Overproduction of laccase by a monokaryotic strain of Pycnoporus cinnabarinus using
ethanol as inducer. J Appl Microbiol 2003;94:618–24. http://dx.doi.org/10.1046/j.1365-
2672.2003.01879.x.
[28] Box GEP, Wilson KB. On the experimental attainment of optimum conditions. J R Stat
Soc Ser B 1951;13:1–45.
[29] Leonowicz A, Grzywnowicz K. Quantitative estimation of laccase forms in some
white rot-fungi using syringaldazine as a substrate. Enzyme Microb Technol 1981; 3:55–8.
http://dx.doi.org/10.1016/0141-0229(81)90036-3.
[30] Criquet S, Tagger S, Vogt G, Iacazio G, Le Petit J. Laccase activity of forest litter. Soil Biol
Biochem 1999;31:1239–44. http://dx.doi.org/10.1016/S0038-0717(99)00038-3.
[31] Miller GL. Use of dinitrosalicylic acid reagent for determination of reducing sugar.
Anal Chem 1959;31:426–8. http://dx.doi.org/10.1021/ac60147a030.
[32] Bradford MM. A rapid and sensitive method for the quantitation of microgram
quantities of protein utilizing the principle of protein-dye binding. Anal Biochem
1976;72:248–54. http://dx.doi.org/10.1016/0003-2697(76)90527-3.
[33] Piscitelli A, Giardina P, Lettera V, Pezzella C, Sannia G, Faraco V. Induction and
transcriptional regulation of laccase. Curr Genomics 2011;12:104–12.
http://dx.doi.org/10.2174/138920211795564331.
[34] Vining LC. Functions of secondary metabolites. Annu Rev Microbiol 1990;44: 395–
427. http://dx.doi.org/10.1146/annurev.mi.44.100190.002143.
[35] Pointing SB, Jones EBG, Vrijmoed LLP. Optimization of laccase production by
Pycnoporus sanguineus in submerged liquid culture. Mycologia 2000;92:139–44.
http://dx.doi.org/10.2307/3761458.
[36] Qiu A, Li W, Fan X, Meng Y, Zheng Y. Carbon-nitrogen regulation of a laccase-producing
mutant of Phanerochaete chrysosporium resisting carbon and nitrogen nutritional
repression. Acta Microbiol Sin 2012;52:334–44.
[37] Lee IR, Chow EWL, Morrow CA, Djordjevic JT, Fraser JA. Nitrogen metabolite repression of
metabolism and virulence in the human fungal pathogen Cryptococcus neoformans. Genetics
2011;188:309–23. http://dx.doi.org/10.1534/genetics.111.128538.
80
1.3 Laccase induction by synthetic dyes in Pycnoporus sanguineus (L.), and their use
for sugar cane bagasse delignification
Artículo aceptado en Applied Microbiology and Biotechnology (Springer).
Sometido el 03 de mayo de 2016
El artículo reporta los resultados obtenidos del capítulo 1. Evaluación de colorantes fenólicos
como inductores de actividad lacasa en cultivos líquidos y su posterior uso para deslignificar
bagazo de caña de azúcar.
81
Applied Microbiology and Biotechnology
Laccase induction by synthetic dyes in Pycnoporus sanguineus, and their
use for sugar cane bagasse delignification --Manuscript Draft--
Manuscript Number:
Full Title: Laccase induction by synthetic dyes in Pycnoporus sanguineus, and their use for sugar cane
bagasse delignification
Article Type: Original Article
Section/Category: Biotechnologically relevant enzymes and proteins
Corresponding Author: Enrique Alarcón, Ph. D.
Universidad Veracruzana
Xalapa, Veracruz MEXICO
Corresponding Author Secondary
Information:
Corresponding Author's Institution: Universidad Veracruzana
Corresponding Author's Secondary
Institution:
First Author: Enrique Alarcón, Ph. D.
First Author Secondary Information:
Order of Authors: Enrique Alarcón, Ph. D.
Anne-Marie Farnet Da Silva, Ph. D.
Fabio Ziarelli, Ph. D
Isabelle Perraud-Gaime, Ph. D.
Beatriz Gutiérrez-Rivera, Ph. D.
Christian Hernández, B.s.
Order of Authors Secondary
Information:
Funding Information: Mexican Consejo Nacional de Ciencia y Tecnología (CONACyT)
B.s. Christian Hernández
ANUIES-CONACyT-ECOS-NORD (M13A02) Dr. Enrique Alarcón
82
1.3 Laccase induction by synthetic dyes in Pycnoporus sanguineus (L.), and their use
for sugar cane bagasse delignification
Hernández C.1, Farnet AM.
3, Ziarelli F.
4, Perraud-Gaime I.
2, Gutierrez-Rivera B
5, Alarcón E.
1*
1Instituto de Biotecnología y Ecología Aplicada (INBIOTECA), Universidad Veracruzana, Xalapa Veracruz, México.
2Equipe Ecotechnologies et Bioremediation, IMBE, UMR CNRS 7263, IRD 237, Aix Marseille Université, Avignon
Université, Campus de l’Etoile, Site de St. Jérôme, Marseille, France 3Equipe Systèmes Microbiens, IMBE, UMR CNRS 7263, IRD 237, Aix Marseille Université, Avignon Université, Campus
de l’Etoile, Site de St. Jérôme, Marseille, France 4Aix Marseille Université, Faculte ́ des Sciences et Techniques de Saint-Jérôme, Spectropole, PO box 512, Avenue Escadrille
Normandie Nie ́men, 13397 Marseille cedex 20, France 5Instituto Tecnológico Superior de Tierra Blanca (ITSTB), Tierra Blanca Veracruz, México.
*Correspondence author: [email protected]
Keywords: Alizarin yellow, Carminic acid, Endoglucanase, 13
C CPMAS solid-state NMR, Cellulose crystallinity
Abstract
The use of synthetic dyes for laccase induction in vivo has been few explored. Here, we aimed to characterize the effect of
adding different synthetic dyes to liquid cultures of the white-rot fungus Pycnoporus sanguineus on laccase production. From
the dyes tested, we found that carminic acid (CA) can induce 722% and alizarin yellow 317% more laccase than control
values, and promote better fungal biomass development, meanwhile aniline blue and crystal violet did not show such positive
effects. In addition, CA and alizarin yellow were degraded during P. sanguineus culturing (12 days) up to 95%. With this
basis, CA was selected as the best inducer and induction of laccase was proved in solid-state fermentation (SSF), using
sugarcane bagasse (SCB) as substrate, in an attempt to reach selective delignification. We found that laccase induction
occurred in SSF, and a slightly inhibition of cellulase production was observed when CA was added to substrate; also,
transformation of SCB under SSF was followed with 13
C CPMAS solid-state NMR technique. Our results showed that P.
sanguineus can selectively delignify SCB, decreasing Aromatic C compounds 32.67% in 16 days, meanwhile O-alkyl C
region (polysaccharides) was degraded less than 2%; however, delignification values were not correlated with laccase
activities values. Cellulose-crystallinity index was increased 27.24% in absence of carminic acid, and 15.94% when 0.01 mM
of CA was added to SCB; this dye also inhibit the production of fungal biomass (measured as alkyl C gain). We conclude that
CA is a good inducer of laccase in liquid media, and that P. sanguineus is a fungi with high potential for biomass
delignification.
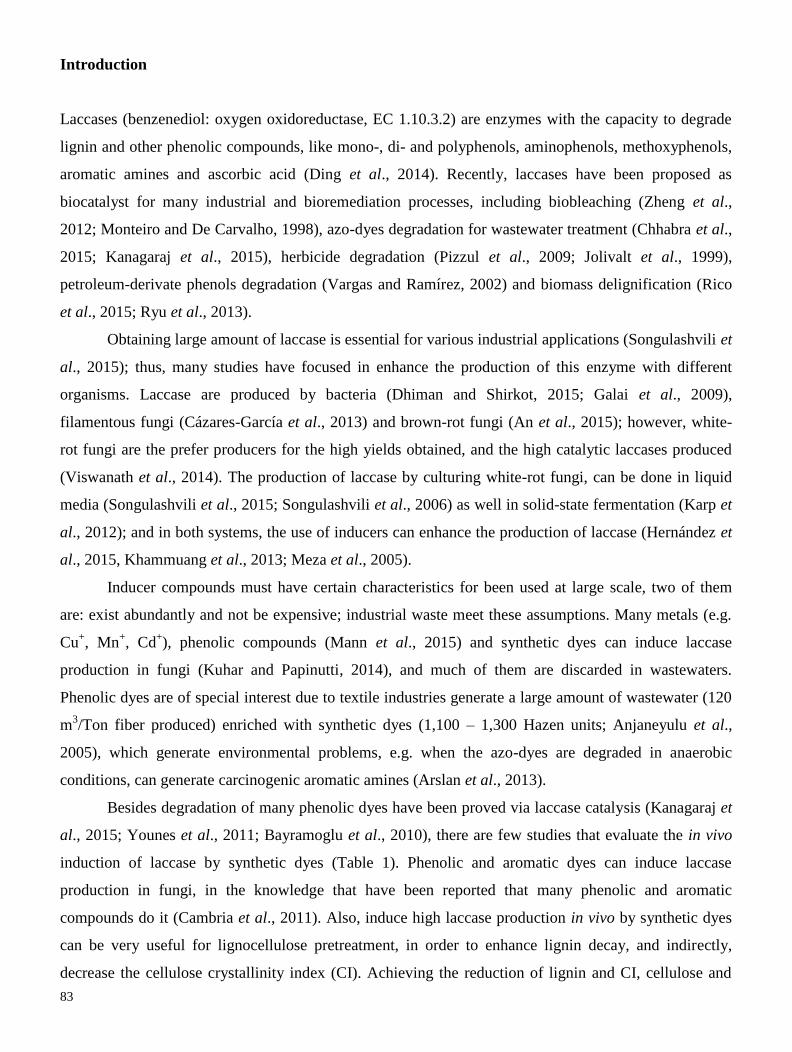
83
Introduction
Laccases (benzenediol: oxygen oxidoreductase, EC 1.10.3.2) are enzymes with the capacity to degrade
lignin and other phenolic compounds, like mono-, di- and polyphenols, aminophenols, methoxyphenols,
aromatic amines and ascorbic acid (Ding et al., 2014). Recently, laccases have been proposed as
biocatalyst for many industrial and bioremediation processes, including biobleaching (Zheng et al.,
2012; Monteiro and De Carvalho, 1998), azo-dyes degradation for wastewater treatment (Chhabra et al.,
2015; Kanagaraj et al., 2015), herbicide degradation (Pizzul et al., 2009; Jolivalt et al., 1999),
petroleum-derivate phenols degradation (Vargas and Ramírez, 2002) and biomass delignification (Rico
et al., 2015; Ryu et al., 2013).
Obtaining large amount of laccase is essential for various industrial applications (Songulashvili et
al., 2015); thus, many studies have focused in enhance the production of this enzyme with different
organisms. Laccase are produced by bacteria (Dhiman and Shirkot, 2015; Galai et al., 2009),
filamentous fungi (Cázares-García et al., 2013) and brown-rot fungi (An et al., 2015); however, white-
rot fungi are the prefer producers for the high yields obtained, and the high catalytic laccases produced
(Viswanath et al., 2014). The production of laccase by culturing white-rot fungi, can be done in liquid
media (Songulashvili et al., 2015; Songulashvili et al., 2006) as well in solid-state fermentation (Karp et
al., 2012); and in both systems, the use of inducers can enhance the production of laccase (Hernández et
al., 2015, Khammuang et al., 2013; Meza et al., 2005).
Inducer compounds must have certain characteristics for been used at large scale, two of them
are: exist abundantly and not be expensive; industrial waste meet these assumptions. Many metals (e.g.
Cu+, Mn
+, Cd
+), phenolic compounds (Mann et al., 2015) and synthetic dyes can induce laccase
production in fungi (Kuhar and Papinutti, 2014), and much of them are discarded in wastewaters.
Phenolic dyes are of special interest due to textile industries generate a large amount of wastewater (120
m3/Ton fiber produced) enriched with synthetic dyes (1,100 – 1,300 Hazen units; Anjaneyulu et al.,
2005), which generate environmental problems, e.g. when the azo-dyes are degraded in anaerobic
conditions, can generate carcinogenic aromatic amines (Arslan et al., 2013).
Besides degradation of many phenolic dyes have been proved via laccase catalysis (Kanagaraj et
al., 2015; Younes et al., 2011; Bayramoglu et al., 2010), there are few studies that evaluate the in vivo
induction of laccase by synthetic dyes (Table 1). Phenolic and aromatic dyes can induce laccase
production in fungi, in the knowledge that have been reported that many phenolic and aromatic
compounds do it (Cambria et al., 2011). Also, induce high laccase production in vivo by synthetic dyes
can be very useful for lignocellulose pretreatment, in order to enhance lignin decay, and indirectly,
decrease the cellulose crystallinity index (CI). Achieving the reduction of lignin and CI, cellulose and
84
hemicellulose are more easily hydrolyzed by enzymes (Yu et al., 2014; Yoshida et al., 2008), which is
very important for bioethanol production.
Table 1. Phenolic dyes used for laccase induction or for decoloration test in vivo with fungi
Dye Type Fungi
Reference
Reactive black 5 Azo-dye Leptosphaerulina sp Copete et al., 2015
Amarath, reactive black 5,
cibracon brillant yellow
Azo-dyes Trametes versicolor Champagne and
Ramsey, 2005
Amido black Azo-dye Pleurotus pulmonarius Zilly et al., 2002
Congo red Azo-dye Pleurotus pulmonarius Zilly et al., 2002
Bromophenol blue Triphenylmethane-
dye
Pycnoporus sanguineus Pointing and Vrijmoed,
2000
Malachite green Triphenylmethane-
dye
Pycnoporus sanguineus Pointing and Vrijmoed,
2000
Violet crystal Triphenylmethane-
dye
Trametes maxima Hernández-Luna et al.,
2008
Amaranth Azo-dye Trametes versicolor Swamy and Ramsay,
1999
Textil wastewater Mixture of colorants Pycnoporus sp. SYBC-
L3
Liu et al., 2012
Remazol brilliant blue
reactive
Anthraquinonic-dye Trametes villosa Hernández-Luna et al.,
2008
Thus, this work aimed to test the degree of induction of laccase of four synthetic/phenolic dyes:
Carminic acid, Alizarin yellow, Aniline blue and Violet crystal (Figure 1) at different concentrations in
liquid media; and subsequently, utilize the best inducer for enhance the production of laccase in solid-
state fermentation (SSF). Substrate (sugar cane bagasse) modifications were evaluated by 13
C cross
polarization magic angle spinning (CPMAS) nuclear magnetic resonance (NMR), in order to determine
if the addition of dyes to lignocellulose promotes a decay in lignin amount and CI values.
Materials and methods
Strain and inoculum
Pycnoporus sanguineus strain was isolated from the sugarcane fields of Jalcomulco, Veracruz, México
(19°20’00’’N, 96°46’00’’W), cultured on a potato-dextrose-agar medium (PDA), stored at 4 °C and
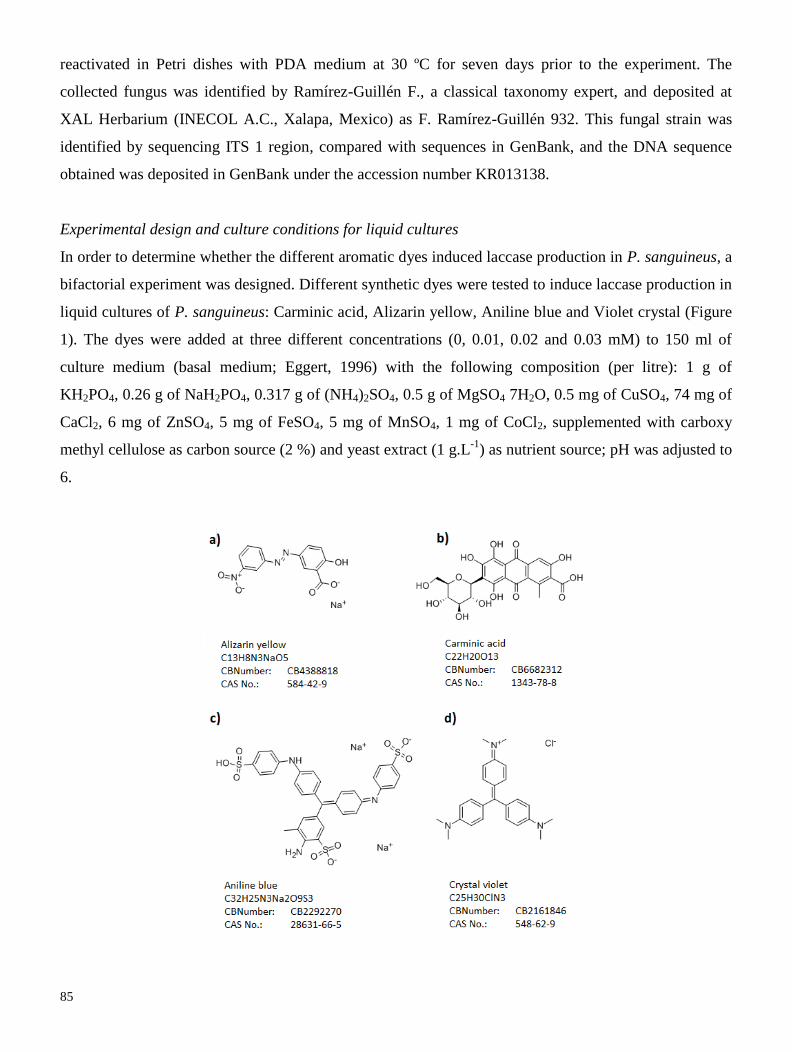
85
reactivated in Petri dishes with PDA medium at 30 ºC for seven days prior to the experiment. The
collected fungus was identified by Ramírez-Guillén F., a classical taxonomy expert, and deposited at
XAL Herbarium (INECOL A.C., Xalapa, Mexico) as F. Ramírez-Guillén 932. This fungal strain was
identified by sequencing ITS 1 region, compared with sequences in GenBank, and the DNA sequence
obtained was deposited in GenBank under the accession number KR013138.
Experimental design and culture conditions for liquid cultures
In order to determine whether the different aromatic dyes induced laccase production in P. sanguineus, a
bifactorial experiment was designed. Different synthetic dyes were tested to induce laccase production in
liquid cultures of P. sanguineus: Carminic acid, Alizarin yellow, Aniline blue and Violet crystal (Figure
1). The dyes were added at three different concentrations (0, 0.01, 0.02 and 0.03 mM) to 150 ml of
culture medium (basal medium; Eggert, 1996) with the following composition (per litre): 1 g of
KH2PO4, 0.26 g of NaH2PO4, 0.317 g of (NH4)2SO4, 0.5 g of MgSO4 7H2O, 0.5 mg of CuSO4, 74 mg of
CaCl2, 6 mg of ZnSO4, 5 mg of FeSO4, 5 mg of MnSO4, 1 mg of CoCl2, supplemented with carboxy
methyl cellulose as carbon source (2 %) and yeast extract (1 g.L-1
) as nutrient source; pH was adjusted to
6.
86
Figure 1. Phenolic dyes used for laccase induction. a) Azo-dye alizarin yellow; b) Carminic acid, an
anthraquinonic dye with a glycosidic bond with one glucose molecule; c) trisulfonate dye aniline blue; d)
triarylmethane dye crystal violet.
The cultures were performed in quadruplicate, in plastic containers of 500 ml. Each experimental
replicate was inoculated with two plugs of agar-containing mycelium (six days old) and were incubated
in darkness at 30° C in an environmental chamber (Binder, GmbH). Samplings were performed each 3
days for 12 days of incubation to test laccase activity (U.L-1
), meanwhile biomass production (mg.DM-1
)
and dye degradation (%) were determined at the end of the incubation time.
Analytical methods for liquid cultures
Laccase activity in liquid cultures was estimated according to Criquet (1999). 20 μL of a solution of 5
mM syringaldazine were added to 980 μL of culture sample. The oxidation kinetics from syringaldazine
to quinone was followed at 525 nm (ε= 65 000 M-1
cm-1
) at 37 °C for 90 s. The activity was expressed as
μmoles of quinone formed from syringaldazine per minute (U) per one liter of culture (U.L-1
).
Fungal biomass from liquid cultures was calculated at the end of the experiment: cultures were
filtered at vacuum and recovered biomass was dried at 60°C by 48h. Biomass weight was estimated by
gravimetric method, and was reported as milligrams of dry mass (mg.DM-1
). Aromatic dye degradation
was estimated according to linear models obtained from known concentrations (0 to 0.03 mM) and the
absorbance measured at the wavelength of the main peaks (nm) in the visible light-spectrum (Aniline
blue: 595, 610 nm; Violet crystal: 588, 592 nm; Carminic acid 494 nm; Alizarine yellow: 358, 363 nm).
Absorbance was quantified with a UV spectrophotometer and transformed into mM according to linear
models (Table 2).
Table 2. Models utilized for phenolic dyes degradation
Model equation R2
[Aniline blue, peak 595 nm] = (γ 595 nm + 0.46)/1.93 0.82
[Aniline blue, peak 610 nm] = (γ 610 nm + 0.643)/2.22 0.90
[Violet crystal, peak 588 nm] = (γ 588 nm – 2.813)/1.75 0.85
[Violet crystal, peak 592 nm] = (γ 592 nm – 2.19)/1.98 0.90
[Alizarin yellow, peak 358 nm] = (γ 358 nm – 0.913)/1.24 0.93
[Alizarin yellow, peak 363 nm] = (γ 358 nm – 0.94)/1.105 0.92
[Carminic acid, peak 494 nm] = (γ 494 nm – 0.176)/0.81 0.99
Experimental design and culture conditions for solid-state fermentation
The conditions that induced the highest laccase activity were used for the second experimental phase.
87
Different concentrations of carminic acid were tested in solid-state fermentation (SSF): 0.00 mM, 0.003
mM, 0.006 mM and 0.01 mM; a volume of basal medium enriched with yeast extract and carminic acid
was added to 50 g of pre-dried sugar cane bagasse (SCB) until a final humidity of 80% v/w. The wet
SCB was deposited into poly-paper plastic bags and sterilized by autoclaving (120°C:1.5 atm) for 20
min. After cooling, three-agar squares 0.25 cm2 in size with reactivated mycelium (7 days of culture)
were used as inoculum. The mesocom were incubated in darkness at 30°C in an environmental chamber
(Binder, GmbH). Each treatment was replicated four times, and samplings for determine laccase and
endoglucanase activities were done each four days during 16 days from expendable replicates;
consequently, a total of 80 mesocosms (4 replicates x 4 carminic acid concentrations x 5 sampling dates)
were set up. SCB samples were analyzed by 13
C CPMAS NMR methodology, in order to determine the
substrate modification by P. sanguineus.
Analytical methods for SSF phase
Enzymatic activities were calculated from concentrated protein extracts, obtained according to Criquet
(1999): 5 g of SSB (fresh weight) were added to 100 ml of 0.2 M CaCl2 buffer added with Tween 80
0.05 % and 6 g of polyvinylpyrrolidone (PVP), stirred per 1 h at ~ 220 rpm and then filtered with 0.2 µm
cellulose filters. 50 ml of the crude extract was dialyzed within cellulose tubular membranes (Sigma-
Aldrich, USA) and Polyethylene glycol (PEG-8000) overnight at 4° C; concentrated proteins were
recovery in one volume of 0.2 M sodium phosphate buffer pH 6 and used for enzymatic determinations.
Reaction mixture for laccase determination was as follows: 100 µl of protein extract, 880 µl of 0.2 M
sodium phosphate buffer pH 6 and 20 µl of syringaldazine 5 mM. Endoglucanase activity was estimated
according to Ghose (1987), measuring simple sugars released from carboxymethyl cellulose (CMC, 2%),
by the method of dinitrosalicilic acid (DNS). Reaction mixture for endoglucanase estimation was as
follows: 250 µl of protein extract was mixed with 250 µl of CMC, 2%, the reaction was incubated in a
water-bath at 50°C for 1 h. The reaction was stopped with 500 µl of DNS reagent, boiled for 5 min and
immediately cooled in icy water for 10 min. The reaction mixture was diluted with 5 ml of dH2O prior
spectrophotometer quantification (540 nm). Absorbance was transform into g.per liter-1
of glucose by
comparison with a standard glucose curve (g.L-1
). Both enzymatic activities were reported as U per g of
dry mass (U.gDM-1
) of SCB.
Substrate modifications
Changes in chemical composition of SCB were followed via 13
C CPMAS NMR in a Bruker Advance
DSX 400 MHz spectrometer (Bruker, Madison, WI, USA). 100 mg of dried and ground SCB were
placed in a zirconium rotor and spun at the Magic angle (54.44°) at 10 KHz. The 13
C CPMAS NMR
technique was performed with a ramped 1H pulse during a contact time of 3 ms and with
1H decoupling
88
during the acquisition time to improve the resolution. Recording 4 K transients with a recycling delay of
2 s represented standard conditions to obtain a good signal-to-noise ratio.
Deconvolution of NMR spectra was performed using the DmFit software (Massiot, 2002).
Specifically regions of NMR spectra were utilized as indicators of chemical shifts in SCB: alkyl C (0-45
ppm) and Carboxyl C (160-190 ppm) were related to fungal biomass production since they can be
assigned to membrane phospholipids and since only very weak signals were observed in the sugar cane
bagasse. Polysaccharides content were estimated measuring the O-alkyl C signal (45-110 ppm), and the
content in aromatic C compounds measuring the signal between 110 – 160 ppm. Cellulose crystallinity
index was calculated according to Park et al (2010), by separating the C4 region of the spectrum into
crystalline and amorphous peaks, and calculated by dividing the total area of the crystalline peak (87 to
93 ppm) by the total area assigned to the C4 peak (80 – 93 ppm). In addition, changes in Aromatic C
region were evaluated according to Hallac et al (2009), measuring the decrease of p-hydroxyphenyl (162
– 157 ppm), aromatic quaternary C (160 – 123 ppm), and aromatic tertiary C (123-103 ppm) signals.
Statistical analysis
Data of laccase activity and biomass production were analyzed by two-way ANOVA (α = 0.05), in order
to identify if the different dyes added to medium or their concentrations had significant effects on these
variables; when ANOVA was significant, a post hoc Fisher LSD analysis were made. In addition,
Pearson correlations between laccase activity, biomass production and percentage of dyes degradation
were done. All the analysis were done in the software STATISTICA 7 (Statsoft, 2004).
Results
Effect of aromatic dyes on laccase production in liquid cultures
According to our ANOVA results, the addition of different aromatic dyes to culture medium of P.
sanguineus, affects its laccase production (F = 79.07; P < 0.001), meanwhile the concentration was not
significant (F = 2.28; P = 0.11) as well as the interaction between the type of dye and dye concentration
(F = 1.31; P = 0.27). Cultures with carminic acid showed the highest laccase activities (0.01 mM =
273.65 ± 90.72 U.L-1
; 0.02 mM = 251.43 ± 102.32 U.L-1
; 0.03 mM = 237.69 ± 49.08 U.L-1
), followed by
alizarin yellow (0.01 mM = 120.85 ± 81.51 U.L-1
; 0.02 mM = 53.90 ± 31.76 U.L-1
; 0.03 mM = 104.85 ±
75.81 U.L-1
), control (37.8 ± 12.25 U.L-1
) and cultures with aniline blue (0.01 mM = 34.46 ± 10.16 U.L-
1; 0.02 mM = 19.13 ± 11.84 U.L
-1; 0.03 mM = 15.07 ± 7.87 U.L
-1). No laccase activity nor-fungal
development were observed in cultures with Violet crystal (Figure 2).
89
Figure 2. Laccase activity (U.L-1
) kinetics of liquid cultures with different dyes addition, in
concentration from 0 to 0.01 mM. Middle points indicate the mean and whiskers the standard error.
Biomass production in liquid media
Two-way ANOVA showed that the type of dye added to liquid media affects the amount of biomass
produced (F2 = 6.10; P = 0.006); meanwhile dye concentration had not significant effects (F2 = 1.29; P =
0.29), but the interaction between dye type and dye concentration was significant (F4 = 4.31; P = 0.007).
Treatments with aniline blue (whatever the concentration), alizarin yellow (0.01 mM) and carminic acid
(0.03 mM) were those that produced more fungal biomass (Figure 3). More precisely, the production of
biomass increased with carminic acid concentrations while an inhibiting effect was found for alzarine
yellow concentrations of 0.02 and 0.03 mM. Moreover, fungal biomass production was positively
correlated with laccase production only in cultures with carminic acid (r = 0.66; P = 0.001) (Figure 4).
90
Figure 3. Biomass production in liquid media enriched with phenolic dyes at different concentrations.
Bars indicate the mean and whiskers the standard error.
Figure 4. Correlations between laccase activity,
biomass production and dye degradation (%). a)
Laccase activity was positive correlated with
carminic acid degradation, and biomass production;
b) laccase activity was negatively correlated with
biomass production, and no dye degradation was
observed; c) positive relations were observed
between laccase activity, alizarin yellow
degradation and biomass production.
91
Dye degradation
Only carminic acid and alizarin yellow were degraded in P. sanguineus liquid cultures (Table 2).
Carminic acid was degraded above of 92% in all concentrations tested, and alizarin yellow 97% in
cultures with an initial concentration of 0.01 mM, 48% in cultures with 0.02 mM and 60% in cultures
with 0.03 mM. This is consistent with the fact that laccase activity was weaker for alizarin yellow
concentrations of 0.02 and 0.03 mM. Dye degradation was indeed positively correlated with laccase
activity (Carminic acid r = 0.91 P < 0.0001; alizarin yellow r = 0.64 P = 0.02 Figure 4).
Enzyme production in SSF
Enzyme activities in SSF showed maximum values after 12 days for endoglucanase (Figure 5a), and
after 8 days for laccase (Figure 5b). ANOVA results indicate that endoglucanase activity decreased with
the amount of carminic acid added to SCB (F3 = 10.96; P = 0.004). According to Fisher LSD posthoc
test, cultures without carminic acid had the highest endoglucanase activity (1116.45 ± 127.12 U.gDM-1
),
meanwhile, cultures with 0.003 mM showed 584.98 ± 171.24 U.gDM-1
, with 0.01 mM , 520.90 ± 109.21
U.gDM-1
and with 0.006 mM 351.58 ± 68.86 U.gDM-1
. After 12 days, all cultures with carminic acid
showed lower values of endoglucanase activity than control cultures. On the other hand, laccase activity
was detected after 4 and 8 days and increased when carminic acid was added. Treatments with carminic
acid showed higher laccase activity than controls 0.75 ± 0.31 U.gDM-1
with an average of 1.09 ± 0.40
U.gDM- 1
whatever the concentrations of carminic acid.
Figure 5. Enzymatic activities observed in SSF phase. a) Endoglucanase activity, highest activity was
registered in treatments without carminic acid at day 12. b) Laccase activity was only registered after 4
92
and 8 days. Middle points indicate the mean and whiskers the standard error.
NMR chemical shifts in SSF
13C CPMAS NMR results showed that, variations in the chemical composition of sugarcane bagasse
under biological pretreatment with P. sanguineus and different concentrations of carminic acid, were
observed over time (after 16 days under SSF) (Figure 6). Cellulose crystallinity index (CI) was increased
in all the treatments; SCB had an initial CI ratio of 0.34, and increased 27.34% in control. When
carminic acid was added the increment in CI was lower (Table 4).
Carboxylic C and Alkyl C regions of the spectra were related to fungal biomass development
(membrane phospholipid production); the increase in those regions were lower when carminic acid was
added to SCB, compared to control (Table 4), which indicated negative effects of carminic acid in
biomass production, in SSF. On the other hand, polysaccharide content (O-alkyl C), was almost
unchanged in all treatments (decreased less than 2%) and no differential effects were observed in
treatments with and without carminic acid.
Changes in the chemical composition of SCB were mainly observed for the Aromatic C region,
which indicates changes in SCB lignin fraction. However, the reduction of these values was higher in
control and when 0.003 mM of carminic acid was added, reaching a reduction in aromatic C signals of
32.67 and 30.65%, respectively. Treatments with 0.006 mM of carminic acid showed a decrease of
16.33%, meanwhile when 0.01 mM were added, aromatic region only decreased 1.95%; however,
aromatic quaternary C diminish its signal 17.60%. 13
C CPMAS NMR analysis also showed that SCB’s
lignin had very little p-hydroxyphenyl (162 – 157 ppm) radicals, and that the peaks obtained for
aromatic C region, corresponded mainly to aromatic quaternary C (160 – 123 ppm) and aromatic tertiary
C (123-103 ppm) (Table 4).
Table 4. Chemical shifts in SCB after 16 days of culturing. Data are given in percentage of increment or
decrement. NC = No changes Treatment Cellulose
crystallinity ratio
COOH
(organic acids)
Alkyl C
(lipids)
O-alkyl C
(Polysaccharides)
Aromatic
C
Aromatic
quaternary C
Aromatic
tertiary C
Control +27.24 % +572.79% +2035.98% NC -32.67% -25.89% -7.05%
Carminic acid
0.003 mM
+18.74% +400.89% +1489.33% -1.94% -30.65% -34.82% -7.05%
Carminic acid
0.006 mM
+15.94% +470.64% +1696.49% -0.94% -16.33% -27.00% -5.18%
Carminic acid
0.01 mM
+15.94% +214.04% +936.99% -1.35% -1.95% -17.60% -5.57%
93
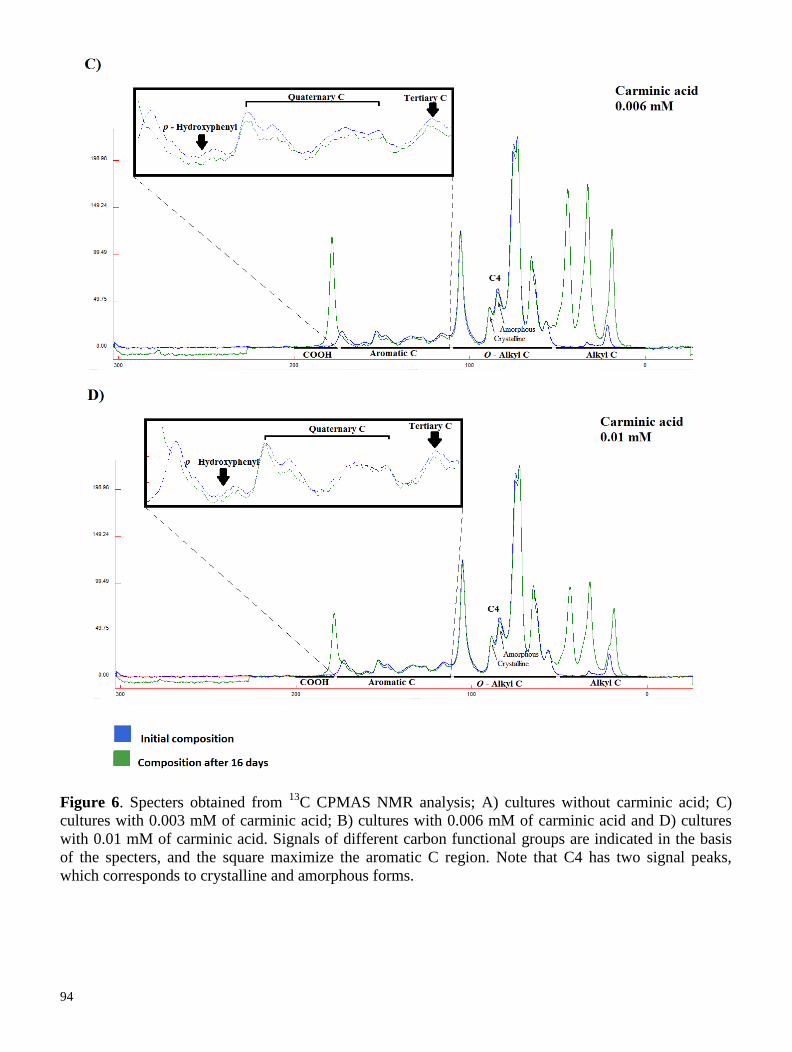
94
Figure 6. Specters obtained from
13C CPMAS NMR analysis; A) cultures without carminic acid; C)
cultures with 0.003 mM of carminic acid; B) cultures with 0.006 mM of carminic acid and D) cultures
with 0.01 mM of carminic acid. Signals of different carbon functional groups are indicated in the basis
of the specters, and the square maximize the aromatic C region. Note that C4 has two signal peaks,
which corresponds to crystalline and amorphous forms.
95
Discussion
Liquid cultures
We observed that carminic acid and alizarin yellow can enhance laccase production 722 and 317% more
than control, respectively. Carminic acid is an anthraquinone-dye with natural occurring in the cochineal
insect Dactylopius coccus (Eisner et al., 1980), and has been used since prehispanic time as a textile and
ceramic dye in México. On the other hand, alizarin yellow is a common azo-dye used in textile industry
(Narayanasamy and Murugesan, 2013), and as other azo-dyes, is potentially hazardous for environment,
because they are toxic (Bae et al., 2006), mutagenic (Freeman et al., 1996) and carcinogenic
(Hildenbrand et al., 1999).
However, both carminic acid and alizarin yellow were successfully degraded in liquid cultures of
P. sanguineus, and this decolourization was positive correlated with laccase production. In addition,
alizarin yellow degradation in cultures of P. sanguineus reached values up to 95% (with an initial
concentration of 0.01 mM), similar to other technological methods, e.g. laser-induced photocatalytic
degradation (Hayat et al., 2010) or hybrid processes like iron-carbon microelectrolysis combined to
aerobic bio-contact oxidation (Liang et al., 2012). The other tested dyes (Aniline blue and Crystal
Violet) were not degraded in liquid cultures, and no-laccase production was registered.
Laccase-mediated dye degradation has been previously reported for carminic acid in agar-plates
and with purified enzymes from Pleutorus ostreatus, Kuehneromyces mutabilis, Trametes versicolor and
Cerrena unicolor (Cho et al., 2007, Cho et al., 1999). Here, we report that P. sanguineus is able to
discolor carminic acid up to 95.97% in liquid cultures, and this is highly correlated with laccase activity
increment. P. sanguineus does not produce either Mn peroxidase (MnP) or lignin peroxidase (LiP)
(Pointing and Vrijmoed, 2000; Eggert et al., 1997), but it is considered as a good laccase producer
(Pointing et al., 2000); thus, the discolor capacity is probably related to the laccase production observed.
Even if the induction mechanism is not clear, some anthraquinone-derived compounds could be involved
in the induction of phenol-oxidases. In an early report Korniłłowicz-Kowalska and Rybczyńska (2014),
indeed indicated that carminic acid can induce the production of other phenoloxidases in Bjerkandera
adusta CCBAS 930, like Mn-peroxidase and horseradish peroxidase, and that the production of these
enzymes its accompanied with a degradation of carminic acid and Poly R-478. Thus, there are evidences
supporting that anthraquinone dyes can be degraded by different lignin-decay enzymes; and, that
anthaquinone dyes could function as inducers of phenol-oxidases in solid and liquid cultures.
Alizarin yellow was also efficiently degraded in P. sanguineus liquid cultures. This azo-dye has
been degraded in vitro by chloroperoxidases of Caldariomyces fumago (Li et al., 2013), but we did not
find previous reports of laccase-mediated decolourization of alizarin yellow. However, in this study we
96
found high correlation with alizarin yellow decolourization and laccase production in vivo. Laccase has
been utilized in many studies for azo-dyes degradation in vitro (Abadulla et al., 2000; Pointing and
Vrijmoed, 2000; Rodriguez et al., 1999), this study increases the knowledge in this field, proving that
alizarin yellow can induce laccase production and that azo-dyes and anthraquinonic dyes can be
degraded in liquid cultures of P. sanguineus. Also, we are in accordance with Rodriguez et al (1999)
who stated that laccase is an enzyme of major importance for industrial dyes degradation.
Biomass production was also modified by the addition of dyes into culture medium: aniline blue
(all concentrations), carminic acid (0.03 mM) and alizarin yellow (0.01 mM) enhanced the production of
biomass in liquid cultures of P. sanguineus. The increased biomass production in cultures with these
dyes, could indicate that P. sanguineus can use them as nutrient sources, i.e. alizarin yellow and aniline
blue can function as nitrogen and sulfur sources (Dave et al., 2015), however the nutrimental role of
carminic acid is still unclear. Biomass production was positive correlated with alizarin yellow and
carminic acid degradation, and with laccase production.
Thus, carminic acid was the stronger laccase inducer tested here in liquid cultures of P.
sanguineus: it promoted higher laccase and biomass production than the other dyes and was degraded
more than 95% at the end of incubation time (12 days). For these reasons, this anthraquinone dye was
selected for being utilized in solid-state fermentation, in an attempt to induce laccase activity and
consequently depolymerize the lignin faction of sugar cane bagasse (SCB).
Solid-state fermentation
Biomass pretreatments for bioethanol production, aimed to reduce the lignin fraction and the cellulose
crystallinity index, while preserving the carbohydrate fraction (Ramos, 2003). Generally, when fungi are
used, these characteristics can be achieved with high phenol-oxidase activities (e.g. laccase), and low
cellulase activities, in order to reach a selective delignification (Dorado et al., 2001). Some authors
considered that Pycnoporus sanguineus is capable of selective delignification (Gupta et al., 2011;
Lomascolo et al., 2011), and it has been reported that this fungi, can produce its own redox-mediator
which enhances lignin decay in the presence of laccase i.e. 3-Hydroxyanthranilic acid (3-HAA; Eggert et
al., 1996). This fungal metabolite can mediates the degradation of non-phenolic lignin structures by
laccase (Eggert et al., 1996). We found that, as well as in liquid cultures, carminic acid was able to
enhance laccase production in SSF, compared to control treatments; though induction was lower. In
addition, when carminic acid was added to sugarcane bagasse, cellulase activity decreased, which is
positive as an attempt to reach selective delignification (Ramos, 2003).
Many studies reported the induction of laccase in SSF using white-rot fungi, and most of them
tested the effect of different carbon sources, nitrogen sources, use of surfactants (e.g. Tween) and metal
or organic inducers, like cooper and xylidine (El-Batal et al., 2015; Karp et al., 2015; Boran and
97
Yeşilada, 2011). However, only few have evaluated the effect of dye absorbed onto lignocelluloses as a
substrate for ligninolytic enzymes production. Usha et al (2014) reported that bioabsorption of synthetic
dyes such as Remazol Brilliant Blue and Remazol Brilliant Violet 5R, onto lignocellulose (wheat bran
and rice bran), and its further use for laccase and lignin peroxidase production was possible, using
Stereum ostrea. Other studies reported that malachite green absorbed onto wheat bran could be used as
solid substrate to produce lignin peroxidase from Fomes sclerodermeus (Papinutti et al., 2006). Remazol
brilliant blue and Remazol brilliant violet 5R are anthraquinone dyes, as well as carminic acid; thus, this
work along with these previous reports showed evidence that anthraquinone dyes can be added onto
lignocellulosic material, and this substrate can enhance phenol-oxidases production.
The enzymatic responses in SSF with or without carminic acid had to be considered together with
chemical shifts in SCB composition measured by 13
C CPMAS NMR. We found that the main structural
shifts in SSF are occurring in Aromatic C region. Other studies that used 13
C CPMAS NMR to evaluate
lignocellulosic transformation (sorghum and wheat wastes), in solid-state cultures of white-rot fungi,
concluded that the growth of such type of fungi mainly led to a decrease in Aromatic C amount (Akin et
al., 1996), which is similar to our observations.
The delignification yields obtained here are interesting when comparing with other studies, which
used white-rot fungi in SSF. Delignification yields of 33% have been reported in SSF using Pleurotus
ostreatus and a combination of ferulic acid and cooper sulfate as laccase inducers (Karp et al., 2015).
Also, our results are similar to those obtained by Masayuki et al (2005) using rice straw inoculated with
either Pleurotus ostreatus (41%), Phanerochaete chrysosporium (21%) or Trametes versicolor (37%).
However, it should be noted that the incubation time in these experiments was longer (about 60 days)
than that used here (16 days). Even if carminic acid induced more laccase production in SSF, we did not
find higher delignification rates; indeed, surprinsingly, when carminic acid was added less Aromatic C
region was degraded. This result could be related to the fact that less biomass was produced and this has
probably affected lignin decay potential. Indeed, conversely to what was observed in liquid cultures,
NMR showed that Alkyl C and Carboxyl C regions, which corresponds to phospholipids (biomass
fungal indicators) were negatively affected when carminic acid was added to SCB. Less biomass
production could have affected other fungal functions, as the production of 3-HAA, and indirectly,
laccase performance in lignin decay. As it was mentioned above, 3-HAA is an important redox mediator
of P. sanguineus between laccase and non-phenolic lignin decay (Eggert et al., 1996) and is also
involved in biomass pigment formation (e.g. cinnabarin; Eggert et al., 1996). Thus, the reduction of
biomass in SSF by adding carminic acid could decrease the amount of available 3-HAA, and affected the
laccase-decay of lignin. However, this hypothesis needs to be tested in further studies, measuring the 3-
HAA production in cultures of P. sanguineus exposed to different carminic acid concentrations.
98
In addition, we observed that O-alkyl C region, which corresponds to polysaccharides, was fewly
affected over time, and decreased less than 2% in all treatments. This result is in accordance to Gupta et
al (2011) and Lomascolo et al (2011), which suggested that P. sanguineus is a fungus with a selective
action on lignin. Selectively delignification of SCB by P. sanguineus could be an efficient way of
pretreatment, in order to enhance enzymatic hydrolysis in second-generation bioethanol production. This
mainly because can diminish 32.67% of lignin, with less than 2% of carbohydrate losses.
Crystallinity index (CI) is another important issue to account in biomass pretreatments. Here, we
observed that solid-state fermentation with P. sanguineus increases 27.24% the CI after 16 days, mainly
when carminic acid was absence. The CI value indicates the relation between the amount of crystalline
cellulose and amorphous cellulose (Park et al., 2010); when the aim is to hydrolyze cellulose with
cellulases, it is desired to have low CI values, because amorphous cellulose is more easily degraded by
cellulases (Yu et al., 2014; Yoshida et al., 2008). When fungi degrade lignocellulose, generally the CI
value increases (Howell et al., 2009), as we observed with P. sanguineus; however, when carminic acid
was added, the increment of CI was lower than controls. According to our results, the addition of
carminic acid at low concentrations (0.003 mM) in combination with P. sanguineus, offers several
advantages for SCB pretreatment i.e. induce the production of laccase, diminish 30.65% of aromatic
compounds, the increment of CI was lower in this treatments (18.79%) than control (27.24%) and
partially avoid the biomass production.
In the basis of the results obtained, we can recommended the use of P. sanguineus for SCB
selective delignification, although increased its CI value; also, carminic acid is a good inducer of laccase
both in liquid cultures and in SSF, however, its use for enhance delignification could be limited because
affects biomass production. Further experiments could be design to avoid this limiting.
Conclusion
This study showed that the use of carminic acid and alizarin yellow, two important textile and industrial
dyes strongly enhance the production of laccase, in cultures of P. sanguineus, both in liquid cultures and
in SSF (carminic acid). Also, the use of P. sanguineus for SCB delignification could bring many
advantages, as a rapid and efficient lignin decay with very few polysaccharides losses, even in the
absence of inducers. Finally, we found that higher laccase amount do not necessary entails to higher
delignification yields, biomass and redox mediators could have important roles in this process.
Acknowledgments
We thanks to Mexican Consejo Nacional de Ciencia y Tecnología (CONACyT) for the PhD scholarship
of Hernández C, to ECOS-NORD Mexique M13A02 and French government for financial, to
Universidad Veracruzana (INBIOTECA) and to Aix Marseille Université (IMBE, IRD and Spectropole)
99
for technical support and to anonymous reviewers of this manuscript.
References
Abadulla E, Tzanov T, Costa S, Robra K, Cavaco-Paulo A, Gübitz GM. 2000. Decolorization and
detoxification of textile dyes with a laccase of Trametes hirsuta. Applied and Environmental
Microbiology 66(8): 3357-3362.
Akin DE, Morrison III WH, Rigsby LL, Gamble GR, Sethuraman A, Eriksson KEL. 1996. Biological
components of plant components by the white-root fungi Ceriporiosis subvermispora and Cyathus
stercoreus. Animal Feed Science Technology 63: 305-321.
An H, Wei D, Xiao T. 2015. Transcriptional profiles of laccase genes in the brown rot fungus Postia
plancenta MAD-R-698. Journal of Microbiology DOI 10.1007/s12275-015-4705-4
Anjaneyulu Y, Chary NS, Suman DS. 2005. Decolourization of industrial effuents – available methods
and emerging technologies: a review. Reviews in environmental science and Bio/Technology 4: 245-273
DOI 10.1007/s11157-005-1246-z
Arslan M, Sayin S, Yilmaz M. 2013. Removal of carcinogenic azo-dyes from water by new
cyclodextrin-immobilized iron oxide magnetic nanoparticules. Water Air Soil Pollut 224:1527 DOI
10.1007/s11270-013-1527-z
Bae J, Freeman HS, Dong S. 2006. Influences of new azo dyes to the acuatic ecosystem. Fibers and
polymers 7(1): 30-35
Boran F and Yeşilada O. 2011. Enhanced production of laccase by fungi under solid substrate
fermentation condition. Bioresources 6(4): 4404-4416
Cambria MT, Ragusa S, Calabrese V, Cambria A. 2011. Enhanced laccase production in white-rot
fungus Rigidoporus lignosus by the addition of selected phenolic and aromatic compounds. Appl
Biochem Biotechnol 163: 415-422 DOI 10.1007/s12010-010-9049-2
Cázares-García SV, Vázquez-Garcidueñas Ma S, Vázquez-Marrufo G. 2013. Structural and phylogenetic
analysis of laccase from Trichoderma: A Bioinformatic Approach. Plos one 8(1) e55295
Champagne P-P and Ramsay JA. 2005. Contribution of manganese peroxidase and laccase to dye
decoloration by Trametes versicolor. Appl Microbiol Biotechnol 69: 276-285 DOI 10.1007/s00253-005-
1964-8
Chhabra M, Mishra S, Sreekrishnan TR. 2015. Immobilized laccase mediated dye decolorization and
transformation pathway of azo dye acid red 27. Journal of environmental health science and engineering
13:38 DOI 10.1186/s40201-015-0192-0
Cho H, Cho N, Jarosa-Wilkolazka A, Rogalski J, Leonowicz A, Shin Y, Ohga S. 2007. Effect of fungal
laccase and new mediators, acetovanillone and acetosyringone, on decolourization of dyes. J. Fac. Agr.,
100
Kyushu Univ., 52(2): 275-280
Cho N, Park JM, Choi TH, Matuszewska A, Jaszek M, Grzywnowicz K, Malarczyk E, Trojanowski K,
Leonowicz A. The effects of wood rooting fungi and laccase on destaining of dyes and KP bleaching
effluent. Mokchae Konghak 27(4): 72-79.
Copete LS, Chanagá X, Barriuso J, López-Lucendo MF, Martínez MJ, Camarero S. 2015. Identification
and characterization of laccase-type multicooper oxidases involved in dye decolorization by the fungus
Leptosphaerulina sp. BMC Biotechnology 15:74 DOI 10.1186/s12896-015-0192-2
Dave SR, Patel TL, Tipre DR. 2015. Bacterial degradation of azo dyes containing wastes. In: Singh SN
(ed.). 2015. Microbial degradation of synthetic dyes in wastewaters. Springer, India
Dhiman K and Shirkot P. 2015. Bioprospecting and molecular characterization of laccase producing
bacteria from paper mills of Himachal Pradesh. Proc. Natl. Acad. Sci., India, Sect. B Biol. Sci. DOI
10.1007/s40011-015-0541-x
Ding Z, Chen Y, Xu Z, Peng L, Xu G, Gu Z, Zhang L, Shi G, Zhang K. 2014. Production and
characterization of laccase from Pleurotus ferulae in submerged fermentation. Ann Microbiol 64: 121-
129 DOI 10.1007/s13213-013-0640-y
Dorado J, Field JA, Almendros G, Sierra-Alvarez R. 2001. Nitrogen-removal with protease as a method
to improve the selective delignification of hemp steamwood by the white-root fungus Bjerkandera sp.
Strain B0S55. Appl Microbiol Biotechnol 57: 205-2011.
Eggert C, Temp U, Dean JFD, Eriksson KEL. 1996. A fungal metabolite mediates degradation of non-
phenolic lignin structures and synthetic lignin by laccase. FEBS letters 391(1-2): 144-148
Eggert C, Temp U, Eriksson KEL. 1997. Laccase is essential for lignin degradation by the white-rot
fungus Pycnoporus cinnabarinus. FEBS letters 407(1997): 89-92
Eisner T, Nowicki S, Goetz M, Meinwald J. 1980. Red cochineal dye (Carminic acid): Its role in nature.
Science 30, 208(4447): 1039-1042 DOI: 10.1126/science.208.4447.1039
El-Batal AI, ElKenawy NM, Yassin AS, Amin MA. 2015. Laccase production by Pleurotus ostreatus
and its application in synthesis of gold nanoparticles. Biotechnology Reports 5: 31-39
doi:10.1016/j.btre.2014.11.001
Freeman HS, Hinks D, Esancy J. 1996. Genotoxicity of azo dyes: Bases and implications. In: A. T.
Peters et al., (eds). Physico-Chemical Principles of Color Chemistry. Chapman and Hall 1996.
Galai S, Limam F, Marzouki MN. 2009. A New Stenotrophomonas maltophilia Strain Producing
Laccase. Use in decolorization of synthetic dyes. Appl Biochem Biotechnol 158:416–431 DOI
10.1007/s12010-008-8369-y
Gupta R, Mehta G, Khasa YP, Kuhad RC. 2011. Fungal delignification of lignocellulosic biomass
improves the saccharification of cellulosics. Biodegradation 22: 797-804 DOI 10.1007/s10532-010-
101
9404-6
Hallac BB, Sannigrahi P, Pu Y, Ray M, Murphy RJ, Ragauskas AJ. 2009. Biomass characterization of
Buddleja davidii: A potential feedstock for biofuel production. Journal of Agricultural and Food
chemistry 57: 1275-1281
Hayat K, Gondal MA, Khaled MM, Ahmed S. 2010. Kinetic study of laser-induced photocatalytic
degradation of dye (alizarin yellow) from wastewater using nanostructured ZnO. Journal of
environmental science and health, Part A: Toxic/Hazardous substances and environmental engineering
45(11): 1413-1420 DOI:10.1080/10934529.2010.500934
Hildenbrand S, Schmahl FW, Wodarz R, Kimmel R, Dartsch PC. 1999. Azo dyes and carcinogenic
aromatic amines in cell cultures. Int Arch Occup Environ Health 72(Suppl 3): M52-M56
Hernández CA, Sandoval N, Mallerman J, García-Pérez JA, Farnet A-M, Perraud-Gaime I, Alarcón E.
2015. Ethanol induction of laccase depends on nitrogen conditions of Pycnoporus sanguineus. Electronic
Journal of Biotechnology 18: 327-332
Hernández-Luna CE, Gutiérrez-Soto G, Salcedo-Martínez SM. 2008. Screening for decolorizing
basidiomycetes in México. World J Microbiol Biotechnol 24: 465-473 DOI 10.1007/s11274-007-9495-3
Howell C, Steenkjær AC, Goodell B, Jellison J. 2009. Temporal changes in wood crystalline cellulose
during degradation by brown rot fungi. International Biodegradation and Biodeterioration 63(4): 414-
419 doi:10.1016/j.ibiod.2008.11.009
Jolivalt C, Raynal A, Caminade E, Kokel B, Le Goffic F, Mougin C. 1999. Transformation of N’, N’ –
dimethyl-N-(hydroxyphenyl)ureas by laccase from the white rot fungus Trametes versicolor. Appl
Microbiol Biotechnol 51: 676-681
Kanagaraj J, Senthilvelan T, Panda RC. 2015. Degradation of azo-dyes by laccase: biological method to
reduce pollution load in dye wastewater. Clean Techn Environ Policy 17:1443–1456 DOI
10.1007/s10098-014-0869-6
Karp SG, Faraco V, Amore A, Birolo L, Giangrande C, Soccol VT, Pandey A, Soccol CR. 2012.
Characterization of laccase isoforms produced by Pleurotus ostreatus in solid state fermentation of
sugarcane baggase. Bioresourse Technology 114: 735-739
Karp SG, Faraco V, Amore A, Letti LAJ, Soccol VT, Soccol CR. 2015. Statistical optimization of
laccase production and delignification of sugarcane bagasse by Pleurotus ostreatus in solid-state
fermentation. BioMed Research International
http://dx.doi.org/10.1155/2015/181204
Khammuang S, Yuwa-amornpitak T, Svasti J, Sarnthima R. 2013. Cooper induction of laccase by
Lentinus polychrous under liquid-state fermentation. Biocatalysis and Agricultural Biotechnology 2(4):
357-362
102
Korniłłowicz-Kowalska and Rybczyńska. 2014. Anthraquinone dyes decolorization capacity of
anamorphic Bjerkandera adusta CCBAS 930 strain and its HRP-like negative mutants. World J
Microbiol Biotechnol 30: 1725-1736 DOI 10.1007/s11274-014-1595-2
Kuhar F and Papinutti L. 2014. Optimization of laccase production by two strains of Ganoderma
lucidum using phenolic and metallic inducers. Revista Argentina de Microbiología 46(2): 144-149
Li X, Zhang J, Jiang Y, Hu M, Li S, Zhai Q. 2013. Highly efficient biodecolorization/degradation of
congo red and alizarin yellow R by chloroperoxidase from Caldariomyces fumago : Catalytic
mechanism and degradation pathway.
Liang B, Yao Q, Cheng H, Gao S, Kong F, Cui D, Guo Y, Ren N, Wang A. 2012. Enhanced degradation
of azo dye alizarin yellow R in a combined process of iron-carbon microelectrolysis and aerobic bio-
contact oxidation. Environ Sci Pollut Res 19 : 1385-1391 http://dx.doi.org/10.1007/s11356-012-1137-0.
Lomascolo A, Uzan-Boukhriz E, Herpoël-Gimbert E, Sigoillot J, Lesage-Meessen L. 2011.
Pecualiarities of Pycnoporus species for applications in biotechnology. Appl Microbiol Biotechnol 92 :
1129-1149 DOI 10.1007/s00253-011-3596-5
Lui J, Cai Y, Liao X, Huang Q, Hao Z, Hu M, Zhang D. 2012. Simultaneous laccase production and
color removal by culturing fungus Pycnoporus sp. SYBC-L3 in a textil wastewater effluent
supplemented with a lignocellulosic waste Phragmites australis. Bull Environ Contam Toxicol 89: 269-
273
Masayuki T, Suzuki H, Watanabe D, Sakai K, Tanaka T. 2005. Evaluation of pretreatment with
Pleurotus ostreatus for enzymatic hydrolysis of rice straw. Journal of bioscience and bioengineering
100: 637-642.
Massiot D, Fayon F, Capron M, King I, Le Calve S, Alonso B et al. 2002. Modelling one- and two-
dimensional solid-state NMR spectra. Magnetic Resonance in Chemistry 40: 70-76
Meza JC, Lomascolo A, Casalot L, Sigoillot J-C, Auria R. 2005. Laccase production by Pycnoporus
cinnabarinus grown on sugar-cane bagasse: Influence of ethanol vapors as inducer. Process
Biochemistry 40: 3365-3371
Monteiro MC and De Carvalho MEA. 1998. Pulp bleaching using laccase from Trametes versicolor
under high temperature and alkaline conditions. Appl Biochem and Biotechnol 70-72(1): 983-993.
Narayasamy L and Murugesan T. 2013. Degradation of alizarin yellow R using UV/H2O2 advanced
oxidation process. Environmental progress and sustainable energy 33(2) DOI 10.1002/ep.11816
Papinutti L, Mouso N, Forchiassin F. 2006. Removal and degradation of the fungicide dye malachite
green from aqueous solution using the system wheat bran-Fomes screlodermeus. Enzyme and Microbial
Technology 39(4): 848-853
Park S, Baker JO, Himmel ME, Parrilla PA, Johnson DK. 2010. Cellulose crystallinity index:
103
measurement techniques and their impact on interpreting cellulase performance. Biotechnology for
biofuels 3:10 http://www.biotechnologyforbiofuels.com/content/3/1/10
Pizzul L, Castillo M del P, Stenström J. 2009. Degradation of glyphosate and other pesticides by
ligninolytic enzymes. Biodegradation 20: 751-759 DOI 10.1007/s10532-009-9263-1
Pointing SB and Vrijmoed LLP. 2000. Decolorization of azo and triphenylmethane dyes by Pycnoporus
sanguineus producing laccase as the sole phenoloxidase. World journal of microbiology and
biotechnology 16: 317-318
Pointing SB, Jones EGB, Vrijmoed LLP. 2000. Optimization of laccase production by Pycnoporus
sanguineus in submerged liquid culture. Mycologia 92(1): 139-144.
Ramos LP. 2003. The chemistry involved in the steam treatment of lignocellulosic matherials. Quim.
Nova 26(6): 863-871
Rico A, Rencoret J, del Río JC, Martínez AT, Gutiérrez A. 2015. In-Depth 2D NMR Study of liginin
modification during pretreatment of Eucalyptus wood with laccase and mediators. Bioenerg. Res. 8: 211-
230 DOI 10.1007/s12155-014-9505-x
Rodriguez E, Pickard MA, Vazquez-Duhalt R. 1999. Industrial dye decolorization by laccases from
ligninolytic fungi. Current Microbiology 38: 27-32
Ryu S-H, Cho M-K, Kim M, Jung S-M, Seo J-H. 2013. Enhanced lignin biodegradation by a laccase-
overexpressed White-rod fungus Polyporus brumalis in the pretreatment of wood chips. Appl Biochem
Biotechnol 171: 1525-1534 DOI 10.1007/s12010-013-0412-y
Songulashvili G, Elisashvili V, Wasser SP, Nevo E, Hadar Y. 2006. Basidiomycetes laccase and
manganese peroxidase activity in submerged fermentation of food industry wastes. Enzyme and
microbial technology 41: 57-61
Songulashvili G, Spindler D, Jiménez-Tobón GA, Jaspers C, Kerns G, Penninckx MJ. 2015. Production
of a high level of laccase by submerged fermentation at 120-L scale of Cerrena unicolor C-139 grown
on wheat bran. Comptes Rendus Biologies 338: 121-125.
Swamy J and Ramsay JA. 1999. Effects of Mn2+
and NH4+ concentrations on laccase and manganese
peroxidase production and amaranth decoloration by Trametes versicolor. Appl Microbiol Biotechnol
51: 391-396
Usha KY, Praveen K, Reddy BR. 2014. Enhanced production of ligninolytic enzymes by a mushroom
Stereum ostrea. Biotechnology Research International Volume 2014
http://dx.doi.org/10.1155/2014/815495
Vargas MC and Ramírez NE. 2002. Phenol oxidation of petrol refinery wastewater catalyzed by laccase.
Ciencia Tecnología y Futuro 2(3): 23-30
Viswanath B, Rajesh B, Janardhan A, Kumar AP, Narasimha G. 2014. Fungal laccases and their
104
applications in bioremediation. Enzyme Research Article ID 163242, 21 pages
Younes SB, Bouallagui Z, Gargoubi A, Sayadi S. 2011. Investigation of dyes degradation intermediates
with Scytalidium thermophilum laccase. Eur Food Res Technol 233: 751-758 DOI 10.1007/s00217-011-
1569-7
Yoshida M, Liu Y, Uchida S, Kawarada K, Ukagami Y, Ichinose H, Kaneko S, Fukuda K. 2008. Effects
of cellulose crystallinity, hemicellulose, and lignin on the enzymatic hydrolysis of Miscanthus sinensis
to monosaccharides. Biosci. Biotechnol. Biochem. 73(3): 805-810 doi:10.1271/bbb.70689
Yu Z, Gwak Y, Treasure T, Jameel H, Chang H, Park S. 2014. Effect of lignin chemistry on the
enzymatic hydrolysis of woody biomass. Chemsuschem 7:1942-1950 DOI: 10.1002/c ssc.201400042
Zheng Z, Li H, Li L, Shao W. 2012. Biobleaching of wheat straw pulp with recombinant laccase from
the hyperthermophilic Thermus thermophilus. Biotechnol Lett 34: 541-547 DOI 10.1007/s10529-011-
0796-0
Zilly A, Souza CGM, Barbosa-Tessmann IP, Peralta RM. 2002. Decolorization of industrial dyes by a
brasilian strain of Pleurotus pulmonarius producing laccase as the sole phenol-oxidazing enzyme. Folia
Microbiol 47(3): 273-277
105
Capítulo 2
Optimización de la producción de celulasas para procesos de
fermentación-sacarificación simultánea
__________________________________
106
2.1 Cellulase and xylanase production from fungal polycultures in liquid media
Artículo sometido a Enzyme and Microbial Technology (Elsevier)
El artículo reporta los resultados obtenidos del capítulo 2. Producción de celulasas y xilanasas en
cultivos mixtos de hongos filamentosos, aislados de bosques veracruzanos.
107
Elsevier Editorial System(tm) for Enzyme and Microbial Technology Manuscript
Draft
Title: Cellulase and xylanase production from different Ascomycota in
mixed cultures of liquid media
Article Type: Research Paper
Keywords: endoglucanase; β-glucosidase; exoglucanase; SDSPAGE;
Trichoderma; Fusarium.
Corresponding Author: Dr. Enrique Alarcón, Ph.D. Corresponding
Author's Institution: Universidad Veracruzana First Author:
Christian Hernández, PhD
Order of Authors: Christian Hernández, PhD; Adriane Milagres , Ph.D.;
Gerardo Vázquez-Marrufo, Ph.D.; Enrique Alarcón, Ph.D.
Manuscript Region of Origin: MEXICO
Abstract: Efficient hydrolysis of holocellulose depends on a proper balance
between cellulase (endoglucanase, exoglucanase, β-glucosidase) and xylanase
activities. A strategy that seeks to produce hydrolytic complexes with these
features is the use of cocultures of filamentous fungi, which produces
different enzyme isoforms, resulting in an enzymatic complex of different
characteristics to those produced with monocultures. The present study aimed
to explore the production of cellulases and xylanases in mixed cultures (one,
two, three and four fungal strains on the same bioreactor) of wild strains of
filamentous fungi from the genus Trichoderma, Aspergillus and Fusarium, in
liquid media. Endoglucanase, exoglucansae, β-glucosidase and xylanase
activities and the profile of extracellular protein isoforms (SDS-PAGE)
produced by different fungal combinations (N = 14) are reported. Pearson´s
correlation matrix and Principal Component Analysis (PCA) were used to analize
data. According to our results, relationships of competition were stablished
in mixed cultures, which produce spositive (endoglucanase and β-glucosidase
productions), negative (number of extracellular protein isoforms and xylanases
productions) or neutral (exoglucanase production) effects in the variables
tested. We conclude that the coculture of Aspergillus niger-Fusarium oxysporum
contributes to increase 19.02% endoglucanase and 6.35% β-glucosidase, compared
with monocultures. The use of tricultures and polycultures (more than three
different strains) trends to diminish the amount of enzymes produced, and the
extracellular protein isoforms, due to the competition relationships
(stressful conditions) between fungal strains.
108
Cellulase and xylanase production from fungal polycultures in liquid media
Hernández C.1, Milagres A.M.F.
2, Vázquez- Marrufo G
3, Alarcón E.
1*
1Universidad Veracruzana, Instituto de Biotecnología y Ecología Aplicada (INBIOTECA) México
2Universidade de São Paulo, Escola de Engenharia de Lorena (EEL) Departamento de Biotecnología, Brasil
3Universidad Michoacana de San Nicolás de Hidalgo, Facultad de Medicina Veterinaria y Zootecnia, Centro
Multidisciplinario de Estudios en Biotecnología (CMEB) México
Keywords: endoglucanase, β-glucosidase, exoglucanase, SDS-PAGE, Trichoderma, Aspergillus,
Fusarium.
Abstract
Efficient hydrolysis of holocellulose depends on a proper balance between cellulase (endoglucanase,
exoglucanase, β-glucosidase) and xylanase activities. A strategy that seeks to produce hydrolytic
complexes with these features is the use of cocultures of filamentous fungi, which produces different
enzyme isoforms, resulting in an enzymatic complex of different characteristics to those produced with
monocultures. The present study aimed to explore the production of cellulases and xylanases in mixed
cultures (one, two, three and four fungal strains on the same bioreactor) of wild strains of filamentous
fungi from the genus Trichoderma, Aspergillus and Fusarium, in liquid media. Endoglucanase,
exoglucansae, β-glucosidase and xylanase activities and the profile of extracellular protein isoforms
(SDS-PAGE) produced by different fungal combinations (N = 14) are reported. Pearson´s correlation
matrix and Principal Component Analysis (PCA) were used to analize data. According to our results,
relationships of competition were stablished in mixed cultures, which produce positive (endoglucanase
and β-glucosidase productions), negative (number of extracellular protein isoforms and xylanases
productions) or neutral (exoglucanase production) effects in the variables tested. We conclude that the
coculture of Aspergillus niger-Fusarium oxysporum contributes to increase 19.02% endoglucanase and
6.35% β-glucosidase, compared with monocultures. The use of tricultures and polycultures (more than
three different strains) trends to diminish the amount of enzymes produced, and the extracellular protein
isoforms, due to the competition relationships (stressful conditions) between fungal strains.
109
Introduction
Cellulases are specialized enzymes in the degradation of cellulose produced in high quantities by
filamentous fungi (mainly Ascomycota), which have been particularly studied in species of the genus
Trichoderma [1, 2]. Cellulase activity [FPU; 3], results of three enzymatic activities: exoglucanase (1, 4-
β-D-glucan-cellobiohydrolase, EC 3.2.1.91), endoglucanase (endo-1, 4-β-D-glucanase, EC 3.2.1.4) and
β-glucosidase (β-D-glucoside glucanohydrolase, cellobiase, EC 3.2.1.21); the synergy of those three
activities is able to degrade cellulose into glucose [4]. Trichoderma spp. are well known for producing
high amounts of endo- and exo-glucanases, but are generally poor producers of β-glucosidase [5]; thus,
for biotechnology purposes, the addition of this enzyme is needed for an effective hydrolysis of cellulose
[6]. Other fungi genera capable to produce cellulase in high amounts are Aspergillus [7], Penicillium [8,
9], and Fusarium [10, 11].
Aspergillus is a genus known for the production of β-glucosidase [12], and these enzymes added
to those produced by Trichoderma can contribute to the construction of efficient cellulase complexes [5].
However, a mix of those enzymes added a posteriori of the production process is not the only strategy to
generate cellulase complexes more efficient than those produced in monocultures. The use of cocultures
of species belonging to to different genera of filamentous fungi seeks to induce the production of
cellulase enzymes with a balance between exo, endo and β-glucosidase activities, more favorable than
those produced by monocultures [13]. Several studies have been conducted in this field [e.g. 14, 15, 16],
mainly in solid state fermentation. This area of research has been increased in last years in response to
the growing demand for cellulases, because of their great importance in various industries that use
lignocellulose as feedstock, like the production of second generation bioethanol [17].
In natural ecosystems, like forest or dessert soils [18], as well as in agricultural residues, like the
piles of sugar cane (Saccharum officinarum L.) baggase produced by sugar industry [19], the
lignocellulose is degraded through the combined action of many microorganisms. The synergistically
degradation of lignocellulose observed by the action of different fungal or bacterial species, is due to the
secretion of different degrading enzymes, like cellulases, xylanases and accessory enzymes [20, 21].
This offers the possibility of the use of fungi consorcium to produce enzymatic complexes with great
potential to enhance lignocellulose degrading performance [5], or for some specific aims, like the
production of thermotolerant enzymes [19]. The use of cocultures of different fungal strains, or fungi-
bacteria combinations [22], are good attemps to desing enzymatic complexes with better features than
those produced in monocultures; however, more research is needed to understand how the production of
lignocellulose degrading enzymes is affected by the interactions of more than two microorganisms.
The increase of Filter Paper Unit (FPU) activity in Trichoderma-Aspergillus cocultures has been
attributed to an increase in β-glucosidase; but also has been hypothesized that an increase in the number
110
of isoforms of cellulases in these cultures are occurring [23], contributing to a better procesing of the
substrate by the enzyme complex (synergistic effects). However, lower cellulase activity of the
Trichoderma reesei – Aspergillus terreus cocultures than those of monocultures has also been reported
[24]. The isoforms of cellulase produced in soil could change according to different management
systems [18], and this modifies the Km of the cellulase system. However, it is unknown that the use of
cocultures, or cultures of more than two strains of fungi, could cause positive or negative effects in the
pattern of enzyme isoforms that were produced.
On the other hand, xylanases are another group of enzymes that are involved in the degradation
of lignocellulose [25]. Xylanase activity represents a group of enzymes that act together to degrade
xylan, the main structural component of the hemicellulose. Just as cellulases, filamentous fungi also
produce xylanases, but there is a scarcity of knowledge about their production in mixed cultures.
Although, in natural ecosystems the same substrate (lignocellulose) can be simultaneously degraded by a
whole community of microorganisms [26, 27], few attemps have been made to describe the production
of cellulase and xylanases in liquid-media polycultures (more than three strains).
With this in mind, the first objective of the present study was to isolate and identify wild strains
of filamentous fungi able to produce cellulases (exoglucanases, endoglucanases, β-glucosidases) and
xylanases. The second aim was to characterize the production of these enzymes’ activities in
monocultures and mixed cultures (2, 3 and 4 strains at the same reactor) of the isolated strains. Finally,
we seek to characterize the profile of extracellular proteins produced for each type of fungal
combination. According to the background, we expected an increase in cellulase and xylanase activities
in mixed cultures, as well as an increase in the number of isoforms in polycultures, compared with those
found in monocultures.
Materials and methods
Strains isolation and identification
The strains here studied were isolated directly from litter of Pinus patula at the Cofre de Perote National
Park, (19°30' N: 97° 9' O; Veracruz, México) and litter of a Citrus sp. plantation at Tuzamapan town
(19°24' N: 96°52' O; Veracruz, México). For strain isolation the selective medium Czapek-Dox (Agar-
carboxy methyl cellulose) was added with tetracicline (50 mg.l-1
) to avoid bacterial contamination [28].
A qualitative analysis for the presence of cellulases by direct Congo red staining was done [29]. Four of
the isolated strains were used to produce cellulases and xylanases in mixed cultures, these strains were
identified by amplification and analysis of the ITS rDNA region [30]. DNA of the selected strains was
isolated using the Fastprep (MP Biomedicals, LLC, USA) a kit for fungal DNA isolation, as described
by the supplier. PCR reactions of the ITS region were conducted with the primers (ITS1/ITS4) and
111
conditions described by White et al., [31]. Amplicons were sequenced at Elimbiopharm (Hayward CA,
USA) and the sequences obtained were subjected to Blastn search in Genbank. Those sequences of
Genbank with maximum identity with amplicons obtained were retrieved and used for phylogenetic
analysis. Additional ITS sequences of the same genus obtained in Blastn search were selected and
retrieved from Genbank in order to make a more robust phylogenetic analysis of each studied strain. The
sequences were aligned by ClustalW and edited by hand. Genetic distances were calculated by the
Kimura- 2 parameters and then the phylogenetic reconstruction was conducted by using the Maximum
Likelihood criteria with 1000 bootstrap replicates. Maximum Parsimony (MP) trees were also generated
using same genetic distances. All these steps for phylogenetic analysis were conducted in Mega 6 [32].
Obtained sequences were deposited in Genbank with the accession numbers KX253665 (strain PS1-
G06), KX253666 (strain PS3), KX253667 (strain Asp 546), KX253668 (strain C02-E06). See strains
code below.
Table 1. Different strain combinations used for cellulase and xylanase production in liquid media
Treatment code Culture type Strains
M1
Monocultures
F. oxisporum
M2 T. harzianum (1)
M3 T. harzianum (2)
M4 A. niger
C1
Cocultures
F. oxisporum + T. harzianum (1)
C2 F. oxisporum + T. harzianum (2)
C3 F. oxisporum + A. niger
C4 T. harzianum (1) + T. harzianum (2)
C5 T. harzianum (1) + A. niger
T1
Tricultures
F. oxisporum + T. harzianum (1) + T. harzianum (2)
T2 F. oxisporum + T. harzianum (1) + A. niger
T3 F. oxisporum + T. harzianum (2) + A. niger
T4 T. harzianum (1) + T. harzianum (2) + A. niger
P1 Polycultures F. oxisporum + A. niger + T. harzianum (1) + T. harzianum
(2)
Experimental design
To evaluate the effect of growing different strains of filamentous fungi together on the production of
cellulases and xylanases, a monofactorial design was performed, where the factor was the type of
combination, i.e. monoculture, coculture, triculture or polyculture (Table 1). The response variables were
the activities of exoglucanase, endoglucanase, β-glucosidase and xylanase, and the profile of
112
extracellular proteins produced.
As an experimental unit, Erlenmeyer 250 ml flasks were used which contained 150 ml of basal medium
[33], with the following composition (per liter): 1 g of KH2PO4, 0.26 g of NaH2PO4, 0.317 g of
(NH4)2SO4, 0.5 g of MgSO4 7H2O, 0.5 mg of CuSO4, 74 mg of CaCl2, 6 mg of ZnSO4, 5 mg of FeSO4, 5
mg of MnSO4, 1 mg of CoCl2, supplemented with sugarcane bagasse as carbon source (2 % w/v). The
flasks were inoculated with 1 square (0.25 cm2) of agar-malt medium, colonized with mycelium of 6
days of culture. Each treatment had three experimental replicates. The cultures were kept in darkness at
30° C without agitation and sampling was performed every 4 days for 20 days.
Analytical methods
The exoglucanase, endoglucanase and xylanase activities were evaluated according to Ghose [34],
quantifying the reducing sugars released from specific substrates [i.e avicel (cellulose microcristalline),
carboxymethyl cellulose and birchwood xylan, respectively] by the method of dinitrosalicylic acid
[DNS; 35]. The enzymatic reaction was performed at 50 ° C in a water bath, stopped with DNS reagent,
read in a spectrophotometer at 540 nm and converted to μM•ml-1
by comparing with a standard curve of
glucose; enzyme activity was reported as U•ml-1
(μM•min-1
•ml-1
).
β-glucosidase activity was evaluated by quantifying the amount of p-nitro phenol liberated from a
solution of p-nitro phenyl-β-D-glucopyranoside, 0.1 mM spectrophotometrically at 412 nm [36]. The
activity was reported as U•ml-1
.
The profile of extracellular proteins was evaluated by electrophoresis in polyacrylamide gel (5%
stacking gel, 12% separating gel) under denaturing conditions (SDS-PAGE) [37, 38]. For this, 50 ml of
culture medium were concentrated 100-fold by lyophilization and resuspended in 500 µl of dH2O.
Electrophoresis was performed with the concentrated protein, at the end, the gel was stained with a
solution of Coomassie blue-methanol-acetic acid, the molecular weight of the detected isoforms was
determined by its coefficient of migration (Rf) and compared with a low molecular weight marker (14-
97 kDa).
Statistical analysis
In order to identify if the presence/absence of the strains cultured at different combinations had relation
(positive or negative) with the enzymatic production, a correlation analysis (Pearson α = 0.05) and
Principal Component Analysis (PCA) was done. The PCA was carried out from a correlation matrix
(Pearson) between different culture combinations (treatments) and response variables; they were also
113
plotted in a triplot together with the different strains as complementary variables. A second PCA was
done using a matrix of presence/absence of protein isoforms categorized by its molecular weight, and the
matrix of enzymatic activity; in order to identify if the activity of the different strains and combinations
had any relation with specific isoforms. Analyses were made in the software XLSTAT v2014.
Results
Phylogenetic analysis of the fungal isolates
Blastn search of amplicons obtained from fungal isolates PS1-G06 and PS3 show maximal identity with
sequences of Trichoderma lixii (Hypocrea lixii)/Trichoderma harzianum complex, whereas isolates
Asp546, and C02-E06 shows maximal identity with Aspergillus niger, and Fusarium oxysporum ITS
sequences, respectively. Phylogenetic reconstruction of the ITS region from strains PS1-G06 and PS3
groups with its corresponding sequences of the H. lixii/T. harzianum complex with a bootstrap value of
95%, clearly separated from all other species within the genus (Figure 1a). The strain C02-E06 grouped
with a bootstrap value of 99% in the clade of Fusarium oxysporum and its teleomorph Gibberella
moniliformis (Figure 1b). The strain Asp546 was grouped with a bootstrap value of 100% in the clade of
Aspergillus niger, Aspergillus tubingensis and Aspergillus awamori (Figure 1c).
Enzymes production in monocultures
The four fungal strains used in this study showed different enzymatic production profiles (Figure 2).
Aspergillus niger produced the highest amount of cellulase and xylanase activities for all monocultures
tested, being 6.36 ± 1.33 U•ml-1
for endoglucanase, 5.98 ± 0.20 U•ml-1
for β-glucosidase, and 2.33 ±
0.06 U•ml-1
for xylanase after 8 days of culture; and 1.6 ± 0.06 U•l-1
for exoglucanase after 20 days of
culture. Trichoderma strain 1 (PS1-G06) showed nearly a half of endoglucanase activity reached by A.
niger (5.58 ± 1.22 U•ml-1
at day12), similar exoglucanase activity (1.40 ± 0.17 U•l-1
at day 16) and was
deficient in β-glucosidase (0.41 ± 0.35 U•ml-1
at day 4) and xylanase activity (0.78 ± 0.03 U•ml-1
at day
20). Trichoderma strain 2 (PS3) was similar to Trichoderma strain 1, producing 3.10 ± 1.68 U•ml-1
of
endoglucanase (at day 8), 0.70 ± 0.02 U•l-1
of exoglucanase (at day 16), 1.89 ± 0.14 U•ml-1
of β-
glucosidase (at day 4), and 0.69 ± 0.01 U•ml-1
of xylanase (at day 20). On the other hand, Fusarium
oxysporum had the lowest values of enzymatic activities of monocultures, its highest enzymatic activities
were: endoglucanase (0.42 ± 0.19 U•ml-1
at day 12), exoglucanase (0.80 ± 0.09 U•l-1
at day 16), β-
glucosidase (0.75 ± 0.31 U•ml-1
at day 12) and xylanase (0.04 ± 0.005 U•ml-1
at day 4).
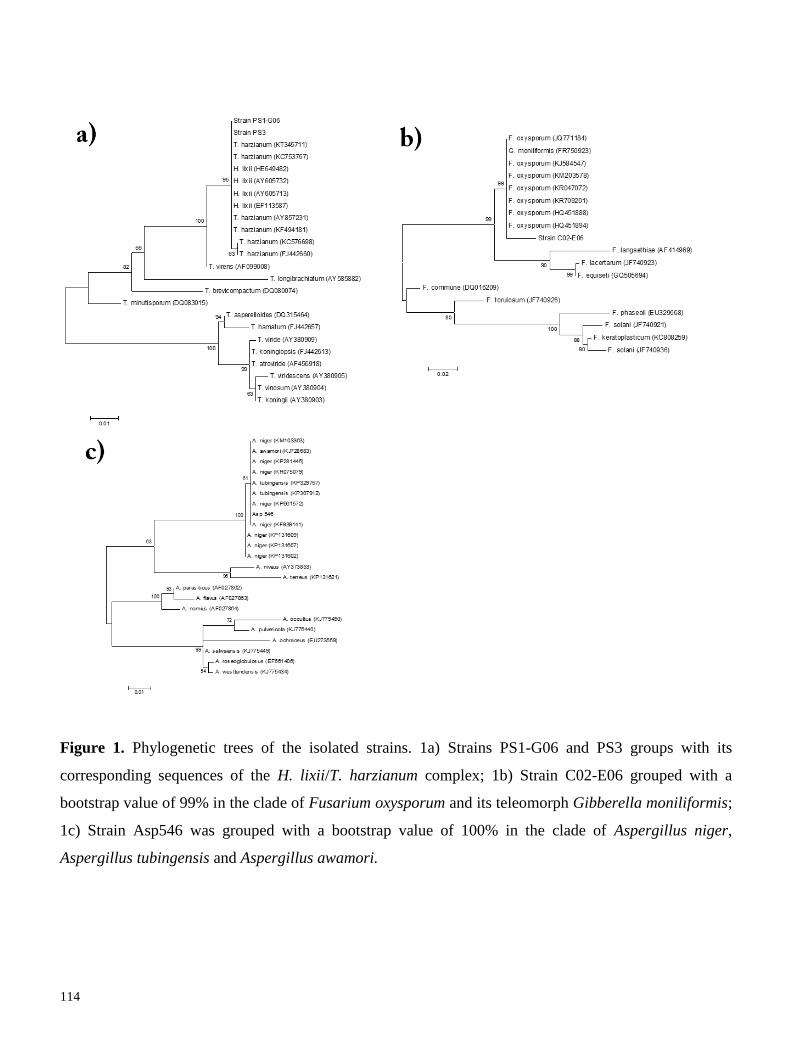
114
Figure 1. Phylogenetic trees of the isolated strains. 1a) Strains PS1-G06 and PS3 groups with its
corresponding sequences of the H. lixii/T. harzianum complex; 1b) Strain C02-E06 grouped with a
bootstrap value of 99% in the clade of Fusarium oxysporum and its teleomorph Gibberella moniliformis;
1c) Strain Asp546 was grouped with a bootstrap value of 100% in the clade of Aspergillus niger,
Aspergillus tubingensis and Aspergillus awamori.
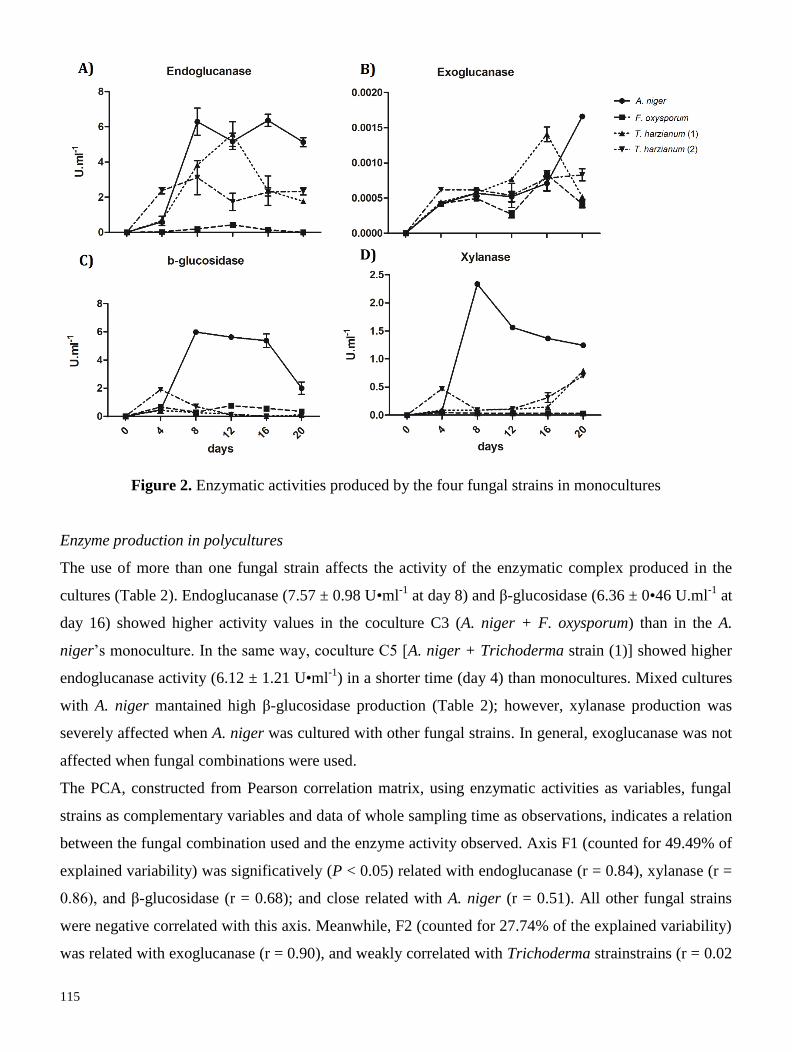
115
Figure 2. Enzymatic activities produced by the four fungal strains in monocultures
Enzyme production in polycultures
The use of more than one fungal strain affects the activity of the enzymatic complex produced in the
cultures (Table 2). Endoglucanase (7.57 ± 0.98 U•ml-1
at day 8) and β-glucosidase (6.36 ± 0•46 U.ml-1
at
day 16) showed higher activity values in the coculture C3 (A. niger + F. oxysporum) than in the A.
niger’s monoculture. In the same way, coculture C5 [A. niger + Trichoderma strain (1)] showed higher
endoglucanase activity (6.12 ± 1.21 U•ml-1
) in a shorter time (day 4) than monocultures. Mixed cultures
with A. niger mantained high β-glucosidase production (Table 2); however, xylanase production was
severely affected when A. niger was cultured with other fungal strains. In general, exoglucanase was not
affected when fungal combinations were used.
The PCA, constructed from Pearson correlation matrix, using enzymatic activities as variables, fungal
strains as complementary variables and data of whole sampling time as observations, indicates a relation
between the fungal combination used and the enzyme activity observed. Axis F1 (counted for 49.49% of
explained variability) was significatively (P < 0.05) related with endoglucanase (r = 0.84), xylanase (r =
0.86), and β-glucosidase (r = 0.68); and close related with A. niger (r = 0.51). All other fungal strains
were negative correlated with this axis. Meanwhile, F2 (counted for 27.74% of the explained variability)
was related with exoglucanase (r = 0.90), and weakly correlated with Trichoderma strainstrains (r = 0.02
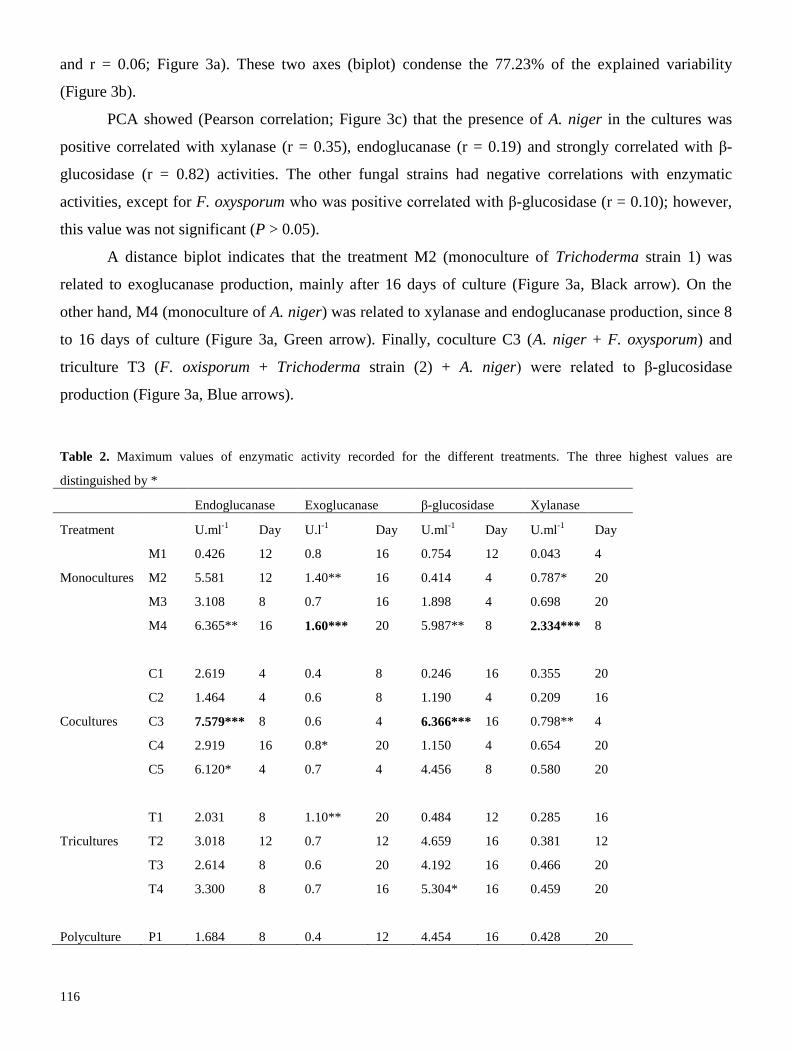
116
and r = 0.06; Figure 3a). These two axes (biplot) condense the 77.23% of the explained variability
(Figure 3b).
PCA showed (Pearson correlation; Figure 3c) that the presence of A. niger in the cultures was
positive correlated with xylanase (r = 0.35), endoglucanase (r = 0.19) and strongly correlated with β-
glucosidase (r = 0.82) activities. The other fungal strains had negative correlations with enzymatic
activities, except for F. oxysporum who was positive correlated with β-glucosidase (r = 0.10); however,
this value was not significant (P > 0.05).
A distance biplot indicates that the treatment M2 (monoculture of Trichoderma strain 1) was
related to exoglucanase production, mainly after 16 days of culture (Figure 3a, Black arrow). On the
other hand, M4 (monoculture of A. niger) was related to xylanase and endoglucanase production, since 8
to 16 days of culture (Figure 3a, Green arrow). Finally, coculture C3 (A. niger + F. oxysporum) and
triculture T3 (F. oxisporum + Trichoderma strain (2) + A. niger) were related to β-glucosidase
production (Figure 3a, Blue arrows).
Table 2. Maximum values of enzymatic activity recorded for the different treatments. The three highest values are
distinguished by *
Endoglucanase Exoglucanase β-glucosidase Xylanase
Treatment U.ml-1
Day U.l-1
Day U.ml-1
Day U.ml-1
Day
Monocultures
M1 0.426 12 0.8 16 0.754 12 0.043 4
M2 5.581 12 1.40** 16 0.414 4 0.787* 20
M3 3.108 8 0.7 16 1.898 4 0.698 20
M4 6.365** 16 1.60*** 20 5.987** 8 2.334*** 8
Cocultures
C1 2.619 4 0.4 8 0.246 16 0.355 20
C2 1.464 4 0.6 8 1.190 4 0.209 16
C3 7.579*** 8 0.6 4 6.366*** 16 0.798** 4
C4 2.919 16 0.8* 20 1.150 4 0.654 20
C5 6.120* 4 0.7 4 4.456 8 0.580 20
Tricultures
T1 2.031 8 1.10** 20 0.484 12 0.285 16
T2 3.018 12 0.7 12 4.659 16 0.381 12
T3 2.614 8 0.6 20 4.192 16 0.466 20
T4 3.300 8 0.7 16 5.304* 16 0.459 20
Polyculture P1 1.684 8 0.4 12 4.454 16 0.428 20
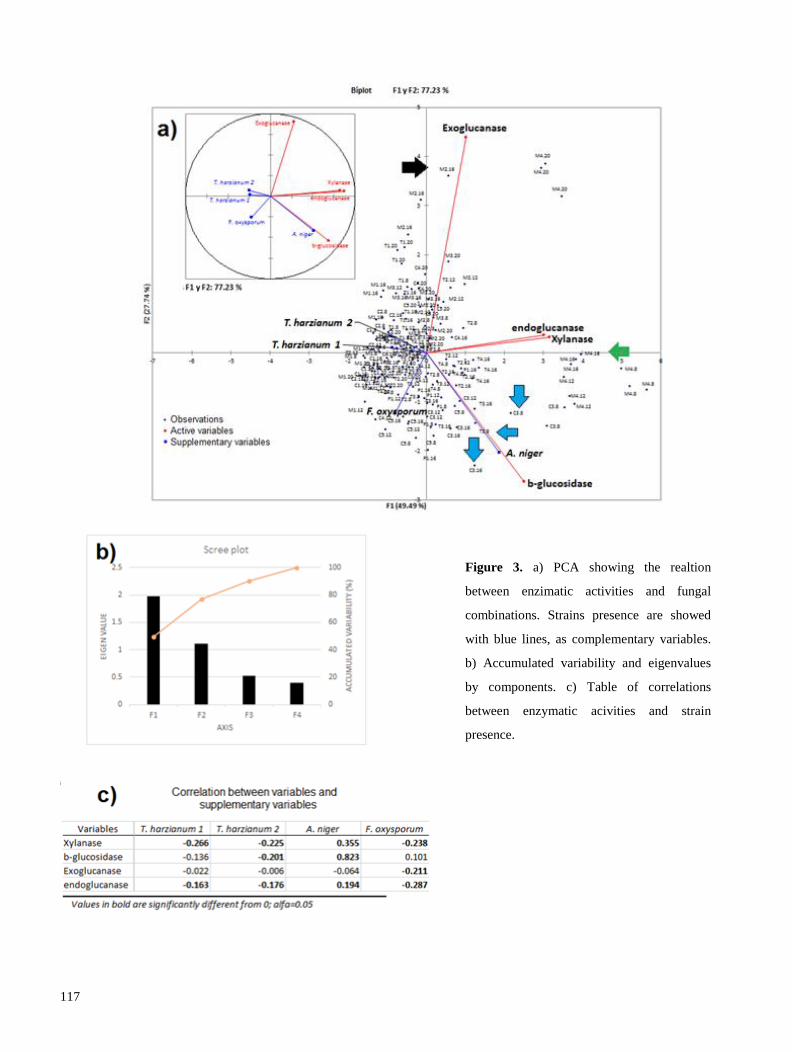
117
Figure 3. a) PCA showing the realtion
between enzimatic activities and fungal
combinations. Strains presence are showed
with blue lines, as complementary variables.
b) Accumulated variability and eigenvalues
by components. c) Table of correlations
between enzymatic acivities and strain
presence.
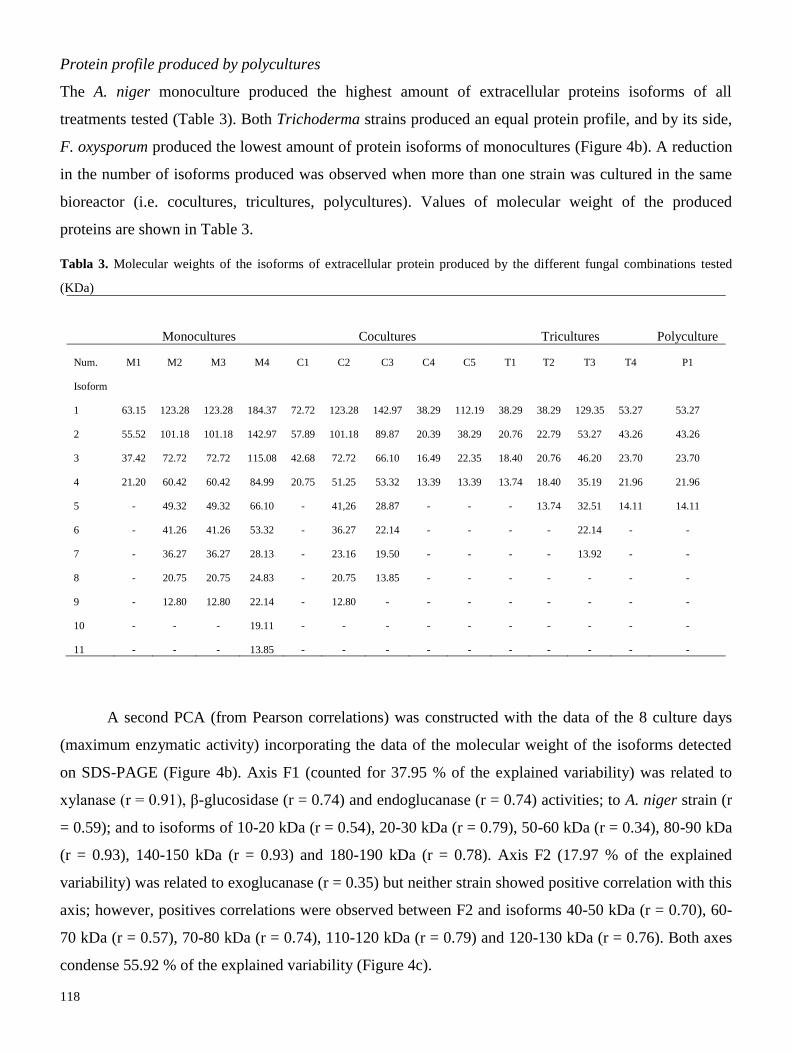
118
Protein profile produced by polycultures
The A. niger monoculture produced the highest amount of extracellular proteins isoforms of all
treatments tested (Table 3). Both Trichoderma strains produced an equal protein profile, and by its side,
F. oxysporum produced the lowest amount of protein isoforms of monocultures (Figure 4b). A reduction
in the number of isoforms produced was observed when more than one strain was cultured in the same
bioreactor (i.e. cocultures, tricultures, polycultures). Values of molecular weight of the produced
proteins are shown in Table 3.
Tabla 3. Molecular weights of the isoforms of extracellular protein produced by the different fungal combinations tested
(KDa)
Monocultures Cocultures Tricultures Polyculture
Num.
Isoform
M1 M2 M3 M4 C1 C2 C3 C4 C5 T1 T2 T3 T4 P1
1 63.15 123.28 123.28 184.37 72.72 123.28 142.97 38.29 112.19 38.29 38.29 129.35 53.27 53.27
2 55.52 101.18 101.18 142.97 57.89 101.18 89.87 20.39 38.29 20.76 22.79 53.27 43.26 43.26
3 37.42 72.72 72.72 115.08 42.68 72.72 66.10 16.49 22.35 18.40 20.76 46.20 23.70 23.70
4 21.20 60.42 60.42 84.99 20.75 51.25 53.32 13.39 13.39 13.74 18.40 35.19 21.96 21.96
5 - 49.32 49.32 66.10 - 41,26 28.87 - - - 13.74 32.51 14.11 14.11
6 - 41.26 41.26 53.32 - 36.27 22.14 - - - - 22.14 - -
7 - 36.27 36.27 28.13 - 23.16 19.50 - - - - 13.92 - -
8 - 20.75 20.75 24.83 - 20.75 13.85 - - - - - - -
9 - 12.80 12.80 22.14 - 12.80 - - - - - - - -
10 - - - 19.11 - - - - - - - - - -
11 - - - 13.85 - - - - - - - - - -
A second PCA (from Pearson correlations) was constructed with the data of the 8 culture days
(maximum enzymatic activity) incorporating the data of the molecular weight of the isoforms detected
on SDS-PAGE (Figure 4b). Axis F1 (counted for 37.95 % of the explained variability) was related to
xylanase (r = 0.91), β-glucosidase (r = 0.74) and endoglucanase (r = 0.74) activities; to A. niger strain (r
= 0.59); and to isoforms of 10-20 kDa (r = 0.54), 20-30 kDa (r = 0.79), 50-60 kDa (r = 0.34), 80-90 kDa
(r = 0.93), 140-150 kDa (r = 0.93) and 180-190 kDa (r = 0.78). Axis F2 (17.97 % of the explained
variability) was related to exoglucanase (r = 0.35) but neither strain showed positive correlation with this
axis; however, positives correlations were observed between F2 and isoforms 40-50 kDa (r = 0.70), 60-
70 kDa (r = 0.57), 70-80 kDa (r = 0.74), 110-120 kDa (r = 0.79) and 120-130 kDa (r = 0.76). Both axes
condense 55.92 % of the explained variability (Figure 4c).
119
Biplot showed that monocultures M2 and M3 (Trichoderma strains), and coculture C2 [F. oxisporum +
Trichoderma strain (2)] were close related to the production of protein isoforms of 40-50 and 70-80 kDa,
and with exoglucanase activity (Figure 4a). Isoforms of 70-80 kDa were correlated with exoglucanase
activity (r = 0.27), thus, Trichoderma strains could be a producer of exoglucanase of 72.72 kDa,
according to molecular-weight isoforms data (Table 3). On the other hand, β-glucosidase activity was
closely related to C3 and A. niger, and correlated with isoforms of 80-90 kDa (r = 0.58; Figure 4a,d).
Thus, it could be possible to assume that the isoform of 84.99 kDa is a β-glucosidase subunit produced
by A. niger.
Xylanase activity was correlated with isoforms of low molecular weight (10-20 and 20-30 kDa),
and significant correlations were found too between xylanases and these isoforms (r = 0.42 and r = 0.72;
respectively). Also, in the biplot of the PCA, this enzyme was related to A. niger (M4) and to isoforms of
80-90 and 140-150 kDa. We observed that the strip of 24.84 kDa is repeated in the treatments M4, C3
and T3 (Figure 4b), and that this is related with the cultures with the highest xylanase activity, and with
A. niger presence.
A second PCA (from Pearson correlations) was constructed with the data of the 8 culture days
(maximum enzymatic activity) incorporating the data of the molecular weight of the isoforms detected
on SDS-PAGE (Figure 4b). Axis F1 (counted for 37.95 % of the explained variability) was related to
xylanase (r = 0.91), β-glucosidase (r = 0.74) and endoglucanase (r = 0.74) activities; to A. niger strain (r
= 0.59); and to isoforms of 10-20 kDa (r = 0.54), 20-30 kDa (r = 0.79), 50-60 kDa (r = 0.34), 80-90 kDa
(r = 0.93), 140-150 kDa (r = 0.93) and 180-190 kDa (r = 0.78). Axis F2 (17.97 % of the explained
variability) was related to exoglucanase (r = 0.35) but neither strain showed positive correlation with this
axis; however, positives correlations were observed between F2 and isoforms 40-50 kDa (r = 0.70), 60-
70 kDa (r = 0.57), 70-80 kDa (r = 0.74), 110-120 kDa (r = 0.79) and 120-130 kDa (r = 0.76). Both axes
condense 55.92 % of the explained variability (Figure 4c).
Biplot showed that monocultures M2 and M3 (T. harzianum), and coculture C2 [F. oxisporum +
T. harzianum (2)] were close related to the production of protein isoforms of 40-50 and 70-80 kDa, and
with exoglucanase activity (Figure 4a). Isoforms of 70-80 kDa were correlated with exoglucanase
activity (r = 0.27), thus, T. harzianum could be a producer of exoglucanase of 72.72 kDa, according to
molecular-weight isoforms data (Table 3). On the other hand, β-glucosidase activity was closely related
to C3 and A. niger, and correlated with isoforms of 80-90 kDa (r = 0.58; Figure 4a,d). Thus, it could be
possible to assume that the isoform of 84.99 kDa is a β-glucosidase subunit produced by A. niger.
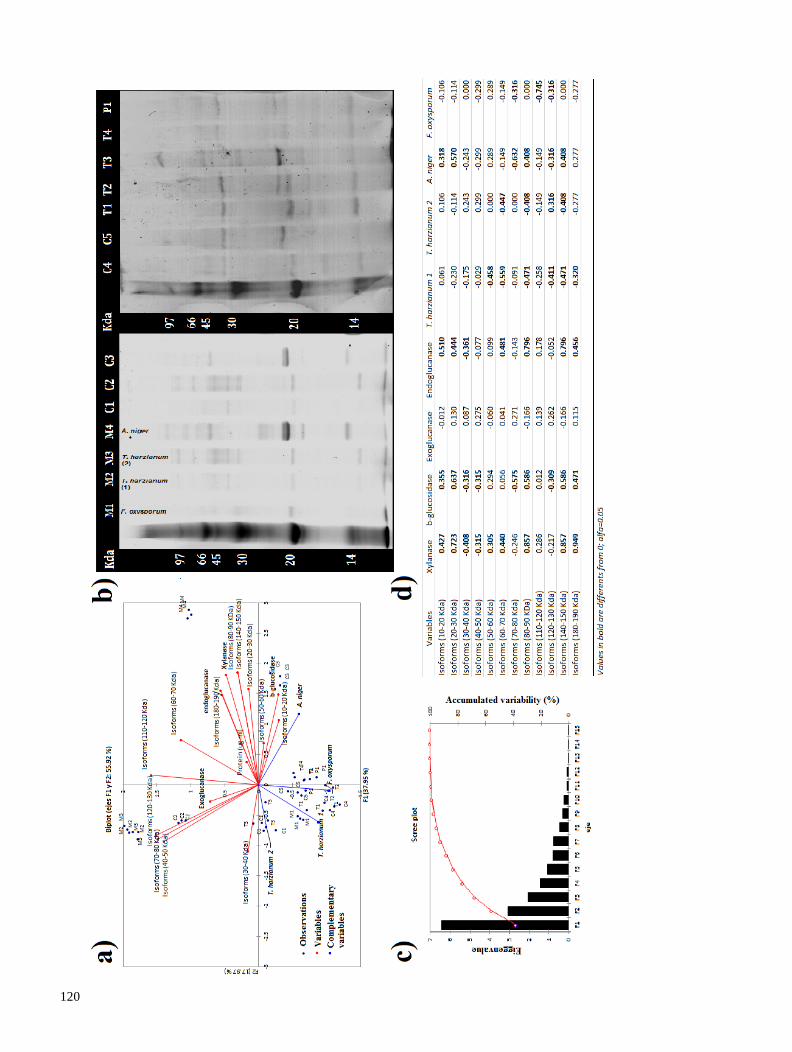
120
121
Xylanase activity was correlated with isoforms of low molecular weight (10-20 and 20-30 kDa), and
significant correlations were found too between xylanases and these isoforms (r = 0.42 and r = 0.72;
respectively). Also, in the biplot of the PCA, this enzyme was related to A. niger (M4) and to isoforms of
80-90 and 140-150 kDa. We observed that the strip of 24.84 kDa is repeated in the treatments M4, C3
and 3 (Figure 4b), and that this is related with the cultures with the highest xylanase activity, and with A.
niger presence.
Discussion
A phylogenetic analysis of the studied isolates was conducted in order to clarify its taxonomic identity.
The ITS region of the Nuclear Ribosomal Unit has been identified as the best DNA region for barcoding
in fungi [30]; thus, we use such genetic marker to identify studied isolates for which we have no
previous taxonomic knowledge. All isolates here studied show to be closely related with taxonomic
groups within Ascomycota which are species complex with uncertain affinities.
Phylogenetic analysis shows that PS1-G06 and PS3 isolates belongs to the T. lixii (H. lixii) /T.
harzianum complex [39]. Isolate Asp546 grouped in a clade that includes Aspergillus niger, Aspergillus
tubingensis and Aspergillus awamori. These are considered to belong to the A. niger aggregate/complex
[40], but some of them are not considered as new species, particularly A. awamori [41]. Finally, isolate
C02-E06 grouped with the anamorph Fusarium oxysporum and its teleomorph Gibberella moniliformis.
This is a complex of more than 80 formae species, each specific of a particular plant host [42, 43].
Because all isolates studied in this work are associated with species complexes, it is necessary in the
future to conduct a more detailed phylogenetic analysis using other genetic regions in order to clarify its
position within such complexes, something that is beyond the scope of present work. Thus, with the
phylogenetic evidence here generated, it could be stated PS1-G06 and PS3 isolates could be assigned to
T. lixii (H. lixii) /T. harzianum complex, isolate Asp546 belongs to the A. niger complex, and isolate
C02-E06 is a member of the F. oxysporum/G. moniliformis complex.
In this work we hipothetized that the use of polycultures (i) would lead to an increase in the cellulase
activity, (ii) would produce cellulolytic complexes with a major balance between exoglucanase,
endoglucanase and β-glucosidase activities; and (iii) could enrich the enzyme isoforms in the culture
medium with respect to those observed in monocultures.
Results here obtained showed that the use of different combinations of fungal strains will produce
cellulolytic complex with different enzymatic activities when compared with those observed in
monocultures, and that this phenomenon is highly dependent on the strains used. On the other hand,
PCA analysis showed a high relation between A. niger and the production of β-glucosidase,
endoglucanase and xylanase activities, in accordance with previous reports [44, 45, 46]. The PCA
122
analysis also showed a high relation between Trichoderma strains and exoglucanase production, but non-
significant correlation was observed; however, it is known that species in the genus Trichoderma are
good producers of exoglucanase [47, 48].
Only the coculture between A. niger and F. oxysporum increased the production of β-glucosidase
and endoglucanase with respect to A. niger monocultures; however, in general, the use of cocultures and
cultures with more than two strains lead to a decrease in the enzymatic activities, when compared with
A. niger monoculture values. This is in accordance with the results obtained by Taha et al. [49], who
observed that some fungal cocultures will lead to an increase in the saccharification capacity of the
enzymatic complex produced; whereas, cultures with three fungal strains lead to a decrease in their
saccharification capacity. In this study, we did not observe a significant higher enzymatic production by
utilizing cocultures, neither A. niger-Trichoderma strains nor with Trichoderma strains-F. oxysporum
strains, in constrast with results obtained in similar studies using liquid media [49, 50].
The decrement in the enzymatic activities observed in mixed cultures, could be atributed to the
limiting nutrient conditions of the culture system utilized, since it was suggested that nutriment
enrichment in cocultures (Trichoderma-Aspergillus) lead to an increase in cellulase activities. However,
most of these studies were carried out in a solid state fermentation [13, 51, 52]. Thus, it can be
hypothetized that non synergistic, but competitive interactions are prevailing in the cultures here studied,
affecting the enzymatic complex produced, as discussed below.
Xylanase production was particularly negative affected by all combinations of fungal strains here
used. This probably may due to the fact that, in stressful situations, filamentous fungi could change their
preferential consumption of sugars, leading to hexoses, which have higher energy content than pentoses.
This preference has been reported for other microorganisms such as yeasts [53], and it is attributed to
carbon catabolite repression (CCR). Filamentous fungi could decrease their production of xylan-
degrading enzymes for major hexoses consumption. This might represent an interesting strategy when
the goal is to degrade cellulose but non-hemicelulose (e.g. production of xylan), since xylan by-products
are of great industrial interest [54, 55, 56], or for producing xylanase-free cellulases. Our culture
conditions were similar to those used by García-Kirchner [57], i.e. Aspergillus terreus-Penicillium sp.
coculture, using sugar cane baggase as carbon source and similar volume of mineral medium. In contrast
to this previous report, we did not observed an increase in xylanase production in our cocultures. This
discrepancy could be atributed to the absece of agitation in our cultures, which can cause an oxygen
limitation. Gutierrez-Correa and Tengerdy [13], also reported higher xylanase production in cocultures
(Trichoderma-Aspergillus) than in monocultures, reaching to activities of 5.9 U.ml-1
; however, solid-
state fermentation was used in that report.
123
All cultures which include A. niger, mantained high β-glucosidase activity; this is a biotechnological
important issue because this is a key enzyme in the process of degradation of cellulose into glucose,
being necessary for prevent endoglucanase and exoglucanase inhibition by cellobiose [46, 50]. Similar to
xylanases results, no increase of β-glucosidase production (excepting coculture A. niger-F. oxysporum)
was observed by utilizing mixed cultures, contrasting with that reported by [5]; but also, there was no
significant decrease in the production observed in mixed cultures when A. niger was used. The coculture
A. niger-F. oxysporum was previously reported as an efficient consortium for cellulase production in
solid-state fermentation [51], here we observed that coculture C3 (A. niger-F. oxysporum) increased β-
glucosidase and endoglucanase production in a liquid culture.
The use of cultures with more than one strain did not affect the exoglucanase production in the
conditions used in this study. It is worthy mentioning that only when A. niger was present in any
combination, the enzymatic activity reached high values. Thus, the other fungal strains (e.g. F.
oxysporum) cultured with A. niger, which is the main enzyme strain producer, can be considered only as
a “helper strain” [13]. The presence of some strains had negative effects on enzymatic production in
mixed cultures. By instance, F. oxysporum had the lowest cellulase, xylanase and extracellular protein
isoforms production in monoculture and, that according to the PCA analysis, had negative relations with
the enzymatic production. It has been reported that F. oxysporum is a good producer of cellulases [10,
11]; however, in this study non-positive effect were observed when F. oxysporum was used in mixed
cultures with Trichoderma strains or alone, only when the coculture A. niger-F. oxysporum was used
(see Figure 3).
Some authors reported that the hydrolytic activity of different cellulases/xylanases acting
together was superior to the hydrolitic activity of single enzymes [49]. In this study the extracellular
protein profile of mixed cultures had a lower number of protein isoforms than in the A. niger and
Trichoderma strains monocultures, and also a lower capacity for degrading the substrates here tested
(Avicel, carboxymetil-cellulose, p-nitrophenyl-β-D-glucopyranoside), in accordance with Massadeh et
al. [24]. Thus, the decrease in the number of isoforms is correlated with a decrease in the
cellulase/xylanase activity, likewise Khalili et al. [18] showed for soil cellulases, associating the highest
cellulase activities in soil samples with sharp cellulase bands of zymographic gels. In this study, PCA
that involved molecular weigth data of the isoforms detected, allowed us to hypothesize that
Trichoderma strains produce an exoglucanase isoform of 72.72 kDa. Previous studies using this fungi
have reported that they produce a β-1,3-exoglucanase of 110 kDa [58], an exoglucanase (CBH1) of 61
kDa [59] and 66 kDa [60]; meanwhile, an exoglucanase II (CBHII) from T. reesei has a molecular
weight of 58 kDa [61]. Thus, this could be a novel exoglucanase isoform for Trichoderma strains here
studied.
124
On the other hand, according to PCA, we hypothesized that A. niger produced an endoglucanase
isoform of 28.13 kDa. This is in accordance with the literature, where there are reported endoglucanases
of 40 kDa [62], 36 kDa [63] and 30 kDa [64, 65] for A. niger. Our results suggest that xylanase activity
is due to the presence of an isoform of 24.83 kDa. Xylanases are a heterogeneous group of enzymes
which have the capacity to degrade xylan [66]. Different kinds of Aspergillus spp. xylanases have been
described, with molecular weights ranging from 21 kDa (xylanase I), 24 kDa (xylanase II; [67]), 34 kDa
(encoded by xlnC; [68]) until 110 kDa (β-xylosidase; [69]). Thus, could be hypothetized that the
xylanase activity recorded in this study, is a xylanase II of A. niger, and that this isoform is highly
affected by the use of mixed cultures.
It is known that β-glucosidase subunits from Aspergillus fumigatus have a molecular weigt of 90
and 45 kDa [70], and that their native form for A. niger and A. wentii could have 240 kDa [71] and 170
kDa [72], respectively. Few β-glucosidases with low molecular weight have been reported, mainly for
bacteria like the 50 kDa protein of Agrobacterium sp [72]; thus, according to the correlation results, PCA
and PAGE, it could be possible to assume that the isoform of 85 kDa is a β-glucosidase subunit. Further
studies are required to test this hypothesis.
We attribute the decrease in the number of isoforms in mixed cultures to the stressful conditions
of the media used, which could cause a restrictive production of extracellular enzymes (or proteins), in
order to save resources. Nonetheless, it was reported that the transcription of endoglucanase, xylanase
and β-glucosidase genes of Magnaporthe oryzae are induced in different stresful conditions, including
carbon or nitrogen limitation [73]. Here we assume that the main restrictive variables were both oxygen
deprivation generated by static cultures, as well as space limitation due to low work volume used (150
ml). Thus, further research is needed to evaluate the effect of these variables on extracellular cellulase
and xylanase isoforms produced in mixed cultures; this might be important in order to promote the
production of cellulolytic complexes enriched by different isoforms in liquid media.
Althougth in this study it was not observed a higher cellulase and xylanase production, as well as
non-isoform gain in the protein profiles in mixed cultures, we think that the use of fungi consortia could
bring some benefits to the enzyme production field. We observed that culturing two or three fungal
strains together showed a balance between the enzymatic activities; thus, in order to improve the results
here obtained, stirring submerged-fermentations or solid-state fermentations must be tested, to promote
synergistic relationships between the fungal strains, and to avoid competition for nutrients or space, that
could cause adverse outcomes.
125
Conclusion
In first instance, for the conditions evaluated here (static liquid-media), the use of A. niger in mixed
cultures is highly recommended in order to produce high amounts of β-glucosidases, no matter the
combination used (i.e. with Trichoderma strainsand F. oxysporum strains). Secondly, the use of mixed
cultures could cause adverse effects in the amount of enzymes produced (mainly xylanase II) and a
decrease in extracellular proteins isoforms; this may be due to stressful conditions including
physicochemical (oxygen and space limitation) and biological (competition relationships) variables.
Thirdly, according to PCA, the characteristics of the enzymatic complex produced in mixed cultures will
be highly dependent of the cellulase/xylanase pattern production showed in monocultures by the fungal
strains employed. Finaly, the combination of A.niger and F. oxysporum could be interesting for cellulase
(endoglucanase and β-glucosidase) production.
Acknowledgments
To the Santander group and REDMACRO for the finantial support, as well as CONACyT for the
doctoral scholarship of Hernández C.; to the Universidade de Sao Paulo (EEL), Universidad
Veracruzana (INBIOTECA) and Universidad Michoacana de San Nicolás de Hidalgo (CMEB) for the
technical support. The authors would like to thank the anonymous reviewers of this paper.
References
[1] H. Esterbahuer, W. Steiner, I. Lavudoba, A. Hermann, M. Hayn, Production of Trichoderma
cellulase in laboratory and pilot scale, Bioresource Technology 36(1) (1991): 51-65 doi:10.1016/0960-
8524(91)90099-6
[2] X. Liming, S. Xueliang, High-yield cellulase production by Trichoderma reesei ZU-02 on corn cob
residue, Bioresource Technology 91(3) (2004): 259-262. doi:10.1016/S0960-8524(03)00195-0
[3] B. Adney, J. Baker, Measurement of cellulase activities, National Renewable Energy Laboratory,
Technical Report (2008) NREL/TP-510-42628
[4] J. Woodward, Synergism in cellulase systems, Bioresourse Technology 36(1) (1991): 67-75
[5] L. M. F. Gottschalk, R. A. Oliveira, E. P. da Silva Bon, Cellulases, xylanases, β-glucosidase and
ferulic acid esterase produced by Trichoderma and Aspergillus act synergistically in the hydrolysis of
sugarcane bagasse, Biochemical Engineering Journal, 51(1) (2010): 72-78.
[6] Y. Baba, J. Sumitani, S. Tani, T. Kawaguchi, Charaterization of Aspergillus aculeatus β-glucosidase
1 accelerating cellulose hydrolisis with Trichoderma cellulase system, AMB Express 5:3 (2015) DOI
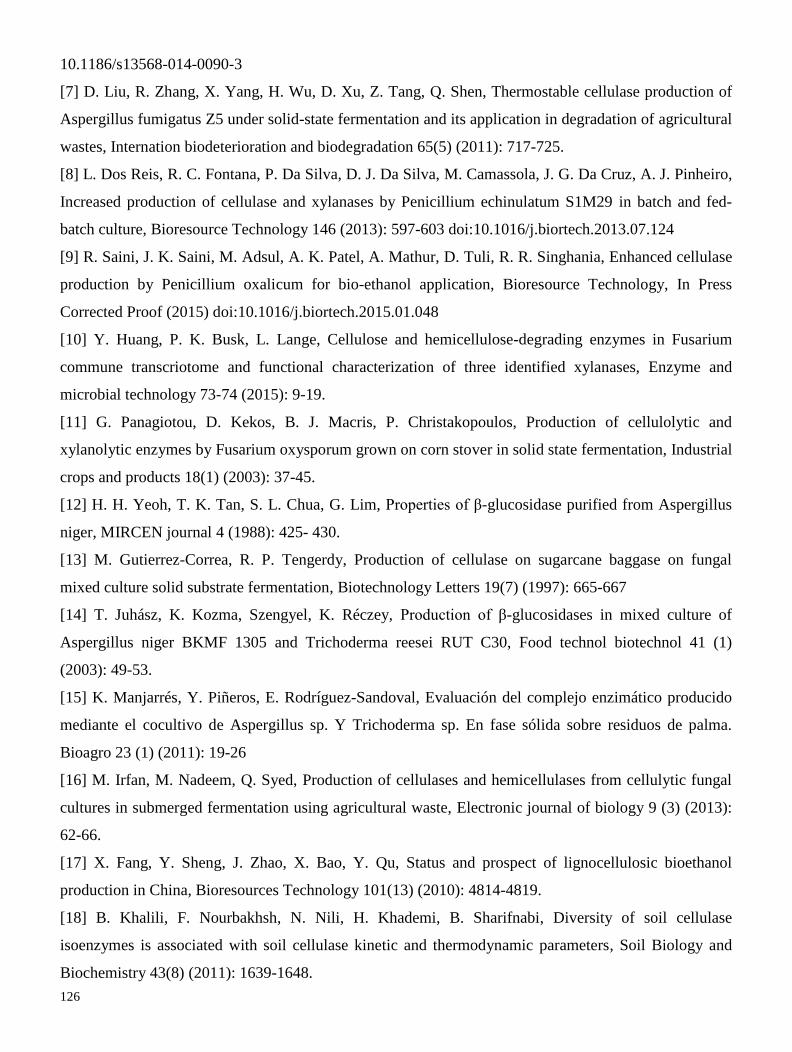
126
10.1186/s13568-014-0090-3
[7] D. Liu, R. Zhang, X. Yang, H. Wu, D. Xu, Z. Tang, Q. Shen, Thermostable cellulase production of
Aspergillus fumigatus Z5 under solid-state fermentation and its application in degradation of agricultural
wastes, Internation biodeterioration and biodegradation 65(5) (2011): 717-725.
[8] L. Dos Reis, R. C. Fontana, P. Da Silva, D. J. Da Silva, M. Camassola, J. G. Da Cruz, A. J. Pinheiro,
Increased production of cellulase and xylanases by Penicillium echinulatum S1M29 in batch and fed-
batch culture, Bioresource Technology 146 (2013): 597-603 doi:10.1016/j.biortech.2013.07.124
[9] R. Saini, J. K. Saini, M. Adsul, A. K. Patel, A. Mathur, D. Tuli, R. R. Singhania, Enhanced cellulase
production by Penicillium oxalicum for bio-ethanol application, Bioresource Technology, In Press
Corrected Proof (2015) doi:10.1016/j.biortech.2015.01.048
[10] Y. Huang, P. K. Busk, L. Lange, Cellulose and hemicellulose-degrading enzymes in Fusarium
commune transcriotome and functional characterization of three identified xylanases, Enzyme and
microbial technology 73-74 (2015): 9-19.
[11] G. Panagiotou, D. Kekos, B. J. Macris, P. Christakopoulos, Production of cellulolytic and
xylanolytic enzymes by Fusarium oxysporum grown on corn stover in solid state fermentation, Industrial
crops and products 18(1) (2003): 37-45.
[12] H. H. Yeoh, T. K. Tan, S. L. Chua, G. Lim, Properties of β-glucosidase purified from Aspergillus
niger, MIRCEN journal 4 (1988): 425- 430.
[13] M. Gutierrez-Correa, R. P. Tengerdy, Production of cellulase on sugarcane baggase on fungal
mixed culture solid substrate fermentation, Biotechnology Letters 19(7) (1997): 665-667
[14] T. Juhász, K. Kozma, Szengyel, K. Réczey, Production of β-glucosidases in mixed culture of
Aspergillus niger BKMF 1305 and Trichoderma reesei RUT C30, Food technol biotechnol 41 (1)
(2003): 49-53.
[15] K. Manjarrés, Y. Piñeros, E. Rodríguez-Sandoval, Evaluación del complejo enzimático producido
mediante el cocultivo de Aspergillus sp. Y Trichoderma sp. En fase sólida sobre residuos de palma.
Bioagro 23 (1) (2011): 19-26
[16] M. Irfan, M. Nadeem, Q. Syed, Production of cellulases and hemicellulases from cellulytic fungal
cultures in submerged fermentation using agricultural waste, Electronic journal of biology 9 (3) (2013):
62-66.
[17] X. Fang, Y. Sheng, J. Zhao, X. Bao, Y. Qu, Status and prospect of lignocellulosic bioethanol
production in China, Bioresources Technology 101(13) (2010): 4814-4819.
[18] B. Khalili, F. Nourbakhsh, N. Nili, H. Khademi, B. Sharifnabi, Diversity of soil cellulase
isoenzymes is associated with soil cellulase kinetic and thermodynamic parameters, Soil Biology and
Biochemistry 43(8) (2011): 1639-1648.
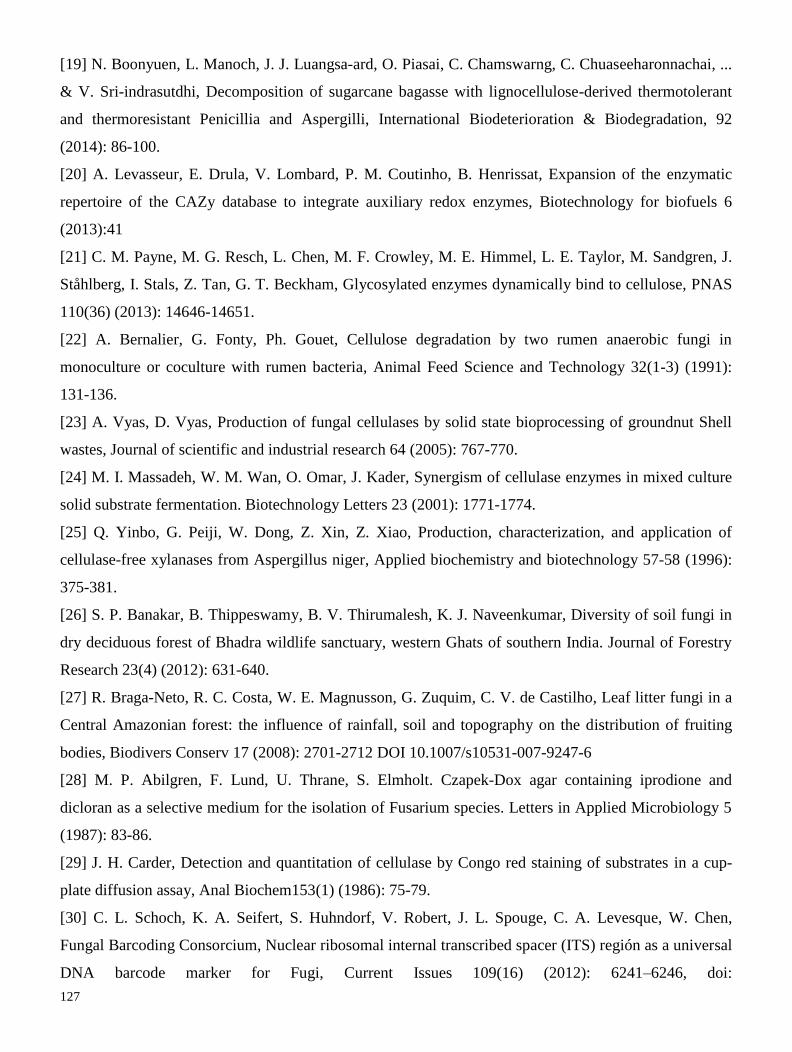
127
[19] N. Boonyuen, L. Manoch, J. J. Luangsa-ard, O. Piasai, C. Chamswarng, C. Chuaseeharonnachai, ...
& V. Sri-indrasutdhi, Decomposition of sugarcane bagasse with lignocellulose-derived thermotolerant
and thermoresistant Penicillia and Aspergilli, International Biodeterioration & Biodegradation, 92
(2014): 86-100.
[20] A. Levasseur, E. Drula, V. Lombard, P. M. Coutinho, B. Henrissat, Expansion of the enzymatic
repertoire of the CAZy database to integrate auxiliary redox enzymes, Biotechnology for biofuels 6
(2013):41
[21] C. M. Payne, M. G. Resch, L. Chen, M. F. Crowley, M. E. Himmel, L. E. Taylor, M. Sandgren, J.
Ståhlberg, I. Stals, Z. Tan, G. T. Beckham, Glycosylated enzymes dynamically bind to cellulose, PNAS
110(36) (2013): 14646-14651.
[22] A. Bernalier, G. Fonty, Ph. Gouet, Cellulose degradation by two rumen anaerobic fungi in
monoculture or coculture with rumen bacteria, Animal Feed Science and Technology 32(1-3) (1991):
131-136.
[23] A. Vyas, D. Vyas, Production of fungal cellulases by solid state bioprocessing of groundnut Shell
wastes, Journal of scientific and industrial research 64 (2005): 767-770.
[24] M. I. Massadeh, W. M. Wan, O. Omar, J. Kader, Synergism of cellulase enzymes in mixed culture
solid substrate fermentation. Biotechnology Letters 23 (2001): 1771-1774.
[25] Q. Yinbo, G. Peiji, W. Dong, Z. Xin, Z. Xiao, Production, characterization, and application of
cellulase-free xylanases from Aspergillus niger, Applied biochemistry and biotechnology 57-58 (1996):
375-381.
[26] S. P. Banakar, B. Thippeswamy, B. V. Thirumalesh, K. J. Naveenkumar, Diversity of soil fungi in
dry deciduous forest of Bhadra wildlife sanctuary, western Ghats of southern India. Journal of Forestry
Research 23(4) (2012): 631-640.
[27] R. Braga-Neto, R. C. Costa, W. E. Magnusson, G. Zuquim, C. V. de Castilho, Leaf litter fungi in a
Central Amazonian forest: the influence of rainfall, soil and topography on the distribution of fruiting
bodies, Biodivers Conserv 17 (2008): 2701-2712 DOI 10.1007/s10531-007-9247-6
[28] M. P. Abilgren, F. Lund, U. Thrane, S. Elmholt. Czapek-Dox agar containing iprodione and
dicloran as a selective medium for the isolation of Fusarium species. Letters in Applied Microbiology 5
(1987): 83-86.
[29] J. H. Carder, Detection and quantitation of cellulase by Congo red staining of substrates in a cup-
plate diffusion assay, Anal Biochem153(1) (1986): 75-79.
[30] C. L. Schoch, K. A. Seifert, S. Huhndorf, V. Robert, J. L. Spouge, C. A. Levesque, W. Chen,
Fungal Barcoding Consorcium, Nuclear ribosomal internal transcribed spacer (ITS) región as a universal
DNA barcode marker for Fugi, Current Issues 109(16) (2012): 6241–6246, doi:
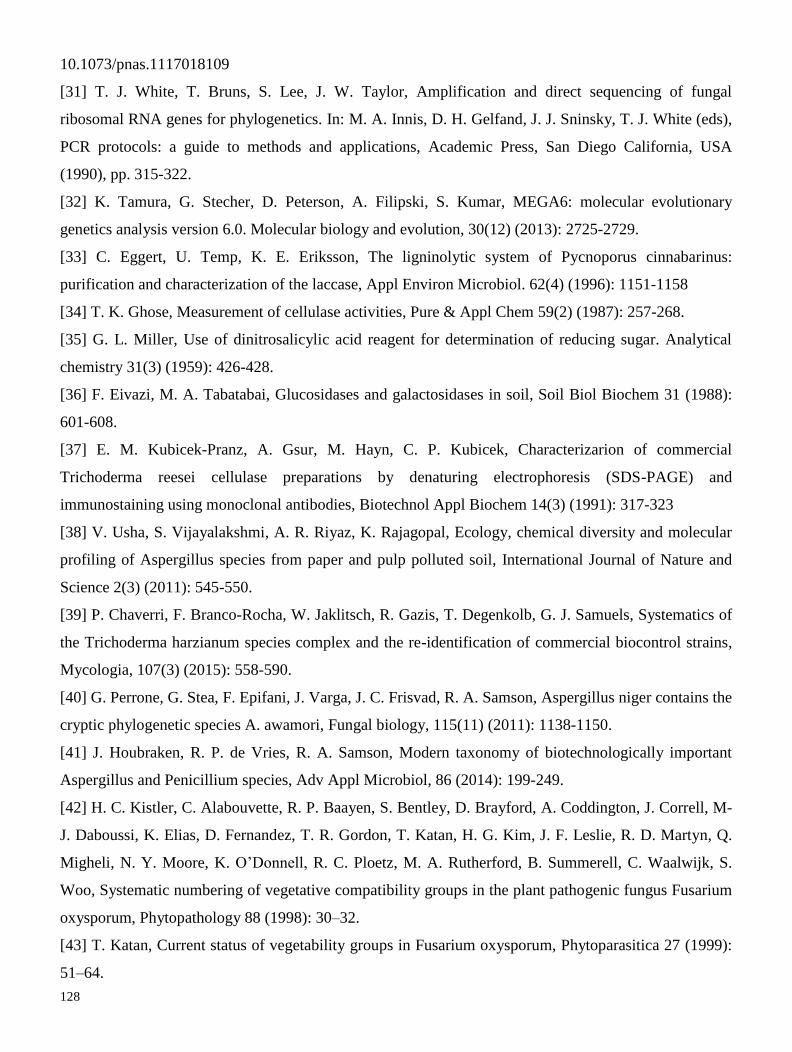
128
10.1073/pnas.1117018109
[31] T. J. White, T. Bruns, S. Lee, J. W. Taylor, Amplification and direct sequencing of fungal
ribosomal RNA genes for phylogenetics. In: M. A. Innis, D. H. Gelfand, J. J. Sninsky, T. J. White (eds),
PCR protocols: a guide to methods and applications, Academic Press, San Diego California, USA
(1990), pp. 315-322.
[32] K. Tamura, G. Stecher, D. Peterson, A. Filipski, S. Kumar, MEGA6: molecular evolutionary
genetics analysis version 6.0. Molecular biology and evolution, 30(12) (2013): 2725-2729.
[33] C. Eggert, U. Temp, K. E. Eriksson, The ligninolytic system of Pycnoporus cinnabarinus:
purification and characterization of the laccase, Appl Environ Microbiol. 62(4) (1996): 1151-1158
[34] T. K. Ghose, Measurement of cellulase activities, Pure & Appl Chem 59(2) (1987): 257-268.
[35] G. L. Miller, Use of dinitrosalicylic acid reagent for determination of reducing sugar. Analytical
chemistry 31(3) (1959): 426-428.
[36] F. Eivazi, M. A. Tabatabai, Glucosidases and galactosidases in soil, Soil Biol Biochem 31 (1988):
601-608.
[37] E. M. Kubicek-Pranz, A. Gsur, M. Hayn, C. P. Kubicek, Characterizarion of commercial
Trichoderma reesei cellulase preparations by denaturing electrophoresis (SDS-PAGE) and
immunostaining using monoclonal antibodies, Biotechnol Appl Biochem 14(3) (1991): 317-323
[38] V. Usha, S. Vijayalakshmi, A. R. Riyaz, K. Rajagopal, Ecology, chemical diversity and molecular
profiling of Aspergillus species from paper and pulp polluted soil, International Journal of Nature and
Science 2(3) (2011): 545-550.
[39] P. Chaverri, F. Branco-Rocha, W. Jaklitsch, R. Gazis, T. Degenkolb, G. J. Samuels, Systematics of
the Trichoderma harzianum species complex and the re-identification of commercial biocontrol strains,
Mycologia, 107(3) (2015): 558-590.
[40] G. Perrone, G. Stea, F. Epifani, J. Varga, J. C. Frisvad, R. A. Samson, Aspergillus niger contains the
cryptic phylogenetic species A. awamori, Fungal biology, 115(11) (2011): 1138-1150.
[41] J. Houbraken, R. P. de Vries, R. A. Samson, Modern taxonomy of biotechnologically important
Aspergillus and Penicillium species, Adv Appl Microbiol, 86 (2014): 199-249.
[42] H. C. Kistler, C. Alabouvette, R. P. Baayen, S. Bentley, D. Brayford, A. Coddington, J. Correll, M-
J. Daboussi, K. Elias, D. Fernandez, T. R. Gordon, T. Katan, H. G. Kim, J. F. Leslie, R. D. Martyn, Q.
Migheli, N. Y. Moore, K. O’Donnell, R. C. Ploetz, M. A. Rutherford, B. Summerell, C. Waalwijk, S.
Woo, Systematic numbering of vegetative compatibility groups in the plant pathogenic fungus Fusarium
oxysporum, Phytopathology 88 (1998): 30–32.
[43] T. Katan, Current status of vegetability groups in Fusarium oxysporum, Phytoparasitica 27 (1999):
51–64.
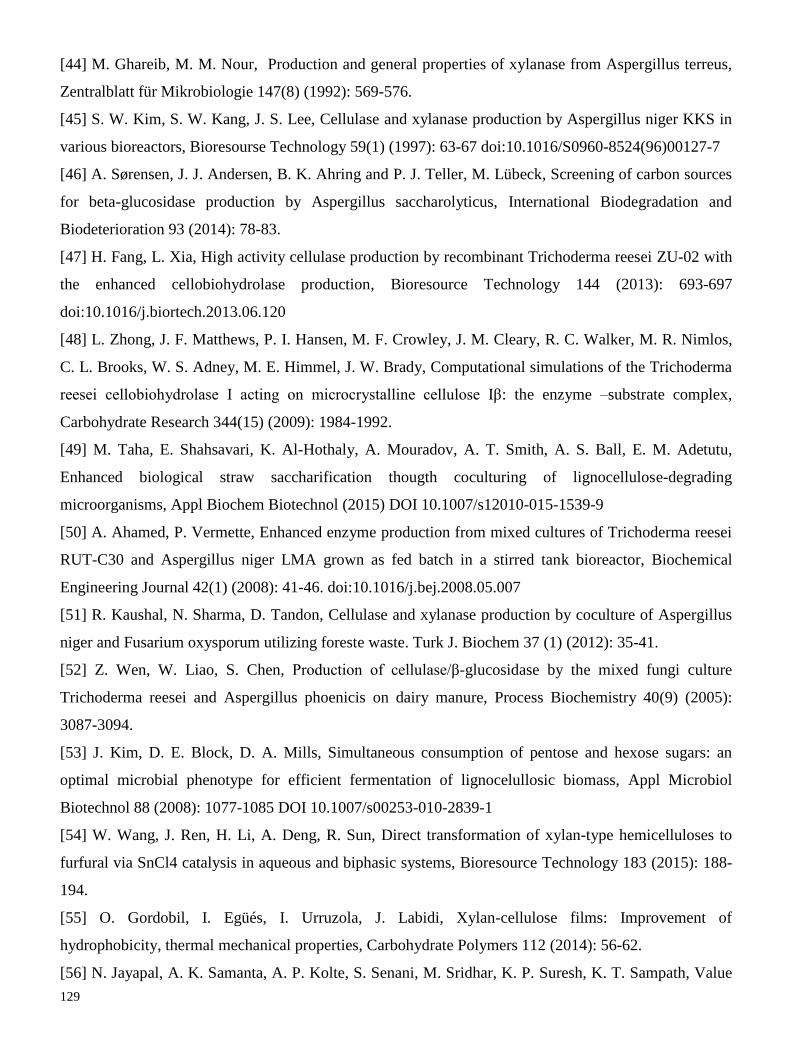
129
[44] M. Ghareib, M. M. Nour, Production and general properties of xylanase from Aspergillus terreus,
Zentralblatt für Mikrobiologie 147(8) (1992): 569-576.
[45] S. W. Kim, S. W. Kang, J. S. Lee, Cellulase and xylanase production by Aspergillus niger KKS in
various bioreactors, Bioresourse Technology 59(1) (1997): 63-67 doi:10.1016/S0960-8524(96)00127-7
[46] A. Sørensen, J. J. Andersen, B. K. Ahring and P. J. Teller, M. Lübeck, Screening of carbon sources
for beta-glucosidase production by Aspergillus saccharolyticus, International Biodegradation and
Biodeterioration 93 (2014): 78-83.
[47] H. Fang, L. Xia, High activity cellulase production by recombinant Trichoderma reesei ZU-02 with
the enhanced cellobiohydrolase production, Bioresource Technology 144 (2013): 693-697
doi:10.1016/j.biortech.2013.06.120
[48] L. Zhong, J. F. Matthews, P. I. Hansen, M. F. Crowley, J. M. Cleary, R. C. Walker, M. R. Nimlos,
C. L. Brooks, W. S. Adney, M. E. Himmel, J. W. Brady, Computational simulations of the Trichoderma
reesei cellobiohydrolase I acting on microcrystalline cellulose Iβ: the enzyme –substrate complex,
Carbohydrate Research 344(15) (2009): 1984-1992.
[49] M. Taha, E. Shahsavari, K. Al-Hothaly, A. Mouradov, A. T. Smith, A. S. Ball, E. M. Adetutu,
Enhanced biological straw saccharification thougth coculturing of lignocellulose-degrading
microorganisms, Appl Biochem Biotechnol (2015) DOI 10.1007/s12010-015-1539-9
[50] A. Ahamed, P. Vermette, Enhanced enzyme production from mixed cultures of Trichoderma reesei
RUT-C30 and Aspergillus niger LMA grown as fed batch in a stirred tank bioreactor, Biochemical
Engineering Journal 42(1) (2008): 41-46. doi:10.1016/j.bej.2008.05.007
[51] R. Kaushal, N. Sharma, D. Tandon, Cellulase and xylanase production by coculture of Aspergillus
niger and Fusarium oxysporum utilizing foreste waste. Turk J. Biochem 37 (1) (2012): 35-41.
[52] Z. Wen, W. Liao, S. Chen, Production of cellulase/β-glucosidase by the mixed fungi culture
Trichoderma reesei and Aspergillus phoenicis on dairy manure, Process Biochemistry 40(9) (2005):
3087-3094.
[53] J. Kim, D. E. Block, D. A. Mills, Simultaneous consumption of pentose and hexose sugars: an
optimal microbial phenotype for efficient fermentation of lignocelullosic biomass, Appl Microbiol
Biotechnol 88 (2008): 1077-1085 DOI 10.1007/s00253-010-2839-1
[54] W. Wang, J. Ren, H. Li, A. Deng, R. Sun, Direct transformation of xylan-type hemicelluloses to
furfural via SnCl4 catalysis in aqueous and biphasic systems, Bioresource Technology 183 (2015): 188-
194.
[55] O. Gordobil, I. Egüés, I. Urruzola, J. Labidi, Xylan-cellulose films: Improvement of
hydrophobicity, thermal mechanical properties, Carbohydrate Polymers 112 (2014): 56-62.
[56] N. Jayapal, A. K. Samanta, A. P. Kolte, S. Senani, M. Sridhar, K. P. Suresh, K. T. Sampath, Value
130
addition to suggar cane baggase: xylan extraction and its process optimization for xylooligosaccharides
production, Industrial crops and products 42 (2013): 14-24.
[57] O. García-Krichner, M. Muñoz-Aguilar, R. Pérez-Villalva, C. Huitrón-Vargas, Mixed submerged
fermentation with two filamentous fungi for cellulolytic and xylanolytic enzyme production, Applied
biochemistry and biotechnology 98-100 (2002): 1105-1114.
[58] R. Cohen-Kupiec, K. E. Broglie, D. Friesem, R. M. Broglie, I. Chet, Molecular characterization of a
novel β-1,3-exoglucanase related to mycoparasitism of T. harzianum, Gene 226(2) (1999): 147-154.
[59] L. Shu-Ying, A. S. Marthandam, J. Hua-Jing, L. Chaur-Tsuen, P. Kou-Cheng, Purification and
characterization of novel glucanases from Trichoderma harzianum ETS 323, J. Agric. Food Chem.
58(19) (2010): 10309-10314. DOI: 10.1021/jf1029338
[60] F. Colussi, V. Serpa, P. Da Silva, L. Regina, M. Luiza, R. Alves, B. Luan, N. Pereira, C. Sanches,
A. M. Golubev, M. A. Morim, I. Polikarpov, Purification, and Biochemical and Biophysical
characterization of cellobiohydrolase 1 from Trichoderma harzianum IOC 3844, J. Microbiol.
Biotechnol. 21(8) (2011): 808-817.
[61] P. Tomme, H. Van Tilbeurgh, G. Pettersson, J. Van Dame, J. Vandekerckhove, J. Knowles, T.
Teeri, M. Claeyssens, Studies of the cellulytic system of Trichoderma reesei QM 9414 Analysis of the
domain function in two cellobiohydrolases by limited proteolysis, Eur. J. Biochem. 170 (1988): 575-581.
[62] S. Akiba, Y. Kimura, K. Yamamoto, H. Kumagai, Purification and characterization of a protease-
resistant cellulase from Aspergillus niger, Journal of fermentation and bioengineering 79(2) (1995): 125-
130.
[63] K. S. Siddiqui, A. A. Najmus, M. H. Rashid, M. I. Rajoka, Carboxyl group modification
significantly altered the kinetic properties of purified carboxymethylcellulase from Aspergillus niger,
Enzyme and Microbial Technology 27 (2000): 467-474.
[64] A. A. Hasper, E. Dekkers, M. van Mil, P. J. I. van de Vondervoort, L. H. de Graaff, EgIC, a new
endoglucanase from Aspergillus niger with major activity towards to xyloglucan, Appl. Environ.
Microb. 68(4) (2002): 1556-1560.
[65] D. H. X. Quay, F. D. A. Bakar, A. Rabu, M. Said, R. M. Illias, N. M. Mahadi, O. Hassan, A. M. A.
Murad, Overexpression, purification and characterization of the Aspergillus niger endoglucanase EgIA,
in Pichia pastoris, African Journal of Biotechnology 10(11) (2011): 2102-2111 DOI:
10.5897/AJB10.1046
[66] Q. K. Beg, M. Kapoor, L. Mahajan, G. S. Hoondal, Microbial xylanases and their industrial
applications: a review, Appl Microbiol Biotechnol 56 (2001): 326-338. DOI 10.1007/s002530100704
[67] M. B. Fialho, E. C. Carmona, Purification and characterization of xylanases from Aspergillus
giganteus, Folia Microbiol 49(1) (2004): 13-18
131
[68] A. P. MacCabe, M. T. Fernández-Espinar, L. H. de Graff, J. Visser, D. Ramón D, Identification,
isolation and sequence of the Aspergillus nidulans xlnC gene encoding the 34-kDa xylanase, Gene 175
(1996): 29-33.
[69] N. N. M. E. Van Peij, J. Brinkmann, M. Vrsanská, J. Visser, L. H. Graaff, β-xylosidase activity,
encoded by xlnD, is essencial for complete hydrolysis of xylan by Aspergillus niger but not for induction
of the xylanolytic enzyme spectrum, Eur. J. Biochem. 245 (1997): 164-173.
[70] E. A. Ximenes, C. R. Felix, C. J. Ulhoa, Production of cellulases by Aspergillus fumigatus and
characterization of one β-glucosidase, Current Microbiology 32(3) (1996): 119-123.
[71] T. Watanabe, T. Sato, S. Yoshioka, T. Koshijima, M. Kuwahara, Purification and properties of
Aspergillus niger β-glucosidase, The FEBS Journal 209(2) (1992): 651-659. DOI: 10.1111/j.1432-
1033.1992.tb17332.x
[72] J. B. Kempton, S. G. Withers, Mechanisms of Agrobacterium β-glucosidase: kinetic studies,
Biochemistry 31(41) (1992): 9961-9969. DOI: 10.1021/bi00156a015
[73] S. M. Mathioni, A. Beló, C. J. Rizzo, R. A. Dean, N. M. Donofrio, Transcriptome profiling of the
rice blast fungus during invasive plant infection and in vitro stresses, BMC Genomics 12 (2011):49
http://www.biomedcentral.com/1471
132
2.2 Cellulases produced from Pico de Orizaba’s cold-ecosystem fungi. Does
hydrolyze at lower temperature than cellulases from Trichoderma reesei does?
Manuscrito finalizado
El artículo reporta los resultados obtenidos del capítulo 2.2 Bioprospección de hongos
productores de celulasas del volcán Pico de Orizaba: las celulasas producidas por dichos hongos
son de naturaleza mesófila, por lo que podrían ser utilizadas en procesos de fermentación-
sacarificación simultánea.
133
Cellulases produced from Pico de Orizaba’s cold-ecosystem fungi. Does hydrolyze
at lower temperature than cellulases from Trichoderma reesei does?
Hernández C1, García G
1, Vázquez-Marrufo G
2, Alarcón E
1*.
1Universidad Veracruzana. Instituto de Biotecnología y Ecología Aplicada (INBIOTECA), Av. de las
culturas veracruzanas #101 col. Emiliano Zapata CP. 91090, Xalapa Veracruz, México. 2Universidad Michoacana de San Nicolás de Hidalgo. Facultad de Veterinaria, Centro Multidisciplinario
de Estudios en Biotecnología, Morelia, Michoacán.
*Correspondence author
Abstract
The use of bioprospections for isolate and discover novel strains capables to produce cellulases with
specific characteristics is very heplful. In this work, we aimed to isolate different fungal strains in a
altitudinal gradient in the Pico de Orizaba volcano (The mexican highest mountain), searching for
mesophilic cellulase-producing fungi, and we compared their yields agains cellulases from Trichoderma
reesei (a tropical fungi) in a temperature gradient. From the isolated strains, on CMC-Czapek Dox Agar,
we selected six strains to produce cellulases in liquid media with different carbon sources. We found that
lactose was the best carbon source for cellulase production (endoglucanase and β-glucosidase) for all
strains. The cellulase activities of the concentrated protein were evaluated in a temperature gradient from
30 to 50 °C, using cellulases from T. reesei as control. Results indicate that fungal strains from Pico de
Orizaba produce mainly mesophilic cellulases, projecting a strain belonging to the family Pleosporaceae
(optimal reaction temperature of 30 and 33°C). This could be understood as an adaptation to cold-
climate of the mountain.
Keywords: endoglucanase, β-glucosidase, fungal bioprospection, Trichoderma reesei, Pleosporaceae.
134
Introduction
Cellulases are important industrial enzymes produced mainly from Ascomycota. Nowdays they are used
as detergent additives, for improving the production process of beer and wine, for production of purees,
for biostoning of jeans, among others (Kuhad et al., 2011). They have the potential for being used for
wood-biopulping, and in large-scale production of second generation bioethanol. Cellulase is a group of
hydrolytic enzymes with different molecular weight and, generally, one of the following activities: β-
1,4-endoglucanase (E.C.3.2.1.4), exoglucanase (cellobiohydrolase; E.C.3.2.1.176) or β-glucosidase
(cellobiase; E.C. 3.2.1.21).
Actually, Trichoderma reesei is the principal source of industrial cellulases, mainly because produce a
large amount of enzymes, its plasticity and its excellent production of exoglucanses (Esterbauer et al.,
1991). Trichoderma’s cellulases (like any enzymes) have specific requirements for catalysis, pH (4.8)
and temperature (50 °C) are some important ones (Ghose, 1987; Ballesteros et al., 2004). Also, they
trend to have low β-glucosidase activity, that is why the mixes with exogenous β-glucosidase are
common for improve their hydrolysis potential (Fortes et al., 2010).
These characteristics are important in industry, because limits the conditions in where they can be used.
In order to diversify the field of applications of cellulases, many efforts have been made to modify their
structure, by mutagenesis or protein engeenering; enhancing their thermostability, thermophilicity,
alkalophilicity (St-Pierre et al., 2012) or the production of β-glucosidase (Jung et al., 2012). However,
despite of the advances in this field, other organisms would exist that produce cellulases with different
catalystic requirements that those produced with Trichoderma reesei, and that could be used for specific
industrial processes. Psycrophilic cellulases were produced from bacterial strains from Indian soils
(Venkatachalam et al., 2014) and mesophilic cellulases from bacterial strains from deep Atlantic Ocean
(Odisi et al., 2012). Likewise, alkaline cellulases were produced from Aspergillus sp and Penicillium sp
strains from soil of the rainforest of Perú (Indira et al., 2014), and cellulases that endure halophytes
conditions were produced from bacterial strains of Odisha region, in India (Vega et al., 2012).
Thermophilic cellulases have attracted the attention of many studies, because their high yields under
extreme operational conditions (Acharya and Chaudhary, 2012). However, for some processes, like
simultaneous fermentation and saccharification of biomass, the use of cellulases with high yields at
mesophilic temperatures (30 °C) could be preferable. This because Saccharomyces cerevisiae can not
survive at thermophilic conditions required for enzymatic hydrolysis of T. reesei cellulases (50 °C).
The use of bioprospections for isolate and discover novel strains capables to produce cellulases with
specific characteristics could be very heplful. In this work, we aimed to isolate different fungal strains in
a altitudinal gradient in the Pico de Orizaba volcano (mexican highest mountain), searching for
mesophilic cellulase-producing fungi, and we compared their yield agains cellulases from T. reesei (a
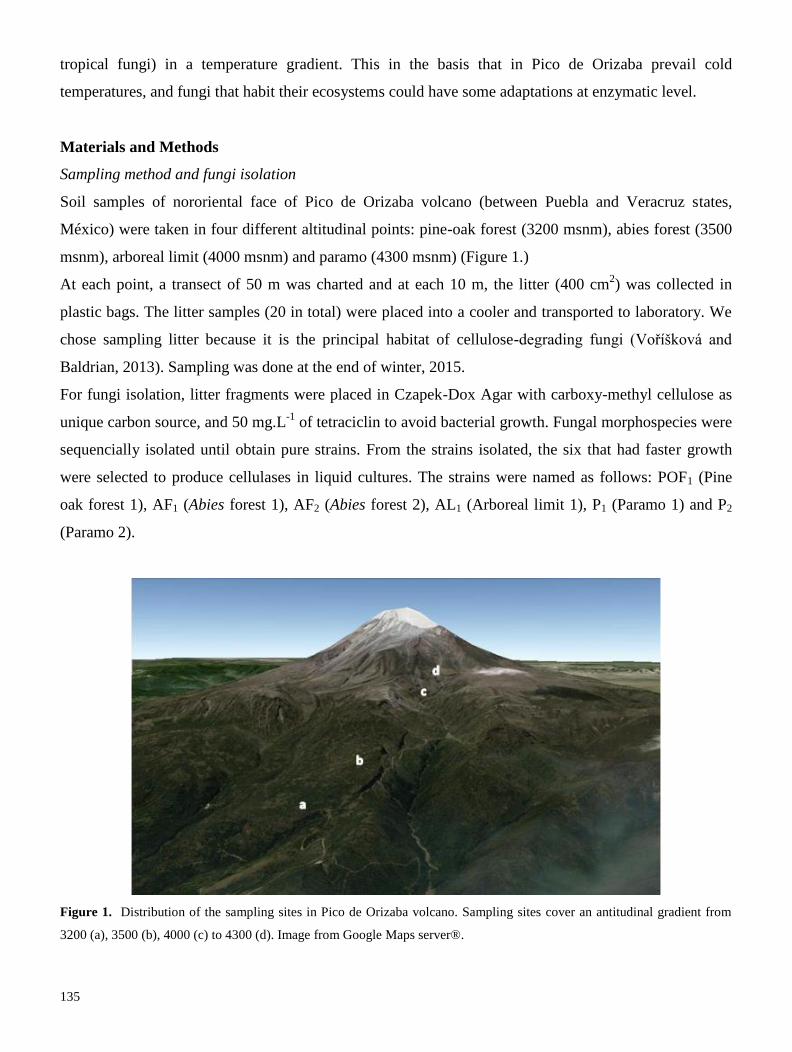
135
tropical fungi) in a temperature gradient. This in the basis that in Pico de Orizaba prevail cold
temperatures, and fungi that habit their ecosystems could have some adaptations at enzymatic level.
Materials and Methods
Sampling method and fungi isolation
Soil samples of nororiental face of Pico de Orizaba volcano (between Puebla and Veracruz states,
México) were taken in four different altitudinal points: pine-oak forest (3200 msnm), abies forest (3500
msnm), arboreal limit (4000 msnm) and paramo (4300 msnm) (Figure 1.)
At each point, a transect of 50 m was charted and at each 10 m, the litter (400 cm2) was collected in
plastic bags. The litter samples (20 in total) were placed into a cooler and transported to laboratory. We
chose sampling litter because it is the principal habitat of cellulose-degrading fungi (Voříšková and
Baldrian, 2013). Sampling was done at the end of winter, 2015.
For fungi isolation, litter fragments were placed in Czapek-Dox Agar with carboxy-methyl cellulose as
unique carbon source, and 50 mg.L-1
of tetraciclin to avoid bacterial growth. Fungal morphospecies were
sequencially isolated until obtain pure strains. From the strains isolated, the six that had faster growth
were selected to produce cellulases in liquid cultures. The strains were named as follows: POF1 (Pine
oak forest 1), AF1 (Abies forest 1), AF2 (Abies forest 2), AL1 (Arboreal limit 1), P1 (Paramo 1) and P2
(Paramo 2).
Figure 1. Distribution of the sampling sites in Pico de Orizaba volcano. Sampling sites cover an antitudinal gradient from
3200 (a), 3500 (b), 4000 (c) to 4300 (d). Image from Google Maps server®.
136
Cellulase production in liquid cultures
For cellulase production assessment, strains were inoculated in 150 mL of Mandels and Weber medium
(1969) with the following composition per litre: yeast extract 1 g, peptone 4 g, KH2PO4 4 g, (NH4)2SO4
2.8 g, MgSO4 x 7 H2O 0.6 g, CaCl2 x 2 H2O 0.8 g. The medium was enriched with trace elements (mg.L-
1): FeSO4 5.0 mg, ZnSO4 x 7H2O 1.4 mg, CoCl2 2.0 mg.
Because the cellulase producing fungi corresponded to new isolations, a monofactorial desing using
three different carbon sources was used to induce cellulase production: lactose, carboxy methyl cellulose
and sugarcane bagasse; all the carbon sources were added to culture medium at 2%. All treatments were
done in triplicate; thus, a total of 54 experimental inits (Crystal flask, 250 ml) with 150 mL of culture
medium were prepared, inoculated and incubated in a environmental chamber Bunker GmbH at 28° C,
without agitation thought 11 days.
Samples to measure cellulase activities: endoglucanase and β-glucosidase, were taken each 48 hours.
Extracellular protein amount was quantificated in order to determine the specific activities of cellulases.
Effect of temperature on cellulase activity
At the end of incubation time, the culture medium was filtered using a kitasato matrass and a vaccum
pump thought Whatmann paper. After that, the crude extract was dialysated using a tubular-cellulose
membrane, and poly-ethylen glycol as dehydrating agent by 18 h at 4 °C. The concentrated protein was
used to determine the cellulase activities in a temperature gradient.
Endoglucanase and β-glucosidase specific activities were evaluated at mesophilic temperatures: 30, 33,
36 and 39 °C, and the termophilic temperature of 50 °C. As control, comercial cellulases of Trichoderma
reesei (Sigma, USA) were evaluated in the same temperature gradient. The strains that produced
cellulases that hydrolyze at mesophilic temperatures were molecular identified.
Fungal identification
Three strains were identified by amplification and analysis of the ITS rDNA region (Schoch et al.,
2012). DNA of the selected strains was isolated using the Fastprep (MP Biomedicals, LLC, USA) a kit
for fungal DNA isolation, as described by the supplier. PCR reactions of the ITS region were conducted
with the primers and conditions described by White et al., (1990). Amplicons were sequenced at
Elimbiopharm (USA) and the sequences obtained were subjected to Blastn search in Genbank. Those
sequences of Genbank with maximum identity with amplicons obtained were retrieved and used for
phylogenetic analysis. Additional ITS sequences of the same genus obtained in Blastn search were
selected and retrieved from Genbank in order to make more robust the phylogenetic analysis of each
studied strain. The sequences were aligned by ClustalW and edited by hand. Genetic distances were
137
calculated by the Kimura- 2 parameters and then the phylogenetic reconstruction was conducted by
using the Maximum Likelihood criteria with 1000 bootstrap replicates. Maximum Parsimony (MO) trees
were also generated using same genetic distances. All these steps for phylogenetic analysis were
conducted in Mega 6 (Tamura et al., 2013).
Analytical methods
Relative activity of β-glucosidase activity was evaluated by quantifying the amount of p-nitro phenol
liberated from a solution of p-nitro phenyl-β-D-glucopyranoside, 0.1 mM spectrophotometrically at 412
nm (Eivazi and Tabatabai, 1988). The activity was reported as U•ml-1
. Relative activity of
endoglucanase was determined according to Ghose (1969), quantifying the reducing sugars released
from carboxymethyl cellulose by the method of dinitrosalicylic acid (DNS; Miller, 1954). The enzymatic
reaction was performed at 50 ° C in a water bath, stopped with DNS reagent, read in a
spectrophotometer at 540 nm and converted to μM•ml-1
by comparing with a standard curve of glucose;
enzyme activity was reported as U•ml-1
(μM•min-1
•ml-1
).
Extracellular protein amount was calculated by the colorimetric method of coomassie blue at 595 nm
according to Bradford (1976). The values of relative activities of cellulases and the protein amount were
used to calculate the specific activities of endoglucanase and β-glucosidase (U.mg protein-1
).
Results
Effect of carbon source in cellulase production
The use of different carbon sources to induce cellulase production affects the production of
endoglucanase and β-glucosidase (Figures 2 and 3). The strains AL1, P1 and POF1 produced the highest
amount of β-glucosidase when lactose (AL1 = 36.67 and POF1 = 4.52 after 11 days of culture, and P1 =
22.66 ± 2.42 U.mg protein -1
after 9 days of culture) or CMC (AL1 = 28.90 and P1 = 31.42 after 11 days
of culture, and POF1 = 43.65 ± 6.37 U.mg protein -1
after 9 days of culture) were used as carbon source;
meanwhile, when SCB was used the activities decreased (AL1 = 18.94; POF1 = 5.32 and P1 =19.36 U.mg
protein -1
after 11 days of culture).
On the other hand, lactose was the prefer carbon source for the production of endoglucanase (Figure 3).
And in the same way that β-glucosidase, the strains P1 (after 9 days of culture) and POF1 (after 4 days of
culture) produced the highest amount of endoglucanase (30.41 ± 9.22; 38.60 ± 10.28 U.mg protein -1
,
respectively). At the end of the incubation time, the enzymes of all strains, produced with lactose, were
concentrated and the effect of temperature on its activities was evaluated.
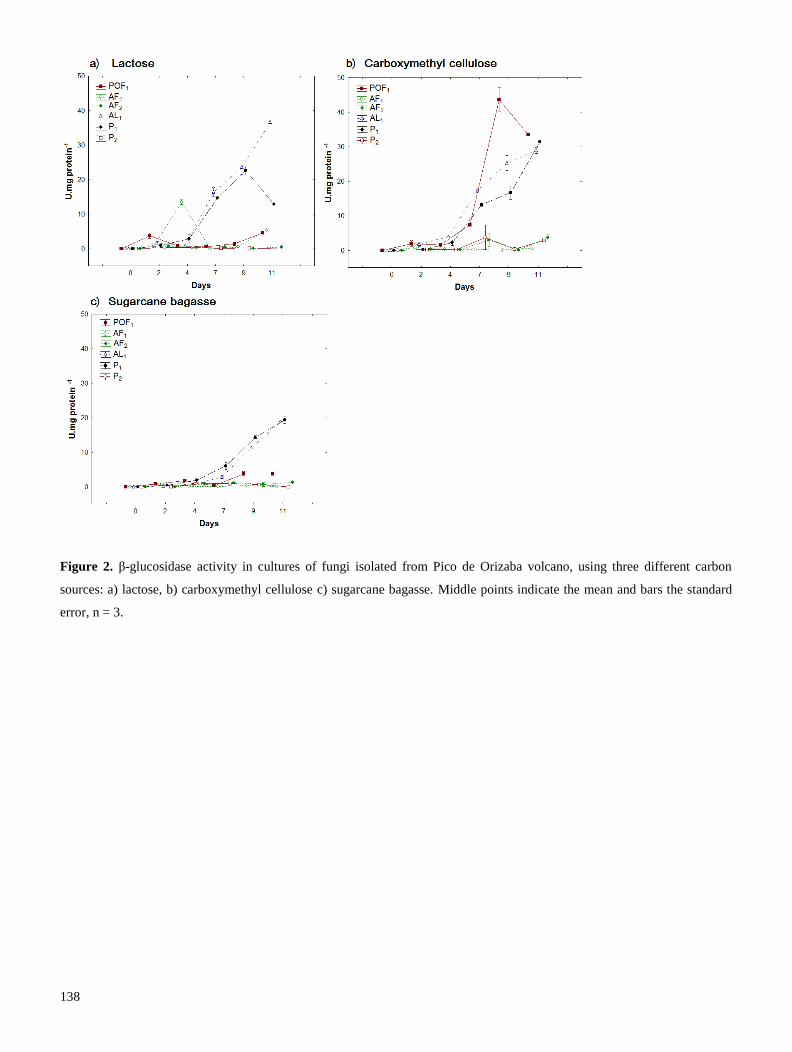
138
Figure 2. β-glucosidase activity in cultures of fungi isolated from Pico de Orizaba volcano, using three different carbon
sources: a) lactose, b) carboxymethyl cellulose c) sugarcane bagasse. Middle points indicate the mean and bars the standard
error, n = 3.
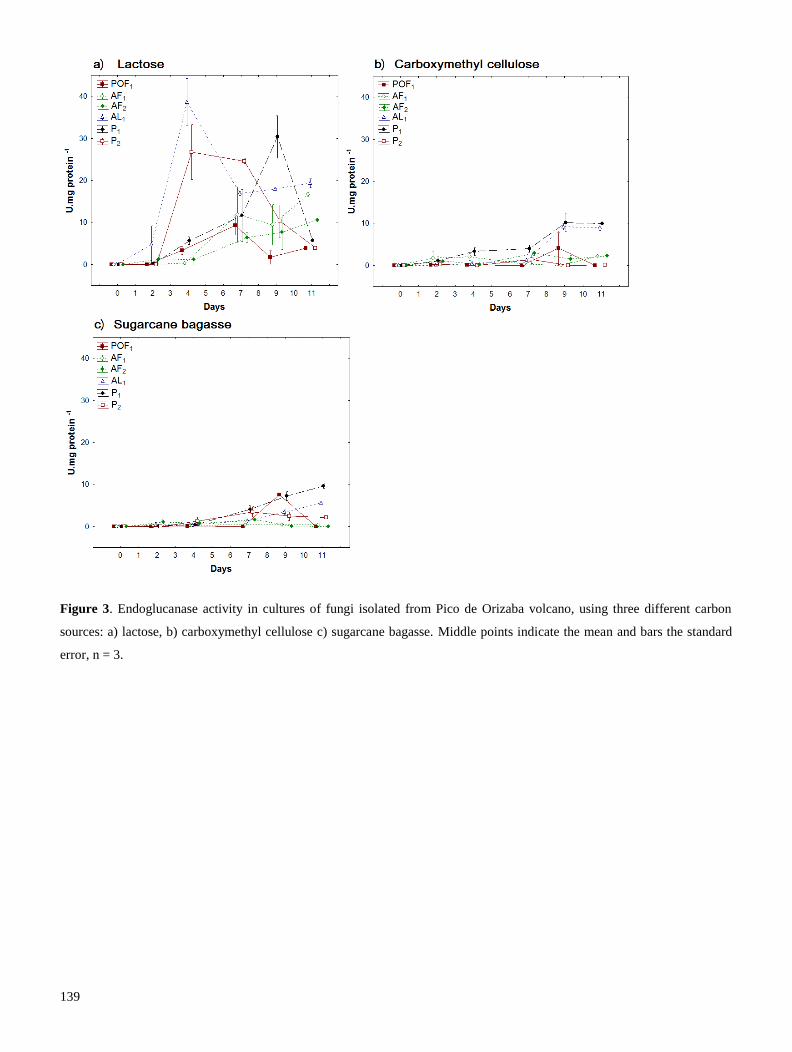
139
Figure 3. Endoglucanase activity in cultures of fungi isolated from Pico de Orizaba volcano, using three different carbon
sources: a) lactose, b) carboxymethyl cellulose c) sugarcane bagasse. Middle points indicate the mean and bars the standard
error, n = 3.
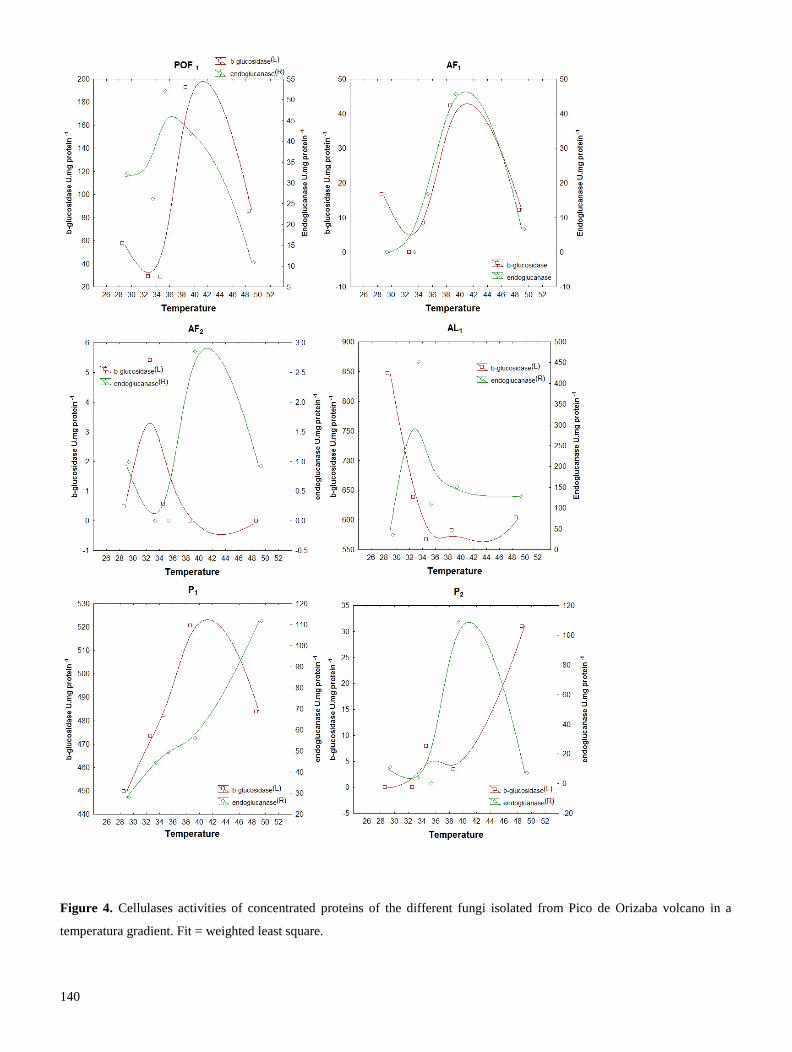
140
Figure 4. Cellulases activities of concentrated proteins of the different fungi isolated from Pico de Orizaba volcano in a
temperatura gradient. Fit = weighted least square.
141
Effect of temperature on cellulase activities
Cellulases produced in liquid media with fungi from cold ecosystems of Pico de Orizaba volcano
showed different optimal reaction temperature (ORT) (Figure 4). Specific endoglucanase activities of the
strains isolated from pine-oak forest and Abies forest (POF1, AF1 and AF2) showed highest activities
between 33 to 39 °C, decreasing at 50 °C. The strain AL1, isolated at 4000 m over sea level in the
arboreal limit, showed its highest activity at 33 °C (452.10 U.mg protein-1
), and decreased when
temperature increased. Contrary, endoglucanase from T. reesei showed its highest endoglucanase activity
at 50 °C (233.98 U.mg protein-1
), and decreased when temperature decreased, until 35.35 U.mg protein-1
at 30 °C.
Specific β-glucosidase activities of AL1, and AF2 showed its highest activities at 30 and 33 °C,
respectively. Thus, the enzymes produced by those strains could be considered as mesophilic β-
glucosidases. Contrary, β-glucosidases of POF1, AF1 and P1 had high activity at 39 °C, and P2 at 50°C
(Figure 4).
Our results inducate that cellulases produced with different fungal strains from forestal areas of Pico de
Orizaba, hydrolyze at temperatures from 30 to 39 °C, better than at 50 °C. Strains from Paramo
produced cellulases that hydrolyze better at 39 to 50 °C, in the same way that cellulases from T. reesei.
Phylogenetic analysis of the fungal isolates
We selected AL1 as a strain with potential to produce mesophilic cellulases, but the strains POF1 and P1,
which had high cellulase production were also identified. Blastn search of amplicons obtained from
fungal isolates P1 and POF1 show maximal identity with sequences of Trichoderma harzianum complex,
whereas isolates AL1 shows maximal identity with Pleosporaceae species (genus Alternaria and
Ulocladium). Phylogenetic reconstruction of the ITS region from strains P1 and POF1 groups with its
corresponding sequences T. harzianum complex with a bootstrap value of 100%, clearly separated from
all other species within the genus (Figure 5). Strain AL1 grouped with genus Alternaria and Ulocladium,
both genus are polyphyletic and paraphyletic related taxa of the Pleosporaceae family, and phylogenetic
between those two genus are commonly not-resolved (Xue and Zhang, 2007; Runa et al., 2009) (Figure
5).
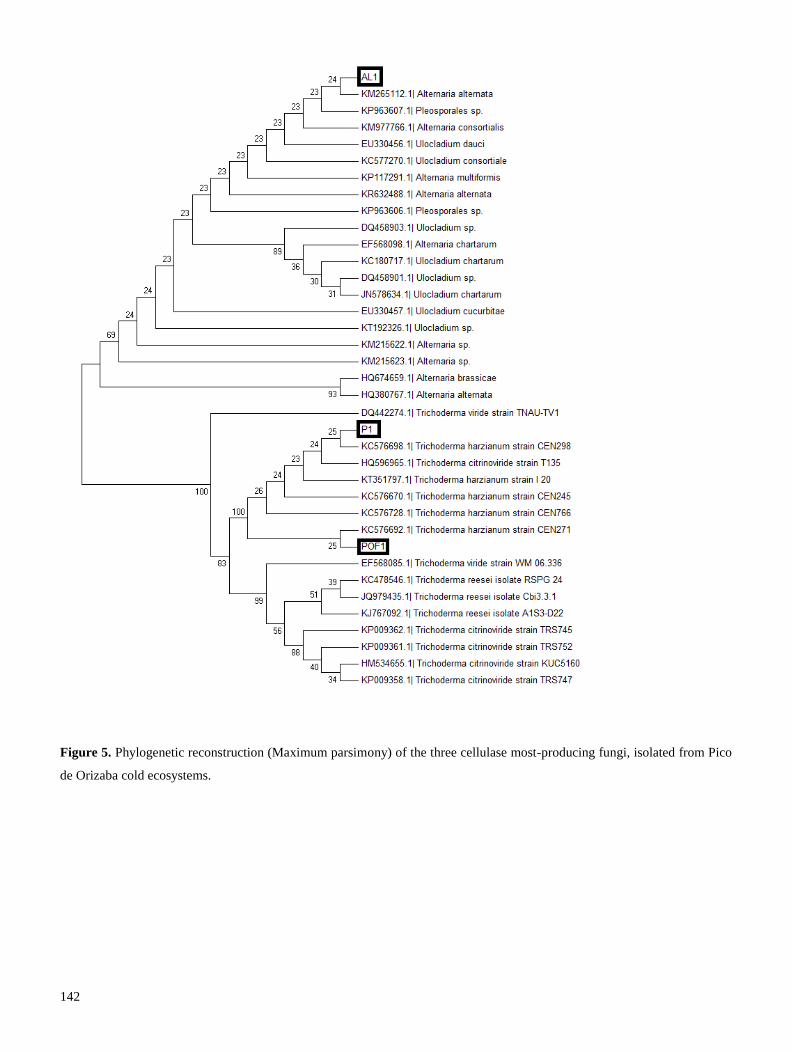
142
Figure 5. Phylogenetic reconstruction (Maximum parsimony) of the three cellulase most-producing fungi, isolated from Pico
de Orizaba cold ecosystems.
143
Discussion
Bioprospection, is a key way to find new organisms with potential biotechnological uses. In this work,
we aimed to find evidence that litter fungi of cold mountain ecosystems have cellulase adapted to
hydrolyze at lower temperatures (mesophilic cellulases) than cellulases of the tropical fungi T. reesei
(thermophilic cellulases: 50 °C). Several studies reported that themophilic bacteria produce
thermotolerant cellulases, which can be used for many industrial processes (Arora et al., 2015;
Norashirene et al., 2014); however, mesophilic cellulases have recibed less attention in the
bioprospection field, in spite of they could be used for simultaneous saccharification and fermentation
processes, insted of cellulases of T. reesei or themotolerant yeast (Kádár et al., 2004).
In order to evaluate the production of cellulase from the fungal strains isolated on CMC-Czapek Dox
agar, we performed liquid media with three different carbon sources, i.e. lactose, CMC and SCB, and
spite of all carbon sources induced cellulase production, the best results were obtained with lactose.
Lactose is considered a good inducer or cellulases, even if the mechanism of induction is not complety
understood (Karaffa et al., 2006; Porciuncula et al., 2013); our results point that lactose and Mendel-
Weber medium, could be useful for the production of cellulases with novel fungal strains.
Of the isolated strains, all produced endoglucanases with mesophilic ORT (33-39 °C) with exception of
P1 wich had an optimal reaction temperature (ORT) of 50 °C (thermophilic). The same was observed for
β-glucosidase, all strains produced mesophilic β-glucosidases with exception of P2. We consider this as a
evolutival characteristic of the fungi that lives in cold ecosystems, in the same way that tropical or
thermophilic organisms have their cellulases adapted to catalyze at high temperatures.
Strains P1 and P2, were isolated at the highest sampling point (4300 m above sea level; Paramo), the ITS
phylogeny revealed that belong to Trichoderma harzianum (P1) and Phoma herbarum (P2, tree don’t
shown). T. harzianum are known to produce cellulase with ORT between 37 to 40 °C (Thrane et al.,
1997); meanwhile, P. herbarum, a pathogenous fungi of plants and salmonids, have attracted the
attention for its capacity to produce xylanases/cellulases, among other chemicals (Alvarez-Navarrete et
al., 2015). However, few is known about the characteristics of their cellulases. In this work we found
that P. herbarum could be a source of thermophilic (50 °C) β-glucosidases, however its production was
very low.
Themophilic cellulases are characterized by hydrophobic protein core and polarity at the surface;
compact structure with lesser internal voids; higher content of proline and leseer content of asparagines,
glutamine, methionine and cysteine; increased level of H-bonding, isoelectric points and salt bridges
(Arora et al., 2015; Taylor and Vaisman, 2010; Li et al., 2011). On the other hand, exist cold-active
cellulases, produced by psychrophilic or psychrotolerant organisms (e.g. from polar regions or marine
sediments). Those cellulases have been propossed for the production of algae-derivated bioethanol

144
(Wang et al., 2015); and are considered important for specific industrial uses (Gerday et al., 2000).
Cold-active cellulases from Pseudoalteromonas sp. (isolated from Antartic region) have their ORT at 30
°C (Wang et al., 2015), as well as the cellulases produced with our strain AL1 who belong to
Pleosporaceae family (isolated in the arboreal limit, at 4000 m above sea level). The optimization to low
temperature is reached via destabilization of the structures bearing the active site, this improves the
dynamic of the active site in the cold (Ferrer, 2013). Phylogeny based on ITS sequence did not clarify
the identity at specie level of the strain AL1; however, pointed that the strain belong to genus Alternaria
or Ulocladium (family Pleosporaceae). Some authors have reported that there is not a clear difference
between those related taxa, and in spite of the efforts, the phylogeny still unresolved (Xue and Zhang,
2007; Runa et al., 2009).
Both, Alternaria and Ulocladium species are commonly leaf phytopathogens and saprotrophic, and their
production of cellulases have been proved. It has been reported that the temperature of incubation for
Alternaria species (A. alternata and A. citri), affects their cellulase production, and that at 30 °C the
production of cellulases was optimal (El-Said et al., 2014). Here, we observed that AL1 has its ORT at
these temperature; however, other studies from Pakistan region (where predominates warm climate),
indicates that cellulase from Alternaria sp have an ORT of 45 °C for β-glucosidase and 50 °C for
endoglucanase (Sohail et al., 2011).
On the other hand, Ulocladium is a potent mycotoxin-free cellulase-producer (Pedersen et al., 2009), but
reports pointed that its cellulases (U. botrytis, endoglucanases) have its maximal activity at 60 °C (Abo-
Elmagd and Housseiny, 2012), contrary to our AL1 cellulases. These previous data, could suggest that
AL1 strain of Pico de Orizaba volcano, belonging to Pleosporaceae family, have developed a cellulase
adapted to function at lower temperatures than other strains of Alternaria or Ulocladium, and that its a
potential source of mesophilic cellulases. However, structural studies of their cellulases are required to
proved this hypothesis.
Further studies using the cellulases obtained from AL1 for simultaneous fermentation and
saccharification, or other biotechnological processes at mesophilic temperatures, shed light on the
suitability of their use compared with cellulases from other more-used fungi, like T. reesei or A. niger.
Conclusion
Fungi isolated from Pico de Orizaba volcano produce mainly mesophilic cellulases (endoglucanases and
β-glucosidases), with exception to those belonging to Trichoderma or Phoma genus. This could be
understood as an adaptation to cold-climate of the mountain.
Among all strains, AL1, who belong to Pleosporaceae family, had high cellulase production when lactose
was used as carbon source. Also, its cellulases have an ORT between 30 and 33 °C, which makes them
145
good candidates for biotechnological uses, developed at mesophilic temperatures.
References
Abo-Elmagd HI and Housseiny MM. 2012. Purification and characterization of carboxymethyl cellulase
and protease by Ulocladium botrytis Preuss ATCC 18042 using water hyacinth as a substrate under solid
state fermentation. Ann Microbiol (2012) 62: 1547-1556.
Alvarez-Navarrete M, López GER, Flores-García A, Lopez R, Martínez-Pacheco MM. 2015. Selection
and molecular identification of fungal isolates that produce xylanolytic enzymes. Genetics and
Molecular Research 14(3): 8100-8116.
Arora R, Behera S, Sharma NK, Kumar S. 2015. Bioprospecting thermostable cellulosomes for efficient
biofuel production from lignocellulosic biomass. Bioresources and Bioprocessing 2:38 DOI
10.1186/s40643-015-0066-4
Acharya S and Chaudhary A. 2012. Bioprospecting thermophiles for cellulase production: A review.
Brazilian Journal of Microbiology (2012): 844-856.
Ballesteros M, Oliva JM, Negro MJ, Manzanares P, Ballesteros I. 2004. Ethanol from lignocellulosic
materials by a simultaneous saccharification and fermentation process (SFS) with Kluyveromyces
marxianus CECT 10875. Process biochemistry 39: 1843-1848.
Eivazi F and Tabatabai MA. 1988. Glucosidases and galactosidases in soil. Soil Biol Biochem 31: 601-
608.
El-Said AHM, Saleem A, Maghraby TA, Hussein MA. 2014. Cellulase activity of some phytopathogenic
fungi isolated from diseased leaves of broad bean. Int. J. Curr. Microbiol. App. Sci. 3(2): 883-900.
Esterbauer H, Steiner W, Labudova I, Hermann A, Hayn M. 1991. Production of Trichoderma cellulase
in laboratory and pilot scale. Bioresource Technology 36(1): 51-65.
Ferrer G. 2013. Psycrophilic enzymes: From folding to function and biotechnology. Scientifica 2013
Article ID 512840, 28 pages http://dx.doi.org/10.1155/2013/512840
Fortes LM, Oliveira RA, Da Silva EP. 2010. Cellulases, xylanases, β-glucosidase and ferulic acid
esterase produced by Trichoderma and Aspergillus act synergestically in the hydrolysis of sugarcane
bagasse. Biochemical engineering journal 51: 72-78.
Gerday C, Aittaleb M, Benthair M, Chessa JP, Claverie P, Collins T, D’Amico S, Dumont J, Garsoux G,
Geolette D, et al. 2000. Cold-addapted enzymes: from fundamentals to biotechnology. Trends
Biotechnology 18(3): 103-107
Ghose TK. 1987. Measurement of cellulase activities. Pure and Appl. Chem. 59(2): 257-268.
Indira D, Moumita S, Ajay D, Kar CS, Jayabalan R. 2014. Chapter 10 Bioprospecting halotolerant
cellulase from saline environment of Bhitarkanika National Park, Odisha. En: Kumar S, Sharma AK,
Tyagi SK, Yadav YK (eds). Recent Advances in Bioenergy Research – Volume III. Kapurthala, India
ISBN 978-81-927097-2-7
146
Jung YR, Shin HY, Yoo HY, Um Y, Kim SW. 2012. Production of cellulases and β-glucosidase in
Trichoderma reesei mutated by proton beam irradiation. Korean J. Chem. Eng. 29(7): 925-930.
Kádár Z, Szengyel Z, Réczey K. 2004. Simultaneous saccharification and fermentation (SSF) of
industrial wastes for the production of ethanol. Industrial crops and products 20(2004): 103-110.
Karaffa L, Fekete E, Gamauf C, Szentirmai A, Kubicek CP, Seiboth B. 2006. D-Galactose induces
cellulase gene expression in Hypocrea jecorina at low growth rates. Microbiology 152(5): 1507-1514.
Kuhad RC, Gupta R, Singh A. 2011. Microbial cellulases and their industrial applications. Enzyme
Research Volume 2011, Article ID 280696. doi:10.4061/2011/280696
Li D-C, Li A-N, Papageorgiou AC .2011. Cellulases from thermophilic fungi: recent insights and
biotechnological potential. Enzyme Res 2011:308730
Mandels M. and Weber J. 1969. The production of cellulases. Adv Chem Ser 95: 391-414.
Miller GL. 1959. Use of dinitrosalicylic acid reagent for determination of reducing sugars. Analytical
chemistry 31(3): 426-428.
Norashirene MJ, Zakiah Y, Nurdiana S, Hilwani IN, Khairiyah MHS, Arif MJM. 2014. Identification of
cellulose-hydrolytic thermophiles isolated from Sg. Klah Hot Spring based on 16S rDNA gene sequence.
International journal of biological, biomolecular, agricultural, food and biotechnological engineering
8(9):1041-1044.
Odisi EJ, Silvestrin MB, Uwamori RY, Castro MA, de Souza AO. 2012. Bioprospection of cellulolytic
and lipolytic South Atlantic Deep-sea bacteria. Electronic Journal of Biotechnology 15(5). DOI:
10.2225/vol15-issue5-fulltext-17
Pedersen M, Hollensted M, Lange L, Andersen B. 2009. Screening for cellulose and hemicellulose
degrading enzymes. International Biodeterioration and Biodegradation 63(2009): 484-489.
Porciuncula J de O, Furukawa T, Shida Y, Mori K, Kuhara S, Morikawa Y, Ogasawara W. 2013.
Identification of major facilitator transporters involved in cellulase production during lactose culture of
Trichoderma reesei PC-3-7. Biosc Biotechnol Biochem 77(5): 1014-1022.
Runa F, Park MS, Pryor BM. 2009. Ulocladium systematics revisited: phylogeny and taxonomic status.
Mycol. Progress 8: 35-47 DOI 10.1007/s11557-008-0576-y
Schoch CL, Seifert KA, Huhndorf S, Robert V, Spouge JL, Levesque CA, Chen W, Fungal Barcoding
Consorcium. 2012. Nuclear ribosomal internal transcribed spacer (ITS) región as a universal DNA
barcode marker for Fugi. Current Issues 109(16): 6241–6246, doi: 10.1073/pnas.1117018109
Sohail M, Ahmad A, Khan SA. 2011. Production of cellulases from Alternaria sp MS28 and their partial
characterization. Pak. J. Bot. 43(6): 3001-3006.
St-Pierre P, Masri N, Fournier M, White TC. 2012. Modified cellulases with increased thermostability,
thermophilicity and alkalophilicity. Patent No. US 8,101,398 B2
Tamura, K., Stecher, G., Peterson, D., Filipski, A., & Kumar, S. 2013. MEGA6: molecular evolutionary
genetics analysis version 6.0. Molecular biology and evolution, 30(12), 2725-2729.
Taylor TJ, Vaisman II .2010. Discrimination of thermophilic and mesophilic proteins. BMC Struct Biol
10:S5
Thrane C, Tronsmo A, Jensen DF. 1997. Endo-1,3-β-glucanase and cellulase from Trichoderma
147
harzianum: purification and partial characterization, induction of and biological activity agains plant
pathogenic Pythium sp. European Journal of Plant Pathology 103: 331-344.
Vega K, Villena GK, Sarmiento VH, Ludeña Y, Vera N, Gutiérrez-Correa M. 2012. Production of
alkaline cellulase by fungi isolated from an undisturbed rain forest of Peru. Biotechnology Research
International 2012, Article ID 934325. doi:10.1155/2012/934325
Venkatachalam S, Sivaprakash M, Gowdaman V, Prabagaran SR. 2014. Bioprospecting of cellulase
producing extremophilic bacterial isolates from India. British Microbiology Research Journal 4(2): 142-
154
Voříšková J and Baldrian P. 2013. Fungal community on decomposing leaf litter undergoes rapid
successional changes. The ISME Journal 7: 477-486.
Wang YB, Gao C, Zheng Z, Liu FM, Zang JY, Miao JL. 2015. Immobilization of cold-active cellulase
from Antartic bacterium and its use for kelp cellulose ethanol fermentation. BioResources 10(1): 1757-
1772.
Xue F, Zhang XG. 2007. Ulocladium capsicuma, a new species identified by morphological and
molecular phylogenetic data. Sydowia 59: 161-178.
148
Capítulo 3
Digestibilidad enzimática de BCA sometido a diferentes
pretratamientos
__________________________________
149
3.1 Sugar cane bagasse pretreatments analysed through 13
C CPMAS NMR:
implications for enzymatic hydrolysis and fermentation
Manuscrito finalizado
El artículo reporta los resultados obtenidos del capítulo 3.1. Evaluación de distitnos
pretratamientos sobre la composición química del bagazo de caña de azúcar, y su posterior efecto
en el rendimiento de hidrolisis y fermentación.
150
Sugar cane bagasse pretreatments analysed through 13
C CPMAS NMR:
implications for enzymatic hydrolysis and fermentation
Hernandez C1, Ziarelli F
4, Gaime I
2, Farnet AM
3, García G
1, Alarcon E
1*
1Instituto de Biotecnología y Ecología Aplicada (INBIOTECA), Universidad Veracruzana, Xalapa Veracruz, México.
2Equipe Ecotechnologies et Bioremediation, IMBE, UMR CNRS 7263, IRD 237, Faculté des Sciences et Techniques de St.
Jérôme, Aix Marseille Université, Marseille, France
3Equipe Systèmes Microbiens IMBE, UMR CNRS 7263, IRD 237, Faculté des Sciences Techniques de St. Jérôme, Aix
Marseille Université, Marseille, France
4Aix Marseille Université, Faculte ́ des Sciences et Techniques de Saint-Jérôme, Spectropole, PO box 512, Avenue Escadrille
Normandie Nie ́men, 13397 Marseille cedex 20, France
*Correspondence author
Abstract
Alkalin and biological pretreatments to lignocellulose are commonly used for enhance enzymatic hydrolysis, and
enhance ethanol production. It is known that those pretreatments change the fiber composition of lignocellulose
(e.g. decreases lignin content); nonetheless, few attemps have been done to detail the chemical changes that occur
when different pretreatments are used. In this study, we used 13
C CPMAS NMR technology to describe changes in
sugarcane bagasse (SCB) pretreated with NaOH and Ca(OH)2 solutions; and with Pycnoporus sanguineus
(Polyporaceae). We found changes in alkyl C, Carboxyl C, Aromatic C (tertiary, quaternary and p-hydroxyphenyl
C), O-alkyl C, aminoacids, ergosterol and chitin contents, and cellulose crystallinity index (CI); when SCB was
submitted to different pretreatments. Changes in the chemical composition of SCB, was after related to enzymatic
hydrolysis by Principal Component Analysis. We found that P. sanguineus promotes better lignin decay, glucose
release and hydrolysis yields than the others pretreatments; also, P. sanguineus increases the amount of
aminoacids and ergosterol in SCB; meanwhile, NaOH increases cellulose crystallinity index. The hydrolizates
were fermented with Saccharomyces cerevisiae by 96 h, and analized by HPLC. The initial composition of the
hydrolyzates, i.e. glucose and saccharose contents (mg.ml-1
), and the biomass production (cells.ml-1
) were then
related to the ethanol production and fermentation yields. We found that ethanol production and fermentation
yield were negatively correlated with biomass production, but positively correlated with glucose comsumption and
with P. sanguineus pretreatment. We conclude, that a biological pretreatment, using P. sanguineus in the
conditions here decribed, is a good way to increase ethanol productivity.
Keywords: Pycnoporus sanguineus, ethanol, cellulose crystallinity, alkaline pretreatments
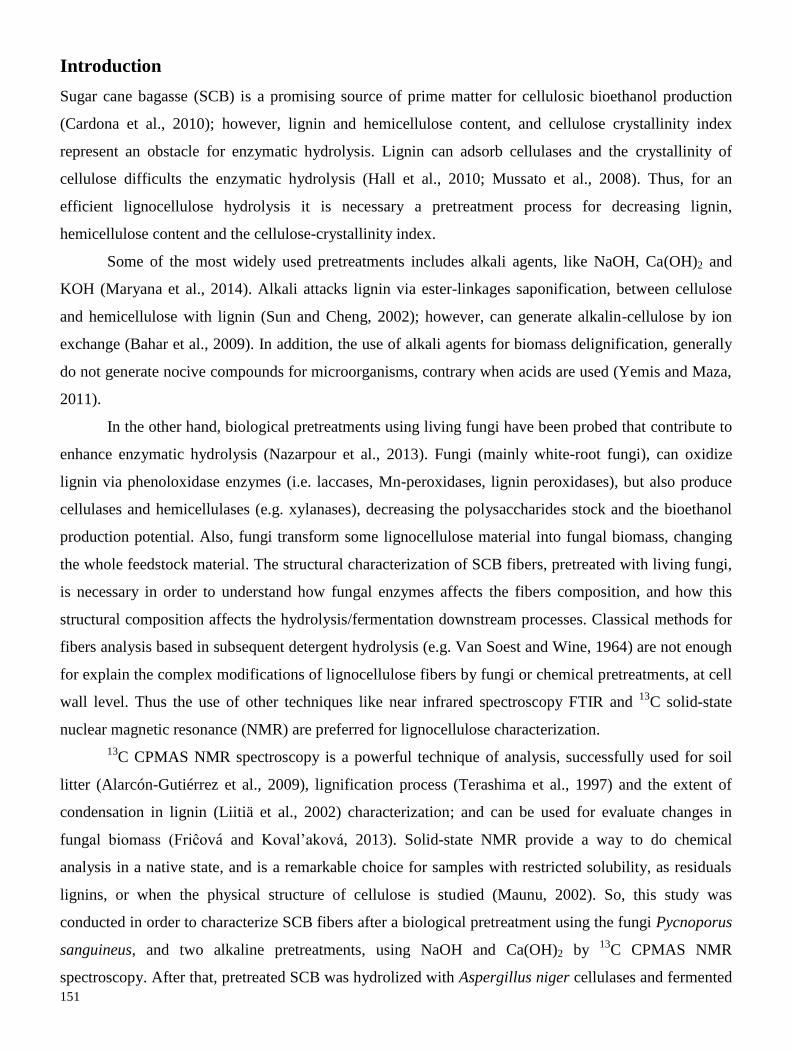
151
Introduction
Sugar cane bagasse (SCB) is a promising source of prime matter for cellulosic bioethanol production
(Cardona et al., 2010); however, lignin and hemicellulose content, and cellulose crystallinity index
represent an obstacle for enzymatic hydrolysis. Lignin can adsorb cellulases and the crystallinity of
cellulose difficults the enzymatic hydrolysis (Hall et al., 2010; Mussato et al., 2008). Thus, for an
efficient lignocellulose hydrolysis it is necessary a pretreatment process for decreasing lignin,
hemicellulose content and the cellulose-crystallinity index.
Some of the most widely used pretreatments includes alkali agents, like NaOH, Ca(OH)2 and
KOH (Maryana et al., 2014). Alkali attacks lignin via ester-linkages saponification, between cellulose
and hemicellulose with lignin (Sun and Cheng, 2002); however, can generate alkalin-cellulose by ion
exchange (Bahar et al., 2009). In addition, the use of alkali agents for biomass delignification, generally
do not generate nocive compounds for microorganisms, contrary when acids are used (Yemis and Maza,
2011).
In the other hand, biological pretreatments using living fungi have been probed that contribute to
enhance enzymatic hydrolysis (Nazarpour et al., 2013). Fungi (mainly white-root fungi), can oxidize
lignin via phenoloxidase enzymes (i.e. laccases, Mn-peroxidases, lignin peroxidases), but also produce
cellulases and hemicellulases (e.g. xylanases), decreasing the polysaccharides stock and the bioethanol
production potential. Also, fungi transform some lignocellulose material into fungal biomass, changing
the whole feedstock material. The structural characterization of SCB fibers, pretreated with living fungi,
is necessary in order to understand how fungal enzymes affects the fibers composition, and how this
structural composition affects the hydrolysis/fermentation downstream processes. Classical methods for
fibers analysis based in subsequent detergent hydrolysis (e.g. Van Soest and Wine, 1964) are not enough
for explain the complex modifications of lignocellulose fibers by fungi or chemical pretreatments, at cell
wall level. Thus the use of other techniques like near infrared spectroscopy FTIR and 13
C solid-state
nuclear magnetic resonance (NMR) are preferred for lignocellulose characterization.
13C CPMAS NMR spectroscopy is a powerful technique of analysis, successfully used for soil
litter (Alarcón-Gutiérrez et al., 2009), lignification process (Terashima et al., 1997) and the extent of
condensation in lignin (Liitiä et al., 2002) characterization; and can be used for evaluate changes in
fungal biomass (Friĉová and Koval’aková, 2013). Solid-state NMR provide a way to do chemical
analysis in a native state, and is a remarkable choice for samples with restricted solubility, as residuals
lignins, or when the physical structure of cellulose is studied (Maunu, 2002). So, this study was
conducted in order to characterize SCB fibers after a biological pretreatment using the fungi Pycnoporus
sanguineus, and two alkaline pretreatments, using NaOH and Ca(OH)2 by 13
C CPMAS NMR
spectroscopy. After that, pretreated SCB was hydrolized with Aspergillus niger cellulases and fermented
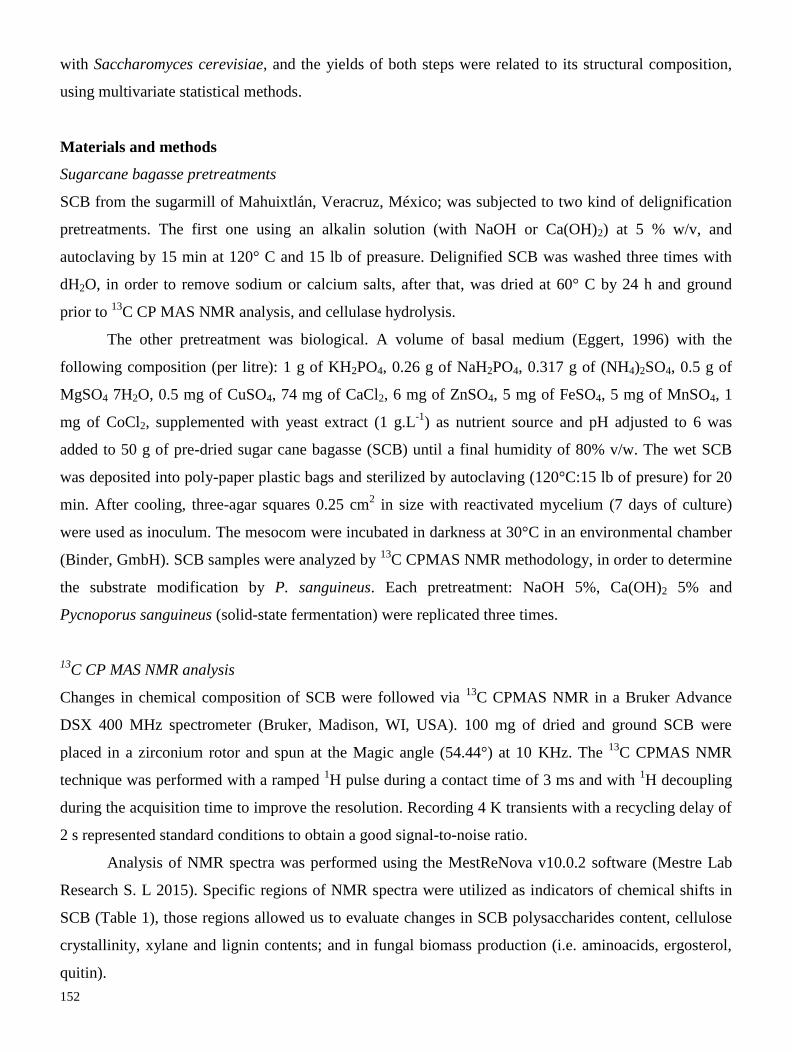
152
with Saccharomyces cerevisiae, and the yields of both steps were related to its structural composition,
using multivariate statistical methods.
Materials and methods
Sugarcane bagasse pretreatments
SCB from the sugarmill of Mahuixtlán, Veracruz, México; was subjected to two kind of delignification
pretreatments. The first one using an alkalin solution (with NaOH or Ca(OH)2) at 5 % w/v, and
autoclaving by 15 min at 120° C and 15 lb of preasure. Delignified SCB was washed three times with
dH2O, in order to remove sodium or calcium salts, after that, was dried at 60° C by 24 h and ground
prior to 13
C CP MAS NMR analysis, and cellulase hydrolysis.
The other pretreatment was biological. A volume of basal medium (Eggert, 1996) with the
following composition (per litre): 1 g of KH2PO4, 0.26 g of NaH2PO4, 0.317 g of (NH4)2SO4, 0.5 g of
MgSO4 7H2O, 0.5 mg of CuSO4, 74 mg of CaCl2, 6 mg of ZnSO4, 5 mg of FeSO4, 5 mg of MnSO4, 1
mg of CoCl2, supplemented with yeast extract (1 g.L-1
) as nutrient source and pH adjusted to 6 was
added to 50 g of pre-dried sugar cane bagasse (SCB) until a final humidity of 80% v/w. The wet SCB
was deposited into poly-paper plastic bags and sterilized by autoclaving (120°C:15 lb of presure) for 20
min. After cooling, three-agar squares 0.25 cm2 in size with reactivated mycelium (7 days of culture)
were used as inoculum. The mesocom were incubated in darkness at 30°C in an environmental chamber
(Binder, GmbH). SCB samples were analyzed by 13
C CPMAS NMR methodology, in order to determine
the substrate modification by P. sanguineus. Each pretreatment: NaOH 5%, Ca(OH)2 5% and
Pycnoporus sanguineus (solid-state fermentation) were replicated three times.
13C CP MAS NMR analysis
Changes in chemical composition of SCB were followed via 13
C CPMAS NMR in a Bruker Advance
DSX 400 MHz spectrometer (Bruker, Madison, WI, USA). 100 mg of dried and ground SCB were
placed in a zirconium rotor and spun at the Magic angle (54.44°) at 10 KHz. The 13
C CPMAS NMR
technique was performed with a ramped 1H pulse during a contact time of 3 ms and with
1H decoupling
during the acquisition time to improve the resolution. Recording 4 K transients with a recycling delay of
2 s represented standard conditions to obtain a good signal-to-noise ratio.
Analysis of NMR spectra was performed using the MestReNova v10.0.2 software (Mestre Lab
Research S. L 2015). Specific regions of NMR spectra were utilized as indicators of chemical shifts in
SCB (Table 1), those regions allowed us to evaluate changes in SCB polysaccharides content, cellulose
crystallinity, xylane and lignin contents; and in fungal biomass production (i.e. aminoacids, ergosterol,
quitin).
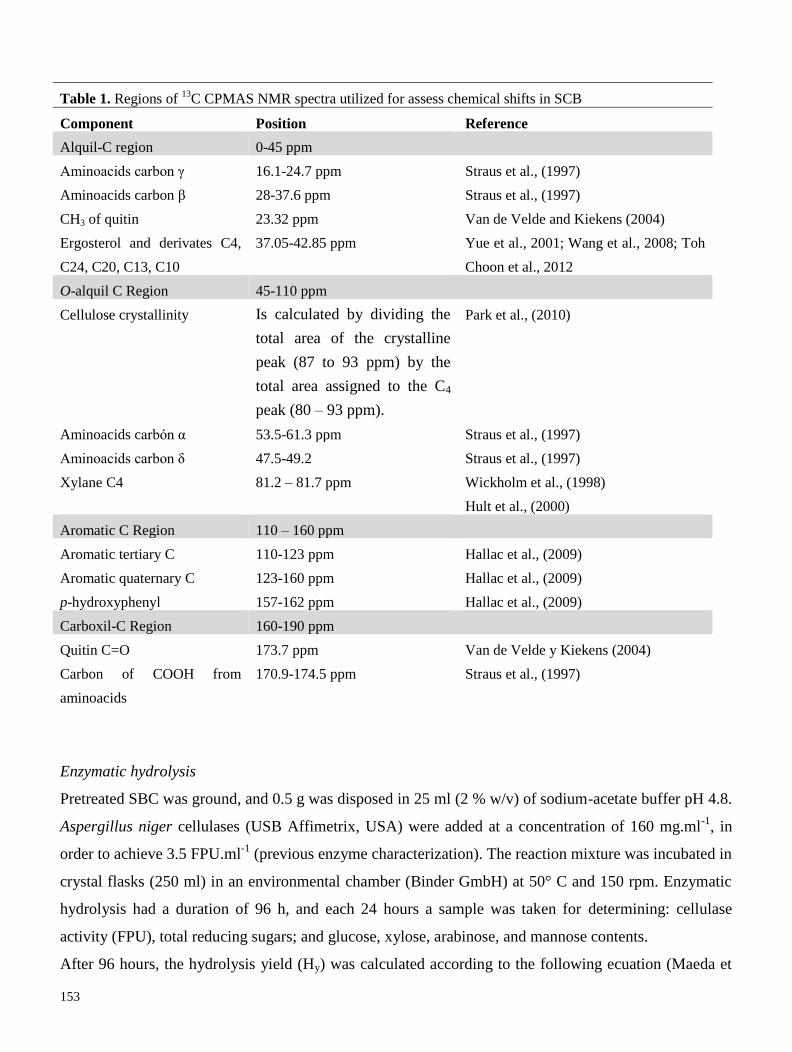
153
Enzymatic hydrolysis
Pretreated SBC was ground, and 0.5 g was disposed in 25 ml (2 % w/v) of sodium-acetate buffer pH 4.8.
Aspergillus niger cellulases (USB Affimetrix, USA) were added at a concentration of 160 mg.ml-1
, in
order to achieve 3.5 FPU.ml-1
(previous enzyme characterization). The reaction mixture was incubated in
crystal flasks (250 ml) in an environmental chamber (Binder GmbH) at 50° C and 150 rpm. Enzymatic
hydrolysis had a duration of 96 h, and each 24 hours a sample was taken for determining: cellulase
activity (FPU), total reducing sugars; and glucose, xylose, arabinose, and mannose contents.
After 96 hours, the hydrolysis yield (Hy) was calculated according to the following ecuation (Maeda et
Table 1. Regions of 13
C CPMAS NMR spectra utilized for assess chemical shifts in SCB
Component Position Reference
Alquil-C region 0-45 ppm
Aminoacids carbon γ 16.1-24.7 ppm Straus et al., (1997)
Aminoacids carbon β 28-37.6 ppm Straus et al., (1997)
CH3 of quitin 23.32 ppm Van de Velde and Kiekens (2004)
Ergosterol and derivates C4,
C24, C20, C13, C10
37.05-42.85 ppm Yue et al., 2001; Wang et al., 2008; Toh
Choon et al., 2012
O-alquil C Region 45-110 ppm
Cellulose crystallinity Is calculated by dividing the
total area of the crystalline
peak (87 to 93 ppm) by the
total area assigned to the C4
peak (80 – 93 ppm).
Park et al., (2010)
Aminoacids carbón α 53.5-61.3 ppm Straus et al., (1997)
Aminoacids carbon δ 47.5-49.2 Straus et al., (1997)
Xylane C4 81.2 – 81.7 ppm Wickholm et al., (1998)
Hult et al., (2000)
Aromatic C Region 110 – 160 ppm
Aromatic tertiary C 110-123 ppm Hallac et al., (2009)
Aromatic quaternary C 123-160 ppm Hallac et al., (2009)
p-hydroxyphenyl 157-162 ppm Hallac et al., (2009)
Carboxil-C Region 160-190 ppm
Quitin C=O 173.7 ppm Van de Velde y Kiekens (2004)
Carbon of COOH from
aminoacids
170.9-174.5 ppm Straus et al., (1997)
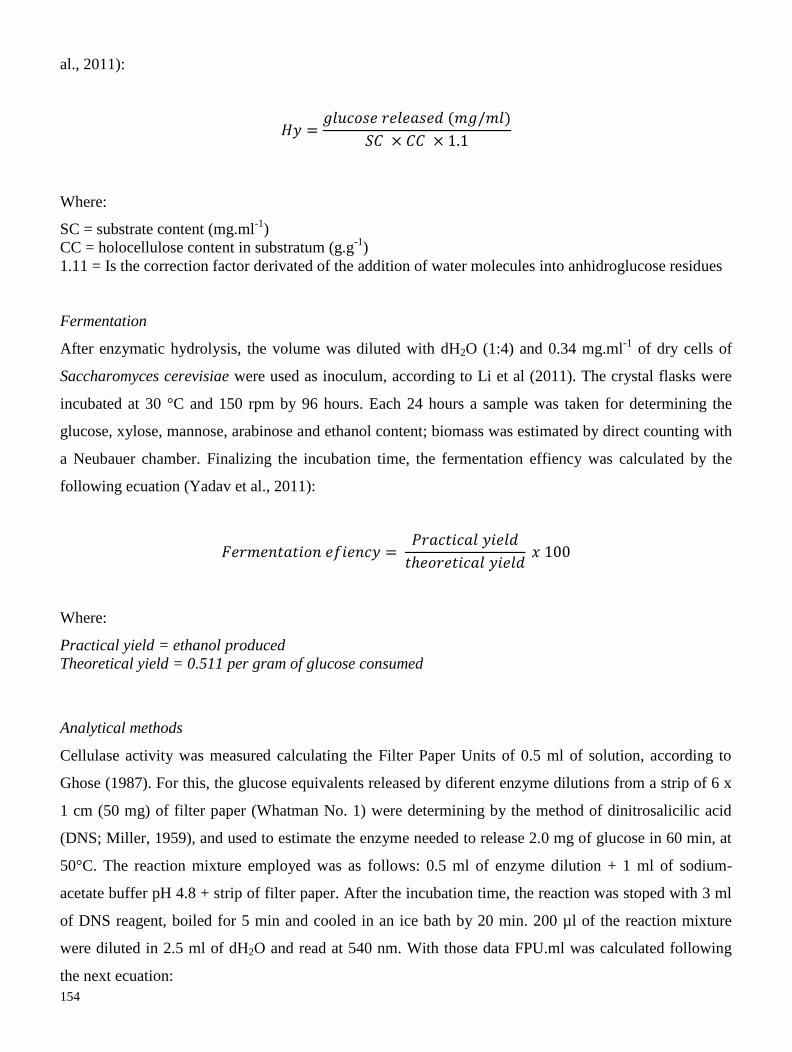
154
al., 2011):
𝐻𝑦 =𝑔𝑙𝑢𝑐𝑜𝑠𝑒 𝑟𝑒𝑙𝑒𝑎𝑠𝑒𝑑 (𝑚𝑔/𝑚𝑙)
𝑆𝐶 × 𝐶𝐶 × 1.1
Where:
SC = substrate content (mg.ml-1
)
CC = holocellulose content in substratum (g.g-1
)
1.11 = Is the correction factor derivated of the addition of water molecules into anhidroglucose residues
Fermentation
After enzymatic hydrolysis, the volume was diluted with dH2O (1:4) and 0.34 mg.ml-1
of dry cells of
Saccharomyces cerevisiae were used as inoculum, according to Li et al (2011). The crystal flasks were
incubated at 30 °C and 150 rpm by 96 hours. Each 24 hours a sample was taken for determining the
glucose, xylose, mannose, arabinose and ethanol content; biomass was estimated by direct counting with
a Neubauer chamber. Finalizing the incubation time, the fermentation effiency was calculated by the
following ecuation (Yadav et al., 2011):
𝐹𝑒𝑟𝑚𝑒𝑛𝑡𝑎𝑡𝑖𝑜𝑛 𝑒𝑓𝑖𝑒𝑛𝑐𝑦 = 𝑃𝑟𝑎𝑐𝑡𝑖𝑐𝑎𝑙 𝑦𝑖𝑒𝑙𝑑
𝑡ℎ𝑒𝑜𝑟𝑒𝑡𝑖𝑐𝑎𝑙 𝑦𝑖𝑒𝑙𝑑 𝑥 100
Where:
Practical yield = ethanol produced
Theoretical yield = 0.511 per gram of glucose consumed
Analytical methods
Cellulase activity was measured calculating the Filter Paper Units of 0.5 ml of solution, according to
Ghose (1987). For this, the glucose equivalents released by diferent enzyme dilutions from a strip of 6 x
1 cm (50 mg) of filter paper (Whatman No. 1) were determining by the method of dinitrosalicilic acid
(DNS; Miller, 1959), and used to estimate the enzyme needed to release 2.0 mg of glucose in 60 min, at
50°C. The reaction mixture employed was as follows: 0.5 ml of enzyme dilution + 1 ml of sodium-
acetate buffer pH 4.8 + strip of filter paper. After the incubation time, the reaction was stoped with 3 ml
of DNS reagent, boiled for 5 min and cooled in an ice bath by 20 min. 200 µl of the reaction mixture
were diluted in 2.5 ml of dH2O and read at 540 nm. With those data FPU.ml was calculated following
the next ecuation:
155
𝐹𝑃𝑈 = 0.37
𝐸𝑛𝑧𝑦𝑚𝑒 𝑐𝑜𝑛𝑐𝑒𝑛𝑡𝑟𝑎𝑡𝑖𝑜𝑛 𝑡𝑜 𝑟𝑒𝑙𝑒𝑎𝑠𝑒 2.0 𝑚𝑔 𝑜𝑓 𝑔𝑙𝑢𝑐𝑜𝑠𝑒𝑢𝑛𝑖𝑡𝑠. 𝑚𝑙
Monomeric sugars, i.e. glucose, xylose, arabinose, mannose and ethanol, were quantified using High
Performance Liquid Chromatography (Aliance Waters e2695), with a column HPX-87H Aminex
BioRad, at 40° C and with a flux of 0.8 ml.min-1
.
Statistical analysis
The data matrix of chemical composition of the different SCB submitted to the different pretreatments
used, was analysed with the data of the hydrolysis products and yield, and with the data of the
fermentation products; using a Canonical Correspondence Analysis (CCA), where the qualitative
variables were the different pretreatments used. This analysis allowed us to found relations between the
chemical composition of SCB obtained from 13
C CPMAS NMR, and the products obtained in the
downstream process.
Results
Chemical shifts in SCB submitted to different pretreatments
The chemical composition of the SCB changed after chemical and biological pretreatments. O-alkyl C
signal, corresponds to the carbohydrate (i.e. holocellulose) content of SCB; this signal indicates, that the
original composition of SCB have 79.76% of holocellulose, and after an alkalin pretreatment with NaOH
the proportion increases to 88.86%, and to 84.13% when Ca(OH)2 was used. Contrary, the biological
pretreatment decreases the amount of holocellulose to 50.65%. Aromatic C region, which corresponds to
lignin, had an original proportion of 12.87%, and the pretreatments decreses this value as follows:
Ca(OH)2 to 10.26%, NaOH to 7.03% and P. sanguineus to 6.53%. The value of the regions Carboxyl C
and Alkyl C, are associated with proteins and lipids (Table 1), and these values were very low in the
original composition of SCB: 3.57% and 2.45%, respectively. Alkalin pretreatments disminish the
amount of Carboxyl C to 1.48% (NaOH) and 1.60% (Ca(OH)2), and in general, did not affected Alkyl C
region. In the other hand, the pretreatment with P. sanguineus strongly increases both regions, Carboxyl
C increases until 9.31%, and Alkyl C until 33.49% (Figure 1a).
Signals corresponding to Cα, Cβ and Cδ of aminoacids, increased in the treatments with P.
sanguineus from 5.61% to 18.38%, as well as signals from chitin and Cγ of aminoacids, from 3.47% to
8.49%; alkalin treatments diminish or did not changed those signals (Figure 1b). Ergosterol signal was
156
near to 0 in the original composition of SCB, and remained in the same way after alkalin pretreatments.
However, when P. sanguineus was employed, ergosterol increased from 0.24% to 4.33%.
The proportion of amorphous cellulose and crystalline cellulose, estimated by the signal position of the
C4 of pyrano-glucose (Figure 1c), indicates that SCB has an original crystallinity index (CI) of 0.29.
This value, changed a little according to the pretreatments employed: SCB pretreated with NaOH
increased its CI to 0.32; decreased to 0.27 when Ca(OH)2 was used, and remained unchanged in P.
sanguineus pretreatment. Finally, the signals of aromaric carbons decreased in all treatments, been P.
sanguineus the treatment that reached the highest decrease of aromatic carbons, near followed by SCB
pretreated with NaOH, and third, the SCB pretreated with Ca(OH)2.
157
Figure 1. Chemical composition of SCB after an alkalin or biological pretreatment. a) Major components of NMR spectra, related to the
presence of organic macromolecules (i.e. lipids, proteins, carbohydrates and aromatic compounds). b) changes in signals associated to the
development of the fungal biomass, i.e. aminoacids, chitin and ergosterol. c) Changes in C4 of glucose and xylose, which can be associated
to an increase or decrease of crystalline/amorphous cellulose, and xylene. d) Changes in the carbon composition of lignin.
Hydrolysis step
Cellulase activity decreases rapidly in the first 24 hours, in all treatments; meanwhile, total sugars
content increases in these 24 hours, and after that remained almost unchanged (Figure 2). The area under
the curve of the FPU activities, showed that when SCB pretreated with P. sanguineus (99.21 FPU in 96
h) and NaOH (115 total FPU in 96 h) were hydrolized, the enzymatic stability was higher. Contrary, less
FPU activity was registred in treatments with SCB pretreated with Ca(OH)2 (56.91 total FPU in 96 h)
and SCB no-treated (57.33 total FPU in 96 hours).
Figure 2. Cellulase (FPU.ml-1) kinetics in 96 h SCB hydrolysis (right Y axis). In color, kinetics of reducing sugars content (mg.ml-1) (Left
Y axis). Middle points indicates average values, and bars the standard error, n = 3.
Figure 3. Glucose (mg.ml-1) kinetics production during enzymatic hydrolysis (96 h). Middle points indicates average values, and bars the
158
standard error, n = 3.
Similar to total reducing sugars release, glucose production was faster in the first 24 h of hydrolysis.
SCB pretreated with P. sanguineus produced the highest amount of glucose (29.76 ± 2.2 mg.ml-1
),
followed by SCB pretreated with Ca(OH)2 (28.19 ± 0.45 mg.ml-1
), NaOH (23.84 ± 2.0 mg.ml-1
), and
finally, the no-treated SCB (9.95 ± 15.93 mg.ml-1
) (Figure 3). Saccharose content, decreases slightly
during the SCB hydrolysis in all treatments (Figure 4); reaching a final concentration of 4.38 ± 0.36
mg.ml-1
, 4.26 ± 0.4 mg.ml-1
, 3.66 ± 0.3 mg.ml-1
and 1.48 ± 2.4 mg.ml-1
; when SCB pretreated with
Ca(OH)2, P. sanguineus, NaOH and no-treated were used, respectively (Figure 4).
Figure 4. Saccharose (mg.ml-1) content during enzymatic hydrolysis (96 h). Middle points indicates average values, and bars the standard
error, n = 3.
With data of glucose production, and the holocellulose initial content, we estimated the hydrolysis yield.
Thus, the highest hydrolysis yield was achieved in the treatments when SCB pretreated with P.
sanguineus, followed by the SCB pretreated with Ca(OH)2, NaOH and finally, the no-treated SCB.
Fermentation step
In the fermentation step, the hydrolyzate was diluted 1:6 with dH2O, the differences in the hydrolysis
yield provoked differences in the initial glucose content of the fermentation cultures (Figure 5). Glucose
decreased near to 0 mg.ml-1
in all treatments, after 48 h of culturing with S. cerevisiae; menwhile,
saccharose was metabolized slower (Figure 6). On the other hand, S. cerevisiae biomass (Figure 8) and
ethanol, increased until 96 h, the hydrolizate of SCB pretreated with NaOH (3.26 ± 0.3 mg-ml-1
) and P.
sanguineus (2.99 ± 0.2 mg.ml-1
), were those who produced more ethanol; followed by no-treated (2.11 ±
0.8 mg.ml-1
) and Ca(OH)2 (1.50 ± 0.3 mg.ml-1
) (Figure 7).
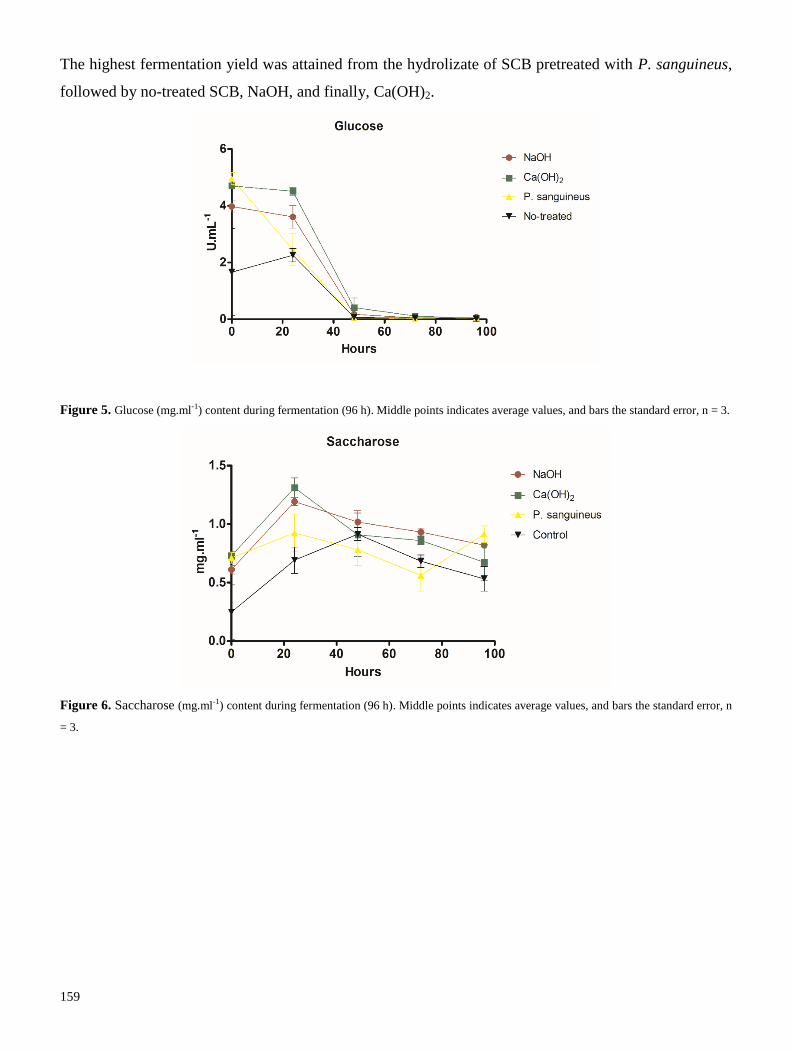
159
The highest fermentation yield was attained from the hydrolizate of SCB pretreated with P. sanguineus,
followed by no-treated SCB, NaOH, and finally, Ca(OH)2.
Figure 5. Glucose (mg.ml-1) content during fermentation (96 h). Middle points indicates average values, and bars the standard error, n = 3.
Figure 6. Saccharose (mg.ml-1) content during fermentation (96 h). Middle points indicates average values, and bars the standard error, n
= 3.
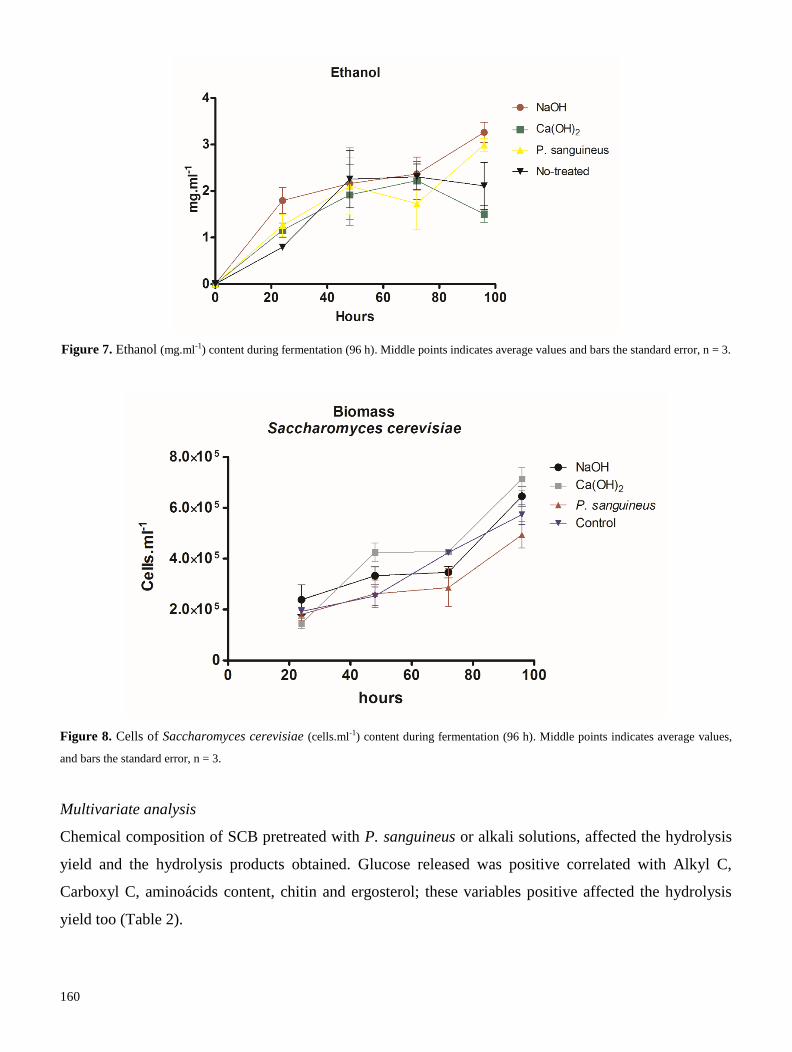
160
Figure 7. Ethanol (mg.ml-1) content during fermentation (96 h). Middle points indicates average values and bars the standard error, n = 3.
Figure 8. Cells of Saccharomyces cerevisiae (cells.ml-1) content during fermentation (96 h). Middle points indicates average values,
and bars the standard error, n = 3.
Multivariate analysis
Chemical composition of SCB pretreated with P. sanguineus or alkali solutions, affected the hydrolysis
yield and the hydrolysis products obtained. Glucose released was positive correlated with Alkyl C,
Carboxyl C, aminoácids content, chitin and ergosterol; these variables positive affected the hydrolysis
yield too (Table 2).
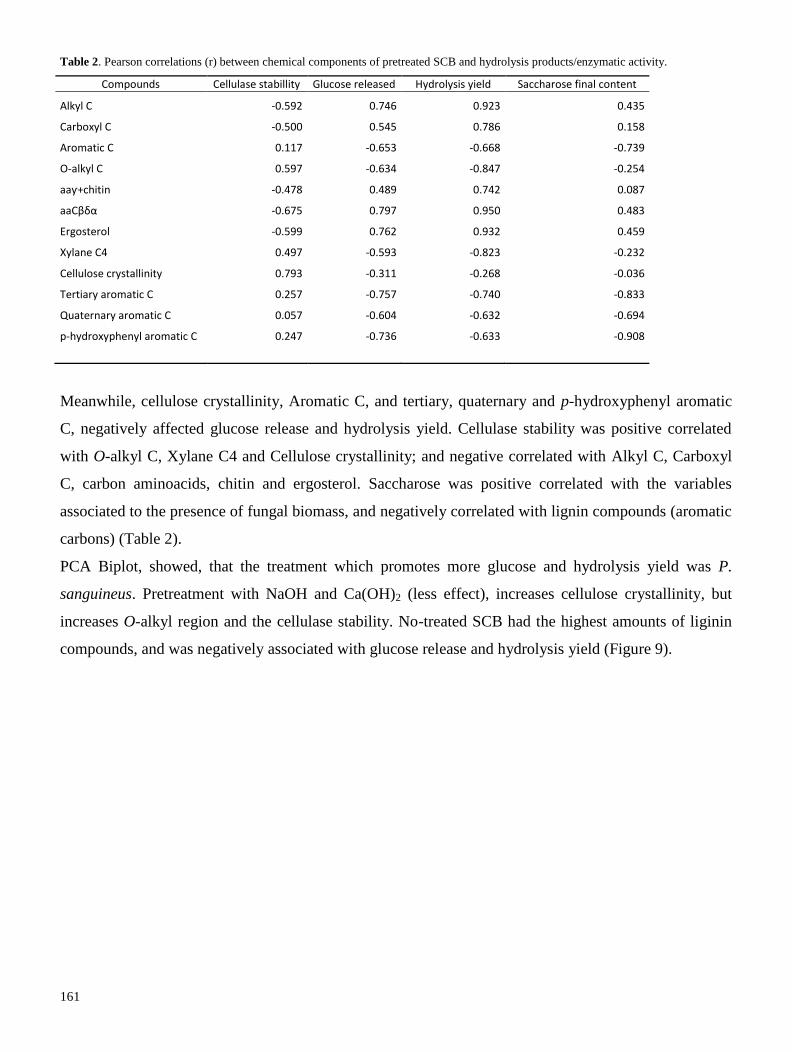
161
Table 2. Pearson correlations (r) between chemical components of pretreated SCB and hydrolysis products/enzymatic activity.
Compounds Cellulase stabillity Glucose released Hydrolysis yield Saccharose final content
Alkyl C -0.592 0.746 0.923 0.435
Carboxyl C -0.500 0.545 0.786 0.158
Aromatic C 0.117 -0.653 -0.668 -0.739
O-alkyl C 0.597 -0.634 -0.847 -0.254
aaƴ+chitin -0.478 0.489 0.742 0.087
aaCβδα -0.675 0.797 0.950 0.483
Ergosterol -0.599 0.762 0.932 0.459
Xylane C4 0.497 -0.593 -0.823 -0.232
Cellulose crystallinity 0.793 -0.311 -0.268 -0.036
Tertiary aromatic C 0.257 -0.757 -0.740 -0.833
Quaternary aromatic C 0.057 -0.604 -0.632 -0.694
p-hydroxyphenyl aromatic C 0.247 -0.736 -0.633 -0.908
Meanwhile, cellulose crystallinity, Aromatic C, and tertiary, quaternary and p-hydroxyphenyl aromatic
C, negatively affected glucose release and hydrolysis yield. Cellulase stability was positive correlated
with O-alkyl C, Xylane C4 and Cellulose crystallinity; and negative correlated with Alkyl C, Carboxyl
C, carbon aminoacids, chitin and ergosterol. Saccharose was positive correlated with the variables
associated to the presence of fungal biomass, and negatively correlated with lignin compounds (aromatic
carbons) (Table 2).
PCA Biplot, showed, that the treatment which promotes more glucose and hydrolysis yield was P.
sanguineus. Pretreatment with NaOH and Ca(OH)2 (less effect), increases cellulose crystallinity, but
increases O-alkyl region and the cellulase stability. No-treated SCB had the highest amounts of liginin
compounds, and was negatively associated with glucose release and hydrolysis yield (Figure 9).
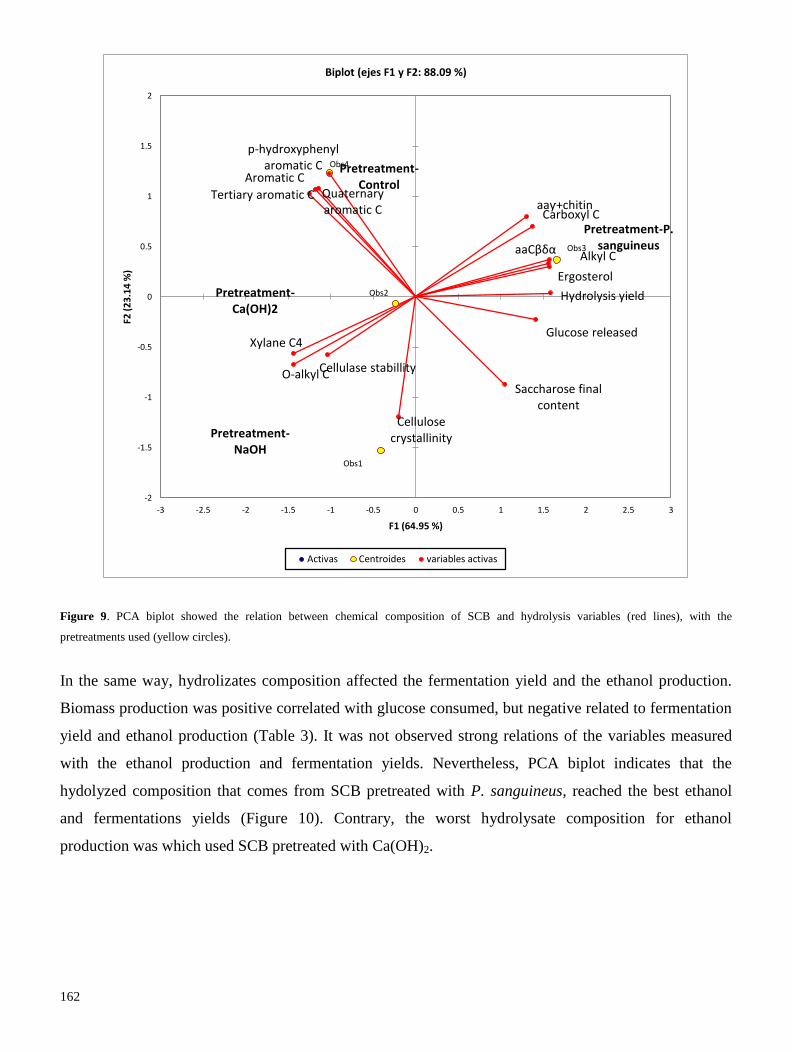
162
Figure 9. PCA biplot showed the relation between chemical composition of SCB and hydrolysis variables (red lines), with the
pretreatments used (yellow circles).
In the same way, hydrolizates composition affected the fermentation yield and the ethanol production.
Biomass production was positive correlated with glucose consumed, but negative related to fermentation
yield and ethanol production (Table 3). It was not observed strong relations of the variables measured
with the ethanol production and fermentation yields. Nevertheless, PCA biplot indicates that the
hydolyzed composition that comes from SCB pretreated with P. sanguineus, reached the best ethanol
and fermentations yields (Figure 10). Contrary, the worst hydrolysate composition for ethanol
production was which used SCB pretreated with Ca(OH)2.
Obs1
Obs2
Obs3
Obs4
Pretreatment-NaOH
Pretreatment-Ca(OH)2
Pretreatment-P. sanguineus
Pretreatment-Control
Alkyl C
Carboxyl C
Aromatic C
O-alkyl C
aaƴ+chitin
aaCβδα
Ergosterol
Xylane C4
Cellulose crystallinity
Tertiary aromatic C Quaternary aromatic C
p-hydroxyphenyl aromatic C
Cellulase stabillity
Glucose released
Hydrolysis yield
Saccharose final content
-2
-1.5
-1
-0.5
0
0.5
1
1.5
2
-3 -2.5 -2 -1.5 -1 -0.5 0 0.5 1 1.5 2 2.5 3
F2 (
23
.14
%)
F1 (64.95 %)
Biplot (ejes F1 y F2: 88.09 %)
Activas Centroides variables activas
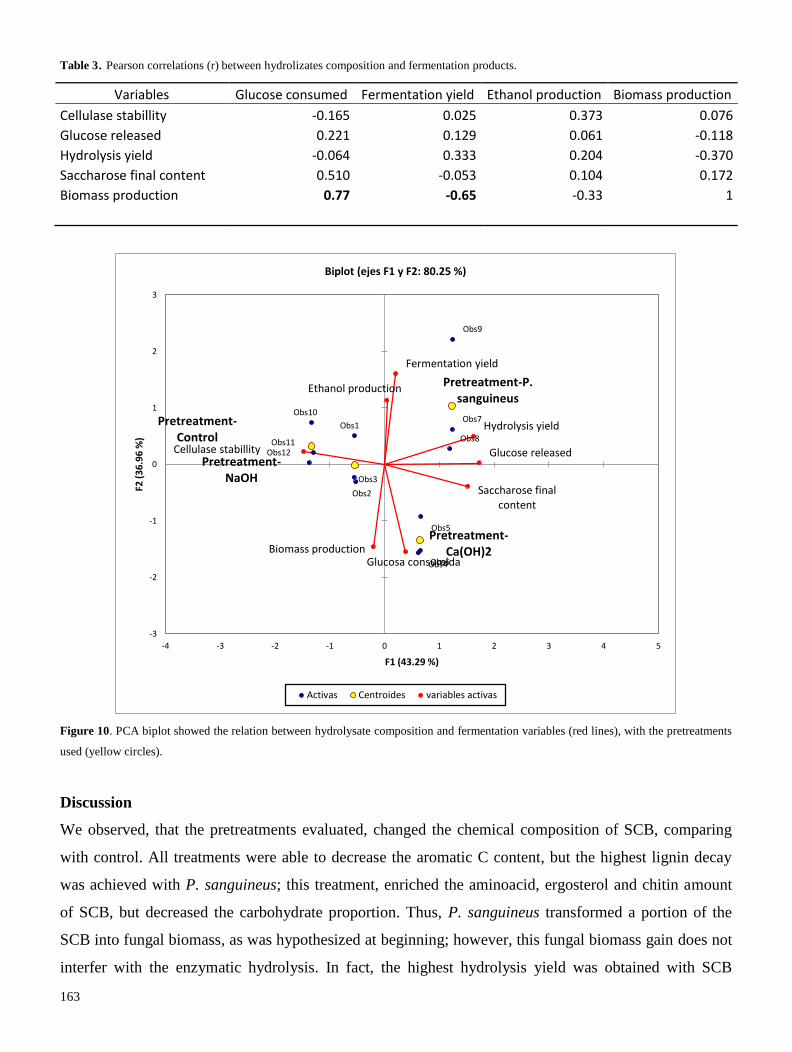
163
Table 3. Pearson correlations (r) between hydrolizates composition and fermentation products.
Variables Glucose consumed Fermentation yield Ethanol production Biomass production
Cellulase stabillity -0.165 0.025 0.373 0.076
Glucose released 0.221 0.129 0.061 -0.118
Hydrolysis yield -0.064 0.333 0.204 -0.370
Saccharose final content 0.510 -0.053 0.104 0.172
Biomass production 0.77 -0.65 -0.33 1
Figure 10. PCA biplot showed the relation between hydrolysate composition and fermentation variables (red lines), with the pretreatments
used (yellow circles).
Discussion
We observed, that the pretreatments evaluated, changed the chemical composition of SCB, comparing
with control. All treatments were able to decrease the aromatic C content, but the highest lignin decay
was achieved with P. sanguineus; this treatment, enriched the aminoacid, ergosterol and chitin amount
of SCB, but decreased the carbohydrate proportion. Thus, P. sanguineus transformed a portion of the
SCB into fungal biomass, as was hypothesized at beginning; however, this fungal biomass gain does not
interfer with the enzymatic hydrolysis. In fact, the highest hydrolysis yield was obtained with SCB
Obs1
Obs2
Obs3
Obs4
Obs5
Obs6
Obs7
Obs8
Obs9
Obs10
Obs11 Obs12
Pretreatment-NaOH
Pretreatment-Ca(OH)2
Pretreatment-P. sanguineus
Pretreatment-Control
Cellulase stabillity Glucose released
Hydrolysis yield
Saccharose final content
Glucosa consumida
Fermentation yield
Ethanol production
Biomass production
-3
-2
-1
0
1
2
3
-4 -3 -2 -1 0 1 2 3 4 5
F2 (
36
.96
%)
F1 (43.29 %)
Biplot (ejes F1 y F2: 80.25 %)
Activas Centroides variables activas
164
pretreated with P. sanguineus.
The effect of proteins or lipids on cellulase catalysis is not well documented, but it is known that some
lipids can act like surfactans, and avoid the absortion of cellulases by cellulose, increasing the hydrolysis
yield (Helle et al., 1993; Eriksson et al., 2002). The same rol can be performed by some proteins, like
bovine serum albumin (Yang and Wyman, 2006). Thus, the enrichment of proteins and ergosterol by P.
sanguineus pretreatment, could be decreasing the cellulase absortion in SCB fibers, and improving the
enzymatic hydrolysis. The decay in aromatic C and O-alkyl C regions in P. sanguineus pretreatments,
are mainly due to the production of laccase and cellulases (data not showed); many authors suggest that
this fungi is a good productor of laccase (Pointing et al., 2000; Vikineswary et al., 2006), and a
remarkable choice for delignification processes (Lomascolo et al., 2011).
According to our PCA analysis, the hydrolysis yield was mainly affected by the aromatic C and xylene
C4 content, which corresponds to lignin and hemicellulose content; this was previously reported (Hall et
al., 2010). Cellulose crystallinity index (CI), was negative related to hydrolysis yield, according to
Mussato et al., (2008); the pretreatment with NaOH increases CI, which is related to their lower
hydrolysis, compared with SCB pretreated with P. sanguineus.
Fermentation performance of the hyzdrolyzates was affected by the SCB pretreatment, and in the same
way that enzymatic hydrolysis, SCB pretreated with P. sanguineus had the highest fermentation yield,
and the second highest production of ethanol. We found a negative relation between Saccharomyces
cerevisiae biomass, and ethanol production; since hydrolizates of SCB pretreated with Ca(OH)2
produced the highest biomass content, but low ethanol production.
The negative effect of the hydrolyzates pretreated with P. sanguineus over S. cerevisiae biomass, could
be related to some secondary metabolite produced by the fungi in the pretreatment. Cinnabarin and
poliporin, produced by P. sanguineus, have antimicrobial properties (Smânia et al., 1997; Rosa et al.,
2003); however, non-antifungal metabolites have been reported from this fungus. In fact, the hydrolized
of SCB pretreated with P. sanguineus do not completely inhibit the S. cerevisiae growth, but induce the
cumpling of the cells. This interesting phenomenum should be further studied.
Thus, examining the effect of alkalin and biological pretreatments on the downstream process, we
conclude, that the use of P. sanguineus is preferable to the use of NaOH or Ca(OH)2 when the aim is to
produce ethanol, because provoke a higher hydrolysis and fermentations yields than alkali treatments.
Further studies will focus on the effect of ergosterol and fungal proteins on cellulase catalysis, and the
use of other fungi for SCB pretreatment.
165
Conclusion
Alkali and biological pretreatments were able to decrease aromatic C, but biological pretreatment
converted a portion of O-alkyl C into fungal biomass (alkyl C and Carboxyl C). The ergosterol and
protein gained in SCB fibers by P. sanguineus pretreatment, could be a positive factor to enhance
hydrolysis yield. The hydrolyzates of SCB pretreated with fungi, have better fermentation yield that
hydrolyzates from SCB pretreated with alkali.
References
Alarcón-Gutiérrez E, Floch C, Augur C, Le Petit J, Ziarelli F, Criquet S. 2009. Spatial variations of
chemical composition, microbial functional diversity, and enzyme activities in a Mediterranean litter
(Quercus ilex L.) profile. Pedobiologia 52: 387-399.
Bahar H, Vu-Manh H and Bechtold T. 2009. Interation of cellulose with alkali metal ions complexed
heavy metals. Lenzinger Berichte 87: 142-150.
Cardona CA, Quintero JA, Paz IC. 2010. Production of bioethanol from sugarcane bagasse: Status and
perspective. Bioresource Technology 101(13): 4754-4766. doi:10.1016/j.biortech.2009.10.097
Eggert C, Temp U, Dean JFD, Eriksson KEL. 1996. A fungal metabolite mediates degradation of non-
phenolic lignin structures and synthetic lignin by laccase. FEBS letters 391(1-2): 144-148
Eriksson T, Börjesson J, Tjemeld F. 2002. Mechanism of surfactant effect in enzymatic hydrolysis of
lignocellulose. Enzyme and Microbial Technology 31(3): 353-364.
Friĉová O and Koval’aková M. 2013. Solid-State 13
C CP MAS NMR Spectroscopy as a tool for
detection of (1 → 3, 1 → 6)-β-D-Glucan in products prepared from Pleurotus ostreatus. ISRN
Analytical Chemistry 2013, Article ID 248164,4 pages http://dx.doi.org/10.1155/2013/248164
Ghose TK. 1987. Measurement of cellulase activities. Pure & Appl Chem. 59(2): 257-268.
Hall M, Bansal P, Lee JH, Realff MJ, Bommarius AS. 2010. Cellulose crystallinity – a key predictor of
the enzymatic hydrolysis rate. FEBS Journal 277(2010): 1571-1582.
Hallac BB, Sannigrahi P, Pu Y, Ray M, Murphy RJ, Ragauskas AJ. 2009. Biomass characterization of
Buddleja davidii: A potential feedstock for biofuel production. Journal of Agricultural and Food
chemistry 57: 1275-1281
Helle S, Duff SJB, Cooper DG. 1993. Effect of surfactans on cellulose hydrolysis. Biotechnology and
Bioengineering 42(5): 611-617.
Li Y, Park J, Shiroma R, Tokuyasu K. 2011. Bioethanol production from rice straw by a sequencial use
of Saccharomyces cerevisiae and Pichia stipitis with heat inactivation of Saccharomyces cerevisiae cells
prior to xylose fermentation. Journal of Bioscience and Bioengineering 111(6): 682-686.
166
Liitiä T, Maunu SL, Sipilä J, Hortling B. 2002. Application of solid-state 13
C NMR Spectroscopy and
dipolar dephasing technique to determine the extent of condensation in technical lignins. Solid state
nuclear magnetic resonance 21(3-4): 171-186
Lomascolo A, Uzan-Boukhris, Herpoël-Gimbert I, Sigoillot J-C, Lesage-Meessen L. 2011. Peculiarities
of Pycnoporus species for applications in biotechnology. Appl Microbiol Biotechnol 92: 1129-1149
Maeda RN, Serpa VI, Lima VA, Alves RA, Melo LM, Machado A, Driemeier CE, Pereira N, Polikarpov
I. 2011. Enzymatic hydrolysis of pretreated sugarcane bagasse using Penicillium funiculosum and
Trichoderma harzianum cellulases. Process Biochemistry 46: 1196-1201.
Maryana R, Ma’rifatun D, Wheni A, Satriyo KW, Angga W. 2014. Alkaline pretreatment on sugarcane
bagasse for bioethanol production. Conference and exhibition indonesia renewable energy and energy
conservation. Energy Procedia 47: 250-254.
Maunu SL. 2002. NMR studies of wood and wood products. Progress in nuclear magnetic resonance
spectroscopy 40: 151-174.
Miller GL. 1959. Use of dinitrosalicylic acid reagent for determination of reducing sugars. Analytical
chemistry 31(3): 426-428.
Mussato SI, Fernandes M, Milagres AMF, Roberto IC. 2008. Effect of hemicellulose and lignin on
enzymatic hydrolysis of cellulose from brewer’s spent grain. Enzyme and Microbial Technology 43(2):
124-129 doi:10.1016/j.enzmictec.2007.11.006
Nazarpour F, Abdullah DK, Abdullah N, Zamiri R. 2013. Evaluation of biological pretreatment of
rubberwood with white rot fungi for enzymatic hydrolysis. Materials 2013(6): 2059-2073
doi:10.3390/ma6052059
Park S, Baker JO, Himmel ME, Parrilla PA, Johnson DK. 2010. Cellulose crystallinity index:
measurement techniques and their impact on interpreting cellulase performance. Biotechnology for
biofuels 3:10 http://www.biotechnologyforbiofuels.com/content/3/1/10
Pointing SB, Jones EBG, Vrijmoed LLP. 2000. Optimization of laccase production by Pycnoporus
sanguineus in submerged liquid culture. Mycologia 92(1): 139-144.
Rosa LH, Gomes KM, Jacob CC, Capelari M, Rosa CA, Zani CL. 2003. Screening of Brazilian
basidiomycetes for antimicrobial activity. Mem Inst Oswaldo Cruz, Rio de Janeiro 98(7): 967-974.
Smânia EFA, Smânia A, Loguercio-Leite C, Gil ML. 1997. Optimal parameter for cinnabarin synthesis
by Pycnoporus sanguineus. J. Chem. Tec. Biotechnol. 70: 57-59.
Straus SK, Bremi T, Ernst RR. 1997. Side-chain conformation and dynamics in a solid peptide: CP-
MAS NMR study of valine rotamers and methyl-group relaxation in fully 13
C-labelled antamanide.
Journal of Biomolecular NMR 10(1997): 119-128.
Sun Y and Cheng J. 2002. Hydrolisis of lignocellulosic materials for ethanol production: a review.
167
Bioresource Technology 83: 1-11.
Terashima N, Atalla RH, Vanderhart DL. 1997. Solid state NMR spectroscopy of specifically 13
C-
enriched lignin in wheat straw from coniferin. Phytochemistry 46(5): 863-870.
Toh Choon RL, Sariah M, Siti Mariam MN. 2012. Ergosterol from the soil borne fungus Ganoderma
boninense. Journal of Basic Microbiology 52: 608-612.
Van de Velde K and Kiekens P. 2004. Structure analysis and degree of substitution of chitin, chitosan
and dibytylchitin by FT-IR spectroscopy and solid state 13
C NMR. Carbohydrate polymers 58: 409-416.
Van Soest PJ and Wine RH. 1968. Determination of lignin and cellulose in acid-detergent fiber with
permanganate. Journal of the association of official analytical chemist 1968(51): 780-785.
Yadav KS, Naseeruddin S, Prashanthi GS, Sateesh L, Rao LV. Bioethanol fermentation of concentrated
rice straw hydrolysate using co-culture of Saccharomyces cerevisiae and Pichia stipitis. Bioresource
Technology 102: 6473-7478.
Yang B and Wyman CE. 2006. BSA treatment to enhance enzymatic hydrolysis of cellulose in lignin
cotantain substrates. Biotechnology and Bioengineering 94(4): 611-617.
Yemis O and Mazza G. 2011. Acid-catalyzed conversión of xylose, xylan and straw into furfural by
microwave-assisted reaction. Bioresource Technology 102: 7371-7378.
Yue JM, Chen SN, Lin ZW, Sun HD. 2001. Sterols from the fungus Lactarium volemus. Phytochemistry
56(2001): 801-806.
Vikineswary S, Adbullah N, Renuvathani M, Sekaran N, Pandey A, Jones EBG. Productivity of laccase
in solid substrate fermentation of selected agro-residues by Pycnoporus sanguineus. Bioresources
Technology 97: 171-177
Wang F, Fang Y, Zhang M, Lin A, Zhu T, Gu Q, Zhu W. 2008. Six new ergosterols from the marine-
derived fungus Rhizopus sp. Steroids 73: 19-26.
Wickholm K, Larsson PT, Iversen T. 1998. Assignment of non-crystalline forms in cellulose I by
CP/MAS 13
C NMR spectroscopy. Carbohydrate Research 312: 123-129.

168
Discusión general
169
Inducción de lacasas para deslignificación biológica de lignina
Debido a la compleja estructura de la pared celular vegetal, se requieren de distintos pretratamientos que
faciliten el acceso de enzimas hidrolíticas a los polímeros de celulosa y hemicelulosa. De acuerdo a la
revisión de la literatura, se identificó que el contenido de lignina y el grado de cristalinidad de la celulosa
son los principales factores que limitan la hidrólisis enzimática de los polisacáridos contenidos en el
bagazo de caña de azúcar (BCA). Por lo tanto, uno de los objetivos propuestos fue diseñar un
pretratamiento biológico utilizando el hongo de pudrición blanca Pycnoporus sanguineus; esto debido a
que este hongo ha sido reportado como un productor de lacasas, enzimas involucradas en la oxidación y
depolimerización de la lignina; e incluso ha sido propuesto para procesos de deslignificación selectiva
(Pointing et al., 2000).
Se eligió trabajar con un pretratamiento biológico, debido a que el uso de pretratamientos químicos a
gran escala ha sido cuestionado, tanto por la cantidad de energía que requieren para trabajar a altas
temperaturas y presiones, como por el uso de agentes peligrosos (ácidos, bases) y de dificil disposición
final. Además, su uso puede provocar la formación de compuestos tóxicos para etapas subsecuentes en el
proceso de producción de bioetanol, como los furfurales (Palmqvist et al., 1999). Sin embargo, para que
un pretratamiento biológico pueda considerarse eficiente, debe disminuir la cantidad de lignina, utilizar
condiciones de bajo costo económico, evitar la pérdida de carbohidratos (celulosa y hemicelulosa) y
utilizar tiempos de retención cortos.
La lignina, al ser un heteropolímero de unidades alquil-fenólicas (Yoshikawa et al., 2013), puede ser
degradada por enzimas del grupo de las polifenol oxidasas, como la lacasa, la Mn-peroxidasa y la lignin-
peroxidasa. Debido a que P. sanguineus no produce Mn-peroxidasas y solo bajas cantidades de lignin-
peroxidasa, el presente estudio se enfocó en estudiar los patrones ecológicos y el uso de inductores para
potencializar la producción de esta enzima, con el objetivo de ser utilizada en procesos eficientes de
deslignificación de BCA.
Las enzimas involucradas en la degradación de la materia orgánica (e.g. celulasas, fosfatasas, proteasas),
son objeto de diversos mecanismos de regulación, de naturaleza fisicoquímica y biológica. Uno de los
estímulos físicos más importantes para los organismos es la luz; este factor, específicamente la luz azul,
se ha asociado con cambios en la producción de enzimas en hongos (Schmoll et al. 2005; 2012). Es por
ello, que el primer factor estudiado en la presente tesis como posible inductor/represor de la producción
de lacasas fue la longitud de onda y la intensidad de la luz. Los resultados obtenidos muestran que P.
sanguineus (cepa nativa de Jalcomulco, Veracruz), cambia su producción de lacasa de acuerdo a
patrones de luminosidad. Encontramos que la luz produce inhibición de la producción de lacasa en este
hongo, y lo hace de acuerdo a un gradiente energético; donde longitudes de onda cortas (de alta energía),
170
que corresponden a la luz azul, inhiben casi completamente la producción de lacasa.
Por otro lado, longitudes de energía media (como luz verde) y en menor medida de baja energía (luz
roja), inhiben solo parcialmente su producción. Es decir, de acuerdo a nuestros resultados, la luz es una
importante fuente de información que reprime la producción de la enzima lacasa en P. sanguineus.
Dentro de nuestro conocimiento, este fue el primer reporte de regulación de esta enzima por luz; sin
embargo, en enero de 2016, un reporte de Janusz et al. (2016), con un diseño experimental muy similar
al aquí utilizado, reportan resultados contrarios, e indican que la luz azul induce la producción de lacasa
en P. sanguineus. La explicación dada por Janusz et al. (2016), es que la inducción de lacasa se debe a
una co-regulación de esta enzima con las enzimas celulasas, las cuales se inducen por un aumento de
AMPc producido por una cascada de señalización dependiente del “White collar system”. Sin embargo,
Janusz y colaboradores no prueban esta hipótesis, y al probar las condiciones de luminosidad en Cerrena
unicolor y Phlebia lindtrien, obtuvieron resultados incongruentes.
La posible regulación de lacasa por el sistema de fotoreceptores asociados al “White collar
system” también es sugerida en este trabajo (Resultados 1.1), ya que los genes de dichos fotoreceptores
para luz azul han sido reportados en diversos grupos de hongos (Rodríguez-Romero et al. 2010) y son
los responsables de la regulación por luz de las celulasas. Sin embargo, creemos que la forma de
regulación por luz de la lacasa, no se encuentra ligada directamente a la producción de celulasas. A
diferencia de Janusz y colaboradores, nuestra hipótesis sugiere que P. sanguineus utiliza la luz azul
como una señal medioambiental que podría indicarle su exposición a ambientes externos, donde no
requiere la producción de lacasa debido a que no existe lignina. Esta conclusión se refuerza con los datos
observados que indican una correlación negativa entre la luminosidad (lx) y la producción de lacasa, y la
inhibición de casi el 100% de su producción en presencia de luz blanca. Además, otros reportes indican
que los compuestos fenólicos de la lignina, poseen una absorbancia entre el ultravioleta y la luz azul
(Jahan y Mun 2007), por lo tanto, sugerimos que la presencia de lignina en la lignocelulosa generaría un
ambiente desprovisto de señales lumínicas de longitud de onda corta y, por lo tanto, la producción de
lacasa es inducida. Contrariamente, cuando el hongo detecta estas longitudes de onda significaría la
ausencia de compuestos que la absorban (lignina), por lo que la producción de lacasa sería inhibida.
Para comprobar esta hipótesis, una de nuestras sugerencias, es probar el efecto de la exposición a luz
sobre los niveles de expresión del gen LAC en diversas especies de hongos por RTq-PCR. De esta
manera, se tendrán más elementos para esclarecer el efecto la luz sobre la producción de esta importante
poli-fenol oxidasa. Es probable que la disparidad de resultados entre el estudio de Janusz y el presente
estudio, se deba a factores metodológicos (medio de cultivo, fuente de luz empleada) o a diferencias
entre las cepas utilizadas (cepa mexicana vs cepa europea); pero para los fines de la presente tesis, la luz
es un inhibidor de la producción de lacasa, por lo que condiciones de oscuridad fueron utilizadas en los
171
pasos subsecuentes de producción de lacasa.
Además de las condiciones físicas como temperatura, luminosidad y humedad, las condiciones químicas
como tipo y cantidad de nutrientes, y/o presencia de algunos xenobióticos puede afectar la producción de
lacasa. De entre estas variables, encontramos que el tipo de nitrógeno disponible posee un rol relevante
en la regulación de esta enzima. Nuestros resultados indican (Resultados 1.2), que cuando una fuente de
nitrógeno simple se encuentra disponible (i.e. urea) la producción de lacasa es reprimida, y al contrario,
una fuente compleja (i.e. extracto de levadura) promueve la producción de lacasa, en P. sanguineus, en
concordancia con lo reportado en Pointing et al, (2000). Cabe mencionar, que ambas fuentes de
nitrógeno (así como ocurrió cuando P. sanguineus fue expuesto a distintas condiciones de luz), producen
la misma cantidad de biomasa, proteína extracelular y similar consumo de glucosa. Estas similitudes
indican que el desarrollo de P. sanguineus en fase micelial no es afectado por alguna condición lumínica
o por el tipo de nitrógeno adicionado al medio. Sin embargo, estas variables si condicionan la
producción de lacasa.
El efecto inductivo del extracto de levadura en P. sanguineus, es atribuido a su cantidad de aminoácidos
(Eugenio et al., 2010), mientras que el efecto represor de la urea se atribuye al mecanismo de represión
catabólica del nitrógeno, el cual dicta que fuentes de nitrógeno simples son consumidas sin la necesidad
de producción de enzimas extracelulares (Lee et al., 2011); de esta manera, existe un ahorro de recursos.
La mayor producción de lacasa observada en presencia de extracto de levadura, y la relación negativa
entre la concentración de urea en el medio y la producción de lacasa, concuerda con lo observado para
otras especies de hongos, como Cryptococcus neoformans (Jiang et al., 2009) y Phaenerochaete
chrysosporium (Qiu et al., 2012), así como cepas de P. sanguineus (Pointing et al., 2000).
Sin embargo, el efecto del tipo y concentración de nitrógeno en el medio puede variar dependiendo el
tipo de cultivo empleado, sea cultivos líquidos (como el aquí utilizado), o cultivos en estado sólido. Se
ha reportado para Pleurotus ostreatus, Lentinula edodes y Agaricus bisporius un incremento en la
producción de lacasa, en estado sólido, cuando urea fue adicionada (D’Agostini et al., 2011). Sin
embargo, este efecto positivo de la urea en cultivos en estado sólido puede atribuirse a otra fuerza
reguladora, la regulación catabólica por carbono. Este tipo de regulación, dicta que cuando fuentes
simples de carbono (e.g. glucosa) se encuentran ausentes, la producción de enzimas extracelulares es
inducida. La lacasa es una enzima involucrada en la degradación de fuentes carbonadas, por lo tanto, la
urea en cultivos en estado sólido no fungiría como un represor, si no como una fuente nutrimental
importante para la producción de enzimas destinadas a degradar la lignocelulosa y obtener fuentes de
carbono.
Observamos también, que la composición de nitrógeno en el medio de cultivo, puede condicionar el
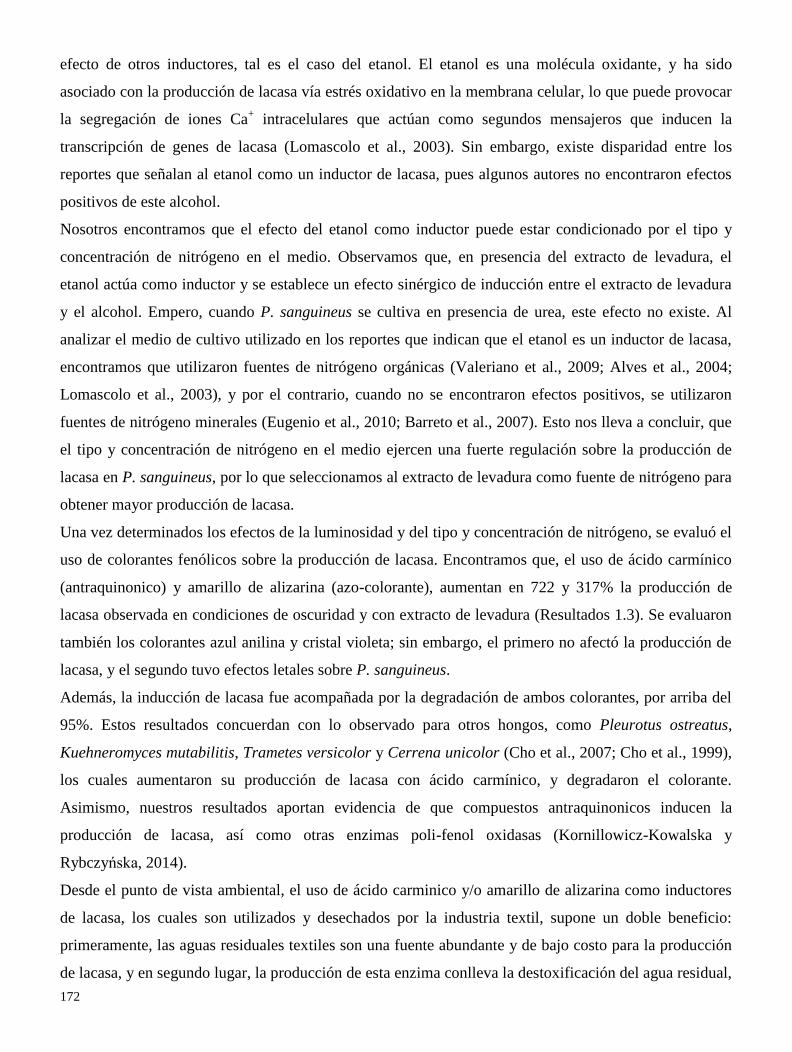
172
efecto de otros inductores, tal es el caso del etanol. El etanol es una molécula oxidante, y ha sido
asociado con la producción de lacasa vía estrés oxidativo en la membrana celular, lo que puede provocar
la segregación de iones Ca+ intracelulares que actúan como segundos mensajeros que inducen la
transcripción de genes de lacasa (Lomascolo et al., 2003). Sin embargo, existe disparidad entre los
reportes que señalan al etanol como un inductor de lacasa, pues algunos autores no encontraron efectos
positivos de este alcohol.
Nosotros encontramos que el efecto del etanol como inductor puede estar condicionado por el tipo y
concentración de nitrógeno en el medio. Observamos que, en presencia del extracto de levadura, el
etanol actúa como inductor y se establece un efecto sinérgico de inducción entre el extracto de levadura
y el alcohol. Empero, cuando P. sanguineus se cultiva en presencia de urea, este efecto no existe. Al
analizar el medio de cultivo utilizado en los reportes que indican que el etanol es un inductor de lacasa,
encontramos que utilizaron fuentes de nitrógeno orgánicas (Valeriano et al., 2009; Alves et al., 2004;
Lomascolo et al., 2003), y por el contrario, cuando no se encontraron efectos positivos, se utilizaron
fuentes de nitrógeno minerales (Eugenio et al., 2010; Barreto et al., 2007). Esto nos lleva a concluir, que
el tipo y concentración de nitrógeno en el medio ejercen una fuerte regulación sobre la producción de
lacasa en P. sanguineus, por lo que seleccionamos al extracto de levadura como fuente de nitrógeno para
obtener mayor producción de lacasa.
Una vez determinados los efectos de la luminosidad y del tipo y concentración de nitrógeno, se evaluó el
uso de colorantes fenólicos sobre la producción de lacasa. Encontramos que, el uso de ácido carmínico
(antraquinonico) y amarillo de alizarina (azo-colorante), aumentan en 722 y 317% la producción de
lacasa observada en condiciones de oscuridad y con extracto de levadura (Resultados 1.3). Se evaluaron
también los colorantes azul anilina y cristal violeta; sin embargo, el primero no afectó la producción de
lacasa, y el segundo tuvo efectos letales sobre P. sanguineus.
Además, la inducción de lacasa fue acompañada por la degradación de ambos colorantes, por arriba del
95%. Estos resultados concuerdan con lo observado para otros hongos, como Pleurotus ostreatus,
Kuehneromyces mutabilitis, Trametes versicolor y Cerrena unicolor (Cho et al., 2007; Cho et al., 1999),
los cuales aumentaron su producción de lacasa con ácido carmínico, y degradaron el colorante.
Asimismo, nuestros resultados aportan evidencia de que compuestos antraquinonicos inducen la
producción de lacasa, así como otras enzimas poli-fenol oxidasas (Kornillowicz-Kowalska y
Rybczyńska, 2014).
Desde el punto de vista ambiental, el uso de ácido carminico y/o amarillo de alizarina como inductores
de lacasa, los cuales son utilizados y desechados por la industria textil, supone un doble beneficio:
primeramente, las aguas residuales textiles son una fuente abundante y de bajo costo para la producción
de lacasa, y en segundo lugar, la producción de esta enzima conlleva la destoxificación del agua residual,
173
al remover los colorantes presentes en ella. Esto es de gran importancia, puesto que los azo-colorantes,
como el amarillo de alizarina, pueden generar aminas cancerígenas si no son adecuadamente oxidados
(Arslan et al., 2013). A pesar de que se ha reportado el uso de cloroperoxidasas para la degradación de
amarillo alizarina (Li et al., 2013), este es el primer reporte que asocia su degradación con la producción
de lacasas. Además de aumentar la producción enzimática, los colorantes (con excepción de cristal
violeta) aumentaron la producción de biomasa fúngica, la cual estuvo positivamente relacionada a la
degradación de los colorantes.
Por lo tanto, ya que el ácido carminico indujo la hiperproducción de lacasa (+700%), este compuesto fue
seleccionado para ser evaluado como potenciador de la deslignificación en estado sólido del BCA, en
conjunto con el extracto de levadura e incubación en condiciones de oscuridad. Además, esta última
parte del estudio de la inducción de lacasa nos permitió reconstruir un mapa de la regulación de la
producción de esta enzima en P. sanguineus (Figura 28).
Recordando la primera pregunta de investigación del capítulo 1: ¿Qué condiciones de luminosidad,
disponibilidad de nitrógeno y presencia de inductores químicos aumentarán la producción de lacasa en el
hongo Pycnoporus sanguineus? Y la hipótesis asociada. Podemos responder, que la luz es un inhibidor
de la producción de lacasa y se requieren condiciones de oscuridad para su producción, que el uso de
fuentes de nitrógeno orgánico/complejo son preferibles para inducirla, que el uso de moléculas oxidantes
como el etanol tiene efectos inductores moderados, y compuestos antraquinónicos y azo-derivados
inducen su hiperproducción en P. sanguineus (Figura 28).
Habiendo identificado las variables que afectan la producción de lacasa con P. sanguineus en medios
líquidos, el siguiente paso fue probar dichas condiciones en cultivos en estado sólido. Para lo cual, se
realizaron mesocosmos de BCA humedecido al 80% con medio basal, el cual contenía extracto de
levadura al 1% y ácido carmínico en distintas concentraciones. El efecto del cultivo de P. sanguineus
sobre la composición química de BCA fue evaluado mediante 13
C CPMAS NMR (Resultados 1.3).
Encontramos que P. sanguineus fue capaz de disminuir la cantidad de compuestos aromáticos,
relacionados con la cantidad de lignina, en un 32.67%, en 16 días. Este resultado, es similar a lo
alcanzado por otros hongos como Pleurotus ostreatus (41%), Phanerochaete chrysosporium (21%) o
Trametes versicolor (37%) (Masayuki et al., 2005). Sin embargo, el tiempo de retención en el presente
estudio fue mucho menor al del estudio de Masayuki et al, (tiempo de 60 días). El efecto deslignificador
fue atribuído a la producción de lacasa, sin embargo, su inducción fue menor a la observada en medio
líquido. El uso de ácido carmínico, tuvo un efecto positivo en la actividad lacasa registrada, y un efecto
negativo en la producción de celulasas. Este resultado es benéfico para los objetivos planeados, pues una
alta producción de lacasa y una baja producción de celulasas, generan las condiciones necesarias para
una deslignificación selectiva (Ramos et al., 2003). Aunado a esto, la inducción de lacasa observada en
174
cultivos en estado sólido con ácido carmínico, concuerda con lo reportado para otros colorantes
antraquinonicos (Usha et al., 2004). Sin embargo, el ácido carmínico también disminuyó la cantidad de
C-carboxilo y C-alquilo, regiones relacionadas con la cantidad de biomasa, lo que en ultima instáncia
afectó la degradación de lignina. Esto se atribuyó a la posible disminución de la producción de ácido 3-
hidroxiantranílico, un mediador de lacasa producido por P. sanguineus, que utiliza para oxidar
componentes no fenólicos (Eggert et al., 1996).
175
Figura 28. Mapa de la regulación de la producción de lacasa en P. sanguineus.
176
Encontramos que la cantidad de compuestos O-alquilo C, correspondientes a la cantidad de
carbohidratos presentes en el BCA, disminuyó aproximadamente 40% después de un pretratamiento con
P. sanguineus. Esta disminución es acompañada con un incremento en la cantidad de proteína, ergosterol
y quitina en el bagazo de caña (Resultados 3.1). Al comparar estos valores con los resultados de
pretratamientos químicos deslignificantes, observamos que P. sanguineus es más eficiente que el NaOH
y el Ca(OH)2 al 5% para eliminar lignina, pues diminuye de 12.87% a 6.56% (cerca del 50% de
remoción), mientras que el NaOH y el Ca(OH)2 alcanzan proporciones finales de 7.06 y 10.26%. La
cristalinidad de la celulosa es afectada levemente en los tres tratamientos.
Recordando nuestra segunda pregunta de investigación del capítulo: ¿El cultivo de P. sanguineus sobre
bagazo de caña de azúcar en estado sólido, utilizando las mejores condiciones para la producción de
lacasa, modificará la estructura química del bagazo de caña de acuerdo a los requerimientos para la
hidrólisis enzimática?, podemos responder, que lo hizo en cuanto a la disminución de la cantidad de
lignina, pues alcanzó remociones mayores a las de pretratamientos químicos. Sin embargo, consumió un
40% de los carbohidratos disponibles y no disminuyó la cristalinidad de la celulosa. Así, tenemos
evidencia suficiente para rechazar la hipótesis H0: Mejorar las condiciones de producción de esta enzima
(i.e. fuente de nitrógeno, luminosidad, presencia y cantidad de inductor) no permitirá deslignificar
selectivamente bagazo de caña de azúcar con este hongo. Aunado a esto, produjo gran cantidad de
proteína, ergosterol y quitina, lo cual podría afectar la hidrólisis enzimática y la fermentación, positiva o
negativamente. Es por ello, que se comparó el rendimiento de hidrólisis y fermentación de sustratos
pretratados con P. sanguineus, NaOH y Ca(OH)2, como se discute a continuación.
Nuestros resultados de análisis multivariados, indican que la presencia de proteína y ergosterol en el
bagazo de caña pretratado con P. sanguineus, aumenta el rendimiento de hidrólisis y la liberación de
glucosa, siendo mayor que cuando el bagazo se pretrató con soluciones alcalinas. Este efecto podría
deberse a una acción surfactante por parte de los lípidos (Helle et al., 1993; Eriksson et al., 2002), así
como de las proteínas (Yang y Wayman, 2006); los cuales evitarían la absorción de las celulasas a las
fibras de bagazo de caña. Los hidrolizados de bagazo de caña pretratado con NaOH, Ca(OH)2 y P.
sanguineus, mostraron diferencias en la producción de biomasa de Saccharomyces cerevisiae, etanol y
rendimiento de fermentación.
El rendimiento de fermentación más alto fue observado con los hidrolizados de bagazo de caña
pretratado con P. sanguineus, mientras que la producción de etanol más alta fue observada con los
hidrolizados de bagazo de caña pretratada con NaOH y P. sanguineus. Se observó también un efecto
inhibitorio parcial del hidrolizado de bagazo de caña pretratado con P. sanguineus, sobre la biomasa de
S. cerevisiae; además, se observó un aglutinamiento celular cuando este hidrolizado fue fermentado. No
se encontraron reportes que indiquen efectos antifúngicos de extractos de P. sanguineus, aunque si se
177
conoce que la cinabarina y la poliporina son metabolitos antimicrobianos producidos por este hongo
(Smânia et al., 1997; Rosa et al., 2003).
Con estos resultados, podemos afirmar que las condiciones de inducción de lacasa reportadas en la
sección de resultados 1.1, 1.2 y 1.3, pueden ser utilizadas como un pretratamiento en estado sólido, de
bagazo de caña de azúcar. El cual, modificará su composición química, haciéndolo más digerible para
celulasas; además, los hidrolizados obtenidos promoverán un rendimiento de fermentación mayor al
obtenido utilizando pretratamientos alcalinos.
Inducción de celulasas
Como se dijo anteriormente, las celulasas son las enzimas responsables de la degradación de la celulosa
hasta sus monómeros de glucosa. Actualmente, las enzimas comerciales disponibles, producidas de
monocultivos de Trichoderma spp. o Aspergillus niger, poseen diversas limitantes como lo son
deficiencia en alguna actividad celulasa, o bajos rendimientos de reacción en temperaturas mesófilas. Es
por eso, que el presente trabajo utilizó bioprospecciones para aislar nuevas cepas de hongos
filamentosos, productores de celulasas, con el fin de encontrar alguna cepa que pudiese producir
celulasas con características adecuadas para el proceso de producción de bioetanol.
En un proceso de bioprospección, se realizan muestreos en hábitats que sean similares al proceso que se
desea emular; en el caso de la producción de bioetanol celulósico, se requiere hidrolizar celulosa hasta
glucosa, para después poderla fermentar. Dado que el mayor reciclaje de celulosa en el mundo, se realiza
en el horizonte 0 y en el horizonte A del suelo, se decidió buscar hongos que habiten mantillos de
bosques veracruzanos, y aislarlos directamente en medio sólido Czapek-Dox-CMC (Abildgren et al.,
1987). Nuestros resultados indican que este hábitat es un reservorio importante de hongos celulolíticos;
además, este medio de cultivo, en combinación con pruebas colorimétricas (Carder, 1986), es adecuado
para el aislamiento de cepas productoras de celulasas.
Se ha probado que el uso de cocultivos de Trichoderma-Aspergillus, puede aumentar la producción de
celulasas; sin embargo, se desconoce el efecto de cultivar más de dos cepas de hongos en un mismo
biorreactor con el afán de producir celulasas. En ecosistemas naturales, la hidrólisis completa de la
lignocelulosa se logra gracias a la acción sinérgica de diversas enzimas, i.e. exoglucanasas,
endoglucanasas, β-glucosidasas, xilanasas, lacasas, etc. (Khalili et al., 2011) Y de diversas isoformas de
cada tipo de enzima. Estas isoformas, provienen de distintas especies de hongos y bacterias; es por ello,
que es preferible un complejo celulasa formado por diversas isoformas de varias especies de hongos, que
el de un monocultivo. Bajo esta premisa, el presente estudio tuvo como objetivo determinar la
producción de celulasas (i.e. exo, endo y β-glucosidasas), xilanasas, y el perfil de isoformas proteicas,
producido por 14 combinaciones de hongos filamentosos celulolíticos, aislados de mantillo de bosques
178
veracruzanos.
Las cepas aisladas pertenecen a los géneros Trichoderma, Aspergillus y Fusarium. La cepa de
Aspergillus niger produjo una alta cantidad de celulasas y xilanasas, lo cual coincide con reportes
previos (Ghareib and Nour, 1992; Kim et al., 1997, Sørensen et al., 2014); de manera similar, las cepas
de Trichoderma produjeron alta actividad exoglucanasa (Fang and Xia, 2013; Zhong et al., 2008).
Encontramos, que el uso de cultivos mixtos genera un decremento en la producción enzimática,
principalmente en la actividad xilanasa, y en la cantidad de isoformas producidas. Únicamente la
combinación (Aspergillus niger-Fusarium oxysporum) aumenta su producción de endoglucanasa y β-
glucosidasa. Esta combinación ya había sido identificada con anterioridad por Taha et al. (2015). El
decremento en la producción de xilanasas puede deberse a que, en condiciones estresantes, los
microorganismos cambian su preferencia de consumo de azúcares, prefieriendo hexosas (por su
contenido energético) a pentosas (Kim et al. 2008). Nuestros resultados sugieren este tipo de regulación
en hongos filamentosos.
El decremento en la actividad celulasa fue acompañado por el decremento en la cantidad de isoformas
proteicas, por lo tanto, el uso de cultivos mixtos en cultivos líquidos, sin agitación, no es una buena
estrategia cuando el objetivo es incrementar la producción de celulasas/xilanasas, y sus respectivas
isoformas. Así, no contamos con evidencia suficiente para rechazar la hipótesis H0: La interacción de
diversas especies de hongos filamentosos en un bioreactor no promoverá la producción de un pool
enzimático de mayor actividad celulasa y mayor riqueza de isoformas que los monocultivos.
Sin embargo, podría ser interesante cuando se require producir celulasas e inhibir la producción de
xilanasas. Se recomienda probar la producción de celulasas y xilanasas, en cultivos mixtos utilizando
fermentación en estado sólido, pues diversos reports de cocultivos indican que este tipo de cultivo, es
más adecuado por emular las condiciones naturales del hábitat de los hongos.
Por otro lado, la segunda bioprospección (realizada en el volcán Pico de Orizaba), nos permitió aislar 6
cepas productoras de celulasas, las cuales fueron cultivadas en medio líquido con diferentes fuentes de
carbono. Encontramos que la lactosa es la mejor fuente de carbono para inducir la producción de
celulasas, con concordancia con reportes previos (Porciuncula et al., 2013; Karaffa et al., 2006). La
característica más interesante de estas enzimas, fue su temperatura óptima de reacción, la cual se
encontraba (en la mayoría) entre 30 y 36° C; estas temperaturas, son similares a las utilizadas en la etapa
de fermentación, por lo que es candidata para optimizar procesos de fermentación y sacarificación
simultánea (FSS). De acuerdo a lo anterior, contamos con evidencia suficiente para rechazar la hipótesis
“H0: Las celulasas producidas por hongos provenientes de climas fríos (Parque Nacional Pico de
Orizaba) no poseerán temperaturas óptimas de reacción más bajas que aquellas provenientes de hongos
tropicales (i.e. Trichoderma reesei), y no podrán ser utilizadas en procesos de fermentación-
179
sacarificación simultánea”.
La FSS, es un proceso donde se mezclan celulasas y levaduras en el mismo reactor, para que la glucosa
producida sea inmediatamente transformada a etanol, y evitar la inhibición de las celulasas por producto.
Empero, las enzimas comerciales disponibles, poseen TOR de 50 °C, por lo que su eficiencia en
procesos de FSS no son los óptimos. Las enzimas producidas por la cepa de la familia Pleorosporaceae,
aislada en el presente trabajo, poseen mayor eficiencia de hidrólisis (de carboximetil celulosa) en
temperaturas mesofilas, son necesarias futuras investigaciones, que comprueben esta hipótesis.
180
Conclusiones generales
El presente trabajo concluye que las enzimas lacasas y celulasas son reguladas por las siguientes
variables, que al manipularlas, podemos generar las condiciones para la producción de estas enzimas con
hongos basidiomicetos y ascomicetos; y utilizarlas en el proceso de producción de bioethanol celulósico:
1. La lacasa es inhibida por señales lumínicas, que obedecen un gradiente energético, donde
longitudes de onda corta inhiben fuertemente la producción de lacasa, y longitudes de onda larga,
inhiben parcialmente su producción. Esto es atribuído a un Sistema de reconocimiento ambiental,
que indicaría al hongo su exposición a ambientes abiertos, desprovistos de lignina.
2. La producción de lacasa está asociada a la represión catabólica de nitrógeno, por lo que fuentes
simples de nitrógeno (e.g. urea) reprimen su producción, mientras que fuentes complejas la
inducen. Las condiciones de nitrógeno en el medio, pueden condicionar el efecto inductor de
otras moléculas, como inductores oxidantes (etanol).
3. El ácido carmínico y el amarillo de alizarina (compuestos antraquinónicos y azo-derivado), son
excelentes inductores de lacasa en medio líquido; la inducción en medio sólido ocurre, pero en
menor medida.
4. Cultivos en estado sólido de P. sanguineus sobre bagazo de caña de azúcar, en condiciones que
promuevan la producción de lacasa, permiten disminuír la cantidad de lignina más del 50%, e
incrementar significativamente la cantidad de proteína y lípidos (e.g. ergosterol) en las fibras;
esto aumenta el rendimiento de hidrólisis enzimática y de fermentación con respecto a
pretratamientos alcalinos
5. La realización de bioprospecciones de hongos celulolíticos en mantillo de ecosistemas forestales,
permite el aislamiento de hongos productores de celulasas con características diferentes a las
disponibles de manera comercial. Estas enzimas, pueden adaptarse al proceso de producción de
bioetanol.
6. El uso de cultivos mixtos tiende a decrementar la producción de celulasas, y aun más de
xilanasas, así como de sus respectivas isoformas en medio líquido.
7. Las celulasas producidas por cepas habitantes de ecosistemas fríos, como los bosques del Pico de
Orizaba, son candidatas para procesos de fermentación y sacarificación simultánea.
181
Referencias
Ahamed A y Vermette P. 2008. Enhanced enzyme production from mixed cultures of Trichoderma
reesei RUT-C30 and Aspergillus niger LMA grown as fed batch in a stirred tank bioreactor.
Biochemical engineering journal 42: 41-46.
Ahi M, Azin M, Shojaosadati SA, Vasheghani-Farahani E, Nosrati M. 2013. Optimization of sugarcane
bagasse hydrolysis by microwave-assisted pretreatment for bioethanol production. Chemical engineering
and technology 36(11): 1997-2005 DOI: 10.1002/ceat.201300233
Ahmari F, Javad M, Khorvash M, Ziaee E, Polikarpov I. 2016. Pre-treatment of sugarcane bagasse with
a combination of sodium hydroxide and lime for improving the ruminal degradability: optimization of
process parameters using response surface methodology. Journal of Applied Animal Research 44(1):
287-296.
Alfenore S, Molina-Jouve C, Guillouet S, Uribelarrea J, Goma G, Benbadis L. 2002. Improving ethanol
production and viability of Saccharomyces cerevisiae by a vitamin feeding strategy during feed-batch
process. Applied Microbiology and Biotechnology 60(1): 67-72.
Alves AMCR, Record E, Lomascolo A, Scholtmeijer K, Asther M, Wessels JGH, et al. 2004. Highly
efficient production of laccase by the basidiomycete Pycnoporus cinnabarinus. Appl Environ Microbiol
2004;70:6379–84. http://dx.doi.org/10.1128/AEM.70.11.6379-6384.2004.
Antal MJ Jr, Leesombon T, Mok WS, Richards GS. 1991. Carbohydr. Res. 217: 71-85
Antil PS, Gupta R, Kuhad RC. 2014. Simultaneous saccharification and fermentation of pretreated
sugarcane bagasse to ethanol using a new thermotolerant yeast. Ann Microbiol 65: 424-429
Archibald FS, Bourbonnais R, Jurasek L, Paice MG, Reid ID. 1997. Kfraft pulp bleaching and
delignification by Trametes versicolor. Journal of Biotechnology 53: 215-336.
Aro N, Pakula T, Penttilä M. 2005. Transcriptional regulation of plant cell wall degradation by
filamentous fungi. FES Microbiology Reviews 29: 719-739.
Arslan M, Sayin S, Yilmaz M. 2013. Removal of carcinogenic azo-dyes from water by new
cyclodextrin-immobilized iron oxide magnetic nanoparticules. Water Air Soil Pollut 224:1527 DOI
10.1007/s11270-013-1527-z
Asgher M, Ahmad Z, Nasir HM. 2013. Alkali and enzymatic delignification of sugarcane bagasse to
182
expose cellulose polymers for saccharification and bio-ethanol production. Industrial Crops and Products
44: 488-495.
Baeyens J, Kang Q, Appels L, Dewil R, Lv Y, Tan T. 2015. Challenges and oportunities in
improving the production of bio-ethanol. Progress in energy and combustión science 47: 60-88.
Bahar H, Vu-Manh H and Bechtold T. 2009. Interation of cellulose with alkali metal ions complexed
heavy metals. Lenzinger Berichte 87: 142-150.
Ballesteros M, Oliva JM, Negro MJ, Manzanares P, Ballesteros I. 2004. Ethanol from lignocellulosic
materials by a simultaneous saccharification and fermentation process (SFS) with Kluyveromyces
marxianus CECT 10875. Process biochemistry 39: 1843-1848.
Bansal N, Tewari R, Soni R, Soni SK. 2012. Production of cellulases from Aspergillus niger NS-2 in
solid state fermentation on agricultural and kitchen waste residues. Waste management 32: 1342-1346.
Bao L, Huang Q, Chang L, Zhou J, Lu H. 2014. Screening and characterization of a cellulase with
endocellulase and exocellulase activity from yak rumen metagenome. Journal of molecular catalysis B:
Enzymatic 73:104-110.
Barreto AMR, Mora AP, Ferreira R, Amado F. 2007. Trametes versicolor growth and laccase induction
with by-products of pulp and paper industry. Electron J Biotechnol 2007; 10.
http://dx.doi.org/10.2225/vol10-issue3-fulltext-1.
Behera S, Arora R, Nandhagopal N, Kumar S. 2014. Importance of chemical pretreatment for
bioconversion of lignocellulosic biomass. Renewable and sustainable energy reviews 36: 91-106.
doi:10.1016/j.rser.2014.04.047
Bhat MK. 2000. Cellulases and related enzymes in biotechnology. Biotechnology Advances 18: 355-
383.
Borges DG, Baraldo A, Sánchez C, Camargo R, Waldir P. 2014. Enhanced saccharification of sugarcane
bagasse using soluble cellulase supplemented with immobilized β-glucosidase. Bioresources Technology
167: 206-213
Bradford MM. A rapid and sensitive method for the quantitation of microgram quantities of protein
utilizing the principle of protein-dye binding. Anal Biochem 1976;72:248–54.
http://dx.doi.org/10.1016/0003-2697(76)90527-3
183
Callow NV, Ray CS, Kelbly MA, Ju L-K. 2016. Nutrient control for stationary phase cellulase
production in Trichoderma reesei Rut C-30. Enzyme and Microbial Technology 82: 8-14.
Cardona CA, Quintero JA, Paz IC. 2010. Production of bioethanol from sugarcane bagasse: Status
and perspectives. Bioresourse Technology 101: 4754-4766 doi:10.1016/j.biortech.2009.10.097
Chandra M, Kalra A, Sangwan NS, Gaurav SS, Darokar MP, Sangwan RS. 2009. Development of a
mutant of Trichoderma citrinoviridae for enhanced production of cellulases. Bioresource Technology
100: 1659-1662.
Chen W, Lin T, Guo G, Huang W. 2012. Ethanol production from rice straw hydrolysates by Pichia
stipitis. Energy Procedia 14: 1261-1266.
Cho H, Cho N, Jarosa-Wilkolazka A, Rogalski J, Leonowicz A, Shin Y, Ohga S. 2007. Effect of fungal
laccase and new mediators, acetovanillone and acetosyringone, on decolourization of dyes. J. Fac. Agr.,
Kyushu Univ., 52(2): 275-280
Cho N, Park JM, Choi TH, Matuszewska A, Jaszek M, Grzywnowicz K, Malarczyk E, Trojanowski K,
Leonowicz A. The effects of wood rooting fungi and laccase on destaining of dyes and KP bleaching
effluent. Mokchae Konghak 27(4): 72-79.
Chun S, Choi E, Lee E, Kim J, Lee S, Lee S. 2012. Eco-friendly cellulose nanofiber paper-derived
separator membranes featuring tunable nanoporous network channels for litium-ion batteries.
Journal of materials chemistry 32, 2012
Criquet S, Tagger S, Vogt G, Iacazio G, Le Petit J. Laccase activity of forest litter. Soil Biol Biochem
1999;31:1239–44. http://dx.doi.org/10.1016/S0038-0717(99)00038-3.
Cuervo L, Folch JL, Quiroz RE. 2009. Lignocelulosa como fuente de azúcares para la producción de
etanol. BioTecnología 13(3): 11-25.
D'Agostini EC, D'Agostini TR, Silveira do Valle J, Paccola-Meirelles LD, Colauto NB, Linde GA. 2011.
Low carbon/nitrogen ratio increases laccase production from basidiomycetes in solid substrate
cultivation. Sci Agric 2011;68:295–300. http://dx.doi.org/10.1590/S0103-90162011000300004.
Delgenes JP, Moletta R, Navarro JM. 1996. Effects oflignocellulose degradation products on ethanol
fermentations of glucose and xylose by Saccharomyces cerevisiae, Zymomonas mobilis, Pichia stipitis,
and Candida shehatae. Enzyme and Microbial Technology 19: 220-225.
184
Dong XQ, Yang JS, Zhu N, Wang ET, Yuan HL. 2013. Sugarcane bagasse degradation and
characterization of three white-rot fungi. Bioresource Technology 131: 243-251
Dos Reis L, Fontana RC, da Silva P, da Silva DJ, Camassola M, da Cruz JG, Pinheiro AJ. 2013.
Increased production of cellulase and xylanase by Penicillium echinulatum S1M29 in batch and fed-bath
culture. Bioresource Technology 146: 597-603.
De Souza MM, Alonso D, Da Costa C, Arévalo M, Micali O, Da Silva R, Boscolo M, Gomes E. 2014.
Pretreatment of sugarcane bagasse with microwaves irradiation and its effect on the structure and on
enzymatic hydrolysis. Applied Energy: 189-195.
Eckert K, Zielinski F, Lo L, Schneider E. 2002. Gene cloning, sequencing, and characterization of a
family 9 endoglucanase (CelA) with an unusual pattern of activity from the thermoacidophile
Alicyclobacillus acidocaldarius ATCC27009. Applied Microbiology and Biotechnology 60(4): 428-436.
Edwards B. 1991. Energy use in cane and beet factories. Proceedings of the Australian Society of
Sugar Cane Technologist 1991: 227-229.
Eggert C, Temp U, Dean JFD, Eriksson KEL. 1996. A fungal metabolite mediates degradation of non-
phenolic lignin structures and synthetic lignin by laccase. FEBS letters 391(1-2): 144-148
Eriksson T, Börjesson J, Tjemeld F. 2002. Mechanism of surfactant effect in enzymatic hydrolysis of
lignocellulose. Enzyme and Microbial Technology 31(3): 353-364.
Eseyin AE, Steele PH. 2015. An overview of the applications of furfural and its derivates. International
Journal of Advanced Chemistry 3(2): 42-47.
Esterbauer H, Steiner W, Labudova I, Hermann A, Hayn M. 1991. Production of Trichoderma cellulase
in laboratory and pilot scale. Bioresource Technology 36(1): 51-65.
Eugenio ME, Carbajo JM, Martín JA, Martín-Sampedro R, González AE, Villar JC. 2010. Synergic
effect of inductors on laccase production by Pycnoporus sanguineus. Afinidad 2010;546:129–35.
Ferreira V, de Oliveira M, da Silva S, Pereira N. 2010. Simultaneous saccharification and fermentation
process of different cellulosic substrates using a recombinant Saccharomyces cerevisiae harbouring the
β-glucosidase gene. Electronic journal of biotechnology 13(2): DOI: 10.2225/vol13-issue2-fulltext-1
Fortes LM, Oliveira RA, Da Silva EP. 2010. Cellulases, xylanases, β-glucosidase and ferulic acid
185
esterase produced by Trichoderma and Aspergillus act synergestically in the hydrolysis of sugarcane
bagasse. Biochemical engineering journal 51: 72-78.
Ghose TK. 1987. Measurement of cellulase activities. Pure and Appl. Chem. 59(2): 257-268.
Grimaldi MP, Marques MP, Laluce C, Cilli EM, Pombeiro SR. 2015. Evaluation of lime and
hydrothermal pretreatments for efficient enzymatic hydrolysis of raw sugarcane bagasse. Biotechnol
Biofuels 8:205.
Hausfather Z. 2009. Recent lower global temperaturas do not undercut CO2/warming relationships.
Yale Climate Connections. Disponible desde
http://www.yaleclimateconnections.org/2009/04/recent-lower-global-temperatures/
Helle S, Duff SJB, Cooper DG. 1993. Effect of surfactans on cellulose hydrolysis. Biotechnology and
Bioengineering 42(5): 611-617.
Hendy NA, Wilke CR, Blanch HW. 1984. Enhanced cellulase production in fed-batch culture of
Trichoderma reesei C30. Enzyme Microb. Technol. 6, 73–77.
Huang Y, Qin X, Luo X, Nong Q, Yang Q, Zhang Z, et al. 2015. Efficient enzymatic hydrolysis and
simultaneous saccharification and fermentation of sugarcane bagasse pulp for ethanol production by
cellulase from Penicillium oxalicum EU2106 and thermotolerant Saccharomyces cerevisiae ZM1-5.
Biomass and Bioenergy 77: 53-63.
IEA. 2013. Renewable energy medium-term market report 2013. International Energy Agency
OECD/IEA 2013.
Igarashi K. 2013. Cooperative biomass breakdown. Nature chemical biology 9: 350-351.
Indira D, Moumita S, Ajay D, Kar CS, Jayabalan R. 2014. Chapter 10 Bioprospecting halotolerant
cellulase from saline environment of Bhitarkanika National Park, Odisha. En: Kumar S, Sharma AK,
Tyagi SK, Yadav YK (eds). Recent Advances in Bioenergy Research – Volume III. Kapurthala, India
ISBN 978-81-927097-2-7
Irfan M, Syed Q, Abbas S, Gul M, Baig S, Nadeem M. 2011. FTIR and SEM analysis of thermo-
chemical fractionated sugarcane bagasse. Turkish Journal of Biochemistry 36(4): 322-328.
Jahan MS, Mun SP (2007) Characteristics of dioxanelignins isolated at different ages of Nalita wood
186
(Tremaorientalis). J Wood Chem Technol 27(2):83–98
Janusz G, Sulej J, Jaszek M, Osińska-Jaroszuk M. 2016. Effect of different wavelenghts of light on
laccase, cellobiose dehydrogenase and proteases producen by Cerrena unicolor, Pycnoporus sanguineus
and Phlebia lindtneri. Acta Biochimica Polonica 63 http://dx.doi.org/10.18388/abp.2015_1235
Jiang N, Xiao D, Zhang D, Sun N, Yan B, Zhu X. Negative roles of a novel nitrogen metabolite
repression-related gene, TAR 1, in laccase production and nitrate utilization by the basidiomycete
Criptococcus neoformans. Appl Environ Microbiol 2009;75:6777–82.
http://dx.doi.org/10.1128/AEM.00708-09.
Karp SG, Faraco V, Amore A, Junior LA, Soccol VT, Soccol CR. 2015. Statistical optimization of
laccase production and delignification of sugarcane bagasse by Pleurotus ostreatus in solid-state
fermentation. BioMed Research International 2015, http://dx.doi.org/10.1155/2015/181204
Kim S y Dale BE. 2004. Global potential bioethanol production from wasted crops and crops
residues. Biomass and Bioenergy 26: 361-375.
Kim Y, Kreke T, Ladisch MR. 2013. Reaction mechanisms and kinetics of xylo-olisaccharide hydrolysis
by dicarboxylic acids. AlChE J. 59: 188-199.
Korniłłowicz-Kowalska and Rybczyńska. 2014. Anthraquinone dyes decolorization capacity of
anamorphic Bjerkandera adusta CCBAS 930 strain and its HRP-like negative mutants. World J
Microbiol Biotechnol 30: 1725-1736 DOI 10.1007/s11274-014-1595-2
Kuhar F y Papinutti L. 2014. Optimization of laccase production by two strains of Ganoderma lucidum
using phenolic and metallic inducers. Revista Argentina de Microbiología 46(2): 144-149.
Kumar S, Dheeran P, Singh SP, Mishra IM, Adhikari DK. 2015. Kinetic studies of two-stage sulfuric
acid hydrolysis of suggarcane bagasse. Renewable energy 83: 850-858.
Kuyper M, Winkler AA, van Dijken JP, Pronk JT. Minimal metabolic engineering of Saccharomyces
cerevisiae for efficient anaerobic xylose fermentation: a proof of principle. FEMS Yeast research 4: 655-
664.
Kyi TS (2011) Screening of potential lignin-degrading microorganisms and evaluating their optimal
enzyme producing culture conditions. Master in Science thesis, Chalmers University of Technology.
Göteborg, Sweden.
187
Lee IR, Chow EWL, Morrow CA, Djordjevic JT, Fraser JA. 2011. Nitrogen metabolite repression of
metabolism and virulence in the human fungal pathogen Cryptococcus neoformans. Genetics
2011;188:309–23. http://dx.doi.org/10.1534/genetics.111.128538.
Li C, Yang Z, Can RH, Zhang D, Chen S, Ma L. 2013. Effect of pH on cellulase production and
morphology of Trichoderma reesei and the application in cellulosic material hydrolysis. Journal of
Biotechnology 168: 470-477.
Li Y, Park J, Shiroma R, Tokuyasu K. 2011. Bioethanol production from rice straw by a sequencial use
of Saccharomyces cerevisiae and Pichia stipitis with heat inactivation of Saccharomyces cerevisiae cells
prior to xylose fermentation. Journal of Bioscience and Bioengineering 111(6): 682-686.
Li X, Zhang J, Jiang Y, Hu M, Li S, Zhai Q. 2013. Highly efficient biodecolorization/degradation of
congo red and alizarin yellow R by chloroperoxidase from Caldariomyces fumago : Catalytic
mechanism and degradation pathway.
Liu Y-Y, Xu J-L, Zhang Y, Liang C-Y, He M-C, Yuan Z-H, Xie J. 2016. Reinforced alkali-pretreatment
for enhancing enzymatic hydrolisis of sugarcane bagasse. Fuel Processing Technology 143: 1-6.
Lo C, Zhang Q, Callow NV, Ju L. 2010. Roles of extracellular lactose hydrolysis in cellulase production
by Trichoderma reesei Rut C30 using lactose as inducing substrate. Process Biochemistry 45(9): 1494-
1503.
Lomascolo A, Record E, Herpoël-Gimbert I, Delattre M, Robert JL, Georis J, et al. 2003.
Overproduction of laccase by a monokaryotic strain of Pycnoporus cinnabarinus using ethanol as
inducer. J Appl Microbiol 2003;94:618–24. http://dx.doi.org/10.1046/j.1365-2672.2003.01879.x.
Lorenzo M, Moldes D, Sanróman M. 2006. Effect of heavy metals on the production of several laccase
isoenzymes by Trametes versicolor and on their ability to decolourise dyes. Chemosphere 63: 912-917.
Madhavi V y Lele SS. 1997. Laccase: properties and applications. BioResources 4(4): 1694-1717.
Maeda RN, Serpa VI, Lima VA, Alves RA, Melo LM, Machado A, Driemeier CE, Pereira N, Polikarpov
I. 2011. Enzymatic hydrolysis of pretreated sugarcane bagasse using Penicillium funiculosum and
Trichoderma harzianum cellulases. Process Biochemistry 46: 1196-1201.
Maghsoodi V y Yaghmaei S. 2010. Comparison of solid substrate and submerged fermentation for
chitosan production by Aspergillus niger. Chemistry and chemical engineering 17(2): 153-157.
188
Massiot D, Fayon F, Capron M, King I, Le Calve S, Alonso B et al. 2002. Modelling one- and two-
dimensional solid-state NMR spectra. Magnetic Resonance in Chemistry 40: 70-76
Maryana R, Ma’rifatun D, Wheni A, Satriyo KW, Angga W. 2014. Alkaline pretreatment on sugarcane
bagasse for bioethanol production. Conference and exhibition indonesia renewable energy and energy
conservation. Energy Procedia 47: 250-254.
Masayuki T, Suzuki H, Watanabe D, Sakai K, Tanaka T. 2005. Evaluation of pretreatment with
Pleurotus ostreatus for enzymatic hydrolysis of rice straw. Journal of bioscience and bioengineering
100: 637-642.
McMillan JD. 1993. Xylose fermentation to ethanol: A review. National Renewable Energy
Laboratory, Golden Colorado 80401-3393
McMillan JD. 1994. Pretreatment of lignocellulosic biomass. En: Himmel ME, Baker JO, Overend RO
(eds), Enzymatic conversión of biomass for fuels production. American Chemical Society, Washington
DC pp 292-324.
Meza JC, Lomascolo A, Casalot L, Sigoillot J-C, Auria R. 2005. Laccase production by Pycnoporus
cinnabarinus grown on sugar-cane bagasse: influence of ethanol vapours as inducer. Process
Biochemistry 40: 3365-3371.
Miller GL. Use of dinitrosalicylic acid reagent for determination of reducing sugar. Anal Chem
1959;31:426–8. http://dx.doi.org/10.1021/ac60147a030.
Narra M, James JP, Balasubramanian V. 2015. Simultaneous saccharification and fermentation of
delignified lignocellulosic biomass at high solid loadings by a newly isolated thermotolerant
Kluyveromyces sp. For ethanol production. Bioresour Technol 179: 331-338.
Negahdar L, Delidovich I, Palkovits R. 2016. Aqueus-phase hydrolysis of cellulose and hemicellulose
over molecular acidic catalysts: insights into the kinetics and reaction mechanism: Applied Catalyst B:
Environmental 184: 285-298.
Negahdar JU, Oltmanns S, Palkovits R, Palkovits. 2014. Kinetic investigation of the catalytic conversion
of cellobiose to sorbitol. Appl. Catal. B: Environ. 147: 677–683
NimLos MR, Qian XH, Davis M, et al. 2006. J. Phys. Chem. A. 110(42): 11824-11838.
189
Odisi EJ, Silvestrin MB, Uwamori RY, Castro MA, de Souza AO. 2012. Bioprospection of cellulolytic
and lipolytic South Atlantic Deep-sea bacteria. Electronic Journal of Biotechnology 15(5). DOI:
10.2225/vol15-issue5-fulltext-17
Ojumu TV, Solomon BO, Betiku E, Layokun SK, Amigun B. 2003. Cellulase production by Aspergillus
flavus Linn isolate NSPR 101 fermented in sawdust, bagasse and corncob. African Journal of
Biotechnology 2(6): 150-152
Paixão SM, Ladeira SA, Silva TP, Arez BF, Roseiro JC, Martins MLL, Alves L. 2006. Sugarcane
bagasse delignification with potassium hydroxide for enhanced enzymatic hydrolisis. RSC Adv. 6: 1042-
1052.
Pal M, Calvo AM, Terrón MC, González AE. 1995. Solid-state fermentation of sugarcane bagasse with
Flammulina velutipes and Trametes versicolor. World Journal of Microbiology and Biotechnology 11:
541-545.
Palmqvist E, Grage H, Meinander NQ, Hahn-Hägerda B. 1999. Main and interaction effects of acetic
acid, furfural and p-hydroxybenzoic acido n growth and ethanol productivity of yeast. Biotechnology
and Bioengineering 63(1): 46-55.
Pandey A, Soccol CR, Nigam P, Soccol VT. 2000. Biotechnological potential of agro-industrial
residues. I: Sugarcane bagasse. Bioresourse Technology 74: 69-80.
Park S, Baker JO, Himmel ME, Parrilla PA, Johnson DK. 2010. Cellulose crystallinity index:
measurement techniques and their impact on interpreting cellulase performance. Biotechnology for
biofuels 3:10 http://www.biotechnologyforbiofuels.com/content/3/1/10
Patel MA, Ou MS, Ingram LO, Shanmugam KT. Simultaneous saccharification and co-fermentation of
crystalline cellulose and sugarcane bagasse hemicellulose hydrolysate to lactate by a thermotolerant
acidophilic Bacillus sp. Biotechnol Prog 21(5): 1453-1460.
Pereira L, Da Silva L, Comelli A, Pitarelo AP, Chiarello LM, Luciano MH. Enzymatic hydrolisis of
steam-exploded sugarcane bagasse using high total solids and low enzyme loadings. Bioresource
Technology: 195-202
Pernalete Z, Piña F, Suárez M, Ferrer A, Aiello C. 2008. Fraccionamiento del bagazo de caña de
azúcar mediante tratamiento amoniacal: efecto de la humedad del bagazo y la carga de amoniaco.
Bioagro 20(1): 3-10.
190
Peyster A y Mihaich E. 2014. Hypothesis-driven weight of evidence analysis to determine the
potential endocrine activity of MTBE. Regulatory toxicology and pharmacology 69(3): 348-370.
Pfromm PH, Amanor-Boadu V, Nelson R, Vadlani P, Madl R. 2010. Bio-butanol vs. Bioethanol: a
technical and economic assessment for corn and swithgrass fermented by yeast or Clostridium
acetobutylicum. Biomass and bioenergy 34: 515-524.
Pietrobon VC, Rosim RT, Bertoni G, Poggi E, Lopes ML, de Amorim HV, da Cruz SH, Diniz EK. 2011.
Enzymatic hydrolysis of sugarcane bagasse pretreated with acid or alkali. Brazilian Archives of biology
and technology 54(2): 229-233.
Pointing SB, Jones EBG, Vrijmoed LLP. 2000. Optimization of laccase production by Pycnoporus
sanguineus in submerged liquid culture. Mycologia 92(1): 139-144.
Prasetyo J, Sumita S, Okuda N, Park EY. 2010. Response of cellulase activity in pH-controlled cultures
of the filamentous fungus Acremonium cellulolyticus. Appl. Biochem. Biotechnol. 162, 52–61.
Qiu A, Li W, Fan X, Meng Y, Zheng Y. Carbon-nitrogen regulation of a laccase-producing mutant of
Phanerochaete chrysosporium resisting carbon and nitrogen nutritional repression. Acta Microbiol Sin
2012;52:334–44.
Rodriguez-Gomez D y Hobley TJ. 2013. Is an organic nitogen source needed for cellulase production
with Trichoderma reesei Rut-C30?. World J Microbiol Biotechnol 29(11): 2157-2165.
Rakshit S, Saha R, Singha A, Abdullah ZS, Kumar S. 2013. Molecular interactions, co-
solubilization of organic pollutants and ecotoxicity of a potential carcinogenic fuel additive MTBE
in water. Journal of molecular liquids 180: 235-243.
Ramos LP. 2003. The chemistry involved in the steam treatment of lignocellulosic matherials. Quim.
Nova 26(6): 863-871
Rosa LH, Gomes KM, Jacob CC, Capelari M, Rosa CA, Zani CL. 2003. Screening of Brazilian
basidiomycetes for antimicrobial activity. Mem Inst Oswaldo Cruz, Rio de Janeiro 98(7): 967-974
SAGARPA. 2012. Importancia de la agroindustria de la caña de azúcar. Disponible desde
http://www.sagarpa.gob.mx/agricultura/Documents/Cultivos%20Agroindustriales/Impactos%20Ca
%C3%B1a.pdf consultado el 13/09/15
191
Saha BC, Qureshi N, Kennedy GJ, Cotta MA. 2016. Biological pretreatment of corn stover with white-
rot fungus for improved enzymatic hydrolysis. International biodeterioration and biodegradation 109:
29-35.
Saritha M, Tiwari R, Singh S, Rana S, Adak A, Sharma A, Arora A, Nain L. 2015. Bioprospecting for
superior biomass hydrolysing fungi from diverse habitats. Biodiversity, Bioprospecting and
Development 2(2) http://dx.doi.org/10.4172/2376-0214.1000149
Schnepf R y Yacobucci BD. 2013. Renewable fuel standards (RFS): Overview and issues.
Congressional research service 7-5700 www.crs.gov R40155
Schmoll M, Franchi L, Kubicek CP (2005) Envoy, a PAS/LOV domain protein of Hypocreaje corina
(Anamorph Trichoderma reesei), mod- ulates cellulase gene transcription in response to light. Eukaryot
Cell 4(12):1998–2007
Schmoll M, Tian C, Sun J, Tisch D, Glass NL (2012) Unravelling the molecular basis for light
modulated cellulase gene expression—the role of photoreceptors in Neurosporacrassa. BMC Genomics
13:127
Sethi S, Datta A, Gupta BL, Gupta S. 2013. Optimization of cellulase production from bacteria isolated
from soil. Hindawi Publishing Corporation 2013 http://dx.doi.org/10.5402/2013/985685
Sigma Aldrich. 2015. Cotización disponible desde http://www.sigmaaldrich.com/life-
science/biochemicals/biochemical-products.html?TablePage=14572954
Sindhu R, Binod P, Pandey A. 2016. Biological pretreatment of lignocellulosic biomass – An overview.
Bioresource Technology199: 76-82.
Slininger PJ, Dien BS, Gorsich SW, Liu ZL. 2006. Nitrogen source and mineral optimization enhance D-
xylose conversion to ethanol by the yeast Pichia stipitis NRRL Y-7124. Appl Microbiol Biotechnol 72:
1285-1296.
Smânia EFA, Smânia A, Loguercio-Leite C, Gil ML. 1997. Optimal parameter for cinnabarin synthesis
by Pycnoporus sanguineus. J. Chem. Tec. Biotechnol. 70: 57-59.
Soni SK, Batra N, Bansal N, Soni R. 2010. Bioconversion of sugarcane bagasse into second generation
bioethanol after enzymatic hydrolysis with in-house produced cellulases from Aspergillus sp. S4B2F.
Bioresources 5(2): 741-758.
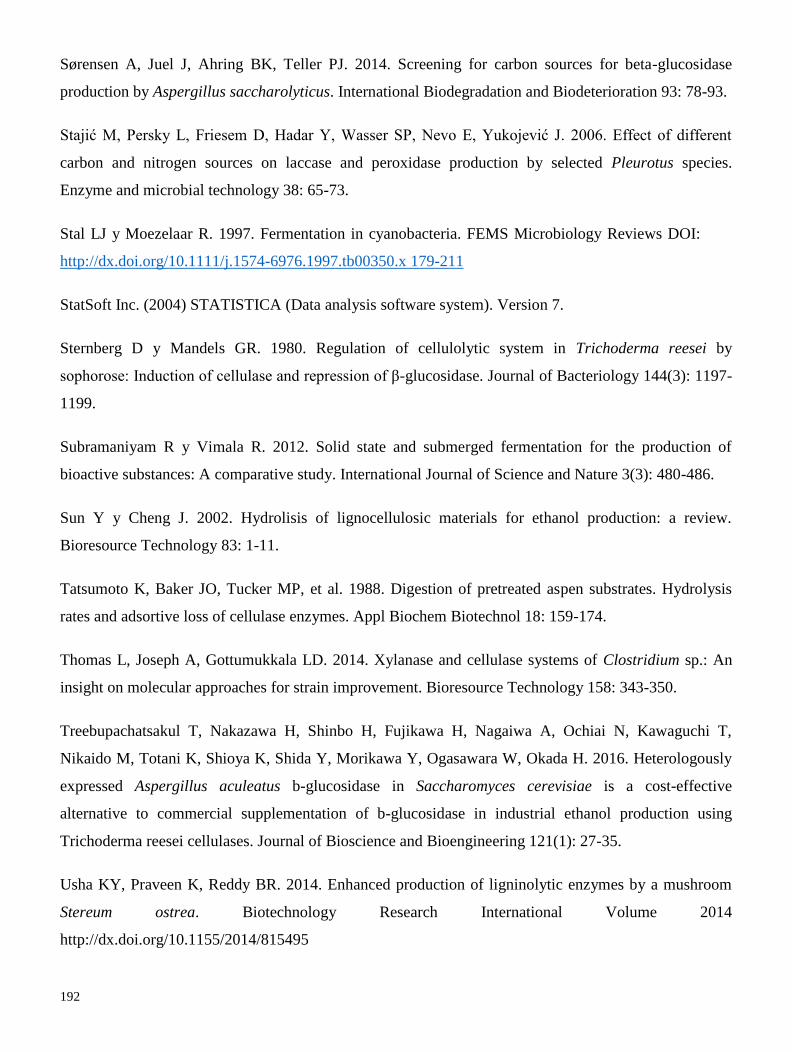
192
Sørensen A, Juel J, Ahring BK, Teller PJ. 2014. Screening for carbon sources for beta-glucosidase
production by Aspergillus saccharolyticus. International Biodegradation and Biodeterioration 93: 78-93.
Stajić M, Persky L, Friesem D, Hadar Y, Wasser SP, Nevo E, Yukojević J. 2006. Effect of different
carbon and nitrogen sources on laccase and peroxidase production by selected Pleurotus species.
Enzyme and microbial technology 38: 65-73.
Stal LJ y Moezelaar R. 1997. Fermentation in cyanobacteria. FEMS Microbiology Reviews DOI:
http://dx.doi.org/10.1111/j.1574-6976.1997.tb00350.x 179-211
StatSoft Inc. (2004) STATISTICA (Data analysis software system). Version 7.
Sternberg D y Mandels GR. 1980. Regulation of cellulolytic system in Trichoderma reesei by
sophorose: Induction of cellulase and repression of β-glucosidase. Journal of Bacteriology 144(3): 1197-
1199.
Subramaniyam R y Vimala R. 2012. Solid state and submerged fermentation for the production of
bioactive substances: A comparative study. International Journal of Science and Nature 3(3): 480-486.
Sun Y y Cheng J. 2002. Hydrolisis of lignocellulosic materials for ethanol production: a review.
Bioresource Technology 83: 1-11.
Tatsumoto K, Baker JO, Tucker MP, et al. 1988. Digestion of pretreated aspen substrates. Hydrolysis
rates and adsortive loss of cellulase enzymes. Appl Biochem Biotechnol 18: 159-174.
Thomas L, Joseph A, Gottumukkala LD. 2014. Xylanase and cellulase systems of Clostridium sp.: An
insight on molecular approaches for strain improvement. Bioresource Technology 158: 343-350.
Treebupachatsakul T, Nakazawa H, Shinbo H, Fujikawa H, Nagaiwa A, Ochiai N, Kawaguchi T,
Nikaido M, Totani K, Shioya K, Shida Y, Morikawa Y, Ogasawara W, Okada H. 2016. Heterologously
expressed Aspergillus aculeatus b-glucosidase in Saccharomyces cerevisiae is a cost-effective
alternative to commercial supplementation of b-glucosidase in industrial ethanol production using
Trichoderma reesei cellulases. Journal of Bioscience and Bioengineering 121(1): 27-35.
Usha KY, Praveen K, Reddy BR. 2014. Enhanced production of ligninolytic enzymes by a mushroom
Stereum ostrea. Biotechnology Research International Volume 2014
http://dx.doi.org/10.1155/2014/815495
193
Valeriano VS, Silva AMF, Santiago MF, Bara MTF, García TA. 2009. Production of laccase by
Pycnoporus sanguineus using 2,5 xylidine and ethanol. Braz J Microbiol 2009;40: 790–4.
http://dx.doi.org/10.1590/S1517-83822009000400009.
Van Lieshout JFT, Pérez ON, Vroom W, Planas A, de Vos WM, van der Oost J, Koutsopoulos S. 2012.
Themal stabilization of an endoglucanase by cyclization. Appl Biochem Biotechnol 167: 2039-2053
DOI 10.1007/s12010-012-9674-z
Vega K, Villena GK, Sarmiento VH, Ludeña Y, Vera N, Gutiérrez-Correa M. 2012. Production of
alkaline cellulase by fungi isolated from an undisturbed rain forest of Peru. Biotechnology Research
International 2012, Article ID 934325. doi:10.1155/2012/934325
Venkatachalam S, Sivaprakash M, Gowdaman V, Prabagaran SR. 2014. Bioprospecting of cellulase
producing extremophilic bacterial isolates from India. British Microbiology Research Journal 4(2): 142-
154
Verma A, Kumar S, Jain PK. 2011. Key pretreatment technologies on cellulosic ethanol production.
Journal of scientific research 55: 57-63.
Visser EM, Ferreira T, Nicolau M, Monteze V. 2015. Increased enzymatic hydrolysis of sugarcane
bagasse from enzyme recycling. Biotechnology for Biofuels 8:5 DOI 10.1186/s13068-014-0185-8
Wang M, Mu Z, Wang J, Hou S, Han L, Dong Y, Xiao L, Xia R, Fang X. 2013. The identification of and
relief from Fe3+
inhibition for both cellulose and cellulase in cellulose saccharification catalyzed by
cellulases from Penicillium decumbens. Bioresource Technology 133: 507-512.
Xi F and Geng A. 2010. Horticultural waste as the substrate for cellulase and hemicellulase production
by Trichoderma reesei under solid-state fermentation. Appl Biochem Biotechnol 162:295-306 DOI
10.1007/s12010-009-8745-2
Yadav KS, Naseeruddin S, Prashanthi GS, Sateesh L, Rao LV. Bioethanol fermentation of concentrated
rice straw hydrolysate using co-culture of Saccharomyces cerevisiae and Pichia stipitis. Bioresource
Technology 102: 6473-7478.
Yang B, Wyman CE. 2006. BSA treatment to enhance enzymatic hydrolysis of cellulose in lignin
containing substrates. Biotechnol Bioeng 94: 611-617.
194
Yang B, Dai Z, Ding S, Wayman CE. 2011. Enzymatic hydrolysis of cellulosic biomass. Biofuels 2(4):
421-450.
Yang W, Li P, Bo D, Chang H. 2012. The optimization of formic acid hydrolysis of xylose in furfural
production. Carbohydrate research 357: 53-61.
Yemis O and Mazza G. 2011. Acid-catalyzed conversión of xylose, xylan and straw into furfural by
microwave-assisted reaction. Bioresource Technology 102: 7371-7378.
Yuan L, Wang W, Pei Y, Lu F. 2012. Screening and identification of cellulase-producing strain of
Fusarium oxysporum. Procedia Environmental Sciences 12: 1213-1219.
Yoshikawa T, Yagi T, Shinohara S, Fukunaga T, Nakasaka Y, Tago T, Masuda T. 2013. Fuel Processing
Technology 108: 69-75 doi:10.1016/j.fuproc.2012.05.003
Zhai Z, Yang T, Zhang B, Zhang J. 2015. Effects of metal ions on the catalytic degradation of dicofol by
cellulase. Journal of environmental sciences 33: 163-168.
Zhou X, Wheeler MM, Oi FM, Scharf ME. 2008. Inhibition of termite cellulases by carbohydrate-based
cellulase inhibitors: Evidence from in vitro biochemistry and in vivo feeding studies. Pesticide
Biochemistry and Physiology 90: 31-41.
Zhou YP, Stuart-Williams H, Farquhar GD, Hocart CH. 2010. The use of natural abundance stable
isotopic ratios to indicate the presence of oxygen-containing chemical linkages between cellulose and
lignin in plant cell walls. Phytochemistry 982-993.
195
11. Anexos
11.1 Curva de calibración para estimar actividad xilanasa
La curva fue realizada con sustrato de xilanasa (xilano de birchwood disuelto en buffer de acetato de
sodio pH 4.8) y adición de concentraciones conocidas de glucosa; tratada como si fuese reacción para
actividad endoglucanasa y cuantificada por espectrofotometría UV-Vis a 540 nm.
y = 0.6141x - 0.1031 R² = 0.9958
0
0.2
0.4
0.6
0.8
1
1.2
0 0.5 1 1.5 2 2.5
Ab
sorb
anci
a
Xilosa micromol.mL
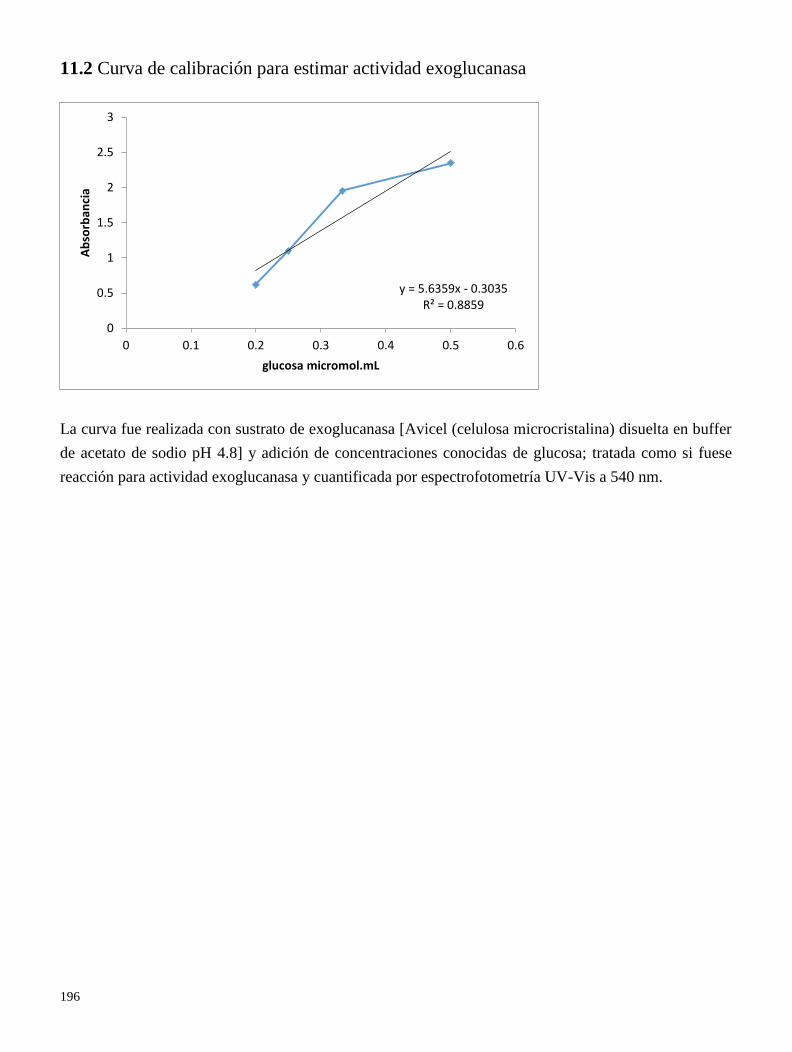
196
11.2 Curva de calibración para estimar actividad exoglucanasa
La curva fue realizada con sustrato de exoglucanasa [Avicel (celulosa microcristalina) disuelta en buffer
de acetato de sodio pH 4.8] y adición de concentraciones conocidas de glucosa; tratada como si fuese
reacción para actividad exoglucanasa y cuantificada por espectrofotometría UV-Vis a 540 nm.
y = 5.6359x - 0.3035 R² = 0.8859
0
0.5
1
1.5
2
2.5
3
0 0.1 0.2 0.3 0.4 0.5 0.6
Ab
sorb
anci
a
glucosa micromol.mL
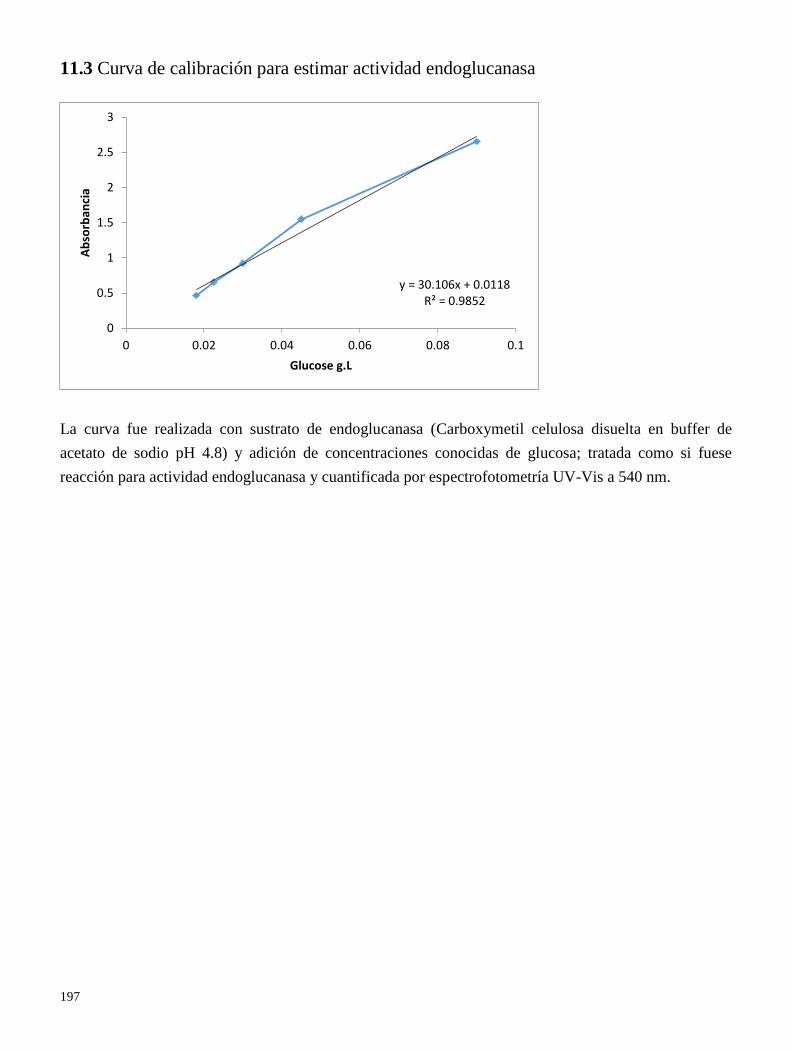
197
11.3 Curva de calibración para estimar actividad endoglucanasa
La curva fue realizada con sustrato de endoglucanasa (Carboxymetil celulosa disuelta en buffer de
acetato de sodio pH 4.8) y adición de concentraciones conocidas de glucosa; tratada como si fuese
reacción para actividad endoglucanasa y cuantificada por espectrofotometría UV-Vis a 540 nm.
y = 30.106x + 0.0118 R² = 0.9852
0
0.5
1
1.5
2
2.5
3
0 0.02 0.04 0.06 0.08 0.1
Ab
sorb
anci
a
Glucose g.L
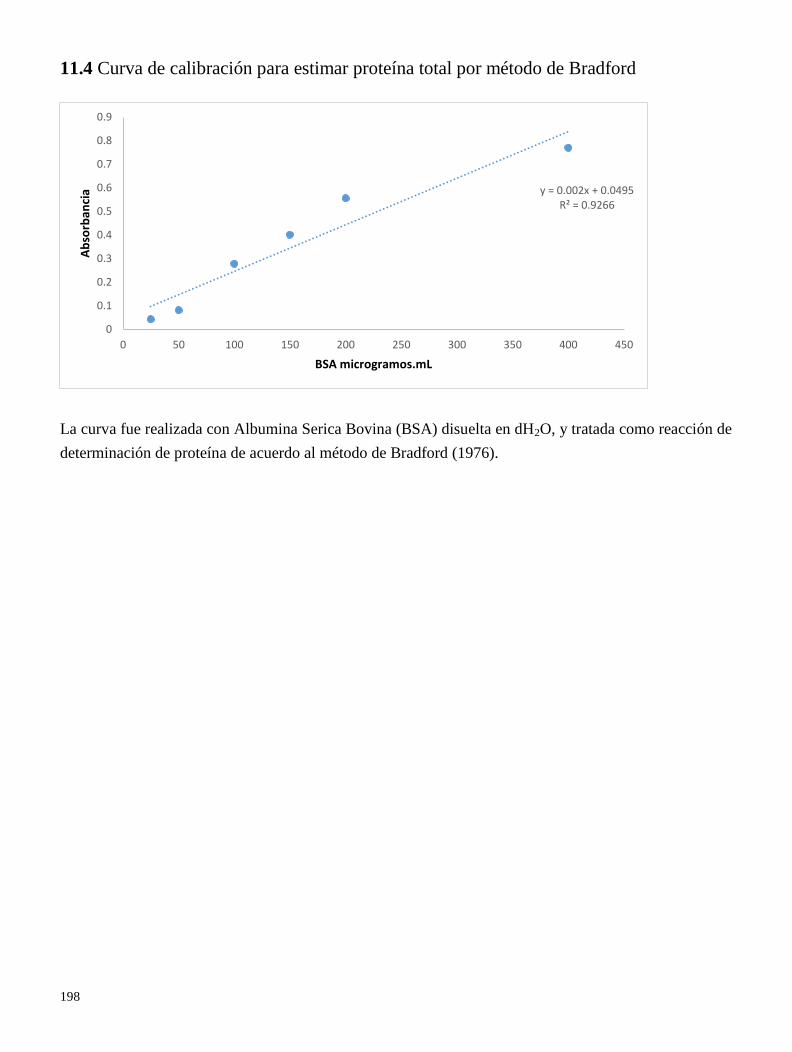
198
11.4 Curva de calibración para estimar proteína total por método de Bradford
La curva fue realizada con Albumina Serica Bovina (BSA) disuelta en dH2O, y tratada como reacción de
determinación de proteína de acuerdo al método de Bradford (1976).
y = 0.002x + 0.0495 R² = 0.9266
0
0.1
0.2
0.3
0.4
0.5
0.6
0.7
0.8
0.9
0 50 100 150 200 250 300 350 400 450
Ab
sorb
anci
a
BSA microgramos.mL
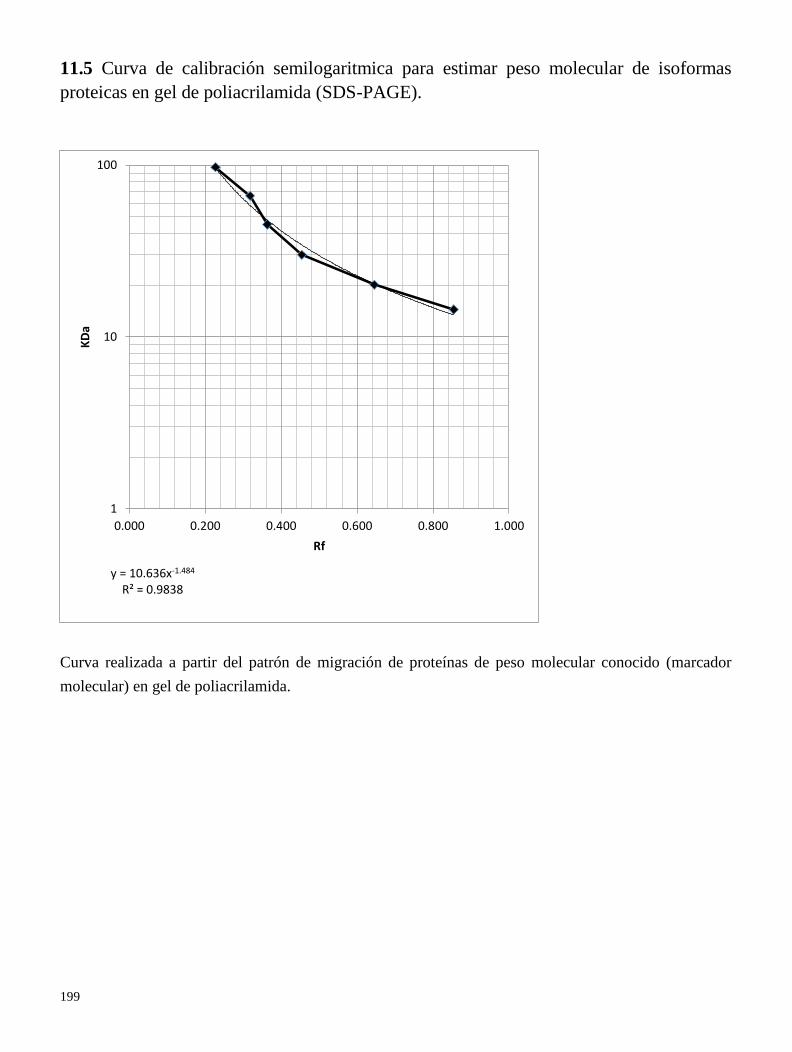
199
11.5 Curva de calibración semilogaritmica para estimar peso molecular de isoformas
proteicas en gel de poliacrilamida (SDS-PAGE).
Curva realizada a partir del patrón de migración de proteínas de peso molecular conocido (marcador
molecular) en gel de poliacrilamida.
y = 10.636x-1.484 R² = 0.9838
1
10
100
0.000 0.200 0.400 0.600 0.800 1.000
KD
a
Rf
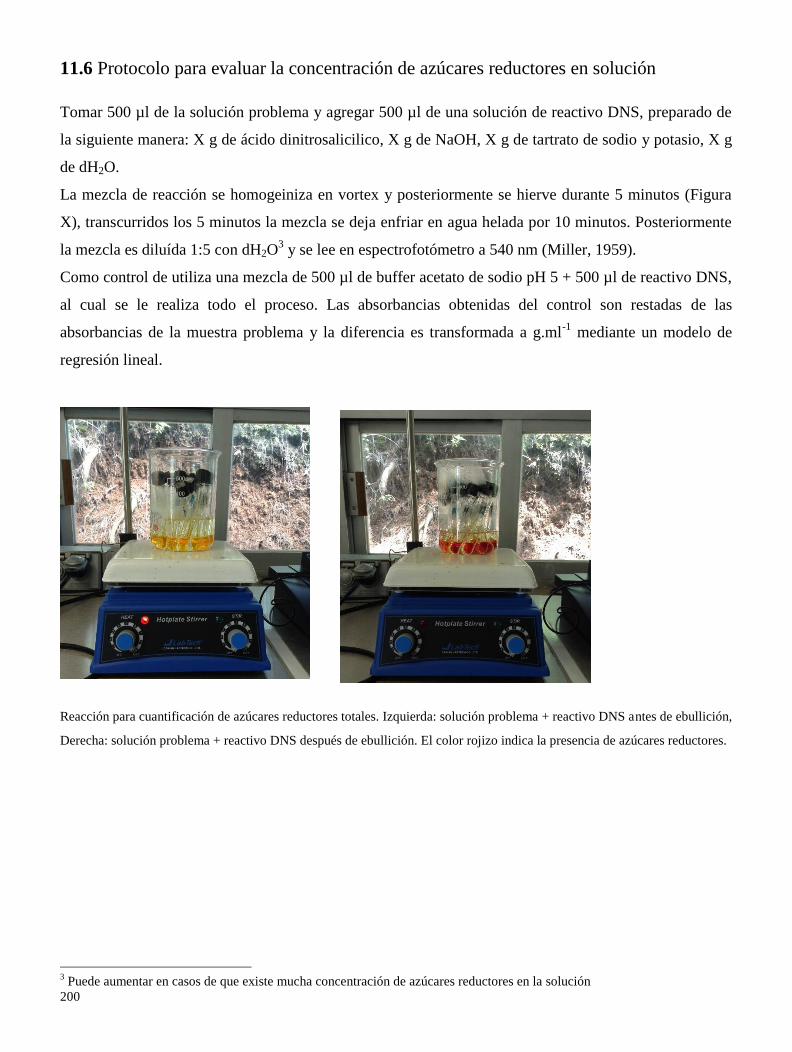
200
11.6 Protocolo para evaluar la concentración de azúcares reductores en solución
Tomar 500 µl de la solución problema y agregar 500 µl de una solución de reactivo DNS, preparado de
la siguiente manera: X g de ácido dinitrosalicilico, X g de NaOH, X g de tartrato de sodio y potasio, X g
de dH2O.
La mezcla de reacción se homogeiniza en vortex y posteriormente se hierve durante 5 minutos (Figura
X), transcurridos los 5 minutos la mezcla se deja enfriar en agua helada por 10 minutos. Posteriormente
la mezcla es diluída 1:5 con dH2O3 y se lee en espectrofotómetro a 540 nm (Miller, 1959).
Como control de utiliza una mezcla de 500 µl de buffer acetato de sodio pH 5 + 500 µl de reactivo DNS,
al cual se le realiza todo el proceso. Las absorbancias obtenidas del control son restadas de las
absorbancias de la muestra problema y la diferencia es transformada a g.ml-1
mediante un modelo de
regresión lineal.
Reacción para cuantificación de azúcares reductores totales. Izquierda: solución problema + reactivo DNS antes de ebullición,
Derecha: solución problema + reactivo DNS después de ebullición. El color rojizo indica la presencia de azúcares reductores.
3 Puede aumentar en casos de que existe mucha concentración de azúcares reductores en la solución
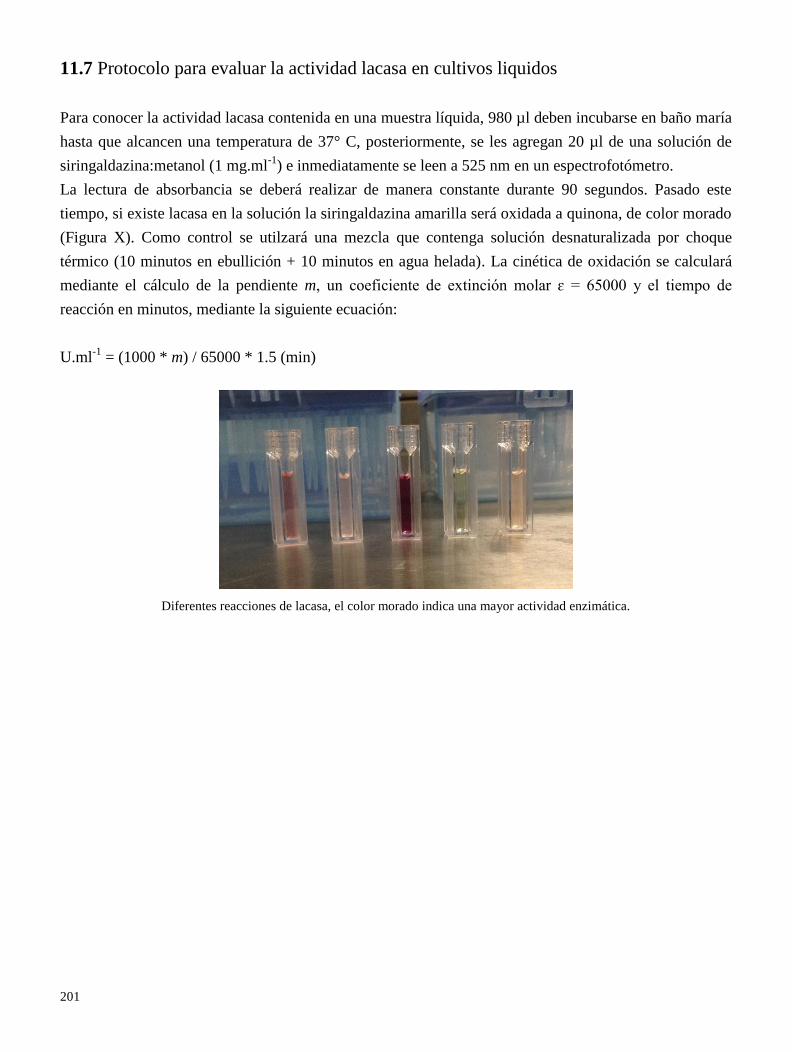
201
11.7 Protocolo para evaluar la actividad lacasa en cultivos liquidos
Para conocer la actividad lacasa contenida en una muestra líquida, 980 µl deben incubarse en baño maría
hasta que alcancen una temperatura de 37° C, posteriormente, se les agregan 20 µl de una solución de
siringaldazina:metanol (1 mg.ml-1
) e inmediatamente se leen a 525 nm en un espectrofotómetro.
La lectura de absorbancia se deberá realizar de manera constante durante 90 segundos. Pasado este
tiempo, si existe lacasa en la solución la siringaldazina amarilla será oxidada a quinona, de color morado
(Figura X). Como control se utilzará una mezcla que contenga solución desnaturalizada por choque
térmico (10 minutos en ebullición + 10 minutos en agua helada). La cinética de oxidación se calculará
mediante el cálculo de la pendiente m, un coeficiente de extinción molar ɛ = 65000 y el tiempo de
reacción en minutos, mediante la siguiente ecuación:
U.ml-1
= (1000 * m) / 65000 * 1.5 (min)
Diferentes reacciones de lacasa, el color morado indica una mayor actividad enzimática.
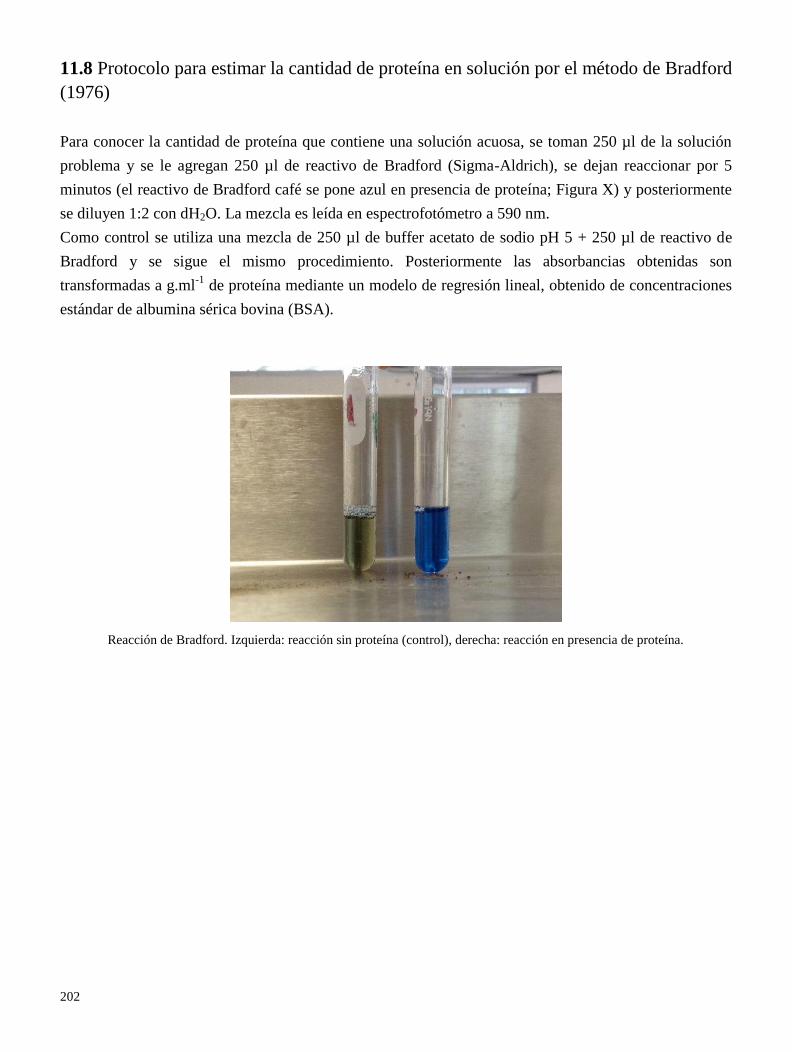
202
11.8 Protocolo para estimar la cantidad de proteína en solución por el método de Bradford
(1976)
Para conocer la cantidad de proteína que contiene una solución acuosa, se toman 250 µl de la solución
problema y se le agregan 250 µl de reactivo de Bradford (Sigma-Aldrich), se dejan reaccionar por 5
minutos (el reactivo de Bradford café se pone azul en presencia de proteína; Figura X) y posteriormente
se diluyen 1:2 con dH2O. La mezcla es leída en espectrofotómetro a 590 nm.
Como control se utiliza una mezcla de 250 µl de buffer acetato de sodio pH 5 + 250 µl de reactivo de
Bradford y se sigue el mismo procedimiento. Posteriormente las absorbancias obtenidas son
transformadas a g.ml-1
de proteína mediante un modelo de regresión lineal, obtenido de concentraciones
estándar de albumina sérica bovina (BSA).
Reacción de Bradford. Izquierda: reacción sin proteína (control), derecha: reacción en presencia de proteína.
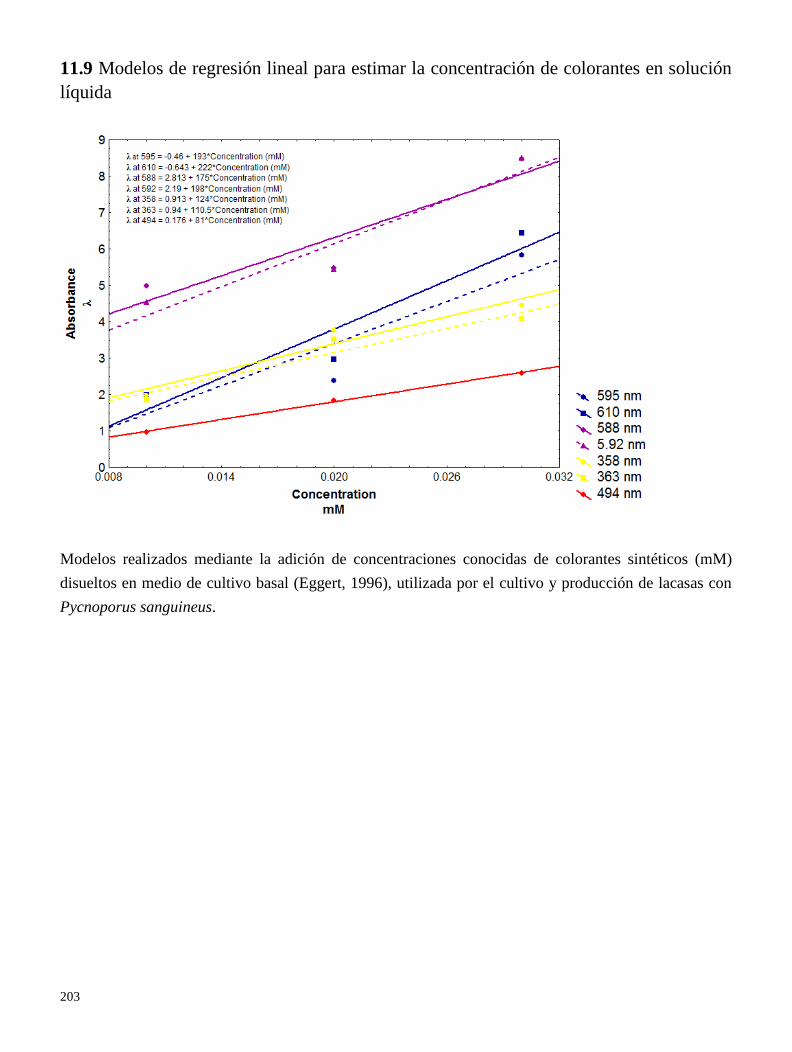
203
11.9 Modelos de regresión lineal para estimar la concentración de colorantes en solución
líquida
Modelos realizados mediante la adición de concentraciones conocidas de colorantes sintéticos (mM)
disueltos en medio de cultivo basal (Eggert, 1996), utilizada por el cultivo y producción de lacasas con
Pycnoporus sanguineus.
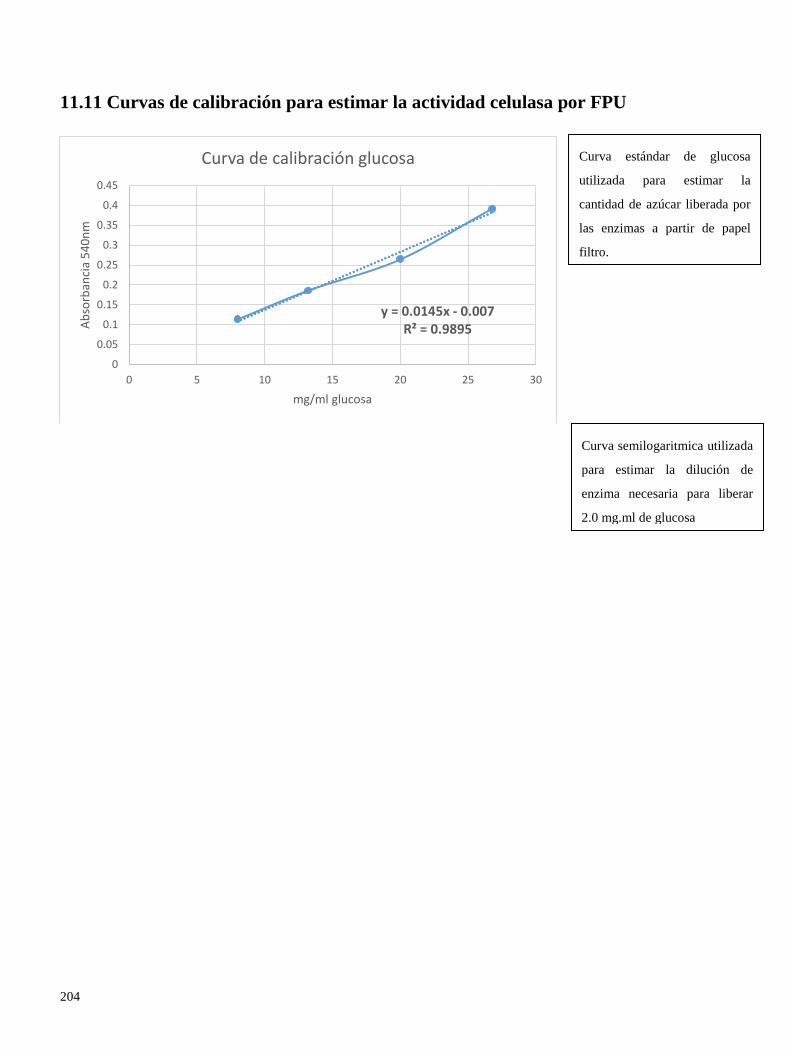
204
11.11 Curvas de calibración para estimar la actividad celulasa por FPU
y = 0.0145x - 0.007 R² = 0.9895
0
0.05
0.1
0.15
0.2
0.25
0.3
0.35
0.4
0.45
0 5 10 15 20 25 30
Ab
sorb
anci
a 5
40
nm
mg/ml glucosa
Curva de calibración glucosa Curva estándar de glucosa
utilizada para estimar la
cantidad de azúcar liberada por
las enzimas a partir de papel
filtro.
Curva semilogaritmica utilizada
para estimar la dilución de
enzima necesaria para liberar
2.0 mg.ml de glucosa
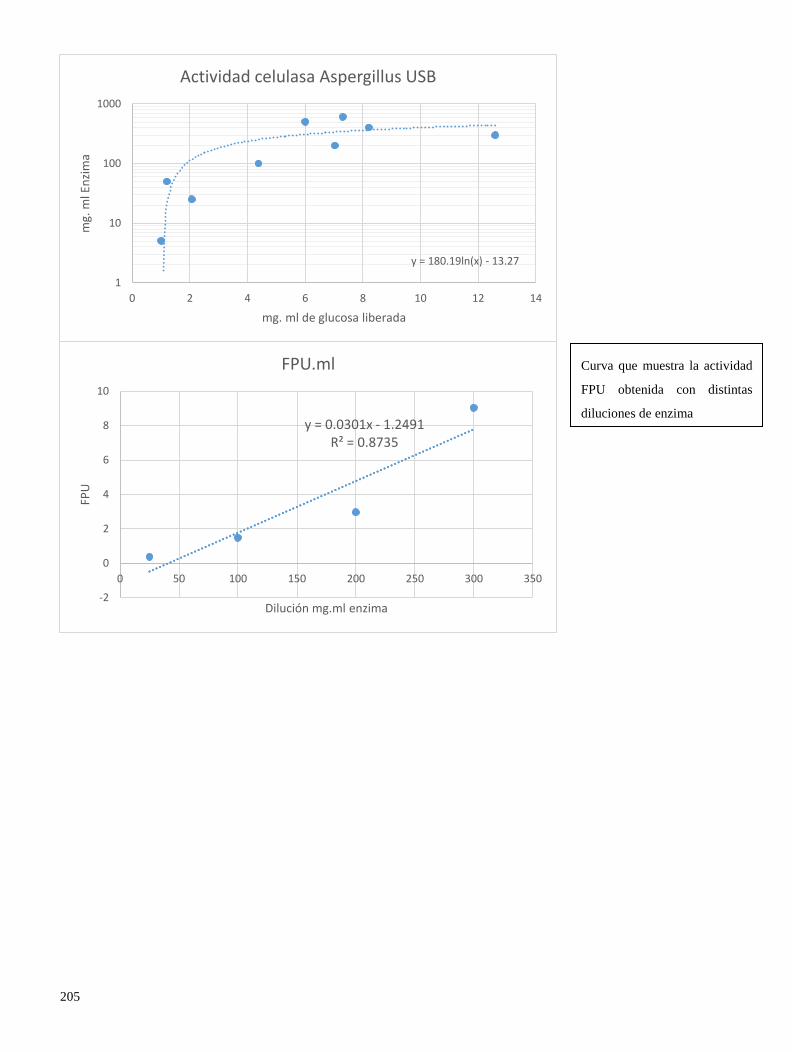
205
y = 180.19ln(x) - 13.27
1
10
100
1000
0 2 4 6 8 10 12 14
mg.
ml E
nzi
ma
mg. ml de glucosa liberada
Actividad celulasa Aspergillus USB
y = 0.0301x - 1.2491 R² = 0.8735
-2
0
2
4
6
8
10
0 50 100 150 200 250 300 350
FPU
Dilución mg.ml enzima
FPU.ml Curva que muestra la actividad
FPU obtenida con distintas
diluciones de enzima