punching shear capacity of prestressed concrete ... - j-stage
TRANSCRIPT
Journal of Advanced Concrete Technology Vol. 19, 1227-1244, December 2021 / Copyright © 2021 Japan Concrete Institute 1227
Scientific paper
Punching Shear Capacity of Prestressed Concrete Slabs Made of Lightweight Concrete Mixed with Short Fibers Yuichi Kitano1*, Hajime Ito2 and Satoshi Suzuki3
Received 3 June 2021, accepted 19 November 2021 doi:10.3151/jact.19.1227
Abstract The purpose of this study is to examine means of creating light and very strong prestressed concrete slabs made of lightweight aggregate concrete mixed with short fibers. The experiments reported in this paper demonstrated that the ratio of short fibers in the mix must be kept to 0.5 vol% or less, in order to obtain the same strength as that demonstrated by lightweight aggregate concrete designed to a standard strength of 50 N/mm2. In addition, the results of load testing various slabs confirmed that lightweight PC slabs mixed with 0.5 vol% of short PVA fibers had the same punching shear capacity as PC slabs made from normal weight concrete. The results led to the conclusion that the increase in the shear capacity of lightweight PC slabs mixed with short fibers was caused by the suppression of the progress of cracks in the RC direction and an accompanying tide arch formation in the PC direction. This paper is the English translation of the authors’ previous work [Kitano, Y., Ito, H. and Suzuki, S., (2020). “Study on lightweight and high strength prestressed concrete slab by using lightweight concrete mixed with short fibers.” Journal of Japan Society of Civil Engineers, Ser. E2 (Materials and Concrete Structures), 76(3), 239-254. (in Japanese)].
1. Introduction
One of the serious problems urgently faced by bridge design and maintenance engineers, which affects may existing bridges, is the deterioration of major compo-nents and a resultant insufficient structural resistance to collapse. Extending the service lives of highway bridges not only contributes to social convenience, but also helps sustain the economic efficiency of the areas served by the highways. Strengthening or upgrading a particular existing bridge assure a measurable extension of the service life of the bridge and helps meet the so-cietal demand for transportation capacity (Bettigole et al. 1997). Among a variety of design choices, the use of prestressed concrete results in a lighter overall structure, and utilizing lightweight concrete reduces the dead load of the superstructure (Sylva et al. 2002). As in the study of Brown et al. (1995), it has been frequently reported that PC bridge structures made of lightweight aggregate are quite durable over the long term. Another considera-tion is that rapid construction is required when strengthening or upgrading existing bridges on impor-tant routes, such as highway networks. The ABC project is an example of a countrywide response to this need (FHWA 2011). The use of precast slabs to enable the rapid construction of steel bridge spans has been con-
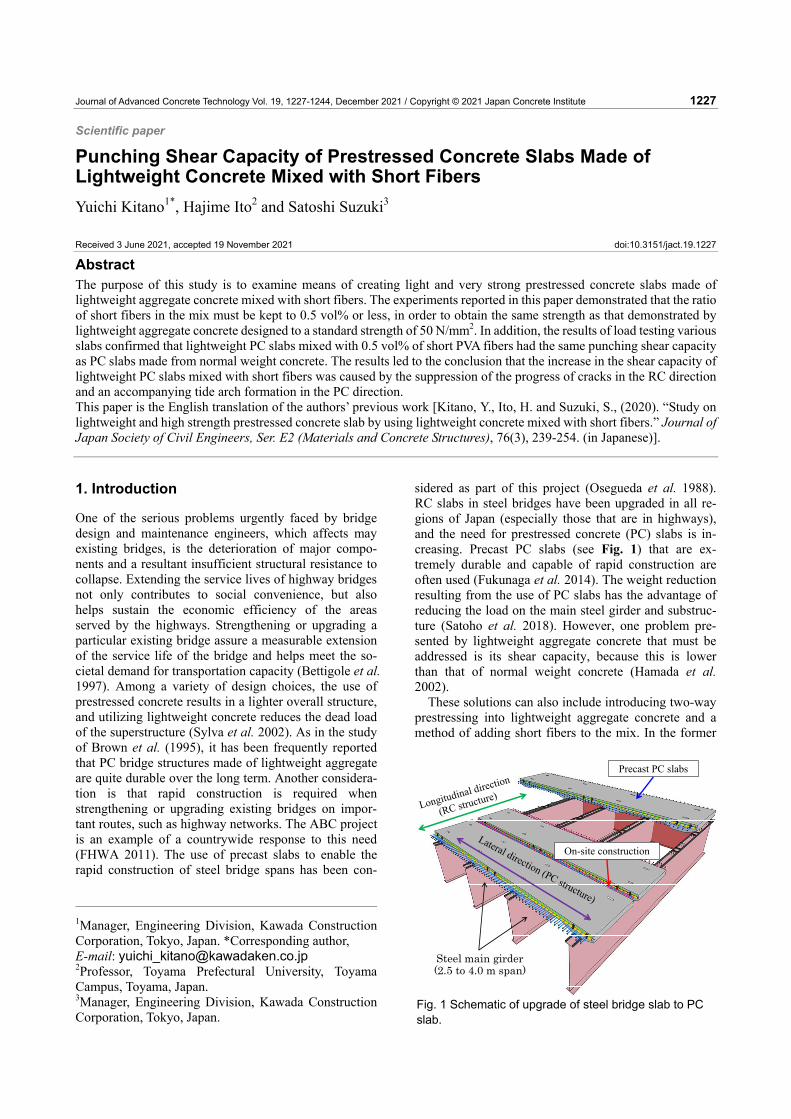
sidered as part of this project (Osegueda et al. 1988). RC slabs in steel bridges have been upgraded in all re-gions of Japan (especially those that are in highways), and the need for prestressed concrete (PC) slabs is in-creasing. Precast PC slabs (see Fig. 1) that are ex-tremely durable and capable of rapid construction are often used (Fukunaga et al. 2014). The weight reduction resulting from the use of PC slabs has the advantage of reducing the load on the main steel girder and substruc-ture (Satoho et al. 2018). However, one problem pre-sented by lightweight aggregate concrete that must be addressed is its shear capacity, because this is lower than that of normal weight concrete (Hamada et al. 2002).
These solutions can also include introducing two-way prestressing into lightweight aggregate concrete and a method of adding short fibers to the mix. In the former
1Manager, Engineering Division, Kawada ConstructionCorporation, Tokyo, Japan. *Corresponding author, E-mail: [email protected] 2Professor, Toyama Prefectural University, ToyamaCampus, Toyama, Japan. 3Manager, Engineering Division, Kawada ConstructionCorporation, Tokyo, Japan.
On-site construction
Steel main girder(2.5 to 4.0m span)
Precast PC slabs
Steel main girder(2.5 to 4.0 m span)
Fig. 1 Schematic of upgrade of steel bridge slab to PC slab.
Y. Kitano, H. Ito and S. Suzuki / Journal of Advanced Concrete Technology Vol. 19, 1227-1244, 2021 1228
case, if the PC slab has deteriorated, partial replacement is possible if the slab has a one-way prestressing, but partial replacement is difficult if it is a two-way prestressed slab. When faced with the latter case, there is a method available, that involves mixing steel or polypropylene fibers into lightweight concrete as de-scribed by De Hanai et al. (2008), Hassan et al. (2015), Matsui et al. (2000), Ono et al. (2004) and others. Steel fibers are very effective for reinforcement, but have the disadvantages that spot corrosion appears near the con-crete surface and there is an unavoidable increase in the total weight of the concrete unit. Polypropylene fibers have excellent in corrosion resistance and are light in weight, but they have a low modulus of tensile elasticity. In order to obtain a sufficient reinforcing effect with them, it is necessary to use a mixing ratio of 1 to 2 vol% of short fibers. This increased short fiber mixing ratio reduces the fluidity of the fresh concrete, it becomes necessary to increase the water content significantly and simultaneously reduce the coarse aggregate content. This then arouses concern that the increased mortar content will lead to an increase drying shrinkage during drying (Ono et al. 2004).
In addition, it has been reported that chloride ions permeate poorly mixed concrete easily, regardless of which short fiber is used (Sasaki et al. 2016). In this regard, it has been pointed out that the effects of fiber content, crack width, exposure conditions and duration, fiber properties, and concrete quality on the durability of fiber reinforced concrete have not been satisfactorily clarified (Paul et al. 2020).
Therefore, the authors have been researching means to provide light and very strong PC slabs using light-weight aggregate concrete mixed with short PVA fibers. The reason for focusing on short PVA fibers is that it has been confirmed that RC members have excellent shear capacity and durability (Ito et al. 2014, 2018). Previous studies confirmed that PC slabs made of lightweight aggregate concrete mixed with 0.5 vol% of short PVA fibers (hereinafter, FLPC slab) results in a concrete den-sity of 19.0 kN/m3 or less even in one-way prestressed slabs, and that these slabs have the same punching shear capacity as those made of normal weight concrete (Ki-tano et al. 2018).
During this investigation, the mechanical strength and resistance to chloride ion penetration of lightweight aggregate concrete mixed with short PVA fibers were examined in detail using material tests (Sections 2 and 3). In Sections 4 and 5, we report on the load tests we carried out on various slabs to examine the punching shear behavior in detail. The ACI formula (ACI 2014), Eurocode 2 formula (CEN 2004) and JSCE formula (JSCE 2018) are available for calculating punching shear strength. Since these equations do not correspond to the factors of prestress, lightweight aggregate and short fibers, their use for these analyses had to be con-firmed experimentally. The experimental values were compared using the JCSE formula, which can be used to
evaluate the punching shear capacity accurately (Hamada et al. 2008). In addition, although there are many analytical studies on the punching shear behavior of RC slabs, for example by Goh et al. (2018) and Vi-dosa et al. (1988), there are few cases focusing on the combination of prestress (Mostafaei et al. 2011), light-weight aggregate (Mon et al. 2018) and short fibers (Ito et al. 2005) taken together. Therefore, nonlinear finite element analysis was performed to verify the punching shear capacity and load bearing mechanism of FLPC slabs (Section 6).
2. Methods of material tests
2.1 Target quality Table 1 shows the target quality of fiber reinforced lightweight concrete. The target for compressive strength was to achieve 35 N/mm2 in one day and 50 N/mm2 in 28 days. Prestressing is introduced at a mate-rial age of one day, so as not to impair the productivity of PC slabs. The concrete density was set to 20% lighter than normal weight concrete, and the Young's modulus and tensile strength were set to about 70%. In addition, the target of the resistance to chloride ion penetration of fiber reinforced lightweight concrete was set to a level similar to that of normal weight concrete. 2.2 Materials and concrete mix proportions Table 2 shows the materials used for making concrete. In order to obtain the specified initial strength, high-early-strength Portland cement was used. As lightweight aggregate, artificial lightweight coarse ag-
Table 2 Materials. Materials Symbol Density (g/cm3)
High-early-strength portland cement C 3.14
Fine aggregate S I and II: 2.64*, III: 2.67*Normal coarse
aggregate N I and II: 2.66*, III: 2.70*
Lightweight coarse aggregate** L 1.29±0.05***
Short PVA fibers F 1.30 *Saturated surface-dry condition. **24-hour water absorption of 10±3%. *** Absolutely dry condition.
Table 1 Target quality of fiber reinforced lightweight concrete.
Quality Target value
Compressive strength Design strength: 50 N/mm2
When being prestressed: 35 N/mm2
Young's modulus 22.0 kN/mm2 (28 days) Tensile strength 2.2 N/ mm2 or more (28 days) Concrete density 19.0 kN/m3 or less (After mixing)
Homogeneity Equivalent to that of normal weight concrete
Resistance to chloride ion penetration
Equivalent to that of normal weight concrete
Y. Kitano, H. Ito and S. Suzuki / Journal of Advanced Concrete Technology Vol. 19, 1227-1244, 2021 1229
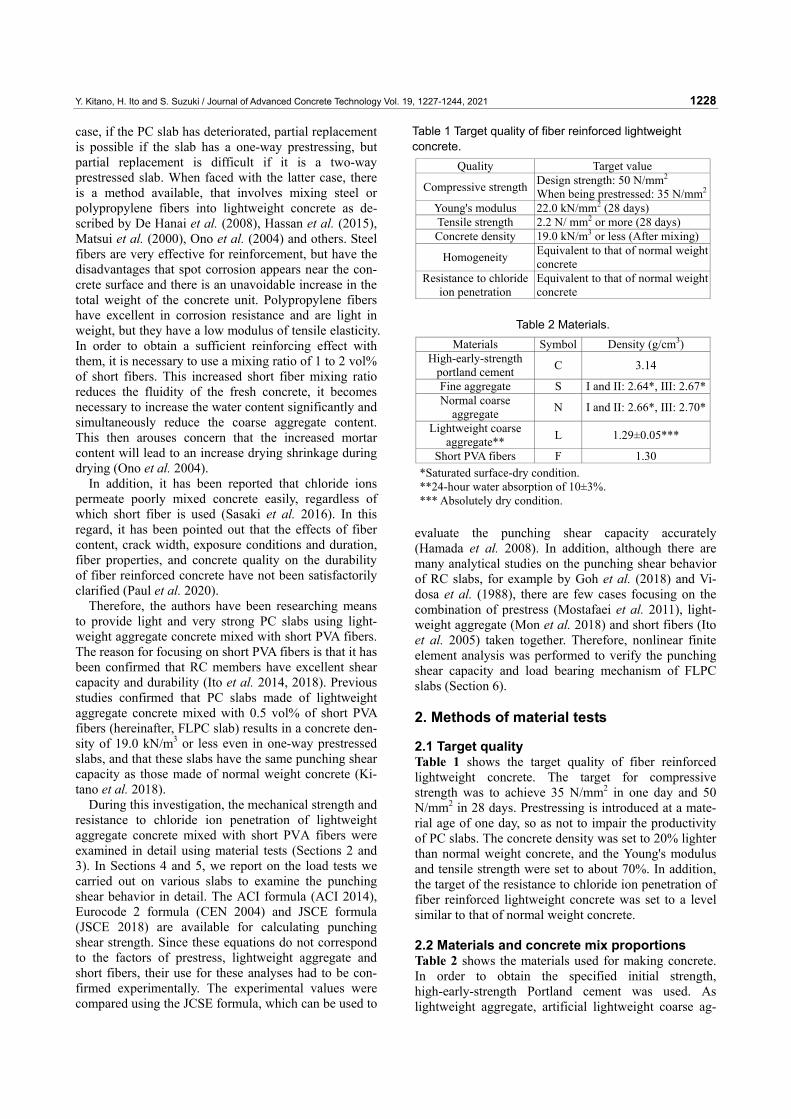
gregate with a maximum size of 15 mm was used (see Fig. 2, left side). Lightweight aggregate may not have sufficient resistance to frost damage when used as AE concrete. It was reported in a previous study that a du-rability index of 90% or more is obtained when the total moisture content of lightweight aggregate is within the range of 0 to 5% (Tachibana et al., 1994). Therefore, the lightweight aggregate used was controlled to have a total moisture content of 2% or less. Table 3 shows the physical properties of short PVA fibers. Short PVA fi-bers with a tensile modulus of elasticity equal to or higher than the Young's modulus of lightweight aggre-gate concrete and a length of 30 mm were used in con-sideration of the cross-linking effect of the fibers (see Fig. 2, right side).
Table 4 shows the concrete mix proportions used in this study. In experiment I, trial mixing was performed on normal weight concrete (N) and lightweight aggre-gate concrete (LA, LB and LC) with different wa-ter-cement ratios to determine the base concrete mix proportion. In experiment II, trial mixing was performed to identify the effects of fiber content on the develop-ment of high strength. In this trial mixing, the quantity
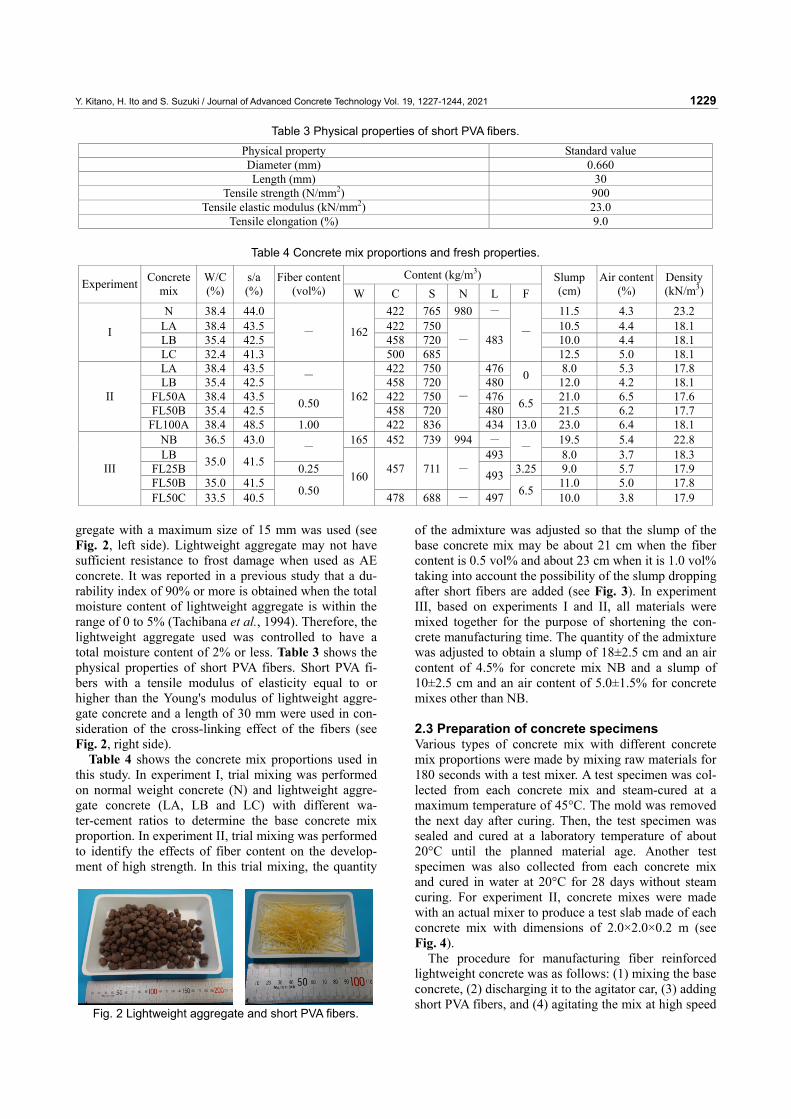
of the admixture was adjusted so that the slump of the base concrete mix may be about 21 cm when the fiber content is 0.5 vol% and about 23 cm when it is 1.0 vol% taking into account the possibility of the slump dropping after short fibers are added (see Fig. 3). In experiment III, based on experiments I and II, all materials were mixed together for the purpose of shortening the con-crete manufacturing time. The quantity of the admixture was adjusted to obtain a slump of 18±2.5 cm and an air content of 4.5% for concrete mix NB and a slump of 10±2.5 cm and an air content of 5.0±1.5% for concrete mixes other than NB.
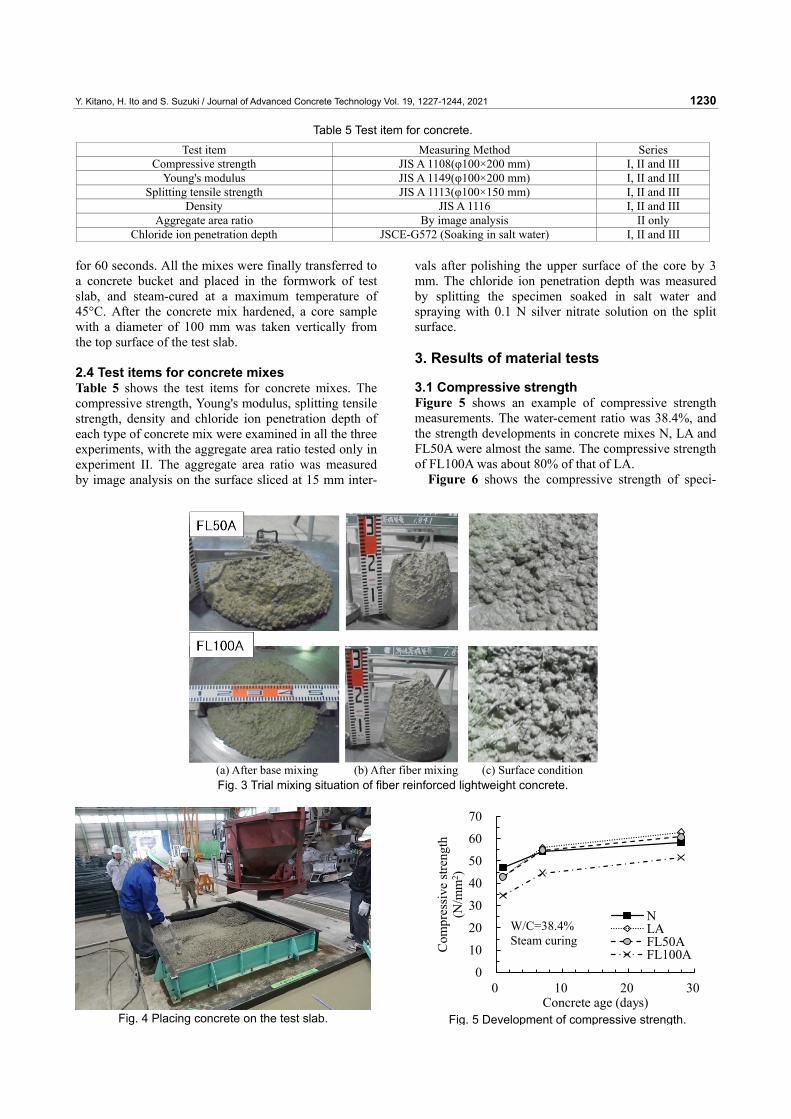
2.3 Preparation of concrete specimens Various types of concrete mix with different concrete mix proportions were made by mixing raw materials for 180 seconds with a test mixer. A test specimen was col-lected from each concrete mix and steam-cured at a maximum temperature of 45°C. The mold was removed the next day after curing. Then, the test specimen was sealed and cured at a laboratory temperature of about 20°C until the planned material age. Another test specimen was also collected from each concrete mix and cured in water at 20°C for 28 days without steam curing. For experiment II, concrete mixes were made with an actual mixer to produce a test slab made of each concrete mix with dimensions of 2.0×2.0×0.2 m (see Fig. 4).
The procedure for manufacturing fiber reinforced lightweight concrete was as follows: (1) mixing the base concrete, (2) discharging it to the agitator car, (3) adding short PVA fibers, and (4) agitating the mix at high speed
Table 4 Concrete mix proportions and fresh properties.
Content (kg/m3) Experiment Concrete
mix W/C (%)
s/a (%)
Fiber content (vol%) W C S N L F
Slump (cm)
Air content (%)
Density(kN/m3)
N 38.4 44.0 422 765 980 - 11.5 4.3 23.2 LA 38.4 43.5 422 750 10.5 4.4 18.1 LB 35.4 42.5 458 720 10.0 4.4 18.1
I
LC 32.4 41.3
- 162
500 685- 483 -
12.5 5.0 18.1 LA 38.4 43.5 422 750 476 8.0 5.3 17.8 LB 35.4 42.5 - 458 720 480 0 12.0 4.2 18.1
FL50A 38.4 43.5 422 750 476 21.0 6.5 17.6 FL50B 35.4 42.5 0.50 458 720 480 6.5 21.5 6.2 17.7
II
FL100A 38.4 48.5 1.00
162
422 836
-
434 13.0 23.0 6.4 18.1 NB 36.5 43.0 165 452 739 994 - 19.5 5.4 22.8 LB
- 493
-8.0 3.7 18.3
FL25B 35.0 41.5 0.25 3.25 9.0 5.7 17.9 FL50B 35.0 41.5
457 711 - 493 11.0 5.0 17.8 III
FL50C 33.5 40.5 0.50 160
478 688 - 497 6.5 10.0 3.8 17.9
Table 3 Physical properties of short PVA fibers. Physical property Standard value Diameter (mm) 0.660 Length (mm) 30
Tensile strength (N/mm2) 900 Tensile elastic modulus (kN/mm2) 23.0
Tensile elongation (%) 9.0
Fig. 2 Lightweight aggregate and short PVA fibers.
Y. Kitano, H. Ito and S. Suzuki / Journal of Advanced Concrete Technology Vol. 19, 1227-1244, 2021 1230
for 60 seconds. All the mixes were finally transferred to a concrete bucket and placed in the formwork of test slab, and steam-cured at a maximum temperature of 45°C. After the concrete mix hardened, a core sample with a diameter of 100 mm was taken vertically from the top surface of the test slab.
2.4 Test items for concrete mixes Table 5 shows the test items for concrete mixes. The compressive strength, Young's modulus, splitting tensile strength, density and chloride ion penetration depth of each type of concrete mix were examined in all the three experiments, with the aggregate area ratio tested only in experiment II. The aggregate area ratio was measured by image analysis on the surface sliced at 15 mm inter-
vals after polishing the upper surface of the core by 3 mm. The chloride ion penetration depth was measured by splitting the specimen soaked in salt water and spraying with 0.1 N silver nitrate solution on the split surface. 3. Results of material tests
3.1 Compressive strength Figure 5 shows an example of compressive strength measurements. The water-cement ratio was 38.4%, and the strength developments in concrete mixes N, LA and FL50A were almost the same. The compressive strength of FL100A was about 80% of that of LA.
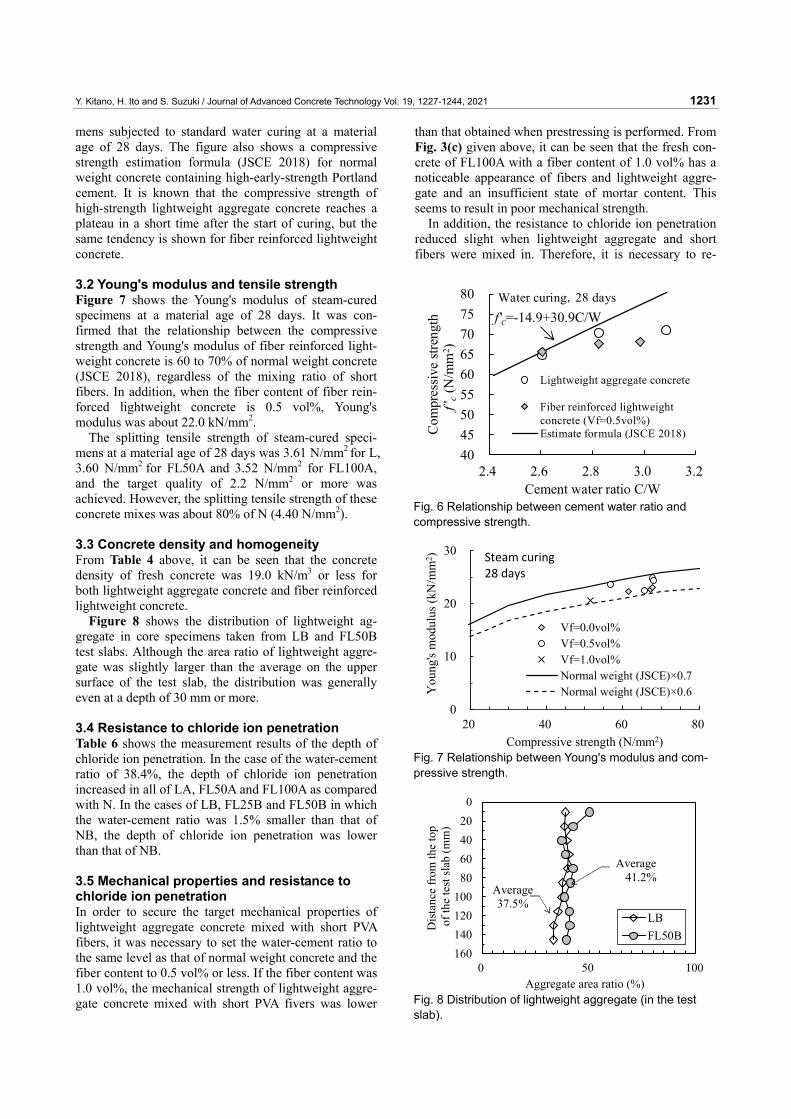
Figure 6 shows the compressive strength of speci-
Table 5 Test item for concrete. Test item Measuring Method Series
Compressive strength JIS A 1108(φ100×200 mm) I, II and III Young's modulus JIS A 1149(φ100×200 mm) I, II and III
Splitting tensile strength JIS A 1113(φ100×150 mm) I, II and III Density JIS A 1116 I, II and III
Aggregate area ratio By image analysis II only Chloride ion penetration depth JSCE-G572 (Soaking in salt water) I, II and III
(a) After base mixing (b) After fiber mixing (c) Surface condition
Fig. 3 Trial mixing situation of fiber reinforced lightweight concrete.
0
10
20
30
40
50
60
70
0 10 20 30
Com
pres
sive
stre
ngth
(N
/mm
2 )
Concrete age (days)
NLAFL50AFL100A
W/C=38.4%Steam curing
Fig. 5 Development of compressive strength.Fig. 4 Placing concrete on the test slab.
Y. Kitano, H. Ito and S. Suzuki / Journal of Advanced Concrete Technology Vol. 19, 1227-1244, 2021 1231
mens subjected to standard water curing at a material age of 28 days. The figure also shows a compressive strength estimation formula (JSCE 2018) for normal weight concrete containing high-early-strength Portland cement. It is known that the compressive strength of high-strength lightweight aggregate concrete reaches a plateau in a short time after the start of curing, but the same tendency is shown for fiber reinforced lightweight concrete.
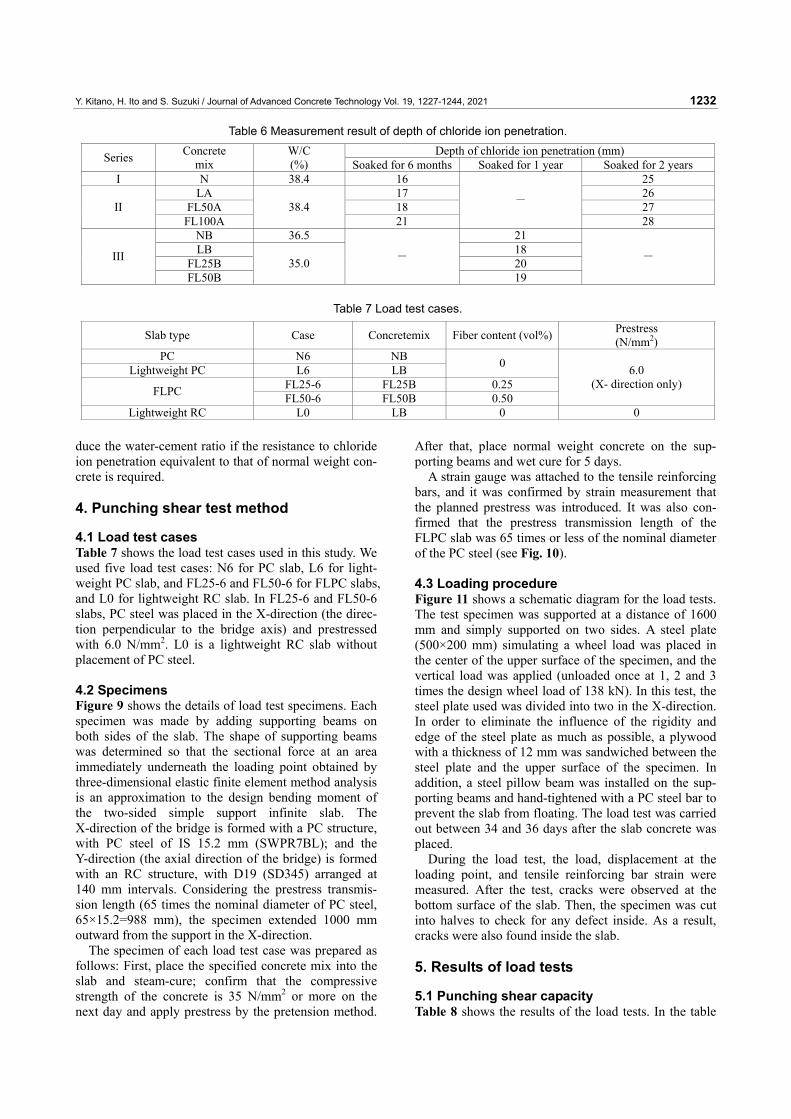
3.2 Young's modulus and tensile strength Figure 7 shows the Young's modulus of steam-cured specimens at a material age of 28 days. It was con-firmed that the relationship between the compressive strength and Young's modulus of fiber reinforced light-weight concrete is 60 to 70% of normal weight concrete (JSCE 2018), regardless of the mixing ratio of short fibers. In addition, when the fiber content of fiber rein-forced lightweight concrete is 0.5 vol%, Young's modulus was about 22.0 kN/mm2.
The splitting tensile strength of steam-cured speci-mens at a material age of 28 days was 3.61 N/mm2 for L, 3.60 N/mm2 for FL50A and 3.52 N/mm2 for FL100A, and the target quality of 2.2 N/mm2 or more was achieved. However, the splitting tensile strength of these concrete mixes was about 80% of N (4.40 N/mm2).
3.3 Concrete density and homogeneity From Table 4 above, it can be seen that the concrete density of fresh concrete was 19.0 kN/m3 or less for both lightweight aggregate concrete and fiber reinforced lightweight concrete.
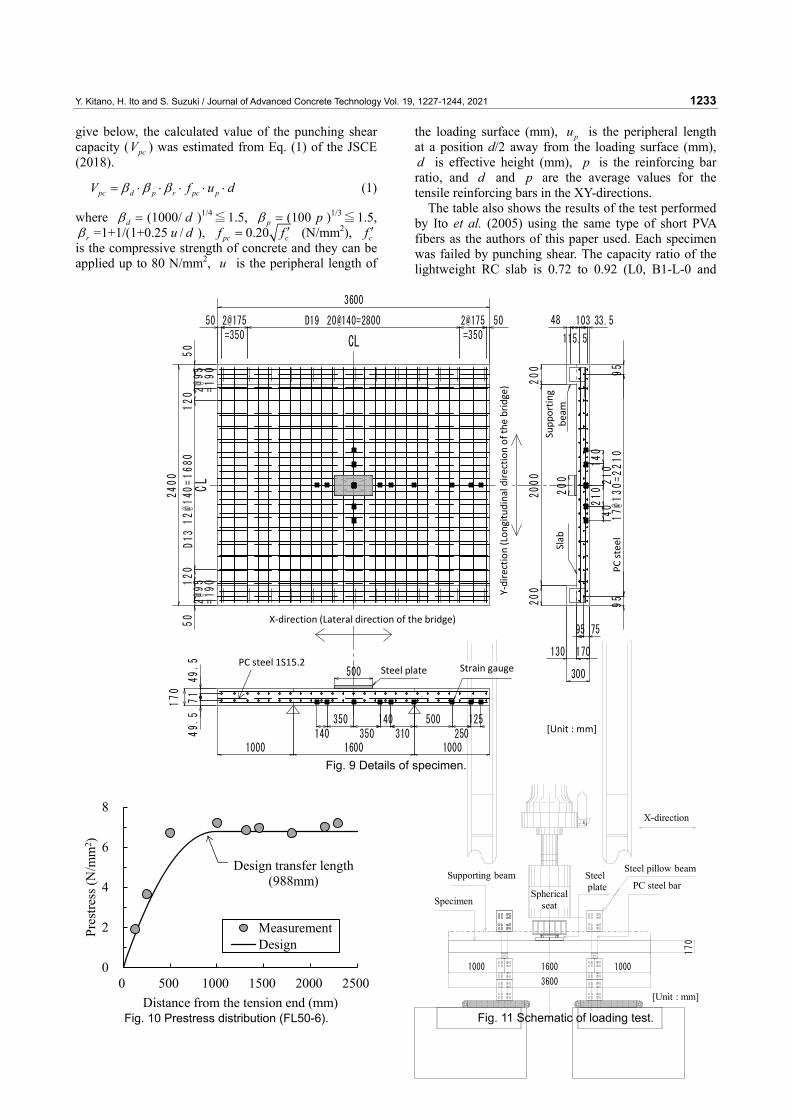
Figure 8 shows the distribution of lightweight ag-gregate in core specimens taken from LB and FL50B test slabs. Although the area ratio of lightweight aggre-gate was slightly larger than the average on the upper surface of the test slab, the distribution was generally even at a depth of 30 mm or more.
3.4 Resistance to chloride ion penetration Table 6 shows the measurement results of the depth of chloride ion penetration. In the case of the water-cement ratio of 38.4%, the depth of chloride ion penetration increased in all of LA, FL50A and FL100A as compared with N. In the cases of LB, FL25B and FL50B in which the water-cement ratio was 1.5% smaller than that of NB, the depth of chloride ion penetration was lower than that of NB. 3.5 Mechanical properties and resistance to chloride ion penetration In order to secure the target mechanical properties of lightweight aggregate concrete mixed with short PVA fibers, it was necessary to set the water-cement ratio to the same level as that of normal weight concrete and the fiber content to 0.5 vol% or less. If the fiber content was 1.0 vol%, the mechanical strength of lightweight aggre-gate concrete mixed with short PVA fivers was lower
than that obtained when prestressing is performed. From Fig. 3(c) given above, it can be seen that the fresh con-crete of FL100A with a fiber content of 1.0 vol% has a noticeable appearance of fibers and lightweight aggre-gate and an insufficient state of mortar content. This seems to result in poor mechanical strength.
In addition, the resistance to chloride ion penetration reduced slight when lightweight aggregate and short fibers were mixed in. Therefore, it is necessary to re-
404550556065707580
2.4 2.6 2.8 3.0 3.2
Com
pres
sive
stren
gth
f'c
(N/m
m2 )
Cement water ratio C/W
Lightweight aggregate concrete
Fiber reinforced lightweightconcrete (Vf=0.5vol%)Estimate formula (JSCE 2018)
f 'c=-14.9+30.9C/WWater curing,28 days
Fig. 6 Relationship between cement water ratio and compressive strength.
020406080
100120140160
0 50 100
Dis
tanc
e fr
om th
e to
pof
the
test
slab
(mm
)
Aggregate area ratio (%)
LBFL50B
Average41.2%
Average37.5%
Fig. 8 Distribution of lightweight aggregate (in the test slab).
0
10
20
30
20 40 60 80
You
ng's
mod
ulus
(kN
/mm
2 )
Compressive strength (N/mm2)
Vf=0.0vol%Vf=0.5vol%Vf=1.0vol%Normal weight (JSCE)×0.7Normal weight (JSCE)×0.6
Steam curing28 days
Fig. 7 Relationship between Young's modulus and com-pressive strength.
Y. Kitano, H. Ito and S. Suzuki / Journal of Advanced Concrete Technology Vol. 19, 1227-1244, 2021 1232
duce the water-cement ratio if the resistance to chloride ion penetration equivalent to that of normal weight con-crete is required.
4. Punching shear test method
4.1 Load test cases Table 7 shows the load test cases used in this study. We used five load test cases: N6 for PC slab, L6 for light-weight PC slab, and FL25-6 and FL50-6 for FLPC slabs, and L0 for lightweight RC slab. In FL25-6 and FL50-6 slabs, PC steel was placed in the X-direction (the direc-tion perpendicular to the bridge axis) and prestressed with 6.0 N/mm2. L0 is a lightweight RC slab without placement of PC steel. 4.2 Specimens Figure 9 shows the details of load test specimens. Each specimen was made by adding supporting beams on both sides of the slab. The shape of supporting beams was determined so that the sectional force at an area immediately underneath the loading point obtained by three-dimensional elastic finite element method analysis is an approximation to the design bending moment of the two-sided simple support infinite slab. The X-direction of the bridge is formed with a PC structure, with PC steel of IS 15.2 mm (SWPR7BL); and the Y-direction (the axial direction of the bridge) is formed with an RC structure, with D19 (SD345) arranged at 140 mm intervals. Considering the prestress transmis-sion length (65 times the nominal diameter of PC steel, 65×15.2=988 mm), the specimen extended 1000 mm outward from the support in the X-direction.
The specimen of each load test case was prepared as follows: First, place the specified concrete mix into the slab and steam-cure; confirm that the compressive strength of the concrete is 35 N/mm2 or more on the next day and apply prestress by the pretension method.
After that, place normal weight concrete on the sup-porting beams and wet cure for 5 days.
A strain gauge was attached to the tensile reinforcing bars, and it was confirmed by strain measurement that the planned prestress was introduced. It was also con-firmed that the prestress transmission length of the FLPC slab was 65 times or less of the nominal diameter of the PC steel (see Fig. 10).
4.3 Loading procedure Figure 11 shows a schematic diagram for the load tests. The test specimen was supported at a distance of 1600 mm and simply supported on two sides. A steel plate (500×200 mm) simulating a wheel load was placed in the center of the upper surface of the specimen, and the vertical load was applied (unloaded once at 1, 2 and 3 times the design wheel load of 138 kN). In this test, the steel plate used was divided into two in the X-direction. In order to eliminate the influence of the rigidity and edge of the steel plate as much as possible, a plywood with a thickness of 12 mm was sandwiched between the steel plate and the upper surface of the specimen. In addition, a steel pillow beam was installed on the sup-porting beams and hand-tightened with a PC steel bar to prevent the slab from floating. The load test was carried out between 34 and 36 days after the slab concrete was placed.
During the load test, the load, displacement at the loading point, and tensile reinforcing bar strain were measured. After the test, cracks were observed at the bottom surface of the slab. Then, the specimen was cut into halves to check for any defect inside. As a result, cracks were also found inside the slab.
5. Results of load tests
5.1 Punching shear capacity Table 8 shows the results of the load tests. In the table
Table 7 Load test cases.
Slab type Case Concretemix Fiber content (vol%) Prestress (N/mm2)
PC N6 NB Lightweight PC L6 LB 0
FL25-6 FL25B 0.25 FLPC FL50-6 FL50B 0.50
6.0 (X- direction only)
Lightweight RC L0 LB 0 0
Table 6 Measurement result of depth of chloride ion penetration. Depth of chloride ion penetration (mm) Series Concrete
mix W/C (%) Soaked for 6 months Soaked for 1 year Soaked for 2 years
I N 38.4 16 25 LA 17 26
FL50A 18 27 II FL100A
38.4 21
-
28 NB 36.5 21 LB 18
FL25B 20 III
FL50B 35.0 -
19
-
Y. Kitano, H. Ito and S. Suzuki / Journal of Advanced Concrete Technology Vol. 19, 1227-1244, 2021 1233
give below, the calculated value of the punching shear capacity ( pcV ) was estimated from Eq. (1) of the JSCE (2018).
pc d p r pc pV f u dβ β β= ⋅ ⋅ ⋅ ⋅ ⋅ (1)
where dβ = (1000/ d )1/4≦1.5, pβ = (100 p )1/3≦1.5, rβ =1+1/(1+0.25 /u d ), 0.20pc cf f= ′ (N/mm2), cf ′
is the compressive strength of concrete and they can be applied up to 80 N/mm2, u is the peripheral length of
the loading surface (mm), pu is the peripheral length at a position d/2 away from the loading surface (mm), d is effective height (mm), p is the reinforcing bar ratio, and d and p are the average values for the tensile reinforcing bars in the XY-directions.
The table also shows the results of the test performed by Ito et al. (2005) using the same type of short PVA fibers as the authors of this paper used. Each specimen was failed by punching shear. The capacity ratio of the lightweight RC slab is 0.72 to 0.92 (L0, B1-L-0 and
試験体
170
球座載荷板(下に合板)
PC鋼棒地覆
橋軸直角方向
鋼製枕梁(H300)
1000 1600 1000
3600
Specimen
Supporting beam
X-direction
PC steel barSpherical
seat
Steelplate
Steel pillow beam
[Unit : mm]
Fig. 11 Schematic of loading test.
0
2
4
6
8
0 500 1000 1500 2000 2500
Pres
tress
(N/m
m2 )
Distance from the tension end (mm)
MeasurementDesign
Design transfer length(988mm)
Fig. 10 Prestress distribution (FL50-6).
CL
3600
2400
7595
170
33.5103
50
50
2000
95
17@
130=2210
95
49.
571
49.5
170
50 20@140=2800 502@175=350
2@175=350
16001000 1000
2@9
5=19
0
12@140
=1680
2@95
=190
130
48
300
200
200
120
120
115.5
200
500 載荷板
地覆
床版
[単位:㎜]
CL
橋軸直角方向(X方向)
橋軸
方向
(Y方
向)
D13
D19
PC鋼
材
140350
350140
310500
250125
1402
1021014
0
鉄筋ゲージStrain gauge
[Unit : mm]
Steel plate
X‐direction (Lateral direction of the bridge)
Y‐direction (Lon
gitudinal dire
ction of th
e bridge)
Slab
Supp
ortin
g be
am
PCsteel
PC steel 1S15.2
Fig. 9 Details of specimen.
Y. Kitano, H. Ito and S. Suzuki / Journal of Advanced Concrete Technology Vol. 19, 1227-1244, 2021 1234
B3-L-0), and it can be said that the use of lightweight aggregate reduces the punching shear capacity of each slab. The capacity ratio of the PC slab is 1.25 (N6), and the capacity ratio of the lightweight PC slab (L6) is 17% higher than that of the lightweight RC slab (L0). There-fore, it can be said that the introduction of prestress in-creases the punching shear capacity. In addition, since the capacity ratio of FLPC slab (FL50-6) increases by 34% compared to lightweight PC slab (L6), it is safe to say that the mixing of short fibers increases the punch-ing shear capacity. By the way, the effect of short fibers
increasing the capacity ratio was more pronounced in the PC slab (authors, increased by 34% with a fiber content of 0.5 vol%) than in the RC slab (Ito et al. 2005, increased by 27% with a fiber content of 1.0 vol%).
5.2 Relationship between load and loading-point displacement Figure 12 shows the relationship between the load and the displacement of the loading point. L0 cracked in two directions with a load of 50 to 60 kN and failed when the loading point displacement reached 12.5 mm. In prestress-introduced specimens, X-direction cracks oc-curred at a load of 60 to 80 kN and Y-direction cracks occurred at 260 to 320 kN, and then each specimen failed without causing much increase in displacement. The initial stiffness of L6, FL25-6 and FL50-6 is smaller than that of N6 because of the small Young's modulus of the concrete mix using lightweight aggre-gate.
Figure 13 shows the situation at the maximum dis-placement of FL50-6. The loads of N6 and L6 dropped sharply after the maximum load. FL25-6 and FL50-6 maintained a capacity of about 3 times the design wheel load until a displacement of 20 mm or more occurred even after punching.
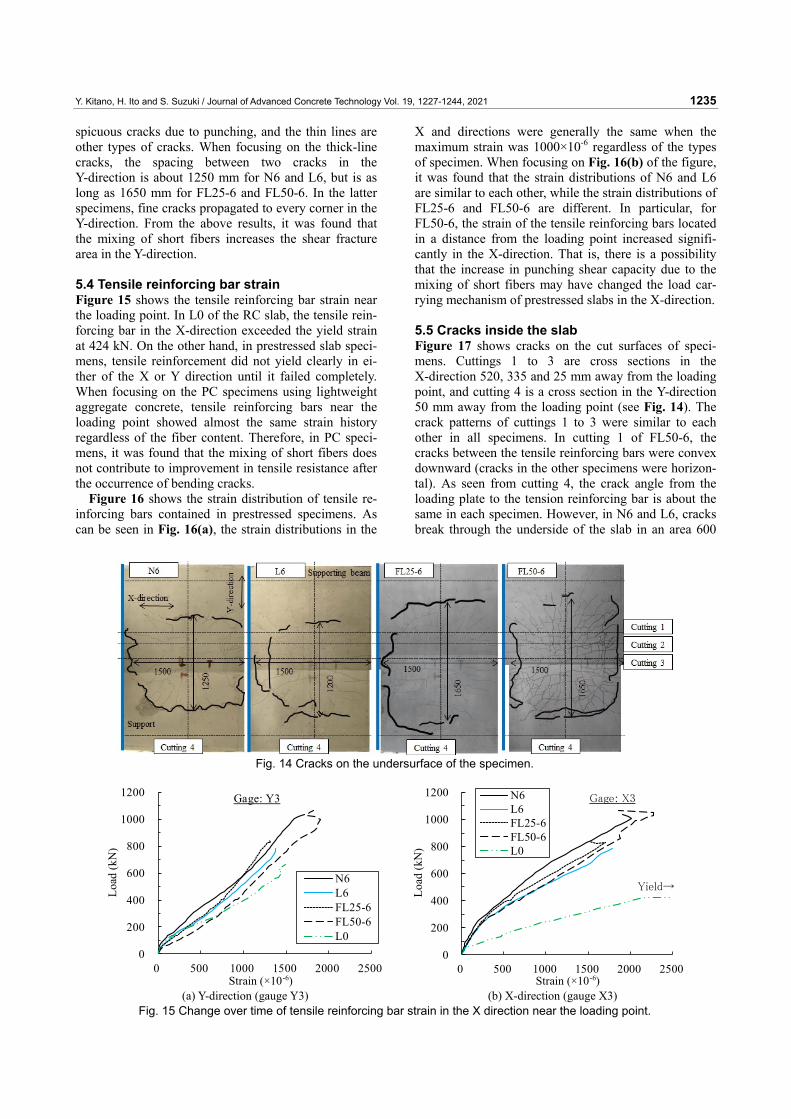
5.3 Cracks on the undersurface of the slab Figure 14 shows the cracks on the bottom surface of prestressed slab specimens. The thick lines are con-
Table 8 Results of loading test.
d p u Prestress Density Fiber content cf ′ Punching shear
capacity (kN) Case mm % mm N/mm2 kg/m3 vol% N/mm2
expV pcV *
Capacity ratio
expV / pcVFracture mode**
N6 2380 0.00 70.6 1037 831 1.25 PS1 L6 1820 0.00 52.6 784 717 1.09 PS1
FL25-6 1820 0.25 57.6 838 751 1.12 PS3 FL50-6
6.0
1820 0.50 56.7 1062 745 1.43 PS3 This work
L0
128.5 1.18 1400
0.0 1820 0.00 52.6 660 717 0.92 PS1 B1-L-0 0.00 37.6 713 919 0.78 PS1 B1-L-1 120 1.00 37.1 960 913 1.05 PS2 B3-L-0 0.00 37.6 1131 1565 0.72 PS1
Ito et al. (2005)
B3-L-1 180 1.60 2600 0.0 1770
1.00 37.1 1545 1554 0.99 PS2 * pcV was calculated from eq. (1). **PS1: Punching shear failure due to the development of diagonal cracks, PS2: Punching shear failure after new cracks are gener-ated on the outside of diagonal cracks, PS3: Punching shear failure after new cracks are generated inside the slab without the di-agonal cracks reaching the bottom surface of the slab.
(a) Near the loading point (b) Undersurface of the specimen
Fig. 13 Situation at maximum displacement of FL50-6.
N6
L6 FL25-6
FL50-6
0
200
400
600
800
1000
1200
0 5 10 15 20
Load
(kN
)
Displacement of loading point (mm)
Punching failure
L0
Fig. 12 Relationship between load and load-point dis-placement in load test.
Y. Kitano, H. Ito and S. Suzuki / Journal of Advanced Concrete Technology Vol. 19, 1227-1244, 2021 1235
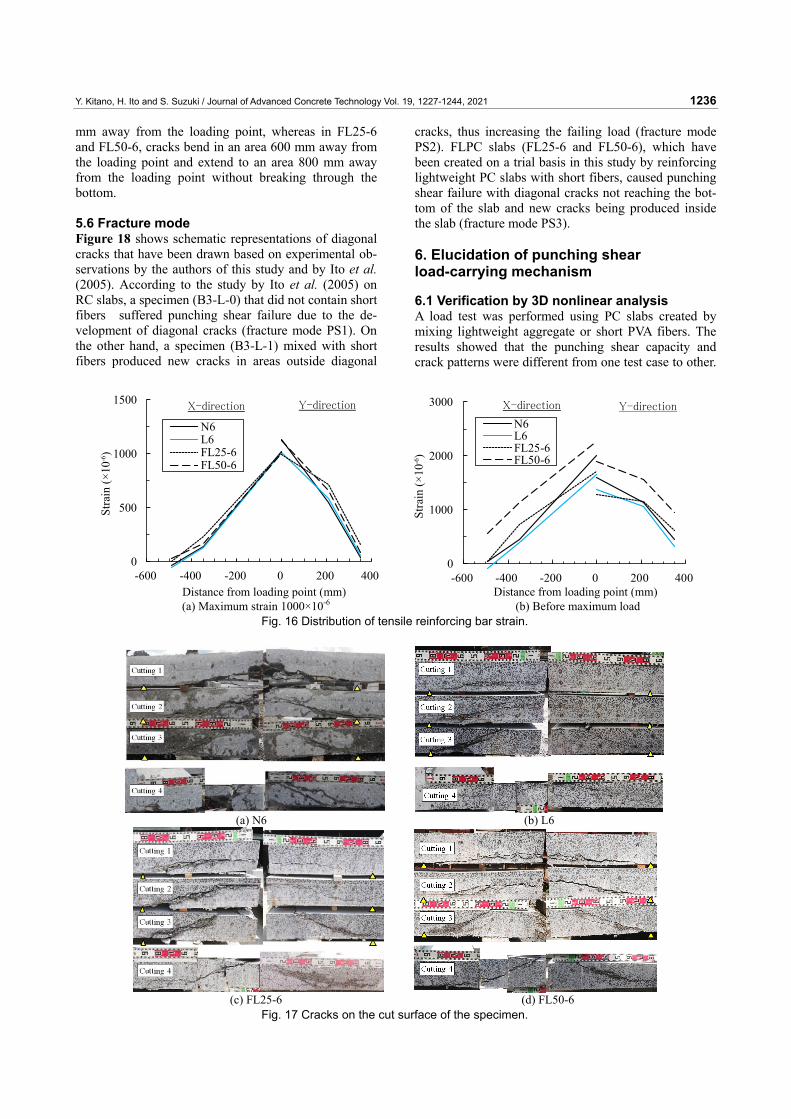
spicuous cracks due to punching, and the thin lines are other types of cracks. When focusing on the thick-line cracks, the spacing between two cracks in the Y-direction is about 1250 mm for N6 and L6, but is as long as 1650 mm for FL25-6 and FL50-6. In the latter specimens, fine cracks propagated to every corner in the Y-direction. From the above results, it was found that the mixing of short fibers increases the shear fracture area in the Y-direction. 5.4 Tensile reinforcing bar strain Figure 15 shows the tensile reinforcing bar strain near the loading point. In L0 of the RC slab, the tensile rein-forcing bar in the X-direction exceeded the yield strain at 424 kN. On the other hand, in prestressed slab speci-mens, tensile reinforcement did not yield clearly in ei-ther of the X or Y direction until it failed completely. When focusing on the PC specimens using lightweight aggregate concrete, tensile reinforcing bars near the loading point showed almost the same strain history regardless of the fiber content. Therefore, in PC speci-mens, it was found that the mixing of short fibers does not contribute to improvement in tensile resistance after the occurrence of bending cracks.
Figure 16 shows the strain distribution of tensile re-inforcing bars contained in prestressed specimens. As can be seen in Fig. 16(a), the strain distributions in the
X and directions were generally the same when the maximum strain was 1000×10-6 regardless of the types of specimen. When focusing on Fig. 16(b) of the figure, it was found that the strain distributions of N6 and L6 are similar to each other, while the strain distributions of FL25-6 and FL50-6 are different. In particular, for FL50-6, the strain of the tensile reinforcing bars located in a distance from the loading point increased signifi-cantly in the X-direction. That is, there is a possibility that the increase in punching shear capacity due to the mixing of short fibers may have changed the load car-rying mechanism of prestressed slabs in the X-direction.
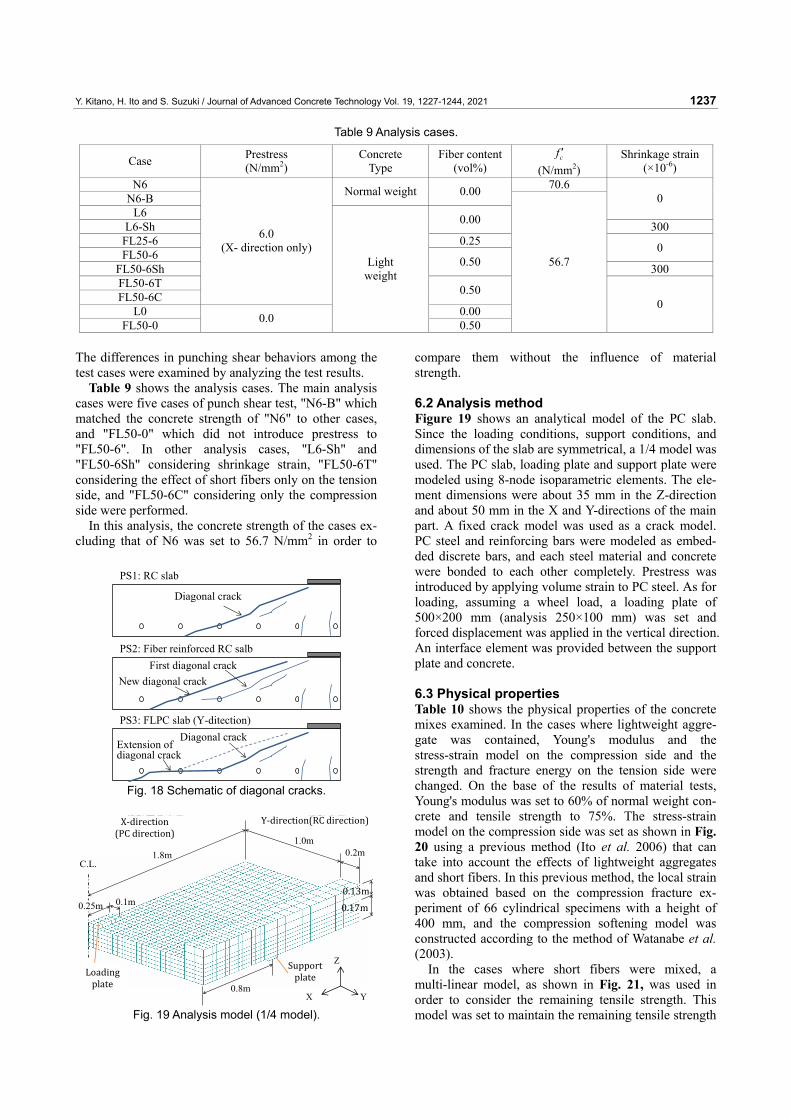
5.5 Cracks inside the slab Figure 17 shows cracks on the cut surfaces of speci-mens. Cuttings 1 to 3 are cross sections in the X-direction 520, 335 and 25 mm away from the loading point, and cutting 4 is a cross section in the Y-direction 50 mm away from the loading point (see Fig. 14). The crack patterns of cuttings 1 to 3 were similar to each other in all specimens. In cutting 1 of FL50-6, the cracks between the tensile reinforcing bars were convex downward (cracks in the other specimens were horizon-tal). As seen from cutting 4, the crack angle from the loading plate to the tension reinforcing bar is about the same in each specimen. However, in N6 and L6, cracks break through the underside of the slab in an area 600
Fig. 14 Cracks on the undersurface of the specimen.
0
200
400
600
800
1000
1200
0 500 1000 1500 2000 2500
Load
(kN
)
Strain (×10
N6L6FL25-6FL50-6L0
Gage: Y3
-6)
0
200
400
600
800
1000
1200
0 500 1000 1500 2000 2500
Load
(kN
)
N6L6FL25-6FL50-6L0
Gage: X3
Yield→
Strain (×10-6) (a) Y-direction (gauge Y3) (b) X-direction (gauge X3)
Fig. 15 Change over time of tensile reinforcing bar strain in the X direction near the loading point.
Y. Kitano, H. Ito and S. Suzuki / Journal of Advanced Concrete Technology Vol. 19, 1227-1244, 2021 1236
mm away from the loading point, whereas in FL25-6 and FL50-6, cracks bend in an area 600 mm away from the loading point and extend to an area 800 mm away from the loading point without breaking through the bottom. 5.6 Fracture mode Figure 18 shows schematic representations of diagonal cracks that have been drawn based on experimental ob-servations by the authors of this study and by Ito et al. (2005). According to the study by Ito et al. (2005) on RC slabs, a specimen (B3-L-0) that did not contain short fibers suffered punching shear failure due to the de-velopment of diagonal cracks (fracture mode PS1). On the other hand, a specimen (B3-L-1) mixed with short fibers produced new cracks in areas outside diagonal
cracks, thus increasing the failing load (fracture mode PS2). FLPC slabs (FL25-6 and FL50-6), which have been created on a trial basis in this study by reinforcing lightweight PC slabs with short fibers, caused punching shear failure with diagonal cracks not reaching the bot-tom of the slab and new cracks being produced inside the slab (fracture mode PS3). 6. Elucidation of punching shear load-carrying mechanism
6.1 Verification by 3D nonlinear analysis A load test was performed using PC slabs created by mixing lightweight aggregate or short PVA fibers. The results showed that the punching shear capacity and crack patterns were different from one test case to other.
(a) N6 (b) L6
(c) FL25-6 (d) FL50-6
Fig. 17 Cracks on the cut surface of the specimen.
0
500
1000
1500
-600 -400 -200 0 200 400
Stra
in (×
10-6)
Distance from loading point (mm)
N6L6FL25-6FL50-6
Y-directionX-direction
0
1000
2000
3000
-600 -400 -200 0 200 400
Stra
in (×
10-6)
Distance from loading point (mm)
N6L6FL25-6FL50-6
X-direction Y-direction
(a) Maximum strain 1000×10-6 (b) Before maximum load
Fig. 16 Distribution of tensile reinforcing bar strain.
Y. Kitano, H. Ito and S. Suzuki / Journal of Advanced Concrete Technology Vol. 19, 1227-1244, 2021 1237
The differences in punching shear behaviors among the test cases were examined by analyzing the test results.
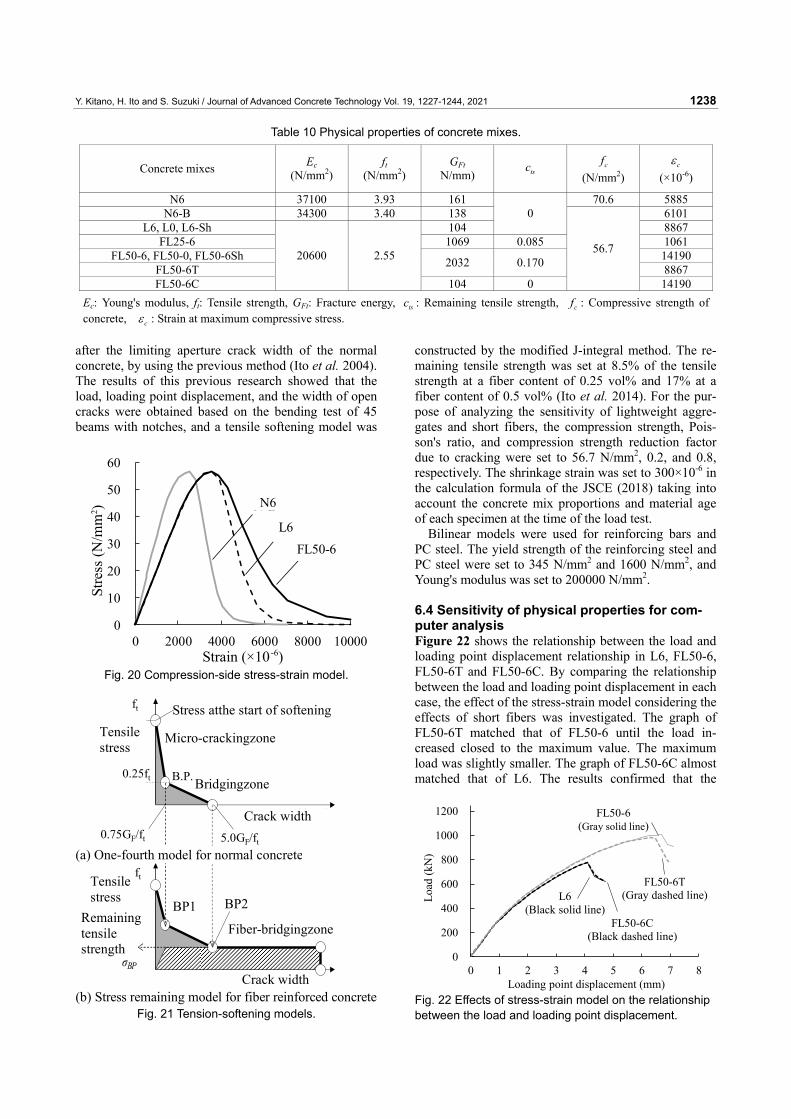
Table 9 shows the analysis cases. The main analysis cases were five cases of punch shear test, "N6-B" which matched the concrete strength of "N6" to other cases, and "FL50-0" which did not introduce prestress to "FL50-6". In other analysis cases, "L6-Sh" and "FL50-6Sh" considering shrinkage strain, "FL50-6T" considering the effect of short fibers only on the tension side, and "FL50-6C" considering only the compression side were performed.
In this analysis, the concrete strength of the cases ex-cluding that of N6 was set to 56.7 N/mm2 in order to
compare them without the influence of material strength.
6.2 Analysis method Figure 19 shows an analytical model of the PC slab. Since the loading conditions, support conditions, and dimensions of the slab are symmetrical, a 1/4 model was used. The PC slab, loading plate and support plate were modeled using 8-node isoparametric elements. The ele-ment dimensions were about 35 mm in the Z-direction and about 50 mm in the X and Y-directions of the main part. A fixed crack model was used as a crack model. PC steel and reinforcing bars were modeled as embed-ded discrete bars, and each steel material and concrete were bonded to each other completely. Prestress was introduced by applying volume strain to PC steel. As for loading, assuming a wheel load, a loading plate of 500×200 mm (analysis 250×100 mm) was set and forced displacement was applied in the vertical direction. An interface element was provided between the support plate and concrete. 6.3 Physical properties Table 10 shows the physical properties of the concrete mixes examined. In the cases where lightweight aggre-gate was contained, Young's modulus and the stress-strain model on the compression side and the strength and fracture energy on the tension side were changed. On the base of the results of material tests, Young's modulus was set to 60% of normal weight con-crete and tensile strength to 75%. The stress-strain model on the compression side was set as shown in Fig. 20 using a previous method (Ito et al. 2006) that can take into account the effects of lightweight aggregates and short fibers. In this previous method, the local strain was obtained based on the compression fracture ex-periment of 66 cylindrical specimens with a height of 400 mm, and the compression softening model was constructed according to the method of Watanabe et al. (2003).
In the cases where short fibers were mixed, a multi-linear model, as shown in Fig. 21, was used in order to consider the remaining tensile strength. This model was set to maintain the remaining tensile strength
Table 9 Analysis cases.
Case Prestress (N/mm2)
Concrete Type
Fiber content(vol%)
cf ′ (N/mm2)
Shrinkage strain (×10-6)
N6 70.6 N6-B Normal weight 0.00
L6 0
L6-Sh 0.00 300 FL25-6 0.25 FL50-6 0
FL50-6Sh 0.50 300 FL50-6T FL50-6C
6.0 (X- direction only)
0.50
L0 0.00 FL50-0 0.0
Light weight
0.50
56.7
0
橋軸直角方向(PC方向)
0.8m
載荷板
橋軸方向(RC方向)
支持板
0.1m
C.L.
0.25m
1.0m0.2m1.8m
Y
Z
X‐direction(PC direction)
Loading plate
X
0.13m0.17m
Support plate
Y‐direction(RC direction)
Fig. 19 Analysis model (1/4 model).
PS1: RC slab
Diagonal crack
PS2: Fiber reinforced RC salb
PS3: FLPC slab (Y-ditection)
First diagonal crackNew diagonal crack
Diagonal crackExtension of diagonal crack
Fig. 18 Schematic of diagonal cracks.
Y. Kitano, H. Ito and S. Suzuki / Journal of Advanced Concrete Technology Vol. 19, 1227-1244, 2021 1238
after the limiting aperture crack width of the normal concrete, by using the previous method (Ito et al. 2004). The results of this previous research showed that the load, loading point displacement, and the width of open cracks were obtained based on the bending test of 45 beams with notches, and a tensile softening model was
constructed by the modified J-integral method. The re-maining tensile strength was set at 8.5% of the tensile strength at a fiber content of 0.25 vol% and 17% at a fiber content of 0.5 vol% (Ito et al. 2014). For the pur-pose of analyzing the sensitivity of lightweight aggre-gates and short fibers, the compression strength, Pois-son's ratio, and compression strength reduction factor due to cracking were set to 56.7 N/mm2, 0.2, and 0.8, respectively. The shrinkage strain was set to 300×10-6 in the calculation formula of the JSCE (2018) taking into account the concrete mix proportions and material age of each specimen at the time of the load test.
Bilinear models were used for reinforcing bars and PC steel. The yield strength of the reinforcing steel and PC steel were set to 345 N/mm2 and 1600 N/mm2, and Young's modulus was set to 200000 N/mm2.
6.4 Sensitivity of physical properties for com-puter analysis Figure 22 shows the relationship between the load and loading point displacement relationship in L6, FL50-6, FL50-6T and FL50-6C. By comparing the relationship between the load and loading point displacement in each case, the effect of the stress-strain model considering the effects of short fibers was investigated. The graph of FL50-6T matched that of FL50-6 until the load in-creased closed to the maximum value. The maximum load was slightly smaller. The graph of FL50-6C almost matched that of L6. The results confirmed that the
Table 10 Physical properties of concrete mixes.
Concrete mixes Ec (N/mm2)
ft (N/mm2)
GFt N/mm) tsc cf
(N/mm2) cε
(×10-6)
N6 37100 3.93 161 70.6 5885 N6-B 34300 3.40 138 6101
L6, L0, L6-Sh 104 0
8867 FL25-6 1069 0.085 1061
FL50-6, FL50-0, FL50-6Sh 14190 FL50-6T 2032 0.170 8867 FL50-6C
20600 2.55
104 0
56.7
14190 Ec: Young's modulus, ft: Tensile strength, GFt: Fracture energy, tsc : Remaining tensile strength, cf : Compressive strength of concrete, cε : Strain at maximum compressive stress.
0
10
20
30
40
50
60
0 2000 4000 6000 8000 10000
FL50L
N-B
Strain (×10
Stre
ss (N
/mm
2 ) N6
L6FL50-6
-6)Fig. 20 Compression-side stress-strain model.
0
200
400
600
800
1000
1200
0 1 2 3 4 5 6 7 8
Load
(kN
)
Loading point displacement (mm)
FL50-6C(Black dashed line)
L6(Black solid line)
FL50-6T(Gray dashed line)
FL50-6(Gray solid line)
Fig. 22 Effects of stress-strain model on the relationship between the load and loading point displacement.
マイクロクラッキングゾーン
開口ひび割れ幅
引張
応力
軟化開始応力
B.P.
σt
σt
引張
応力
第1B.P.第2B.P.
σBP
5.0 GF /σt限界開口ひび割れ幅
0.75GF/σt
Stress atthe start of softening
Micro-crackingzone
Bridgingzone
Crack width
Crack width
BP2BP1
Fiber-bridgingzone
Tensilestress
ft
Remainingtensilestrength
(a) One-fourth model for normal concrete
(b) Stress remaining model for fiber reinforced concrete
ft
Tensilestress
0.25ft
0.75GF/ft 5.0GF/ft
Fig. 21 Tension-softening models.
Y. Kitano, H. Ito and S. Suzuki / Journal of Advanced Concrete Technology Vol. 19, 1227-1244, 2021 1239
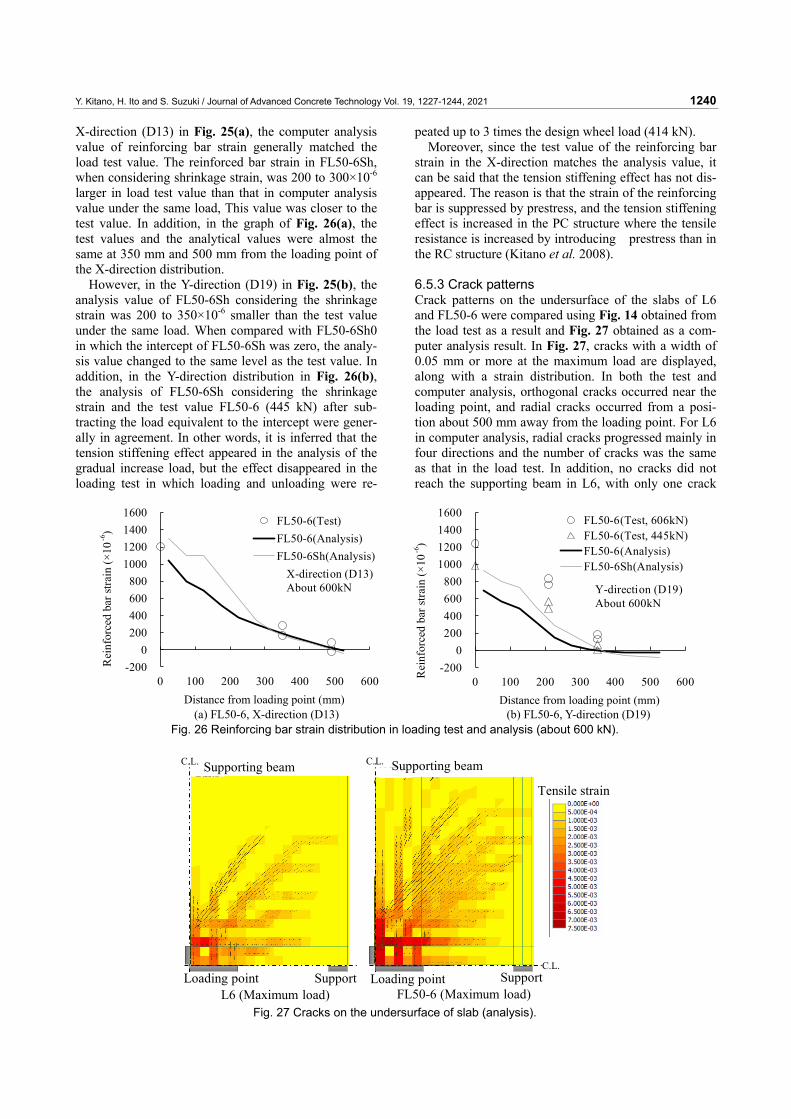
stress-strain relationship on the tension side is dominant in the punching shear behavior of the FLPC slab, and the stress-strain relationship on the compression side has an effect near the maximum load. 6.5 Comparison with load test results 6.5.1 Relationship between load and displacement Figure 23 shows the relationship between the load and
loading-point displacement obtained by our analysis. The bending stiffness in computer analysis almost agreed with that in the load test shown in Fig. 12 in all cases. When the load was at maximum, the ratio of ana-lytical results to test results was close to 0.94 to 1.05 in all cases. The RC slab L0 has a displacement of 4.24 mm larger in computer analysis than in the load test when the load was at maximum. The displacement in the four cases of PC slabs was smaller in computer analysis than in the load test, and the difference was as small as 0.58 to 1.68 mm.
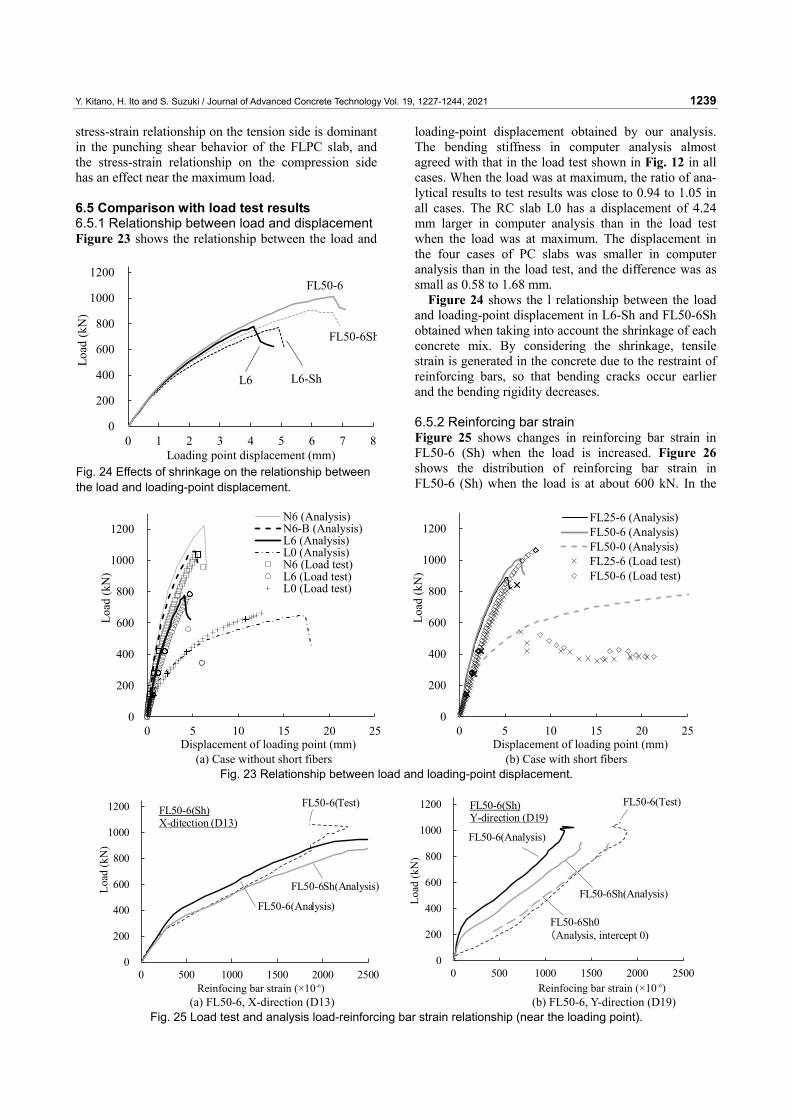
Figure 24 shows the l relationship between the load and loading-point displacement in L6-Sh and FL50-6Sh obtained when taking into account the shrinkage of each concrete mix. By considering the shrinkage, tensile strain is generated in the concrete due to the restraint of reinforcing bars, so that bending cracks occur earlier and the bending rigidity decreases.
6.5.2 Reinforcing bar strain Figure 25 shows changes in reinforcing bar strain in FL50-6 (Sh) when the load is increased. Figure 26 shows the distribution of reinforcing bar strain in FL50-6 (Sh) when the load is at about 600 kN. In the
0
200
400
600
800
1000
1200
0 5 10 15 20 25
Load
(kN
)
Displacement of loading point (mm)
N6 (Analysis)N6-B (Analysis)L6 (Analysis)L0 (Analysis)N6 (Load test)L6 (Load test)L0 (Load test)
0
200
400
600
800
1000
1200
0 5 10 15 20 25
Load
(kN
)
Displacement of loading point (mm)
FL25-6 (Analysis)FL50-6 (Analysis)FL50-0 (Analysis)FL25-6 (Load test)FL50-6 (Load test)
(a) Case without short fibers (b) Case with short fibers
Fig. 23 Relationship between load and loading-point displacement.
0
200
400
600
800
1000
1200
0 500 1000 1500 2000 2500
Load
(kN
)
Reinfocing bar strain (×10
FL50-6Sh(Analysis)
FL50-6(Sh)X-ditection (D13)
FL50-6(Test)
FL50-6(Analysis)
-6)
0
200
400
600
800
1000
1200
0 500 1000 1500 2000 2500
Load
(kN
)
FL50-6Sh(Analysis)
FL50-6(Sh)Y-direction (D19)
FL50-6(Test)
FL50-6(Analysis)
FL50-6Sh0(Analysis, intercept 0)
Reinfocing bar strain (×10-6) (a) FL50-6, X-direction (D13) (b) FL50-6, Y-direction (D19)
Fig. 25 Load test and analysis load-reinforcing bar strain relationship (near the loading point).
0
200
400
600
800
1000
1200
0 1 2 3 4 5 6 7 8
Load
(kN
)
Loading point displacement (mm)
L6-ShL6
FL50-6Sh
FL50-6
Fig. 24 Effects of shrinkage on the relationship between the load and loading-point displacement.
Y. Kitano, H. Ito and S. Suzuki / Journal of Advanced Concrete Technology Vol. 19, 1227-1244, 2021 1240
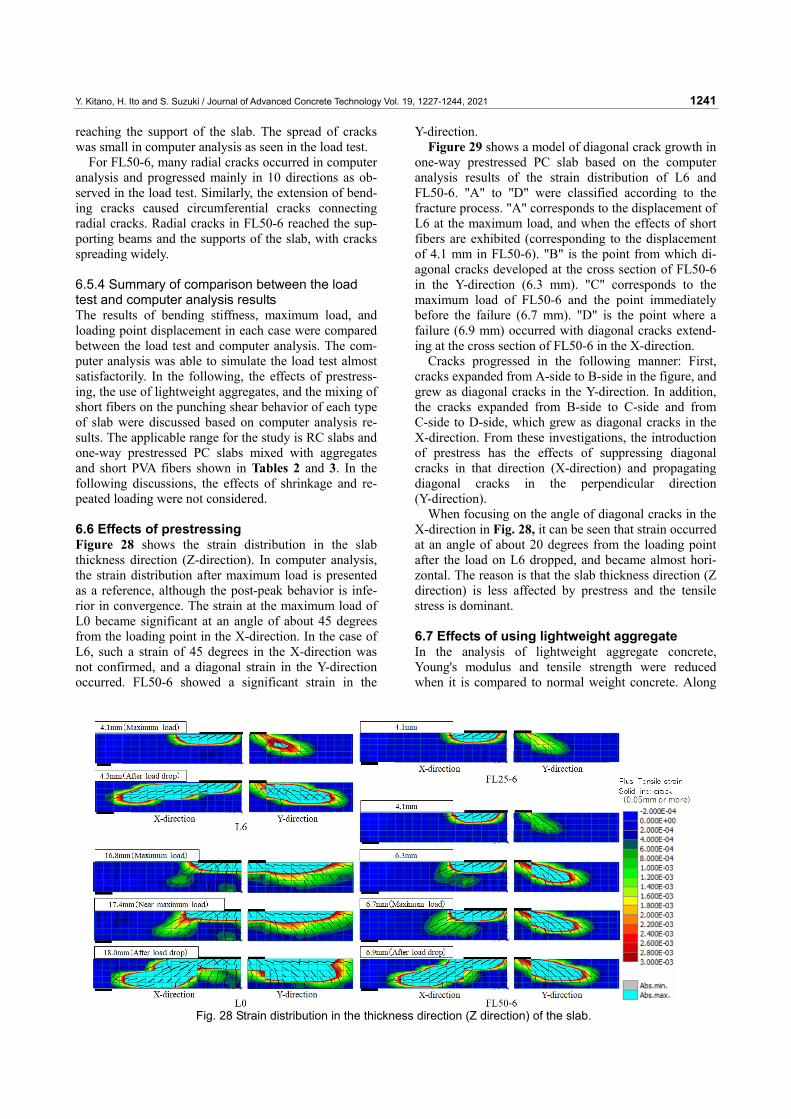
X-direction (D13) in Fig. 25(a), the computer analysis value of reinforcing bar strain generally matched the load test value. The reinforced bar strain in FL50-6Sh, when considering shrinkage strain, was 200 to 300×10-6 larger in load test value than that in computer analysis value under the same load, This value was closer to the test value. In addition, in the graph of Fig. 26(a), the test values and the analytical values were almost the same at 350 mm and 500 mm from the loading point of the X-direction distribution.
However, in the Y-direction (D19) in Fig. 25(b), the analysis value of FL50-6Sh considering the shrinkage strain was 200 to 350×10-6 smaller than the test value under the same load. When compared with FL50-6Sh0 in which the intercept of FL50-6Sh was zero, the analy-sis value changed to the same level as the test value. In addition, in the Y-direction distribution in Fig. 26(b), the analysis of FL50-6Sh considering the shrinkage strain and the test value FL50-6 (445 kN) after sub-tracting the load equivalent to the intercept were gener-ally in agreement. In other words, it is inferred that the tension stiffening effect appeared in the analysis of the gradual increase load, but the effect disappeared in the loading test in which loading and unloading were re-
peated up to 3 times the design wheel load (414 kN). Moreover, since the test value of the reinforcing bar
strain in the X-direction matches the analysis value, it can be said that the tension stiffening effect has not dis-appeared. The reason is that the strain of the reinforcing bar is suppressed by prestress, and the tension stiffening effect is increased in the PC structure where the tensile resistance is increased by introducing prestress than in the RC structure (Kitano et al. 2008).
6.5.3 Crack patterns Crack patterns on the undersurface of the slabs of L6 and FL50-6 were compared using Fig. 14 obtained from the load test as a result and Fig. 27 obtained as a com-puter analysis result. In Fig. 27, cracks with a width of 0.05 mm or more at the maximum load are displayed, along with a strain distribution. In both the test and computer analysis, orthogonal cracks occurred near the loading point, and radial cracks occurred from a posi-tion about 500 mm away from the loading point. For L6 in computer analysis, radial cracks progressed mainly in four directions and the number of cracks was the same as that in the load test. In addition, no cracks did not reach the supporting beam in L6, with only one crack
-2000
200400600800
1000120014001600
0 100 200 300 400 500 600Distance from loading point (mm)
FL50-6(Test)FL50-6(Analysis)FL50-6Sh(Analysis)
X-direction (D13)About 600kN
Rei
nfor
ced
bar s
train
(×10
-6)
-2000
200400600800
1000120014001600
0 100 200 300 400 500 600Rei
nfor
ced
bar s
train
(×10
Distance from loading point (mm)
FL50-6(Test, 606kN)FL50-6(Test, 445kN)FL50-6(Analysis)FL50-6Sh(Analysis)
Y-direction (D19)About 600kN
-6)
(a) FL50-6, X-direction (D13) (b) FL50-6, Y-direction (D19)
Fig. 26 Reinforcing bar strain distribution in loading test and analysis (about 600 kN).
地覆部C.L. C.L.
C.L.
地覆部引張ひずみTensile strain
Loading point Loading pointSupport SupportL6 (Maximum load) FL50-6 (Maximum load)
Supporting beam Supporting beam
Fig. 27 Cracks on the undersurface of slab (analysis).
Y. Kitano, H. Ito and S. Suzuki / Journal of Advanced Concrete Technology Vol. 19, 1227-1244, 2021 1241
reaching the support of the slab. The spread of cracks was small in computer analysis as seen in the load test.
For FL50-6, many radial cracks occurred in computer analysis and progressed mainly in 10 directions as ob-served in the load test. Similarly, the extension of bend-ing cracks caused circumferential cracks connecting radial cracks. Radial cracks in FL50-6 reached the sup-porting beams and the supports of the slab, with cracks spreading widely.
6.5.4 Summary of comparison between the load test and computer analysis results The results of bending stiffness, maximum load, and loading point displacement in each case were compared between the load test and computer analysis. The com-puter analysis was able to simulate the load test almost satisfactorily. In the following, the effects of prestress-ing, the use of lightweight aggregates, and the mixing of short fibers on the punching shear behavior of each type of slab were discussed based on computer analysis re-sults. The applicable range for the study is RC slabs and one-way prestressed PC slabs mixed with aggregates and short PVA fibers shown in Tables 2 and 3. In the following discussions, the effects of shrinkage and re-peated loading were not considered. 6.6 Effects of prestressing Figure 28 shows the strain distribution in the slab thickness direction (Z-direction). In computer analysis, the strain distribution after maximum load is presented as a reference, although the post-peak behavior is infe-rior in convergence. The strain at the maximum load of L0 became significant at an angle of about 45 degrees from the loading point in the X-direction. In the case of L6, such a strain of 45 degrees in the X-direction was not confirmed, and a diagonal strain in the Y-direction occurred. FL50-6 showed a significant strain in the
Y-direction. Figure 29 shows a model of diagonal crack growth in
one-way prestressed PC slab based on the computer analysis results of the strain distribution of L6 and FL50-6. "A" to "D" were classified according to the fracture process. "A" corresponds to the displacement of L6 at the maximum load, and when the effects of short fibers are exhibited (corresponding to the displacement of 4.1 mm in FL50-6). "B" is the point from which di-agonal cracks developed at the cross section of FL50-6 in the Y-direction (6.3 mm). "C" corresponds to the maximum load of FL50-6 and the point immediately before the failure (6.7 mm). "D" is the point where a failure (6.9 mm) occurred with diagonal cracks extend-ing at the cross section of FL50-6 in the X-direction.
Cracks progressed in the following manner: First, cracks expanded from A-side to B-side in the figure, and grew as diagonal cracks in the Y-direction. In addition, the cracks expanded from B-side to C-side and from C-side to D-side, which grew as diagonal cracks in the X-direction. From these investigations, the introduction of prestress has the effects of suppressing diagonal cracks in that direction (X-direction) and propagating diagonal cracks in the perpendicular direction (Y-direction).
When focusing on the angle of diagonal cracks in the X-direction in Fig. 28, it can be seen that strain occurred at an angle of about 20 degrees from the loading point after the load on L6 dropped, and became almost hori-zontal. The reason is that the slab thickness direction (Z direction) is less affected by prestress and the tensile stress is dominant.
6.7 Effects of using lightweight aggregate In the analysis of lightweight aggregate concrete, Young's modulus and tensile strength were reduced when it is compared to normal weight concrete. Along
Fig. 28 Strain distribution in the thickness direction (Z direction) of the slab.
Y. Kitano, H. Ito and S. Suzuki / Journal of Advanced Concrete Technology Vol. 19, 1227-1244, 2021 1242
with this, the strain at the maximum stress on the com-pression side and tension side was increased. By chang-ing these material properties, the decrease in bending stiffness of lightweight aggregate concrete experimen-tally confirmed in Fig. 12 could be expressed by the analysis in Fig. 23. In addition, the reduction ratio of shear capacity due to the use of lightweight aggregate was 0.73 in the case of N6-B, which could be expressed roughly. 6.8 Effects of mixing short PVA fibers Based on Figs. 28 and 29, the effects of mixing short fibers on the growth of diagonal cracks, compressive strain distribution, and diagonal crack patterns were examined.
First, the strain distributions in L6, FL25-6 and FL50-6 with different fiber content were compared for diagonal crack growth. The maximum strain at a dis-placement of 4.1 mm in the Y-direction in Fig. 28 was about 3000, 1800 and 1200×10-6 for L6, FL25-6 and FL50-6, respectively. That is, the maximum strain de-creased as the fiber content increased. Therefore, mixing of short fibers into PC slabs helped suppress the devel-opment of diagonal cracks in the Y-direction from the A-side to the B-side, as shown in Fig. 29. Correspond-ing to this effect, the diagonal crack growth in the X-direction from the B-side to the D-side as shown in Fig. 29 was detained, resulting in an increased shear capacity.
Figure 30 shows the minimum principal strain dis-tribution. When focusing on the compression strain dis-tribution of diagonal crack formation areas, a compres-sion strain zone (arch rib) is generated in the center of the cross section in the figure, and the formation of a tide arch can be seen. From the strain distribution at the maximum load of FL50-6, it was confirmed that the arch rib was retained even with a large load by mixing short fibers.
After the load drop, diagonal cracks in the X-direction of FL50-6 shown in Fig. 28 had a larger angle than that of L6 and were formed along the tensile reinforcing bar on the support side. This difference in
fracture mode was considered to be due to the fact that the arch ribs of FL50-6 were strong even under heavy loads, and the arch ribs hindered the horizontal growth of diagonal cracks.
The main effect of mixing short fibers in non-prestressed slabs is the suppression of diagonal cracks growing in the X-direction. As an effect, the maximum load of FL50-0 was 1.21 times bigger and the loading point displacement was 1.57 times larger than that of L0 in Fig. 23.
6.9 Punching shear load-carrying mechanism of FLPC slab As shown in Table 8 and Fig. 12 given above, the re-sults of load tests confirmed that FLPC slabs has an increased punching shear capacity than lightweight PC slabs, and that if 0.5 vol% of short PVA fibers are mixed, they have the same punching shear capacity as that of normal weight concrete PC slabs. In addition, as shown in Figs. 23 to 27, it was also confirmed that the same results as those of the load test can be reproduced by computer analysis. FLPC slabs did not fail immediately after the formation of diagonal cracks (see Fig. 13). This is probably because the load carrying mechanism of the FLPC slab shifted to the load carrying mechanism seen in a tide arch (see Fig. 30), thus increasing its punching shear capacity. In particular, the effects of tide arch for-mation are high in the X-direction (PC-direction) in which the tensile reinforcing bar strain increases overall (see Fig. 16) and the growth of diagonal cracks is sup-pressed by the introduction of prestress as shown in Fig. 28.
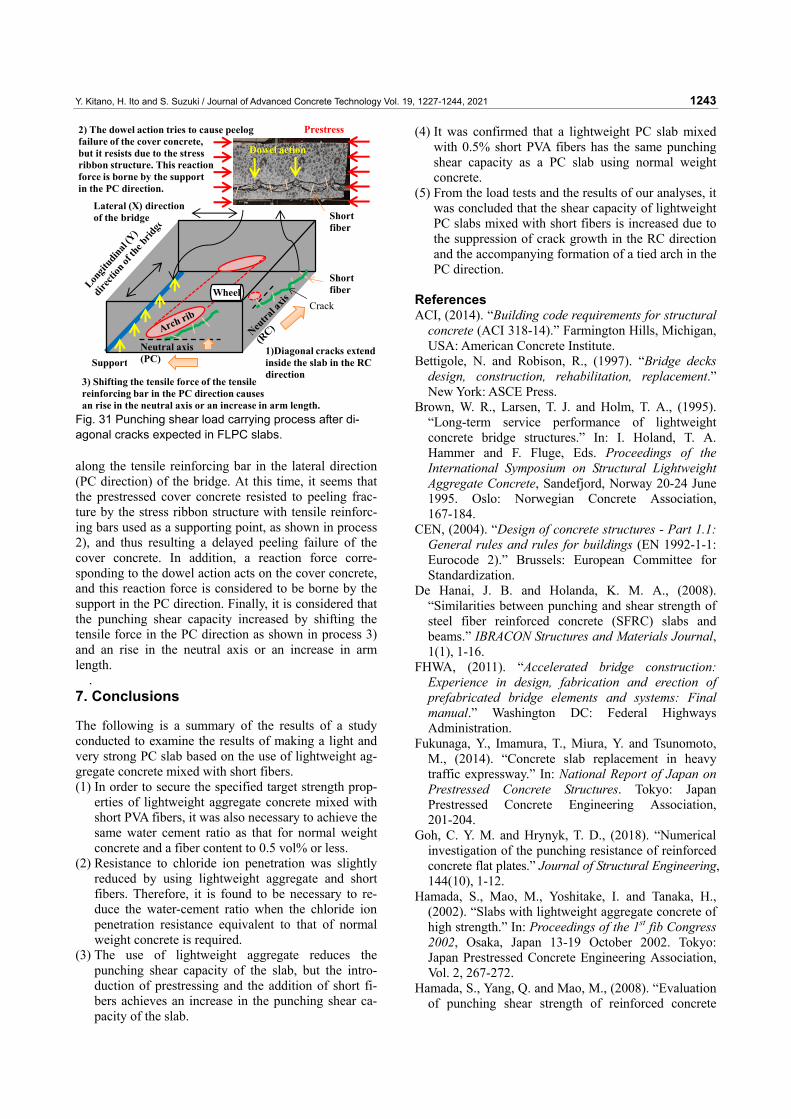
Figure 31 shows the punching shear load-carrying process after the occurrence of diagonal cracks which are expected in the FLPC slab. In the FLPC slab, the growth of cracks is suppressed by mixing short fibers, and cracks are extended inside the slab in the longitudi-nal direction (RC direction) of the bridge as in process 1) in Fig. 31. Along with this, the dowel action on the tensile reinforcing bar that intersects the diagonal crack increased. In addition, horizontal cracks developed
AX-direction(PC direction)
Y-direction(RC direction)
B
CD
Support plate
Loading plate
Fig. 29 Diagonal crack growth pattern in a one-way prestressed PC slab.
L6
6.3mm( Maximum load )
4.1mm
4.1mm( Maximum load )
X-direction
FL50-6
FL50-6
Plus: Tensile strainSolid line: crack(0.05mm or more)
Fig. 30 Minimum principal strain distribution.
Y. Kitano, H. Ito and S. Suzuki / Journal of Advanced Concrete Technology Vol. 19, 1227-1244, 2021 1243
along the tensile reinforcing bar in the lateral direction (PC direction) of the bridge. At this time, it seems that the prestressed cover concrete resisted to peeling frac-ture by the stress ribbon structure with tensile reinforc-ing bars used as a supporting point, as shown in process 2), and thus resulting a delayed peeling failure of the cover concrete. In addition, a reaction force corre-sponding to the dowel action acts on the cover concrete, and this reaction force is considered to be borne by the support in the PC direction. Finally, it is considered that the punching shear capacity increased by shifting the tensile force in the PC direction as shown in process 3) and an rise in the neutral axis or an increase in arm length.
. 7. Conclusions
The following is a summary of the results of a study conducted to examine the results of making a light and very strong PC slab based on the use of lightweight ag-gregate concrete mixed with short fibers. (1) In order to secure the specified target strength prop-
erties of lightweight aggregate concrete mixed with short PVA fibers, it was also necessary to achieve the same water cement ratio as that for normal weight concrete and a fiber content to 0.5 vol% or less.
(2) Resistance to chloride ion penetration was slightly reduced by using lightweight aggregate and short fibers. Therefore, it is found to be necessary to re-duce the water-cement ratio when the chloride ion penetration resistance equivalent to that of normal weight concrete is required.
(3) The use of lightweight aggregate reduces the punching shear capacity of the slab, but the intro-duction of prestressing and the addition of short fi-bers achieves an increase in the punching shear ca-pacity of the slab.
(4) It was confirmed that a lightweight PC slab mixed with 0.5% short PVA fibers has the same punching shear capacity as a PC slab using normal weight concrete.
(5) From the load tests and the results of our analyses, it was concluded that the shear capacity of lightweight PC slabs mixed with short fibers is increased due to the suppression of crack growth in the RC direction and the accompanying formation of a tied arch in the PC direction.
References ACI, (2014). “Building code requirements for structural
concrete (ACI 318-14).” Farmington Hills, Michigan, USA: American Concrete Institute.
Bettigole, N. and Robison, R., (1997). “Bridge decks design, construction, rehabilitation, replacement.” New York: ASCE Press.
Brown, W. R., Larsen, T. J. and Holm, T. A., (1995). “Long-term service performance of lightweight concrete bridge structures.” In: I. Holand, T. A. Hammer and F. Fluge, Eds. Proceedings of the International Symposium on Structural Lightweight Aggregate Concrete, Sandefjord, Norway 20-24 June 1995. Oslo: Norwegian Concrete Association, 167-184.
CEN, (2004). “Design of concrete structures - Part 1.1: General rules and rules for buildings (EN 1992-1-1: Eurocode 2).” Brussels: European Committee for Standardization.
De Hanai, J. B. and Holanda, K. M. A., (2008). “Similarities between punching and shear strength of steel fiber reinforced concrete (SFRC) slabs and beams.” IBRACON Structures and Materials Journal, 1(1), 1-16.
FHWA, (2011). “Accelerated bridge construction: Experience in design, fabrication and erection of prefabricated bridge elements and systems: Final manual.” Washington DC: Federal Highways Administration.
Fukunaga, Y., Imamura, T., Miura, Y. and Tsunomoto, M., (2014). “Concrete slab replacement in heavy traffic expressway.” In: National Report of Japan on Prestressed Concrete Structures. Tokyo: Japan Prestressed Concrete Engineering Association, 201-204.
Goh, C. Y. M. and Hrynyk, T. D., (2018). “Numerical investigation of the punching resistance of reinforced concrete flat plates.” Journal of Structural Engineering, 144(10), 1-12.
Hamada, S., Mao, M., Yoshitake, I. and Tanaka, H., (2002). “Slabs with lightweight aggregate concrete of high strength.” In: Proceedings of the 1st fib Congress 2002, Osaka, Japan 13-19 October 2002. Tokyo: Japan Prestressed Concrete Engineering Association, Vol. 2, 267-272.
Hamada, S., Yang, Q. and Mao, M., (2008). “Evaluation of punching shear strength of reinforced concrete
Lateral (X) directionof the bridge
Support
Wheel
1)Diagonal cracks extendinside the slab in the RCdirection
Shortfiber
Crack
3) Shifting the tensile force of the tensile reinforcing bar in the PC direction causesan rise in the neutral axis or an increase in arm length.
2) The dowel action tries to cause peelogfailure of the cover concrete, but it resists due to the stressribbon structure. This reaction force is borne by the supportin the PC direction.
Dowel action
Neutral axis(PC)
Prestress
Shortfiber
Fig. 31 Punching shear load carrying process after di-agonal cracks expected in FLPC slabs.
Y. Kitano, H. Ito and S. Suzuki / Journal of Advanced Concrete Technology Vol. 19, 1227-1244, 2021 1244
slabs based on database.” Journal of Advanced Concrete Technology, 6(1), 205-214.
Hassan, A. M. T., Mahmud, G. H., Jones S. W. and Whitford, C., (2015). “A new test method for investigating punching shear strength in ultra high performance fibre reinforced concrete (UHPFRC) slabs.” Composite Structures, 131, 832-841.
Ito, H., Iwanami, M. and Yokota, H., (2004). “Mechanical behavior of L-shaped menbers using lightweight concrete reinforced by vinylon short fibers.” Journal of Structural Engineering, 50A, 979-990. (in Japanese)
Ito, H., Iwanami, M. and Yokota, H., (2005). “Influence of PVA short fibers on punching shear behavior of lightweight concrete slab.” Journal of Structural Engineering, 51A, 1321-1331. (in Japanese)
Ito, H., Iwanami, M., Yokota, H., Kishizoe, T., Ishikawa, Y. and Kubo, M., (2006). “Experimental study on compression failure properties of concrete with short fiber.” Journal of Japan Society of Civil Engineers, 62(2), 341-355. (in Japanese)
Ito, H., Iwanami, M., Yokota, H. and Kato, E., (2014). “Analytical study on shear capacity evaluation of RC beams with PVA short fiber.” Journal of Advanced Concrete Technology, 12(6), 187-199.
Ito, H., Watanabe, K., Todoroki, S., Suemori, H. and Shinjyo, R., (2018). “Study on performance of PVA fiber reinforced concrete exposed for 10 years to seawater spray.” Journal of Advanced Concrete Technology, 16(3), 159-169.
JSCE, (2018). “Standard specification for concrete structures - 2017.” Tokyo: Japan Society of Civil Engineers. (in Japanese)
Kitano, Y., Suzuki, S., Kawaguchi, C. and Ito, H., (2018). “Punching shear test of fiber reinforced lightweight concrete PC slab.” In: Proceedings of the 27th Symposium on Developments in Prestressed Concrete, Matsuyama, Ehime Prefecture, Japan 8-9 November 2018. Tokyo: Japan Prestressed Concrete Engineering Association, 189-194. (in Japanese)
Kitano, Y., Koga, H., Takeuchi, Y. and Watanabe, H., (2008). “Influence of the prestressing on crack width of PRC members.” Proceedings of the Japan Concrete Institute, 30(3), 547-552. (in Japanese)
Matsui, S., Fujii, S., Yasumatsu, T. and Fujiki, E., (2000). “Fatigue study on steel fiber reinforced slabs with artificial lightweight aggregate concrete.” In: Proceedings of the 2nd Symposium on Decks of Highway Bridges, Sendai, Japan October 2000. Tokyo: Japan Society of Civil Engineers, 95-100. (in Japanese)
Mostafaei, H., Vecchio, F. J., Gauvreau, P. and Semelawy, M., (2011). “Punching shear behavior of externally prestressed concrete slabs.” Journal of
Structural Engineering, 137(1), 100-108. Mon, M. T., Ito, H., Kitano, Y. and Suzuki, S., (2019).
“Examination on punching shear behavior of lightweight prestressed concrete slab.” In: Proceedings of the 4th International Symposium on Concrete and Structures for Next Generation, Kanazawa, Japan 17-19 June 2019. Tokyo: Japan Concrete Institute, 510-517.
Ono, K., Inaba, N., Shito, K. and Shounaka, T., (2004). “Fatigue durability of precast PC Slabs with lightweight concrete.” In: Proceedings of the 4th Symposium on Decks of Highway Bridges, Tokyo 15-16 November 2004. Tokyo: Japan Society of Civil Engineers, 43-48. (in Japanese)
Osegueda, R. A. and Noel, J. S., (1988). “Rapid bridge deck replacement: A field demonstration and load test (Report No. 324-5F).” College Station, Texas, USA: Texas Transportation Institute, Texas A&M University.
Paul, S. C., van Zijl, G. P. and Savija, B., (2020). “Effect of fibers on durability of concrete: A practical review.” Materials, 13(20), Article ID 4562.
Sasaki, W., Onda, Y. and Taniguchi, H., (2018). “Effect of short fibers on chloride ion diffusion coefficient and carbonation of poorly mixed concrete.” Proceedings of the 73rd Annual Meeting of the Japan Society of Civil Engineers, V-435. (in Japanese)
Satoho, H., Yamamura, S. and Hiroi, Y., (2018). “Design and construction for replacement of deck slab using high strength lightweight precast PC slab.” In: National Report of Japan on Structural Concrete 2018, Tokyo: Japan Prestressed Concrete Engineering Association, 131-134.
Sylva, G. S., Breen, J. E. and Burns, N. H., (2002). “Feasibility of utilizing high performance lightweight concrete in pretensioned bridge girders and panels (Research Report No. 1852-2).” Austin, Texas, USA: Center for Transportation Research, The University of Texas at Austin.
Tachibana, D. and Imai, M., (1994). “Improving techniques for frost resistance of high-strength lightweight concrete.” Doboku Gakkai Ronbunshu, 496/V-24, 51-60. (in Japanese)
Vidosa, F. G., Kotsovos, M. D. and Pavlovic, M. N., (1988). “Symmetrical punching of reinforced concrete slabs: An analytical investigation based on nonlinear finite element modeling.” ACI Structural Journal, 85(3), 241-250.
Watanabe, K., Niwa, J., Yokota, H. and Iwanami, M., (2003). “Formulation of stress-strain relationship of concrete considering the localized compressive failure zone.” Doboku Gakkai Ronbunshu, 725/V-58, 197-211. (in Japanese)