corrosion-free precast prestressed concrete
TRANSCRIPT
GEORGIA DOT RESEARCH PROJECT 1134 FINAL REPORT
CORROSION-FREE PRECAST PRESTRESSED CONCRETE PILES MADE WITH STAINLESS STEEL
REINFORCEMENT: CONSTRUCTION, TEST AND EVALUATION
OFFICE OF RESEARCH
GDOT Research Project No. 1134
Final Report
CORROSION-FREE PRECAST PRESTRESSED CONCRETE PILES MADE
WITH STAINLESS STEEL REINFORCEMENT: CONSTRUCTION, TEST
AND EVALUATION
By
Alvaro Paul, Lawrence F. Kahn, and Kimberly Kurtis
Georgia Institute of Technology
Contract with
Georgia Department of Transportation
In cooperation with
U.S. Department of Transportation
Federal Highway Administration
March 2015
The contents of this report reflect the views of the author(s) who is (are) responsible for the facts
and the accuracy of the data presented herein. The contents do not necessarily reflect the official
views or policies of the Georgia Department of Transportation or of the Federal Highway
Administration. This report does not constitute a standard, specification, or regulation.
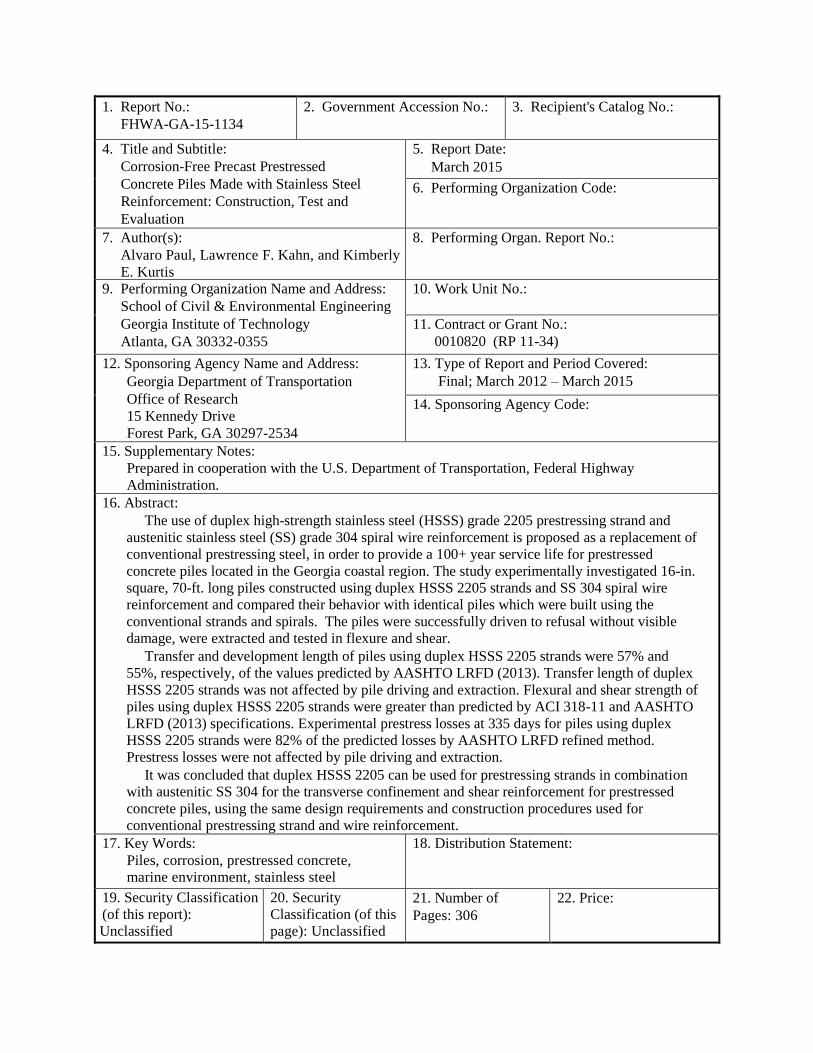
1. Report No.:
FHWA-GA-15-1134
2. Government Accession No.: 3. Recipient's Catalog No.:
4. Title and Subtitle:
Corrosion-Free Precast Prestressed
Concrete Piles Made with Stainless Steel
Reinforcement: Construction, Test and
Evaluation
5. Report Date:
March 2015
6. Performing Organization Code:
7. Author(s):
Alvaro Paul, Lawrence F. Kahn, and Kimberly
E. Kurtis
8. Performing Organ. Report No.:
9. Performing Organization Name and Address:
School of Civil & Environmental Engineering
Georgia Institute of Technology
Atlanta, GA 30332-0355
10. Work Unit No.:
11. Contract or Grant No.:
0010820 (RP 11-34)
12. Sponsoring Agency Name and Address:
Georgia Department of Transportation
Office of Research
15 Kennedy Drive
Forest Park, GA 30297-2534
13. Type of Report and Period Covered:
Final; March 2012 – March 2015
14. Sponsoring Agency Code:
15. Supplementary Notes:
Prepared in cooperation with the U.S. Department of Transportation, Federal Highway
Administration.
16. Abstract:
The use of duplex high-strength stainless steel (HSSS) grade 2205 prestressing strand and
austenitic stainless steel (SS) grade 304 spiral wire reinforcement is proposed as a replacement of
conventional prestressing steel, in order to provide a 100+ year service life for prestressed
concrete piles located in the Georgia coastal region. The study experimentally investigated 16-in.
square, 70-ft. long piles constructed using duplex HSSS 2205 strands and SS 304 spiral wire
reinforcement and compared their behavior with identical piles which were built using the
conventional strands and spirals. The piles were successfully driven to refusal without visible
damage, were extracted and tested in flexure and shear.
Transfer and development length of piles using duplex HSSS 2205 strands were 57% and
55%, respectively, of the values predicted by AASHTO LRFD (2013). Transfer length of duplex
HSSS 2205 strands was not affected by pile driving and extraction. Flexural and shear strength of
piles using duplex HSSS 2205 strands were greater than predicted by ACI 318-11 and AASHTO
LRFD (2013) specifications. Experimental prestress losses at 335 days for piles using duplex
HSSS 2205 strands were 82% of the predicted losses by AASHTO LRFD refined method.
Prestress losses were not affected by pile driving and extraction.
It was concluded that duplex HSSS 2205 can be used for prestressing strands in combination
with austenitic SS 304 for the transverse confinement and shear reinforcement for prestressed
concrete piles, using the same design requirements and construction procedures used for
conventional prestressing strand and wire reinforcement.
17. Key Words:
Piles, corrosion, prestressed concrete,
marine environment, stainless steel
18. Distribution Statement:
19. Security Classification
(of this report):
Unclassified
20. Security
Classification (of this
page): Unclassified
21. Number of
Pages: 306
22. Price:
iv
EXECUTIVE SUMMARY
The use of duplex high-strength stainless steel (HSSS) grade 2205 prestressing
strand and austenitic stainless steel (SS) grade 304 spiral wire reinforcement is proposed
as a replacement of conventional prestressing steel, in order to provide a 100+ year
service life for prestressed concrete piles located in the Georgia coastal region.
The study experimentally investigated 16-in. square, 70-ft. long piles constructed using
duplex HSSS 2205 strands and SS 304 spiral wire reinforcement and compared their
behavior with identical piles which were built using the conventional strands and spirals.
The piles were successfully driven to refusal without visible damage, were extracted and
tested in flexure and shear.
Transfer and development length of piles using duplex HSSS 2205 strands were
57% and 55%, respectively, of the values predicted by AASHTO LRFD. Transfer length
of duplex HSSS 2205 strands was not affected by pile driving and extraction.
Flexural and shear strength of piles using duplex HSSS 2205 strands were greater
than predicted by ACI 318 and AASHTO LRFD specifications.
Experimental prestress losses at 335 days for piles using duplex HSSS 2205
strands were 82.3% of the predicted losses by AASHTO LRFD refined method. Prestress
losses were not affected by pile driving and extraction.
It was concluded that duplex HSSS 2205 can be used for prestressing strands in
combination with austenitic SS 304 for the transverse confinement and shear
reinforcement for prestressed concrete piles, using the same design requirements and
construction procedures used for conventional prestressing strand and wire
reinforcement.

v
ACKNOWLEDGMENTS
The research reported herein was sponsored by the Georgia Department of
Transportation through Research Project Number 11-34, Task Order Number 02-105. Mr.
Paul Liles, Assistant Division Director of Engineering, Mr. Ben Rabun, Bridge and
Structures Engineer, and Ms. Supriya Kamatkar, Research Engineer, of GDOT provided
many valuable suggestions throughout the study. The opinions and conclusions expressed
herein are those of the authors and do not represent the opinions, conclusions, policies,
standards or specifications of the Georgia Department of Transportation, the Federal
Highway Administration, or of other cooperating organizations.
Captain Lorintz Gleich assisted in all phases of the research; Ph.D. student Nan
Gao collaborated during flexure and shear testing; and Dr. Preet Singh, professor of the
School of Materials Science and Engineering at Georgia Institute of Technology, assisted
in corrosion testing.
vi
TABLE OF CONTENTS
EXECUTIVE SUMMARY ............................................................................................... iv
ACKNOWLEDGMENTS .................................................................................................. v
TABLE OF CONTENTS ................................................................................................... vi
LIST OF FIGURES ........................................................................................................... xi
LIST OF TABLES .......................................................................................................... xxii
LIST OF SYMBOLS AND ABBREVIATIONS ........................................................... xxv
INTRODUCTION .............................................................................................................. 1
1.1 Research Purpose ..................................................................................................... 1
1.2 Objectives and Scope ............................................................................................... 2
1.3 Organization of the Report ....................................................................................... 3
BACKGROUND ................................................................................................................ 6
2.1 Deterioration of Prestressed Concrete Piles ............................................................. 6
2.1.1 Characteristics of prestressing reinforcement..................................................... 6
2.1.2 Corrosion of prestressed concrete structures ...................................................... 9
2.1.3 Corrosion of prestressing strand ....................................................................... 12
2.1.4 Alternative reinforcement for corrosion prevention ......................................... 24
2.2 Properties of Stainless Steels ................................................................................. 26
2.2.1 Classification of stainless steels ....................................................................... 29
2.2.2 Use of stainless steel in prestressing strands .................................................... 31
2.3 Prestress Losses ...................................................................................................... 34
2.4 Transfer and Development Lengths: Code Provisions and Research Estimations 37
2.4.1 AASHTO and ACI estimations of transfer and development length ............... 40
2.4.2 Research estimation of transfer and development length ................................. 42
DESIGN AND CONSTRUCTION OF PRESTRESSED PILES ..................................... 50
vii
3.1 Design of Prestressed Piles .................................................................................... 51
3.2 Piles Fabrication and Instrumentation .................................................................... 53
3.3 Composite Beam Construction .............................................................................. 62
MATERIAL PROPERTIES ............................................................................................. 65
4.1 Steel Properties....................................................................................................... 65
4.1.1 Duplex high-strength stainless steel 2205 ........................................................ 65
4.1.2 Austenitic stainless steel 304 ............................................................................ 69
4.2 Concrete Properties ................................................................................................ 71
4.2.1 Concrete mixture composition .......................................................................... 72
4.2.2 Variability of concrete ...................................................................................... 73
4.2.3 Strength of concrete .......................................................................................... 75
4.2.4 Stress-strain behavior of concrete ..................................................................... 76
4.2.5 Splitting tensile strength ................................................................................... 78
4.2.6 Creep of concrete .............................................................................................. 80
4.2.7 Rapid chloride permeability test (RCPT) ......................................................... 88
DRIVING AND EXTRACTION OF PILES .................................................................... 89
5.1 Driving Operation and Procedures ......................................................................... 90
5.2 Results and Conclusion of the chapter ................................................................... 95
FLEXURAL CAPACITY OF PILES ............................................................................... 97
6.1 Flexure Test Setup.................................................................................................. 97
6.2 Results .................................................................................................................... 99
6.2.1 Comparison of results with ACI 318 and AASHTO LRFD ........................... 104
6.2.2 Effect of type of steel ...................................................................................... 104
6.2.3 Concrete at failure .......................................................................................... 105
6.3 Conclusions of the Chapter .................................................................................. 105
viii
SHEAR CAPACITY OF PILES ..................................................................................... 107
7.1 Shear Test Setup ................................................................................................... 108
7.2 Results and Discussion ......................................................................................... 109
7.2.1 Shear-deflection curves .................................................................................. 111
7.2.2 Statistical analysis of results ........................................................................... 114
7.3 Conclusions of the Chapter .................................................................................. 115
PRESTRESS LOSSES.................................................................................................... 116
8.1 Results .................................................................................................................. 117
8.1.1 Experimental losses compared with the AASHTO refined method ............... 118
8.1.2 Effect of pile driving and type of prestressing steel ....................................... 121
8.1.3 Experimental losses compared with AASHTO lump-sum method ................ 122
8.2 Conclusions of the Chapter .................................................................................. 123
TRANSFER LENGTH ................................................................................................... 124
9.1 CSS Measurements .............................................................................................. 125
9.2 Transfer Length Results ....................................................................................... 131
9.3 Comparison of Results with Proposed Expressions ............................................. 133
9.4 Conclusions of the Chapter .................................................................................. 135
DEVELOPMENT LENGTH .......................................................................................... 136
10.1 Test Description ................................................................................................. 138
10.2 Development Length Results ............................................................................. 142
10.2.1 Strand slip results.......................................................................................... 143
10.2.2 Failure type ................................................................................................... 147
10.2.3 Moment-curvature behavior ......................................................................... 149
10.2.4 Evaluation of development length using experimental prestress losses ....... 151
10.3 Comparison of Results with Proposed Expressions ........................................... 152
ix
10.4 Conclusions of the Chapter ................................................................................ 154
LONG-TERM DURABILITY ASSESSMENT ............................................................. 155
11.1 Durability Samples ............................................................................................. 155
11.2 Results ................................................................................................................ 157
11.2.1 Compressive strength of cores ...................................................................... 159
11.2.2 Chloride content ........................................................................................... 160
11.2.3 Corrosion of prestressing strands ................................................................. 164
CONCLUSIONS AND RECOMMENDATIONS ......................................................... 172
12.1 Conclusions ........................................................................................................ 172
12.2 Recommendations and Research Needs............................................................. 175
REFERENCES ............................................................................................................... 176
APPENDIX A: ACTUAL DIMENSIONS OF PILE SECTIONS ................................. 184
APPENDIX B: FORMWORK DESIGN AND CONSTRUCTION .............................. 189
APPENDIX C: GALVANIC CORROSION EVALUATION: SS 304 and HSSS 2205 194
C.1 Test Procedure ..................................................................................................... 194
C.2 Results ................................................................................................................. 198
APPENDIX D: PROPERTIES OF CONCRETE ........................................................... 201
APPENDIX E: PILE DRIVING INFORMATION ........................................................ 205
APPENDIX F: CALCULATION OF ULTIMATE CURVATURE BY MOMENT-
AREA METHOD............................................................................................................ 209
APPENDIX G: CALCULATION OF FLEXURAL CAPACITY OF PILES................ 212
G.1 ACI 318 Moment-Curvature Calculation for Pile SS #2 – Top Half. ................. 212
G.2 ACI 318 Moment-Curvature Calculation for Pile 1080 #1 – Bottom Half. ........ 215
G.3 AASHTO Moment-Curvature Calculation for Pile SS #2 – Top Half. .............. 218
G.4 AASHTO Moment-Curvature Calculation for Pile 1080 #1 – Bottom Half. ..... 220
x
APPENDIX H: INDIVIDUAL RESULTS OF FLEXURE TEST ................................. 222
APPENDIX I: CALCULATION OF NOMINAL SHEAR STRENGTH ...................... 241
I.1 ACI 318 Nominal Shear Strength for Piles Using Conventional Steel. ............... 241
I.2 ACI 318 Nominal Shear Strength for Piles Using Stainless Steel ........................ 243
I.3 AASHTO LRFD Nominal Shear Strength for Piles Using Conventional Steel. .. 245
I.4 AASHTO LRFD Nominal Shear Strength for Piles Using Stainless Steel. ......... 247
APPENDIX J: SUMMARY OF SHEAR TESTS .......................................................... 249
APPENDIX K: AASHTO LRFD PRESTRESS LOSSES CALCULATION ................ 251
APPENDIX L: INDIVIDUAL PRESTRESS LOSSES ................................................. 257
APPENDIX M: CONCRETE SURFACE STRAIN PROFILES ................................... 260
APPENDIX N: DEVELOPMENT LENGTH TEST – INDIVIDUAL RESULTS ........ 265
xi
LIST OF FIGURES
Figure 2.1 Microstructure of the (a) longitudinal and (b) transverse direction of
prestressing steel (Moser et al., 2011a). .............................................................................. 6
Figure 2.2 Stress-strain diagram of prestressing steel compared to mild steel (Nawy,
2009). .................................................................................................................................. 7
Figure 2.3 (a) Standard strand section and (b) compacted strand section (Nawy, 2009). .. 8
Figure 2.4 Impact of chloride exposure level on the predicted service life (Kurtis et al.,
2013). ................................................................................................................................ 11
Figure 2.5 Breakdown potential versus chloride concentration for prestressing strand and
wire (Moser et al., 2011b). ................................................................................................ 17
Figure 2.6 Schematic representation of pitting corrosion of steel in concrete (Bertolini et
al., 2004). .......................................................................................................................... 19
Figure 2.7 Core sample from corroded prestressed bridge pile evidencing crevice
corrosion (Holland et al., 2012). ....................................................................................... 19
Figure 2.8 Crevice corrosion: initiation, propagation into the crevice regions and spread
of the attack to strand surface (Moser et al., 2011a). ........................................................ 20
Figure 2.9 HAC of steel in concrete at a pit site (Nurnberger, 2002). .............................. 24
Figure 2.10 Effect of chromium content on corrosion depth of stainless steel on (a)
industrial and semi-rural, and (b) marine environments (Schmitt and Mullen, 1969). .... 26
Figure 2.10 (cont.) Effect of chromium content on corrosion depth of stainless steel on (a)
industrial and semi-rural, and (b) marine environments (Schmitt and Mullen, 1969). .... 27
Figure 2.11 Stress-strain curves for conventional AISI 1080, austenitic 304 and 316,
martensitic 17-7 and duplex 2101, 2205 and 2304 wires (Moser et al., 2013). ................ 33
Figure 2.12 Stress-strain curves for conventional AISI 1080 steel, and duplex grades
2205 and 2304 prestressing strands (modified from Schuetz, 2013). 1 ksi = 6.9 MPa. ... 34
Figure 2.13 Change of stress on strands due to prestress losses (Tadros et al., 2003). .... 35
Figure 2.14 Strand stress along development length (Meyer, 2002). ............................... 38
Figure 2.15 Hoyer’s Effect in prestressing strand (Meyer, 2002). ................................... 39
xii
Figure 3.1 Standard Concrete Products plant, located in Savannah, GA. ........................ 50
Figure 3.2 Cross section of a Grade 270 strand, 16-in. squared pile (GDOT Spec 3215).51
Figure 3.3 Cross section of a Grade 270 strand 16-in. squared pile cross section. ........... 52
Figure 3.4 Prestressing forms and metallic spacers. ......................................................... 53
Figure 3.5 Anchorage chucks at the dead end of the strands. ........................................... 54
Figure 3.6 Loading of strands. .......................................................................................... 55
Figure 3.7 Spiral wire distribution. 1 in. = 2.54 cm. ......................................................... 55
Figure 3.8 Vibrating wire strain gauge for prestress losses measurement. ....................... 56
Figure 3.9 Instrument cables for prestress losses measurement. ...................................... 57
Figure 3.10 Prestress losses measurements. ..................................................................... 57
Figure 3.11 Concrete placing and compaction. ................................................................ 58
Figure 3.12 Strips for embedment of DEMEC points for transfer length measurement. . 59
Figure 3.13 DEMEC points in pile concrete surface. ....................................................... 60
Figure 3.14 Strand release. ................................................................................................ 61
Figure 3.15 Piles removal from the prestressing forms. ................................................... 61
Figure 3.16 27-ft. (8.23 m) piles for development length evaluation. .............................. 62
Figure 3.17 Compressive strength of concrete used in top section of beams. .................. 63
Figure 4.1 Duplex HSSS 2205 strand and austenitic SS 304 wire samples. .................... 66
Figure 4.2 Stress-strain curve of duplex HSSS 2205 strand. 1 ksi = 6.9 MPa. ................ 68
Figure 4.3 Stress-strain curve for austenitic SS 304 wire. 1 ksi = 6.9 MPa. .................... 70
Figure 4.4 Yield point calculation for austenitic SS 304 wire. 1 ksi = 6.9 MPa. ............. 71
Figure 4.5 Compressive strength of concrete at 4, 7, 28, 91, 243, and 438 days from
casting. 1,000 psi = 6.9 MPa. Vertical bars indicate ± one standard deviation. ............... 75
Figure 4.6 Cylinder end grinding machine. ...................................................................... 80
Figure 4.7 Creep test set up (ASTM C512). ..................................................................... 82
xiii
Figure 4.8 Creep and shrinkage measurements during the first 1,247 hours. ................... 83
Figure 4.9 Creep calculation during the first 1,247 hours. ............................................... 84
Figure 4.10 Specific creep calculation during the first 52 days. Blue dashed line shows
correlation expressed in Equation 4.6. 1 με/psi = 145 με/MPa......................................... 85
Figure 4.11 Creep coefficient calculation during the first 52 days. Blue dashed line shows
correlation expressed in Equation 4.7. .............................................................................. 86
Figure 4.12 Creep plus shrinkage results compared to ACI 209 estimations. Red dashed
line shows logarithmic correlation of experimental results. ............................................. 87
Figure 5.1 Piles being loaded onto a barge. ...................................................................... 91
Figure 5.2 Barge, crane, and pile template in Savannah River, GA. ................................ 91
Figure 5.3 Lifting of pile HSSS #2 off the barge (left), and placing of pile HSSS #2 into
the template (right). ........................................................................................................... 92
Figure 5.4 Driving of pile HSSS #2 (left), and blow counting of pile HSSS #2 (right). .. 92
Figure 5.5 Final condition of piles after driving operation. .............................................. 93
Figure 5.6 Positioning of the water jet (left) and extraction of pile HSSS #1 (right). ...... 93
Figure 5.7 Preparation to extract pile HSSS #1 (left), and extraction of pile HSSS #1
(right). ............................................................................................................................... 94
Figure 5.8 70-feet long piles were cut in halves and transported to Georgia Tech
Structures and Materials Lab in Atlanta, GA.................................................................... 95
Figure 6.1 Diagram of flexure test. 1 in. = 2.54 cm, 1-ft. = 30.5 cm. ............................... 97
Figure 6.2 Flexure test setup. 1 in. = 2.54 cm, 1-ft. = 30.5 cm. ........................................ 99
Figure 6.3 Summary of load-deflection (P-δ curves) for HSSS 2205 (blue) and AISI 1080
steel (red). 1 kip = 4.45 kN. ............................................................................................ 102
Figure 6.4 Summary of moment-curvature curves for piles using duplex HSSS 2205.
Results are compared with calculated curves using ACI 318. ........................................ 102
Figure 6.5 Summary of moment-curvature curves for piles using AISI 1080 steel. Results
are compared with calculated curves using ACI 318...................................................... 103
xiv
Figure 6.6 Summary of moment-curvature curves for piles using duplex HSSS 2205.
Results are compared with calculated curves using AASHTO LRFD. .......................... 103
Figure 6.7 Summary of moment-curvature curves for piles using AISI 1080 steel. Results
are compared with calculated curves using AASHTO LRFD. ....................................... 104
Figure 7.1 Diagram of shear test. 1 in. = 2.54 cm, 1-ft. = 30.5 cm. ................................ 107
Figure 7.2 Shear test setup. 1 in. = 2.54 cm, 1-ft. = 30.5 cm. ......................................... 108
Figure 7.3 Load application system. ............................................................................... 109
Figure 7.4 Typical crack pattern at failure. Numbers on the pile indicate the applied load
when cracks appeared. 1 kip = 4.45 kN. ......................................................................... 110
Figure 7.5 Shear-deflection curves for HSSS 2205 piles (spacings 3-in. and 6-in.). ..... 111
Figure 7.6 Shear-deflection curves for AISI 1080 piles (spacings 3-in. and 6-in.). ....... 112
Figure 7.7 Shear divided by f 'c for HSSS 2205 piles (spacings 3-in. and 6-in.). .......... 112
Figure 7.8 Shear divided by f 'c for AISI 1080 piles (spacings 3-in. and 6-in.). ............ 113
Figure 8.1 Strain gauge installation (left) and measurement of strains (right). .............. 116
Figure 8.2 Prestress losses during the first 335 days. ..................................................... 118
Figure 8.3 Loss of initial prestress for the first 335 days. Error bars correspond to
standard deviation of losses. ........................................................................................... 122
Figure 9.1 Idealization of strand stresses along the pile (modified from Russell and Burns
(1993))............................................................................................................................. 124
Figure 9.2 Concrete surface strain measurements. Note the two parallel rows of DEMEC
gauge points on each side of the top surface of the pile ................................................. 126
Figure 9.3 Raw concrete surface strain profile for Pile 1080 #1 – Jacking End. ............ 127
Figure 9.4 Smoothed concrete surface strain profile for Pile 1080 #1 – Jacking End. ... 129
Figure 9.5 Determination of transfer length from the smoothed strain profile for Pile 1080
#1 – Jacking End at 14-days after release. 1 in. = 2.54 cm ............................................. 130
Figure 10.1 Idealized steel stress along the pile. ............................................................ 136
Figure 10.2 Setup for development length test. 1 in. = 2.54 cm. .................................... 140
xv
Figure 10.3 Development length test. Opposite side of the pile was equipped with analog
dial strain gauges, in the same way as shown in the picture. .......................................... 141
Figure 10.4 Analog dial gauges were epoxied to bottom strands for slip determination.
......................................................................................................................................... 141
Figure 10.5 Average strand slip with shear increase during testing. Dashed, vertical line
shows limit of 0.01-in. (0.254 mm) for strand slip at failure. 1-in. = 2.54 cm. .............. 143
Figure 10.6 Slip at failure. Dashed line shows the assumed slip failure limit and defined
flexure and shear failure of piles. The calculated ld by Equation 10.1 for duplex HSSS
2205 and conventional steel are 78.3 and 72.0-in., respectively. Using Equation 10.2,
these values are 125.2 and 115.3-in., respectively. 1 in. = 2.54 cm. .............................. 144
Figure 10.7 Stress and strain of bottom layer of strands during testing. Stress is shown as
percentage of the UTS of the strand. .............................................................................. 145
Figure 10.8 Average strand slip with stress increase in the bottom layer of strands. Stress
is shown as percentage of the UTS of the strand. 1-in. = 2.54 cm. ................................ 146
Figure 10.9 Typical crack pattern exhibited after (a) flexural failure when the strands
ruptured, and (b) shear/bond failure of piles. 1 kip = 4.45 kN. ...................................... 148
Figure 10.10 Experimental and predicted moment-curvature results. The ratio of the
actual embedment length to predicted development lengths from Equation 10.1 are given
in parentheses. 1 kip·in = 113 N·m, 1 rad/in = 39.37 rad/m. .......................................... 150
Figure 11.1 Construction of small specimens for long term evaluation of concrete and
steel. ................................................................................................................................ 156
Figure 11.2 Placement of specimens on the Savannah River. ........................................ 156
Figure 11.3 Core drilling operation. ............................................................................... 157
Figure 11.4 (a) Removal of specimens from the river and (b) stainless steel specimen
after cleaning. .................................................................................................................. 158
Figure 11.5 Drilled core at different depths for chloride content determination. ........... 161
Figure 11.6 Autotitrator for chloride content determination. ......................................... 162
xvi
Figure 11.7 Presence of corrosion products at AISI 1080 prestressing steel (top surface
core), after 620 days from casting................................................................................... 164
Figure 11.8 Surface of control AISI 1080 prestressing strand, exposed to room conditions
(X6.5). ............................................................................................................................. 165
Figure 11.9 Surface of AISI 1080 prestressing strand from top surface core (X6.5). .... 166
Figure 11.10 Corrosion products in AISI 1080 prestressing strand surface (top surface
core, X6.5). ..................................................................................................................... 166
Figure 11.11 Surface of AISI 1080 prestressing strand from top surface core (X10). ... 167
Figure 11.12 Surface of AISI 1080 prestressing strand from side surface core (X10). .. 168
Figure 11.13 Surface of control duplex HSSS 2205 prestressing strand (X6.5). ........... 169
Figure 11.14 Surface of duplex HSSS 2205 prestressing strand (top surface core, X6.5).
......................................................................................................................................... 170
Figure 11.15 Surface of duplex HSSS 2205 prestressing strand (top surface core, X6.5).
......................................................................................................................................... 170
Figure 11.16 Surface of duplex HSSS 2205 prestressing strand (side surface core, X6.5).
......................................................................................................................................... 171
Figure 11.17 Surface of duplex HSSS 2205 prestressing strand (side surface core, X6.5).
......................................................................................................................................... 171
Figure B.1 Diagram of a plywood panel and position of the drilled holes. .................... 189
Figure B.2 Surface coating application. .......................................................................... 190
Figure B.3 Distribution of studs on the formwork sheathing. ........................................ 190
Figure B.4 Formwork panel before positioning on the piles. ......................................... 191
Figure B.5 Formwork sheathing before concrete placing. .............................................. 192
Figure B.6 Placing (left) and vibration (right) of the top section of concrete. ............... 192
Figure B.7 Curing and protection of concrete after placing. .......................................... 193
Figure B.8 27-ft piles with top concrete section. ............................................................ 193
Figure C.1 Sample preparation ....................................................................................... 195
xvii
Figure C.2 Duplex HSSS 2205 (top) and austenitic SS 304 (bottom) samples. ............. 195
Figure C.3 Epoxy coating application. ........................................................................... 196
Figure C.4 System of 6 cells (three solutions, two replicates per solution). ................... 197
Figure C.5 Galvanic corrosion test set up. ...................................................................... 197
Figure C.6 Current evolution during galvanic corrosion test. ........................................ 198
Figure C.7 Current evolution from 5 to 60 hours. .......................................................... 199
Figure D.1 Stress-strain curve of concrete at 4 days (ASTM C469). ............................. 203
Figure D.2 Stress-strain curve of concrete at 28 days (ASTM C469). ........................... 203
Figure D.3 Stress-strain curve of concrete at 91 days (ASTM C469). ........................... 204
Figure D.4 Stress-strain curve of concrete at 445 days (ASTM C469). ......................... 204
Figure F.1 Curvature diagram for ultimate curvature calculation where lp is the plastic
hinge length assumed as the distance between load points............................................. 210
Figure H.1 Load-deflection curve for top half of pile 1080 #1, from flexure test. Dashed
line shows calculations following ACI 318 requirements. ............................................. 224
Figure H.2 Strain distributions of top half of pile 1080 #1. ............................................ 224
Figure H.3 Moment-curvature curve for top half of pile 1080 #1. Extension (dashed line)
includes estimated ultimate curvature and moment. Dashed line shows calculations
following ACI 318 requirements. ................................................................................... 225
Figure H.4 Cracking pattern of top half of pile 1080 #1 before failure. ......................... 225
Figure H.5 Load-deflection curve for bottom half of pile 1080 #1, from flexure test.
Dashed line shows calculations following ACI 318 requirements. ................................ 226
Figure H.6 Strain distributions of bottom half of pile 1080 #1. ..................................... 226
Figure H.7 Moment-curvature curve for bottom half of pile 1080 #1. Dashed line shows
calculations following ACI 318 requirements. ............................................................... 227
Figure H.8 Cracking pattern of bottom half of pile 1080 #1 before failure. ................... 227
Figure H.9 Load-deflection curve for top half of pile 1080 #2, obtained from flexure test.
Dashed line shows calculations following ACI 318 requirements. ................................ 228
xviii
Figure H.10 Cracking pattern of top half of pile 1080 #2 before failure. ....................... 228
Figure H.11 Load-deflection curve for bottom half of pile 1080 #2, from flexure test.
Dashed line shows calculations following ACI 318 requirements. ................................ 229
Figure H.12 Strain distributions of bottom half of pile 1080 #2. ................................... 229
Figure H.13 Moment-curvature curve for bottom half of pile 1080 #2. Dashed line shows
calculations following ACI 318 requirements. ............................................................... 230
Figure H.14 Cracking pattern of bottom half of pile 1080 #2 after failure. ................... 230
Figure H.15 Load-deflection curve for top half of pile HSSS 2205 #1, from flexure test.
Dashed line shows calculations following ACI 318 requirements. ................................ 231
Figure H.16 Strain distributions of top half of pile HSSS 2205 #1. .............................. 231
Figure H.17 Moment-curvature curve for top half of pile HSSS 2205 #1. Dashed line
shows calculations following ACI 318 requirements. .................................................... 232
Figure H.18 Cracking pattern of top half of pile HSSS 2205 #1 before failure. ............ 232
Figure H.19 Load-deflection curve for bottom half of pile HSSS 2205 #1, from flexure
test. Dashed line shows calculations following ACI 318 requirements. ......................... 233
Figure H.20 Cracking pattern of bottom half of pile HSSS 2205 #1 after failure. ......... 233
Figure H.21 Load-deflection curve for top half of pile HSSS 2205 #2, from flexure test.
Dashed line shows calculations following ACI 318 requirements. ................................ 234
Figure H.22 Strain distributions of top half of pile HSSS 2205 #2. ............................... 234
Figure H.23 Moment-curvature curve for top half of pile HSSS 2205 #2. Dashed line
shows calculations following ACI 318 requirements. .................................................... 235
Figure H.24 Cracking pattern of top half of pile HSSS 2205 #2 before failure. ............ 235
Figure H.25 Load-deflection curve for bottom half of pile HSSS 2205 #2, from flexure
test. Dashed line shows calculations following ACI 318 requirements. ......................... 236
Figure H.26 Strain distributions of bottom half of pile HSSS 2205 #2. ......................... 236
Figure H.27 Moment-curvature curve for bottom half of pile HSSS 2205 #2. Dashed line
shows calculations following ACI 318 requirements. .................................................... 237
xix
Figure H.28 Cracking pattern of bottom half of pile HSSS 2205 #2 before failure. ...... 237
Figure H.29 Load-deflection curve for top half of pile HSSS 2205 #3, from flexure test.
Dashed line shows calculations following ACI 318 requirements. ................................ 238
Figure H.30 Strain distributions of top half of pile HSSS 2205 #3. ............................... 238
Figure H.31 Moment-curvature curve for top half of pile HSSS 2205 #3. Dashed line
shows calculations following ACI 318 requirements. .................................................... 239
Figure H.32 Cracking pattern of top half of pile HSSS 2205 #3 after failure. ............... 239
Figure H.33 Load-deflection curve for bottom half of pile HSSS 2205 #3, from flexure
test. Dashed line shows calculations following ACI 318 requirements. ......................... 240
Figure H.34 Cracking pattern of bottom half of pile HSSS 2205 #3 after failure. ......... 240
Figure L.1 Prestress losses of pile 1080 #1. Wires 3 and 4 correspond to vibrating wire
sensors closer to the jacking end of the pile. .................................................................. 257
Figure L.2 Prestress losses of pile 1080 #2. Wires 3 and 4 correspond to vibrating wire
sensors closer to the jacking end of the pile. .................................................................. 257
Figure L.3 Prestress losses of pile HSSS 2205 #1. Wires 3 and 4 correspond to vibrating
wire sensors closer to the jacking end of the pile. .......................................................... 258
Figure L.4 Prestress losses of pile HSSS 2205 #2. Wires 3 and 4 correspond to vibrating
wire sensors closer to the jacking end of the pile. .......................................................... 258
Figure L.5 Prestress losses of pile HSSS 2205 #3. Wires 3 and 4 correspond to vibrating
wire sensors closer to the jacking end of the pile. .......................................................... 259
Figure M.1 Smoothed concrete surface strain profiles of pile 1080 #1, jacking end. .... 260
Figure M.2 Smoothed concrete surface strain profiles of pile 1080 #1, dead end. ........ 260
Figure M.3 Smoothed concrete surface strain profiles of pile 1080 #2, jacking end. .... 261
Figure M.4 Smoothed concrete surface strain profiles of pile 1080 #2, dead end. ........ 261
Figure M.5 Smoothed concrete surface strain profiles of pile HSSS 2205 #1, jacking end.
......................................................................................................................................... 262
xx
Figure M.6 Smoothed concrete surface strain profiles of pile HSSS 2205 #1, dead end.
......................................................................................................................................... 262
Figure M.7 Smoothed concrete surface strain profiles of pile HSSS 2205 #2, jacking end.
......................................................................................................................................... 263
Figure M.8 Smoothed concrete surface strain profiles of pile HSSS 2205 #2, dead end.
......................................................................................................................................... 263
Figure M.9 Smoothed concrete surface strain profiles of pile HSSS 2205 #3, jacking end.
......................................................................................................................................... 264
Figure M.10 Smoothed concrete surface strain profiles of pile HSSS 2205 #3, dead end.
......................................................................................................................................... 264
Figure N.1 Load-deflection curve for pile 1080 (le = 72-in.). ........................................ 265
Figure N.2 Strain distribution for pile 1080 (le = 72-in.). ............................................... 265
Figure N.3 Moment-curvature curve for pile 1080 (le = 72-in.). .................................... 266
Figure N.4 Strand slip for pile 1080 (le = 72-in.). ........................................................... 266
Figure N.5 Load-deflection curve for pile 1080 (le = 61-in.). ........................................ 267
Figure N.6 Strain distribution for pile 1080 (le = 61-in.). ............................................... 267
Figure N.7 Moment-curvature curve for pile 1080 (le = 61-in.). .................................... 268
Figure N.8 Strand slip for pile 1080 (le = 61-in.). ........................................................... 268
Figure N.9 Load-deflection curve for pile 1080 (le = 57-in.). ........................................ 269
Figure N.10 Strain distribution for pile 1080 (le = 57-in.). ............................................. 269
Figure N.11 Moment-curvature curve for pile 1080 (le = 57-in.). .................................. 270
Figure N.12 Strand slip for pile 1080 (le = 57-in.). ......................................................... 270
Figure N.13 Load-deflection curve for pile 1080 (le = 53.5-in.). ................................... 271
Figure N.14 Strain distribution for pile 1080 (le = 53.5-in.). .......................................... 271
Figure N.15 Moment-curvature curve for pile 1080 (le = 53.5-in.). ............................... 272
Figure N.16 Strand slip for pile 1080 (le = 53.5-in.). ...................................................... 272
xxi
Figure N.17 Load-deflection curve for pile HSSS 2205 (le = 79.75-in.). ....................... 273
Figure N.18 Strain distribution for pile HSSS 2205 (le = 79.75-in.). ............................. 273
Figure N.19 Moment-curvature curve for pile HSSS 2205 (le = 79.75-in.). .................. 274
Figure N.20 Strand slip for pile HSSS 2205 (le = 79.75-in.). ......................................... 274
Figure N.21 Load-deflection curve for pile HSSS 2205 (le = 69-in.). ............................ 275
Figure N.22 Strain distribution for pile HSSS 2205 (le = 69-in.). .................................. 275
Figure N.23 Moment-curvature curve for pile HSSS 2205 (le = 69-in.). ....................... 276
Figure N.24 Strand slip for pile HSSS 2205 (le = 69-in.). .............................................. 276
Figure N.25 Load-deflection curve for pile HSSS 2205 (le = 61.75-in.). ....................... 277
Figure N.26 Strain distribution for pile HSSS 2205 (le = 61.75-in.). ............................. 277
Figure N.27 Moment-curvature curve for pile 2 HSSS 205 (le = 61.75-in.). ................. 278
Figure N.28 Strand slip for pile HSSS 2205 (le = 61.75-in.). ......................................... 278
Figure N.29 Load-deflection curve for pile HSSS 2205 (le = 57-in.). ............................ 279
Figure N.30 Strain distribution for pile HSSS 2205 (le = 57-in.). .................................. 279
Figure N.31 Moment-curvature curve for pile HSSS 2205 (le = 57-in.). ....................... 280
Figure N.32 Strand slip for pile HSSS 2205 (le = 57-in.). .............................................. 280
xxii
LIST OF TABLES
Table 1.1 Calendar dates of research events and age of concrete at those times. ............... 3
Table 2.1 Composition and PREN values of the most common stainless steels (Moser et
al., 2012). .......................................................................................................................... 31
Table 4.1 Mechanical properties of duplex HSSS 2205 and conventional steel strands. . 67
Table 4.2 Corrosion behavior of different steel alloys (modified from Moser et al.
(2012))............................................................................................................................... 68
Table 4.3 Mechanical properties of austenitic SS 304 wire. 1 ksi = 6.9 MPa. ................. 70
Table 4.4 Mixture design of concrete. .............................................................................. 72
Table 4.5 QXRD analysis of cement type I/II used. ......................................................... 73
Table 4.6 Variability of concrete strength of prestressed concrete elements at 28 and 438
days (time of flexure and shear testing). 1,000 psi = 6.9 MPa. ........................................ 73
Table 4.7 Statistical analysis of compressive strength results at 438 days. ...................... 74
Table 4.8 Elastic modulus and Poisson’s ratio of concrete at 4, 28, 91, and 445 days. ... 77
Table 4.9 Splitting tensile strength of concrete at 7, 28, and 445 days. ........................... 79
Table 5.1 Pile driving results for AISI 1080 steel and duplex HSSS 2205 strands. ......... 95
Table 6.1 Experimental and calculated ultimate moments. 1 kip·in = 113 N·m. ........... 100
Table 6.2 Experimental and calculated ultimate curvatures. 1 rad/in = 39.37 rad/m. .... 101
Table 7.1 Comparison of average ultimate shear with ACI 318 and AASHTO LRFD
nominal shear strengths. 1 kip = 4.45 kN. ...................................................................... 110
Table 7.2 Shear strength provided by concrete, Vc, according to ACI 318 and AASHTO
LRFD. 1 kip = 4.45 kN. .................................................................................................. 113
Table 7.3 Statistical analysis of ultimate shear results. .................................................. 114
Table 7.4 Statistical analysis of ultimate deflection results. ........................................... 114
Table 8.1 Comparison between experimental and predicted prestress losses at 335 days.
......................................................................................................................................... 119
xxiii
Table 8.2 Ratio of experimental to calculated losses at 335 days and estimated losses at
100 years. ........................................................................................................................ 120
Table 8.3 Comparison of measured losses at 335 days and calculated losses with the
AASHTO lump-sum method. ......................................................................................... 123
Table 9.1 Summary of transfer lengths of piles before and after driving. The percentage
of the value given by AASHTO LRFD is shown in parenthesis. 1 in. = 2.54 cm. ......... 131
Table 9.2 Comparison of experimental transfer length with code values and research
proposed expressions. 1 in. = 2.54 cm. ........................................................................... 134
Table 10.1 Embedment lengths used for development length determination. 1 in. = 2.54
cm. ................................................................................................................................... 142
Table 10.2 Comparison of experimental ld with codes values and research proposed
expressions for development length. 1 in. = 2.54 cm. .................................................... 153
Table 10.3 Expressions closer to experimental values. .................................................. 154
Table 11.1 Compressive strength of cores and cylinders of batch #1 at 42 days. .......... 159
Table 11.2 Acid-soluble chloride content of cores, obtained by titration (ASTM C1152).
......................................................................................................................................... 163
Table C.1 Rate of galvanic corrosion under tested conditions. ...................................... 200
Table F.1 Ultimate curvature calculated by moment-area method. 1 rad/in = 39.37 rad/m.
......................................................................................................................................... 211
Table H.1 Calculated moments and curvatures at cracking, yield, and ultimate condition
for piles using AISI 1080 steel strands (ACI 318). ......................................................... 222
Table H.2 Calculated moments and curvatures at cracking, yield, and ultimate condition
for piles using duplex HSSS 2205 strands (ACI 318). ................................................... 222
Table H.3 Calculated moments and curvatures at cracking and ultimate condition for
piles using AISI 1080 steel strands (AASHTO LRFD). ................................................. 223
Table H.4 Calculated moments and curvatures at cracking and ultimate condition for
piles using duplex HSSS 2205 strands (AASHTO LRFD). ........................................... 223
Table J.1 Experimental ultimate shear for piles using conventional steel. ..................... 249
xxiv
Table J.2 Experimental ultimate shear for piles using stainless steel. ............................ 249
xxv
LIST OF SYMBOLS AND ABBREVIATIONS
AASHTO American Association of State Highway and Transportation Officials
ACI American Concrete Institute
AISI American Iron and Steel Institute
APE American Piledriving Equipment, Inc.
ASTM American Society for Testing and Materials
CTL Chloride threshold level
db Nominal diameter of strand
DEMEC Detachable Mechanical Strain Gauge
EAC Environmentally assisted cracking
Ec Concrete modulus of elasticity
Eci Concrete modulus of elasticity at release
f’c,28 Concrete compressive strength at 28 days
f’ci Concrete compressive strength at release
fpe (fse) Effective stress in the prestressing steel after losses
fps Stress in the prestressing strand at nominal strength of member
fpu Tensile strength of prestressing strand
fpt Stress in the prestressing strand prior to transfer
fpy Yield strength of prestressing strand
fsi Stress in prestressing strand after strand release
fsp Splitting tensile strength of concrete
FHWA Federal Highway Administration
xxvi
GDOT Georgia Department of Transportation
HE Hydrogen embrittlement
HPC High-performance concrete
HSC High-strength concrete
HSSS High-strength stainless steel
ld Development length
le Embedment length for development length testing
LRFD Load and Resistance Factor Design
lt Transfer length
LVDT Linear Variable Displacement Transformer
PREN Pitting resistance equivalency number
SCC Stress corrosion cracking
SCM Supplementary cementitious material
SS Stainless steel
UNS Unified Numbering System
USGS United States Geological Survey
UTS Ultimate tensile strength
VWSG Vibrating wire strain gauge
w/c Water to cement mass ratio
w/cm Water to cementitious material mass ratio
εu Strain at ultimate state in prestressing strand

1
CHAPTER 1
INTRODUCTION
1.1 Research Purpose
The research presented in this report continued the research developed in two
previous projects funded by Georgia Department of Transportation (GDOT); the global
objective is to increase the service life of prestressed concrete piles in marine
environments to 100 or more years.
The first project studied the environmental conditions at which bridges were
exposed in marine environments of Georgia. The deterioration evidenced by precast
prestressed concrete piles of eleven inspected bridges had service lives between 24 and
58 years at the time of the inspection, and corrosion damage of conventional steel
prestressing strands and wires was evident (Moser et al., 2011). Based on the degradation
mechanisms of prestressed concrete piles in marine environments found in the first
project, the second project recommended two stainless steel alloys (duplex grades 2205
and 2304) and two high-performance concrete mixtures intended to improve the
durability of prestressed concrete piles. The goal was to provide a service life for bridges
of 100+ years (Holland et al., 2012; Moser et al., 2012).
The main findings obtained in these two previous reports were:
- Precast prestressed concrete piles in Georgia coastal regions evidence
accelerated chloride intrusion and significant cracking and damage due to corrosion of
reinforcement, sulfate attack, surface abrasion, biological attack from boring sponges,
and pile over-driving.
2
- Conventional steel AISI 1080 used in prestressing strands does not provide the
necessary corrosion resistance to reach the required service life goal for bridges in marine
environments.
- The presence of crevices and surface imperfections in prestressing strands
generates additional sites for corrosion initiation that reduces the chloride threshold limit
(CTL) compared to individual wires.
- Duplex high strength stainless steel grade 2205 (HSSS 2205) exhibited the best
corrosion resistance among the analyzed, strain-hardened high strength stainless steels.
- Duplex high strength stainless steel grade 2205 and 2304 prestressing strands are
able to be produced using the existing facilities and procedures used for conventional
grade AISI 1080 prestressing strand production.
1.2 Objectives and Scope
The purpose of this research was to develop corrosion-free precast prestressed
concrete piles which can be adopted for use in Georgia’s coastal, marine environment.
The specific objectives were to evaluate if precast concrete piles constructed with
high-strength stainless steel prestressing strand and spiral wire reinforcement and with
high-durability concrete may be easily fabricated, driven without failure or cracking, had
flexural and shear strength capacities exceeding those determined using standard
AASHTO LRFD provisions, determine if the transfer and development lengths of
stainless steel strand satisfied standard AASHTO LRFD provisions, examine the long-
term durability of the strand and concrete under marine conditions, and provide
3
specifications and design recommendations for corrosion-free piles which may be
implemented by the Georgia Department of Transportation (GDOT).
The scope of the research was limited to testing duplex high strength stainless
steel grade 2205 (HSSS 2205, UNS grade S32205) and conventional A1080 steel for
prestressing strand and using stainless steel grade 304 (SS 304, UNS grade S30400) and
conventional plain wire (ASTM A 82).
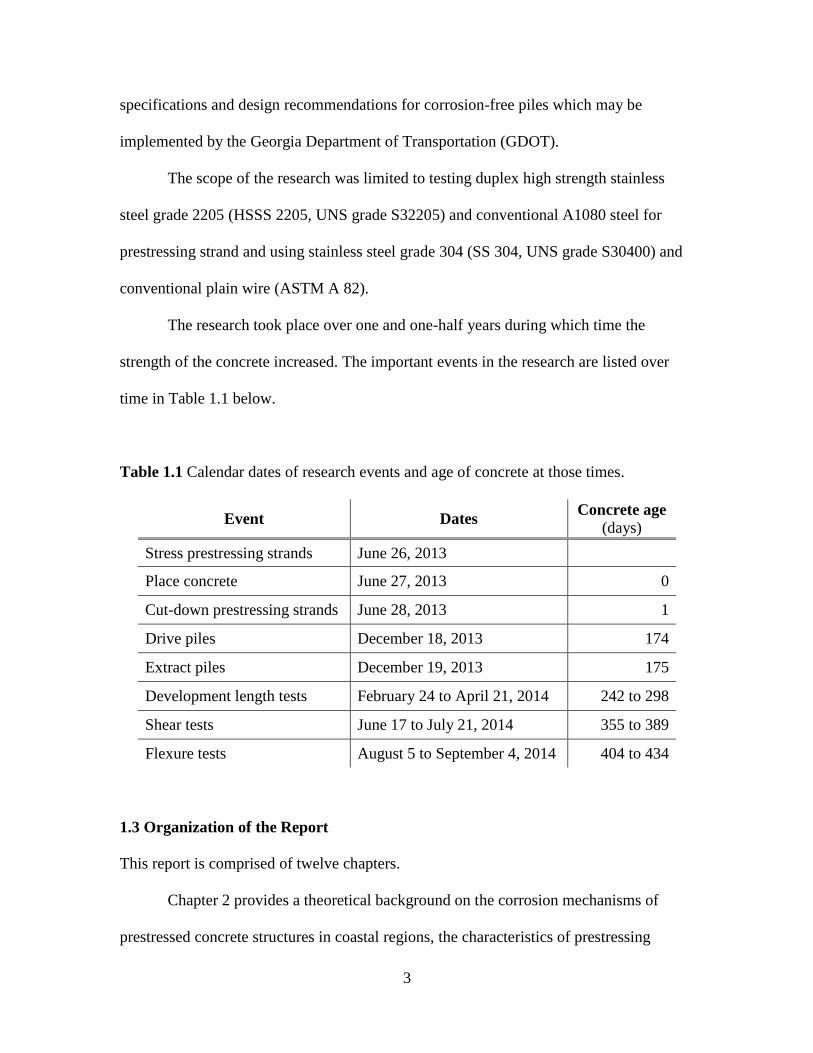
The research took place over one and one-half years during which time the
strength of the concrete increased. The important events in the research are listed over
time in Table 1.1 below.
Table 1.1 Calendar dates of research events and age of concrete at those times.
Event Dates Concrete age
(days)
Stress prestressing strands June 26, 2013
Place concrete June 27, 2013 0
Cut-down prestressing strands June 28, 2013 1
Drive piles December 18, 2013 174
Extract piles December 19, 2013 175
Development length tests February 24 to April 21, 2014 242 to 298
Shear tests June 17 to July 21, 2014 355 to 389
Flexure tests August 5 to September 4, 2014 404 to 434
1.3 Organization of the Report
This report is comprised of twelve chapters.
Chapter 2 provides a theoretical background on the corrosion mechanisms of
prestressed concrete structures in coastal regions, the characteristics of prestressing
4
reinforcement, and a description of stainless steel. Also, the factors that influence the
prestress losses, development and transfer lengths are described, along with expressions
proposed in the literature to predict the development and transfer lengths.
Chapter 3 describes the design of the prestressed concrete piles and the samples
built for the study. The construction procedure of the piles is presented, including the
instrumentation for prestress losses and transfer length monitoring, and the construction
of the specimens for development length testing is detailed.
Chapter 4 summarizes the properties of the steel and concrete used in the piles. It
includes the mechanical properties of duplex HSSS 2205 strand, conventional steel
strand, and austenitic SS 304 wire, the evaluation of the galvanic corrosion of the couple
HSSS 2205 – SS 304, concrete mixture composition, the mechanical properties of
concrete over time (compressive strength, splitting tensile strength, elastic modulus of
elasticity, and Poisson modulus), the variability of the concrete used in each pile, creep
and shrinkage testing results, and the permeability of concrete to chloride ions.
Chapter 5 describes the pile driving operation in the Savannah River, at Savannah,
Georgia, and the extraction by water-jet. Potential cracking and spalling damage by
driving was especially monitored. The bearing capacity of piles is compared with
required design capacity.
Chapter 6 presents the flexural capacity of the piles. Tests performed in piles with
duplex HSSS 2205 and conventional steel strands are described, and the results are
compared with predicted behavior by ACI 318 and AASHTO LRFD provisions. Chapter
7, which shows the shear capacity of piles, follows the same organization.
5
Chapter 8 shows the prestress losses measured in the piles during the first year
after placement. The measured values are compared with the prediction from the
AASHTO LRFD refined method.
Chapter 9 shows the transfer length calculated from concrete surface strains, for
piles using duplex HSSS 2205 and conventional steel strands. The compliance with
calculated values from AASHTO LRFD and ACI 318, and the prediction of expressions
proposed by previous studies are evaluated. The effect of driving on the transfer length of
piles is also assessed.
Chapter 10 presents the development length testing of piles using duplex HSSS
2205 and conventional steel strands. A flexure test using variable test embedment length
to induce slip of the strands is described, and the results are compared with predictions
from AASHTO LRFD, ACI 318, and expressions proposed in the literature.
Chapter 11 describes the evaluation of the long-term performance of piles using
30-inch long specimens located in the Savannah River. Preliminary evaluation of the
specimens was performed to establish an “undamaged” state of the samples to be used for
future assessment of deterioration.
Chapter 12 presents the conclusions of the study and provides recommendations
for the use of duplex HSSS 2205 strands and austenitic SS 304 wire in prestressed
concrete piles.
6
CHAPTER 2
BACKGROUND
2.1 Deterioration of Prestressed Concrete Piles
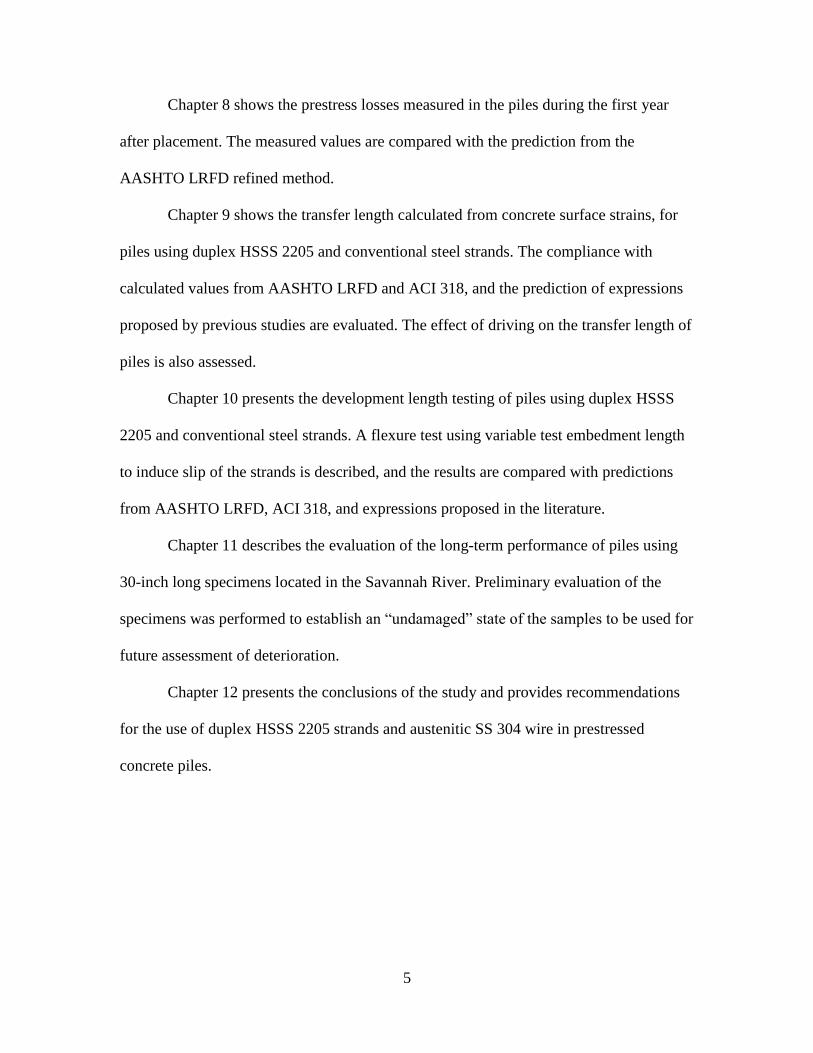
2.1.1 Characteristics of prestressing reinforcement
Conventional prestressing steel is a pearlitic (α-ferrite + Fe3C [cementite])
eutectoid steel with approximate elemental composition of 0.75-0.88% C, 0.6-0.9% Mn,
0.05% S (max), 0.04% P (max), and traces of other elements, such as Si, Mo, Cr, and Ni
(Moser et al., 2011a), conforming to specification of AISI 1080 steel. Microstructure of
the longitudinal and transverse orientations of the prestressing steel is shown in Figure
2.1, where white plates correspond to the ferrite phase and black plates correspond to the
cementite phase. The anisotropic microstructure is oriented in the direction of cold
drawing.
(a) (b)
Figure 2.1 Microstructure of the (a) longitudinal and (b) transverse direction of
prestressing steel (Moser et al., 2011a).
7
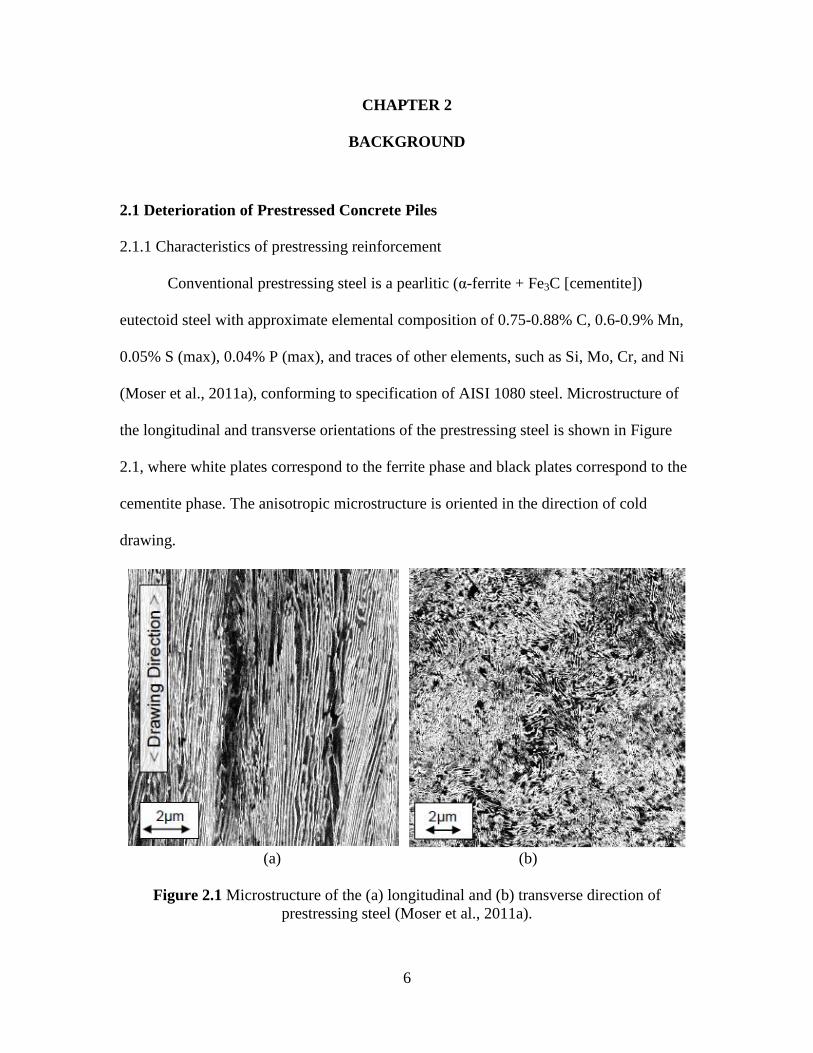
Prestressing steel reinforcement has higher yield and ultimate tensile strength than
typical reinforced concrete reinforcement (Figure 2.2), in order to provide effective
prestressing even after prestress losses reduce the magnitude of the prestressing force.
Most common specified ultimate tensile strengths (UTS, often termed guaranteed
ultimate tensile strengths, GUTS) are 250 and 270 ksi (1,724 and 1,862 MPa), and are
typically stressed between 60% to 80% of the UTS; ultimate strain is about 7% and a
modulus of elasticity of 29,000 ksi (200 GPa) is recommended by AASHTO (2013) and
ACI 318 (2011) provisions.
Figure 2.2 Stress-strain diagram of prestressing steel compared to mild steel (Nawy,
2009).
Prestressing steel is available in three forms: 1) uncoated wires (stress-relieved or
low relaxation), 2) uncoated strands (stress-relieved or low relaxation), and 3) uncoated
high-strength steel bars. Prestressing wires are cold-drawn to increase their tensile
8
strength, followed by a stress relieving process in which wires are exposed to
temperatures of about 700 °F (371 °C) to remove residual stresses in steel. Low-
relaxation wires and strands are subjected to the combined action of high temperature of
stress relieving and stress approximately 40% of the UTS. Low-relaxation steel has a
relaxation stress loss less than 2% to 3%, which is 25% of that of typical stress-relieved
steel (Nawy, 2009; Moser et al., 2011a).
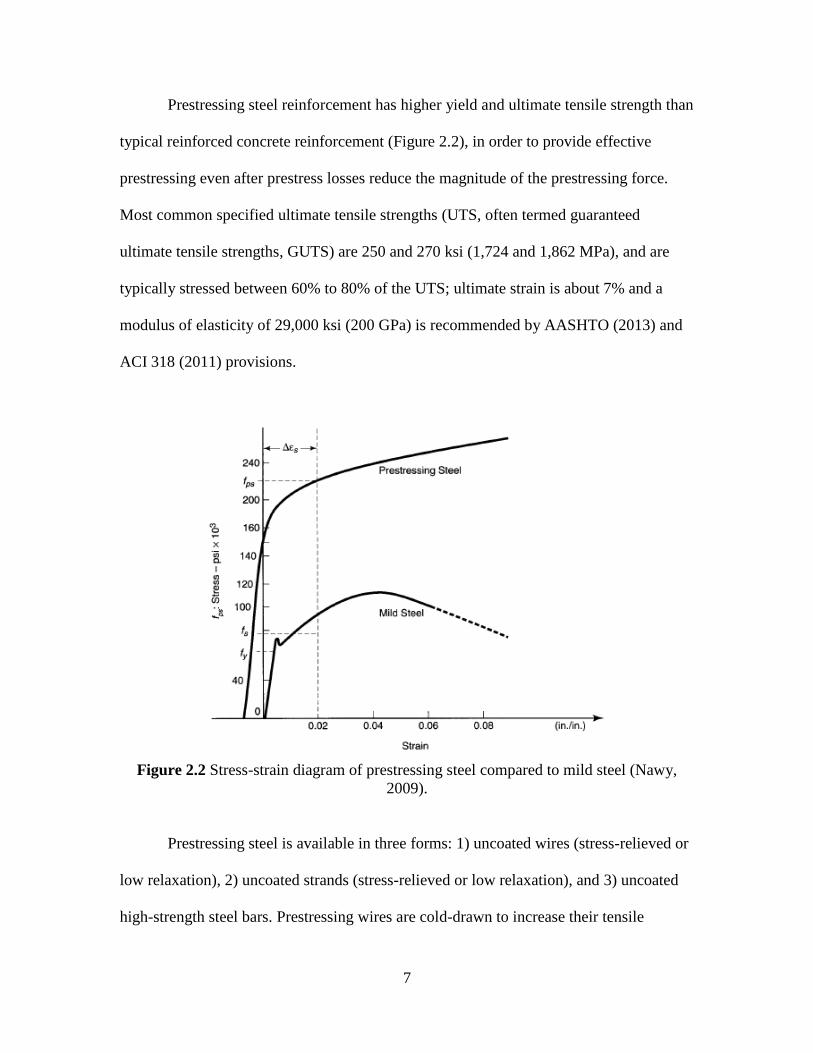
Standard strands are composed of seven wires; six of them twisted around one
slightly larger central wire (Figure 2.3a). A compacted strand can also be formed to
maximize the steel area of the 7-wire strand for a given nominal diameter (Figure 2.2b).
The nominal diameter of the strand, db, ranges from 3/8 to 0.6-in. (9.5 to 15.2 mm).
(a)
(b)
Figure 2.3 (a) Standard strand section and (b) compacted strand section (Nawy, 2009).
9
Prestressing wires are coated with ZnPO4 to ease the cold working process and to
provide a protective layer from the atmosphere before being placed in concrete. It has
been shown that imperfections of this coating can be expected due to scratching,
stranding, or cold-working. As a result, corrosion may initiate at these imperfection sites
well before the breakdown of the ZnPO4 layer (Moser et al., 2011b).
2.1.2 Corrosion of prestressed concrete structures
The failure mechanism due to corrosion of steel in prestressed concrete may differ
significantly from conventional reinforced concrete. The nominal strength of prestressed
concrete is dependent on the prestressing force. Thus, the corrosion of the prestressing
steel and the subsequent reduction of the strand will have a higher impact compared to
reinforced concrete structures. In extreme cases, corrosion of prestressing reinforcement
can lead to catastrophic failure of prestressed concrete elements, which may occur
without outward evidence (Nawy, 2009).
In the case of prestressed concrete piles exposed to marine environments, there
are several mechanisms that contribute to the deterioration of these elements; the
corrosion of the steel reinforcement is the most prevalent damage evidenced (Cannon et
al., 2006). A survey of the condition of concrete bridges in the Georgia coastal region
performed by Moser et al. (2011a) showed extensive damage of the substructure and
superstructure. Most significant damage to piles was found in the submerged and tidal
zones of bridges in contact with brackish water, where the most common deterioration
features were abrasion of concrete, cracking and spalling of concrete, and corrosion
staining. Analysis of water samples showed a pH between 5.88 and 7.47, and water
10
salinity and sulfate concentration consistent with brackish water (0.1-2.5% NaCl
concentration and 1,000-2,700 mg/L SO42-
, respectively). Further examination of the
piles identified chloride-induced corrosion and high chloride concentration in the tidal
and splash zones, and evidence of concrete deterioration due to sulfate attack,
carbonation, and the action of boring sponges.
These observations are consistent with the evaluation of prestressed concrete piles
in the coast of Florida performed by Cannon et al. (2007). Half-cell potentials suggesting
high probability of active corrosion of the reinforcement (≤ -350 mV) were reported in
the splash zone of piles, and higher chloride concentration was measured in submerged,
splash, and tidal zones. Additionally, severe corrosion of the prestressing strands was
observed at the pick-up points suggesting that accelerated chloride intrusion occurred at
these regions.
The highest concentration of chloride in concrete piles partially submerged in
seawater has been measured between 0 to 1 ft. (0 to 30.5 cm) above the waterline (Hartt
and Rosemberg, 1980). Capillary flow of seawater and transverse evaporation of water
from the sides of the piles explain the high concentration of residual salts in these regions
(Chaix et al., 1995). Availability of moisture, chlorides, and oxygen at the splash and
tidal regions can explain the higher corrosion rates and damage.
The accelerated deterioration of concrete structures in marine environments leads
to a significant decrease of the predicted service life. Kurtis et al. (2013) estimated the
predicted service life of reinforced concrete exposed to urban and marine environments.
The diffusion coefficient of concrete was estimated from rapid chloride permeability tests
(RCPT) performed on concrete mixtures with different water-to-cementitious material
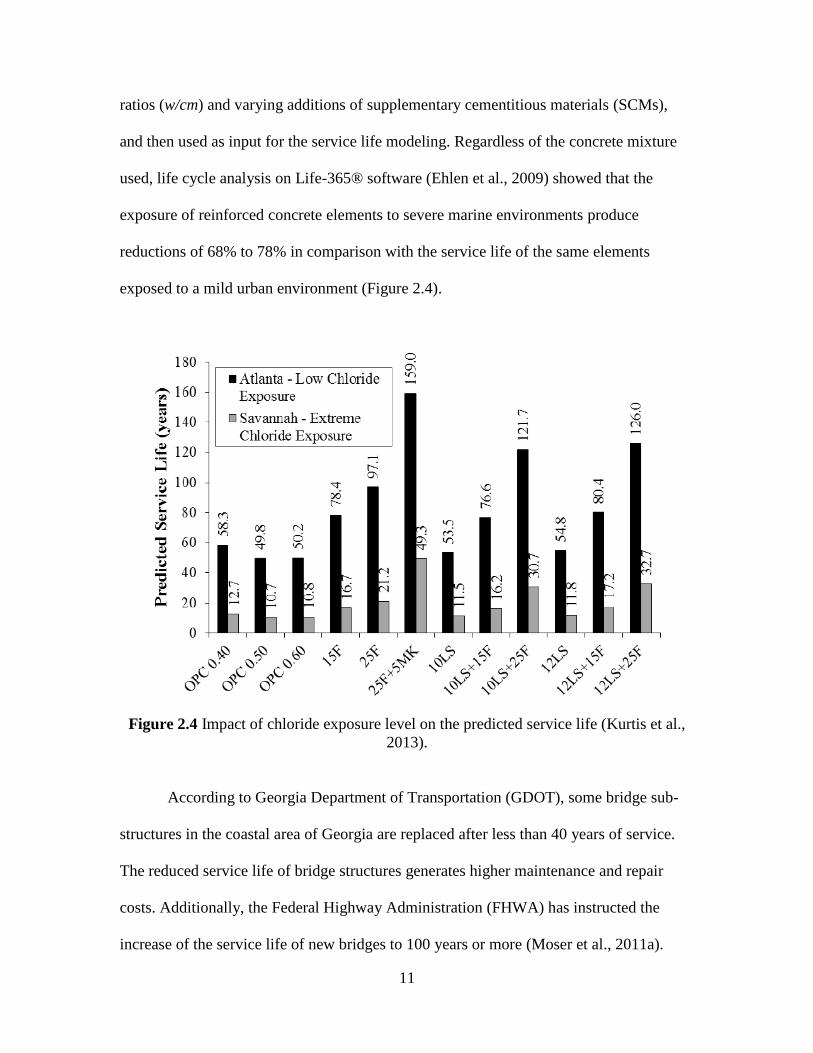
11
ratios (w/cm) and varying additions of supplementary cementitious materials (SCMs),
and then used as input for the service life modeling. Regardless of the concrete mixture
used, life cycle analysis on Life-365® software (Ehlen et al., 2009) showed that the
exposure of reinforced concrete elements to severe marine environments produce
reductions of 68% to 78% in comparison with the service life of the same elements
exposed to a mild urban environment (Figure 2.4).
Figure 2.4 Impact of chloride exposure level on the predicted service life (Kurtis et al.,
2013).
According to Georgia Department of Transportation (GDOT), some bridge sub-
structures in the coastal area of Georgia are replaced after less than 40 years of service.
The reduced service life of bridge structures generates higher maintenance and repair
costs. Additionally, the Federal Highway Administration (FHWA) has instructed the
increase of the service life of new bridges to 100 years or more (Moser et al., 2011a).
12
This objective cannot be reached in marine environments using conventional construction
practices for prestressed concrete.
2.1.3 Corrosion of prestressing strand
The corrosion of prestressed concrete may be triggered by the action of different
mechanisms. The two most common mechanisms are carbonation and chloride-induced
corrosion; both of these involve the diffusion of deleterious elements through concrete,
which eventually reach the depth of the prestressing strand and can initiate active
corrosion. Additionally, environmentally-induced cracking can be produced in
prestressing strands by two mechanisms: 1) stress corrosion cracking (SCC) and 2)
hydrogen-assisted cracking (HAC) by hydrogen embrittlement (HE). These mechanisms
of corrosion of prestressing steel strands are described below.
a) Carbonation-induced corrosion
Carbonation of concrete is initiated by the diffusion of airborne carbon dioxide
(CO2) through concrete porosity. CO2 reaction with the alkaline components of cement
paste (mainly calcium hydroxide (Ca(OH)2, sodium hydroxide (NaOH), and potassium
hydroxide (KOH)) and calcium silicate hydrate (C-S-H) may affect the service life of
concrete structures (Bohni, 2005). The two main consequences of carbonation are: 1) the
drop of pH due to the reduction in hydroxide concentration in the pore solution which is a
process that induces the breakage of the passive layer of steel, and 2) the change of
concrete permeability due to volume changes and microcracking caused by chemical
reactions (Johanneson and Utgenannt, 2001). Ca(OH)2 and alkali hydroxyls (NaOH and
13
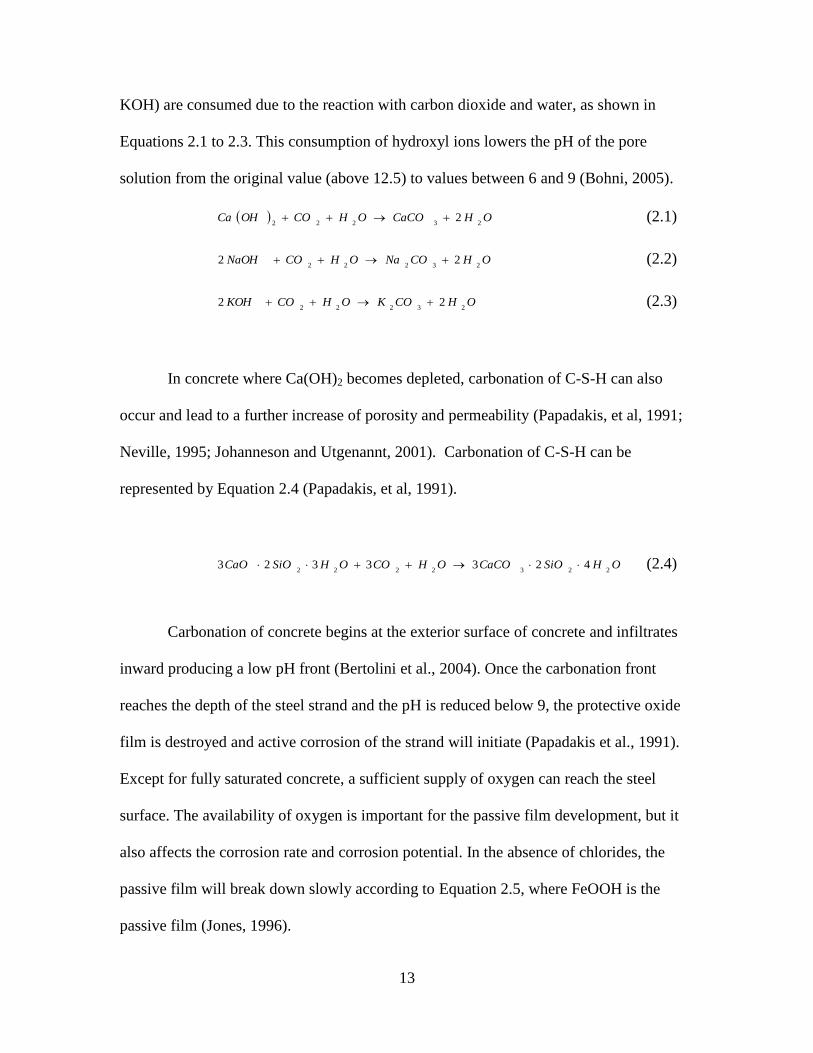
KOH) are consumed due to the reaction with carbon dioxide and water, as shown in
Equations 2.1 to 2.3. This consumption of hydroxyl ions lowers the pH of the pore
solution from the original value (above 12.5) to values between 6 and 9 (Bohni, 2005).
OHCaCOOHCOOHCa23222
2 (2.1)
OHCONaOHCONaOH23222
22 (2.2)
OHCOKOHCOKOH23222
22 (2.3)
In concrete where Ca(OH)2 becomes depleted, carbonation of C-S-H can also
occur and lead to a further increase of porosity and permeability (Papadakis, et al, 1991;
Neville, 1995; Johanneson and Utgenannt, 2001). Carbonation of C-S-H can be
represented by Equation 2.4 (Papadakis, et al, 1991).
OHSiOCaCOOHCOOHSiOCaO2232222
4233323 (2.4)
Carbonation of concrete begins at the exterior surface of concrete and infiltrates
inward producing a low pH front (Bertolini et al., 2004). Once the carbonation front
reaches the depth of the steel strand and the pH is reduced below 9, the protective oxide
film is destroyed and active corrosion of the strand will initiate (Papadakis et al., 1991).
Except for fully saturated concrete, a sufficient supply of oxygen can reach the steel
surface. The availability of oxygen is important for the passive film development, but it
also affects the corrosion rate and corrosion potential. In the absence of chlorides, the
passive film will break down slowly according to Equation 2.5, where FeOOH is the
passive film (Jones, 1996).
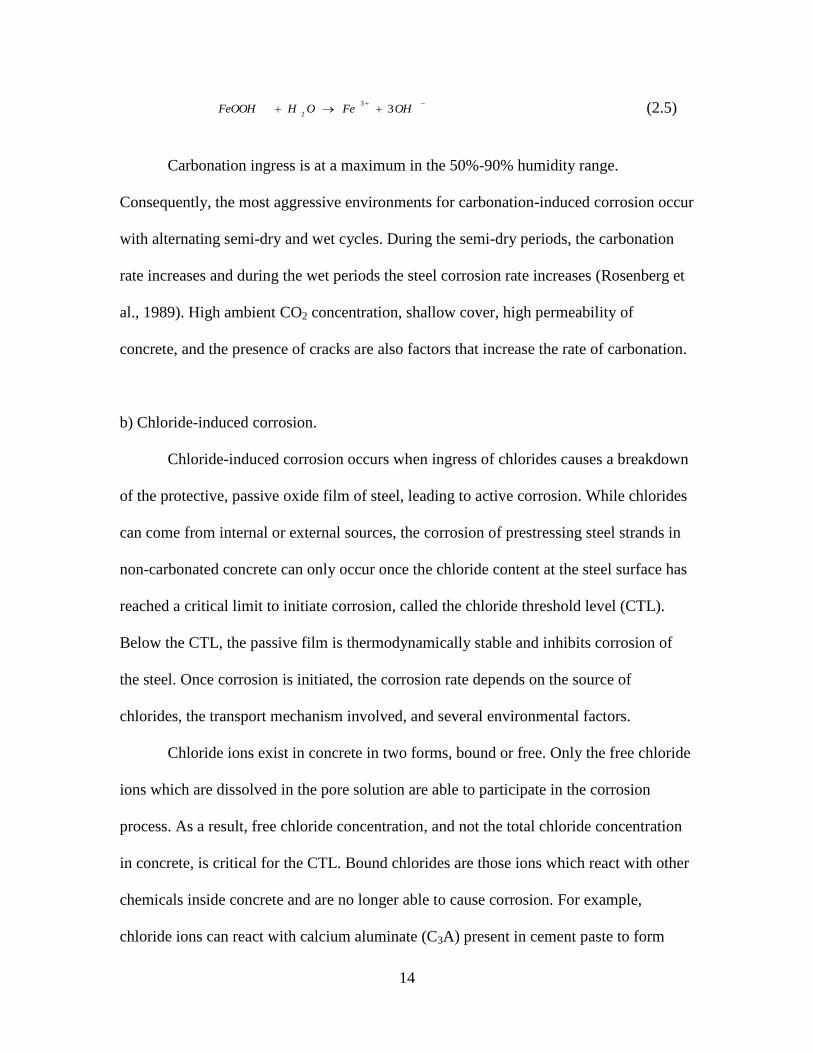
14
OHFeOHFeOOH 3
3
2 (2.5)
Carbonation ingress is at a maximum in the 50%-90% humidity range.
Consequently, the most aggressive environments for carbonation-induced corrosion occur
with alternating semi-dry and wet cycles. During the semi-dry periods, the carbonation
rate increases and during the wet periods the steel corrosion rate increases (Rosenberg et
al., 1989). High ambient CO2 concentration, shallow cover, high permeability of
concrete, and the presence of cracks are also factors that increase the rate of carbonation.
b) Chloride-induced corrosion.
Chloride-induced corrosion occurs when ingress of chlorides causes a breakdown
of the protective, passive oxide film of steel, leading to active corrosion. While chlorides
can come from internal or external sources, the corrosion of prestressing steel strands in
non-carbonated concrete can only occur once the chloride content at the steel surface has
reached a critical limit to initiate corrosion, called the chloride threshold level (CTL).
Below the CTL, the passive film is thermodynamically stable and inhibits corrosion of
the steel. Once corrosion is initiated, the corrosion rate depends on the source of
chlorides, the transport mechanism involved, and several environmental factors.
Chloride ions exist in concrete in two forms, bound or free. Only the free chloride
ions which are dissolved in the pore solution are able to participate in the corrosion
process. As a result, free chloride concentration, and not the total chloride concentration
in concrete, is critical for the CTL. Bound chlorides are those ions which react with other
chemicals inside concrete and are no longer able to cause corrosion. For example,
chloride ions can react with calcium aluminate (C3A) present in cement paste to form
15
Friedel’s salt (C3A·CaCl2·15H2O). Studies have demonstrated that increasing the C3A
content of concrete from 2.43% to 14% increased the CTL by a factor of 2.85 (Kurtis and
Mehta, 1997). However, sulfate present in Na2SO4 and MgSO4 can affect the stability of
bound chlorides, replacing Cl‒ by SO4
2‒ in Friedel’s salt structure. This reaction that
releases Cl‒ and may increase the content of ettringite in concrete (Geng et al., 2015).
Currently, most design codes set limits on the amount of chloride content
introduced from raw materials during the manufacturing of cement. The use of
contaminated mixing water, unwashed aggregate or sand, or admixtures can also be
sources of internal chlorides. In the past, calcium chloride was used extensively as an
admixture before being forbidden because of its ties to corrosion. With internal chloride
levels limited, the major source of chlorides is the ingress from the surrounding
environment of the structure. The main sources of environmental chlorides are deicing
salts and seawater (Bertolini et al., 2004).
Chloride penetration into concrete is a complex function of position, environment,
and concrete properties (Bertolini et al., 2004). Chloride permeation can occur due to a
large pressure gradient such as in pressure vessels or piping. Chloride absorption can
occur through capillary suction of a moisture gradient where cyclic wetting and drying
occur, but absorption has been shown to be unable to penetrate to the depth of the steel
(Holland et al., 2012). Thus, the primary transport mechanism for chlorides to penetrate
concrete is diffusion.
Mathematical models are able to predict a chloride profile based on depth, time,
apparent diffusion coefficient, and the surface chloride content. The apparent diffusion
coefficient depends on the pore structure of the concrete and can vary based on w/cm,
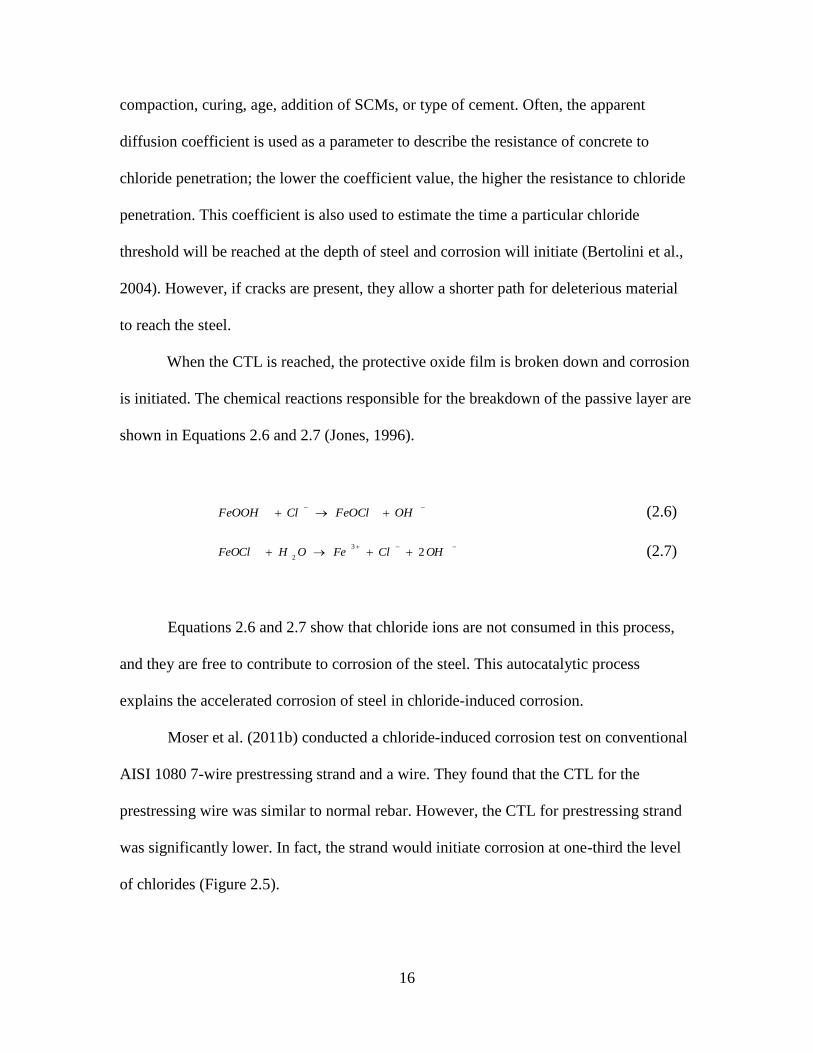
16
compaction, curing, age, addition of SCMs, or type of cement. Often, the apparent
diffusion coefficient is used as a parameter to describe the resistance of concrete to
chloride penetration; the lower the coefficient value, the higher the resistance to chloride
penetration. This coefficient is also used to estimate the time a particular chloride
threshold will be reached at the depth of steel and corrosion will initiate (Bertolini et al.,
2004). However, if cracks are present, they allow a shorter path for deleterious material
to reach the steel.
When the CTL is reached, the protective oxide film is broken down and corrosion
is initiated. The chemical reactions responsible for the breakdown of the passive layer are
shown in Equations 2.6 and 2.7 (Jones, 1996).
OHFeOClClFeOOH (2.6)
OHClFeOHFeOCl 2
3
2 (2.7)
Equations 2.6 and 2.7 show that chloride ions are not consumed in this process,
and they are free to contribute to corrosion of the steel. This autocatalytic process
explains the accelerated corrosion of steel in chloride-induced corrosion.
Moser et al. (2011b) conducted a chloride-induced corrosion test on conventional
AISI 1080 7-wire prestressing strand and a wire. They found that the CTL for the
prestressing wire was similar to normal rebar. However, the CTL for prestressing strand
was significantly lower. In fact, the strand would initiate corrosion at one-third the level
of chlorides (Figure 2.5).
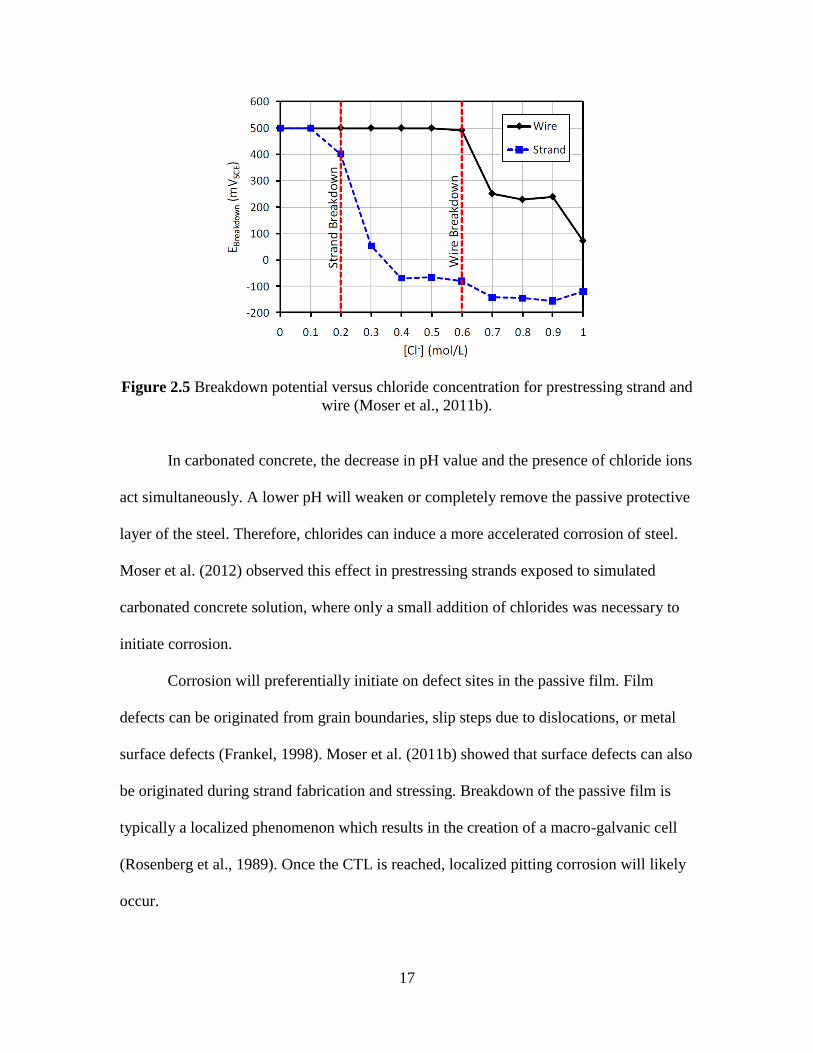
17
Figure 2.5 Breakdown potential versus chloride concentration for prestressing strand and
wire (Moser et al., 2011b).
In carbonated concrete, the decrease in pH value and the presence of chloride ions
act simultaneously. A lower pH will weaken or completely remove the passive protective
layer of the steel. Therefore, chlorides can induce a more accelerated corrosion of steel.
Moser et al. (2012) observed this effect in prestressing strands exposed to simulated
carbonated concrete solution, where only a small addition of chlorides was necessary to
initiate corrosion.
Corrosion will preferentially initiate on defect sites in the passive film. Film
defects can be originated from grain boundaries, slip steps due to dislocations, or metal
surface defects (Frankel, 1998). Moser et al. (2011b) showed that surface defects can also
be originated during strand fabrication and stressing. Breakdown of the passive film is
typically a localized phenomenon which results in the creation of a macro-galvanic cell
(Rosenberg et al., 1989). Once the CTL is reached, localized pitting corrosion will likely
occur.
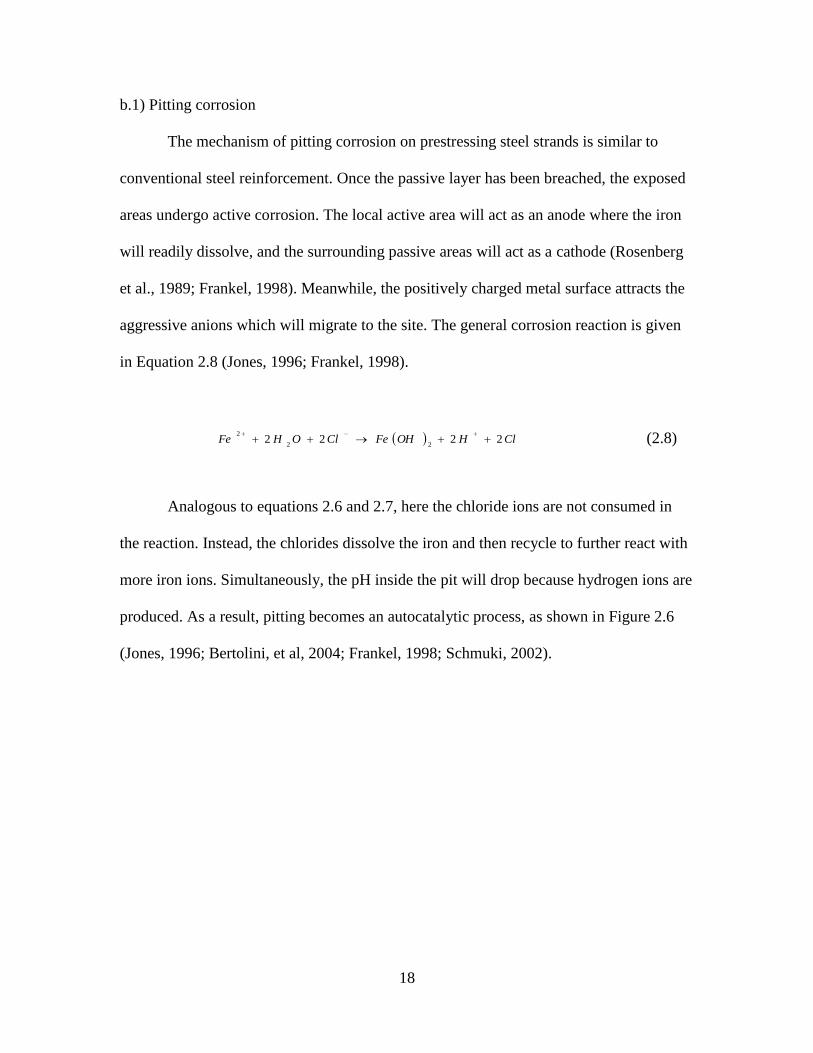
18
b.1) Pitting corrosion
The mechanism of pitting corrosion on prestressing steel strands is similar to
conventional steel reinforcement. Once the passive layer has been breached, the exposed
areas undergo active corrosion. The local active area will act as an anode where the iron
will readily dissolve, and the surrounding passive areas will act as a cathode (Rosenberg
et al., 1989; Frankel, 1998). Meanwhile, the positively charged metal surface attracts the
aggressive anions which will migrate to the site. The general corrosion reaction is given
in Equation 2.8 (Jones, 1996; Frankel, 1998).
ClHOHFeClOHFe 222222
2
(2.8)
Analogous to equations 2.6 and 2.7, here the chloride ions are not consumed in
the reaction. Instead, the chlorides dissolve the iron and then recycle to further react with
more iron ions. Simultaneously, the pH inside the pit will drop because hydrogen ions are
produced. As a result, pitting becomes an autocatalytic process, as shown in Figure 2.6
(Jones, 1996; Bertolini, et al, 2004; Frankel, 1998; Schmuki, 2002).
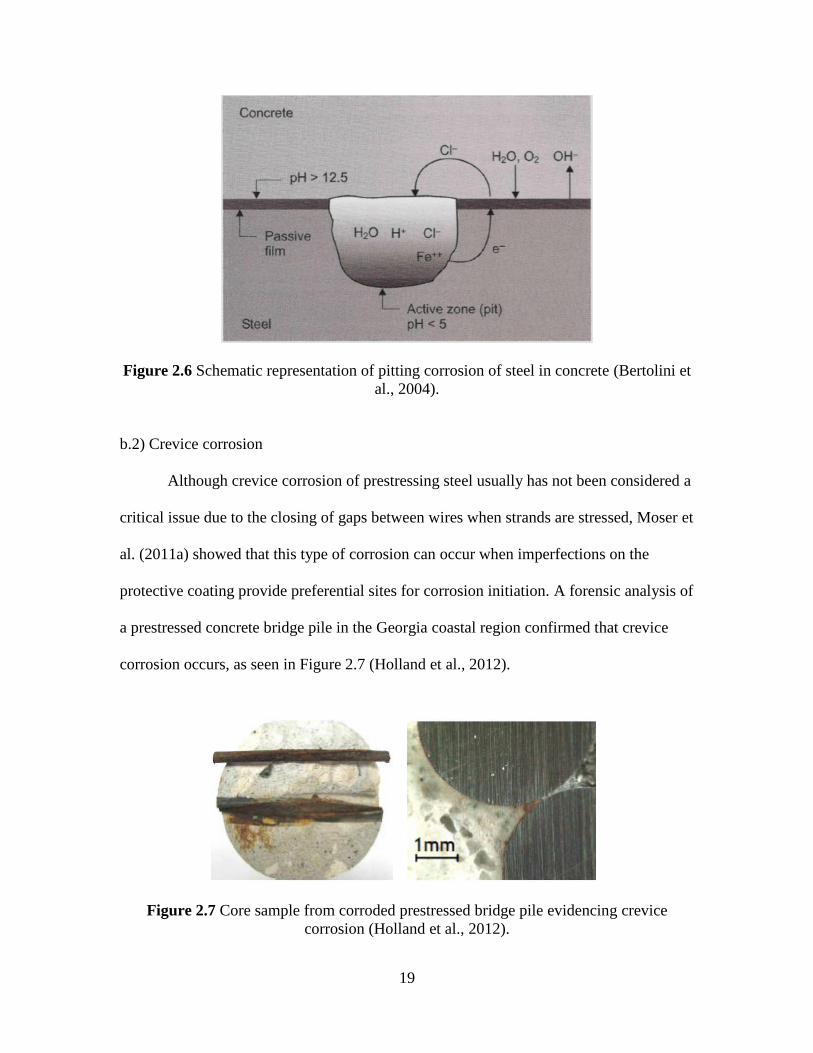
19
Figure 2.6 Schematic representation of pitting corrosion of steel in concrete (Bertolini et
al., 2004).
b.2) Crevice corrosion
Although crevice corrosion of prestressing steel usually has not been considered a
critical issue due to the closing of gaps between wires when strands are stressed, Moser et
al. (2011a) showed that this type of corrosion can occur when imperfections on the
protective coating provide preferential sites for corrosion initiation. A forensic analysis of
a prestressed concrete bridge pile in the Georgia coastal region confirmed that crevice
corrosion occurs, as seen in Figure 2.7 (Holland et al., 2012).
Figure 2.7 Core sample from corroded prestressed bridge pile evidencing crevice
corrosion (Holland et al., 2012).
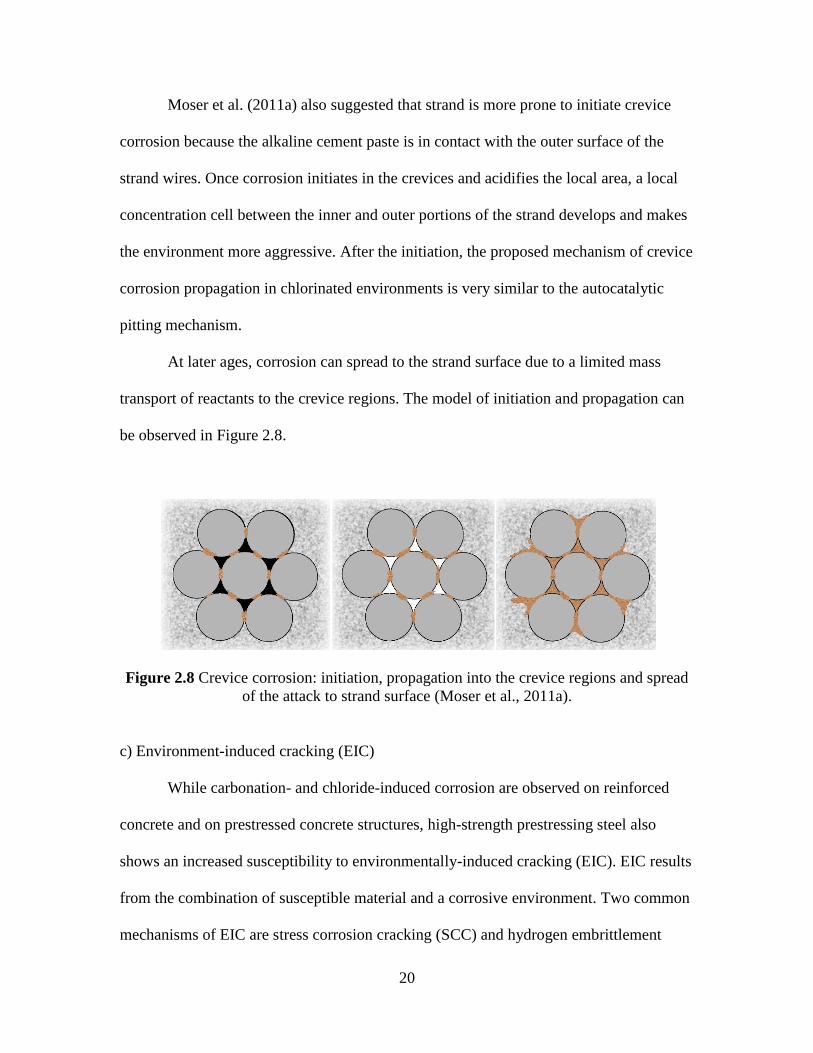
20
Moser et al. (2011a) also suggested that strand is more prone to initiate crevice
corrosion because the alkaline cement paste is in contact with the outer surface of the
strand wires. Once corrosion initiates in the crevices and acidifies the local area, a local
concentration cell between the inner and outer portions of the strand develops and makes
the environment more aggressive. After the initiation, the proposed mechanism of crevice
corrosion propagation in chlorinated environments is very similar to the autocatalytic
pitting mechanism.
At later ages, corrosion can spread to the strand surface due to a limited mass
transport of reactants to the crevice regions. The model of initiation and propagation can
be observed in Figure 2.8.
Figure 2.8 Crevice corrosion: initiation, propagation into the crevice regions and spread
of the attack to strand surface (Moser et al., 2011a).
c) Environment-induced cracking (EIC)
While carbonation- and chloride-induced corrosion are observed on reinforced
concrete and on prestressed concrete structures, high-strength prestressing steel also
shows an increased susceptibility to environmentally-induced cracking (EIC). EIC results
from the combination of susceptible material and a corrosive environment. Two common
mechanisms of EIC are stress corrosion cracking (SCC) and hydrogen embrittlement
21
(HE), which can occur independently or simultaneously, and cause hydrogen-assisted
cracking (HAC).
These three mechanisms may significantly reduce mechanical properties of
prestressing steel. While prestressing steel is typically loaded to 60-80% of the UTS, the
reduction of tensile stresses due to EIC can cause a catastrophic and brittle failure without
even considering service loads. Because of their resulting brittle mode of failure, stress
corrosion cracking, hydrogen embrittlement and hydrogen-assisted cracking are of great
concern and are described below.
c.1) Stress corrosion cracking (SCC)
Stress corrosion cracking is the phenomena where a metal under tensile stresses
forms sharp, defined cracks due to exposure to a certain environment. Commonly,
cracking due to SCC takes the form of intergranular or transgranular cracking; that is,
cracks form along the grain boundaries or through the grains. Cracks generally start at
surface discontinuities like corrosion pits, grain boundaries, microstructure defects, or
fabrication defects.
The two most common theories to explain the crack propagation phenomenon are
electrochemical dissolution and stress sorption. The electrochemical dissolution theory
proposes that galvanic cells are formed on the grain boundaries, and localized metal
dissolution initiates a crack. Then, the stress disturbs the brittle oxide film over new
anodic material, which is corroded. This process continues and the crack propagates
within the material. The stress-sorption theory suggests that adsorbed deleterious
elements reduce the cohesion between metal ions creating a weakened boundary, and the
22
applied stress causes crack growth along this boundary (ACI 222.2R, 2001; Jones, 1996).
In the case of prestressing strands, hydrogen is generally the element that causes the
brittle fracture of steel and thus, hydrogen assisted cracking (HAC) is the prevailing EIC
mechanism.
Independent from the mechanism of initiation and propagation, SCC occurrence
will depend on the type of metal or alloy used and the conditions of the environment. A
stress field ahead of the crack tip can be characterized by a stress intensity factor, KI. This
parameter is related to both the stress level and crack size. When KI reaches a critical
threshold level, failure occurs. SCC will occur when KI =43 MPa·m0.5 and a brittle
fracture will occur when KI =86 MPa·m0.5 (Darmawan and Stewart, 2007). Several tests
have shown that present day prestressing strand has KI values well above the SCC critical
threshold in atmospheric and chloride environments. Thus, conventional steel strands are
resistant to SCC in these environments (Nurnberger, 2002; Toribio and Ovejero, 2005;
Darmawan and Stewart, 2007).
c.2) Hydrogen embrittlement (HE) and hydrogen-assisted cracking (HAC)
Hydrogen embrittlement (HE) is the reduction of ductility of metals and alloys
due to the absorption of hydrogen atoms into the metal lattice (Fontana, 1986). HE does
not require stress to occur, and hydrogen can be introduced during manufacturing of
strand and strand storage, and during precast concrete pile construction and life of the
pile. Some sources of hydrogen are welding, electroplating, hydrogen gas, cathodic
polarization, and corrosion products. Hydrogen atoms present on the metal surface
penetrate the metal lattice occupying different positions in the microstructure.
23
Hydrogen atoms trapped in the metal lattice are mainly responsible for the
occurrence of HE on prestressing steel, because they deform the steel lattice. This
deformation affects the mechanical properties of the steel, and straining the lattice limits
the ductile slip mechanism and reduces toughness. The level of embrittlement increases
with the amount of hydrogen trapped inside the steel (Recio et al., 2013), and some
chemicals have been shown to accelerate HE, including hydrogen sulfide (H2S), carbon
dioxide (CO2), chloride (Cl‒), cyanide (CN
‒), and ammonium ions (NH4
+).
Novokshchenov (1994) found that the susceptibility of steel to HE increases with
increased carbon content, increased cold working, increased stress relieving, increased
chloride concentration, and increased temperature. Additionally, forensics performed on
structures affected by HE have revealed that embrittled steel presents the following
characteristics: lower tensile strength reflects a loss of ductility due to hydrogen
absorption, failure occurs over a broad range of applied stress, time to failure depends on
the applied stress, and below a critical stress, failure does not occur (ACI 222.2R, 2001).
However, hydrogen uptake is a function of environmental pH and HE is only observed
with pH lower than 7. Thus, hydrogen absorption is not feasible when steel is in a passive
state (Griess and Naus, 1980).
HE can act concurrently with SCC to form hydrogen-assisted cracking (HAC).
Cracks are initiated by pitting corrosion which causes a local concentration of hydrogen
ions and a lower pH. Simultaneously, hydrogen also has a tendency to concentrate where
tensile stresses are the highest within the metal lattice, near the crack tip. The crack will
propagate once the lattice is sufficiently embrittled, combined with an adequate tensile
force (Figure 2.9). This process will continue to repeat itself and lead to steel failure as
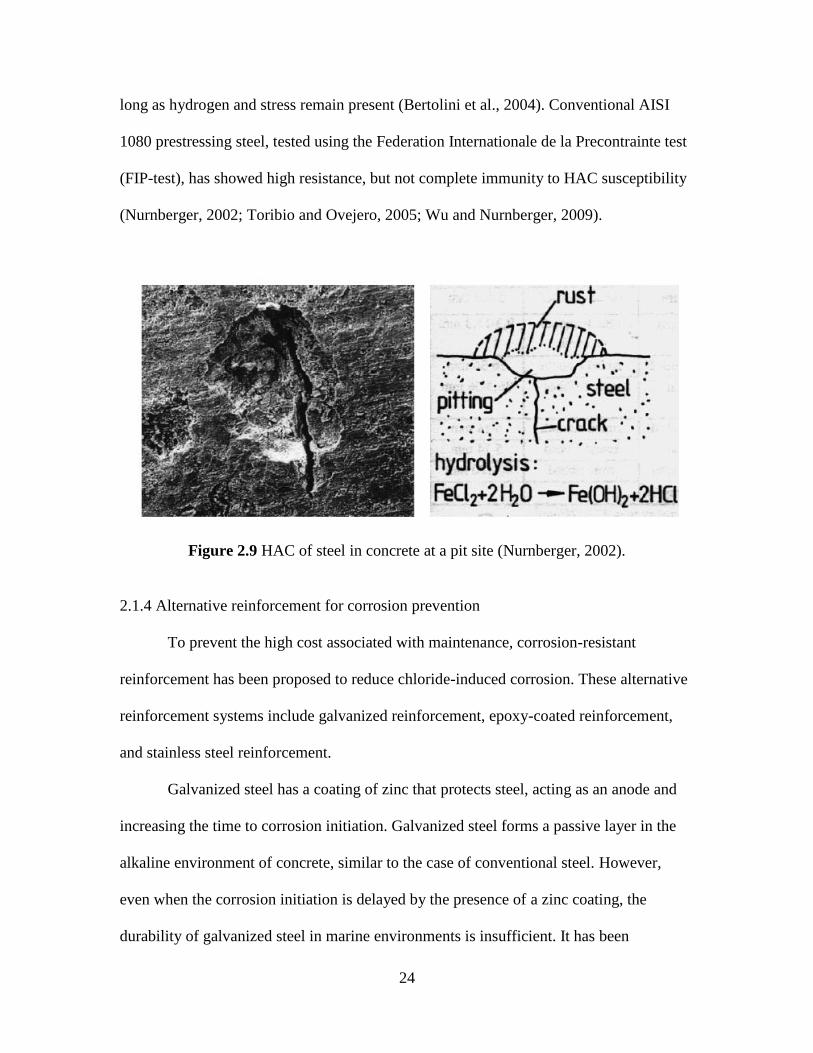
24
long as hydrogen and stress remain present (Bertolini et al., 2004). Conventional AISI
1080 prestressing steel, tested using the Federation Internationale de la Precontrainte test
(FIP-test), has showed high resistance, but not complete immunity to HAC susceptibility
(Nurnberger, 2002; Toribio and Ovejero, 2005; Wu and Nurnberger, 2009).
Figure 2.9 HAC of steel in concrete at a pit site (Nurnberger, 2002).
2.1.4 Alternative reinforcement for corrosion prevention
To prevent the high cost associated with maintenance, corrosion-resistant
reinforcement has been proposed to reduce chloride-induced corrosion. These alternative
reinforcement systems include galvanized reinforcement, epoxy-coated reinforcement,
and stainless steel reinforcement.
Galvanized steel has a coating of zinc that protects steel, acting as an anode and
increasing the time to corrosion initiation. Galvanized steel forms a passive layer in the
alkaline environment of concrete, similar to the case of conventional steel. However,
even when the corrosion initiation is delayed by the presence of a zinc coating, the
durability of galvanized steel in marine environments is insufficient. It has been
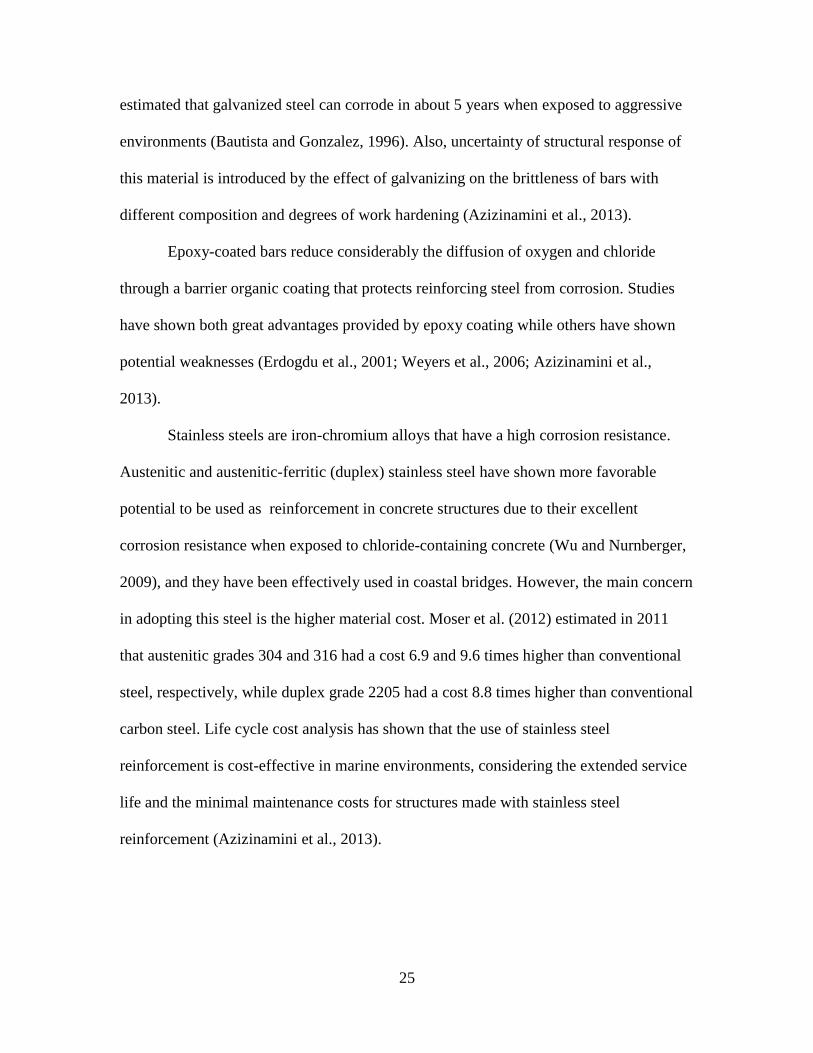
25
estimated that galvanized steel can corrode in about 5 years when exposed to aggressive
environments (Bautista and Gonzalez, 1996). Also, uncertainty of structural response of
this material is introduced by the effect of galvanizing on the brittleness of bars with
different composition and degrees of work hardening (Azizinamini et al., 2013).
Epoxy-coated bars reduce considerably the diffusion of oxygen and chloride
through a barrier organic coating that protects reinforcing steel from corrosion. Studies
have shown both great advantages provided by epoxy coating while others have shown
potential weaknesses (Erdogdu et al., 2001; Weyers et al., 2006; Azizinamini et al.,
2013).
Stainless steels are iron-chromium alloys that have a high corrosion resistance.
Austenitic and austenitic-ferritic (duplex) stainless steel have shown more favorable
potential to be used as reinforcement in concrete structures due to their excellent
corrosion resistance when exposed to chloride-containing concrete (Wu and Nurnberger,
2009), and they have been effectively used in coastal bridges. However, the main concern
in adopting this steel is the higher material cost. Moser et al. (2012) estimated in 2011
that austenitic grades 304 and 316 had a cost 6.9 and 9.6 times higher than conventional
steel, respectively, while duplex grade 2205 had a cost 8.8 times higher than conventional
carbon steel. Life cycle cost analysis has shown that the use of stainless steel
reinforcement is cost-effective in marine environments, considering the extended service
life and the minimal maintenance costs for structures made with stainless steel
reinforcement (Azizinamini et al., 2013).
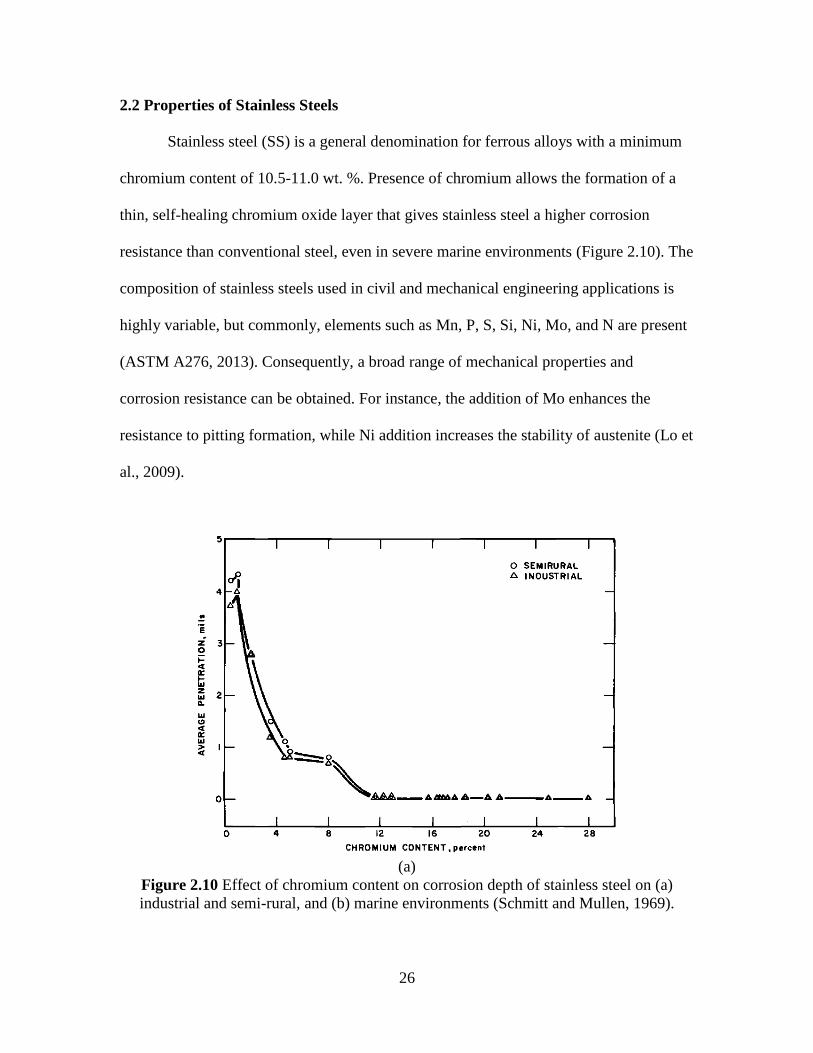
26
2.2 Properties of Stainless Steels
Stainless steel (SS) is a general denomination for ferrous alloys with a minimum
chromium content of 10.5-11.0 wt. %. Presence of chromium allows the formation of a
thin, self-healing chromium oxide layer that gives stainless steel a higher corrosion
resistance than conventional steel, even in severe marine environments (Figure 2.10). The
composition of stainless steels used in civil and mechanical engineering applications is
highly variable, but commonly, elements such as Mn, P, S, Si, Ni, Mo, and N are present
(ASTM A276, 2013). Consequently, a broad range of mechanical properties and
corrosion resistance can be obtained. For instance, the addition of Mo enhances the
resistance to pitting formation, while Ni addition increases the stability of austenite (Lo et
al., 2009).
(a)
Figure 2.10 Effect of chromium content on corrosion depth of stainless steel on (a)
industrial and semi-rural, and (b) marine environments (Schmitt and Mullen, 1969).
27
(b)
Figure 2.10 (cont.) Effect of chromium content on corrosion depth of stainless steel on
(a) industrial and semi-rural, and (b) marine environments (Schmitt and Mullen, 1969).
Compared to conventional carbon steel used in structural applications, stainless
steel exhibits a different stress-strain behavior. No clear yield point is appreciable and
post-yield behavior cannot be modeled as a flat plateau (Gardner, 2005). Ramberg-
Osgood expression (Equations 2.9) is often used to represent the stress-strain relation of
SS before yield (Ramberg and Osgood, 1941).
n
E
2.00
002.0
for
2.0 (2.9)
28
where E0 is the initial elastic modulus, σ0.2 is the stress obtained by the 0.2% offset
method, σ is the tensile strength, ε is the tensile strain, and n is a parameter calculated
using Equation 2.10.
01.0
2.0ln
20ln
n (2.10)
where σ0.01 is the stress obtained by the 0.01% offset method.
Rasmussen (2003) proposed an expression for the stress-strain behavior after
yield (Equation 2.11).
m
u
u
E
2.0
2.0
2.0
2.0
for
2.0 (2.11)
where E0.2 is the tangent elastic modulus at yield point, σu is the ultimate tensile strength,
εu is the ultimate tensile strain, and m is a parameter calculated using Equation 2.12.
u
m
2.0
5.31 (2.12)
Equations 2.9 and 2.11 showed good agreement with tensile test results performed
on austenitic grades AISI 304, AISI 304L, and AISI 316L, duplex grade 2205, and
ferritic grades AISI 430 and 3Cr12 (UNS 41050) (Rasmussen, 2003).
29
Additionally, stainless steels exhibit higher retention of strength and stiffness at
elevated temperatures compared to conventional steel (Gardner, 2005).
2.2.1 Classification of stainless steels
Stainless steels can be classified as austenitic, ferritic, duplex (austenitic-ferritic),
martensitic, and precipitation hardening.
Austenitic stainless steels are iron-chromium alloys that form face-centered cubic
(FCC) austenite phase, with typical composition of Cr and Ni greater than 18% and 8%,
respectively. They usually are non-magnetic and have high ductility, toughness, and work
hardening during cold drawing. Also, nickel acting synergistically with chromium
provides improved corrosion resistance compared with other stainless steels (Jones, 1996;
Moser et al, 2012). Austenitic stainless steels are the most widely used stainless steels.
Most common austenitic grades, AISI 304 and AISI 316, have been used in construction
elements exposed to marine and urban environments, and also as reinforcement in
concrete structures (Wallinder et al., 2002; Hartt, 2006). When austenitic SS is exposed
to cold drawing higher than 40%, a process that affects the mechanical properties and
reduces the corrosion resistance of steel, its microstructure can partially or fully
transform to martensite (Wu and Nurnberger, 2009).
Ferritic stainless steels have a body-centered cubic (BCC) structure and they are
alloyed mostly with 12-16% of chromium that acts as a ferrite stabilizer. Little amounts
of Mo and Ni can also be incorporated. Ferritic SS grades have higher ultimate and yield
strengths, and lower ductility, toughness, and corrosion resistance compared to austenitic
grades (Moser et al., 2012).
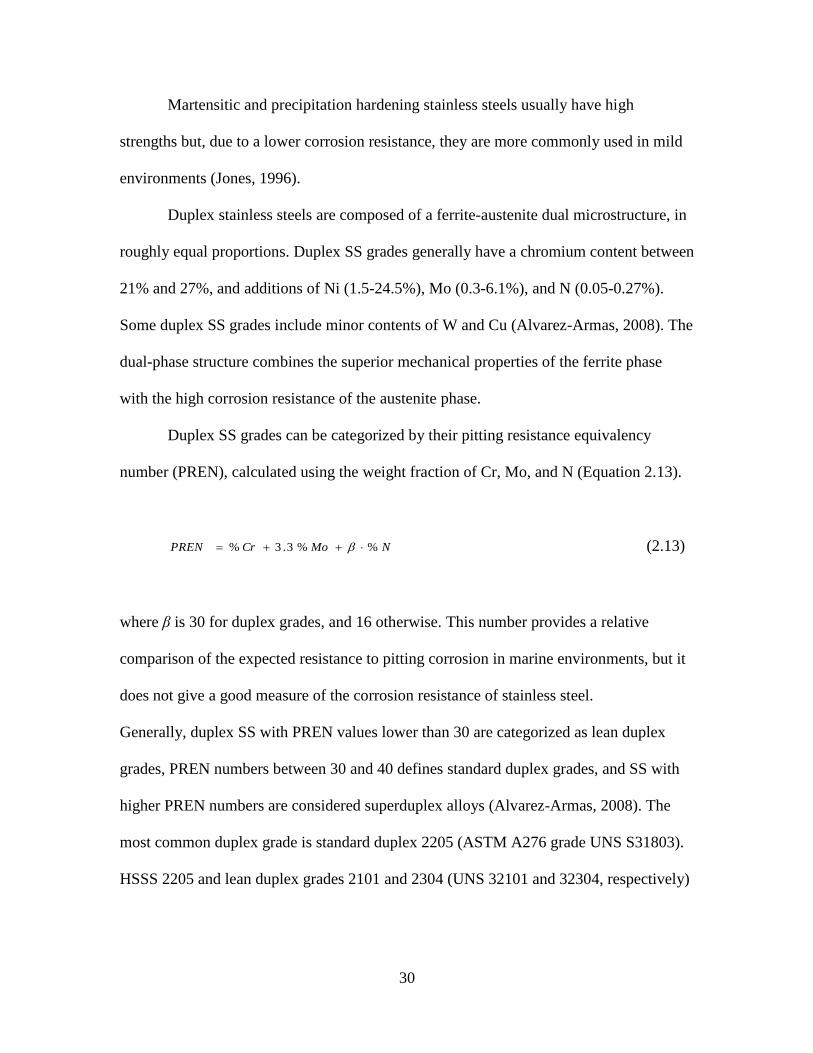
30
Martensitic and precipitation hardening stainless steels usually have high
strengths but, due to a lower corrosion resistance, they are more commonly used in mild
environments (Jones, 1996).
Duplex stainless steels are composed of a ferrite-austenite dual microstructure, in
roughly equal proportions. Duplex SS grades generally have a chromium content between
21% and 27%, and additions of Ni (1.5-24.5%), Mo (0.3-6.1%), and N (0.05-0.27%).
Some duplex SS grades include minor contents of W and Cu (Alvarez-Armas, 2008). The
dual-phase structure combines the superior mechanical properties of the ferrite phase
with the high corrosion resistance of the austenite phase.
Duplex SS grades can be categorized by their pitting resistance equivalency
number (PREN), calculated using the weight fraction of Cr, Mo, and N (Equation 2.13).
NMoCrPREN % % 3.3% (2.13)
where β is 30 for duplex grades, and 16 otherwise. This number provides a relative
comparison of the expected resistance to pitting corrosion in marine environments, but it
does not give a good measure of the corrosion resistance of stainless steel.
Generally, duplex SS with PREN values lower than 30 are categorized as lean duplex
grades, PREN numbers between 30 and 40 defines standard duplex grades, and SS with
higher PREN numbers are considered superduplex alloys (Alvarez-Armas, 2008). The
most common duplex grade is standard duplex 2205 (ASTM A276 grade UNS S31803).
HSSS 2205 and lean duplex grades 2101 and 2304 (UNS 32101 and 32304, respectively)
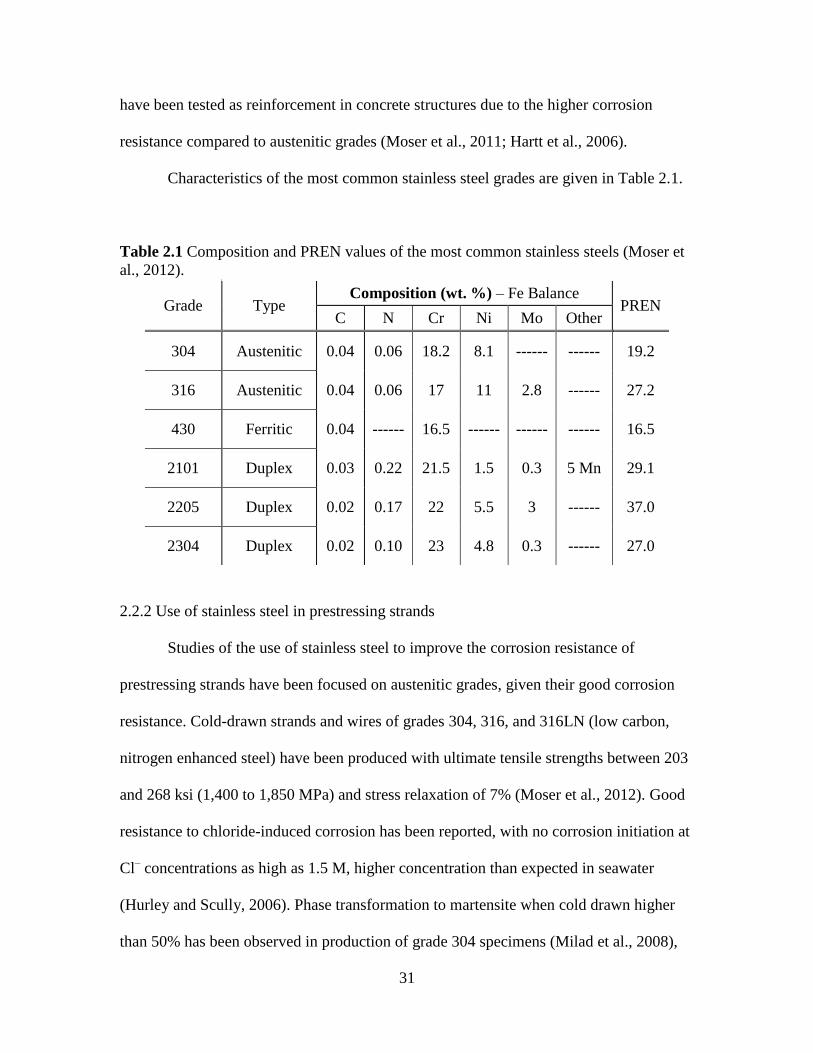
31
have been tested as reinforcement in concrete structures due to the higher corrosion
resistance compared to austenitic grades (Moser et al., 2011; Hartt et al., 2006).
Characteristics of the most common stainless steel grades are given in Table 2.1.
Table 2.1 Composition and PREN values of the most common stainless steels (Moser et
al., 2012).
Grade Type Composition (wt. %) – Fe Balance
PREN C N Cr Ni Mo Other
304 Austenitic 0.04 0.06 18.2 8.1 ------ ------ 19.2
316 Austenitic 0.04 0.06 17 11 2.8 ------ 27.2
430 Ferritic 0.04 ------ 16.5 ------ ------ ------ 16.5
2101 Duplex 0.03 0.22 21.5 1.5 0.3 5 Mn 29.1
2205 Duplex 0.02 0.17 22 5.5 3 ------ 37.0
2304 Duplex 0.02 0.10 23 4.8 0.3 ------ 27.0
2.2.2 Use of stainless steel in prestressing strands
Studies of the use of stainless steel to improve the corrosion resistance of
prestressing strands have been focused on austenitic grades, given their good corrosion
resistance. Cold-drawn strands and wires of grades 304, 316, and 316LN (low carbon,
nitrogen enhanced steel) have been produced with ultimate tensile strengths between 203
and 268 ksi (1,400 to 1,850 MPa) and stress relaxation of 7% (Moser et al., 2012). Good
resistance to chloride-induced corrosion has been reported, with no corrosion initiation at
Cl‒ concentrations as high as 1.5 M, higher concentration than expected in seawater
(Hurley and Scully, 2006). Phase transformation to martensite when cold drawn higher
than 50% has been observed in production of grade 304 specimens (Milad et al., 2008),
32
which can explain a lower resistance to pitting corrosion and chloride-assisted SCC
compared to grades 316 and 316 LN (Wu and Nurnberger, 2009). Application of
austenitic stainless steel prestressing strands in full scale structures has not been reported.
Duplex high-strength stainless steel (HSSS) similar in composition to grade 2205,
was analyzed as a replacement of carbon prestressing steel by Shirahama et al. (1999).
Duplex HSSS was cold-drawn and stranded, the UTS was 237 ksi (1,636 MPa), the
ultimate strain was 4.0%, and stress relaxation was 0.5% at an accelerated 10-hour test.
Experimental analysis showed low susceptibility to chloride-induced corrosion, pitting
corrosion, HE, and SCC.
Use of Nitronic 33 stainless steel (ASTM A580 grade XM-29), 3/16-in. (4.76
mm) diameter 7-wire prestressing strands in marine structures was reported by Jenkins
(1987). Nitronic 33 strands had 17.7% Cr, 12.2% Mn, and 3.5% Ni. UTS and ultimate
strain of wires were 136 ksi and 33.3%, respectively. The study included full scale piles,
which showed enhanced corrosion protection compared to piles using carbon steel.
Moser et al. (2012) analyzed different HSSS grades to select the most promising
to be used as a replacement of conventional AISI 1080 steel in prestressing strands. Low-
relaxation wires of austenitic grades 304 and 316, martensitic grade 17-7, and duplex
grades 2101, 2304, and 2205 were prepared using conventional practice. UTS of stainless
steel wires varied from 181 to 225 ksi (1,250 to 1,550 MPa), and a lack of strain
hardening after yielding was observed (Figure 2.11).
Analysis of the fracture surface showed a non-ductile failure in duplex HSSS
2205 samples. Corrosion testing of wires showed lower chloride-induced corrosion
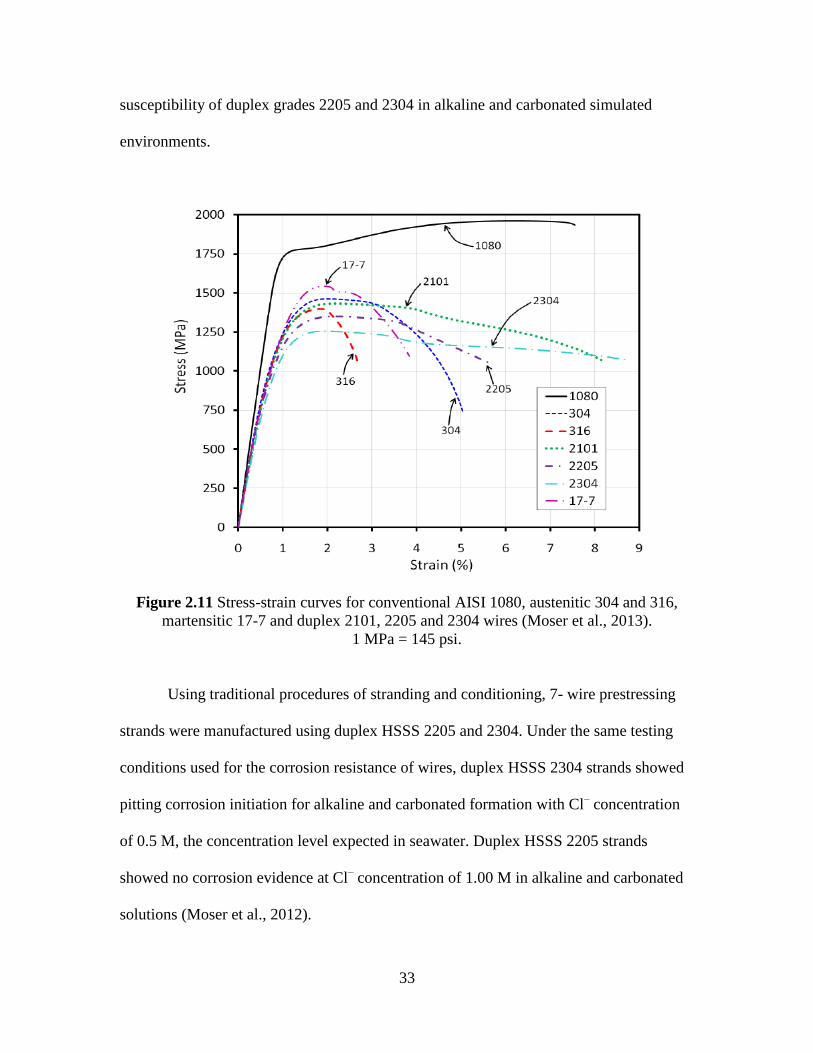
33
susceptibility of duplex grades 2205 and 2304 in alkaline and carbonated simulated
environments.
Figure 2.11 Stress-strain curves for conventional AISI 1080, austenitic 304 and 316,
martensitic 17-7 and duplex 2101, 2205 and 2304 wires (Moser et al., 2013).
1 MPa = 145 psi.
Using traditional procedures of stranding and conditioning, 7- wire prestressing
strands were manufactured using duplex HSSS 2205 and 2304. Under the same testing
conditions used for the corrosion resistance of wires, duplex HSSS 2304 strands showed
pitting corrosion initiation for alkaline and carbonated formation with Cl‒ concentration
of 0.5 M, the concentration level expected in seawater. Duplex HSSS 2205 strands
showed no corrosion evidence at Cl‒ concentration of 1.00 M in alkaline and carbonated
solutions (Moser et al., 2012).
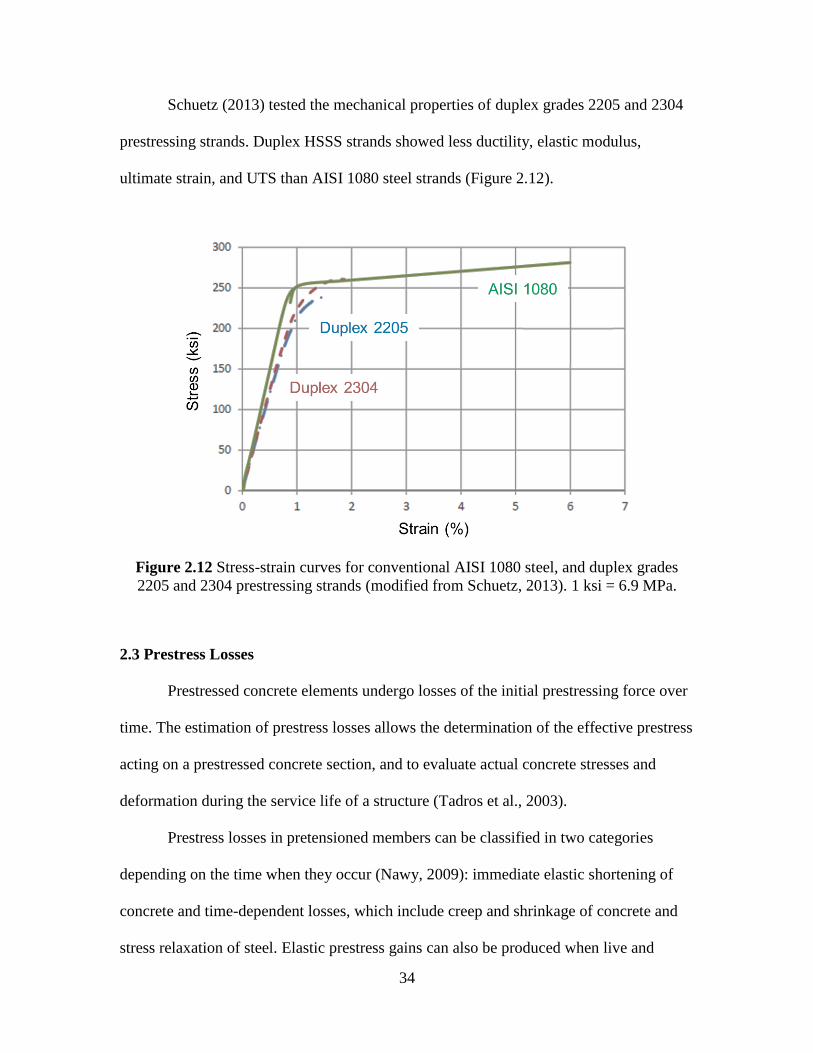
34
Schuetz (2013) tested the mechanical properties of duplex grades 2205 and 2304
prestressing strands. Duplex HSSS strands showed less ductility, elastic modulus,
ultimate strain, and UTS than AISI 1080 steel strands (Figure 2.12).
Figure 2.12 Stress-strain curves for conventional AISI 1080 steel, and duplex grades
2205 and 2304 prestressing strands (modified from Schuetz, 2013). 1 ksi = 6.9 MPa.
2.3 Prestress Losses
Prestressed concrete elements undergo losses of the initial prestressing force over
time. The estimation of prestress losses allows the determination of the effective prestress
acting on a prestressed concrete section, and to evaluate actual concrete stresses and
deformation during the service life of a structure (Tadros et al., 2003).
Prestress losses in pretensioned members can be classified in two categories
depending on the time when they occur (Nawy, 2009): immediate elastic shortening of
concrete and time-dependent losses, which include creep and shrinkage of concrete and
stress relaxation of steel. Elastic prestress gains can also be produced when live and
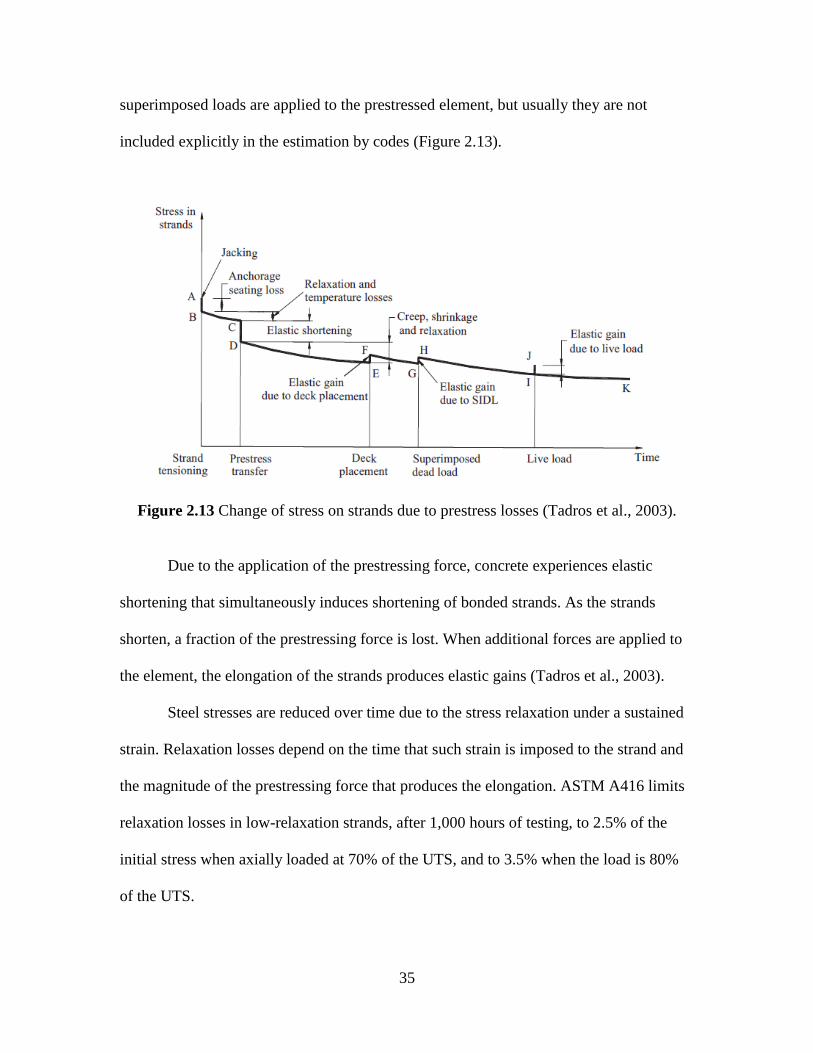
35
superimposed loads are applied to the prestressed element, but usually they are not
included explicitly in the estimation by codes (Figure 2.13).
Figure 2.13 Change of stress on strands due to prestress losses (Tadros et al., 2003).
Due to the application of the prestressing force, concrete experiences elastic
shortening that simultaneously induces shortening of bonded strands. As the strands
shorten, a fraction of the prestressing force is lost. When additional forces are applied to
the element, the elongation of the strands produces elastic gains (Tadros et al., 2003).
Steel stresses are reduced over time due to the stress relaxation under a sustained
strain. Relaxation losses depend on the time that such strain is imposed to the strand and
the magnitude of the prestressing force that produces the elongation. ASTM A416 limits
relaxation losses in low-relaxation strands, after 1,000 hours of testing, to 2.5% of the
initial stress when axially loaded at 70% of the UTS, and to 3.5% when the load is 80%
of the UTS.
36
Prestress losses due to creep and shrinkage of concrete are commonly the
principal source of losses in prestressed concrete elements (Bandyopadhyay and
Sengupta, 1986; Tadros et al., 2003). Deformation of concrete due to creep and shrinkage
produces the shortening of the prestressing strands and reduces the prestressing force
applied to the member. Generally, the estimation of creep and shrinkage losses has a
higher uncertainty compared with the other losses, given the number of factors that affect
their magnitude. Creep losses depend on the environmental conditions, dimension and
geometry of the element, the magnitude and duration of load application, mixture
proportion and mechanical properties of concrete, time and method of curing, and age of
concrete at transfer. Shrinkage losses are determined by environmental conditions,
dimension and geometry of the element, mixture proportion of concrete, time and method
of curing, and age of concrete at transfer.
AASHTO LRFD (2013) estimates the losses of pretensioned elements using
Equation 2.14.
pLTpESpTfff (2.14)
where total losses, ΔfpT, are the sum of losses due to elastic shortening, ΔfpES, and long-
term losses, ΔfpLT.
ΔfpES combines elastic losses and gains and is calculated using Equation 2.15.
cgp
ct
ps
pESf
E
Ef (2.15)
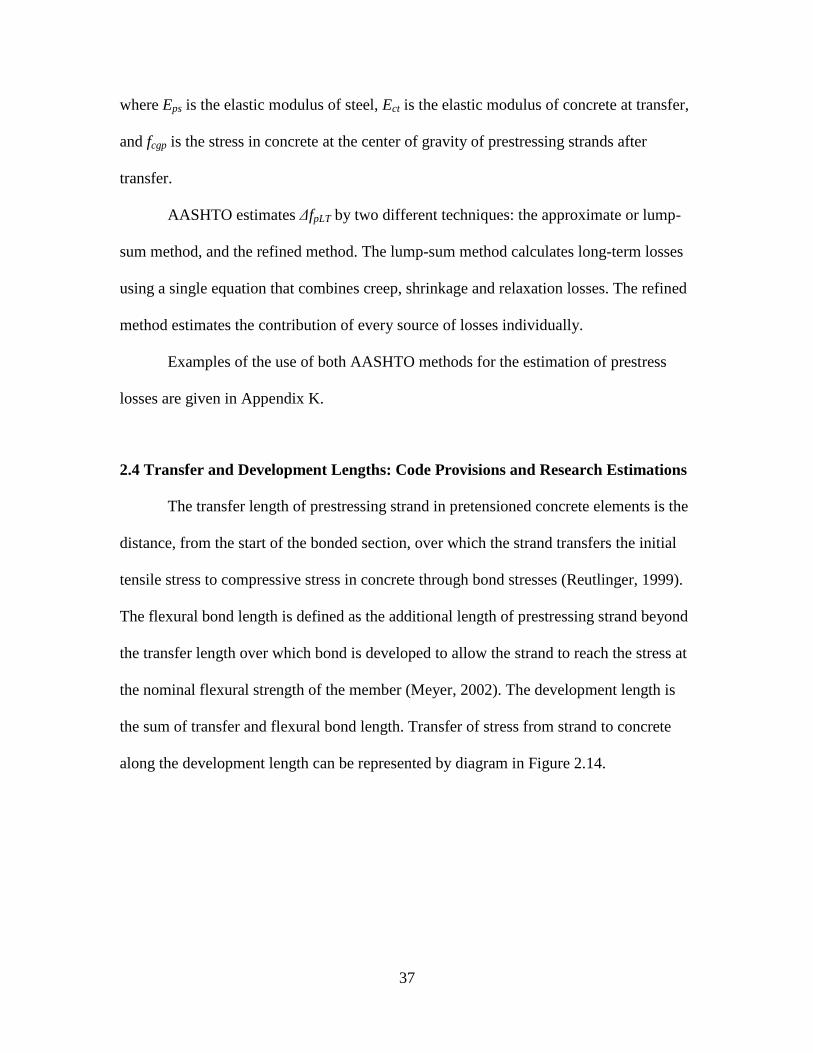
37
where Eps is the elastic modulus of steel, Ect is the elastic modulus of concrete at transfer,
and fcgp is the stress in concrete at the center of gravity of prestressing strands after
transfer.
AASHTO estimates ΔfpLT by two different techniques: the approximate or lump-
sum method, and the refined method. The lump-sum method calculates long-term losses
using a single equation that combines creep, shrinkage and relaxation losses. The refined
method estimates the contribution of every source of losses individually.
Examples of the use of both AASHTO methods for the estimation of prestress
losses are given in Appendix K.
2.4 Transfer and Development Lengths: Code Provisions and Research Estimations
The transfer length of prestressing strand in pretensioned concrete elements is the
distance, from the start of the bonded section, over which the strand transfers the initial
tensile stress to compressive stress in concrete through bond stresses (Reutlinger, 1999).
The flexural bond length is defined as the additional length of prestressing strand beyond
the transfer length over which bond is developed to allow the strand to reach the stress at
the nominal flexural strength of the member (Meyer, 2002). The development length is
the sum of transfer and flexural bond length. Transfer of stress from strand to concrete
along the development length can be represented by diagram in Figure 2.14.
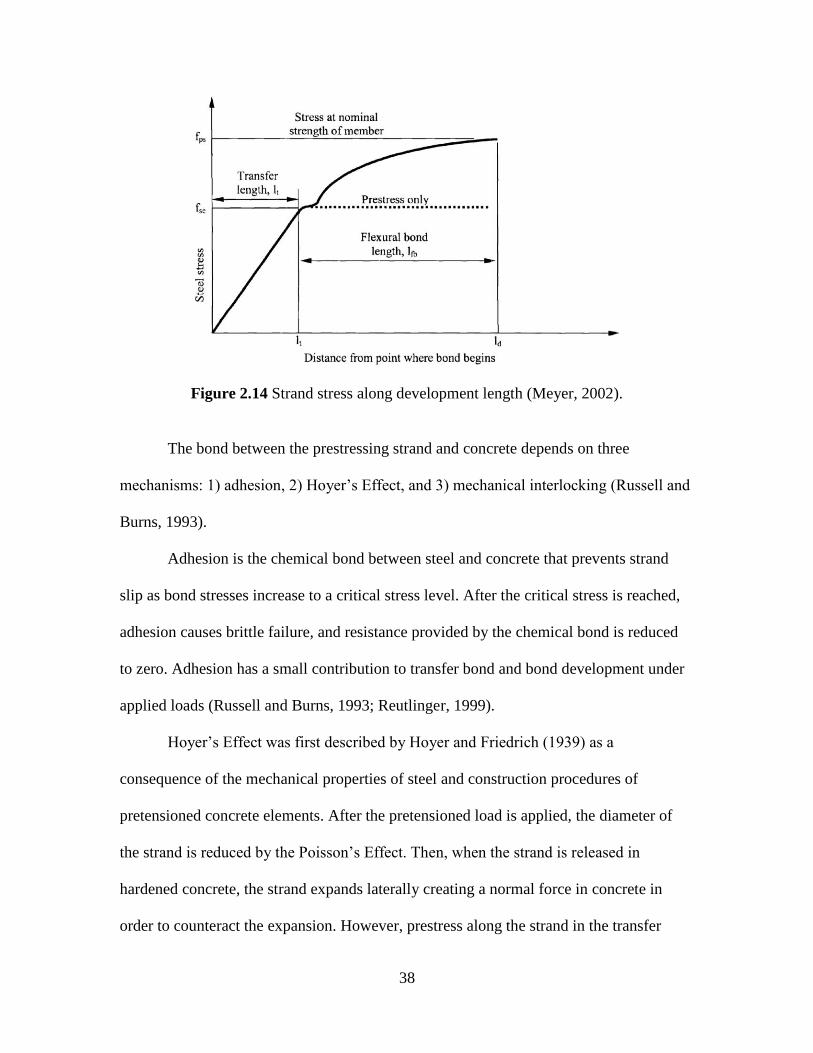
38
Figure 2.14 Strand stress along development length (Meyer, 2002).
The bond between the prestressing strand and concrete depends on three
mechanisms: 1) adhesion, 2) Hoyer’s Effect, and 3) mechanical interlocking (Russell and
Burns, 1993).
Adhesion is the chemical bond between steel and concrete that prevents strand
slip as bond stresses increase to a critical stress level. After the critical stress is reached,
adhesion causes brittle failure, and resistance provided by the chemical bond is reduced
to zero. Adhesion has a small contribution to transfer bond and bond development under
applied loads (Russell and Burns, 1993; Reutlinger, 1999).
Hoyer’s Effect was first described by Hoyer and Friedrich (1939) as a
consequence of the mechanical properties of steel and construction procedures of
pretensioned concrete elements. After the pretensioned load is applied, the diameter of
the strand is reduced by the Poisson’s Effect. Then, when the strand is released in
hardened concrete, the strand expands laterally creating a normal force in concrete in
order to counteract the expansion. However, prestress along the strand in the transfer
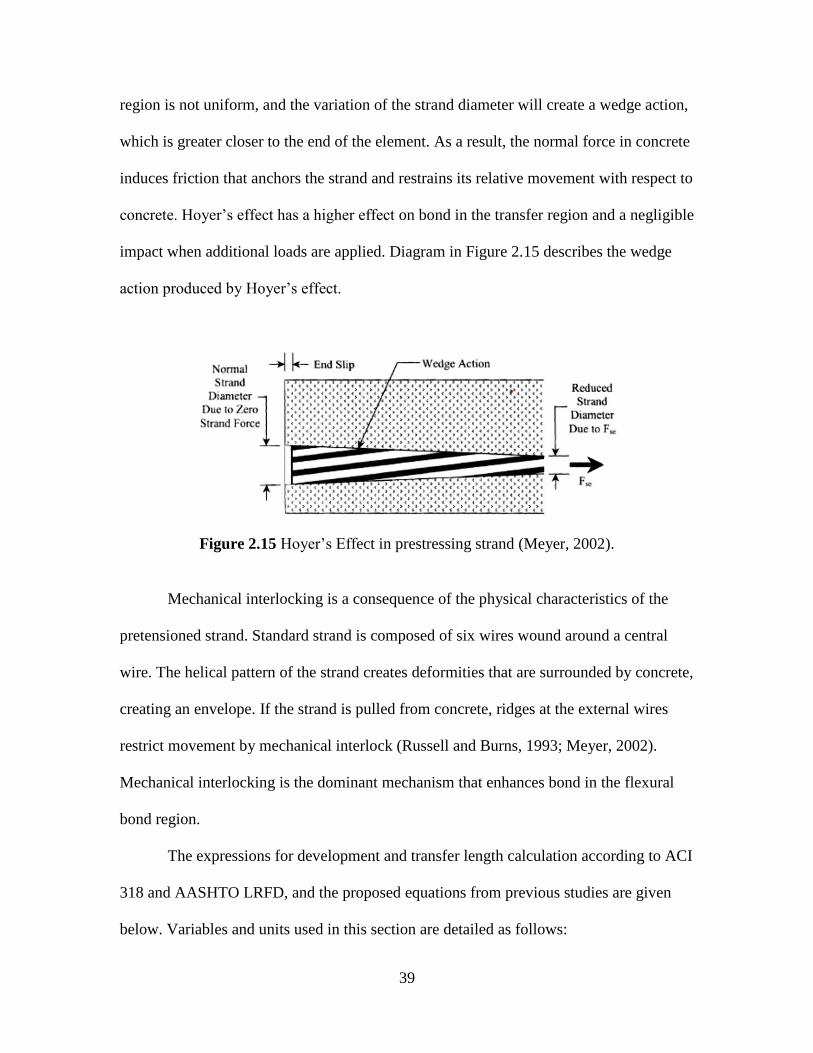
39
region is not uniform, and the variation of the strand diameter will create a wedge action,
which is greater closer to the end of the element. As a result, the normal force in concrete
induces friction that anchors the strand and restrains its relative movement with respect to
concrete. Hoyer’s effect has a higher effect on bond in the transfer region and a negligible
impact when additional loads are applied. Diagram in Figure 2.15 describes the wedge
action produced by Hoyer’s effect.
Figure 2.15 Hoyer’s Effect in prestressing strand (Meyer, 2002).
Mechanical interlocking is a consequence of the physical characteristics of the
pretensioned strand. Standard strand is composed of six wires wound around a central
wire. The helical pattern of the strand creates deformities that are surrounded by concrete,
creating an envelope. If the strand is pulled from concrete, ridges at the external wires
restrict movement by mechanical interlock (Russell and Burns, 1993; Meyer, 2002).
Mechanical interlocking is the dominant mechanism that enhances bond in the flexural
bond region.
The expressions for development and transfer length calculation according to ACI
318 and AASHTO LRFD, and the proposed equations from previous studies are given
below. Variables and units used in this section are detailed as follows:
40
lt: transfer length, in inches.
ld: development length, in inches.
db: nominal diameter of the prestressing strand, in inches.
fps: stress in prestressing steel at nominal flexural strength, in ksi.
fpt: stress in prestressing strand, in ksi.
fsi: stress in prestressing strand after transfer, in ksi.
fse: effective stress in prestressing strand after losses, in ksi.
fsu: ultimate strength of prestressing strand, in ksi.
Eci: elastic modulus of concrete at release, in ksi.
fc': design compressive strength of concrete, in ksi.
fci': compressive strength of concrete at release, in ksi.
Mcr: cracking moment, in kip-in.
Mn: nominal flexural resistance, in kip-in.
Vu: factored shear force, in kips.
Vcw: nominal shear resistance provided by tensile stresses in concrete in the web,
in kips.
2.4.1 AASHTO and ACI estimations of transfer and development length
a) AASHTO LRFD (2013).
The determination of transfer and development lengths of prestressing strands is
covered in Section 5.11.4 of the 6th
Edition of AASHTO LRFD Bridge Design
Specifications (2013). Equations 2.16 and 2.17 are proposed for lt and ld, respectively.
bt
d l 60 (2.16)
bpepsddffl
3
2 (2.17)
41
where κ is 1.6 for pretensioned members with a depth greater than 24.0-in. (61.0 cm), and
1.0 otherwise. Units from expression in parenthesis in Equation 2.17 should be
disregarded.
Expression for ld was adopted mainly as a result of the experimental study of
Hanson and Kaar (1959), while the addition of factor κ was adopted after a FHWA
memorandum in 1988, based on poor transfer and development length test results at the
University of North Carolina (Reutlinger, 1999).
b) ACI 318 (2011).
Equations 2.18 and 2.19 are proposed for lt and ld, respectively, in Section 12.9 of
the Building Code Requirements for Structural Concrete (ACI 318-11).
000,3
bse
t
dfl
(2.18)
b
seps
b
se
dd
ffd
fl
000,1000,3 (2.19)
where the stresses fse and fps are expressed in psi, and the values calculated from
expressions in parenthesis should be used as constants without units.
Transfer length expression in Equation 2.18 was established after experimental
studies of Hanson and Kaar (1959) and Kaar et al. (1963), and it considered the
calculated length in order to provide proper bond performance under an average transfer
bond stress of 400 psi.
It should be noted that, when factor κ = 1.0 in Equation 2.17, the equations for
development length provided by ACI 318 and AASHTO LRFD coincide.
42
2.4.2 Research estimation of transfer and development length
Equations for transfer and development length in AASHTO and ACI are based on
limited test results. Expressions were developed from conditioned Grade 250 prestressing
strands, with a maximum strand diameter of ½-in. (12.7 mm), and without the use or
consideration of the traditional construction procedures in the prestressed concrete
industry (Hanson and Kaar, 1959). Extensive research has been developed in order to
propose better estimations of lt and ld (Reutlinger, 1999). Some of the equations proposed
by previous studies for the estimation of transfer and development length of prestressed
concrete elements are described below.
c) Martin and Scott (1976).
Martin and Scott (1976) reevaluated the results from Kaar et al. (1963) and
proposed a conservative limit for lt for strand diameters ranging from ¼-in (6.35 mm) to
0.6-in. (15.24 mm), shown in Equation 2.20. Additionally, a bi-linear relationship
(Equation 2.21) was developed by fitting the experimental data of Hanson and Kaar
(1959), in order to provide the maximum stress in the strand at ultimate condition, given
an embedment length lx. The use of the ultimate tensile strength of prestressing strand in
Equation 2.21 can be used to estimate the development length.
bt
dl 80 (2.20)
bx
b
x
b
ps
bx
b
x
b
ps
dlford
l
d
f
dlfor d
l
d
f
80 39.0135
80 80
31135
61
61
(2.21)
where lx is the embedment length, in inches.
43
d) Zia and Mostafa (1977).
Estimations of lt and ld provided by Zia and Mostafa (1977) are empirical
relationships based on a literature survey of bond development testing. The parameters
considered in this study were: type of steel (strand or wire), prestress level, nominal
diameter of strands, surface condition of strands, compressive strength of concrete, type
of loading, type of strand release, and type of confining reinforcement.
Analysis of test data determined that transfer length depends on the initial stress
in the strand and the compressive strength of concrete at transfer. As a result of the linear
regression analysis of reported results, conservative equations for lt and ld were proposed
for strands up to ½-in. (12.7 mm). It was suggested that the second term of Equation 2.19
from ACI Code, corresponding to the flexural bond length, should be increased by 25%
to properly control bond failure of prestressing strands.
Equations 2.22 and 2.23 account for the effect of strand size, initial prestress
level, and concrete strength at transfer; they are applicable for concrete strengths ranging
from 2,000 to 8,000 psi (13.8 to 55.2 MPa).
6451 .df
f.l
b'
ci
si
t (2.22)
bsesub
ci
si
ddffd
f
f.l
25.16.451
' (2.23)
e) Deatherage, Burdette, and Chew (1989).
An experimental study performed on 20 AASHTO Type I girders at the
University of Tennessee by Deatherage et al. in 1989 suggested that the use of ACI
44
estimation of the transfer length (Equation 2.19) for ½, ½ special, 9/16, and 0.6-in.
diameter Grade 270 prestressing strands should consider the stress in prestressing strand
after transfer, fsi, instead of the stress in prestressing strand after losses, fse (Equation
2.24). Also, an increase of 50% of the flexural bond length in AASHTO and ACI
expression for development length was proposed to avoid bond failure, as shown in
Equation 2.25.
3
bsi
t
dfl
(2.24)
bsesu
bsi
ddff.
dfl
501
3 (2.25)
f) Russell and Burns (1992).
A comprehensive study of the influence of the size and shape of prestressed
concrete sections, number of strands, nominal diameter of strands, debonding, confining
reinforcement, and strand spacing was developed at the University of Texas, Austin, in
1992 (Russell, 1992; Russell and Burns, 1993). They concluded that bond failure is a
result of shear cracking through the transfer region. Thus, the prevention of these cracks
will allow the strand to develop its prestressing force and the additional tension required
by external loads. Proposed expressions for lt and ld consider a criterion to prevent
cracking in the transfer region. However, variables analyzed by Russell and Burns did not
include the strength of concrete.
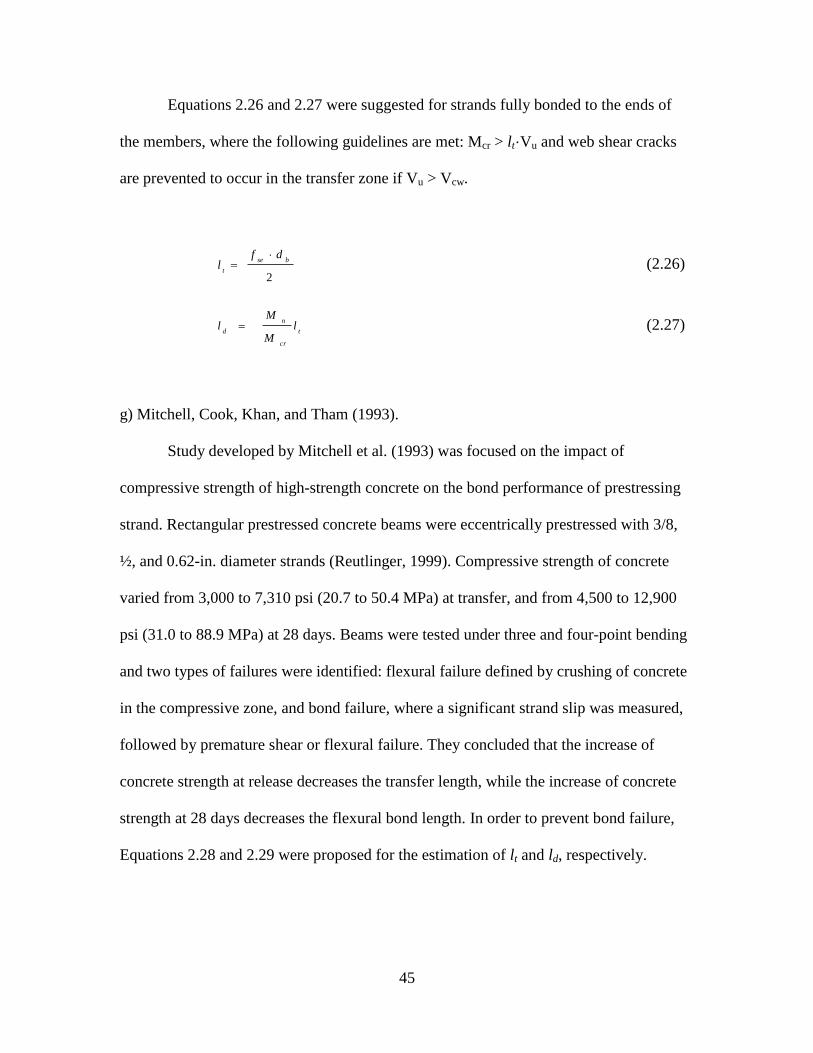
45
Equations 2.26 and 2.27 were suggested for strands fully bonded to the ends of
the members, where the following guidelines are met: Mcr > lt·Vu and web shear cracks
are prevented to occur in the transfer zone if Vu > Vcw.
2
bse
t
dfl
(2.26)
t
cr
n
dl
M
M l (2.27)
g) Mitchell, Cook, Khan, and Tham (1993).
Study developed by Mitchell et al. (1993) was focused on the impact of
compressive strength of high-strength concrete on the bond performance of prestressing
strand. Rectangular prestressed concrete beams were eccentrically prestressed with 3/8,
½, and 0.62-in. diameter strands (Reutlinger, 1999). Compressive strength of concrete
varied from 3,000 to 7,310 psi (20.7 to 50.4 MPa) at transfer, and from 4,500 to 12,900
psi (31.0 to 88.9 MPa) at 28 days. Beams were tested under three and four-point bending
and two types of failures were identified: flexural failure defined by crushing of concrete
in the compressive zone, and bond failure, where a significant strand slip was measured,
followed by premature shear or flexural failure. They concluded that the increase of
concrete strength at release decreases the transfer length, while the increase of concrete
strength at 28 days decreases the flexural bond length. In order to prevent bond failure,
Equations 2.28 and 2.29 were proposed for the estimation of lt and ld, respectively.
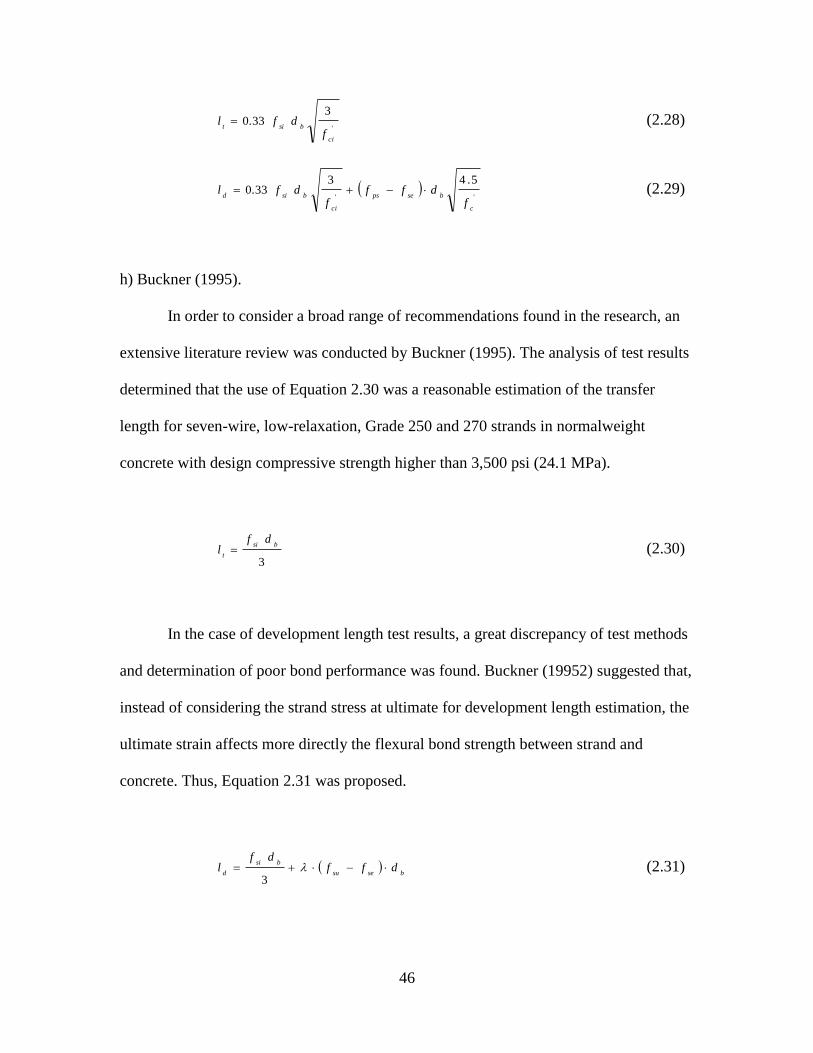
46
'
3 0.33
ci
bsit
fdfl (2.28)
''
5.43 0.33
c
bseps
ci
bsid
fdff
fdfl (2.29)
h) Buckner (1995).
In order to consider a broad range of recommendations found in the research, an
extensive literature review was conducted by Buckner (1995). The analysis of test results
determined that the use of Equation 2.30 was a reasonable estimation of the transfer
length for seven-wire, low-relaxation, Grade 250 and 270 strands in normalweight
concrete with design compressive strength higher than 3,500 psi (24.1 MPa).
3
bsi
t
dfl (2.30)
In the case of development length test results, a great discrepancy of test methods
and determination of poor bond performance was found. Buckner (19952) suggested that,
instead of considering the strand stress at ultimate for development length estimation, the
ultimate strain affects more directly the flexural bond strength between strand and
concrete. Thus, Equation 2.31 was proposed.
bsesu
bsi
ddff
dfl
3
(2.31)
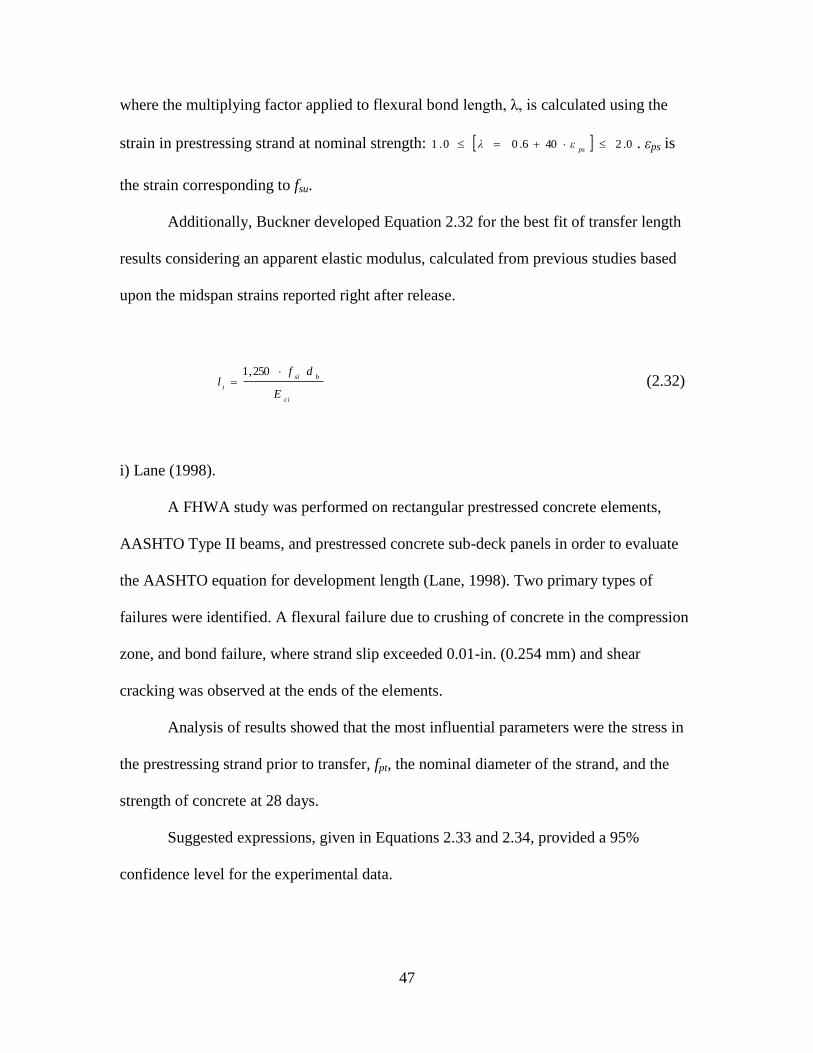
47
where the multiplying factor applied to flexural bond length, λ, is calculated using the
strain in prestressing strand at nominal strength: 02 4060 0.1 .ε. λ ps
. εps is
the strain corresponding to fsu.
Additionally, Buckner developed Equation 2.32 for the best fit of transfer length
results considering an apparent elastic modulus, calculated from previous studies based
upon the midspan strains reported right after release.
ci
bsi
t
E
dfl
250,1
(2.32)
i) Lane (1998).
A FHWA study was performed on rectangular prestressed concrete elements,
AASHTO Type II beams, and prestressed concrete sub-deck panels in order to evaluate
the AASHTO equation for development length (Lane, 1998). Two primary types of
failures were identified. A flexural failure due to crushing of concrete in the compression
zone, and bond failure, where strand slip exceeded 0.01-in. (0.254 mm) and shear
cracking was observed at the ends of the elements.
Analysis of results showed that the most influential parameters were the stress in
the prestressing strand prior to transfer, fpt, the nominal diameter of the strand, and the
strength of concrete at 28 days.
Suggested expressions, given in Equations 2.33 and 2.34, provided a 95%
confidence level for the experimental data.
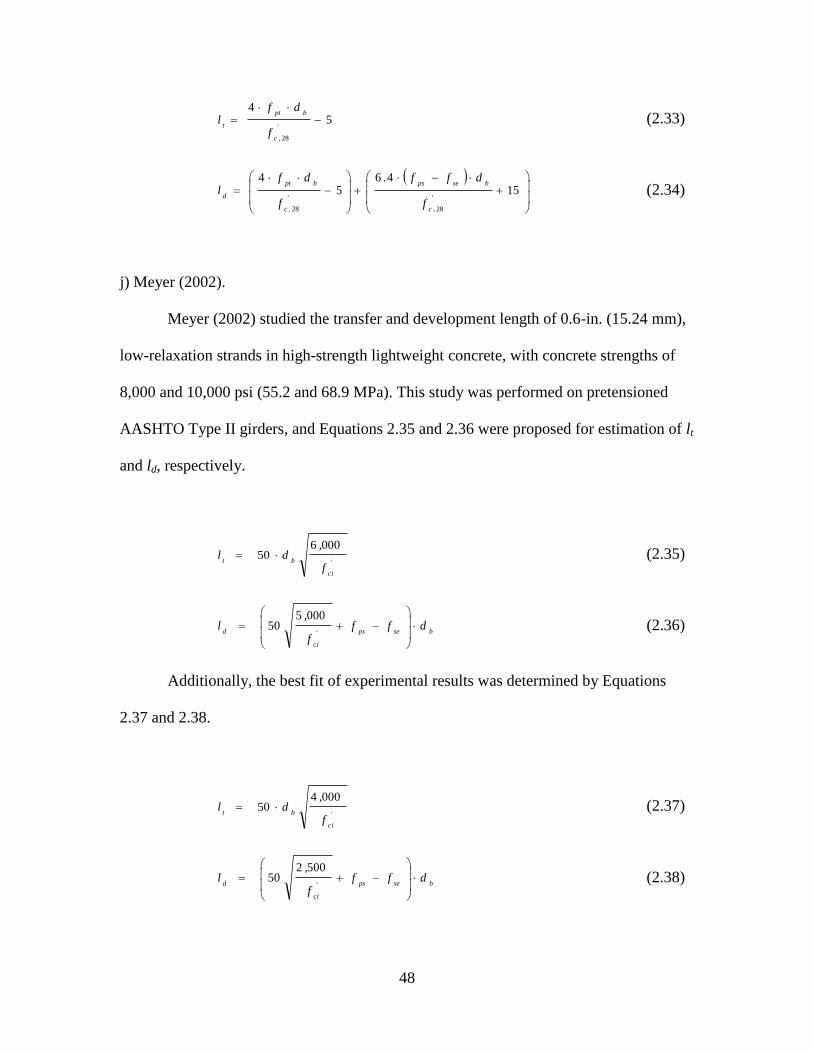
48
54
'
28,
c
bpt
t
f
dfl (2.33)
15
4.65
4
'
28,
'
28, c
bseps
c
bpt
d
f
dff
f
dfl (2.34)
j) Meyer (2002).
Meyer (2002) studied the transfer and development length of 0.6-in. (15.24 mm),
low-relaxation strands in high-strength lightweight concrete, with concrete strengths of
8,000 and 10,000 psi (55.2 and 68.9 MPa). This study was performed on pretensioned
AASHTO Type II girders, and Equations 2.35 and 2.36 were proposed for estimation of lt
and ld, respectively.
'
ci
bt
f
,d l
000650 (2.35)
bseps'
ci
ddff
f
, l
000550 (2.36)
Additionally, the best fit of experimental results was determined by Equations
2.37 and 2.38.
'
ci
bt
f
,d l
000450 (2.37)
bseps'
ci
ddff
f
, l
500250 (2.38)
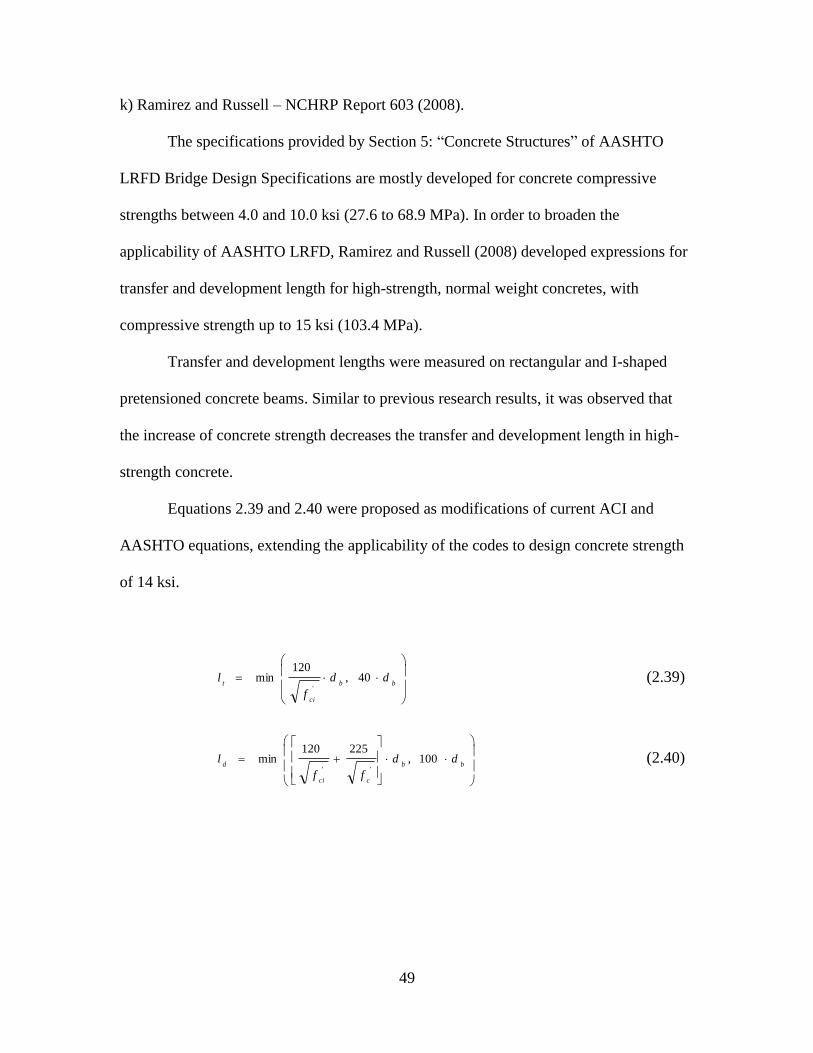
49
k) Ramirez and Russell – NCHRP Report 603 (2008).
The specifications provided by Section 5: “Concrete Structures” of AASHTO
LRFD Bridge Design Specifications are mostly developed for concrete compressive
strengths between 4.0 and 10.0 ksi (27.6 to 68.9 MPa). In order to broaden the
applicability of AASHTO LRFD, Ramirez and Russell (2008) developed expressions for
transfer and development length for high-strength, normal weight concretes, with
compressive strength up to 15 ksi (103.4 MPa).
Transfer and development lengths were measured on rectangular and I-shaped
pretensioned concrete beams. Similar to previous research results, it was observed that
the increase of concrete strength decreases the transfer and development length in high-
strength concrete.
Equations 2.39 and 2.40 were proposed as modifications of current ACI and
AASHTO equations, extending the applicability of the codes to design concrete strength
of 14 ksi.
d, d
f
lbb
'
ci
t
40120
min (2.39)
100225120
min
bb
'
c
'
ci
dd, d
ff
l (2.40)
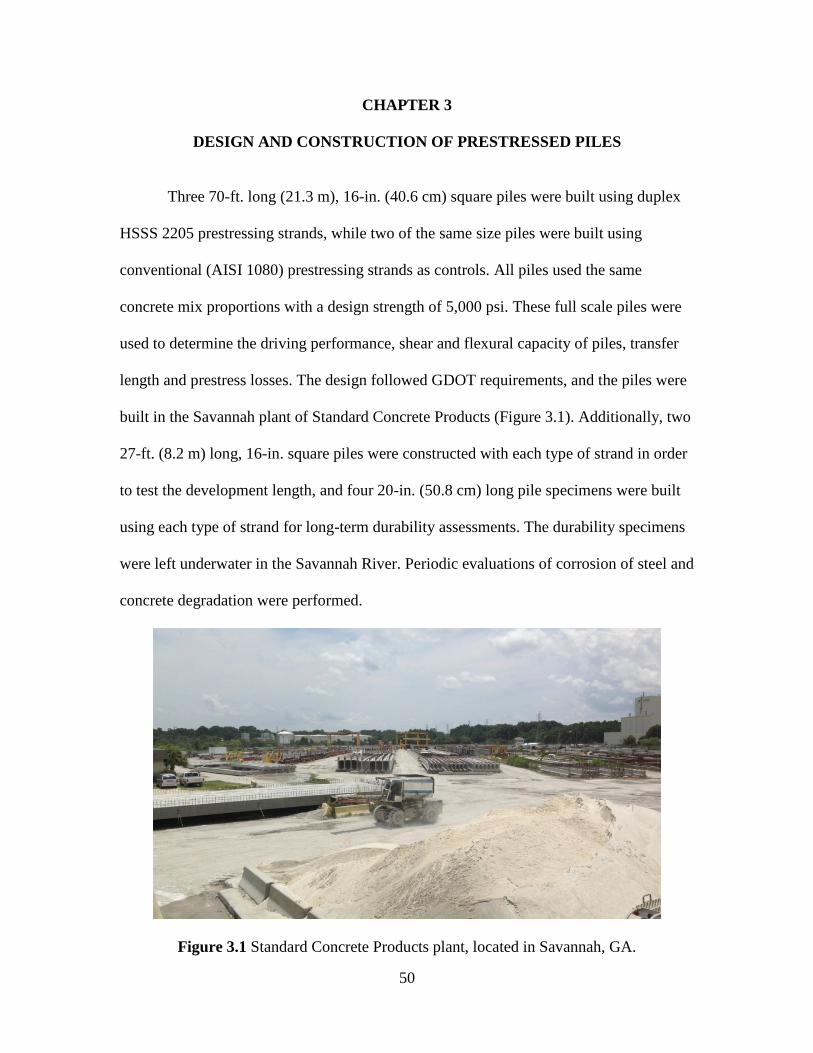
50
CHAPTER 3
DESIGN AND CONSTRUCTION OF PRESTRESSED PILES
Three 70-ft. long (21.3 m), 16-in. (40.6 cm) square piles were built using duplex
HSSS 2205 prestressing strands, while two of the same size piles were built using
conventional (AISI 1080) prestressing strands as controls. All piles used the same
concrete mix proportions with a design strength of 5,000 psi. These full scale piles were
used to determine the driving performance, shear and flexural capacity of piles, transfer
length and prestress losses. The design followed GDOT requirements, and the piles were
built in the Savannah plant of Standard Concrete Products (Figure 3.1). Additionally, two
27-ft. (8.2 m) long, 16-in. square piles were constructed with each type of strand in order
to test the development length, and four 20-in. (50.8 cm) long pile specimens were built
using each type of strand for long-term durability assessments. The durability specimens
were left underwater in the Savannah River. Periodic evaluations of corrosion of steel and
concrete degradation were performed.
Figure 3.1 Standard Concrete Products plant, located in Savannah, GA.
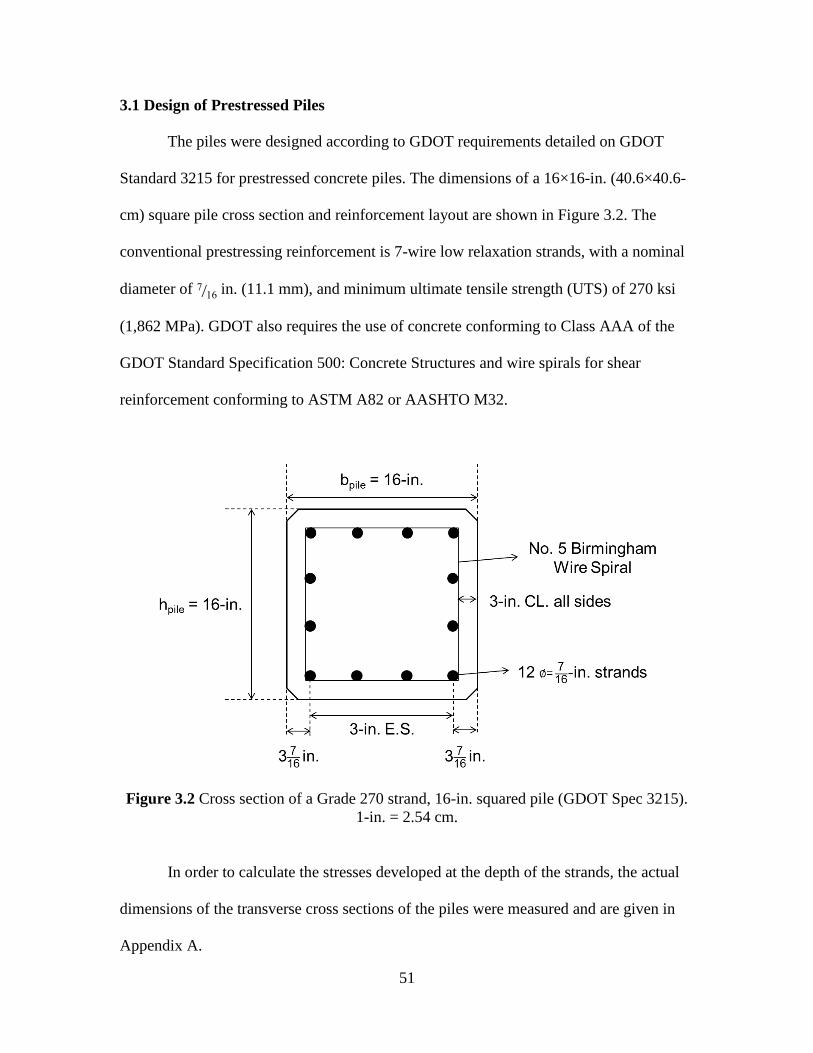
51
3.1 Design of Prestressed Piles
The piles were designed according to GDOT requirements detailed on GDOT
Standard 3215 for prestressed concrete piles. The dimensions of a 16×16-in. (40.6×40.6-
cm) square pile cross section and reinforcement layout are shown in Figure 3.2. The
conventional prestressing reinforcement is 7-wire low relaxation strands, with a nominal
diameter of 7 16⁄ in. (11.1 mm), and minimum ultimate tensile strength (UTS) of 270 ksi
(1,862 MPa). GDOT also requires the use of concrete conforming to Class AAA of the
GDOT Standard Specification 500: Concrete Structures and wire spirals for shear
reinforcement conforming to ASTM A82 or AASHTO M32.
Figure 3.2 Cross section of a Grade 270 strand, 16-in. squared pile (GDOT Spec 3215).
1-in. = 2.54 cm.
In order to calculate the stresses developed at the depth of the strands, the actual
dimensions of the transverse cross sections of the piles were measured and are given in
Appendix A.
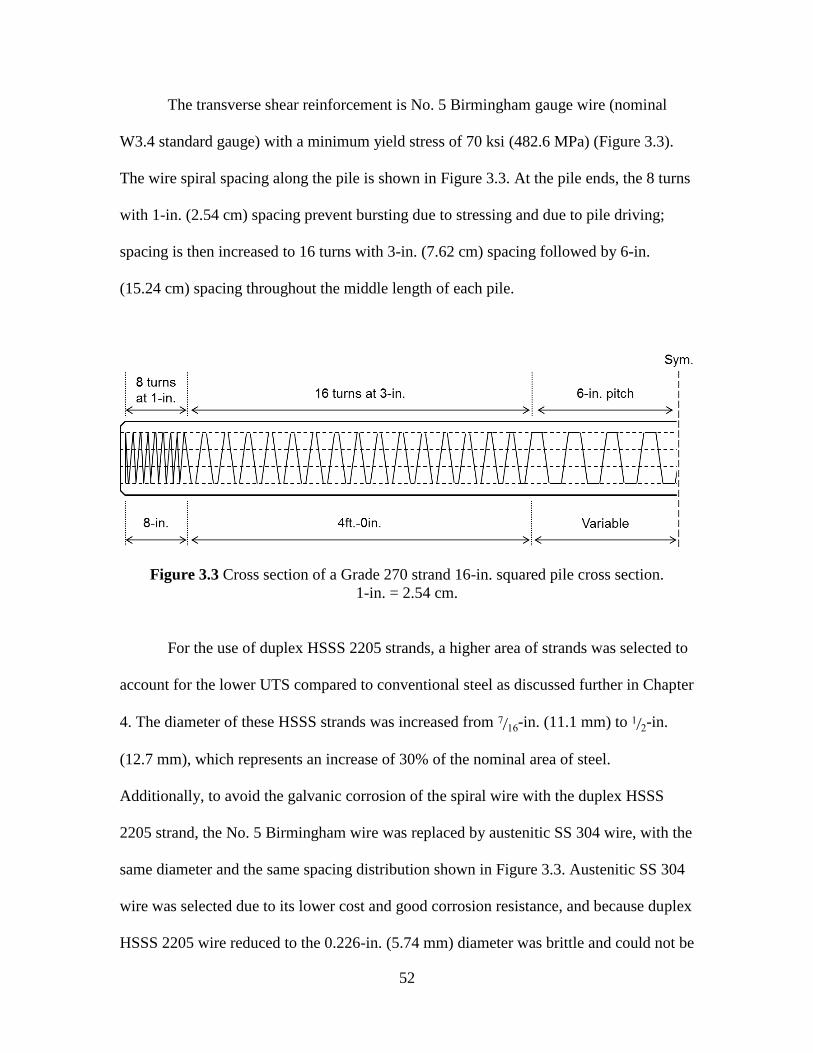
52
The transverse shear reinforcement is No. 5 Birmingham gauge wire (nominal
W3.4 standard gauge) with a minimum yield stress of 70 ksi (482.6 MPa) (Figure 3.3).
The wire spiral spacing along the pile is shown in Figure 3.3. At the pile ends, the 8 turns
with 1-in. (2.54 cm) spacing prevent bursting due to stressing and due to pile driving;
spacing is then increased to 16 turns with 3-in. (7.62 cm) spacing followed by 6-in.
(15.24 cm) spacing throughout the middle length of each pile.
Figure 3.3 Cross section of a Grade 270 strand 16-in. squared pile cross section.
1-in. = 2.54 cm.
For the use of duplex HSSS 2205 strands, a higher area of strands was selected to
account for the lower UTS compared to conventional steel as discussed further in Chapter
4. The diameter of these HSSS strands was increased from 7 16⁄ -in. (11.1 mm) to 1 2⁄ -in.
(12.7 mm), which represents an increase of 30% of the nominal area of steel.
Additionally, to avoid the galvanic corrosion of the spiral wire with the duplex HSSS
2205 strand, the No. 5 Birmingham wire was replaced by austenitic SS 304 wire, with the
same diameter and the same spacing distribution shown in Figure 3.3. Austenitic SS 304
wire was selected due to its lower cost and good corrosion resistance, and because duplex
HSSS 2205 wire reduced to the 0.226-in. (5.74 mm) diameter was brittle and could not be
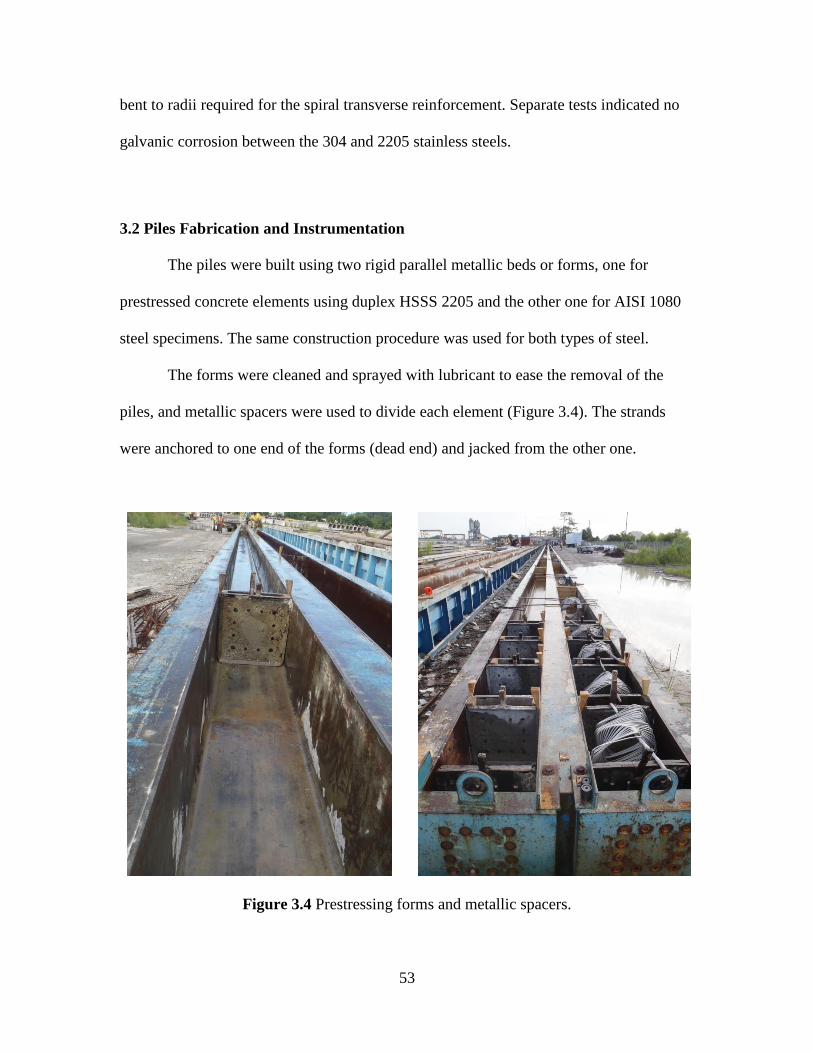
53
bent to radii required for the spiral transverse reinforcement. Separate tests indicated no
galvanic corrosion between the 304 and 2205 stainless steels.
3.2 Piles Fabrication and Instrumentation
The piles were built using two rigid parallel metallic beds or forms, one for
prestressed concrete elements using duplex HSSS 2205 and the other one for AISI 1080
steel specimens. The same construction procedure was used for both types of steel.
The forms were cleaned and sprayed with lubricant to ease the removal of the
piles, and metallic spacers were used to divide each element (Figure 3.4). The strands
were anchored to one end of the forms (dead end) and jacked from the other one.
Figure 3.4 Prestressing forms and metallic spacers.
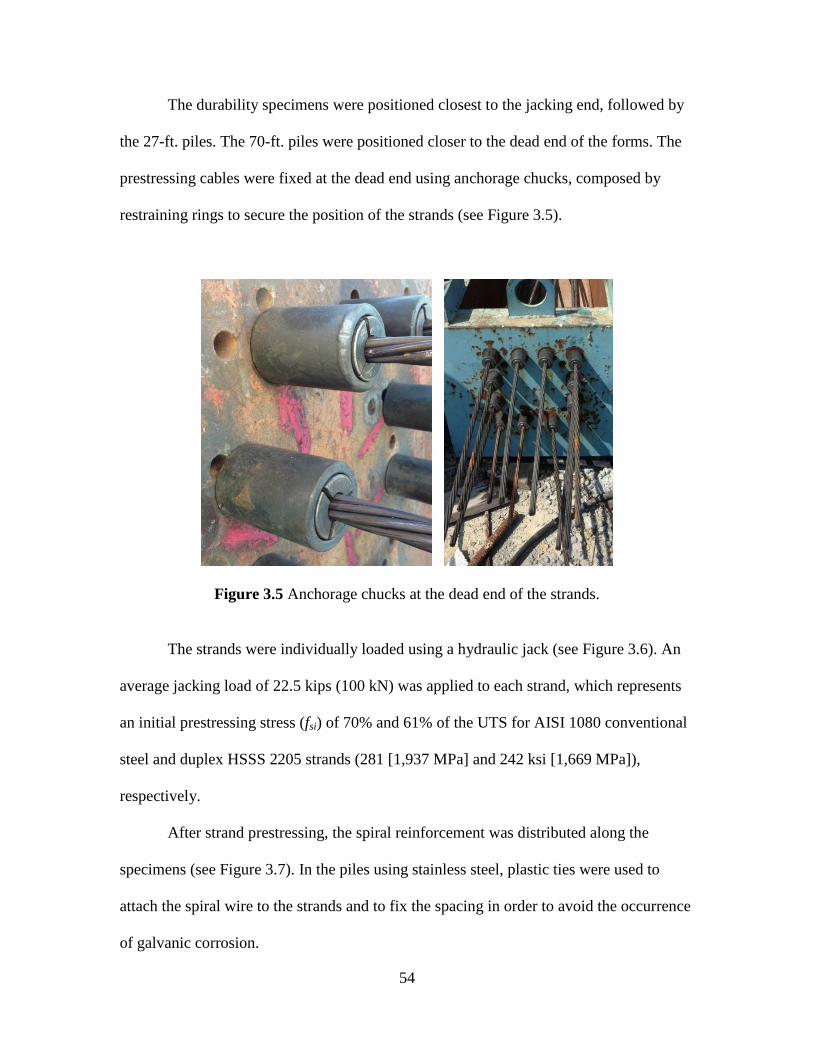
54
The durability specimens were positioned closest to the jacking end, followed by
the 27-ft. piles. The 70-ft. piles were positioned closer to the dead end of the forms. The
prestressing cables were fixed at the dead end using anchorage chucks, composed by
restraining rings to secure the position of the strands (see Figure 3.5).
Figure 3.5 Anchorage chucks at the dead end of the strands.
The strands were individually loaded using a hydraulic jack (see Figure 3.6). An
average jacking load of 22.5 kips (100 kN) was applied to each strand, which represents
an initial prestressing stress (fsi) of 70% and 61% of the UTS for AISI 1080 conventional
steel and duplex HSSS 2205 strands (281 [1,937 MPa] and 242 ksi [1,669 MPa]),
respectively.
After strand prestressing, the spiral reinforcement was distributed along the
specimens (see Figure 3.7). In the piles using stainless steel, plastic ties were used to
attach the spiral wire to the strands and to fix the spacing in order to avoid the occurrence
of galvanic corrosion.
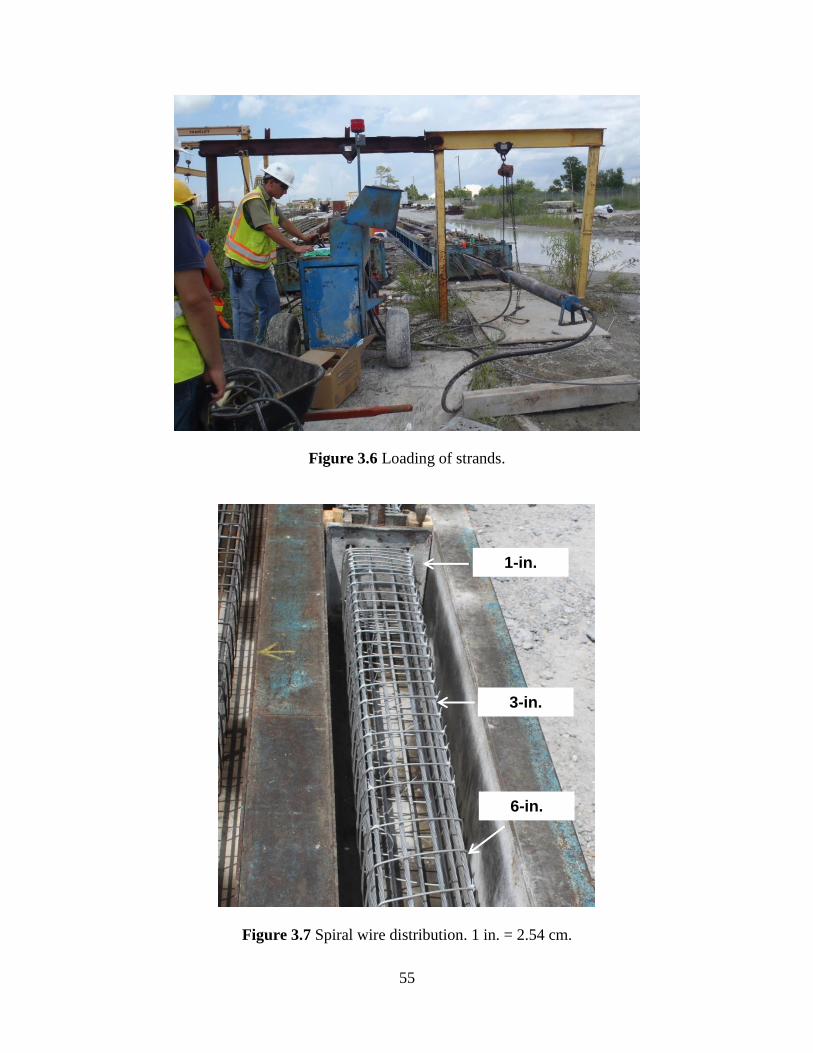
55
Figure 3.6 Loading of strands.
Figure 3.7 Spiral wire distribution. 1 in. = 2.54 cm.
1-in.
3-in.
6-in.
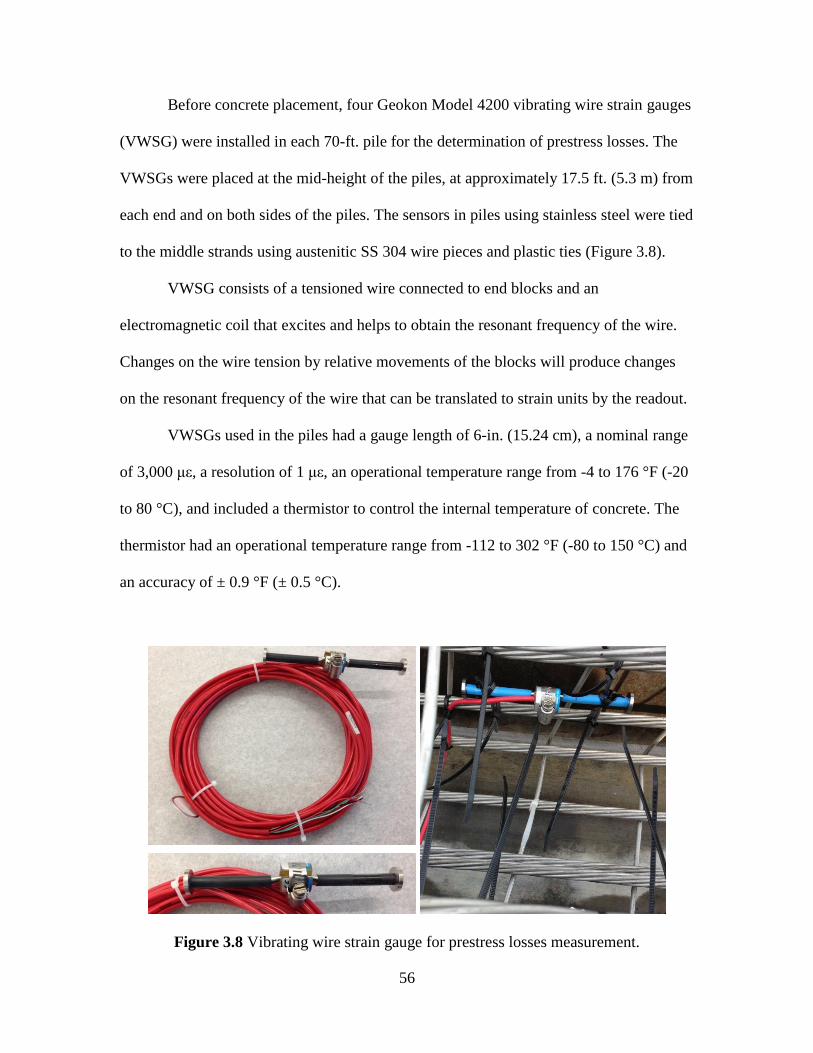
56
Before concrete placement, four Geokon Model 4200 vibrating wire strain gauges
(VWSG) were installed in each 70-ft. pile for the determination of prestress losses. The
VWSGs were placed at the mid-height of the piles, at approximately 17.5 ft. (5.3 m) from
each end and on both sides of the piles. The sensors in piles using stainless steel were tied
to the middle strands using austenitic SS 304 wire pieces and plastic ties (Figure 3.8).
VWSG consists of a tensioned wire connected to end blocks and an
electromagnetic coil that excites and helps to obtain the resonant frequency of the wire.
Changes on the wire tension by relative movements of the blocks will produce changes
on the resonant frequency of the wire that can be translated to strain units by the readout.
VWSGs used in the piles had a gauge length of 6-in. (15.24 cm), a nominal range
of 3,000 με, a resolution of 1 με, an operational temperature range from -4 to 176 °F (-20
to 80 °C), and included a thermistor to control the internal temperature of concrete. The
thermistor had an operational temperature range from -112 to 302 °F (-80 to 150 °C) and
an accuracy of ± 0.9 °F (± 0.5 °C).
Figure 3.8 Vibrating wire strain gauge for prestress losses measurement.
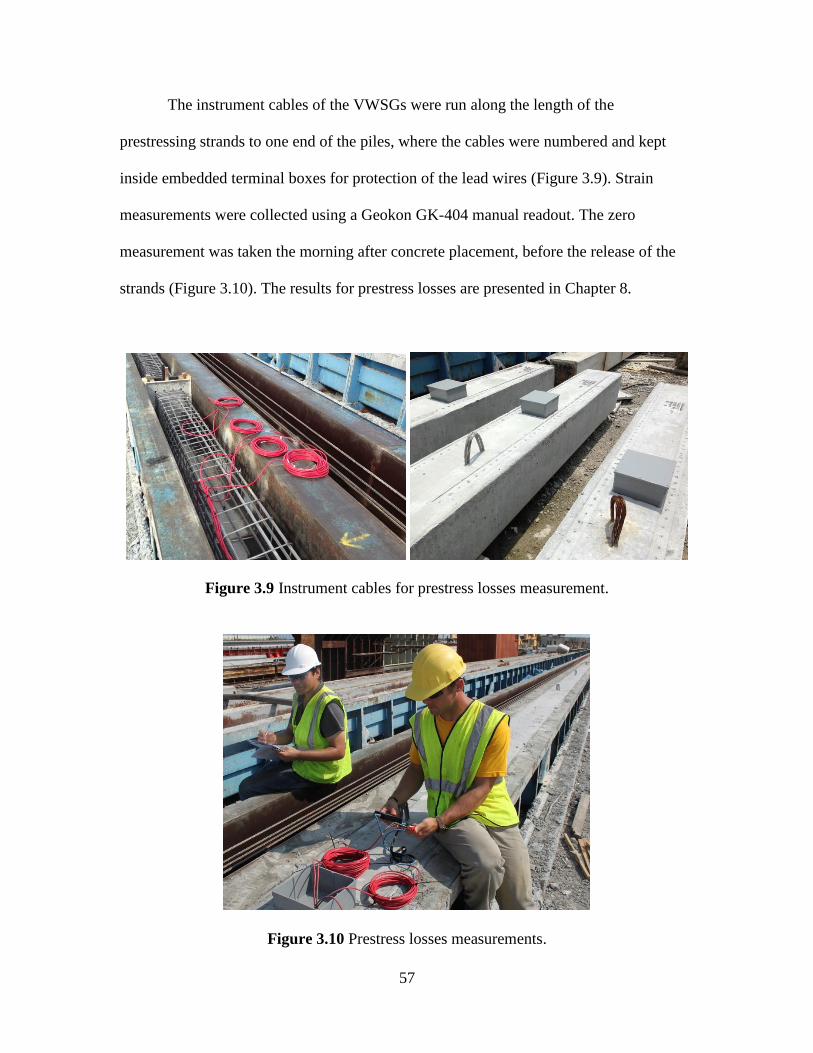
57
The instrument cables of the VWSGs were run along the length of the
prestressing strands to one end of the piles, where the cables were numbered and kept
inside embedded terminal boxes for protection of the lead wires (Figure 3.9). Strain
measurements were collected using a Geokon GK-404 manual readout. The zero
measurement was taken the morning after concrete placement, before the release of the
strands (Figure 3.10). The results for prestress losses are presented in Chapter 8.
Figure 3.9 Instrument cables for prestress losses measurement.
Figure 3.10 Prestress losses measurements.
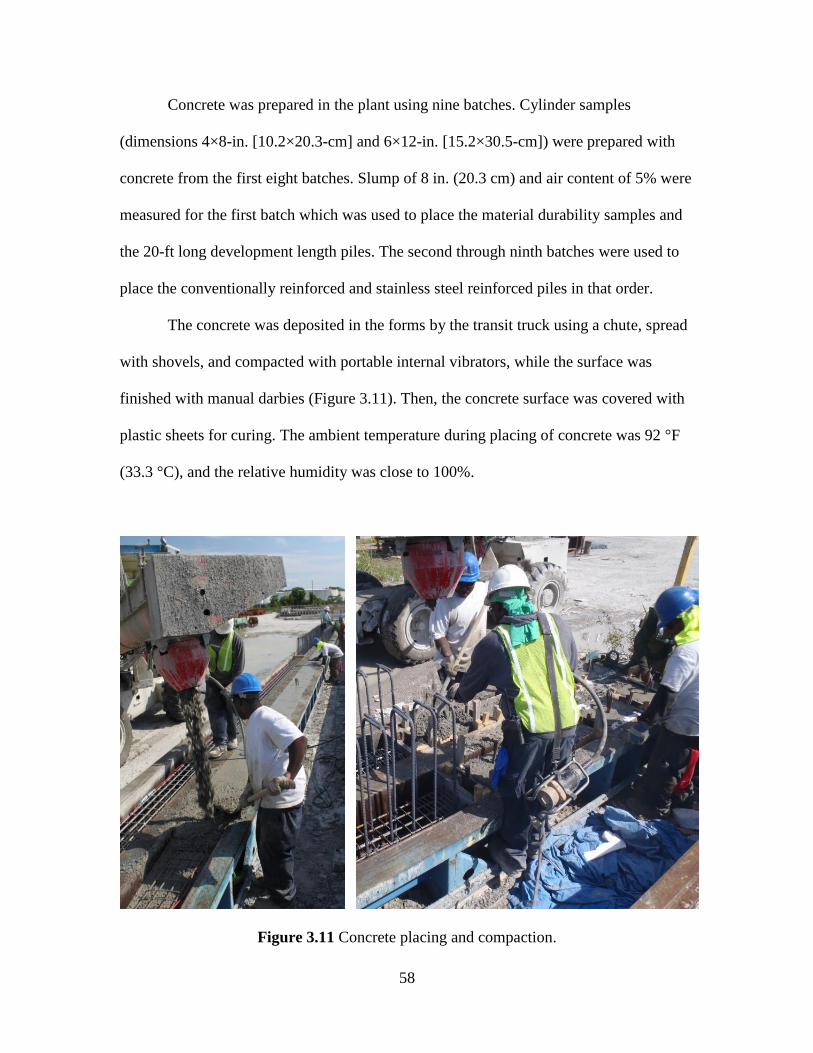
58
Concrete was prepared in the plant using nine batches. Cylinder samples
(dimensions 4×8-in. [10.2×20.3-cm] and 6×12-in. [15.2×30.5-cm]) were prepared with
concrete from the first eight batches. Slump of 8 in. (20.3 cm) and air content of 5% were
measured for the first batch which was used to place the material durability samples and
the 20-ft long development length piles. The second through ninth batches were used to
place the conventionally reinforced and stainless steel reinforced piles in that order.
The concrete was deposited in the forms by the transit truck using a chute, spread
with shovels, and compacted with portable internal vibrators, while the surface was
finished with manual darbies (Figure 3.11). Then, the concrete surface was covered with
plastic sheets for curing. The ambient temperature during placing of concrete was 92 °F
(33.3 °C), and the relative humidity was close to 100%.
Figure 3.11 Concrete placing and compaction.
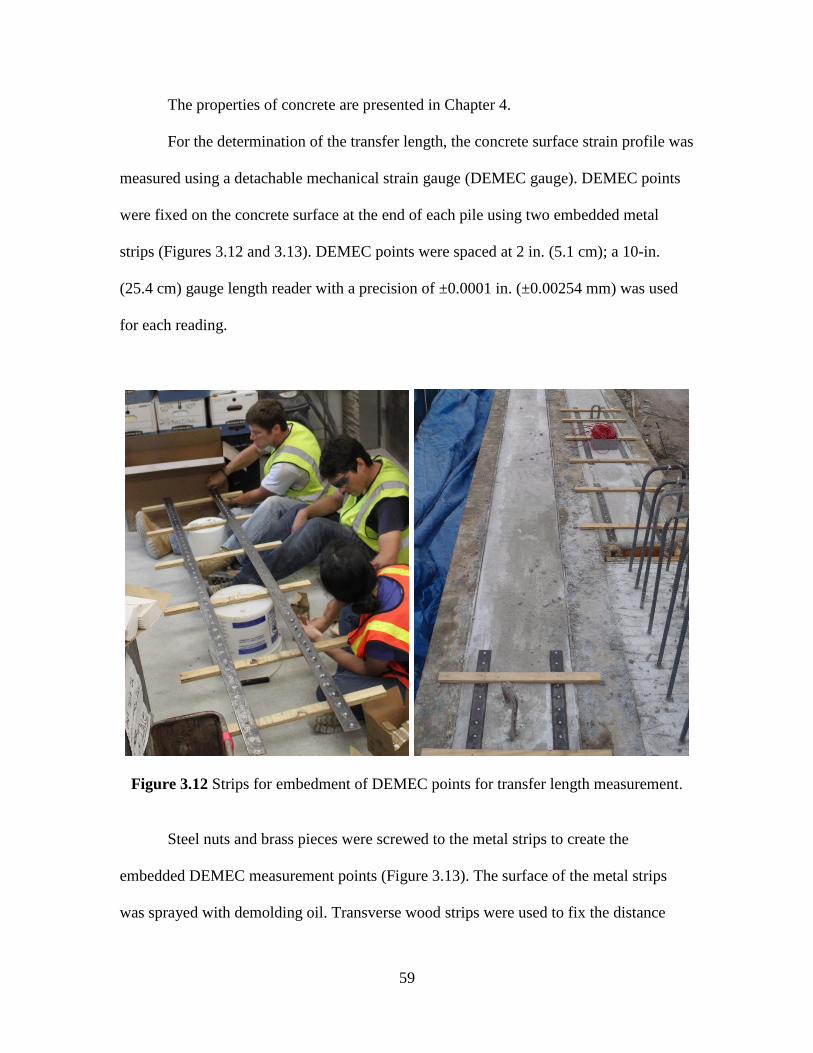
59
The properties of concrete are presented in Chapter 4.
For the determination of the transfer length, the concrete surface strain profile was
measured using a detachable mechanical strain gauge (DEMEC gauge). DEMEC points
were fixed on the concrete surface at the end of each pile using two embedded metal
strips (Figures 3.12 and 3.13). DEMEC points were spaced at 2 in. (5.1 cm); a 10-in.
(25.4 cm) gauge length reader with a precision of ±0.0001 in. (±0.00254 mm) was used
for each reading.
Figure 3.12 Strips for embedment of DEMEC points for transfer length measurement.
Steel nuts and brass pieces were screwed to the metal strips to create the
embedded DEMEC measurement points (Figure 3.13). The surface of the metal strips
was sprayed with demolding oil. Transverse wood strips were used to fix the distance
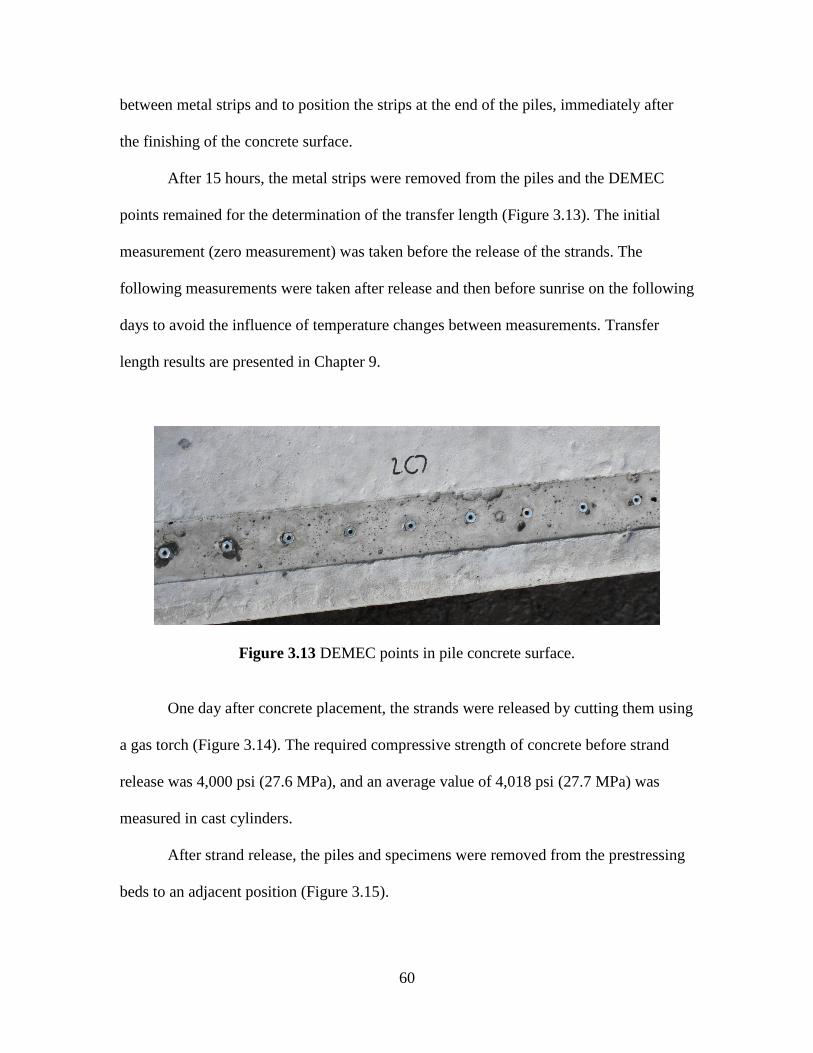
60
between metal strips and to position the strips at the end of the piles, immediately after
the finishing of the concrete surface.
After 15 hours, the metal strips were removed from the piles and the DEMEC
points remained for the determination of the transfer length (Figure 3.13). The initial
measurement (zero measurement) was taken before the release of the strands. The
following measurements were taken after release and then before sunrise on the following
days to avoid the influence of temperature changes between measurements. Transfer
length results are presented in Chapter 9.
Figure 3.13 DEMEC points in pile concrete surface.
One day after concrete placement, the strands were released by cutting them using
a gas torch (Figure 3.14). The required compressive strength of concrete before strand
release was 4,000 psi (27.6 MPa), and an average value of 4,018 psi (27.7 MPa) was
measured in cast cylinders.
After strand release, the piles and specimens were removed from the prestressing
beds to an adjacent position (Figure 3.15).
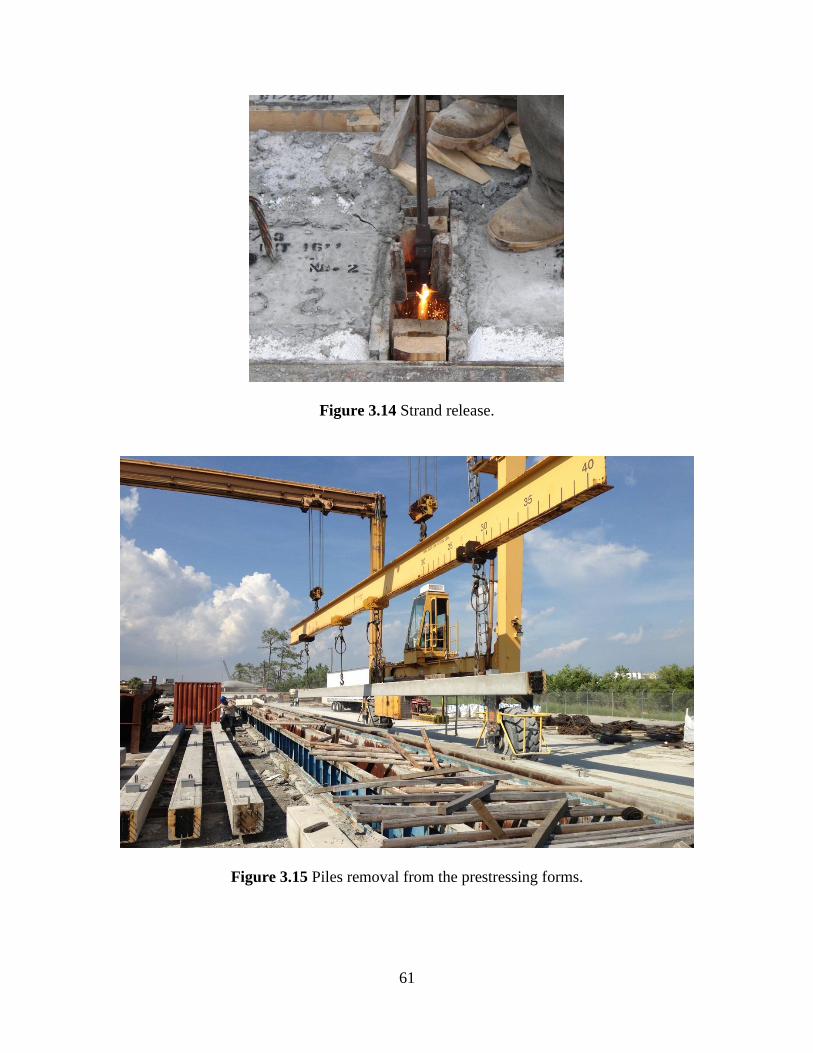
61
Figure 3.14 Strand release.
Figure 3.15 Piles removal from the prestressing forms.
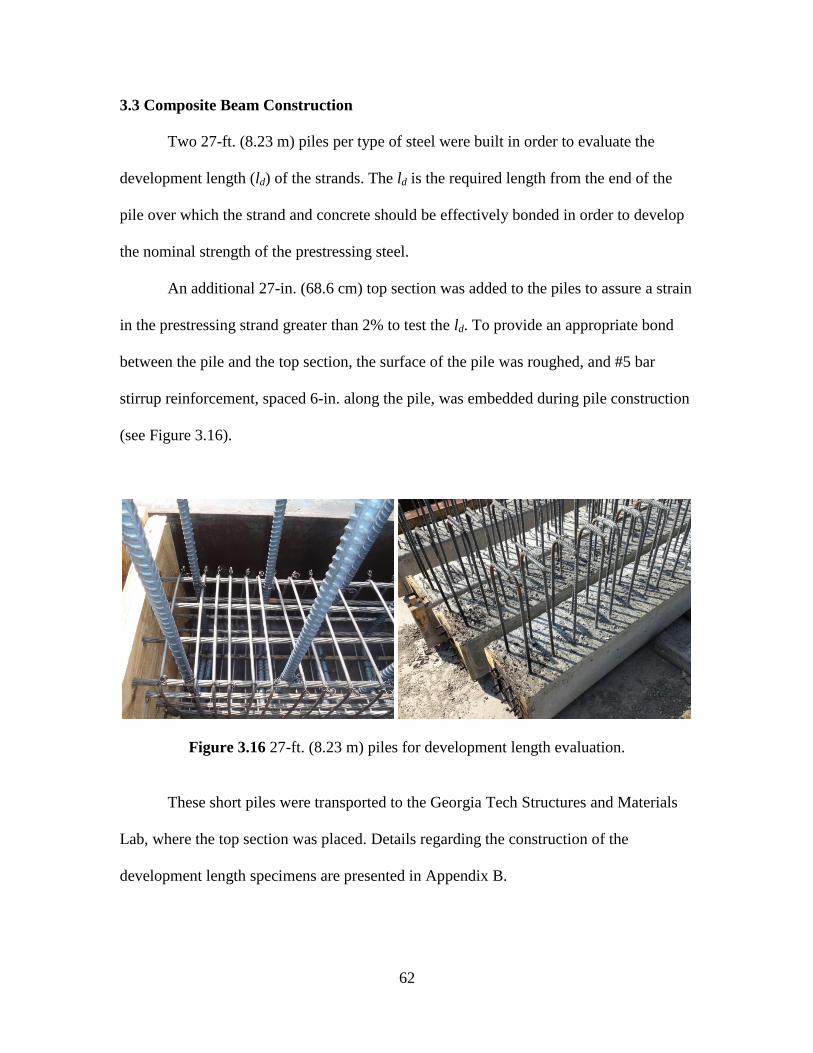
62
3.3 Composite Beam Construction
Two 27-ft. (8.23 m) piles per type of steel were built in order to evaluate the
development length (ld) of the strands. The ld is the required length from the end of the
pile over which the strand and concrete should be effectively bonded in order to develop
the nominal strength of the prestressing steel.
An additional 27-in. (68.6 cm) top section was added to the piles to assure a strain
in the prestressing strand greater than 2% to test the ld. To provide an appropriate bond
between the pile and the top section, the surface of the pile was roughed, and #5 bar
stirrup reinforcement, spaced 6-in. along the pile, was embedded during pile construction
(see Figure 3.16).
Figure 3.16 27-ft. (8.23 m) piles for development length evaluation.
These short piles were transported to the Georgia Tech Structures and Materials
Lab, where the top section was placed. Details regarding the construction of the
development length specimens are presented in Appendix B.
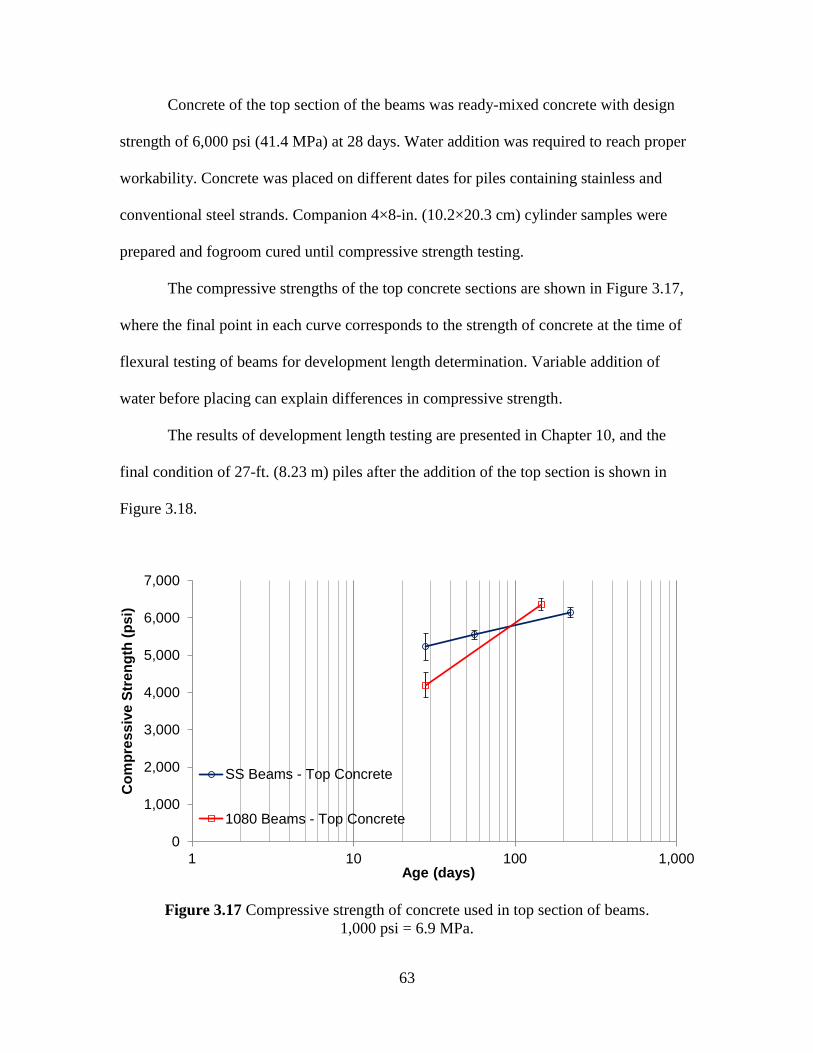
63
Concrete of the top section of the beams was ready-mixed concrete with design
strength of 6,000 psi (41.4 MPa) at 28 days. Water addition was required to reach proper
workability. Concrete was placed on different dates for piles containing stainless and
conventional steel strands. Companion 4×8-in. (10.2×20.3 cm) cylinder samples were
prepared and fogroom cured until compressive strength testing.
The compressive strengths of the top concrete sections are shown in Figure 3.17,
where the final point in each curve corresponds to the strength of concrete at the time of
flexural testing of beams for development length determination. Variable addition of
water before placing can explain differences in compressive strength.
The results of development length testing are presented in Chapter 10, and the
final condition of 27-ft. (8.23 m) piles after the addition of the top section is shown in
Figure 3.18.
Figure 3.17 Compressive strength of concrete used in top section of beams.
1,000 psi = 6.9 MPa.
0
1,000
2,000
3,000
4,000
5,000
6,000
7,000
1 10 100 1,000
Co
mp
res
siv
e S
tren
gth
(p
si)
Age (days)
SS Beams - Top Concrete
1080 Beams - Top Concrete
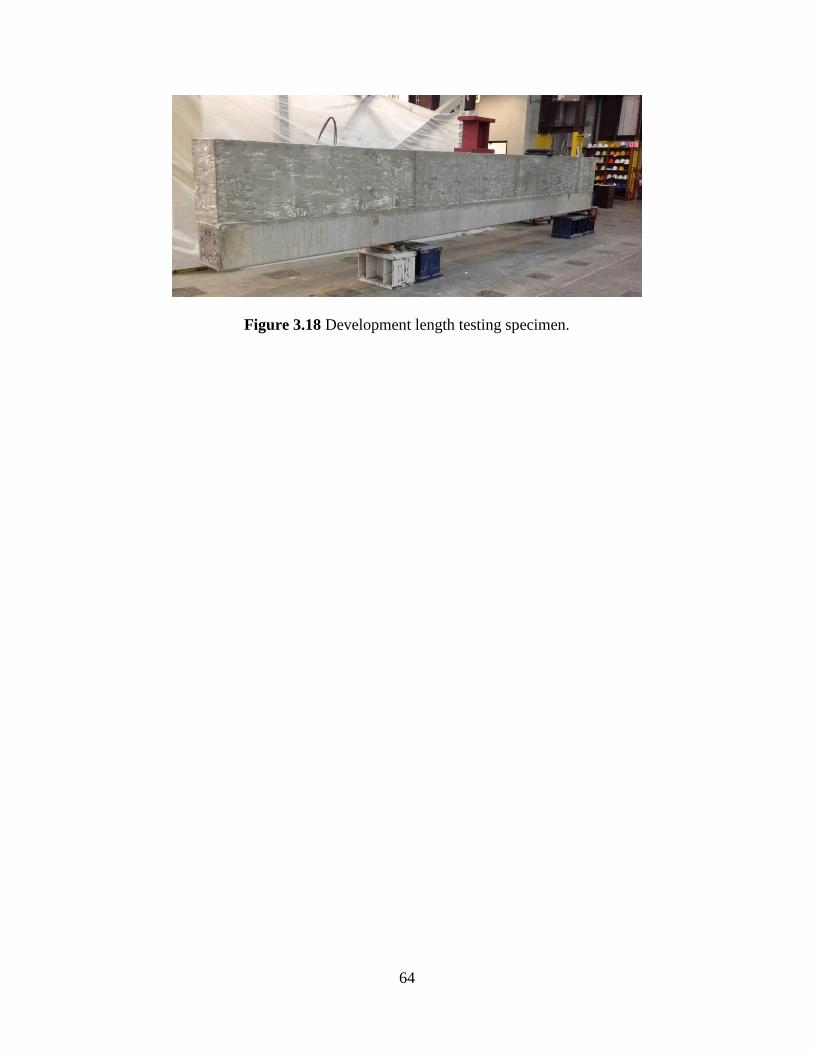
64
Figure 3.18 Development length testing specimen.
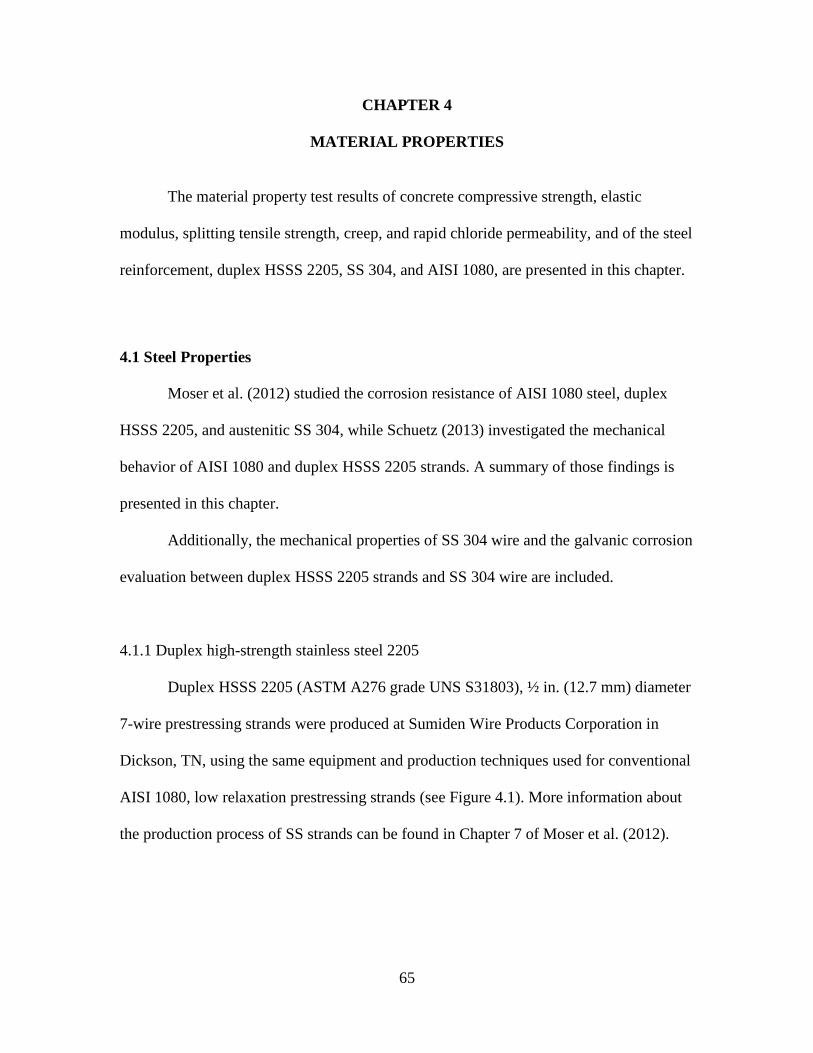
65
CHAPTER 4
MATERIAL PROPERTIES
The material property test results of concrete compressive strength, elastic
modulus, splitting tensile strength, creep, and rapid chloride permeability, and of the steel
reinforcement, duplex HSSS 2205, SS 304, and AISI 1080, are presented in this chapter.
4.1 Steel Properties
Moser et al. (2012) studied the corrosion resistance of AISI 1080 steel, duplex
HSSS 2205, and austenitic SS 304, while Schuetz (2013) investigated the mechanical
behavior of AISI 1080 and duplex HSSS 2205 strands. A summary of those findings is
presented in this chapter.
Additionally, the mechanical properties of SS 304 wire and the galvanic corrosion
evaluation between duplex HSSS 2205 strands and SS 304 wire are included.
4.1.1 Duplex high-strength stainless steel 2205
Duplex HSSS 2205 (ASTM A276 grade UNS S31803), ½ in. (12.7 mm) diameter
7-wire prestressing strands were produced at Sumiden Wire Products Corporation in
Dickson, TN, using the same equipment and production techniques used for conventional
AISI 1080, low relaxation prestressing strands (see Figure 4.1). More information about
the production process of SS strands can be found in Chapter 7 of Moser et al. (2012).
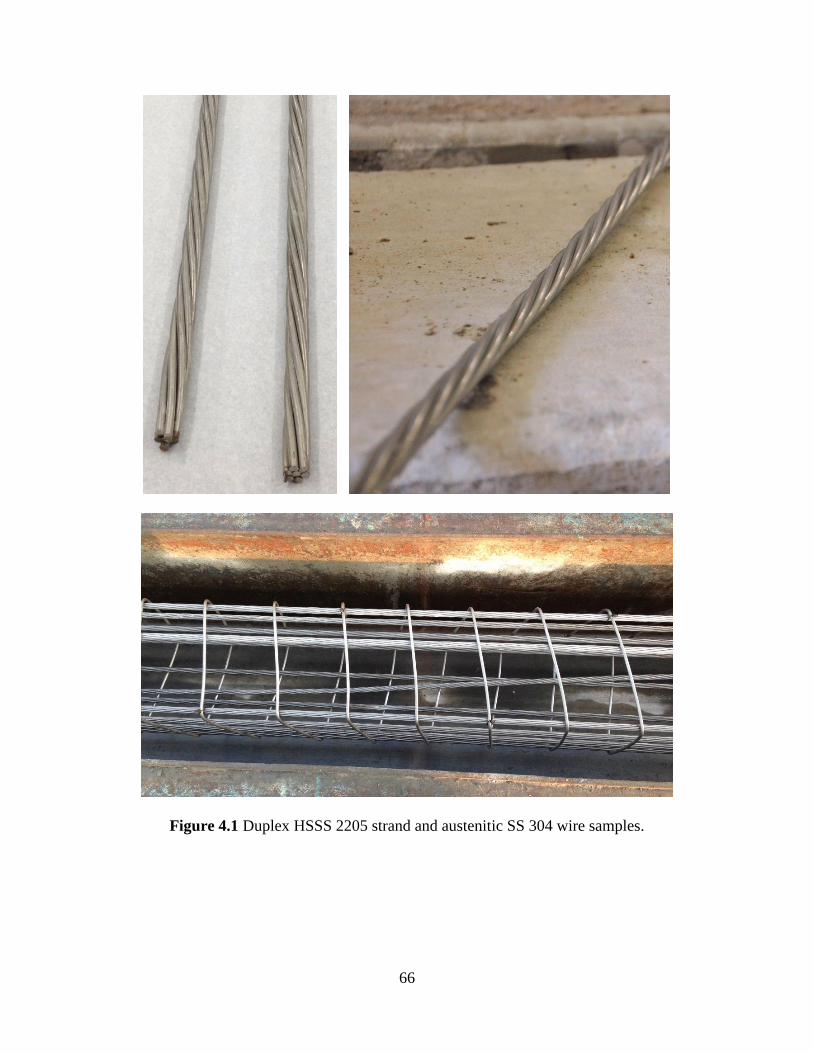
66
Figure 4.1 Duplex HSSS 2205 strand and austenitic SS 304 wire samples.
67
The mechanical properties of the strands tested by Schuetz (2013) are given in
Table 4.1 and in Figure 4.2. Duplex HSSS 2205 strands have a lower ultimate tensile
strength (UTS), elastic modulus, and yield stress compared to conventional strands. To
account for lower mechanical properties, the area of the strand was increased about 30%
in the case of duplex HSSS 2205 (diameter of 1 2⁄ -in. [12.7 mm] instead of the commonly
used 7 16⁄ -in. [11.1 mm]). Also, the ultimate strain of HSSS 2205 is only 27% of the value
for conventional AISI 1080 steel, which indicates a lower ductility of duplex HSSS 2205
strands (Figure 4.2).
Table 4.1 Mechanical properties of duplex HSSS 2205 and conventional steel strands.
1 ksi = 6.9 MPa.
Duplex HSSS 2205 AISI 1080 Steel
Average Std Dev Average Std Dev
UTS (ksi) 241.5 1.6 281.8 2.0
Ultimate strain (in/in) 1.60% 0.07% 5.89% 0.59%
Elastic modulus (ksi) 23,500 190 29,400 130
Yield Stress (ksi,
0.2% offset criterion) 228.7 2.4 254.7 0.6
Stress-relaxation
70% UTS – 1,000 h 2.49% 0.24% 2.40% ---------
Schuetz (2013) observed a stress relaxation loss of 2.49% when testing duplex
HSSS 2205 strands following standard ASTM E328 (1,000 hours of test duration,
temperature controlled room, at 70% UTS), while Moser et al. (2012) estimated a stress
loss of 2.40% in AISI 1080 wires from 200 hours results. The limit for low relaxation
prestressing strand according to ASTM A416 is 2.5% for 1,000 h tests with strands
loaded at 70% of UTS.
68
Figure 4.2 Stress-strain curve of duplex HSSS 2205 strand. 1 ksi = 6.9 MPa.
Moser et al. (2012) analyzed the corrosion behavior of the steels included in this
report. Using electrochemical cyclic potentiodynamic polarization techniques in
simulated concrete alkaline and carbonated environments contaminated by chloride ions,
they found the results given in Table 4.2, where the higher corrosion resistance of duplex
2205 is evidenced.
Table 4.2 Corrosion behavior of different steel alloys (modified from Moser et al.
(2012)).
Alkaline (pH = 12.5) Carbonated (pH = 9.5)
Cl- content (M) 0.00 0.25 0.50 1.00 0.00 0.25 0.50 1.00
Duplex 2205 NC NC NC NC NC NC NC NC
Austenitic 304 NC NC MP SP NC MP SP SP
AISI 1080 NC SP SP SP MP SP SP SP
Note: NC: no corrosion initiated - MP: metastable pitting - SP: stable pitting
0
50
100
150
200
250
0.0% 0.2% 0.4% 0.6% 0.8% 1.0% 1.2% 1.4% 1.6% 1.8%
Str
es
s (
ks
i)
Strain (%)
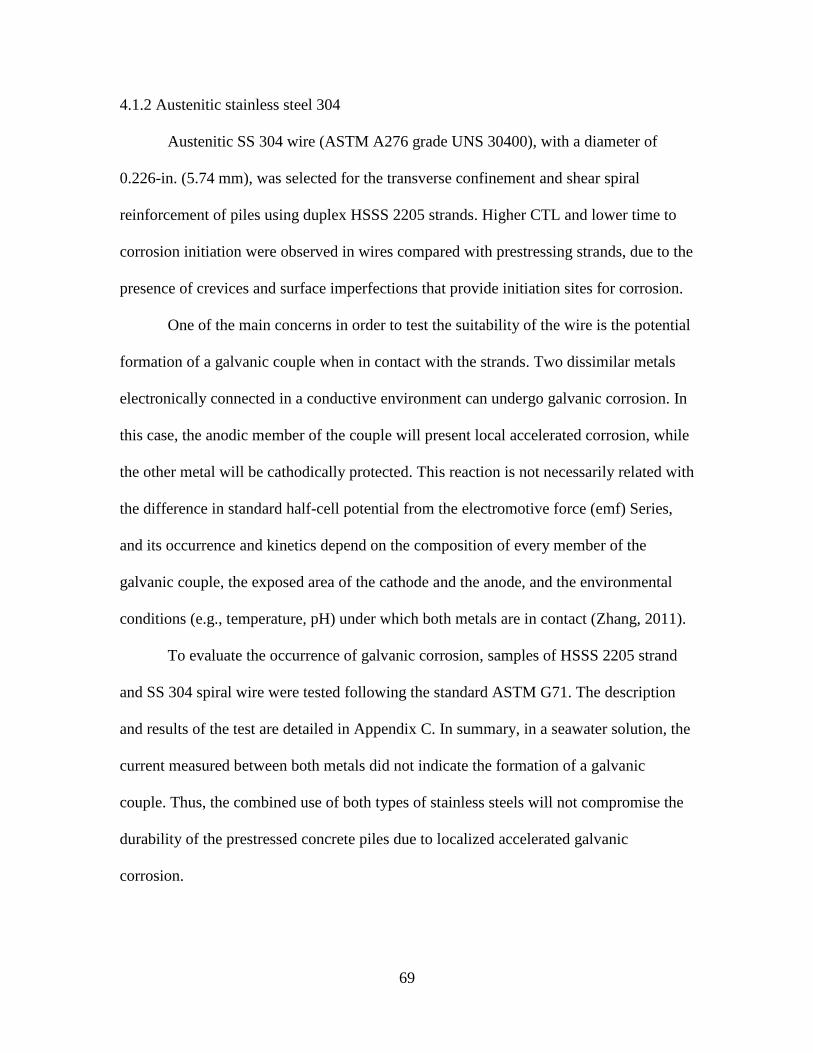
69
4.1.2 Austenitic stainless steel 304
Austenitic SS 304 wire (ASTM A276 grade UNS 30400), with a diameter of
0.226-in. (5.74 mm), was selected for the transverse confinement and shear spiral
reinforcement of piles using duplex HSSS 2205 strands. Higher CTL and lower time to
corrosion initiation were observed in wires compared with prestressing strands, due to the
presence of crevices and surface imperfections that provide initiation sites for corrosion.
One of the main concerns in order to test the suitability of the wire is the potential
formation of a galvanic couple when in contact with the strands. Two dissimilar metals
electronically connected in a conductive environment can undergo galvanic corrosion. In
this case, the anodic member of the couple will present local accelerated corrosion, while
the other metal will be cathodically protected. This reaction is not necessarily related with
the difference in standard half-cell potential from the electromotive force (emf) Series,
and its occurrence and kinetics depend on the composition of every member of the
galvanic couple, the exposed area of the cathode and the anode, and the environmental
conditions (e.g., temperature, pH) under which both metals are in contact (Zhang, 2011).
To evaluate the occurrence of galvanic corrosion, samples of HSSS 2205 strand
and SS 304 spiral wire were tested following the standard ASTM G71. The description
and results of the test are detailed in Appendix C. In summary, in a seawater solution, the
current measured between both metals did not indicate the formation of a galvanic
couple. Thus, the combined use of both types of stainless steels will not compromise the
durability of the prestressed concrete piles due to localized accelerated galvanic
corrosion.
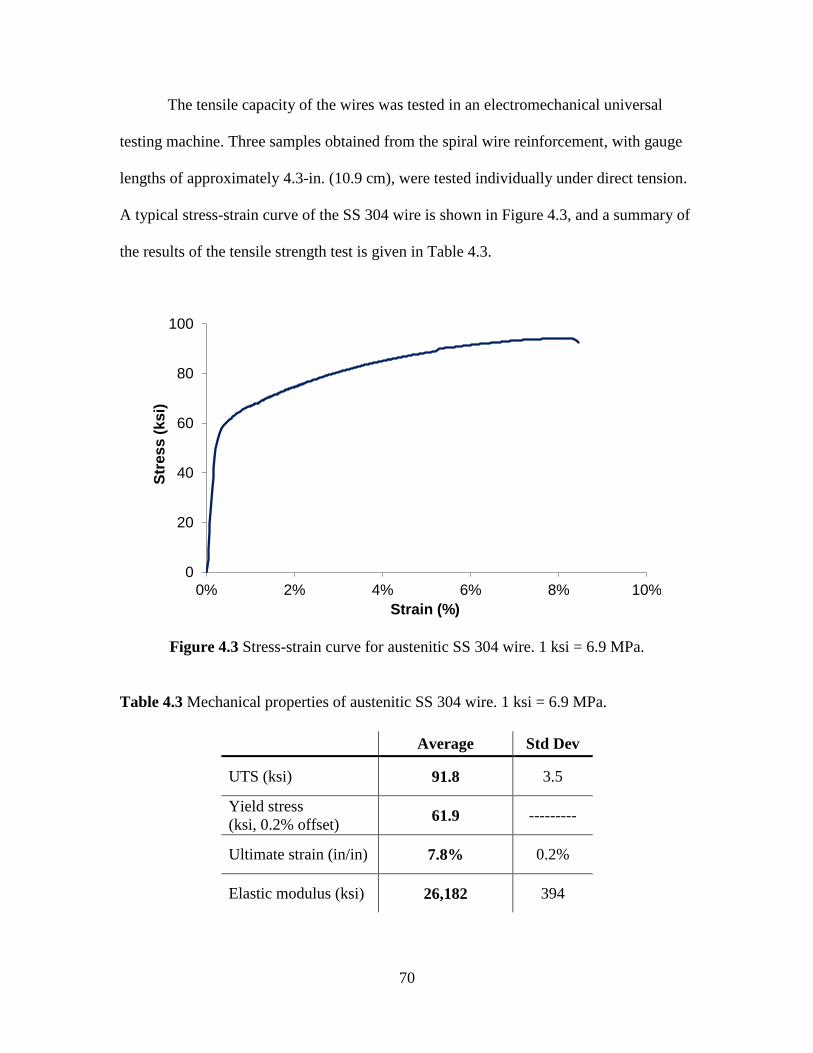
70
The tensile capacity of the wires was tested in an electromechanical universal
testing machine. Three samples obtained from the spiral wire reinforcement, with gauge
lengths of approximately 4.3-in. (10.9 cm), were tested individually under direct tension.
A typical stress-strain curve of the SS 304 wire is shown in Figure 4.3, and a summary of
the results of the tensile strength test is given in Table 4.3.
Figure 4.3 Stress-strain curve for austenitic SS 304 wire. 1 ksi = 6.9 MPa.
Table 4.3 Mechanical properties of austenitic SS 304 wire. 1 ksi = 6.9 MPa.
Average Std Dev
UTS (ksi) 91.8 3.5
Yield stress
(ksi, 0.2% offset) 61.9 ---------
Ultimate strain (in/in) 7.8% 0.2%
Elastic modulus (ksi) 26,182 394
0
20
40
60
80
100
0% 2% 4% 6% 8% 10%
Str
ess (
ksi)
Strain (%)
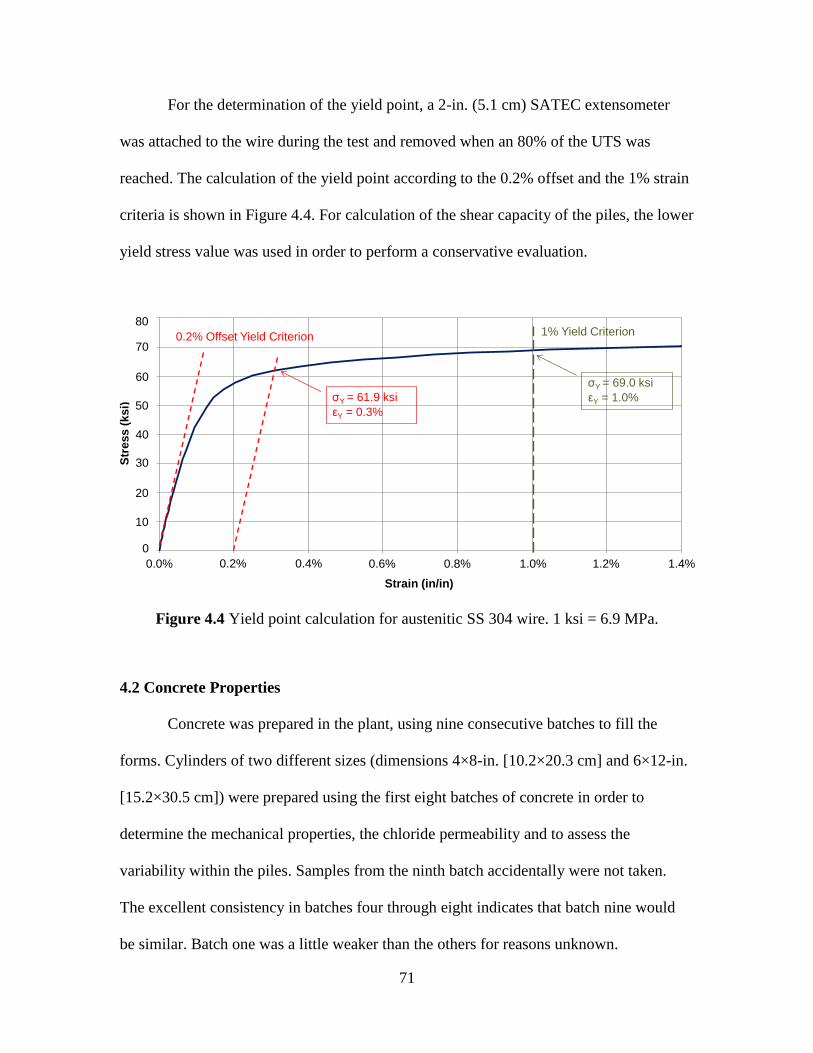
71
For the determination of the yield point, a 2-in. (5.1 cm) SATEC extensometer
was attached to the wire during the test and removed when an 80% of the UTS was
reached. The calculation of the yield point according to the 0.2% offset and the 1% strain
criteria is shown in Figure 4.4. For calculation of the shear capacity of the piles, the lower
yield stress value was used in order to perform a conservative evaluation.
Figure 4.4 Yield point calculation for austenitic SS 304 wire. 1 ksi = 6.9 MPa.
4.2 Concrete Properties
Concrete was prepared in the plant, using nine consecutive batches to fill the
forms. Cylinders of two different sizes (dimensions 4×8-in. [10.2×20.3 cm] and 6×12-in.
[15.2×30.5 cm]) were prepared using the first eight batches of concrete in order to
determine the mechanical properties, the chloride permeability and to assess the
variability within the piles. Samples from the ninth batch accidentally were not taken.
The excellent consistency in batches four through eight indicates that batch nine would
be similar. Batch one was a little weaker than the others for reasons unknown.
0
10
20
30
40
50
60
70
80
0.0% 0.2% 0.4% 0.6% 0.8% 1.0% 1.2% 1.4%
Str
es
s (
ks
i)
Strain (in/in)
1% Yield Criterion0.2% Offset Yield Criterion
σY = 61.9 ksi
εY = 0.3%
σY = 69.0 ksi
εY = 1.0%
Strain (in/in)
Str
ess (
ksi)
30
0.0% 0.2% 0.4% 0.6% 0.8% 1.0% 1.2% 1.4%
0
10
20
40
50
60
70
80
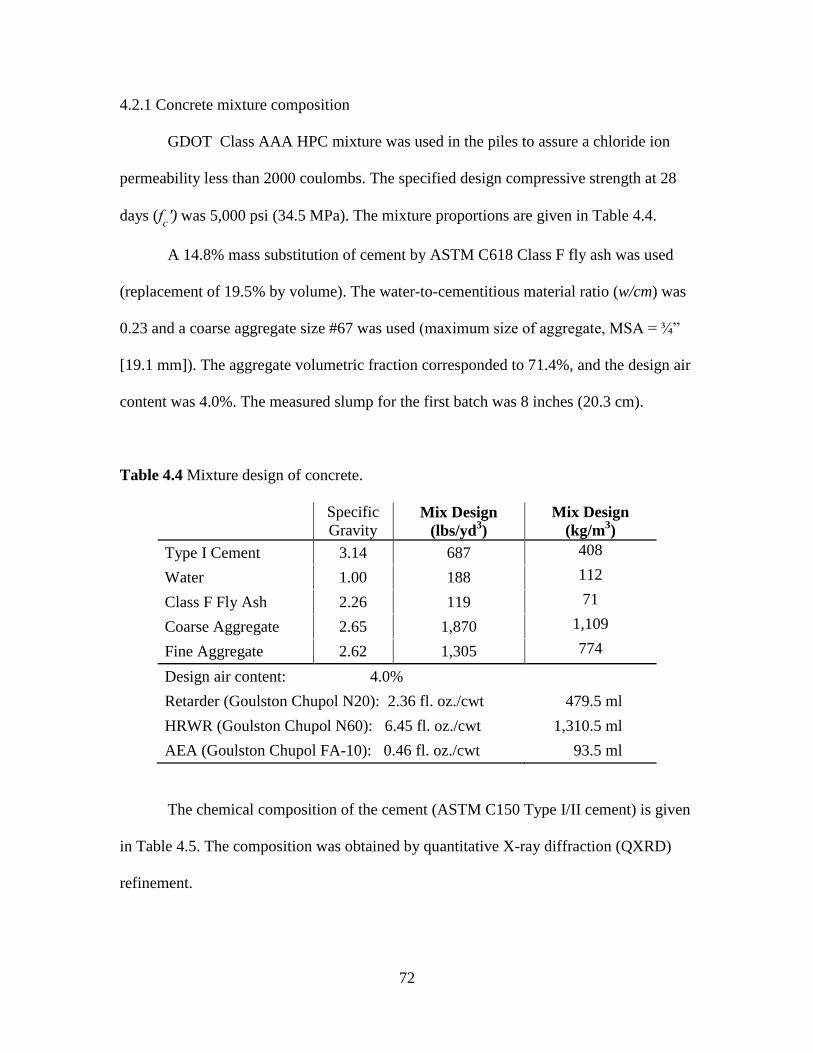
72
4.2.1 Concrete mixture composition
GDOT Class AAA HPC mixture was used in the piles to assure a chloride ion
permeability less than 2000 coulombs. The specified design compressive strength at 28
days (fc') was 5,000 psi (34.5 MPa). The mixture proportions are given in Table 4.4.
A 14.8% mass substitution of cement by ASTM C618 Class F fly ash was used
(replacement of 19.5% by volume). The water-to-cementitious material ratio (w/cm) was
0.23 and a coarse aggregate size #67 was used (maximum size of aggregate, MSA = ¾”
[19.1 mm]). The aggregate volumetric fraction corresponded to 71.4%, and the design air
content was 4.0%. The measured slump for the first batch was 8 inches (20.3 cm).
Table 4.4 Mixture design of concrete.
Specific
Gravity Mix Design
(lbs/yd3)
Mix Design
(kg/m3)
Type I Cement 3.14 687 408
Water 1.00 188 112
Class F Fly Ash 2.26 119 71
Coarse Aggregate 2.65 1,870 1,109
Fine Aggregate 2.62 1,305 774
Design air content: 4.0%
Retarder (Goulston Chupol N20): 2.36 fl. oz./cwt 479.5 ml
HRWR (Goulston Chupol N60): 6.45 fl. oz./cwt 1,310.5 ml
AEA (Goulston Chupol FA-10): 0.46 fl. oz./cwt 93.5 ml
The chemical composition of the cement (ASTM C150 Type I/II cement) is given
in Table 4.5. The composition was obtained by quantitative X-ray diffraction (QXRD)
refinement.
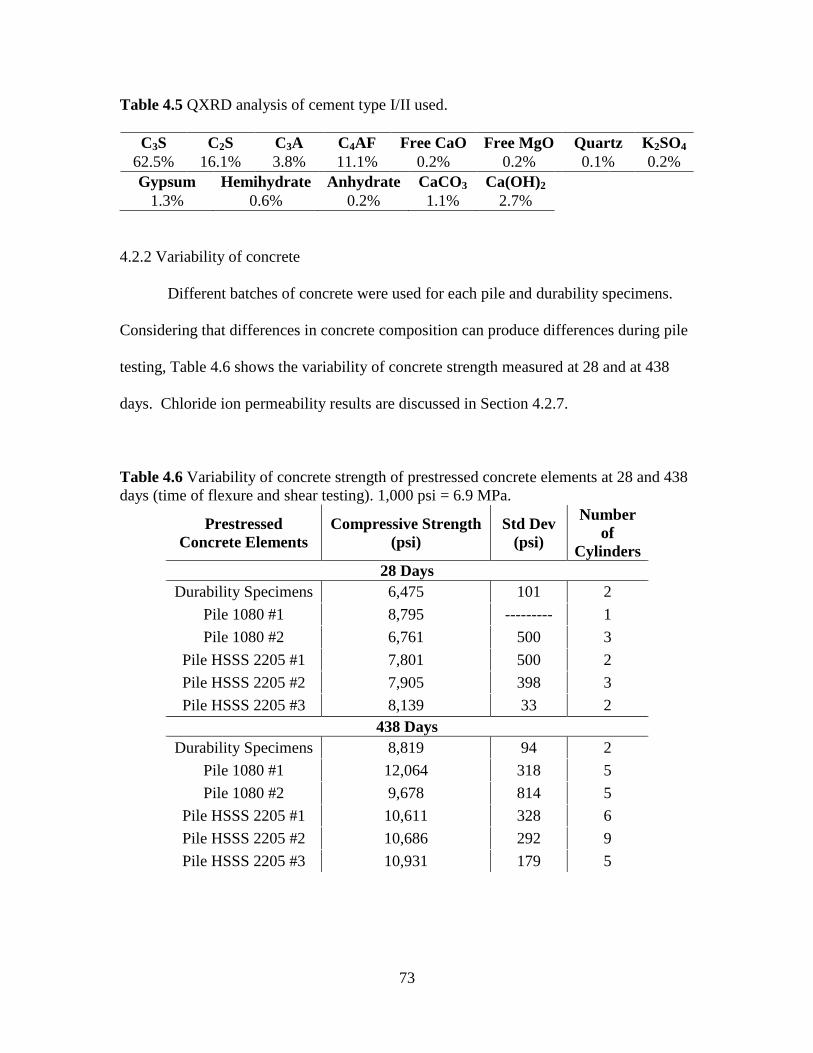
73
Table 4.5 QXRD analysis of cement type I/II used.
C3S C2S C3A C4AF Free CaO Free MgO Quartz K2SO4
62.5% 16.1% 3.8% 11.1% 0.2% 0.2% 0.1% 0.2%
Gypsum Hemihydrate Anhydrate CaCO3 Ca(OH)2
1.3% 0.6% 0.2% 1.1% 2.7%
4.2.2 Variability of concrete
Different batches of concrete were used for each pile and durability specimens.
Considering that differences in concrete composition can produce differences during pile
testing, Table 4.6 shows the variability of concrete strength measured at 28 and at 438
days. Chloride ion permeability results are discussed in Section 4.2.7.
Table 4.6 Variability of concrete strength of prestressed concrete elements at 28 and 438
days (time of flexure and shear testing). 1,000 psi = 6.9 MPa.
Prestressed
Concrete Elements
Compressive Strength
(psi)
Std Dev
(psi)
Number
of
Cylinders
28 Days
Durability Specimens 6,475 101 2
Pile 1080 #1 8,795 --------- 1
Pile 1080 #2 6,761 500 3
Pile HSSS 2205 #1 7,801 500 2
Pile HSSS 2205 #2 7,905 398 3
Pile HSSS 2205 #3 8,139 33 2
438 Days
Durability Specimens 8,819 94 2
Pile 1080 #1 12,064 318 5
Pile 1080 #2 9,678 814 5
Pile HSSS 2205 #1 10,611 328 6
Pile HSSS 2205 #2 10,686 292 9
Pile HSSS 2205 #3 10,931 179 5
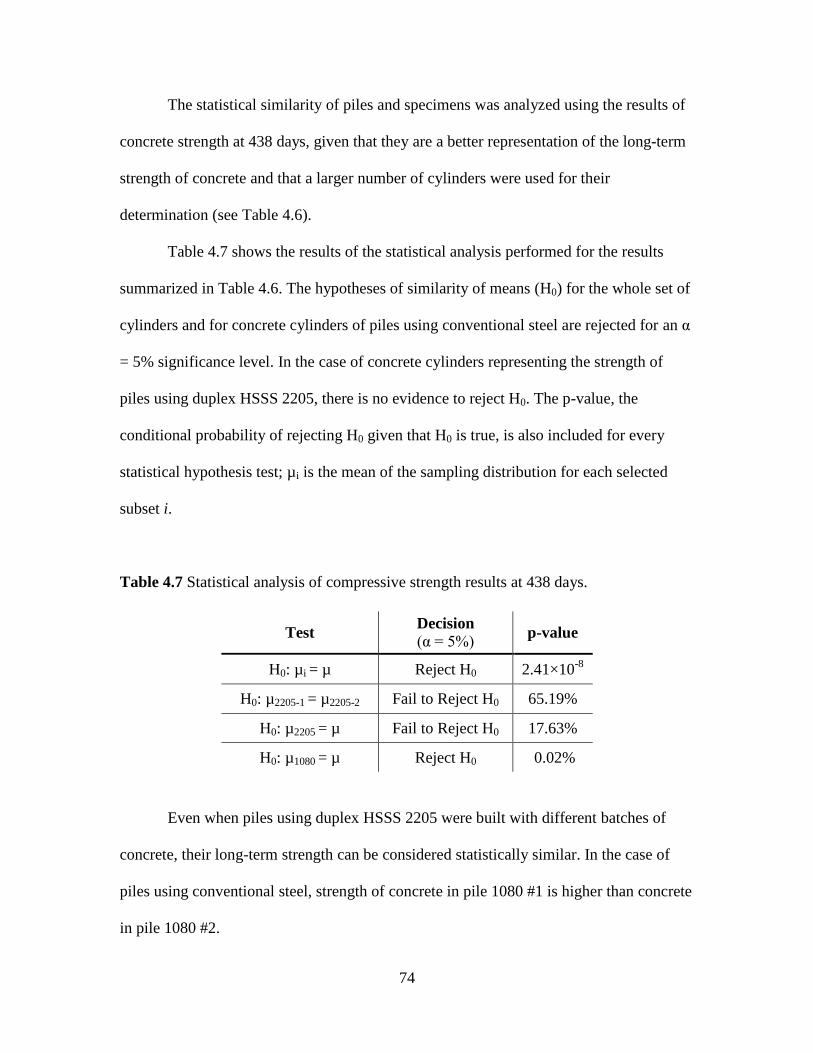
74
The statistical similarity of piles and specimens was analyzed using the results of
concrete strength at 438 days, given that they are a better representation of the long-term
strength of concrete and that a larger number of cylinders were used for their
determination (see Table 4.6).
Table 4.7 shows the results of the statistical analysis performed for the results
summarized in Table 4.6. The hypotheses of similarity of means (H0) for the whole set of
cylinders and for concrete cylinders of piles using conventional steel are rejected for an α
= 5% significance level. In the case of concrete cylinders representing the strength of
piles using duplex HSSS 2205, there is no evidence to reject H0. The p-value, the
conditional probability of rejecting H0 given that H0 is true, is also included for every
statistical hypothesis test; µi is the mean of the sampling distribution for each selected
subset i.
Table 4.7 Statistical analysis of compressive strength results at 438 days.
Test Decision
(α = 5%) p-value
H0: µi = µ Reject H0 2.41×10⁻⁸
H0: µ2205-1 = µ2205-2 Fail to Reject H0 65.19%
H0: µ2205 = µ Fail to Reject H0 17.63%
H0: µ1080 = µ Reject H0 0.02%
Even when piles using duplex HSSS 2205 were built with different batches of
concrete, their long-term strength can be considered statistically similar. In the case of
piles using conventional steel, strength of concrete in pile 1080 #1 is higher than concrete
in pile 1080 #2.
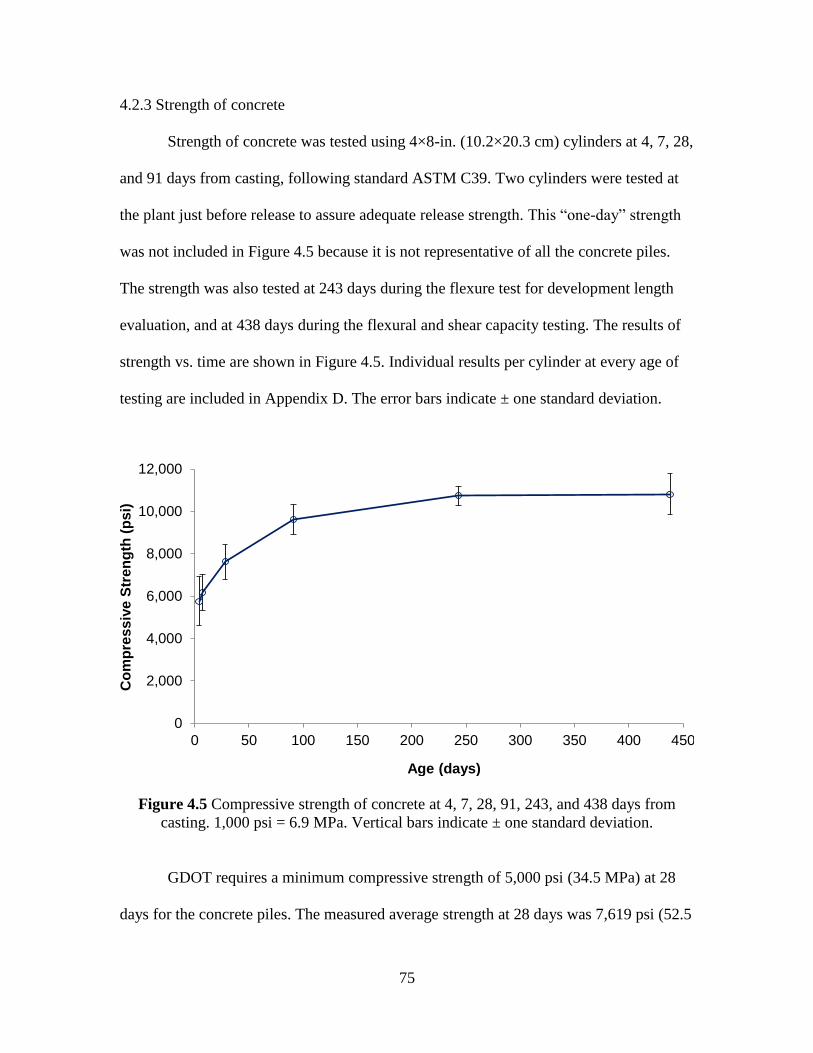
75
4.2.3 Strength of concrete
Strength of concrete was tested using 4×8-in. (10.2×20.3 cm) cylinders at 4, 7, 28,
and 91 days from casting, following standard ASTM C39. Two cylinders were tested at
the plant just before release to assure adequate release strength. This “one-day” strength
was not included in Figure 4.5 because it is not representative of all the concrete piles.
The strength was also tested at 243 days during the flexure test for development length
evaluation, and at 438 days during the flexural and shear capacity testing. The results of
strength vs. time are shown in Figure 4.5. Individual results per cylinder at every age of
testing are included in Appendix D. The error bars indicate ± one standard deviation.
Figure 4.5 Compressive strength of concrete at 4, 7, 28, 91, 243, and 438 days from
casting. 1,000 psi = 6.9 MPa. Vertical bars indicate ± one standard deviation.
GDOT requires a minimum compressive strength of 5,000 psi (34.5 MPa) at 28
days for the concrete piles. The measured average strength at 28 days was 7,619 psi (52.5
0
2,000
4,000
6,000
8,000
10,000
12,000
0 50 100 150 200 250 300 350 400 450
Co
mp
res
siv
e S
tre
ng
th (
ps
i)
Age (days)
76
MPa), and the average strength for every pile or specimen was also higher than the
requirement (see Table 4.6). Also, the strength of concrete was tested before strand
release in the plant at 1 day from casting, and an average value of 4,018 psi (27.7 MPa)
was measured (result not included in Figure 4.5). A minimum compressive strength of
concrete of 4,000 psi (27.6 MPa) is required to release the strands. The relationship of
strength-time of concrete can be represented by Equation 4.1 (t in days, R2=98.4%).
4381 999,3)ln(3.174,1'
ttfc
(4.1)
ACI 363R: Report on High Strength Concrete (2010) defines the term high-
strength concrete as “concrete that has a specified compressive strength for design of
8000 psi (55.2 MPa) or greater”. Even considering that the report recognizes that there is
no definitive limit that determines a dramatic change on the mechanical properties of
concrete and that the design strength is commonly considered at 28 days of age (in this
case, lower than 8,000 psi [55.2 MPa]), the equations of reports ACI 363R and ACI 318
to predict the elastic modulus and splitting tensile strength are compared with the results
obtained experimentally.
4.2.4 Stress-strain behavior of concrete
The modulus of elasticity and Poisson’s modulus were obtained according to
standard ASTM C469 at 4, 28, 91, and 445 days. Cylinders of dimensions 6×12-in.
(15.2×30.5 cm) were selected from different batches. Three cylinders were tested at every
age, and the deformations until 40% of the ultimate load were used for the calculation of
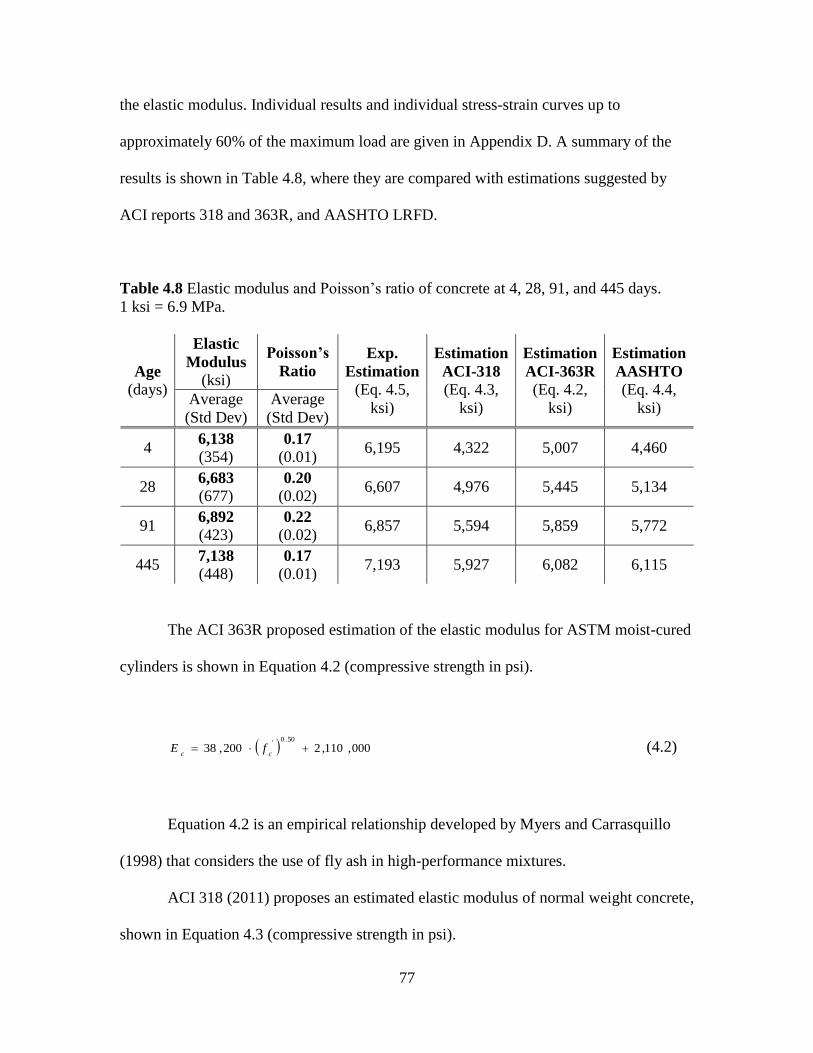
77
the elastic modulus. Individual results and individual stress-strain curves up to
approximately 60% of the maximum load are given in Appendix D. A summary of the
results is shown in Table 4.8, where they are compared with estimations suggested by
ACI reports 318 and 363R, and AASHTO LRFD.
Table 4.8 Elastic modulus and Poisson’s ratio of concrete at 4, 28, 91, and 445 days.
1 ksi = 6.9 MPa.
Age (days)
Elastic
Modulus
(ksi)
Poisson’s
Ratio
Exp.
Estimation
(Eq. 4.5,
ksi)
Estimation
ACI-318
(Eq. 4.3,
ksi)
Estimation
ACI-363R
(Eq. 4.2,
ksi)
Estimation
AASHTO
(Eq. 4.4,
ksi) Average
(Std Dev)
Average
(Std Dev)
4 6,138
(354) 0.17
(0.01) 6,195 4,322 5,007 4,460
28 6,683
(677) 0.20
(0.02) 6,607 4,976 5,445 5,134
91 6,892
(423) 0.22
(0.02) 6,857 5,594 5,859 5,772
445 7,138 (448)
0.17 (0.01)
7,193 5,927 6,082 6,115
The ACI 363R proposed estimation of the elastic modulus for ASTM moist-cured
cylinders is shown in Equation 4.2 (compressive strength in psi).
000,110,2200,3850.0
'
ccfE (4.2)
Equation 4.2 is an empirical relationship developed by Myers and Carrasquillo
(1998) that considers the use of fly ash in high-performance mixtures.
ACI 318 (2011) proposes an estimated elastic modulus of normal weight concrete,
shown in Equation 4.3 (compressive strength in psi).
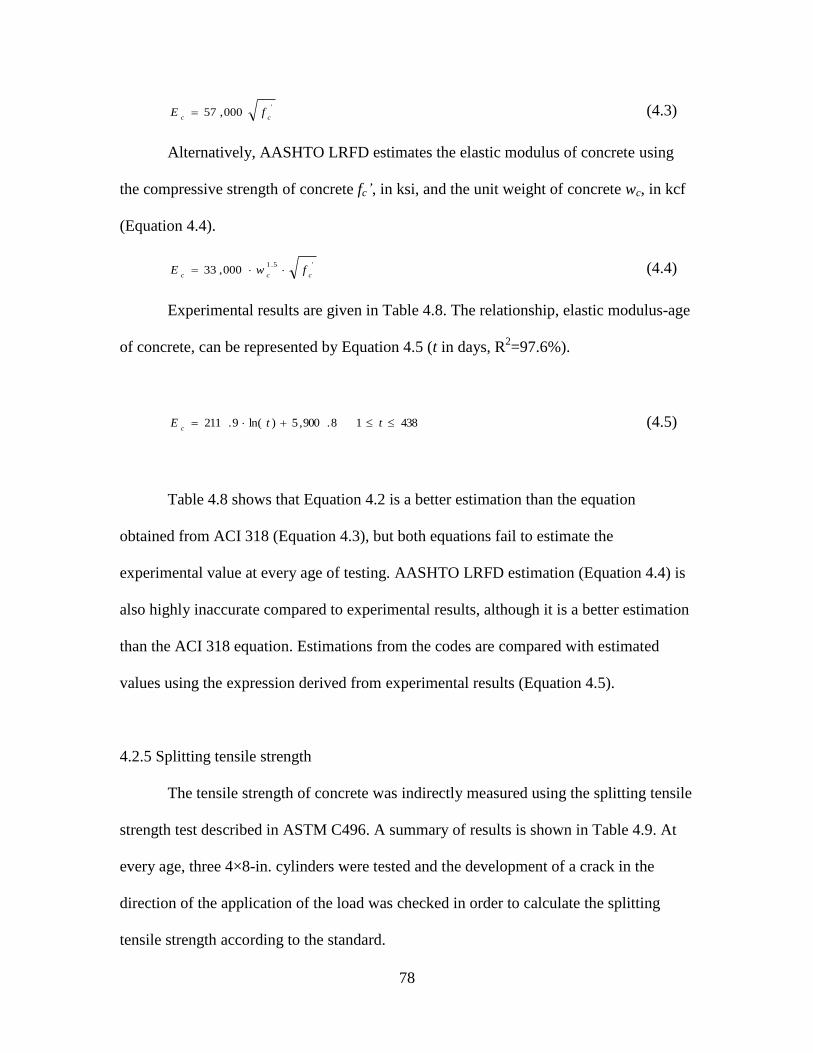
78
'000,57
ccfE (4.3)
Alternatively, AASHTO LRFD estimates the elastic modulus of concrete using
the compressive strength of concrete fc’, in ksi, and the unit weight of concrete wc, in kcf
(Equation 4.4).
'5.1000,33
cccfwE (4.4)
Experimental results are given in Table 4.8. The relationship, elastic modulus-age
of concrete, can be represented by Equation 4.5 (t in days, R2=97.6%).
4381 8.900,5)ln(9.211 ttEc
(4.5)
Table 4.8 shows that Equation 4.2 is a better estimation than the equation
obtained from ACI 318 (Equation 4.3), but both equations fail to estimate the
experimental value at every age of testing. AASHTO LRFD estimation (Equation 4.4) is
also highly inaccurate compared to experimental results, although it is a better estimation
than the ACI 318 equation. Estimations from the codes are compared with estimated
values using the expression derived from experimental results (Equation 4.5).
4.2.5 Splitting tensile strength
The tensile strength of concrete was indirectly measured using the splitting tensile
strength test described in ASTM C496. A summary of results is shown in Table 4.9. At
every age, three 4×8-in. cylinders were tested and the development of a crack in the
direction of the application of the load was checked in order to calculate the splitting
tensile strength according to the standard.
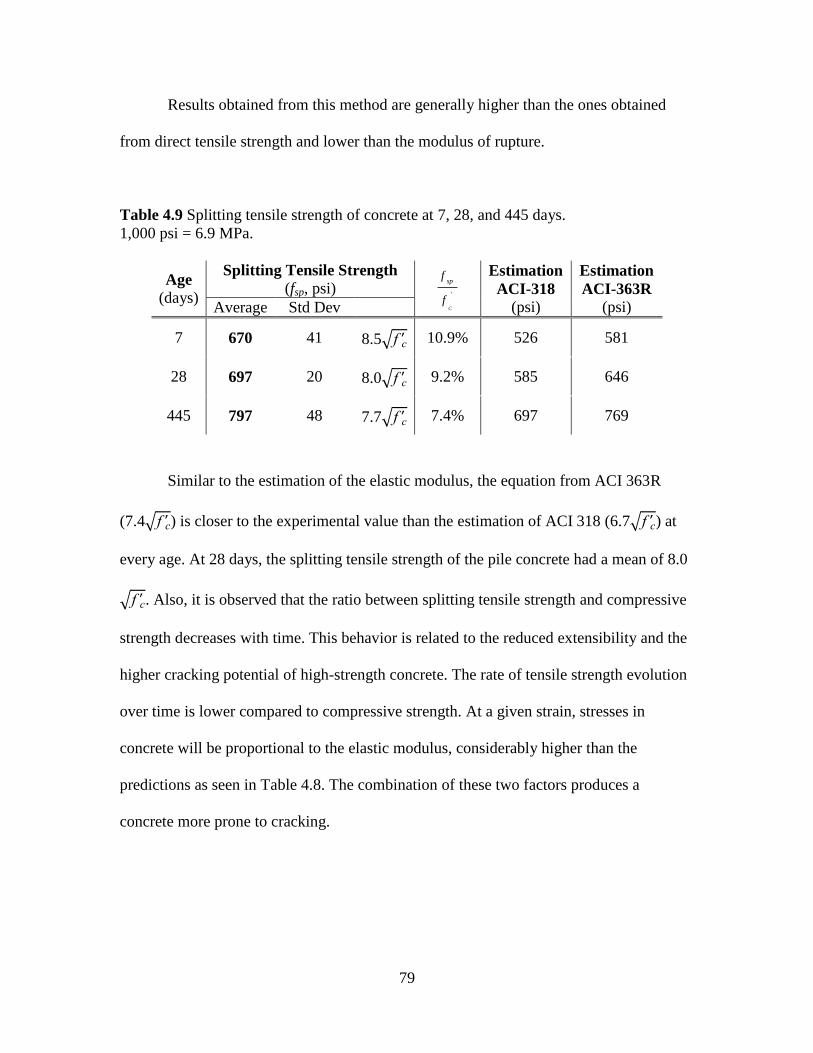
79
Results obtained from this method are generally higher than the ones obtained
from direct tensile strength and lower than the modulus of rupture.
Table 4.9 Splitting tensile strength of concrete at 7, 28, and 445 days.
1,000 psi = 6.9 MPa.
Age
(days)
Splitting Tensile Strength
(fsp, psi) '
C
f
fsp
Estimation
ACI-318
(psi)
Estimation
ACI-363R
(psi) Average Std Dev
7 670 41 8.5√f'c 10.9% 526 581
28 697 20 8.0√f'c 9.2% 585 646
445 797 48 7.7√f'c 7.4% 697 769
Similar to the estimation of the elastic modulus, the equation from ACI 363R
(7.4√f'c) is closer to the experimental value than the estimation of ACI 318 (6.7√f'c) at
every age. At 28 days, the splitting tensile strength of the pile concrete had a mean of 8.0
√f'c. Also, it is observed that the ratio between splitting tensile strength and compressive
strength decreases with time. This behavior is related to the reduced extensibility and the
higher cracking potential of high-strength concrete. The rate of tensile strength evolution
over time is lower compared to compressive strength. At a given strain, stresses in
concrete will be proportional to the elastic modulus, considerably higher than the
predictions as seen in Table 4.8. The combination of these two factors produces a
concrete more prone to cracking.
80
4.2.6 Creep of concrete
Creep testing was performed according to ASTM C512, beginning at 28 days
from casting. Three 6×12-in. cylinders, cured in fogroom until testing and obtained from
different batches, were placed in the creep loading frame, while two additional cylinders
were kept in the same temperature and humidity controlled room during the duration of
the tests to evaluate drying shrinkage. The cylinder ends were ground smooth with a
water grinder (Figure 4.6).
Figure 4.6 Cylinder end grinding machine.
DEMEC points were epoxied to the cylinders for creep and shrinkage evaluation
at two opposite sides of the cylinders. The measurements were made by the same person,
using the same DEMEC gauge equipment to minimize the variability of the test. The test
6×12-in. cylinder
Cutting head (diamond wheel)
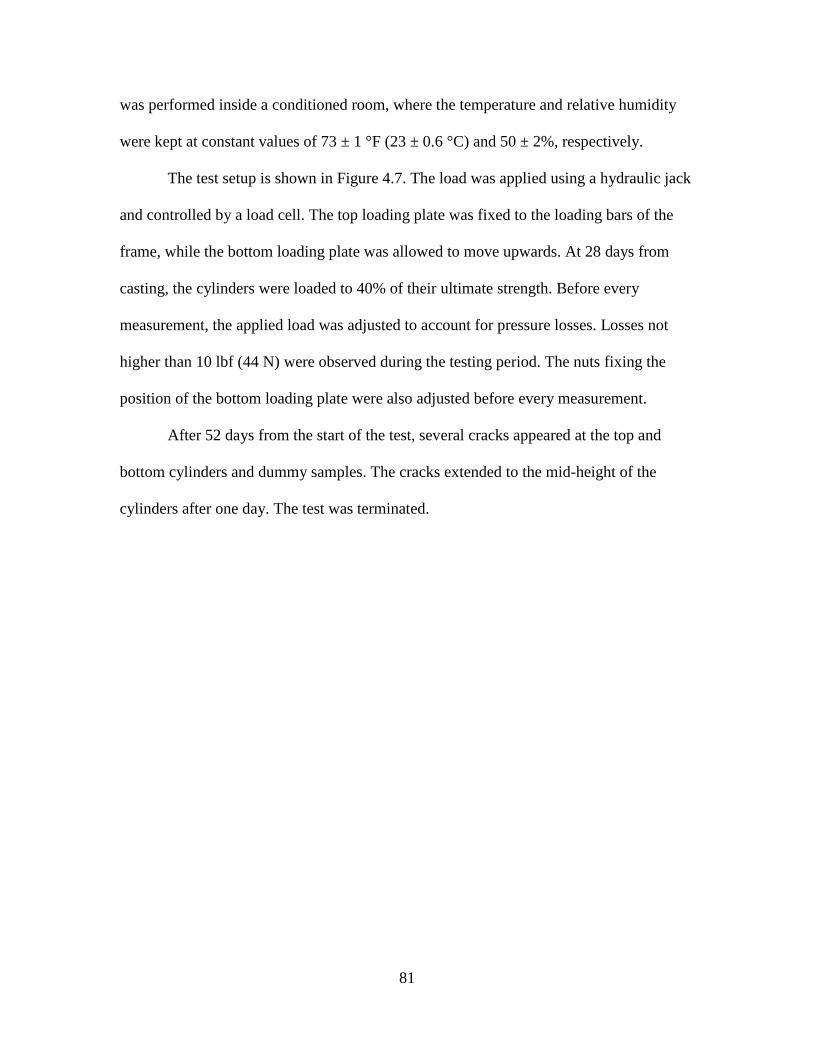
81
was performed inside a conditioned room, where the temperature and relative humidity
were kept at constant values of 73 ± 1 °F (23 ± 0.6 °C) and 50 ± 2%, respectively.
The test setup is shown in Figure 4.7. The load was applied using a hydraulic jack
and controlled by a load cell. The top loading plate was fixed to the loading bars of the
frame, while the bottom loading plate was allowed to move upwards. At 28 days from
casting, the cylinders were loaded to 40% of their ultimate strength. Before every
measurement, the applied load was adjusted to account for pressure losses. Losses not
higher than 10 lbf (44 N) were observed during the testing period. The nuts fixing the
position of the bottom loading plate were also adjusted before every measurement.
After 52 days from the start of the test, several cracks appeared at the top and
bottom cylinders and dummy samples. The cracks extended to the mid-height of the
cylinders after one day. The test was terminated.
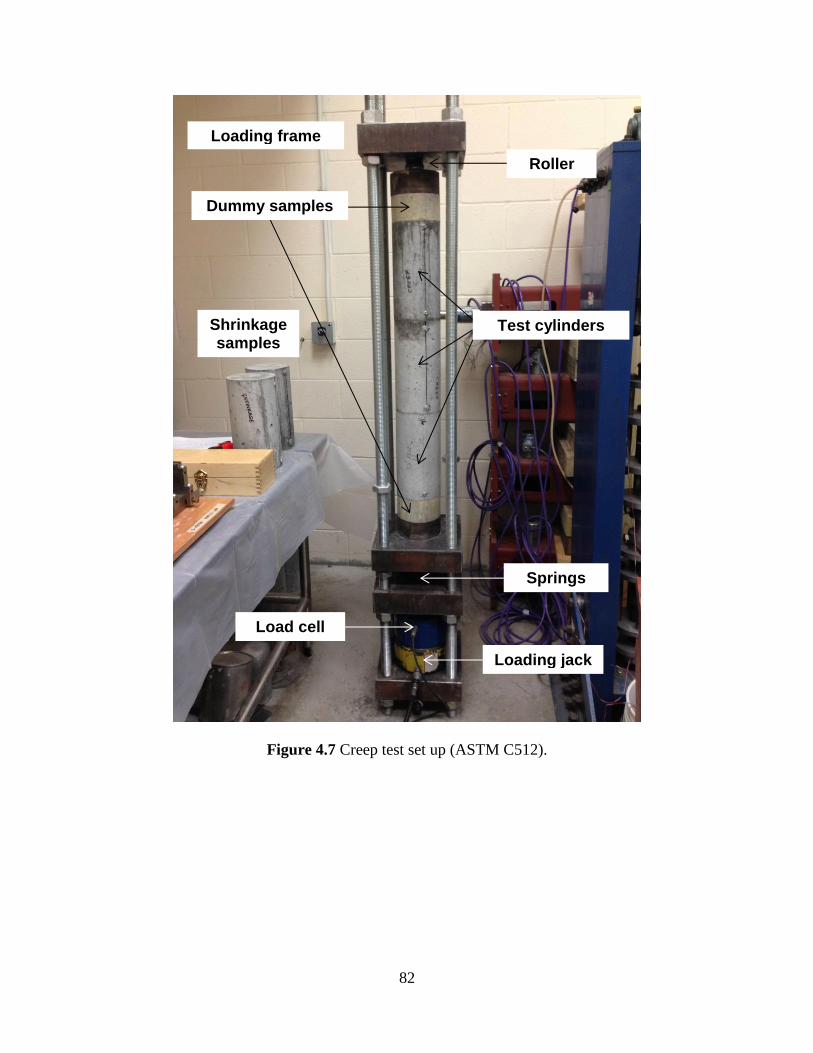
82
Figure 4.7 Creep test set up (ASTM C512).
Dummy samples
Loading frame
Load cell
Loading jack
Roller
Test cylinders Shrinkage samples
Springs
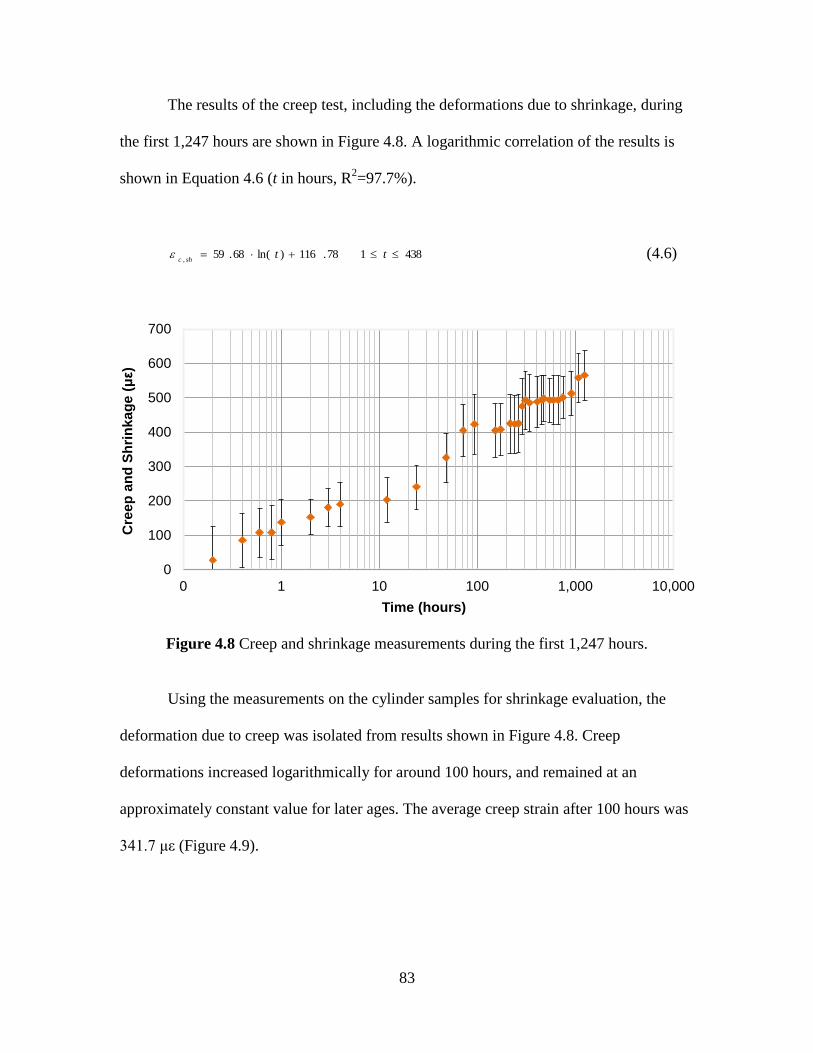
83
The results of the creep test, including the deformations due to shrinkage, during
the first 1,247 hours are shown in Figure 4.8. A logarithmic correlation of the results is
shown in Equation 4.6 (t in hours, R2=97.7%).
4381 78.116)ln(68.59,
ttshc
(4.6)
Figure 4.8 Creep and shrinkage measurements during the first 1,247 hours.
Using the measurements on the cylinder samples for shrinkage evaluation, the
deformation due to creep was isolated from results shown in Figure 4.8. Creep
deformations increased logarithmically for around 100 hours, and remained at an
approximately constant value for later ages. The average creep strain after 100 hours was
341.7 με (Figure 4.9).
0
100
200
300
400
500
600
700
0 1 10 100 1,000 10,000
Cre
ep
an
d S
hri
nkag
e (με)
Time (hours)
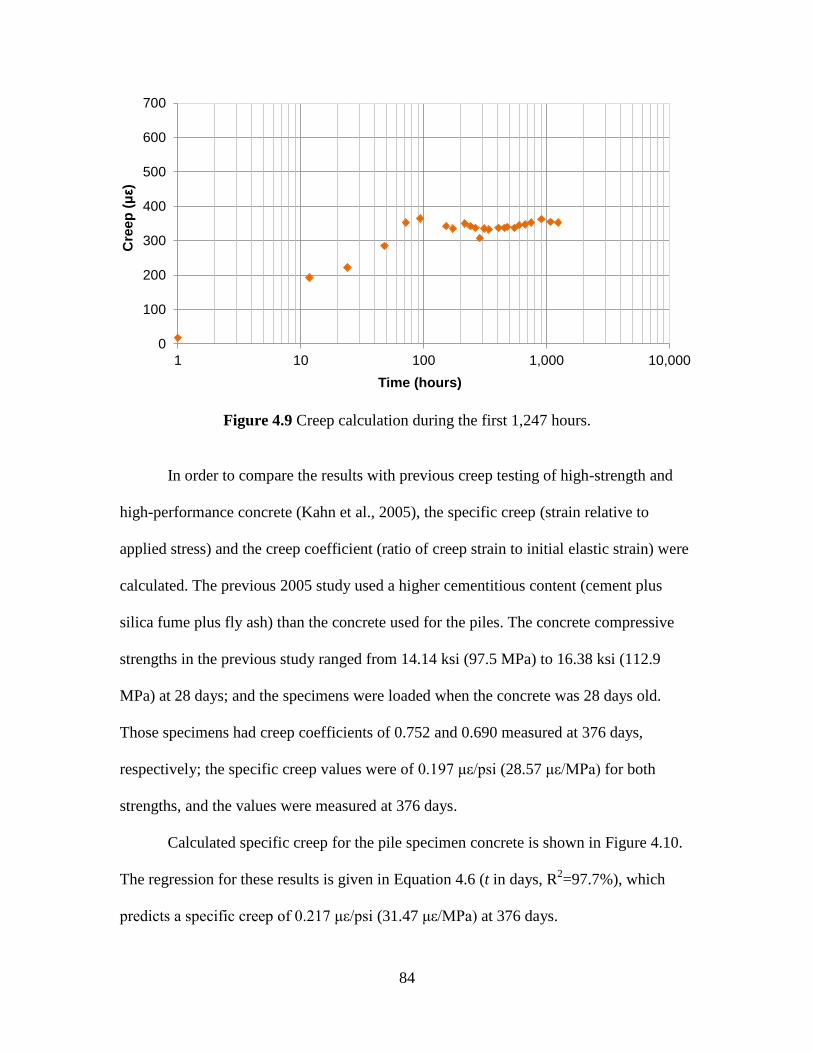
84
Figure 4.9 Creep calculation during the first 1,247 hours.
In order to compare the results with previous creep testing of high-strength and
high-performance concrete (Kahn et al., 2005), the specific creep (strain relative to
applied stress) and the creep coefficient (ratio of creep strain to initial elastic strain) were
calculated. The previous 2005 study used a higher cementitious content (cement plus
silica fume plus fly ash) than the concrete used for the piles. The concrete compressive
strengths in the previous study ranged from 14.14 ksi (97.5 MPa) to 16.38 ksi (112.9
MPa) at 28 days; and the specimens were loaded when the concrete was 28 days old.
Those specimens had creep coefficients of 0.752 and 0.690 measured at 376 days,
respectively; the specific creep values were of 0.197 με/psi (28.57 με/MPa) for both
strengths, and the values were measured at 376 days.
Calculated specific creep for the pile specimen concrete is shown in Figure 4.10.
The regression for these results is given in Equation 4.6 (t in days, R2=97.7%), which
predicts a specific creep of 0.217 με/psi (31.47 με/MPa) at 376 days.
0
100
200
300
400
500
600
700
1 10 100 1,000 10,000
Cre
ep
(με)
Time (hours)
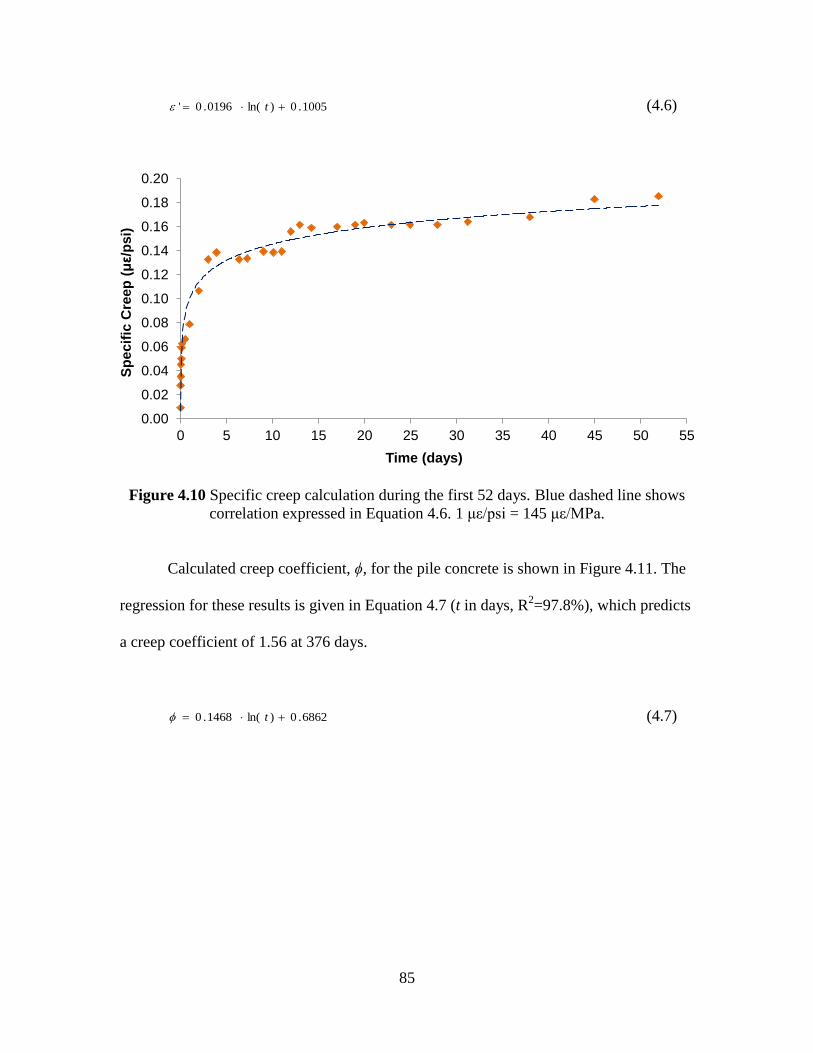
85
1005.0)ln(0196.0' t (4.6)
Figure 4.10 Specific creep calculation during the first 52 days. Blue dashed line shows
correlation expressed in Equation 4.6. 1 με/psi = 145 με/MPa.
Calculated creep coefficient, ϕ, for the pile concrete is shown in Figure 4.11. The
regression for these results is given in Equation 4.7 (t in days, R2=97.8%), which predicts
a creep coefficient of 1.56 at 376 days.
6862.0)ln(1468.0 t (4.7)
0.00
0.02
0.04
0.06
0.08
0.10
0.12
0.14
0.16
0.18
0.20
0 5 10 15 20 25 30 35 40 45 50 55
Sp
ecif
ic C
reep
(με/p
si)
Time (days)
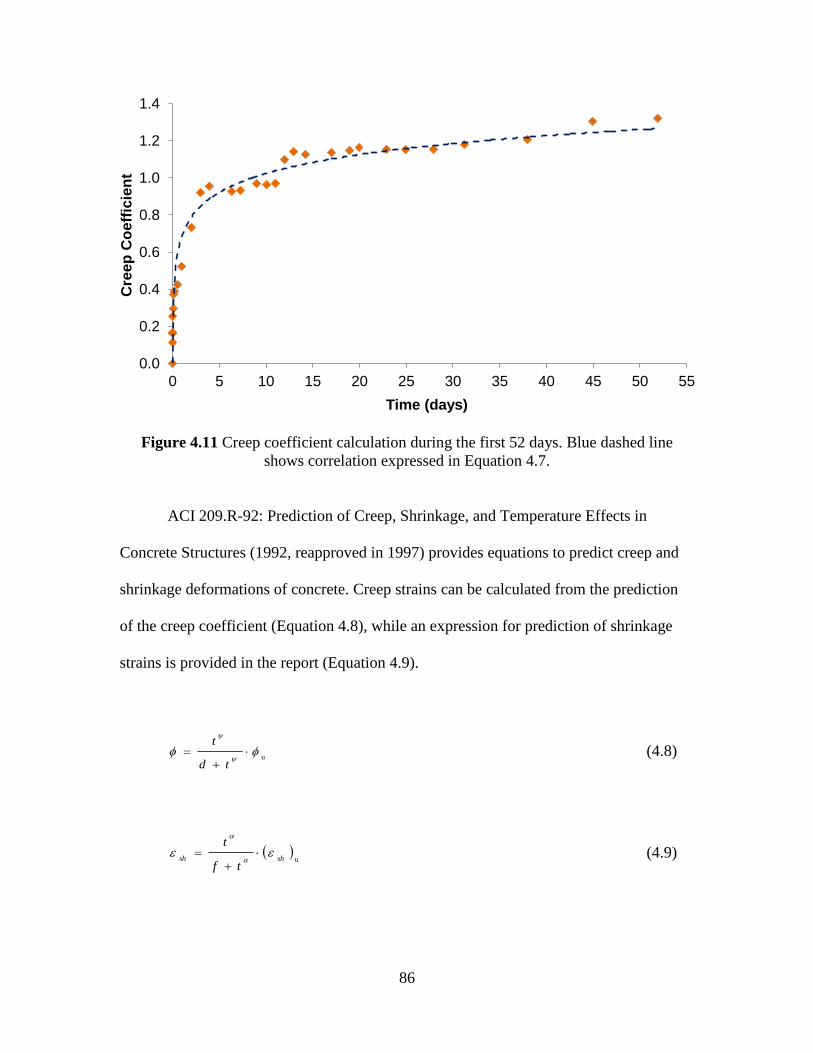
86
Figure 4.11 Creep coefficient calculation during the first 52 days. Blue dashed line
shows correlation expressed in Equation 4.7.
ACI 209.R-92: Prediction of Creep, Shrinkage, and Temperature Effects in
Concrete Structures (1992, reapproved in 1997) provides equations to predict creep and
shrinkage deformations of concrete. Creep strains can be calculated from the prediction
of the creep coefficient (Equation 4.8), while an expression for prediction of shrinkage
strains is provided in the report (Equation 4.9).
u
td
t (4.8)
ushsh
tf
t
(4.9)
0.0
0.2
0.4
0.6
0.8
1.0
1.2
1.4
0 5 10 15 20 25 30 35 40 45 50 55
Cre
ep
Co
eff
icie
nt
Time (days)
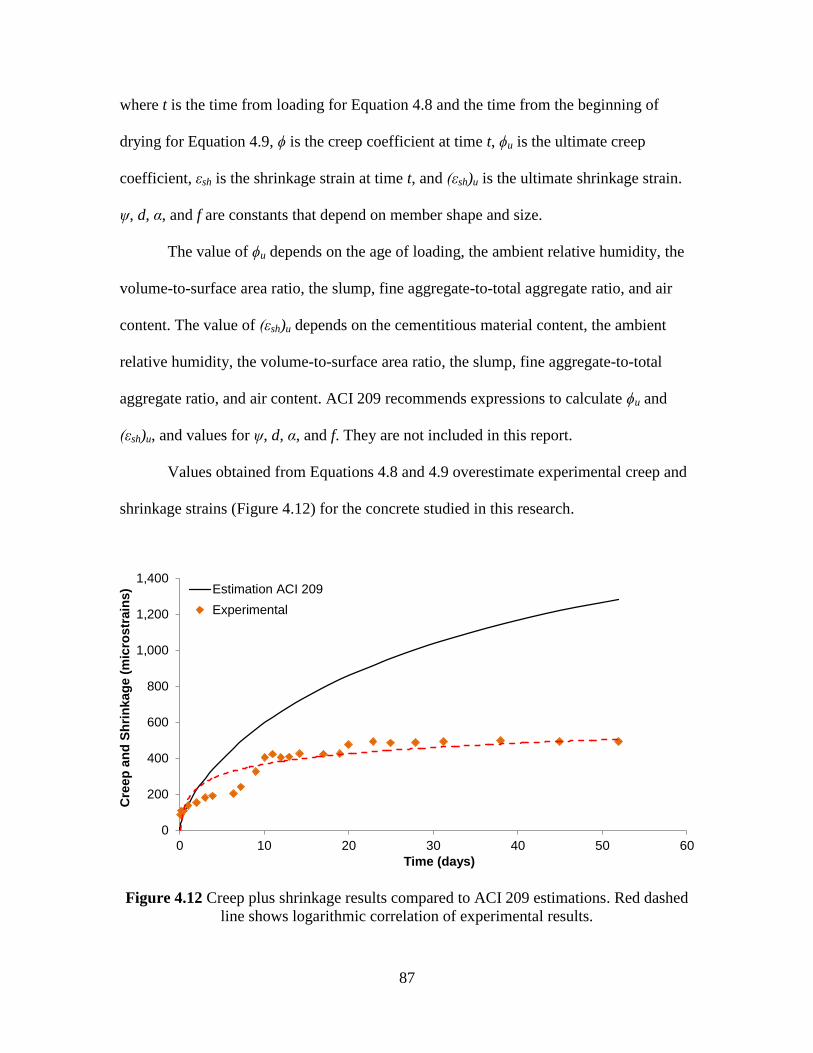
87
where t is the time from loading for Equation 4.8 and the time from the beginning of
drying for Equation 4.9, ϕ is the creep coefficient at time t, ϕu is the ultimate creep
coefficient, εsh is the shrinkage strain at time t, and (εsh)u is the ultimate shrinkage strain.
ψ, d, α, and f are constants that depend on member shape and size.
The value of ϕu depends on the age of loading, the ambient relative humidity, the
volume-to-surface area ratio, the slump, fine aggregate-to-total aggregate ratio, and air
content. The value of (εsh)u depends on the cementitious material content, the ambient
relative humidity, the volume-to-surface area ratio, the slump, fine aggregate-to-total
aggregate ratio, and air content. ACI 209 recommends expressions to calculate ϕu and
(εsh)u, and values for ψ, d, α, and f. They are not included in this report.
Values obtained from Equations 4.8 and 4.9 overestimate experimental creep and
shrinkage strains (Figure 4.12) for the concrete studied in this research.
Figure 4.12 Creep plus shrinkage results compared to ACI 209 estimations. Red dashed
line shows logarithmic correlation of experimental results.
0
200
400
600
800
1,000
1,200
1,400
0 10 20 30 40 50 60
Cre
ep
an
d S
hri
nka
ge (
mic
rostr
ain
s)
Time (days)
Estimation ACI 209
Experimental
88
Overall, the long-term creep response of the high-performance concrete used for
the piles is much less than predicted using standard models and it is similar to the
behavior of very high-performance concrete used for long-span bridge girders in Georgia.
Such lower creep deformations are expected to lead to reduced prestress losses in marine
piles.
4.2.7 Rapid chloride permeability test (RCPT)
To evaluate the permeability to chloride ions of concrete, the standard ASTM
C1202 test was performed on 2-in. (5.1 cm) long sections of 4×8-in. (10.2×20.3 cm)
cylinders at 56 days. Three cylinders cured in fogroom were sawed to obtain the testing
specimens. An average charge of 2,850 C (standard deviation of 156 C) passed during the
test period of 6 hours. According to the standard, the chloride penetrability of this
concrete can be categorized as “moderate.”
Special Provision for GDOT Standard Specification 500 specifies a maximum
chloride permeability at 56 days of 2,000 C for HPC, but Holland et al. (2012) proposed a
maximum charge of 1,000 C passed during the test for a concrete to be considered a high-
performance mixture for prestressed concrete piles exposed to marine environments. The
two recommended ternary concrete mixtures given by Holland et al. (2012) for marine
piles showed a total charge passed of 354 and 273 C, at 56 days.
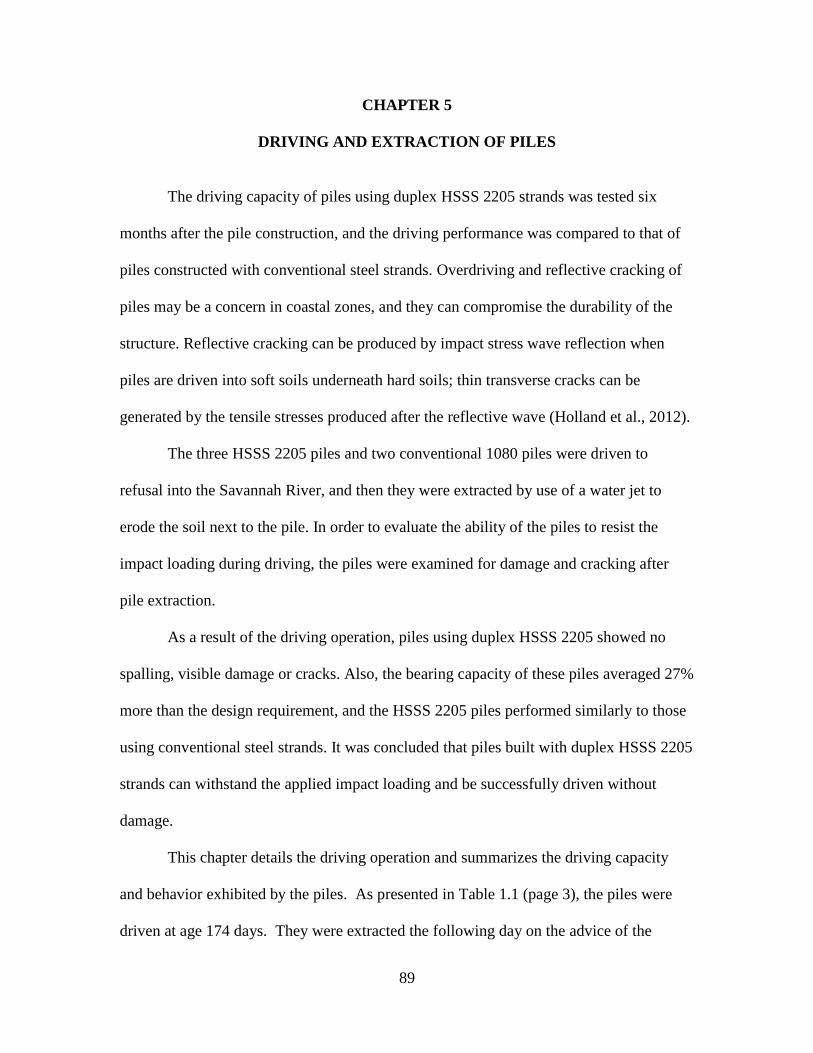
89
CHAPTER 5
DRIVING AND EXTRACTION OF PILES
The driving capacity of piles using duplex HSSS 2205 strands was tested six
months after the pile construction, and the driving performance was compared to that of
piles constructed with conventional steel strands. Overdriving and reflective cracking of
piles may be a concern in coastal zones, and they can compromise the durability of the
structure. Reflective cracking can be produced by impact stress wave reflection when
piles are driven into soft soils underneath hard soils; thin transverse cracks can be
generated by the tensile stresses produced after the reflective wave (Holland et al., 2012).
The three HSSS 2205 piles and two conventional 1080 piles were driven to
refusal into the Savannah River, and then they were extracted by use of a water jet to
erode the soil next to the pile. In order to evaluate the ability of the piles to resist the
impact loading during driving, the piles were examined for damage and cracking after
pile extraction.
As a result of the driving operation, piles using duplex HSSS 2205 showed no
spalling, visible damage or cracks. Also, the bearing capacity of these piles averaged 27%
more than the design requirement, and the HSSS 2205 piles performed similarly to those
using conventional steel strands. It was concluded that piles built with duplex HSSS 2205
strands can withstand the applied impact loading and be successfully driven without
damage.
This chapter details the driving operation and summarizes the driving capacity
and behavior exhibited by the piles. As presented in Table 1.1 (page 3), the piles were
driven at age 174 days. They were extracted the following day on the advice of the
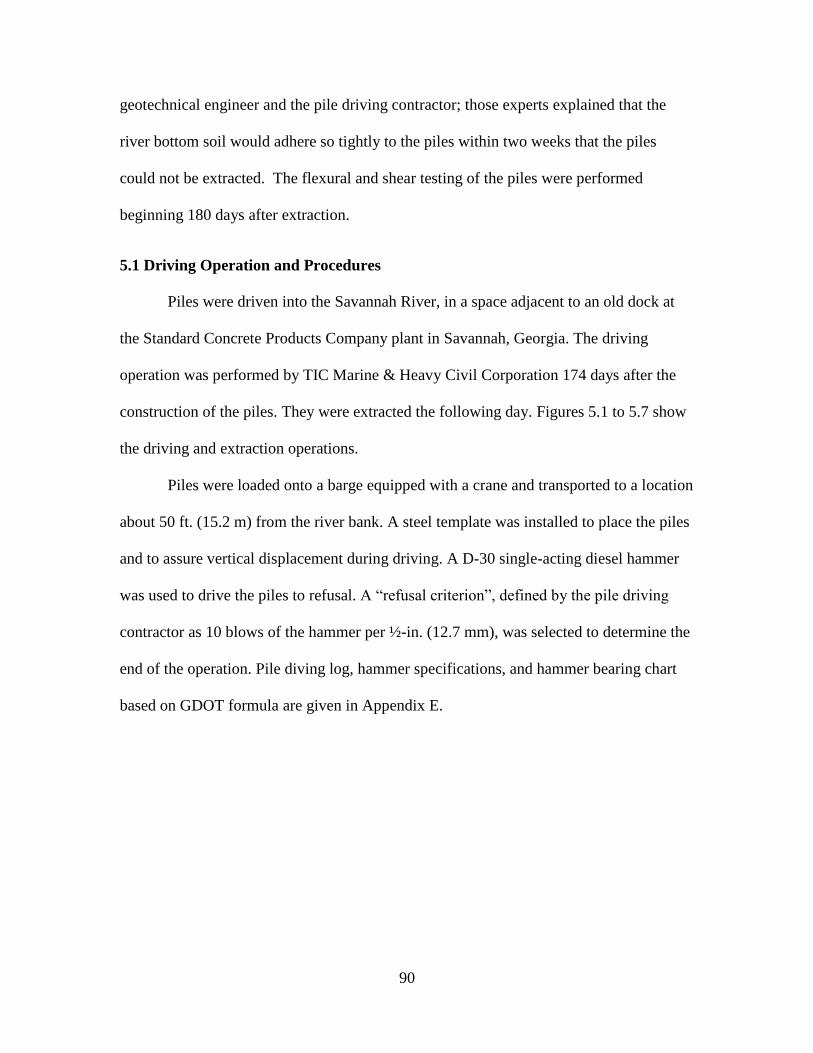
90
geotechnical engineer and the pile driving contractor; those experts explained that the
river bottom soil would adhere so tightly to the piles within two weeks that the piles
could not be extracted. The flexural and shear testing of the piles were performed
beginning 180 days after extraction.
5.1 Driving Operation and Procedures
Piles were driven into the Savannah River, in a space adjacent to an old dock at
the Standard Concrete Products Company plant in Savannah, Georgia. The driving
operation was performed by TIC Marine & Heavy Civil Corporation 174 days after the
construction of the piles. They were extracted the following day. Figures 5.1 to 5.7 show
the driving and extraction operations.
Piles were loaded onto a barge equipped with a crane and transported to a location
about 50 ft. (15.2 m) from the river bank. A steel template was installed to place the piles
and to assure vertical displacement during driving. A D-30 single-acting diesel hammer
was used to drive the piles to refusal. A “refusal criterion”, defined by the pile driving
contractor as 10 blows of the hammer per ½-in. (12.7 mm), was selected to determine the
end of the operation. Pile diving log, hammer specifications, and hammer bearing chart
based on GDOT formula are given in Appendix E.
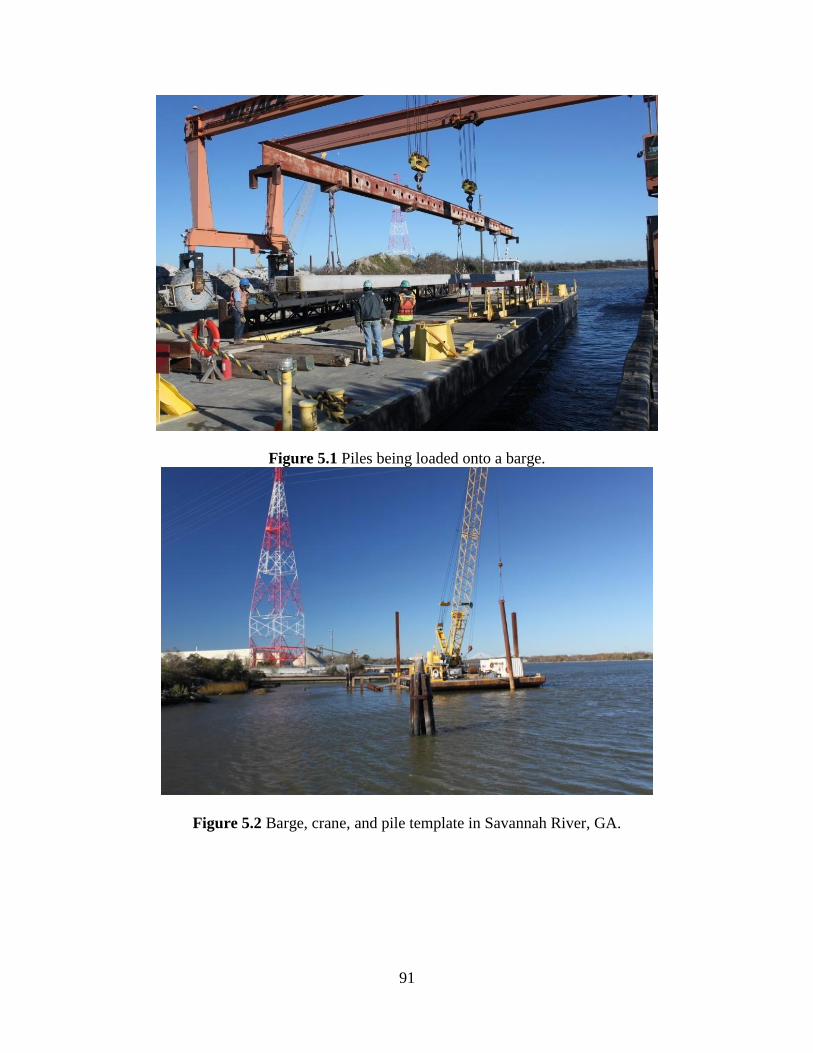
91
Figure 5.1 Piles being loaded onto a barge.
Figure 5.2 Barge, crane, and pile template in Savannah River, GA.
92
Figure 5.3 Lifting of pile HSSS #2 off the barge (left), and placing of pile HSSS #2 into
the template (right).
Figure 5.4 Driving of pile HSSS #2 (left), and blow counting of pile HSSS #2 (right).
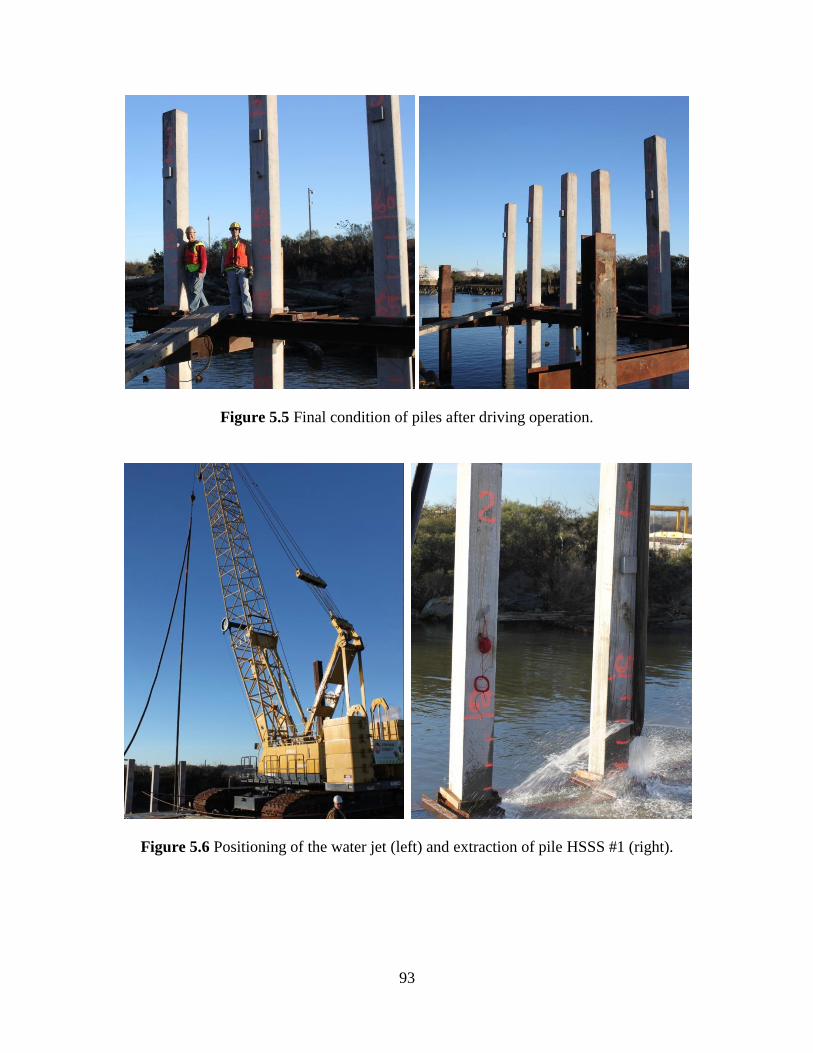
93
Figure 5.5 Final condition of piles after driving operation.
Figure 5.6 Positioning of the water jet (left) and extraction of pile HSSS #1 (right).
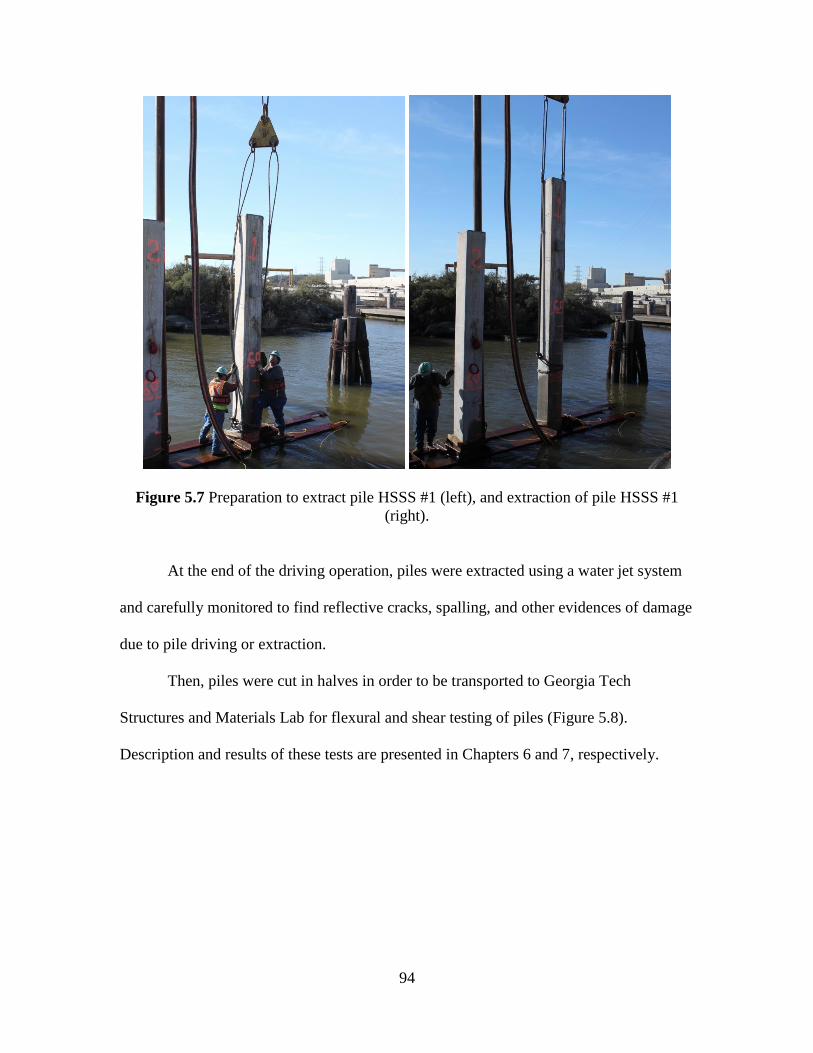
94
Figure 5.7 Preparation to extract pile HSSS #1 (left), and extraction of pile HSSS #1
(right).
At the end of the driving operation, piles were extracted using a water jet system
and carefully monitored to find reflective cracks, spalling, and other evidences of damage
due to pile driving or extraction.
Then, piles were cut in halves in order to be transported to Georgia Tech
Structures and Materials Lab for flexural and shear testing of piles (Figure 5.8).
Description and results of these tests are presented in Chapters 6 and 7, respectively.
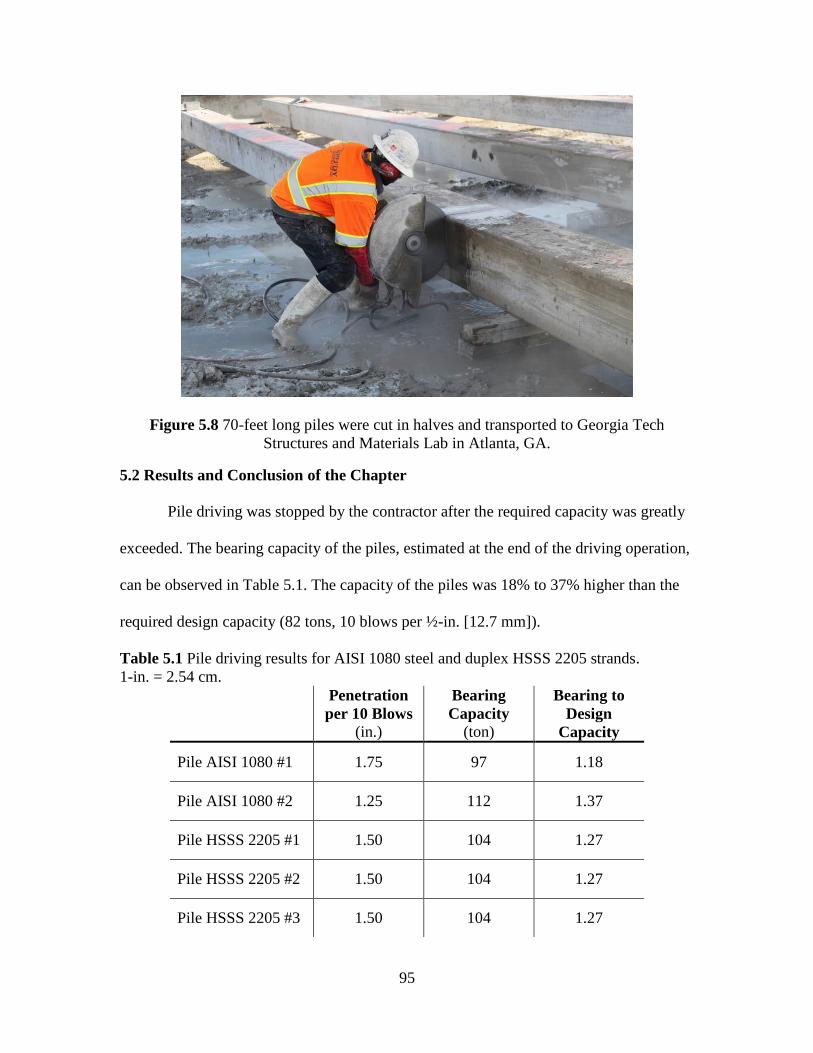
95
Figure 5.8 70-feet long piles were cut in halves and transported to Georgia Tech
Structures and Materials Lab in Atlanta, GA.
5.2 Results and Conclusion of the Chapter
Pile driving was stopped by the contractor after the required capacity was greatly
exceeded. The bearing capacity of the piles, estimated at the end of the driving operation,
can be observed in Table 5.1. The capacity of the piles was 18% to 37% higher than the
required design capacity (82 tons, 10 blows per ½-in. [12.7 mm]).
Table 5.1 Pile driving results for AISI 1080 steel and duplex HSSS 2205 strands.
1-in. = 2.54 cm.
Penetration
per 10 Blows
(in.)
Bearing
Capacity
(ton)
Bearing to
Design
Capacity
Pile AISI 1080 #1 1.75 97 1.18
Pile AISI 1080 #2 1.25 112 1.37
Pile HSSS 2205 #1 1.50 104 1.27
Pile HSSS 2205 #2 1.50 104 1.27
Pile HSSS 2205 #3 1.50 104 1.27
96
Additionally, no damage, spalling or visible cracking was observed after driving
in piles using duplex HSSS 2205 strands, while one of the piles including conventional
steel exhibited a small hairline crack.
It can be concluded that piles using duplex HSSS 2205 strands can be
successfully driven to refusal without visible damage.
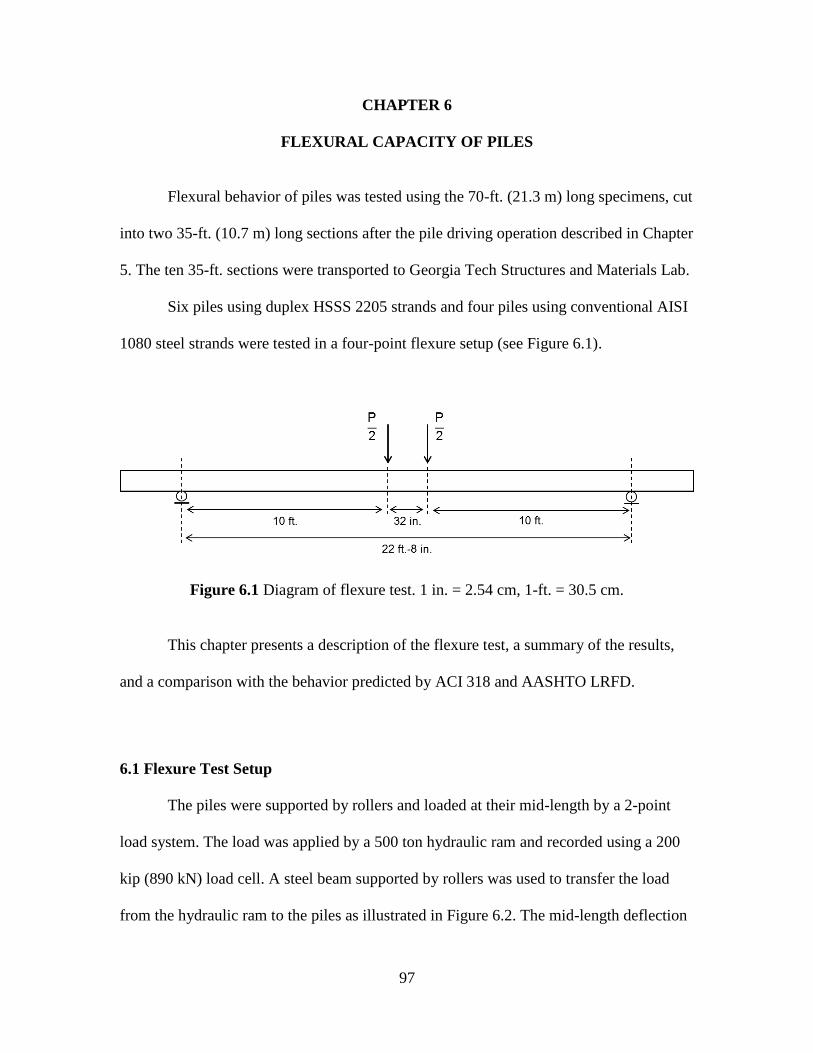
97
CHAPTER 6
FLEXURAL CAPACITY OF PILES
Flexural behavior of piles was tested using the 70-ft. (21.3 m) long specimens, cut
into two 35-ft. (10.7 m) long sections after the pile driving operation described in Chapter
5. The ten 35-ft. sections were transported to Georgia Tech Structures and Materials Lab.
Six piles using duplex HSSS 2205 strands and four piles using conventional AISI
1080 steel strands were tested in a four-point flexure setup (see Figure 6.1).
Figure 6.1 Diagram of flexure test. 1 in. = 2.54 cm, 1-ft. = 30.5 cm.
This chapter presents a description of the flexure test, a summary of the results,
and a comparison with the behavior predicted by ACI 318 and AASHTO LRFD.
6.1 Flexure Test Setup
The piles were supported by rollers and loaded at their mid-length by a 2-point
load system. The load was applied by a 500 ton hydraulic ram and recorded using a 200
kip (890 kN) load cell. A steel beam supported by rollers was used to transfer the load
from the hydraulic ram to the piles as illustrated in Figure 6.2. The mid-length deflection
98
of the piles was measured using a string potentiometer. Three digital gauge dials were
attached to one side of the piles, in order to estimate the strains in the prestressing strands
at pile failure. Two dials were attached to the pile at 1-in. (2.54 cm) from the top and
from the bottom, while a third was installed at the mid-height of the pile. Initially, a
gauge length of 13-in. (33.0 cm) was used for the first four tests (pile 1080-1 Bottom, pile
HSSS-1 Bottom and Top, and pile HSSS-3 Bottom); the gauge length was increased to
18-in. (45.7 cm) for the rest of the tests in order to cover the more extensive flexural
cracking region. Strains were similar for both gauge lengths. The load was applied
monotonically and was paused to mark crack patterns.
While the load-deflection data were recorded even after crushing of the concrete,
the dial gauges were removed before the ultimate load to avoid damage. As a
consequence, load-deflection curves show the behavior of the piles along the whole
duration of the test, but some moment-curvature results calculated from strain and load
measurements do not represent the complete behavior of the piles before failure. In these
cases, the ultimate point was estimated from the load-deflection data, using a moment-
area technique. The application of the moment-area method for the calculation of the
ultimate curvatures is given and calculated ultimate curvatures are shown in Appendix F.
Average concrete compressive strength of individual piles (see Chapter 4) and the
actual position of the strands (Appendix A) were used in the calculation of the flexural
nominal strength. Also, a Todeschini stress block was assumed for the estimation of
concrete compressive stresses (Wight and MacGregor, 2011) for ACI 318 method and a
rectangular stress block was assumed for AASHTO calculations. ACI 318 and AASHTO
calculations are given in Appendix G.
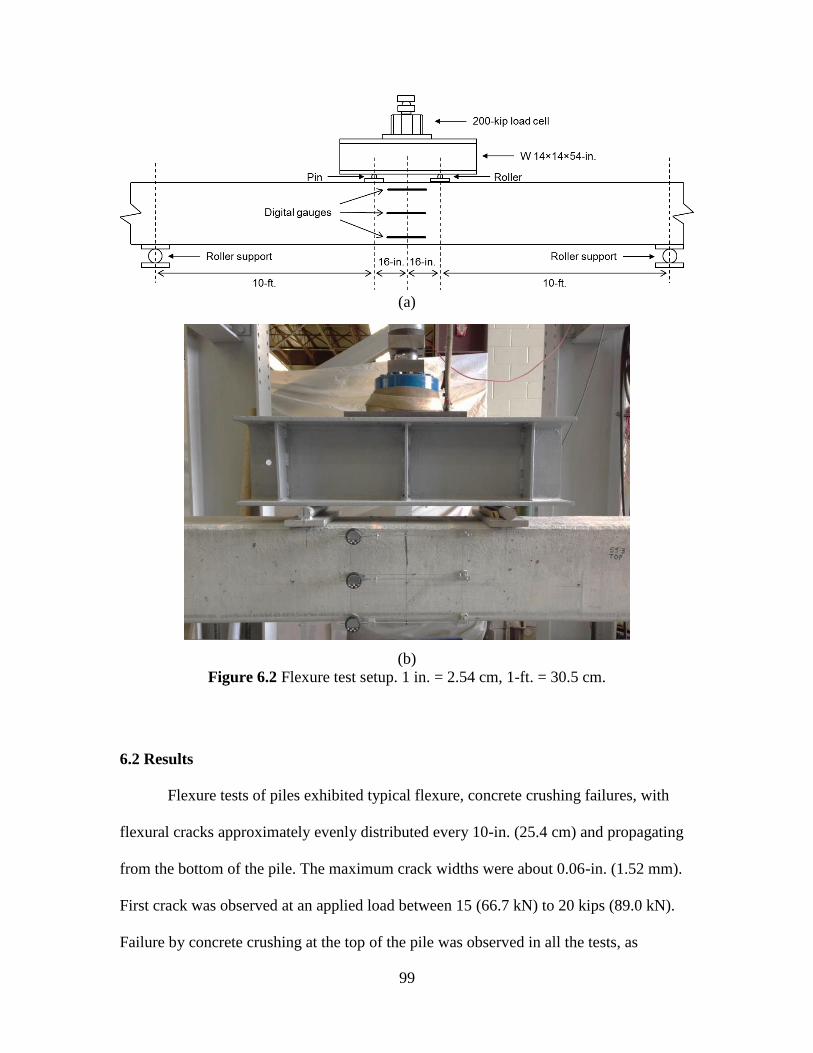
99
(a)
(b)
Figure 6.2 Flexure test setup. 1 in. = 2.54 cm, 1-ft. = 30.5 cm.
6.2 Results
Flexure tests of piles exhibited typical flexure, concrete crushing failures, with
flexural cracks approximately evenly distributed every 10-in. (25.4 cm) and propagating
from the bottom of the pile. The maximum crack widths were about 0.06-in. (1.52 mm).
First crack was observed at an applied load between 15 (66.7 kN) to 20 kips (89.0 kN).
Failure by concrete crushing at the top of the pile was observed in all the tests, as
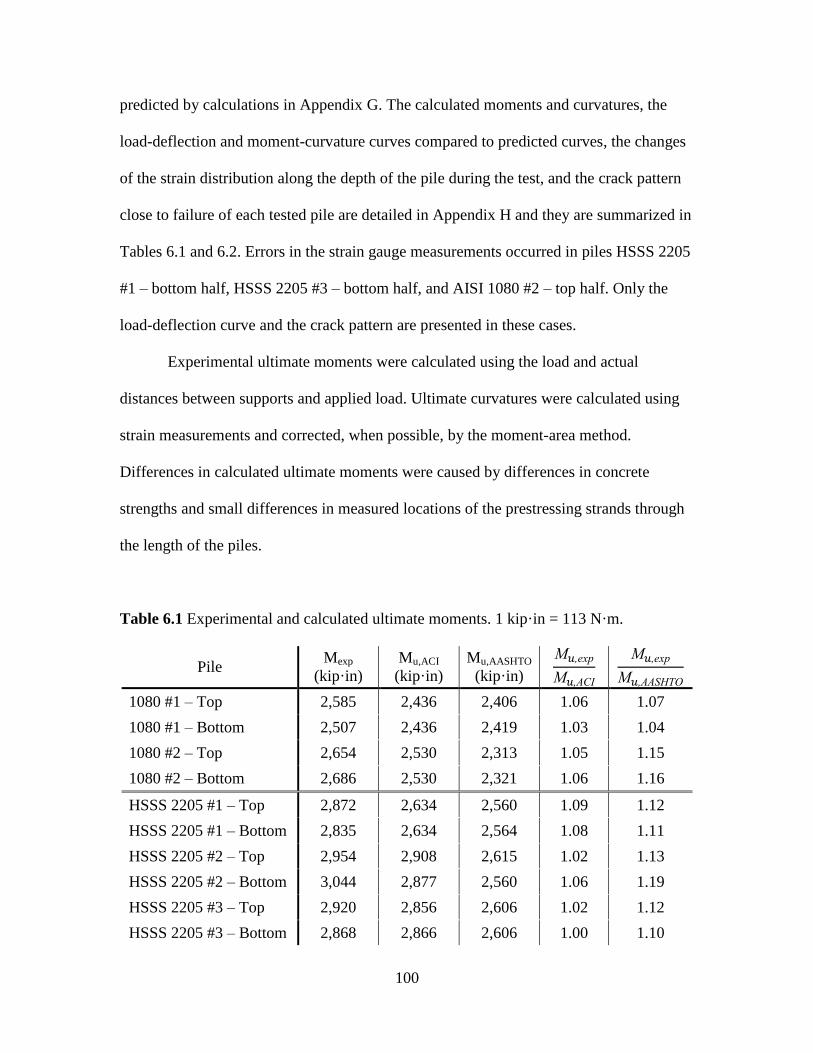
100
predicted by calculations in Appendix G. The calculated moments and curvatures, the
load-deflection and moment-curvature curves compared to predicted curves, the changes
of the strain distribution along the depth of the pile during the test, and the crack pattern
close to failure of each tested pile are detailed in Appendix H and they are summarized in
Tables 6.1 and 6.2. Errors in the strain gauge measurements occurred in piles HSSS 2205
#1 – bottom half, HSSS 2205 #3 – bottom half, and AISI 1080 #2 – top half. Only the
load-deflection curve and the crack pattern are presented in these cases.
Experimental ultimate moments were calculated using the load and actual
distances between supports and applied load. Ultimate curvatures were calculated using
strain measurements and corrected, when possible, by the moment-area method.
Differences in calculated ultimate moments were caused by differences in concrete
strengths and small differences in measured locations of the prestressing strands through
the length of the piles.
Table 6.1 Experimental and calculated ultimate moments. 1 kip·in = 113 N·m.
Pile Mexp
(kip·in)
Mu,ACI
(kip·in)
Mu,AASHTO
(kip·in)
M𝑢,exp
M𝑢,ACI
M𝑢,exp
M𝑢,AASHTO
1080 #1 – Top 2,585 2,436 2,406 1.06 1.07
1080 #1 – Bottom 2,507 2,436 2,419 1.03 1.04
1080 #2 – Top 2,654 2,530 2,313 1.05 1.15
1080 #2 – Bottom 2,686 2,530 2,321 1.06 1.16
HSSS 2205 #1 – Top 2,872 2,634 2,560 1.09 1.12
HSSS 2205 #1 – Bottom 2,835 2,634 2,564 1.08 1.11
HSSS 2205 #2 – Top 2,954 2,908 2,615 1.02 1.13
HSSS 2205 #2 – Bottom 3,044 2,877 2,560 1.06 1.19
HSSS 2205 #3 – Top 2,920 2,856 2,606 1.02 1.12
HSSS 2205 #3 – Bottom 2,868 2,866 2,606 1.00 1.10
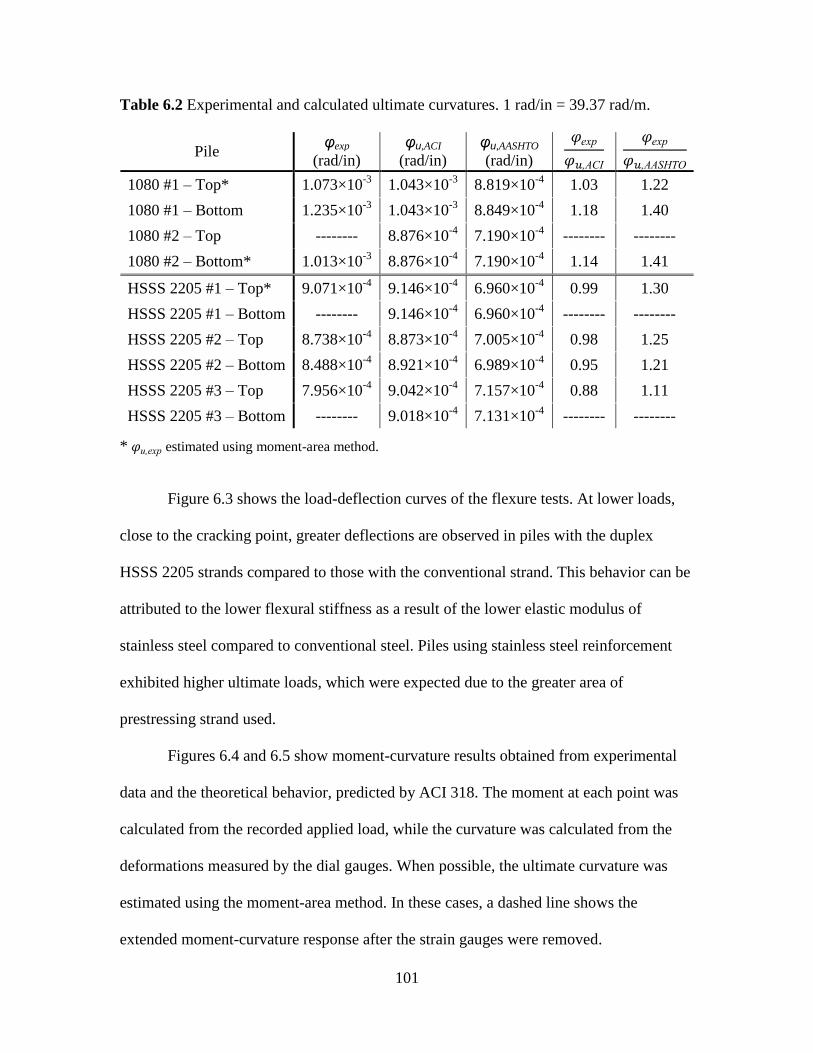
101
Table 6.2 Experimental and calculated ultimate curvatures. 1 rad/in = 39.37 rad/m.
Pile φexp
(rad/in)
φu,ACI
(rad/in)
φu,AASHTO
(rad/in)
𝜑exp
𝜑𝑢,ACI
𝜑exp
𝜑𝑢,AASHTO
1080 #1 – Top* 1.073×10⁻³
1.043×10⁻³
8.819×10⁻⁴
1.03 1.22
1080 #1 – Bottom 1.235×10⁻³
1.043×10⁻³
8.849×10⁻⁴
1.18 1.40
1080 #2 – Top -------- 8.876×10⁻⁴
7.190×10⁻⁴
-------- --------
1080 #2 – Bottom* 1.013×10⁻³
8.876×10⁻⁴
7.190×10⁻⁴
1.14 1.41
HSSS 2205 #1 – Top* 9.071×10⁻⁴
9.146×10⁻⁴
6.960×10⁻⁴
0.99 1.30
HSSS 2205 #1 – Bottom -------- 9.146×10⁻⁴
6.960×10⁻⁴
-------- --------
HSSS 2205 #2 – Top 8.738×10⁻⁴
8.873×10⁻⁴
7.005×10⁻⁴
0.98 1.25
HSSS 2205 #2 – Bottom 8.488×10⁻⁴
8.921×10⁻⁴
6.989×10⁻⁴
0.95 1.21
HSSS 2205 #3 – Top 7.956×10⁻⁴
9.042×10⁻⁴
7.157×10⁻⁴
0.88 1.11
HSSS 2205 #3 – Bottom -------- 9.018×10⁻⁴
7.131×10⁻⁴
-------- --------
* 𝜑u,exp estimated using moment-area method.
Figure 6.3 shows the load-deflection curves of the flexure tests. At lower loads,
close to the cracking point, greater deflections are observed in piles with the duplex
HSSS 2205 strands compared to those with the conventional strand. This behavior can be
attributed to the lower flexural stiffness as a result of the lower elastic modulus of
stainless steel compared to conventional steel. Piles using stainless steel reinforcement
exhibited higher ultimate loads, which were expected due to the greater area of
prestressing strand used.
Figures 6.4 and 6.5 show moment-curvature results obtained from experimental
data and the theoretical behavior, predicted by ACI 318. The moment at each point was
calculated from the recorded applied load, while the curvature was calculated from the
deformations measured by the dial gauges. When possible, the ultimate curvature was
estimated using the moment-area method. In these cases, a dashed line shows the
extended moment-curvature response after the strain gauges were removed.
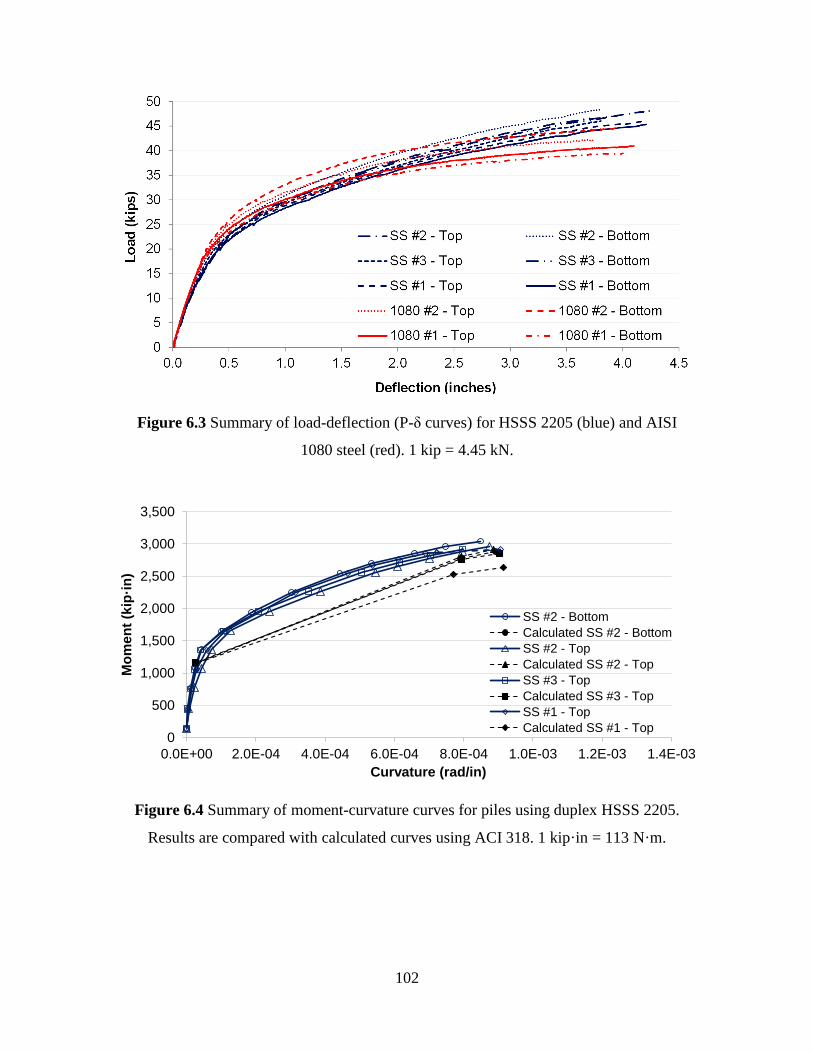
102
Figure 6.3 Summary of load-deflection (P-δ curves) for HSSS 2205 (blue) and AISI
1080 steel (red). 1 kip = 4.45 kN.
Figure 6.4 Summary of moment-curvature curves for piles using duplex HSSS 2205.
Results are compared with calculated curves using ACI 318. 1 kip·in = 113 N·m.
0
500
1,000
1,500
2,000
2,500
3,000
3,500
0.0E+00 2.0E-04 4.0E-04 6.0E-04 8.0E-04 1.0E-03 1.2E-03 1.4E-03
Mo
me
nt
(kip
·in
)
Curvature (rad/in)
SS #2 - Bottom
Calculated SS #2 - Bottom
SS #2 - Top
Calculated SS #2 - Top
SS #3 - Top
Calculated SS #3 - Top
SS #1 - Top
Calculated SS #1 - Top
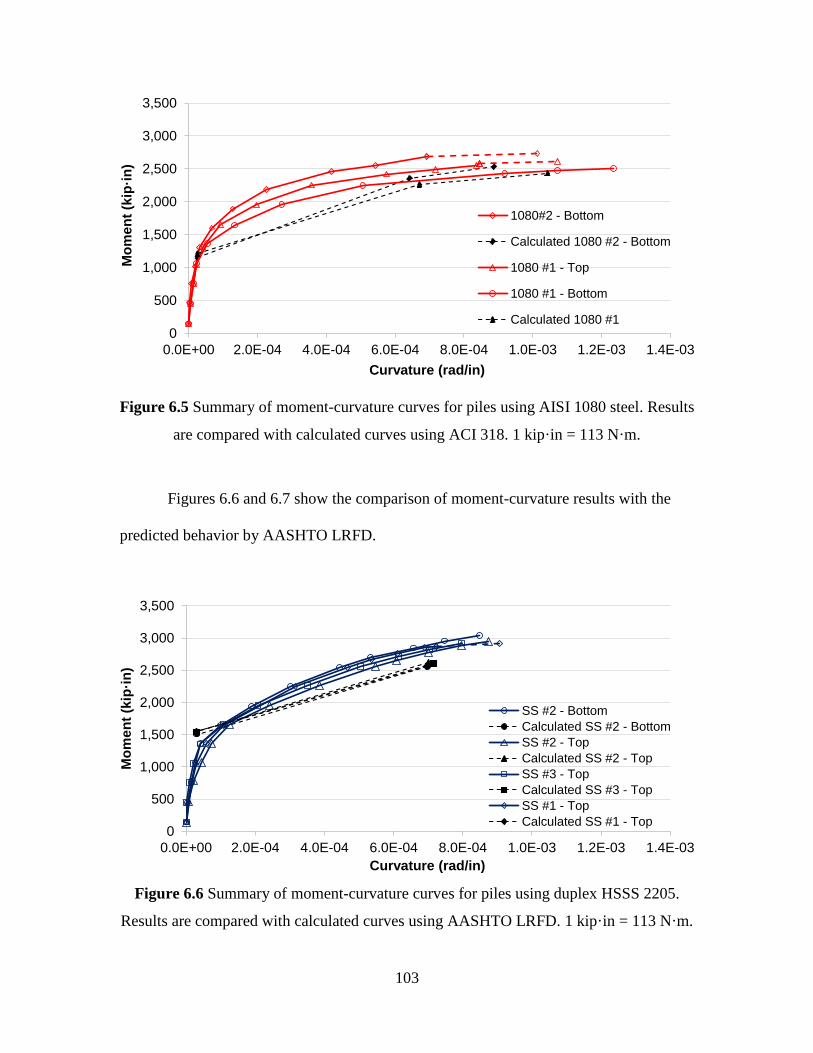
103
Figure 6.5 Summary of moment-curvature curves for piles using AISI 1080 steel. Results
are compared with calculated curves using ACI 318. 1 kip·in = 113 N·m.
Figures 6.6 and 6.7 show the comparison of moment-curvature results with the
predicted behavior by AASHTO LRFD.
Figure 6.6 Summary of moment-curvature curves for piles using duplex HSSS 2205.
Results are compared with calculated curves using AASHTO LRFD. 1 kip·in = 113 N·m.
0
500
1,000
1,500
2,000
2,500
3,000
3,500
0.0E+00 2.0E-04 4.0E-04 6.0E-04 8.0E-04 1.0E-03 1.2E-03 1.4E-03
Mo
me
nt
(kip
·in
)
Curvature (rad/in)
1080#2 - Bottom
Calculated 1080 #2 - Bottom
1080 #1 - Top
1080 #1 - Bottom
Calculated 1080 #1
0
500
1,000
1,500
2,000
2,500
3,000
3,500
0.0E+00 2.0E-04 4.0E-04 6.0E-04 8.0E-04 1.0E-03 1.2E-03 1.4E-03
Mo
me
nt
(kip
·in
)
Curvature (rad/in)
SS #2 - Bottom
Calculated SS #2 - Bottom
SS #2 - Top
Calculated SS #2 - Top
SS #3 - Top
Calculated SS #3 - Top
SS #1 - Top
Calculated SS #1 - Top
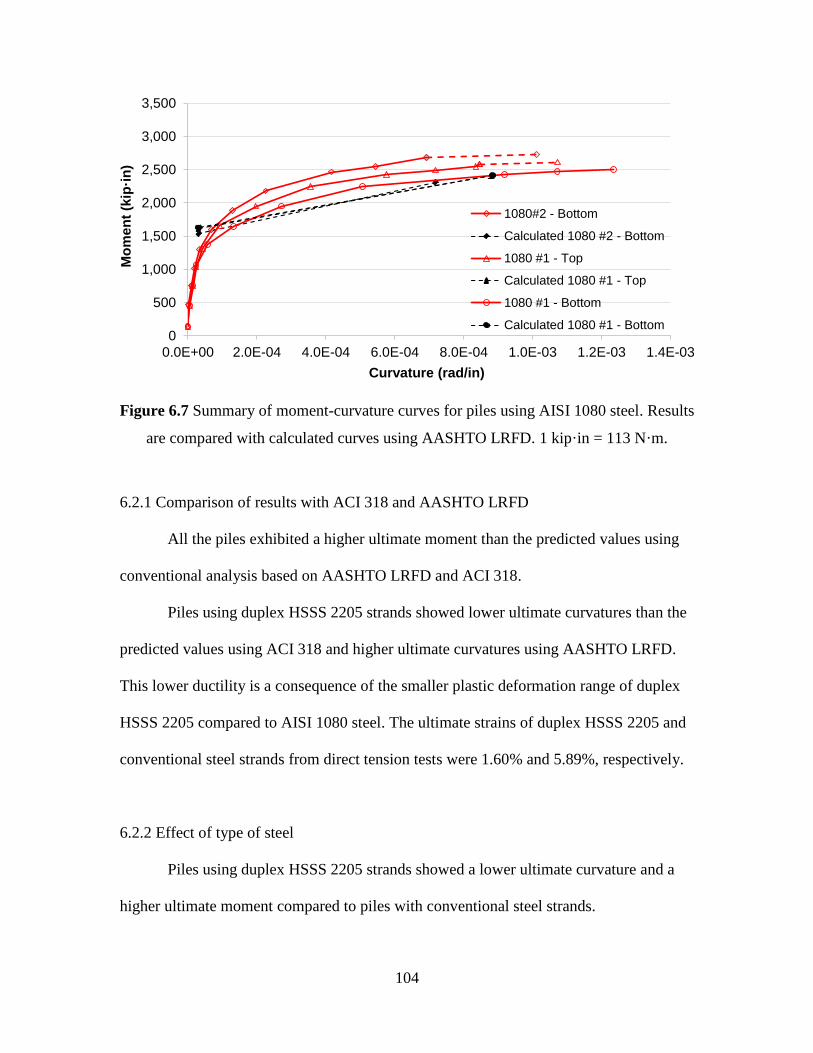
104
Figure 6.7 Summary of moment-curvature curves for piles using AISI 1080 steel. Results
are compared with calculated curves using AASHTO LRFD. 1 kip·in = 113 N·m.
6.2.1 Comparison of results with ACI 318 and AASHTO LRFD
All the piles exhibited a higher ultimate moment than the predicted values using
conventional analysis based on AASHTO LRFD and ACI 318.
Piles using duplex HSSS 2205 strands showed lower ultimate curvatures than the
predicted values using ACI 318 and higher ultimate curvatures using AASHTO LRFD.
This lower ductility is a consequence of the smaller plastic deformation range of duplex
HSSS 2205 compared to AISI 1080 steel. The ultimate strains of duplex HSSS 2205 and
conventional steel strands from direct tension tests were 1.60% and 5.89%, respectively.
6.2.2 Effect of type of steel
Piles using duplex HSSS 2205 strands showed a lower ultimate curvature and a
higher ultimate moment compared to piles with conventional steel strands.
0
500
1,000
1,500
2,000
2,500
3,000
3,500
0.0E+00 2.0E-04 4.0E-04 6.0E-04 8.0E-04 1.0E-03 1.2E-03 1.4E-03
Mo
me
nt
(kip
·in
)
Curvature (rad/in)
1080#2 - Bottom
Calculated 1080 #2 - Bottom
1080 #1 - Top
Calculated 1080 #1 - Top
1080 #1 - Bottom
Calculated 1080 #1 - Bottom
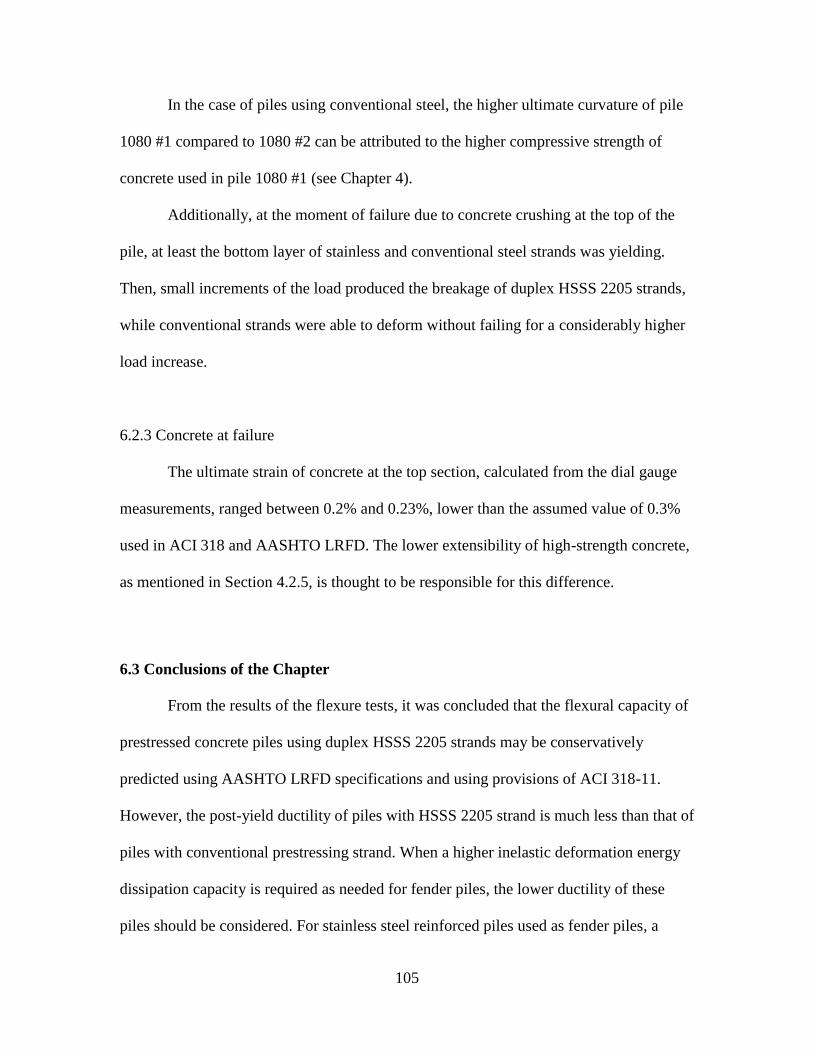
105
In the case of piles using conventional steel, the higher ultimate curvature of pile
1080 #1 compared to 1080 #2 can be attributed to the higher compressive strength of
concrete used in pile 1080 #1 (see Chapter 4).
Additionally, at the moment of failure due to concrete crushing at the top of the
pile, at least the bottom layer of stainless and conventional steel strands was yielding.
Then, small increments of the load produced the breakage of duplex HSSS 2205 strands,
while conventional strands were able to deform without failing for a considerably higher
load increase.
6.2.3 Concrete at failure
The ultimate strain of concrete at the top section, calculated from the dial gauge
measurements, ranged between 0.2% and 0.23%, lower than the assumed value of 0.3%
used in ACI 318 and AASHTO LRFD. The lower extensibility of high-strength concrete,
as mentioned in Section 4.2.5, is thought to be responsible for this difference.
6.3 Conclusions of the Chapter
From the results of the flexure tests, it was concluded that the flexural capacity of
prestressed concrete piles using duplex HSSS 2205 strands may be conservatively
predicted using AASHTO LRFD specifications and using provisions of ACI 318-11.
However, the post-yield ductility of piles with HSSS 2205 strand is much less than that of
piles with conventional prestressing strand. When a higher inelastic deformation energy
dissipation capacity is required as needed for fender piles, the lower ductility of these
piles should be considered. For stainless steel reinforced piles used as fender piles, a

106
lower strength reduction factor (ϕ) as used for compression-controlled members is
recommended.
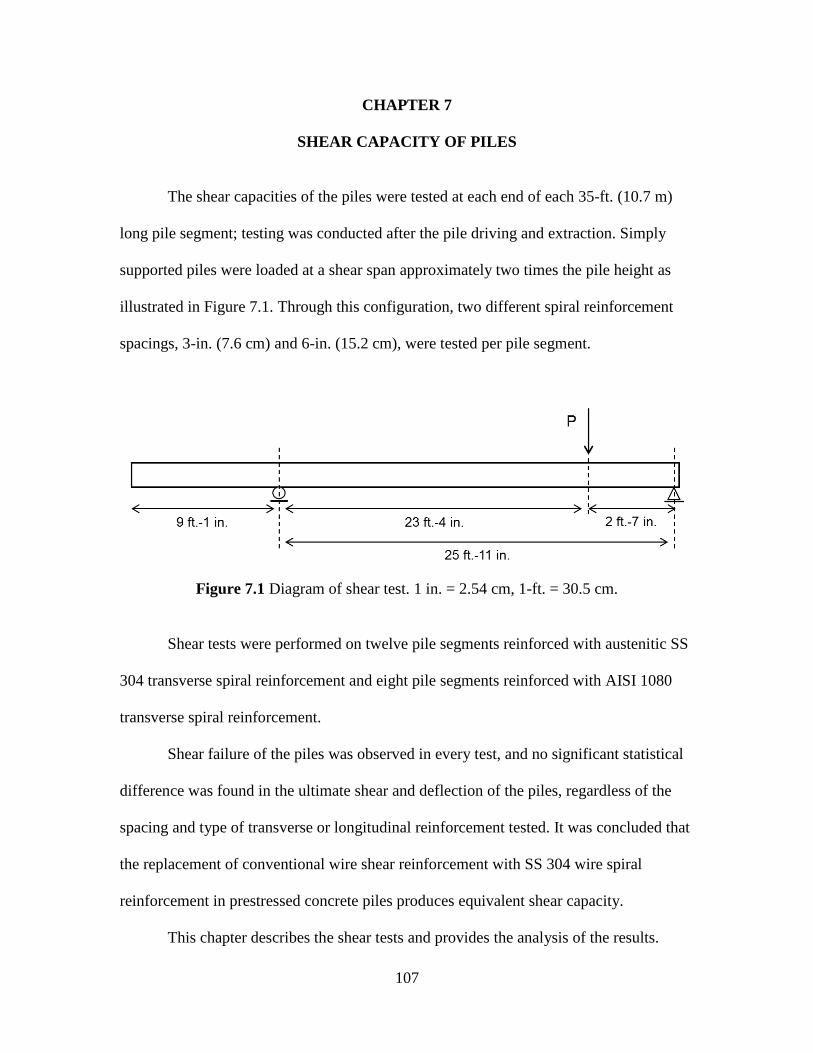
107
CHAPTER 7
SHEAR CAPACITY OF PILES
The shear capacities of the piles were tested at each end of each 35-ft. (10.7 m)
long pile segment; testing was conducted after the pile driving and extraction. Simply
supported piles were loaded at a shear span approximately two times the pile height as
illustrated in Figure 7.1. Through this configuration, two different spiral reinforcement
spacings, 3-in. (7.6 cm) and 6-in. (15.2 cm), were tested per pile segment.
Figure 7.1 Diagram of shear test. 1 in. = 2.54 cm, 1-ft. = 30.5 cm.
Shear tests were performed on twelve pile segments reinforced with austenitic SS
304 transverse spiral reinforcement and eight pile segments reinforced with AISI 1080
transverse spiral reinforcement.
Shear failure of the piles was observed in every test, and no significant statistical
difference was found in the ultimate shear and deflection of the piles, regardless of the
spacing and type of transverse or longitudinal reinforcement tested. It was concluded that
the replacement of conventional wire shear reinforcement with SS 304 wire spiral
reinforcement in prestressed concrete piles produces equivalent shear capacity.
This chapter describes the shear tests and provides the analysis of the results.
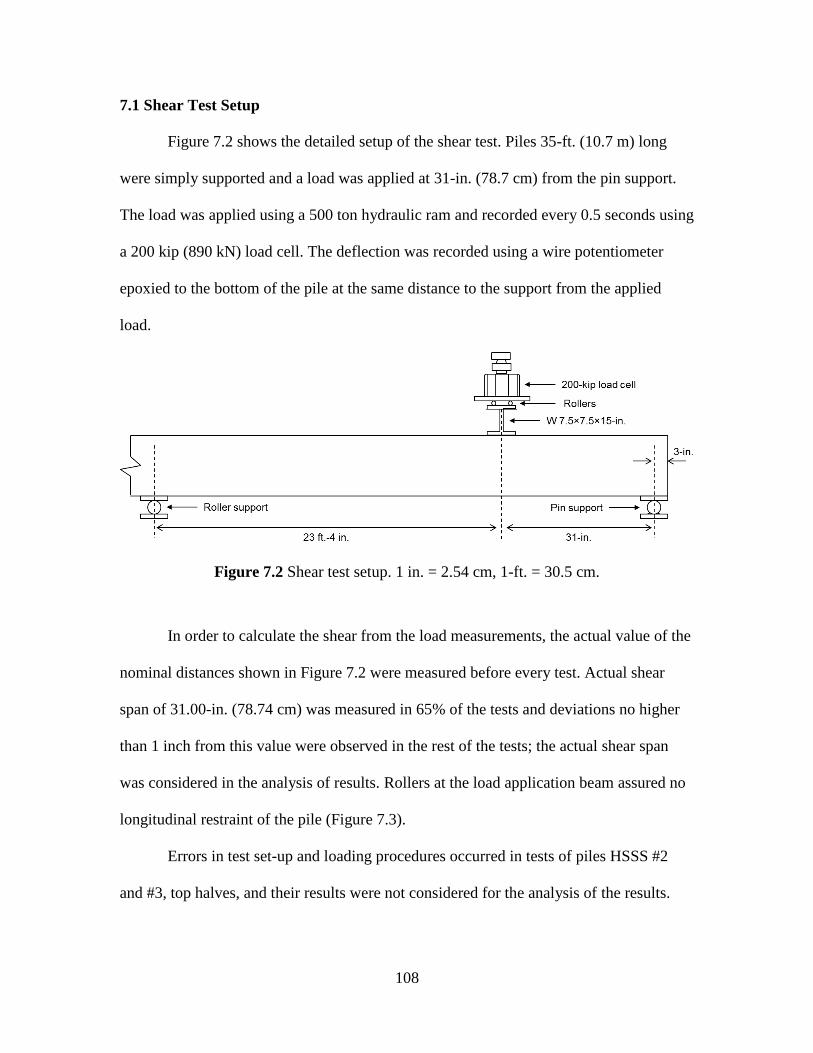
108
7.1 Shear Test Setup
Figure 7.2 shows the detailed setup of the shear test. Piles 35-ft. (10.7 m) long
were simply supported and a load was applied at 31-in. (78.7 cm) from the pin support.
The load was applied using a 500 ton hydraulic ram and recorded every 0.5 seconds using
a 200 kip (890 kN) load cell. The deflection was recorded using a wire potentiometer
epoxied to the bottom of the pile at the same distance to the support from the applied
load.
Figure 7.2 Shear test setup. 1 in. = 2.54 cm, 1-ft. = 30.5 cm.
In order to calculate the shear from the load measurements, the actual value of the
nominal distances shown in Figure 7.2 were measured before every test. Actual shear
span of 31.00-in. (78.74 cm) was measured in 65% of the tests and deviations no higher
than 1 inch from this value were observed in the rest of the tests; the actual shear span
was considered in the analysis of results. Rollers at the load application beam assured no
longitudinal restraint of the pile (Figure 7.3).
Errors in test set-up and loading procedures occurred in tests of piles HSSS #2
and #3, top halves, and their results were not considered for the analysis of the results.
109
Figure 7.3 Load application system.
7.2 Results and Discussion
The first crack appeared when the shear at the loading point reached 45 (200 kN)
to 50 kips (222.4 kN) and the deflection was close to 0.2-in. (5.08 mm). A shear crack
propagated from the bottom of the pile, at a distance of 15-in. (38.1 cm) to 20-in. (50.8
cm) from the support, in the direction of the applied load with an angle close to 45°.
Evidence of concrete crushing at the top of the beam and initiation of bond failure was
observed at the end of the test (see Figure 7.4).
Examples of nominal shear strength calculations according to ACI 318 and
AASHTO LRFD are given in Appendix I.
A summary of the experimental and calculated ultimate shear capacities of the
piles is given in Table 7.1. A summary of the ultimate shear of every tested pile is given
in Appendix J.
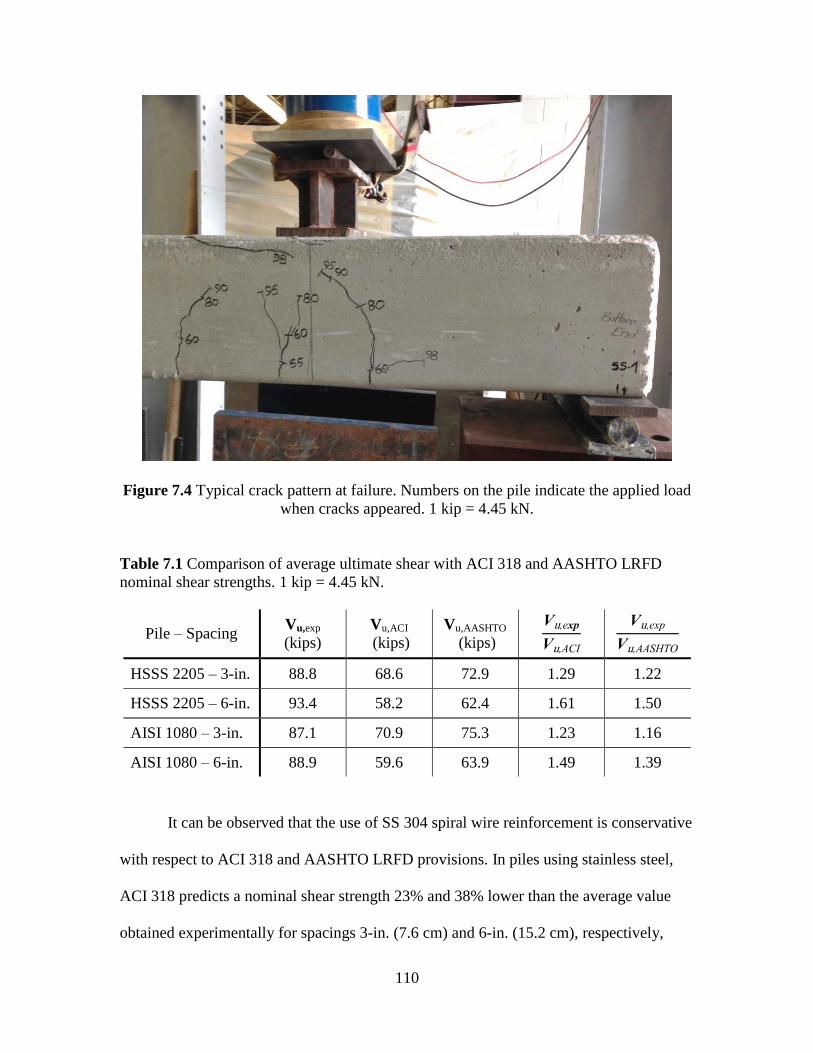
110
Figure 7.4 Typical crack pattern at failure. Numbers on the pile indicate the applied load
when cracks appeared. 1 kip = 4.45 kN.
Table 7.1 Comparison of average ultimate shear with ACI 318 and AASHTO LRFD
nominal shear strengths. 1 kip = 4.45 kN.
Pile – Spacing Vu,exp
(kips)
Vu,ACI
(kips)
Vu,AASHTO
(kips)
Vu,exp
Vu,ACI
Vu,exp
Vu,AASHTO
HSSS 2205 – 3-in. 88.8 68.6 72.9 1.29 1.22
HSSS 2205 – 6-in. 93.4 58.2 62.4 1.61 1.50
AISI 1080 – 3-in. 87.1 70.9 75.3 1.23 1.16
AISI 1080 – 6-in. 88.9 59.6 63.9 1.49 1.39
It can be observed that the use of SS 304 spiral wire reinforcement is conservative
with respect to ACI 318 and AASHTO LRFD provisions. In piles using stainless steel,
ACI 318 predicts a nominal shear strength 23% and 38% lower than the average value
obtained experimentally for spacings 3-in. (7.6 cm) and 6-in. (15.2 cm), respectively,
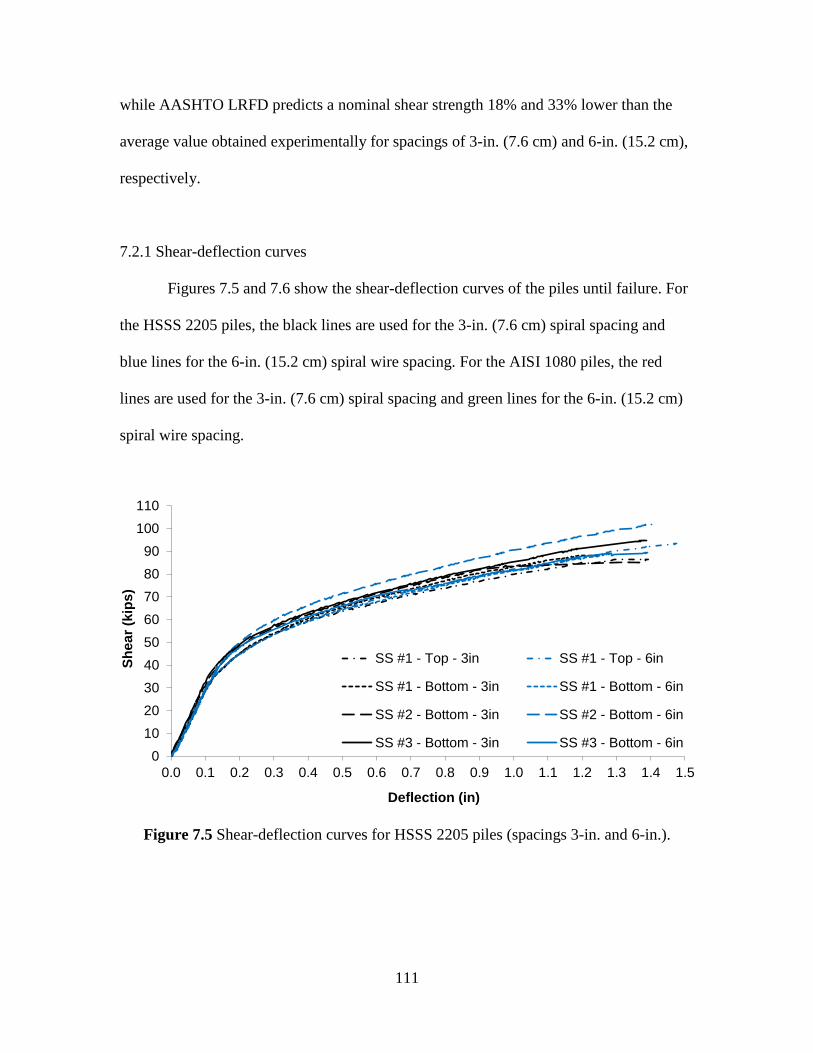
111
while AASHTO LRFD predicts a nominal shear strength 18% and 33% lower than the
average value obtained experimentally for spacings of 3-in. (7.6 cm) and 6-in. (15.2 cm),
respectively.
7.2.1 Shear-deflection curves
Figures 7.5 and 7.6 show the shear-deflection curves of the piles until failure. For
the HSSS 2205 piles, the black lines are used for the 3-in. (7.6 cm) spiral spacing and
blue lines for the 6-in. (15.2 cm) spiral wire spacing. For the AISI 1080 piles, the red
lines are used for the 3-in. (7.6 cm) spiral spacing and green lines for the 6-in. (15.2 cm)
spiral wire spacing.
Figure 7.5 Shear-deflection curves for HSSS 2205 piles (spacings 3-in. and 6-in.).
0
10
20
30
40
50
60
70
80
90
100
110
0.0 0.1 0.2 0.3 0.4 0.5 0.6 0.7 0.8 0.9 1.0 1.1 1.2 1.3 1.4 1.5
Sh
ea
r (k
ips
)
Deflection (in)
SS #1 - Top - 3in SS #1 - Top - 6in
SS #1 - Bottom - 3in SS #1 - Bottom - 6in
SS #2 - Bottom - 3in SS #2 - Bottom - 6in
SS #3 - Bottom - 3in SS #3 - Bottom - 6in
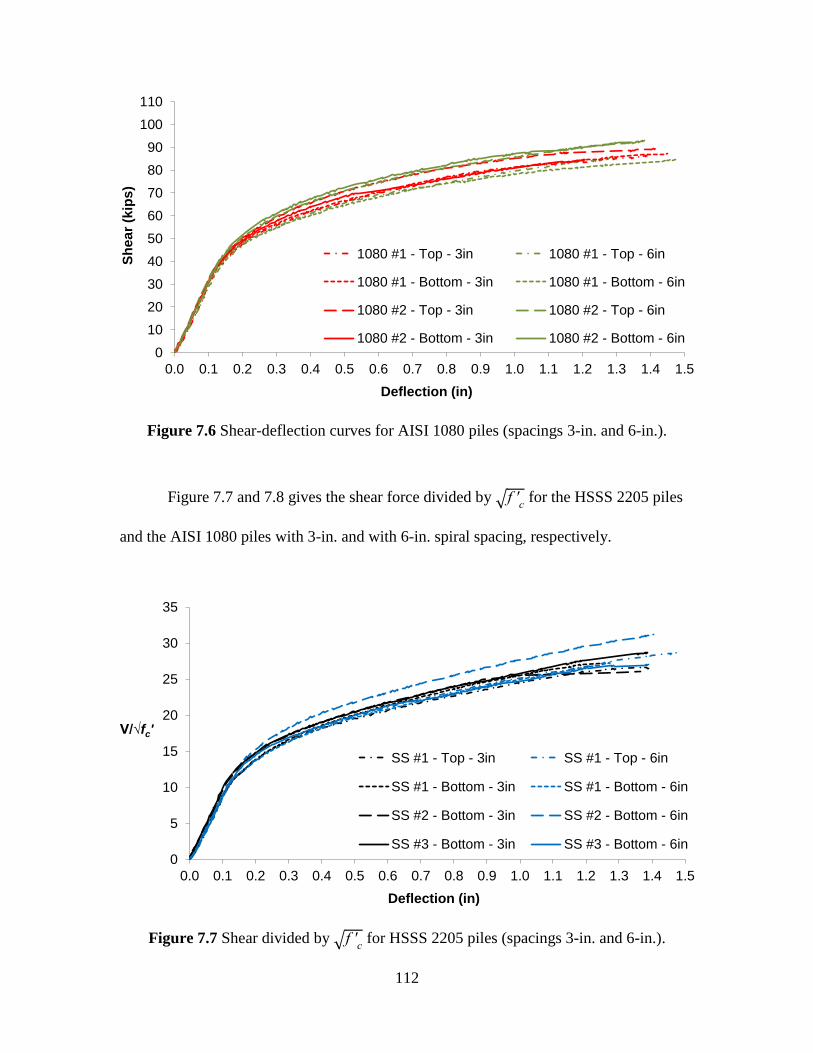
112
Figure 7.6 Shear-deflection curves for AISI 1080 piles (spacings 3-in. and 6-in.).
Figure 7.7 and 7.8 gives the shear force divided by √f 'c for the HSSS 2205 piles
and the AISI 1080 piles with 3-in. and with 6-in. spiral spacing, respectively.
Figure 7.7 Shear divided by √f 'c for HSSS 2205 piles (spacings 3-in. and 6-in.).
0
10
20
30
40
50
60
70
80
90
100
110
0.0 0.1 0.2 0.3 0.4 0.5 0.6 0.7 0.8 0.9 1.0 1.1 1.2 1.3 1.4 1.5
Sh
ea
r (k
ips
)
Deflection (in)
1080 #1 - Top - 3in 1080 #1 - Top - 6in
1080 #1 - Bottom - 3in 1080 #1 - Bottom - 6in
1080 #2 - Top - 3in 1080 #2 - Top - 6in
1080 #2 - Bottom - 3in 1080 #2 - Bottom - 6in
0
5
10
15
20
25
30
35
0.0 0.1 0.2 0.3 0.4 0.5 0.6 0.7 0.8 0.9 1.0 1.1 1.2 1.3 1.4 1.5
V/√fc'
Deflection (in)
SS #1 - Top - 3in SS #1 - Top - 6in
SS #1 - Bottom - 3in SS #1 - Bottom - 6in
SS #2 - Bottom - 3in SS #2 - Bottom - 6in
SS #3 - Bottom - 3in SS #3 - Bottom - 6in
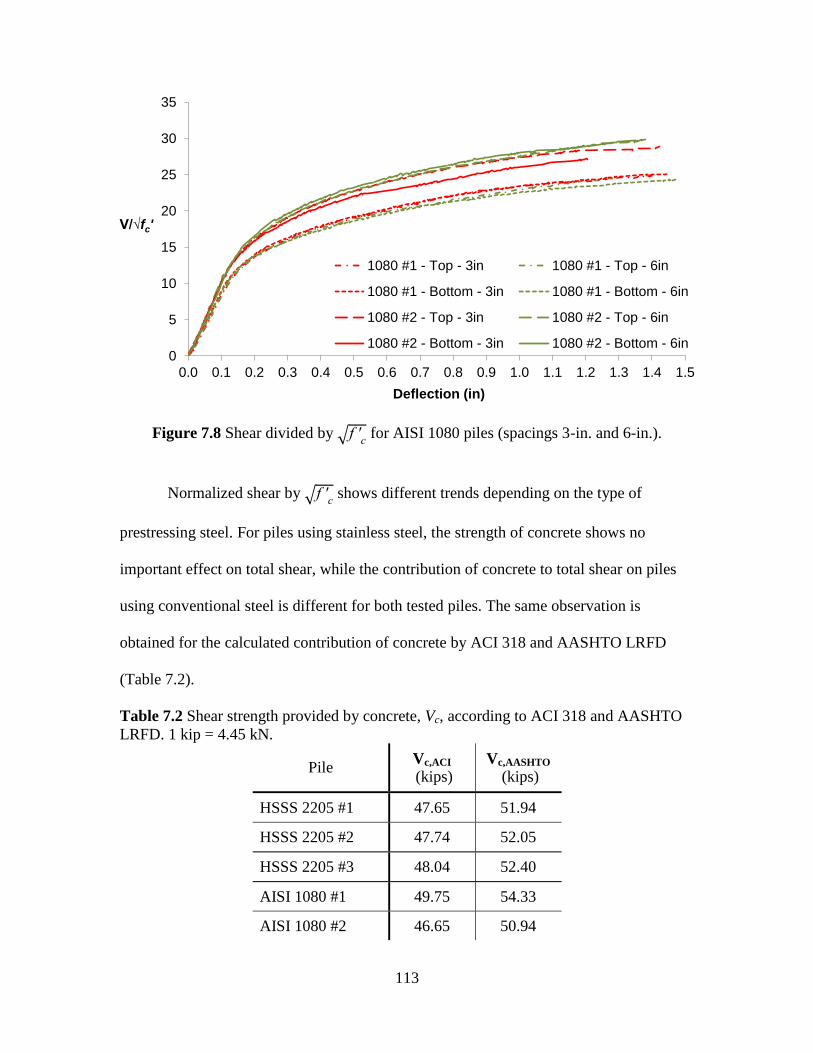
113
Figure 7.8 Shear divided by √f 'c for AISI 1080 piles (spacings 3-in. and 6-in.).
Normalized shear by √f 'c shows different trends depending on the type of
prestressing steel. For piles using stainless steel, the strength of concrete shows no
important effect on total shear, while the contribution of concrete to total shear on piles
using conventional steel is different for both tested piles. The same observation is
obtained for the calculated contribution of concrete by ACI 318 and AASHTO LRFD
(Table 7.2).
Table 7.2 Shear strength provided by concrete, Vc, according to ACI 318 and AASHTO
LRFD. 1 kip = 4.45 kN.
Pile Vc,ACI
(kips) Vc,AASHTO
(kips)
HSSS 2205 #1 47.65 51.94
HSSS 2205 #2 47.74 52.05
HSSS 2205 #3 48.04 52.40
AISI 1080 #1 49.75 54.33
AISI 1080 #2 46.65 50.94
0
5
10
15
20
25
30
35
0.0 0.1 0.2 0.3 0.4 0.5 0.6 0.7 0.8 0.9 1.0 1.1 1.2 1.3 1.4 1.5
V/√fc'
Deflection (in)
1080 #1 - Top - 3in 1080 #1 - Top - 6in
1080 #1 - Bottom - 3in 1080 #1 - Bottom - 6in
1080 #2 - Top - 3in 1080 #2 - Top - 6in
1080 #2 - Bottom - 3in 1080 #2 - Bottom - 6in
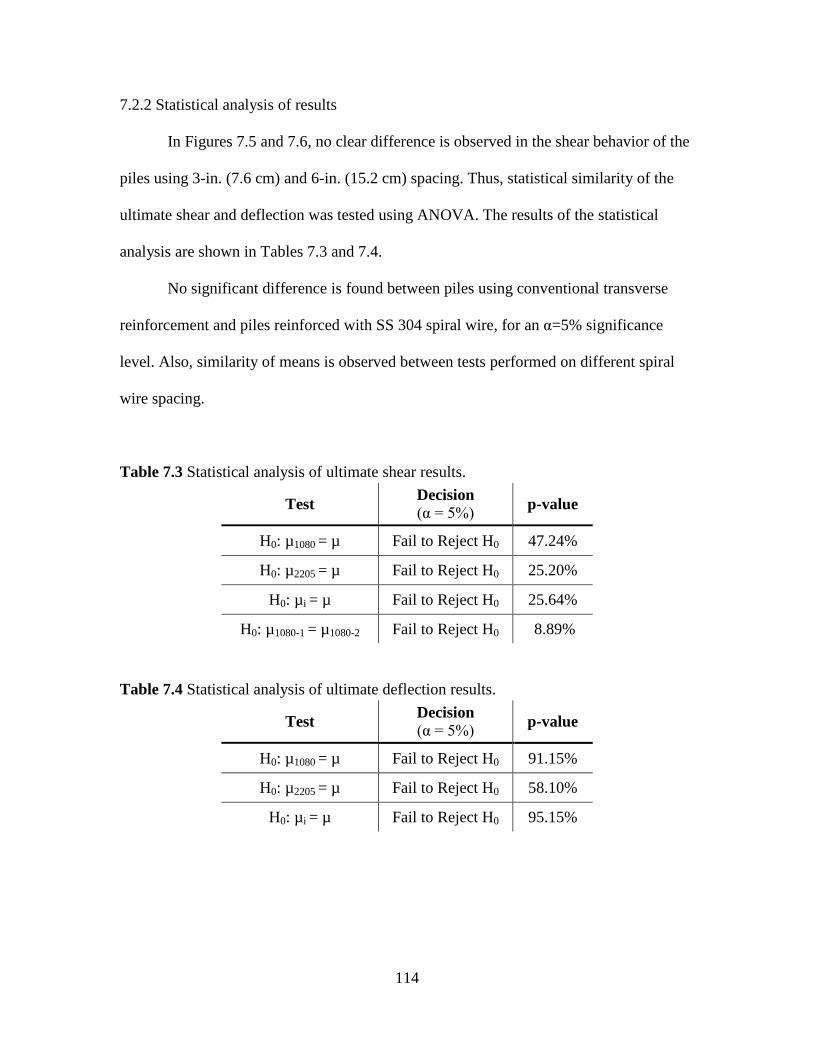
114
7.2.2 Statistical analysis of results
In Figures 7.5 and 7.6, no clear difference is observed in the shear behavior of the
piles using 3-in. (7.6 cm) and 6-in. (15.2 cm) spacing. Thus, statistical similarity of the
ultimate shear and deflection was tested using ANOVA. The results of the statistical
analysis are shown in Tables 7.3 and 7.4.
No significant difference is found between piles using conventional transverse
reinforcement and piles reinforced with SS 304 spiral wire, for an α=5% significance
level. Also, similarity of means is observed between tests performed on different spiral
wire spacing.
Table 7.3 Statistical analysis of ultimate shear results.
Test Decision
(α = 5%) p-value
H0: µ1080 = µ Fail to Reject H0 47.24%
H0: µ2205 = µ Fail to Reject H0 25.20%
H0: µi = µ Fail to Reject H0 25.64%
H0: µ1080-1 = µ1080-2 Fail to Reject H0 8.89%
Table 7.4 Statistical analysis of ultimate deflection results.
Test Decision
(α = 5%) p-value
H0: µ1080 = µ Fail to Reject H0 91.15%
H0: µ2205 = µ Fail to Reject H0 58.10%
H0: µi = µ Fail to Reject H0 95.15%
115
7.3 Conclusions of the Chapter
The use of SS 304 wire spiral reinforcement provides shear strength equivalent to
that of conventional wire spiral reinforcement.
Shear strength provided by SS 304 wire spiral reinforcement was 29% and 61%
higher than predicted nominal shear strength by ACI 318 for spacings of 3-in. (7.6 cm)
and 6-in. (15.2 cm), respectively, and 22% and 50% higher than the predicted nominal
shear strength by AASHTO LRFD for spacings of 3-in. (7.6 cm) and 6-in. (15.2 cm),
respectively.
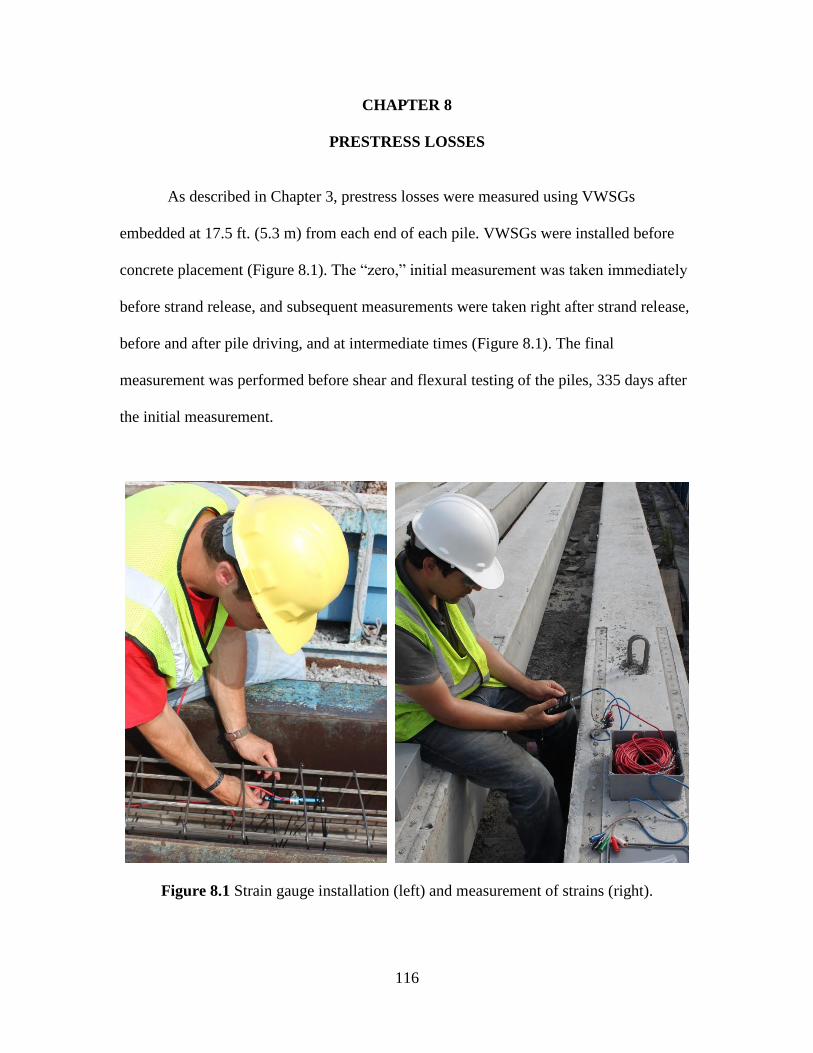
116
CHAPTER 8
PRESTRESS LOSSES
As described in Chapter 3, prestress losses were measured using VWSGs
embedded at 17.5 ft. (5.3 m) from each end of each pile. VWSGs were installed before
concrete placement (Figure 8.1). The “zero,” initial measurement was taken immediately
before strand release, and subsequent measurements were taken right after strand release,
before and after pile driving, and at intermediate times (Figure 8.1). The final
measurement was performed before shear and flexural testing of the piles, 335 days after
the initial measurement.
Figure 8.1 Strain gauge installation (left) and measurement of strains (right).
117
Experimental results were compared with the refined and lump-sum estimation
methods described in AASHTO LRFD (2013) and as illustrated in Appendix K. The
refined method calculates the total prestress loss in pretensioned elements as the sum of
the losses due to elastic shortening at jacking, relaxation of steel, and shrinkage and creep
of concrete. The lump-sum method estimates long-term losses (creep and shrinkage of
concrete and relaxation of steel stress) using a single formula.
Losses predicted by the AASHTO LRFD refined method were 59% higher than
the measured values. It was concluded that the use of AASHTO LRFD for the estimation
of prestress losses of duplex HSSS 2205 strands is conservative.
Also, duplex HSSS 2205 strands exhibited similar early loss of the initial
prestress and higher losses at later ages compared to conventional strands. GDOT
Standard 3215 specifies a maximum loss of 22% of the initial pretension force. At 335
days, losses of the initial prestressing load of 7.84% and 9.39% were measured for AISI
1080 steel and duplex HSSS 2205 strands, respectively. The AASHTO refined method
predicts that losses at 335 days are approximately 90% of the total losses considering a
service life of 100 years for the analyzed prestressed concrete piles. Thus, it is very
unlikely that prestress losses in prestressed concrete piles will surpass the GDOT
Standard 3215 limit for loss of pretension force.
8.1 Results
Using vibrating wire strain gauges, the strains of the concrete over time and the
internal temperature were obtained. Perfect bond between the strands and concrete was
assumed so that the change in strain of the concrete equaled the change in strain of the
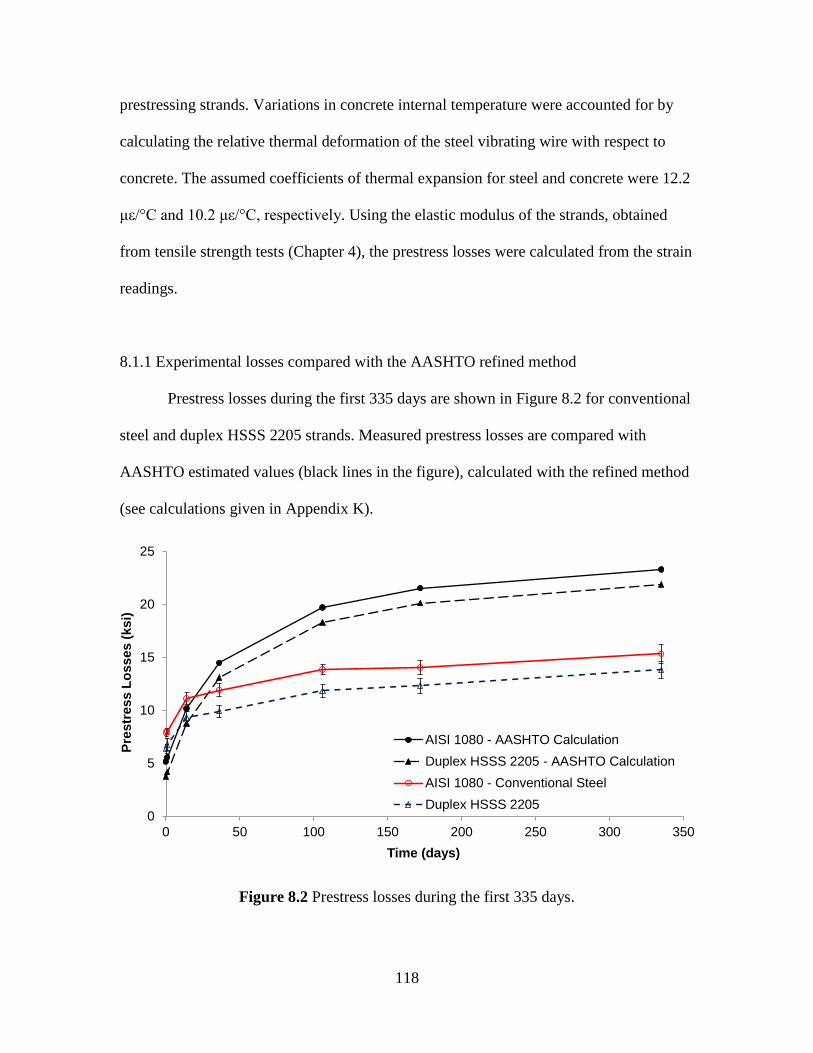
118
prestressing strands. Variations in concrete internal temperature were accounted for by
calculating the relative thermal deformation of the steel vibrating wire with respect to
concrete. The assumed coefficients of thermal expansion for steel and concrete were 12.2
με/°C and 10.2 με/°C, respectively. Using the elastic modulus of the strands, obtained
from tensile strength tests (Chapter 4), the prestress losses were calculated from the strain
readings.
8.1.1 Experimental losses compared with the AASHTO refined method
Prestress losses during the first 335 days are shown in Figure 8.2 for conventional
steel and duplex HSSS 2205 strands. Measured prestress losses are compared with
AASHTO estimated values (black lines in the figure), calculated with the refined method
(see calculations given in Appendix K).
Figure 8.2 Prestress losses during the first 335 days.
0
5
10
15
20
25
0 50 100 150 200 250 300 350
Pre
str
es
s L
oss
es
(ks
i)
Time (days)
AISI 1080 - AASHTO Calculation
Duplex HSSS 2205 - AASHTO Calculation
AISI 1080 - Conventional Steel
Duplex HSSS 2205
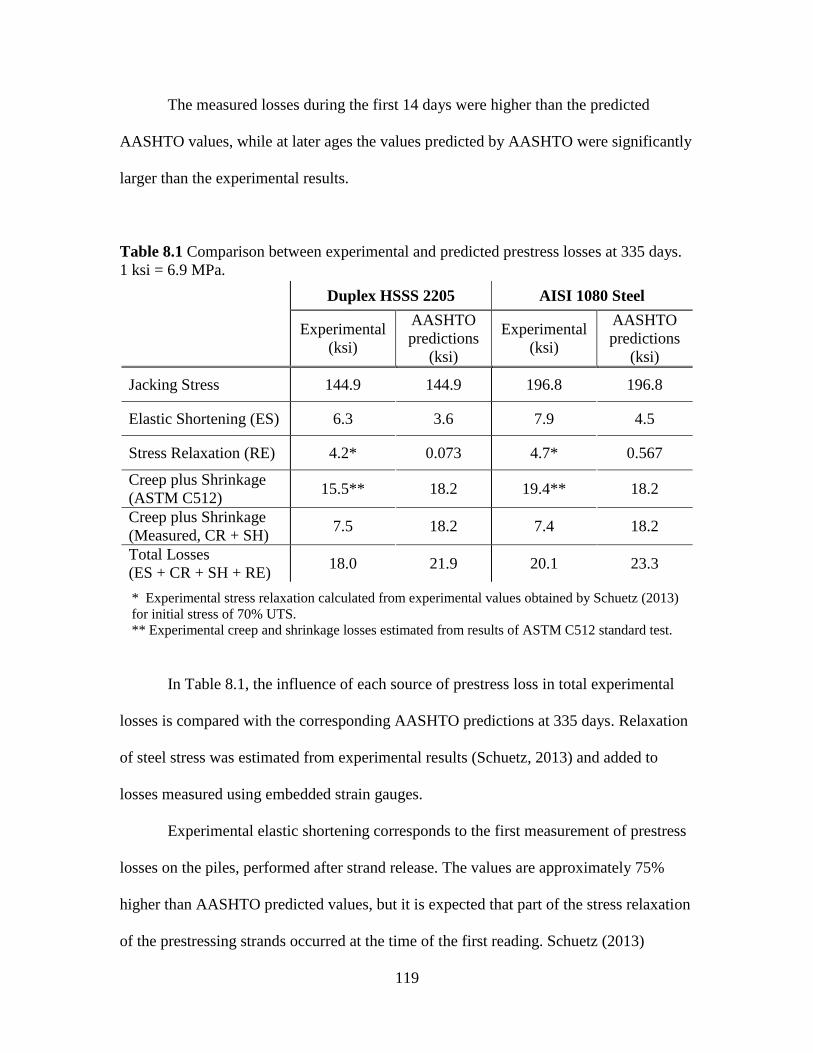
119
The measured losses during the first 14 days were higher than the predicted
AASHTO values, while at later ages the values predicted by AASHTO were significantly
larger than the experimental results.
Table 8.1 Comparison between experimental and predicted prestress losses at 335 days.
1 ksi = 6.9 MPa.
Duplex HSSS 2205 AISI 1080 Steel
Experimental
(ksi)
AASHTO
predictions
(ksi)
Experimental
(ksi)
AASHTO
predictions
(ksi)
Jacking Stress 144.9 144.9 196.8 196.8
Elastic Shortening (ES) 6.3 3.6 7.9 4.5
Stress Relaxation (RE) 4.2* 0.073 4.7* 0.567
Creep plus Shrinkage
(ASTM C512) 15.5** 18.2 19.4** 18.2
Creep plus Shrinkage
(Measured, CR + SH) 7.5 18.2 7.4 18.2
Total Losses
(ES + CR + SH + RE) 18.0 21.9 20.1 23.3
* Experimental stress relaxation calculated from experimental values obtained by Schuetz (2013)
for initial stress of 70% UTS.
** Experimental creep and shrinkage losses estimated from results of ASTM C512 standard test.
In Table 8.1, the influence of each source of prestress loss in total experimental
losses is compared with the corresponding AASHTO predictions at 335 days. Relaxation
of steel stress was estimated from experimental results (Schuetz, 2013) and added to
losses measured using embedded strain gauges.
Experimental elastic shortening corresponds to the first measurement of prestress
losses on the piles, performed after strand release. The values are approximately 75%
higher than AASHTO predicted values, but it is expected that part of the stress relaxation
of the prestressing strands occurred at the time of the first reading. Schuetz (2013)
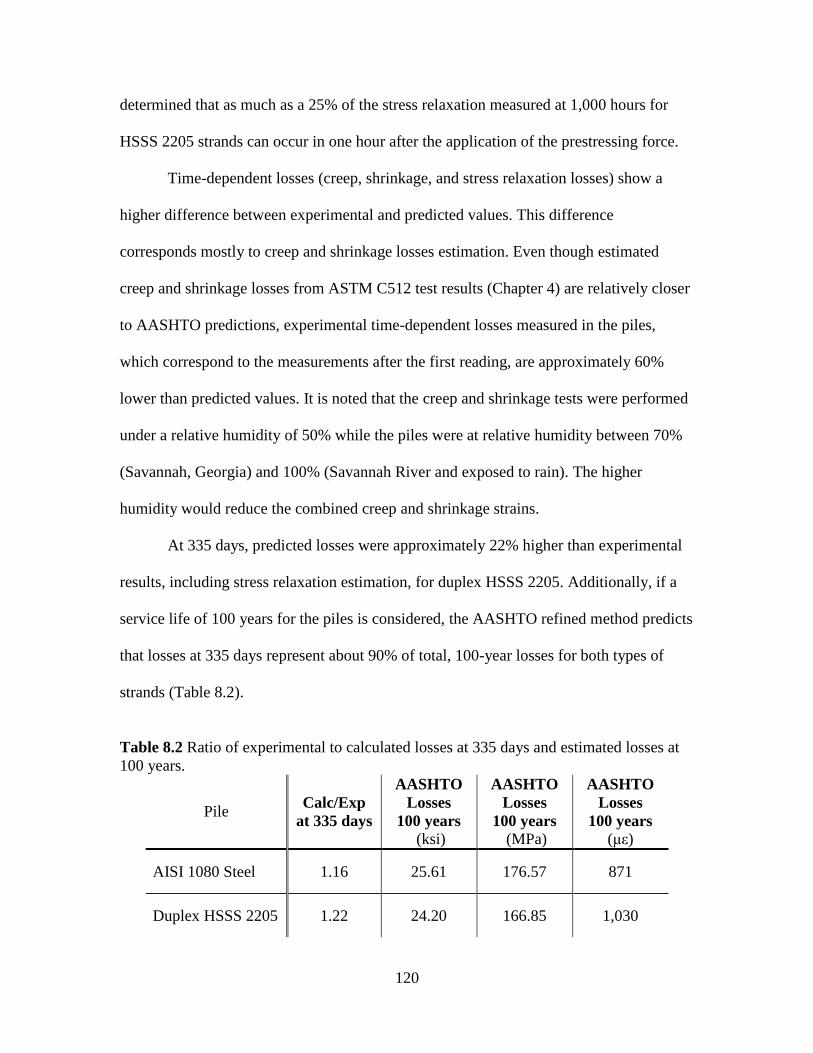
120
determined that as much as a 25% of the stress relaxation measured at 1,000 hours for
HSSS 2205 strands can occur in one hour after the application of the prestressing force.
Time-dependent losses (creep, shrinkage, and stress relaxation losses) show a
higher difference between experimental and predicted values. This difference
corresponds mostly to creep and shrinkage losses estimation. Even though estimated
creep and shrinkage losses from ASTM C512 test results (Chapter 4) are relatively closer
to AASHTO predictions, experimental time-dependent losses measured in the piles,
which correspond to the measurements after the first reading, are approximately 60%
lower than predicted values. It is noted that the creep and shrinkage tests were performed
under a relative humidity of 50% while the piles were at relative humidity between 70%
(Savannah, Georgia) and 100% (Savannah River and exposed to rain). The higher
humidity would reduce the combined creep and shrinkage strains.
At 335 days, predicted losses were approximately 22% higher than experimental
results, including stress relaxation estimation, for duplex HSSS 2205. Additionally, if a
service life of 100 years for the piles is considered, the AASHTO refined method predicts
that losses at 335 days represent about 90% of total, 100-year losses for both types of
strands (Table 8.2).
Table 8.2 Ratio of experimental to calculated losses at 335 days and estimated losses at
100 years.
Pile Calc/Exp
at 335 days
AASHTO
Losses
100 years
(ksi)
AASHTO
Losses
100 years
(MPa)
AASHTO
Losses
100 years
(με)
AISI 1080 Steel 1.16 25.61 176.57 871
Duplex HSSS 2205 1.22 24.20 166.85 1,030
121
8.1.2 Effect of pile driving and type of prestressing steel
The pile-driving operation was performed at day 174 from initial prestress
application. As a result, no significant effect on prestress losses due to driving was
observed.
Also, when prestress losses in each end of the piles are analyzed (see separated
graphs in Appendix L), no clear differences are observed. Two piles using duplex HSSS
2205 strands and one pile using conventional steel exhibit similar prestress loss values at
both ends. On the contrary, piles AISI 1080 #1 and HSSS 2205 #3 show higher prestress
losses on the end closer to the jacking end of the prestressing form.
It was also observed in Table 8.1 that higher average values of prestress losses are
obtained with the AISI 1080 steel strands. This difference is properly predicted by
AASHTO. However, considering the lower elastic modulus of duplex HSSS 2205
strands, these prestress losses represent lower strains than in conventional steel.
Since duplex HSSS 2205 and conventional steel strands were prestressed at 60%
and 70% of the UTS, respectively, a proper comparison should include the loss of the
initial prestress of each type of strand. It is noted that the relaxation loss of prestressing
force in each strand type was about 2.5% if loaded to 70% of UTS.
Figure 8.3 shows the loss of initial prestress with time. The initial elastic loss in
the piles with HSSS 2205 and in piles with conventional strands was similar. The long-
term loss in piles with duplex HSSS 2205 strands is slightly larger than the loss in piles
with conventional strand. Considering the initial prestress of each strand (60% UTS vs.
70% UTS), the relaxation of duplex HSSS 2205 strands is slightly less than that of
conventional steel strands. Given that the initial prestressing force is the same, a higher
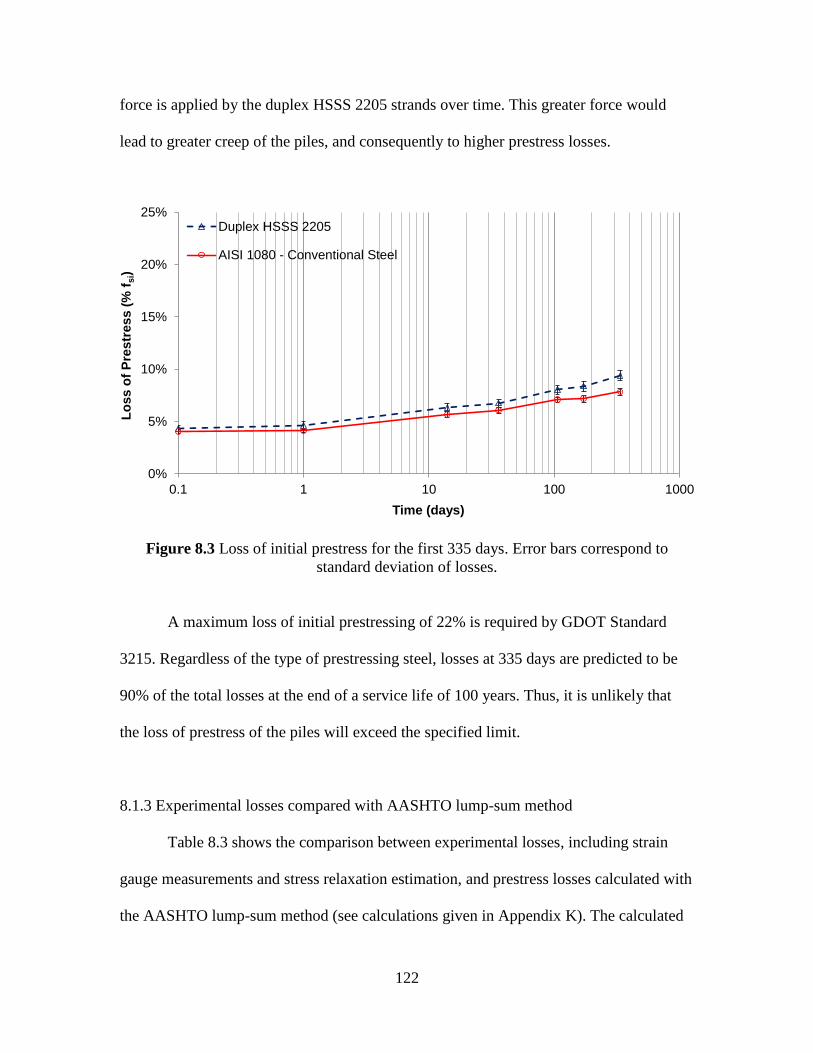
122
force is applied by the duplex HSSS 2205 strands over time. This greater force would
lead to greater creep of the piles, and consequently to higher prestress losses.
Figure 8.3 Loss of initial prestress for the first 335 days. Error bars correspond to
standard deviation of losses.
A maximum loss of initial prestressing of 22% is required by GDOT Standard
3215. Regardless of the type of prestressing steel, losses at 335 days are predicted to be
90% of the total losses at the end of a service life of 100 years. Thus, it is unlikely that
the loss of prestress of the piles will exceed the specified limit.
8.1.3 Experimental losses compared with AASHTO lump-sum method
Table 8.3 shows the comparison between experimental losses, including strain
gauge measurements and stress relaxation estimation, and prestress losses calculated with
the AASHTO lump-sum method (see calculations given in Appendix K). The calculated
0%
5%
10%
15%
20%
25%
0.1 1 10 100 1000
Lo
ss
of
Pre
str
es
s (
% f
si)
Time (days)
Duplex HSSS 2205
AISI 1080 - Conventional Steel
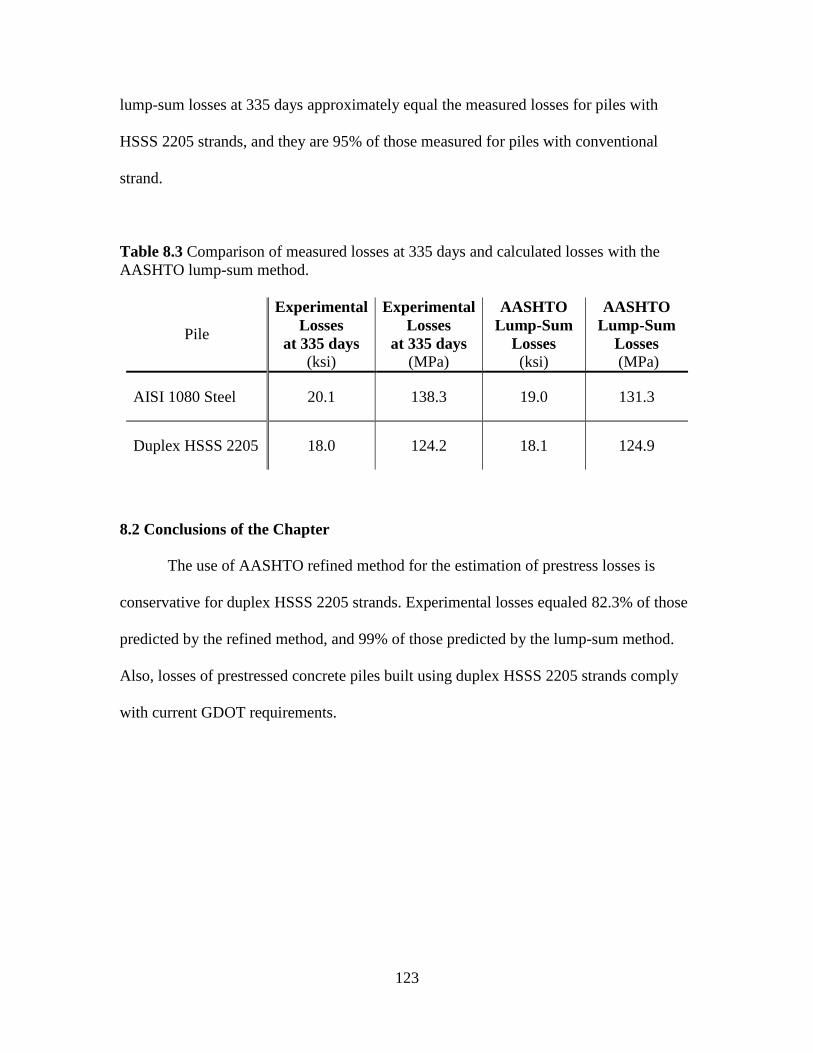
123
lump-sum losses at 335 days approximately equal the measured losses for piles with
HSSS 2205 strands, and they are 95% of those measured for piles with conventional
strand.
Table 8.3 Comparison of measured losses at 335 days and calculated losses with the
AASHTO lump-sum method.
Pile
Experimental
Losses
at 335 days
(ksi)
Experimental
Losses
at 335 days
(MPa)
AASHTO
Lump-Sum
Losses
(ksi)
AASHTO
Lump-Sum
Losses
(MPa)
AISI 1080 Steel 20.1 138.3 19.0 131.3
Duplex HSSS 2205 18.0 124.2 18.1 124.9
8.2 Conclusions of the Chapter
The use of AASHTO refined method for the estimation of prestress losses is
conservative for duplex HSSS 2205 strands. Experimental losses equaled 82.3% of those
predicted by the refined method, and 99% of those predicted by the lump-sum method.
Also, losses of prestressed concrete piles built using duplex HSSS 2205 strands comply
with current GDOT requirements.
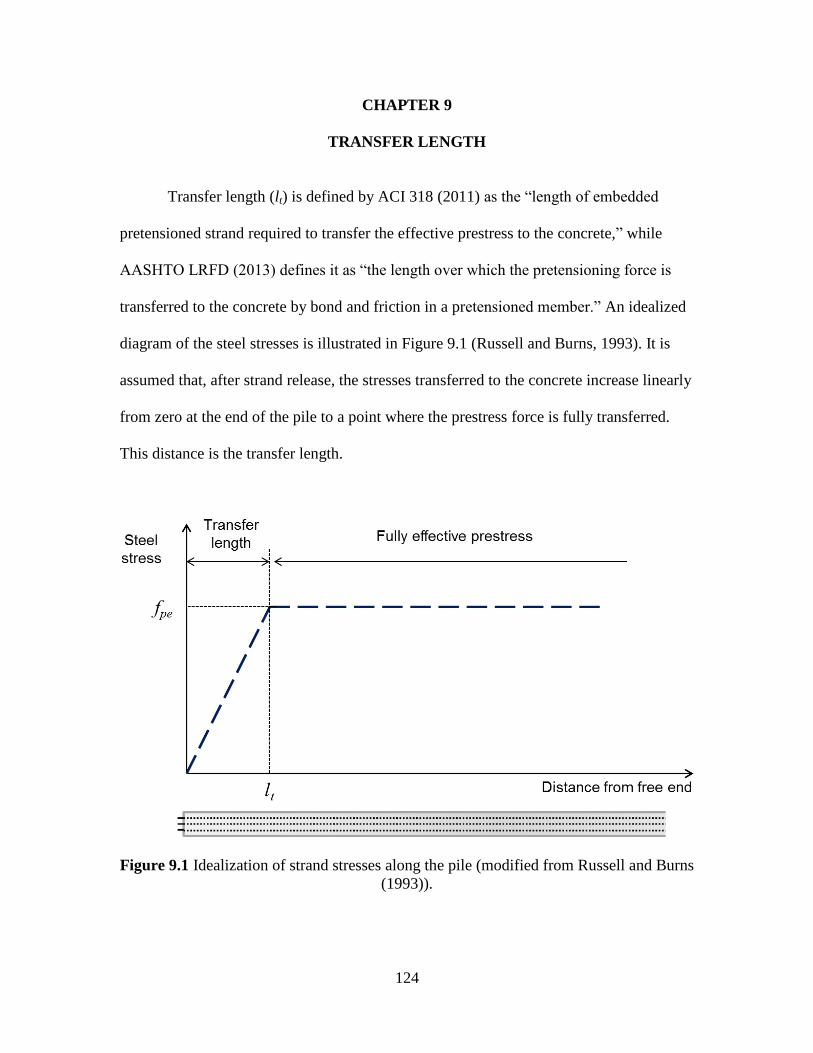
124
CHAPTER 9
TRANSFER LENGTH
Transfer length (lt) is defined by ACI 318 (2011) as the “length of embedded
pretensioned strand required to transfer the effective prestress to the concrete,” while
AASHTO LRFD (2013) defines it as “the length over which the pretensioning force is
transferred to the concrete by bond and friction in a pretensioned member.” An idealized
diagram of the steel stresses is illustrated in Figure 9.1 (Russell and Burns, 1993). It is
assumed that, after strand release, the stresses transferred to the concrete increase linearly
from zero at the end of the pile to a point where the prestress force is fully transferred.
This distance is the transfer length.
Figure 9.1 Idealization of strand stresses along the pile (modified from Russell and Burns
(1993)).
125
Transfer length of the prestressed concrete piles was measured at each end of the
piles, using the concrete surface strain (CSS) method (Russell and Burns, 1993). As a
result of the prestressing force transferred from the steel strands to the concrete, strains
and compressive stresses are induced. By equilibrium, these compressive stresses in the
concrete balance the tensile stresses in the prestressing strands. Thus, the measurement of
the concrete surface strains mirror the strain profile of the prestressing strands
(Reutlinger, 1999; Kahn et al., 2002).
The average transfer lengths of the piles using duplex HSSS 2205 and
conventional steel strands were shorter than the predicted values using AASHTO LRFD
and ACI 318. After pile driving and extraction, the average transfer lengths of the piles
remained the same or shorter than before driving and less than the AASHTO LRFD and
ACI 318 predictions.
This chapter describes the determination of the transfer length of the piles by the
CSS method. Also, results before and after driving are compared with estimated transfer
lengths according to ACI 318, AASHTO LRFD, and expressions proposed in the
literature and described in Chapter 2.
9.1 CSS Measurements
The CSS method was used by Russell (1992) to determine the transfer length of
0.6-in. (15.2 mm) diameter, 7-wire strands of prestressed concrete girders. This technique
considers that 1) stress of prestressing strand varies linearly from zero at the end of the
pretensioned element to a maximum value where full prestressing force is transferred to
the concrete, 2) prestress transfer to the concrete depends on bond strength developed by
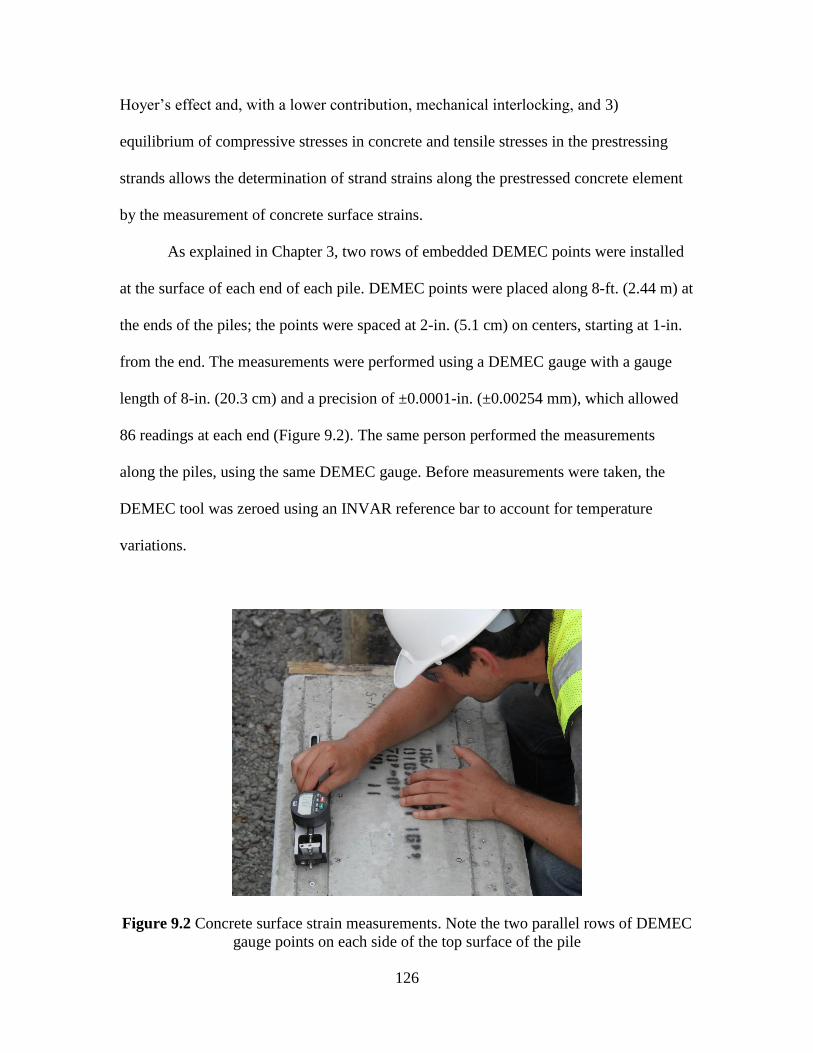
126
Hoyer’s effect and, with a lower contribution, mechanical interlocking, and 3)
equilibrium of compressive stresses in concrete and tensile stresses in the prestressing
strands allows the determination of strand strains along the prestressed concrete element
by the measurement of concrete surface strains.
As explained in Chapter 3, two rows of embedded DEMEC points were installed
at the surface of each end of each pile. DEMEC points were placed along 8-ft. (2.44 m) at
the ends of the piles; the points were spaced at 2-in. (5.1 cm) on centers, starting at 1-in.
from the end. The measurements were performed using a DEMEC gauge with a gauge
length of 8-in. (20.3 cm) and a precision of ±0.0001-in. (±0.00254 mm), which allowed
86 readings at each end (Figure 9.2). The same person performed the measurements
along the piles, using the same DEMEC gauge. Before measurements were taken, the
DEMEC tool was zeroed using an INVAR reference bar to account for temperature
variations.
Figure 9.2 Concrete surface strain measurements. Note the two parallel rows of DEMEC
gauge points on each side of the top surface of the pile
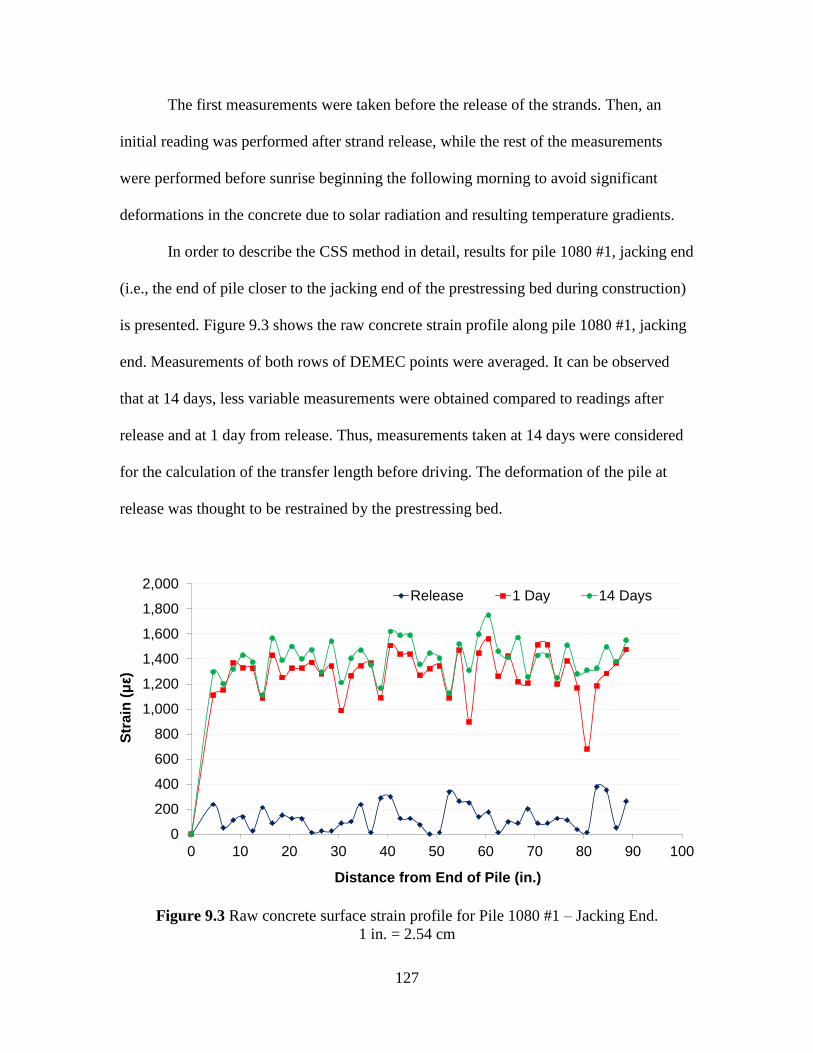
127
The first measurements were taken before the release of the strands. Then, an
initial reading was performed after strand release, while the rest of the measurements
were performed before sunrise beginning the following morning to avoid significant
deformations in the concrete due to solar radiation and resulting temperature gradients.
In order to describe the CSS method in detail, results for pile 1080 #1, jacking end
(i.e., the end of pile closer to the jacking end of the prestressing bed during construction)
is presented. Figure 9.3 shows the raw concrete strain profile along pile 1080 #1, jacking
end. Measurements of both rows of DEMEC points were averaged. It can be observed
that at 14 days, less variable measurements were obtained compared to readings after
release and at 1 day from release. Thus, measurements taken at 14 days were considered
for the calculation of the transfer length before driving. The deformation of the pile at
release was thought to be restrained by the prestressing bed.
Figure 9.3 Raw concrete surface strain profile for Pile 1080 #1 – Jacking End.
1 in. = 2.54 cm
0
200
400
600
800
1,000
1,200
1,400
1,600
1,800
2,000
0 10 20 30 40 50 60 70 80 90 100
Str
ain
(με)
Distance from End of Pile (in.)
Release 1 Day 14 Days
128
The CSS method smooths the raw strain profile shown in Figure 9.3 by averaging
every three consecutive readings. The objective of the smoothening of the curve is to
reduce anomalies and remove part of the noise associated with the measurement
acquisition. Equation 9.1 was used for smoothening of raw data (Russell and Burns,
1993).
3
11
iii
i
(9.1)
where εi is the i-th strain for i = 2,…, 42 in the case of the prestressed concrete piles.
As a result, the profile in Figure 9.4 was obtained by the smoothening of raw
strain profiles. The smoothed strain profile was used to determine the transfer length of
the prestressed concrete element. It should be noted that the distances of the reading
points are also averaged in the smoothed profile. Thus, the initial strain of the raw profile
(Figure 9.3) is located at 4.51-in. (11.46 cm) from the end of the pile, while the first
averaged strain of the smoothed profile is positioned at 6.53-in (16.59 cm) from the end
of the pile.
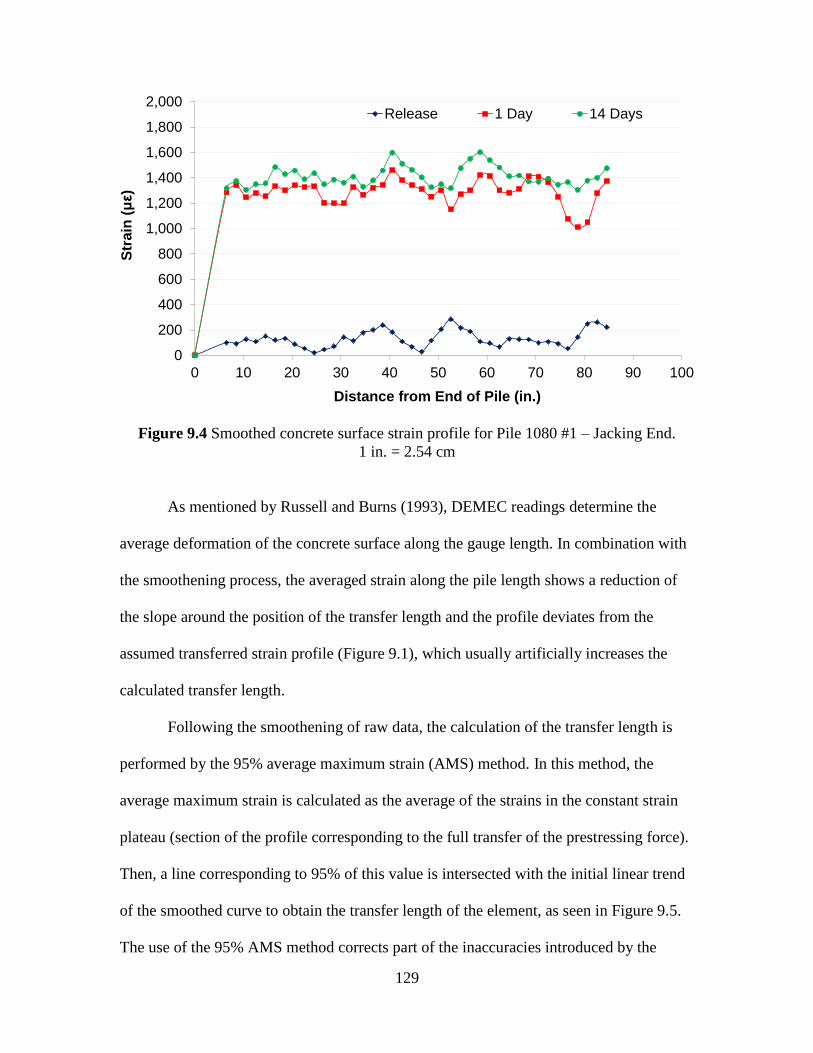
129
Figure 9.4 Smoothed concrete surface strain profile for Pile 1080 #1 – Jacking End.
1 in. = 2.54 cm
As mentioned by Russell and Burns (1993), DEMEC readings determine the
average deformation of the concrete surface along the gauge length. In combination with
the smoothening process, the averaged strain along the pile length shows a reduction of
the slope around the position of the transfer length and the profile deviates from the
assumed transferred strain profile (Figure 9.1), which usually artificially increases the
calculated transfer length.
Following the smoothening of raw data, the calculation of the transfer length is
performed by the 95% average maximum strain (AMS) method. In this method, the
average maximum strain is calculated as the average of the strains in the constant strain
plateau (section of the profile corresponding to the full transfer of the prestressing force).
Then, a line corresponding to 95% of this value is intersected with the initial linear trend
of the smoothed curve to obtain the transfer length of the element, as seen in Figure 9.5.
The use of the 95% AMS method corrects part of the inaccuracies introduced by the
0
200
400
600
800
1,000
1,200
1,400
1,600
1,800
2,000
0 10 20 30 40 50 60 70 80 90 100
Str
ain
(με)
Distance from End of Pile (in.)
Release 1 Day 14 Days
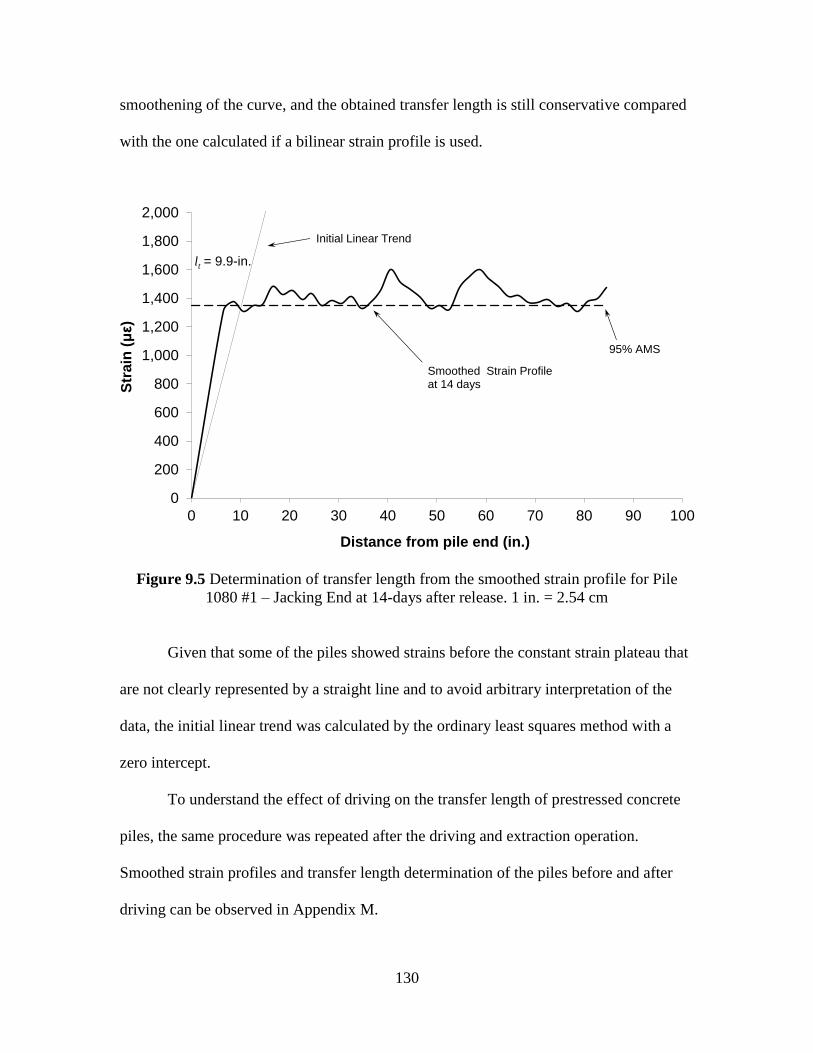
130
smoothening of the curve, and the obtained transfer length is still conservative compared
with the one calculated if a bilinear strain profile is used.
Figure 9.5 Determination of transfer length from the smoothed strain profile for Pile
1080 #1 – Jacking End at 14-days after release. 1 in. = 2.54 cm
Given that some of the piles showed strains before the constant strain plateau that
are not clearly represented by a straight line and to avoid arbitrary interpretation of the
data, the initial linear trend was calculated by the ordinary least squares method with a
zero intercept.
To understand the effect of driving on the transfer length of prestressed concrete
piles, the same procedure was repeated after the driving and extraction operation.
Smoothed strain profiles and transfer length determination of the piles before and after
driving can be observed in Appendix M.
0
200
400
600
800
1,000
1,200
1,400
1,600
1,800
2,000
0 10 20 30 40 50 60 70 80 90 100
Str
ain
(με)
Distance from pile end (in.)
Smoothed Strain Profileat 14 days
lt = 9.9-in.
95% AMS
Initial Linear Trend
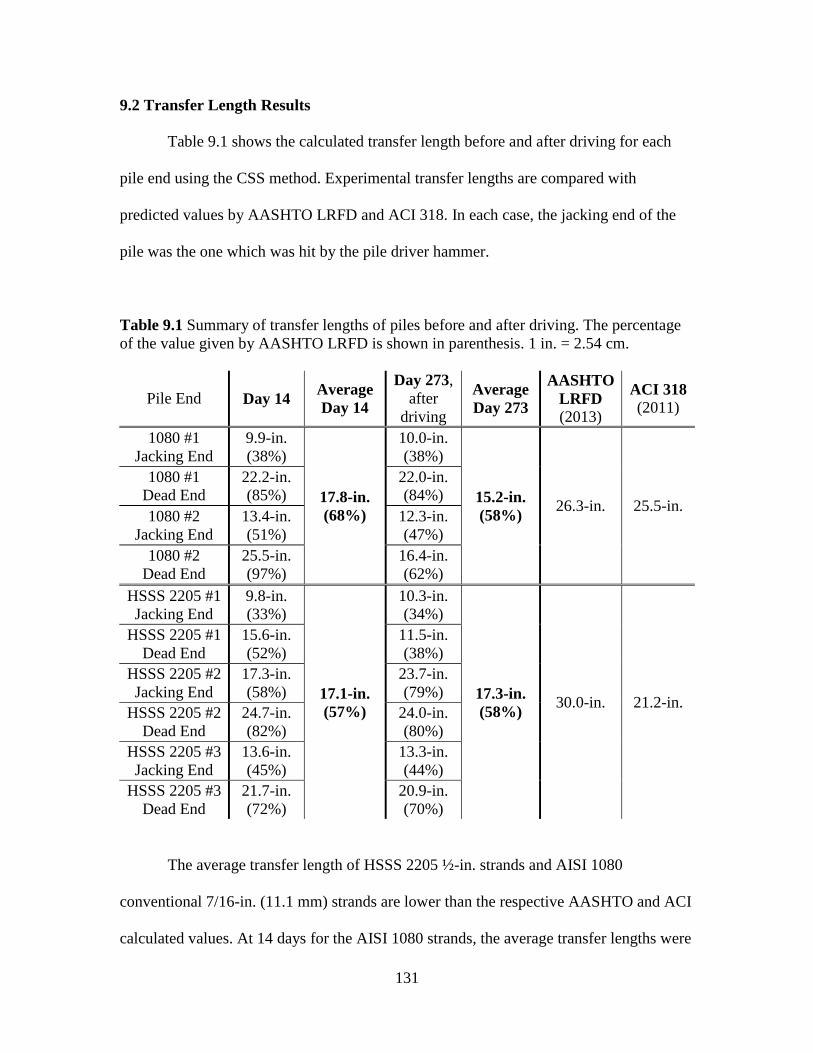
131
9.2 Transfer Length Results
Table 9.1 shows the calculated transfer length before and after driving for each
pile end using the CSS method. Experimental transfer lengths are compared with
predicted values by AASHTO LRFD and ACI 318. In each case, the jacking end of the
pile was the one which was hit by the pile driver hammer.
Table 9.1 Summary of transfer lengths of piles before and after driving. The percentage
of the value given by AASHTO LRFD is shown in parenthesis. 1 in. = 2.54 cm.
Pile End Day 14 Average
Day 14
Day 273,
after
driving
Average
Day 273
AASHTO
LRFD
(2013)
ACI 318
(2011)
1080 #1
Jacking End
9.9-in.
(38%)
17.8-in.
(68%)
10.0-in.
(38%)
15.2-in.
(58%) 26.3-in. 25.5-in.
1080 #1
Dead End
22.2-in.
(85%)
22.0-in.
(84%)
1080 #2
Jacking End
13.4-in.
(51%)
12.3-in.
(47%)
1080 #2
Dead End
25.5-in.
(97%)
16.4-in.
(62%)
HSSS 2205 #1
Jacking End
9.8-in.
(33%)
17.1-in.
(57%)
10.3-in.
(34%)
17.3-in.
(58%) 30.0-in. 21.2-in.
HSSS 2205 #1
Dead End
15.6-in.
(52%)
11.5-in.
(38%)
HSSS 2205 #2
Jacking End
17.3-in.
(58%)
23.7-in.
(79%)
HSSS 2205 #2
Dead End
24.7-in.
(82%)
24.0-in.
(80%)
HSSS 2205 #3
Jacking End
13.6-in.
(45%)
13.3-in.
(44%)
HSSS 2205 #3
Dead End
21.7-in.
(72%)
20.9-in.
(70%)
The average transfer length of HSSS 2205 ½-in. strands and AISI 1080
conventional 7/16-in. (11.1 mm) strands are lower than the respective AASHTO and ACI
calculated values. At 14 days for the AISI 1080 strands, the average transfer lengths were
132
68% and 66% of the AASHTO and ACI 318 lengths, respectively. At 14 days for the
duplex HSSS 2205 strands, the average transfer lengths were 57% and 74% of the
AASHTO and ACI 318 lengths, respectively. Also, individual results at 14 and 273 days
ranged between 33% and 97% of the AASHTO prediction. Conversely, the transfer
lengths of conventional steel strands were less than the ACI equation, but not all of the
duplex HSSS 2205 strand lengths were.
In the case of pile HSSS 2205 #2, one end showed a transfer length higher than
the ACI 318 prediction before driving, while both ends showed a higher transfer length
after driving. Pile HSSS 2205 #2 was not easily removed from the form bed during
fabrication and additional mechanical hammering was required. This early disturbance
and vibration of the pile may have contributed to the relatively higher transfer length
values.
Transfer length results present an important variability, with values ranging from
9.8-in. (24.9 cm) to 25.5-in. (64.8 cm). Transfer length of pretensioned elements may be
influenced by strand diameter, specimen cover, concrete strength at strand release, and is
usually higher at the cut end (Oh and Kim, 2000; Oh et al., 2006). As mentioned in
Chapter 4, the use of concrete mixtures from different batches introduced variability in
the strength of concrete for different specimens. Even when concrete strength measured
in cylinders before strand release was 4,018 psi (27.7 MPa), it is expected that concrete
strength varied among the piles. Additionally, results show that the tested end of the pile
has a high influence on the obtained transfer length. Calculated transfer length at the
jacking end was lower than the dead end (anchorage end) in all cases. The anchorage end
133
had approximately 100 ft. (30.5 m) of free strand compared to about 10 ft. (3 m) at the
jacking end.
Pile driving had little effect on calculated transfer length. While Figures M.1 to
M.10 in Appendix M show an increase of the overall compressive strain after driving, the
transfer lengths remained the same.
9.3 Comparison of Results with Proposed Expressions
Expressions for transfer length reported by previous studies and detailed in
Chapter 2 are compared with experimental results in Table 9.2. Calculation of transfer
lengths considers prestress losses obtained by the AASHTO refined estimation method.
Percentage difference was calculated using Equation 9.2. Thus, a positive difference
between experimental lt and a proposed equation indicated that the equation is a
conservative prediction.
erimentalt
erimentaltproposedt
l
llDifference
exp,
exp,,
(9.2)
Experimental results are conservative compared to most of the expressions. The
equation described by Buckner (1995) for the best fit for transfer length results,
calculated using the 95% AMS method from data originated in many research programs,
is the only non-conservative expression for both types of steel.
Equations based only on the diameter of the prestressing strand (AASHTO LRFD
(2013) and Martin and Scott (1976)) are overly conservative for duplex HSSS 2205
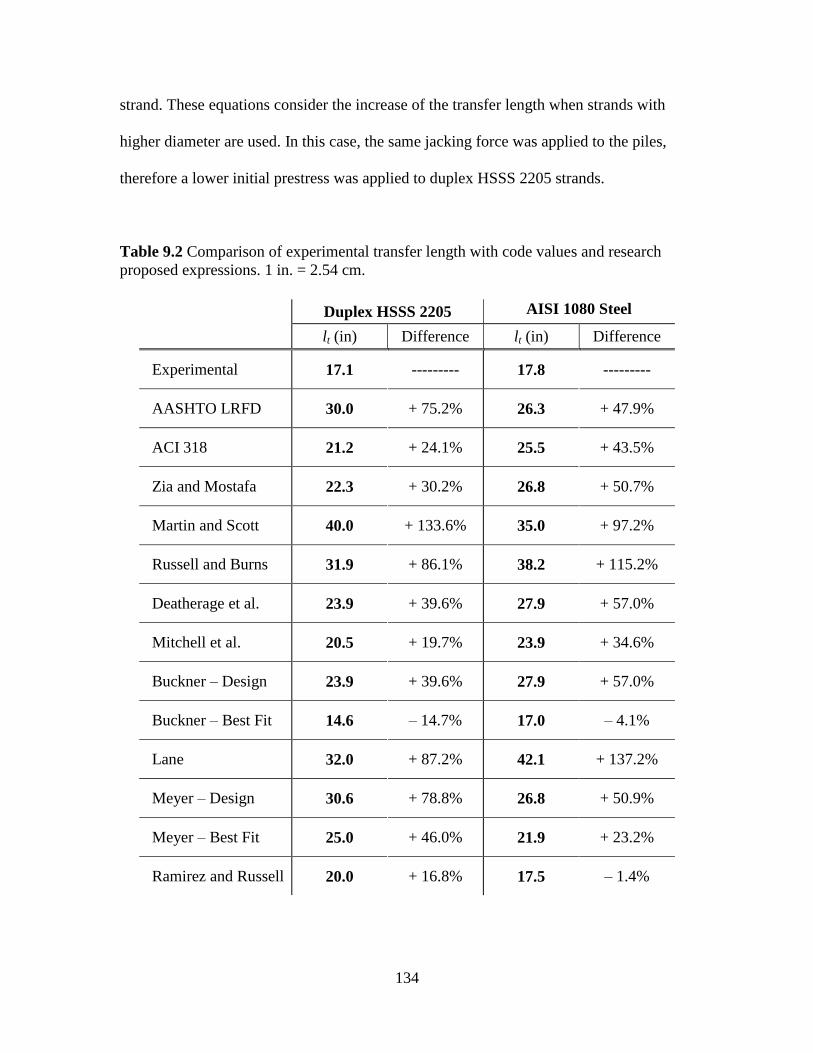
134
strand. These equations consider the increase of the transfer length when strands with
higher diameter are used. In this case, the same jacking force was applied to the piles,
therefore a lower initial prestress was applied to duplex HSSS 2205 strands.
Table 9.2 Comparison of experimental transfer length with code values and research
proposed expressions. 1 in. = 2.54 cm.
Duplex HSSS 2205 AISI 1080 Steel
lt (in) Difference lt (in) Difference
Experimental 17.1 --------- 17.8 ---------
AASHTO LRFD 30.0 + 75.2% 26.3 + 47.9%
ACI 318 21.2 + 24.1% 25.5 + 43.5%
Zia and Mostafa 22.3 + 30.2% 26.8 + 50.7%
Martin and Scott 40.0 + 133.6% 35.0 + 97.2%
Russell and Burns 31.9 + 86.1% 38.2 + 115.2%
Deatherage et al. 23.9 + 39.6% 27.9 + 57.0%
Mitchell et al. 20.5 + 19.7% 23.9 + 34.6%
Buckner – Design 23.9 + 39.6% 27.9 + 57.0%
Buckner – Best Fit 14.6 ‒ 14.7% 17.0 ‒ 4.1%
Lane 32.0 + 87.2% 42.1 + 137.2%
Meyer – Design 30.6 + 78.8% 26.8 + 50.9%
Meyer – Best Fit 25.0 + 46.0% 21.9 + 23.2%
Ramirez and Russell 20.0 + 16.8% 17.5 ‒ 1.4%
135
Expressions using stress in prestressing strand after release, fsi, (i.e., stress after
losses due to elastic shortening) and concrete strength at release, fci’, provide better
agreement with experimental transfer lengths than the predictions using the effective
stress at the prestressing strand after all losses, fse. It has been observed previously that
transfer length of pretensioned members is directly related to the stress of prestressing
strand right after or at release and inversely related to the strength of concrete at release
(Oh and Kim, 2000; Barnes et al., 2003). The use of these parameters can account for the
use of non-conventional strands.
9.4 Conclusions of the Chapter
Transfer length of prestressed concrete piles using duplex HSSS 2205 strands can
be conservatively estimated using predicted values by AASHTO LRFD and ACI 318.
Additionally, pile driving does not affect the transfer length of prestressed concrete piles.
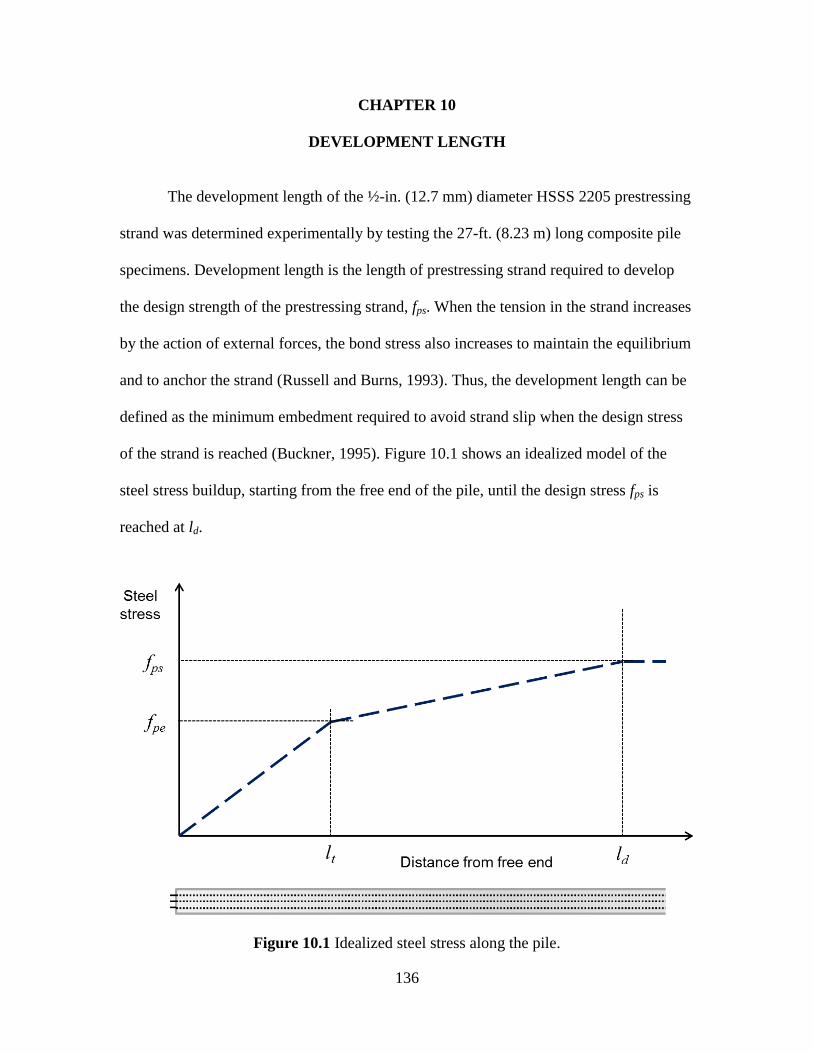
136
CHAPTER 10
DEVELOPMENT LENGTH
The development length of the ½-in. (12.7 mm) diameter HSSS 2205 prestressing
strand was determined experimentally by testing the 27-ft. (8.23 m) long composite pile
specimens. Development length is the length of prestressing strand required to develop
the design strength of the prestressing strand, fps. When the tension in the strand increases
by the action of external forces, the bond stress also increases to maintain the equilibrium
and to anchor the strand (Russell and Burns, 1993). Thus, the development length can be
defined as the minimum embedment required to avoid strand slip when the design stress
of the strand is reached (Buckner, 1995). Figure 10.1 shows an idealized model of the
steel stress buildup, starting from the free end of the pile, until the design stress fps is
reached at ld.
Figure 10.1 Idealized steel stress along the pile.
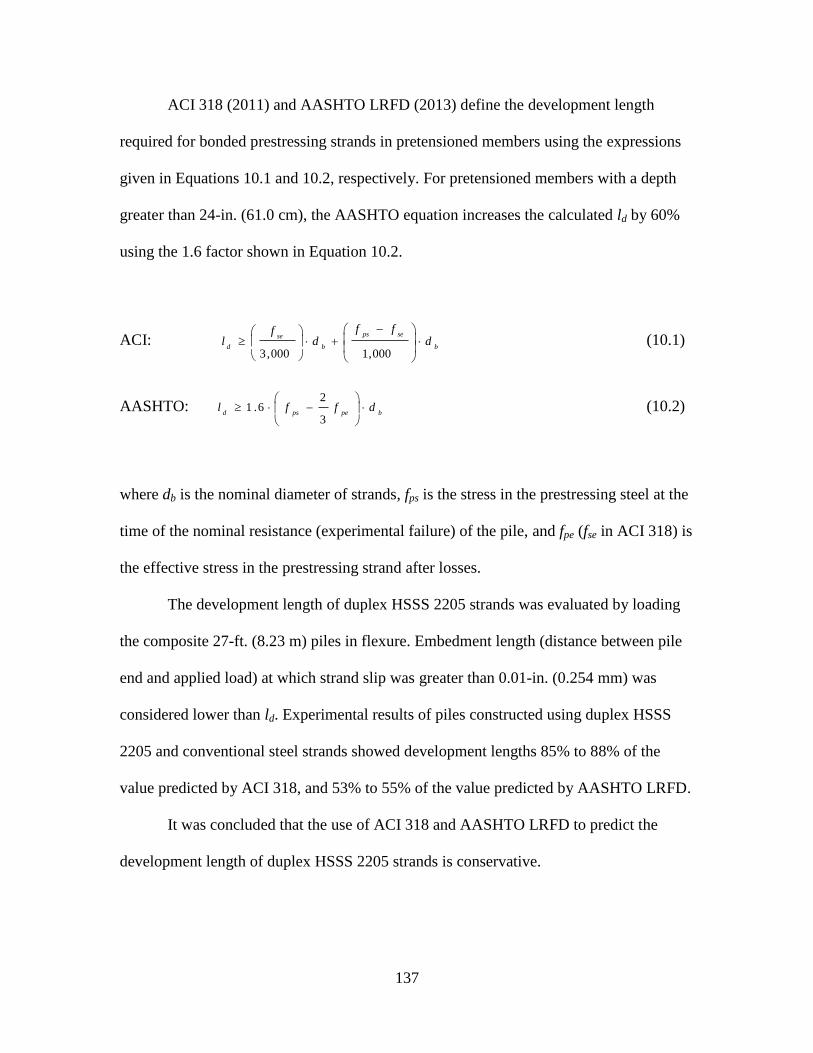
137
ACI 318 (2011) and AASHTO LRFD (2013) define the development length
required for bonded prestressing strands in pretensioned members using the expressions
given in Equations 10.1 and 10.2, respectively. For pretensioned members with a depth
greater than 24-in. (61.0 cm), the AASHTO equation increases the calculated ld by 60%
using the 1.6 factor shown in Equation 10.2.
ACI: b
seps
b
se
dd
ffd
fl
000,1000,3 (10.1)
AASHTO: bpepsd
dffl
3
26.1 (10.2)
where db is the nominal diameter of strands, fps is the stress in the prestressing steel at the
time of the nominal resistance (experimental failure) of the pile, and fpe (fse in ACI 318) is
the effective stress in the prestressing strand after losses.
The development length of duplex HSSS 2205 strands was evaluated by loading
the composite 27-ft. (8.23 m) piles in flexure. Embedment length (distance between pile
end and applied load) at which strand slip was greater than 0.01-in. (0.254 mm) was
considered lower than ld. Experimental results of piles constructed using duplex HSSS
2205 and conventional steel strands showed development lengths 85% to 88% of the
value predicted by ACI 318, and 53% to 55% of the value predicted by AASHTO LRFD.
It was concluded that the use of ACI 318 and AASHTO LRFD to predict the
development length of duplex HSSS 2205 strands is conservative.
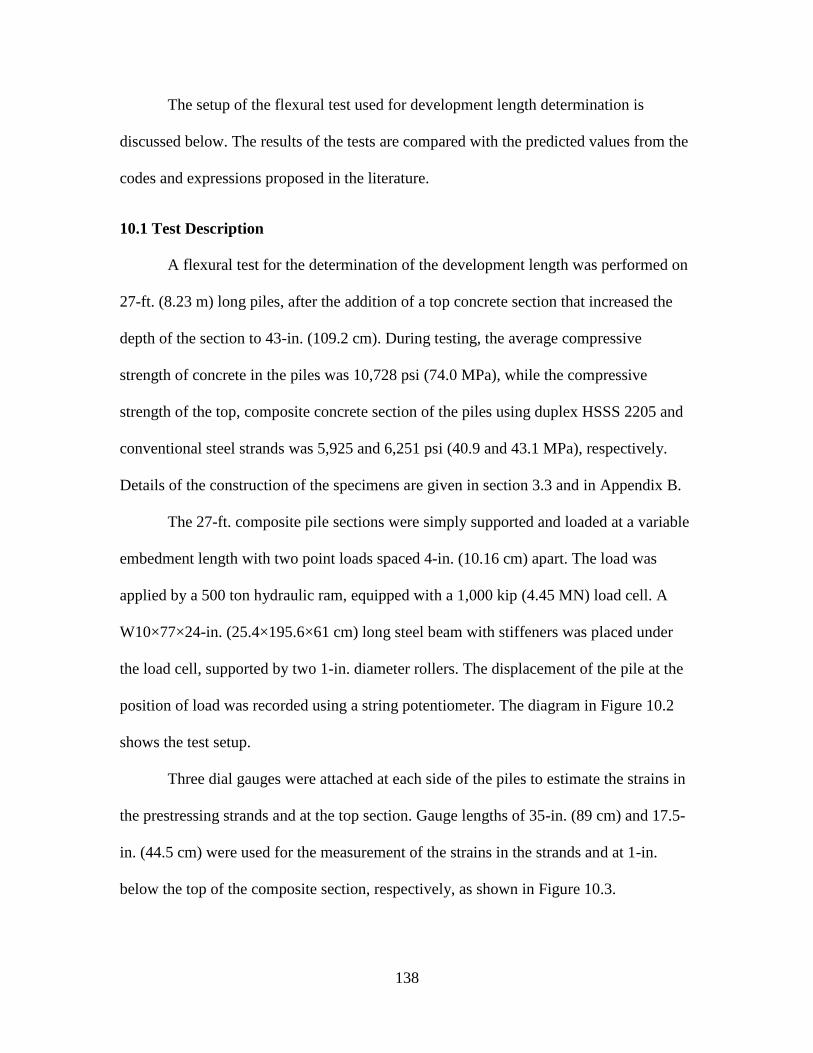
138
The setup of the flexural test used for development length determination is
discussed below. The results of the tests are compared with the predicted values from the
codes and expressions proposed in the literature.
10.1 Test Description
A flexural test for the determination of the development length was performed on
27-ft. (8.23 m) long piles, after the addition of a top concrete section that increased the
depth of the section to 43-in. (109.2 cm). During testing, the average compressive
strength of concrete in the piles was 10,728 psi (74.0 MPa), while the compressive
strength of the top, composite concrete section of the piles using duplex HSSS 2205 and
conventional steel strands was 5,925 and 6,251 psi (40.9 and 43.1 MPa), respectively.
Details of the construction of the specimens are given in section 3.3 and in Appendix B.
The 27-ft. composite pile sections were simply supported and loaded at a variable
embedment length with two point loads spaced 4-in. (10.16 cm) apart. The load was
applied by a 500 ton hydraulic ram, equipped with a 1,000 kip (4.45 MN) load cell. A
W10×77×24-in. (25.4×195.6×61 cm) long steel beam with stiffeners was placed under
the load cell, supported by two 1-in. diameter rollers. The displacement of the pile at the
position of load was recorded using a string potentiometer. The diagram in Figure 10.2
shows the test setup.
Three dial gauges were attached at each side of the piles to estimate the strains in
the prestressing strands and at the top section. Gauge lengths of 35-in. (89 cm) and 17.5-
in. (44.5 cm) were used for the measurement of the strains in the strands and at 1-in.
below the top of the composite section, respectively, as shown in Figure 10.3.

139
At the end of the pile closer to the applied load, four dial gauges were epoxied to
the bottom row of strands and two additional dial gauges were attached to the pile in
order to determine strand slip (Figure 10.4). A strand slip higher than 0.01-in. indicated
slip and that the bond stress capacity was not able to counteract the increasing stress in
the prestressing steel, meaning that the embedment length was lower than the
development length.
Load was applied monotonically and was intermittently paused to mark crack
patterns and to record dial gauge measurements.
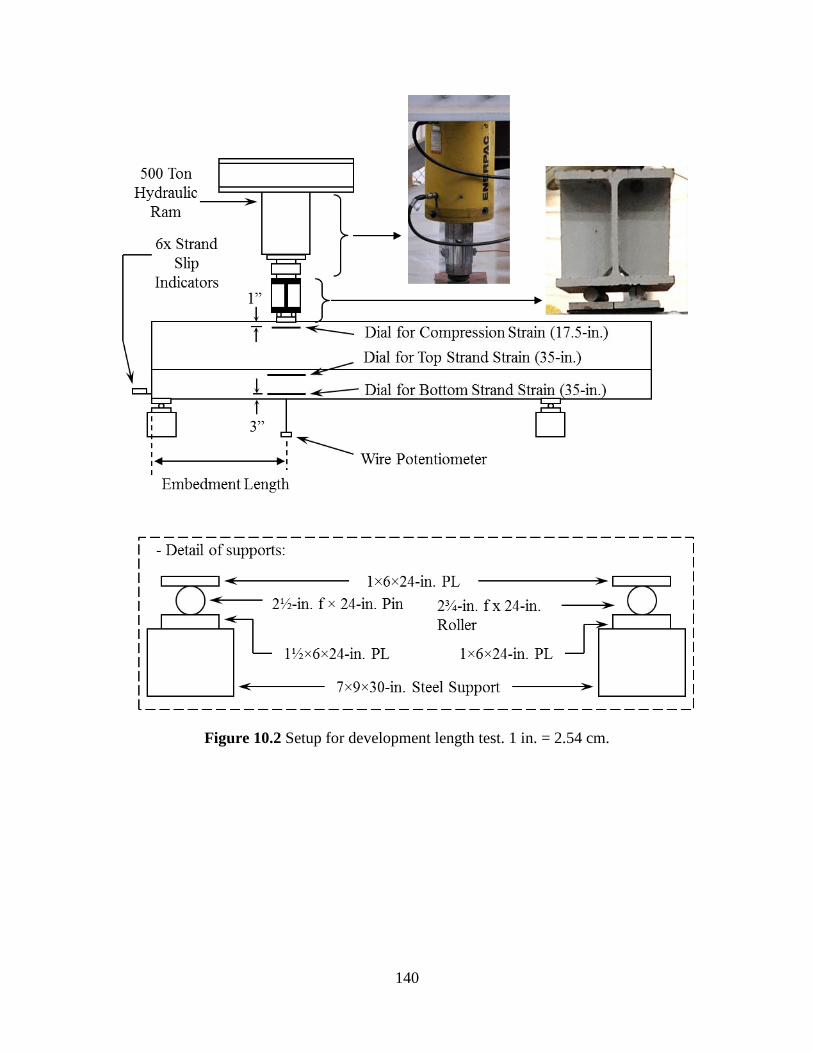
140
Figure 10.2 Setup for development length test. 1 in. = 2.54 cm.
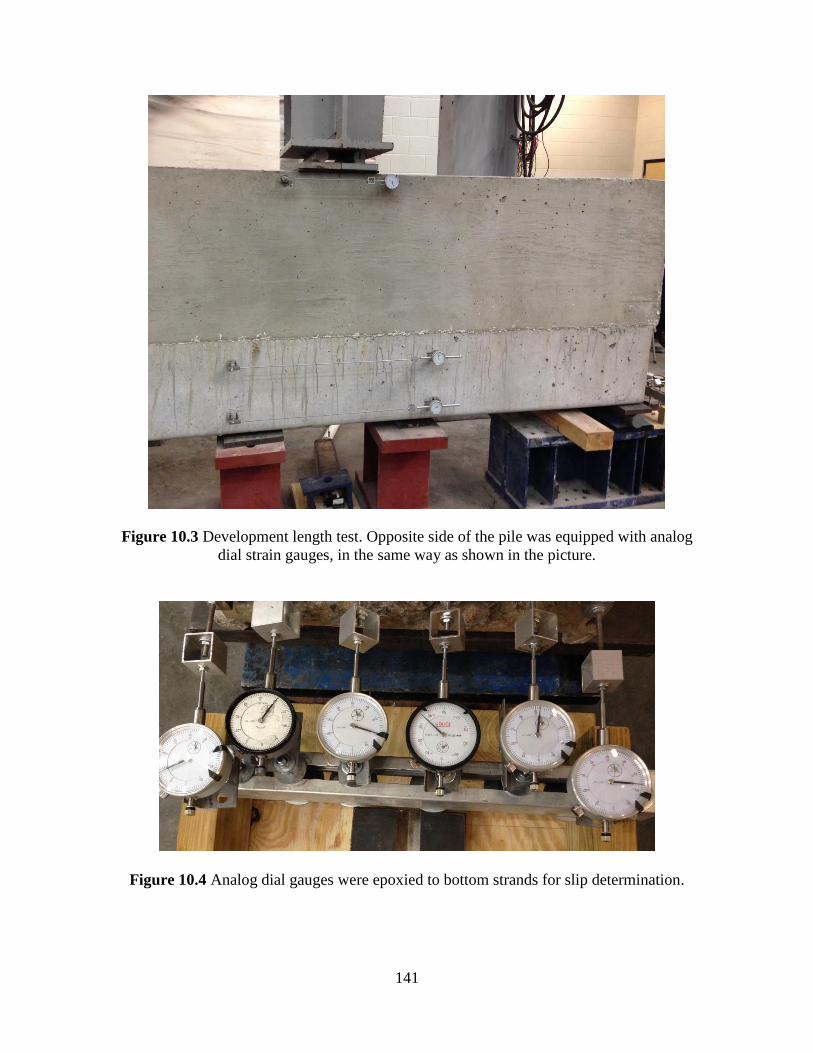
141
Figure 10.3 Development length test. Opposite side of the pile was equipped with analog
dial strain gauges, in the same way as shown in the picture.
Figure 10.4 Analog dial gauges were epoxied to bottom strands for slip determination.
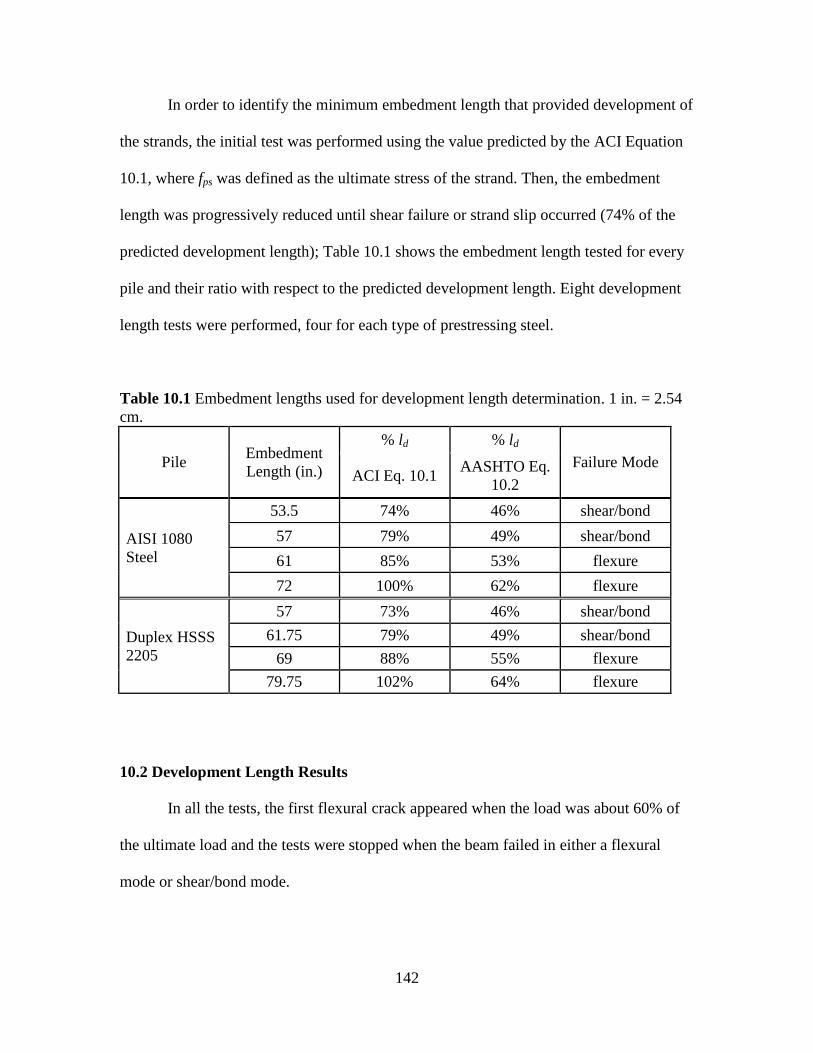
142
In order to identify the minimum embedment length that provided development of
the strands, the initial test was performed using the value predicted by the ACI Equation
10.1, where fps was defined as the ultimate stress of the strand. Then, the embedment
length was progressively reduced until shear failure or strand slip occurred (74% of the
predicted development length); Table 10.1 shows the embedment length tested for every
pile and their ratio with respect to the predicted development length. Eight development
length tests were performed, four for each type of prestressing steel.
Table 10.1 Embedment lengths used for development length determination. 1 in. = 2.54
cm.
Pile Embedment
Length (in.)
% ld % ld
Failure Mode ACI Eq. 10.1
AASHTO Eq.
10.2
AISI 1080
Steel
53.5 74% 46% shear/bond
57 79% 49% shear/bond
61 85% 53% flexure
72 100% 62% flexure
Duplex HSSS
2205
57 73% 46% shear/bond
61.75 79% 49% shear/bond
69 88% 55% flexure
79.75 102% 64% flexure
10.2 Development Length Results
In all the tests, the first flexural crack appeared when the load was about 60% of
the ultimate load and the tests were stopped when the beam failed in either a flexural
mode or shear/bond mode.
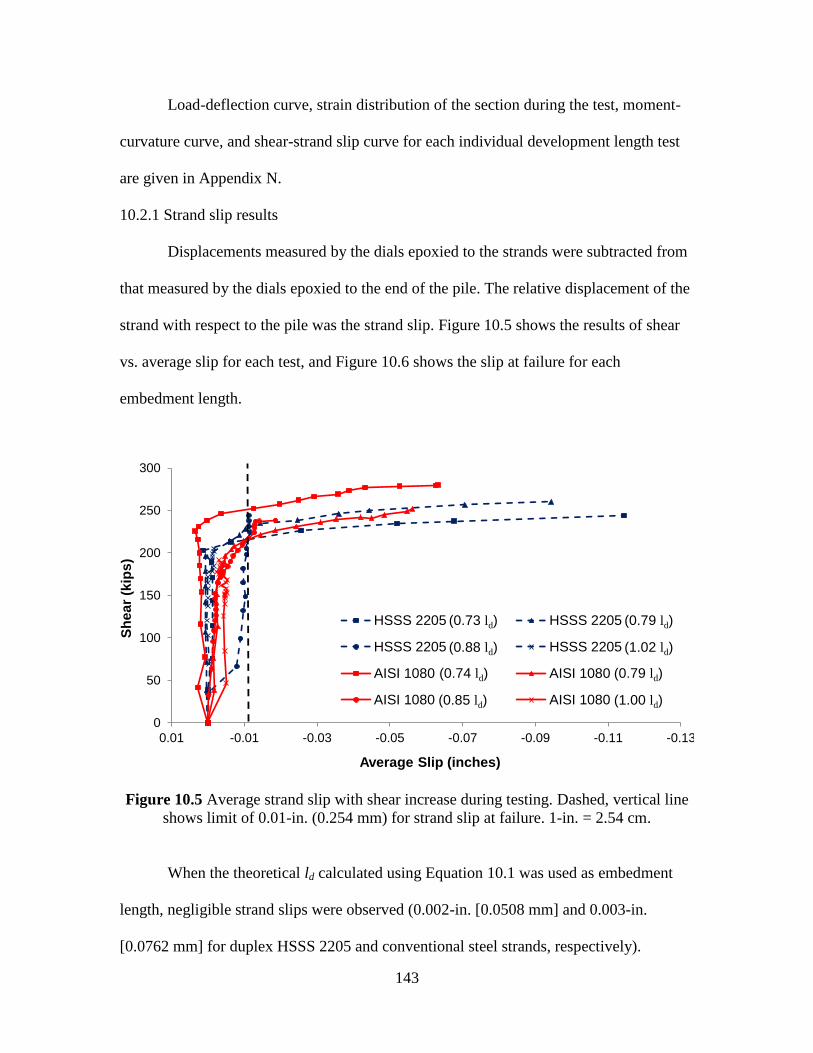
143
Load-deflection curve, strain distribution of the section during the test, moment-
curvature curve, and shear-strand slip curve for each individual development length test
are given in Appendix N.
10.2.1 Strand slip results
Displacements measured by the dials epoxied to the strands were subtracted from
that measured by the dials epoxied to the end of the pile. The relative displacement of the
strand with respect to the pile was the strand slip. Figure 10.5 shows the results of shear
vs. average slip for each test, and Figure 10.6 shows the slip at failure for each
embedment length.
Figure 10.5 Average strand slip with shear increase during testing. Dashed, vertical line
shows limit of 0.01-in. (0.254 mm) for strand slip at failure. 1-in. = 2.54 cm.
When the theoretical ld calculated using Equation 10.1 was used as embedment
length, negligible strand slips were observed (0.002-in. [0.0508 mm] and 0.003-in.
[0.0762 mm] for duplex HSSS 2205 and conventional steel strands, respectively).
0
50
100
150
200
250
300
-0.13-0.11-0.09-0.07-0.05-0.03-0.010.01
Sh
ea
r (k
ips
)
Average Slip (inches)
HSSS 2205 (0.73 ld) HSSS 2205 (0.79 ld)
HSSS 2205 (0.88 ld) HSSS 2205 (1.02 ld)
AISI 1080 (0.74 ld) AISI 1080 (0.79 ld)
AISI 1080 (0.85 ld) AISI 1080 (1.00 ld)
(0.79 ld)
(1.02 ld)
(0.79 ld)
(1.00 ld)(0.85 ld)
(0.74 ld)
(0.73 ld)
(0.88 ld)
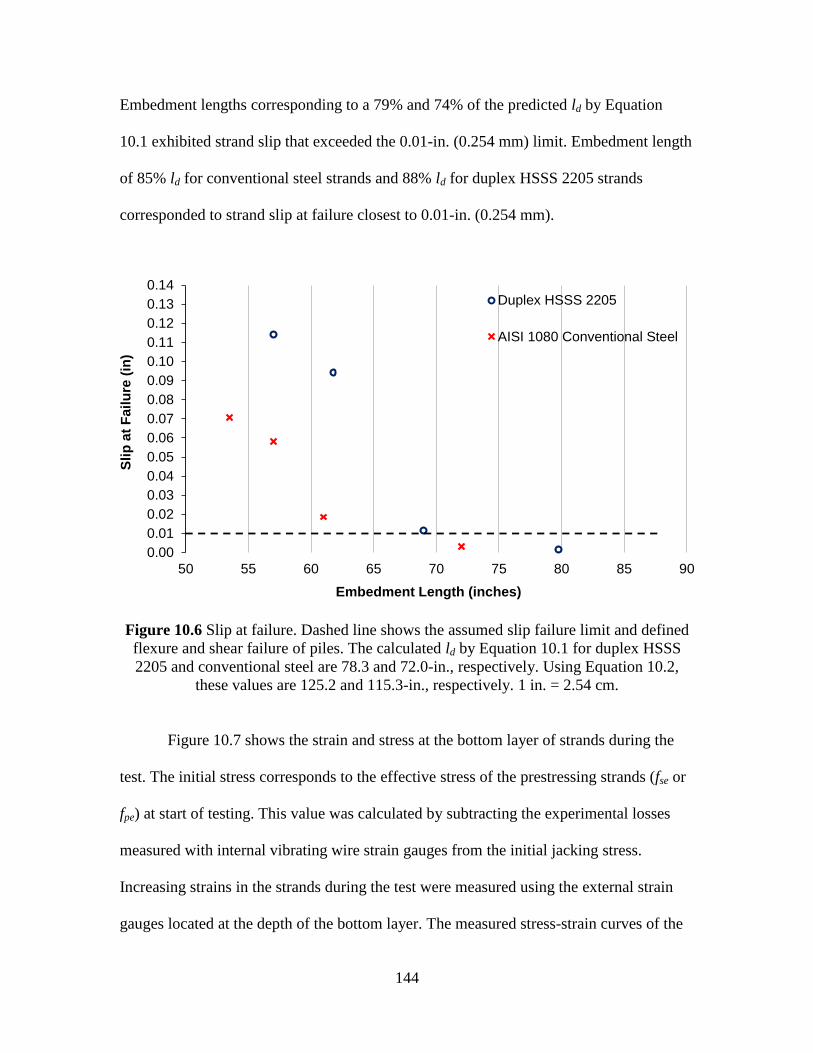
144
Embedment lengths corresponding to a 79% and 74% of the predicted ld by Equation
10.1 exhibited strand slip that exceeded the 0.01-in. (0.254 mm) limit. Embedment length
of 85% ld for conventional steel strands and 88% ld for duplex HSSS 2205 strands
corresponded to strand slip at failure closest to 0.01-in. (0.254 mm).
Figure 10.6 Slip at failure. Dashed line shows the assumed slip failure limit and defined
flexure and shear failure of piles. The calculated ld by Equation 10.1 for duplex HSSS
2205 and conventional steel are 78.3 and 72.0-in., respectively. Using Equation 10.2,
these values are 125.2 and 115.3-in., respectively. 1 in. = 2.54 cm.
Figure 10.7 shows the strain and stress at the bottom layer of strands during the
test. The initial stress corresponds to the effective stress of the prestressing strands (fse or
fpe) at start of testing. This value was calculated by subtracting the experimental losses
measured with internal vibrating wire strain gauges from the initial jacking stress.
Increasing strains in the strands during the test were measured using the external strain
gauges located at the depth of the bottom layer. The measured stress-strain curves of the
0.00
0.01
0.02
0.03
0.04
0.05
0.06
0.07
0.08
0.09
0.10
0.11
0.12
0.13
0.14
50 55 60 65 70 75 80 85 90
Sli
p a
t F
ail
ure
(in
)
Embedment Length (inches)
Duplex HSSS 2205
AISI 1080 Conventional Steel
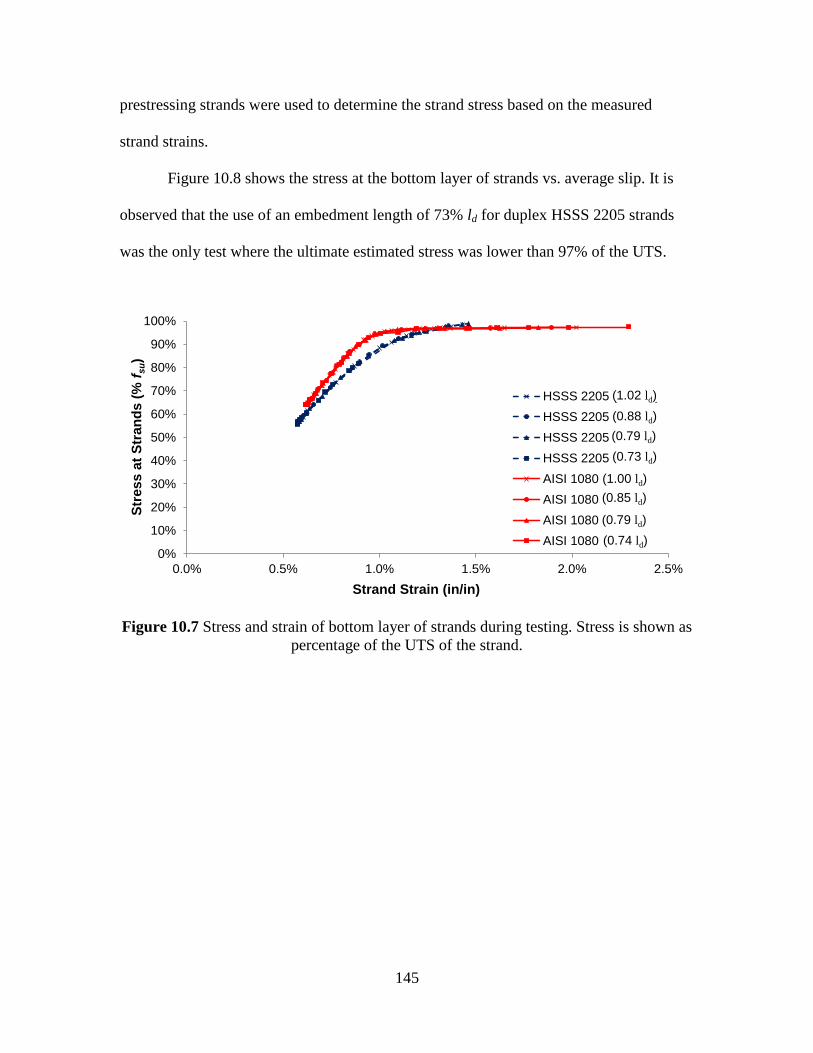
145
prestressing strands were used to determine the strand stress based on the measured
strand strains.
Figure 10.8 shows the stress at the bottom layer of strands vs. average slip. It is
observed that the use of an embedment length of 73% ld for duplex HSSS 2205 strands
was the only test where the ultimate estimated stress was lower than 97% of the UTS.
Figure 10.7 Stress and strain of bottom layer of strands during testing. Stress is shown as
percentage of the UTS of the strand.
0%
10%
20%
30%
40%
50%
60%
70%
80%
90%
100%
0.0% 0.5% 1.0% 1.5% 2.0% 2.5%
Str
ess a
t S
tran
ds (
% f
su)
Strand Strain (in/in)
HSSS 2205 (1.02 ld)
HSSS 2205 (0.88 ld)
HSSS 2205 (0.79 ld)
HSSS 2205 (0.73 ld)
AISI 1080 (1.00 ld)
AISI 1080 (0.85 ld)
AISI 1080 (0.79 ld)
AISI 1080 (0.74 ld)
(1.00 ld)
(0.79 ld)
(1.02 ld)
(0.79 ld)
(0.73 ld)
(0.88 ld)
(0.85 ld)
(0.74 ld)
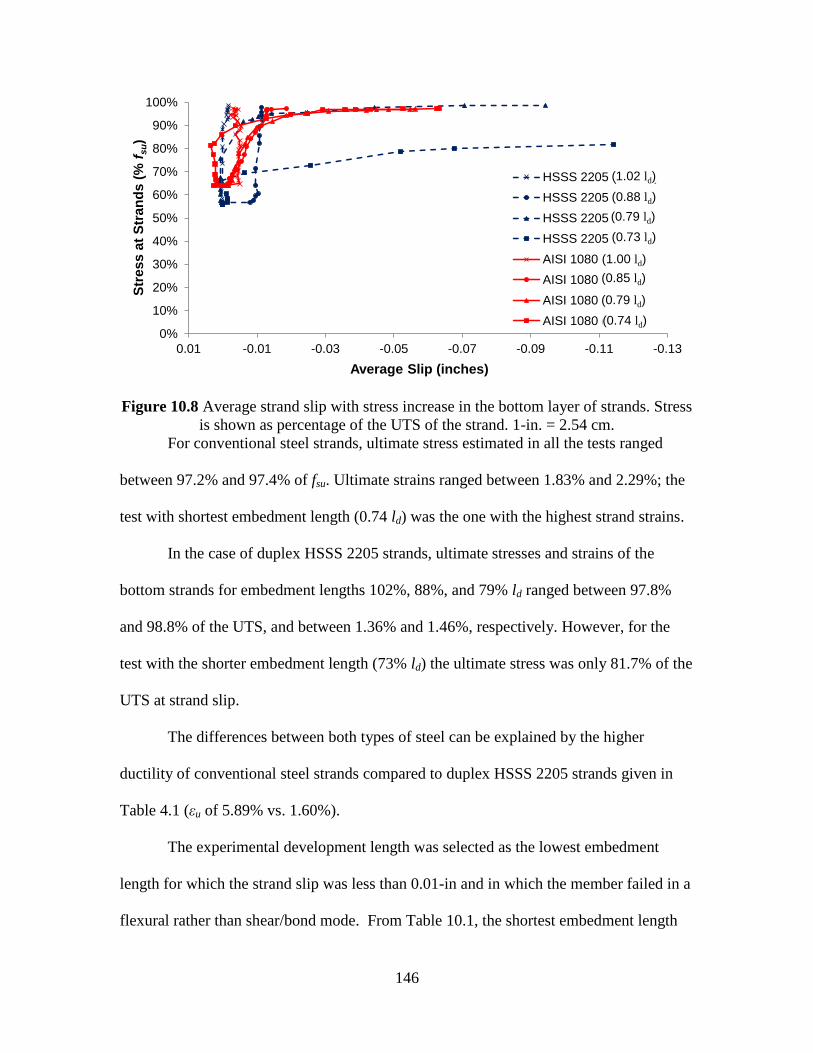
146
Figure 10.8 Average strand slip with stress increase in the bottom layer of strands. Stress
is shown as percentage of the UTS of the strand. 1-in. = 2.54 cm.
For conventional steel strands, ultimate stress estimated in all the tests ranged
between 97.2% and 97.4% of fsu. Ultimate strains ranged between 1.83% and 2.29%; the
test with shortest embedment length (0.74 ld) was the one with the highest strand strains.
In the case of duplex HSSS 2205 strands, ultimate stresses and strains of the
bottom strands for embedment lengths 102%, 88%, and 79% ld ranged between 97.8%
and 98.8% of the UTS, and between 1.36% and 1.46%, respectively. However, for the
test with the shorter embedment length (73% ld) the ultimate stress was only 81.7% of the
UTS at strand slip.
The differences between both types of steel can be explained by the higher
ductility of conventional steel strands compared to duplex HSSS 2205 strands given in
Table 4.1 (εu of 5.89% vs. 1.60%).
The experimental development length was selected as the lowest embedment
length for which the strand slip was less than 0.01-in and in which the member failed in a
flexural rather than shear/bond mode. From Table 10.1, the shortest embedment length
0%
10%
20%
30%
40%
50%
60%
70%
80%
90%
100%
-0.13-0.11-0.09-0.07-0.05-0.03-0.010.01
Str
es
s a
t S
tra
nd
s (
% f
su)
Average Slip (inches)
HSSS 2205 (1.02 ld)
HSSS 2205 (0.88 ld)
HSSS 2205 (0.79 ld)
HSSS 2205 (0.73 ld)
AISI 1080 (1.00 ld)
AISI 1080 (0.85 ld)
AISI 1080 (0.79 ld)
AISI 1080 (0.74 ld)
(1.00 ld)
(0.79 ld)
(1.02 ld)
(0.79 ld)
(0.73 ld)
(0.88 ld)
(0.85 ld)
(0.74 ld)
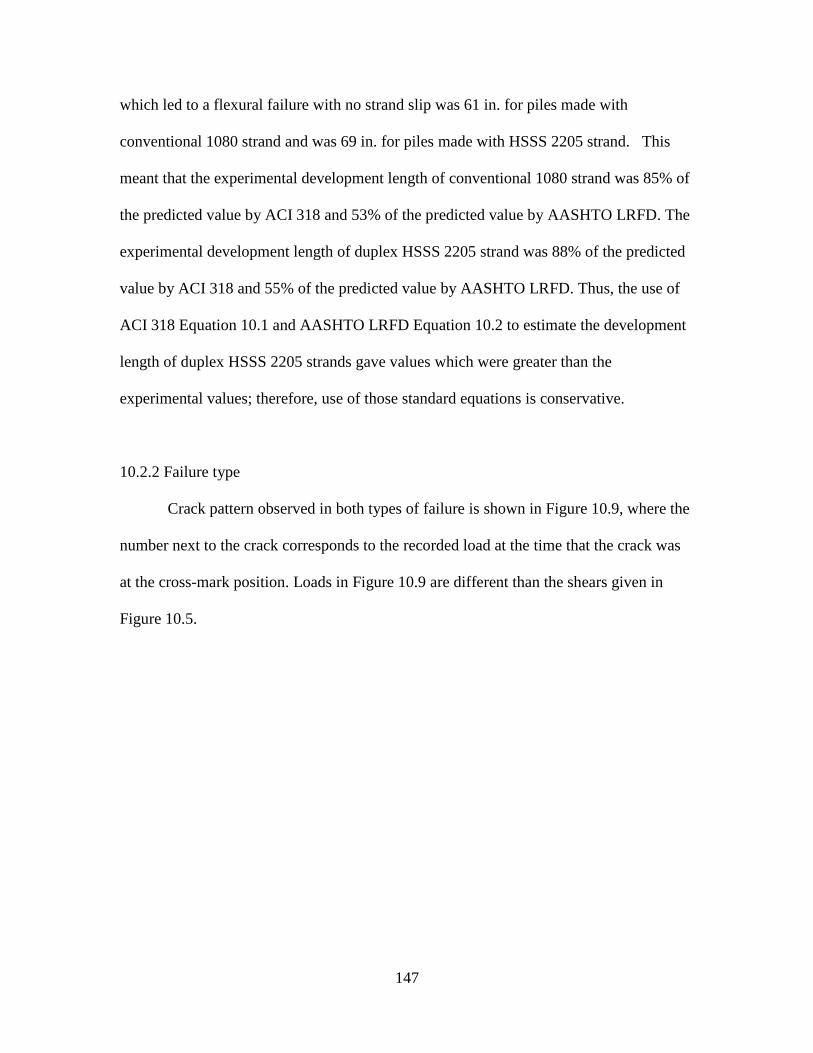
147
which led to a flexural failure with no strand slip was 61 in. for piles made with
conventional 1080 strand and was 69 in. for piles made with HSSS 2205 strand. This
meant that the experimental development length of conventional 1080 strand was 85% of
the predicted value by ACI 318 and 53% of the predicted value by AASHTO LRFD. The
experimental development length of duplex HSSS 2205 strand was 88% of the predicted
value by ACI 318 and 55% of the predicted value by AASHTO LRFD. Thus, the use of
ACI 318 Equation 10.1 and AASHTO LRFD Equation 10.2 to estimate the development
length of duplex HSSS 2205 strands gave values which were greater than the
experimental values; therefore, use of those standard equations is conservative.
10.2.2 Failure type
Crack pattern observed in both types of failure is shown in Figure 10.9, where the
number next to the crack corresponds to the recorded load at the time that the crack was
at the cross-mark position. Loads in Figure 10.9 are different than the shears given in
Figure 10.5.
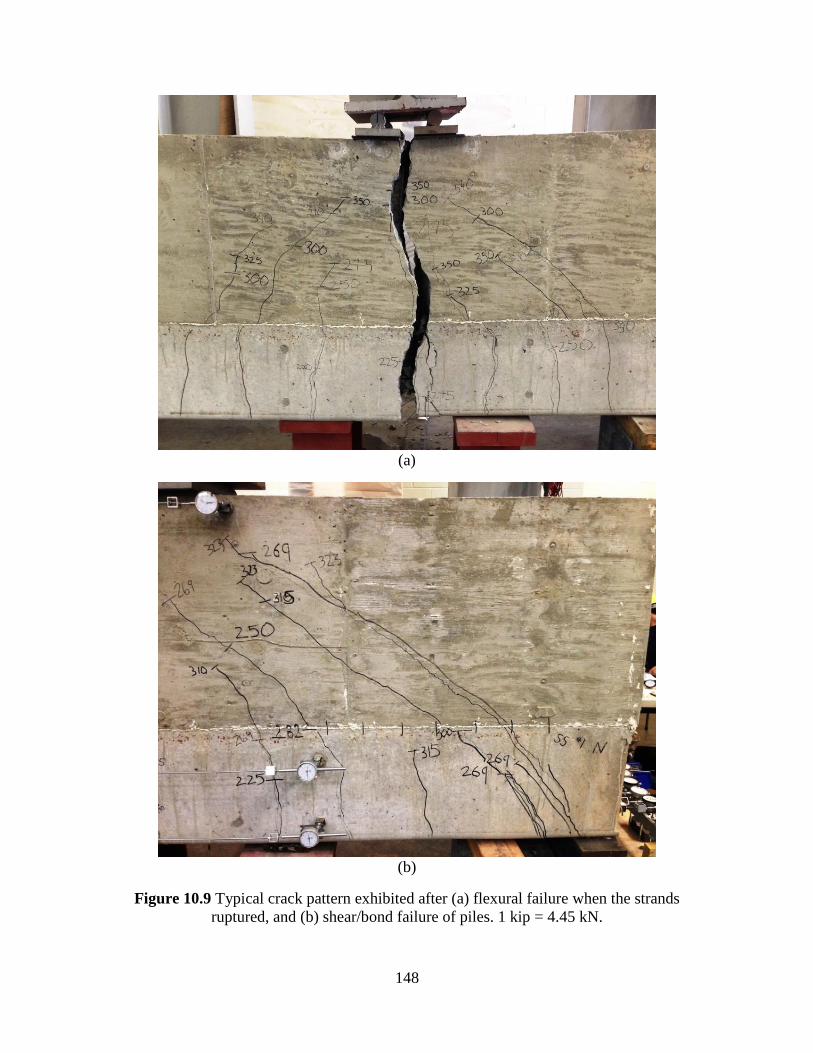
148
(a)
(b)
Figure 10.9 Typical crack pattern exhibited after (a) flexural failure when the strands
ruptured, and (b) shear/bond failure of piles. 1 kip = 4.45 kN.
149
Good composite behavior was evidenced by the continuity of the cracks between
the precast pile and poured-in-place top section.
Piles loaded at an embedment length around 102% and 88% of ld predicted by
ACI 318 exhibited a typical flexural failure (Figure 10.9a) with the HSSS 2205 strand
breaking at the end of the test and with strand slips lower or similar to the 0.01-in. (0.254
mm) limit. After strand breaking, the rupture of the whole section was observed at the
location of the applied load.
Piles loaded at embedment lengths of 79% and 73% of ld predicted by ACI 318
showed shear failure (Figure 10.9b). Shear cracks initiated at 2 to 8-in. (5 to 23 cm) from
the pin support at a moment that coincided with the onset of slip of the strands (see
Figure 10.5). Large increases of strand slip after initiation of shear cracks in the transfer
length zone have also been reported by Meyer (2002) and Russell (1992).
The first shear crack extended from the bottom of the pile to the mid-height of the
original pile, passing through at least two rows of strands at an angle approximately 45°
from the horizontal. Tests that exhibited shear failures were stopped after a sudden drop
of the recorded load was observed, which corresponded to strand slip and before a
general rupture of the section.
10.2.3 Moment-curvature behavior
The experimental curvature was estimated using the strain distributions included
in Appendix N, which were determined from the strain gauges attached to the sides of the
composite pile specimens; the experimental moment was estimated using the applied load
and the actual position of the load with respect to the supports.
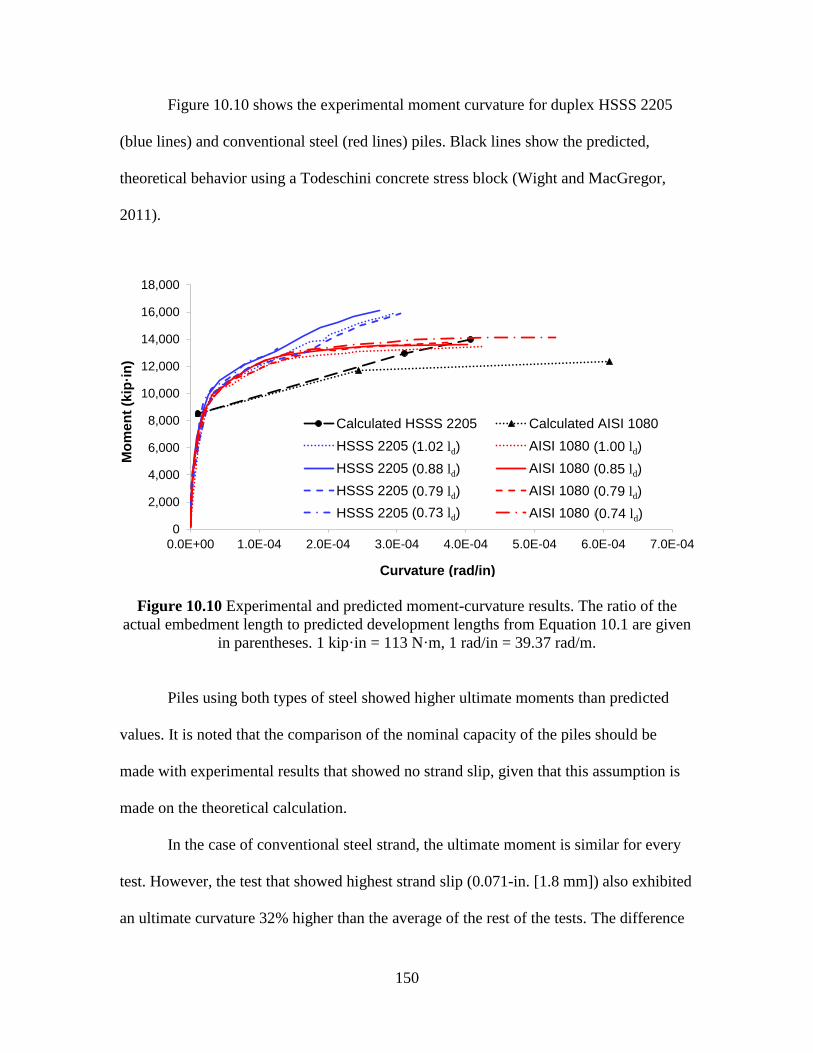
150
Figure 10.10 shows the experimental moment curvature for duplex HSSS 2205
(blue lines) and conventional steel (red lines) piles. Black lines show the predicted,
theoretical behavior using a Todeschini concrete stress block (Wight and MacGregor,
2011).
Figure 10.10 Experimental and predicted moment-curvature results. The ratio of the
actual embedment length to predicted development lengths from Equation 10.1 are given
in parentheses. 1 kip·in = 113 N·m, 1 rad/in = 39.37 rad/m.
Piles using both types of steel showed higher ultimate moments than predicted
values. It is noted that the comparison of the nominal capacity of the piles should be
made with experimental results that showed no strand slip, given that this assumption is
made on the theoretical calculation.
In the case of conventional steel strand, the ultimate moment is similar for every
test. However, the test that showed highest strand slip (0.071-in. [1.8 mm]) also exhibited
an ultimate curvature 32% higher than the average of the rest of the tests. The difference
0
2,000
4,000
6,000
8,000
10,000
12,000
14,000
16,000
18,000
0.0E+00 1.0E-04 2.0E-04 3.0E-04 4.0E-04 5.0E-04 6.0E-04 7.0E-04
Mo
me
nt
(kip
·in
)
Curvature (rad/in)
Calculated HSSS 2205 Calculated AISI 1080
HSSS 2205 (1.02 Ld) AISI 1080 (1.00 Ld)
HSSS 2205 (0.88 Ld) AISI 1080 (0.85 Ld)
HSSS 2205 (0.79 Ld) AISI 1080 (0.79 Ld)
HSSS 2205 (0.73 Ld) AISI 1080 (0.74 Ld)(0.73 ld)
(0.79 ld)
(0.88 ld)
(1.02 ld) (1.00 ld)
(0.85 ld)
(0.79 ld)
(0.74 ld)
151
in ultimate curvature can be attributed to a higher deformation of the horizontal strain
gauges due to the combined effect of the applied load and the slip of the strands.
However, using the measurement of the deformations of the pile, an estimated ultimate
stress in the bottom strands of about 273.5 ksi was calculated in each case.
For the piles using duplex HSSS 2205 strands, similar behavior was observed on
tests with the three higher embedment lengths, but the test with the lowest embedment
length and highest strand slip (0.114-in. [2.9 mm]) present an ultimate moment and
curvature 17% and 57% lower than the average of the rest of the tests, respectively. Also,
the estimated ultimate stress in the bottom strands dropped from 237.9 ksi (le = 1.02 ld,
[1,640 MPa]) to 197.4 ksi (le = 0.73 ld, [1,361 MPa]).
10.2.4 Evaluation of development length using experimental prestress losses
The calculation of fpe and fse in Equations 10.1 and 10.2 was performed by the
estimation of prestress losses at testing time using the AASHTO refined method (Chapter
8 and Appendix K). However, the measured losses were lower than the predicted ones.
Thus, the use of experimental losses leads to lower calculated development lengths for
the piles.
Estimated prestress losses during testing were 21.0 and 19.6 ksi (145 MPa and
135 MPa) for piles using conventional steel and duplex HSSS 2205 strands, respectively;
measured prestress losses closest to testing time were 14.0 and 12.3 ksi (96.5 MPa and
84.8 MPa). Using the latter values for the estimation of the development length in
Equation 10.1, ld changes from 72.0-in. to 70.0-in. (182.9 to 177.8 cm) for piles using
152
conventional steel, and from 78.3-in. to 75.8-in. (198.9 to 192.5 cm) for piles using
duplex HSSS 2205.
Considering this change, embedment lengths that exhibited strand slips close to
0.01-in. correspond to 87% and 91% of ld based on Equation 10.1 for piles using
conventional steel and duplex HSSS 2205 strands, respectively. Thus, the experimental
estimations of development length remain conservative when actual losses are considered
in the calculation of ld.
10.3 Comparison of Results with Proposed Expressions
Table 10.2 shows the experimental estimation of the development length
compared to expressions proposed in the literature. The difference was calculated with
respect to the experimental estimation, according to Equation 10.3.
erimentald
erimentaldproposedd
l
llDifference
exp,
exp,,
(10.3)
Expressions with positive difference were considered conservative. Thus,
equations proposed by Russell and Burns (1993), Mitchell et al. (1993), and Ramirez and
Russell (2008) are non-conservative expressions for the estimation of ld.
Good approximations of development length consider the nominal diameter of
strand, db, the stress in the strand after transfer, fsi, the effective stress after prestress
losses, fpe or fse, and the stress in the strand at nominal strength of member, fps. Concrete
strength at strand release is also considered by some of the theoretical relations.
153
Table 10.2 Comparison of experimental ld with codes values and research proposed
expressions for development length. 1 in. = 2.54 cm.
Duplex HSSS 2205 AISI 1080 Steel
ld (in) Difference ld (in) Difference
Experimental 69.0 --------- 61.0 ---------
ACI 318 78.3 + 13.4% 72.0 + 18.1%
AASHTO LRFD 125.2 + 81.4% 115.3 + 89.0%
Zia and Mostafa 93.5 + 35.6% 85.0 + 39.3%
Martin and Scott 115.3 + 67.1% 141.5 + 132.0%
Russell and Burns 52.3 ‒ 24.2% 55.4 ‒ 9.2%
Deatherage et al. 109.4 + 58.6% 97.7 + 60.2%
Mitchell et al. 59.5 ‒ 13.8% 55.7 ‒ 8.6%
Buckner 94.6 + 37.1% 165.5 + 171.4%
Lane 93.0 + 34.8% 88.5 + 44.3%
Meyer – Design 84.9 + 23.1% 71.0 + 16.4%
Meyer – Best Fit 76.7 + 11.2% 63.9 + 4.7%
Ramirez and Russell 50.0 ‒ 27.5% 43.8 ‒ 28.3%
Equations included in ACI 318 (2011) and AASHTO LRFD (2013) provided
conservative estimations for transfer and development length. Additionally, Table 10.3
shows the expressions proposed in the literature that gave closer approximations of
experimental transfer and development length for piles using duplex HSSS 2205 and
conventional steel strands. The selection of the best proposed equations other than ACI
154
and AASHTO are those which gave a ratio of experimental-to-predicted development
length and a ratio of experimental-to-predicted transfer length less than 1.0.
Table 10.3 Expressions closer to experimental values.
Zia and Mostafa
(1977)
lt 6451 .df
f.l
b'
ci
si
t
ld bsesub
ci
si
ddffd
f
f.l
25.16.451
'
Deatherage et al.
(1994)
lt 3
bsi
t
dfl
ld bsesu
bsi
ddff.
dfl
501
3
Meyer (2002)
lt 'b
000,6d50
ci
t
fl
ld b'd
000,550
seps
ci
dff
fl
10.4 Conclusions of the Chapter
Experimental development length of duplex HSSS 2205 strands were found to be
88% of the specified value computed by ACI 318, and 55% of the specified value
computed by AASHTO LRFD. Thus, development length of prestressed concrete piles
using duplex HSSS 2205 strands can be conservatively estimated using equations given
by AASHTO LRFD and ACI 318.
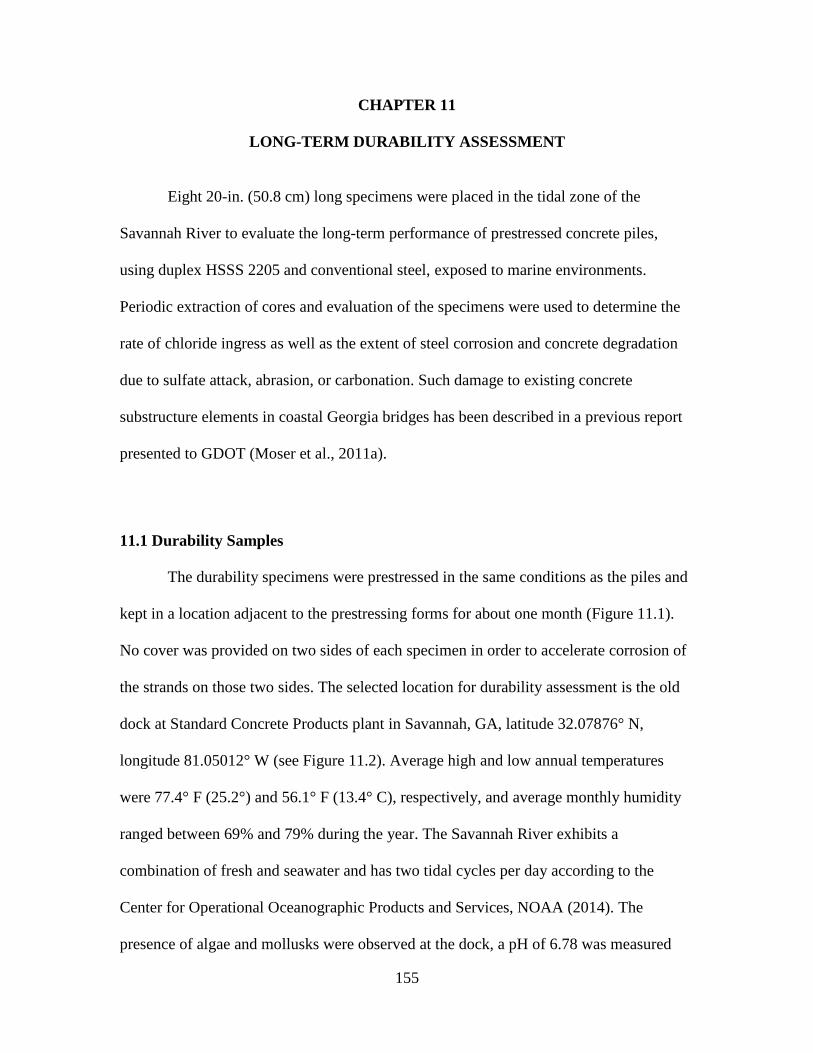
155
CHAPTER 11
LONG-TERM DURABILITY ASSESSMENT
Eight 20-in. (50.8 cm) long specimens were placed in the tidal zone of the
Savannah River to evaluate the long-term performance of prestressed concrete piles,
using duplex HSSS 2205 and conventional steel, exposed to marine environments.
Periodic extraction of cores and evaluation of the specimens were used to determine the
rate of chloride ingress as well as the extent of steel corrosion and concrete degradation
due to sulfate attack, abrasion, or carbonation. Such damage to existing concrete
substructure elements in coastal Georgia bridges has been described in a previous report
presented to GDOT (Moser et al., 2011a).
11.1 Durability Samples
The durability specimens were prestressed in the same conditions as the piles and
kept in a location adjacent to the prestressing forms for about one month (Figure 11.1).
No cover was provided on two sides of each specimen in order to accelerate corrosion of
the strands on those two sides. The selected location for durability assessment is the old
dock at Standard Concrete Products plant in Savannah, GA, latitude 32.07876° N,
longitude 81.05012° W (see Figure 11.2). Average high and low annual temperatures
were 77.4° F (25.2°) and 56.1° F (13.4° C), respectively, and average monthly humidity
ranged between 69% and 79% during the year. The Savannah River exhibits a
combination of fresh and seawater and has two tidal cycles per day according to the
Center for Operational Oceanographic Products and Services, NOAA (2014). The
presence of algae and mollusks were observed at the dock, a pH of 6.78 was measured
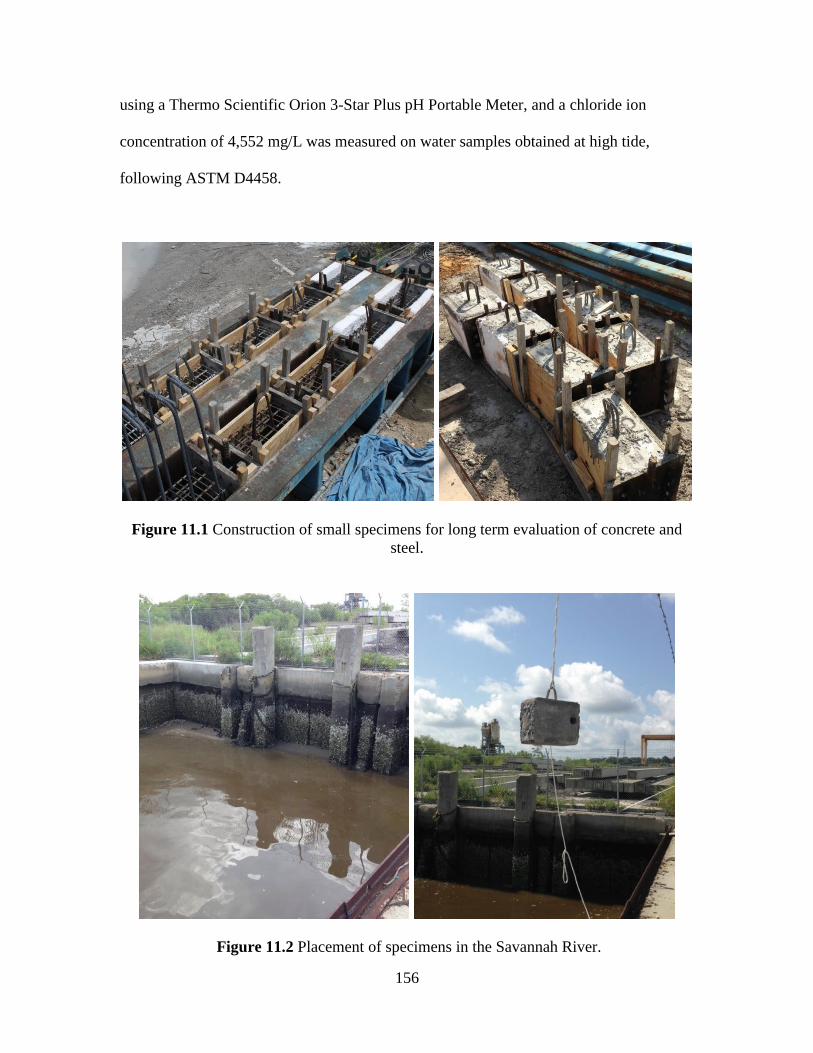
156
using a Thermo Scientific Orion 3-Star Plus pH Portable Meter, and a chloride ion
concentration of 4,552 mg/L was measured on water samples obtained at high tide,
following ASTM D4458.
Figure 11.1 Construction of small specimens for long term evaluation of concrete and
steel.
Figure 11.2 Placement of specimens in the Savannah River.
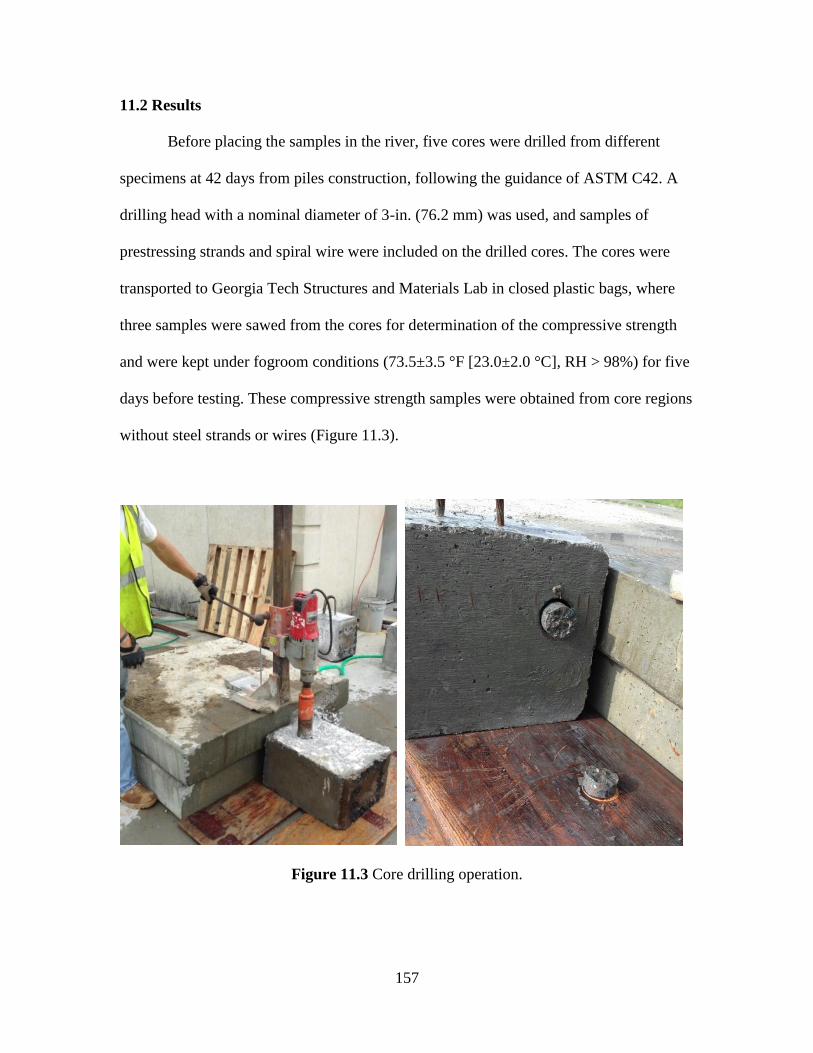
157
11.2 Results
Before placing the samples in the river, five cores were drilled from different
specimens at 42 days from piles construction, following the guidance of ASTM C42. A
drilling head with a nominal diameter of 3-in. (76.2 mm) was used, and samples of
prestressing strands and spiral wire were included on the drilled cores. The cores were
transported to Georgia Tech Structures and Materials Lab in closed plastic bags, where
three samples were sawed from the cores for determination of the compressive strength
and were kept under fogroom conditions (73.5±3.5 °F [23.0±2.0 °C], RH > 98%) for five
days before testing. These compressive strength samples were obtained from core regions
without steel strands or wires (Figure 11.3).
Figure 11.3 Core drilling operation.
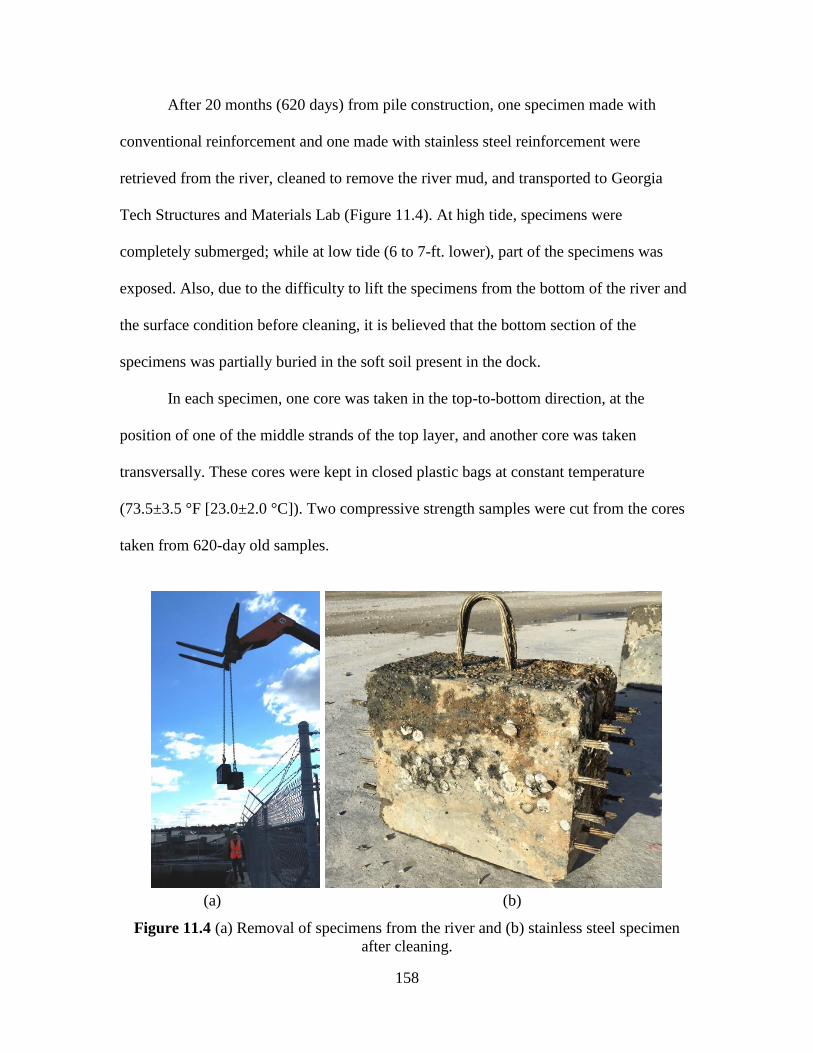
158
After 20 months (620 days) from pile construction, one specimen made with
conventional reinforcement and one made with stainless steel reinforcement were
retrieved from the river, cleaned to remove the river mud, and transported to Georgia
Tech Structures and Materials Lab (Figure 11.4). At high tide, specimens were
completely submerged; while at low tide (6 to 7-ft. lower), part of the specimens was
exposed. Also, due to the difficulty to lift the specimens from the bottom of the river and
the surface condition before cleaning, it is believed that the bottom section of the
specimens was partially buried in the soft soil present in the dock.
In each specimen, one core was taken in the top-to-bottom direction, at the
position of one of the middle strands of the top layer, and another core was taken
transversally. These cores were kept in closed plastic bags at constant temperature
(73.5±3.5 °F [23.0±2.0 °C]). Two compressive strength samples were cut from the cores
taken from 620-day old samples.
(a) (b)
Figure 11.4 (a) Removal of specimens from the river and (b) stainless steel specimen
after cleaning.
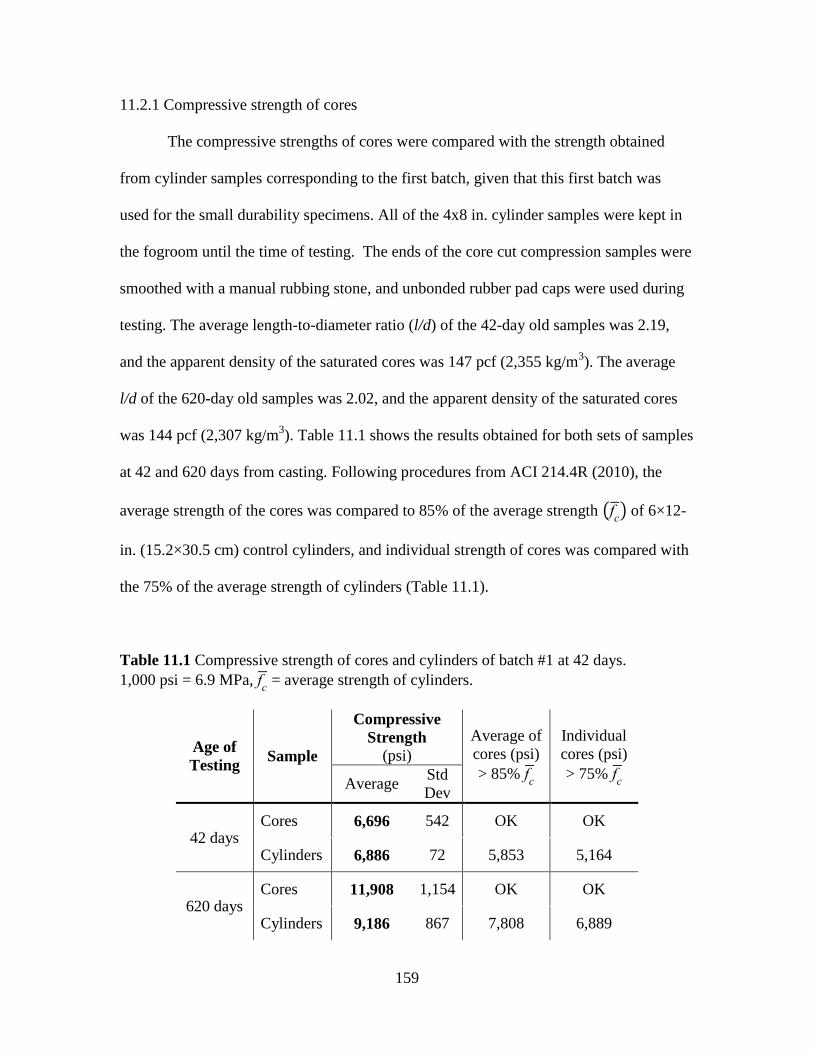
159
11.2.1 Compressive strength of cores
The compressive strengths of cores were compared with the strength obtained
from cylinder samples corresponding to the first batch, given that this first batch was
used for the small durability specimens. All of the 4x8 in. cylinder samples were kept in
the fogroom until the time of testing. The ends of the core cut compression samples were
smoothed with a manual rubbing stone, and unbonded rubber pad caps were used during
testing. The average length-to-diameter ratio (l/d) of the 42-day old samples was 2.19,
and the apparent density of the saturated cores was 147 pcf (2,355 kg/m3). The average
l/d of the 620-day old samples was 2.02, and the apparent density of the saturated cores
was 144 pcf (2,307 kg/m3). Table 11.1 shows the results obtained for both sets of samples
at 42 and 620 days from casting. Following procedures from ACI 214.4R (2010), the
average strength of the cores was compared to 85% of the average strength (fc
) of 6×12-
in. (15.2×30.5 cm) control cylinders, and individual strength of cores was compared with
the 75% of the average strength of cylinders (Table 11.1).
Table 11.1 Compressive strength of cores and cylinders of batch #1 at 42 days.
1,000 psi = 6.9 MPa, fc
= average strength of cylinders.
Age of
Testing Sample
Compressive
Strength
(psi)
Average of
cores (psi)
> 85% fc
Individual
cores (psi)
> 75% fc
Average
Std
Dev
42 days Cores 6,696 542 OK OK
Cylinders 6,886 72 5,853 5,164
620 days Cores 11,908 1,154 OK OK
Cylinders 9,186 867 7,808 6,889
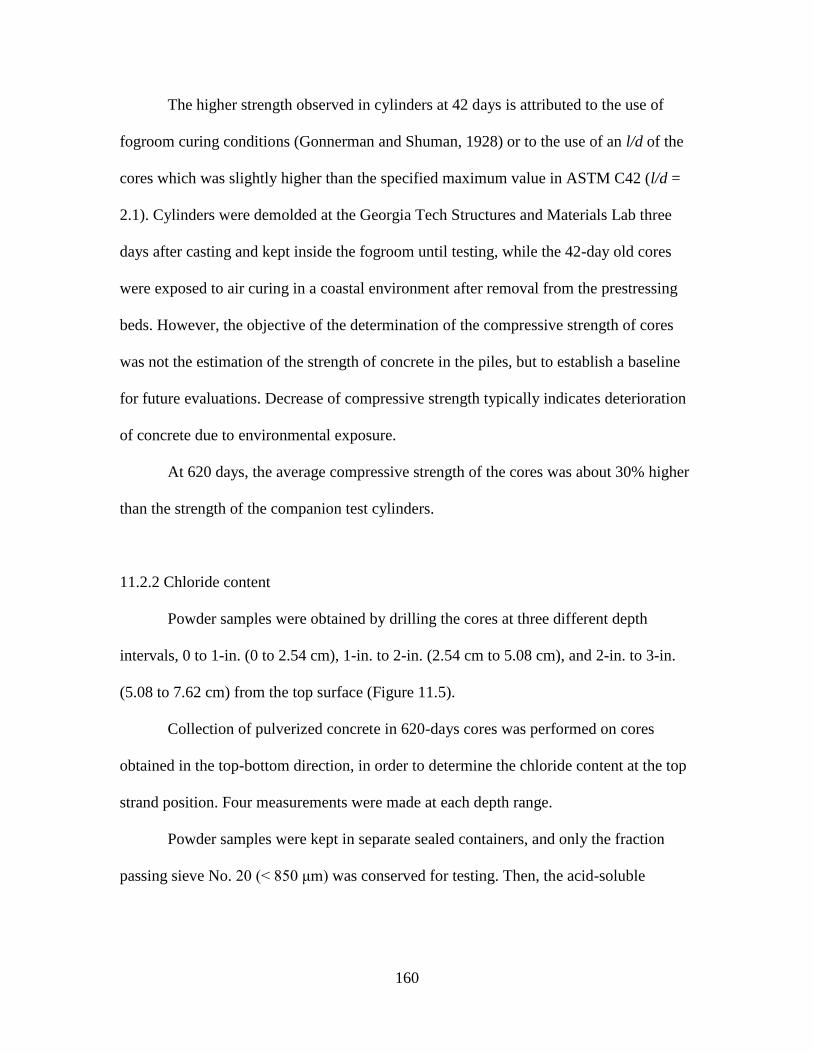
160
The higher strength observed in cylinders at 42 days is attributed to the use of
fogroom curing conditions (Gonnerman and Shuman, 1928) or to the use of an l/d of the
cores which was slightly higher than the specified maximum value in ASTM C42 (l/d =
2.1). Cylinders were demolded at the Georgia Tech Structures and Materials Lab three
days after casting and kept inside the fogroom until testing, while the 42-day old cores
were exposed to air curing in a coastal environment after removal from the prestressing
beds. However, the objective of the determination of the compressive strength of cores
was not the estimation of the strength of concrete in the piles, but to establish a baseline
for future evaluations. Decrease of compressive strength typically indicates deterioration
of concrete due to environmental exposure.
At 620 days, the average compressive strength of the cores was about 30% higher
than the strength of the companion test cylinders.
11.2.2 Chloride content
Powder samples were obtained by drilling the cores at three different depth
intervals, 0 to 1-in. (0 to 2.54 cm), 1-in. to 2-in. (2.54 cm to 5.08 cm), and 2-in. to 3-in.
(5.08 to 7.62 cm) from the top surface (Figure 11.5).
Collection of pulverized concrete in 620-days cores was performed on cores
obtained in the top-bottom direction, in order to determine the chloride content at the top
strand position. Four measurements were made at each depth range.
Powder samples were kept in separate sealed containers, and only the fraction
passing sieve No. 20 (< 850 μm) was conserved for testing. Then, the acid-soluble
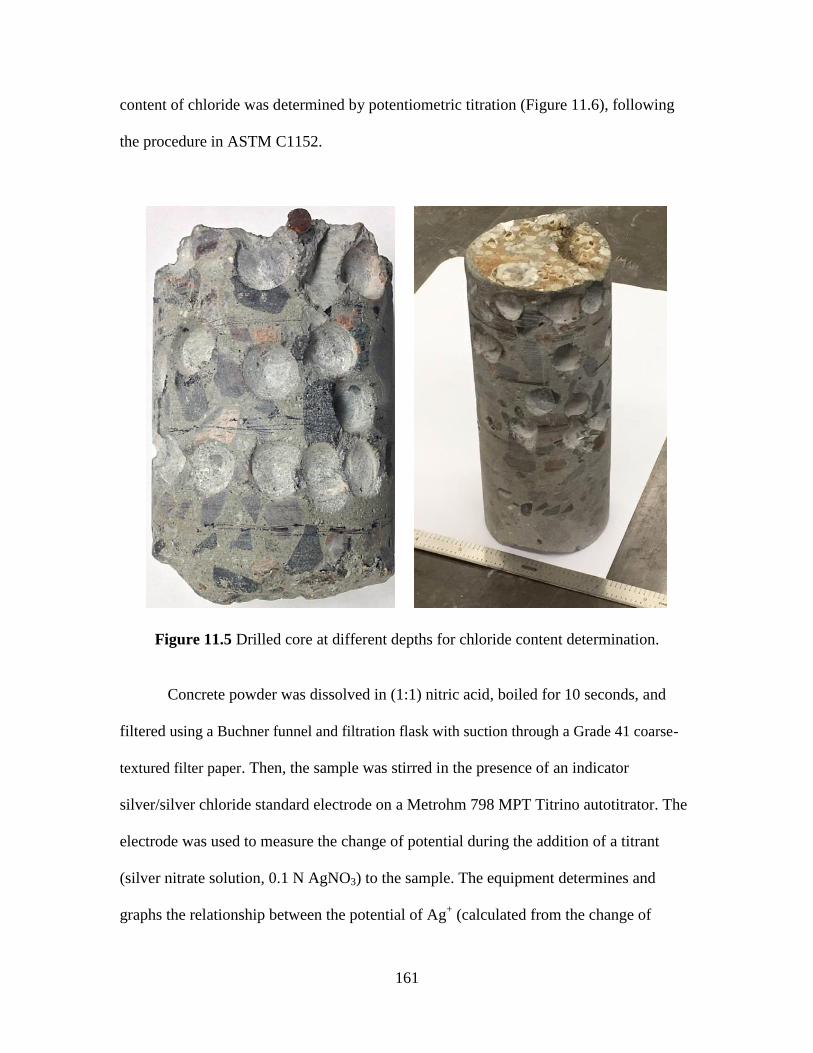
161
content of chloride was determined by potentiometric titration (Figure 11.6), following
the procedure in ASTM C1152.
Figure 11.5 Drilled core at different depths for chloride content determination.
Concrete powder was dissolved in (1:1) nitric acid, boiled for 10 seconds, and
filtered using a Buchner funnel and filtration flask with suction through a Grade 41 coarse-
textured filter paper. Then, the sample was stirred in the presence of an indicator
silver/silver chloride standard electrode on a Metrohm 798 MPT Titrino autotitrator. The
electrode was used to measure the change of potential during the addition of a titrant
(silver nitrate solution, 0.1 N AgNO3) to the sample. The equipment determines and
graphs the relationship between the potential of Ag+ (calculated from the change of
162
potential) and the added amount of titrate. The amount of silver nitrate needed to stabilize
the reaction, identified from the inflection point of the curve, is used to calculate the
chloride content of the sample. The results are compared with a blank measurement
performed with deionized (DI) water (electrical resistivity ρ = 18.2 MΩ·cm).
Figure 11.6 Autotitrator for chloride content determination.
The determination of the percentage of chloride that initiates steel corrosion
(chloride threshold limit, CTL) is of interest, but various CTL values have been reported
in the literature and various values are found in standards. For prestressed concrete using
conventional steel, the British standard BS 8110 set the maximum chloride content of
0.10% by mass of cement, while ACI 357 and ACI 222 use 0.06% and 0.08% for the
same CTL estimation, respectively (Ann and Song, 2007). In a previous report (Holland
et al., 2012), a value of 0.05% of chloride content by mass of concrete was chosen as a
reference for corrosion initiation. This number is the default chloride threshold for
corrosion initiation used in Life-365 software (Bentz, 2003), and the 0.05% value was
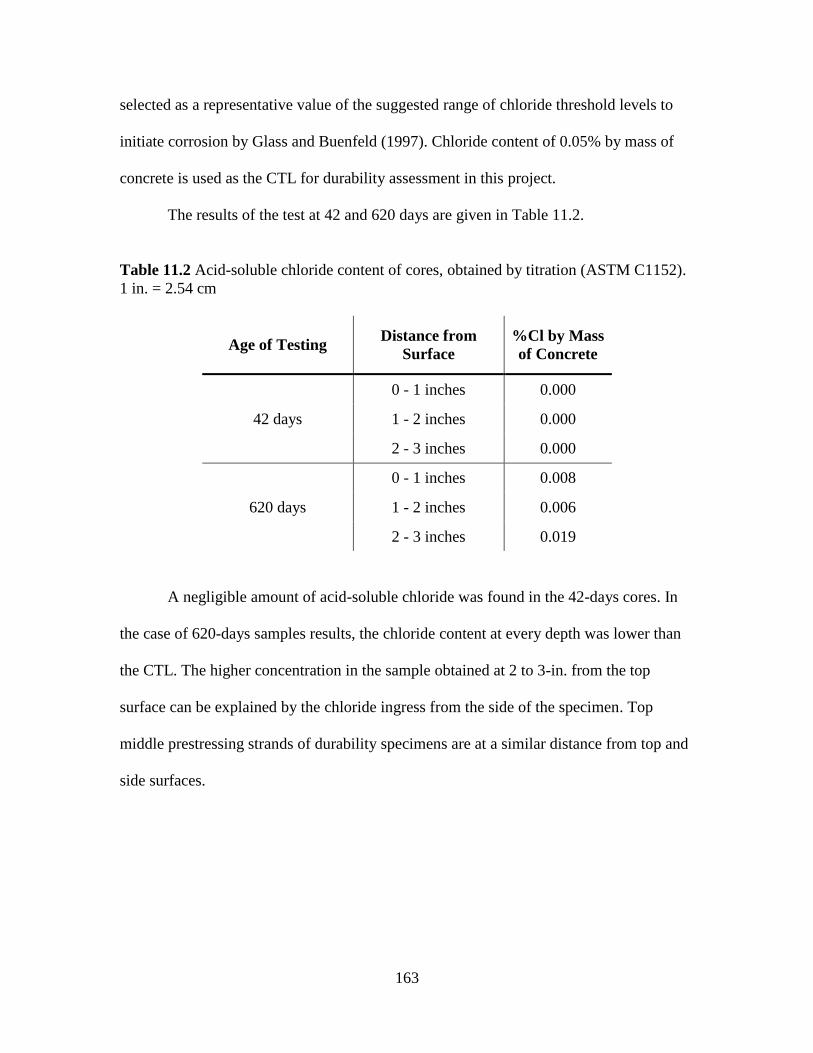
163
selected as a representative value of the suggested range of chloride threshold levels to
initiate corrosion by Glass and Buenfeld (1997). Chloride content of 0.05% by mass of
concrete is used as the CTL for durability assessment in this project.
The results of the test at 42 and 620 days are given in Table 11.2.
Table 11.2 Acid-soluble chloride content of cores, obtained by titration (ASTM C1152).
1 in. = 2.54 cm
Age of Testing Distance from
Surface
%Cl by Mass
of Concrete
42 days
0 - 1 inches 0.000
1 - 2 inches 0.000
2 - 3 inches 0.000
620 days
0 - 1 inches 0.008
1 - 2 inches 0.006
2 - 3 inches 0.019
A negligible amount of acid-soluble chloride was found in the 42-days cores. In
the case of 620-days samples results, the chloride content at every depth was lower than
the CTL. The higher concentration in the sample obtained at 2 to 3-in. from the top
surface can be explained by the chloride ingress from the side of the specimen. Top
middle prestressing strands of durability specimens are at a similar distance from top and
side surfaces.
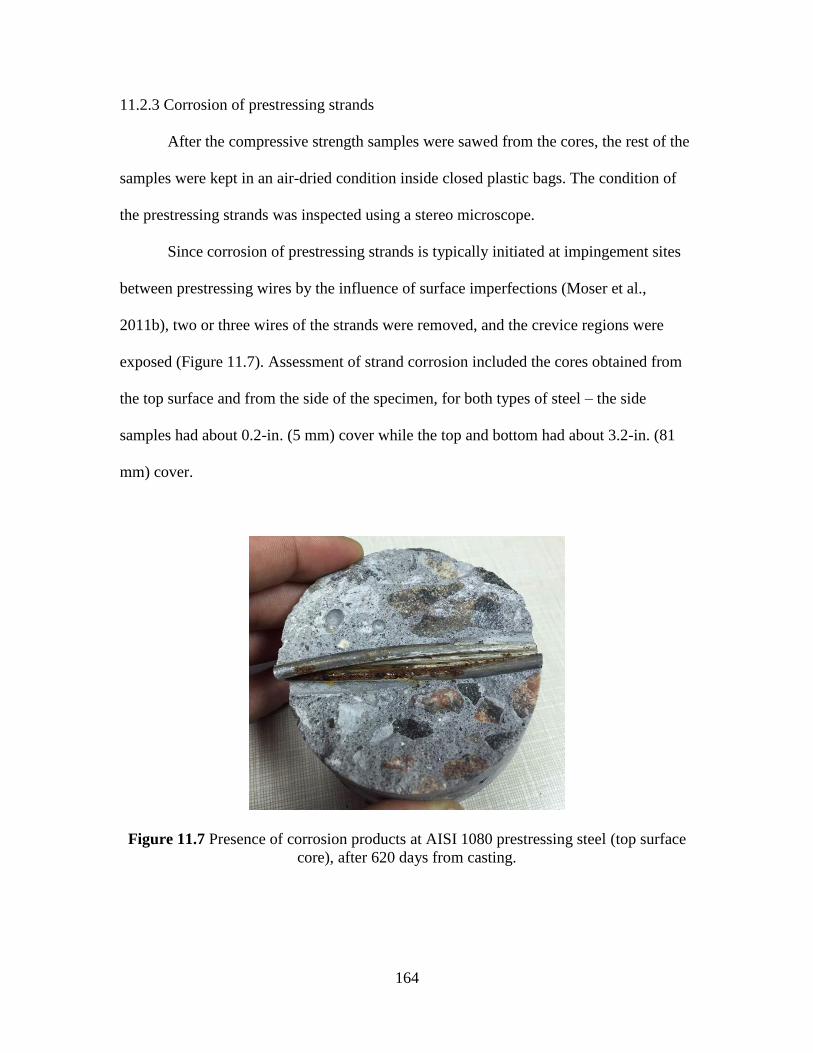
164
11.2.3 Corrosion of prestressing strands
After the compressive strength samples were sawed from the cores, the rest of the
samples were kept in an air-dried condition inside closed plastic bags. The condition of
the prestressing strands was inspected using a stereo microscope.
Since corrosion of prestressing strands is typically initiated at impingement sites
between prestressing wires by the influence of surface imperfections (Moser et al.,
2011b), two or three wires of the strands were removed, and the crevice regions were
exposed (Figure 11.7). Assessment of strand corrosion included the cores obtained from
the top surface and from the side of the specimen, for both types of steel – the side
samples had about 0.2-in. (5 mm) cover while the top and bottom had about 3.2-in. (81
mm) cover.
Figure 11.7 Presence of corrosion products at AISI 1080 prestressing steel (top surface
core), after 620 days from casting.
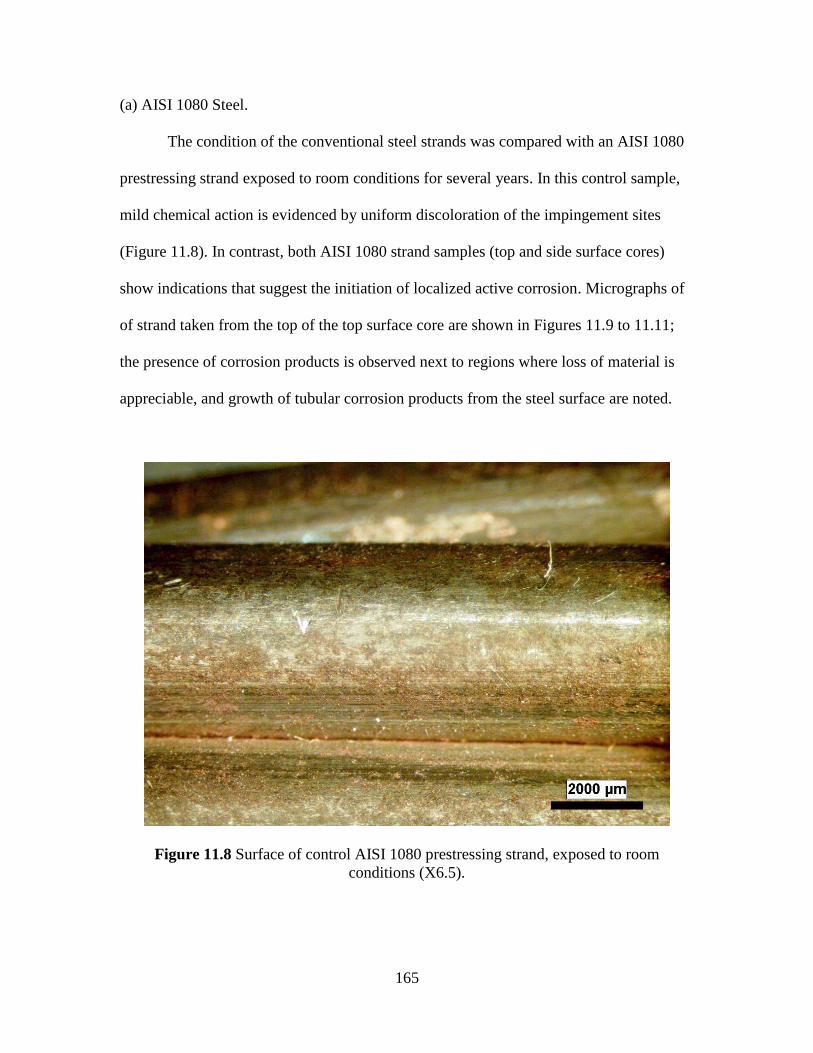
165
(a) AISI 1080 Steel.
The condition of the conventional steel strands was compared with an AISI 1080
prestressing strand exposed to room conditions for several years. In this control sample,
mild chemical action is evidenced by uniform discoloration of the impingement sites
(Figure 11.8). In contrast, both AISI 1080 strand samples (top and side surface cores)
show indications that suggest the initiation of localized active corrosion. Micrographs of
of strand taken from the top of the top surface core are shown in Figures 11.9 to 11.11;
the presence of corrosion products is observed next to regions where loss of material is
appreciable, and growth of tubular corrosion products from the steel surface are noted.
Figure 11.8 Surface of control AISI 1080 prestressing strand, exposed to room
conditions (X6.5).
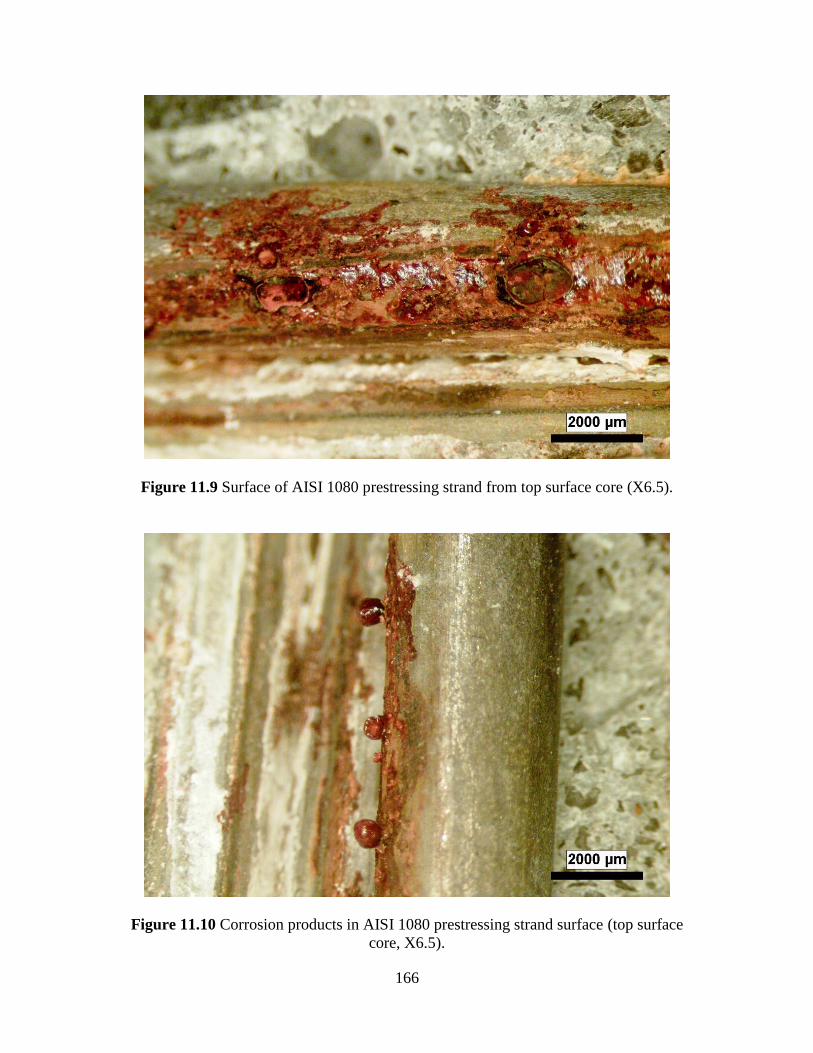
166
Figure 11.9 Surface of AISI 1080 prestressing strand from top surface core (X6.5).
Figure 11.10 Corrosion products in AISI 1080 prestressing strand surface (top surface
core, X6.5).
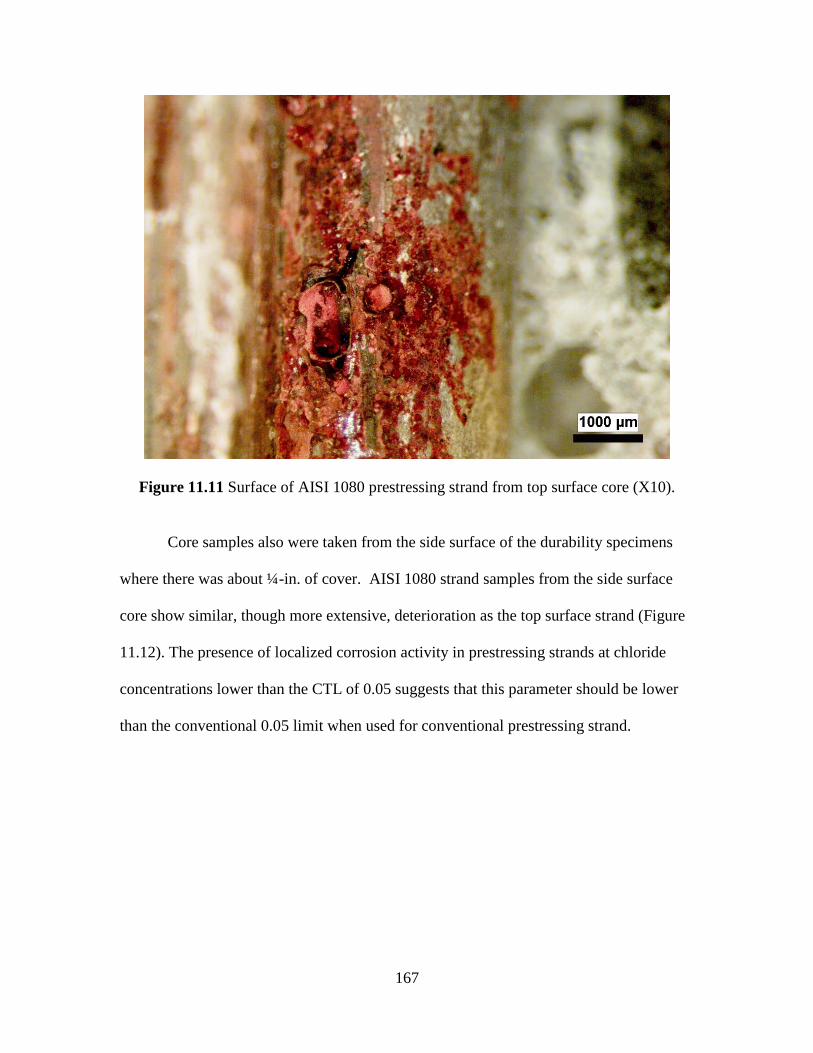
167
Figure 11.11 Surface of AISI 1080 prestressing strand from top surface core (X10).
Core samples also were taken from the side surface of the durability specimens
where there was about ¼-in. of cover. AISI 1080 strand samples from the side surface
core show similar, though more extensive, deterioration as the top surface strand (Figure
11.12). The presence of localized corrosion activity in prestressing strands at chloride
concentrations lower than the CTL of 0.05 suggests that this parameter should be lower
than the conventional 0.05 limit when used for conventional prestressing strand.
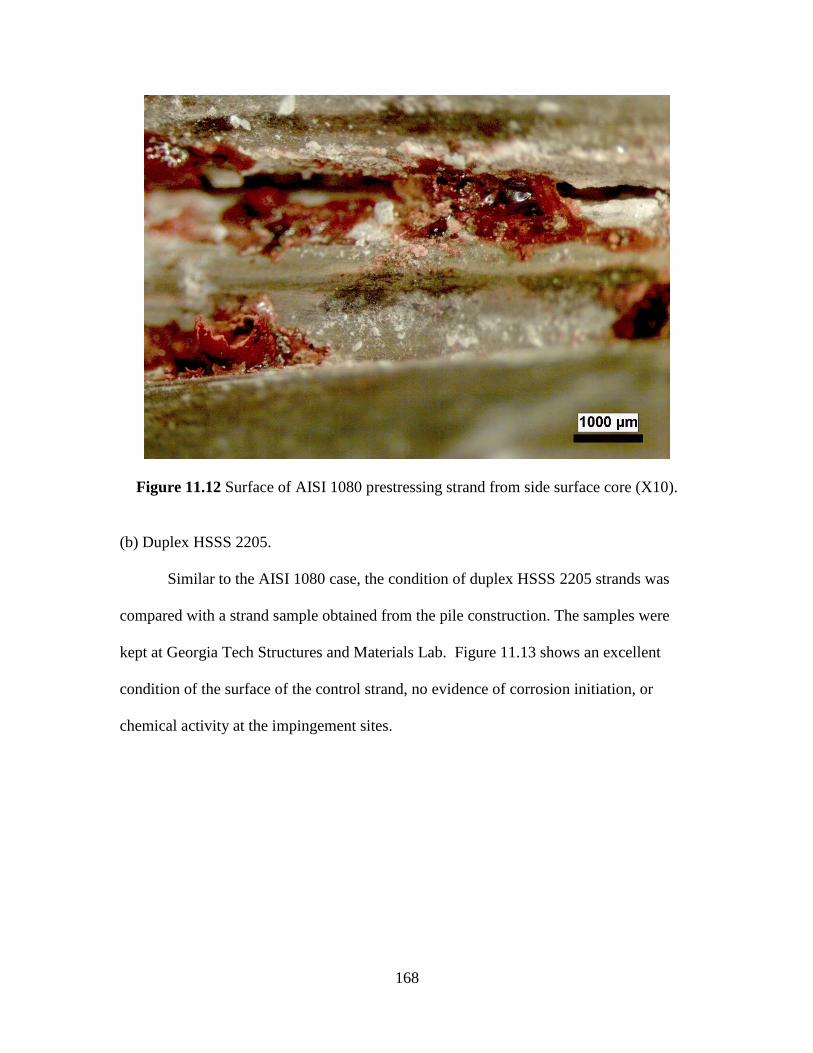
168
Figure 11.12 Surface of AISI 1080 prestressing strand from side surface core (X10).
(b) Duplex HSSS 2205.
Similar to the AISI 1080 case, the condition of duplex HSSS 2205 strands was
compared with a strand sample obtained from the pile construction. The samples were
kept at Georgia Tech Structures and Materials Lab. Figure 11.13 shows an excellent
condition of the surface of the control strand, no evidence of corrosion initiation, or
chemical activity at the impingement sites.
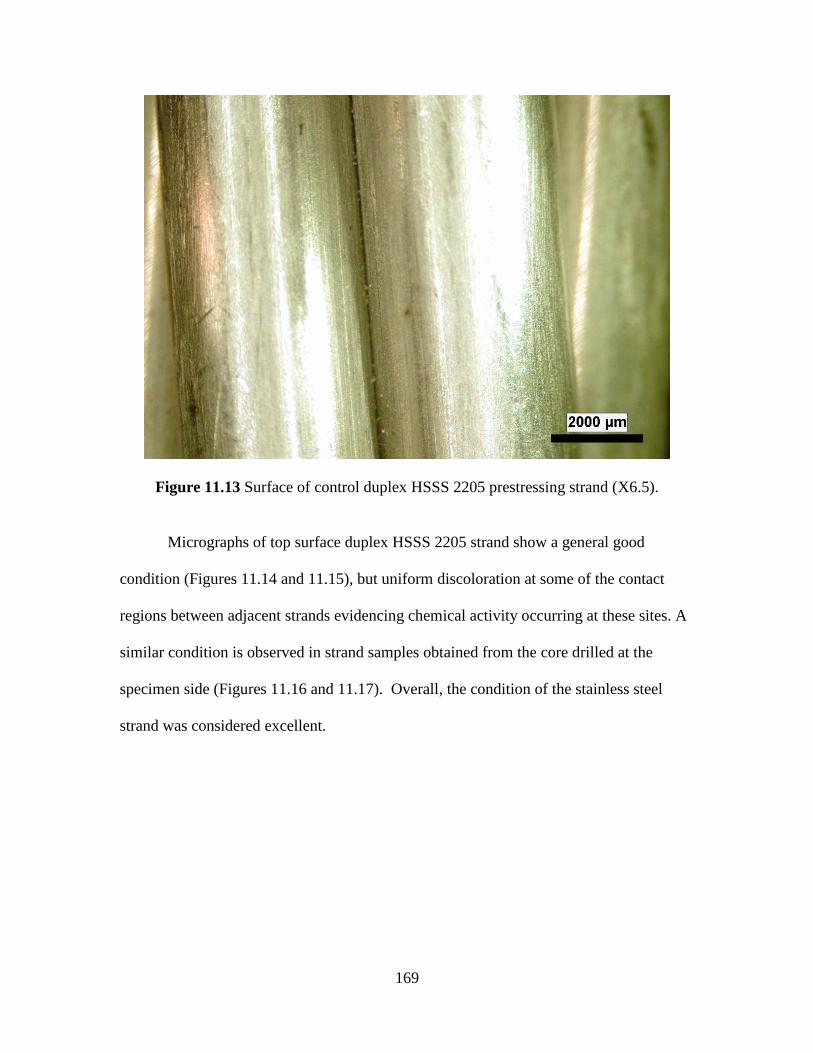
169
Figure 11.13 Surface of control duplex HSSS 2205 prestressing strand (X6.5).
Micrographs of top surface duplex HSSS 2205 strand show a general good
condition (Figures 11.14 and 11.15), but uniform discoloration at some of the contact
regions between adjacent strands evidencing chemical activity occurring at these sites. A
similar condition is observed in strand samples obtained from the core drilled at the
specimen side (Figures 11.16 and 11.17). Overall, the condition of the stainless steel
strand was considered excellent.
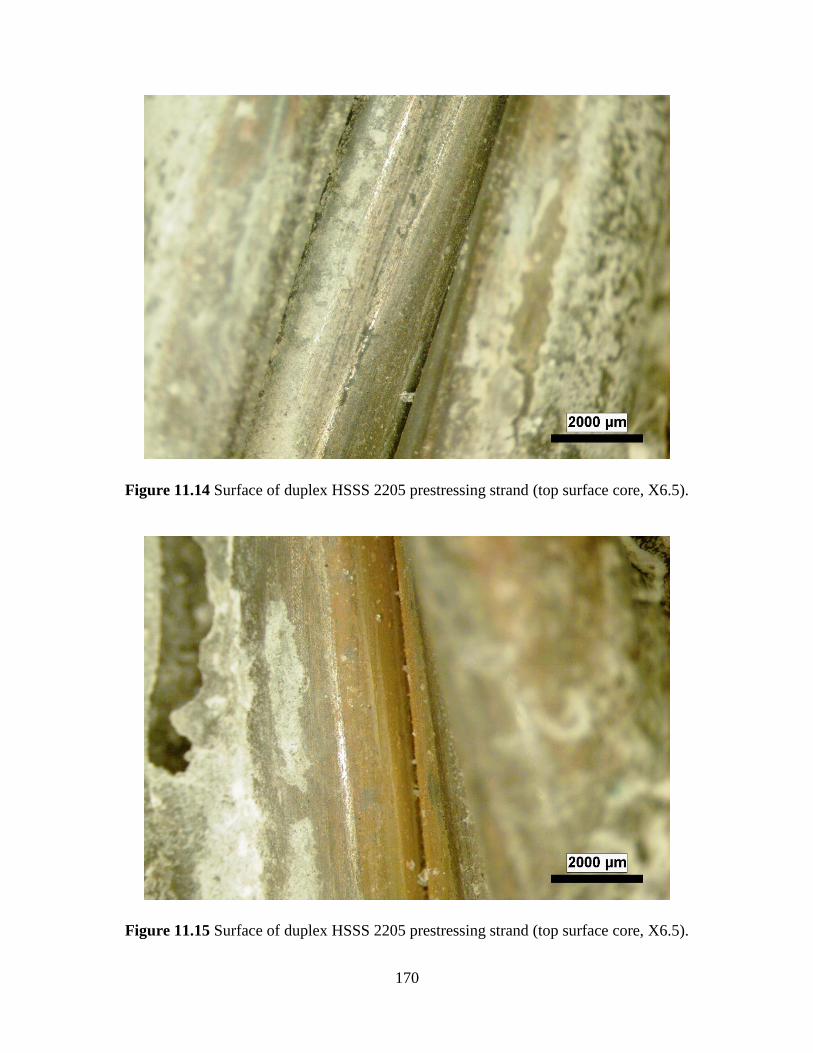
170
Figure 11.14 Surface of duplex HSSS 2205 prestressing strand (top surface core, X6.5).
Figure 11.15 Surface of duplex HSSS 2205 prestressing strand (top surface core, X6.5).
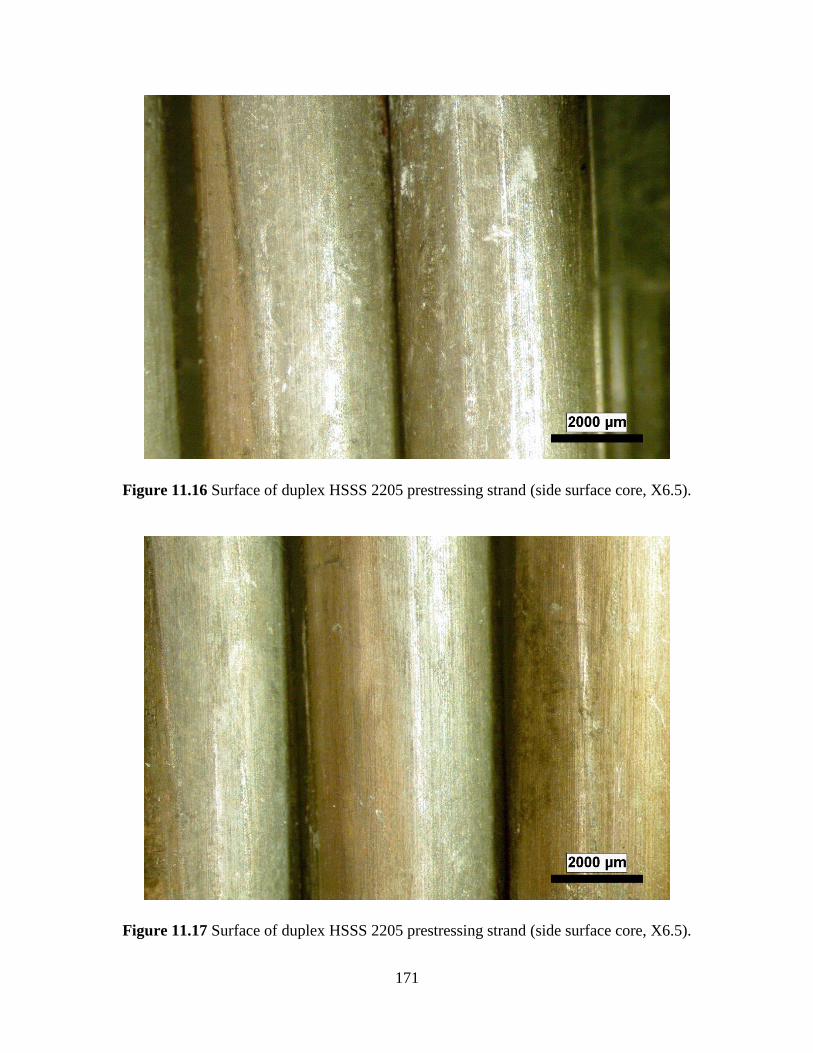
171
Figure 11.16 Surface of duplex HSSS 2205 prestressing strand (side surface core, X6.5).
Figure 11.17 Surface of duplex HSSS 2205 prestressing strand (side surface core, X6.5).
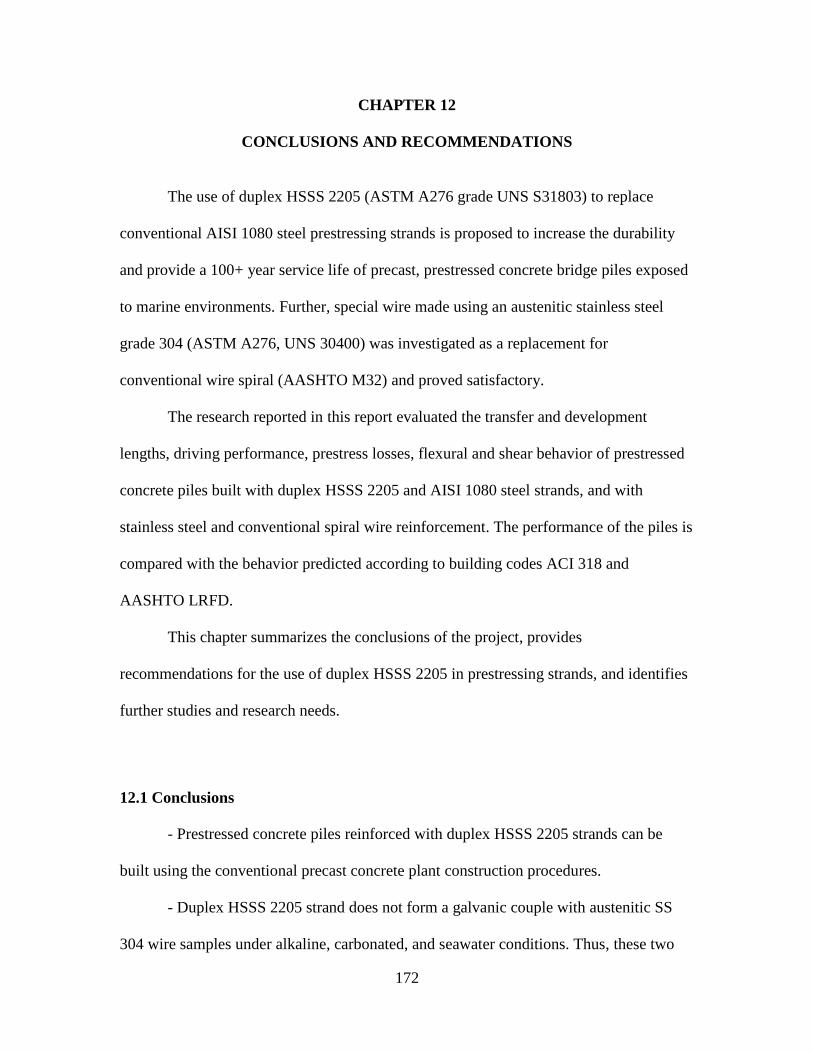
172
CHAPTER 12
CONCLUSIONS AND RECOMMENDATIONS
The use of duplex HSSS 2205 (ASTM A276 grade UNS S31803) to replace
conventional AISI 1080 steel prestressing strands is proposed to increase the durability
and provide a 100+ year service life of precast, prestressed concrete bridge piles exposed
to marine environments. Further, special wire made using an austenitic stainless steel
grade 304 (ASTM A276, UNS 30400) was investigated as a replacement for
conventional wire spiral (AASHTO M32) and proved satisfactory.
The research reported in this report evaluated the transfer and development
lengths, driving performance, prestress losses, flexural and shear behavior of prestressed
concrete piles built with duplex HSSS 2205 and AISI 1080 steel strands, and with
stainless steel and conventional spiral wire reinforcement. The performance of the piles is
compared with the behavior predicted according to building codes ACI 318 and
AASHTO LRFD.
This chapter summarizes the conclusions of the project, provides
recommendations for the use of duplex HSSS 2205 in prestressing strands, and identifies
further studies and research needs.
12.1 Conclusions
- Prestressed concrete piles reinforced with duplex HSSS 2205 strands can be
built using the conventional precast concrete plant construction procedures.
- Duplex HSSS 2205 strand does not form a galvanic couple with austenitic SS
304 wire samples under alkaline, carbonated, and seawater conditions. Thus, these two
173
different stainless steel alloys may be used together to reinforce prestressed concrete
piles.
- Total prestress loss in piles with duplex HSSS 2205 was 18.0 ksi which
represented a 12.4% loss from the initial jacking stress at 335 days. Total prestress loss in
piles with conventional 1080 strand was 20.1 ksi which represented a 10.2% loss from
the initial jacking stress at 335 days. The lower relaxation of duplex HSSS 2205 strands
resulted in higher compressive stresses in the piles with the HSSS 2205 strand which
caused higher creep strains and increased total loss. A loss of prestressing force lower
than the GDOT specified limit is expected at the end of the service life.
- Prestress losses of duplex HSSS 2205 are 82.3% and 99.4% of the value
predicted by AASHTO LRFD refined and lump-sum methods at 335 days, respectively.
It is concluded than the use of AASHTO LRFD refined method for the calculation of
prestress losses of duplex HSSS 2205 strands is conservative.
- Prestress losses of duplex HSSS 2205 and conventional steel strands were not
affected by pile driving and extraction.
- The transfer lengths (lt) of duplex HSSS 2205 and conventional steel obtained
by concrete surface strain measurements at 14 days were shorter than the lt predicted
using AASHTO LRFD and ACI 318. Compared to calculations of transfer length
following AASHTO LRFD, AISI 1080 steel and duplex HSSS 2205 presented average
experimental values that were 68% and 57% of the predicted value, respectively.
- Prestressed concrete piles using duplex HSSS 2205 can be driven until refusal
following GDOT requirements, without appreciable damage or visible cracking. The
174
bearing capacity of piles using duplex HSSS 2205 was 27% higher than the design
capacity.
- The transfer lengths of duplex HSSS 2205 and conventional steel strands were
not significantly affected by pile driving and extraction. After driving, the lt of AISI 1080
steel and duplex HSSS 2205 strands were 58% and 58% of the predicted value by
AASHTO LRFD, respectively.
- The shortest embedment length which led to a flexural failure with no strand slip
was 61 in. for piles made with conventional 1080 strand. Based on this experimental
development length (ld), the ld of conventional AISI 1080 strands was found to be 53% of
the value computed by AASHTO LRFD and 85% of the value computed by ACI 318.
- The shortest embedment length which led to a flexural failure with no strand
slip was 69 in. for piles made with HSSS 2205 strand. Based on this experimental
development length (ld), theld of duplex HSSS 2205 strands was found to be 55% of the
value computed by AASHTO LRFD and 88% of the value computed by ACI 318..
- Development and transfer length results demonstrated that duplex HSSS 2205
strands may be designed using current AASHTO LRFD and ACI 318 standards.
- For piles made with duplex HSSS 2205 strands, ultimate moment strengths
obtained experimentally were 10 to 19% higher than those calculated using AASHTO
LRFD provisions, and they were 0 to 9% higher than those calculated using ACI 318
provisions. For piles made with conventional AISI 1080 strands, ultimate moment
strengths obtained experimentally were 4 to 16% higher than those calculated using
AASHTO LRFD provisions, and they were 3 to 6% higher than those calculated using
ACI 318 provisions.
175
- Piles using duplex HSSS 2205 and with spiral, transverse reinforcement made
using SS 304 showed statistically similar ultimate shear strengths as the piles made with
conventional steel. There was no significant difference in pile strengths with spiral
reinforcement spaced between 3 in. and 6 in.
Considering the conclusions stated above, duplex HSSS 2205 can be used in
prestressing strands in combination with austenitic SS 304 for the transverse confinement
and shear reinforcement for prestressed concrete piles, using the same design
requirements and construction procedures used for conventional AISI 1080 steel.
12.2 Recommendations and Research Needs
It is recommended that duplex HSSS 2205 prestressing strand be used to reinforce
precast prestressed concrete piles in marine environments and that austenitic SS 304 be
used as transverse, spiral reinforcement in these same piles.
Until further studies are completed, it is recommended that the HSSS 2205 be
initially stressed to not greater than 70% of the ultimate tensile strength.
Further research is recommended in order to develop a heat treatment for the 2205
alloy or to develop a new alloy which has greater ductility than the current 2205 strand
studied herein.
176
REFERENCES
AASHTO LRFD (2013). “AASHTO LRFD Bridge Design Specifications (6th
Edition)
with 2012 and 2013 Interim Revisions,” American Association of State Highway and
Transportation Officials, Washington, DC, USA.
ACI Committee 209 (1992). “Prediction of Creep, Shrinkage, and Temperature Effects in
Concrete Structures (ACI 209.R-92),” American Concrete Institute, Farmington Hills,
MI, USA.
ACI Committee 214 (2010). “Guide for Obtaining Cores and Interpreting Compressive
Strength Results (ACI 214.4R-10),” American Concrete Institute, Farmington Hills, MI,
USA.
ACI Committee 222 (2001). “Corrosion of Prestressing Steels (ACI 222.2R-01),”
American Concrete Institute, Farmington Hills, MI, USA.
ACI Committee 318 (2011). “Building Code Requirements for Structural Concrete (ACI
318-11) and Commentary,” American Concrete Institute, Farmington Hills, MI, USA.
ACI Committee 363 (2010). “Report on High-Strength Concrete (ACI 363R-10),”
American Concrete Institute, Farmington Hills, MI, USA.
Alvarez-Armas, I. (2008), Duplex Stainless Steels: Brief History and Some Recent
Alloys, Recent Patents on Mechanical Engineering 1 (1), 51-57.
Ann, K.Y., and Song, H.-W. (2007), Chloride Threshold Level for Corrosion of Steel in
Concrete, Corrosion Science 49 (11), 4113-4133.
ASTM A82 (2002). “Standard Specification for Steel Wire, Plain, for Concrete
Reinforcement,” American Society for Testing and Materials West Conshohocken, PA,
USA.
ASTM A276 (2013). “Standard Specification for Stainless Steel Bars and Shapes,”
American Society for Testing and Materials West Conshohocken, PA, USA.
ASTM A416/A416M (2012). “Standard Specification for Steel Strand, Uncoated Seven-
Wire for Prestressed Concrete,” American Society for Testing and Materials West
Conshohocken, PA, USA.
ASTM A580/A580M (2014). “Standard Specification for Stainless Steel Wire,”
American Society for Testing and Materials West Conshohocken, PA, USA.
177
ASTM C39/C39M (2014). “Standard Test Method for Compressive Strength of
Cylindrical Concrete Specimens,” American Society for Testing and Materials West
Conshohocken, PA, USA.
ASTM C42/C42M (2013). “Standard Test Method for Obtaining and Testing Drilled
Cores and Sawed Beams of Concrete,” American Society for Testing and Materials
West Conshohocken, PA, USA.
ASTM C150/C150M (2012). “Standard Specification for Portland Cement,” American
Society for Testing and Materials West Conshohocken, PA, USA.
ASTM C469/C469M (2014). “Standard Test Method for Static Modulus of Elasticity and
Poisson's Ratio of Concrete in Compression,” American Society for Testing and
Materials West Conshohocken, PA, USA.
ASTM C496/C496M (2011). “Standard Test Method for Splitting Tensile Strength of
Cylindrical Concrete Specimens,” American Society for Testing and Materials West
Conshohocken, PA, USA.
ASTM C512/C512M (2010). “Standard Test Method for Creep of Concrete in
Compression,” American Society for Testing and Materials West Conshohocken, PA,
USA.
ASTM C618 (2012). “Standard Specification for Coal Fly Ash and Raw or Calcined
Natural Pozzolan for Use in Concrete,” American Society for Testing and Materials
West Conshohocken, PA, USA.
ASTM C1152/C1152M (2012). “Standard Test Method for Acid-Soluble Chloride in
Mortar and Concrete,” American Society for Testing and Materials West
Conshohocken, PA, USA.
ASTM C1202 (2012). “Standard Test Method for Electrical Indication of Concrete's
Ability to Resist Chloride Ion Penetration,” American Society for Testing and Materials
West Conshohocken, PA, USA.
ASTM D4458 (2009). “Standard Test Method for Chloride Ions in Brackish Water,
Seawater, and Brines,” American Society for Testing and Materials West
Conshohocken, PA, USA.
ASTM E328 (2013). “Standard Test Methods for Stress Relaxation for Materials and
Structures,” American Society for Testing and Materials West Conshohocken, PA, USA.
ASTM G71 (2014). “Standard Guide for Conducting and Evaluating Galvanic Corrosion
Tests in Electrolytes,” American Society for Testing and Materials West
Conshohocken, PA, USA.
178
Azizinamini, A., Ozyildirim, H.C., Power, E.H., Kline, E.S., Mertz, D.R., Myers, G.F.,
and Whitmore, D.W. (2013). “Design Guide for Bridges for Service Life,”
Prepublication Draft Report No. SHRP 2 Renewal Project R19A, Transportation
Research Board, National Academy of Sciences, 744 pp.
Bandyopadhyay, T.K. and Sengupta, B. (1986), Determining Time Dependent Losses of
Prestress with due Consideration of Aging Coefficient and Percentage of Steel, ACI
Journal Proceedings 83 (2), 236-243.
Barnes, R.W., Grove, J.W., and Burns, N.H. (2003), Experimental Assessment of Factors
Affecting Transfer Length, ACI Structural Journal 100 (6), 740-748.
Bautista, A., and Gonzalez, J.A. (1996), Analysis of the Protective Efficiency of
Galvanizing Against Corrosion of Reinforcements Embedded In Chloride Contaminated
Concrete, Cement and Concrete Research 26 (2), 215-224.
Bentz, E.C. (2003), Probabilistic Modeling of Service Life for Structures Subjected to
Chlorides, ACI Materials Journal 100 (5), 391-397.
Bertolini, L., Elsener, B., Pedeferri, P. and Polder, R (2004), Corrosion of Steel in
Concrete: Prevention, Diagnosis, Repair, Wiley-VCH, Heppenheim, Germany.
Bohni, H. (2005), Corrosion in Reinforced Concrete Structures, Woodhead Publishing
Limited, Cambridge, England.
Buckner, C.D. (1995), A Review of Strand Development Length for Pretensioned
Concrete Members, PCI Journal 40 (2), 84-105.
Cannon, E., Lewinger, C., Abi, C., and Hamilton, H.R. (2006). “St. George Island Bridge
Pile Testing,” Final Report, UF Project No. 00051711, Florida Department of
Transportation, 113 pp.
Center for Operational Oceanographic Products and Services, National Oceanic and
Atmospheric Administration (NOAA), November 6th
, 2014 (website update date:
October 15th
, 2013), from http://tidesandcurrents.noaa.gov/
Chaix, O., Hartt, W.H., Kessler, R., and Powers, R. (1995), Localized Cathodic
Protection of Simulated Prestressed Concrete Pilings in Seawater, Corrosion Science 51
(5), 386-398.
Darmawan, M.S. and Stewart, M.G. (2007), Effect of Pitting Corrosion on Capacity of
Prestressing Wires, Magazine of Concrete Research 59 (2), 131-139.
Deatherage, J.H., Burdette, E.G., and Chew, C.K. (1994), Development Length and
Lateral Spacing Requirements of Prestressing Strand for Prestressed Concrete Bridge
Girders, PCI Journal 39 (1), 70-83.
179
Ehlen, M.A., Thomas, M.D.A, and Bentz, E.C. (2009), Life-365 Service Life Prediction
ModelTM
Version 2.0, Concrete International, 31 (5), 41-46.
Erdogdu, S., Bremner, T.W., and Kindratova, I.L. (2001), Accelerated Testing of Plain
and Epoxy-coated Reinforcement in Simulated Seawater and Chloride Solutions,
Cement and Concrete Research 31 (6), 861-867.
Fontana, M. (1986), Corrosion Engineering, 3rd Edition, McGraw-Hill, New York,
USA.
Frankel, G.S. (1998), Pitting Corrosion of Metals, A Review of the Critical Factors,
Journal of The Electrochemical Society 145 (6), 2186-2198.
Gardner, L. (2005), The Use of Stainless Steel in Structures, Progress in Structural
Engineering and Materials 7 (2), 45-55.
Geng, J., Easterbrook D., Li, L-Y, and Mo, L-W (2015), The Stability of Bound
Chlorides in Cement Paste with Sulfate Attack, Cement and Concrete Research 68,
211-222.
Glass, G.K., and Buenfeld, N.R. (1997), Chloride Threshold Levels for Corrosion
Induced Deterioration of Steel in Concrete, in: L.O. Nilsson and J. Ollivier (Eds.),
Chloride Penetration into Concrete, Proceedings of the RILEM International Workshop
on Chloride Penetration into Concrete, RILEM Paris, 429–452.
Gonnerman, H.F., and Shuman, E.C. (1928), Flexure and Tension Tests of Plain
Concrete, Major Series 171 (209), 149.
Griess, J.C., and Naus, D.J. (1980), Corrosion of Steel Tendons Used in Prestressed
Concrete Pressure Vessels, in: D.E. Tonini and J.M. Gaidis (Eds.), Corrosion of
Reinforcing Steel in Concrete, ASTM STP 713, American Society for Testing and
Materals, 32–50.
Hanson, N.W. and Kaar, P.H (1959), Flexural Bond Tests of Pretensioned Prestressed
Beams, ACI Journal 55 (1), 783-802.
Hart, W.H. and Rosenberg, A.M. (1980), Influence of Ca(NO2)2 on Sea Water Corrosion
of Reinforcing Steel in Concrete, ACI Special Publication 65, 609-622.
Hart, W.H., Powers, R.G., Lysogorski, D.K., Paredes, M., and Virmani, Y.P. (2006).
“Job Site Evaluation of Corrosion-Resistant Alloys for Use as Reinforcement in
Concrete,” Final Report, No. FHWA-HRT-06-078, Federal Highway Administration,
92 pp.
180
Holland, B., Moser, R., Kahn, L.F., Singh, P., and Kurtis, K.E. (2012). “Durability of
Precast Prestressed Concrete Piles in Marine Environment, Part 2 Volume 1: Concrete,”
Georgia Institute of Technology, Atlanta, GA.
Hoyer, E. and Friedrich, E. (1939), Beitrag zur Frage der Haftspannung in
Eisenbetonbauteilen, Beton und Eisen 50 (9), 717-736.
Hurley, M.F. and Scully, J.R. (2006), Threshold Chloride Concentrations of Selected
Corrosion-Resistant Rebar Materials Compared to Carbon Steel, Corrosion 62 (10),
892-904.
Jenkins, J.F. (1987). “Validation of Nitronic 33 in Reinforced and Prestressed Concrete,”
Final Report, No. TN-1764, Naval Civil Engineering Laboratory, 63 pp.
Johannesson, B. and Utgenannt, P. (2001), Microstructural Changes Caused by
Carbonation of Cement Mortar, Cement and Concrete Research 31 (6), 925-931.
Jones, D. (1996), Principles and Prevention of Corrosion: 2nd Edition, Princeton-Hall,
Upper Saddle River, NJ.
Kaar, P.H., LaFraugh, R.W., and Mass, M.A. (1963), Influence of Concrete Strength on
Transfer Length, PCI Journal 8 (5), 47-67.
Kahn, L.F., Dill, J.C, Reutlinger, C.G. (2002), Transfer and Development Length of 15-
mm Strand in High Performance Concrete Girders, Journal of Structural Engineering
128 (7), 913-921.
Kahn, L.F., Lai, J.S., Kurtis, K., Saber, A., Shams, M., Reutlinger, C., Dill, J., Slapkus,
A., Canfield, S., Lopez, M., and Haines, B. (2005). “High Strength/High Performance
Concrete for Precast Prestressed Bridge Girders in Georgia,” Georgia Institute of
Technology, Atlanta, GA.
Kurtis, K.E. and Mehta, K. (1997), A Critical Review of Deterioration of Concrete Due
to Corrosion of Reinforcing Steel, ACI Special Publication 170, 535-554.
Kurtis, K.E., Kahn, L.F., and Nadelman, E. (2013). “Viability of Concrete Performance-
Based Specification for Georgia DOT Projects,” Georgia Institute of Technology,
Atlanta, GA.
Lane, S.N. (1998). “A New Development Length Equation for Pretensioned Strands in
Bridge Beams and Piles,” Final Report, No. FHWA-RD-98-116, Federal Highway
Administration, 131 pp.
Lo K.H., Shek, C.H., and Lai, J.K.L. (2009), Recent Developments in Stainless Steels,
Materials Science and Engineering: R: Reports 65 (4), 39-104.
181
Martin, L.D., and Scott, N.L. (1976), Development of Prestressing Strand in Pretensioned
Members, ACI Journal 73 (8), 453-456.
Meyer K.F. (2002). Transfer and Development Length of 0.6-inch Diameter Prestressing
Strand in High Strength Lightweight Concrete. Doctoral Thesis, Georgia Institute of
Technology, pp. 643.
Milad, M., Zreiba, V., Elhalouani, F., and Baradai, C. (2008), The Effect of Cold Work
on Structure and Properties of AISI 304 Stainless Steel, Journal of Materials
Processing Technology 203 (1-3), 80-85.
Mitchell, D., Cook, W.D., Khan, A.A., and Tham, T. (1993), Influence of High Strength
Concrete on Transfer and Development Length of Pretensioning Strand, PCI Journal 38
(3), 52-66.
Moser, R.D., Holland, B., Kahn, L.F., Singh, P., and Kurtis, K.E. (2011). “Durability of
Precast Prestressed Concrete Piles in Marine Environment: Reinforcement Corrosion
and Mitigation – Part 1,” Georgia Institute of Technology, Atlanta, GA.
Moser, R.D., Singh, P.M., Kahn, L.F., Kurtis, K.E. (2011), Chloride-Induced Corrosion
of Prestressing Steels Considering Crevice Effects and Surface Imperfections,
Corrosion 67 (6), 065001-1‒065001-14.
Moser, R.D., Singh, P., Kahn, L.F., and Kurtis, K.E. (2012). “Durability of Precast
Prestressed Concrete Piles in Marine Environment, Part 2 Volume 2: Stainless Steel
Prestressing Strand and Wire,” Georgia Institute of Technology, Atlanta, GA.
Myers, J.J., and Carrasquillo, R. L. (1998). “The Production and Quality Control of High
Performance Concrete in Texas Bridge Structures,” The University of Texas at Austin,
Austin, TX.
Nawy, E.G. (2009), Prestressed Concrete: A Fundamental Approach, 5th Edition,
Princeton-Hall, Upper Saddle River, NJ, USA.
Neville, A.M. (1995), Properties of Concrete, Fourth Edition, Pearson Education
Limited, Essex, England.
Novokshchenov, V. (1994), Brittle Fractures of Prestressed Bridge Steel Exposed to
Chloride-Bearing Environments Caused by Corrosion-Generated Hydrogen, Corrosion,
50 (6), 477-485.
Nurnberger, U. (2002), Corrosion Induced Failure Mechanisms of Prestressing Steel,
Materials and Corrosion, 53 (8), 591-601.
Oh, B.H., and Kim, E.S. (2000), Realistic Evaluation of Transfer Lengths in
Pretensioned, Prestressed Concrete Members, ACI Materials Journal 97 (6), 821-830.
182
Oh, B.H., Kim, E.S., and Choi, Y.C. (2006), Theoretical Analysis of Transfer Lengths in
Pretensioned Prestressed Concrete Members, Journal of Engineering Mechanics 132
(10), 1057-1066.
Papadakis, V.G, Vayenas, C.G., and Fardis, M.N. (1991), Experimental Investigation and
Mathematical Modeling of the Concrete Carbonation Problem, Chemical Engineering
Science 46 (5-6), 1333-1338.
Ramberg, W. and Osgood W.R. (1941), Determination of Stress–Strain Curves by Three
Parameters, NACA Technical Note 503.
Ramirez, J.A. and Russell, B.W. (2008). “Transfer, Development, and Splice Length for
Strand/Reinforcement in High-Strength Concrete,” NCHRP Report No. 603, National
Cooperative Highway Research Program, Transportation Research Board, National
Research Council.
Rasheeduzzafar, Dakhil, F.H., Bader, M.A., and Khan, M.M. (1992), Performance of
Corrosion-Resisting Steels in Chloride-Bearing Concrete, ACI Materials Journal 89 (5),
439-448.
Rasmussen, K.J.R (2003), Full-Range Stress–Strain Curves for Stainless Steel Alloys,
Journal of Constructional Steel Research 59 (1), 47-61.
Recio, F.J., Wu, Y., Alonso, M.C., and Nurnberger, U. (2013), Hydrogen Embrittlement
Risk in Cold-Drawn Stainless Steels, Materials Science and Engineering: A 564, 57-64.
Reutlinger, C.G. (1999). Direct Pull-Out Capacity and Transfer Length of 0.6-inch
Diameter Prestressing Strand in High-Performance Concrete. Master’s Thesis, Georgia
Institute of Technology, pp. 371.
Rosenberg, A., Hansson, C.M. and Andrade, C. (1989), Mechanisms of Corrosion of
Steel in Concrete, Materials Science of Concrete 1, 285-314.
Russell, B.W. (1992). Design Guidelines for Transfer, Development and Debonding of
Large Diameter Seven Wire Strands in Pretensioned Concrete Girders. Doctoral Thesis,
The University of Texas at Austin.
Russell, B.W., and Burns, N.H. (1993). “Design Guidelines for Transfer, Development
and Debonding of Large Diameter Seven Wire Strands in Pretensioned Concrete
Girders,” The University of Texas at Austin, Austin, TX.
Schmitt, R.J., and Mullen, C.X. (1969), Influence of Chromium on the Atmospheric-
Corrosion Behavior of Steel, in: Stainless Steel for Architectural Use, ASTM STP 454,
American Society for Testing and Materials, 124–136.
183
Schuetz, D.P. (2013). Investigation of High Strength Stainless Steel Prestressing Strands.
Master’s Thesis, Georgia Institute of Technology, pp. 173.
Shirahama, S., Fang, S., Kobayashi, T., and Miyagawa, T. (1999), Basic Properties of
Duplex Stainless Prestressing Steel and Flexural Behaviors of Prestressed Concrete
Beams Using the Tendon, Journal of the Society of Material Science Japan 48 (10),
1199-1206.
Tadros, M.K., Al-Omaishi, N., Seguirant, S.J., and Gallt, J.G. (2003). “Prestress Losses
in Pretensioned High-Strength Concrete Bridge Girders,” NCHRP Report No. 496,
National Cooperative Highway Research Program, Transportation Research Board,
National Research Council.
Toribio, J. and Ovejero, E. (2005), Failure Analysis of Cold Dawn Prestressing Steel
Wires Subjected to Stress Corrosion Cracking, Engineering Failure Analysis 12 (5),
654-661.
Wallinder, I.O., Lu, J., Bertling, S., and Leygraf, C. (2002), Release Rates of Chromium
and Nickel from 304 and 316 Stainless Steel During Urban Atmospheric Exposure—A
Combined Field and Laboratory Study, Corrosion Science 44 (10), 2303-2319.
Weyers, R.E., Sprinkel, M.M., and Brown, M.C. (2006). “Summary Report on the
Performance of Epoxy-Coated Reinforcing Steel in Virginia,” Final Report No.
FHWA/VTRC 06-R29, Federal Highway Administration and Virginia Department of
Transportation, 37 pp.
Wight, J.K., and MacGregor, J.G. (2011), Reinforced Concrete: Mechanics and Design
(6th
Ed.), Prentice Hall, Upper Saddle River, NJ.
Wu, Y. and Nurnberger, U. (2009), Corrosion-Technical Properties of High-Strength
Stainless Steels for the Application in Prestressed Concrete Structures, Materials and
Corrosion 60 (10), 771-780.
Zhang, X.G. (2011), Galvanic Corrosion, in: R.W. Revie (Ed.), Uhlig’s Corrosion
Handbook, Third Edition, John Wiley & Sons, Inc., 123–143.
Zia, P. and Mostafa, T. (1977), Development Length of Prestressing Strands, PCI Journal
22 (5), 54-65.
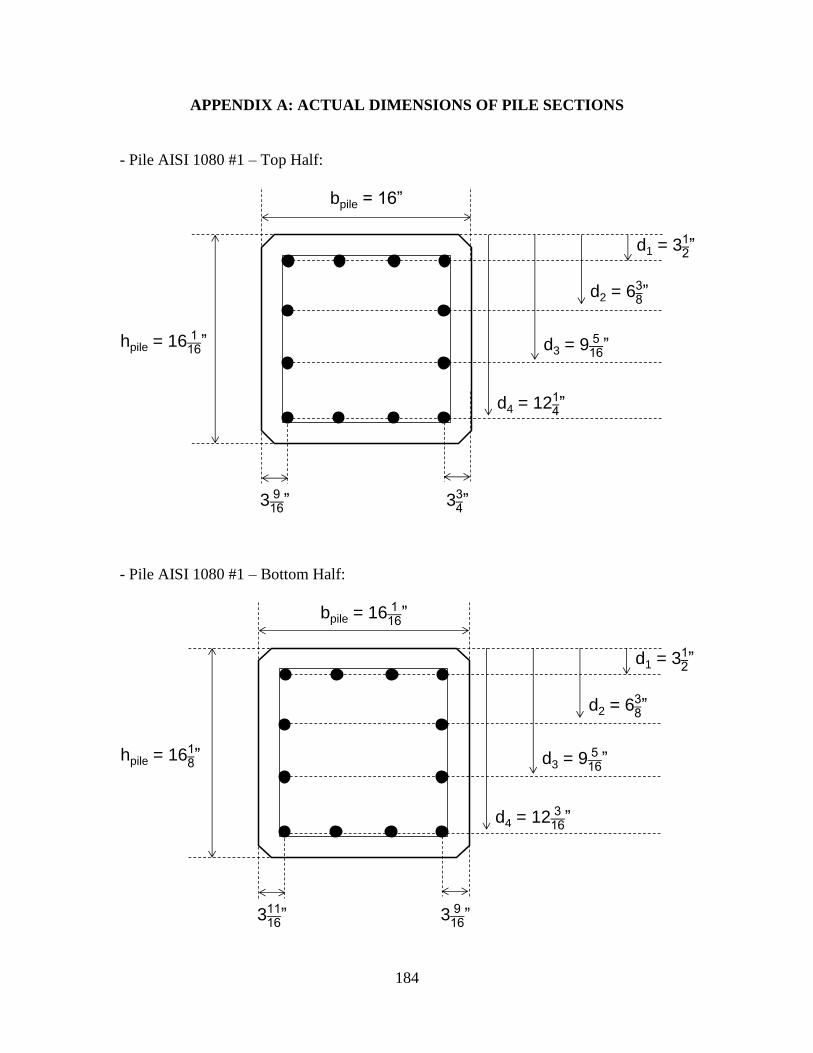
184
APPENDIX A: ACTUAL DIMENSIONS OF PILE SECTIONS
- Pile AISI 1080 #1 – Top Half:
- Pile AISI 1080 #1 – Bottom Half:
hpile = 16 ”
bpile = 16”
d4 = 12 ”
d3 = 9 ”
d2 = 6 ”
d1 = 3 ”
3 ” 3 ”
hpile = 16 ”
bpile = 16 ”
d4 = 12 ”
d3 = 9 ”
d2 = 6 ”
d1 = 3 ”
3 ” 3 ”
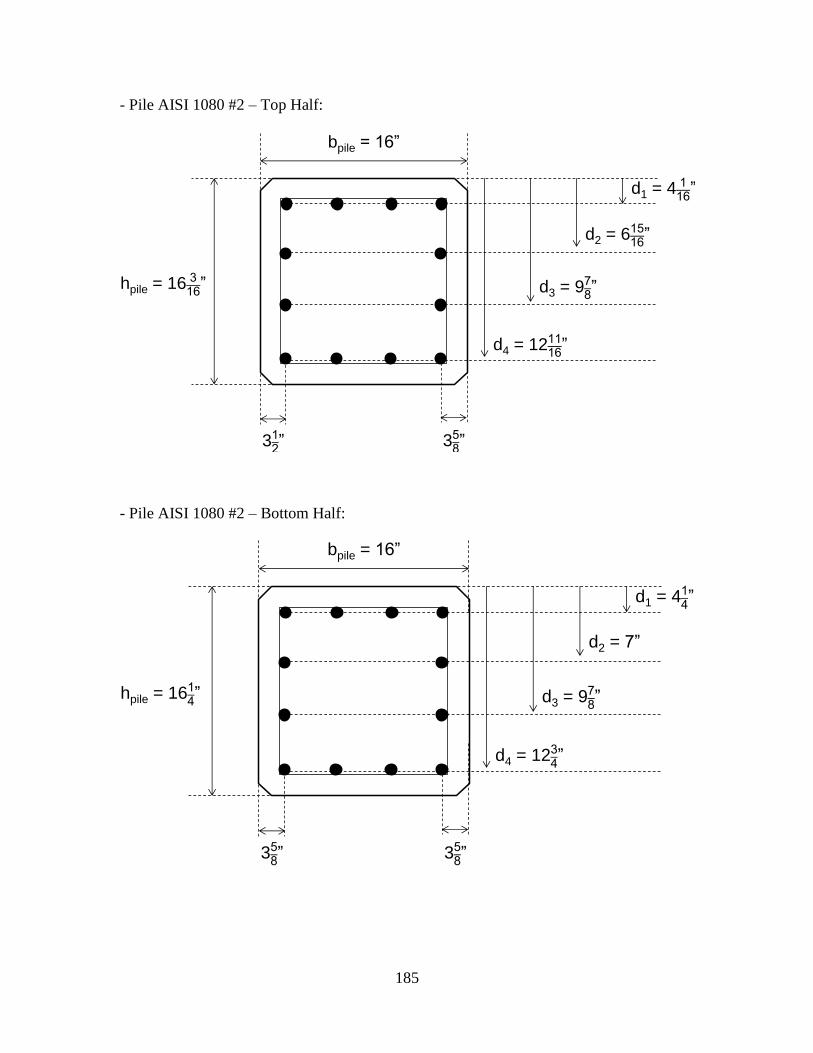
185
- Pile AISI 1080 #2 – Top Half:
- Pile AISI 1080 #2 – Bottom Half:
hpile = 16 ”
bpile = 16”
d4 = 12 ”
d3 = 9 ”
d2 = 6 ”
d1 = 4 ”
3 ” 3 ”
hpile = 16 ”
bpile = 16”
d4 = 12 ”
d3 = 9 ”
d2 = 7”
d1 = 4 ”
3 ” 3 ”
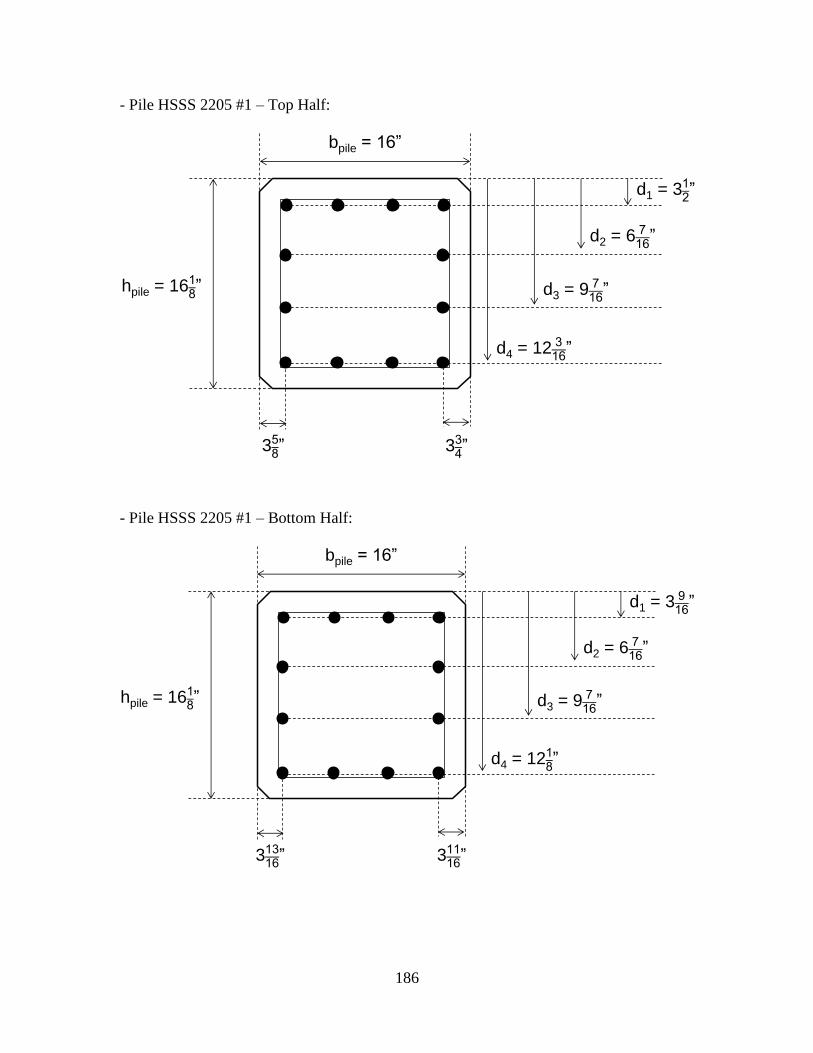
186
- Pile HSSS 2205 #1 – Top Half:
- Pile HSSS 2205 #1 – Bottom Half:
hpile = 16 ”
bpile = 16”
d4 = 12 ”
d3 = 9 ”
d2 = 6 ”
d1 = 3 ”
3 ” 3 ”
hpile = 16 ”
bpile = 16”
d4 = 12 ”
d3 = 9 ”
d2 = 6 ”
d1 = 3 ”
3 ” 3 ”
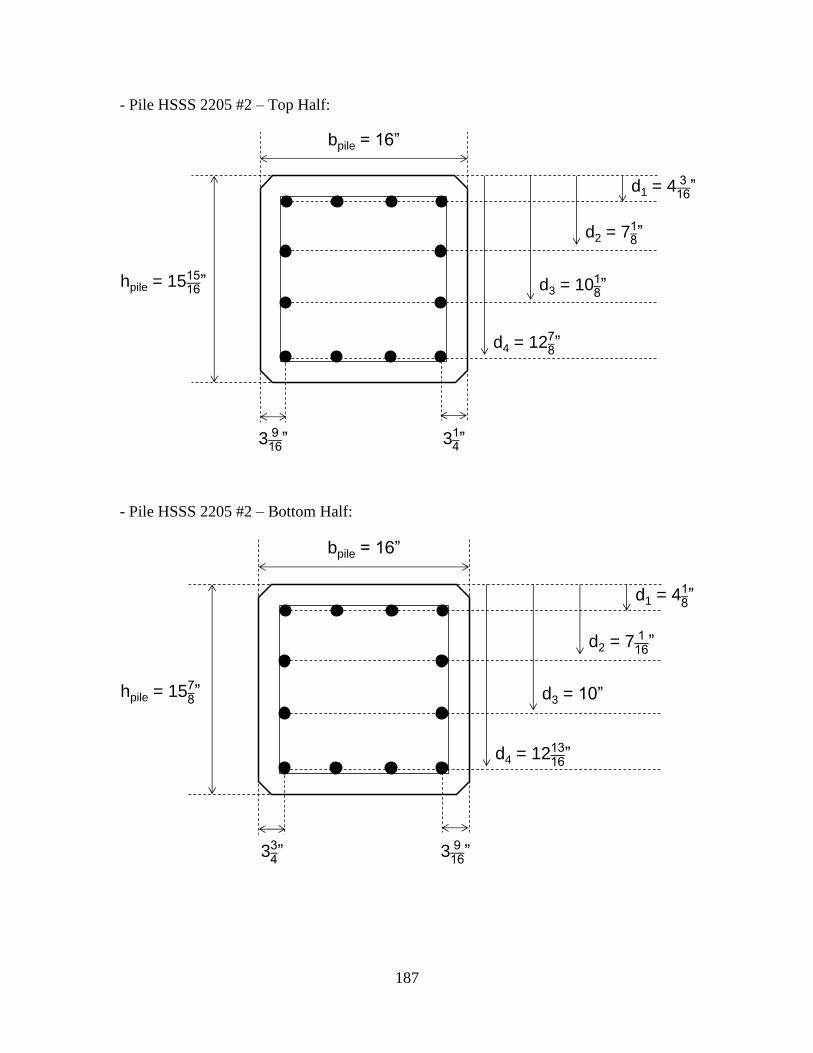
187
- Pile HSSS 2205 #2 – Top Half:
- Pile HSSS 2205 #2 – Bottom Half:
hpile = 15 ”
bpile = 16”
d4 = 12 ”
d3 = 10 ”
d2 = 7 ”
d1 = 4 ”
3 ” 3 ”
hpile = 15 ”
bpile = 16”
d4 = 12 ”
d3 = 10”
d2 = 7 ”
d1 = 4 ”
3 ” 3 ”
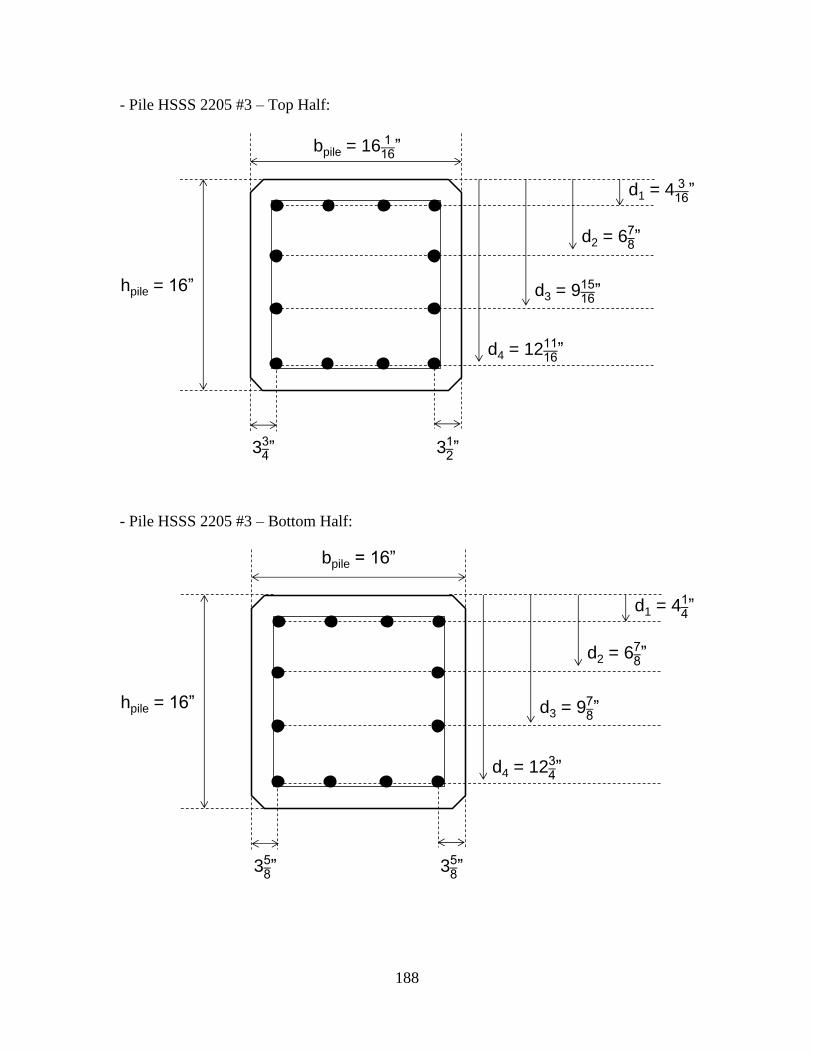
188
- Pile HSSS 2205 #3 – Top Half:
- Pile HSSS 2205 #3 – Bottom Half:
hpile = 16”
bpile = 16 ”
d4 = 12 ”
d3 = 9 ”
d2 = 6 ”
d1 = 4 ”
3 ” 3 ”
hpile = 16”
bpile = 16”
d4 = 12 ”
d3 = 9 ”
d2 = 6 ”
d1 = 4 ”
3 ” 3 ”
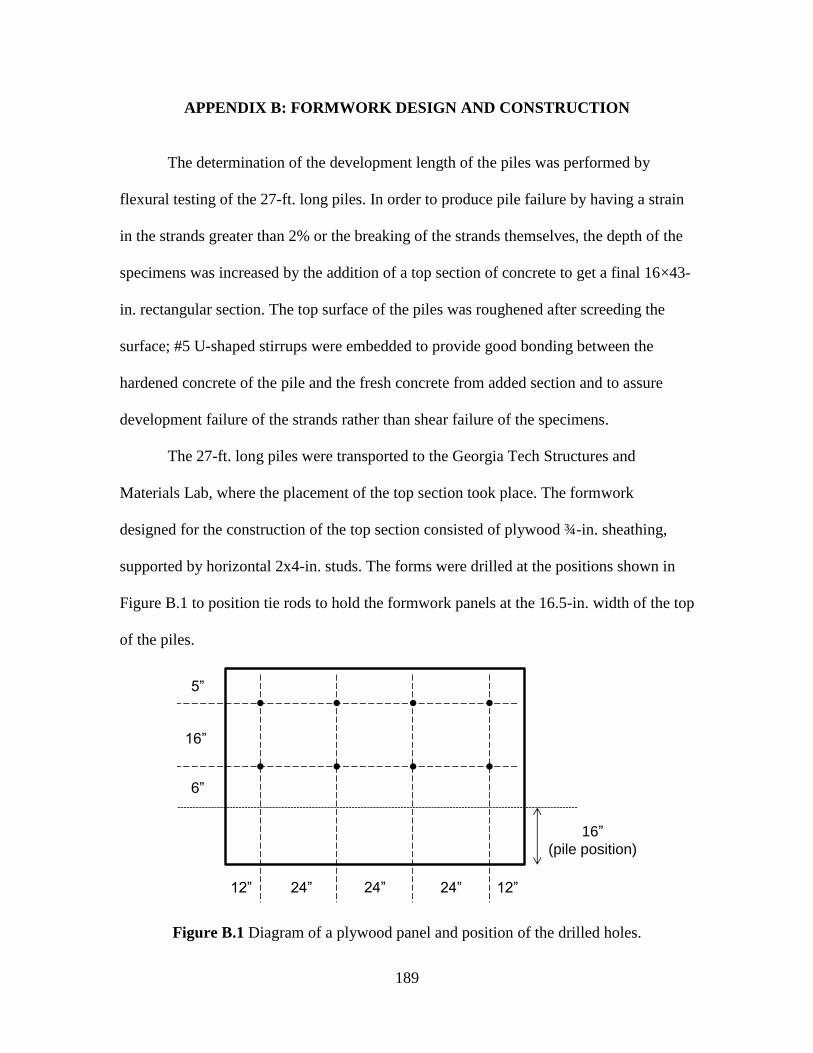
189
APPENDIX B: FORMWORK DESIGN AND CONSTRUCTION
The determination of the development length of the piles was performed by
flexural testing of the 27-ft. long piles. In order to produce pile failure by having a strain
in the strands greater than 2% or the breaking of the strands themselves, the depth of the
specimens was increased by the addition of a top section of concrete to get a final 16×43-
in. rectangular section. The top surface of the piles was roughened after screeding the
surface; #5 U-shaped stirrups were embedded to provide good bonding between the
hardened concrete of the pile and the fresh concrete from added section and to assure
development failure of the strands rather than shear failure of the specimens.
The 27-ft. long piles were transported to the Georgia Tech Structures and
Materials Lab, where the placement of the top section took place. The formwork
designed for the construction of the top section consisted of plywood ¾-in. sheathing,
supported by horizontal 2x4-in. studs. The forms were drilled at the positions shown in
Figure B.1 to position tie rods to hold the formwork panels at the 16.5-in. width of the top
of the piles.
Figure B.1 Diagram of a plywood panel and position of the drilled holes.
12” 24” 12”24”24”
16”
(pile position)
5”
16”
6”
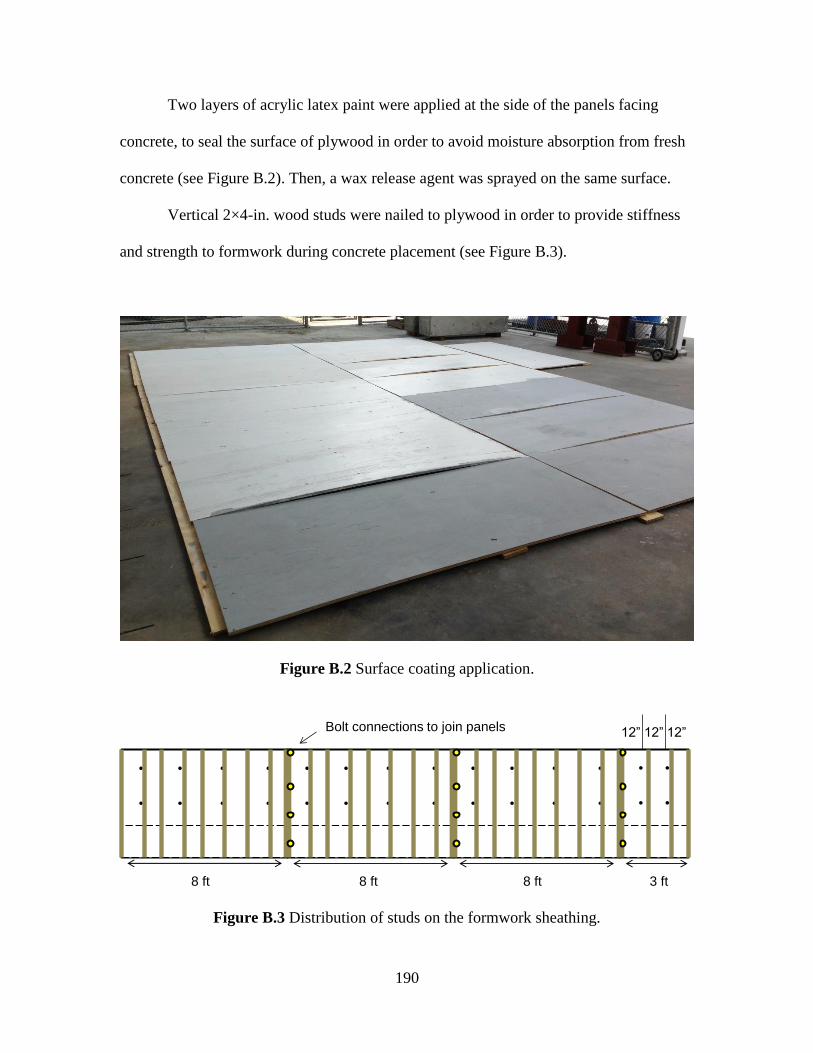
190
Two layers of acrylic latex paint were applied at the side of the panels facing
concrete, to seal the surface of plywood in order to avoid moisture absorption from fresh
concrete (see Figure B.2). Then, a wax release agent was sprayed on the same surface.
Vertical 2×4-in. wood studs were nailed to plywood in order to provide stiffness
and strength to formwork during concrete placement (see Figure B.3).
Figure B.2 Surface coating application.
Figure B.3 Distribution of studs on the formwork sheathing.
8 ft 8 ft8 ft 3 ft
12”12” 12”Bolt connections to join panels
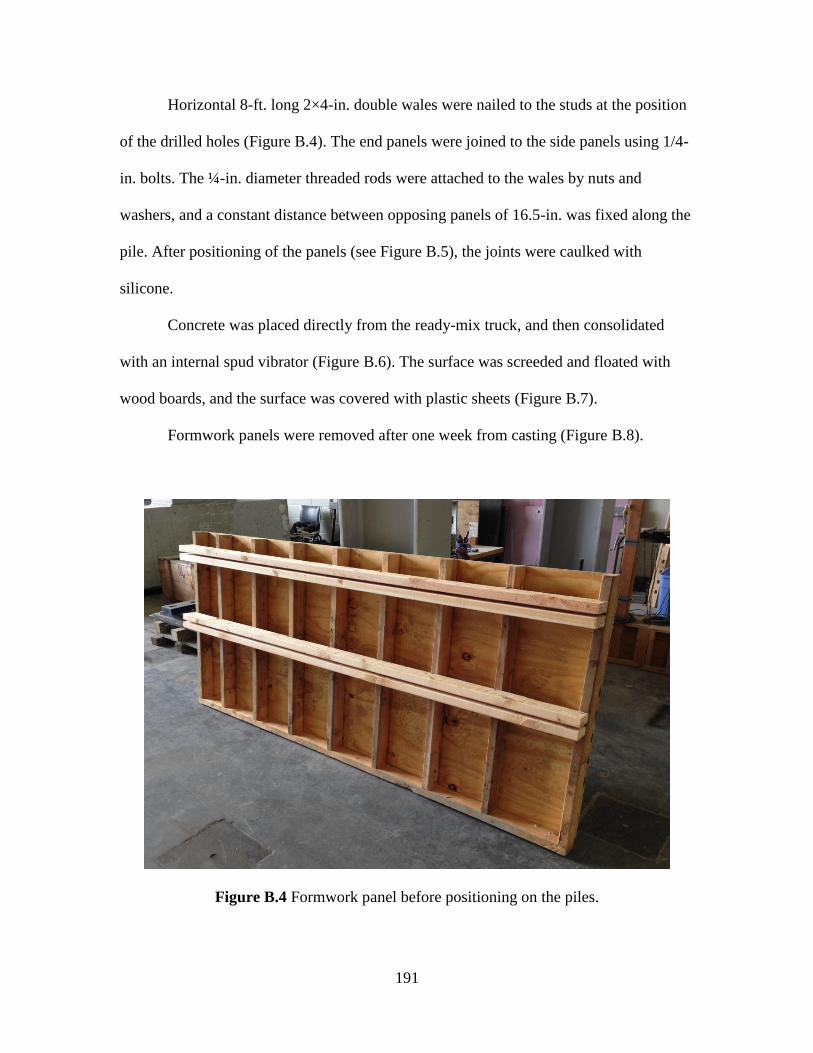
191
Horizontal 8-ft. long 2×4-in. double wales were nailed to the studs at the position
of the drilled holes (Figure B.4). The end panels were joined to the side panels using 1/4-
in. bolts. The ¼-in. diameter threaded rods were attached to the wales by nuts and
washers, and a constant distance between opposing panels of 16.5-in. was fixed along the
pile. After positioning of the panels (see Figure B.5), the joints were caulked with
silicone.
Concrete was placed directly from the ready-mix truck, and then consolidated
with an internal spud vibrator (Figure B.6). The surface was screeded and floated with
wood boards, and the surface was covered with plastic sheets (Figure B.7).
Formwork panels were removed after one week from casting (Figure B.8).
Figure B.4 Formwork panel before positioning on the piles.
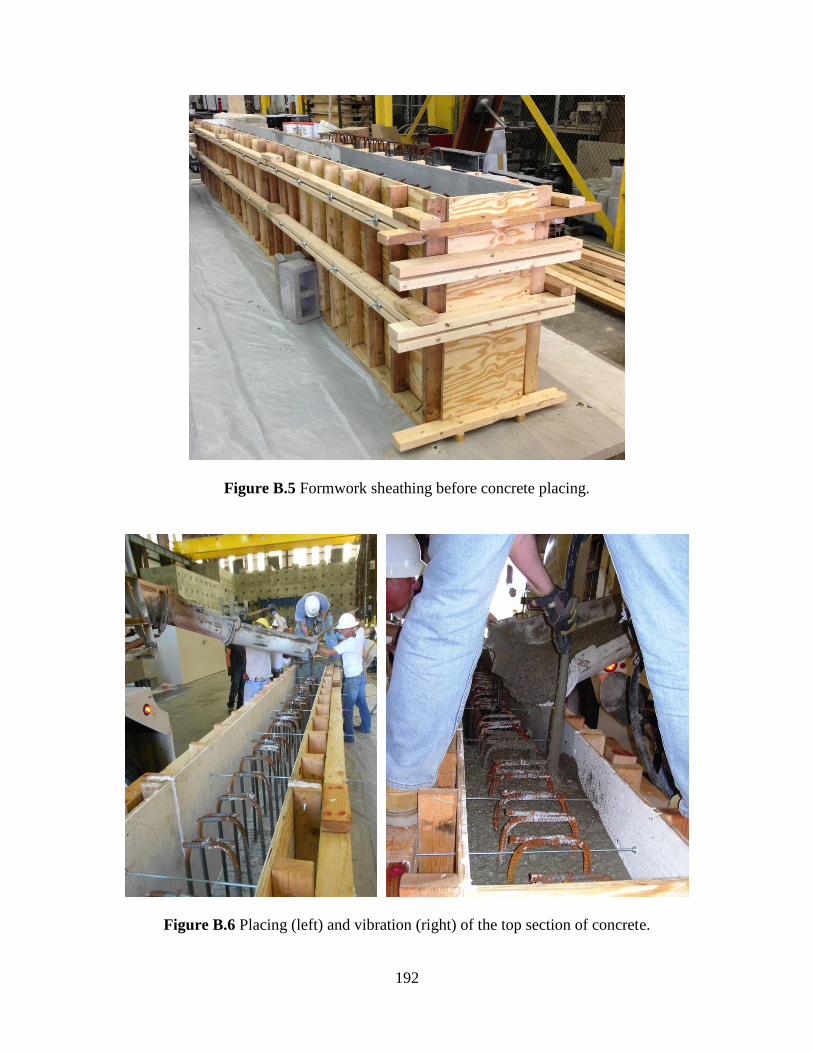
192
Figure B.5 Formwork sheathing before concrete placing.
Figure B.6 Placing (left) and vibration (right) of the top section of concrete.
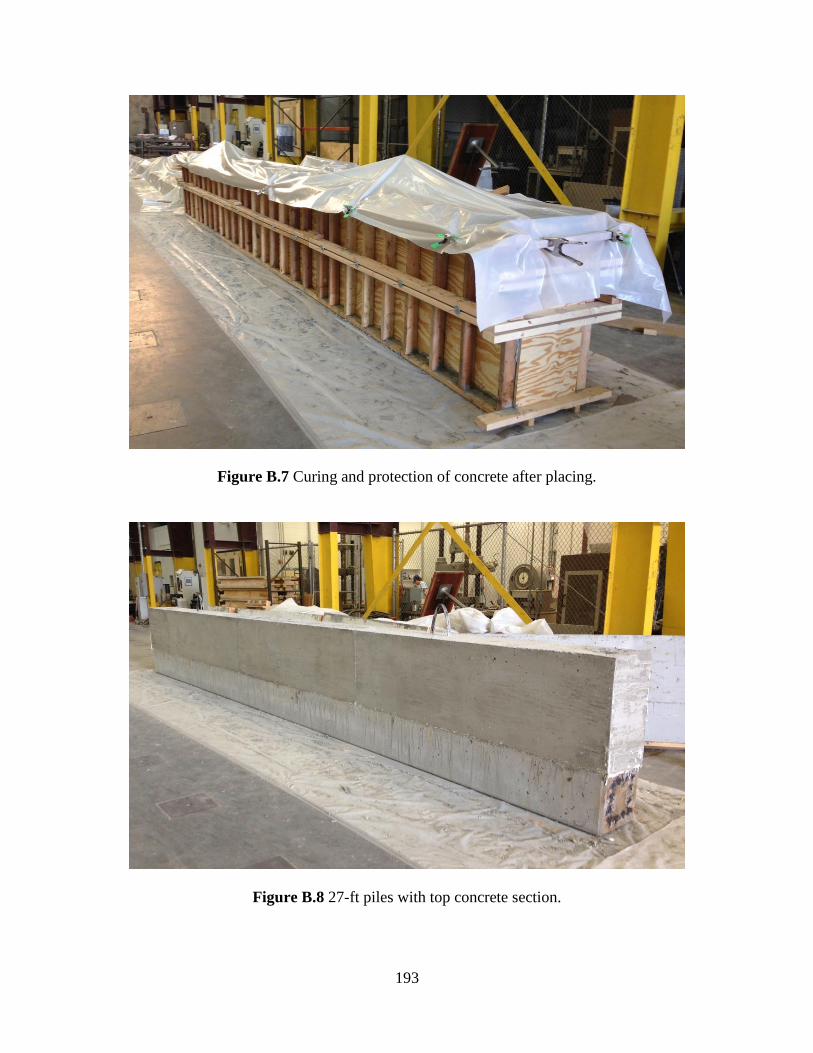
193
Figure B.7 Curing and protection of concrete after placing.
Figure B.8 27-ft piles with top concrete section.
194
APPENDIX C: GALVANIC CORROSION EVALUATION: SS 304 and HSSS 2205
The use of dissimilar metals for prestressing strands and transverse shear
reinforcement in the piles can create the conditions under which a galvanic couple and
accelerated corrosion of the more active metal (anode) could happen. To evaluate the
occurrence of galvanic corrosion between the couple duplex HSSS 2205 (strands) –
austenitic SS 304 (shear reinforcement), the standard test ASTM G71 was performed
under three exposures representing potential environments for the metallic couple during
service life: seawater, alkaline and carbonated conditions.
C.1 Test Procedure
To represent each condition, the following solutions were used:
a) Seawater: 0.5M Cl- solution (pH=6.5).
b) Carbonated: 0.3M NaHCO3 + 0.1M Na2CO3 (pH=9.5).
c) Alkaline: 4 g/l Ca(OH)2 (pH=12.5).
Standard ASTM G71 suggests the use of 40 cm3 of solution for every 1 cm
2 of
exposed surface area of the couple. Thus, 2-cm (0.787-in.) long samples for duplex 2205
strands and austenitic 304 wires were cut using a precision water saw (Figures C.1 and
C.2). Strand and shear reinforcement samples had approximately 22.87 cm2 (3.545 in
2)
and 4.12 cm2 (0.639 in
2) of exposed area, respectively. Following the suggestion of the
standard, a volume of 1 liter (33.814 oz.) was used for every condition. Additionally, the
anode-to-cathode area ratio was kept constant at 0.18 and the surfaces were used as-
received.
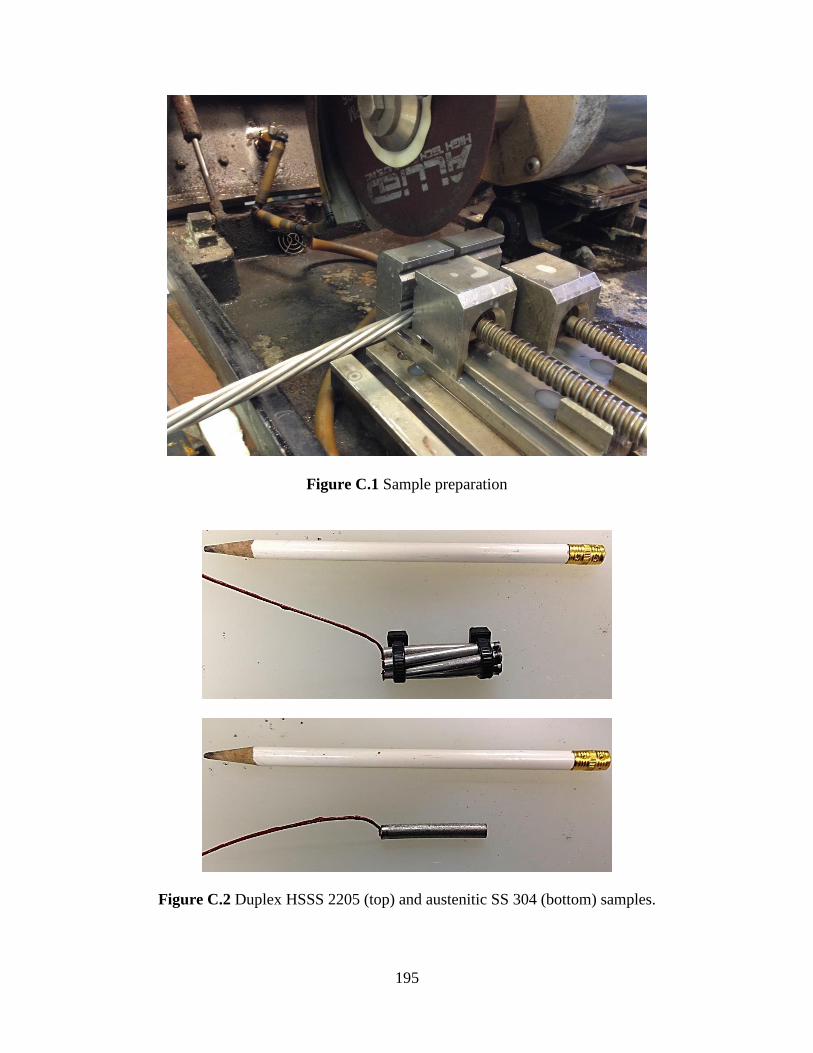
195
Figure C.1 Sample preparation
Figure C.2 Duplex HSSS 2205 (top) and austenitic SS 304 (bottom) samples.
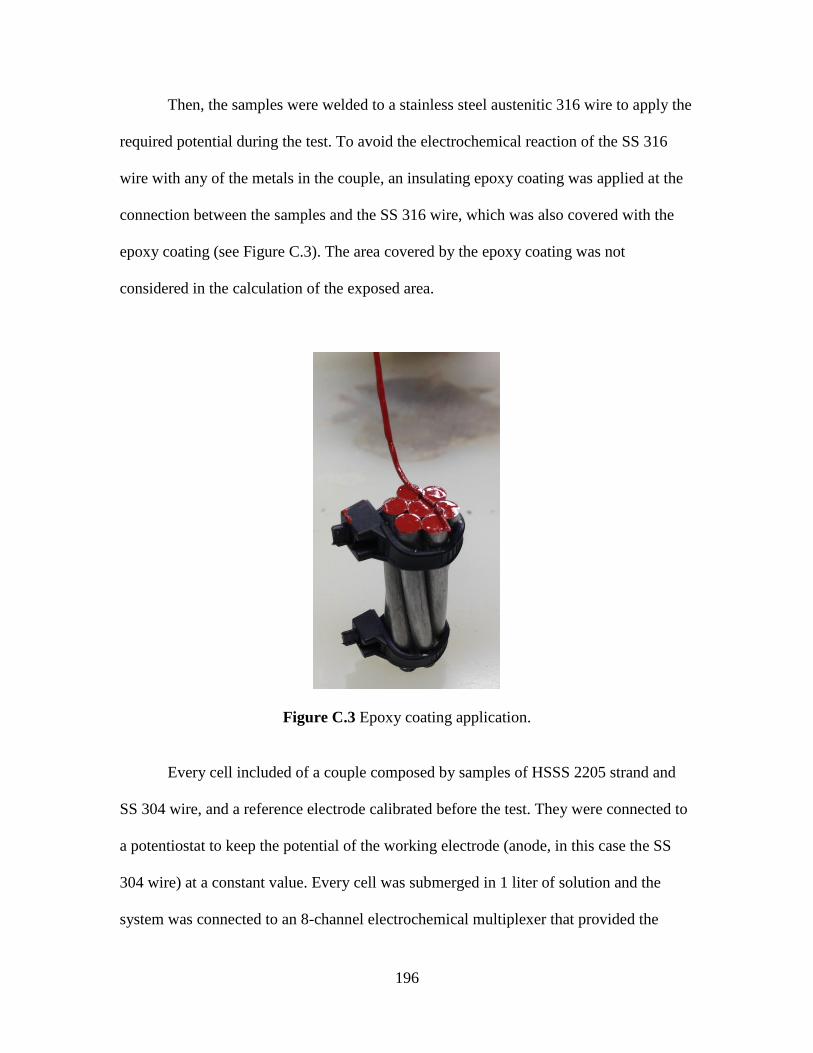
196
Then, the samples were welded to a stainless steel austenitic 316 wire to apply the
required potential during the test. To avoid the electrochemical reaction of the SS 316
wire with any of the metals in the couple, an insulating epoxy coating was applied at the
connection between the samples and the SS 316 wire, which was also covered with the
epoxy coating (see Figure C.3). The area covered by the epoxy coating was not
considered in the calculation of the exposed area.
Figure C.3 Epoxy coating application.
Every cell included of a couple composed by samples of HSSS 2205 strand and
SS 304 wire, and a reference electrode calibrated before the test. They were connected to
a potentiostat to keep the potential of the working electrode (anode, in this case the SS
304 wire) at a constant value. Every cell was submerged in 1 liter of solution and the
system was connected to an 8-channel electrochemical multiplexer that provided the
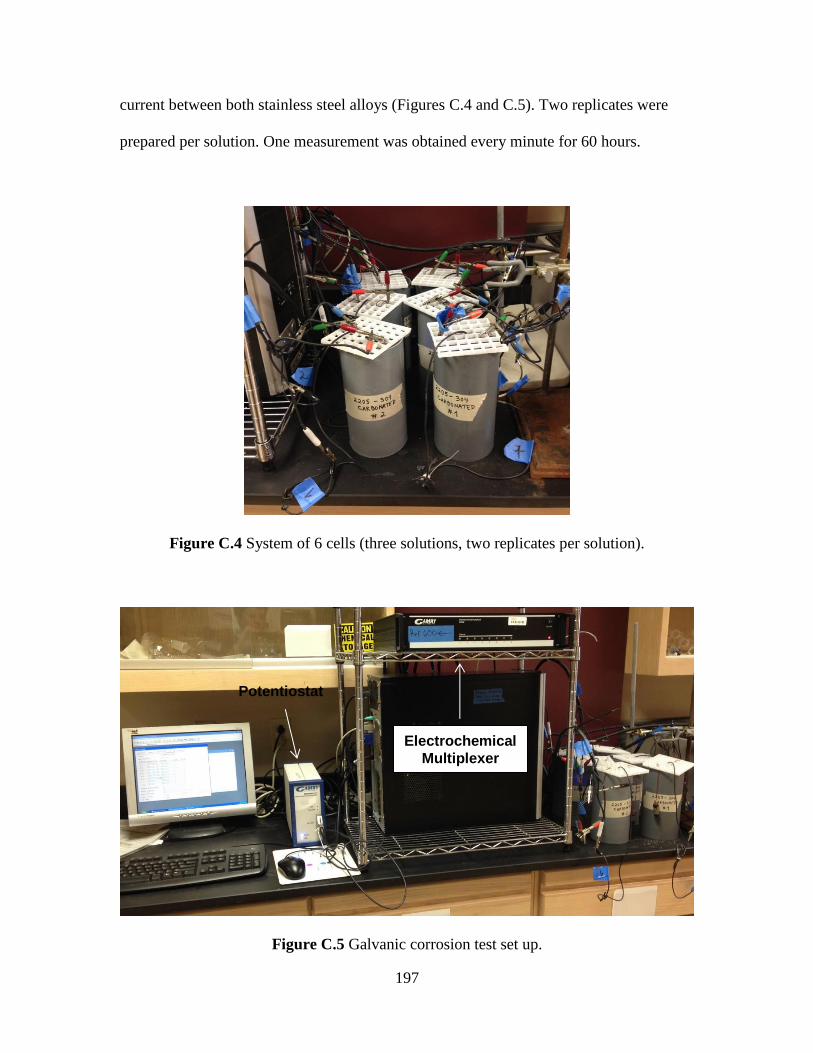
197
current between both stainless steel alloys (Figures C.4 and C.5). Two replicates were
prepared per solution. One measurement was obtained every minute for 60 hours.
Figure C.4 System of 6 cells (three solutions, two replicates per solution).
Figure C.5 Galvanic corrosion test set up.
Potentiostat
Electrochemical
Multiplexer
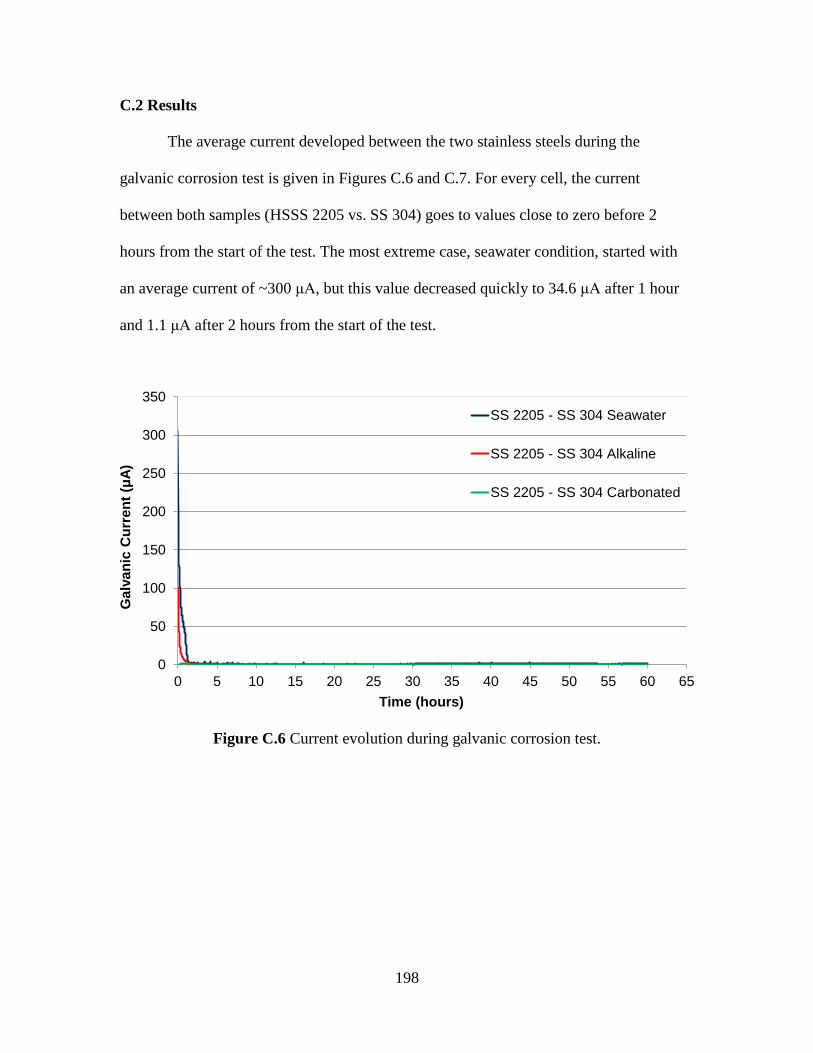
198
C.2 Results
The average current developed between the two stainless steels during the
galvanic corrosion test is given in Figures C.6 and C.7. For every cell, the current
between both samples (HSSS 2205 vs. SS 304) goes to values close to zero before 2
hours from the start of the test. The most extreme case, seawater condition, started with
an average current of ~300 μA, but this value decreased quickly to 34.6 μA after 1 hour
and 1.1 μA after 2 hours from the start of the test.
Figure C.6 Current evolution during galvanic corrosion test.
0
50
100
150
200
250
300
350
0 5 10 15 20 25 30 35 40 45 50 55 60 65
Galv
an
ic C
urr
en
t (μ
A)
Time (hours)
SS 2205 - SS 304 Seawater
SS 2205 - SS 304 Alkaline
SS 2205 - SS 304 Carbonated
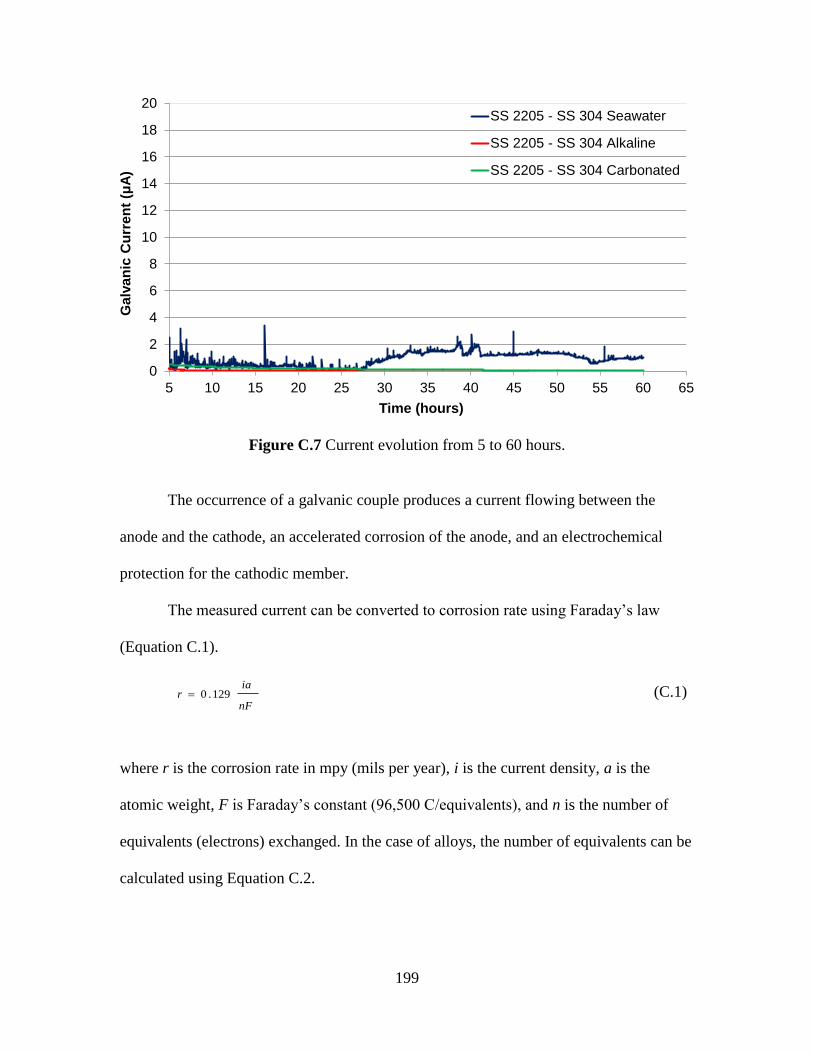
199
Figure C.7 Current evolution from 5 to 60 hours.
The occurrence of a galvanic couple produces a current flowing between the
anode and the cathode, an accelerated corrosion of the anode, and an electrochemical
protection for the cathodic member.
The measured current can be converted to corrosion rate using Faraday’s law
(Equation C.1).
nF
iar 129.0 (C.1)
where r is the corrosion rate in mpy (mils per year), i is the current density, a is the
atomic weight, F is Faraday’s constant (96,500 C/equivalents), and n is the number of
equivalents (electrons) exchanged. In the case of alloys, the number of equivalents can be
calculated using Equation C.2.
0
2
4
6
8
10
12
14
16
18
20
5 10 15 20 25 30 35 40 45 50 55 60 65
Ga
lva
nic
Cu
rre
nt
(μA
)
Time (hours)
SS 2205 - SS 304 Seawater
SS 2205 - SS 304 Alkaline
SS 2205 - SS 304 Carbonated
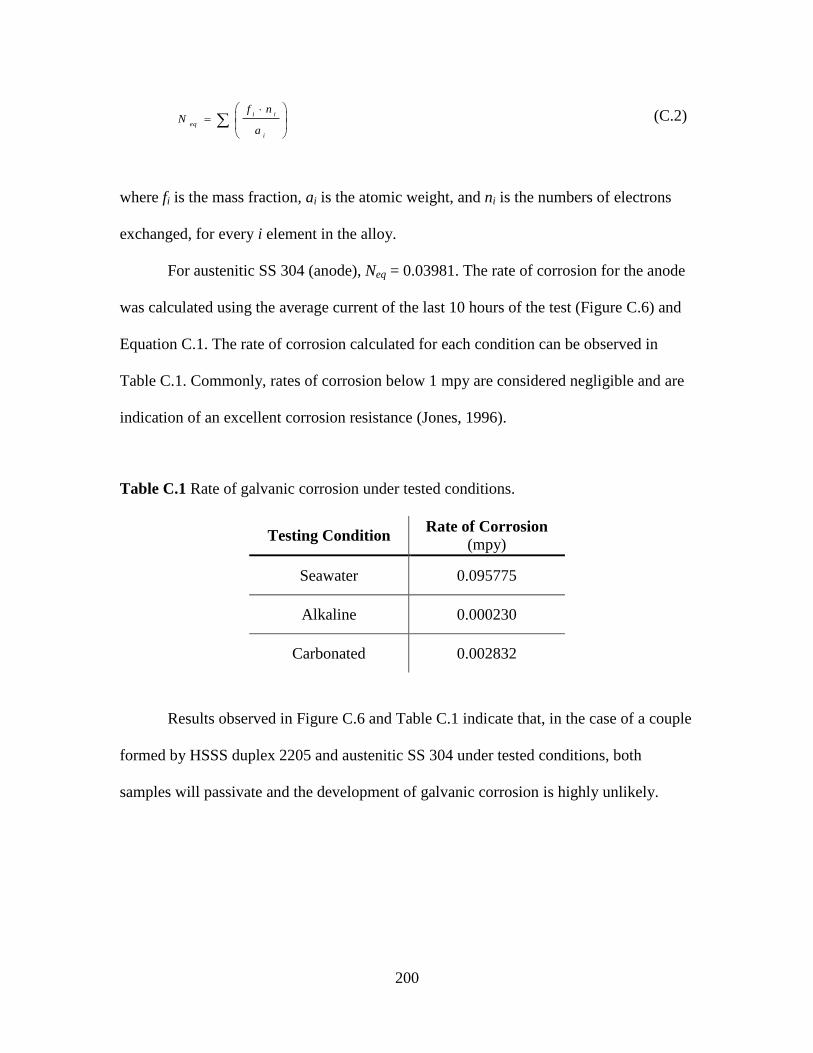
200
i
ii
eq
a
nfN (C.2)
where fi is the mass fraction, ai is the atomic weight, and ni is the numbers of electrons
exchanged, for every i element in the alloy.
For austenitic SS 304 (anode), Neq = 0.03981. The rate of corrosion for the anode
was calculated using the average current of the last 10 hours of the test (Figure C.6) and
Equation C.1. The rate of corrosion calculated for each condition can be observed in
Table C.1. Commonly, rates of corrosion below 1 mpy are considered negligible and are
indication of an excellent corrosion resistance (Jones, 1996).
Table C.1 Rate of galvanic corrosion under tested conditions.
Testing Condition Rate of Corrosion
(mpy)
Seawater 0.095775
Alkaline 0.000230
Carbonated 0.002832
Results observed in Figure C.6 and Table C.1 indicate that, in the case of a couple
formed by HSSS duplex 2205 and austenitic SS 304 under tested conditions, both
samples will passivate and the development of galvanic corrosion is highly unlikely.
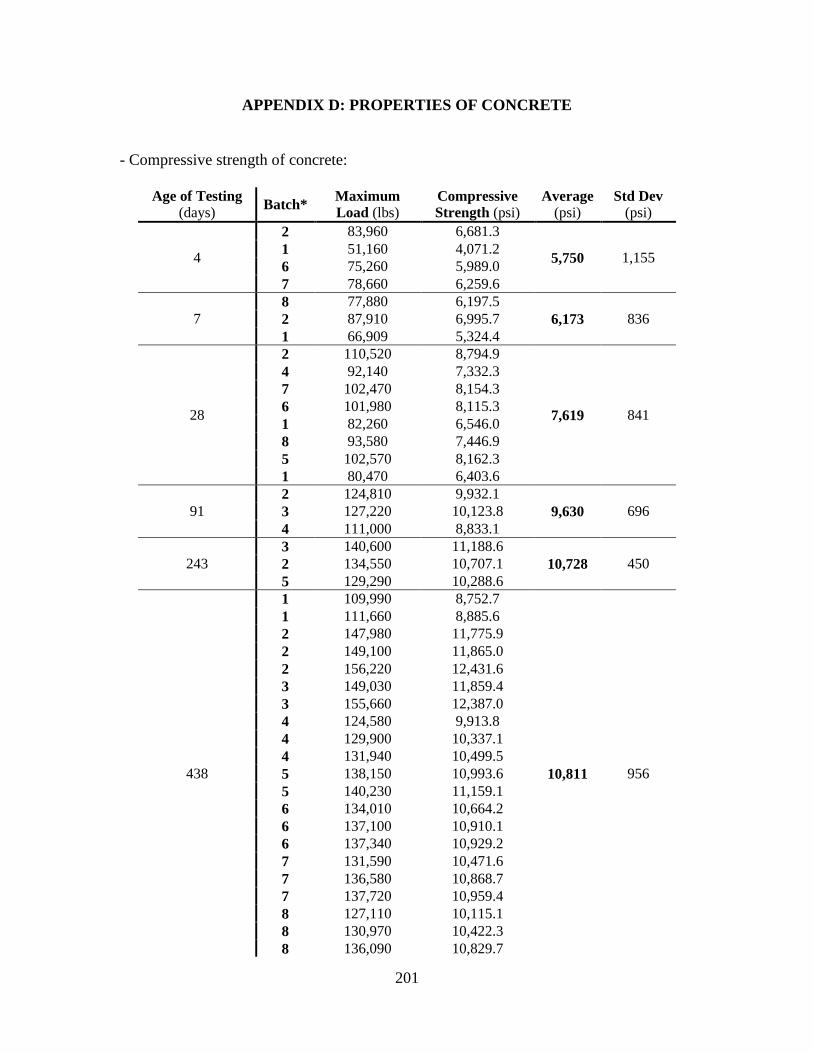
201
APPENDIX D: PROPERTIES OF CONCRETE
- Compressive strength of concrete:
Age of Testing
(days) Batch*
Maximum
Load (lbs) Compressive
Strength (psi) Average
(psi) Std Dev
(psi)
4
2 83,960 6,681.3
5,750 1,155 1 51,160 4,071.2
6 75,260 5,989.0
7 78,660 6,259.6
7
8 77,880 6,197.5
6,173 836 2 87,910 6,995.7
1 66,909 5,324.4
28
2 110,520 8,794.9
7,619 841
4 92,140 7,332.3
7 102,470 8,154.3
6 101,980 8,115.3
1 82,260 6,546.0
8 93,580 7,446.9
5 102,570 8,162.3
1 80,470 6,403.6
91
2 124,810 9,932.1
9,630 696 3 127,220 10,123.8
4 111,000 8,833.1
243
3 140,600 11,188.6
10,728 450 2 134,550 10,707.1
5 129,290 10,288.6
438
1 109,990 8,752.7
10,811 956
1 111,660 8,885.6
2 147,980 11,775.9
2 149,100 11,865.0
2 156,220 12,431.6
3 149,030 11,859.4
3 155,660 12,387.0
4 124,580 9,913.8
4 129,900 10,337.1
4 131,940 10,499.5
5 138,150 10,993.6
5 140,230 11,159.1
6 134,010 10,664.2
6 137,100 10,910.1
6 137,340 10,929.2
7 131,590 10,471.6
7 136,580 10,868.7
7 137,720 10,959.4
8 127,110 10,115.1
8 130,970 10,422.3
8 136,090 10,829.7
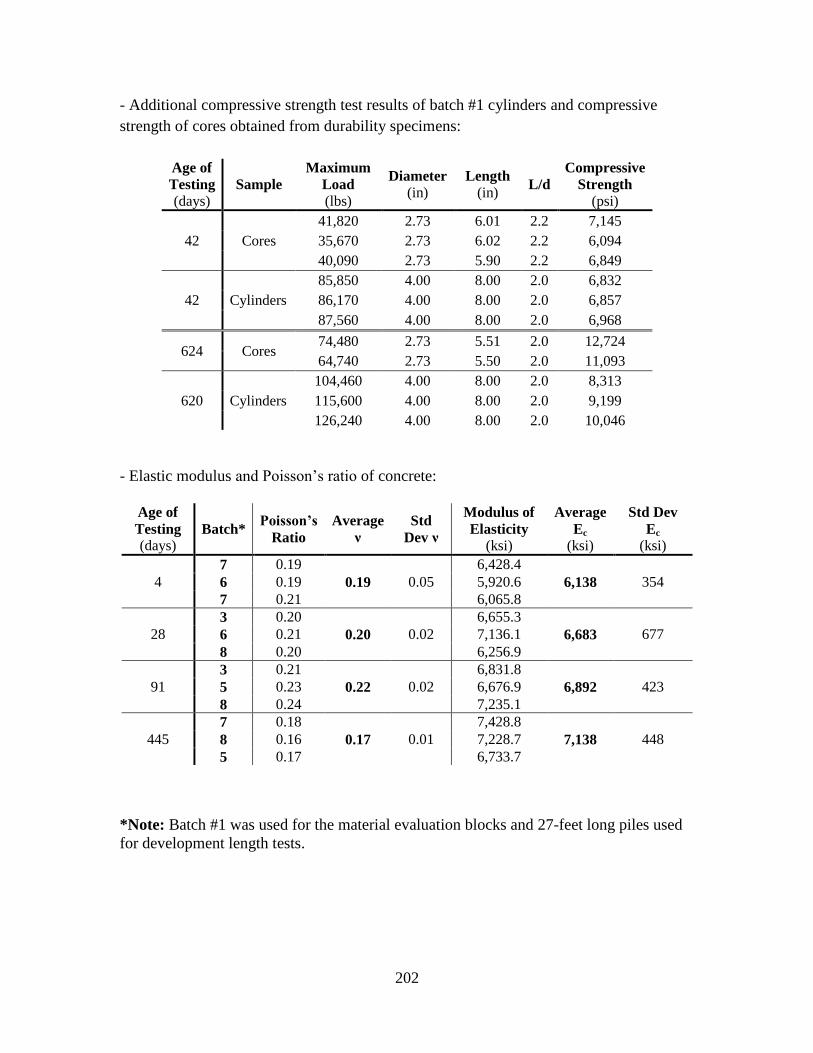
202
- Additional compressive strength test results of batch #1 cylinders and compressive
strength of cores obtained from durability specimens:
Age of
Testing
(days) Sample
Maximum
Load
(lbs)
Diameter
(in) Length
(in) L/d
Compressive
Strength
(psi)
42 Cores
41,820 2.73 6.01 2.2 7,145
35,670 2.73 6.02 2.2 6,094
40,090 2.73 5.90 2.2 6,849
42 Cylinders
85,850 4.00 8.00 2.0 6,832
86,170 4.00 8.00 2.0 6,857
87,560 4.00 8.00 2.0 6,968
624 Cores 74,480 2.73 5.51 2.0 12,724
64,740 2.73 5.50 2.0 11,093
620 Cylinders
104,460 4.00 8.00 2.0 8,313
115,600 4.00 8.00 2.0 9,199
126,240 4.00 8.00 2.0 10,046
- Elastic modulus and Poisson’s ratio of concrete:
Age of
Testing
(days) Batch*
Poisson’s
Ratio
Average
ν
Std
Dev ν
Modulus of
Elasticity
(ksi)
Average
Ec
(ksi)
Std Dev
Ec
(ksi)
4
7 0.19
0.19 0.05
6,428.4
6,138 354 6 0.19 5,920.6
7 0.21 6,065.8
28
3 0.20
0.20 0.02
6,655.3
6,683 677 6 0.21 7,136.1
8 0.20 6,256.9
91
3 0.21
0.22 0.02
6,831.8
6,892 423 5 0.23 6,676.9
8 0.24 7,235.1
445
7 0.18
0.17 0.01
7,428.8
7,138 448 8 0.16 7,228.7
5 0.17 6,733.7
*Note: Batch #1 was used for the material evaluation blocks and 27-feet long piles used
for development length tests.
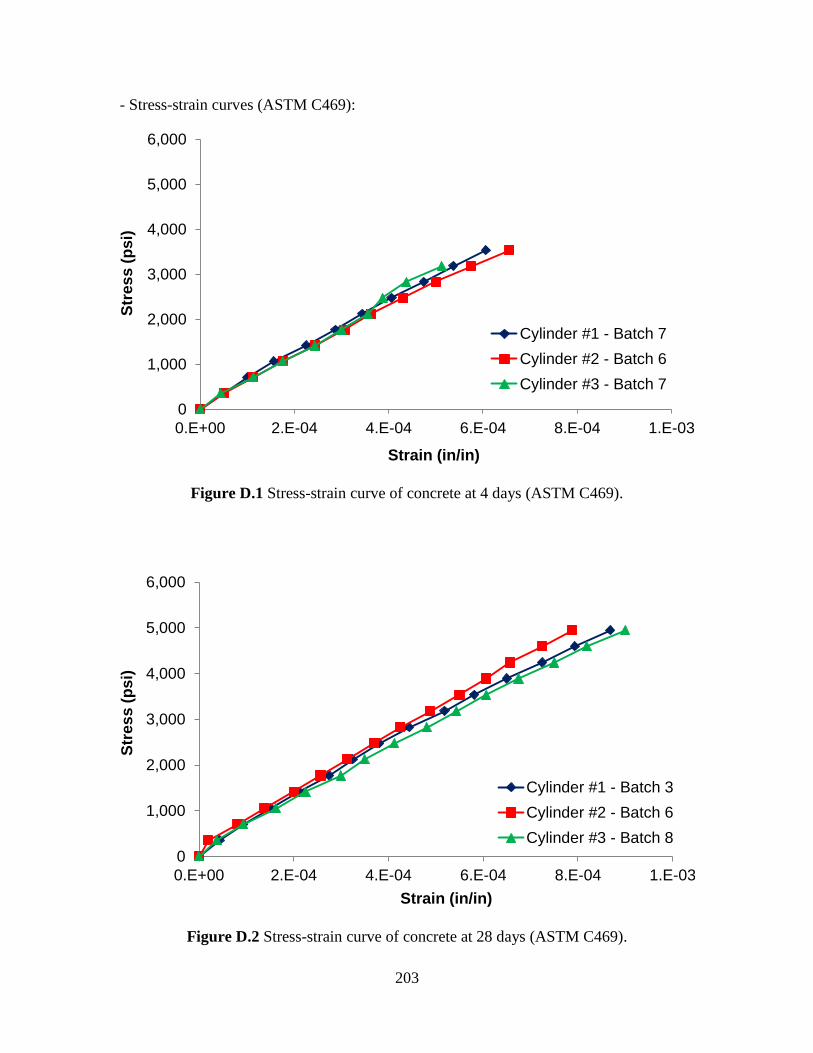
203
- Stress-strain curves (ASTM C469):
Figure D.1 Stress-strain curve of concrete at 4 days (ASTM C469).
Figure D.2 Stress-strain curve of concrete at 28 days (ASTM C469).
0
1,000
2,000
3,000
4,000
5,000
6,000
0.E+00 2.E-04 4.E-04 6.E-04 8.E-04 1.E-03
Str
es
s (
ps
i)
Strain (in/in)
Cylinder #1 - Batch 7
Cylinder #2 - Batch 6
Cylinder #3 - Batch 7
0
1,000
2,000
3,000
4,000
5,000
6,000
0.E+00 2.E-04 4.E-04 6.E-04 8.E-04 1.E-03
Str
es
s (
ps
i)
Strain (in/in)
Cylinder #1 - Batch 3
Cylinder #2 - Batch 6
Cylinder #3 - Batch 8
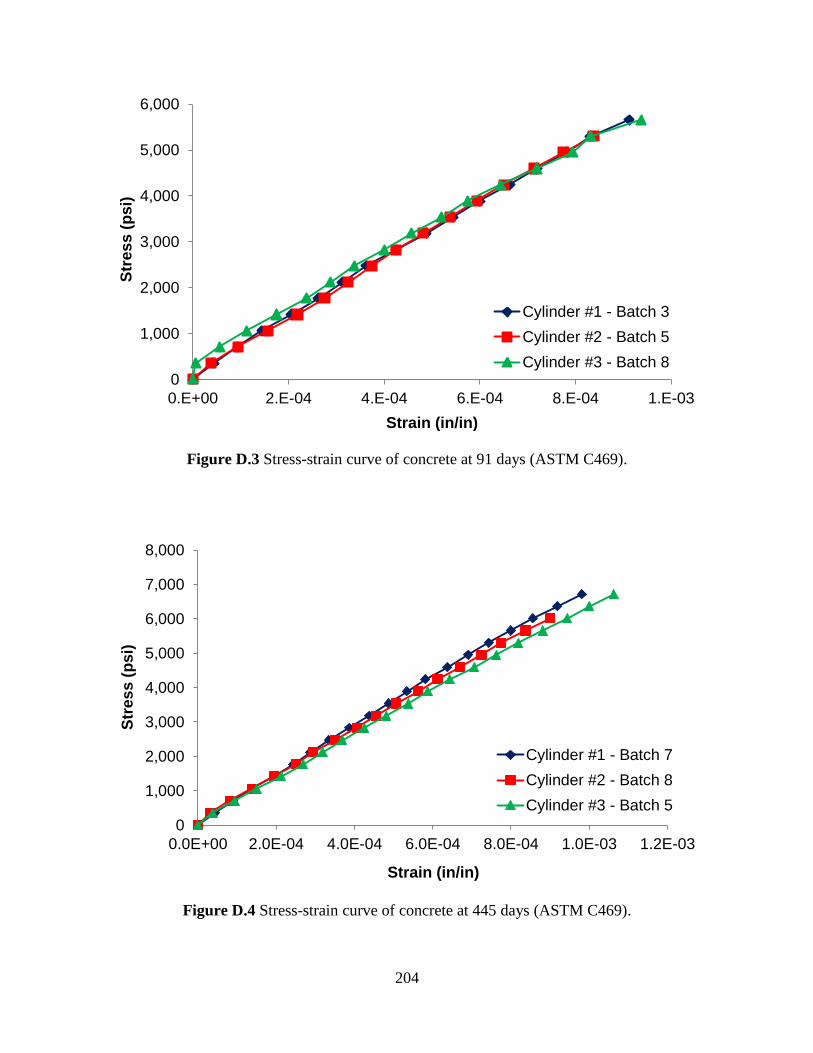
204
Figure D.3 Stress-strain curve of concrete at 91 days (ASTM C469).
Figure D.4 Stress-strain curve of concrete at 445 days (ASTM C469).
0
1,000
2,000
3,000
4,000
5,000
6,000
0.E+00 2.E-04 4.E-04 6.E-04 8.E-04 1.E-03
Str
es
s (
ps
i)
Strain (in/in)
Cylinder #1 - Batch 3
Cylinder #2 - Batch 5
Cylinder #3 - Batch 8
0
1,000
2,000
3,000
4,000
5,000
6,000
7,000
8,000
0.0E+00 2.0E-04 4.0E-04 6.0E-04 8.0E-04 1.0E-03 1.2E-03
Str
es
s (
ps
i)
Strain (in/in)
Cylinder #1 - Batch 7
Cylinder #2 - Batch 8
Cylinder #3 - Batch 5
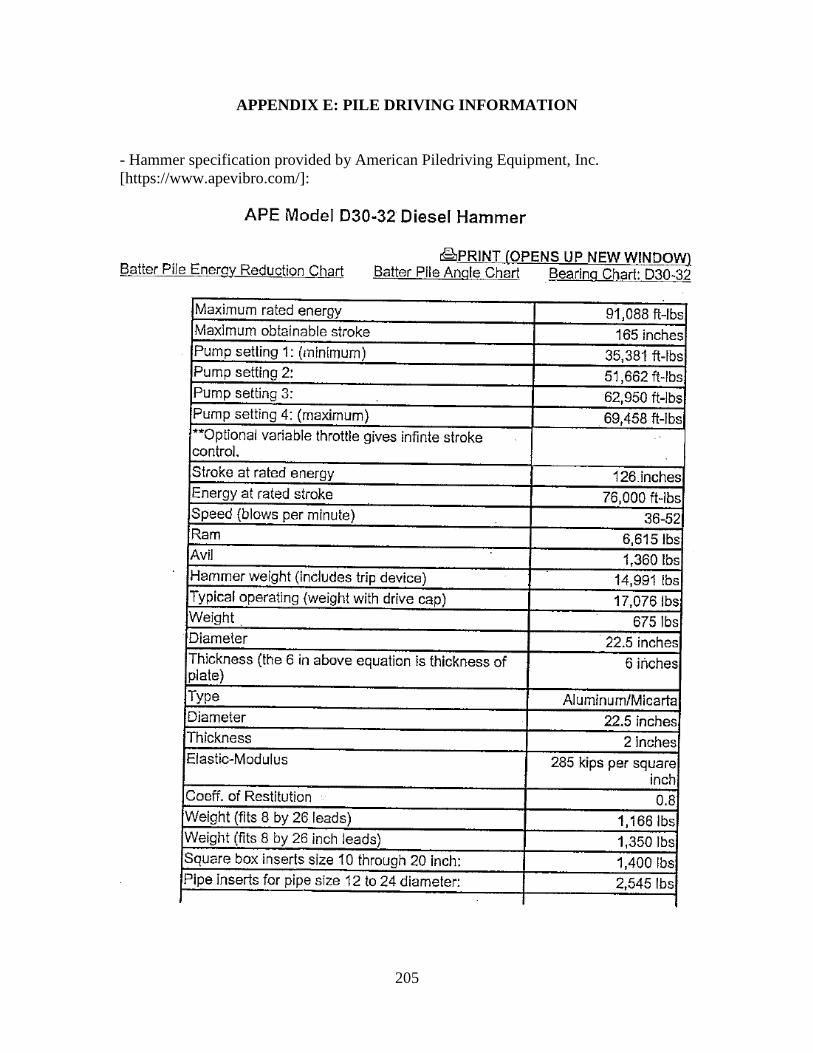
205
APPENDIX E: PILE DRIVING INFORMATION
- Hammer specification provided by American Piledriving Equipment, Inc.
[https://www.apevibro.com/]:
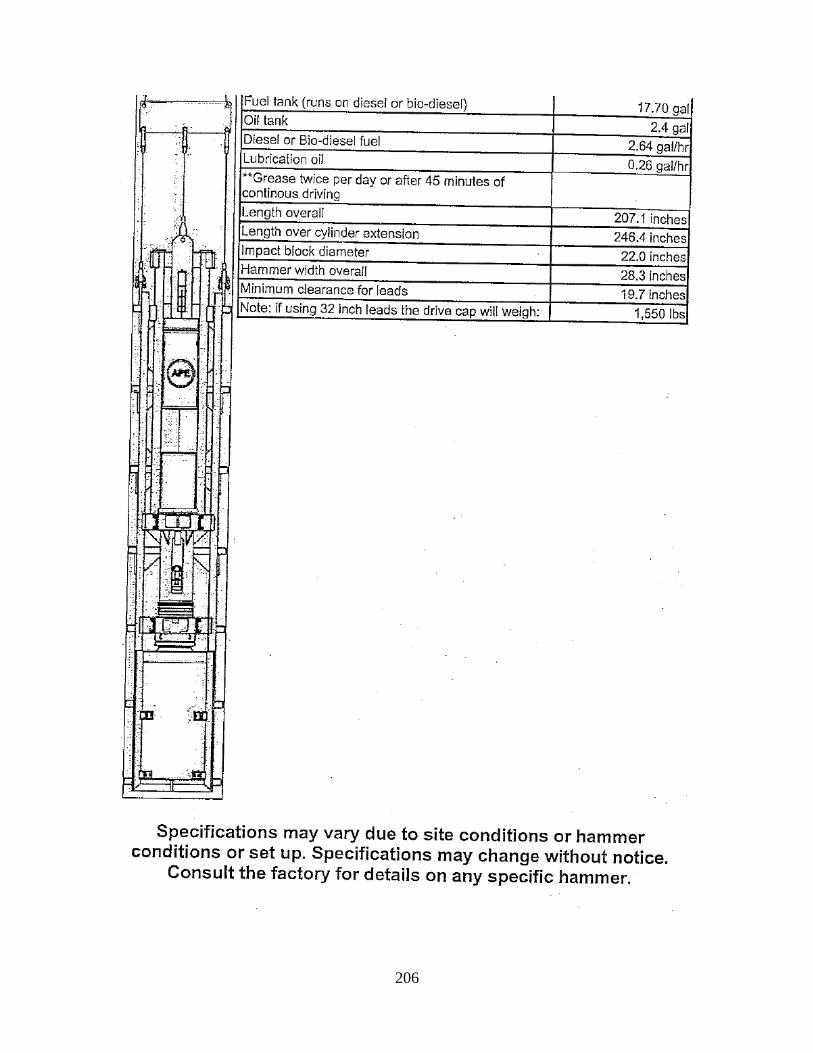
206
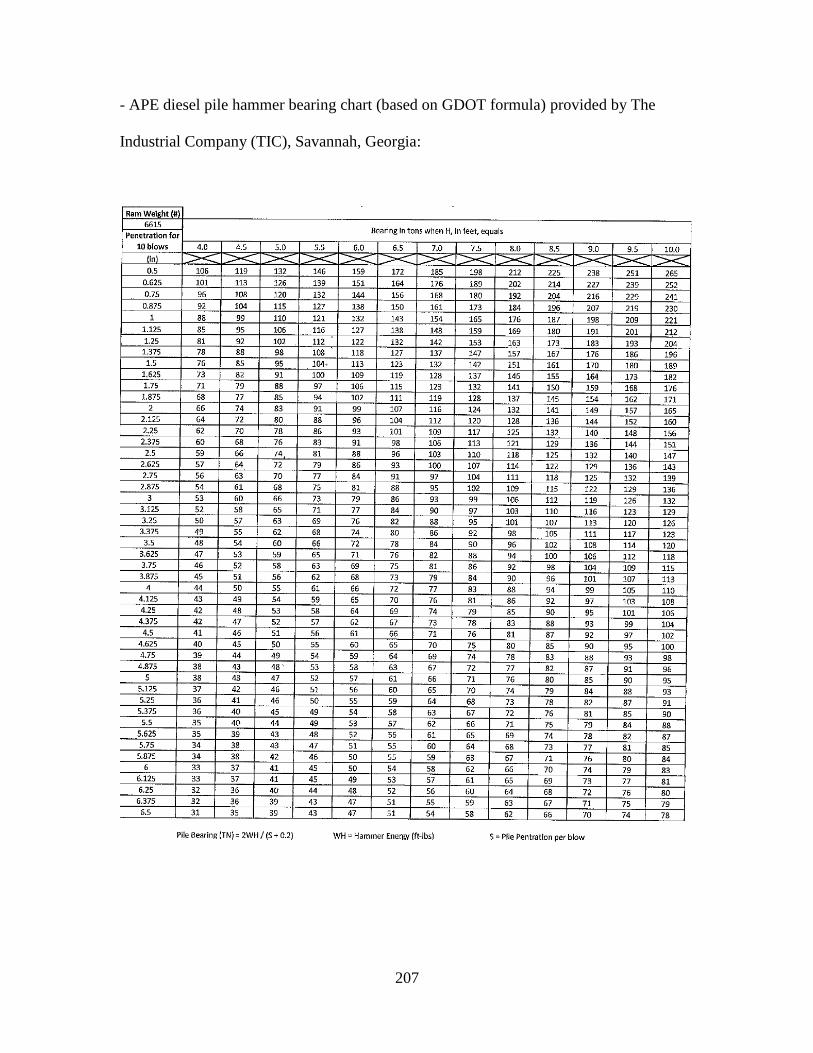
207
- APE diesel pile hammer bearing chart (based on GDOT formula) provided by The
Industrial Company (TIC), Savannah, Georgia:
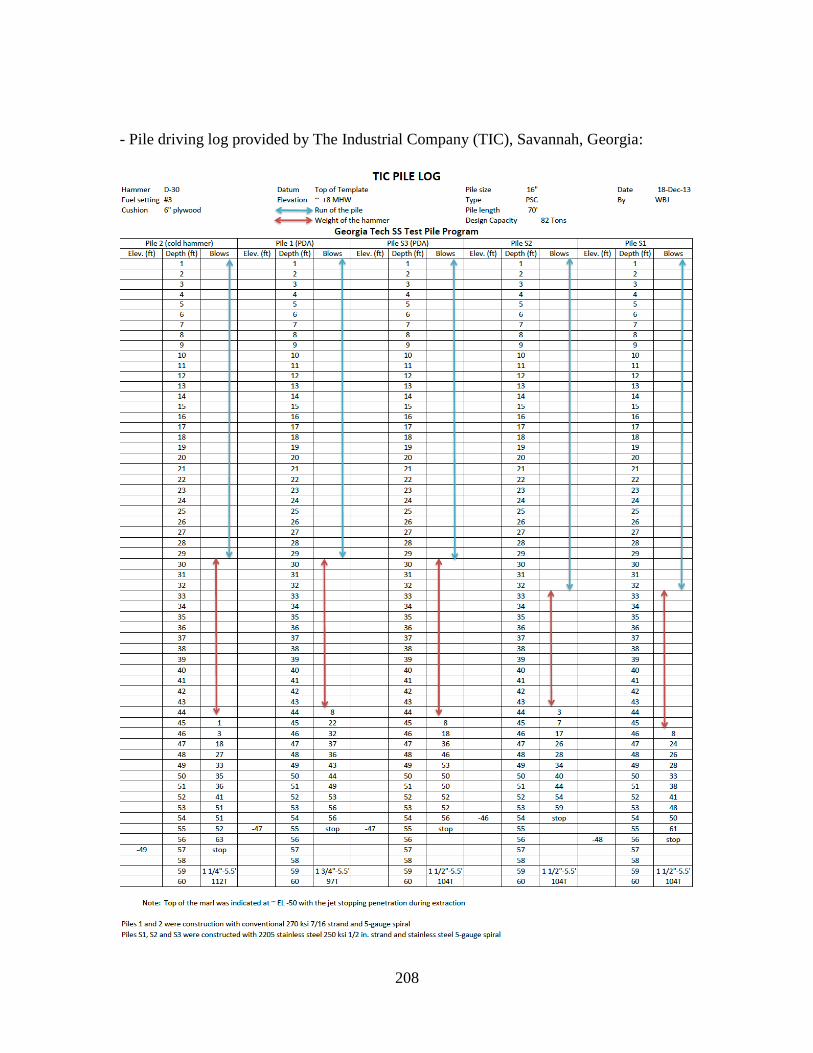
208
- Pile driving log provided by The Industrial Company (TIC), Savannah, Georgia:
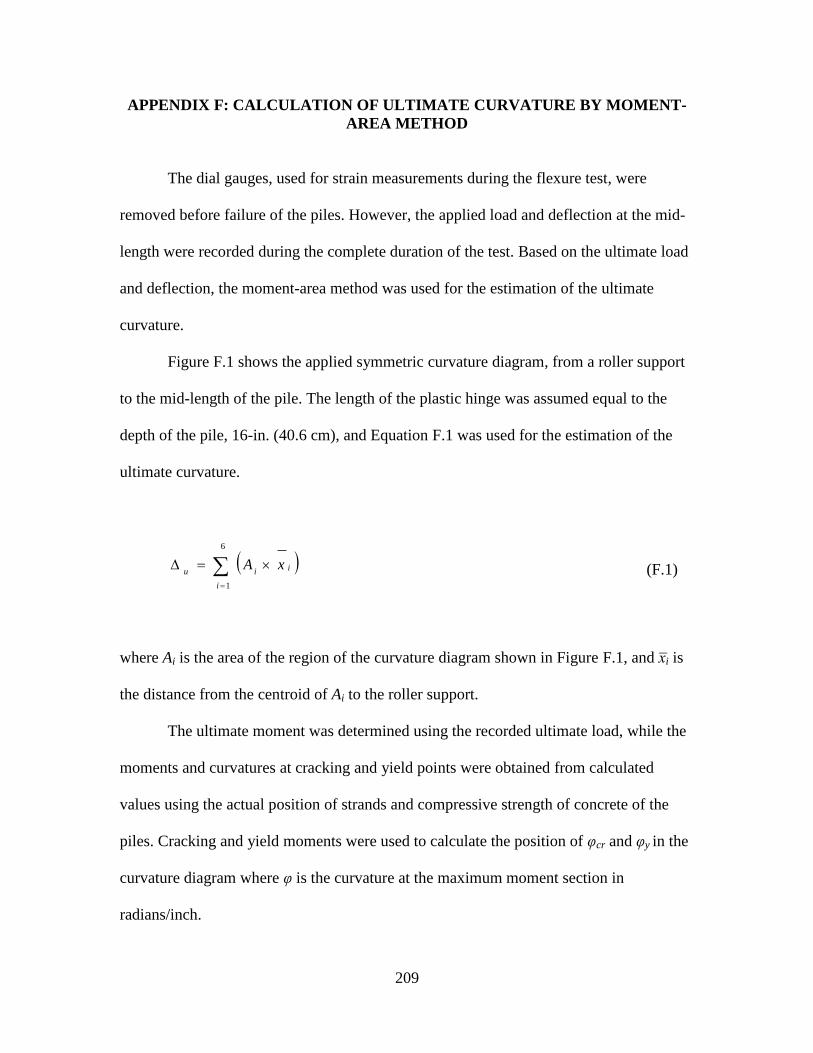
209
APPENDIX F: CALCULATION OF ULTIMATE CURVATURE BY MOMENT-
AREA METHOD
The dial gauges, used for strain measurements during the flexure test, were
removed before failure of the piles. However, the applied load and deflection at the mid-
length were recorded during the complete duration of the test. Based on the ultimate load
and deflection, the moment-area method was used for the estimation of the ultimate
curvature.
Figure F.1 shows the applied symmetric curvature diagram, from a roller support
to the mid-length of the pile. The length of the plastic hinge was assumed equal to the
depth of the pile, 16-in. (40.6 cm), and Equation F.1 was used for the estimation of the
ultimate curvature.
6
1i
iiuxA (F.1)
where Ai is the area of the region of the curvature diagram shown in Figure F.1, and xi is
the distance from the centroid of Ai to the roller support.
The ultimate moment was determined using the recorded ultimate load, while the
moments and curvatures at cracking and yield points were obtained from calculated
values using the actual position of strands and compressive strength of concrete of the
piles. Cracking and yield moments were used to calculate the position of φcr and φy in the
curvature diagram where φ is the curvature at the maximum moment section in
radians/inch.
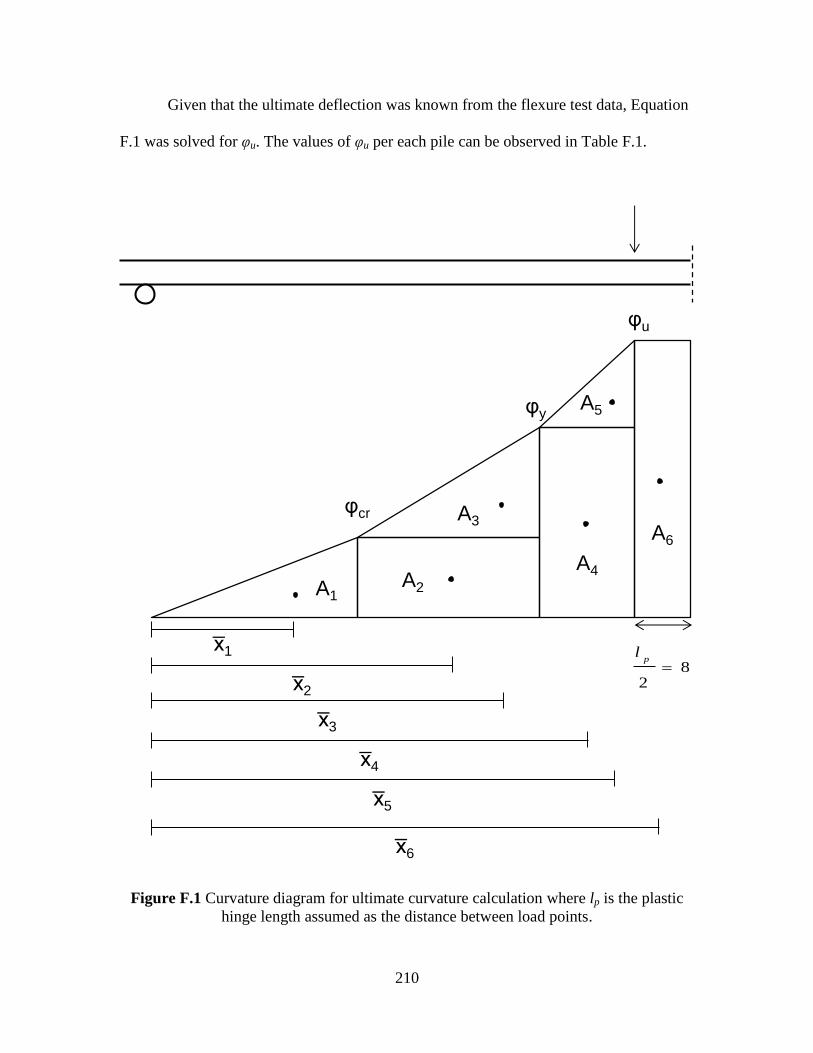
210
Given that the ultimate deflection was known from the flexure test data, Equation
F.1 was solved for φu. The values of φu per each pile can be observed in Table F.1.
Figure F.1 Curvature diagram for ultimate curvature calculation where lp is the plastic
hinge length assumed as the distance between load points.
φcr
φy
φu
A1A2
A3
A4
A5
A6
x1
x2
x3
x4
x5
x6
82
p
l
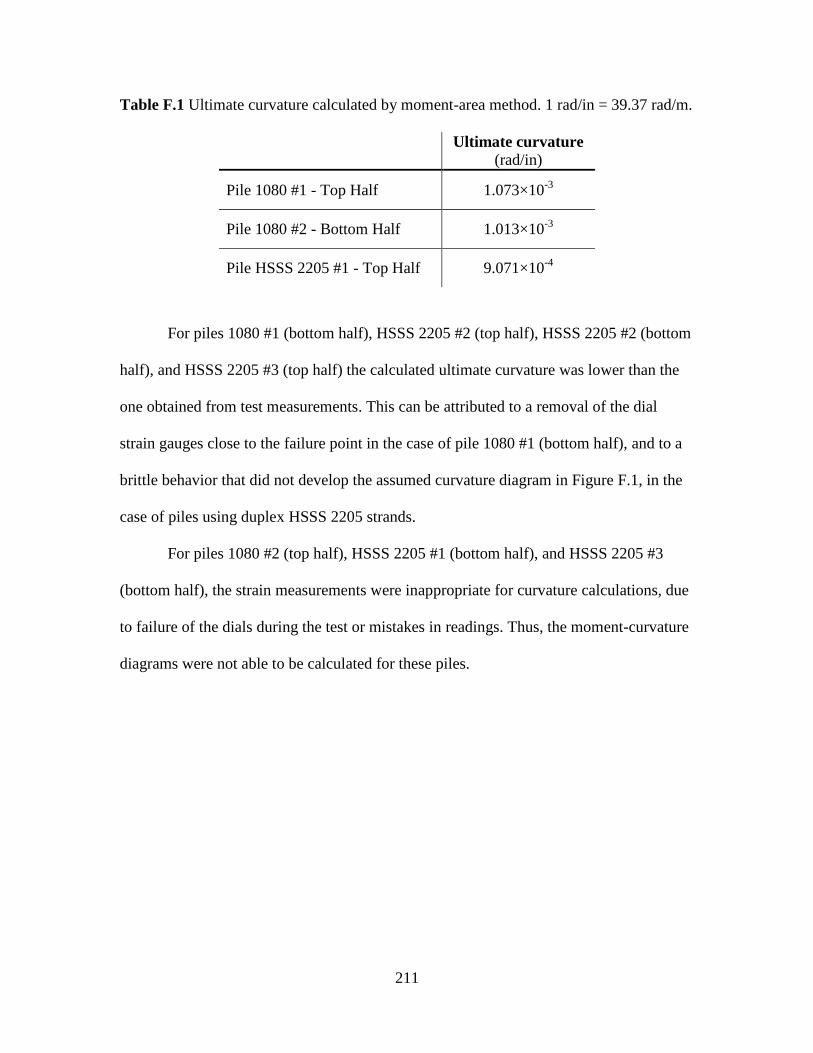
211
Table F.1 Ultimate curvature calculated by moment-area method. 1 rad/in = 39.37 rad/m.
Ultimate curvature
(rad/in)
Pile 1080 #1 - Top Half 1.073×10⁻³
Pile 1080 #2 - Bottom Half 1.013×10⁻³
Pile HSSS 2205 #1 - Top Half 9.071×10⁻⁴
For piles 1080 #1 (bottom half), HSSS 2205 #2 (top half), HSSS 2205 #2 (bottom
half), and HSSS 2205 #3 (top half) the calculated ultimate curvature was lower than the
one obtained from test measurements. This can be attributed to a removal of the dial
strain gauges close to the failure point in the case of pile 1080 #1 (bottom half), and to a
brittle behavior that did not develop the assumed curvature diagram in Figure F.1, in the
case of piles using duplex HSSS 2205 strands.
For piles 1080 #2 (top half), HSSS 2205 #1 (bottom half), and HSSS 2205 #3
(bottom half), the strain measurements were inappropriate for curvature calculations, due
to failure of the dials during the test or mistakes in readings. Thus, the moment-curvature
diagrams were not able to be calculated for these piles.
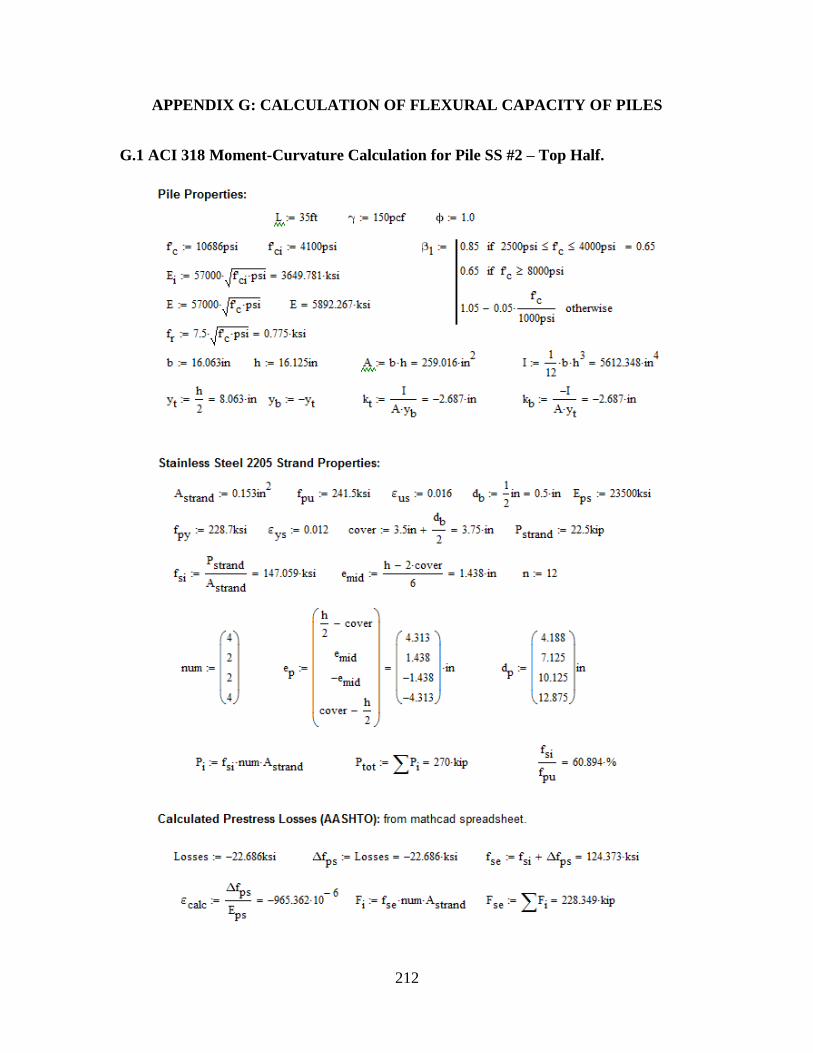
212
APPENDIX G: CALCULATION OF FLEXURAL CAPACITY OF PILES
G.1 ACI 318 Moment-Curvature Calculation for Pile SS #2 – Top Half.
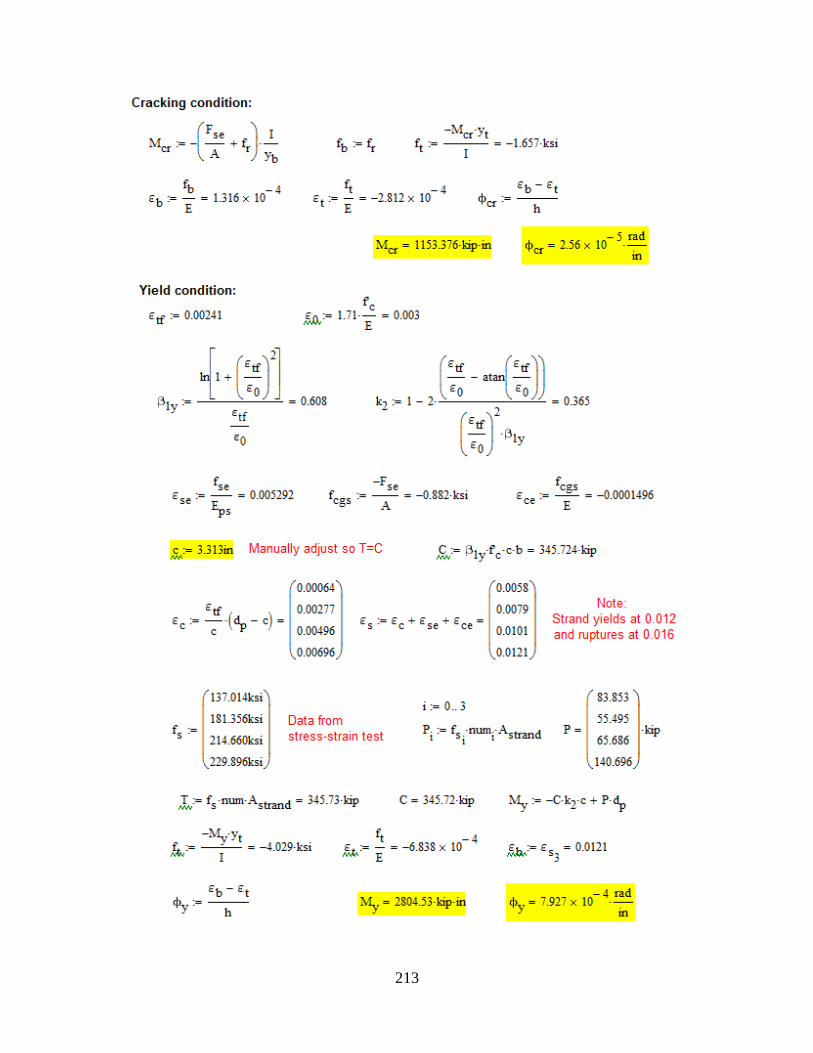
213
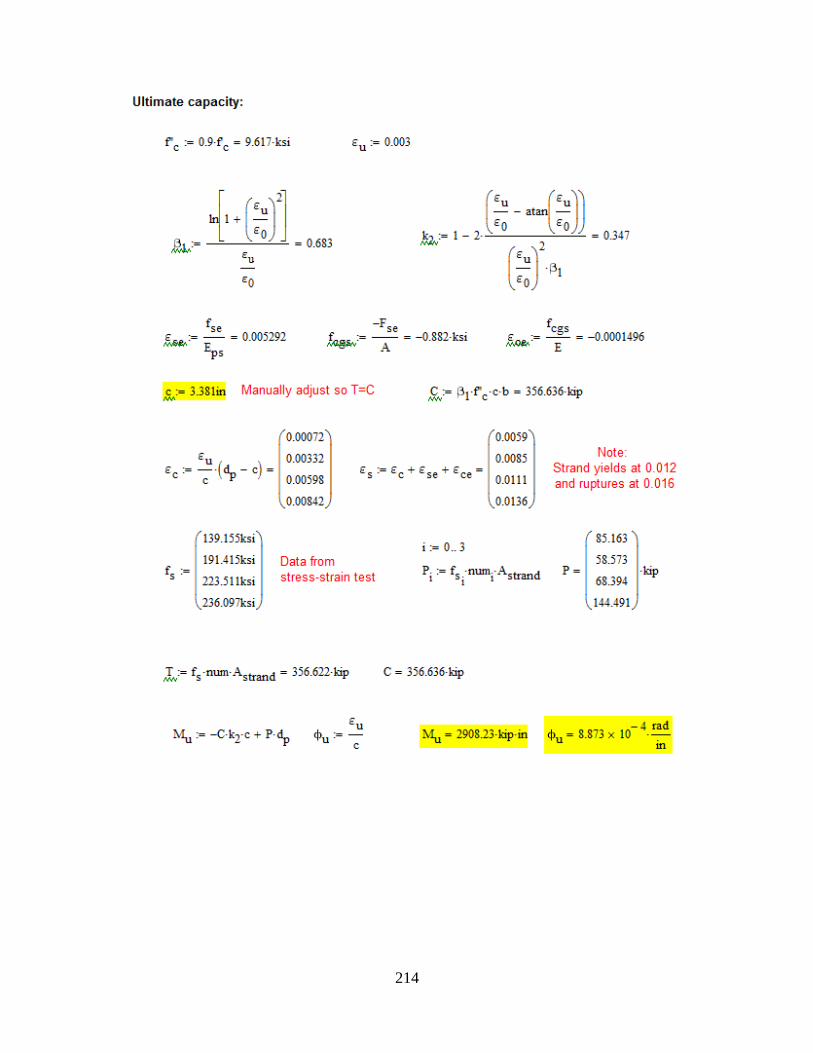
214
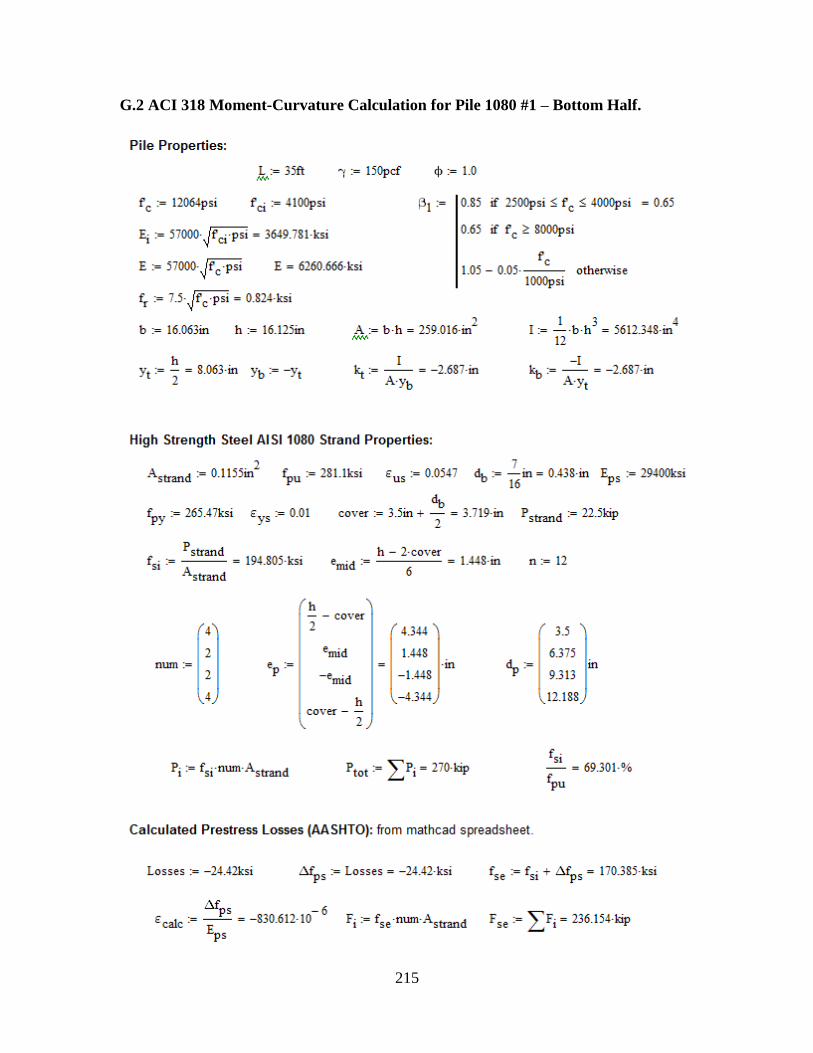
215
G.2 ACI 318 Moment-Curvature Calculation for Pile 1080 #1 – Bottom Half.
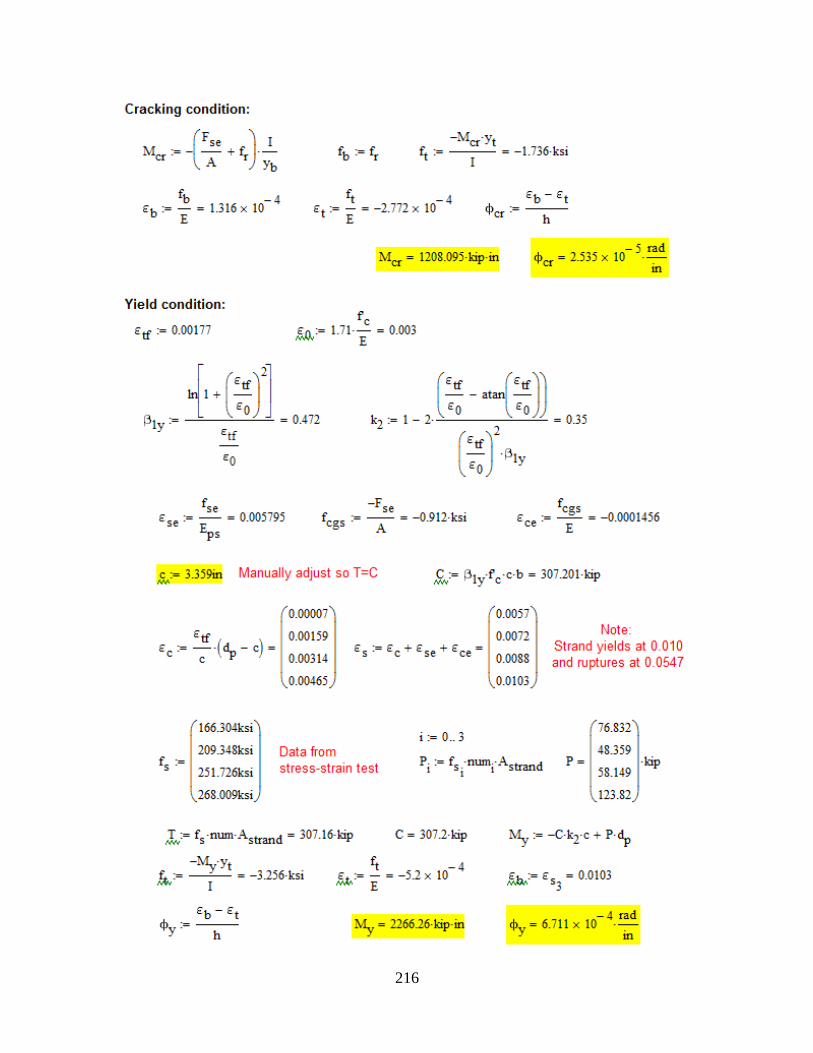
216
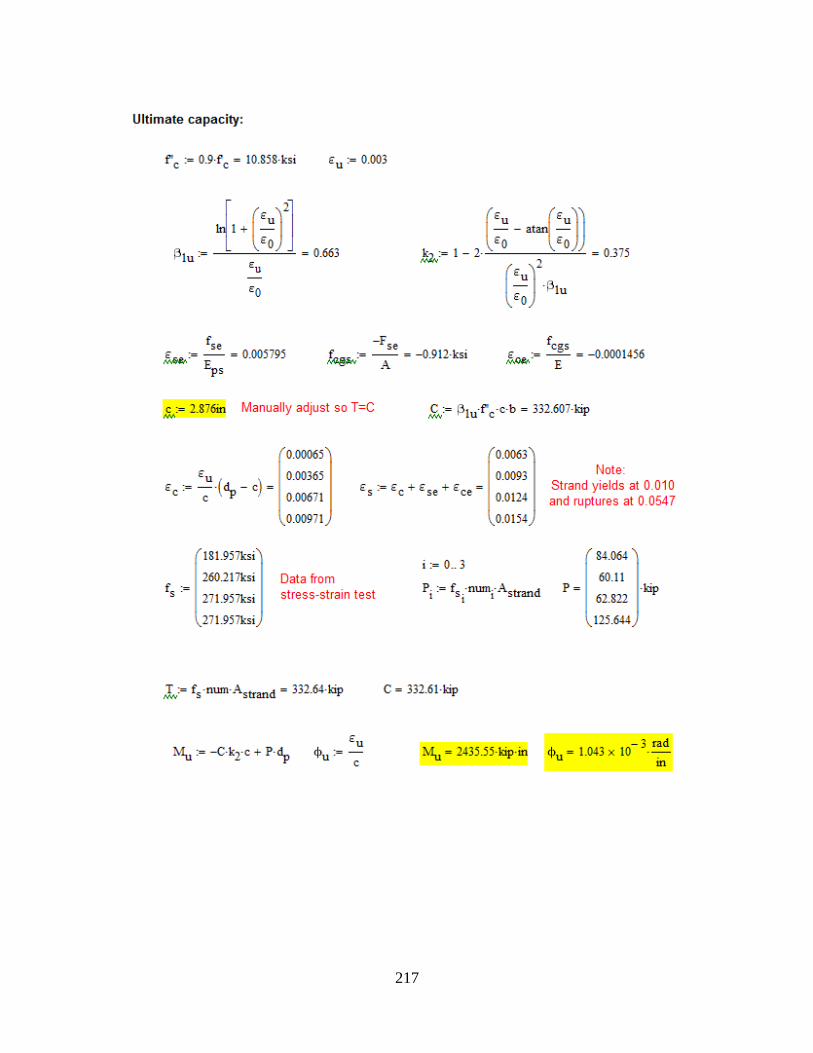
217
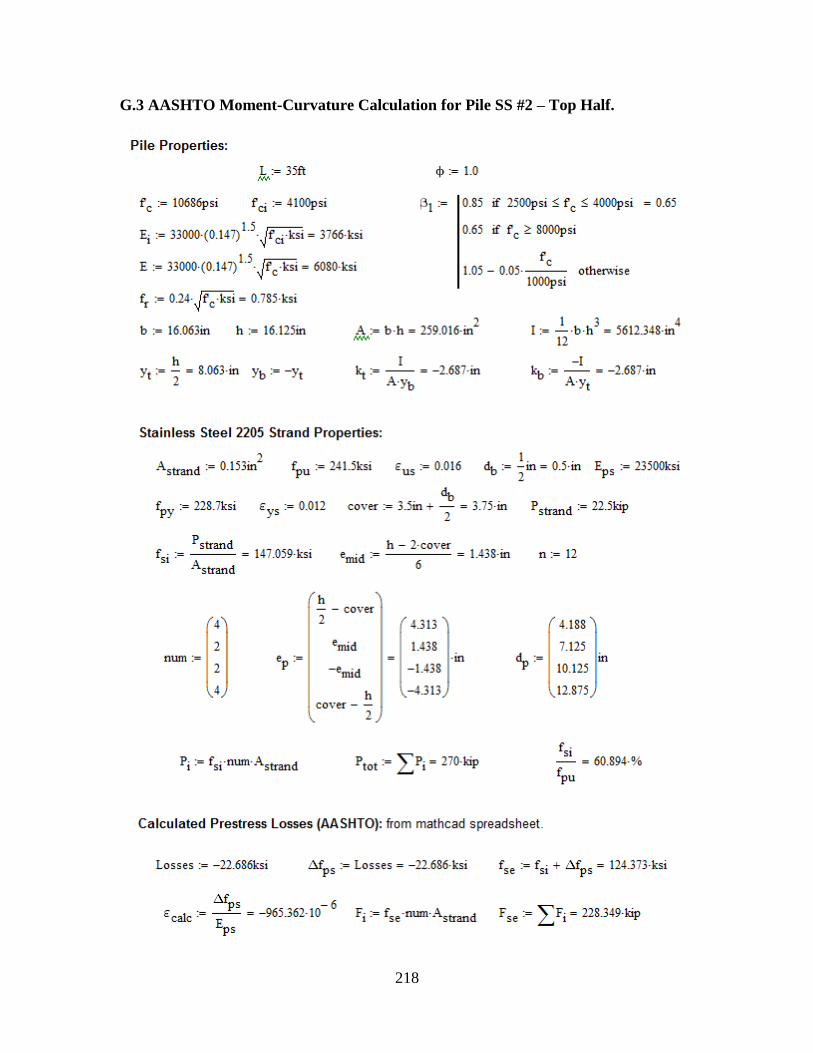
218
G.3 AASHTO Moment-Curvature Calculation for Pile SS #2 – Top Half.
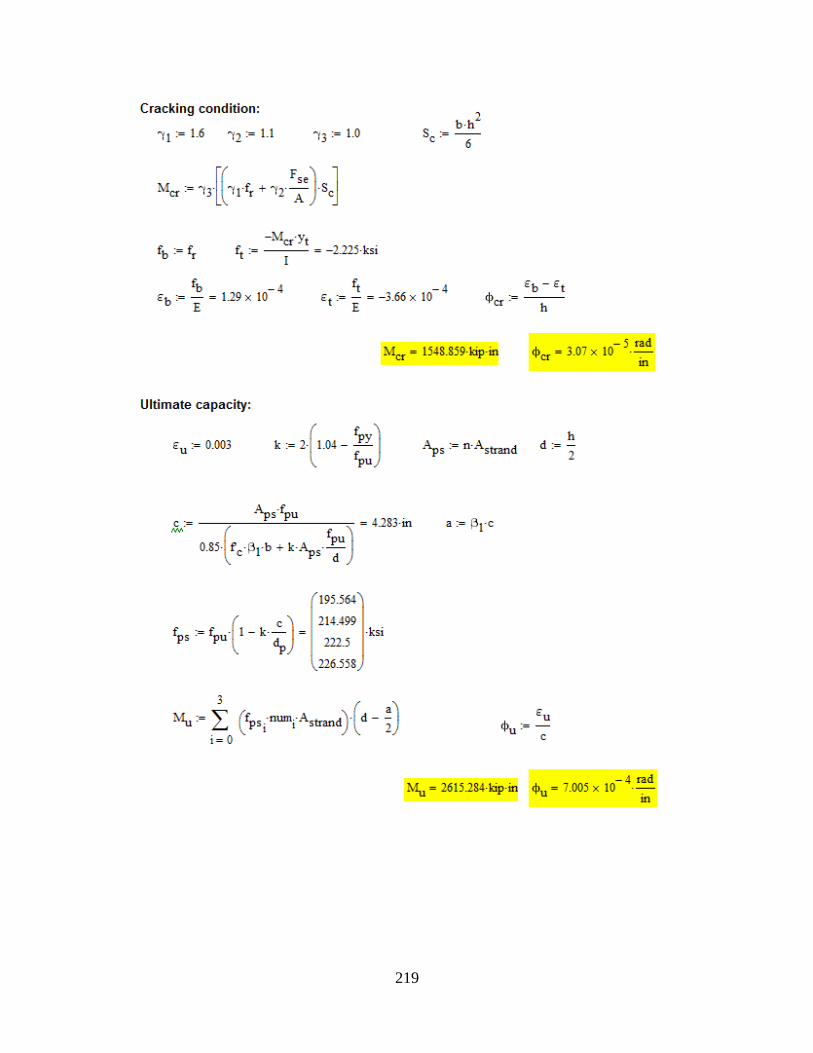
219
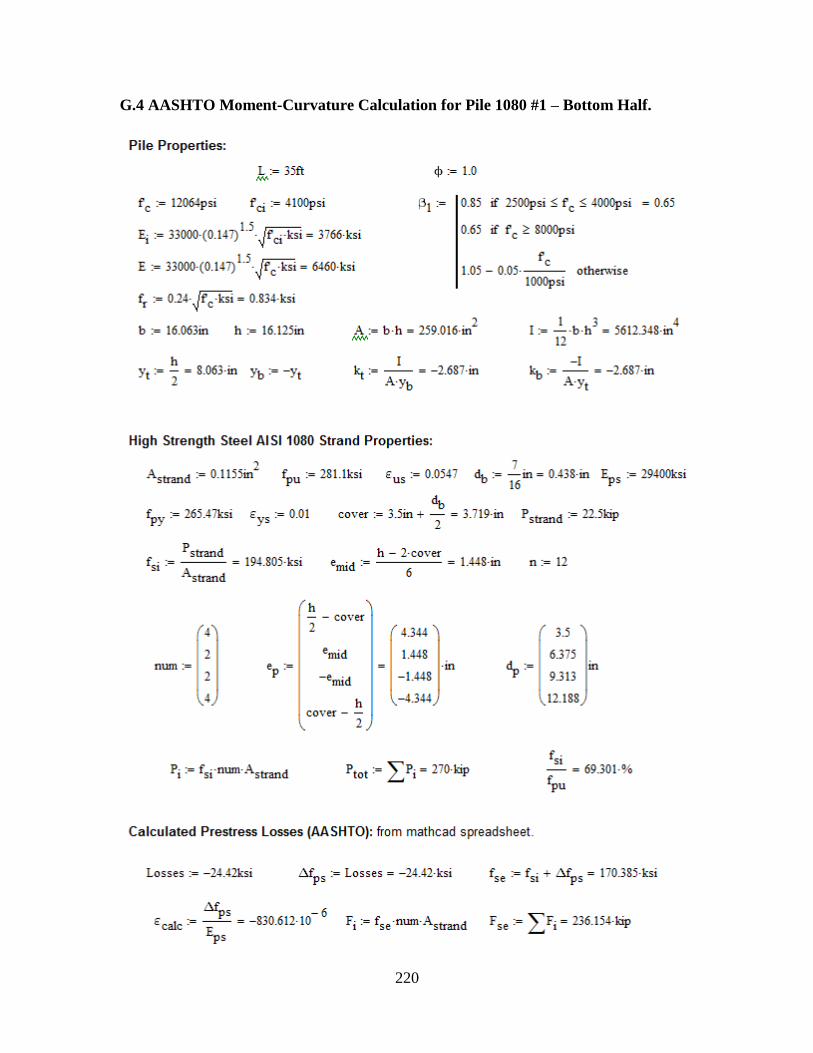
220
G.4 AASHTO Moment-Curvature Calculation for Pile 1080 #1 – Bottom Half.

221
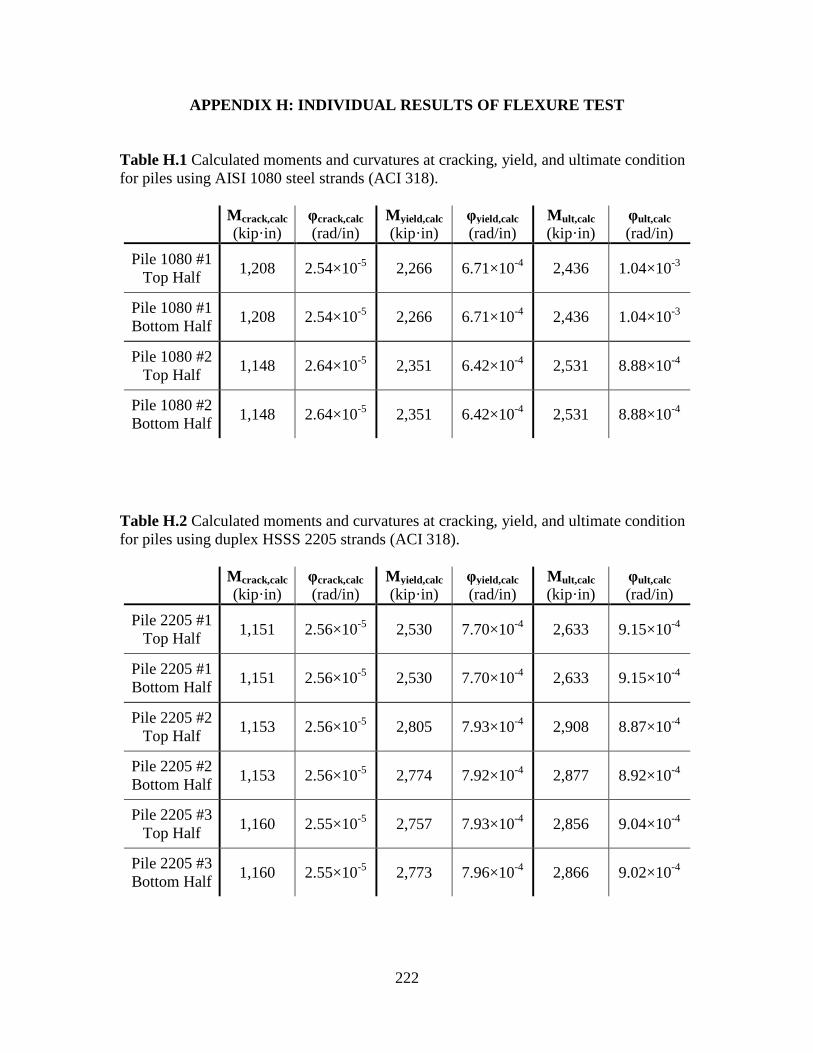
222
APPENDIX H: INDIVIDUAL RESULTS OF FLEXURE TEST
Table H.1 Calculated moments and curvatures at cracking, yield, and ultimate condition
for piles using AISI 1080 steel strands (ACI 318).
Mcrack,calc
(kip·in) φcrack,calc
(rad/in) Myield,calc
(kip·in) φyield,calc
(rad/in) Mult,calc
(kip·in) φult,calc
(rad/in)
Pile 1080 #1
Top Half 1,208 2.54×10
-5 2,266 6.71×10
-4 2,436 1.04×10
-3
Pile 1080 #1
Bottom Half 1,208 2.54×10
-5 2,266 6.71×10
-4 2,436 1.04×10
-3
Pile 1080 #2
Top Half 1,148 2.64×10
-5 2,351 6.42×10
-4 2,531 8.88×10
-4
Pile 1080 #2
Bottom Half 1,148 2.64×10
-5 2,351 6.42×10
-4 2,531 8.88×10
-4
Table H.2 Calculated moments and curvatures at cracking, yield, and ultimate condition
for piles using duplex HSSS 2205 strands (ACI 318).
Mcrack,calc
(kip·in) φcrack,calc
(rad/in) Myield,calc
(kip·in) φyield,calc
(rad/in) Mult,calc
(kip·in) φult,calc
(rad/in)
Pile 2205 #1
Top Half 1,151 2.56×10
-5 2,530 7.70×10
-4 2,633 9.15×10
-4
Pile 2205 #1
Bottom Half 1,151 2.56×10
-5 2,530 7.70×10
-4 2,633 9.15×10
-4
Pile 2205 #2
Top Half 1,153 2.56×10
-5 2,805 7.93×10
-4 2,908 8.87×10
-4
Pile 2205 #2
Bottom Half 1,153 2.56×10
-5 2,774 7.92×10
-4 2,877 8.92×10
-4
Pile 2205 #3
Top Half 1,160 2.55×10
-5 2,757 7.93×10
-4 2,856 9.04×10
-4
Pile 2205 #3
Bottom Half 1,160 2.55×10
-5 2,773 7.96×10
-4 2,866 9.02×10
-4
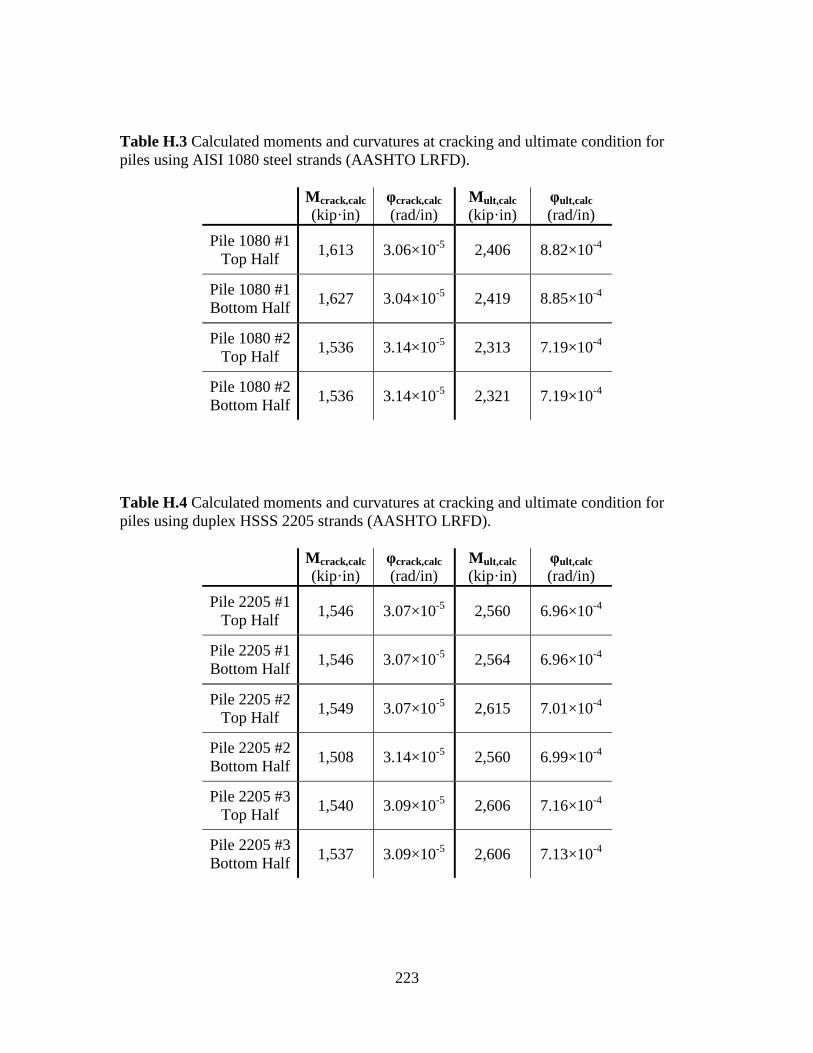
223
Table H.3 Calculated moments and curvatures at cracking and ultimate condition for
piles using AISI 1080 steel strands (AASHTO LRFD).
Mcrack,calc
(kip·in) φcrack,calc
(rad/in) Mult,calc
(kip·in) φult,calc
(rad/in)
Pile 1080 #1
Top Half 1,613 3.06×10
-5 2,406 8.82×10
-4
Pile 1080 #1
Bottom Half 1,627 3.04×10
-5 2,419 8.85×10
-4
Pile 1080 #2
Top Half 1,536 3.14×10
-5 2,313 7.19×10
-4
Pile 1080 #2
Bottom Half 1,536 3.14×10
-5 2,321 7.19×10
-4
Table H.4 Calculated moments and curvatures at cracking and ultimate condition for
piles using duplex HSSS 2205 strands (AASHTO LRFD).
Mcrack,calc
(kip·in) φcrack,calc
(rad/in) Mult,calc
(kip·in) φult,calc
(rad/in)
Pile 2205 #1
Top Half 1,546 3.07×10
-5 2,560 6.96×10
-4
Pile 2205 #1
Bottom Half 1,546 3.07×10
-5 2,564 6.96×10
-4
Pile 2205 #2
Top Half 1,549 3.07×10
-5 2,615 7.01×10
-4
Pile 2205 #2
Bottom Half 1,508 3.14×10
-5 2,560 6.99×10
-4
Pile 2205 #3
Top Half 1,540 3.09×10
-5 2,606 7.16×10
-4
Pile 2205 #3
Bottom Half 1,537 3.09×10
-5 2,606 7.13×10
-4
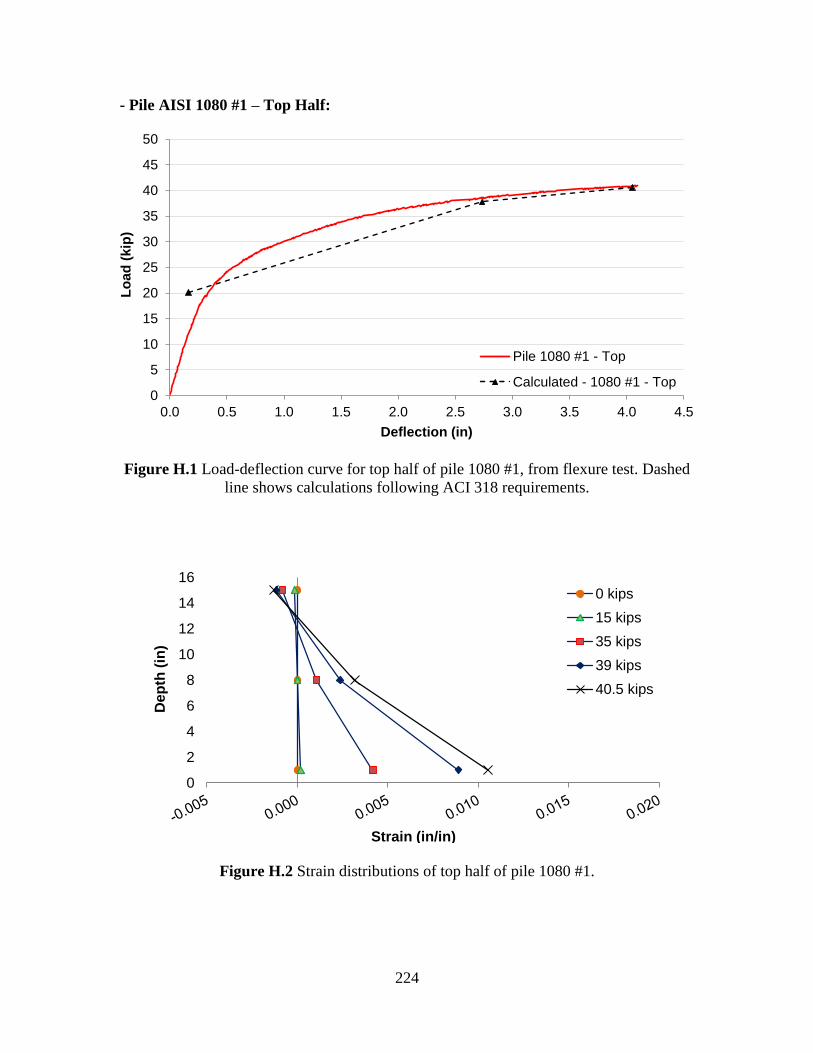
224
- Pile AISI 1080 #1 – Top Half:
Figure H.1 Load-deflection curve for top half of pile 1080 #1, from flexure test. Dashed
line shows calculations following ACI 318 requirements.
Figure H.2 Strain distributions of top half of pile 1080 #1.
0
5
10
15
20
25
30
35
40
45
50
0.0 0.5 1.0 1.5 2.0 2.5 3.0 3.5 4.0 4.5
Lo
ad
(kip
)
Deflection (in)
Pile 1080 #1 - Top
Calculated - 1080 #1 - Top
0
2
4
6
8
10
12
14
16
De
pth
(in
)
Strain (in/in)
0 kips
15 kips
35 kips
39 kips
40.5 kips
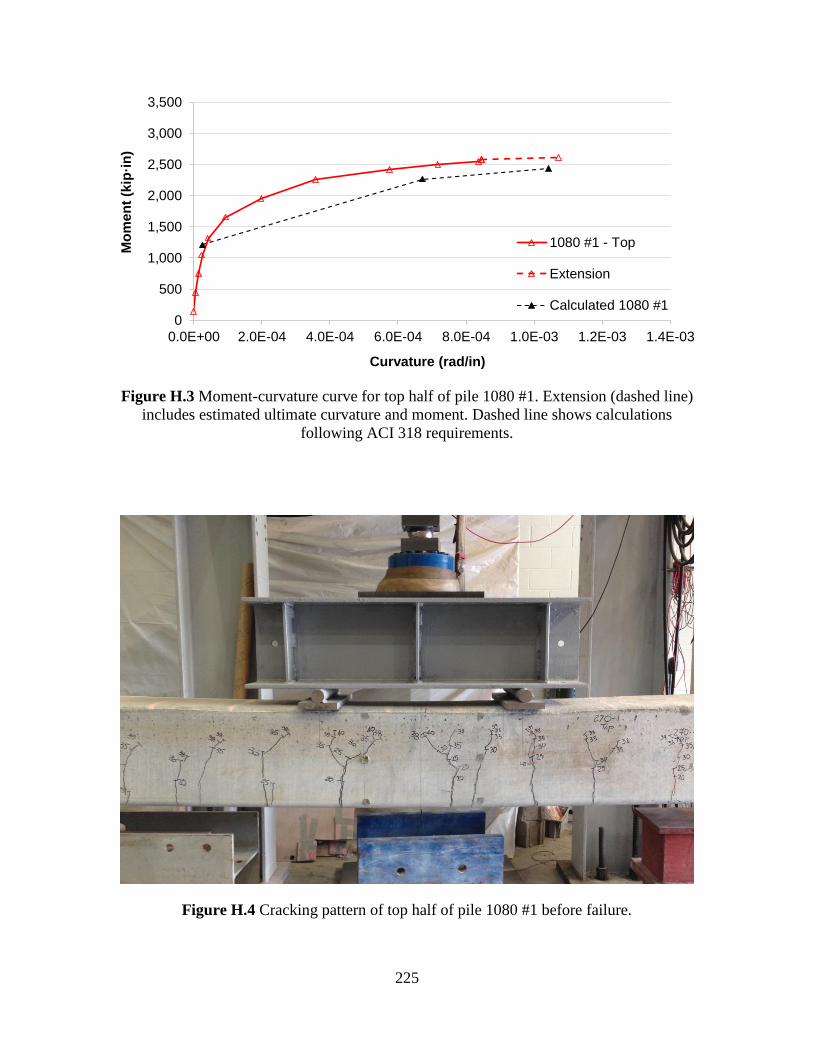
225
Figure H.3 Moment-curvature curve for top half of pile 1080 #1. Extension (dashed line)
includes estimated ultimate curvature and moment. Dashed line shows calculations
following ACI 318 requirements.
Figure H.4 Cracking pattern of top half of pile 1080 #1 before failure.
0
500
1,000
1,500
2,000
2,500
3,000
3,500
0.0E+00 2.0E-04 4.0E-04 6.0E-04 8.0E-04 1.0E-03 1.2E-03 1.4E-03
Mo
me
nt
(kip
·in
)
Curvature (rad/in)
1080 #1 - Top
Extension
Calculated 1080 #1
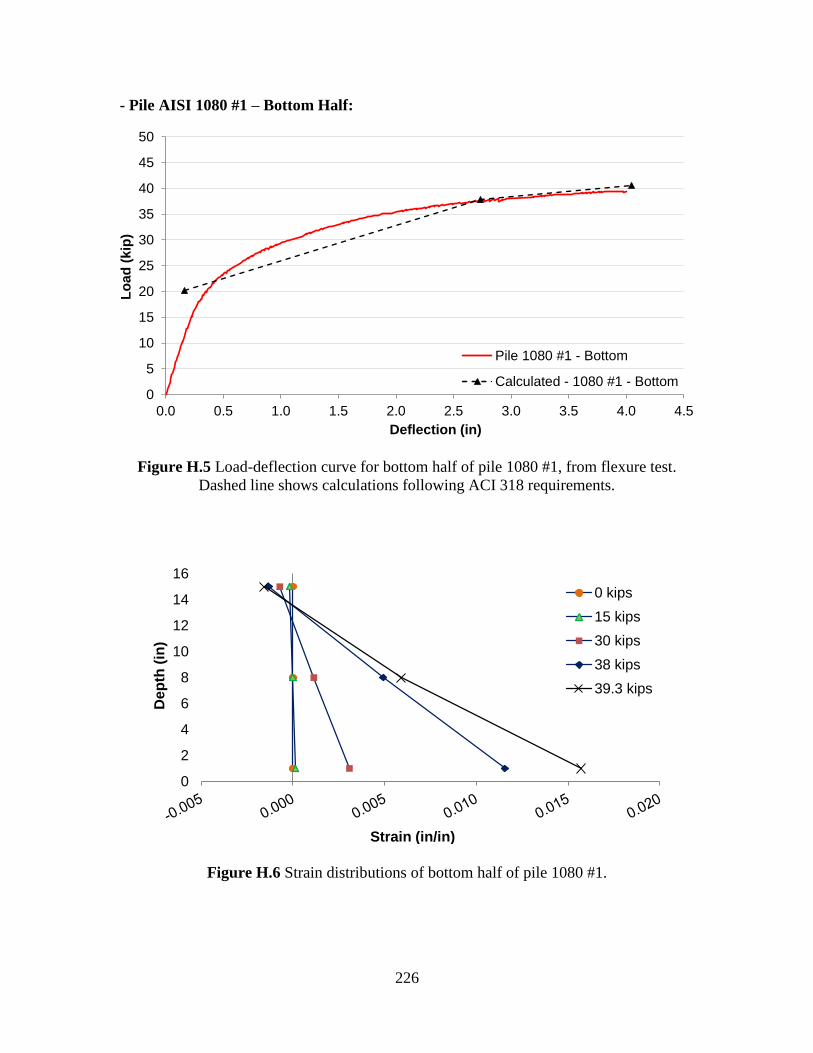
226
- Pile AISI 1080 #1 – Bottom Half:
Figure H.5 Load-deflection curve for bottom half of pile 1080 #1, from flexure test.
Dashed line shows calculations following ACI 318 requirements.
Figure H.6 Strain distributions of bottom half of pile 1080 #1.
0
5
10
15
20
25
30
35
40
45
50
0.0 0.5 1.0 1.5 2.0 2.5 3.0 3.5 4.0 4.5
Lo
ad
(kip
)
Deflection (in)
Pile 1080 #1 - Bottom
Calculated - 1080 #1 - Bottom
0
2
4
6
8
10
12
14
16
De
pth
(in
)
Strain (in/in)
0 kips
15 kips
30 kips
38 kips
39.3 kips
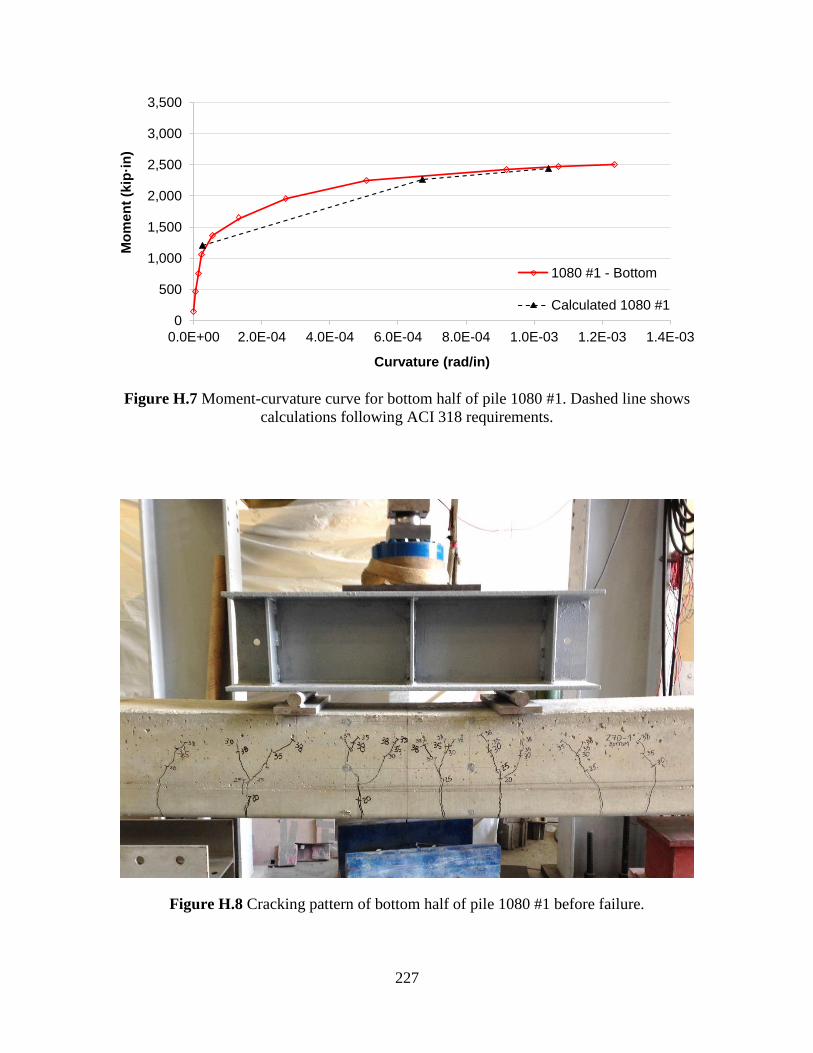
227
Figure H.7 Moment-curvature curve for bottom half of pile 1080 #1. Dashed line shows
calculations following ACI 318 requirements.
Figure H.8 Cracking pattern of bottom half of pile 1080 #1 before failure.
0
500
1,000
1,500
2,000
2,500
3,000
3,500
0.0E+00 2.0E-04 4.0E-04 6.0E-04 8.0E-04 1.0E-03 1.2E-03 1.4E-03
Mo
me
nt
(kip
·in
)
Curvature (rad/in)
1080 #1 - Bottom
Calculated 1080 #1
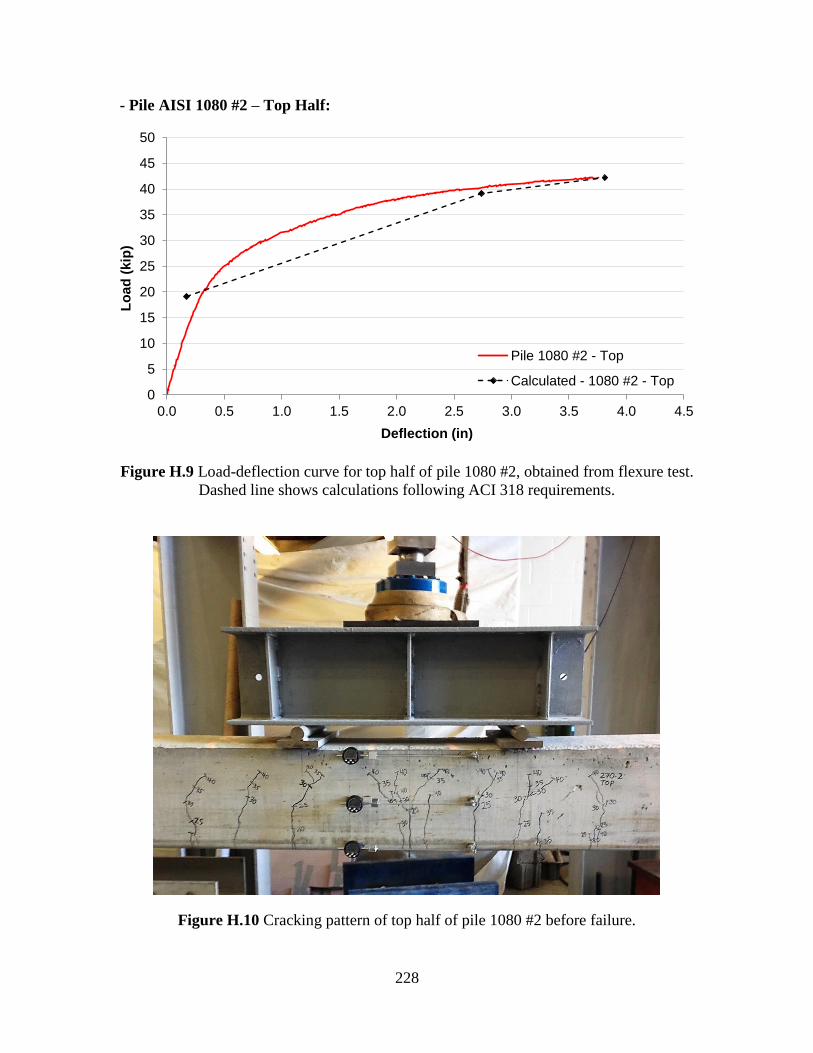
228
- Pile AISI 1080 #2 – Top Half:
Figure H.9 Load-deflection curve for top half of pile 1080 #2, obtained from flexure test.
Dashed line shows calculations following ACI 318 requirements.
Figure H.10 Cracking pattern of top half of pile 1080 #2 before failure.
0
5
10
15
20
25
30
35
40
45
50
0.0 0.5 1.0 1.5 2.0 2.5 3.0 3.5 4.0 4.5
Lo
ad
(kip
)
Deflection (in)
Pile 1080 #2 - Top
Calculated - 1080 #2 - Top
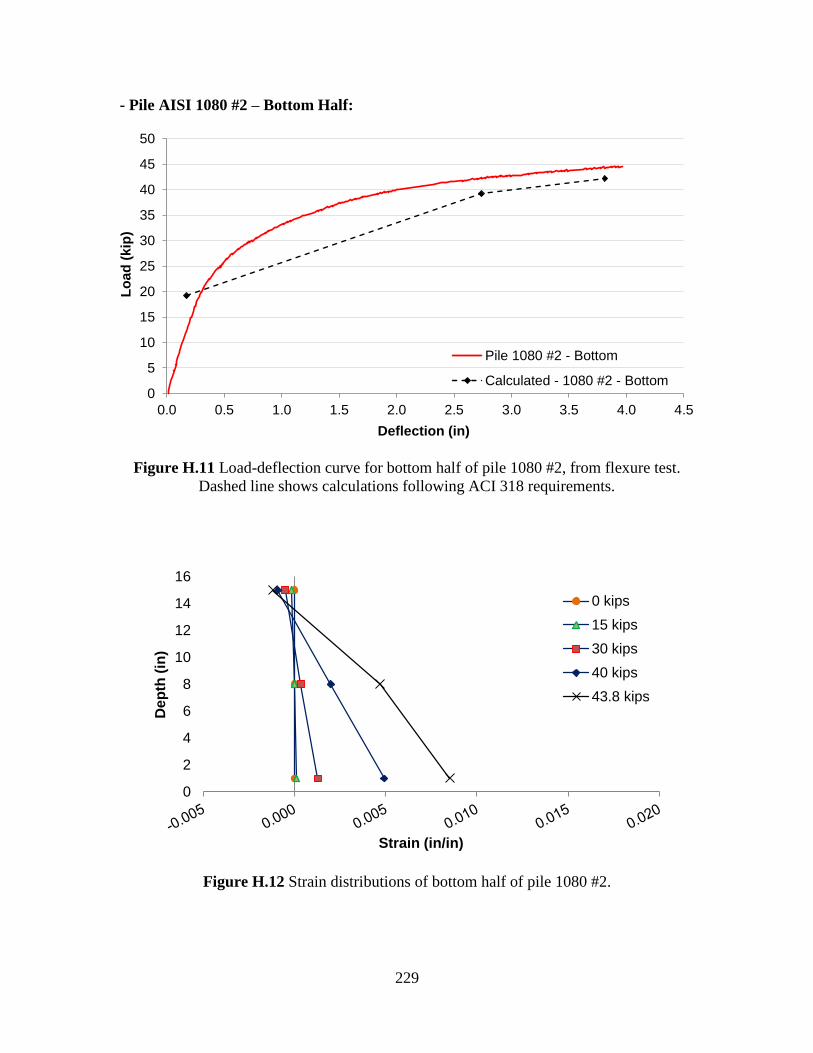
229
- Pile AISI 1080 #2 – Bottom Half:
Figure H.11 Load-deflection curve for bottom half of pile 1080 #2, from flexure test.
Dashed line shows calculations following ACI 318 requirements.
Figure H.12 Strain distributions of bottom half of pile 1080 #2.
0
5
10
15
20
25
30
35
40
45
50
0.0 0.5 1.0 1.5 2.0 2.5 3.0 3.5 4.0 4.5
Lo
ad
(k
ip)
Deflection (in)
Pile 1080 #2 - Bottom
Calculated - 1080 #2 - Bottom
0
2
4
6
8
10
12
14
16
Dep
th (
in)
Strain (in/in)
0 kips
15 kips
30 kips
40 kips
43.8 kips
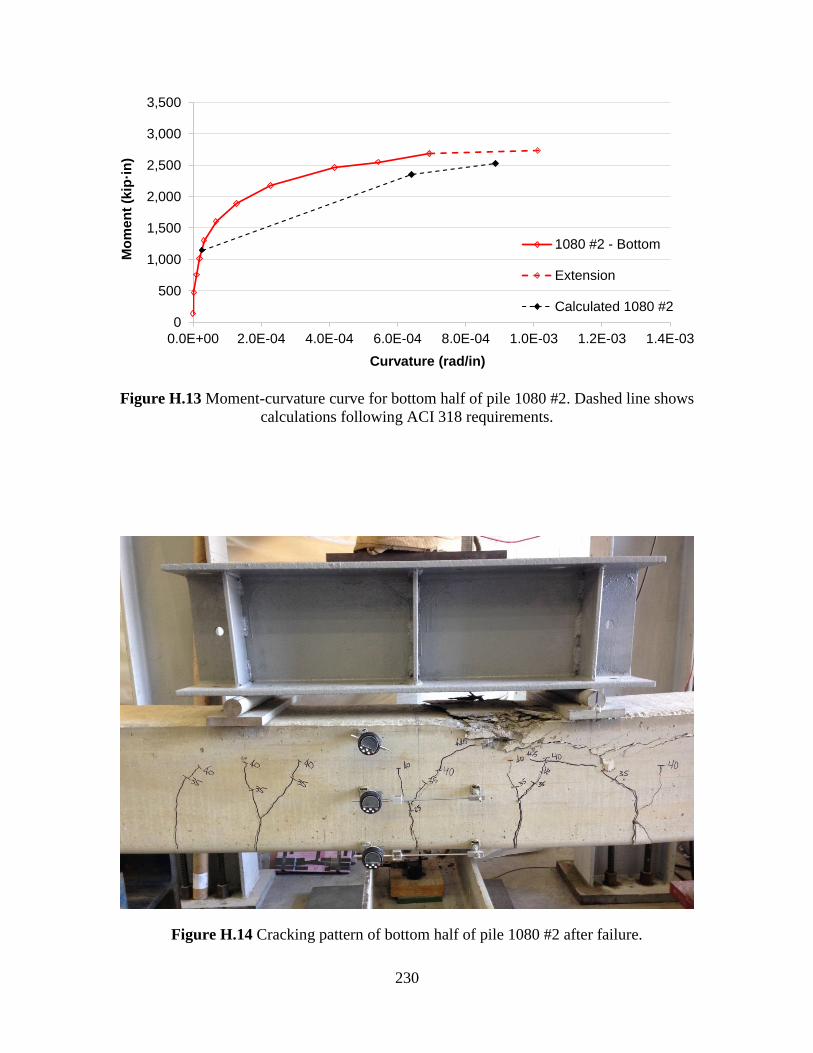
230
Figure H.13 Moment-curvature curve for bottom half of pile 1080 #2. Dashed line shows
calculations following ACI 318 requirements.
Figure H.14 Cracking pattern of bottom half of pile 1080 #2 after failure.
0
500
1,000
1,500
2,000
2,500
3,000
3,500
0.0E+00 2.0E-04 4.0E-04 6.0E-04 8.0E-04 1.0E-03 1.2E-03 1.4E-03
Mo
me
nt
(kip
·in
)
Curvature (rad/in)
1080 #2 - Bottom
Extension
Calculated 1080 #2
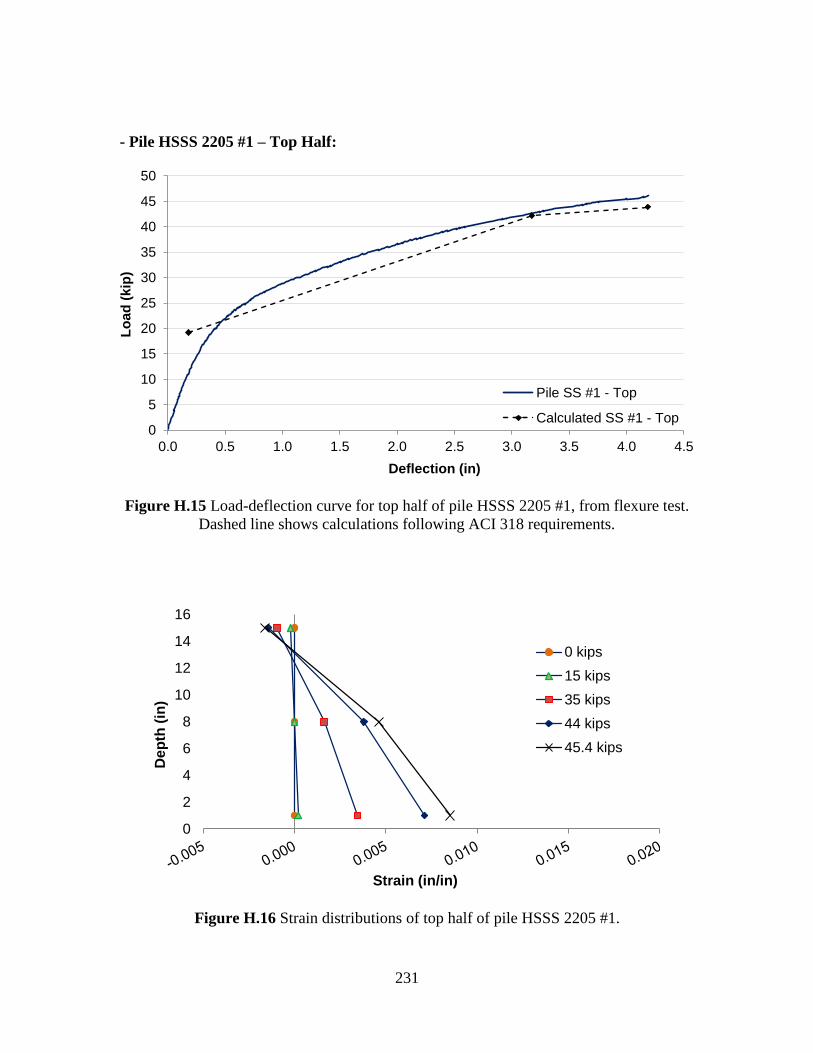
231
- Pile HSSS 2205 #1 – Top Half:
Figure H.15 Load-deflection curve for top half of pile HSSS 2205 #1, from flexure test.
Dashed line shows calculations following ACI 318 requirements.
Figure H.16 Strain distributions of top half of pile HSSS 2205 #1.
0
5
10
15
20
25
30
35
40
45
50
0.0 0.5 1.0 1.5 2.0 2.5 3.0 3.5 4.0 4.5
Lo
ad
(kip
)
Deflection (in)
Pile SS #1 - Top
Calculated SS #1 - Top
0
2
4
6
8
10
12
14
16
Dep
th (
in)
Strain (in/in)
0 kips
15 kips
35 kips
44 kips
45.4 kips
232
Figure H.17 Moment-curvature curve for top half of pile HSSS 2205 #1. Dashed line
shows calculations following ACI 318 requirements.
Figure H.18 Cracking pattern of top half of pile HSSS 2205 #1 before failure.
0
500
1,000
1,500
2,000
2,500
3,000
3,500
0.0E+00 2.0E-04 4.0E-04 6.0E-04 8.0E-04 1.0E-03 1.2E-03 1.4E-03
Mo
me
nt
(kip
·in
)
Curvature (rad/in)
SS #1 - Top
Extension
Calculated SS #1 - Top
233
- Pile HSSS 2205 #1 – Bottom Half:
Figure H.19 Load-deflection curve for bottom half of pile HSSS 2205 #1, from flexure
test. Dashed line shows calculations following ACI 318 requirements.
Figure H.20 Cracking pattern of bottom half of pile HSSS 2205 #1 after failure.
0
5
10
15
20
25
30
35
40
45
50
0.0 0.5 1.0 1.5 2.0 2.5 3.0 3.5 4.0 4.5
Lo
ad
(kip
)
Deflection (in)
Pile SS #1 - Bottom
Calculated SS #1 - Bottom
234
- Pile HSSS 2205 #2 – Top Half:
Figure H.21 Load-deflection curve for top half of pile HSSS 2205 #2, from flexure test.
Dashed line shows calculations following ACI 318 requirements.
Figure H.22 Strain distributions of top half of pile HSSS 2205 #2.
0
5
10
15
20
25
30
35
40
45
50
0.0 0.5 1.0 1.5 2.0 2.5 3.0 3.5 4.0 4.5
Lo
ad
(kip
)
Deflection (in)
Pile SS #2 - Top
Calculated SS #2 - Top
0
2
4
6
8
10
12
14
16
De
pth
(in
)
Strain (in/in)
0 kips
15 kips
35 kips
42 kips
46.6 kips
235
Figure H.23 Moment-curvature curve for top half of pile HSSS 2205 #2. Dashed line
shows calculations following ACI 318 requirements.
Figure H.24 Cracking pattern of top half of pile HSSS 2205 #2 before failure.
0
500
1,000
1,500
2,000
2,500
3,000
3,500
0.0E+00 2.0E-04 4.0E-04 6.0E-04 8.0E-04 1.0E-03 1.2E-03 1.4E-03
Mo
me
nt
(kip
·in
)
Curvature (rad/in)
SS #2 - Top
Calculated SS #2 - Top
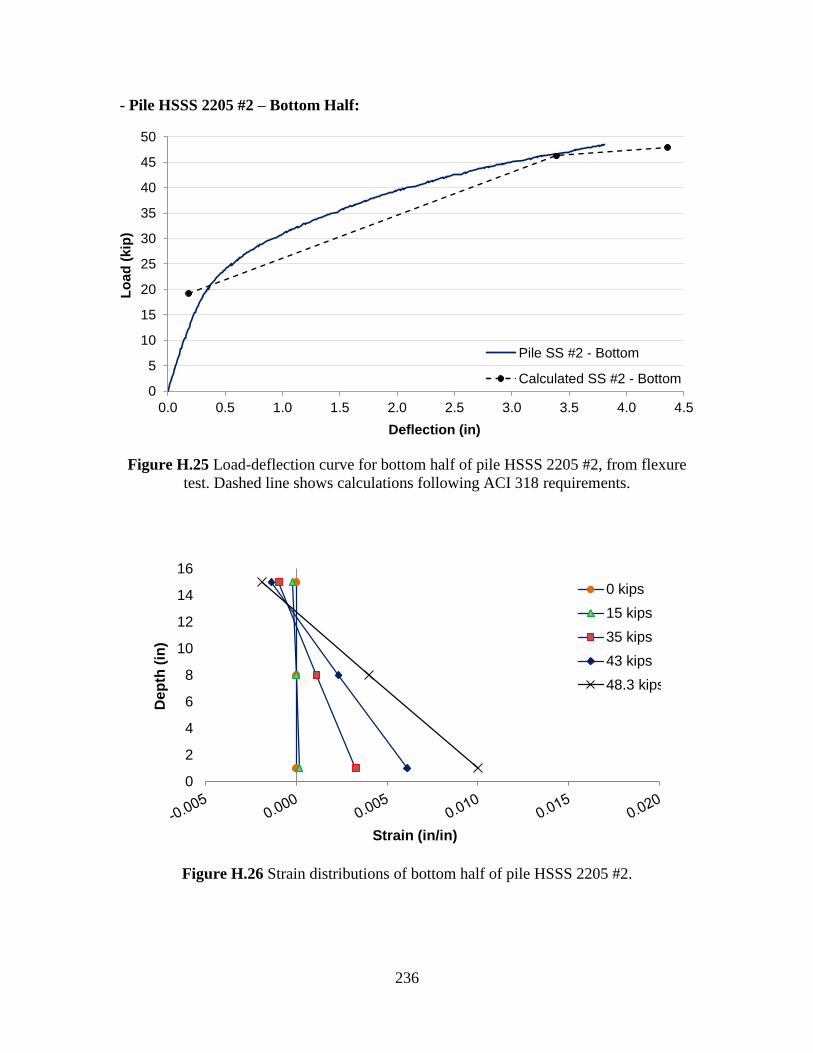
236
- Pile HSSS 2205 #2 – Bottom Half:
Figure H.25 Load-deflection curve for bottom half of pile HSSS 2205 #2, from flexure
test. Dashed line shows calculations following ACI 318 requirements.
Figure H.26 Strain distributions of bottom half of pile HSSS 2205 #2.
0
5
10
15
20
25
30
35
40
45
50
0.0 0.5 1.0 1.5 2.0 2.5 3.0 3.5 4.0 4.5
Lo
ad
(kip
)
Deflection (in)
Pile SS #2 - Bottom
Calculated SS #2 - Bottom
0
2
4
6
8
10
12
14
16
Dep
th (
in)
Strain (in/in)
0 kips
15 kips
35 kips
43 kips
48.3 kips
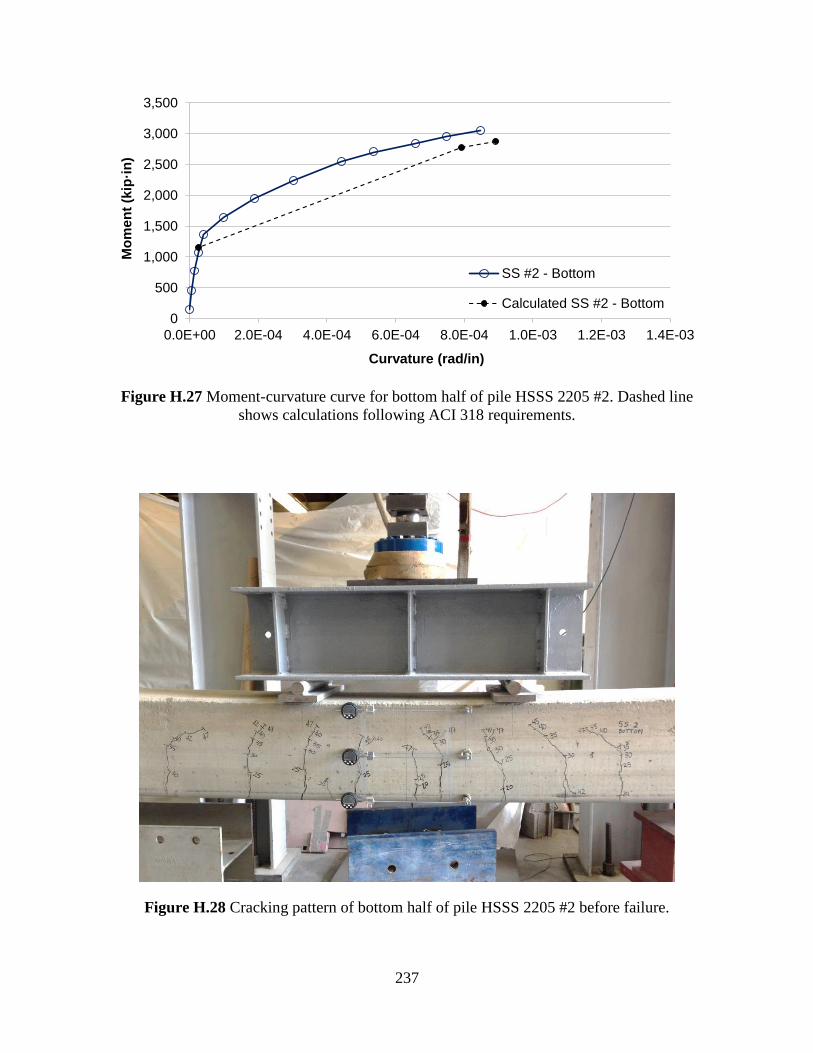
237
Figure H.27 Moment-curvature curve for bottom half of pile HSSS 2205 #2. Dashed line
shows calculations following ACI 318 requirements.
Figure H.28 Cracking pattern of bottom half of pile HSSS 2205 #2 before failure.
0
500
1,000
1,500
2,000
2,500
3,000
3,500
0.0E+00 2.0E-04 4.0E-04 6.0E-04 8.0E-04 1.0E-03 1.2E-03 1.4E-03
Mo
me
nt
(kip
·in
)
Curvature (rad/in)
SS #2 - Bottom
Calculated SS #2 - Bottom
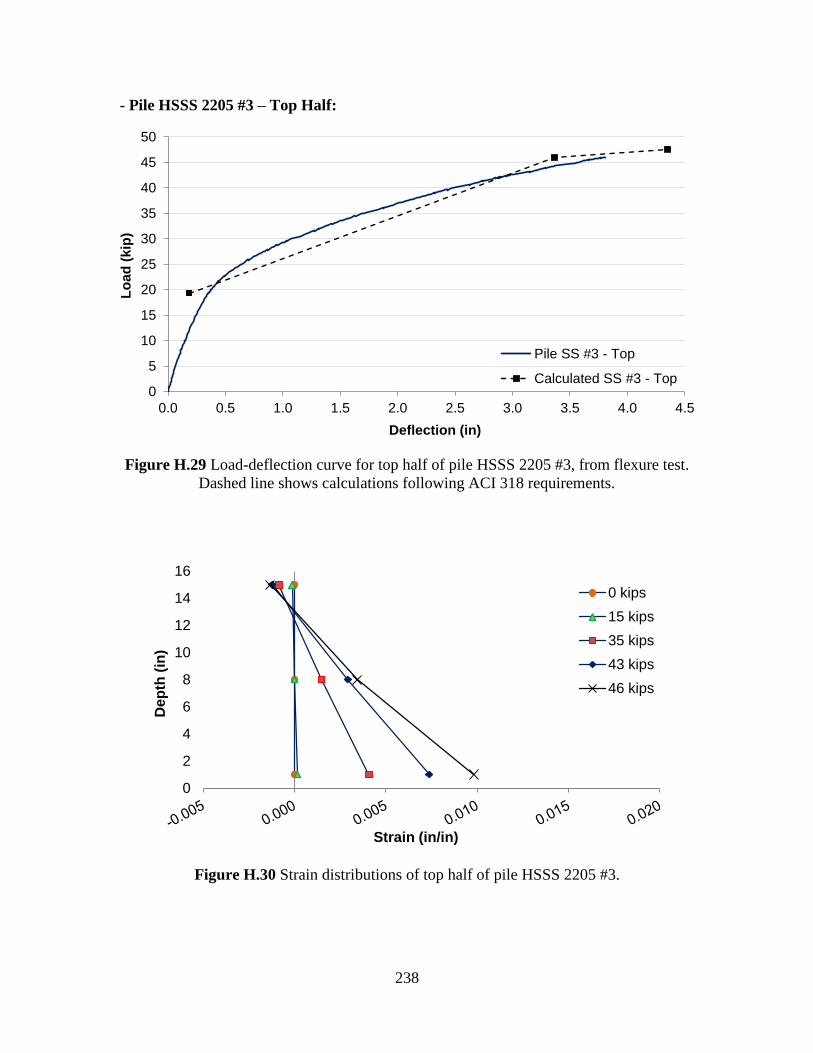
238
- Pile HSSS 2205 #3 – Top Half:
Figure H.29 Load-deflection curve for top half of pile HSSS 2205 #3, from flexure test.
Dashed line shows calculations following ACI 318 requirements.
Figure H.30 Strain distributions of top half of pile HSSS 2205 #3.
0
5
10
15
20
25
30
35
40
45
50
0.0 0.5 1.0 1.5 2.0 2.5 3.0 3.5 4.0 4.5
Lo
ad
(k
ip)
Deflection (in)
Pile SS #3 - Top
Calculated SS #3 - Top
0
2
4
6
8
10
12
14
16
Dep
th (
in)
Strain (in/in)
0 kips
15 kips
35 kips
43 kips
46 kips
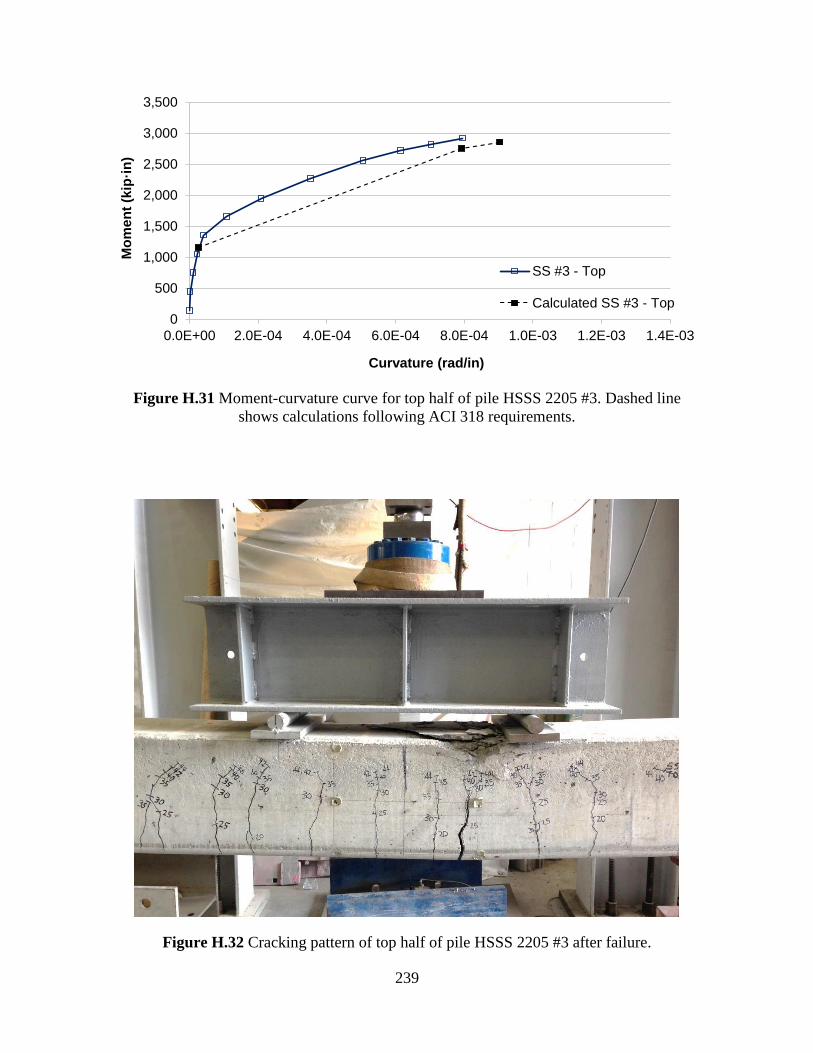
239
Figure H.31 Moment-curvature curve for top half of pile HSSS 2205 #3. Dashed line
shows calculations following ACI 318 requirements.
Figure H.32 Cracking pattern of top half of pile HSSS 2205 #3 after failure.
0
500
1,000
1,500
2,000
2,500
3,000
3,500
0.0E+00 2.0E-04 4.0E-04 6.0E-04 8.0E-04 1.0E-03 1.2E-03 1.4E-03
Mo
me
nt
(kip
·in
)
Curvature (rad/in)
SS #3 - Top
Calculated SS #3 - Top
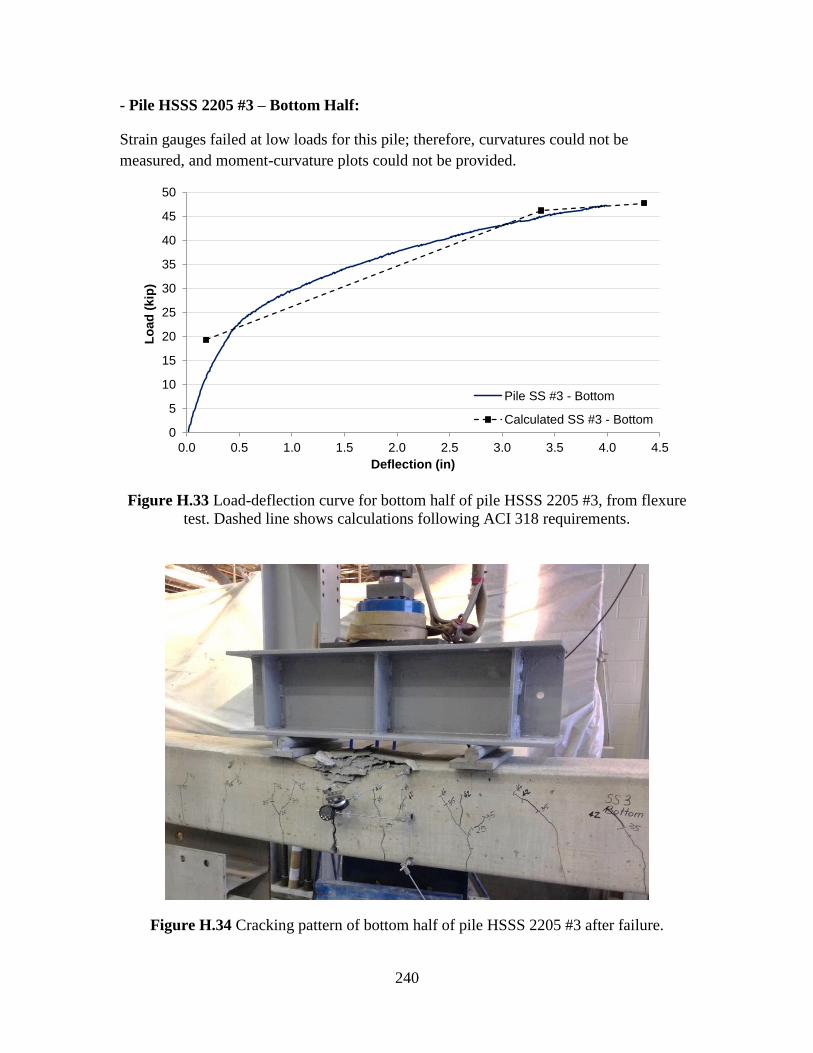
240
- Pile HSSS 2205 #3 – Bottom Half:
Strain gauges failed at low loads for this pile; therefore, curvatures could not be
measured, and moment-curvature plots could not be provided.
Figure H.33 Load-deflection curve for bottom half of pile HSSS 2205 #3, from flexure
test. Dashed line shows calculations following ACI 318 requirements.
Figure H.34 Cracking pattern of bottom half of pile HSSS 2205 #3 after failure.
0
5
10
15
20
25
30
35
40
45
50
0.0 0.5 1.0 1.5 2.0 2.5 3.0 3.5 4.0 4.5
Lo
ad
(k
ip)
Deflection (in)
Pile SS #3 - Bottom
Calculated SS #3 - Bottom
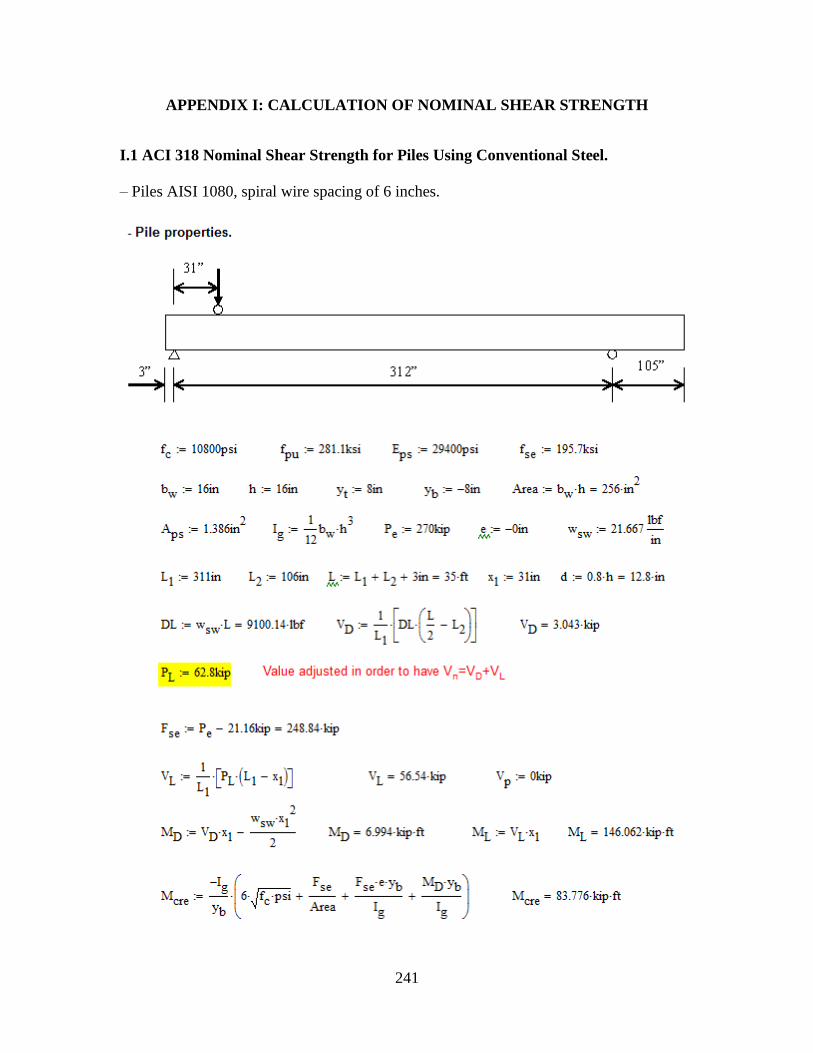
241
APPENDIX I: CALCULATION OF NOMINAL SHEAR STRENGTH
I.1 ACI 318 Nominal Shear Strength for Piles Using Conventional Steel.
– Piles AISI 1080, spiral wire spacing of 6 inches.
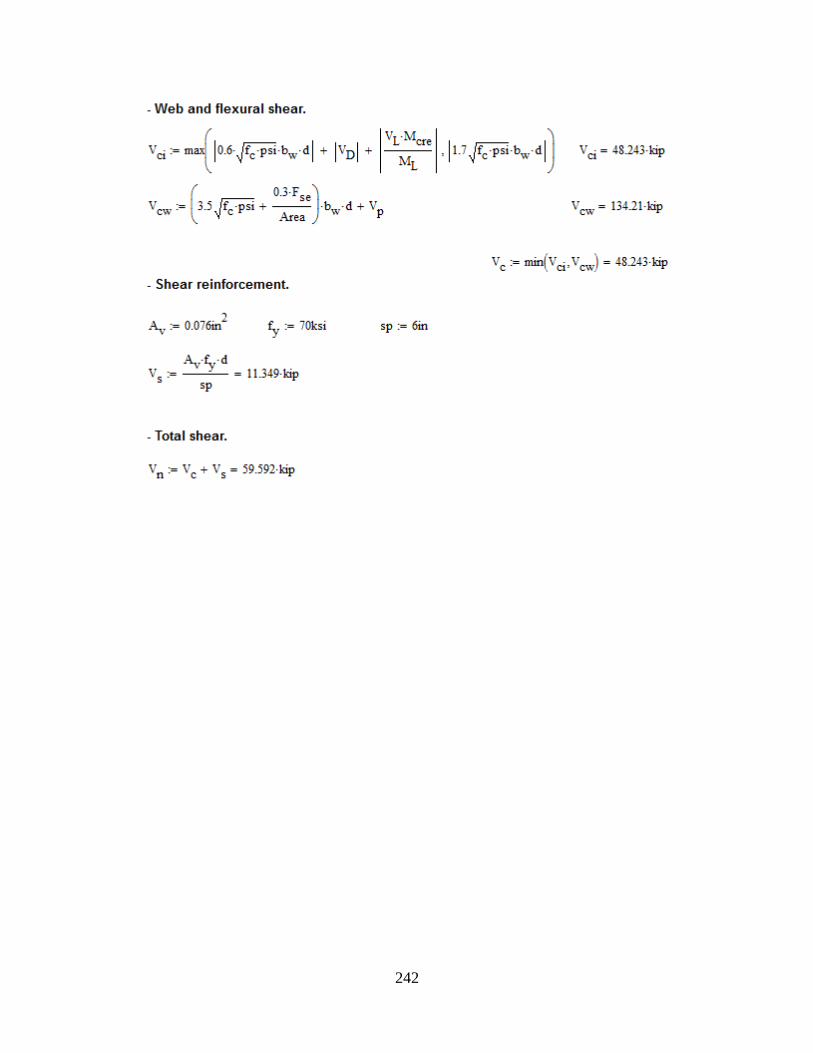
242
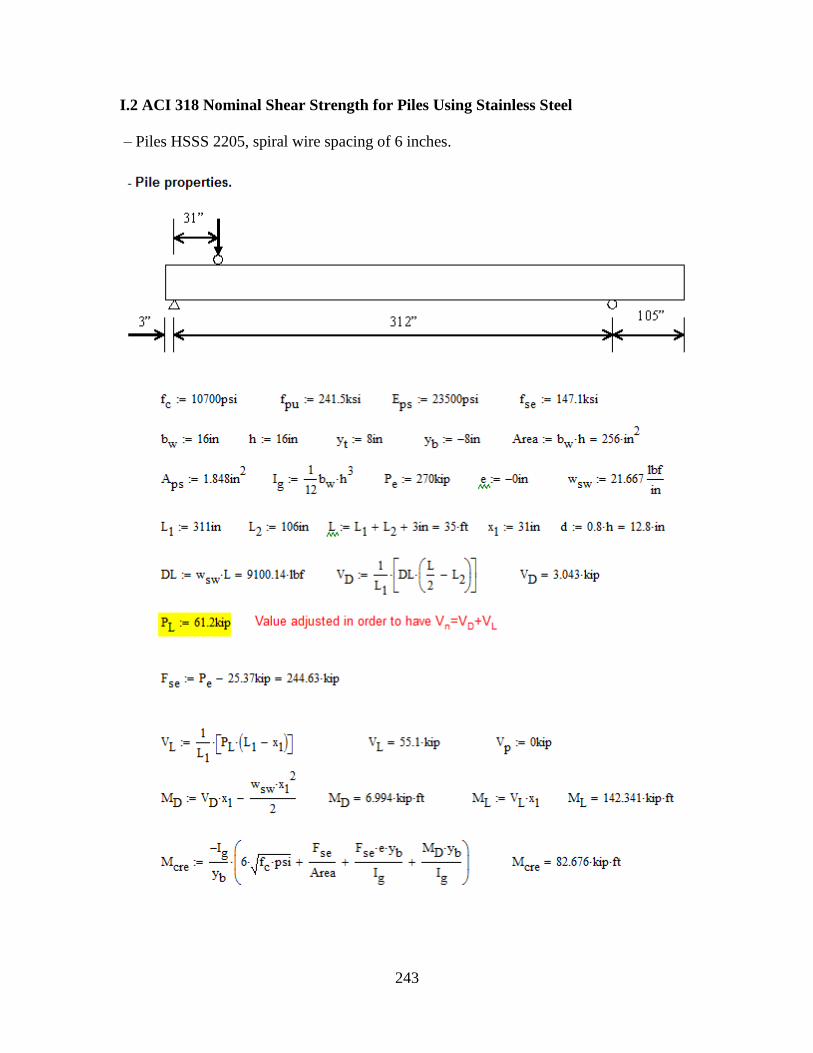
243
I.2 ACI 318 Nominal Shear Strength for Piles Using Stainless Steel
– Piles HSSS 2205, spiral wire spacing of 6 inches.
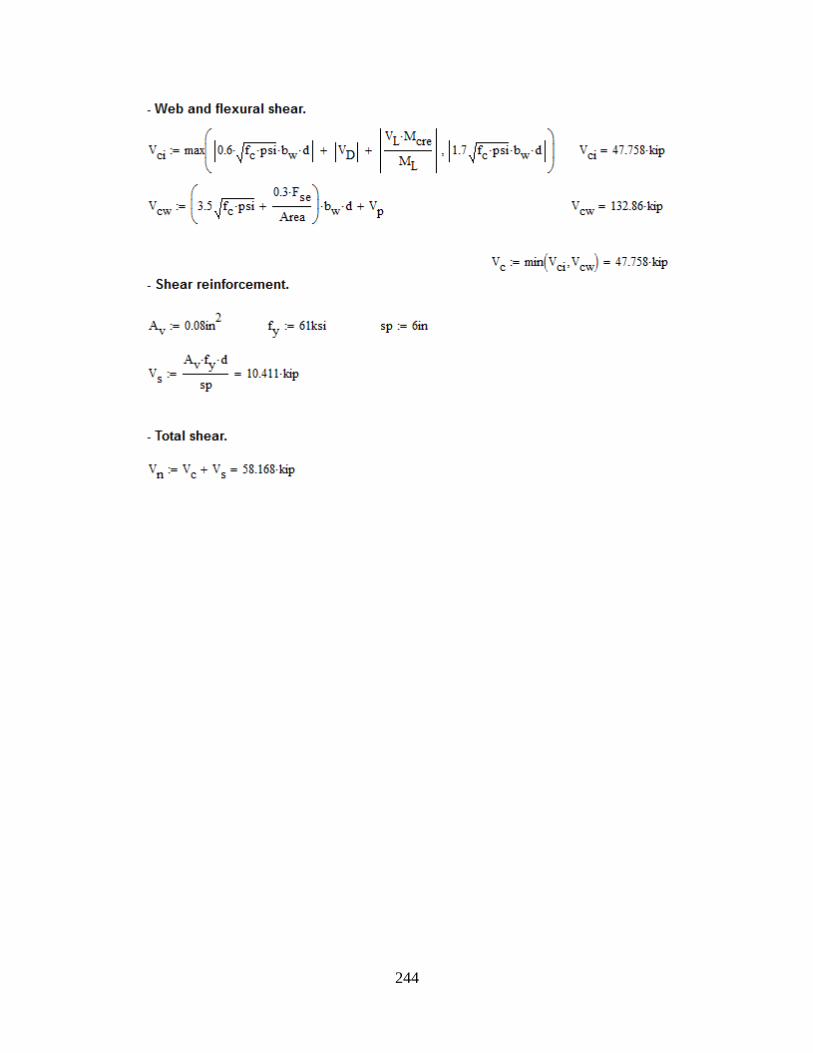
244
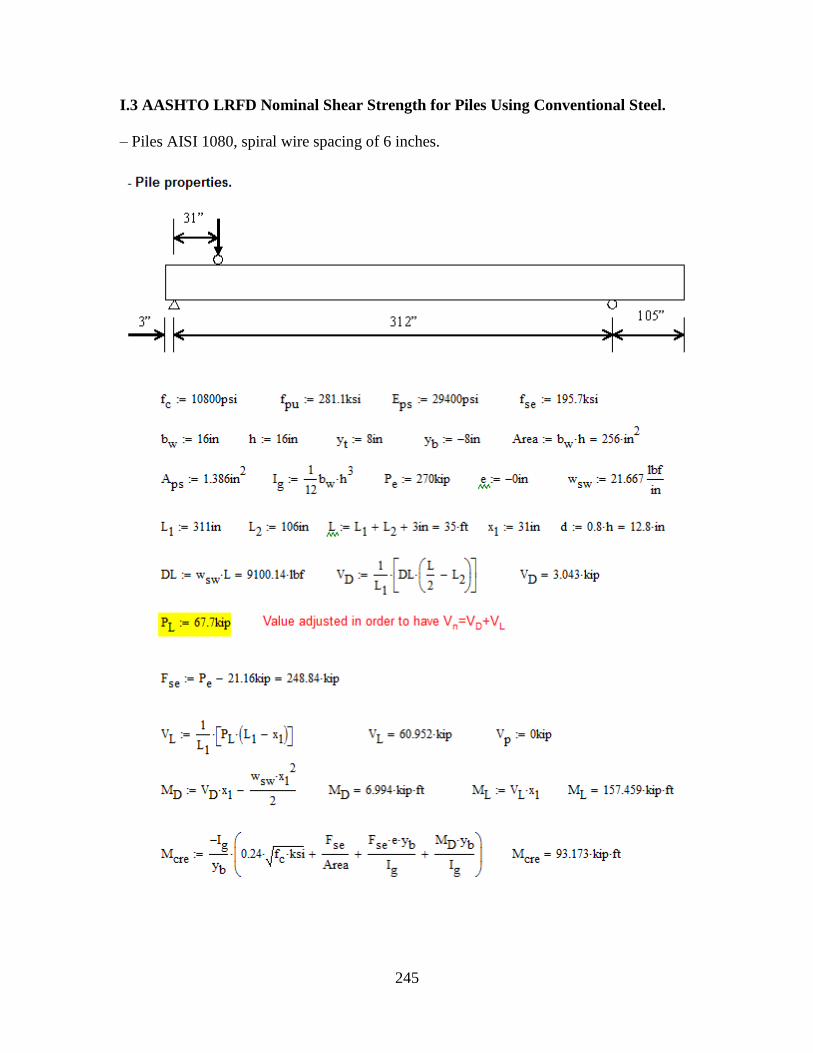
245
I.3 AASHTO LRFD Nominal Shear Strength for Piles Using Conventional Steel.
– Piles AISI 1080, spiral wire spacing of 6 inches.
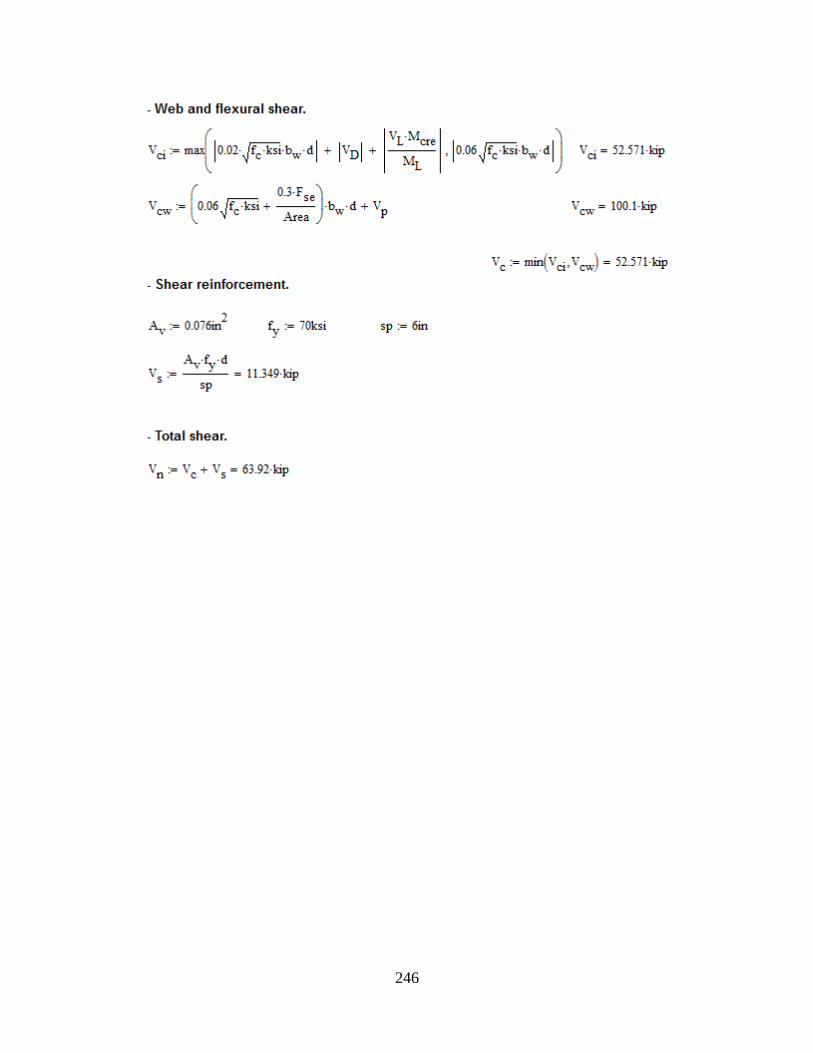
246
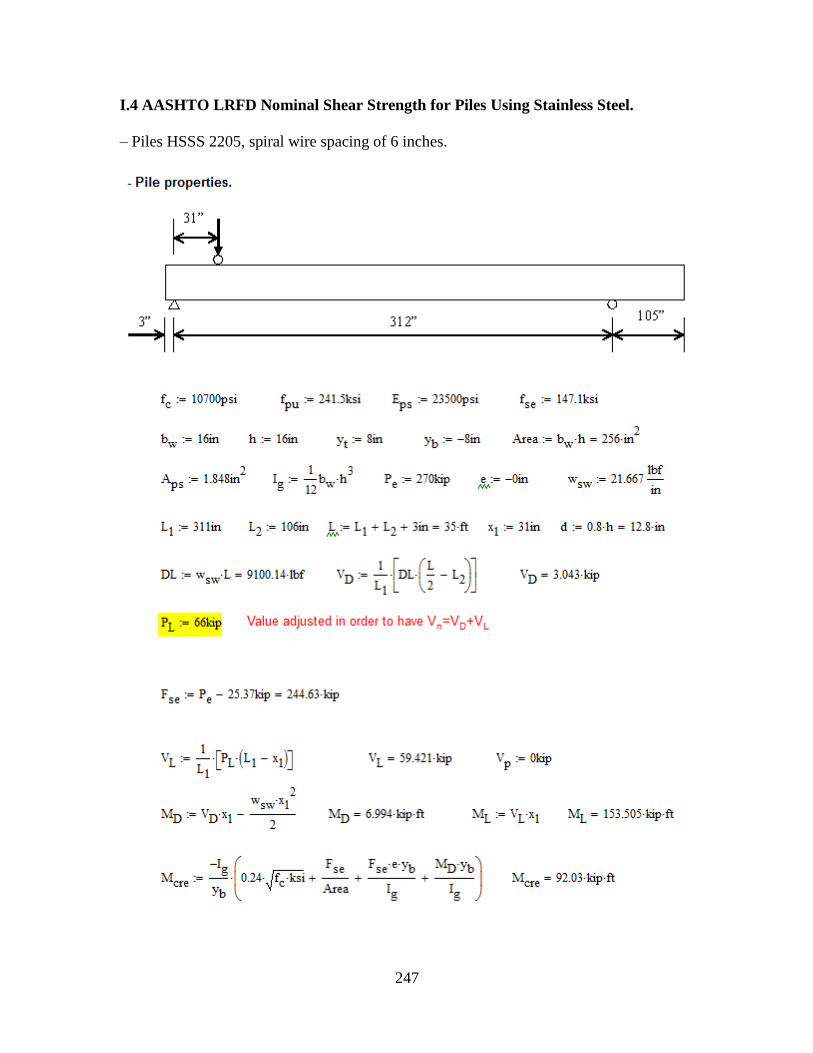
247
I.4 AASHTO LRFD Nominal Shear Strength for Piles Using Stainless Steel.
– Piles HSSS 2205, spiral wire spacing of 6 inches.

248
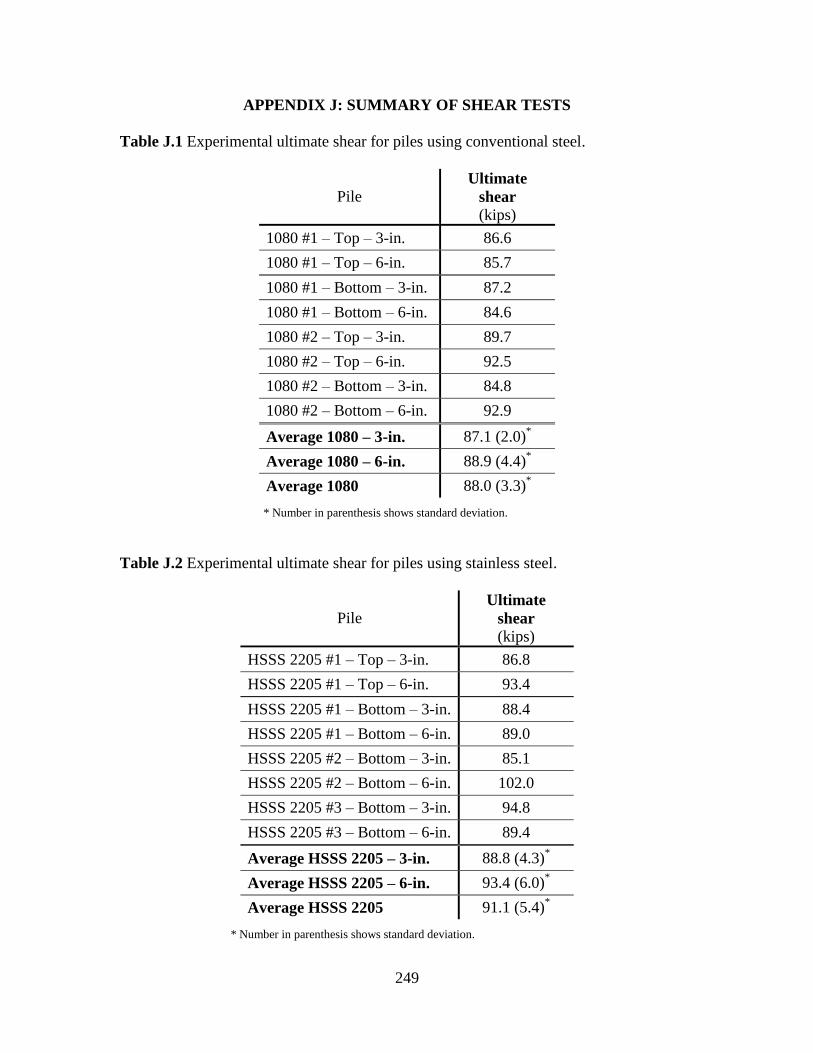
249
APPENDIX J: SUMMARY OF SHEAR TESTS
Table J.1 Experimental ultimate shear for piles using conventional steel.
Pile
Ultimate
shear
(kips)
1080 #1 – Top – 3-in. 86.6
1080 #1 – Top – 6-in. 85.7
1080 #1 – Bottom – 3-in. 87.2
1080 #1 – Bottom – 6-in. 84.6
1080 #2 – Top – 3-in. 89.7
1080 #2 – Top – 6-in. 92.5
1080 #2 – Bottom – 3-in. 84.8
1080 #2 – Bottom – 6-in. 92.9
Average 1080 – 3-in. 87.1 (2.0)*
Average 1080 – 6-in. 88.9 (4.4)*
Average 1080 88.0 (3.3)*
* Number in parenthesis shows standard deviation.
Table J.2 Experimental ultimate shear for piles using stainless steel.
Pile
Ultimate
shear
(kips)
HSSS 2205 #1 – Top – 3-in. 86.8
HSSS 2205 #1 – Top – 6-in. 93.4
HSSS 2205 #1 – Bottom – 3-in. 88.4
HSSS 2205 #1 – Bottom – 6-in. 89.0
HSSS 2205 #2 – Bottom – 3-in. 85.1
HSSS 2205 #2 – Bottom – 6-in. 102.0
HSSS 2205 #3 – Bottom – 3-in. 94.8
HSSS 2205 #3 – Bottom – 6-in. 89.4
Average HSSS 2205 – 3-in. 88.8 (4.3)*
Average HSSS 2205 – 6-in. 93.4 (6.0)*
Average HSSS 2205 91.1 (5.4)*
* Number in parenthesis shows standard deviation.
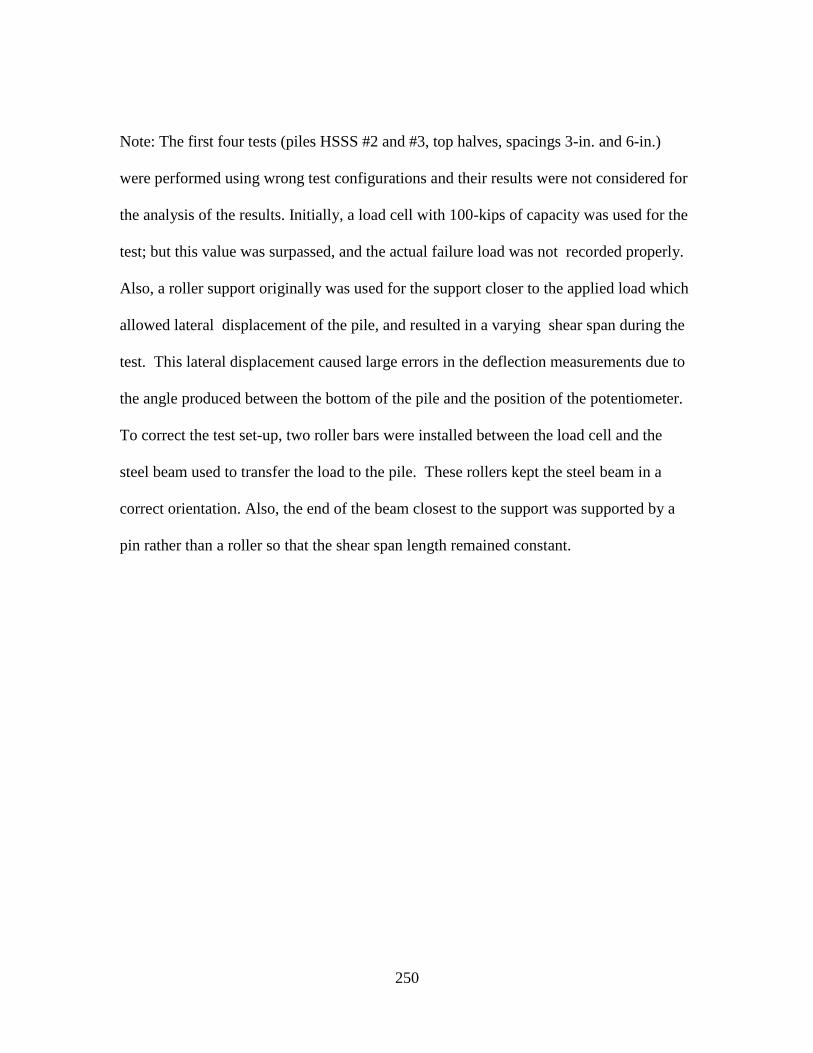
250
Note: The first four tests (piles HSSS #2 and #3, top halves, spacings 3-in. and 6-in.)
were performed using wrong test configurations and their results were not considered for
the analysis of the results. Initially, a load cell with 100-kips of capacity was used for the
test; but this value was surpassed, and the actual failure load was not recorded properly.
Also, a roller support originally was used for the support closer to the applied load which
allowed lateral displacement of the pile, and resulted in a varying shear span during the
test. This lateral displacement caused large errors in the deflection measurements due to
the angle produced between the bottom of the pile and the position of the potentiometer.
To correct the test set-up, two roller bars were installed between the load cell and the
steel beam used to transfer the load to the pile. These rollers kept the steel beam in a
correct orientation. Also, the end of the beam closest to the support was supported by a
pin rather than a roller so that the shear span length remained constant.
251
APPENDIX K: AASHTO LRFD PRESTRESS LOSSES CALCULATION
- AASHTO Refined and AASHTO Lump-sum Methods:
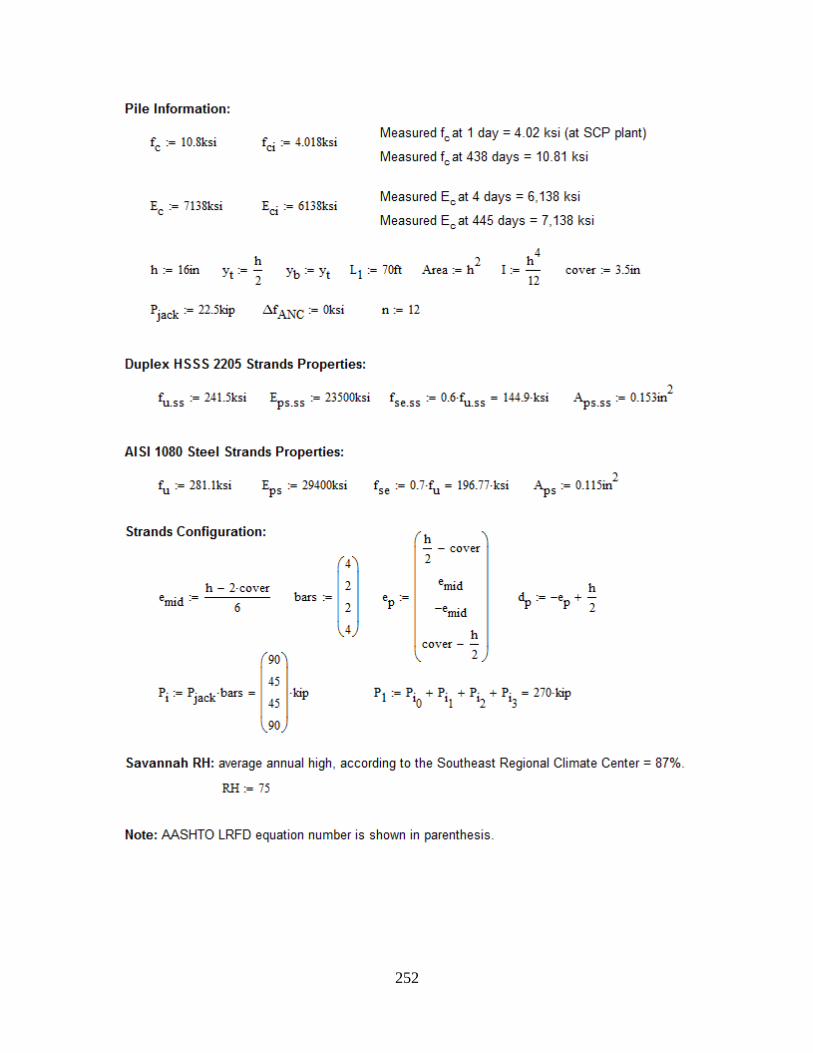
252
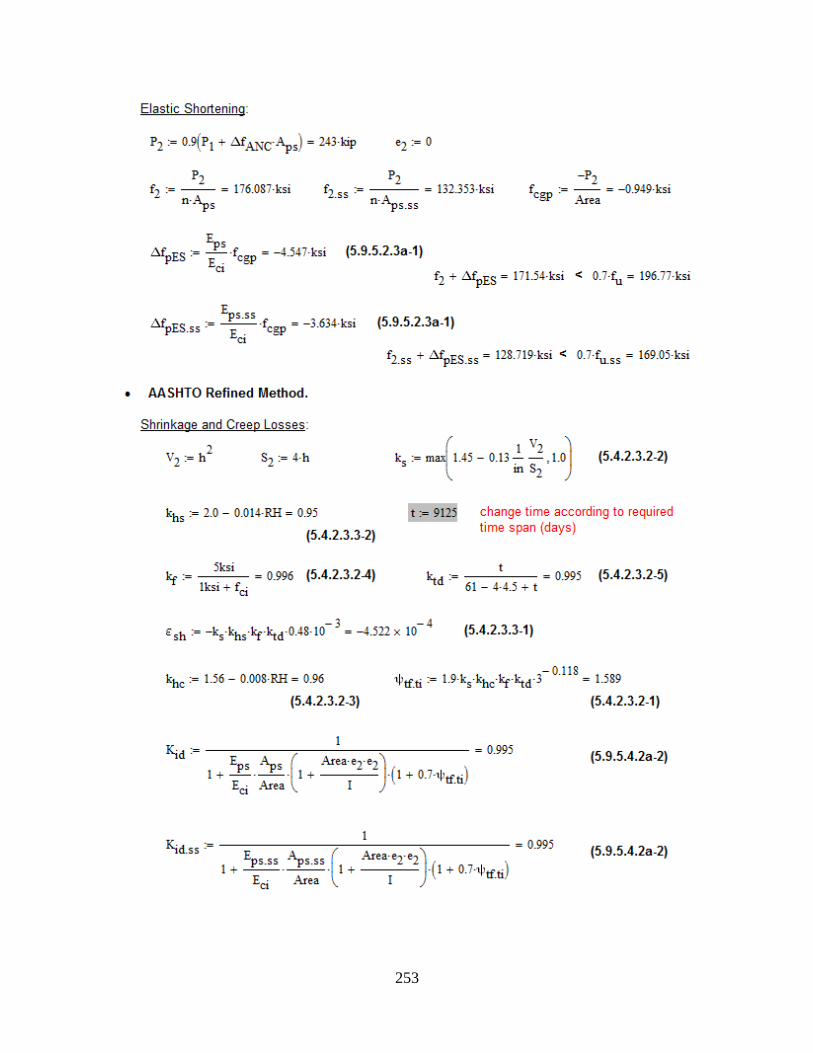
253
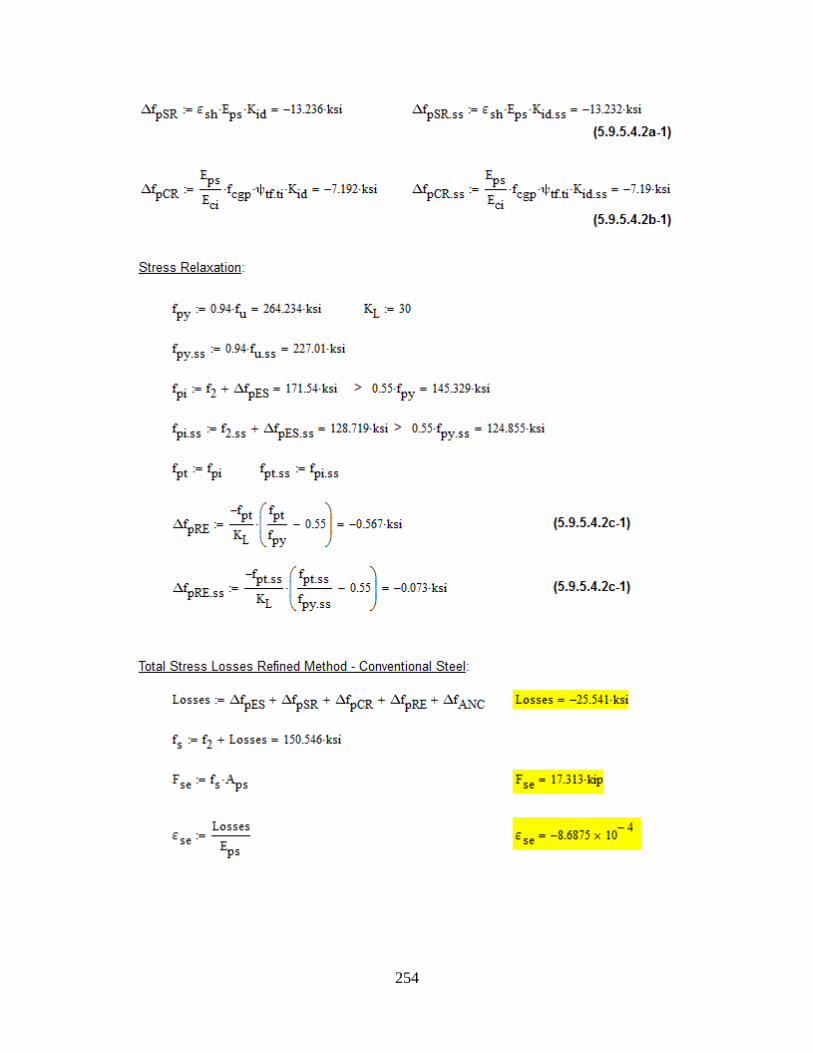
254
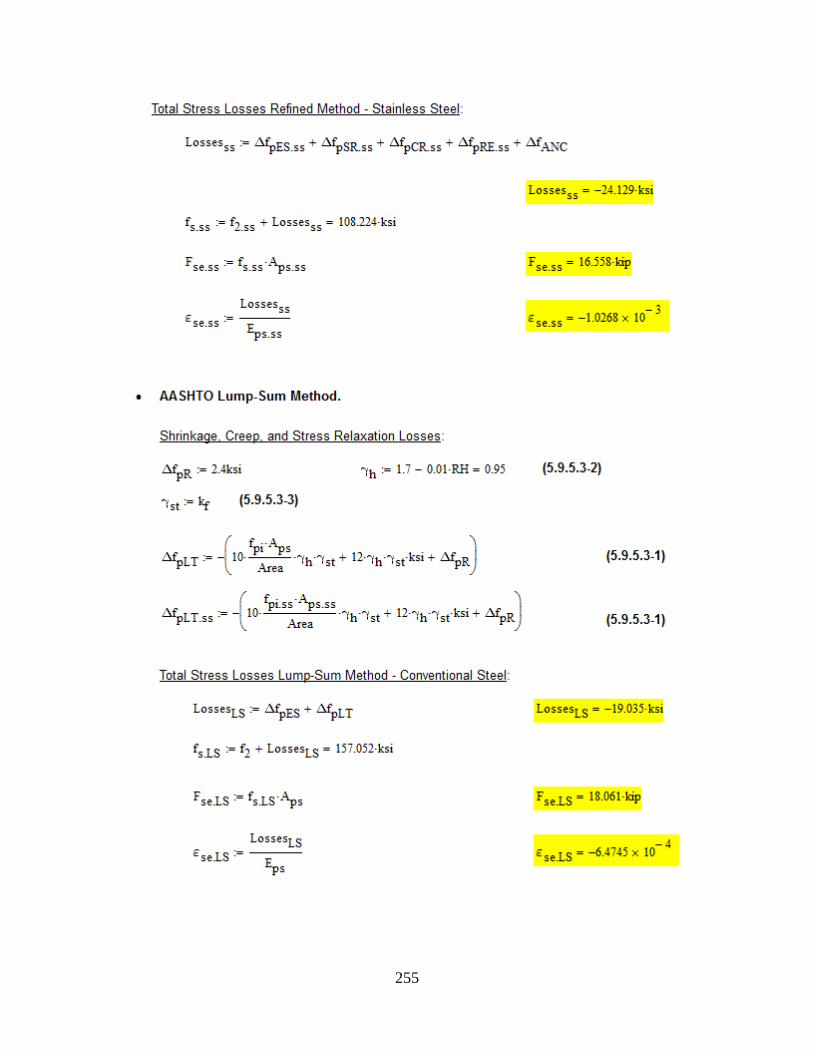
255
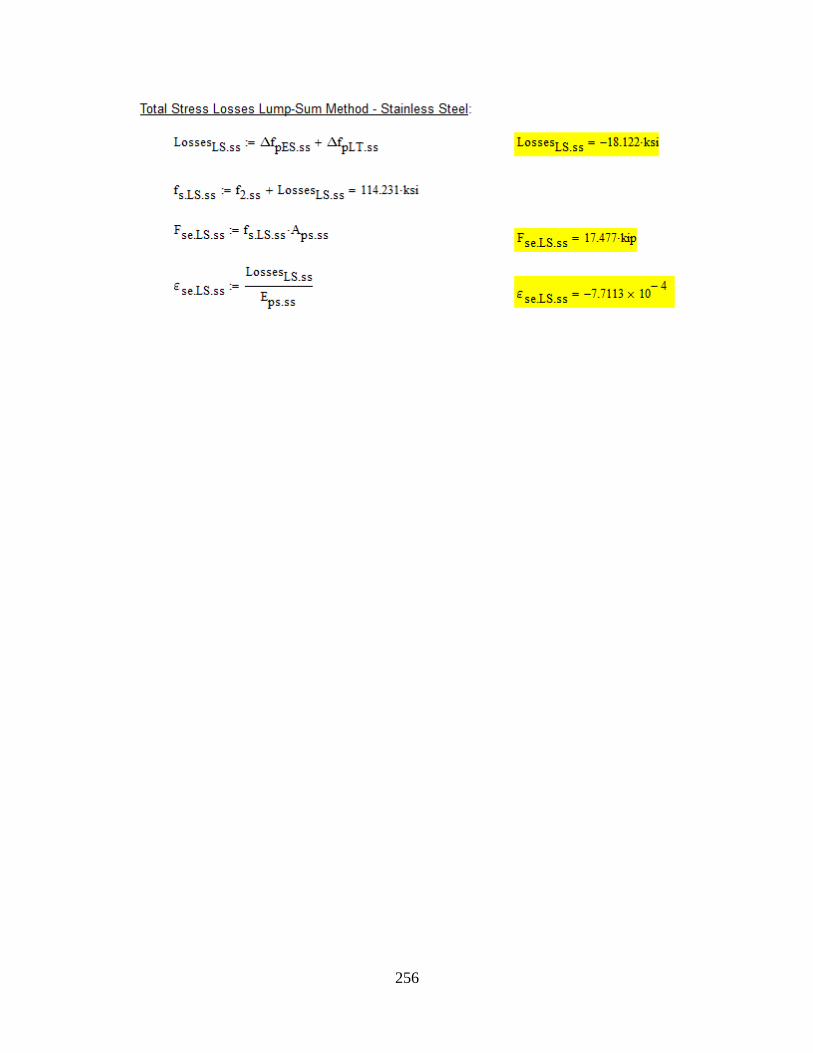
256
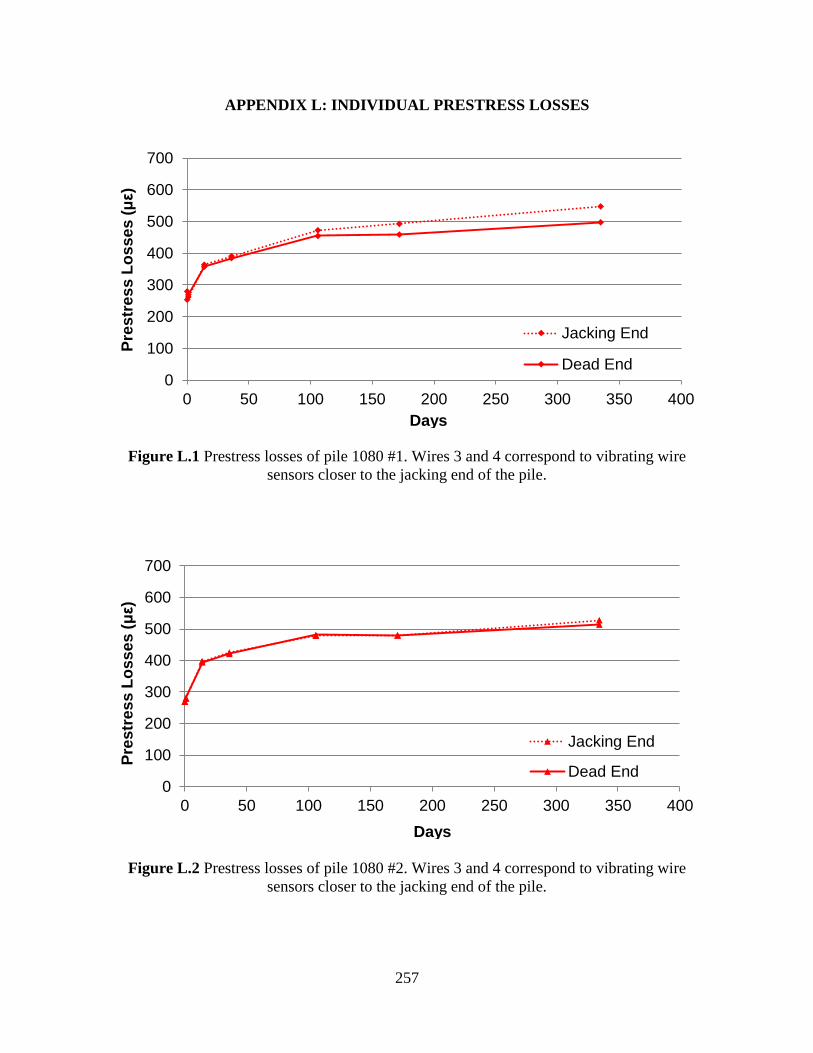
257
APPENDIX L: INDIVIDUAL PRESTRESS LOSSES
Figure L.1 Prestress losses of pile 1080 #1. Wires 3 and 4 correspond to vibrating wire
sensors closer to the jacking end of the pile.
Figure L.2 Prestress losses of pile 1080 #2. Wires 3 and 4 correspond to vibrating wire
sensors closer to the jacking end of the pile.
0
100
200
300
400
500
600
700
0 50 100 150 200 250 300 350 400
Pre
str
es
s L
os
se
s (με)
Days
Jacking End
Dead End
0
100
200
300
400
500
600
700
0 50 100 150 200 250 300 350 400
Pre
str
es
s L
os
se
s (με)
Days
Jacking End
Dead End
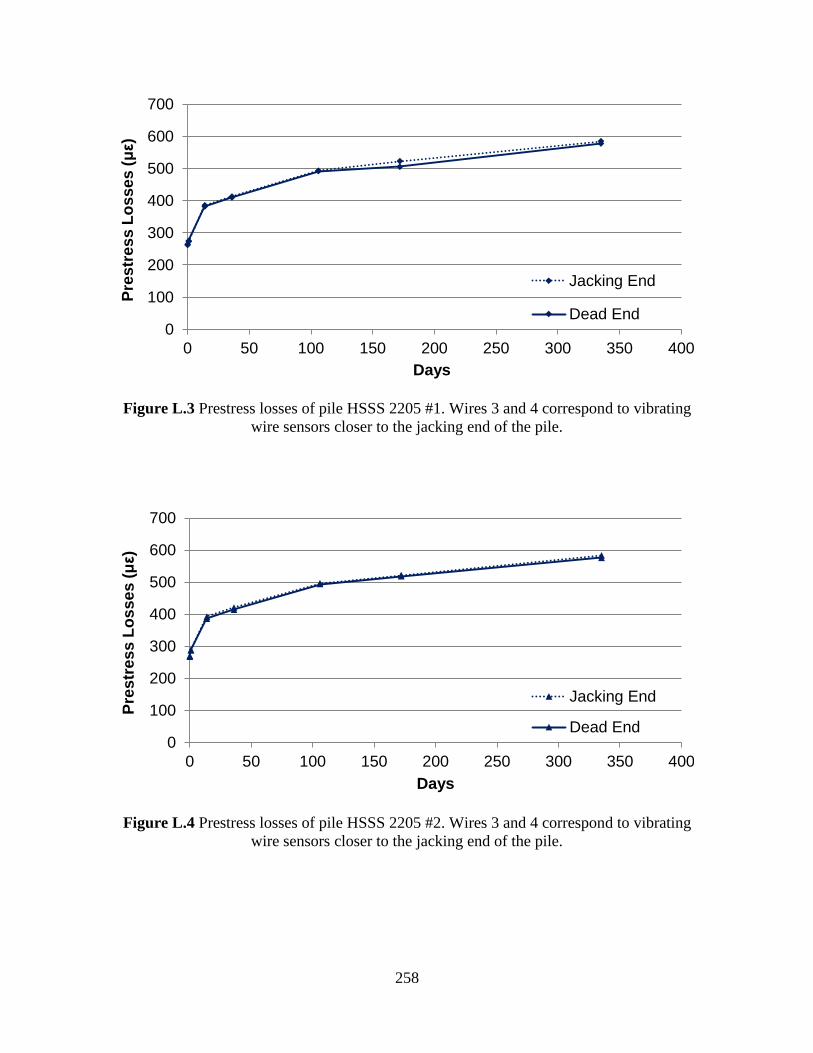
258
Figure L.3 Prestress losses of pile HSSS 2205 #1. Wires 3 and 4 correspond to vibrating
wire sensors closer to the jacking end of the pile.
Figure L.4 Prestress losses of pile HSSS 2205 #2. Wires 3 and 4 correspond to vibrating
wire sensors closer to the jacking end of the pile.
0
100
200
300
400
500
600
700
0 50 100 150 200 250 300 350 400
Pre
str
es
s L
oss
es
(με)
Days
Jacking End
Dead End
0
100
200
300
400
500
600
700
0 50 100 150 200 250 300 350 400
Pre
str
es
s L
os
se
s (με)
Days
Jacking End
Dead End
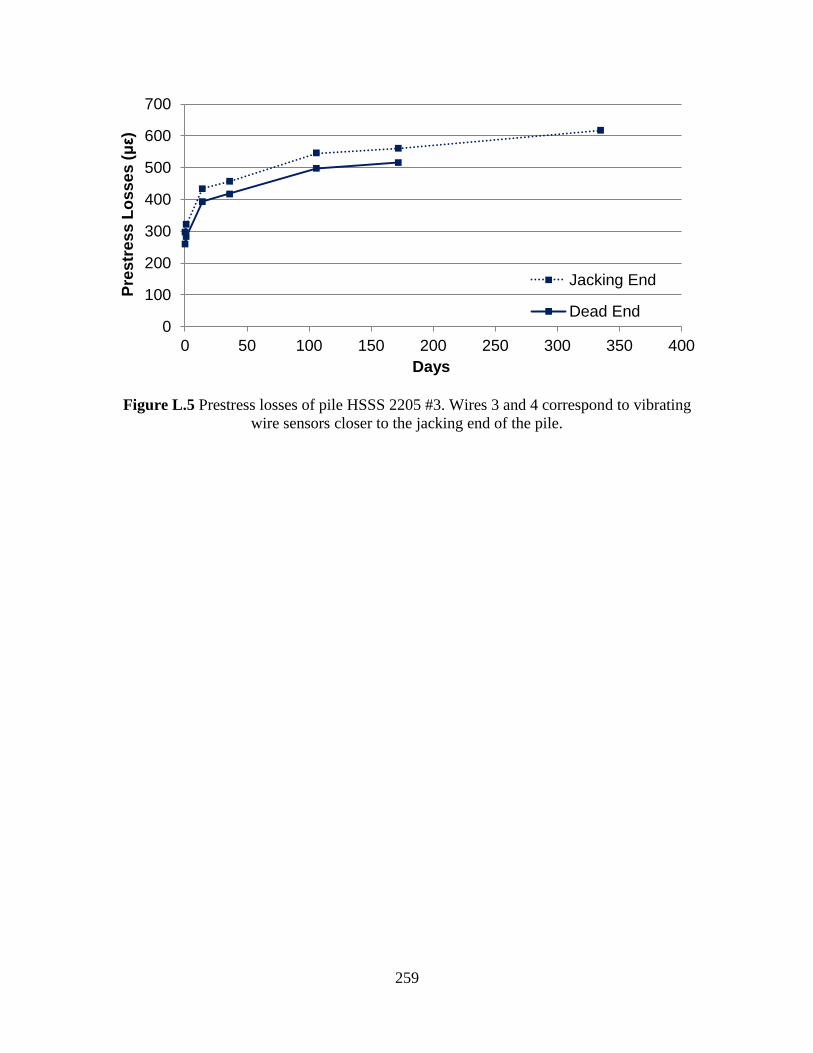
259
Figure L.5 Prestress losses of pile HSSS 2205 #3. Wires 3 and 4 correspond to vibrating
wire sensors closer to the jacking end of the pile.
0
100
200
300
400
500
600
700
0 50 100 150 200 250 300 350 400
Pre
str
es
s L
os
se
s (με)
Days
Jacking End
Dead End
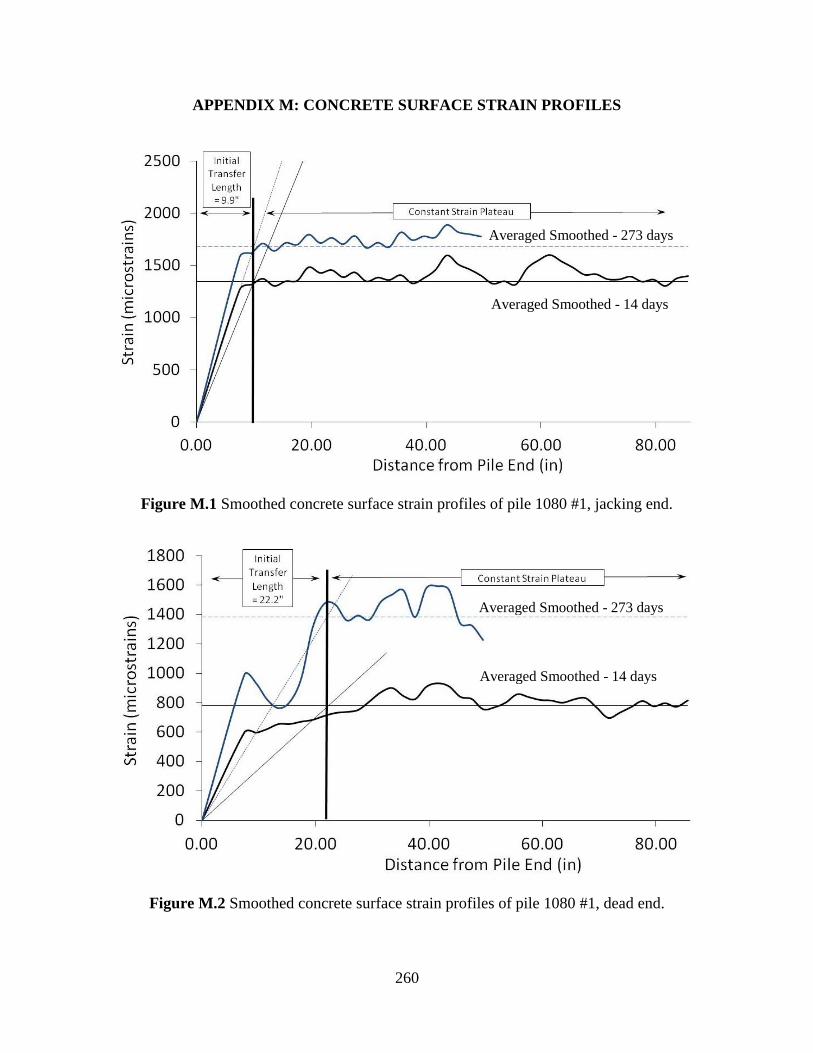
260
APPENDIX M: CONCRETE SURFACE STRAIN PROFILES
Figure M.1 Smoothed concrete surface strain profiles of pile 1080 #1, jacking end.
Figure M.2 Smoothed concrete surface strain profiles of pile 1080 #1, dead end.
Averaged Smoothed - 273 days
Averaged Smoothed - 14 days
Averaged Smoothed - 273 days
Averaged Smoothed - 14 days
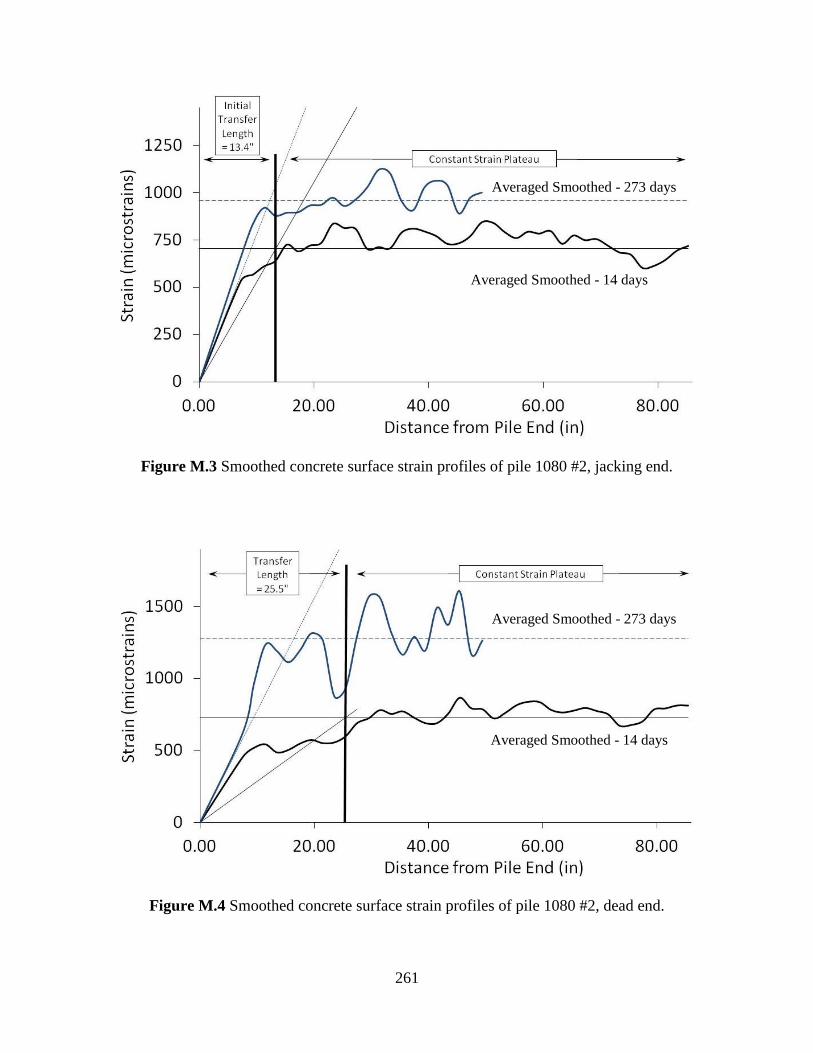
261
Figure M.3 Smoothed concrete surface strain profiles of pile 1080 #2, jacking end.
Figure M.4 Smoothed concrete surface strain profiles of pile 1080 #2, dead end.
Averaged Smoothed - 273 days
Averaged Smoothed - 14 days
Averaged Smoothed - 273 days
Averaged Smoothed - 14 days
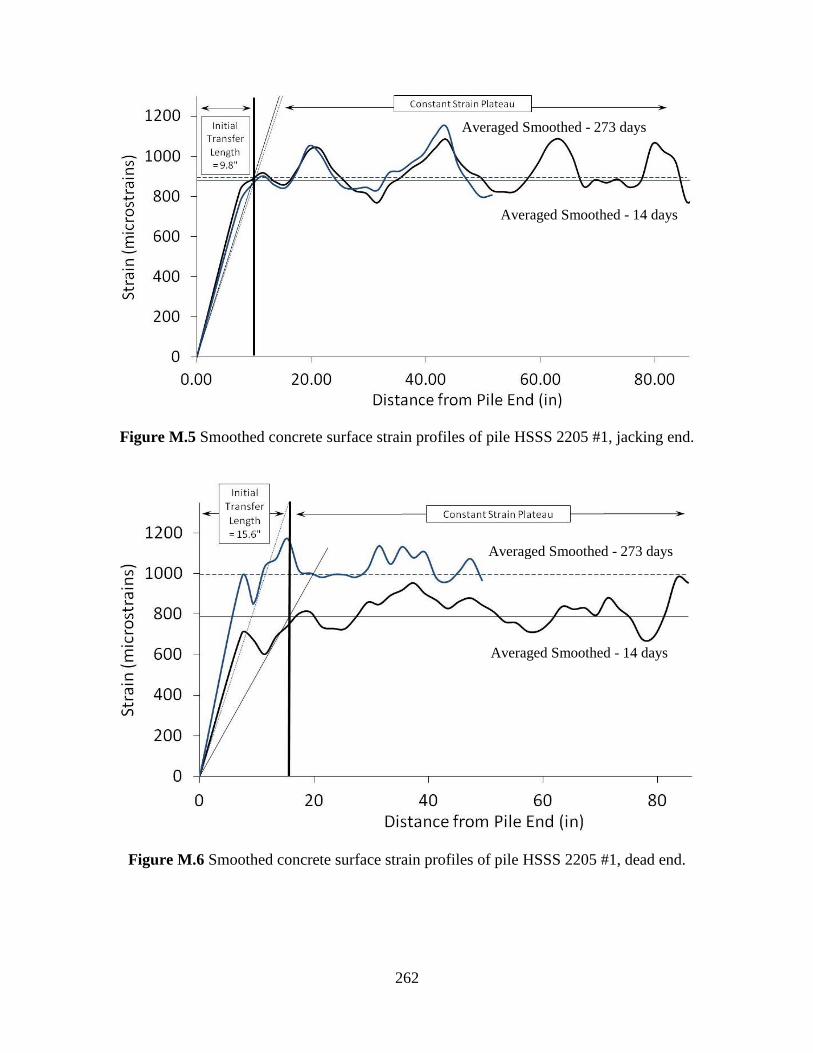
262
Figure M.5 Smoothed concrete surface strain profiles of pile HSSS 2205 #1, jacking end.
Figure M.6 Smoothed concrete surface strain profiles of pile HSSS 2205 #1, dead end.
Averaged Smoothed - 14 days
Averaged Smoothed - 273 days
Averaged Smoothed - 273 days
Averaged Smoothed - 14 days
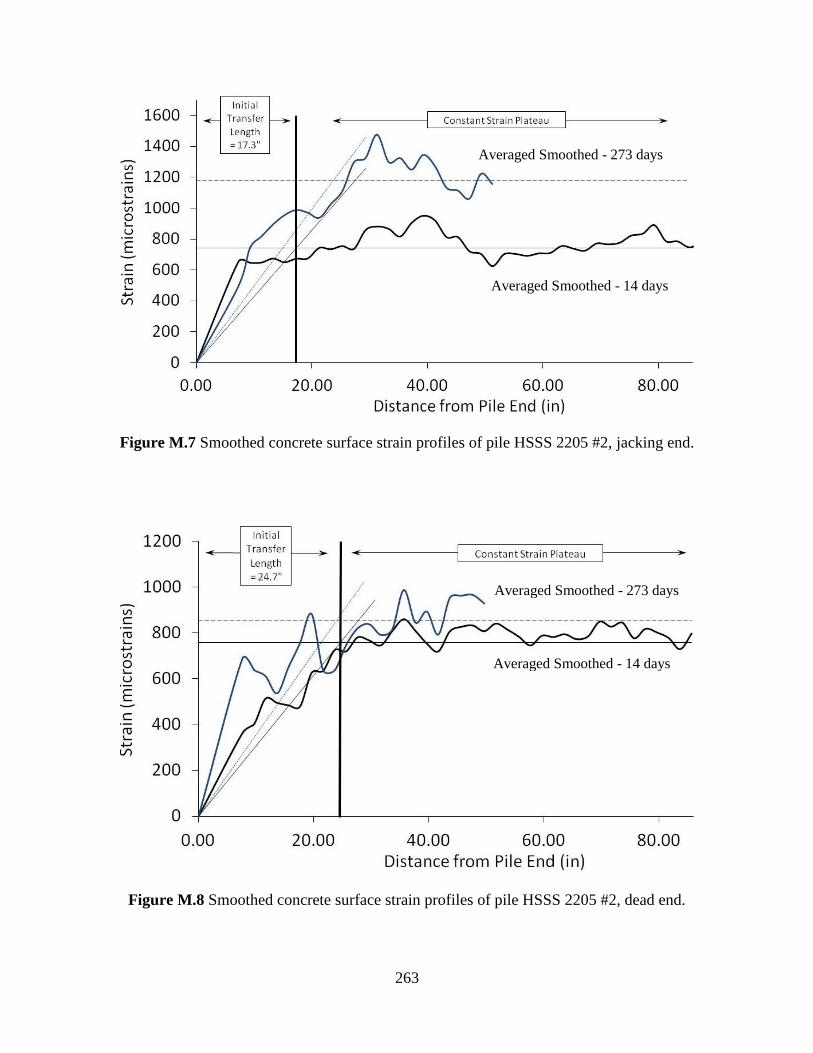
263
Figure M.7 Smoothed concrete surface strain profiles of pile HSSS 2205 #2, jacking end.
Figure M.8 Smoothed concrete surface strain profiles of pile HSSS 2205 #2, dead end.
Averaged Smoothed - 273 days
Averaged Smoothed - 14 days
Averaged Smoothed - 273 days
Averaged Smoothed - 14 days
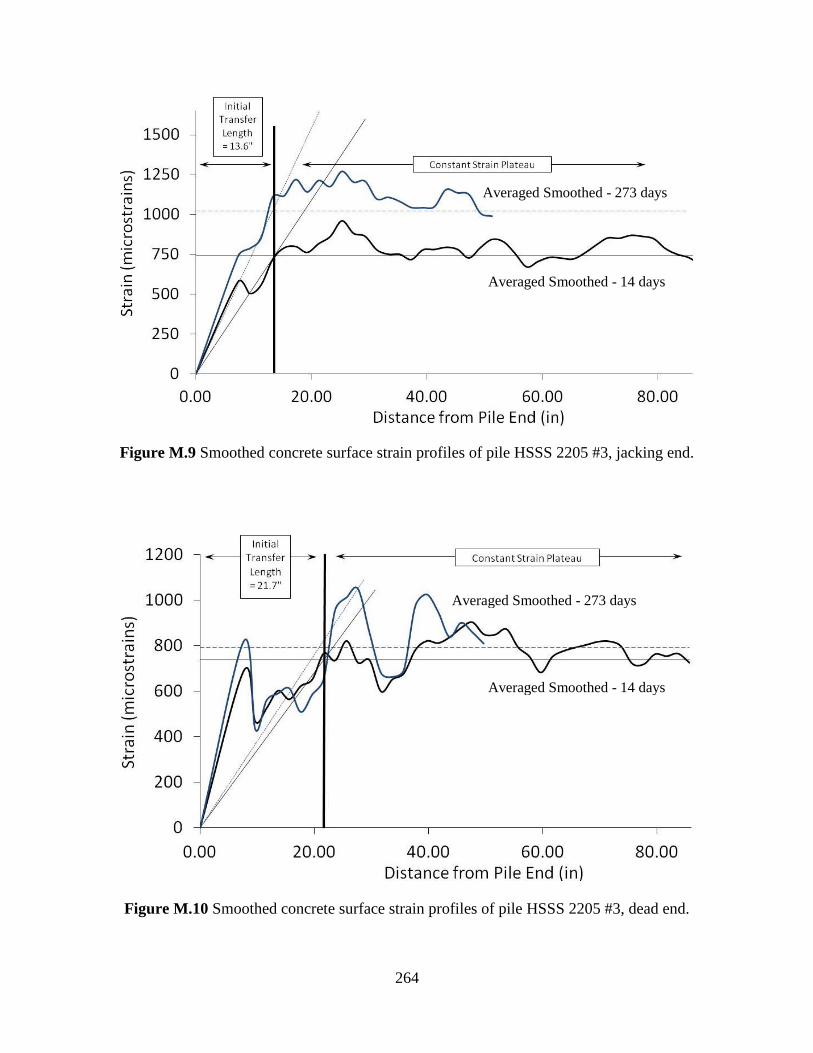
264
Figure M.9 Smoothed concrete surface strain profiles of pile HSSS 2205 #3, jacking end.
Figure M.10 Smoothed concrete surface strain profiles of pile HSSS 2205 #3, dead end.
Averaged Smoothed - 273 days
Averaged Smoothed - 14 days
Averaged Smoothed - 273 days
Averaged Smoothed - 14 days
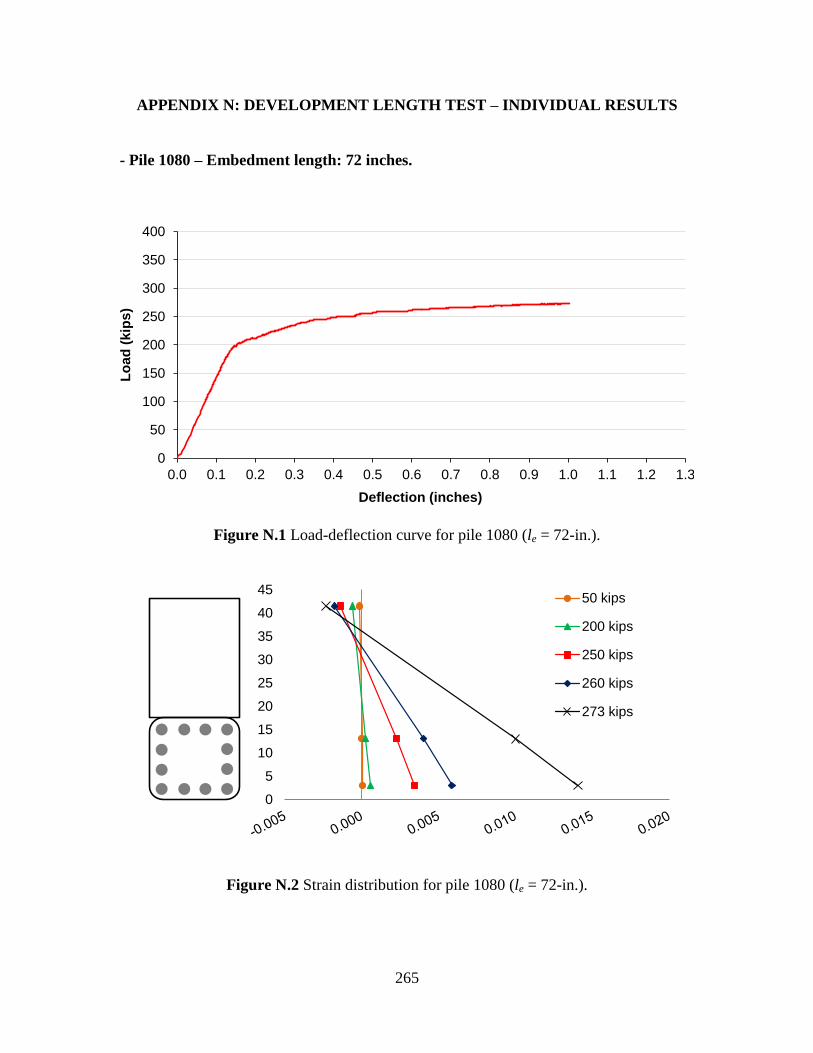
265
APPENDIX N: DEVELOPMENT LENGTH TEST – INDIVIDUAL RESULTS
- Pile 1080 – Embedment length: 72 inches.
Figure N.1 Load-deflection curve for pile 1080 (le = 72-in.).
Figure N.2 Strain distribution for pile 1080 (le = 72-in.).
0
50
100
150
200
250
300
350
400
0.0 0.1 0.2 0.3 0.4 0.5 0.6 0.7 0.8 0.9 1.0 1.1 1.2 1.3
Lo
ad
(kip
s)
Deflection (inches)
0
5
10
15
20
25
30
35
40
4550 kips
200 kips
250 kips
260 kips
273 kips
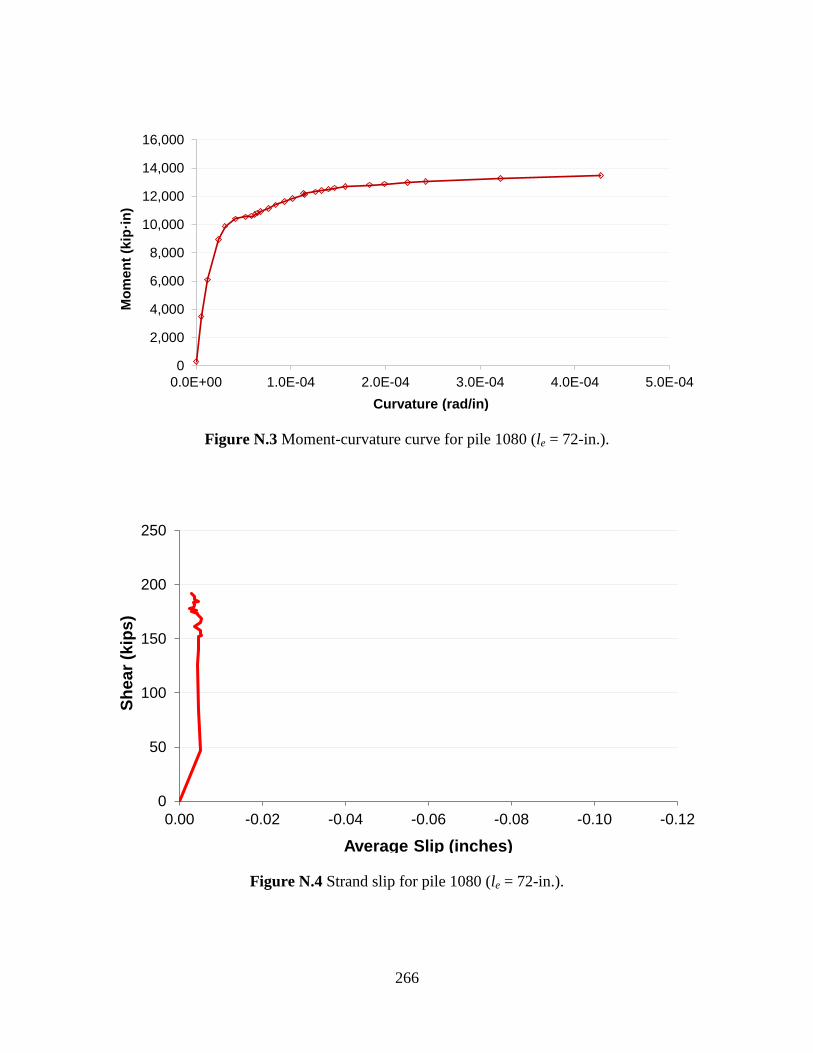
266
Figure N.3 Moment-curvature curve for pile 1080 (le = 72-in.).
Figure N.4 Strand slip for pile 1080 (le = 72-in.).
0
2,000
4,000
6,000
8,000
10,000
12,000
14,000
16,000
0.0E+00 1.0E-04 2.0E-04 3.0E-04 4.0E-04 5.0E-04
Mo
me
nt
(kip
·in
)
Curvature (rad/in)
0
50
100
150
200
250
-0.12-0.10-0.08-0.06-0.04-0.020.00
Sh
ea
r (k
ips
)
Average Slip (inches)
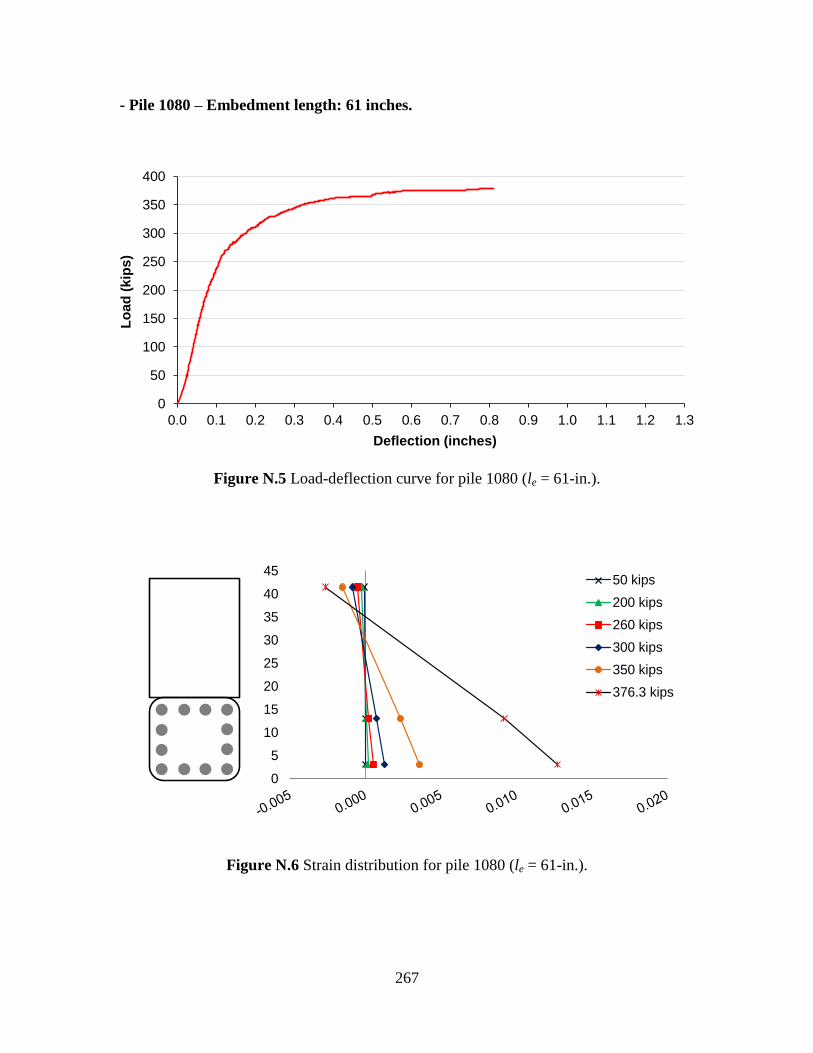
267
- Pile 1080 – Embedment length: 61 inches.
Figure N.5 Load-deflection curve for pile 1080 (le = 61-in.).
Figure N.6 Strain distribution for pile 1080 (le = 61-in.).
0
50
100
150
200
250
300
350
400
0.0 0.1 0.2 0.3 0.4 0.5 0.6 0.7 0.8 0.9 1.0 1.1 1.2 1.3
Lo
ad
(kip
s)
Deflection (inches)
0
5
10
15
20
25
30
35
40
4550 kips
200 kips
260 kips
300 kips
350 kips
376.3 kips
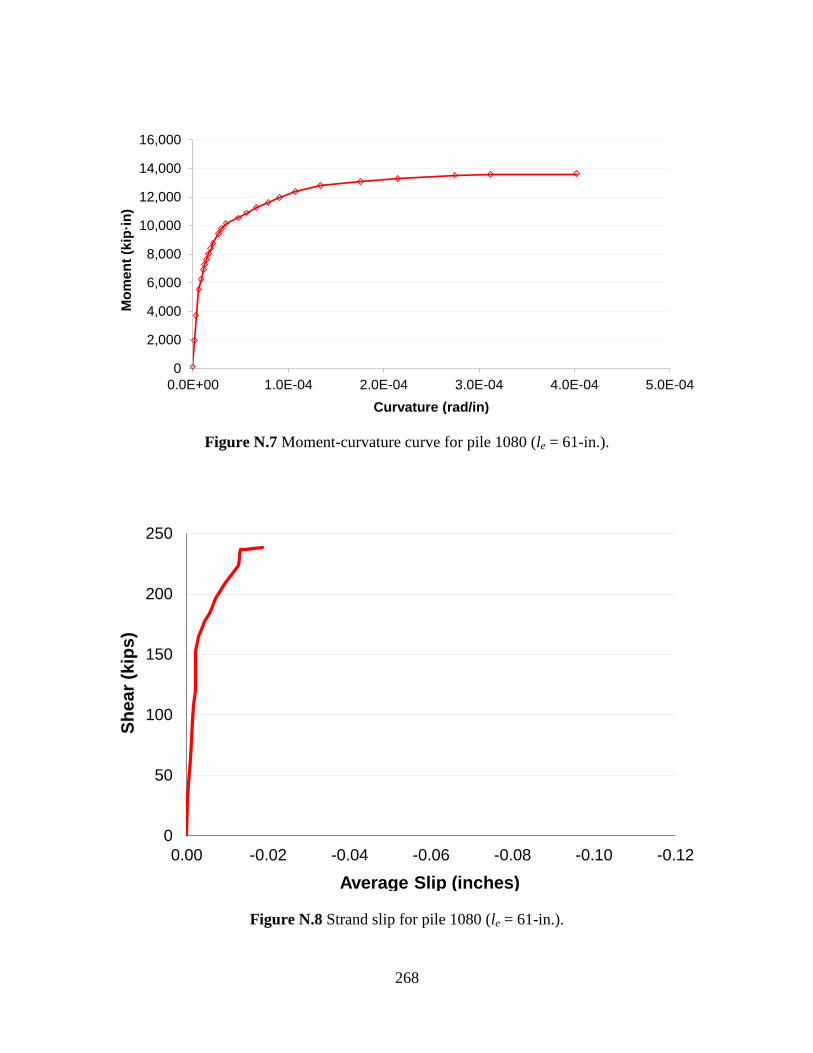
268
Figure N.7 Moment-curvature curve for pile 1080 (le = 61-in.).
Figure N.8 Strand slip for pile 1080 (le = 61-in.).
0
2,000
4,000
6,000
8,000
10,000
12,000
14,000
16,000
0.0E+00 1.0E-04 2.0E-04 3.0E-04 4.0E-04 5.0E-04
Mo
me
nt
(kip
·in
)
Curvature (rad/in)
0
50
100
150
200
250
-0.12-0.10-0.08-0.06-0.04-0.020.00
Sh
ea
r (k
ips
)
Average Slip (inches)
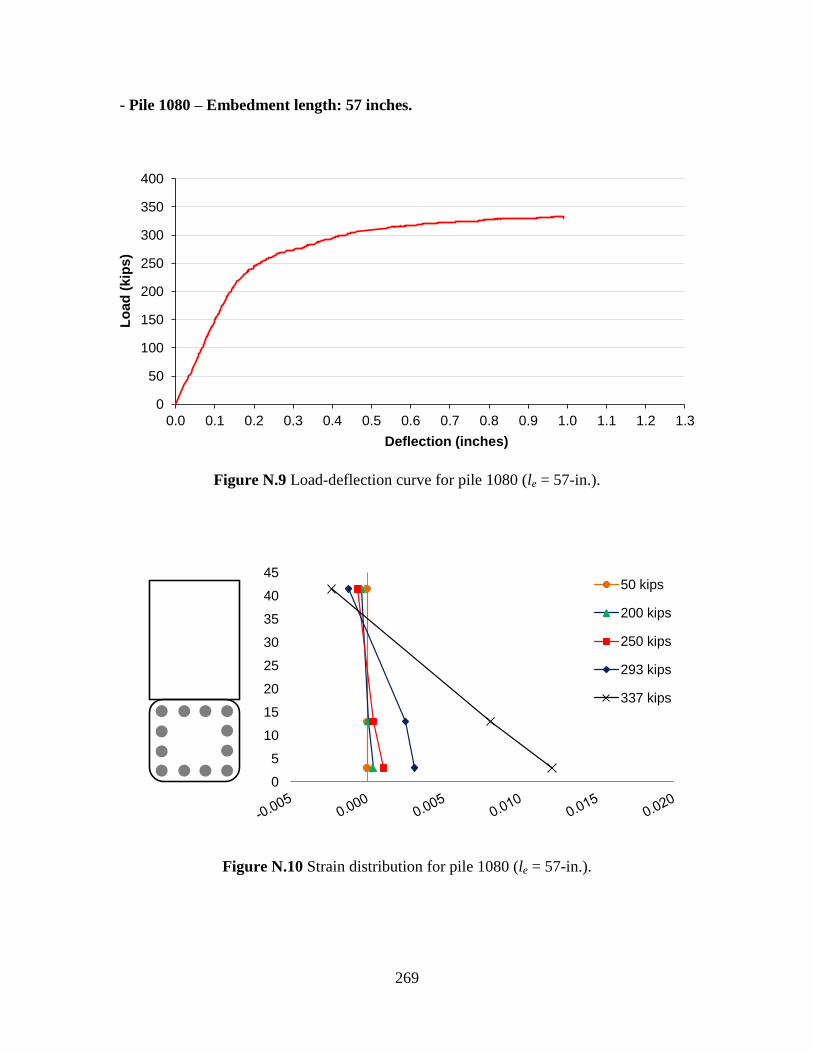
269
- Pile 1080 – Embedment length: 57 inches.
Figure N.9 Load-deflection curve for pile 1080 (le = 57-in.).
Figure N.10 Strain distribution for pile 1080 (le = 57-in.).
0
50
100
150
200
250
300
350
400
0.0 0.1 0.2 0.3 0.4 0.5 0.6 0.7 0.8 0.9 1.0 1.1 1.2 1.3
Lo
ad
(k
ips
)
Deflection (inches)
0
5
10
15
20
25
30
35
40
4550 kips
200 kips
250 kips
293 kips
337 kips
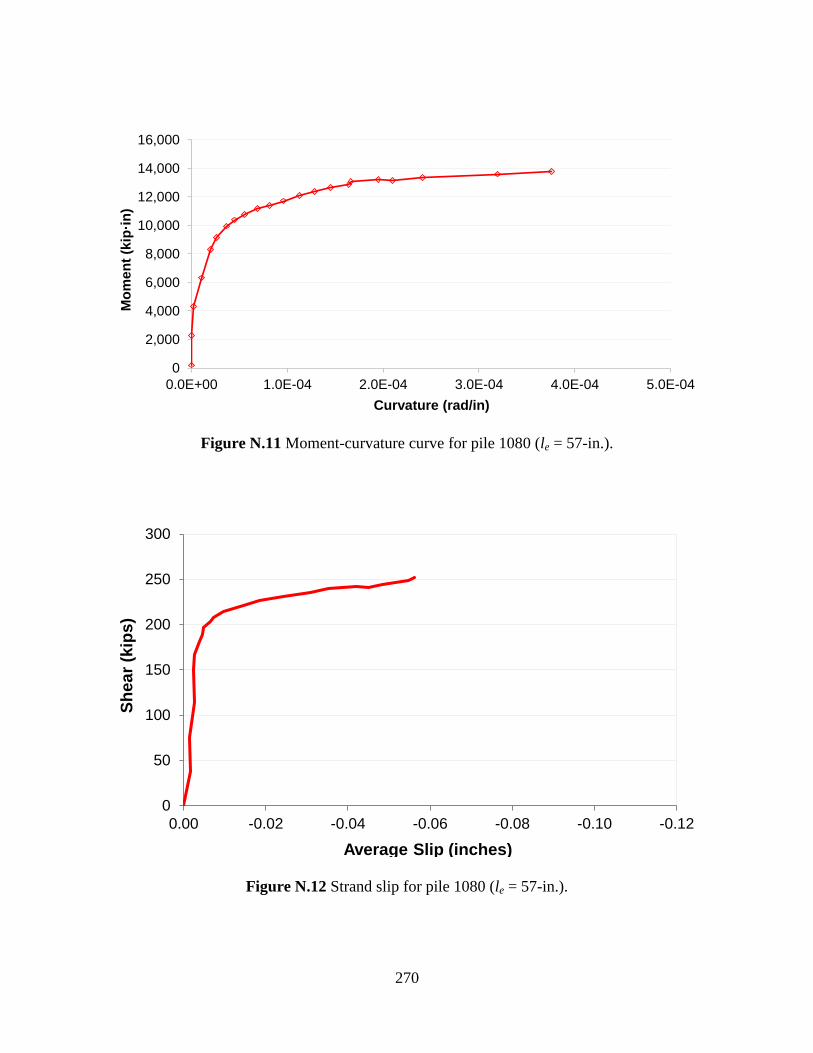
270
Figure N.11 Moment-curvature curve for pile 1080 (le = 57-in.).
Figure N.12 Strand slip for pile 1080 (le = 57-in.).
0
2,000
4,000
6,000
8,000
10,000
12,000
14,000
16,000
0.0E+00 1.0E-04 2.0E-04 3.0E-04 4.0E-04 5.0E-04
Mo
me
nt
(kip
·in
)
Curvature (rad/in)
0
50
100
150
200
250
300
-0.12-0.10-0.08-0.06-0.04-0.020.00
Sh
ea
r (k
ips
)
Average Slip (inches)
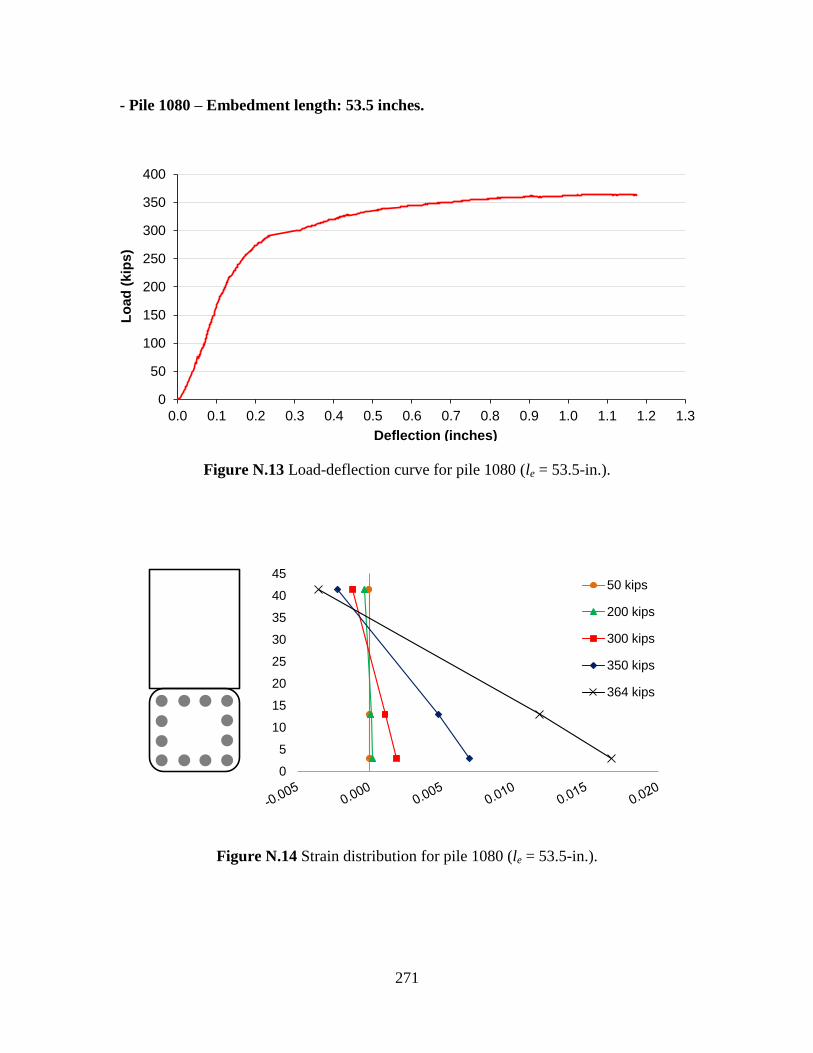
271
- Pile 1080 – Embedment length: 53.5 inches.
Figure N.13 Load-deflection curve for pile 1080 (le = 53.5-in.).
Figure N.14 Strain distribution for pile 1080 (le = 53.5-in.).
0
50
100
150
200
250
300
350
400
0.0 0.1 0.2 0.3 0.4 0.5 0.6 0.7 0.8 0.9 1.0 1.1 1.2 1.3
Lo
ad
(k
ips
)
Deflection (inches)
0
5
10
15
20
25
30
35
40
4550 kips
200 kips
300 kips
350 kips
364 kips
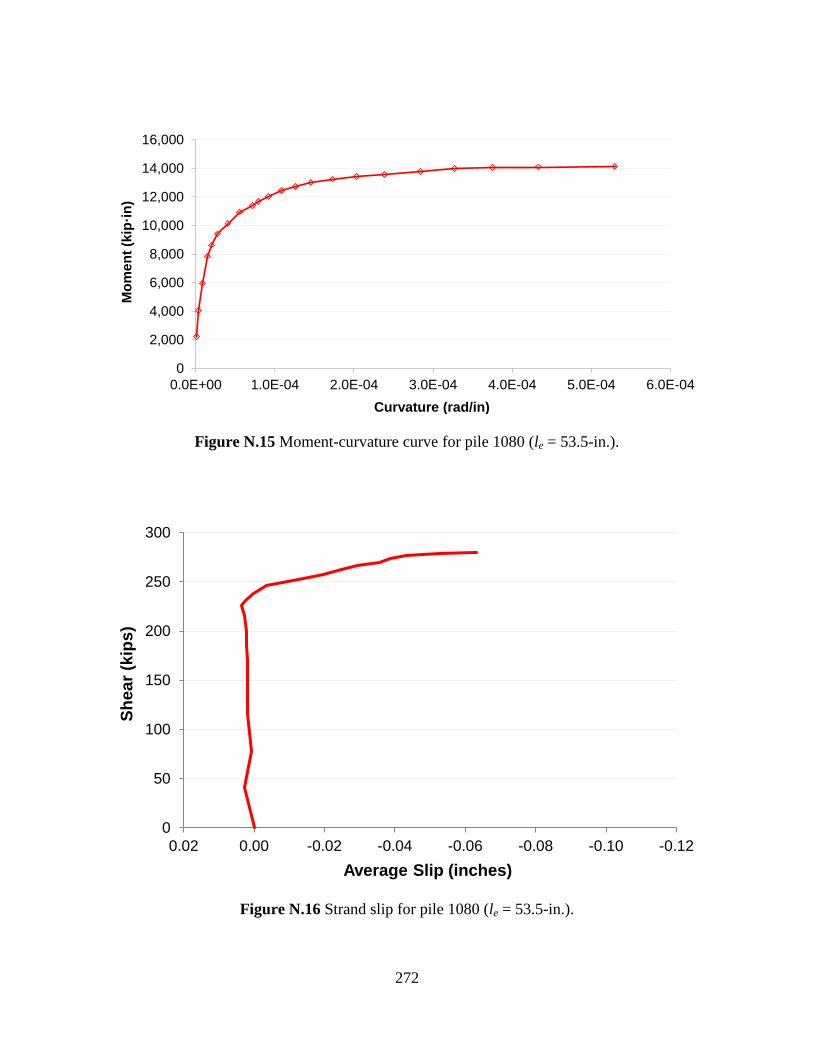
272
Figure N.15 Moment-curvature curve for pile 1080 (le = 53.5-in.).
Figure N.16 Strand slip for pile 1080 (le = 53.5-in.).
0
2,000
4,000
6,000
8,000
10,000
12,000
14,000
16,000
0.0E+00 1.0E-04 2.0E-04 3.0E-04 4.0E-04 5.0E-04 6.0E-04
Mo
me
nt
(kip
·in
)
Curvature (rad/in)
0
50
100
150
200
250
300
-0.12-0.10-0.08-0.06-0.04-0.020.000.02
Sh
ea
r (k
ips
)
Average Slip (inches)
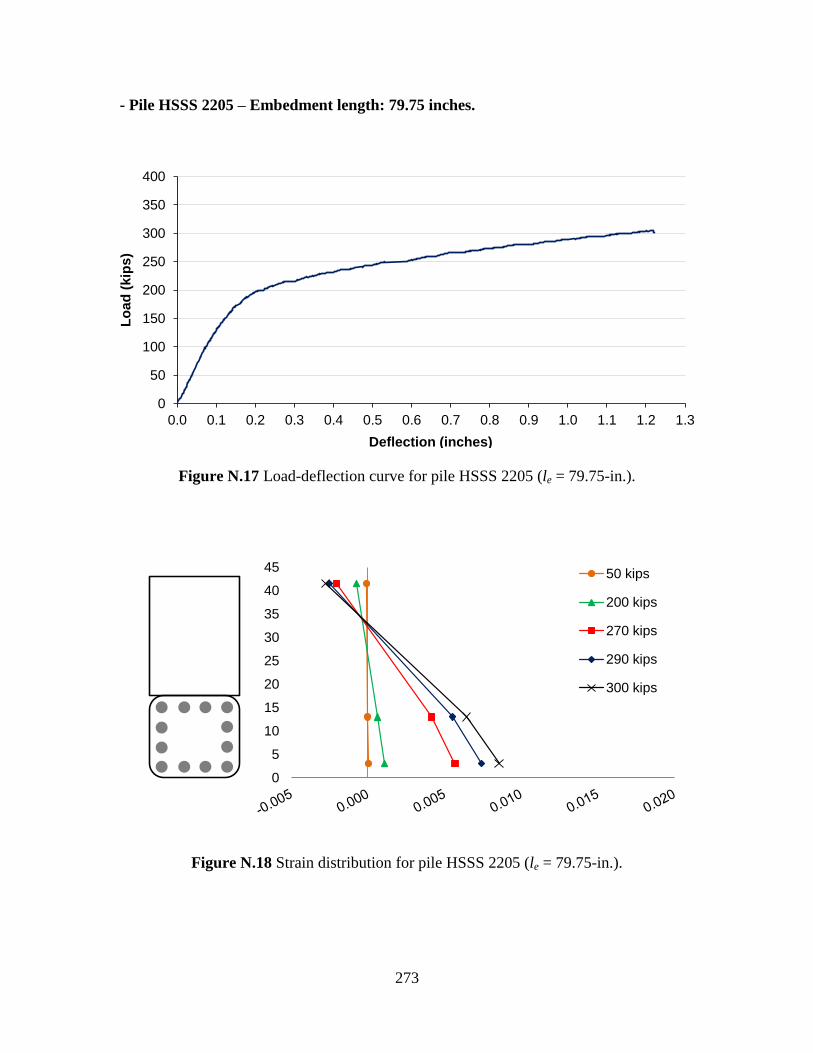
273
- Pile HSSS 2205 – Embedment length: 79.75 inches.
Figure N.17 Load-deflection curve for pile HSSS 2205 (le = 79.75-in.).
Figure N.18 Strain distribution for pile HSSS 2205 (le = 79.75-in.).
0
50
100
150
200
250
300
350
400
0.0 0.1 0.2 0.3 0.4 0.5 0.6 0.7 0.8 0.9 1.0 1.1 1.2 1.3
Lo
ad
(kip
s)
Deflection (inches)
0
5
10
15
20
25
30
35
40
4550 kips
200 kips
270 kips
290 kips
300 kips
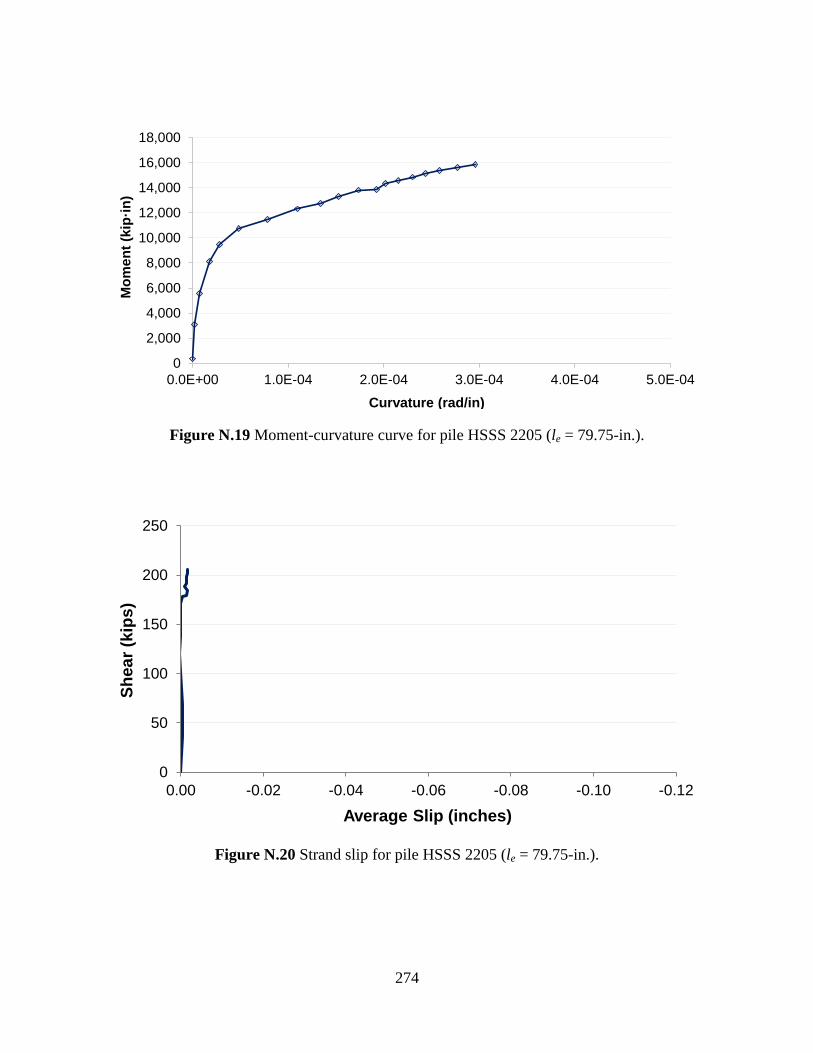
274
Figure N.19 Moment-curvature curve for pile HSSS 2205 (le = 79.75-in.).
Figure N.20 Strand slip for pile HSSS 2205 (le = 79.75-in.).
0
2,000
4,000
6,000
8,000
10,000
12,000
14,000
16,000
18,000
0.0E+00 1.0E-04 2.0E-04 3.0E-04 4.0E-04 5.0E-04
Mo
me
nt
(kip
·in
)
Curvature (rad/in)
0
50
100
150
200
250
-0.12-0.10-0.08-0.06-0.04-0.020.00
Sh
ea
r (k
ips
)
Average Slip (inches)
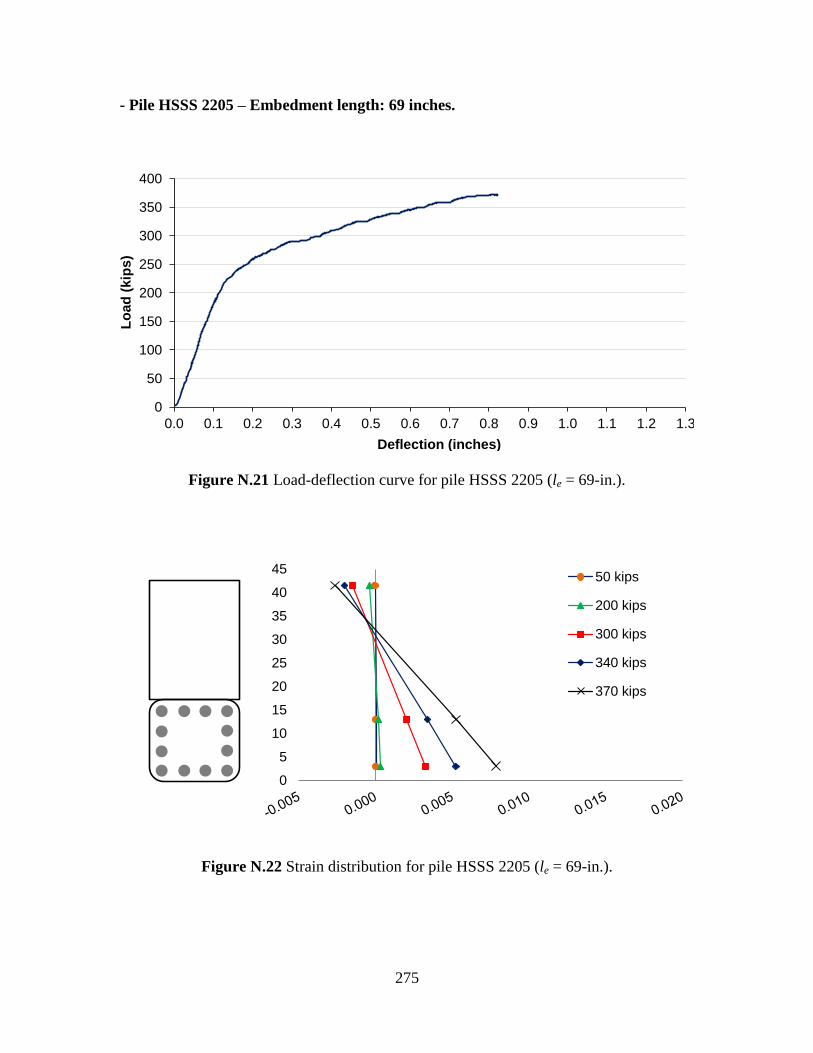
275
- Pile HSSS 2205 – Embedment length: 69 inches.
Figure N.21 Load-deflection curve for pile HSSS 2205 (le = 69-in.).
Figure N.22 Strain distribution for pile HSSS 2205 (le = 69-in.).
0
50
100
150
200
250
300
350
400
0.0 0.1 0.2 0.3 0.4 0.5 0.6 0.7 0.8 0.9 1.0 1.1 1.2 1.3
Lo
ad
(k
ips
)
Deflection (inches)
0
5
10
15
20
25
30
35
40
4550 kips
200 kips
300 kips
340 kips
370 kips
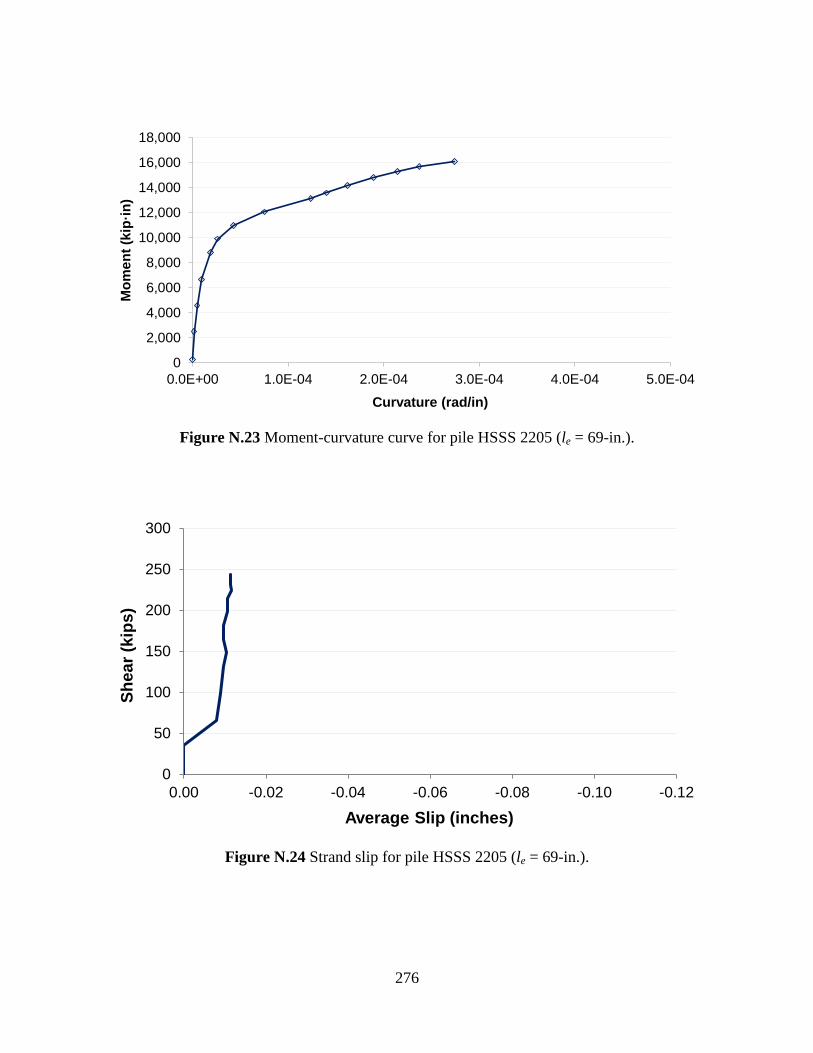
276
Figure N.23 Moment-curvature curve for pile HSSS 2205 (le = 69-in.).
Figure N.24 Strand slip for pile HSSS 2205 (le = 69-in.).
0
2,000
4,000
6,000
8,000
10,000
12,000
14,000
16,000
18,000
0.0E+00 1.0E-04 2.0E-04 3.0E-04 4.0E-04 5.0E-04
Mo
me
nt
(kip
·in
)
Curvature (rad/in)
0
50
100
150
200
250
300
-0.12-0.10-0.08-0.06-0.04-0.020.00
Sh
ea
r (k
ips
)
Average Slip (inches)
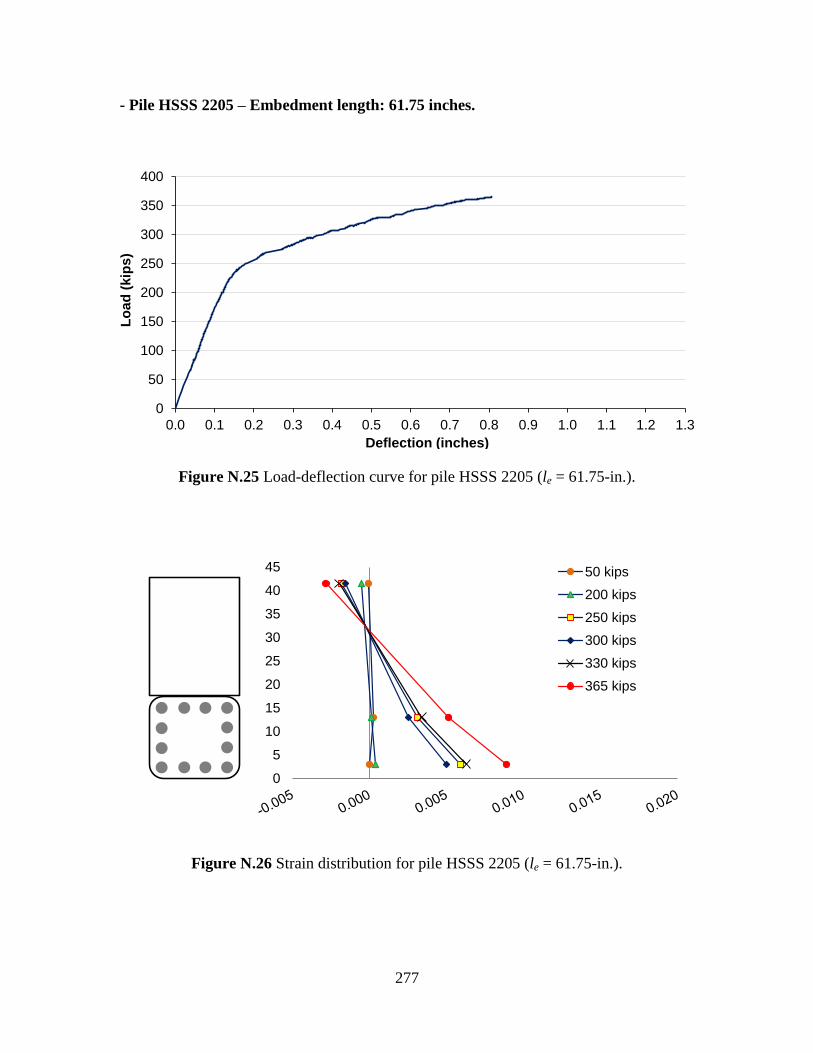
277
- Pile HSSS 2205 – Embedment length: 61.75 inches.
Figure N.25 Load-deflection curve for pile HSSS 2205 (le = 61.75-in.).
Figure N.26 Strain distribution for pile HSSS 2205 (le = 61.75-in.).
0
50
100
150
200
250
300
350
400
0.0 0.1 0.2 0.3 0.4 0.5 0.6 0.7 0.8 0.9 1.0 1.1 1.2 1.3
Lo
ad
(k
ips
)
Deflection (inches)
0
5
10
15
20
25
30
35
40
45 50 kips
200 kips
250 kips
300 kips
330 kips
365 kips
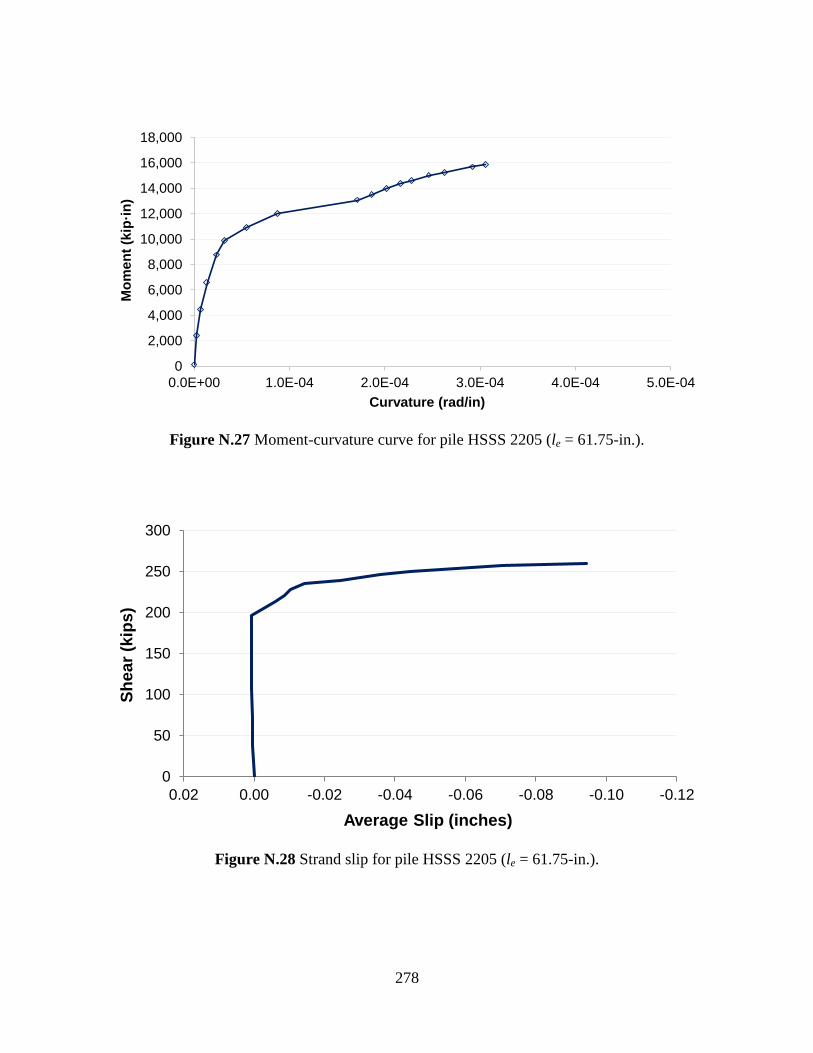
278
Figure N.27 Moment-curvature curve for pile HSSS 2205 (le = 61.75-in.).
Figure N.28 Strand slip for pile HSSS 2205 (le = 61.75-in.).
0
2,000
4,000
6,000
8,000
10,000
12,000
14,000
16,000
18,000
0.0E+00 1.0E-04 2.0E-04 3.0E-04 4.0E-04 5.0E-04
Mo
me
nt
(kip
·in
)
Curvature (rad/in)
0
50
100
150
200
250
300
-0.12-0.10-0.08-0.06-0.04-0.020.000.02
Sh
ea
r (k
ips
)
Average Slip (inches)
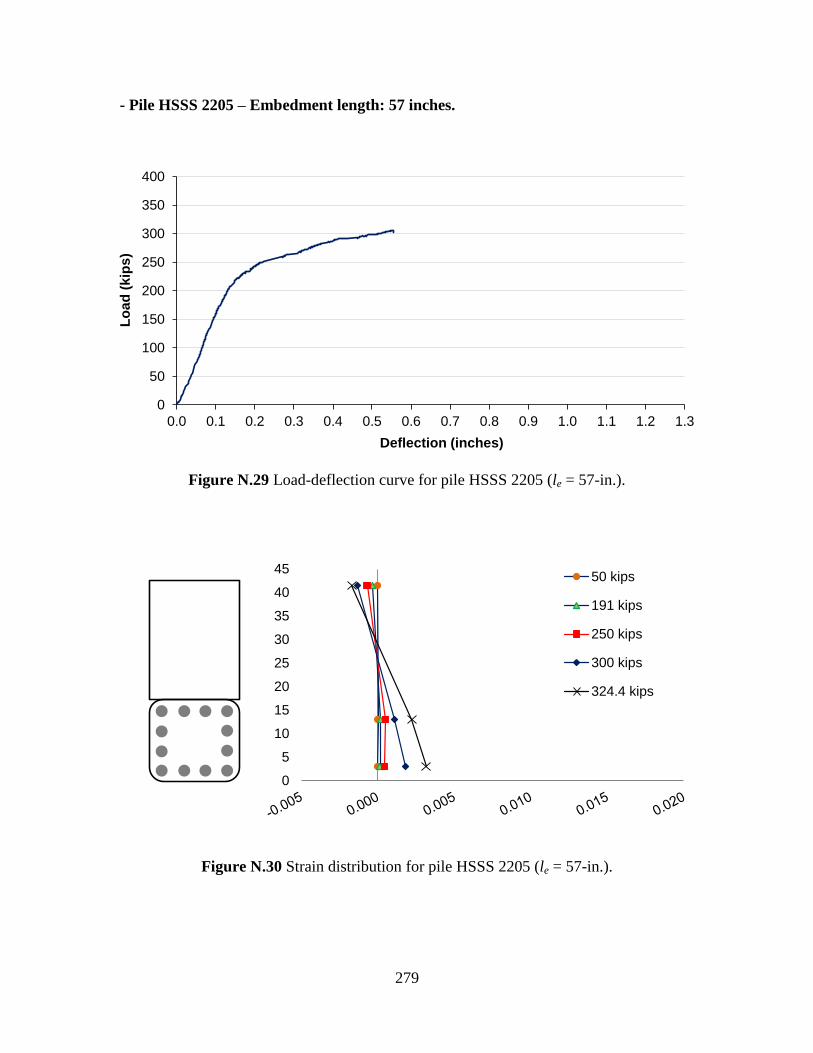
279
- Pile HSSS 2205 – Embedment length: 57 inches.
Figure N.29 Load-deflection curve for pile HSSS 2205 (le = 57-in.).
Figure N.30 Strain distribution for pile HSSS 2205 (le = 57-in.).
0
50
100
150
200
250
300
350
400
0.0 0.1 0.2 0.3 0.4 0.5 0.6 0.7 0.8 0.9 1.0 1.1 1.2 1.3
Lo
ad
(k
ips
)
Deflection (inches)
0
5
10
15
20
25
30
35
40
4550 kips
191 kips
250 kips
300 kips
324.4 kips
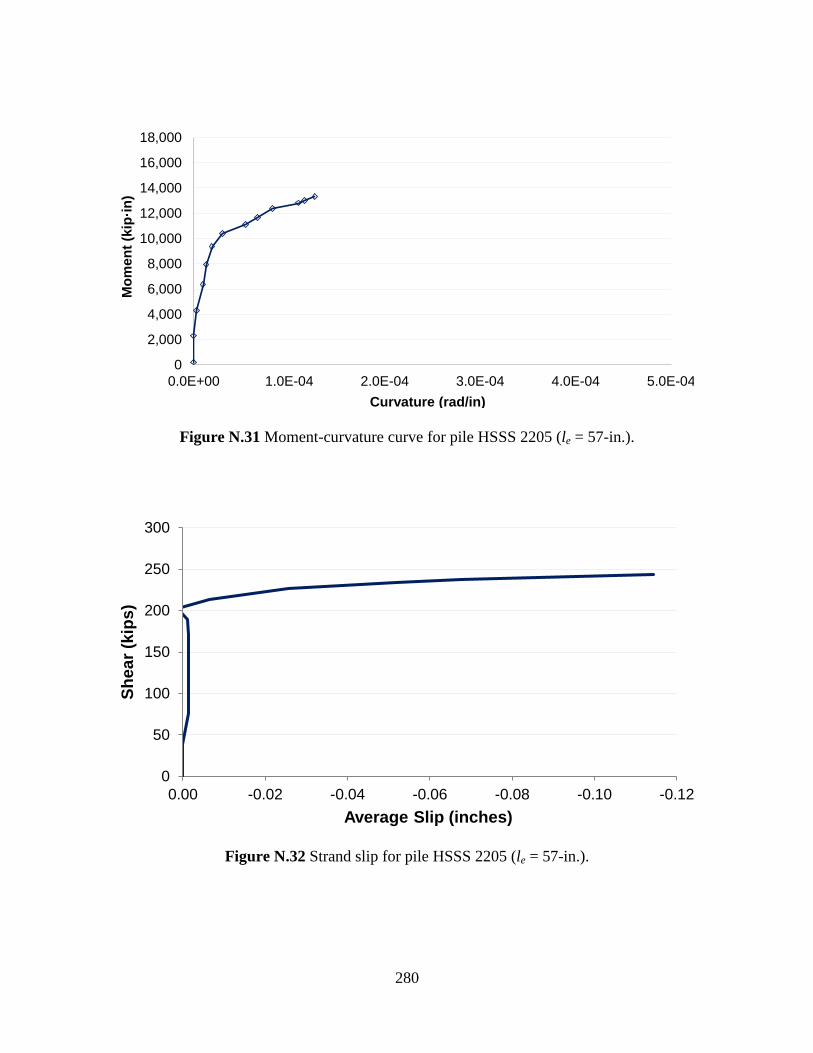
280
Figure N.31 Moment-curvature curve for pile HSSS 2205 (le = 57-in.).
Figure N.32 Strand slip for pile HSSS 2205 (le = 57-in.).
0
2,000
4,000
6,000
8,000
10,000
12,000
14,000
16,000
18,000
0.0E+00 1.0E-04 2.0E-04 3.0E-04 4.0E-04 5.0E-04
Mo
me
nt
(kip
·in
)
Curvature (rad/in)
0
50
100
150
200
250
300
-0.12-0.10-0.08-0.06-0.04-0.020.00
Sh
ea
r (k
ips
)
Average Slip (inches)