public version of "earthquake emergency planning at diablo
TRANSCRIPT
~ > ~
BiiOOi0306 Bi0929
FPDH AOQCK 05000279
PGR

EARTHQUAKEEMERGENCY PLANNING
AT DIABLOCANYON
Submitted to:
Mr.'teven M. SkidmorePacific Gas and Electric Company77 Beale StreetSan Francisco, California 94I06
September 2, I 98l
TERA CORPORATION
2150 Shattuck AvenueBerkeley, California 94704415 845 5200
Berkeley, CaliforniaDallas, TexasBethesda MarylandBaton Rouge, LoulslanaDel Mar, CaliforniaNew York, New YorkSan Antonio, TexasDenver, Coloradot.os Angekl. California

TABLEOF CONTENTS
Section Pacae
1.0 INTRODUCTION AND EXECUTIVE SUMMARY ~ ~ ~ ~ ~ ~ ~ ~ ~ ~ ~ ~ ~ ~ ~ ~ ~ ~ I - I
2.0
I~e
. I Introduction ~ ~ ~ ~ ~ ~ ~ ~ ~ ~ ~ ~ ~ ~ ~ ~ ~ ~ ~ ~ ~ ~ ~ ~ ~ ~ ~ ~ ~ ~ ~ ~ ~ ~ ~ ~ ~ ~ ~ ~ ~ ~ ~ ~
I .2 Executive Summary ..................... ~... ~ ~ ~ ~ ~ ~ ~ ~ ~ ~ ~ ~
TUDY AREAS ..............................................S
I-I1-3
2-1
3.0 EARTHQUAKE EFFECTS ..................................... 3-1
3.1
3.2
General Earthquake Effects ..........3.1.1 Earthquake Description ........3.1.2 Earthquake Hazards ...........3.1.3 Characteristics and Prediction
of Strong Ground Motion .......Earthquake Effects on Transportation ..3.2.1 Background ..................3.2.2 Road Network ................
~ ~ ~ ~ ~ ~ ~ ~ ~ ~ ~ ~ ~ ~ ~ ~ ~ e ~ ~
~ ~ ~ ~ ~ ~ ~ ~ ~ ~ ~ ~ ~ ~ ~ ~ ~ ~ ~ ~
3-13-13-3
3-53-93-9
3-45
4.0 EVACUATIONTIME ESTIMATES...................,............ 4-1
5.0
4.1
4,2
4.34.44.5
Main Evacuation Route Transportation Model .......S
Iimulation Approach ............................4.2.1 Preparation Time ......................; ..4.2.2 Transit Time Between Residences
and Main Evacuation Routes................4.2.3 Merging Time Onto Main Evacuation Routes ..4.2.4 Transit Time On Main Evacuation Routes.....T I I Crrraffle Control e ~ ~ ~ ~ ~ ~ ~ ~ ~ ~ e ~ ~ ~ ~ ~ ~ ~ ~ ~ ~ ~ ~ ~ ~ ~ ~ ~ ~ ~ ~ ~
Modeling Earthquake Damage.....................Summary of Results .............................
5.1
5.2
5.3
5.4
Earthquake Effects on Communications ............PGandE Communications Systems .................5.2.1 Power Plant Private Unified Telephone System5.2.2 PGandE UHF and VHF Radio Systems........5.2.3 Critical Elements ..................... ~ ~ ~ ~
Pacific Telephone Company .................... ~ ~
5.3.1 General Description .......................5.3.2 Redundancy and Seismic Criteria............5.3.3 Critical Elements .........................San Luis Obispo County Communications System ....5.4.1 General Description .......................5.4.2 Critical Elements .........................
COMMUNICATIONS............................ ~ ~ ~ ~ ~ ~ ~ ~ ~ ~ ~ ~ ~ ~
4 44-64-7
4-74-8
4-104-134-144-14
5-1
5-15-15-1
5-105-135-165-165-175-185-195-195-20
B-81-269
TERA CORPORATION
TABLEOF CONTENTS
(CONT.)
Section Pacae
6.0
5.5 Emergency Broadcast System..........5.5. I General Description ............5.5.2 Critical Elements ..............
5.6 Early Warning System ................5.6. I General Description ............5.6.2 Critical Elements ..............
DIABLOCANYON EARTHQUAKE RESPONSE PLAN ~ ~ ~ ~ ~ ~ ~ ~ ~ ~ ~ ~ ~
5-2I5-2I5-2I5-255-255-26
6-I
6~O.I Introduc I ion ~ ~ ~ ~ ~ ~ ~ ~ ~ ~ ~ ~ ~ ~ ~ ~ ~ ~ ~ ~ ~ ~ ~ ~ ~ ~ ~ ~ ~ ~ ~ ~ ~ ~ ~ ~ ~ ~ ~ ~ ~ ~ ~ ~
6.I. I
6.I.26.I.3
urpose ..........................................PRelationship to Other Plans ........................State-of-the-Art..................................
6.~O2 Operational Concepts....................................
6.2. I General..........................................6.2.2 Reporting of the Emergencies ..........'............6. 2.3 Emergency Periods.............................. ~ ~
6.2.4 Concept of Local Operations .......................6.2.5 Earthquake Damage Assessment Center (EDAC).......6.2.6 Additional Interfaces with State Earthquake
Response Plan ....................................6. 3 Special Tasks.....................'.............. ~ ~ ~ ~ ~ ~ ~-
Task ADamage Assessment of Transportation Routes and Communications .
Task BResources and Support (Repairs) ............. - ~ ~ ~ - ~ - ~ ~ ~ ~ - ~ ~ - ~ ~ ~
Task CTraffic Control .............................. ~ ~ ~ ~ ~ ~ ~ ~ ~ ~ ~ ~ ~ ~ ~-
Task DProtective Actions for Nonessential Plant PersonnelTask EProtective Actions for the Public ..............................R ~Oeferences for Section 6.0 ....................................
7.0 REFERENCES CITED ........................................
6-'I6-I6-l6-46-46-46-66-66-7
6-II
6-126-l3
6-l3
6-37
6-39
6-4I
6-436-48
7- I
B-8I-269
TERA CORPORATION
LIST OF TABLES
TableNo. ~Pa e
3-I Expected Landslide Assessment Criteria .....'.......... ~.... ~ ~ ~ ~
3-2 Landslides Potential Summary by Roads.........................3-3 Expected Liquefaction Assessment Criteria..............3-4 Repair Time Estimates for Liquefaction (Two Lanes)......3-5 Liquefaction Potential Summary (By Roads) .............3-6 Best Estimate Bridge Performance Summary (By Roads)...4-I Repair Time for Seismic Damage Used in Network Analysis
4-2 Summary of Estimated Evacuation Times (Hours).........4-3A Availabilityof Crews Assumed in Evacuation Scenarios ...4-3B Reduced Resources........................... -.... - ~ ~ ~ ~ ~ ~ ~ ~ ~ ~
4-3C Reduced Resources........................... ~ ..... ~ ~ ~ ~ ~I
5- I Major Components of the Diablo Canyon Power PlantC
~ ~ ~ommunicaiions Systems ....................... - - .. -. ~ ~ ~
5-2 PGandE Communications Capabilities by Location ...........5-3 Availabilityof Communications System Backup Power Supplies
5-4 PGandE Radio Systems ........................... 5-5 Alternate Links for the Communications Systems
3-25
3-26
3-28
3-29
3-30
3-43
4-l94-22
4-23
4-24
4-25
5-5
5-65-9
5-I25-l5
5-6
5-7
6- I
6-2
San Luis Obispo County EBS Stations ..............San Luis Obispo County Emergency Broadcast System
Bridge Performance Summary .............. ~ ~ ~ ~ ..Summary of Estimated Evacuation Times (Hours)....
~ ~ ~ ~ ~ ~ ~ ~ ~ ~ ~ ~ ~
~ ~ ~ ~ ~ ~ ~ ~ ~ ~ ~ ~ ~
5-23
5-24
6-27
6-47
, B-8 I-269
TERA CORPORATION
LIST OF FIGURES
FigureNo. Pacae
2- I General Road Network........................................ 2-63- I Median Peak Ground Acceleration.............................. 3- I I
3-2 Areas of Potential Landslide..................'................. 3-233-3
3-4
Areas of Potential Liquefaction.....................5
~ Qtate Bridges .....................................~ ~ ~ ~ ~ ~ ~ ~ ~ ~ ~ 3 24
~ ~ ~ ~ ~ ~ ~ ~ ~ ~ ~ 3 39
3-5 County and City Bridges ...........................4- I Location of Entrance Nodes Used in Network Simulation
~ ~ ~ ~ ~ ~ ~ ~ ~ ~ ~ 3 4I
Model..... 4-34- ~ ~-2 Car Speed vs. Density ........................................ 4-5
4-3 Volume of Cars vs. Density.................................... 4-56- I Earthquake Emergency Plan Response Schematic ......6-2 Protective Action Decision Matrix ............'......
~ ~ ~ ~ ~ ~ ~ ~ ~ ~ o 6 IO
~ ~ ~ ~ ~ ~ ~ ~ ~ ~ ~ 6 46
6-3 San Luis Obispo Area ....................................... 6- I 9
B-8I-269
TERA CORPORATION
I.O INTRODUCTIONANDEXECUTIVESUhhMARY
I. I INTRODUCTION
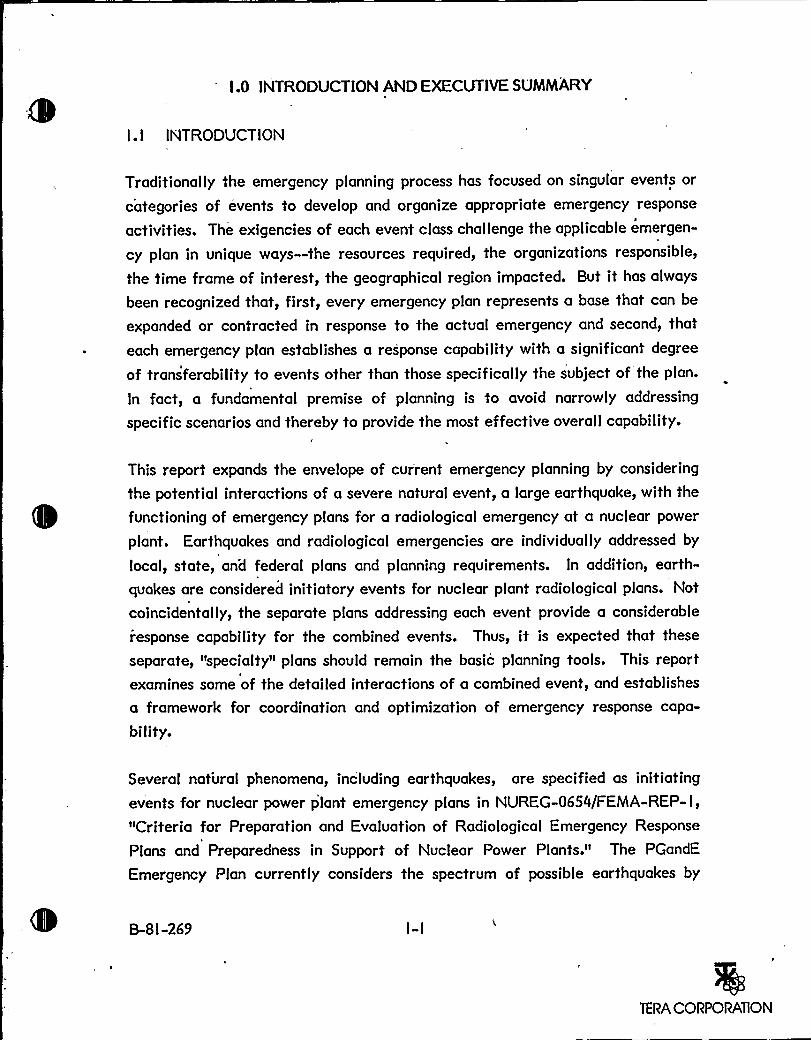
Traditionally the emergency planning process has focused on singular events or
categories of events to develop and organize appropriate emergency response
activities. The exigencies of each event class challenge the applicable emergen-
cy plan in unique ways —the resources required, the organizations responsible,
the time frame of interest, the geographical region impacted. But it has always
been recognized that, first, every emergency plan represents a base that can be
expanded or contracted in response to the actual emergency and second, that
~ each emergency plan establishes a response capability with a significant degree
of transferability to events other than those specifically the subject of the plan.
ln fact, a fundamental premise of planning is to avoid narrowly addressing
specific scenarios and thereby to provide the most effective overall capability.
This report expands the envelope of current emergency planning by considering
the potential interactions of a severe natural event, a large earthquake, with the
functioning of emergency plans for a radiological emergency at a nuclear power
plant. Earthquakes and radiological emergencies are individually addressed by
local, state, and federal plans and planning requirements. In addition, earth-
quakes are considered initiatory events for nuclear plant radiological plans. Not
coincidentally, the separate plans addressing each event provide a considerable
response capability for the combined events. Thus, it is expected that these
separate, "specialty" plans should remain the basic planning tools. This report
examines some of the detailed interactions of a combined event, and establishes
a framework for coordination and optimization of emergency response capa-
bility.
Several natural phenomena, including earthquakes, are specified as initiating
events for nuclear power plant emergency plans in NUREG-0654/FEMA-REP-I,
"Criteria for Preparation and Evaluation of Radiological Emergency Response
Plans and Preparedness in Support of Nuclear Power Plants." The PGandE
Emergency Plan currently considers the spectrum of possible earthquakes by
B-8l-269
TERA CORPORATION
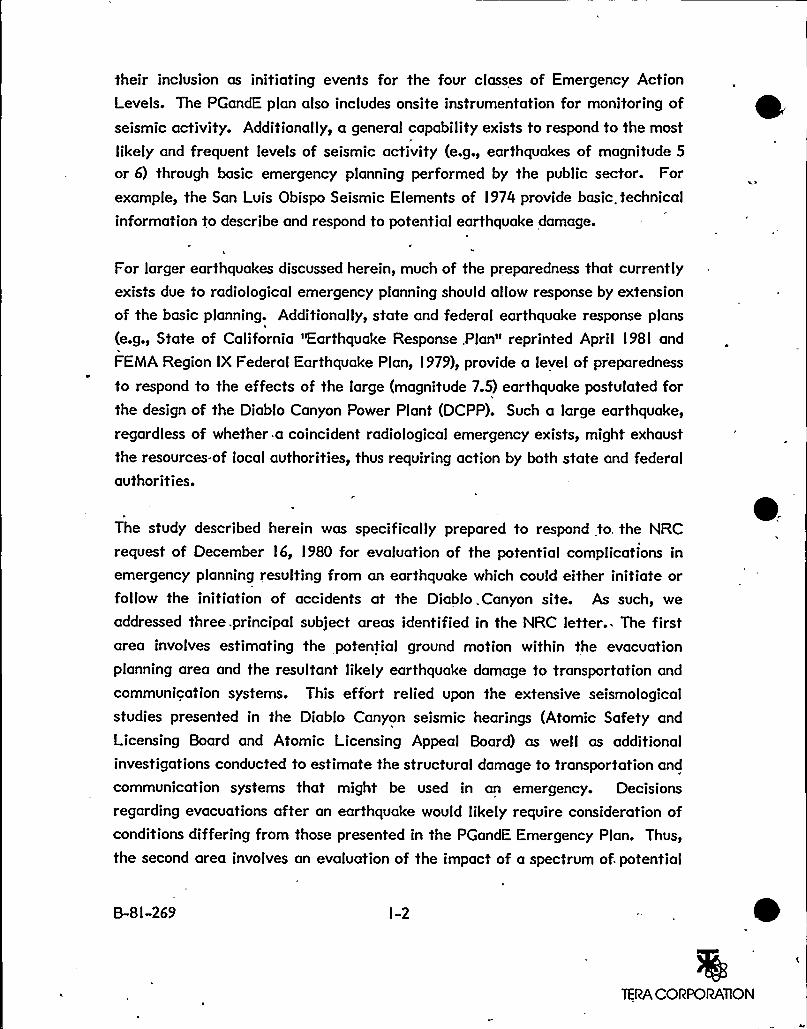
their inclusion as initiating events for the four classes of Emergency ActionLevels. The PGandE plan also includes onsite instrumentation for monitoring ofseismic activity. Additionally, a general capability exists to respond to the most
likely and frequent levels of seismic activity (e.g., earthquakes of magnitude 5
or 6) through basic emergency planning performed by the public sector. For
example, the San Luis Obispo Seismic Elements of l974 provide basic. technical
information to describe and respond to potential earthquake damage.
For larger earthquakes discussed herein, much of the preparedness that currentlyexists due to radiological emergency planning should allow response by extension
of the basic planning. Additionally, state and federal earthquake response plans
(e.g., State of California 'Earthquake Response. Plan" reprinted April l98l and
FEMA Region IX Federal Earthquake Plan, l 979), provide a level of preparedness
to respond to the effects of the large (magnitude 7.5) earthquake postulated forthe design of the Diablo Canyon Power Plant (DCPP). Such a large earthquake,
regardless of whether a coincident radiological emergency exists, might exhaust
the resources. of local authorities, thus requiring action by both state and federal
authorities.
The study described herein was specifically prepared to respond to. the NRC
request of December l6, l980 for evaluation of the potential complications in
emergency planning resulting from an earthquake which could either initiate orfollow the initiation of accidents at the Diablo. Canyon site. As such, we
addressed three. principal subject areas identified in the NRC letter.- The firstarea involves estimating the potential ground motion within the evacuation
planning area and the resultant likely earthquake damage to transportation and
communication systems. This effort relied upon the extensive seismologicalstudies presented in the Diablo Canyon seismic hearings (Atomic Safety and
Licensing Board and Atomic Licensing Appeal Board) as well as additionalinvestigations conducted to estimate the structural damage to transportation and
communication systems that might be used in an emergency. Decisions
regarding evacuations after an earthquake would likely require consideration ofconditions differing from those presented in the PGandE Emergency Plan. Thus,
the second area involves an evaluation of the impact of a spectrum of. potential
B-8l-269 l-2
TERA CORPORAllON
earthquake damage levels on evacuation time estimates..This effort utilized a
realistic simulation model of the evacuation route network including the dynamic
effects of traffic congestion and control.
The third area identifies revised planning concepts intended to facilitate the.
response of local authorities to the complicating effects of a large earthquake on
a radiological emergency. As with all planning, periodic review and upgrading of
these concepts is required to assure a dynamic planning status. In this case, we
have identified a major revision to response dictated by the combined seismic
and radiological emergencies; however, the continued development of earthquake
response plans by federal, state and local authorities will necessitate revision
and cross-reference to their respective radiological emergency preparedness
plans. Annual review and updating of radiological planning is assured by federal
requirements.
I.'2 EXECUTIVE SUMMARY
The study focused. on two areas where the most significant earthquake interac-tions would be manifested: transportation and communications. The study also
establishes a conceptual framework for an "earthquake response plan" which
addresses both the response to the complicating eFfects of damage as well as
advanced planning concepts to deal with the duality of a radiological and
earthquake emergency. The specific evaluations rest on the assumption of a
7.S magnitude surface wave located on the Hosgri fault. The specific earthquake
postulated is not considered to be particularly crucial as for the most part the
study proceeded and, in fact, endeavored to generalize the initiating events.
Due to the complexity of a combined emergency, it was important to develop a
detailed data base on earthquake-generated damage. In doing so, it is not
contended that such damage can be deterministically predicted; rather, it is to-amplify our understanding of the likely nature and extent of damage as a basis
for rational planning decisions. In recognition of the range of possible earth-
quake ground motion, the range of effects over a geographical area due to thatground motion, and the variable response of individual structures and geologic
B-SI-269 l-3
TERA CORPORATION
formations with respect to a given earthquake input, the data base was actuallytriplicated to encompass three defined damage levels. These are Level I as an
optimistic evaluation, Level 2 as a best estimate, and Level 3 as a pessimistic,evaluation. The terms minor, ~ex ected, and ~ma or are also used interchangeablyto characterize these levels. Again, the value of this tiered approach is not tobe viewed in terms of a predictive capability but in the achievement of a,
generalized and adaptive data base to be used in planning and in responding tothe event actually encountered.
e
For road systems the data base considered two principal damage mechanisms:
ground failure resulting in soil liquefaction underneath the road beds or landslid-
ing onto the roadways, and structural or settlement damage to bridges and
overpasses. Each bridge in the evacuation routes was evaluated as to its design
and the types of damage likely to be sustained. For landsliding and liquefaction,the full traverse of each highway was surveyed to locate potential liquefactionsites, and to assess the likelihood of such liquefaction and the extent ofencroachment of slide material on the highway or damage to the highway due toground subsidence. In addition, estimates were made of the expected times and
required resources to repair each item of damage and restore the road toservice.
The data base for earthquake damage also included information on the suscepti-
bilityof essential communications equipment to earthquake forces. The types ofdamage that could interrupt communications include loss of electrical power,loss of telephone lines, loss of buildings housing the equipment, loss of equipmentwithin the building and loss of antennae towers.
From a planning perspective, damage to transportation and communicationssystems reflects most directly on the selection and implementation of protectiveactions. Protective action decisions for the combined radiological/earthquakeemergency would benefit from a pre-analysis of evacuation times representativeof the degraded conditions likely to be encountered. Therefore, analyses wereundertaken using a computer simulation technique that dynamically modeled theflow of cars through the evacuation network. A flexible menu of evacuationoptions and strategies were considered to minimize the impacts of damage to the
B-8l-269 I-4
TERA CORPORATION
road system. Evacuation times were computed for the range of damage levels
contained in the data base. A matrix was then prepared (Table 4-2) correlating
evacuation times, damage levels and extent of evacuation (i.e., partial versus
total). This matrix represents a distillation of the detailed analyses performed in
the study and effectively coalesces the decision-making process for protective
action.
The final step in the study was to design a planning structure that would have at
its core the modified protective action matrix and which would implement the
various survey, assessment, and coordination functions necessary to sustain the
decision process. The plan has been formulated such that emergency functions
related to each type of event (i.e., radiological and earthquake) proceed largely
in parallel, with provisions made for (I) prioritizing actions where necessary,
(2) coordinating key organizations, and (3) synthesizing data and decisions to
adequately reflect the contingencies of each emergency.
In addition to the development of the damage data base, evacuation matrix, and
response plan, this study provided more refined insights into emergency planning
for these combined events. The conclusions able to be reached are perhaps as (or
more) important than the specific results. They are as follows:
I. Even on a pessimistic basis, a large earthquake in thestudy area would not be expected to result in totalneutralization of emergency response capabilities. This isattributable to the inherent resistance of much of thephysical equipment and structures involved and the diver-sity of capabilities provided by redundant and separatemeans of transport and communications.
2. Evacuation, as a protective action option, is availablewithin a reasonable time for most geographic areas undermost damage conditions. The availability of evacuation isenhanced considerably by pre-analyses of potential dam-age and repair resources, and the establishment of plansto survey, assess and repair damage and to utilize avail-able evacuation routes in a maximum manner.
3. Emergency planning must be considered as an evolvingprocess and in the context of other related plans andevents. The detailed assessment of earthquake effects
B-S I-269 I-5
TERA CORPORATION
and conceptual plan provided in this study are at perhapsthe leading edge of planning for these types ofemergencies. Planning resources and attention should bedistributed such that local, state and federal emergencyplanning is conducted in an integrated and harmoniousmanner.
I-6
TERA CORPORATION
2.0 STUDY, AREAS
From a natural disaster viewpoint, large earthquakes are somewhat unique in
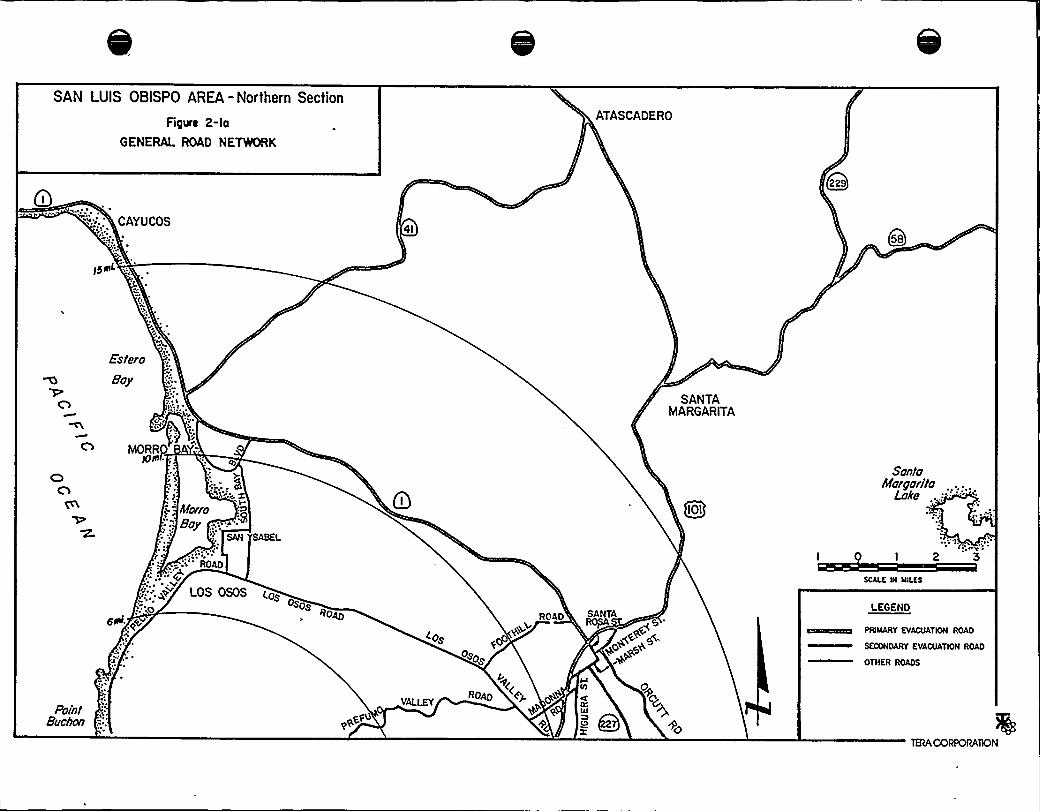
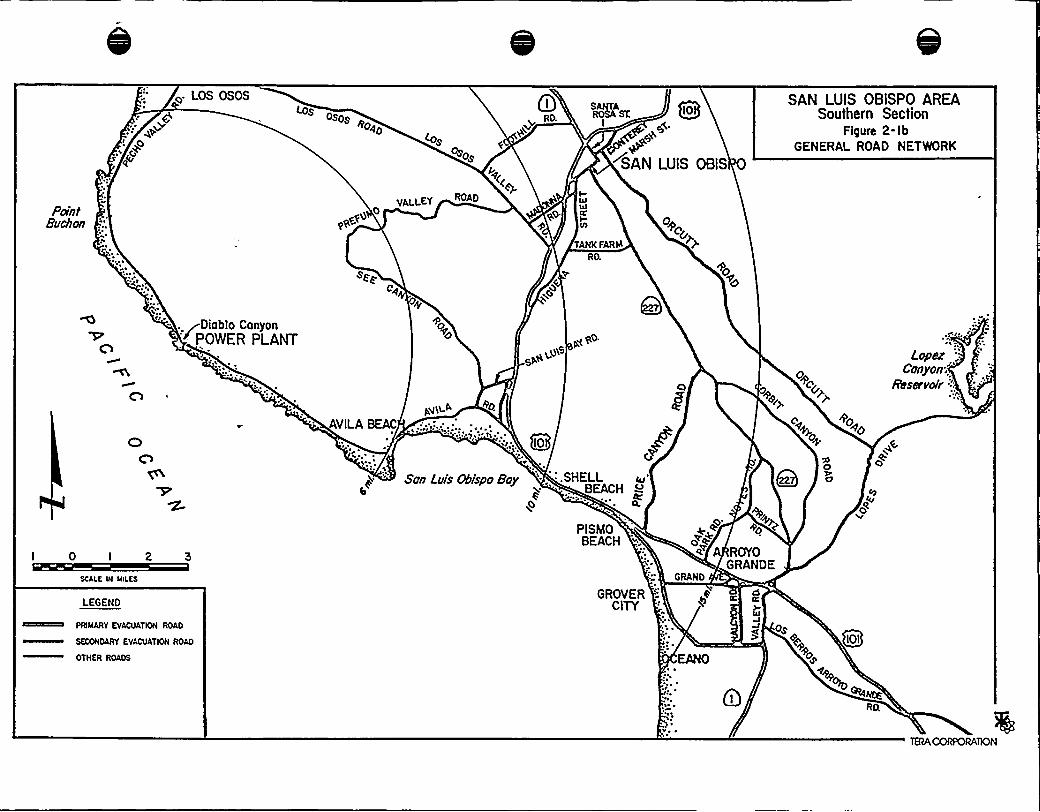
their ability to challenge simultaneously a variety of emergency responsefunctions over a wide geographic area. To provide the technical basis to developsite specific planning, we conducted a detailed study of the expected effectsthat a large earthquake occurring on the Hosgri fault would have on the areawithin about I 5 miles of the Diablo Canyon Power Plant (Figure 2- la, b).
This geographic area is called the Basic Emergency Planning Zone and was
chosen for detailed evaluation since it is the area where one expects that thecombined effects of a radiological and earthquake emergency would be encoun-tered. The effects of a large earthquake could be experienced over an extendedarea. Earthquake effects over such an extended area are addressed in state andfederal earthquake plans. Radiological emergency planning requirements focuson an approximate IO-mile zone for the radiological plume exposure pathway.Therefore, the study area was selected to envelop the most likely complicatingeffects that an earthquake would have on radiological planning.
This study of earthquake emergency planning was able to focus on a single,specified large earthquake for two reasons: (I) the specific earthquake that wasconsidered is the most logical one to be involved in a combined radio-logical/earthquake emergency and (2) the planning concepts determined to be
appropriate are not particularly sensitive to the choice of earthquake size orlocation.
There are a variety of faults within San Luis Obispo County; however, only th'reeare considered capable of generating major earthquakes (Envicom, l 974). Thelargest earthquake, of surface wave magnitude 8.0 to 8.5, is believed to becapable of occurring on the San Andreas fault, which is located approximately60 kilometers northeast of the city of San Luis Obispo and approximately80 kilometers from the Diablo Canyon Power Plant. The maximum magnitudethat has been assigned to the Hosgri fault is a surface wave magnitude of 7.5.
B-8l-269 2-I
TERA CORPORATION
This large earthquake would pose the greatest hazard to the coastal areas since
it is located offshore approximately-6 kilometers southwest of DCPP and
approximately 25 kilometers from the city of San Luis,Obispo. The Rinconada
fault trend is believed to be capable of generating a surface wave magnitude 7.0to 7.5 earthquake. Due to its location some I5 kilometers northwest of the cityof San Luis Obispo and 35kilometers from DCPP, a large earthquake on thisfault would pose the greatest hazard to San Luis Obispo and the mountainous
areas lying just northeast of the city.
For this study the postulated magnitude 7.5 earthquake on the Hosgri fault was
used as the basis for developing damage scenarios and investigating evacuation
times. This earthquake was chosen because of its use as the seismic design basis
for the Diablo Canyon Power Plant and its dominant seismic hazard to the plant.Furthermore, the use of this large earthquake was responsive to the directives ofFEMA and NRC. The hypothesized earthquakes on the San Andreas and
Rinconada faults pose a substantially lesser hazard to DCPP because the peakaccelerations from either are expected to be only 30 percent of those expectedfrom the Hosgri earthquake. Therefore, one would expect that the probability ofa concurrent radiological emergency with either of these two earthquakes wouldbe much less than that with the Hosgri earthquake.
The planning concepts identified in this study are not particularly sensitive tothe choice of the Hosgri earthquake due to the large variability in damage that is
expected from this particular earthquake. This diversity in damage compre-hensively challenges emergency plans and requires them to be extremelyflexible. In fact, the variety of damage and evacuation scenarios simulated inthis study largely envelop those expected for the other two hypothesizedearthquakes, the main difference being the relative likelihood of specificscenarios. For instance, the proximity of the Rinconada fault to US. IOI Northwould require considering an alternate evacuation to the northwest and south-west along the coast under conditions of light-to-moderate damage in the eventof this hypothesized earthquake. Therefore, since the hypothesized largeoffshore earthquake poses the greatest hazard to DCPP, is responsive to FEMAand NRC directives, encompasses the effects expected from other major
B-8l-269 2-2
TERA CORPORATION
earthquakes in the area, and does not control the development of emergency
plans, we believe that it is the only earthquake that need be considered in detail
for this study.
The principal earthquake effects considered in this study'are those on the
transportation and communication systems. Obviously, the major earthquake
postulated in this study would produce other effects of concern to local
authorities, including fire damage, potential fatalities and injuries. Mitigation ofthese other effects is the goal to which most earthquake response plans have
been directed and are therefore not repeated here.
Transportation of both emergency materials and personnel, as well as the
protective evacuation of the public, are key requirements for effective radiolog-
ical emergency response and ones which an earthquake might significantlyaffect. Disruption of the communications systems due to earthquake effects
could also prevent effective emergency response. This necessitated an evalu-
ation of both transportation and communication systems including a detailed
review of the local road network and communications equipment that would most
likely be required to function in a radiological emergency. We did not attemptto address the non-radiological preparedness that should be included in local
earthquake response planning. However, some of these data and the approaches
described herein might be useful for that purpose.
To a very large measure our evaluation of earthquake effects was not deter-
ministic, but recognized the stochastic nature of earthquake damage. Addi-
tionally, it was believed that a range of potential damage levels would be useful
to consider in developing planning concepts and guidelines. In this way, the truestochastic nature of potential earthquake effects are captured and a range ofprotective action guidelines are formulated. One should also note that such a
spectrum of damage locations and levels is not artificially imposed due toresource constraints or to satisfy planning goals. The spectrum of damage
represents our evaluation of each bridge and roadway within the study area and
consideration of their potential response to the forces of a magnitude 7.5
earthquake.
B-8I-269 2-3
TERA CORPORATION
The transportation network model developed for estimating the effect of damageon evacuation times is somewhat different from that originally developed and
used in the radiological plans. This model includes the dynamic effects of trafficcongestion and control. For the conditions included in the current radiologicalplans, we would predict similar times using similar assumptions. We have, infact, used essentially all of the input data developed by Voorhees (l980) for thoseestimates. However, in evaluating the effects of seismic damage, such as delaysdue to bridge repair or landslide clearing, transient times on individual sectionsof road becomes important. Additionally, we found it useful to consider morelimited protective actions, such as partial or staged evacuation of the populationwithin l0 miles of the plant or in the downwind directions should heavy damagebe inflicted to evacuation routes. These considerations led us to the develop-ment of a dynamic evacuation model.
Based upon the results of these studies, we developed revised planning conceptsto address combined seismic and radiological emergencies. A key revision in thisplanning is the need to survey the post-earthquake damage and allocateresources to repair communications and roadways prior to decisions on pro-tective actions. Such an approach would be useful in dealing with anycombination of natural phenomena and radiological accident.
The general properties of earthquakes, the types of hazards they create and theexpected effects from the large earthquake postulated in this study aredescribed in Section 3.1 of this report. The principal earthquake hazardsaffecting the transportation systems and the potential for ground failure andstructural failure are presented in Section 3.2. Section 4 describes the evacu-ation model developed, evacuation scenarios analyzed and evacuation timeestimates. Section 5 presents our evaluation of communication systems in thestudy area, including that of PGandE, Pacific Telephone, and the County andEmergency Broadcast Systems. Section 6 provides our recommended planningconcepts for addressing a combined earthquake and radiological accident.
Much of the detailed survey information compiled in our investigation is includedin Appendices to this report. Additional detailed description of our geologic and
B-8I-269 2-4
TERA CORPORATION
engineering evaluation methods is also provided. Several of the detailed maps,
identifying potential seismic hazard areas, might be effective for inclusion in the
procedures for damage assessment reporting and subsequent repair activities.
B-81-269 2-5
TERA CORPORATION

SAN LUIS OBISPO AREA-Northern Section
Figwa 2-laGENERAL ROAD NETWORK
ATASCADERO
azs
CAYUCOS4I
Ester o
8oy
Cr
MORRP
:,:.R1
Nero8oy:..:...:
SAN SABEL
'E
LOsOSos
ROAD
ROAD
LOS OSOS
~'
64 ~S
Oi
<Os
0sos
ROAD SANTAROPA
SANTAMARGARITA
IOI
SontoNorgorito
Loke
I 0 I 2 3
SCALE N NIECES
LEGEND
~IUWUIT EVACUATIDII ED ID
EUXTIDAIITEVIICU!TIDE READ
OTHER RCADE
Point8uohov
VALLEY
l~ROAD 8~ <q.

~. LOS OSOSI-os
os +oohioros
+os
RD.QIOR% ST.
SAN LUIS OBIS
SAN LUIS OBISPO AREASouthern Section
Figure 2- IbGENERAL ROAD NETWORK
Point8uohon
VALET0yQ
lEliilK'
lO
ANKFARlh
0+c~
Pp
Diablo Canyon+POV/ER PLANT
I 0 I 2
SCALE lM llll.ES
LEGEND
PRIMARY EPACIIAPEIM ROAR
AREPIOARP EPACUAPIOR ROAR
OTHER ROADS
~o0
gVT
AVILABEAC
San Luis Obispo 8oy
Qo
:.SHELLBEACH
PISMOBEACH
GROVERCITY
Gp0
O~
OO
o~e.~~ A ROYO
GRANDEGRAND
CS
oS
~o
CSCv
O
QOI
Lopar;.Canyon;"
RrsarvoiiA
R ~

ia
3.0 EARTHQUAKEEFFECTS
3. I GENERAL EARTHQUAKEEFFECTS
3.l.l EARTHQUAKE DESCRIPTION
Shallow crustal earthquakes, the type common to California, occur as a result of
a sudden break and movement of the rock in response to stress build-up in the
Earth's crust. This sudden movement generates seismic waves that propagate
through the crust and manifest at the Earth's surface as ground shaking. The
break occurs along a zone of weakness in the crust known as a fault or fault
plane. It initiates at a specific location on the fault called the hypocenter, then
propagates along the fault for some finite distance. The area of the fault plane
involved in the break is known as the rupture zone and the point on the surface
of the Earth directly above the hypocenter is referred to as the epicenter.
There are three basic mechanisms that describe the faulting process: strike-slip,
reverse (or thrust), and normal. These mechanisms refer to the relative
direction of movement of the rock on opposite sides of the fault with respect tothe orientation of the fault. This orientation is described in terms of the strike
and dip of the fault plane, the strike being the direction of the surface trace ofthe fault usually given as the azimuth, and the dip being the angle between the
fault plane and the surface of the Earth. As an example, a fault described as
striking N45oW and dipping 85o refers to a fault whose surface trace is oriented
in a northwest-southeast direction and whose fault plane is nearly vertical.
A strike-slip mechanism is faulting in which the rocks on opposite sides of the
fault move horizontally with respect to one another in the direction of the strike
of the fault. Most major faults in California, including the San Andreas, are of
this type, with the l979 Imperial Valley earthquake being a recent example of
this type of faulting. The other two mechanisms refer to faulting in which the
relative movement of the rocks on opposite sides of the fault is in the direction
of the dip of the fault plane, which is generically referred to as dip-slip
movement. In this respect, a reverse (or thrust) mechanism refers to dip-slip
B-8l-269 3-I
TERA CORPORATION
movement in which the opposite sides of the fault move towards one another,
with one side overriding the other in response to compressional forces. The I 97l
San Fernando earthquake was an example of this type of faulting. A normal
mechanism refers to dip-slip movement in which the opposite sides of the faultmove away from one another in response to extensional forces. The Foothill
fault system, located along the western edge of the Sierra Nevada Mountains, is
representative of this type of faulting, with a recent example being the l975
Oroville earthquake. Faulting in which relatively equal amounts of strike-slip
and dip-slip motion occur is referred to as oblique-slip movement. Geological
evidence indicates that the predominant movement of the Hosgri fault is strike-
slip, similar to faults of the San Andreas system.
Earthquakes commonly occur in clusters called earthquake sequences. The
'argestor outstanding earthquake of the sequence is known as the mainshock.
Although not so common to California, multiple mainshocks of nearly the same
size and separated by hours, days, or sometimes weeks may occur. Foreshocks
usually precede the mainshock by several days to several months. Relatively few
in number, they tend to cluster in a few isolated areas within the eventual
rupture zone, the largest concentration usually occurring in the immediate
vicinity of the hypocenter. Immediately following the mainshock, a large
number of smaller earthquakes called aftershocks occur. Depending on the size
of the mainshock, aftershock sequences can last as long as several months to
several years; however, as time goes on, both their size and their number
diminish. Although not as large as the mainshock, foreshocks and aftershocks in
many cases can cause as much damage locally as the mainshock. Aftershocks
are especially serious, since manmade structures, as well as natural deposits thathave been weakened by the mainshock, are highly susceptible to further damage.
There are various-measures available that characterize the size of an earth-
quake. The most common of these is earthquake magnitude, a standard measure
related to the logarithm of the amplitude of ground motion resulting from an
earthquake. For smaller earthquakes in California, local Richter magnitude (ML)is used as the standard measure of magnitude and is the value generally reported
by the seismographic stations at Berkeley and Pasadena. For larger earthquakes
B-8I-269
TERA CORPORATION
worldwide, surface wave magnitude (M ) is generally used as the standard.smeasure of magnitude. As a general rule, magnitude values exceeding 6.8 to 7.0
represent surface wave magnitude due to limitations of the other magnitude
scales. For the. purposes of this study a surface wave magnitude 7.5 earthquakewas postulated to occur on the Hosgri fault with the center of the rupturelocated offshore approximately six kilometers from DCPP.
Other measures of the size of an earthquake include epicentral intensity, area ofthe rupture zone and seismic moment. Epicentral intensity is a measure of thelargest degree of damage sustained during the earthquake (the intensity scale is
discussed in a later section). This zone of greatest damage is usually confined tothe vicinity of the rupture zone and, hence, the term epicentral intensity has
been historically used to refer to the observed maximum intensity. The area ofthe rupture zone can vary from as little as several square meters for very small
earthquakes to as large as several thousand square kilometers for the largestearthquakes that can occur in California. Seismic moment is a measure of theearthquake size that depends only on the physical mechanism of the source. It is
related to the overall energy or force of the earthquake.
3.1.2 EARTHQUAKEHAZARDS
The primary natural hazards from an earthquake are ground shaking and groundrupture along the surface trace of the fault rupture zone. Secondary naturalhazards are ' result of the above-named hazards and include landslides,
liquefaction, settlement, tsunamis, seiches, lurching and'round shaking. The
interaction of these natural hazards with manmade structures generates thepotential for structural hazards. These include the collapse or destruction ofbuildings, bridges, towers, smoke stacks and piers; the failure'f retainingstructures such as dams, reservoirs, tanks, pipelines, canals, dikes, earthretaining walls and sea walls; and the failure or movement of equipment such as
pumps, valves, electrical equipment, machinery, piping, and furniture.
The natural seismic haza'rds,of major concern to radiological emergency planningin the study area are 'ground shaking, landslides, liquefaction, settlement and
B-8I-269 3-3
TERA CORPORATION
tsunami. The most widespread hazard affecting the study area is ground shaking.
Although the characterization of this hazard, is, discussed in the next section,
some fundamental properties are discussed here. Ground shaking results from
seismic waves that are generated by the sudden movement of rock along opposite
sides of'the fault. As the waves travel away from the rupture surface, their
amplitude decays (i.e., attenuates) due to the energy absorption properties of
rock and soil through which they travel and the dispersion of the energy with
area., Since the waves originate at all points along the rupture zone of the fault,
the distance most appropriate for characterizing the amplitude of the seismic
wave or ground shaking at a specific location is the shortest distance between
the site and the rupture zone.
Strong ground motion refers to ground shaking of sufficient amplitude to be
considered important to the performance and safety of manmade structures.
The instrument used to record strong motion is the accelerograph.. It was
designed to measure and 'record the time history of the acceleration of the
ground, called an accelerogram, because of the use of acceleration by engineers
in the design of structures. They are nominally set to start recording when
accelerations exceed one percent of gravity (.Ol g), although strong motion is
commonly thought to be ground motion in excess of five percent of gravity(.05 g). The accelerograph records acceleration time histories in three directions
called components. Two components are oriented to record motion in the
horizontal plane, orthogonal to one another, while the third component is
oriented to record motion in the vertical plane. The three components taken
together serve as a three-dimensional description of ground motion.
Due to the hilly topography of the study area, landslides are a major potentialhazard for evacuation, especially during the rainy season. The actual number
and location of landslides expected to occur along evacuation routes throughout
the study area during a major earthquake on the Hosgri fault is discussed in
detail in Section 3.2 and the appendix on ground failure. Due to the dominance
of the strike-slip mechanism of faulting expected on the Hosgri, large areas of
tectonic settlement are not expected to occur. The greatest hazard forsettlement comes from artificial fills, especially thick bridge abutments and
road fills, which tend to compact and spread laterally under seismic shaking.
B-8 l-269 3-4
. TERA CORPORATION
Liquefaction is a term used to describe the loss of strength of a saturated soil
deposit due to an increase in pore water pressure caused by ground shaking. This
loss in strength can result in ground failure such as landslides and lateral spreads
or result in a loss. of foundation support for manmade structures. Due to the
large number of water crossings and the presence of soil deposits with shallow
water tables along evacuation routes, liquefaction has been identified as a majorpotential'azard affecting the safe evacuation of the study area. Specificdetails regarding the number and location of liquefaction areas along evacuation
routes throughout the study area during a major earthquake on the Hosgri faultmay be found in Section 3.2 and the appendix on ground failure.
A tsunami is a tidal wave which is generated by rapid vertical displacement ofocean water either from tectonic movements associated with faulting or bysubmarine landslides. The strike-slip mechanism of faulting expected on the
Hosgri would preclude the tectonic generation of a tsunami since the horizontalmovement of the ocean floor associated with this type of faulting would not
displace ocean water. (Note that the most recent analysis reported in
Section 2.4 of the FSAR conservatively postulates for design basis purposes a
vertical displacement of 7.33 feet on the Hosgri fault leading to the generation ofa tsunami. The very conservative assumptions contained in the FSAR were not
considered to be applicable for planning purposes.) There is, however, a remote
possibility of a tsunami generated by a submarine landslide triggered by the
earthquake. Large submarine landslides, however, have been observed togenerate only relatively small, local tsunamis presumably due to their failuremechanism, their poor efficiency in generating tsunami energy, and the rela-.tively small amount of potential energy available for tsunami generation (Wiegel,
l975). The effects of such a tsunami, therefore, would be expected to be
relatively localized with waves sufficiently small so as not to interfere with theevacuation of the study area.
3.I.3 CHARACTERISTICS AND PREDICTIONOF STRONG GROUND MOTION
The accelerogram, while providing a complete description of strong motion, is
extremely difficult and expensive to use in design, since it requires complex
B-8 I-269 3-5
TERA CORPORATION
mathematical models and procedures. Therefore, design engineers over the
years have developed techniques that rely upon certain parameters characteris-
tic of the actual acceleration time histories. The parameters most commonly
used are peak ground acceleration (PGA) and response spectral ordinates.
Peak acceleration is simply the maximum acceleration value recorded by the
accelerograph and is usually reported as three peak values,'ne for each
component. Response spectral ordinates are somewhat more complex in nature,
but similar in principle to PGA. 'A response spectral ordinate is the maximum
response of a single-degree-of-freedom system (e.g., a pendulum), having a given
natural frequency and damping, to a specific acceleration time history input atits base. The response of the system is commonly described in terms of a
velocity time history,- more specifically, the velocity at the top of the system
relative to the velocity at its base. When these spectral ordinates are computed
for a suite of single-degree-of-freedom systems of various natural frequencies,
all having the same damping, and plotted as a function of frequency, the result is
what engineers refer to as a response spectrum.
Two other parameters typically used by engineers are intensity and duration.
Intensity is a non-instrumental measure of the earthquake effects at a particularlocation given in terms of the response of humans, manmade structures and the
natural environment. By its very nature, it serves as a subjective measure of the
severity of the ground motion at a specific location. Its usefulness stems fromits non-instrumental source, which allows the quantification of the severity ofground motion in areas lacking accelerographs, and in many cases is a more
accurate measure of the level of damage than are some instrumental measures
of ground motion. The standard measure of intensity in the United States is
Modified Mercalli intensity, a twelve-level scale specified in ter'ms of Roman
numerals I,through XII, with XII being the most severe level of earthquake
effects.
Duration is a measure of the length of time over which strong motion is
observed. It is an important characteristic of ground motion when considering
time-degrading systems subject to strain softening or fatigue. Examples of such
B-8I-269 3-6
TERA CORPORATION
systems are natural soil deposits, soil structures and manmade structures subject
to nonlinear behavior. Although several measures of duration exist, one of the
most simple and common measures is bracketed duration. It represents the time
over which the first and last occurrence of a specified level of acceleration,
ysually five percent of gravity (.05 g), is observed.
Peak acceleration and duration were the two strong-motion parameters used in
the evacuation study, so the prediction of these parameters will be discussed
briefly. Due to the proximity of the source of the design earthquake to the study
area, a relationship for predicting near-source acceleration's recently developed
at TERA Corporation (Campbell, l980; l98I) was used to predict the level of
peak acceleration to be expected at specific locations.
This relationship was developed from strong-motion data recorded within 50 kilo-meters of the rupture zone from selected worldwide earthquakes of magni-
tudes S.O to 7.7. The data base used in the study was assembled using criteriadesigned to select only consistent and quality data in the range of magnitudes
and distances of interest for most design applications. It consists of 229 horizon-
tal components (I l6 records) of peak acceleration from 27 earthquakes, including
the October I S, I 979, Imperial Valley earthquake. A weighted, nonlinear
regression analysis was used to establish 'the relationship, where weights were
used to control the effects of well-recorded events such as the l979 Imperial
Valley and I 97 I San Fernando earthquakes.
The relationship resulting from the regression analysis is given by the following
equation:
PGA = .Ol 59 Exp (.868M) R + .0606 Exp (.700M)
where PGA represents the mean of the peak acceleration values from the two
horizontal components from each recording in fractions of the acceleration of
gravity (g), M is magnitude, and R is closest distance to the fault rupture zone in
kilometers. Magnitude is defined as local Richter magnitude (ML) for magni-
tudes less than 6.0 and surface wave magnitude (M ) for magnitudes of 6.0 ors
B-8 I-269 3-7
TERA CORPORATION
greater. Peak acceleration was found to be lognormally distributed with a
standard error representing a 45-percent increase in the median estimate as
given by the above equation. Predictions from Equation I were found to be valid
for both soil and rock.
Bracketed duration, based on a threshold of .0.05g, was predicted from an
expression developed by McGuire and Barnhard (l979). They used 50strong-
motion records from earthquakes of local Richter magnitude (ML) 4.5 to 7.2,
recorded at distances of 6 to 2l8 kilometers, to establish a relationship between
bracketed duration and magnitude, distance, geology type and component type.
Distance was defined as either closest distance to the rupture zone when
available or epicentral distance. Their equation for the duration of the
horizontal component is given by
D = .000452 Exp (2.0M+.20S) R (2)
where D is duration in seconds, M is local Richter magnitude (ML), S is 0.0 for
rock and l.0 for alluvium and R is distance in kilometers. The duration expected
at San Luis Obispo, located on alluvium some 25kilometers from an M 7.5
(roughly equal to ML 6.9) earthquake on the Hosgri fault, would be about
IOseconds using this expression. This value would be reduced by about
l 8 percent for rock at the same distance. Using Equation l, this same site would
be expected to experience a peak horizontal acceleration of roughly 0.2 g. Sites
located about 10 kilometers from the fault would be expected to experience a
peak acceleration of approximately 0.4g and a duration on alluvium of approxi-
mately 30 seconds.
B-8l-269 3-8
TERA CORPORATION
3.2 EARTHQUAKE EFFECTS ON TRANSPORTATION
In this section we analyze the potential effects on transportation of an earth-
quake of surface wave magnitude 7.5 occurring on the offshore Hosgri fault. The
earthquake-induced effects considered are landslides, liquefaction, bridge dam-
age or failure, and flooding from dam failure or tsunami that might reduce the
traffic capacity of highways.
3.2.1 BACKGROUND
3.2.I. I EARTHQUAKE LOADING
A magnitude 7.5 earthquake on the Hosgri fault would result in widespread
ground shaking of long duration (over IO seconds) in the study area. Such an
earthquake would generate a fault rupture of over 60 km with such a large area
of energy release that the ground shaking would attenuate inversely in proportionwith distance to the linear trend of the ruptured area of fault. The ground
motion model used to predict peak ground acceleration throughout the region is
based on previous work by TERA (Campbell, l980; l98l) specifically developed
for such applications.
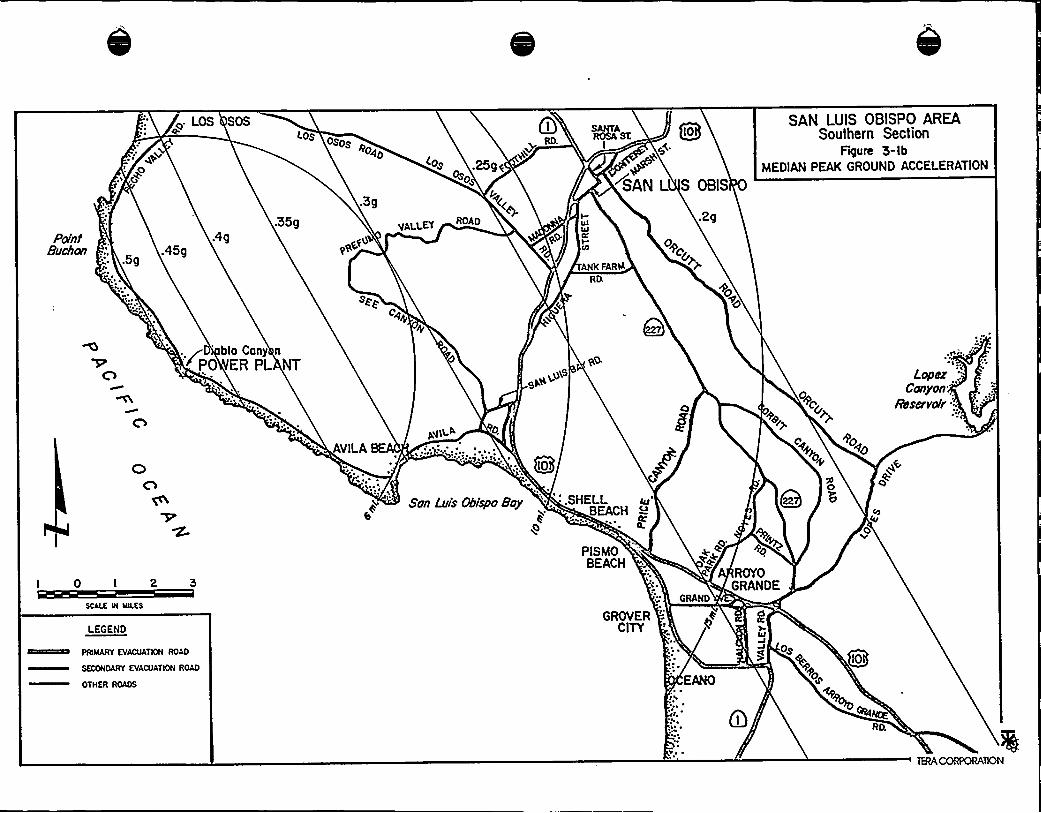
From a planning viewpoint, one must expect that the damage patterns resulting
from even a major earthquake, such as the magnitude 7.5 postulated here, could
vary significantly within the study area. A contour map of expected peak ground
acceleration, based on Equation I, for a magnitude 7.5 earthquake on the Hosgri
fault is presented in Figures 3-la and 3-lb. A large amount of uncertainty is
associated with the'level of ground motion and duration for any given earthquake
and, correspondingly, the potential damage resulting from its occurrence. This is
not only because the amplitude of ground shaking is systematically decreasing
with distance from the fault, but because observed ground motion, at the same
distance from an earthquake fault, can vary by as much as 45 percent or more.
Therefore, three levels of damage have been modelled to more realisticallyaccount for these uncertainties, and to provide for the greater flexibility in
planning options that these uncertainties require. Level I corresponds to an
B-8I-269 3-9
TERA CORPORATION
optimistic estimation of the damage and can be considered as a lower bound ofthe expected damage from a magnitude 7.5 earthquake. Level 2 is a best
estimate, while level 3 represents a pessimistic damage estimate. We also use
the terms "minor," "expected," or "major" to describe these damage estimates.
Therefore, the three damage levels represent a spectrum of possible damage thatcould occur, even though the systematic effects of attenuation of PGA withdistance and localized damage potentials (e.g., individual bridge designs) have
been considered.
In general, we have identified two major damage mechanisms that could affectthe road network in the study area: 'I) ground failure resulting in soil
liquefaction underneath the road beds and landsliding onto the roadways, and
(2) structural and settlement damage to bridges and overpasses. The procedure
for damage assessment is presented in the following sections.
In a later section of this report, we briefly discuss possible earthquake-induced
flooding damage from either dam failures or tsunami. It was not possible withinthe scope of this study, nor necessary from the planning concepts presented, toconduct detailed damage assessments from these causes.,The potential damage
areas are localized to the areas downstream of the dams, and most likely the
damage would have the same net effect on transportation routes as one of the
three damage levels discussed below.
B-81-269 3-IO
TERA CORPORATION

SAN LUIS 08ISPO AREA - Northern Section
Figure 3-loMEDIAN PEAK GROUND ACCELERATION GENERATED
BY AN EARTHQUAKE OF SURFACE WAVE MAGNITUDE 7.5OCCURRING OF THE HOSGRI FAULT
ATASCADERO
(Qs
"'4::..'A COS058
IEIllll
RA
Estera
Bay 'I
„~ 'ISANTA
MARGARITA
.ISg
MORRP
lcv/a
SAN SABEL
AD
A29
IOI
Santagaritake
r
I 0 I
SCALE N MLLES
l ~
LOS SOS r.os 5gosos
OAD6&. ~
'I <os
RC'AD
os .
SANTALEGEND
ARkARV EVAOOATERI ROAD
EEOOHOARV EVAOOATIDH ROAD
OTHER ROIHIE
FbintBrlcikn -:. 59
.45g
eEqLI
VALLEY
l~ROAD 8> o+
O~
0+

PointBuchan
~. LOS SOS
o~+
S
H45g.5g
<ososps
owo
35g
os .25g qSo
l~C~
VALLEY ROADIIII
qO.III
Qo
.2g
RIASK
4P'AN
L S OBIS
SAN LUIS OBISPO AREASouthern Section
Figure 5-IbMEDIAN PEAK GROUND ACCELERATION
SEE,Cq~
ANK FARiA
+o~o
bio Cony n+PO ER PL NT
C)
z-
I 0 I 2 3
SCALE III IIILES
LEGEND
ROIIART EVAOOATIOR ROAD
ERXWDART EV IOOATIOH ROAD
OTHER RATIO
D
AVILABE
~:,''""""'.':..
Oo
Son Luis Obispo Boy '... SHELLBEACH
PISMOBEACH
GROVERCITY
e~'A
ROYGRAN
GRAND
0DE
I'vA
E
OgCg
+o~o
O
n
QIOI
I,.Lopar
Conyon"
Reservoir:.

3.2.1.2 DAMAGEDUE TO GROUND FAILURE
Landslides - Overview
Earthquake-induced landslides differ from conventional landslides by their geo-
metry, failure mechanism, and type of sliding. Conventional landslides are
caused by water infiltrating a slope after rainfall which reduces the shear
strength (i.e., cohesion and friction) of weathered rock and soil material. In
addition, the water increases the weight of the slide mass and decreases the
confining effects at. the toe of the slope. Once the shear strength of the
material is exceeded, the slide mass moves downward in response to gravity.
Earthquake-induced landslides are trigger'ed by energy developed by the earth-
quake in the form of ground shaking.. The shaking, depending on its intensity and
duration, weakens and eventually loosens rock and soil materials, resulting in
downslope movement. These landslides are mostly confined to surficial failures
and result in rock falls, rock slides, soil falls, and soil debris. Very few deep-
seated rotational block glides or slump failures have been observed as a result ofearthquake shaking.
The controlling factors needed to trigger landslides are the intensity and
duration of the ground shaking and the steepness of the slope. The potential is
increased when steep slopes are underlain by low density, weathered, weakly
cemented soils and/or highly fractured bedrock. There are indications that rain
saturation has little or no additional adverse effect on slopes that would
otherwise be susceptible to earthquake-induced failures (Harp, I 98 I).
Seismic-induced landslides normally occur with the initial shock of an earth-
quake. However, in some cases the initial shock may only loosen or weaken rock
or soil material on a slope, while subsequent aftershocks may eventually cause
failure. To compound the problem, heavy rain following a major earthquake
might cause failure of slopes that were originally weakened by the initial shock.
B-SI-269 3-I3
TERA CORPORATION
Studies by Wilson (l978) of the August l3, l978, Santa Barbara earthquake
(M = 5.I) showed that artificially cut slopes are significantly more prone toseismically induced landslides than natural slopes in the same geologic material.
Based on work by Harp (l98I), slopes greater than 35 (I.5:I slope ratio) where
rock is exposed are prone to rock'falls and rock slides. This is considered
conservative since statistics indicate a 40-to-45 lower limit. The higher thedegree of fracturing or jointing of the rock, the higher the probability of failure.Soils or colluvial materials have a tendency to fail on slopes of 25 (2:I slope
ratio) or greater (Harp, l98 I). Research has shown that soils most susceptible tofailure are granular and nonorganic. Slopes which comprise artificial fillalso areprone to seismic-induced failures. The geometry of the fill(e.g., slope ratio and
slope height) and consistency of the soil materials will control its stability orlack of stability. Fills're known to fail by either slumping or debris slide.
Poorly compacted, low-cohesive fill materials on slopes in excess of 25 aresubject to earthquake-induced failure.
Landslides - San Luis Obis o Area
Numerous landslides have occurred in the study region (Envicom, l974). The
type and distribution of failure were probably functions of specific bedrock
conditions, namely: bedding, jointing and fracturing, and steep slope. These
slides-were most likely triggered by water infiltrating the slopes and were notrelated to earthquake activity. None of the mapped landslides near theevacuation roads and highways are known to be active, and the majority of thelarger features are considered quite old, possibly having moved during a much
wetter climate (e.g., over I l,000 years ago).
Where ear thquake-induced slides are likely to occur in the study area, they wouldin most cases fall onto highways rather than below them. Materials falling on
the roadways will cause at least partial blockage. The slides that occur below
(downslope from) a roadway could sever one or more lanes, rendering themimpassable.
B-8I-269 3-l4
TERA CORPORATION
The quantities of materials generated at the toe of a slope from any one slide
will vary depending on the dimension of the slide. Most of the shallow slides that
occurred during the I 97 I San Fernando earthquake had lengths of I 5 to
300'meters and thicknesses of 0.2 to I meter (Morton, l97l). Based on the
survey of mapped landslides, we assumed the average width of these slides to be
about one-third of the length, and the average thickness to be I meter.
Quantities ranged between 45 and 300 cubic meters of displaced debris. It is
estimated, based on similarity of relief, that similar quantities could be
developed from slides occurring in the study area. Slides might occur adjacent
to each other and form coalescent slide masses.
The removal time to clear a road blocked with slide debris depends on the
amount of materials to be removed, the number and type of heavy equipment
available, access to the site, and distance to a suitable disposal or borrow area.
The most practical types of heavy equipment for expediting road repair work are
rubber-tired loaders and tractor bulldozers. Normally, a loader of the type
owned by CALTRANS can excavate'300 cubic yards of loose, unconsolidated
material per hour'. Such loaders are available at the CALTRANS maintenance
stations and could be onsite within 30 minutes. A bulldozer (e.g., D-7
Caterpillar) would be able to move more yardage per hour. However, the only
one'wned by CALTRANS in this area is stationed on Highway I north of Morro
Bay and would require a long time to reach most sites. Local contractors would
be able to provide such equipment with a delay of two to four hours. In order to
obtain clearing time estimates for our study, we have assumed that once onsite,
front end loaders would be able to clear the road at the rate of 200 ft/hour per
lane. This implies that no hauling is required and the debris is l2 feet wide with
an average thickness of 3 feet. All the estimates have been made assuming that
only one loader is working on any given road.
Because roads are long linear structures, multiple failure can occur any place
along them, creating several blockages. In this case, the blockages may have to
be removed one at a time from each end unless equipment is available at
intermediate points. As an alternative, for emergency purposes a road can be
reopened after a major landslide by grading a road over the top of the slide mass
B-8I-269 3-I 5
TERA CORPORATION
or by passing it around the perimeter of the mass. This would certainly be time-
saving; however, caution must be exercised when people or equipment are
working in an area of potential active sliding. Roads severed or heavily damaged
by a slide located below the road may be difficult to repair within a reasonable
time frame. Such occurrences would have to be dealt with on a case-by-case
basis.
Assessment of Landslide Potential
The number of technical reports on earthquake-induced landsliding is verylimited. Much of the state-of-the-art work is presently being conducted by the
U.S. Geological Survey through their Earthquake Hazard Reduction Program.
Criteria for assessing earthquake-induced landslides for this study were devel-
oped primarily from the criteria established by the U.S. Geological Survey.
Using these criteria (ABAG, l980-8l) to determine seismic-induced landslide
potential, all slopes analyzed within the study area fall into. an "unstable
condition" for both summer and winter conditions. However, based on distance
from the fault, the intensity of ground shaking will vary from strong to very
strong to occasionally violent (Table 2- I presented in the Ground Failure
Appendix). On the Modified Mercalli scale, intensities will range from Vll.to IX.
According to the definition given to the scale, earthquake landsliding has been
known to take place within this range of intensities.
Basically, there are four main factors that control earthquake-induced landslid-
ing: (I) strong ground motion, (2) slope inclination, (3) surface geologic and
engineering parameters, and (4) conventional landsliding susceptibility (water-
induced failures). Aerial photographs (Fairchild, l978), geologic and topographic
maps, and a field inspection were used to collect information on those slopes
suspected of potential landsliding. Field data sheets prepared for each siteduring our field investigation, and a summary of the pertinent data for each site,are shown in the Appendix.
Only slopes that trend immediately adjacent to or near the roads or highways
were considered in this study. All slopes (natural slopes, cuts, and fills) were
B-8I-269 3-l6
TERA CORPORATION
excluded from this study unless they exceeded the lower limits of the criteriapresented in the Appendix. No deep-seated potential slides were suspected or
recognized along the roads surveyed. Fill slopes normally are difficult to
analyze by inspection since their stability is in part related to how well theyI
were constructed (e.g., compacted). Usually new road fills have been construct-ed to adequate standards, though there are exceptions. Old road fills or newer
ones with slope ratios in excess of 2:I (horizontal-to-vertical) were considered
zones of likely failure.
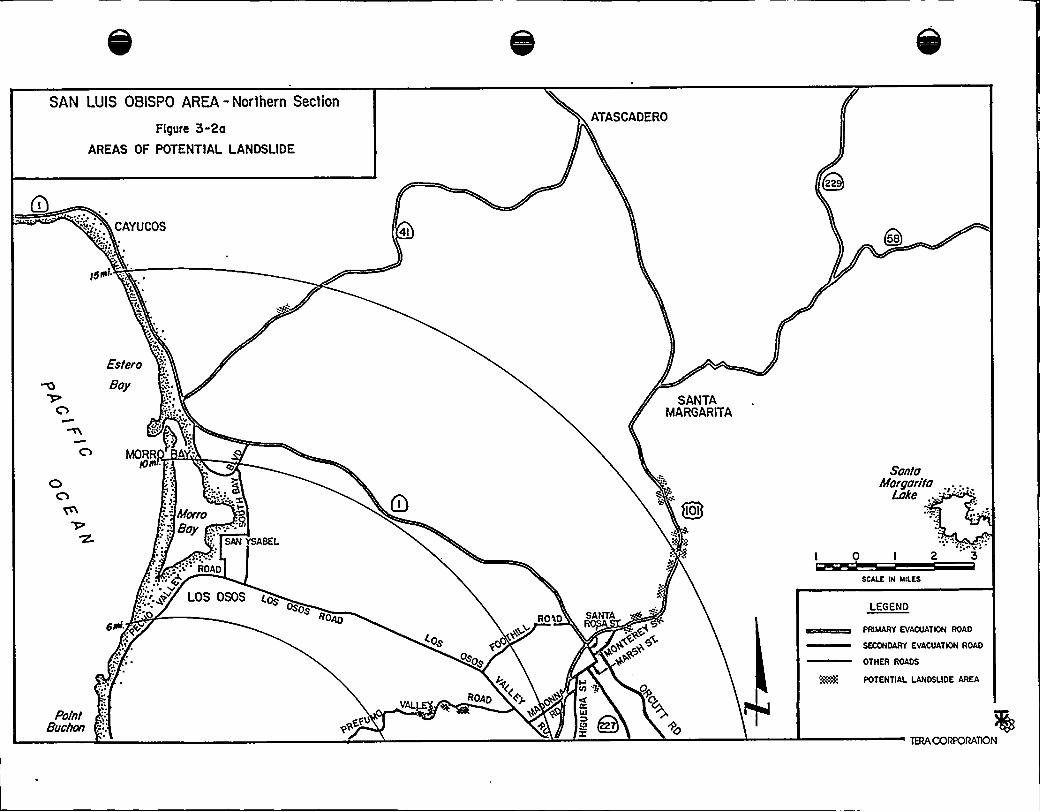
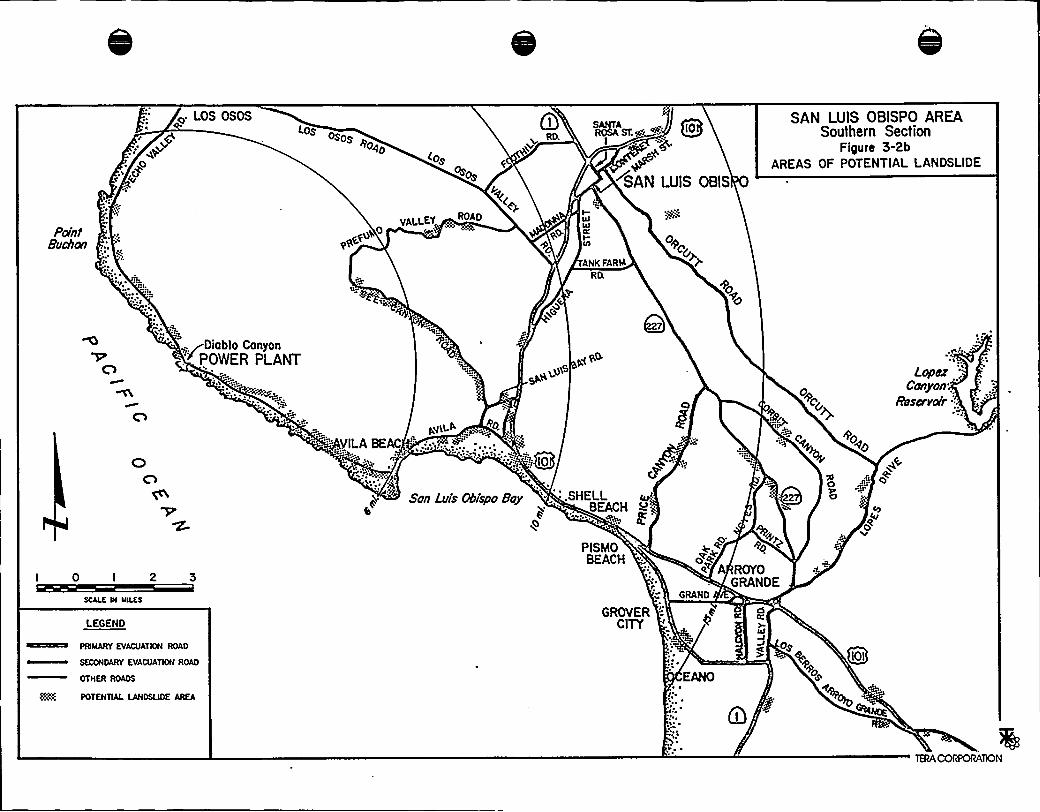
Based on the assessment criteria, many slopes along the evacuation routes have
been categorized as landslide zones (Figure 3-2), potentially capable of failingunder seismic shaking. Since the current state-of-the-art required a conserva-
tive approach to formulating the assessment criteria, one does not expect thatall slopes so judged would fail. It is expected that the number of failures willdecrease rapidly with distance from the fault, based principally on the attenua-tion of acceleration. In order to estimate the expected number of slides and thecorresponding clearing times, the criteria pr'esented in Table 3- I were developedfor three damage levels. These criteria reflect engineering judgment based on
geological data and past earthquake experience. For a potential landslide
located in a given acceleration zone, the expected footage of failure wasI
obtained by multiplying the total potential footage by the percentage corre-sponding to the selected damage level.
A summary of expected footage failure and clearing time is presented in
Table 3-2 for each road surveyed.. This represents clearing time for two lanes oftraffic for the major evacuation routes. As the volume demand is less forsecondary routes, the clearing time is for only one lane on these roads.
Li uefaction - Overview
Under certain soil and ground water conditions, ground failure by liquefaction
may occur during an earthquake. Liquefaction is defined as the transformationof cohesionless water-saturated material, such as sand, from a solid state to a
fluid state. The cause of cyclic mobility or liquefaction in sands is the build-upof excess hydrostatic pore pressure due to the application of cyclic shear
B-8I-269 3-l7
TERA CORPORATION"
stresses. The shear stresses are generated in a soil deposit during ground
shaking. As a consequence of the applied cyclic stresses, the structure of the
undrained soil tends to become more compact. If the sand is loose, the pore
pressure increases rapidly to a value equal to the confining pressure, and the soil
layer may undergo large deformations and be in a state of extreme liquefaction.If the sand is more compact, it will undergo limited deformation and partialliquefaction. Any structure, fillor embankment located on a liquefying soil willundergo some deformation varying from minor settlement to complete sinking.The goal of a liquefaction potential analysis is to differentiate between those
situations where liquefaction can cause damage and those situations where
liquefaction, per se, may not cause significant damage.
Three major factors are conducive to liquefaction: ground shaking, shallow
water table, and sandy material. Generally, low-lying areas mantled by young,
unconsolidated, weil-sorted sand and/or silty sand (clay free) materials are themost susceptible to liquefy. In addition, some minor topographic relief, such as
stream banks or gentle to steep slopes, is normally needed to cause liquefactionground failure. However, some ground failure can occur on flat ground if the
liquefiable materials are unevenly loaded, as in the case of road fills.
Li uefaction - San Luis Obis o Are'a
Several of the evacuation routes travel through areas susceptible to liquefactionin the event of a major earthquake. However, no known historic liquefaction has
occurred in the study area. The areas susceptible to liquefaction could
experience accelerations between O. I2 and 0.50 g for an event of magnitude7.5'ccurring
on the, Hosgri fault. According to Youd, et al. (I978), the lower limitfor liquefaction to occur is about an acceleration of 0.2 g. This suggests thatalmost all locations within the study area have the potential to liquefy. The
resulting damage at each site will depend upon the specific soil and groundwaterconditions.
Those areas most capable of liquefaction damage to roads and highways arelocated on valley floors, river channels, estuaries, and low-lying coastal areas.
B-81-269 3-I8
TERACORPORATION
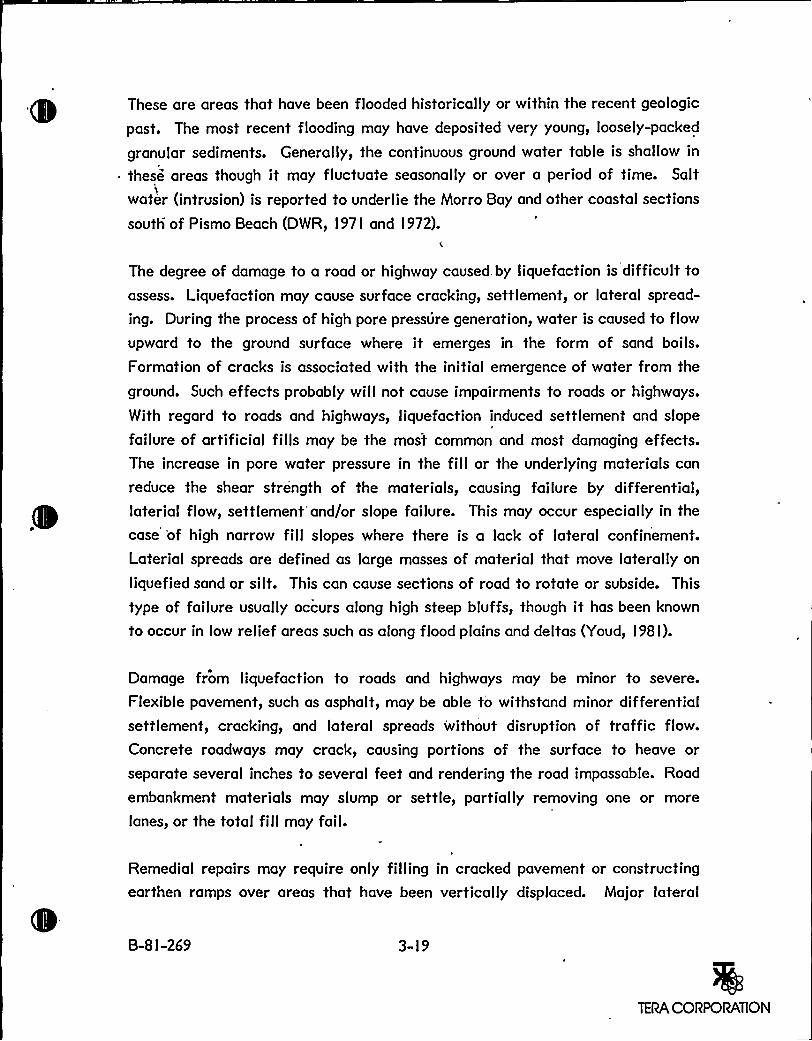
These are areas that have been flooded historically or within the recent geologic
past. The most recent flooding may have deposited very young, loosely-packed
granular sediments. Generally, the continuous ground water table is shallow in
these areas though it may fluctuate seasonally or over a period of time. Salt
water (intrusion) is reported to underlie the Morro Bay and other coastal sections
south'f Pismo Beach (DWR, l97 I and I 972).
The degree of damage to a road or highway caused. by liquefaction is difficulttoassess. Liquefaction may cause surface cracking, settlement, or lateral spread-
ing. During the process of high pore pressure generation, water is caused to flow
upward to the ground surface where it emerges in the form of sand boils.
Formation of cracks is associated with the initial emergence of water from the
ground. Such effects probably will not cause impairments to roads or highways.
With regard to roads and highways, liquefaction induced settlement and slope
failure of artificial fills may be the most common and most damaging effects.The increase in pore water pressure in the fill or the underlying materials can
reduce the shear strength of the materials, causing failure by differential,laterial flow, settlement'and/or slope failure. This may occur especially in the
case 'of high narrow fill slopes where there is a lack of lateral confinement.
Laterial spreads are defined as large masses of material that move laterally on
liquefied sand or silt. This can cause sections of road to rotate or subside. This
type of failure usually occurs along high steep bluffs, though it has been known
to occur in low relief areas such as along flood plains and deltas (Youd, l98 I).
Damage from liquefaction to roads and highways may be minor to severe.
Flexible pavement, such as asphalt, may be able to withstand minor differentialsettlement, cracking, and lateral spreads without disruption of traffic flow.
Concrete roadways may crack, causing portions of the surface to heave or
separate several inches to several feet and rendering the road impassable. Road
embankment materials may slump or settle, partially removing one or more
lanes, or the total fillmay fail.
Remedial repairs may require only filling in cracked pavement or constructing
earthen ramps over areas that have been vertically displaced. Major lateral
B-8 I-269 3-I9
TERA CORPORATION
displacements can probably be easily and quickly repaired by importing fillmaterials and regrading the displaced portion of the road. It is doubtful, though
possible, that a major settlement could cause flooding by surface or groundwater. Depending on the severity of the damage, it could be temporarilyrepaired by importing fill and placing it in the flooded area,to reestablish
continuity of the roadway.
Li uefaction Potential Assessment
Criteria developed by the U.S. Geological Survey were used to assess potentialliquefaction areas in the San Fernando Valley, California (Youd et al., l978). In
l979 the U.S. Geological Survey (Helley et al., l979) used techniques similar to,but more refined than, those used by Youd for the San Francisco Bay area. The
Seismic Safety Element for San Luis Obispo County (Envicom, l 974) has
delineated areas which have a potential to liquefy; however, their techniques forclassifying liquefied areas did not include the more recent techniques developed
by the U.S. Geological Survey. When boring logs and standard penetration testsare available, more refined methods may be used to determine the liquefactionpotential, the most common one being the technique developed by Seed and Idriss
(I 97 I) and Seed (I 979) which is presented in the Appendix.
For this study topographic soil and geologic maps, aerial photographs, and ground
water studies were used to delineate low-lying areas where younger sedimentshave been deposited and where ground water may be shallow (i.e., less than
I5 meters below the ground surface). A field reconnaissance was made to verifyor characterize the relief, types of surficial sediments, and their consistency.No subsurface exploration was performed to determine the types and consisten-cies of subsurface soils below a particular site. The subsurface conditions wereestimated using mapped and reported data and geologic projection techniques.The criteria used in the study are similar to those used by the U.S. GeologicalSurvey (Youd et al., I 979, and Helley et al., l 979).
In addition, boring logs at bridge locations were obtained from state and countytransportation departments to determine the local subsurface conditions and
B-8I-269 3-20
TERA CORPORATION
apply the procedure developed by Seed and Idriss (l97I) and Seed (l979). This
was possible for about 50 percent of the zones for which a'potential forliquefaction exists.
Using the ground data provided by topographic and geologic maps and the point
data at the bridges, the zones of potential liquefaction along the highways and
roads were localized and classified in terms of low or high susceptibility
(Figure 3-3). The low susceptibility areas include those underlain by young age
(Holocene) alluvial materials that are estimated to contain appreciable amounts
of sand and silt layers or lenses and where ground water is within 50 feet of the
ground surface. The high liquefaction susceptibility areas have the same
characteristics as the low susceptibility areas, except that these zones eitherlack lateral confinement, have gentle slopes, or are differentially loaded
(artificial fills). In each case, accelerations are in excess of 0.2 g. Maps and
tables describing these zones in greater detail are presented in the Appendix.
Based on the assessment criteria, many areas along the evacuation routes have
been categorized as potential liquefaction zones, capable of failing under
excessive seismic shaking. Since there is a reasonable amount of conservatism
built into the assessment criteria, not all areas considered are expected to
liquefy. The number of liquefaction zones will decrease rapidly with distance
from the rupture, based principally on the attenuation of acceleration. More-
over, as explained in the previous section, there is a difference between
liquefaction, per se, and damage. In order to estimate the expected number ofliquefaction zones and the corresponding clearing times, the criteria presented in
Table 3-3 were developed for three damage levels. These criteria are based on
considerations such as topographic and geologic conditions, soil profile charac-
teristics (sand and silt layers, presence of clay or gravel layers, depth to waterlevel), level of earthquake shaking (PGA), and liquefaction potential assessment
using Seeds (l979) criterion. Engineering judgment played an important role in
this evaluation, especially in the areas where subsurface conditions were not
known. Each high liquefaction potential area was assigned a susceptibility level
ranging from I to IV. Level I corresponds to a low potential for damage to roads
and highways (i.e., very small deformation with little or no impairment to the
B-8 I-269 3-2I
TERA CORPORATION
road). Level IV would correspond to large deformation, settlement, slope failure
and/or lateral spreading. In this case the road would be impassable in some
sections and significant repair would be necessary. Levels II and III are interme-
diate between these two. The susceptibility level was decreased by one unit forthe adjacent low potential zone. For a potential liquefaction area located in a
given acceleration zone, the expected footage of failure was obtained by
multiplying the total potential footage by the reduction factor for the selected
damage level. To estimate the repair time, it was assumed that each major
deformation would require a fixed amount of time depending upon the damage
level assumed plus an additional amount of time depending upon the degree ofliquefaction. Both of these time estimates are functions of the liquefaction
susceptibility and damage levels. They are presented for two lanes of repair in
Table 3-4.
A summary of expected footage failure and clearing time is presented for each
road surveyed in Table 3-5. This represents clearing time for two lanes for themajor evacuation routes and for one lane for the secondary roads.
B-SI-269 3-22
TERA CORPORATION
SAN LUIS OBISPO AREA - Northern Section
Figure 3-2a
AREAS OF POTENTIAL LANDSLIDE
ATASCADERO
EES
CAYUCOS 4IQse
Io
Ester o
Bay
'L
A
, ~ E
'r".EE
''Ei
~ A
SANTAMARGARITA
MORRP
INero „.,:8
SAN SASEL
s:R" ROAD
ioi
A C
SantaNorgarita
Lake
I 0 I 2
SCALE IN MILKS
PointBaohon
LOS OSOSOSOS
~ "0nocto6IIII ~S
A <os
Sos
S~
OAD WJR
K'OID
SANTAaopa
go+ g+
III "$ O~
LEGEND
DREARY EVACIHTIOII RDAD
EECOHDARY EVIICDATICH ROAD
OTHER RECCE
$$ POTENTIAL LANDSLIDE AREA

Po'ntBudian
~ LOS OSOS
r
~ ~O
Lososos
0<a(os
~os
+(~ROAO
RO.
I-IIIla>
I(lI
@@~~ ~) 00
SAN LUIS OBIS
SAN LUIS OBISPO AREASouthern Section
Figure 5-2bAREAS OF POTENTIAL LANDSLIDE
ANN FARIA
Diablo Canyon'.+POSER PLANT
::.VILABEAC
Son Luis Obispo Boy '- '.SHELLBEACH
Opco,p
.::" C~+p.
OO
~o
z: o+
Cy4v
O
Loper;Ciwyon
'ibscrvoir:.
I 0 I 2 3
SCALE IH IllLES
LEGEND
l%llQRY EVACUATION ROAD
SECONDARY EVACUATION ROAD
OTHER ROADS
QR POTENTIAL LANDSLIDE AREA
PISMOBEACH
GROVERCITY cr''~
e
GRANO
EANO
GRA
CS
II/
ROYONDE
Qoi+o
OI

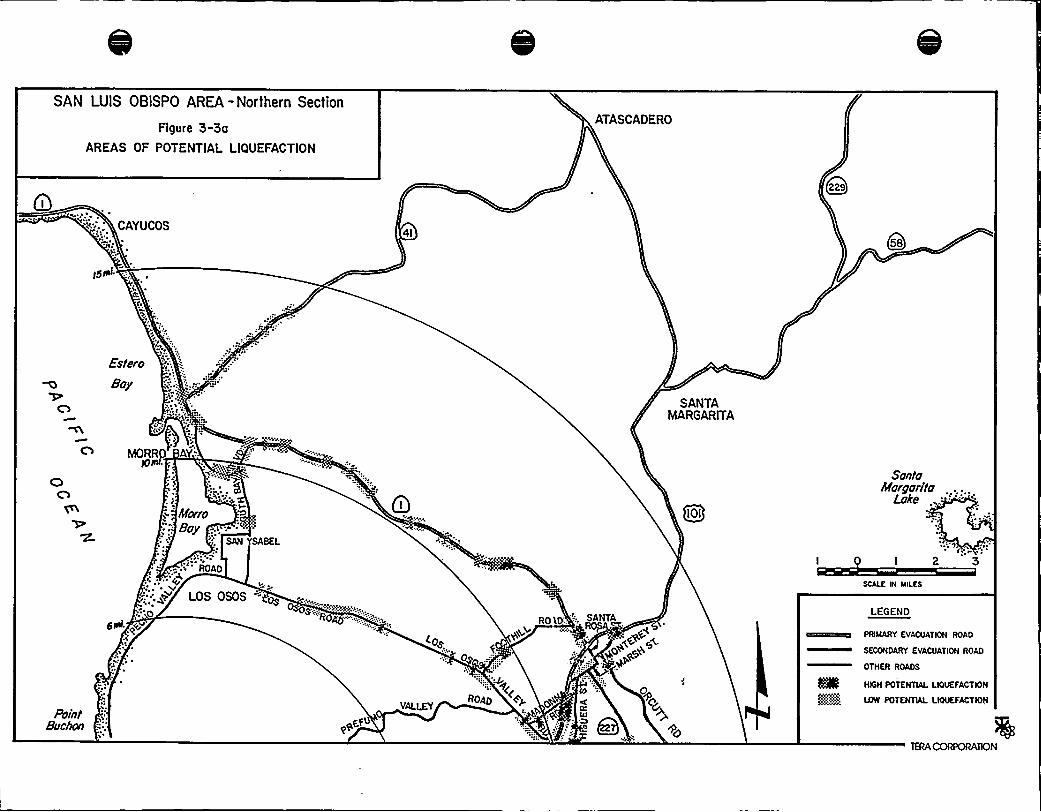
SAN LUIS OBISPO AREA -Northern Section
Figure 3-3aAREAS OF POTENTIAL LIQUEFACTION
ATASCADERO
CAYUCOS4I
058
LEI+L
r,
A
EVEv
Esfero
Boy
SANTAMARGARITA
MORRP
'AA,A
INorroBoy .„H.p.:
SAN SABEL
ROAD
". Err
Ioi
SonfoNorgorifo
Luke
I 2 3
FbinfBucfIOFI
~ . ~ r
LOS OSOS gps 0 P ~~A:.:"0JAM.
e@au
(Pe0
-!I "Y4~
C@ROAD
IY
RO lD:, SANTA
pe+ q+
'40 'gSCALE IN MILKS
LEGEND
ARNNIY EVACUATION ROAD
EECOHDAIIY 'VACUIITIDN ROA.D
DTHER ROADS
5% HIGH POTENTIAL LIOUEFACTION
mama Low PoTENTIAL LIGUEFAOTIoN

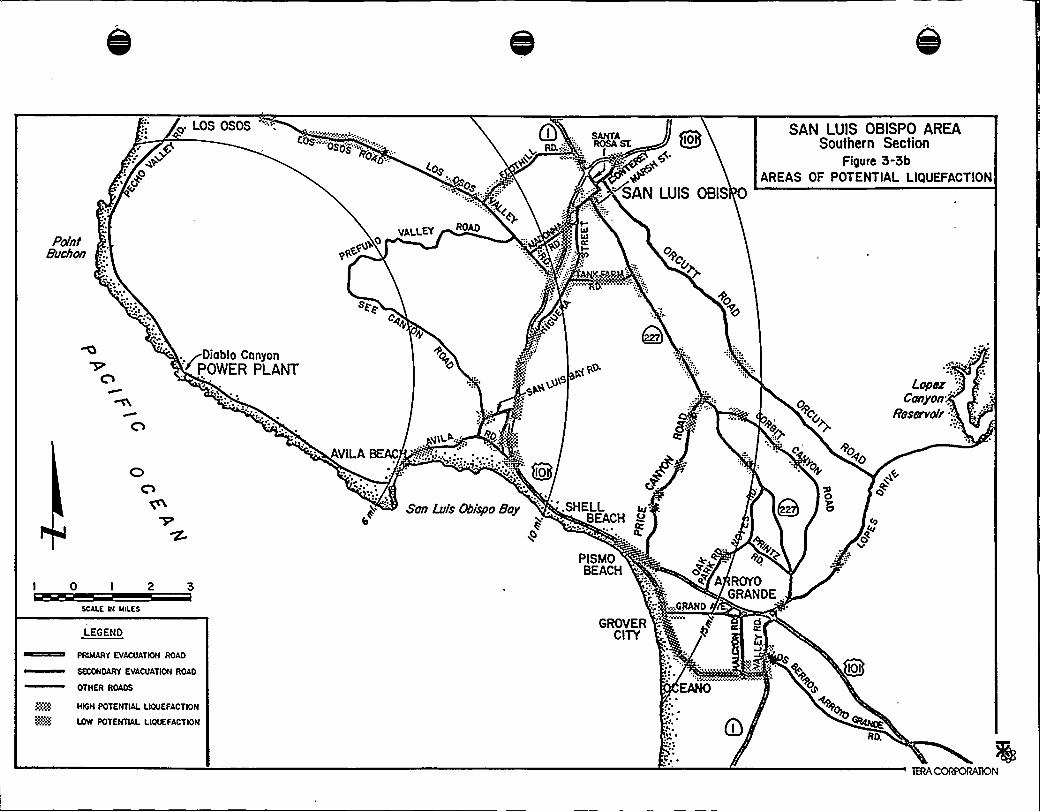
<. LOS OSOS
i
'-E:UW,.CRACE.EOG "os '""". '""""
D"'>o~'..O~„. ~'„OIO
?" 4Cog .
'':: ~+SAN LUIS OBIS
SAN LUIS OBISPO AREASouthern Section
Figure 5-3bAREAS OF POTENTIAL LIQUEFACTION
Prin8uchon e
EeQgo
ALLEY ROADV
pOW
I
A SAVUCR UUw
0+c~
Pp,
Diablo Canyon+POSER PLANT
AVILABEAC
~gO S5
..'O~qI A„U <0
/E
OgCg
+o~o~.'p
Lope;Canyon
"
Rwarvofr:,
San Luis C8ispo Bay .. SHELLBEACH
O
Q 5Cy
O'AU
I 0 I 2
SCALE N MILES
LEGEND
ARUARY EVACUATIOII ROAR
RRXVIOARI EVACUATICR ROIUI
OTHER ROADS
PISMOBEACH
Ut
GROVERCITY
ao>e~ A ROYO
GRANDE .
(, GRANDUS UU'IA d
W,.A
EANO
GOI
Qg HIGH POTENTIAL LIOUEFACTIOM
LOW POTENTIAL LIOUEFACTIOM

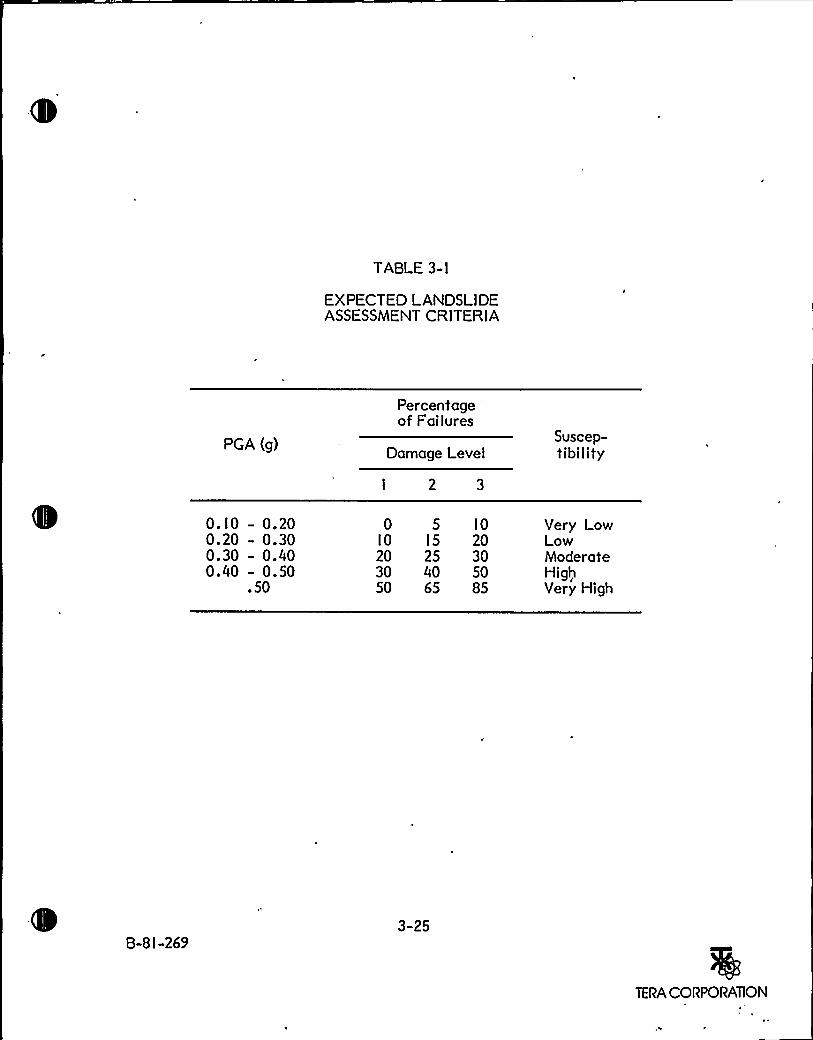
TABLE 3-I
EXPECTED LANDSLIDEASSESSMENT CRITERIA
PGA (g)
Percentage'f
Failures
Damage Level
I 2 3
Suscep-tibility
O.IO — 0.200.20 - 0.300.30 - 0.400.40 - 0.50
.50
0 5 10IO I5 2020 25 3030 40 5050 65 85
Very LowLowModerateHighVery High
3-25
TERA CORPORATION
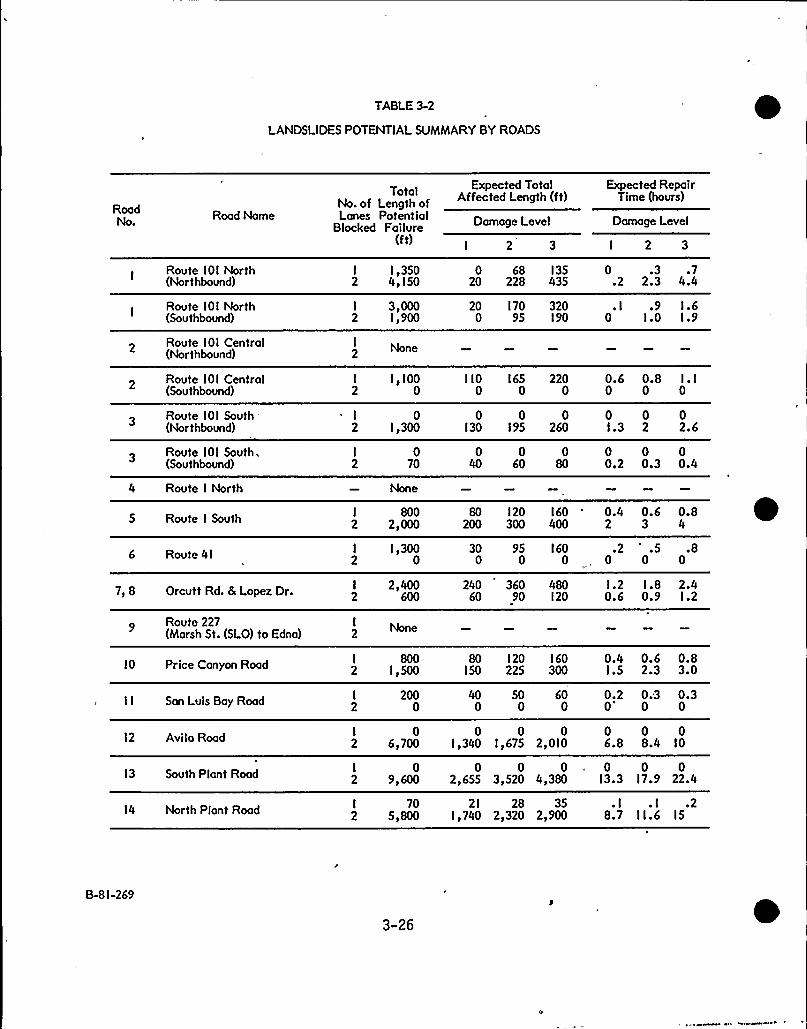
TABLE 3-2
LANDSLIDES POTENTIAL SUMMARYBY ROADS
RoadNo. Rood Name
TotalNo. of Length ofLanes Potential
Blocked Failure(ft)
Expected TotalAffected Length (ft)
Damage Level
Expected RepairTime (hours)
Damage Level
I 2 3 I 2 3
Route IOI North(Northbound)
Route 101 North(Southbound)
Route IOI Central(Northbound)
Route 101 Central(Southbound)
Route 101 South(Northbound)
Route IOI South.(Southbound)
4 Route I North
5 Route I South
6 Route 41
7, 8 Orcutt Rd. 8 Lopez Dr.
Route 227(Marsh St. (SLO) to Edna)
10 Price Canyon Road
I I Son Luis Bay Road
12 Avi la Road
13 South Plant Road
14 North Plant Road
I 1,350 0 68 135 0 .3 .72 4,150 20 228 435 .2 2.3 4.4
I 3,000 20 170 320 .I .9 1.62 1,900 0 95 190 0 1.0 1.9
NoneI
I I,IOO IIO 165 220 0.6 0.8 I.I2 0 0 0 0 0 0 0
I 0 0 0 0 0 0 02 1,300 130 195 260 1.3 2 2.6
I 0 0 0 0 0 0 02 70 40 60 80 0.2 0.3 0.4
I 800 80 120 160 '.4 0.6 0.82 2,000 200 300 400 2 3 4
I 1,300 30 95 160 .2 .5 .82 0 0 0 0, 0 0 0
I 2,400 240 360 480 1.2 1.8 2.42 600 60 90 120 0.6 0.9 1.2
I
2None
I 800 80 120 160 0.4 0.6 0.82 1,500 150 225 300 1.5 2.3 3.0
I 200 40 50 60 0.2 0.3 0.32 0 0 0 0 0' 0
I 0 0 0 0 0 0 02 6~700 I ~340 I ~ 675 2~010 6 8 8 4 10
I 0 0 0 0 0 0 02 9,600 2,655 3,520 4,380 13.3 17.9 22.4
I 70 2! 28 35 .I .I .22 5~800 1~740 2~320 2f900 8 7 II 6 15
B-81-269
3-26
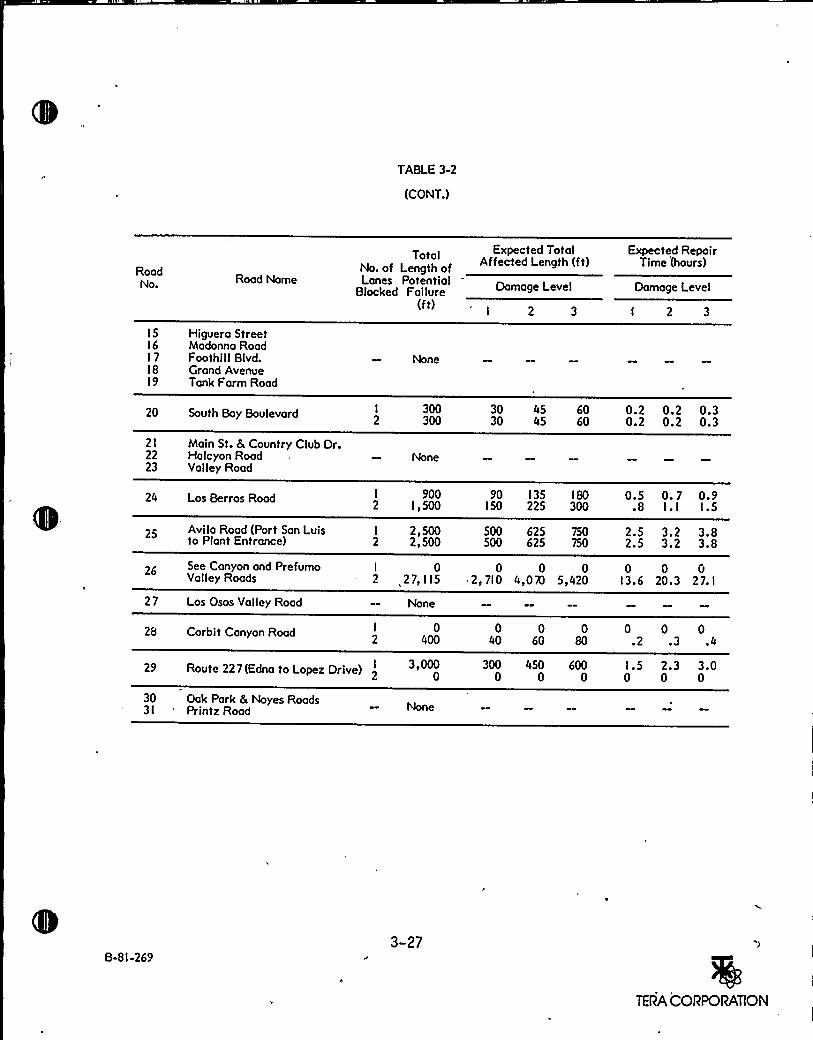
TABLE 3-2
(CONT.)
RoadNo.
ISl617I8l9
Road Name
Higuero StreetMadonna RoadFoothill Blvd.Crand AvenueTonk Farm Road
Expected TotalAffected Length (ft)No. of Length of
Lanes Potential D ma eLeveBlocked Failure
2
None
Expected RepairTime (hours)
Damage Level
I 2 3
20 South Bay Boulevard
2I Main St. 8 Country Club Dr.22 Halcyon Rood23 Valley Road
I 3002 300
None
30 45 60 0.2 0.2 0.330 45 60 0.2 0.2 0.3
24 Los Berros Road
Avila Road (Port San Luisto Plant Entrance)
I 900 90 l35 I80 0.5 0. 7 0.92 I,500 ISO 225 300 .8 I.I I.S
I 2,500 500 625 750 2.5 3.2 3.82 2,500 500 625 750 2.5 3,2 3.8
See Canyon and PrefumoValley Roads
I 0 0 0 02 27~ I IS 'i 7I0 4i070 5 420
0 0 0I3.6 20.3 27. I
27 Los Osos Valley Road
28 Corbit Canyon Road
None
I 0 0 0 0 0 0 02 400 40 60 80 .2 .3 .4
29 Route 227(Edna to Lopez Drive)2 O O O O O O O
30 Oak Park 8 Noyes Roads3 I 'rintz Road None
B-8I-2693-27
TERA CORPORATION
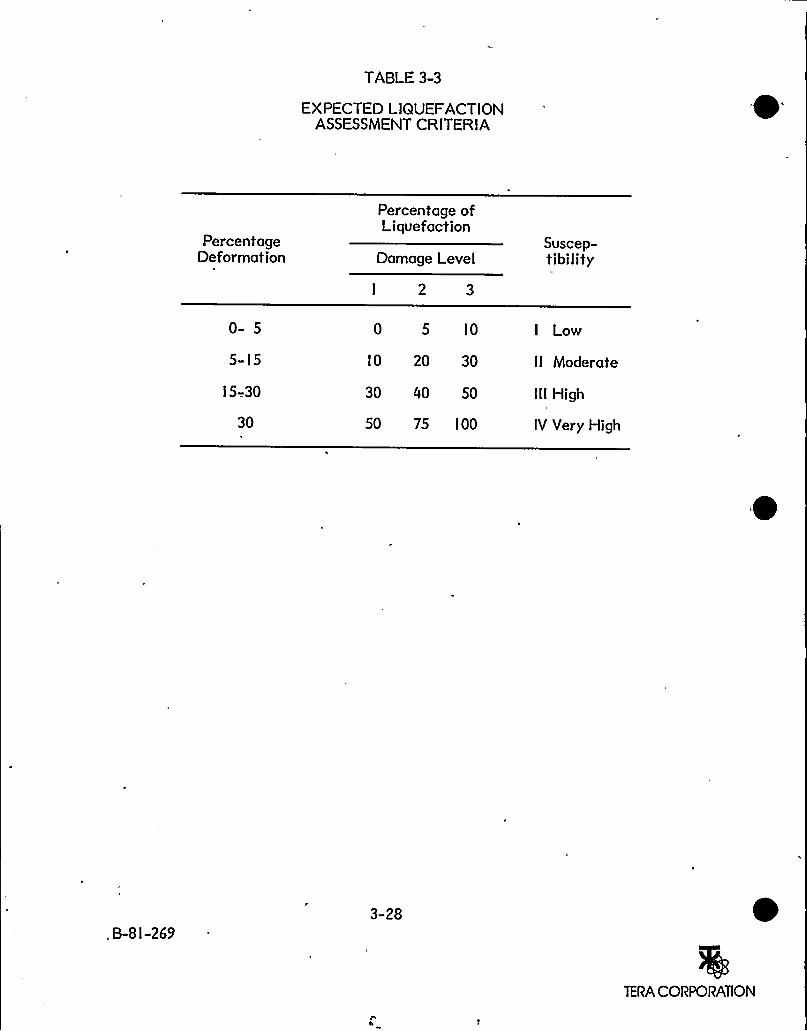
TABLE 3-3
EXPECTED LIQUEFACTIONASSESSMENT CRITERIA
PercentageDeformation
Percentage ofLiquefaction
Damage Level
I 2 3
Suscep-tibility
0- 5
5- I 5
I 5-.30
30
0 5 IO
10 20 30
30 40 50
50 75 IOO
I Low
II Moderate
III High
IV Very High
3-28
TERA CORPORATION
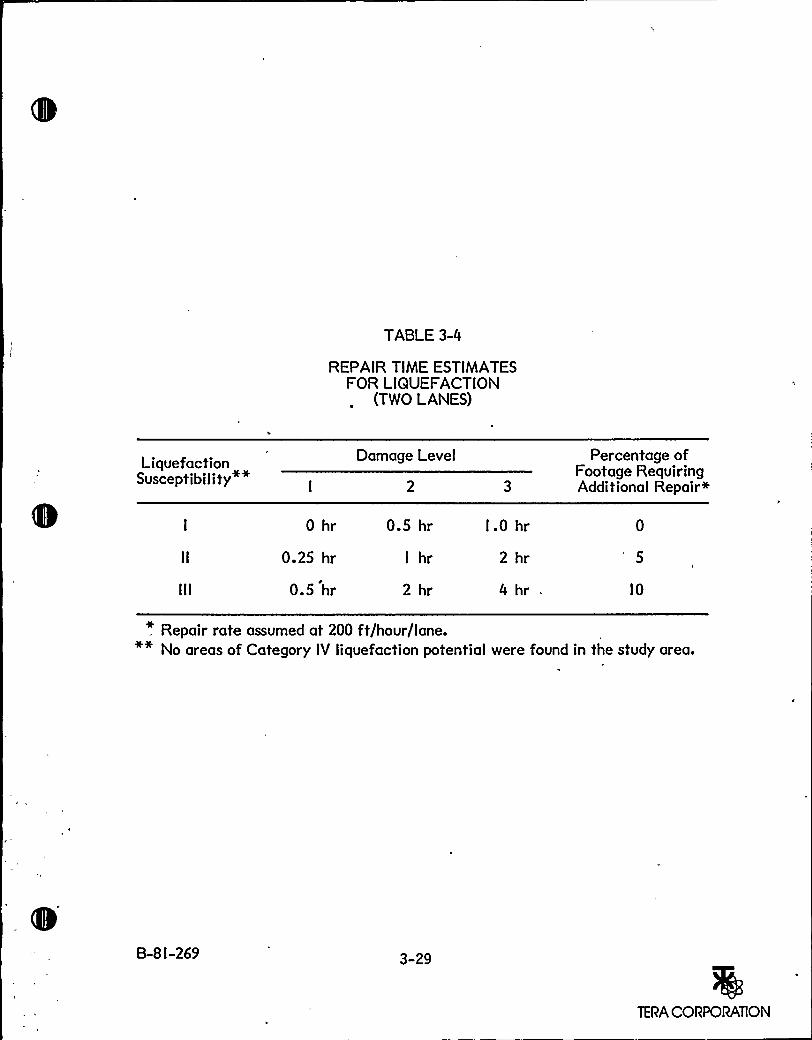
TABLE 3-4
REPAIR TIME ESTIMATESFOR LIQUEFACTION
(TWO LANES)
LiquefactionSusceptibility""
Damage Level Percentage ofFootage RequiringAdditional Repair+
0 hr
0.25 hr
0.5 hr
0.5 hr
I hr
2 hr
I.O hr
2 hr
4 hr IO
. Repair rate assumed at 200 ft/hour/lane."" No areas of Category IV liquefaction potential were found in the study area.
B-SI-269 3-29
TERA CORPORATlON
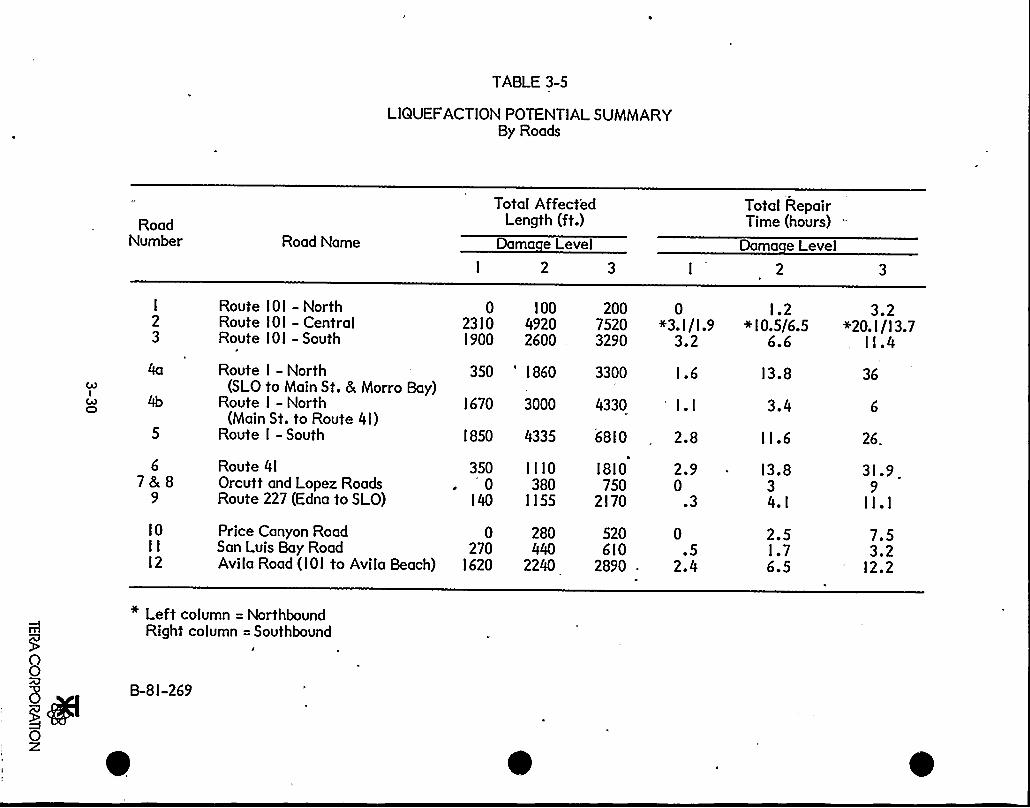
TABLE 3-5
LIQUEFACTIONPOTENTIALSUMMARYBy Roads
RoadNumber Road Name
Total AffectedLength (ft.)
Dama e Level
Total RepairTime (hours) '-
Dama e Level
Route 101 - NorthRoute 101 —CentralRoute 101 - South
Route I - North(SLO to Main St. & Morro Bay)
Route I - North(Main St. to Route 41)
Route I —South
023101900
10049202600 .
200 0 1.27520 4 3.1/1.9 +10.5/6.53290 3.2 6.6
350 '860 3300 1.6 13.8
1670 3000 4330 I.l 3.4
1850 4335 6810 2.8 11.6
3.2+20.1/13.7
11.4
36
26,
678 8
9
10II12
Route 41 350Orcutt and Lopez Roads 0Route 227 (Edna to SLO) 140
Price Canyon Road 0San Luis Bay Road 270Avila Road (IOI to Avila Beach) 1620
1110380
1155
280440
2240
1810 2.9 13.8750 0 3
2170 .3 4.1
520 0 2.5610 .5 1.7
2890 . 2.4 6.5
31.99Il.l7.53.2
12.2
Left column = NorthboundRight column = Southbound
B-81-269
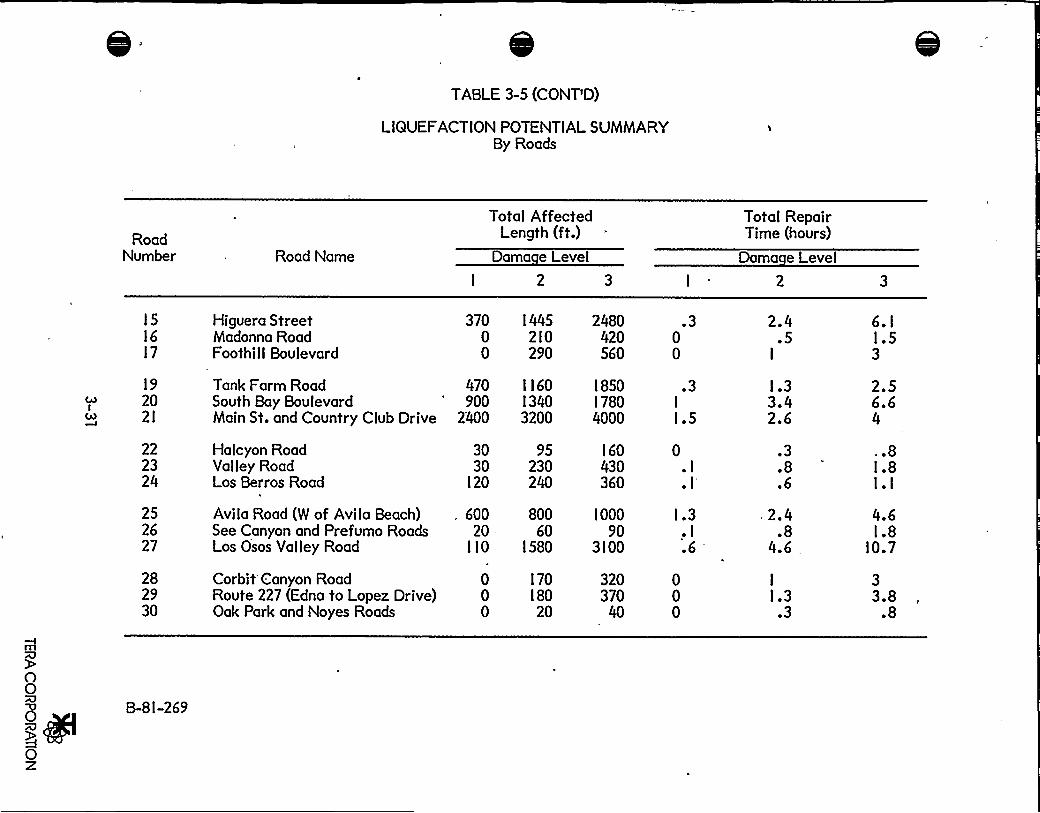
TABLE 3-5 (CONT'D)
LIQUEFACTIONPOTENTIALSUMMARYBy Roads
RoadNumber Road Name
Total AffectedLength (ft.)
Dama e Level
Total RepairTime (hours)
Dama e Level
ISl6l7
l9202I
222324
252627
282930
Higuera StreetMadonna RoadFoothill Boulevard
Tank Farm RoadSouth Bay BoulevardMain St. and Country Club Drive
Halcyon RoadValley RoadLos Berros Road
Avila Road (W of Avila Beach)See Canyon and Prefumo RoadsLos Osos Valley Road
Corbit Canyon RoadRoute 227 (Edna to Lopez Drive)Oak Park and Noyes Roads
370 I 445 24800 2IO 4200 290 560
470 II60 I850900 I340 I780
2'400 3200 4000
30 95 I6030 230 430
l20 240 360
. 600 800 IOOO
20 60 90IIO I580 3IOO
0 I70 3200
,I80 370
0 20 40
.300
.3I
l.5
0.I.I
I.3.I.6
2.4.5
I
l.33.42.6
.3
.8
.6
. 2.4.8
4.6
I
l.3.3
B-8I-269
3.2. I.3 BRIDGES
A standard method for evaluating the seismic vulnerability of bridges is not
presently available. The problem can be addressed using one of several
approaches.
The first approach involves performing a dynamic analysis in order to predict the
forces and displacements generated in the bridge as a result of an earthquake.
These forces and displacements are then compared with allowable forces and
displacements and a judgment is made as to the likelihood and extent of damage.
There are some uncertainties with respect to the accuracy of the predicted
forces and displacements and the corresponding allowable values. Even though-
quantitative results are obtained from this approach, prediction of earthquake
damage is still very much an art and must rely heavily on engineering judgment
if reasonable answers are to be obtained.
The second and more subjective approach to bridge seismic evaluation consists of
classifying different types of bridges and bridge components based on their
performance in past earthquakes. From this classification, a judgment can be
made regarding the probable performance of similar bridges and bridge compon-
ents in future earthquakes. This approach is far less expensive and time
consuming than the first approach and in general will yield reliable results. This
type of approach has been used by the California Department of Transportation
in deciding which bridges should be strengthened to resist earthquake loads.
The second approach was selected for this study. Guidelines for evaluating
bridges were specifically developed for this study based on experience with
bridge failures in past earthquakes. These guidelines are included in the
Appendix of this report. Each bridge was field inspected and photographed.
Drawings were obtained from the state and county departments of transporta-
tion, and a study of each bridge was performed following the guidelines. The few
secondary bridges for which drawings were unavailable were assessed from field
inspections. The following paragraphs discuss in general the basis for the
development of certain provisions in these guidelines.
B-8I-269 3-32
ERA CORPORATION
The primary concern of this part of the study is to assess the ability of bridges to
serve as effective components on the evacuation routes. As such, the predicted
structural damage was classified into one of three categories. The first category
involves little or no damage and results in little delay to traffic using an
evacuation route. Minor settlements in the abutment fills of approximately 4 to
5 inches are not considered obstacles to traffic since fillcan be added to smooth
the roadway. Likewise, minor structural damage to bridge bearings, columns,
and abutments are not considered an obstruction. For evacuation routes which
pass under a structure, only total collapse will result in traffic delays.
A second category of damage involves a delay to traffic of less than four hours.
In this case damage will occur that renders the bridge unusable by traffic, and
repair is necessary to make it usable for evacuation. The repair time should be
less than four hours. In assigning bridges to this category, no attempt was made
to anticipate the demand on personnel and materials for other purposes. Only
the physical time restraints for repairing the individual bridge were considered.
The third and final category of damage involves the total loss of the bridge as a
component of the proposed evacuation route. Repair is considered physically
impossible within a period of four hours regardless of the commitment of men
and material to the task.
Although the performance of a bridge is based on the interaction of all of its
components, it has been noticed in past earthquakes that four bridge components
are most vulnerable to damage. These are the bearings, columns or piers,
abutments, and foundations. Therefore the following guidelines were developed
around the evaluation of each of these components.
~Bearin s
Bearings are used at superstructure/substructure interfaces as well as at in-span
joints. For the purpose of evaluation, bearings are considered to include
restraints provided at these locations, including shear keys, restrainer bars, etc.
Bearings may be "fixed" bearings which do not provide for translational move-
B-81-269 3-33
TERA CORPORATION
ment, or expansion bearings which do. A bearing may provide for translation in
one orthogonal direction but not in the other.
There are basically four types of bearings used in bridge construction. First is
the rocker bearing, which is constructed of steel and which rocks to provide for
translational and/or rotational movement. It is the most vulnerable of bridge
bearings because it becomes unstable after a limited movement. The second
type is the roller bearing, which is also constructed of steel. It is. usually a fairlystable bearing during an earthquake except that it can become misaligned and
eventually displaced. Third is the elastomeric bearing pad, which has become
very popular in California. It is constructed of an elastomer and relies on the
distortion of this material to provide for movement. It is very stable during an
earthquake, although it has been known to "walk-out" under severe shaking. The
final bearing type is the sliding bearing, which may consist of anything from
asbestos sheet packing between two concrete surfaces to sophisticated teflon
and stainless steel bearings. I
Transverse restraint of some type is almost always provided at the bearings,
which usually consists of concrete shear keys, keeper plates, or anchor bolts. It
has been noticed that certain bearing applications have always performed well in.past earthquakes. Therefore, some structures may be considered nonvulnerable.
In vulnerable structures, failure is usually related to the relative transverse or
longitudinal movement at the bearings. The expected movement at a bearing is
dependent on many factors and is not easily analyzed. In the development of
Seismic Design Guidelines for Highway Bridges, the Applied Technology Council
(ATC) developed ari empirical formula for required support length at a bearing.
Since it is very difficult to predict relative movement, evaluation of bearing
vulnerability for the purpose of this study uses the ATC formula as the basis for
checking the adequacy of longitudinal and transverse support lengths. The ATC
formula is assumed to represent an upper bound for movement at the bearing.
Transverse restraining devices are assumed to fail at various peak ground
accelerations depending on the type of restraint provided. These assumptions
are based on past performance of these devices plus engineering judgment.
B-8I-269 3-34
TERA CORPORATION
Rocker bearings have proved to be the most vulnerable in past earthquakes and
are assumed to topple at various combinations of skew and peak ground
acceleration. If bearings topple, the guidelines require that some basic minimum
seat dimensions exist to prevent collapse. These are based on geometric
considerations and are considered necessary to keep the bearing from falling offthe seat.
A limitation is also placed on the amount of longitudinal movement that could
occur in a non-skewed bridge. Movement is limited to the maximum expected
opening at the expansion joints (twice the nominal opening) plus a factor to
account for loss of support effectiveness resulting from impacting at the joints.
The settlement of a span due to a bearing toppling is assumed to be a minor
problem easily solved by ramping with asphalt fill, etc. Only total loss ofsupport will result in Category 3 damage.
Columns and Piers
Columns have failed in past earthquakes due to lack of proper transverse
reinforcement and poor structural details. Excessive ductility demands have
resulted in a degradation of column strength in shear and flexure. In the most
serious failures in past earthquakes, the column eventually failed in shear
resulting in severe vertical settlements or its total disintegration. Another typeof column failure observed in the San Fernando earthquake was the pull-out oflongitudinal reinforcing at the footing. Fortunately, serious bridge column
failures usually do not occur except at fairly high ground accelerations.
During the San Fernando earthquake, all the damaged columns had insufficienttransverse reinforcement. There appeared to be a correlation between column
damage and the ratio of shear capacity to maximum shear force. The maximum
shear force is related to the flexural capacity of the bridge column. Therefore itis possible to calculate the shear capacity to maximum shear force ratio fromthe dimensions and reinforcement in the column. By making some simplifyingassumptions, a parameter was developed which reflects the vulnerability of the
B-8I-269 3-35
TERA CORPORATION
column to damage. This parameter was tested on bridges which failed in the San
Fernando earthquake. Critical values for the column vulnerability parameter.
were identified by observing the extent of damage that occurred. These values
were then adjusted using judgment to reflect'damage at different force levels.
More information about the development of this parameter is included in the
Appendix.
The guidelines also require that high single column bents be checked for possible
pull-out of the longitudinal reinforcement. None of the bridges within the study
area appear to be vulnerable to this type of damage.
Abutments
Abutment failures during earthquakes do not usually result in total loss of the
bridge. This is especially true for earthquakes of the intensity expected within
the study area. Therefore, the abutment guidelines were developed with the goal
of predicting damage that would temporarily prevent access to the bridge.
One of the major types of problems observed in past earthquakes has been the
settlement of fillat the abutment. Elms (l979) reports that in past earthquakes
of this magnitude th'ese settlements have been on the order of IO-l5 percent of
the fill height. However, observations of damage during the San Fernando and
other California earthquakes suggest far less settlement. Bridges within the
damage area of the San Fernando earthquake experienced average fill settle-
ments on the order of 3-5 percent. This was assumed to be due to superior
construction of fills, the absence of water, and the generally wider and better
retained bridge approaches. Based on judgment, an upper limit of l0 percent fillsettlement was considered possible in the study area. This value was then scaled
down for cases with lower ground accelerations, absence of water, and wide or
well-retained fills. The resulting predicted fill settlements are approximate but
give a good indication of the type of damage that can be expected.
Additional abutment fill settlements are considered likely in the event of
abutment failures due to excessive seismic earth pressures or seismic forces
B-8 l-269 3-36
TERA CORPORATION
transferred from the superstructure. Some simple rules were developed to
identify abutment types that could be vulnerable to this type of damage. These
rules were based on engineering judgment and the performance of abutments in
past earthquakes.
Foundations
For the purpose of this study, only foundation failures due to liquefaction were
considered. Because of the many water crossings within the study area, the
potential for this type of failure is considered high. A special study was
conducted to determine the potential for liquefaction at each of the bridge sites
on the major evacuation routes using boring logs and the procedure of Seed and
Idriss (l97I) and Seed (l979). Four different levels of liquefaction were
predicted.
The classification of bridge damage is based on the liquefaction potential and the
susceptibility of different types of bridges to liquefaction-induced ground move-
ment. The vulnerability of different bridge types was determined by studying
bridge liquefaction failures during the l964 Alaskan earthquake as reported byRose et al. (I 973), and various Japanese earthquakes as reported by Iwasaki et al.
It was observed in these earthquakes that bridges with continuous super-
structures and supports that were capable of large translational deformations
usually remained serviceable with minor repairs in the case of large liquefactionmovement. However, bridges with discontinuous superstructures and/or brittlesupporting members usually were rendered useless. Therefore, this observation
was taken into account in determining the damage category for the various
bridges in the study area.
The guidelines are generally written to consider the effect of the failure of one
component on the failure of the entire structure. Therefore, the final damage
category is usually the maximum category chosen for any one of the fourcomponents. It is still necessary to look at the total damage and use engineering
judgment to determine ifbridges should be classified in a higher or lower damage
B-8 I-269 3-37
TERACORPORATION
category. Often a bridge will be such that its exact damage category is
questionable. 'This is taken into account by using engineering judgment to
establish the best estimate of total bridge damage due to the anticipated
earthquake. Figures 3-4 and 3-5 present the locations of the state and county
bridges considered in the analysis. Table 3-6 presents a summary of the bridge
damage by roads. Detailed bridge review is presented in the Appendix.
B-8I-269 3-38
TERA CORPORATION

SAN LUIS OBISPO AREA -Northern Section
Figure 3-4aSTATE BRIDGES
ATASCADERO
CAYUCOS
I$ NcL
TORO CREEK49»05
RTE I 4 I SEP
41 ATASCADERO49-51
ATASCADERO4~
058
MORRO CREEK49-ISI
ATASCADEROCRKI4M9
Eslero
Boy
M
'I
. ~ 'IO'S I
NMORROBAYVC2l9-109
5 MORRO BAY49-l08
BAYWOODPK49-I 77
BUENA VIS49-94
CRAM)AVEVC 2i3SANTA
M
RTESB IOI SEP49-I 58
ST MARGARITA49%7
MORRP
".:.„:., R
Mero;:. Boy
SAN
,-.s 'OAD
CHORRO CR OH 2i3
5N BRpsu7o Eo v49-ISS
SAN BERNARDO C4~RTE I IOI SEP I49 l4l
CALIFBLVDUP49-l47
CALIFBLVDOC49-79
STEPS'REEK49-I 23
CUESTA OVERH2(3
Qoi
ACACIACREEK49-I 17
SAN L CBISPO C49-52
SAN L OBISPO C49-57
SantaNargorila
Lake
I 0 I 2 3
SCALE MI ISLES
FaintBrjahcs7
6NM. ~S~I
'S
A
LOS OSOS
SLOBI4ILSS
MARSH ST SEP.4948
MADOISIARD OC49 l90 I,
I.OsOSOs
ROAD
CHORRO ST UC
4~'os
OS
DAD
<c
EI+
''GCL'j
CG
X
Is A
gong+
+o
LEGEND
RRRAIIT SVACQITIOR ROaD
STOORDARV RVaOOaaloll ROAD
OTRRR ROADS
0 STATE BRIDGE
SROGE NAME
avaa~»s ~EXPECTED CAMAGE
SRDGE NMMSER
TERACORPORATION

0
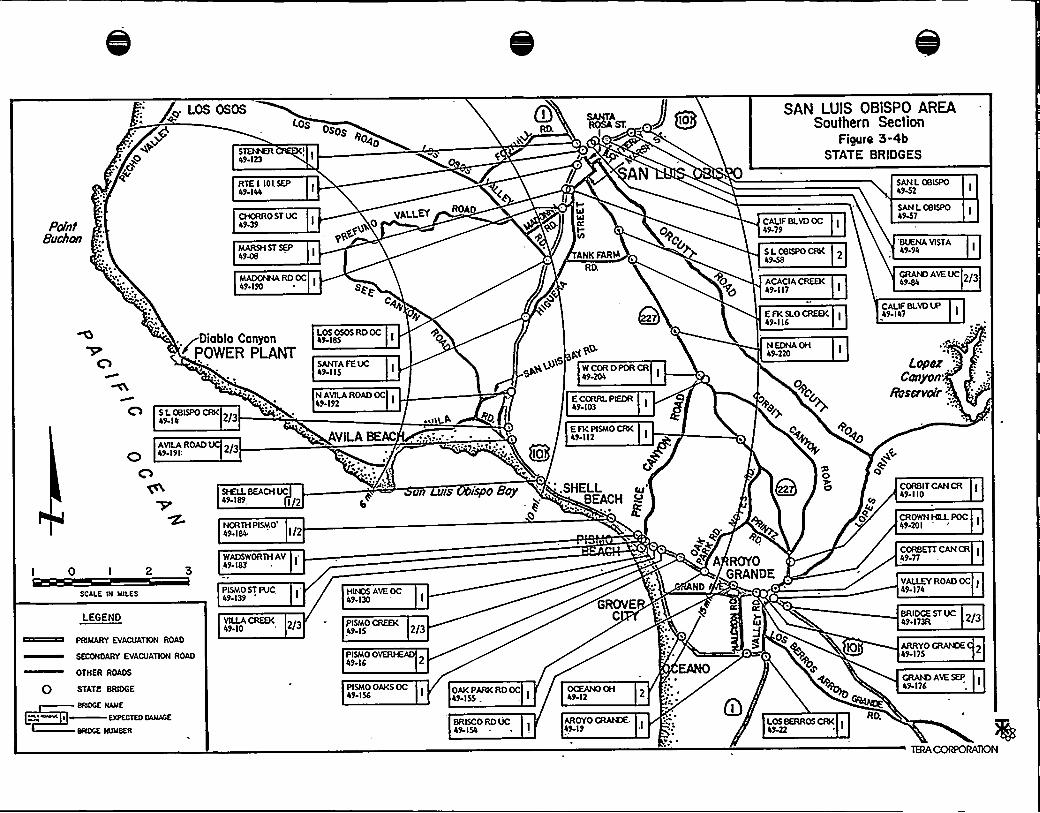
A3. LOS OSOS
STEI883449-123
RTE I IOLSEP49-144
I.DSOSDS
leap~
0 gg;»ih
SAN LUIS OBISPO AREASouthern Section
Figure 5-4bSTATE BRIDGES
SAN L 0815PO49«52
Paint8ua/Ian
CHORR0 ST UC4IL39
MARSH ST SEP4948
p LLEar ROAD
eceoT,O
MADOMAARD OC49 190 Sp~
a~4
IMlMIIL'
MI 0
ANILFARIA
RD.
0~o
CALIFBLVDOC49-79
5 L OBISPO CRKl9-58
ACACIACREEK49-117
E FK SLO CREEK49-116
SAN L OBISPO4947
'BUENA VISTA49-94
GRAM)AVEUC 2/349M
CALIFBLVDUP49-147
5 L 085PO CRK2/3
AVILAROAD49 191'/3
Diablo Conyon+POWER PLANT
LOS 0505 RD OC49-185
SANTA FE UC49-115
N AVILAROAD OCl9-192
AYILABEAC
~peG
W COR D PDR CR49-204
E CORRI. PIEDR49-103
E FK P5MO CRKI49-112
N EDNA OH49-220
Og
+e~
~o
Lopar'anyon
Absmefr "..
0 I 2 3
SCALE iN MILES
LEGEND
VRIIIRT EVEDDETER RaaD
EEDOROIJIV EVIOOITIOR ROaD
OTHER ROADS
O STATE BRIDGE
BROGE NAME
'«'~» I «EXPECTED CAMAGE
SROGE NUMBER
QKLLBEACH UC49 189 I 2
NORTH PISMO'9
184
WADSWORTH AV,49-183
PISMO ST PUC,49-139
VtLLACREEK
HIM35 AVE OC49-130
PIQAO CREEK49-15
PIQAO OVERIKAD49 16
PIQAO OAKSOC'9-156
AKPARKRDOCIl9 155
BR5CO RD UC49-154
on rs isloo oy
E3
SHELLMA'EACH
GROVEC
OCEANO OH49-12
AROYO CRAM3E'49-19
eo+R~ A ROYO
GRANDEND /
O
MI
OS
oe
LOS BERROS CRK
4vCT
Rp.
CORBIT CAN CR49 I IO
CROWN HLLPOC49-201
CORBETT CAN CR49-77
VALLEYROAD OC I49-174
BRIDGE ST UC49 173R
ARRYO CRAM7E49-175
CRAM3 AVE SEP49-176

!
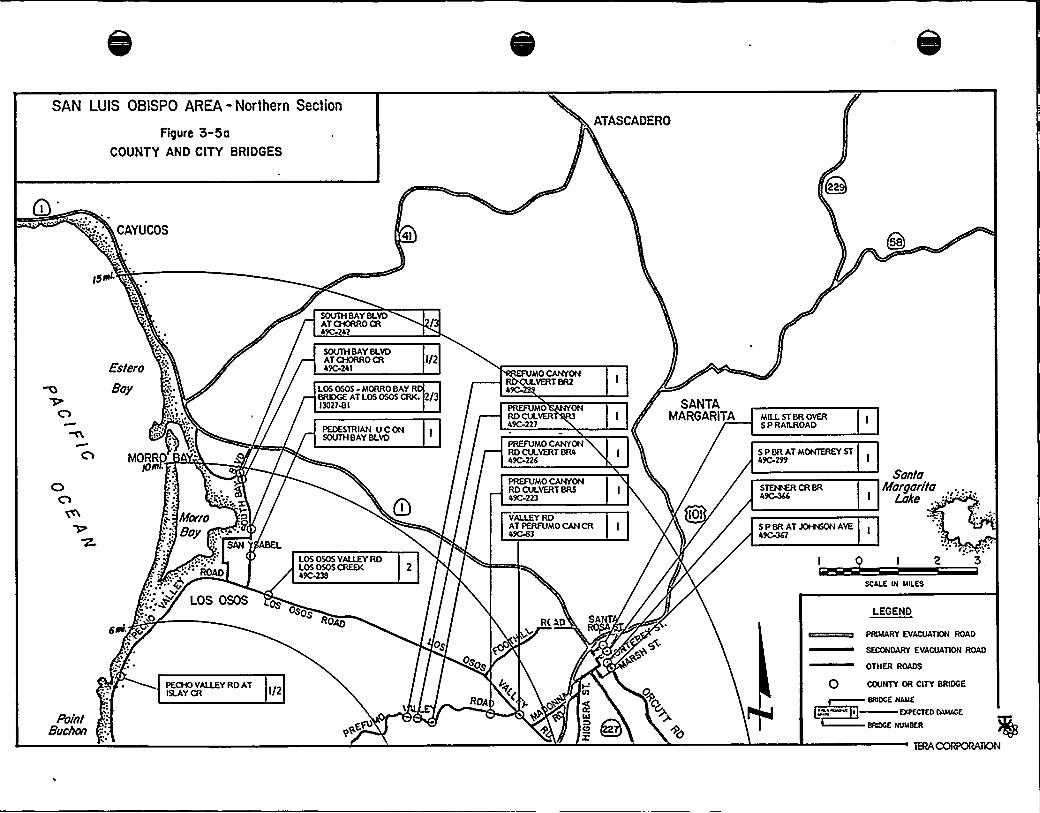
SAN LUIS OBISPO AREA-Northern Section
Figure 5-5aCOUNTY AND CITY BRIDGES
ATASCADERO
QI
CAYUCOS 4IQss
'\ ~
Es/ero
8oy.. ~ E
'>TEE ~
ITIORRP
SOUTH BAYBLVDATCHORRO CR49C-242
SOUTH BAYBLVDATCHORROCR I/249C-2 4 I
LOS OSOS - MORRO BAYRBRIDGE AT LOS OSOS CRK /3I3027< I
PEDESTRIAN U C ONSOUTH BAYBLVD
MO CANYONVERT BR2
49C-
PREFUM0 ONRD CULVER49C-227
PREFUMO CANYONRD CIA.VERT BR449C-226
SANTAMARGARITA MILLST BR ovER
S P RAILROAD
S P BR AT MONTEREY ST49C 299
Point8oo/7orr
Norro.. 8oy '.:
SAN ABEL
.T" ROAD
QI
LOS OSOS VALLEYRDLOS OSOS CREEK 249C-233
ososos
ROAD
'
PECHO VALLEYRD ATISLAYCR
eEqu
LOS OSOS
~ "AO
BIIN e%
os
PREFUMO CANYONRD COVERT BRS49C-223
VALLEYRDAT PERFUMO CANCR496%9
R( AD SANT'v ROP'IA
OSps
l~ROA p.
IOI
O~
+o
STEPPER CR BR490466
Son/oNorgori/o
Loke
S P BR AT 3O494MN AVE4~7
I 0 I 2
SCALE DI MILES
LEGEND
TRIIARY EVACOATHH ROAD
EECCHDAAY EVACOATIOH ROAD
OTHER ROACH
O COUNTY OR CITY BRIDGE
BRIDGE NALIE
EXPECTED CAMAGE
BRXXIE NUMSER

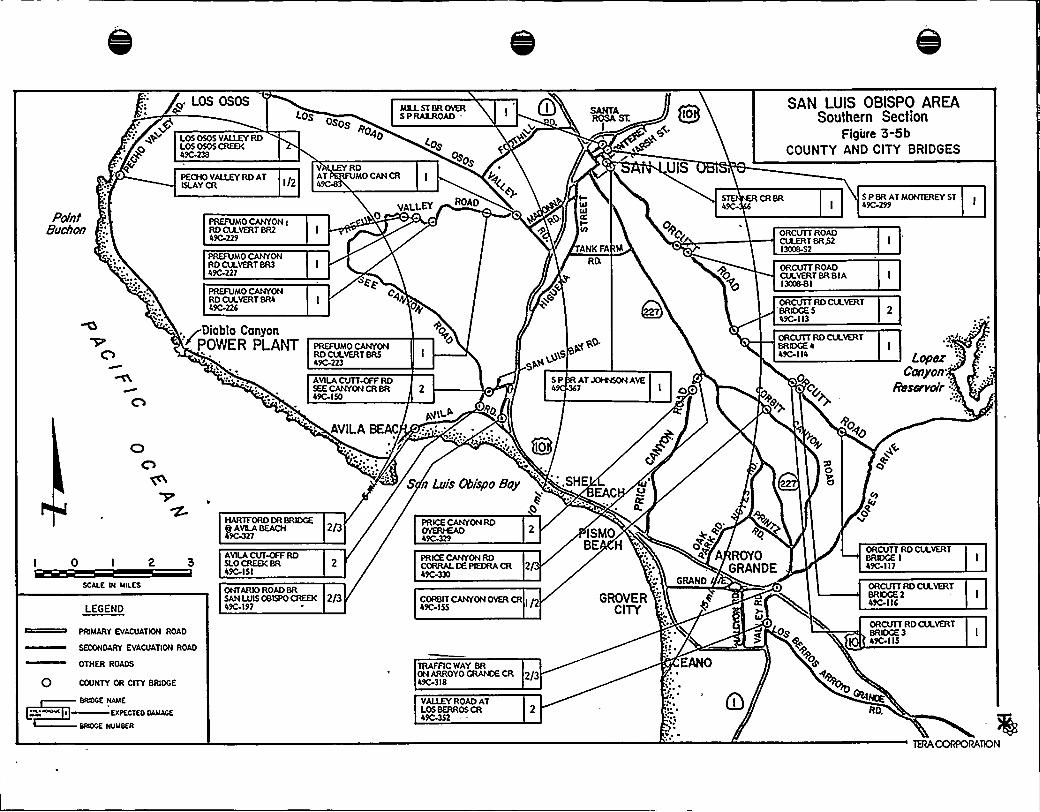
o LOS OSOS
~ . ~+ LOS OSOS VALLEYRD~ o LOS OSOS CREEK
o+ 49C-238
PECHO VALLEYRD ATISLAYCR I/2
MILLST BR OVERSPRALROAD-<Os
OSno40
<OS
+oI
V LEY RDAT MO CANCR4
'R% UT. QNO
I
UIS
SAN LUIS OBISPO AREASouthern Section
Figure 3«5bCOUNTY AND CITY BRIDGES
Point8ud/on
PREFUMO CANYON IRD CULVERT BR249C-229
PREFUMO CANYONRD CLLVERTBR349C-227
PREFUMO CANYONRD CULVERTBR449C«I26
VALLEY ROAD
L3
MIIEI
ILO
ANKFA IA
0
549C-
+o0
5 P BR AT MONTEREY STI 49C-299
ORCVTT ROADCVLERT BR$213008-52
ORCVTT ROADCLX.VERTBR B IA1300881
ORCVTT RD CIAVERT'RIDGE 549C-113
Diablo Canyon~POWER PLANT PREFVMO CANYON
RD CLX.VERTBRS49C-223
AVILACVTT~RDSEE CANYONCR BR49C-150
s>54
Agg.A nO
AVILABEAC
~:..'. r '"i... QIO
AT 3019eON AVE1 o ~
ORCVTT RD CLAVERTBRIDGE 449C-114
O gg+e,
+0~o
E«A
~ E
Lopez '.
CL2nyon.
/IIFSCFVNI'
I 0 I 2 3
SCALE W MILES
LEGEND
~UIIUIYEvaEUaTENI RoaD
EONNIDARY EhaOUATIUU ROAD
OThER RDAOE
0 COUNTY OR CITY BRIDGE
8140CE LIAME
~«*«hovET ~EXPECTE00AMACE
88OCE MCMSEIL
HARTFORD CR BRIDGEO AVILABEACH49C427
AVILACUT~ RDSLO CREEK BR49C-ISI
ONTARIO ROAD BRSAN LUIS 085PO CREEK49C-191
2/3
2/3
PRICE CANYONRDCORRAL DE PIEDRA CR49C-330
2/
CORBIT CANYONOVER CRI /249C 155
TRAFFIC WAY BRON ARROYO CRAM3E CR49C-318
VALLEYROAD ATLOS BERROS CR49C852
2/3
S n Luis Obispo Bay
L3
PRICE CANYONRDOVERtEAD49D829
SHEEAC
ISMOBE H
GROVERCITY
E
N
E
ROYONDE
Os
~o'~+
e~ AGRA
GRAND I
O5
o+
oe
«U'RCVTTRD CLLVERT
BRIDGE I I49C-117
ORCUIT RD COVERTBREXZ 2 I49C 115
ORCUTT RD CULVERTBRIDGE 3 I
IQ 49C I I 5
+O
RD.

e
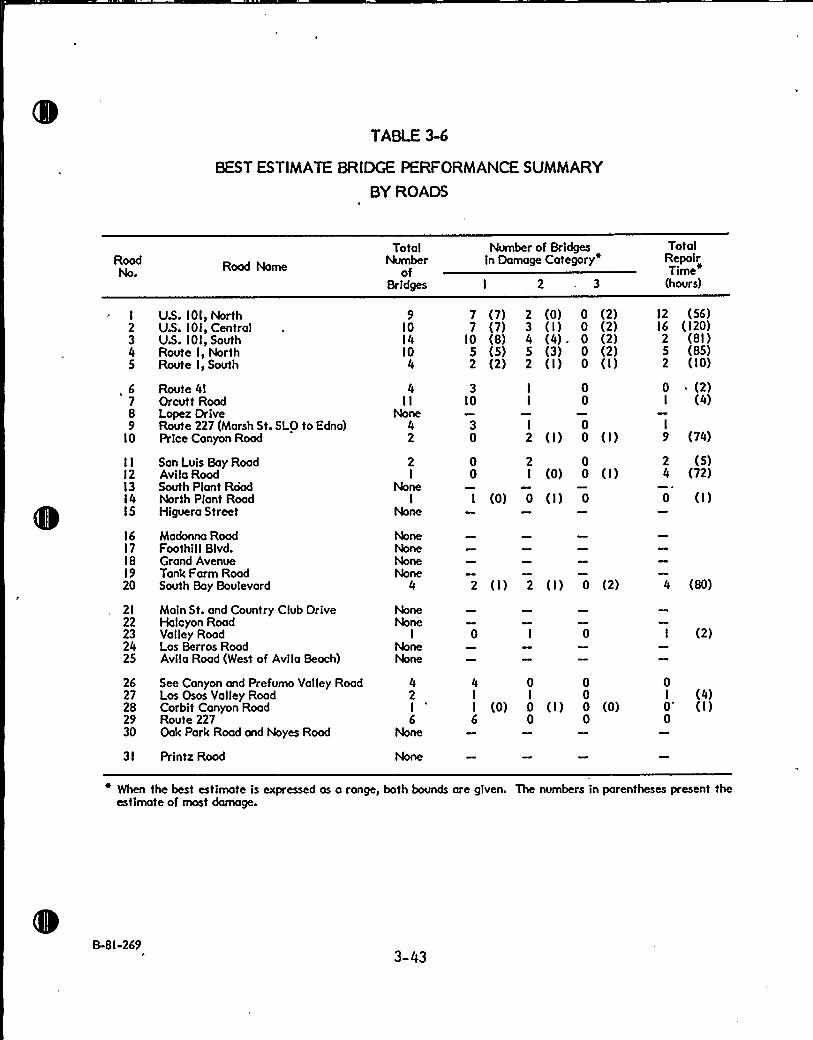
TABLE 3-6
BEST ESTIMATE BRIDGE PERFORMANCE SUMMARY
BY ROADS
RoadNo.
US. IOI, NorthU5. IOI, CentralUS. IOI, SouthRoute I, NorthRoute I, South
TotalNumber
ofBridges
91014104
Number of Bridgesin Damage Category"
I 2 3
7 (7) 2 (0) 0 (2)7 (7) 3 (I) 0 (2)
10 (8) 4 (4) ~ 0 (2)5 (5) 5 (3) 0 (2)2 (2) 2 (I) 0 (I)
TotalRepairTime"
(hours)
12 (56)16 (120)2 (81)5 (85)2 (10)
. 6'789
10
Route 41Orcut t RoadLopez DriveRoute 227 (Marsh St. SLO to Edna)Price Canyon Road
4II
None42
3IO
30
I 0I 0
I 02 (I) 0 (I)
0 (2)I (4)
I
9 (74)
II121314!5
1617181920
San Luis Bay RoadAvila RoadSouth Plant RoadNorth Plant RoadHiguera Street
Madonna RoadFoothill Blvd.Grand AvenueTank Farm RoadSouth Bay Boulevard
2I
NoneI
None
0 2 00 I (0) 0 ( I )
I (0) 0 (I) 0
2 (I) 2 (I) 0 (2)
2 (5)4 (72)
0 (I)
4 (80)
2122232425
Main St. and Country Club DriveHalcyon RoadValley RoadLos Berros RoadAvila Road (West of Avilo Beoch)
0 0 I (2)
2627282930
31
See Canyon and Prefumo Valley RoadLos Osos Valley RoadCorbit Canyon RoadRoute 227Oak Park Road and Noyes Rood
Printz Road
42I6
None
4 0 0I I 0I (0) 0 (I) 0 (0)6 0 0
0I (4)0'I)0
" When the best estimate is expressed as a ronge, both bounds are given. fhe numbers in parentheses present theestimate of most damage.
B-81-2693-43
3.2. I.4 DAMAGEDUE TO FLOODING
Dam Failure
Three major dams are located in the vicinity of the study area. The Salinas dam
has its valley located totally outside the study area and is not considered herein.
The Lopez dam, built in l 968, is an earth-filled zoned dam owned by the SanLuis'bispo
County Flood Control Department. The Whale Rock dam, built in l96I, is
a rock-filled dam with a clay core and is under the jurisdiction of State Dams
Operation and Maintenance in Sacramento. Both dams have had a "National Dam
Inspection Report." They are considered safe for the storage of water; however,
both are underlain by alluvium, and a liquefaction potential exists. The owners
have been asked to study the problem. The Whale Rock dam is presently being
studied for its seismic safety by Converse, Ward, Davis, Dixon and Associates.
Their preliminary findings indicate that the foundation is not susceptible to
liquefaction (Babbit, I 98 I).
It is outside the scope of this study to assess the seismic safety of these dams.
However, their potential failures are a major threat to life and property as well
as to important evacuation routes. The Lopez Canyon Reservoir would flood the
Arroyo Grande Valley, damaging Arroyo Grande, Grover City, Pismo Beach, and
Oceano, thereby closing Routes IOI and I south. The failure of Whale Rock dam
would flood Cayucos and close Route I north of Route 4I.
Tsunami
Tsunamis are tidal waves generated by rapid vertical displacements of ocean
water either from tectonic movements of the ocean floor associated with
faulting or by major submarine landslides. Since the Hosgri fault is of the strike-
slip type, it is very improbable that it can generate a tsunami. There is a remote
possibility of a seismically-induced submarine landslide; however, its effects
would be expected to be localized with waves sufficiently small so as not to
interfere with the safe evacuation of the study area. Therefore, tsunamis were
not considered as a potential seismic hazard in this study.
B-81-269 3-44
TERA CORPORATION
3.2.2 ROAD NETWORK
The evacuation route network consists of the following three major radial
highways:
o Route I 0 I crossing the mountains north of San LuisObispo;
o Route IOI south of San Luis Obispo passing through theurbanized region along the south coast; and
o Route I from San Luis Obispo to Morro Bay and passingalong the coast to the north.
To supplement these interregional highways, four other routes have been
identified:
Route 4 I from the intersection with Route I in Morro Bayto Route IOI in Atascadero;
Orcutt Road from San Luis Obispo via Lopez Drive to theintersection with Route I 0 I in Arroyo Grande;
Route 227 to Price Canyon Road and then to the inter-section with Route IOI in Pismo Beach; and
Route I from the interchange with Route I 0 I on thenorthern outskirts of Pismo Beach south along the coastand out of the study area.
In addition, a number of city streets and secondary roads will be used to access
the major highways.
In the following sections, each major highway is reviewed in order to assess the
potential damage to the evacuation network that might result from the earth-quake under consideration. Detailed tables are presented in the Appendix.
B-SI-269 3-45
TERA CORPORATION
3.2.2. I ESTIMATED DAMAGE TO MAJOR EVACUATIONROUTES
Route IOI North (road length: 8.0 miles)
From the junction with Route I in San Luis Obispo, Route IOI follows the
general alignment of El Camino Real. Within the city, it is constructed to
freeway standards; however, some features, such as shoulder and median widths
and spacing and design of interchanges and ramps, do not conform to current
practice. On the outskirts of the city, the ascent to Cuesta Pass begins, and the
design standard is reduced to expressway, although there are few intersecting
roads and practically no tributary traffic. As the'grade steepens to 7'h percent,
the shoulders and median narrow, and a median barrier has been installed to
prevent cross-median accidents. A number of openings are provided in the
barrier which would allow median crossing if need be. In this section and
continuing on the descent to Santa Margarita, the overall roadway (pavement and
shoulders) is too narrow to accommodate disabled vehicles without impeding
traffic. At the bottom of the grade, the highway enters a rollirigvalley, and the
design changes to freeway standards, with full control of access and normal
shoulder widths.
Ground Failure
The California Department of Transportation reports continued fill settlement
and ground water problems in this area. Because natural slopes and cut-and-fill
slopes are over-steepened due to the existing settlement problems, some
blockage is anticipated even though the expected ground acceleration is low
(~0.20 g). Many rockfalls may occur, along with some rock slides and debris
slides, which could close the two northbound lanes in several areas. The higher
fills will probably settle down and out, severing the two southbound lanes locally
and possibly all lanes. Wet weather would certainly increase the damage.
Slumps and debris slides may occur on the westerly facing fill slopes. The total
road lengths where potential blockages of one and two lanes were identified are
5,500 feet for the northbound direction and 4,900 feet for the southbound
direction. Bounding expected blockages for damage levels I and 3 respectively
B-8I-269 3-46
TERA CORPORATION
vary between 0 and 920 feet (northbound) and 20 and 200 feet (southbound). No
significant liquefaction is expected on this road.
Bridge Failure
Several bridges present potential problems in this area leading to potential
closure of IOI North and requiring the use of alternate routes and bypasses.
o The Pacific Railroad California Boulevard Overcrossing(49-79) is expected to fall off its bearing, but not tocollapse on the road; this would not affect the roadtraffic.
o The Grand Avenue Undercrossing (49-84) might sustain aloss of „support at span 4 resulting in partial collapse andclosure to traffic. City streets would have to be used tobypass this bridge.
o The Pacific Railroad Cuesta Grade Overcrossing (49-60)might sustain a loss of support at the expansion joints. Ifno collapse occurs, the span might be shored, resulting ina traffic delay of one-half to one day. The collapse of thespan would effectively result in the closing of IOI North,since the bypass to this bridge is a one lane dirt road.
o The Route 58/IOI Separation Bridge (49-l58) might po-tentially collapse, although this is doubtful at the lowacceleration levels expected at its location. A directofframp bypass is available.
Route IOI Central between junction of Route I and Avila turnoff (road length:8.9 miles)
Running south from the intersection with Route I in San Luis Obispo, Route I 0 I
follows the gently rolling San Luis Obispo Creek Valley before it turns southeast
along the coast. The entire route to the study area boundary and beyond is offreeway design construction, although the portion within San Luis Obispo is
below today's standards.
B-8 I-269 3-47
TERA CORPORATION
Ground Failure
A 400-foot road cut section is susceptible to failure (onramp northbound IOI
from Avila); this could cause total closure of this onramp due to rock falls and
rock slides. Rock falls might close the southbound lane over an estimated
I,I00 foot section of cut slopes. Bounding lengths of expected blockages vary
between I IO and 220 feet.
Liquefaction is a major concern through the San Luis Obispo Creek area (l7,000
feet discontinuous). Lateral spreading and fill settlement may remove one or
more lanes where the highway either crosses the creek or parallels the creek.
Groundwater is very high, near the surface, with numerous fills along the
highway. Bounding estimates of the lengths of damaged roadways vary between
2,300 and 7,500 feet mainly'in the northbound direction.
Bridge Failure
Two bridges present potential problems to this section of the highway. The San
Luis Obispo Creek Bridge (49-I4) is in a highly liquefiable zone. While the
northbound lane has been retrofitted to improve its earthquake performance, the
southbound lane has not been upgraded, making it most vulnerable. However,
both lanes might undergo extensive damage forcing the closure of the bridge.
The bypass is involved since it requires the use of San Luis Bay Road and Avila
Road, because the truss bridge on the frontage road (49C-l97) is expected to
collapse. Both bridges on the bypass road (49C-IS I and 49C-l50) might undergo
some settlement resulting in minor to moderate traffic delay. The Avila Road
Undercrossing (49-l9l) might also undergo severe deformation due to liquefac-
tion, requiring shoring with a traffic delay of at least 8 hours.
Route IOI South from Avila turnoff to I.4 miles south of Los Berros turnoff4: 144
This stretch has 'intermittent frontage roads on both sides of the highway, and
access ramps are spaced from one-half to two miles apart. This route has
B-8I-269 3-48
TERA CORPORATION
moderate grades and curves, and ample space for disabled vehicles outside the
traffic lanes.
Ground Failure
A number of soil and rock falls, over l400 feet of the roadway, might be
anticipated l.2 miles north of Los Berros Road, north of Pismo Beach and near
Gragg Canyon. Bounding lengths of expected blockage vary between l30 and 260
feet in the northbound direction and are negligible in the southbound direction.
One main area of liquefaction is expected in the 5,000 lineal feet of fills across
the Price Canyon drainage area. This would result in lateral spreads and
settlement to fills, closing all four lanes in several locations. Liquefaction could
also take place at the Avila Beach - U.S. IOI interchange across Gragg Canyon
drainage, where fills might be susceptible to settlement. The estimate of the
length of damaged roadway varies between l,900 and 3,300 feet.
Bridge Failure
Structural damage is not expected to affect traffic on IOI South in this area,
although some overcrossings might be closed to traffic. The Bridge Street
Undercrossing (49-l73R) will probably topple off its bearings and possibly lose
spans I and 3, thereby closing IOI to northbound traffic.
Route I North (road length: I5.3 miles)
Route I, known as the "Coastal Highway," is a designated primary state route.
The segment of interest originates on Santa Rosa Street at the Route IOI
overpass structure and terminates l.9 miles north of the Route 4I intersection.
lt is developed as a four-lane urban arterial, changing to expressway standards
near Foothill Boulevard. Through the rural area between San Luis Obispo and
Morro Bay, the route is a four-lane, divided expressway with limited access and
at-grade intersections. Through the southern portion of Morro Bay, Route I is
constructed to freeway standards, with four full interchanges. North of the
B-SI-269 3-49
TERA CORPORATION
Route 4I interchange, the highway reverts to expressway standards. Outside the
study area, and beyond the town of Cayucos, Route I becomes a two-lane
highway. Both horizontal and vertical alignment of this highway are good and
there are no serious roadside restrictions. Full shoulders provide ample space for
disabled vehicles. The median is usually at grade without fences or barriers,
which would allow easy access between the south and northbound lanes.
Ground Failure
No landslides are anticipated along this portion of Route I, since both cut and
fillslopes are not expected to fail.
Fourteen zones of variable length along the road, for a total of l2,500 feet, have
been found susceptible to liquefaction, lateral spreading, and fill settlement.
Significant damage might be expected in fills constructed over stream channels
or where the road parallels stream channels. Due to the width of the highway
and relatively low slopes, it is unlikely that all four lanes would require repair in
more than a few areas, the most susceptible being those close to the sea coast
due to higher predicted accelerations. Bounding lengths of expected damage for
this road vary between 2,000 and 7,500 feet.
Bridge Failure
The Chorro Creek Overhead (49-63) is expected to undergo some settlement and
possibly complete closure in the event of liquefaction. The northern bypass
consists of a four-mile, one lane road. No other bridges are expected to sustain
structural damage, but all four bridges north of the south Morro Bay Undercross-
ing could potentially undergo 6- to I 2-inch fillsettlement.
B-8I-269 3-50
TERA CORPORATION
Route I South from Pismo Beach to Valley Road (road length: 4.4 miles)
Ground Failure
The road fills constructed over the railroad tracks (Oceano Overhead) are
susceptible to settlement and debris slides possibly closing the outside lanes.
Total closure is not anticipated by failure of the road fills. Bounding estimates
vary between 80 and l60 feet for damage to one lane and between 200 and
400 feet for damage to two lanes.
Moderate to major damage can be expected by liquefaction along an 8,000-foot
discontinuous section near Meadow Creek (Lagoon area) and over stream
crossings in Pismo Beach, Grover City, and Arroyo Grande Creek. Fill settle-
ments and lateral spreads are likely. The bounding estimates of the lengths of
damaged roadways vary between I,800 and 6,800 feet.
Bridge Failure
The Oceano Overhead (49-l2) might topple off its bearings and undergo some
settlement requiring minor ramping. Liquefaction might produce large deforma-
tions in the bridge across Villa Creek (49- I 0) and necessitate bent shoring.
Route 4I (road length: 5.0 miles)
This route provides a connection between the Morro Bay urbanized area and
Route IOI North at Atascadero. The route is two-lane, built to mountainous
terrain standards, with steep grades, sharp curves, and narrow shoulders. Traffic
capacity is correspondingly low and, therefore, Route 4I should be regarded as a
limited alternative for light damage scenarios, to be used primarily by vehicles
originating in the Morro Bay area, with the preferred evacuation route being the
Route IOI North corridor.
B-8I-269 3-5 I
TERA CORPORATION
Ground Failure
Debris and rock slides may be severe over the I.5 miles of roadway which passes
through the steep hilly area. Total closure might occur to both lanes but is notexpected due to the low peak ground accelerations. Bounding lengths ofexpected blockages vary between 60 and 200 feet for one lane.
Nine zones of potential liquefaction are found on this five-mile stretch. Lateral
spreads and minor fill settlements are anticipated over stream channels.
Bounding estimates of the lengths of damaged roadways vary between 350 and
I,800 feet.
Bridge Failure
The four bridges on the road to Atascadero are expected to sustain only minor
damage with no traffic delay.
3.2.2.2 ESTIMATED DAMAGE TO SECONDARY EVACUATIONROADS
Orcutt Road (road length: I5.4 miles)
The Orcutt Road route provides an alternative to Route IOI South that may be
used by vehicles originating in San Luis Obispo and preferring to evacuate to thesouth or by vehicles from the Arroyo Grande and Grover City regions heading
north. This route may become particularly important if prevailing winds should
cause early exposure of the south coastal area to a radiological release. OrcuttRoad originates in San Luis Obispo and is maintained by the county throughoutmost of its length. The road traverses rolling terrain and has fair alignmentwithout any long steep grades.'n the southern end, the route follows LopezDrive and State Route 227 into and through the city of Arroyo Grande.
B-8I-269 3-52
TERA CORPORATION
Ground Failure
Minor landsliding with one lane closure could be expected near the Southern
Pacific Railroad overpass at Johnson Avenue. On the Lopez Drive section, five
locations of potential rock fall and debris slides extend discontinuously over
2,200 feet. The bounding estimates of blockage vary between 240 and 480 feet
for one lane and 60 and l20 feet for both lanes.
Liquefaction may occur at the intersection of San Luis Obispo Creek and Johnson
Avenue and at the various Corral de Piedra Creek crossings, resulting in lateral
spread and minor filldisplacements. On the Lopez Drive section, three areas of
potential liquefaction extend discontinuously over l,200 feet. The bounding
estimates of the length of damaged roadway vary between zero and 750 feet.
The potential for liquefaction in the road fill, traversing the. reservoir near
Lopez Drive, is considered remote due to the low acceleration level.
Bridge Failure
The bridges on this road are of the small culvert type. Minor damage is expected
due to settlement, requiring no repair with the possible exception of Bridge
49C-I I3, which is located in a zone of high liquefaction potential. The bridges
on Johnson Street (49C-367 and 49C-366) are not expected to undergo traffic-delaying damage.
Route 227 and Price Can on Road (road length: I I.5 miles)
This route is generally parallel to Orcutt Road and would serve a similar
function. The evacuation route originates in San Luis Obispo and follows
Route 227 to its intersection with Price Canyon Road, continuing over the
county-maintained Price Canyon Road, terminating at Route IOI in Pismo
Beach. This route avoids not only a section of Route 227 with poor vertical and
horizontal alignment but also the congested urban business district of Arroyo
B-8 I-269 3-53
TERA CORPORATION
Grande. This route has a relatively wide pavement (including paved shoulders on
Price Canyon Road) that could permit two-lane traffic in the principal evacua-
tion direction in extreme circumstances.
Ground Failure
No landslides are anticipated on Route 227. On Price Canyon Road, one
discontinuous section (three cuts) approximately 800 feet long is susceptible torock falls. Another major l,500-foot section of potential rock falls and rock
slides is located l.3 miles north of Route lOI and may block both lanes. The
bounding estimates of the length of road blockage vary between 80 and l60 feetfor one lane and l50 and 300 feet for'both lanes.
Four zones of potential liquefaction are recognized for a total length of3,200 feet on Route 227. On Price Canyon Road, a major 2,000-foot section near
Edna and two small zones (200 feet each) at stream crossings have been
identified. Minor fill settlement and lateral spreads are anticipated. The
bounding estimates of the length of damaged roadway vary between l40 and
2,700 feet.
Bridge Failure
No damage is expected to bridges on this section of Route 227. The bridge over
San Luis Obispo Creek on Marsh Street (49-58) may undergo bearing failurerequiring minor ramping. On Price Canyon Road, the Price Canyon Road
Overhead (49C-329) is expected to undergo moderate settlement and liquefac-tion requiring ramping. The bridge over Corral de Peidra Creek (49C-330) mightbe closed to traffic due to severe liquefaction. Both bridges can be easily
bypassed on the old Price Canyon Road.
B-8l-269 3-54
TERA CORPORATION
3.2.2.3 ESTIMATED DAMAGE TO PLANT ACCESS ROADS
San Luis Ba Road (road length: I.4 miles)
Ground Failure
One oversteepened fill 200 feet long is susceptible to settlement and possible
slumping on both sides of the road. Damage would result in partial closure to
both lanes, leaving the road center open to traffic. The estimate of the length
of road blockage is about 50 feet.
One 400-foot section across the See Canyon drainage may fail due to liquefac-
tion, lateral spreads and minor fill settlement. Significant damage may be
anticipated for both lanes. Another l,200 feet of road crosses an area of low
liquefaction potential. The bounding estimates of the length of damaged
roadways vary between 250 and 600 feet.
Bridge Failure
The bridge over San Luis Obispo Creek (49C-ISI) is expected to undergo
moderate settlement requiring minor ramping, while the bridge over See Canyon
Creek may be damaged by liquefaction and require more significant ramping.
Avila Road from Route IOI to Marina (road length: 4.6 miles)
Ground Failure
There is a potential for major landsliding along 5,000 feet of oversteepened cut
and natural slopes which could result in the closing of both lanes. Some failures
presently exist. The bounding estimates of the length of road blockage vary
between l,300 and 2,000 feet.
Major liquefaction damages are expected along 7,300 feet (discontinuous) of the
road with closure of both lanes. The fill area at the public pier and the road
B-SI-269 3-55
TERA CORPORATION
from the bridge over San Luis Obispo Creek east to below the storage tanks have
the highest susceptibility to damage. The bounding estimates of the length of
damaged roadway vary between l,600 and 2,900 feet.
Bridge Failure
The Harford Drive Bridge (49C-327) is expected to be damaged by settlement
and shifting at the bearings requiring moderate ramping. If the severe
liquefaction potential in the area materialized, the structure would likely lose a
span.
PGandE Access Road from Avila Road to Diablo Canyon (road length: 7.0 miles)
Ground Failure
Natural slopes are oversteepened, and 5,000 to 6,000 feet of roadway are
susceptible to debris slides and rock falls, which could result in the closure of
both lanes. Fourteen steep, high fills have been placed across the major
southwest flowing drainages. There is much evidence (tension cracks and repair
patching) that the fills are presently settling. Slumping and debris slides are
expected on some of these fills resulting in the closure of both lanes. The
expected length of blockage of both lanes varies between 700 and l,000 feet.
No liquefaction is anticipated along this road.
Bridge Failure
There are no bridges on this road.
B-8I-269 3-56
TERA CORPORATION
North Plant Road. Northern Access to the Plant. Fields Ranch Road and PechoValley Road from Diablo Canyon to intersection of South Bay Blvd. and Los OsosRoad (road length: IO. I miles)
Ground Failure
Surficial debris flows and possible slumping can be expected in the deep fillacross Diablo Canyon. Natural oversteepened slopes some 4,500 feet in length
are susceptible to debris slides resulting in potential closure of the road. The
problem is compounded by the relatively high acceleration expected in the area.
The expected length of blockage of both lanes varies between l,700 and
2,900 feet.
No liquefaction is anticipated along this road.
Bridge Failure
The bridge over Islay Creek (49C-239) is expected to undergo some moderate
settlement and possible shifting of the deck, but could handle light trafficwithout repair.
3.2.2.4 ESTIMATED DAMAGEDTO OTHER ROADSWITHINTHE SIX-MILEZONE
Port San Luis Road from Plant Entrance to Lighthouse (road length: I.4 miles)
Ground Failure
The road is in poor condition, narrow, with numerous steep slopes. The first mile
is susceptible to debris slides and complete failure at many points. No
liquefaction is anticipated on this road and no bridges exist.
B-8 I-269 3-57
TERA CORPORATION
See Can on and Prefumo Can on (road length: 12.1 miles)
Ground Failure
Extremely steep natural slopes and manmade cuts are nearly continuous along
See Canyon's westerly side. Numerous debris slides are anticipated along a four-
mile section. There are several steep, high cuts discontinuous-about 6,000 feet
in the upper reaches of See Canyon and central portions of Prefumo Canyon
which are susceptible to failure. Many slides are expected, resulting in total
closure of both canyon roads.
Some minor liquefaction may occur at the intersection of Davis Canyon.
Bridge Failure
No damage is anticipated on the four bridges in Prefumo Canyon.
South Ba Boulevard (Morro Bay) (road length: 3.9 miles)
Ground Failure
A 600-foot cut adjacent to Black Hill is susceptible to rock falls and possible
rock slides that would close at least the southbound lane and possibly both lanes.
The fills placed across Los Osos Creek and the bay inlet area between Black Hill
and Cerro Cabrillo Hill are very susceptible to lateral spreads and fill settle-
ment. Both lanes could be anticipated to be closed at several locations.
Bridge Failure
The bridges over Turri and Chorro creeks are located in high potential liquefac-
tion areas. Some settlement is expected and collapse is possible.
B-81-269 3-58
TERA CORPORATION
Main Street and Countr Club Drive (Morro Bay) (road length: 2.9 miles)
Ground Failure
No landslides are anticipated in this area. Liquefaction ground failure and
lateral spreads are likely to occur over a 7,000-foot continuous section of road
adjacent to the bay. A large portion of this section may be damaged by lateral
displacements, resulting in the closure of both lanes.
Bridge Failure
There are no bridges on this road.
B-8 I-269 3-59
TERA CORPORATION

1
4.0 EVACUATIONTIME ESTIMATES
Evacuation time estimates are an important ingredient in emergency planning.
They provide a key input to the protective action decision making process by
indicating whether sufficient time is available to conduct a partial or total
evacuation of the population within the plume exposure zone. Where earthquake
damage has impacted the evacuation road system, decisions regarding evacuation
become more complex. Also it is desirable, if not necessary, to consider a
variety of evacuation options in order to provide the greatest protection to the
most people. Therefore, it was determined that protective action decisions
could benefit from pre-analysis of evacuation times representative of post-
earthquake conditions. Such analyses were performed in this study for the Basic
Emergency Planning Zone (BEPZ) surrounding the Diablo Canyon Power Plant for
specified evacuation zones and earthquake damage levels.
The evacuation of part or all of the population around the Diablo Canyon Power
Plant was simulated using a computer model of the evacuation process. This
model dynamically simulates the distribution and flow of cars through the
evacuation road network. For each evacuation scenario, distributions can be
obtained for various quantities of interest, such as total time to evacuate, total
time spent on the road in an evacuation, and the density and velocity of cars at
various points in the evacuation road network (Figure 4- l).
\
The evacuation process is initiated when the affected populace is notified of the
need to evacuate. Once this notification is issued, the process of evacuating
from a given area for any given individual is modeled by a sequence of activities,
or steps. An example of such a sequence is:
o Become aware of the notification
o Prepare to leave work
o Drive home
o Prepare to evacuate from home
o Drive from home to a main evacuation route
B-8I-269 4-I
TERA CORPORATION
o Merge onto the main evacuation route
o Drive out of the evacuation zone on the main evacuationroute.
The time required to evacuate from a given area-equals the sum of the times
taken to complete whatever individual activities are required.
The September 1980 PRC-Voorhees report, "Evacuation Times Assessment forthe Diablo Canyon Nuclear Power Plant," obtained distributions for the times
needed to complete the steps leading up to a person leaving his or her residence
and entering the transportation network. These time distributions were then
combined to derive an overall distribution for the times at which evacuees can
be expected to enter the transportation network with the purpose of directlyexiting the evacuation zone. The following types of evacuees.were considered in
the Voorhees analysis: (I) students attending California Polytechnic State
University, (2) visitors to Pismo Beach State Park, and (3) everyone else includ-
ing workers who must drive home from work before evacuating, and spouses and
children at home who will wait until the other spouse arrives home before
evacuating.
In this report, the last three basic steps in the evacuation process were modeled,
namely:
0 Transit between a person's residence and a main evacua-tion route
Merging onto the main evacuation route
Transit from the point of entrance onto the main evacua-tion route to the evacuation zone boundary.
The times required to complete these three activities were calculated using
TERA's evacuation simulation model. The results were combined with the
distributions given in the Voorhees report for the three types of evacuees. This
yielded an overall evacuation analysis which explicitly described the timecomponents involved in the various steps in an evacuation, from the time atwhich notification is given to the affected populace until the evacuation is
complete.B-8I-269 4-2
TERA CORPORATION
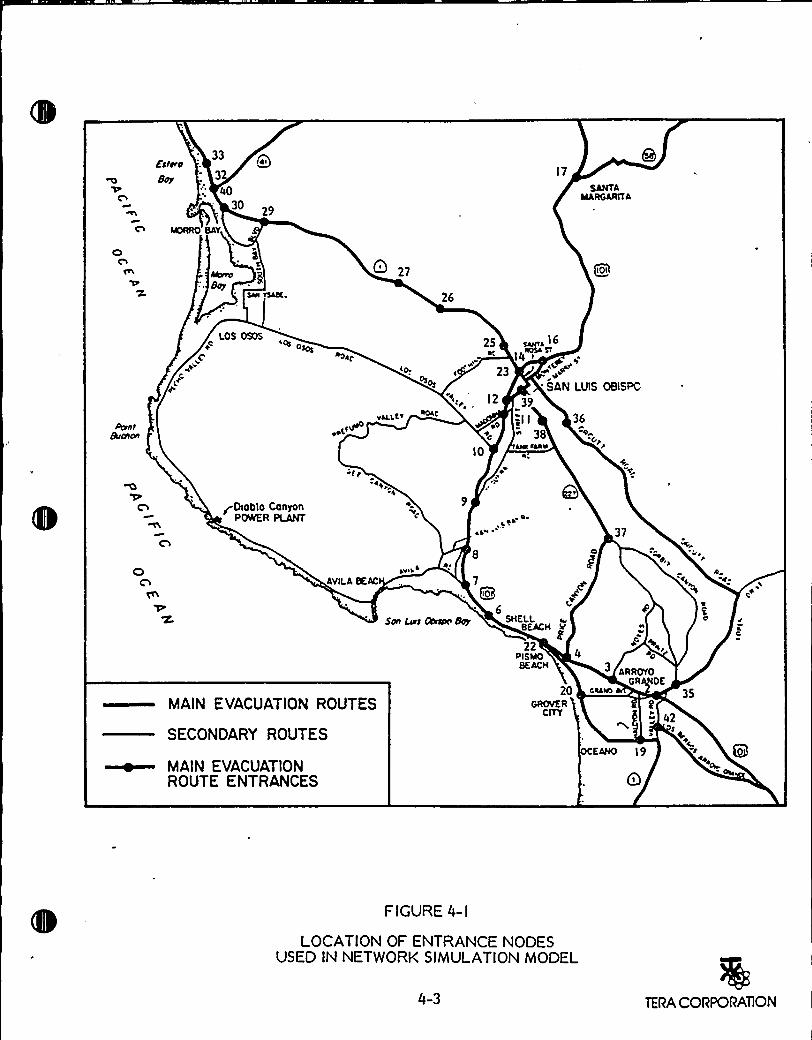
33
32
4030 29
17
SANTAAIARGARITA
AknyBay
27
26
OI
LOS OSOS~c
.ryP
~c
'+ og
A(p
vz.iE'
25
23
12
10
~,1614 ~
gC ar'AN LUIS OBISPC
39
=,I I 36
38k~ CRSV
0
pOIoblo ConyonPOWER PLANT ql
ai» 37
AVILA&AC
4gV >I
7
QO
6S~C s~aoy
22RISMO8EACH
A P
icP
~o
ARROYOGR OE
JEc
MAIN EVACUATION ROUTES
SECONDARY ROUTES
MAIN EVACUATIONROUTE ENTRANCES
20GROVER
CITY
EANO 19
42
35
FIGURE 4-I
LOCATION OF ENTRANCE NODESUSED IN NETWORK SIMULATIONMODEL
4-3 TERA CORPORATlON
4.1 MAINEVACUATIONROUTE TRANSPORTATION MODEL
The principal dynamic characteristic of the evacuation process is the flow ofvehicles along the evacuation routes. To compute the transit times associated
with the flow of vehicles, a general model of vehicle flow was used. In this
model, car speed (S) over a given section of roadway is assumed to be a function
of the density of cars (p) and the capacity of the given section of roadway. The
density of cars is merely the number of cars per unit of highway length, and the
roadway capacity is a direct function of the type of road (e.g., limited access
freeway) and the number of lanes. At low densities, cars can travel relativelyfast, but the volume of traffic or throughput, v (which equals p.s), moving past a
given point is relatively small. As the density of cars increases, speed decreases,
and throughput is increased until an "optimum" density (popt) is attained. Atthis density, the corresponding speed (Sopt) Is such that throughput (which equals
popt Sopt) is maximized, and the maximum capacity of the road is attained. As
the density increases past poptp car speed continues to decrease, and throughput
decreases until the density equals approximately I.7 times the optimum density.
At this point, both car speed and throughput are effectively reduced to zero. A
graphical representation of this model is given in Figures 4-2 and 4-3.
B-8I-269 4-4
TERA CORPORATION
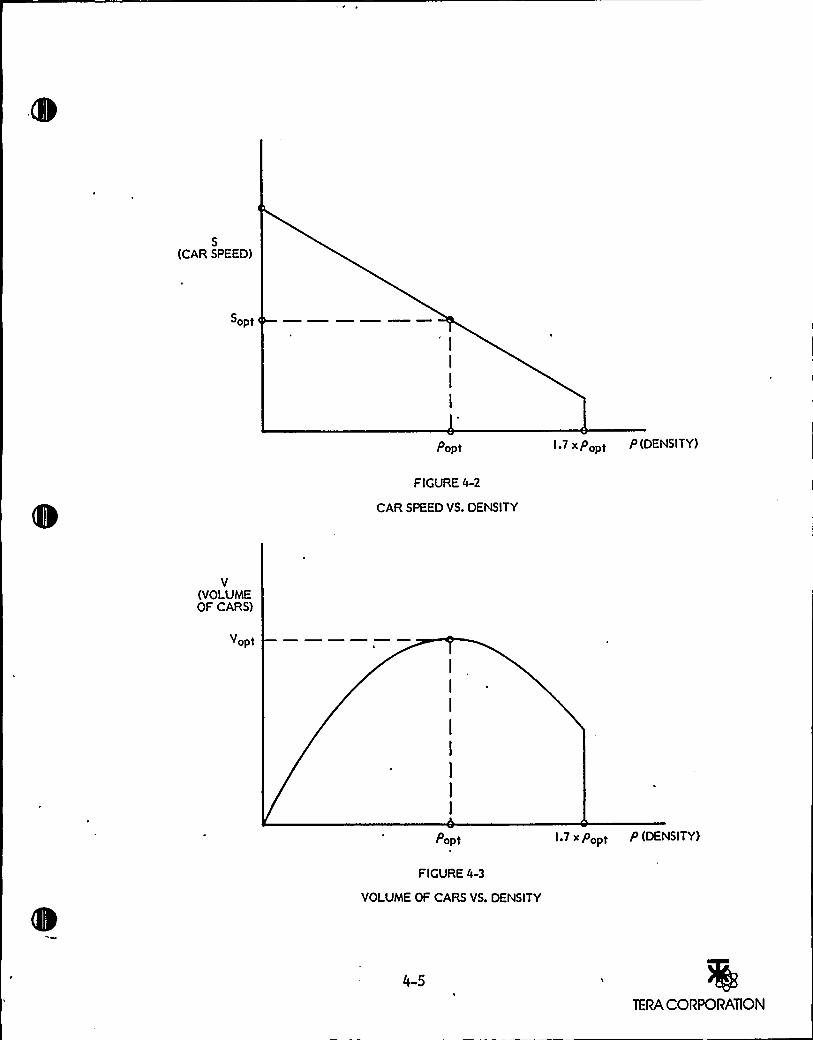
S(CAR SPEED)
Sopt
I
I
I
I
Popt 1.7 x Popt P (DENSITY)
FIGURE 4-2
CAR SPEED VS. DENSITY
V(VOLUMEOF CARS)
Vopt
Popt I 7 x Popt P (DENSITY
FIGURE 4-3
VOLUMEOF CARS VS. DENSITY
4-5
TERA CORPORATION
4.2 SIMULATIONAPPROACH
The simulation technique used in computing evacuation time estimates utilized a
network model of the main evacuation routes leading from the Basic Emergency
Planning Zone. The network consists of points of entrance onto the main
evacuation routes, "nodes," and the sections of roadway between entrances,
"links." Evacuation times were computed by simulating the flow of trafficthrough the network model.
Because of the large number of vehicles that would be involved in an evacuation,
vehicles having similar simulated characteristics were grouped into units called
"entities." Each entity represented 25 vehicles having a common origin, destina-
tion, and type of evacuee. Therefore, the flow of 55,000 vehicles from the
evacuation zone was simulated by sending 2,200 (55,000/25) entities through the
network. The fact that one entity represents 25 vehicles was reflected in allcalculations.
In cases where a given network node corresponds to a main evacuation route
entrance which is close to other entrances not represented by nodes, it was
assumed that the given node represented these nearby entrances as well. Thus,
the number of cars (as represented by entities) which were routed to each
entrance node in a given evacuation scenario represented the number of cars
which would be entering any of the entrances represented by that node. Also, at
each node which represents more than one actual entrance, the merge time foreach entity was reduced by a factor corresponding to the number and type ofnearby entrances. This reflects the fact that cars would be entering the main
evacuation routes from all possible entrances.
At the time the first notification to evacuate is issued, in any given evacuation
scenario, each entity under consideration is identified as to the type of evacuee
it represents and labeled with the number of the node wheie it will be entering
the main evacuation network. The evacuation process is then modeled in the
network by calculating a sequence of time components that each entity
B-8I-269 4-6
TERA CORPORATION
experiences before it has exited from the network. These components are
discussed below.
4.2.I PREPARATION TIME
The first time component that an entity experiences is the time required to
complete all of the steps necessary before a person is ready to leave his or her
'residence in an evacuation. For this time component,.each entity is assigned a
time taken from the PRC-Voorhees distributions corresponding to the type ofevacuee specified.
4.2.2 TRANSIT TIME BETWEEN RESIDENCESAND MAINEVACUATIONROUTES
The second time component that an entity experiences is the time required for a
person to drive from his or her residence to an entrance of a main evacuation
route. This time generally contributes only a small increment to the totalevacuation time. However, because the distance to a suitable evacuation route
varies considerably for some population concentrations, there are significantdifferences in travel time among various segments of the population. Very short
travel times occur in San Luis Obispo,'orro Bay, and the Five Cities area
because of the proximity of the designated evacuation routes to these concen-
trated populations. For communities that are comparatively remote from the
main evacuation routes, such as Los Osos, Baywood Park, and Cuesta-By-The-
Sea, local travel times are greater. In addition, zones that have relativelydispersed populations have greater variability of travel times.
A distribution of times for this part of the evacuation process was-obtained foreach emergency planning zone as given in the Voorhees report. This involved
obtaining travel times from three points in each zone: a modal or average timefor trips originating near the centroid of the zone's population; a maximum timefor trips from the most remote residences in the zone; and a minimum time fortrips originating on the roads or streets nearest to the evacuation routes. The
estimate of travel time in each case was based on the travel distance and the
B-SI-269 4-7
TERA CORPORATION
assumed travel speed, which was a function of roadway type and condition.
Generally, top speeds of 25 mph on rural roads and l5 mph on city streets were
used, recognizing that congestion during evacuation would be greater than usual
and that these are trip averages rather than preferred driving speeds.
4.2.3 MERGING TIME ONTO MAINEVACUATIONROUTES
The third time component that an entity experiences is the time which is
required to merge onto the main evacuation route. This part of the evacuation
process is important because the rate at which cars enter a section of roadwayaffects the density of cars on that roadway. This in turn affects the speed oftraffic and throughput on the main evacuation routes, and therefore the totalevacuation time.
Capacity at the entry points to the evacuation network depends in part on thegeometry of the ramp or intersection and the characteristics of traffic controls.However, when the highway is operating at or near maximum capacity, theoverriding consideration is the density and speed of highway traffic approachingthe entry point and, hence, the frequency of opportunities for cars to merge intothe traffic stream. At freeway ramps during heavy traffic, opportunities resultbecause of the irregularity of intervals between cars and because upstream cars
tend to move to the left-hand traffic lane in order to avoid conflict withentering cars. As the density increases, fewer opportunities for merging occur.At intersections with traffic signals, opportunities to enter the traffic streamdepend on the signal cycles and the relative proportions of traffic light greentime allocated to entering streets. In these cases, congestion is likely to limitentry severely if traffic tie-ups cause blockage of intersections. At unsignalizedsurface intersections, right-turn entry opportunities depend on the occurrence ofgaps in the through traffic stream, much as they do at freeway ramps. Left-turnopportunities depend on breaks in on-coming traffic and, therefore, may be
virtually impossible unless the on-coming traffic flow is very light (as may wellbe the case in the return direction during an evacuation) or manual trafficcontrol is provided. When opportunities to cross the opposing traffic are
B-81-269 4-8
TERA CORPORATION
plentiful, the merge into the traffic stream is similar to that for right-turn
traffic.
The following simplified expression was developed to describe the volume of cars
entering the evacuation network at each entry node:
K l l l'7 t S t for 0 — < l.7 (I)P P
p t opt opt ~opt
for ) l.7P
~opt
where: e = entering traffic volume (cars/hour)
p = actual density of cars (cars/mile)
and
p t— density of cars at maximum capacity (cars/mile)
optS t
— speed at maximum capacity (miles/hour)opt
~ = a constant depending on the type of intersection and thenumber and type of nearby entrances.
These equations are consistent with the nomographs given in Figures 8.2 and 8.8
in the Highway Capacity Manual-l965 (HCM) for ramp capacities on four-lane
highways and with the graphs (Figures 6.8 and 6.9) of surface street intersection
capacities when through traffic is moving freely at less than possible capacity.
(The HCM is a publication of the Highway Research Board that is widely
regarded as the standard reference on practical analytical methods for determin-
ing traffic capacity and predicting traffic performance.) The equations also
conform to the general constraint that "if the demand volume exceeds the
capacity, the bottleneck will be critical and queueing and speed reduction can be
expected either on the ramp or on the through freeway lanes, or both" (HCM,
p. 197). The controlling variables in these equations are the relative density of
traffic and the traffic capacity (which equals p ~ S ) for the evacuationopt opt
B-8I-269 4-9
TERA CORPORAllON
route. Thus, if traffic is very light, a steady stream of cars can enter; however,
as the route approaches saturation few, if any, cars will be able to merge intothe traffic stream.
When a car arrives at an entrance to a main evacuation route, there may be
other cars waiting to merge. Thus, the total time taken for a car to merge ontoa main evacuation route equals the time that it must spend waiting while othercars are merging plus its own merging time (which on average equals I/e). In theevacuation simulation, when an entity arrives at an entrance node into the
network, it is held in a queue (if necessary) while any preceding entities merge.When the entity reaches the head of the queue it computes its own merging timefrom the equation:
entity merging time = 25 ~ (I/e)
where e is computed from expression (I). The factor of 25 reflects the fact thatone entity represents 25 cars, each of which takes approximately I/e (hours) tomerge onto the main evacuation route.
4.2.4 TRANSIT TIME ON MAINEVACUATIONROUTES
The last time component that an entity experiences is the time required totravel on the main evacuation route out of the evacuation zone. This timedepends on the speed at which cars can travel, which in turn is largely dependent
on the capacity of the roadway and the density of cars on the roadway.
The capacity of a highway to carry traffic (usually expressed as vehicles per hour
or vehicles per lane per hour) is a physical quantity that depends on certainrecognized geometric characteristics of the roadway. Among these characteris-tics are vertical and horizontal alignment (the frequency and sharpness of curves
and grades, usually subsumed under aggregate measures such as safe operatingspeed or average highway speed) and percentages of the roadway mileage having
adequate sight distances for passing other vehicles. Other geometric character-istics that directly affect capacity are roadway or lane width and the width of
B-8 I-269 4-IO
TERA CORPORATION
shoulders or distance from the road to obstructions, such as trees, bridge
abutments, and parked vehicles. The length and steepness of grades has littledirect effect on traffic capacity for passenger automobiles, but does affect the
treatment of trucks and buses in terms of car equivalents. Thus, a heavy truck
such as a five-axle semi-trailer combination, which on a good highway in level or
lightly rolling terrain is equivalent to two passenger cars, may displace more
than l00 cars on sections of roadway with long, steep grades. These and many
similar relationships have been determined quantitatively by observation ofactual traffic and are reported in the HCM.
Throughout the HCM, the authors use the basic relationship between operating
speed and traffic volume to illustrate how speed changes as the number of
vehicles on the road changes. In general, traffic is known to proceed at the
average highway speed, or safe operating speed, when traffic volumes are very
.Iow. Speed declines gradually, but at an increasing rate, as volume increases.
When the peak capacity is approached, movement rates become unstable and
speed may decline precipitously as a result of either an incident that disrupts
flow or the addition of a small number of cars to the stream. If traffic increases
beyond this point, throughput of the highway declines. These relationships are
the speed versus traffic volume analogs to the speed versus density relationships
described previously. On all highways the maximum capacity occurs at rela-
tively low speeds, usually about 25 to 30 mph in rural areas or on urban highways,
and l5 mph on urban arterial streets.
For the simulation of traffic over the main evacuation route network, the basic
relationship between operating speed and traffic volume has been converted to a
speed versus density relationship (Figure 4-2). For most types of highway, a
nearly linear relationship exists between speed and density, although there are
minor irregularities in the region of maximum capacity where traffic flow tends
to be unstable. For purposes of simulation a conservative linear equation has
8-8I-269 4-II
TERA CORPORATION
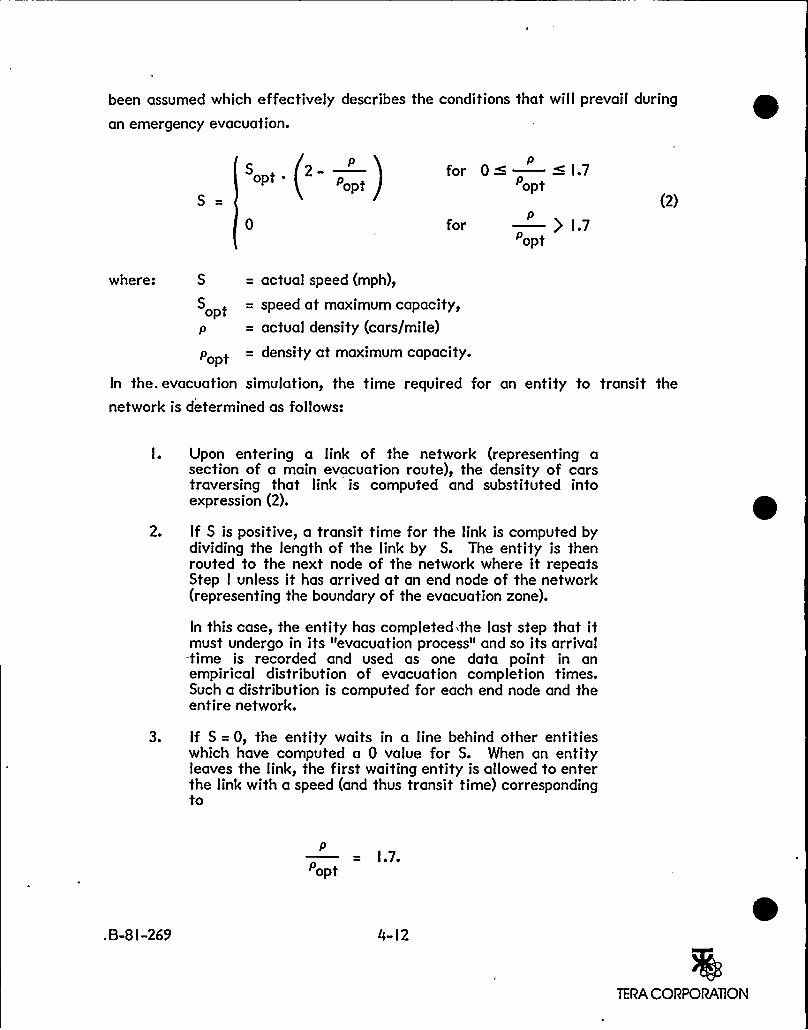
been assumed which effectively describes the conditions that will prevail during
an emergency evacuation.
S 2P
p popt
Pfor 0 < —< l.7
opt(2)
for —) I.7P
opt
where: S = actual speed (mph),
S t— speed at maximum capacity,
p = actual density (cars/mile)
po t— density at maximum capacity.
In the. evacuation simulation, the time required for an entity to transit the
network is determined as follows:
I. Upon entering a link of the network (representing asection of a main evacuation route), the density of carstraversing that link is computed and substituted intoexpression (2).
2. If S is positive, a transit time for the link is computed bydividing the length of the link by S. The entity is thenrouted to the next node of the network where it repeatsStep I unless it has arrived at an end node of the network(representing the boundary of the evacuation zone).
In this case, the entity has completed the last step that itmust undergo in its "evacuation process" and so its arrival-time is recorded and used as one data point in anempirical distribution of evacuation completion times.Such a distribution is computed for each end node and theentire network.
3. If S = 0, the entity waits in a line behind other entitieswhich have computed a 0 value for S. When an entityleaves the link, the first waiting entity is allowed to enterthe link with a speed (and thus transit time) correspondingto
P1.7.
~opt
. B-81-269 4-l2
TERA CORPORATION
Each subsequent entity which leaves the link allows onewaiting entity to enter the link (with the same speed)until there are no more entities waiting. After an entityenters a link, it is routed to the next node (after theappropriate transit time) where Step I is repeated (if it isnot an end node) as in Step 2.
Step 3 corresponds to a traffic-jam situation in which cars must come to a stop
and wait because the density of cars on the road has become too great. This
condition persists until cars farther up the road have moved forward, allowing
the waiting cars also to move forward.
Thus the time required for an entity to traverse a link equals its waiting time
(representing the time a car may spend sitting in a traffic jam) plus its transit
time once it has begun moving. The time required for an entity to exit from the
evacuation zone once it has entered a main evacuation route equals the time the
entity takes to traverse all of the links which it must pass through before it has
left the evacuation zone.
4.3 TRAFFIC CONTROL
As described previously, the volume of cars which can pass through a given
section of roadway is maximized when the density of cars (p) equals poptp which
in turn yields an average car speed of Sopt. Thus the goal of a traffic control
program should be to guarantee that the density of cars on a roadway does not
exceed popt. Such a program could be implemented by traffic control personnel
at the major entrances to the main evacuation routes.
ln the simulation, this type of traffic control was modeled by not allowing an
entity to join the moving stream of entities on a main evacuation route link if by
doing so it would cause the density of cars on that link to exceed popt.
B-8I-269 4-l3
TERA CORPORATION
4.4 MODELING EARTHQUAKEDAMAGE
In the scenarios where damage was assumed to occur to the highway system,
(e.g., bridge damage, landslides, or liquefaction), damage repair times were
modeled as follows:
I. Estimates were made of the time needed to repair eachoccurrence of damage on each section of roadway corres-ponding to a link in the network.
2. An estimate was made as to the number of crews whichwould be available to repair damage on each section ofroadway, and from this an estimate of the total timeneeded to repair each link in the network was computed.
3. If a bypass existed around the damaged area, the capacityof the link was lowered to the capacity of the bypass forthe duration of the repair time. If no bypass existed, noentities were allowed onto the link for the duration of therepair time.
4. In addition to the above steps, it was assumed that carswould not travel at speeds greater than So t (i.e., thecapacity maximizing speed). This speed equals about one-half of the speed which would be expected if the roadwaywas uncongested and no damage had occurred. In caseswhere traffic control was assumed, traffic was assumedto be moving at a speed of Sopt since the purpose oftraffic control is to assure that maximum capacity ismaintained on the evacuation routes.
4.5 SUMMARYOF RESULTS
Evacuations of population in several geographic regions were modeled using the
simulation approach described above. Four types of evacuation were considered:
I. Total - the entire Basic Emergency Planning Zone (BEPZ)
2. Partial (Northern) - the region north of the plant whichcontains Morro Bay and Baywood Park
3. Partial (Eastern) - the region east of the plant whichcontains San Luis Obispo
B-8I-269 4-l4
TERA CORPORATION
4. Partial (Southern) - the region south of the plant whichcontains Avila Beach, Shell Beach and the Five Citiesarea.
The number of cars which were assumed to be involved in each of these
evacuations was derived from the number of cars expected to be involved from
each of the evacuation zones (I through XVIII) of the September l980 PRC-
Voorhees report.
For each of the four types of evacuation, four earthquake damage levels were
modeled:
I. No damage
2. Light damage
3. Moderate damage
4. Heavy damage.
The repair times that were computed for each link in the network for each of
these damage levels, along with the number of crews which would be required to
attain these repair times, are given in Table 4- I.
For each combination of evacuation type and damage level, a rough optimization
of the routing of the evacuating cars was performed. The goal of this
optimization process was to distribute and route the cars on the main evacuation
routes such that the Basic Emergency Planning Zone (i.e., the end node of each
of these routes) was cleared at approximately the same time. The distributions
and routing of cars which resulted from this process are given in the Appendix.
Should there be a different evacuation objective —for example, to clear the
IO-mile radius as quickly as possible —a different distribution and routing of cars
may be appropriate.
The estimated evacuation times for the BEPZ for the l6 possible combinations of
evacuation types and damage levels are given in Table 4-2. It was assumed in
obtaining these estimates that the type of traffic control described above was in
B-8I-269 4-l5
TERA CORPORATION
effect and that there were sufficient resources available to repair all of the
occurrences of damage within the time interval required to repair the worst
occurrence of damage for each link. The effect of assuming a more limitedavailability of resources is discussed below. Also listed are the times required toclear a IO-mile radius around the plant. These represent entities which have
been routed to clear the larger radius (BEPZ) in the optimal time and, therefore,do not necessarily represent an optimal !0-mile evacuation time.
Total Evacuations
The evacuation time estimated to clear the entire evacuation zone ranges from
6.5 hours if no damage is assumed to I0.5 hours if heavy damage is assumed.
Partial Evacuations
The time estimated to clear the 10-mile radius in an eastern evacuation is threehours for all four damage levels. The constant time estimates are a product ofthe very few residents within IO miles of the plant in this direction and the
evacuation model which does not include any main evacuation routes within this
area. Thus the time to clear the region in the model simply equdls the time for
people in the region to leave their homes (which is assumed to be less than orequal to three hours in the PRC-Voorhees report) plus the transit time on local
roads past the IO-mile radius (approximately 5-IO minutes). The three-hour
estimate for people to leave their homes and exit the IO-mile zone is based upon
use of private automobiles with little delay in reaching the main evacuation
route. From the damage estimates given in Section 3.2.2.3, forms of egress fromthe Avila Beach area other than private automobile may be necessary due to the
potential for road damage. For example, walking around the damage to
Highway IOI and then being transported by buses or cars out of the BEPZ may be
required if the Avila Beach Road is heavily damaged. This could require some
additional time beyond the three hours even though the distance is not great (less
than three miles).
B-SI-269 4-l6
TERA CORPORATION
The time estimated to clear the IO-mile radius in a southern evacuation equals
three hours for the light, moderate, and heavy damage levels which is less than
the 3.5 hours for the no-damage case. The reason for this lies in the assumed
routing of cars for the damage versus no-damage scenarios. In the damage
scenarios a bridge failure was assumed to occur on Route IOI between Avila
Road and San Luis Bay Road. Because of this, in these scenarios no traffic was
routed from Shell Beach and the Five Cities area onto Route IOI going north'.
This allows the traffic from the Avila Beach area to enter and exit from the
section of Route IOI which is within the IO-mile radius with almost no delay.
Thus, the time to clear the IO-mile radius essentially equals the time taken by
people in the region to leave their homes (less than or equal to three hours, per
PRC-Voorhees, l980). In the no-damage case, however, traffic which is routed
from the Shell Beach and Five Cities area on to Route I 0 I going north interferes
with the Avila Beach traffic which is attempting to clear the IO-mile radius.
This results in the time required to clear the IO-mile radius being longer in this
case than in the three damage scenarios.
Effect of Available Resources on Evacuation Time Estimates
The evacuation time estimates above were based upon the assumption thatsufficient resources would be available to repair the damage to all sections of
the roadways simultaneously and the only delay that would result in longer
evacuation times was that due to lower capacity bypasses and the time to repair
the worst link on a given section of roadway. These repair times and resources
are presented in Tables 4- I and 4-3A.
Since it is not possible to know ahead of time the level of resources (equipment
and labor) that would be available, we have estimated the incremental increase
in evacuation times that would result from limitations on these resources.
Table 4-3B is a tabulation of the reduced resources which would result in a delay
of less than one hour for light damage level, less than two hours for moderate
damage and less than four hours for heavy damage. If the available resources
were less than those shown in Table 4-3A, but greater than or equal to those
shown in Table 4-3B, one would add these incremental times to the evacuation
B-8 I-269 4-I7
TERA CORPORATION
time estimates shown in Table 4-2. Similarly, Table 4-3C provides resource
levels which would result in delays of two, four and eight hours for the three
damage levels. If the available resources were less than those shown in
Table 4-3B, but greater than or equal to those shown in Table 4-3C, one would
add these incremental times to the evacuation time estimates shown in
Table 4-2.
tn Table 4-3A we have tabulated the availability of crews which were assumed
for the various evacuation scenarios and upon which the results in Table 4-2 are
based.
B-8I-269 4-I8
TERA CORPORATION
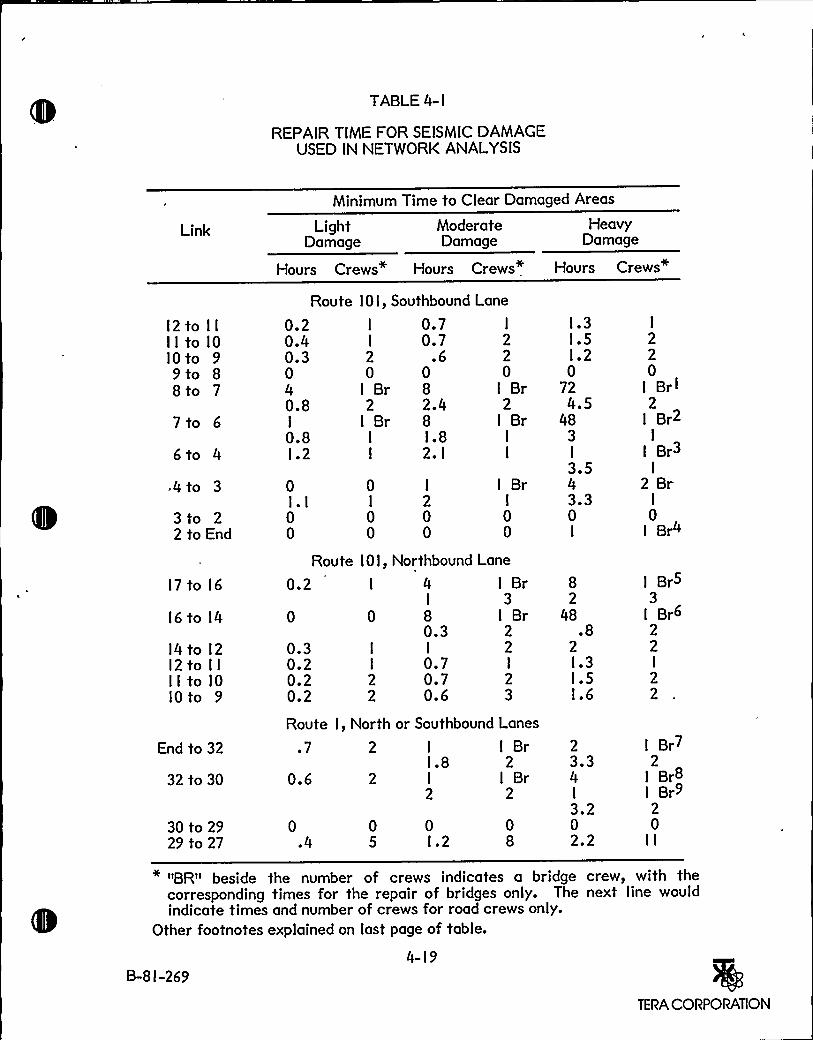
TABLE4- I
REPAIR TIME FOR SEISMIC DAMAGEUSED IN NETWORK ANALYSIS
Minimum Time to Clear Damaged Areas
Link LightDamage
ModerateDamage
HeavyDamage
Hours Crews" Hours Crews" Hours Crews
l2 to I I
I I to IOIOto 99 to 88 to 7
7 to 6
6 to 4
.4 to 3
3 to 22 to End
Route
0.20.40.3040.8I
0.81.2
0I.I00
I 0 I, Southbound
I 0.7I 0.72 .60 0
I Br 82 2.4
I Br 8I l.8I 2.1
0 I
I 20 00 0
Lane
I
220
I Br2
I BrI
I
I BrI
00
l.3I.5l.20
724.5
483I
3.543.30I
I
220
i Brl2
I Br2I
I Br3I
2 BrI
0I Br4
l7 to l6
l6 to l4
l4 to l2l2 to I I
I I to IOIOto 9
Route
0.2
0.30.20.20.2
IOI, Northbound Lane
I 4 I BrI 3
0 8 I Br0.3 2
I I 2I 07 I
2 0.7 22 0.6 3
82
48.8
2I.3I.5l.6
I Br53
I Br622I
22
End to 32
32 to 30
30 to 2929 to 27
2 I I
2 2
0 0 05 I.2 8.4
Route I, North or Southbound Lanes
.7 2 I I BrI.8 2
0.6 Br
23.34I
3.202.2
I Br72
I Br8I Br920
II
""BR" beside the number of crews indicates a bridge crew, with thecorresponding times for the repair of bridges only. The next line wouldindicate times and number of crews for road crews only.
Other footnotes explained on last page of table.
4-19B-8 I-269
TERA CORPORATION
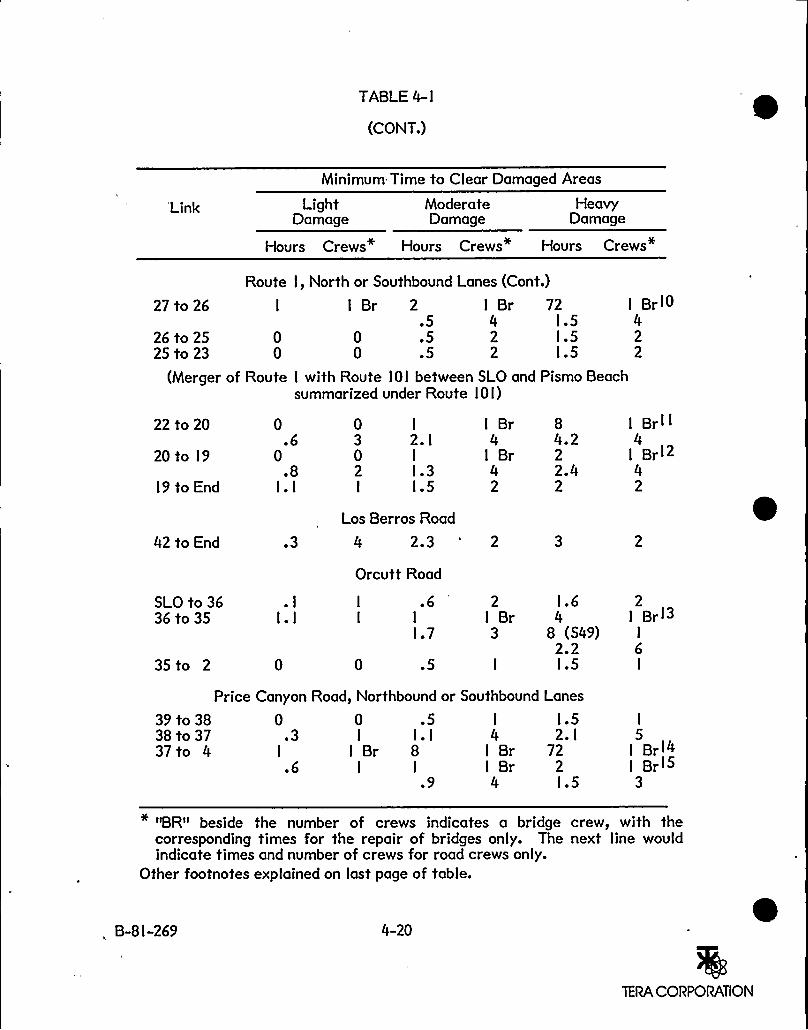
TABLE4- I
(CONT.)
Minimum.Time to Clear Damaged Areas
Link LightDamage
ModerateDamage
HeavyDamage
Hours Crews Hours Crews" Hours Crews"
Route
27 to 26 I
26 to 25 025 to 23 0
(Merger of Route
I, North or Southbound Lanes (Cont.)
I Br 2 I Br 72 I Brl0.5 4 l.5 4
0 .5 2 I.5 20 .5 2 I.5 2
I with Route I 0 I between SLO and Pismo Beachsummarized under Route I 0 I)
22 to 20
20 to l9
l9 to End
42 to End
0.6
0.8
I. I
.3
0 I
3 2. I
0 I
2 I.3I I.5
Los Berros Road
4 2.3
Orcutt Road
I Br4
I Br42
84.222.42
I Brll4
I Brl242
SLO to 3636 to 35
35 to 2
I .6I I
1.7
0 .5
2I Br3
1.6 2I Brl3
8 (S49) I
2.2 6I.S I
Price Canyon Road, Northbound or
39to38 0 0 .538 to 37 .3 I I.I37 to 4 I I Br 8
.6 I I
.9
Southbound
I
4I BrI Br4
Lanes
l.52. I
722l.5
I
5I Brl4I Brl53
''BR" beside the number of crews indicates a bridge crew, with thecorresponding times for the repair of bridges only. The next line wouldindicate times and number of crews for road crews only.
Other footnotes explained on last page of table.
. B-8I-269 4-20
TERA CORPORATION
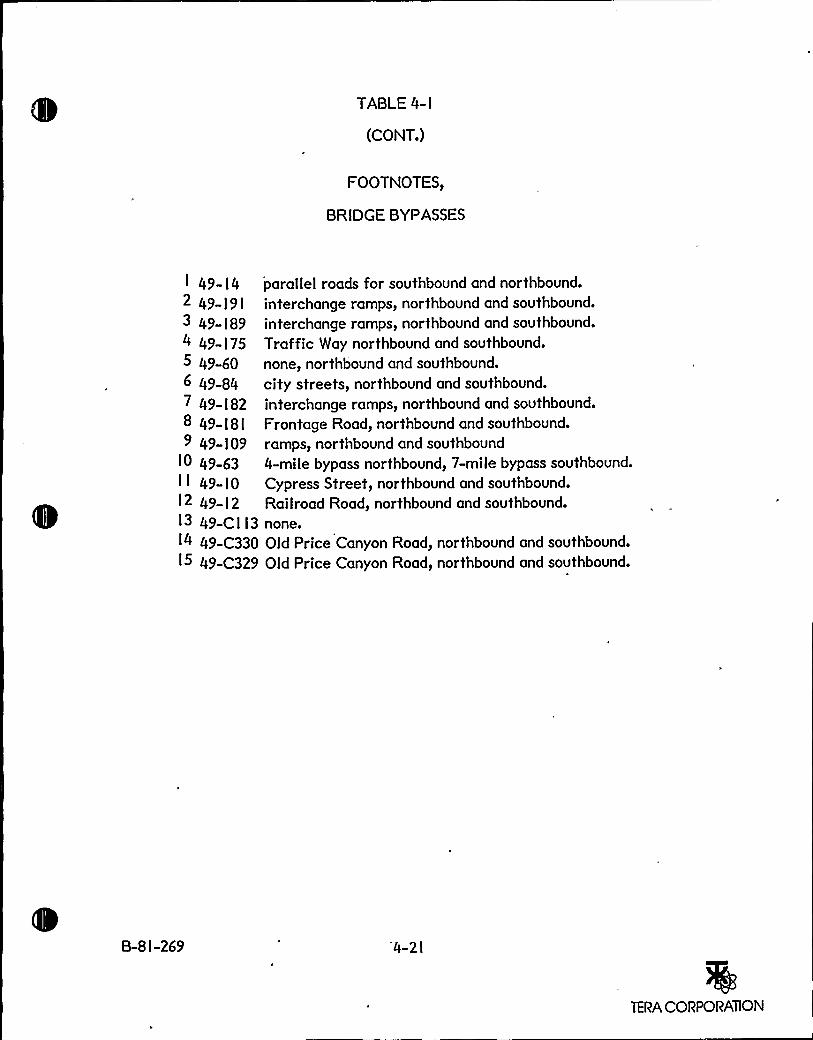
TABLE4-l
(CONT.)
FOOTNOTES,
BRIDGE BYPASSES
I 49-I42 49 I9I3 49-I894 49- I 755 49-606 49-847 49-I828 49-I8I9 49-I09
10 49-63II 49-IOl2 49 l2I3 49-CI I3I4 49-C330I5 49-C329
parallel roads for southbound and northbound.interchange ramps, northbound and southbound.
interchange ramps, northbound and southbound.
Traffic Way northbound and southbound.
none, northbound and southbound.
city streets, northbound and southbound.
interchange ramps, northbound and southbound.
Frontage Road, northbound and southbound.
ramps, northbound and southbound4-mile bypass northbound, 7-mile bypass southbound.
Cypress Street, northbound and southbound.Railroad Road, northbound and southbound.none.Old Price Canyon Road, northbound and southbound.
Old Price Canyon Road, northbound and southbound.
B-8I-269 '4-2l
TERA CORPORATION
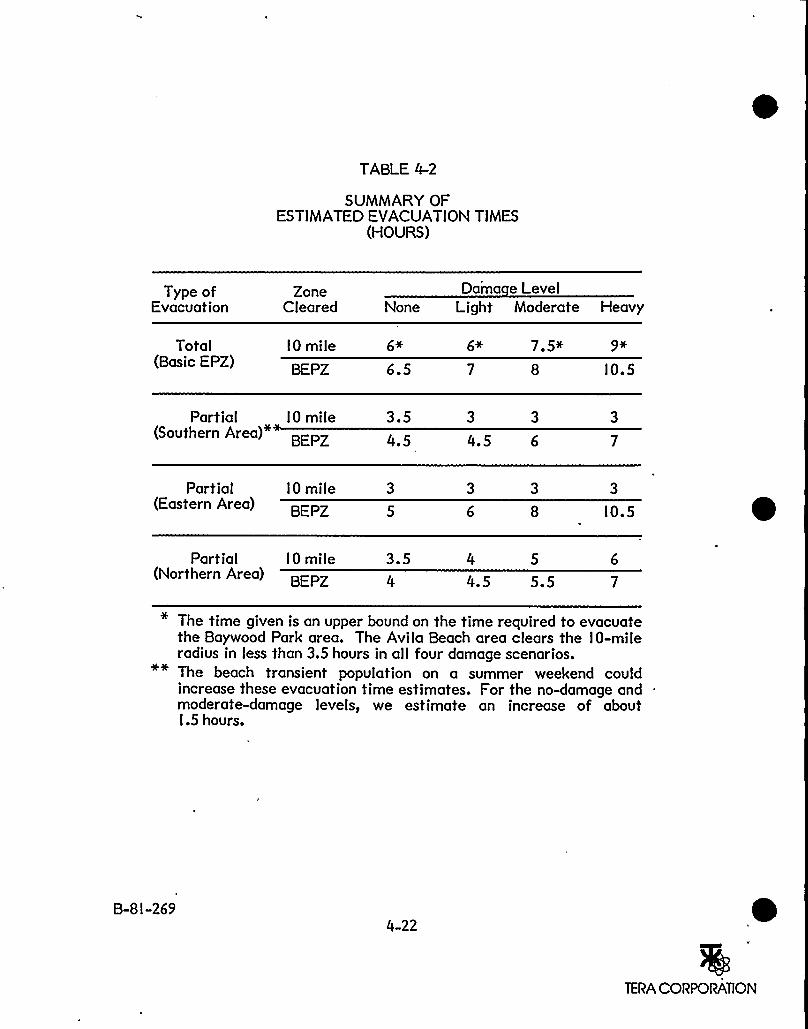
TABLE 4-2
SUMMARYOFESTIMATED EVACUATIONTIMES
(HOURS)
Type ofEvacuation
ZoneCleared
Da'ma e LevelNone Light Moderate Heavy
Total(Basic EPZ)
I 0 mile
BEPZ 6.57 5+
l0.5
Partial I 0 mile(Southern Area) BEPZ
3.54.5
3 3
4.5 6
Partial I 0 mile(Eastern Area) BEPZ l0.5
Partial I 0 mile(Northern Area) BEPZ
3.5 4 5
4.5 5.5
The time given is an upper bound on the time required to evacuatethe Baywood Park area. The Avila Beach area clears the IO-mileradius in less than 3.5 hours in all four damage scenarios.The beach transient population on a summer weekend couldincrease these evacuation time estimates. For the no-damage andmoderate-damage levels, we estimate an increase of aboutI.S hours.
B-SI-2694-22
TERA CORPORATION
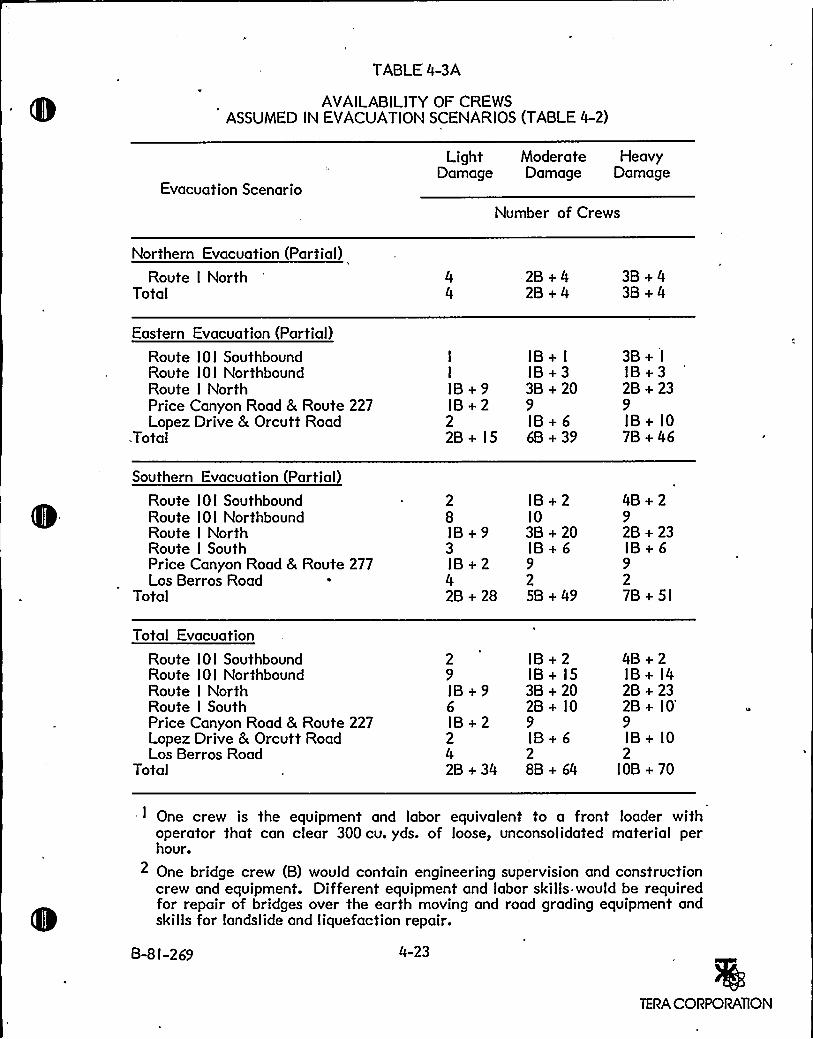
TABLE 4-3A
AVAILABILITYOF CREWSASSUMED IN EVACUATIONSCENARIOS (TABLE 4-2)
Evacuation Scenario
Light Moderate HeavyDamage Damage Damage
Number of Crews
Northern Evacuation (Partial)Route I North
Total2B+ 42B+ 4
3B+ 43B+4
Eastern Evacuation (Partial)Route IO I SouthboundRoute IO I NorthboundRoute I NorthPrice Canyon Road 6 Route 227Lopez Drive & Orcutt Road
Total
I
I
IB+ 9IB+222B+ I5
IB+ I
IB+33B+ 209IB+ 66B+ 39
3B+ I
IB+ 32B+ 239IB+ IO7B+ 46
Southern Evacuation (Partial)Route IOI SouthboundRoute I 0 I NorthboundRoute I NorthRoute I SouthPrice Canyon Road Bc Route 277Los Berros Road
Total
28IB+ 93IB+ 242B+ 28
IB+ 2IO3B+ 20IB+ 6925B+ 49
4B+ 292B+ 23IB+ 6927B+ 51
Total Evacuation
Route IOI SouthboundRoute I 0 I NorthboundRoute I NorthRoute I SouthPrice Canyon Road 6 Route 227Lopez Drive Bc Orcutt RoadLos Berros Road
Total
29IB+ 96IB+ 2242B+ 34
IB+ 2IB+ l53B+ 202B+ IO9IB+ 628B+ 64
4B+ 2IB+ l42B+ 232B+ IO'
IB+ IO2
IOB + 70
One crew is the equipment and labor equivalent to a front loader withoperator that can clear 300 cu. yds. of loose, unconsolidated material perhour.
2 One bridge crew (B) would contain engineering supervision and constructioncrew and equipment. Different equipment and labor skills would be requiredfor repair of bridges over the earth moving and road grading equipment andskills for landslide and liquefaction repair.
B-8 I-269 4-23
TERA CORPORATION
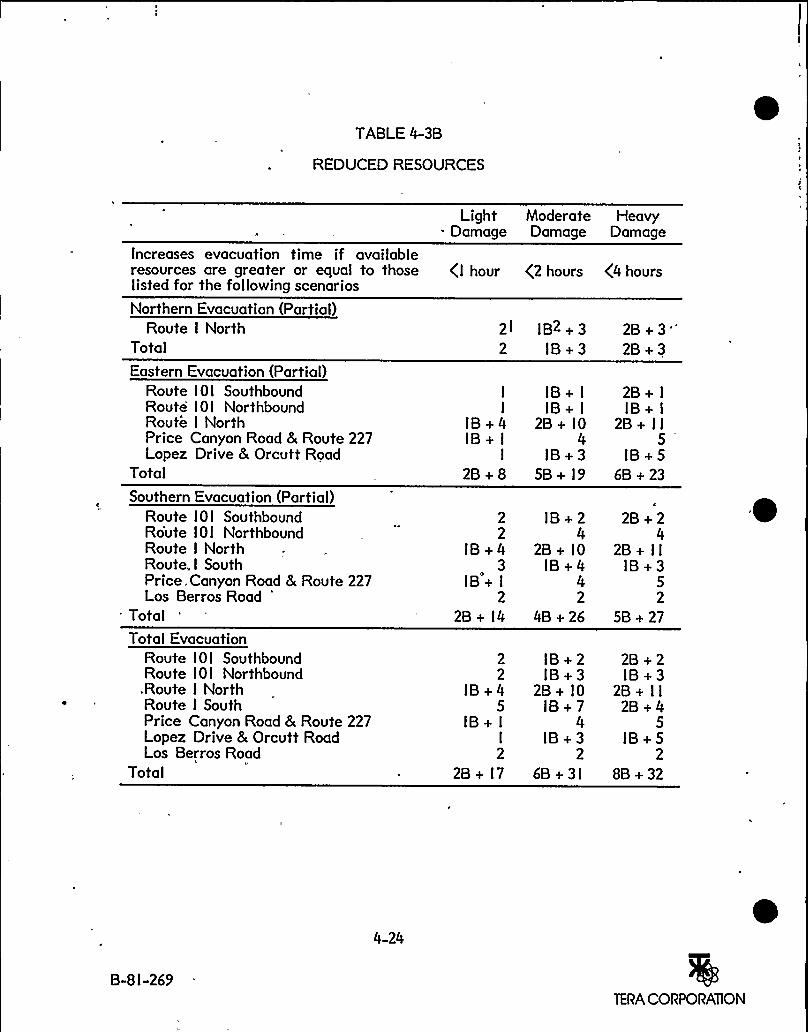
TABLE4-3B
REDUCED RESOURCES
0
Light Moderate Heavy. Damage Damage Damage
Increases evacuation time if availableresources are greater or equal to those (I hour (2 hours (4 hourslisted for the following scenarios
Northern Evacuation (Partial)Route I North
Total21 IB2+ 3
2 IB+32B+ 3''2B+ 3
Eastern Evacuation (Partial)Route IOI SouthboundRoute I 0 I NorthboundRoute I NorthPrice Canyon Road & Route 227Lopez Drive & Orcutt Road
Total
Southern Evacuation (Partial)
I IB+ I 2B+ I
I IB+ I IB+ I
IB+ 4 2B+ IO 2B+ I I
IB+ I 4 5I IB+3 IB+5
2B+ 8 5B+ l9 6B+ 23
Route IOI SouthboundRoute I 0 I NorthboundRoute I NorthRoute. I SouthPrice, Canyon Road & Route 227Los Berros Road
'otal
Total EvacuationRoute I 0 I SouthboundRoute I 0 I Northbound
,Route I NorthRoute I SouthPrice Canyon Road & Route 227Lopez Drive & Orcutt RoadLos Berros Road
Total
22
IB+ 4. 3
IB+ I
22B+ l4
22
IB+ 45
IB+ I
I
2
2B+ l7
IB+ 24
2B+ IOIB+ 4
42
4B+ 26
IB+ 2IB+ 3
2B+ IOIB+ 7
4IB+ 3
2
6B+ 3I
2B+ 24
2B+ I I
IB+ 352
5B+ 27
2B+ 2IB+ 3
2B+ I I
2B+ 45
IB+ 52
8B+ 32
4-24
B-8l-269TERA CORPORATION
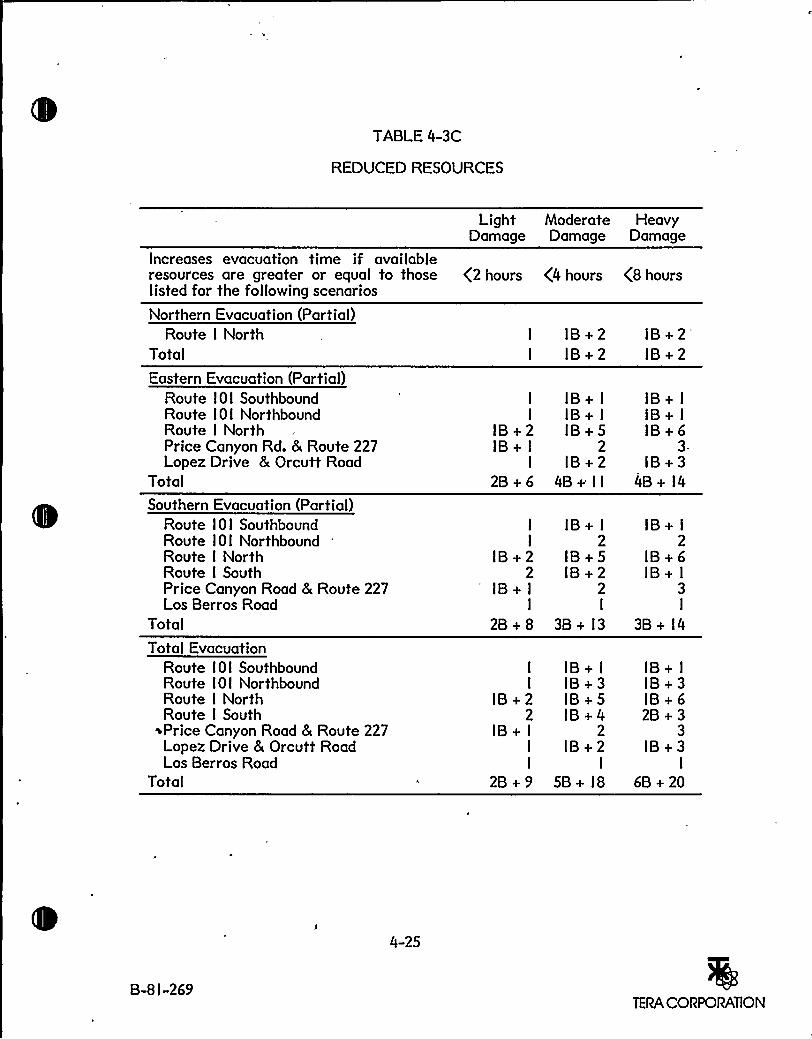
TABLE 4-3C
REDUCED RESOURCES
Light Moderate HeavyDamage Damage Damage
Increases evacuation time if availableresources are greater or equal to those g2 hours (4 hours 48 hourslisted for the following scenarios
Northern Evacuation (Partial)Route I North
Total
Eastern Evacuation (Partial)Route I 0 I SouthboundRoute I 0l NorthboundRoute I NorthPrice Canyon Rd. & Route 227Lopez Drive & Orcutt Road
Total
Southern Evacuation (Partial)Route IOI SouthboundRoute I 0 I NorthboundRoute I NorthRoute I SouthPrice Canyon Road 8 Route 227Los Berros Road
Total
Total EvacuationRoute I 0 I SouthboundRoute I 0 I NorthboundRoute I NorthRoute I South
~Price Canyon Road & Route 227Lopez Drive 8 Orcutt RoadLos Berros Road
Total
I IB+ 2 IB+ 2'IB+ 2 IB+ 2
I IB+ I IB+ I
I IB+ I IB+ I
IB+ 2 IB+ 5 IB+ 6IB+ I 2 3-
I IB+2 IB+32B+6 4B+ I I 4B+ l4
I IB+ I IB+ I
I 2 2IB+ 2 IB+ 5 IB+ 6
2 IB+2 IB+ I
IB+ I 2 3I I I
2B+ 8 3B+ l3 3B+ l4
I IB+ I IB+ I
I IB+ 3 IB+ 3IB+ 2 IB+ 5 IB+ 6
2 IB+4 2B+3IB+ I 2 3
I IB+2 IB+3I I I
2B+ 9 5B+ I8 6B+ 20
4-25
B-8 I-269TERA CORPORATION

5.0 COMMUNICATIONS
5. I EARTHQUAKE EFFECTS ON COMMUNICATIONS
As with transportation systems, a magnitude 7.5 earthquake on the Hosgri faultcould damage communications systems within the study area. For example, in
the l97l San Fernando earthquake, substantial damage was reported to the com-mercial telephone system, generally due to a lack of restraint or support to
'revent equipment from falling over. The type of damage that could interruptcommunications within the study area includes loss of electrical power, loss oftelephone lines, loss of buildings housing the equipment, loss of equipment withinthe building and loss of antennae towers. Additional factors that could furtherimpede communications include the high volume of transmissions expected aftersuch an earthquake, both from within the damaged area and from concernedindividuals outside of the area.
In our investigation, we examined the susceptibility of essential communicationsequipment to earthquake forces. This investigation was based upon our evalua-tion of the critical elements of each system reviewed which might be sensitiveto seismic forces; Some elements, for example, automobile portable radios,were not examined since they should not be damaged by an earthquake. Afterthe critical elements were identified, the location, mounting and emergencypower for each were reviewed, generally during an onsite inspection.
5.2 PACIFIC GAS AND ELECTRIC COMPANY COMMUNICATIONSSYSTEMS
5.2.l POWER PLANT PRIVATE UNIFIED TELEPHONE SYSTEM
PGandE" has a private dial telephone system which provides voice communica-tions among all company facilities. The Diablo Canyon Power Plant is served bytwo independent microwave systems: the primary link, Coast Valley MicrowaveSystem and the alternate link, West Valley Microwave System. The system is
designed to allow plant telephone access to any other company facility.Telephones are located at various locations throughout the plant, including the
B-SI-269 5- I
TERA CORPORATION
Control Room, Hot Shutdown Panels, Technical Support Center, Operational
Support Center, and the offsite Emergency Operations Facility. In addition,
there are phone jacks located at strategic operating points throughout the plant
such as the Control Room, which enable a portable telephone unit to communi-cate with any other telephone in the power plant.
The plant telephone system is a combination of an existing private Automatic
Branch Exchange (PABX) and a Computerized Branch Exchange (CBX). In this
system the telephones connected to the PABX are limited to intra-company
telephone communications, code calling, and conferencing capabilities. Directaccess to the Pacific Telephone System is not available to telephones on this
exchange. The Computerized Branch Exchange (CBX) is a computer-based,
software-controlled telephone exchange and is connected to the PABX via ten
tie trunks..
The CBX telephone system standard features include call transfer, call waiting,conferencing, call forwarding and toll restriction in varying degrees. The CBX
allows telephone sets to be programmed to have various levels of priorityrelative to trunk, line, or feature availability. This capability allows thetelephone system to serve the needs of its users in terms of need or importancerather'than on a first-come first-served basis. Certain CBX telephone sets
serving the key centers will have, in addition to standard CBX station features,an executive override feature which allows the calling party to place'a call toany other CBX telephone, even if the called station is in use. In this instance,
the called party will hear a tone; then the calling party is connected in a fewseconds.
The CBX has been programmed to allow high priority telephone sets to service
the Technical Support Center, Control Room, Operational Support Center,
Emergency Operations Facility, Corporate Incident Response Center and other
key locations. These sets have sole access to the critical telecommunications
lines which interconnect these centers and the Pacific Telephone System dial
network. All other telephones, served by the CBX and utilized for administra-tive or other purposes, will be restricted from using these critical lines when the
B-8I-269
TERA CORPORATION
priority sets are being used. Calls from'either intra-company telephones or thePacific Telephone System which are calling high priority telephones will be
answered by an At'tendant's Console, thereby screening calls not critical to the
handling of an emergency, but allowing important calls to be'extended to high
priority telephones by the individual operating the Attendant s Console.
V
The power plant telephone'system provides a code call feature which can be
initiated by dialing the appropriate code from any power plant telephone. This
sounds code bell units located throughout the plant.'ode numbers are assigned
to key members of the plant staff. A person can acknowledge his code and
communicate with the person initiating the code call by picking up any companytelephone in the plant and dialing his acknowledgement code. The planttelephone system has several built-in conference call features. One seven-phone
conference feature is set aside for emergency use and is normally initiatedfollowing the sounding of the emergency signal or the fire alarm. The controloperator enters the conference call with a pushbutton on the control console.
The next six persons who pick up a company phone and dial a special conferencecall number will be included in the 'call. Four other independent conference callsystems are available, each having a capacity of four in-plant phones plus one
phone from offsite. These conference circuits are available to any grouprequiring this service.
During normal plant operations, all calls into the plant's PGandE Private DialSystem will be via the l8 trunk circuits. In addition, l2 one-way tie trunks willprovide direct dial access to the Private Branch Exchange (PBX) in theCorporate Headquarters in=San Francisco. These tie trunks bypass normal dialtraffic and can only be accessed by high-priority telephones; this ensures thatthe high-priority telephones can call the Corporate Incident Response Center and
the Corporate Offices and also provides an alternate access to the PacificTelephone System through San Francisco if the local Pacific Telephone Exchangein San Luis Obispo were congested due to heavy use during an emergency. The
Corporate Headquarters and Corporate Incident Response Center are providedwith l6 Off-Premises Extensions which allow unrestricted access by eliminatingthe need to have calls come through the San Francisco PBX.
B-Sl-269 5-3
TERA CORPORATION
Direct-dial access to locations outside the company system will be available on
selected CBX telephones via 20outgoing Pacific Telephone System trunks.
These telephone locations will include the Control Room, Technical Support
Center, Operational Support Center, and other designated key plant personnel.
All incoming calls will be via 20 incoming Pacific Telephone System trunks. The
plant will also have four separate special-purpose lines. One line will be
mounted on the" Senior Control Operator's desk in the Control Room and willprovide a means of calling out from the Control Room in the event of an
emergency. This number will be completely unlisted, not even on the dial, toensure that is will not be tied up by persons trying to reach the plant in the event
of any emergency. A second line will be to a telephone in the Plant
Superintendents office. A third line will be to a telephone in the Security
Supervisor's office, and a fourth line. will be dedicated to the Central Alarm
Station (CAS) and the Secondary Alarm Station (SAS) for security use. These
numbers also will be unlisted.
All critical equipment is securely braced and anchored to prevent sliding,
overturning, or striking other equipment or the building. Experience has shown
that when equipment frames are thus restrained, the components within are
capable of withstanding considerable earthquake vibration. All critical telecom-
munications equipment has been strengthened and braced. This includes equip-
ment racks, battery racks, antennae and supports. All equipment evaluated willsurvive the 7.5M Hosgri earthquake loading.
The major components of the PGandE communications systems are presented in
Table 5-I. The PGandE communications capabilities listed by location are
presented in Table 5-2. The power and backup-power supplies for the compo-
nents of the Plant PGandE telephone system, along with information PGandE
radio communications systems, are presented in Table 5-3.
B-8l-269 5-4
TERA CORPORATlON
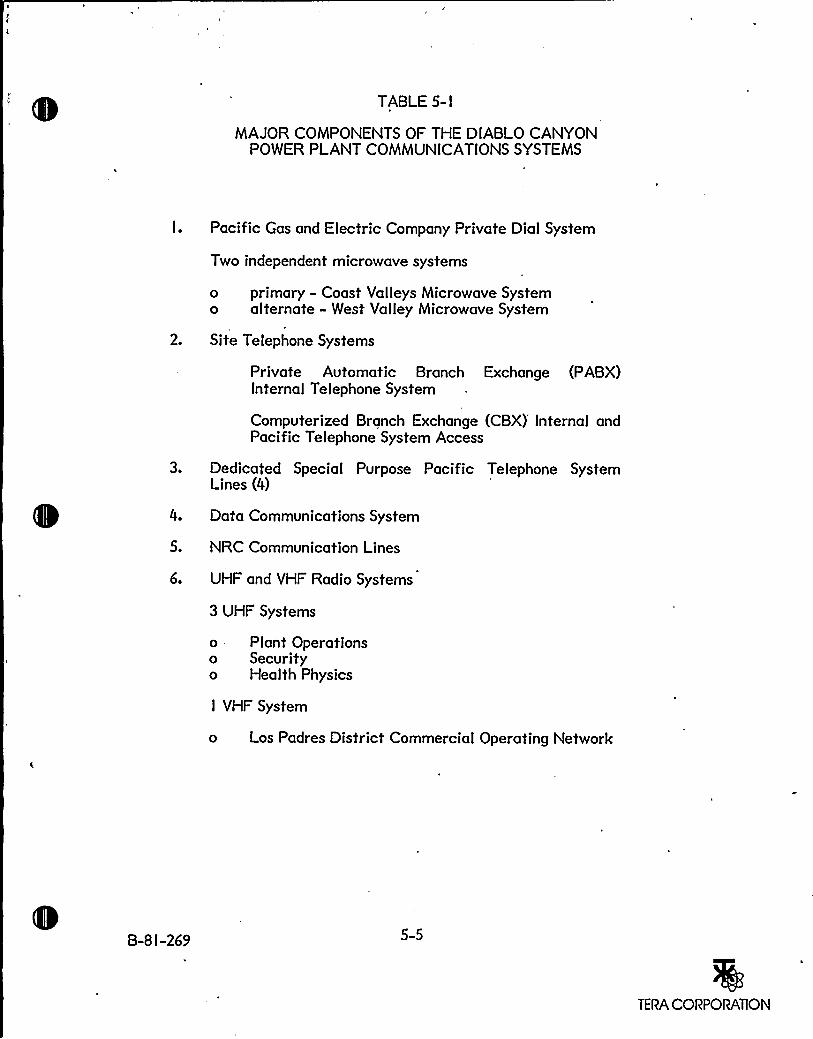
TABLE 5-I
MAJOR COMPONENTS OF THE DIABLOCANYONPOWER PLANT COMMUNICATIONSSYSTEMS
I. Pacific Gas and Electric Company Private Dial System
Two independent microwave systems
o primary - Coast Valleys Microwave Systemo alternate - West Valley Microwave System
2. Site Telephone Systems
Private Automatic Branch Exchange (PABX)Internal Telephone System
Computerized Branch Exchange (CBX)'nternal andPacific Telephone System Access
3. Dedicated Special Purpose Pacific Telephone SystemLines (4)
4. Data Communications System
5. NRC Communication Lines
6. UHF and VHF Radio Systems
3 UHF Systems
o Plant Operationso Securityo Health Physics
I VHF System
o Los Padres District Commercial Operating Network
B-SI-269
TERA CORPORATION
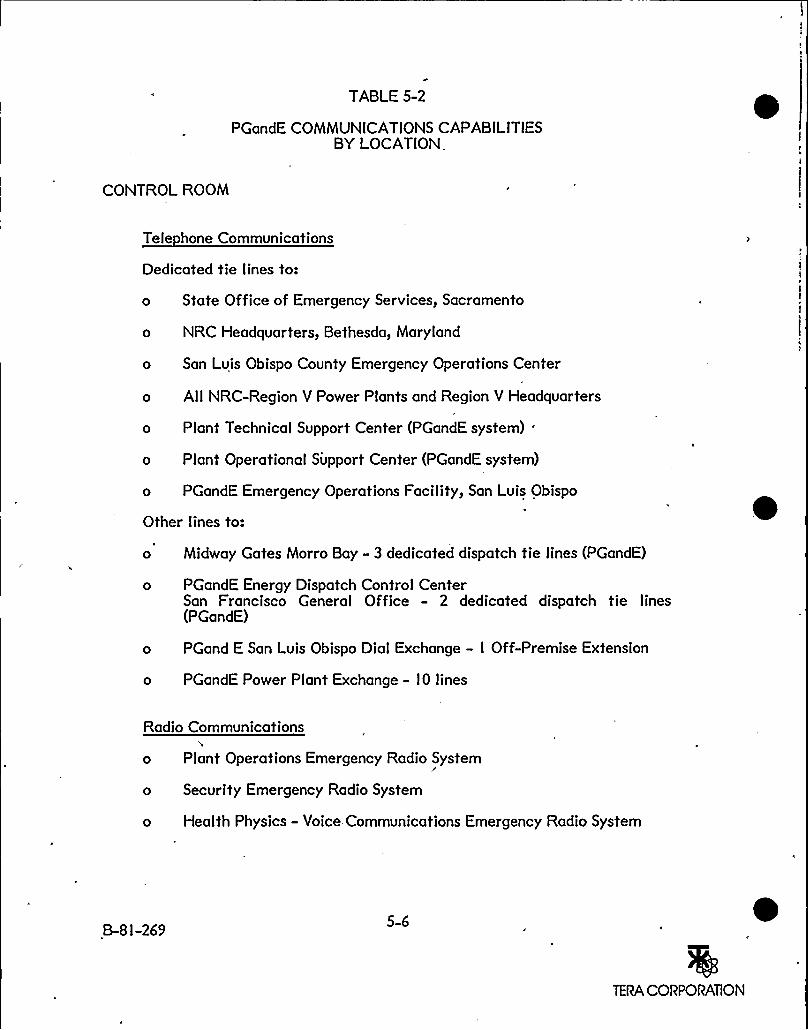
TABLE 5-2
PGandE COMMUNICATIONSCAPABILITIESBY LOCATION
CONTROL ROOM
Tele hone Communications
Dedicated tie lines to:
o State Office of Emergency Services, Sacramento
o NRC Headquarters, Bethesda, Maryland
o San Lyis Obispo County Emergency Operations Center
o All NRC-Region V Power Plants and Region V Headquarters
o Plant Technical Support Center (PGandE system)
o Plant Operational Support Center (PGandE system)
o PGandE Emergency Operations Facility, San Luis Obispo
Other lines to:
0 Midway Gates Morro Bay - 3 dedicated dispatch tie lines (PGandE)
PGandE Energy Dispatch Control CenterSan Francisco General Office - 2 dedicated dispatch tie lines(PGandE)
PGand E San Luis Obispo Dial Exchange - I Off-Premise Extension
PGandE Power Plant Exchange - IO lines
Radio Communications
o Plant Operations Emergency Radio System
o Security Emergency Radio System
o Health Physics - Voice Communications Emergency Radio System
B-8I-269 5-6
TERA CORPORATION
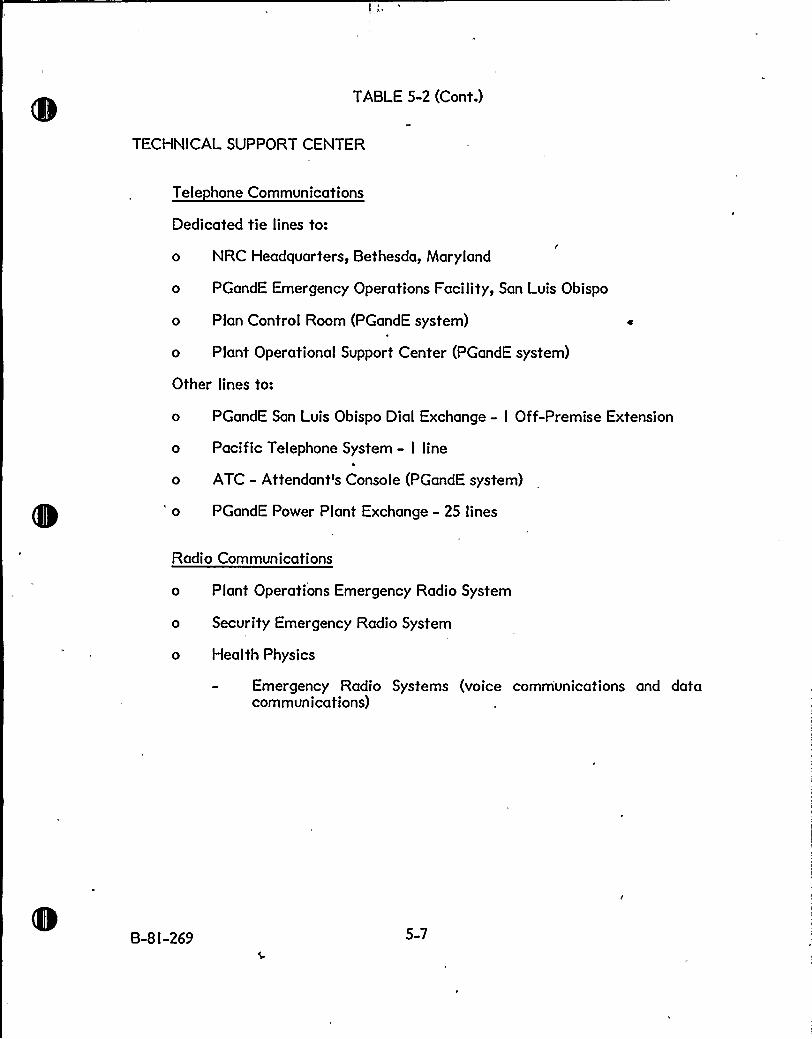
TABLE 5-2 (Cont.)
TECHNICAL SUPPORT CENTER
Tele hone Communications
Dedicated tie lines to:
o NRC Headquarters, Bethesda, Maryland
o PGandE Emergency Operations Facility, San Luis Obispo
o Plan Control Room (PGandE system)
o Plant Operational Support Center (PGandE system)
Other lines to:
PGandE San Luis Obispo Dial Exchange - I Off-Premise Extension
Pacific Telephone System - I line
ATC - Attendant's Console (PGandE system)
0 PGandE Power Plant Exchange - 25 lines
Radio Communications
o Plant Operations Emergency Radio System
o Security Emergency Radio System
o Health Physics
Emergency Radio Systems (voice comm'unications and datacommunications)
B-SI-269 5-7
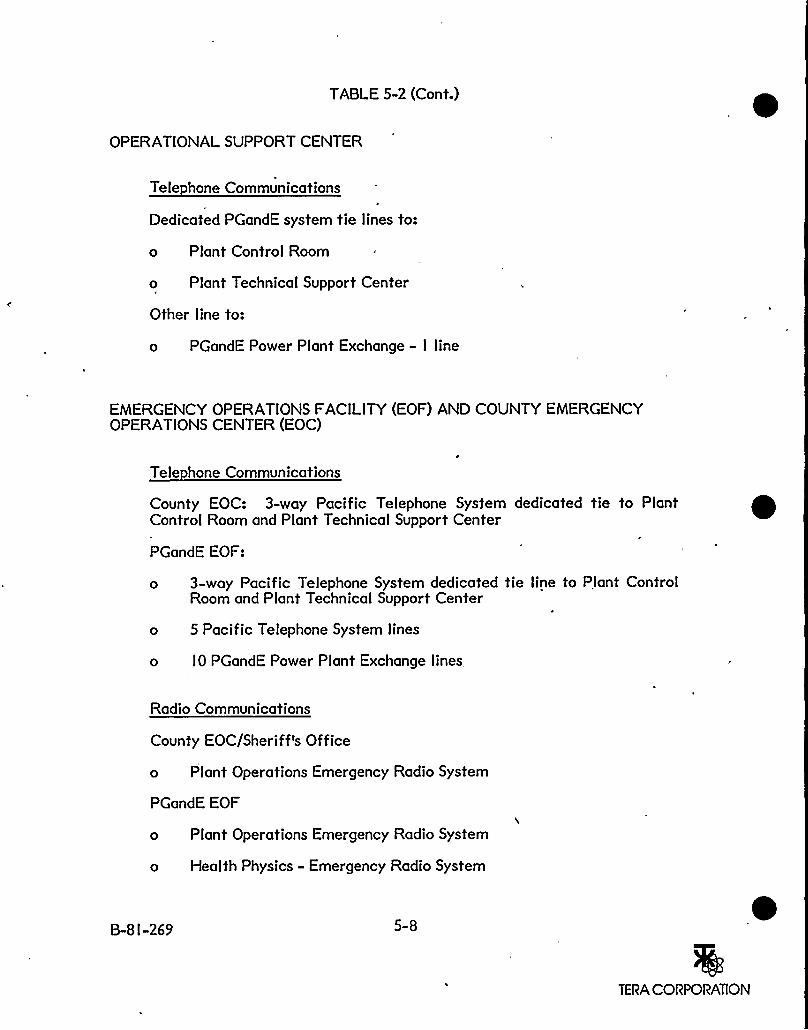
TABLE 5-2 (Cont.)
OPERATIONAL SUPPORT CENTER
Tele hone Communications
Dedicated PGandE system tie lines to:
o Plant Control Room
o Plant Technical Support Center
Other line to:
o PGandE Power Plant Exchange - I line
EMERGENCY OPERA'TIONS FACILITY(EOF) AND COUNTY EMERGENCYOPERATIONS CENTER (EOC)
Tele hone Communications
County EOC: 3-way Pacific Telephone System dedicated tie to PlantControl Room and Plant Technical Support Center
PGandE EOF:
3-way Pacific Telephone System dedicated tie line to Plant ControlRoom and Plant Technical Support Center
5 Pacific Telephone System lines
IO PGandE Power Plant Exchange lines.
Radio Communications
County EOC/Sheriff's Office
o Plant Operations Emergency Radio System
PGandE EOF
o Plant Operations Emergency Radio System
o Health Physics - Emergency Radio System
B-8I-269 5-8
TERA CORPORATION
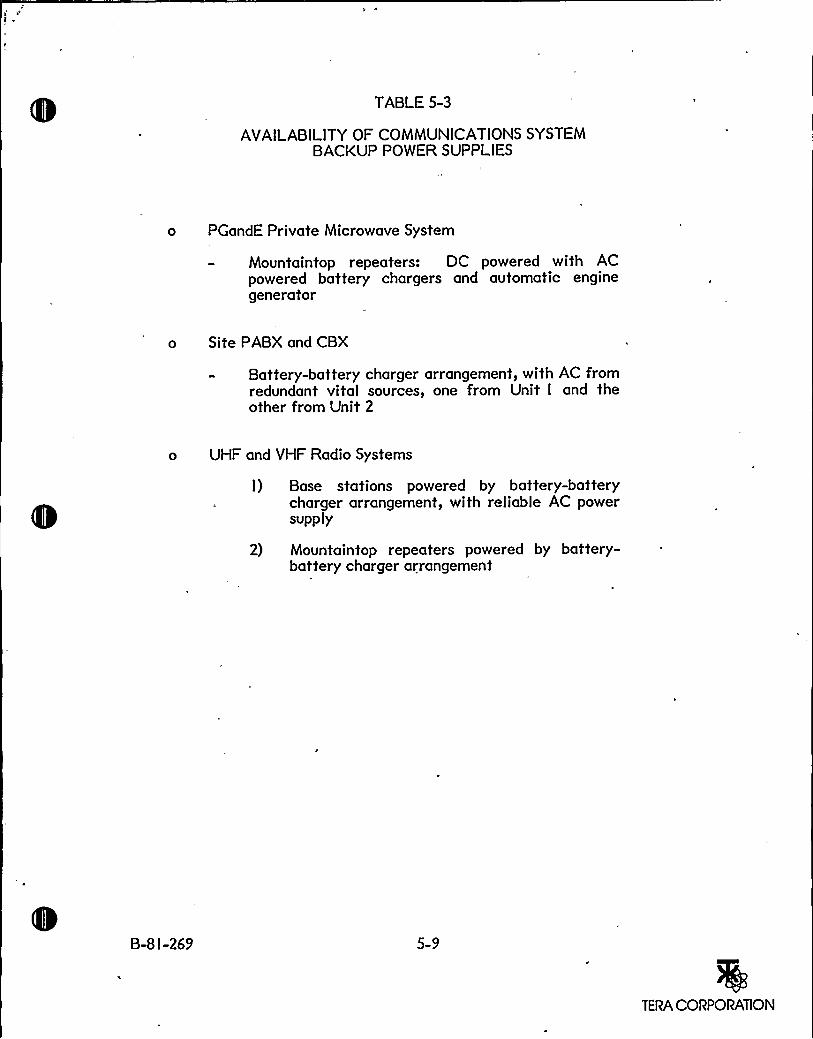
TABLE 5-3
AVAILABILITYOF COMMUNICATIONSSYSTEMBACKUP POWER SUPPLIES
o PGandE Private Microwave System
Mountaintop repeaters: DC powered with ACpowered battery chargers and automatic enginegenerator
o Site PABX and CBX
Battery-battery charger arrangement, with AC fromredundant vital sources, one from Unit I and theother from Unit 2
o UHF and VHF Radio Systems
I) Base stations powered by battery-batterycharger arrangement, with reliable AC powersupply
2) Mountaintop repeaters powered by battery-battery charger arrangement
B-81-269 5-9
TERA CORPORATION
5.2.2 PACIFIC GAS AND ELECTRIC COMPANY UHFAND VHF RADIO SYSTEMS
The plant maintains three UHF radio systems which will be used in the event ofan emergency to establish and maintain point-to-point communications between
the plant Control Room, the Morro Bay Switching Center, the PGandE Informa-
tion Center, the Port San Luis guardhouse, the San Luis Obispo County Sheriff's
Office Emergency Operations Center, the plant Technical Support Center, the
, PGandE Emergency Operations Facility, the Security Department, and several
mobile and portable radio sets. The radio system equipment provided includes
base stations or radio control consoles at the locations listed above, mobile units
in several of the plant vehicles, numerous hand-held walkie-talkie units, and
mountaintop repeaters (see Table 5-4). The three UHF radio systems are used
for Plant Operations, Security, and Health Physics. The Health Physics system
has two separate modes, one for voice communications and the other for data
transmission. The Health Physics voice communication channel will be used by
field monitoring teams.
All three UHF radio systems are two-frequency systems. The two channel
capability increases the flexibilityof each system for both normal and emer-
gency uses. One channel has short-range onsite coverage, and the other provides
long-range coverage. The short-range channel provides direct radio-unit toradio-unit communications around the plant site, independent of the telephone
system. The use of the long-range radio channels requires all radio transmissions
to be rebroadcast by a mountaintop repeater. The long-range coverage extends
north to Cambria, south to Santa Maria, and east to San Luis Obispo. All the
UHF radio systems have similar short-range and long-range coverage.
The plant radio systems can be used in conjunction with paging devices tocontact onsite personnel who are out of range from other paging systems (i.e.,
the plant intercom). This paging capability can also be used to contact offsitekey plant personnel during offshift hours.
B-8l-269 5-I 0
TERA CORPORATION
The VHF radio system is the company's Los Padres «District Commercial
Operating Network, providing coverage from King City in the north to Solvang in
the south. The Districts radio-equipped vehicles are normally dispatched
through this system by one of several base stations in this network. The Control
Room radio station, the Technical Support Center communications console,'he
Emergency Operations Facility and the mobile stations in the Plant Manager'
and Security Supervisor's automobiles will have the capability to enter and
dispatch through this network if required during an emergency.
Marine and aeronautical radio communications capabilities are considered part
of the Security Emergency Radio System. Access to these radio frequencies willbe available at key plant locations: the Control Room, the Technical Support
Center, the Central Alarm Station and the Secondary Alarm Station.
n
The radio equipment is securely braced and anchored in the same manner as
previously discussed for the PGandE telephone system. All of the PGandE radio
communication systems are powered by battery-battery charger arrangements;
the chargers are supplied by reliable A'C power sources.
B-8I-269 5-l I
TERA CORPORATION
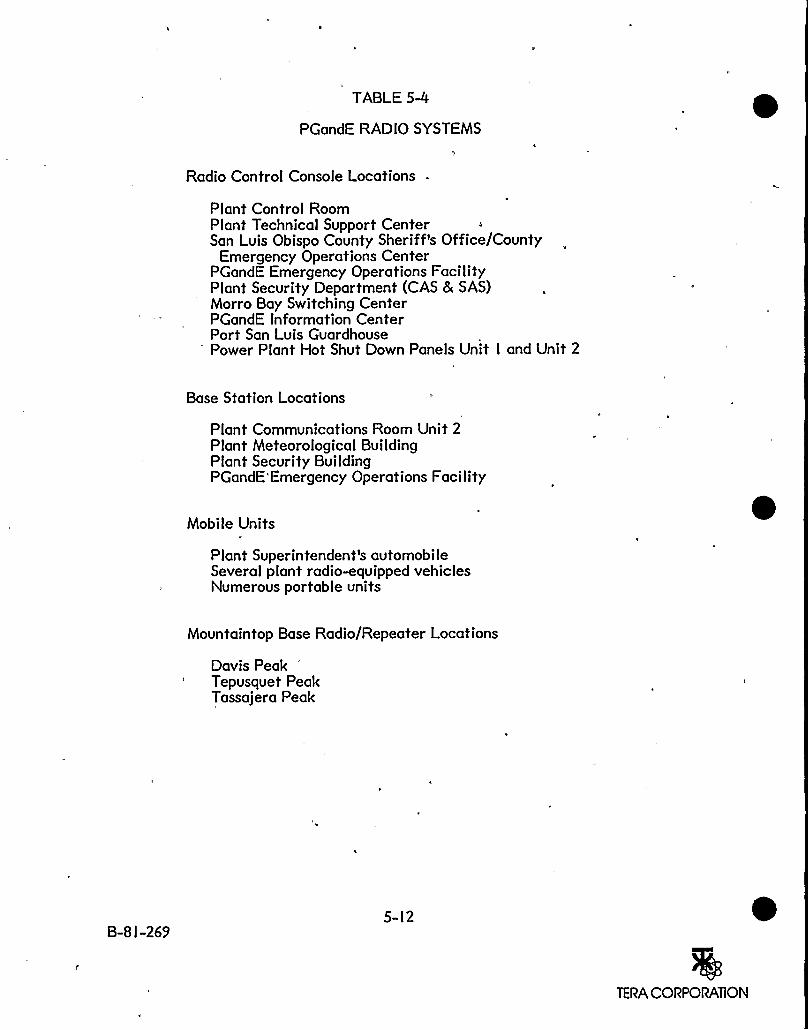
TABLE 5-4I
PGandE RADIO SYSTEMS
Radio Control Console Locations
Plant Control RoomPlant Technical Support CenterSan Luis Obispo County Sheriff's Office/County
Emergency Operations CenterPGandE Emergency Operations FacilityPlant Security Department (CAS & SAS)Morro Bay Switching CenterPGandE Information CenterPort San Luis GuardhousePower Plant Hot Shut Down Panels Unit I and Unit 2
Base Station Locations
Plant Communications Room Unit 2Plant Meteorological BuildingPlant Security BuildingPGandE Emergency Operations Facility
Mobile Units
Plant Superintendent's automobileSeveral plant radio-equipped vehiclesNumerous portable units
Mountaintop Base Radio/Repeater Locations
Davis PeakTepusquet PeakTassajera Peak
5-I2
TERA CORPORATION
5.2.3 CRITICALELEMENTS
While the PGandE communications system is obviously very complicated, our
evaluation indicated that for emergency purposes there are three major redun-
dant and diverse methods of communications for each of the three important
information channels, between the plant and EOF. Communications within the
plant are much less vulnerable to seismic damage. The three major methods ofcommunications, in addition to the "normal" Pacific Telephone System, are:
(I) Off-premise dial telephone lines on the plant exchange using dedicated
'Pacific Telephone lines which are routed both north and south, (2) Dedicated
Pacific Telephone tie lines from the Control Room and the TSC to the PGandE
EOF, and (3) UHF radio transmission from the plant (and portable radios) to the
Davis Peak base/repeater radio and the base radios on Tassajera Peak and
Tepusquet Peak, and VHF radio transmission from the plant to base stations
located on Tassajera and Tepusquet Peaks. The three important radio/telephone
channels of information which are expected at the EOF are the Plant Operations
channel from the Control Room and TSC, the voice Health Physics from the
Control Room and TSC, and the data Health Physics for dose assessment.
For each of these methods, we examined the location and mounting of equipment
and backup power at the plant, at Davis Peak and at the EOF. All the PGandE
communications equipment appears to have been installed -following strictseismic criteria. All the equipment is placed in frames bolted to the floor and
braced to the ceiling. Emergency power is provided by batteries mounted on
seismically designed racks. Backup diesel. generators are available at the plantand at Davis Peak. The microwave antennae are designed to resist !00-mph'wind velocities comparable to seismic loading. The buildings housing 'the
equipment are seismically resistant structures at the plant. The building atDavis Peak has not been analyzed in detail, but it appears to be in a sound
location and capable of withstanding the type of acceleration expected at thatstructure. The temporary trailer housing the equipment at the EOF needs strongfoundation anchoring. In the past, trailers have reacted very poorly duringearthquakes, usually being thrown off their supports. This could sever
all the underground and above ground electrical connections necessary for
B-8I-269 5-l3
TERA CORPORATION
communications and power supply. A permanent EOF is planned and will be
located near the County Sheriff s office. This facility will be designed to meet
seismic criteria. ~"Considering the redundancy of the communications system (Table 5-5),.it is
expected that communications could not be rendered totally inoperable by an
earthquake. Since all three communications channels can use each of the threemajor methods, we would expect that there is a high probability all threecommunications channels would be available to the EOF. Even if one channelwere unavailable, the two remaining channels could be used successfully eventhough the data channel for the dose assessment might require voice relay ofresults from the plant.
B-8I-269 5-I 4
TERA CORPORATION
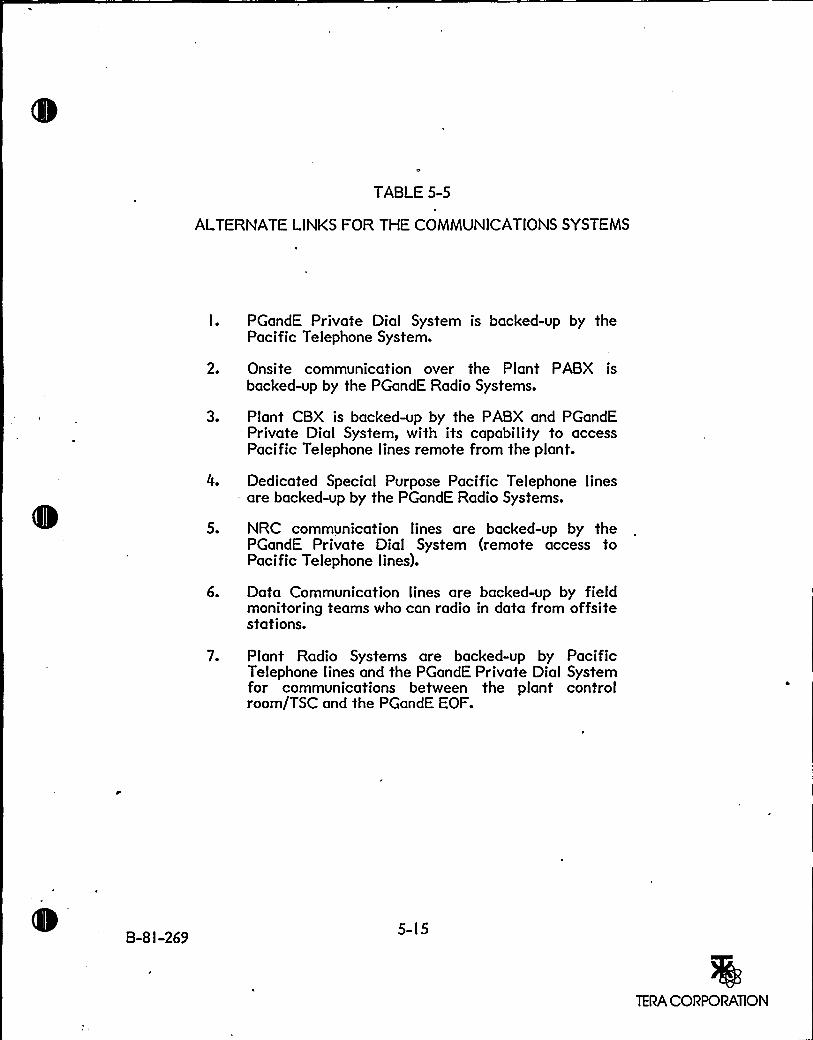
TABLE 5-5
ALTERNATELINKS FOR THE COMMUNICATIONSSYSTEMS
I. PGandE Private Dial System is backed-up by thePacific Telephone System.
2. Onsite communication over the Plant PABX isbacked-up by the PGandE Radio Systems.
3. Plant CBX is backed-up by the PABX and PGandE"Private Dial System, with its capability to accessPacific Telephone lines remote from the plant.
4. Dedicated Special Purpose Pacific Telephone linesare backed-up by the PGandE Radio Systems.
5. NRC communication lines are backed-up by thePGandE Private Dial System (remote access toPacific Telephone lines).
6. Data Communication lines are backed-up by fieldmonitoring teams who can radio in data from offsitestations.
7. Plant Radio Systems are backed-up by PacificTelephone lines and the PGandE Private Dial Systemfor communications between the plant controlroom/TSC and the PGandE EOF.
B-8I-269 5- I 5
TERA CORPORATION
5.3 PACIFIC TELEPHONE COMPANY
5.3.l GENERAL DESCRIPTION
The Pacific Telephone Company provides telephone service in the San Luis
Obispo area. A Central Office is located in the city of San Luis Obispo, and thearea's associated Community Dialing Offices/Central Offices are located in
Avila Beach, Morro Bay and Pismo Beach. Pacific Telephone serves the DiabloCanyon Power Plant from both the Avila Beach and Morro Bay offices, with each
office providing the plant with 20 trunk lines.
The carrier to Central Offices consists of cable pairs either above or under-
ground; both are present in the study area. Central Offices or switching stationsreroute calls either locally through cable pair. or long distance to another centraloffice. The San Luis Obispo Central Office equipment is presently of themechanical type, but is scheduled to b'e replaced with new electronic equipmentby the end of the year. The equipment at Avila Beach, Morro Bay and PismoBeach offices are the mechanical type. All Central Offices use commercial DC
power, with batteries in line that can provide backup power for 3 to l2 hours.Diesel generators are also available to provide system electricity and to chargethe batteries.
In the study area, all long distance calls must go through the San Luis ObispoCentral Office before being rerouted either north to San Jose, south to the Los
Angeles Basin, or east to Bakersfield.
The carriers between Central Offices are either underground coaxial cables ormicrowave transmitters, or both. Small repeaters are placed underground alongthe coaxial cables and are powered by the cable itself. Depending on the line, a
signal enhancer is necessary every 30 miles or so. It is placed above ground in a
small 8' IO'tructure and uses commercial AC power with the same backuppower as a Central Office. Microwave installations'ccount for a smallpercentage of the carriers. Microwave repeaters have the same role and
B-81-269 5-l6
TERA CORPORATION
characteristics as coaxial signal enhancer equipment. Microwave dishes are
mounted on towers or small buildings.
The routing of calls on dedicated lines is similar to that used for normal calls,except that they always have a free carrier reserved for their use and thereforeare unaffected by the traffic on the system. However, they are susceptible tothe same type of system failure.
5.3.2 REDUNDANCYAND SEISMIC CRITERIA
All the equipment in Central Offices and repeater stations has redundant
backups, except the emergency power generators. The equipment has alarmsystems indicating equipment failure. The company buildings are seismicallydesigned to meet or exceed Uniform Building Code criteria. All the equipmentin Central Offices is set in frames that are bolted to the floor, braced and tiedtogether. Older equipment also is braced to the ceiling vertically with 45 anglesteel braces. New electronic equipment has the tops of the frames braced to thestructural columns in the building. Batteries are stored on seismic racks, and theemergency generators are mounted on springs with locking pins. Microwavedishes and towers are designed for high wind speeds comparable to seismic
loadings.
Pacific Telephone equipment has come through recent California earthquakes
without damage or service disruption. In January l980, two earthquakesoccurred, both centered north of Livermore and both registering greater than 5.0
on the Richter scale. A third, the October l979 El Centro Imperial Valleyearthquake, was over 6.3 on the Richter scale, and the epicenter was onlyI4 miles from the company's Central Office. While these earthquakes did notresult in loss of telephone services past experience has shown above-ground linesto be very resistant to earthquake damage and underground lines to be affectedonly by severe shear movement (fault crossing).
The Pacific Telephone Company has emergency plans for natural and human-
caused service disturbances. The plans include the procedures to be followed in
B-SI-269 5-l7
TERA CORPORATION
the event of.a major earthquake. Emergency capabilities of Pacific Telephone
include:
o Operations Report Center to collect and compile reportsof damage.
o Two emergency centers, one in San Francisco and theother in Sherman Oaks, where managers collectively as-sess damage and direct restoration of service.
o Priority service can be provided to essential customers,-including police, fire, ambulance, doctors, civil defense,and selected federal, state, and city agencies and mostcoin telephones.
o ~ Within hours of,,a major earthquake, telephone employeesfrom outside the area can be mobilized and sent to theaffected area to assist in the assessment of damage andthe restoration of service. This can be done becausetelephone equipment is standardized.
5.3.3 CRITICALELEMENTS
The critical elements of the Pacific Telephone System consist of the power
supply for Central Offices and repeater-enhancer stations, the cable pairs and
coaxial cables, the equipment at the Central Offices and repeaters, the micro-wave tower, and the buildings housing the equipment.
In view of the seismic criteria and the redundancy of the system, it should
survive an earthquake of magnitude 7.5. The most likely failure modes ofcommunication between PGandE and Pacific Telephone consist of losing an
underground cable between the site and either the Morro Bay or Avila Beach
Central Office due to landslides. Other more unlikely modes of failure includethe complete loss of the Central Offices at Morro Bay, Avila Beach and San LuisObispo. Pacific Telephone communications at the plant would not be lost unless
both the Morro Bay and Avila Beach offices were lost. The loss of the San LuisObispo Central Office would disable long-distance calling in the area.
B-81-269 5-'I 8
TERA CORPORATION
5.4 SAN LUIS OBISPO COUNTY COMMUNICATIONSSYSTEM
5.4. I GENERAL DESCRIPTION
San Luis Obispo County is currently evaluating the County's emergency com-
munications requirements. The County Emergency Response Plan addresses the
use of the existing law enforcement, radio communications and teletype services
including the state Public Safety Microwave System, along with the use of new
dedicated tie lines, paging devices, emergency monitoring devices, and radio
equipment. The new emergency communications system configuration is ex-
pected to be finalized in the near future.
The San Luis Obispo County Emergency Operations Center (EOC) will be co-
located in the County Sheriff s Office and will use the Sheriff's radio communi-
cations during an emergency. The County Sheriff's Department has 70-80 radio-
equipped vehicles including patrol cars, vans, and four-wheel drive vehicles, and
40-50 portable radio sets operating on the three different frequencies designated
blue, yellow, and red channels. The radio system mountaintop repeaters are
located on Davis Peak; Rocky Butte, Black Mountain, and Cuesta Peak. The
system has simulcast communications over all four repeaters. The simulcast
system enhances the voice communications quality and operates in a loop
arrangement with the Sheriff's Office Communications Center, from where allcommunications are rebroadcast. Communications between radio-equipped vehi-cles can be accomplished over a separate white channel for limited distances up
to three miles.
The repeaters for the County Local Government frequency and the County
Medical Communications (Med Com), for ambulance dispatching, are co-located
with the Sheriff's mountaintop repeaters; The County Engineering Department
operates on the local government frequency. A base station for the county 'fire
departments is also located at each repeater site.
The mountaintop installations have backup power, liquid petroleum generatorswith 450-gallon tanks..The switchover to backup power takes only a few
B-81-269 5- I 9
TERA CORPORATION
seconds. Batteries provide the backup power for the Sheriff s Office Communi-
cations Center.
The county will be able to notify simultaneously all law enforcement agencies
via the California Law Enforcement Teletype Service, which operates over
leased telephone lines coming from Santa Barbara. The California Office ofEmergency Services (OES) can provide additional communications capability over
the state Public Safety Microwave Radio System. This multichannel system
enables the OES to talk to San Luis Obispo area local police, sheriff, and
California Highway Patrol offices, as well as local government offices. The
radio system base station is located on Mount Lowe, northeast of the city of San
Luis Obispo.
5.4.2 CRITICALELEMENTS
The critical elements of the county communications systems consist of the
mountaintop repeaters and the radio-equipped vehicles. The communications
center at the Sheriff s Office is needed to provide simulcast communications. Ifthe communications center were lost, each repeater would have to be manually
switched to operate in the general repeater mode. The quality 'of the
transmission would decrease but the communications system would be opera-
tional. However, the base stations for the fire department would be lost since
the communications center transmits to the base stations.
A number of portable transmitters.and repeaters are available to replace any
major failure of one system's components.
The facilities at the Sheriff s Office and Davis Peak were visited. The building
housing the equipment at the Sheriff's Office appears to be of marginal
earthquake resistance, although no analysis has been made. The equipment is
bolted to the ground but lacks ceiling bracings. These would greatly improve the
equipment stability. At Davis Peak, the equipment is housed in the PGandE
building; here again it is bolted to the floor but not braced to the ceiling even
though a top railing is provided in the building.
B-81-269 5-20
TERA CORPORATION
5.5 EMERGENCY BROADCAST SYSTEM
5.5.I GENERAL DESCRIPTION
San Luis Obispo County/cities have established an Emergency Broadcast SystemPlan to be used in the event of an emergency situation, such as a natural disaster
or a major accident/explosion. The Emergency Broadcast System (EBS) is
available to disseminate emergency information and warnings to the general
public at the request of designated local, state and federal officials. The countyplan presents the objectives of the EBS, which include providing the public withaccurate information in an expeditious manner and controlling rumors withtimely release of information.
The operation of the EBS relies on primary EBS stations to monitor a Common
Program Control Station (CPCS) for emergency alerting and programming. Allother EBS stations are considered primary stations. The County EBS Plan
identifies three radio stations to be Common Program Control Stations (CPCSs),although only one will function as the CPCS at any time. The three stations areKVEC (CPCS-I), KSLY (CPCS-2) and KATY (CPCS-3). The operating CPCS
sends emergency programming to all primary EBS stations, following theactivation of the EBS for an emergency. Primary EBS stations rebroadcast localemergency programming only on a voluntary basis. The procedure for state ornational emergencies is slightly different and primary stations are required torebroadcast emergency programming.
5.5.2 CRITICALELEMENTS
The radio transmission towers and their telephone links are critical to theoperation of the EBS system and are vulnerable to earthquake damage. Anotherconsideration is backup power; the CPCS-I station, KVEC, is the only stationwith backup power for the transmitter and studio. At the present time thestation is not on the air 24 hours a day. The earthquake resistance of the EBS
communications equipment is in question, because the stations reviewed reportedthat the stations'arthquake resistance has not been previously evaluated.
B-8I-269 5-2I
TERA CORPORATION
The activation of the EBS system relies on communications to the CPCS station
over Pacific Telephone lines. The emergency message to be broadcast is also
delivered over the telephone. Activation of the EBS and delivery of the message
could be performed by a messenger or by radio.
One would not expect that all of the EBS stations would sustain damage
rendering them inoperable following an earthquake. The County EBS Plan has
provisions ensuring the operation of the EBS to provide emergency informationto the public. For that purpose, the radio station designated CPCS- I is equipped
with backup power for both the studio and the transmitter to ensure its operation
following the loss of commercial power. In addition, the CPCS-I station has the
capability to arrange to transmit directly from the transmitter site, should the
telephone lines to the transmitter be unavailable. This transmission arrangement
will require that a technician and special equipment be sent to the transmittersite. If the CPCS- I station is not operating, one of the two backup stations
(CPCS-2 or CPCS-3) would assume the role of the operating CPCS. Should it be
necessary, an airborne public address system could be used to complete thenotification of the public.
A list of participating San Luis Obispo County EBS radio and television stationsis presented in Table 5-6. Descriptive information on the three CPCSs is
provided in Table 5-7.
B-8I- 9 5-22
TERA CORPORATION
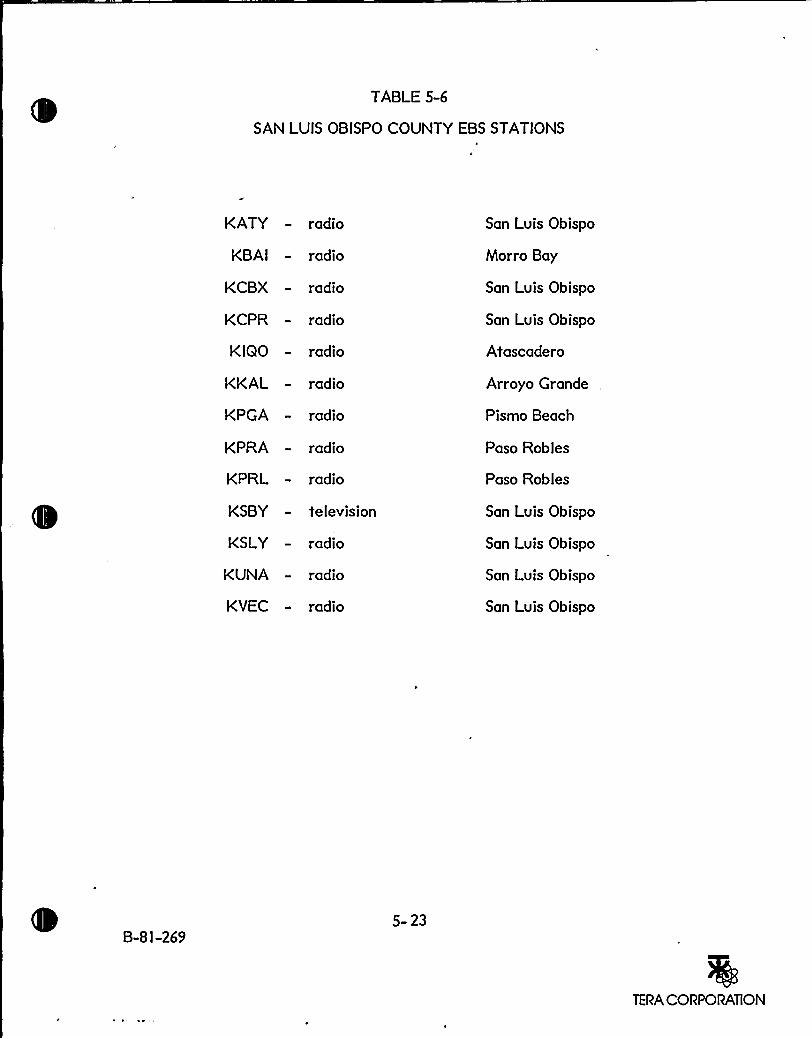
TABLE 5-6
SAN LUIS OBISPO COUNTY EBS STATIONS
KATY - radio
KBAI - radio
KCBX - radio
KCPR - radio
KIQO - radio
KKAL - radio
KPGA - radio
KPRA - radio
KPRL - radio
KSBY - television
KSLY — radio
KUNA - radio
KVEC - radio
San Luis Obispo
Morro Bay
San Luis Obispo
San Luis Obispo
Atascadero
Arroyo Grande
Pismo Beach
Paso Robles
Paso Robles
San Luis Obispo
San Luis Obispo
San Luis Obispo
San Luis Obispo
5- 23
TERA CORPORATION
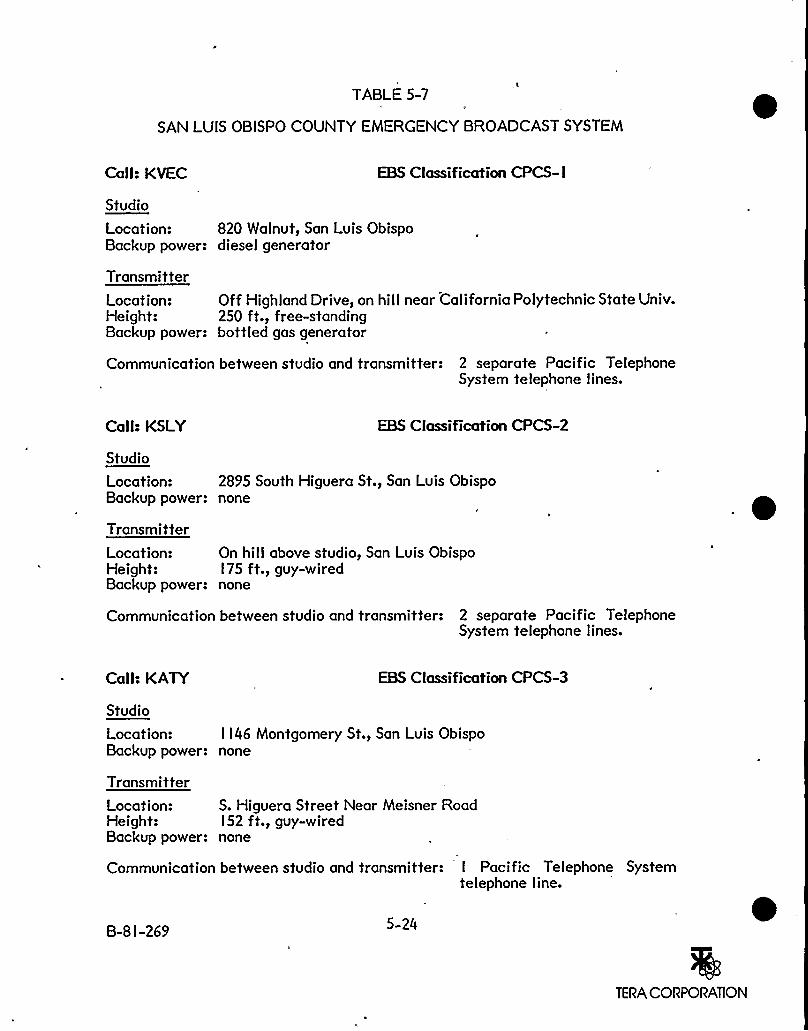
TABLE 5-7
SAN LUIS OBISPO COUNTY EMERGENCY BROADCAST SYSTEM
Call: KVEC EBS Classification CPCS- I
Studio
Location: 820 Walnut, San Luis ObispoBackup power: diesel generator
Transmitter
Location: Off Highland Drive, on hill near California Polytechnic State Univ.Height: 250 ft., free-standingBackup power: bottled gas generator
Communication between studio and transmitter: 2 separate Pacific TelephoneSystem telephone lines.
Call: KSLY EBS Classification CPCS-2
Studio
Location: 2895 South Higuera St., San Luis ObispoBackup power: none
Transmitter
Location: On hill above studio, San Luis ObispoHeight: 175 ft., guy-wiredBackup power: none
Communication between studio and transmitter: 2 separate Pacific TelephoneSystem telephone lines.
Call: KATY EBS Classification CPCS-3
Studio
Location: I I46 Montgomery St., San Luis ObispoBackup power: none
TransmitterLocation: S. Higuera Street Near Meisner RoadHeight: I52 ft., guy-wiredBackup power: none
Communication between studio and transmitter: I Pacific Telephone Systemtelephone line.
B-8I-269 5-24
TERA CORPORATION
5.6 EARLY WARNING SYSTEM
5.6.l GENERAL DESCRIPTION
The Early Warning System (EWS), an area-wide siren system, will be installedwithin the state Basic Emergency Planning Zone to alert the public promptly in
the event of a major accident at the Diablo Canyon Power Plant. The county is
responsible for sounding the EWS and providing emergency information and
instructions to the public. The initial sounding of the EWS will notnecessarily'ean
that an evacuation is ordered; it will serve to alert the public to tuneradios or televisions to an Emergency Broadcast System station for emergencyinformation and instructions.
The EWS siren system consists of a network of approximately 75 area-type sirensof various sizes designed to attain the desired radius of coverage. The sirens will
I
be installed on existing structures in the PGandE electric distribution system. In
addition, the EWS has a number of sirens used to notify individual houses inremote areas outside the range of area sirens. Indoor warning devices orprocedures will be used in large buildings that may not allow the area sirens tobe heard. Buildings in this category include hospitals, schools, detentionfacilities, factories and large office buildings.
The EWS sirens will be tone-activated through a radio system. Activation of thesiren system is planned to be over the San Luis Obispo County local frequencyI58.805 mHz. This radio network consists of three remote mountaintop trans-mitters linked by microwave to the Sheriff's Office. With this arrangement a
tone encoder is installed at the Sheriff's Office which will activate the threemountaintop transmitters via the county microwave system. Each siren'sactivation signal will be provided by at least one of the three remote mouritain-top transmitters, located at Davis Peak, Rocky Butte and Cuesta Peak.
Backup control of the sirens will be provided by installing necessary encoders on
transmitters located at the Morro Bay, San Luis Obispo, and Pismo Beach city
B-8I-269 5-25
TERA CORPORATION
police or fire departments and designated Zones I, II and III, respectively. These
transmitters willoperate independently of each other.
The Sheriff, upon receiving authorization as stipulated in the San Luis ObispoCounty Emergency Response Plan, will activate the EWS. Security provision toprevent inadvertent operation of the EWS will be built into the system.
5.6.2 CRITICALELEMENTS
We did not conduct a detailed seismic assessment of the EWS. It has no backuppower supply to the normal AC power. The purpose of the EWS system is toalert the public.to turn on their radios for information in the event of aradiological emergency. This system would not be required to notify people ofthe occurrence of a magnitude 7.5 earthquake in the study area. Such anearthquake would be felt for many miles and the strong shaking in the study areawould be sufficient to alert at least as many people as the EWS, and therebyalert people to turn on their radio for further information.
B-8 l-269 5-26
TERA CORPORATION
6.0 DIABLOCANYON EARTHQUAKERESPONSE PLAN
6. I INTRODUCTION
The planning approach described in this section provides a conceptual frameworkfor dealing with the occurrence of a large earthquake and radiological accident
in the vicinity of the Diablo Canyon Power Plant (DCPP). The existing siteradiological emergency plan for DCPP incorporates many of the planningactivities and interfaces appropriate for handling any type of emergency. In
addition, plans exist at the local, state and federal levels for responding to'
major earthquake. The intent of this plan is to supplement and expand, where
necessary, the guidance and planning base in existing plans to specificallyconsider a combined earthquake/radiological emergency. Consistent with the
approach for radiological emergencies, a spectrum of potential earthquakeeffects is considered in terms of specified damage levels. By not limiting the
plan to consideration of specific scenarios, it should be possible to provide a
broad and flexible planning base that can be readily adapted to the exigencies ofthe actual event.
6.I.I PURPOSE
The purposes of the Diablo Canyon Earthquake Response Plan are as follows:
I. Enhance, through the use of specialized operational con-cepts and emergency actions, the overall preparednessand capability of responsible organizations to respond tothe compounding effects of an earthquake on the imple-mentation of radiological emergency plans;
2. Identify the scope and nature of potential earthquakeeffects on critical elements of the DCPP emergency planand actions to ameliorate these effects.
3. Provide suggested operational concepts to be followed bythe responsible organizations to respond to earthquakeeffects and minimize their impact on the radiologicalemergency plans.
B-8I-269 6-I
TERA CORPORATION
4. Provide a planning base for the development of detailedStandard Operating Procedures and interorganizationalagreements.
6.I.2 RELATIONSHIP TO OTHER PLANS
I. State of California Earth uake Res onse Plan
The state Earthquake Response Plan is the basic plan for responding to a majorearthquake within California. It sets forth the operational concepts and
responsibilities for such emergencies and is the primary source of earthquake-related planning. It provides guidance for each level of emergency response
(Local, Operational Area, Mutual Aid Region, and State) and outlines procedures
by function (Direction and Control, Fire and Rescue, Law Enforcement and
Traffic Control, Medical and Health, Emergency Welfare, and Resources and
Support).
The DCPP Earthquake Response Plan is designed to interface the state plan withradiological emergency plans and provide supplemental guidance for the unique
potentiality of a combined emergency.
2. San Luis Obis o Count Nuclear Power Plant Emer enc Res onse Plan
The county plan establishes organizational responsibilities and actions requiredto minimize radiation exposure in the event of a radiological emergency at theDCPP. It is supplemented by Standard Operating Procedures covering emer-
gency notification, mobilization of emergency personnel, dissemination of infor-mation, responsibilities and authorities, interfaces with other agencies, and
resource listings.
3. DCPP Emer enc Res onse Plan
Pacific Gas and Electric Company has prepared a facility emergency plan toaddress potential accidents or severe natural phenomena occurring at the plant.The plan is, directed at actions necessary to be undertaken by PGandE to
B-SI-269 6-2
TERA CORPORATION
minimize the course of the plant'emergency and to assess the future course of
events and recommended protective actions.
4. State of California Nuclear Power Plant Emer enc Res onse Plan
The state plan describes the responsibilities of state organizations in responding
to a nuclear plant emergency.
5. California De t. of Trans ortation Emer enc Plan (CALTRANS)
The state CALTRANS emergency plan outlines the response of CALTRANS to
peacetime and war emergencies, including earthquakes. This plan ensures that
actions are taken to (I) restore and maintain the state transportation system in
effective operating condition, (2) assist local governments to restore and
maintain their transportation systems in effective operating condition, and (3)
provide engineering and communications support to the state Office of Emer--
gency Services (OES), the CHP, and other agencies. Under the plan CALTRANS
maintains inventories of various equipment including aircraft for emergency
operations support. In implementing the plan CALTRANS will provide highway
damage assessment data and assistance in clearing and repairing major trafficarteries.
6. California De t. of Trans ortation District 5 Emer enc Plan (CALTRANS)
The District 5 CALTRANS plan for the San Luis Obispo area is the local
counterpart of the state CALTRANS plan. It provides for the establishment. of a
District Emergency Planning Officer and for liaison with local agencies and OES
Regional Managers.
7. Federal Plans
The Federal Emergency Management Agency (FEMA), Department of Energy
(DOE), and Nuclear Regulatory Commission (NRC) would all assist the primaryresponse organizations in the event of a radiological emergency at the DCPP. In
B-8I-269 6-3
TERA CORPORATION
addition, FEMA would have the lead federal agency role for other natural
disasters, such as a severe earthquake.
6. I.3 STATE-OF-THE-ART
The state of planning for a radiological emergency in the same frame ofreference as the occurrence of a major earthquake is still an ongoing and
evolving process. Radiological emergency planning has received constant
attention for many years as part of the federal licensing requirements for
nuclear power plants. The current plans, in fact, represent a new generation of
complexity and sophistication as a result of the experience gained during the
Three Mile Island accident. The decision to explicitly overlay the effects of an
earthquake on the functionability of the radiological plan is most recent and
mandates a synthesis of analysis, planning concepts, and responsibilities not
previously envisioned. Compounding this is the fact that detailed earthquake
planning is still evolving in this country and, for a major event, transcends the
authority, responsibility and capability of a single utility or local governmental
entity.
The approach taken in this plan reflects the developmental nature of this unique
type of planning and the organic character of emergency planning in general. As
for all types of emergencies, the planning process does not focus on the conse-
quences of the events. Rather, in the event that those consequences ever come
to be, it assures that plans are in place which have anticipated and made
provisions for a suitable response.
6.2. OPERATIONAL CONCEPTS
6.2. I - GENERAL
The combined occurrence of a large earthquake and a radiological emergency at
DCPP represents a new challenge to emergency planners. Fortunately reason-
able planning has been accomplished for each event occurring individually. This
plan attempts to bridge the existing planning structure for the separate events,
B-8 I-269 6-4
TERA CORPORATION
leaving intact those elements of each plan that are essentially independent and
providing additional plans for those aspects of a combined. event that present
new or unique problems. It is recognized that more detailed planning, par-
ticularly in terms of implementation, is required.
There are two emergency activities that are of particular concern for this plan:
protective actions for plant personnel and the general public, and the capability
to maintain communications systems relied upon to implement emergency plans.
With regard to the former, evacuations are ordinarily considered as either pre-
impact or post-impact of a given disaster. Pre-impact evacuations are accom-
plished when there is sufficient warning of an event, such as may be the case forfloods or dam failures. Post-impact evacuations, on the other hand, generally
are oriented toward reconstruction or rehabilitation of an already damaged area.
Radiological accidents would normally fall in the pre-impact evacuation cat-
egory while earthquakes, due to the general lack of predictive capability, usually
involve a post-impact evacuation. It is clear that when an earthquake is
considered in common with a radiological emergency, an evacuation could be a
hybrid, serving multiple purposes such as hazard avoidance and rescue. The
decision-making process outlined in this plan is directed at the potential need forevacuation due to a release of radioactivity from the DCPP. It is recognized
that other valid, independent reasons compelling evacuation could arise (e.g., the
potential for a dam failure following an earthquake) and that decisions under
these circumstances would be made on more general criteria applicable topeacetime disasters.
Another general operational concept of relevance here is the inverse pyramid ofresources described in the state Earthquake Response Plan. That is, when a
major earthquake occurs, the initial response and resources must come fromlocal authorities to the extent possible. If these resources are exhausted,
additional assistance may be requested from the Mutual Aid Region and from the
state. Ultimately for large disasters, federal assistance may be required tocontend fully with all aspects of the emergency. It appears that this concept ofoperations is, if anything, even more applicable to the very severe disaster thatan earthquake .and radiological accident would effect. This plan offers
B-81-269 6-5
TERA CORPORATION
appropriate guidance for the initial authorities that would be involved in the
response, i.e., PGandE and San Luis Obispo County. It is expected that where
conditions require additional assistance and resources, they would be obtained
from the appropriate state and federal agencies in the manner described in other
plans.
6.2.2 REPORTING OF THE EMERGENCIES
The occurrence of an earthquake within the State of California would be
reported to the state Office of Emergency Services (OES) by one or more of the
following means:
o The National Earthquake Information Service (USGS)
o Local authorities that experience substantial earthquakeeffects
o Field units of state agencies that experience substantialearthquake effects
o Pacific Gas and Electric Company: for the Diablo Canyonsite PGandE would notify local, state, and federal offi-cials of the occurrence of earthquakes in accordance withthe emergency action levels specified in Reference 3.
The report and confirmation of a major earthquake will precipitate a number ofactions at the state level as described in Reference I, Part II E.
6.2.3 EMERGENCY PERIODS
The state Earthquake Response Plan describes three phases of an earthquake
generated emergency:
o Phase I - Immediate Emergency Phase
o Phase II - Sustained Emergency Phase
o Phase III - Recovery/Rehabilitation Phase
B-8I-269 6-6
'
TERA CORPORATION
The activities 'uniquely associated with a combined radiological emergency and
earthquake would fall into the first phase.'ubsequent response under Phases II.
and III would need to be caveated so that activities taking place in the DCPP
Radiological Emergency Planning Zones would be modified as appropriate to
account for any radiological release.
Somewhat analogously, the utility,county and state radiological emergency plans
for the DCPP specify the sequence of activities for that category of events. If
earthquake effects are superimposed on these plans, the major interactions are
again found in the assessment and protective action functions. Other emergency
activities would need to take account of any direct earthquake effects but would
otherwise be essentially unchanged.
6.2.4 CONCEPT OF LOCAL OPERATIONS
As indicated in the San Luis Obispo County Nuclear Power Plant Emergency
Response Plan, the organizational form of the county and city governments
within the area does not require major changes in the no'rmal lines of authority
to conduct effectively the various actions outlined in the Plan. For an
emergency condition encompassing several political jurisdictions,.the San Luis
Obispo County/Cities~Basic Plan for Peacetime Emergencies and supporting
emergency ordinances at the county and city level provide for a coordinated
emergency preparedness organization with the county assuming the key coordi-
nating role.
As stated in the county plan, county departments participating actively in
responding to an emergency are classified into four groups, according to
function:
o Direction and Control Group
o Response Group
o Support Group
o Assessment Group.
B-SI-269 6-7
TERA CORPORATION
Figure 6-I=provides a schematic for the local response activities associated with
a combined earthquake and radiological emergency. In concept it provides for
parallel activation and implementation of earthquake response plans and radio-
logical emergency plans. In addition, it specifies areas requiring coordination
and joint assessment. A principal element would be an Earthquake Damage
Assessment Center (EDAC) to evaluate the impact of a combined event on the
emergency response activities that would otherwise be prescribed for the
individual events. In addition, the Unified Dose Assessment Center (UDAC)
would evaluate radiological releases from DCPP and recommend the appropriate
radiological protective actions for emergency workers and the public.
The earthquake is taken as the triggering event for the earthquake emergency
plan. If a radiological event had already been in progress at the time of an
earthquake, the only change would be that the radiological emergency plans
would have been previously activated. In either event, the experience of an
earthquake would trigger earthquake response plans (state and local) and would
also activate radiological plans since seismic events are included under each
emergency action level (the action level being a function of the earthquake size).
While the activation of each plan will precipitate a number of response
activities, a timely assessment of damage both at DCPP and within the Basic
Emergency Planning Zone is necessary to establish any synergistic effects.Damage assessment within the Basic Emergency Planning Zone would focus on
primary evacuation routes and communications systems. Damage assessment atthe DCPP would consider any short-term or long-term degradation of plant
systems, onsite evacuation routes, and communications equipment. At this
point, decisions will be made as to the need to continue emergency plansin'ffect.If the earthquake was minor and caused essentially no damage, this
finding would be transmitted to the EDAC (described below) and the earthquake
plans phased out. If significant earthquake damage was experienced, damage
assessment and repair activities would be undertaken and, in the longer term, the
Phase II and III activities of the state Earthquake Response Plan would be
required.
B-81-269 6-8
TERA CORPORATION
In a parallel path, a negative finding of damage to the DCPP itself would be
reported to the EDAC and, in accordance with the radiological plans, emergency
preparedness activities would be phased down. If there was significant damage
reported at the DCPP, appropriate damage assessment activities would be
undertaken. The damage'evaluation would be passed on to EDAC to allow an
integrated assessment of earthquake damage and to UDAC for development of a
dose assessment prediction.
Upon determination that there had been more than slight earthquake damage and
that a potential for a radiocictive release from the DCPP existed, an integrated
protective action assessment would be established. The UDAC would provide
input as to the likelihood and timing of any radioactive release and the
advisability of implementing any protective action. Concurrently, the EDAC
would provide their evaluation of the integrity of communications systems and
evacuation routes and the feasibility of implementing various protection actions.
This input would be made available to the county Direction and Control Group
for a determination of the protective actions to be followed. The range of
protective actions and the protective action guidelines would be identical to
those currently found in the radiological emergency plans. The basis for
selection of protective actions would also be'essentially the same, only the data
base on evacuation. times will have been adjusted to account for the effects of
the earthquake. Where an evacuation is determined to be the appropriate
protective action, the actual implementation options available will be more
numerous and flexible to minimize any earthquake-related impediments.
The specific tasks involved in damage assessment and protective action assess-
ments are described in detail in Section 6.3.
B-8I-269 6-9
TERA CORPORATION
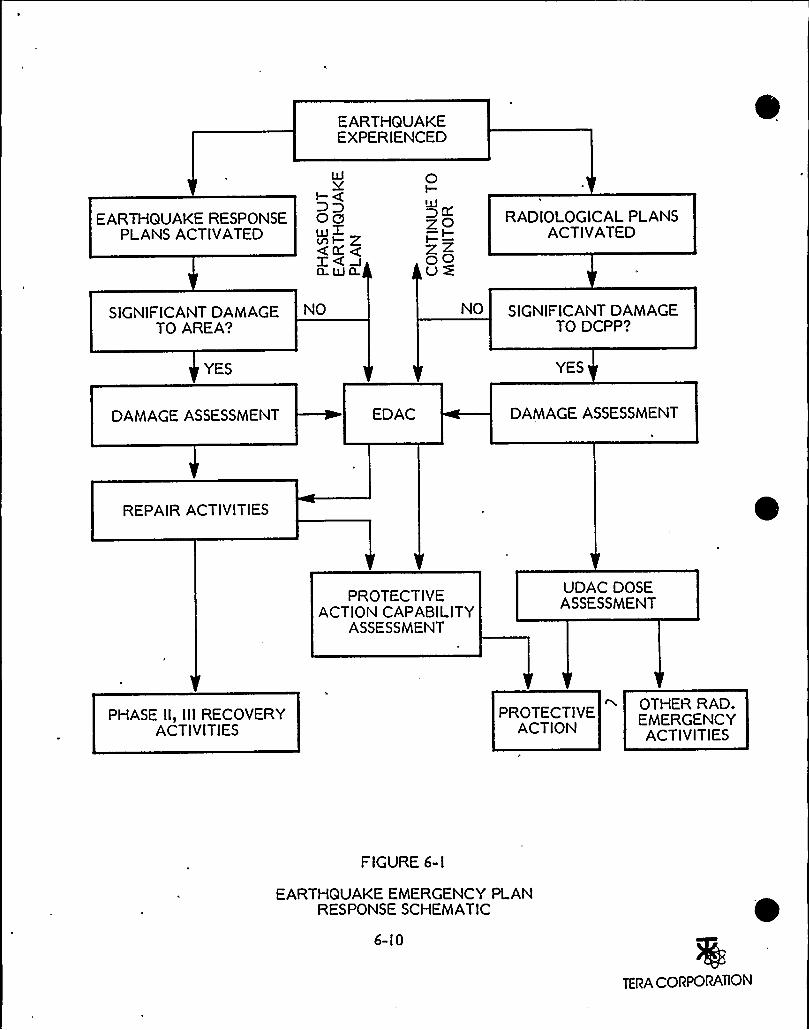
EARTHQUAKEEXPERIENCED
EARTHQUAKE RESPONSEPLANS ACTIVATED
RADIOLOGICALPLANSACTIVATED
SIGNIFICANT DAMAGETO AREA?
NO NO SIGNIFICANT DAMAGETO DCPP?
YES YES
DAMAGE ASSESSMENT EDAC DAMAGE ASSESSMENT
REPAIR ACTIV I TIES
PROTECTIVEACTION CAPABILITY
ASSESSMENT
UDAC DOSEASSESSMENT
PHASE II, III RECOVERYACTIVITIES
PROTECTIVEACTION
OTHER RAD.EMERGENCYACTIVITIES
FIGURE 6-I
EARTHQUAKEEMERGENCY PLANRESPONSE SCHEMATIC
6-IO
TERA CORPORATION
6.2.5 EARTHQUAKEDAMAGE ASSESSMENT CENTER (EDAC)
In contemplating the combined effects of an earthquake and radiological
emergency, it is important to provide the capability for an integrated assessment
function of earthquake damage to the extent that it could impact on emergency
activities. To provide this capability, an Earthquake Damage Assessment Center
(EDAC) will be established. The EDAC will receive reports from damage survey
teams deployed to inspect primary evacuation routes and communications
systems. PGandE would still input plant status and damage to the UDAC but, in
addition, damage to plant transportation routes and communications systems
would be reported to the EDAC.
Based on the damage reports the EDAC will:
(I) Provide an assessment of the availability of,communica-tion links, including EWS and EBS.
(2) Provide an overall evaluation of damage to the evacuationroad network (i.e., no, light, moderate or heavy damage).
(3) Specify the available evacuation routes and alternaterouting if necessary, and approximate capacities at anytime.
(4) Update the. assessments as more detailed reports arereceived or repairs are effected.
Prioritize allocation of repair resources to damaged sys-tems.
The EDAC will comprise representatives of the county, PGandE, CALTRANS,
and Pacific Telephone. These individuals will have the requisite expertise in
highway/bridge design and repair and communications systems.
B-8I-269 6-II
TERA CORPORATION
6.2.6 ADDITIONALINTERFACES WITHSTATE EARTHQUAKERESPONSE PLAN
6.2.6. I EMERGENCY CONDITIONS
Section II of the state Earthquake Response Plan defines five emergency
conditions, A through E, as the basis for planning and response. Condition A is a
general preparedness, or standby, condition based on the assumption that a
serious earthquake will occur in the future. Conditions B, C, D, and E describe
situations prevailing after an earthquake has occurred. The conditions are as
follows:
Condition A - Pre-Emergency
Condition B - Distant from Damaged Area
Condition C - Close to Damaged Area
Condition D - Damaged
Condition E - Evacuation
The operation of this Earthquake Response Plan would only arise under condi-
tions C, D and E. These same emergency conditions can still be used to describe
the earthquake-related status in interfacing with state and other agencies, withone modification. As currently envisioned by the state plan, condition E would
effectively arise only when there existed a risk of dam failure subsequent to an
earthquake. For the DCPP Emergency Planning Zone there could also be the
potential need to evacuate due to a radiological emergency.
6.2.6.2 COORDINATION OF OPERATIONS
Under the state Earthquake Response Plan,
Operational Area. At the next level there
Regions, the DCPP being located in Region I.
local and state resources, these area and
each county is designated an
are six designated Mutual Aid
As a basis for coordination of
region designations should be
B-8 I-269 6- I 2
TERA CORPORATION
maintained to the extent possible under a combined earthquake/radiological
emergency.
The state plan also provides an outline of state, federal, and military operations
that would be responsive in the event of a major earthquake. These conceptual
plans provide a reasonable basis for response by these organizations. Since these
same agencies also have responsibilities under radiological emergency plans forthe DCPP, the individual agencies may want to provide additional guidance forresponding to a dual emergency.
6.3 SPECIAL TASKS
This part identifies those special tasks that might have to be performed
following a major earthquake and radiological emergency. The focus is on those
tasks that require special attention due to the uniqueness of a combined event.
Tasks that would be required to respond to each event independently are assumed
to be performed in accordance with applicable'plans. Where various organiza-
tions are assigned tasks, it is expected that implementing plans and procedures
will be developed accordingly.
TASK A DAMAGE ASSESSMENT OF TRANSPORTATION ROUTESAND COMMUNICATIONS
I. ~Pur ose
To establish policies and objectives and assign general responsibilities for the
following activities:
a.
b.
Early conducting of a reconnaissance of the Basic Emer-gency Planning Zone to determine the nature, extent, andlocation of damage to primary evacuation routes andcommunications sytems.
Follow-up assessment activities to monitor repair andrestoration activities and update evacuation routes andcommunications availability.
B-8I-269 6-l3
TERA CORPORATION
co Assessment of damage reports for input to protectiveaction decisionmaking, allocation of repair resources, andrequirements for alternate means of transport or com-munications.
2. Conce t of 0 erations
Following an earthquake, field units of local government and state agencies will
promptly conduct a rapid reconnaissance of the affected areas to determine the
extent and nature of damage (see References I, 5 and 6). For the Basic Planning
Zone described in Reference 2, particular attention will be given to the condition
of the primary evacuation routes. Reports of damage to these routes will be
channeled to an Earthquake Damage Assessment Center (EDAC) for assessment
and use by the county, Direction and Control Group. In addition, communications
systems availability will be determined by actual usage and system checkouts.
Where specific problems are enc'ountered, damage teams will be dispatched as
appropriate (e.g., to Davis Peak). Other forms of general earthquake damage
assessment will be conducted and reported in accordance with the requirements
of the state Earthquake Response Plan.
3.
~Sifts*
T k
A. DAMAGE RECONNAISSANCE
Following the occurrence of a major earthquake, an immediate area reconnais-
sance of the Basic Emergency Planning Zone will be undertaken. The survey
would normally be conducted as follows:
(I) Roads and overpasses for the primary evacuation routeslisted below are surveyed to determine the extent andlocation of damage.
o Route I from San Luis Obispo to Morro Bay andalong the coast to the north;
o Route IOI north and over the mountain range fromSan Luis Obispo;
B-8I-269 6-I4
TERA CORPORATION
Route IOI south from San Luis Obispo and throughthe urbanized region along the south coast;
4
Route 4l, from the intersection with Route I inMorro Bay to Route IOI in Atascadero;
o Orcutt Road, from San Luis Obispo via Huasna Roadand Route 227, to the intersection with Route IOI in
'rroyo Grand;
o Route 227 to Price Canyon Road and hence to theintersection with Route IO I in Pismo Beach; and
o Route I, from the interchange with Route 10l onthe northern outskirts of Pismo Beach, along thecoast and out of the EPZ.
(2) The. damage surveys should identify any failures or dam-age to bridges/overpasses and the occurrence of anylandsliding or ground subsidence. Locations of damageshould be given by bridge number and highway mileagemarker. Figures 6-3a through 6-3h indicate the locationsof bridges and potential areas for landslides and liquefac-tion. The following damage characterizations should beobserved.
~Brid ee
o No observable damage
o Light damage, bridge passable at reduced speed
o Moderate damage, bridge temporarily impassable upto four hours, repairs required
o Heavy damage/failure, bridge impassable and notrepairable within four hours.
Landslides
Estimate number of feet and depth of encroachment ofslide on road shoulder and pavement.
Subsidence
Where subsidence is observed, categorize as light, mod-erate or heavy in a similar manner as described underbridges.
B-8 I -269 6- I 5
TERA CORPORATION
(3) Where moderate or heavy bridge damage or road subsi-dence occurs, or significant encroachment due to slidingis observed, survey the availability of alternate routing.A list of alternate routes for critical highway bridges isincluded in Table 6-l.
(4) Damage assessment should also be performed for all vitalcommunications links relied upon in the'adiologicalemergency plans. These are listed below. Generalassessments can be made'hrough the continued usage andavailability of normal communications channels. Forspecial systems such as EWS and EBS or where specificproblems are encountered;,damage survey teams will bedispatched to the scene (e.g. Davis Peak). If all EBSstations are unavailable, other commercial radio stationswill be surveyed to identify those capable of transmittingemergency instructions. Alternate means will be estab-lished to convey the messages to the station for broad-cast. Reports should be made to the EDAC.
Pacific Gas and Electric Company
o PABX
o CABX
o Coast Valley Microwave System
o West Valley Microwave System
o UHF- Radio System
o VHF Radio System
o Early Warning System
San Luis Obispo County"
o Telephone Lines to EOC
o 'HF Radio
o VHF Radio
Pacific Telephone and Telegraph
o PGandE Interface
o Telephone Lines
Radio/Television Stations
B-SI-269 6-l6
TERA CORPORATION
o EBS
(5) Local damage reconnaissance will usually be accomplishedthrough ground surveys using local agency emergencyvehicles.
(6) Aerial reconnaissance will be utilized where capabilitiesand conditions permit. To the extent practicable, thesesurveys will be initiated by San Luis Obispo County usinglocally available aircraft. Flights will be coordinatedwith and additional equipment requested from the stateOES Mutual-Aid Region (see Appendix A of Reference I
and References 5 and 6).
(7)
(8)
All damage reconnaissance missions will be coordinated,or be a part of, the general damage reconnaissancemissions conducted pursuant to the state EarthquakeResponse Plan.
Where no damage to evacuation routes or communicationssystems is observed, negative reports are to be made toEDAC to establish completeness of reconnaissance.
B. DAMAGE ASSESSMENT
(2)
Following the submission of damage reports from the fieldreconnaissance teams, the EDAC will evaluate the dataon evacuation route and communications systems damage.
An overall assessment will be made as to the damagesustained by the evacuation road system in accordancewith the four categories defined below:
(3)
o Essentially no damage
o Light damage
o Moderate damage
o Heavy damage.
An overall assessment of the damage to communicationssystems will be made with findings as to capability forvoice and data transmission from the plant to the EOFand EOC; capability for communications between ele-ments of the county emergency organization; and theoperability of the EWS and EBS.
Estimates will be made of the resources required to repairprimary evacuation routes and communications systems.
B-8I-269 6-l7
TERA CORPORATION
The resource requirements will be compared to resourceavailability and a priority agenda will be prepared
for'onductingrepairs. Time estimates for the restoration ofservice will then be determined and made available todecisionmakers.
(5) Periodic updating of the damage assessments will be madeto include progress of. repairs and more detailed damagesurveys.
C. ORGANIZATIONS AND RESPONSIBiLITIES
~DSPGandE: Access road to Port San Luis
Gate and northern routethrough Montana de Oro StatePark.
CALTRANSCounty EngineerCounty Sheriff's OfficeCalifornia Highway PatrolLocal Police Departments
Pacific TelephonePacific Gas and ElectricCounty Sheriff's Office
Offsite Primary EvacuationRoutes
Communications Systems
B-8I-269 6-I8
TERA CORPORATION
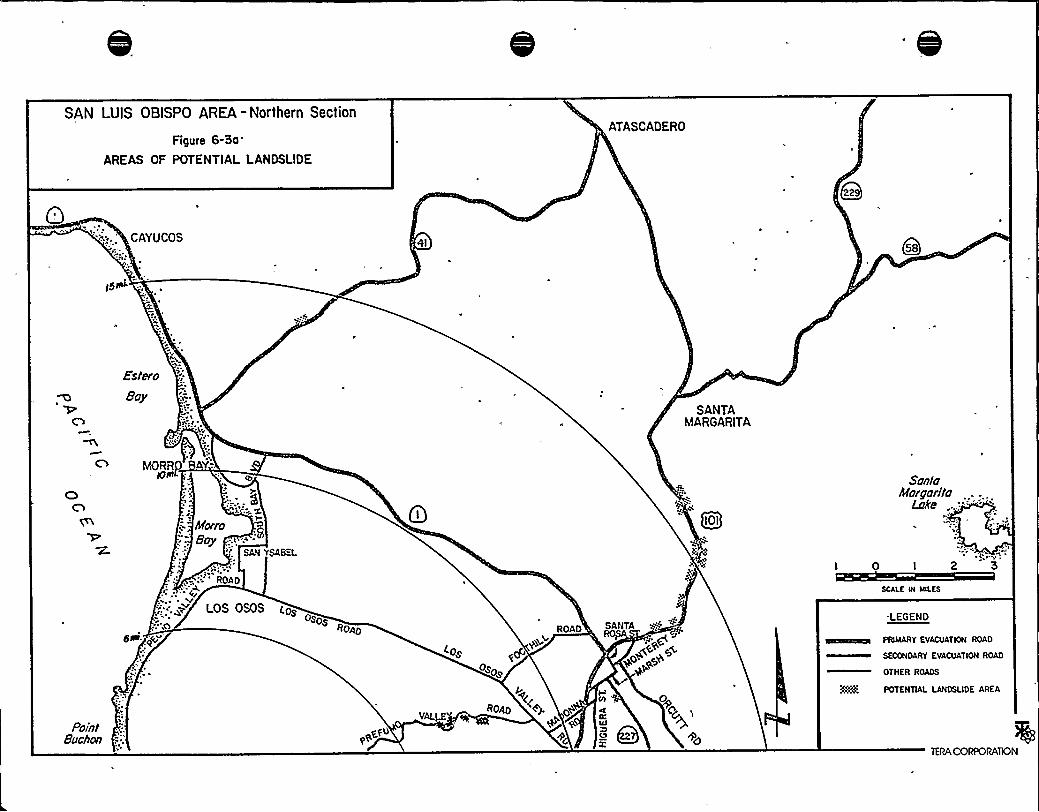
SAN LUIS OBISPO AREA-Northern Section
Figure 6-3a
AREAS OF POTENTIAL LANDSLIDE
ATASCADERO
CAYUCOS 4IQss
Estero
8ay EU ~
SANTAMARGARITA
VIDRRP
Nero8oy
SAM 'rSABEL
'ROAD
ioi~ A
SanlaNorgari la
Lake
0 I 2 3
SCALE N ISLES
Point8rlchon
LOS OSOS r,oO>OS:"O
ROAD$ yg
Eeu
ee'ossos
ROAD
pc&
C~ic
ROAD Q Oq
SANTAROPA
go+ q+
LEGEND
PNMNIY EVACUAYION ROAD
SECONDARY EVACUAYICN ROAD
OYIIER ROADS
%% POTENTlAL LANDSLIDE AREA
TERA CORPORAllON

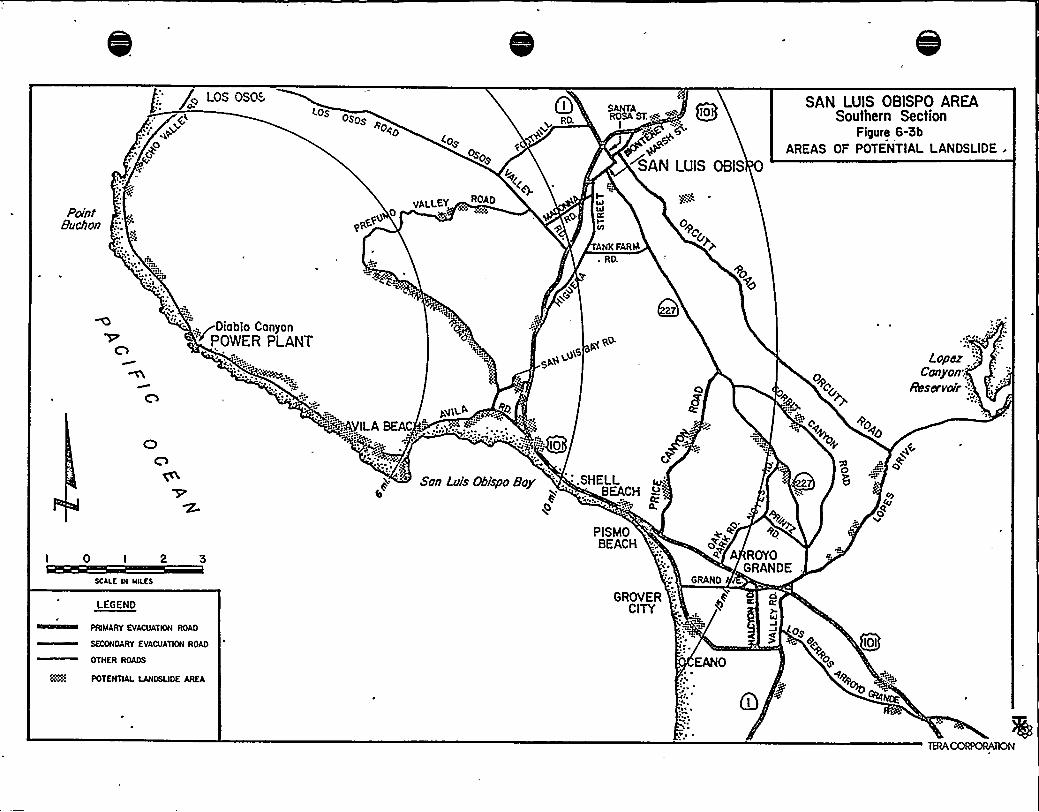
Punt8udion
o LOS QSOS<OS
OSOs
ohio<os
so
yALLET ROADI-IEI
ANKFAR|A
0+c~
P~
SANTAROSA ST.m ~"
I
4Y
SAN LUIS OBIS
SAN LUIS OBISPO AREASouthern Section
Figure 6-3bAREAS OF POTENTIAL LANDSLIDE .
E V
- „.„~Diablo CanyonPOWER PLANT
E
I 0 I 2 3
SCAI.r. III MII.SS
LEGEND
-4;AyiLABEACrLVV.A LM
0
~IOE ~
San Luis Obispo Boy SHELLBEACH
PISMOBEACH
GROVERCITY
LO
e~ A
GRAND I
ROYOGRANDE
dIL
ILI
+o~o
= o~
ISA
oeAY'
E
Loper ."
Canyon"
Abscrvul -'.
YHMARY EYACIIATHH RDAO
SHXHDAIIY EYACDATEH RDAD
OTIIER ROADS
8I rmeNmAL uwosuoE ~A
D ~OI
osQIOI
+o

0
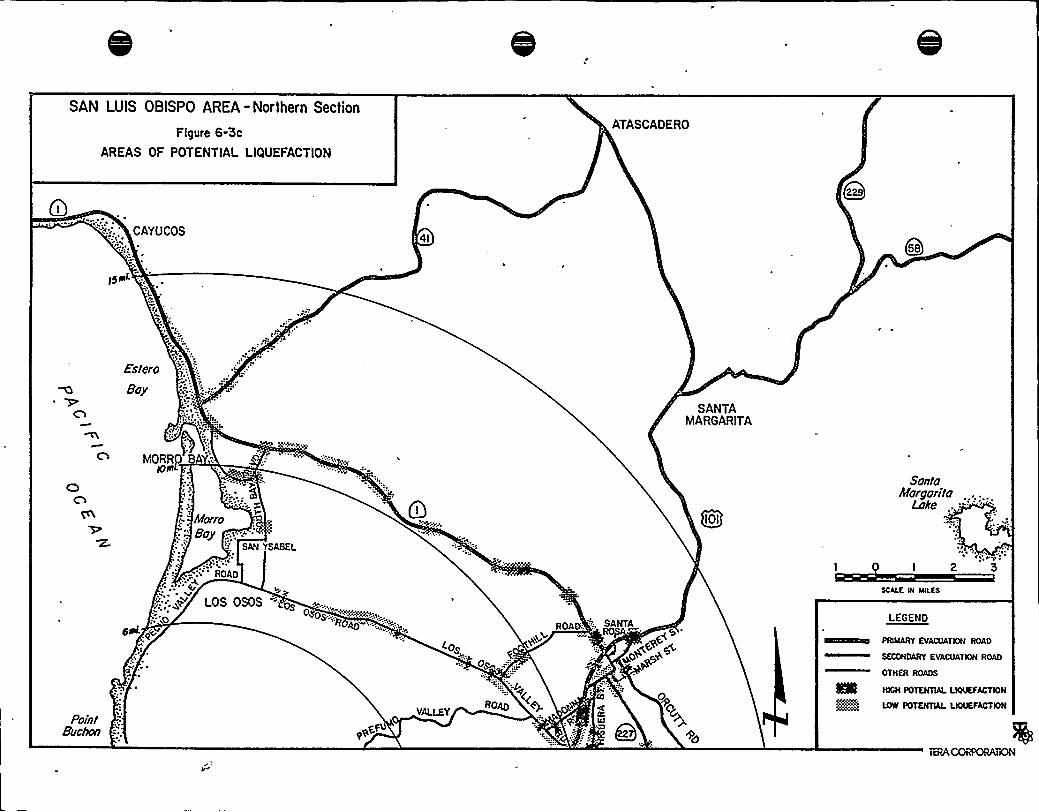
SAN LUIS OBISPO AREA-Northern Section
Figure 6-3C
AREAS OF POTENTIAL LIQUEFACTION
ATASCADERO
I ~
CAYUCOS
r$ gglL
L ~
4lQss
Estero
8oy
'V,E 1
I" SANTAMARGARITA
C)
MORRP A ".
IOFI .
E 'I; vAATE
V
'Irr, 'E
Narro8oy
SAN TSABEL
ROADr....'~<
I~
LOS OSOS gpDODS... %",gear.0
OIE'rI rrrE
~op
0
ROADA ":„. SANTA
+0 cj
Qoi
SontoNargorito
Loke
I 2 3
SCALE IH NLES
LEGEND
THHART EVIIOOATIOH ROAD
EEHHDAIH EVAOOATIOH IHVID
Point8riohur
VALLEY
4(ROAD
+o
OTIIER RDAIHIi HIGH P0TENTIAL LICVEFAcTNN
Nm Iow P0TENTIAL LICUEFAGTNN

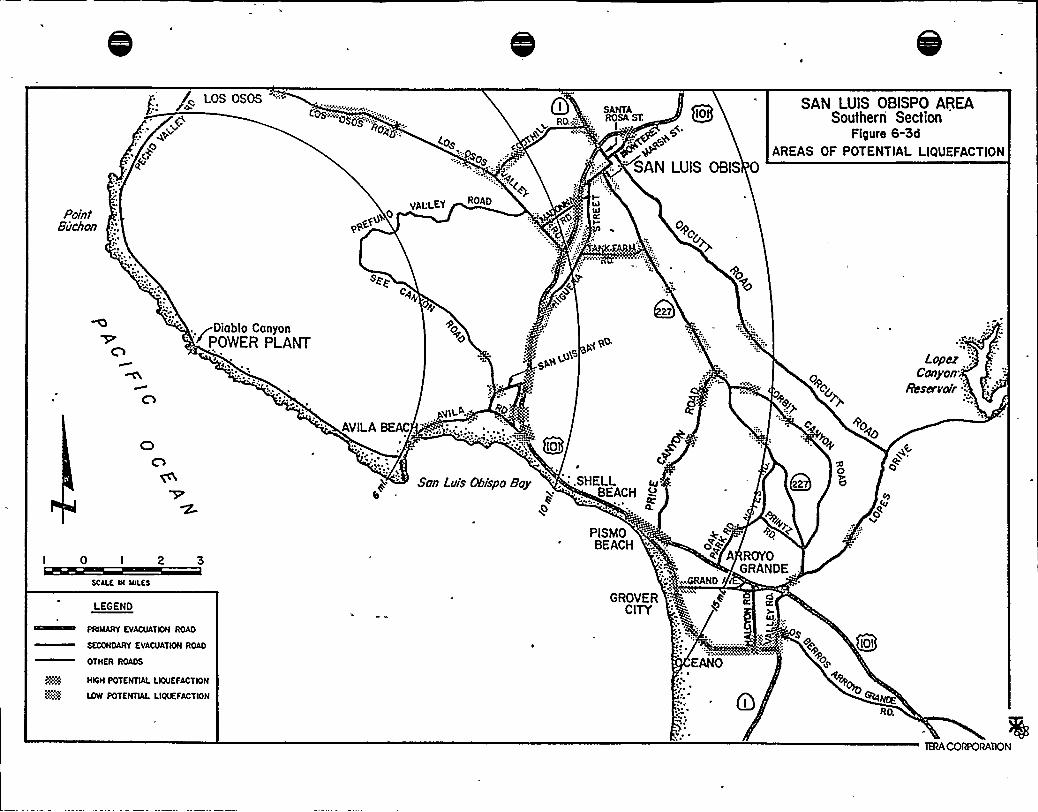
PrintBudIon
I LOS OSOS '-AV,vga'~~
~8$ 'h Kos .,~,os""jpo,
'l'os-.'::::>os,:,,
'''(eyALLEY ROAD
I-4lILI
+
SAN LUIS OBIS
SAN LUIS OBISPO AREASouthern Section
Figure 6-3dAREAS OF POTENTIAL LIQUEFACTION
sg~Cq
Diablo Canyon+POSER PLANT
yl A<
AVILABEAC .,';.;,:.,:...
OpCg
+elp
0~~'o~
Lope;:Conyon;
'incrvoir:.1h
Son Luis C5ispo Boye
1
SHELLBEACH
O
I 0 I 2 3
SCALE W MILES
LEGEND
PRIIAIIYEVACIUITKNI IIOAD
SECONDARY EVACUATION ROAD
OTHER ROADS
@5 HICH POTENTIAL LIOUEFACTION
LOW POTENTIAL LIOUEFACTNN
PISMOBEACH
\A
~IGROVER
CITY
+ e. +o~~+R~ A ROYO
GRANDE,CjRAND I
QIOI
oe
+~RD.
TERACORPORAllON

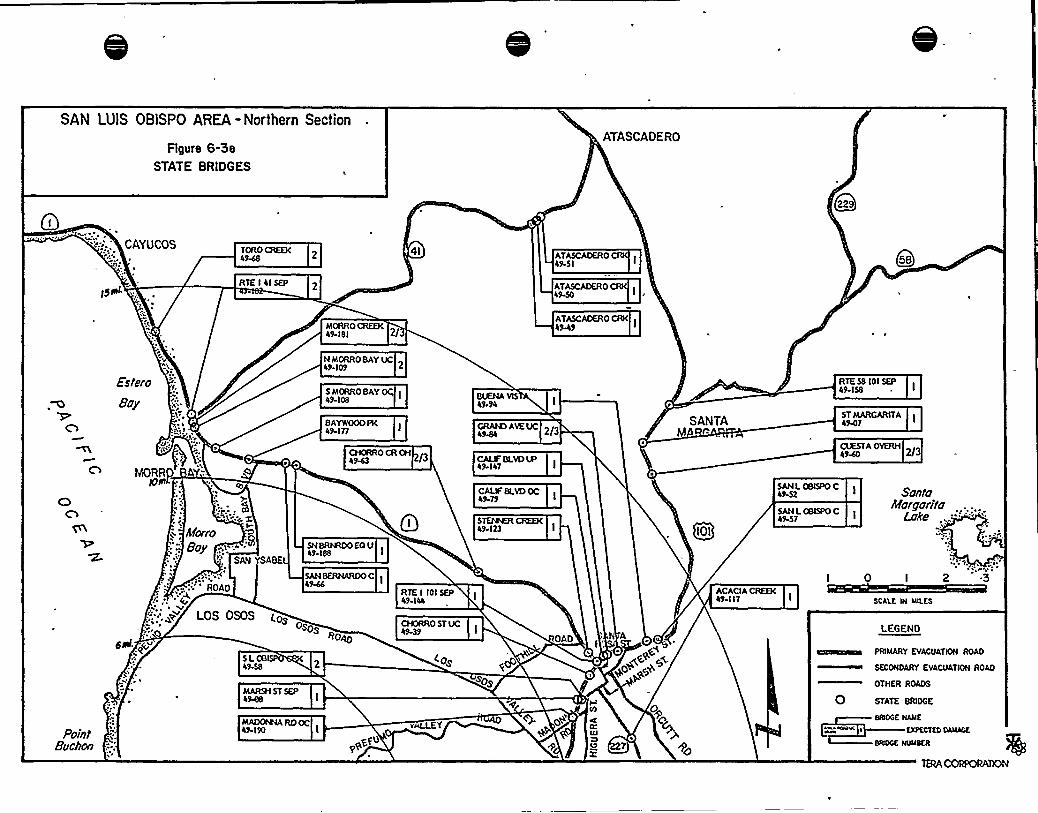
SAN LUIS OBISPO AREA-Northern Section
Figure 6-SeSTATE BRIDGES
ATASCADERO
220
IEIPL
CAYUCOS TORO CREEK49-68
RTE I 4 I SEP
4I ATASCAOERO49-5 I
ATASCAOERO CRKI
4'58MORR0 CREEK49-I 8 I
ATASCADERO CRKI
Estero
8ay
c NMORROBAYVC49-109
5 MORRO BAY49-l08
BAYINOOOPK49-I 77
BUENA VIS49 94
CRAMBO AVE VC 2pSANTA
RTE 58 I0 I SEP49-158
ST MARGARITA4947
COSTA OVERH
NOTCRP
iIrtorroBay:.;-:~
?', SARI YSABE
''ROAD
LOS OSOS I.os"a
6IIII 0QSLOBI49-58
SN BRI8IDO EO II19-188
SANBERNAROOCI4546
osos7IOAD
RTE I IOI SEP49-l44
CHORRO ST VC4~
<os
CHORR0 CR OH p49-63 CAUF BLVDLS'9
I47
CALFBLVDOC49 79
STEER CREEK49 l23
OAD N A
OI
SAN L OBISPO C4S42
5AN L OBISPO C49-57
ACACIACREEK49-ll7
SantoNorgorita
Lake
Ic'A
I 2 5
SCALE IN LGLES
LEGEND
NIIIIART ETACIIATICR IIOAD
ERXWDIUIT ETACUATRU ROAD
PointBeet?cv7
MARSH ST SEP49kB
AAOOA94ARO OC49 I90
sos OTHER ROUN
0 STATE BRIDGE
8800K NAME'~ ~~
D ~EXPtCTTOOAUAGESRCGE NUMBER
lERACOAPORAIIOITI

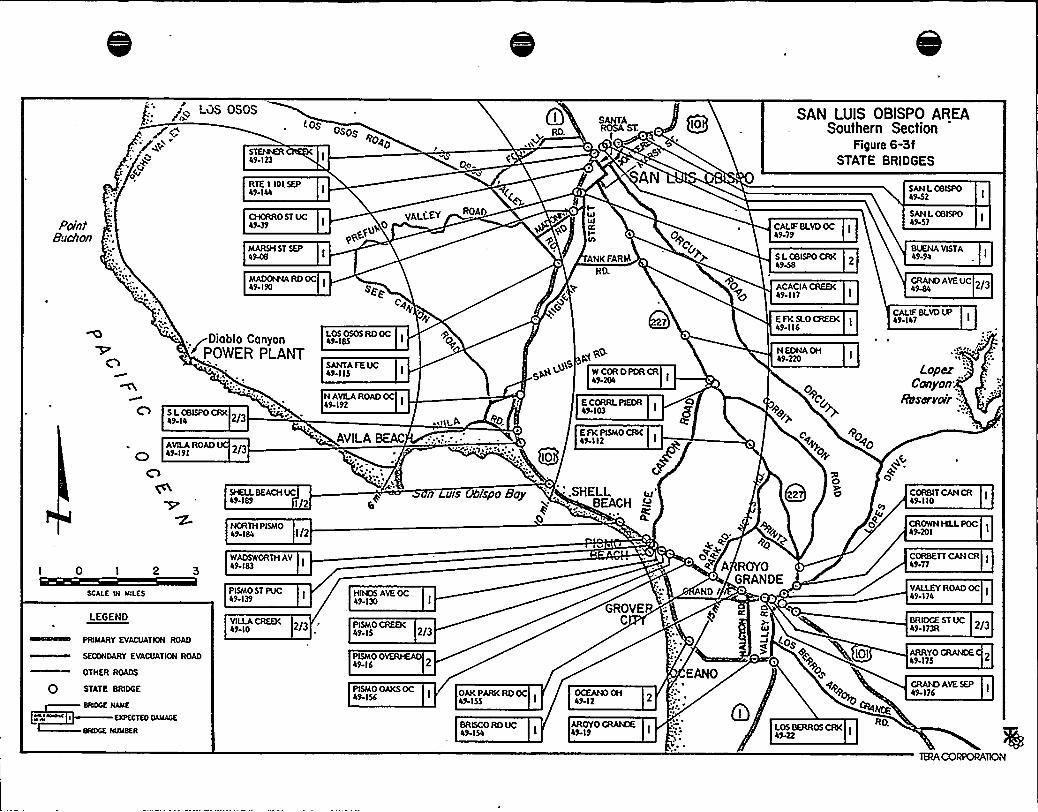
j LOS OSOS
RTE I 101. SEP49-144
(OSOSOS ~+o~o
o,
OiRD. RK ST.
IOo
SAN LUIS OBISPO AREASouthern Section
Figure 6-3fSTATE BRIDGES
SAN L 085PO4942
Print»o/ton
49M
MARSH ST SEP4949
VALfSY ROA
0gE
<+
PIJSSII
IlO
MADOIItIARD OC49-190 I
SE
Cg
I.OS 0505 RD OC49-185
SANTA FE VC49-1 IS
5 L OBISPO CRK2/349-14
NAVILAROADOCIl9-192
AVILAROAD49-191 2/3
AVILABEAC
Diablo Canyon+POWER PLANT
r
tto
QO
ANKFARIA
W COR D PDR CR49-204
Q7
E CORRL PIEDR49 103
E FK P5MO CRK49-112
0lO
CALIFBLVDOC49 79
SAN L OBISPO49-57
5 L OB5PO CRK4948
49-94
N EDNA OH49-220
ACACIACREEK49-1 i7
GRAMS AVE V4944
LopezCanyon
'ibsttrttot/',Op
0~rir
CALIFBLVD45l49-147E FK SLO CREEK
49-116
0 I 2
SCALE Ot IlllfS
LEGEND
~rIIIrIIYEVIrIIrTICH ROID
SECONDARY EVACUATION ROAD
OTHER ROADS
Q STATE BRIDGE
8ISOSE NAllE
~~~ I ~EXPECTED OAMASE
8ISOCE NUllSEA
SIKll.BEACH VC49-189 I 2
NORTH PISMO49-184
n c.rtts Obispo Boy
WADSWORTH AV49-183
PISMO ST PVC49-139
H1NDS AVE OC49-130
PISMO OVERtEAD49-16
P5MO OAKS OC49-156 OAK PARK RD OC
49-155
BRISCO RD VC49-154
2/3 'ISMOCREEK49 10 49-15 2/3
SHELL 4al
BEACH4.
GROVEC
OCEANO OH49-12
AROYO GRAtCE49-19
o.
e~+e A Rg(O
GRANDEND t
CS
lAI
O
u CORBIT CANCR49-110
o~ CROWN tELLPOC49-201 I
CORBETT CANCR49 77
VALLEYROAD OC I49-174
BRIDGE ST VC 2/349-173R
ARRYO GRANDE49-ITS
GRAM)AVE SEP49-176
~ ~osQIOI
o~
67889r~
LOS BERROS CRKI

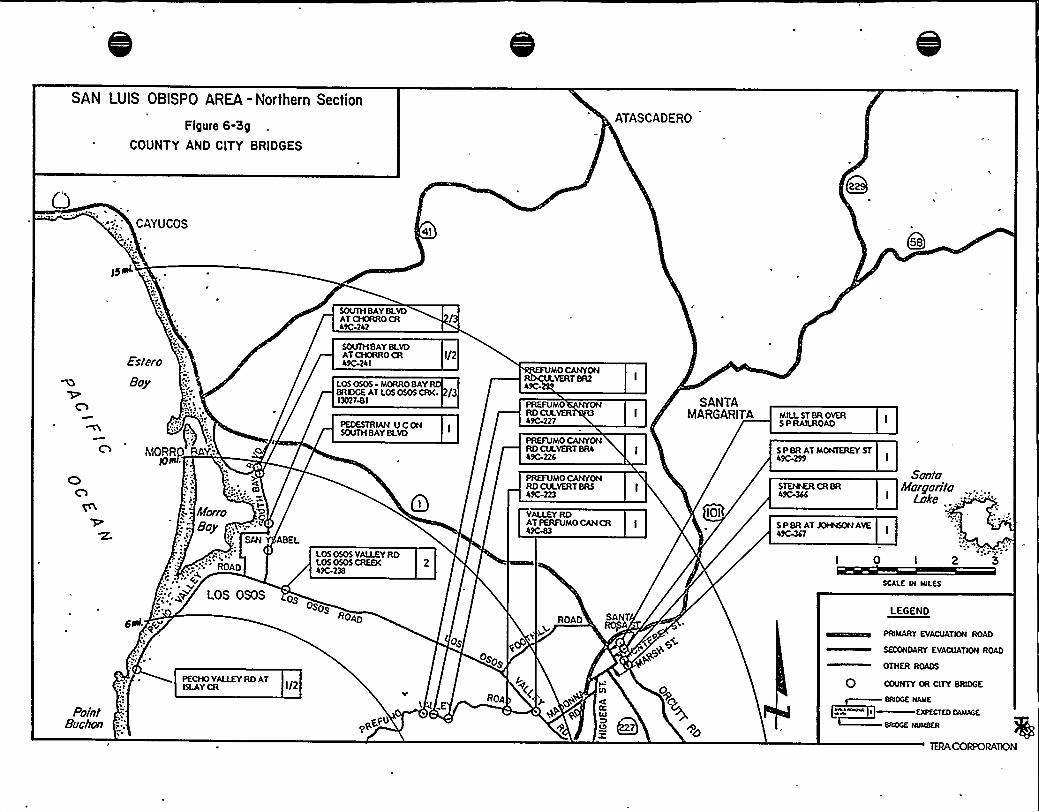
SAN LUIS OBISPO AREA-Northern Section
Figure 6-Sp
COUNTY AND CITY BRIDGES
ATASCADERO
CAYUCOS4I
Qss
I$ /IL
SOUTH BAYBLVDAT CHORRO CR49C-242
Estero
MORRP RO 7
IiVorloBoy
SAN Y ABEL
LOS OSOS MORRO BAYBRE7GE AT LOS OSOS CRK.I3027&l
/3
PEDESTRIAN U C ONSOUTH BAYBLVD
SOUTH BAYBLVDATCHORRO CR I/249C-24 I
MO CANYONVERT BR2
49C
PREFUMO ONRD CIA.VER49C<27
PREFUMO CANYONRD CILVERTBR449C-224
PREFUMO CANYONRD COVERT BRS49C-223
VALLEYRDAT PERFUMO CAN CR4~
SANTAMARGARITA
IOI
MILLST BR OVER5 P RAILROAD
S P BR AT MONTEREY ST49C-299
STBPKR CR BR49G36S
S P BR AT~ AVE49G367
SantaNorgori to
Lake
''ROAD'4,
C ~ ~
'VLOS OSOS
LOS OSOS VALLEYRDLOS OSOS CREEK49C-238
Ososos
ROAD
os
Osos
ROAD SANTROKER
I - 0 I 2 3
SCALE MI WLES
LEGEND
OOIIIIIVEV4CU4TOU ROOD
EECCUDIRT EVICU4TIOR RO4D
OTIIOI RECCE
PointBvchan
PECHO VALLEYRD ATISLAYCR
E
Efue9
3~Cg
ROA + OqO~
G~
+o
0 COuNTY OR CITY BRIDGE
BRIOCE NAME
EXPECTED CAMACE
SROGE NVMSER

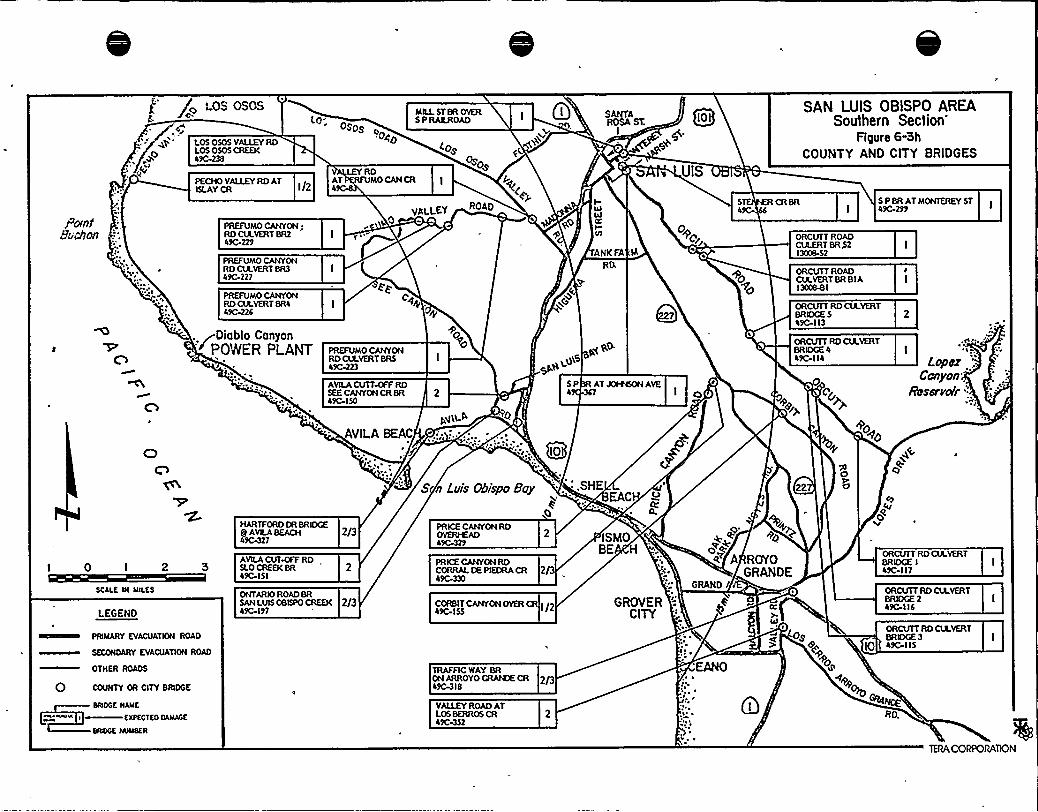
e, I~OS OSCS
LOS OSOS VALLEYRDLOS OSOS CREEK49C 238
PECHO VALLEYRD ATERLAY CR I/2
MLLST BR OVER5 P RALROAO
O'DS oogo
(ossos
AT MO CANCR I4
SANTAROSA ST.
IQIO
UIS
SAN LUIS OBISPO AREASouthern Section
Figure 6-Sh
COUNTY AND CITY BRIDGES
gantL7oJ/on
PREFVMO CANYON;RD CLLVERT BR249C-229
VALLEY ROAD
b
IIRILRJ
ILIrrI
ANKFA
0
5 CRBR4
ORCVTT ROADCVLERT BR52I 300$ 42
5 P BR ATMONTEREY STI 49C-299
R
PREFVMO CANYONRD COVERT BR349C-227
PREFVMO CANYONRO CLAVERTBR449C-226
Diablo Canyon'<i OWER PLANTr
~R
PREFVMO CANYONRD CULVERTBRS49C-223
AVILACLAT~RDSEE CANYONCR BR49C-I 50
+o~o
LL3SSB+"SP4
ATJOFB40N AVE7 I
ORCVTT ROADCLA.VERTBR 8 IAI300$8 I
ORCUTT RD CLAVERTBRIDGE 549C-I I3
ORCUTT RD CLA.VERTBRIDGE 449C ll4
rRr.. rR
Loper;Canyon
/ibssrvofr '~V
Aqg 0 'O
AVILABEAC
':r„L QIQ
S n Luis Obispo Boy SHE I
EAC22
I 0 I 2 3
SCALE LN MLLES
LEGEND
RRIRRRV RVRRRRVRR RRRR
SECONDARY EVACUATION ROAD
OTHER ROADS
0 COUNTY OR CITY BRIDGE
BRIDGE NAME
I~ EXPECT C0 DAMAGE
BRDGE NUMBER
HARTFORD DR BRIDGEQ AYEABEACH49G327
2/3
AVILACUT~ RDSLO CREEK BR49C.I 5 I
ONTARIO ROAD BRSANLUISOBISPO CREEK 2/349C-l97
PRICE CANYONRDOVERHEAD4~
CORBIT CANYONOYER CR49C-I 55
TRAFFIC WAY BRON ARROYO GRAICE CR49G3 IB
VALLEYROAD ATLOS BERROS CR496452
2
I/2
ISMOBE H
R
4 ~
GROVERCITY
CI'r~4r
e~ A
GRAIID /
RIR7.
ROYOGRANDE
CL
IRrI
osIO
ORCUTT RO CLA.VERTBRIDGE 349C-I IS
o~
RD.
ORCUTT RD CULVERTBRIDGE I I49C-IIT
ORCVTT RO CLLVERTBRIGE 2 I49C-I I6

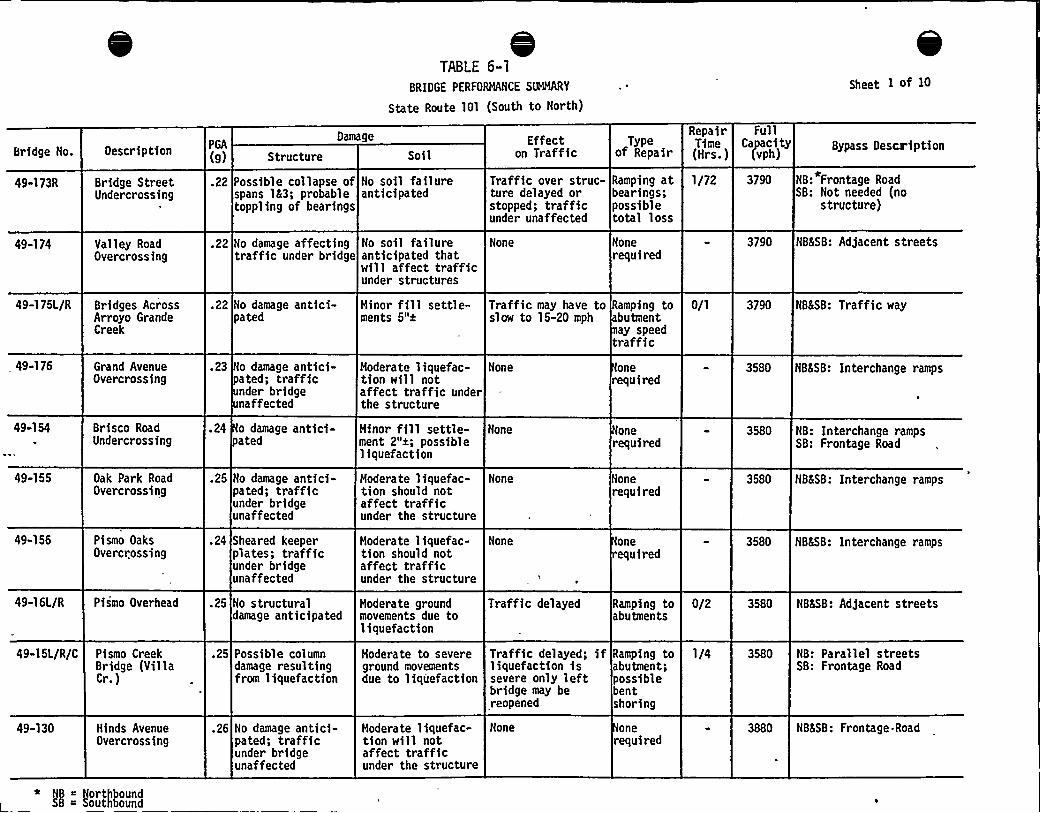
TABLE 6-1
BRIDGE PERFORMANCE SUMMARY
State Route 101 (South to North)
Sheet I of IO
Bridge Ho.
49-173R
Description
Bridge StreetUndercrossing
PGA
(9)
.22
Structure
Damage
Soil
Possible collapse ofspans 153; probabletoppling of bearings
No soil failureanticipated
Effecton Traffic
Typeof Repair
Traffic over struc- Ramping atture delayed or bearings;stopped; traffic possibleunder unaffected total loss
RepairTime(Hrs.)
1/72
FullCapacity
(vph)
3790
Bypass Description
NB:*Frontage RoadSB: Not needed (no
structure)
49-174 Valley RoadOvercrossing
22 No damage affectingtraffic under bridge
No soil failureanticipated thatwill affect trafficunder structures
None Nonerequired
3790 NBASB: Adjacent streets
49-175L/R Bridges AcrossArroyo GrandeCreek
.22 No damage antici-pated
Minor fill settle-ments 5"t
Traffic may have to Ramping toslow to 15-20 mph butment
ay speedtraffic
0/1 3790 NB8SB: Traffic way
49-176
49-154
49-155
49-156
Grand AvenueOvercrossing
Brisco RoadUndercrossing
Oak Park RoadOvercrossing
Pismo OaksOvercrossing
.23 Ho damage antici-pated; trafficnder bridgenaffected
.24 o damage antici-pated
~ 25 Ho damage antici-pated; trafficunder bridgeunaffected
.24 Sheared keeperplates; trafficunder bridgeunaffected
Moderate liquefac-tion will notaffect traffic underthe structure
Minor fill settle-ment 2"a; possibleliquefaction
Moderate 1 iquefac-tion should notaffect trafficunder the structure
Moderate liquefac-tion should notaffect trafficunder the structure
None
Hone
None
Hone
onerequired
onerequired
Nonerequired
oneequired
3580
3580
3580
3580
NB8SB: Inter change ramps
NB: Interchange rampsSB: Frontage Road
NBSSB: Interchange ramps
NBSSB: Interchange ramps
49-16L/R Pismo Overhead .25 No structuraldamage anticipated
Moderate groundmovements due toliquefaction
Traffic delayed Ramping toabutments
0/2 3580 NB!5B: Adjacent streets
49-1 5L/R/C
49-130
Pismo CreekBridge (VillaCr.)
Hinds AvenueOvercrossing
.25 Possible columndamage resultingfrom liquefaction
.26 No damage antici-pated; trafficunder bridgeunaffected
Moderate to severeground movementsdue to liquefaction
Moderate liquefac-tion will notaffect trafficunder the structure
Traffic delayed; ifliquefaction issevere only leftbridge may bereopened
Hone
Ramping toabutment;possiblebentshoring
onerequired
1/4 3580
3880
NB: Parallel streetsSB: Frontage Road
NBSSB: Frontage Road
* I ~ Northbound
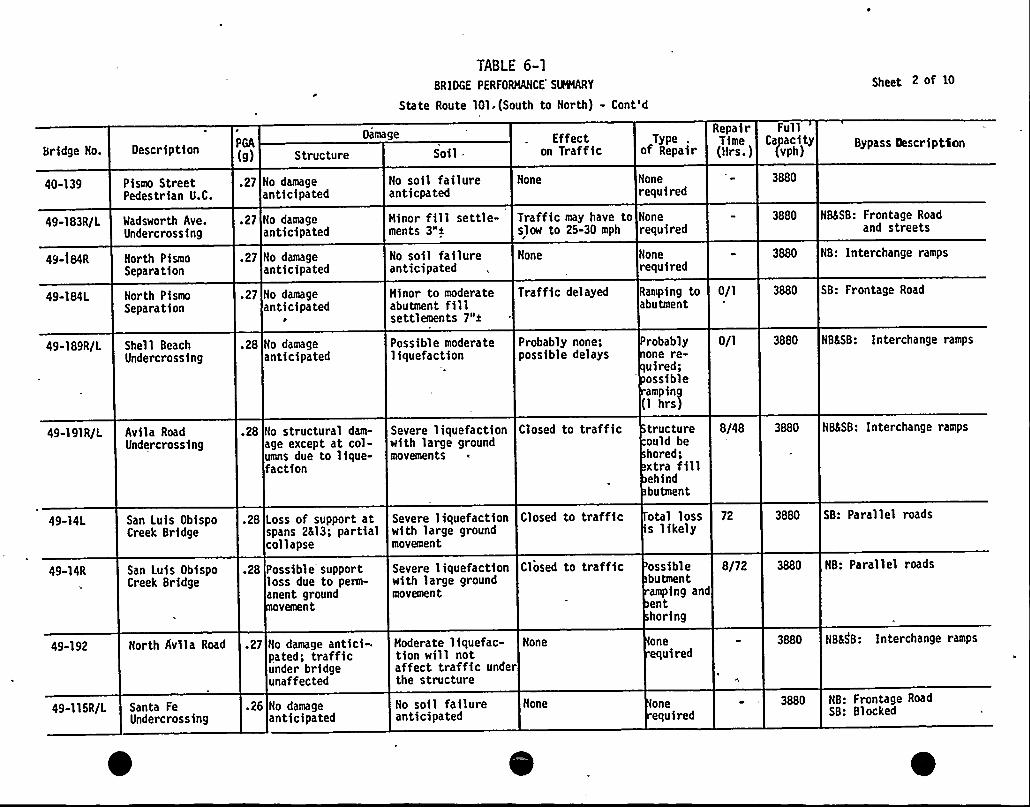
I ~
I ~ ~ I
~ ~
I ~ I. I ~
I
~,~
I ~
I ~ ~
~ I
~ ~
~, '
I I ~
muggm~~gg ~'
~ I
I ', ~',, ~
I ~ ~ I ~' I I ~ ~ I '
~ I
', ~ I, ~
~ ~ ~ ~ ~, ~ ~ ~ ~ ~ ~ I ~
I ~ ~'
~'
~ ', I I
~ ~
~ ~ ~~ ~
I ' I
I ~
I ~ I ~
~ I
~ I I
~ ~
I ' ~
I ~ I ~ I I ~
~ I I ~
~ I I ~, ~ ~ ~ I ~ I
~ I
~, ~ I ~ ~ ~ I ~ ~
I
~ ~ ~
I ~
I '~ ~ ~
I
~ ~ ~
I . ~
~ ~ ~, I ~ I ~
I, '~ ~ 'I
~ ~
I '
I ', I
I ~ ~
~, ~ ggggg:
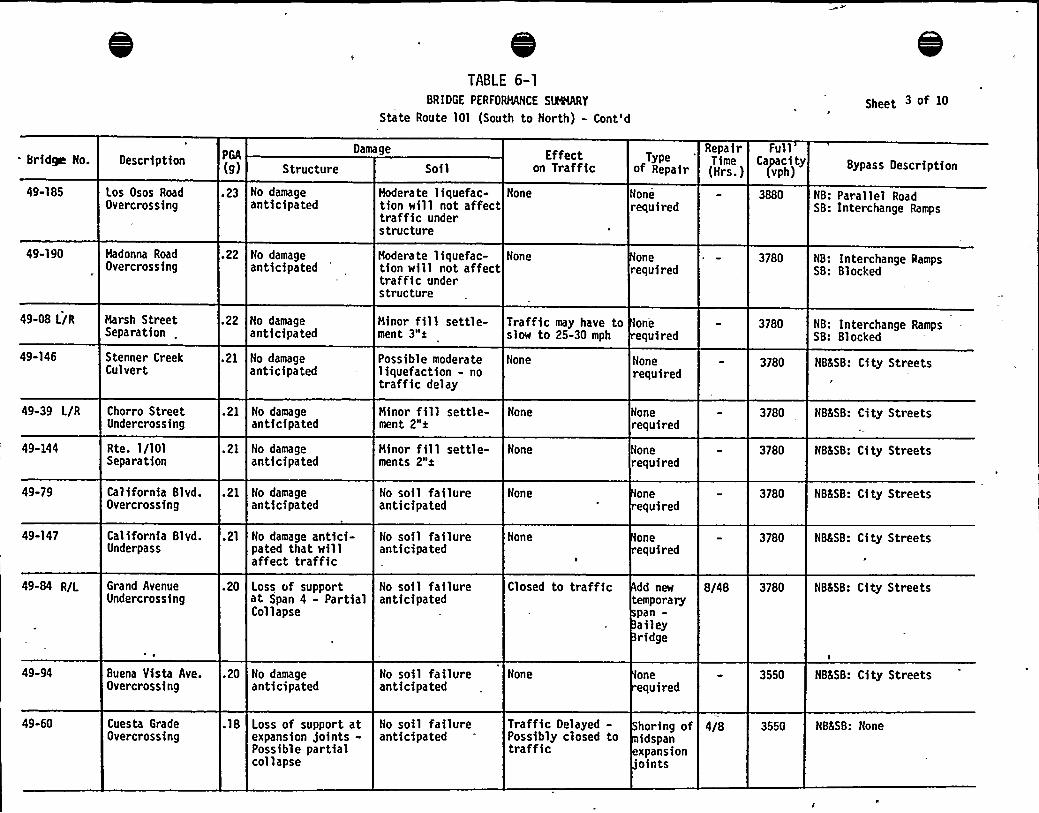
TABLE 6-1BRIDGE PERFORMANCE SINMARY
State Route 101 (South to North) - Cont'dhect 3 of 10
Bridge No. Description PGA
(9) StructureDamage
SoilEffect
on TrafficType
of Repair
RepairTime(Hrs.)
FullCapaci ty
(vph)Bypass Description
49-185
49-190
Los Osos RoadOvercrossing
Madonna RoadOvercrossing
.23
.22
No damageanticipated
Ko damageanticipated
Moderate liquefac- Nonetion will not affecttraffic understructure
Moderate liquefac- Nonetion will not affecttraffic understructure
Nonerequired
onerequired
3880
3780
NB: Parallel RoadSB: Interchange Ramps
NB: Interchange RampsSB: Blocked
49-08 L/R
49-146
Marsh StreetSeparation
Stenner CreekCulvert
.22
.21
No damageanticipated
No damageanticipated
Minor fill settle-ment 3"a
Possible moderateliquefaction - notraffic delay
None Nonerequired
Traffic may have to oneslow to 25-30 mph equired
3780 NB: Interchange RampsSB: Blocked
3780 NB&58: City Streets
49-39 L/R
49-144
Chorro StreetUndercrossing
Rte. 1/101Separation
.21
.21
No damageanticipated
No damageanticipated
Minor fill settle-ment 2"x
Minor fill settle-ments 2"x
None
None
Honerequired
Honerequired
3780 NB&SB: City Streets
3780 NB&SB: City Streets
49-79 California Blvd.Overcrossing
.21 No damageanticipated
Ho soil failureanticipated
None onerequired
3780 NB&SB: City Streets
49-147 California Blvd.Underpass
.21 No damage antici-pated that willaffect traffic
No soil failureanticipated
None oneequired
3780 NB&SB: City Streets
49-84 R/L Grand AvenueUndercrossing
.20 Loss of supportat Span 4 - PartialCollapse
No soil failureanticipated
Closed to traffic dd new
temporarypan-a ileyridge
8/48 3780 NB&58: City Streets
49-94 Buena Vista Ave.Overcrossing
.20 No damageanticipated
Ho soil failureanticipated
None oneequired
3550 NB&58: City Streets
49-60 Cuesta GradeOvercrossing
.18 Loss of support atexpansion joints-Possible partialcollapse
No soil failureanticipated
Traffic Delayed-Possibly closed totraffic
horing ofidspanxpansionoints
4/8 3550 NB&58: None
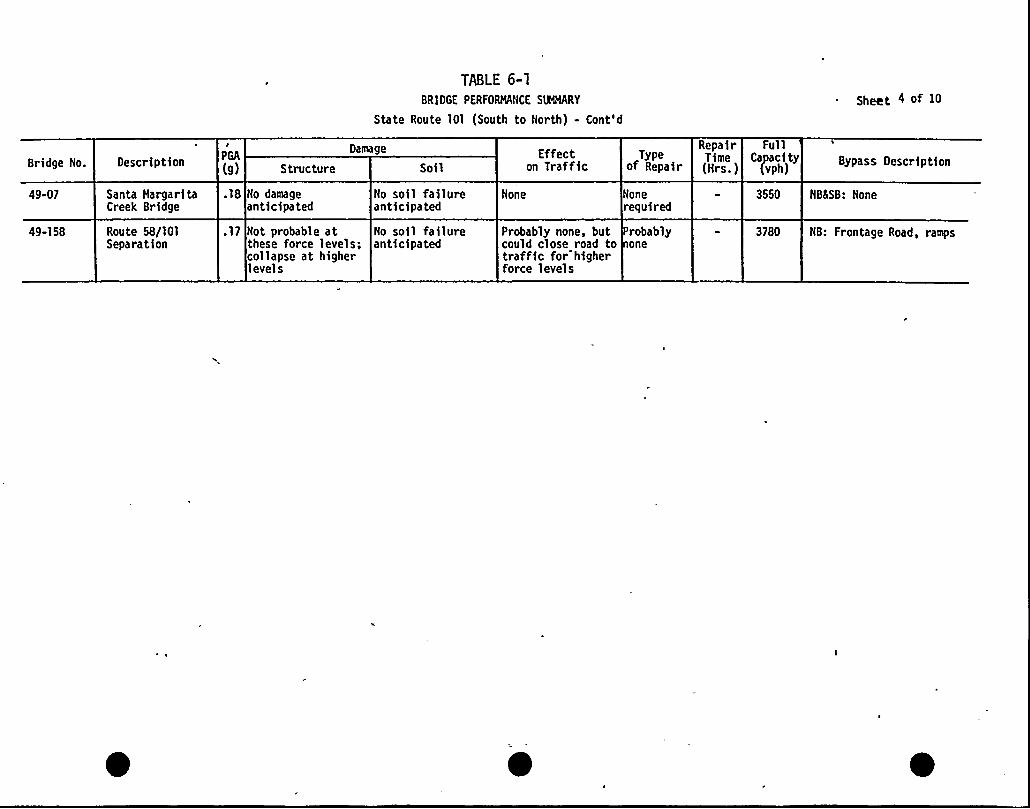
TABLE 6-1BRIDGE PERFORNNCE SINNARY
State Route 101 (South to North) - Cont'dSheet 4 of 10
Bridge No. Description
IPGA
(g) Structure
Damage
SoilEffect
on TrafficType
of Repair
RepairTime(Hrs.)
FullCapacity
(vph)Bypass Description
49-07
49-158
Santa HargaritaCreek Bridge
Route 58/IOISeparation
.18 No damageanticipated
.17 Not probable atthese force levels;collapse at higherlevels
No soil failureanticipated
No soil failureanticipated
Mone Nonerequired
Probably none, but Probablycould close road to onetraffic for'higherforce levels
3550 HBSSB: Hone
3780 NB: Frontage Road, ramps
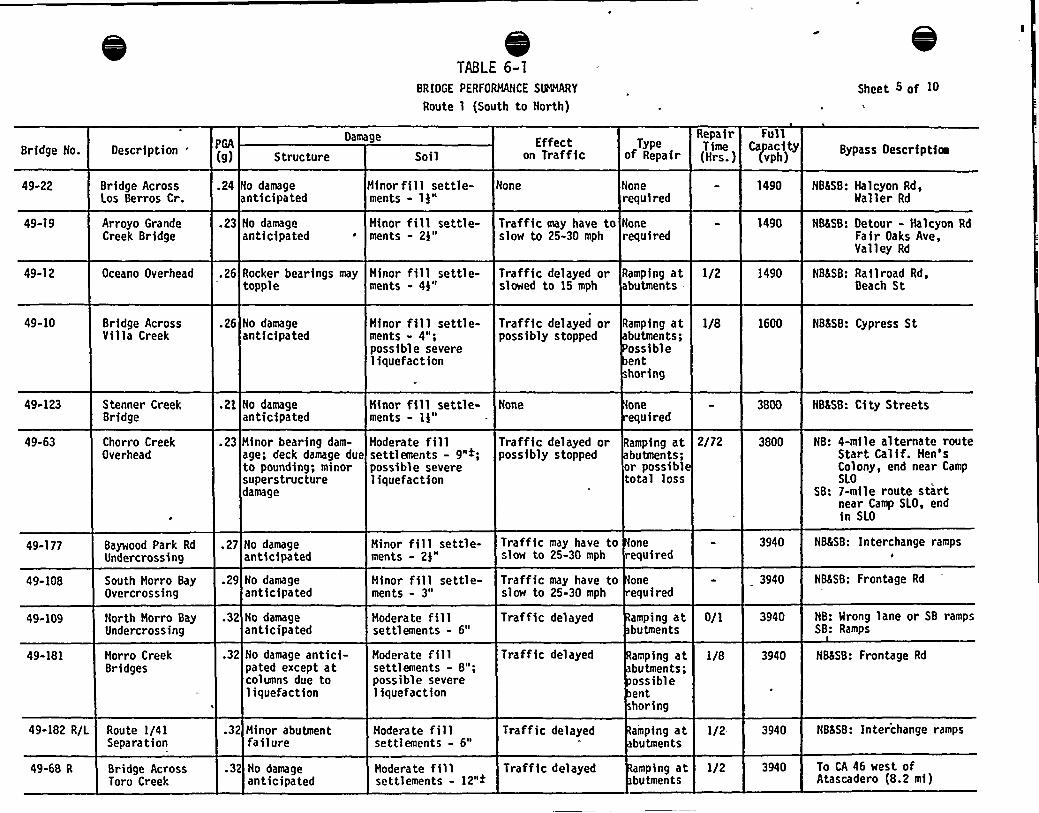
s ~
~ ~ t ' I ~s I ~ . I . I ~
~ I
~'
I I, I IHRW ~ ~
\~
~ ~ I ~,, 'I
~ ' I s '~ ~
I ~ . I I - -.s ~ ~ I '
~ ~ ~
~ ', '
~ ~ I I
~ I ~ ~ I I
~ I ~ ~ I ~
~, I ~
I ' '~
~ I I '~ I
~ I ~ II
t ~
s slI~ I ~
I I
I .. s
I ' ~ II''~ I'
I ~ I
I ~
~ I
I ', ~ ~
I ~ I I I ~'
~ I
I I I ~
I ~ I
~,, I
s I s
I ~
~ ~
I ~
~ ~
~ ~ ~
I
~ ~
~ ~ ~
~ t
~ I ~ ' t
~ ~ I ~ ~
mm
~ 'I
I ~ ~
~, I
I ~ 'I ' I
I '
~ ~
~ ~
t ~
I ~
~ ~
RAHU~ggmtN
I I ~
WRil
I '
~ '
~ ~ I ~
~, ~ ~
~ ', ~
~'
~'
I I
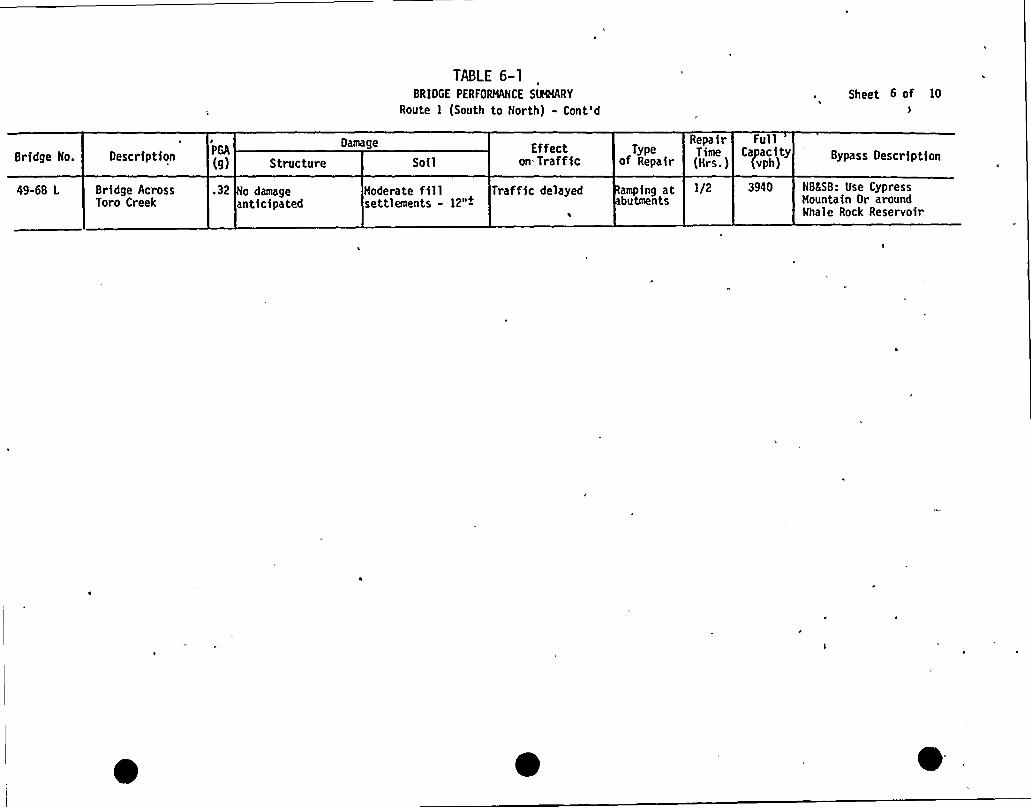
TABLE 6-1BRIDGE PERFORNNCE St@MARY
Route 1 (South to North) - Cont'dSheet 6 of 10
Bridge No.
49-68 L
Description
Bridge AcrossToro Creek
PGA
(9)
.32
Structure
o damageanticipated
Damage
Soil
Hoderate fillsettlements - 12"+
Effecton Traffic
Traffic delayed
Typeof Repair
amping atbutments
Repair Full
(Hrs.) [vph)Time CaPaci ty "'ypass Description
3940I/2 KB558: Use CypressHountain Or aroundMhale Rock Reservoir

TABLE 6-1BRIDGE PERFORMANCE SINHARY
Route 227 (South to North)Sheet 7 of 10
Bridge No. Description PGA
(9) StructureDamage
SoilEffect
on TrafficType
of Repair
Repair FullTime Capacity(Mrs.) (vph)
Bypass Description
49-77 Corbit CreekCanyon
.22 No damageanticipated
No soil failureanticipated
None Nonerequired
1260 NB: Left on Hason St thenright 9 LePoint Stto 227 (.5 mi)
SB: Right 9 LePoint St,left 9 Hason St to227 (.5 mi)
49-201 Branch StreetPedestrianOvercrossing
.21 No damage antici-pated .that wouldaffect traffic
No soil failure Noneanticipated thatwill affect trafficunder the structure
Nonerequired
1260 NBKSB: Use Crown Stparallel to 227(on the north side)(.3 mi)
49-112
49-103
49-204
49-220
49-116
East Fork PismoCreek Bridge
East Corral dePiedra Creek Br.
Mest Corral dePiedra Creek Br.
North EdnaOverhead
East Fork SanLuis OpispoCreek Bridge
.21
.21
.21
.21
.21
No damageanticipated
No damageanticipated
No damageanticipated
No damageanticipated
No damageanticipated
Hinor fill settle-ment 2"+
No soil failuresanticipated
Hinor fill settle-ment 1$ "+
Hinor fill settle-ment - 4"
Hinor fill settle-ment - 3"
None
None
None
Traffic may have toslow to 20-25 mph
Traffic may have toslow to 25-30 mph
onerequired
oneequired
oneequired
Nonerequired
Nonerequired
1490
1490
None
None
None
None
None
49-117 Acacia CreekCulvert
.21 No damage, anticipated
Settlements will not Noneresult in roadway
~ discontinuities
oneequired
1490 None
49-58 Bridge AcrossSan Luis ObispoCreek
.21 Possible bearingfailures resultingin vertical offset
Low liquefactionpotential
Traffic delayed amping atbutments
1490 NB(MB): Higuera to HadonnaSB(EB): Hadonna exit on
101 to Higuerato 227
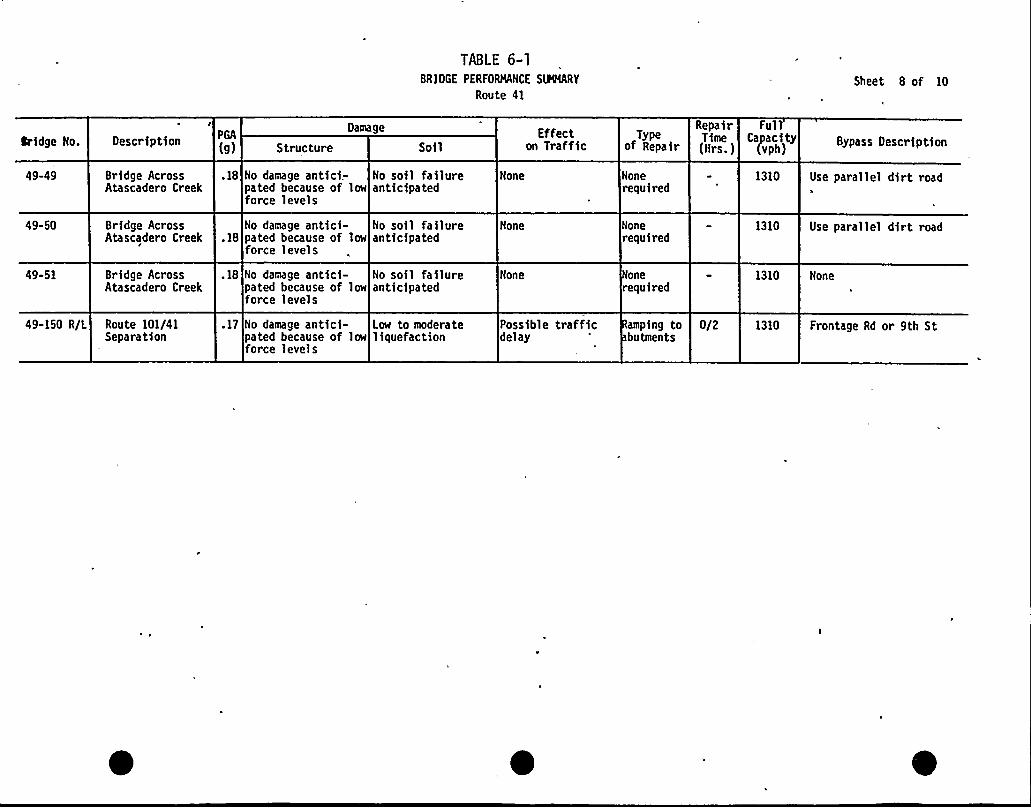
TABLE 6-1BRIDGE PERFORNNCE SlÃQRY
Route 41Sheet 8 of 10
~rldge No. Description PGA
(9) Structure
Damage
SoilEffect
on TrafficType
of Repair
Repair FullTime Capacity(Nrs.) (vph)
Bypass Description
49-49 Bridge AcrossAtascadero Creek
.18 No damage antici.- No soil failurepated because of low anticipatedforce levels
None Nonerequired
1310 Use parallel dirt road
49-50 Bridge AcrossAtascadero Creek .18
No damage antici- Ho soil failurepated because of low anticipatedforce levels
None Nonerequired
1310 Use parallel dir t road
49-51 Bridge AcrossAtascadero Creek
.18 No damage antici- No soil failurepated because of low anticipatedforce levels
Hone onerequired
1310 None
Route 101/41Separation
.17 No damage antici- Low to moderatepated because of low liquefactionforce levels
Possible trafficdelay
amping tobutments
0/2 1310 Frontage Rd or 9th St
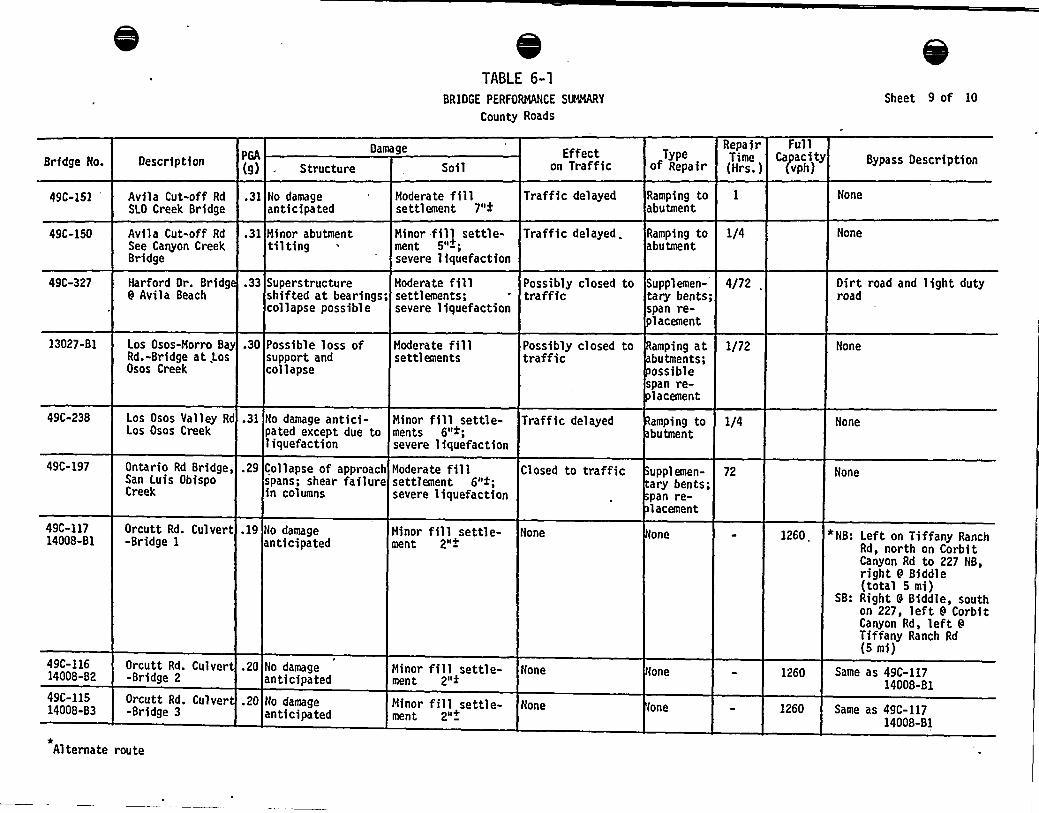
TABLE 6-1BRIDGE PERFORMANCE SDMHARY
County Roads
Sheet 9 of 10
Bridge No. Description PGA
(9) Structure
Damage
SoilEffect
on TrafficType
of Repair
RepairTime(Hrs.)
FullCapacity
(vph)Bypass Description
49C-151 Avila Cut-off RdSLO Creek Bridge
.31 No damageanticipated
Moderate fillsettl ement 7"+
Traffic delayed Ramping toabutment
None
49C-150 Avila Cut-off RdSee Canyon CreekBridge
.31 Minor abutmenttilting
Minor fill settle- Traffic delayed .ment 5"+;severe liquefaction
Ramping toabutment
I/4 None
49C-327 Harford Dr. Bridg9 Avila Beach
.33 Superstructureshifted at bearings;collapse possible
Moderate fill Possibly closed to Supplemen-settlements; traffic tary bents;severe liquefaction span re-
placement
4/72 Dirt road and light dutyroad
13027-81 Los Osos-Horro BayRd.-Bridge at .LosOsos Creek
.30 Possible loss ofsupport andcollapse
Moderate fillsettlements
Possibly closed totraffic
Ramping atbutments;ossib'le
span re-lacement
I/72 None
49C-238
49C-197
Los Osos Valley RdLos Osos Creek
Ontario Rd Bridge,San Luis ObispoCreek
.31
.29
No damage antici-pated except due toliquefaction
Collapse of approachspans; shear failurein columns
Minor fill settle- Traffic delayedments 6">;severe liquefaction
Moderate fill Closed to trafficsettlement 6">;severe liquefaction
amping tobutment
upplemen-ary bents;pan re-lacement
1/4
72
None
None
49C-11714008-81
49C-11614008-82
Orcutt Rd. Culvert-Bridge 1
Orcutt Rd. Culver-Bridge 2
.19
.20
No damageanticipated
No damageanticipated
Minor fill settle-ment 2"+
Minor fil'i settle-ment 2">
None
None
one
None
1260 .
1260
*NB: Left on Tiffany RanchRd, north on CorbitCanyon Rd to 227 NB,right 9 Biddle(total 5 mi)
SB: Right 9 Biddle, southon 227, left 9 CorbitCanyon Rd, left 9Tiffany Ranch Rd(5 mi)
Same as 49C-11714008-B1
49C-11514008-B3
Orcutt Rd. Culver-Bridge 3
.20 No damageanticipated
Minor fill settle-ment 2"+
None one 1260 Same as 49C-11714008-Bl
*Alternate route
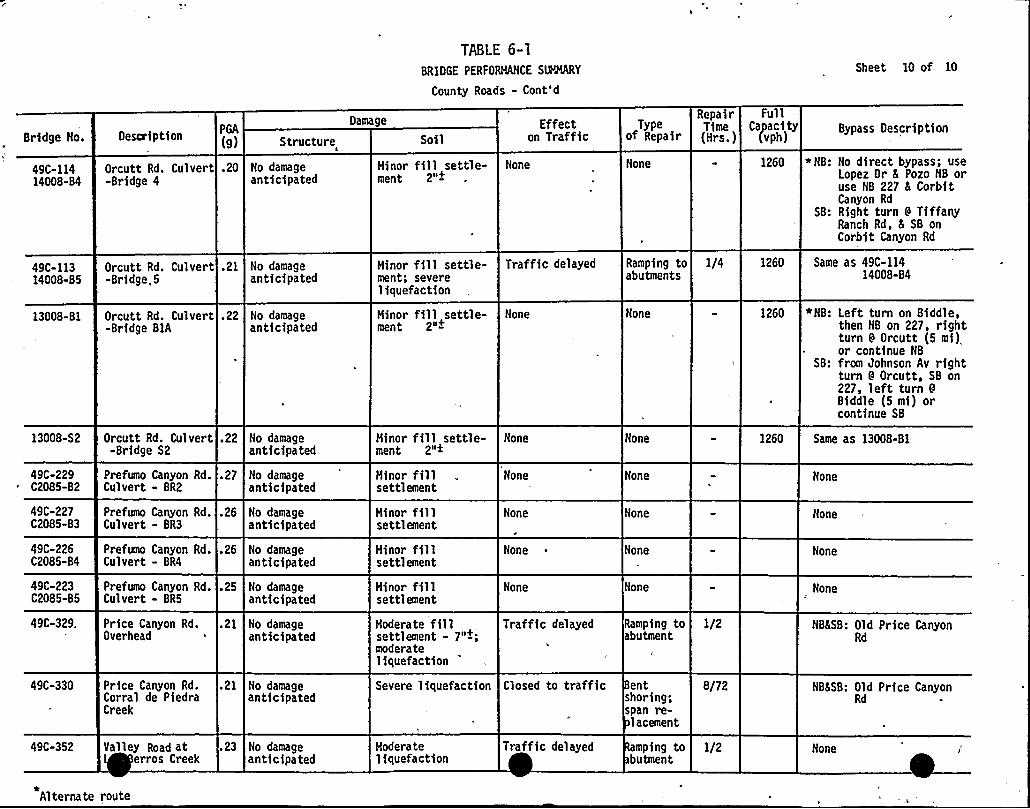
TABLE 6-1
BR1DGE PERFORMANCE SUMMARY
County Roads - Cont'd
Sheet 10 of 10
Bridge No. Description PGA
(9) Structure SoilEffect
on TrafficRepair
Type Timeof Repair (Mrs.)
FullCapacity
(vph)Bypass Description
49C-11414008-84
49C-11314008-85
13008-B1
13008-52
49C-229C2085-82
49C-227C2085-B3
49C-226C2085-B4
49C-223C2085-85
49C-329.
Orcutt Rd. Culvert .20 No damage-Bridge 4 anticipated
Orcutt Rd. Culvert .21 No damage-Bridge.5 anticipated
Orcutt Rd. Culvert .22 No damage-Bridge 81A anticipated
Price Canyon Rd.Overhead
.21 No damageanticipated
Orcutt Rd. Culvert .22 No damage-Bridge S2 anticipated
Prefumo Canyon Rd. .27 No damageCulvert - BR2 anticipated
Prefumo Canyon Rd..26 No damageCulvert - BR3 anticipated
Prefumo Canyon Rd. .26 No damageCulvert - BR4 anticipated
Prefumo Canyon Rd. .25 No damageCulvert - BR5 anticipated
Hinor fill settle-ment 2"+
Minor fill settle-ment; severeliquefaction
Minor fill settle-ment 2"+
Hinor fill settle-ment 2">
Hinor fillsettlement
Minor fillsettlement
Minor fillsettlement
Hinor fillsettlement
Moderate fillsettlement - 7"+;moderateliquefaction
None
Traffic delayed
None
None
None
None
None
None
Traffic delayed
None
Ramping toabutments
None
None
None
None
None
None
Ramping toabutment
1/2
1260
1260
1260
*NB: No direct bypass; useLopez Dr 8 Pozo NB oruse NB 227 B CorbitCanyon Rd
SB: Right turn 9 TiffanyRanch Rd, 6 SB onCorbit Canyon Rd
Same as 49C-11414008-B4
*NB: Left turn on Biddle,then NB on 227, rightturn 9 Orcutt (5 mi)or continue NB
SB; from Johnson Av rightturn 9 Orcutt, SB on227, left turn 9Biddle (5 mi) orcontinue SB
Same as 13008-Bl
None
None
None
None
NBSSB: Old Price CanyonRd
49C-330
49C-352
Price Canyon Rd.Corral de PiedraCreek
Valley Road aterros Creek
.21 No damageanticipated
.23 No damageanticipated
Severe 1 iquefaction
Hoderateliquefaction
Closed to traffic
Traffic delayed
entshoring;span re-lacement
amping tobutment
8/72
1/2
NB!LSB: Old Price CanyonRd
None
*Alternate route
TASK B RESOURCES AND SUPPORT (REPAIRS)
~Pur ose
To establish policies and objectives and assign general responsibilities for the
following activities:
a. Conduct emergency repair and/or restoration of essentialstreets, roads, highways and related bridges, overpasses,underpasses and tunnels.
b. Clear debris. from access routes, evacuation routes, andother vital roads, streets, and highways, to include that onboth public and private property.
Ce Coordinate, with appropriate law enforcement agencies,the barricading of areas which must be cordoned off inthe best interest of public safety.
d. Procure and allocate required transportation resources(air and surface).
2. Conce t of 0 erations
Following an earthquake, there would be heavy demands placed on emergency
manpower and essential supplies, equipment and services. This might include:
skilled workers, transportation, fuels, heavy equipment, food, potable water, etc.
Consequently, government at all levels must be organized accordingly and be
prepared to respond expeditiously to, and meet, the many demands that will be
placed on resources required to support emergency operations. Coupled with the
above would be the immediate requirements for clearance of debris from firelanes, access routes, pre-planned evacuation routes, and main traffic arterials.
Engineering/public works agencies, and segments of the private sector would be
in great demand for this activity.
For a combined earthquake/radiological emergency it will be most essential toestablish priorities for those resources required to maintain or re-establishevacuation capabilities. This objective will not be inconsistent with the more
8-SI-269 6-37
TERA CORPORATION
general need to reopen transportation arteries and communications links to
recover from an earthquake independent of a radiological event. As discussed
under Task A, the EDAC will evaluate damage reports, estimate repair resources
and prioritize the implementation of repairs. The purpose of this task is toeffect those repairs.
3. ~S*i i* T
ao For bridge-type damage, repairs will consist of restoringthe roadway to a level and adequately supported condi-tion. Where the damage has resulted from abutmentsettlement or rocker bearing failure, ramping with anappropriate fill material will be required. Where thedamage has resulted in the loss of support columns (butnot collapse of the span) shoring will be required.
b. For roadway impairments due to subsidence, regradingwill be required to return serviceability.
c. For landslides leading to road blockage, clearing of slidematerial willbe required to reopen the route.
4. Or anizations and Res onsibilities
CALTRANS
County Engineer/Public Works
B-8 I-269 6-38
TERA CORPORATiON
TASK C TRAFFIC CONTROL
~Pur ose
To establish policies and objectives and assign general responsibilities for the
following activities:
a.
b.
Provide traffic and crowd control in accordance withevacuation plans.
Provide law enforcement and crowd control support tomultipurpose staging areas and other major operations.
Ce Survey and report damage and other vital information.
2. Conce t of 0 erations
If the protective action selected by the county Direction and Control Group is to
implement a partial or total evacuation, traffic controls will have to be applied.
These controls will channel traffic to the appropriate evacuation routes, control
access to major arterials to maximize flow, and block off damaged road areas or
hazards and provide rerouting. The county Direction and Control Group will
initiate plans to establish traffic control during the evacuation (see Section Il.7.5
of Reference 2). Various law enforcement agencies will have responsibilities for
implementing traffic controls. Additional assistance will be procured from
Mutual Aid Regions and state and federal agencies in accordance with
Appendix C of Reference I.
3. ~5e T k
In addition to those tasks specified in Section ll.7.5.B of Reference 2, the
following should be performed:
a. Coordinate with the county Direction and Control Groupto confirm the sequence of evacuation and routes. Theroutes may differ significantly from the pre-designatedevacuation routes established in the county plan for a
B-8I-269 6-39
TERA CORPORATIONl
radiological emergency. The routing will be a function ofearthquake damage and the restoration of damagedroutes.
b. Install traffic controls and barricades. Earthquake dam-aged sections of road and bridges will need to be blockedoff and traffic rerouted as necessary. If the availableevacuation routes have been significantly reduced, addi-tional traffic controls will be required to maximizetraffic flows.
4. Or anizations and Res onsibilities
CALTRANS
Country Engineer
County Sherif f's
CHP
B-8 I-269 6-40
TERA CORPORATION
TASK D PROTECTIVE ACTIONS FOR NONESSENTIALPLANT PERSONNEL
~Pur ose
To establish an approach and assign general responsibilities for the following
activities:
a. The integrated evaluation of emergency data as a basisfor decision making.
b. Determination of the appropriate protective actions fornonessential plant personnel taking into consideration theeffects of earthquake damage.
2. Conce t of 0 erations
In the event of a coincident earthquake and radiological emergency, the response
plan described in Section 2 of this plan would provide the framework forcoordination of key tasks. From a protective action perspective, it will be
essential to obtain two types of information: (I) the status of the plant and the
likelihood and timing of any onsite release of radioactivity, and (2) the status of
evacuation routes from the site. Under this plan the type (I) information willcontinue to be provided by the onsite emergency organization in a manner
essentially unchanged from a purely radiological emergency (see Section 6 of
Reference 3). The type (2) information would also be provided by the onsite
emergency organization. Four options exist for the evacuation of onsite
personnel:
o Evacuation south via the access road to the Avila BeachGate
o Evacuation north through Montana de Oro State Park
o Evacuation via air (helicopter)
o Evacuation via water.
8-8I-269 6-4 I
TERA CORPORATION
The land evacuation routes will be surveyed for earthquake damage and revised
transit time estimates made in accordance with Task A. Availability of
helicopter or water transport will be determined on a continuing basis. The Site
Emergency Coordinator will be responsible for deciding the appropriate protec-tive actions. The selection of protective action will be made on the basis of
minimizing personnel exposures to radiation.
The determination of the most effective protective actions to be taken would be
conducted as follows:
ao Initially a determination will be made as to the ability toevacuate personnel along either the northern or southernland routes. This decision will be based on the timeavailable before a release of radioactivity onsite and thetime required to transit the evacuation route. Evacuationon foot would also be considered if, by doing so, a furthermitigation of the radiological hazard is assured.
b. An ongoing assessment should be made of the availabilityand capacity of helicopter and'boat transport. Thesemodes of evacuation would normally be considered asbackups to a land evacuation.
4. Or anizations and Res onsibilities:
Pacific Gas and Electric Assessment of plant status, availability of helicoptertransport.
U.S. Coast Guard Availabilityof water transport.
B-8I-269 6-42
TERA CORPORATION
TASK E PROTECTIVE ACTIONS FOR THE PUBLIC
I. ~Pur ose
To establish an approach and assign general responsibilities for the following
activities:
a. Integrated evaluation of emergency data as' basisfor'ecisionmaking.
b. Determination of the appropriate protective actions forthe public taking into consideration the effects of earth-quake damage.
2. Conce t of 0 erations
In the event of a coincident earthquake and radiological emergency, theresponse'lan
described in Section 6.2 of this plan would provide the framework for
coordination of key tasks. From a protective action perspective, it will be
essential to obtain two types of info'rmation: (I) the likelihood and probable
timing of releases of radioactive materials offsite from the DCPP and (2) the
continued viability of various protective action options. Under this plan, the
type (I) information will continue to be provided. by the Unified Dose Assessment
Center (UDAC) in a manner essentially unchanged from a'urely radiological
emergency (see Section l.6 of Reference 2 and Section 6 of Reference 3). The
type (2) information will be supplied by the Earthquake Damage Assessment
Center (EDAC) and will indicate a damage-level characterization for the
evacuation road system, the locations of specific damage and alternate routing
around the damage, and the status of emergency communications systems. With
these data the county Direction and Control Group will be able to make an
integrated evaluation of the overall emergency situation.. It should be noted
(reference Figure 6-I) that this dual evaluation will only arise where there has
been non-negligible earthquake damage in the Basic- Emergency Planning Zone
and where there exists a coincident potential for an offsite release of radioactiv-
ity from the DCPP site. If either element is not present, emergency planning
B-8I-269 6-43
TERA CORPORATION
activities will be governed by the appropriate earthquake response plans or the
DCPP Emergency Plan.
The fundamental criteria that would trigger protective action would remain the
Protective Action Guidelines (see Section l.4 of Reference 2.and Section 6 of
Reference 3). The types of protective actions that are available would also be
substantially the same as those indicated in the San Luis Obispo County Nuclear
Power Plant Response Plan:
o initial precautionary actions
o Selective evacuation
o General sheltering
o Relocation
o ~ General evacuation
o Selective sheltering
o Administering of radioprotective drugs
o Ingestion pathway isolation.~ .
Emphasis, however, will be placed on a flexible evacuation menu that minimizes'ny
impacts resulting from earthquake damage.'.
~5ifi*T
The determination of the most effective protective actions to be taken would be
conducted as follows (see Figure 6-2): I
ao Initially, a determination yvill be made as to the ability toconduct a general evacuation of the Basic EmergencyPlanning Zone. This decision will be based on the timeavailable before the arrival of radiation offsite and thetime required to conduct a general evacuation. Theevacuation time will be a value keyed to the level ofearthquake damage sustained by the evacuation roadsystem. Representative evacuation times for four levels
B-8I-269 6-44
TERA CORPORATION
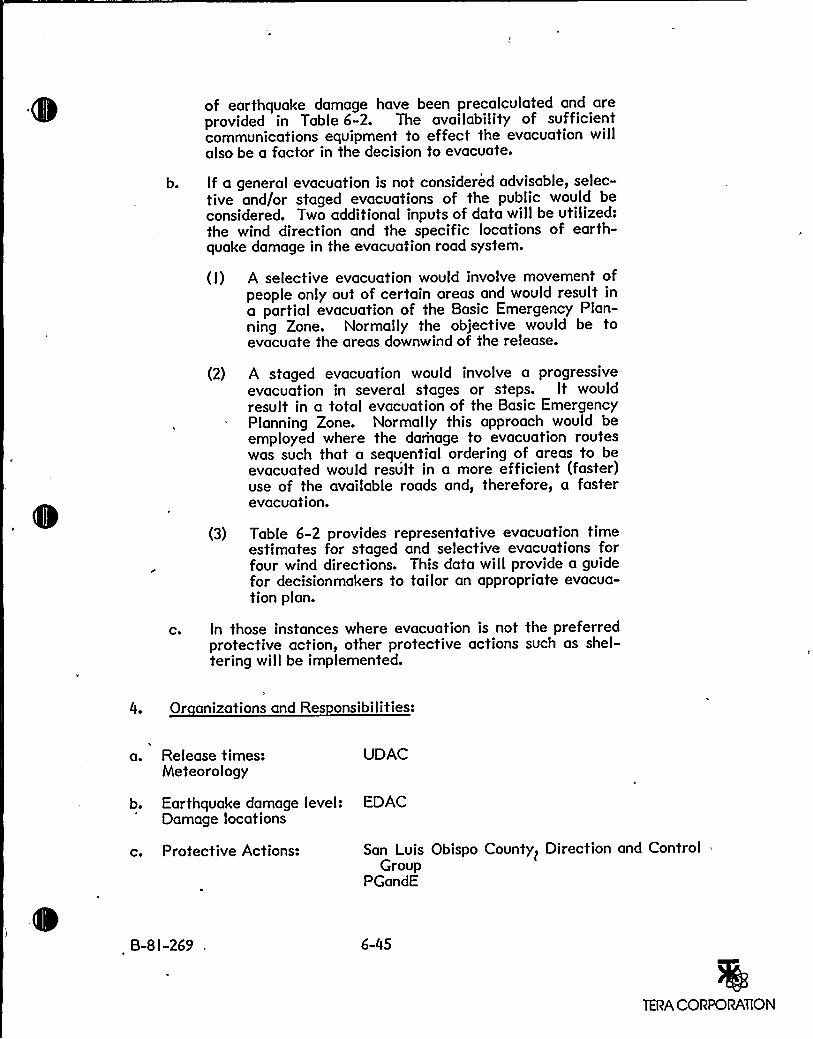
of earthquake damage have been precalculated and areprovided in Table 6-2. The availability of sufficientcommunications equipment to effect the evacuation willalso be a factor in the decision to evacuate.
b. If a general evacuation is not considered advisable, selec-tive and/or staged evacuations of the public would beconsidered. Two additional inputs of data will be utilized:the wind direction and the specific locations of earth-quake damage in the evacuation road system.
(I) A selective evacuation would involve movement ofpeople only out of certain areas and would result ina partial evacuation of the Basic Emergency Plan-ning Zone. Normally the objective would be toevacuate the areas downwind of the release.
(2) A staged evacuation would involve a progressiveevacuation in several stages or steps. It wouldresult in a total evacuation of the Basic EmergencyPlanning Zone. Normally this approach would beemployed where the damage to evacuation routeswas such that a sequential ordering of areas to beevacuated would result in a more efficient (faster)use of the available roads and, therefore, a fasterevacuation.
(3) Table 6-2 provides representative evacuation timeestimates for staged and selective evacuations forfour wind directions. This data will provide a guidefor decisionmakers to tailor an appropriate evacua-tion plan.
co In those instances where evacuation is not the preferredprotective action, other protective actions such as shel-tering will be implemented.
4. Or anizations and Res onsibilities:
a. Release times:Meteorology
UDAC
b. Earthquake damage level: EDACDamage locations
c. Protective Actions: San Luis Obispo County> Direction and ControlGroup
PGandE
B-SI-269 6-45
TERA CORPORATION
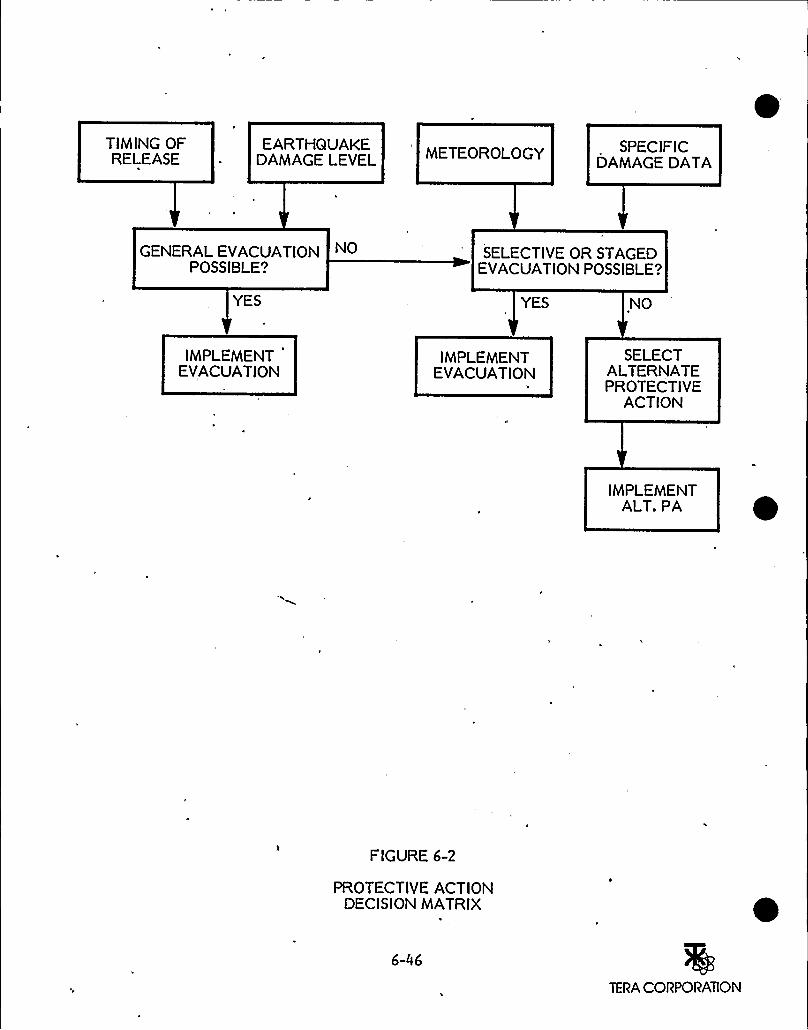
TIMING OFRELEASE
EARTHQUAKEDAMAGE LEVEL METEOROLOGY SPECIFIC
DAMAGEDATA
GENERAL EVACUATIONPOSSIBLE?
NO SELECTIVE OR STAGEDEVACUATIONPOSSIBLE?
YES YES NO
IMPLEMENTEVACUATION
IMPLEMENTEVACUATION
'
SELECTALTERNATEPROTECTIVE
ACTION
IMPLEMENTALT. PA
FIGURE 6-2
PROTECTIVE ACTIONDECISION MATRIX
1
6-46
TERA CORPORATION
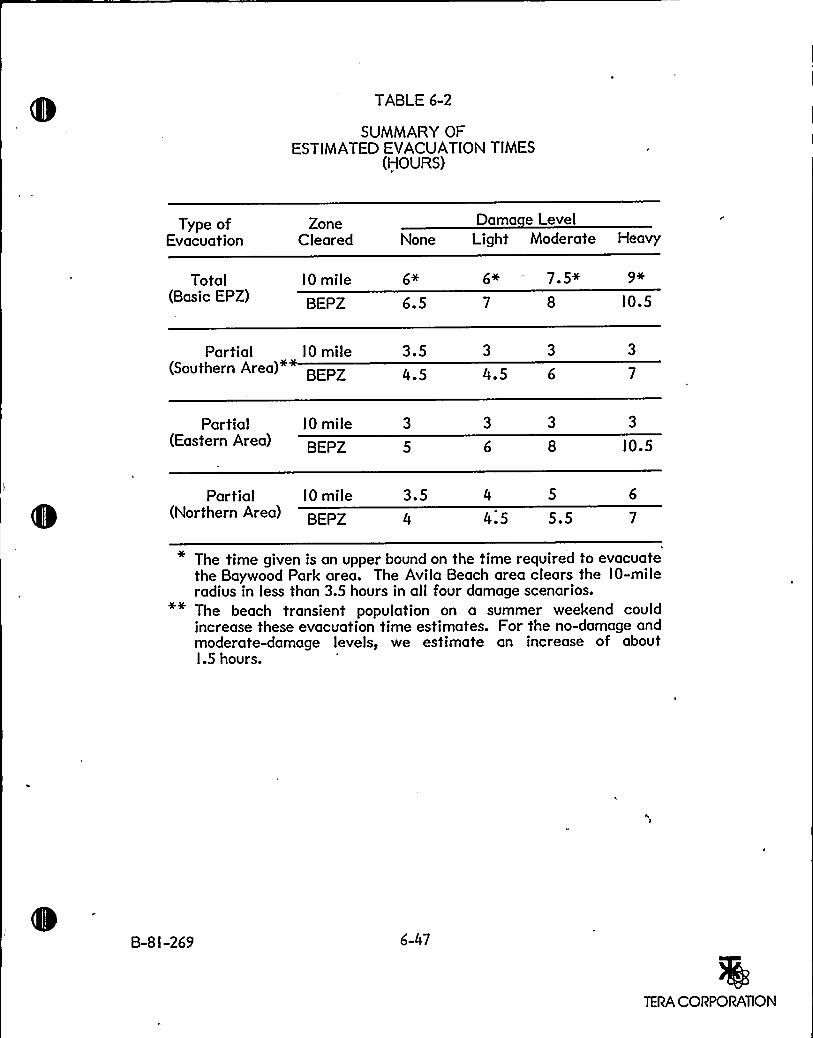
TABLE 6-2
SUMMARY OFESTIMATED EVACUATIONTIMES
(HOURS)
Type ofEvacuation
ZoneCleared
Dama e LevelNone Light Moderate Heavy
Total(Basic EPZ)
IO mile
BEPZ 6.5
7. 5+
l0.5
Partial I 0 mile(Southern Area) BEPZ
3.54.5
3 3
4.5 6
Partial I 0 mile(Eastern Area) BFPZ l0.5
Partial l0 mile(Northern Area) BEPZ
3.5 4 5
4.5 5.5
The time given is an upper bound on the time required to evacuatethe Baywood Park area. The Avila Beach area clears the IO-mileradius in less than 3.5 hours in all four damage scenarios.The beach transient population on a summer weekend couldincrease these evacuation time estimates. For the no-damage andmoderate-damage levels, we estimate an increase of aboutl.5 hours.
B-SI-269 6-47
TERA CORPORATION
REFERENCES FOR SECTION 6.0
I. State of California Earthquake Response Plan, California Office of Emer-gency Services, reprint, April I 98 I.
2. San Luis Obispo County Nuclear Power Plant Emergency Response Plan,Revision 3, June l5, l98I.
3. Diablo Canyon Power Plant Emergency Plan, Revision 3, September l98I.
4. State of California Nuclear Power Plant Emergency Response Plan, Revi-sion 3, June l5, l98I.
5. State of California Department of Transportation (CALTRANS) EmergencyPlan, August l979.
6. State of California Department of Transportation (CALTRANS), District 5,Emergency Plan, October l980.
B-8 I-269
ERA CORPORATION
7.0 REFERENCES CITED
Applied Technology Council, l98l, "Guidelines for the Evaluation of HighwayBridges, ATC-b, Final Draft Report," Applied Technology Council,Berkeley, California.
Association of Bay Area Governments (ABAG), l980-8I, "A Guide to ABAG'sEarthquake Mapping Capability," Berkeley, California.
Babbit, D., l98I, personal communication, August 25, l98l, California Dept. ofWater Resources, Div. of Safety of Dams, Sacramento.
Bailey, E. H., Irwin, W. P. and Jones, D. L., l964, "Franciscan and Related'ocksand their Significance in the Geology of Western California,"
California Div. of Mines and Geology, Bulletin I83, Sacramento.
Blanc, R. P. and Cleveland, G. B., l968, "Natural Slope Stability as Related toGeology of the San Clemente Area, Orange and San Diego Counties,California," California Div. of Mines and Geology, SR-98, Sacramento.
Borchardt, G. A., l 977, "Clay Mineralogy and Slope Stability", California Div. ofMines and Geology, SR-I33, Sacramento.
California Dept. of Water Resources, l954, "San Luis Obispo County Investi-gation," DWR Bulletin 18, Sacramento.
California Dept. of Water .Resources, l97I, "Water Well Standards, ArroyoGrande Basin, San Luis Obispo County," DWR Bulletin 74-7, Sacramento.
California Dept. of Water Resources, l972, "Sea Water Intrusion, Pismo andGuadalupe Areas," DWR Bulletin 63-3, Sacramento.
California Dept. of Water Resources, l972, "Sea Water Intrusion, Morro BayArea, San Luis Obispo County," DWR Bulletin 63-6, Sacramento.
California Dept. of Water Resources, l979, "Ground Water in the Arroyo GrandeArea," District Report, Sacramento.
California Dept. of Water Resources, l979, "Morro Bay Sandspit Investigation,"District Report, Sacramento.
California Div. of Mines and Geology, l978, "Geological Map of California, San
Luis Obispo Sheet," Sacramento.
Campbell, K. W., l980, "Attenuation of Peak Horizontal Acceleration within theNear-Source Region of Moderate to Large Earthquakes," TERA Corpora-tion, Technical Report 80-I, Berkeley, California.
B-8I-269 7-I
TERA CORPORATION
Campbell, K. W., l98I, "Near-Source Attenuation of Peak Horizontal Accelera-tion," Bulletin of the Seismological Society of America, Vol. 7 I (in press).
Campbell, R. H., l980, "Landslide Maps Showing Field Classifications, Pt. DumeQual., California," U.S. Geological Survey, MF-I l67, Menlo Park, Cali-fornia.
Eckel, E. B., ed., 1958, "Landslides and Engineering Practice," Highway ResearchBoard, Special Report 29 (NAS-NRC Publication 544), Washington, D.C.
Elms, D. G. and Martin, G. R., l979, "Factors Involved in the Seismic Design ofBridges," Proceedin s of a Worksho on Earth uake Resistance of Hi hwaBrid es Januar 29-3l l979 Applied Technology Council, Berkeley, Cali-fornia sponsored by the National Science Foundation).
Envicom Corporation, l974, "Seismic Safety Element, San Luis Obispo County,California," San Luis Obispo.
Fairchild National, Inc., l978, "Stereo Aerial Photographs, May l978," Scotts-dale, Arizona (total 30 photos).
Goodwin, M., personal communication, June 25, l98I (Water Conservation-Ground Water), San Luis Obispo, California.
Hall, C. A., l973, "Geology of the 'Arroyo Grande Quadrangle, California,"California Div. of Mines and Geology, MS-24, Sacramento.
Hall, C. A., l973, "Geologic Map of the Morro Bay South and Port San LuisQuadrangles, San Luis Obispo County, California," U.S. Geological Survey,MF-SI I, Menlo Park, California.
Hall, C. A. and Prior, S. W., l975, "Geologic Map of the Cayucos - San LuisObispo Region, San Luis Obispo County, California," U.S. GeologicalSurvey, MF-686 (2 sheets), Menlo Park, California.
Hall, C. A. et al., l979, "Geologic Map of the San Luis Obispo - San SimeonRegion, California," U.S. Geological Survey, I-l097 (3 sheets), Menlo Park,California.
Harp, E. L., l98l, personal communication, June l5, l98I, U.S. GeologicalSurvey, Menlo Park, California.
Harp, E. L., l978, "Earthquake-Induced Landslides," U.S. Geological Survey,National Earthquake Hazards Reduction Program, Summaries of TechnicalReports Vol. Vll, pp. 210-2I2, Menlo Park, California.
Harp, E. L., l979, "Earthquake-Induced Landslides," U.S. Geological Survey,National Earthquake Hazards Reduction Program, Summaries of TechnicalReports Vol. Vill, Menlo Park, California.
B-8I-269 7-2
TERA CORPORATION
Harp, E. L., l980, "Earthquake-Induced Landslides,"~U.S. Geological Survey,Open-File Report 80-6, pp. I82-I83, Menlo Park, California.
Harp, E. L, l980, "Earthquake-Induced Landslides," U.S. Geological Survey,Open-File Report 80-842, pp. 295-296, Menlo Park, California.
Harp, L. H., l978, "Earthquake-Induced Landslides: Investigation of PredictionCriteria," U.S. Geological Survey, Open-File Report 79-387, pp. 35-36,Menlo Park, California.
~ Harp, L. H., Keefer, D. K. and Wilson, R. C., l980, "Artificialand Natural SlopeFailure, the Santa Barbara Earthquake of August l3, l978," California~Geolo, California Div. of Mines and Geology, May 1980, pp. 102~05.
Hart, E. W., l976, "Basic Geology of the Santa Margarita Area, San Luis ObispoCounty, California," California Div. of Mines and Geology, Bulletin l99,Sacramento.
Helley, E. J. and LaJoie, K. R., l979, "Flatland Deposits of the San FranciscoBay Region, California - their Geology and Engineering Properties andtheir Importance to Comprehensive Planning," U.S. Geological Survey,Professional Paper 943, Menlo Park, California.
Iwasaki, T., Penzien, J. and Clough, R. W., 1972, "An Investigation of theEffectiveness of Existing Bridge Design Methodology in Providing AdequateStructural Resistance to Seismic Disturbances," Federal Highway Admin-istration, Office of Research and Development, Report FHWA-RD 73-I3,Washington, D.C.
Keefer, D. R., l978, "Ground Failures Caused by Historic Earthquakes," U.S.Geological Survey, National Earthquake Hazards Reduction Program, Sum-maries of Technical Reports Vol. Vill,pp. 2 I4-2 I 7, Menlo Park, California.
Keefer, D. R., l979, "Ground Failures Caused by Historic Earthquakes," U.S.Geological Survey, National Earthquake Hazards Reduction Program, Sum-maries of Technical Reports Vol. Vill,pp. 2I9-22I, Menlo Park, California.
Keefer, D. R. et al., l979, "Preliminary Assessment of Seismically InducedLandslide Susceptibility," U.S. Geological Survey, Circular 807, pp. 49-60,Menlo Park, California.
Keefer, D. R., l980, "Ground Failures Caused by Historic Earthquakes," U.S.Geological Survey, Open-File Report 80-6, pp. I84-I85, Menlo Park, Cali-fornia.
Keefer, D. R., l980, "Ground Failures Caused by Historic Earthquakes," U.S.Geological Survey, Open-File Report 80-842, pp. 297-299, Menlo Park,California.
B-8 I-269 7-3
TERA CORPORATION
Leighton, B. F. et al., l978, "Surficial Landslides Triggered by Seismic Shaking,San Fernando Earthquake of I 97 I," U.S. Geological Survey, NationalEarthquake Hazards Reduction Program, Summaries of Technical ReportsVol. Vll, pp. 2I8-2 I 9, Menlo Park, California.
Leighton, B. F., l978, "Surficial Landslides Triggered by Seismic Shaking, SanFernando Earthquake of I 97 I," U.S. Geological Survey, Open-FileReport 79-387, p. 36, Menlo Park, California.
McGuire, R. K. and Barnhard, T. P., l979, "Four Definitions of Strong MotionDuration: their Predictability and Utility for Seismic Hazard Analysis,"U.S. Geological Survey, Open-File Report 79-15 I 5, Denver, Colorado.
Morton, D. M., 197 I, "Seismically Triggered Landslides in the Area above the SanFernando Valley," U.S. Geological Survey, Professional Paper 733, pp. 99-l04, Menlo Park, California.
Pacific Gas and Electric Company, l970, "Final Safety Analysis Report, DiabloCanyon Power Plant," Geology and Seismicity Chapter and Appendix 2.5(prepared by Earth Sciences Associates, Palo Alto, California).
Rogers, T. H. and Williams, J. W., l974, "Potential Seismic Hazards in SantaClara County, California," California Div. of Mines and Geology; SR-I07,Sacramento.
Ross, G. A., Seed, H. B. and Migliaccio, R. R., l973, "Performance of HighwayBridge Foundations, the Great Alaska Earthquake of I 964," NationalAcademy of Sciences, Washington, D.C.
San Luis Obispo County, Engineering Dept., l 974, "Groundwater Seasons l970-7I,l97I-72, County of San Luis Obispo," San Luis Obispo, California.
San Luis Obispo County, Office of Emergency Services, l98I, "San Luis ObispoCounty/Cities Emergency Broadcast System Plan (EBS)," San Luis Obispo,California.
Seed, H. B., l979, "Soil Liquefaction and Cyclic, Mobility Evaluation for Groundduring Earthquakes," Journal of the Geotechnical Engineering Division,
",. *
ASCE, l05.
Seed, H. B. and Idriss, I. M., l97l, "Simplified Procedure for Evaluating SoilLiquefaction Potential," Journal of the Soil Mechanics and FoundationsDivision, ASCE.
U.S. Soil Conservation Service, l977, "General Soil Map, San Luis Obispo County-Coastal 'Part" (including text of soil descriptions), USDA (unpublished;'available at SCS Santa Maria office).
Voorhees, A. M., 1980, "Evacuation Times Assessment for the Diablo CanyonNuclear Power Plant," Alan M. Voorhees & Associates, Berkeley, Cali-fornia.
B-8 I-269 7-4
TERA CORPORATION
Wiegel, R. L., l970, "Tsunamis," in Earth uake En ineerin R. L. Wiegel, ed.,Prentice-Hall, Inc., Englewood Cliffs, New Jersey, pp. 53-306.
Wilson, R. C., l978, "Interaction between Ground Motion and Ground Failure,"U.S. Geological Survey, National Earthquake Hazards Reduction Program,Summaries of Technical Reports Vol. Vll, pp. 222-225, Menlo Park, Cali-fornia.
Yen, B. C., I 978, "Seismically Induced Shallow Hillside Failures," U.S. GeologicalSurvey, National Earthquake Hazards Reduction Program, Summaries ofTechnical Reports Vol. Vll, pp. 226-228, Menlo Park, California.
Youd, T. L. et al., l979, "Liquefaction Potential Map of San Fernando Valley,California," U.S. Geological Survey, Circular 807, pp. 37-48, Menlo Park,California.
Youd, T. L., l98I, personal communication, July l3, l98I, U.S. GeologicalSurvey, Menlo Park, California.
B-8 I-269 7-5
TERA CORPORATION

>e.4
J
t
* ~w ...,, ~m ~
I I-
~,l l
?
j- R
~ s ~

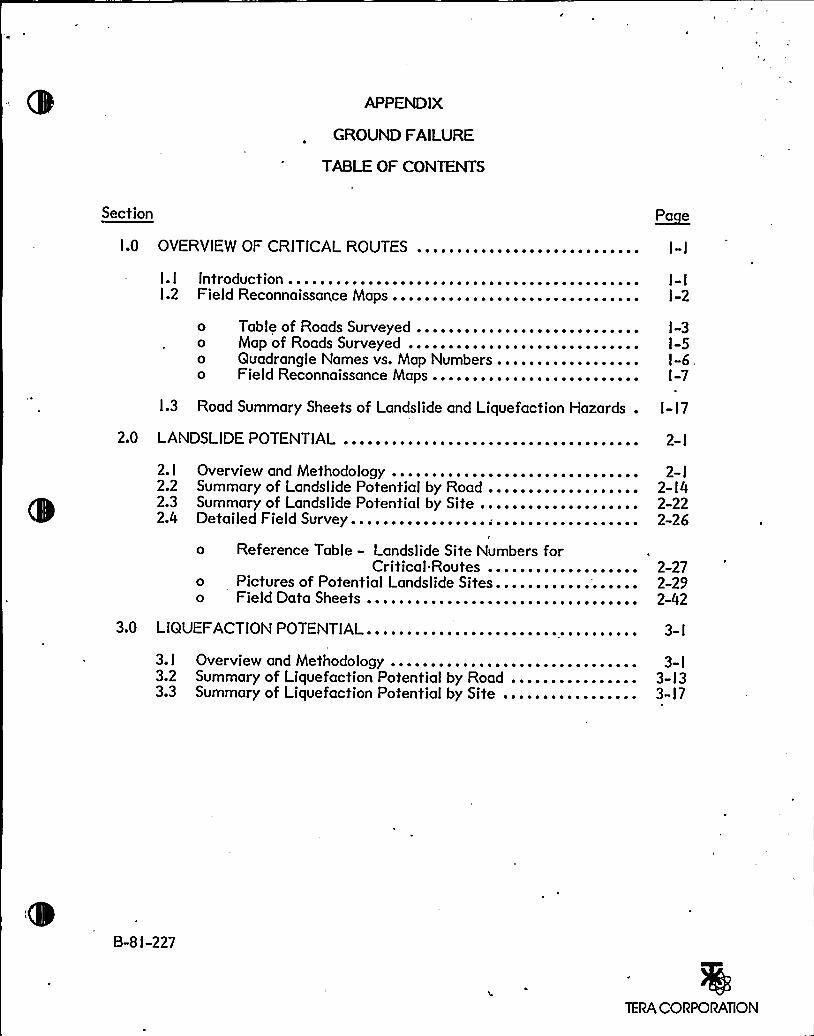
APPENDIX
GROUND FAILURE
TABLEOF CONTENTS
Section ~Pa e
I.O OVERVIEW OF CRITICALROUTES .............. ~ ~ ~ ~.... ~ ~ ~... I-I
Ie ~.I Introduction ~ ~ ~ ~ ~ ~ ~ ~ ~ ~ ~ ~ ~ ~ ~ ~ ~ ~ ~ ~ ~ ~ ~ ~ ~ ~ ~ ~ ~ ~ ~ ~ ~ ~ ~ ~ ~ ~ ~ ~ ~ ~ ~ ~ I-I
l.2 Field Reconnaissance Maps............................... I -2
0000
Table of Roads Surveyed ...................Map of Roads Surveyed ....................Quadrangle Names vs. Map Numbers.........Field Reconnaissance Maps.................
~ ~ ~ ~ ~ ~ ~ ~ ~ I-3~ ~ ~ ~ ~ ~ ~ ~ ~ I-5~ ~ ~ ~ ~ ~ ~ ~ ~ I-6~ ~ ~ ~ ~ ~ ~ ~ ~ I-7
l.3 Road Summary Sheets of Landslide and Liquefaction Hazards . I-l7
2.0 LANDSLIDEPOTENTIAL ..................................... 2- I
2.I2.22.32.4
Overview and Methodology ...................Summary of Landslide Potential by Road .......Summary of Landslide Potential by Site ........Detailed Field Survey.................;... ~ ..
2- I
2-l42-222-26
0
00
Reference Table - Landslide Site NumbersCritical.Routes .......
Pictures of Potential Landslide Sites......Field Data Sheets ......................
for~ ~ ~ ~ ~ ~ ~ ~ ~ ~
~ ~ ~ ~ ~ ~ ~ ~ ~ ~
~ ~ ~ ~ ~ ~ ~ ~ ~ ~
2-272-292-42
3.0 LIQUEFACTIONPOTENTIAL.................................. 3- I
3. I Overview and Methodology ...................3.2 Summary of Liquefaction Potential by Road ....3.3 Summary of Liquefaction Potential by Site .....
3-I3-I33-l7
B-8I-227
TERA CORPORATION

I.O OVERVIEW OF CRITICALROUTES
I. I INTRODUCTION
This section contains maps, tables and summary sheets which provide an
overview of the evacuation routes and plant access roads discussed in the report.This section should be used as reference for the location of roads and sites ofpotential ground failure.
A table of roads surveyed is presented providing a uniform numbering system
used in subsequent sections, and a description of the sections of the roads
considered. This is followed by a map of the roads which should be referred tofor their locations, as the field reconnaissance maps do not contain thisinformation.
The color field reconnaissance maps contain a detailed view of potential sites ofground failure in relation to the critical routes, topography, population and
cultural features. The site numbering systems defined by these maps are
referred to in subsequent sections.
The "Road Summary Sheets" presents a summary of potential ground failureproblems for each of the critical routes.
B-8I-227
TERA CORPORATION

I.2 FIELD RECONNAISSANCE MAPS
0
0
0
0
Table of Roads Surveyed
Map of Roads Surveyed
Quadrangle Names vs. Map Numbers
Field Reconnaissance Maps
B-8I-227 I-2
TERA CORPORATION
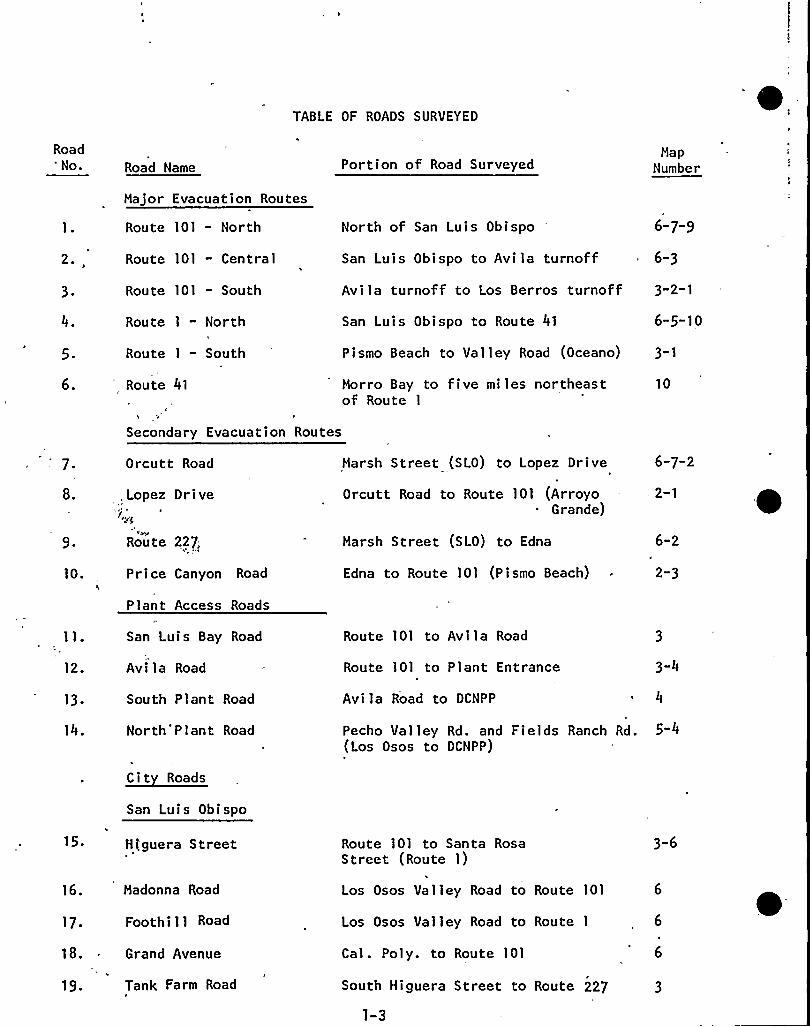
TABLE OF ROADS SURVEYED
RoadNo.
2 ~,
3-
4.
5 ~
6 ~
Road Name
Major Evacuation Routes
Route 101 - North
Route 101 - Central
Route 101 - South
Route 1- North
Route 1- South
Route 41
Portion of Road Surveyed
North of San Luis Obispo
San Luis Obispo to Avila turnoff
Avila turnoff to Los Berros turnoff
San Luis Obispo to Route 41
Pismo Beach to Valley Road (Oceano)
Horro Bay to five miles northeastof Route 1
MapNumber
6-7-9
6-3
3-2-1
6-5-10
3-1
10
7 ~
Secondary Evacuation Routes
Orcutt Road Harsh Street (SLO) to Lopez Drive 6-7-2
8.
9.
10.
,Lopez Drive
Route 227,
Price Canyon Road
Plant Access Roads
Orcutt Road to Route 101 (ArroyoGrande)
2-1
Marsh Street (SLO) to Edna 6-2
Edna to Route 101 (Pismo Beach) - 2-3
12.
13.
14.
San Luis Bay Road
Avi la Road
South Plant Road
North'Plant Road
Route 101 to Avila Road
Route 101 to Plant Entrance
Avi la Road to DCNPP
3-4
~ 4
Pecho Valley Rd. and Fields Ranch Rd. 5-4(Los Osos to DCNPP)
San Luis Obispo
15. Htguera Street
16. Madonna Road
17- Foothill Road
18. - Grand Avenue
19. Tank Farm Road
Route 101 to Santa RosaStreet (Route 1)
Los Osos Valley Road to Route 101
Los Osos Valley Road to Route 1
Cal. Poly. to Route 101
South Higuera Street to Route 227
1-3
3-6
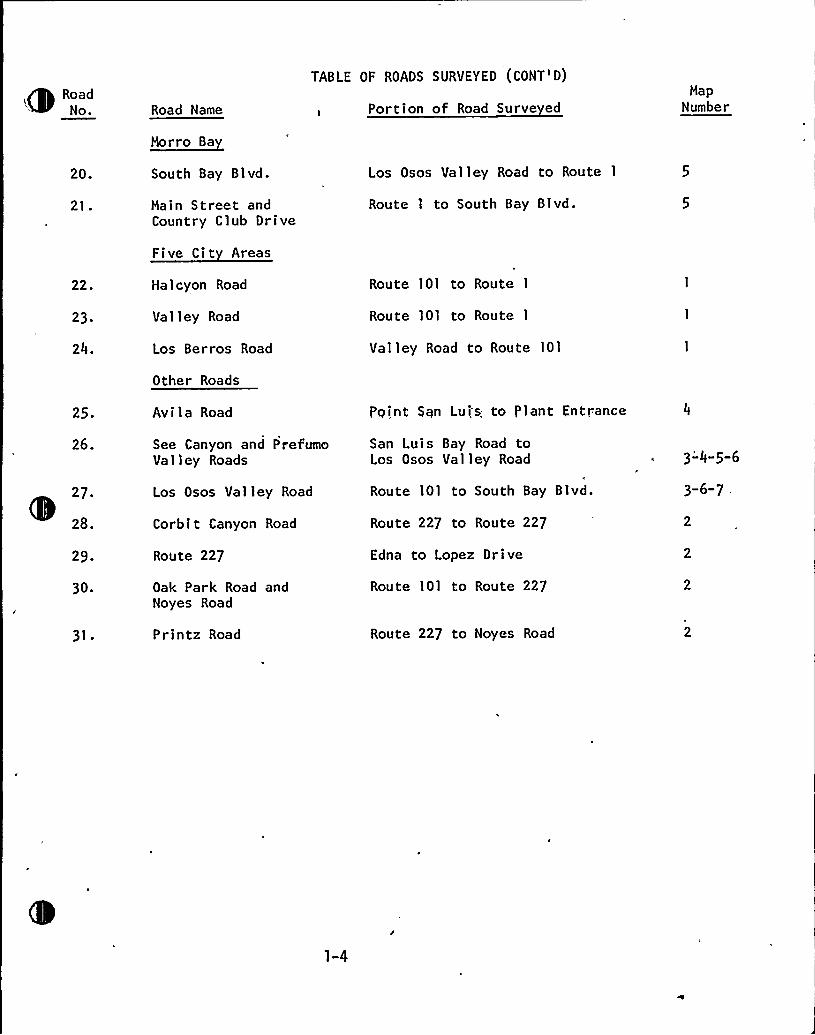
RoadNo.
20.
21.
Road Name
~Morro Ba
South Bay Blvd.
Main Street andCountry Club Drive
Five Cit Areas
TABLE OF ROADS SURVEYED (CONT'D)
Portion of Road Surve ed
Los Osos Valley Road to Route 1
Route 1 to South Bay Blvd.
MapNumber
22.
23
24.
25.
26.
„29.
30.
31.
Ha 1 cyon Road
Valley Road
Los Berros Road
Other Roads
Avila Road
See Canyon and PrefumoValley Roads
Los Osos Val ley Road
Corbit Canyon Road
Route 227
Oak Park Road andNoyes Road
Printz Road
Route 101 to Route 1
Route 101 to Route 1
Valley Road to Route 101
Point Sqn Lui's. to I'lant Entrance
San Luis Bay Road toLos Osos Valley Road
Route 101 to South Bay Blvd.
Route 227 to Route 227
Edna to Lopez Drive
Route 101 to Route 227
Route 227 to Noyes Road
3-4-5-6
3-6-7 .
1-4
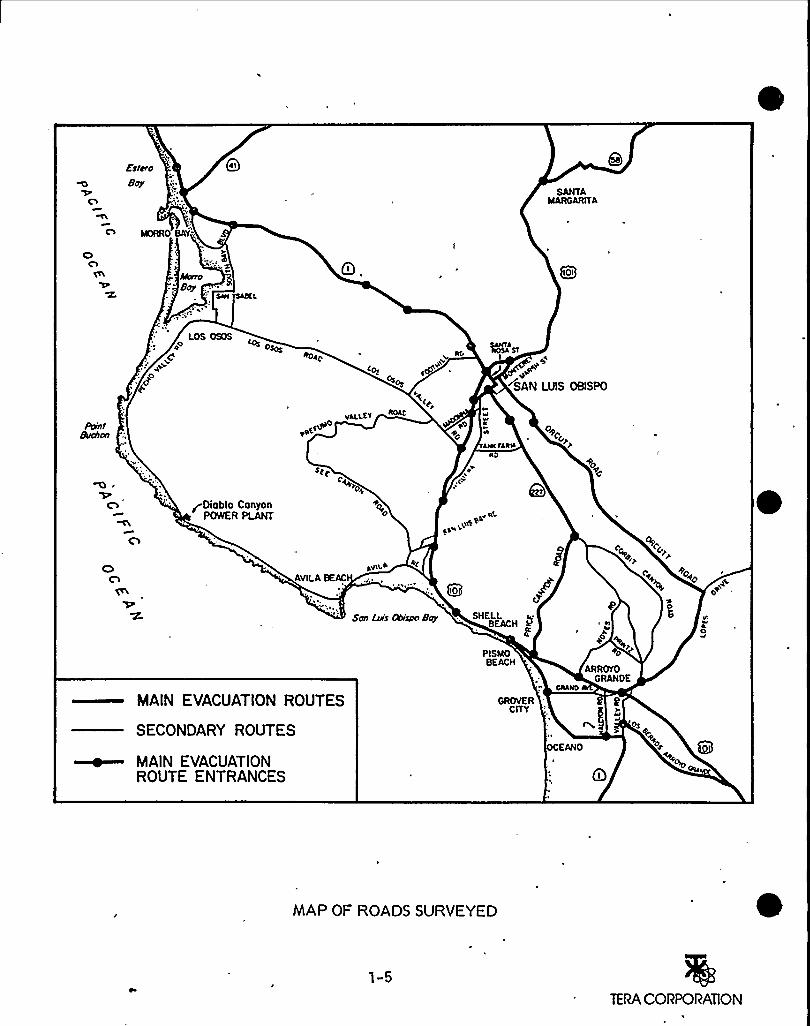
Esto8os
04I
SANTAMARGARITA
BAY,
8ao
IOI
isasnsBIachon
LOS OSOS4O
~O
~ os<4C
ao
ag
VALLEY t
OC saI ~E
SAN LUIS OBISPO
roO
OgC~
Jak( fan V Pko
n"
COn
~Diablo CanyonPOWER PLANT
spyC4+
O4
g+AA a
AVILABEAC
Son Lais C5ispo 8'
aL„c,eL
ck"
L'o
rc
~vJ
CgP
~O4+g 0 gc
'k
O
MAIN EVACUATION ROUTES
SECONDARY ROUTES
MAIN EVACUATIONROUTE ENTRANCES
PISMOBEACH
GROVERCITY
ARROYOGRANDE
EANO O~ Q
MAP OF ROADS SURVEYED
1-5
TERA CORPORATION
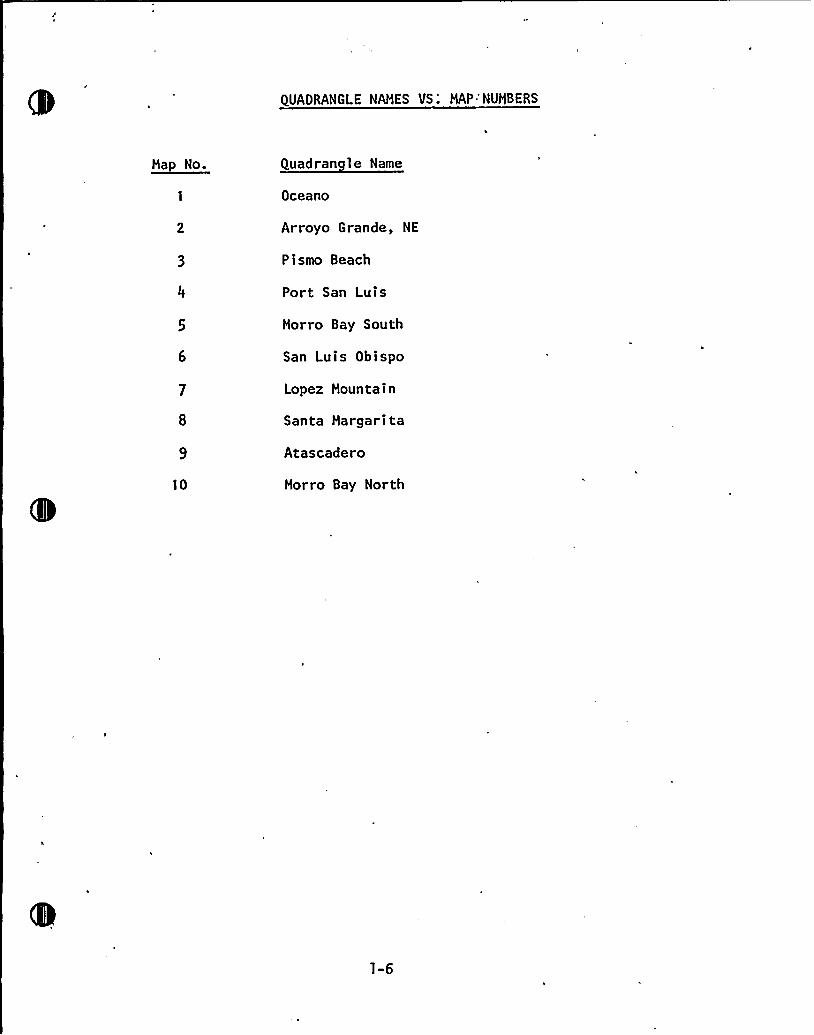
QUADRANGLE NAHES VS; HAP:NUHBERS
Quadran 1 e Name
Oceano
Arroyo Grande, NE
Pismo Beach
Port San Luis
Horro Bay South
San Luis Obispo
Lopez Hountain
Santa Hargarita
Atascadero
Horro Bay North
1-6

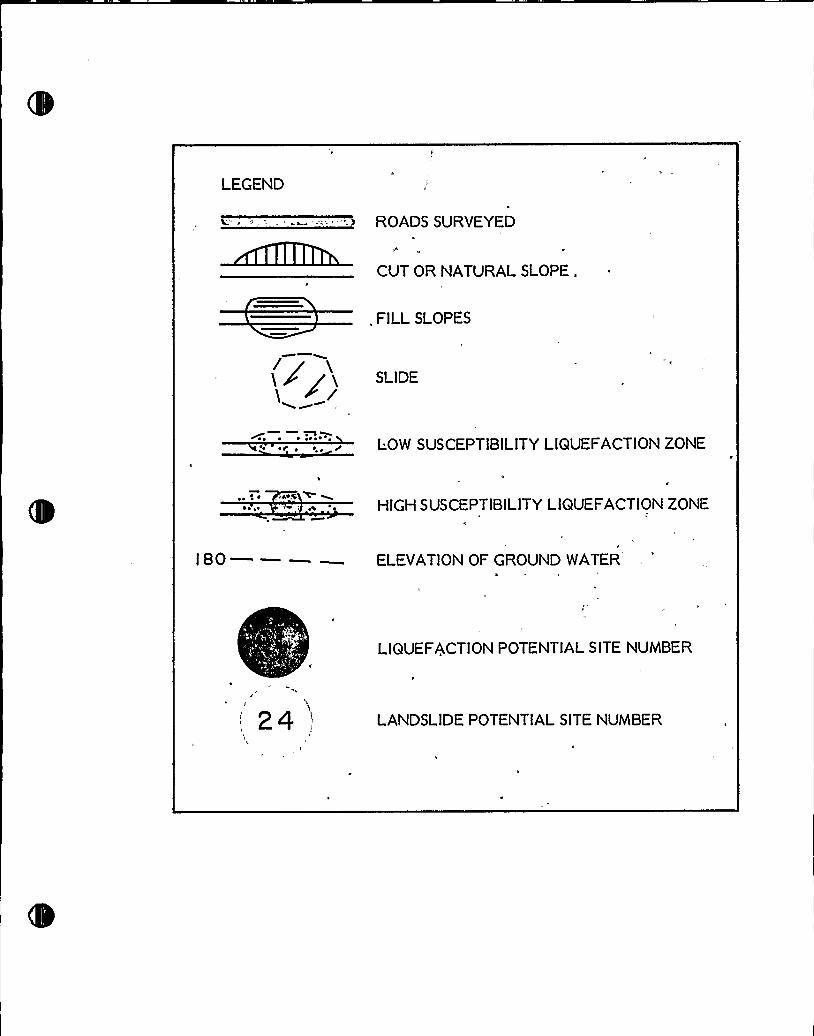
LEGEND
ROADS SORYSYSO
AS
CUT OR NATURALSLOPE .
. FILL SLOPES
SLIDE
~ O ~ ~ ~
Re Op ~ ~ ~ LOW SUSCEPTIBILITY LIQUEFACTIONZONE
~ o i ~
~ R OO HIGH SUSCEPTIBILITY LIQUEFACTIONZONE
ISO ELEVATIONOF GROUND WATER
LIQUEFACTIONPOTENTIAL SITE NUMBER
A'
24,'ANDSLIDEPOTENTIAL SITE NUMBER

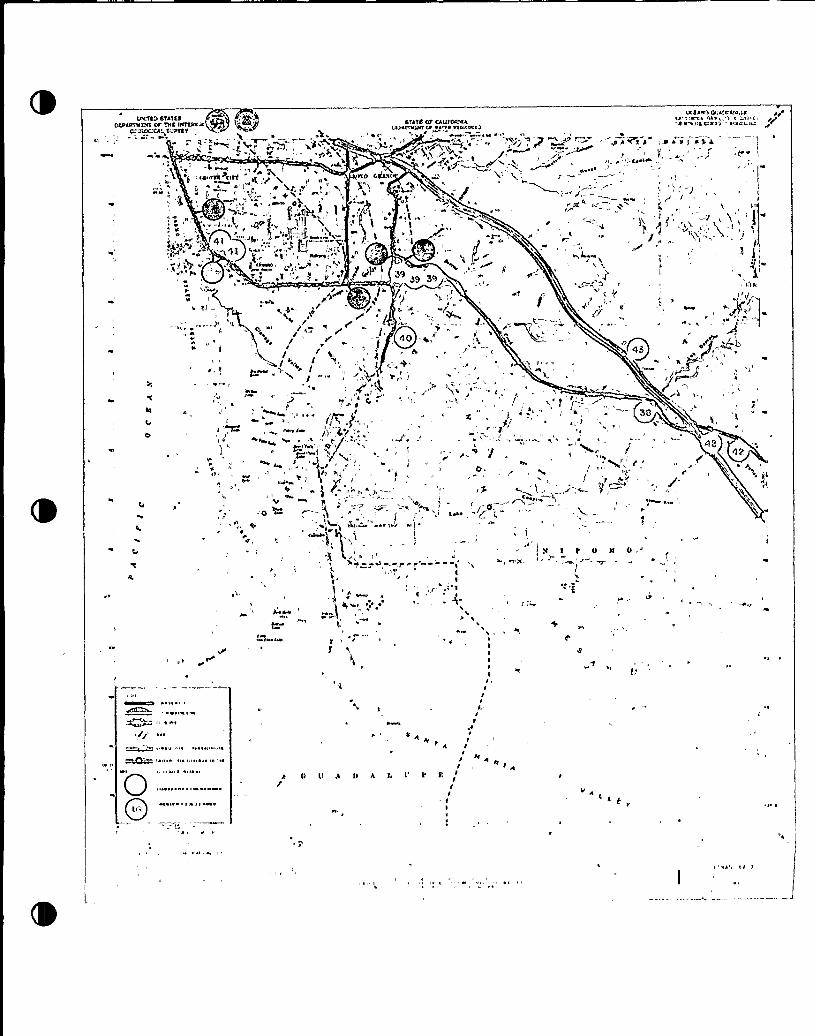
Ilfctt>etatcsOII'aktaattrt Ol'aft IfattStffO .
ClfaWCCIL1'rtt
Iwwtt at
tt'.wg»
Stattf 01 CAUIORIO1(aralfrloart ar Qerrs ffaafafaraaf%c''i r ~ . 1 f
I 'I gaalaa
ursa~a ooawafa,ltraa''f1~a ra'af 1 a fffIVallIIJ Ia,'-I afar
,r a I S it af
f 0
at I I'
/ Ga ,I rr ,f f
r
af
fr,
r'
I,'
~ p,
1
r
K
Icr
f
I
4f f ~ 1
I 4'
I ~
I'If'a
1 'ra r ~
ar r
/g" ra ~
W\
OS ~
C
O »Wtl
tl A t I
II
II
4 II
O I ~c
III
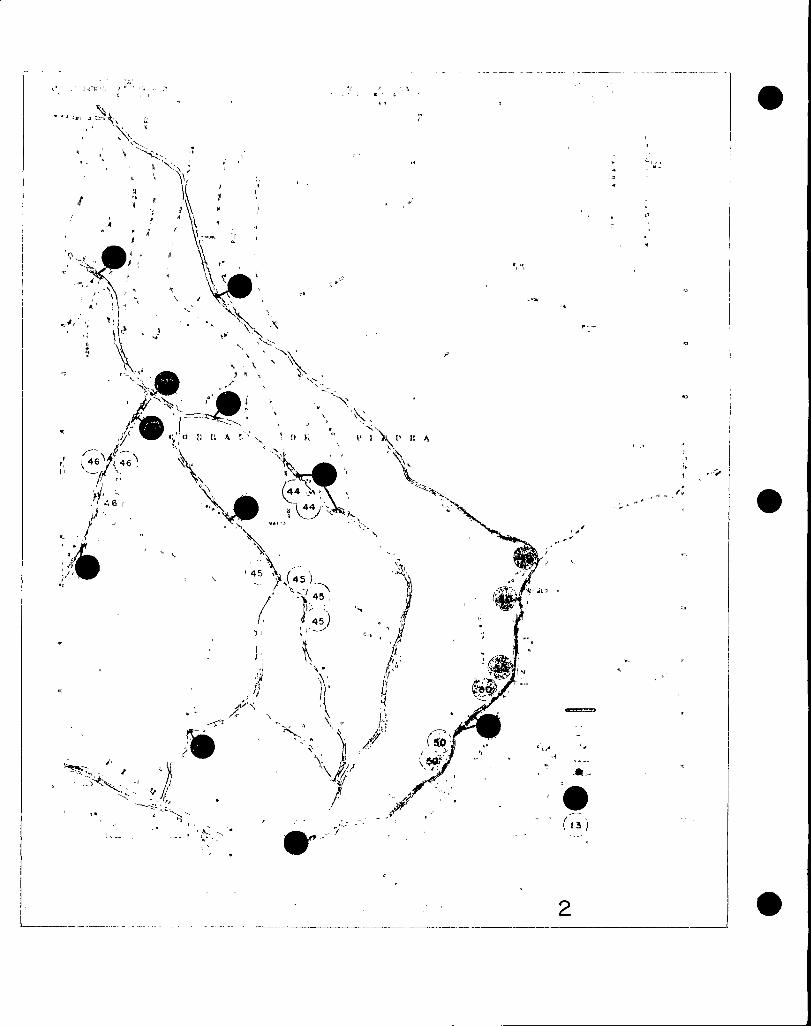
(
1'1,
1
II
1
F' i'1
t.1
(( i
1 .F( ~
I,
)/y'F
i
.-'.6I
h
( J'.) -.
YI, 4@""
JI
(
h."j
lh'(>I
1 ~ S
1 ~
(~~)
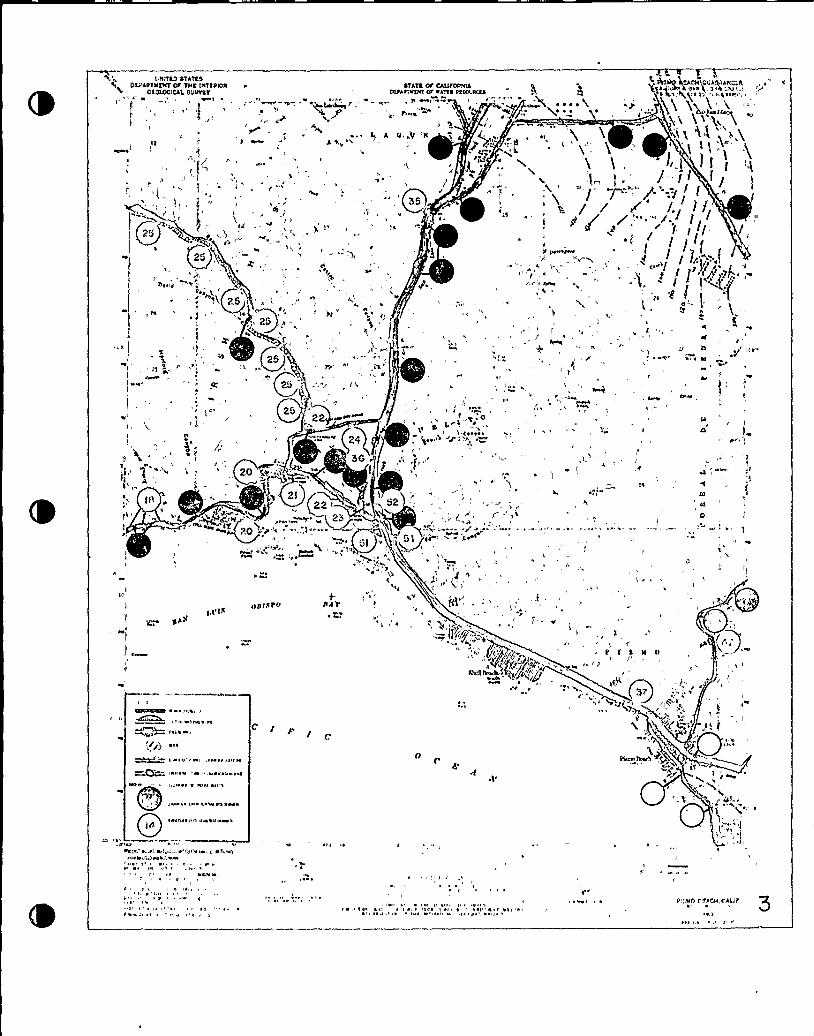
\ JIJTKO STATK9TtKfattTTIKTJT Of TlIC tttTKKJOt
Cantttnma KOJJTKT
I'
Z ~ ~ .,)) ))-
~ ) / // 1/$j"al
,.:f
Jl tap 4JJ I
'\
TftfaftatlltOf aa",ta OINMCKK TIE tt t ...OEIPI',,
p,
1) It',7- i~
J' '' j'l/ ))'
'
/ 'I
I
T,
I)
JI
!
T yEO
E CE 44 ~C „,49 Fgt TE
!
1 II
25
Cg) Ft~ N F Kaa'I
~ 1I
Ja
I I al
pA
la
JCI
nTJTTJ»T,KITS
99TE
ilr I
4 ~F'
:;- II(r/X)"~;.,~ (3-
I l
J
> ', ~ a
CgRSSS ~
~ Ela I
J/~$ al ~
~ al al,pair I I 4
" ~ laaa ~
0
lal = I I I ~ '1 EN ~ I'I
T'!pall * I '11 ~ paI
O
�4alai ~ I 'E pa 'aa Faaa
)ET
Ia ~ 'r'ar~b,m pFEa*l! —.F"!Eral .I
a!'III
Faa
I ' aaIEEEI - I
~ E
P!'MO i'Tafnl, C'lttf~ '
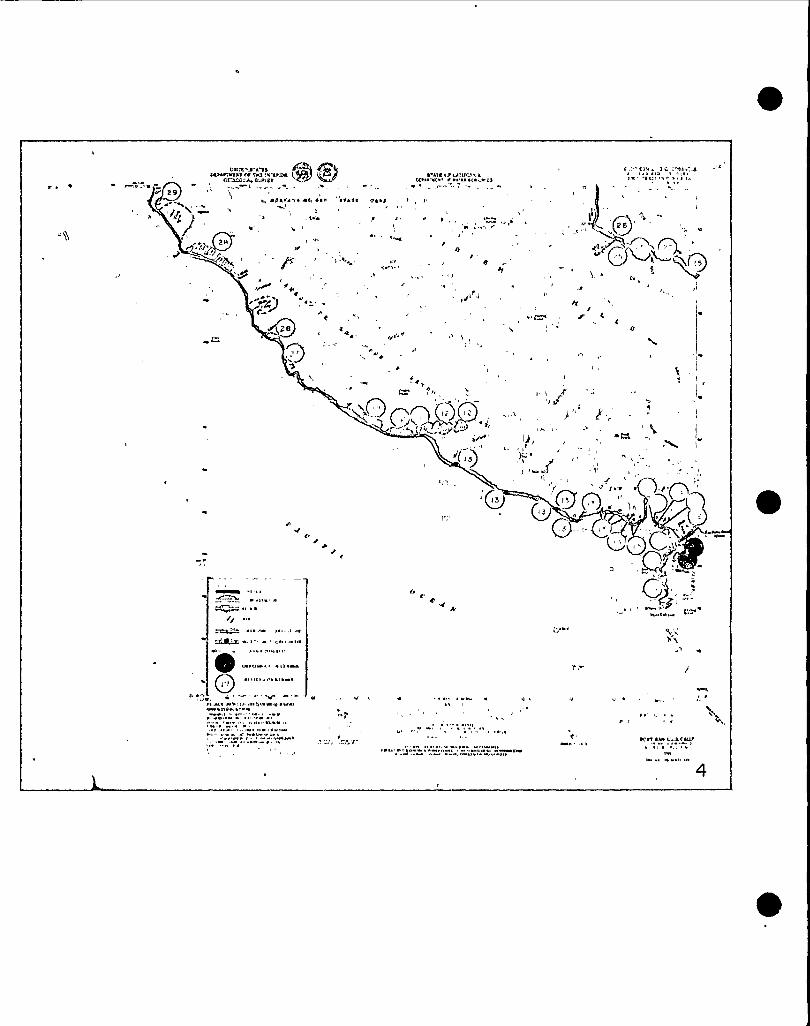
a%i.r J r ts + ~a+ 4Crkka.clat At IIr W CRW (gapCA "e* certMe
29~ Ib IIfre C 4 l. rr r It eg ~
"l:O,
F
racer l I
Jl l'l ~
l
dll
eJy
~ ~ t (r lrl'It("%ktc\u'el r ~ I'Ie ~Ie~cre.e'ie ac l"el';QI I I I IIc le
28
I4
Ie 'l
~ ~
,'lg ~
A r''*
e r,*eeI rle Ielle&I49IO p ~ 4ace re I'
a . ~ v Il~ 'I
W
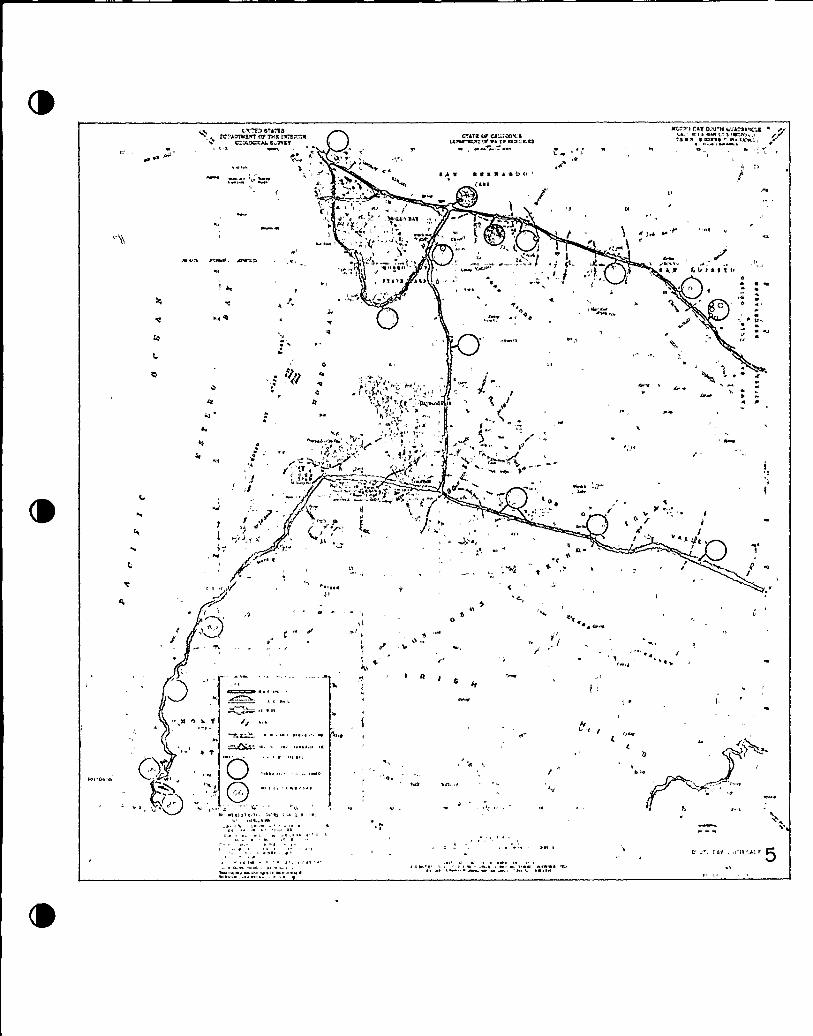
La AS"l SSttf AIKattttIOF TNS tKTF~
at C ~ALS 4364al
Ma jh t
~ ~ra
a E'I,'uQ
alrt tlat
aatata. Eahaa 4 . It, JSI hart tjatt " 3
~ '3 3 3 ~
r/
6, Att EIF CA"Fat tr 4~It%at Utaaa Rataa ~I a I
~ A 4 ~ ~ ~ ta 6 6 33 ttt' 4 4
~1
ET
j~ . 0
64
=krrIj
«I'a
KO- I I:lT OahtrK OUA aaat'AEa'. ' *I a aaa 'Ioa toaat,ttlsa 4 43344 ., O AEKE-'I
I
ir
p
~ 6 tt Tr'lr I 6 I I tt
I'I~ 'I
o
44
Eal
6
4 aa4
a.I
I'
a
~ 46
a
tl
At4 a Ij'3 II
3
'* ~aaaIa
6 r a
'I
3, tt
II~ I
aa~a~
/E'*
4 R g
AF6 E
3aat ao, I
»I t.tata I 'lt
= ~
I a w o«= ~
6 '. r a-r . „Oral F 51
E-
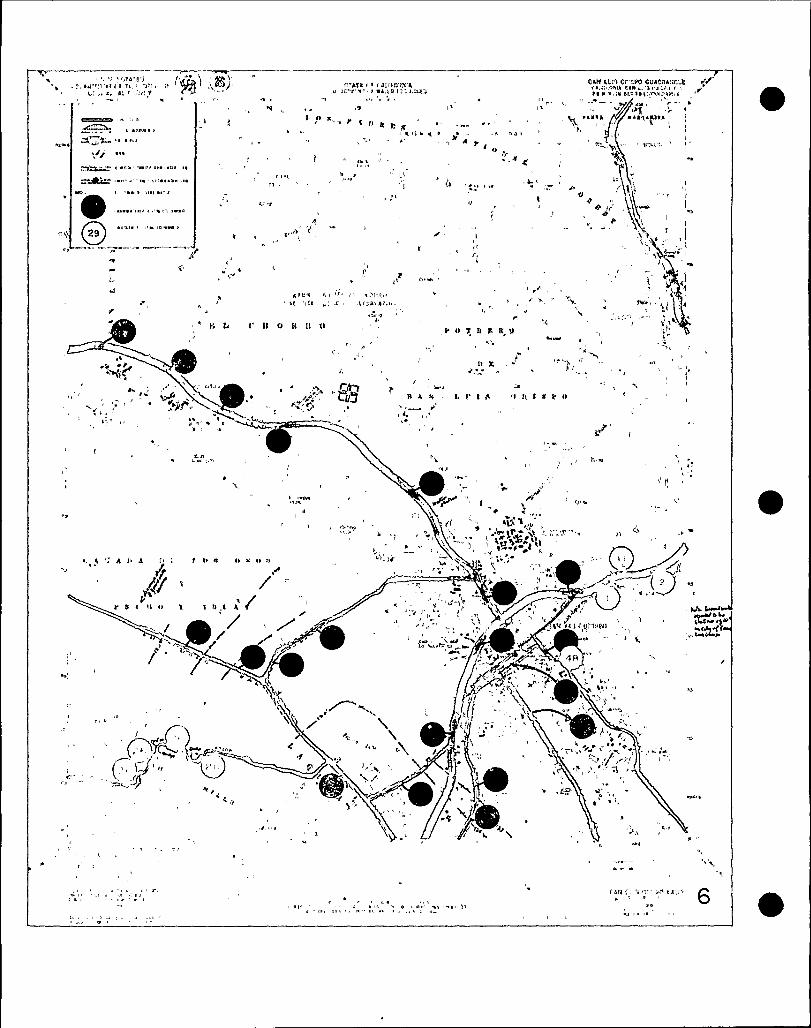
E, 1,' 'If V
I~ *IE» I
IVg'
~ EE'»'' II~ (*I I ~
~ 'I I I ~ I III . ~
O DI'I( '%0 I ~ ICB 9
f:"Atf(C I,V' II(1" I
JB
I CI
(D ~,
I
I kf 'IViltll~ BHI V I I
ffIf, I(
JI
V ACI
(,S
BB»tB »EBIHJ)SBB
I
*
CHIC Hft(11 1 BCS CdB SB (
I' ll I !(I IIS III;.IV(E.EIV»t
VD B
Hf4.» I I 'r '' (D!IllIf. 'I'fit V,'1 I tr(B( ~ I I
I"(" lI C) 14 I'B B'l J A 5 R tt
'C
E.
"l
J(
( I
11
il XIV I'
v
~ ~
1 '. »
SS
CCD I(»
m ~
L l' C CS ff l (f t'I
I IS I A SI b !! I V II Cl Ii SI II
S'S 1 ff II X I SS B CS f
'IJD
I(
ET-II
(
t~»4 44 <e4 ~'tlff
Df ~
.IB -( i
C IIJ I
r '*" ". I » .IBIS S SV Ctl'IEV(S
DI »I Bvt I
~I ~
C
r- ID
Qf
J( '(
4I '
/
V
I afc f! 'I II! 4;VB(aglt
I (1 »» I
e
J„
II
'k
1
)l
I
I
II
("I'
(io','
II
f
A
A
oo0 eo0 0 ~
0 ~
0
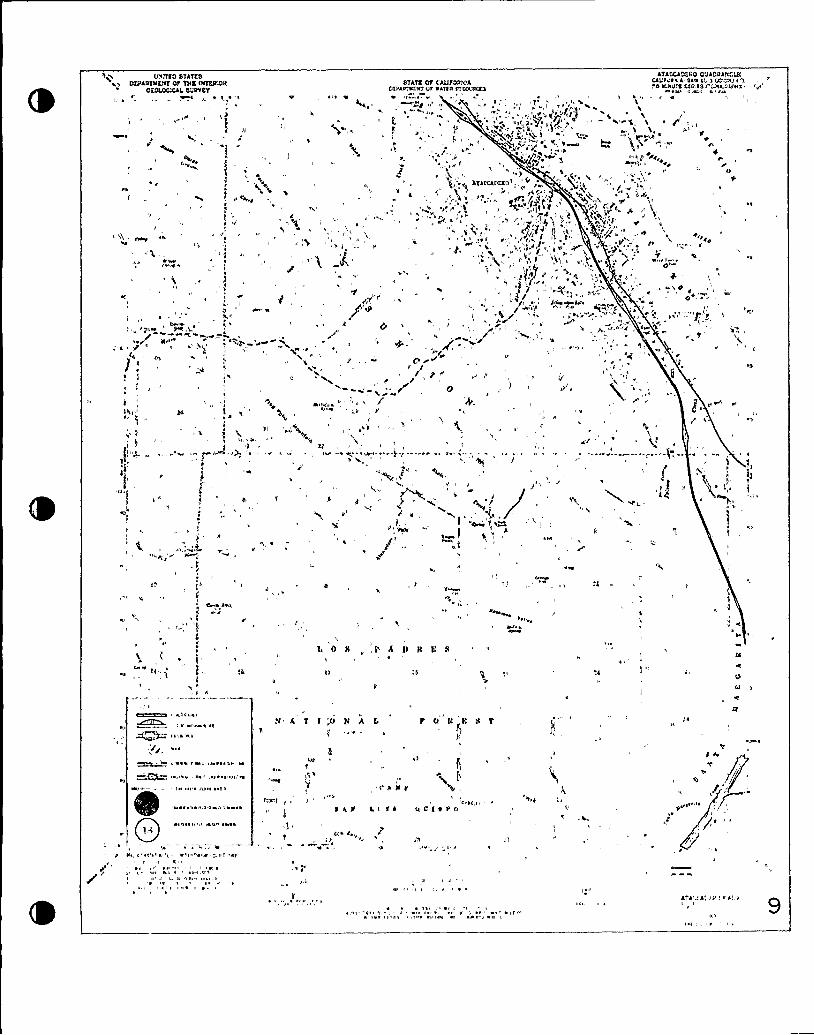
e IAAf~
n
CC *~I
TC I
IINITTO 8TATK8 ATAFOAOAPO O'JACAAIC Lg
A,y DTPAOTIIXICTOf THE CNTnCAIN STATC Of CAUTOANlA CAUCJCC C-CCN Cl 3 CC:" I!COOXOIOOXAL8!!ACCT oceceNIANT ctc ececa scwvctc33 AA ICltl!38 CCC 33 ('TLCILA(3
I'e ~ C \ ~ I
tf)
~CC
( ~ ~, (e ~ e't~ rg
~ A
!
r lrtC
F
I'11
I fp Pe.C. I
I
3
C
'Ce .I ~ t
frit I 11 8
).-- ~
I> 1f't
(I J
"I
13
.,; P1
f t~It( „b 4
Ct C1OACC Cec
/'
I 1, 0 8, P 4 l? T3CC
C e'
II la1 C
33
I
A 1
I'e C
I ~ 'I %
./j ~ C
~ I'
~ e IAI' ~ ~ I re
ee — I I 'C At I ~
1'1 Ac ~ 'IA c 'A1eeec
O AI jt~ A ' IAC'\
tet
8 %,8 fiI
CCC C
'
T T,"„0 N A L'I
TT g 8; !3 T
C CC,(CC 8 g 8 P O
1 I C
I .''J I. I 'C'I~ e
Ct~ —..- ~ te 1 ~ I
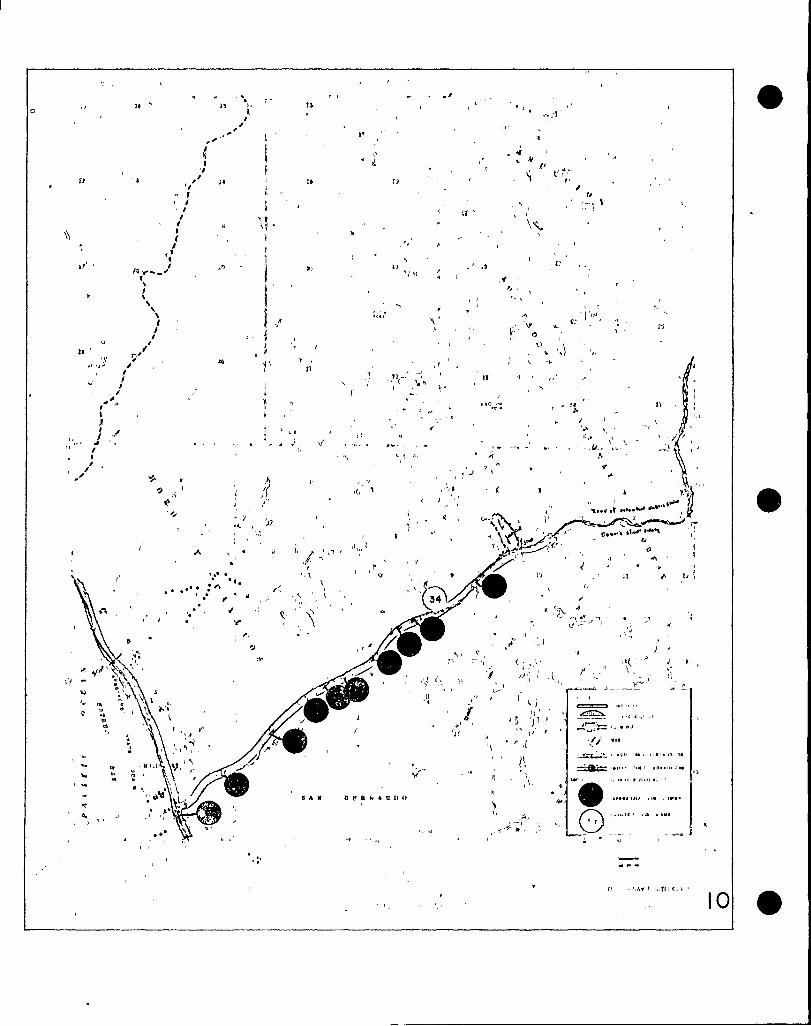
E?
(I ef~fE
I
II/
//
I//
1
I II
I
r
j~
f/II
I'//
/
//I
I1
'I
/I elk
e
ln
El
ll,1
, f
\
~ /
Ej
IE
* 4*1, fkf
Ilrr '
II
FJ
ElV
IIJl
I
/I//
~ t 1
F'I I 1
1
1
rhC le
I
i. l.
1 1/7'l
~ ~
I ~~ ~ ~ Fk
~ e~ ~
'
F-.1
Ql
,k l
f
,"f~
I
e 'J=I, ~
Ir
sr<el ref ~ ~1
1
kk, ~ W e~™
fl
~ 1
'e~
ef I I I lp
1
~ e
.IS * II S fr EI lf fk lt Il if
ll
lk
I
I'/ lFI
I
< j
IEI
1 FI
ff!
\
)II(
'Clif'NJ
er ~
~ f*c e t ler ~ ree
lee =- !i ~ 1"- f ~
I ~ 1 ll e: 1 1
OI1
l.3 ROAD SUMMARYSHEETS OF LANDSLIDEAND LIQUEFACTIONHAZARDS
B-8 I-227 1-17
TERA CORPORATION
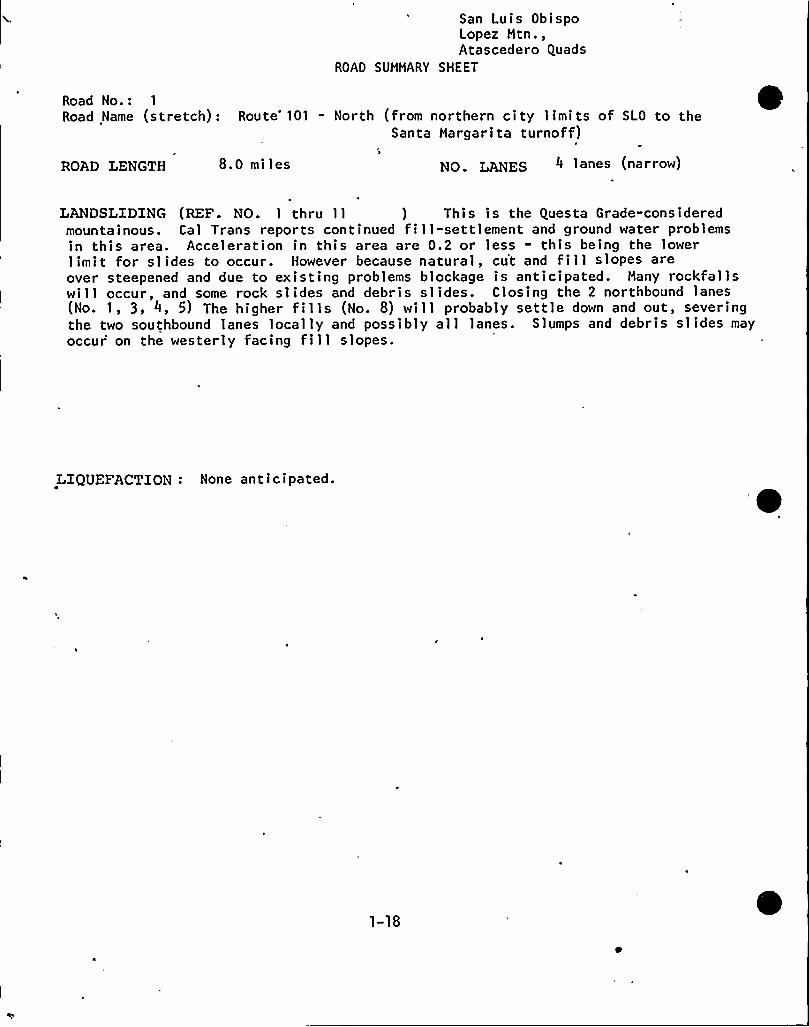
San Luis ObispoLopez Mtn.,Atascedero Quads
ROAD SUMMARY SHEET
ROAD LENGTH
Road No.: 1
Road Name (stretch): Route 101 - North (from northern city limits of SLO to theSanta Margarita turnoff)
8.0 miles NO LANES 4 1 anes (narrow)
LANDSLIDING (REF. NO. 1 thru 11 ) This is the Questa Grade-consideredmountainous. Cal Trans reports continued fill-settlement and ground water problemsin this area. Acceleration in this area are 0.2 or less - this being the lowerlimit for slides to occur. However because natural, cu't and fill slopes areover steepened and due to existing problems blockage is anticipated. Many rockfallswill occur, and some rock slides and debris slides. Closing the 2 northbound lanes(No 1, 3, 4, 5) The higher fills (No. 8) will probably settle down and out, severingthe two southbound lanes locally and possibly all lanes. Slumps and debris slides mayoccur on the westerly facing fill slopes.
LIQUEFACTION: None anticipated.
1-18
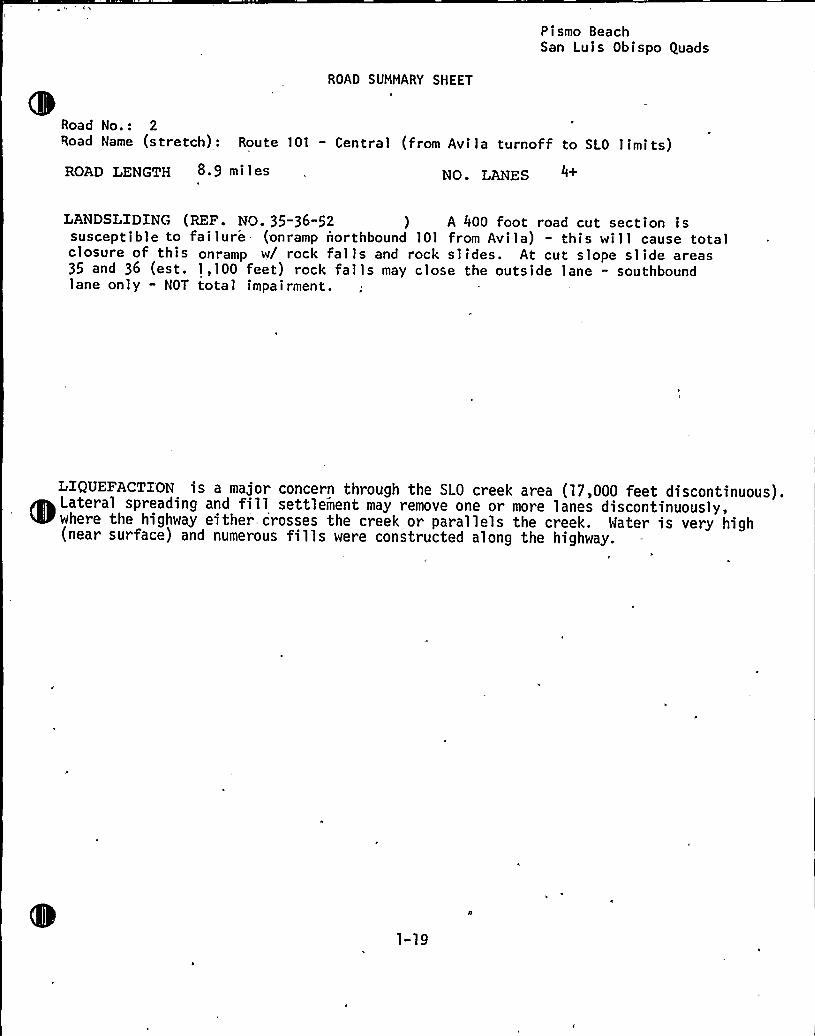
Pismo BeachSan Luis Obispo Quads
ROAD SUMMARY SHEET
Road No.: 2Road Name (stretch): Route 101 - Central (from Avila turnoff to SLO limits)ROAD LENGTH 8. 9 mi 1 es NO. LANES 4+
LANDSLIDING (REF. NO.35-36-52 ) A 400 foot road cut section issusceptible to failure (onramp northbound 101 from Avila) " this will cause totalclosure of this onlamp w/ rock falls and rock slides. At cut slope slide areas35 and 36 (est. 1,100 feet) rock falls may close the outside lane - southboundlane only - NOT total impairment.
LIQUEFACTION is a major concern through the SLO creek area (17,000 feet discontinuous).Lateral spreading and fill settlement may remove one or more lanes discontinuously,where the highway either, crosses the creek or parallels the creek. Water is very high(near surface) and numerous fills were constructed along the highway.
1-19
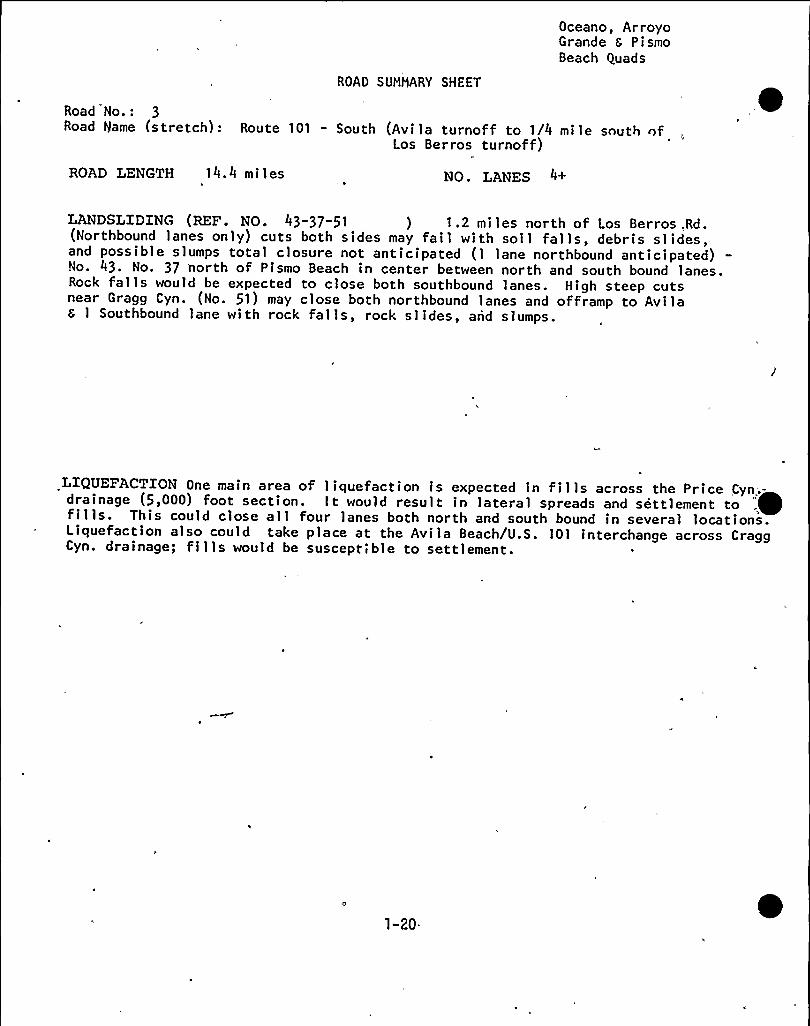
ROAD SUMMARY SHEET
Oceano, ArroyoGrande 6 PismoBeach Quads
Road No.: 3Road Name (stretch):
ROAD LENGTH 14.4 mi les
Route 101 - South (Avi la turnoff to 1/4 mile south nfLos Berros turnoff)
NO. LANES 4+
LANDSLIDING (REF. NO. 43"37-51 ) 1 a2 mi les north of Los Berros .Rd.(Northbound lanes only) cuts both sides may fail with soil falls, debris slides,=and possible slumps total closure not anticipated (1 lane northbound anticipated)No. 43. No. 37 north of Pismo Beach in center between north and south bound lanes.Rock falls would be expected to close both southbound lanes. High steep cutsnear Gragg Cyn. (No. 51) may close both northbound lanes and offramp to Avila
1 Southbound lane with rock falls, rock slides, and slumps.
LIQUEFACTION One main area of 1 iquefaction is expected in fills across the Price Cyn;-drainage (5,000) foot section. It would result in lateral spreads and settlement to .fills. This could close all four lanes both north and south bound in several locations.Liquefaction also could take place at the Avila Beach/U.S. 101 interchange across CraggCyn. drainage; fills would be susceptible to settlement. e
1-20.
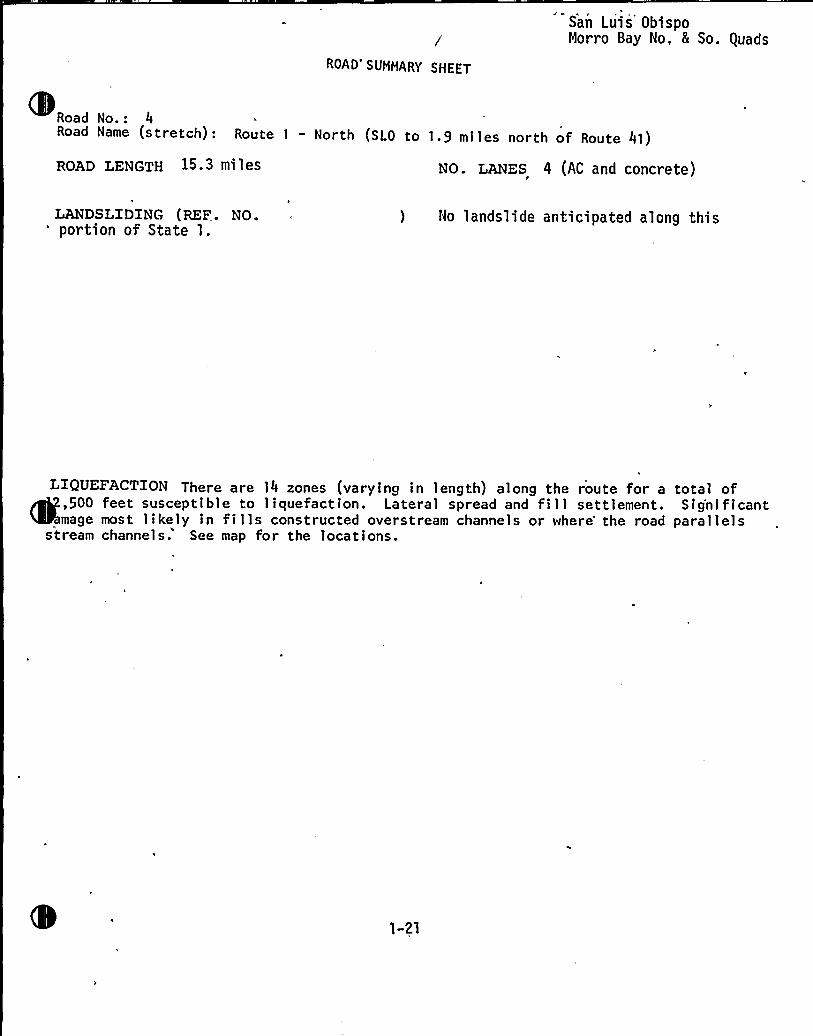
ROAD'UMMARY SHEET
San Luis ObispoMorro Bay No, 8 So. quads
Road No.: 4Road Name (stretch): Route 1
- North (SLO to 1.9 mi1es north of Route 41)
ROAD LENGTH NO. LANES 4 (AC and concrete)
LANDSLIDING (REF.. NO.'ortion of State l. ) No 1 ands 1 ide anticipated along thi s
L>QUEFA<T>ON There are 14 zones (varying in length) along the route for a total of,500 feet susceptible to liquefaction. Lateral spread and fill settlement. Sig'nificantmage most likely in fills constructed overstream channels or where the road parallels
stream channels. See map for the locations.
1-21
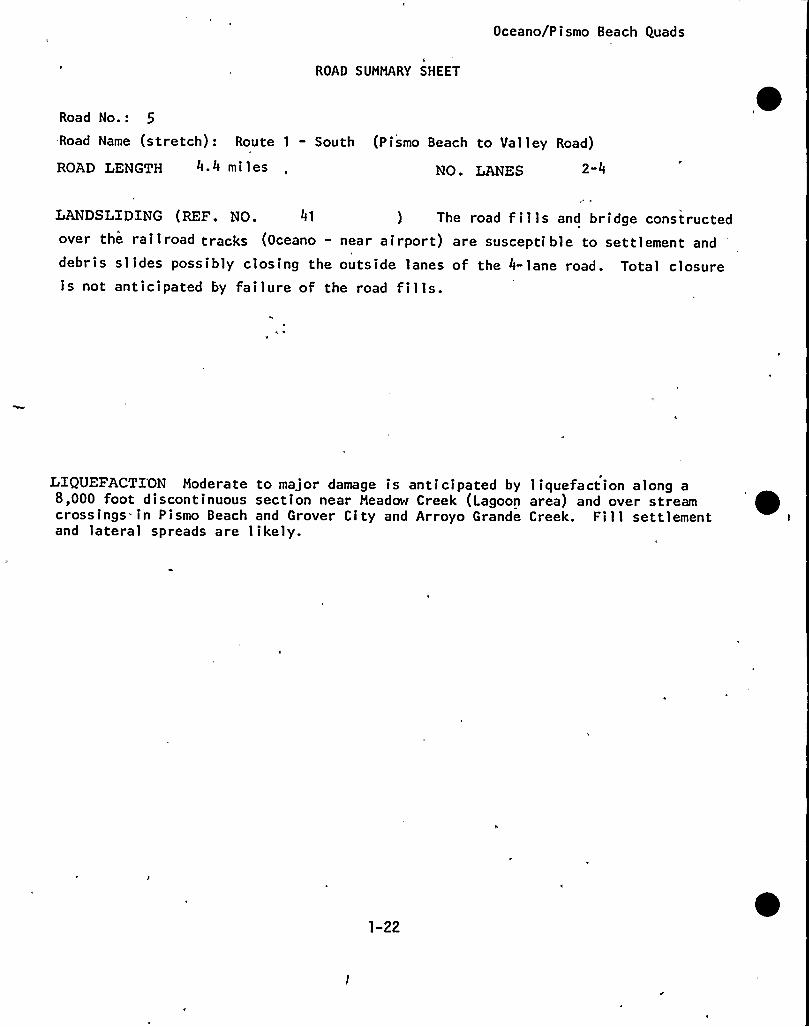
Oceano/Pismo Beach Quads
ROAD SUMMARy SHEET
Road No.: 5
-Road Name (stretch): Route 1- South (Pismo Beach to Valley Road)
ROAD LENGTH 4.4 mi les 2-4NO. LANES
LANDSLIDING (REF. NO. 41 ) The road f ills and bridge constructedover the railroad tracks (Oceano - near airport) are suscepti ble to settlement and
debris slides possibly closing the outside lanes of the 4- lane road. Total closureis not anticipated by failure of the road fills.
LIQUEFACTI'ON Moderate to major damage is anticipated by liquefaction along a8,000 foot discontinuous section near Meadow Creek (Lagoon area) and over streamcrossings in Pismo Beach and Grover City and Arroyo Grande Creek. Fill settlementand lateral spreads are likely.
~,
1-22
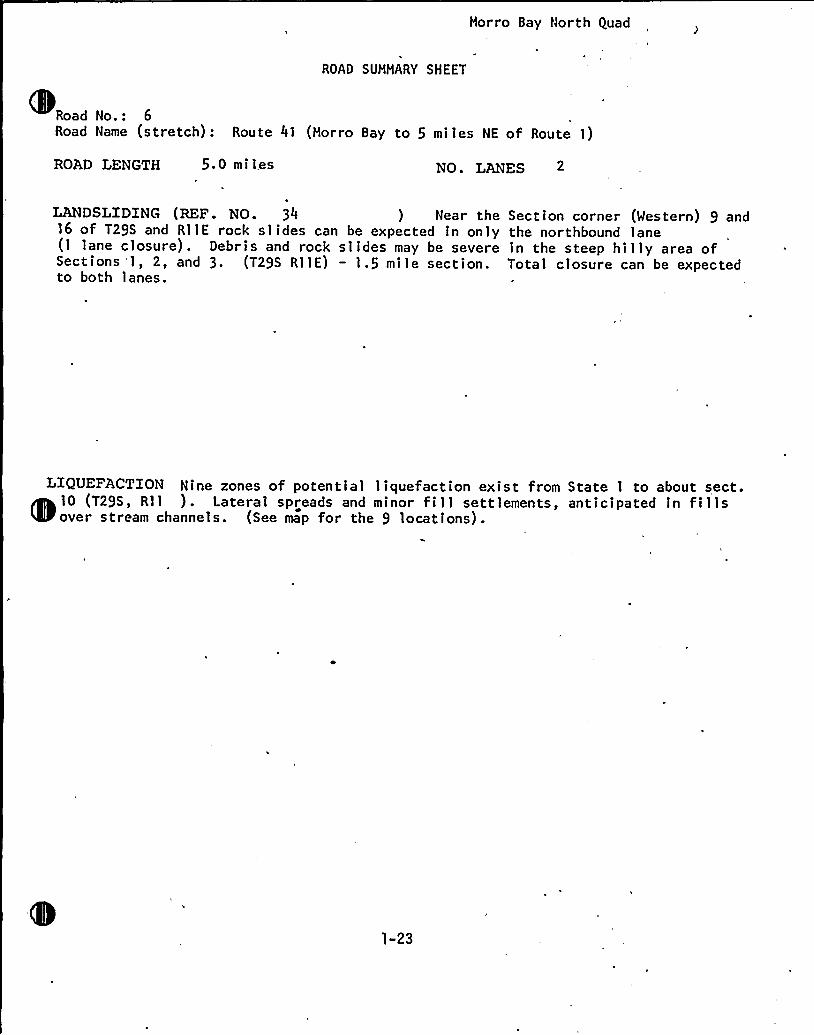
Morro Bay North Quad
ROAD SUMMARY SHEET
Road No.: 6.Road Name (stretch): Route 41 (Morro Bay to 5 miles NE of Route 1)
ROAD LENGTH 5.0 mi les NO. LANES
LANDSLIDING (REF. NO. 34 ) Near the16 of T29S and RllE rock slides can be expected in only(1 lane closure). Debris and rock slides may be severeSections 1, 2, and 3. (T29S RllE) — 1.5 mile section.to both lanes.
Section corner (Western) 9 andthe northbound lanein the steep hilly area ofTotal closure can be expected
LIQUEFACTION Nine zones of potential liquefaction exist from State 1 to about sect.10 (T29S, Rll ). Lateral spreads and minor fill settlements, anticipated in fillsover stream channels. (See map for the 9 locations).
1-23
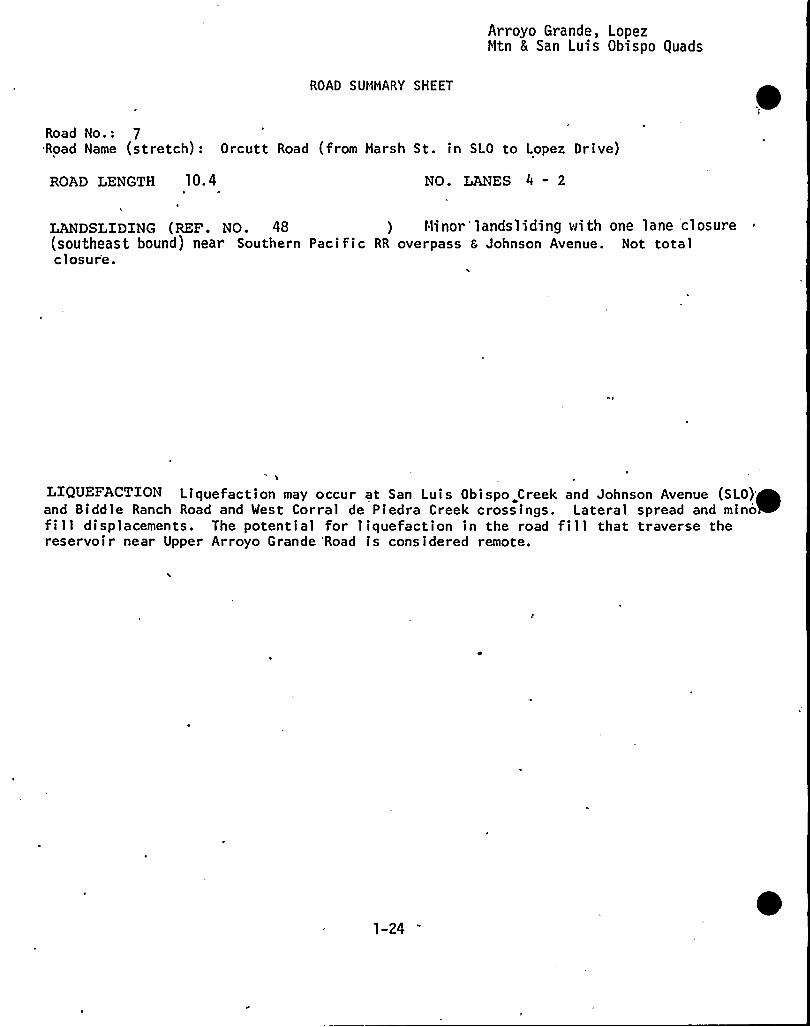
Arroyo Grande, LopezNtn 8 San Luis Obispo quads
ROAD SUMMARY SHEET
Road No.: 7Road Name (stretch): Orcutt Road (from Marsh St. in SLO to Lopez Drive)
ROAD LENGTH 10.4 NO. LANES 4 - 2
LANDSLIDING (REF. NO. 48 ) t1inor'landsliding With one lane closure(southeast bound) near Southern Pacific RR overpass 6 Johnson Avenue. Not totalclosur'e.
L>QUEFACTXON Liquefaction may occur at San Luis Obispo Creek and Johnson Avenue (SLO)'~and Biddle Ranch Road and West Corral de Piedra Creek crossings. Lateral spread and mino~fill displacements. The potential for liquefaction in the road fill that traverse thereservoir near Upper Arroyo Grande 'Road is considered remote.
1-24
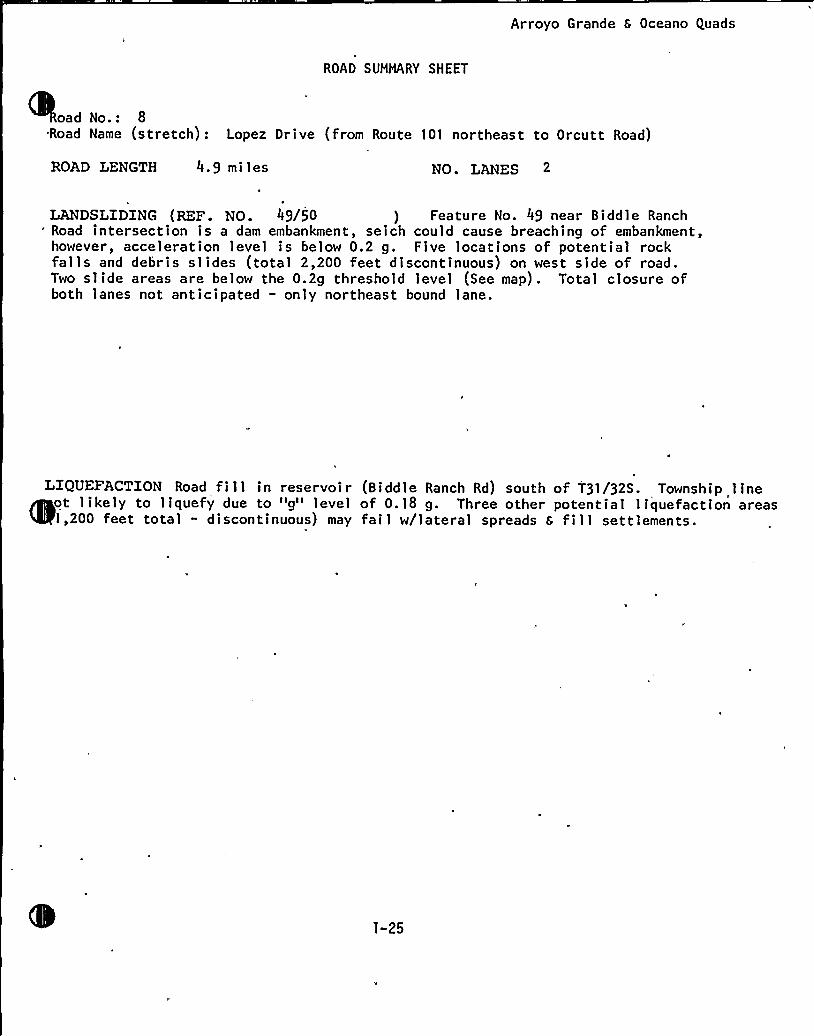
Arroyo Grande 8 Oceano Quads
ROAD SUMMARY SHEET
oad No.: 8Road Name (stretch): Lopez Drive (from Route 101 northeast to Orcutt Road)
ROAD LENGTH 4.9 mi les NO. LANES 2
LANDSLIDING (REF. NO. 49/50 ) Feature No. 49 near Biddle Ranch'oad intersection is a dam embankment, seich could cause breaching of embankment,
however, acceleration level is below 0.2 g. Five locations of potential rockfalls and debris slides (total 2,200 feet discontinuous) on west side of road.Two slide areas are below the 0.2g threshold level (See map). Total closure ofboth lanes not anticipated - only northeast bound lane.
LIQUEFACTION Road fill in reservoir (Biddle Ranch Rd) south of 731/32S. Township lineot likely to liquefy due to "g" level of 0.18 g. Three other potential liquefaction areas1,200 feet total " discontinuous) may fail w/lateral spreads 6 fill settlements.
1-25
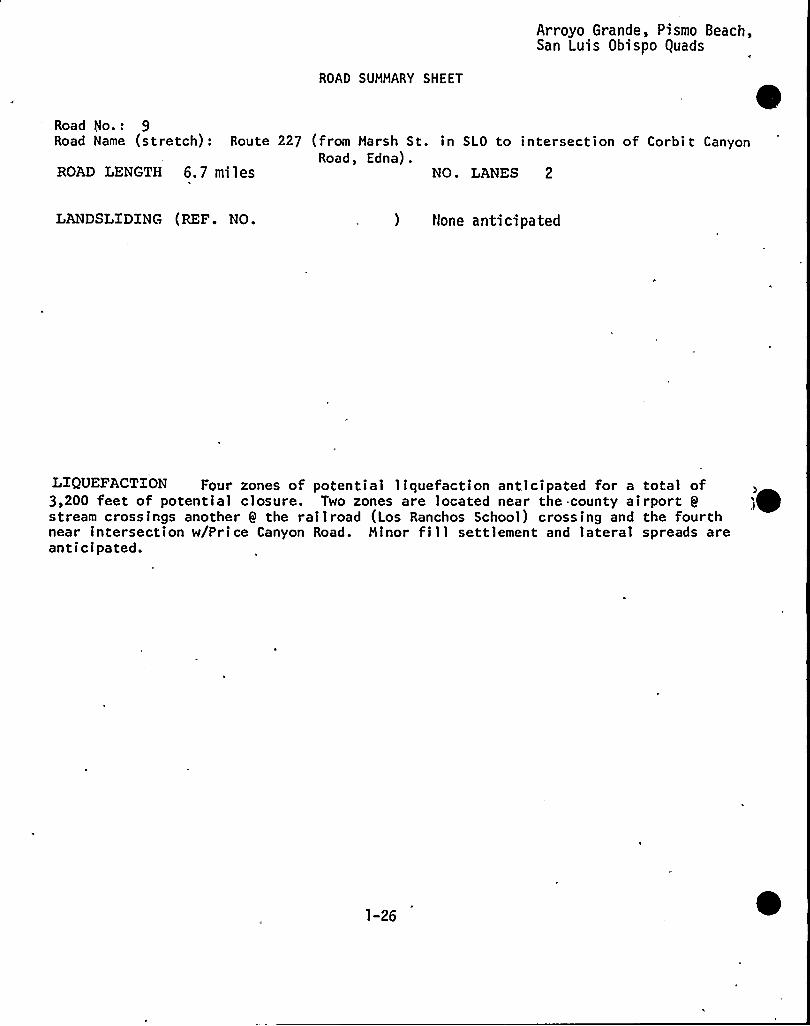
Arroyo Grande, Pismo Beach,San Luis Obispo quads
RQAD sUMMARy sHEET
Road No.: 9Road Name (stretch): Route 227 (from Marsh St. in SLO to intersection of Corbit Canyon
Road, Edna).ROAD LENGTH 6.7 miles NO. LANES 2
LANDSLIDING (REF. NO. ) t/one anticipated
LIQUEFACTION Four zones of potential liquefaction anticipated for a total of3,200 feet of potential closure. Two zones are located near the county airport Q
stream crossings another 9 the railroad (Los Ranchos School) crossing and the fourthnear intersection w/Price Canyon Road. Minor fill settlement and lateral spreads areanticipated.
1-26
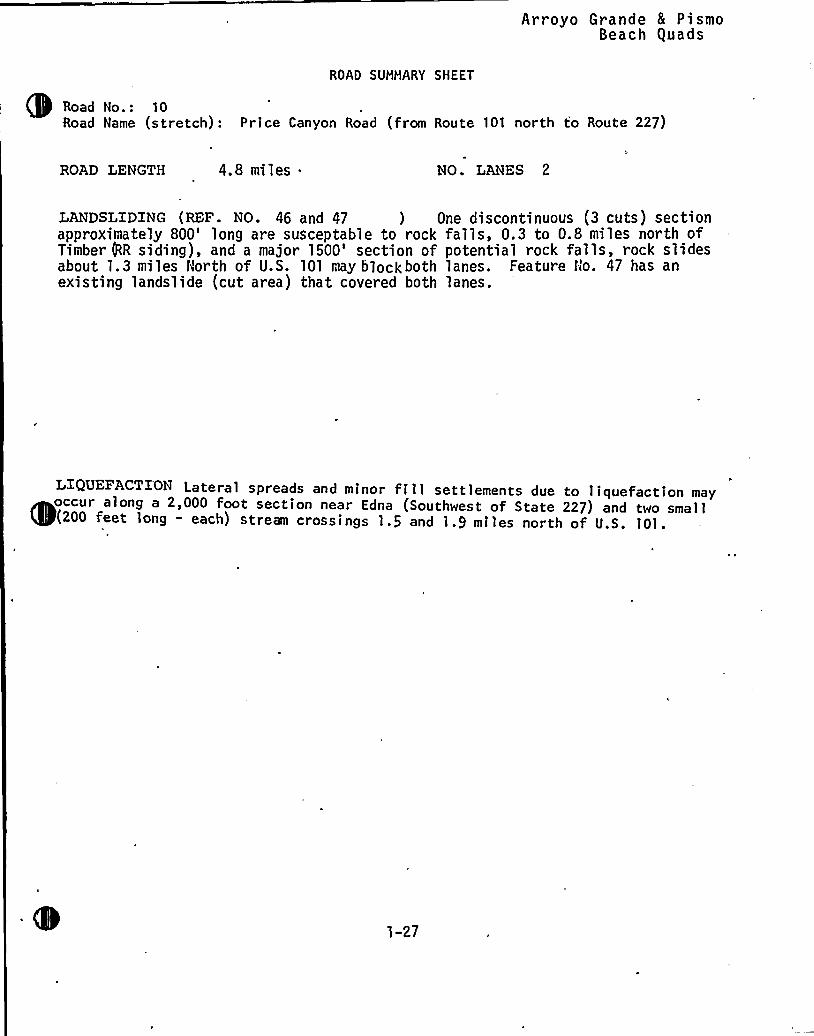
Arroyo Grande 8 Pi smoBeach Quads
ROAD SUMMARY SHEET
Road No.: 10Road Name (stretch): Price Canyon Road (from Route 101 north to Route 227)
ROAD LENGTH 4.8 miles NO. LANES 2
LANDSLIDING (REF. NO. 46 and 47 ) One discontinuous (3 cuts) sectionapproximately 800'ong are susceptable to rock falls, 0.3 to 0.8 miles north ofTimber (RR siding), and a major 1500'ection of potential rock falls, rock slidesabout 1.3 miles fiorth of U.S. 101 may blockboth lanes. Feature flo. 47 has anexisting landslide (cut area) that covered both lanes.
LIQUEFACTI'ON Lateral spreads and minor fill settlements due to liquefaction may~ e
occur along a 2,000 foot section near Edna (Southwest of State 227) and two small(200 feet long - each) stream crossings 1.5 and 1.9 miles north of U.S. 101.
1-27
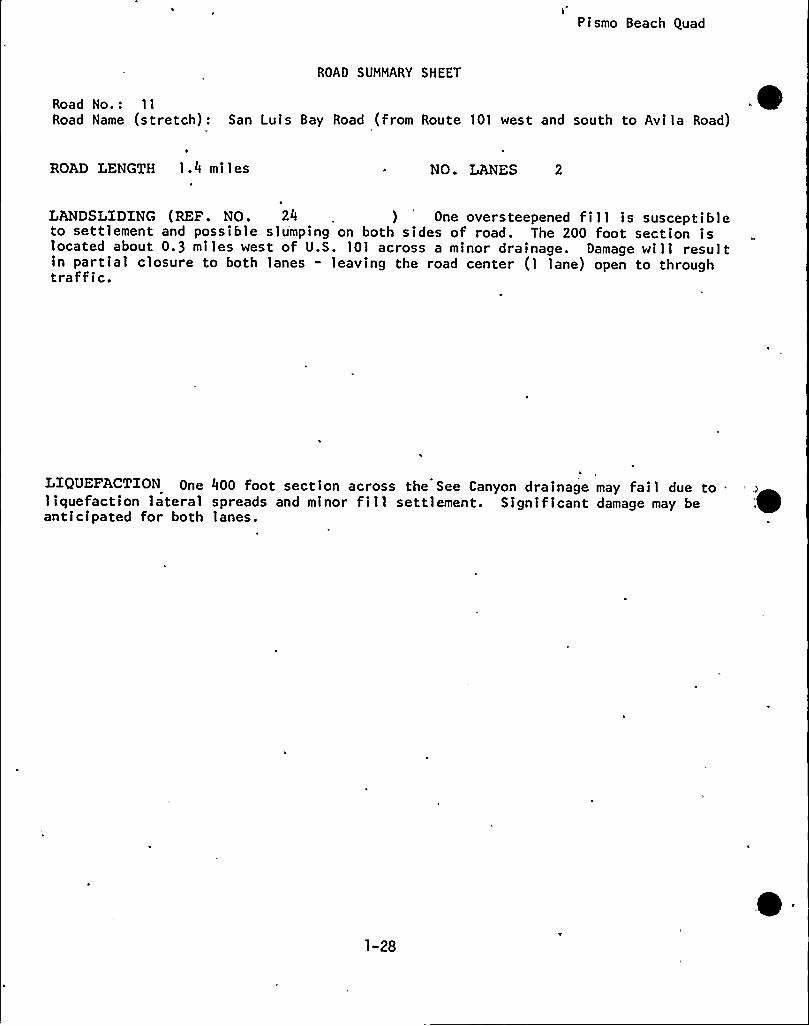
Pismo Beach Quad
ROAD SUMMARY SHEET
Road No.: 11
Road Name (stretch): San Luis Bay Road (from Route 101 west and south to Avi la Road)
ROAD LENGTH 1.4 mi les NO. LANES 2
LANDSLIDING (REF. NO. 24 ) One oversteepened fill is susceptibleto settlement and possible slumping on both sides of road. The 200 foot section islocated about 0.3 miles west of U.S. 101 across a minor drainage. Damage will resultin partial closure to both lanes - leaving the road center (1 lane) open to throughtraffic.
LIQUEFACTION One 400 foot section across the*See Canyon drainage may.fail due to .
liquefaction lateral spreads and minor fill settlement. Significant damage may beanticipated for both lanes.
'0
1-28
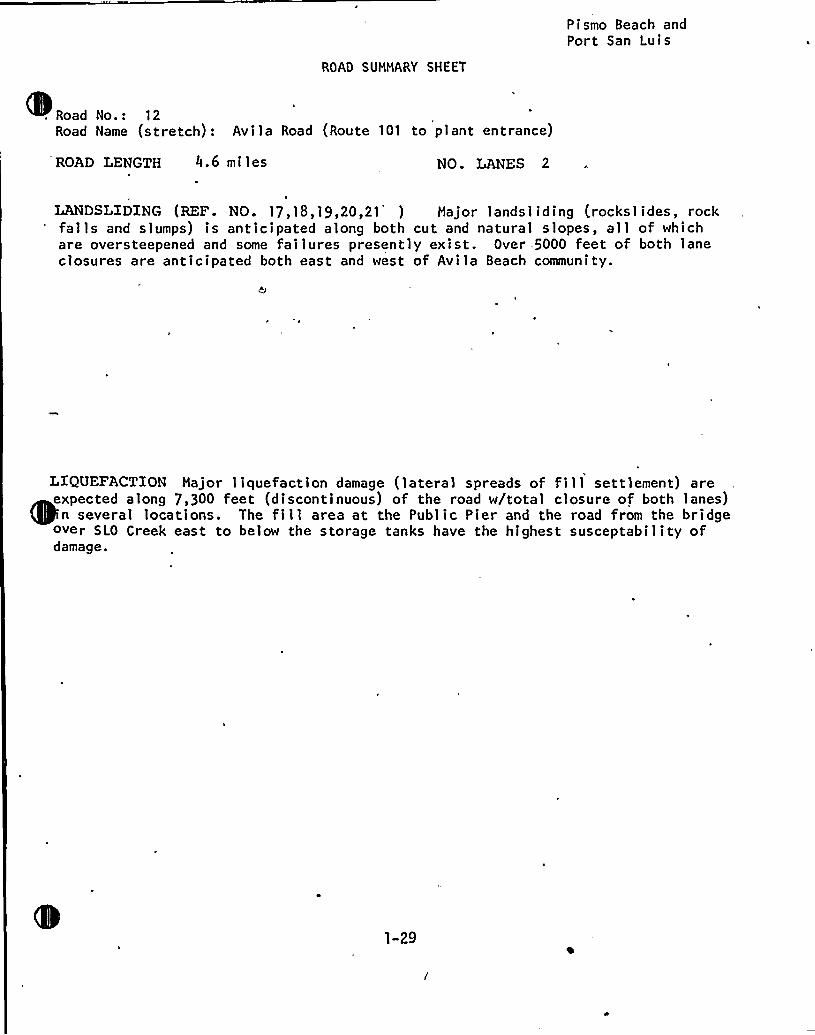
ROAD SUMMARY SHEET
Pismo Beach andPort San Luis
. Road No.: 12Road Name (stretch): Avila Road (Route 101
ROAD LENGTH 4.6 mi les
to plant entrance)
NO. LANES 2
LANDSLIDING (REF. NO. 17,18,19,20,21 ) Major landsl iding (rocksl ides, rockfalls and slumps) is anticipated along both cut and natural slopes, all of whichare oversteepened and some failures presently exist. Over 5000 feet of both laneclosures are anticipated both east and west of Avila Beach community.
LIQUEFACTION Major liquefaction damage (lateral spreads of fill settlement) areexpected along 7,300 feet (discontinuous) of the road w/total closure of both lanes)
n several locations. The fill area at the Public Pier and the road from the bridgeover SLO Creek east to below the storage tanks have the highest susceptability ofdamage.
1-29
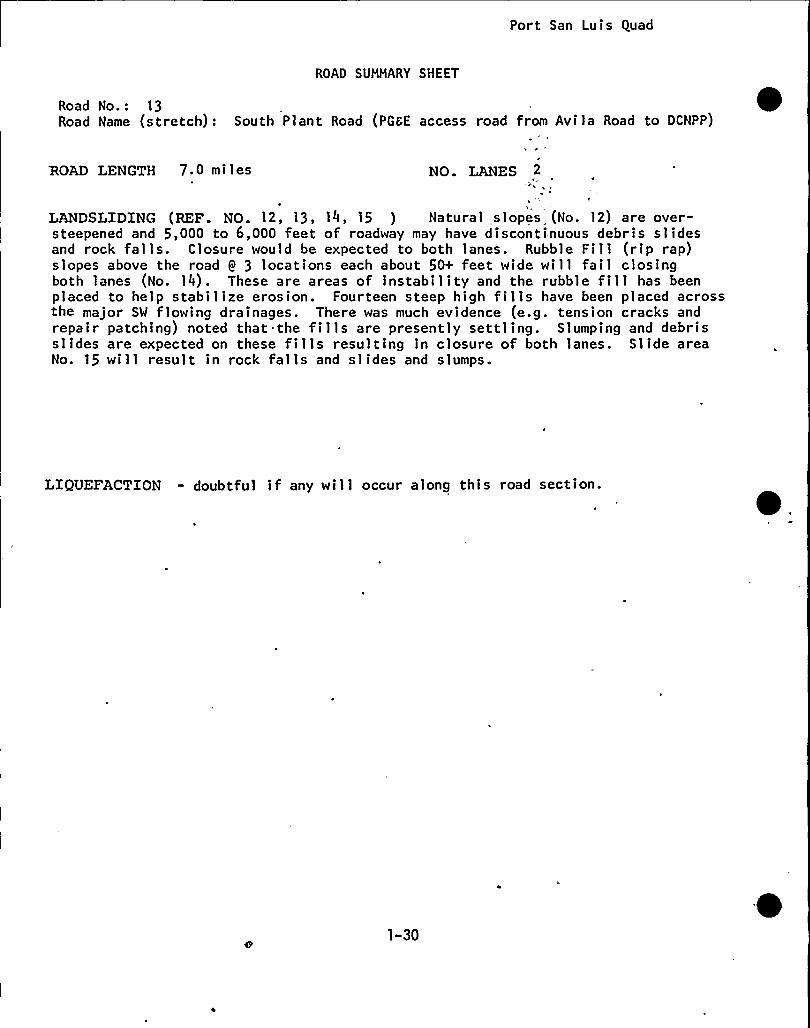
Port San Luis Quad
ROAD SUMMARY SHEET
Road No.: 13Road Name (stretch): South Plant Road (PG6E access road from Avila Road to DCNPP)
ROAD LENGTH 7.0 mi les NO. LANES 2
LANDSLIDING (REF. NO. 12, 13, 14, 15 ) Natural slopes (No. 12) are over-steepened and 5,000 to 6,000 feet of roadway may have disconti,nuous debris slidesand rock falls. Closure would be expected to both lanes. Rubble Fill (rip rap)slopes above the road Q 3 locations each about 50+ feet wide will fail closingboth lanes (No. 14). These are areas of instability and the rubble fill has beenplaced to help stabilize erosion. Fourteen steep high fills have been placed acrossthe major SW flowing drainages. There was much evidence (e.g. tension cracks andrepair patching) noted that the fills are presently settling. Slumping and debrisslides are expected on these fills resulting in closure of both lanes. Slide areaNo. 15 will result in rock falls and slides and slumps.
LIQUEFACTION - doubtful if any will occur along this road section.
1-30
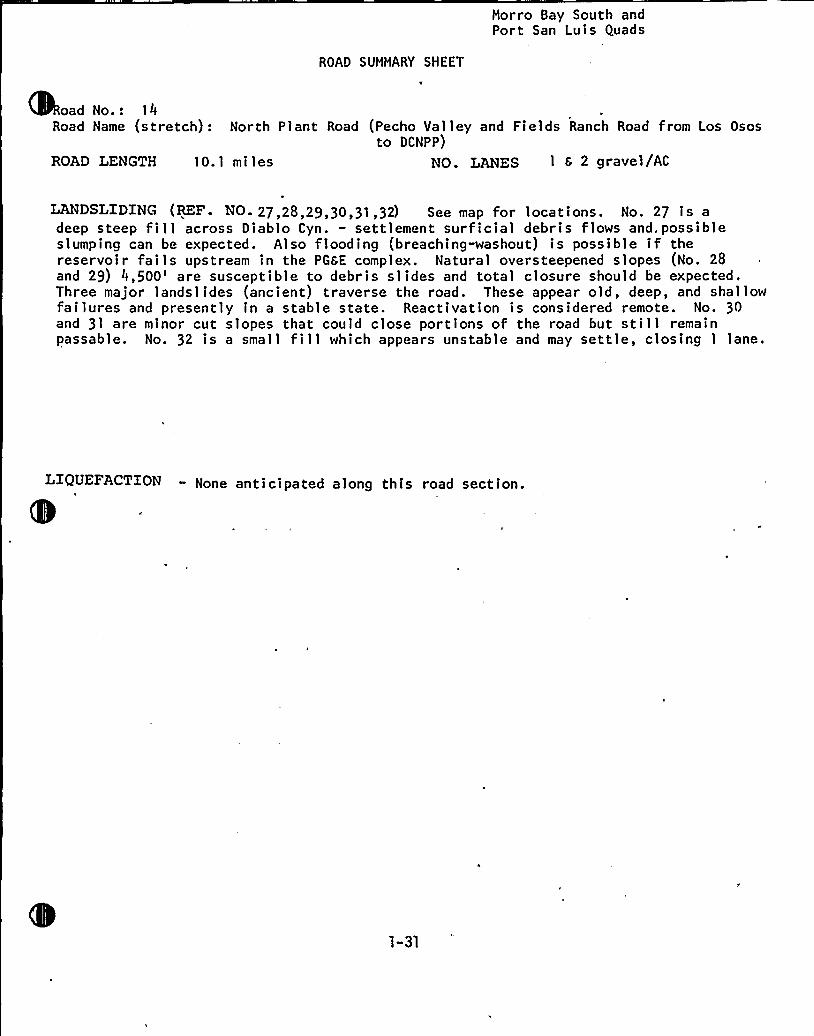
Morro Bay South andPort San Luis Quads
ROAD SUMMARy SHEET
oad No.: 14Road Name (stretch): North Plant Road (Pecho Valley and Fields Ranch Road from Los Osos
to DCNPP)
ROAD LENGTH 10.1 mi les NO. LANES 1 s 2 gravel/AC
LANDSLIDING (REF. NO. 27,28,29,30,31,32) See map for locations. No. 27 is adeep steep fill across Diablo Cyn. - settlement surficial debris flows and,possibleslumping can be expected. Also flooding (breaching-washout) is possible if thereservoir fails upstream in the PG8E complex. Natural oversteepened slopes (No. 28and 29) 4,500're susceptible to debris slides and total closure should be expected.Three major landsl ides (ancient) traverse the road. These appear old, deep, and shallowfailures and presently in a stable state. Reactivation is considered remote. No. 30and 31 are minor cut slopes that could close portions of the road but still remainpassable. No. 32 is a small fill which appears unstable and may settle, closing 1 lane.
" None anticipated along this road section.
1-31
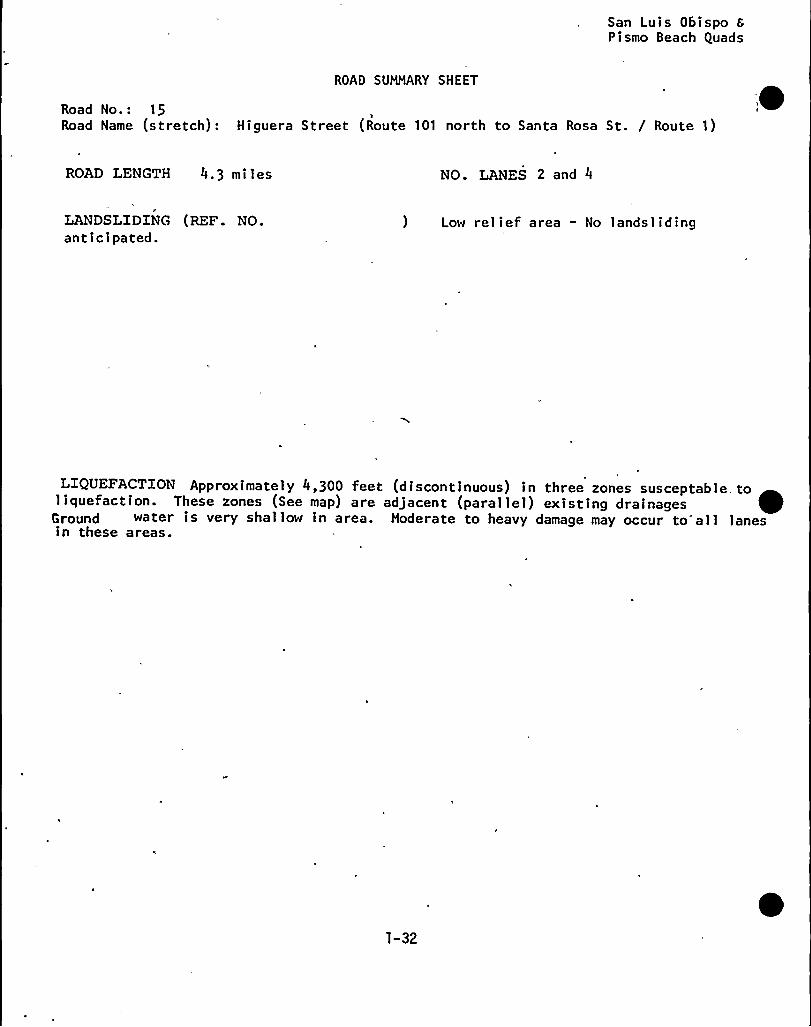
San Luis Obispo 6Pismo Beach Quads
ROAD SUMMARY SHEET
Road No.: 15Road Name (stretch): Higuera Street (Route 101 north to Santa Rosa St. / Route 1)
.~
ROAD LENGTH 4m 3 mi les NO. LANES 2 and 4
LANDSLIDING (REF. NO.anticipated.
) Low relief area - No landsliding
LIQUEFACTION Approximately 4,300 feet (discontinuous) in three zones susceptable. toiiquefaction. These zones (See map) are adjacent (paraiiei) existing drainages '
water is very shallow in area. Moderate to heavy damage may occur to'all lanesin these areas.
1-32
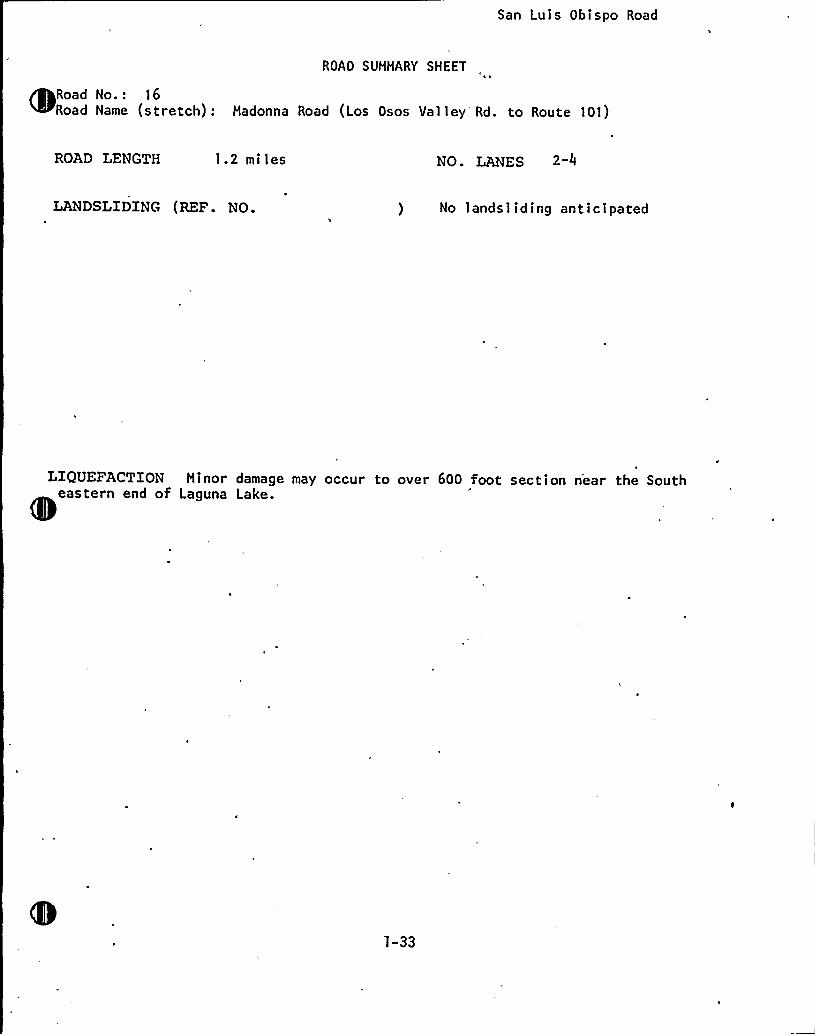
San Luis Obispo Road
ROAD SUMMARy SHEET
Road No.: 16Road Name (stretch): Madonna Road (Los Osos Valley Rd. to Route 101)
ROAD LENGTH 1.2 miles NO. LANES 2 "4
LANDSLIDING (REF. NO. ) No landsliding anticipated
LIQUEFACTION Minor damage may occur to over 600 foot section n'ear the Southeastern end of Laguna Lake.
1-33
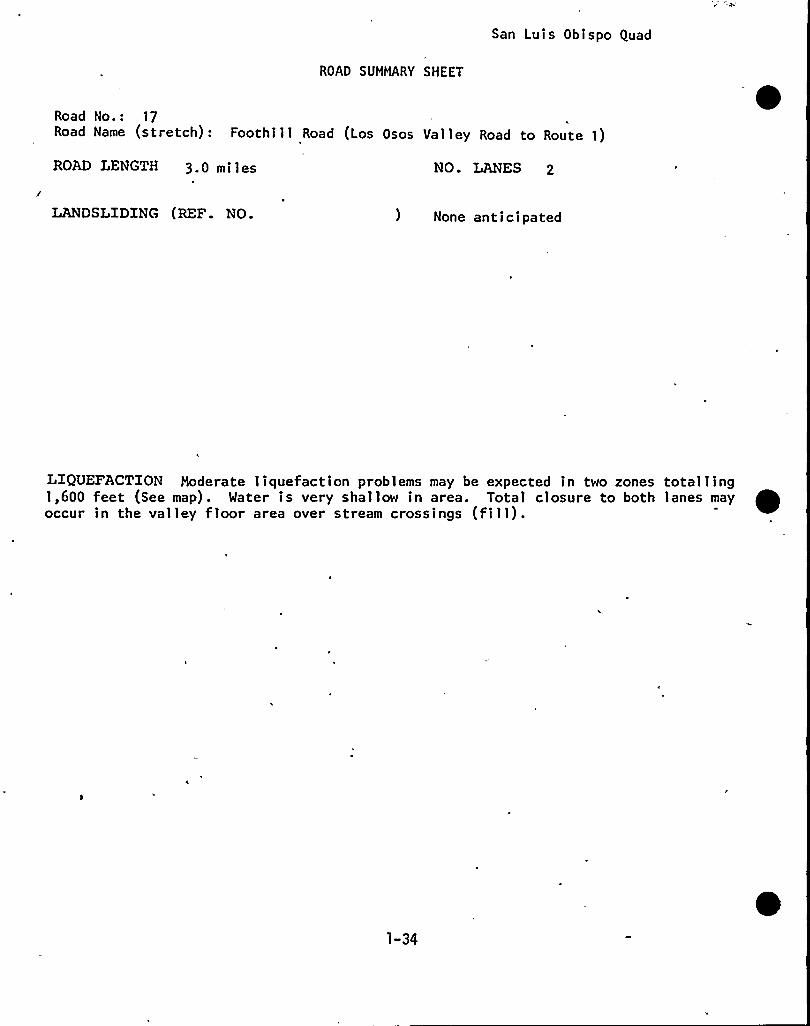
San Luis Obispo Quad
ROAD SUMMARY SHEET
Road No.: 17Road Name (stretch): Foothill Road (Los Osos Valley Road to Route 1)
ROAD LENGTH 3.0 miles NO. LANES 2
LANDSLIDING (REF. NO. ) None anticipated
LIQUEFACTION Moderate liquefaction problems may be expected in two zones total ling1,600 feet (See map). Water is very shallow in area. Totai ciosure to both lanes may ~occur in the valley floor area over stream crossings (fill).
1-34
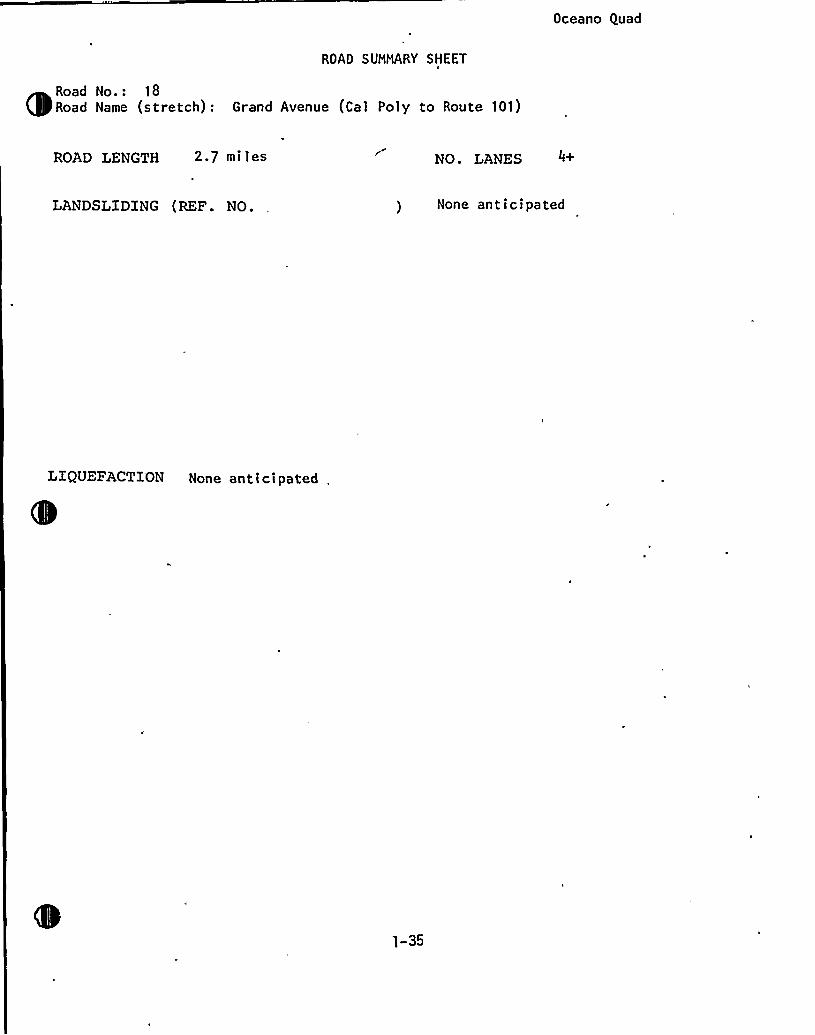
Oceano Quad
ROAD SUHHARY SHEET
Road No.: 18Road Name (stretch): Grand Avenue (Cal Poly to Route 101)
ROAD LENGTH 2.7 miles NO. LANES 4+
LANDSLIDZNG (REF. NO. ) None anticipated
L1QUEFACTI'ON None anti ci pated
1-35
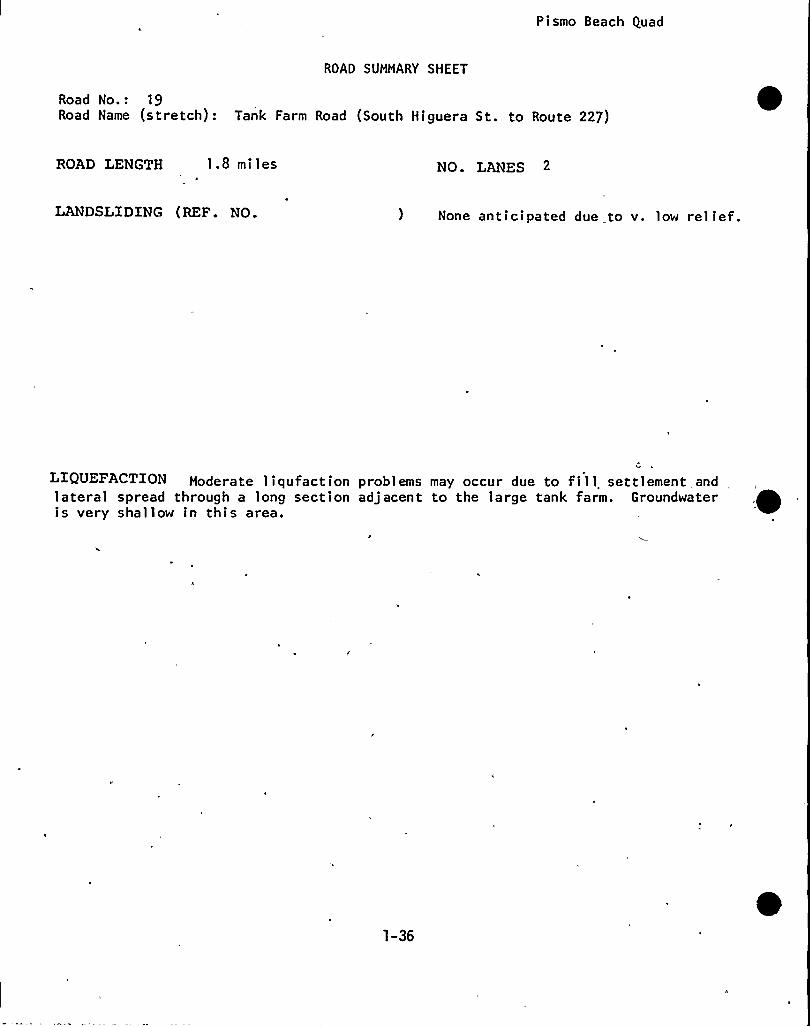
Pismo Beach Quad
ROAD SUMMARy SHEET
Road No.: 19Road Name (stretch): Tank Farm Road (South Higuera St. to Route 227)
ROAD LENGTH 1.8 miles NO. LANES
LANDSLIDENG (REF. NO. ) None anticipated due to v. low relief.
Moderate 1iqufaction problems may occur due to fill settlement andlateral spread through a long section adjacent to the large tank farm. Groundwateris very shallow in this area.
1-36
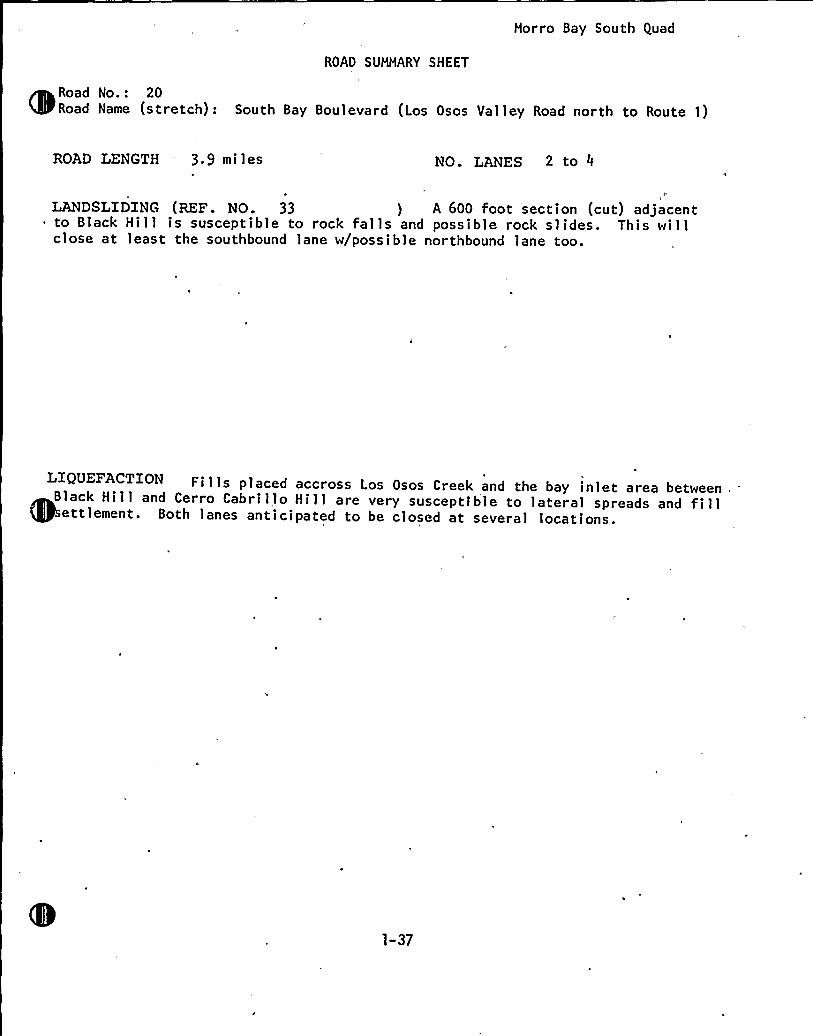
Morro Bay South Quad
ROAD SUMMARY SHEET
Road No.: 20Road Name (stretch): South Bay Boulevard (Los Osos Valley Road north to Route 1)
ROAD LENGTH 3.9 mi les NO. LANES 2 to 4
LANDSLIDING ( REF . NO. 33 ) A 600 foot section (cut) adjacent~ to Black Hill is susceptible to rock falls and possible rock slides. This will
close at least the southbound lane w/possible northbound lane too.
OU CTION F> 1 ls placed accross Los Osos Creek and the bay inlet area between,Black Hill and Cerro Cabrillo Hill are very susceptible to lateral spreads and fillettlement. Both lanes anticipated to be closed at several locations.
1-37
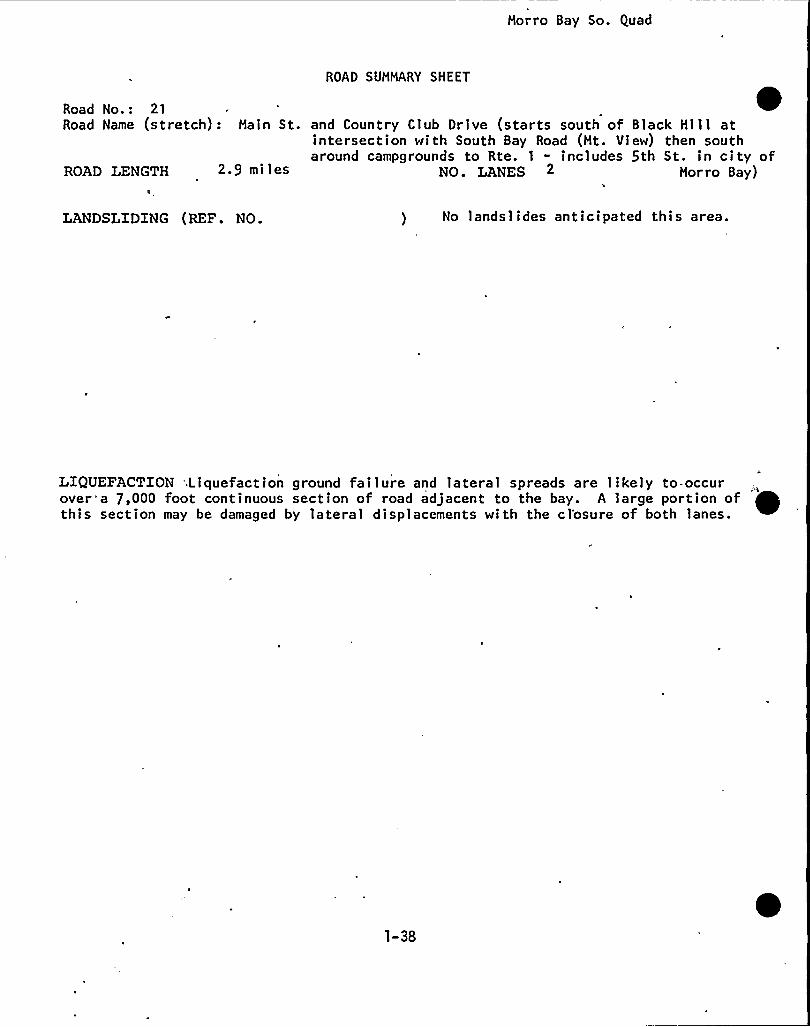
Morro Bay So. Quad
ROAD SUMMARY SHEET
ROAD LENGTH
tRoad No.: 21Road Name (stretch): Hain St. and Country Club Drive (starts south of Black Hill at
intersection with South Bay Road (Mt. View) then southaround campgrounds to Rte. 1
- includes 5th St. in city of2.9 miles NO. LANES 2 Horro Bay)
LANDSLIDING (REF. NO. ) No landslides anticipated this area.
LIQUEFACTION '.Liquefaction ground failure and lateral spreads are likely to-occurover'a 7,000 foot continuous section of road adjacent to the bay. A large portion ofthis section may be damaged by lateral displacements with the cl'osure of both lanes.
1-38
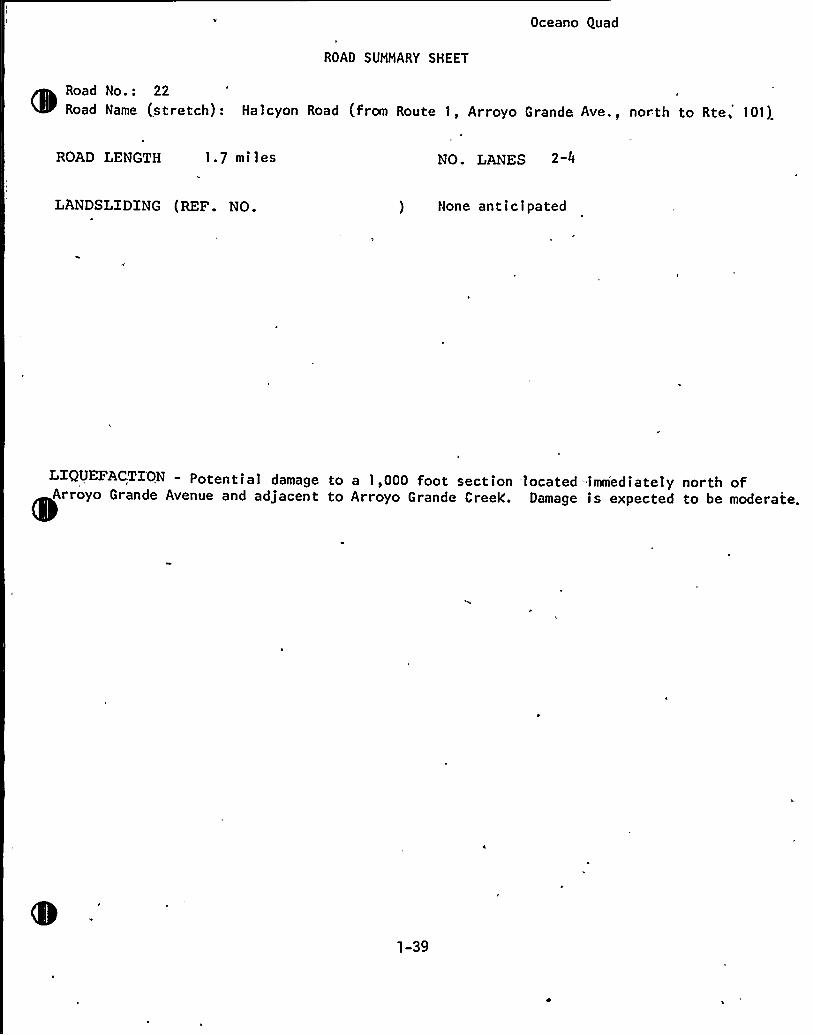
t
ROAD SUHHARY SHEET
Oceano Quad
Road No.: 22Road Name (stretch): Halcyon Road (from Route 1, Arroyo Grande Ave., north to Rte, 101)
ROAD LENGTH 1.7 miles NO. LANES 2-4
LANDSLIDING (REF. NO. ) None anticipated
LIQUEFACTION - Potential damage to a 1,000 foot section located immediately north ofArroyo Grande Avenue and adjacent to Arroyo Grande Creek. Damage is expected to be moderate.
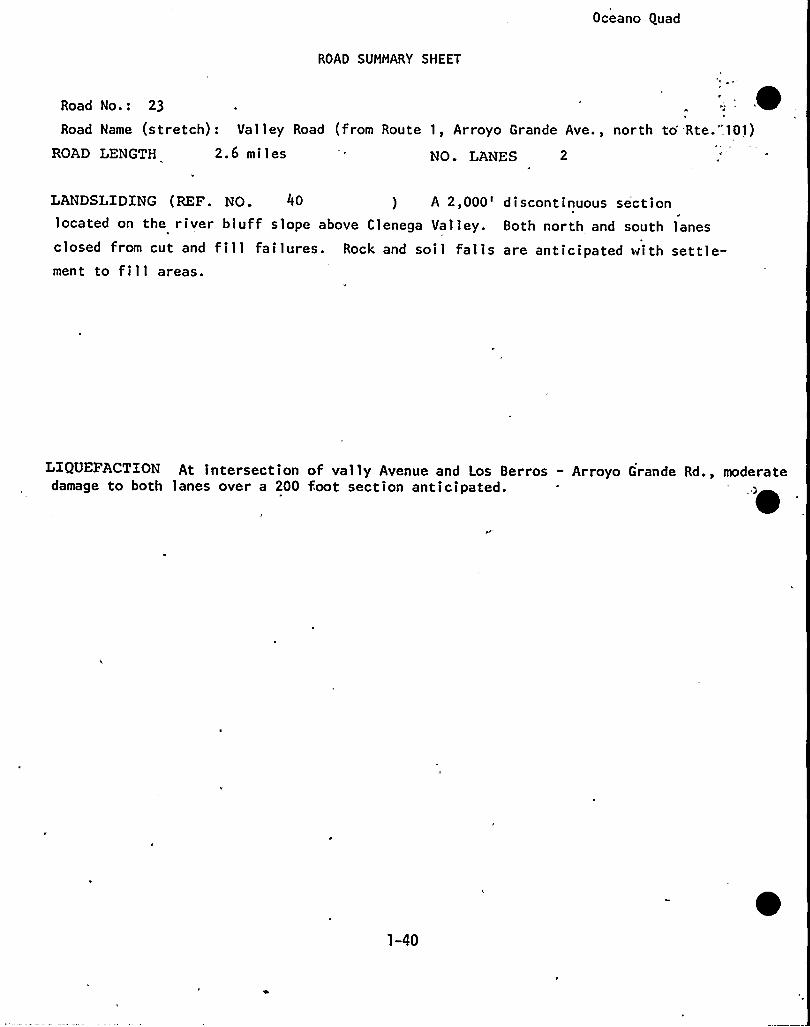
Oceano Quad
ROAD SUMHARY SHEET
Road No.: 23
Road Name (stretch): Valley Road (from Route 1, Arroyo Grande Ave., north to'te." 10'i)
ROAD LENGTH 2.6 miles NO. LANES 2
LANDSLIDING (REF. NO. 40 ) A 2,000'iscontinuous sectionlocated on the river bluff slope above Clenega Valley. Both north and south lanesclosed from cut and fill failures. Rock and soil falls are anticipated with settle-ment to fill areas.
LIQUEFACTION At intersection of vally Avenue and Los Berros - Arroyo Grande Rd., moderatedamage to both lanes over a 200 foot section anticipated.
1-40
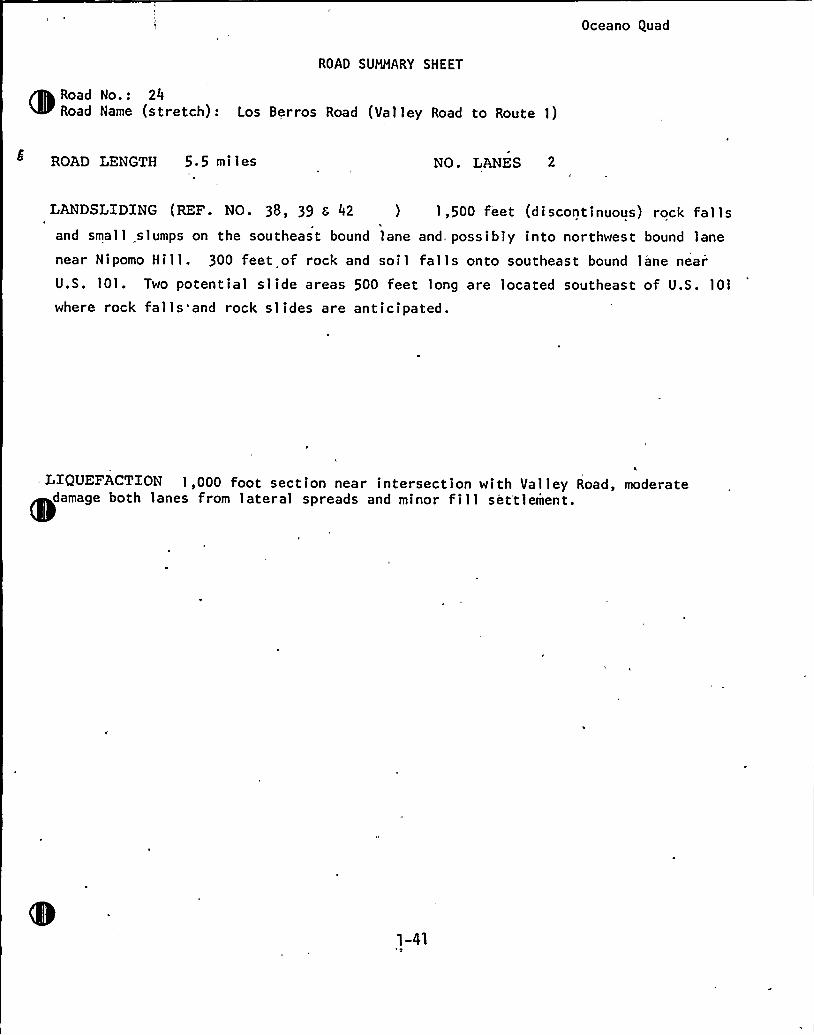
Oceano Quad
ROAD SUNMARY SHEET
Road No.: 24Road Name (stretch): Los Berros Road (Valley Road to Route 1)
ROAD LENGTH 5.5 mi les NO. LANES 2
LANDSLXDZNG (REF. NO. 38, 39 6 42 ) 1,500 feet (discontinuous) rock fallsand small slumps on the southeast bound lane and, possibly into northwest bound lane
near Nipomo Hill. 300 feet of rock and soil falls onto southeast bound lane near
U.S. 101. Two potential slide areas 500 feet long are located southeast of U.S. 101
where rock falls'and rock slides are anticipated.
L>QUEFA<T>ON 1,000 foot section near intersection with Valley Road, moderatedamage both lanes from lateral spreads and minor fi 1 1 set'tlement.
1-41
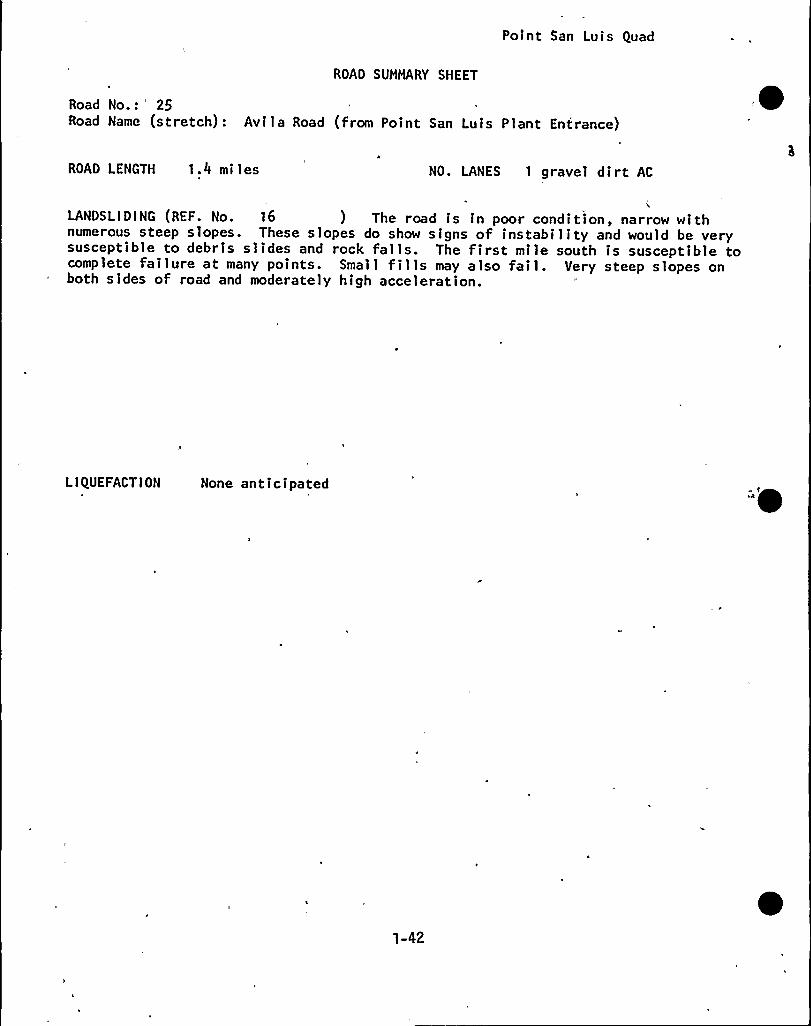
Point San Luis Quad
ROAD SUMMARY SHEET
Road No.:'5Road Name (stretch): Avila Road (from Point San Luis Plant Entrance)
ROAD LENGTH 1.4 miles NO. LANES 1 gravel dirt AC
LANDSLIDING (REF. No. 16 ) The road is in poor condition, narrow withnumerous steep slopes. These slopes do show signs of instability and would be verysusceptible to debris slides and rock falls. The first mile south is susceptible tocomplete failure at many points. Small fills may also fail. Very steep slopes onboth sides of road and moderately high acceleration.
LiQUEFACTiON None anticipated "~
1-42
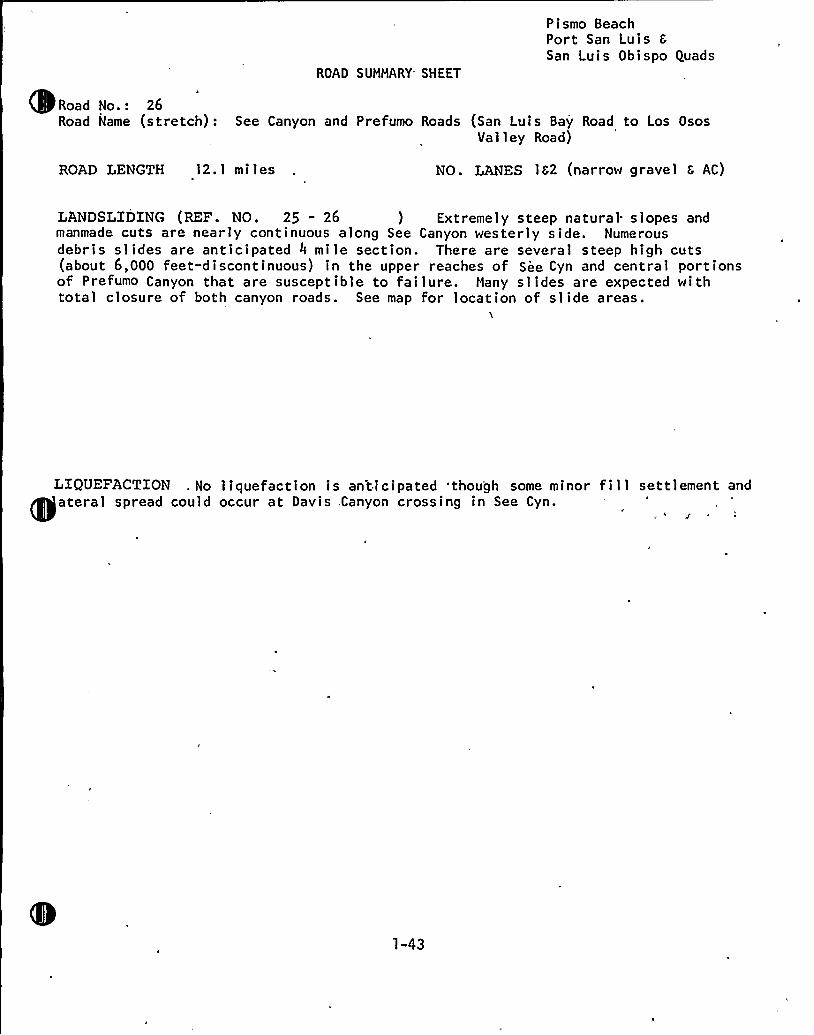
ROAD SUHHARY SHEET
Pismo BeachPort San Luis 6San Luis Obispo Quads
Road No.: 26Road Name (stretch): See Canyon and Prefumo Roads (San Luis Bay Road to Los Osos
Valley Road)
ROAD LENGTH 12.1 mi les NO. LANES 182 (narrow gravel 8 AC)
LANDSLIDING (REF. NO. 25 - 26 ) Extremely steep natural slopes andmanmade cuts are nearly continuous along See Canyon westerly side. Numerousdebris slides are anticipated 4 mile section. There are several steep high cuts(about 6,000 feet-discontinuous) in the upper reaches of See Cyn and central portionsof Prefumo Canyon that are susceptible to failure. Nany slides are expected withtotal closure of both canyon roads. See map for location of slide areas.
L~QUEFACT1ON: No liquefaction is anticipated 'though some minor fill settlement andateral spread could occur at Davis Canyon crossing in See Cyn.
4
1-43
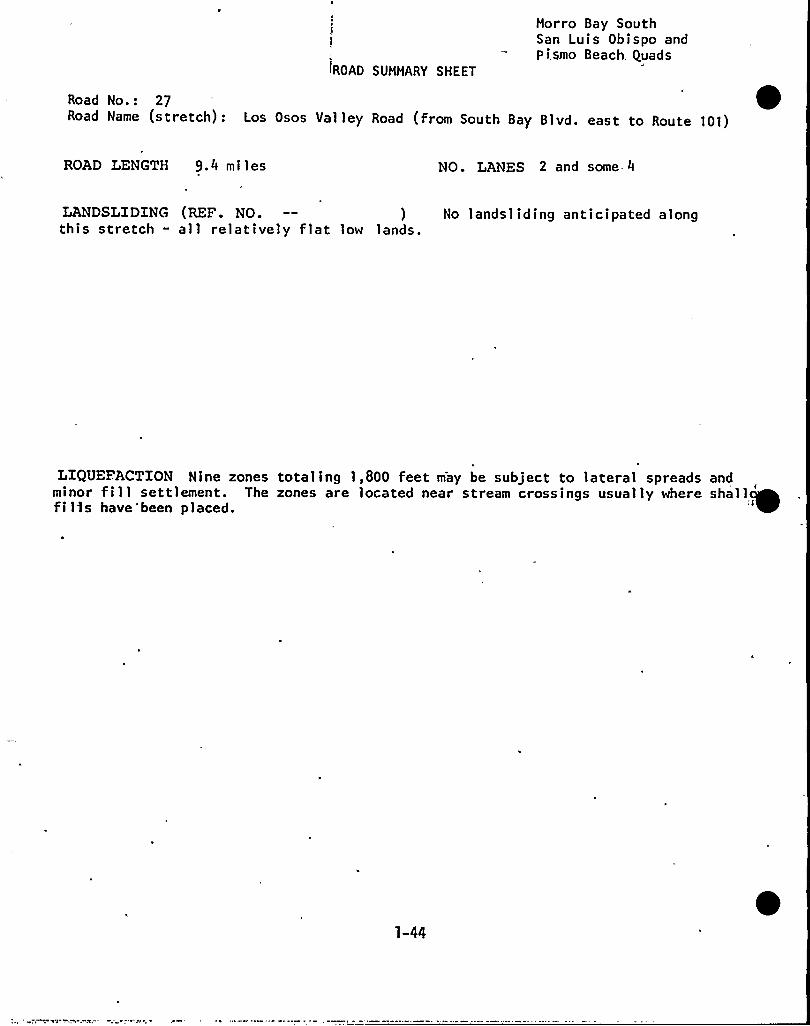
IROAD SUMMARy SHEET
Morro Bay SouthSan Luis Obispo andpi.smo Beach, Quads
Road No.: 27Road Name (stretch): Los Osos Valley Road (from South Bay Blvd. east to Route 101)
ROAD LENGTH 9.4 mi les NO. LANES 2 and some 4
LANDSLIDING (REF. NO. ) No landsl iding anticipated alongthis stretch - all relatively flat low lands.
LIQUEFACTION Nine zones totaling 1,800 feet may be subject to lateral spreads andminor fill settlement. The zones are located near stream crossings usually where shallfil)s have'been placed.
1-44
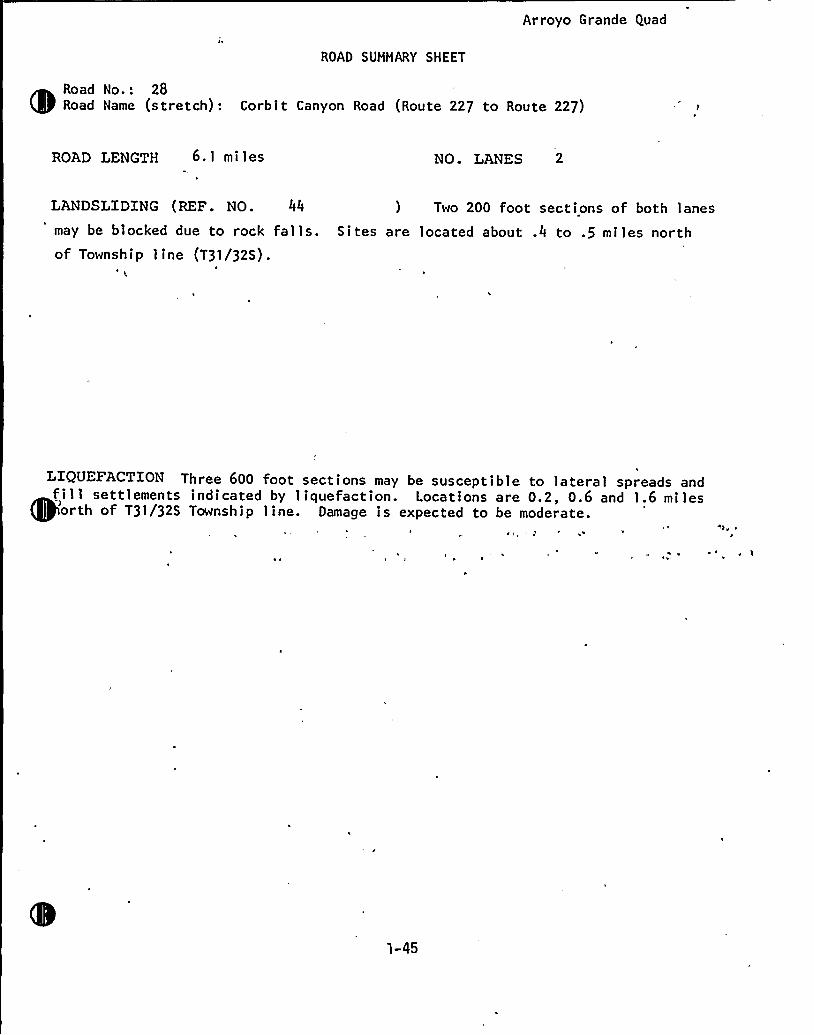
Arroyo Grande Quad
ROAD SUMMARY SHEET
Road No.: 28Road Name (stretch): Corbit Canyon Road (Route 227 to Route 227)
ROAD LENGTH 6.1 mi les NO. LANES 2
LANDSLIDING (REF. NO. 44 ) Two 200 foot sections of both lanes
may be blocked due to rock falls. Sites are located about .4 to e5 miles northof Township line (T31/32S).
LIQUEFACTION Three 600 foot sections may be susceptible to lateral spreads andfill settlements indicated by liquefaction. Locations are 0.2, 0.6 and 1.6 milesorth of 731/32S Township line. Damage is expected to be moderate.
gs) e ~
P
1-45
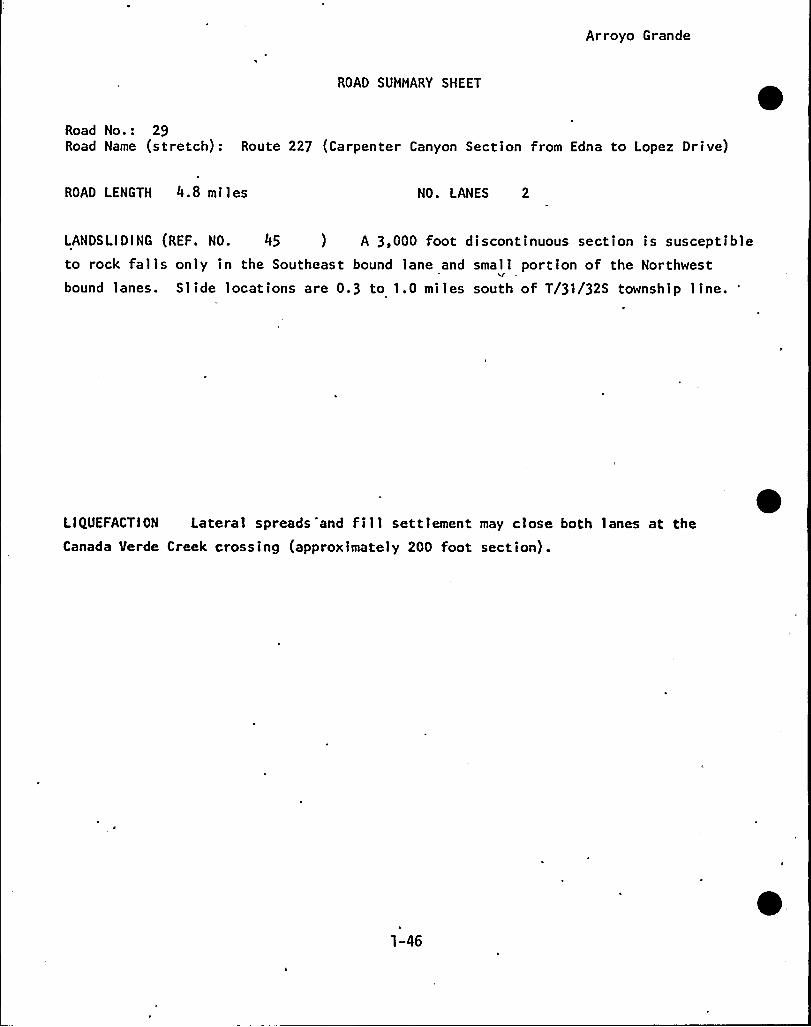
Arroyo Grande
ROAD SUMMARY SHEET
Road No.: 29Road Name (stretch): Route 227 (Carpenter Canyon Section from Edna to Lopez Drive)
ROAD LENGTH 4.8 miles NO. LANES 2
LANDSLIDING (REF. NO. 45 ) A 3,000 foot discontinuous section is susceptibleto rock falls only in the Southeast bound lane and small portion of the Northwestbound lanes. Slide locations are 0.3 to 1.0 miles south of T/31/32S township line.
LiQUEFACTION Lateral spreads and fill settlement may close both lanes at theCanada Verde Creek crossing (approximately 200 foot section) .
1-46
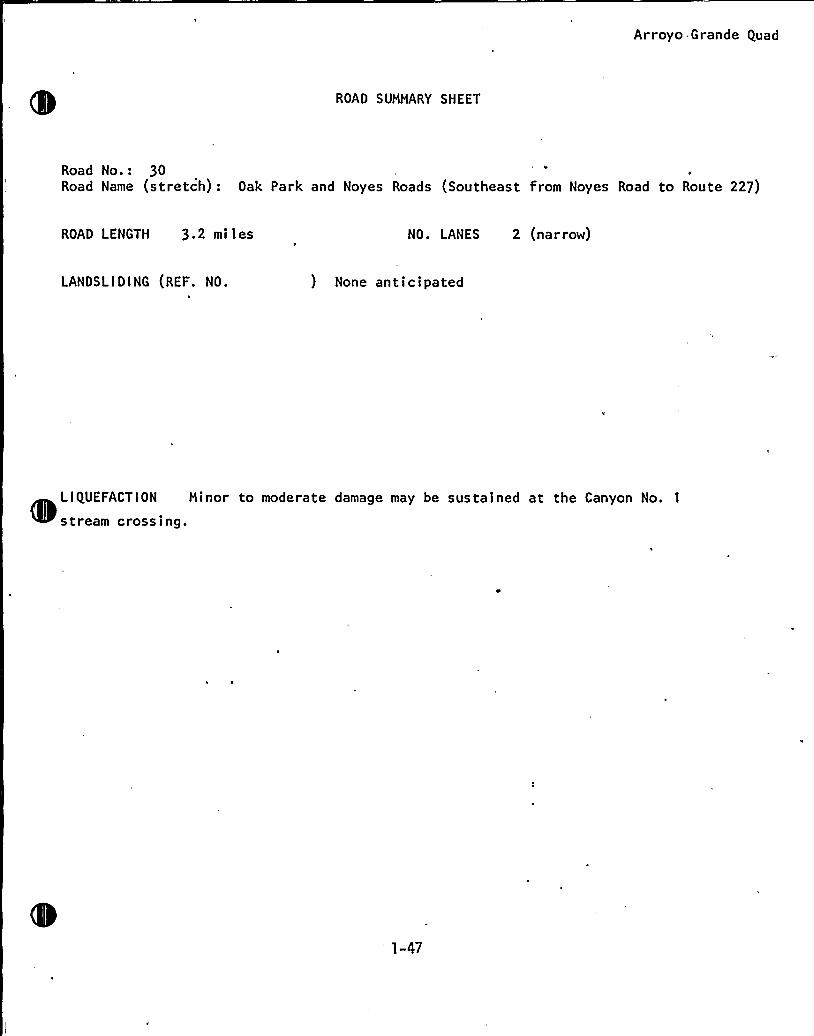
Arroyo. Grande Quad
ROAD SUHHARY SHEET
Road No.: 30Road Name (stretch): Oak Park and Noyes Roads (Southeast from Noyes Road to Route 227)
ROAD LENGTH 3.2 miles NO. LANES 2 (narrow)
LANDSLIDING (REF. NO. ) None anticipated
LIQUEFACTION Minor to moderate damage may be sustained at the Canyon No. I
stream crossing.
'-47
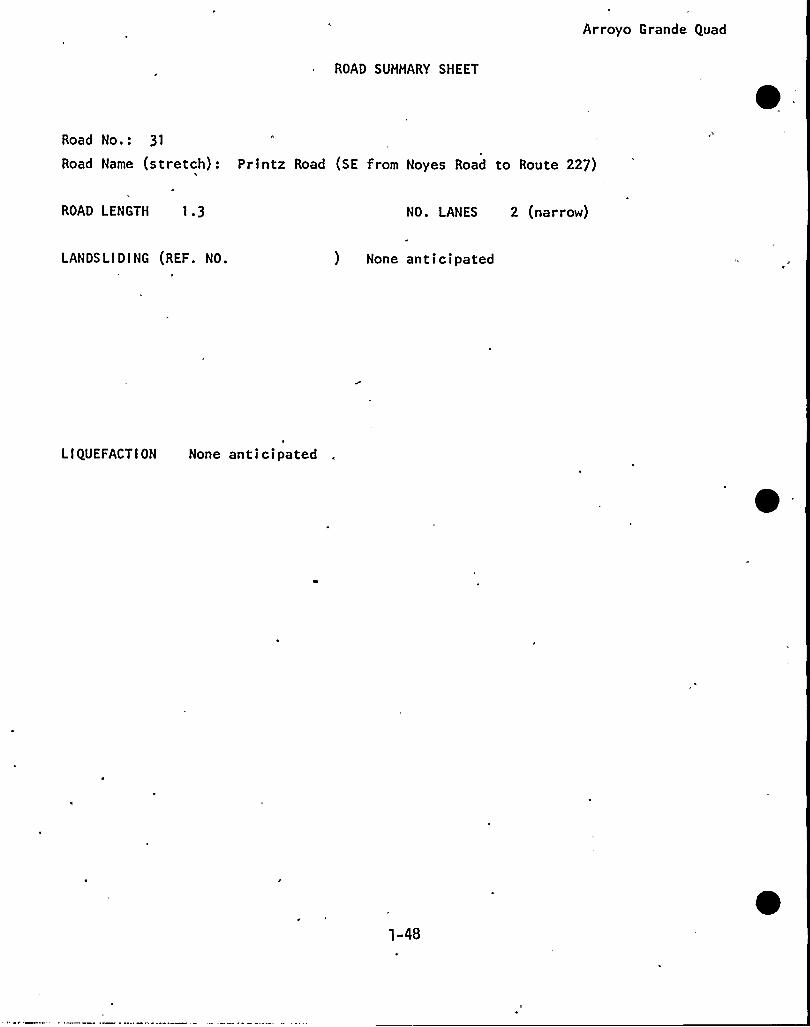
Arroyo Grande Quad
ROAD SUMMARY SHEET
Road No.: 31
Road Name (stretch): Printz Road (SE from Noyes Road to Route 227)
ROAD LENGTH 1.3 NO. LANES 2 (narrow)
LANDS LI DI NG (REF. NO. ) None anticipated
LlQUEFACTION None anticipated
1-48
2.0 LANDSLIDES
2. I OVERVIEW AND METHODOLOGY
Landslides - Overview
Earthquake-induced landslides differ from conventional landslides by their geo-
metry, failure mechanism, and type of sliding. Conventional landslides arecaused by water infiltrating a slope after rainfall. The water has a tendency tosignificantly decrease the shear strength (e.g., cohesion and friction) of wea-thered rock and soil material. In addition, the infiltrated water increases theweight of the slide mass and decreases the confining effects at the toe of theslope. Once the shear strength of the material is exceeded, the slide mass movesdownward in response to gravity.
Earthquake-induced landslides are triggered by energy developed by the earth-quake in the form of ground shaking. The shaking, depending on its intensity andduration, weakens and eventually loosens rock and soil materials, forcing themdown the slope. These landslides appear to be mostly confined to surfacefailures and result in rock falls, rock slides, soil falls, and debris slides. Very fewdeep-seated rotational block glides or slump failures have been observed as a
result of earthquakes. Approximately 90 percent of the failures will be eitherrock falls, rock slides, soil falls or debris slides. Only IO percent will form deep-
I
seated rotation, block glide or slump types of failures (Harp, l981). During thel97l San Fernando earthquake most of the failures were only I. meter thick andhad average length-to-depth ratios of 3I-to-I to a maximum of 80-to-I (Yen,I 978).
The factors controlling the triggering of landslides are the intensity and durationof ground shaking and steepness of the slope. The potential for landslides isincreased when steep slopes are underlain by low density, weathered, weaklycemented soils and/or highly fractured material. There are indications that rainsaturation has little or no additional adverse effect on slopes that wouldotherwise be susceptible to earthquake-induced failures (Leighton, I 974, Harp,
B-8!-227 2-I
TERA CORPORATION
l98I). Since this has not been proven, and for the purposes of this study, we
have considered the worst possible condition which would be the combined effectof water-saturated slopes and simultaneous excessive ground shaking at a site.
Seismic-induced landslides normally occur with the initial shock of an earth-quake. However, in some cases the initial shock may only loosen or weaken rockor soil material on a slope, while subsequent aftershocks may eventually cause
failure. To compound the problem, heavy 'rain following a major earthquakemight cause failure of slopes that were originally weakened by the initial shock.
Studies by Wilson (l978) of the Santa Barbara (M = 5.I) earthquake of August l3,l978 showed that artificially cut slopes are significantly more prone to earth-quake induced failure than natural slopes of the same geologic material.
Rock falls and rock slides are most common on steep slopes devoid of a soilcover. Broken rock in steep road cuts is very susceptible to falls or slides. Soil
falls generally occur along very steep (near vertical) natural slopes or on man-made cuts where blocks of unconsolidated materials become detached and fall.
Based on work by'Harp (l98l), slopes greater than 35o (I'h:I slope ratio) whererock is exposed are prone to rock falls and rock slides. This is considered
conservative since statistics indicate a 40-to-45o lower limit. Furthermore, thehigher the degree of fracturing or jointing of the rock, the higher, is theprobability of failure. Other discontinuities such as bedding or foliation,'nlessadversely oriented out of slope, appear not to be a major issue with regard toseismically-induced rock falls or rock slides (Harp, I 98I). Debris slides usuallyoccur on moderate-to-steep natural slopes and include only loose soil or colluvialmaterials above the bedrock. Usually very steep slopes are devoid of a soil coverand bedrock is exposed which is subsceptible to failure. Soils or colluvialmaterial have a tendency to fail on slopes of 25o (2:I slope ratio) or greater(Harp, 198I). Research has shown that soils most susceptible to failure
are'ranular
and nonorganic.
B-8 I-.227 2-2
TERA CORPORATION
Had the l978 Santa Barbara earthquake been any larger, a number of severe
failures would have resulted. In a study of earthquake-induced landslides of I5
major earthquakes throughout the world, cut failures were very common whilefill failures were less frequent (Wilson, l.978). However, slopes comprisingartificial fillalso are prone to seismic induced failures. The geometry of the fill(i.e., slope ratios and slope heights) and consistency of the soil materials willcontrol its stability or lack of stability. Fills are known to fail either byslumping or by debris slide. Poorly compacted, low cohesive fill materials on
slopes in excess of 25o are subject to earthquake-induced failure.
Landslides - San Luis Obis o Area
Numerous landslides have occurred in the study region (Envicom, l974). The
type and distribution of failure probably reflect specific bedrock conditions,namely: bedding, jointing and fracturing, and steep slope. These slides weremost likely triggered by water infiltrating the slopes and were not related 'toearthquake activity. None of the slides near the evacuation roads and highwaysare known to be active and the majority of the larger features are consideredquite old, possibly having moved during a much wetter climate (i.e., over I l,000years ago).
Where earthquake-induced slides are likely to occur in the study area, they wouldin most cases fall onto highways rather than occur below them. While materialsfalling on the roadways would cause at least partial blockage, the slides thatoccur downslope from a roadway could sever one or more lanes, rendering themimpassable.
The quantities of materials generated at the toe of a slope from any one slidewill vary depending on the dimension of the slide. Most of the shallow slides thatoccurred during the l97l San Fernando earthquake had lengths of IS to 300
meters and thicknesses of .2 to I meter (Morton, l97I). Assuming average widthof these slides to be about one-third of the length and average thickness to be
I meter, quantities ranged between 45 to 300 cubic meters of displaced debris.It is estimated that similar quantities could be developed from slides occurring in
B-8 I-227 2-3
TERA CORPORATION
the study area. Slides might occur adjacent to each other and form coalescing
slide masses.
The removal time to clear a road blocked with slide debris depends on theamount of materials to be removed, the number and type of heavy equipment
available, access to the site, and distance to a suitable disposal or borrow area.
The most practical types of heavy equipment for expediting road repair work are
rubber-tired loaders and tractor bulldozers. Normally, a loader of the typeowned by CALTRANS can excavate 300 cubic yards of loose unconsolidated
material per hour. Such loaders are available at the CALTRANS maintenance
stations and could be on site within 30 minutes. A bulldozer (e.g., D-7
Caterpillar) would be able to move more yardage per hour. However, the onlyone owned by CALTRANS in this area is stationed on Highway I north of Morro
Bay and would require a long time to bring to most sites..Local contractorswould be able to provide such equipment with a delay of 2 to 4 hours. In order toobtain clearing time estimates for our study, we have assumed that once on site,front loaders would be able to clear the road at the rate of 200 ft/hour per lane.
This implies that no hauling is required and the debris is l2 feet wide with an
average thickness of 3 feet. All the estimates have been made assuming thatonly one loader is working on any given road.
Because roads are long linear structures, multiple failure can occur any place
along them, creating several blockages. In this case, the blockages may have tobe removed one at a time from each end unless equipment is available at
tintermediate points. As an alternative, for emergency purposes a road can be
reopened after a major landslide by grading a road over the top of the slide mass
or by passing it around the perimeter of the mass. This would certainly be time-saving; however, caution must be exercised when people or equipment areworking in an area of potential active sliding. Roads severed or heavily damaged
by a slide located below the road may be difficult to repair within a reasonable
time frame. Such occurrences would have to be dealt with on a case-by-casebasis.
B-8l-227 2-4
TERA CORPORATION
Assessment of Landslide Potential
The number of technical reports on earthquake-induced landsliding is verylimited. Much of the state-of-the-art work is presently being conducted by theU.S. Geological Survey through their Earthquake Hazard Reduction Program.
The criteria established by the Geological Survey have been used for an earth-quake-induced landslide study of San Mateo County, California (in press).Geologic conditions in San Mateo County are in part similar to those in this studyarea. The Association of Bay Area Governments also have used the GeologicalSurvey's criteria for developing landslide assessment maps in the greater San
Francisco area. The California Division of Mines and Geology has procured a
seismic hazard study of Santa Clara County, California (CDMG, 1974), thoughthe criteria used for their "Relative Seismic Stability Map" (Plate 6) were notdiscussed. The Seismic Safety Element of San Luis Obispo County (Envicom,1974) includes a "Landslide Risk Map" (Plate 2B); however, the criteria used inthat study appear to be antiquated.
Criteria for assessing earthquake-induced landslides for this study were de-
veloped primarily from the criteria established by the U.S. Geological Survey.Tables 2-1, 2-2, and 2-3 summarize the criteria developed by the U.S.Geological Survey for studies in the San Francisco Bay area. Tables 2-2 and 2-3have been modified slightly to take into account local geologic conditions. Usingthese criteria (ABAG, 1980-81) to determine seismic-induced landslide potential,all slopes analyzed within the study area fall into an "unstable condition" forboth summer and winter conditions. However, the intensity of ground shakingwill vary from strong to very strong to occasionally violent with distance fromthe fault (tables presented in Appendix). On the Modified Mercalli scale,intensities will range from Vll to IX. According to the definition given to thescale, earthquake landsliding has been known to take place within this range ofintensities.
B-81-227 2-5
TERA CORPORATION
Basically, there are four main factors that control earthquake-induced landslid-
ing: I) strong ground motion, 2) slope inclination, 3) surface geologic and
engineering parameters, and 4) conventional landsliding susceptibility (water-
induced failures). Aerial photographs (Fairchild, l 978), geologic and topographic
maps, and a field inspection were used to collect information on those slopes
suspected of potential landsliding. Field data sheets were prepared for each site,'nd a summary of pertinent data for each site is given later in the Appendix.
Only slopes that trend immediately adjacent to or near the roads or highways
were considered in this study. All slopes (natural slopes, cuts, and fills) were
excluded from this study unless they exceeded the lower limits of the criteriapresented in Table 2-4. No deep-seated potential slides were suspected or
recognized along the roads surveyed. Fill slopes normally are difficult toanalyze by inspection since their stability is in part related to hoyr well theywere compacted during construction. Usually new road fills have been con-
structed to adequate standards, though there are exceptions. Old road fills or
newer ones with slope ratios in excess of 2:I (horizontal-to-vertical) were
considered zones of likely failure. Table 2-5 summarizes the relative suscepti-
bility to seismically-induced landsliding for each of the slope areas investigated
in this study.
Based on the assessment criteria, many slopes along the evacuation routes have
been categorized as potential landslide zones, capable of failing under seismic
shaking. Since the current state-of-the-art requires a conservative approach toformulating the assessment criteria, one does not expect that all slopes so
identified will actually fail. It is judged that the number of failures- willdecrease rapidly with distance from the fault, based principally on the attenua-tion of acceleration. In order to estimate the expected number of slides and the
corresponding clearing times, the criteria presented in Table 2-6 were developed
for three damage levels. These criteria reflect engineering judgment based on
geological data and past earthquake experience. For a potential landslide
located in a given acceleration zone, the expected footage of failure was
obtained by multiplying the total potential footage by the percentage corres-
ponding to the selected damage level.
B-8I-227 2-6
TERA CORPORATION
A summary of expected footage failure and clearing time is presented in the
table, "Summary of Landslide Potential by Road" (Section 2.2). tn this table,each road was divided according to the range of expected ground accelerations itwas expected to experience (PGA zone). For each hypothetical demand level,the number of expected failures, number of lanes affected, and the. totalaffected footage are summarized. The estimated repair times for each damage
level is summarized first by number of affected lanes, by PGA zone, and finallyby the total repair time estimate for the road. For roads 13-3l, those notconsidered main evacuation routes, we have summarized the clearing time foronly one lane of traffic, as this was considered sufficient clearance for thoseroads under emergency conditions.
Section 2.3 presents detailed summary data concerning each landslide potentialsite. The times for clearance referenced in. that section represent timeestimates obtained from the field survey. Section 2.4 presents detailedinformation from this field survey.
B-8I-227 2-7
TERA CORPORATION
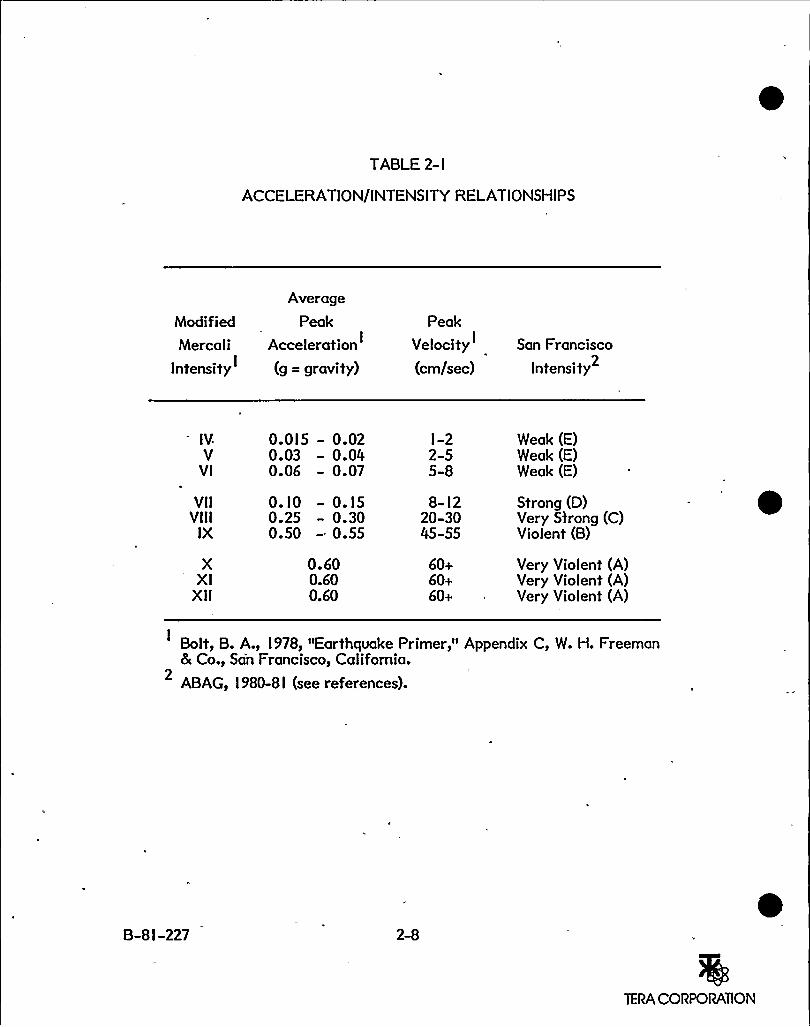
TABLE 2-I
ACCELERATION/INTENSITYRELATIONSHIPS
Modified
Mercali
Intensity
Average
Peak
Acceleration
(g = gravity)
Peak
Velocity
(cm/sec)
San Francisco
Intensity
IVV
Vl
VllVill
IX
XXI
XII
O.OI5 — 0.020.03 — 0.040.06 - 0.07
O.IO — O.I50.25 — 0.300.50 - 0.55
0.600.600.60
I-22-55-8
8-l220-3045-55
60+60+60+
Weak (E)Weak (E)Weak (E)
Strong (D)Very Strong (C)Violent (B)
Very Violent (A)Very Violent (A)Very Violent (A)
Bolt, B. A., l978, "Earthquake Primer," Appendix C, W. H. Freeman& Co., San Francisco, California.
2ABAG, l 980-8I (see references).
B-8I-227
TERA CORPORATION
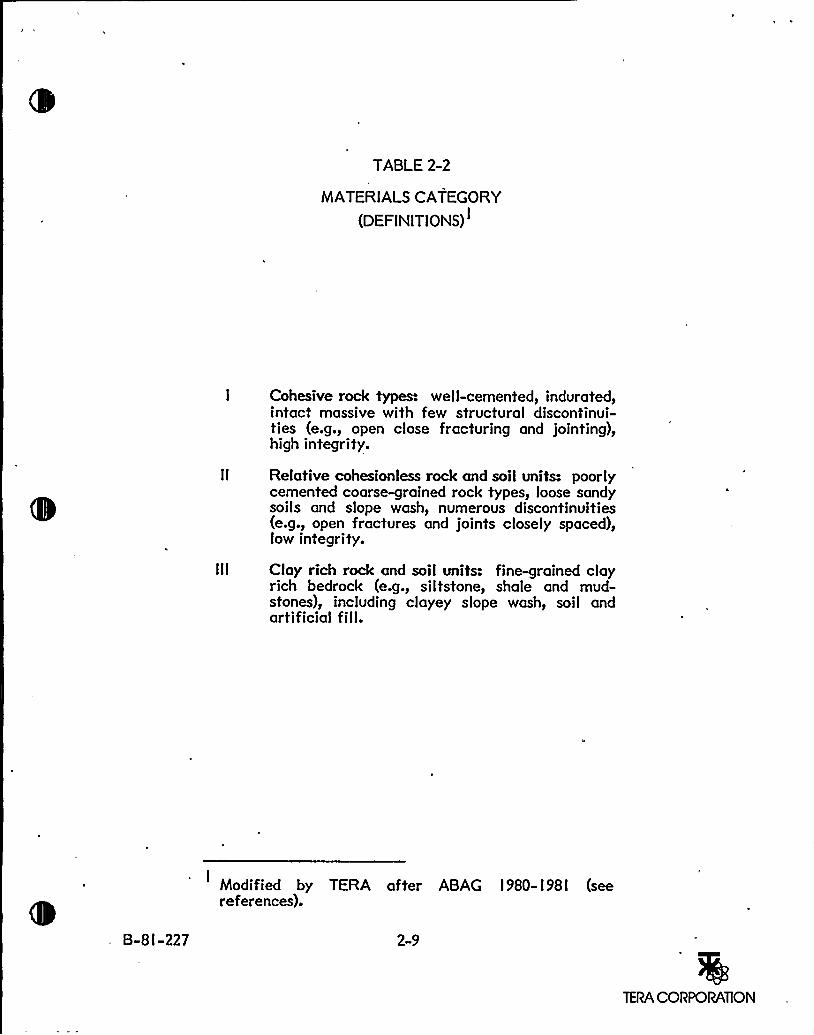
TABLE 2-2
MATERIALSCATEGORY
(DEFINITIONS)
I Cohesive rock types: well-cemented, indurated,intact massive with few structural discontinui-ties (e.g., open close fracturing and jointing),high integrity.
II Relative cohesionless rock and soil units: poorlycemented coarse-grained rock types, loose sandysoils and slope wash, numerous discontinuities(e.g., open fractures and joints closely spaced),low integrity.
III Clay rich rock and soil units: fine-grained clayrich bedrock (e.g., siltstone, shale and mud-stones), including clayey slope wash, soil andartificial fill.
I Modified by TERA after ABAG I 980- I 98 I (seereferences).
2-9
TERA CORPORATION
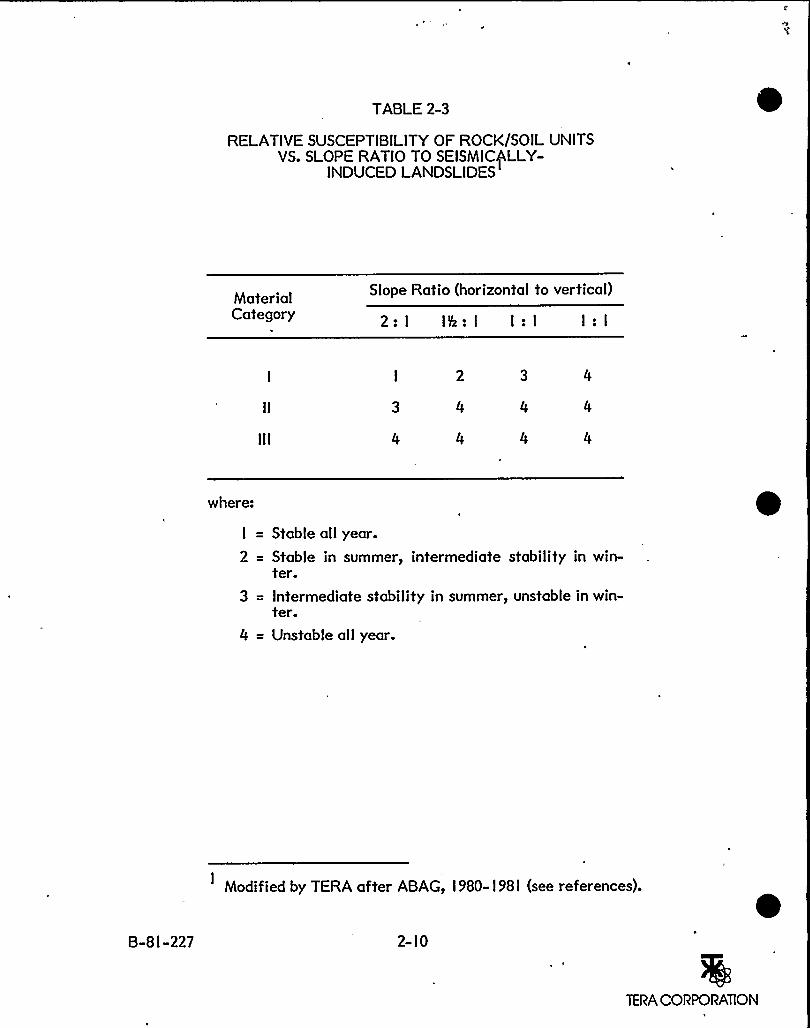
TABLE 2-3
RELATIVESUSCEPTIBILITY OF ROCK/SOIL UNITSVS. SLOPE RATIO TO SEISMIC)LLY-
INDUCED LANDSLIDES
MaterialCategory
Slope Ratio (horizontal to vertical)
2:I I6:I I:I I:I
where:
I =
2 =
Stable all year.
Stable in summer, intermediate stability in win-ter.
3 = Intermediate stability in summer, unstable in win-ter.
4 = Unstable all year.
Modified by TERA after ABAG, I 980- I 981 (see references).
2-IO
TERA CORPORATION
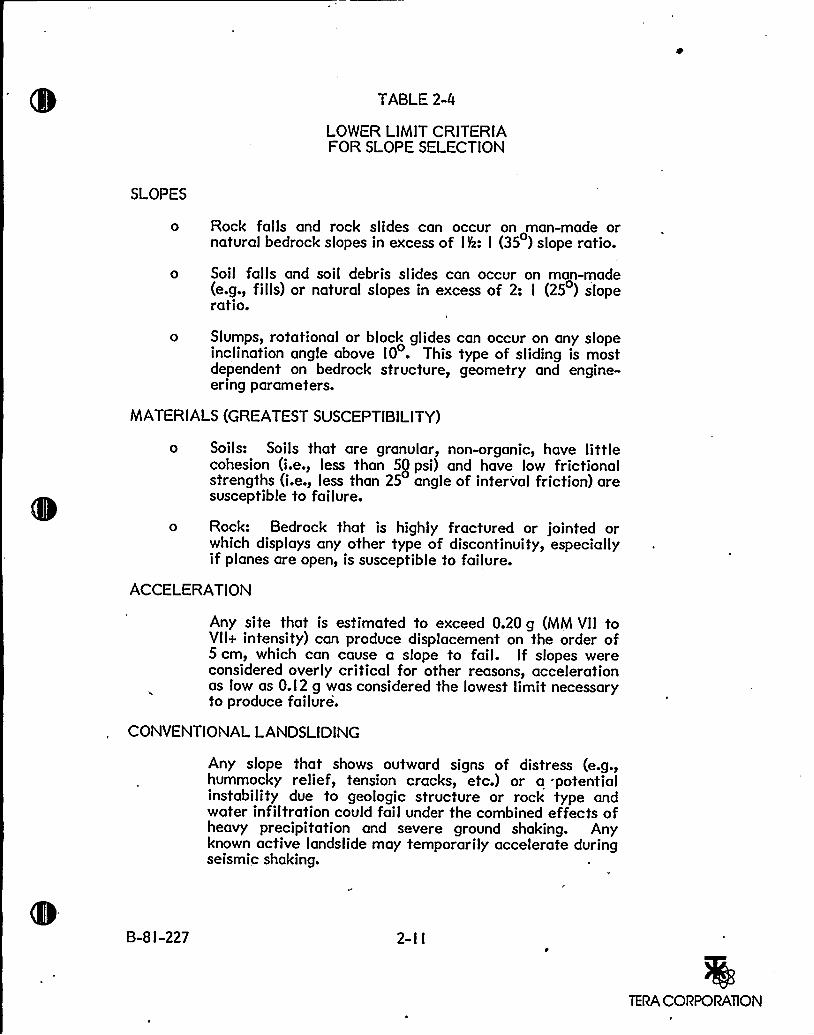
TABLE 2-4
LOWER LIMITCRITERIAFOR SLOPE SELECTION
SLOPES
o Rock falls and rock slides can occur on man-made ornatural bedrock slopes in excess of I6: I (35 ) slope ratio.
o Soil falls and soil debris slides can occur on man-made(e.g., fills) or natural slopes in excess of 2: I (25 ) sloperatio.
o Slumps, rotational or block glides can occur on any slopeinclination angle above IO . This type of sliding is mostdependent on bedrock structure, geometry and engine-ering parameters.
MATERIALS(GREATEST SUSCEPTIBILITY)
o Soils: Soils that are granular, non-organic, have littlecohesion (i.e., less than 5II psi) and have low frictionalstrengths (i.e., less than 25 angle of interval friction) aresusceptible to failure.
o Rock: Bedrock that is highly fractured or jointed orwhich displays any other type of discontinuity, especiallyif planes are open, is susceptible to failure.
ACCELERATION
Any site that is estimated to exceed 0.20 g (MM Vll toVll+ intensity) can produce displacement on the order of5cm, which can cause a slope to fail. If slopes wereconsidered overly critical for other reasons, accelerationas low as O.I2 g was considered the lowest limit necessaryto produce failure.
CONVENTIONALLANDSLIDING
Any slope that shows outward signs of distress (e.g.,hummocky relief, tension cracks, etc.) or a potentialinstability due to geologic structure or rock type andwater infiltration could fail under the combined effects ofheavy precipitation and severe ground shaking. Anyknown active landslide may temporarily accelerate duringseismic shaking.
B-8 I-227 2-II
TERA CORPORATION
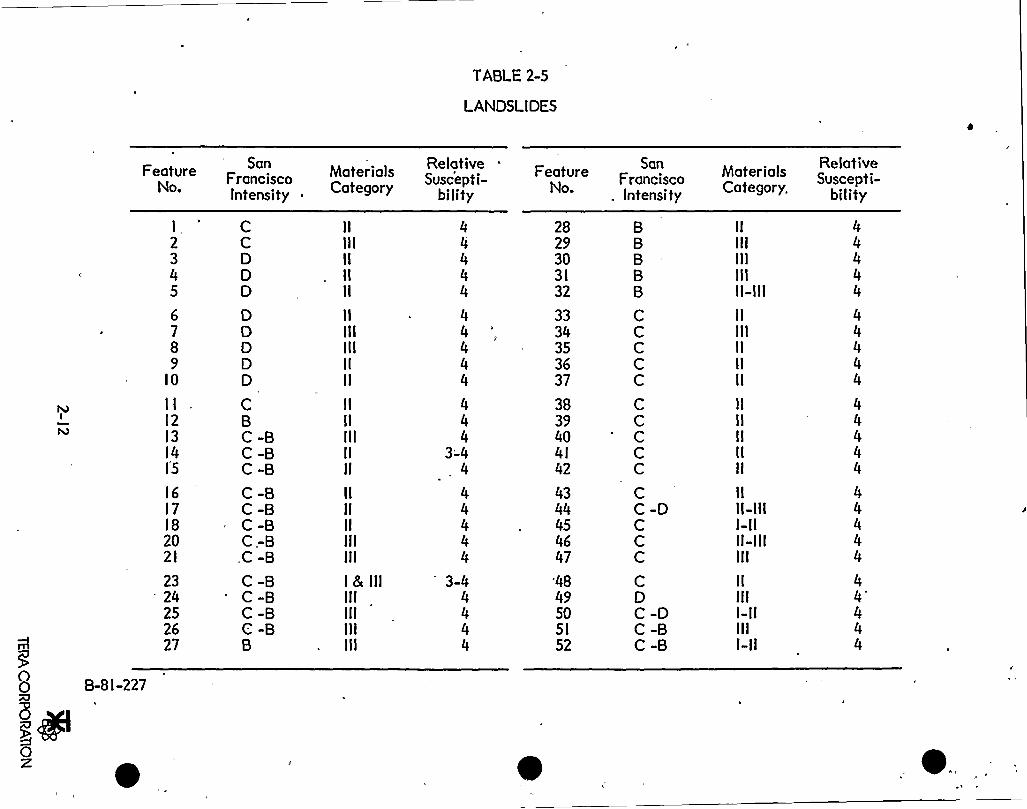
TABLE 2-5
LANDSLIDES
FeatureNo.
SanFranciscoIntensity
MaterialsCategory
RelativeSuscepti-
bilityFeature
No.
SanFrancisco
. Intensity
Materials Relative
Category.l I
I
2345
6789
IO
IIl2l3l4l5
l6l7I8202I
2324252627
CCDDD
DDQDD
CBC-BC-BC-BC-BC-BC-BC-BC-BC-BC-BC-BC-BB
IIIIIIIIIII
lllllIIIIIII
IIIIIIIIIII
IIIIIIIIIIII
I 8 IIIIIIIIIIIIIII
44
4
4
444
4
43'-4
4
44444
3-4444
2829303l32
3334353637
3839404I42
4344454647
'484950Sl52
BBBBB
CCCCC
CCCCC
C-DCCC
DC-DC-BC-B
IIIIIlllIIIII-III
IIIIIIIIIII
IIIIIIIIII
IIII-IIII-IIII-IIIIII
ItIIII-IIIIII-II
44
44
44
4
4
444
44444
44'
44
B-8I-227
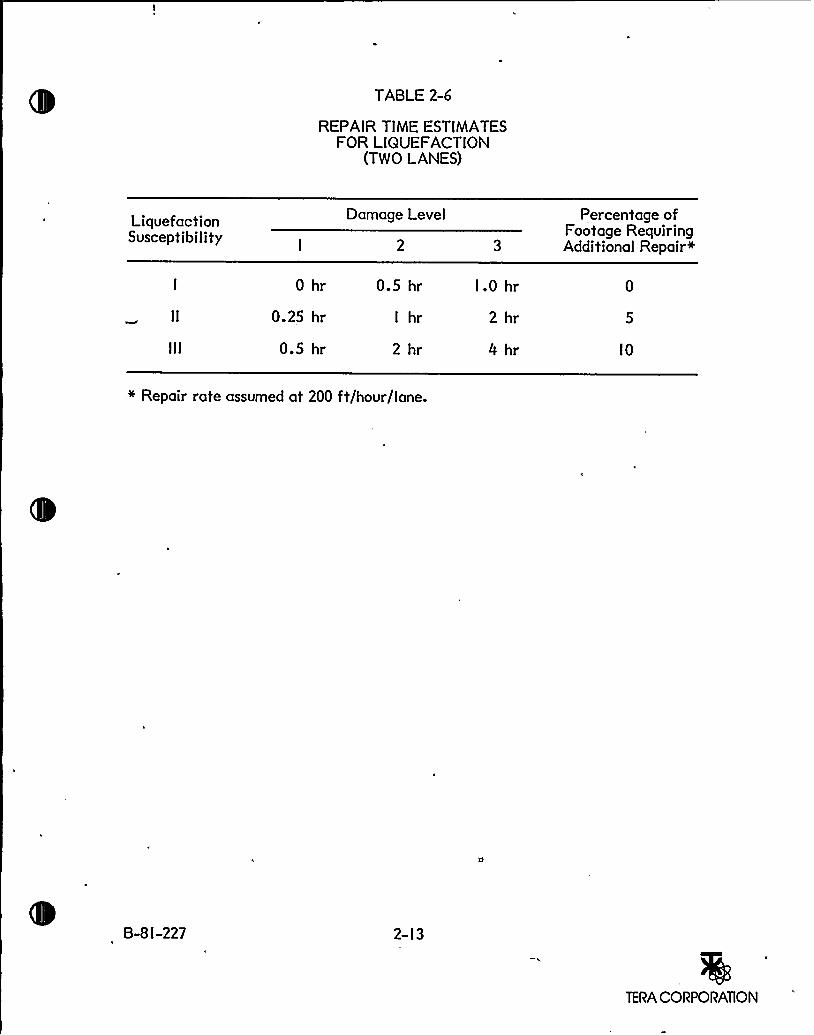
TABLE 2-6
REPAIR TIME ESTIMATESFOR LIQUEFACTION
(TWO LANES)
LiquefactionSusceptibility
Damage Level Percentage ofFootage RequiringAdditional Repair+
0 hr
0.25 hr
0.5 hr
0.5 hr
I hr
2 hr
1.0 hr
2 hr
4 hr IO
+ Repair rate assumed at 200 ft/hour/lane.
B-8 I-227 2- I 3
TERA CORPORATION

0
2.2 SUMhAARYOF LANDSLIDEPOTENTIALBY ROAD
2-l4
TERA CORPORATION

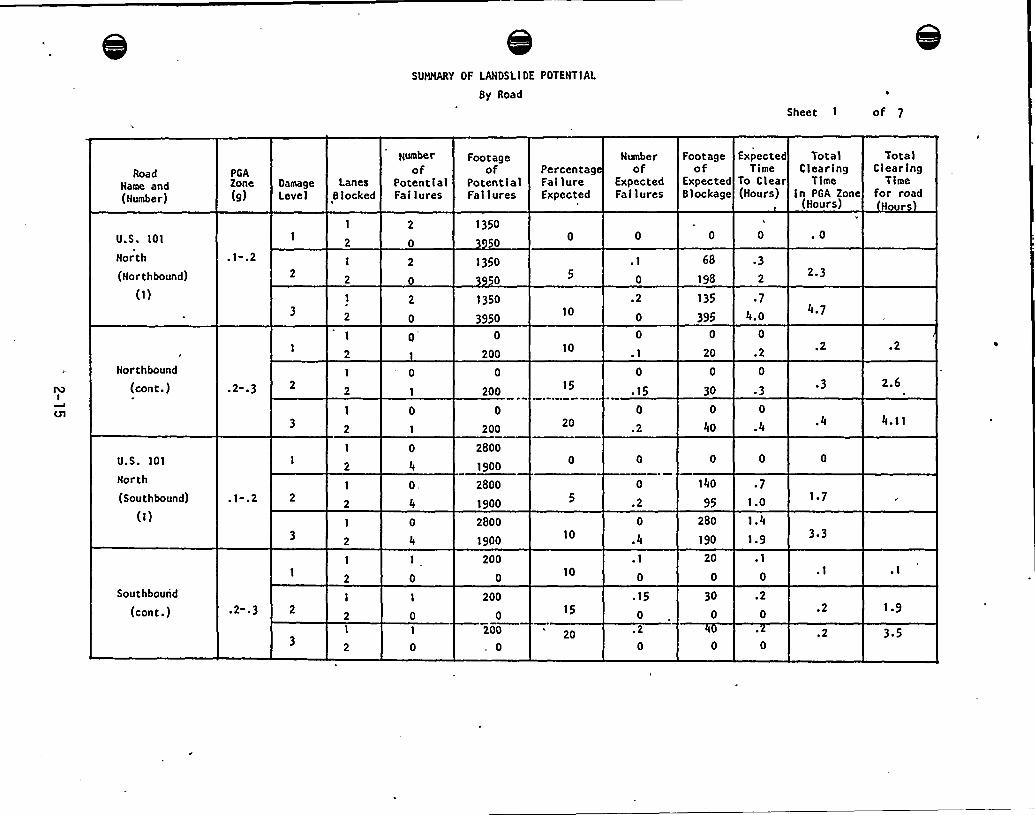
SUHHARY OF LANDSL1DE POTENTlAL
By Road
Sheet 1 of 7
RoadName and(Number)
U.S. 101
PGAZone(g)
DamageLevel
LanesB locked
Number
ofPotentialFailures
Footageof
PotentialFailures
1350
0
PercentageFa i lureExpected
Numberof
ExpectedFa i lures
Footage Expectedof Time
Expected To ClearBlockage (Hours)
TotalClearing
Timein PGA Zone
(Hours)
.0
TotalClearing
Timefor road
H r
North
(Northbound)
(1)
Northbound
(cont.)
U.S. 101
North
(Southbound)
(i)
Southbound
(cont.)
1-.2
~ 2 ~ 3
.1-.2
~ 2- 3 2
0,
1350
0
1350
3950
0
200
200
0
200
2800
1900
2800
1900
2800
1900
200
0
200
0
200
0
10
10
15
20
10
10
15
20
.2
0
0
.1
.15
0
.2
0
.2
0
.4
.15
0.20
68
198
135
395
0
20
0
30
0
40
140
95
280
190
20
30
0
~ 3
2
~ 7
4.00
.2
.3
0
.4
~ 7
1.0
1.4
1.9
.1
0
0
2.3
4.7
.2
.3
.4
1.7
3 3
.2
.2
2.6
4.11
1.9
3 '
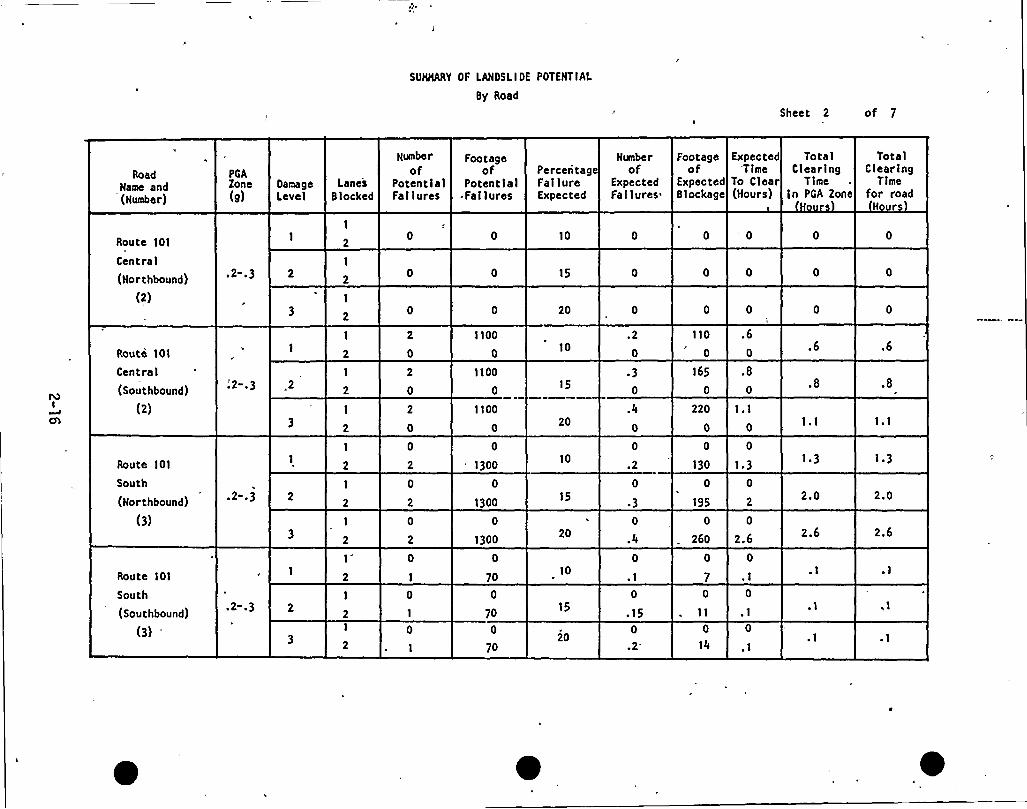
SUHHARY OF LANDSLIDE POTENTIAL
By Road
Sheet 2 of 7
RoadName and(Number)
PGAZone(g)
DamageLevel
LanesB locked
Number
ofPotentialFailures
Footageof
PotentialFailures
PerceritagFai lureExpected
Kenberof
ExpectedFailures
Footage Expected Totalof 'Time Clearing
Expected To Clear TimeBlockage (Hours) ln PGA Zone
Tote IC'I ear ing
Timefor road
Hour
Route 101
Central
(Northbound)
(2)
~ 2 ~ 3
10
15
20
0'
Route 101
Central
(Southbound)
(2)
2 i3 .2
1100
0
1100
0
1100
0
10
15
20
~ 2
.4
0
110
0
165
0
220
0
.6
.8
.6 .6
Route 101
South
(Northbound)
(3)
~ 2 03
0
1300
0
1300
0
1300
10
15
20
0
.2
~ 3
.4
0
260 2.6
130 1.3
0
195
1.3
2.0
2.6
1.3
2.0
2.6
Route 101
South
(Southbound)
(3) '
2 3
1
2
0
70
0
70
0
70
10
15
20
0
.15
.20
14
0
.1
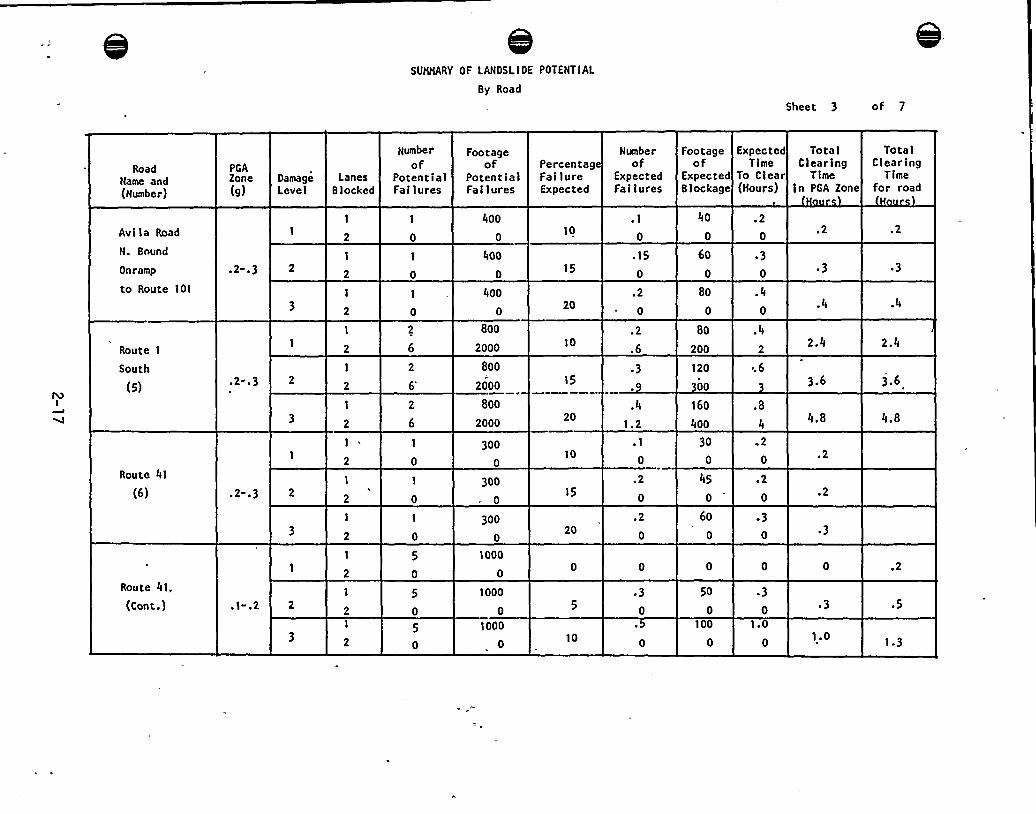
SUHHARY OF LANDSLIDE POTENTIAL
By Road
Sheet 3 of 7
RoadName and(Number)
Avila Road
N. Bound
Onramp
to Route 101
Route I
PGAZone(g)
~ 2 ~ 3
DamageLevel
LanesB locked
Number
ofPotentialFailures
Footageof
PotentialFailures
400
0
400
400
0
800
2000
PercentageFailureExpected
10
15
20
10
Nunberof
ExpectedFailures
.'15
Footageof
ExpectedBlockage
40
0
60
0
80
0
80
200
Expected TotalTime Clearing
To Clear Time(Hours) in PGA Zone
.2
0
0 3
.4
2.4
Tota IClearing
Timefor road
2.4
South
(5)
Route 41
(6)
Route 41,
(Cont.)
.2- 3
.2 ~ 3
.1-.2
I
2
26'002000
800
2000
300
0
300
0
300
0
1000
1000
1000
0
15
20
10
15
20
10
.4
1.2
.I0
.2
0
.2
~ 3
0
120
00
160
400
30
0
0
60
0
50
0100
0
.6
.8
4
.2
~ 2
~ 3
0
.3
1.0
0
3.6
4.8
02
1.0
3.6
4.8
.2
.5
1.3
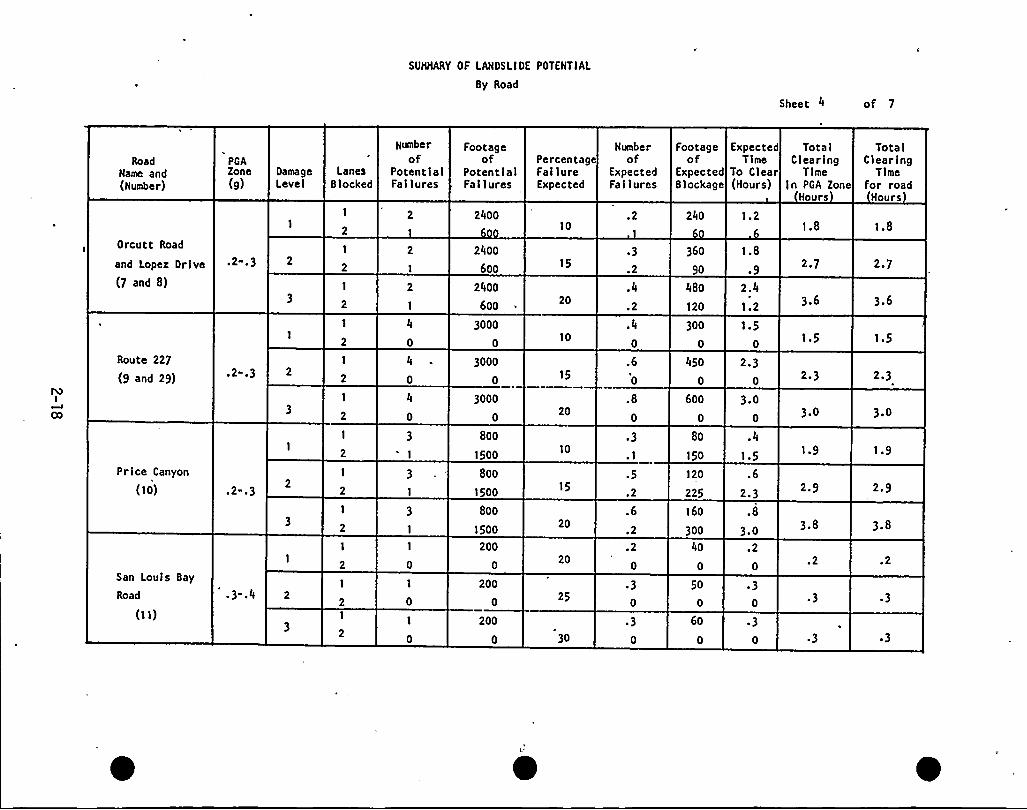
SUHHARY OF LANDSLIDE POTENTIAL
By Road
Sheet 4 of 7
RoadName and(Number)
Orcutt Road
and Lopez Drive
(7 and 8)
Route 227
(9 and 29)
Price Canyon
(lo)
San Louis Bay
Road
PGAZone(g)
~ 2 ~ 3
2- 3
~ 2- 3
.3- 4
DamageLevel
LanesBlocked
Number
ofPotentialFailures
4
3
Footageof
PotentialFailures
2400
2400
600
2400
6oo
3000
0
3000
0
3000
0
Soo
1500
Soo
1500
Soo
1500
200
0
200
0
200
0
PercentageFa I lureExpected
10
15
20
10
15
20
10
15
20
20
25
30
Humberof
ExpectedFailures
~ 2
~ 3
.4
.4
0
.6
0
.8
0
~ 3
.I
.2
.2
Footageof
ExpectedBlockage
240
36o
90
48o
120
300
0
45o
0
600
So
150
120
225
160
300
4o
50
0
6o
ExpectedTime
To Clear(Hours)
1.2
1.8
.9
2.4
1.2
1.5
2 3
0
3.0
0
I ~ 5
.6
2 '
3.0
~ 3
~ 3
TotalClearing
T imeln PGA Zone
Hours
1.8
2.7
3.6
1.5
2 '
3.0
1.9
2.9
3.8
Tota I
ClearingTime
for roadHours
1.8
2 '
3.6
1.5
2 3
3.0
1.9
2.9
3.8
~ 3
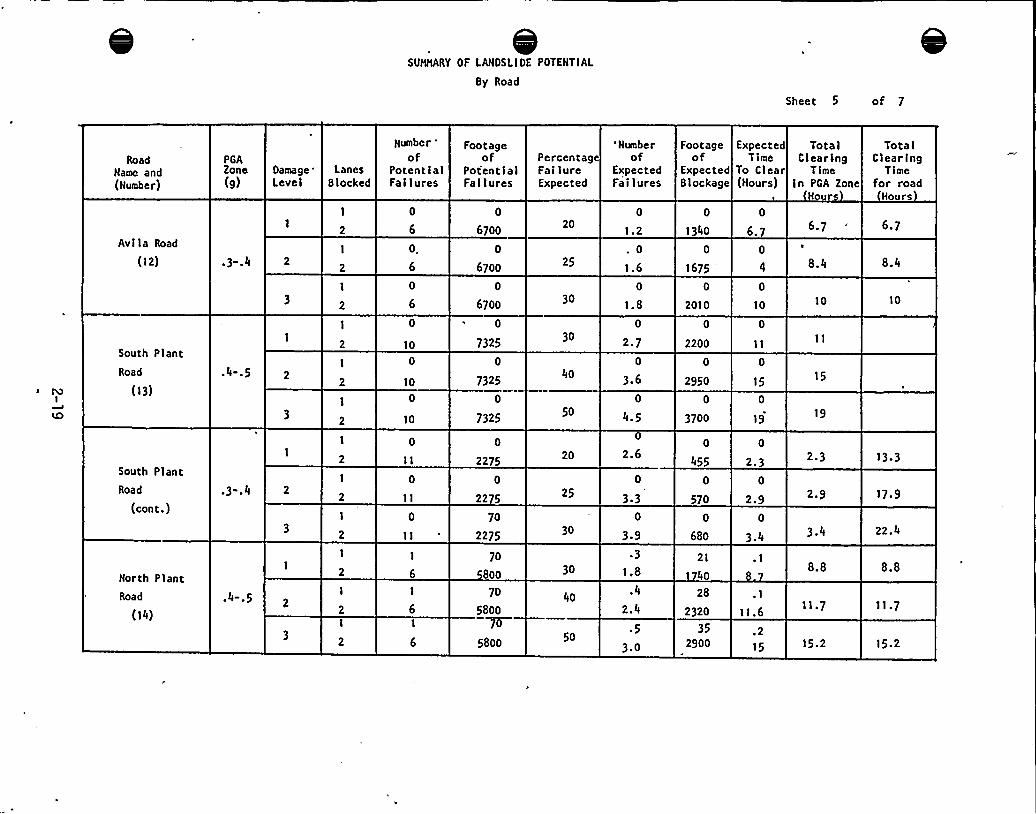
SUNNARY OF LANDSLIDE POTENTIAL
By Road
Sheet 5 of 7
RoadName and(Number)
Avila Road
(12)
South Plant
Road
(i3)
South PlantRoad
(cont.)
North PlantRoad
(i4)
PGAZone(g)
.3-.4
.4-.5
.3-.4
.4-.5
DamageLevel
LanesBlocked
Number
ofPotentialFailures
0.
6
10
10
10
Footageof
PotentialFailures
0
6700
0
6700
0
6700
0
7325
0
7325
0
7325
0
2275
0
2275
70
2275
70
800
70
5800777
5800
PercentageFailureExpected
20
25
30
30
40
50
20
25
30
30
40
50
'Numberof
ExpectedFailures
0
1.2
. 0
1.6
1.8
0
2.7
0
3.6
4.5
2.6
3 '0
3 '~ 3
1.8
2.4
.5
3.0
Footageof
ExpectedBlockage
0
1340
0
1675
2010
2200
2950
0
3700
0
455
0
570
0
680
21
1 40
28
2320
352900
ExpectedTime
To Clear(Hours)
0
6.7
10
15
0
19
0
2 3
0
2.90
3.4
.I11.6
.215
Tota I
Clear ingTime
ln PGA ZoneHour
c
8.4
10
15
19
2 '
2.9
3.4
8.8
11.7
15.2
Tota IClearing
Timefor road
Hours
6.7
8.4
10
13 '
17 '
22.4
8.8
11.7
15.2
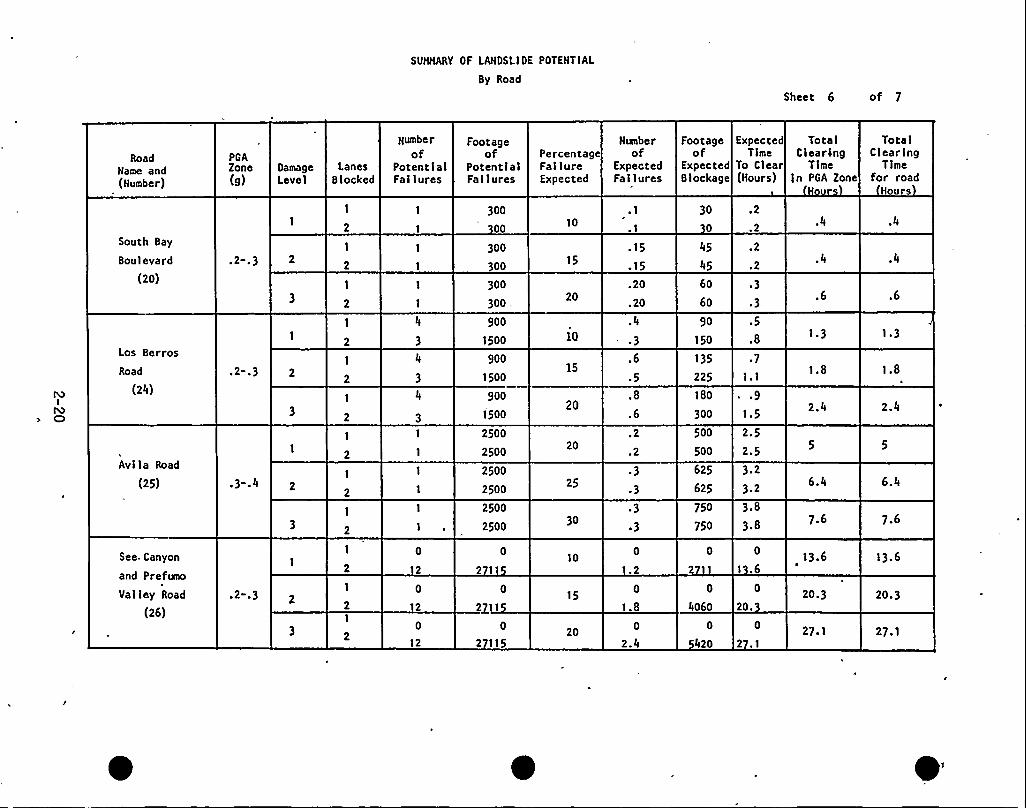
SUHHARY OF LANDSLIOE POTENTIAL
By Road
Sheet 6 of 7
RoadName and(Number)
PGAZone(g)
DamageLevel
LanesBlocked
Number
ofPotentialFailures
Footageof
PotentialFailures
300
00
PercentageFa I lureExpected
10
Numberof
ExpectedFailures
Footageof
ExpectedBlockage
30
0
Expected TotalTime Clearing
To Clear Time(Hours) ln PGA Zone
.2
Tote I
Clear lngTime
for roadHours
.4
South Bay
Boulevard
(20)
Los Berros
Road
(24)
Avila Road
(25)
See Canyon
and Prefumo
Valley Road
(26)
~ 2-.3
02 .3
.3-.4
~ 2- 312
0
12
300
300
300
300 „
900
1500
900
1500
900
1500
2500
2500
2500
2500
2500
2500
2/i 1
0
2 115
15
20
10
20
20
25
30
10
15
20
.15
.15
.20
.20
.4
~ 3
.6
~ 5
.8
.6
.2
~ 3
~ 3
~ 3
0
1.8
0
2.4
45
45
60
60
90
150
135
225
180
300
500
500
625
625
750
750
2 11
0
4060
0
420
.2
.2
~ 3
~ 3
~ 5
.8
~ 7
1.1
~ 9
1.5
2.5
2.5
3 2
323.8
3.8
0
1.60
20.
0
2 .1
.6
1.3
1.8
2.4
6.4
7.6
13.6
20.3
27.1
1.3
1.8
2.4
6.4
7.6
13.6
20.3
27.1
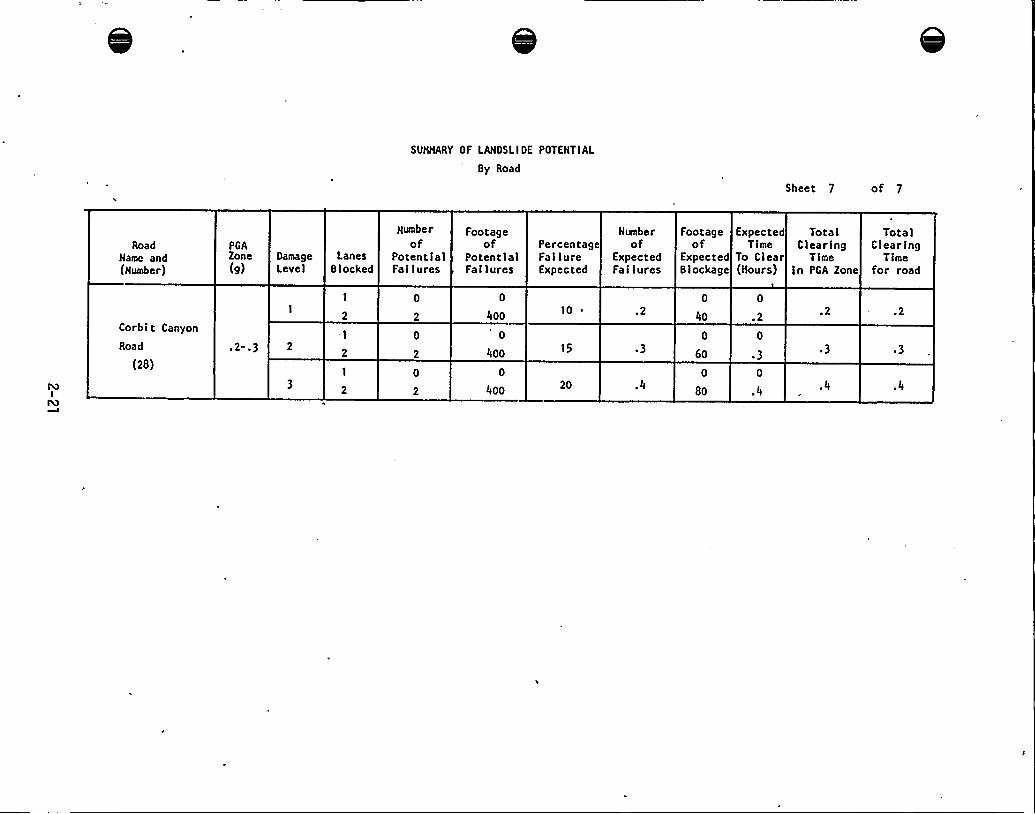
SUHNARY OF LANDSI.IDE POTENTIAL
By Road
Sheet 7 of 7
RoadName and(Number)
PGAZone(g)
DamageLevel
LanesBlocked
Number
ofPotentialFailures
Footageof
PotentialFailures
PercentageFai lureExpected
Numberof
ExpectedFa i lures
Footageof
ExpectedBlockage
ExpectedTime
To Clear(Hours)
Tota IClearing
Timeln PGA Zone
Tote IClearing
Timefor road
Corbit Canyon
Road
(28)
.2-.3
0
400
0
400
0
400
10 ~
15
20
.2
.4
0
40
0
60
0
80
0
.2
0
~ 3
0
.4

2.3 SUMMARYOF LANDSLIDEPOTENTIALBY SITE
2-22
TERA CORPORATION
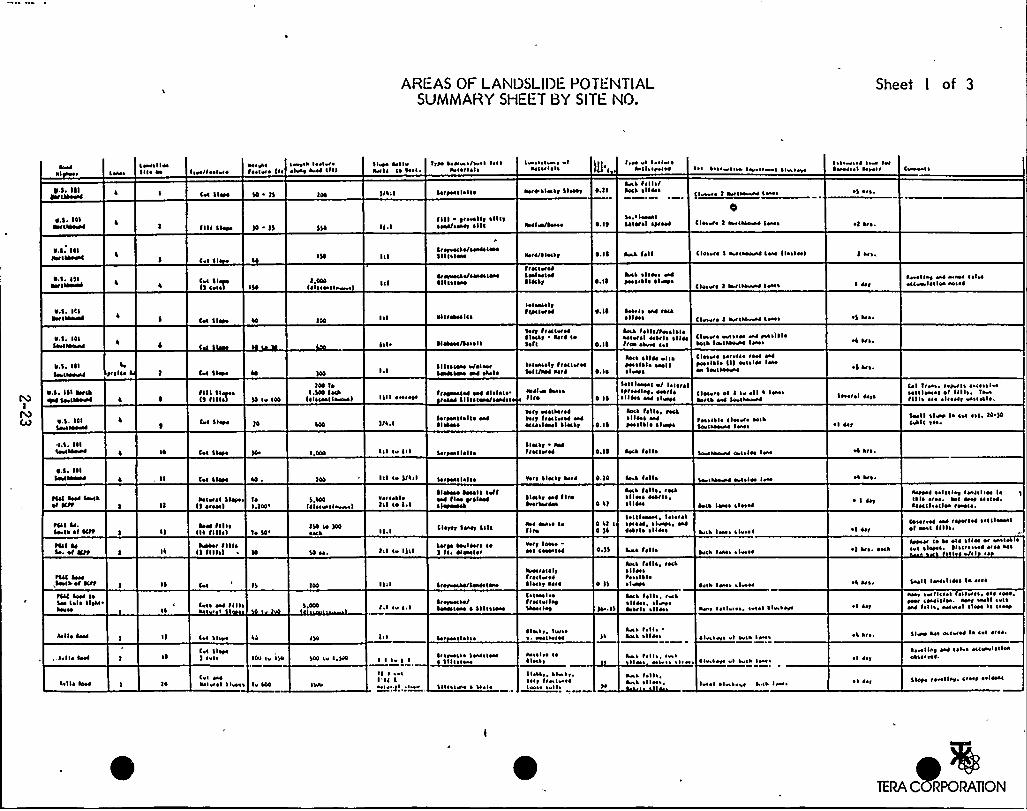
AREAS OF LANDSLIDEPOTLNTIALSUMMARYSHEET BY SITE NO.
Sheet I of 3
~eso~ I ~
I S. III0«ILOO«4.
1Wo~ Ws I 1 44II I~ 14 Itt»/toot«a
Cel Sl«e
1s t ea IIs«et ~ C ~ s
)0 )S
cw<le Ioecvo~ Iwy a»4 It<i
'll«N kite«N I ~ c ~ 1< ~ ~ ~
)/~ il
lire loot»L/ceil I ~ actat ~ it~ I~
~orreal I el I~
1 ~ t ~ ce r I141 ~tl~ I~
4<Pal«ar SION< ~ .21
late ~ I ~ el»41 ckieocoo
~esa toll~ /loc ~ s Ilats
I ~ C St ~ twc ae tk \ ~ ~ ~ i
)lwete \ a«csw»N iws
I~ s ~ C41 a tw~ WWt~ I ki it
~I ars.
Ctwwc s
0.$ . 1410«1 tao«4 <I II Slots )S IS.I
III I ~ Otaeall ~ ~ II<I~ 444/sos<< ~ I II Ilea Iee/Ow 4 0.1)
lo 'leasesSal«1) St<N1 Ctwve ) «N<ssow lw, ~I ka ~
KI. IOIk«cLO«<c4 1$0
Itarso<la/«44SIWSl I I~ Iwe kot4/INCL< 0.1$ OKL Csl I C14s tt I «Nisse»eo lees CI ~OIN) 1 ks
1.$ ~ Ill~Vlsseee<
Cel SlaysCS cela) 1$0
).000C ~ Is<wct ~
~/aye«La/SWSI«NIlllsceao
t<KI«44leslasce<~ l«ly 4.II
kaa ~ I I4es 441tws c ~ I~ ~ I»as
CSN«te ) kt <COO»»4 I~ I 44<4,elias eas ~ eat ~ ~ 1stK<wl~ 1144 avoa
1$ , KIIetllkeee4
1.$ . IIISaeilaeeoo
0.$ ~ I~ I~a laaaa<
1.$ . Ill0«4~ Swcsoa«4
1.$ . KlSeel Laa«4
4. ~ . I~ Ilee<la««4
~tylca
14
CK ~ l«o
Cet Itoys
II I I ~ loyosCS I I ISO)
Cec Slots
CQI SI«e
14 ae 100
100 loI.SOO lock
I~ Iscwileww)
1.040
)il~
I)il owtale
)/L.I
Ill ce ill
SIC<40«l<o
~toae«/locals
~ Iilsloao 1/slee<~ca<as«a «a4 41st ~
t/eaoaalo1 W ~ I ~ lal~~ oi44 II Ilalw/awol
loryoaal ~ <C ~ W~ Isa«o
leis« I I~ I I~
lalsaklrIrk<lars<
yet< tro«ere<~ 14CL< 14<4 lo$44
Iaiwsaly <to<ceres~el I/144 14<4
i«<lee Oasisy lre
~ory wockrs<Wtr 4«leis< oaoKcNINOI ~ IKL<
~ loci< ks4<itel«a<
1.1 ~
0. II
O. I~
41 ~
O.i)
O.II
4atl ~ W <KL~ tikekca tolls/teasingas<Otal 4oltl ~ ~ Sloetree saws 4 I
~ era I atrtaawao leNS
~K~ ~ IIN ella~Willis laail~ Iowa
Claceta So<trit t4« W~assi ~ I~ CI) aN ~ loa less~1 Swiss«ON
Sollloesal 4/ I~ iotal~ ttss<la< 44<1 ~~ liats w ~ loess
ktca 41< ~, tecL~ 11<el aal~4S I I~ I~ ~ Isots
Closero al I ce ~ II ~ Iws~at<1 ae< Ss csw«N
toast ~ I~ clos«4 lai114ecaoaeN liats
~or.L 4ll~ 14 cta«44 4 <OIN Iw
Classis «4 ~ CN eao tessl ~ I~
~oc ~ sa casa«4 lose ~
~I ks.
~I ks
~ I Ltl
lateral Nt~
~ I 4sr
~0 Lts ~
csl Itws ret«rc ~ tact«i~oiilaeoal a« ills, la S
I I I la ~ t ~ ~ I«So ~ eat C el I~ .
Swll ~ Iw I~ c I ~ ii. 10 )0C«LIC IN
0.$ . I~ S
los<la«eel
~441 ONO lac<1~I Ktt
Cel Sl«o
~sietal Slate ~ I~1$ arses) 1.100 ~
$ . LOO
illscos C I cows )
Ill le )/Iil
e@t s os I~)il lo ).I
loryoal 1st lo
~ l<OW 4tall leftWO flN 0<4140~ lateoaak
1st ~ ~ I«sy Lai~
~ lesly ea4 tireWrle<44
0. 10
4 4)
~a ~ I el I ~
O«s 411 ~, rosa~ Ilva 4«I ~
~ 114O
14 case«so ~ c ~ IN Iw
~4<1 lws close<
~1 ks
~ I 4yksewo sal ~ clos Isaoili« laial ~ otto, lac Nw sot<os,ka<llrscloa teaec ~ .
tS<I 4.Cocle ~I Klt 4«<I II~
Cll <lllsl 14 $4'$ 0 N )00 Clover SW<r Sill 41 owsa Ie
tire44) s
I )I
'lail losses. I«siss~ Stoa< ~ I«as W44 ~ I ~ ~ llks ~ec ~ Iws clelol ~ I 1st
yeso<too W reyeri44 Sei tlaeeal~ I «Nl IIII~ .
~4) 01So. ot t<tt
tSCC INO,leeia ot Ktt
~QC 444 I~Sae 1st ~ I l
sac'ww
IS
IS
~OON< <III~
C) llllsl
Cec
Cei ~ W IIII~
~ t
$0 44. lil Ce l)il
I. ~ Ce I ~ I
~vya akl«ts loI Ii. at«slot
~ terse<44/1444 CW
~ tare«se/~444ceaa 4 llllskea
yott lo«o ~
Nl CNwla<
Iaeitai ~ I~<i«i«so~ IKL< 1st ~
la<W< I e1
4K<atlasSLN< lay Sv ~ IS
SeaL tell~, re<a~ I I NO ~ I»esOoatl ~ ~ Ilats
0 )S ktca 411 ~
KNL 411 ~ ~ ra<1~ ll<es4ssl ~ I~~ Isays
~4<1 IWO el»44
aeia lws syweo
aw toil t ~ ~ . <ec ~ I Ll»Lese
~ I ka N<1
~ 'I Its ~
~ I 1st
~ I~ ~ IIN ar « ic ~
ce< ~ loyes. ~ I ~ iroisoo stoa 1<sIlls /rl
leal l l«NLIINS Ia ako
taat svttct ~ I lail tts ~ t ~ tws~ev cwstctw. wt cwts c I~
«N loll~, assai ~ I ~ lees is <t«4
kilo Iw 1st llese I is loi i<~ is ~~ loss ~ . Iwto~ ON C k t« IL
1«L tall ~ ~
1«a ~ It<Os ~ I»sets I swa lws ~ 1 ats. Stela INs ol< tt1 11 cec Ores,
le I I~ IN<
ltll4 Ie«
I~
la
Cel Slays) cet ~
Cei ~III~itet ~ I ltwes
IDti I IIS
Ie LOO
$40 ce 1,1<4
Lice
ll s ~
ill<~t I ~ g I ~ t NN
~ toteKLO los<close~ lilt~ iw
Ills~ ieae ~ loci~
res ~ itt C1~ Is<st
I I ONt. ~ I» s ~ .lot ~ I<wc tooiwse soll ~
1 ~ I~ II~,awa ~ I lks, I i~ I ~ I ~ 4< ~ C1 twt
1«s toll~, t»sli4ei oes ~ ~ ~ tt ~ ~ ie ~ ow s s ~ t le«s ~ I Nt
~ I 1«
~ o ~ lcay w1 ~ st ~ Kcweloclw41«iff<
stats ~ 4to liar <rett telo«i
TERA C RPORATION
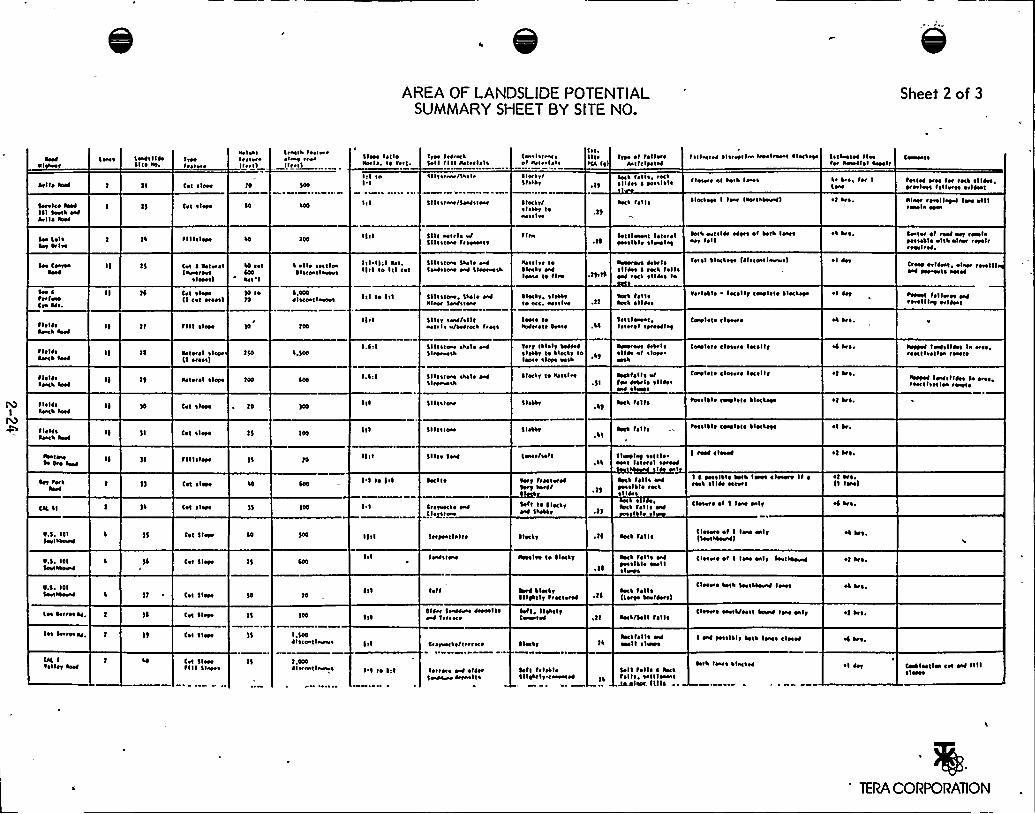
AREA OF LANDSLIDEPOTENTIALSUMMARYSHEET BY SITE NO.
Sheet 2 of 3
~eobal
h I I~ anb
Sonics tsebItl Seet1 Wha I I~ tees
Ia» I lear< I<to5 I < ~ ae.
Irtsr<sawr
Cr t ~ IOar
Cvt ~ lots
a»less<nave(«t<)
fo
~0
lf I<1 trsawr lint I~ II~<as<I ~, I~ Tstl ~
III raI'I
Irrt I<bractSoll <III <etttl ala
<Iltaawf/lasl ~
Sl I IK<wt/5W<wwr
1» a< ~ <veret af< ~ I~ I ~
~ lof ~ ~ /5 lark<
fleet</~ <star loa»<tlat
1st,II lana (1)
~ lt
Trro of fallenistic<a<tet
axt loll~, roc<~ I < b st ~ tea a I ~ I~
1rct tell ~
I ~ <<astra ala<Mr<as <aMla»al ~ IS<tote
t<saart et seat lo»s
~ IKIOM I Io» (OK<Its<re)
St<<astro lies<er aa»CI ~ I ten<<
I~ ts,fvlIsf»
~ f an.
Cwwwt~
tattoo o<M fv tKS ~ llbet~<tales< <el<Orts tribes<
alav revel(OMI lose villtwla atra
SM Srl ~~M 0<In
See 1~wfweCta sbs.
1$
)4
II I I ~ lobo
cet ~ as<vs<(a<Mat<ra
~ <trot)
Ce< ~ leer() crl vest)
Io cst400~st'I
)0 toTo
1 all ~ <Mlles0 I Kva < Ia a<sea
4.000~ <scca<<a»M<
l<l~ II:I ast.II <I te 1<1 tel
I<I I~ (Il
511< Mnl~ <4Sll\ ~ <a» ffseaMI~
5<ltKW 5tel ~ Oal5oat ~ <sao w st<awe<a
511< ~ Iaaf, Srel ~ Walso< SW«owe
I i<a
as<tlat I~~ Irtsr WIwws la llaw
I<sett, <IONTIo occ Mlsln
Sr<<IMMI lots<el~os<111 ~ el»atlas
~aaerae tetr I ~
~ I<bee 0 rect I~ II~~OC ~ ~ I<AS I~
~ect tell~~Kt ~ Ilare
OK<a ort ~ 14s obvt o< Iet1 Ia»s~f< foll
local ilectrM (tlscoat lasers)
Ts<lstlo IKellftwl~ I~ ~ lac<off
~I 1st.
sl Ar
al Av
Coo<A of <Mb aef rassle~tnotl~ »111 a<acr rent ~~OMlrsb.
Cron t<IAat, alar< rwel f1~ab tot MI~ <et tb
~teen tello et Wraft< 1 1st MIAOI
~ lolAta»t tas4
fit IA~Snt tan
T I~ IA~snt <sob
I I~ IAtent IMT
15
11 II ~ TOOO
Te Iwo I ~ loof(I ores<)
aster ~ I ~ lese
Cet ~ lore
)0
10
~,)oo1,4<I
I.Sat
Sll<r <sat/sillastrl ~ w/Sab<ect <ma
Slit~ ta» <4le WS iota»at
SII< ~ <ee stol ~ oab5 I saw»at
5111 ~ loaf
loots I~ao4<<sl ~ Orate
Trrf It<alt ie44rb~ ION< I~ Noes< taleoat clots Maa
~ Iactr C ~ ata ~ 1st
1 IoNr
,15
.51
.15
Sss ~ TMsac,lettre< st<rob<sf
~w<M< At<I~
~ I Ibr sf ~ lors.~es1
~ecttel ls»//M 4M<I~ sl lnsW ~ <ws
~ect foll~
Cear1 ~ I~ t <Me< s
Cwl<f~ closets <Mt<if
Cw1st ~ c lesr<r lect< lr
~et ~ lil~ Coral ~ t ~ ~ IOCISM
at tre.
<4 a<sr
~I I»1.
~I In.
Irrtsb IKAIIAI la o<M~<KII<olla< <Iwrl~
<roost Iw< I<A< Is sass,<oK I I<st l<w fwas< ~
I I~ 1st~sacs tee4
<<sate»~s Ore IOM
~or toft~as4
Cat tl
~ .s. 101SM<stavab
)5
Crt ~ 1sM
1 I I I ~ lore
Cet ~ IOM
Cet ~ lore
Cet SIOM
)$
)5
I I I~ Ial
1<11 ~ <ear
St<tv SW
~e< I I~
Crsranso WClslw<w»
5t<TMIIOII~
5 laNT
least/Mtl
TKT t<KIO<ot~ttt lett/
Soft tt ~ fact<W SOONT
~ lactv
. ~ I
.14
~act All~
5 twist sot<It~Mc Iotttel stfnb
I os I
tact toll~ Wloss< ~ le rect~ I<A<
tnt fell~ WI lo I
tact fel I ~
~ettlil~ Cess< ~ I~ ~ leCtstt
I vasb ~ IOM4
I ~ TOM<~ I~ OM1 IMM ~ Ion<a I ~ ~~Mt ~ I<A Mtvt
Close< ~ of I Iw soir
C lasers of I Iae soir(In<ate<re)
~ I I»,
~ I 1rt.
~t tn.(I <Me)
~4 1<1,
ot trt.
~ .$ . 101Seataaew
0.5. 1015or < Meawb
Cst Slats
Cec Slots
15
To
IW<«f»
jeff
rani<a ta 0<OCtr
~t<4 i<oct rI litt< tv fr eC<sreb
~ ll
.t4
tact fell~ oaltet s I1 < ~ tao I I~ I»M
tnt till~(lsrM tc»14erl)
C <Mr<a ~I I IOM Ml~ SM<sbaW
Clttwr Or<1 SM<t<OW least
ol 1»l.
oi a ~ .
CM ttftti4,
IM 4<<M ab,
C<C Iteller tees
Cst ~ leer
Cot Stove
Cst Stars~ III St<MS
1$
t5
1.5004< ~ <0 I<sears
1.000~ lafw <lwfws
I at
I'I t ~ I<l
014<r IWb»» Are<It<~«4 1<f<Ko
4 < O TOM N/IK< KO
1K<K@ W tlbv1<abc»a 4<ra<I I ~
a
~a<I, I lots I1Csea te4
~ Tacit
Iotl trloilollITMIT <vv<<4
ixt/5oll tall~
tectfall ~ W~Oe II ~ lwe
loll foll~ 0 tactfoll~, tel<loess<~+(sat„ f((l~
Cia<Oft corti/Os<I tfa<N Ia» balt
I W OK<I~ It 1st ~ Ives sfMOI
tv1 la»t ~ lac lob
~I 1st.
OS In.
~I 4er Cast<as<les tet W IIII~ IMM
TERA CORPORATION
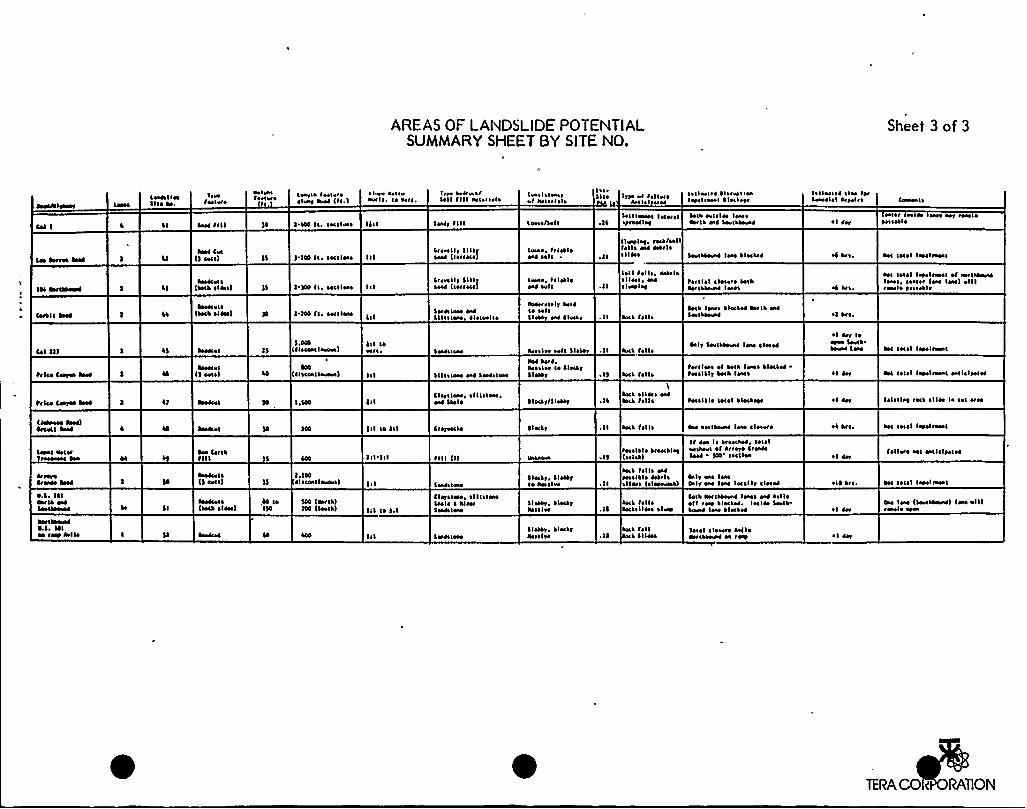
AREAS OF LANDSLIDEPOTENTIALSUMMARYSHEET BY SITE NO.
Sheet 3 of 3
Cal I
lw»I I»'III~ W.
Srto4al»fe
~se1 IIII
stirs ~
Iaolwa conte I»lots~ 4oa esto l/I.l
I 100 gl lacll»s
Irwin
4ttvowl ~ . Io Tell ~
Irre 4ettoo/Soll gill aotots ~ I ~
Iwrg gill
cos ~ I ~ IRRr~ I atlttlau
leon/loll
I ~ IIII~
11
Irn tn garrotea ~ lcl stoa
Stu1»»l Swot ~ Iotto»In
I~ Ilet I t1 ~ I~ r» I r soloeo I rotor ~ l oct alt
Isla 41 ~ I» IRNC~Nta etc S»tlknoa
I~ Ilotlra II» INloeoel ~ I arnln
~ I 1st
Cewea I~
~trot w» onr etr nn ~~tss»I ~
lose Col)) cecal
~taster ~
isola sl ~ ~ ) l5
)'100 II cacti»s
I )00 4. socsloas
Cottony Silly~soa lr~ trace)
Crttrll~ )Illyual )lactate)
Swee. Itloll~W soll .
lowe. Irloll~~ao sou
IIWln. twa/nil411 ~ asc Aarl~
s I lots
loll toll ~ . »NIL~ II»I ORI~ lwe lao
Stvlaaana loot ~ lecto1
~soll ~ I closet ~ lolaONISWNN least
RS arl.
~I Nl.
wl IollI Ienlrooal
Wl 1st ~ I I»alto»I og»tlnarRIIrnt ctalst (ote uet) Rillr»slo »cull~
Carall ION~so»el ~
IWA ~11») I 100 4 ~ stella» Sra»INN toa~ 1st ~ ton ~ I~ coal to
w»tot~ Ig aotele lollSl otn ~ loess .21 awl I~ II~
~OA lotos ~ lottoc aw ta ooc1st IINOWS
Cal Sl)
~r lce Coarse loca
trice Cosy» area
~st»el
WOSCOII) coul
)5).000
1 1 I Icosi Iarran)
IIISel lcosl laooos)
1,500
lll lanrl ~ SRNstteo
~ 1llslooo Nt lens lan
C logs to». ~ I I tueso,wl Seel ~
a»tire so/I 'llssar .11
Wa INrc,aesrln le ~ localI)way
~ Iactg/S letty
Wcs 4u ~
~ocs 411 ~
\loca ~ Il»s ORIIou lail~
Soir sootasevN Iwo closet
totl loss eg lola loot ~ ~ locatetosslalg Sera loses
tessl ~ I~ 1st ~ I ~ Inane
~ I aty I~~aoe Sana.~oNN s»o
tl 1st
~ I 1st
~w ltl~ I Iwltoast
~w 1st ~ I I»sin»I aallclsoltc
I~ I~ riel rwa ~ Il» I~ tel N»
I»asses lose)Acell aso0 )ll ta Ill Crorowaa ~ Iwlg ~ocs 411 ~ ON aotueval IotN cltswo Wt Iel~ I I»el»»t
Nasl WINTtoocoeac Ioa
~ . ~ . I~I0NA ORIWouaotna
~et Cneorn~. ~ . Sllaa rW atilt
SI
~ea Car AIIII~wocoloSS cou)
lose»l I(IOA ~ Iw)
)5
)5
,la Io150
).100el scaal lso»s)
500 leans))00 Sl»la) I:I to I.I
Saaeslooo
C Ior Ic»o. ~ I I I~ leosleal ~ ~ M»rS»ostatn
S owl lose
~ Iwig, Citalyta awtln
II stay, ~ IOCS Iyesclro
sloatr. Slwlrassslre
~ ISrwsl ~ I~ at»cainIstical
loca 411 ~ orN~ass I ~ I~ AlrI ~
~ Ilwe I~ IooRNA)
loca roll~letllI lass ~ lwe
lor.a rolllees l llew
II aes I ~ at»cato, lol~ I~tslloot ~ I artoro Crea»Wa1 )lat oacllw
I lr NN Ioasly aoe loot lecally ~ lasso
leA awrlkostn Iws wl atl I~~gg ttn aleck». los l» WOAWwl Stot ~ leclo1
Toltl clowre at)I ~~NIOORON» rwt
tl cor
~ 10 ats ~
tl cer
~ I »t
golloto aal oslltlsalte
on local I»tin»t
on leos Cseotaaown) Iota «I IIroot 1 ~ eyes
TERACO ( RATION
2.4 DETAILEDFIELD SURVEY
o Reference Table - Landslide Site Numbersfor Critical Routes
o Pictures of Potential Landslide Sites
o Field Data Sheets
B-8I-227 2-26 ~
TERA CORPORATION
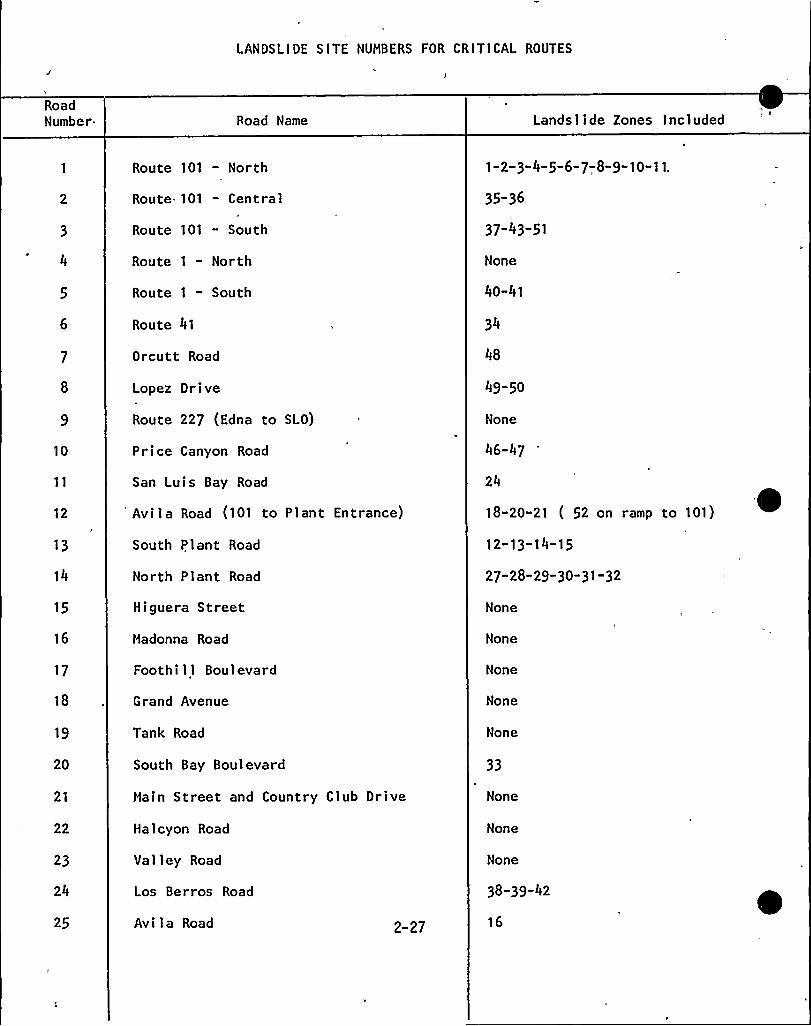
LANDSLIDE S ITE NUMBERS FOR CRITI CAL ROUTES
RoadNumber. Road Name Landslide Zones Included
4
10
12
13
14
15
16
17
18
Route 101 — North
Route.101 - Central
Route 101 - South
Route 1— North
Route 1- South
Route 41
Orcutt Road
Lopez Drive
Route 227 (Edna to SLO)
Price Canyon Road
San Luis Bay Road
Avila Road (101 to Plant Entrance)
South P.lant Road
North Plant Road
Higuera Street
Madonna Road
Foothill Boulevard
Grand Avenue
1-2-3"4-5-6-7-,8"9"10"11
35-36
37-43-51
None
40-41
34
48
49-50
None
46-47
24
18-20-21 ( 52 on ramp to 101)
1 2-1 3-14-1 5
27-28-29-30-31-32
None
None
None
None
19
20
21
22
23
24
Tank Road
South Bay Boulevard
Hain Street and Country Club Drive
Halcyon Road
Valley Road
Los Berros Road
None
33
None
None
None
38-39-42
25 Avi la Road 2-27 16
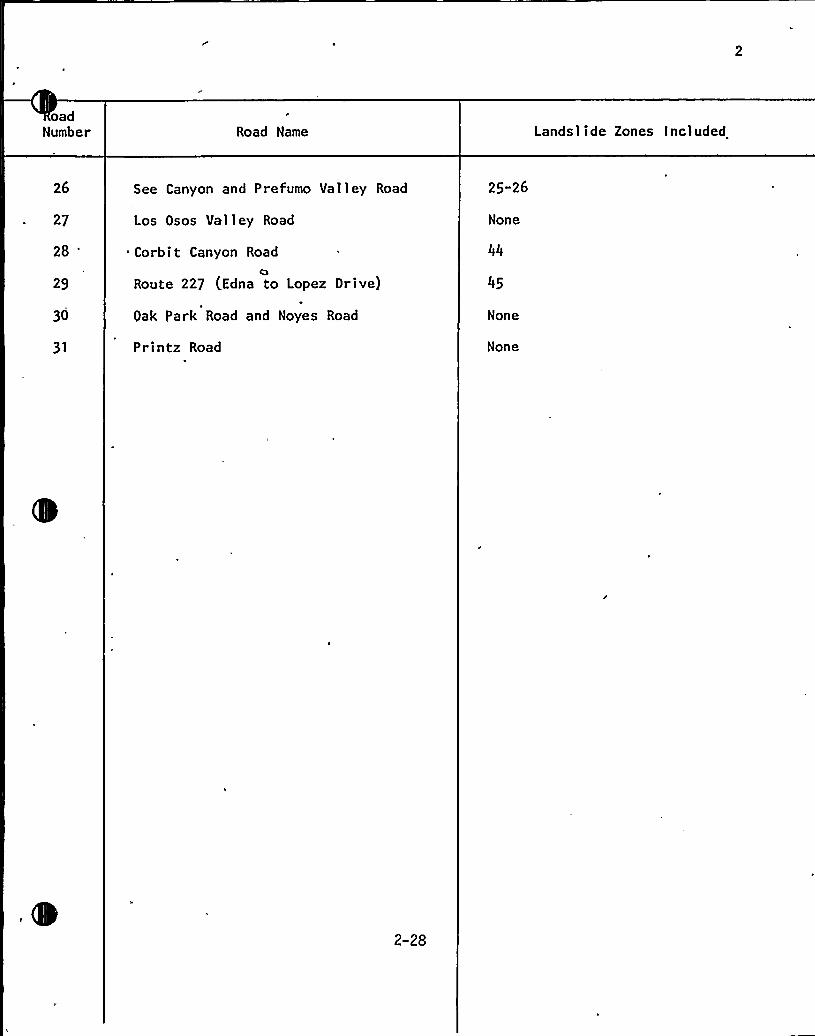
oadNumber Road Name Landsl ide Zones Included
26
27
28'9
30
31
See Canyon and Prefumo Valley Road
Los Osos Valley Road
Corbit Canyon Road
ORoute 227 (Edna to Lopez Drive}
Oak Park Road and Noyes Road
Printz Road
25-26
None
44
45
None
None
2-28

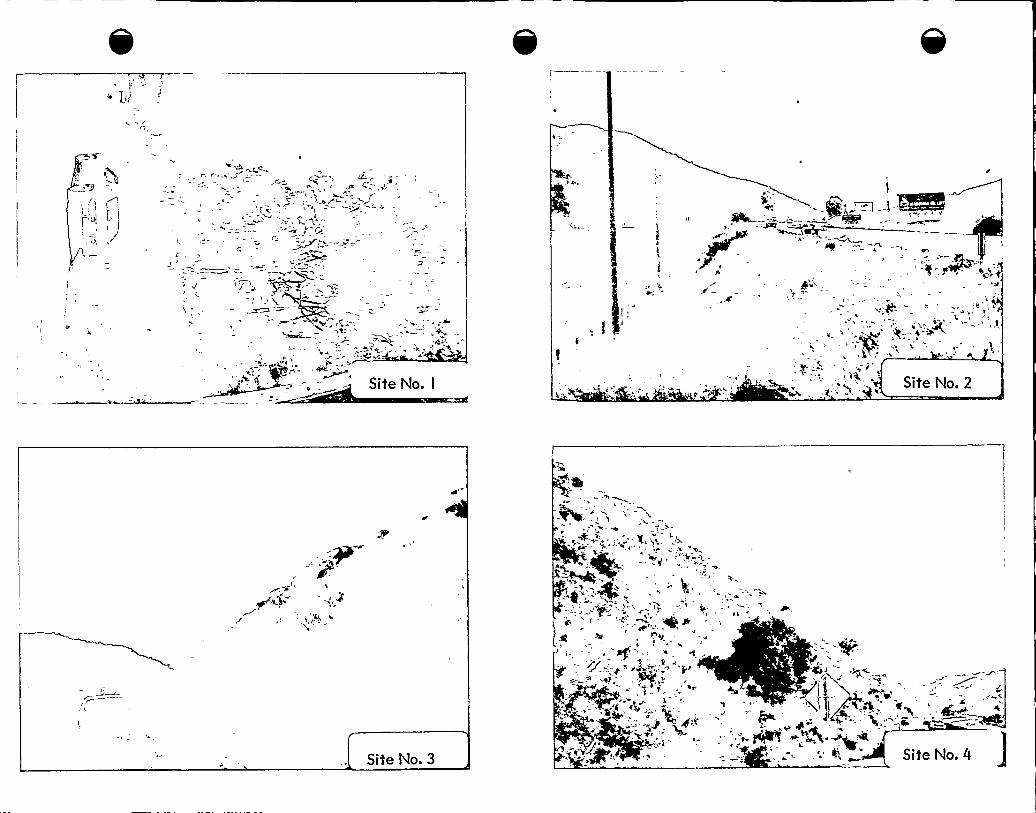
r
/''
'c „~
(
Ggh4 . I
Site
I
No. It y,
. ~ I IÃSII
1 I
Site No. 2L
I,
, I
, i~
Site No. 3
4'",
1
Site No. 4
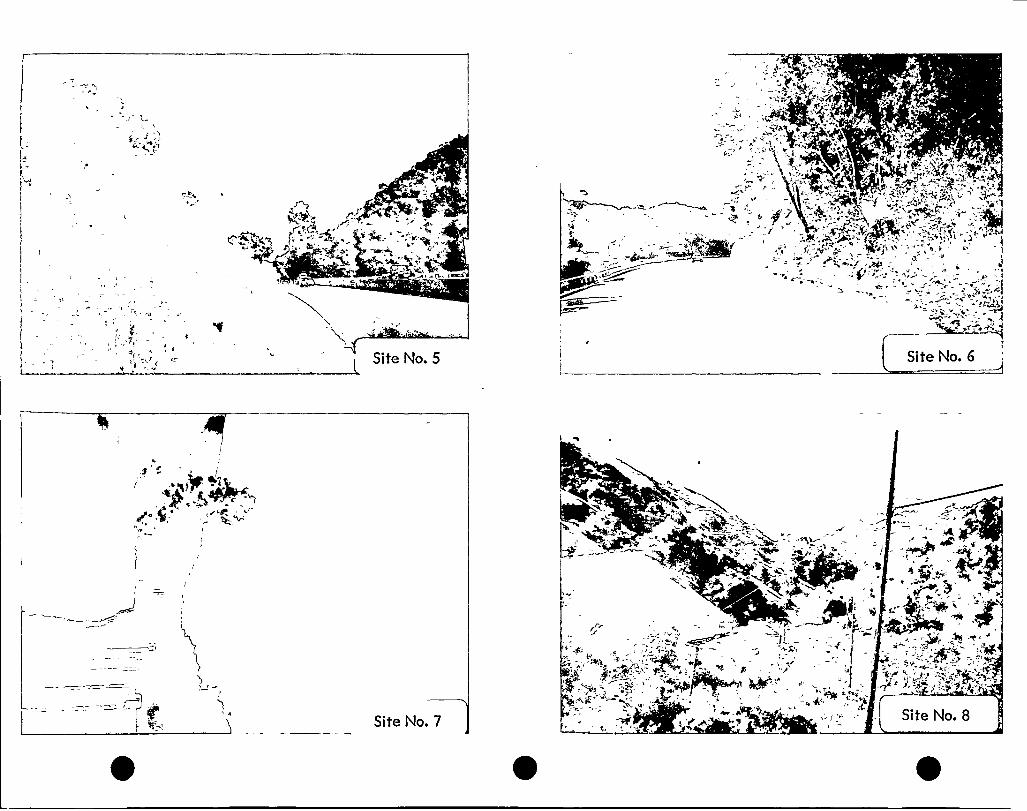
4
gt c
~lg+gp":"-j,
C.
Site No. 5
Z
*
Site No. 6
S
lI
v'
1
C.4I
gN~ 'la
y i'
'+c
I
Site No. 7 Site No. 8
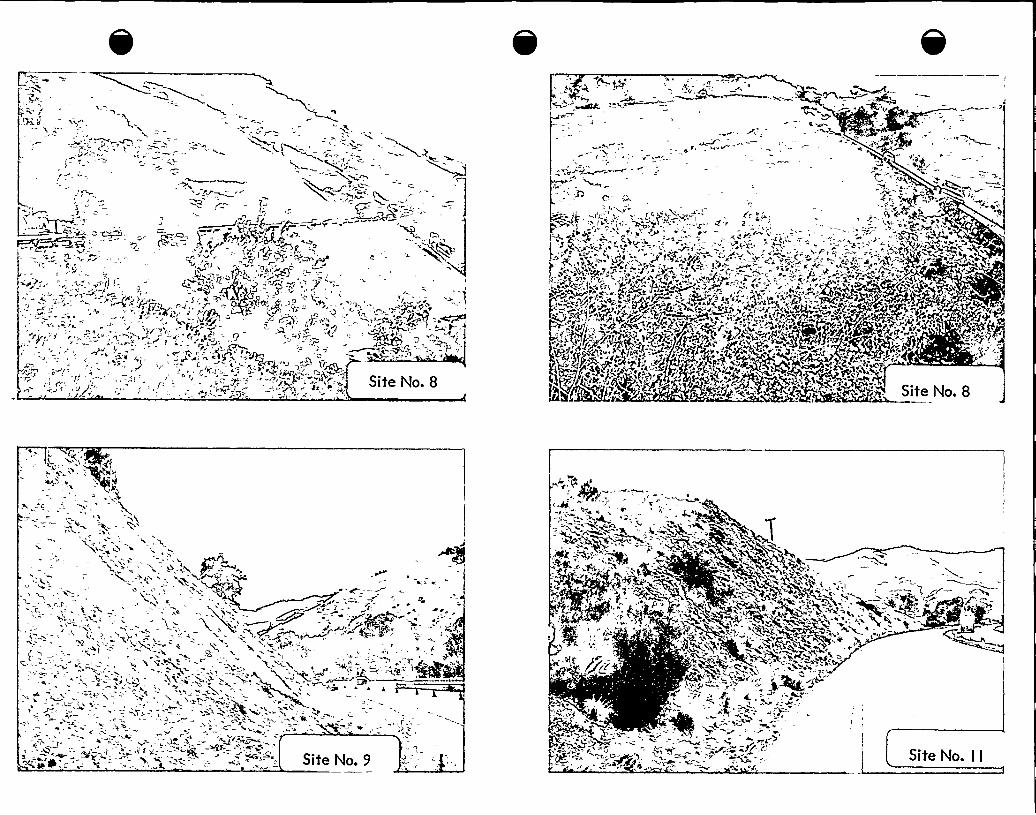
L-'.- =
't -,I
Lf, »
A
Jy \ ~ ~w, ~ LN
g C =+
I~ ~~
Site No. I I
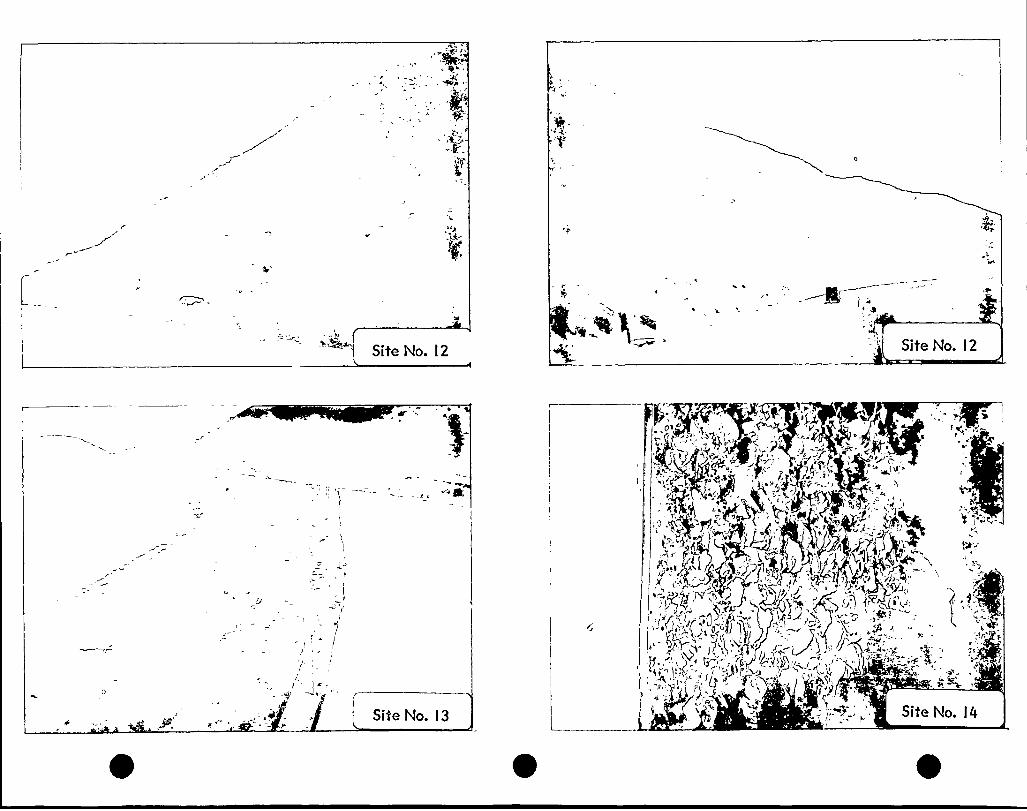
(
Site No. l2 Site No. l2
J
/
I
I
/
I
, I
P
Site No. l3
'E
~
! jf -I ).' ',,I „g... i'
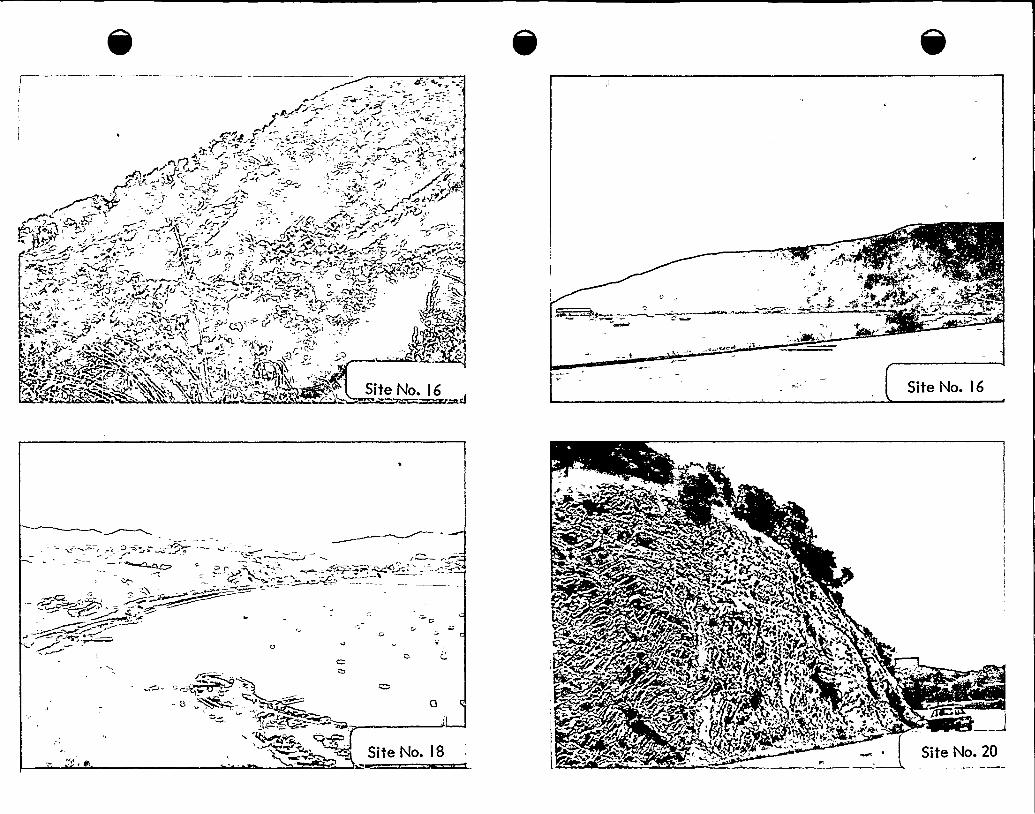
Site No. I 6
S>te No. IS Site No. 20
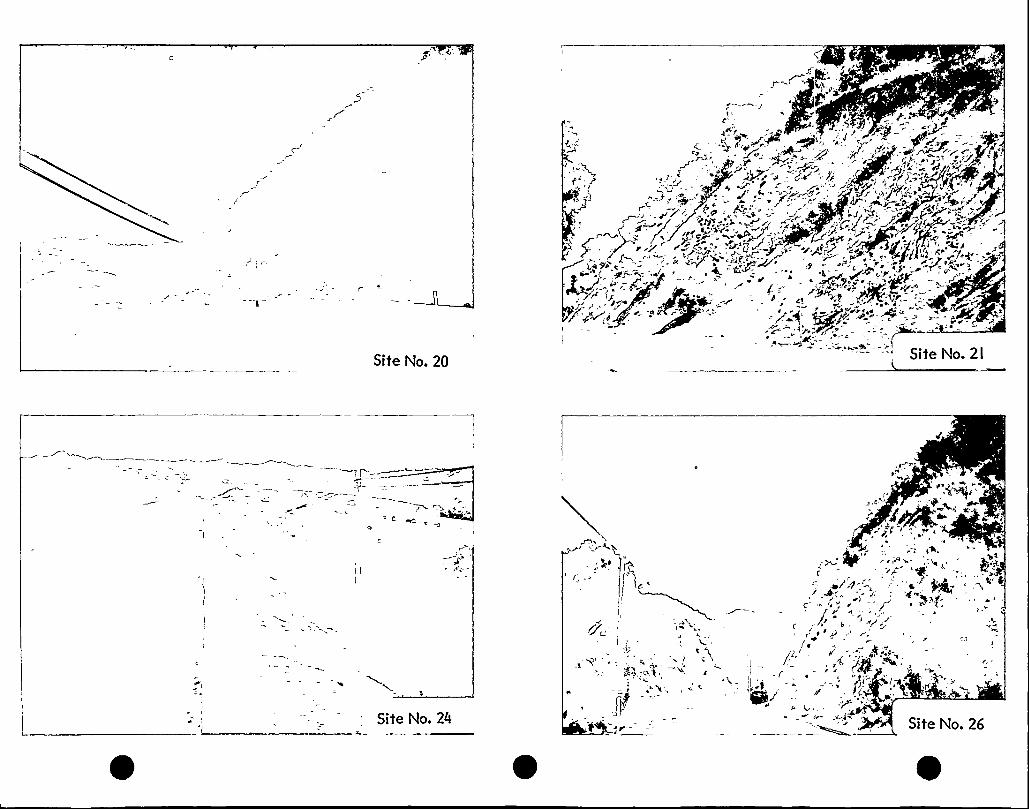
Site No. 2P
Site No. 24 Site No. 26
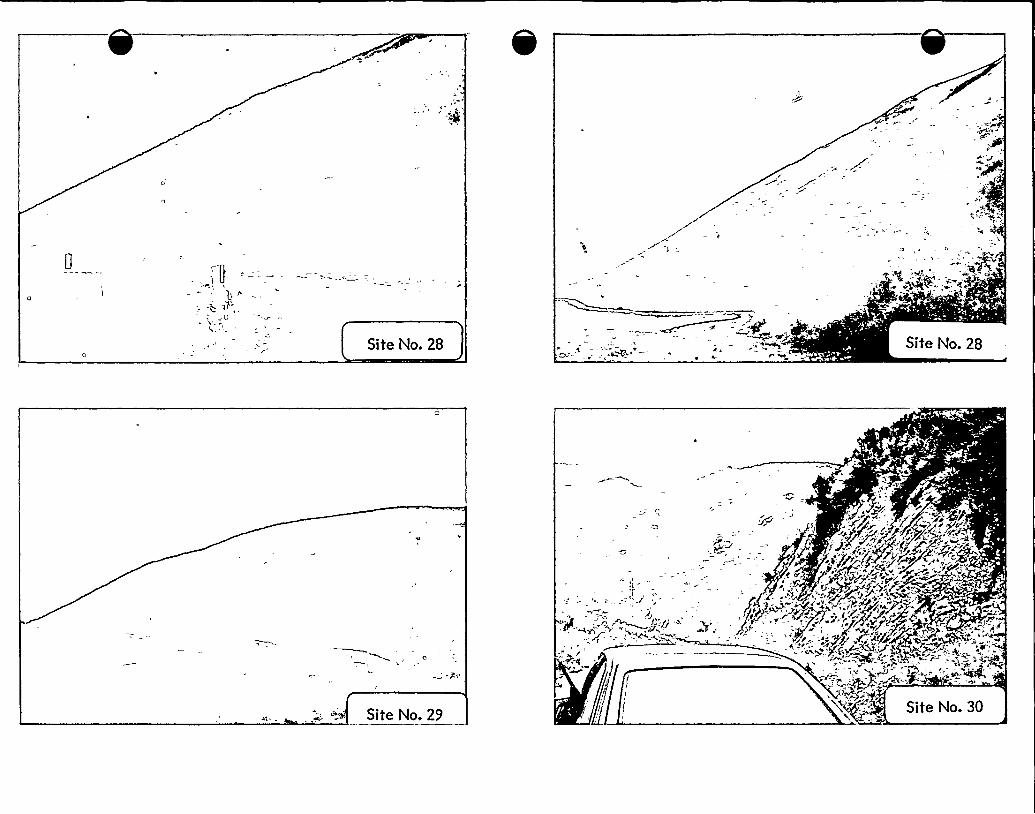
Site No. 28 Site No. 28
'4C
Site No 29
f;
' Site No 30l
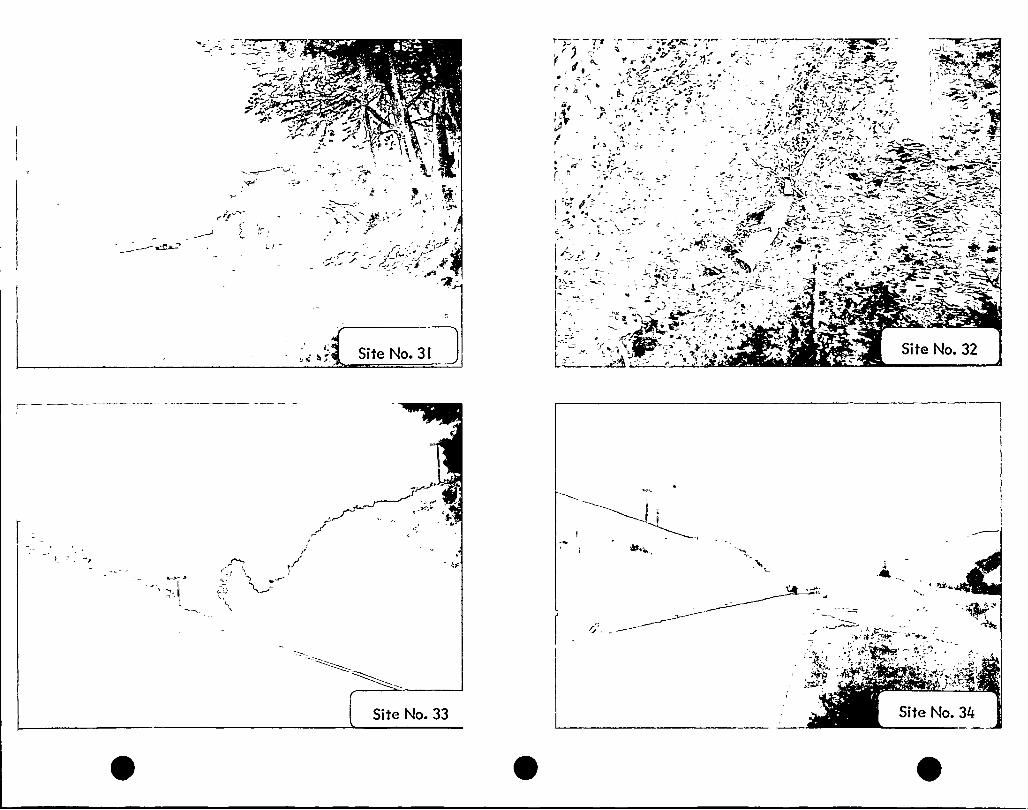
co < Cl
','P
I'
I
/
Site No. 3I
*
4 r~J ~C It
I'I
~4"v ~
~ ', - g h
Site No. 32L==- =-m"
EF
4-
A,:F
Site No. 33 Site No. 34
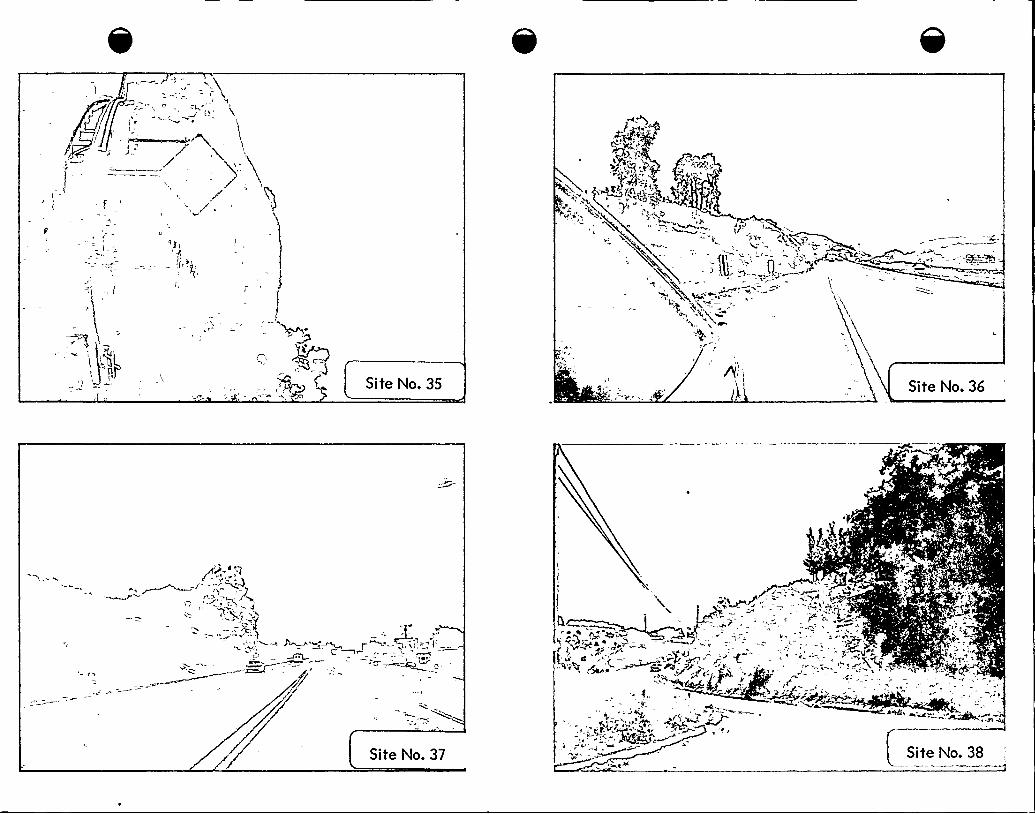
Site No. 35 Site No. 36
Site No. 37
..J..
b.
,~ ~
s
Site No. 38
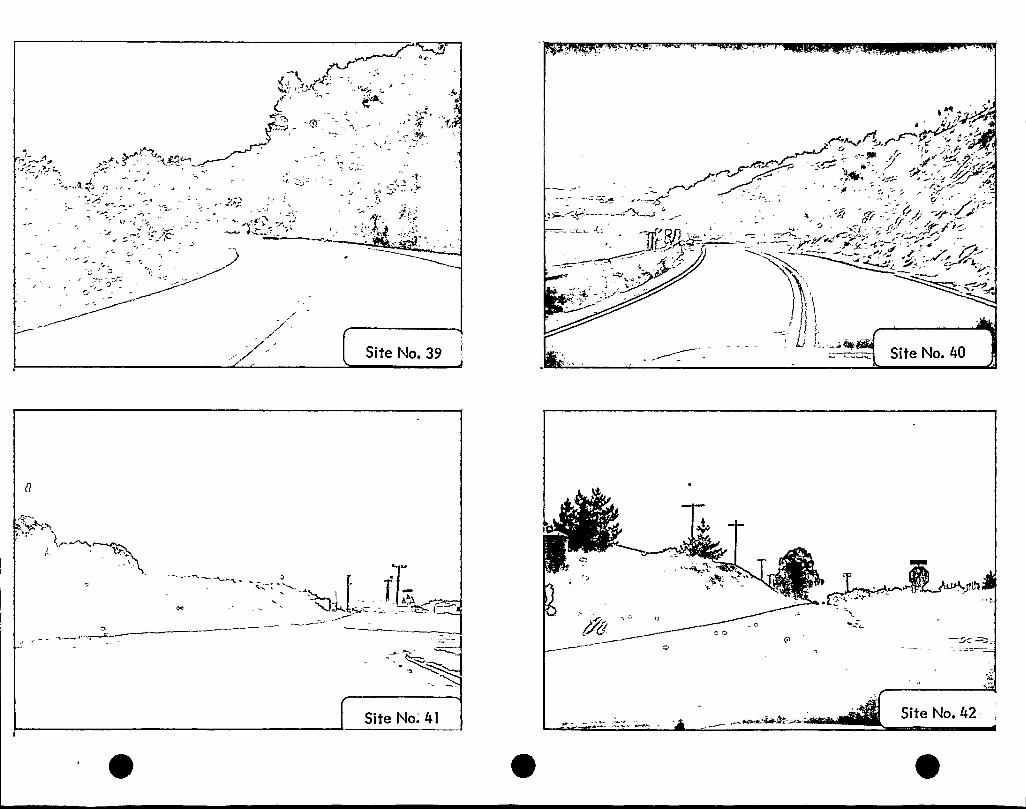
Site No 39 Site No. 40
FA<
Site No. 4l Site No. 42
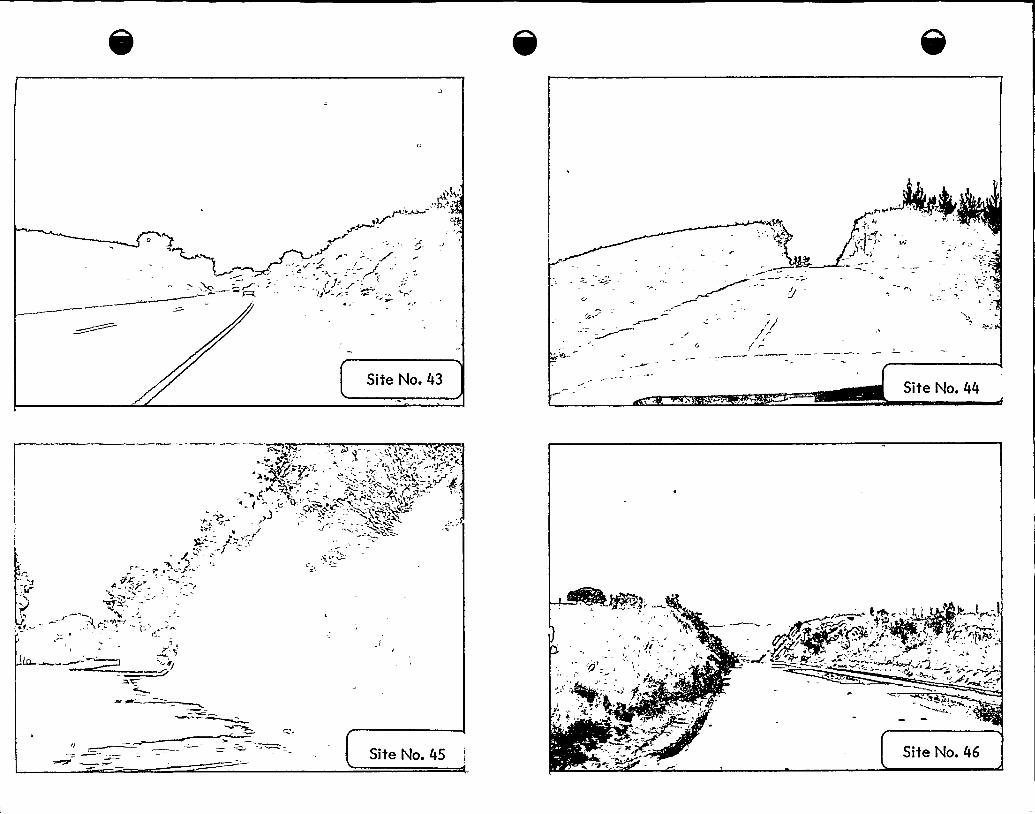
Site No. 43 Site No. 44
Jg C~
li f.
f
Site No. 45 Site No. 46
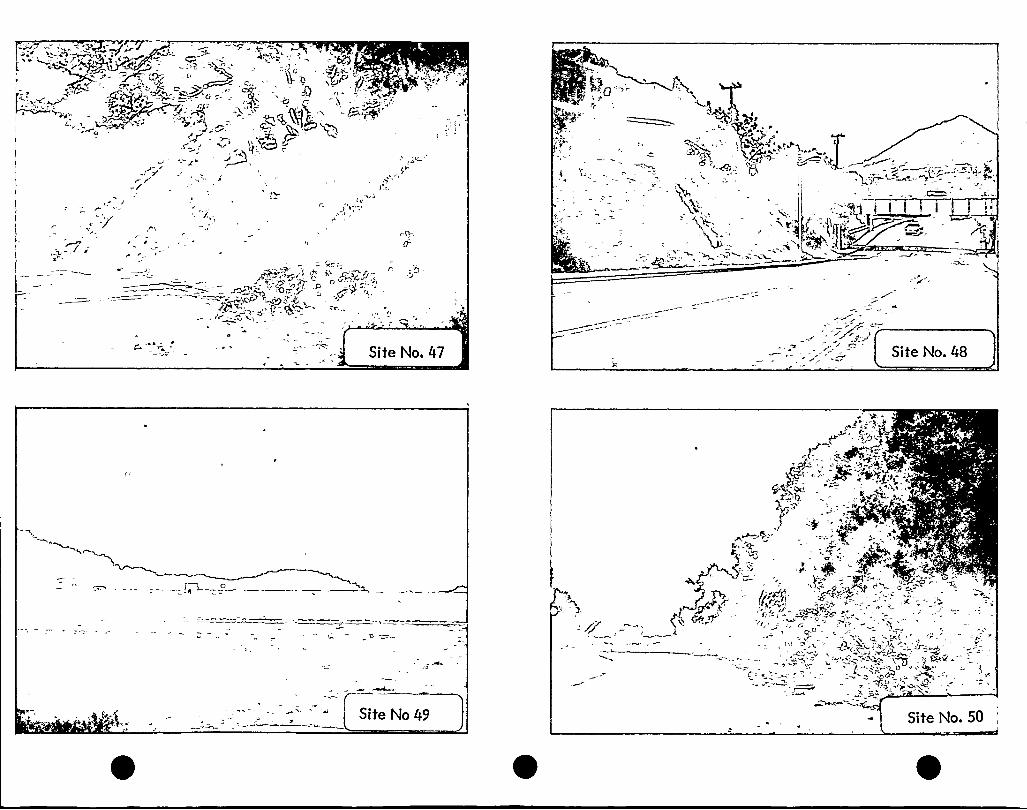
Site No. 47 Site No. 48
Site No 49 Site No. 50
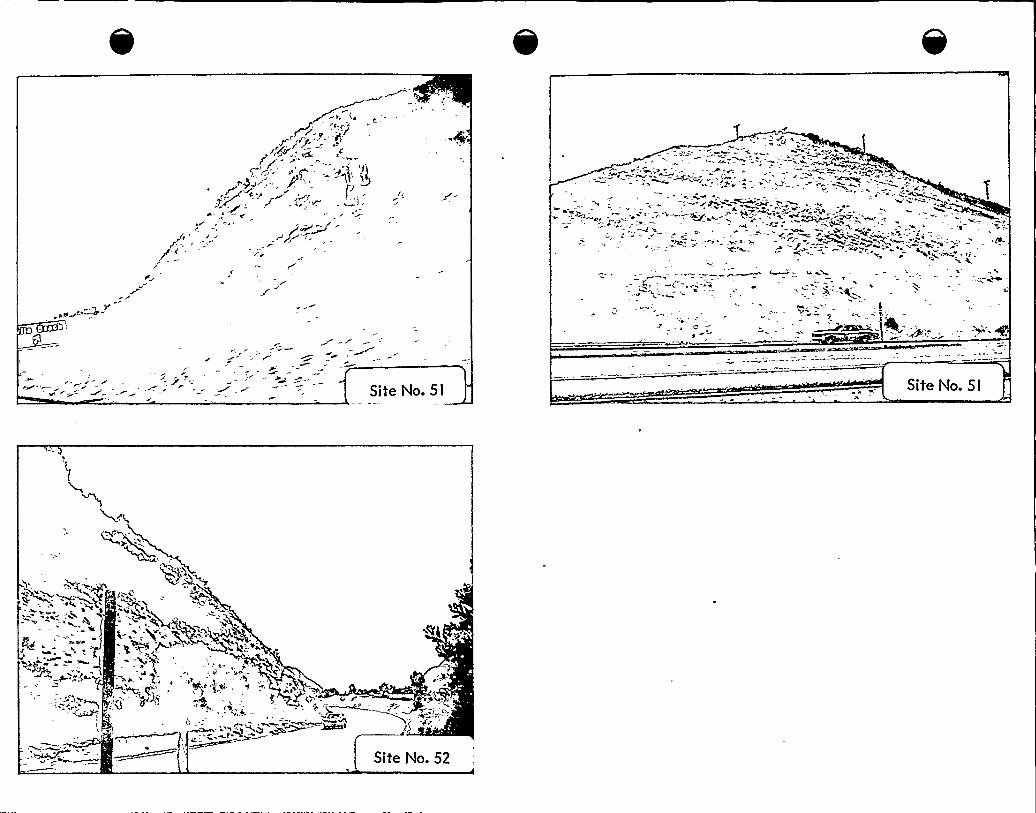
Site No. Sl Site No. 5I
Site No. 52
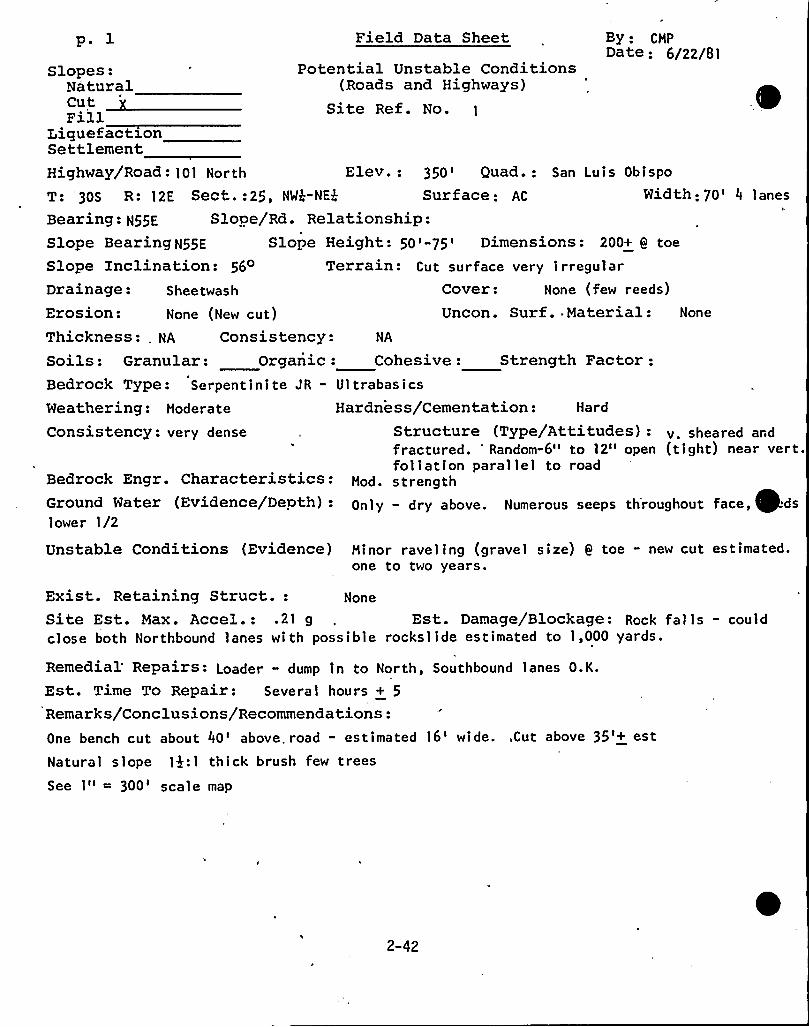
p. 1
Slopes:NaturalCutFill
LiquefactionSettlement
Field Data Sheet
Potential Unstable Conditions(Roads and Highways)
Site Ref. No.
By - CMPDate: 6/22/81
Highway/Road: 101 Nor th Elev.: 350'uad.: San Luis Obispo
T: '30S R: 12E Sect.:25, NW4-NEk Sur face: AC Width: 70' lanes
Bearing: N55E Slope/Rd. Relationship:Slope BearingN55E Slope Height: 50 '75 'imensions: 200+ Q toe
Slope Inclination: 56 Terrain: Cut surface very irregularDrainage: Sheetwash Cover: None (few reeds)
Erosion: None (New cut) Uncon. Surf. Material: None
Thickness: . NA Consistency: NA
Soils: Granular: Organic: Cohesive: Strength Factor:Bedrock Type: Serpentinite JR - UltrabasicsWeathering: Moderate Hardness/Cementation: Hard
Consistency: very dense Structure (Type/Attitudes) - v. sheared andfractured. 'andom-6" to 12" open (tight) near vert.foliation parallel to road
Bedrock Engr. Characteristics: Mod, strengthGround Water (Evidence/Depth): gal y — dry above. numerous seeps throughout face, dslower 1/2
Unstable Conditions (Evidence) Minor raveling (gravel size) g toe - new cut estimated.one to two years.
Exist. Retaining Struct.: None
Site Est. Max. Accel.: .21 g Est. Damage/Blockage: Rock fal ls - couldclose both Northbound lanes with possible rockslide estimated to 1,000 yards.
Remedial'epairs: Loader - dump in to North, Southbound lanes O.K.
Est. Time To Repair: Several hours + 5
Remarks/Conclusions/Recommendations:One bench cut about 40'bove, road - estimated 16'ide.,Cut above 35'+ est
Natural slope 14:1 thick brush few trees
See 1" = 300'cale map
2-42
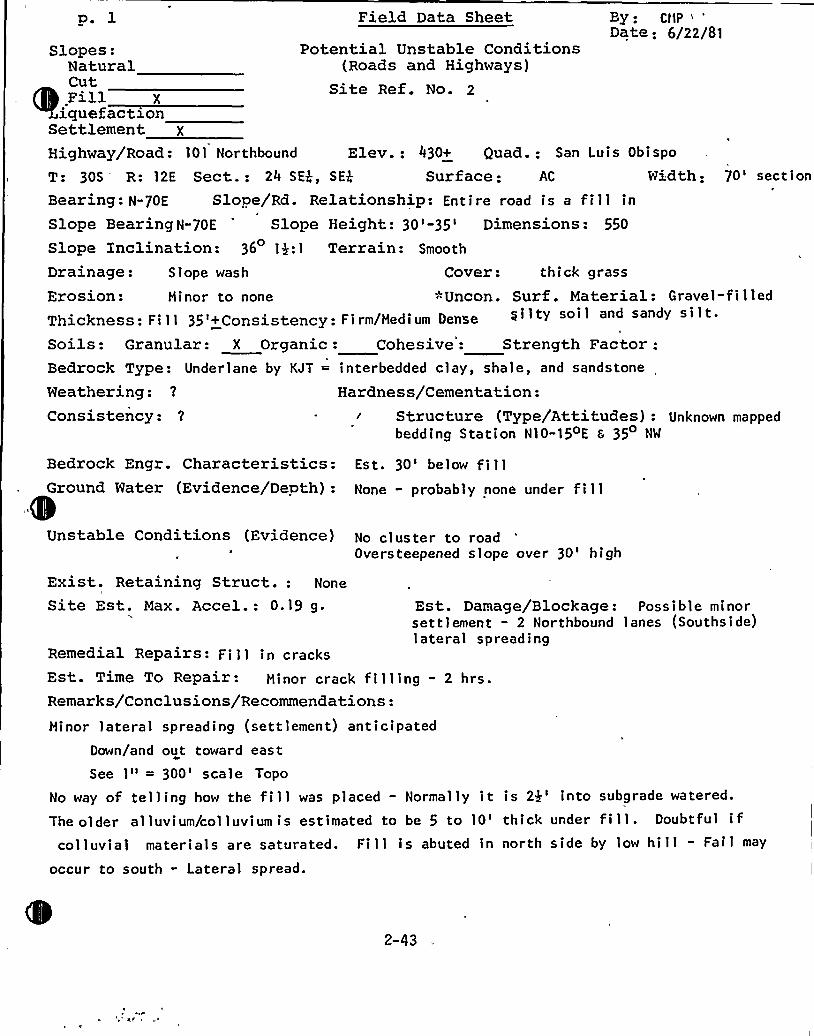
p 1 Field Data Sheet By: CHP ~
'ate:6/22/81Potential Unstable Conditions
(Roads and Highways)Site Ref. No. 2
Slopes:NaturalCutFill X
iquefactionSettlement X
Highway/Road: 101 Northbound Elev.: 430+ Quad.: San Lui s Obi spo
T: 30S R: 12E Sect.: 24 SE4, SE4 Surface: AC Width: 70'ectionBearing: N-70E Slope/Rd. Relationship: Ent i re road i s a fi 1 1 in
Slope BearingN-70E Slope Height: 30'-35'imensions: 550
Slope Inclination: 36 1$ :1 Terrain: Smooth
Drainage: Slope wash Cover: thick grass
Erosion: Hinor to none +Uncon. Surf . Material: Gravel-f i 1 led
Thickness: Fi 1 1 35'+Consistency: Firm/Hedium Dense i it soil and sandy silt.Soils: Granular: X Organic: Cohesive: Strength Factor:Bedrock Type: Underlane by KJT = interbedded clay, shale, and sandstone
Weathering: ? Hardness/Cementation:Consistency: Structure (Type/Attitudes): Unknown mapped
bedding Station N10-15 E 6 35 NW
Bedrock Engr. Characteristics:Ground Water (Evidence/Depth):
Unstable Conditions (Evidence)
Est. 30'elow fillNone - probably none under fill
No cluster to roadOversteepened slope over 30'igh
Exist. Retaining Struct.: None
Site Est. Max. Accel.: 0.19 g. Est. Damage/Blockage: Possible minorsettlement - 2 Northbound lanes {Southside)lateral spreading
Remedial RePairs: F i 11 i n cracksEst. Time To Repair: Hinor crack f i 1 1 ing - 2 hrs.Remarks/Conclusions/Recommendations:Hinor lateral spreading {settlement) anticipated
occur to south " Lateral spread.
Down/and out toward eastSee 1" = 300'cale Topo
No way of telling how the fill was placed - Normally it is 24'nto subgrade watered.
The older alluvium/col luviumis estimated to be 5 to 10'hick under fill. Doubtful ifcolluvial materials are saturated. Fill is abuted in north side by iow hill - Fail may
2-43
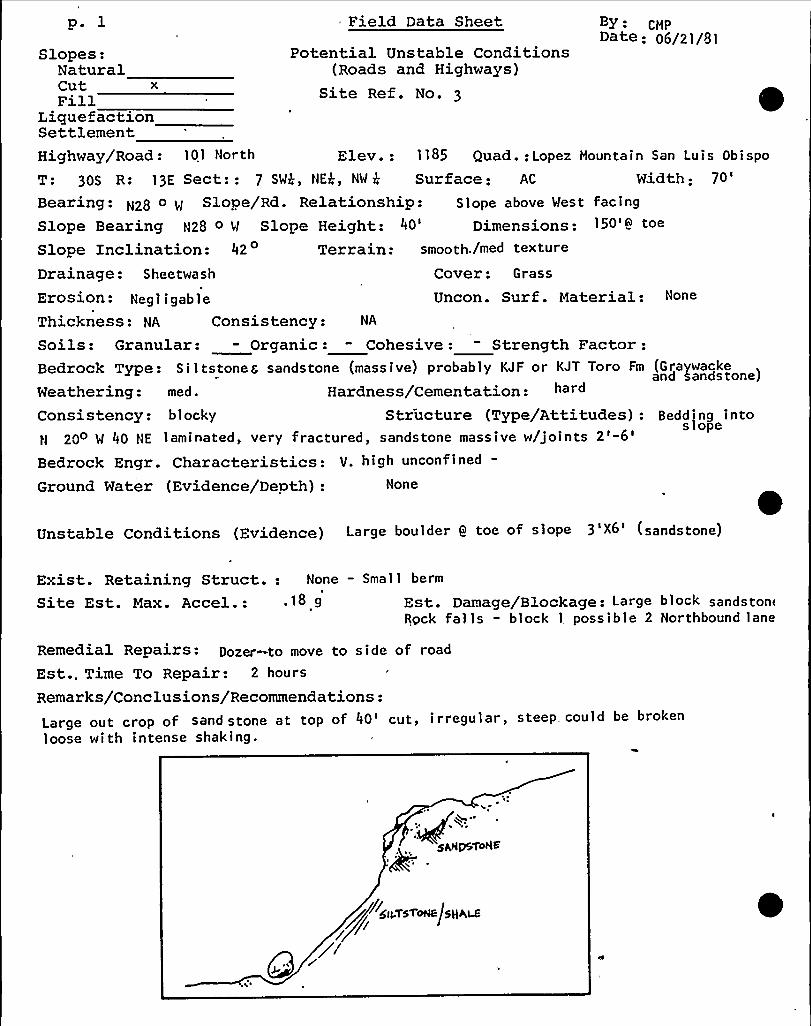
p. 1
Slopes:NaturalCut xFill
LiquefactionSettlement
Field Data Sheet
Potential Unstable Conditions(Roads and Highways)
Site Ref. No.
By -. CMpDate: 06/21/91
Highway/Road: 101 Nor th Elev.: 1185 Quad.:Lopez Mountain San Luis Obispo
T: 30S R: 13E Sect:: 7 SWk, NEk, NW4 Surface: AC Width:70'earing:
N28 o W Slope/Rd. Relationship: S 1 ope above Wes t facing
Slope Bearing N2S o W Slope Height: 40'imensions:Slope Inclination: 42 Terrain: smooth./med texture
Drainage: Sheetwash Cover: Grass
Erosion: Negl i gable Uncon. Surf. Material:Thickness: NA Consistency: NA
I
Soils: Granular: - Organic: - Cohesive: - Strength Factor:Bedrock Type: Si1tstones sandstone (massive) probably KJF or KJT Toro Fm (Graywacke
and sandstone)Weathering: med. Hardness/Cementation:Consistency: blocky Structure (Type/Attitudes) - Bedding into
slopeN 20 W 40 NE laminated, very fractured, sandstone massive w/joints
2'-6'edrock
Engr. Characteristics: V. high unconfined-
Ground Water (Evidence/Depth): None
Unstable Conditions (Evidence) Large boulder 9 toe of slope 3'X6'sandstone)
Exist. Retaining Struct.: None — Smal 1 berm
Site Est. Max. Accel.: ~8 9 Est. Damage/Blockage: Large block sandston~Rock falls - block 1, possible 2 Northbound lane
Remedial Repairs: pozer-to move to side of road
Est.. Time To Repair: 2 hours
Remarks/Conclusions/Recommendations:Large out crop of sand stone at top of 40'ut, irregular, steep could be broken
loose with intense shaking.
gW ~ ~
sgNpswgF
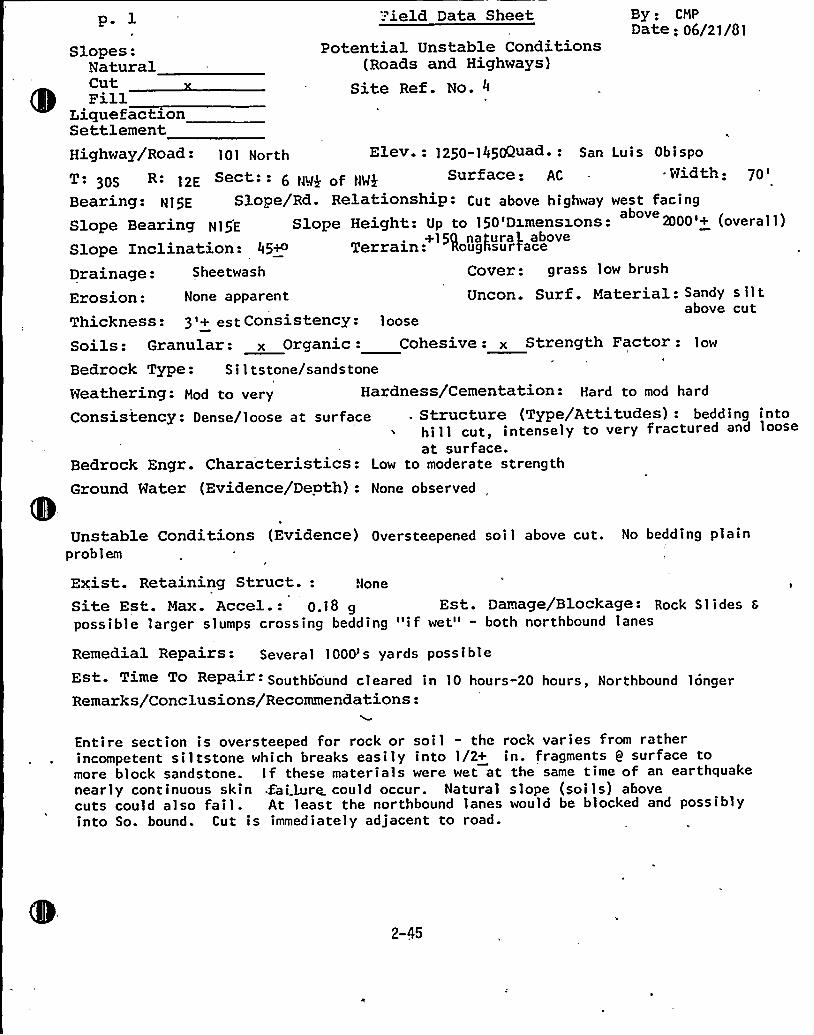
p. lSlopes:
Natural
fSettlement
="ield Data Sheet
Potential Unstable Conditions(Roads and Highways)
Site Ref. No. 4
By: CMP
Date; 06/21/81
Highway/Road: 101 North Elev- - 1250-1450Quad. - San Luis Obispo
T: pOS R: 12F Sect:: 6 tgg of [~J Surface: AC ~ Width: 70
Bearing- N15E Slope/Rd. Relationship: Cut above highway west facingabove
Slope Bearing N15E- Slope Height: Up to 150'Dzmenszons: 2000'+ (overal 1)+15Q natural. above
Slope Inclination: 45W Terrain Lugnsurrace
Drainage: Sheetwash Cover: grass low brush
Erosion: None apparent Uncon. Surf. Material: Sandy s iltabove cut
Thickness: 3'+ est Consistency: loose
Soils: Granular: x Organic: Cohesive: x Strength Factor: low
Bedrock Type: Si 1 tstone/sandstoneWeathering- Mod to very Hardness/Cementation: Hard to mod hard
Consistency: Dense/loose at surface . Structure (Type/Attitudes): bedding intohill cut, intensely to very fractured and looseat surface.
Bedrock Engr. Characteristics: Low to moderate strength
Ground Water (Evidence/Depth): None observed
Unstable Conditions (Evidence) Oversteepened soi 1 above cut. No bedding plainprob 1 em
Exist. Retaining Struct.:Site Est. Max. Accel.: 0.18 g Est. Damage/Blockage - Rock S 1 i des 6
possible larger slumps crossing bedding "if wet" - both northbound lanes
Remedial Repairs: Several 1000's yards possibleEst. Tzme To Repair: Southbo'und cleared in 10 hours-20 hours, Northbound longerRemarks/Conclusions/Recommendations:
Entire section is oversteeped for rock or soil - the rock varies from ratherincompetent siltstone which breaks easily into 1/2+ in. fragments Q surface tomore block sandstone. If these materials were wet at the same time of an earthquakenearly continuous skin Mi.lurz could occur. Natural slope (soils) abovecuts could also fail. At least the northbound lanes would be blocked and possiblyinto So. bound. Cut is immediately adjacent to road.
2-45
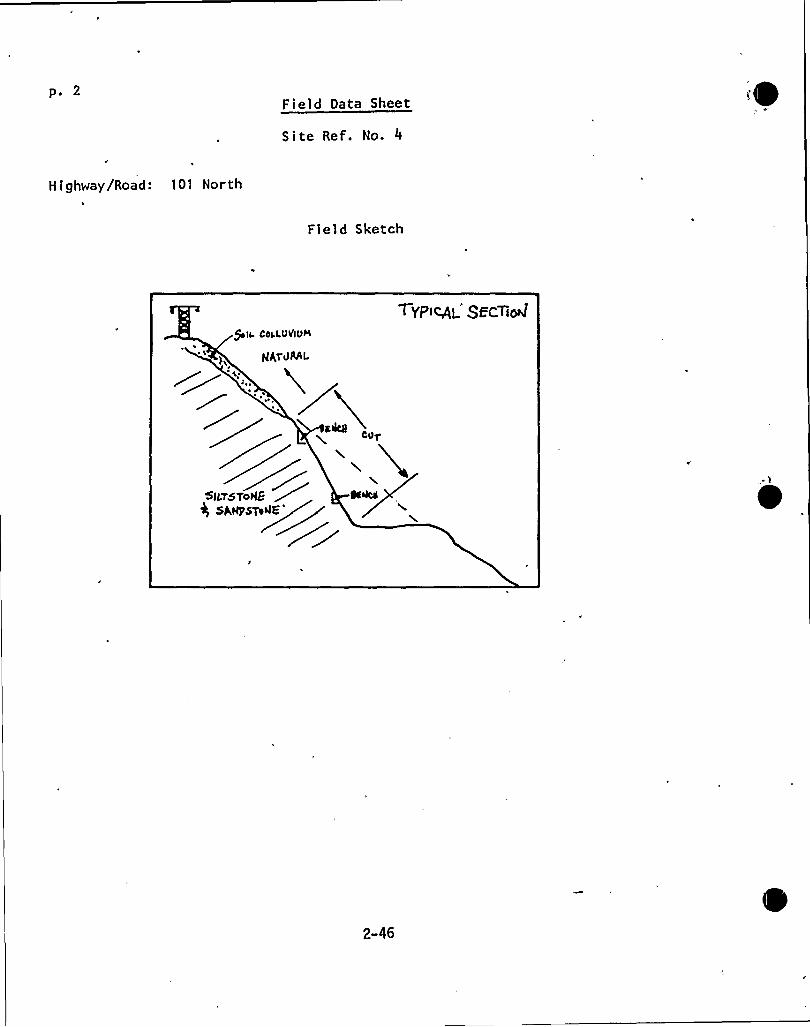
pi 2Field Data Sheet
Site Ref. No. 4
Highway/Road: 101 North
Field Sketch
mls Cbl.LOVIOM'
HhTORAL
~YP>MI SECTi A
2-46
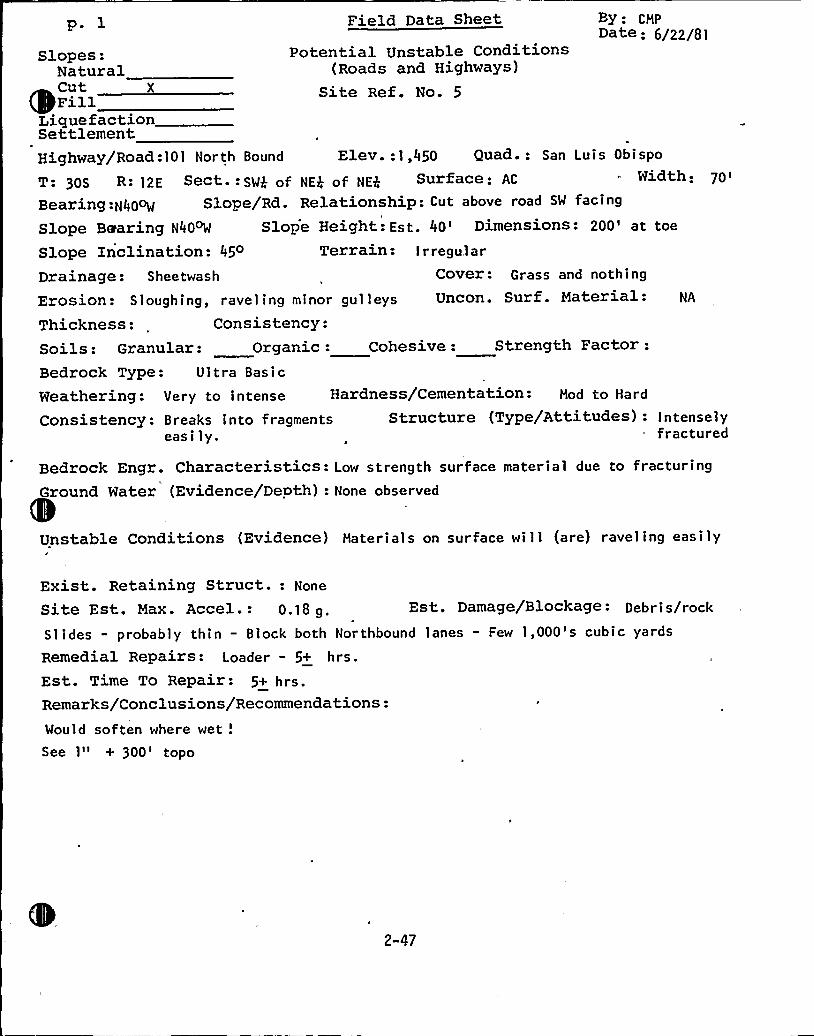
p. 1 Field Data Sheet By: CNpDate: 6/22/81
Potential Unstable Conditions(Roads and Highways)
Site Ref. No. 5
Bedrock Engr. Characteristics- Low strength surface material due to fracturingGround Water (Evidence/Depth): None observed
Unstable Conditions (Evidence) Haterial s on surface will (are) ravel ing easily
Slopes:NaturalCut X
Lique factionSet tlementHighway/Road:101 North Bound Elev.:1,450 Quad.: San Luis Obispo
T: 30S R: 12'ect.:SWP of NEP of NPP Surface: AC Width: 70 >
Bearing:N40oW Slope/Rd. Relationship: Cut above road SW facing
Slope Bearing N40oW Slope Height- Est. 40'imensions- 200't toe
Slope Inclination: 45o Terrain: I r regu.l a rDrainage: Sheetwash Cover: Grass and nothing
Erosion: Sloughing, ravel ing minor gul 1 eys Uncon. Surf. Material:Thickness: Consistency:Soils: Granular: Organic: Cohesive: Strength Factor:Bedrock Type: Ultra Basic
Weathering: Very to intense Hardness/Cementation: Nod to Nard
Consistency: Breaks into fragments Structure (Type/Attitudes) - I ntense 1 yeas i ly. fractured
Exist. Retaining Struct.: None
Site Est. Max. Accel.: 0.] 8 g. Est. Damage/Blockage - Debri s/rock
Slides - probably thin - Block both Northbound lanes - Few 1,000's cubic yards
Remedial Repairs: Loader — 5+ hrs.Est. Time To Repair: 5+ hrs.Remarks/Conclusions/Recommendations:Would soften where wet!See 1" + 300'opo
2-47
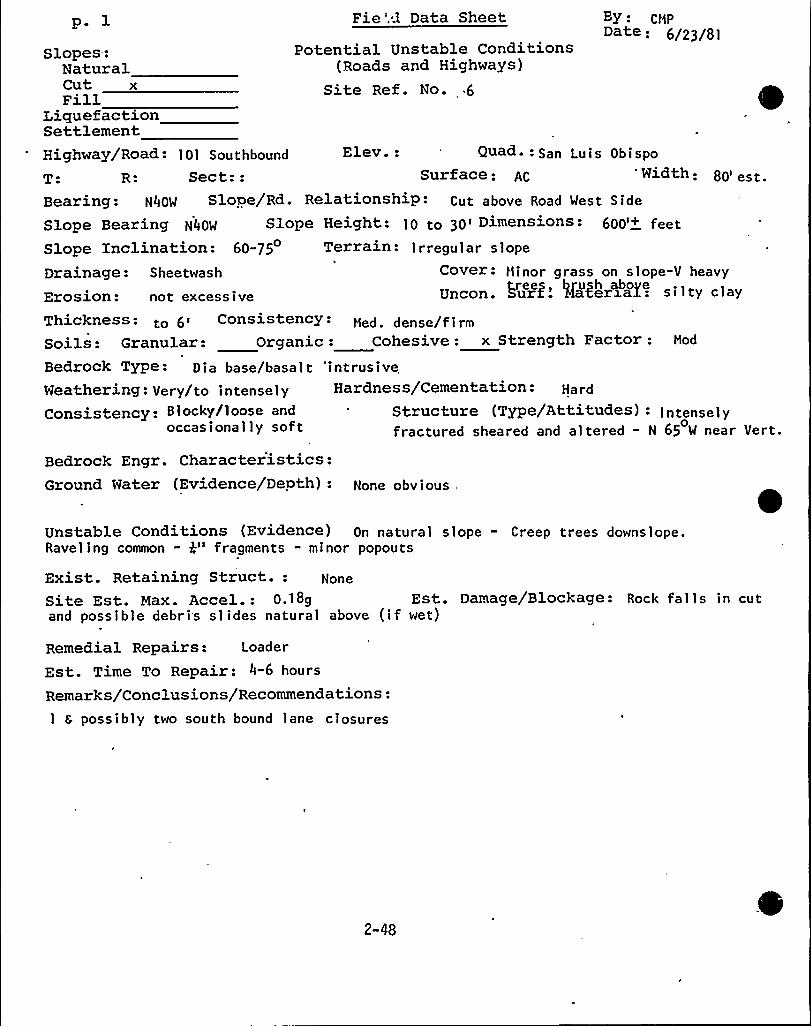
Fie'.3 Data Sheetp. l CMPDate: 6/23/81
Potential Unstable Conditions(Roads and Highways)
Site Ref. No.
Bedrock Engr. Characteristics:Ground Water (Evidence/DePth): None obv ious
Slopes:NaturalCut x
LiquefactionSettlementHighway/Road - 101 Southbound Elev.: Quad- - San Luis Obispo
T R: Sect:: Surface: AC 'Width: 80< est.Bearing: N40W Slope/Rd. Relationship- Cut above Road West Side
Slope Bearing NOHOW Slope Height: 10 to 30'imensions: 600'+ feetSlope inclination: 60-75 Terrain - I rregu 1 a r s 1 ope
Drainage: Sheetwash Cover'- Minor grass on slope-V heavy
Erosion: not excess i ve Uncon. kurz.'fazerxaf.: si 1 ty clay
Thickness: to 6> Consistency: Med dense/f i rm
Soils: Granular: Organic: Cohesive: x Strength Factor: Mod
Bedrock Type- Dia base/basalt 'intrusiveWeathering: Very/to i ntense 1 y Hardness/Cementation:Consistency: B locky/loose and Structure (Type/Attitudes): 1 ntense1 y
occasionally soft fractured sheared and altered - N 65 W near Vert.
Unstable Conditions (Evidence) On natural slope - Creep trees downslope.Raveling common - 4" fragments - minor popouts
Exist. Retaining Struct.: None
Site Est. Max. Accel.: 0.18g Est. Damage/Blockage: Rock fal 1 s in cutand possible debri's slides natural above (if wet)
Remedial Repairs: Loader
Est. Time To Repair: 4-6 hours
Remarks/Conclusions/Recommendations:1 6 possibly two south bound lane closures
2-48
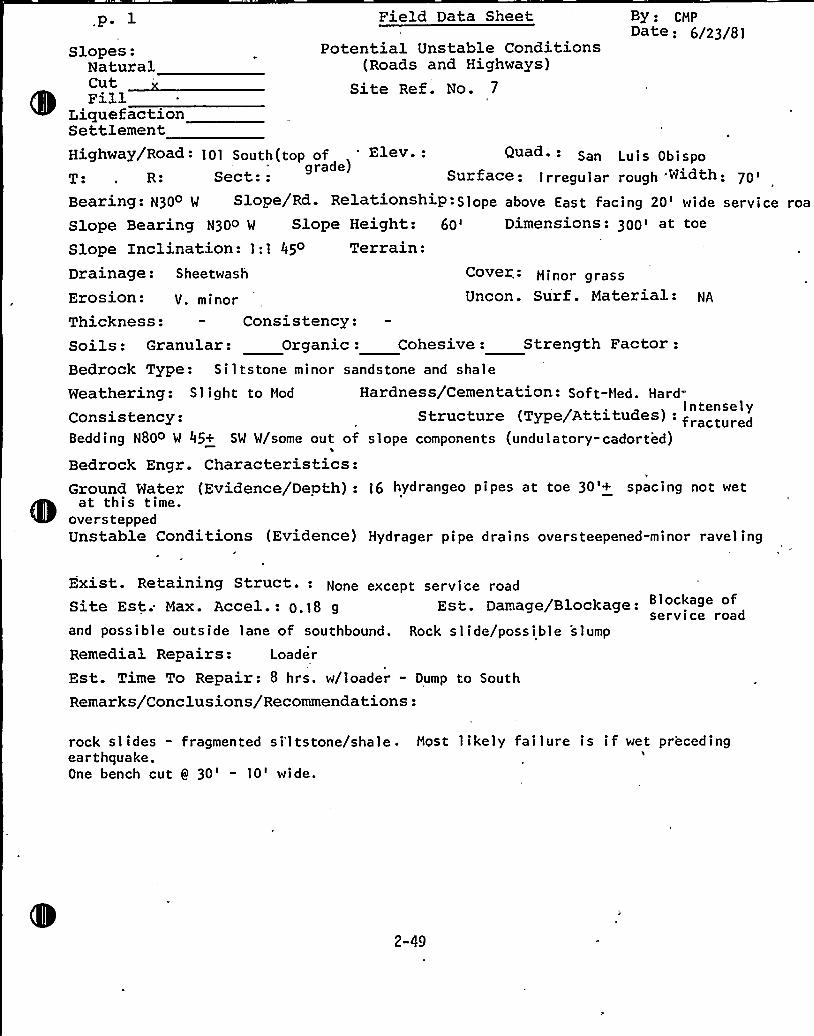
p. l Field Data Sheet By ~ CMPDate: 6/23/81
Cover,: Minor grassUncon. Surf. Material: NA
Thickness: - Consistency:Soils: Granular: Organic: Cohesive: Strength Factor:Bedrock Type: Siltstone minor sandstone and shale
Weathering: S 1 i ght to Mod Hardness/Cementation: Sof t-Med. HardIntenselyConsistency: Structure (Type/Attitudes):fractu
Bedding N80o W 45+ SW W/some out of slope components (undulatory-cadorted)'
Bedrock Engr. Characteristics:Ground Water (Evidence/Depth): I6 hydrangeo pipes at toe 30'+ spacing not wet
at this time.oversteppedUnstable Conditions (Evidence) Hydrager pipe drains overs teepened-minor raveling
Slopes: Potential Unstable ConditionsNatural (Roads and Highways)
Site Ref. No. 7FillLiquefactionSettlementHighway/Road: 101 South(top of Elev.: San Luis Obispo
grade)T: ~ R: Sect:: Surface: Irregular rough Width: 70 i
Bearing: N30 W Slope/Rd. Relationship:Slope above East facing 20'ide service roa
Slope Bearing N30o W Slope Height: 6p'imensions: 3pp't toe
Slope Inclination: 1:1 45o Terrain:Drainage: Sheetwash
Erosion: V. minor
Exist. Retaining Struct.: None except service roadSite Est; Max. Accel.: 0.18 g Est. Damage/Blockage: service roadand possible outside lane of southbound. Rock slide/possible slump
Remedial Repairs: Loader
Est. Time To Repair: 8 hrs. w/loader - Dump to South
Remarks/Conclusions/Recommendations:
rock slides - fragmented si'ltstone/shale. Most likely failure is if wet precedingearthquake.One bench cut 9 30' 10'ide.
2-49
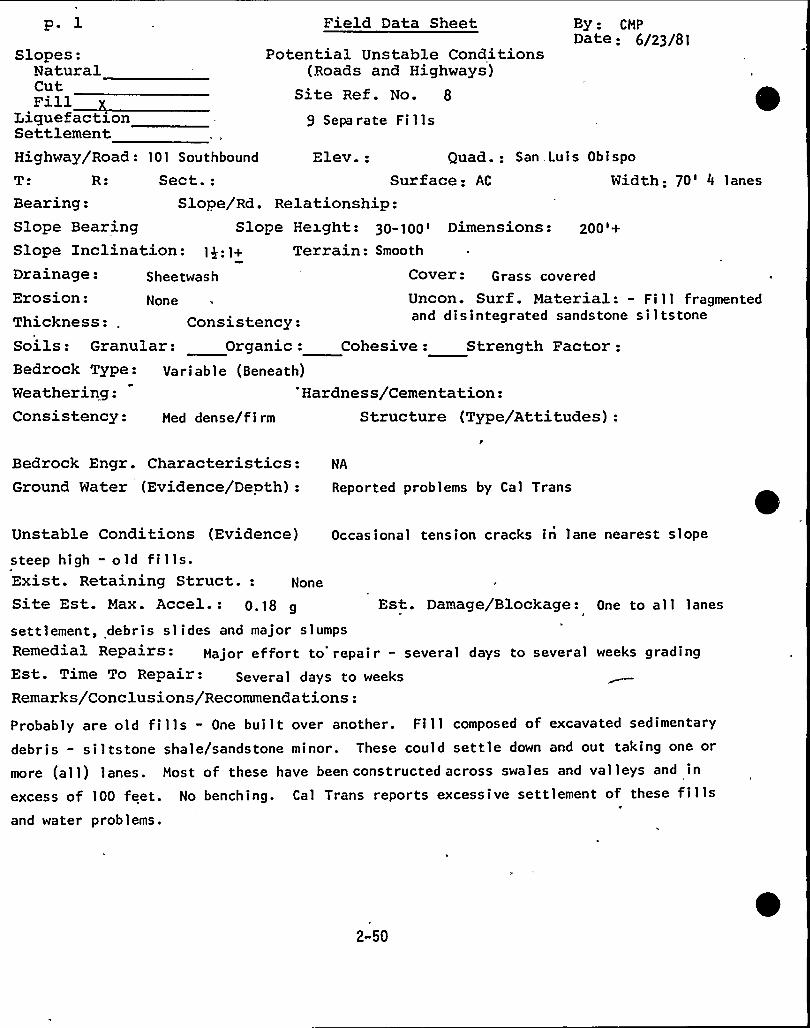
p. lSlopes:
NaturalCut
LiquefactionSettlement
Field Data Sheet
Potential Unstable Conditions(Roads and Highways)
Site Ref. No. 8
9 Separate Fills
By: CMPDate: 6/23/81
Highway/Road: 101 Southbound Elev.: Quad.: San Luis Obispo
T: R: Sect.: Surface: AC Width: 70' lanes
Bearing: Slope/Rd. Relationship:Slope Bearing Slope Height: 30-]Ops Dimensions: 2pp'+Slope Inclination: 1 g:1+ Terrain: Smooth
Drainage-.Sheetwash Cover- Grass coveredErosion:Thickness:
None
Consistency:Uncon. Sur f . Material: - Fi 11 fragmentedand disintegrated sandstone siltstone
Soils: Granular: Organic: Cohesive: Strength Factor:Bedrock Type: Variable (Beneath)Weathering: 'Hardness/Cementation:Consistency: Med dense/firm Structure (Type/Attitudes):
Bedrock Engr. Characteristics:Ground Water (Evidence/Depth):
NA
Reported problems by Cal Trans
Unstable Conditions (Evidence) Occasional tension cracks in lane nearest slope
steep high - old fills.Exist. Retaining Struct.:Site Est. Max. Accel.: p.l8settlement, debris slides and major slumps
Repa>rs - Major effort to repair - several days to several weeks gradingEst. Time To Repair: Several days to weeks
Remarks/Conclusions/Recommendations:
Est. Damage/Blockage: One to al 1 lanes
Probably are old fills - One built over another. Fill composed of excavated sedimentary
debris - siltstone shale/sandstone minor. These could settle down and out taking one or
more (all) lanes. Most of these have been constructed across swales and valleys and in
excess of 100 feet. No benching. Cal Trans reports excessive settlement of these fillsand water problems.
2-50
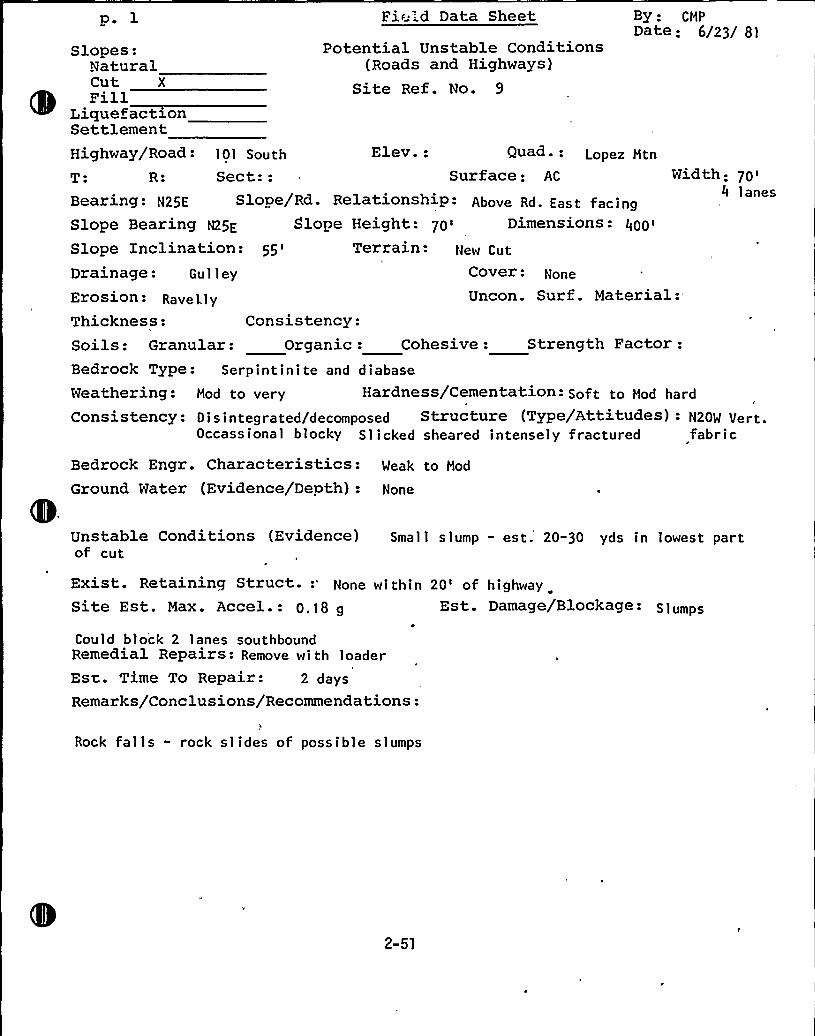
p~ lSlopes:
NaturalCut XFill
LiquefactionSettlement
Fir'd Data Sheet
Potential Unstable Conditions(Roads and Highways)
Site Ref. No. 9
By: CMPDate: 6/23/ 81
R: Sect::Highway/Road - 101 South Elev.: Quad- - Lopez Mtn
Surface: AC Width: 70'lanesSlope/Rd. RelationshiP - Above Rd. Eas t fac i ng
Slope Height: 70> Dimensions:400'5'errain:
New Cut
Bearing: N25E
Slope Bearing N25E
Slope InclinationDrainage: Gu 1 1 ey
Erosion - Ravel.l y
Cover:Uncon. Surf. Material:
Thickness: Consistency:Soils: Granular: Organic: Cohesive: Strength Factor:Bedrock Type: Serpintinite and diabaseWeathering: Mod to very Hardness/Cementation- Soft to Mod hard
Consistency: pi s integrated/decomposed Structure (TyPe/Attitudes) - N20W Vert.Occassional blocky Slicked sheared intensely fractured fabric
Bedrock Engr. Characteristics:Ground Water (Evidence/Depth):
Weak to Mod
None
Unstable Conditions (Evidence) Smal 1 slump - est. 20-30 yds in lowest partof cut
Exist. Retaining Struct. None wi thin 20'f highwaySite Est. Max. Accel-- 0.18 g Est. Damage/Blockage: S 1 umps
Could block 2 lanes southboundRemedial Repairs - Remove wi th loaderEst.. Time To Repair: 2 days
Remarks/Conclusions/Recommendations:
Rock falls - rock slides of possible slumps
2-51
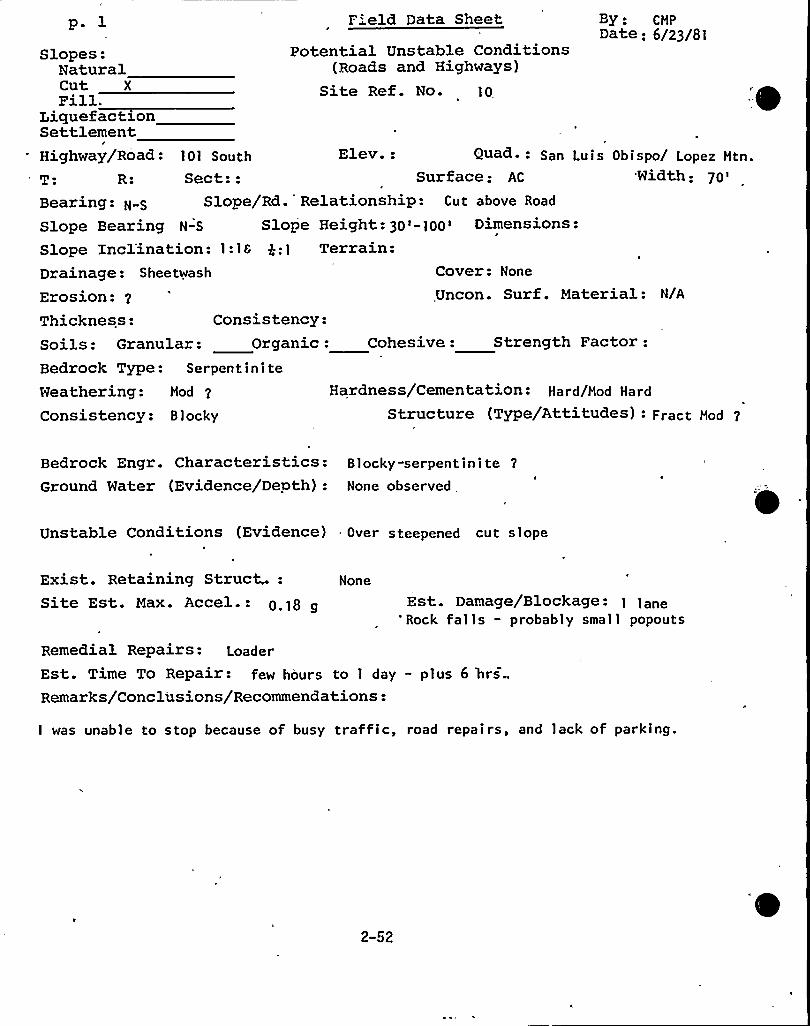
p. l Field Data Sheet By - CMPDate: 6/23/81
Slopes:NaturalCut XFill,.
LiquefactionSettlementHighway/Road:
R:101 South
Sect::
Potential Unstable Conditions(Roads and Highways)
Site Ref. No. 1O
Elev.: Quad. - San Luis Obispo/ Lopez Mtn.Surface: AC Width: 7O~
Bearing: N S Slope/Rd. Relationship: Cut above Road
Slope Bearing N-S Slope Height: 3O>-1OO> Dimensions:Slope Inclination: 1:lf p:1 Terrain:Drainage: Sheetwash
Erosion: 2
Thickness: Consistency:
Cover: None
,Uncon. Surf. Material: N/A
Bedrock Type:Weathering: Hardness/Cementation- Hard/Mod Hard
Structure (Type/Attitudes) - Fract Mod 2
Mod
Consistency: Blocky
Soils: Granular: Organic: Cohesive: Strength Factor:Serpentinite
Bedrock Engr. Characteristics:Ground Water (Evidence/Depth):
Blocky-serpentinite 2
None observed
Unstable Conditions (Evidence) Over steepened cut slope
Exist. Retaining Struct,.:Site Est. Max. Accel.: O 18
None
Est. Damage/Blockage:'Rock falls - probably small popouts
Remedial Repairs: Loader
Est. Time To Repair: few hours to 1 day - plus 6 hrsRemarks/Conclusions/Recommendations:
I was unable to stop because of busy traffic, road repairs, and lack of parking.
2-52
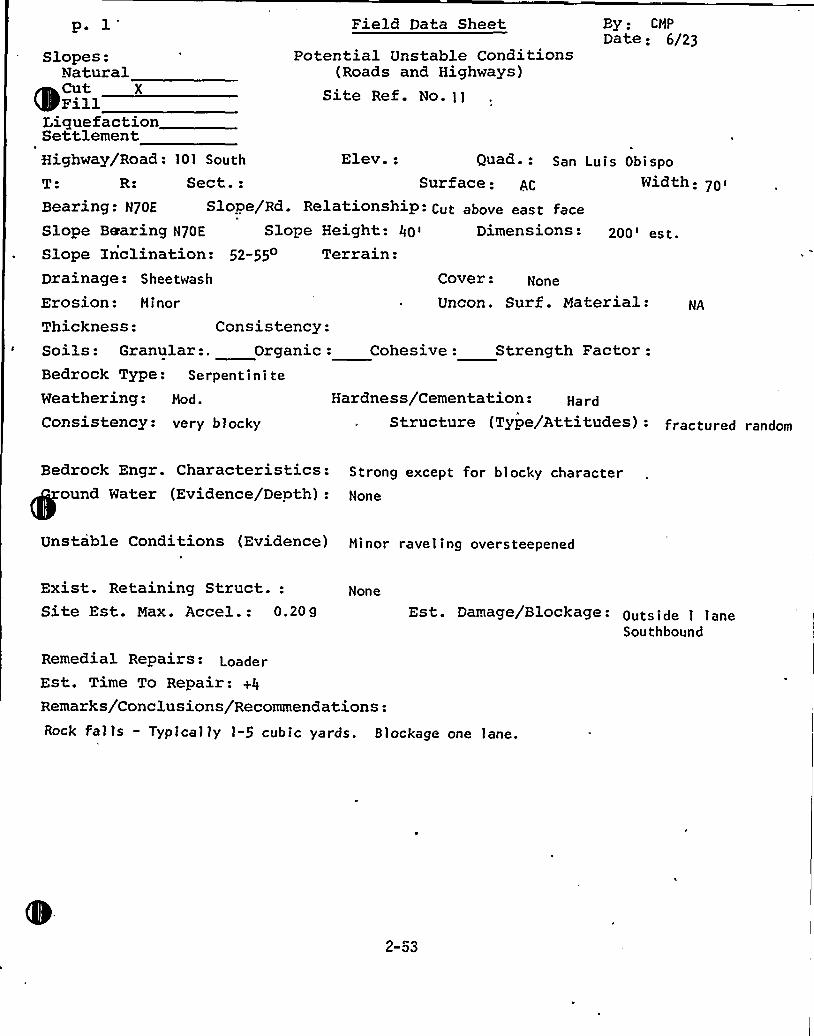
p. l Field Data Sheet By - CHP
Date: 6/23Potential Unstable Conditions
(Roads and Highways)Site Ref No. 11
Cover None
Uncon. Surf. Material: NAErosion: HinorThickness: Consistency:Soils: Granular:. Organic: Cohesive: Strength Factor:Bedrock Type: Serpent ini teWeathering: Mod.
Consistency: very blocky
Hardness/Cementation: Hard
Structure (Type/Attitudes): fractured random
Slopes:Natural
(Icut x
LiciuefactionSettlementHighway/Road: 101 South Elev.: Q«d- - San Luis Obispo
T R: Sect.: Surface: AC Width:70'earing:
N70E Slope/Rd. Relationship- Cut above east faceSlope Bearing N70E Slope Height: 40> Dimensions- 200'st.Slope Inclination: 52-55 Terrain:Drainage: Shee twas h
Bedrock Engr. Characteristics:ound Water (Evidence/Depth):
Strong except for blocky characterNone
Unstable Conditions (Evidence) Ninor ravel ing oversteepened
Exist. Retaining Struct.:Site Est. Max. Accel.: 0.20g
Remedial RePairs: LoaderEst. Time To Repair: +4
Remarks/Conclusions/Recommendations:
Est. Damage/Blockage: Outs i de I I aneSouthbound
Rock fal ls - Typical ly 1-5 cubic yards. Blockage one lane.
2-03
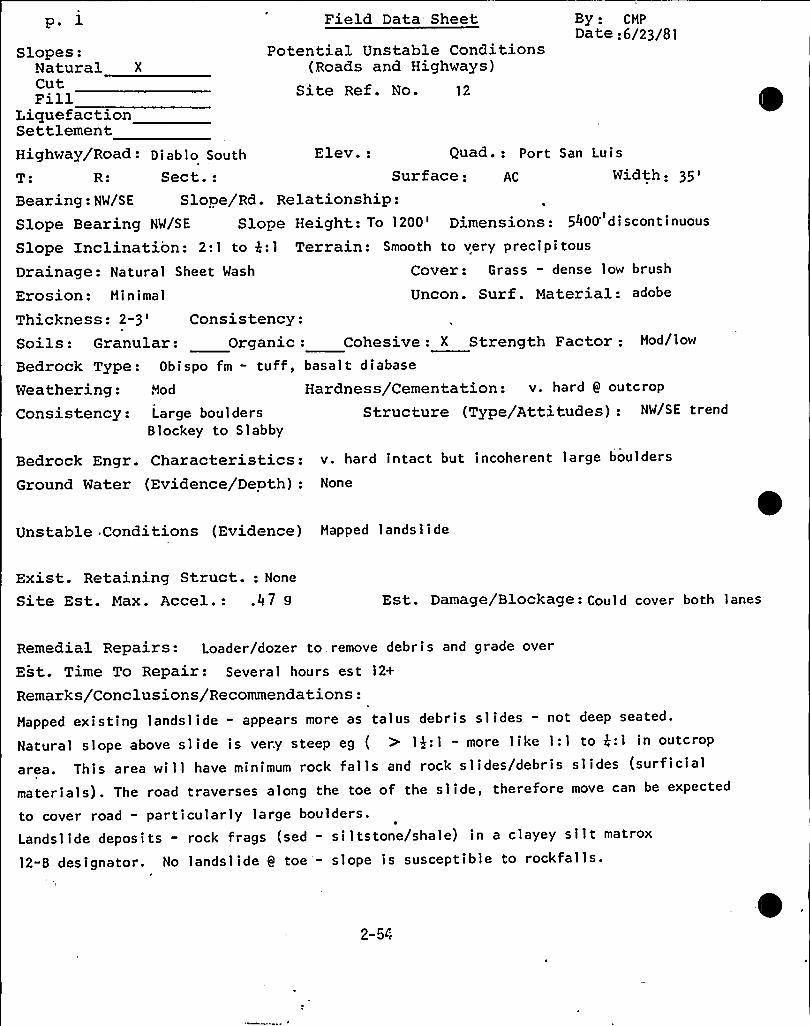
p. lSlopes:
Natural X
CutFillLiquefactionSettlement
Field Data Sheet
Potential Unstable Conditions(Roads and Highways)
Site Ref. No. 12
By: CHPDate: 6/23/81
Highway/Road: pi ab 1 o South Elev.: Quad.: Port San Luis
T R: Sect.: Surface: AC Width:35'earing:NW/SESlope/Rd. Relationship:
Slope Bearing NW/SE Slope Height: To 1200'imensions: 5400'iscontinuous
Slope Inclination: 2:1 to k:1 Terrain: Smooth to very precipitous
Drainage: Natural Sheet Wash Cover: Grass — dense low brush
Erosion: Hinimal Uncon. Surf. Material: adobe
Thickness: 2-3'onsistency:Soils: Granular: Organic: Cohesive: X Strength Factor: Hod/low
Bedrock Type: Obispo fm - tuff, basalt diabase
Weathering: Hod
Consistency: Large bouldersBlockey to Slabby
Hardness/Cementation: v. hard 9 outcrop
Structure (Type/Attitudes): NW/SE trend
Bedrock Engr. Characteristics: v. hard intact but incoherent large boulders
Ground Water (Evidence/Depth): None
Unstable Conditions (Evidence) Happed landslide
Exist. Retaining Struct.: None
Site Est. Max. Accel.: .47 9 Est. Damage/Blockage: Coul d cover both lanes
Remedial Repairs: Loader/dozer to remove debris and grade over
Est. Time To Repair: Several hours est 12+
Remarks/Conclusions/Recommendations:
Happed existing landslide - appears more as talus debris slides - not deep seated.
Natural slope above slide is very steep eg ( > 14:1 - more like 1:1 to 4:1 in outcrop
area. This area wi 11 have minimum rock falls and rock slides/debris slides (surficial
materials). The road traverses along the toe of the slide, therefore move can be expected
to cover road - particularly large boulders.
Landslide deposits - rock frags (sed - si ltstone/shale) in a clayey silt matrox
12-B designator. No landslide Q toe'- slope is susceptible to rockfalls.
f~4
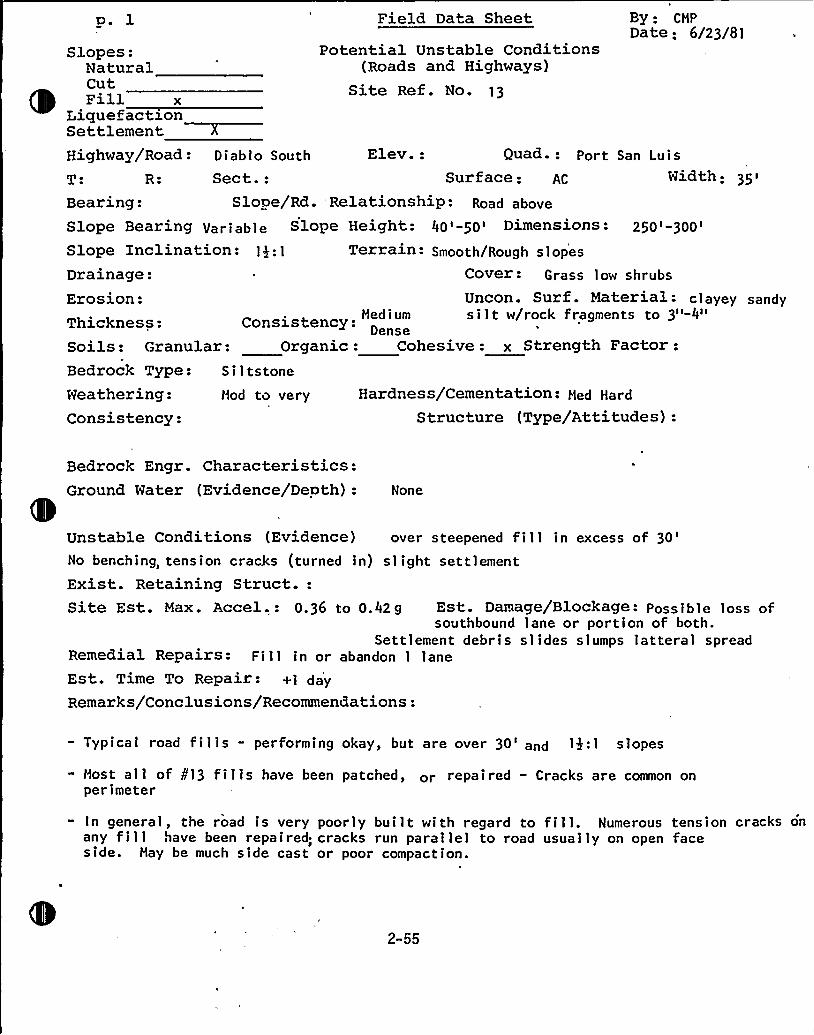
p. lSlopes:
NaturalCutFill x
LiquefactionSettlement
Field Data Sheet
Potential Unstable Conditions(Roads and Highways)
Site Ref. No.
By CMP
Date; 6/23/81
Highway/Road: D i ab I o South
R: Sect.:Elev.: Quad- - Port San Lui s
Surface: Width:Bearing: SloPe/Rd. RelationshiP: Road above
Slope Bearing yariable Slope Height: 40~-50~ Dimensions: 250~-300~
Slope Inclination: Ig:I Terrain- Smooth/Rough slopesDrainage: Cover: Grass low shrubs
Erosion: Uncon. Sur f . Material - cl ayey sandyMedium silt w/rock fragments to 3"-4"Thickness: Consistency: Dense
Soils: Granular: Organic: Cohesive: x Strength Factor:Bedrock Type: Si1tstoneWeathering:Consistency:
Mod - to very Hardness/Cementation- Med Hard
Structure (Type/Attitudes):
Bedrock Engr. Characteristics:Ground Water (Evidence/Depth): None
Unstable Conditions (Evidence) over steepened fill in excess of30'o
benching, tension cracks (turned in) slight settlementExist. Retaining Struct.:Site Est. Max. Accel,: 0.36 to 0.42g Est. Damage/Blockage: poss ible loss of
southbound lane or portion of both.Settlement debris slides slumps latteral spread
Remedial Repairs: Fill in or abandon 1 laneEst. Time To Repair - +1 dayRemarks/Conclusions/Recommendations:
- Typical road fills - performing okay, but are over 30'nd 14:1 slopes
" Most all of ¹13 fills have been patched, or repaired - Cracks are common onperimeter
In general, the road is very poorly built with regard to fill. Numerous tension cracks onany fill have been repaired; cracks run parallel to road usually on open faceside. May be much side cast or poor compaction.
2-55
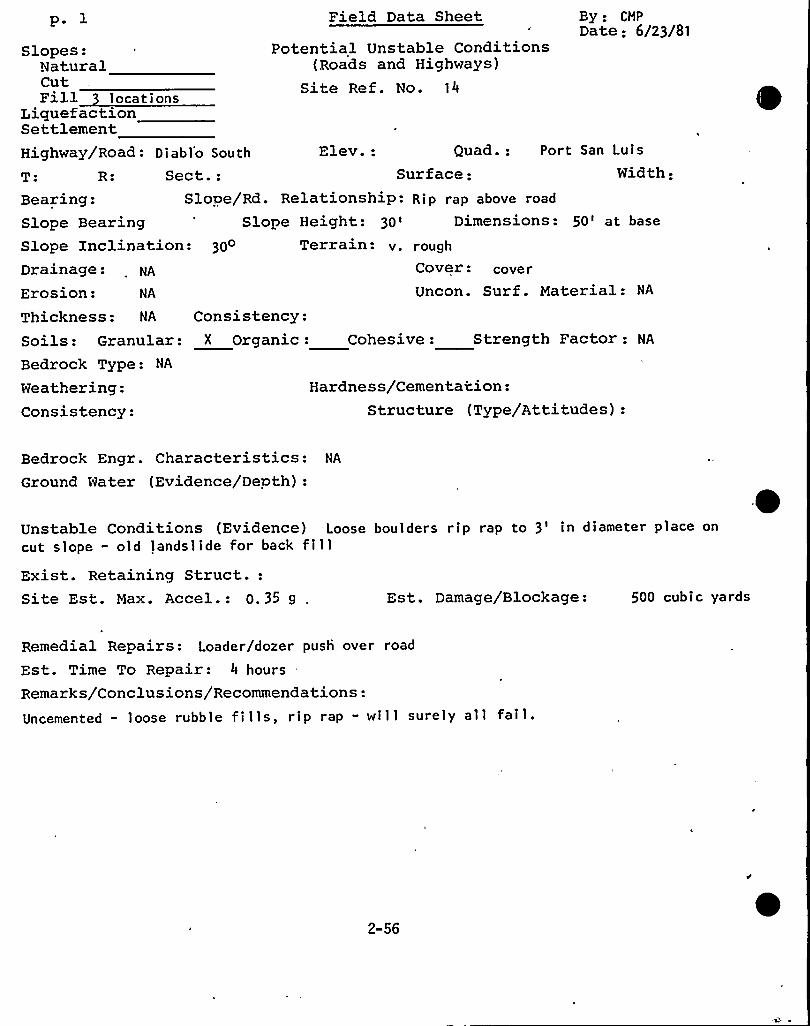
p. 1
Slopes:NaturalCutFill loca t i ons
LiquefactionSettlement
Field Data Sheet
Potential Unstable Conditions(Roads and Highways)
Site Ref. No. 14
By - CMP
Date: 6/23/81
Highway/Road: Diablo South Elev.: Quad.: Port San Luis
R: Sect.: Surface: Width:Bearing: Slope/Rd. Relationship:
Slope Height: 30>
300 Terrain: v.Slope BearingSlope Inclination:Drainage: NA
Erosion: NA
Thickness: NA Consistency:
Ri p rap above road
Dimensions: 50't base
roughCover: coverUncon. Surf. Material: NA
Soils: Granular:Bedrock Type: NA
Weathering:Consistency:
X Organic: Cohesive: Strength Factor: NA
Hardness/Cementation:Structure (Type/Attitudes):
Bedrock Engr. Characteristics: NA
Ground Water (Evidence/Depth):
Unstable Conditions (Evidence) Loose boulders rip rap to 3'n diameter place on
cut slope - old landslide for back fillExist. Retaining Struct.:Site Est. Max. Accel.: 0.35 g Est. Damage/Blockage: 500 cubic yards
Remedial Repairs: Loader/dozer push over road
Est. Time To Repair: 4 hours
Remarks/Conclusions/Recommendations:Uncemented - loose rubble fills, rip rap - will surely all fail.
2-56
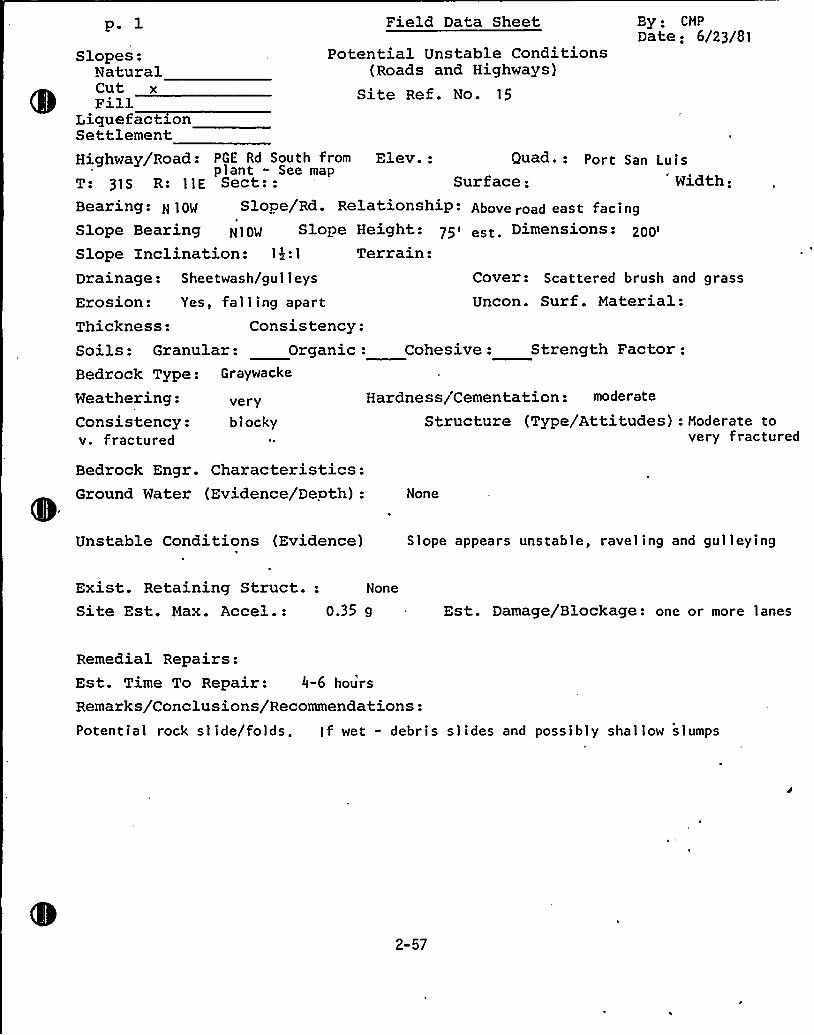
p. lSlopes:
NaturalCut x
LiquefactionSettlement
Field Data Sheet
Potential Unstable Conditions(Roads and Highways)
Site Ref. No. 15
By: CMP
Date: 6/23/81
Quad.: Port San Luise: 'idth:
Cover: Scattered brush and grass
Uncon. Surf. Material:
Highway/Road: PGE Rd South from Elev.:plant - See map
T: 31S R: 1lE Sect:: SurfacBearing: N IOW Slope/Rd. Relationship: Above road east facingSlope Bearing N10M Slope Height: 75~ est Dimensions: 200~
Slope Inclination: Ig:I Terrain:Drainage: Sheetwash/gul 1 eys
Erosion: Yes, fal 1 ing apartThickness: Consistency:
Bedrock Type:Weathering: Hardness/Cementation: moderate
Structure (Type/Attitudes): Moderate tovery fractured
veryblockyConsistency:
v. fractured
Bedrock Engr. Characteristics:Ground Water (Evidence/Depth): None
'
Soils: Granular: Organic: Cohesive: Strength Factor:Graywacke
Unstable Conditions (Evidence) Slope appears unstable, raveling and gul leying
Exist. Retaining Struct.: None
Site Est. Max. Accel.: 0.35 g Est. Damage/Blockage: one or more lanes
Remedial Repairs:Est. Time To Repair: 0-6 hours
Remarks/Conclusions/Recommendations:Potential rock slide/folds. lf wet - debris slides and possibly shallow slumps
2-57
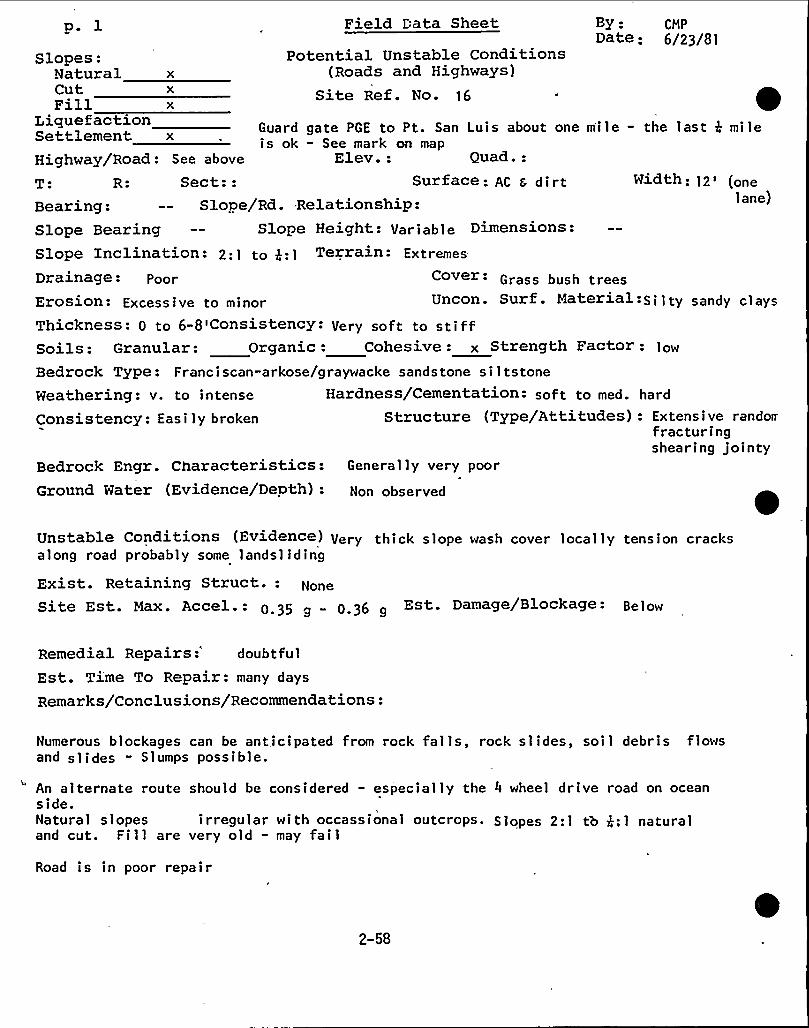
p. 1 Field Data Sheet BY: CMPDate: 6/23/81
Potential Unstable Conditions(Roads and Highways)
Site Ref. No. 16
Slopes:Natural xCut xFill x
LiquefactionSettlement x Guard gate PGE to Pt. San Luis about one mile - the last 4 mile
is ok - See mark on mapQuad.:
Bedrock Engr. Characteristics: General ly very poor
Ground Water (Evidence/Depth): Non observed
Highway/Road: See above Elev.:T: R: Sect:: Surface: AC c di rt Width: 12~ (one
Bearing: -- Slope/Rd. Relationship: lane)
Slope Bearing Slope Height: Variable Dimensions:
Slope Inclination: 2:1 to p.. 1Terrain: Extremes
Drainage: poor Grass bush treesErosion: Excessive to minor Uncon. Surf. Material-Silty sandy clays
Thickness: 0 to 6-8'Consistency: Very soft to stiffSoils: Granular: Organic: Cohesive: x Strength Factor: low
Bedrock Type: Franciscan-arkose/graywacke sandstone si1 tstoneWeathering: v. to intense Hardness/Cementation- soft to med. hard
Consistency: Easily broken Structure (Type/Attitudes): Extensive randorrfracturingshearing jointy
Unstable Conditions (Evidence) Very thick slope wash cover local ly tension cracksalong road probably some landsl iding
Exist. Retaining Struct.:Site Est. Max. Accel.: 0 35 g 0 36 g
Est. Damage/Blockage: Below
Remedial Repairs: doubtfulEst. Time To Repair: many days
Remarks/Conclusions/Recommendations:
Numerous blockages can be anticipated from rock falls, rock slides, soil debris flowsand s 1 i des - S 1 umps poss i b1 e.
'n alternate route should be considered - especially the 4 wheel drive road on oceanside.Natural slopes irregular with occassional outcrops. Slopes 2:1 tb $ ;1 naturaland cut. Fill are very old - may failRoad is in poor repair
2-58
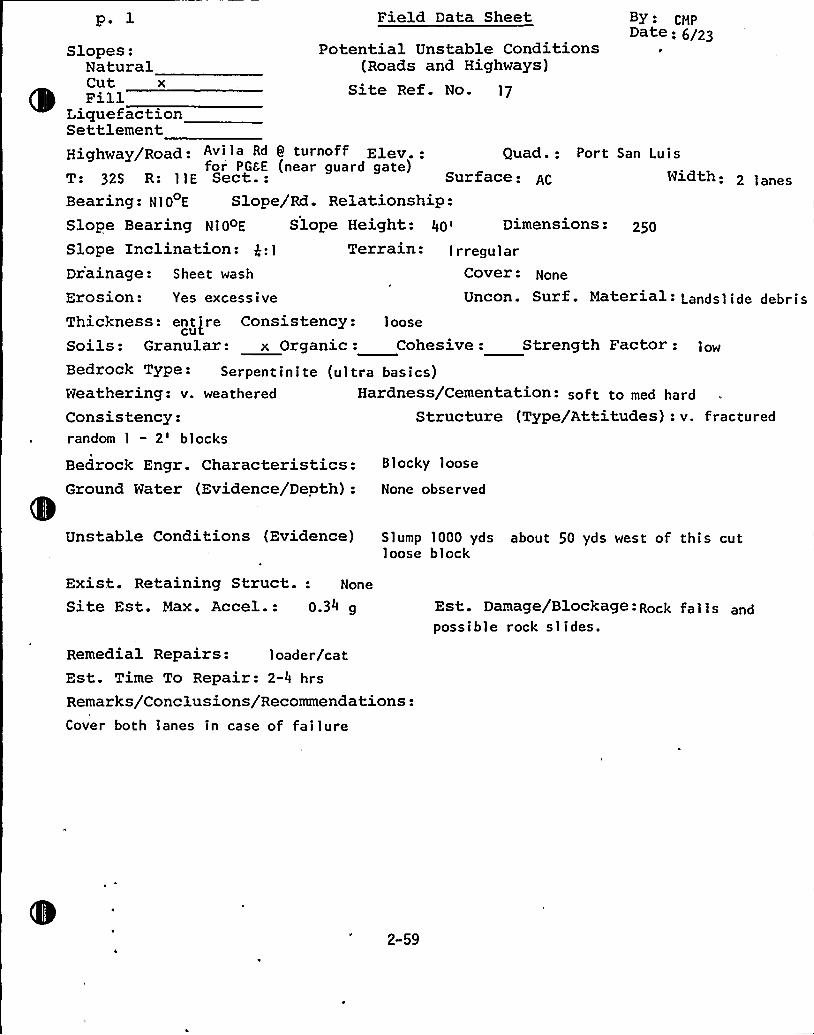
p. 1 Field Data Sheet By-.CNPDate: 6/23
Potential Unstable Conditions(Roads and Highways)
Site Ref. No. 1/
Slopes:NaturalCut xFill
LiquefactionSettlementHighway/Road: Avi la Rd 0 turnoff Elev.: Quad.: Port San Luis
for'GEE (near guard gate)T: 32S R: 11E Sect.: Surface: Width: 2 l,nesBearing: N10 E Slope/Rd. Relationship:Slope Bearing N10oE Slope Height: 40> Dimensions: 250
Slope Inclination: (:1 Terrain: I rregu 1 arDr'ainage: Sheet wash Cover: None
Erosion: Yes excessive Uncon. Surf. Material: Landsl ide debrisThickness: ent i re Consistency: loosecutSoils: Granular: x Organic: Cohesive: Strength Factor: low
Bedrock Type: Serpentinite (ultra basics)Weathering: v. weathered Hardness/Cementation: soft to med hard
Consistency: Structure (Type/Attitudes): v. fracturedrandom 1
- 2'locksBedrock Engr. Characteristics:Ground Water (Evidence/Depth):
Blocky loose
None observed
Unstable Conditions (Evidence) Slump 1000 yds about 50 yds west of this cutloose block
Exist. Retaining Struct.: None
Site Est. Max. Accel.: 0.34 g
Remedial Repair s: 1 oad er/catEst. Time To Repair: 2-4 hrsRemarks/Conclusions/Recommendations:Cover both lanes in case of failure
Est. Damage/Blockage: Rock fa 1 1 s andpossible rock slides.
2-59
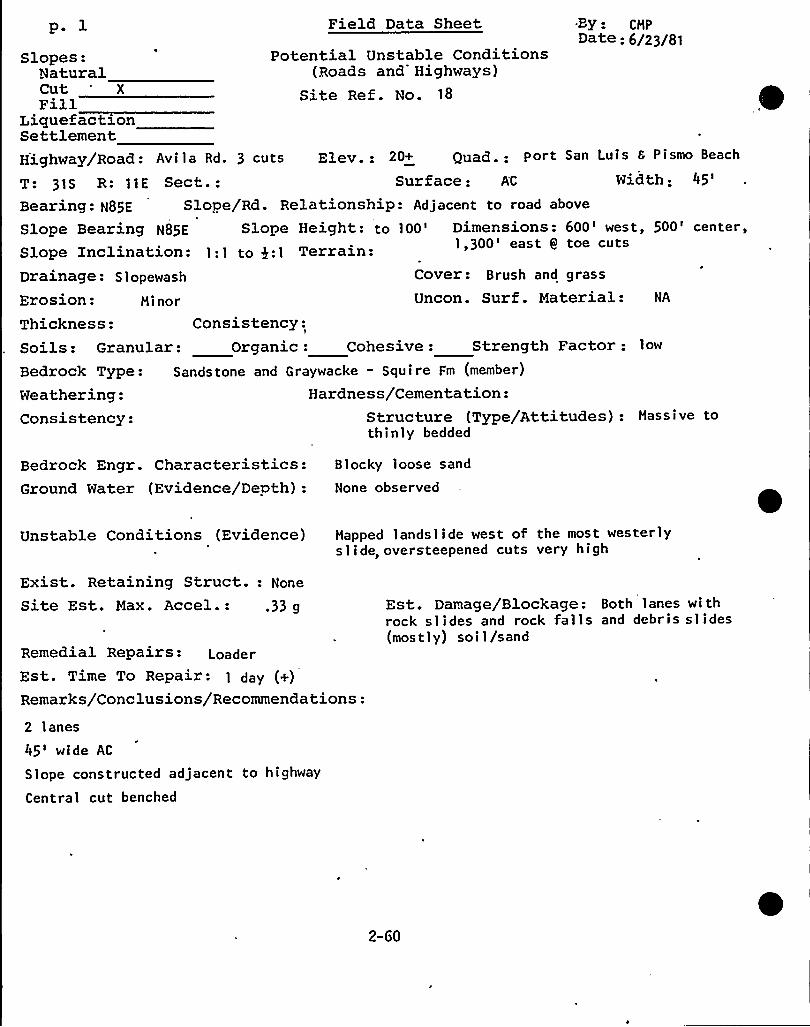
p~ l Field Data Sheet By: CMPDate: 6/23/81
Potential Unstable Conditions(Roads and Highways)
Site Ref. No. 18
Thickness: Consistency:Soils: Granular: Organic: Cohesive: Strength Factor: low
Bedrock Type: Sandstone and Graywacke - Squire Fm (member)
Weathering: Hardness/Cementation:Consistency: Structure (Type/Attitudes): Mass i ve to
thinly bedded
Bedrock Engr. Characteristics: Blocky loose sand
Ground Water (Evidence/Depth): None observed
Slopes:NaturalCut '
FillLiquefactionSettlementHighway/Road: Avila Rd. 3 cuts Elev.: 20+ Quad.: port San Luis 8 Pismo Beach
T: 31S R: 11E Sect.: Sur face: AC Width:45'earing:
N85E Slope/Rd. Relationship: Adjacent to road above
Slope Bearing N85E Slope Height: to 100'imensions: 600'est, 500'enter,Slope Inclination: 1:'i to $ :'I Terrain: 1,300'ast Q toe cuts
Drainage: S 1 opewash Cover: Brush and grass
Erosion: Minor Uncon. Surf. Material: NA
Unstable Conditions (Evidence) Mapped landslide west of the most westerlyslide, oversteepened cuts very high
Exist. Retaining Struct.: None
Site Est. Max. Accel.: .33 g
Remedial Repairs: Loader
Est. Time To Repair: 1 day (+)Remarks/Conclusions/Recommendations:
2 lanes
45'ide AC
Slope constructed adjacent to highway
Central cut benched
Est. Damage/Blockage: Both lanes wi throck slides and rock falls and debris slides(mostly) soil/sand
2-60
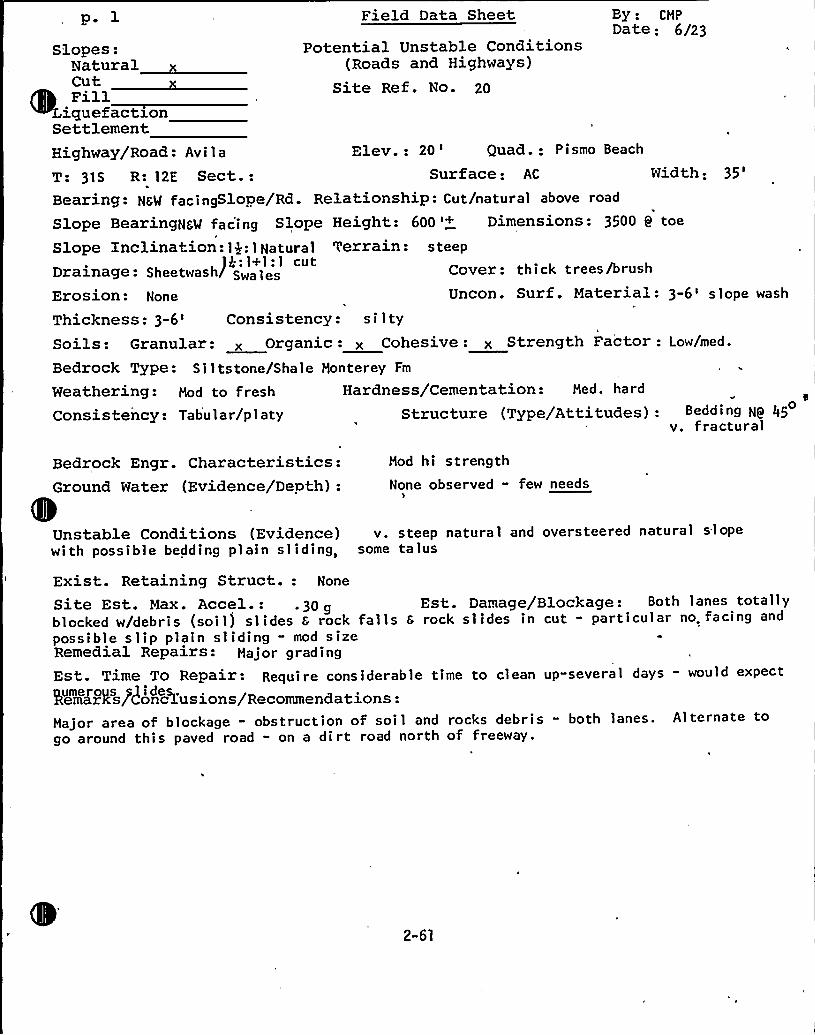
p. lSlopes:
NaturalCut x
~
~Filliquefaction
Settlement
Field Data Sheet
Potential Unstable Conditions(Roads and Highways)
Site Ref. No. 20
By: CMPDate: 6/23
Highway/Road: Avila Elev.: 20 'uad.: Pismo Beach
T: 31S R: 12E Sect.: Surface: AC Width:35'earing-
NSW facingSlope/Rd. Relationship: Cut/natural above road
Slope BearingNN far'ing Slope Height: 600 '+ Dimensions: 3500 9 toe
Slope Inclination - 1 g: 1 Natura 1 Terrain: s teep14:1+1:1 cutDrainage: Sheetwash/ Swa les Cover: thick trees/brush
Erosion: None Uncon. Surf. Material: 3-6'lope wash
Thickness: 3-6'onsistency: siltySoils: Granular: x Organic: x Cohesive: x Strength Factor: Low/med.
Bedrock Type: Si 1 tstone/Shale Monterey Fm
Weathering: Mod to fresh Hardness/Cementation: Med. ha rd
Consistency: Tabular/pl aty Structure (Type/Attitudes): Bedding N9 45v. fractural
Bedrock Engr. Characteristics: Mod hi strength
Ground Water (Evidence/Depth):)
Unstable Conditions (Evidence) v. steep natural and oversteered natural s-lope
with possible bedding plain sliding, some talus
None observed - few needs
Exist. Retaining Struct.: None
Site Est. Max. Accel.: . 30 g Est. Damage/Blockage: Both 1 anes tota 1 1 yblocked w/debris (soil) slides 6 rock falls 6 rock slides in cut - particular no. facing and
possible slip plain sliding - mod sizeRemedial RePairs: Major gradingEst ~ Time To Repair- Require considerable time to clean up-several days - would expect
Femirks/Conclusions/Recommendations:Major area of blockage - obstruction of soil and rocks debris - both lanes. Alternate togo around this paved road - on a dirt road north of freeway.
2-6l
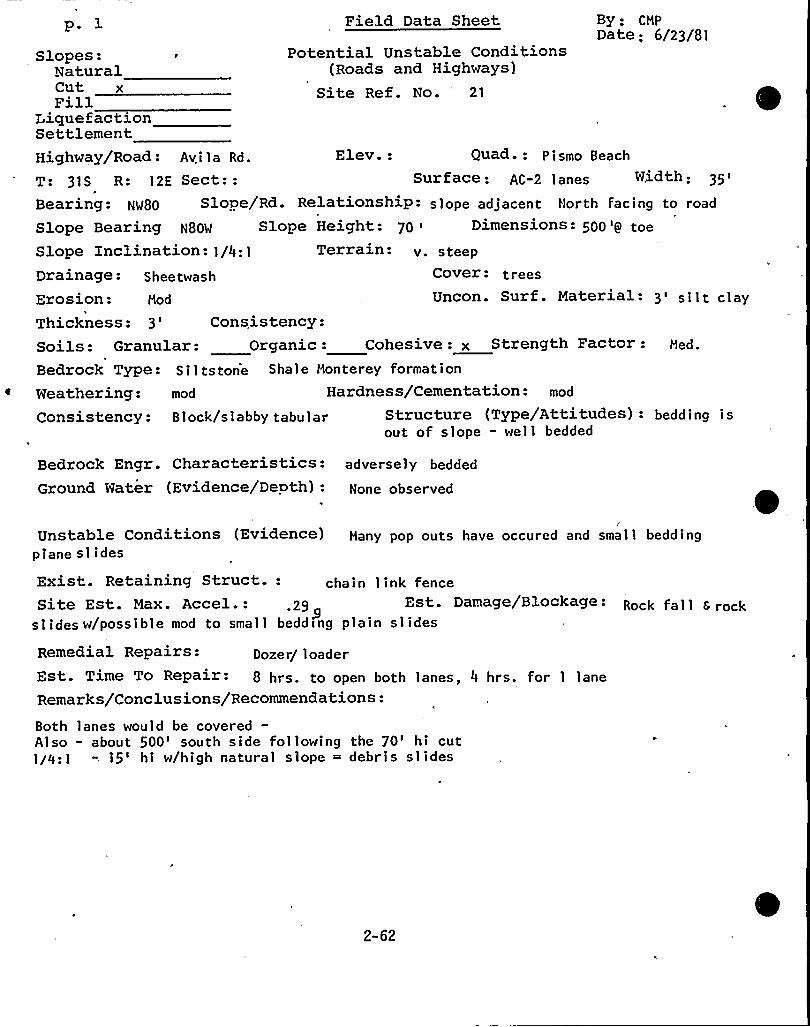
p. 1 Field Data Sheet By: CMP
Date; 6/23/81Potential Unstable Conditions
(Roads and Highways)Slopes:
NaturalCut x Site Ref. No. "
21FillLiquefactionSettlementHighway/Road: Av.i 1 a Rd. Elev.: Quad- - Pismo Beach
T: 31S R: 12E Sect:: Surface: AC-2 1 anes Width:Bearing: Ng80 Slope/Rd. Relationship- slope adjacent North Facing to road
Slope Bearing N80g Slope Height: 70 i Dimensions: 500 <y toe
Slope Inclination: 1/4:1 Terrain: v. steep
Drainage: Sheetwash Cover: trees
Erosion: Mod Uncon. Surf. Material- 3'ilt clayThickness: 3'onsistency:Soils: Granular: Organic: Cohesive: x Strength Factor:Bedrock Type: S i 1 ts tone Shale Monterey formation
Weathering: mod Hardness/Cementation: mod
Consistency: Block/slabby tabular Structure (Type/Attitudes) - bedding isout of slope - wel 1 bedded
Bedrock Engr. Characteristics: adverselyGround Water (Evidence/DePth) Hone observed
Unstable Conditions (Evidence) Many pop outs have occured and smal 1 beddingplane sl ides
Exist. Retaining Struct.: chain 1 ink fenceSite Est. Max. Accel.: .29 Est. Damage/Blockage: Rock fal 1 s rock
slides w/possible mod to small beddPng plain slides
Remedial Repairs: pozer/ loaderEst. Time To Repair- 8 hrs. to open both lanes, 4 hrs. for 1 laneRemarks/Conclusions/Recommendations:
Both lanes would be covered—Also - about 500'outh side following the 70'i cut1/0:] -, 15'i w/high natural slope = debris slides
2-62
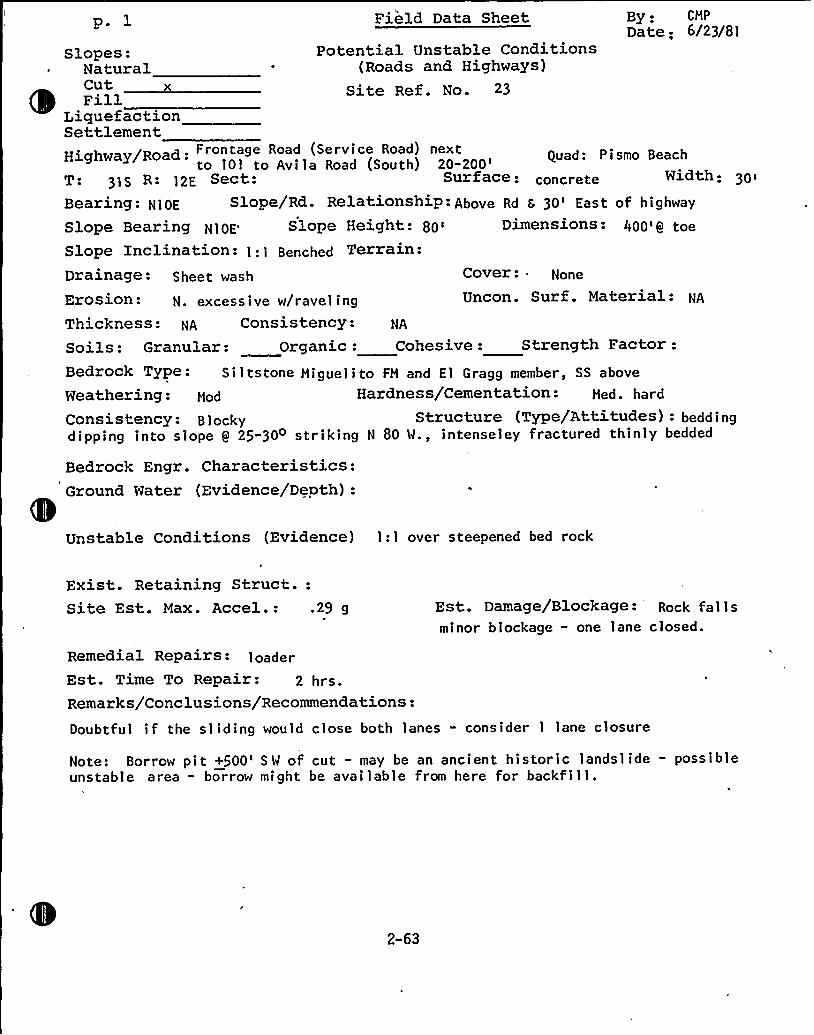
p 1 Field Data Sheet By: CMP
Date: 6/23/81Potential Unstable Conditions
(Roads and Highways)Site Ref. No. 23
Uncon. Surf. Material: NAN. excessive w/ravelingThickness: NA Consistency:Soils: Granular: Organic: Cohesive: Strength Factor:Bedrock Type- Siltstone Miguelito FM and El Gragg member, SS above
Weathering: Mod Hardness/Cementation: Med. hard
Consistency: B 1 ocky Structure (Type/Attitudes) - bedd i ng
dipping into slope g 25-30 striking N 80 W., intenseley fractured thinly bedded
Bedrock Engr. Characteristics:Ground Water (Evidence/Depth):
Slopes:NaturalCut xFill
Liquefactz.onSettlement
gray/Road.Frontage Road(Serv ice Road)nextto 101 to Avi la Road (South) 20-200':
31S R: 12E Sect: Sur face: concrete Width -3Q'earing:
N10E Slope/Rd. Relationship- Above Rd s 30'ast of highway
Slope Bearing N10E Slope Height: 80~ Dimensions: F00~ q toe
SloPe Inclination: 1.1 Benched Terrain:Drainage: Sheet wash Cover: None
Unstable Conditions (Evidence) 1:1 over steepened bed rock
Exist. Retaining Struct.:Site Est. Max. Accel.: .29 g
Remedial RePairs: loaderEst. Time To Repair:Remarks/Conclusions/Recommendations:
Est. Damage/Blockage: Rock fa 1 1 s
minor blockage - one lane closed.
Doubtful if the sliding would close both lanes - consider 1 lane closure
Note: Borrow pit +500' W of cut - may be an ancient historic landslide - possibleunstable area - borrow might be available from here for backfill.
2-63
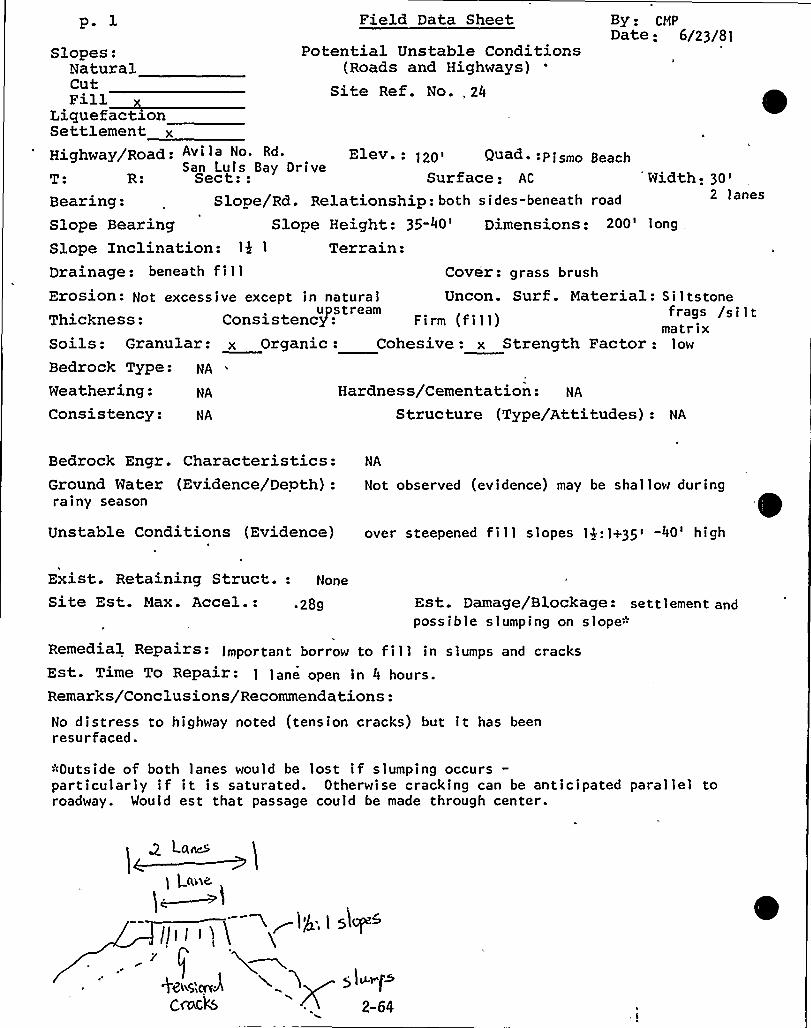
p. 1 Field Data Sheet By: CHPDate; 6/23/81
Potential Unstable Conditions(Roads and Highways)
Site Ref. No.,24
Width: 30'lanes
Hardness/Cementation: NA
Structure (Type/Attitudes): NAConsistency: NA
Slopes:NaturalCutFill
LiquefactionSettlement x
Highway/Road.. Avila No. Rd. Elev.: 120'uad. ~ Pismo BeacSan Luis Bay Drive
T R: Sect:: Surface: AC
Bearing: Slope/Rd. Relationship: both s i des-beneath road
Slope Bearing Slope Height: 35-40'imensions: 200'ong .
Slope Inclination: 14 1 Terrain:Drainage: beneath f i 1 1 Cover: grass brush
Erosion- Not excessive except in natural Uncon. Surf. Material: Siltstoneupstream frags /siltThickness: Consistency: Firm (fill) matrix
Soils: Granular: x Organic: Cohesive: x Strength Factor: low
Bedrock Type: NA
Weathering: NA
Bedrock Engr. Characteristics:Ground Water (Evidence/Depth):rainy season
Unstable Conditions (Evidence)
NA
Not observed (evidence) may be shallow during
over steepened fill slopes 1$ :1+35< -40'igh'I
Exist. Retaining Struct.: None
Site Est,. Max. Accel.: .28g Est. Damage/Blockage: settlement andpossible slumping on slope"-
Remedial Repairs: important borrow to fill in slumps and cracksEst. Time To Repair: 1 lane open in 4 hours.Remarks/Conclusions/Recommendations:No distress to highway noted (tension cracks) but it has beenresurfaced.
*Outside of both lanes would be lost if slumping occurs-particularly if it is saturated. Otherwise cracking can be anticipated parallel toroadway. Would est that passage could be made through center.
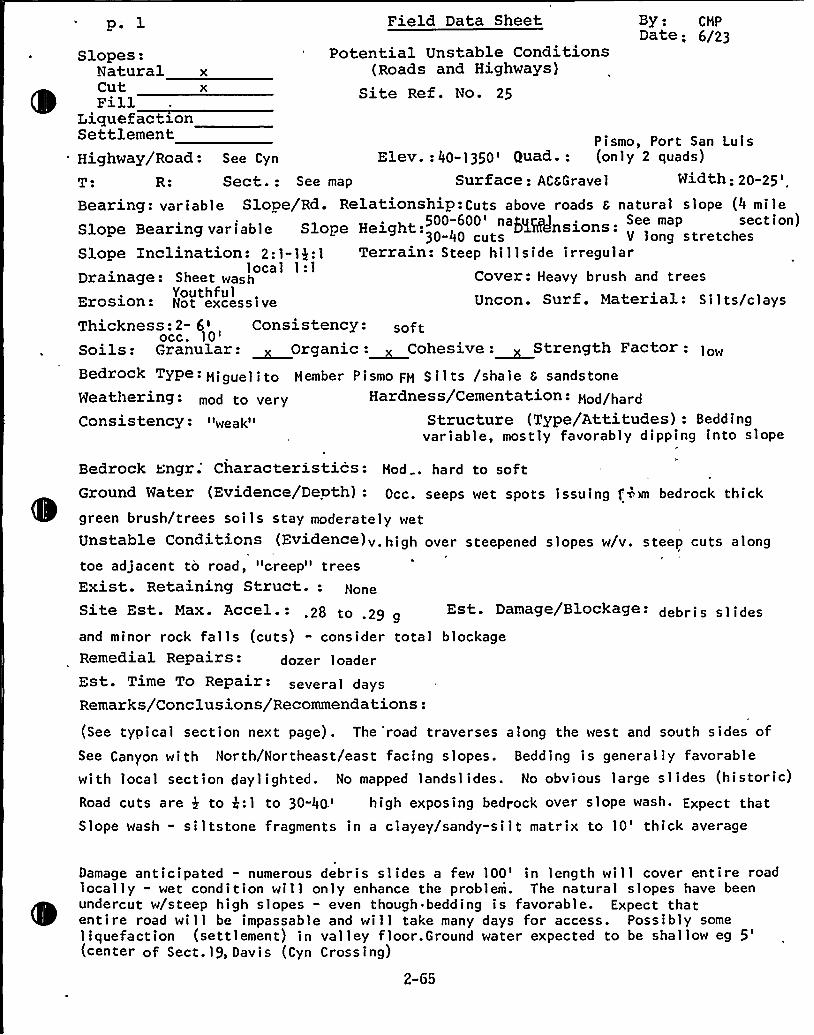
p. l Field Data Sheet By - CMPDate: 6/23
Potential Unstable Conditions(Roads and Highways)
Site Ref. No. 25
Slopes:Natural xCut xFill
LiquefactionPismo, Port San Luis
Highway/Road: See Cyn Elev.:40-]350> Quad.: (only 2 quads)
T R: Sect.: See map Surface: ACSGravel Width: 20-25 >
Bearing: variable Slope/Rd. Relationship-Cuts above roads 6 natural slope (4 mile
Slope Bearing variable Slope Height:0 4
D'Cmensxons:500-600'ae ral . See map section)30-40 cuts V long stretches
Slope Inclination: 2:1-lg:1 Terrain: Steep hillside irregularlocal 1:1Drainage: Sheet wash Cover: Heavy brush and trees
Erosion- Not excessiveYouthful Uncon. Sur f . Material: S i 1 ts/cl ays
Thickness:2- 6'onsistency: softocc.10'oils:Granular: ~Organic: x Cohesive:~Strength Factor: low
yp 'iguel i to Member pismo FM S il ts /shale 6 sandstoneWeathering: mod to very Hardness/Cementation: Mod/hard
Consistency: Structure (Type/Attitudes): Beddingvariable, mostly favorably dipping into slope
Bedrock engr. Characteristics: Mod . hard to softGround Water (Evidence/Depth) - Occ. Seeps wet spots issuing fkm bedrock thickgreen brush/trees soils stay moderately wetUnstable Conditions (Evidence)v.high over steepened slopes w/v. steep cuts along
toe adjacent to road, "creep" treesExist. Retaining Struct.:Site Est. Max. Accel.: .28 to .29 g
Est. Damage/Blockage: debris slidesand minor rock falls (cuts) - consider total blockageRemedial RePairs: dozer loaderEst. Time To RePair: several daysRemarks/Conclusions/Recommendations:
(See typical section next page). The 'road traverses along the west and south sides ofSee Canyon with North/Northeast/east facing slopes. Bedding is generally favorablewith local section daylighted. No mapped landslides. No obvious large slides (historic)Road cuts are 4 to 4".1 to 30-40.'igh exposing bedrock over slop~ wash Expect thatSlope wash - siltstone fragments in a clayey/sandy-silt matrix to 10'hick average
Damage anticipated - numerous debris slides a few 100'n length will cover entire roadlocally - wet condition will only enhance the problem. The natural slopes have beenundercut w/steep high slopes - even though bedding is favorable. Expect thatentire road will be impassable and will take many days for access. Possibly someliquefaction (settlement) in valley floor. Ground water expected to be shallow eg
5'centerof Sect.19, Davis (Cyn Crossing)
2-65
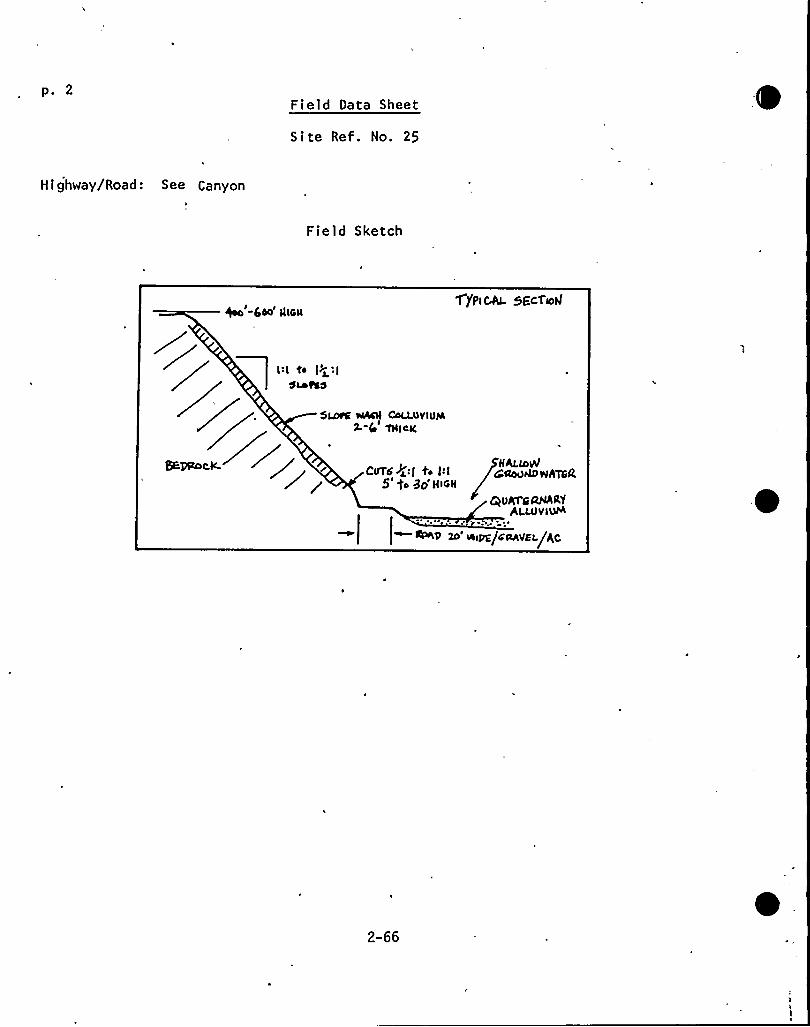
po 2Field Data Sheet
Site Ref. No. 25
Highway/Road: See Canyon
Field Sketch
~'-6OO'iIeII1 (PICA. SfcteIi
5LOt% 14ACH CoUAVIVfAMlcK
HhuCVVCvT6P:i 4. i:I Caookv~hts5 4a 3O'IIIOH
QuNa RHAR'fALLOV10+
f~p ao'im/saavzi/Ac
2-66
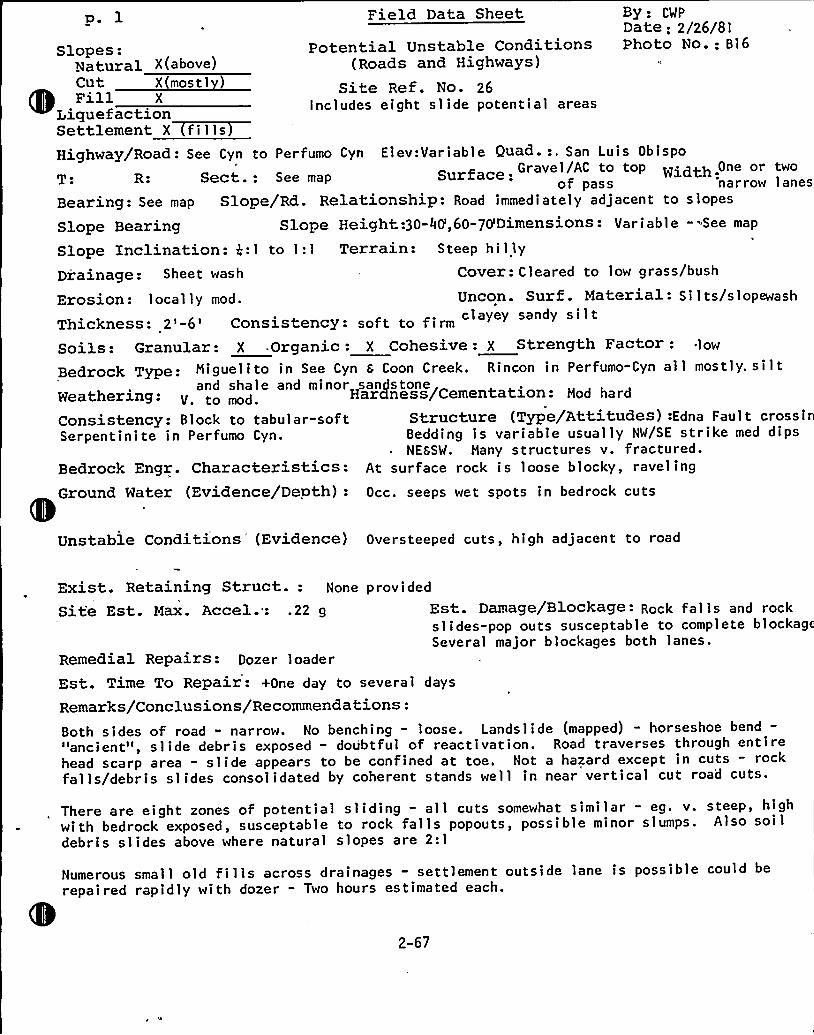
By: CWp
Date: 2/26/81Photo No.: B16
Field Data Sheetp. lSlopes: Potential Unstable Conditions
Natural X(above) (Roads and Highways)
~
~
Site Ref. No. 26Includes eight slide potential areasLiquefaction
Settlement X~fi11s
Highway/Road: See Cyn to Perfumo Cyn Elev:Variable Quad-: ~ San Luis ObispoGravel/AC to top Width One or two
T ~ ~ ect.: See map ur'narrow lanes
Bearing: See map Slope/Rd. Relationship: Road immediately adjacent to slopes
Slope Bearing Slope Height:30-40',60-70'Dimensions - Variable - See map
Slope Inclination: 4".1 to 1:1 Terrain: Steep hi 1 lyDiainage: Sheet wash Cover: Cleared to low grass/bush
Erosion: 1 oca 1 1 y mod. Uncon. Surf . Material: S i 1 ts/s lopewash
Thickness: 2'-6'onsistency- soft to firm clayey sandy siltSoils: Granular: X Organic: X Cohesive: X Strength Factor: .low
Bedrock Type: ~iguelito in See Cyn 6 Coon Creek. Rincon in Perfumo-Cyn all mostly. siltand shale and minor sandstone
Weathering: Hardness/Cementation: Hod hard
Consistency: Block to tabular-soft Structure (Type/Attitudes) -Edna Faul t cross i
Serpentinite in Perfumo Cyn. Bedding is variable usually NW/SE strike med dips~ NESSW. Hany structures v. fractured.
Bedrock Engr. Characteristics: At surface rock is loose blocky, raveling
Ground Water (Evidence/Depth): Occ. seeps wet spots in bedrock cuts
Unstable Conditions'Evidence) Oversteeped cuts, high adjacent to road
Exist. Retaining Struct.: None provided
Site Est. Max. Accel."..22 g Est. Damage/Blockage: Rock falls and rockslides-pop outs susceptable to complete blockagSeveral major blockages both lanes.
Remedial Repairs: Dozer loader
Est. Time To Repair: +One day to several days
Remarks/Conclusions/Recommendations:Both sides of road - narrow. No benching - loose. Landslide (mapped) - horseshoe bend-"ancient", slide debris exposed - doubtful of reactivation. Road traverses through entirehead scarp area - slide appears to be confined at toe. Not a hazard except in cuts - rockfalls/debris slides consolidated by coherent stands well in near vertical cut road cuts.
There are eight zones of potential sliding - all cuts somewhat similar - eg. v. steep, highwith bedrock exposed, susceptable to rock falls popouts, possible minor slumps. Also soildebris slides above where natural slopes are 2:1
Numerous small old fills across drainages - settlement outside lane is possible could be
repaired rapidly with dozer - Two hours estimated each.
2-67
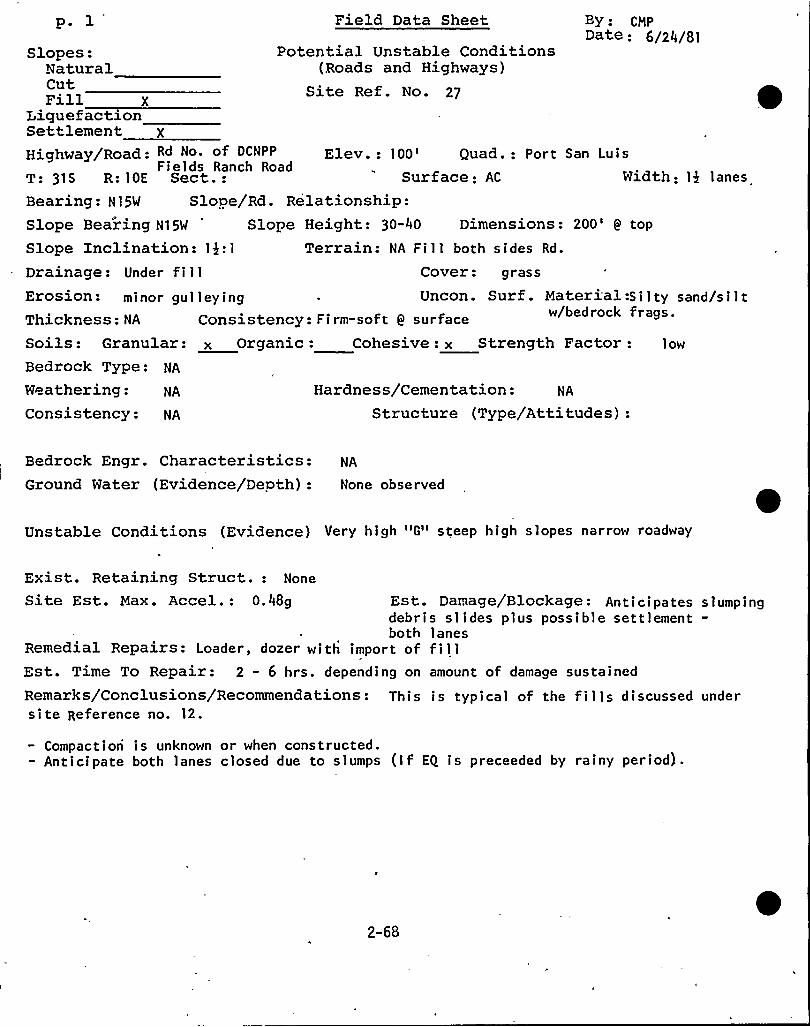
pe l Field Data Sheet By: CNPDate: 6/24/81
Potential Unstable Conditions(Roads and Highways)
Site Ref. No. 27
Slopes:NaturalCutFill X
LiquefactionSettlementHighway/Road: Rd "o. «OCNPP Elev.: 100'uad.: Port San Luis
Fields Ranch RoadT: 31S R: 10E Sect.: Surface: AC Width: 14 lanes
Bearing- N15W Slope/Rd. Relationship:Slope Bearing N15W Slope Height: 30-40 Dimensions: 200' top
Slope Inclination: 1$ :1 Terrain: NA Fill both sides Rd.
Drainage: Under fi 1 1 Cover: grass
Erosion: minor gu1 1 ey ing Uncon. Surf. Material-Si 1 ty sand/sil tThickness: NA Consistency: Firm-soft Q surface w/bedrock frags.
Soils: Granular: x Organic: Cohesive: x Strength Factor: low
Bedrock Type: NA
Weathering: NA
Consistency: NA
Hardness/Cementation: NA
Structure (Type/Attitudes):
Bedrock Engr. Characteristics:Ground Water (Evidence/Depth):
NA
None observed
Unstable Conditions (Evidence) Very high "G" steep high slopes narrow roadway
Exist. Retaining Struct.: None
Site Est. Max. Accel.: 0.48g Est. Damage/Blockage: Antici pates s lumpingdebris slides plus possible settlement-both lanes
Remedial Repairs: Loader, dozer wi th import of f i 1 1
Est. Time To Repair: 2 - 6 hrs. depending on amount of damage sustained
Remarks/Conclusions/Recommendations: This is typical of the fills discussed undersite Reference no. 12.
- Compaction is unknown or when constructed.- Anticipate both lanes closed due to slumps (If EQ is preceeded by rainy period).
2-68
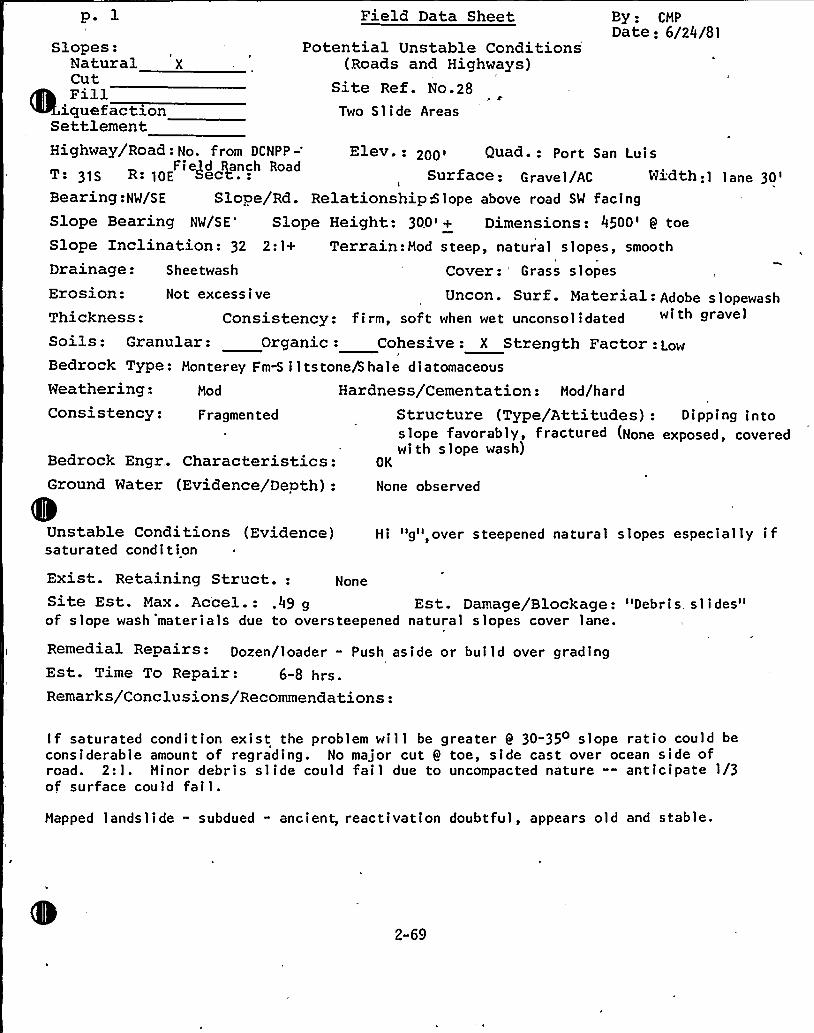
p. lSlopes:
Natural XCutFill
icluefactzonSettlement
Field Data Sheet
Potential Unstable Conditions(Roads and Highways)
Site Ref. No.28Two Slide Areas
By - CHPDate: 6/24/81
Highway/Road: No. from DCNPP-" Elev.: 200'uad.: port San LuisFied,d Ranch RoadT: 31S R: 10E >ec<.: Surface: Gravel/AC Wk.dth:1 1 ane
30'earing:NW/SESlope/Rd. Relationship Slope above road SW facingSlope Bearing NW/SE'lope Height: 300'+ Dimensions: 4500' toeSlope Inclination: 32 2:1+ Terrain:Nod steep, natural slopes, smooth
Drainage: Shee twas h Cover: 'rass slopes
Bedrock Engr,. Characteristics:Ground Water -(Evidence/Depth):
Unstable Conditions (Evidence)saturated condition
None observed
Hi "g",over steepened natural slopes especially if
Erosion: Not excess i ve Uncon. Surf . Material: Adobe s lopewashThickness: Consistency: firm, soft when wet unconsolidatedSoils: Granular: Organic: Cohesive: X Strength Factor:LowBedrock Type: Monterey Fm-S i 1 tstone/S hale diatomaceous
Weathering: Mod Hardness/Cementation: Nod/hardConsistency: Fragmented Structure (Type/Attitudes): D i ppi ng into
slope favorably, fractured (None exposed, coveredwi th slope wash)
OK
Exist. Retaining Struct.: None
Site Est. Max. Accel.: .49 g Est. Damage/Blockage: "Debris. slides"of slope wash materials due to oversteepened natural slopes cover lane.
Remedial RePairs: Dozen/loader - Push aside or bui ld over gradingEst. Time To Repair: 6-8 hrs.Remarks/Conclusions/Recommendations:
If saturated condition exist the problem will be greater 9 30-35 slope ratio could beconsiderable amount of regrading. No major cut 9 toe, side cast over ocean side ofroad. 2:1. Hinor debris slide could fail due to uncompacted nature -- anticipate 1/3of surface could fai 1 .
Happed landslide - subdued - ancient, reactivation doubtful, appears old and stable.
2-69
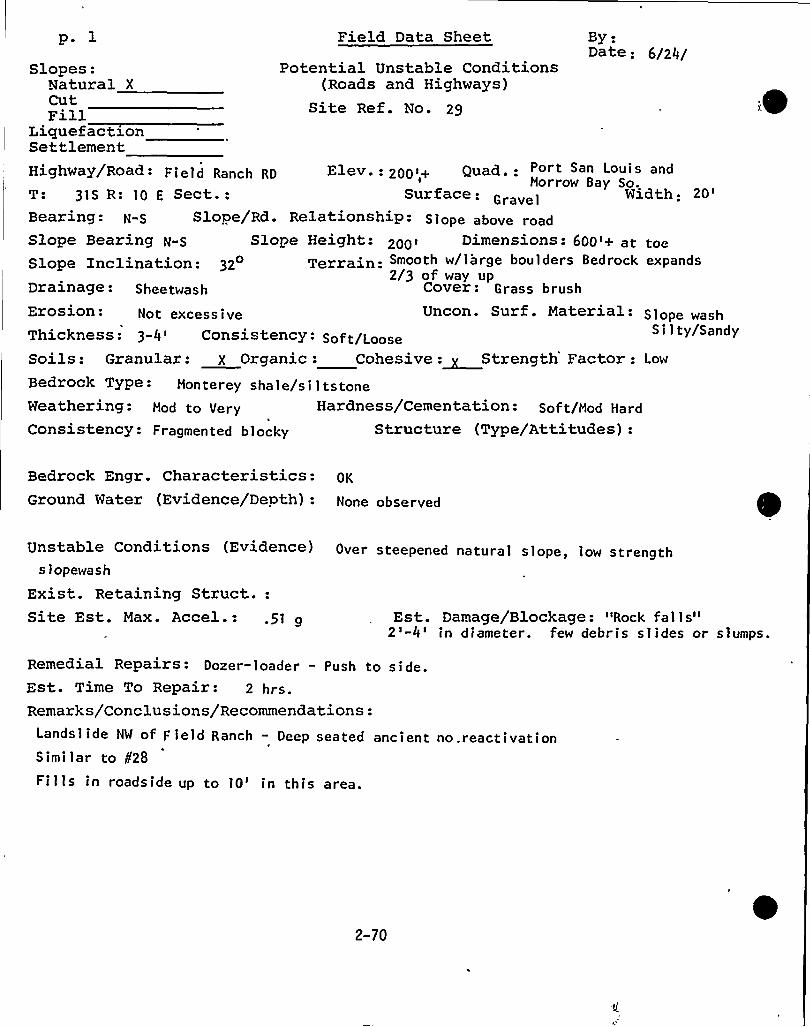
p. l Field Data Sheet By:Date: 6/24/
Potential Unstable Conditions(Roads and Highways)
Site Ref. No. 29
Slopes:Natural X
CutFillLiciuefactionSettlementHighway/Road: Field Ranch RD Elev. - 200'+ Quad.. Port San Lo~is and
Horrow Bay So,T: 31S R: 10 E Sect.: Sur face: Gravel Ldth:
20'earing:
N-S Slope/Rd. Relationship: S 1 ope above roadSlope Bearing N-S Slope Height: 200~ Dimensions: 600'+ at toeSlope Inclination: 32 Terrain. Smooth w/large boulders Bedrock expands
2/3 of way upDrainage: Sheetwash Cover: Grass brushErosion: Not excessive Uncon. Surf . Material: Slope wash
Thickness: 3-4'onsistency- Soft/Loose Silty/Sandy
Soils: Granular: X Organic: Cohesive:~Strength Factor: Low
Bedrock Type - Honterey shale/s i 1 ts toneWeathering: Hod to Very Hardness/Cementation: Sof t/Mod Hard
Consistency: Fragmented blocky Structure (Type/Attitudes):
Bedrock Engr. Characteristics: OK
Ground Water (Evidence/Depth): None observed
Unstable Conditions (Evidence) Over steepened natural slope, low strengthslopewash
Exist. Retaining Struct.:Site Est. Max. Accel.: .5] 9 Est. Damage/Blockage: "Rock fal 1 s"2'-4'n diameter. few debris slides or slumps.
Remedial Repairs: Dozer-loader - Push to side.Est. Time To Repair: 2 hrs.Remarks/Conclusions/Recommendations:
Landslide NW of F ield Ranch - Deep seated ancient no.reactivationSimilar to ¹28Fills in roadside up to 10'n this area.
2-70
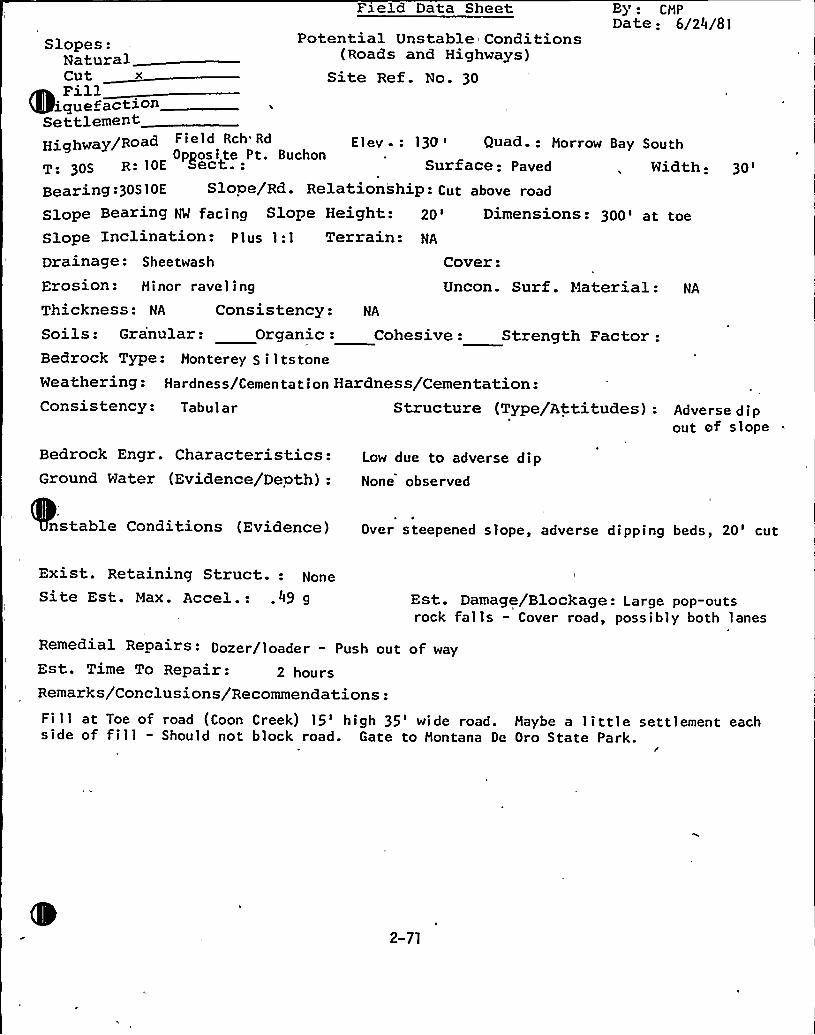
Field Data Sheet By: CMPDa te: 6/24/81
Potential Unstable1Conditions(Roads and Highways)
Site Ref. No. 30
Slopes:NaturalCut xFill
iquefactionSettlementHighway/Road P ield Rch Rd Elev.: 13p 1
Opposite Pt. 8uchonT: 305 R: 10E Sect.. Surfac
Rel atacing Slope Height- 20'
lope inclination: Plus 1:1 T
Drainage: Sheetwash Cover:
Quad.: Morrow 8ay South
e: Paved Width:
30'ncon.
Surf. Material: NAErosion: Minor ravel ingThickness: NA Consistency: NA
Soils: Granular: Organic: Cohesive: Strength Factor:Bedrock Type: Monterey S 11tstoneWeatherin: Hardness Cemen a i n Hardness Cementation:g / t to /Consistency: Tabul ar Structure (Type/Attitudes): Adverse d i p
out ef slope
Bedrock Engr. Characteristics:Ground Water (Evidence/Depth):
Low due to adverse dipNone observed
nstable Conditions (Evidence) Over steepened slope, adverse dipping beds, 20'ut
Exist. Retaining Struct.: None
Site Est. Max. Accel.: .49 g Est. Damage/Blockage: Large pop-outsrock falls " Cover road, possibly both lanes
Remedial Repairs: Dozer/loader - Push out of wayEst. Time To Repair: 2 hoursRemarks/Conclusions/Recommendations:Fill at Toe of road (Coon Creek) 15'igh 35'ide road. Maybe a little settlement eachside of fill - Should not block road. Gate to Montana De Oro State Park.
s
2-71
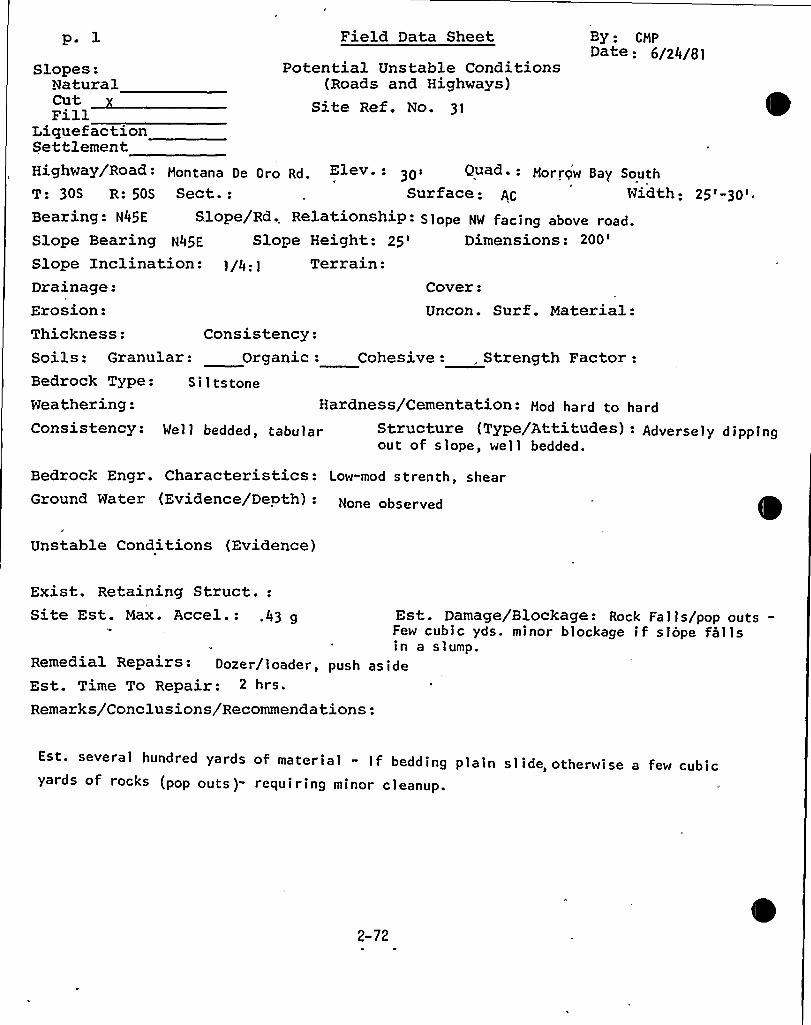
p l Field Data Sheet By CMPDate: 6/24/8 I
Potential Unstable Conditions(Roads and Highways)
Site Ref. No. 31
Slopes:NaturalCutFill
LiquefactionSettlementHighway/Road: Montana De pro Rd Elev.: 30I Quad.: Morrow 8ay goutT: 30S R: 50S Sect.: Surface: gC Width ..25 < -30<.
Bearing: N45E Slope/Rd, Relationship: Slope NW facing aboye road.Slope Bearing N45E Slope Height: 25'imensions:
200'lopeInclination: I/4..l Terrain:Drainage: Cover:Erosion: Uncon. Surf. Material:Thickness: Consistency:Soils: Granular: Organic: Cohesive: , Strength Factor:Bedrock Type: SiltstoneWeathering: H
Consistency: Wel I bedded, tabular
ardness/Cementation: Mod hard to hardStructure (Type/Attitudes): Adversely d I ppingout of slope, well bedded.
Bedrock Engr. Characteristics: Low-mod strenth, shearGround Water (Evidence/Depth): None obsef yed
Unstable Conditions (Evidence)
Exist. Retaining Struct.:Est. Damage/Blockage: Rock Falls/pop outs-Few cubic yds. minor blockage if slope fallsin a slump.
Remedial Repairs: Dozer/loader, push asideEst. Time To Repair: 2 hrs.
Remarks/Conclusions/Recommendations:
Est. several hundred yards of material - If bedding plain slide, otherwise a few cubicyards of rocks (pop puts)- requiring minor cleanup.
2-72
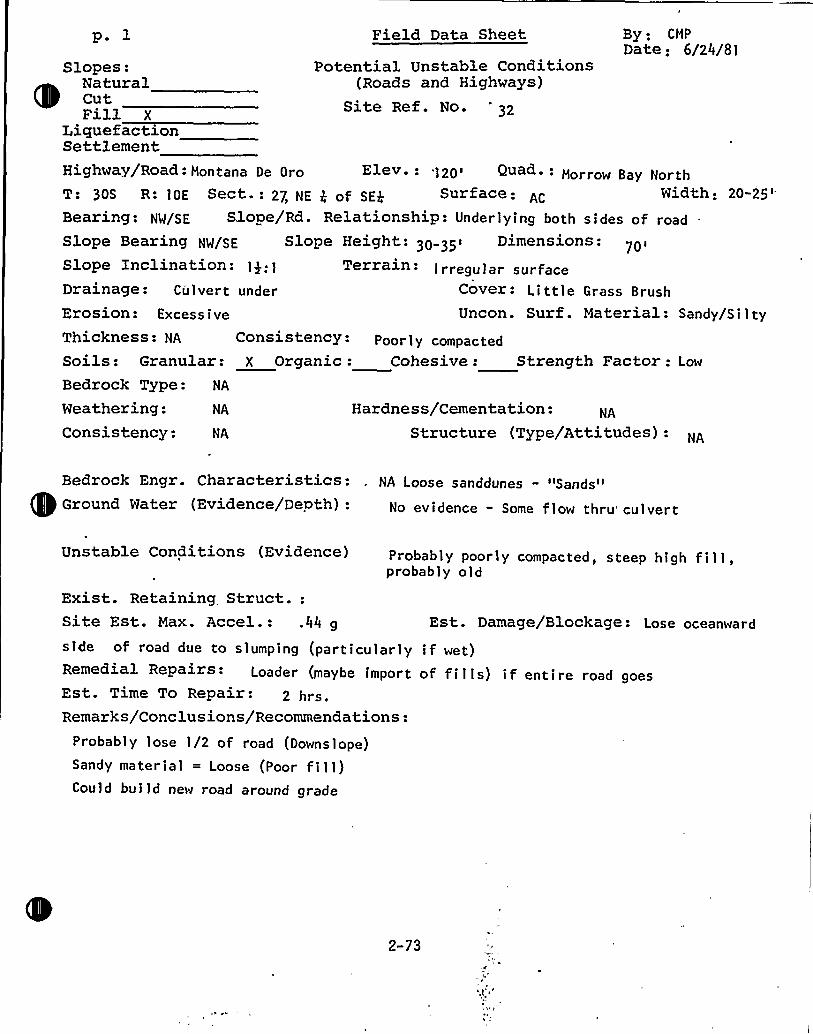
p. 1 Field Data Sheet By: CMP
Date: 6/24/81Potential Unstable Conditions
(Roads and Highways)Site Ref. No.
Consistency: Poorly compactedSoils: Granular: X Organic: Cohesive: Strength Factor: Low
Bedrock Type: NA
Thickness: NA
Slopes:
~
~
NaturalCutFill X
LiquefactionSettlementHighway/Road: Montana De Oro '120' d 'orrow Bay NorthT: 30S R: 10E Sect.: 27, NE $ of SEP f e - AC Width: 20-25
'earing:e/SE Slope/Rd. Relationship: Underlying both sides of road
Slope Bearing Ng/SE Slope Height: 3Q 35I Dimensions: 70/Slope Inclination: Irregular surfaceDrainage: Culvert under Cover: Li tt le Grass Brush
Erosion: Excess i ve Uncon ~ Sur f . Material: Sandy/S i 1 ty
Weathering: NA
Consistency: NA
Hardness/Cementation:Structure (Type/Attitudes): NA
Bedrock Engr. Characteristics: . NA Loose sanddunes - "Sands"Ground Water (Evidence/Depth) - No evidence - Some flow thru'ulvert
Unstable Conditions (Evidence) Probably poorly compacted, steep high fill,probably old
Exist. Retaining Struct.:Site Est. Max. Accel.: .44 g Est. Damage/Blockage: Lose oceanward
side of road due to slumping (particularly if wet)Remedial Repairs- Loader (maybe import of fills) if entire road goesEst. Time To Repair: 2 hrs.Remarks/Conclusions/Recommendations:
Probably lose 1/2 of road (Downslope)Sandy material = Loose (Poor fill)Could build new road around grade
2-73
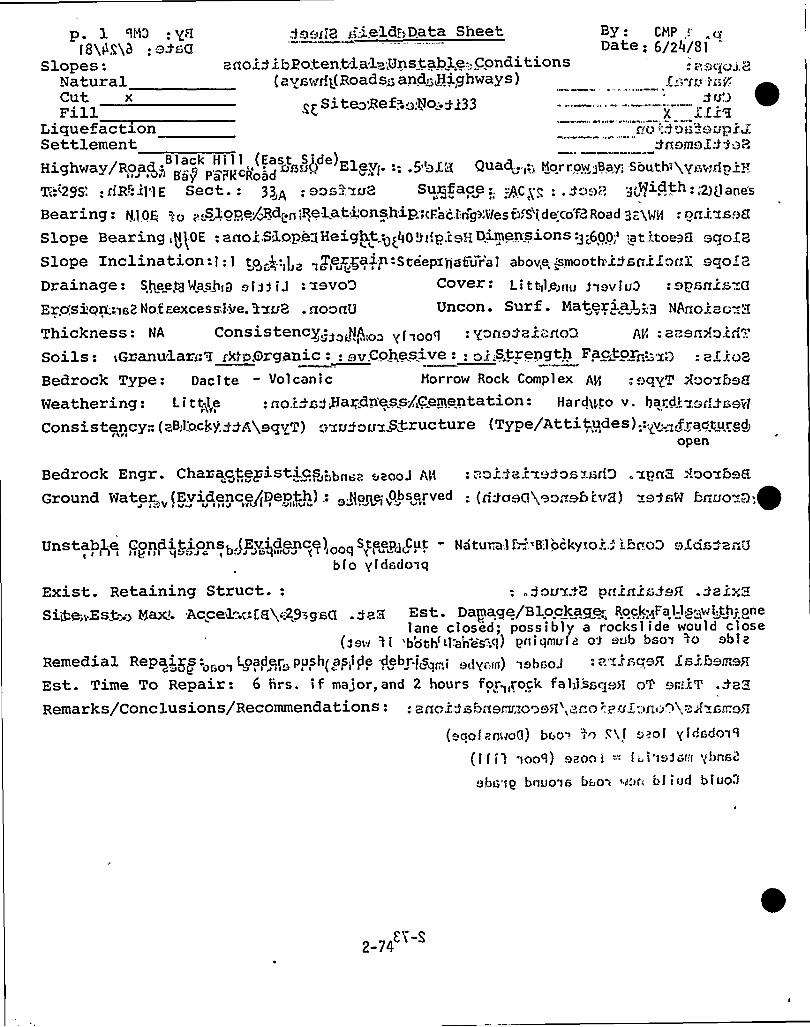
aaoidib2otential~,Unstable,-.-,Conditions( ayswffL(Roads„- ands Highways }
«;~ Si tedge f .o 1«lo.;gq33
p l '1N3 . gc q-g~~Lip y;,.ieldE~Data Sheet CHP «
f8~60,h: e.fsQ Date: 6/24/81Slopes:
NaturalCutFill
Liquefaction fKO«;:foie 8VpXZSettlement daemoXD+oR
Highway/Roke(.«c Q~GU(> 'levf- -.: .5'of 3 Quad„-'>, Nor row jBay,'South)gyrwdo j:H
T;-.l29S'.. dR":il«) E Sect.: 3]A:sos~ zg~> Suxlface:,:p,C ~«; -. go,,>p «Widtah: plane's
Bearing: N]0E; po;.„.Sgope/gdgn fRelat j.'onship.«:Fac.i:ngg'lesb~S'jde'(oQ Road g "gQ: nr.izsgGSlope Bearing,IfIOE: anode,Slopi 3Heightgg400t'.pisH Dimen'sions-g.„600 atiptoe>G eqoIBSlope Inclination:1:1 to,p.:,ga „p'px'palp-Seeepzlla5'ur'al above.ymoothidsoiXor(X eqo<B
Drainage: Sleety Ma«swig of~a i J -'xevo3 L i t tqlg)nu p q v fu3: e psalm s .Q
Ero'si«qn.'-.~e2 Notrexcess;ive. ixoB .goonU Uncon. Surf. Material>g +godThickness: NA Consistencyg»pA,,oo < f„ooq: yoqo~aq;:go~ AV« .-
a,.en>!oui"..'oils:
<Granular'.'I rM o.9rganic:: sv.Cohesive:: z~.;Strength Factor:„-zgBedrock Type: Dac 1 te - Volcanic Horrow Rock Comp) ex Aff „Qq+T goo+QQQ
Weathering: L i tt>l„e:ao.i„rggartdness/Cerflentation - Hard@to v. hardy g f QQQW
Consistency" (aB,l:ocky.ddt'««,eqvT) ozoyoir~Structure (Type/Attitudes):-«~v~.fractured:open
Bedrock Engr. CharacteyisticP„:,bn.a .„aoo~ A1;
Ground ««ater,„(Evidence@«Death).: apple;„Obaarved .. (cace««geo, ehzug e,ae hnco >,~Unstable Conditionsb,/Evidence) Speqpdput
bfo yfdsdoaq
Exist. Retaining Struct.: : .Dovx48 pnJ.airdeH .Ssix3Sigg~gsg-q Max«. Accel:.",sfggc'29;9@G .ga™> Est. Dapage/Blockage:. RockqFal„-lp,;wf thyone
lane closed; possibly a rockslide would close{Sew >1 'both'Ll>«nes".q) pniqmufa oP sub bsow >o obis
Remedial Repqipg:«o„Loade1-„„posh(ap~iffe debrl~s~mf ed«,,„} „absorb .«azisc",eR gs'papierEst. Time To Repair: 6 hrs. if major,and 2 hours for>«rock fal3isq.yfRemarks/Conclusions/Recommendations:
(eqofanwo0} boo» 'i~ <'«if soof «i fdsdoa'1
{ 1 f l3 ioo J} epoo..l " fi; i'ASS t«foal Qbn62
ebG'«q bnuoia bvoa «~l~n bi iud bfuoJ
2 74CE
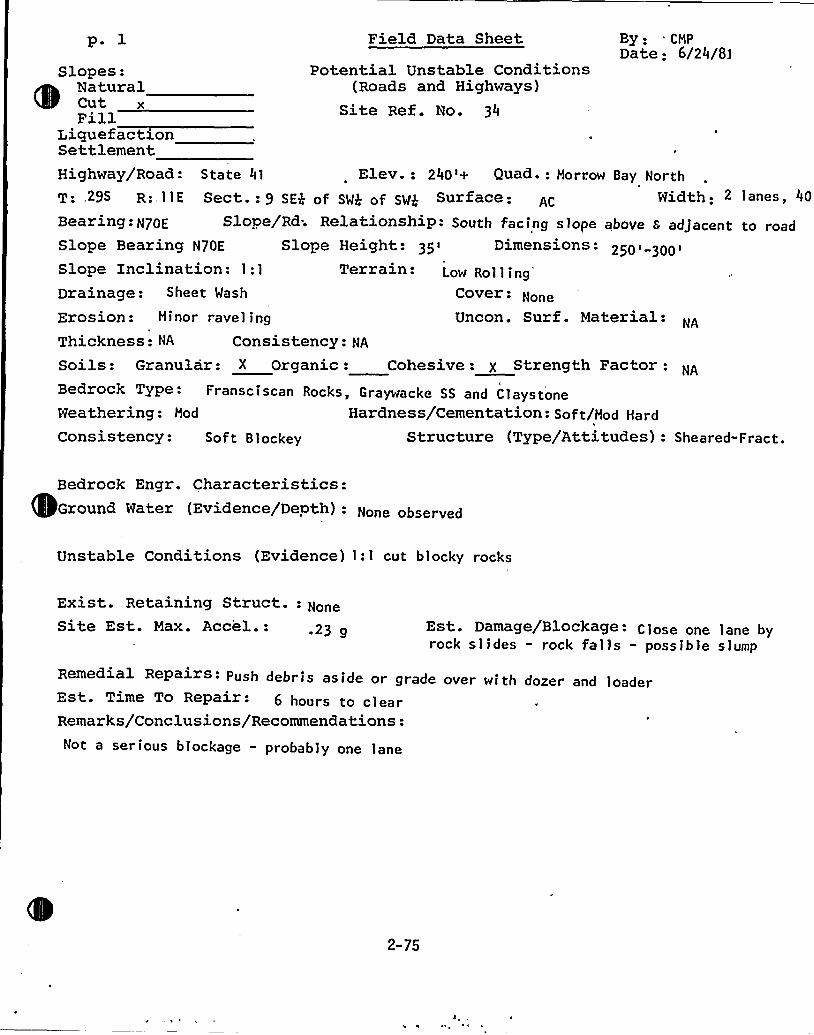
p. lSlopes:
~
~
NaturalCut xFill
LiquefactionSettlement
Field Data Sheet
Potential Unstable Conditions(Roads and Highways)
Site Ref. No. 34
By: CMP
Date: 6/24/8]
Highway/Road: State 41 Elev.: 240'+ Quad-: Morrow Bay NorthT:,29S R:, 1 1 E Sect 9 SQ 0f SW$ 0f SW$ Surface: AC Width: 2 lanes, 40
Bearing: N7QE Slope/Rd; Relationship- South facing slope above 8 adjacent to roadSlope Bearing N70E Slope Height: 35~ Dimensions: 250 i 3QQ I
Slope Inclination: 1:1 Terrain: LowRolling'rainage:
Sheet Wash Cover: None
Erosion: Minor ravel ing Uncon. Surf. Material: NA
Thickness: NA Consistency: NA
Soils: Granular: X Organic: Cohesive: X Strength Factor:Bedrock Type: Fransciscan Rocks, Graywacke SS and ClaystoneWeathering: Mod Hardness/Cementation - Sof t/Mod Hard
Consistency: Soft Blockey Structure (Type/Attitudes): Sheared" Fract.
Bedrock Engr. Characteristics:Ground Water (Evidence/Depth): None observed
Unstable Conditions (Evidence) 1:1 cut blocky rocks
Exist. Retaining Struct. None
Site Est. Max. Accel.: 23 g Est. Damage/Blockage: Close one lane byrock slides " rock fal)s " possible slump
Remedial Repairs: Push debris aside or grade over with dozer and loaderEst. Time To Repair- 6 hours to clearRemarks/Conclusions/Recommendations:Not a serious blockage - probably one lane
2-75
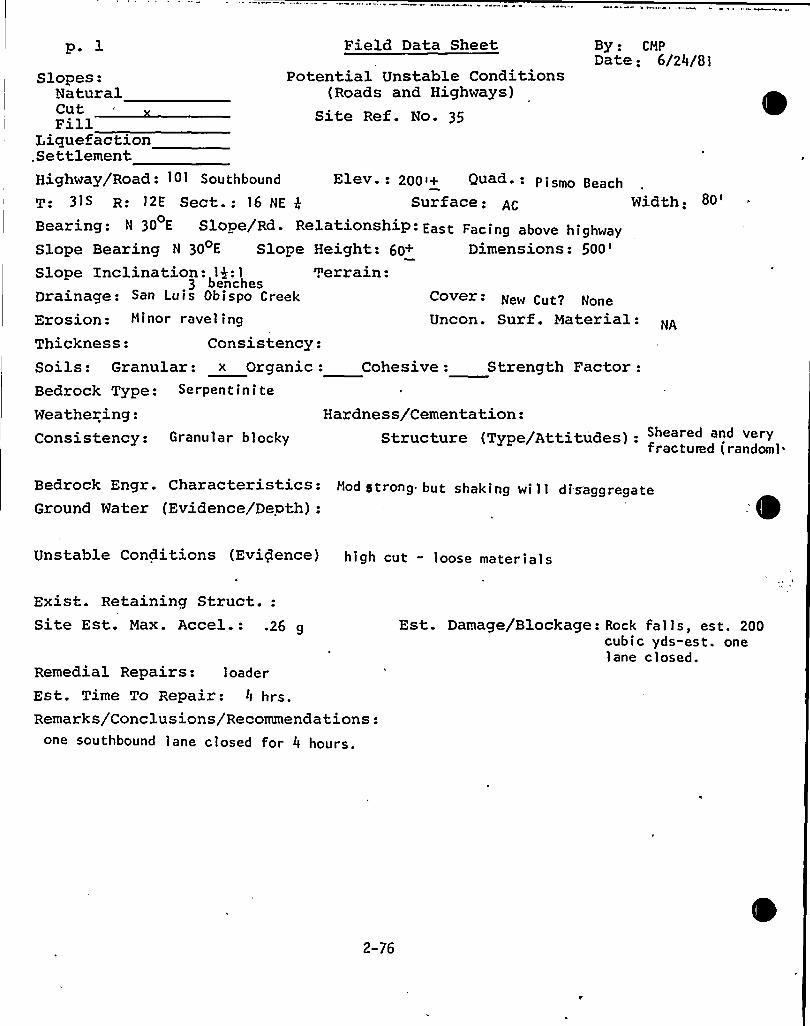
p. l Field Data Sheet By: CMPDate: 6/24/81
Potential Unstable Conditions(Roads and Highways)
Site Ref. No. 35
Cover: New Cut7 None
Uncon. Surf. Material:Consistency:
Soils: Granular: x Organic: Cohesive: Strength Factor:Bedrock Type: Serpentinite
Thickness:
Slopes:NaturalCutFill
Liquefaction.SettlementHighway/Road: 101 Southbound Elev.: 200'+ Quad. - pi smo peach
31S R: 12E Sect.: 16 NE $ Surface: Width:Bearing: N 30 E Slope/Rd. RelationshiP- East Facing above highwaySlope Bearing N 30 E Slope Height: 60+ Dimensions:
500'lopeInclination: 14:1 'terrain:benches
Drainage: San Luis Obispo Creek
Erosion: Minor ravel ing
80>
Weathering:Consistency:
Hardness/Cementation:Structure (TYPe/Attitudes) . Sheared and very
fractured (random]
Bedrock Engr. Characteristics: Mod strong but shaking wi 1 1 dis'aggregateGround Water (Evidence/Depth):
Unstable Conditions (Evidence) high cut - loose materials
Exist. Retaining Struct.:Site Est. Max. Accel 26 g
Remedial Repairs: loaderEst. Time To Repair: 4 hrs.Remarks/Conclusions/Recommendations:
one southbound lane closed for 4 hours.
Est. Damage/Blockage: Rock fal ls, est. 200cubic yds-est. onelane closed.
2-76
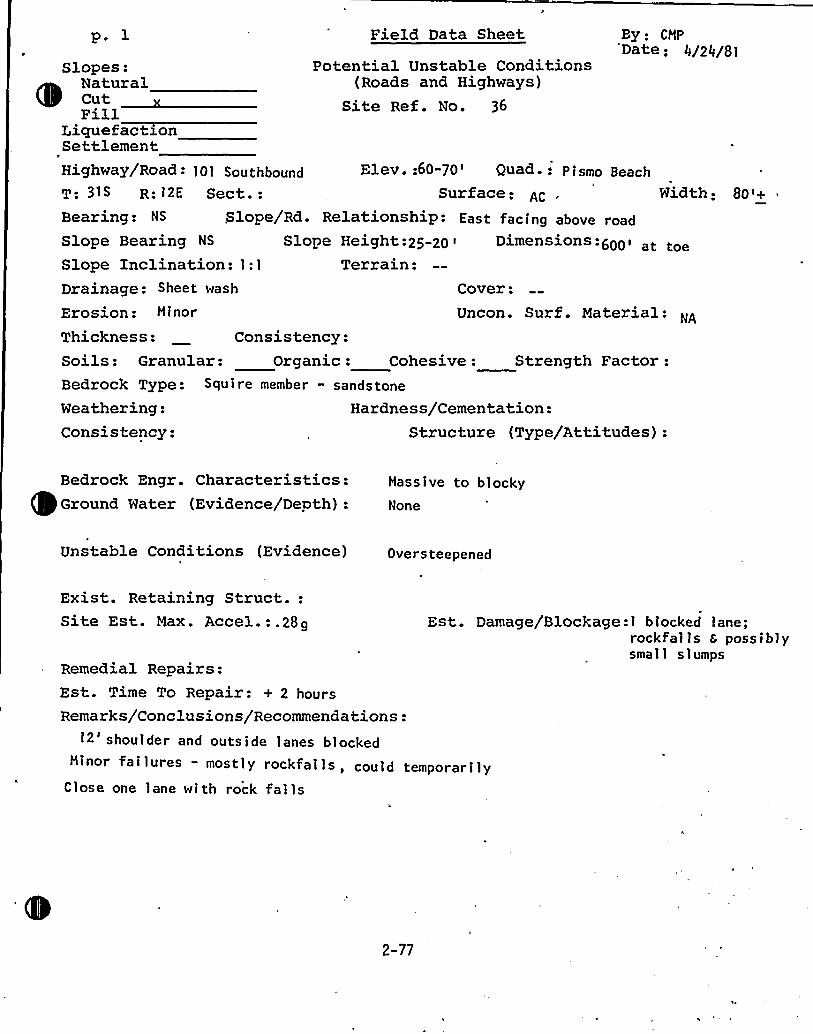
Field Data Sheetp. l By: CMPDate: 4/24/9)
Potential Unstable Conditions(Roads and Highways)
Site Ref. No. 36
Width: 80 ~+
Uncon. Surf. Material:Thickness: Consistency:Soils: Granular: Organic: Cohesive: Strength Factor:
Squire member - sandstoneBedrock Type:Weathering:Consistency:
Hardness/Cementation:Structure {Type/Attitudes):
Slopes:NaturalCutFill
LiquefactionSettlementHighway/Road - 'l0l Southbound Elev.:60-70'uad. - Pismo Beach
T: 3I S R: l2E Sect.: Surface:Bearing: NS Slope/Rd. Relationship: East facing above roadSlope Bearing NS Slope Height:25-20 ~ Dimensions:600 I
Slope Inclination: I:I Terrain:Drainage: Sheet wash Cover:Erosion: Minor
Bedrock Engr. Characteristics:Ground Water (Evidence/Depth):
Massive to blockyNone
Unstable Conditions {Evidence)r
Oversteepened
Exist. Retaining Struct.:Site Est. Max. Accel.:.28g Est. Damage/Blockage: I b locked lane;
rockfal Is s possiblysmall slumps
Remedial Repairs:Est. Time To Repair: + 2 hoursRemarks/Conclusions/Recommendations:
I2'houlder and outside lanes blockedMinor failures - mostly rockfalls, could temporarily
Close one lane with rock falls
2-77
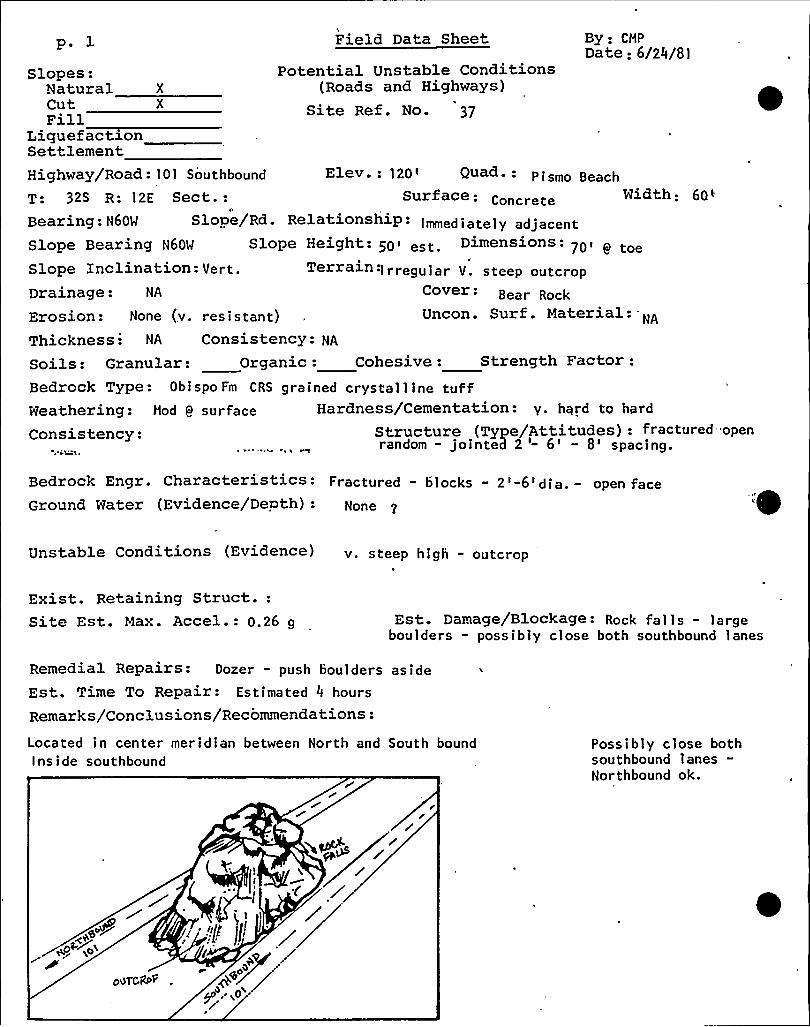
po lSlopes:
NaturalCutFill
LiquefactionSettlement
Field Data Sheet
Potential Unstable Conditions(Roads and Highways)
Site Ref. No. 37
By: CMP
Date: 6/24/81
Highway/Road: 101 Southbound Elev.: 120'uad.: pismo Beach
T: 32S R: 12E Sect.: Sur face: Concrete Width: 60
Bearing: N60W Slope/Rd. Relationship- Immed i ately adjacentSlope Bearing N60W Slope Height: g0 est Dimensions 70'Slope Inclination:Vert. rain 'I rregu 1 ar V. steep outcropDrainage: NA Cover: Bear Rock
Erosion: None (y. res i s tant) Uncon. Surf. Material:-+,Thickness: NA Consistency: NA
Soils: Granular: Organic: Cohesive: Strength Factor:Bedrock Type: Obispo Fm CRS grained crystal 1 ine tuffWeathering: Mod Q surface Hardness/Cementation: y. hqrd to hard
Consistency: Structure (Type/Attitudes): fractured "openrandom - jointed 2 '- 6' 8'pacing.
Bedrock Engr. Characteristics- Fractured - blocks - 2'-6'dia. - open faceGround Water (Evidence/Depth) - None
Unstable Conditions (Evidence) v. steep high - outcrop
Exist. Retaining Struct.:Site Est. Max. Accel.: 0.26 g Est. Damage/Blockage: Rock fal 1 s - large
boulders - possibly close both southbound lanes
Remedial Repairs: Dozer — push boulders asideEst. Time To Repair - Est ima ted 4 hours
Remarks/Conclusions/Recommendations:
Located in center meridian between North and South boundInside southbound
Possibly close bothsouthbound lanes-Northbound ok.
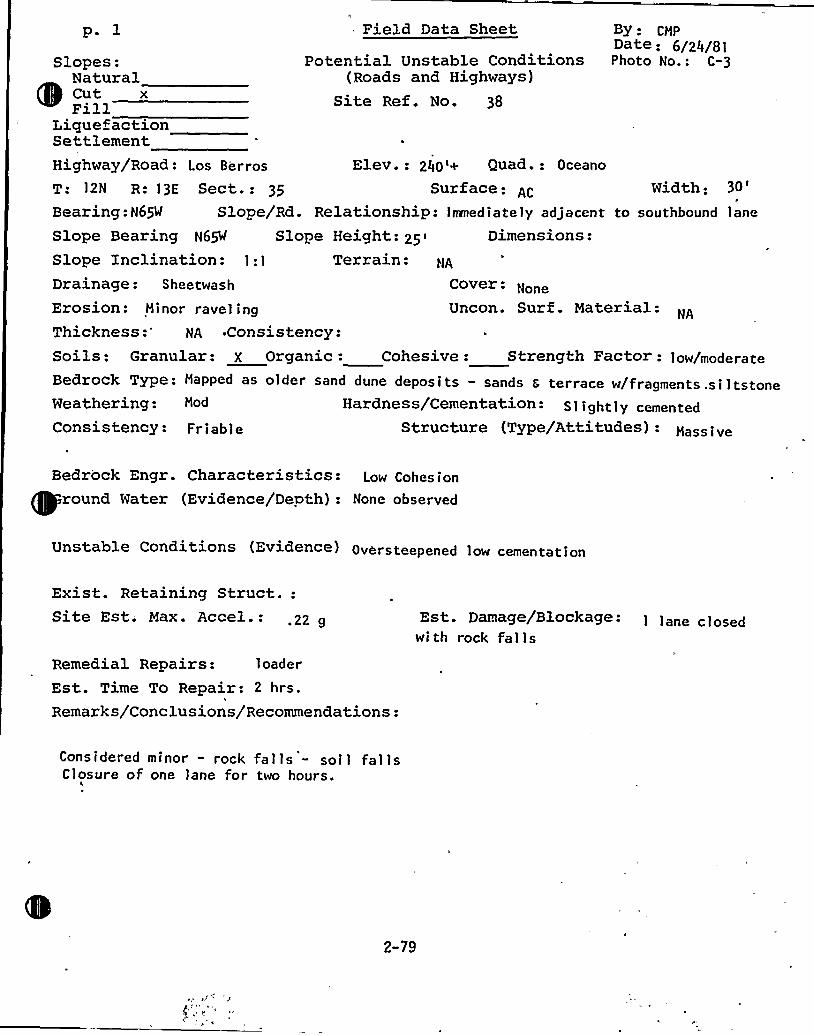
p. lSlopes:
NaturalCut xFill
LiquefactionSettlement
Field Data Sheet
Potential Unstable Conditions(Roads and Highways)
Site Ref. No. 38
CHP
6/24/81Photo No.: C-3
Highway/Road: Los Berros Elev.: 24O <+ Quad.: Oceano
T: 12N R: 13E Sect.: 35 Surface: AC Width:30'earing:
N65W Slope/Rd. Relationship: Immediately adjacent to southbound lane
Slope Bearing N65W Slope Height: 25< Dimensions:Slope Inclination: 1:1 Terrain: NA
Drainage: Sheetwash Cover: None
Erosion: Hinor ravel ing Uncon. Surf. Material:Thickness NA .Consistency:
I'oils:Granular: X Organic - Cohesive: Strength Factor: low/moderateBedrock Type: Happed as older sand dune deposits - sands 8 terrace w/fragments.siltstoneWeathering: Hod Hardness/Cementation: S 1 ight1y cementedConsistency: Friable Structure (Type/Attitudes) - Hass ive
Bedrock Engr. Characteristics: Low Cohes ionround Water (Evidence/Depth): None observed
Unstable Conditions (Evidence) Oversteepened low cementation
Exist. Retaining Struct.:Site Est. Max. Accel.: 22 g
Remedial Repairs: 1 oader
Est. Time To Repair: 2 hrs.Remarks/Conclusions/Recommendations:
Est. Damage/Blockage:1 1 ane closed
with rock falls
Considered minor " rock falls " soil fallsClosure of one lane for two hours.
2-79
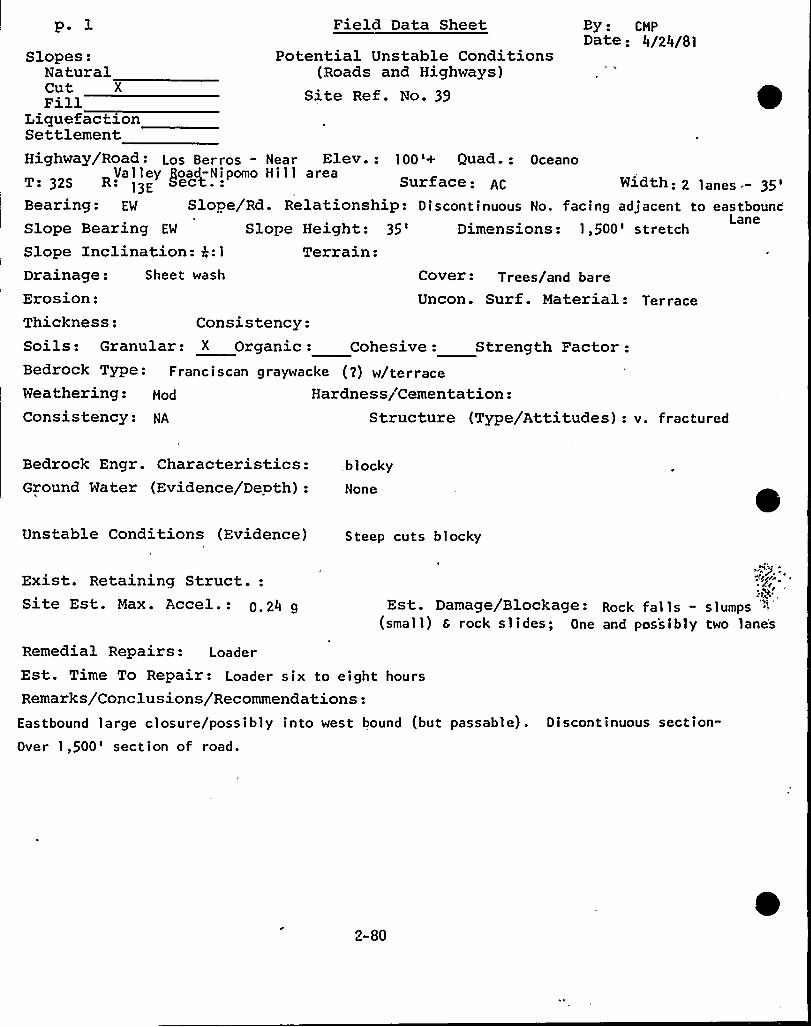
po lSlopes:
NaturalCut XFill
LiquefactionSettlement
Field Data Sheet
Potential Unstable Conditions(Roads and Highways)
Site Ref. No. 39
By - CMPDate: 4/24/Sl
Width: 2 lanes "35'acingadjacent to eastbounc
Lane1,500'tretch
Cover - Trees/and bare
Highway/Road: Los Berros - Near Elev.: 100'+ Quad.: OceanoValley Road-Nipomo Hill areaT: 32S R: 13E Neet.: Surface:
Bearing: EW Slope/Rd. Relationship: D i s cont i nuous No.
Slope Bearing EW Slope Height: 35'imensionsSlope Inclination: k:1 Terrain:Drainage: Sheet wash
Erosion: Uncon. Surf . Material: TerraceThickness: Consistency:Soils: Granular: X Organic: Cohesive: Strength Factor:Bedrock Type: Franciscan graywacke (2) w/terraceWeathering: Mod Hardness/Cementation:Consistency: NA Structure (Type/Attitudes): v. fractured
Bedrock Engr. Characteristics: blockyGround Water (Evidence/Depth): None
Unstable Conditions (Evidence) Steep cuts b 1 ocky
Exist. Retaining Struct.:Site Est. Max. Accel.: 0.24 g
Remedial Repairs: Loader
~i'jy
Est. Damage/Blockage: Rock falls - slumps(small) s rock slides; One and possibly two lane's
Est. Time To Repair: Loader six to eight hours
Remarks/Conclusions/Recommendations:Eastbound large closure/possibly into west bound (but passable). Discontinuous section-Over 1,500'ection of road.
2-80
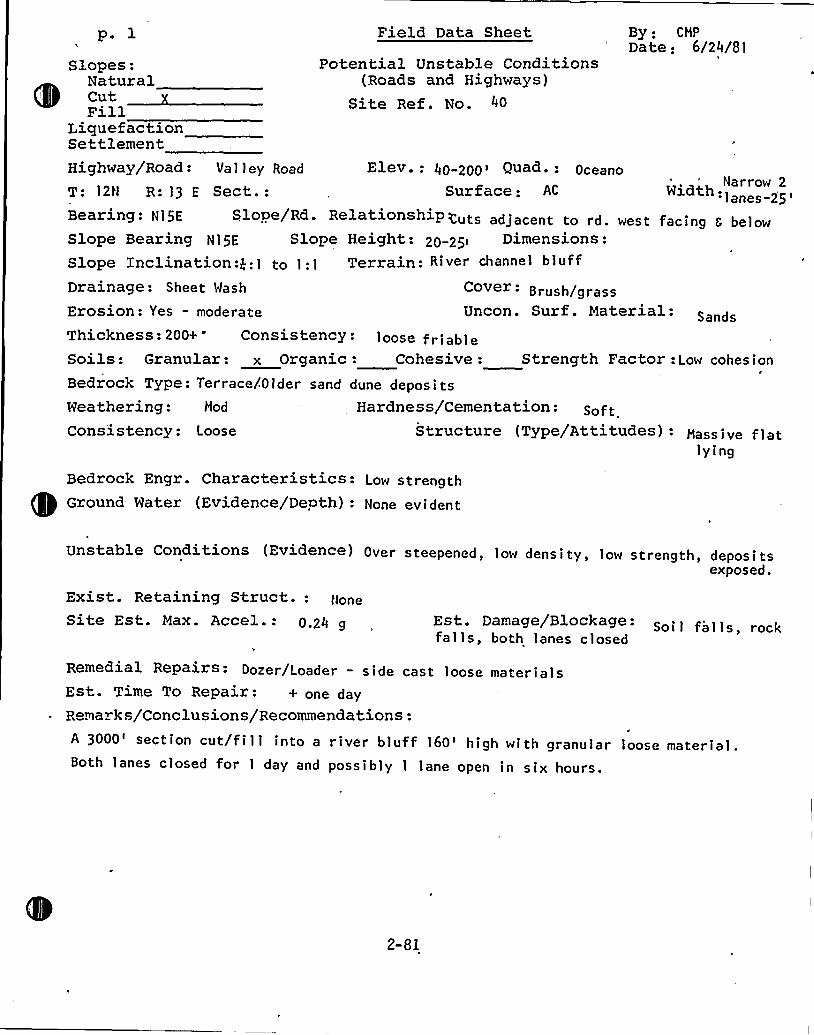
p. l Field Data Sheet By: CMP
Date: 6/24/81Potential Unstable Conditions
(Roads and Highways)Site Ref. No. 40
SandsThickness: 200+ Consistency: loose friabl e
Soils: Granular: x Organic: Cohesive: Strength Factor: Low cohes ion
Bedrock Type: Terrace/Older sand dune depositsWeathering: Mod Hardness/Cementation: SpftConsistency: Loose Structure (Type/Attitudes): Mass 1 ve flat
lyingBedrock Engr. Characteristics - Low strengthGround Water (Evidence/Depth): None evident
Slopes:NaturalCutFill
LiquefactionSettlementHighway/Road: Va 1 1 ey Road Elev.: 40 200> Quad. - Oceano
Narrow 2T: 12N R: 13 E Sect.: Surface: AC WidthB r ng: N15E Slope/Rd. Relationship Cuts adjacent to rd. west f ' loSlope Bearing N15E Slope Height ~ 20-25~ Dimensions:Slope Inclination:$ :1 tp 1:1 Terrain: River channel bluffDrainage: Sheet Mash Cover: Brush/grassErosion: Yes - moderate Uncon. Surf. Material:
Unstable Conditions (Evidence) Over steepened, low density, low strength, depositsexposed.
Exist. Retaining Struct.: lloneSite Est. Max. Accel.: 0.24 g Est. Damage/Blockage: Sp 1 1 fa 1 1 s rpckfalls, both lanes closed
Remedial Repairs- Dozer/Loader - side cast loose materialsEst. Time To Repair: + one dayPemarks/Conclusions/Recommendations:A 3000'ection cut/fill into a river bluff 160'igh with granular loose material.Both lanes closed for 1 day and possibly 1 lane open in six hours.
2-81
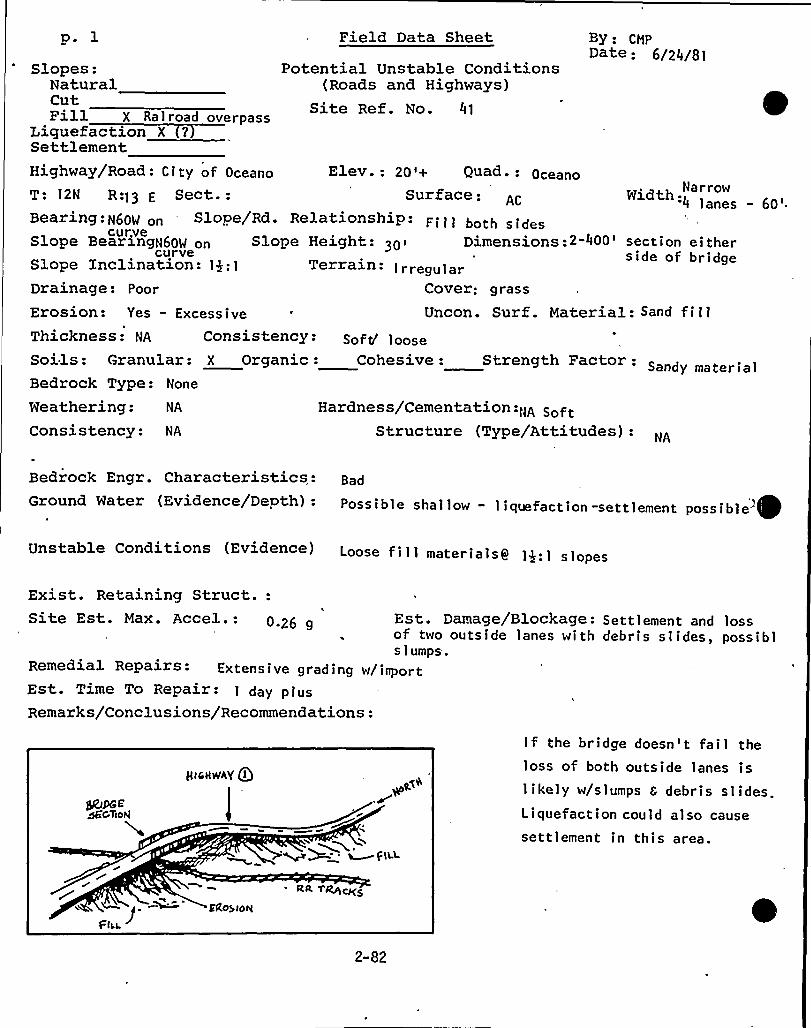
p. lSlopes:
NaturalCutFill X Ra I road
Settlement
Field Data Sheet
Potential Unstable Conditions(Roads and Highways)
Site Ref. No. 41overpass
By: CNPDate: 6/24/8)
Highway/Road: City of Oceano Elev.: 20'+ Quad-: Oceano
T: 12N R:13 E Sect.: Surface: AC
Bearing-N60W on Slope/Rd. Relationship: F j) ) bothSlope BearingN60W on Slope Height: 30l Dimensions:2"400'ection either
curve side of bridgeSlope Inclination: )$ :) Terrain- Irregu)arDrainage: Poor Cover: grass
Erosion: Yes — Excessive Uncon. Surf. Material: Sand f i )1
Width4 lanes - 60'
Hardness/Cementation:NA SoftStructure (Type/Attitudes): NA
Consistency: NA
Thickness: NA Consistency:Soils: Granular: X Organic: Cohesive: Strength Factor: Sandy mater ia)Bedrock Type: None
Weathering: NA
Bedrock Engr. Characteristics:ground Water (Evidence/Depth): possible shallow — liquefaction-settlement possible ~Unstable Conditions (Evidence) Loose fi)1 materia)s9 )g:) slopes
Exist. Retaining Struct.:Site Est. Max. Accel.: 0.26 g
Est. Damage/Blockage- Settlement and )ossof two outside lanes with debris slides, possiblslumps.
Remedial Repairs- Extensive grading w/inportEst. Time To Repair: 1 day plusRemarks/Conclusions/Recommendations:
If the bridge doesn't fail theloss of both outside lanes islikely w/slumps 8 debris slides.Liquefaction could also cause
settlement in this area.
Eko> ION
Flbb.
RR 7 ~~S
2-82
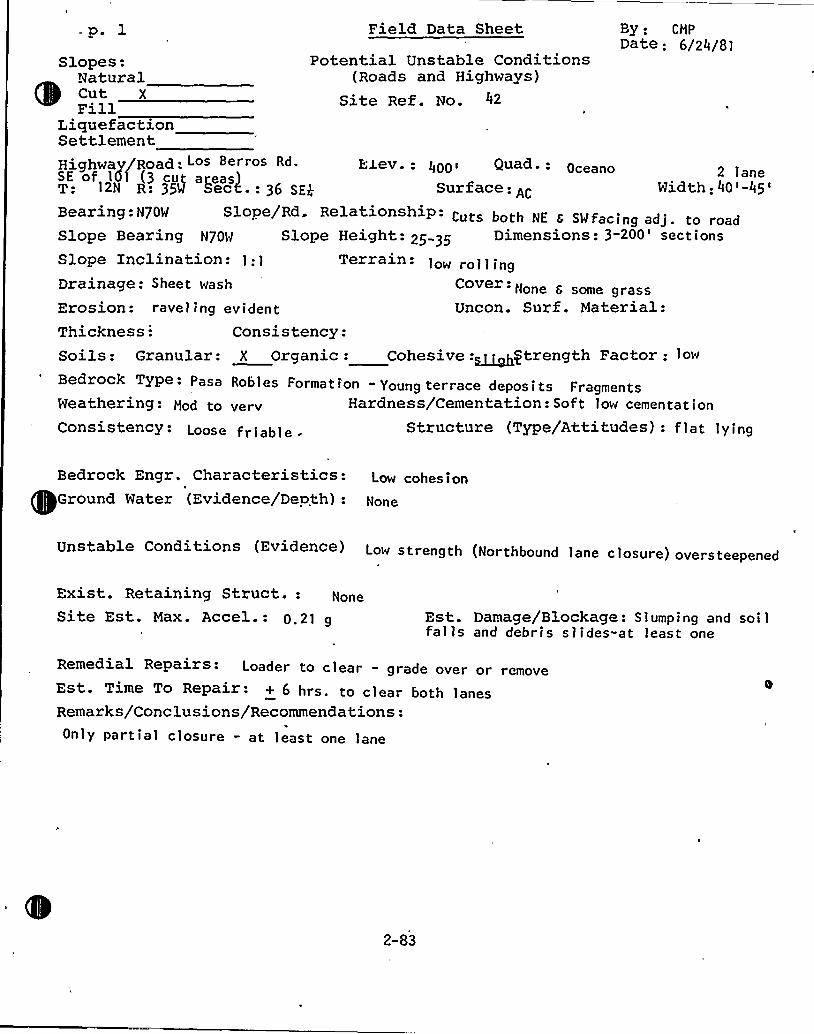
p 1 Field Data Sheet By: CMP
Date: 6/24/81Potential Unstable Conditions
(Roads and Highways)Site Ref. No. 42
2 laneWidt,h: 40 '-45
'lopes:NaturalCut XFill
LiquefactionSettlementHighwav/Road, Los Berros Rd. Elev: 400'uad. - OceanoSE of 161 (3 cut areas)T: 12N R: 35'g Sect.: 36 SEp Surface: AC
Bearing: N70M Slope/Rd. Relationship- Cuts both NE 6 SWfacing adj. to roadSlope Bearing N70W Slope Height - 25-35 Dimensions: 3-200'ect i ons
Slope inclination: 1:1 Terrain: low rol 1 ingDrainage: Sheet wash Cover'None g some grassErosion: ravel ing evident Uncon. Surf. Material:Thickness Consistency:Soils: Granular: X Organic: Cohesive:~strength Factor: low
Bedrock Type» Pasa Robles Formation - young terrace deposits FragmentsWeathering- Mod to verv Hardness/Cementation: Soft low cementation
ConsistencY: Loose friable . Structure (Type/Attitudes): f lat lying
Bedrock Engr. Characteristics: Low cohesionGround Water (Evidence/Depth):
Unstable Conditions (Evidence) Low strength (Northbound lane closure) oversteepened
Exist. Retaining Struct- - None
Site Est.. Max. Accel.: 0 '1 g Est.. Damage/Blockage: Slumping and soi 1
falls and debris slides-at least one
Remedial Repairs- Loader to clear - grade over or removeEst. Time To Repair - + 6 hrs. to cl ear both lanesRemarks/Conclusions/Recommendations:
'
Only partial closure - at least one lane
2-83
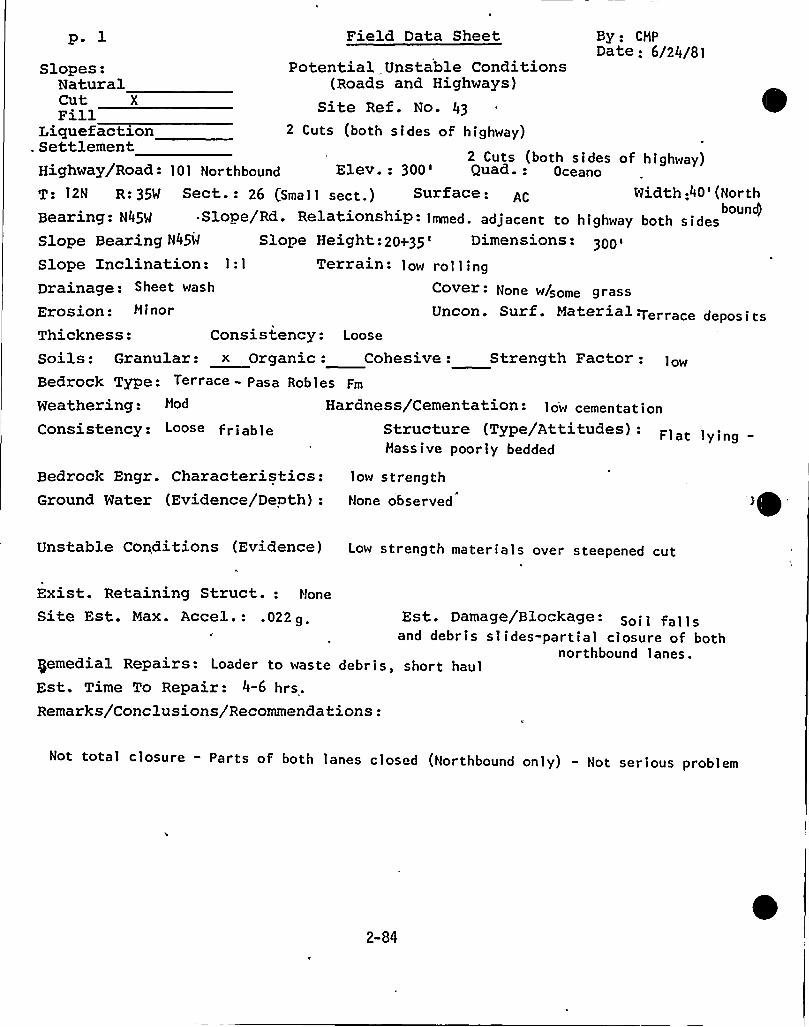
p. l Field Data Sheet By ~ CMP
Date: 6/24/81Slopes: Potential, Unstable Conditions
Natural (Roads and Highways}Cut X Site Ref. No. 43Fill
Liquefactzon 2 Cuts (both sides of highway).SettlementHighway/Road: 101 Northbound Elev.: 300 'uad.: Oceano
T: 12N R: 35W Sect.: 26 (Sma1 1 sect.) Surface: Width:40 'Northboun/Bearing: N45W .Slope/Rd. Relationship: Immed. adjacent to highway both sides
Slope Bearing N45W Slope Height:20+35'imensions: 300<
Slope Inclination: 1:1 Terrain: low rol 1 ingDrainage: Sheet wash Cover: None w/some grassErosion: M i nor Uncon. Surf. Material terrace d
Thickness: Consistency: Loose
Soils: Granular: x Organic: Cohesive: Strength Factor:Bedrock Type: Terrace - Pasa Robics Fm
Weathering: Mod Hardness/Cementation: low cementat ionConsistency: Loose fri able Structure (Type/Attitudes): Fl at 1 y 1 ng
Massive poorly bedded
Bedrock Engr. Characteristics: low strengthGround Water (Evidence/Depth): Hone observed
Unstable Conditions (Evidence) Low strength materials over steepened cut
Exist. Retaining Struct.: Hone
Site Est. Max. Accel.: .022 g. Est. Damage/Blockage: So 1 1 fa 1
and debris slides-partial closure of bothnorthbound lanes.gemedial Repairs: Loader to waste debris, short haul
Est. Time To Repair: 4-6 hrs.Remarks/Conclusions/Recommendations:
Not total closure - Parts of both lanes closed (Northbound only) - Not serious problem
2-84
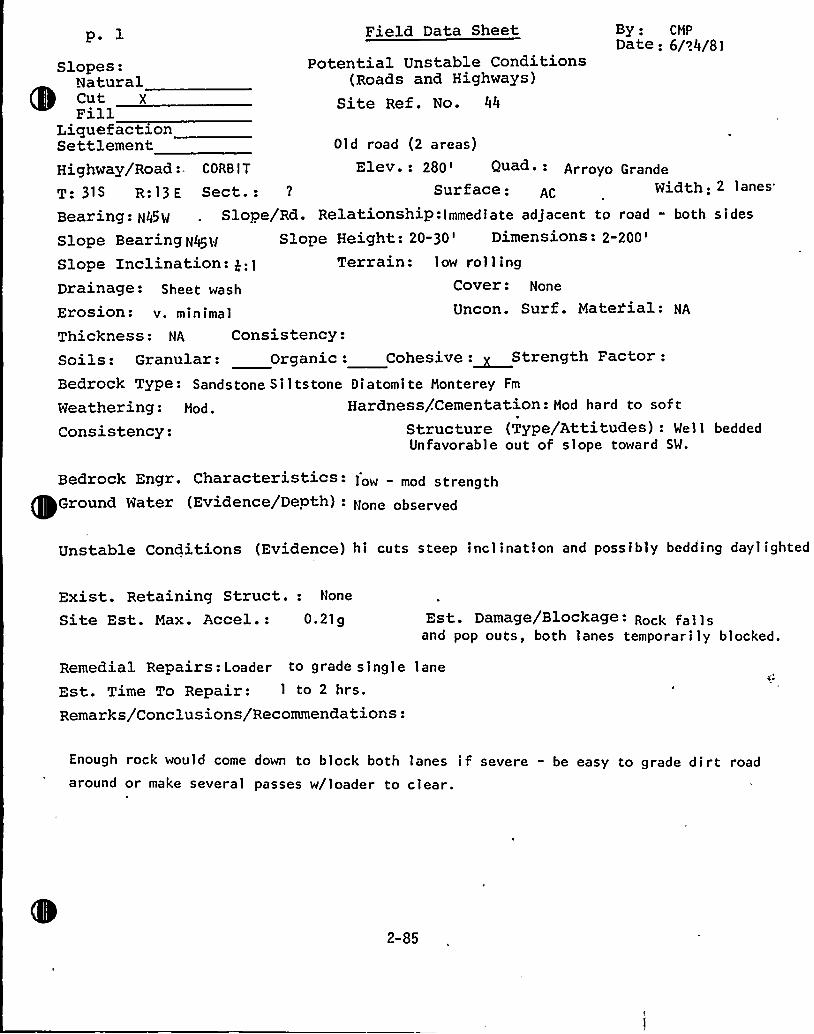
p. l Field Data Sheet By: CMP
Date: 6/24/81Potential Unstable Conditions
(Roads and Highways)Site Ref. No. 44
Slopes:NaturalCut XFill
LiquefactionSettlement Old road (2 areas)
Highway/Road:- CORB I T Elev.: 280'uad ~ - Arroyo Grande
T: 31S R:13 E Sect.: '? Surface: AC, Width. 2 lanes
Bearing: N45W . Slope/Rd. Relationship: Immediate adjacent to road - both sid~s
Slope BearingN45W Slope Height: 20-30'imensions:2-200'lope
Inclination: p. I Terrain: low rol 1 ing
Drainage: Sheet wash Cover: None
Erosion: v. minimal Uncon. Surf. Material: NA
Thickness: NA Consistency:Soils: Granular: Organic: Cohesive:~Strength Factor:Bedrock Type: Sands tone S i 1 ts tone Diatomite Monterey Fm
Weathering: Mod. Hardness/Cementation: Mod ha rd to soft
Consistency: Structure (Type/Attitudes): Wel 1 beddedUnfavorable out of slope toward SW.
Bedrock Engr. Characteristics: I'ow mod strengthGround Water (Evidence/Depth): None observed
Unstable Conditions (Evidence) hi cuts steep inclination and possibly bedding daylighted
Exist. Retaining Struct.: None
Site Est. Max. Accel.: 0.21g Est. Damage/Blockage: Rock fa1 1 sand pop outs, both lanes temporarily blocked.
Remedial Repairs: Loader to grade s ing I e lane
Est. Time To Repair: 1 to 2 hrs.Remarks/Conclusions/Recommendations:
Enough rock would come down to block both lanes if severe - be easy to grade dirt roadaround or make several passes w/loader to clear.
2-85
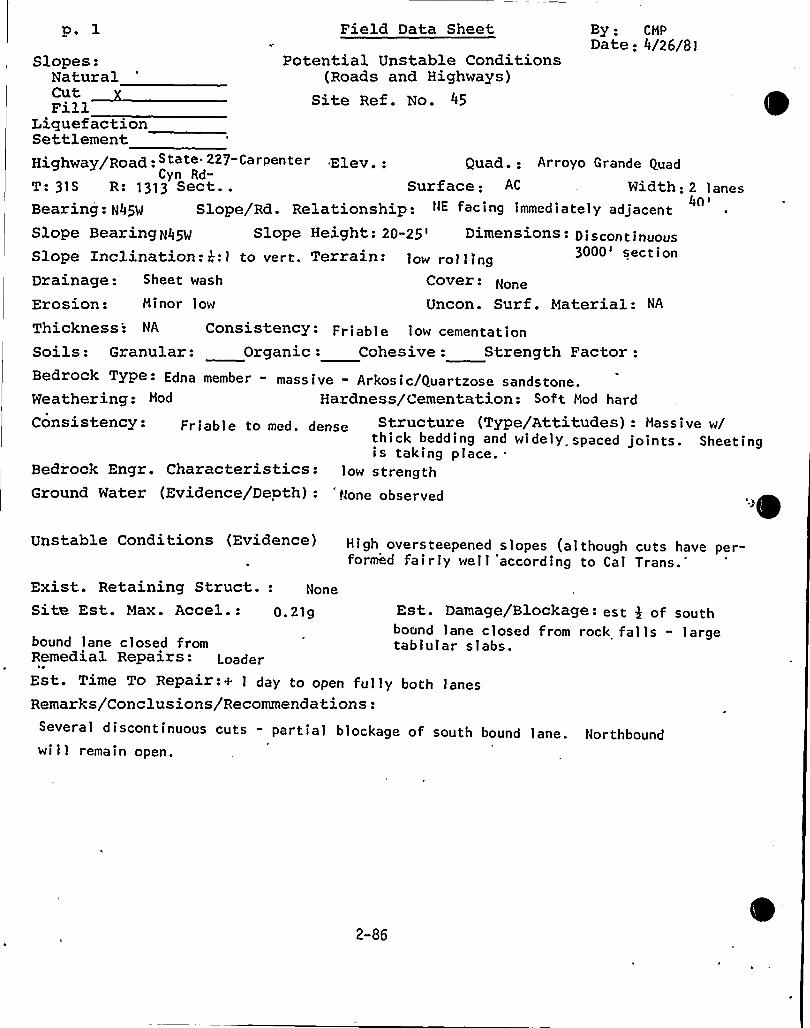
p. l Field Data Sheet By: CMPDate: 4/26/81
Potential Unstable Conditions(Roads and Highways)
Site Ref. No. 45
Slopes:NaturalCutFill
LiciuefactionSettlementHighway/Road. State 227-Carpenter Elev.: Quad.: Arroyo Grande Quad
Cyn Rd-T: 31S R: 1313 Sect.. Surface: AC Width: 2 lanes
4nBearing: N45W Slope/Rd. Relationship: NE facing immediately adjacentSlope. Bearing N45g Slope Height: 20-25'imensions: 0iscontinuousSlope Inclination: k:1 to vert. Terrain: low rol 1 ing 3000'ectionDrainage: Sheet wash Cover:Erosion: Minor low Uncon. Surf . Material: NA
Thickness'. NA Consistency- Friable low cementationSoils: Granular: Organic: Cohesive: Strength Factor:Bedrock Type- Edna member - massive - Arkosic/Quartzose sandstone.Weathering: Mod Hardness/Cementation: Soft Mod hard
Consistency: Fr i able to med dense Structure (Type/Attitudes): Mass ive w/thick bedding and widely. spaced joints. Sheetingis taking place..
Bedrock Engr. Characteristics - low s t reng thGround Water (Evidence/Depth): None observed
Exist. Retaining Struct.: None
Site Est. Max. Accel.: 0.21g Est. Damage/Blockage- est $ of southbound lane closed from rock falls - largetablular slabs.bound lane c 1 osed from
Remedial Repairs- LoaderEst. Time To Repair:+ I day to open fui ly both lanesRemarks/Conclusions/Recommendations:Several discontinuous cuts - partial blockage of south bound lane. Northboundwill remain open.
Unstable Conditions (Evidence) High oversteepened slopes (al though cuts have per-formed fairly well 'according to Cal Trans.
2-86
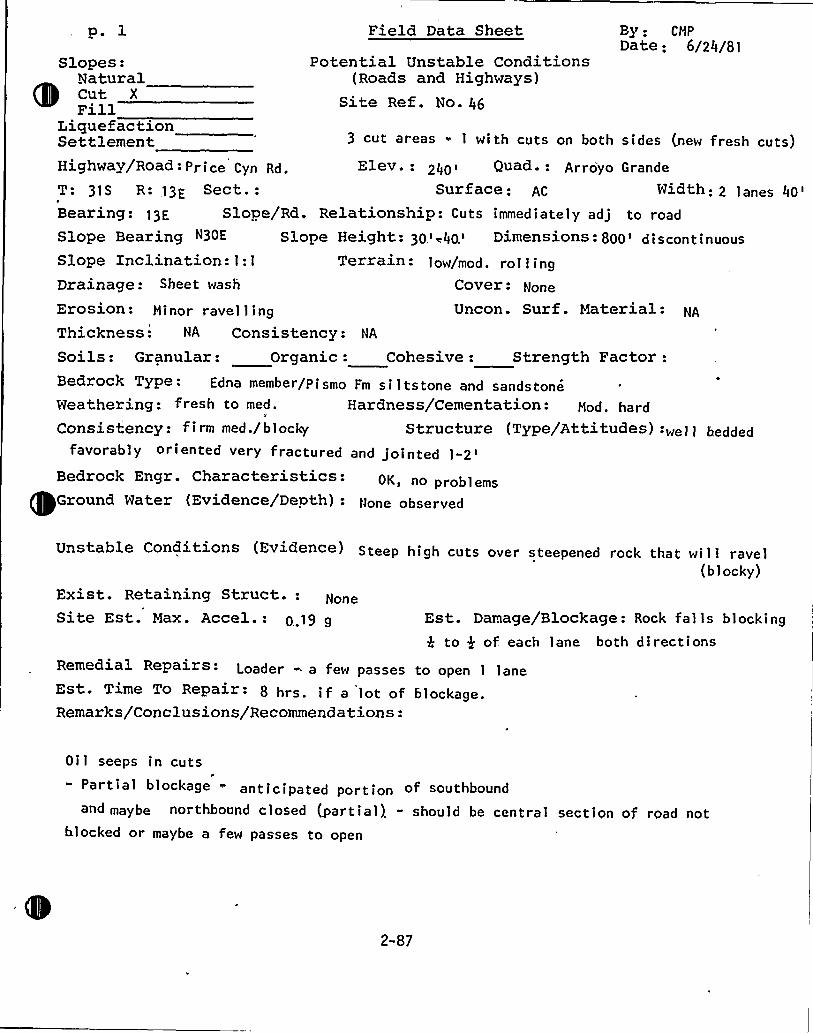
p 1 Field Data Sheet By: CMP
Date: 6/24/81Slopes:
NaturalCut XFill
LiquefactionSettlement
Potential Unstable Conditions(Roads and Highways)
Site Ref. No. 46
3 cut areas - 1 with cuts on both sides {new fresh cuts)Highwav/Road- Price Cyn Rd. Elev.: 2q0i Quad.: Arroyo Grande
T: 31S R: 13E Sect.: Surface: AC Width: 2 lanes 40'Bearing: 13E Slope/Rd. Relationship: Cuts immediately adj to road
Slope Bearing N30E Slope Height: 30.~ ~40.~ Dimensions: 800'iscontinuousSlope Xnclination: 1:1 Terrain - low/mod. ro1 1 ingDrainage: Sheet wash Cover: None
Erosion- Minor ravel ling Uncon. Surf. Material: NA
Thickness: NA Consistency: NA
Soils: Granular: Organic: Cohesive: Strength Factor:Bedrock Type: Edna member/Pismo Fm si 1 tstone and sandstoneWeathering: fresh to med. Hardness/Cementation:
1
Consistency: f i rm med./blocky Structure (Type/Attitudes):„el 1 beddedfavorably oriented very fractured and jointed 1-2>
Bedrock Engr. Characteristics: 0K no problGround Water (Evidence/Depth): None observed
Unstable Conditions (Evidence) Steep high cuts over steepened rock that wi 1 1 ravel{blocky)
Exist. Retaining Struct.:Site Est. Max. Accel.: 0 19 g Est. Damage/Blockage: Rock fal ls blocking
k to $ of. each lane both directionsRemedial Repairs: Loader - a few passes to open 1 laneEst. Time To Repair: 8 hrs. if a lot of blockage.Remarks/Conclusions/Recommendations:
Oil seeps in cuts" Partial blockage = anticipated portion of southbound
and maybe northbound closed {partial) - should be central section of road notblocked or maybe a few passes to open
2-87
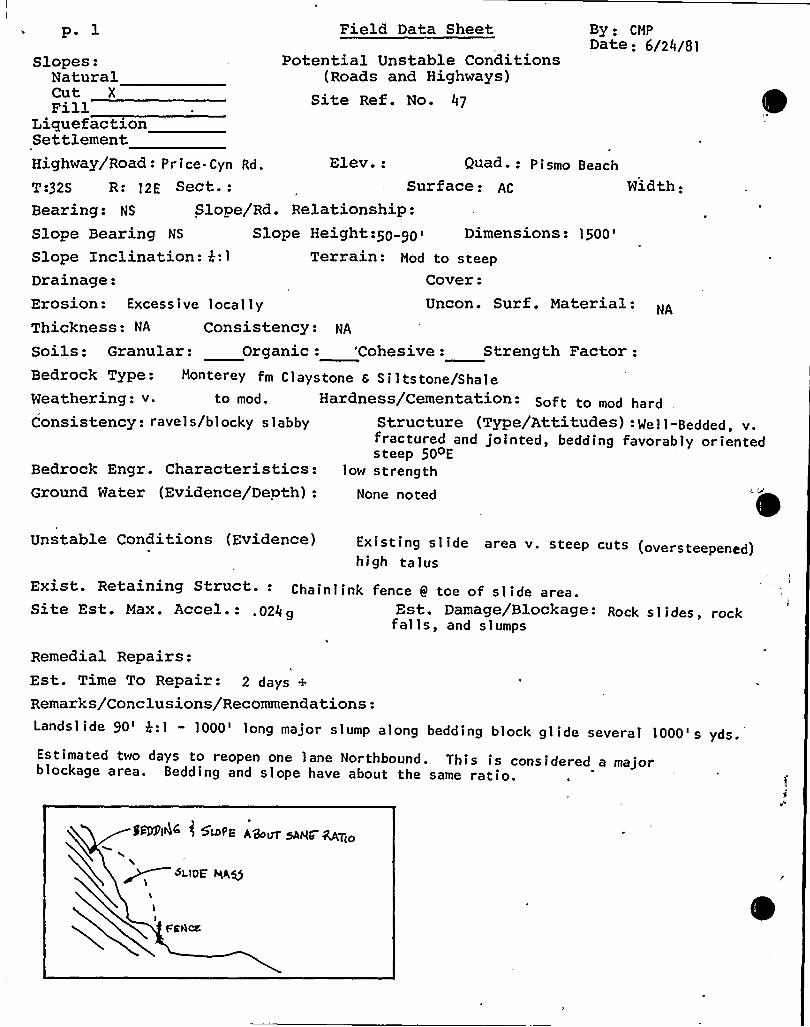
p. l Field Data Sheet By ~ CMPDate: 6/24/81
Potential Unstable Conditions(Roads and Highways)
Site Ref. No. 47
Dimensions:
1500'edrock
Engr. Characteristics:Ground Water (Evidence/Depth): None noted
Slopes:NaturalCut, XPill
LiquefactionSettlementHighway/Road: Price Cyn Rd. Elev.: Quad ~: Pismo Beach
T:32S R: 12E Sect.: Surface: AC Width:Bearing: NS Slope/Rd. Relationship:Slope Bearing NS Slope Height:50 90 <
Slope Inclination: 4:1 Terrain: Mod to steepDrainage: Cover:Erosion: Excessive locally Uncon. Surf. Material: NA
Thickness: NA Consistency: NA
Soils: Granular: Organic: 'Cohesive: Strength Factor:Bedrock Type: Monterey fm Claystone s Si 1 tstone/ShaleWeathering: v. to mod. Hardness/Cementation: Soft to mod
Consistency: ravel s/blocky slabby Structure (Type/Attitudes) - We 1 1 -Bedded, v.fractured and jointed, bedding favorably orientedsteep 50oE
low strength
Unstable Conditions (Evidence) Existing slide area v. steep cuts (overstee d)hi gh ta 1 us
Exist. Retaining Struct ~ - Chainiink fence 9 toe of slide area.Site Est. Max. Accel.: .024 g Est. Damage/Blockage - Rock s 1 ides, rockfalls, and slumps
Remedial Repairs:Est. Time To Repair: 2 days +
Remarks/Conclusions/Recommendations:Landslide 90':1 - 1000'ong major slump along bedding block glide several 1000' yds.Estimated two days to reopen one lane Northbound. This is considered a majorblockage area. Bedding and slope have about the same ratio.
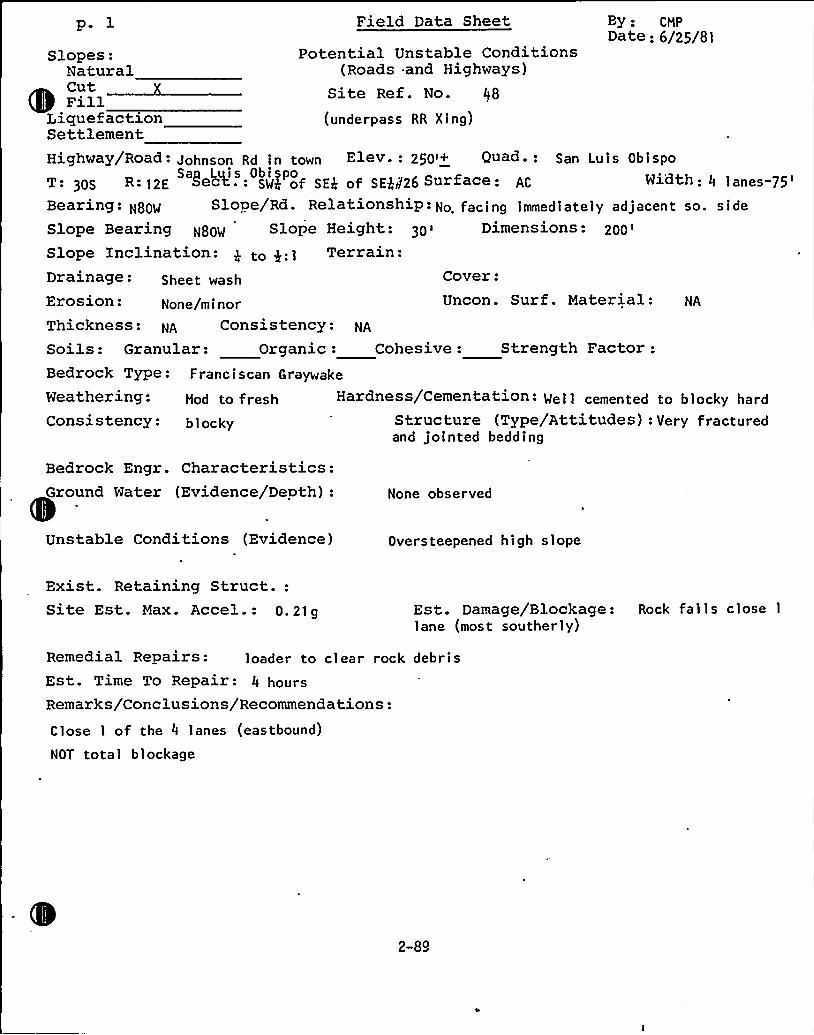
p 1
Slopes:NaturalCut
LiquefactionSettlement
Field Data Sheet
Potential Unstable Conditions(Roads *and Highways)
Site Ref. No. 48
(underpass RR Xing)
By- CapDate: 6/25/81
Uncon. Surf. Material:Erosion - None/minorThickness: NA Consistency:Soils: Granular: Organic: Cohesive: Strength Factor:Bedrock Type: Franciscan Graywake
Weathering: Mod to fresh Hardness/Cementation'- Mell cemented to blocky hardConsistency: blocky Structure (Type/Attitudes): Very fractured
and jointed bedding
Highway'/Road: Johnson Rd in town Elev.: 25O>+ Quad.: San Luis Obispo
30S R'2E >e<< ~: SW$ of SE$ of SEJM/26 Surface - ACSan Luis Obispo Width:
4»nes-75'~aring:
N8OM Slope/Rd. Relationship: No. facing immediately adjacent so. side
Slope Bearing N8Og Slope Height: 3O ~ Dimensions: 2OO >
SloPe inclination: P to y.l Terrain:Drainage - Sheet wash Cover:
Bedrock Engr. Characteristics:Ground Water (Evidence/Depth): None observed
Unstable Conditions (Evidence) Oversteepened high slope
Exist. Retaining Struct.:Site Est. Max. Accel.: 0.21g Est. Damage/Blockage: Rock fa1 1 s close 1
lane (most southerly)
Remedial Repairs: loader to clear rock debrisEst. Time To Repair: 4 hoursRemarks/Conclusions/Recommendations:Close 1 of the 4 lanes (eastbound)
NOT total blockage
2-89
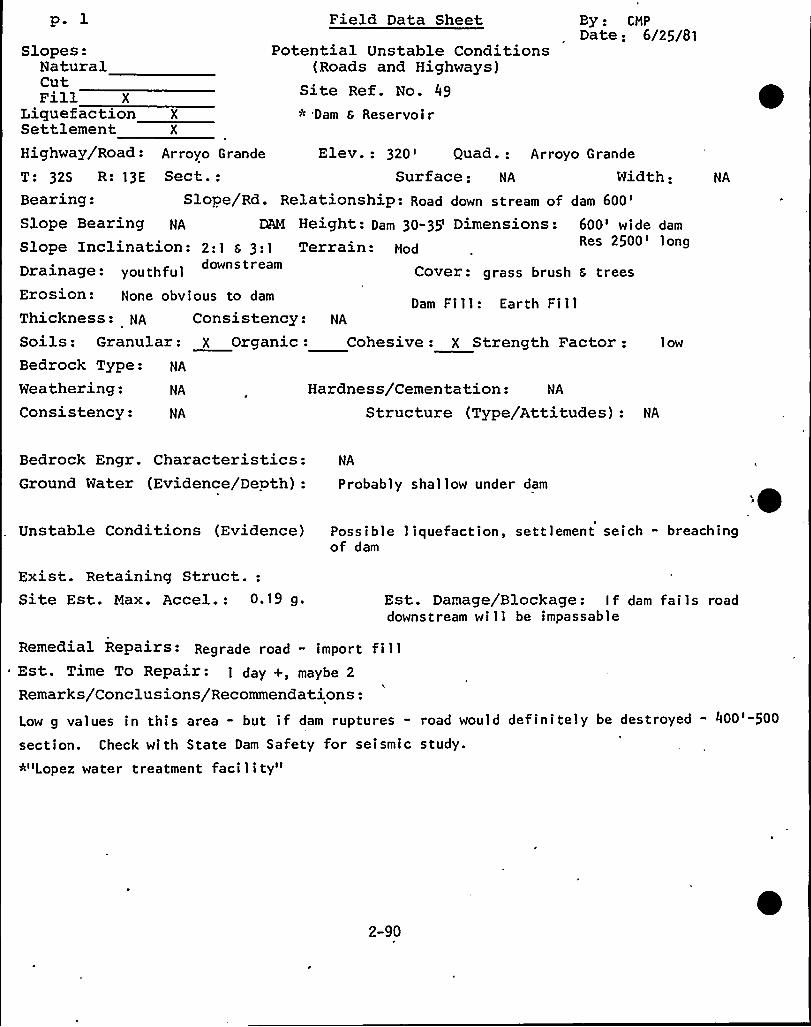
pe 1
Slopes:NaturalCutFill X
LiquefactionSettlement
Field Data Sheet
Potential Unstable Conditions(Roads and Highways)
Site Ref. No. 49
* Dam 6 Reservoir
By - CHPDate: 6/25/81
Hardness/Cementation: NA
Structure (Type/Attitudes): NAConsistency: NA
Highway/Road: Arroyo Grande Elev.: 320'uad.: Arroyo Grande
T: 32S R: 13E Sect.: Surface: NA Width-Bearing: Slope/Rd. Relationship - Road down stream of dam
600'lope
Bearing NA MM Height: Dam 30-35'imensions: 600'ide dam
Slope inclination: 2:1 s 3:1 Terrain: NodRes 2500'ong
Drainage: youthful downstream Cover: grass brush 6 treesErosion: None obvious to dam
Thickness: NA Consistency: NA
Soils: Granular: X Organic: Cohesive: X Strength Factor: low
Bedrock Type: NA
Weathering: NA
NA
Bedrock Engr. Characteristics:Ground Water (Evidence/Depth):
NA
Probably shal low under dam
IUnstable Conditions (Evidence) Possible 1 iquefaction, settlement seich - breachingof dam
Exist. Retaining Struct.:Site Est. Max. Accel.: 0.19 g. Est. Damage/Blockage: I f dam fails road
downstream will be impassable
Remedial Repairs: Regrade road - import fillEst. Time To Repair: 1 day +, maybe 2
Remarks/Conclusions/Recommendations:
Low g values in this area - but if dam ruptures - road would definitely be destroyed - 400'-500
section. Check with State Dam Safety for seismic study.*"Lopez water treatment facility"
2-90
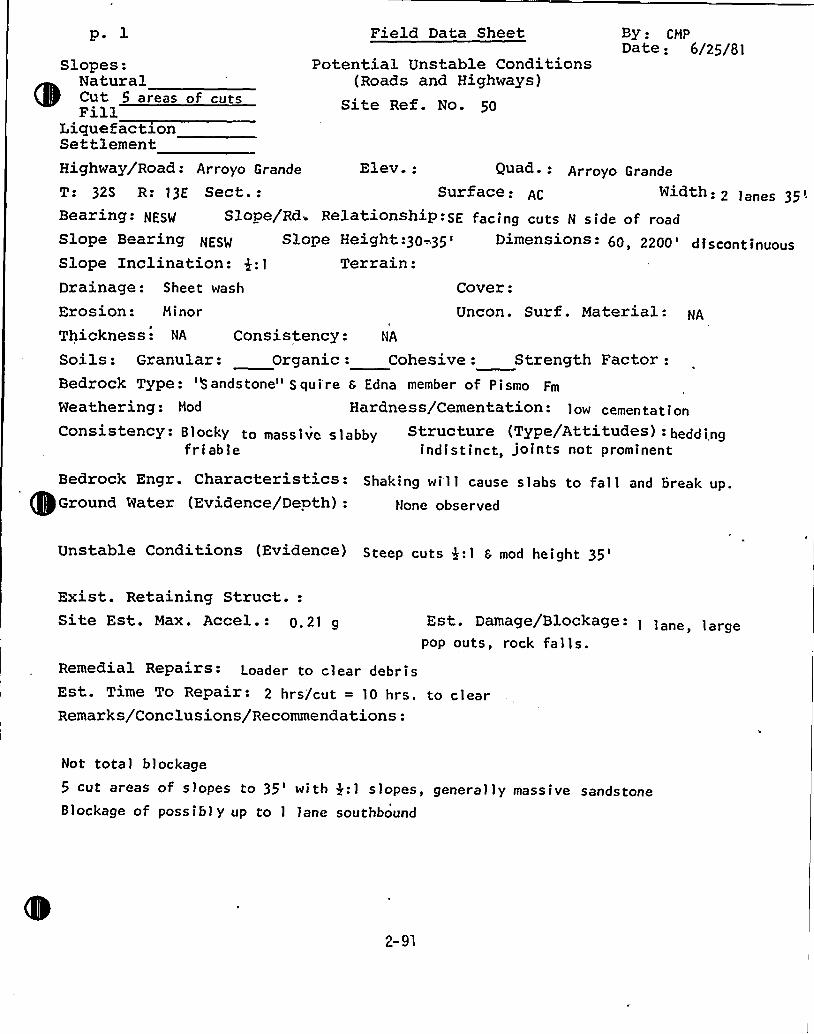
p l Field Data Sheet By: CMPDate: 6/25/81
Potential Unstable Conditions(Roads and Highways)
Site Ref. No. 50
Drainage: Sheet wash
Erosion: Minor Uncon. Surf. Material:Thickness: NA Consistency: NA
Soils: Granular: Organic: Cohesive: Strength Factor:Bedrock Type: "Sandstone" Squi're 6 Edna member of Pismo Fm
Weathering: Mod Hardness/Cementation: 1 ow cemen ta t i on
Consistency: Blocky to massive s)abby Structure (Type/Attitudes) - beddingfriable indistinct, joints not prominent
Cover:
Bedrock Engr. Characteristics- Shaking wi'll cause slabs to fall and break up.Ground Water (Evidence/Depth): Hone observed
Slopes:NaturalCut 5 areas of cutsFill
LiciuefactionSettlementHighway/Road: Arroyo Grande Elev.: Quad. - Arroyo Grande
T: 32S R: 13E Sect.: Surface: Width - 2 1 anes 35Bearing: NESTS Slope/Rd. Relationsh>p -SE facing cuts N s ide of roadSlope Bearing NESTS Slope Height:30-.35 'imensions - 60, 2200'iscont inuousSlope Xnclination: $ :I Terrain:
Unstable Conditions (Evidence) Steep cuts $ :) s mod height
35'xist.
Retaining Struct.:Site Est. Max. Accel.: 0.21 g Est. Damage/Blockage:
1 lane, largepop outs, rock fa1 )s.
Remedial Repairs- Loader to clear debrisEst. Time To Repair: 2 hrs/cut = 10 hrs. to clearRemarks/Conclusions/Recommendations:
Not tota 1 blockage5 cut areas of slopes to 35'ith 4:) slopes, genera) ly massive sandstoneB)ockage of possibly up to 1 lane southbound
2-9l
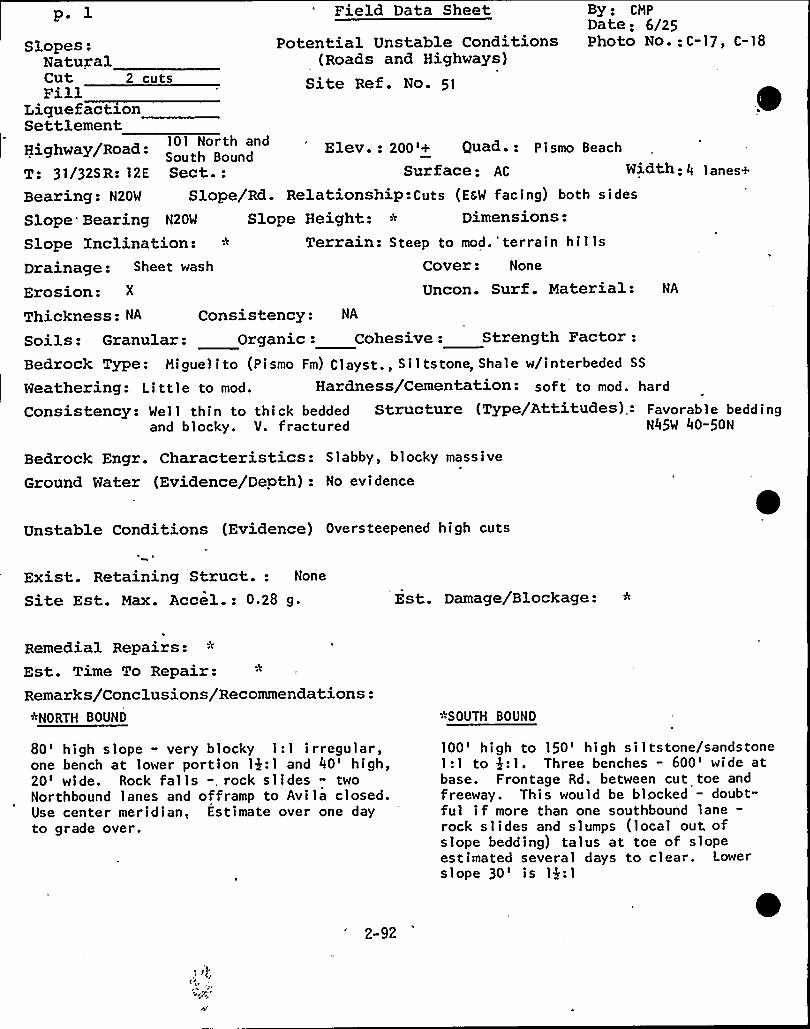
Field Data Sheet By: CMP
Date: 6/25Photo No.: C-17, C-18
p. lPotential Unstable Conditions
(Roads and Highways)Site Ref. No. 51
Slopes:NaturalCut 2 cutsFill
LiquefactionSettlementHighway/Road: Elev.: 200'+ Quad-: Pismo Beach101 North and
South BoundT: 31/32S R: 12E Sect.: Surface: AC Width: 4 lanes+
Bearing: N20W Slope/Rd. Relationship-Cuts (EsW facing) both sides
Slope Bearing N20W Slope Height: Dimensions:
Slope Inclination: Terrain: Steep to mod. 'errain hillsDrainage: Sheet wash Cover: None
Erosion: X Uncon. Surf. Material: NA
Bedrock Engr. Characteristics: S 1 abby, b 1 ocky mass i ve
Ground Water (Evidence/Depth): No evi dence
Thickness: NA Consistency: NA
Soils: Granular: Organic: Cohesive: Strength Factor:Bedrock Type:,Miguel ito (Pismo Fm) Clayst,, Siltstone, Shale w/interbeded SS
Weathering: Li t tie to mod. Hardness/Cementation: soft to mod. hard
Consistency: Wel 1 thin to thick bedded Structure (Type/Attitudes) - Favorable beddingand blocky. V. fractured N45W 40-50N
Unstable Conditions (Evidence) Overs teepened high cuts
Exist. Retaining Struct.: None
Site Est. Max. Accel.: 0 ~ 28 g ~ Est. Damage/Blockage:
Remedial Repairs:Est. Time To Repair:Remarks/Conclusions/Recommendations:
"-NORTH BOUND %SOUTH BOUND
80'igh slope - very blocky 1:1 irregular,one bench at lower portion 14:1 and 40'igh,20'ide. Rock falls -, rock slides - twoNorthbound lanes and offramp to Avi la closed.Use center meridian, Estimate over one dayto grade over.
100'igh to 150'igh siltstone/sandstone1:1 to 4:1. Three benches - 600'ide atbase. Frontage Rd. between cut toe andfreeway. This would be blocked — doubt-ful if more than one southbound lane-rock slides and slumps (local out ofslope bedding) talus at toe of slopeestimated several days to clear. Lowerslope 30's 1$ :1
2-92
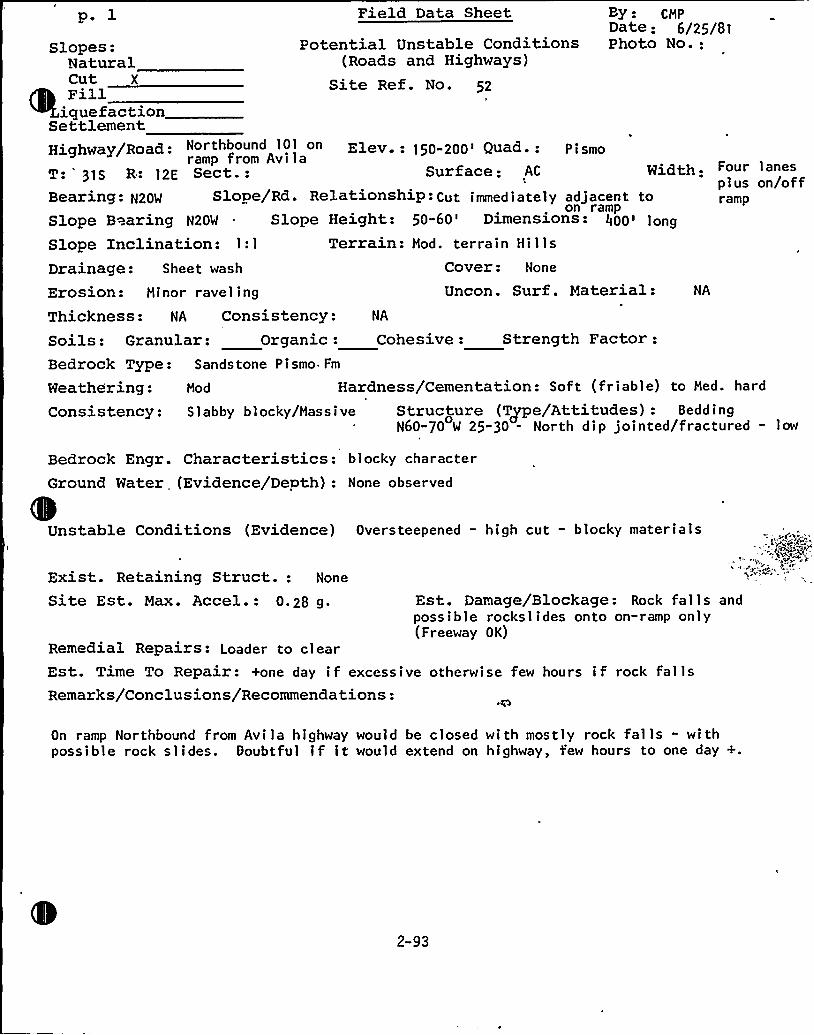
Field Data Sheet By: CMPDate: 6/25/81Photo No.:
p. lPotential Unstable Conditions
(Roads and Highways)Site Ref. No. 52
Bedrock Engr. Characteristics: blocky characterGround Water (Evidence/Depth): None observed
Unstable Conditions (Evidence) Oversteepened — high cut - blocky materials
Slopes:NaturalCut XFill
iquefactionSettlementHighway/Road: Northbound 101 on Elev. - 150-200'uad. Pi smo
ramp from AvilaT: 31S R.: 12E Sect.: Surface: AC Width. Four 1 anes
plus on/offBearing: N20W Slope/Rd. Relationship:Cut immediately adjacent to ramp
on rampSloPe B>aring N20W SloPe Height: 50-60'imensions: 400> long
Slope Inclination: 1:1 Terrain: Mod. terrain Hi 1 lsDrainage: Sheet wash Cover: None
Erosion: Minor ravel ing Uncon. Surf. Material: NA
Thickness: NA Consistency: NA
Soils: Granular: Organic: Cohesive: Strength Factor:Bedrock Type: Sandstone Pismo Fm
Weathering: Mod Hardness/Cementation: Sof t (fr i ab1 e) to Med. hard
Consistency: S 1 abby blocky/Mass i ve Structure (Type/Attitudes): BeddingN60-70 W 25-30 - North dip jointed/fractured - low
Exist. Retaining Struct.: None
Site Est. Max. Accel.: 0.28 g. Est. Damage/Blockage: Rock fa 1 1 s andpossible rocksl ides onto on-ramp only(Freeway OK)
Remedial Repairs: Loader to clearEst. Time To Repair: +one day if excessive otherwise few hours if rock fal lsRemarks/Conclusions/Recommendations:
On ramp Northbound from Avila highway would be closed with mostly rock fal ls - withpossible rock slides. Doubtful if it would extend on highway, few hours to one day +.
2-93

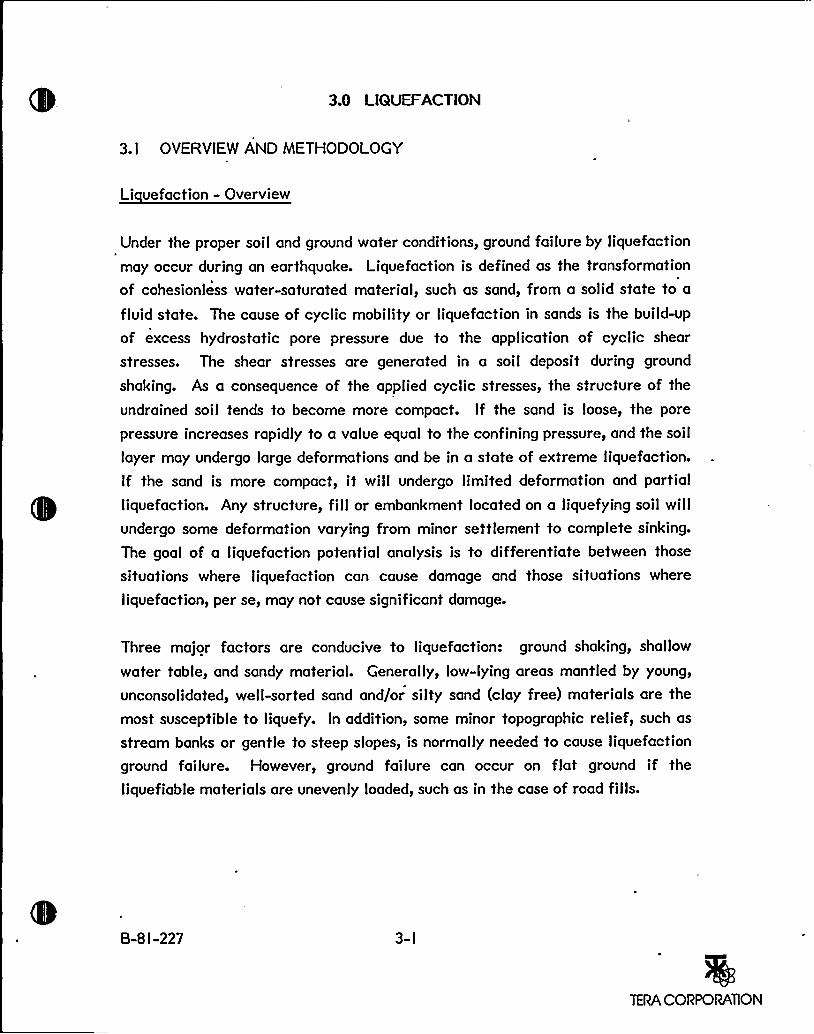
3.0 LIQUEFACTION
3. I OVERVIEW AND METHODOLOGY
Li uefaction - Overview
Under the proper soil and ground water conditions, ground failure by liquefaction
may occur during an earthquake. Liquefaction is defined as the transformation
of cohesionless water-saturated material, such as sand, from a solid state to a
fluid state. The cause of cyclic mobility or liquefaction in sands is the build-up
of excess hydrostatic pore pressure due to the application of cyclic shear
stresses. The shear stresses are generated in a soil deposit during ground
shaking. As a consequence of the applied cyclic stresses, the structure of the
undrained soil tends to become more compact. If the sand is loose, the pore
pressure increases rapidly to a value equal to the confining pressure, and the soil
layer may undergo large deformations and be in a state of extreme liquefaction.
If the sand is more compact, it will undergo limited deformation and partial
liquefaction. Any structure, fillor embankment located on a liquefying soil willundergo some deformation varying from minor settlement to complete sinking.
The goal of a liquefaction potential analysis is to differentiate between those
situations where liquefaction can cause damage and those situations where
liquefaction, per se, may not cause significant damage.
Three major factors are conducive to liquefaction: ground shaking, shallow
water table, and sandy material. Generally, low-lying areas mantled by young,
unconsolidated, well-sorted sand and/or silty sand (clay free) materials are the
most susceptible to liquefy. In addition, some minor topographic relief, such as
stream banks or gentle to steep slopes, is normally needed to cause liquefaction
ground failure. However, ground failure can occur on flat ground if the
liquefiable materials are unevenly loaded, such as in the case of road fills.
B-8 I-227 3-I
TERA CORPORATION
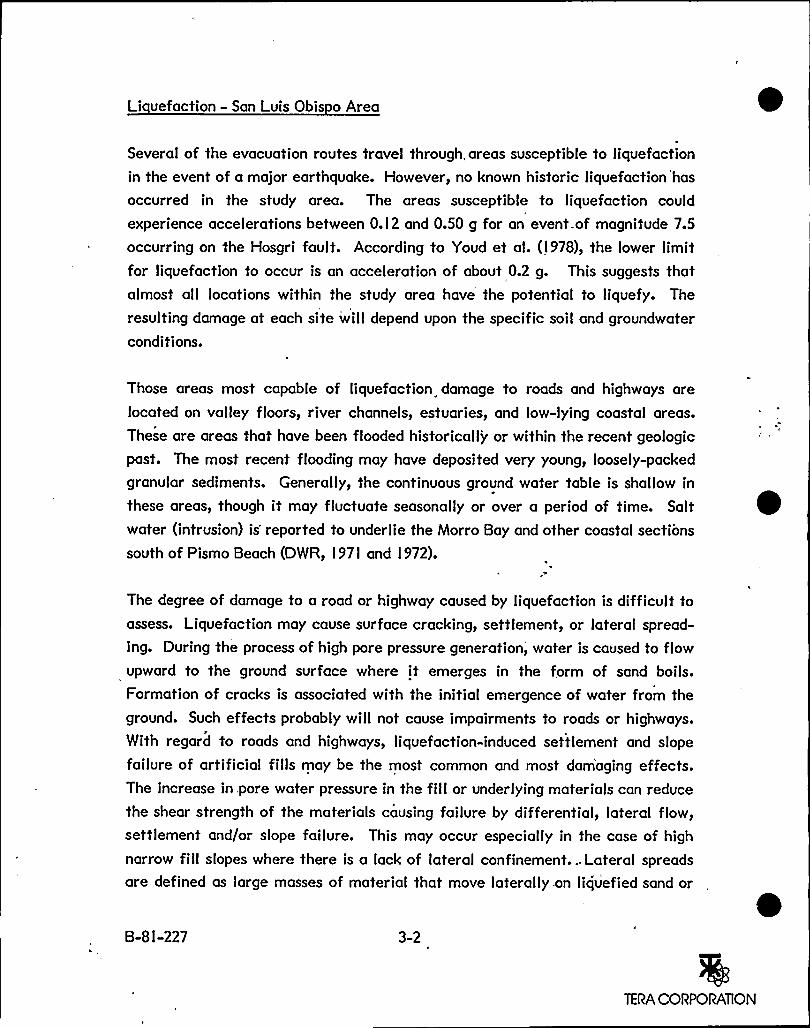
Li uefaction - San Luis Obis o Area
Several of the evacuation routes travel through, areas susceptible to liquefactionin the event of a major earthquake. However, no known historic liquefaction has
occurred in the study area. The areas susceptible to liquefaction could
experience accelerations between 0.12 and 0.50 g for an event of magnitude 7.5
occurring on the Hosgri fault. According to Youd et al. (1978), the lower limitfor liquefaction to occur is an acceleration of about 0.2 g. This suggests thatalmost all locations within the study area have the potential to liquefy. The
resulting damage at each site will depend upon the specific soil and groundwater
conditions.
Those areas most capable of liquefaction damage to roads and highways are
located on valley floors, river channels, estuaries, and low-lying coastal areas.
These are areas that have been flooded historically or within the recent geologic
past. The most recent flooding may have deposited very young, loosely-packed
granular sediments. Generally, the continuous ground water table is shallow in
these areas, though it may fluctuate seasonally or over a period of time. Salt
water (intrusion) is reported to underlie the Morro Bay and other coastal sections
south of Pismo Beach (DWR, 1971 and 1972).h
The degree of damage to a road or highway caused by liquefaction is difficult toassess. Liquefaction may cause surface cracking, settlement, or lateral spread-
ing. During the process of high pore pressure generation,'ater is caused to flowupward to the ground surface where it emerges in the form of sand boils.Formation of cracks is associated with the initial emergence of water from theground. Such effects probably will not cause impairments to roads or highways.
With regard to roads and highways, liquefaction-induced settlement and slope
failure of artificial fills may be the most common and most dam'aging effects.The increase in pore water pressure in the fillor underlying materials can reduce
the shear strength of the materials causing failure by differential, lateral flow,settlement and/or slope failure. This may occur especially in the case of high
narrow fill slopes where there is a lack of lateral confinement. Lateral spreads
are defined as large masses of material that move laterally.on liquefied sand or
B-81-227 3-2
TERA CORPORATION
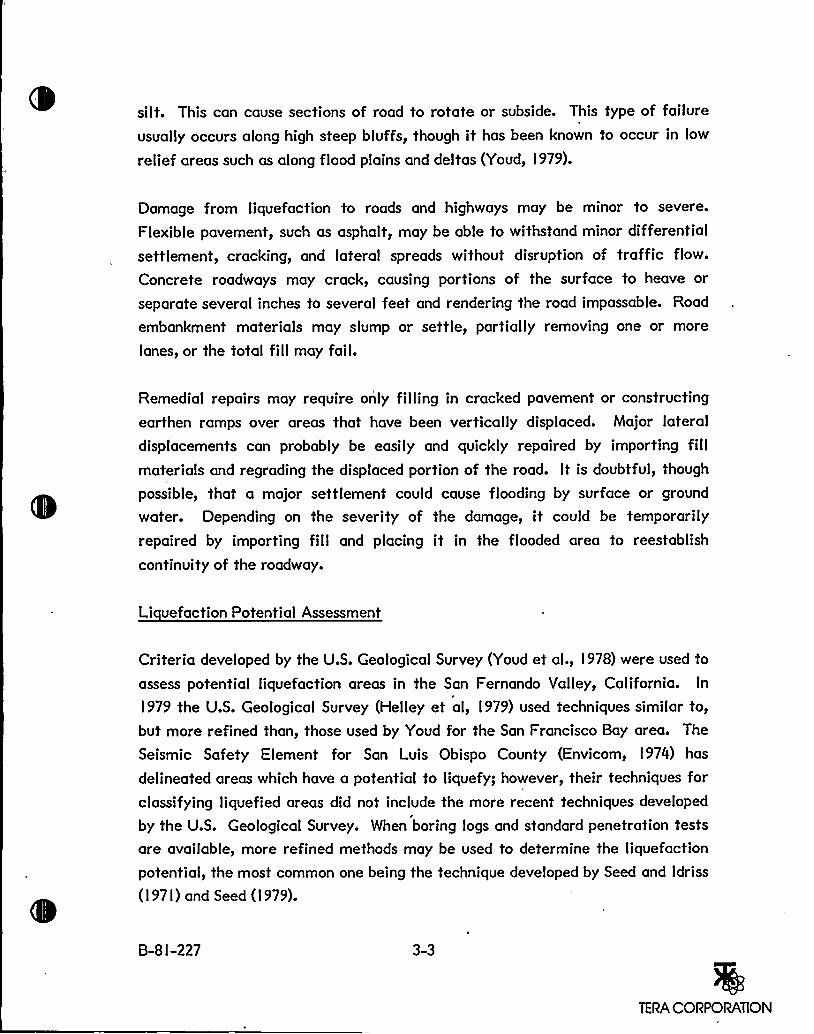
silt. This can cause sections of road to rotate or subside. This type of failure
usually occurs along high steep bluffs, though it has been known to occur in low
relief areas such as along flood plains and deltas (Youd, I 979).
Damage from liquefaction to roads and highways may be minor to severe.
Flexible pavement, such as asphalt, may be able to withstand minor differential
settlement, cracking, and lateral spreads without disruption of traffic flow.
Concrete roadways may crack, causing portions of the surface to heave or
separate several inches to several feet and rendering the road impassable. Road
embankment materials may slump or settle, partially removing one or more
lanes, or the total fillmay fail.
Remedial repairs may require only filling in cracked pavement or constructing
earthen ramps over areas that have been vertically displaced. Major lateral
displacements can probably be easily and quickly repaired by importing fillmaterials and regrading the displaced portion of the road. It is doubtful, though
possible, that a major settlement could cause flooding by surface or ground
water. Depending on the severity of the damage, it could be temporarily
repaired by importing fill and placing it in the flooded area to reestablish
continuity of the roadway.
Li uefaction Potential Assessment
Criteria developed by the U.S. Geological Survey (Youd et al., l 978) were used to
assess potential liquefaction areas in the San Fernando Valley, California. In
l979 the U.S. Geological Survey (Helley et al, l979) used techniques similar to,but more refined than, those used by Youd for the San Francisco Bay area. The
Seismic Safety Element for San Luis Obispo County (Envicom, 1974) has
delineated areas which have a potential to liquefy; however, their techniques for
classifying liquefied areas did not include the more recent techniques developed
by the U.S. Geological Survey. When boring logs and standard penetration tests
are available, more refined methods may be used to determine the liquefaction
potential, the most common one being the technique developed by Seed and ldriss
(l97 I) and Seed (1979).
B-8I-227 3-3
TERA CORPORATION
For this study, topographic soil and geologic maps, aerial photographs, and
ground water studies were used to delineate low-lying areas where youngersediments have been deposited and where ground water may be shallow (i.e., less
than l5 meters below the ground surface). A field reconnaissance was made toverify or characterize the relief, types of surficial sediments, and theirconsistency. No subsurface exploration was performed to determine the typesand consistencies of subsurface soils below a particular site. The subsurface
conditions were estimated using mapped and reported data and geologic projec-tion techniques. The criteria used in the study are similar to those used by theU.S. Geological Survey (Youd et al., l978, Helley et al., l979) and are presentedin Table 3- I.
In addition, boring logs at bridge locations were obtained from state and countytransportation departments to determine locally the subsurface conditions and
apply the procedure developed by Seed and Idriss (197I) and Seed (l979). Thiswas possible for about 50percent of the zones for which a potential forliquefaction exists.
This procedure is summarized below:
o Compute the maximum shear stress developed in the soil deposit
(Figure 3- I) during the earthquake:
'Yh~max = amax rd
9
where
v = unit weight of soil
h = depth of soil element
g = acceleration of gravity
amax = maximum ground surface acceleration
rd = stress reduction factor (Figure 3-2)
B-8 I-227 3-4
TERA CORPORATION
o Compute the average equivalent shear stress for 20 significant cyclesfor an earthquake of magnitude 7.5:
b'av = 0.65 rmax
o Compute the effective stress in the soil element (Figure 3-2):
~'v = Vh- Vw {h hw~
where
V = unit weight of water
h = depth to water tablew
o Compute the cyclic stress ratio of average equivalent shear stress to
effective stress
~av~v
o Compute the modified penetration resistance:
Nl = (I - l.25 logl0 o'v~ N
where
o'v is in ton/ft2
N = measured penetration resistance in blow/foot.
o From Figure 3-3, determine the liquefaction potential for an earth-
quake of magnitude 7.5. A line is drawn for a magnitude 7.5
earthquake separating the diagram into two regions. Any combina-
tion of penetration resistance and cyclic stress ratio which lies in the
region above that line represents circumstances where liquefaction
B-SI-227 3-5
TERA CORPORATlON
. has occurred in model tests and field cases. No liquefaction has been
observed for cases below that line. Also given at the top ofFigure 3-3 is a plot of potential shear strains which can accompany a
liquefaction event. This plot may help differentiate between a case
where ground failures are expected and a case where they are not.
Using the ground data provided by topographic and geologic maps and the sitespecific data at the bridges, the zones of potential liquefaction along thehighways and roads were localized and classified in term's of low or highsusceptibility. The low susceptibility areas include those underlain by young age(Holocene) alluvial materials that are estimated to contain appreciable amountsof sand and silt layers or lenses. Also, ground water is within 50 feet of theground surface. The high liquefaction susceptibility areas are included in thesame zones as the low susceptibility areas; however, these zones either lacklateral confinement, have gentle slopes, or are differentially loaded (artificialfills). In each case, accelerations are in excess of 0.2g. Maps and tablesdescribing these zones are presented in the Appendix.
Based on the assessment criteria, many areas along the evacuation routes havebeen categorized as potential liquefaction zones, capable of failing underexcessive seismic shaking. Since there is a reasonable amount of conservatismbuilt into the assessment criteria, not all areas considered will liquefy. Thenumber of actual liquefaction zones will decrease rapidly with distance from theepicenter, based principally on the attenuation of acceleration. Moreover, as
explained in the previous section, there is a difference between liquefaction, perse, and damage. In order to estimate the expected number of liquefaction zones
and the corresponding clearing times, the criteria presented in Table 3-2 weredeveloped for three damage levels. These criteria are based on topographic and
geologic conditions, soil profile characteristics (sand and silt layers, presence ofclay or gravel layers, depth to water level), level of earthquake shaking (PGA),liquefaction potential assessment using Seeds (l979) criterion, etc. Engineeringjudgment played an important role in this evaluation, especially in the areas
where subsurface conditions were not known. Each area of high liquefactionpotential was assigned a susceptibility level ranging from I to IV. Level I
B-81-227 3-6
TERA CORPORATION
corresponds to a low potential for damage to roads and highways (i.e., very small
deformation with little or no impairment to the road). Level IV would corres-
pond to large deformation, settlement, slope failure and/or lateral spreading. In
this case the road would be impassable in some sections and a significant repair
time would be necessary. Levels II and III are intermediate between these two.
The susceptibility level was decreased by one unit for the adjacent low potential
zone. For a potential liquefaction area located in a given acceleration zone, the
expected footage of failure was obtained by multiplying the total potential
footage by the percentage corresponding to the selected damage level.
A summary of expected footage failure and clearing time is presented for each
road surveyed in Section 3.2. In this table the clearing times for the l2 main
roads considered (roads I- l2) are for the clearing of two lanes of traffic. For all
other roads it was considered necessary in an emergency situation to initiallyclear only one lane for traffic. This will be reflected in the clearing time in this
table.
Section 3.3 presents a summary of liquefaction potential for each liquefaction
site. This table divides each site into areas of low potential and high potential
liquefaction and sums the total expected length of failure for both potentials.
The number of lanes expected to be affected is also given.
B-SI-227 3-7
TERA CORPORATION
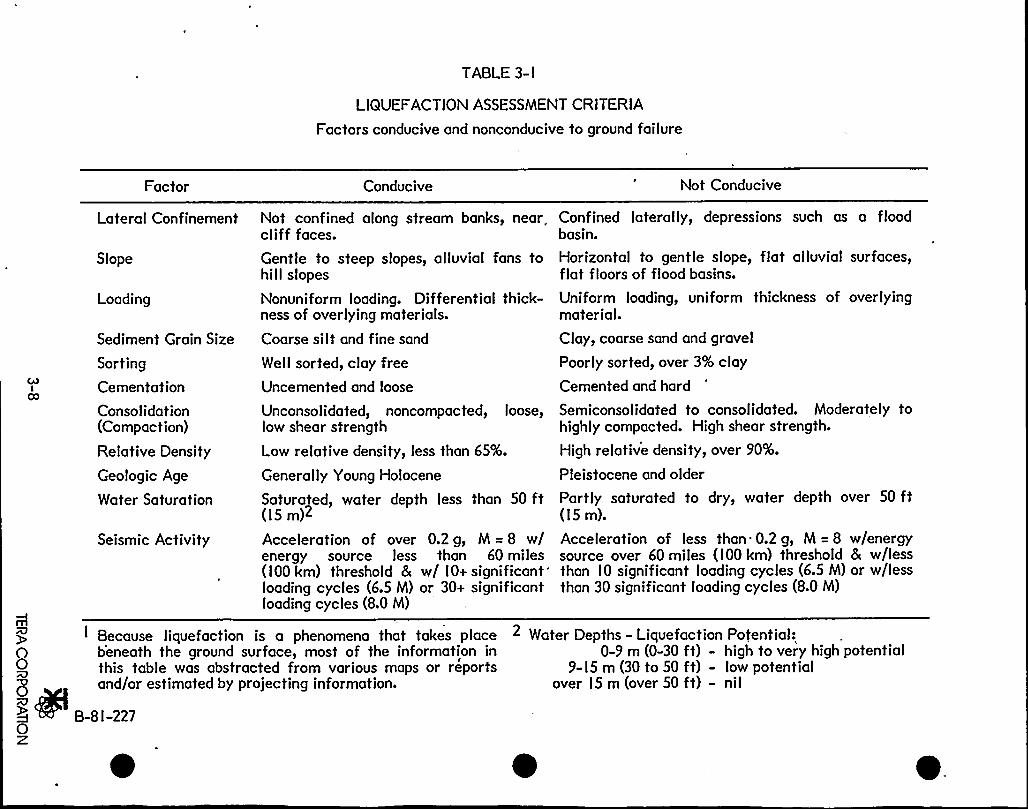
TABLE 3- I
LIQUEFACTION ASSESSMENT CRITERIA
Factors conducive and nonconducive to ground failure
Factor Conducive Not Conducive
Lateral Confinement Not confined along stream banks, near, Confined laterally, depressions such as a floodclifffaces. basin.
Slope
Loading
Sediment Grain Size
Sorting
Cementation
Consolidation(Compaction)Relative Density
Geologic Age
Water Saturation
Seismic Activity
Gentle to steep slopes, alluvial fans tohil I slopes
Nonuniform loading. Differential thick-ness of overlying materials.
Coarse silt and fine sand
Well sorted, clay free
Uncemented and loose
Unconsolidated, noncompacted, loose,low shear strength
Low relative density, less than 65%.
Generally Young Holocene
Saturated, water depth less than 50 ft(ism)2
'cceleration of over 0.2g, M =8 w/energy source less than 60 miles(l00 km) threshold & w/ IO+
significant'oading
cycles (6.5 M) or 30+ significantloading cycles (8.0 M)
Horizontal to gentle slope, flat alluvial surfaces,flat floors of flood basins.
Uniform loading, uniform thickness of overlyingmaterial.
Clay, coarse sand and gravel
Poorly sorted, over 3% clay
Cemented and hard
Semiconsolidated to consolidated. Moderately tohighly compacted. High shear strength.
High relative density, over 90%.
Pleistocene and older
Partly saturated to dry, water depth over 50 ft(is m).
Acceleration of less than 0.2g, M =8 w/energysource over 60 miles (l00km) threshold & w/lessthan IO significant loading cycles (6.5 M) or w/lessthan 30 significant loading cycles (8.0 M)
Bg (gl0Z
I Because liquefaction is a phenomena that takes placeb'eneath the ground surface, most of the information inthis table was abstracted from various maps or reportsand/or estimated by projecting information.
B-8 I-227
2 Water Depths - Liquefaction Potential:0-9 m (0-30 ft) - high to very high potential
9- l5 m (30 to 50 ft) - low potentialover 15 m (over 50 ft) - nil
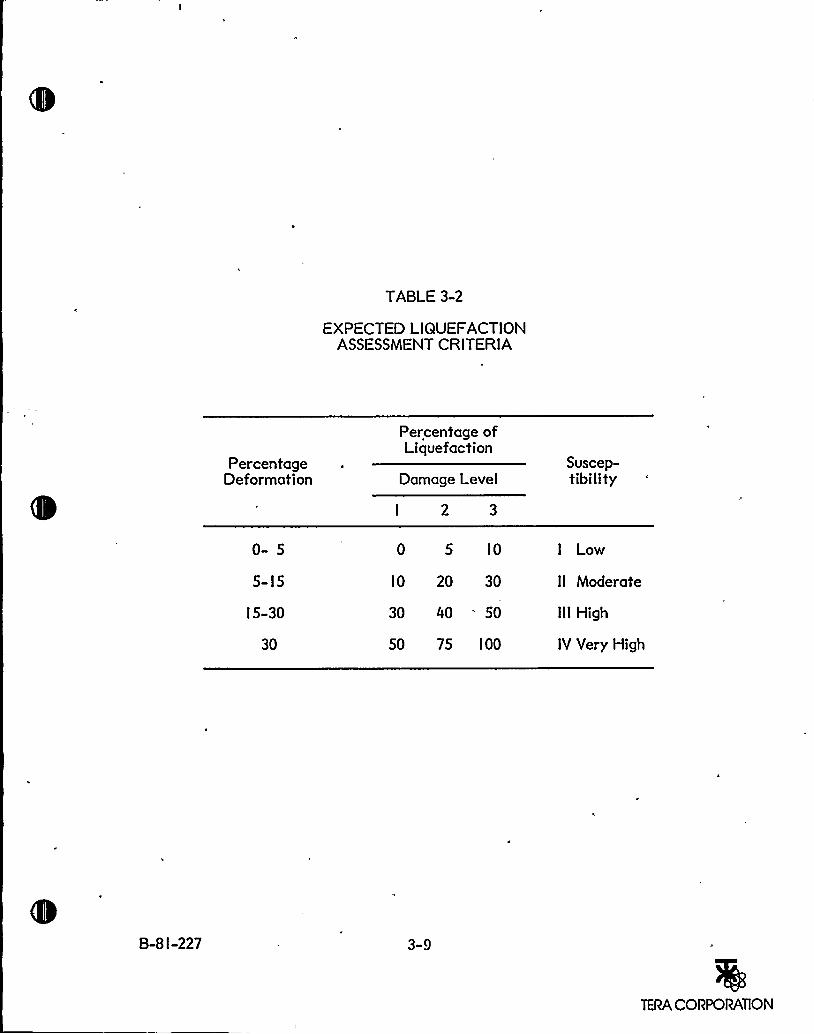
TABLE 3-2
EXPECTED LIQUEFACTIONASSESSMENT CRITERIA
PercentageDeformation
0- 5
5-l5
l5-30
30
Percentage ofLiquefaction
Damage Level
I 2 3
0 5 IO
IO 20 30
30 40 50
50 75 IOO
Suscep-tibility
I Low
II Moderate
III High
IV Very High
3-9
TERA CORPORATION
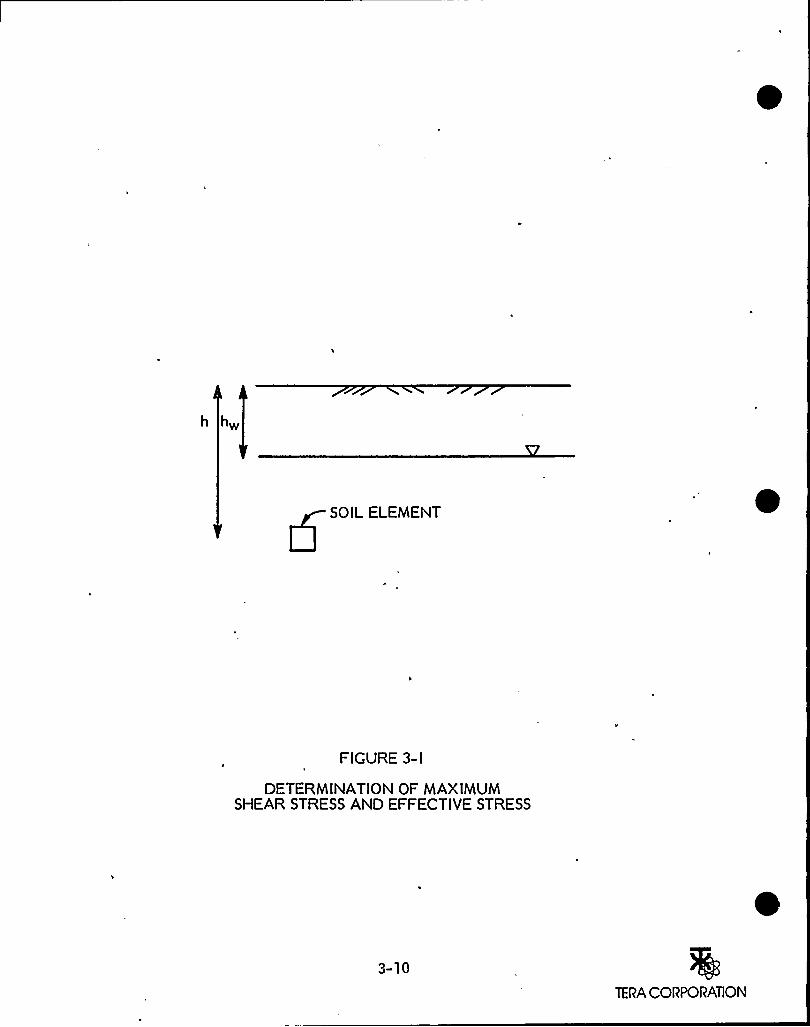
h hw
SOIL ELEMENT
FIGURE 3- I
DETERMINATIONOF MAXIMUMSHEAR STRESS AND EFFECTIVE STRESS
3-10
TERA CORPORATION
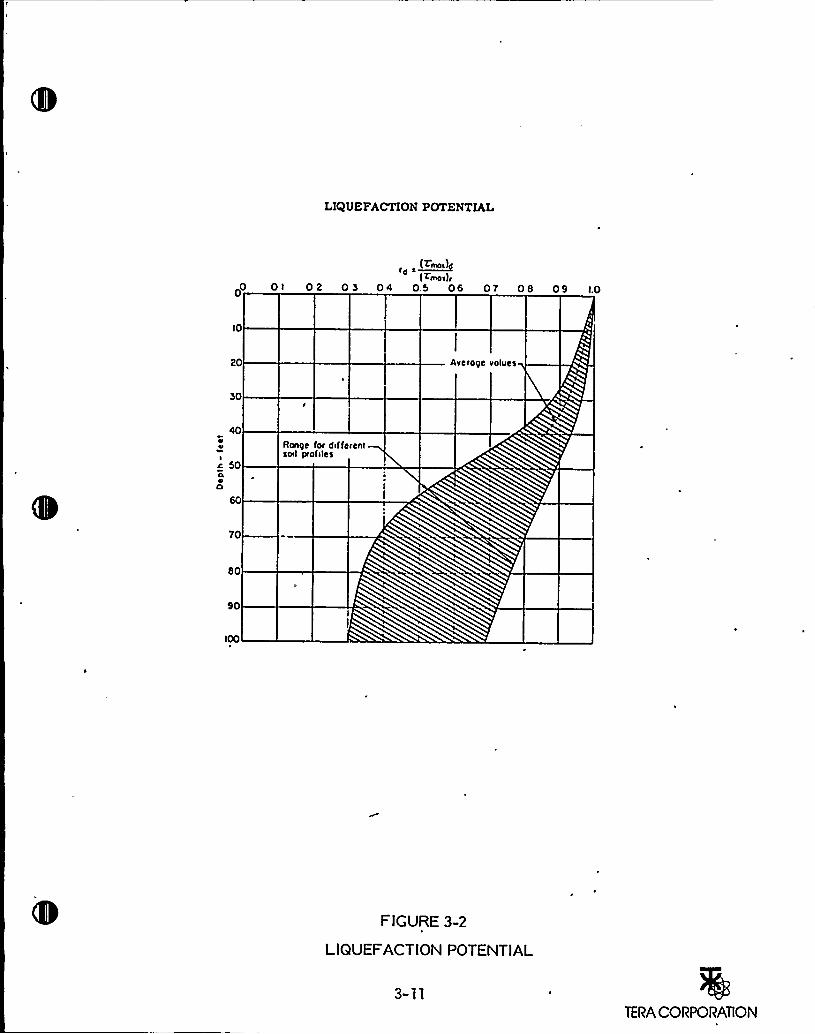
LIQUEFACTION POTENTIAL
~(Trivia)
(<moi)r0 Ol 02 03 04 05 06 07 08 09 l0
lO
20 elvesverope v
30
40e~I
Ic 50a4O
Renege for difterentsoil profiles
70
80
90
IOO
F IGURE 3-2
LIQUEFACTION POTENTIAL
3-11TERA CORPORATION
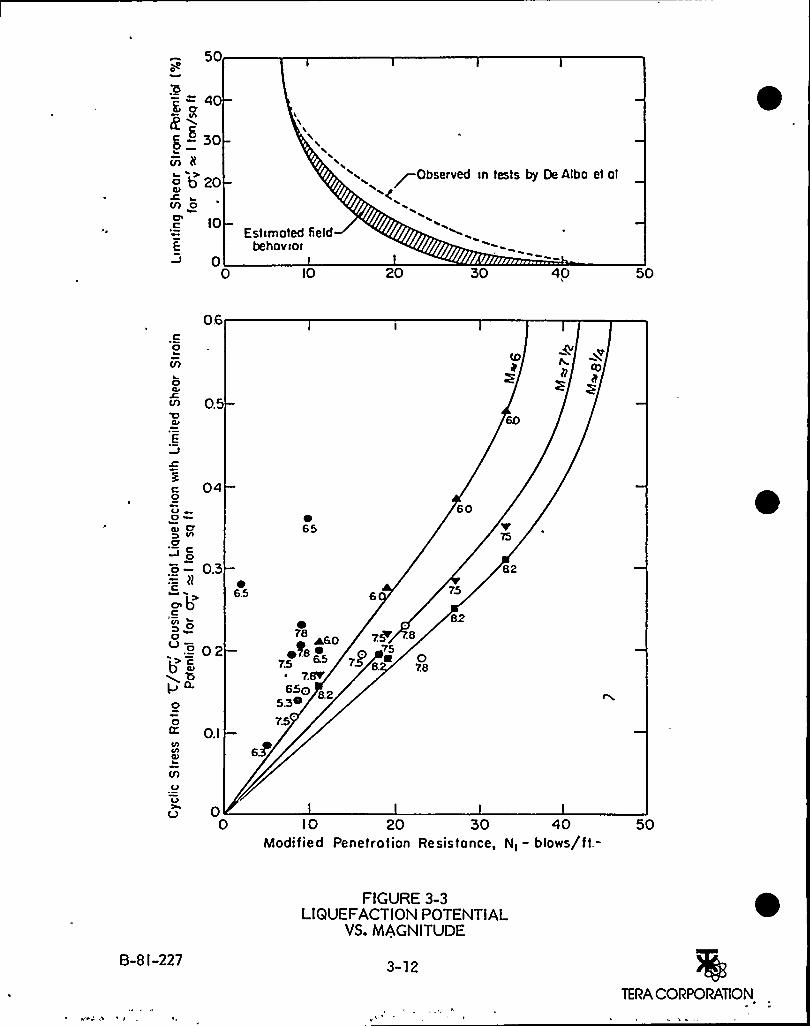
50o<
.c540
g-308
v) 8
ob20Crn o
10
E
00
Estrmoted fieldbehovror
10 20 30 40
~Observed rn tests by De Albo et ol
50
cO
06
OOk
rn'O
E
0.5
DKlAID
VlEJ
Ll
O
O.l
00
c 040
Q eo
a CrI/l
Cf~oo —0.3c~b
O
g 02b) c~ l$p o.
6.5
65
60
&2
?8
~ 7.&O &2s.so
7.5
82
10 20 30 40Modified Penetrotion Resistance, Nr —blows/ft.-
50
FIGURE 3-3LIQUEFACTIONPOTENTIAL
VS. MAGNITUDE
B-8I-227 3-12
TERA CORPORATION
3.2 SUMMARYOF LIQUEFACTIONPOTENTIALBY ROAD
3-13TERA CORPORATION
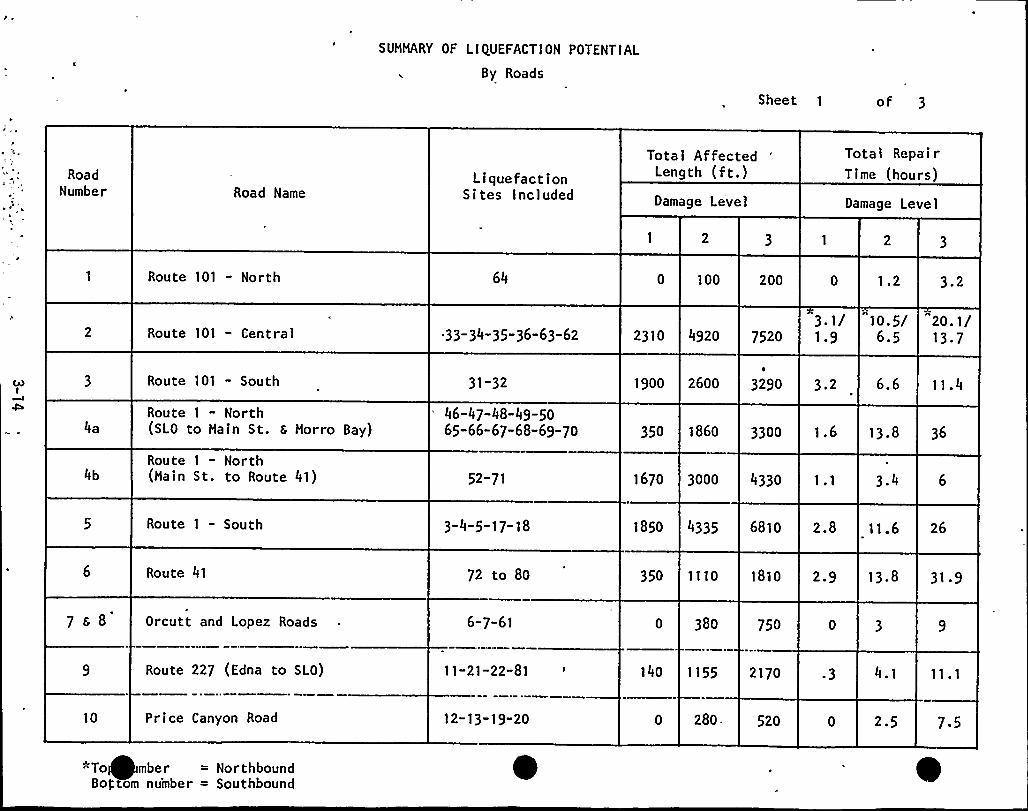
SUMMARY OF L I QUEFACT I ON POTENT I AL
By Roads
Sheet 1 of 3
RoadNumber Road Name
LiquefactionSites Included
Total AffectedLength -(ft.)Damage Level
Total RepairTime (hours)
Damage Level
Route 101 " North 64 100 200 1.2 3 2
4a
4b
Route 101 - Central
Route 101 - South
Route 1- North
(SLO to Main St. 6 Morro Bay)
Route 1- North
(Main St. to Route 41)
~ 33-34-35-36-63-62
31-32
46-47-48-49-5065-66-67-68-69-70
52-71
2310
1900
350
1670
4920 7520
2600 3290
1860 3300
3000 4330
3.1/1.9
32.
1.6
10.5/6.5
20. 1/13 ~ 7
13.8 36
3.4
6.6 11.4
Route 1- South 3-4-5-17-18 1850 4335 6810 2.8 11.6 26
Route 41 72 to 80 350 1110 1810 2.9 13.8 31.9
7s8 Orcutt and Lopez Roads 6-7-61 380 750
Route 227 (Edna to SLO) 11-21-22-81 140 1155 2170 ~ 3 4.1
10 Price Canyon Road 12-13-19-20 280. 520 2.5 7.5
+To mber = NorthboundBop.tom number = Southbound
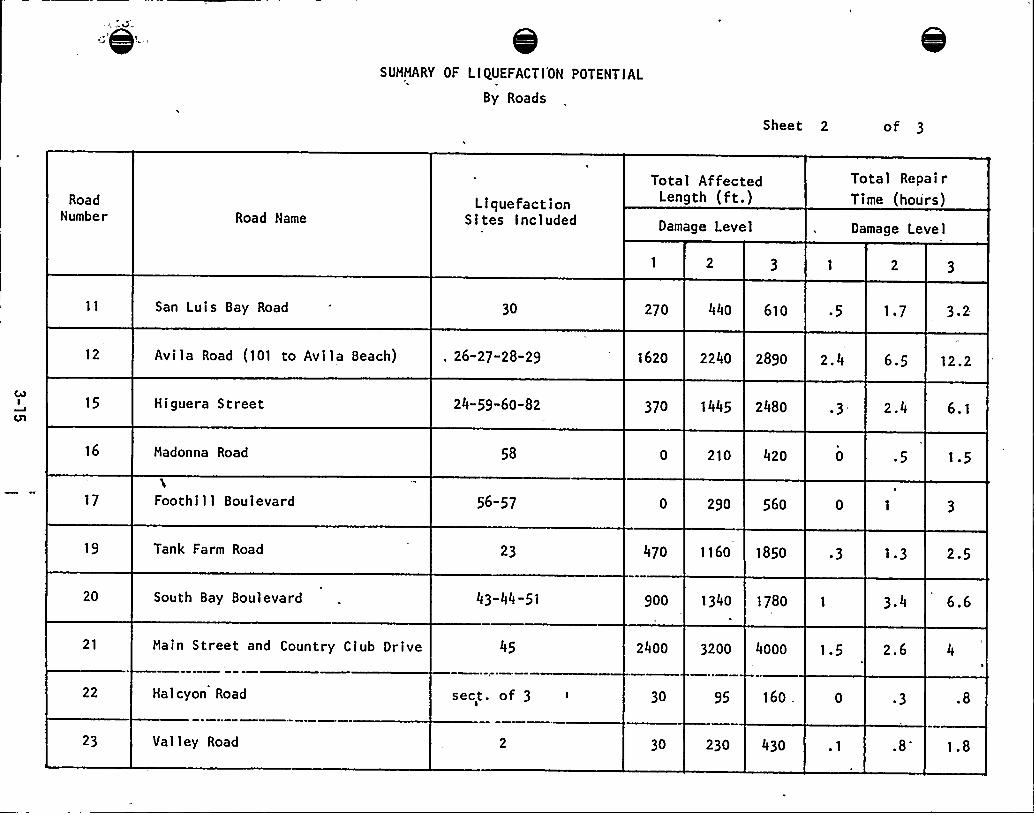
\
'-SUMMARY OF LIQUEFACTION POTENTIAL
By Roads
Sheet 2 of
RoadNumber Road Name
LiquefactionSites Included
Total AffectedLength (ft.)Damage Level
Total RepairTime (hours)
Damage Level
San Luis Bay Road 30 270 440 610 .5 1.7 3.2
12 Av i I a Road (101 to Av i I a Beach) 26-27-28-29 1620 2240 2890 2.4 6.5 12.2
15 Higuera Street 24-59-60-82 370 1445 2480 ~ 3 2.4 6.1
16 Madonna Road 58 210 420 5 1.5
17 Foothi I I Boulevard 56-57 0 290 560
19 Tank Farm Road 23 470 1160 1850 ~ 3 1.3 2.5
20 South Bay Boulevard 43-44-51 900 1340 1780 3.4 6.6
21 Hain Street and Country Club Drive 45 2400 3200 4000 1.5 2.6
22 Halcyon Road sect. of 3I 30 95 160 ~ 3 .8
23 Valley Road 30 230 430 .8'.8
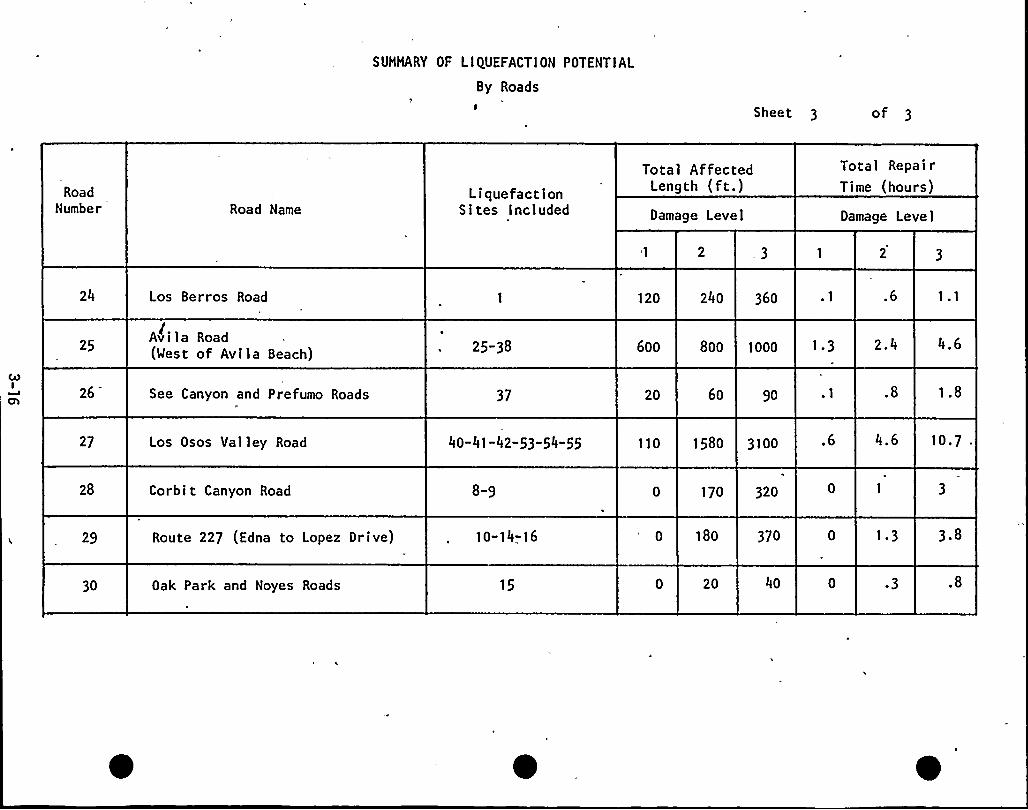
SUHHARY OF LIQUEFACTION POTENTIAL
By RoadsI Sheet 3 of 3
Road—Number Road Name
LiquefactionSites Included
Total AffectedLength (ft.)Damage Level
Total RepairTime (hours)
Damage Level
24 Los Berros Road 120 24o 36o .6
25Av i I a Road(West of Avila Beach) 25-38 6oo 8oo 1000 1.3 2.4 4.6
26 See Canyon and Prefumo Roads 37 20 6o 90 .8 1.8
27 Los Osos Valley Road 40-41-42-53-54-55 110 1580 3100 .6 4.6 10.7
28 Corbit Canyon Road 8-9 170 320
29 Route 227 (Edna to Lopez Drive) 10-14-16 o 18o 370 1.3 3.8
30 Oak Park and Noyes Roads 15 20 4o .3 .8
3.3 SUMMARYOF LIQUEFACTIONPOTENTIALBY SITE
3-17
TERA CORPORATION
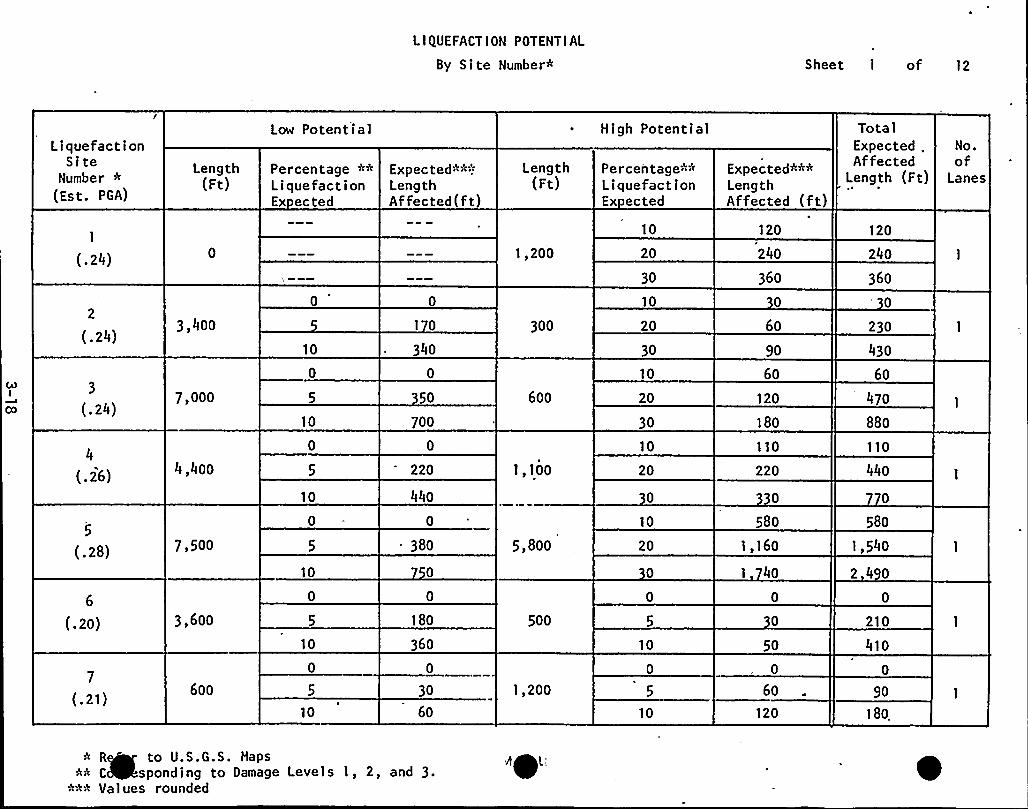
LIQUEFACTION POTENTIAL
By Site Number+ Sheet I of 12
LiquefactionSite
Number +
(Est. PGA)
Length(Ft)
Low Potential
Percentage "-:>
LiquefactionEx ected
Expected+»:>LengthAffected(f t)
Length(Ft)
~ High Potential
Percentage:>:>LiquefactionEx ected
Expected++*LengthAffected (ft)
TotalExpected .
AffectedLength (Ft)
No.of
Lanes
1
(.24)
2
(.24)
3
(.24)
4
(. 26)
5
(. 28)
6
(.20)
7
(.21)
3,400
7,000
4,400
7,500
3,600
600
10
10
10
10
10
10
I 0
340
50
700
220
440
380
180
360
30
60
1,200
300
600
1,100
5,800
500
1,200
10
20
30
10
20
30
10
20
30
10
20
10
20
0
10
10
120
240
360
60
90
60
120
180
110
220
30
580
1,160
I 40
50
60
120
120
240
360
230
430
60
470
880
110
440
580
i,540
240
210
410
90
180.
"- R~ to U.S.G.S. HapsC~sponding to Damage Levels I, 2, and 3.
:>:»> Values rounded
Al;
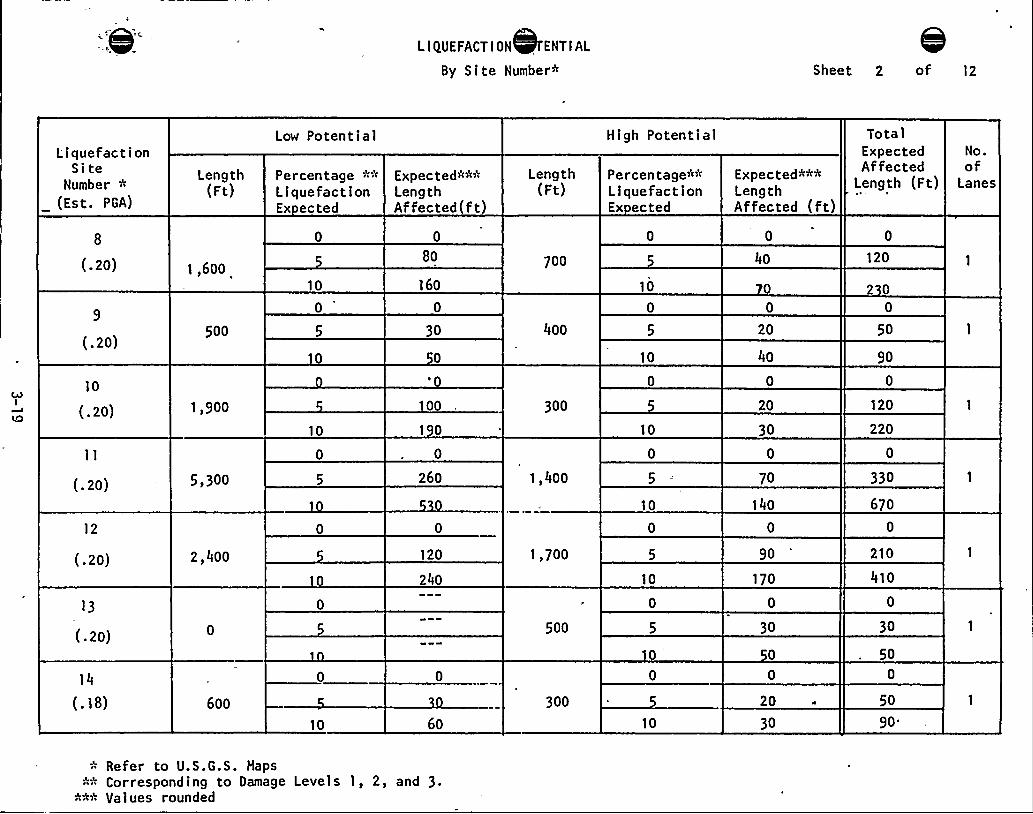
LIQUEFACTION ENTIAL
By Site Number» Sheet 2 of 12
LiquefactionSite
Number *(Est. PGA)
8
(.20)
Length(Ft)
1,600
Low Potential
Percentage »»LiquefactionEx ected
10
Expected«»»LengthAffected(f t)
80
160
Length(Ft)
700
High Potential
Percentage»*LiquefactionEx ected
10
Expected»»»LengthAffected (ft)
40
Tota 1
ExpectedAffected
Length (Ft)
120
2 0
No.of
Lanes
(.20)
10
(.20)
500
1,900
10
30
00
1 0
400
300
10
10
20
40
20
30
50
90
120
220
(.20)
12
(.20)
13
(.20)
5,300
2,400
260
120
240
1,400
1,700
500
10
10
70
140
90
170
30
330
670
210
410
30
50
(.18) 600
10 60
300
10
20
30
50
90'-
Refer to U.S.G.S. Haps"-:" Corresponding to Damage Levels I, 2, and 3.
»»» Values rounded
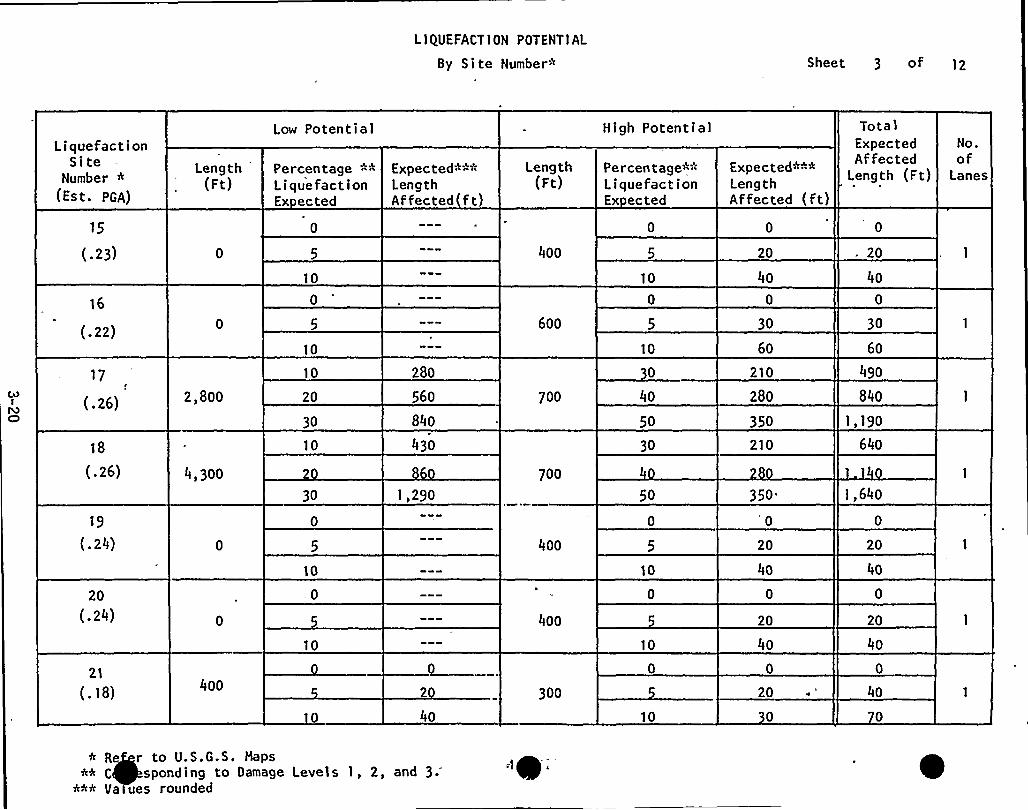
LIQUEFACT10N POTENTIAL
By Site Number» Sheet 3 of
LiquefactionSi te
Number »
(Est. PGA)
15
(.23)
16
(.22)
17
(.26)
18
(. 26)
19
(. 24)
20
(.24)
21
(.18)
Length(Ft)
2,800
4,300
400
Low Potential
Percentage »»
LiquefactionEx ected
0
10
10
10
20
30
10
30
10
10
Expected»»»LengthAffected(ft)
280
560
840
430
1,290
40
Length(Ft)
400
600
700
700
400
400
300
High Potential
Percentage»»LiquefactionEx ected
10
10
40
50
30
50
10
10
10
Expected*»*LengthAffected (ft)
20
40
30
60
210
280
350
210
350
20
40
20
40
20 ~"
TotalExpectedAffected
Length (Ft)
20
40
30
60
490
840
1,190
640
i,640
20
40
20
40
40
No.of
Lanes
Re r to U.S.G.S. Haps»* C sponding to Damage Levels 1, 2, and 3.
**» Va ues rounded
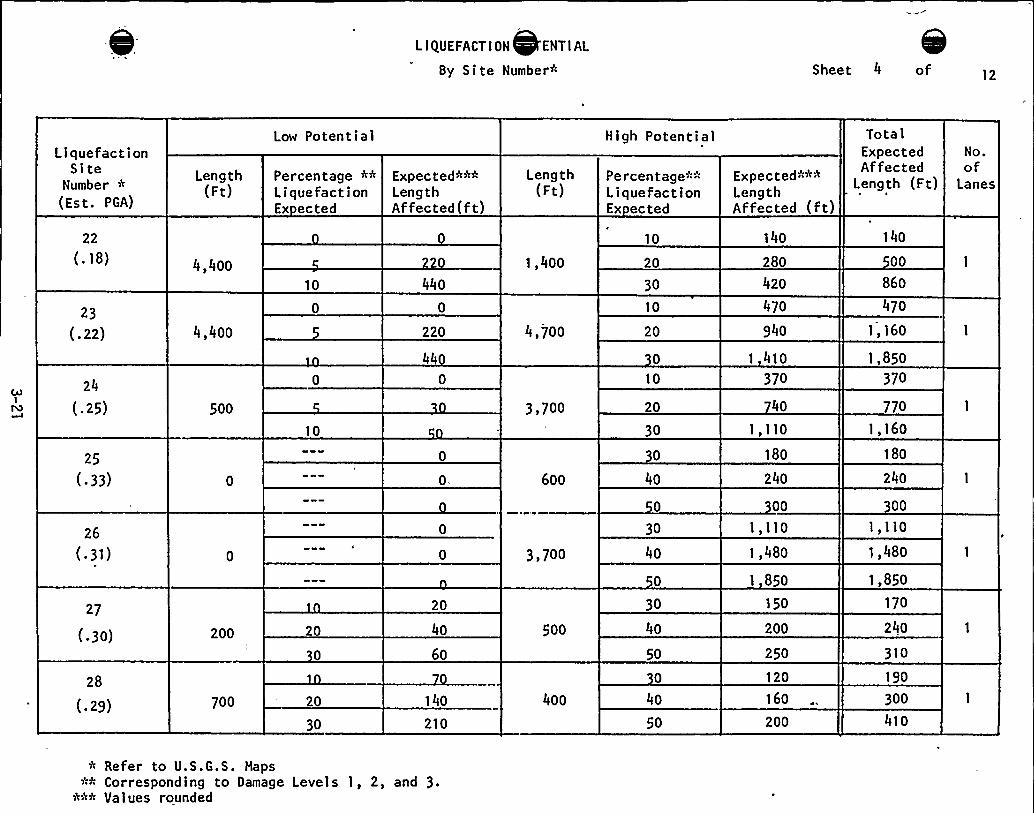
LIQUEFACTION ENTIAL
By Site Number+ Sheet 4 of 12
LiquefactionSite
Number *(Est. PGA)
22
(. 18)
23
( 22)
24
(.25)
25
(. 33)
26
(.31)
27
(.3o)
28
(.29)
Length(F't)
4,4oo
4,4oo
500
200
700
Low Potential
Percentage ++
LiquefactionEx ected
10
10
20
20
30
Expected+"-:"LengthAffected(f t)
20
44o
220
44
0.
20
4o
6o
140
210
Length(Ft)
1,400
4,700
3,700
6oo
3,700
500
4oo
High Potential
Percentage+:>LiquefactionEx ected
10
20
30
10
20
10
20
30
4o
30
4o
30
4o
50
4o
50
Expected+**LengthAffected (ft)
140
28o
42o
47o
940
41o
370
4o
I,IIO180
24o
00
I,llo1,48o
85o
150
200
250
120
160
200
TotalExpectedAffected
Length (Ft)
140
00
86o
47o
1,160
1,850370
770
1,160
180
24o
300
I, I 10
1,48o
1,850
170
24o
310
190
300
410
No.of
Lanes
* Refer to U.S.G.S. Maps~~ Corresponding to Damage Levels I, 2, and 3.
*:>* Values rounded
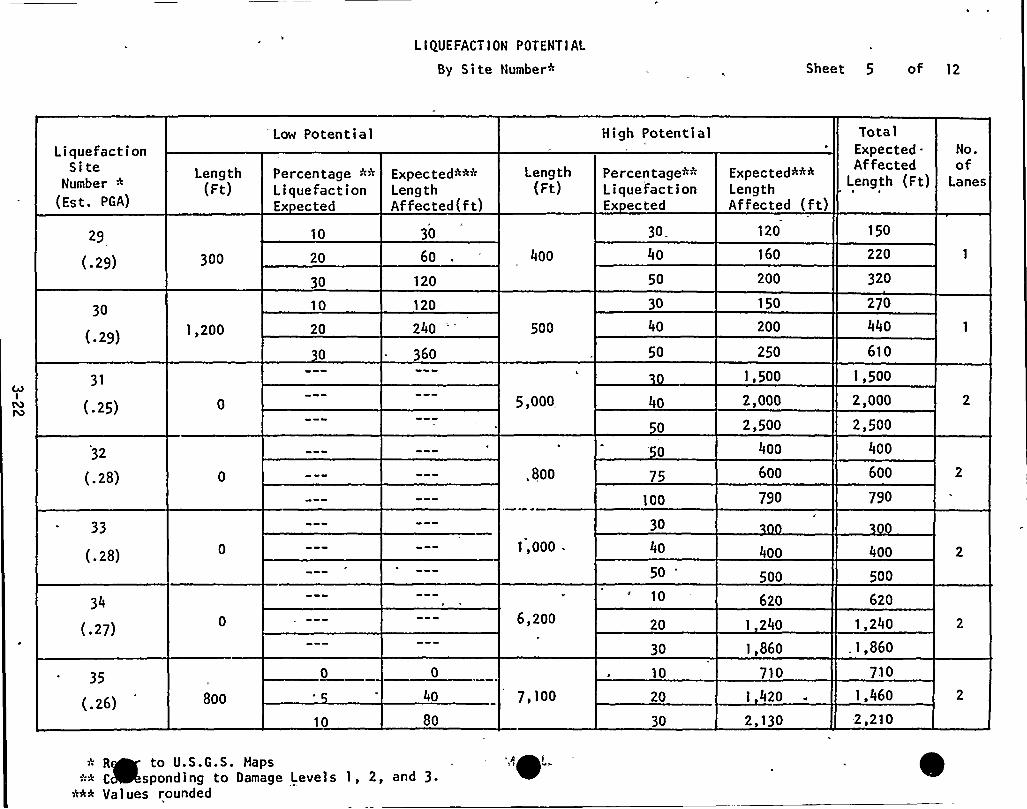
LIQUEFACTION POTENTIAL
By Site Number* Sheet 5 of 12
Liquefact i onSite
Number +
(Est. PGA)
29
(.29)
30
(.29)
31
(.25)
32
(. 28)
33
(.28)
34
(.27)
35
(.26)
Length(Ft)
300
1,200
8oo
Low Potential
Percentage >"-
LiquefactionEx ected
10
20
30
10
20
10
Exp ec ted:>*2"LengthAffected(ft)
30
6o
120
120
24o
36o
4o
8o
Length(Ft)
4oo
500
5,000
,8oo
1,000
6,200
7,100
High Potential
Pe rcen tage"-"-LiquefactionEx ected
30
4o
50
30
4o
50
40
'
75
100
30
40
50
10
20
30
10
20
30
Expected*-~LengthAffected (ft)
120
160
200
150
200
250
1,500
2,000
2,500
4oo
6oo
790
400
500
62o
I 24o
1,86o
710
420
2,130
TotalExpected.Affected
Length (Ft)
150
220
320
270
44o
61o
1,500
2,000
2,500
4oo
600
790
4oo
500
620
1,24o
. 1,860
710
1,46o
2,210
No.of
Lanes
~ R~ to U. S. G. S. HapsC~sponding to Damage Levels I, 2, and 3.
~:>+ Values rounded
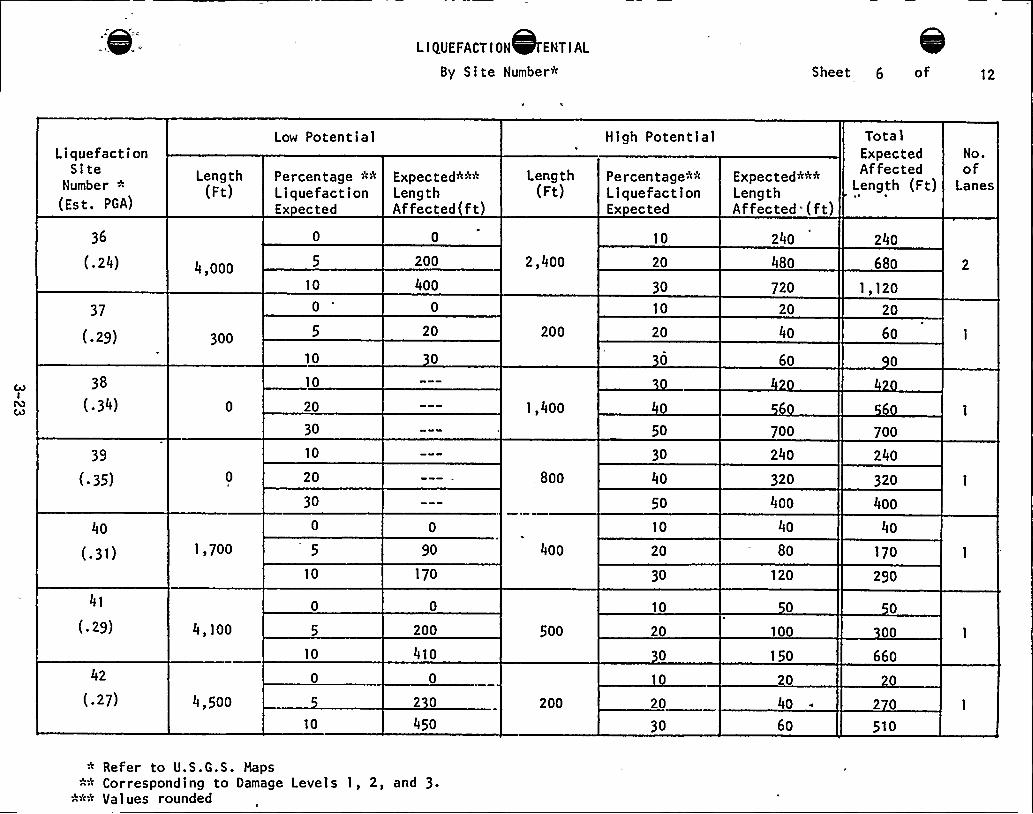
LIQUEFACTION ENTIAL
By Site Number* Sheet 6 of 12
LiquefactionSite
Number »
(Est. PGA)
36
(. 24)
37
(.29)
38
(.34)
39
(.35)
4o
(.31)
41
(.29)
42
(.27)
Length(Ft)
4,ooo
300
1,700
4,100
4,5oo
Low Potential
Percentage *»LiquefactionEx ected
10
10
10
20
30
10
20
30
10
10
10
Expected»»»LengthAffected ft)
0
200
4oo
20
90
170
200
410
0
2 0
45o
Length(Ft)
2,400
200
1,4oo
. Soo
4oo
500
200
High Potential
Percentage»*LiquefactionEx ected
10
20
30
10
20
50
30
4o
50
10
20
30
10
20
20
30
Expected»»*LengthAffected (ft)
24o
48o
720
20
4o
6o
700
24o
320
4oo
4o
So
120
100
150
20
40
6o
TotalExpectedAffected
Length (Ft)
24o
680
1,12020
6o
700
24o
320
4oo
4o
170
290
00
66o
2 0
510
No.of
Lanes
Refer to U.S.G.S. Maps»» Corresponding to Damage Levels I, 2, and 3.
Values rounded
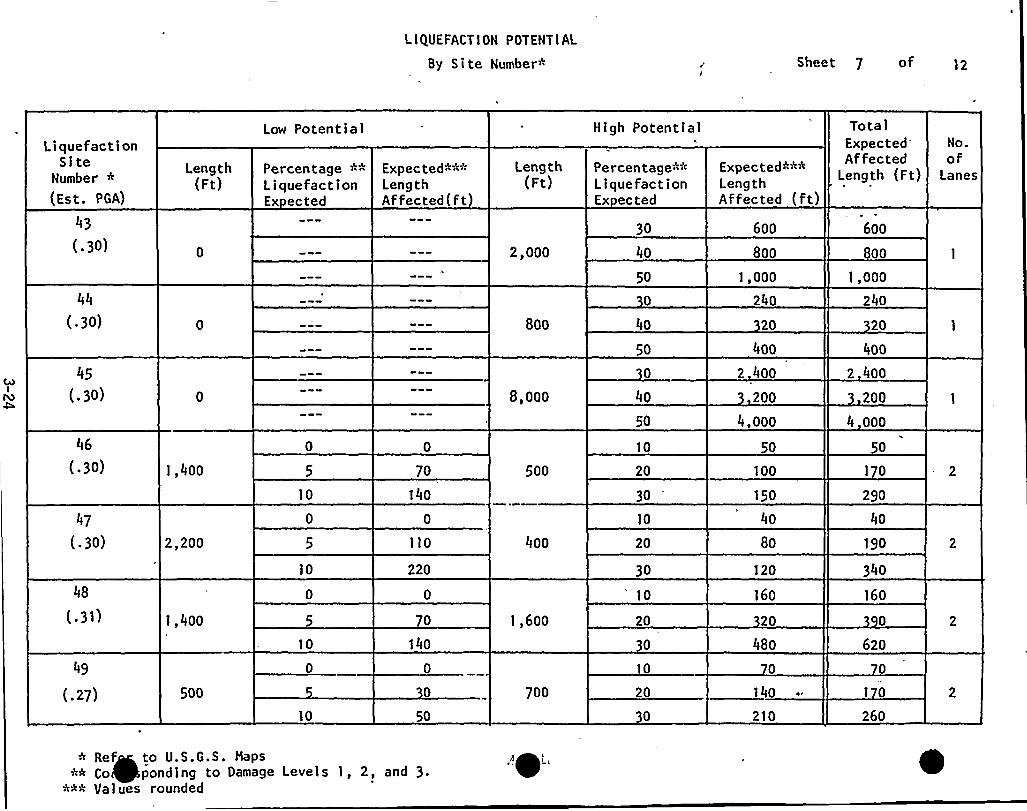
L I QUEFACT I ON POTENT I AL
By Site Number* Sheet 7 of
l.iquefactionSite
Number »
(Est. PGA)
43
(.3o)
44
(.3o)
45
(. 3o)
46
(.3o)
47
(.3o)
48
(.31)
(.27)
Length(Ft)
1,4oo
2,200
1,400
500
Low Potential
Percentage »«LiquefactionEx ected
10
10
10
0
10
Expected«*«LengthAffected(ft)
70
140
0
1 lo
220
140
0
50
Length(Ft)
2,000
Soo
S,ooo
500
4oo
1,600
700
High Potential
Percentage"-«LiquefactionEx ected
30
4o
50
4o
50
4o
50
10
20
30
10
20
30
10
20
0
20
Expected««*LengthAffected (ft)
6oo
Soo
1,000
24o
20
4oo
2 40o
200
4,ooo
50
100
150
4o
8o
120
i6o
20
48o
140 ~
210
TotalExpectedAffected
Length (Ft)
6oo
Soo
1,000
24o
20
4oo
2 4oo
200
4 ooo
50
170
290
4o
190
34o
i6o
62o
I 0
26o
No.of
Lanes
Ref~ to U.S.G.S. Haps»» Co~ponding to Damage Levels 1, 2, and 3.
*»» Values rounded
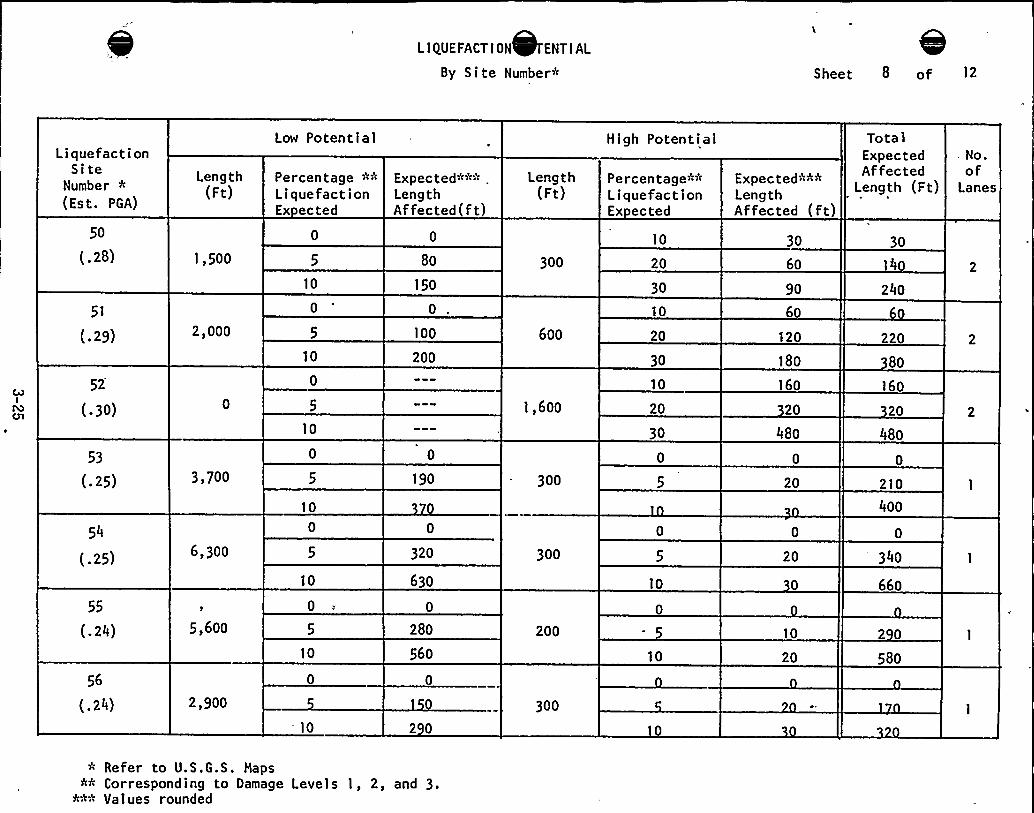
LIQUEFACTION ENTIAL
By Site Number+ Sheet 8 of
Liquefact i onSite
Number *(Est. PGA)
50
(.28)
51
(.29)
52
(.30)
53
(.25)
54
(.25)
55
(.24)
56
(.24)
Length(Ft)
1,500
2,000
3,700
6,300
1
5,600
2,900
Low Potential
Percentage *~LiquefactionEx ected
10
10
10
10
10
0
10
'10
Expec ted~~":" .
LengthAffected(ft)
80
150
100
200
190
320
630
280
560
2 0
Length(Ft)
300
600
1,600
300
300
200
300
High Potential
Percentage»>'<LiquefactionEx ected
10
20
30
10
20
30
10
20
30
10
-5
10
Expected:"++LengthAffected (ft)
30
60
90
60
120
180
160
20
480
20
20
10
20
TotalExpectedAffected
Length (Ft)
30
140
240
220
80
i60
20
480
210
400
340
660
2 0
580
No.of
Lanes
* Refer to U.S.G.S. Haps** Corresponding to Damage Levels I, 2, and 3.
~~* Values rounded
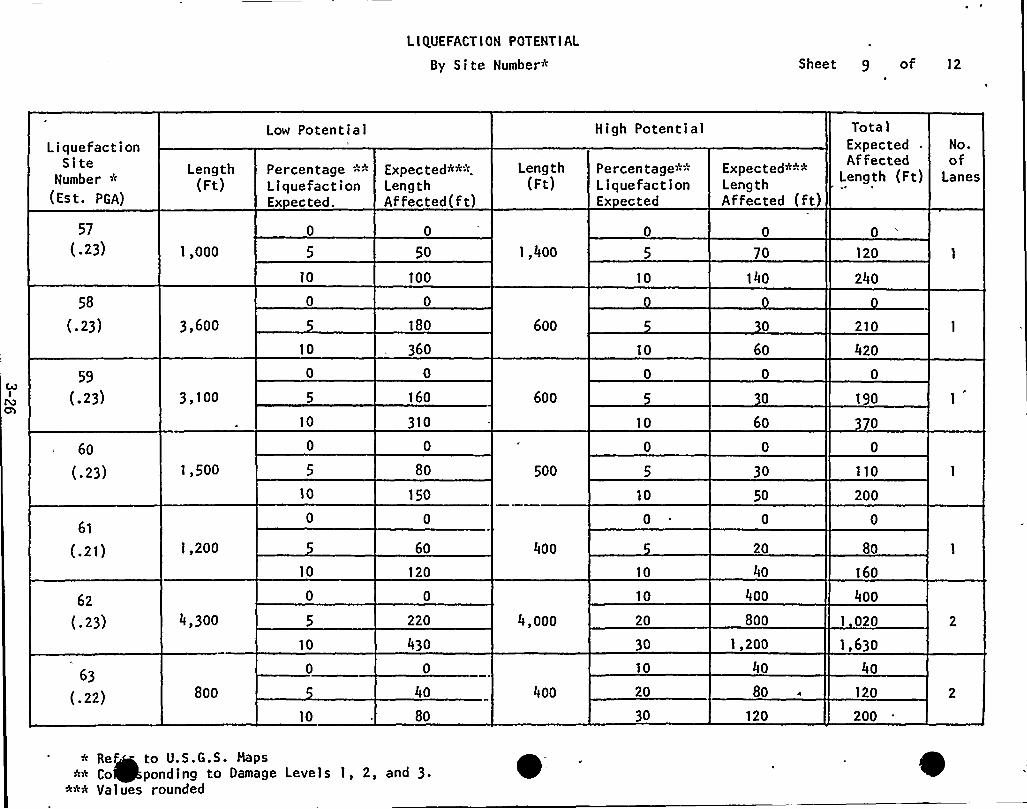
LIQUEFACTION POTENTIAL
By Site Number» Sheet 9 of 12
LiquefactionSite
Number *(Est. PGA)
57
(.23)
58
(. 23)
59
(.23)
6o
( ~ 23)
61
(.21)
62
(.23)
63
(.22)
Length(Ft)
I,ooo
3,600
3,100
1,500
1,200
4,300
Soo
Low Potential
Percentage »»LiquefactionEx ected.
10
10
10
lo
10
10
10
Expected**:".LengthAffected(ft)
50
100
180
36o
16o
310
8o
150
60
120
220
43o
4o
So
Length(Ft)
1,4oo
6oo
6oo
500
4oo
4,ooo
4oo
High Potential
Percentage»»LiquefactionEx ected
10
10
10
10
10
10
20
30
10
20
30
Expected*»*LengthAffected (ft)
70
14o
6o
6o
30
50
20
40
4oo
8oo
1,200
4o
So
120
Tota 1
ExpectedAffected
Length (Ft)
0
120
24o
210
42o
190
370
110
200
&o
— 160
4oo
1 020
1,63o
4o
120
200
No.of
Lanes
Ref~ to U. S. G.S. Haps»* Co~ponding to Damage Levels I, 2, and 3.
***Values rounded
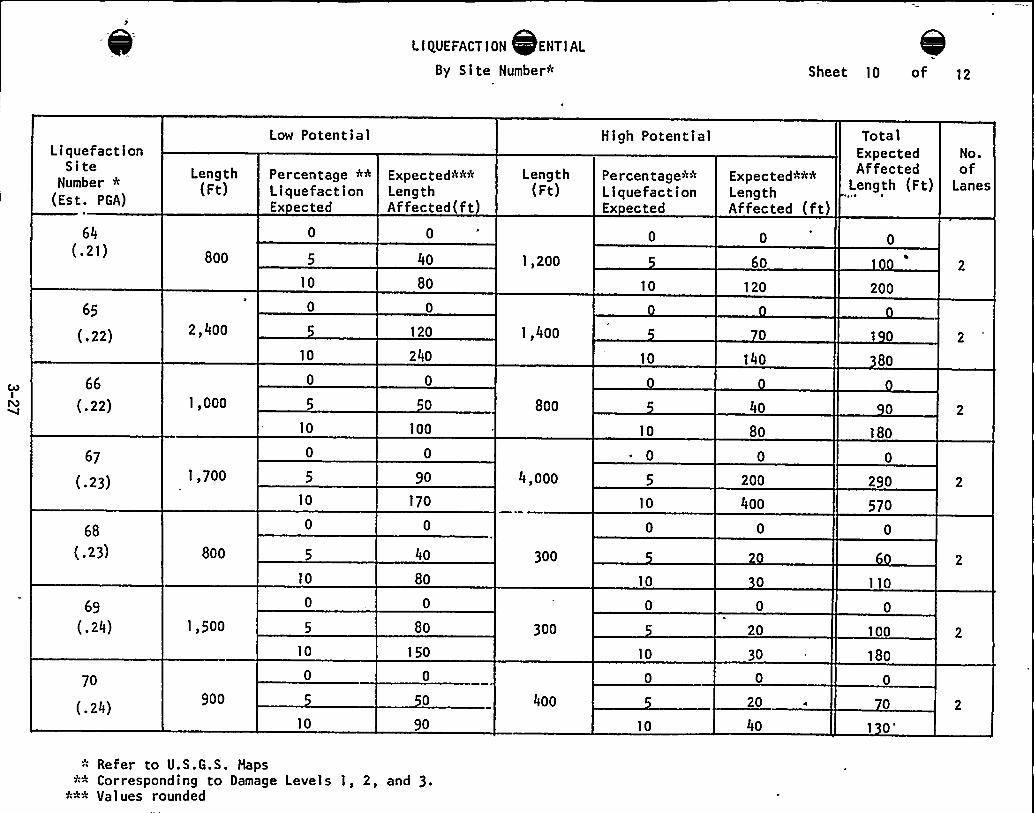
LIQUEFACTION ENTIAL
By Site Number* Sheet 10 of
Liquef act i onSite
Number *(Est. PGA)
64
( 2l)
65
( 22)
66
( 22)
67
( 23)
68
(.23)
69
(.24)
70
(.24)
Length(Ft)
Soo
2,400
1,000
1,700
Soo
1,500
900
Low Potential
Percentage »*LiquefactionEx ected
10
10
10
10
IO
10
10
Expected»»»LengthAffected(ft)
0
4o
8o
120
24o
100
90
170
4o
8o
So
150
90
Length(Ft)
18200
1,400
Soo
4,ooo
300
300
4oo
High Potential
Percentage»*LiquefactionEx ected
lo
10
10
~ 0
10
10
10
10
Expected*»»LengthAffected (ft)
60
120
140
40
So
200
4oo
20
30
20
4o
TotalExpectedAffected
Length (Ft)
200
l 0
So
18o
290
570
110
100
180
1
0'o.
ofLanes
Refer to U.S.G.S. HapsCorresponding to Damage Levels I, 2, and 3.Values rounded
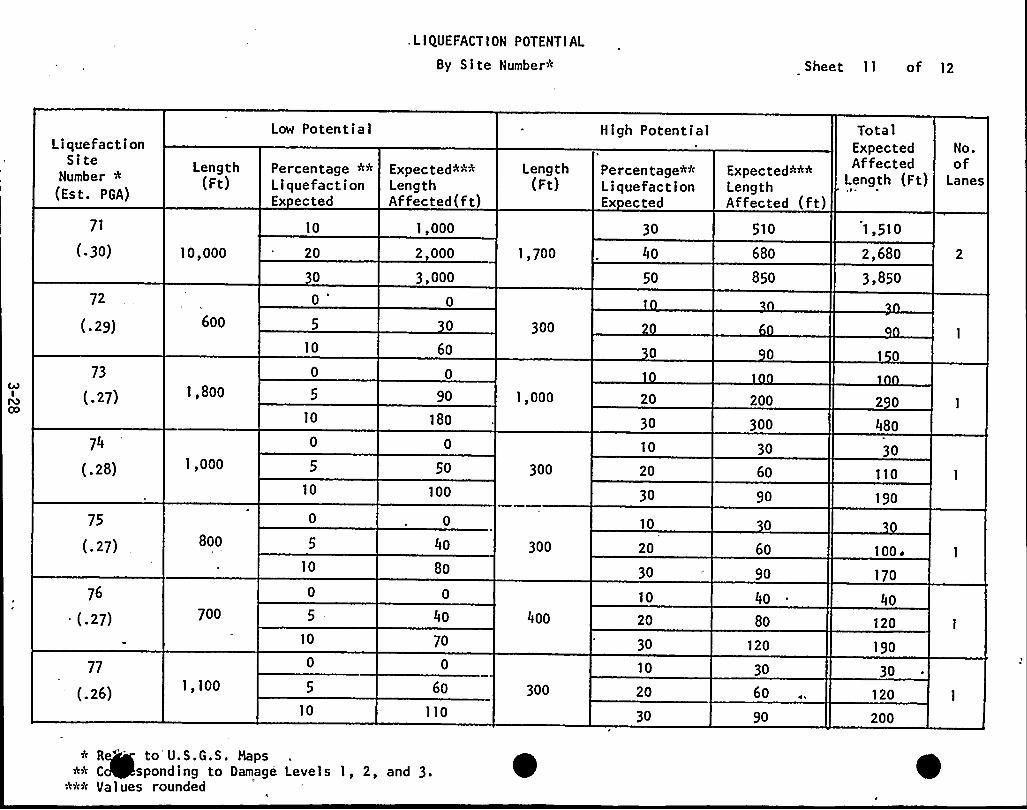
,LIQUEFACTION POTENTIAL
By Site Number* Sheet 11 of 12
Liquef act i onSite
Number *(Est. PGA)
71
(-3o)
72
(.29)
73
(-27)
74
(.28)
75
(.27)
76
(.27)
77
(.26)
Length(Ft)
10,000
6oo
1,8oo
1,000
Soo
700
1, IOO
Low Potential
IO
10
10
10
10
10
Percentage »»LiquefactionEx ected
10
20
30
0
'xpected»»»LengthAffected(ft)
'I,000
2 000
3,000
6o
90
180
50
100
4o
8o
4o
70
6o
110
Length(Ft)
1, 700
300
1,000
300
300
4oo
300
High Potential
Percentage*«LiquefactionEx ected
30
4o
50
20
30
10
20
30
10
20
30
10
20
30
10
20
30
Expected"-*»LengthAffected (ft)
510
68o
85o
200
300
30
6o
90
6o
90
4o
So
120
30
6o
90
TotalExpectedAffected
Length (Ft)
1,510
2,68o
3,850
2 0
48o
30
110
190
100 ~
170
4o
120
190
30 ~
120
200
No.of
Lanes
R~ to U.S.G.S. Haps»* C~spondlng to Damage Levels
»*» Values rounded1,2, and 3.
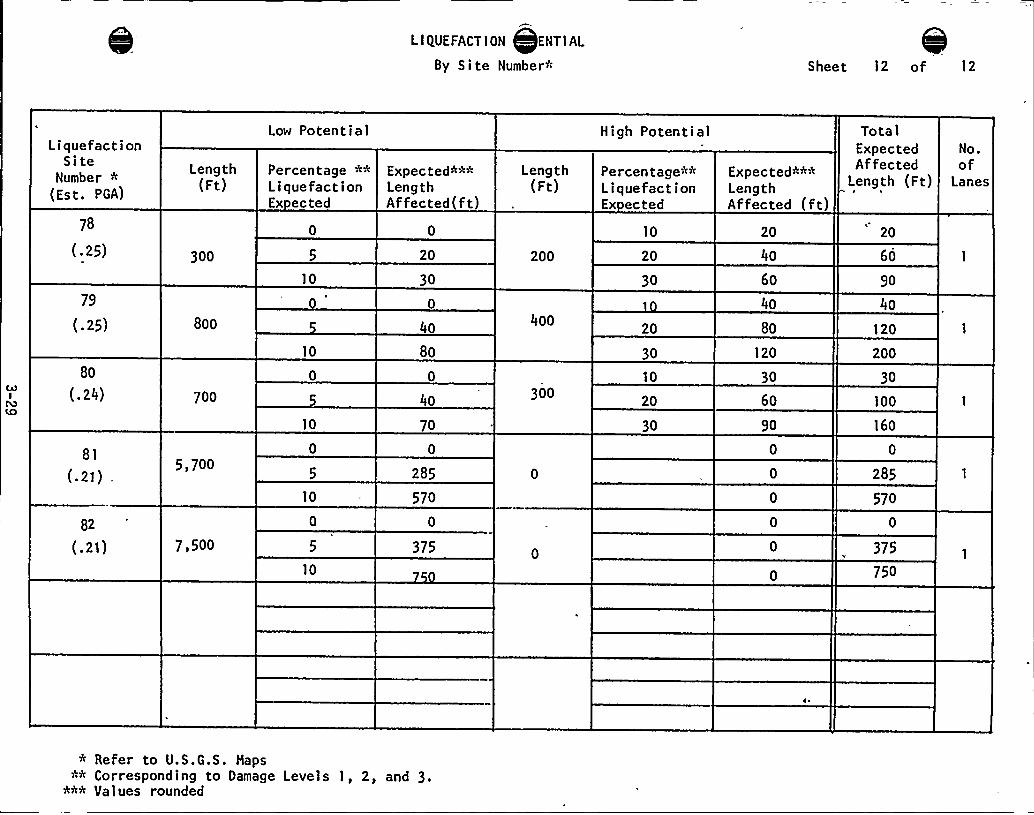
LIQUEFACTION ENTIAL
By Site Number« Sheet 12 of 12
LiquefactionSite
Number *(Est. PGA)
78
(.25)
79
(.25)
8o
(.24)
81
(.21),
82
(.21)
Length(Ft)
300
8oo
700
5,700
7,500
Low Potential
Percentage **LiquefactionEx ected
10
10
10
10
10
Expected*««LengthAffected(ft)
20
30
40
So
40
70
285
570
375
Length(Ft)
200
4oo
300
High Potential
Percentage«*LiquefactionEx ected
10
20
30
20
30
10
20
30
Expected«««LengthAffected (ft)
20
4o
6o
4o
So
120
30
6o
90
Tota I
ExpectedAffected
Length (Ft)
20
6o
90
4o
120
200
30
100
16o
285
570
375
750
No.of
Lanes
* Refer to U.S.G.S. Haps«* Corresponding to Damage Levels I, 2, and 3.
*«* Values rounded


h
~
~ l
4 Q
~ ~' ~ ~ '
,yO

APPENDIX
BRIDGES AND EVACUATION
TABLEOF CONTENTS
Section Pacae
I.O GUIDELINES FOR EVALUATINGTHE PROBABLE SEISMIC DAMAGE'O
HIGHWAYBRIDGES IN THE SAN LUIS OBISPO AREA......... I-I
I. I
I.2l.3I.4l.5
Introduction 0 ~ ~ ~ ~ ~ ~ ~ ~
Bearings ~ ~ ~ ~ ~ ~ ~ ~ ~ ~ ~ ~
Piers and Columns ...Abutments ~ ~ ~ ~ ~ ~ ~ ~ ~ ~
Foundations ~ ~ ~ ~ ~ ~ ~ ~ ~
~ ~ ~ ~ ~ ~ ~ ~ ~ ~ ~ ~ ~ ~ ~ ~ ~ ~ ~ ~ ~ ~ ~ ~ ~ ~ ~ ~ ~ ~ ~ ~ ~ ~ ~
~ ~ ~ ~ ~ ~ ~ ~ ~ ~ ~ ~ ~ ~ ~ ~ ~ ~ ~ ~ ~ ~ ~ ~ ~ ~ ~ ~ ~ ~ ~ ~ ~ ~ ~
~ ~ ~ ~ ~ ~ ~ ~ ~ ~ ~ ~ ~ ~ ~ ~ ~ t ~ ~ ~ ~ ~ ~ ~ ~ ~ ~ ~ ~ ~ ~ ~ ~ ~
~ ~ ~ ~ ~ ~ ~ ~ ~ ~ ~ ~ ~ ~ ~ ~ ~ ~ ~ ~ ~ ~ ~ ~ ~ ~ ~ ~ ~ ~ ~ ~ ~ ~ ~
~ ~ ~ ~ ~ ~ ~ ~ ~ ~ ~ ~ ~ ~ ~ ~ ~ ~ ~ ~ ~ ~ ~ ~ ~ ~ ~ ~ ~ ~ ~ ~ ~ ~ ~
I-II-21-3l-4I-5
2.0 TESTING OF BRIDGE EVALUATIONGUIDELINES ............... 2- I
3.0 SEISMIC EVALUATIONOF BRIDGE COLUMNS .................. 3-I
3 .I Introduction ...............................3.2 Development of Column Vulnerability Factor ..
3-I3-2
4.0 SUMMARYDATAOF BRIDGES SURVEYED ................. ~ ~ ~ . 4-I
4.I4.24.34.4
4.5
Bridge Performance Summary Sheets .........P tIctul'es ~ ~ ~ ~ ~ ~ ~ ~ ~ ~ ~ e ~ ~ ~ ~ ~ ~ ~ ~ ~ ~ ~ ~ ~ ~ ~ ~ ~ ~ ~ ~ ~ ~
Bridge Seismic Data Forms..................Summary of Evaluation of Bridges for which NoW
olere Available ............................Behavior of Bridges During Past Earthquakes ..
~ ~ ~ ~ ~ ~ ~ ~ I ~ ~ ~ ~
Plans
4-24-I 34-32
4-l9I4-I94
5.0 EVACUATIONNETWORK....................... ~ - ~ ~ ~ ~ ~ ~ ~ ~ ~ ~ ~ ~ 5-I
5. I Evacuation Network...............5.2 Formulae for Traffic Flow Quantities5.3 Access to Evacuation Routes .......5.4 'outing of Vehicles ...............5.5 Pictures - Communications Elements
5-25-65-8
5-II5-44
B-8 I-227
TERA CORPORATION

0
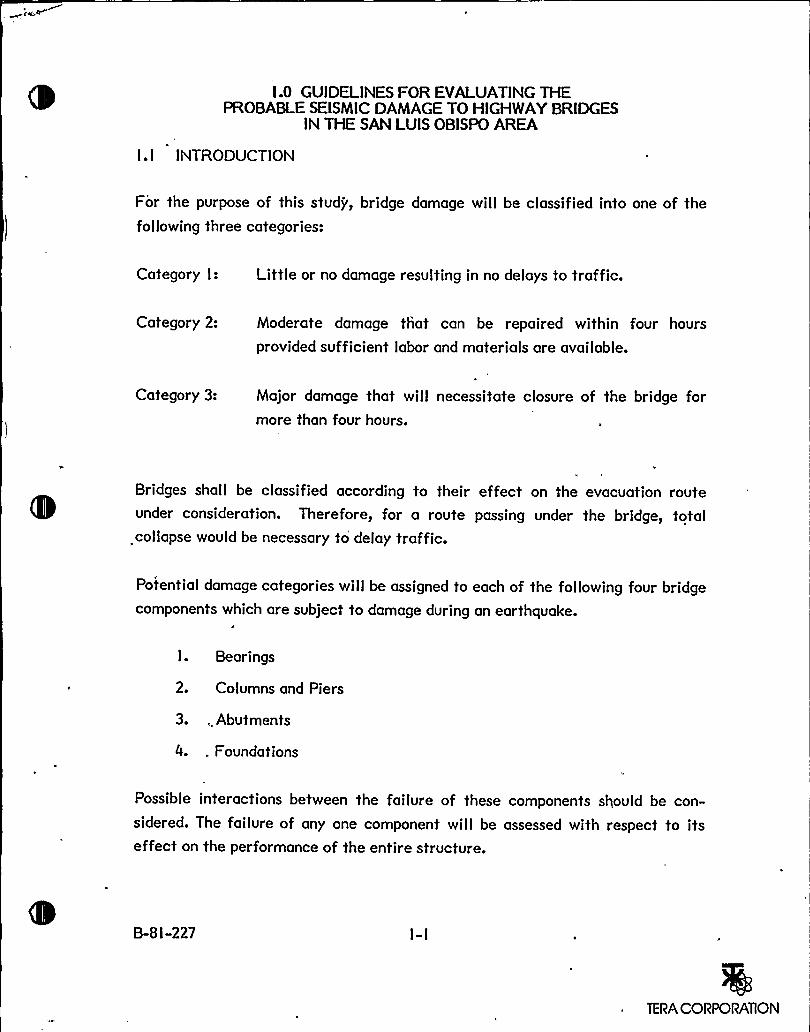
I-0 GUIDELINES FOR EVALUATINGTHEPROBABLE SEISMIC DAMAGETO HIGHWAYBRIDGES
IN THE SAN LUIS OBISPO AREA
I. I INTRODUCTION
For the purpose of this study, bridge damage will be classified into one of the
following three categories:
Category I: Little or no damage resulting in no delays to traffic.
Category 2: Moderate damage that can be repaired within four hours
provided sufficient labor and materials are available.
Category 3: Major damage that will necessitate closure of the bridge formore than four hours.
Bridges shall be classified according to their effect on the evacuation routeunder consideration. Therefore, for a route passing under the bridge, totalcollapse would be necessary to delay traffic.
Potential damage categories will be assigned to each of the following four bridgecomponents which are subject to damage during an earthquake.
r
I. Bearings
2. Columns and Piers
3., Abutments
4.. Foundations
Possible interactions between the failure of these components should be con-sidered. The failure of any one component will be assessed with respect to itseffect on the performance of the entire structure.
B-8l-227
TERA CORPORATION
Seismic vulnerability of the bridge structures will be evaluated according to
these guidelines, which are based on observations of damage in past earthquakes
and engineering judgment with respect to the performance of critical bridge
components in future earthquakes. The following paragraphs describe methods
for evaluating the seismic vulnerability of each of the four components listed
above.
l.2 BEARINGS
Bearings shall be considered to include longitudinal and transverse restrainers as
well as vertical load carrying components. Bearings shall be evaluated withrespect to their ability to continue to support the vertical load when subjected tothe forces and displacements generated by an earthquake. The step-by-stepprocedure detailed below should be followed in evaluating the seismic vulner-ability of bridge bearings.
Screen non-vulnerable bridges (these should be classified in
damage category I).
A. No bearings - continuous structure with end diaphragm
abutments
B. Continuous multi-span or single-span structures withskew $20o not supported on rocker bearings
C. Continuous multi-span or single-span structure withskew )20o not supported on rocker bearings and having a
length-to-width ratio greater than I.5.
Note: Structures qualifying in B and C must have an allowable transversemovement greater than (A/.4)N where A is the maximum expectedground acceleration (in g) and N is the required support lengthdefined in the Applied Technology Council's "Guidelines for theSeismic Design of Highway Bridges" (Report ATC-6, I 98 I) anddiscussed below.
B-8I-227 I-2
TERA CORPORATION
2. Calculate in inches the ATC-6 required support length
N = l2+.03L+.I2H
where
N = Required support length in inches
L = Length of bridge deck to adjacent joint or end of bridge in
feet
H = (Abutments) The average height (in feet) of columns
supporting the bridge deck to the next expansion joint.(H = 0 for single span bridges)
(Piers) The height of the pier (in feet)
(Midspan Joint) The average height (in feet) of adjacent
two columns.
3. Measure the allowable transverse movement at the support. Allow-able movement will be the limit at which all girders of a multigirderbridge will lose support. The displacement required to move one
girder off the edge of the seat will be considered allowable for a 2 or
3 girder bridge.
4. Assume keeper plates and anchor bolts will fail in shear at a peak
ground acceleration of .20 g. If skew is greater than 40 then rockerbearings will probably topple. The upper bound transverse movement,
which may be assumed equal to (A/.4)N, must be compared to theallowable transverse movement measured in Step 3.
If bearings topple, the minimum distance to the edge. of the bearingseat from any corner of the bearing must exceed. the bearing heightto prevent total collapse.
B-8 I-227 1-3
'ERA CORPORATION
For pedestal seats, the transverse distance from the edge of the
bearing to the edge of the seat must exceed the sum of the height
and the width of the bearing. In addition, the longitudinal distance
from the face of the bearing to the edge of the seat must exceed
D= putana +W h
cos a
where
W = the width of the bearing
h = the height of the bearing
a = skew angle
5. Nominally reinforced concrete shear keys are assumed to fail in shear
at a peak ground acceleration'f .30 g. Check transverse motion
after failure as in Step 4.
6. Rocker bearings in nonskewed structures are assumed to topple at
.30g. Assume span collapse will not occur if structure otherwise
qualifies under IB and IC above or if support length exceeds (A/.4)N.
7. Loss of support at abutments or midspan joints has a slight chance of
occurring in bridges with one or more midspan joints if (A/.4)N
exceeds the support length. If the structure has non-skewed
(skew $20 ) joints and the support length is greater than twice the
sum of the nominal joint openings plus ten inches times the peak
ground acceleration in "g's" times the number of joints in the bridge
deck, then no loss of support is assumed.
8. Classify failures as follows:
B-81-227
A. Little or no vertical movement (Category I)
l-4-0
TERA CORPORATION
B. Vertical movement equal to bearing height (Category 2). Ifstructural collapse will not result from support loss at an inspanbearing, then shoring may be possible and Category 2 damagemay be assumed.
C. Loss of girder support resulting in collapse (Category 3).
Note: If structure crosses an evacuation route, only Category 3 needs to beconsidered.
I.3 PIERS AND COLUMNS
Columns shall be evaluated for failure due to shear and pull-out of longitudinalreinforcement. Column vulnerability to shear failure will be determined based
on an empirical relationship observed during the San Fernando earthquake (see
Section 3.2). The following steps will be followed in evaluating the vulnerabilityof bridge columns.
I. Relate the possible categories of damage to the expected ground
accelerations.
A. A (.20g (Category I)
B..20g QA(.30g (Category I or 2)
C. A $ .30g (Category I, 2 or 3)
2. Eliminate piers from consideration (H/W 2.5) for ground accelera-
tions below .40 g.
3. When bearing keeper plates transfer load to columns, damage Cate-
gory I may be assumed.
4. Calculate the empirical factor for column vulnerability to shear
failure.
LCVF =~p
B-8 I-227 I-5
TERA CORPORATION
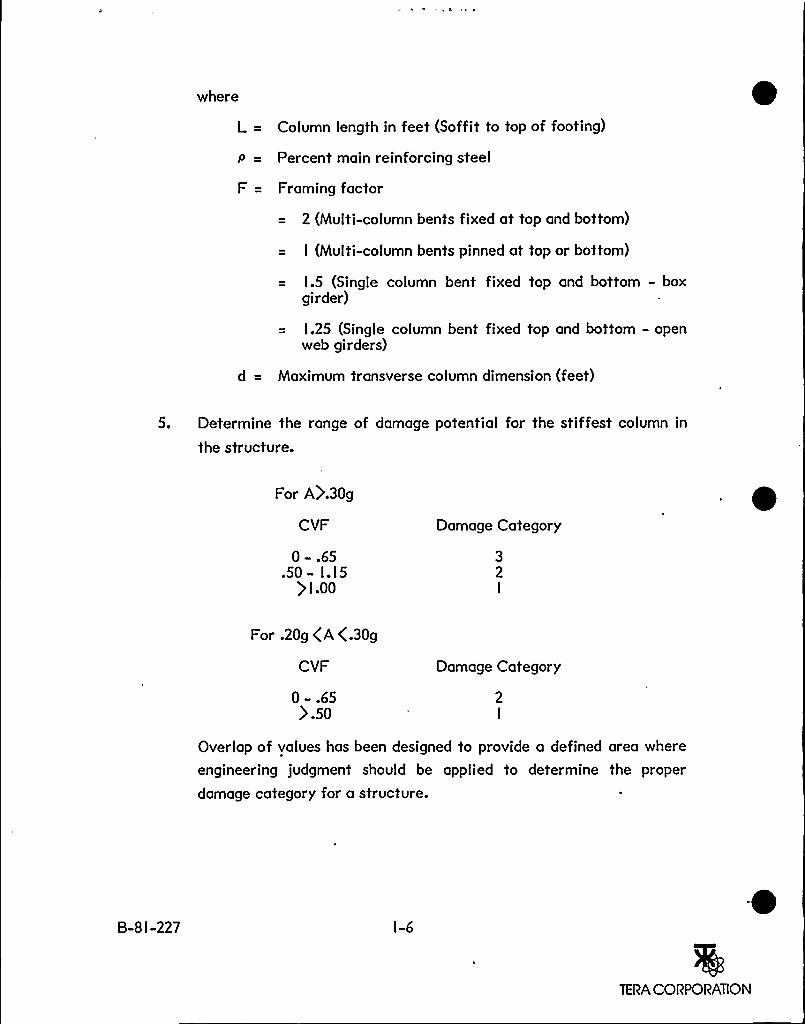
where
Column length in feet (Soffit to top of footing)
Percent main reinforcing steel
Framing factor
2 (Multi-column bents fixed at top and bottom)
I (Multi-column bents pinned at top or bottom)
l.5 (Single column bent fixed top and bottom — boxgirder)
l.25 (Single column bent fixed top and bottom - openweb girders)
Maximum transverse column dimension (feet)
5. Determine the range of damage potential for the stiffest column in
the structure.
For A)'.30g
CVF Damage Category
0-.65.50 - l. I5
) l.00
For .20g gA 4.30g
CVF Damage Category
0-.65).So
Overlap of values has been designed to provide a defined area where
engineering judgment should be applied to determine the proper
damage category for a structure.
B-8 I-227 I-6
TERA CORPORATION
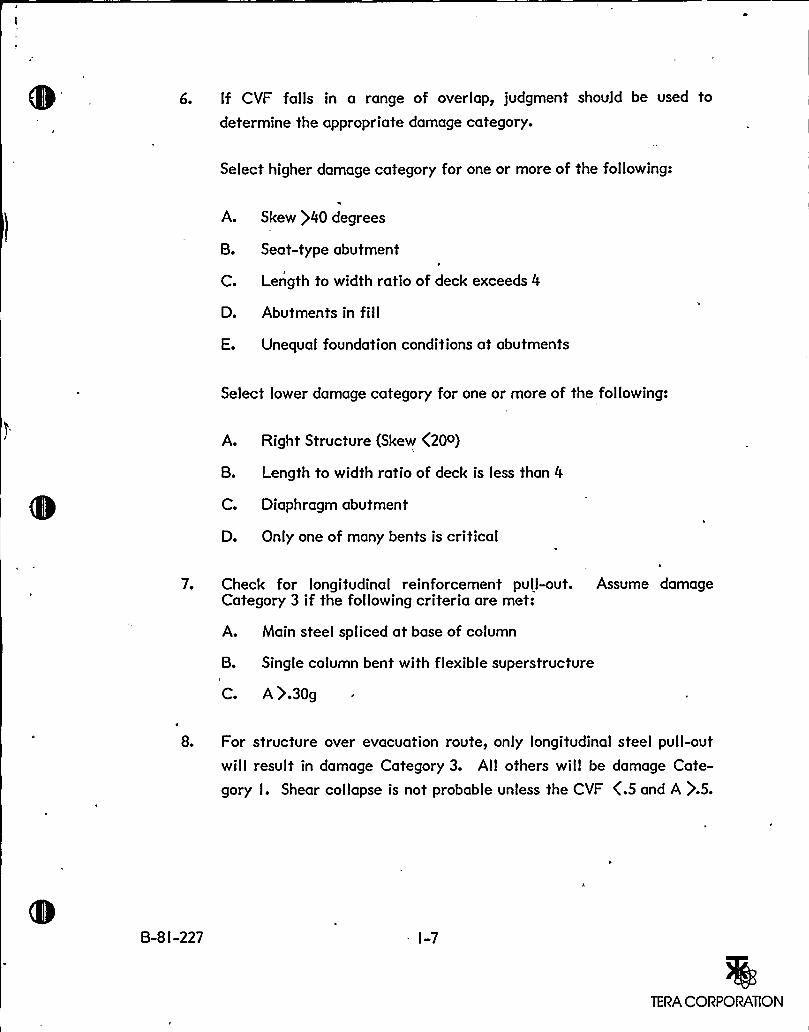
6. If CVF falls in a range of overlap, judgment shouid be used to
determine the appropriate damage category.
Select higher damage category for one or more of the following:
A. Skew )40 degrees
B. Seat-type abutment
C. Length to width ratio of deck exceeds 4
D. Abutments in fill
E. Unequal foundation conditions at abutments
Select lower damage category for one or more of the following:
A. Right Structure (Skew C20o)
B. Length to width ratio of deck is less than 4
C. Diaphragm abutment
D. Only one of many bents is critical
7. Check for longitudinal reinforcement pull-out. Assume damageCategory 3 if the following criteria are met:
A. Main steel spliced at base of column
B. Single column bent with flexible superstructure
C. A ).30g
8. For structure over evacuation route, only longitudinal steel pull-out
will result in damage Category 3. All others will be damage Cate-
gory I. Shear collapse is not probable unless the CVF (.5 and A ).5.
B-8 I-227 I-7
TERA CORPORATION
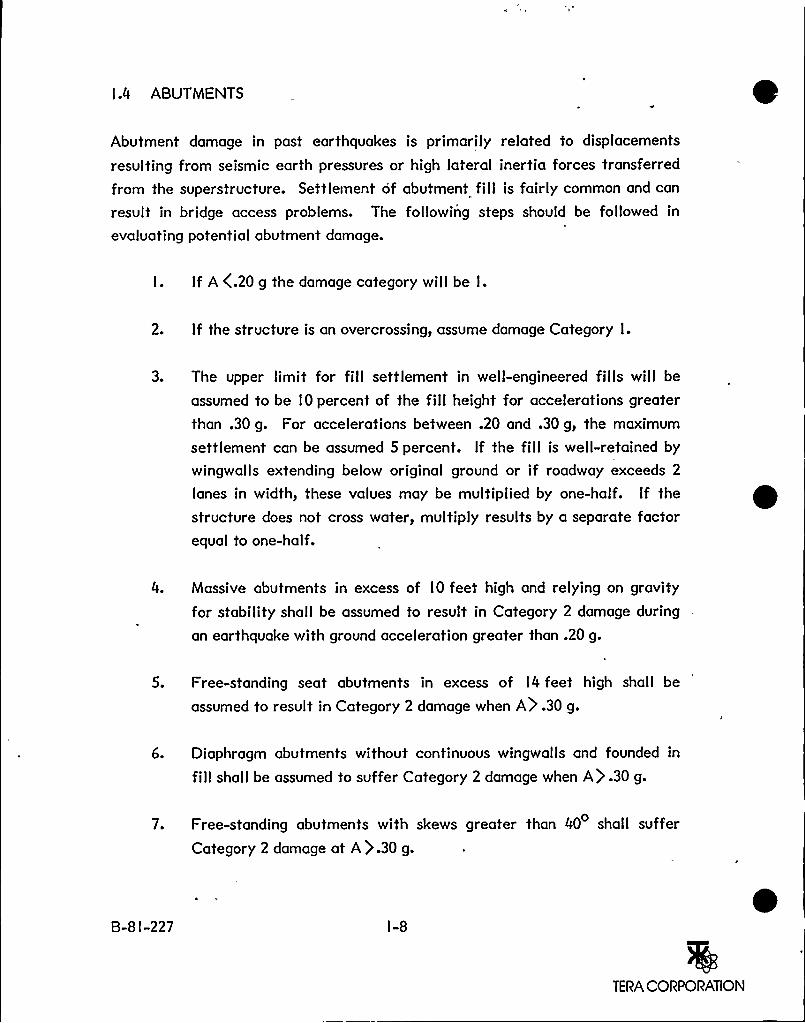
l.4 ABUTMENTS
Abutment damage in past earthquakes is primarily related to displacements
resulting from seismic earth pressures or high lateral inertia forces transferred
from the superstructure. Settlement of abutment fill is fairly common and can
result in bridge access problems. The following steps should be followed in
evaluating potential abutment damage.
I. If A C.20 g the damage category will be I.
2. If the structure is an overcrossing, assume damage Category I.
3. The upper limit for fill settlement in well-engineered fills will be
assumed to be IO percent of the fill height for accelerations greater
than .30 g. For accelerations between .20 and .30 g, the maximum
settlement can be assumed 5 percent. If the fill is well-retained by
wingwalls extending below original ground or if roadway exceeds 2
lanes in width, these values may be multiplied by one-half. If the
structure does not cross water, multiply results by a separate factorequal to one-half.
4. Massive abutments in excess of IO feet high and relying on gravity
for stability shall be assumed to result in Category 2 damage during
an earthquake with ground acceleration greater than .20 g.
5. Free-standing seat abutments in excess of I4 feet high shall be
assumed to result in Category 2 damage when A) .30 g.
6. Diaphragm abutments without continuous wingwalls and founded in
fillshall be assumed to suffer Category 2 damage when A) .30 g.
7. Free-standing abutments with skews greater than 40 shall suffer
Category 2 damage at A) .30 g.
B-SI-227 I-8
TERA CORPORATION
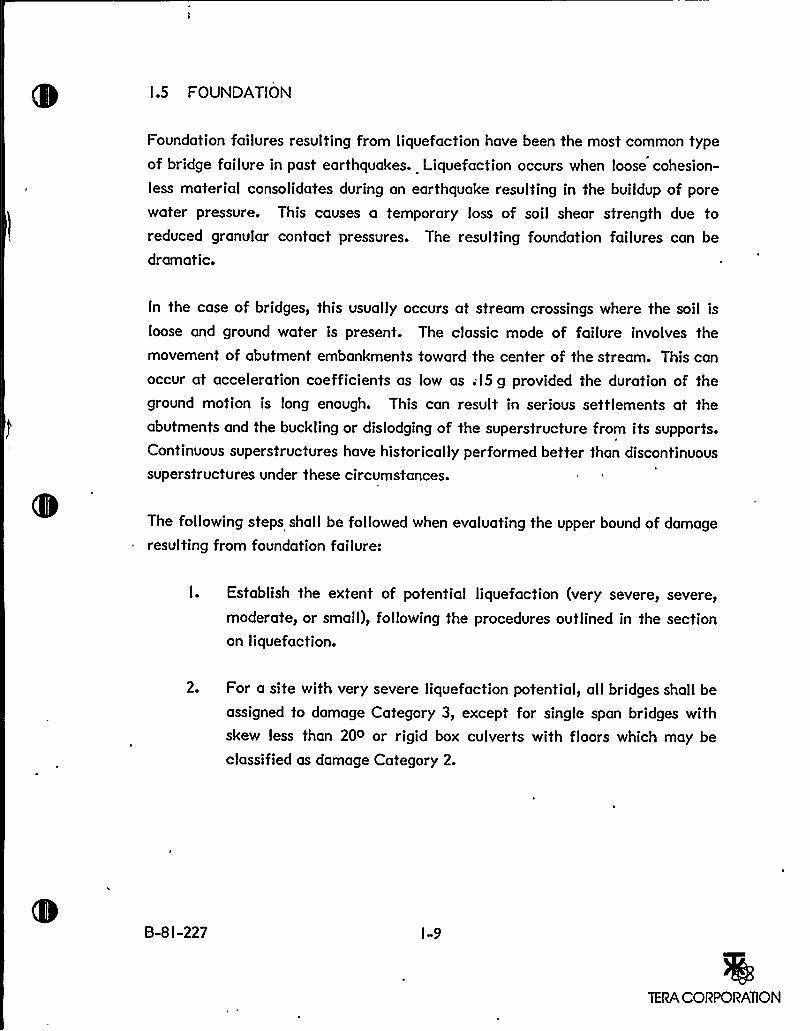
I.5 FOUNDATION
Foundation failures resulting from liquefaction have been the most common typeof bridge failure in past earthquakes. Liquefaction occurs when loose cohesion-
less material consolidates during an earthquake resulting in the buildup of porewater pressure. This causes a temporary loss of soil shear strength due toreduced granular contact pressures. The resulting foundation failures can be
dramatic.
In the case of bridges, this usually occurs at stream crossings where the soil is
loose and ground water is present. The classic mode of failure involves themovement of abutment embankments toward the center of the stream. This can
occur at acceleration coefficients as low as;l5 g provided the duration of theground motion is long enough. This can result in serious settlements at theabutments and the buckling or dislodging of the superstructure from its supports.Continuous superstructures have historically performed better than discontinuoussuperstructures under these circumstances.
The following steps shall be followed when evaluating the upper bound of damage
resulting from foundation failure:
I. Establish the extent of potential liquefaction (very severe, severe,
moderate, or small), following the procedures outlined in the sectionon liquefaction.
2. For a site with very severe liquefaction potential, all bridges shall be
assigned to damage Category 3, except for single span bridges withskew less than 20o or rigid box culverts with floors which may be
classified as damage Category 2.
B-8I-227 I-9
TERA CORPORATION
3. For a site with severe liquefaction potential, all bridges shall be
assumed in damage Category 3, except that damage Category 2 may
be assumed for single span bridges with skew less than 40o, rigid box
culverts with floors, and continuous multi-span bridges with skew less
than 20o provided one of the following is true:
A. Reinforced concrete columns continuous with the superstruc-ture have a CVF greater than !.5 and a height in excess of 25feet.
B. Steel columns are constructed of mild steel and are in excess of25 feet high.
C. Columns are discontinuous with the superstructure, and shiftingof the superstructure will not result in instability.
4. For sites with moderate liquefaction potential, damage Category 2
will be assumed, except for bridges which have been classified in
damage Category 2 for bearing failure, in which case damage
Category 3 shal I be assigned.
5. Damage Category I shall be assumed for the foundations if the
liquefaction potential is small.
8-8I-227 I-IO
TERA CORPORATION
2.0 TESTING OF BRIDGE EVALUATIONGUIDELINES
The guidelines for evaluating the probable seismic damage to highway bridgeswere applied to several bridges which have experienced various levels of failureduring past earthquakes. As can be seen from the following paragraphs, theguidelines generally yield reliable results.
The damage levels indicated by the evaluation guidelines were in very closeconformance with the observed bridge damage in the Imperial Valley, Californiaearthquake of October I 5, I 979. The following bridges were investigated:
I. Bridge across New River (Br. 58-05 R/L)
Predicted Dama e:
Damage Category I
Minor abutment fillsettlements (2")Shifting at abutment (9.4")
~AI ~
Damage Category 2Moderate abutment fillsettlements (6")Shifting at abutment (7.5") - Minor column spalling
Reconciliation:
Movement at abutment indicated moderate liquefaction mayhave occurred. Peak ground accelerations may have beenhigher during aftershocks. These factors could account for thehigher damage category.
2. Bridge across Alamo River (Br. 58-292)
Predicted Dama e:
Damage Category I
Bearing keeper bars fail, but bearings remain standingMinor abutment fillsettlements (4")
B-8I-227 2-I
TERA CORPORATlON
Damage Category I
Bearing keeper bars failed but bearings remain standingNo fillsettlement reported
Reconciliation:
Longer duration of shaking would have probably producedgreater set t lements.
3. Rte 8/I I I Separation (Br. 58-256 R/L)
Predicted Dama e:
Damage Category I
Minor abutment fillsettlements (4")
~A»Damage Category I
Minor abutment fillsettlements (I /2")
Reconciliation:
Longer duration of shaking would have probably producedgreater settlements.
4. Alamo River Bridge (Br. 58- I 36)
Predicted Dama e:
Damage Category I or 2Slight to moderate column damageMinor fillsettlement (36")
Damage Category I
Slight column spoilingMinor fillsettlement (amount not reported)
Reconciliation:
Column steel was estimated which probably yielded lowerCVFs.
B-8I-227 2-2
TERA CORPORATION
5. Meloland Road O.C. (Br. 58-2 I 5)
Predicted Dama e:
Damage Category 2Moderate fillsettlements (6")
Damage Category I
Minor fillsettlements (amount not reported)
Reconciliation:
Longer duration of shaking would have probably producedgreater settlements.
6. Bridge across Alamo River (Br. 58-07)
Predicted Dama e:
Damage Category I
Failure of keeper plates at bearingsTransverse shifting of superstructureMinor abutment fillsettlements (26")
~AID
Damage Category I
Failure of keeper plates at bearingsSlight transverse shifting of superstructureFill settlements not reported
Reconciliation:
Transverse shifting limited by keeper bars and short duration ofshaking. Duration also responsible for low abutment fillsettle-ments.
The guidelines were also applied to the Fields Landing Overhead (Br. 4-I2I) thatfailed during the Trinidad-Eureka Earthquake of November 8, l980. For an
estimated peak ground acceleration of . I 2g the required support length is
calculated to be slightly over 6 inches. Since only 6 inches was provided, the
collapse of the structure was accurately predicted. Since many of the spans did
B-8 I-227 2-3
TERA CORPORATION
not collapse, the required support length must have been very close to the actual
movement.
The guidelines also predicted Category 2 damage due to fill settlement at the
Greenville Rd. Undercrossing during the Greenville, California earthquake ofD
January 24, l980. A settlement of 0.6 feet was predicted, and settlements
between 0.0 and I.O feet actually occurred.
An earthquake of very short duration occurred near Coyote Lake, California on
August 6, I 979. Bridge damage was investigated for several bridges.
I. Pajaro River Bridge (Br. 43-0 I)
Predicted Dama e:
Damage Category I
Minor fillsettlements (3")Shifting at abutments (IO")
~A* I D
Damage Category I
Shifting at abutments (5")No settlements reported at abutmentsMinor column spal ling
Reconciliation:
Short duration of motion caused small fillsettlements.
As was the case in the other bridges investigated for this earthquake, Category I
damage was predicted.
The investigation and analysis of the Feburary 9, l97I San Fernando Earthquake
is discussed in Section 3.2 under the development of the column vulnerabilityfactor.
The bridge seismic data forms for most of the bridges investigated are included
in Section 4.5 of this appendix.
B-8I-227 2-4
TERA CORPORATION
3-0 SEISMIC EVALUATIONOF BRIDGE COLUMNS
3. I INTRODUCTION
It is desirable to have a simple method for predicting the behavior of bridge
columns during an earthquake. It has been reasonably well established by
experience and research that transverse reinforcement in the zones of yielding
plays an important role in the successful performance of reinforced concrete
columns. Transverse reinforcement serves to confine the main longitudinal
reinforcement and the concrete within t6e core of the column, thus preventingthe buckling of the main reinforcement and the severe loss of shear strength in
the concrete. Transverse reinforcement is also effective as shear reinforcementand increases the shear capacity of the column.
Modern bridge design standards such as the AASHTO specifications and theATC-6 Guidelines require minimum transveise confinement reinforcement and
sufficient shear reinforcement to resist forces developed by the formation ofplastic hinges. Careful attention is also given to the reinforcement details toinsure that transverse reinforcement remains effective during the cyclic loadingcharacteristic of large earthquakes.
Unfortunately, prior to l97l the transverse reinforcement placed in most bridgecolumns was totally inadequate by today's standards. For example, a typicalCalifornia Department of Transportation detail consisted of hoops of 6-inch bars
spaced at l2 inches on center. Hoops usually were lap spliced and often therewere no cross ties to support rectangular hoops at intermediate points. Thecolumn damage suffered during the San Fernando Earthquake demonstrated theinadequacy of this detail. Most bridges in service today have column transversereinforcement details that are just as inadequate for seismic loading.
Therefore, in evaluating the seismic vulnerability of existing structure, a fastand effective way of screening the most critical of these columns is needed.
B-SI-227 3-I
TERA CORPORATION
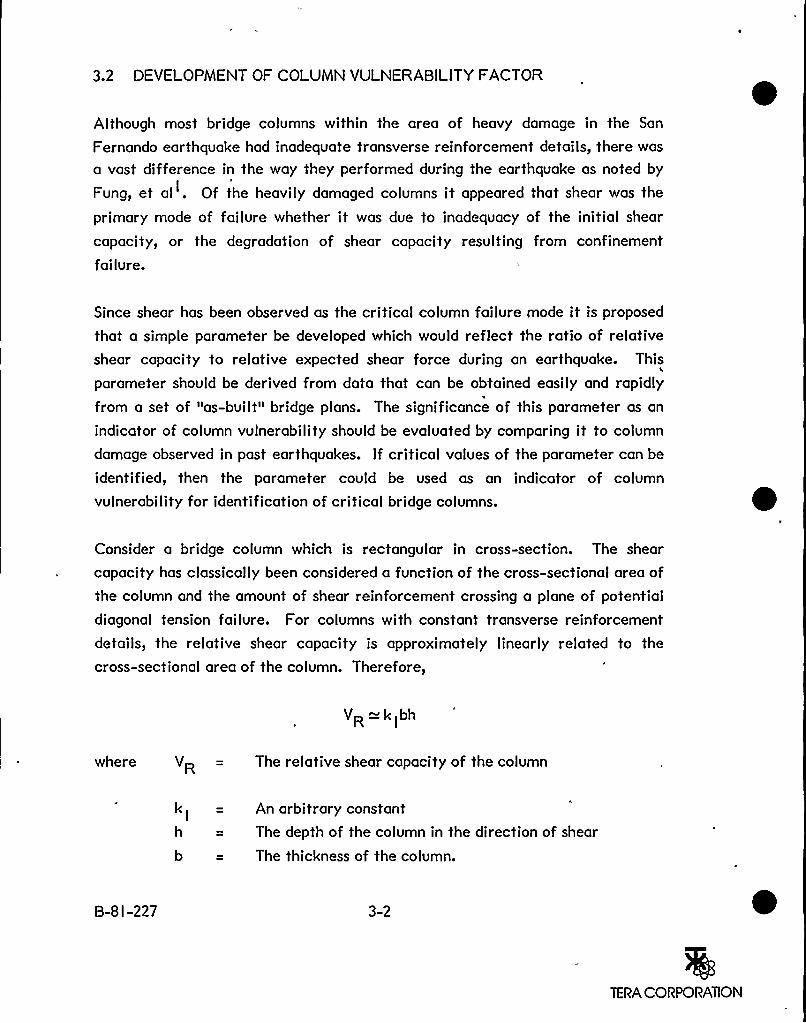
3.2 DEVELOPMENT OF COLUMN VULNERABILITYFACTOR
Although most bridge columns within the area of heavy damage in the San
Fernando earthquake had inadequate transverse reinforcement details, there was
a vast difference in the way they performed during the earthquake as noted by
Fung, et al . Of the heavily damaged columns it appeared that shear was theI
primary mode of failure whether it was due to inadequacy of the initial shear
capacity, or the degradation of shear capacity resulting from confinement
fai lure.
Since shear has been observed as the critical column failure mode it is proposed
that a simple parameter be developed which would reflect the ratio of relativeshear capacity to relative expected shear force during an earthquake. This
parameter should be derived from data that can be obtained easily and rapidly
from a set of "as-built" bridge plans. The significance of this parameter as an
indicator of column vulnerability should be evaluated by comparing it to column
damage observed in past earthquakes. If critical values of the parameter can be
identified, then the parameter could be used as an indicator of column
vulnerability for identification of critical bridge columns.
Consider a bridge column which is rectangular in cross-section. The shear
capacity has classically been considered a function of the cross-sectional area ofthe column and the amount of shear reinforcement crossing a plane of potential
diagonal tension failure. For columns with constant transverse reinforcement
details, the relative shear capacity is approximately linearly related to the
cross-sectional area of the column. Therefore,
VR ——k lbh
where VR = The relative shear capacity of the column
klh
An arbitrary constant
The depth of the column in the direction of shear
The thickness of the column.
B-SI-227 3-2
TERA CORPORATION
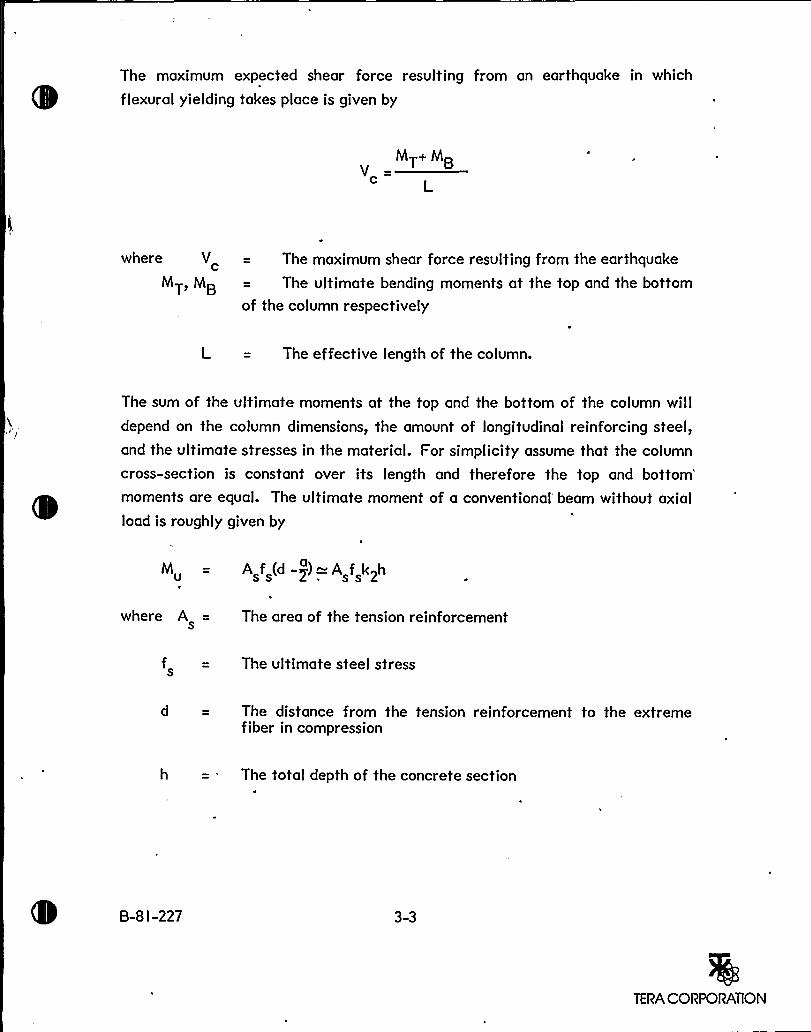
The maximum expected shear force resulting from an earthquake in which
flexural yielding takes place is given by
MT™BVc=
L
where VcMT,M
The maximum shear force resulting from the earthquake
The ultimate bending moments at the top and the bottomof the column respectively
L = The effective length of the column.
The sum of the ultimate moments at the top and the bottom of the column willdepend on the column dimensions, the amount of longitudinal reinforcing steel,and the ultimate stresses in the material. For simplicity assume that the column
cross-section is constant over its length and therefore the top andbottom'oments
are equal. The ultimate moment of a conventional beam without axial
load is roughly given by
u ss P ss
where A = The area of the tension reinforcements
f = The ultimate steel stresss
d = The distance from the tension reinforcement to the extremefiber in compression
h = The total depth of the concrete section
B-SI-227 3-3
TERA CORPORATION
a and k2 Constants associated with the size of the concrete compression
block and, in the case of k2, the relative dimensions of theconcrete cover.
For a column the main steel is usually uniformly distributed about the perimeterof the column cross-section. Therefore, the area of the tension reinforcement is
approximately equal to a constant proportion of the total main reinforcement.
A = k3pbh
where p = The ratio of longitudinal reinforcement area to gross
concrete area
k3 — An arbitrary constant
Most bridge columns will have axial loads approximately equal to IO percent ofthe ultimate axial load. If the ultimate moment at this axial load is assumed tobe a constant proportion to the ultimate moment at zero axial load, and the steelstress, f, and constants k2 and k3 are assumed approximately constant for mosttypical columns, the ultimate moment at the top and bottom of the column is
given by:
MT MB —kgpbh2
where k< — an arbitrary constant.
In many columns, the ultimate moment can only be produced at one end. Toaccount for this it would be useful to consider a framing factor, F. This framingfactor would be multiplied by the ultimate moment to give an approximation of
B-8 I -227 3-0
TERA CORPORATION
the sum of the moments at the top and the bottom of the column. Therefore,the maximum earthquake shear force would be given by:
FMT k4 F pbh
where F = 2.0 For multi-column bents - both ends fixed
F = I.O . For multi-column bent' one end fixed
F = I.O For single column bents - one end fixed
F = l.5 For single column bents - both ends fixed - torsionallyrigid superstructure
F = I.25 For single column bents — both ends fixed - torsionallyflexible superstructure
Therefore, a parameter which reflects the relative likelihood of a shear failure,and thus the column vulnerability, may be given by the ratio of relative shearcapacity to the expected maximum earthquake shear force. Therefore, thecolumn vulnerability factor CVF, is given by
V~ klbh klCVF = —= 2
VC k4FPbh k4 FPh
L
by setting I = I, the column vulnerability factor becomes:k
k4
CVF =—LF~d
B-SI-227 3-5
TERA CORPORATION
To test the validity of this factor as an indicator of potential column damage itwas compared with the column damage observed in the San Fernando earthquake
of l97I. In doing this, column damage was classified as follows:
0 = no damage observed
I = minor damage (spalling) - does not weaken structure
2 = moderate damage which weakens structure but not to the extentthat normal light traffic should be restricted
3 = major damage necessitating closure to traffic but no structurecollapse - damage may be irreparable
4 = total damage —column disintegration and structure collapse.
Using these damage classifications and data from the field investigation ofbridges in the San Fernando Earthquake, several bridges were considered in an
attempt to evaluate the column vulnerability factor concept. The following is a
tabulation of results for the bridges studied:
I. Rte 5 (Truck Lane)/405 Separation (Br. No. 53-I 548)
L =20'=5'
= 3.9%
F = 2.0
CVF = 20/2(3.9)(5.0)
Damage Classification.5I
B-8I-227 3-6
TERA CORPORATION
2. San Fernando Road Overhead O.H. (Br. No. 53- I 990R)
L=32'=
7'
= 4.2%
F = l.5CVF = 32/I.5 (4.2) (7)
Damage Classification
= .73
= 3.0-3.5
3. Northbound Truck Route Undercrossing (Br.. No. 53- I 99 I R)
L =20'1
p = 3.5%
F = I 0
CVF = 20/2(3.5)(4.0)
Damage Classification
= !.43
= 2.0.- 2.5
4.. Foothill Blvd. U.C. (Br. No. 53-20I 6R)
L = l9d= 4'
= 4.2%
F = 2.0
CVF = I9/2 (4.2) (4)
Damage Classification
= .57= 3.0 -3.5
5. Foothill Blvd. U.C. (Br. No. 53-20 I 6L)
L =22'=4'= 2.9%
F =2.0CVF = 22/2(2.9)(4)
Damage Classification
= .95
= 2.0
B-8 I-227 3-7
TERA CORPORATION
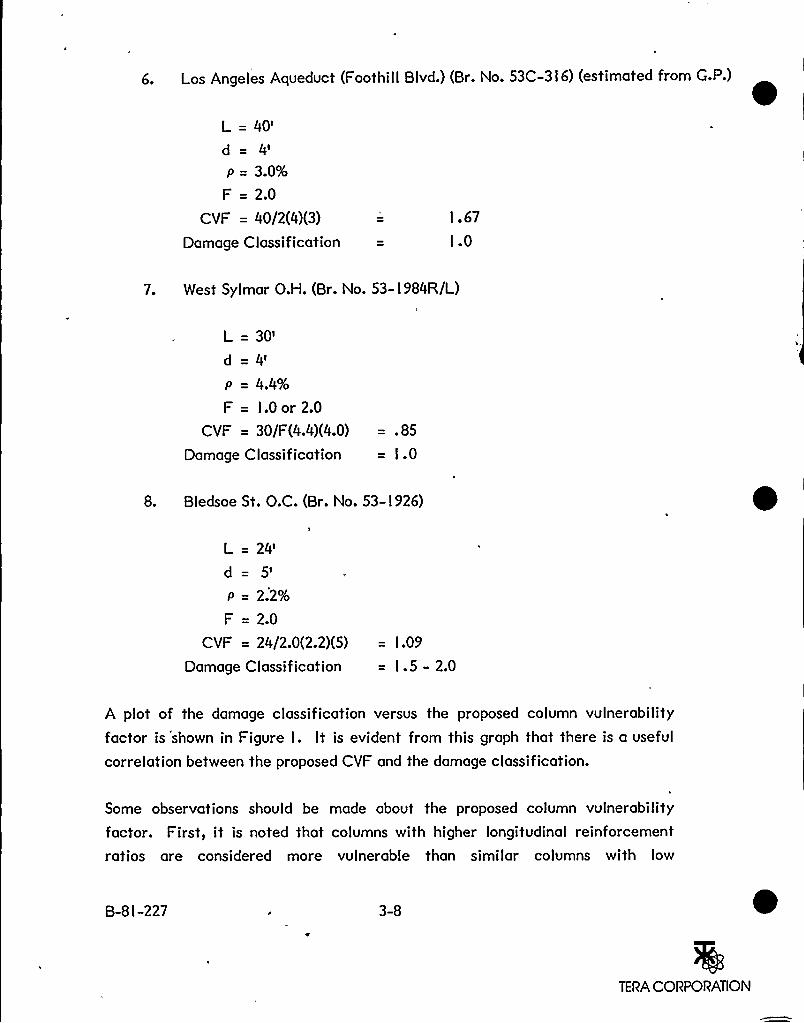
L =40'=
4'
= 3.0%
F = 2.0
CVF = 40/2(4)(3)
Damage Classification
I.67I.O
7. West Sylmar O.H. (Br. No. 53- I 984R/L)
L = 30'
=4'= 4.4%
F = I.0 or 2.0
CVF = 30/F(4.4)(4.0)
Damage Classification
= .85
= 1.0
8. Bledsoe St. O.C. (Br. No. 53-1926)
L=24'=
5'
= 2.2%
F = 2.0
CVF = 24/2.0(2.2)(5)
Damage Classification
= I.09
= I.5-20
A plot of the damage classification versus the proposed column vulnerability
factor is'shown in Figure I. It is evident from this graph that there is a useful
correlation between the proposed CVF and the damage classification.
I
Some observations should be made about the proposed column vulnerability
factor. First, it is noted that columns with higher longitudinal reinforcement
ratios are considered more vulnerable than similar columns with low
B-8I-227 3-8
TERA CORPORATION
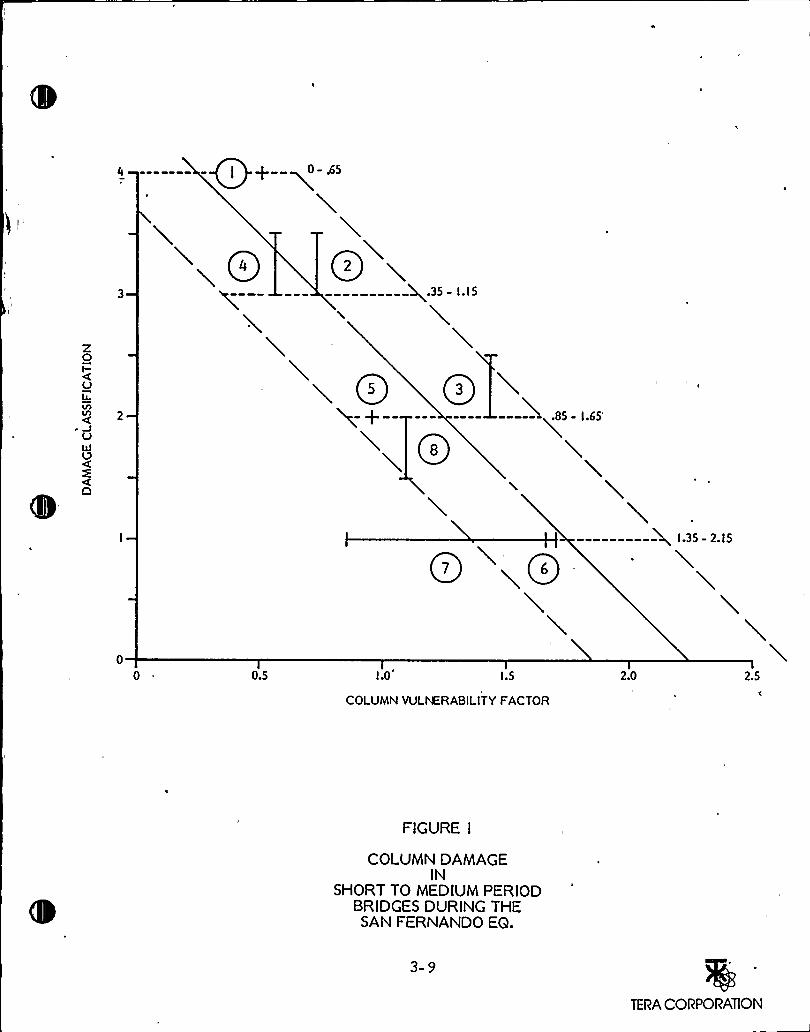
Z0I-U4.
lA
UJlD
+.35 - I. I 5
L
.85 - 1.65
Q l.35 - 2.I5
l0.5 I.O I.5 2.0 2.5
COLUMN VULNERABILITYFACTOR
FIGURE I
COLUMN DAMAGEIN
SHORT TO MEDIUMPERIODBRIDGES DURING THESAN FERNANDO EQ.
3-9
TERA CORPORATION
reinforcement ratios. This will probably only be the case for columns withapproximately equal ductility demands. For columns designed for similar forcelevels in regions where seismic loading governs the column design, this is
probably approximately true. Secondly, it should be noted that all the bridgesinvestigated were in the short to medium period range. It is expected that thelonger the period of the structure the less important the CVF as an indicator ofindividual column damage since both the maximum and cumulative ductilitydemands will be less. In general, the primary mode of column failure in long
period structures would tend to be flexural.
A flexural failure can be critical if the supports are single column bents.Another critical failure can result from the pullout of main longitudinal re-inforcement as was the case in the Route 2IO/5 Separation and O.H. during theSan Fernando Earthquake. This structure had CVFs that average approximatelyI.89 which are well above the range corresponding to serious column damage due
to shear failure in the short to medium period structures.
Certain factors besides the CVF appear to affect the performance of short tomedium period bridge structures although CVF seems to be the most important.For example, a highly skewed structure will tend to respond in a torsional modewhich introduces additional torsional shear stresses in the columns which mayaccelerate a column shear failure. This could have been the case in bridges 3
and 4 above. The flexibility of the foundation can be important since it canreduce the effective fixity at the footing. This may have been important in
bridge 5 mentioned above with a CVF which would seem to indicate moredamage than actually occurred. Variation in the foundation flexibility at theabutments may also be important. This was probably important in bridges I and
3, where one abutment was in filland the other in cut. This may have caused thedamage to be more severe than it ordinarily would have been. A transverselyrigid and continuous superstructure on continuous diaphragm abutments willcarry excess load and tend to mitigate the seriousness of column failures.Although no examples were studied, it is assumed that architectural flares willincrease the sum of the moments and thus result in a greater maximumearthquake shear force.
8-SI-227 3-IO
TERA CORPORATION
Obviously, the intensity and duration of the earthquake ground motion will effectthe performance of the column. The greater resulting maximum and cumulative
ductility demands will cause a more rapid degradation of column strength. The
estimated peak acceleration of each of the bridges studied above was near .40g
or greater. A lower peak acceleration but longer duration of ground motion.could have similar effects.
B-SI-227 3-II
TERA CORPORATION

4.0 DETAILEDDATAON BRIDGES SURVEYED
This section contains summary and detailed information concerning the investi-
gation and analysis of bridges and bridge response presented in this report.
Section 4.l is a brief summary description of the bridges surveyed in the study
area. They are described by route in a general south to north direction. Section
4.2 consists of pictures of those bridges presented in the same order. There are
some bridges pictured in this section but not described in the previous table. Allof these are not expected to sustain significant damage (Category I).
Section 4.3 presents detailed data sheets of the bridges, ordered as in Sec-
tion 4. I. Section 4.4 summarizes our evaluation of bridges for which no plans are
available. Section 4.5 contains detailed data sheets for the study of bridgeresponse in past earthquakes.
B-8 I-227 4- I
TERA CORPORATION
4. I BRIDGE PERFORMANCE SUMMARYSHEETS
4-2
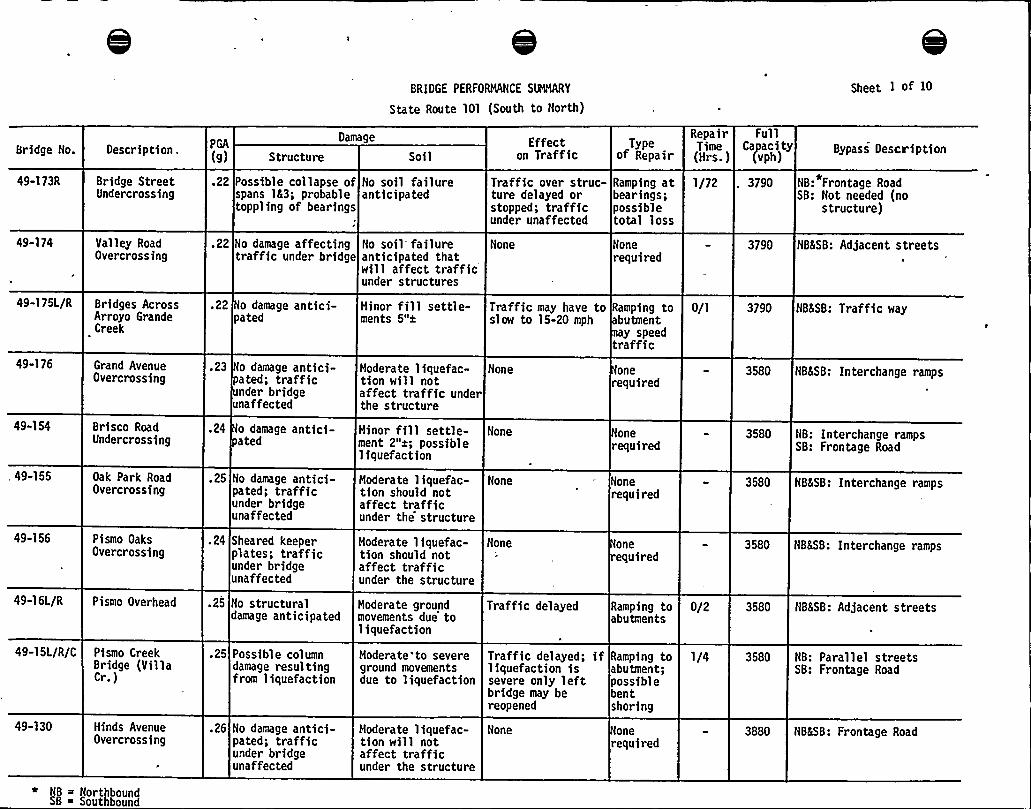
BRIDGE PERFORMANCE SUMMARY
State Route 101 (South to North)
Sheet I « IO
Bridge No. Description .PGA
(9) Structure
Damage
SoilEffect
on TrafficType
of Repair
RepairTime(Mrs.)
FullCapacity
(vph)Bypass Description
49-173R Bridge StreetUndercrossing
.22 Possible collapse of No soil failurespans 1&3; probable anticipatedtoppling of bearings
Traffic over struc-ture delayed orstopped; trafficunder unaffected
Ramping atbearings;possibletotal loss
1/72 . 3790 NB:*Frontage RoadSB: Hot needed (no
structure)
49-174 Valley RoadOvercrossing
.22 No damage affecting No soil failure Nonetraffic under bridge anticipated that
will affect trafficunder structures
Nonerequired
3790 NB&SB: Adjacent streets
49-175L/R Bridges AcrossArroyo GrandeCreek
.22 No damage antici-pated
Minor fill settle-ments 5"i
Traffic may have toslow to 15-20 mph
Ramping tobutmentay speed
traffic
0/1 3790 NB&SB: Traffic way
49-176 Grand AvenueOvercrossing
.23 Ho damage antici-pated; trafficunder bridgeunaffected
Moderate 1 iquefac- Nonetion will notaffect traffic underthe structure
onerequired
3580 NB&SB: Interchange ramps
49-154 Brisco RoadUndercrossing
.24 o damage antici-pated
Minor fill settle-ment 2"a; possibleliquefaction
None onerequired
3580 NB: Interchange rampsSB: Frontage Road
, 49-155 Oak Park RoadOvercrossing
.25 No damage antici-pated; trafficunder bridgeunaffected
Moderate liquefac- Honetion should notaffect trafficunder the structure
Nonerequired
3580 NB&SB: Interchange ramps
49-156 Pismo OaksOvercrossing
.24 Sheared keeperplates; trafficunder bridgeunaffected
Moderate 1 iquefac- Honetion should notaffect trafficunder the structure
oneequired
3580 NB&SB: Interchange ramps
49-16L/R
49-15L/R/C
Pismo Overhead
Pismo CreekBridge (VillaCr. )
.25
.25
Ho structuraldamage anticipated
Possible columndamage resultingfrom liquefaction
Moderate groundmovements due toliquefaction
Moderate to severeground movementsdue to liquefaction
Traffic delayed
Traffic delayed; ifliquefaction issevere only leftbri'dge may bereopened
Ramping toabutments
Ramping toabutment;possiblebentshoring
0/2
1/4
3580
3580
NB&SB: Adjacent streets
NB: Parallel streetsSB: Frontage Road
49-130 Hinds AvenueOvercrossing
.26 No damage antici-pated; trafficunder bridgeunaffected
Moderate liquefac- Honetion will notaffect trafficunder the structure
onerequired
3880 NB&SB: Frontage Road
* NB = NorthboundSB = Southbound
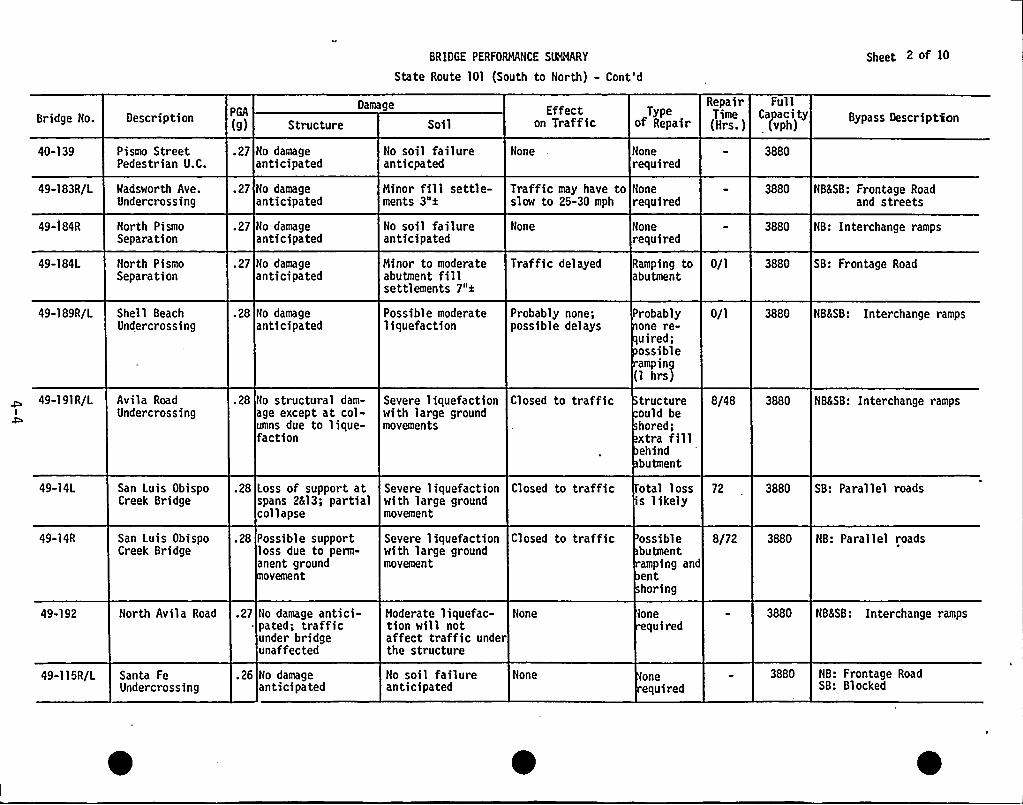
BRIDGE PERFORHANCE SNHARY
State Route 101 (South to North) - Cont'd
2 of 10
Bridge Ho. Description PGA
(9) Structure
Damage
SoilEffect
on TrafficType
of Repair
Repair FullTime Capacity(Hrs.) (vph)
Bypass Description
40-139 Pismo StreetPedestrian U.C.
.27 No damageanticipated
Ho soil failureanticpated
None Honerequired
3880
49-183R/L Wadsworth Ave.Undercrossing
.27 No damageanticipated
Hinor fill settle-ments 3"x
Traffic may have to Noneslow to 25-30 mph required
3880 NB&SB: Frontage Roadand streets
49-184R
49-184L
49-189R/L
North PismoSeparation
North PismoSeparation
Shell BeachUndercrossing
.27
27
.28
No damageanticipated
No damageanticipated
No damageanticipated
No soil failureanticipated
Hinor to moderateabutment fillsettlements 7"s
Possible moderateliquefaction
None
Traffic delayed
Probably none;possible delays
Nonerequired
Ramping toabutment
Probablyone re-uired;ossibleamping
(1 hrs)
0/1
0/1
3880 NB: Interchange ramps
3880 SB: Frontage Road
3880 NB&SB: Interchange ramps
49-191R/L Avila RoadUndercrossing
.28 No structural dam-age except at col-umns due to lique-faction
Severe liquefaction Closed to trafficwith large groundmovements
tructureovid behored;xtra fillehindbutment
8/48 3880 NB&SB: Interchange ramps
49-14L San Luis ObispoCreek Bridge
.28 Loss of support atspans 2&13; par tialcollapse
Severe liquefaction Closed to trafficwith large groundmovement
otal loss's likely
72 3880 SB: Parallel roads
49-14R San Luis ObispoCreek Bridge
.28 Possible supportloss due to perm-anent ground
ovement
Severe liquefaction Closed to trafficwith large groundmovement
ossiblebutmentamping andenthoring
8/72 3880 NB: Parallel roads
49-192 North Avila Road .27 No damage antici-pated; trafficunder bridgeunaffected
Hoderate liquefac- Nonetion will notaffect traffic underthe structure
oneequired
3880 NB&SB: Interchange ramps
49-115R/L Santa FeUndercrossing
.26 No damageanticipated
Ho soil failureanticipated
None oneequired
3880 NB: Frontage RoadSB: Blocked
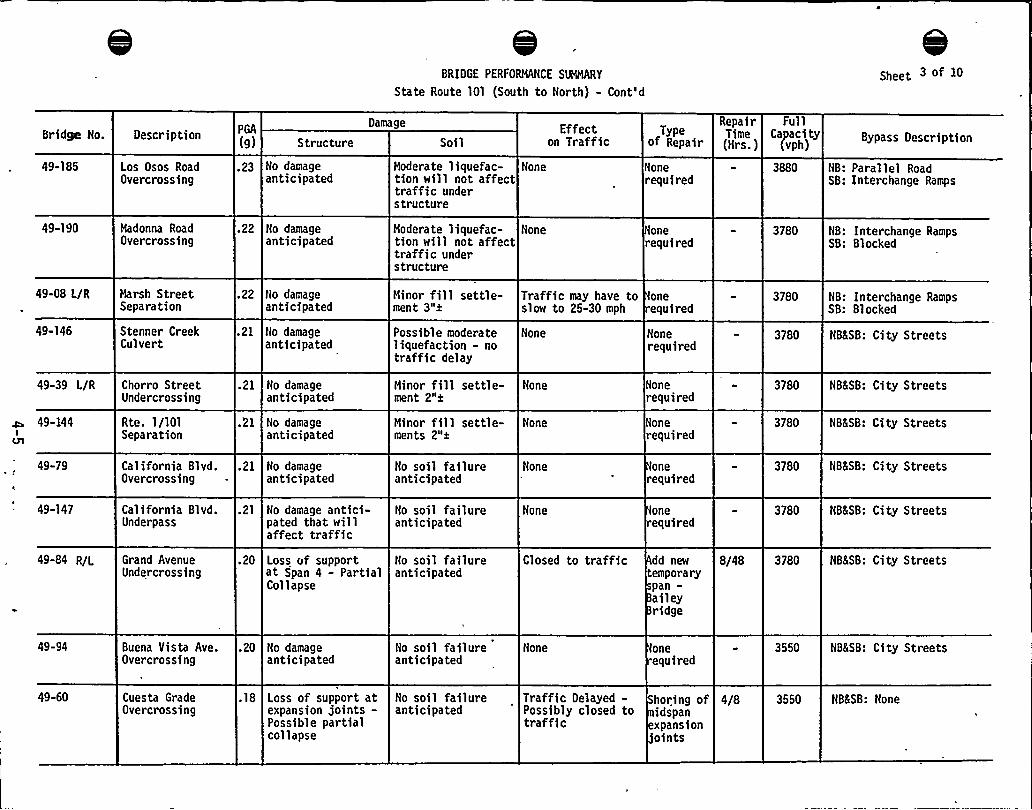
BRIDGE PERFORMANCE SUHHARY
State Route 101 (South to North) - Cont'dSheet 3 of IO
Bridge No. Description PGA
(9) StructureDamage
SoilEffect
on TrafficType
of Repair
RepairTime(Hrs.)
FullCapacity
(vph)Bypass Description
49-185
49-190
Los Osos RoadOvercrossing
Madonna RoadOvercrossing
.23 Ho damageanticipated
.22 Ho damageanticipated
Moderate liquefac-tion will not affecttraffic understructure
Noderate liquefac-tion will not affecttraffic understructure
Hone
Hone
Nonerequired
'lonerequired
3880
3780
NB: Parallel RoadSB: Interchange Ramps
NB: Interchange RampsSB: Blocked
49-08 L/R Harsh StreetSeparation
.22 No damageanticipated
Ninor fill settle-ment 3"a
Traffic may have to oneslow to 25-30 mph equired
3780 NB: Interchange RampsSB: Blocked
49-146 Stenner CreekCulvert
.21 No damageanticipated
Possible moderateliquefaction - notraffic delay
None Nonerequired
3780 NB&SB: City Streets
49-39 L/R
49-144I
Chorro StreetUndercrossing
Rte. 1/101Separation
.21 No damageanticipated
.21 No damageanticipated
Minor fill settle-ment 2"s
Minor fill settle-ments 2"s
None
Hone
Nonerequired
Nonerequired
3780 NB&SB: City Streets
3780 NB&SB: City Streets
49-79 California Blvd. .21 No damageOvercrossing . anticipated
Ho soil failureanticipated
Hone onerequired
3780 NB&SB: City Streets
49-147 California Blvd.Underpass
.21 No damage antici-pated that willaffect traffic
Ho soil failureanticipated
Hone oneequired
3780 NB&SB: City Streets
49-84 R/L Grand AvenueUndercrossing
.20 Loss of supportat Span 4 - PartialCollapse
Ho soil failureanticipated
Closed to traffic dd newtemporarypan-aileyridge
8/48 3780 NB&SB: City Streets
49-94 Buena Vista Ave.Overcrossing
.20 No damageanticipated
No soil failureanticipated
Hone oneequired
3550 NB&SB: City Streets
49-60 Cuesta GradeOvercrossing
.18 Loss of support atexpansion joints-Possible partialcollapse
No soil failureanticipated
Traffic Delayed - horing ofPossibly closed to idspantraffic expansion
'oints
4/8 3550 NB&SB: None
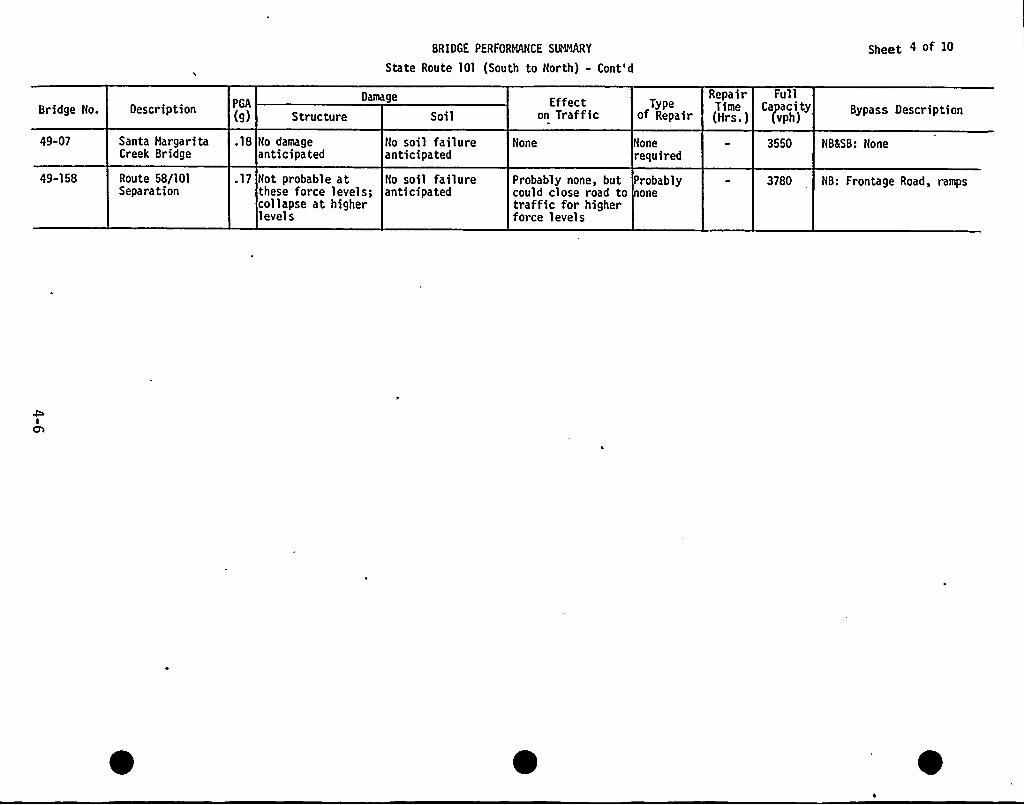
BRIDGE PERFORNNCE SINlQRY
State Route 101 (South to North) - Cont'd
Sheet 4 of >0
Bridge No. Description PGA
(g) Structure
Damage
SoilEffect
on TrafficType
of Repair
RepairTime(Hrs.)
FullCapacity
(vph)Bypass Description
49-07 Santa HargaritaCreek Bridge
.18 No damageanticipated
No soil failureanticipated
None Nonerequired
3550 NBSSB: None
49-158 Route 58/101Separation
.17 Not probable atthese force levels;collapse at higherlevels
No soil failureanticipated
Probably none, but Probablycould close road to onetraffic for higherforce levels
3780 NB: Frontage Road, ramps
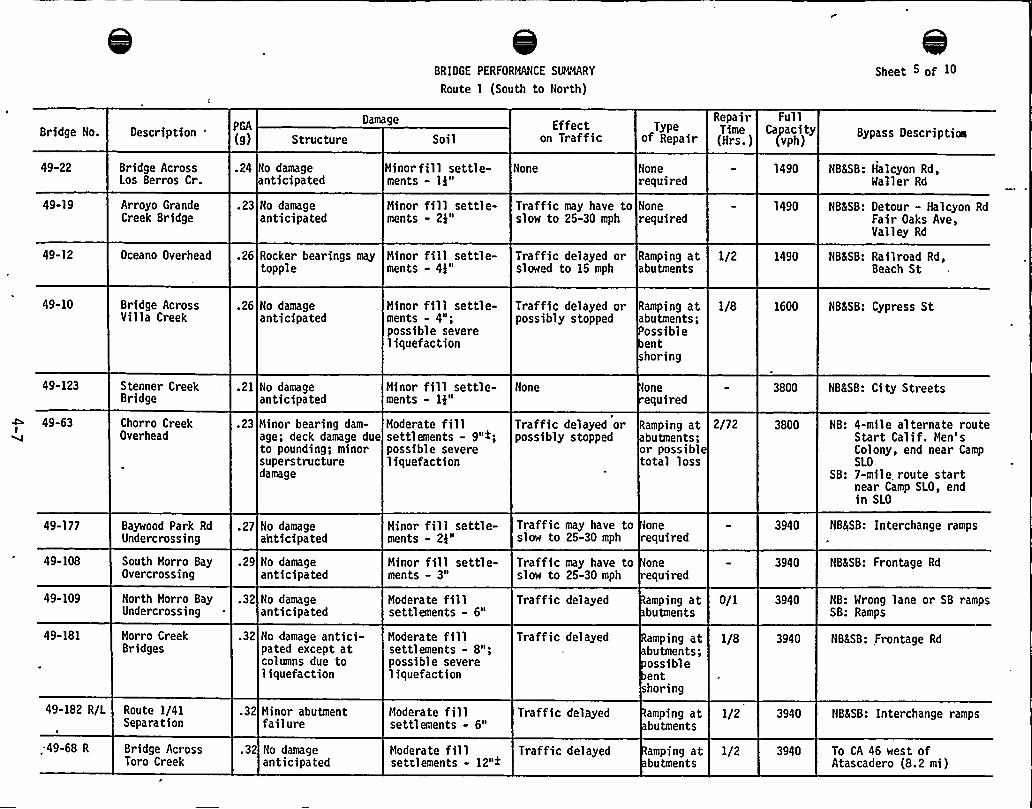
BRIDGE PERFORMANCE SUMMARY
Route I (South to North)Sheet 5 of 10
Bridge No. Description 'GA(9) Structure
Damage
SoilEffect
on TrafficType
of Repair
Repair FullTime Capacity(Hrs.) (vph)
Bypass Descriptim
49-22
49-19
Bridge AcrossLos Berros Cr.
Arroyo GrandeCreek Bridge
.24
.23
No damageanticipated
No damageanticipated
Minorfill settle-ments - II"Minor fill settle-ments - 2k"
None
Traffic may have toslow to 25-30 mph
Nonerequired
Nonerequired
1490
1490
NB&SB: Halcyon Rd,Wailer Rd
NB&SB: Detour - Halcyon RdFair Oaks Ave,Valley Rd
49-12 Oceano Overhead .26 Rocker bearings may Minor fill settle-topple ments - 4I"
Traffic delayed orslowed to 15 mph
Ramping atabutments
1/2 1490 NB&SB: Railroad Rd,Beach St
49-10 Bridge AcrossVilla Creek
.26 No damageanticipated
Minor fill settle-ments - 4";possible severeliquefaction
Traffic delayed orpossibly stopped
Ramping atabutments;ossibleenthoring
1/8 1600 NB&SB: Cypress St
49-123
49-63I'V
Stenner CreekBridge
Chorro CreekOverhead
.21
.23
No damageanticipated
Minor bearing dam-age; deck damage dueto pounding; minorsuperstructuredamage
Minor fill settle-ments - 14"
Moderate fillsettlements - 9">;possible severeliquefaction
None
Traffic delayed orpossibly stopped
oneequired
Ramping atbutments;
or possibletotal loss
2/72 3800 NB: 4-mile alternate routeStart Calif. Men'Colony, end near CampSLO.
SB: 7-mile, route startnear Camp SLO, endin SLO
3800 NB&SB: City Streets
49-177 Baywood Park RdUndercrossing
.27 No damageahticipated
Minor fill settle-ments - 2I"
Traffic may have toslow to 25-30 mph
Lonerequired
3940 NB&jSB: Interchange ramps
49-108 South Horro BayOvercrossing
.29 No damageanticipated
Minor fill settle-ments - 3"
Traffic may have toslow to 25-30 mph
oneequired
3940 NB&SB: Frontage Rd
49-109
49-181
49-182 R/L
North Horro BayUndercrossing
Horro CreekBridges
Route 1/41Separation
.32
.32
.32
No damageanticipated
No damage antici-pated except atcolumns due toliquefaction
Minor abutmentfailure
Hoderate fillsettlements - 6"
Moderate fillsettlements - 8";possible severeliquefaction
Moderate fillsettlements - 6"
Traffic delayed
Traffic delayed
Traffic delayed
amping atbutments
amping atbutments;ossibleent
shoring
amping atbutments
0/1
1/8
1/2
3940
3940
3940
NB: Wrong lane or SB rampsSB: Ramps
NB&SB:,Frontage Rd
NB&SB: Interchange ramps
, 49-68 R Bridge AcrossToro Creek
.32 No damageanticipated
Hoderate fillsettlements - 12">
Traffic delayed amping atbutments
1/2 3940 To CA 46 west ofAtascadero (8.2 mi)
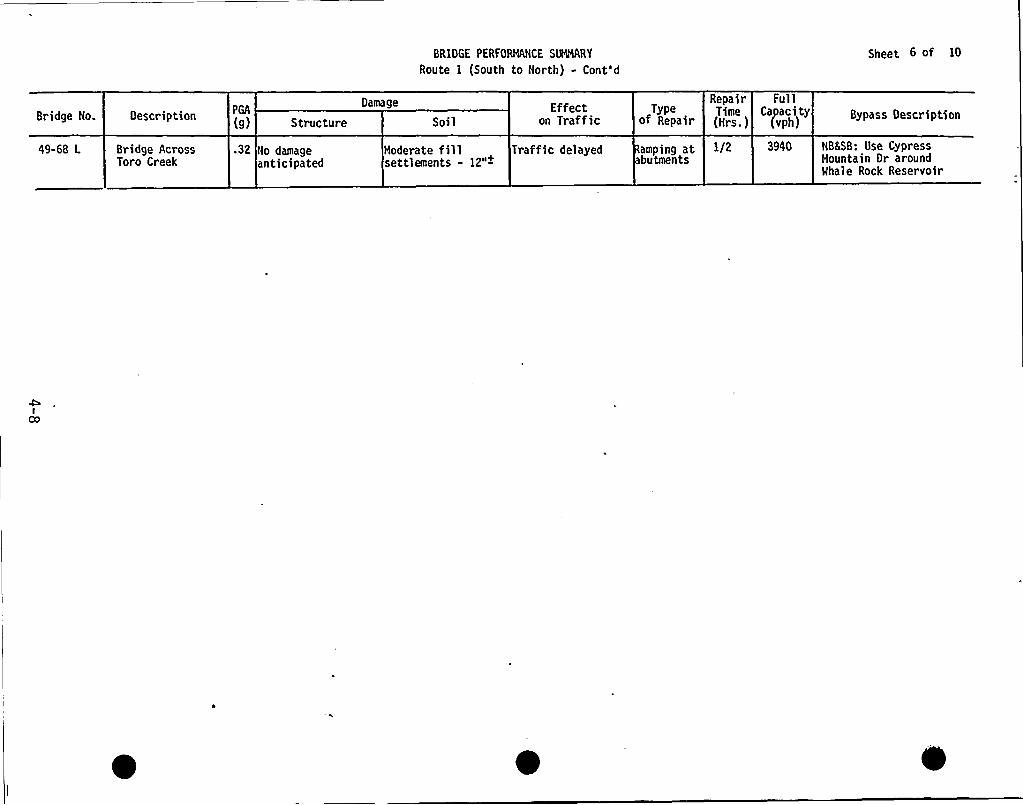
BR1DGE PERFORMANCE SUMMARY
Route 1 (South to North) - Cont'dSheet 6 of 10
Bridge No. Description PGA
(g) Structure
Damage
SoilEffect
on TrafficType
of Repair
Repair FullTime Capacity(Hrs.) (vph)
Bypass Description
49-68 L Bridge AcrossToro Creek
.32 No damageanticipated
Moderate fillsettlements - 12"+
Traffic del ayed amping atbutments
1/2 3940 NBLSB: Use CypressMountain Dr aroundWhale Rock Reservoir
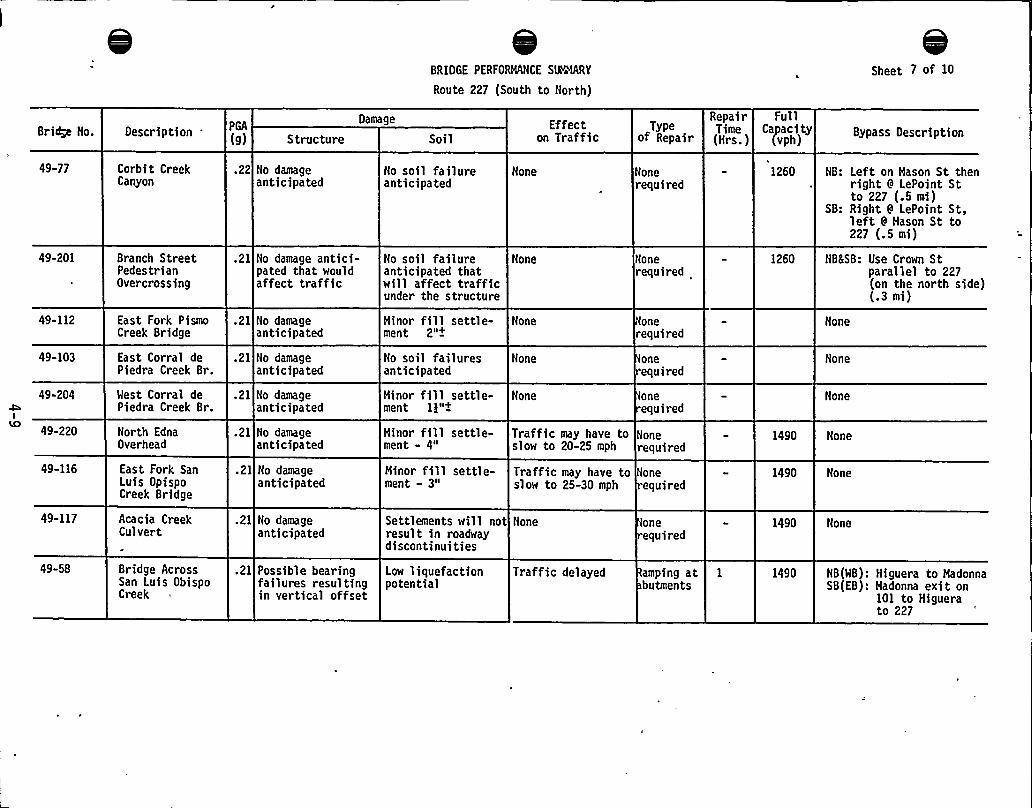
BR1DGE PERFORMANCE SW'CRY
Route 227 (South to North)
Sheet 7 of 10
Bridy.'o. Description 'GA(9) Structure
Damage
SoilEffect
on TrafficType
of Repair
Repair FullTime Capacity(Mrs.) (vph)
Bypass Description
49-77
49-201
49-112
49-103
49-204
I
49-220
49-116
Corbit CreekCanyon
Branch StreetPedestrianOvercrossing
East Fork PismoCreek Bridge
East Corral dePiedra Creek Br.
West Corral dePiedra Creek Br.
North EdnaOverhead
East Fork SanLuis OpispoCreek Bridge
.22 No damageanticipated
.21 No damage antici-pated that wouldaffect traffic
.21 No damageanticipated
.21 No damageanticipated
.21 No damageanticipated
.21 No damageanticipated
.21 Ho damageanticipated
No soil failureanticipated
No soil failureanticipated thatwill affect trafficunder the structure
Minor fill settle-ment 2"+
No soil failuresanticipated
Minor fill settle-ment lk"+
Minor fill settle-ment - 4"
Minor fill settle-ment - 3"
None
None
None
Hone
Hone
Traffic may have toslow to 20-25 mph
Traffic may have toslow to 25-30 mph
Nonerequired
Nonerequired
onerequired
onerequired
oneequired
Nonerequired
Nonerequired
1260
1260
1490
1490
NB: Left on Mason St thenright 9 LePoint Stto 227 (.5 mi)
SB: Right Ia LePoint St,left 8 Mason St to227 (.5 mi)
NBSSB: Use Crown Stparallel to 227(on the north side)(.3 mi)
None
Hone
None
None
None
49-117
49-58
Acacia CreekCulvert
Bridge AcrossSan Luis ObispoCreek
.21 No damageanticipated
.21 Possible bearingfailures resultingin vertical offset
Settlements will notresult in roadwaydiscontinuities
Low liquefactionpotential
Hone
Traffic delayed
oneequired
amping atbutments
1490
1490
None
NB(WB): Higuera to MadonnaSB(EB): Madonna exit on
101 to Higuerato 227
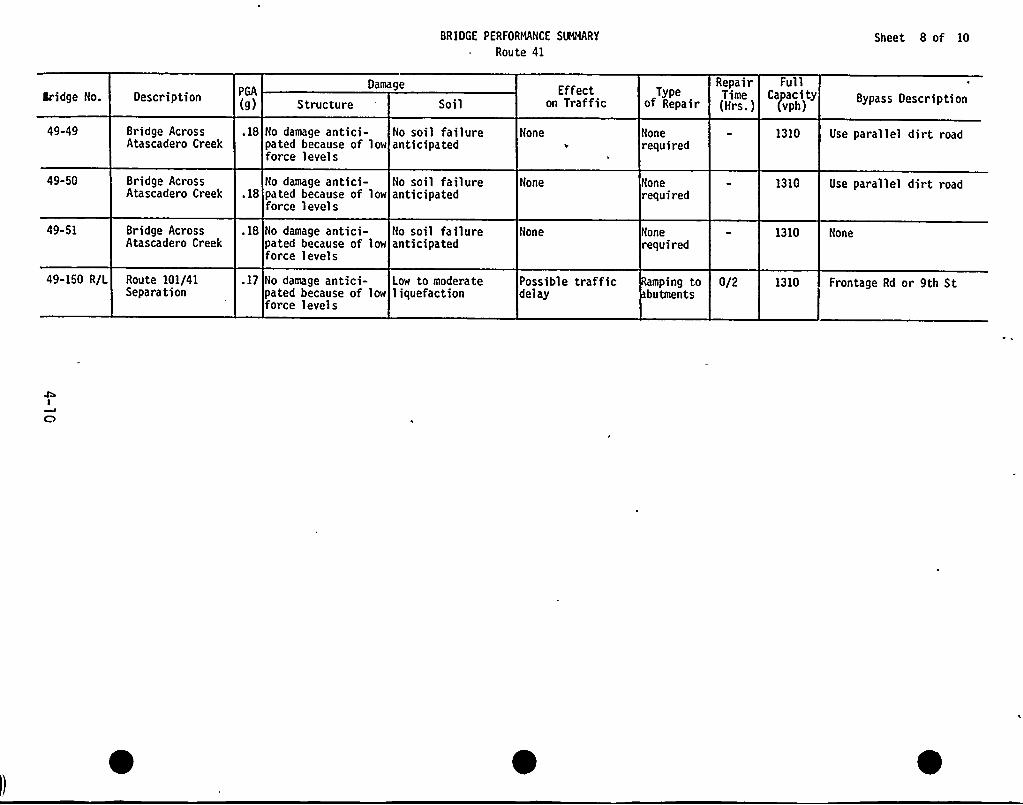
BRIDGE PERFORMANCE SUMMARY
Route 41
Sheet 8 of 10
Description PGA
(9) Structure
Damage
SoilEffect
on TrafficType
of Repair
Repair FullTime Capacity(Hrs.) (vph)
Bypass Description
49-49
49-50
49-51
Bridge AcrossAtascadero Creek
Bridge AcrossAtascadero Creek
Bridge AcrossAtascadero Creek
Route 101/41Separation
.18 No damage antici- No soil failurepated because of low anticipatedforce levels
No damage antici- No soil failure. 18 pated because of low anticipated
force levels
. 18 No damage antici- No soil failurepated because of low anticipatedforce levels
.17 No damage antici- Low to moderatepated because of low liquefactionforce levels
Hone
None
Hone
Possible trafficdelay
Nonerequired
Nonerequired
Nonerequired
amping tobutments
0/2
1310
1310
1310
1310
Use parallel dirt road
Use parallel dirt road
None
Frontage Rd or 9th St
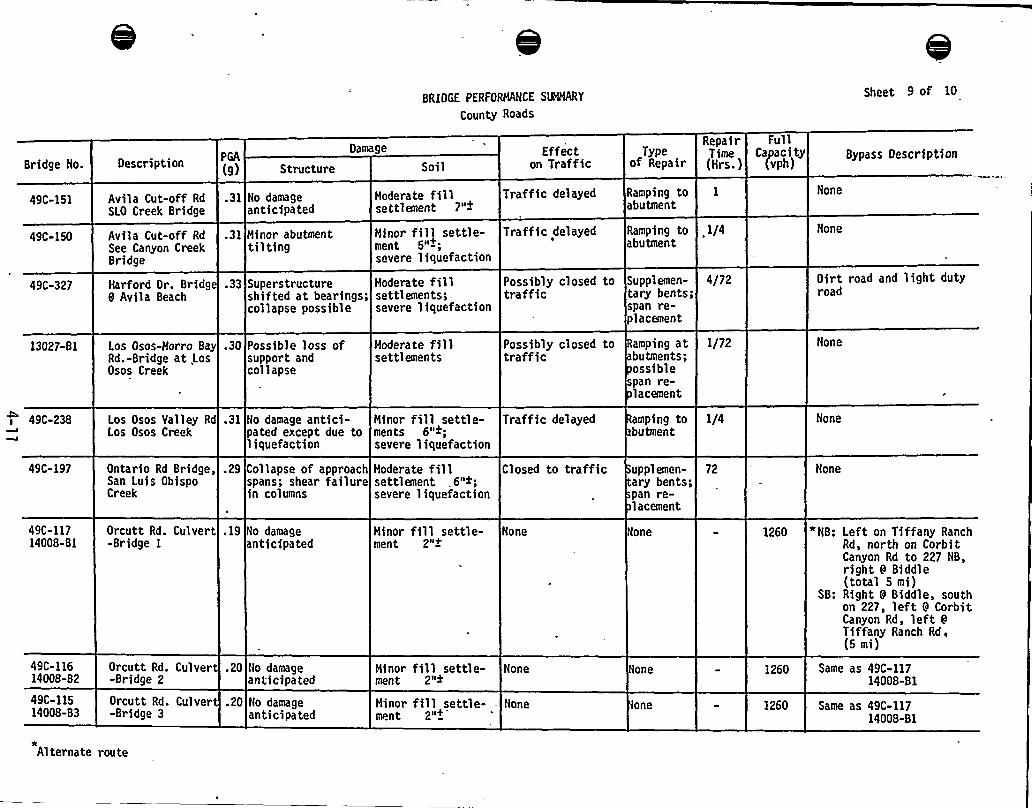
BRIDGE PERFORMANCE SUMMARY
County Roads
Sheet 9 of 10
Bridge No. Description PGA
(9) Structure SoilEffect
on TrafficType
of Repair
RepairTime(Hrs.)
FullCapacity
(vph)Bypass Descri ption
49C-151
49C-150
49C-327
Avila Cut-off Rd
SLO Creek Bridge
Avila Cut-off Rd
See Canyon CreekBridge
Harford Dr. Bridg8 Avila Beach
.31
.31
.33
No damageanticipated
Hinor abutmenttilting
Superstructureshifted at bearings;collapse possible
Moderate fillsettlement 7"+
Traffic delayed
Minor fi'll settle- Traffic delayedment 5"+;severe liquefaction
Moderate fill Possibly closed tosettlements; trafficsevere liquefaction
Ramping toabutment
Ramping to 1/4abutment
Supplemen- 4/72tary bents;span re-placement
None
Dirt road and light dutyroad
13027-81 Los Osos-Horro BayRd.-Bridge at .LosOsos Creek
.30 Possible loss ofsuppor t andcollapse
Moderate fillsettlements
Possibly closed totraffic
Ramping atbutments;ossible
span re-lacement
1/72 None
49C-238
49C-197
Los Osos Valley RdLos Osos Creek
Ontario Rd Bridge,San Luis ObispoCreek
.31
.29
No damage antici-pated except due toliquefaction
Collapse of approachspans; shear failurein columns
Minor fill settle- Traffic delayedments 6">;severe liquefaction
Moderate fill Closed to trafficsettlement 6">;severe liquefaction
amping tohutment
upplemen-ary bents;pan re-lacement
1/4
72
None
None
49C-11714008-81
Orcutt Rd. Culvert-Bridge 1
.19 No damageanticipated
Minor fill settle-ment 2"+
None None 1260 *NB; Left on Tiffany RanchRd, north on CorbitCanyon Rd to 227 NB,right 9 Biddle(total 5 mi)
SB: Right 9 Biddle, southon 227, left La CorbitCanyon Rd, left La
Tiffany Ranch Rd,(5 mi)
49C-11614008-82
49C-11514008-B3
Orcutt Rd. Culver-Bridge 2
Orcutt Rd. Culver-Bridge 3
.20
.20
No damageanticipated
No damageanticipated
Hinor fill settle-ment 2">
None
Minor fill settle- Nonement 2"+
None
one
1260
1260
Same as 49C-11714008-Bl
Same as 49C-11714008-Bl
Alternate route
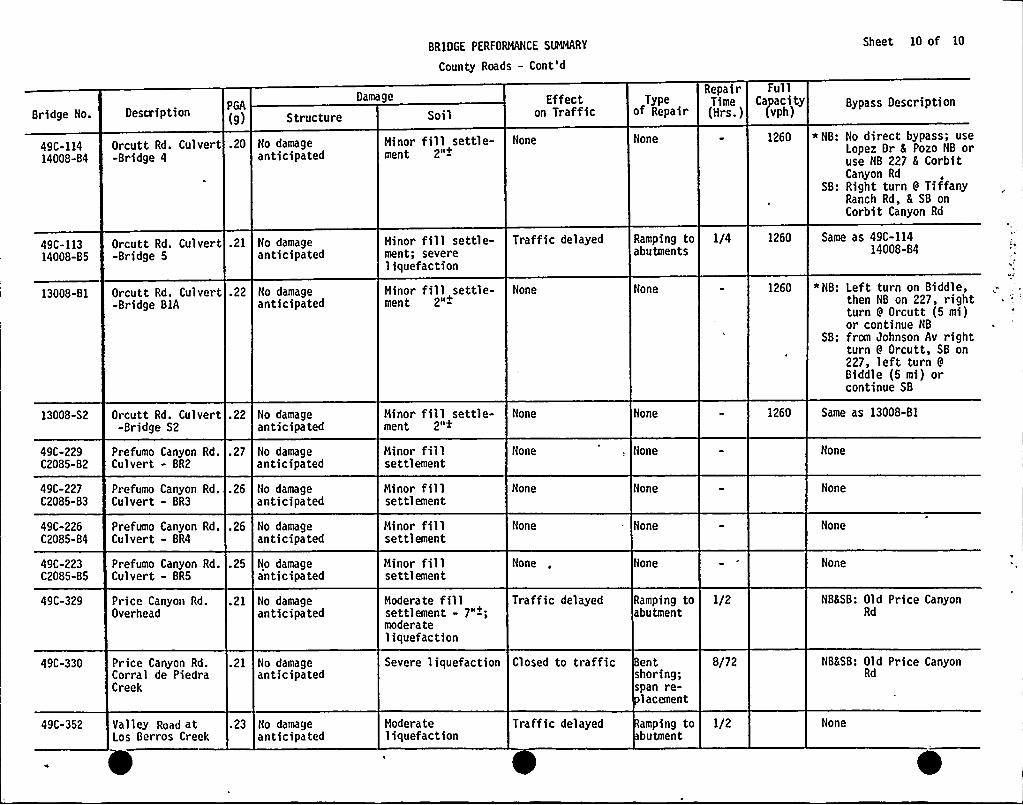
BRIDGE PERFORMANCE SUMMARY
County Roads - Cont'd
Sheet 10 of 10
Bridge No.
49C-11414008-84
49C-11314008-85
13008-81
Description PGA
(9) Structure
Orcutt Rd. Culvert .21 No damage-Bridge 5 anticipated
Orcutt Rd. Culvert .22 No damage-Bridge BIA anticipated
Orcutt Rd. Culvert .20 No damage-Bridge 4 anticipated
Soil
Minor fill settle-ment 2"+
Minor fill settle-ment; severeliquefaction
Minor fill settle-ment 2"-+
Effecton Traffic
Traffic delayed
None
Typeof Repair
Ramping toabutments
None
RepairTime(Hrs. )
I/4
Capacity(vph)
1260
1260
Bypass Description
*NB: No direct bypass; useLopez Dr & Pozo NB oruse NB 227 & CorbitCanyon Rd
SB: Right turn La TiffanyRanch Rd, & SB onCorbit Canyon Rd
Same as 49C-11414008-B4
*NB: Left turn on Biddle,then NB on 227, rightturn La Orcutt (5 mi)or continue NB
SB: from Johnson Av rightturn La Orcutt, SB on227, left turn La
Biddle (5 mi) orcontinue SB
13008-S2
49C-229C2085-82
49C-227C2085-83
49C-226C2085-84
49C-223C2085-85
49C-329 Price Canyon Rd.Overhead
.21 No damageanticipated
Orcutt Rd. Culvert .22 No damage-Bridge S2 anticipated
Prefumo Canyon Rd..27 No damageCulvert - BR2 anticipated
Prefumo Canyon Rd. .26 No damageCulvert - BR3 anticipated
Prefumo Canyon Rd. .26 No damageCulvert - BR4 anticipated
Prefumo Canyon Rd. .25 No damageCulvert - BR5 anticipated
Hinor fill settle-ment 2">
Minor fillsettlement
Minor fillsettlement
Minor fillsettlement
Minor fillsettlement
Moderate fillsettlement - 7"+;moderateliquefaction
None
None
None
None
None
Traffic delayed
None
None
None
None
None
Ramping toabutment
I/2
1260 Same as 13008-81
None
None
None
None
NB&SB: Old Price CanyonRd
49C-330 Price Canyon Rd.Corral de PiedraCreek
.21 No damageanticipated
Severe liquefaction Closed to traffic Bentshoring;span re-lacement
8/72 NB&SB: Old Price CanyonRd
49C-352 Valley Road atLos Berros Creek
.23 No damageanticipated
Moderateliquefaction
Traffic delayed amping tobutment
I/2 None
4.2 PICTURES OF BRIDGES SURVEYED
4-13

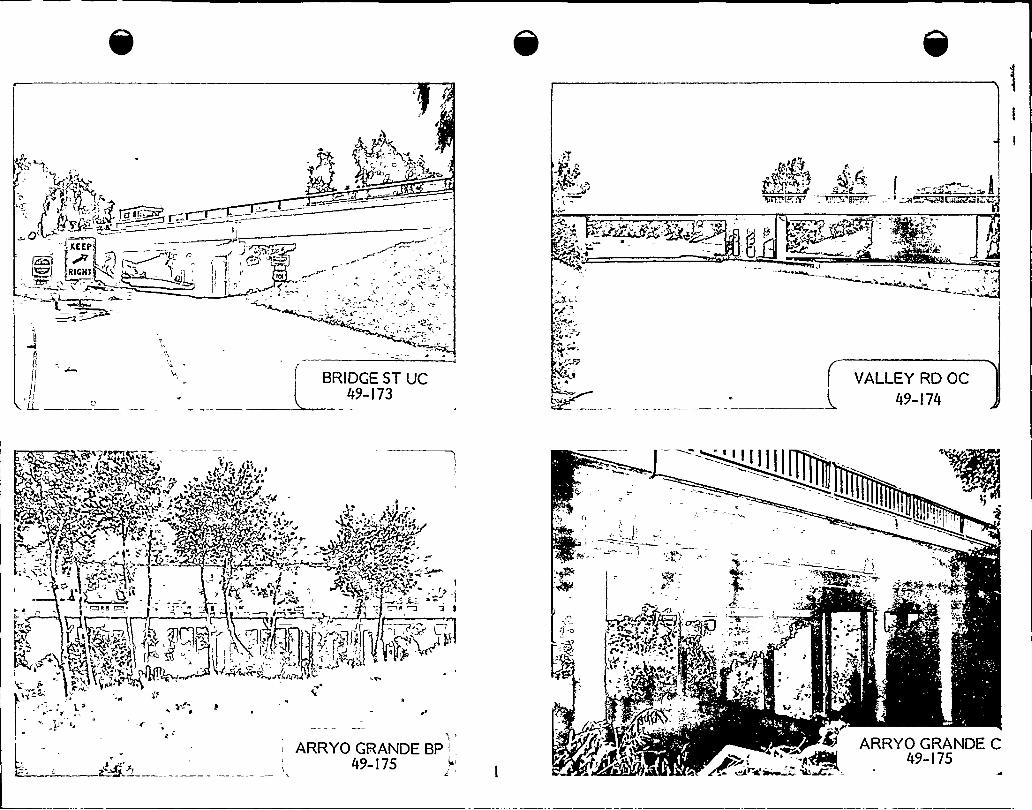
h
~f1 ..g~~„,0
"~~XEEP,~ Iwt.)(~S:-'RICH1,
W
J
WOI ~ ~
,1
" ~.C-=-'Z
BRIDGE ST UC49-l73
fT
+l
J
yrR
h
. P.htt-'W ~i" FC1PR
VALLEYRD OC49-174
j>
WO l'lW, ~
Pgyf h
.ge.h,
1PtW"
W
y'„"C l i
'rt "; 4th'.g r
l'PR
'Wl
'L= 9tt'Ih
R
~WAR»
ARRYO GRANDE BP49- ! 75
W
W) tt"'I,
ARRYO GRANDE C49-l75
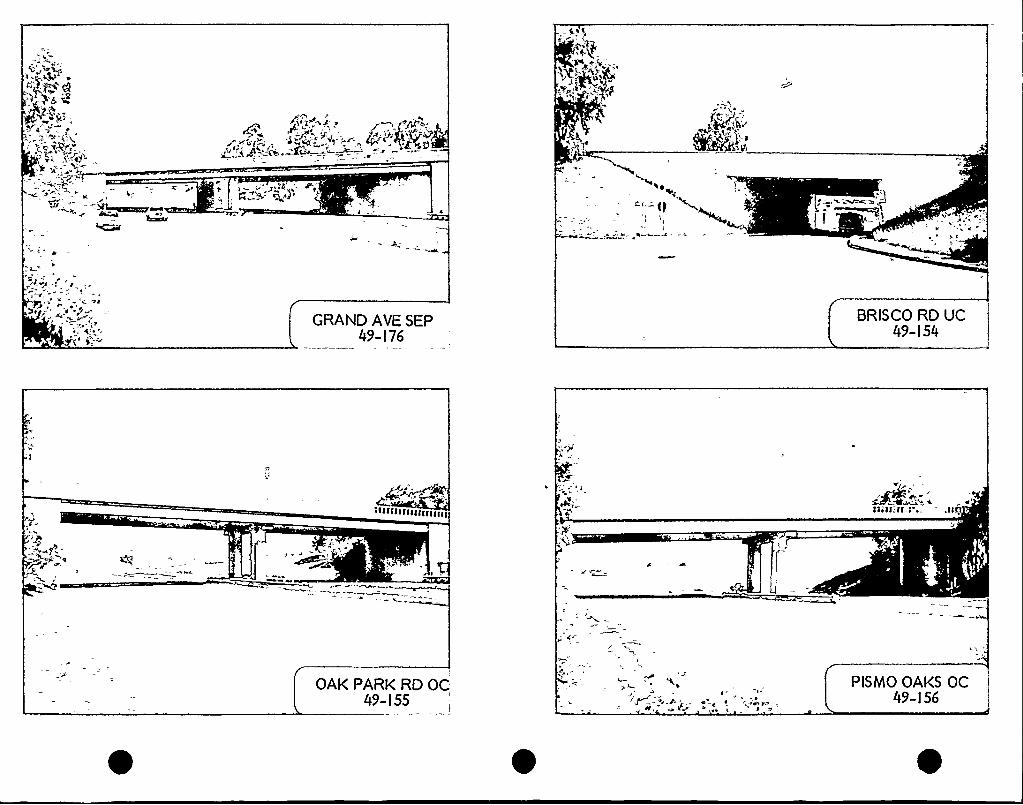
GRAND AVE SEP49-I 76
BRISCO RD UC49-I54
~
'IIIIIIIIIIIIII
OAK PARK RD OC',49-I 55 4
4,, 4.
PISMO OAKS OC49-l56
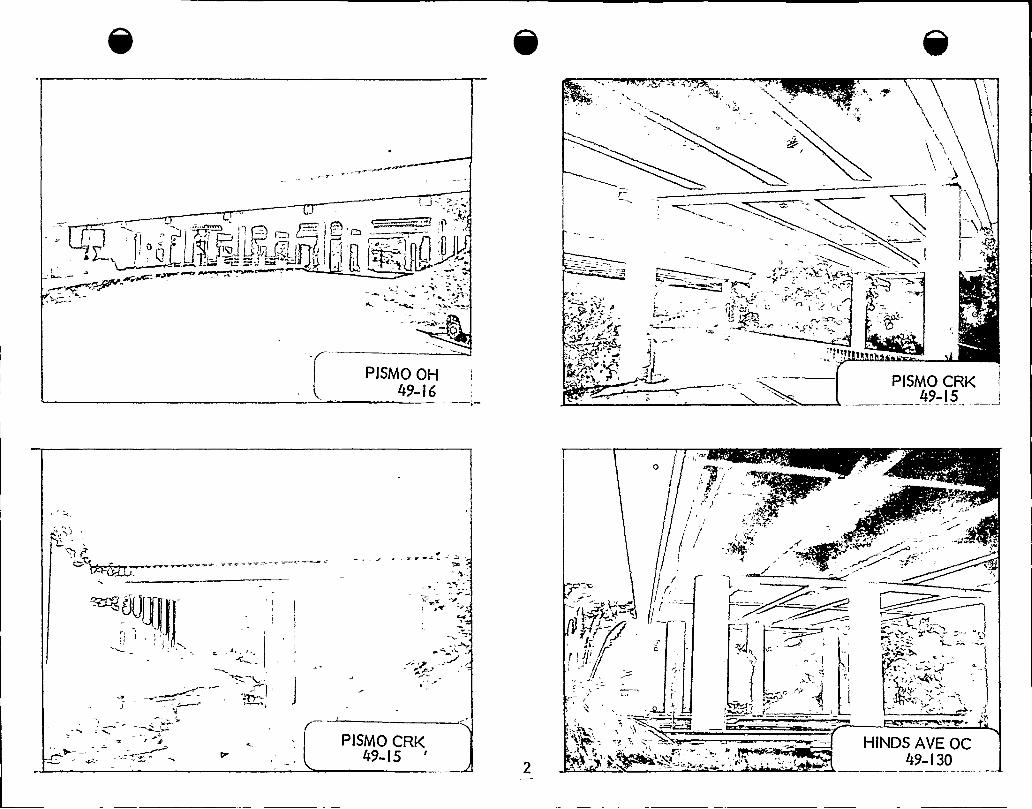
Q
P)SMO OH49-I 6
PISMO CRK49-I 5
lb'i.
p( j(i /
pter
~K 5I
PISMO CRK49-l5
HINDS AVE OC49-I 30
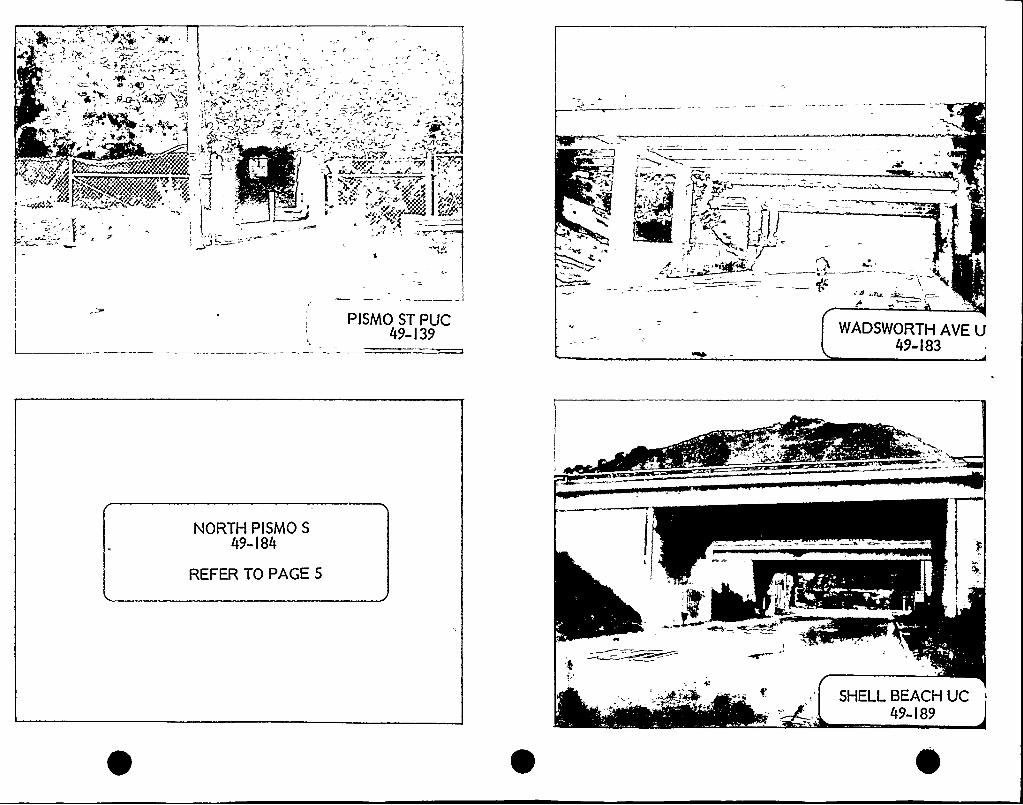
aJQ
PISMO ST PUC49-I 39
« I
4 fif
WADSWORTH AVE U49-I83
NORTH PISMO S49- I 84
REFER TO PAGE 5
~ «
SHELL BEACH UC49- I 89
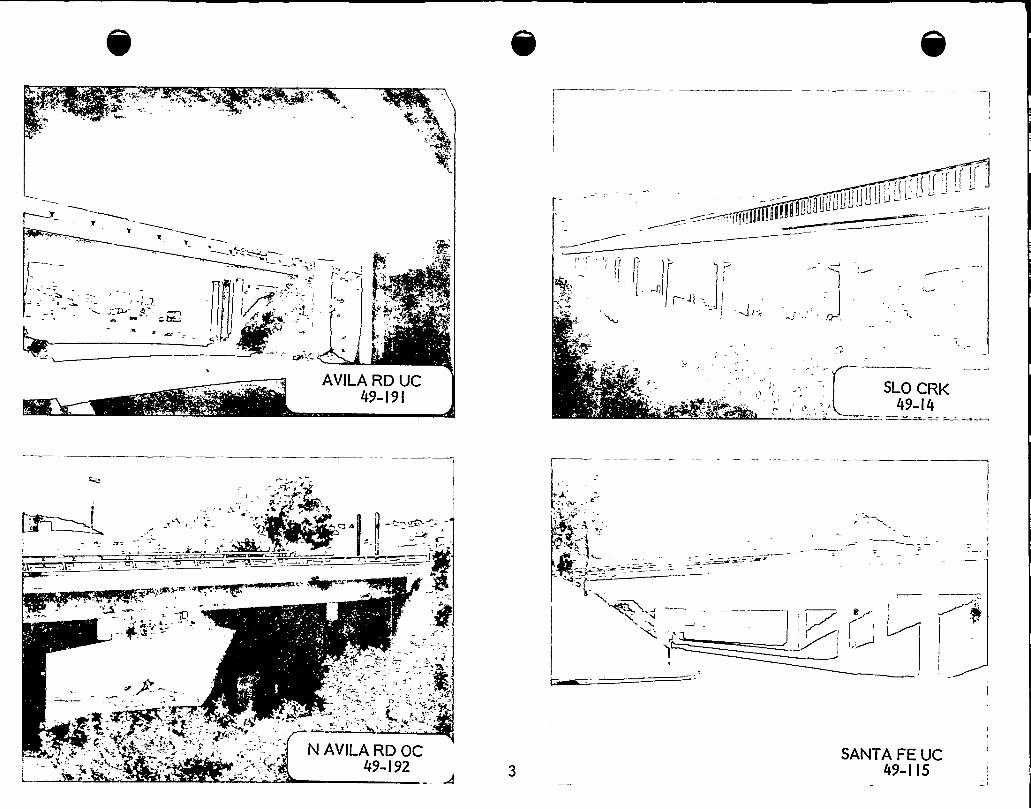
AVILARD UC49-I 9 I
SLO CRK49-l4
N AVILARD OC49-I92
SANTA FE UC49-II5
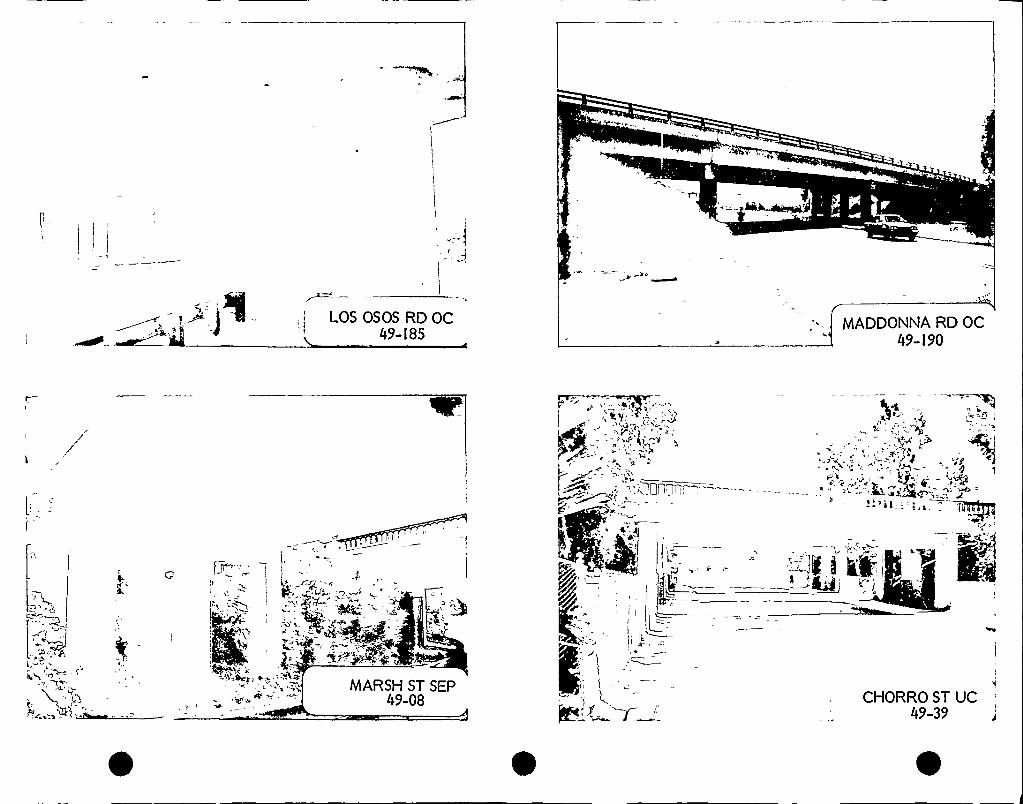
'V
LOS OSOS RD OC49- I 85
MADDONNARD OC49-I90
t DRL
1
ct ~ ~V
MARSH ST SEP49-08
I
IL=1
CHORRO ST UC49-39
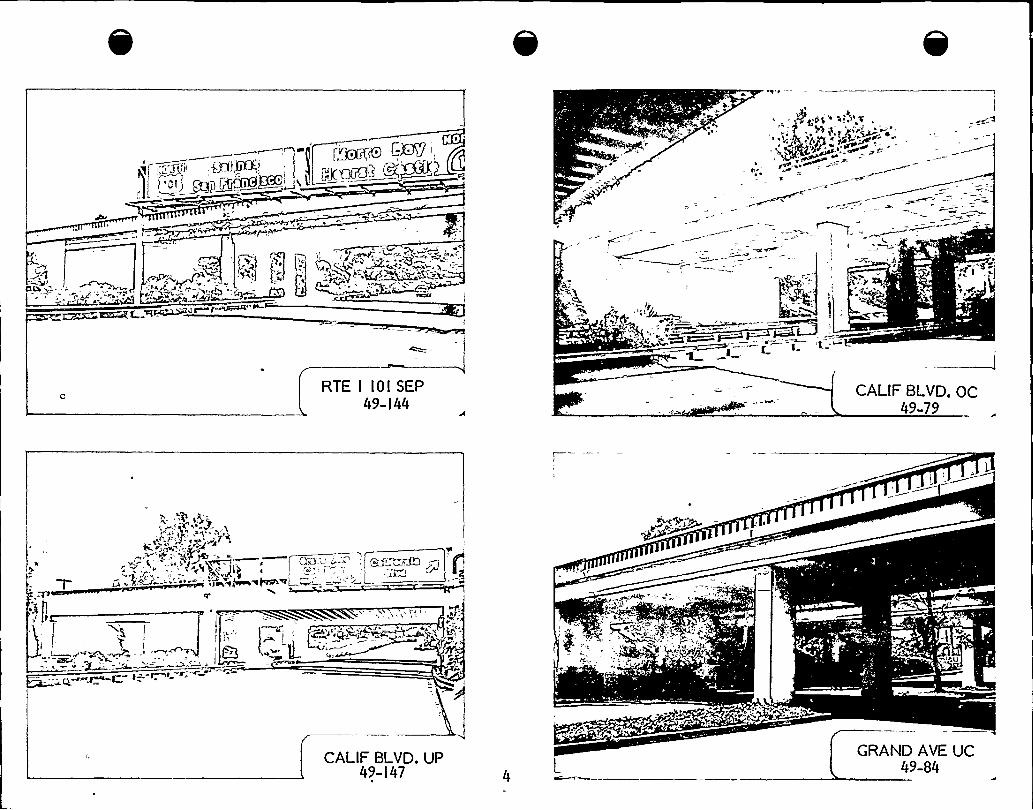
RTE I I 0 I SEP49-l44
CALIF BLVD. OC49-79
CALIF BLVD. UP49-I47
GRAND AVE UC49-84
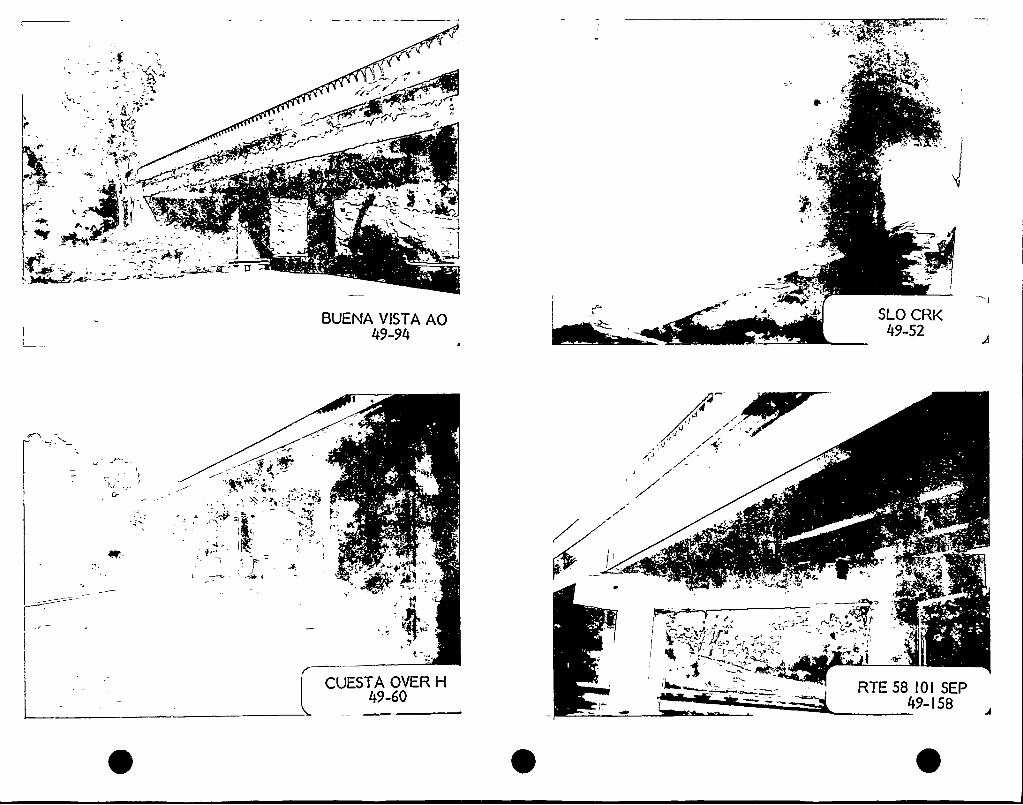
BUENA VISTA AO49-94
SLO CRK49-52
gl F
r
CUESTA OVER H49-60
RTE 58 IOI SEP49- I 58
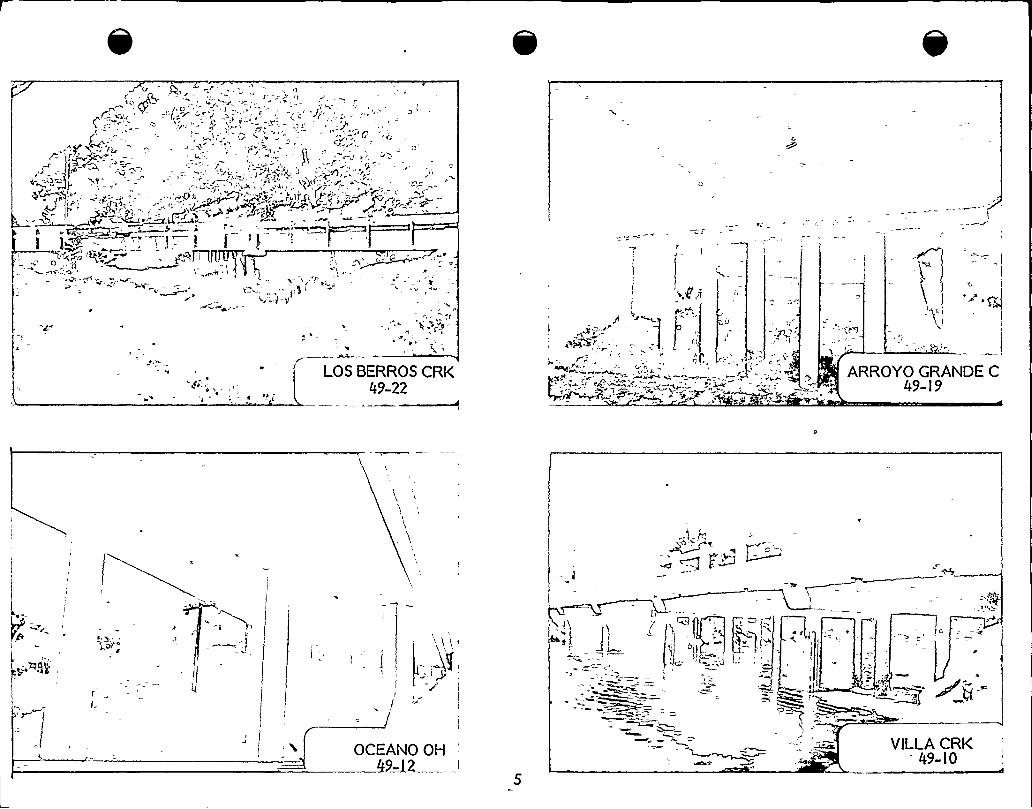
LOS BERROS CRK49-22
Q
ARROYO GRANDE C49- I 9
OCEANO OH9A2
VILLACRK49- IO
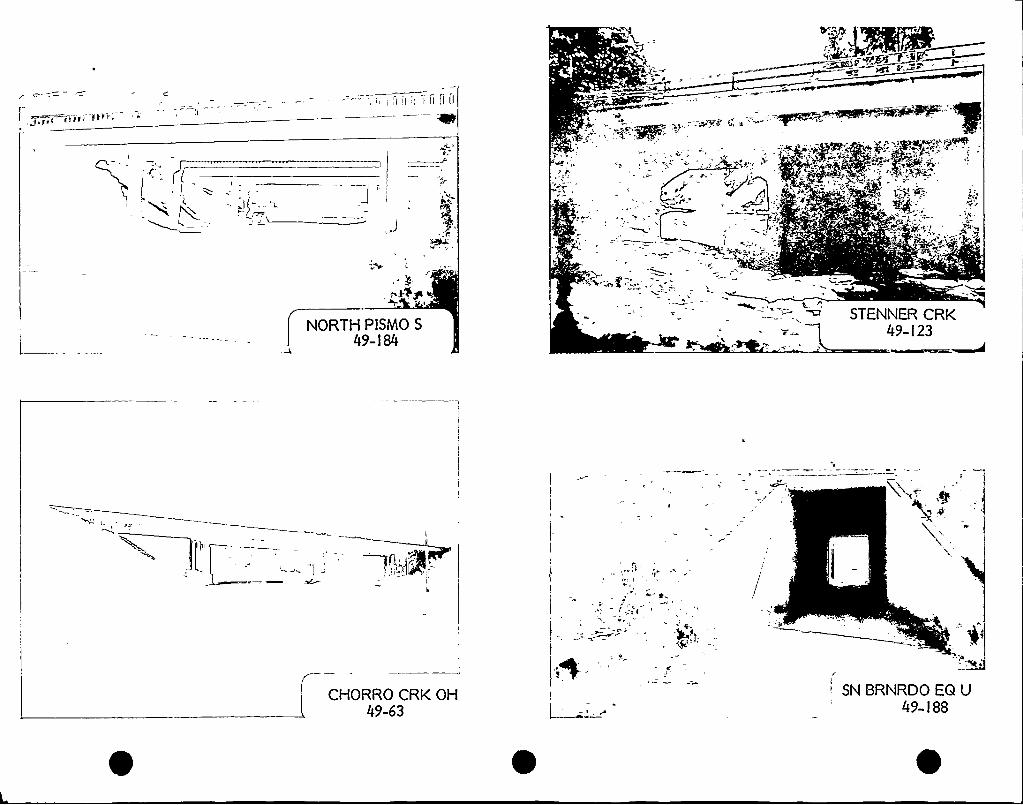
X
C
VS
NORTH PISMO S
49- I 84
STENNER CRK49- I 23
I l,l
~ jt
CHORRO CRK OH49-63
fit
'N BRNRDO EQ U49- I 88
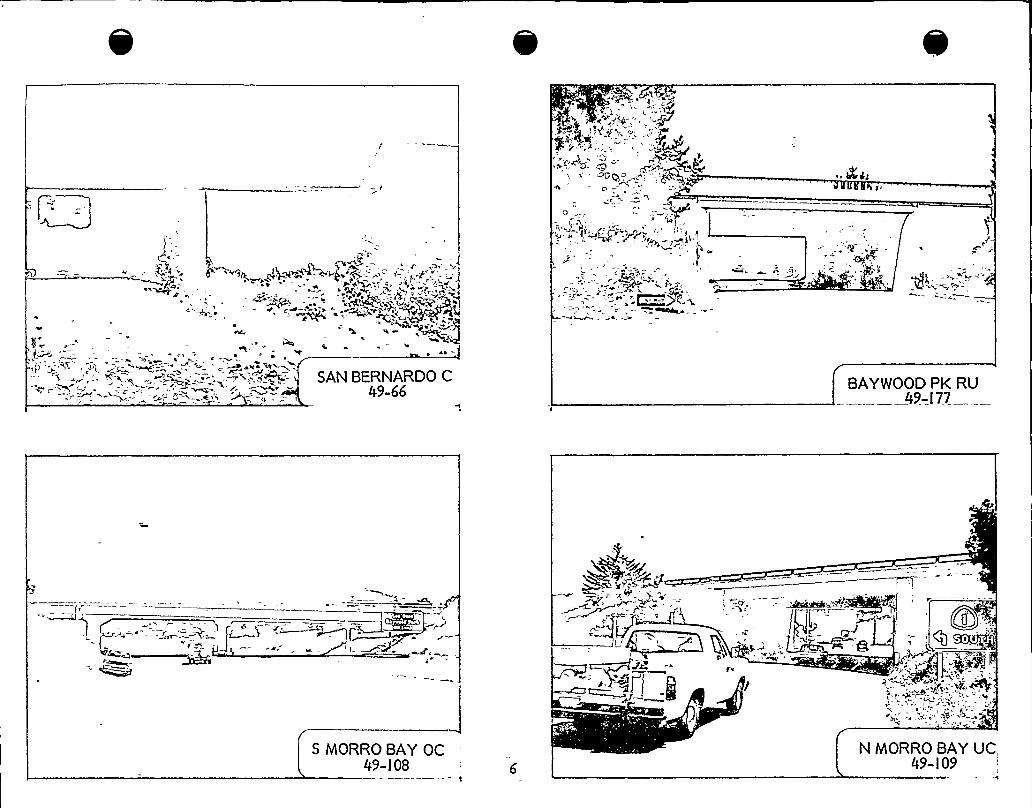
IF
*
<l
SAN BERNARDO C49-66 BAYWOOD PK RU
49-l77
QI-.
S MORRO BAY OC49-I08
N MORRO BAY UC,49-l 0 9
MORRO CRK49- I 8 I
MORRO CRK49-I8I
RTE I 4 I SEP49-I82
TORO CRK49-68
GRAND AyE SPP49-I76
REFER TO PAGE I
Yj
gp3
CORBIT C'N CHK49-77
~~Mal% I%x~w
CROWN HILLPOC49-20 I~
C
CORISIT CANY CRK49- I IO
E CORRAL PIEDRA49-l03
W CORRAL PIEDRA49-204
~i-F
N EDNA OH49-220
z
E FKSLO CRK49-I I 6
ACACIACRK49-I l7
KP
~YiARSH SLO CRK49-58
~) q~
ATASCAOERO CRK49-49
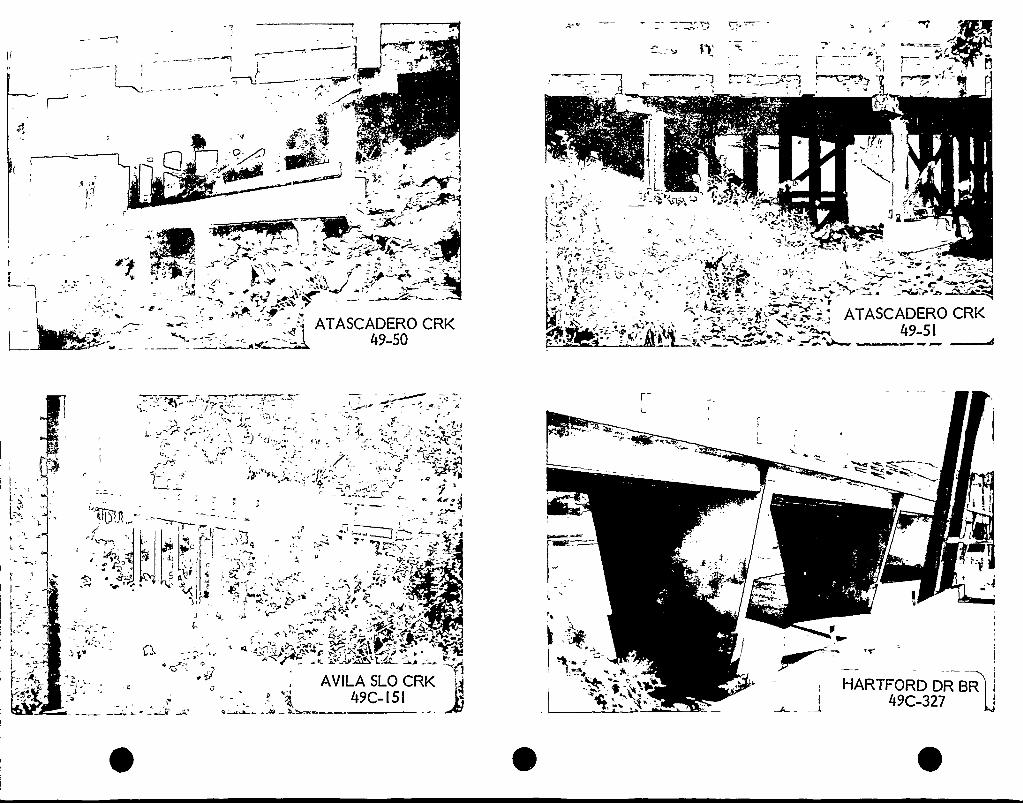
j'*
Ac. c. ~ "j
'I
I, g
r-t,
,w'el
4" 4. o~
jATASCADERO CRK
49-50
'I
4
J
r W "- ~
i.;r-
- ~~v~-C
ATASCADERO CRK49-5 I
F
AIPP -,9'll
z ., -Wgl. s
)iF „
AVILASLO CRK49C- I 5 I
HARTFORD DR BR49C-327
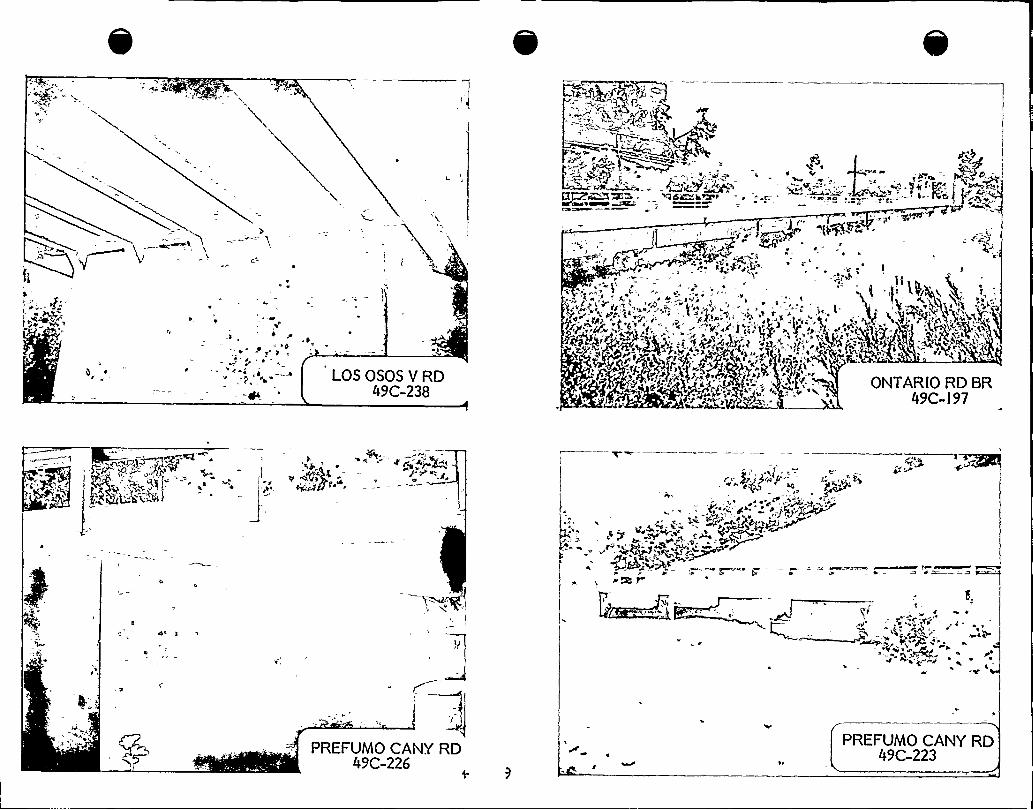
.s„' rr'
J'.i~ - ~
C 44e LOS OSOS V RD
49C-238
pg
I
V
'r <s gt
a
-~y-~ '*9> ~~ > " y I 'L(
49C-I 97
~ ~cA~ „.~gaN ~'
«g'~i%<j Hw.l»
PREFUMO CANY RD49C-226
PREFUMO CANY RD49C-223
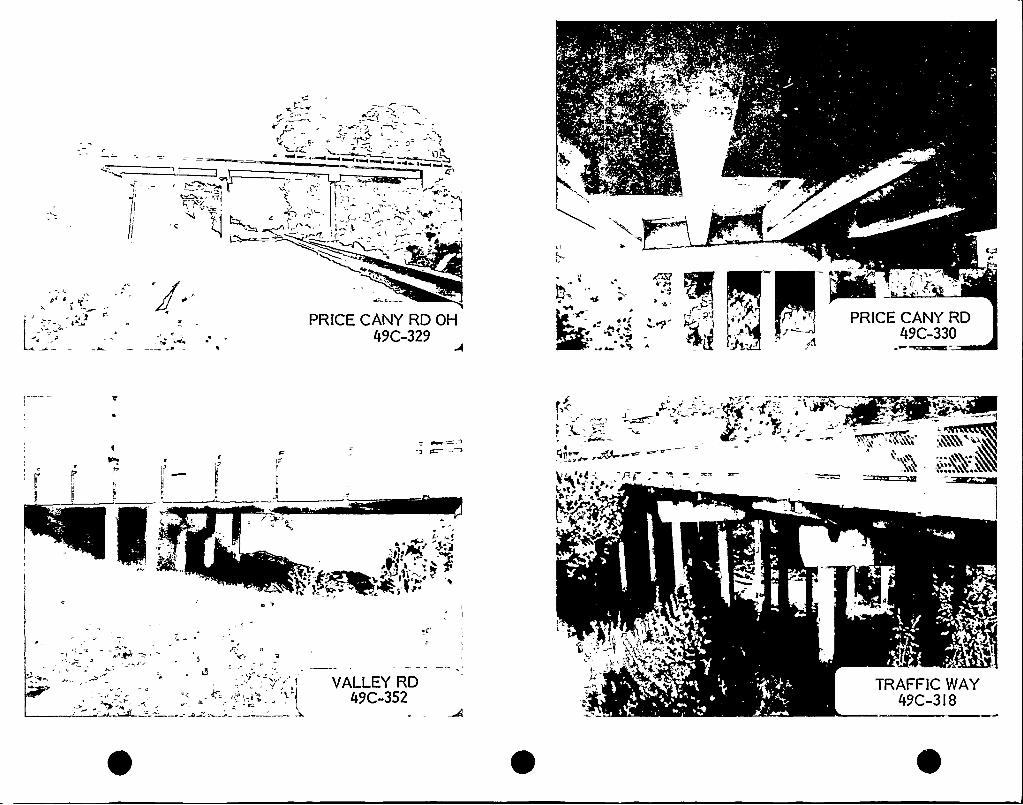
a )g
~ >~~a
h,
C
9
PRICE CANY RD OH49C-329 '—
PRICE CANY RD/ 49C-330
7
r,
rI
4n A-
~>Mi%
iblh "
VALLEYRD49C-352
'
TRAFFIC WAY49C-3 I 8
4.3 BRIDGE SEISMIC DATAFORMS
4-32
TERA CORPORATION

BRIDGE SEISMIC DATA FORM
General:
Name- Brid e Street Undercrossin 49-173R
Location: Rte 101 PM 12.5
Alignmen t: Stra ightLength:
219'kewed 67'urved
Width:34'ear
Built: 1959
Seismically Retrofitted: Yea X No No Plans
Site:Classification: Regular X Irregular
Peak Acceleration:
Liquefaction Potential:.22
Su erstructure:Material and Type: Welded Steel Plate Girder w/ Com osite PCC Deck
Number of Spans: 3
Continuous: Yes No X
Bear inces:
Type - Steel rocker bearin s
Condition: Functioning X Not Functioning
Restraint (Trans): Steel Kee er Bars
Restraint (Longit): A arentl none - not visible from hoto raphs
Bearing Height:
Support Length: 1' 3"
4-33
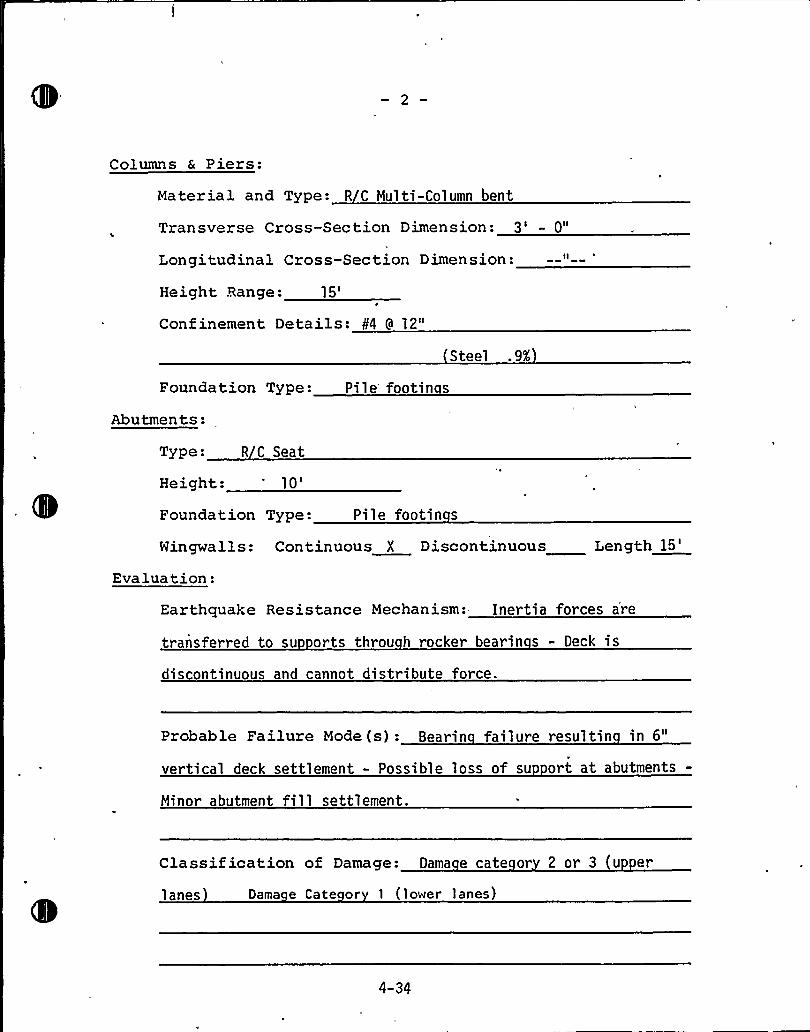
Columns & Piers:
Material and Type: R C Multi-Column bent
Transverse Cross-Section Dimension: 3' 0"
Longitudinal Cross-Section Dimension:
Height Range:15'onfinementDetails: II4 9 12"
Steel .9X
Foundation Type: Pile footin s
Abutments:
Type: R C Seat
Height:10'oundationType: Pile footin s
Wingwalls: Continuous X Discontinuous Length15'va
lua tion:Earthquake Resistance Mechanism: Inertia forces a'e
transferred to su orts throu h rocker bearin s - Deck i s
discontinuous and cannot distribute force.
Probable Failure Mode (s): Bearin failure resul tin in 6"
vertical deck settlement - Possible loss of su ort at abutments-
Minor abutment fill settlement.
Classif ication of Damage: Dama e cate or 2 or 3 (u er
lanes Dama e Cate or 1 (lower lanes)
4-34
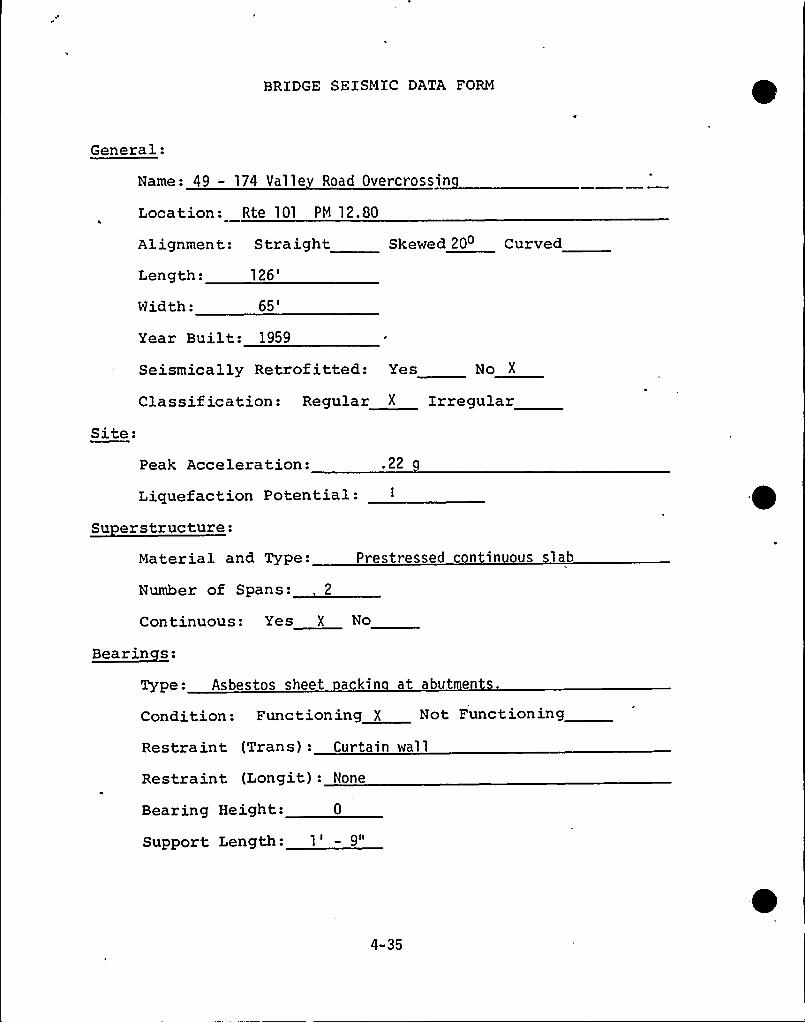
BRIDGE SEISMIC DATA FORM
General:
Name: 49 — 174 Val le Road Overcrossin
Location: Rte 101 PM 12.80
Alignment: StraightLength:
126'idth:
65'ear
Built: 1959
Skewed 20 Curved
Site:
Seismically Retrofitted: Yes No X
Classif ication: Regular X Irregular
Peak Acceleration: .22
Liquefaction Potential:
Su erstructure:Material and Type: Prestressed continuous lab
Number of Spans: 2
Continuous: Yes X No
Bearinces:
Type: Asbestos sheet ackin at abutmen s.
Condition: Functioning X Not Functioning
Restraint (Trans): Curtain wall
Restraint (Longit) - None
Bearing Height:
Support Length:
0
1I 9ll
4-35
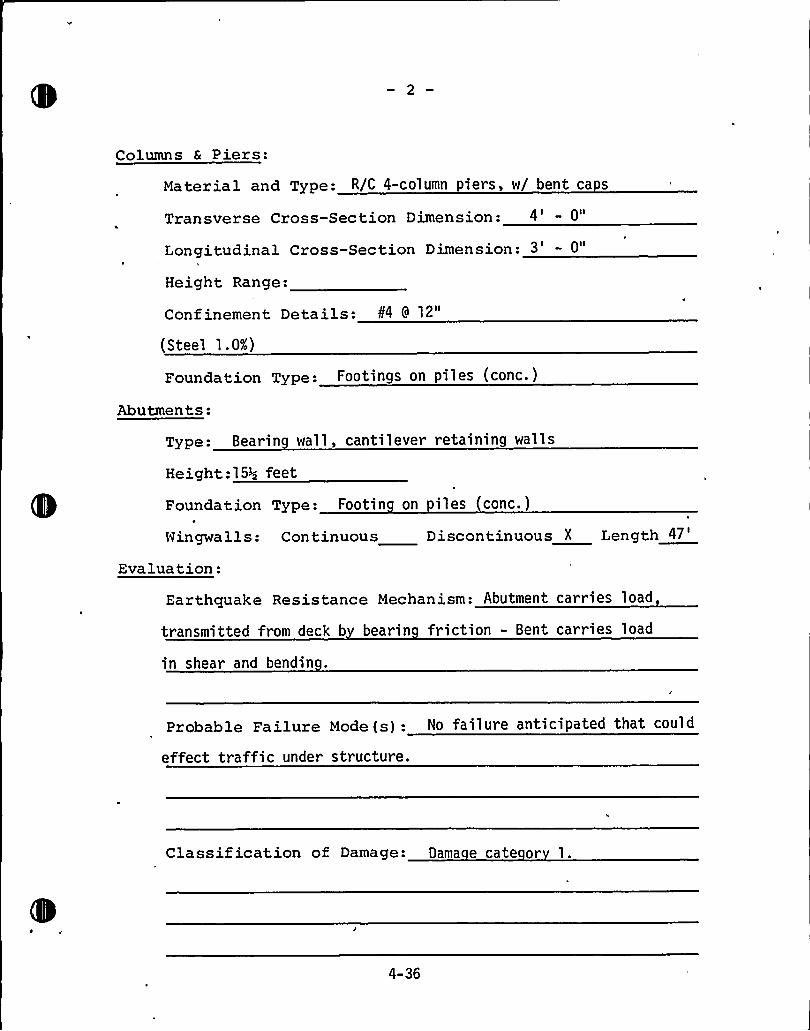
Columns 6 Piers:
Material and Type: R/C 4-column piers, w/ bent ca s
Transverse Cross-Section Dimension: 4' 0"
Longitudinal Cross-Section Dimension: 3' 0"
Height Range:
Confinement Details: b4 9 12"
(Steel 1.0X)
Foundation Type: Footings on piles (conc.)
Abutmen ts:Type: Bearin wall, cantilever retaining wall s
Height:153; feet
Foundation Type: Footin on iles (conc. )
Wingwalls: Continuous Discontinuous X Length47'va
lua tion:Earthquake Resistance Mechanism: Abutment carries load
transmitted from deck b bearin friction - Bent carries load
in shear and bendin .
Probable Failure Mode(s): No failure anticipated that could
effect traffic under structure.
Classif ication of Damage: Dama e cate or 1.
4-36
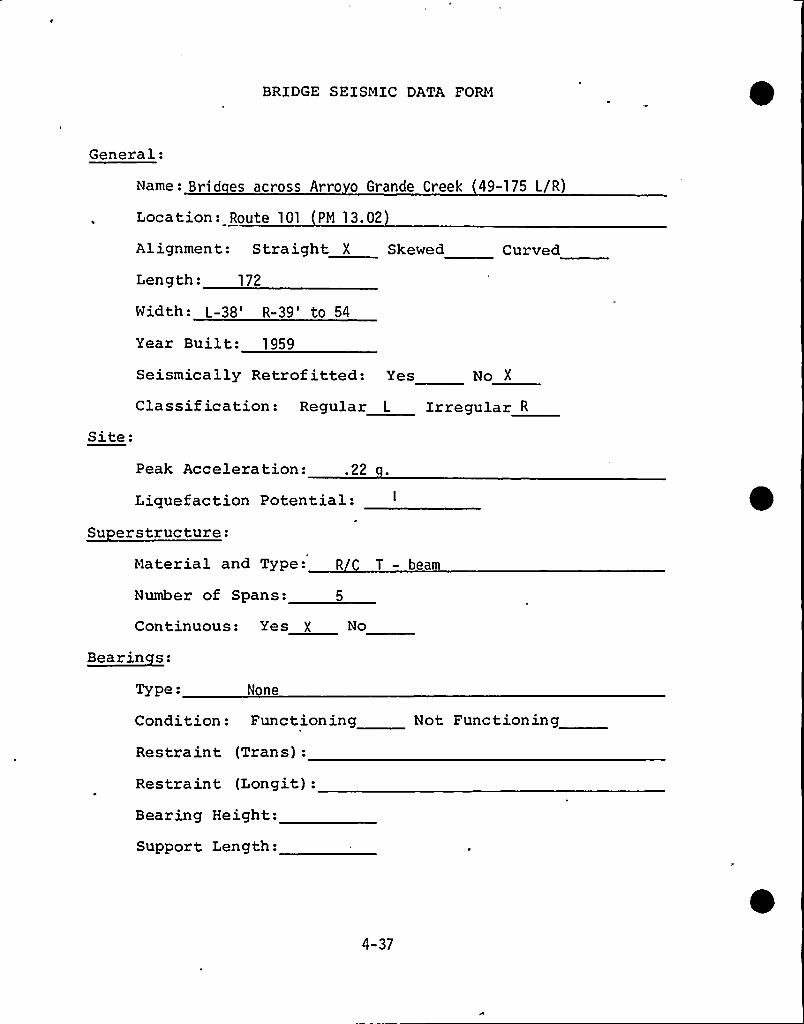
BRIDGE SEISMIC DATA FORM
General:
Name: Brid es across Arro o Grande Creek 49-175 L/R)
Location: Route 101 PN 13.02
Alignment: Straight X Skewed
Length: 172
Width: L-38'-39'o 54
Year Built: 1959
Curved
Site:
Seismically Retrof itted: Yes No X
Classif ication: Regular L Irregular R
Peak Acceleration: .22
Liquefaction Potential:
Su erstructure:Material and Type: R T - beam
Number of Spans:
Continuous: Yes No
B~earinces:
Type: None
Condition: Functioning
Restraint (Trans):
Restraint (Longit):Bearing Height:
Support Length:
Not Functioning
4-37
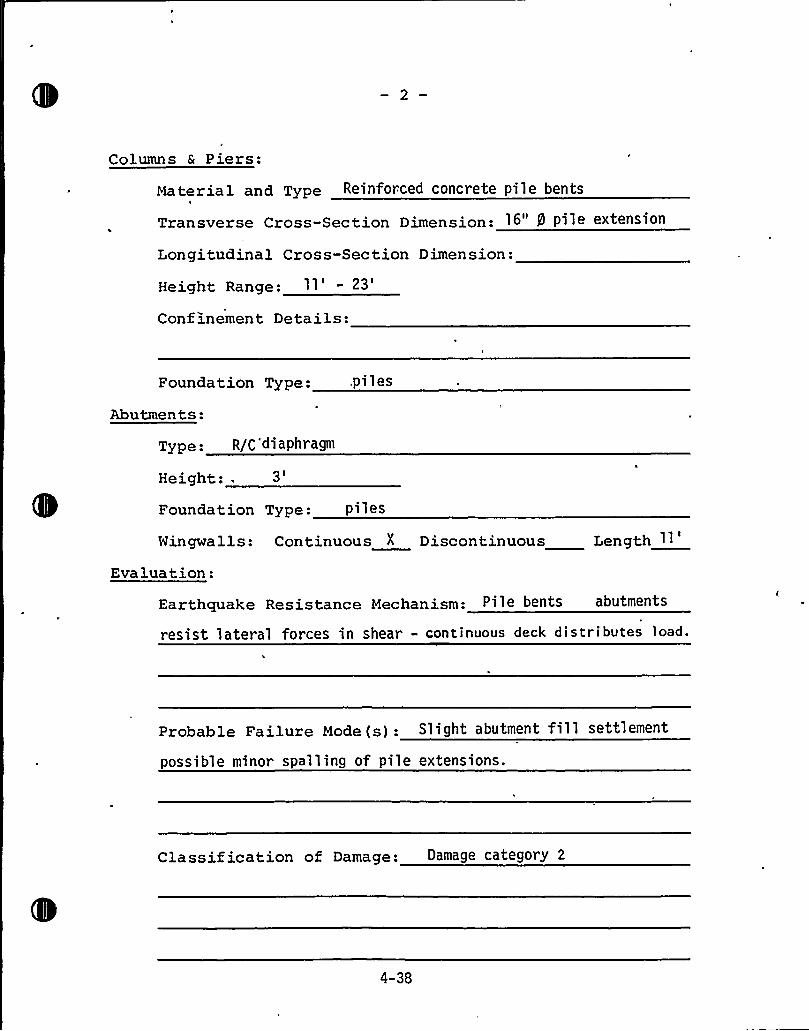
Columns 6 Piers:
Material and Type Reinforced concrete pile bents
Transverse Cross-Section Dimension: 16" g pile extension
Longitudinal Cross-Section Dimension:
Height Range: 11 - 23
Confinement Details:
Foundation Type: .piles
Abutments:
Type: R/C 'di aphr agm
Height: .
3'oundationType: pi 1 es
Wingwalls: Continuous X Discontinuous Length "1
Evaluation:
Earthquake Resistance Mechanism: Pile bents abutments
resist lateral forces in shear - continuous deck distributes load.
Probable Failure Mode (s): Slight abutment fill settlement
possible minor spalling of pile extensions.
Classif ication of Damage: Damage category 2
4-38
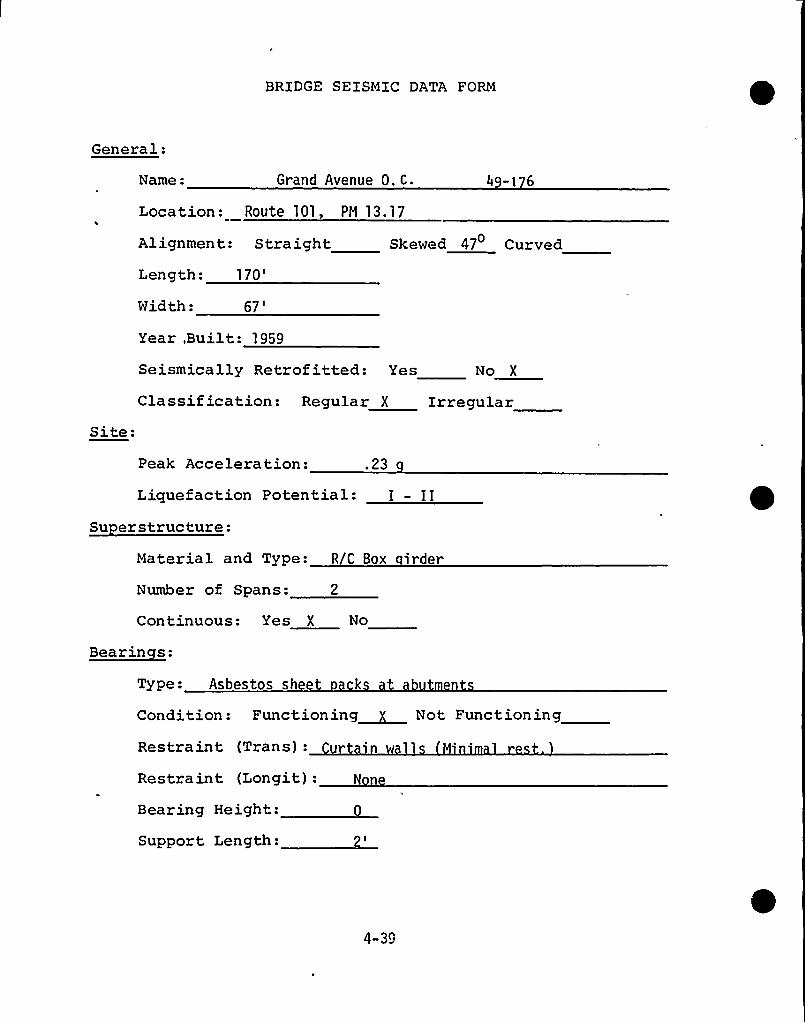
BRIDGE SEISMIC DATA FORM
General:
Name: Grand Avenue 0. C.
Location: Route 101, PM 13.17
Alignmen t: S tra ightLength:
170'idth:
67'kewed 47 Curved
Site:
Year, Built: 1959
Seismically Retrofitted: Yes No X
Classification: Regular X Irregular
Peak Acceleration: .23
Liquefaction Potential: I - IISu erstructure:
Material and Type: R C Box irder
Number of Spans: 2
Continuous: Yes X No
~Baarin a:
Type: Asbestos sheet k
Condition: Functioning~ Not Functioning
Restraint (Trans):
Restraint (Longit):
Bearing Height:
Support Length:
2'-39
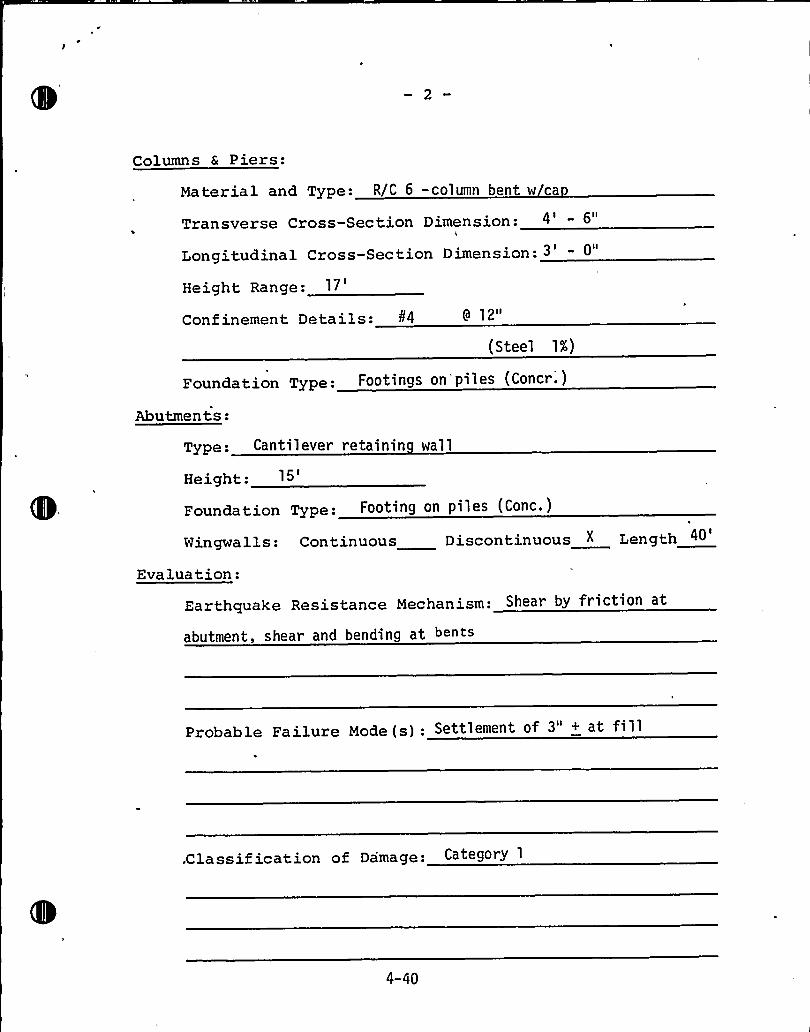
Columns S Piers:
Material and Type: R/C 6 -column bent w ca
Transverse Cross-Section Dimension: 4
Longitudinal Cross-Section Dimension: 3
Height Range:17'onfinementDetails: 84 9 12"
(Steel 1%)
Foundation Type: Footings on 'i1 es (Concr . )
Abutmen ts:
Type: Cantil ever retainin wal 1
Height:
Foundation Type: Footing on piles (Conc.)
Wingwalls: Continuous Discontinuous " Length 40
Evaluation:
Earthquake Resistance Mechanism: Shear by friction at
abutment, shear and bending at b«<>
Probable Failure Mode(s): Settlement of 3" + at fill
,Classif ication of Damage: Category 1
4-40
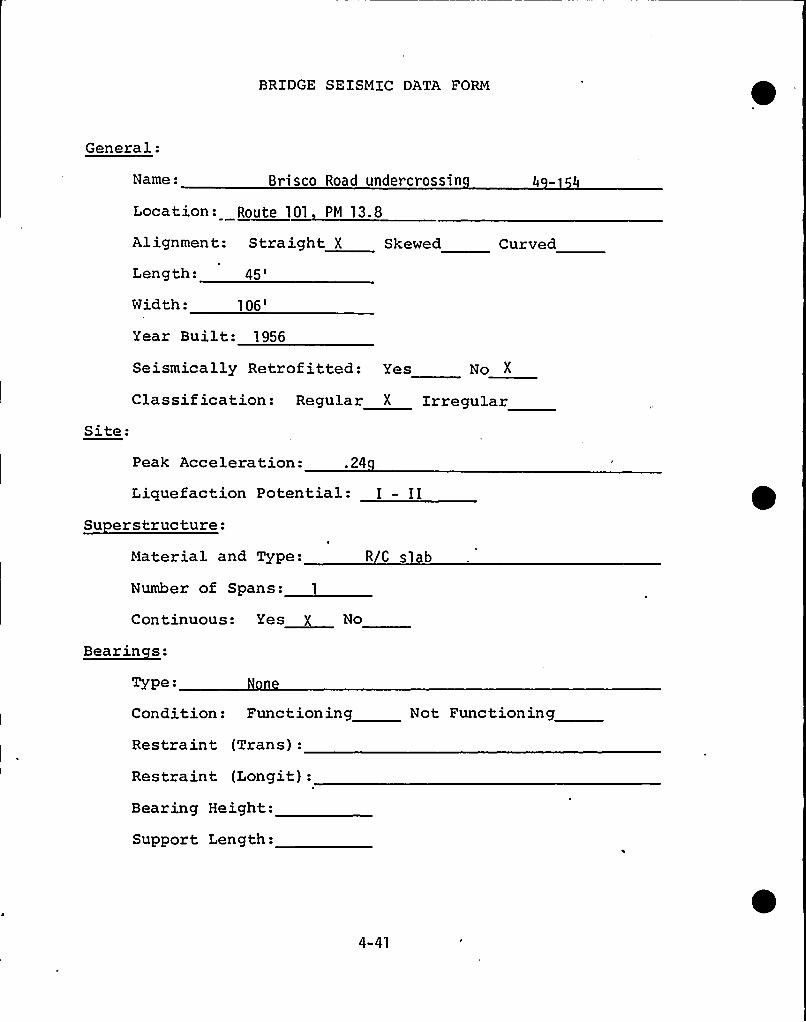
BRIDGE SEISMIC DATA FORM
General:
Name: Brisco Road undercrossin
Location: Route 101 PM 13.8
Alignment: Straight X Skewed
Length:45'idth:
106'ear
Built: 1956
Curved
Site:
Seismically Retrofitted: Yes No X
Classif ication: Regular X Irregular
Peak Acceleration: a24
Liquefaction Potential: I - IISu erstructure:
Material and Type:
Number of Spans: 1
Continuous: Yes~ No
Bearinces:
Type:
Condition: Functioning
Restraint (Trans):
Restraint (Longit):
Bearing Height:
Support Length:
R C slab
Not Functioning
4-41
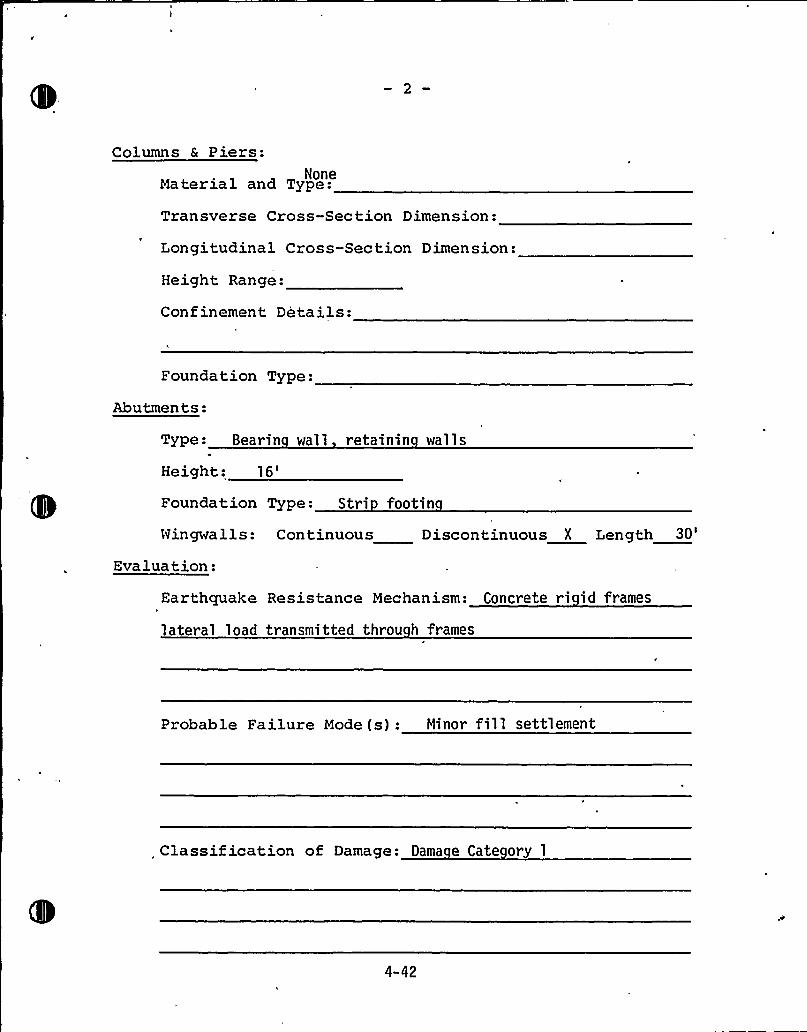
Columns 6 Piers:NoneMaterial and Type:
Transverse Cross-Section Dimension:
Longitudinal Cross-Section Dimension:
Height Range:
Confinement Details:
Foundation Type:
Abutments:
Type: Bearin wall retainin wall s
Height:16'oundation Type: Stri footin
Wingwa lls:
Evaluation:
Continuous Discontinuous X Length 30
Earthquake Resistance Mechanism: Concrete ri id frames
lateral load transmitted throu h frames
Probable Failure Mode (s): Minor fill settlement
Classif ication of Damage: Oama e Cate ory 1
4-42
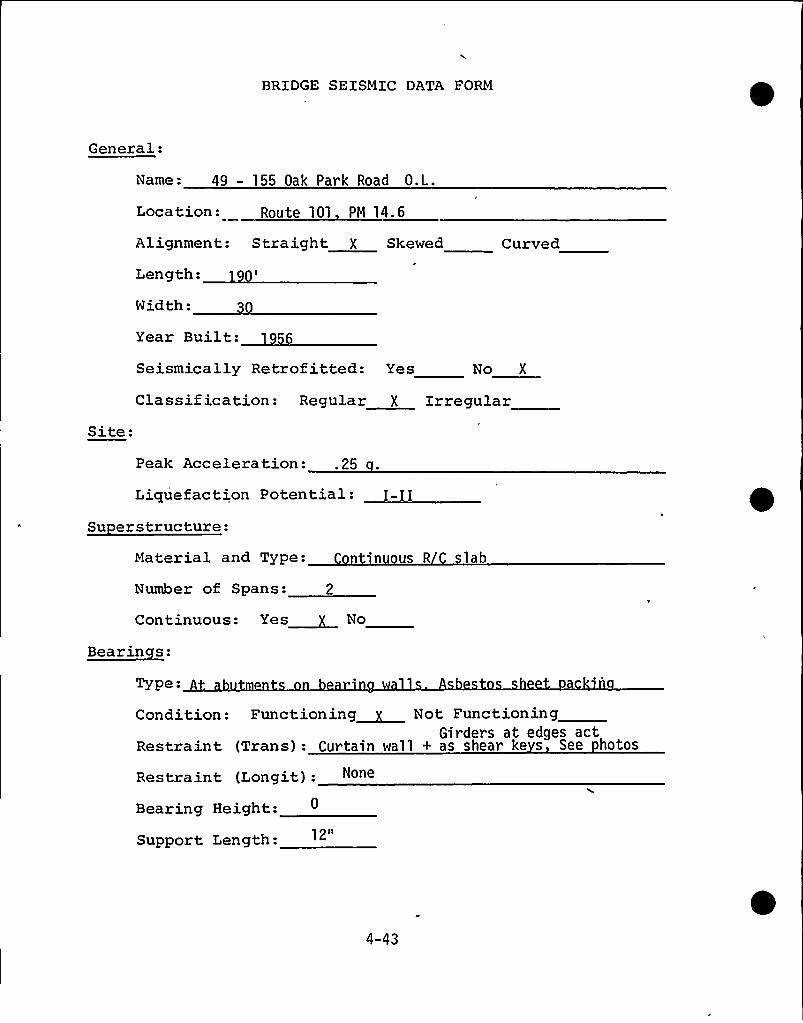
BRIDGE SEISMIC DATA FORM
General:
Name: 49 — 155 Oak Park Road 0.L.
Location: Route 101 PM 14.6
Alignmen t: S tra ight X Skewed Curved
Length:
Width:
Year Built: 56
Seismically Retrofitted: Yes No X
Classif ication: Regular X IrregularSite:
Peak Acceleration: .25
Liquefaction Potential:
Su erstructure:Material and Type: ontinuous R slab
Number of Spans: 2
Continuous: Yes~ No
Bearinces:
Type:
Condition: Functioning~ Not FunctioningGirders at edges act
Restraint (Trans): Curtain wall + as shear ke s See hotos
Restraint (Longit):
Bearing Height:
rt L
4-43
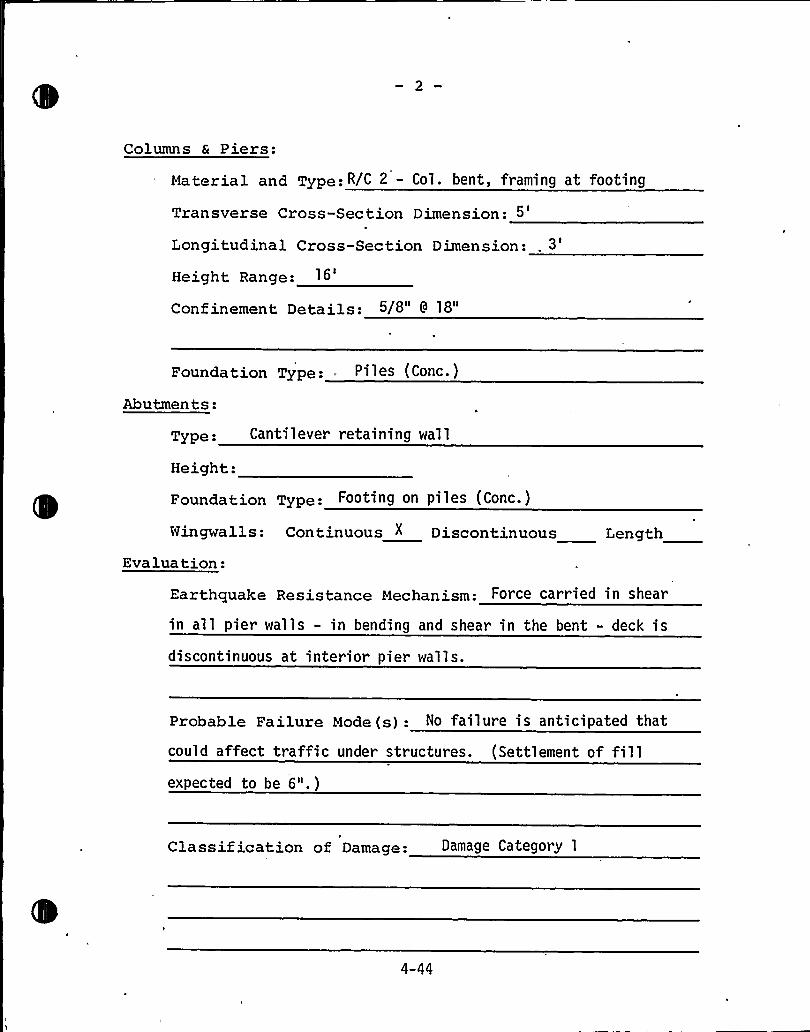
Columns & Piers:
Material and Type: R/C 2 — Col. bent, framing at footing
Transverse Cross-Section Dimension: 5
Longitudinal Cross-Section Dimension:
Height Range:
Confinement Details: 5/8" 9 18"
Foundation Type:, Piles (Conc.)
Abutments:
Type. Cantilever retaining wall
Height:
Foundation Type: Footing on Pi les (Conc. )
Wingwalls: Continuous " Discontinuous Length
Evaluation:
Earthquake Resistance Mechanism: Force carried in shear
in all pier walls - in bending and shear in the bent - deck is
discontinuous at interior pier walls.
Probable Failure Mode(s): No failure is anticipated that
could affect traffic under structures. (Settlement of fillexpected to be 6". )
Classif ication of Damage: Damage Category 1
4-44
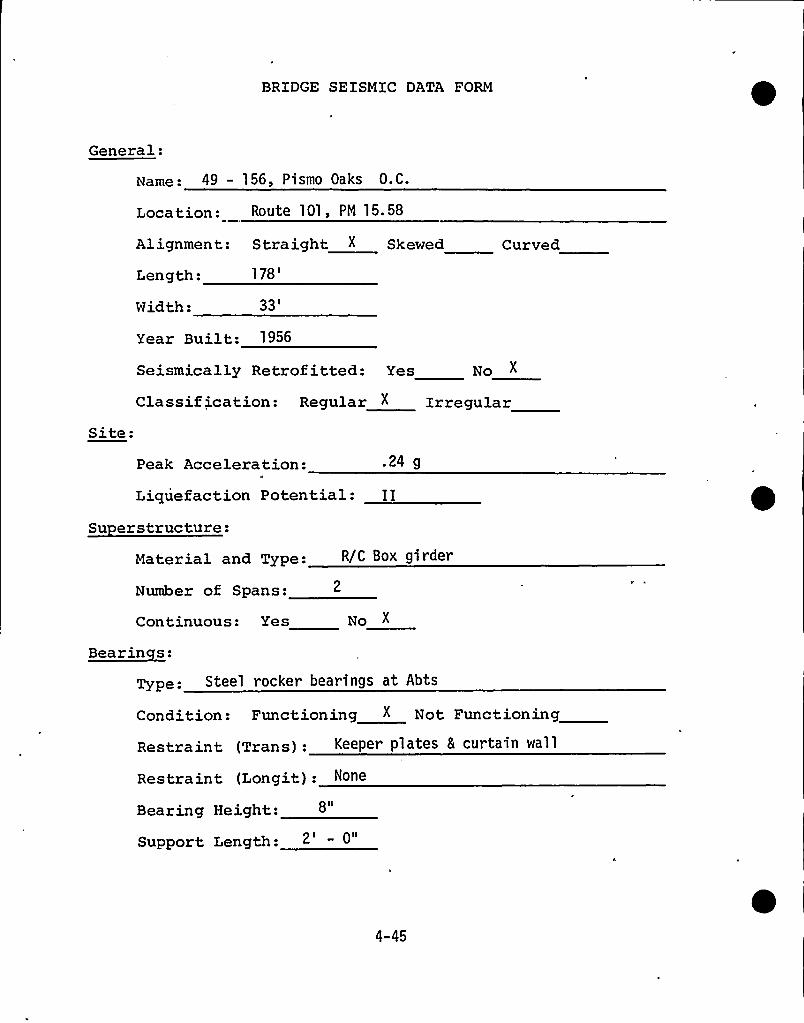
BRIDGE SEISMIC DATA FORM
General:
Name: 49 - 156, Pismo Oaks O.C.
Location: Route 101, PM 15.58
Alignment: Straight X Skewed
Length:178'idth:
33'ear
Built: 1956
Seismically Retrof itted: Yes No
Classif ication: Regular " IrregularSite:
Peak Acceleration: .24 g
Liquefaction Potential: IISu erstructure:
Material and Type: R/C Box girder
Number of Spans:
Continuous: Yes No
Bearinces:
Type: Steel rocker bearings at Abts
Condition: Functioning " Not Functioning
Restraint (Trans): Keeper plates & curtain wall
Restraint (Longit): None
Bearing Height:
Support Length: 2' 0"
4-45
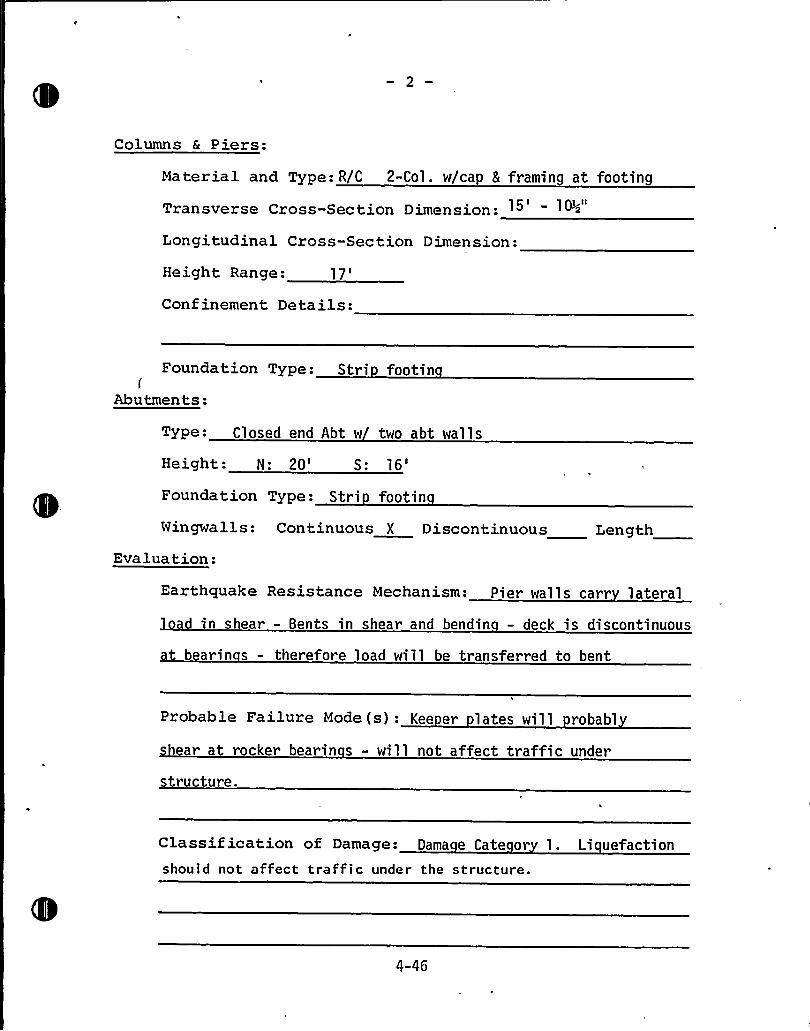
Columns & Piers:
Material and Type: R/C 2-Col. w/cap & framing at footing
Transverse Cross-Section Dimension: 1"
Longitudinal Cross-Section Dimension:
Height Range:17'onfinementDetails:
Foundation Type: Stri footin
Abutments:
Type- Closed end Abt w two abt walls
Height: N: 20':16'oundationType: Stri footin
Wingwalls: Continuous X Discontinuous Length
Evaluation:
Earthquake Resistance Mechanism: Pier walls carr lateral
in shear - Bents in shear and bendin — deck is discontinuous
b grin s - therefore load will be transferred to bent
Probable Failure Mode(s): Kee er lates will robabl
h ar at rocker bearin s - will not affect traffic under
ucture.
Classif ication of Damage: Dama e Cate or 1. Li uefactionshould not affect traffic under the structure.
4-46
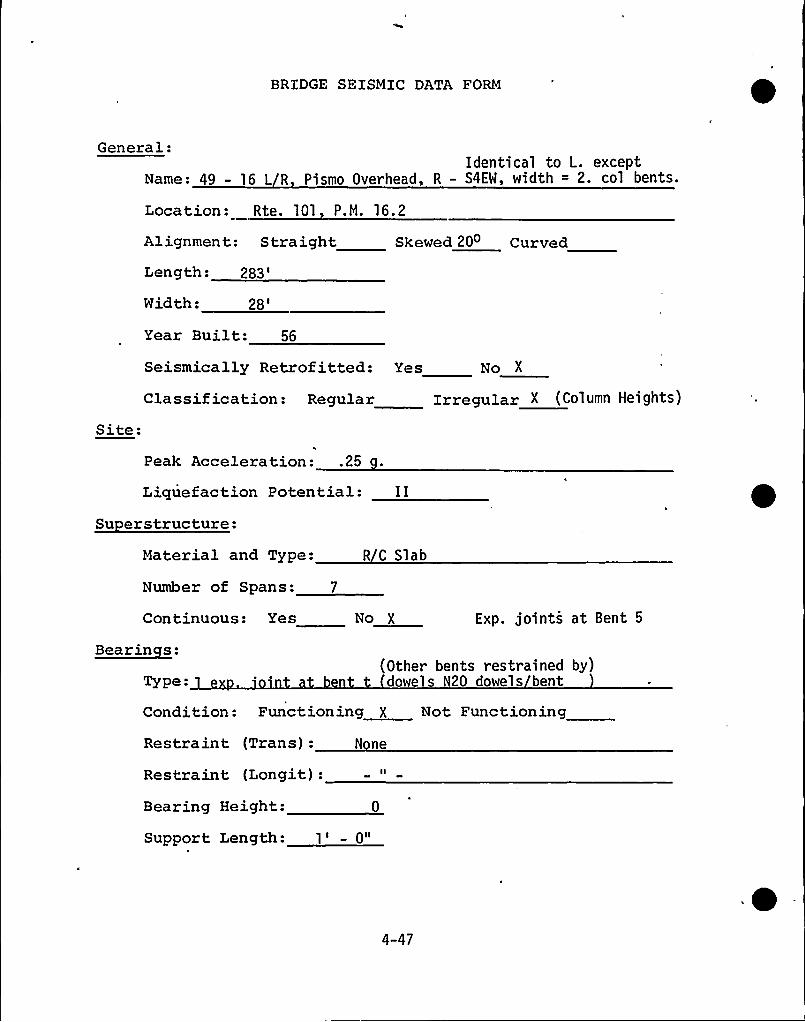
BRIDGE SE ISMIC DATA FORM
General:Identical to L. except
Name: 49 - 16 L R Pismo Overhead, R - S4EW, width = 2. col bents.
Location: Rte. 101 P.M. 16.2
Alignment: Straight Skewed 20 Curved
Length:283'idth:
28'ite:
Year Built: 56
Seismically Retrof itted: Yes
Classif ication: Regular
Peak Acce lera tion: . 25
No X
Irregular X (Column Hei ghts)
Lique faction Potential: I I
Su erstructure:Material and Type:
Number of Spans: 7
Continuous: Yes
Bearinces:
R C Slab
No X Exp. joints at Bent 5
Type:(Other bents restrained by)dowels N20 dowels bent
Condition: Functioning X Not Functioning
Restraint (Trans):
Restraint (Longit):
Bearing Height:
N ne
Support Length: 1' 0"
4-47
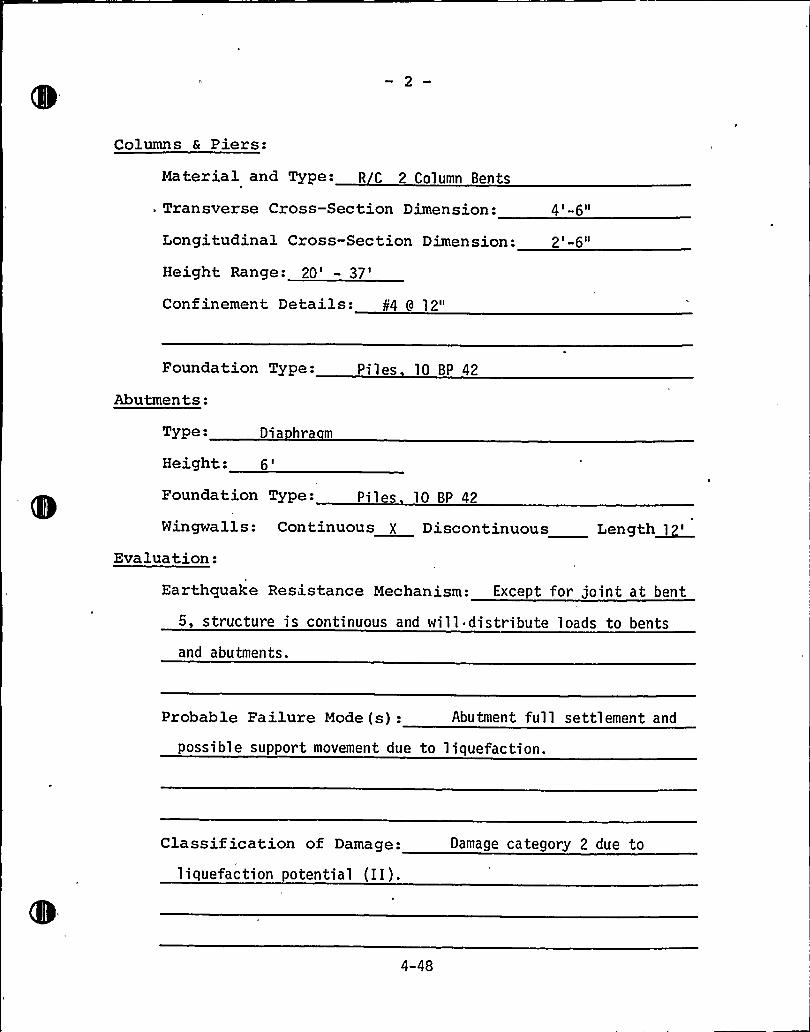
Columns 6 Piers:
Material and Type.-R C 2 Column Bents
. Transverse Cross-Section Dimension: 4'-6"
Longitudinal Cross-Section Dimension:
Height Range: 20'37''-6"
Confinement Details: g4 9 12"
Foundation Type: Pi 1 es 10 BP 42
Abutments:
Type Dia hra m
Height:6'oundation Type: P 1 s 10 BP 42
Wingwalls: Continuous X Discontinuous Length~1
Evaluation:
Earthquake Resistance Mechanism: Except for joint at bent
5, structure is continuous and will distribute loads to bents
and abutments.
Probable Failure Mode(s): Abutment full settlement and
possible support movement due to liquefaction.
Classification of Damage:
liquefaction potential (II).Damage category 2 due to
4-48
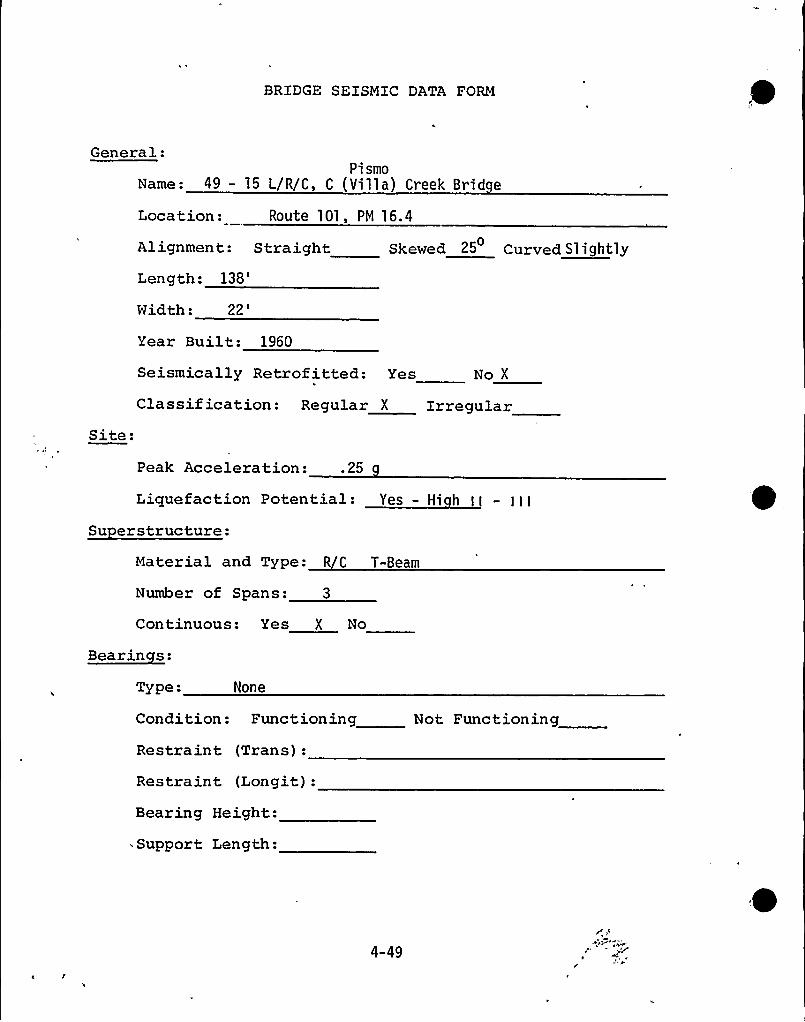
BRIDGE SEISMIC DATA FORM
General:Pi smo
Name: 49 — 15 L/R/C, C (Villa) Creek Brid e
Location: Route 101, PM 16.4
Alignment: StraightLength:
138'idth:
22'ear
Built: 1960
Skewed 25 Curved Sl ightly
Seismically Retrofitted: Yes No X
Site:Classif ication: Regular X Irregular
Peak Acceleration: . 25
~Y- YY
Su erstructure:Material and Type: R C T-Beam
Number of Spans: 3
Continuous: Yes X No
Bearinces:
Type: None
Condition: Functioning
Restraint (Trans):
Restraint (Longit):
Bearing Height:
Support Length:
Not Functioning
4-49
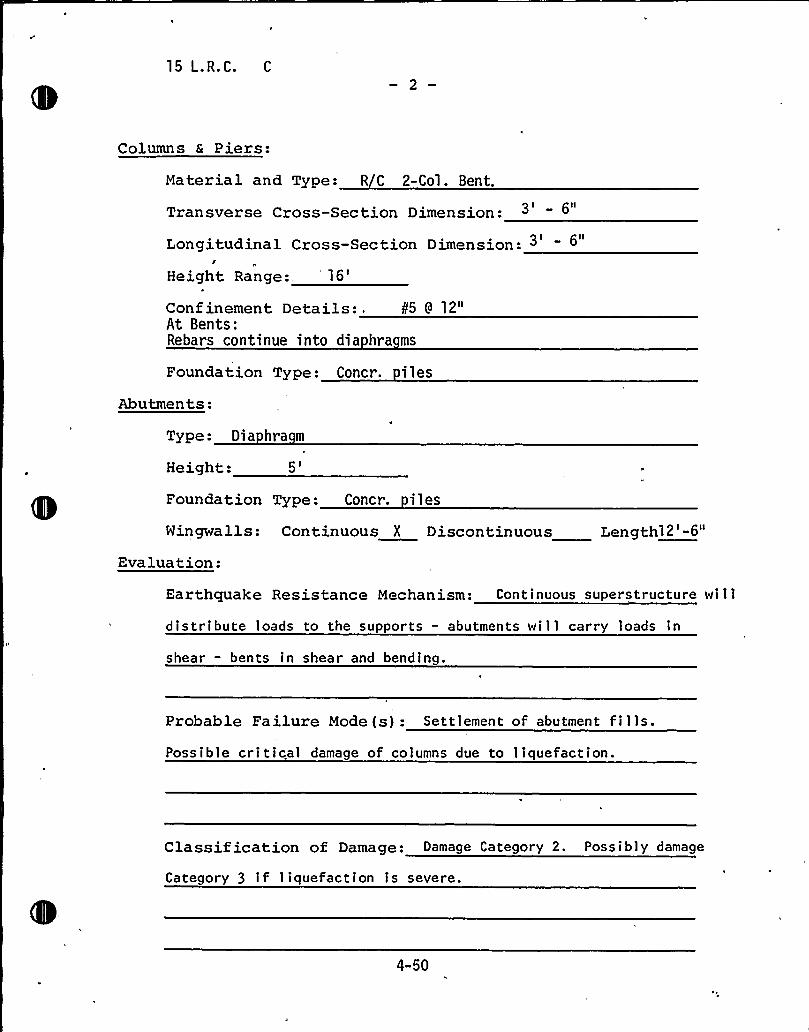
15 L.R.C. C
Columns 6 Piers:
Material and Type: R C 2-Col. Bent.
Q I QllTransverse Cross-Section Dimension:0 I @IILongitudinal Cross-Section Dimension: 3
/Height Range:, '6'5
9 12"Conf inement Details:,At Bents:Rebars continue into dia hra ms
Foundation Type: Concr. iles
Abutments:
Type: Dia hra m
Height:5'oundationType: Concr. i 1 es
Wingwalls: Continuous X Discontinuous Lengthl2'-6"
Evaluation:
Earthquake Resistance Mechanism: Continuous superstructure will
distribute loads to the supports - abutments will carry loads in
shear — bents in shear and bending.
Probable Failure Mode (s): Settlement of abutment fills.Possible critical damage of columns due to liquefaction.
Classification of Damage: Damage Category 2. Possibly damage
Category 3 if liquefaction is severe.
4-50
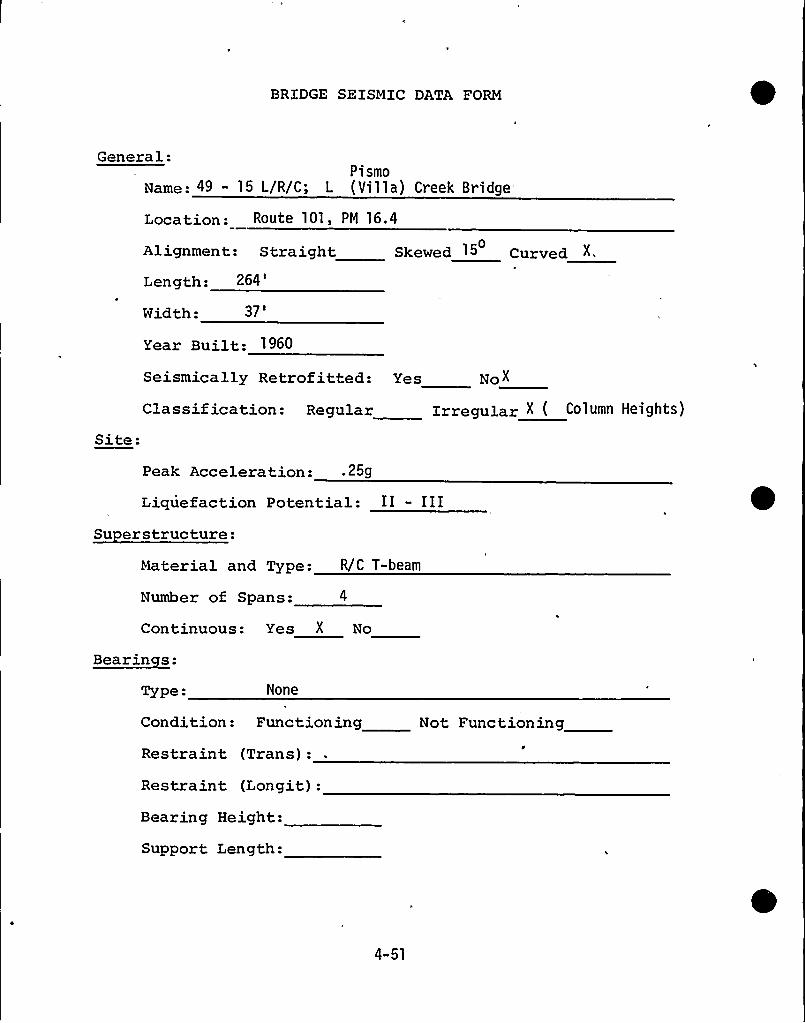
BRIDGE SEISMIC DATA FORM
General:Pismo
Name: 49 - 15 L/R/C; L (Villa) Creek Bridge
Location: Route 101, PM 16.4
Alignment: Straight Skewed ig Curved0
Length: 264
Width:37'ear
Built: 1960
Seismically Retrof itted: yes
Classif ication: Regular Zrregular X ( Column Heights)
Site:Peak Acceleration: 259
Liquefaction Potential: II - IIISu erstructure:
Material and Type: R/C T-beam
Number of Spans: 4
Continuous: Yes X No
Bearinces:
Type: None
Condition: Functioning
Restraint (Trans):
Restraint (Longit):
Bearing Height:
Support Length:
Not Functioning
4-51
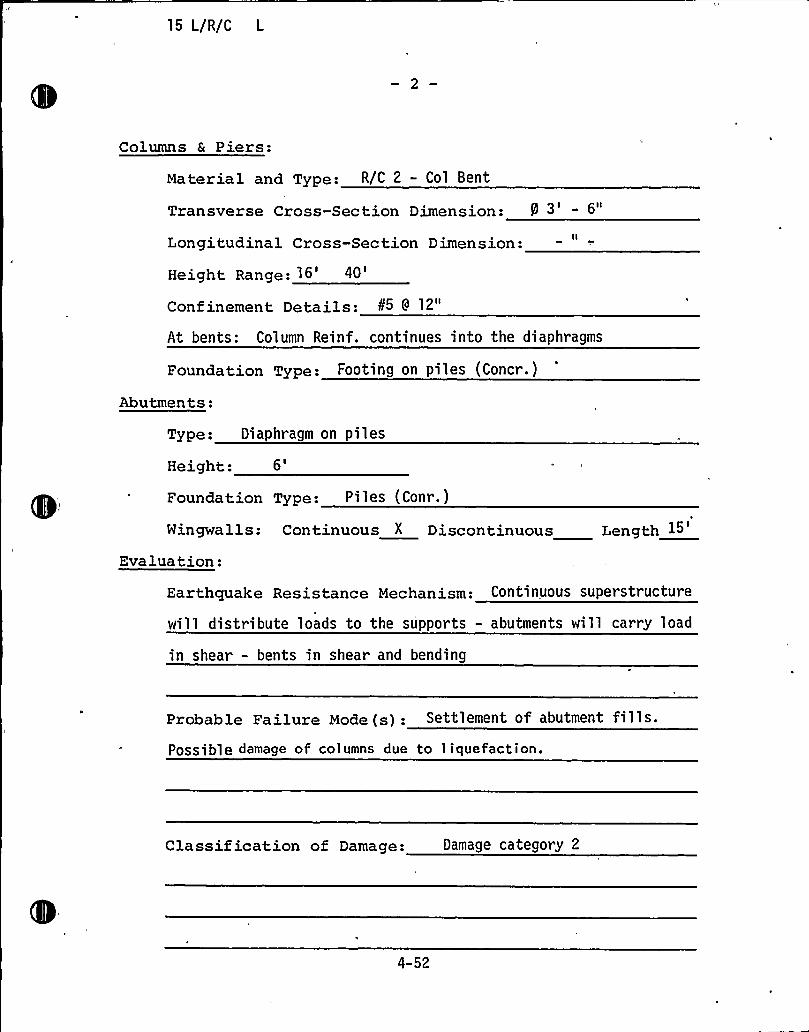
15 L/R/C L
Columns & Piers:
Material and Type: R/C 2 - Col Bent
Transverse Cross-Section Dimension: P 3
Longitudinal Cross-Section Dimension:
Height Range:16'0'onfinementDetails:
At bents: Column Reinf. continues into the diaphragms
Foundation Type: Footing on piles (Concr.)
Abutments:
Type: Diaphragm on piles
Height:6'oundationType: Pi 1 es (Conr. )
Wingwalls: Continuous X Discontinuous Length >~
Evaluation:
Earthquake Resistance Mechanism: Continuous superstructure
will distribute loads to the supports - abutments will carry load
in shear - bents in shear and bending
Probable Failure Mode(s): Settlement of abutment fills.Possible damage of columns due to liquefaction.
Classif ication of Damage: Damage category 2
4-52
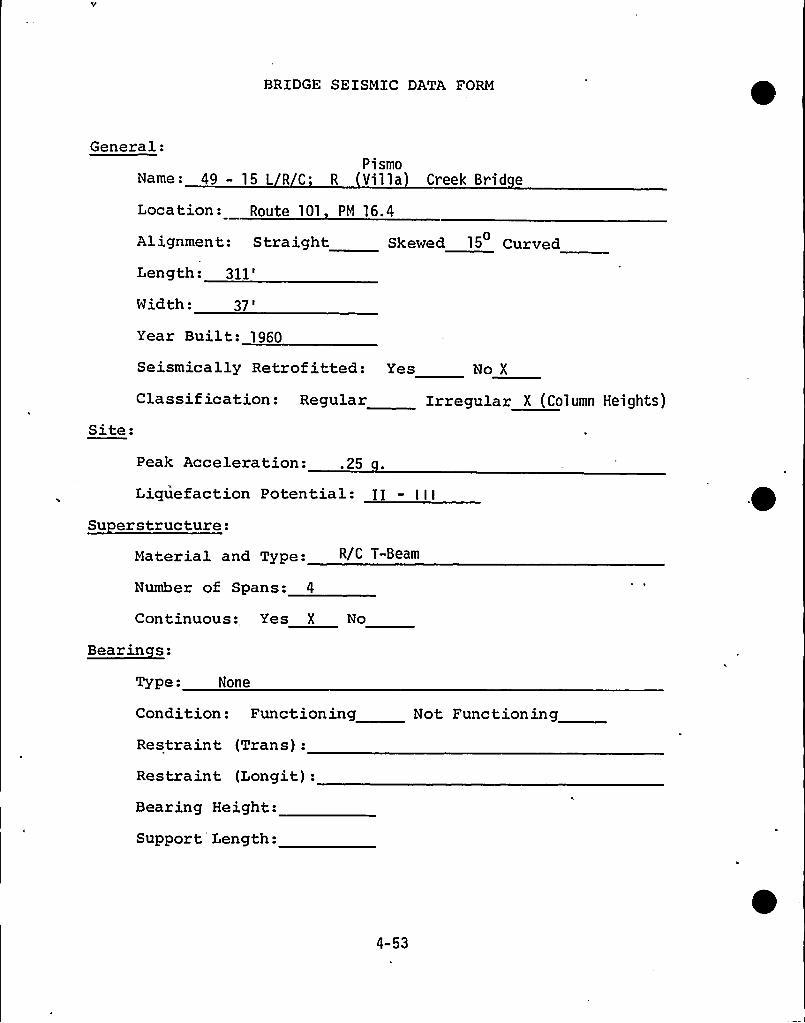
BRIDGE SEISMIC DATA FORM
General:Pismo
Name: 49 - 15 L R C. R Villa Creek Brid e
Loca tion: Route 101 PM 16. 4
Alignment: Straight Skewed 15 Curved
Length:311'idth:
37'ear
Built: 1960
Seismically Retrofitted: Yes No X
Site:Classif ication: Regular Irregular X (Column Heights)
Peak Acceleration: a 25
Liquefaction Potential: >I - IIISu erstructure:
Material and Type: R/C T-Beam
Number of Spans: 4
Continuous: Yes X No
Bearinces:
Type: None
Condition: Functioning
Restraint (Trans):
Restraint (Longit):Bearing Height:
Support Length:
Not Func tion ing
4-53
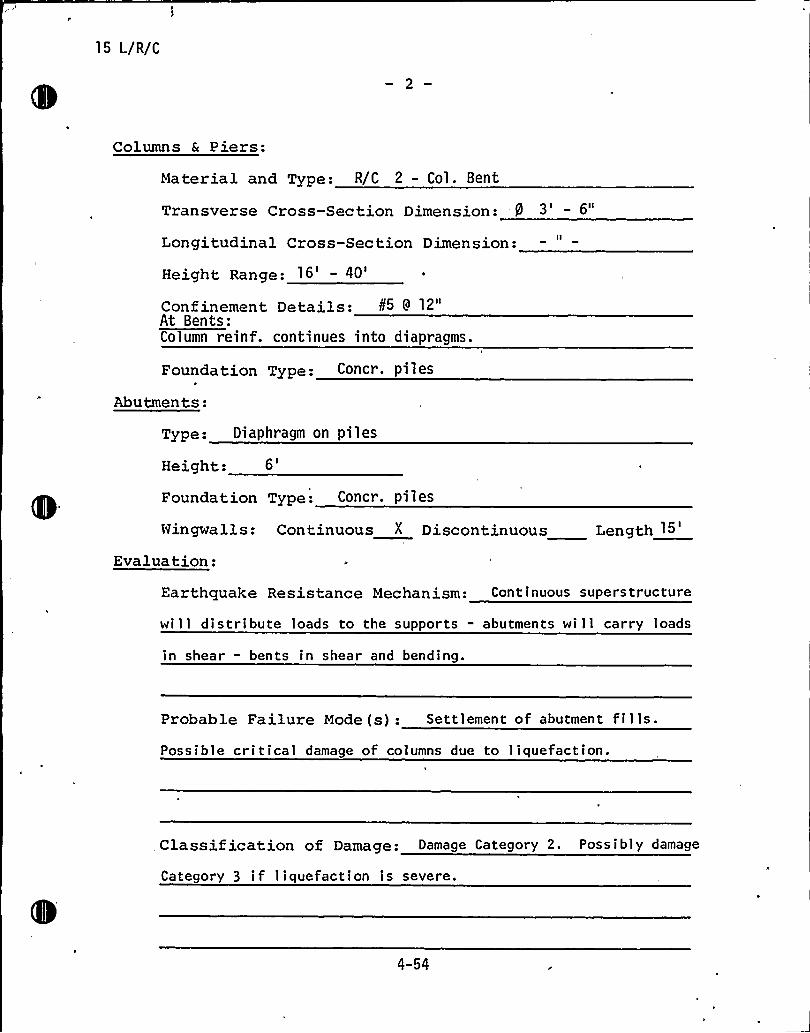
15 L/R/C
Columns & Piers:
Material and Type: R/C 2 - Col. Bent
Transverse Cross-Section Dimension:
Longitudinal Cross-Section Dimension:
Height Range: 16'40'onf
inement Details:At Bents:Column reinf. continues into diapragms.
Foundation Type: Concr. piles
Abutments:
Type: Diaphragm on piles
Height:6'oundationType: Concr. piles
Wingwalls: Continuous X Discontinuous Length 15
Evaluation:
Earthquake Resistance Mechanism: Cont inuous superstructure
will distribute loads to the supports - abutments will carry loads
in shear - bents in shear and bending.
Probable Failure Mode (s): Settlement of abutment fills.Possible critical damage of columns due to liquefaction.
.Classification of Damage: Damage Category 2. Possibly damage
Category 3 if liquefaction is severe.
4-54

BRIDGE SEISMIC DATA FORM
General:
Name: Hinds Avenue O.C., 49 - 130
Location: Route 101, PH 16.6
Alignment:Straight'ength:
206
'idth:
45'ear
Built: 1960
Skewed Curved
Seismically Retrof itted: Yes No X
Site:Classification: Regular " Irregular
Peak Acceleration:
Liquefaction Potential:Su erstructure:
.26 g.
I — II
Material and Type:
Number of Spans:
R/C T-beam
Continuous: Yes X No
Bearinces:
Type- None
Condition: Functioning
Restraint (Trans):
Restraint (Longit):
Bearing Height:
Support Length:
Not Functioning
4-55
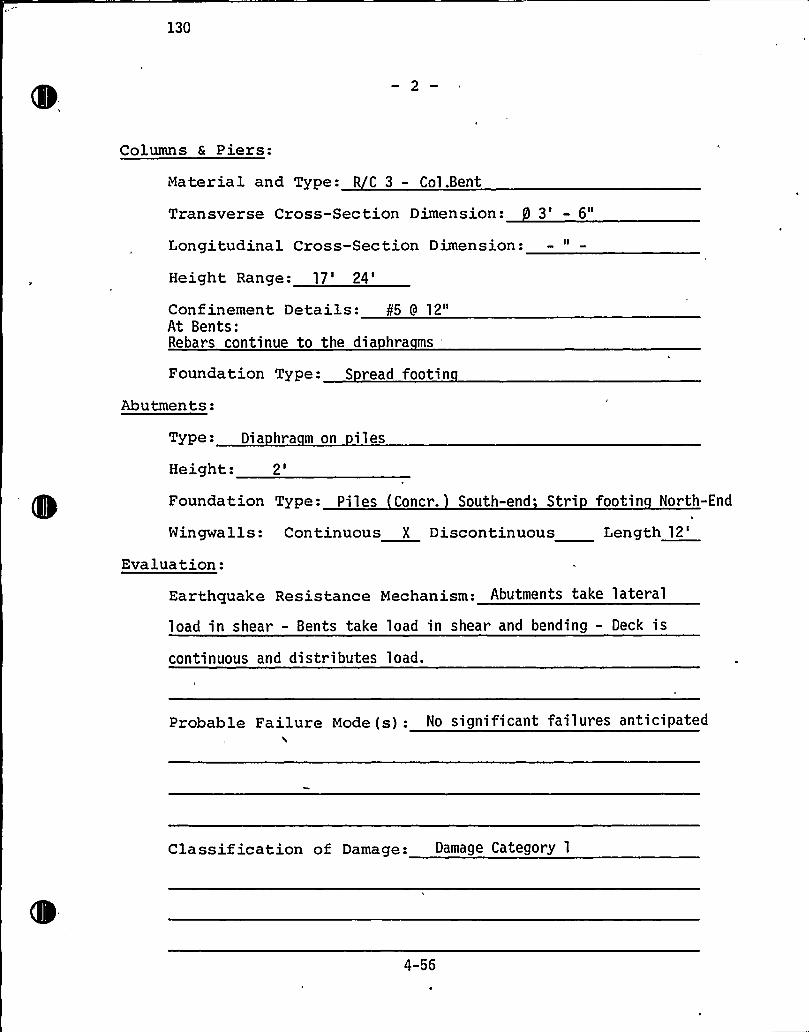
130
Columns 6 Piers:
Material and Type: R C 3 - Col.Bent
Transverse Cross-Section Dimension: 3' 6"
Longitudinal Cross-Section Dimension:
Height Range:17'4'onfinement.Details: 85 9 12"
At Bents:Rebars continue to the dia hra ms
Foundation Type: S read footin
Abutments:
Type- Dia hra m on iles
Height:2'oundationType: Piles Concr. South-end'tri footin North-End
Wingwalls: Continuous X Discontinuous Length12'valuation:
Earthquake Resistance Mechanism: Abutments take lateral
load in shear - Bents take load in shear and bending - Deck is
continuous and distributes load.
Probable Failure Mode(s): No significant failures anticipated
Classif ication of Damage: Damage Category 1
4-56

BRIDGE SEISMIC DATA FORM
General:
Name: Pismo Street Pedestrian U.C. 49 - 139
Location: Route 101, PM 16.8
Alignment: Straight X Skewed
Length:10'idth:
210'ear
Built: 1960
Seismically Retrof itted: Yes
Curved
No "
Site:Classif ication: Regular " Irregular
Peak Acceleration: 27 9 ~
Liquefaction Potential:Su erstructure:
Material and Type: Concrete Culvert
Number of Spans: 1
Continuous: Yes X No
Bearinces:
Type: None
Condition: Functioning Not Functioning
Restraint (Trans):
Restraint (Longit):
Bearing Height:
Support Length:
4-57
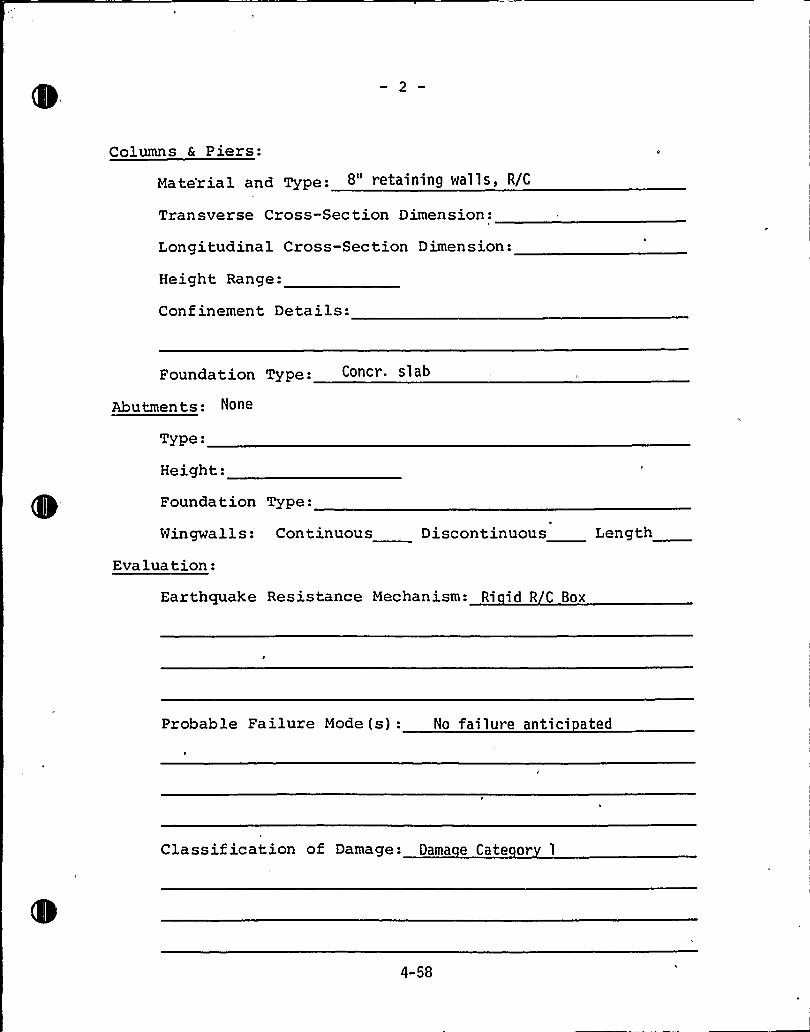
Columns & Piers:
Material and Type: 8" retaining walls, R/C
Transverse Cross-Section Dimension:
Longitudinal Cross-Section Dimension:
Height Range:
Conf inement Details:
Foundation Type: Concr. sl ab
Abutments: None
Type:
Height:
Foundation Type:
Wingwalls: Continuous Discontinuous Length
Evaluation:
Earthquake Resistance Mechanism: Ri id R C Box
Probable Failure Mode(s): No failure antici ated
Classif ication of Damage: Dama e Cate or 1
4-S8
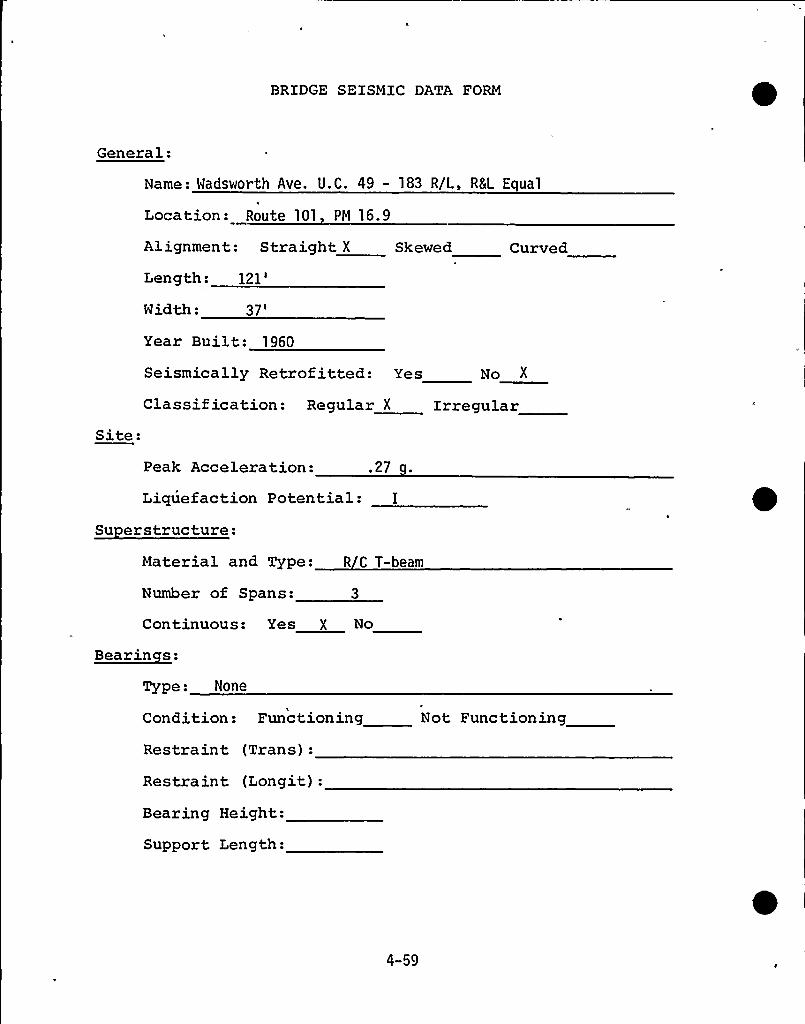
BRIDGE SEISMIC DATA FORM
General:
Name: Wadsworth Ave. U.C. 49 — 183 R/L, R&L Equal
Location: Route 101 PM 16.9
Alignment: Straight X
Length:121'idth:
37'ear
Built: 1960
Skewed Curved
Site:
Seismically Retrofitted: Yes No X
Classif ication: Regular X Irregular
Peak Acceleration: .27
Liquefaction Potential: I
Su erstructure:Material and Type: R C T-beam
Number of Spans: 3
Continuous: Yes X No
Bearinces:
Type: None
Condition: Functioning
Restraint (Trans):
Restraint (Longit):
Bearing Height:
Support Length:
Not Functioning
4-59
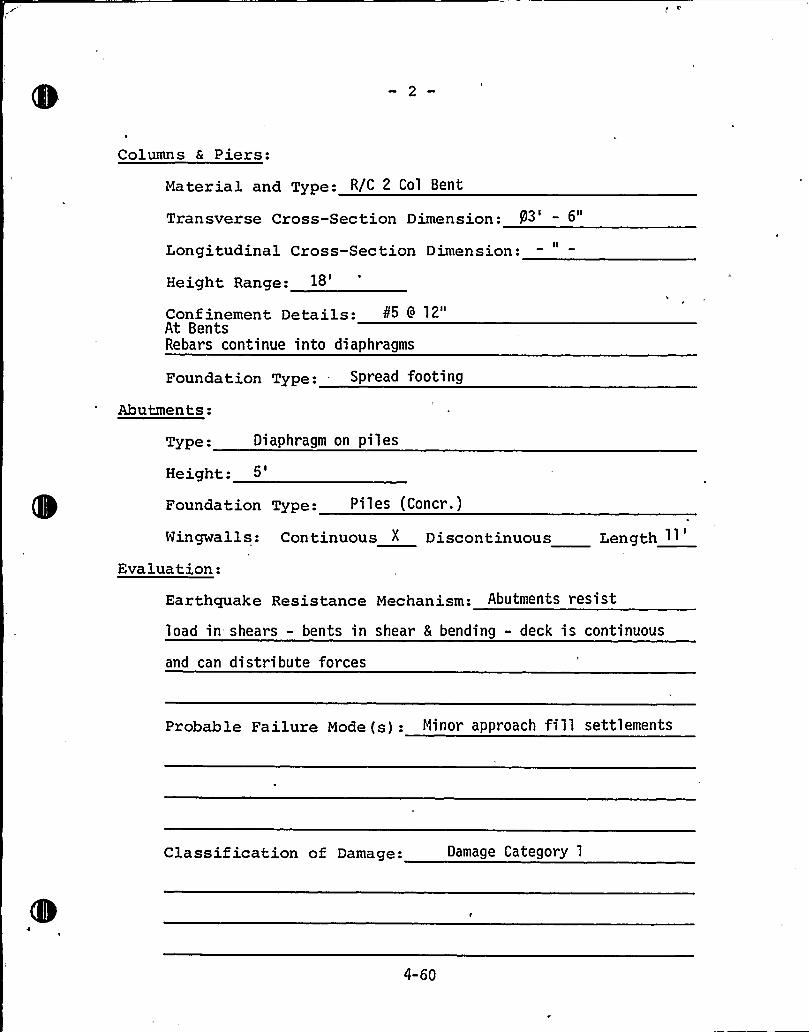
Columns 6 Piers:
Material and Type: R/C 2 Col Bent
Transverse Cross-Section Dimension: P3
Longitudinal Cross-Section Dimension:
Height Range:
Confinement Details:At BentsRebars continue into diaphragms
Foundation Type: Spread footing
Abutments:
Type: Diaphragm on piles
Height:
Foundation Type: Pi 1 es (Concr. )
Wingwalls: Continuous " Discontinuous Length 11
Evaluation:
Earthquake Resistance Mechanism: Abutments resist
load in shears - bents in shear 8 bending - deck is continuous
and can distribute forces
Probable Failure Mode(s): Minor approach fill settlements
Classification of Damage: Damage Category 1
4-60
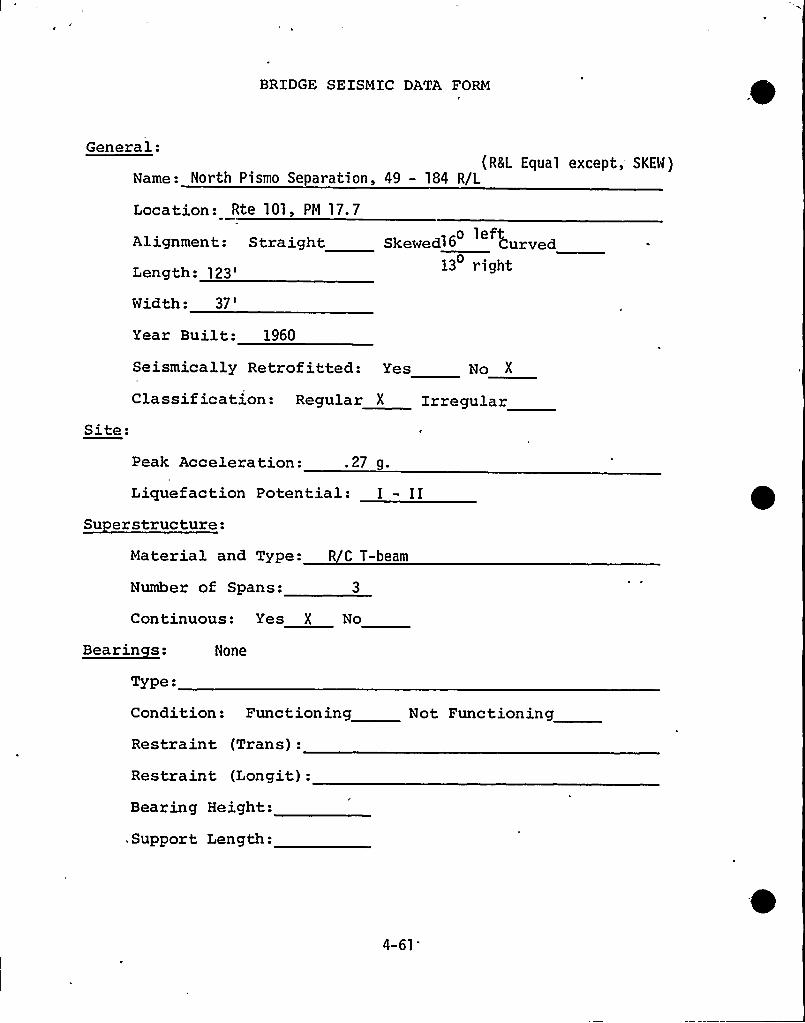
BRIDGE SEISMIC DATA FORM
General:(R&L Equal except, SKEW)
Name: North Pismo Separation, 49 - 184 R/L
Location: Rte 101, PM 17.7
Alignment: StraightLength:
123'idth:
37'
leftSkewed1S Curved13 t'ight
Year Built: 1960
Seismically Retrof itted: Yes
Classification: Regular X
Site:Peak Acceleration: .27 g.
No X
Irregular
Liquefaction Potential: I - IISu erstructure:
Material and Type: R C T-beam
Number of Spans: 3
Continuous: Yes X No
Bearinces: None
Type:
Condition: Functioning
Restraint (Trans):
Restraint (Longit):Bearing Height:
,Support Length:
Not Functioning
4-61 '
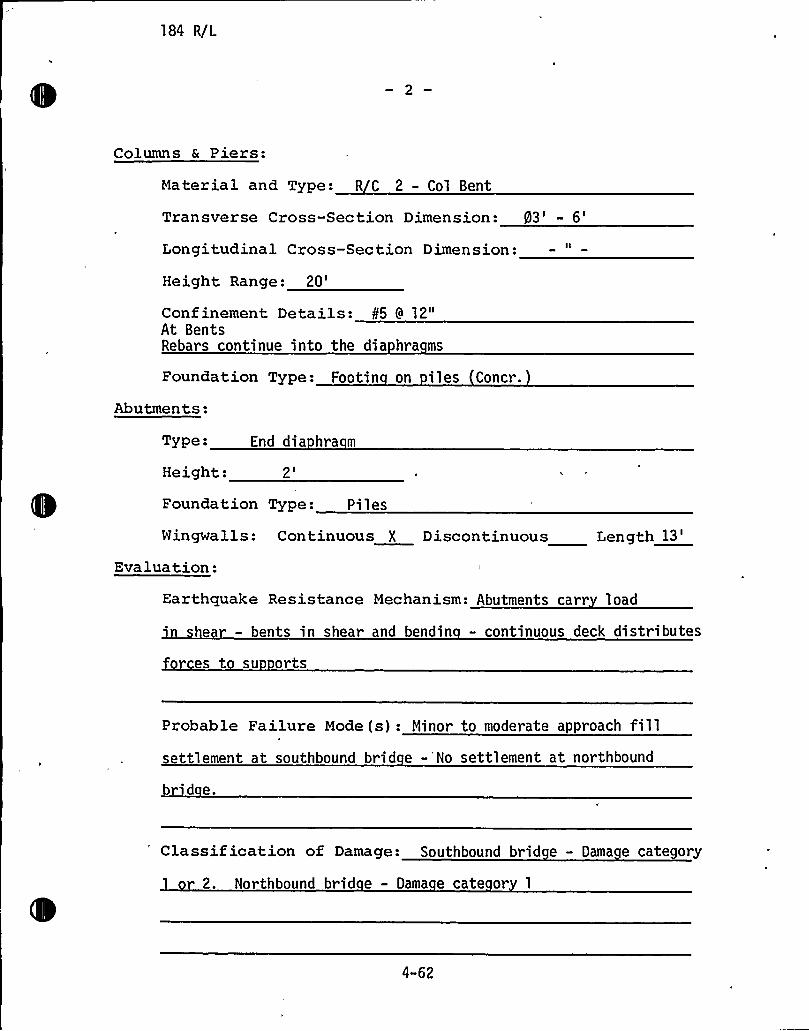
184 R/L
Columns & Piers:
Ma ter ia 1 and Type: R C 2 - Col Bent
Transverse Cross-Section Dimension: g3'
6'ongitudinalCross-Section Dimension:
Height Range:20'onfinementDetails: b5 9 12"
At BentsRebars continue into the dia hra ms
Foundation Type: Footin on i 1 es Concr.
Abutments:
Type:
Height:
End dia hra m
2'oundationType: Pi 1 es
Wingwalls: Continuous X Discontinuous Length13'valuation:
Earthquake Resistance Mechanism: Abutments carr load
hear — bents in shear and bendin - continuous deck distributes
rces to su orts
Probable Failure Mode (s): Minor to moderate approach fillsettlement at southbound brid e -'No settlement at northbound
brid e.
Classif ication of Damage: Southbound brid e - Dama e category
2. Northbound brid e - Dama e cate or 1
4-62
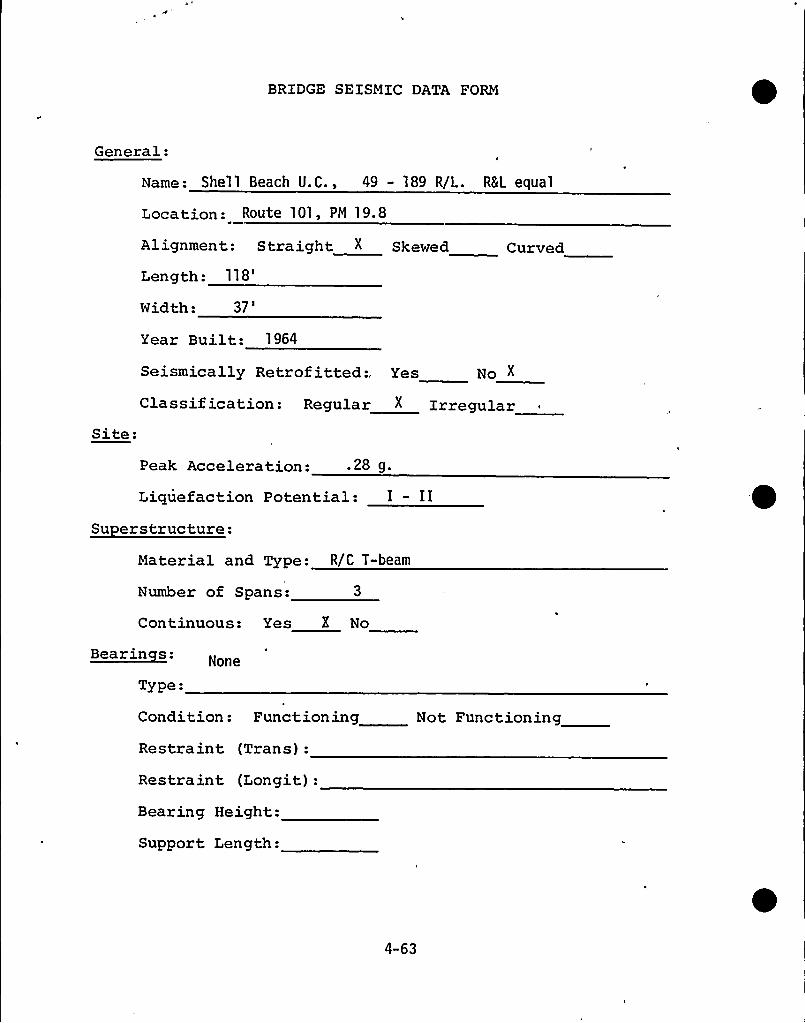
BRIDGE SEISMIC DATA FORM
General:
Name: Shell Beach U.C., 49 - 189 R/L. RSL equal
Location: Route 101, PM 19.8
Alignment: Straight I Skewed Cursed
Length:118'idth:
37
'earBuilt: 1964
Seismically Retrof itted:, Yes No I
Site:Classif ication: Regular I Irregular
Peak Acceleration: ~ 28 9 ~
Liquefaction Potential: I - IISu erstructure:
Material and Type: R/C T-beam
Number of Spans: 3
Continuous: Yes X No
Bearinces:
Type:
Condition: Functioning
Restraint (Trans):
Restraint (Longit):
Bearing Height:
Support Length:
Not Functioning
4-63
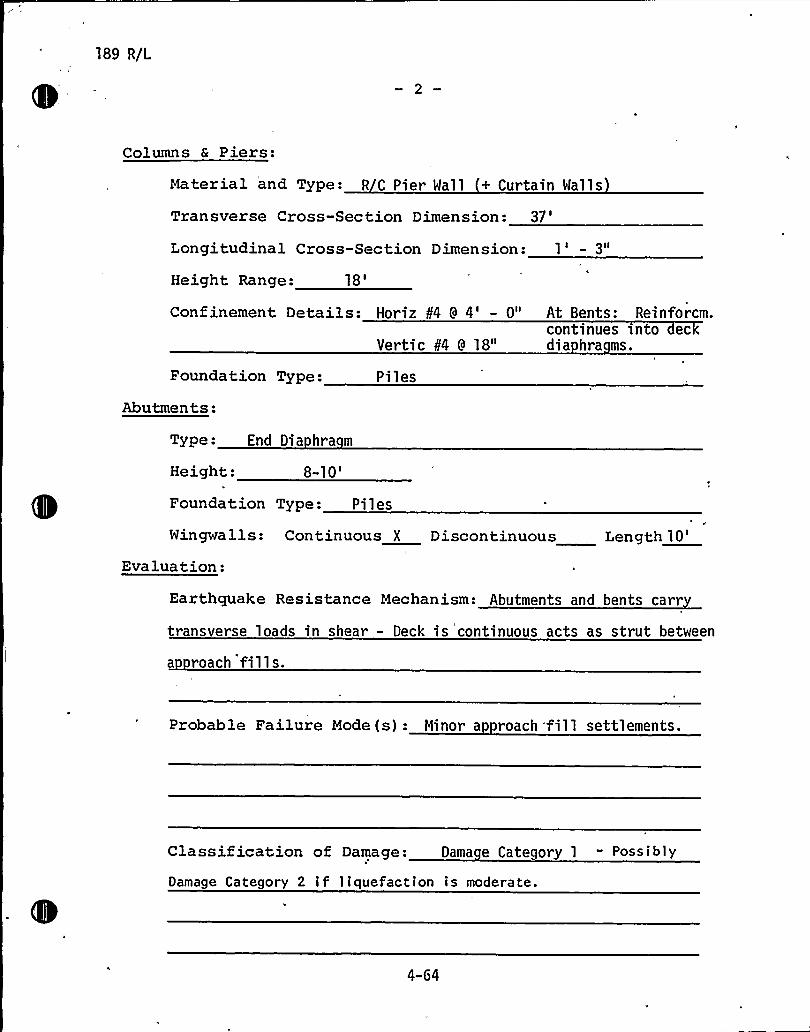
189 R/L
Columns 6 Piers:
Material and Type.-R C Pier Wall + Curtain Walls
Transverse Cross-Sec tion Dimension: 37
'ongitudinalCross-Section Dimension: 1I 3ll
Height Range:18'onfinementDetails: Horiz 84 9 4' 0" At Bents: Reinforcm.
Vertic k'4 9 18"continues snto ecdia hra ms.
Foundation Type:
Abutments:
Piles
Type: End Dia hra m
Height:8-10'oundation
Type: Piles
Wingwalls: Continuous X Discontinuous Length10'valuation:
Earthquake Resistance Mechanism: Abutments and bents carr
transverse loads in shear - Deck is continuous acts as strut between
a roach fills.
Probable Failure Mode (s): Minor a roach 'fill settlements.
Classification of Damage: Dama e Category 1- Possibly
Damage Category 2 if liquefaction is moderate.
4-G4
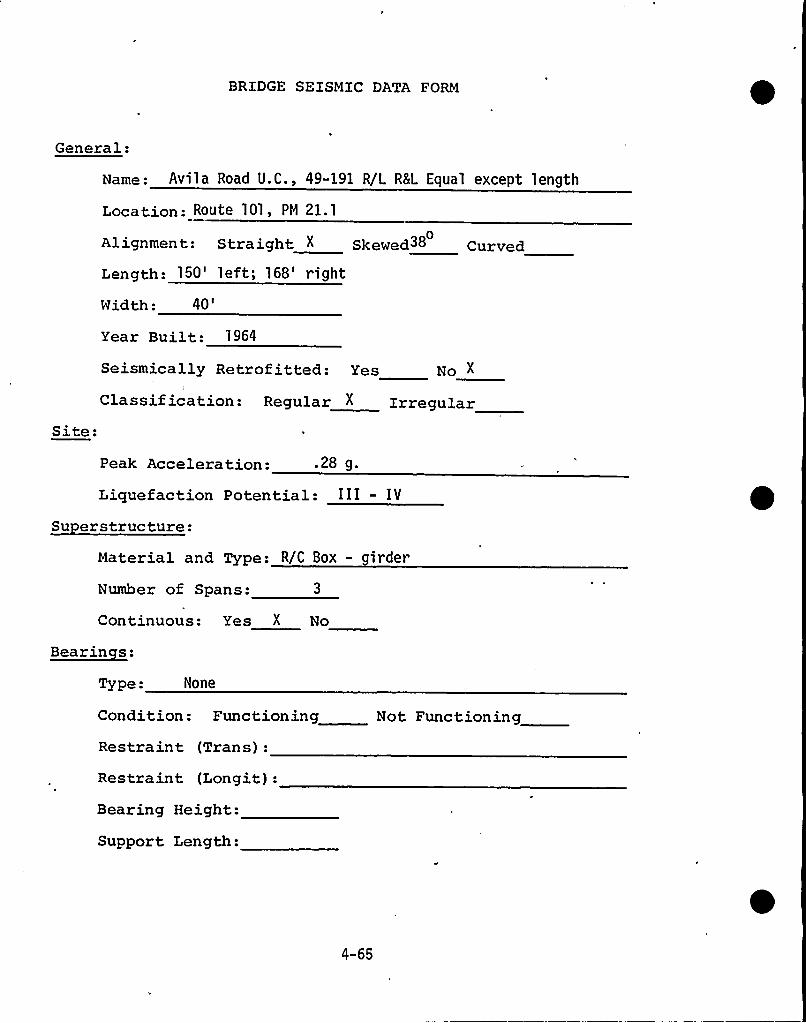
BRIDGE SEISMIC DATA FORM
General:
Name: Avila Road U.C., 49-191 R/L R&L Equal except length
Location: Route 101, PM 21.1
0Alignment: Straight I SkewedSS Curved
Length: 150'eft; 168'ightWidth:
40'ear
Built: 1964
Seismically Retrofitted: Yes Ro IClassification: Regular I Irregular
Site:
Peak Acceleration: 2B g ~
Liquefaction Potential: III - IV
Su erstructure:Material and Type: R/C Box - girder
Number of Spans: 3
Continuous: Yes X No
Bearinces:
Type: None
Condition: Functioning
Restraint (Trans):
Restraint (Longit):Bearing Height:
Support Length:
Not Functioning
4-65
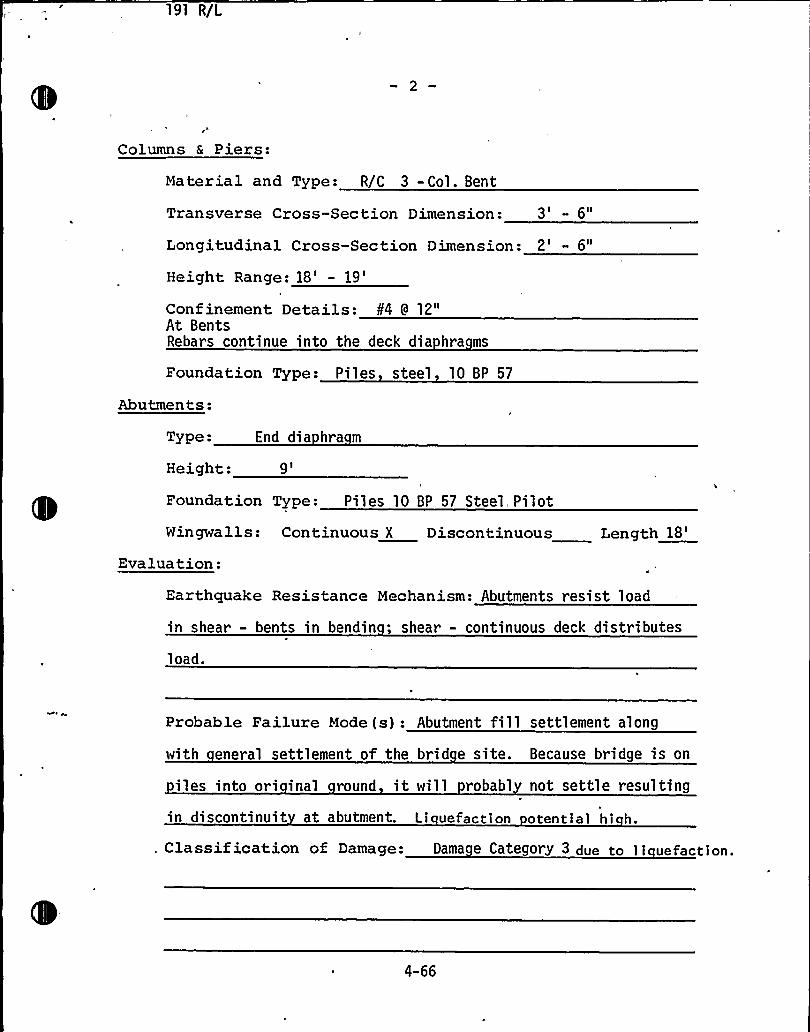
191 R/L
Columns E Piers:
Material and Type: R/C 3 -Col. Bent
Transverse Cross-Section Dimension: 3 I 6II
Longitudinal Cross-Section Dimension: 2' 6"
Height Range: 18'
19'onfinementDetails: ¹4 9 12"At BentsRebars continue into the deck dia hra ms
Foundation Type: Piles steel 10 BP 57
Abutments:
Type:
Height:
End dia hra m
9I
Foundation Type: Pil es 10 BP 57 Steel, Pilot
Wingwalls: Continuous X Discontinuous Length18'valuation:
Earthquake Resistance Mechanism: Abutments resist load
in shear - bents in bendin ; shear - continuous deck distributes
1 oad.
Probable Failure Mode(s): Abutment fill settlement along
with eneral settlement of the brid e site. Because bridge is on
iles into ori inal round it will robabl not settle resulting
in discontinuit at abutment. Li uefaction otentia1 hi h.
Classification of Damage: Dama e CategorY 3 due to 11 uefact1on.
4-66
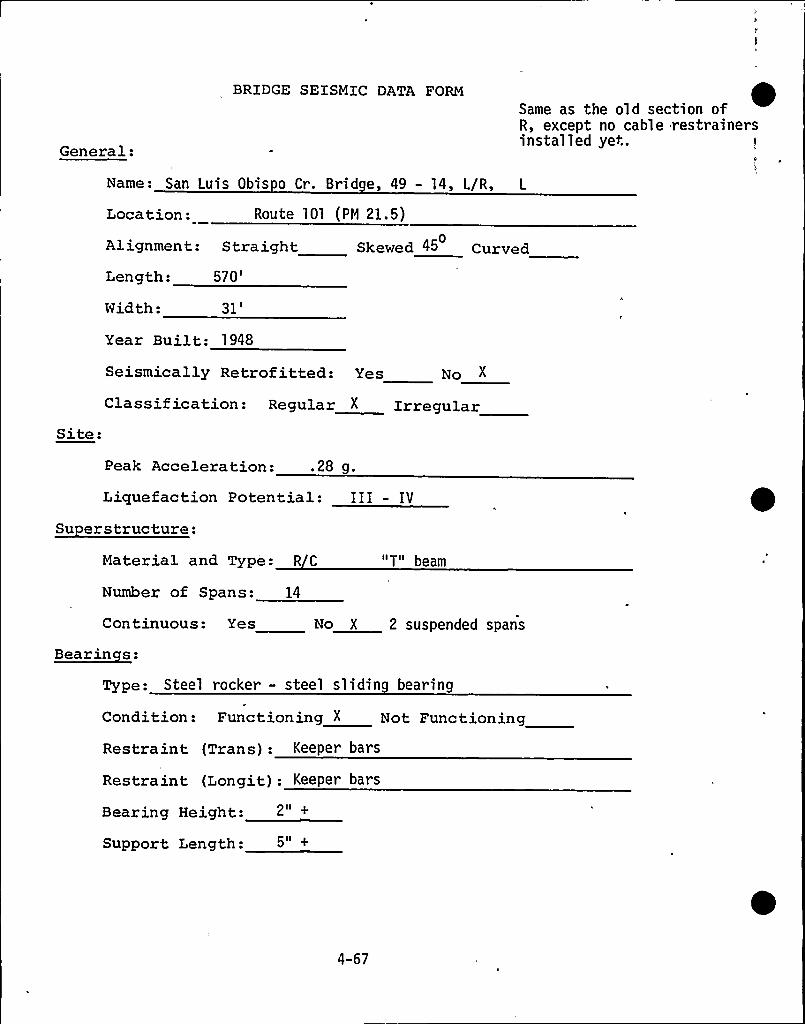
General:
BRIDGE SEISMIC DATA FORMSame as the old section ofR, except no cable restr ainersinstalled yet.
Name: San Luis Obis o Cr. Bridge, 49 - 14, L/R, L
Location: Route 101 (PM 21.5)0Alignatent: Straight Skewed 45 Curved
Length:570'idth:
31'ear
Built: 1948
Seismically Retrof itted: Yes No X
Site:Classification: Regular X Irregular
Peak Acceleration: ~ 28 g.
Liquefaction Potential: III - IV
Su erstructure:Material and Type: R C "T" beam
Number of Spans: 14
Continuous: Yes
Bearinces:
No X 2 suspended spans
Type: Steel rocker - steel sliding bearing
Condition: Functioning X Not Functioning
Restraint (Trans): Keeper bars
Restraint (Longit): Keeper bars
Bearing Height:
Support. Length:
2 II
5 I I
4-67
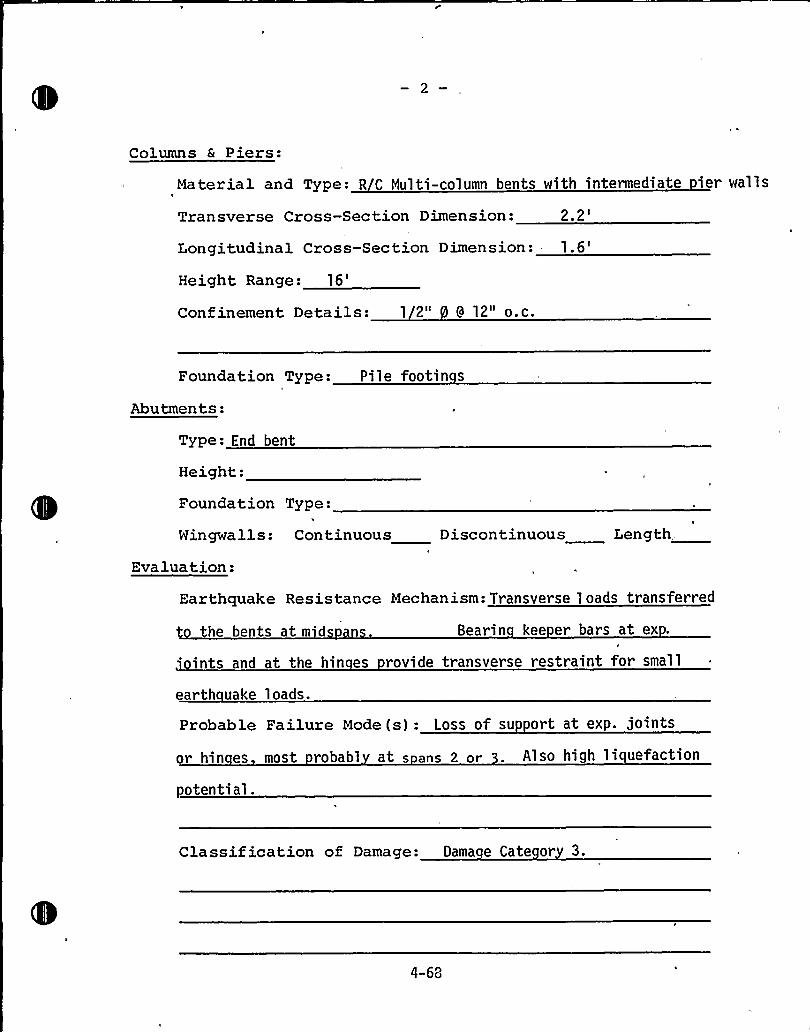
Columns & Piers:
Material and Type: R C Multi-column bents with intermediate ier walls
Transverse Cross-Section Dimension:2.2'ongitudinalCross-Section Dimension: -
1.6'eight
Range:16'onfinementDetails: 1 2" 9 12" o.c.
Foundation Type: Pile footin s
Abutments:
Type: End bent
Height:
Foundation
Wingwalls:
Type:
Continuous Discontinuous Length,
Evaluation:
Earthquake Resistance Mechanism: Transverse 1 pads transferred
the bents at m d - Bearin kee er bars at ex .
ints and at the hin es rovide transverse restraint for small
earth uake loads.
probable Failure Mode (s): Loss of su ort at exp. joints
or hin es most robabl at s ans 2 or . Also high liquefaction
potential.
Classif ication of Damage: Dama e Cate or 3.
4-68
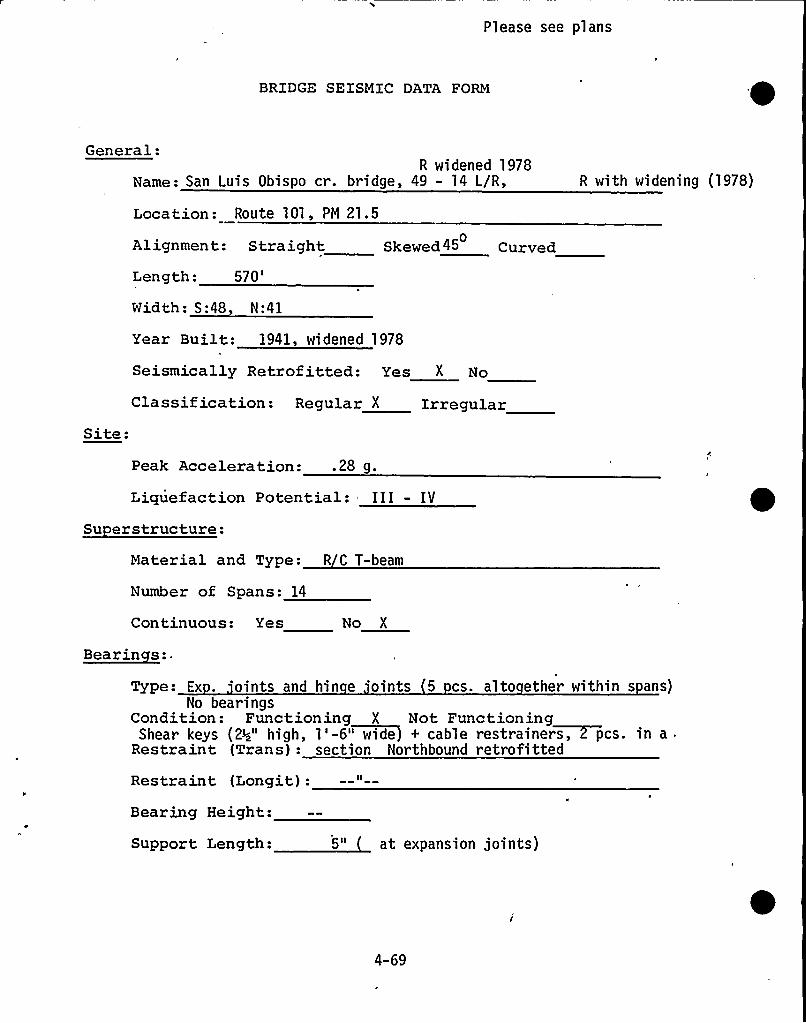
Please see plans
BRIDGE SEISMIC DATA FORM
General:R widened 1978
Name: San Luis Obispo cr. bridge, 49 - 14 L/R,
Location: Route 101, PN 21.5
Alignment: Straight Skewed46 Curved0
Length:570'idth:
S:48, N:41
Year Built: 1941, widened 1978
Seismically Retrofitted: Yes à No
Classification: Regular I IrregularSite:
Peak Acceleration: .28 g.
Liquefaction Potential: III - IV
Su erstructure:Material and Type: R C T-beam
R with widening (1978)
Number of Spans: 14
Continuous: Yes No X
Bearinces:.
Type: Ex . pints and hin e pints 5 cs. alto ether within s ans)No bearings
Condition: Functioning X Not FunctioningShear keys (2>" high, 1'-6" wide) + cable restrainer~a, pcs. in a
Restraint (Trans): section Northbound retrofi tted
Restraint (Longit):
Bearing Height:
Support Length: 5" at expansion joints)
4-69
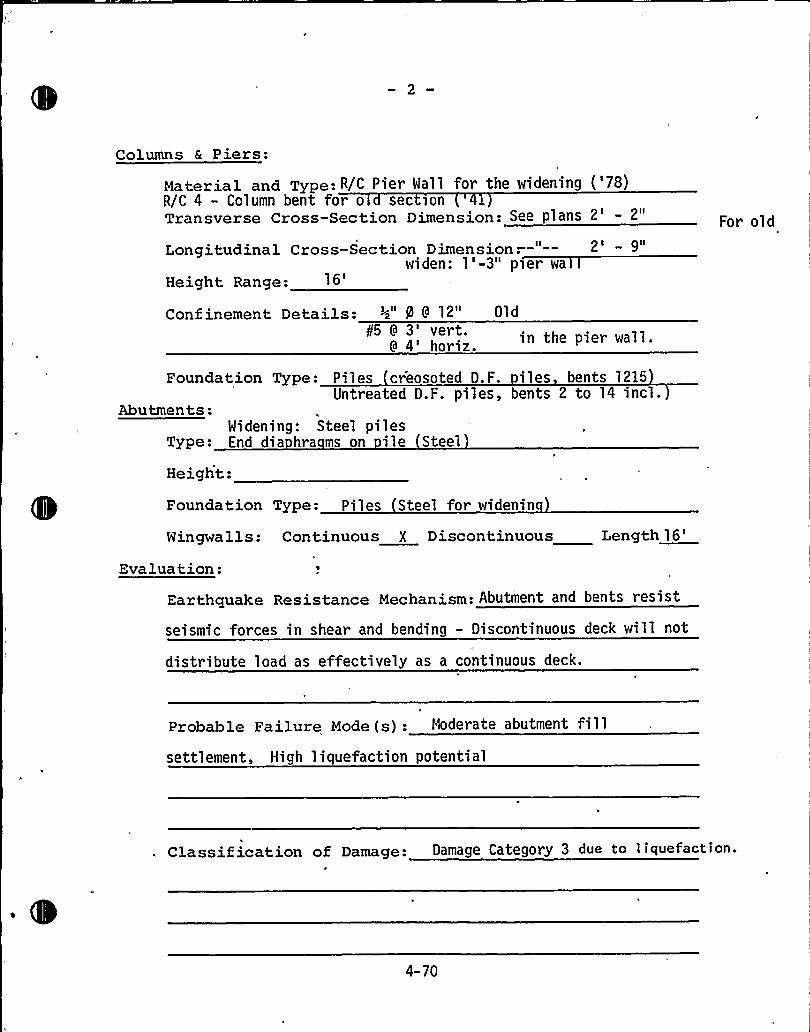
Columns 6 Piers:
Material and Type: R/C Pier Wall for the widening ('78)R/C 4 - Column bent for o sec ionTransverse Cross-Section Dimension:.See plans 2' 2"
Longitudinal Cross-Section Dimension.-- -- 2 - 9widen: 1'-3" pier wa
Height Range:
Confinement Details: 3~" 0 9 12" Oldk'5 9 3'n the pier wall.
9 4'oriz.Foundation Type: Pi 1 es cr'eosoted D.F. iles bents 1215
Untreated D.F. piles, bents 2 to 14 incl.Abutments:
Widening: Steel pilesType: End dia hra ms on ile Steel
Height:
Foundation Type: Piles Steel for widenin
Wingwalls: Continuous X Discontinuous Length16'valuation:
For old
Earthquake Resistance Mechanism: Abutment and bents resist
seismic forces in shear and bending - Discontinuous deck will not
distribute load as effectively as a continuous deck.
Probable Failure Mode (s): Moderate abutment fillsettlement, High liquefaction potential
Classification of Damage: Damage Category 3 due to liquefaction.
4-70
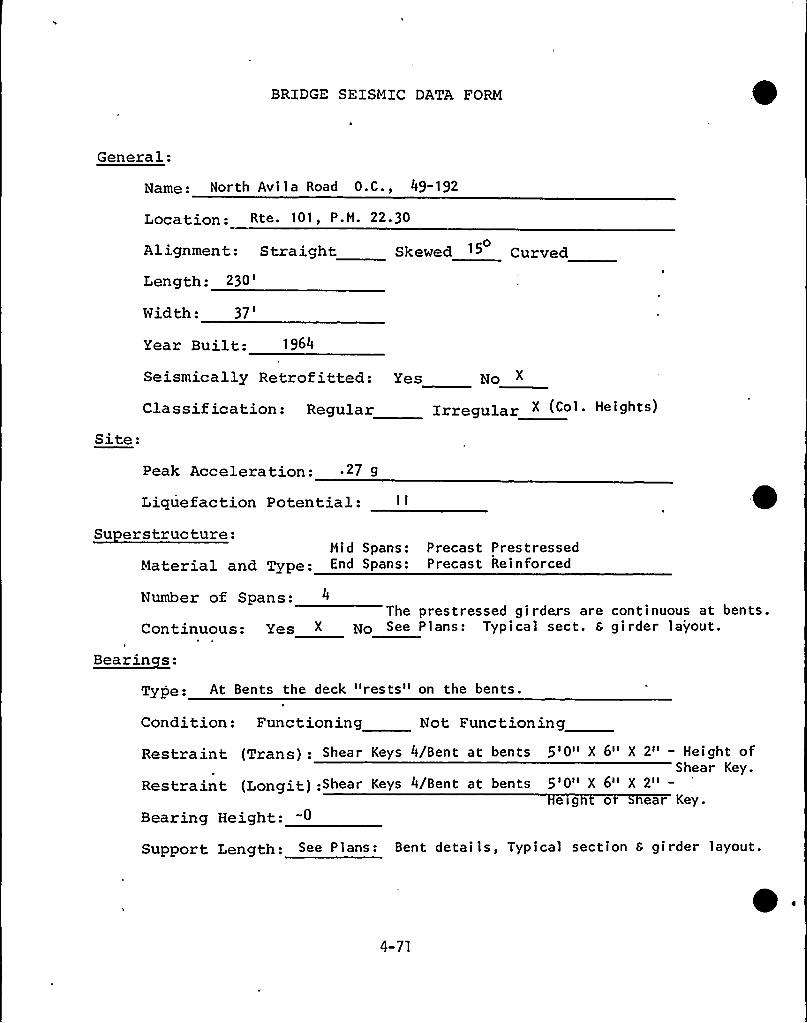
BRIDGE SEISMIC DATA FORM
General:
Name: North Avila Road O.C., 49-192
Location: Rte. 101, P.M. 22.30
0Alignment: Straight Skewed ~S Curved
Length:230'idth:
37'ear
Built: 1964
Site:
Seismically Retrofitted: Yes No
Classification: Regular irregular
Peak Acceleration: 27 g
Liquefaction Potential:Su erstructure:
Mid Spans:Material and Type: End Spans:
Precast PrestressedPrecast Reinforced
Number of Spans:The prestressed girders are continuous at bents.
Continuous: Yes X No See Plans: Typical sect. 6 girder layout.
Bearinces:
Type: At Bents the deck "rests" on the bents.
Condition: Functioning Not Functioning
Restraint (Trans): Shear Keys 4/Bent at bents
Restraint (Longit):Shear Keys 4/Bent at bents
Bearing Height:
5'0" X 6" X 2" - Height ofShear Key.
5'0" X 6" X 2"—e<g o ear Key.
Support Length: See Plans: Bent details, Typical section 8 girder layout.
4-71
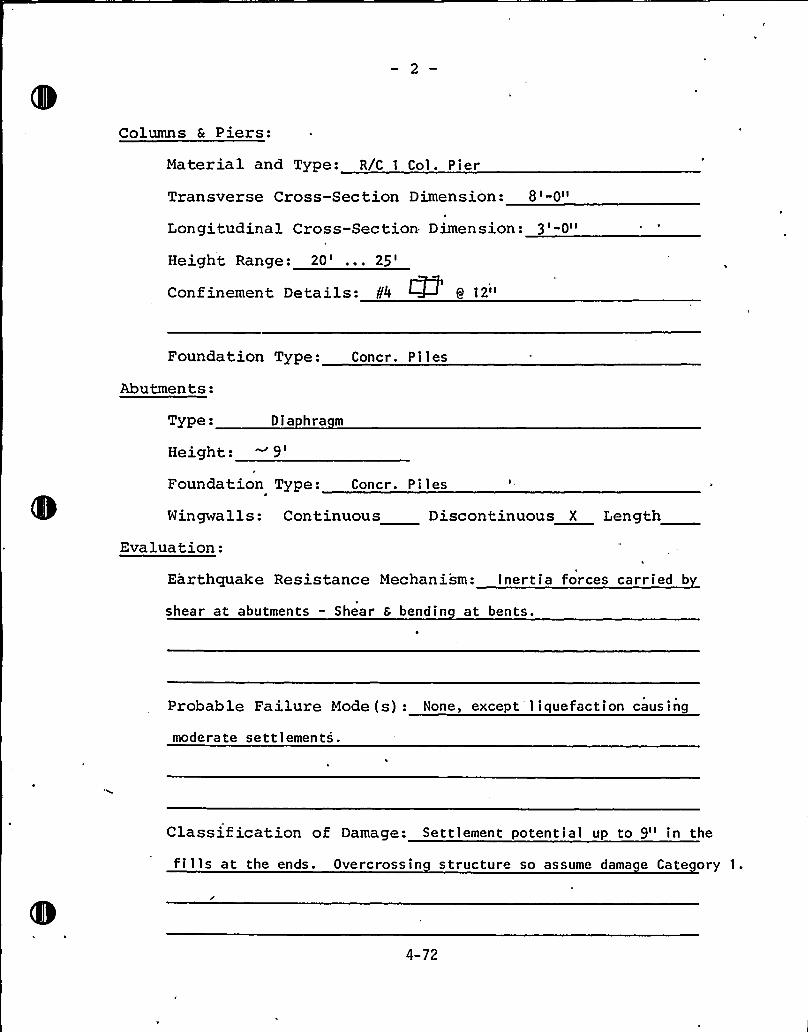
Columns & Piers:
Material and Type: R/C 1 Col . P i er
Transverse Cross-Section Dimension: 8'-0"
Longitudinal Cross-Section Dimension: 3'-0"
Height Range: 20'..25'onfinementDetails: ¹4 W 8 12"
Foundation Type: Goner. Pi les
Abutments:
Type: Dia hra m
Height:9'oundationType: Goner. Piles
Wingwalls: Continuous Discontinuous X Length
Evaluation:I
Earthquake Resistance Mechanism: inertia forces carried b
shear at abutments - Shear 8 bendin at bents.
Probable Failure Mode(s): None, except liquefaction causing
moderate settlements.
Classification of Damage: Settlement potential up to 9" in the
fills at the ends. Overcrossin structure so assume dama e Cate ory l.
4-72
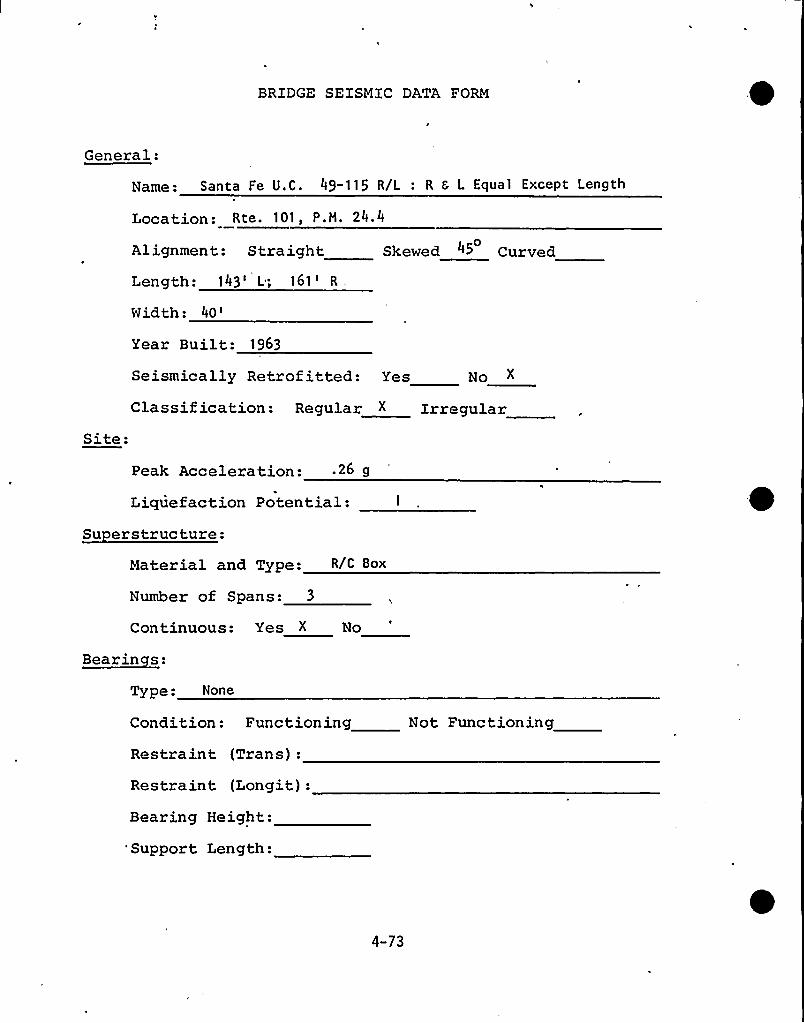
BRIDGE SEISMIC DATA FORM
General:
Name: Santa Fe U.C. 49-115 R/L: R 6 L Equal Except Length
Location: Rte. 101, P.M. 24.4
Alignment: S tra ightLength: 143' ~ 161',Width:
40'ear
Built: 1963
0Skewed 4> Curved
Site:
Seismically Retrofitted: Yes No X
Classif ication: Regular X Irregular
Peak Acceleration: .26 9
Liquefaction Potential:Su erstructure:
Material and Type: R/C Box
Number of Spans: 3
Continuous: Yes X No
Bearinces:
Type: None
Condition: Functioning
Restraint (Trans):
Restraint. (Longit):
Bearing Height:
'Support Length:
Not Functioning
4-73
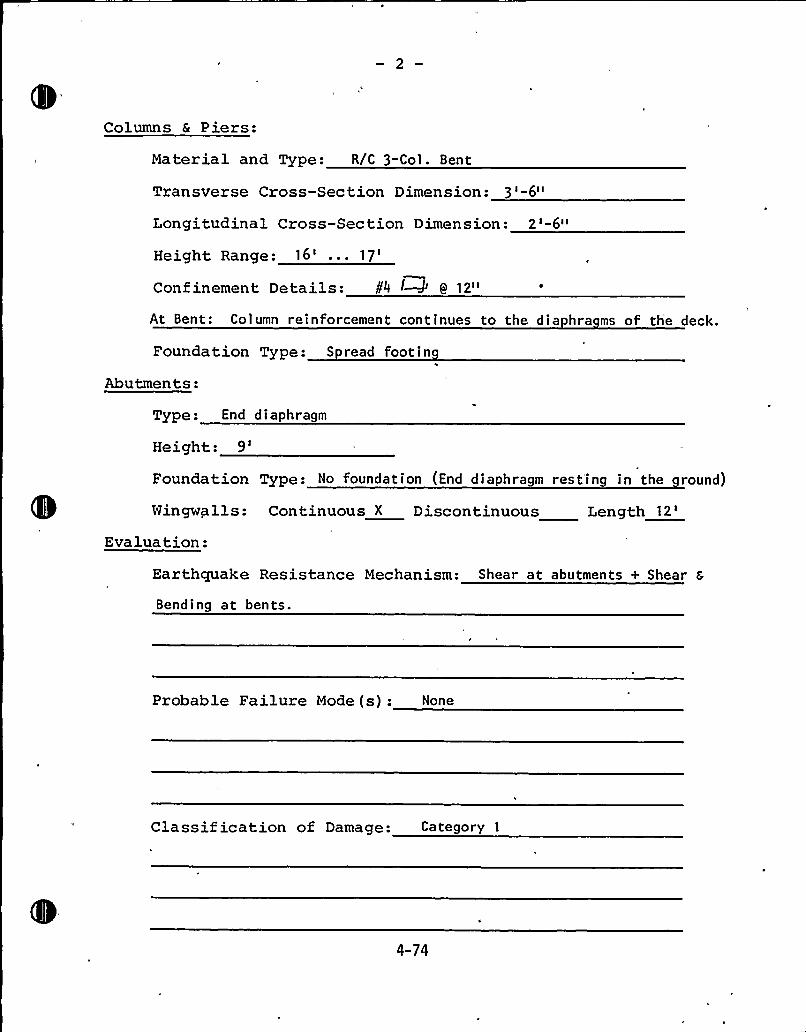
Columns 6 Piers:
Material and Type: R/C 3-Co i . Bent
Transverse Cross-Section Dimension: 3'-6"
Longitudinal Cross-Section Dimension: 2'-6"
Height Range: 16'..17'onfinementDetails: ¹4 IW 9 12"
At Bent: Coiumn reinforcement continues to the dia hra ms of th'e deck.
Foundation Type: S read foot i n
Abu tmen ts:Type: End diaphragm
Height:9'oundation Type: No foundation (End diaphragm rest'ing in the round)
Wingwalls: Continuous X Discontinuous Length12'valuation:
Earthquake Resistance Mechanism: Shear at abutments + Shear 8
Bending at bents.
Probable Failure Mode (s): None
Classif ication of Damage: Category 1
4-74
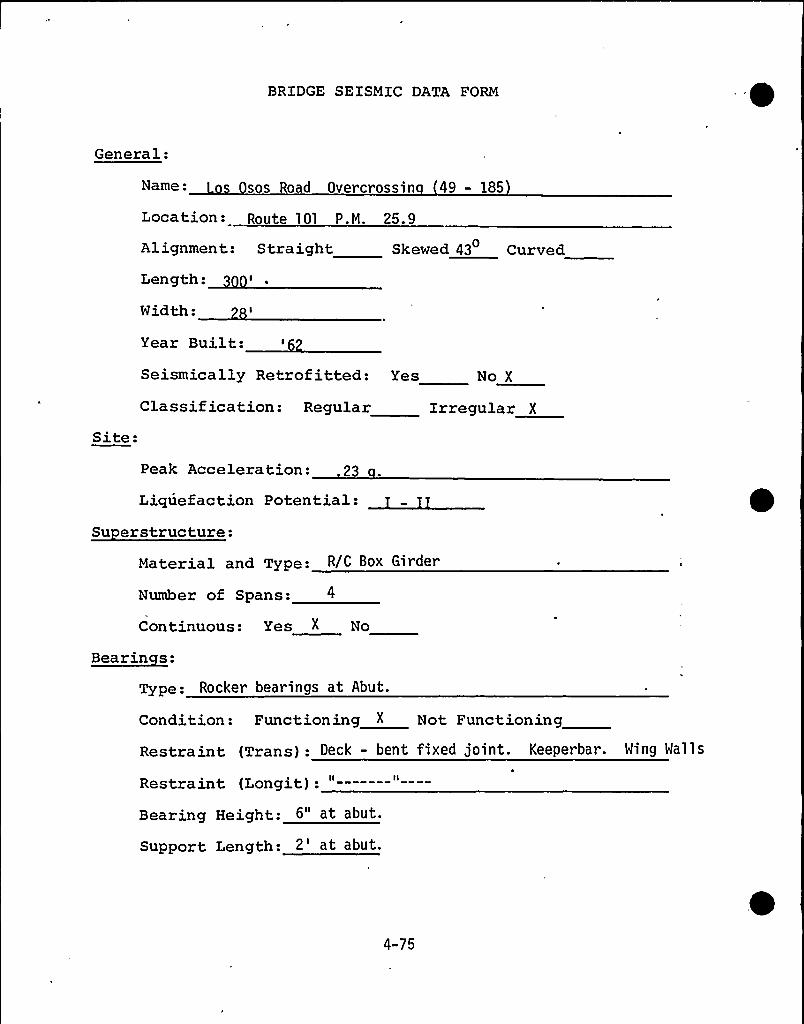
BRIDGE SEISMIC DATA FORM
General:
Name: s s Road Overcrossin 49 - 185
Location: Route 1Ol p.M. 25. 9
Alignment: Straight Skewed 43 Curved
Length:
Width:
Site:
Seismically Retrof itted: Yes
Classification: Regular
No X
Irregular X
Peak Acceleration: .23
Liquefaction Potential:Su erstructure:
Material and Type: R/C Box Girder
Number of Spans: 4
Continuous: Yes X No
Bearinces:
Type: Rocker bearings at Abut.
Condition: Functioning X Not Functioning
Restraint (Trans): Deck - bent fixed joint. Keeperbar. Wing Walls
Restraint (Longit): "--—---"——
Bearing Height: 6" at abut.
Support Length: 2't abut.
4-75
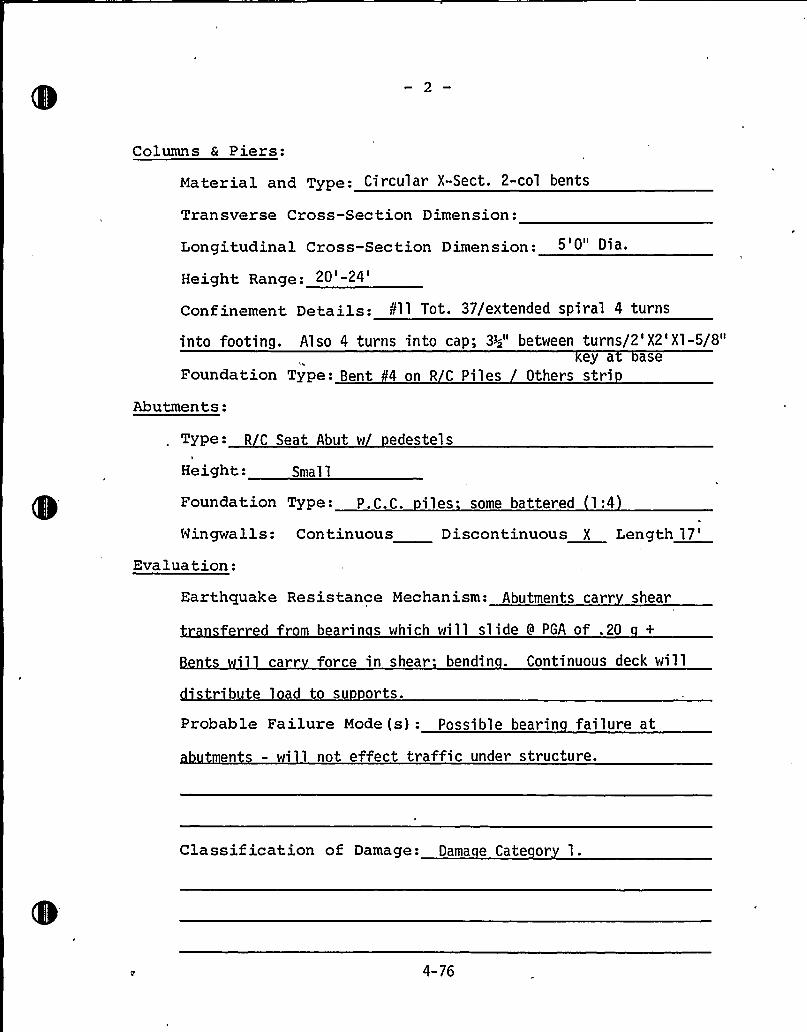
Columns 6 Piers:
Material and Type: Circular X-Sect. 2-col bents
Transverse Cross-Section Dimension:
Longitudinal Cross-Section Dimension:
Height Range:2o'-24'onfinement
Details: 811 Tot. 37/extended spiral 4 turns
into footing. Also 4 turns into cap; 33;" between turns/2'X2'Xl-5/8"ey a ase
Foundation Type: Bent 4 on R C Piles Others stri
Abutments:
Type - R C Seat Abut w edestel s
Height: Smal 1
Foundation Type: P.C.C. iles. some battered 1:4
Wingwalls: Continuous Discontinuous X Length17'valuation:
Earthquake Resistance Mechanism: Abutments carr shear
ed f om bearin s which will slide 9 PGA of .20 +
il carr for ce in shear bendin . Continuous deck will'b te 1 ad to su orts.
Probable Failure Mode (s): Possible bearin failure at
en - i 1 not effect traffic under structure.
Classif ication of Damage: Dama e Cate or 1.
4-76
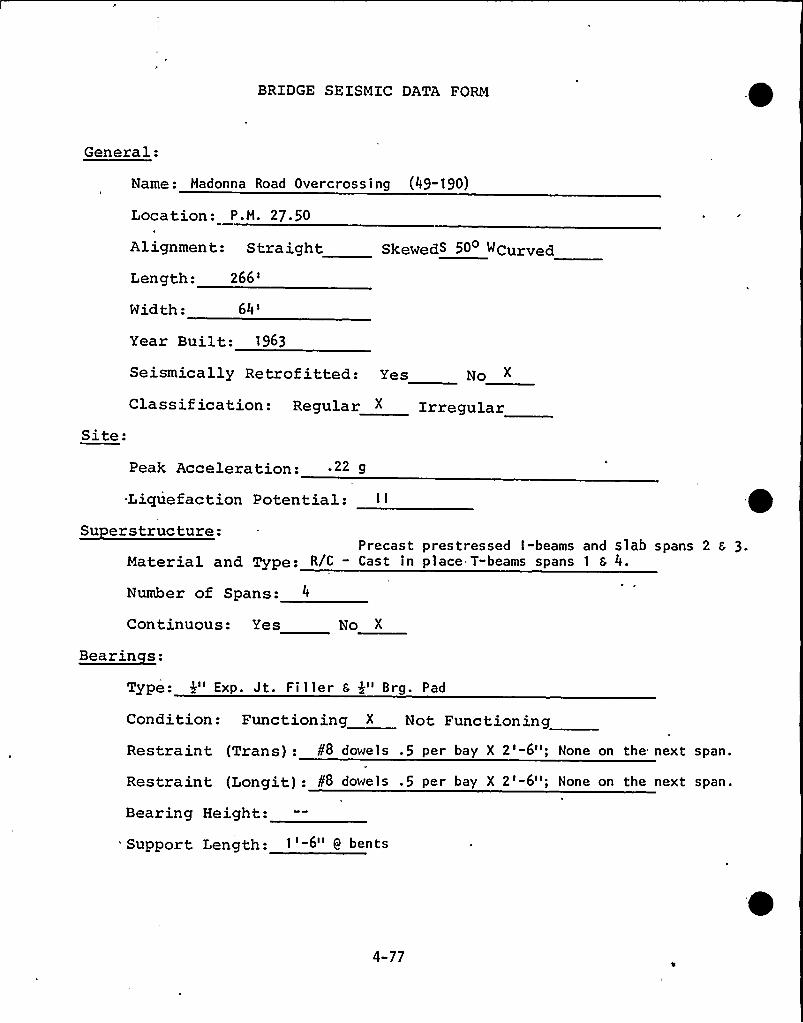
BRIDGE SEISMIC DATA FORM
General:
Name: Hadonna Road Overcross ing (49-190)
Location: P.H. 27.50
Alignment: Straight Skeweda 500 Wcurved
Length:266'idth:
64'ear
Built: 1963
Seismically Retrofitted: Yes No
Classification: Regular X IrregularSite:
Peak Acceleration: .22 g
Liquefaction Potential:Su erstructure:
Precast prestressed I-beams and s1ab spans 2 8 3.Material and Type: R/C - Cast in place T-beams spans 1 6 4.
Number of Spans: 4
Continuous: Yes No X
Bearinces:
Type: 4" Exp. Jt. Filler S 4" Brg. Pad
Condition: Functioning X Not FunctioningRestraint (Trans): ¹8 dowel s .5 per bay X 2'-6"; None on the next span.
Restraint (Longit): ¹8 dowels .5 per bay X 2'-6"; None on the next span.
Bearing Height:
'Support Length: 1'-6" 9 bents
4-77
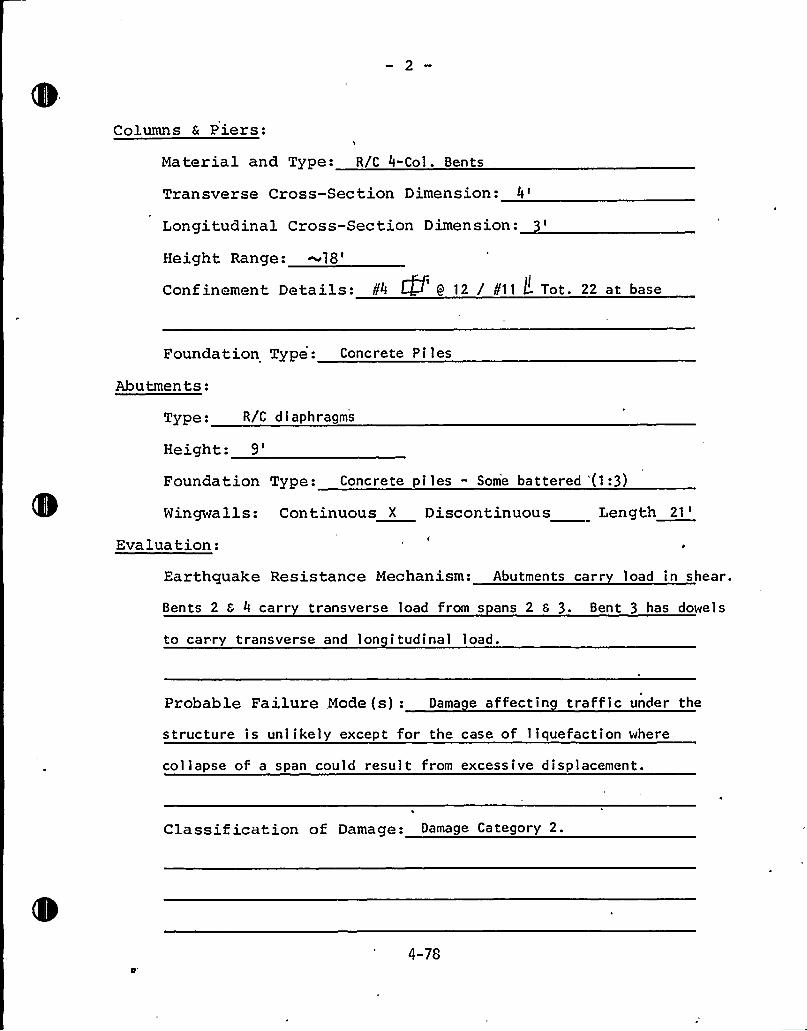
Columns 6 Piers:
Material and Type: R/C 4-Col . Bents
Transverse Cross-Section Dimension:
4'ongitudinalCross-Section Dimension:
Height Range:~18'onf
inement Details: ¹4 ~ 9 12 / ¹11 L Tot. 22 at baseII
Foundation Type: Concrete Piles
Abutments:
Type: R/C diaphragms
Height:9'oundation Type: Concrete piles - Some battered '(1:3)
Wingwalls: Continuous X Discontinuous Length 21
'valuation:
Earthquake Resistance Mechanism: Abutments carr load in shear.
Bents 2 8 4 carr transverse load from s ans 2 L 3. Bent 3 has dowel s
to carry transverse and ion itudinal load.
Probable Failure Mode(s): Dama e affecting traffic under the
structure is unlikely except for the case of liquefaction where
collapse of a span could result from excessive displacement.
Classif ication of Damage: Damage Category 2.
4-78
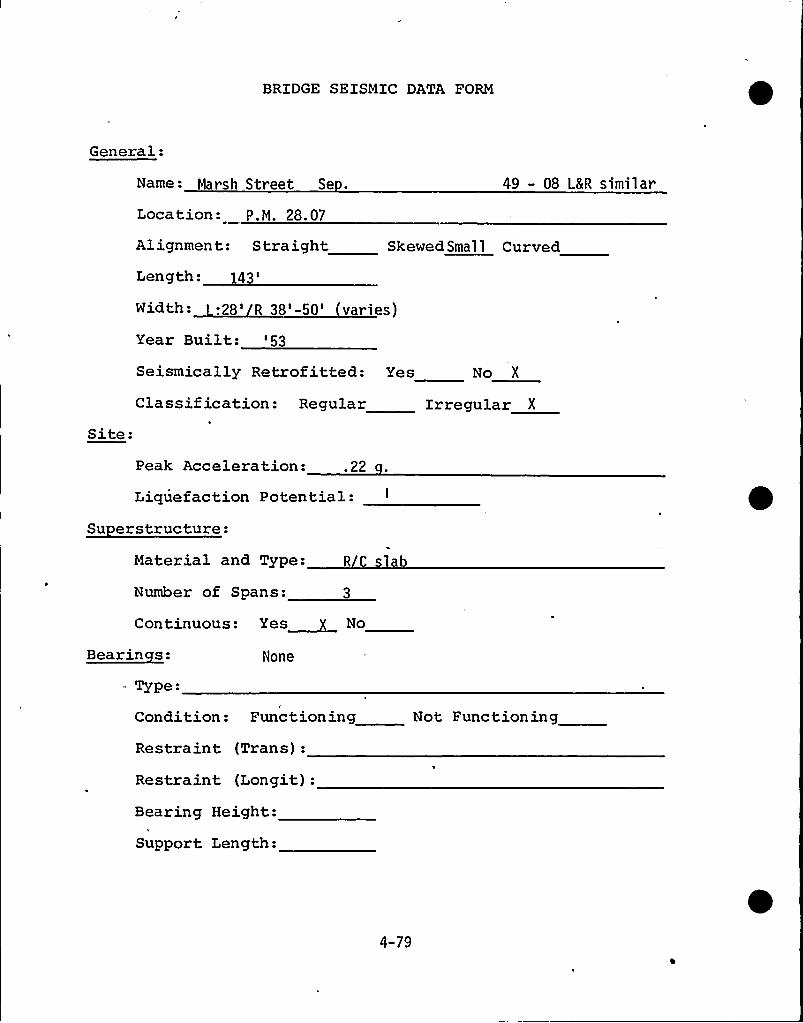
BRIDGE SEISMIC DATA FORM
General:
Name- Marsh Street Se .
Location: P.M. 28.07
49 - 08 LSR similar
Alignment: StraightLength:
3'kewedSmal1 Curved
Width-:28'8'50'ari es)
Year Built: '53
Seismically Retrof itted:Classif ication: Regular
Site:
Yes No X
Irregular X
Peak Acceleration: . 22
Liquefaction Potential:Su erstructure:
Material and Type: R C slab
Number of Spans: 3
Continuous: Yes~ No
Bearinces:
Type:
None
Condition: Functioning
Restraint (Trans):
Restraint (Longit):
Bearing Height:
Support Length:
Not Functioning
4-79
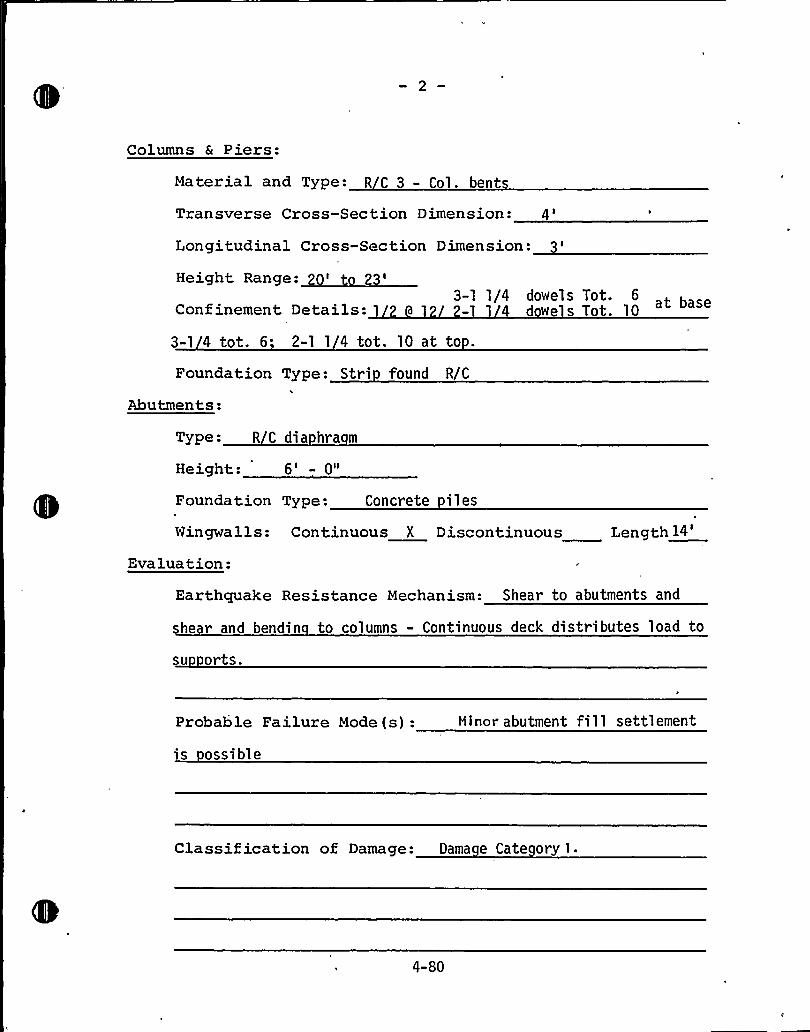
Columns & Piers:
Material and Type: R C 3 - Col. bent
Transverse Cross-Section Dimension:
4'ongitudinalCross-Section Dimension:
RRR2Confinement Details: 1
3-1 1/4 dowel s Tot. 62-1 1 4 dowe s Tot. 10
3-1 4 tot. 6 2-1 1 4 tot. 10 at to .
Foundation Type: Stri found R/C
Abutments:
Type- R C dia hra m
Height: 6' 0"
Foundation Type: Concrete iles
Wingwalls: Continuous X Discontinuous Length14'valuation:
Earthquake Resistance Mechanism: Shear to abutments and
shear and bendin to columns - Continuous deck distributes load to
su orts.
Probable Failure Mode (s): Hinor abutment fill settlement
is ossible
Classif ication of Damage: Dama e Cate ory 1 ~
4-80

BRIDGE SEISMIC DATA FORM
General:
Name: Stenner Creek Cul vert 49-146
Location:
Alignment: StraightLength:
230'idth: 25't.20'ear
Built: '77
0Skewed H curved
Seismically Retrof itted: Yes
Classif ication: Regular
No
IrregularSite:
Peak Acceleration: .21 .
Liquefaction Potential: I - IISuperstructure: None
Material and Type:
Number of Spans:
Continuous: Yes
Bearinces: None
Type:
Condition: Functioning
Restraint (Trans):
Not Functioning
Restraint (Longit):Bearing Height:
Support Length:
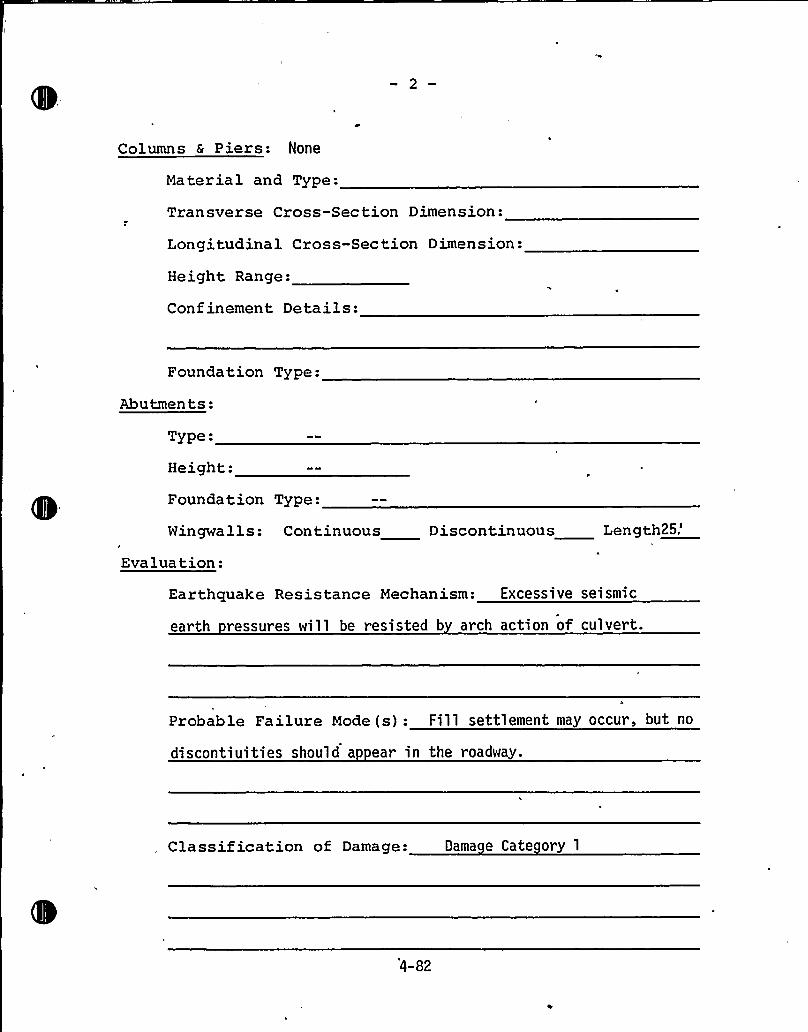
Columns & Piers: None
Material and Type:
Transverse Cross-Section Dimension:
Longitudinal Cross-Section Dimension:
Height Range:
Conf inement Details:
Foundation Type:
Abutments:
Type:
Height:
Foundation Type:.
Wingwa 1ls:
Evaluation:
Continuous Discontinuous
Length25,'arthquake
Resistance Mechanism: Excessive seismic
earth ressures will be resisted b arch action of culvert.
Probable Failure Mode (s): Fill settlement may occur, but no
discontiuities should a ear in the roadway.
Classification of Damage: Dama e Cate ory 1
4-82
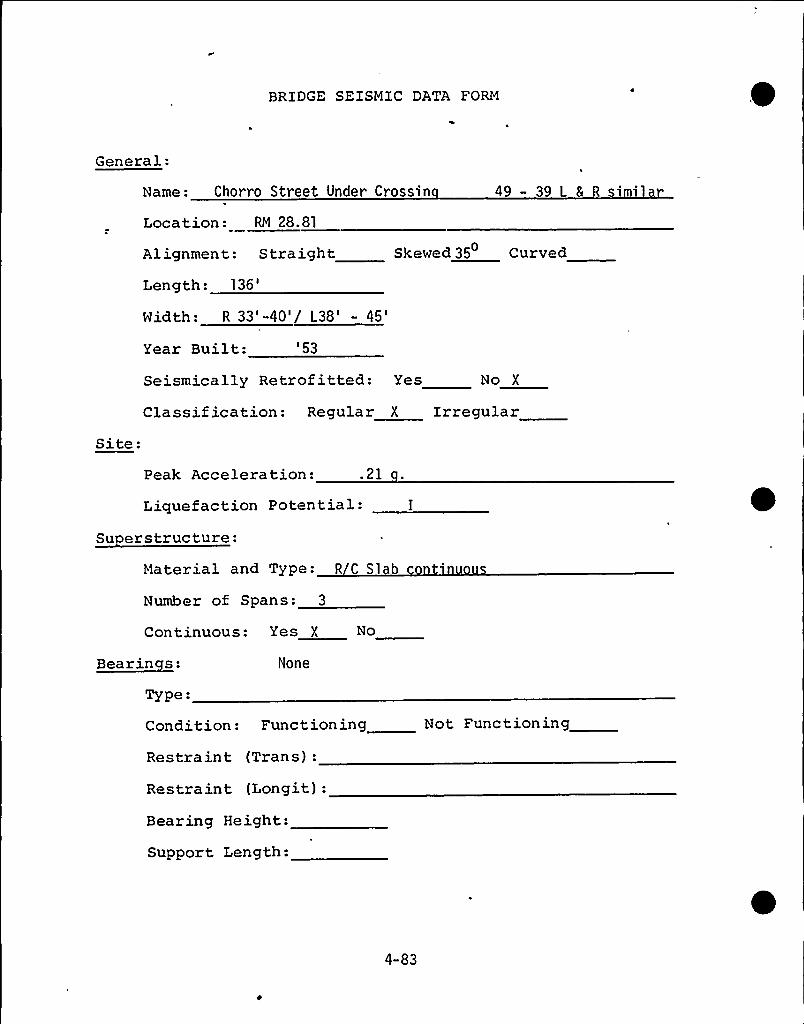
BRIDGE SEISMIC DATA FORM
General:
Name: Chorro Street Under Crossin 49 - 39 L & R simil
Loca tion: RM 28. 81
Alignment: Straight
Length:136'idth:
R 33'-40'/ L38'
45'kewed35 Curved
Year Built: '53
Site:
Seismically Retrofitted: Yes No X
Classif ication: Regular X Irregular
Peak Acceleration: .21
Liquefaction Potential:
Su erstructure:Material and Type: R C Sl ab n
Number of Spans: 3
Continuous: Yes X No
Bearinces:
Type:
None
Condition: Functioning Not Functioning
Restraint (Trans):
Restraint (Longit):
Bearing Height:
Support Length:
4-83
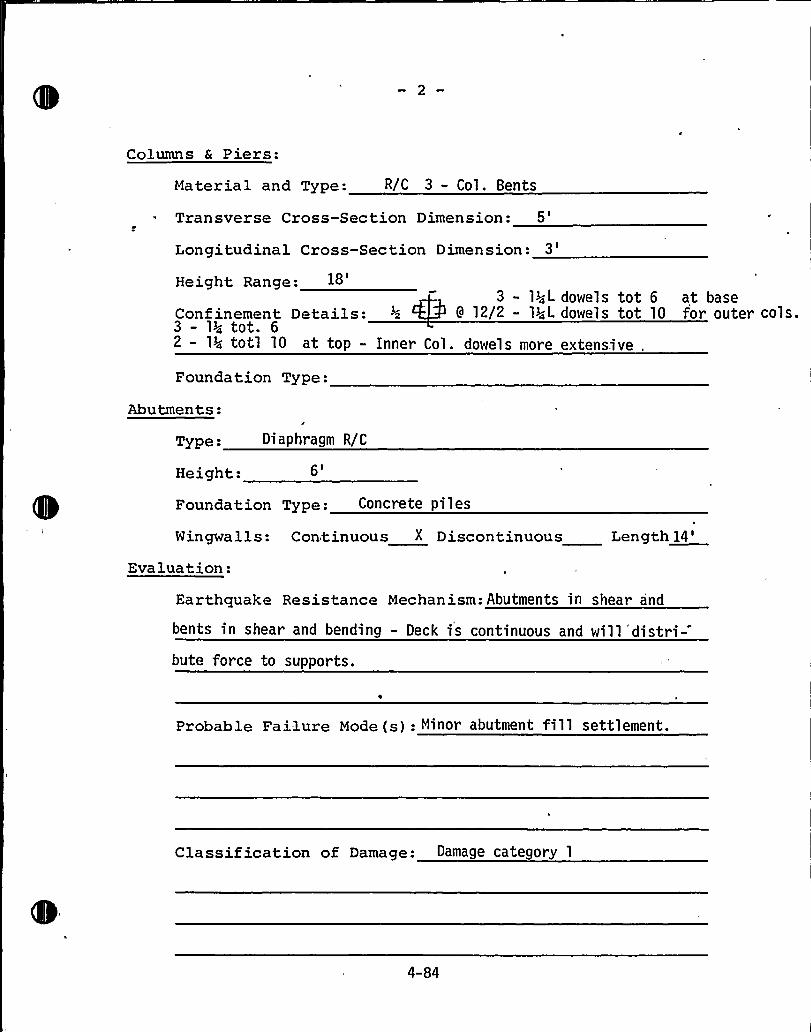
Columns & Piers:
Material and Type: R/C 3 - Col. Bents
Transverse Cross-Section Dimension:5'ongitudinalCross-Section Dimension:
3'eight
Range:
Confinement Details: ~i 9 12/2 - 13-L dowels to3 - l>4 tot. 62 - 13; totl 10 at top - Inner Col. dowels more extensive
18'- 13;L dowels tot 6 at base
t 10 for outer cols.
Foundation Type:
Abutments:
Type: Diaphragm R/C
Height:6'oundationType: Concrete pi 1 es
Wingwalls: Continuous X Discontinuous Length14'valuation:
Earthquake Resistance Mechanism: Abutments in shear and
bents in shear and bending - Deck is continuous and will distri-bute force to supports.
Probable Failure Mode (s): Minor abutment fill settlement.
Classif ication of Damage: Damage category 1
4-84
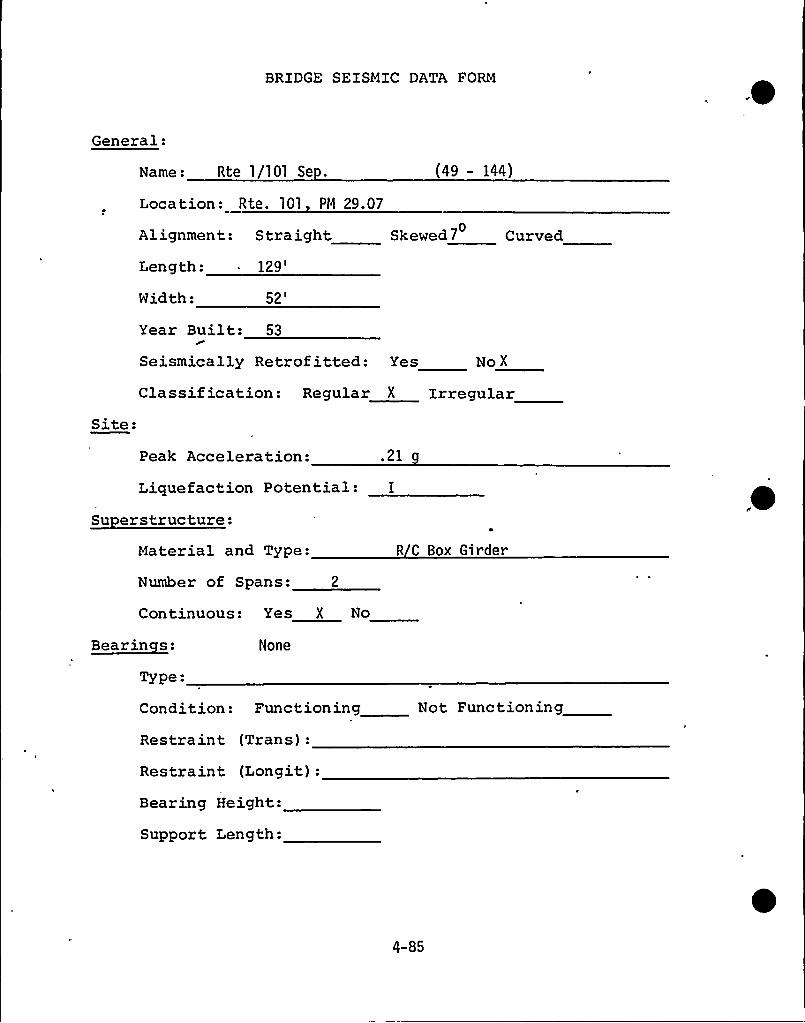
BRIDGE SEISMIC DATA FORM
General:
Name: Rte 1/101 Se .
Location: Rte. 101, Ptl 29.07
Alignment: StraightLength:
129'idth:
52'49- 144)
Skewed7 Curved0
Site:
Year Built: 53
Seismically Retrof itted: Yes No X
Classif ication: Regular X Irregular
Peak Acceleration: .21 g
Liquefaction Potential: 1
Su erstructure:Material and Type:
Number of Spans: 2
Continuous: Yes X No
R C Box Girder
Bearinces: None
Type:
Condition: Functioning
Restraint (Trans):
Restraint (Longit):
Bearing Height-
Support Length:
Not Functioning
4-85
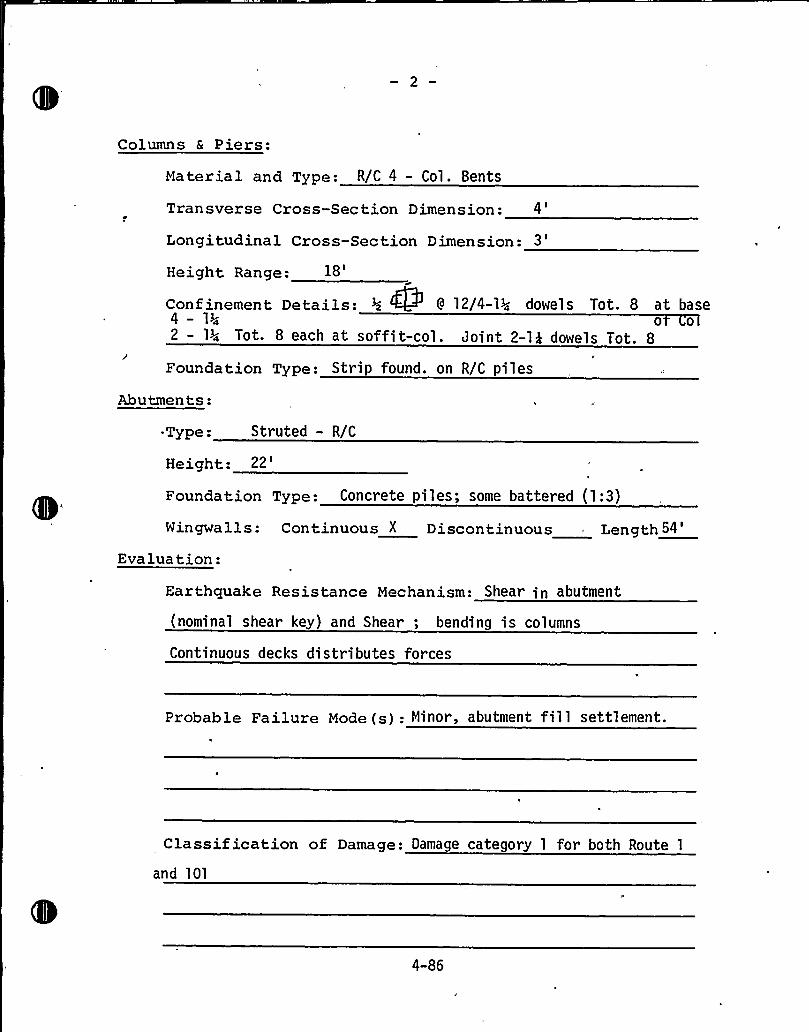
Columns a Piers:
Material and Type: R/C 4 - Col. Bents
Transverse Cross-Section Dimension: 4
Longitudinal Cross-Section Dimension: 3
Height Range:18'onf
inement Details: >~ 9 12/4-13; dowel s Tot. 8 at base4- 1>4 0 02 - 13„- Tot. 8 each at soffit-col. Joint 2-1k dowels Tot. 8
Foundation Type: Strip found. on R/C piles
Abutments:
~ Type: Struted - R/C
Height:22'oundation Type: Concrete piles; some battered (1:3)
Wingwalls: Continuous X Discontinuous Length~4
Evaluation:
Earthquake Resistance Mechanism: Shear in abutment
(nominal shear key) and Shear ; bending is columns
Continuous decks distributes forces
Probable Failure Mode (s): Minor, abutment fill settlement.
Classif ication of Damage: Damage category 1 for both Route 1
and 101
4-86
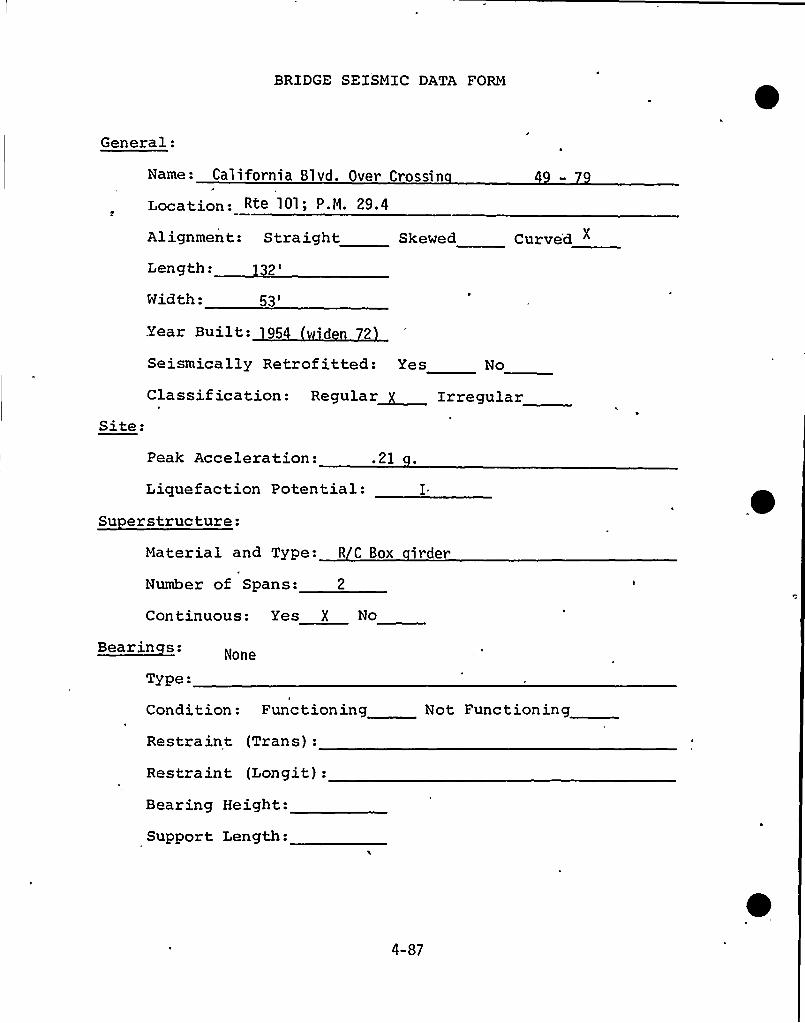
BRIDGE SEISMIC DATA FORM
General:
Name: California Blvd. Over Crossin
Location: Rte 101; P.M. 29.4
Alignment: Straight Skewed Curved
Length:2'idth:
53l
2'ear Built: 1954 d 2
Site:
Seismically Retrof itted: Yes No
Classif ication: Regular~ Irregular
Peak Acceleration: .21
Liquefaction Potential:Su erstructure:
Material and Type: R C Box irder
Number of Spans: 2
Continuous: Yes I No
Bearinces:
Type o
None
Condition: Functioning Not Functioning
Restraint (Trans):
Restraint (Longit):
Bearing Height:
Support Length:
4-87
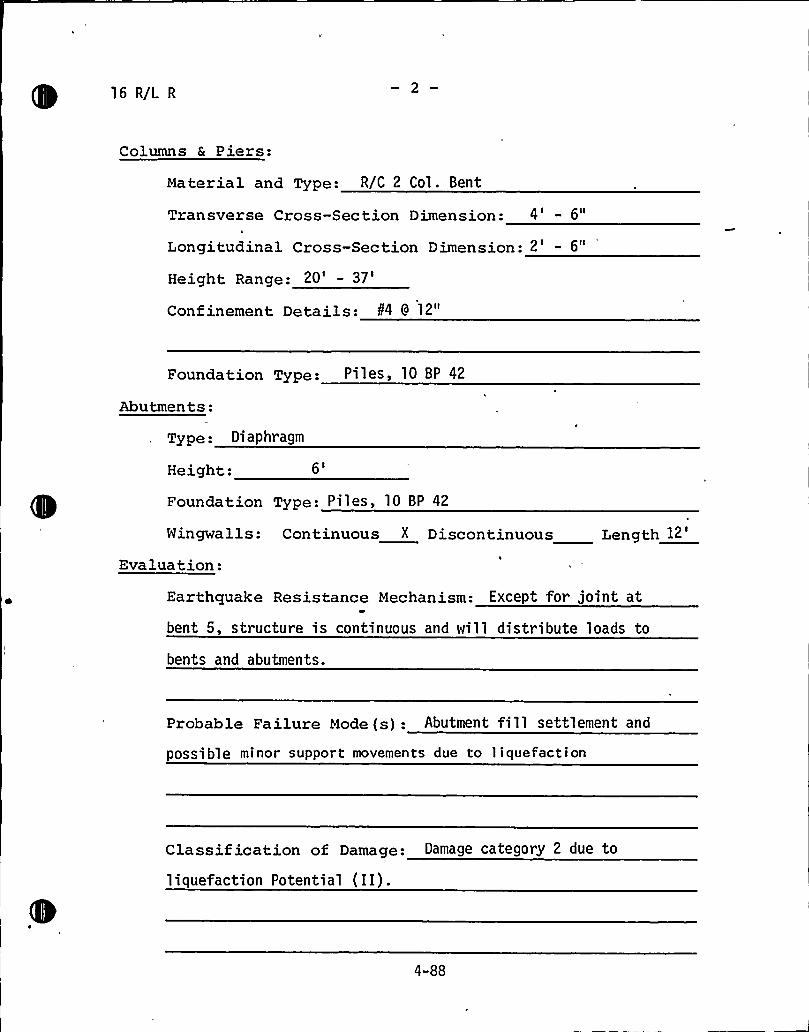
16 R/L R
Columns 6 Piers:
Material and Type: R/C 2 Col. Bent
Transverse Cross-Section Dimension: 4 - 6"4
Longitudinal Cross-Sec tion D imen sion: 2 ' 6"
Height Range: 20'37'onf
inement Details: t4 9 12"
Foundation Type: Piles, 10 BP 42
Abutments:
Type: Diaphragm
Height: 6I
Foundation Type: Piles, 10 BP 42
Wingwalls: Continuous X Discontinuous Length I2
Evaluation:
Earthquake Resistance Mechanism: Except for joint at
bent 5, structure is continuous and wi11 distribute loads to
bents and abutments.
Probable Failure Mode(s): Abutment fill settlement and
possible minor support movements due to liquefaction
Classif ication of Damage: Damage category 2 due to
liquefaction Potential (II).
4-88
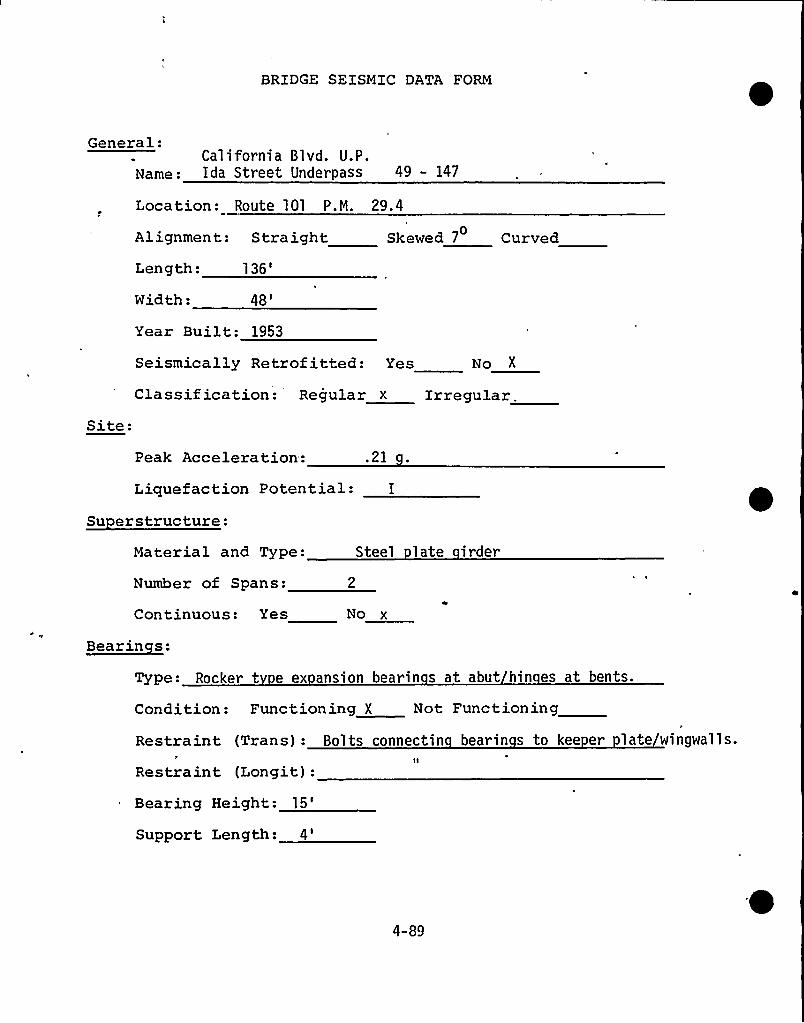
BRIDGE SEISMIC DATA FORM
General:California Blvd. U.P.
Name: Ida Street Underpass 49 - 147
Location: Route 101 P.M. 29.4
Alignment: StraightLength:
136'idth:
48'kewed 7 Curved0
Year Built: 1953
Seismically Retrofitted: Yes No X
Classification: Regular x Irregular.Site:
Peak Acceleration: .21
Liquefaction Potential: I
Su erstructure:Material and Type:
Number of Spans:
Continuous: Yes
Steel late irder
No x
Bearinces:
Type: Rocker t e ex ansion bearin s at abut hin es at bents.
Condition: Functioning X Not Functioning
Restraint (Trans): Bolts connectin bearin s to kee er late wingwalls.II
Restraint (Longit):Bearing Height:
15'upportLength:
4'-89
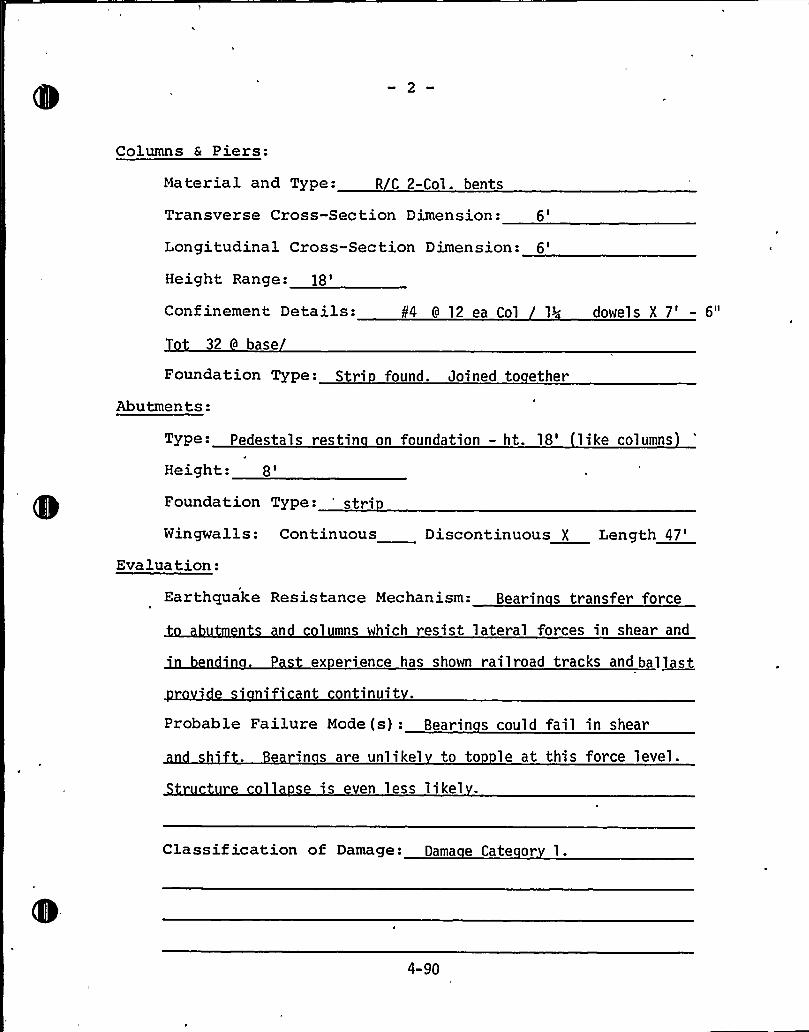
Columns & Piers:
Material and Type: R C 2-Col. bents
Transverse Cross-Section Dimension:6'ongitudinalCross-Section Dimension:6'eight
Range:]8'onfinementDetails: k4 9 12 ea Col 13- dowels X 7' 6"
32 base
Foundation Type: Stri found. Joined to ether
Abutments:
Type- Pedestal s restin on foundation — ht. 18'ike columns
Height:8'oundation Type: 'tri
Wingwalls: Continuous Discontinuous X Length47'valuation:
Earthquake Resistance Mechanism: Bearin s transfer force
n c 1 mns which resist lateral forces in shear and
P ex erience has shown railroad tracks andbal~lst
n ntinuit .
Probable Failure Mode(s): Bearin s could fail in shear
in s are unlikel to to le at this force level.
1 e is even less likel
Classif ication of Damage: Dama e Cate or 1.
4-90
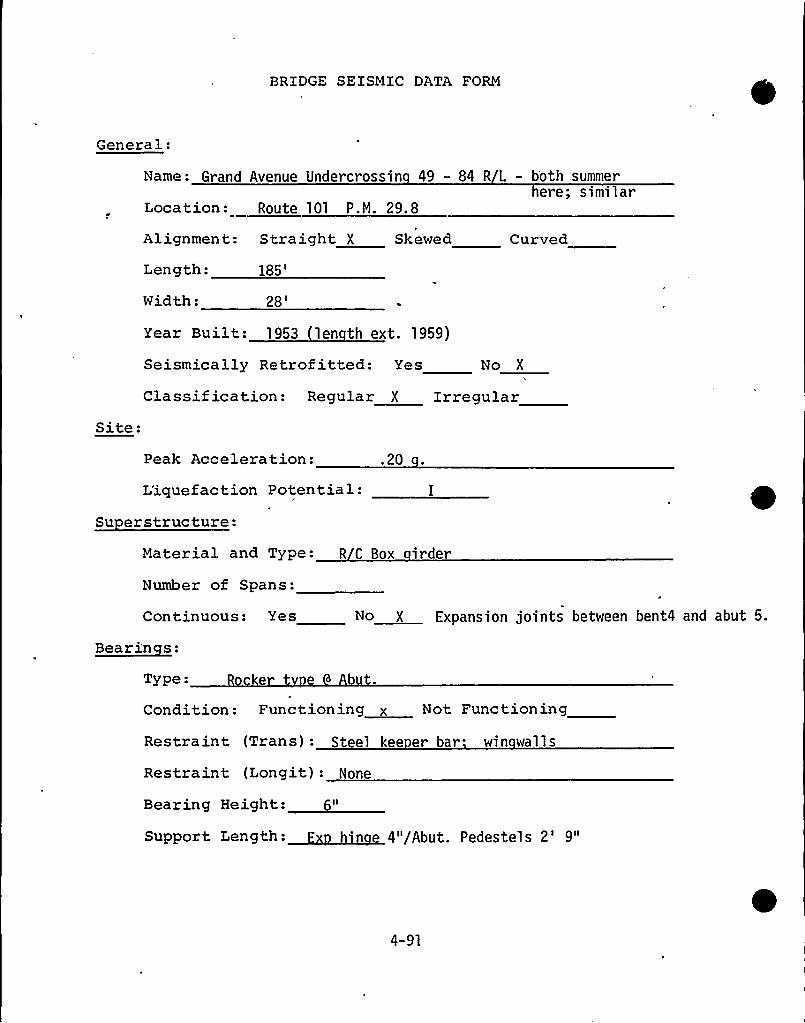
BRIDGE SEISMIC DATA FORM
General:
Name: Grand Avenue Undercrossin 49 - 84 R L - b'oth summerere; similar
Location: Route 101 P.M. 29. 8
Alignment: Straight X Skewed
Length:185'urved
Width:28'ear
Built: 1953 1 en th ext. 1959)
Seismically Retrof itted: Yes No X
Classif ication: Regular X IrregularSite:
Peak Acceleration: .20
L'iquefaction Potential:
Su erstructure:Material and Type: R C Box irder
Number of Spans:
Continuous: Yes
Bearinces:
Type: e b t.
X Expansion joints between bent4 and abut 5.
Condition: Functioning x Not Functioning
Restraint (Trans): Steel kee er bar win walls
Restraint (Longit) '- None
Bearing Height:
Support Length: 'I/Ab . d 1 2" 9'"
4-91
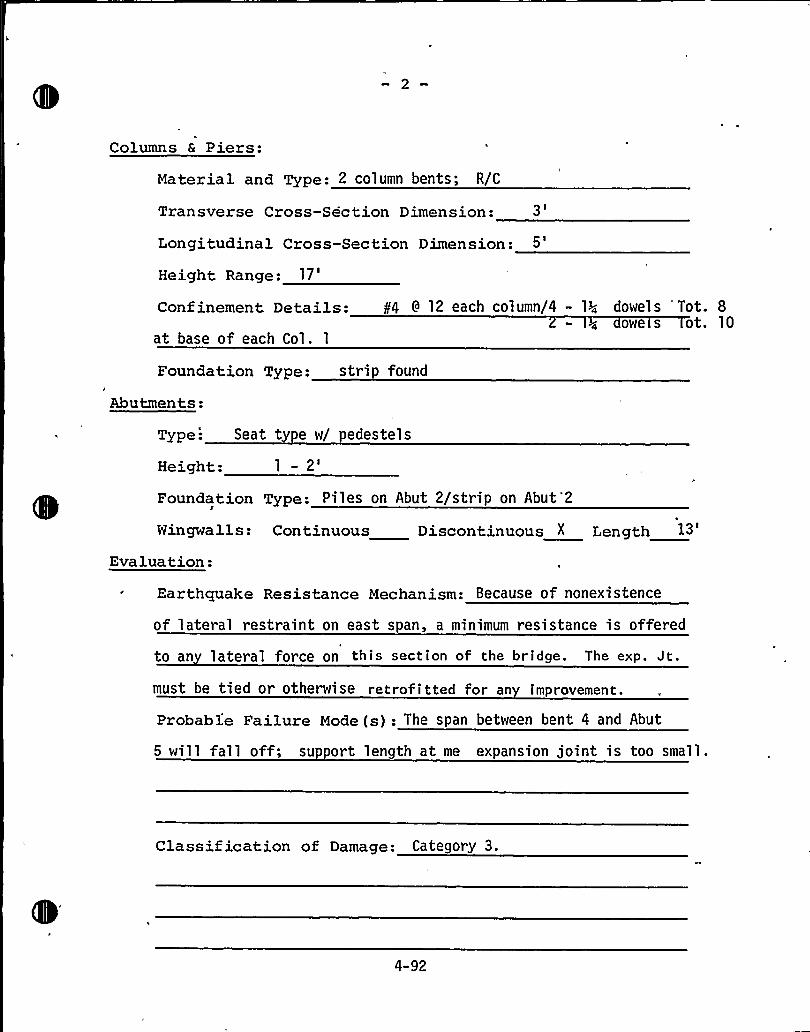
2
Columns 6 Piers:
Material and Type: 2 column bents; R/C
Transverse Cross-Section Dimension: 3
Longitudinal Cross-Section Dimension:
Height Range:17'onf
inement Details:at base of each Col. 1
g4 9 12 each column/4 - 13; dowels" Tot. 8
owe s ot. 10
Foundation Type: stri foundJ
Abutments:
Type! Seat ty e w/ pedestels
Height:1-2'oundation
Type: Piles on Abut 2/strip on Abut'2
Wingwalls: Continuous Discontinuous X Length
Evaluation:
Earthquake Resistance Mechanism: Because of nonexistence
of lateral restraint on east span, a minimum resistance is offered
to an lateral force on this section of the bridge. The exp. Jt.
must be tied or otherwise retrofitted for any improvement.
Probable Failure Mode(s): The span between bent 4 and Abut
5 will fall off; su ort length at me expansion joint is too small.
Classif ication of Damage: Category 3.
4-92
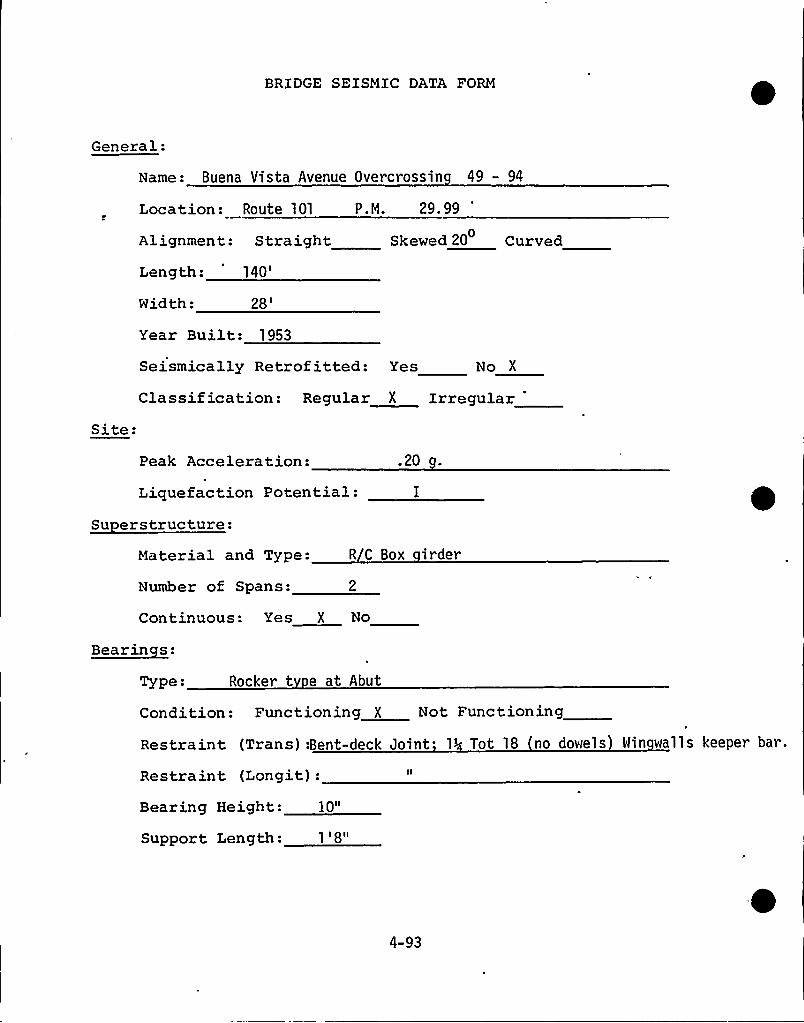
BRIDGE SEISMIC DATA FORM
General:
Name: Buena Vista Avenue Overcrossin 49 - 94
Location: Route 101 P.M. 29. 99
Alignment: StraightLength:
140'idth:
28'kewed 20 Curved0
Year Built: 1953
Site:
Seismically Retrof itted: Yes No X
Classif ication: Regular X Irregular
Peak Acceleration:
Liquefaction Potential:
Su erstructure:
.20 g.
Material and Type: R C Box irder
Number of Spans: 2
Continuous: Yes X No
Bearinces:
Type: Rocker t e at Abut
Condition: Functioning X Not Functioning
Restraint (Trans):Bent-deck Joint 13- Tot 18 no dowel s Win wall s keeper bar.
Restraint (Longit):
Bearing Height:
Support Length:
] Oll
1IBII
4-93
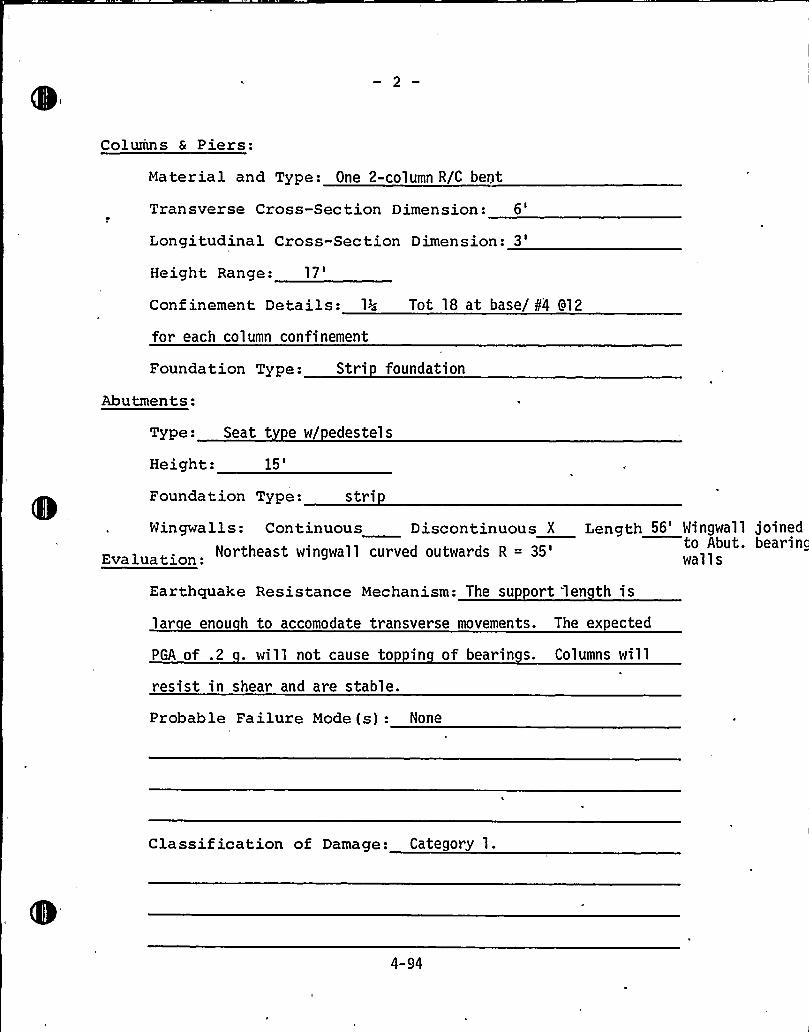
Columns & Piers:
Material and Type: One 2-column R/C. beret
Transverse Cross-Section Dimension: 6'
Longitudinal Cross-Section Dimension:3'eight
Range:17'onfinementDetails: 1>4 Tot 18 at base/ b4 912
for each column confinement
Foundation Type: Stri foundation
Abutments:
Type: Seat t e w/ edestels
Height:15'oundationType: stri
Wingwalls: Continuous Discontinuous X Length 56'ingwal 1 joined
Evaluation ~Northeast wingwall curve outwards R = 3 'allsto Abut. bearing
Earthquake Resistance Mechanism: The su ort len th is
lar e enou h to accomodate transverse movements. The ex ected
PGA of .2 . will not cause to in of bearin s. Columns will
resist in shear and are stable.
Probable Failure Mode (s): None
Classif ication of Damage: Category 1.
4-94
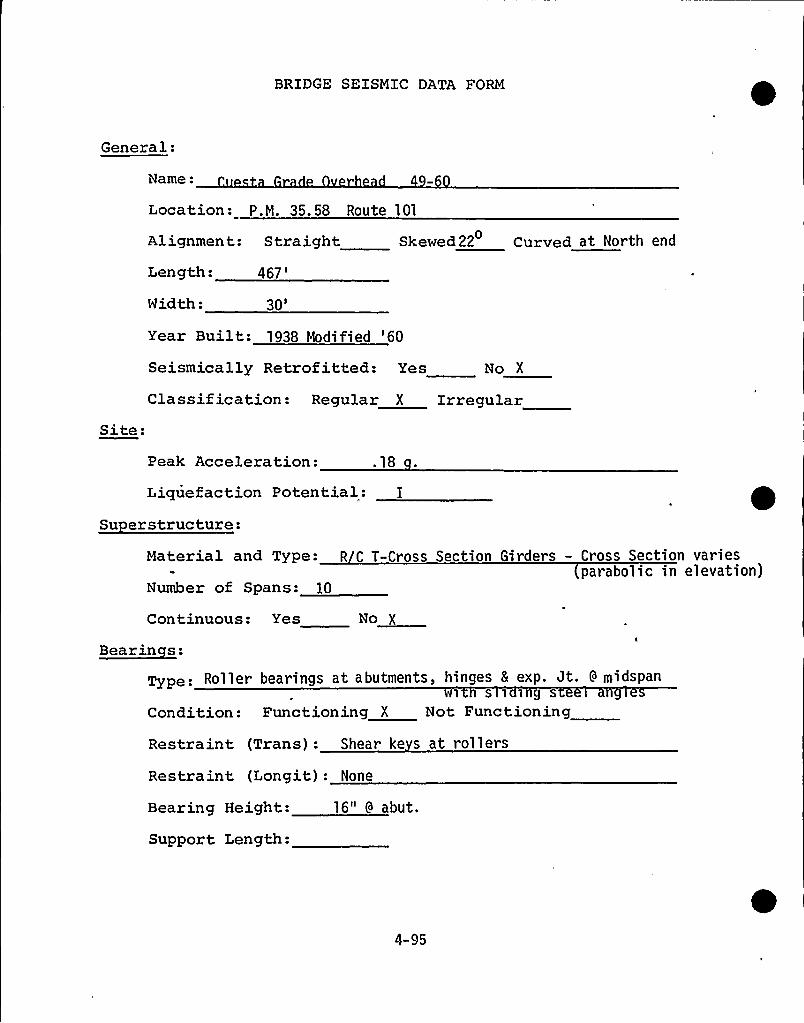
BRIDGE SEISMIC DATA FORM
General:
Name:
Location: p.M. 35.58 Route 101
Alignment: Straight Skewed 22 Curved at North end0
Length:467'idth:
30'ear
Built: 1938 Modified '60
Seismically Retrof itted: Yes No X
Classif ication: Regular X IrregularSite:
Peak Acceleration: .18
Liquefaction Potential:
Su erstructure:Material and Type: R C T-Cross Section Girders - Cross Section varies
parabolic in elevation)Number of Spans: 10
Continuous: Yes No X
Bearinces:
Type: Roller bearings at abutments, hinges 5 exp. Jt. 9 midspan
Condition: Functioning X
1 S 1 1 9 S
Not Functioning
Restraint (Trans): Shear ke s at rollers
Restraint (Longit): None
Bearing Height: 16" 9 abut.
Support Length:
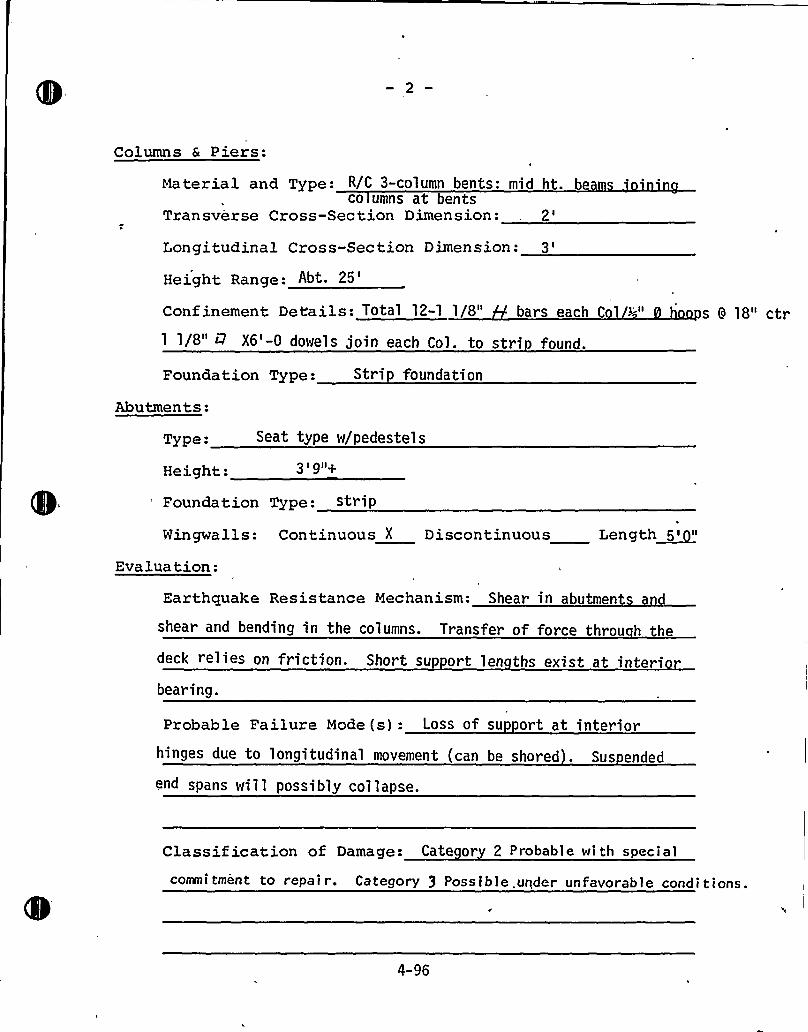
Columns & Piers:
Material and Type: R/C 3-column bents: mid ht. beco umns at bents
Transverse Cross-Section Dimension: .
2'ongitudinalCross-Section Dimension:3'eight
Range: Abt
25'onfinementDetails: Total 12-1 1/8" bars each C 1 3-"
1 1/8" i:I X6'-0 dowels Join each Col. to stri found.
s 9 18" ctr
Foundation Type: Stri foundation
Abutments:
Type:
Height:
Seat type w/pedestels
3 I 9II+
Foundation Type: strip
Ningwalls: Continuous X Discontinuous Length~5<
Evaluation:
Earthcpxake Resistance Mechanism: Shear in abutment
shear and bending in the columns. Transfer of force throu h the
deck relies on friction. Short su ort len ths exist at interibearing.
Probable Failure Mode (s): Loss of su ort at interiorhinges due to longitudinal movement {can be shored . Sus ended
end spans wi11 possibly co11apse.
Classification of Damage: Cate or 2 Probable with special
commitment to repair. Category 3 Possible.under unfavorabie conditions.
4-96
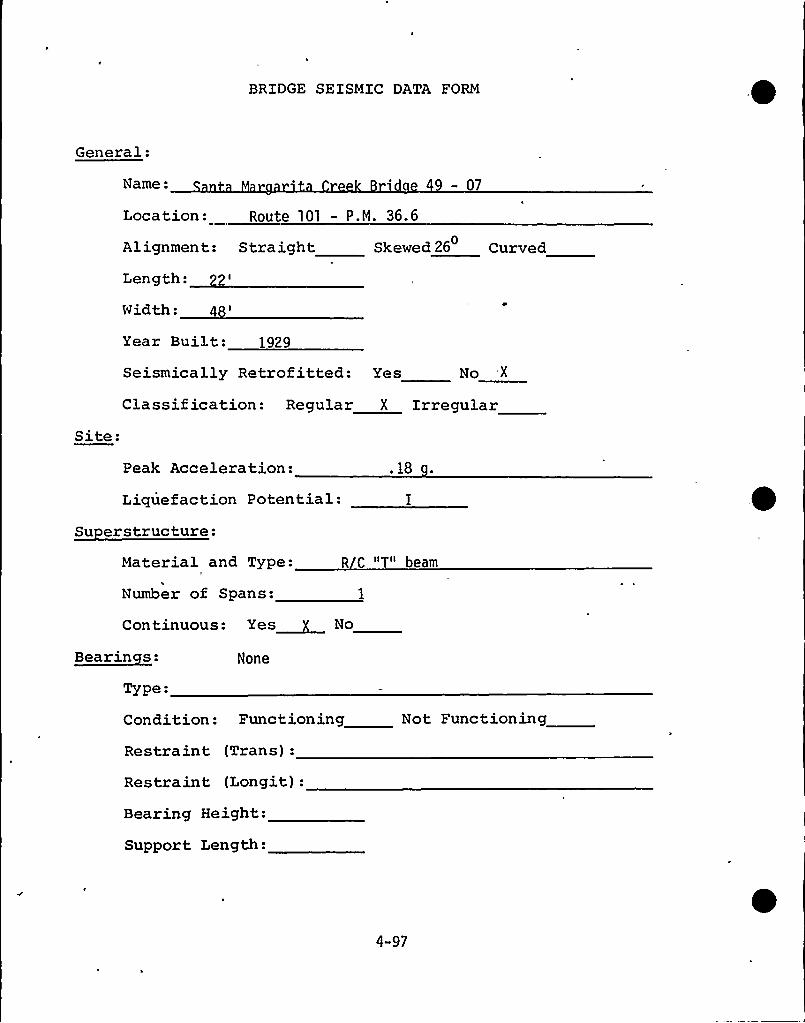
BRIDGE SEISMIC DATA FORM
General:
Name:
Location: Route 101 - P.N. 36.6
- 07
Alignment: Stra ightLength:
Width:
Year Built: 1929
Skewed 26 Curved0
Seismically Retrof itted: Yes No 'X
Site:Classification: Regular X Irregular
Peak Acceleration: .18
Liquefaction Potential:
Su erstructure:Material and Type:
Number of Spans:
R C "T" beam
Continuous: Yes~ No
Bear inces:
Type-
None
Condition: Functioning Not Functioning
Restraint (Trans):
Restraint (Longit):
Bearing Height:
Support Length:
4-97
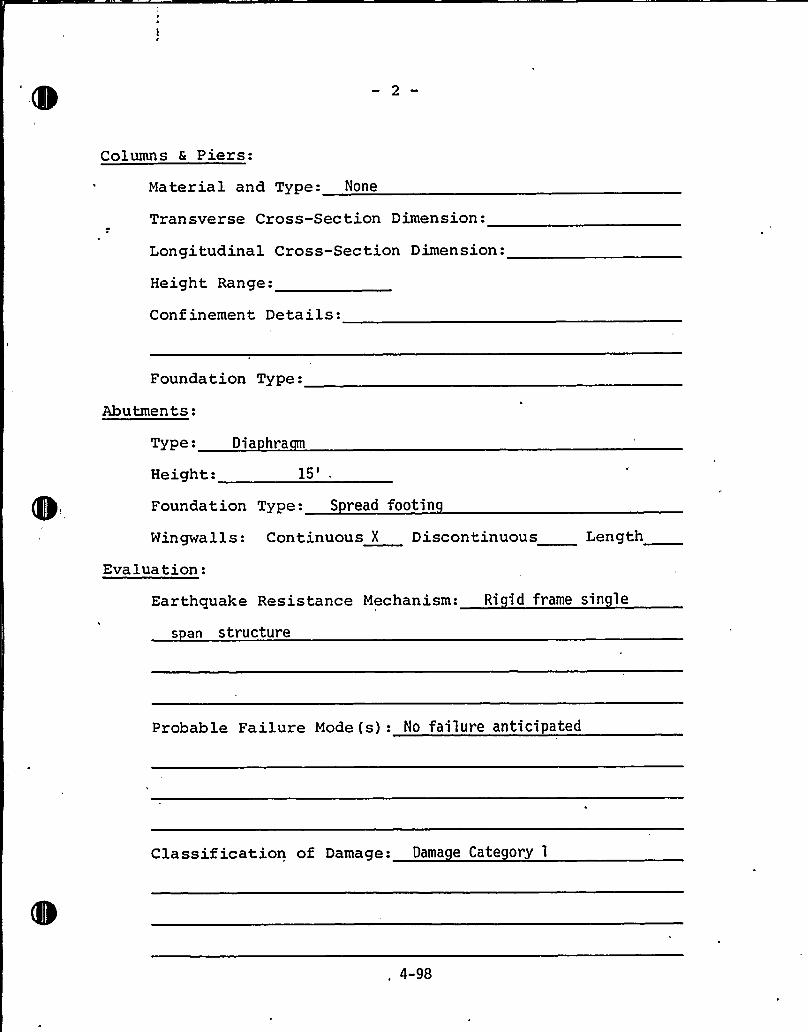
Columns 6 Piers:
Material and Type: None
Transverse Cross-Section Dimension:
Longitudinal Cross-Section Dimension:
Height Range:
Conf inement Details:
Foundation Type:
Abutments:
Type: Dia hra
Height:15'oundationType: S read footin
Wingwalls: Continuous X Discontinuous Length
Evaluation:
Earthquake Resistance Mechanism: Ri id frame sin le
s an structure
Probable Failure Mode (s): No failure anticipated
Classif ication of Damage: Dama e Cate ory 1
, 4-98
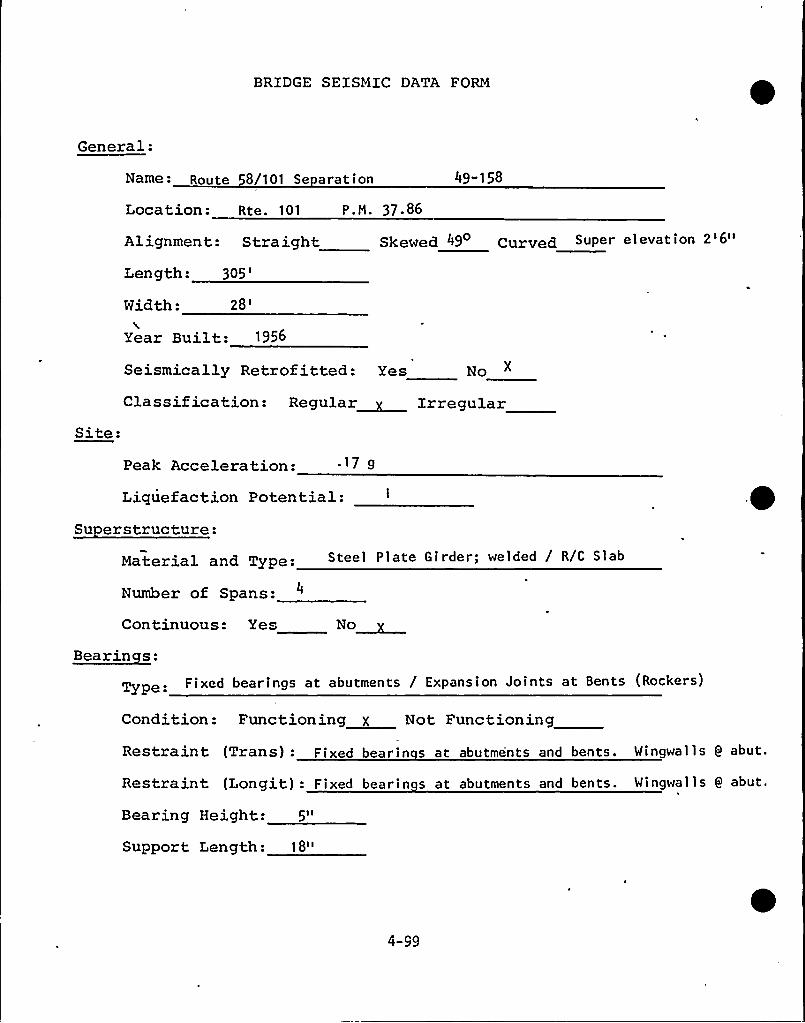
BRIDGE SEISMIC DATA FORM
General:
Name- Route 8/101 Se aration
Location: Rte. 101 P.H. 37.86
49-158
Alignment: Straight Skewed 49 Curved Super elevation 2'6"
Length:305'idth:
28'ear
Built: 1956
Site:
Seismically Retrofitted: yes No
Classif ication: Regular~ Irregular
Peak Acceleration: .17 g
Liquefaction Potential:Su erstructure:
Material and Type: Steel Plate Girder; welded / R/C Slab
Number of Spans: 4
Continuous: Yes No~Bearinces:
Type F i xed bear i ngs at abutmen ts / Expans i on Jo i nts at Ben ts ( Rockers)
Condition: Functioning X Not Functioning
Restraint (Trans): Fixed bearin s at abutments and bents. Wingwal 1s 9 abut.
Restraint (Longit): Fixed bearin s at abutments and bents. Wingwal ls 0 abut.
Bearing Height: 5"
Support Length: 18"
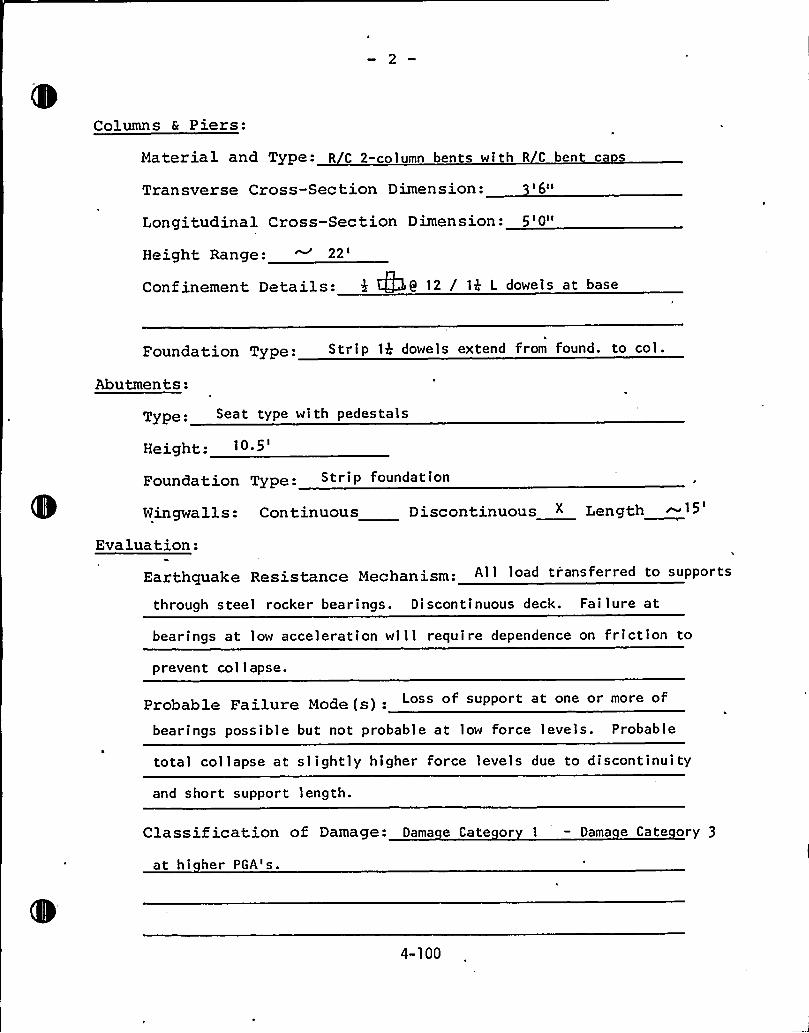
Columns & Piers:
Material and Type: R C 2-column bents with R C ben c s
Transverse Cross-Section Dimension:
Longitudinal Cross-Section Dimension: 5'0"
Height Range: ~22'onfinementDetails: 4 Cff3 11 12 / 1$ t dowals at base
Foundation Type: Strip 14 dowels extend from found. to col.
Abutments:
Type: Seat type with pedestals
Height: 10.
5'oundationType: S t r i p foundation
Wingwalls: Continuous Discontinuous X Length ~15
Evaluation:
Earthquake Resistance Mechanism: Al 1 load transferred to supports
through steel rocker bearings. Discontinuous deck. Failure at
bearings at low acceleration will require dependence on friction to
prevent col l apse.
Probable Failure Mode (s) . Loss of suPPort at one or more of
bearings possible but not probable at low force levels. Probable
total collapse at slightly higher force levels due to discontinuity
and short support length.
Classif ication of Damage: Dama e Cate or 1— Dama e Cate ory 3
at hi her PGA's.
4-100
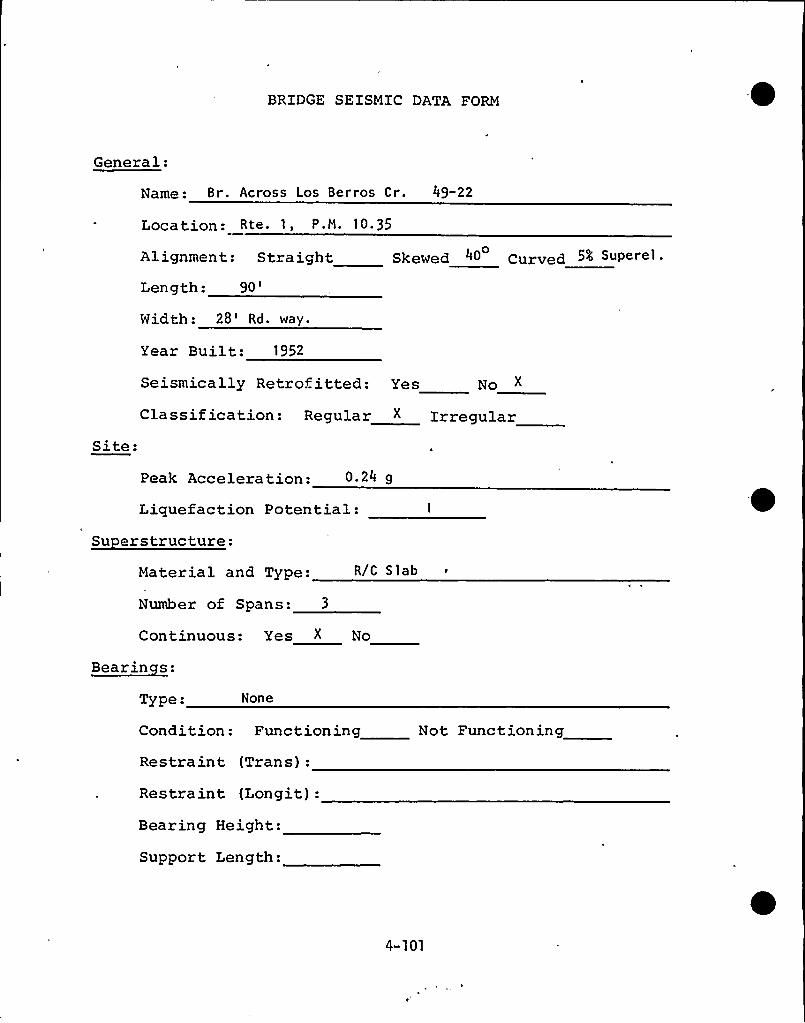
BRIDGE SEISMIC DATA FORM
General:
Name: Br. Across Los Berros Cr. 49-22
Location: Rte. 1, P.M. 10.35
Alignment: StraightLength: 90
'idth:28'd. way.
Year Built: 1952
Skewed 40 Curved 54 Supere1 .0
Seismically Retrof itted: Yes No X
Site:Classif ication: Regular " Irregular
Peak Acceleration: 0.24 9
Liquefaction Potential:Su erstructure:
Material and Type: R/C Slab
Number of Spans: 3
Continuous: Yes X No
Bearinces:
Type: None
Condition: Functioning
Restraint (Trans):
Restraint (Longit):Bearing Height:
Support Length:
Not Functioning
4-101
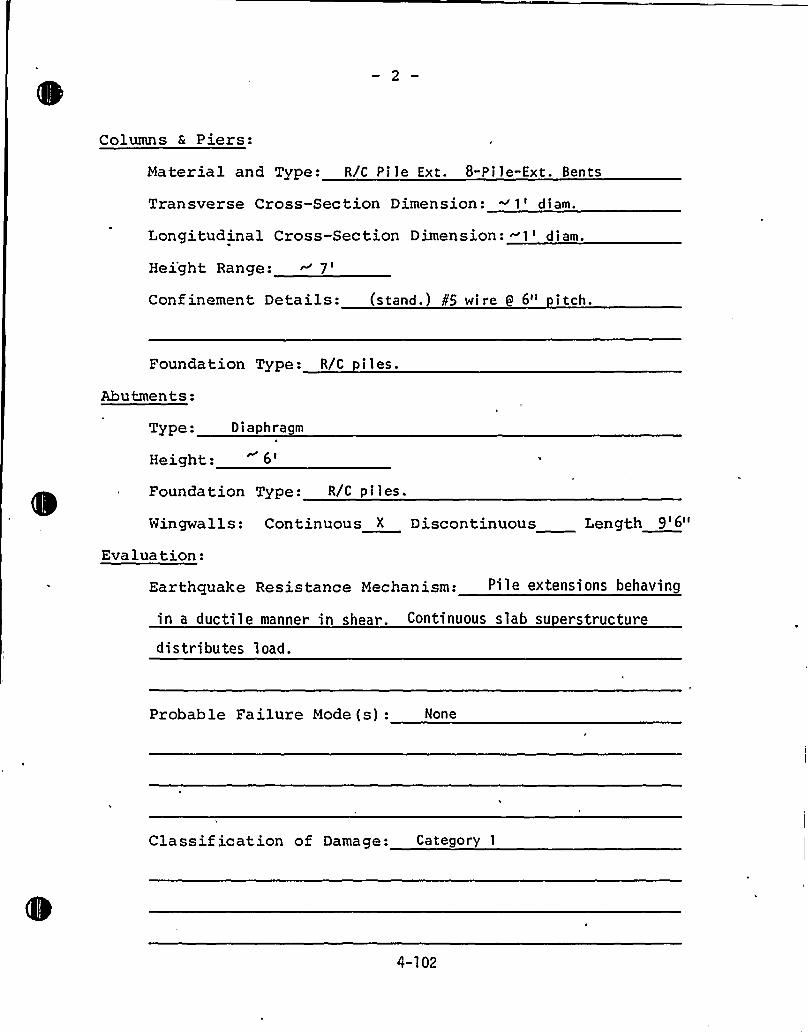
Columns & Piers:
Material and Type: R/C Pi le Ext. 8-Pile-Ext. Bents
Transverse Cross-Section Dimension: ~1'iam.Longitudinal Cross-Sec tion Dimen sion: ~1 ' i am.
Height Range: ~7'onf
inement Details: (stand.) ¹5 wi re 9 6" i tch.
Foundation Type: R/C i 1 es.
Abutmen ts:Type: Diaphragm
Height:6'oundat ion Type: R/C p i l es.
Wingwalls: Continuous X Discontinuous Length 9'6"
Evaluation:
Earthquake Resistance Mechanism: Pile extensions behaving
in a ductile manner in shear. Continuous slab su erstructure
distributes load.
Probable Failure Mode (s): None
Classif ication of Damage: Category 1
4-102
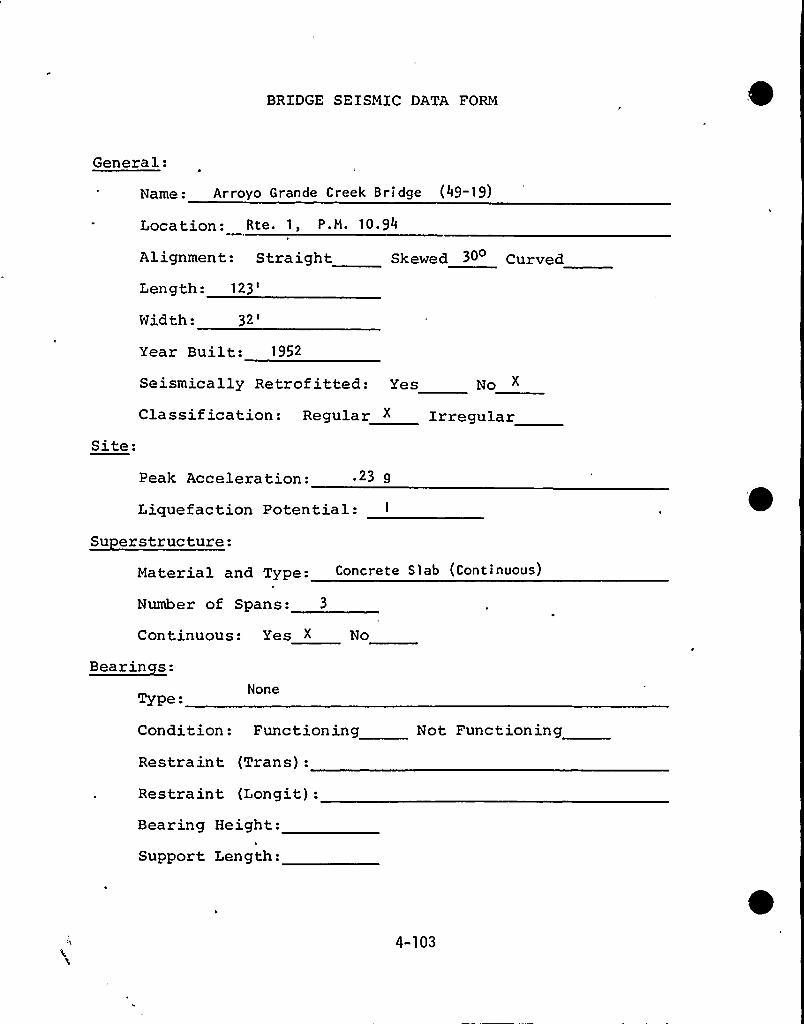
BRIDGE SEISMIC DATA FORM
General:
Name: Arroyo Grande Creek Bridge (49-19)
Location: Rte. 1, P.M. 10.94
Alignment: Straight Skewed 30 CurveS
Length:123'idth:
32'ear
Built: 1952
Seismically Retrofitted: Yes No X
Classif ication: Regular X IrregularSite:
Peak Acceleration: 23 g
Liquefaction Potential:Su erstructure:
Material and Type: Concrete Slab (Continuous)
Number of Spans: 3
Continuous: Yes X No
Be a r in ce s:
Type:None
Condition: Functioning
Restraint (Trans):
Restraint (Longit):Bearing Height:
Support. Length:
Not Functioning
4-103
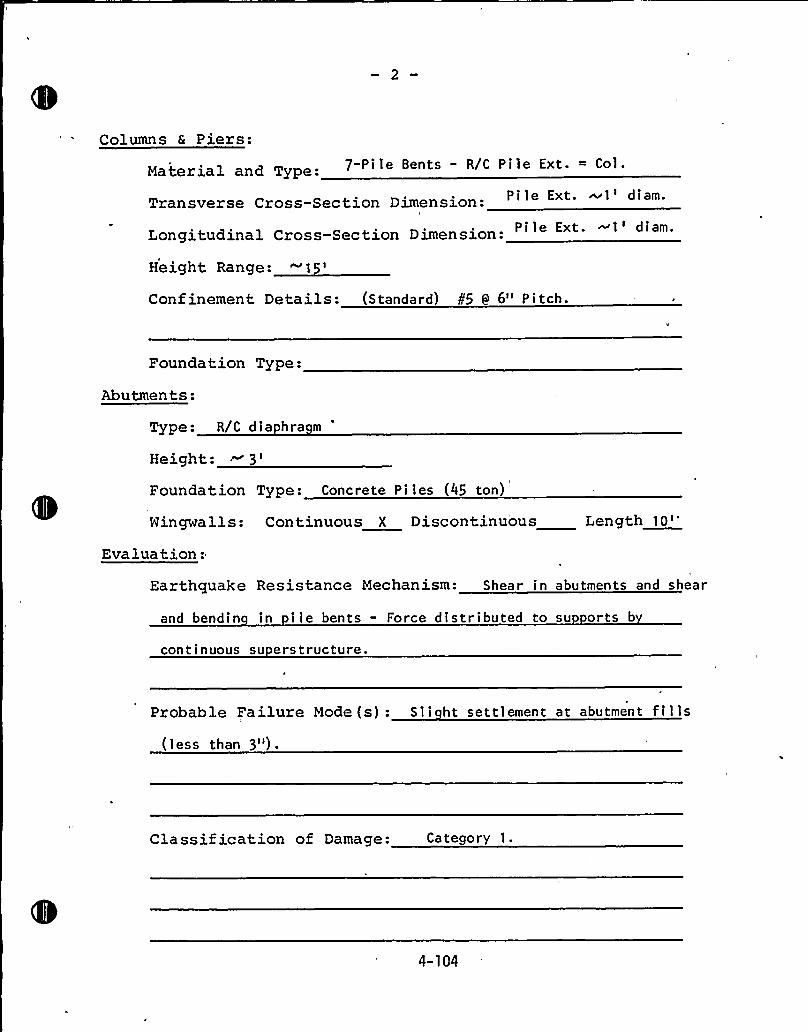
Columns 6 Piers:7-Pile Bents - R/C Pile Ext. = Col.
Transverse Cross-Section Dimension:Pile Ext. ~1'iam.Longitudinal Cross-Section Dimension:
Confinement Details: (Standard P5 9 6" Pitch.
Foundation Type:
Abutmen ts:Type: R/C dia hra m
'eight:.~
3'oundationType: Concrete P i 1 es (45 ton)
Wingwalls:
Evaluation:
Continuous X Discontinuous Length 10''
Earthquake Resistance Mechanism: Shear in abutments and shear
and bendin in i le bents - Force distributed to su orts b
continuous su erstructure.
Probable Failure Mode (s): Sli ht settlement at abutment fills(less than 3").
Classif ication of Damage: Category l.
4-104
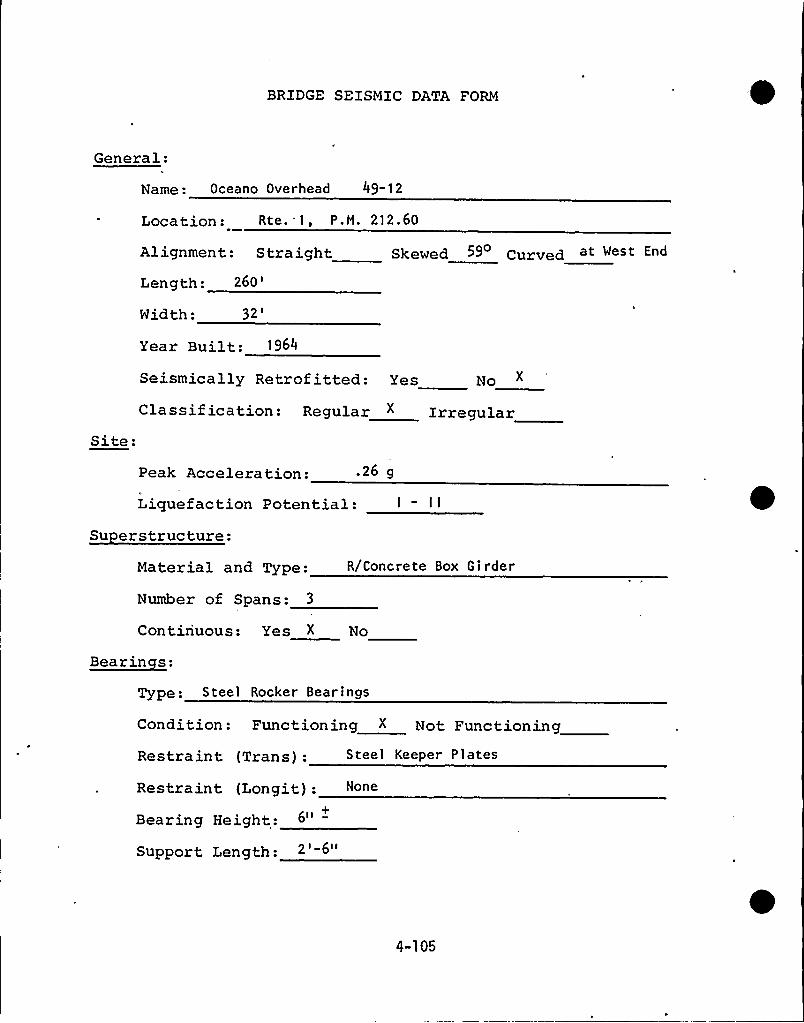
BRIDGE SEISMIC DATA FORM
General:
Name: Oceano Overhead 49-12
Location: Rte. 1, P.M. 212.60
Alignment: S tra ightLength:
260'idth:
32'ear
Built: 1964
Skewed Sg curved at West fnd
Seismically Retrofitted: Yes No
Classification: Regular " IrregularSite:
Peak Acceleration: .26 9
Liquefaction Potential:Su erstructure:
Material and Type:
Number of Spans: 3
Continuous: Yes
R/Concrete Box Girder
No
~Bearin s:
Type: Steel Rocker Bearings
Condition: Functioning X Not Functioning
Restraint (Trans): Steel KeePer Pl ates
Restraint (Longit):Bearing Height:
Support Length:
4-105
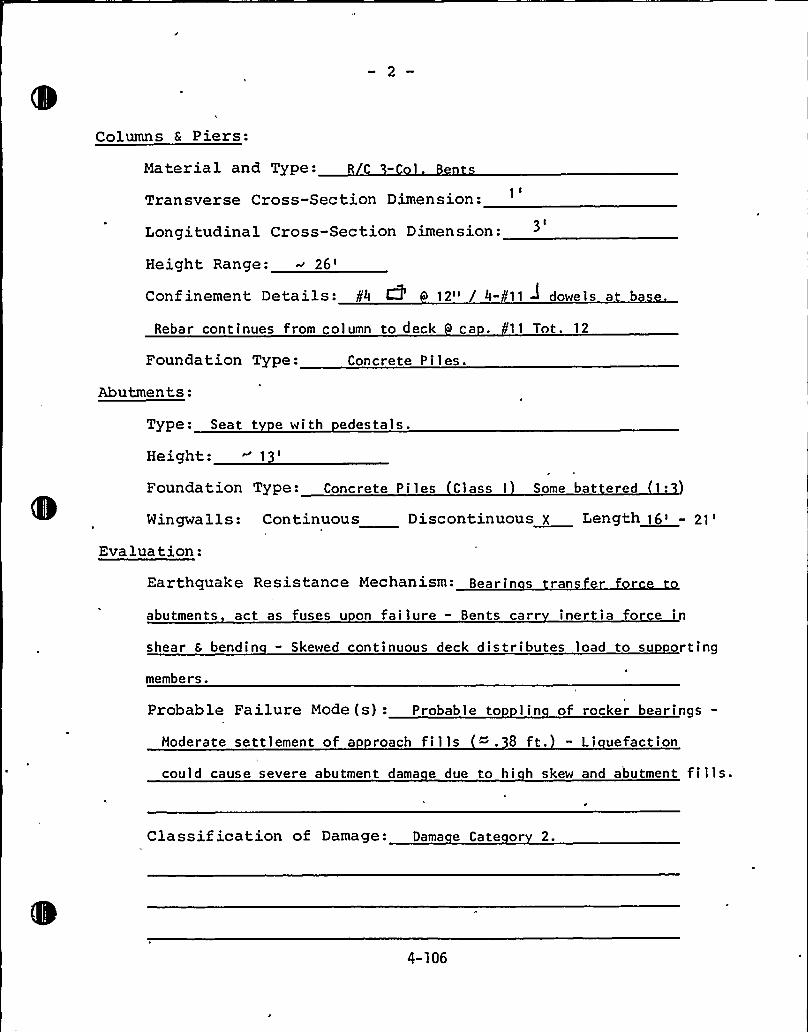
Columns & Piers:
Material and Type: R C
1'ransverseCross-Section Dimension:g ILongitudinal Cross-Section Dimension:
Height Range: ~
26'onfinementDetails: g4 CI'2" 4- 11 ~ dowels a b
Rebar continues from column to deck ca . 11 Tnt. 12
Foundation Type: Concrete Piles.
Abutments:
Type: Seat t e with edestals.
Height: 1
Foundation Type: Concrete Pi les Class I Some bat ered 1:
Wingwalls: Continuous Discontinuous X Length ]6> - 21>
Evaluation:
Earthquake Resistance Mechanism- Bearin s ran
abutments act as fuses u on failure - Bents carr inertia for e in
shear & bendin - Skewed continuous deck distributes load to su orting
members.
Probable Failure Mode (s): Probable to lin of rocker bearings-
Hoderate settlement of a roach fills . 8 ft. - Li uefaction
could cause severe abutment dama e due to hi h skew and abutment fills.
Classif ication of Damage: Dama e Cate or 2.
4-106
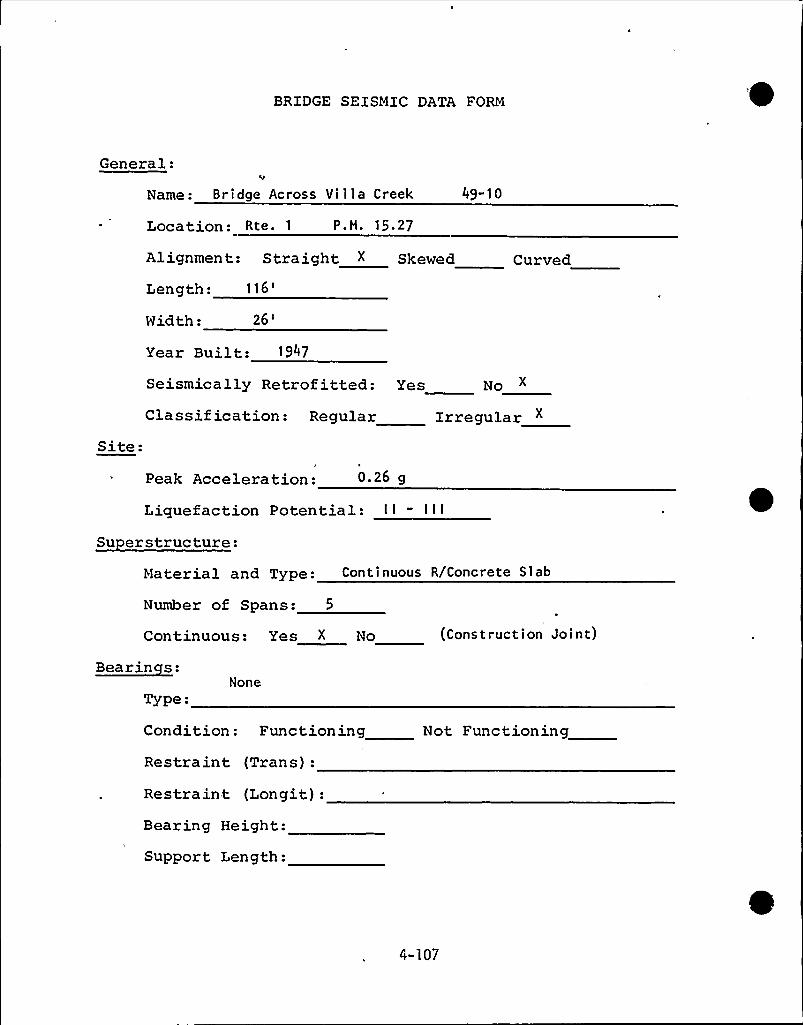
BRIDGE SEISMIC DATA FORM
General:
Name: Bridge Across Villa Creek
Location: Rte. 1 P.M. 15.27
Alignment: Straight " Skewed
Length:116'idth:
26'ear
Built: 1947
49-10
Curved
Seismically Retrof itted: Yes No X
Site:Classification: Regular irregular
Peak Acceleration: 0 26 9
Liquefaction Potential: I i
Su erstructure:Material and Type: Continuous R/Concrete Slab
Number of Spans: 5
Continuous: Yes X No (Construction Joint)
~Bearin s:
Type-None
Condition: Functioning
Restraint (Trans):
Restraint (Longit):Bearing Height:
Support Length:
Not Functioning
4-107
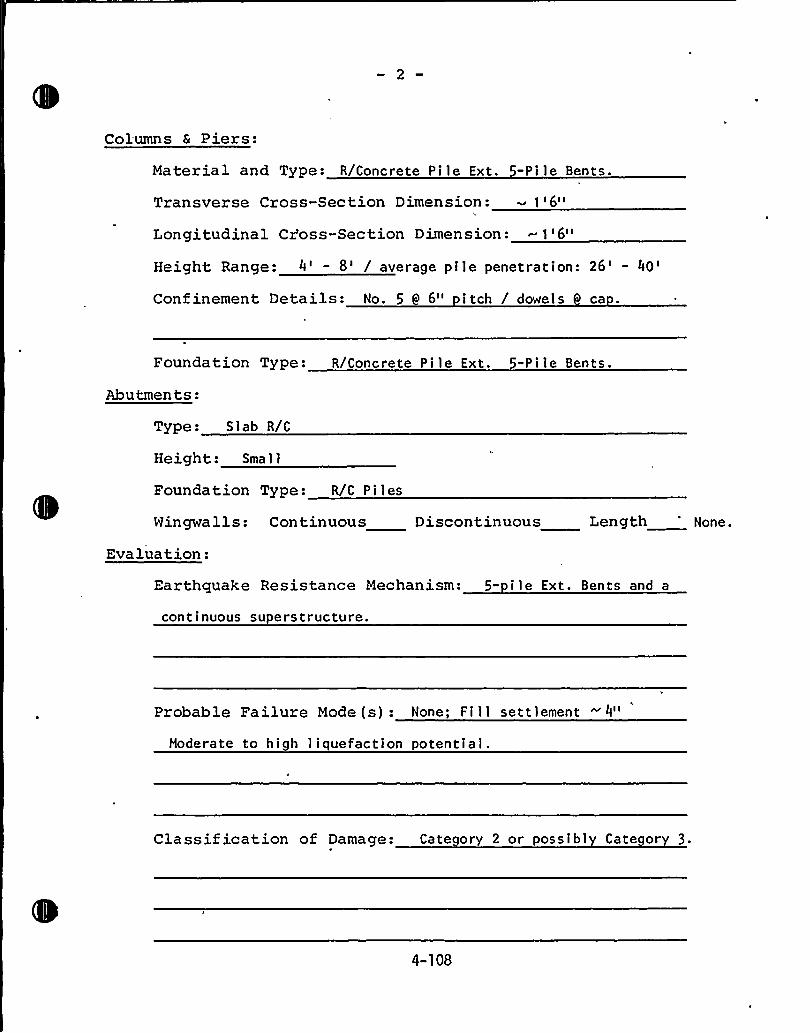
Col-umns 6 Piers:
Material and Type: R/Concrete Pile Ext. -Pi le Bents.
Transverse Cross-Section Dimension: 1 '6"
Longitudinal Cz'oss-Section Dimension: 1'6"
Height, Range: 4' 8' average pile penetration: 26'40'onf
inement Details: No. 5 0 6" i tch / dowel s ca
Foundation Type: R/Concrete P i 1 e Ext. -Pile Bents.
Abutments:
Type: S 1 ab R/C
Height: Sma 1 1
Foundation Type: R/C Pi les
Wingwalls: Continuous Discontinuous Length 'one.Evaluation:
Earthquake Resistance Mechanism: 5- i le Ext. Bents and a
cont inuous superstructure.
Probable Failure Mode (s): None; Fi ll settlement 4"
Moderate to high liquefaction potential.
Classification of Damage: Cate ory 2 or possibl Cate ory 3.
4-108
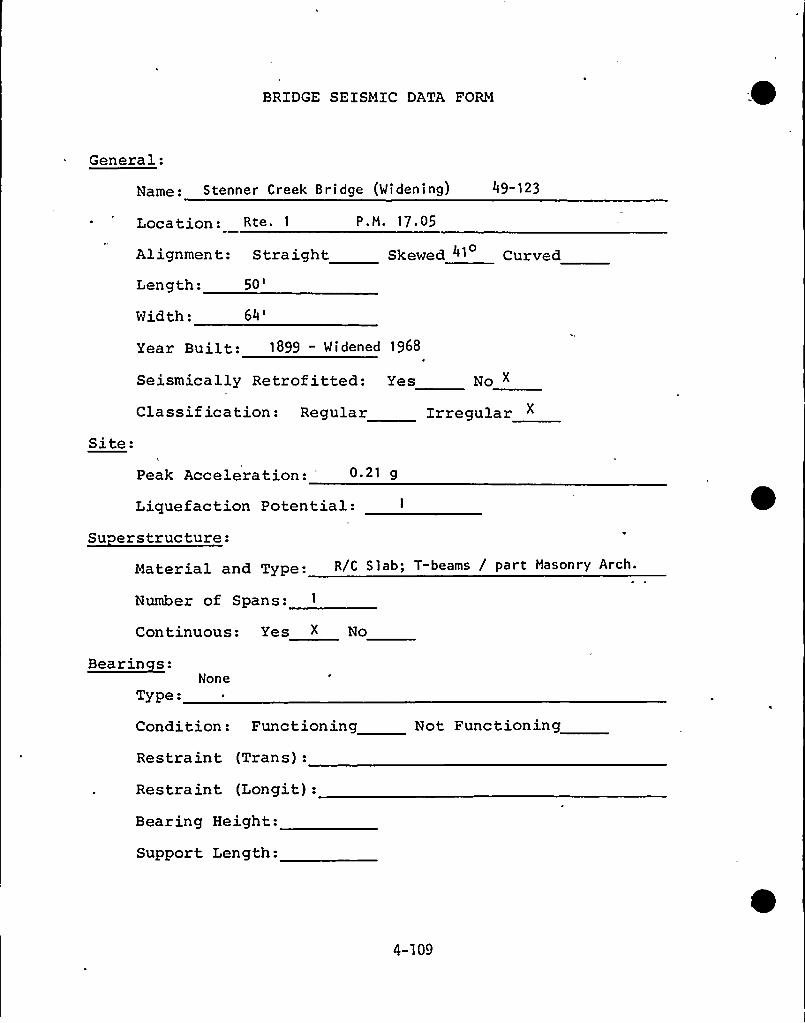
BRIDGE SEISMIC DATA FORM
General:
Name: Stenner Creek Bridge (Widening)
Location: Rte. 1 P. M. 17. 05
49-123
Alignment: StraightLength:
50'kewed 41 Curved
Width:64'ear
Built: 1899 - Widened 1968
Seismically Retrof itted: Yes
Classification: Regular
Site:
No X
Irregular
4
Peak Acceleration: 0.21 g
Liquefaction Potential:Su erstructure:
Material and Type: R/C Slab; T-beams / part Masonry Arch.
Number of Spans:
Continuous: Yes X No
Bearinces:None
Type-
Condition: Func t ion ing
Restraint (Trans):
Restraint (Longit):
Bearing Height:
Support Length:
Not Functioning
4-109
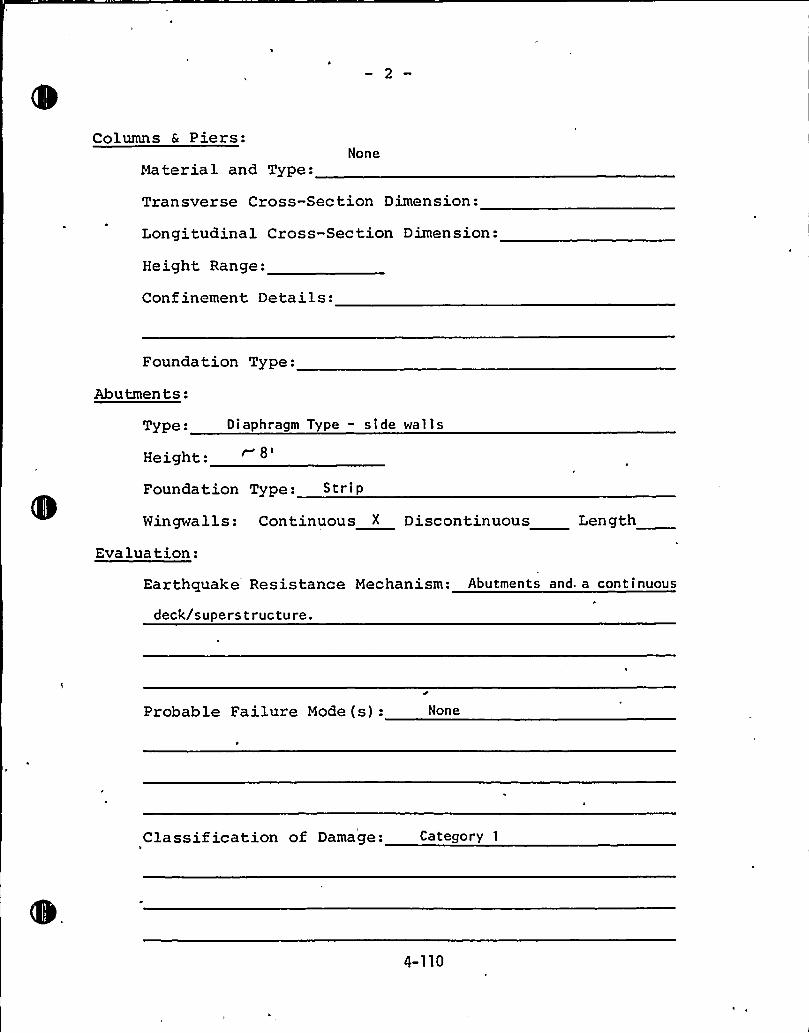
Columns & Piers:
Material and Type:None
Transverse Cross-Section Dimension:
Longitudinal Cross-Section Dimension:
Height Range:
Confinement Details:
Foundation Type:
Abutments:
Type: Diaphragm Type - side walls
Height:
Foundation Type: S«i p
Wingwalls: Continuous X Discontinuous Length
Eva lua tion:Earthquake Resistance Mechanism: Abutments and a continuous
deck/supe rs t rue ture.
Probable Failure Mode(s): None
Classif ication of Damage: Category 1
4-110
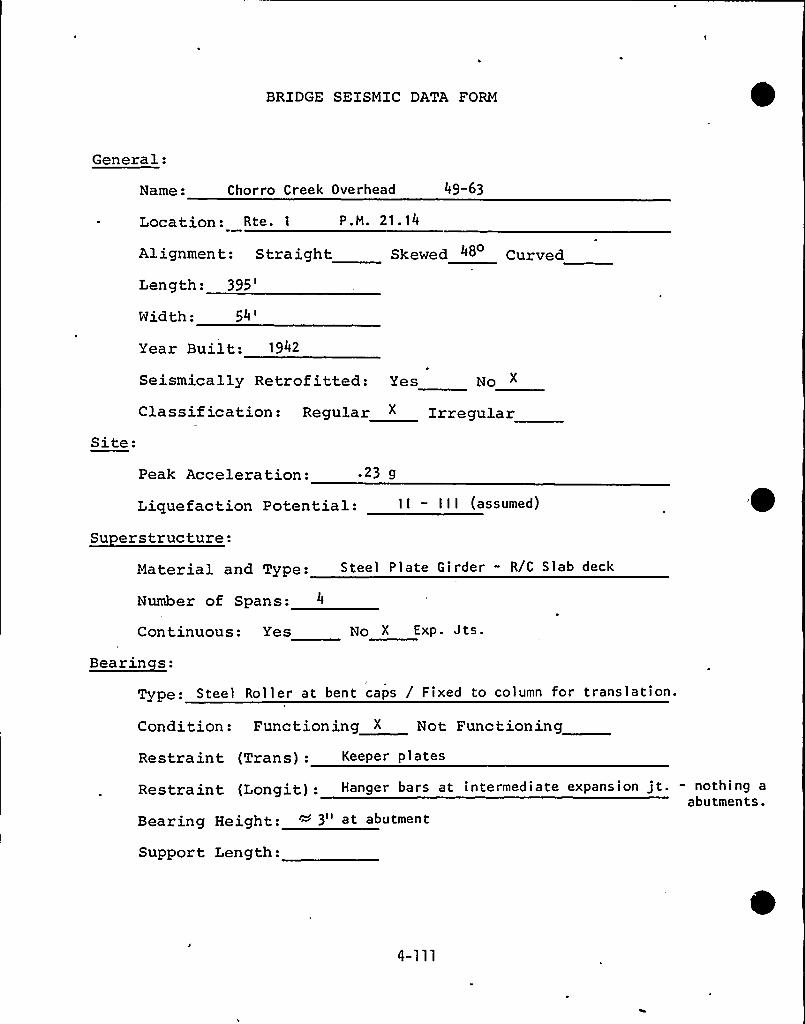
BRIDGE SEISMIC DATA FORM
General:
Name: Chorro Creek Overhead 49-63
Location: Rte. 1 P.H. 21.14
Alignment: StraightLength:
395'idth:
54
Skewed 48 Curved
Year Built: 1942
Seismically Retrofitted: Yes No X
Classif ication: Regular X IrregularSite:
Peak Acceleration:
Liquefaction Potential:
~ 23 g
I I - I I I (assumed)
Su erstructure:Material and Type: Steel Plate Girder - R/C Slab deck
Number of Spans: 4
Continuous: Yes No X Exp. Jts.
Bearinces:
Type: Steel Roller at bent caps / Fixed to column for translation.
Condition: Functioning X Not Functioning
Restraint (Trans): Keeper plates
Restraint (Longit):Bearing Height: 3"
Support Length:
Hanger bars at intermediate expansion jt. - nothing aabutments.
at abutment
4-111
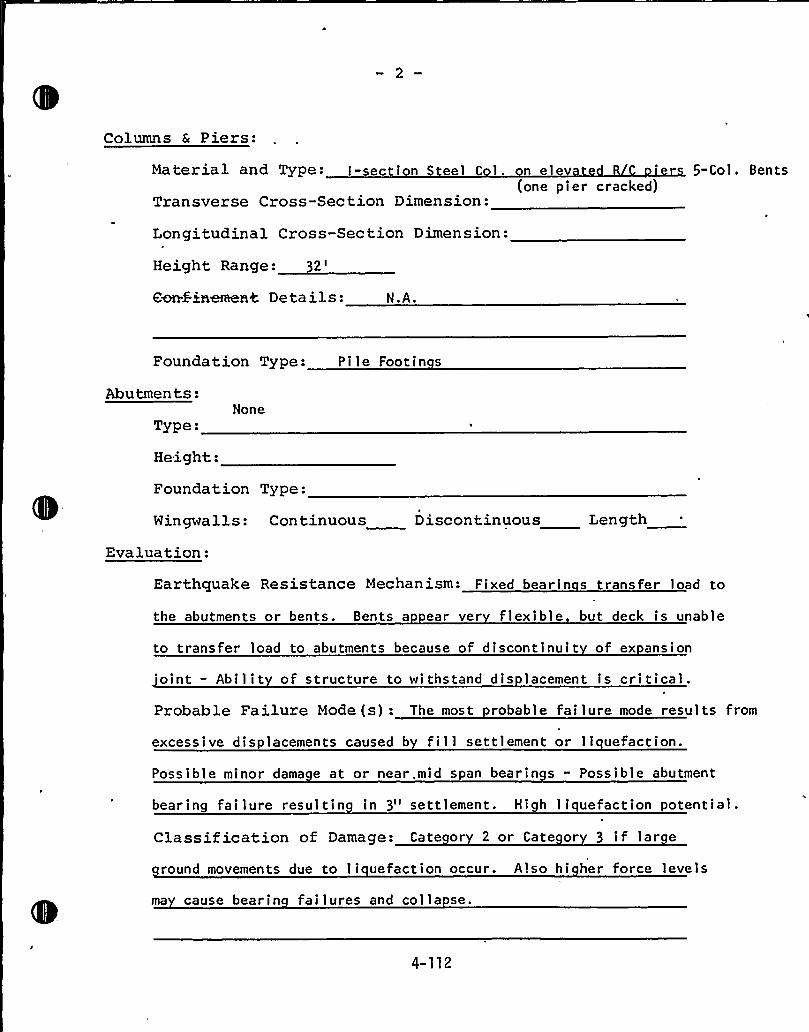
Columns & Piers:
Material and Type: I-section Steel C 1. n e 5-Col. Bents(one pier cracked)
Transverse Cross-Section Dimension:
Longitudinal Cross-Section Dimension:
Height Range:32'm&ineateatDetails: N.A.
Foundation Type: Pile Footin s
Abutments:
Type
Height:
None
Foundation Type:
Wingwalls: Continuous Discontinuous Length
Evaluation:
Earthquake Resistance Mechanism: Fixed bearin s transfer load to
the abutments or bents. Bents a ear ver flexible but deck is unable
to transfer load to abutments because of discontinuit of ex ansion
oint - Abilit of structure to withstand dis lacement is critical.Probable Failure Mode(s): The most robable failure mode results from
excessive displacements caused b fill settlement or li uefaction.
Possible minor dama e at or near.mid span bearin s - Possible abutment
bearing failure resul tin in 3" settlement. High liquefaction potential.
Classification of Damage: Cate or 2 or Cate or 3 if lar e
round movements due to li uefaction occur. Also hi her force levels
ma cause bearin failures and colla se.
4-112
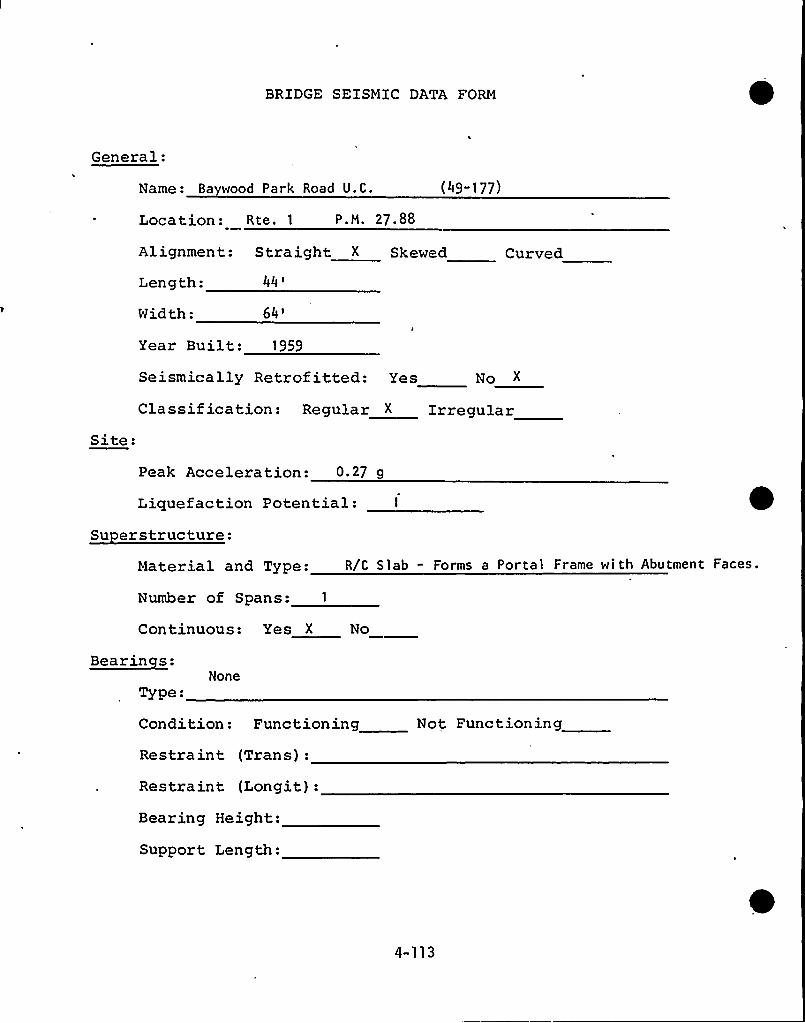
BRIDGE SEISMIC DATA FORM
General:
Name: Ba wood Park Road U.C. (49-177)
Location: Rte. 1 P.M. 27.88
Alignment: Straight X Skewed
Length:44'idth:
64'urved
Site:
Year Built: 1959
Seismically Retrof itted: Yes No X
Classif ication: Regular X Irregular
Peak Acceleration: 0.27 g
Liquefaction Potential:Su erstructure:
Material and Type: R/C Slab - Forms a Portal Frame with Abutment Faces.
Number of Spans:
Continuous: Yes X No
Bearinces:
Type:None
Condition: Functioning
Restraint (Trans):
Restraint (Longit):
Bearing Height:
Support Length:
Not Functioning
4-113
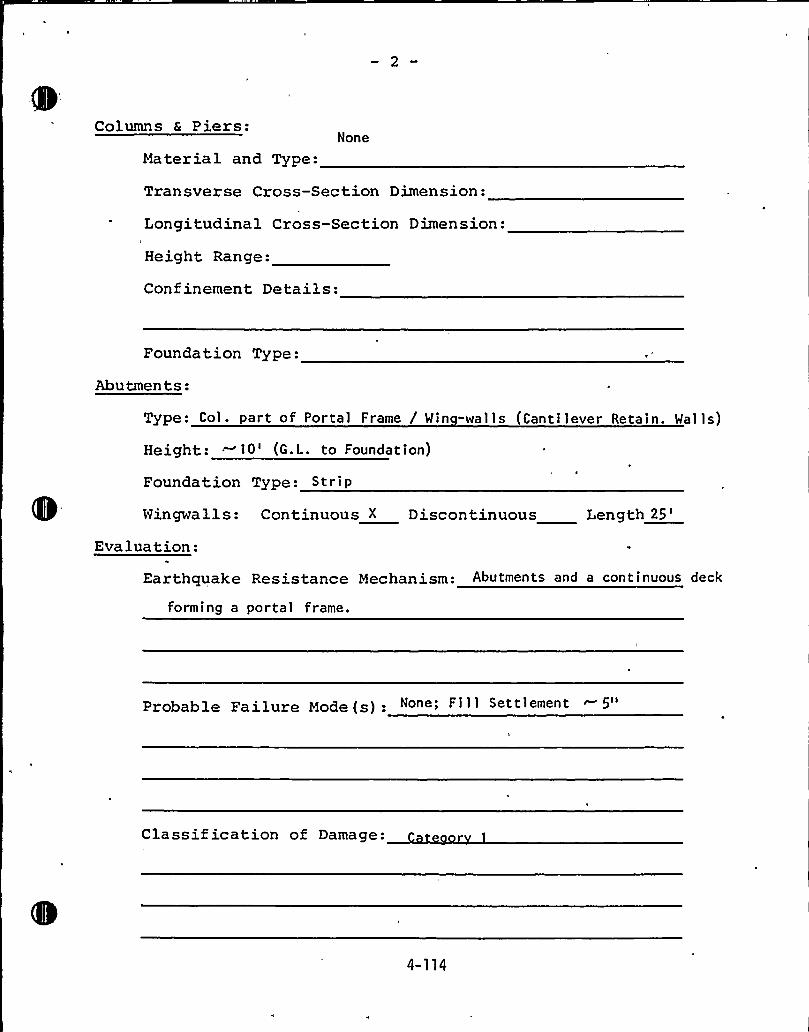
Columns & Piers:
Material and Type:None
Transverse Cross-Section Dimension:
Longitudinal Cross-Section Dimension:
Height Range:
Confinement Details:
Foundation Type:
Abu tmen ts:Type: Col. part of Portal Frame / Win -walls (Cantilever Retain. Wal ls)
Height: . 10'G.L. to Foundation)
Foundation Type: S t r i p
Wingwalls: Continuous X Discontinuous Length25'valuation:
Earthciuake Resistance Mechanism: Abutments and a continuous deck
forming a portal frame.
Probable Failure Mode (s) . None; Fill Settlement ~ 5"
Classif ication of Damage:
4-114
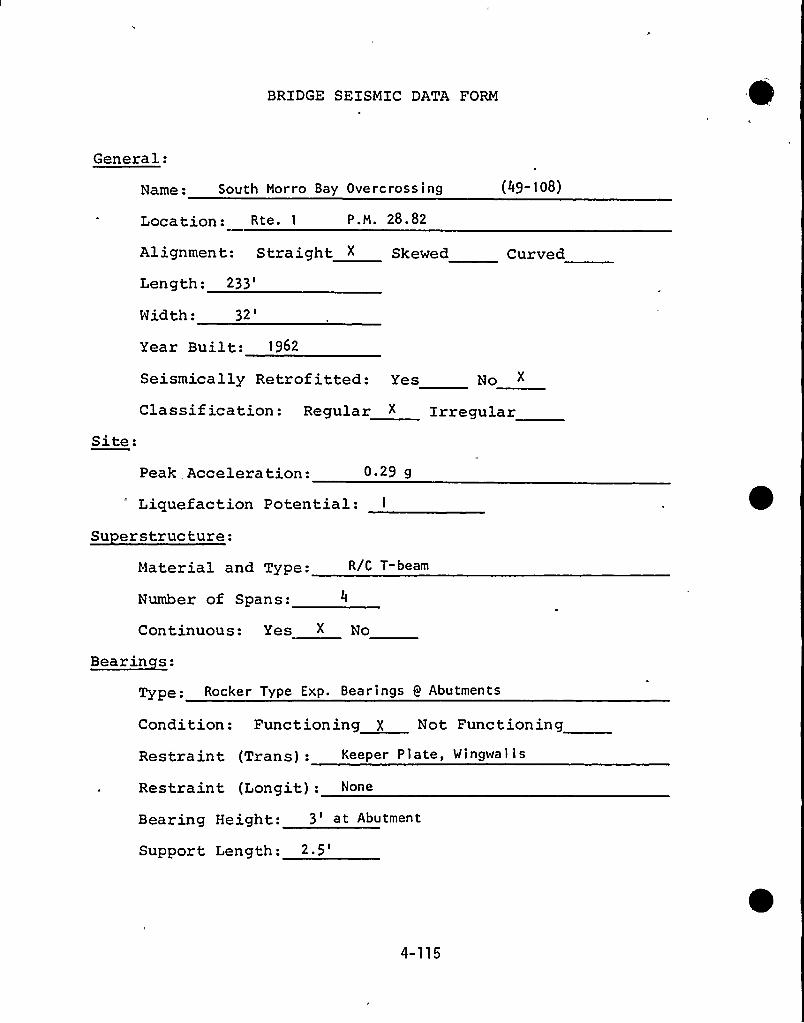
BRIDGE SEISMIC DATA FORM
General:
Name: South Morro Bay Overcrossing
Location: Rte. 1 P.M. 28.82
(49-1O8)
Alignment: StraightLength:
233'idth:
32'ear
Built: 1962
Skewed Curved
Site:
Seismically Retrofitted: Yes No
Classif ication: Regular X Irregular
Peak Acceleration: 0.29 g
Liquefaction Potential:Su erstructure:
Material and Type: R/C T-beam
Number of Spans: 4
Continuous: Yes X No
~Bearin s:
Type: Rocker Type Exp. Bearings Q Abutments
Condition: Functioning X Not Functioning
Restraint (Trans): Keeper Plate, Wingwa1 1 s
Restraint (Longit): None
Bearing Height.: 3't Abutment
Support Length:
2.5'-115
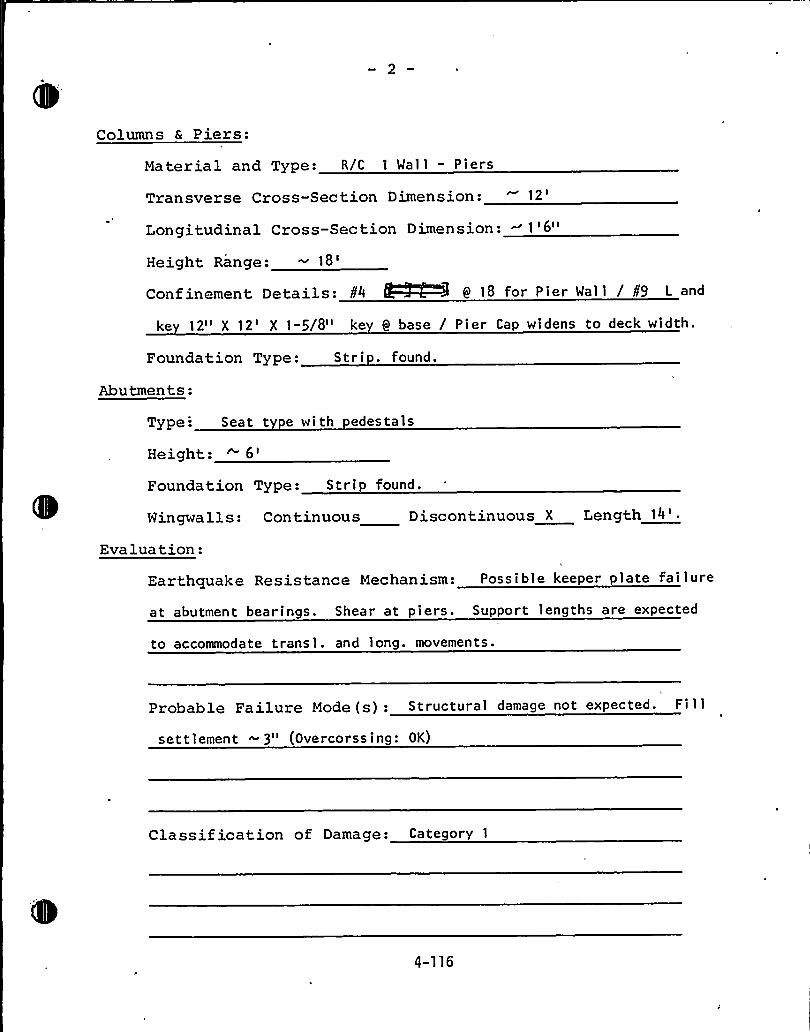
Columns & Piers:
Material and Type: R/C 1 Wall - Piers
Transverse Cross-Section Dimension:12'ongitudinalCross-Section Dimension: ~ 1'6"
Height Range:18'onfinementDetails: P4 WW4 0 18 for Pier Wal 1 / P9 L and
ke 12" X 12' 1"5/8" ke Ia base / Pier Cap widens to deck width.
Foundation Type: Stri . found.
Abu tmen ts:Type'. Seat t e wi th edes tais
Height: ~6'oundation Type: S t r i p found.
Wingwalls: Continuous Discontinuous X Length14'valuation:
Earthquake Resistance Mechanism: Possible keeper plate failure
at abutment bearings. Shear at piers. Support lengths are expected
to accommodate transl. and long. movements.
Probable Failure Mode (s): Structural damage not expected, Fi 1 l
settlement 3" (Overcorssing: OK)
Classif ication of Damage: Category 1
4-116

BRIDGE SEISMIC DATA FORM
General:
Name: North Morro Bay Undercrossing
Location: Ate P.M. 29. 62
(49-109)
Alignment: Straight Skewed 3> Curved0
Leng th: 61
'idth:
74'ear
Built: 1962
Seismically Retrofitted: Yes No X
Classification: Regular ~ IrregularSite:
Peak Acceleration: O 32 g
Liquefaction Potential:Su erstructure:
Material and Type: R/C Box Girder
Number of Spans:
Continuous: Yes " No Exp. Jts. 9 Abutment
Bearinces:
Type: Expansion Jts. 9 Abutment
Condition: Functioning X Not Functioning
Restraint (Trans): Shear keys 9 Abut. 2'ey 9 15'enters.
Restraint (Longit): Abutment wingwa11s.
Bearing Height:
Support Length:
4-117
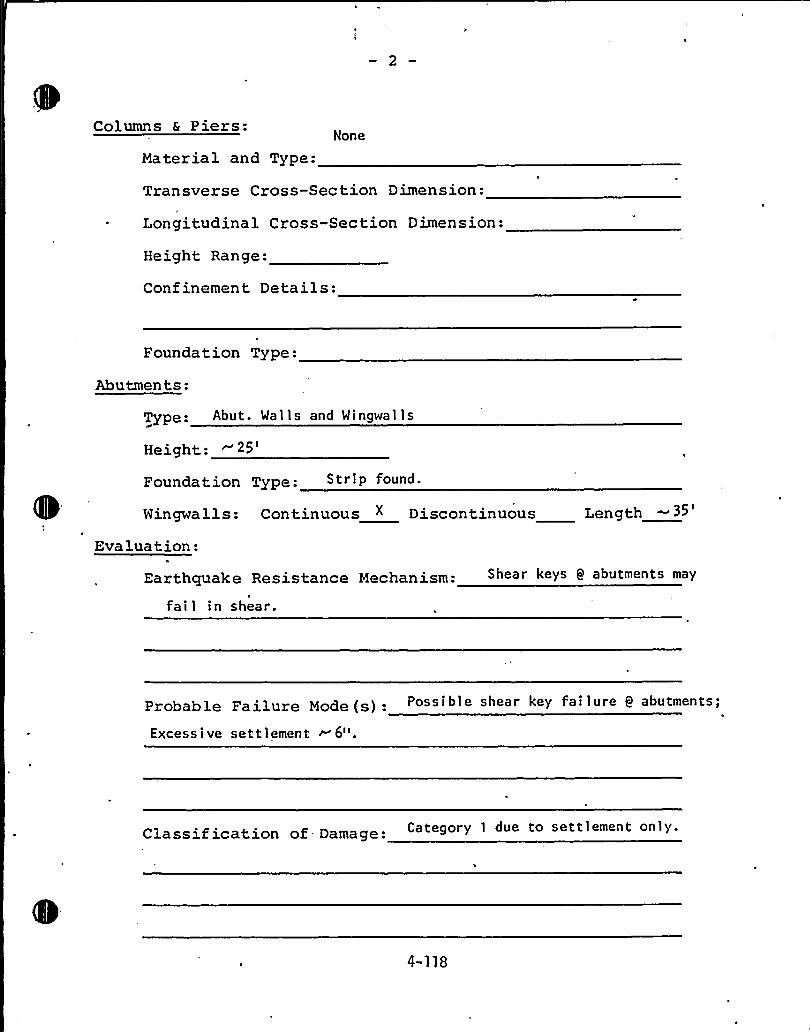
Columns & Piers:
Material and Type:None
Transverse Cross-Section Dimension:
Longitudinal Cross-Section Dimension:
Height Range:
Confinement Details:
Foundation Type:
Abutments:
Type: Abut. Walls and Wingwalls
Height: ~25'oundation Type.. Strip found.
Wingwalls: Continuous X Discontinuous Length —35
Evaluation:
Earthquake Resistance Mechanism: Shear keys Q abutments may
fail in shear.
Probable Failure Mode ~s1. Possible shear key failure 9 abutments;
Excessive settlement ~ 6".
Classification of - Damage Category 1 due to settlement only.
4-118
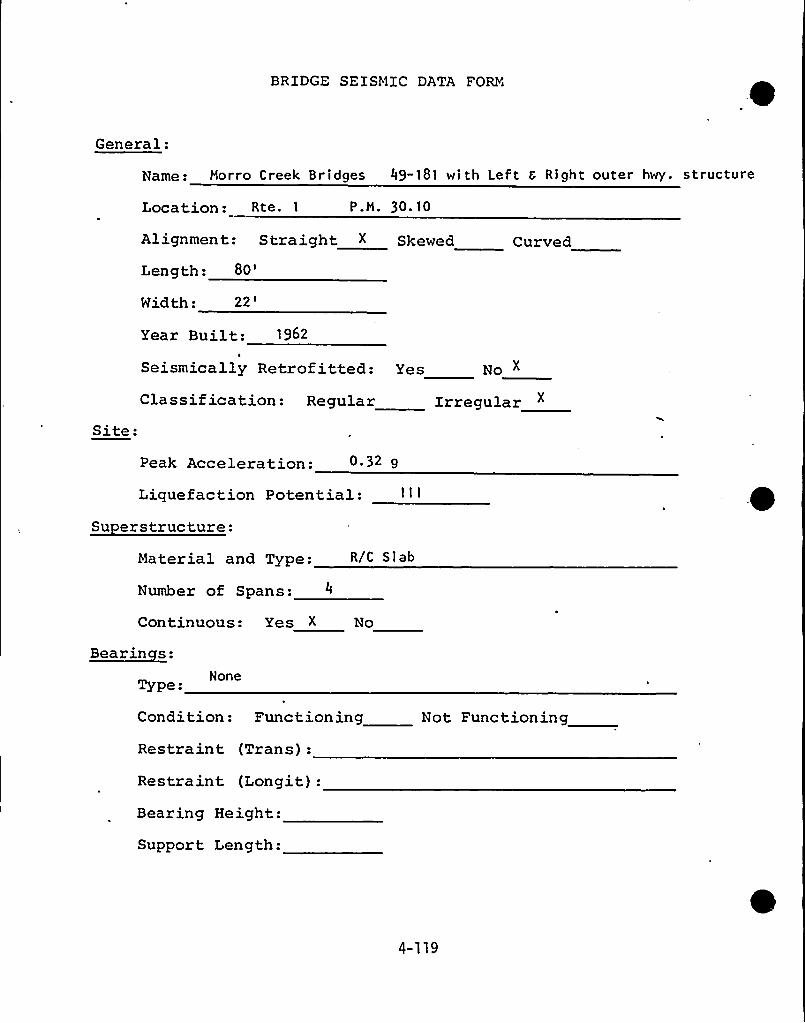
BRIDGE SEISMIC DATA FORYi
General:
Name: Morro Creek Bridges 49-181 with Left 6 Right outer hwy. structure
Location: Rte. 1 P.M. 30.10
Alignment: Straight X Skewed Curved
Length:80'idth:
Site:
Year Built: 1962
Seismically Retrofitted: Yes
Classification: Regular
Peak Acceleration: 0.32 9
No X
Irregular
Liquefaction Potential:Su erstructure:
Material and Type: R/C Slab
Number of Spans: 4
Continuous: Yes X No
Bearinces:NoneType:
Condition: Functioning
Restraint (Trans):
Restraint (Longit):Bearing Height:
Support Length:
Not Functioning
4-119
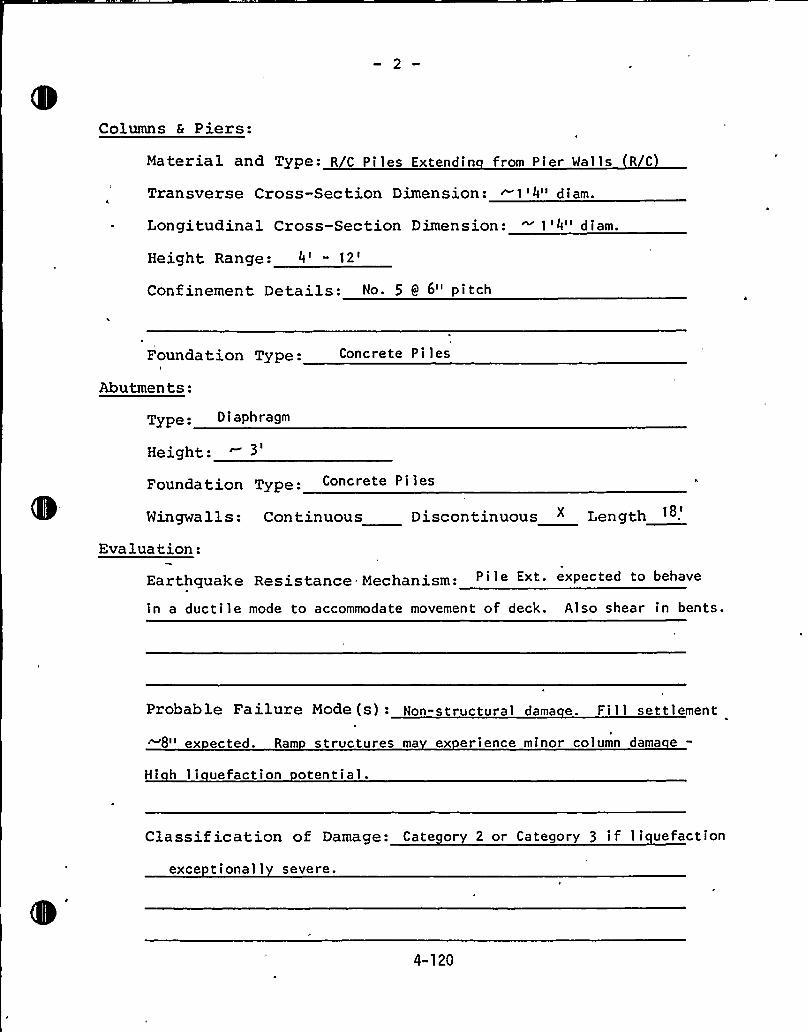
Columns & Piers:
Material and Type: R/C Piles Extendin from Pier Walls R/C
Transverse Cross-Section Dimension: ~1'4" diam.
Longitudinal Cross-Section Dimension: 1'4" diam.
Height Range: 4'
12'onfinementDetails: No. 5 9 6" pitch
Foundation Type:I
Abutments:
Concrete Piles
Type D i aphragm
Height:
Foundation Type: Concrete Pi les
Wingwa 1ls: Continuous Discontinuous " Length
Eva lua t ion:
Earthquake Resistance Mechanism: Pile Ext. expected to behave
in a ductile mode to accommodate movement of deck. Also shear in bents.
Probable Failure Mode (s): Non-structural dama e. Fi11 settlement
~8" ex ected. Ram structures ma ex erience minor column dama e-Hi h li uefaction otential.
Classification of Damage: Cate or 2 or Category 3 if liquefaction
exce tionall severe.
4-120
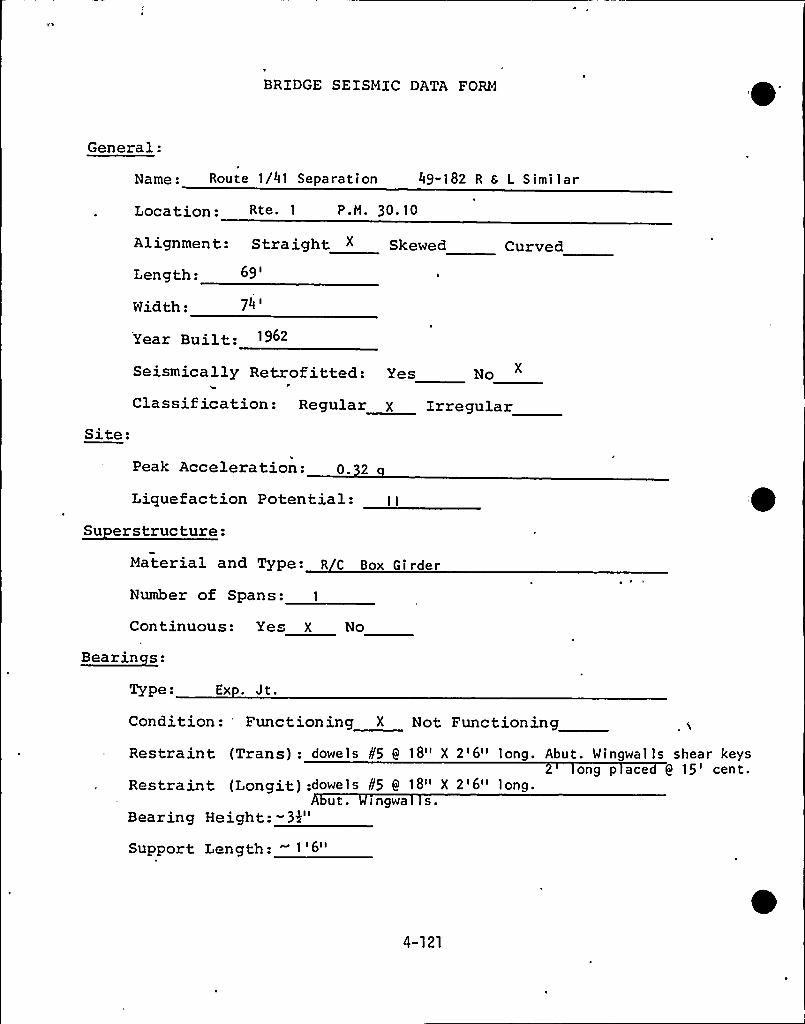
BRIDGE SEISMIC DATA FORM
General:
Name: Route 1/41 Separation
Location: R«. 1 P.~ 3o 1o
49-182 R 6 1 Similar
Alignment: Straight ~ Skewed Cursed
Length:69'idth:
74 t
Year Built:Seismically Retrofitted: Yes No
Classit ic'ation: Regular x IrregularSite:
Peak Acceleration: 0. 2
Liquefaction Potential:Su erstructure:
Material and Type- R C Box Girder
Number of Spans: 1
Continuous: Ye X No
Bearinces:
Type: Ex . Jt.
Condition: Functioning X Not Functioning
Re stra int (Tran s ): dowe 1 s
Restraint (Longit):dowe 1 sut.
Bearing Height: "3k"
Support Length:
¹5 g 18" X 2'6" long. Abut. Wingwalls shear keysong p ace 9 15'ent.
¹5 Q 18" X 2'6" long.ingwa s.
4-121
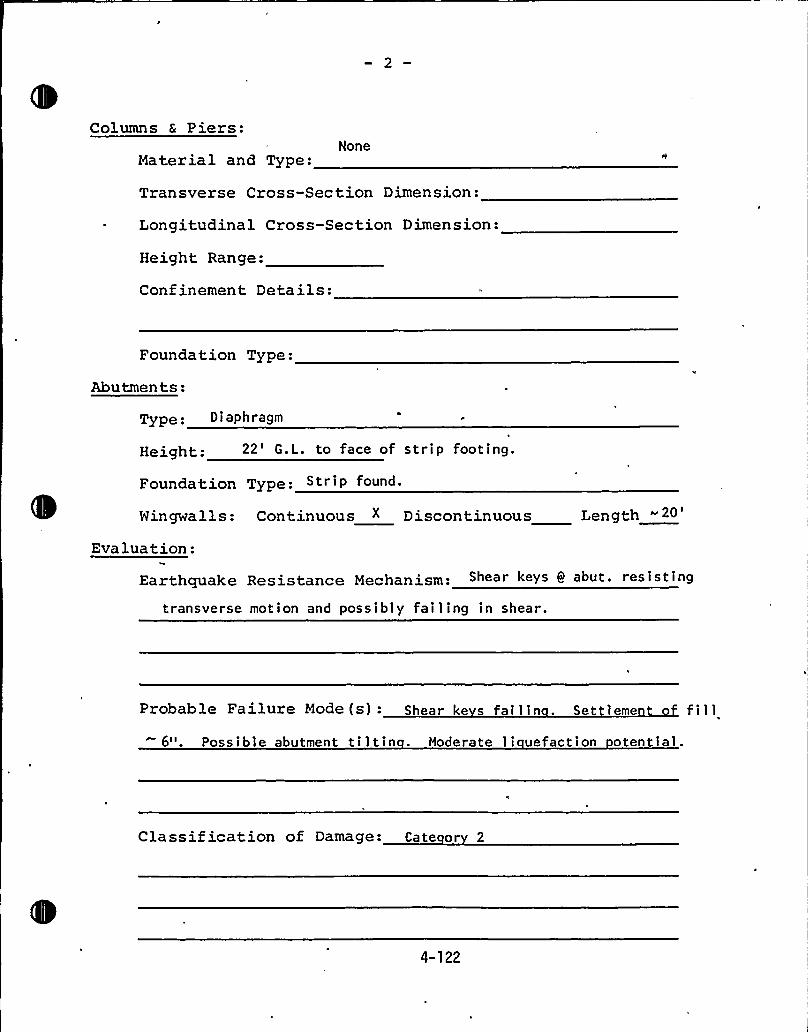
Columns & Piers:
Material and Type:None
Transverse Cross-Section Dimension:
Longitudinal Cross-Section Dimension:
Height Range:
Confinement Details:
Foundation Type:
Abutments:
Type; Di aPhragm
Height.-22'.L. to face of strip footing.
Foundation Type: Strip found.
Wingwalls: Continuous X Discontinuous Length"20'valuation:
Earthquake Resistance Mechanism: Shear keYs 9 abut. resisting
transverse motion and possibly failing in shear.
Probable Failure Mode (s): Shear ke s fai 1 in . Set leme
6". Possible abutment tiltin . Moderate li uefaction otential.
Classif ication of Damage: Cate or 2
4-122
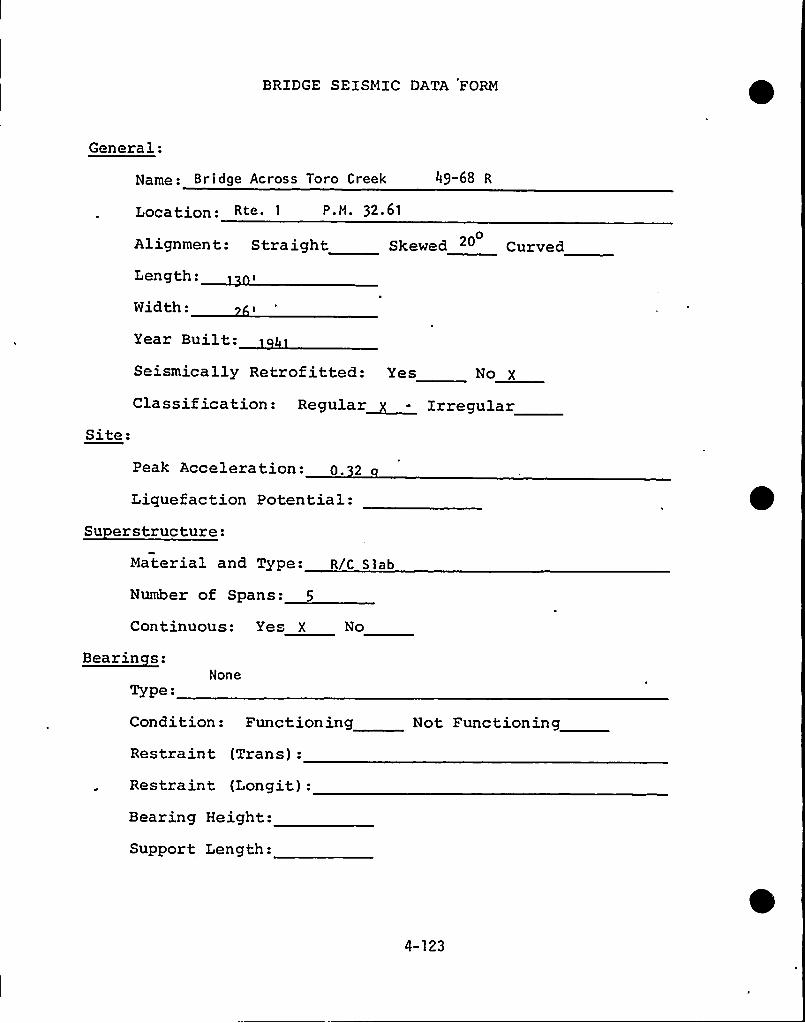
BRIDGE SEISMIC DATA FORM
General:
Name: Bridge Across Toro Creek 49-68 R
Location: Rre. 1 P.H. 32.61
0Alignment: Straight Shewed 20 Car<ed
Length:
Width:
Year Built:Seismically Retrofitted: Yes No X
Classif ication: Regular X - IrregularSite:
Peak Acceleration: 0. 2
Liquefaction Potential:Su erstructure:
Material and Type: R/C Slab
Number of Spans: 5
Continuous: Yes X No
Bearinces:
Type:None
Condition: Functioning
Restraint (Trans):
Restraint (Longit):Bearing Height:
Support Length:
Not Functioning
4-123
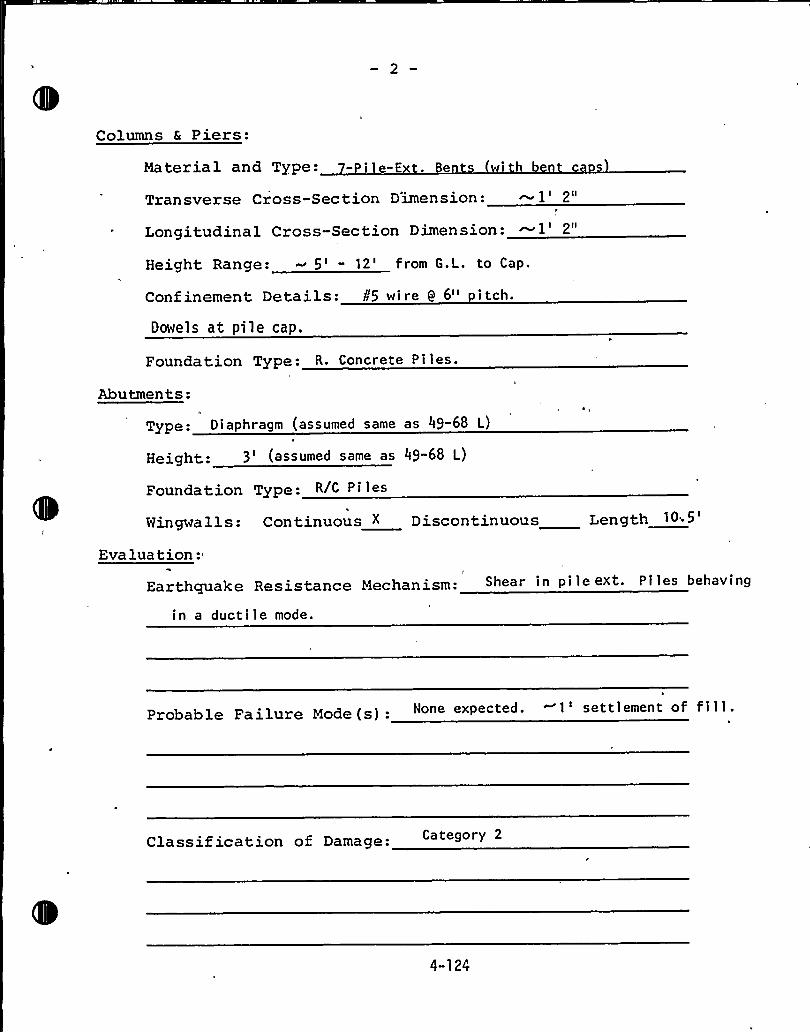
Columns & Piers:
Material and Type: -Pile-Ext. en 'b n
Transverse Cross-Section D'imension: ~1'"Longitudinal Cross-Section Dimension: ~1'"Height. Range: 5' 12' rom G. L. to Cap.
Confinement Details: ¹5 wire I 6" itch.
Dowels at pile cap.
Foundation Type: R. Concrete Piles.
Abutments:
Type: Diaphragm (assumed same as 49-68 L)
Height: 3'assumed same as 49-68 L)
Foundation Type: R/C P i l es
Wingwalls: Continuous X Discontinuous Length10'5'valuation:
Earth~age Resistance Mechanism: Shear in pile ext. Pil~s behaving
in a ductile mode.
Probable Failure Mode (s): None exPected. 1 'ettlement of f i 1 l.
Classif ication of Damage:
4-124
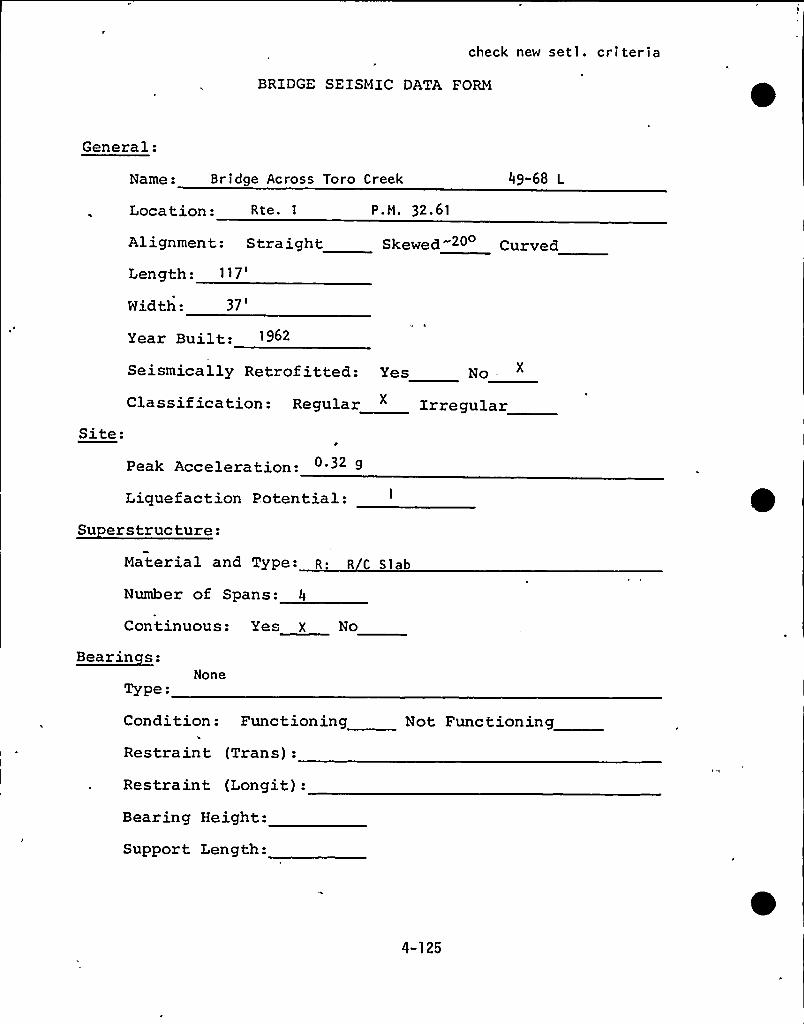
check new setl. criteria
BRIDGE SEISMIC DATA FORM
General:
Name: Bridge Across Toro Creek
Location: Rte. P.H. 32.61
49-68 L
Alignment: Straight Skewed"Ie Curved
Length:117'idth:
37'ear
Built: 1962
Seismically Retrofitted: Yes Ro .
Classification: Regular " IrregularSite:
Peak Acceleration:
Liquefaction Potential:Su erstructure:
Material and Type: R R C Sl ab
Number of Spans: 4
Continuous: Yes X No
Bearinces:
Type:None
Condition: Functioning
Restraint (Trans):
Not Functioning
Restraint (Longit):
Bearing Height:
Support Length:
4-125
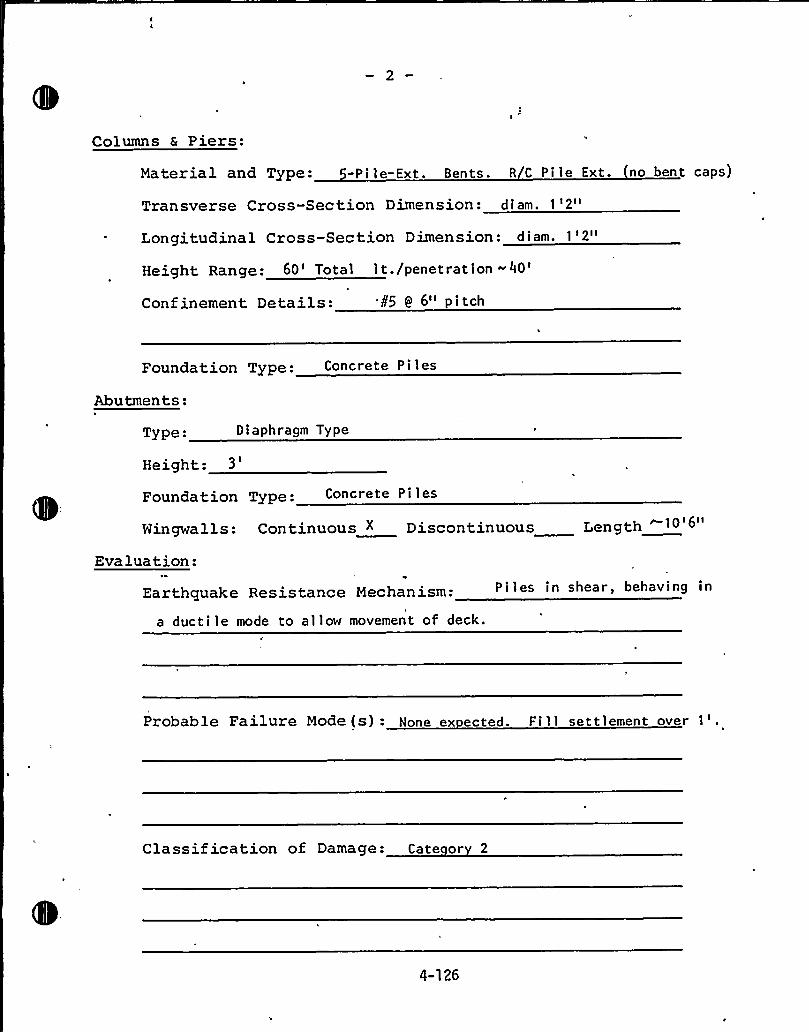
Columns & Piers:
Material and Type: -Pi le-Ext. Bents. R C Pi le Ext. no bent caps)
Transverse Cross-Section Dimension: diam. 1'2"
Longitudinal Cross-Section Dimension: diam. 1'2"
Height Range: 60'otal lt./penetration-40'onfinementDetails: '¹5 0 6" pitch
Foundation Type: Concrete Piles
Abutments:
Type: D i aphragm Type
Height: 3
Foundation Type: Concrete Pi les
Wingwalls: Continuous X Discontinuous Length
Evaluation:
Earthquake Resistance Mechanism:
a ductile mode to al)ow movement of deck.
Piles in shear, behaving in
Probable Failure Mode (s): None ex ected. Fill settlement over 1'.
Classif ication of Damage: Cate or 2
4-126
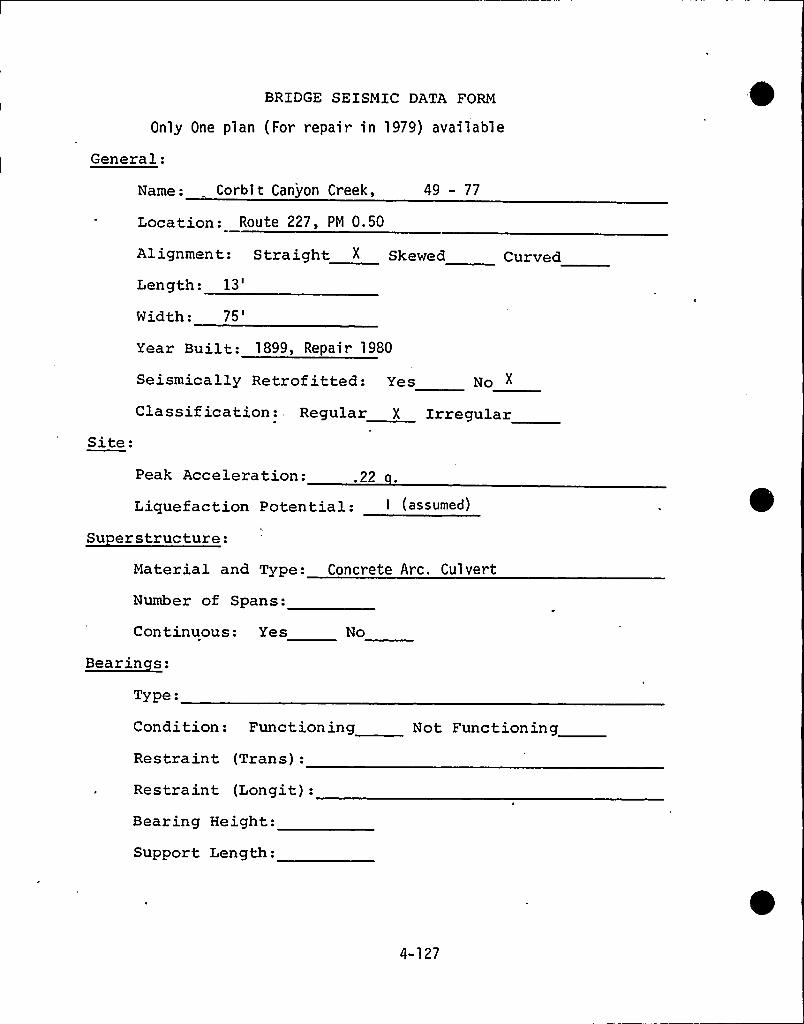
BRIDGE SEISMIC DATA FORM
Only One plan (For repair in 1979) available
General:
Name: Corb| t Canyon Creek,
Location: Route 227, PM 0.50
49 - 77
Alignmen t: S tra ight " Skewed
Length:13'idth:
75'ear
Built: 1899, Repair 1980
Seismically Retrof itted: Yes
Curved
No X
Site:Classif ication: Regular X Irregular
Peak Acceleration: .22
Liquefaction Potential: ~ (»sum«)
Su erstructure:Material and Type: Concrete Arc. Cul vert
Number of Spans:
Continuous: Yes No
Bea~inces:
Type:
Condition: Functioning
Restraint (Trans):
Restraint, (Longit):
Not Functioning
Bearing Height:
Support Length:
4-127
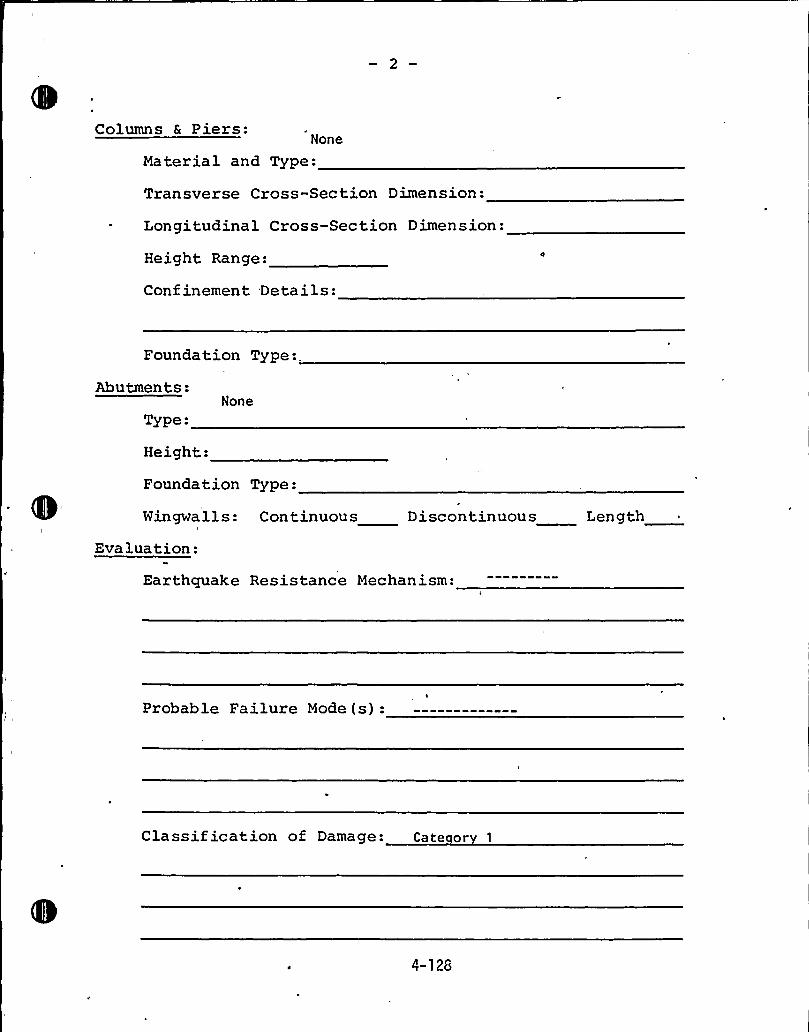
Columns & Piers:None
Material and Type:
Transverse Cross-Section Dimension:
Longitudinal Cross-Section Dimension:
Height Range:
Confinement Details:
Foundation Type:.
Abutments:None
Type-
Height:
Foundation Type:
Wingwa l1 s: Continuous Discontinuous Length
Evaluation:
Earthquake Resistance Mechanism:
4
Probable Failure Mode (s):
Classif ication of Damage: Cate or 1
4-126
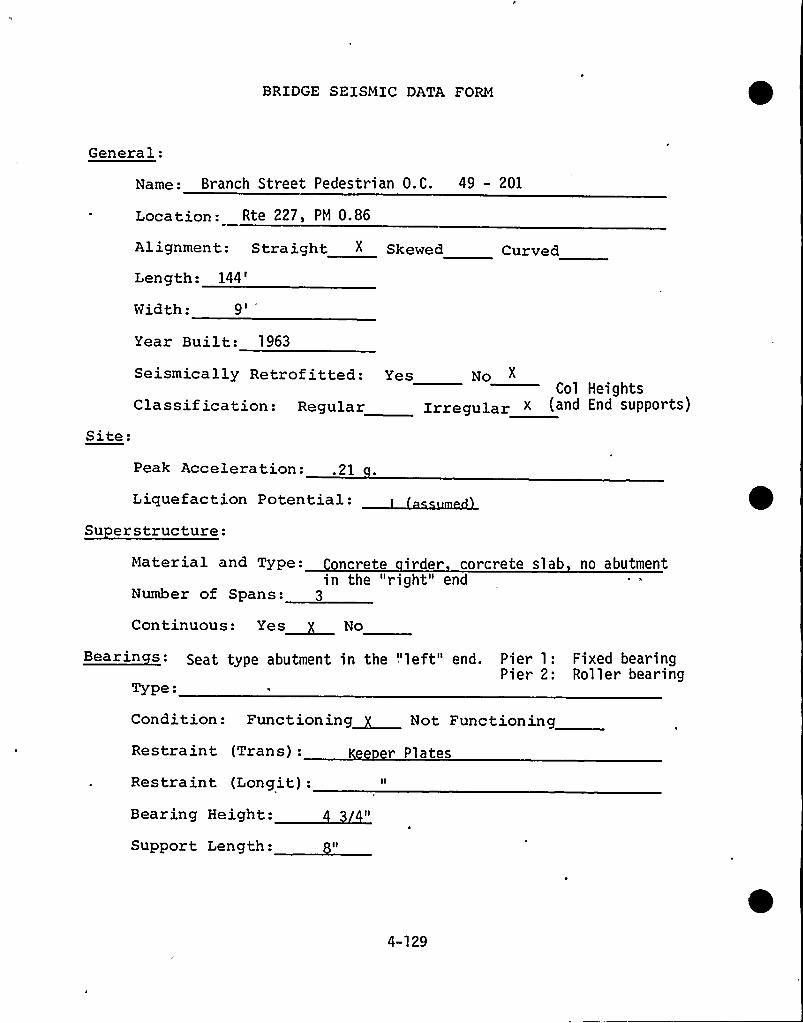
BRIDGE SEISMIC DATA FORM
General:
Name: Branch Street Pedestrian O.C. 49 - 201
Location: Rte 227, PM 0.86
Alignmentl Straight X Skewed Curved
Length:144'idth:
9'ear
Built: 1963
Seismically Retrofitted: Yes No X
Col HeightsClassification: Regular Irregular " ~ " f"d "PP "
Site:Peak Acceleration: .21
Liquefaction Potential:Su erstructure:
Material and Type: oncrete irder corcrete slab no abutmentin the "right" end
Number of Spans: 3
Continuous: Yes~ No
~Bearin s: Seat type abutment. in the",left" end. Pier 1: Fixed bearingPier 2: Roller bearing
Type-
Condition: Functioning~ Not Functioning
Restraint (Trans):
Restraint (Longit):r Plates
Bearing Height: 4 4ll
Support Length:
4-129
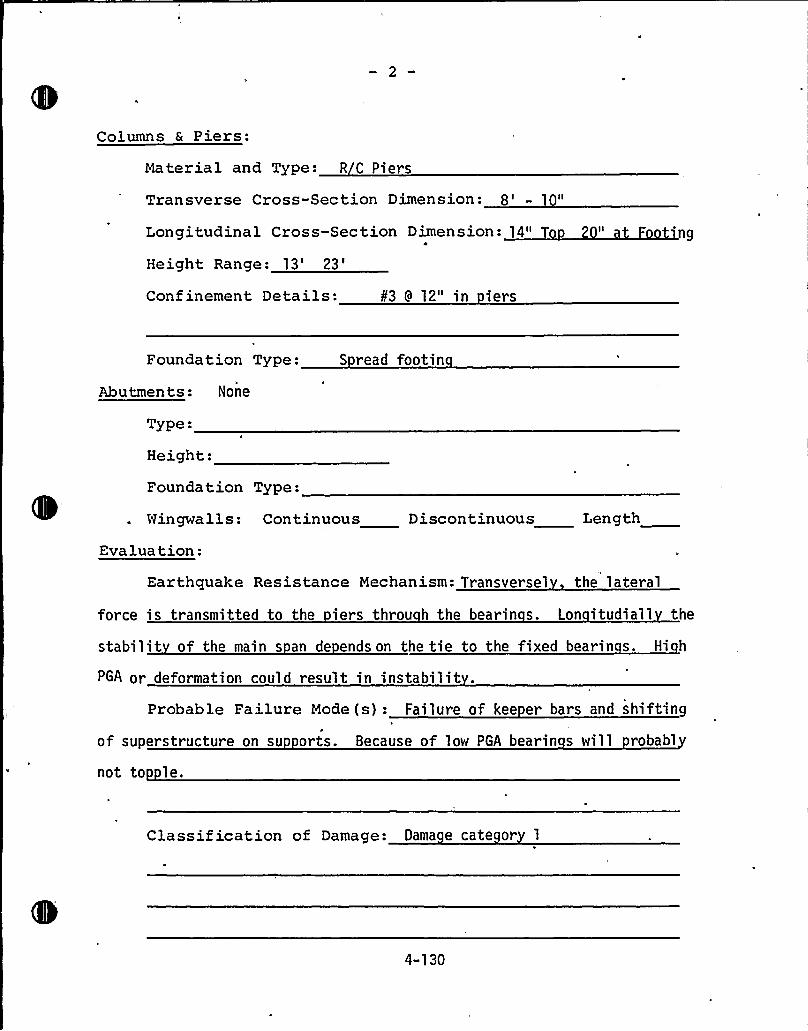
Columns & Piers:
Material and Type: R C Piers
Transverse Cross-Section Dimension:
8'ongitudinalCross-Section Dimension: 14"
Height Range: 13'3'gConf inement Details: ¹3 9 12" in iers
Foundation Type: S read footin1
Abutments: None
Type:
Height:
Foundation Type:
Wingwalls: Continuous Discontinuous Length
Evaluation:
Earthquake Resistance Mechanism: Transversel the lateral
force is transmitted to the iers throu h the bearin s. Lon itudiall the
stabilit of the main s an de ends on the tie to the fixed bearin s. Hi h
PGA or deformation could result in instabilit .
Probable Failure Mode(s): Failure of kee er bars and shifting
of superstructure on su orts. Because of low PGA bearin s will robabl
not to le.
Classif ication of Damage: Dama e cate or 1
4-130
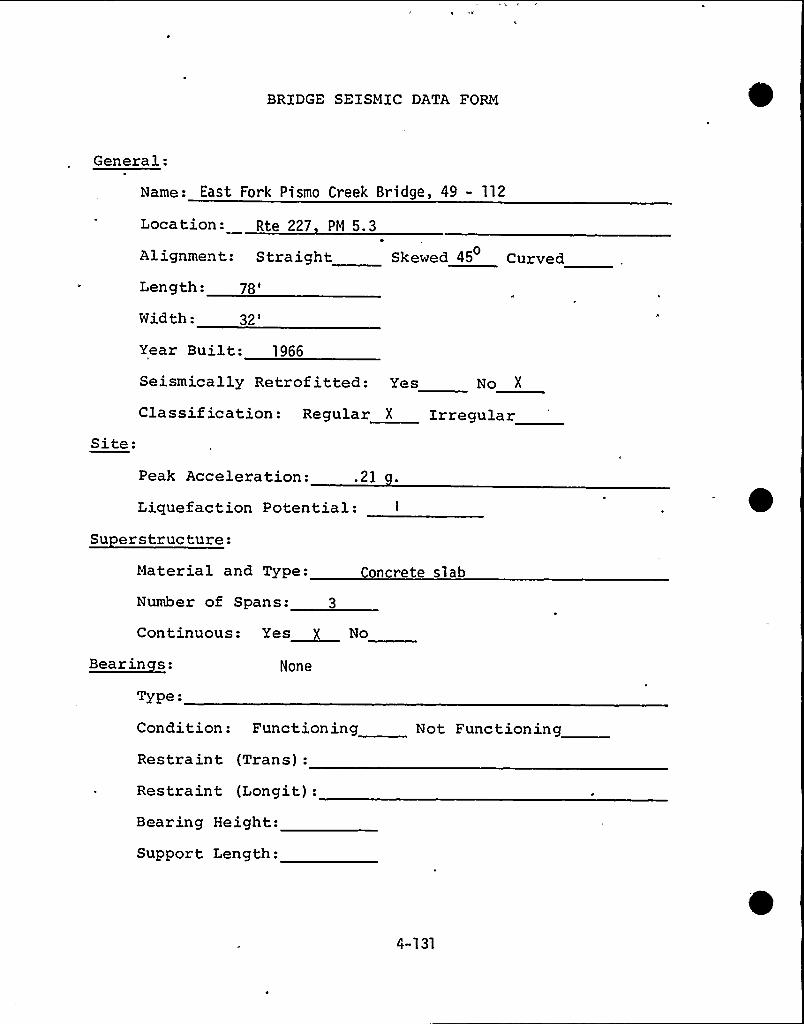
BRIDGE SEISMIC DATA FORM
General:
Name: East Fork Pismo Creek Bridge, 49 - 112
Location: Rte 227 PN 5.3
Alignment: Straight Skewed 45 Curved0
Length:78'idth:
32'ear
Built: 1966
Site:
Seismically Retrof itted: Yes No X
Classification: Regular X Irregular
Peak Acceleration: .21
Liquefaction Potential: I
Su erstructure:Material and Type: Concrete slab
Number of Spans: 3
Continuous: Yes X No
Bearinces: None
Type:
Condition: Funct,ioning
Restraint (Trans):
Restraint (Longit):
Not Functioning
Bearing Height:
Support Length:
4-131
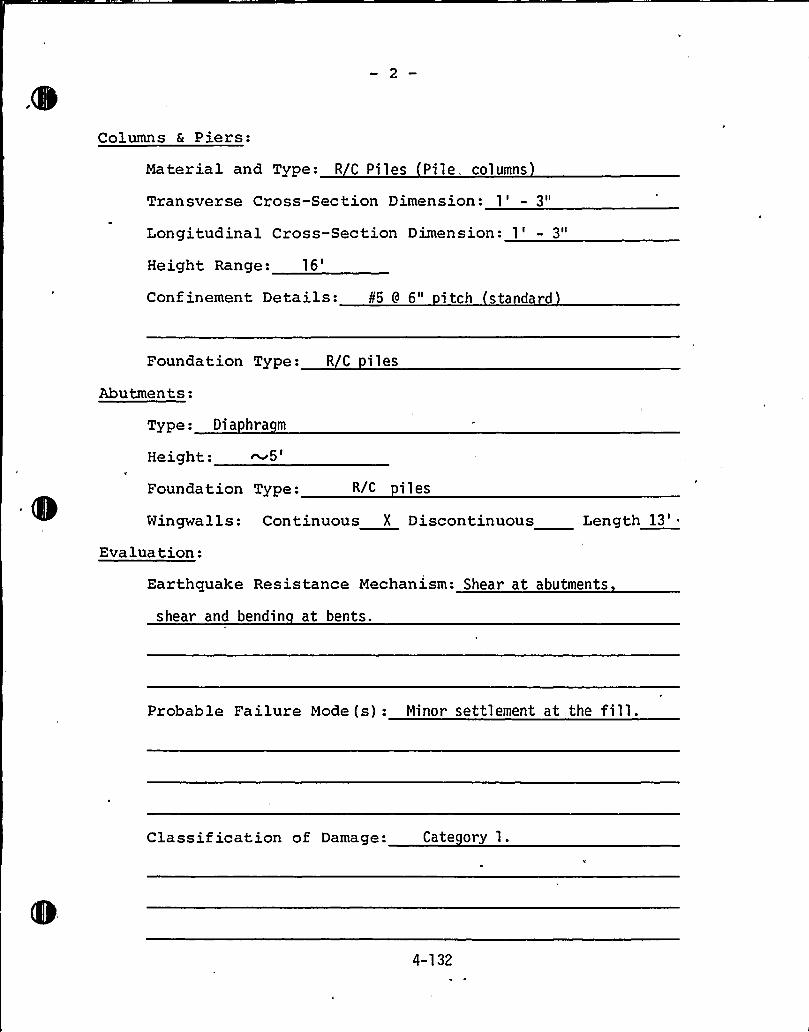
Columns & Piers:
Material and Type: R C Piles Pile. columns
Transverse Cross-Section Dimension: 1' 3"
Longitudinal Cross-Section Dimension: 1' 3"
Height Range:16'onfinementDetails: 85 9 6" itch standard
Foundation Type: R/C i les
Abutments:
Type: Dia hra m
Height:
Foundation Type: R/C iles
Wingwalls: Continuous X Discontinuous Length13'valuation:
Earthquake Resistance Mechanism: Shear at abutments
shear and bendin at bents.
Probable Failure Mode(s): Minor settlement at the fill.
Classif ication of Damage: Cate ory l.
4-132
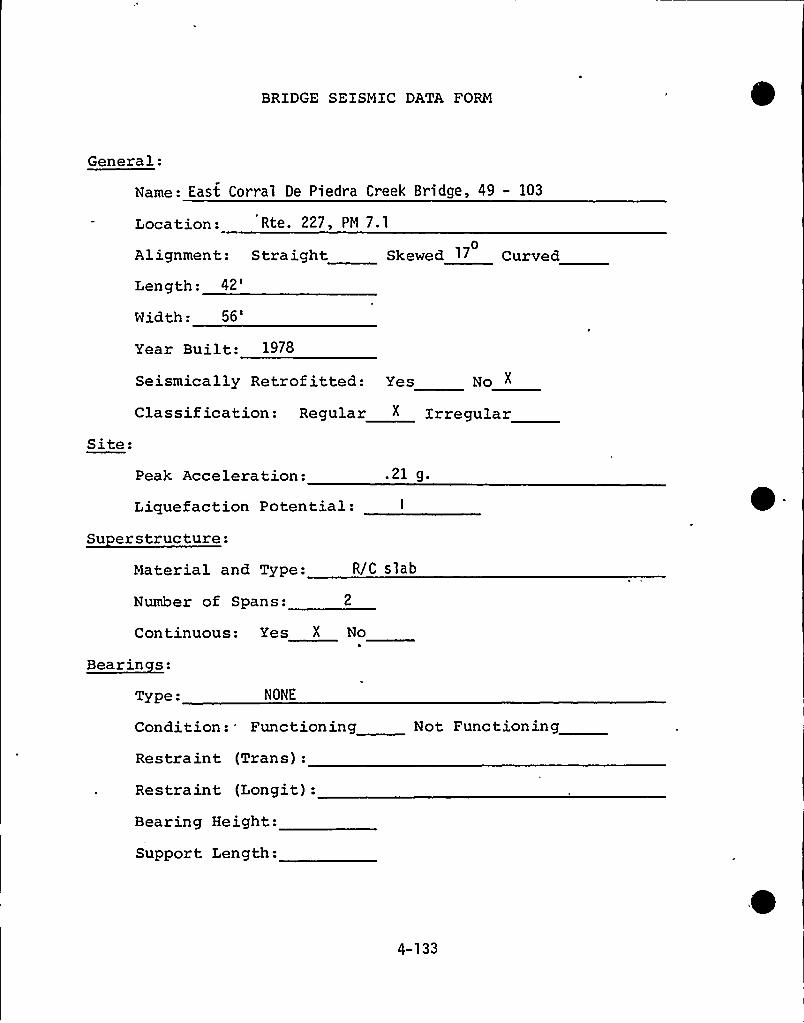
BRIDGE SEISMIC DATA FORM
General:
Name: East Corral De Piedra Creek Bridge, 49 - 103
Location: Rte. 227, PM 7.1
Alignment: StraightLength:
42'idth:
56'
Skewed l7 Curved
Year Built: 1978
Seismically Retrofitted: Yes No
Classification: Regular " IrregularSite:
Peak Acceleration: .21 g.
Liquefaction Potential:Su erstructure:
Material and Type:
Number of Spans:
R/C slab
Continuous: Yes X No
~Baarin s:
Type. NONE
Condition: * Functioning
Restraint (Trans):
Restraint (Longit):
Bearing Height:
Support Length:
Not Functioning
4-133
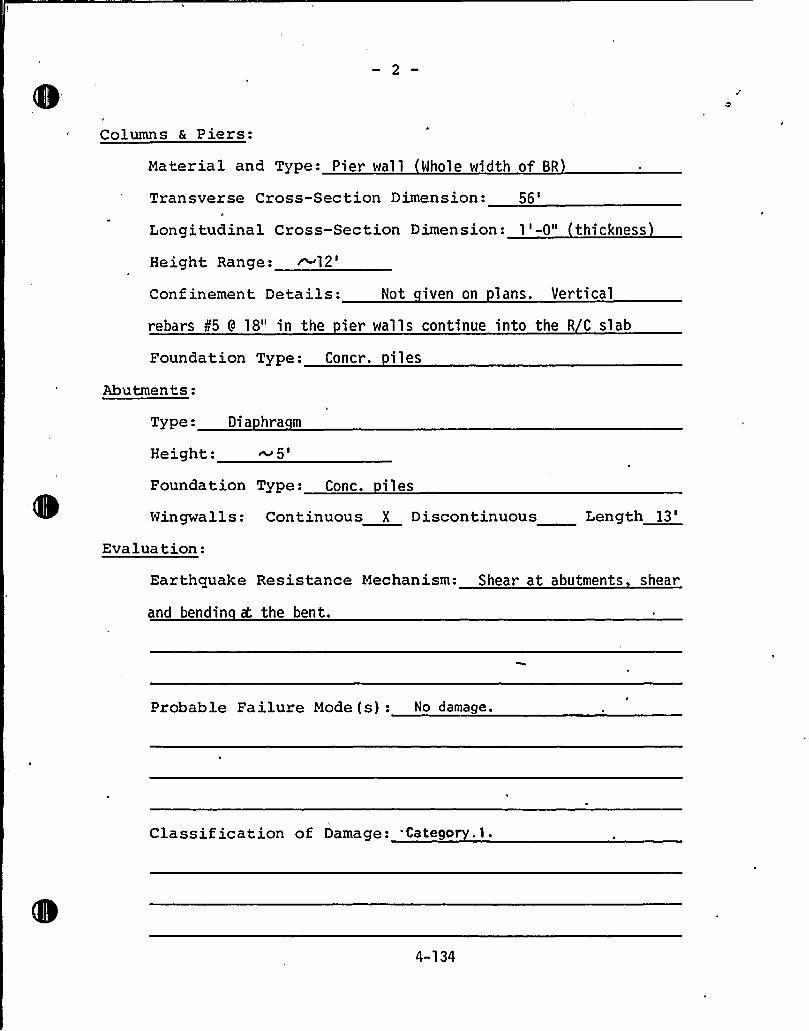
Columns a Piers:
Material and Type: Pier wall Whole width of BR
Transverse Cross-Section Dimension:56'ongitudinalCross-Section Dimension: 1 '-0" thi ckness
Height Range:~12'onf
inement Details: Not iven on lans. Vertical
rebars k5 9 18" in the ier walls continue into the R C slab
Foundation Type: Concr. iles
Abutments:
Type: Dia hra m
Height:
Foundation Type: Conc. iles
Wingwalls: Continuous X Discontinuous Length13'valuation:
Earthquake Resistance Mechanism: Shear at abutments shear
and bendin 4 the bent.
Probable Failure Mode (s): No damage.
Classification of Damage: .Categor .l.
4-134
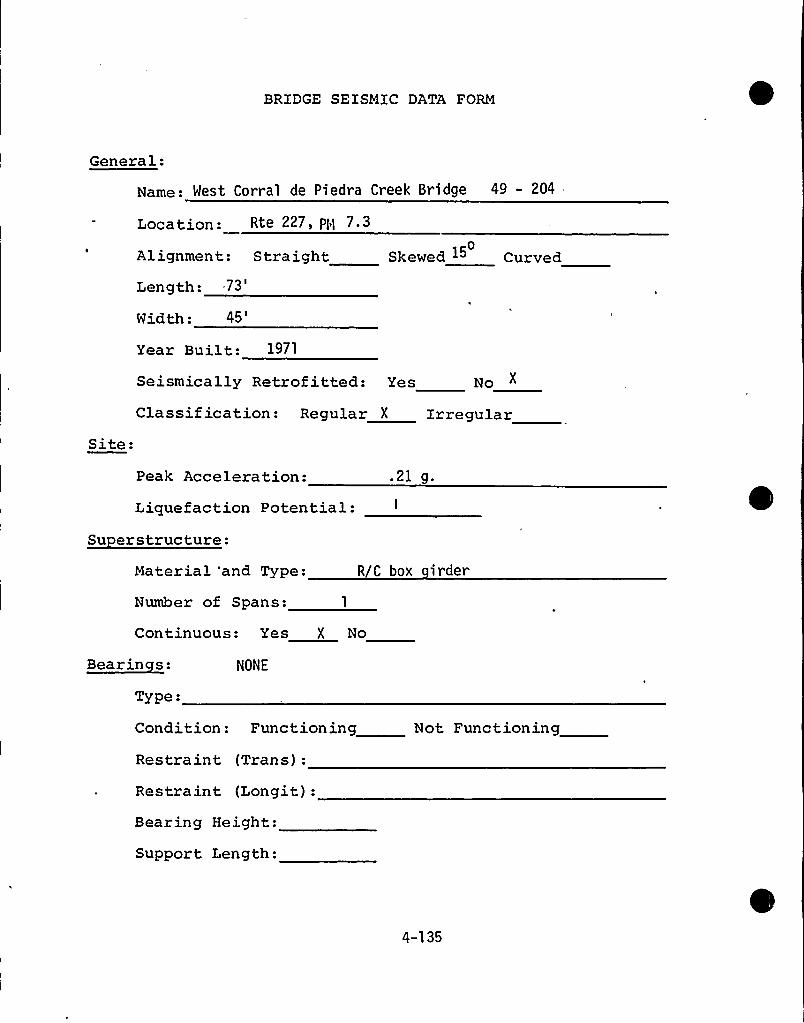
BRIDGE SEISMIC DATA FORM
General:
Name: West Corral de Piedra Creek Bridge 49 - 204
Location: Rte 227 PH 7 3
Alignment: StraightLength:
.73'idth:
45
0Skewed 15 Curved
Year Built: 1971
Seismically Retrofitted: Yes No
Classif ication: Regular X IrregularSite:
Peak Acceleration: .21 g.
Liquefaction Potential:Su erstructure:
Material and Type:
Number of Spans: 1
R C box irder
Continuous: Yes X No
Bearinces:
Type:
NONE
Condition: Functioning
Restraint (Trans):
Restraint (Longit):Bearing Height:
Support Length:
Not Functioning
4-135
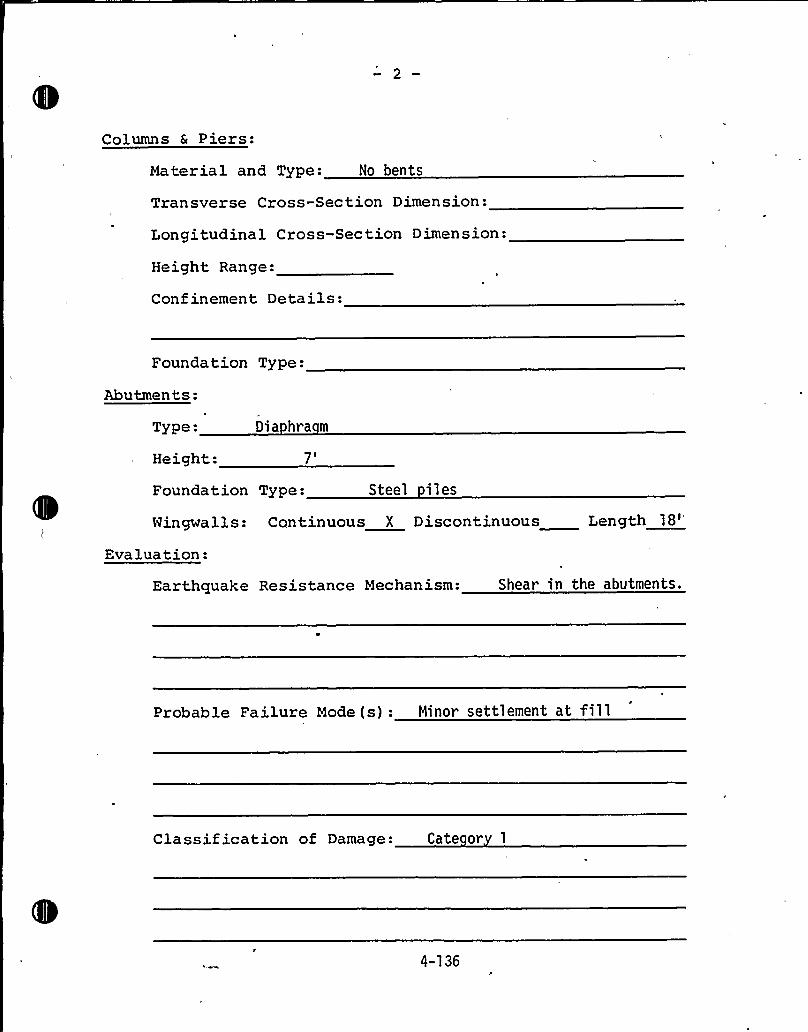
Columns & Piers:
Material and Type: No bents
Tran sverse Cross-Sec tion Dimension:
Longitudinal Cross-Section Dimension:
Height Range:
Confinement Details:
Foundation Type:
Abutments:
Type:
Height:
Dia hra m
7I
Foundation Type: Steel iles
Wingwalls: Continuous X Discontinuous Length18'valuation:
Earthquake Resistance Mechanism: Shear in the abutments.
Probable Failure Mode(s): Minor settlement at fill
Classification of Damage: Cate or 1
4-136
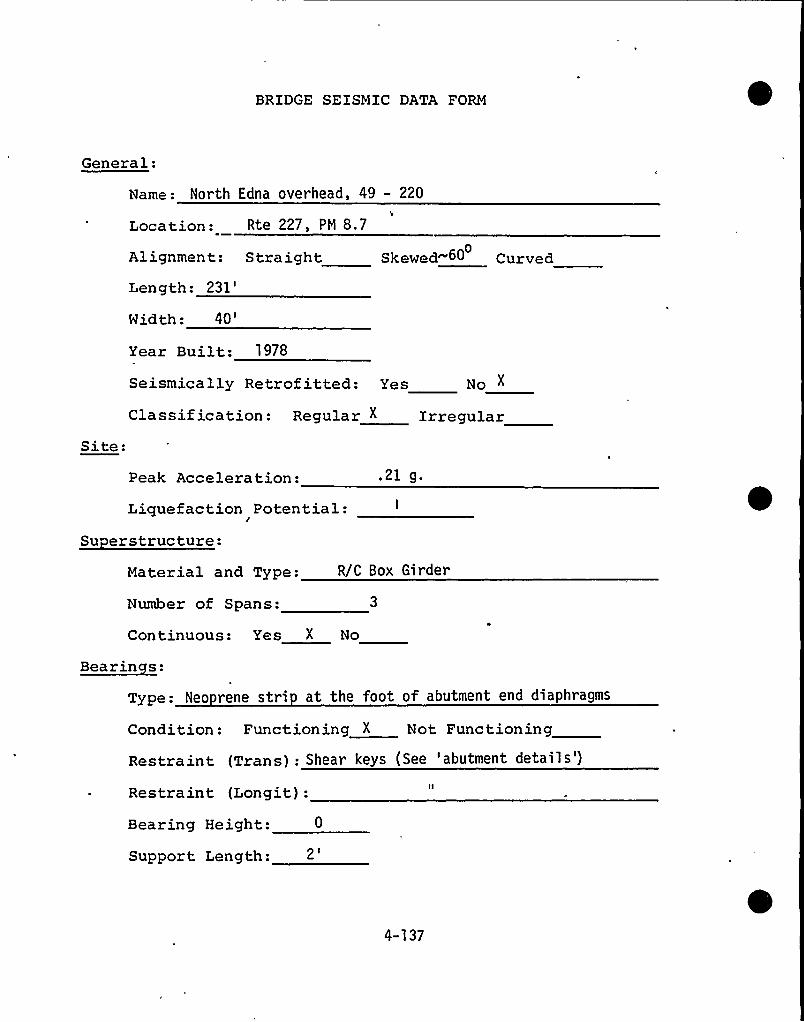
BRIDGE SEISMIC DATA FORM
General:
Name: North Edna overhead, 49 - 220
Location: Rte 227, PM 8.7
Alignment: StraightLength:
231'idth:
40'
Skewed 60 Curved
Year Built: 1978
Seismically Retrofitted: Yes
Classification: Regular "
Site:
No X
Irregular
Peak Acceleration: .21 g.
Liquefaction Potential:Su erstructure:
Material and Type:
Number of Spans:
R/C Box Girder
Continuous: Yes X No
~Bearin s:
Type: Neo rene stri at the foot of abutment end diaphragms
Condition: Functioning X Not Functioning
Restraint (Trans): Shear keys (See 'abutment details')
Restraint (Longit):
Bearing Height: 0
Support Length:
4-137
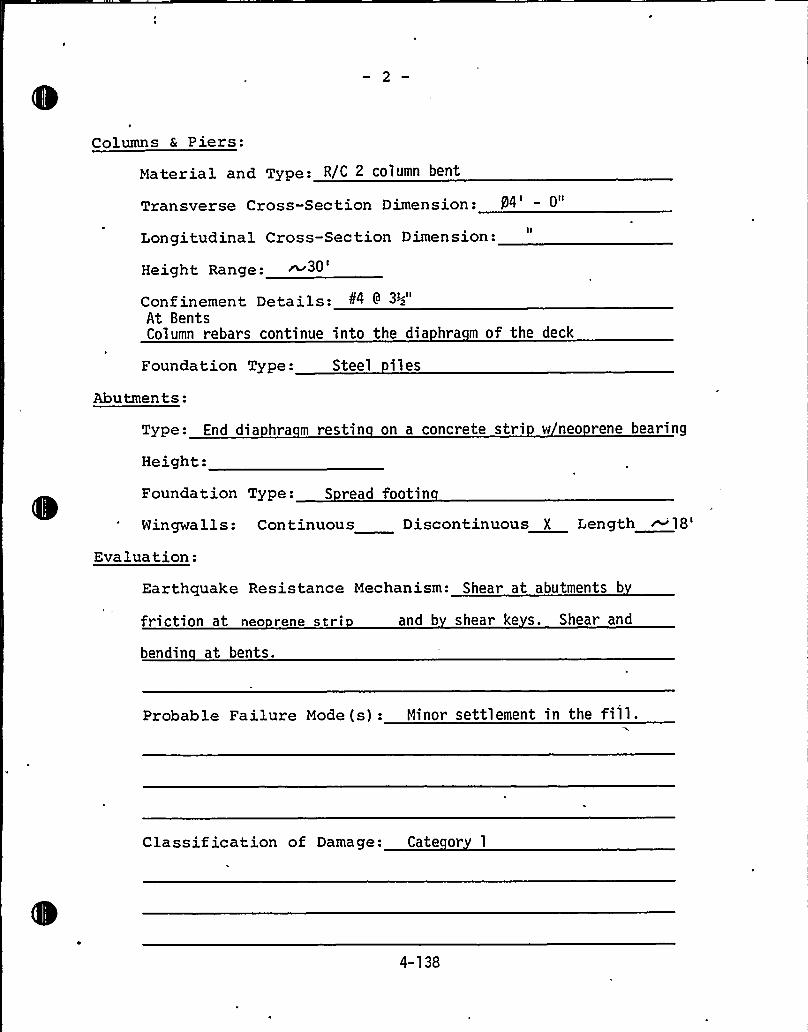
I
Columns & Piers:
Material and Type: R/C 2 column bent
Transverse Cross-Section Dimension: 84 - 0
Longitudinal Cross-Section Dimension:
Height Range:
Confinement Details: "4 9 3~At BentsColumn rebars continue into the dia hra m of the deck
Founda tion Type: Steel i 1 es
Abutments:
Type: End dia hra m restin on a concrete stri w neo rene bearing
Height:
Foundation Type: S read footin
Wingwalls: Continuous Discontinuous X Length~18'valuation:
Earthquake Resistance Mechanism: Shear at abutments b
friction at neo rene str| and b shear ke s. Shear and
bendin at bents.
Probable Failure Mode (s): Minor settlement in the fill.
Classif ication of Damage: Cate or 1
4-138
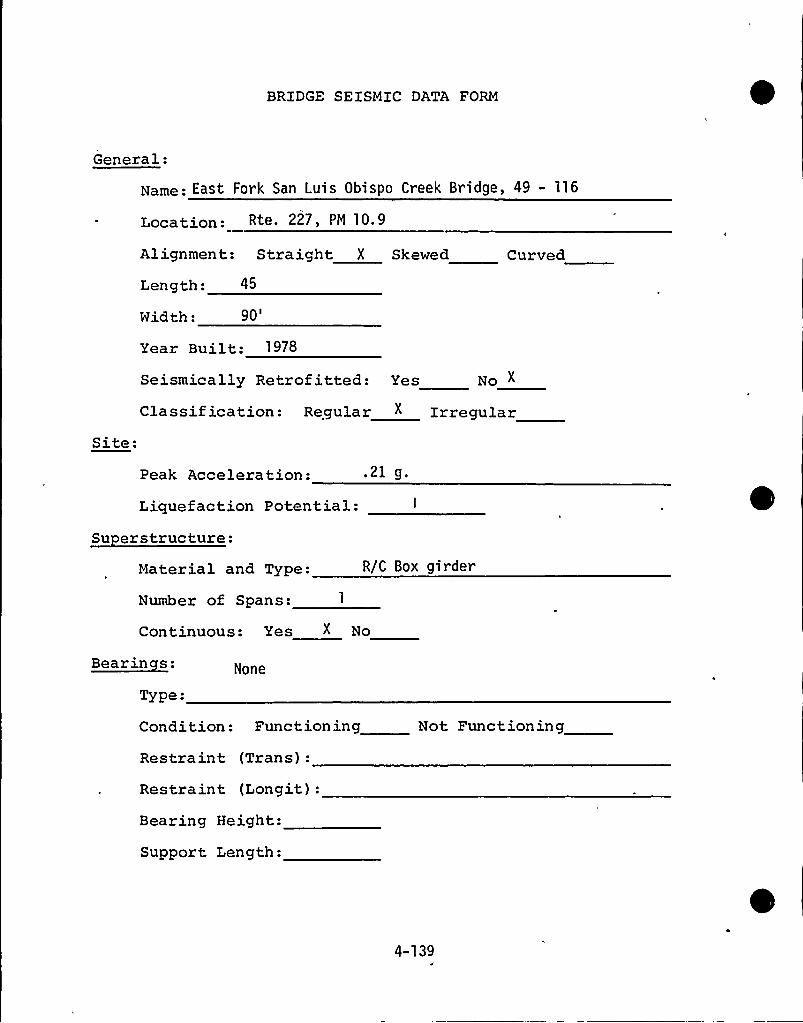
BRIDGE SEISMIC DATA FORM
General:
Name: East Fork San Luis Obispo Creek Bridge, 49 - 116
Location: Rte 227 PN 1O 9
Alignment: Straight X Skewed
Length: 45
Width:
9O'urvedYear Built: 1978
Seismically Retrof itted: Yes No "
Site:Classif ication: Regular " Irregular
Peak Acceleration: .21 g.
Liquefaction Potential:
Su erstructure:Material and Type:
Number of Spans:
R/C Box girder
Continuous: Yes X No
Bearinces:
Type:
None
Condition: Functioning
Restraint (Trans):
Restraint (Longit):
Bearing Height:
Support Length:
Not Functioning
4-139
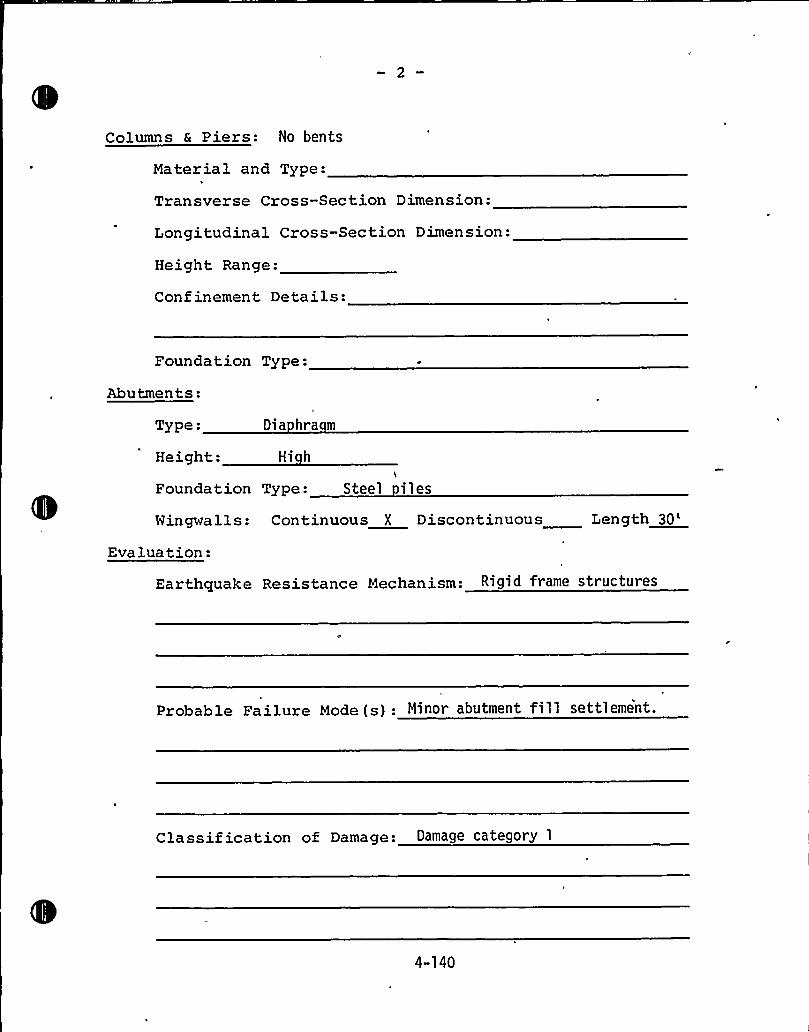
Columns & Piers: No bents
Material and Type:
Transverse Cross-Section Dimension:
Longitudinal Cross-Section Dimension:
Height Range:
Confinement Details:
Foundation Type:
Abutments:
Type:
Height:
Dia hra m
Hi h
Foundation Type: Steel i 1 es
Wingwalls: Continuous X Discontinuous Length30'valuation:
Earthquake Resistance Mechanism: Rigid frame structures
Probable Failure Mode(s): Minor abutment fill settlement.
Classif ication of Damage: Damage category 1
4-140
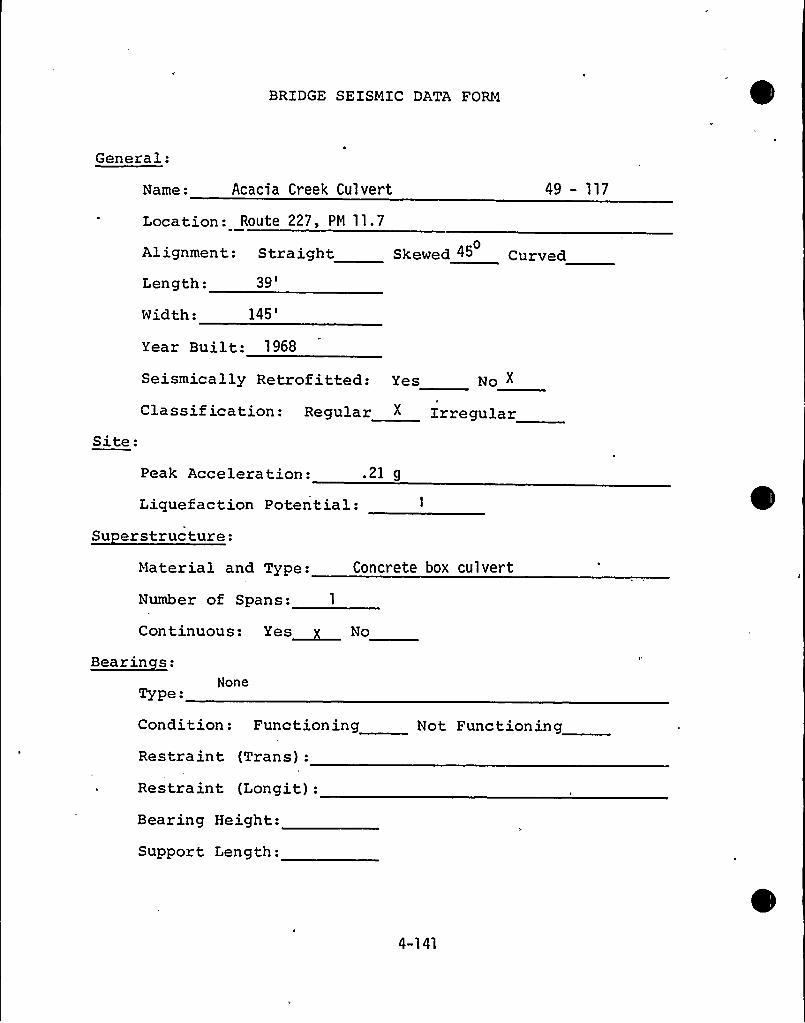
BRIDGE SEISMIC DATA FORM
General:
Name: Acacia Creek Culvert
Location: Route 227, PM 11. 7
49 - 117
0Alignment: Straight Skewed 4S Curved
Length:39'idth:
145'ear
Built: 1968
Seismically Retrofitted: Yes No Y
Classification: Regular X XrregularSite:
Peak Acceleration: .21 g
Liquefaction Potential:Su erstructure:
Material and Type:
Number of Spans: 1
Concrete box culvert
Continuous: Yes~ No
Bearinces:lNone
Type-
Condition: Functioning
Restraint (Trans):
Restraint (Longit):Bearing Height:
Support Length:
Not Functioning
4-141
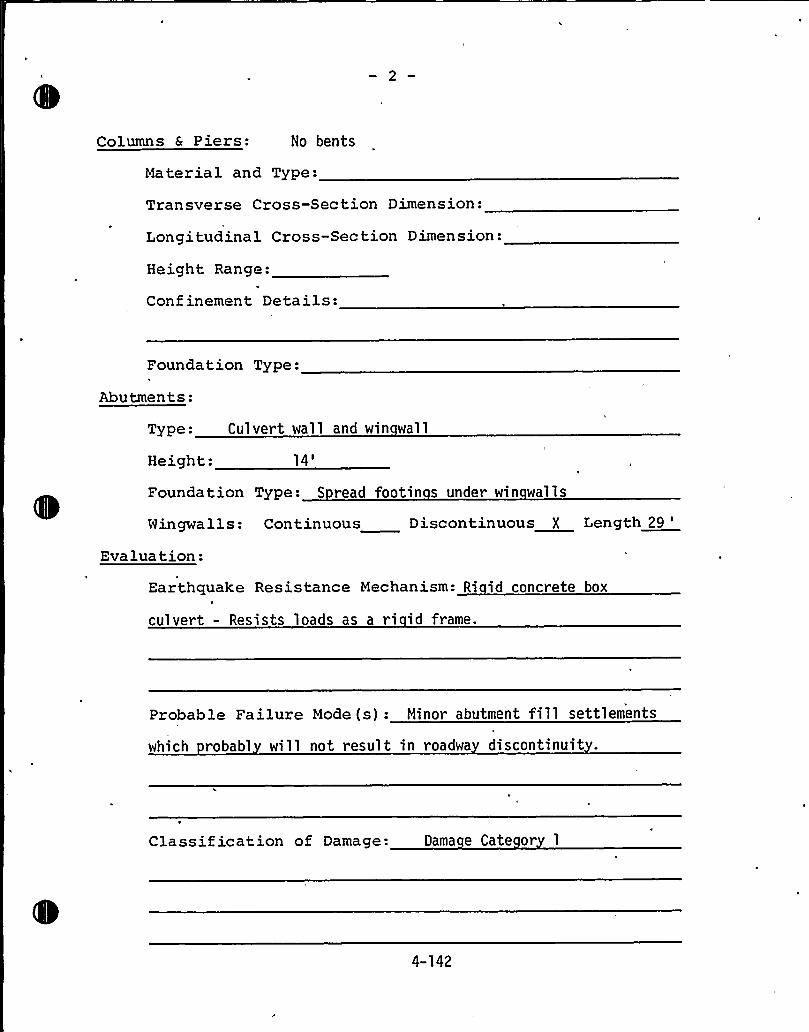
Columns & Piers: No bents
Material and Type:
Transverse Cross-Section Dimension:
Longitudinal Cross-Section Dimension:
Height Range:
Confinement Details:
Foundation Type:
Abutments:
Type: Culvert wall and win wall
Height:14'oundationType: S read footin s under win walls
Wingwalls: Continuous Discontinuous X Length 29
'valuation:
Earthquake Resistance Mechanism: Ri id concrete box
culvert - Resists loads as a ri id frame.
Probable Failure Mode(s): Minor abutment fill settlements
which robabl will not result in roadwa discontinuit .
0
Classif ication of Damage: Dama e Cate or 1
4-142
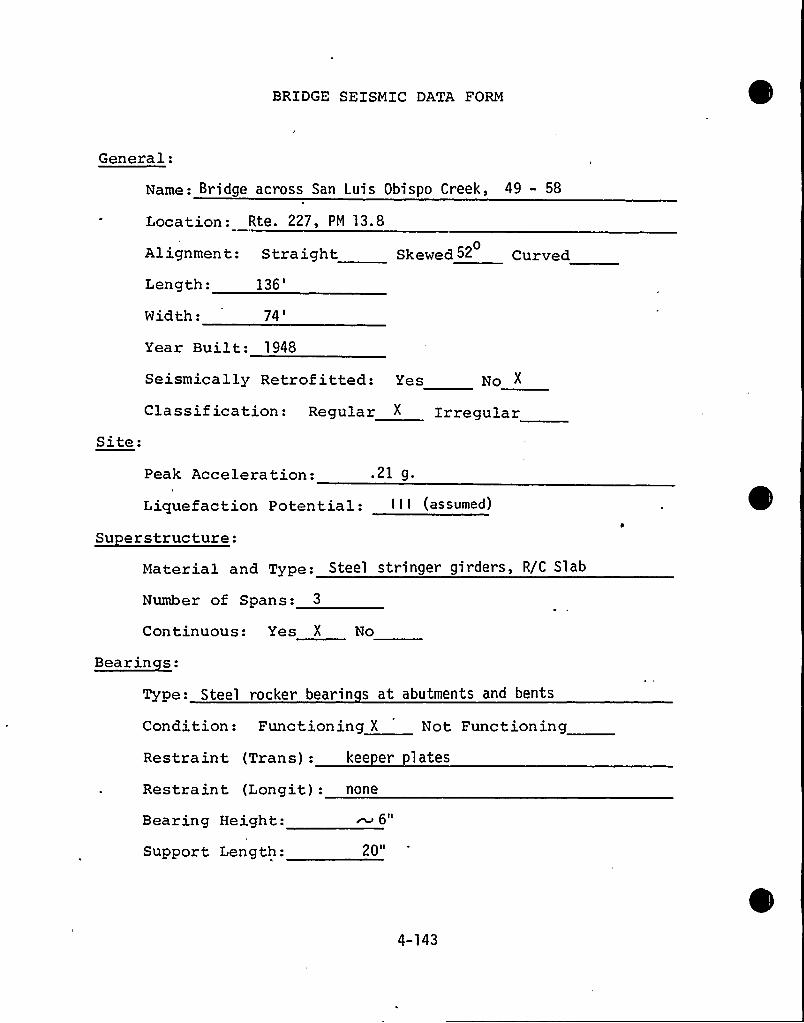
BRIDGE SEISMIC DATA FORM
General:
Name: Bridge across San Luis Obispo Creek, 49 - 58
Location: Rte. 227, PM 13.8
Alignment: S tra ightLength:
136'idth:
74'
Skewed 52 Curved
Site:
Year Built: 1948
Seismically Retrof itted: Yes No X
Classif ication: Regular " Irregular
Peak Acceleration: .21 g.
Liquefaction Potential: I I I (assumed)
Su erstructure:Material and Type: Steel stringer girders, R/C Slab
Number of Spans: 3
Continuous: Yes X No
~Bearin s:
Type: Steel rocker bearin s at abutments and bents
Condition: Functioning X Not Functioning
Restraint (Trans): keeper plates
Restraint (Longit): none
Bearing Height:
Support Length:
6 II
20"
4-143
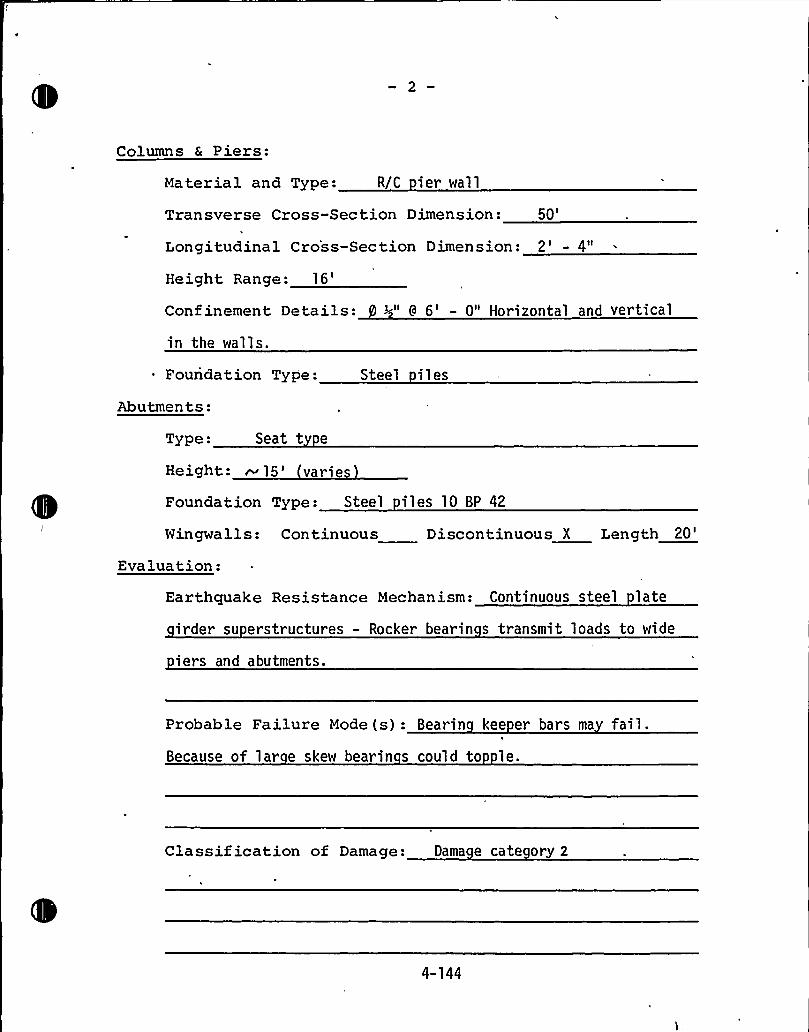
Columns 6 Piers:
Material and Type: R/C ier wall
Transverse Cross-Section Dimension:50'ongitudinalCross-Section Dimension: 2' 4"
Height Range:16'onfinementDetails: 3-" 9 6' 0" Horizontal and vertical
in the walls.
Foundation Type: Steel iles
Abutments:
Type: Seat t e
Height: ~ 15'ariesFoundation Type: Steel iles 10 BP 42
Wingwalls: Continuous Discontinuous X Length20'valuation:
Earthquake Resistance Mechanism: Continuous steel late
irder su erstructures - Rocker bearin s transmit loads to wide
iers and abutments.
Probable Failure Mode (s): Bearin kee er bars ma fail.Because of lar e skew bearin s could to le.
Classif ication of Damage: Dama e cate ory 2
4-144
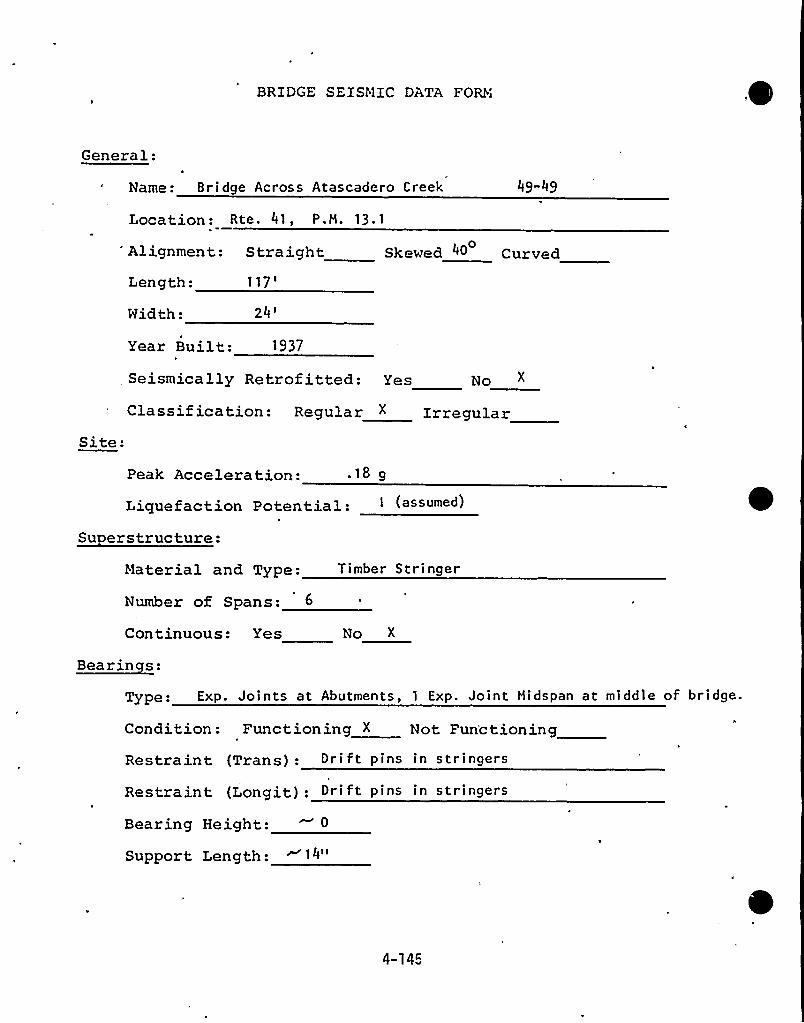
BRIDGE SEISMIC DATA FORM1 eGeneral:
Name: Bridge Across Atascadero Creek
Location: Rte. 41, P.M. 13.1
49-49
Alignment: Straight 0Skewed 4O Curved
Length:
Width: 117'4'ear
Built: 1937
. Seismically Retrof itted: Yes No X
Classif ication: Regular X IrregularSite:
Peak Acceleration: ~ 18 9
Iiquefaction Potential:Su erstructure:
Material and Type: T imbe r S t ringer
Number of Spans:
Continuous: Yes No X
Bearinces:
Type: Exp. Joints at Abutments, 1 Exp. Joint Midspan at middle of bridge.
Condition: Functioning X Not Fun'ctioning
Restraint (Trans): Drift pins in stringers
Restraint (Longit): Dri ft pins in stringers
Bearing Height:
Support Length: ~14"
4-145
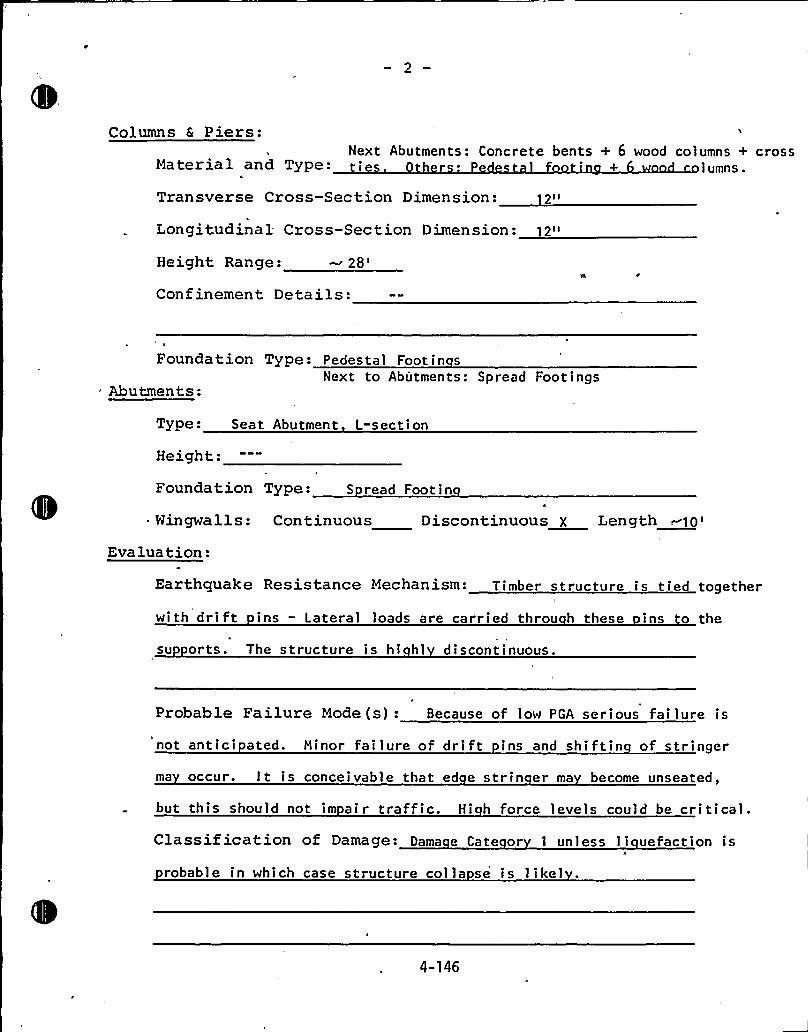
Columns & Piers:Next Abutments: Concrete bents + 6 wood columns + cross
Material and Type: + lumns.
Transverse Cross-Section Dimension: 2»
Longitudinal- Cross-Section Dimension: ]2»
Height Range:28'onfinementDetails:
Foundation Type: Pedestal Foot in sNext to Abutments: Spread Footings
Abutments:
Type: Seat Abutment L-section
Height:
Foundation Type: S read Foot in
Wingwalls: Continuous Discontinuous X Length ~] p ~
Evaluation:
Earthquake Resistance Mechanism: Timber structure is tied together
with drift ins - Lateral loads are carried throu h these ins to the
su orts'he structure is hi hl discontinuous.
Probable Failure Mode(s): Because of low PGA serious failure is
not antici ated. Hinor failure of drift ins and shiftin of stringer
ma occur. It is conceivable that ed e strin er ma become unseated,
but this should not im air traffic. Hi h force levels could be critical.Classification of Damage: Dama e Cate or 1 unless 1 i uefaction is
robable in which case structure colla se is likel
4-146
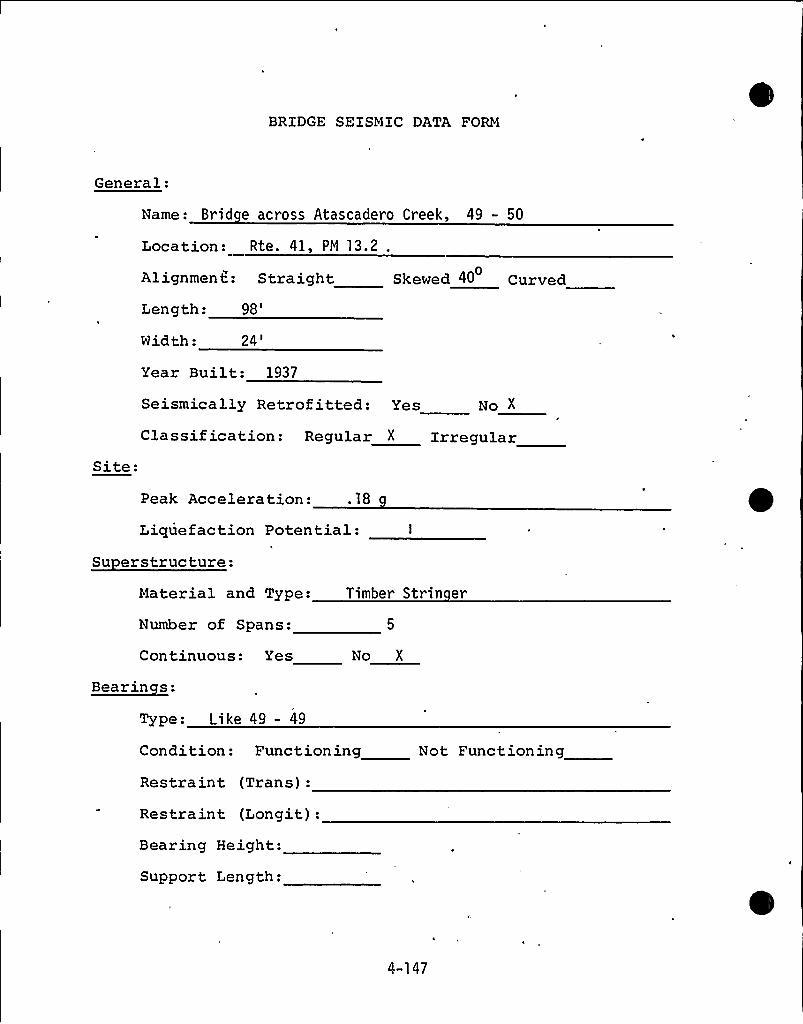
BRIDGE SEISMIC DATA FORM
General:
Name: Brid e across Atascadero Creek, 49 - 50
Location: Rte. 41, PM 13.2 .
Alignment: Straight Skewed 40 Cursed
Length:98'idth:
24'ite:
Year Built: 1937
Seismically Retrof itted: Yes No X
Classification: Regular I Irregular
Peak Acceleration: .18
Liquefaction Potential:Su erstructure:
Material and Type:
Number of Spans:
Continuous: Yes
Timber Strin er
No X
Bearinces:
Type: Like 49 - 49
Condition: Functioning
Restraint (Trans):
Restraint (Longit):Bearing Height:
Support Length:
Not Functioning
4-147
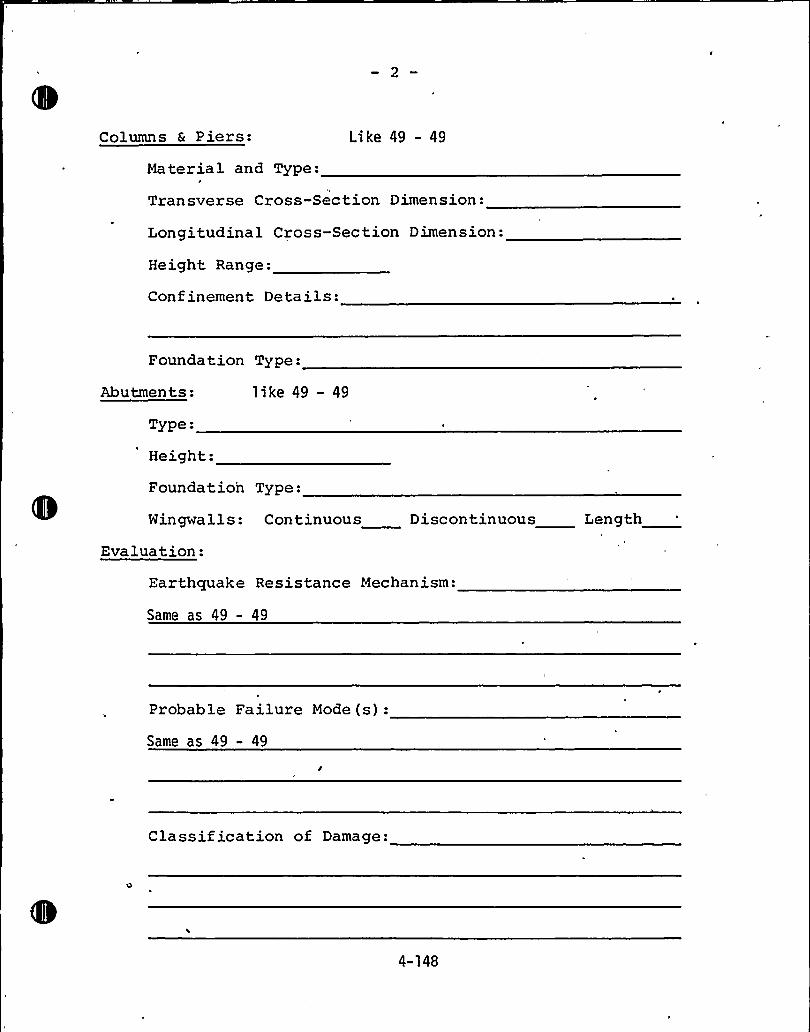
Columns & Piers: Like 49 - 49
Material and Type:
Transverse Cross-Section Dimension:
Longitudinal Cross-Section Dimension:
Height Range:
Confinement Details:
Foundation Type:
Abutments: like 49 - 49
Type:
Height:
Foundation Type:
Wingwalls: Continuous Discontinuous Length
Evaluation:
Earthquake Resistance Mechanism:
Same as 49 — 49
Probable Failure Mode (s):Same as 49 - 49
Classif ication of Damage:
4-148
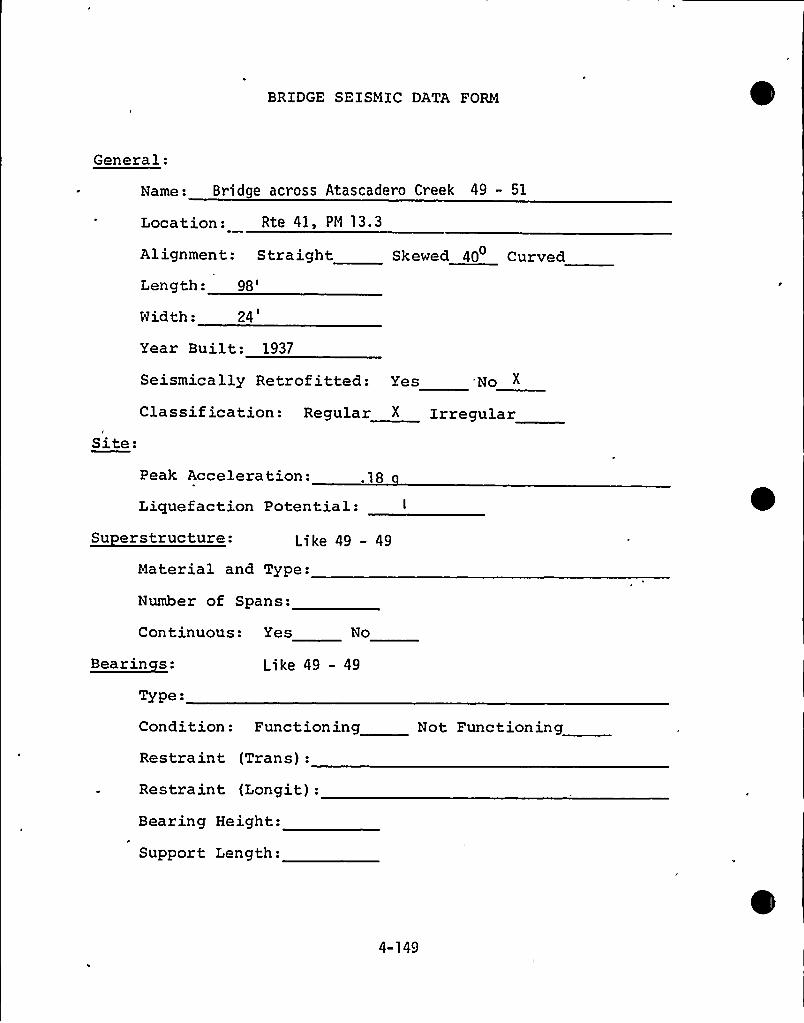
BRIDGE SEISMIC DATA FORM
General:
Name: Bridge across Atascadero Creek 49 - 51
Location: Rte 41, PH 13.3
Alignment: Straight Skewed 40 Curved
Length:98'idth:
24
Site:
Year Built: 1937
Seismically Retrofitted: Yes -No
Classif ication: Regular I Irregular
Peak Acceleration: .18
Liquefaction Potential:Su erstructure: Like 49 - 49
Material and Type:
Number of Spans:
Continuous: Yes No
Bearinces:
Type:
Like 49 - 49
Condition: Functioning
Restraint (Trans):
Restraint (Longit):
Bearing Height:
Support Length:
Not Functioning
4-149
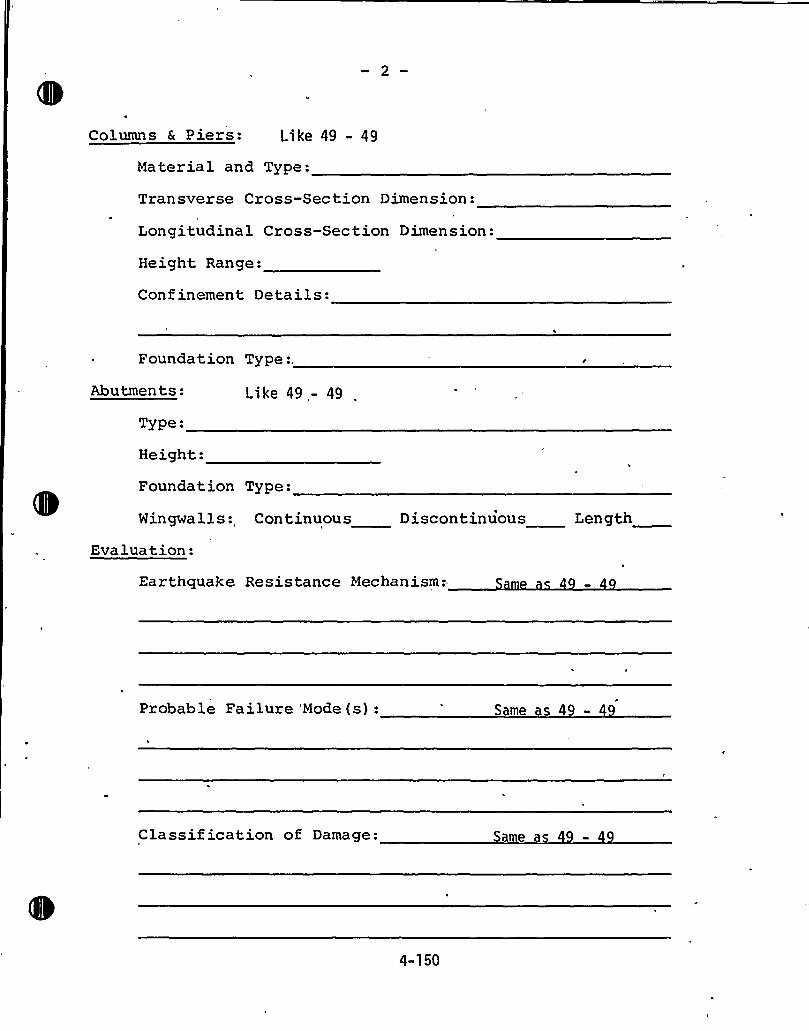
Columns & Piers: Like 49 - 49
Material and Type:
Transverse Cross-Section Dimension:
Longitudinal Cross-Section Dimension:
Height Range:
Confinement Details:
Foundation Type:,
Abutments: Like 49 - 49
Type-
Height:
Foundation Type:
Wingwalls: Continuous Discontinuous Length
Evaluation:
Earthquake Resistance Mechanism:
Probable Failure Mode (s): Same as 9-
Classif ication of Damage: Same
4-150
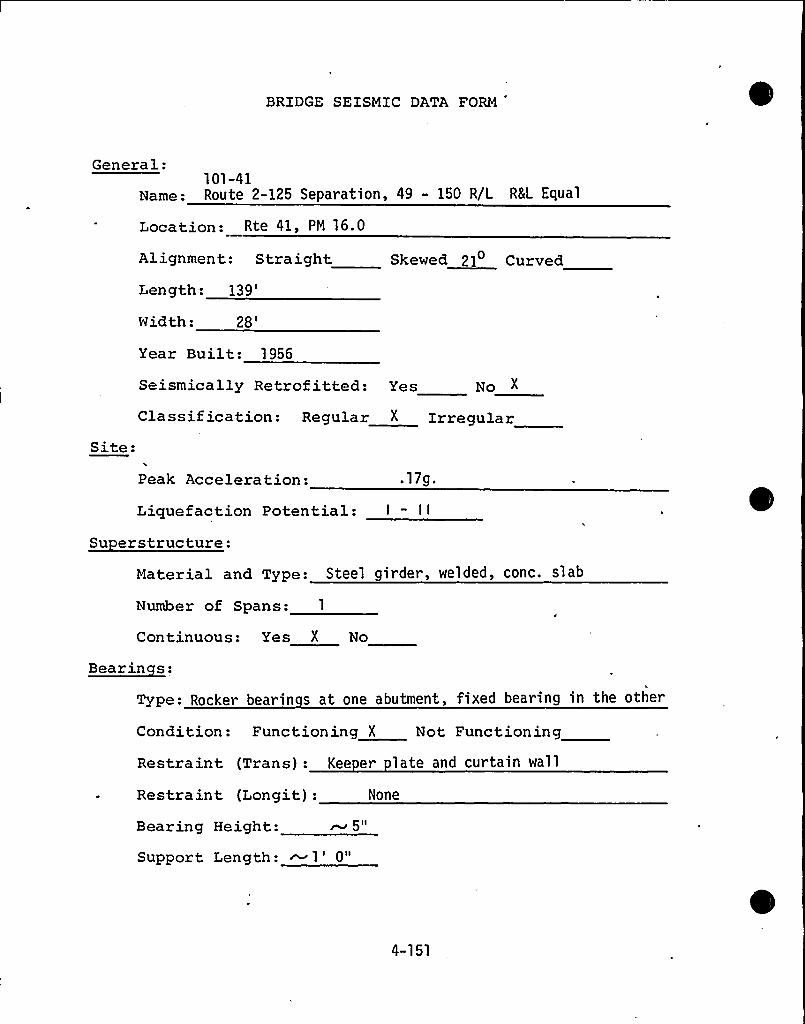
BRIDGE SEISMXC DATA FORM
General:101-41
Name: Route 2-125 Separation, 49 - 150 R/L RSL Equal
Location: Rte 41, PM 16. 0
Alignment: StraightLength:
139'idth:
28'ear
Built: 1956
Skewed 21 Curved
Site:
Seismically Retrofitted: Yes No X
Classification: Regular I Irregular
Peak Acceleration: .17g.
Liquefaction Potential: I - I I
Su erstructure:Material and Type: Steel girder, welded, conc. slab
Number of Spans: 1
Continuous: Yes X No
Bear incesl
Type: Rocker bearin s at one abutment, fixed bearing in the other
Condition: Functioning X Not Functioning
Restraint (Trans): Kee er late and curtain wall
Restraint (Longit): None
Bearing Height:
Support Length: ~ 1'"511
4-151
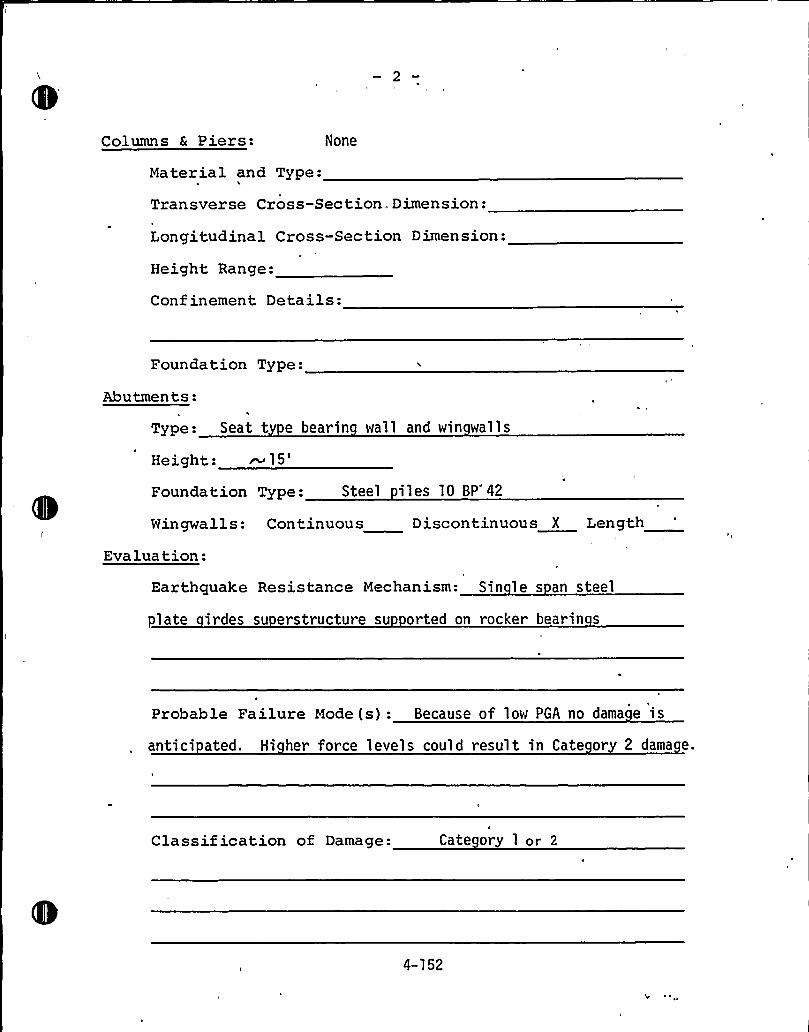
2
Columns 6 Piers: None
Material and Type:
Transverse Cross-Section. Dimension:
Longitudinal Cross-Section Dimension:
Height Range:
Confinement Details:
Foundation Type:
Abutments:
Type: Seat t e bearin wall and win walls
Height:~15'oundation
Type: Steel iles 10 BP'42
Wingwalls:
Evaluation:
Continuous Discontinuous X Length
Earthquake Resistance Mechanism: Sin le s an steel
plate irdes su erstructure su orted on rocker bearin s
Probable Failure Mode(s): Because of low PGA no dama e is
antici ated. Hi her force levels could result in Cate or 2 dama e.
Classification of Damage: Cate ory 1 or 2
4-152
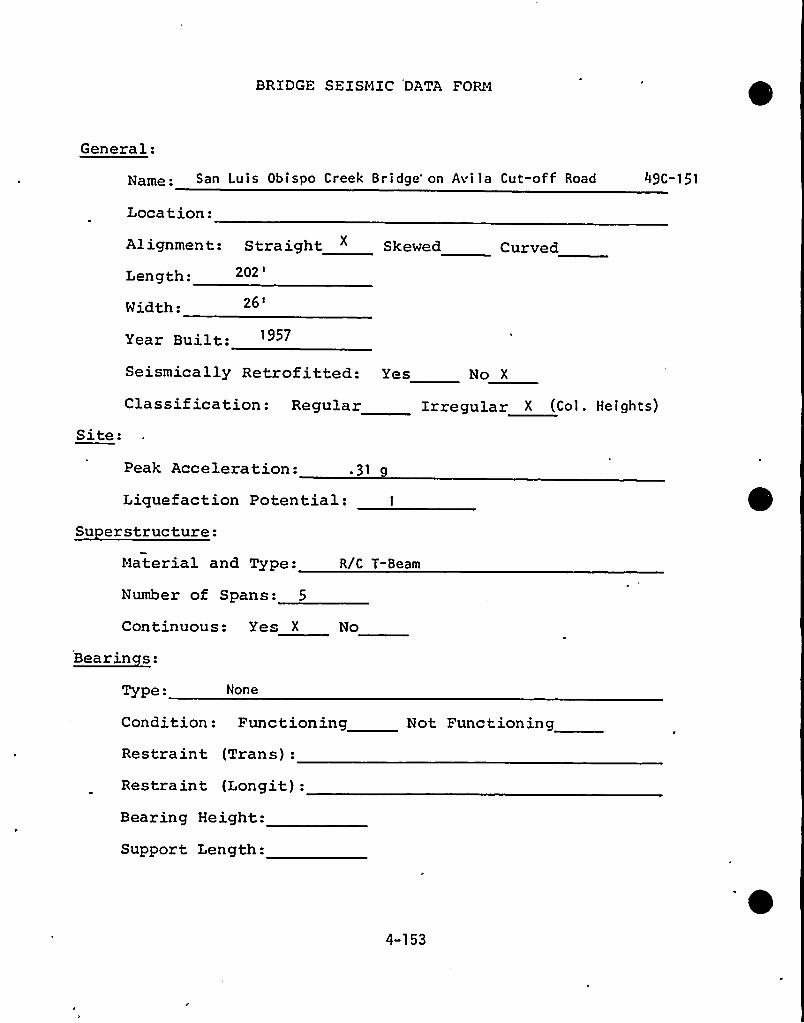
BRIDGE SEISMIC DATA FORM
General:
San Luis Obispo Creek Bridge'n Avila Cut-off Road 49C-151
Location:
Alignment: Straight " Skewed Curved
Length:
Width:
Year Built:Seismically Retrofitted: Yes No X
Site:Classification: Regular irregular X (tel «i gals)
Peak Acceleration: s31 g
Liquefaction Potential:Su erstructure:
Material and Type:
Number of Spans: 5
R/C T-Beam
Continuous: Yes X No
Bearinces:
TYpe: None
Condition: Functioning
Restraint (Trans):
Restraint (Longit):Bearing Height:
Support Length:
Not Functioning
4-153
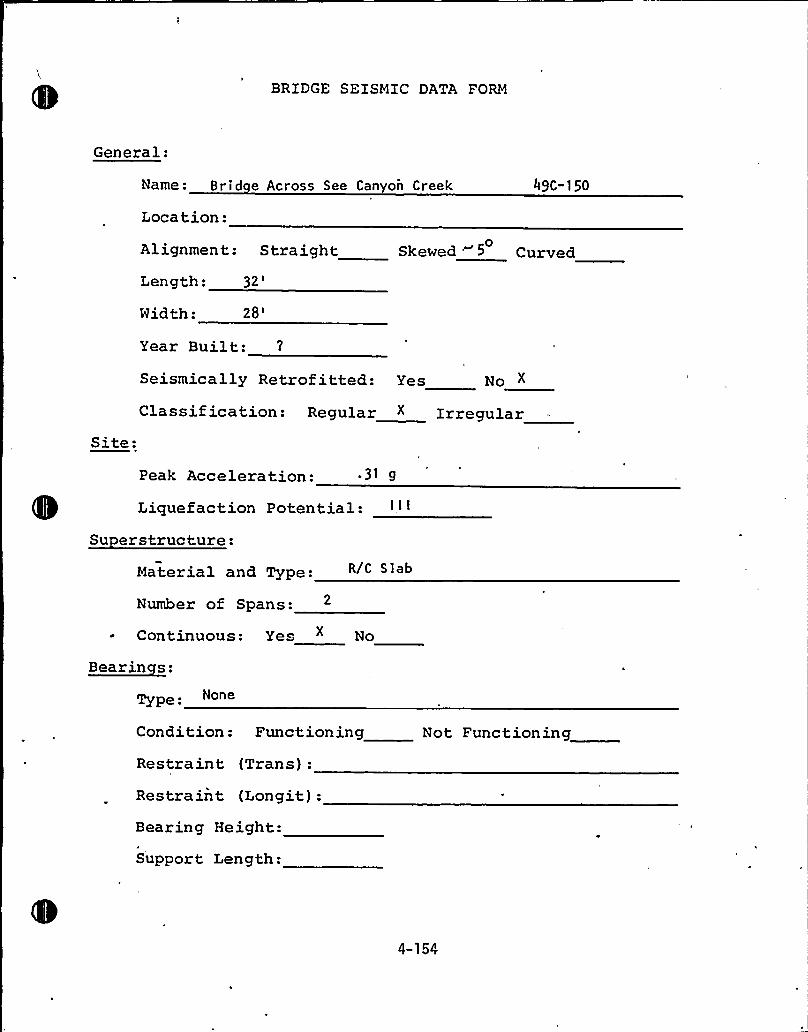
BRIDGE SEISMIC DATA FORM
General:
Name: Brid e Across See Canyon Creek
Location:
49C-150
0Alignment: Straight Skewed 5 Curved
Length:32'idth:
28'ear
Built:Seismically Retrof itted: Yes No X
Site:Classif ication: Regular X Irregular
Peak Acceleration:
Liquefaction Potential:Su erstructure:
Material and Type: R/C Sla6
Number of Spans:
Continuous: Yes " No
Bearinces:
Type None
Condition: Functioning
Restraint (Trans):
Restraint (Longit):Bearing Height:
Support Length:
Not Functioning
4-154
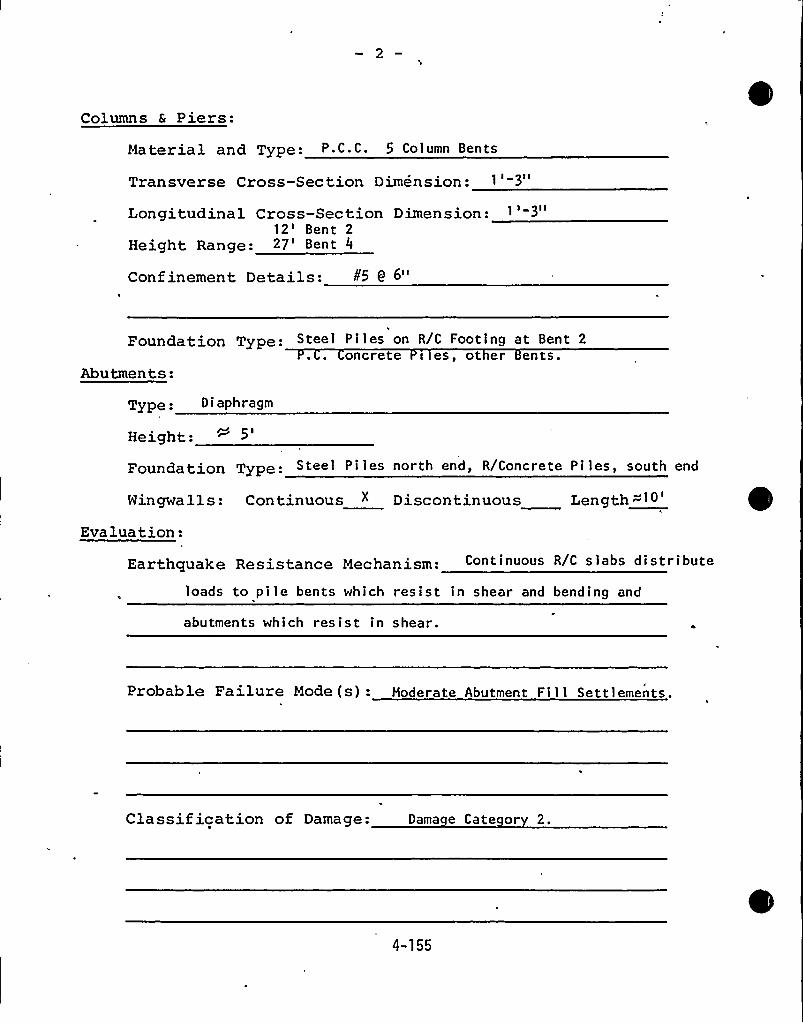
Columns & Piers:
Material and Type: P C ~ C. 5 Column Bents
Transverse Cross-Section Dimension: 1'"Longitudinal Cross-Section Dimension: 1'"
12'ent 2
Height Range: 27'ent 4
Confinement Details: ¹5 6 6"
Foundation Type: Steel Piles on R/C Footing at Bent 2oncrete i es, ot er ents.
Abu tmen ts:Type. Di aPhragm
Height:
Foundation Type Steel Pi les north end, R/Concrete Pi les, south end
Wingwalls: Continuous " Discontinuous Length
Evaluation:
Earthquake Resistance Mechanism: Continuous R/C slabs distribute
loads to pile bents which resist in shear and bending and
abutments which resist in shear.
Probable Failure Mode (s): Moderate Abutment Fil 1 Settlements.
Classif ication of Damage: Dama e Cate or 2.
4-155
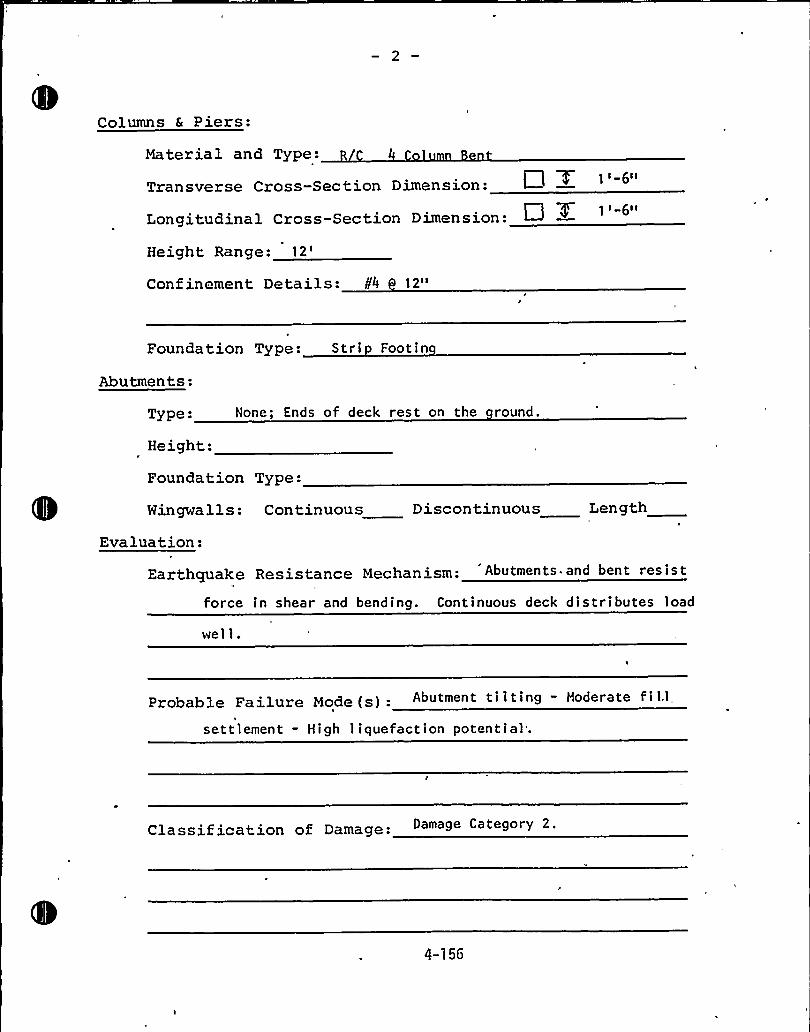
Columns & Piers:
Material and Type:
Transverse Cross-Section Dimension: L+ XLongitudinal Cross-Section Dimension:
Height Range:12'onfinementDetails: t4 9 12"
Foundation Type: Stri Footin
Abu tmen ts:Type: None; Ends of deck rest on the round.
Height:
Foundation Type:
Wingwalls: Continuous Discontinuous Length
Evaluation:
Earthquake
force
Resistance Mechanism: Abutments and bent resist
in shear and bending. Continuous deck distributes load
wel 1.
Probable Failure Mode (s): Abutment tilting " Moderate fil,l
settlement - High 1 iquefact ion potential".
Classif ication of Damage: Damage Category 2.
4-156
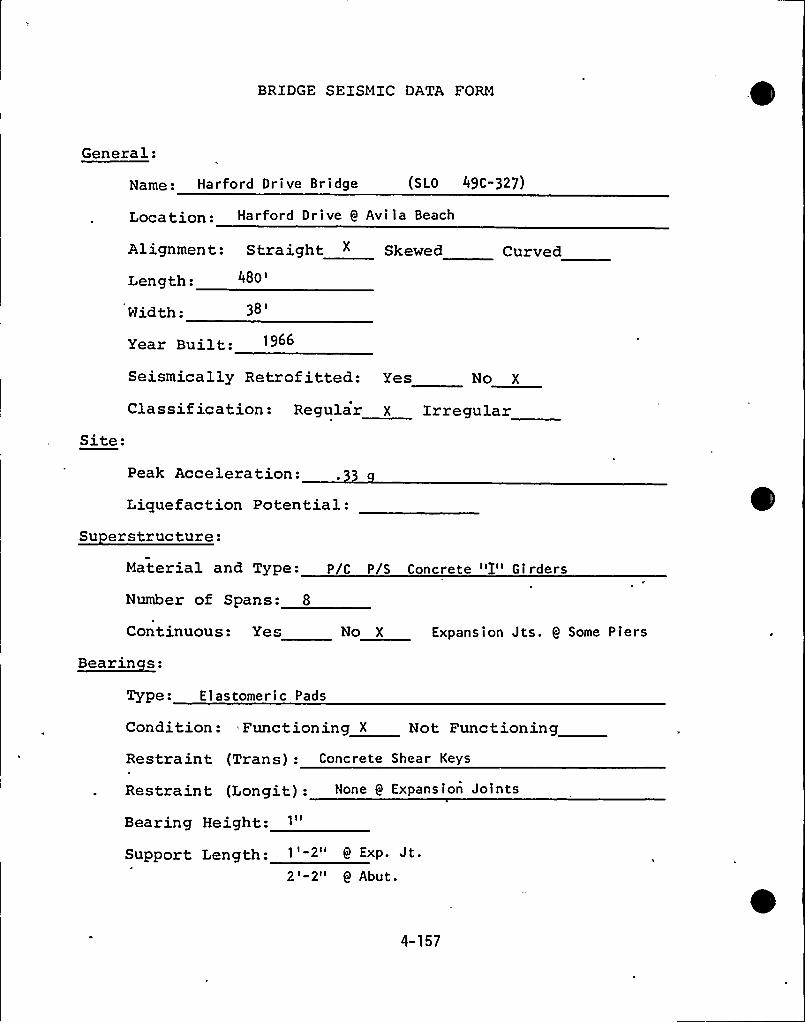
BRIDGE SEISMIC DATA FORM
General:
Name: Harford Drive Bridge (SLO 49C-327)
Location Ha rford D r i ve 0 Av i 1 a Beach
Alignment: StraightLength: 480
Skewed Curved
Width:38'ear
Built:Seismically Retrofitted: Yes No X
Site:Classification: Regular X Irregular
Peak Acceleration:
Liquefaction Potential:Su erstructure:
Material and Type: P/C P/S Concrete "I" Girders
Number of Spans: 8
Continuous: Yes No X
Bearinces:
Type: Elastomeric Pads
Expansion Jts. 9 Some Piers
Condition: Functioning X Not Functioning
Restraint (Trans): Concrete Shear Keys
Restraint (Longit): None 9 Expansion Joints
Bearing Height:
Support Length: i '-2" 9 Exp. Jt.2'-2" 9 Abut.
4-157
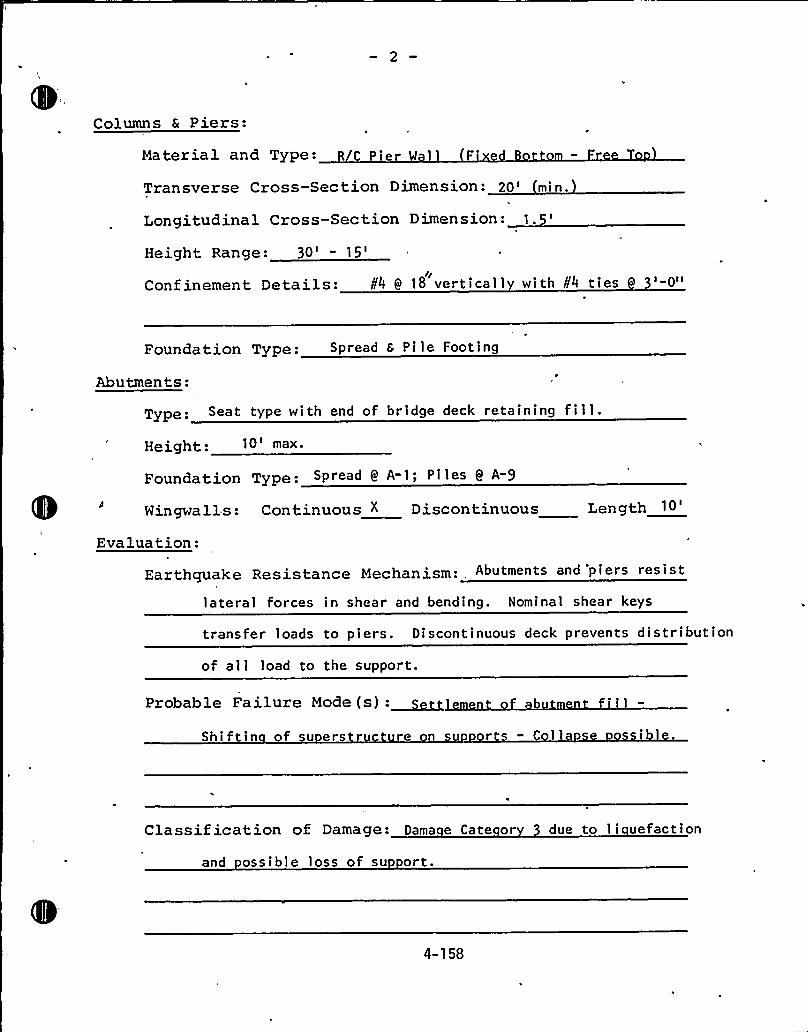
Columns & Piers:
Material and Type: R Pie
F'ransverseCross-Section Dimension: 20'in.Longitudinal Cross-Section Dimension: 1.
Height Range: 30' 15'IConfinement Details: ¹4 0 18 verticall with ¹4 ties 0u
Foundation Type: Spread s Pile Footing
Abutmen ts:Type: Seat type with end of bridge deck retaining fill.Height: 10'ax.
Foundation Type: Spread 0 A-1; Pi les 9 A-9
Wingwalls: Continuous X Discontinuous Length10'valuation:
Earthquake Resistance Mechanism: Abutments and 'Piers resist
lateral forces in shear and bending. Nominal shear keys
transfer loads to piers. Discontinuous deck prevents distribution
of all load to the support.
Probable Failure Mode (s):~~Shiftin of su ers r r -C 1
Classification of Damage: Dama e Cate or 3 due to li uefaction
and ossible loss of su ort.
4-158
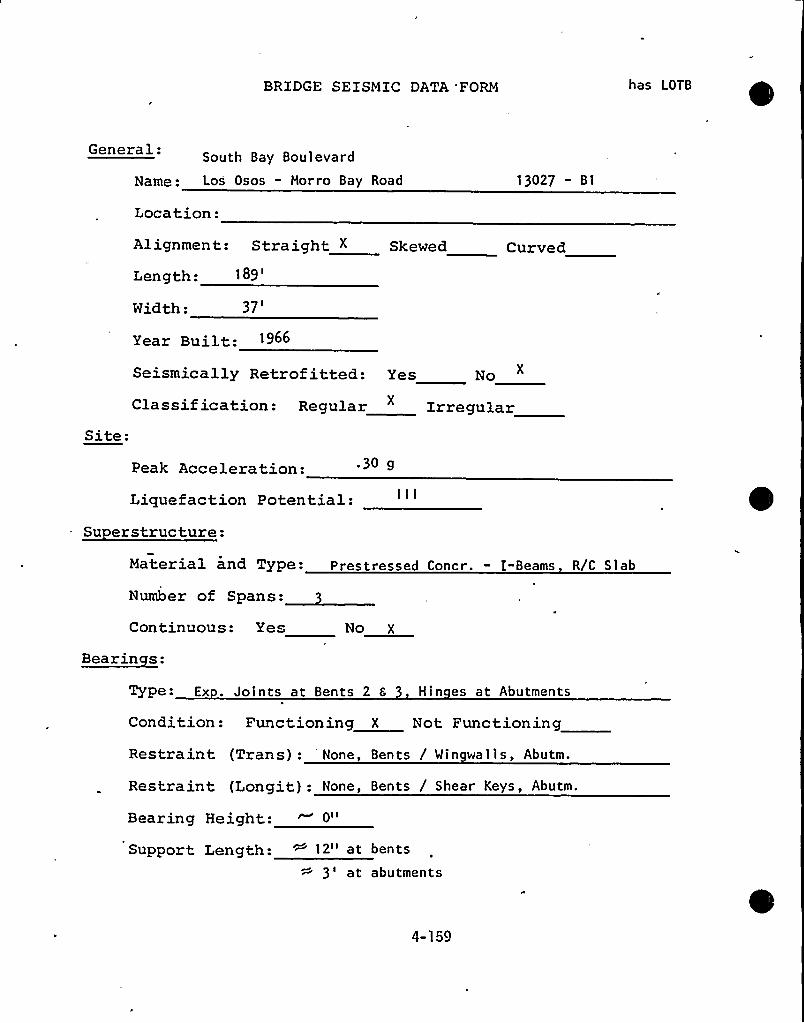
BRIDGE SEISMIC DATA 'FORM has LOTB
South Bay Boulevard
Name: Los Osos — Morro Bay Road
Location:
13027 - B1
Alignment: Straight ~ Skewed Curved
Length: 189
Width:37'ear
Built: 1966
Seismically Retrofitted: Yes No
Classification: Regular IrregularSite:
Peak Acceleration: .30 g
Liquefaction Potential:Su erstructure:
Material and Type: Prestressed Concr. - I-Beams R/C Slab
Number of Spans:
Continuous: Yes No X
Bearinces:
Type- Ex . Joints at Bents 2 6 Hin es at Abutments
Condition: Functioning X Not Functioning
Restraint (Trans): None, Bents / Wingwal 1 s, Abutm.
Restraint (Longit): None, Bents / Shear Keys, Abutm.
Bearing Height: ~ 0"
Support Length: ~ 12" at3't
bents
abutments
4-159
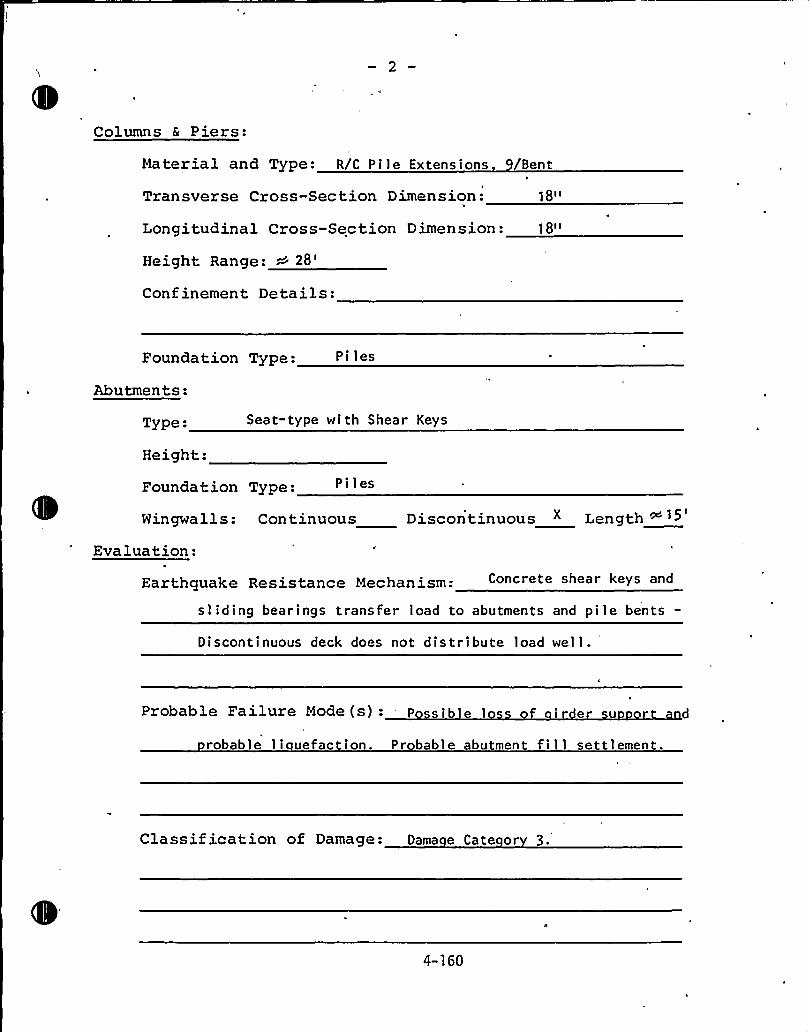
Columns & Piers:
Material and Type: R/C Pile Extensions /Bent
Transverse Cross-Section Dimension: 18"
Longitudinal Cross-Section Dimension: 18"
Height Range: ~~
28'onfinementDetails:
Foundation Type:
Abutments:
Type- Seat"type with Shear Keys
Height:
Foundation Type:
Wingwalls: Continuous
Evaluation:
Discontinuous " Length ~15
Earthquake Resistance Mechanism: Concrete shear keys and
sliding bearings transfer load to abutments and pile bents-
Discontinuous deck does not distribute load well.
Probable Failure Mode (s): p sib e e u
robable li uefac ion. Pr bable abutment fill settlement.
Classif ication of Damage: Dama e Cate or 3.
4-160
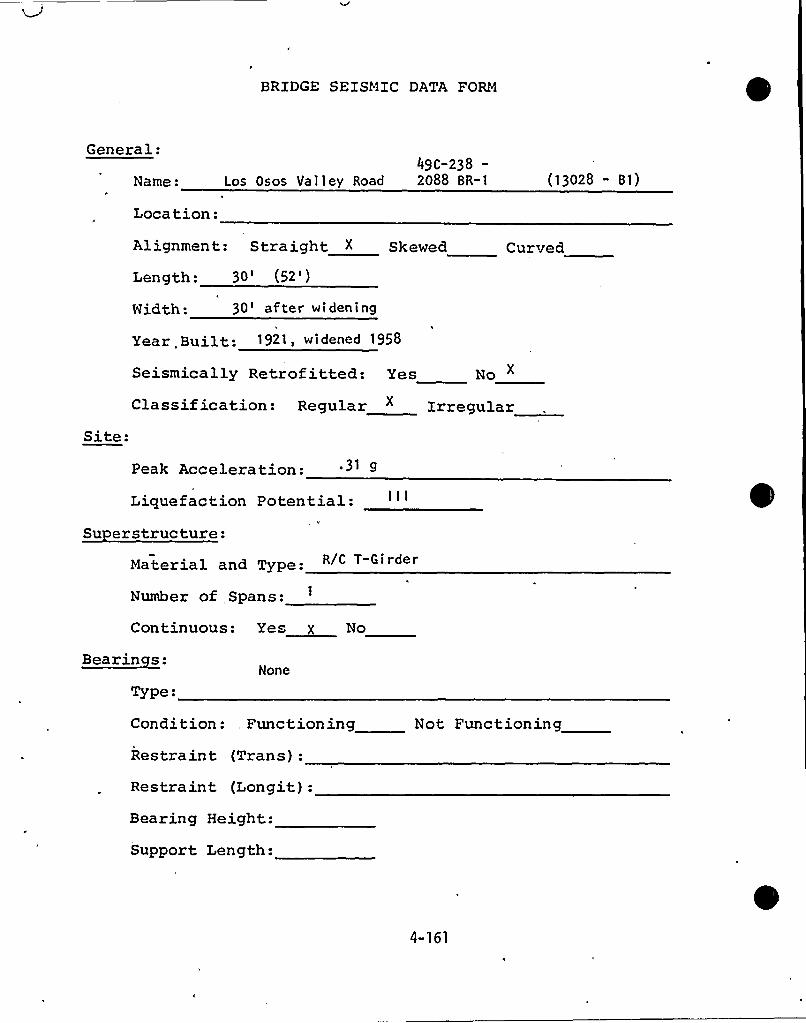
BRIDGE SEISMIC DATA FORM
General:
Name:
Location:
49C-238-Los Osos Valley Road 2088 BR-1 (13028 - B1)
Alignment: Straight X Skewed Curved
Length: 30'52')Nidth: 30'fter widening
Year . Built: 1921, widened 1958
Seismically Retrof itted: Yes No
Classif ication: Regular " IrregularSite:
Peak Acceleration:
Liquefaction Potential:Su erstructure:
Material and Type: R/C T-Girder
Number of Spans:
Continuous: res X No
Bearinces:
Type:None
Condition:, Functioning
Restraint (Trans):
Restraint (Longit):Bearing Height:
Support Length:
Not Functioning
4-161
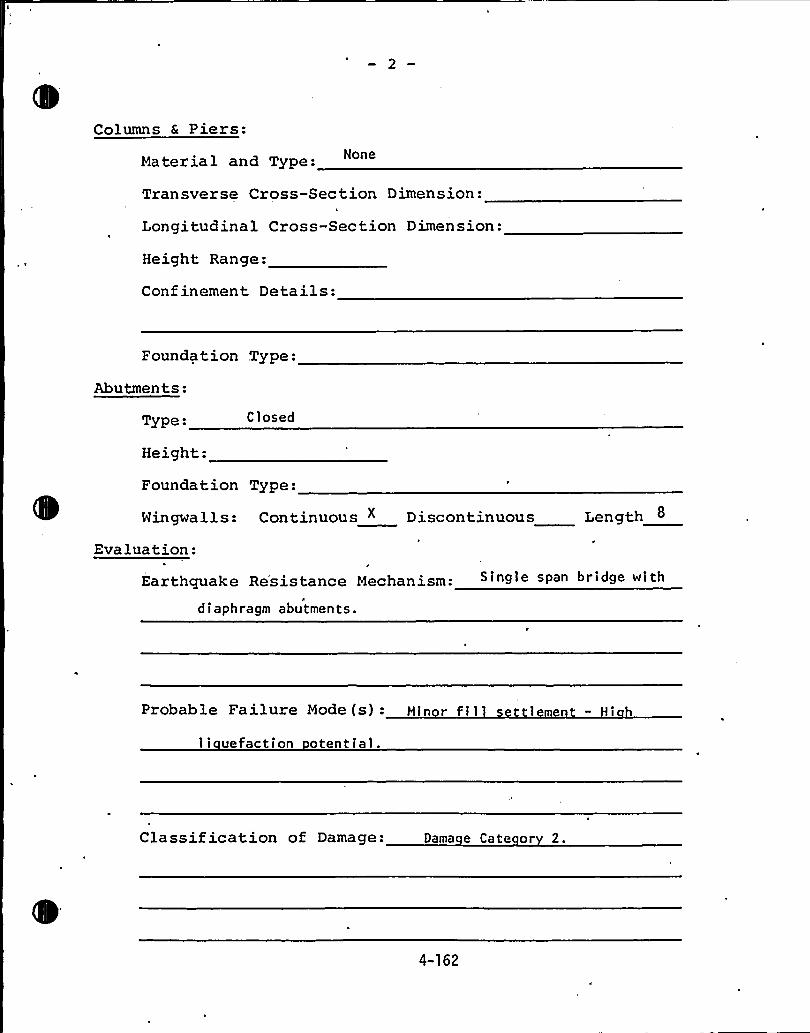
Columns & Piers:
Material and Type:
Transverse Cross-Section Dimension:
Longitudinal Cross-Section Dimension:
Height Range:
Confinement Details:
Foundation Type:
Abutments:
Type- Closed
Height:
Foundation Type:
Wingwalls: Continuous " Discontinuous Length
Evaluation:
Earthquake Re'sistance Mechanism: Single sPan bridge with
diaphragm abutments.
Probable Failure Mode (s): Min r fi 1 lee - i
li uefaction otential.
Classif ication of Damage: Dama e Cate or 2.
4-162
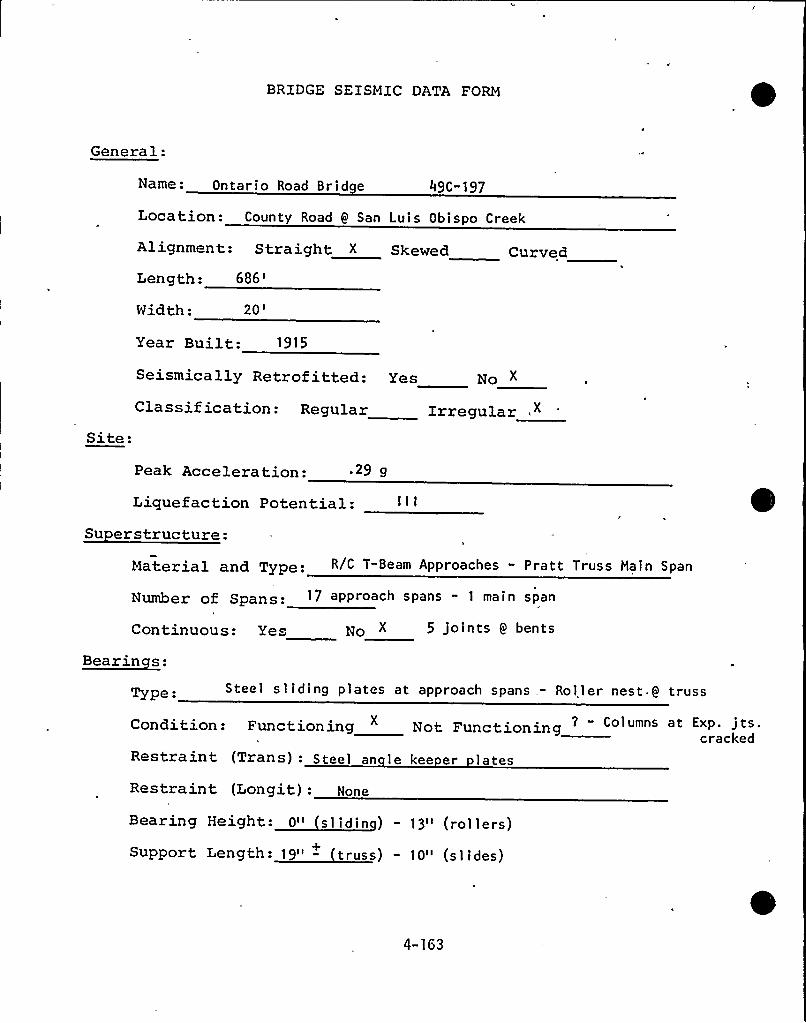
BRIDGE SEISMIC DATA FORM
General:
Name: Ontario Road Brid e 49C-197
Location: County Road 9 San Luis Obispo Creek
Alignment: Straight X Skewed Curved
Length:686'idth:
20'ear
Built: 1915
Seismically Retrofitted: yes Ro X
Site:Classification: Regular irregular ,X
Peak Acceleration: .29 g
Liquefaction Potential:Su erstructure:
Material and Type R/C T-Beam Approaches " P rat t Truss Ha in Span
Number of Spans 1 7 approach spans -1 ma i n span
continuous: ye Ro x S Joints S tenss
Bearinces:
Type: Steel sliding plates at approach spans,.- Roller nest Q truss
Cond it ion: Functioning Not Functionin 2 - Columns at ExP. jts.cracked
Restraint (Trans) - Steel an le kee er lates
Restraint (Longit): None
4-163
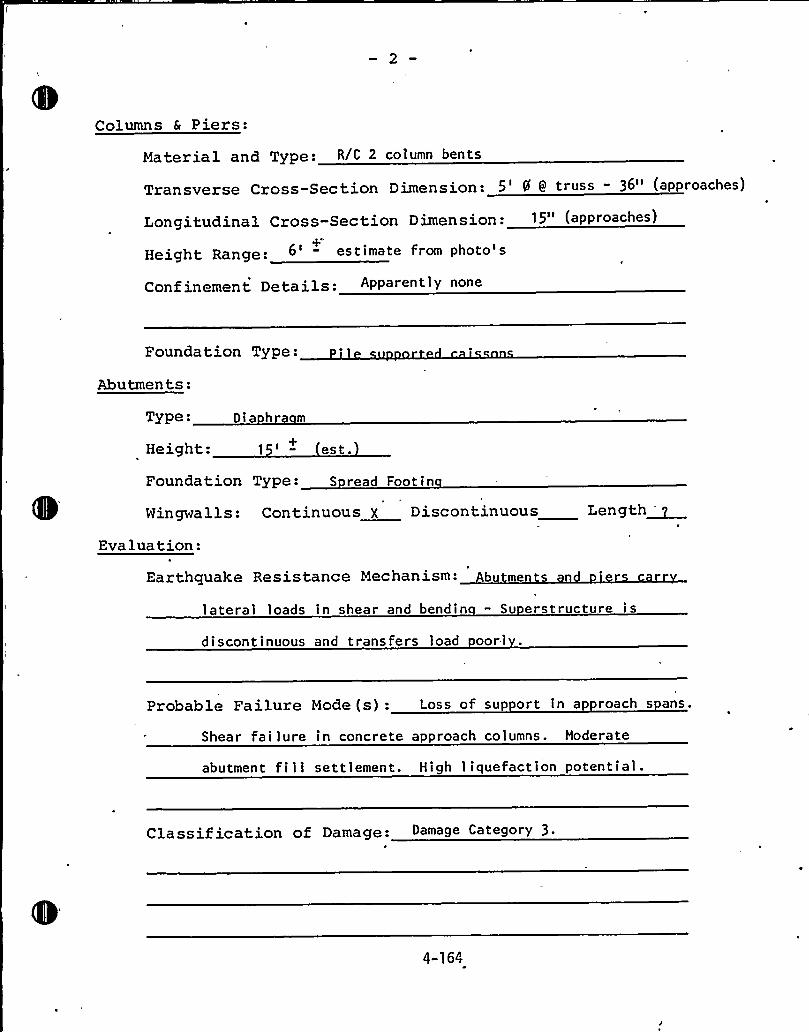
Columns & Piers:
Material and Type: R/C 2 column bents
Transverse Cross-Section Dimension: O' 6 truss - 36" (approaches)
Longitudinal Cross-Section Dimension: 15" (approaches)
Height Range: 6' estimate from photo's
Conf inement Details: Apparently none
Foundation Type:
Abutments:
TyPe: Dia hra m
Height: 1' est.+
Foundation Type: S read Footin
Wingwa 1 1 s: Continuous X Discontinuous Length~Evaluation:
Earthquake Resistance Mechanism: Abutme
lateral loads in shear and bendin - Su erstructure is
discontinuous and transfers load oorl
Probable Failure Mode (s): Loss of sup ort in a roach s ans.
Shear failure in concrete approach columns. Hoderate
abutment fill settlement. High liquefaction potential.
Classif ication of Damage: Damage Category 3.
4-164
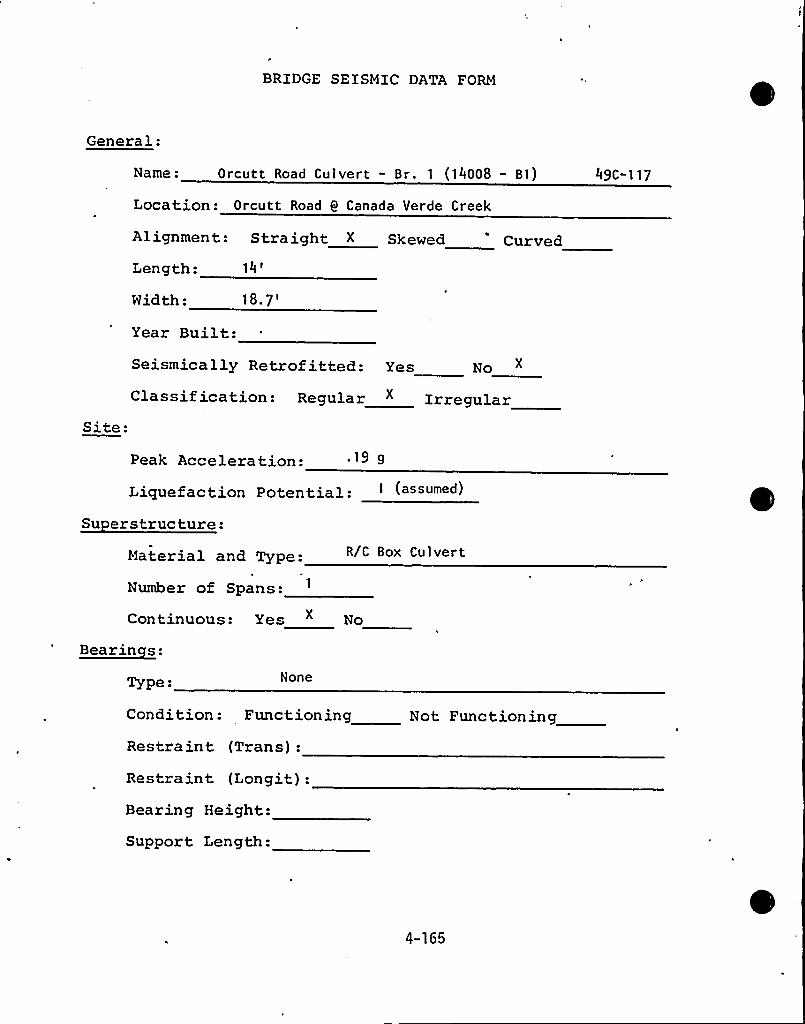
BRiDGE SEISMIC DATA FORM
General:
Name: Orcutt Road Culvert - Br. 1 (14008 - Bl)
Location: Orcutt Road 9 Canada Verde Creek
Alignment: Straight X Skewed Curved
Length: 14
'idth:
Year Built:
Site:
Seismically Retrofitted: Yes No X
Classification: Regular X Zrregular
Peak Acceleration: 9 g
Liquefaction Potential:Su erstructure:
Material and Type: R/C Box Culvert
Number of Spans:
Continuous: Yes No
Bearinces:
Type- None
Condition: Functioning
Restraint (Trans):
Restraint (Longit):
Not Functioning
Bearing Height:
Support Length:
4-165
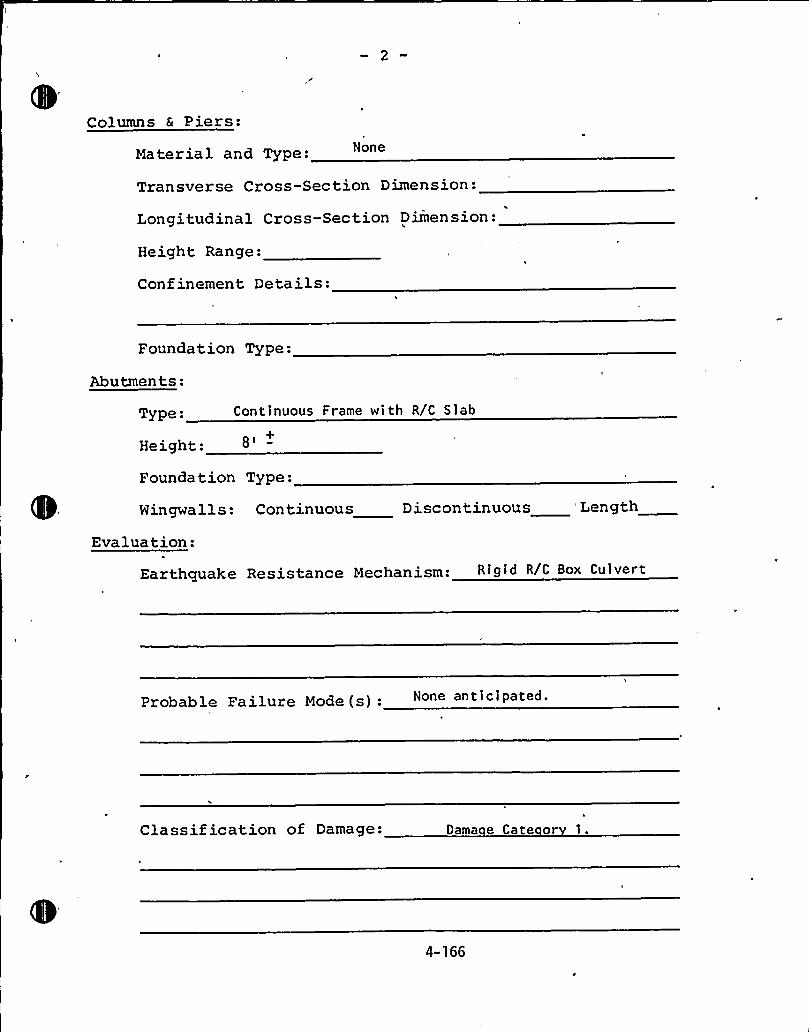
Columns & Piers:
Material and Type: None
Transverse Cross-Section Dimension:
Longitudinal Cross-Section Dimension:
Height Range:
Confinement Details:
Foundation Type:
Abutments:
Type: Continuous Frame with R/C Slab
Height:+
Foundation Type:
Wingwalls: Continuous Discontinuous 'ength
Evaluation:
Earthquake Resistance Mechanism: Rigid R/C Box Culvert
Probable Failure Mode ( s ): None an t i c i pated.
Classification of Damage: Dama e Cate or 1.
4-166
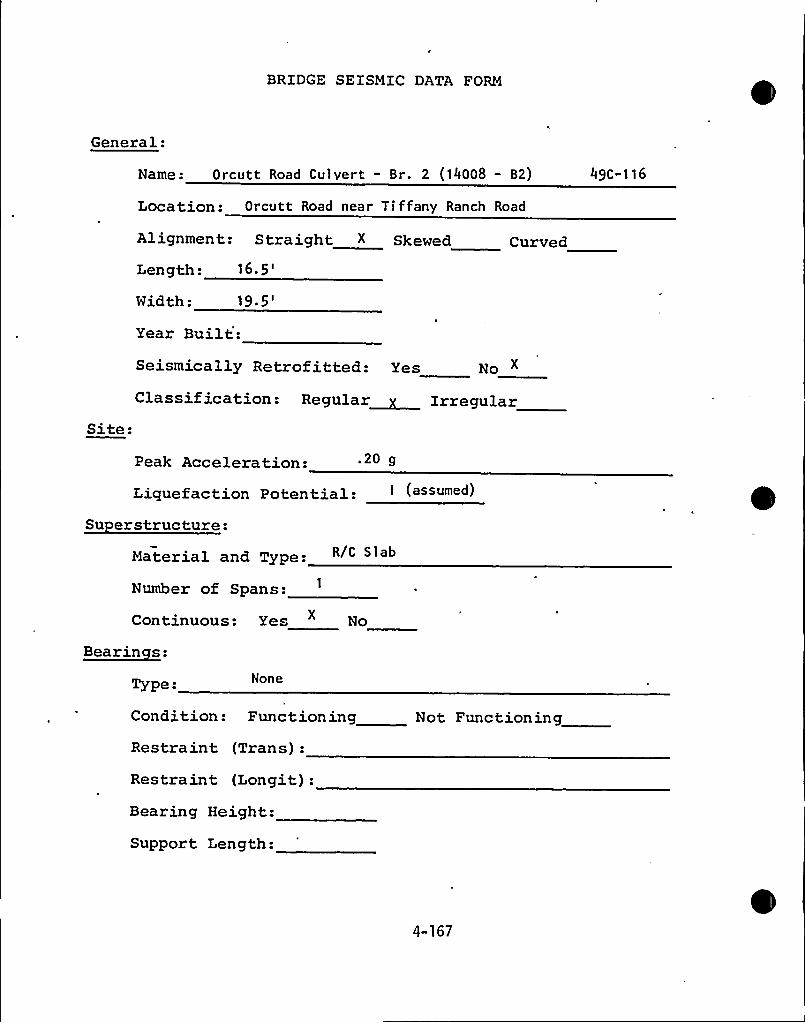
BRIDGE SEISMIC DATA FORM
General:
Name: Orcutt Road Culvert - Br. 2 (14008 - B2)
Location: Orcutt Road near Tiffany Ranch Road
Alignment: Straight < Skewed Curved
Length: 16. 5
'idth:19.5'ear
Built,:
Site:
Seismically Retrofitted: Yes No
Classif ication: Regular~ Irregular
Peak Acceleration:Liquefaction Potential:
Su erstructure:Material and Type: R/C Slab
Number of Spans:
Continuous: Yes No
Bearinces:
Type: None
Condition: Functioning
Restraint (Trans):
Restraint (Longit):Bearing Height:
Support Length:
Not Functioning
4-167
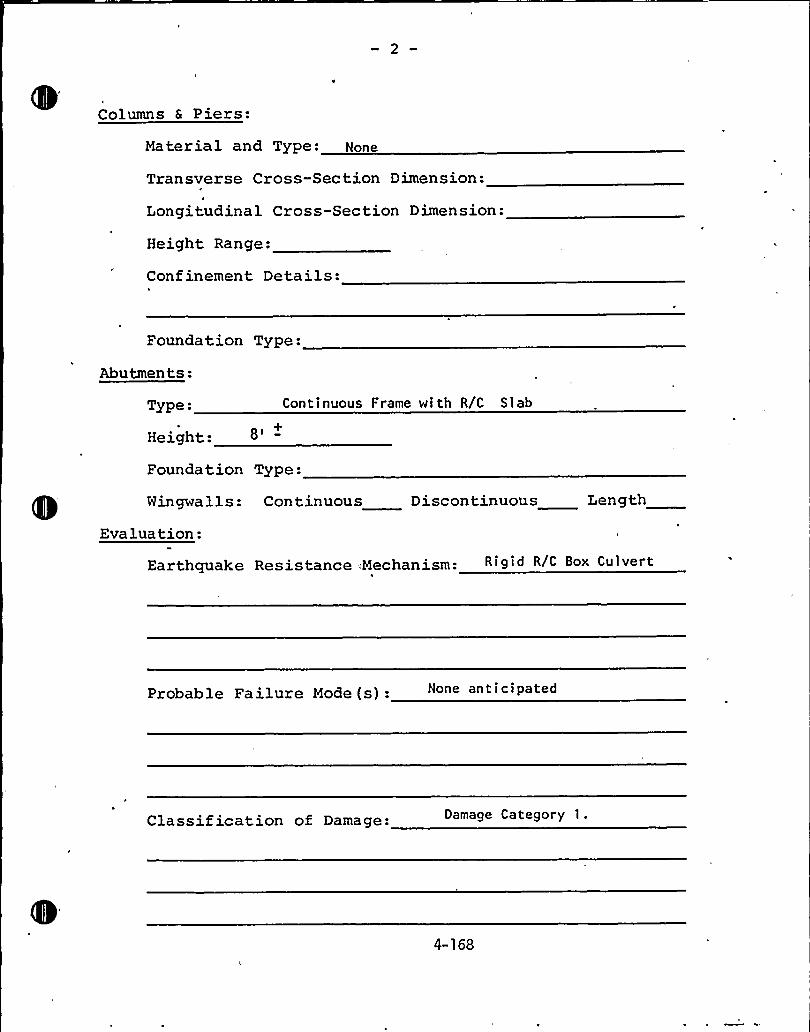
Columns & Piers:
Material and Type: None
Transverse Cross-Section Dimension:
Longitudinal Cross-Section Dimension:
Height Range:
Confinement Details:
Foundation Type:
Abutments:
Type:
Height: 8'-Continuous Frame with R/C Slab
Foundation Type:
Wingwa 1 1 s: Continuous Discontinuous Length
Evaluation:
Earthquake Resistance ~Mechanism: Rigid R/C Box Culvert
Probable Failure Mode (s): None anticipated
Classification of Damage: Damage Category 1.
4-168

BRIDGE SEISMIC DATA FORM
General:
Name: Orcutt Road Culvert - Br. 3 (14008 - B3)
Location: Ti ffany Ranch Road
Alignment: Straight X Skewed Curved
Length:14.4'idth:
22.0'ear
Built:Seismically Retrofitted: Yes No
Classification: Regular " IrregularSite:
Peak Acceleration: .20 g
Liquefaction potential: I (assumed)
Su erstructure:Material and Type:
Number of Spans:
R/C Box Culvert
Continuous: Ye, No
Bear inces:
Type: None
Condition: Functioning
Restraint (Trans):
Restraint (Longit):
Bearing Height:
Support Length:
Not Functioning
4-169
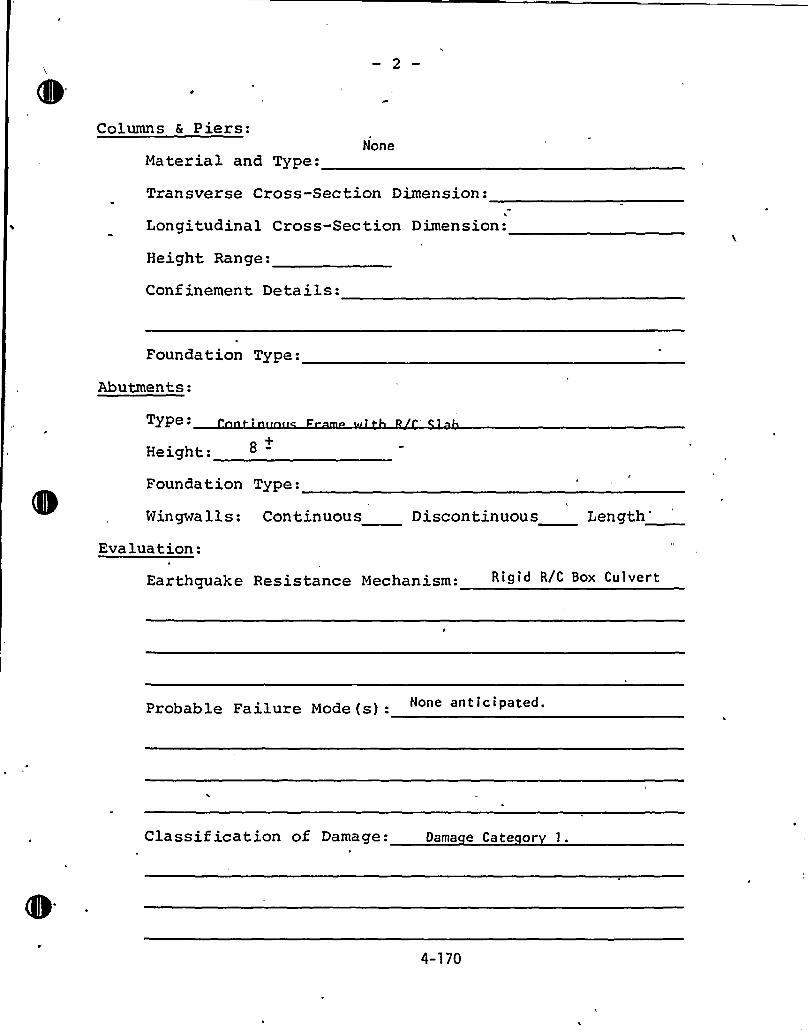
Columns & Piers:
Material and Type:None
Transverse Cross-Section Dimension:
Longitudinal Cross-Section Dimension:
Height Range:
Confinement Details:
Foundation Type:
Abutments:
Type:
Height: 8»
Foundation Type:
Wingwalls: Continuous1
Discontinuous Length
'valuation:
Earthquake Resistance Mechanism: Rigid R/C Box Culvert
Probable Failure Mode (s): Hone anticipated.
Classif ication of Damage: Dama e Cate or 1.
4-170
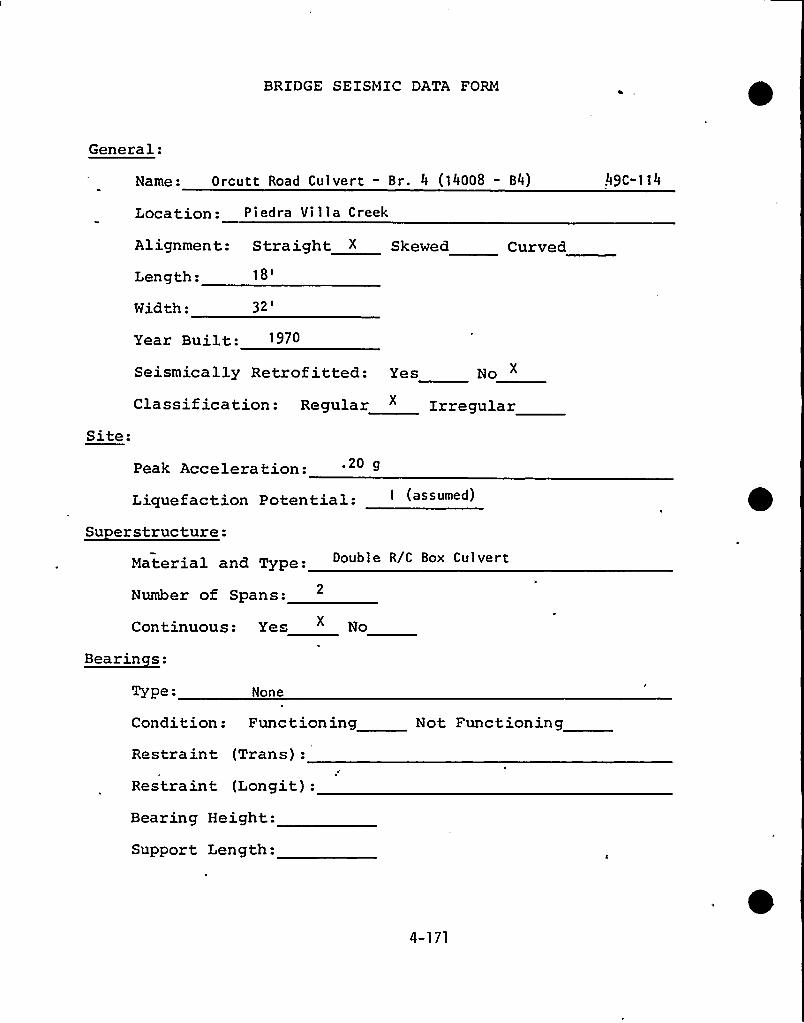
BRIDGE SEISMIC DATA FORM
General:
Name: Orcutt Road Culvert - Br. 4 (14008 - B4)
Location: Piedra Villa Creek
Alignment: Straight X Skewed Curved
Length:18'idth:
32'ear
Built:Seismically Retrofitted: Yes No
Classification: Regular IrregularSite:
Peak Acceleration:Liquefaction Potential:
Su erstructure:Material and Type Double R/C Box Culvert
Number of Spans:
Continuous: Yes No
Bearinces:
Type: None
Condition: Funct,ioning
Restraint (Trans):
Restraint (Longit):Bearing Height:
Support Length:
Not Functioning
4-171
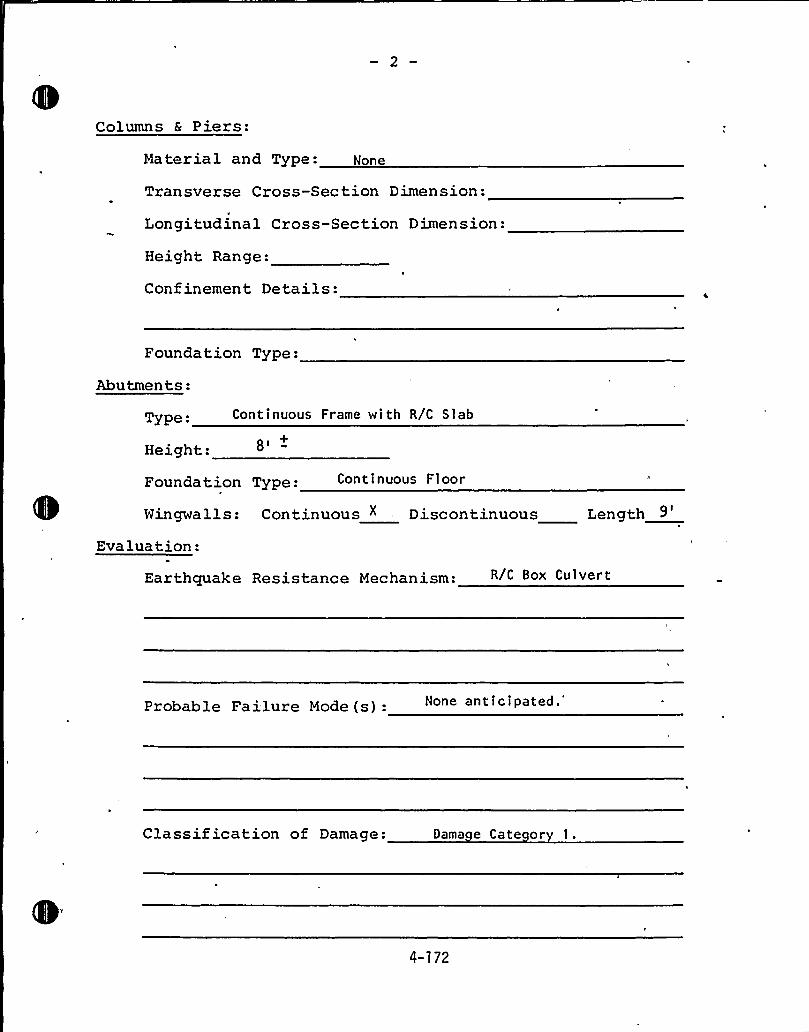
Columns & Piers:
Material and Type: None
Transverse Cross-Section Dimension:
Longitudinal Cross-Section Dimension:
Height Range:
Conf inement Details:
Foundation Type:
Abutments:
Type Cont inuous Frame wi th R/C Sl ab
Height:
Foundation Type: Continuous Floor
Wingwa 11 s: Continuous X Discontinuous Length 9
Evaluation:
Earthquake Resistance Mechanism: R/C Box 'u1 ver t
probable Failure Mode (s) '- None ant i c i
Pated.'lassif
ication of Damage: Dama e Cate or 1.
4-172
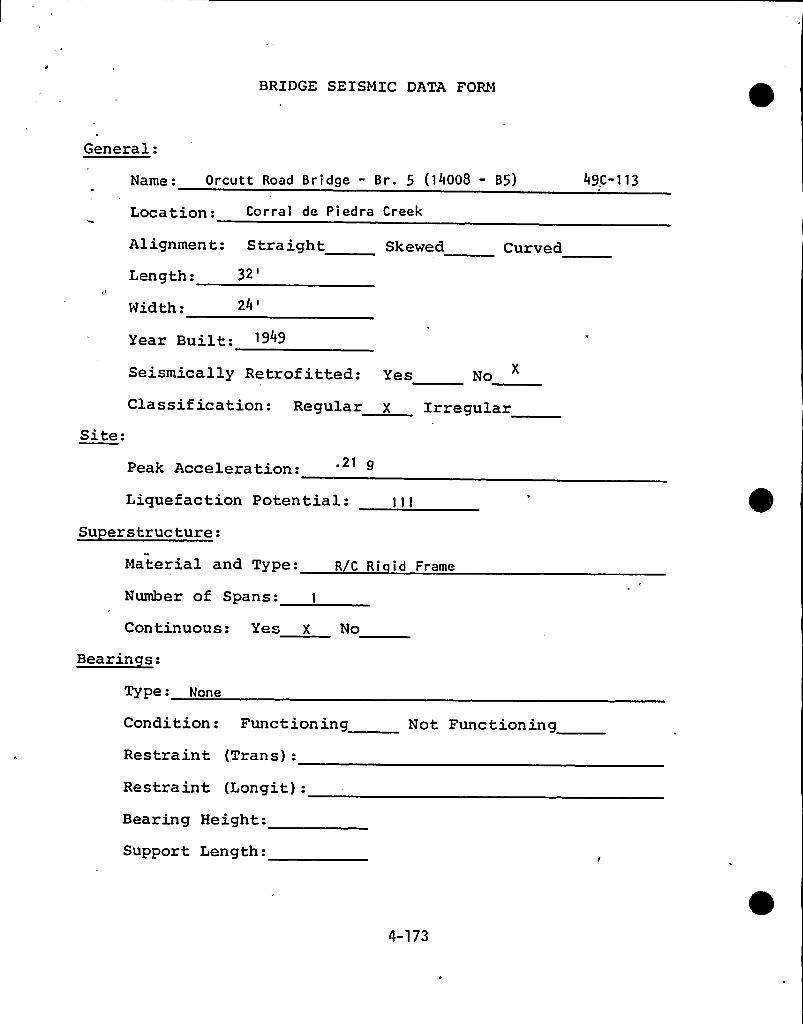
BRIDGE SEISMIC DATA FORM
General:
Name: Orcutt Road Bridge - Br. 5 (14008 - B5)
Location: Corral de Piedra Creek
Alignment: Straight Skewed Curved
Length: 32
'idth:24~
Year Built: 1949
Seismically Retrofitted: Yes No
Classification: Regular X IrregularSite:
Peak Acceleration:
Liquefaction Potential:Su erstructure:
Material and Type:
Number of Spans: 1
R/C Ri id Frame
Continuous: Yes X No
Bearinces:
Type: None
Condition: Functioning
Restraint (Trans):
Restraint (Longit):Bearing Height:
Support Length:
Not Functioning
4-173
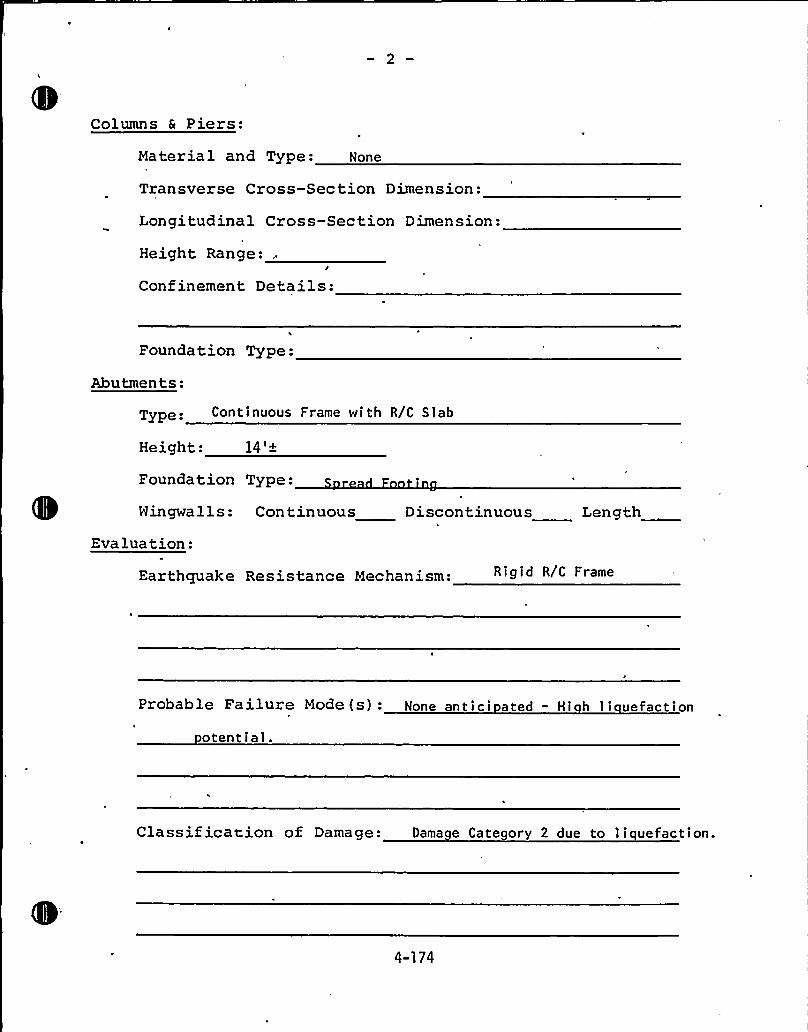
Columns & Piers:
Material and Type: None
Transverse Cross-Section Dimension:
Longitudinal Cross-Section Dimension:
Height Range: .
Confinement Details:
Foundation Type:
Abutments:
Type. Continuous Frame with R/C Slab
Height: 14'+
Foundation Type:
Wingwalls: Continuous Discontinuous Length
Eva lua tion:Earthquake Res is tance Mechanism: Rigid R/C Frame
Probable Failure Mode (s): None antici ated - Hi h l i uefaction
otential.
Classif ication of Damage: Dama e Category 2 due to 1 i uefaction.
4-174
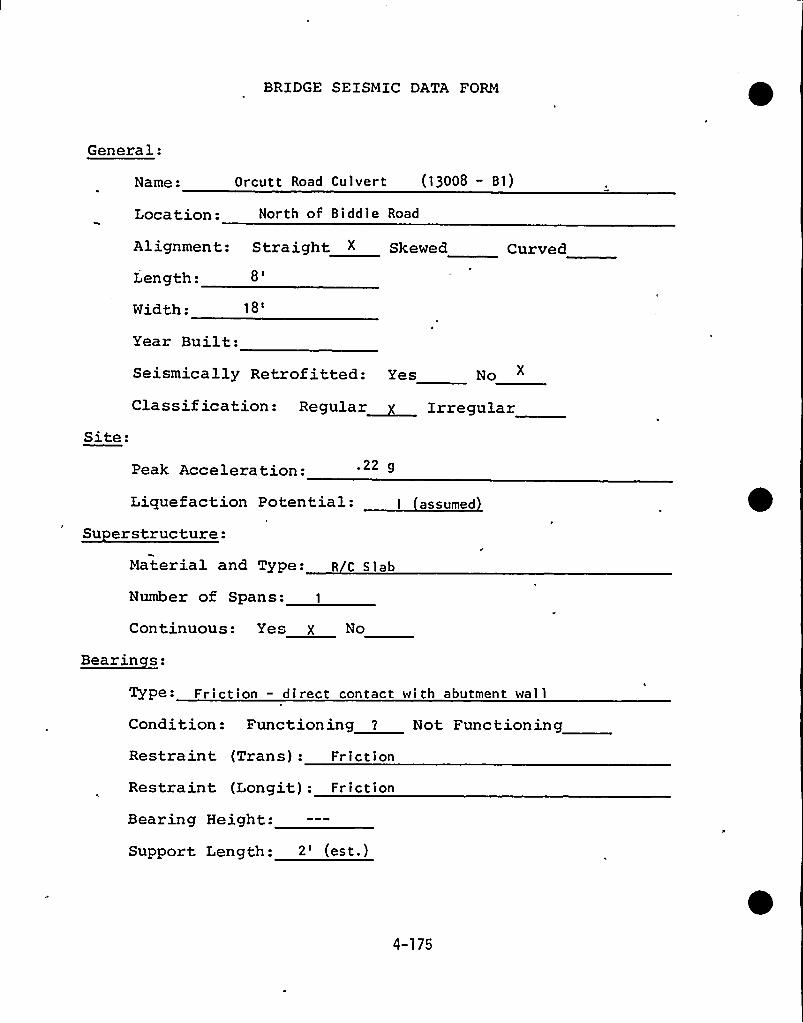
BRIDGE SEISMIC DATA FORM
General:
Name: Orcutt Road Culvert (13008 - Bl)
Location: North of Biddle Road
Alignment: Straight < Skewed Curved
Length:
Width:
Year Built:Seismically Retrof itted: Yes No
Site:
Classif ication: Regular~ Irregular
Peak Acceleration:Liquefaction Potential:
~ 22 9
I assumed
Su erstructure:Material and Type: R C Slab
Number of Spans: 1
Continuous: Yes X No
Bearinces:
Type- Friction - direct contact with abutment wal 1
Condition: Functioning 2 Not FunctioningRestra int (Tran s): Fr i c t i on
Restraint (Longit): Fr i c t i on
Bearing Height:
Support Length: 2'est ~ )
4-175
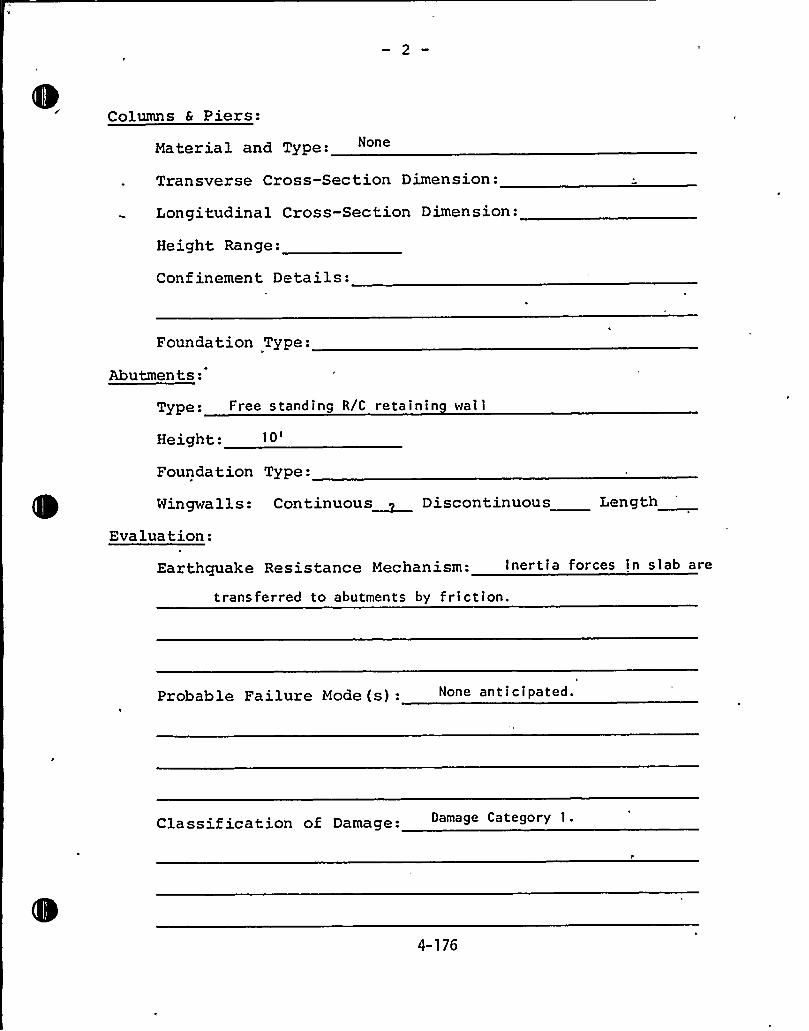
Columns 6 Piers:
Material and Type:
Transverse Cross-Section Dimension:
Longitudinal Cross-Section Dimension:
Height, Range:
Confinement Details:
Foundation Type:
Abutments:
Type: Free standing R/C retaining wall
Height:
Foundation Type:
Ningwalls: Continuous~ Discontinuous
Eva lua tion:
Length
Earthquake Resistance Mechanism: Inertia forces in slab are
transferred to abutments by friction.
Probable Failure Mode (s): None anticiPated.
Classification of Damage: Damage Category 1.
4-176
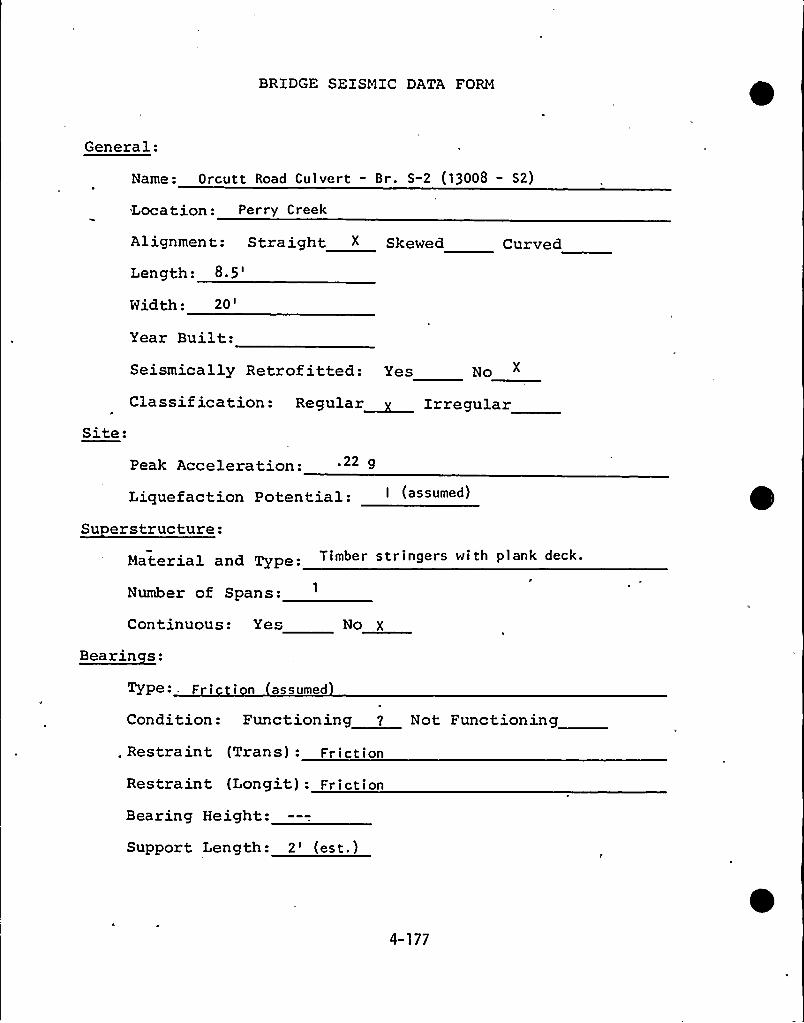
BRIDGE SEISMIC DATA FORM
General:
Name: Orcutt Road Culvert - Br. S-2 (13008 - S2)
Loca tion: Per ry C reek
Alignment: Straight X Skewed
Length:8.5'urved
Site:
Width:20'ear
Built:Seismically Retrof itted: Yes No X
Classif ication: Regular~ Irregular
Peak Acceleration:
Liquefaction Potential:Su erstructure:
Material and Type: Timber stringers with plank deck.
Number of Spans:
Continuous: Yes
Bearinces:
TyPe- - F i i n a sumed
No X
Condition: Functioning 7 Not Functioning
, Restraint (Trans): Fr ict ion
Restraint (Longit) - Fr i ct i on
Bearing Height:
Support Length: 2'est,)
4-177
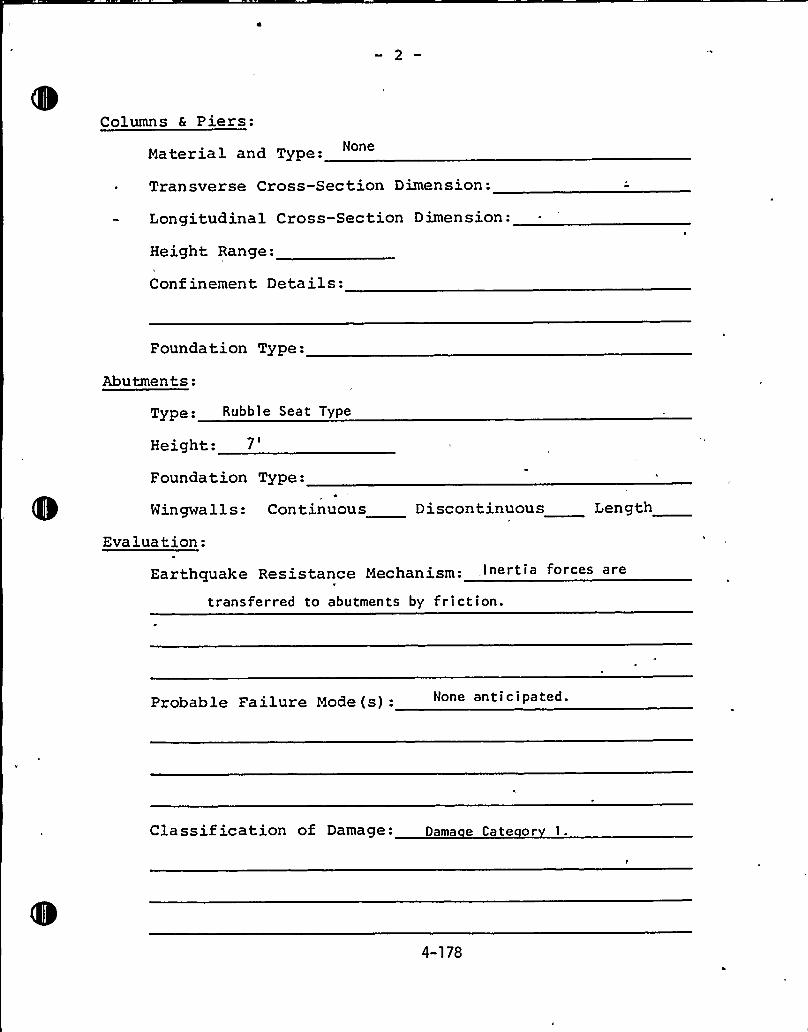
Columns & Piers:
Material and Type:
Transverse Cross-Section Dimension:
Longitudinal Cross-Section Dimension:
Height Range:
Conf inement Details:
Foundation Type:
Abutments:
Type. Rubb I e Seat Type
Height:7'oundation Type:
Wingwalls: Continuous Discontinuous Length
Evaluation:
Earthquake Resistance Mechanism:,Inertia forces are
transferred to abutments by friction.
Probable Failure Mode (s): None anticiPated ~
Classif ication of Damage: Dama e Cate or 1.
4-178
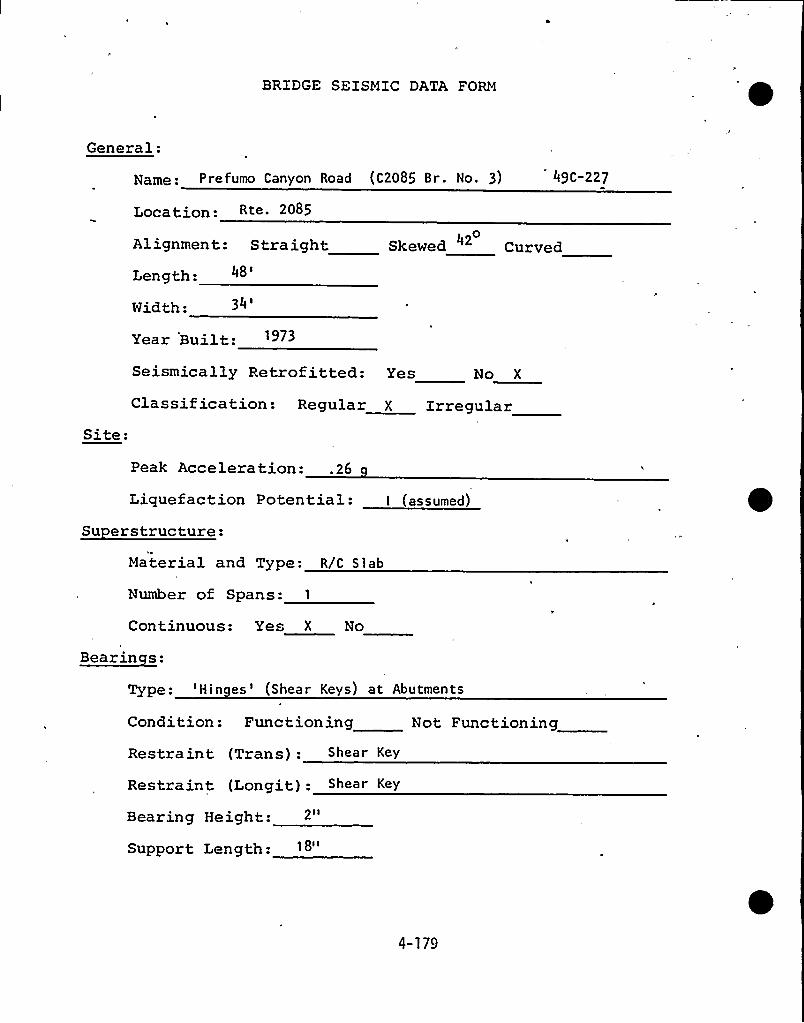
BRIDGE SEISMIC DATA FORM
General:
Name: Prefumo Canyon Road (C2085 Br. No, 3)
Location: Rte. 2085
49C-227
0Alignment: Straight Skewed Curved
Length: 48
Width: 34
Year Built:Seismically Retrofitted: Yes No X
Site:Classification: Regular X Irregular
Peak Acceleration: .26
Liquefaction Potential: I (assumed)
Su erstructure:Material and Type: R/C Slab
Number of Spans: 1
Continuous: Yes X No
Bearinces:
Type: 'Hin es'Shear Keys) at Abutments
Condition: Functioning
Restraint (Trans): Shear Key
Restraint (Longit,): Shear Key
Bearing Height:
Support, Length: 18"
Not Functioning
4-179
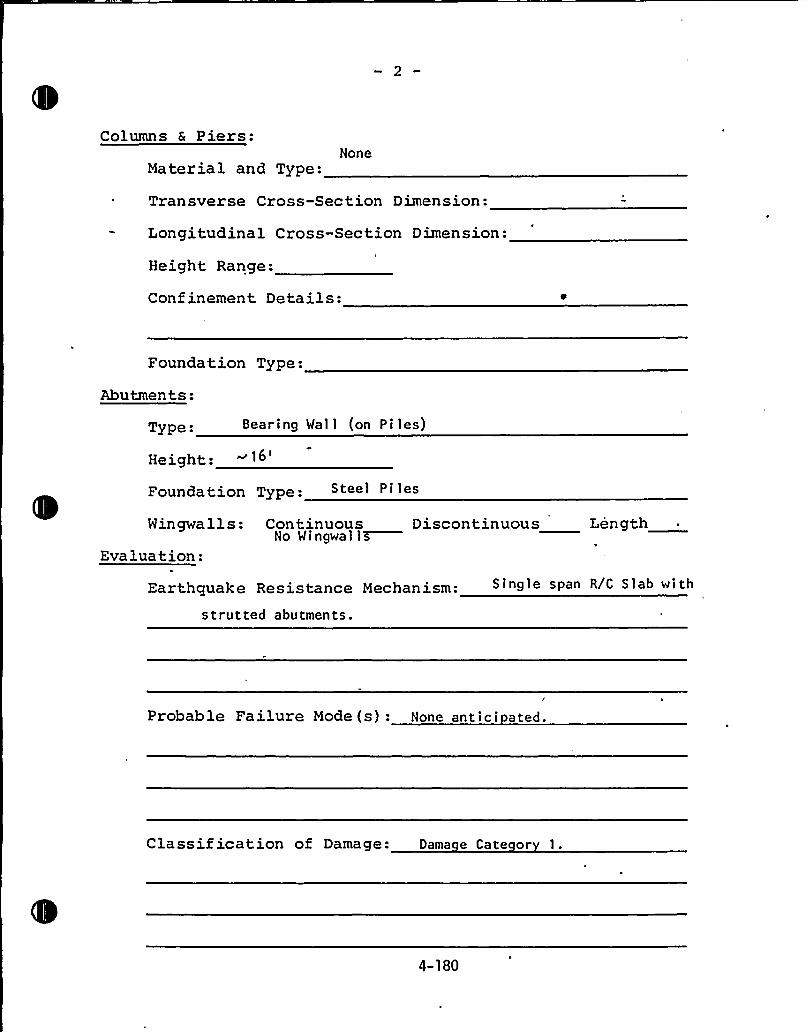
Columns & Piers:
Material and Type:None
Transverse Cross-Section Dimension:
Longitudinal Cross-Section Dimension:
Height Range:
Confinement Details:
Foundation Type:
Abutments:
Type Bearing Wal 1 (on Pi les)
Height. ~ 16
'oundationType: Steel Pi les
LengthDiscontinuousWingwalls: ContinuousNo Wingwall~
Evaluation:
Earthquake Resistance Mechanism:
strutted abutments.
Single span R/C Slab wi'th
Probable Failure Mode(s): None antici ated.
Classif ication of Damage: Dama e Cate or 1.
4-180
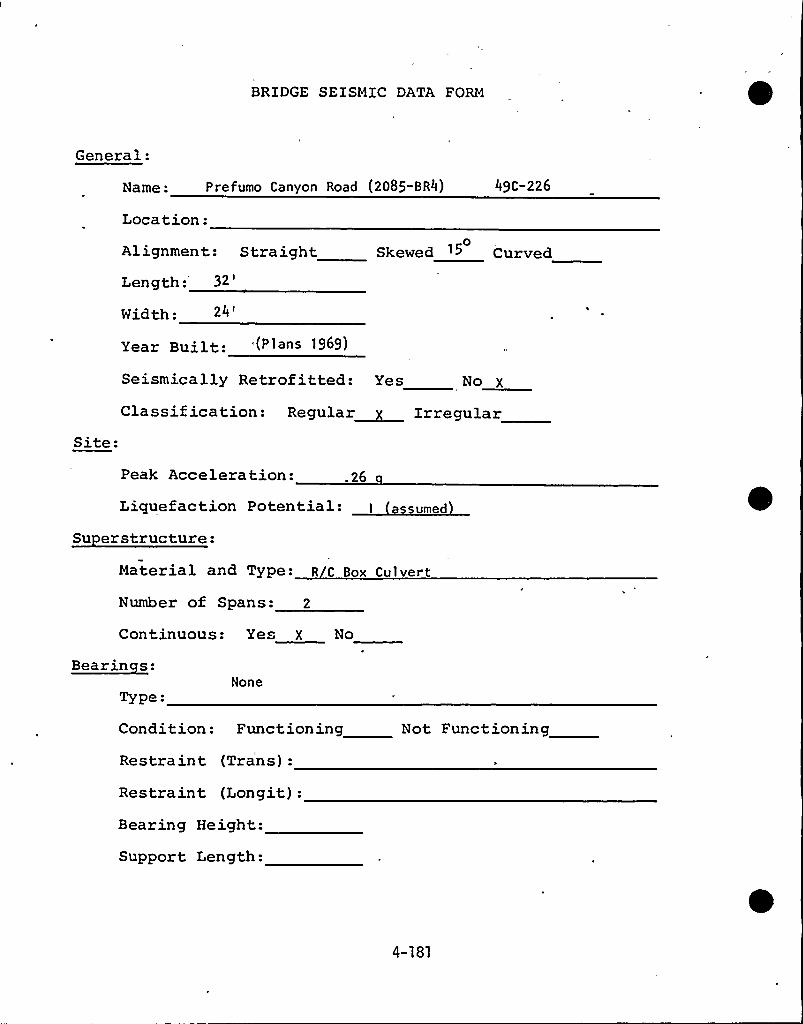
BRIDGE SEISMIC DATA FORM
General:
Name: Prefumo Canyon Road (2085-BR4)
Location:
49C-226
Alignment: StraightLength: 32
'idth:24
0Skewed 15 Curved
Site:
Year Built: (P lans 1969)
Seismically Retrofitted: Yes No X
Cia ssif ication: Regular~ Irregular
Peak Acceleration: .26
Su erstructure:Material and Type: R C Box Cu1vert
Number of Spans: 2
Continuous: Yes X No
Bearinces:None
Type
-'ondition: Functioning
Restraint (Trans):
Restraint (Longit):
Bearing Height:
Support Length:
Not Functioning
4-181
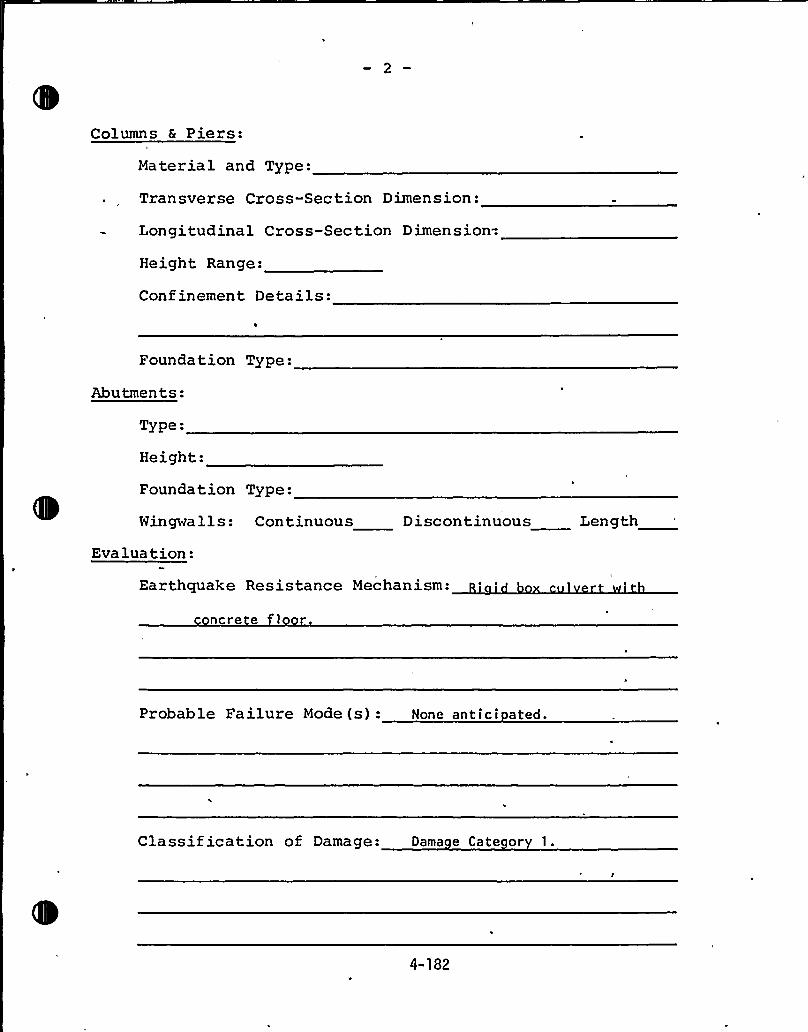
Columns & Piers:
Material and Type:
Transverse Cross-Section Dimension:
Longitudinal Cross-Section Dimension".
Height Range:
Confinement Details:
Foundation Type:
Abutments:
Type:
Height:
Foundation Type:
Wingwa 11 s: Con tinuou s Discontinuous Length
Evaluation:
Earthquake Resistance Mechanism:
ncre e 1
Probable Failure Mode (s): None antici ated.
Classif ication of Damage: Dama e Cate or 1.
4-182
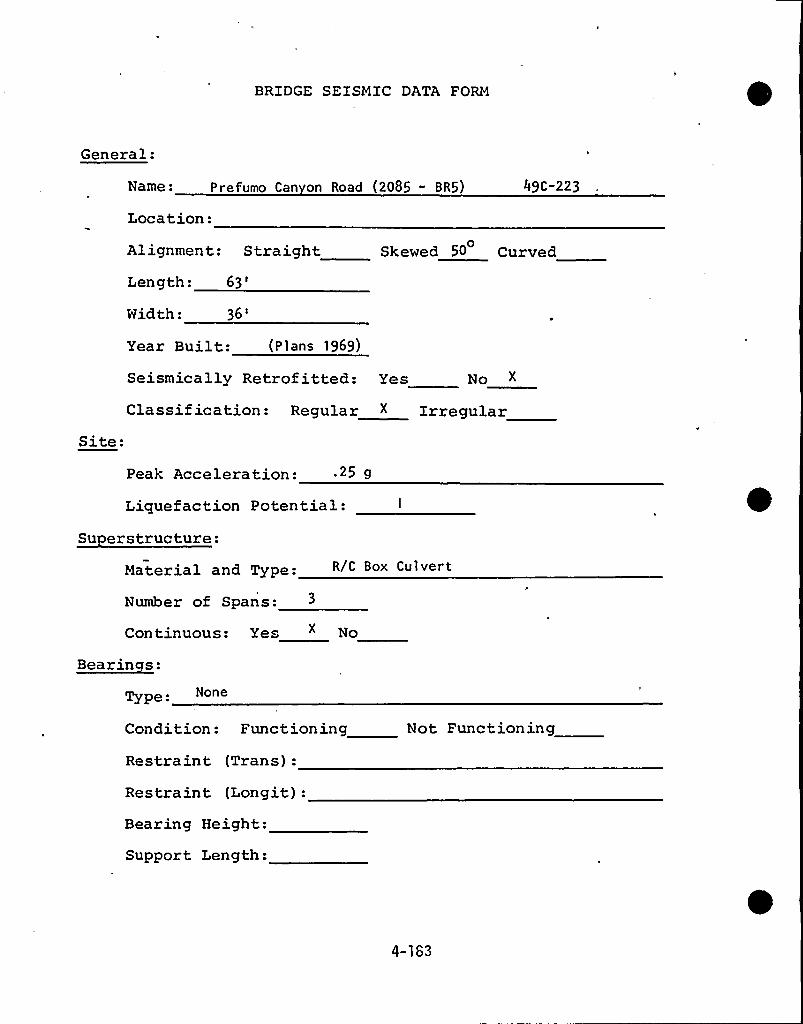
BRIDGE SEISMIC DATA FORM
General:
Name: Pret'umo Can on Road (2085 - BR5)
Location:
49C-223
Site:
Alignment: Straight Skewed 50 Curved0
Length:63'idth:
36'ear
Built: (P lans 1969)
Seismically Retrofitted: Yes No X
Classif ication: Regular X Irregular
Peak Acceleration: 25 g
Liquefaction Potential:
Su erstructure:
Material and Type: R/C Box Culvert
Number of Spans:
Continuous: Yes " No
Bearinces:
None
Condition: Funct,ioning
Restraint (Trans):
Restraint (Longit):Bearing Height:
Support Length:
Not Functioning
4-1S3
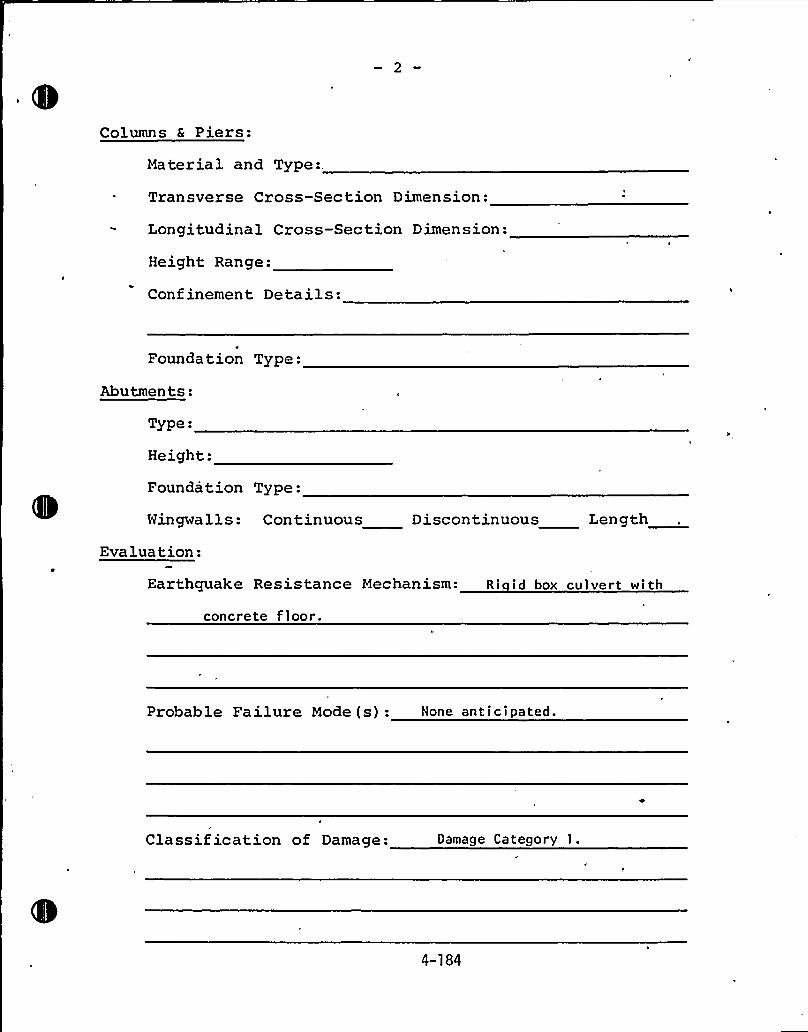
Columns & Piers:
Material and Type:.
Transverse Cross-Section Dimension:
Longitudinal Cross-Section Dimension:
Height Range:
Confinement Details:
Foundation Type:
Abutments:
Type:
Height:
Foundation Type:
Wingwalls: Continuous Discontinuous Length
Eva lua tion:Earthquake Resistance Mechanism: Ri id box culvert with
concrete floor.
Probab le Fa ilure Mode ( s ): None ant i c i pated.
Classif ication of Damage: Damage Category l.
4-184
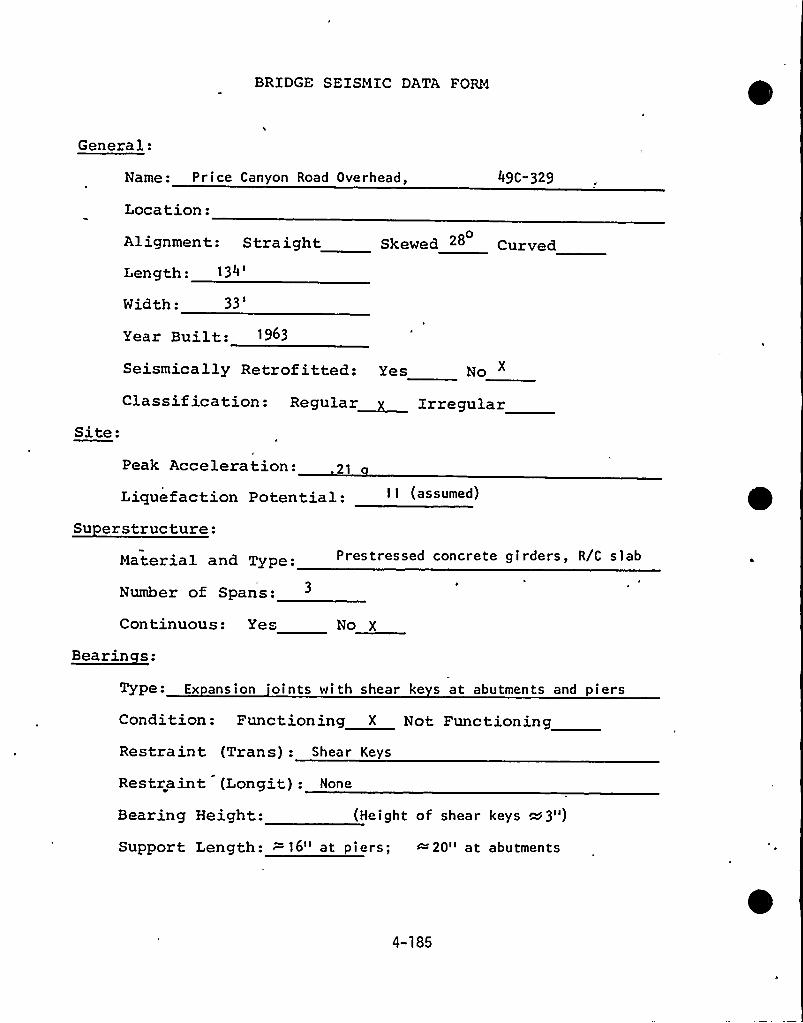
BRIDGE SEISMIC DATA FORM
General:
Name: Price Canyon Road Overhead, 49C-329
Location:0Alignment: Straight Skewed IS Curved
Length:134'idth:
33'ite:
Year Built:. 1963
Seismically Retrofitted: Yes Ro
Classification: Regular~ Irregular
Peak Acceleration: 21
Liquefaction Potential: II (assumed)
Su erstructure:Material and Type:
Number of Spans:
Continuous: Yes
Prestressed concrete girders, R/C slab
No X
Bearinces:
Type: Ex ansion 'oints with shear ke s at abutments and piers
Condition: Functioning X Not FunctioningRestraint (Trans): Shear Keys
Restraint (Longit): None
Bearing Height: (Height of shear keys ~~3")
Support Length: 16" at piers; ~20" at abutments
4-185
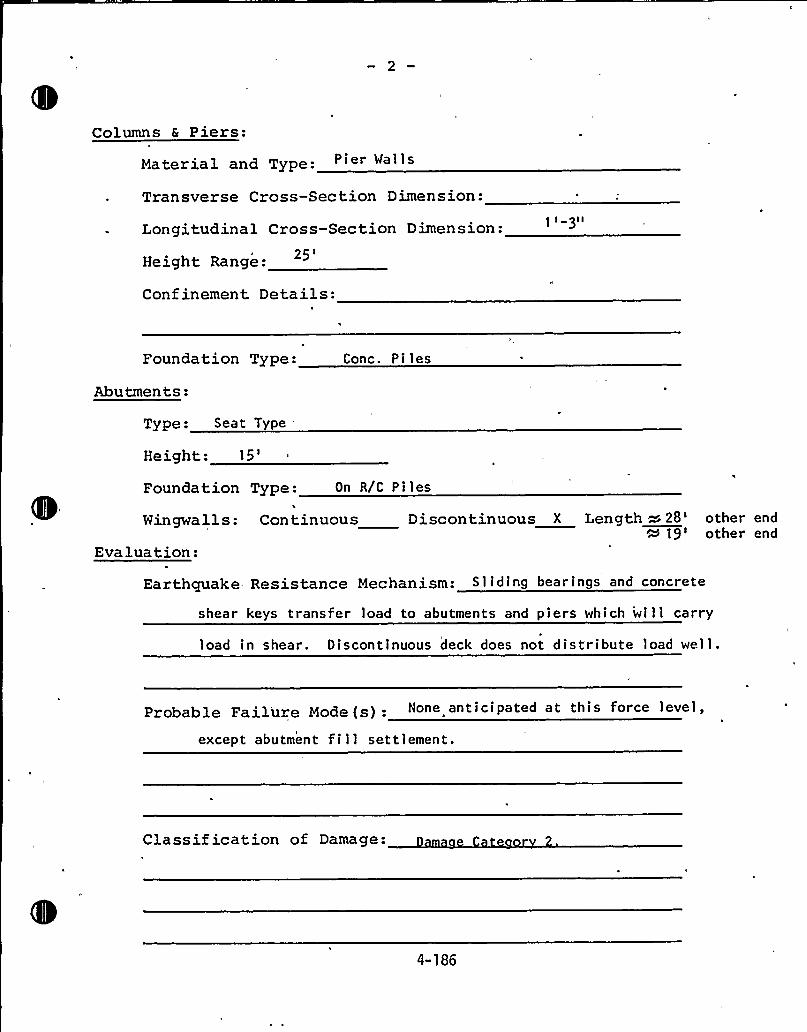
Columns & Piers:
Material and Type: Pier Walls
Transverse Cross-Section Dimension:
Longitudinal Cross-Section Dimension:
25'eightRange:
I 3I I
Conf inement Details:
Foundation Type: Conc. Piles
Abutmen ts:Type: Seat Type
Height:15'oundation Type: On R/C Piles
Wingwalls: Continuous Discontinuous X Length ~ 28'ther end19'ther end
Evaluation:
Earthquake Resistance Mechanism: S 1 i ding bear ings and concrete
shear keys transfer load to abutments and piers which will carry
load in shear. Discontinuous deck does not distribute load well.
Probable Failure Mode (s): None anticiPated at this force level,
except abutment fill settlement.
Classif ication of Damage:
4-186
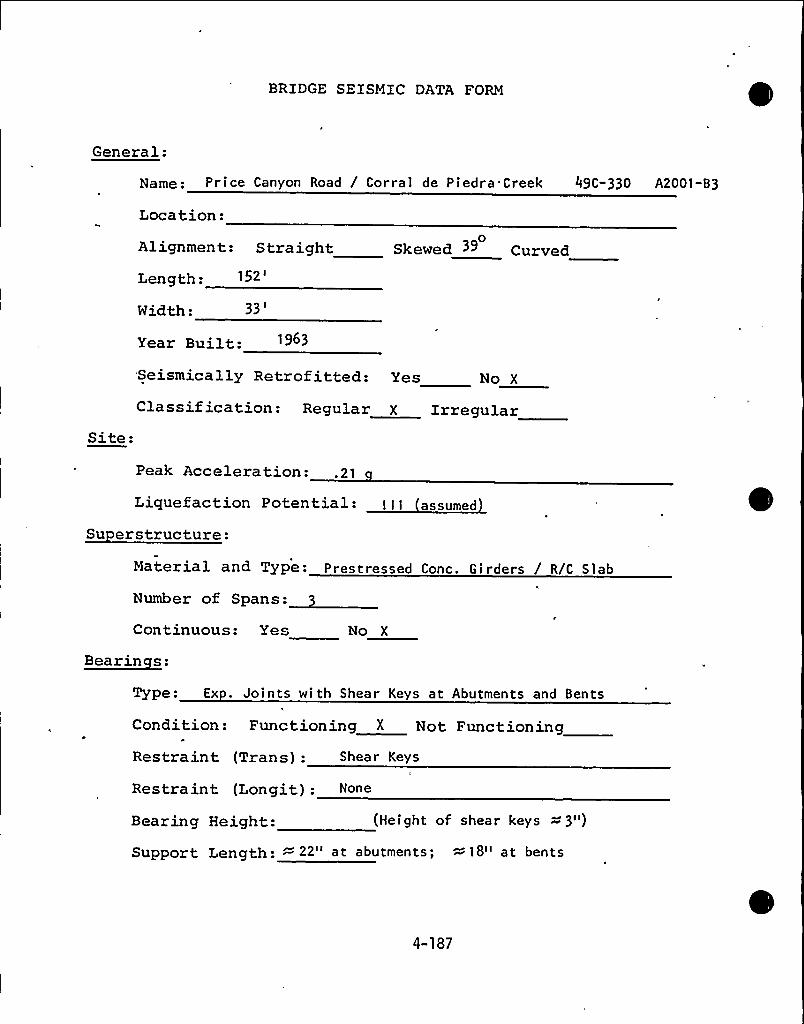
BRIDGE SEISMIC DATA FORM
General:
Name: Price Canyon Road / Corral de Piedra Creek 49C-330 A2001-B3
Location:0Alignment: Straight Skewed >g Curved
Length:
Width:
Year Built:Seismically Retrofitted: Yes No X
Classification: Regular X IrregularSite:
Peak Acceleration: .21
Su erstructure:Material and Type: Prestressed Conc. Girders / R/C Slab
Number of Spans:
Continuous: Yes No X
Bearinces:
Type: Ex . Joints with Shear Keys at Abutments and Bents
Condition: Functioning X Not Functioning
Restraint (Trans): Shear Keys
Restraint (Longit): None
Bearing Height: (Height of shear keys = 3")
Support Length: ~22" at abutments; ~18" at bents
4-187
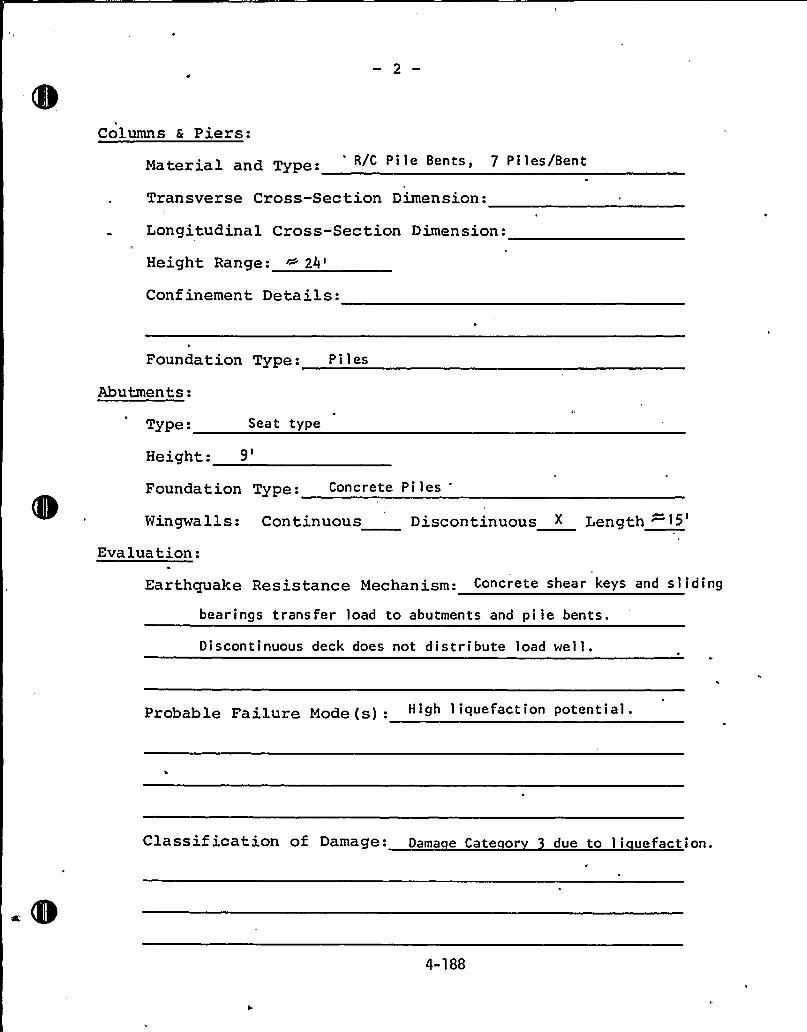
Columns & Piers:
material and Type: '/C Pile Bents, 7 Piles/Bent
Transverse Cross-Section Dimension:
Longitudinal Cross-Section Dimension:
Height Range: ~~
24'onfinementDetails:
Foundation Type: P i 1 es
Abutments:
Type Seat type
Height:9'oundation Type: Concrete Piles
Wingwalls: Continuous Discontinuous X Length
Evaluation:
Earthquake Resistance mechanism: Concrete shear keys and sl iding
bearings transfer load to abutments and pile bents.
Discontinuous deck does not distribute load well.
Probable Failure gode (s): High 1 iquefaction potential.
Classification of Damage: Dama e Cate or due to li uefaction.
4-188
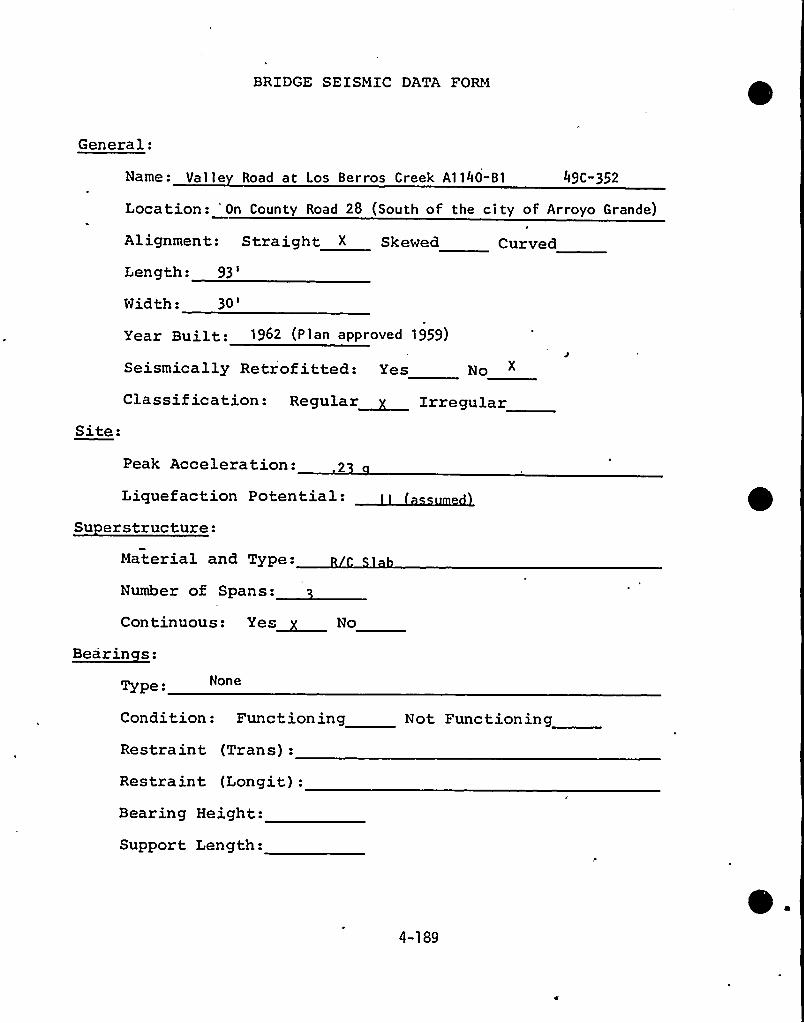
BRIDGE SEISMIC DATA FORM
General:
Name: Val le Road at Los Berros Creek A1140-B1 49C-352
Location: 'On County Road 28 (South of the city of Arroyo Grande)
Alignment: Straight X
Length: 93
'idth:
3O'kewed Curved
Year Built: 1962 (Plan approved 1959)
Site:
Seismically Retrofitted: Yes No
Classification: Regular~ Irregular
Peak Acceleration:
Liquefaction Potential:Su erstructure:
Material and Type:
Continuous: Yes~ No
~Bearin s:
TYpe: None
Condition: Functioning
Restraint (Trans):
Restraint (Longit):Bearing Height:
Support Length:
Not Functioning
4-189
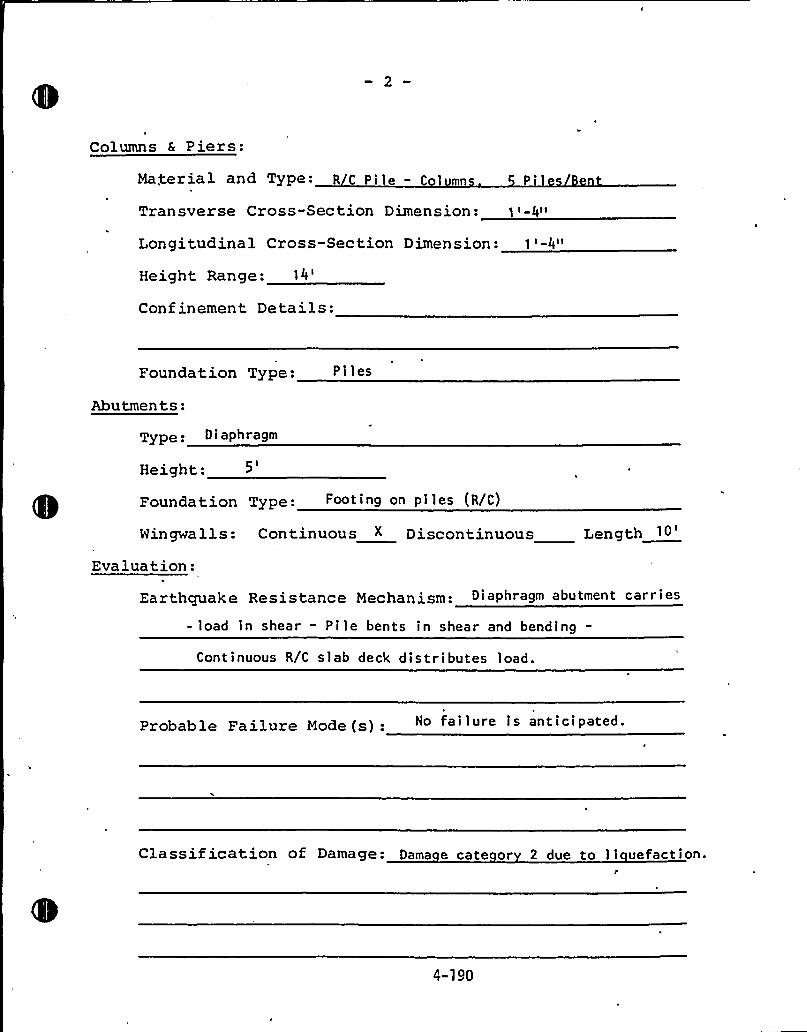
Columns 6, Piers:
Material and Type: R C Pile - C
Transverse Cross-Section Dimension: 1i-4»
Longitudinal Cross-Section Dimension: 1'-4»
Height Range:14'onf
inement Details:
Foundation Type: P i i es
Abutmen ts:Type, Di aphragm
Height:
Foundation Type: Footing on pi les (R/C)
Wingwalls:
Evaluation:
Continuous X Discontinuous Length
10'arthquake
Resistance Mechanism: Diaphragm abutment carries
- load in shear - Pile bents in shear and bending
Continuous R/C slab deck distributes load.
Probable Failure Mode (s): No failure is anticipated.
Classif ication of Damage: Dama e cate or 2 due to 1 i uefaction.P
4-190

4.4 SUMMARYOF EVALUATIONOF BRIDGES
FOR WHICH NO PLANS WERE AVAILABLE
4-191
TERA CORPORATION
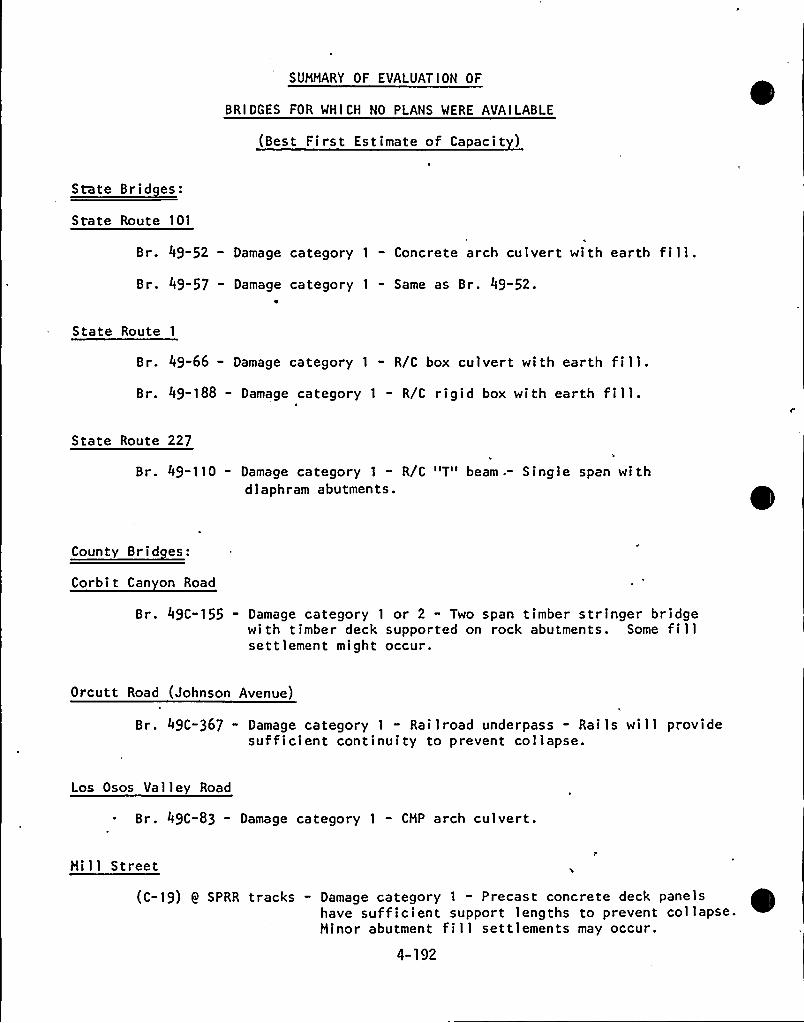
SUMMARy OF EVALUATION OF
BRIDGES FOR WHICH NO PLANS WERE AVAILABLE
(Best First Estimate of Capacit )
State Route 101
Br. 49-52 - Damage category 1- Concrete arch culvert with earth fill.
Br. 49-57 - Damage category 1- Same as Br. 49-52.
State Route 1
Br. 49-66 - Damage category 1 - R/C box culvert with earth fill.Br. 49-188 - Damage category 1
- R/C rigid box with earth fill.
State Route 227
Br. 49-110 - Damage category 1- R/C "T" beam -- Single span with
diaphram abutments.
Corbit Can on Road
Br. 49C-155 - Damage category 1 or 2 - Two span timber stringer bridgewith timber deck supported on rock abutments. Some fillsettlement might occur.
Orcutt Road (Johnson Avenue)
Br. 49C-367 - Damage category 1- Railroad underpass - Rails will provide
sufficient continuity to prevent collapse.
Los Osos Valley Road
Br. 49C-83 - Damage category 1- CMP arch culvert.
Mill Street
(C-19) 0 SPRR tracks — Damage category 1— Precast concrete deck panels
have sufficient support lengths to prevent collapse.Minor abutment fill settlements may occur.
4-192
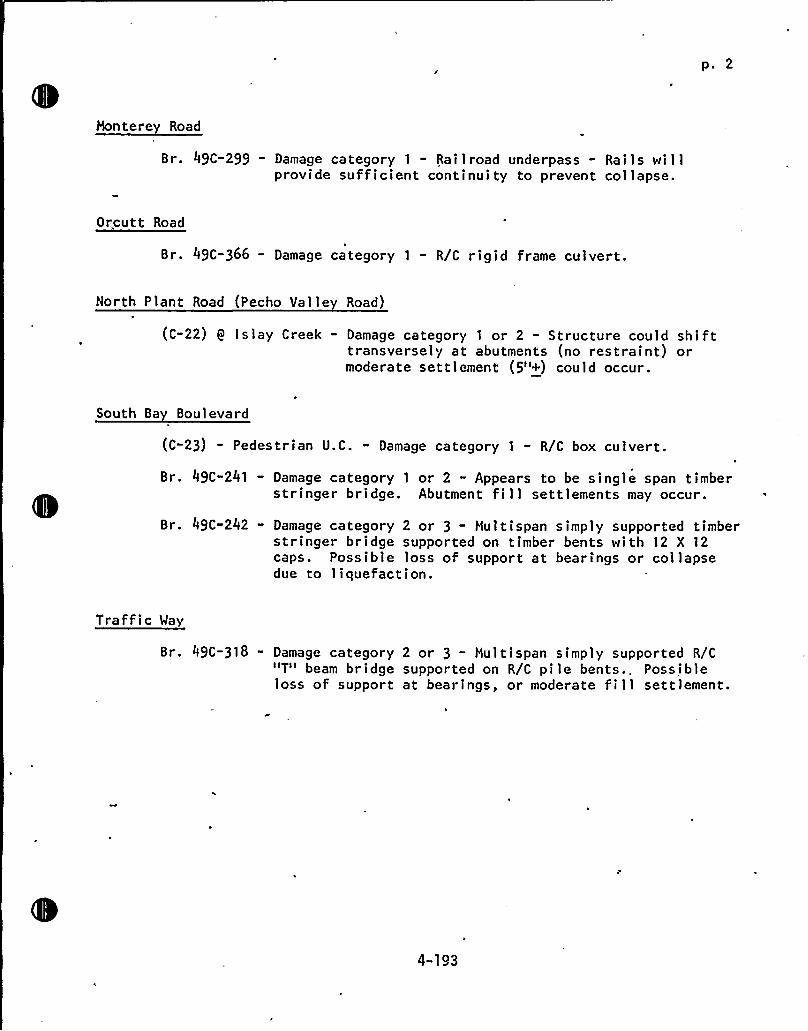
po 2
Montere Road
Br. 49C-299 — Damage category 1- Railroad underpass - Rails will
provide sufficient continuity to prevent collapse.
Orcutt Road
Br. 49C-366 — Damage category 1- R/C rigid frame culvert.
North Plant Road (Pecho Valley Road)
(C-22) 0 Islay Creek - Damage category 1 or 2 - Structure could shifttransversely at abutments (no restraint) ormoderate settlement (5"+) could occur.
South Ba Boulevard
(C-23) - Pedestrian U.C. - Damage category 1- R/C box culvert.
Br. 49C"241 - Damage category 1 or 2 " Appears to be single span timberstringer bridge. Abutment fill settlements may occur.
Br. 49C-242 - Damage category 2 or 3 - Multispan simply supported timberstringer bridge supported on timber bents with 12 X 12caps. Possible loss of support at bearings or collapsedue to liquefaction.
Traffic Way
Br. 49C-318 - Damage category 2 or 3 - Multispan simply supported R/C"T" beam bridge supported on R/C pile bents., Possibleloss of support at bearings, or moderate fill settlement.
4-1 o3

4.5 BEHAVIOR OF BRIDGES DURING PAST EARTHQUAKES
BRIDGE SEISMIC DATAFORMS
4-194
TERA CORPORATION
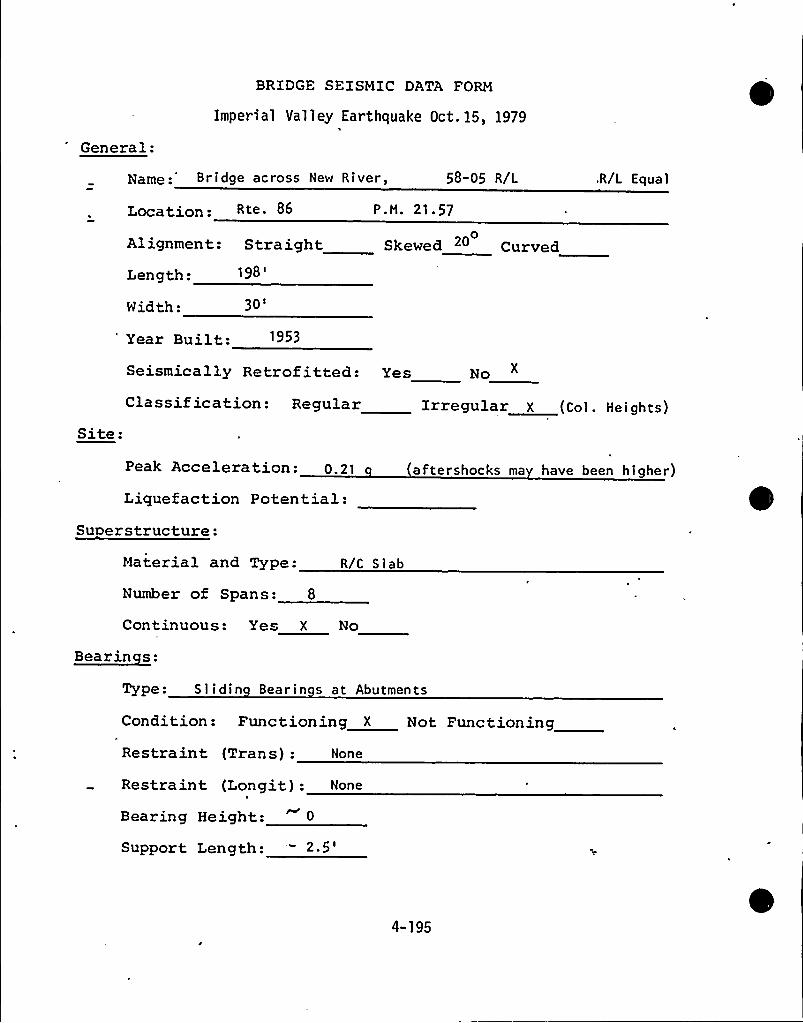
General:
BRIDGE SEISMIC DATA FORM
Imperial Va11ey Earthquake Oct.15, 1979
Name: Bridge across New River, 58-05 R/L
Location: Rte. 86 P.M. 21.57
0Alignment: Straight Skewed Ig Curved
Length:
R/L Equal
Width: 301
Year Built:Seismically Retrofitted: Yes No
Site:Classification: Regular Irregular I (Col. Heights)
Peak Acceleration: 0.21
Liquefaction Potential:Su erstructure:
aftershocks ma have been higher)
Material and Type:
Number of Spans: 8
R/C S lab
Continuous: Yes X No
Bearinces:
Type: Slidin Bearin s at Abutments
Condition: Functioning X Not Functioning
Restraint (Trans): Hone
Restraint (Longit): None
Bearing Height:
Support Length: "
2.5'-195
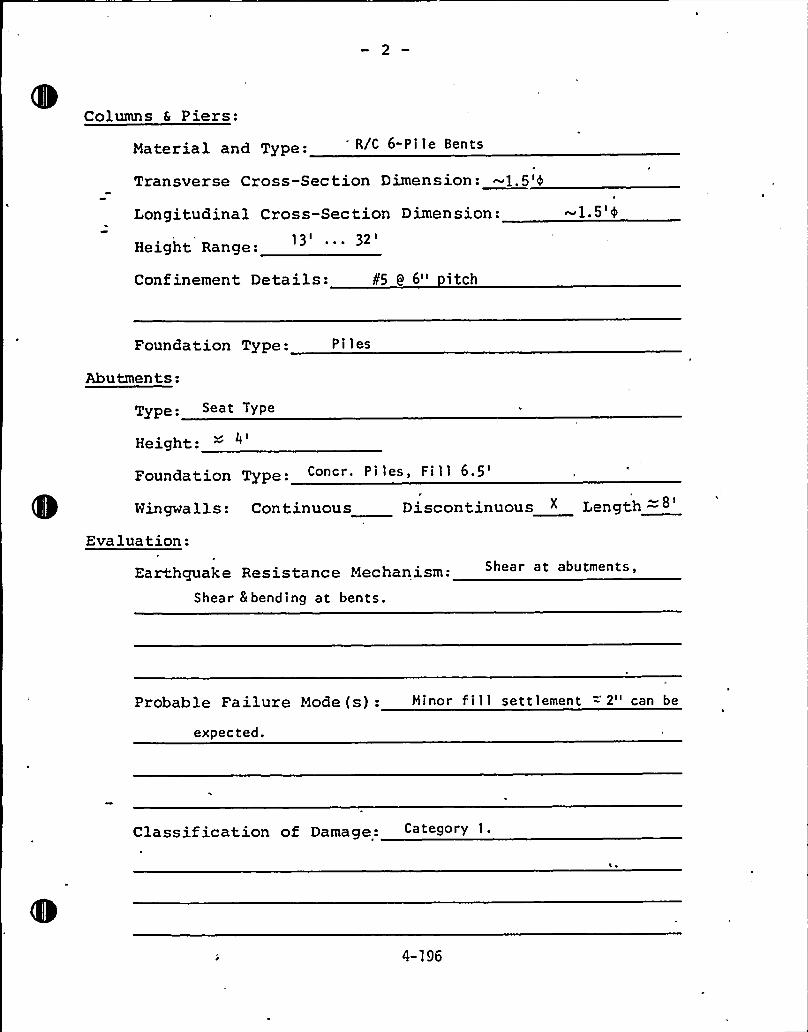
Columns & Piers:
Material and Type: R/C 6-Pile Bents
Transverse Cross-Section Dimension: -1.5'4
Longitudinal Cross-Section Dimension: -1.5'4
Height Range:
Confinement Details: ¹5 y 6" itch
Foundation Type: Pi les
Abutments:
Type Seat TyPe
Height: - 4
Foundation Type: Concr. Pi les, Fi l l
6,5'ingwa
1 1 s: Continuous Discontinuous " Length =g
Evaluation:
Earthquak e
Shear
Resistance Mechanism: Shear at abutments,
8 bending at bents.
Probable Failure Mode (s): Minor fill settlement ='2" can be
expected.
Classif ication of Damage: Ca«gory
4-196
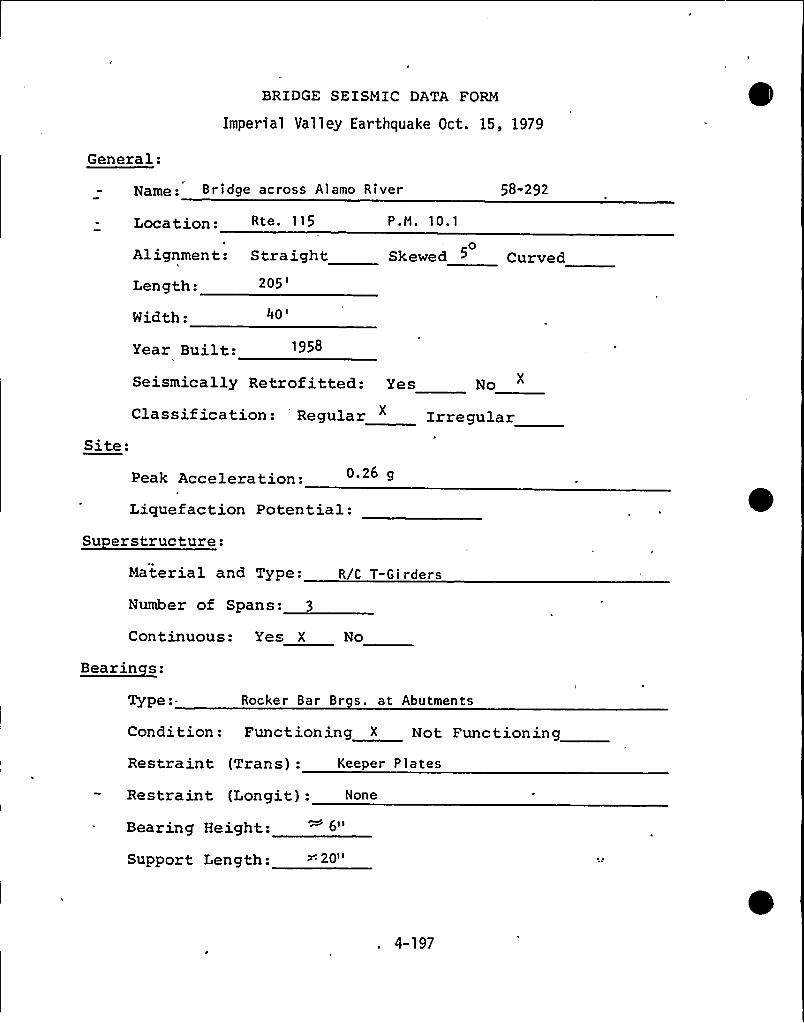
BRIDGE SEISMIC DATA FORM
Imperial Valley Earthquake Oct. 15, 1979
General:
Name: Bridge across Alamo River
Location: Rte. 115 P.M. 10.1
58-292
N
Alignment: Straight 0Skewed S Curved
Length:
Width:
Year Built:
205'0'958
Seismically Retrofitted: Yes No
Site:Classification: Regular " Irregular
Peak Acceleration:Liquefaction Potential:
Su erstructure:Material and Type: R/C T-Girders
Number of Spans: 3
Continuous: Yes X No
~Bearin s:
Type:— Rocker Bar Br s. at Abutments
Condition: Functioning X Not Functioning
Restraint (Trans): Keeper P lates
Restraint (Longit): None
Bearing Height:
Support Length:
6I I
- 20"
4-197
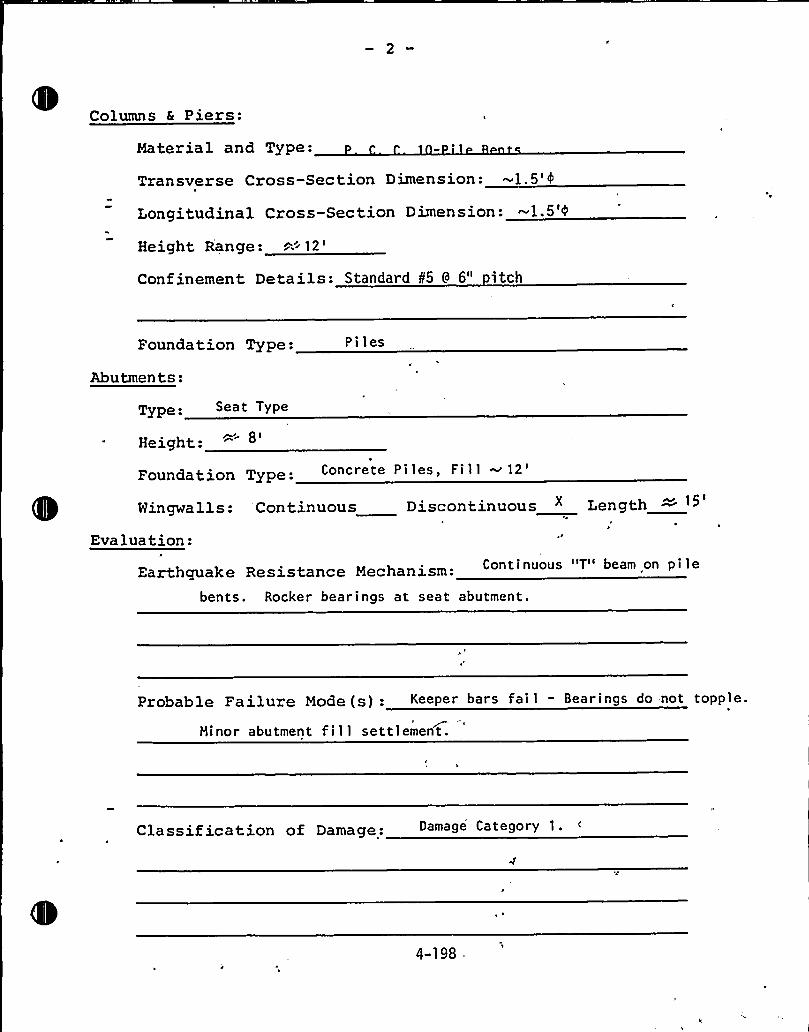
Columns 6 Piers:
Material and Type:
Transverse Cross-Section Dimension: -1. 5'
Longitudinal Cross-Section Dimension: -1.5'4
Height Range: ."12'onf
inement Details: Standard 85 9 6" itch
Founda tion Type: Pi les
Abutments:
Type Sea t TyPe
Height:
Foundation Type: Concrete Piles, Fill ~
12'ingwalls:'Continuous Discontinuous " Length
Evaluation:
Earthquake Resistance Mechanism: Continuous "T" beam on Pile
bents. Rocker bearings at seat abutment.
Probable Failure Mode (s): KeePer bars fail - Bearings do not toPPle.
Minor abutment f i 1 1 settlement.
Classi fication of Damage: a g eg ry
4-198 =
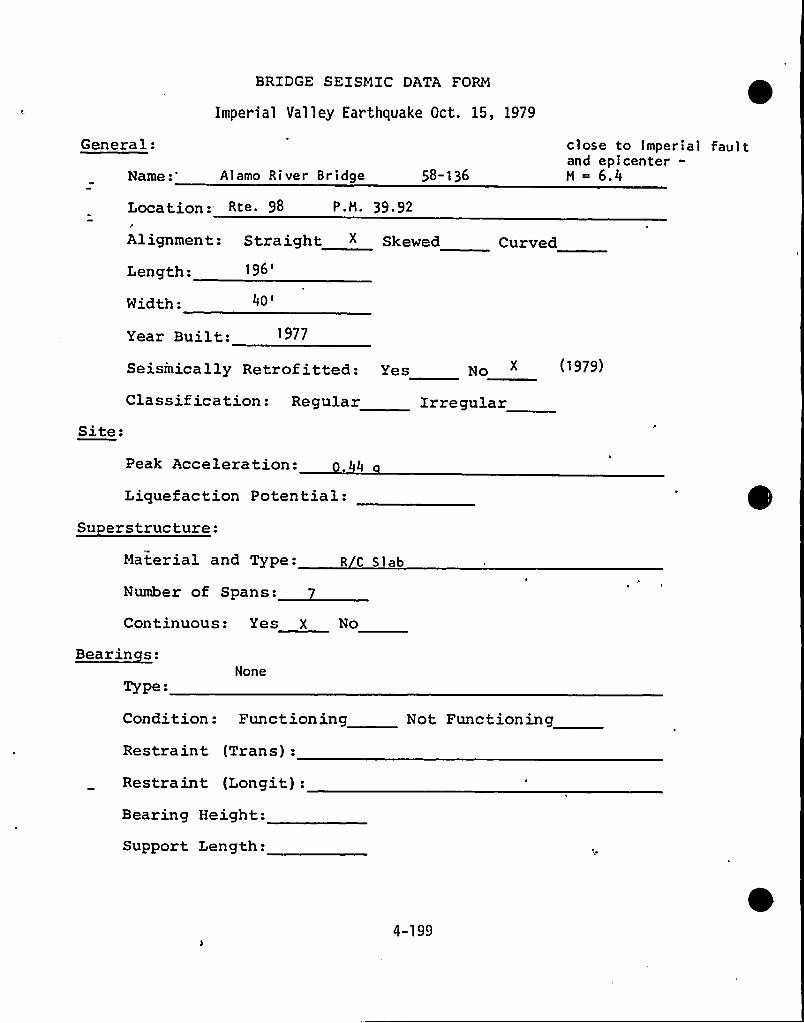
BRIDGE SEISMIC DATA FORM
Imperial Valley Earthquake Oct. 15, 1979
General:
Name Alamo River Bridge 58-136
close to Imperial faultand epicenter-M - 6.4
Location: Rte. 98 P.M. 39,92
Alignment: Straight < Skewed Curved
Length:
Width:
Year Built:
196'0'977
Seisinically Retrofitted: Yes No
Classif ication: Regular IrregularSite:
Peak Acceleration: .44
Liquefaction Potential:Su erstructure:
Material and Type: R C Slab
Continuous: Yes X No
Bearinces:None
Type-
Condition: Functioning
Restraint (Trans):
Restraint (Longit):Bearing Height:
Support Length:
Not Functioning
4-199
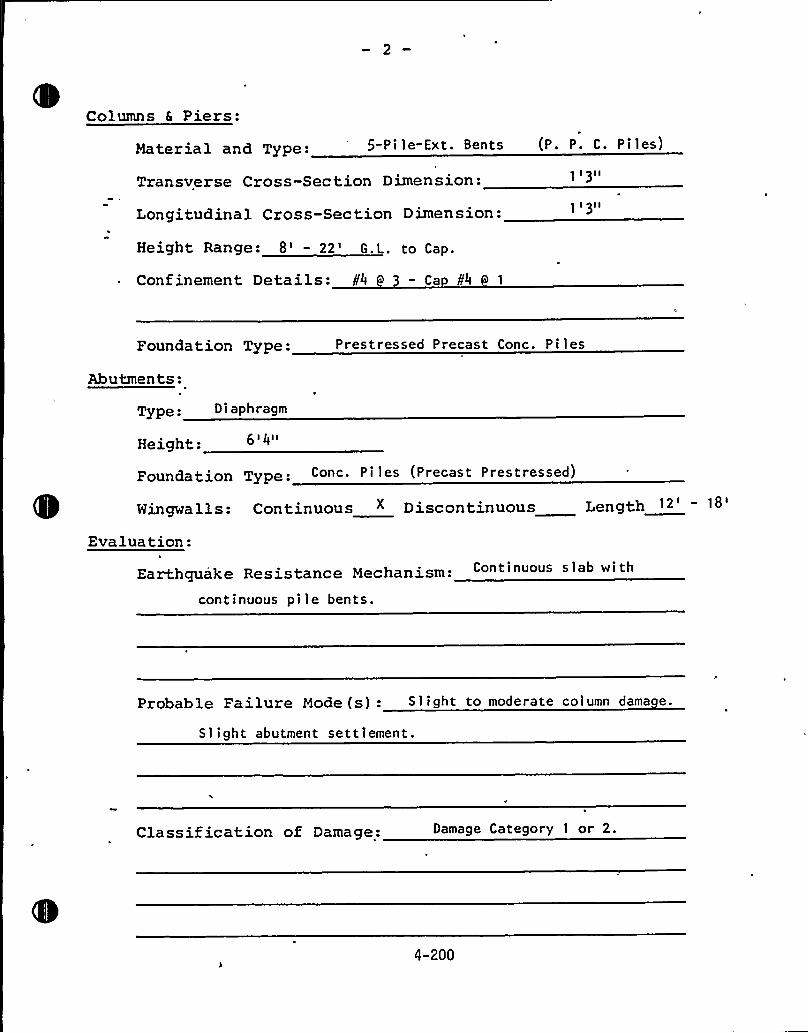
Columns & Piers:
Material and Type: 5-Pile-Ext. Bents (P. P. C. Piles)
Transverse Cross-Section Dimension:
Longitudinal Cross-Section D imen sion:
Height Range: 8' 22'. L. to Cap.
Conf inement Details: ¹4 - Ca ¹4 1
1l 3II
Foundation Type: Prestressed Precast Conc. Piles
Abutmen ts:
Type. Di aphragm
Height: 6'4"
Foundation Type Conc. P i 1 es (Precast Pres t ressed)
Wingwells: Continuous " Discontinuous Length 12'
18'valuation:
Earthquake Resistance Mechanism: Cont inuous s lab wi th
continuous pile bents.
Probable Failure Mode (s): S 1 ight to moderate column dama e.
Slight abutment settlement.
Classif ication of Damage: Damage Category 1 or 2.
4-200
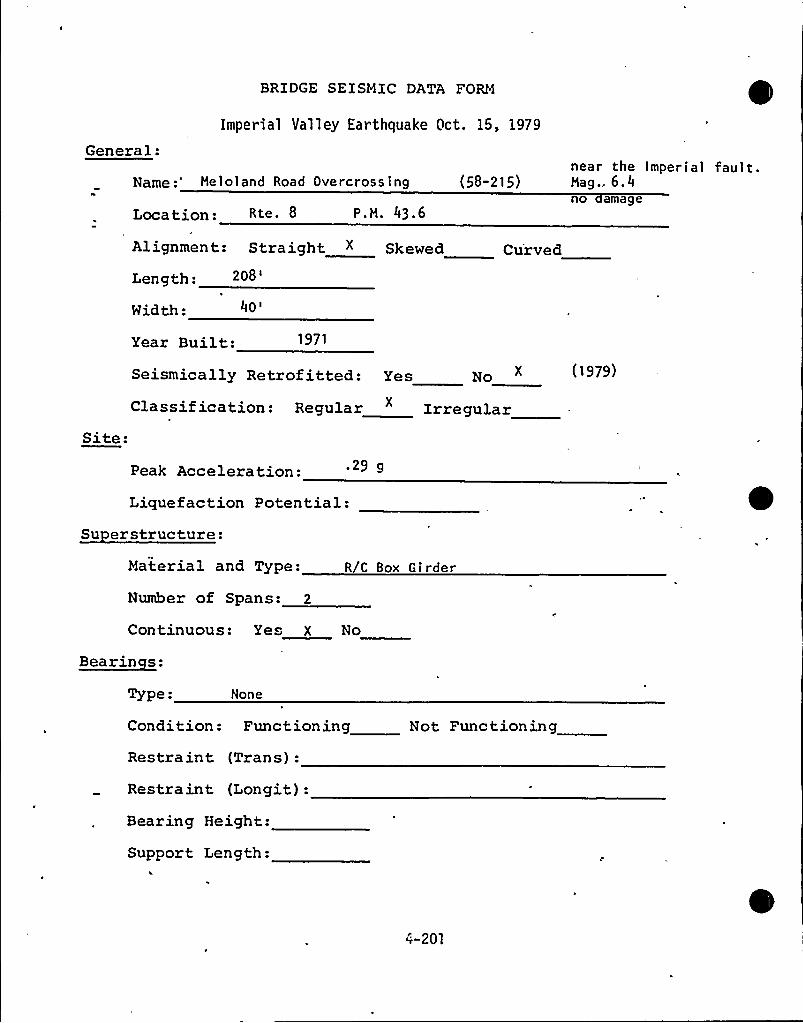
General:
BRIDGE SEISMIC DATA FORM
Imperial Valley Earthquake Oct. 15, 1979
Name Meloland Road Overcrossing
Location: Rte. 8 e.M. 43.6
(58-215)near the Imperial faultMag.. 6.4no amage
Alignment: Straight ~ Skewed Curved
Length: 208
'idth:40
Year Built: 1971
Site:
Seismically Retrof itted: Yes No
Classit ication: Regular Irregular
(1979)
Peak Acceleration: .29 g
Liquefaction Potential:Su erstructure:
Material and Type: R/C Box Girder
Number of Spans: 2
Continuous: Yes X No
Bearinces:
Type: None
Condition: Functioning
Restraint (Trans):
Restraint (Longit):Bearing Height:
Support Length:
Not Functioning
4-201
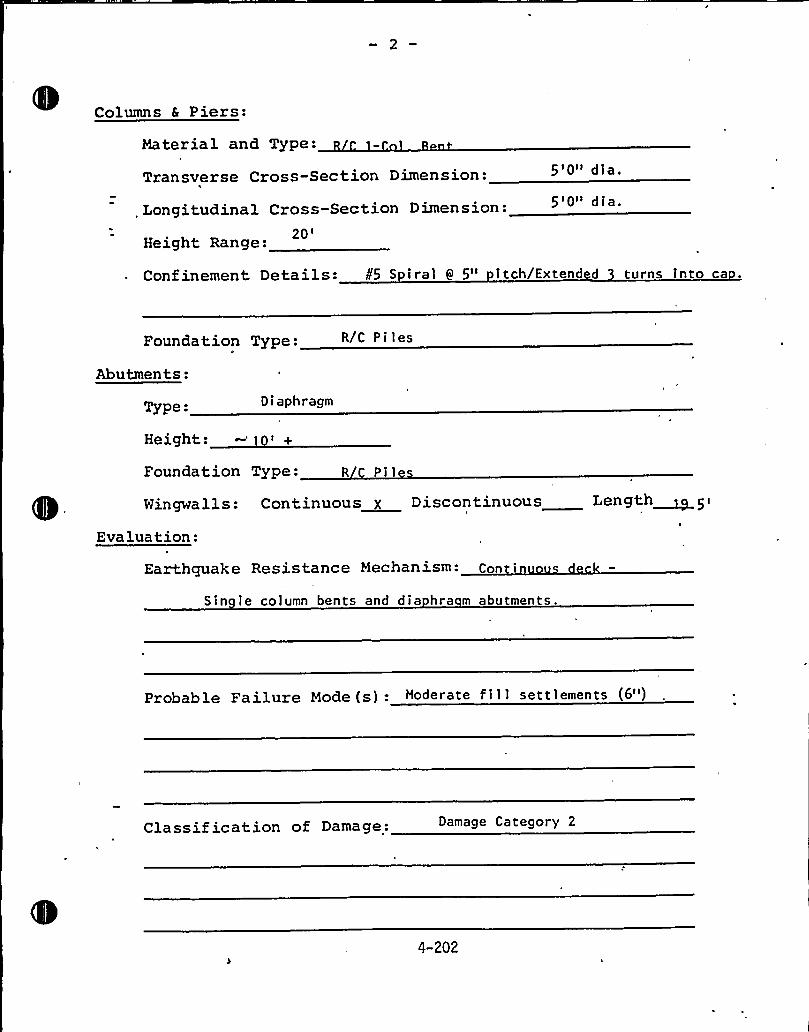
Columns 6 Piers:
Material and Type:
Transverse Cross-Section Dimension:
. Longitudinal Cross-Section Dimension:
20'eightRange:
5'0" dia.
5'0" dia.
Conf inement Details: ¹5 S iral 0 5" itch/Extended turns into ca .
Foundation Type: R/C P i 1 es
Abutmen ts:
Type: Diaphragm
Height: - 0< +
Foundation Type: R Pil
gingwa] ].s: Continuous X Discontinuous Densth~ g'valuation:
Earthquake Resistance Mechanism: Con in
Sin le column bents and dia hra m abutments.
Probable Failure Mode (s): Moderate f i 1 1 settlements (6")
Classif ication of Damage: Damage Category 2
4-202
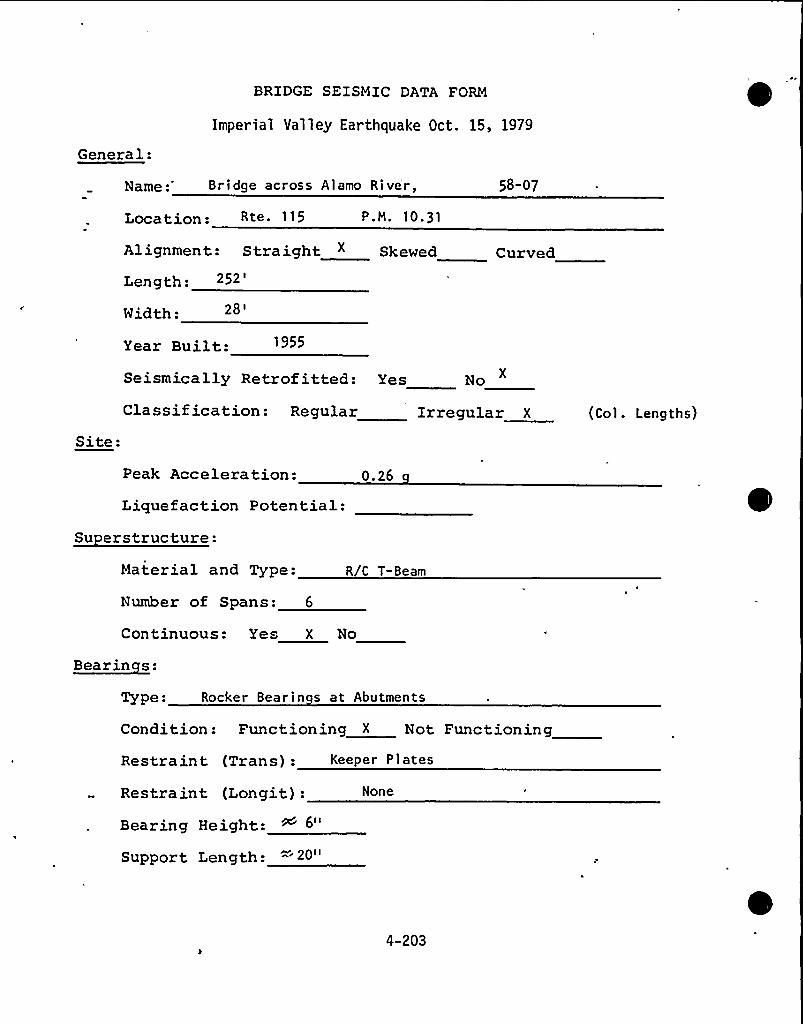
General:
BRIDGE SEISMIC DATA FORM
Imperial Valley Earthquake Oct. 15, 1979
Name: Bridge across Alamo River, 58-07
Location: Rte. 115 P.H. 10.31
Alignment: Straight " Skewed Curved
Length:252'idth:
Year Built: 1955
Seismically Retrof itted: Yes No
Site:Classification: Regular Irregular I (Col. Lengths)
Peak Acceleration:Liquefaction Potential:
Su erstructure:
0.26
Material and Type:
Number of Spans: 6
R/C T-Beam
Continuous: Yes X No
Bearinces:
Type: Rocker Bearin s at Abutments
Condition: Functioning X Not Functioning
Restraint (Trans): Keeper Plates
Restraint (Longit):Bearing Height:
Support Length:
None
4-203
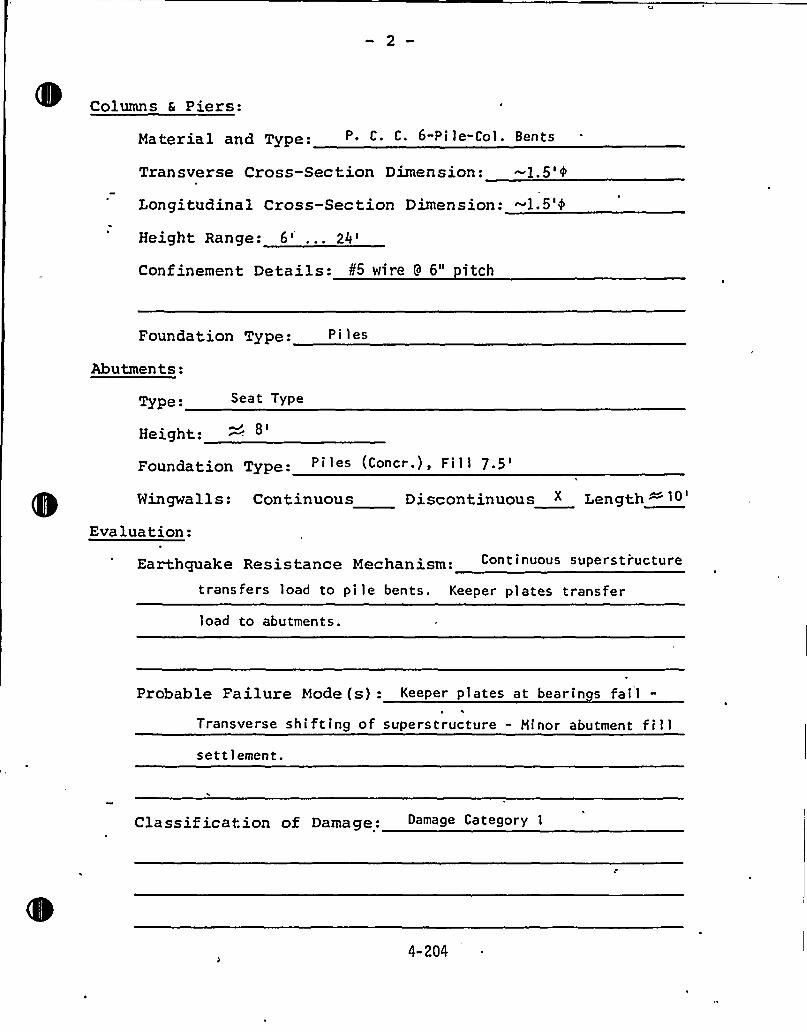
Columns 6 Piers:
Material and Type: P. C. C. 6-Pile"Col. Bents
Transverse Cross-Section Dimension: -1.5'4
Longitudinal Cross-Section Dimension: -1.5'4
Height Range: 6'..24'onf
inement Details: 85 wire 9 6" itch
Foundation Type:
Abutments:
Type: Seat TyPe
Height:
Foundation Type: Piles (Con«.), Fi1 1
7.5'ingwells:Continuous Discontinuous X Length
Evaluation:
Earthquake Resistance Mechanism: Continuous superstiucture
transfers load to pile bents. Keeper plates transfer
load to abutments.
Probable Failure Mode (s): Keeper plates at bearin s failTransverse shifting of superstructure " Hinor abutment fillsettlement.
Classif ication of Damage: »»9e Cate9ory
4-204
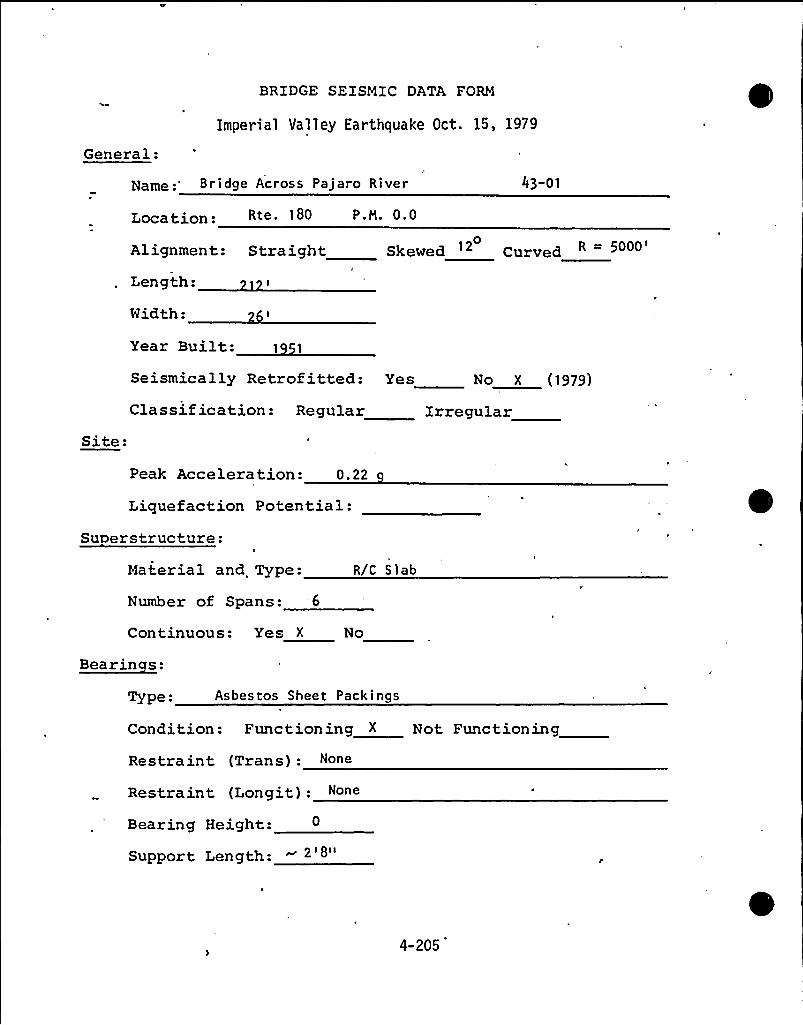
General:
BRIDGE SEISMIC DATA FORM
Imperial Valley Earthquake Oct. 15, 1979
Name: Bridge Across Pajaro River
Location: Rte. 180 P. H. 0. 0
43" 01
Alignment:
Length:
Width:
0 IStraight Skewed 12 Curved R = 5000
Site:
Year Built: 1 1
Seismically Retrofitted: Yes No X (1979)
Classification: Regular Irregular
Peak Acceleration: 0.22
Liquefaction Potential:Superstructure:
Material and, Type:
Number of Spans: 6
R/C Siab
Continuous: Yes X No
Bearinces:
TYpe: Asbestos Sheet Packings
Condition: Functioning X Not Functioning
Restraint (Trans):
Restraint (Longit):Bearing Height:
Support Length:
4-205
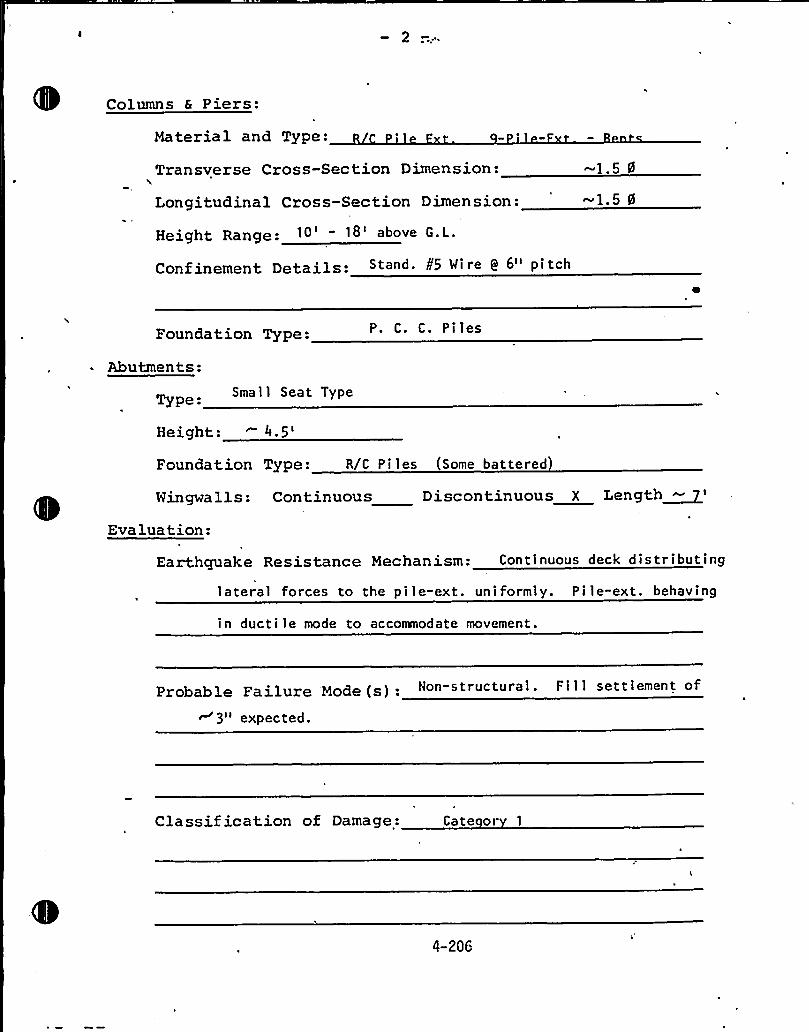
Columns & Piers:
Material and Type:
Transverse Cross-Section Dimension:
Longitudinal Cross-Section Dimension:
Height Range: 10' 18'bove G.L.
Conf inement Details: Stand. ¹5 Wire Q 6" pitch
-1.5 0
1.5 8
Foundation Type: P. C. C. P i les
Abutments:Small Seat Type
Height:4.5'oundation
Type: R/C Pi les (Some battered
Wingwa 1 1 s:
Evaluation:
Continuous Discontinuous X Length~
Earthquake Resistance Mechanism: Continuous deck distributing
1 a terai forces to the pi le-ext. uni formly. P i 1 e-ext. behaving
in ductile mode to accommodate movement.
Probable Failure Mode (s): Non-structural. Fi 1 1 settlement of
~3" expected.
Classif ication of Damage: Cate or 1
4-206
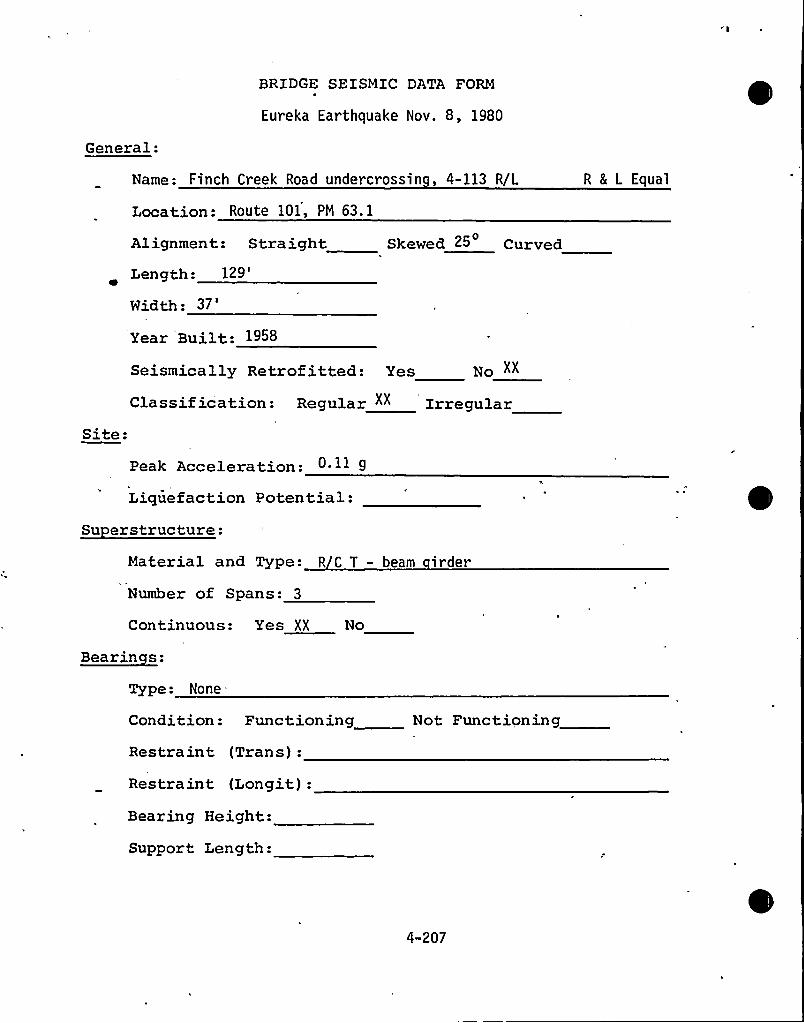
General:
BRIDGE SEISMIC DATA FORM
Eureka Earthquake Nov. 8, 1980
Name: Finch Creek Road undercrossin, 4-113 R/L
Location: Route 101, PM 63.1
Alignment: Straight Skewed SS'urvedLength:
129'idth:
37'
8 L Equal
Year Built: 1958
Seismically Retrofitted: Yes No XX
Classification: Regular "" IrregularSite:
Peak Acceleration:Liquefaction Potential:
Su erstructure:Material and Type: R C T - beam irder
Number of Spans: 3
Continuous: Yes XX No
Bearinces:
Type: None =
Condition: Functioning
Restraint (Trans):
Restraint (Longit):Bearing Height:
Support Length:
Not Functioning
4-207
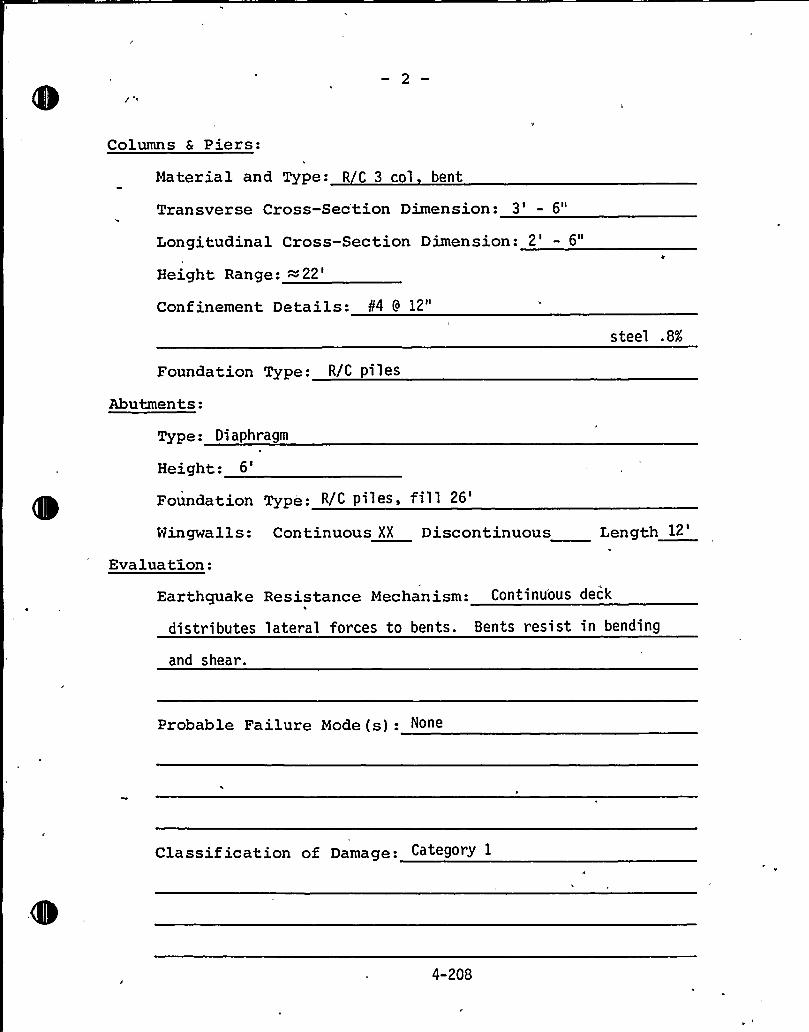
Columns & Piers:
Material and Type: R C 3 col bent
Transverse Cross-Sec'tion Dimension: 3' 6"
Longitudinal Cross-Section Dimension: 2' 6"
Height Range:=22'onfinementDetails: k4 9 12"
steel .8Ã
Foundation Type: R/C piles
Abutments:
Type: Diaphragm
Height:6'oundation Type: R/C piles, fill
26'ingwalls:
Evaluate.on:
Continuous XX Discontinuous Length
12'arthquake
distributes
and shear.
Resistance Mechanism: Continu'ous deck
lateral forces to bents. Bents resist in bending
Probable Failure Mode (s):
Classification of Damage: Category 1
4-208
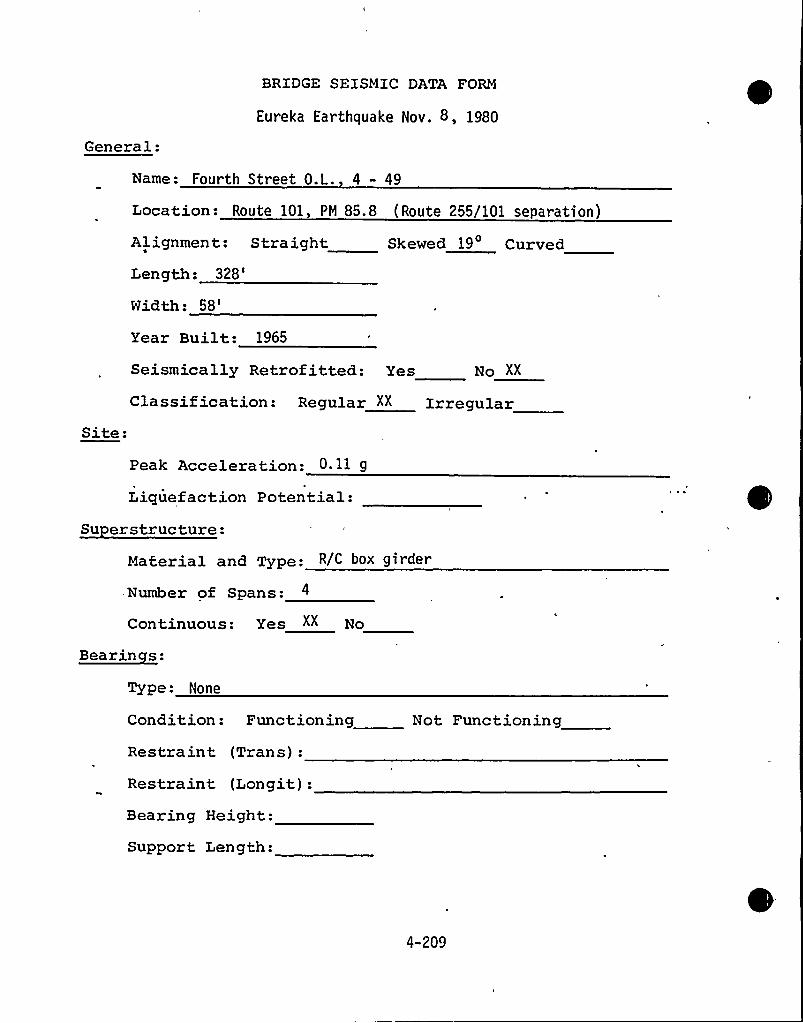
General:
BRIDGE SEISMIC DATA FORM
Eureka Earthquake Nov. 8, 1980
Name: Fourth Street 0.L. 4 - 49
Location: Route 101, PM 85.8 (Route 255/101 separation)
Alignment: StraightLength:
328'idth:
58'kewed 19 Curved
Site:
Year Built: 1965
Seismically Retrofitted: Yes No YY
Classif ication: Regular XX Irregular
Peak Acceleration: 0 11 g
Liquefaction Potential:Su erstructure:
Material and Type: R/C box girder
-Number of Spans: 4
Continuous: Yes "" No
Bear in ces:
Type: None
Condition: Functioning
Restraint (Trans):
Restraint (Longit):Bearing Height:
Support Length:
Not Functioning
4-209
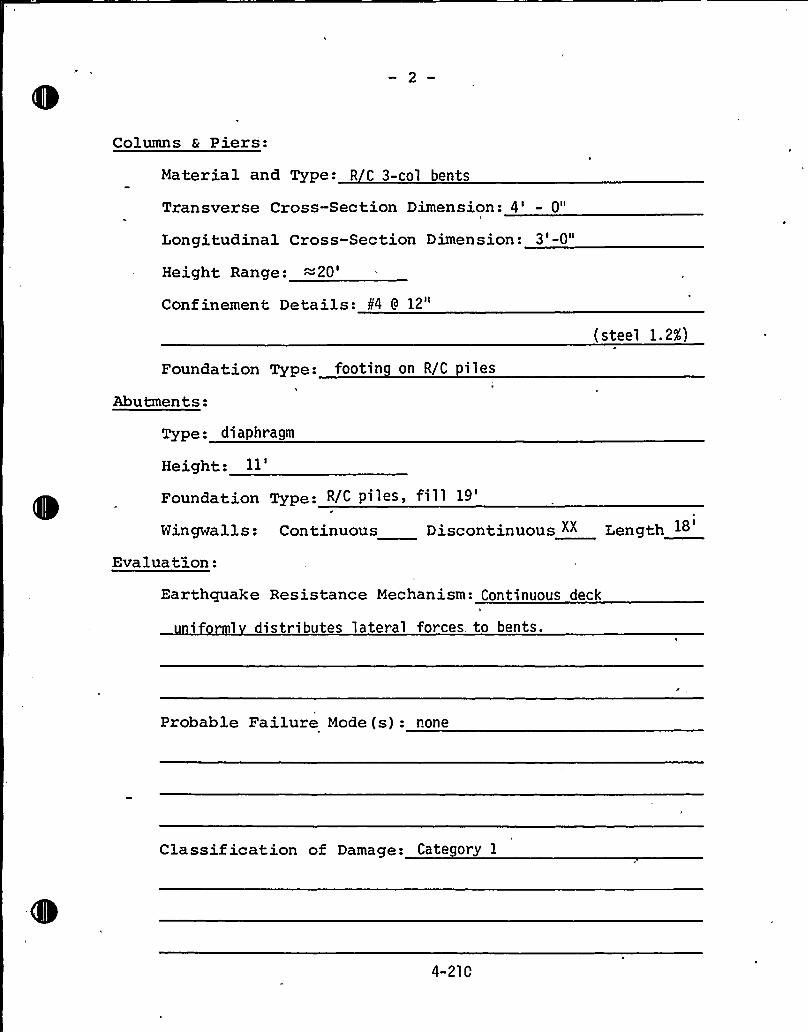
Columns & Piers:
Material and Type: R C 3-col bents
Transverse Cross-Section Dimension: 4' 0"
Longitudinal Cross-Section Dimension: 3'-0"
Height, Range:=20'onfinementDetails: b'4 9 12"
(steel 1.2X)
Foundation Type: footin on R/C piles
Abutments:
Type: di aphragm
Height:ll'oundation Type: R/C piles, fill
19'ingwalls:Continuous Discontinuous "" Length 18
Evaluation:
Earthquake Resistance Mechanism: Continuous deck
1 distributes lateral forces. to bents.
Probable Failure Mode (s): none
Classif ication of Damage: Category 1
4-210
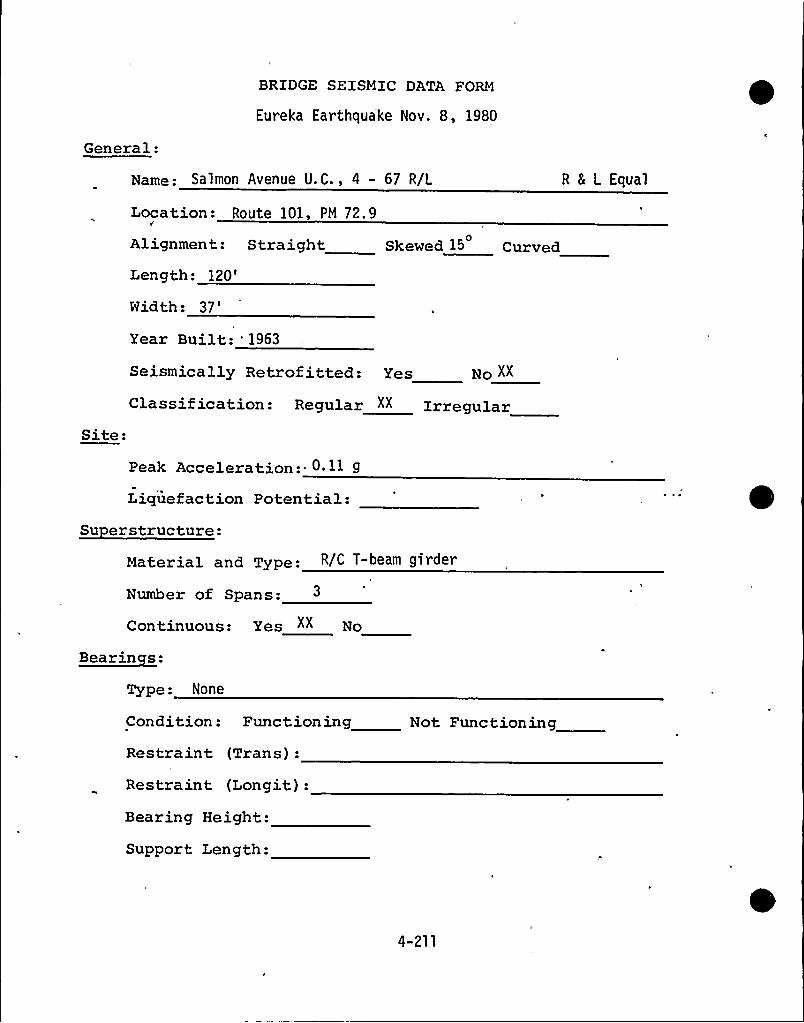
General:
BRIDGE SEISMIC DATA FORM
Eureka Earthquake Nov. S, 1980
Name: Salmon Avenue U.C., 4 - 67 R/L
Location: Route 101, PM 72.90Alignment: Straight Skewed 15 Curved
Length:120'idth:
37'ear
Built: 1963
R & L Equal
Seismically Retrof itted: Yes No XX
Site:
Classif ication: Regular XX Irregular
Peak Acceleration:- 0 11 g
Liquefaction Potential:Su erstructure:
Material and Type: R/C T-beam girder
Number of Spans:
Continuous: Yes "" No
Bearinces:
Type: None
Condition: Functioning
Restraint (Trans):
Not Functioning
Restraint (Longit):Bearing Height:
Support Length:
4-211
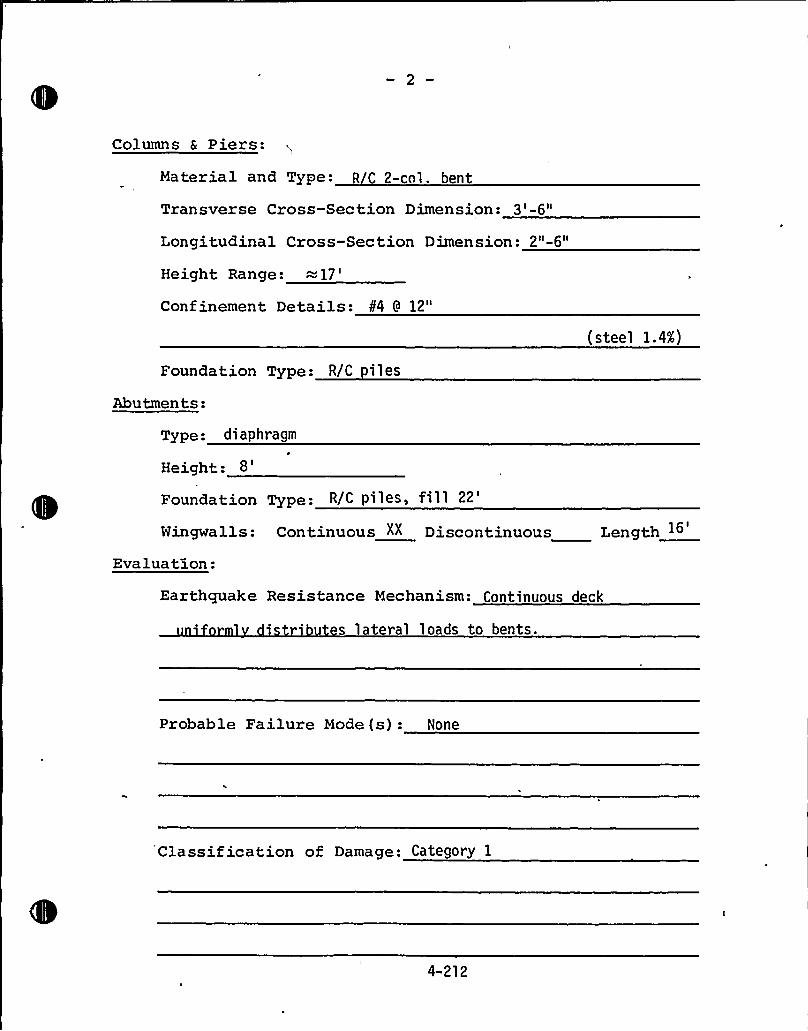
Columns & Piers:
Material and Type: R 2-col. bent
Transverse Cross-Section Dimension: 3'-6"
Longitudinal Cross-Section Dimension: 2"-6"
Height Range: = 17
'onfinementDetails: k'4 9 12"
(steel 1.4%)
Foundation Type: R/C iles
Abutments:
Type: di aphragm
Height:8'oundation Type: R/C piles, fill
22'ingwalls:
Evaluation:
IContinuous "" Discontinuous Length 16
Earthquake Resistance Mechanism: Continuous deck
s lateral loads to bents.
Probable Failure Mode (s): None
Classification of Damage: Category 1
4-212
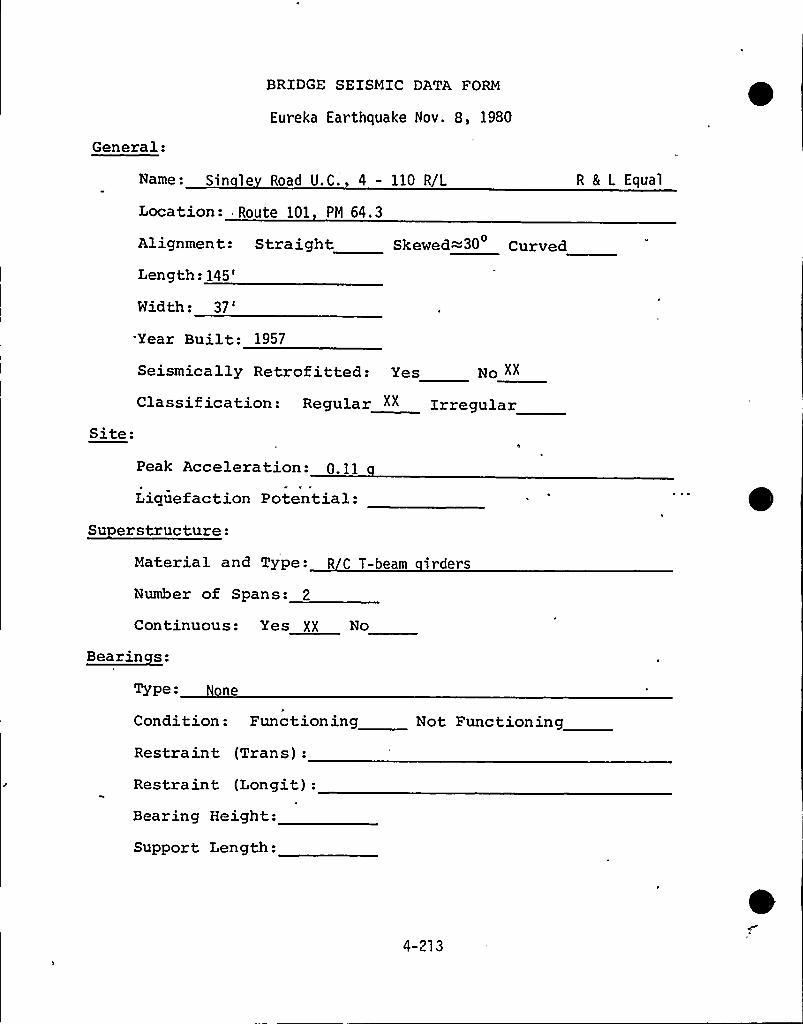
General:
BRIDGE SEISMIC DATA FORM
Eureka Earthquake Nov. 8, 1980
Name: Sin le Road U.C. 4 - 110 R/L
Location: Route 101 PM 64.3
Alignment: Straight Skewed=30 Curved
Length:145'idth:
37'
& L Equal
Year Built: 1957
Seismically Retrof itted: Yes Ro XX
Site:Classification: Regular "X Irregular
Peak Acceleration: 0.11
Liquefaction Potential:Su erstructure:
Material and Type: R C T-beam irders
Number of Spans: 2
Continuous: Yes XX No
~Bearin s:
Type: ne
Condition: Functioning Not Functioning
Restraint (Trans):
Restraint (Longit):Bearing Height:
Support Length:
4-213
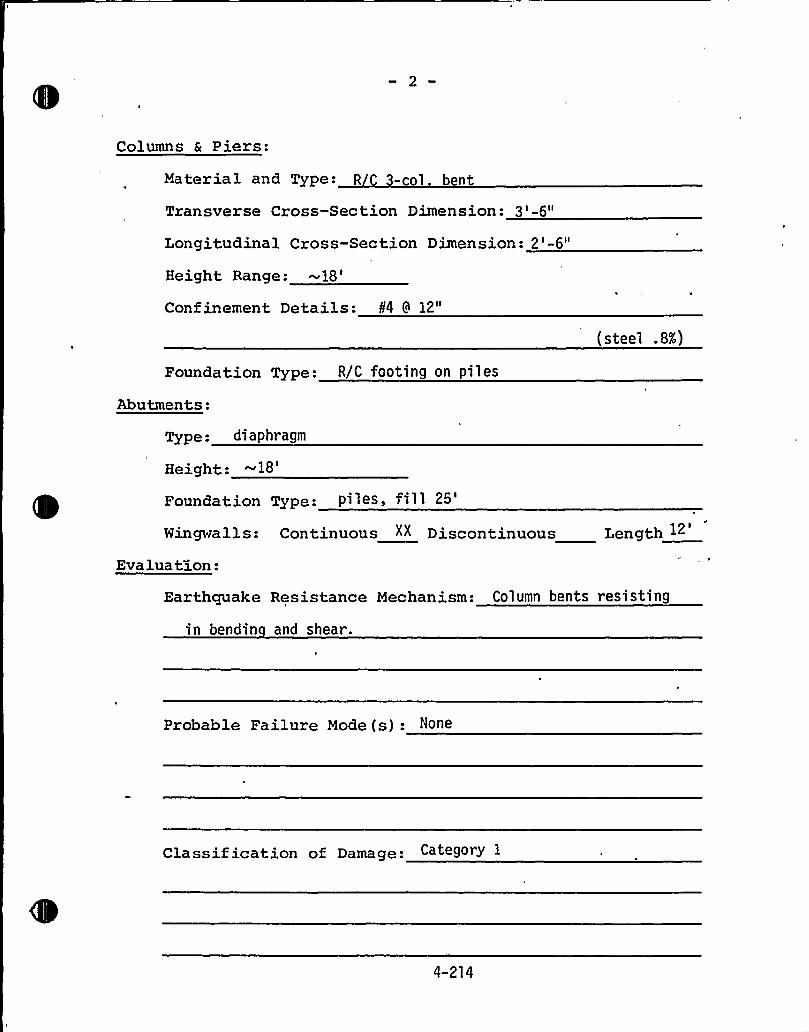
Columns & Piers:
Material and Type: R - l
Transverse Cross-Section Dimension: 3'-6"
Longitudinal Cross-Section Dimension: 2'-6"
Height Range:18'onfinementDetails: 0'4 8 12"
(steel .8%)
Foundation Type: R/C footing on piles
Abutments:
Type: di aphragm
Height:~18'oundation
Type: Piles, fill25'ingwa
1 1 s: Continuous "" Discontinuous Length 12
Evaluation:
Earthquake
in bendin
Resistance Mechanism: Column bents resisting
and shear.
Probable Failure Mode (s): None
Classif ication of Damage: Category 1
4-214
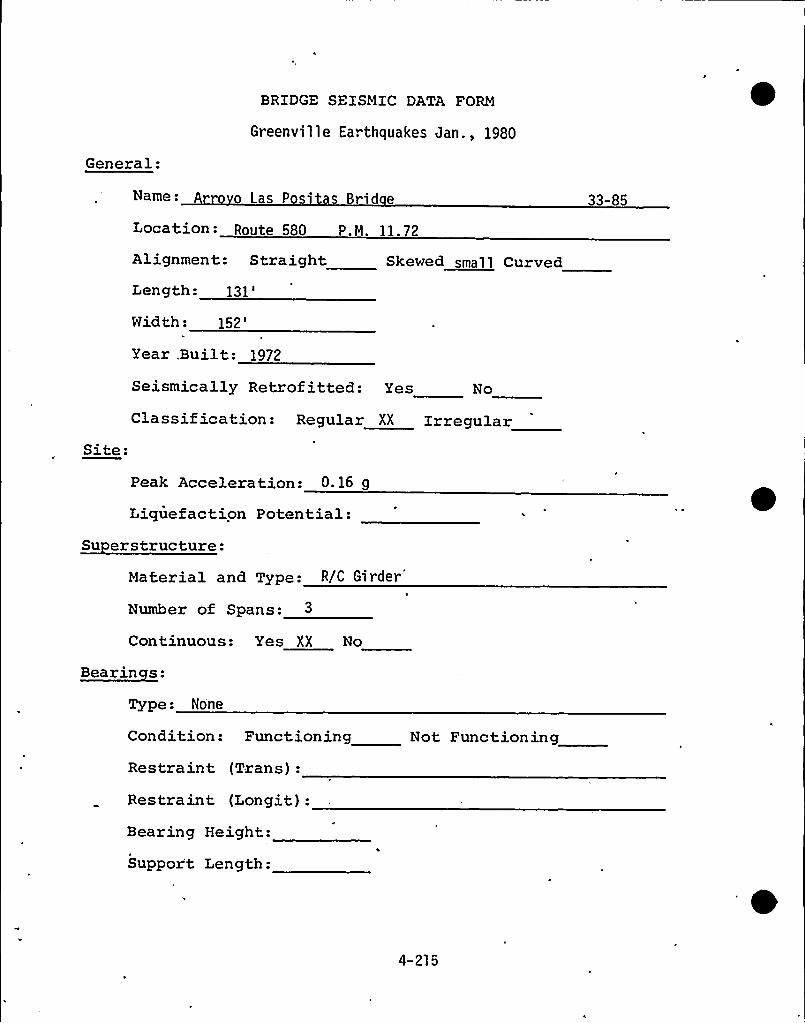
General:
BRIDGE SEISMIC DATA FORM
Greenville Earthquakes Jan., 1980
Name: Las P' id e
Location- Route 580 P.M. 11.72
Alignment: Straight Skewed small Curved
Length:131'idth:
152'ear
.Built: 1972
Site:
Seismically Retrofitted: Yes No
Classification: Regular Q Irregular
Peak Acceleration: 0.16 g
Liquefaction Potential:Su erstructure:
Material and Type: R/C Girder
Number of Spans:
Continuous: Yes XX No
Bearinces:
Type: None
Condition: Functioning
Restraint (Trans):
Restraint. (Longit):
Not Functioning
Bearing Height:
Suppor't Length:
4-215
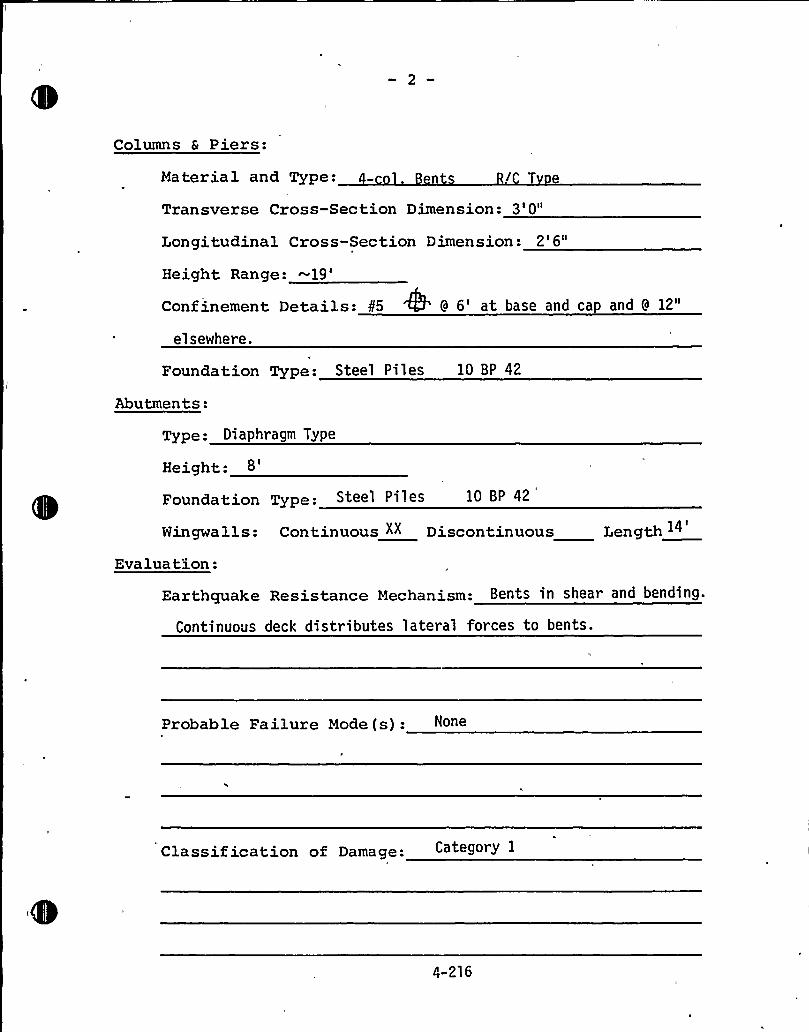
Columns & Piers:
Material and Type: n e
Transverse Cross-Section Dimension: 3'0"
Longitudinal Cross-Section Dimension: 2'6"
Height Range:19'ondinementDetails: 85 '5 9 6't base and cap and 8 12"
elsewhere.
Foundation Type: Steel Piles 10 BP 42
Abutments:
Type: Diaphragm Type
Height:
Foundation Type: Steel Piles 10 BP 42
il IWingwalls: Continuous "" Discontinuous Length 14
Evaluation:
Earthquake Resistance Mechanism: Bents in shear and bending.
Continuous deck distributes lateral forces to bents.
Probable Failure Mode (s):
Classification of Damage:
4-2l6
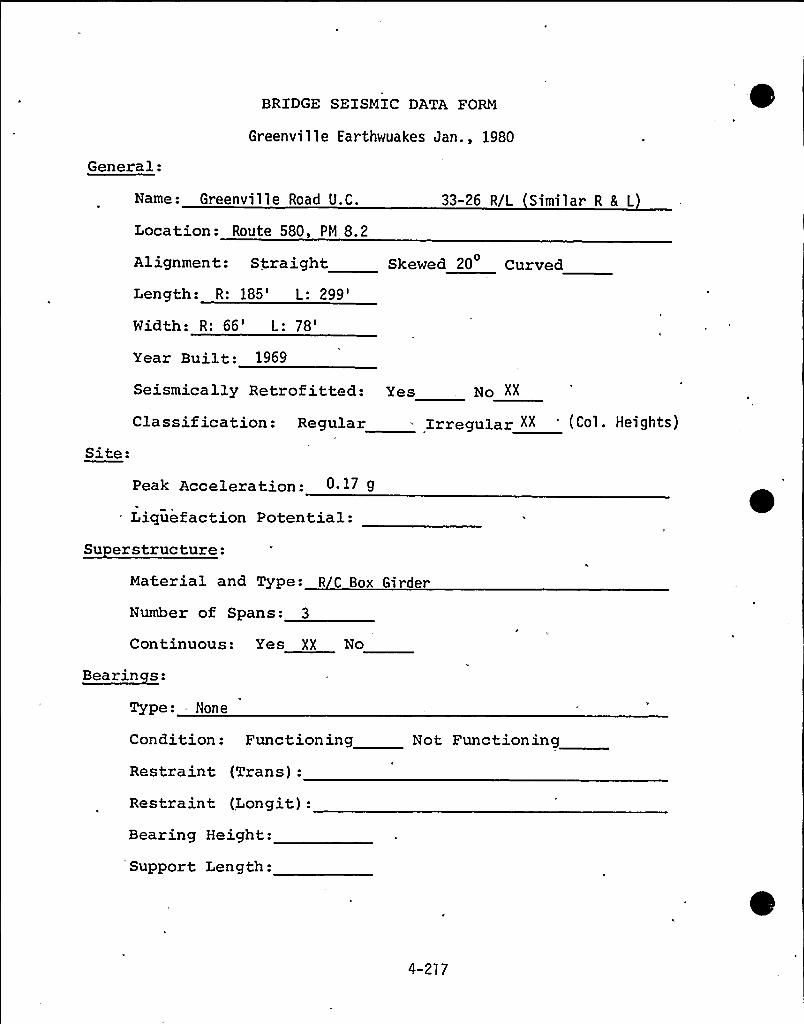
General:
BRIDGE SEISMIC DATA FORM
Greenville Earthwuakes Jan., 1980
Name: Greenvi 1 1 e Road U.C.
Location: Route 580, PM 8.2
33-26 R/L Similar R 8 L
Alignment: Straight Skewed 20 Curved
Length: R: 185':299'idth:
R: 66':78'ear
Built: 1969
Seismically Retrof itted: Yes So XX
Site:Classification: Regular " Irregular XX 'Ccl. Hei9hts)
Peak Acceleration: 0 17 9
Liquefaction Potential:Su erstructure:
Material and Type: R C Box Girder
Number of Spans: 3
Continuous: Yes XX No
~Bearin s:
Type: None
Condition: Functioning
Restraint (Trans):
Restraint (Longit):Bearing Height:
'Support Length:
Not Functioning
4-217
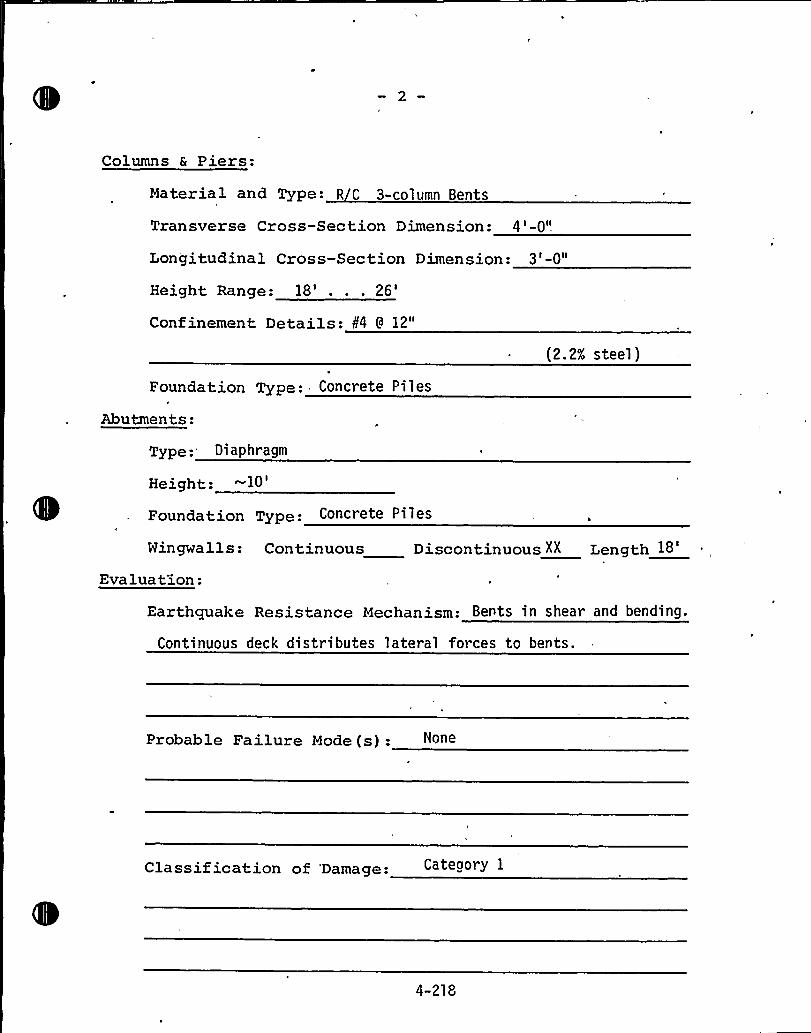
Columns & Piers:
Material and Type: R C 3-column Bents
Transverse Cross-Section Dimension: 4'-0"
Longitudinal Cross-Section Dimension: 3'-0"
Height Range: 18'...26'onfinementDetails: II4 8 12"
(2.2X steel)
Foundation Type: Concrete Piles
Abutments:
Type: Diaphragm
Heighto™10'oundation
Type: Concrete Pi les
Wingwalls: Continuous Discontinuous XX Length 1B
Evaluation:
Earthquake Resistance Mechanism: Bents in shear and bending.
Continuous deck distributes lateral forces to bents.
Probable Failure Mode (s):
Classif ication of 'Damage:
4-218
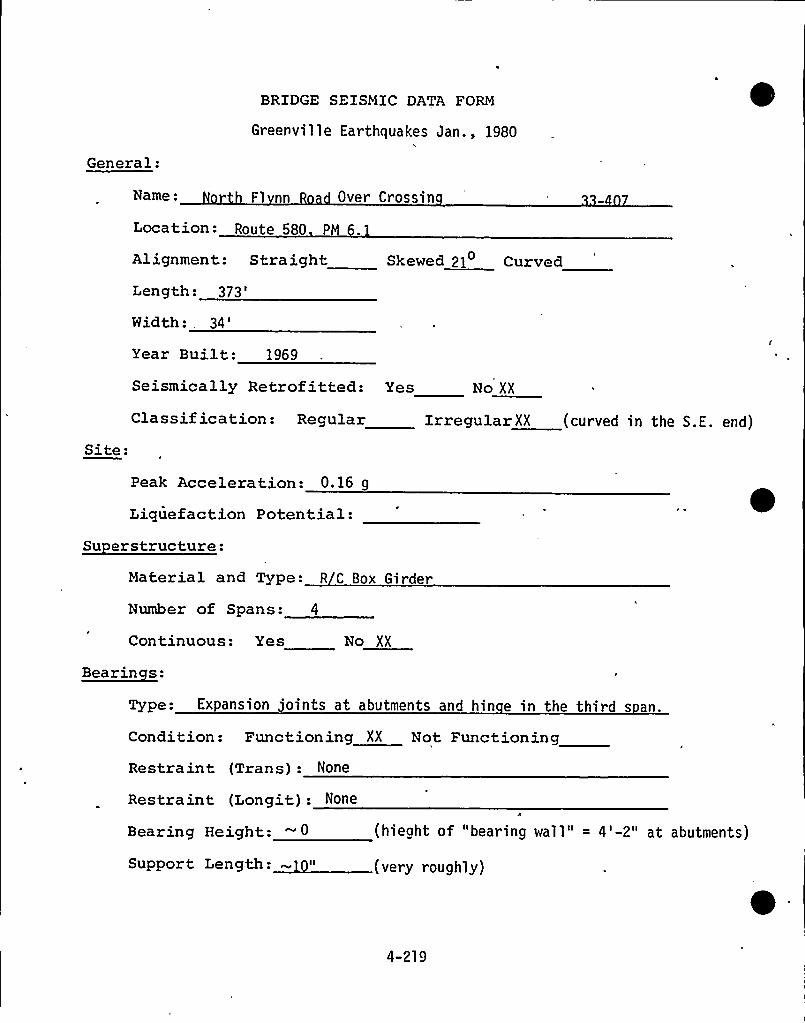
BRIDGE SEISMIC DATA FORM
Greenville Earthquakes Jan., 1980
eGeneral:
Name: h Fl nn Over Crossin
Location: Route 580 PM
Alignment: Straight Skewed 21 Curved
Length:373'idth:,
34'ear
Built: 1969
Seismically Retrof itted: Yes
Classification: Regular
No XX
IrregularXX (curved in the S.E. end)
Site:
Peak Acceleration: 0.16 g
Liquefaction Potential:Su erstructure:
Material and Type: R C Box Girder
Number of Spans: 4
Continuous: Yes
Bearinces:
No XX
Type: Expansion 'pints at abutments and hin e in the third s an.
Condition: Functioning XX Not FunctioningRestraint (Trans): None
Res tra int (Longit): None
Bearing Height: (hieght of "bearing wa11" = 4'-2" at abutments)
(very roughly)
4-219
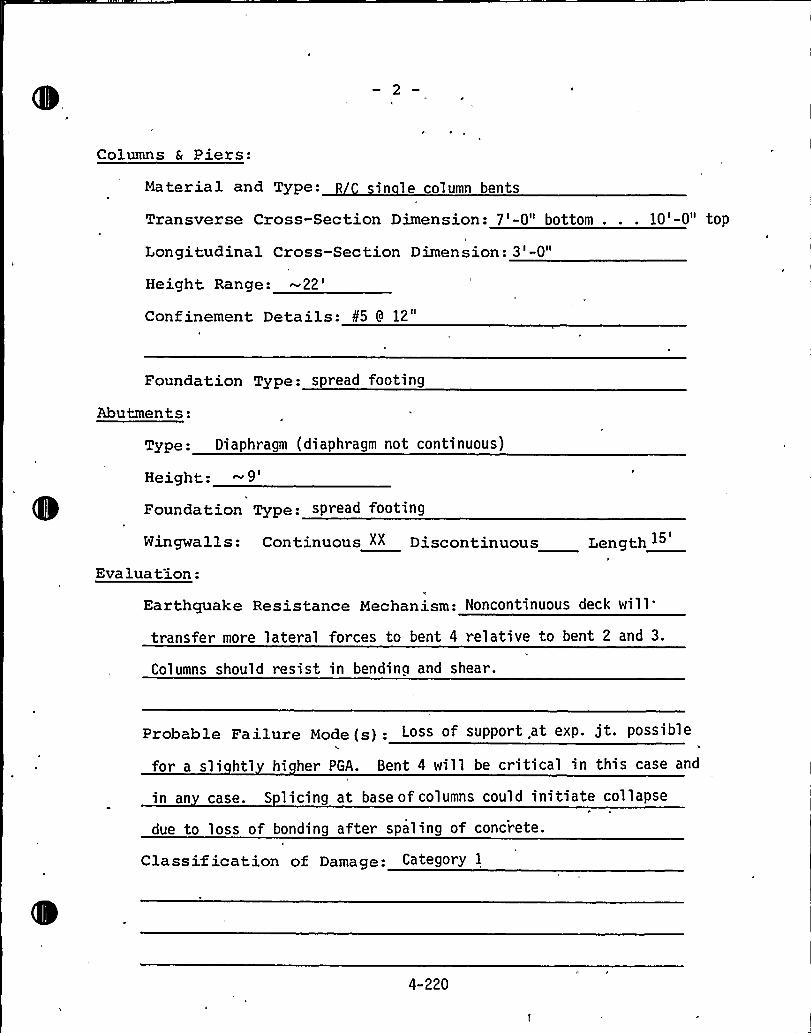
Columns & Piers:
Material and Type: sin le column bents
Transverse Cross-Section Dimension: 7'-0" bottom... 10'-0" top
Longitudinal Cross-Section Dimension: 3'-0"
Height Range:-22'onfinementDetails: 85 9 12"
Foundation Type: spread footing
Abutments:
Type: Diaphragm (diaphragm not continuous)
Height:-9'oundation Type: spread footing
Wingwalls: Continuous lx Discontinuous Length ~
Evaluation:
Earthquake Resistance Mechanism: Noncontinuous deck will
transfer more lateral forces to bent 4 relative to bent 2 and 3.
Columns should resist in bending and shear.
Probable Failure Mode(s): Loss of support, at exp. jt. possible
for a sli htl hi her PGA. Bent 4 will be critical in this case and
in an case. S licing at base of columns could initiate collapse
due to loss of bonding after spaling of concrete.
Classif ication of Damage: CategorY 1
4-220
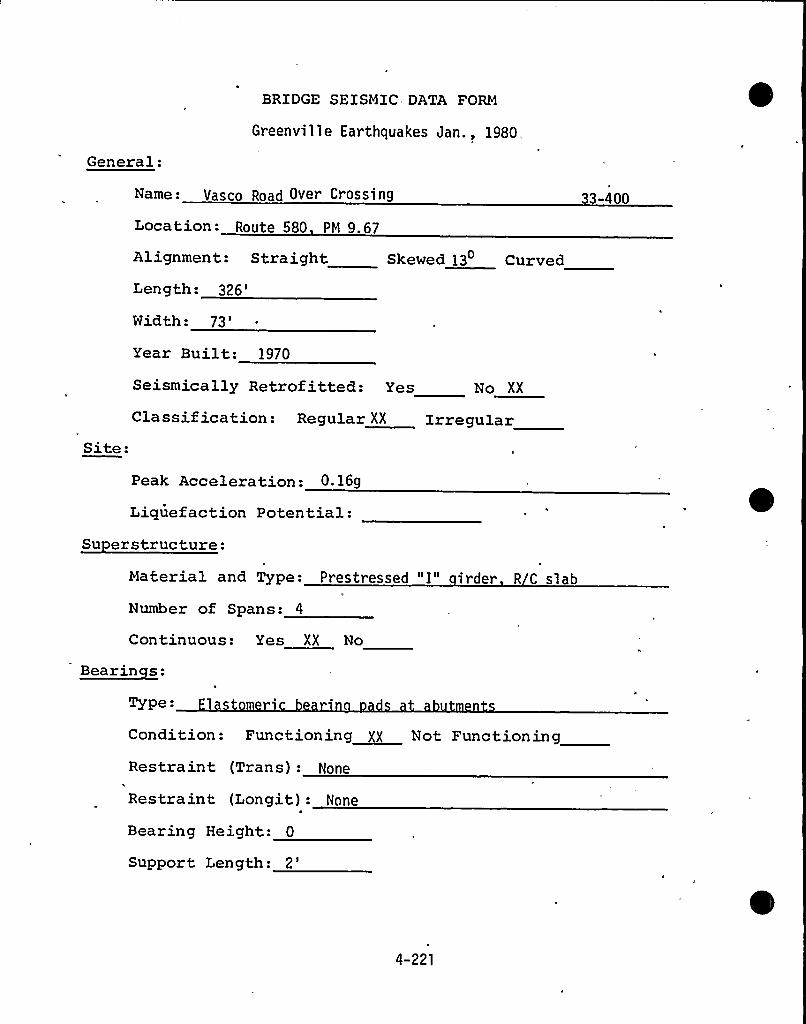
General:
BRIDGE SEISMIC DATA FORM
Greenville Earthquakes Jan., 1980.
Name: Vasco Road Over Crossing
Location: Route 580 PM 9.67
Alignment: Straight Skewed 13 Curved
Length:326'idth:
73'ear
Built: 1970
Site:
Seismically Retrof itted: Yes No XX
Classification: Regular XX Irregular
Peak Acceleration: 0 169
Liquefaction Potential:Su erstructure:
Material and Type: Prestressed "I" irder R C slab
Number of Spans: 4
Continuous: Yes XX No
Bearinces:
Type: 1 t mriCondition: Functioning~I Not Functioning
Restraint (Trans): None
Restraint (Longit) - None
Bearing Height: 0
Support Length:
2'-221
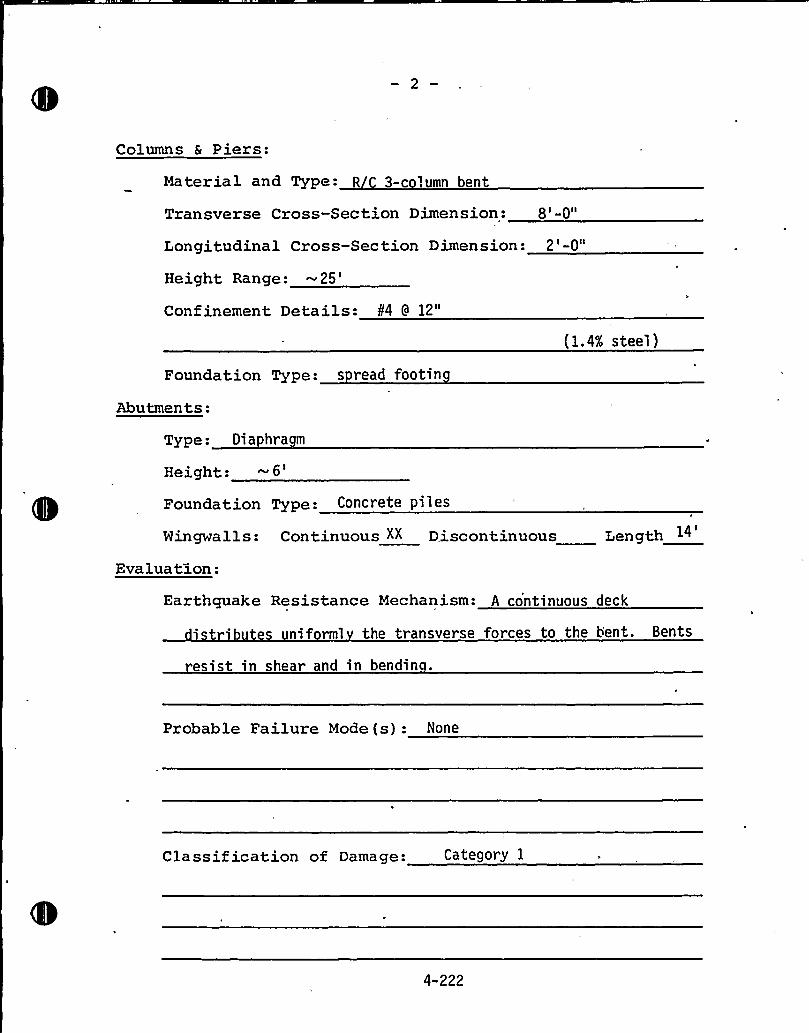
Columns & Piers:
Material and Type- 3-c ]umn bent
Transverse Cross-Section Dimension: 8'-0"
Longitudinal Cross-Section Dimension: 2'-0"
Height Range:-25'onfinementDetails: ¹4 9 12"
(1.4% steel )
Foundation Type: s read footin
Abutments:
Type: Dia hra m
Height:6'oundationType: Concrete piles
Wingwalls: Continuous XX Discontinuous Length ~4
Evaluation:
Earthquake Resistance Mechanism: A continuous deck
niforml the transverse forces to the bent. Bents
resist in shear and in bendin .
Probable Failure Mode (s): None
Classif ication of Damage: Category 1
4-222
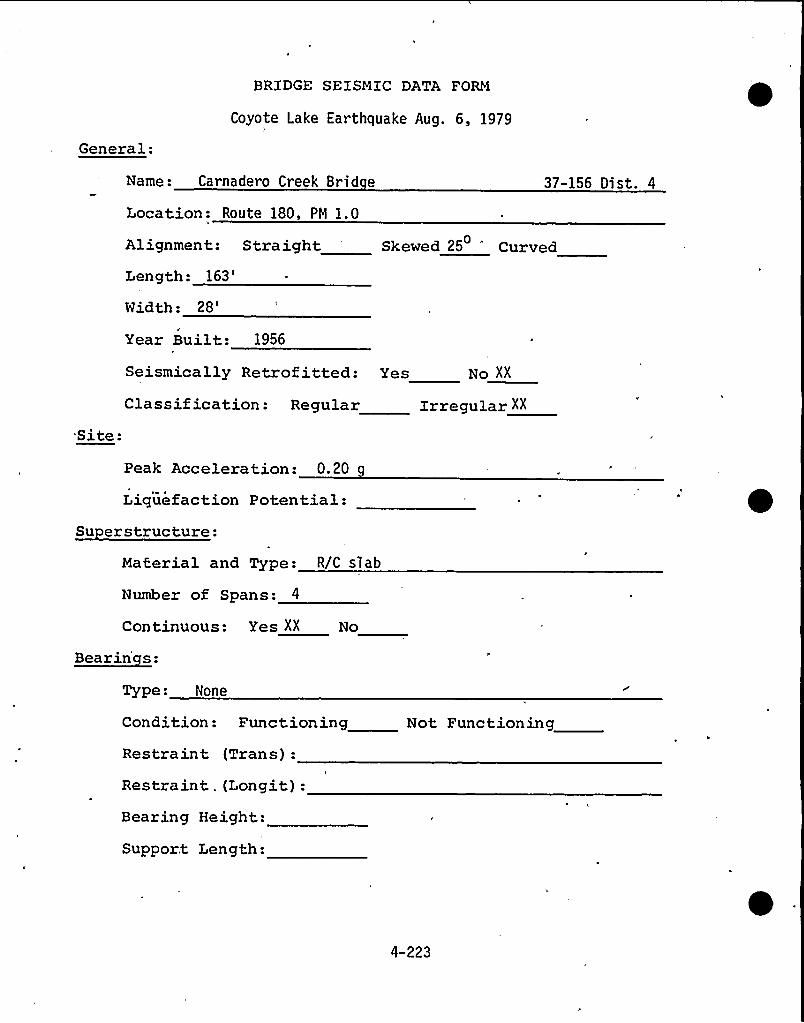
General:
BRIDGE SEISMIC DATA FORM
Coyote Lake Earthquake Aug. 6, 1979
Name: Carnadero Creek Brid e 37-156 Dist. 4
Location: Route 180, PM 1.0
Alignment: StraightLength:
163'idth:
28'ear
Built: 1956
Skewed 25 Curved0
Site:
Seismically Retrof itted: Yes
Classification: Regular
Nu XX
IrregularXX
Peak Acceleration: 0.20 g
Liquefaction Potential:Su erstructure:
Material and Type: R/C s1ab
Number of Spans: 4
Continuous: Yes XX No
~Bearin a:
Type: None
Condition: Functioning
Restraint (Trans):
Restraint.(Longit):Bearing Height:
Support Length:
Not Functioning
4-223
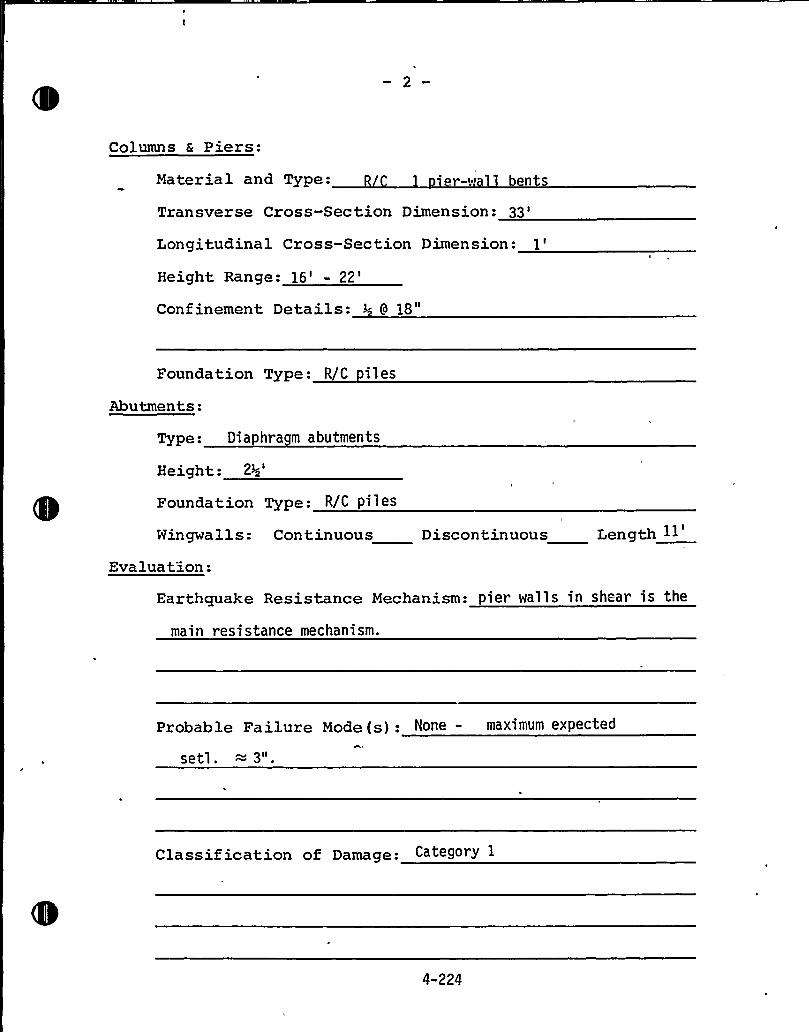
Columns & Piers:
Material and Type: '~ -v bents
Transverse Cross-Section Dimension:33'ongitudinalCross-Section Dimension:
1'eightRange: 16'
22'onfinementDetails: 3- 9 18"
Foundation Type: R/C i 1 es
Abutments:
Type: Dia hra m abutments
Height:2>'oundation Type: R/C pi 1 es
Wingwalls: Continuous Discontinuous Length 11
Evaluation:
Earthquake Resistance Mechanism: pier walls in shear is the
main resistance mechanism.
Probable Failure Mode (s): None - maximum expected
setl. = 3".
Classif ication of Damage: Category 1
4-224
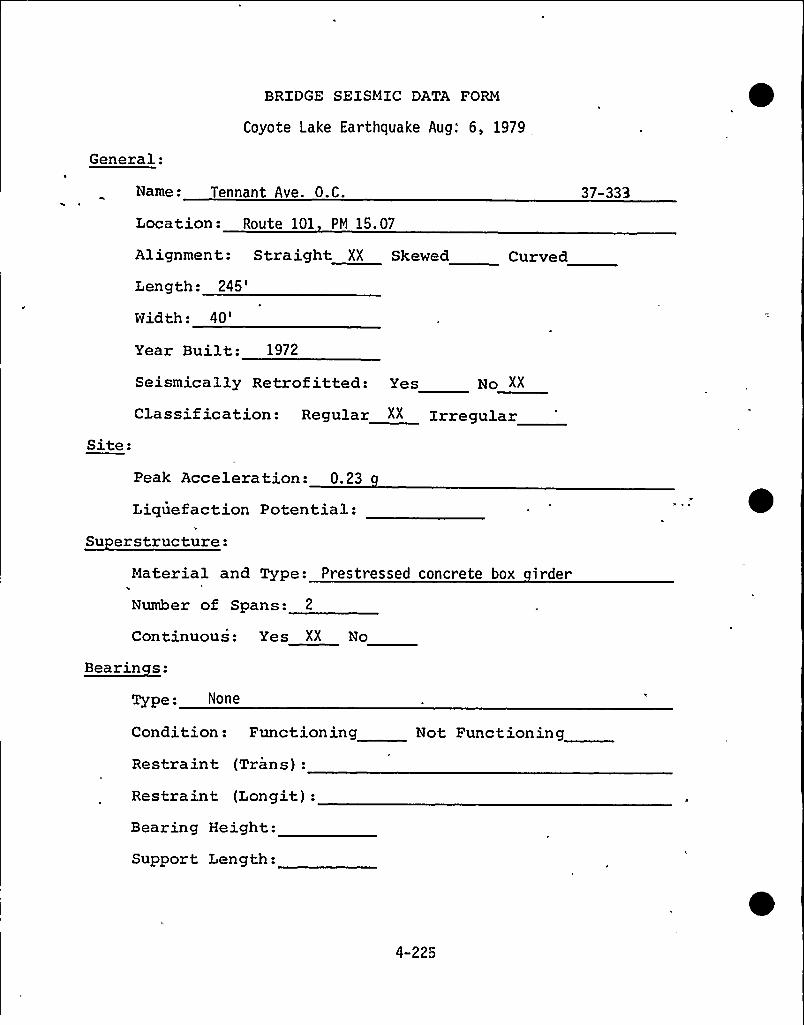
General:
BRIDGE SEISMIC DATA FORM
Coyote Lake Earthquake Aug: 6, 1979
Name: Tennant Ave. 0.C.~ ~
Location: Route 101 PM 15. 07
37-333
Alignment: Straight II Skewed Curved
Length:245'idth:
40'ear
Built: 1972
Seismically Retrof itted: Yes Ro XX
Classification: Regular II IrregularSite:
Peak Acceleration: 0.23
Liquefaction Potential:Su erstructure:
Material and Type: Prestressed concrete box irder
Number of Spans: 2
Continuous: Yes XX No
~Bearin s:
Type: None
Condition: Functioning
Restraint (Trans):
Restraint (Longit):Bearing Height:
Support Length:
Not Functioning
4-225
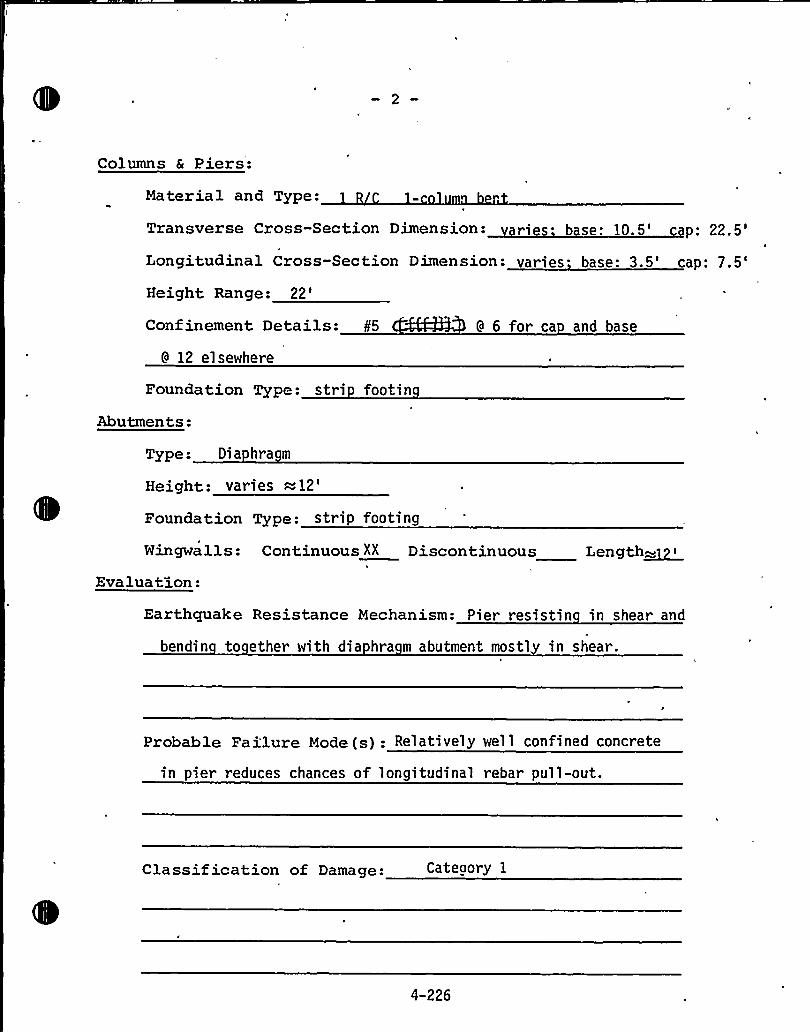
Columns & Piers:
Material and Type:
Transverse Cross-Section Dimension: r ies base:10.5'ongitudinalCross-Section Dimension: varies. base:
3.5'eight
Range:22': 22.5'ap:
7.5'onf
inement Details: g5 9 6 for ca and base
9 12 elsewhere
Foundation Type: stri footin
Abutments:
Type: Dia hra m
Height: varies=12'oundation
Type: strip footing
Wingwalls: Continuous XX Discontinuous Length~Evaluate.on:
Earthquake Resistance Mechanism: Pier resistin in shear and
bendin to ether with dia hra m abutment mostl in shear.
Probable Failure Mode (s): Relatively well confined concrete
in pier reduces chances of longitudinal rebar pull-out.
Classif ication of Damage: Categol y 1
4-226
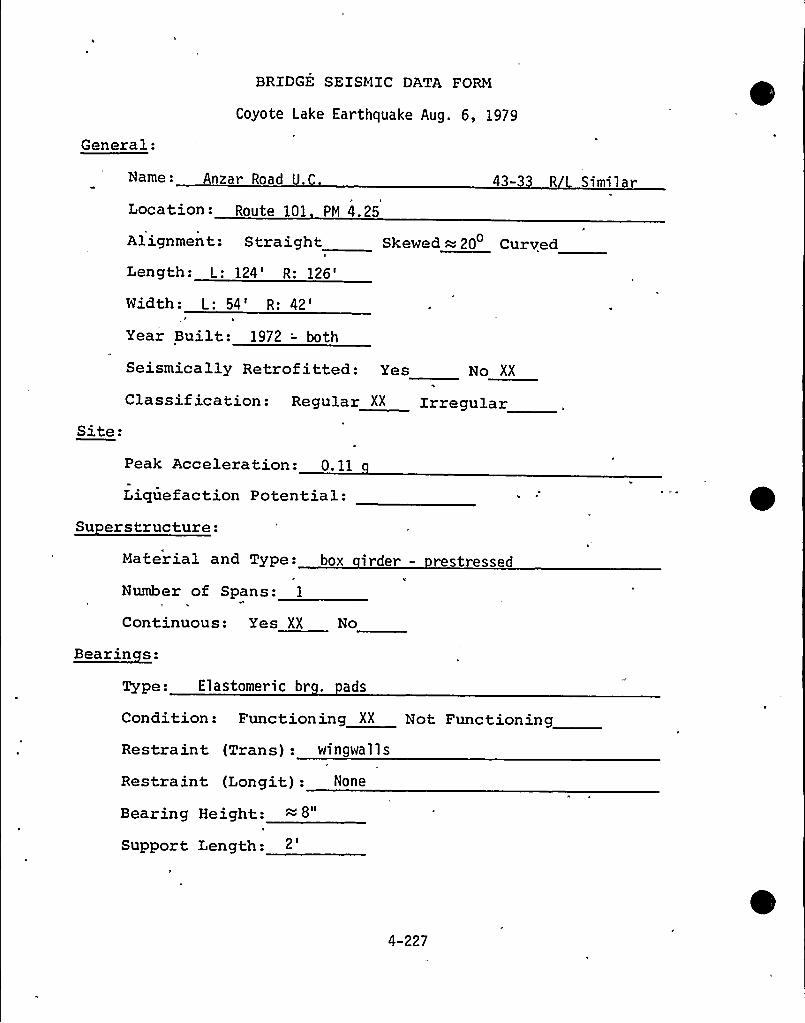
General:
BRIDGE SEISMIC DATA FORM
Coyote Lake Earthquake Aug. 6, 1979
Name: Anzar Road U.
Location: Route 101 PM 4.25
43-33 R Similar
Alignment: Straight Skewed 20 Curved
Length: L: 124':126'idth:
L: 54':42'ear
Built: 1972 -'oth
Site:
Seismically Retrofitted: Yes No XX
Classification: Regular XX Irregular
Peak Acceleration: 0.11
Liquefaction Potential:Su erstructure:
Material and Type: box irder - restressed
Number of Spans: 1
Continuous: Yes XX No
Bearinces:
Type: Elastomeric br . ads
Condition: Functioning XX Not FunctioningRestraint (Trans): wingwal 1 s
Restraint (Longit): None
Bearing Height:
Support Length:
4-227
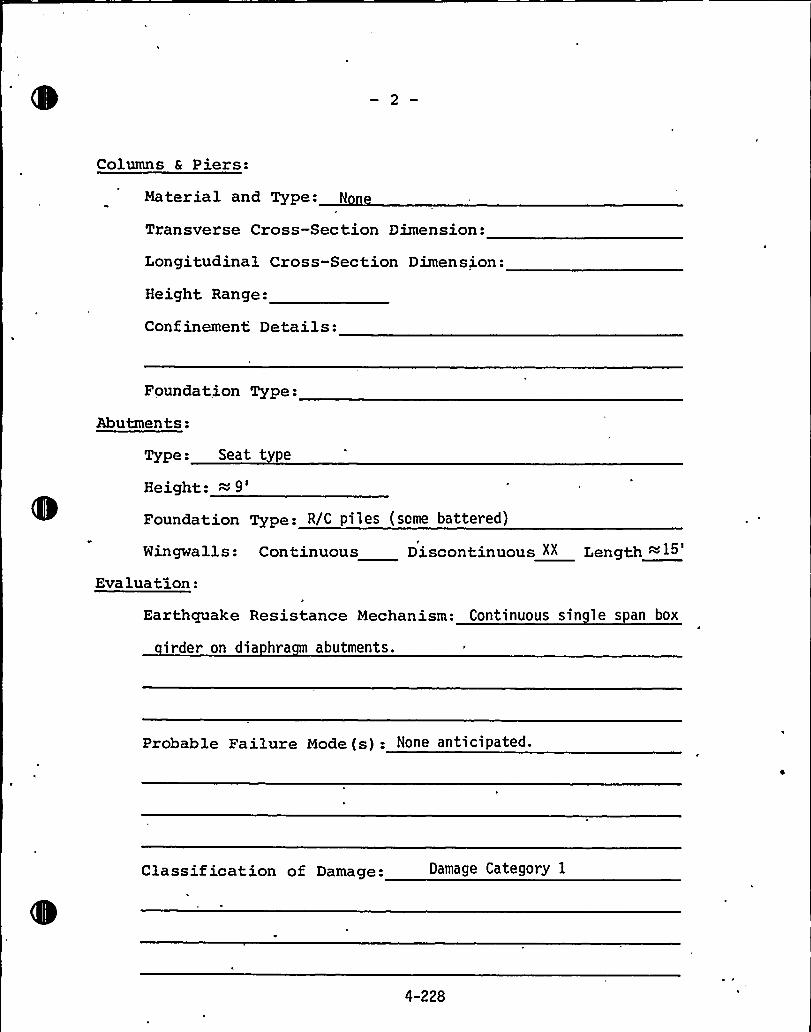
Columns & Piers:
Material and Type: N
Transverse Cross-Section Dimension:
Longitudinal Cross-Section Dimension:
Height Range:
Confinement Details:
Foundation Type:
Abutments:
Type: Seat t e
Height:9'oundation Type: R/C piles (some battered)
Wingwalls: Continuous Discontinuous XX Length=15'valuation:
Earthquake Resistance Mechanism: Continuous sin le span box
irder on dia hra abutments.
Probable Failure Mode (s): None anticipated.
Classification of Damage: Damage Category 1
4-228
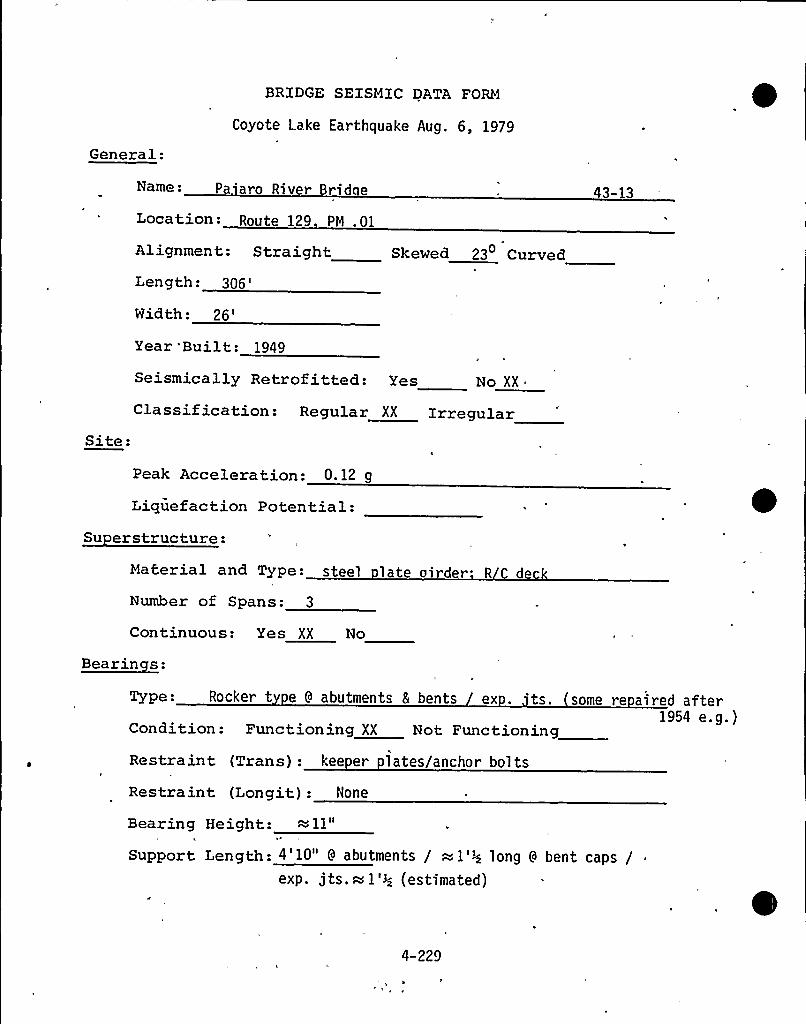
BRIDGE SEISMIC DATA FORM
General:
Coyote Lake Earthquake Aug. 6, 1979
Name: Pa aro River rid e 43-13
Location: Route 129 PM .01
Alignment: Straight Skewed 23 Curved
Length: 306
'idth:
26'ear'Built:
1949
Seismically Retrofitted: Yes No XX
Site:Classification: Regular XX Irregular
Peak Acceleration: 0.12 g
Liquefaction Potential:Su erstructure:
Material and Type: steel late girder R de
Number of Spans: 3
Continuous: Yes XX No
Bea~inces:
Type: Rocker t e 9 abutments 8 bents ex . 'ts. some re aired after1954 e.g. )Condition: Functioning XX Not Functioning
Restraint (Trans): kee er 1 ates/anchor bol ts
Restraint (Longit): None
Bearing Height: 11"
Support Length: 4'10" 9 abutments / =1'~ long 9 bent caps / ~
exp. jts. = 1'3; (estimated)
4-229
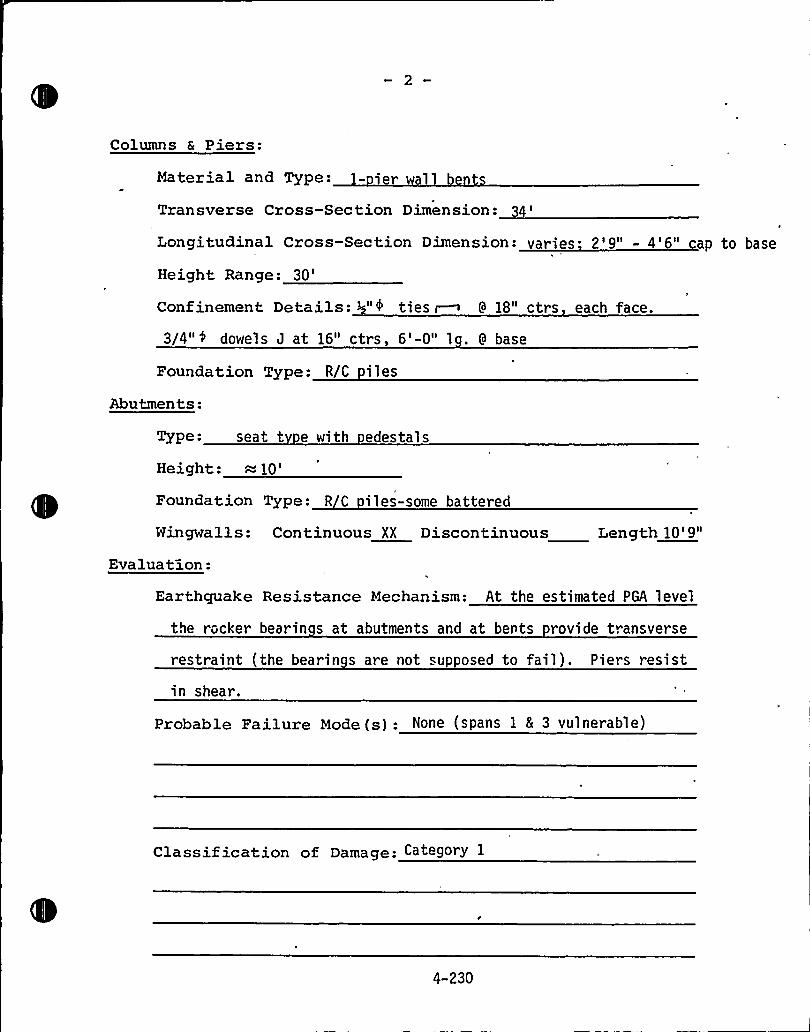
Columns a Piers:
Material and Type- - ier l
Transverse Cross-Section Dimension:4'ongitudinalCross-Section Dimension: varies 2'9" - 4'6" cap to base
Height Range:30'onfinementDetails: 3-"0 ties ~~ 9 18" ctrs each face.
3/4" 4 dowels J at 16" ctrs, 6'-0" l . 9 base
Foundation Type: R/C i 1 es
Abutments:
Type: seat t e with edestals
Height: =10'oundationType: R C iles-some battered
Wingwalls:
Evaluate.on:
Continuous XX Discontinuous Length 10'9"
Earthquake Resistance Mechanism: At the estimated PGA level
the rocker bearin s at abutments and at bents rovide t.ansverse
restraint (the bearin s are not supposed to fail). Piers resist
in shear.
Probable Failure Mode(s): None (spans 1 & 3 vulnerable)
Classif ication of Damage: Cate9oU 1
4-230
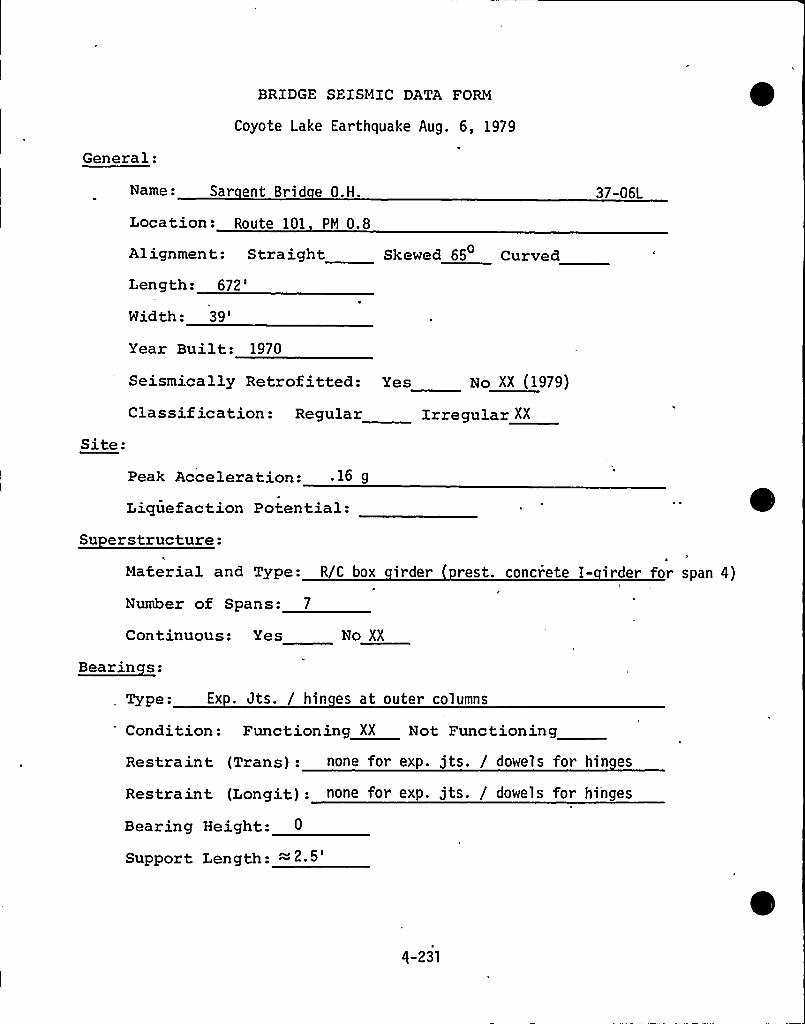
BRIDGE SEISMIC DATA FORM
Coyote Lake Earthquake Aug. 6, 1979
General:
Name: Sar ent Brid e O.H.
Location: Route 101 PM 0.8
Alignment: Straight Skewed 65 Curved
Length:
672'7-06LWidth:
39'ear
Built: 1970
Seismically Retrofitted: Yes No II (1979)
Classification: Regular Irregular YY
Site:
Peak Acceleration: 16 g
Liquefaction Potential:Su erstructure:
I
Material and Type: R C box irder rest. concrete I- irder for span 4)
Number of Spans: 7
Continuous: Yes No XX
Bearinces:
Type: Exp. Jts. / hin es at outer columns
Condition: Functioning XX Not Functioning
Restraint (Trans): none for exp. jts. / dowels for hin es
Restraint (Longit): none for exp. jts. / dowel s for hinges
Bearing Height: 0
Support Length: = 2 5
g-231
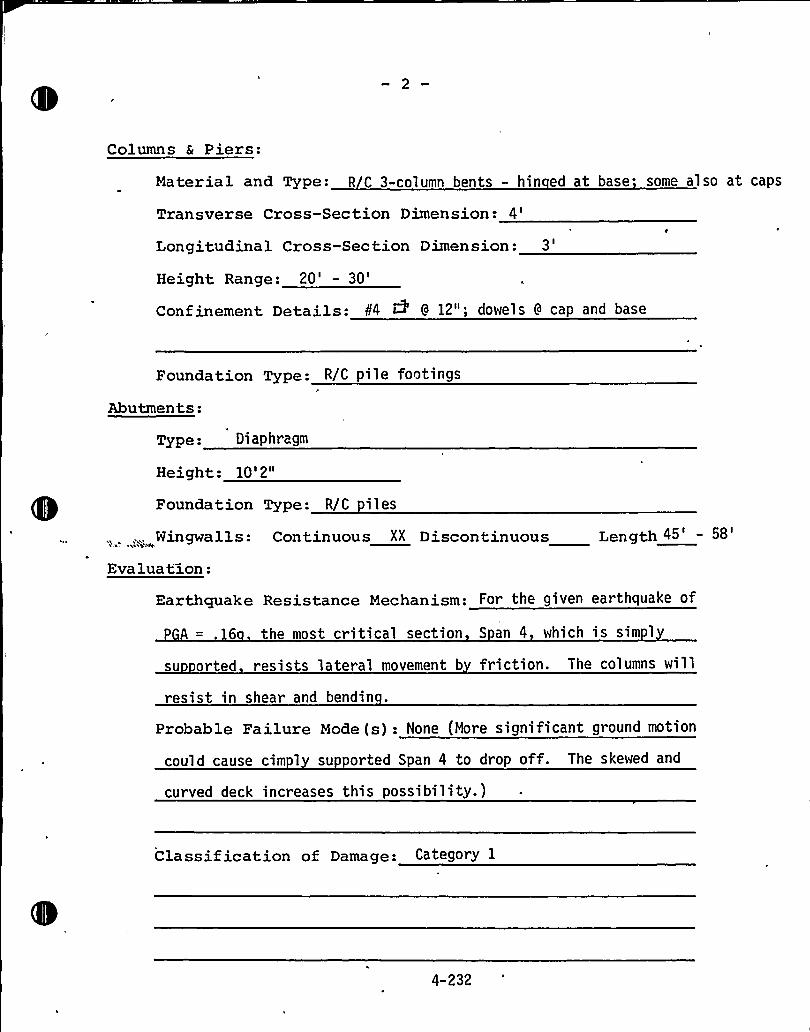
Columns & Piers:
Material and Type: R C 3-column bents - hin ed at base'ome also at caps
Transverse Cross-Section Dimension:4'ongitudinalCross-Section Dimension:
3'eight
Range: 20'
30'onfinementDetails: P4 D 9 12"; dowels 9 cap and base
Foundation Type: R/C pile footings
Abutments:
Type: Di aphragm
Height: 10'2"
Foundation Type: R/C i 1 es
,„. Wingwalls: Continuous XX Discontinuous Length 45
Eva lua t3.on:
Earthquake Resistance Mechanism: For the given earthquake of
= , 6 the most critical section S an 4 which is sim 1
su orted resists lateral movement b friction. The columns will
resist in shear and bendin .
Probable Failure Mode (s): None (More significant ground motion
could cause cim ly supported Span 4 to drop off. The skewed and
curved deck increases this possibility.)
Classif ication of Damage: Category 1
4-232
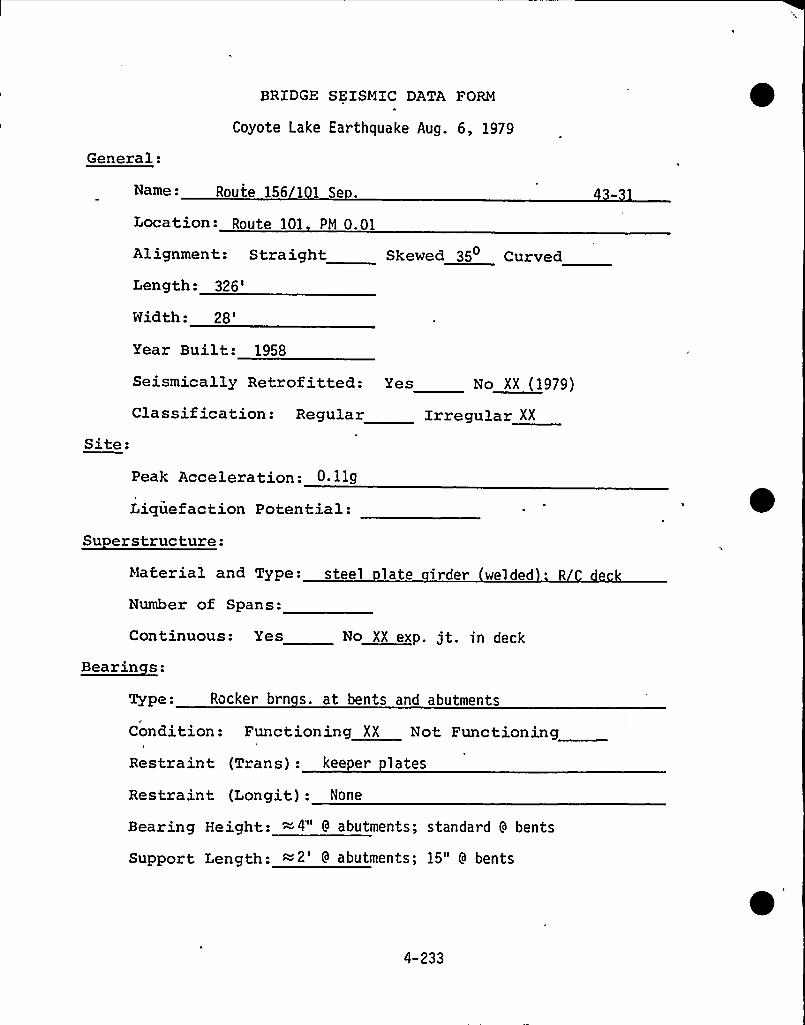
General:
BRIDGE SEISMIC DATA FORM
Coyote Lake Earthquake Aug. 6, 1979
Name: Route 156 101 Se .
Location: Route 101 PM 0.01
Alignment: Straight Skewed 35 Curved
Length:326'idth:
28'ite:
Year Built: 1958
Seismically Retrof itted: Yes No~XX 1979)
Classification: Regular Irregular XX
Peak Acceleration: 0 11g
Liquefaction Potential:Su erstructure:
Material and Type: steel late irder wel ded
Number of Spans:
Continuous: Yes
Bearinces:
No XX exp. jt. in deck
Type: Rocker brn s. at bents and abutments
Condition: Functioning XX Not Functioning
Restraint (Trans): kee er lates
Restraint (Longit): None
Bearing Height: =4"' abutments; standard 9 bents
Support Length: 2' abutments; 15" 9 bents
4-233
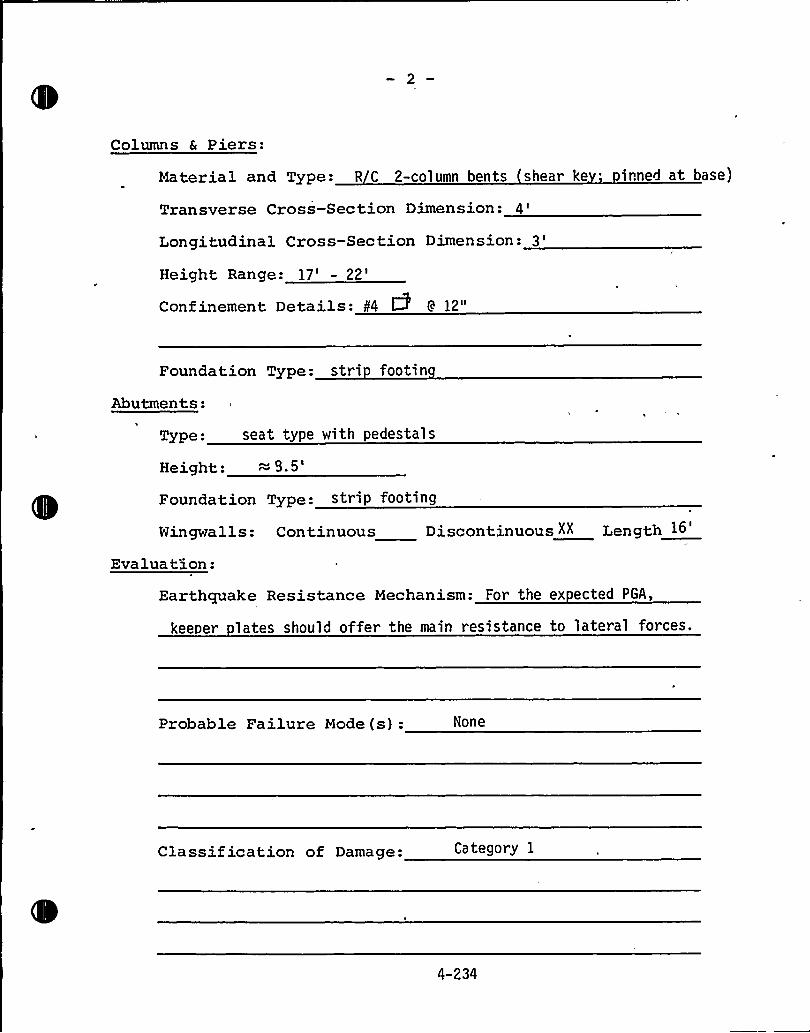
Columns & Piers:
Material and Type: R C 2-column bents shear ke inned at base)
Transverse Cross-Section Dimension:
4'ongitudinalCross-Section Dimension:3'eight
Range: 17'
22'onfinementDetails: 0'4 5 9 12"
Foundation Type: stri footin
Abutments:
Type: seat type with pedestal s
Height: =9.5'oundation
Type: strip footing
Wingwalls: Continuous Discontinuous "" Length 16
Evaluation:
Earthquake Resistance Mechanism: For the ex ected PGA,
keeper lates should offer the main resistance to lateral forces.
Probable Failure Mode (s): None
Classification of Damage: Category 1
4-234
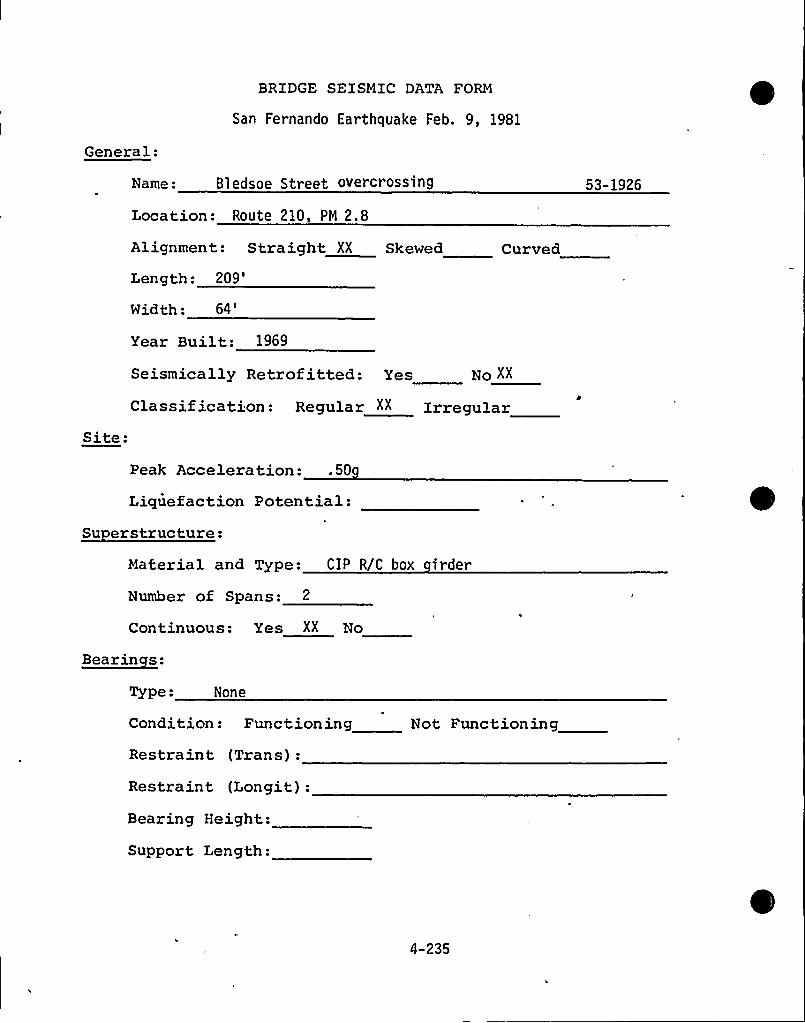
BRIDGE SEISMIC DATA FORM
San Fernando Earthquake Feb. 9, 1981
General:
Name: Bledsoe Street overcrossing
Location: Route 210, PM 2.8
Alignment: Straight D Skewed
Length:209'idth:
64'ear
Built: 1969
Seismically Retrofitted: Yes
Curved
Bo XX
Site:Classification: Regular >> Irregular
Peak Acceleration: .50
Liquefaction Potential:Su erstructure:
Material and Type: CIP R/C box irder
Number of Spans: 2
Continuous: Yes XX No
Bearinces:
Type: None
Condition: Functioning
Restraint (Trans):
Restraint (Longit):Bearing Height:
Support Length:
Not Functioning
4-235
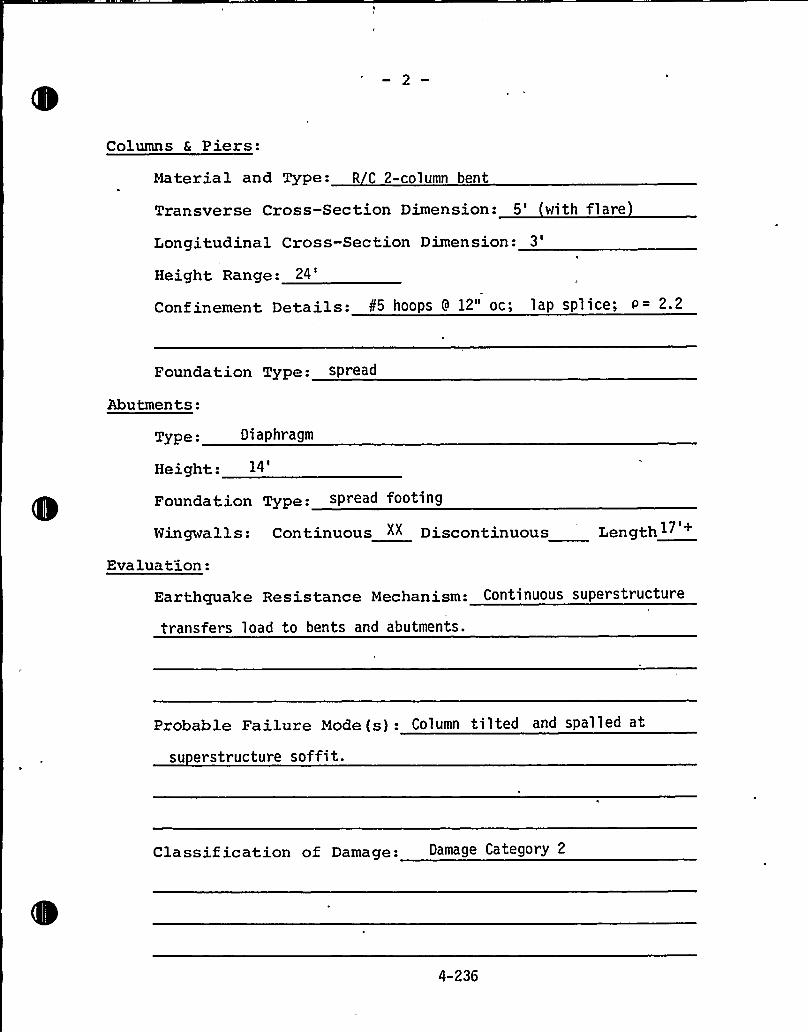
Columns & Piers:
Material and Type: R C 2-column bent
Transverse Cross-Section Dimension: 5'ith flare
Longitudinal Cross-Section Dimension:3'eight
Range:24'onfinementDetails: 85 hoops 9 12" oc; lap splice; P= 2.2
Foundation Type: spread
Abutments:
Type: Diaphragm
Height:14'oundation Type: spread footing
Wingwalls: Continuous "" Discontinuous Length 1" +
Evaluation:
Earthquake Resistance Mechanism: Continuous superstructur e
transfers load to bents and abutments.
Probable Failure Mode (s): Column tilted and spalled at
su erstructure soffit.
Classif ication of Damage: Damage Category 2
4-236
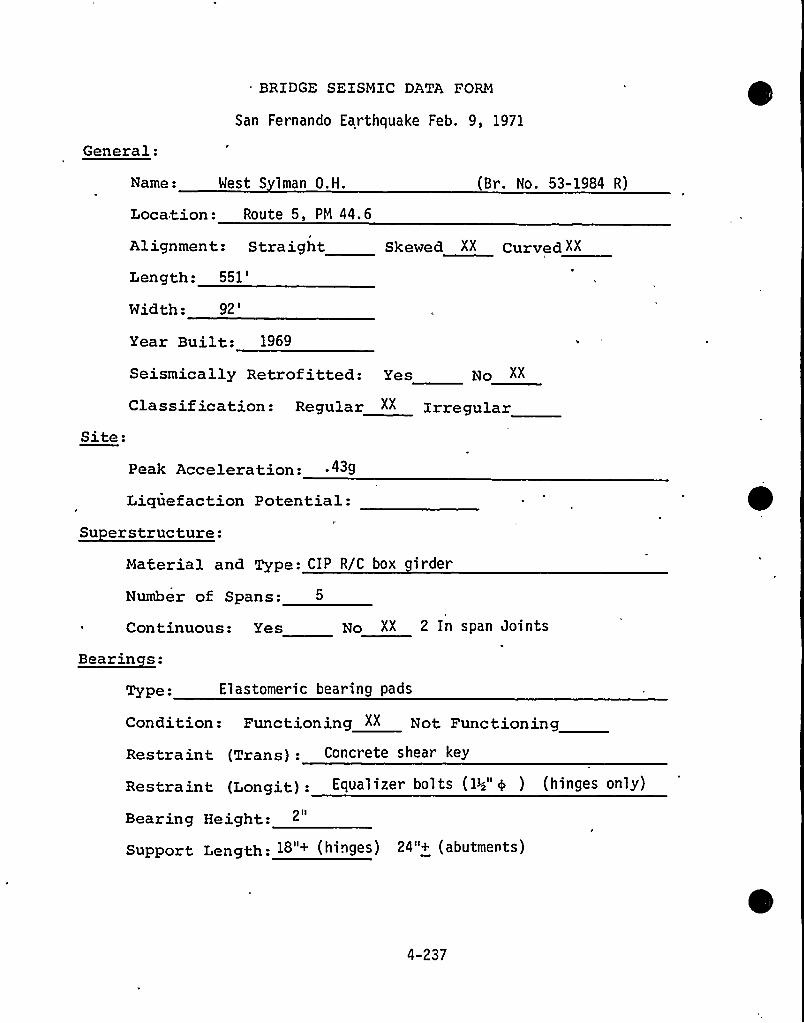
General:
. BRIDGE SEISMIC DATA FORM
San Fernando Earthquake Feb. 9, 1971
Name: West S lman O.H.
Location: Route 5, PM 44. 6
(Br. No. 53-1984 R)
Alignment: Straight Skewed XX curved XX
Length:551'idth:
92'ear
Built: 1969
Seismically Retrofitted: Yes XX
Classif ication: Regular "" IrregularSite:
Peak Acceleration: .439
Liquefaction Potential:Su erstructure:
Material and Type: CIP R/C box girder
Number of Spans:
~ Continuous: Yes
Bear in ca s:
XX 2 In span Joints
Type: Elastomeric bearing pads
Condition: Functioning "" Not Functioning
Restraint (Trans): Concrete shear key
Restraint (Longit) ~ Equalizer bol ts (1>" 4 ) (hinges only)
Bearing Height:
Support Length- 18"+ (hinges) 24"+ (abutments)
4-237
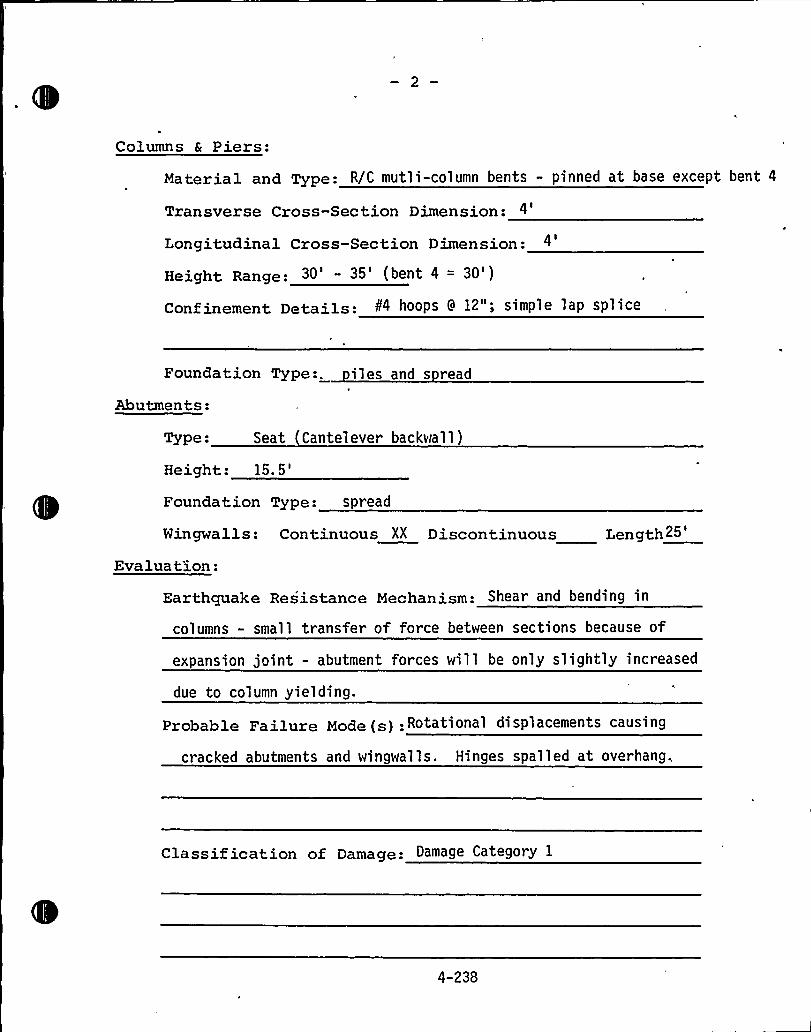
Columns 8 Piers:
Material and Type: R/C mutli-column bents - pinned at base except bent 4
Transverse Cross-Section Dimension:
Longitudinal Cross-Section Dimension: 4
Height, Range: 30 - 35'bent 4 = 30')
Confinement Details: P4 hoops 9 12"; simple lap splice
Foundation Type:. iles and s read
Abutments:
Type -. Seat Cantel ever backwa1 1 )
Height:15.5'oundation
Type: spread
Wingwalls: Continuous XX Discontinuous Length 25
Evaluation:
Earthquake Resistance Mechanism: Shear and bending in
columns - small transfer of force between sections because of
expansion joint - abutment forces will be only slightly increased
due to column yielding.
Probable Failure Mode (s) .- Rotational di spl acements causing
cracked abutments and wingwalls. Hinges spalled at overhang,
Classif ication of Damage: Damage Category 1
4-238
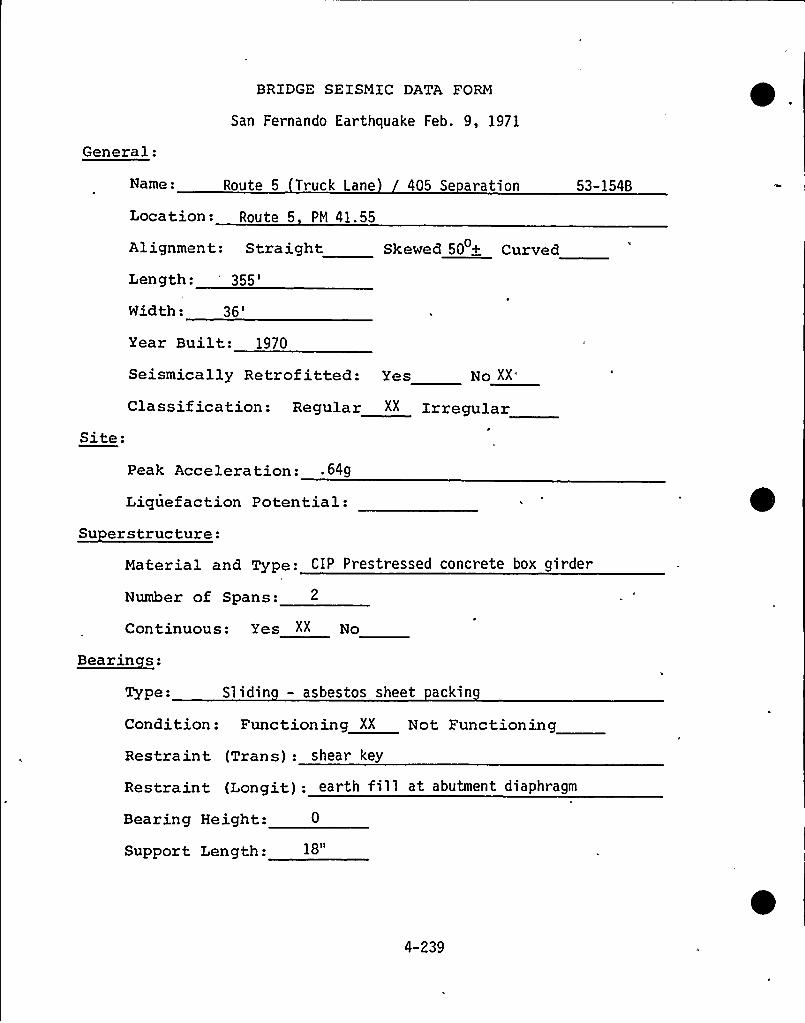
General:
BRIDGE SEISMIC DATA FORM
San Fernando Earthquake Feb. 9, 1971
Name: Route 5 Truck Lane 405 Se aration
Location: Route 5 PM 41.55
53-1548
Alignment: Straight Skewed 50 + Curved
Length:'55'idth:
36'ear
Built: 1970
Site:
Seismically Retrofitted: Yes Ro XX
Classification: Regular XX Xrregular
Peak Acceleration: ~ 649
Liquefaction Potential:Su erstructure:
Material and Type: CIP Prestressed concrete box girder
Number of Spans:
Continuous: Yes XX No
Bearinces:
Type: Slidin — asbestos sheet ackin
Condition: Functioning XX Not Functioning
Restraint. (Trans): shear key
Restraint. (Longit): earth fill at abutment diaphragm
Bearing Height: 0
Support Length: 18"
4-239
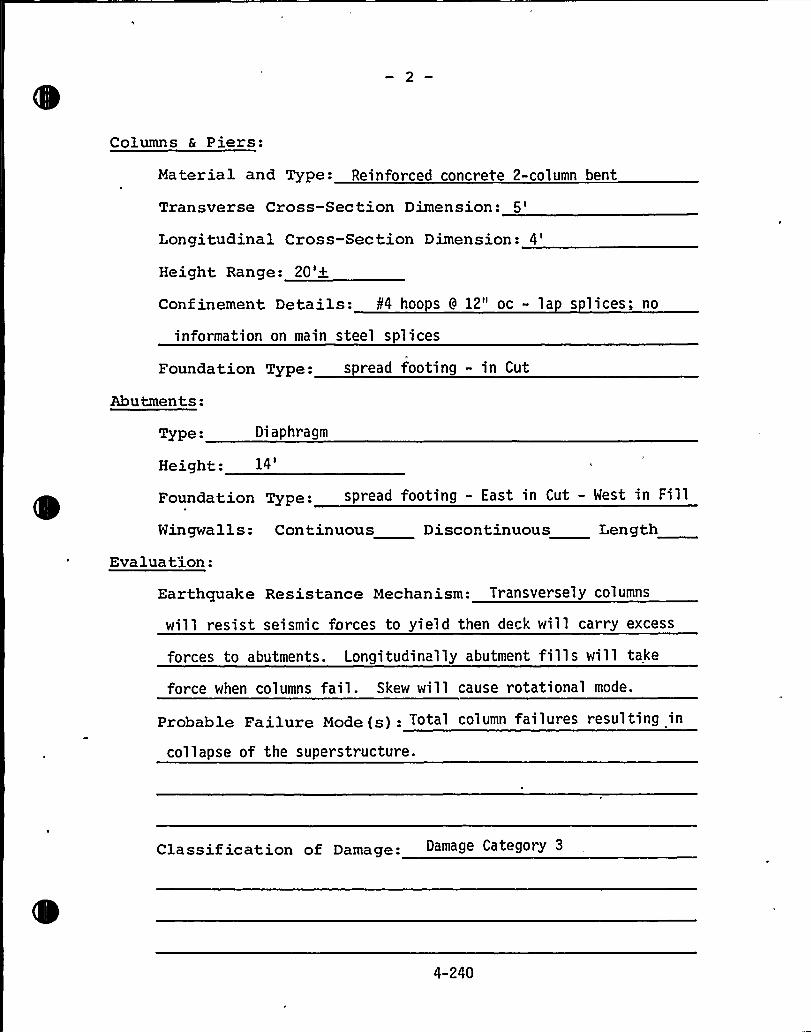
Columns 6 Piers:
Material and Type: Reinforced concrete 2-column bent
Transverse Cross-Section Dimension:5'ongitudinalCross-Section Dimension:
4'eight
Range: 20'2
Conf inement Details: ¹4 hoo s 9 12" oc - la s 1 ices; no
information on main steel splices
Foundation Type: spread footing - in Cut
Abutments:
Type: Di aphragm
Height:14'oundation Type: spread footing - East in Cut - West in Fill
Wingwalls: Continuous Discontinuous Length
Evaluation:
Earthquake Resistance Mechanism: Transversely columns
will resist seismic forces to yield then deck will carry excess
forces to abutments. Longitudinally abutment fills will take
force when columns fail. Skew will cause rotational mode.
Probable Failure Mode (s>: Total column failures resulting in
collapse of the superstructure.
Classif ication of Damage: Damage Category 3
4-240
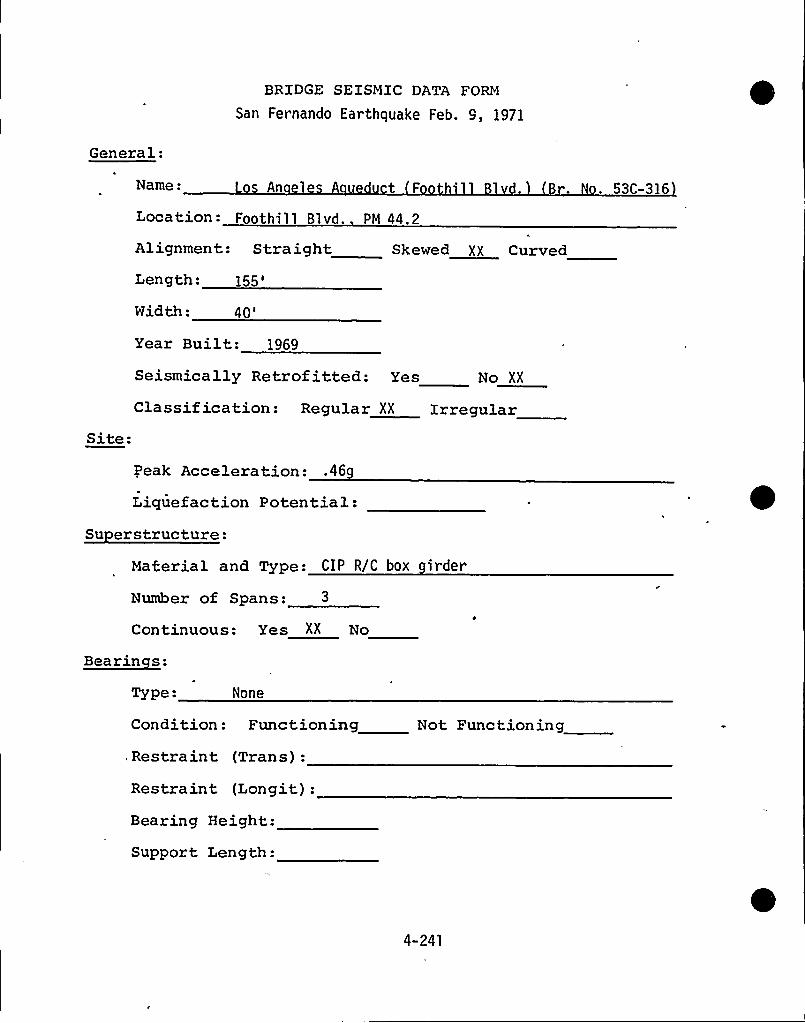
BRIDGE SEISMIC DATA FORM
San Fernando Earthquake Feb. 9, 1971
General:
Name: sAn 1 tLocation: Foothil 1 Blvd. PN 44. 2
1 d. Br.
Alignment: Straight Skewed XX Curved
Length:155'idth:
40'ear
Built: 1969
Site:
Seismically Retrof itted: Yes No XX
Classification: Regular XX Irregular
Peak Acceleration: .469
Liquefaction Potential:Su erstructure:
Material and Type: CIP R/C box irder
Number of Spans: 3
Continuous: Yes XX No
~Bearin s:
Type: None
Condition: Functioning,. Restraint (Trans):
Restraint (Longit):Bearing Height:
Support Length:
Not Func tion ing
4-241
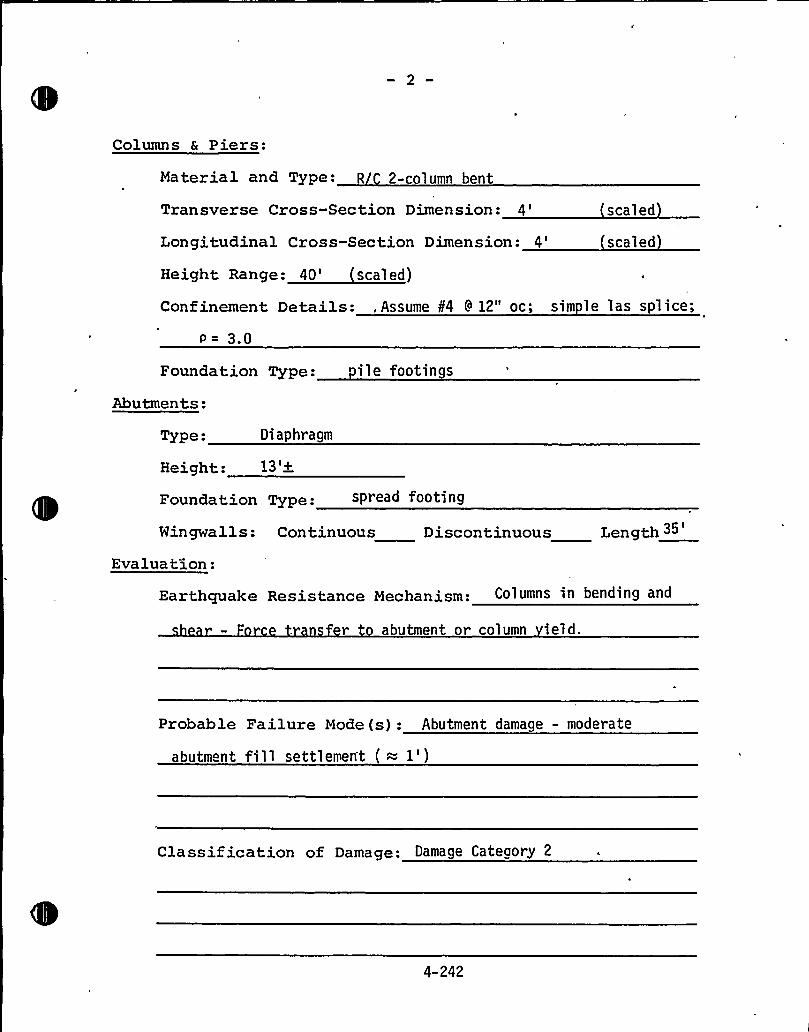
Columns a Piers:
Material and Type: R 2- olumn bent
Transverse Cross-Section Dimension: 4'caledLongitudinal Cross-Section Dimension: 4'caledHeight Range: 40'eal ed)
Confinement Details:,Assume 84 9 12" oc; sim le las splice;
~= 3.0
Foundation Type: ile footings
Abutments:
Type: Diaphragm
Height: 13'+
Foundation Type: spread footing
Wingwa 1 1 s: Continuous Discontinuous Length 35
Evaluation:
Earthquake Resistance Mechanism: Columns in bending and
r abutment or column ield.
Probable Failure Mode(s): Abutment damage - moderate
abutm nt fill settlement ( = 1')
Classif ication of Damage: Damage Category 2
4-242
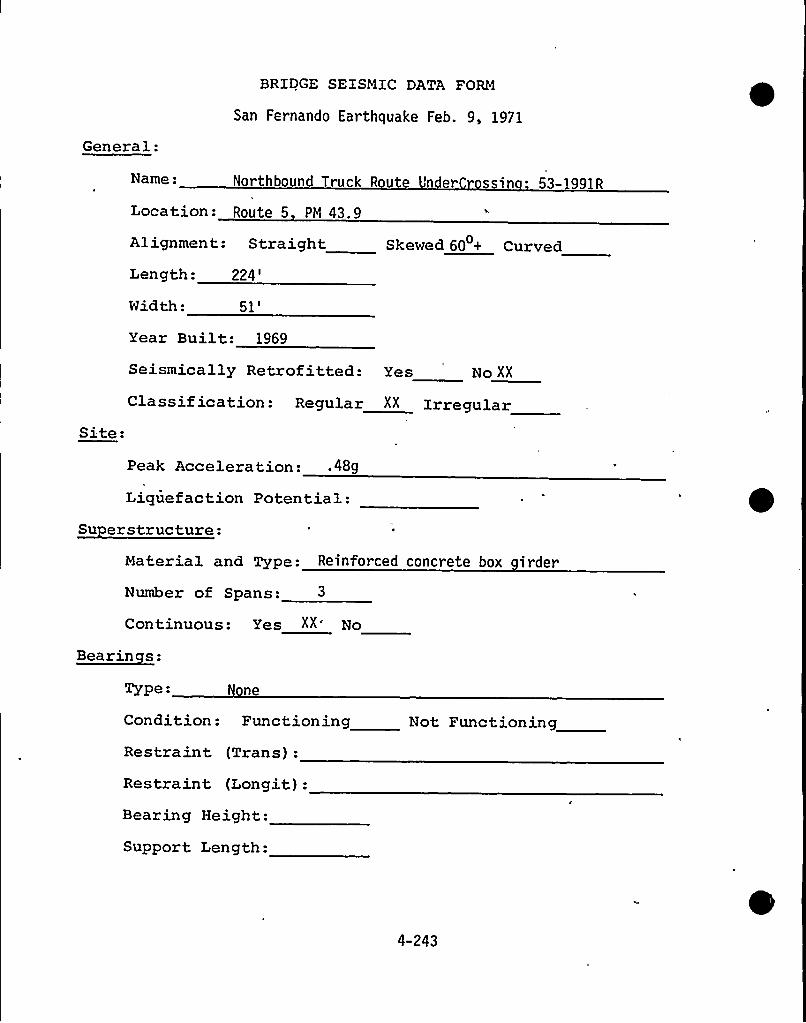
General:
BRIDGE SEISMIC DATA FORM
San Fernando Earthquake Feb. 9, 1971
Name: Northbound Truck Route 'nder ssin 53-1991R
Location: Route 5 PM 43.9
Alignment: Straight Skewed 60 + Curved
Length:224'idth:
51'ear
Built: 1969
Site:
Seismically Retrofitted: yes No IIClassification: Regular XX Irregular
Peak Acceleration: .489
Liquefaction Potential:Su erstructure:
Material and Type: Reinforced concrete box irder
Number of Spans: 3
Continuous: yes II'oBearinces:
Type: ne
Condition: Functioning
Restraint (Trans):
Restraint (Longit):Bearing Height:
Support Length:
Not Functioning
4-243
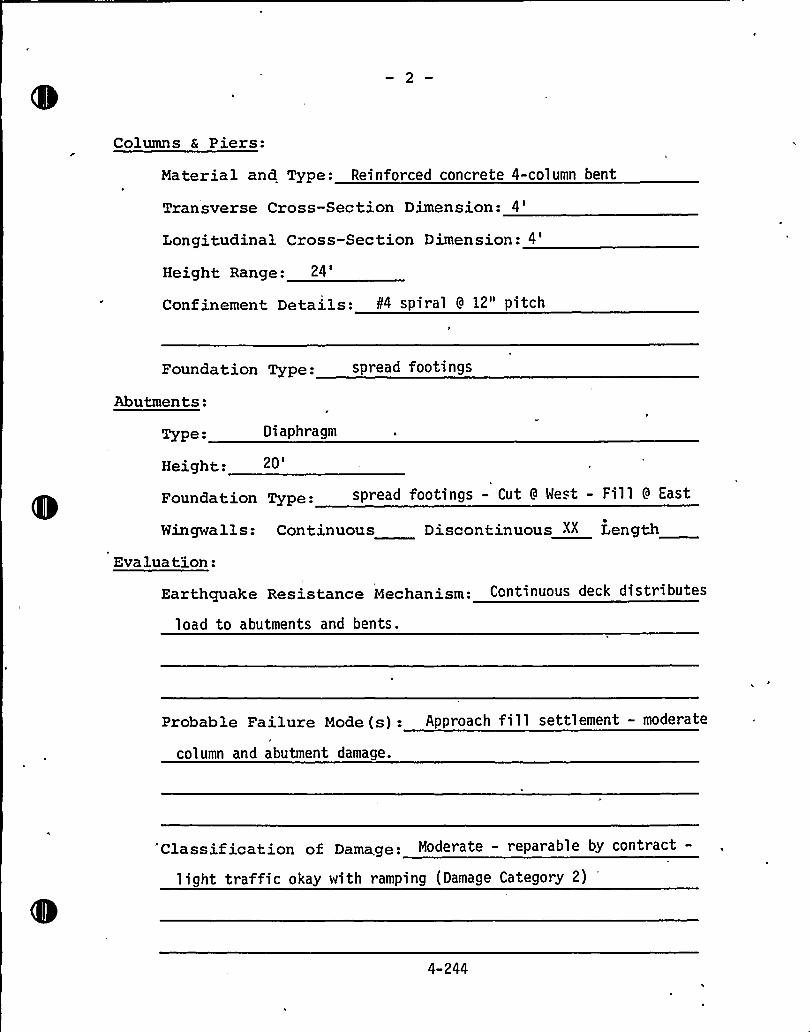
Columns & Piers:
Material and Type: Reinforced concrete 4-column bent
Transverse Cross-Section Dimension:4'ongitudinalCross-Section Dimension:
4'eight
Range:24'onfinementDetails: P4 spiral 9 12" pitch
Foundation Type: spread footings
Abutments:
Type: Diaphragm
Height:
Foundation Type: spread footings - Cut 9 West - Fill 9 East
Wingwalls: Continuous Discontinuous ~X Length
Evaluate.on:
Earthquake Resistance Mechanism: Continuous deck distributes
load to abutments and bents.
Probable Failure Mode(s): Approach fill settlement - moderate
column and abutment damage.
"Classification of Damage: Moderate - reparable by contract-
light traffic okay with ramping (Damage Category 2)
4-244
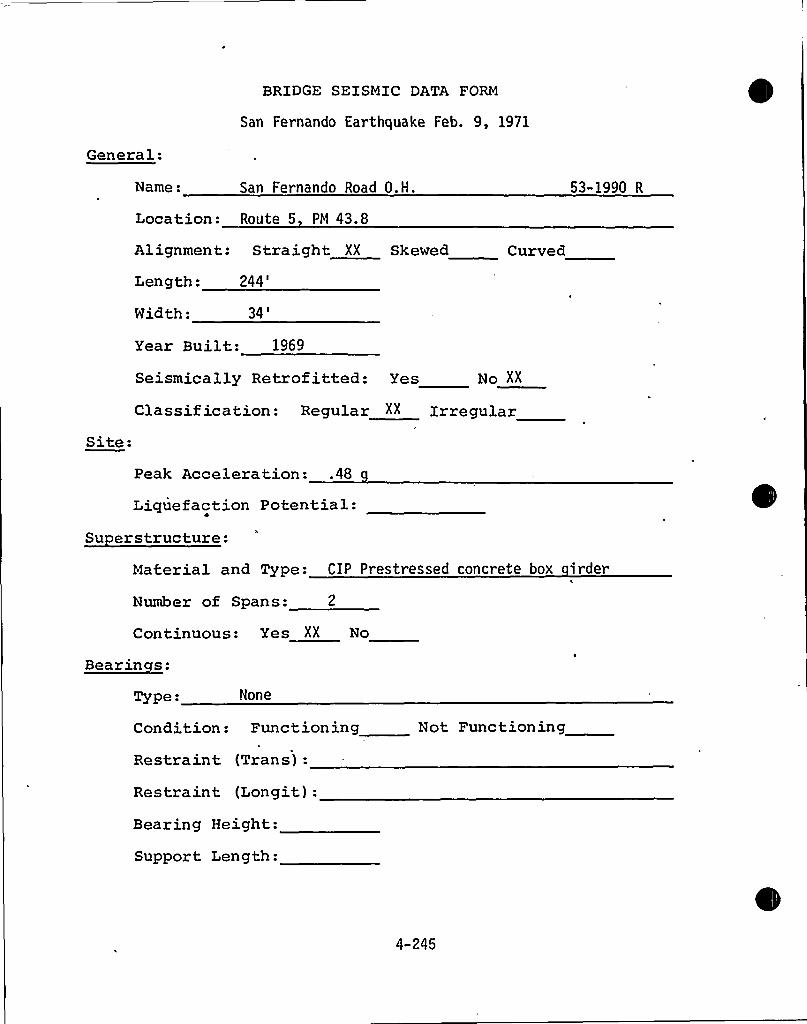
BRIDGE SEISMIC DATA FORM
San Fernando Earthquake Feb. 9, 1971
General:
Name: San Fernando Road O.H.
Location: Route 5 PN 43.8
Alignment: Straight XX Skewed Curved
Length:244'idth:
34'ear
Built: 1969
53-1990 R
Seismically Retrofitted: Yes No XX
Site:Classif ication: Regular XX Irregular
Peak Acceleration: .48
Liquefaction Potential:
Su erstructure:Material and Type: CIP Prestressed concrete box irder
Number of Spans: 2
Continuous: Yes XX No
Bearinces:
Type: None
Condition: Functioning Not Functioning
Restraint (Trans):
Restraint (Longit):
Bearing Height:
Support Length:
4-245
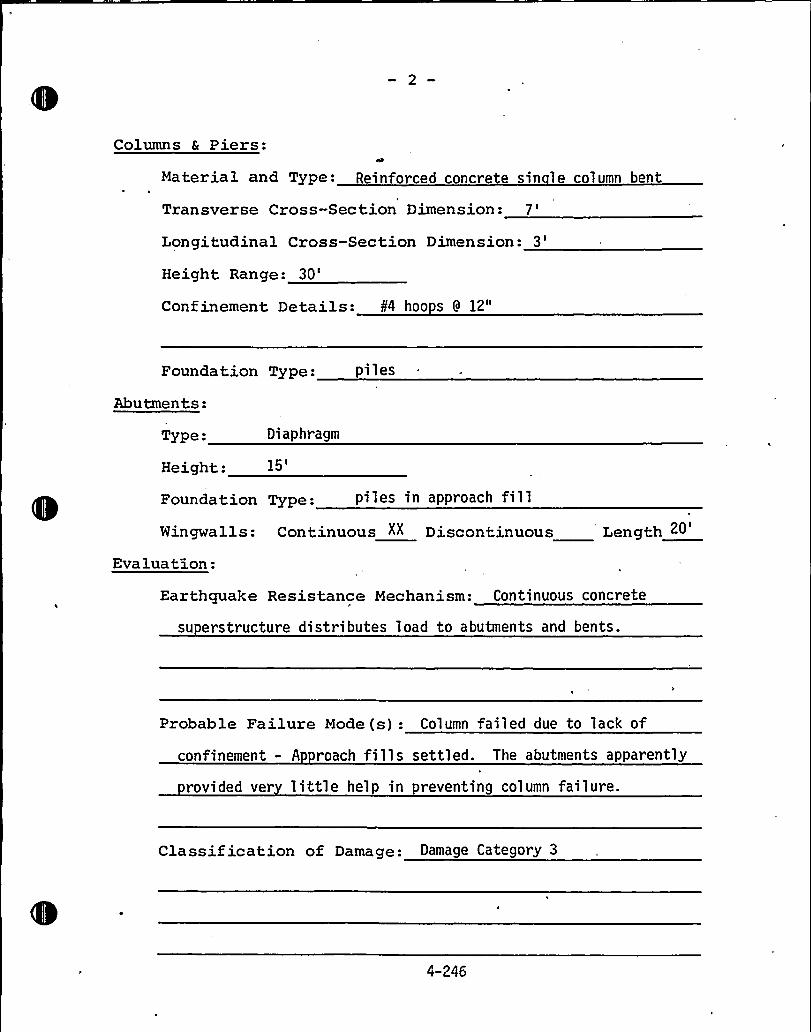
Columns & Piers:
Material and Type- Reinforced concrete sin le column bent
Transverse Cross-Section Dimension:7'ongitudinalCross-Section Dimension:
3'eight
Range:30'onfinementDetails: ¹4 hoo s 9 12"
Foundation Type: pi 1 es
Abutments:
Type Diaphragm
Height:
Foundation Type: piles in approach fi1 1
Wingwalls: Continuous "" Discontinuous
Evaluation:
Length 20
Earthquake Resistance Mechanism: Continuous concrete
su erstructure distributes load to abutments and bents.
Probable Failure Mode(s): Column failed due to lack of
confinement - A roach fills settled. The abutments apparently
rovided ver little help in preventing column failure.
Classif ication of Damage: Damage Category 3
4-246
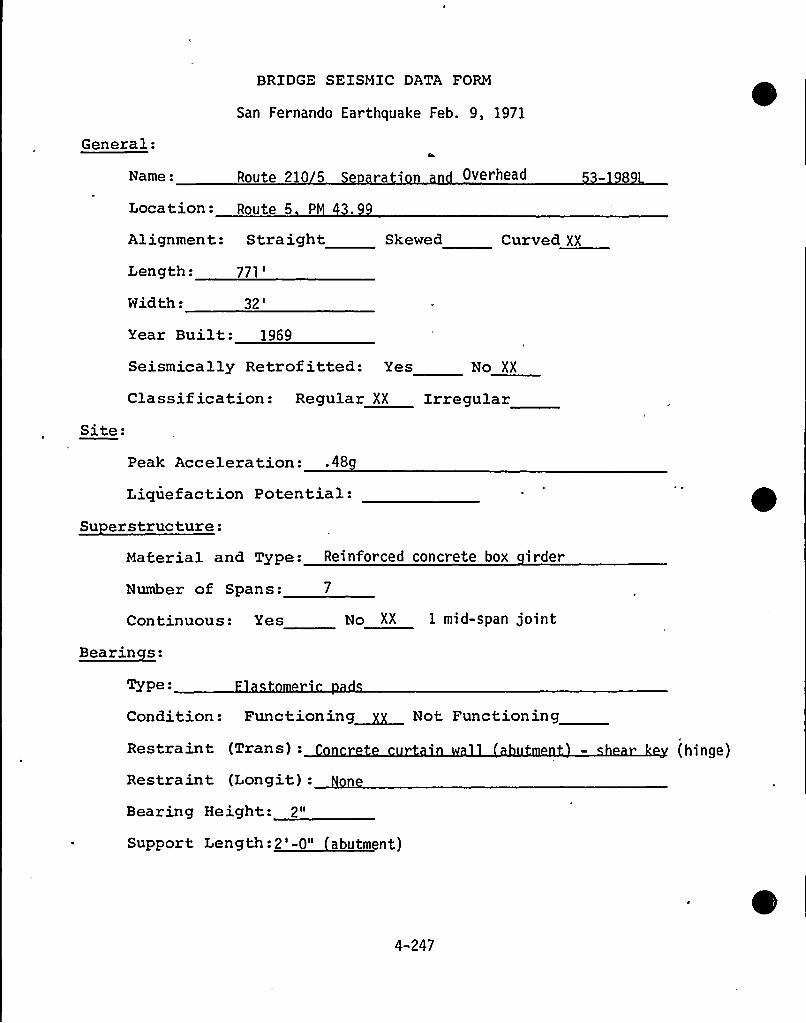
General:
BRIDGE SEISMIC DATA FORM
San Fernando Earthquake Feb. 9, 1971
Name: Route 210 5 ra Overhead
Location: Route 5 PN 43. 99
Alignment: StraightLength:
771'idth:
32'kewed Curved XX
Year Built: 1969
Site:
Seismically Retrof itted: Yes No XX
Classif ication: Regular XX Irregular
Peak Acceleration: .48
Liquefaction Potential:Su erstructure:
Material and Type: Reinforced concrete box irder
Number of Spans: 7
Continuous: Yes
Bearinces:
Type:
No XX 1 mid-span joint
Condition: Functioning~ Not Functioning
Restraint (Trans):
Restraint (Longit):Bearing Height: 2"
(hinge)
4-247
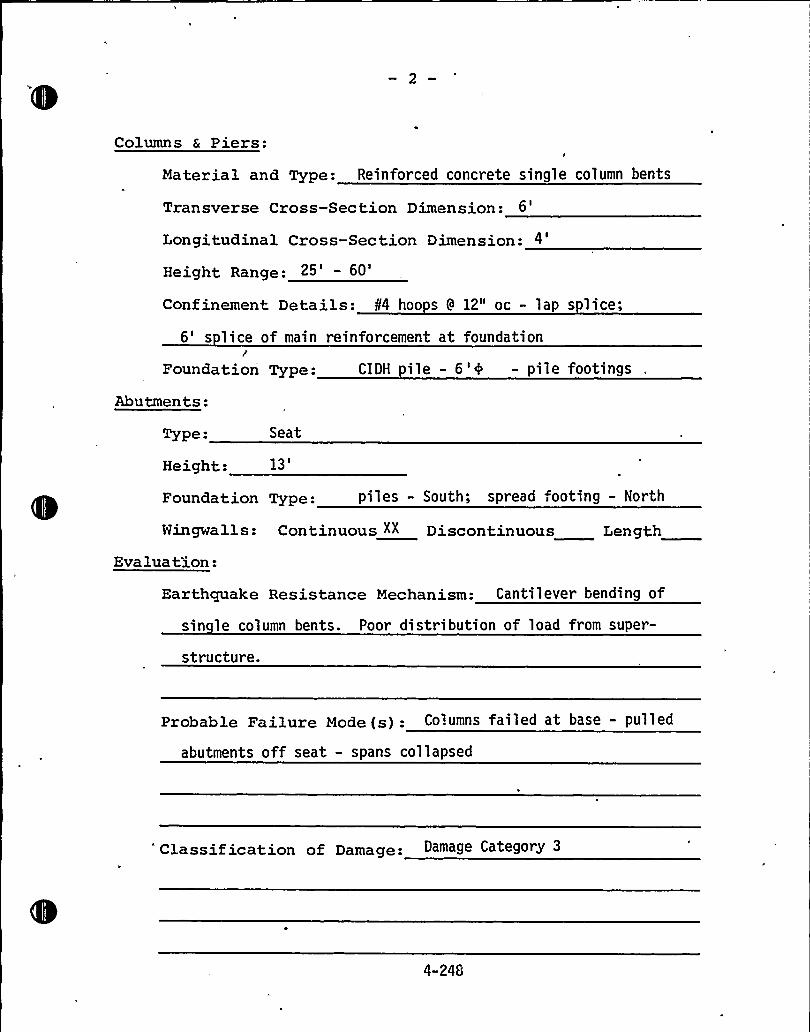
Columns & Piers:/
Material and Type: Reinforced concrete single column bents
Transverse Cross-Section Dimension: 6
Longitudinal Cross-Section Dimension: 4
Height Range:
Confinement Details: P4 hoo s 9 12" oc - lap s lice;6' lice of main reinforcement at foundation
Foundatiori Type: CIDH pile - 6 ' - pile footings
Abutments:
Type-
Height:
Seat
13'oundationType: piles - South; spread footing - North
Wingwalls:
Evaluation:
Continuous XX Discontinuous Length
Earthquake Resistance Mechanism: Cantilever bending of
sin le column bents. Poor distribution of load from super-
structure.
Probable Failure Mode(s): Columns failed at base - pulled
abutments off seat - spans collapsed
'lassif ication of Damage- Damage Category 3
4-248

e
5.0 EVACUATIONNETWORK
5-1TERA CORPORATION
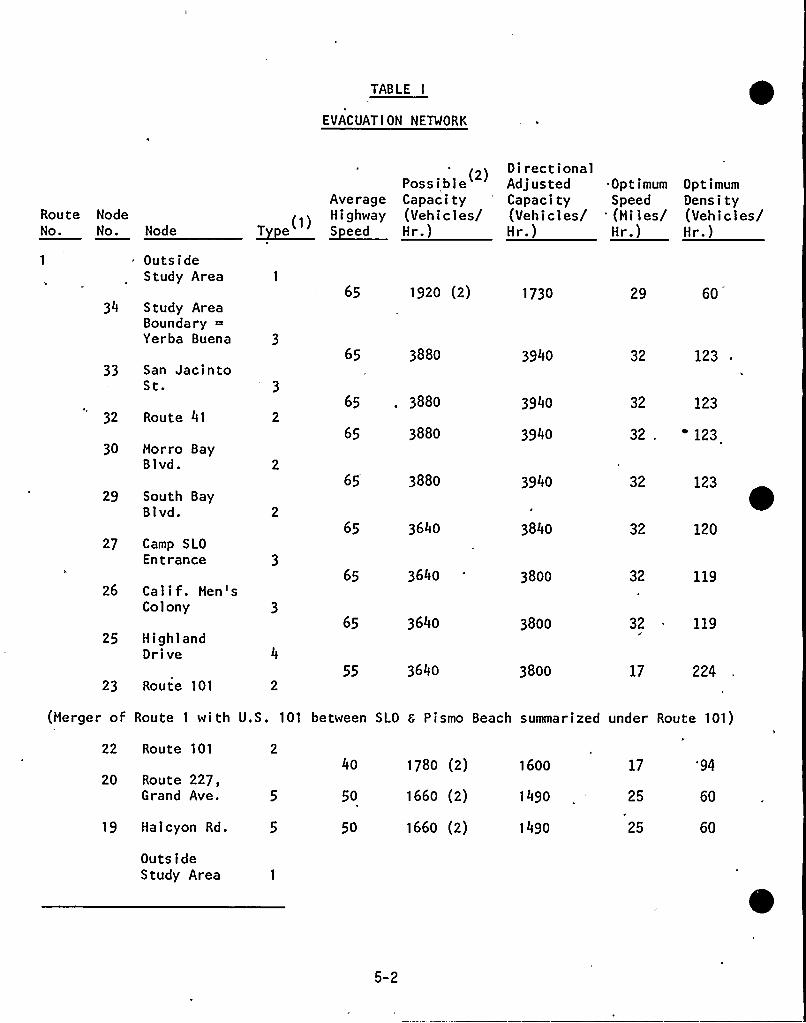
TABLE I
EVACUATION NETWORK
Route NodeNo. No. Node
OutsideStudy Area
Possible (2)
Average Capaci tyHighway (Vehicles/
Tyye Speed Hr.)
DirectionalAdjustedCapacity(Vehicles/Hr.)
.OptimumSpeed
'(Miles/Hr.)
OptimumDensity(Vehicles/Hr.)
34 Study AreaBoundary =Yerba Buena 3
33 San JacintoSt.
65
65
1920 (2)
388o
1730
3940
29
32
60
123
32 Route 41
30 Morro BayBlvd.
65
65
388o
388o
3940
3940
32 123
32 . 123
29 South BayBlvd.
27 Camp SLOEntrance
26 Calif. Men'Colony
25 HighlandDrive 4
23 Route 101 2
65
65
65
65
55
388o
364o
364o
364o
364o
3940
384o
3800
3800
3800
32
32
32
32
17
123 ~120
119
119
224
(Merger of Route 1 with U.S. 101 between SLO 8 Pismo Beach summarized under Route 101)
22 Route 101
20 Route 227,Grand Ave. 5
19 Halcyon Rd. 5
OutsideStudy Area
4o
50
50
1780 (2)
166o (2)
166o (2)
1600
1490
1490
17
25
60
60
5-2
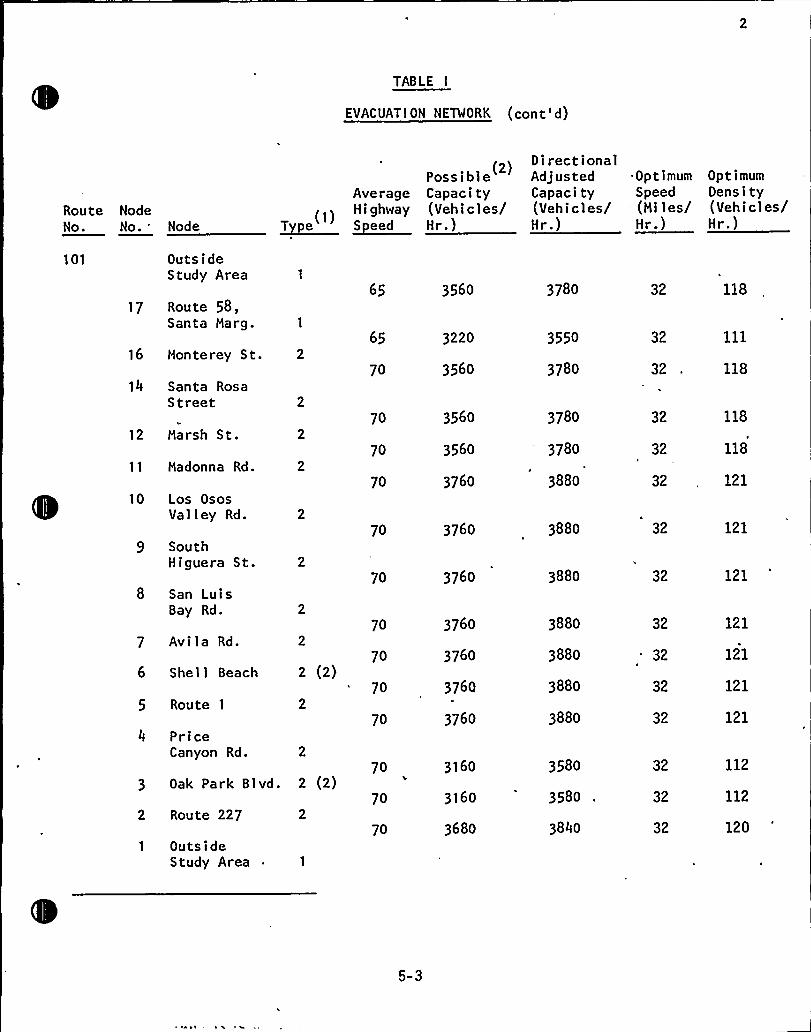
TABLE I
EVACUATION NETWORK (cont'd)
Route NodeNo.
No.'01
17
Node
Outs ideStudy Area
Route 58,Santa Marg.
65 3560
Possible (2)
Average CapacityHighway (Vehicles/
~Tpe ~Seed Nr. )
DirectionalAdjustedCapacity(Vehicles/Hr.)
3780
.OptimumSpeed
-(Miles/Hr.)
32
OptimumDensity(Vehicles/Hr.)
118
16 Monterey St.65
70
3220
3560
3550
3780
32
32 11814 Santa Rosa
Street70 3560 3780 32 118
12 Marsh St.
11 Madonna Rd.70
70
3560
3760
3780
3880
32
32
118
12110 Los Osos
Valley Rd.
SouthHiguera St.
San LuisBay Rd.
70
70
70
3760
3760
3760
3880
3880
3880
32
32
32
121
121
121
7 Avila Rd.
6 Shell Beach
5 Route 1
702 (2)
702
70
3760
3760
3760
3880
3880
3880
32
32
32
121
121
121
4 PriceCanyon Rd. 2
3 Oak Park Blvd. 2 (2)
2 Route 227 2
1 OutsideStudy Area
70
70
70
3160
3160
3680
3580
3580
3840
32
32
32
112
112
120
5-3
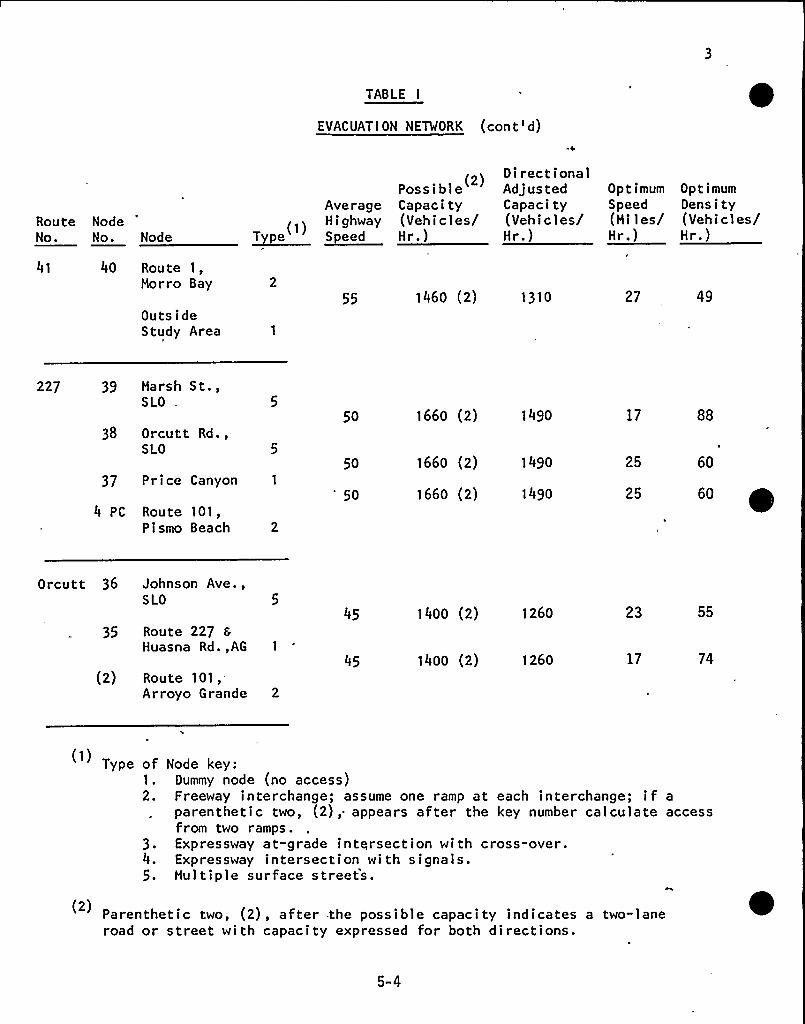
TABLE I
EVACUATION NETWORK (cont'd)
Route NodeNo. No. Node
Possible (2)
Average CapacityHighway (Vehicles/
~Tpe Speed Hr.)
DirectionalAdj ustedCapacity(Vehicles/Hr.)
OptimumSpeed(Hiles/Hr.)
OptimumDensity(Vehicles/Hr.)
41 40 Route 1,Morro Bay
Outs ideStudy Area
55 146O (2) 1310 27 49
227 39 Harsh St.,SLO
38 Orcutt Rd.,SLO
37 Price Canyon 1
4 PC Route 101,Pismo Beach
50
50
'0
166O (2)
166O (2)
166O (2)
1490
1490
1490
17
25
25
88
60
60 ~
Orcutt 36 Johnson Ave.,SLO
35 Route 227 E
Huasna Rd.,AG 1
(2) Route 101,.Arroyo Grande 2
45
14OO (2)
1400 (2)
126O
1260
23
17
55
74
Type of1.2.
3 ~
4.5.
Node key:Dummy node (no access)Freeway interchange; assume one ramp at each interchange; if aparenthetic two, (2), appears after the key number calculate accessfrom two ramps.Expressway at-grade intt„rsection with cross-over.Expressway intersection with signals.Multiple surface streets.
Parenthetic two, (2), after .the possible capacity indicates a two-laneroad or street with capacity expressed for both directions.
5-4
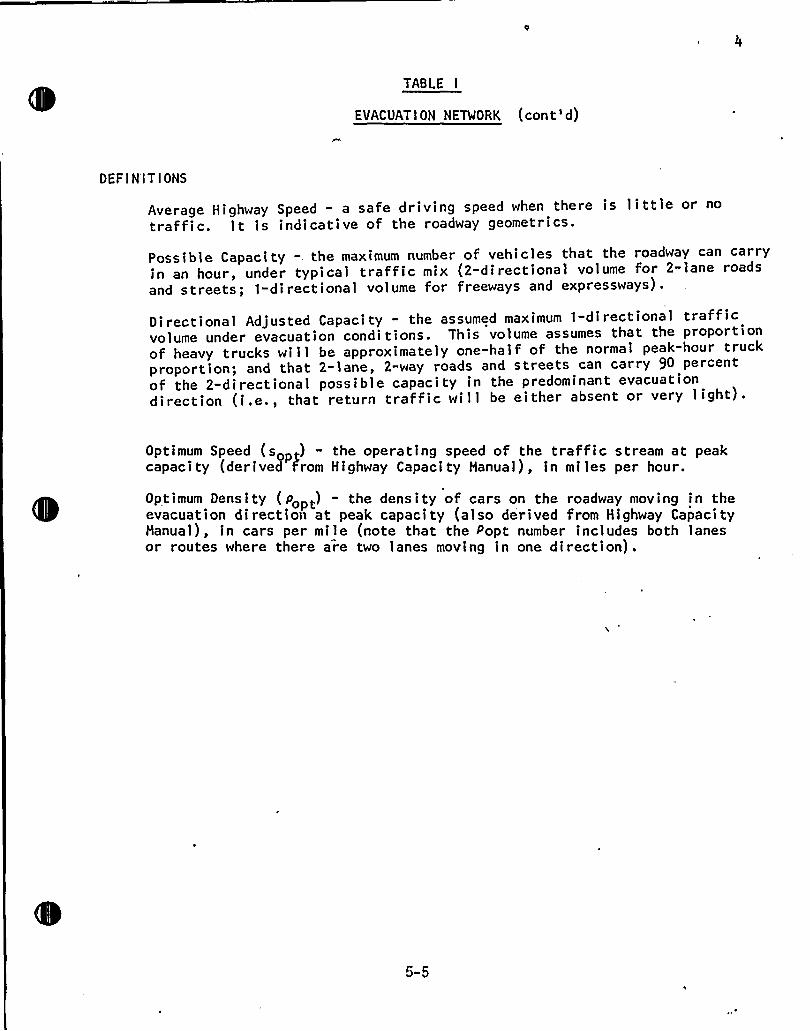
TABLE I
EVACUATION NETWORK (cont'd)
DEFIN'ITIONS
Average Highway Speed - a safe driving speed when there is little or no
traffic. It is indicative of the roadway geometries.
Possible Capacity - the maximum number of vehicles that the roadway can carryin an hour, under typical traffic mix (2-directional volume for 2-lane roads
and streets; 1-directional volume for freeways and expressways).
Directional Adjusted Capacity - the assumed maximum 1-directional trafficvolume under evacuation conditions. This volume assumes that the proportionof heavy trucks will be approximately one-half of the normal peak-hour truckproportion; and that 2-lane, 2-way roads and streets can carry 90 percentof the 2-directional possible capacity in the predominant evacuationdirection (i.e., that return traffic will be either absent or very light).
Optimum Speed (sopt) the operating speed of the traffic stream at peakcapacity (derived From Highway Capacity Manual), in miles per hour.
Optimum Density ( popt) the density of cars on the roadway moving in theevacuation directio~i at peak capacity (also derived from Highway CapacityManual), in cars per mile (note that the Popt number includes both lanesor routes where there a'e two lanes moving in one direction).
5 5
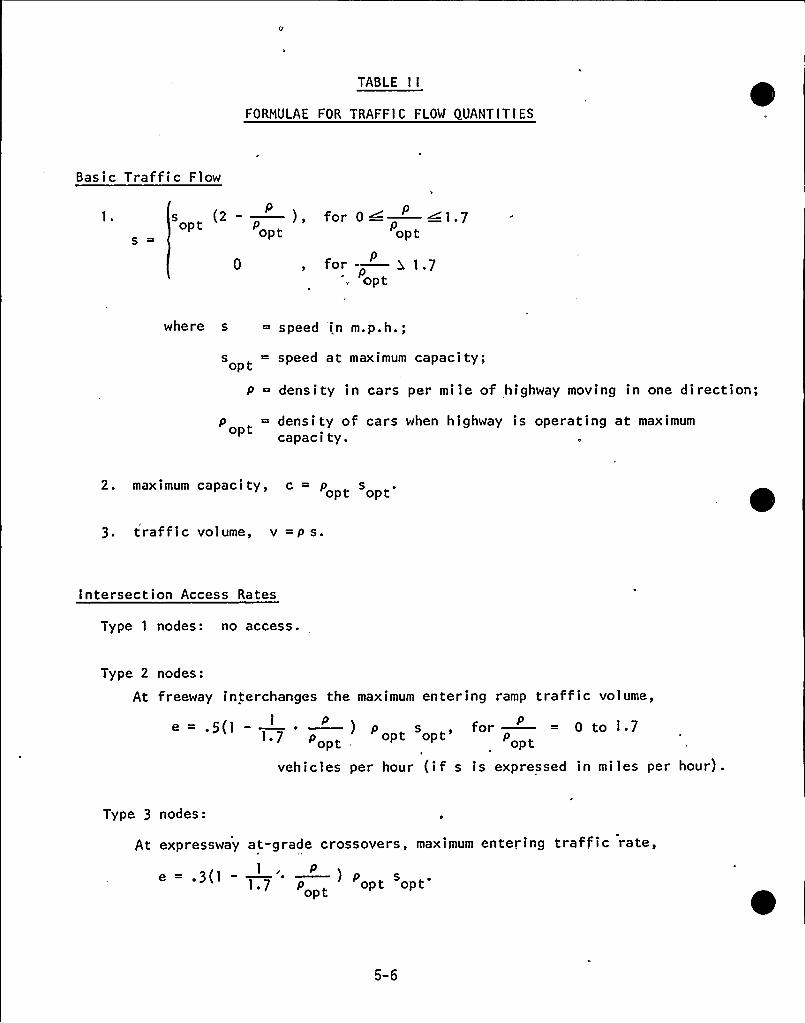
TABLE II
FORMULAE FOR TRAFFIC FLOW OUANTITIES
Basic Traffic Flow
s (2 - —), for 0 ~—~1.7p p
optopt P opt
for —3 1.7p
'opt
where s = speed in m.p.h.;
s = speed at maximum capacity;optP = density in cars per mile of highway moving in one direction;
p = density of cars when highway is operating at maximumopt capacity.
2. maximum capacity, c = p „ sopt opt
3. traffic volume, v = p s.
Intersection Access Rates
Type 1 nodes: no access.
Type 2 nodes:
At freeway interchanges the maximum entering ramp traffic volume,
.5(l - —~ —) pl
1.7 P optopt'pt
vehicles per hour (if s
for —= 0 to I ~ 7P
optis expressed in miles per hour).
Type 3 nodes:
At expressway at-grade crossovers, maximum entering traffic rate,
e=.3(l - —') p s
I
1.7 P opt optopt
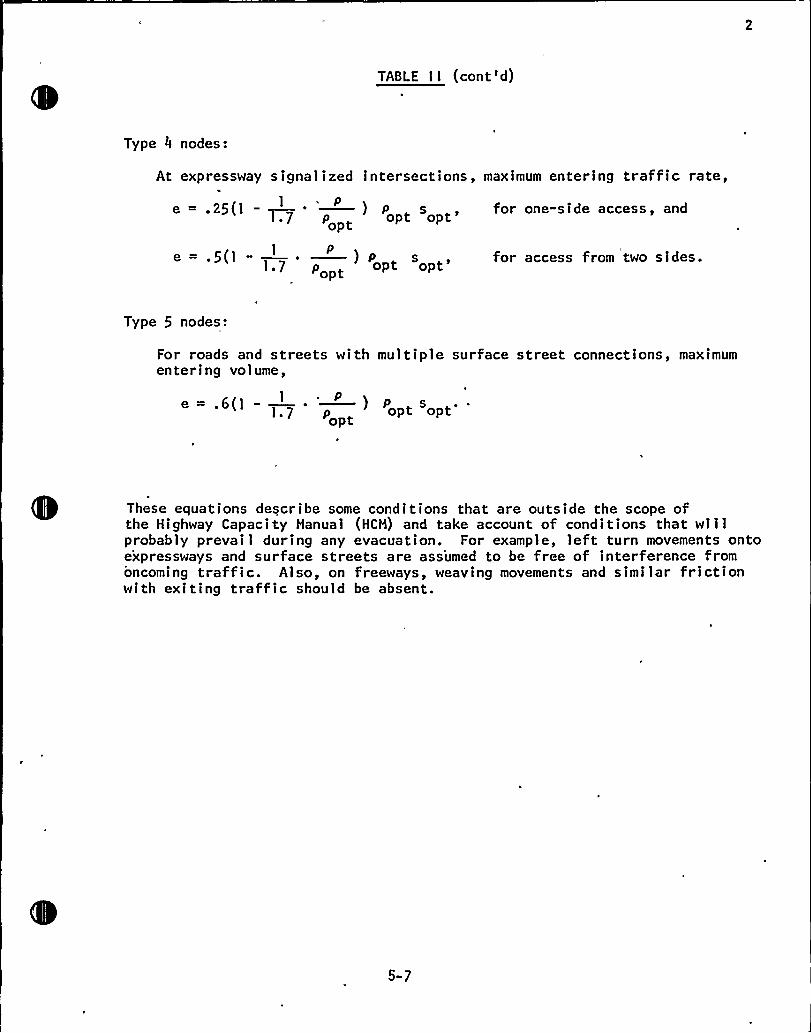
TABLE I I (cont'd)
Type 4 nodes:
At expressway signalized intersections, maximum entering traffic rate,
e = .25(l - ——) P s , for one-side access, and1
1.7 p opt opt'pt
e=.5(l - —~ —) p s1 P
1.7 p optopt'pt
for access from two sides.
Type 5 nodes:
For roads and streets with multiple surface street connections, maximumentering volume,
e=.6(l - —~'
)1
1 7 opt
opt'hese
equations describe some conditions that are outside the scope ofthe Highway Capacity Manual (HCM) and take account of conditions that wi'llprobably prevail during any evacuation. For example, left turn movements ontoexpressways and surface streets are ass'umed to be free of interference fromoncoming traffic. Also, on freeways, weaving movements and similar frictionwith exiting traffic should be absent.
5-7
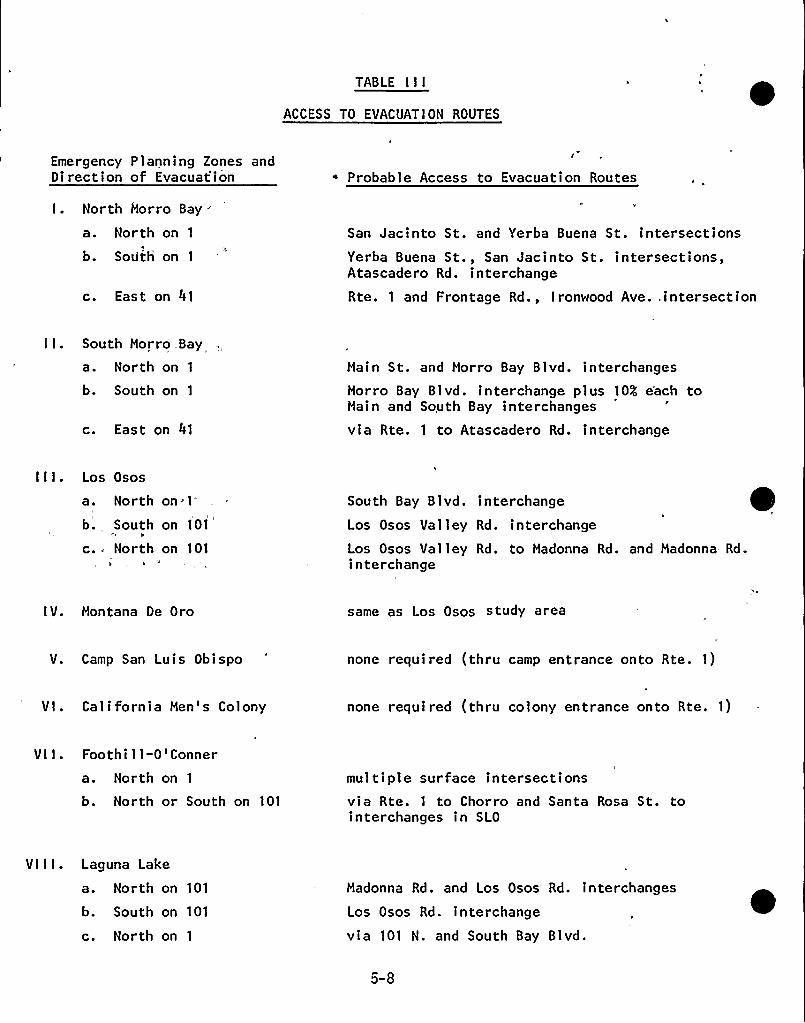
TABLE IIIACCESS TO EVACUATION ROUTES
Emergency Planning Zones andDirection of Evacuat'ion " Probable Access to Evacuation Routes
I. North Horro Bay"
a. North on 1
b. South on 1
c. East on 41
San Jacinto St. and Yerba Buena St. intersectionsYerba Buena St., San Jacinto St. intersections,Atascadero Rd. interchangeRte. 1 and Frontage Rd., Ironwood Ave.:intersection
II. South Morro Bay
a. North on 1
b. South on 1
c. East on 41
Hain St. and Horro Bay Blvd. interchangesMorro Bay Blvd. interchange plus 10''ach toHain and South Bay interchangesvia Rte. 1 to Atascadero Rd. interchange
III. Los Osos
a. North on ~ 1-
b. South on 101
c. North on 101
South Bay Blvd. interchangeLos Osos Valley Rd. interchangeLos Osos Valley Rd. to Madonna Rd. and Madonna Rd.interchange
IV. Montana De Oro same as Los Osos study area
V. Camp San Luis Obispo none required (thru camp entrance onto Rte. 1)
VI. Cali fornia Hen's Colony none required (thru colony entrance onto Rte. 1)
V I I . Foothi 11-0 'onnera. North on 1
b. North or South on 101
multiple surface intersectionsvia Rte. 1 to Chorro and Santa Rosa St. tointerchanges in SLO
VIII. Laguna Lake
a. North on 101
b. South on 101
c. North on 1
Madonna Rd. and Los Osos Rd. interchanges
Los Osos Rd. interchange
via 101 N. and South Bay Blvd.
5-8
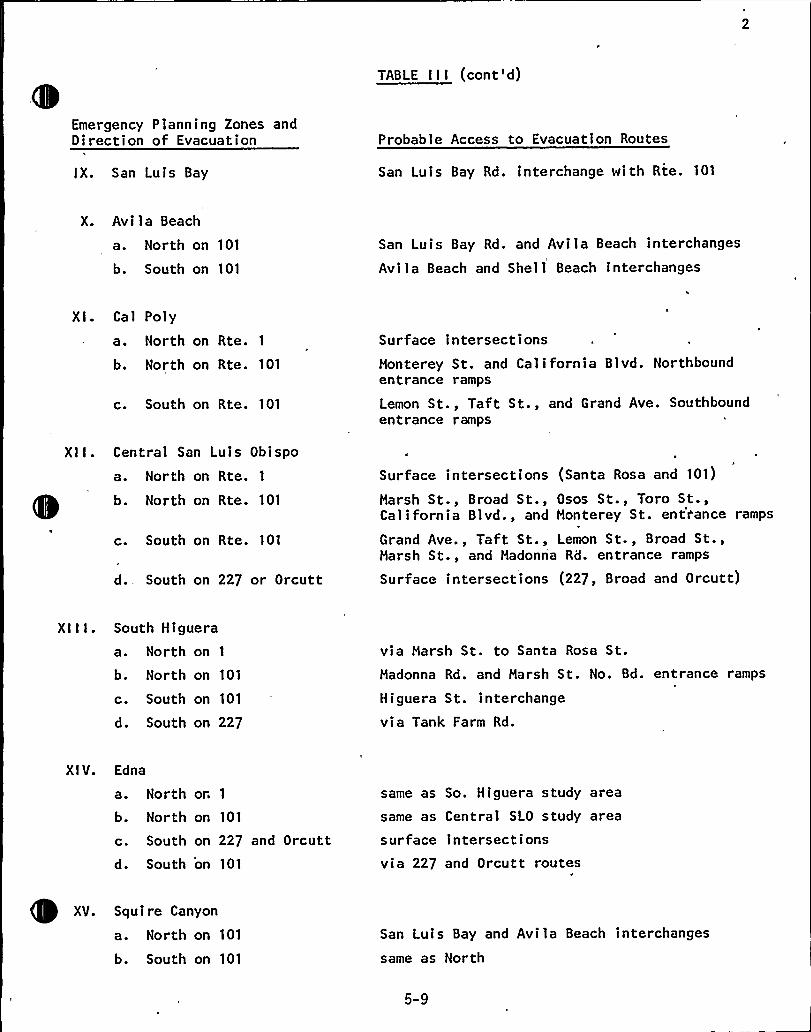
TABLE III (cont'd)
Emergency Planning Zones andDirection of Evacuation Probable Access to Evacuation Routes
IX. San Luis Bay San Luis Bay Rd. interchange with Rte. 101
X. Avila Beach
a. North on 101
b. South on 101
San Luis Bay Rd. and Avila Beach interchanges
Avila Beach and Shell Beach interchanges
X I . Ca I Pol y
a. North on Rte. 1
b. North on Rte. 101
c. South on Rte. 101
Surface intersectionsMonterey St. and California Blvd. Northboundentrance ramps
Lemon St., Taft St., and Grand Ave. Southboundentrance ramps
XII. Central San Luis Obispo
a. North on Rte. 1
b. North on Rte. 101
c. South on Rte. 101
d. South on 227 or Orcutt
Surface intersections (Santa Rosa and 101)
Harsh St., Broad St., Osos St., Toro St.,California Blvd., and Monterey St. ent'rance ramps
Grand Ave., Taft St., Lemon St., Broad St.,Harsh St., and Madonna Rd. entrance ramps
Surface intersections (227, Broad and Orcutt)
XIII. South Higuera
a. North on 1
b. North on 101
c. South on 101
d. South on 227
via Harsh St. to Santa Rosa St.Madonna Rd. and Marsh St. No. Bd. entrance ramps
Hlguera St. interchange
via Tank Farm Rd.
XIV. Edna
a. North or 1
b. North on 101
c. South on 227 and Orcuttd. South on 101
same as So. Higuera study area
same as Central SLO study area
surface intersectionsvia 227 and Orcutt routes
XV. Squire Canyon
a. North on 101
b. South on 101
San Luis Bay and Avila Beach interchanges
same as North
5-9
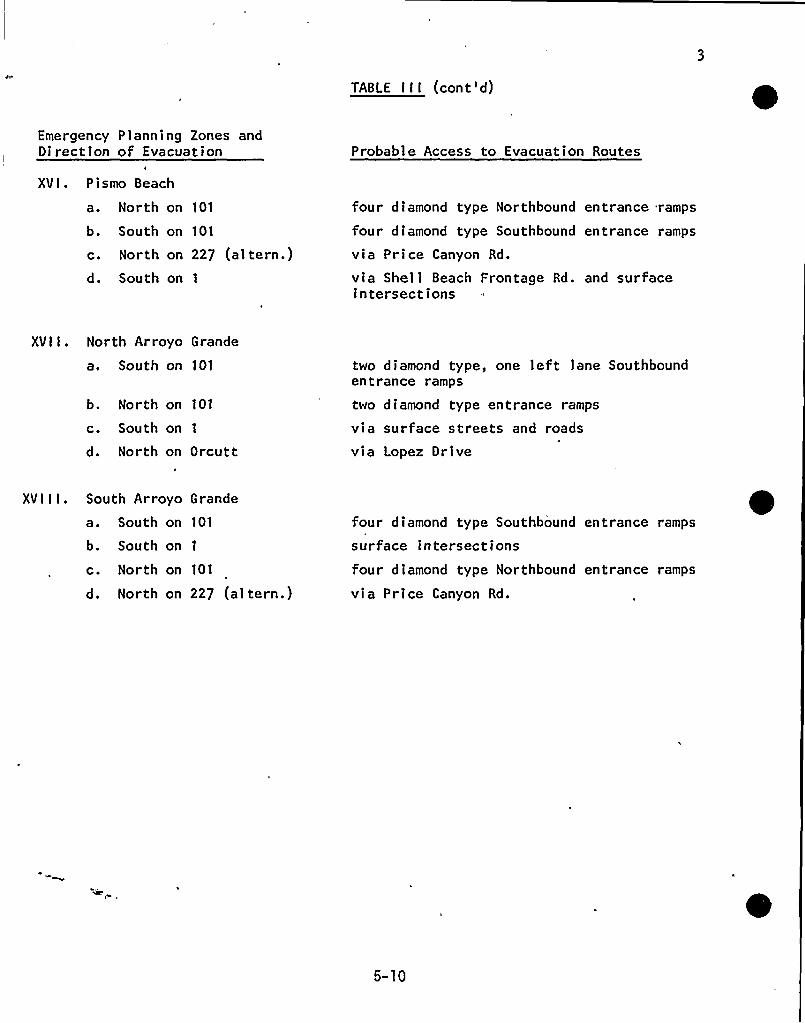
TABLE III (cont'd)
Emergency Planning Zones andDirection of Evacuation Probable Access to Evacuation Routes
XVI. Pismo Beach
a. North on 101
b. South on 101
c. North on 227 (altern.)d. South on 1
four diamond type Northbound entrance ramps
four diamond type Southbound entrance ramps
via Price Canyon Rd.
via Shel 1 Beach Frontage Rd. and surfaceintersections
XVII. North Arroyo Grande
a. South on 101
b. North on 101
c. South on 1
d. North on Orcutt
two diamond type, one left lane Southboundentrance ramps
two diamond type entrance ramps
via surface streets and roads
via Lopez Drive
XVIII. South Arroyo Grande
a. South on 101
b. South on 1
c. North on 101
d. North on 227 (altern.)
four diamond type Southbound entrance ramps
surface intersectionsfour diamond type Northbound entrance ramps
via Price Canyon Rd.
5-10
5.4 ROUTING OF VEHICLES
5-11TERA CORPORATION
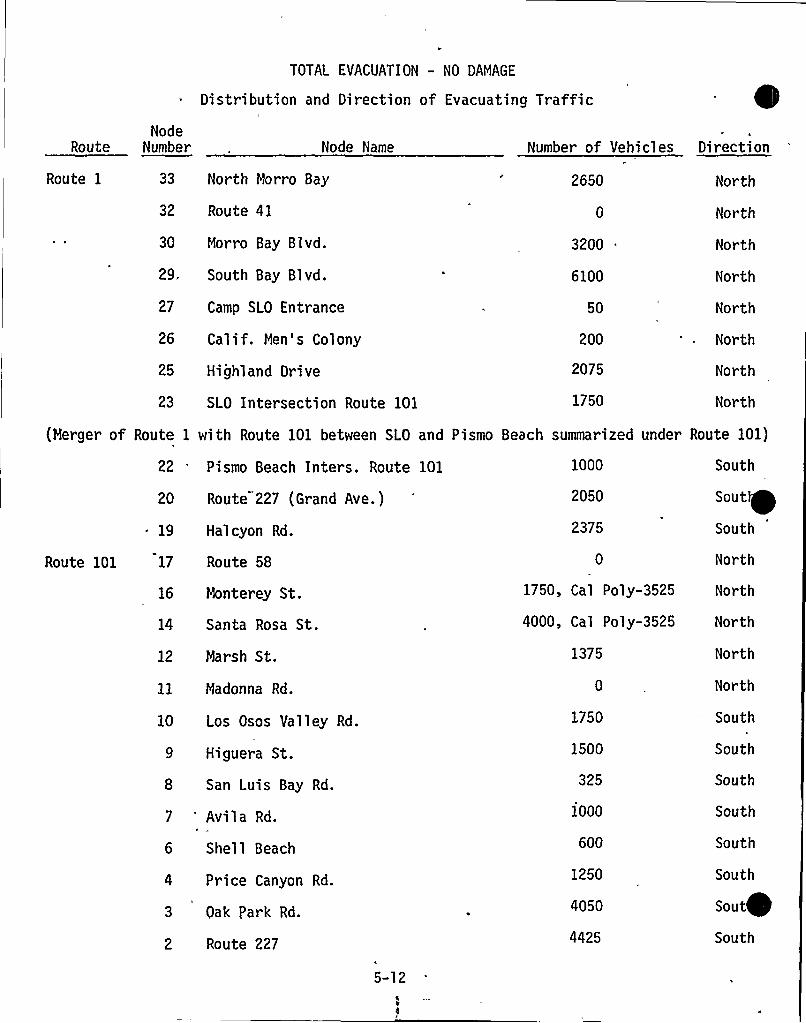
TOTAL EVACUATION - NO DAMAGE
~ Distribution and Direction of Evacuating Traffic
NodeRoute Number Node Name
Route 1 33 North Morro Bay
32 Route 41
30 Morro Bay Blvd.
29. South Bay Blvd.
27 Camp SLO Entrance
Number of Vehicles
2650
3200
6100
50
Direction
North
North
North
North
North
26 Calif. Men's Colony 200 North
25 Highland Drive
23 SLO Intersection Route 101
2075
1750
North
North
(Merger of Route 1 with Route 101 between SLO and Pismo Beach summarized under Route 101)
22 . Pismo Beach Inters. Route 101
20 Route 227 (Grand Ave.)
19 Halcyon Rd.
1000
2050
2375
South
Sout
South
Route 101 17 Route 58 North
16 Monterey St.
14 Santa Rosa St.
12 Marsh St.
ll Madonna Rd.
10 Los Osos Valley Rd.
Higuera St.
San Luis Bay Rd.
7 'vila Rd.
6 Shell Beach
Price Canyon Rd.
3 Oak Park Rd.
2 Route 227
5-12
1750, Cal Poly-3525
4000, Cal Poly-3525
1375
1750
1500
325
)000
600
1250
4050
4425
North
Nor th
North
North
South
South
South
South
South
South
Sout
South
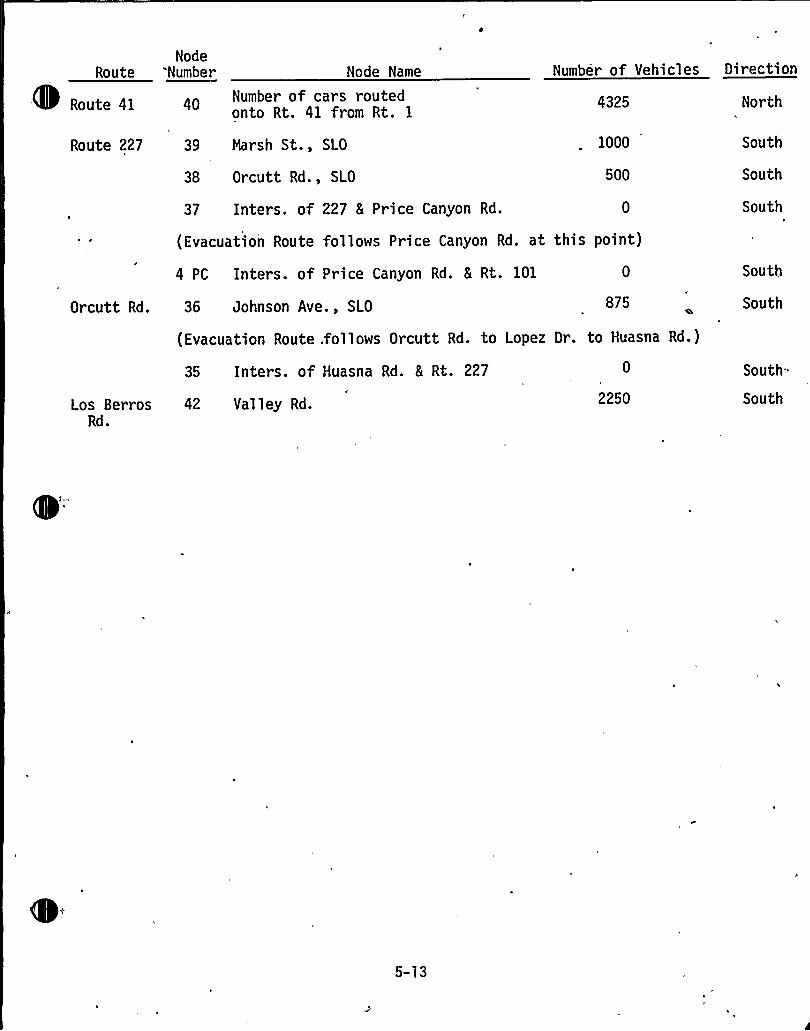
Route
Route 41
NodeNumber Node Name
Number of cars routedonto Rt. 41 from Rt. 1
4325 North
Number of Vehicles Direction
Route 227 39 Marsh St., SLO
38 Orcutt Rd., SLO
37 Inters. of 227 5 Price Canyon Rd.
1000
500
South
South
South
(Evacuation Route follows Price Canyon Rd. at this point)
4 PC Inters. of Price Canyon Rd. 8 Rt. 101 South
Orcutt Rd. 36 Johnson Ave., SLO 875 South
(Evacuation Route .follows Orcutt Rd. to Lopez Dr. to Huasna Rd.)
Los BerrosRd.
35 Inters. of Huasna Rd. 5 Rt. 227
42 Valley Rd. 2250
South-.
South
5-13
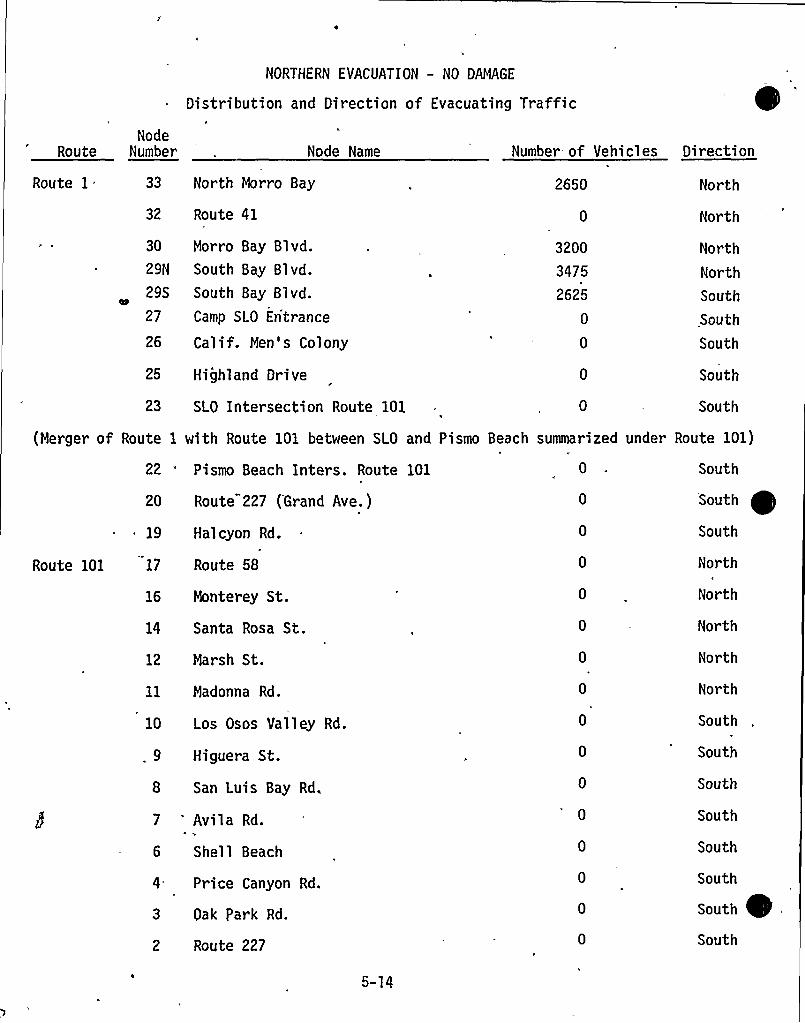
NORTHERN EVACUATION — NO DAMAGE
Distribution and Direction of Evacuating Traffic'ode
Route Number Node Name Number- of Vehicles Direction
Route 1 33 North Morro Bay
32 Route 41
2650 North
North
30
29N
29S
27
Morro Bay Blvd.South Bay Blvd.South Bay Blvd.
Camp SLO Entrance
Calif. Men's Colony
3200
3475
2625
0
0
North
North
South
South
South
25 Highland Drive
23 SLO Intersection Route 101
(Merger of Route 1 with Route 101 between SLO and
South
South
Pismo Beach summarized under Route 101)
22 . Pismo Beach Inters. Route 101
20 Route 227 (Grand Ave.)
19 Halcyon Rd.
Route 101 17 Route 58
16 Monterey St.
14 Santa Rosa St.
12 Marsh St.
11 Madonna Rd.
10 Los Osos Valley Rd.
Higuera St.
8 San Luis Bay Rd.
Avila Rd.
Shell Beach
4 Price Canyon Rd.
3 Oak Park Rd.
2 Route 227
0
0
0
South
South
South
North
North
North
North
North
South
South
South
South
South
South
South
South
5-14
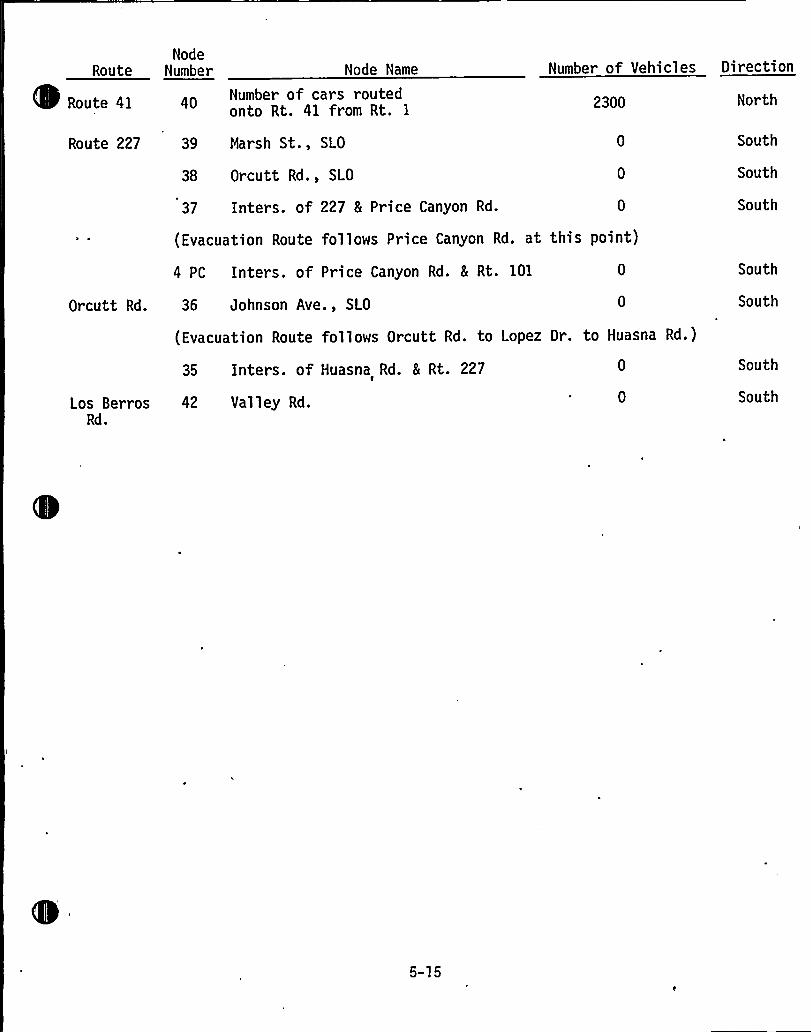
RouteNode
Number Node Name Number of Vehicles Direction
Route 41
Route 227
Number of cars routedonto Rt. 41 from Rt. 1
39 Marsh St., SLO
38 Orcutt Rd., SLO
37 Inters. of 227 8 Price Canyon Rd.
2300 North
South
South
South
(Evacuation Route follows Price Canyon Rd. at this point)
4 PC Inters. of Price Canyon Rd. 5 Rt. 101
Orcutt Rd. 36 Johnson Ave., SLO
(Evacuation Route follows Orcutt Rd. to Lopez Dr. to Huasna Rd.)
South
South
Los Ber rosRd.
35 Inters. of Huasna Rd. 5 Rt. 227
42 Valley Rd.
South
South
5-15
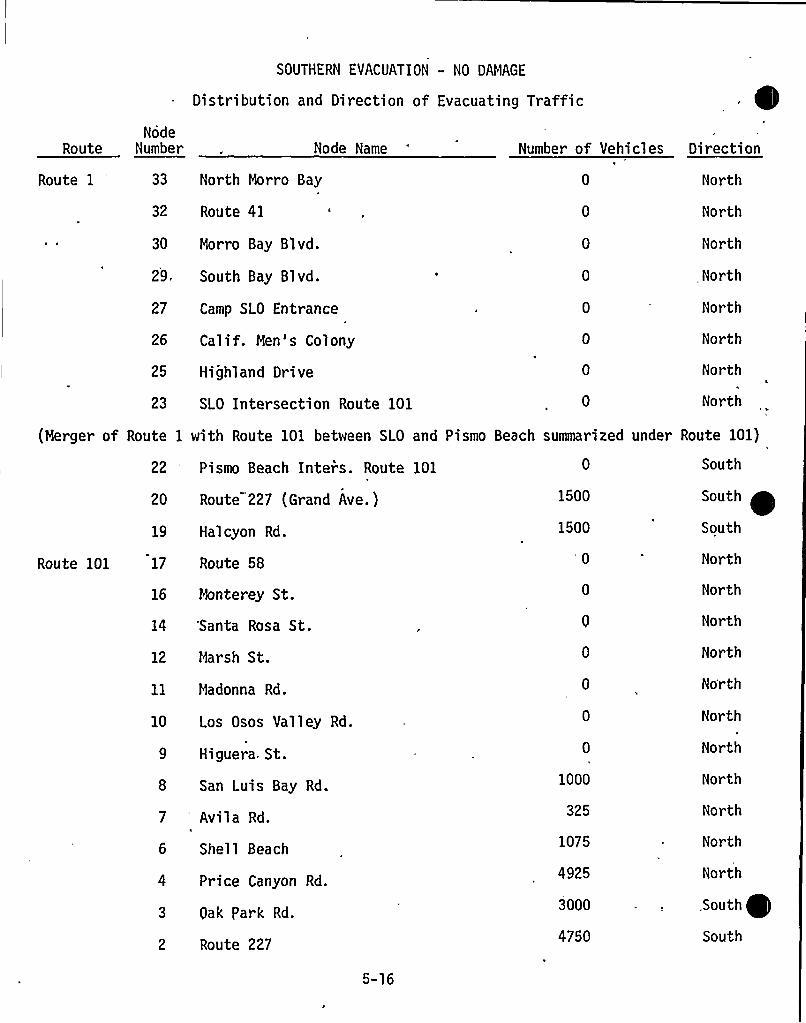
SOUTHERN EVACUATION - NO DAMAGE
Distribution and Direction of Evacuating Traffic
Node,Route Number Node Name Number of Vehicles Direction
Route 1 '3 North Morro Bay
32 Route 41
30 Morro Bay Blvd.
29, South Bay Blvd.
27 Camp SLO Entrance
26 Calif. Men's Colony
25 Highland Drive
23 SLO Intersection Route 101
North
North
North
North
North
North
North
North
(Merger of Route 1 with Route 101 between SLO and Pismo Beach summarized under Route 101)
22 Pismo Beach Inters. Route 101
20 Route 227 (Grand Ave.)
19 Halcyon Rd.
Route 101 17 Route 5S
16 Monterey St.
14 'Santa Rosa St.
12 Marsh St.
11 Madonna Rd.
10 Los Osos Valley Rd.
9 Higuera. St.
8 San Luis Bay Rd.
7 Avila Rd.
6 Shell Beach
4 Price Canyon Rd.
3 Pak Park Rd.
2 Route 227
5-16
1500
1500
'0
1000
325
1075
4925
3000
4750
South
South
South
North
North
North
North
No'rth
North
North
North
North
North
North
.South
South
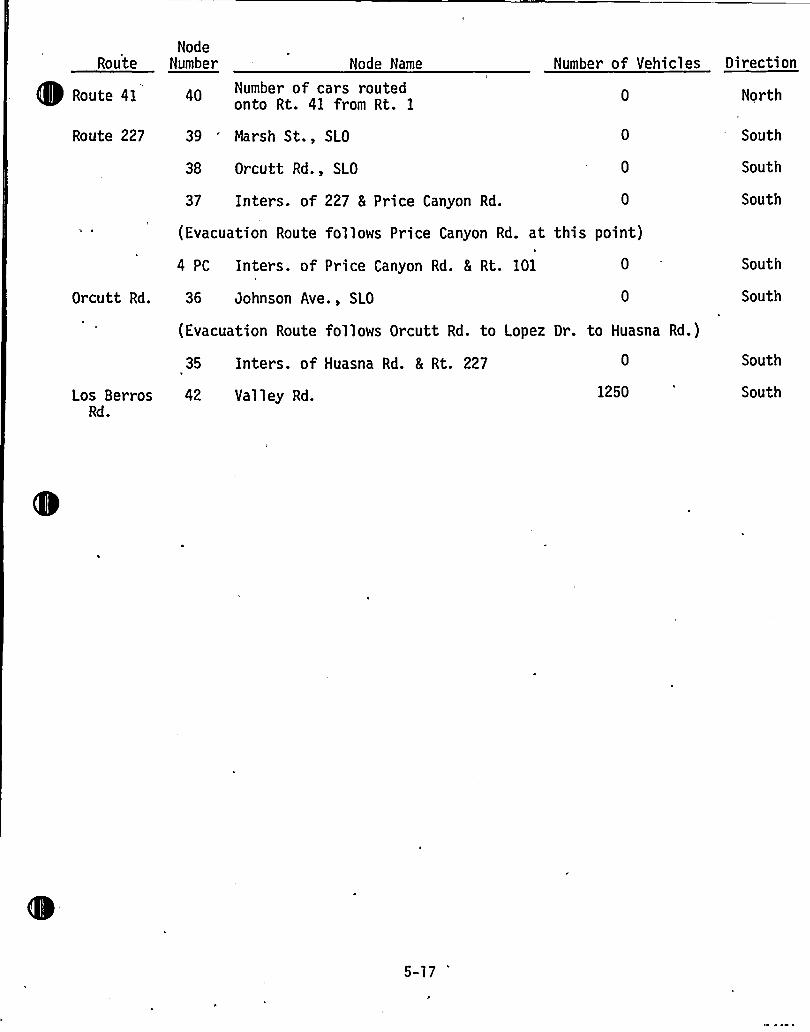
RouteNode
Number Node Name Number of Vehicles Direction
Route 41
Route 227
Number of cars routedonto Rt. 41 from Rt. 1
39 'arsh St., SLO
38 Orcutt Rd., SLO
37 Inters. of 227 5 Price Canyon Rd.
0 North
South
South
South
(Evacuation Route follows Price Canyon Rd. at
4 PC Inters. of Price Canyon Rd. 5 Rt. 101
Orcutt Rd. 36 Johnson Ave., SLO
this point)
South
South
(Evacuation Route follows Orcutt Rd. to Lopez Dr. to Huasna Rd.)
Los BerrosRd.
35 Inters. of Huasna Rd. & Rt. 227
42 Valley Rd. 1250
South
South
5-17
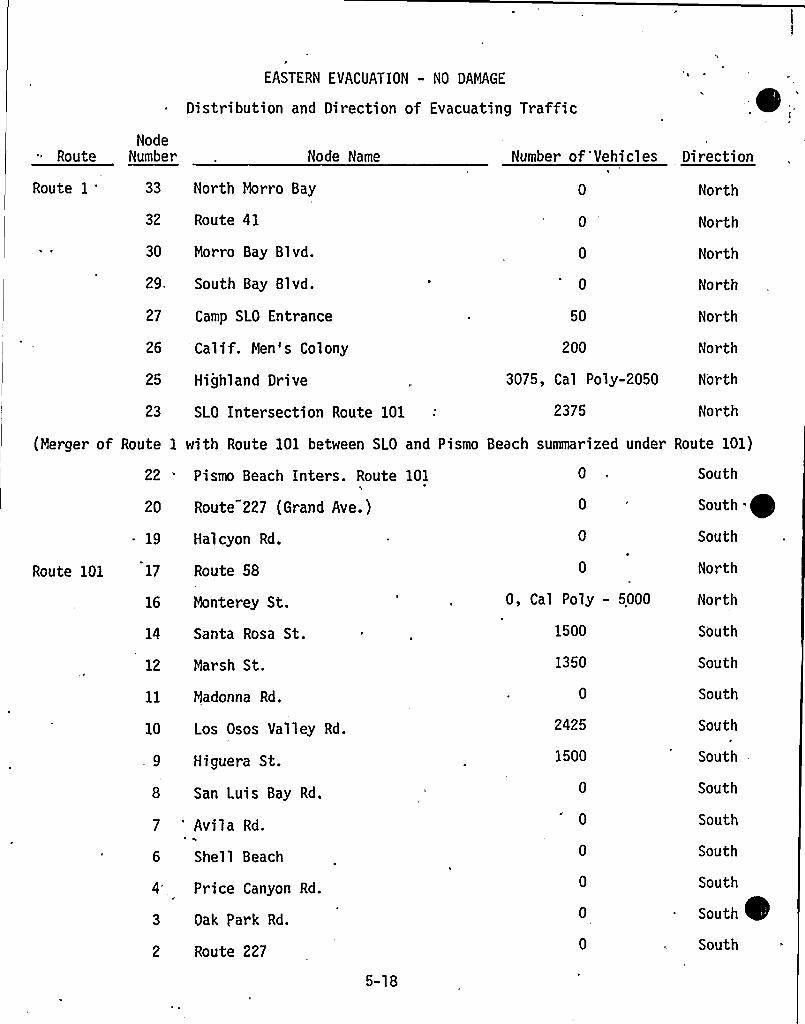
EASTERN EVACUATION - NO DAMAGE
~ Distribution and Direction of Evacuating Traffic
NodeRoute Number Node Name Number of Vehicles Direction
Route 1 33 North Morro Bay
32 Route 41
30 Morro Bay Blvd.
29. South Bay Blvd.
27 Camp SLO Entrance
26 Calif. Men's Colony
25 Highland Drive
23 SLO Intersection Route 101
50
200
3075, Cal Poly-2050
2375
North
North
North
Nor th
North
North
North
North
(Merger of Route 1 with Route 101 between SLO and Pismo Beach summarized under Route 101)
22
20
Pismo Beach Inters. Route 101
Route 227 (Grand Ave.)
5-18
19 Hal cyon Rd.
Route 101 17 Route 58
16 Monterey St.
14 Santa Rosa St.
12 Marsh St.
11 Madonna Rd.
10 Los Osos Valley Rd.
9 Higuera St.
San Luis Bay Rd.
Avila Rd.
Shell Beach
4 Price Canyon Rd.
3 Oak Park Rd.
2 Route 227
0, Cal Poly - 5000
1500
1350
2425
1500
0
0
South
South
South
North
North
South
South
South
South
South
South
South
South
South
South
South
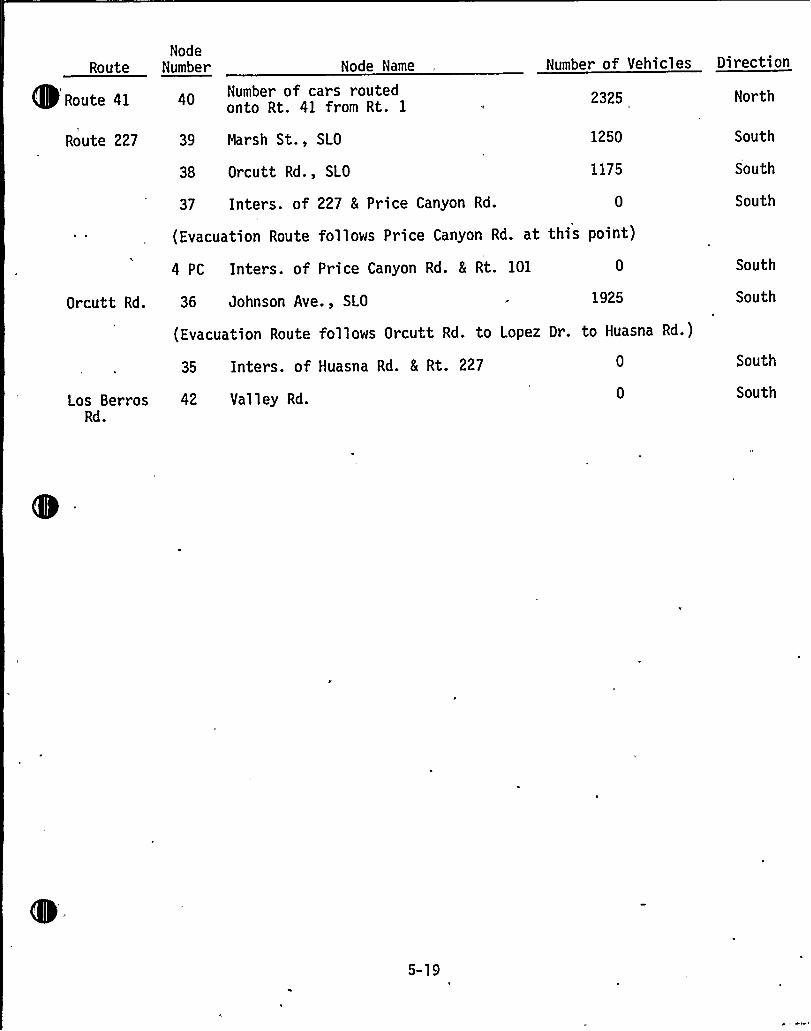
Route
Route 41
NodeNumber Node Name
Number of cars routedonto Rt. 41 from Rt. 1
Number of Vehicles Direction
2325
Route 227 39 Marsh St., SLO
38 Orcutt Rd., SLO
37 Inters. of 227 8 Price Canyon Rd.
1250
1175
South
South
South
(Evacuation Route follows Price Canyon Rd. at this point)
4 PC Inters. of Price Canyon Rd. & Rt. 101 South
Orcutt Rd. 36 Johnson Ave., SLO 1925 South
Los BerrosRd.
(Evacuation Route follows Orcutt Rd. to Lopez Dr. to Huasna Rd.)
35 Inters. of Huasna Rd. 5 Rt. 227
42 Valley Rd.
South
South
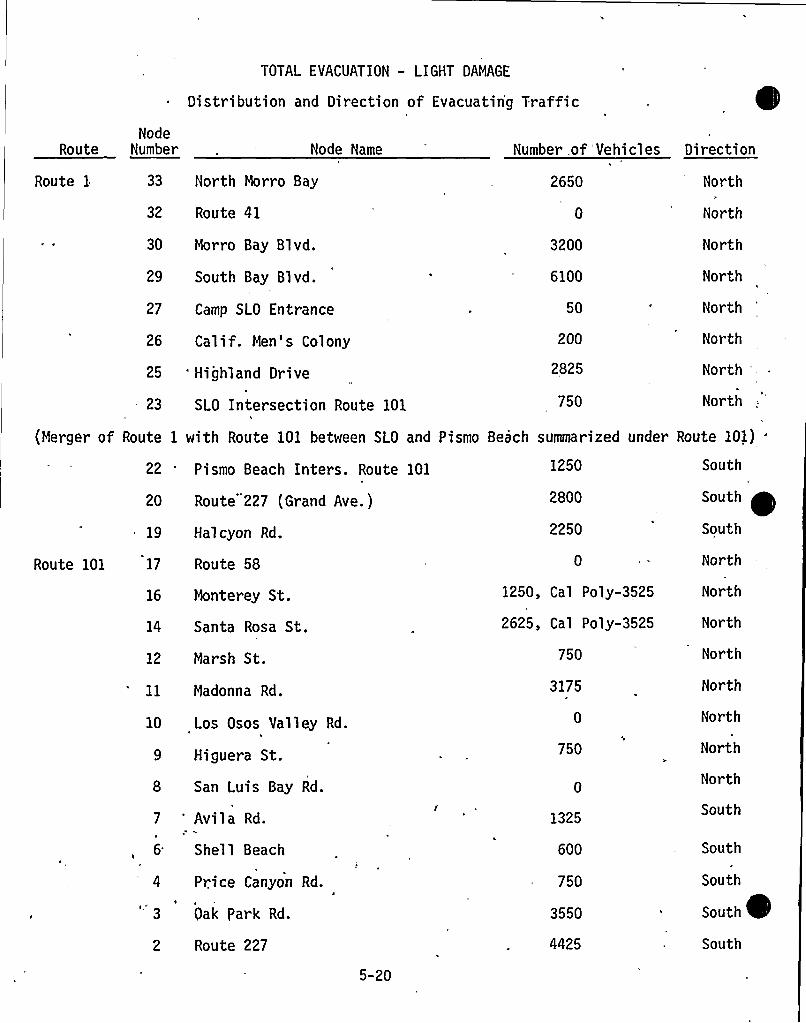
TOTAL EVACUATION - LIGHT DAMAGE
Distribution and Direction of Evacuatin'g Traffic
NodeRoute Number Node Name Number .of 'Vehicles Direction
Route 1 33 North Morro Bay
32 Route 41
30 Morro Bay Blvd.
29 South Bay Blvd.
27 Camp SLO Entrance
26 Calif. Men's Colony
25 Highland Drive
2650
3200
6100
50
200
2825
North
North
North
North
North
North
North
- 23
(Merger of Route
SLO Intersection Route 101
1 with Route 101 between SLO and
750 North
Pismo Beach summarized under Route 101)'2
Pismo Beach Inters. Route 101
20 Route 227 (Grand Ave.)
19 Halcyon Rd.
Route 101 17 Route 58
16 Monterey St.
14 Santa Rosa St.
12 Marsh St.
ll Madonna Rd.
10 Los Osos Valley Rd.
Higuera St.
8 San Luis Bay Rd.
1250
2800
2250
1250, Cal Poly-3525
2625, Cal Poly-3525
750
3)75
750
South
South
South
North
North
North
North
North
North
North
North
6
'3
'vi la Rd.
Shell Beach
Price Canyon Rd.
Oak Park Rd.
1325
600
750
3550
South
South
South
South
2 Route 227 4425 South
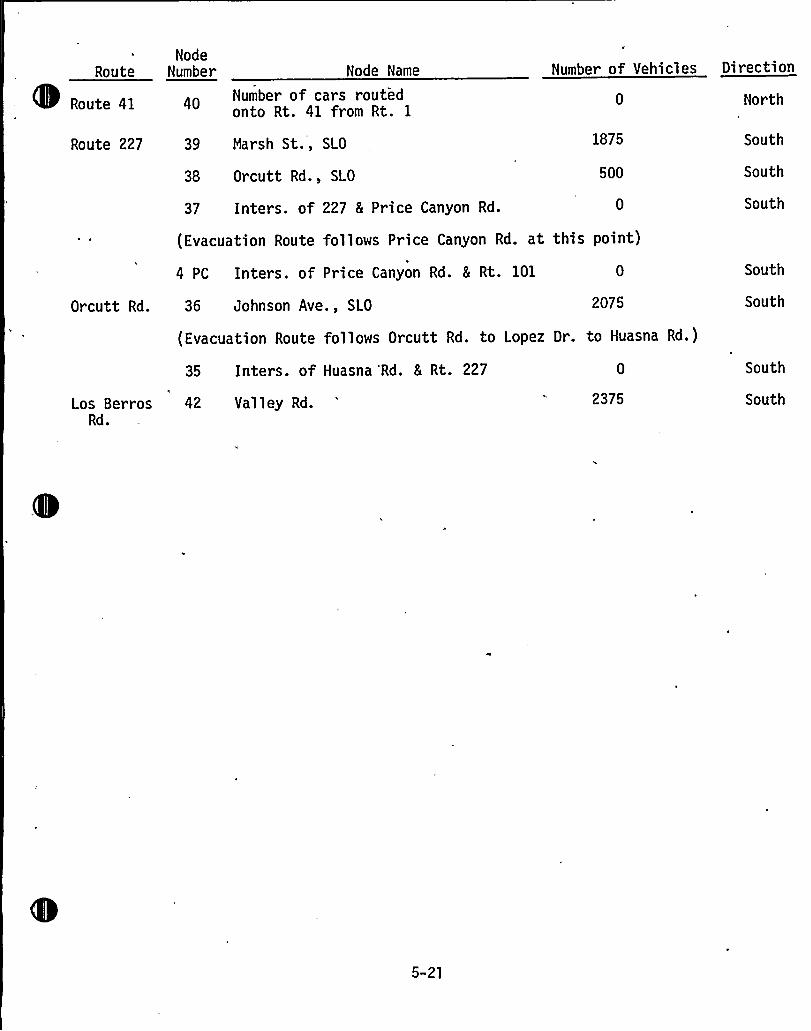
Routefllh%Ã Route 41
Route 227
NodeNumber Node Name
Number of cars routedonto Rt. 41 from Rt. 1
39 Marsh St., SLO
38 Orcutt Rd., SLO
37 Inters. of 227 8 Price Canyon Rd.
1875
500
Nor th
South
South
South
Number of Vehicles Direction
(Evacuation Route follows Price Canyon Rd. at this point)
4 PC Inters. of Price Canyon Rd. 5 Rt. 101 South
Orcutt Rd. 36 Johnson Ave., SLO 2075 South
(Evacuation Route follows Orcutt Rd. to Lopez Dr. to Huasna Rd.)
Los BerrosRd.
35 Inters. of Huasna 'Rd. 8 Rt. 227
42 Valley Rd. 2375
South
South
5-21
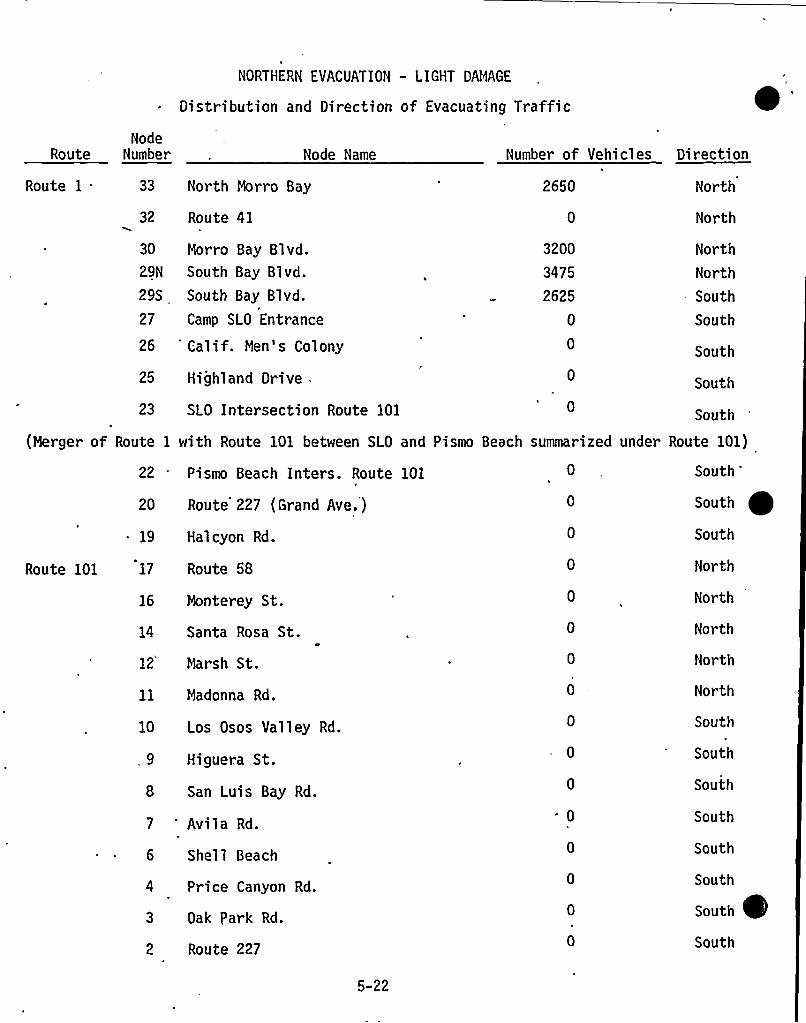
NORTHERN EVACUATION - LIGHT DAMAGE
Distribution and Direction of Evacuating Traffic
NodeRoute Number Node Name Number of Vehicles Direction
Route 1 33 North Morro Bay
32 Route 41
2650 North
North
30
29N
29S
27
Morro Bay Blvd.South Bay Blvd.South Bay Blvd.
Camp SLO Entrance
3200
3475
2625
0
North
North- South
South
26 Calif. Men's Colony South
25
23
(Merger of Route 1
Highland Drive-
SLO Intersection Route 101 0
South
South
with Route 101 between SLO and Pismo Beach summarized under Route 101)
22
20
Pismo Beach Inters. Route 101t
Route 227 (Grand Ave.)
19 Halcyon Rd.
Route 101 17 Route 58
16 Monterey St.
14 Santa Rosa St.
12 Marsh St.
11 Madonna Rd.
10 Los Osos Valley Rd.
, 9 Higuera St.
8 San Luis Bay Rd.
7 Avila Rd.
6 Shell Beach
Price Canyon Rd.
3 Oak Park Rd.
2 Route 227
South
'outh
South
North
North
North
North
North
South
South
South
South
South
South
South
South
5-22

Route
Route 41
NodeNumber Node Name
Number of cars routedonto Rt. 41 from Rt. 1
Number of Vehicles Direction
North
Route 227 39 Marsh St., SLO
38 Orcutt Rd., SLO
37 Inters. of 227 8 Price Canyon Rd.
(Evacuation Route follows Price Canyon Rd. at this point)
4 PC Inters. of Price Canyon Rd. 8 Rt. 101
South
South
South
South
Orcutt Rd. 36 Johnson Ave., SLO
(Evacuation Route follows Orcutt Rd. to Lopez Dr. to Huasna Rd.)
South
Los BerrosRd.
35 Inters. of Huasna Rd. 5 Rt. 227
42 Valley Rd.
South
South
5-23
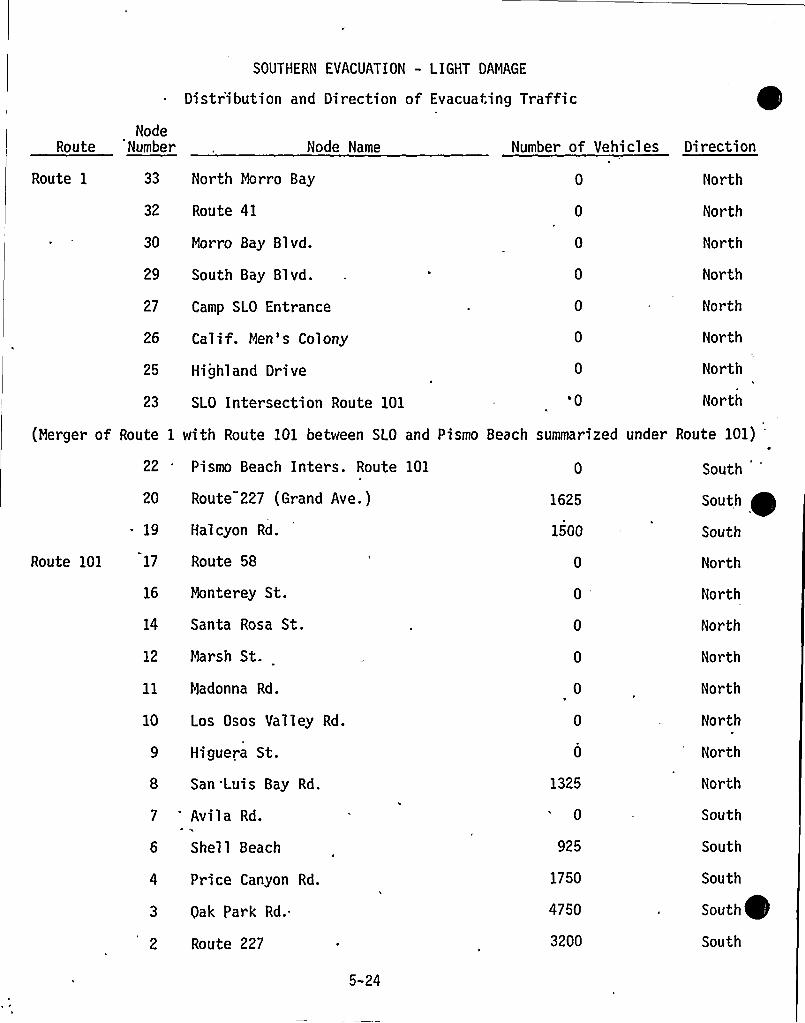
SOUTHERN EVACUATION - LIGHT DAMAGE
Distr'ibution and Direction of Evacuating Traffic
NodeRoute Number Node Name Number of Vehicles Direction
Route 1 33 North Morro Bay
32 Route 41
30 Morro Bay Blvd.
29 South Bay Blvd.
27 Camp SLO Entrance
26 Calif. Men's Colony
25 Highland Drive
23 SLO Intersection Route 101 aO
North
North
North
North
North
North
North
North
(Merger of Route 1 with Route 101 between SLO and Pismo Beach summarized under Route 101)
Route 101
- 19
17
Halcyon Rd.
Route 58
16 Monterey St.
14 Santa Rosa St.
12 Marsh St.
11 Madonna Rd.
10 Los Osos Valley Rd.
Higuera St.
San'Luis Bay Rd.
Avila Rd.
She'l Beach
Price Canyon Rd.
3 Oak Park Rd..
2 Route 227
22 'ismo Beach Inters. Route 101
20 Route 227 (Grand Ave.) 1625
1500
0
1325
925
1750
4750
3200
South
South
South
North
North
North
North
North
North
North
North
South
South
South
South
South
5-24
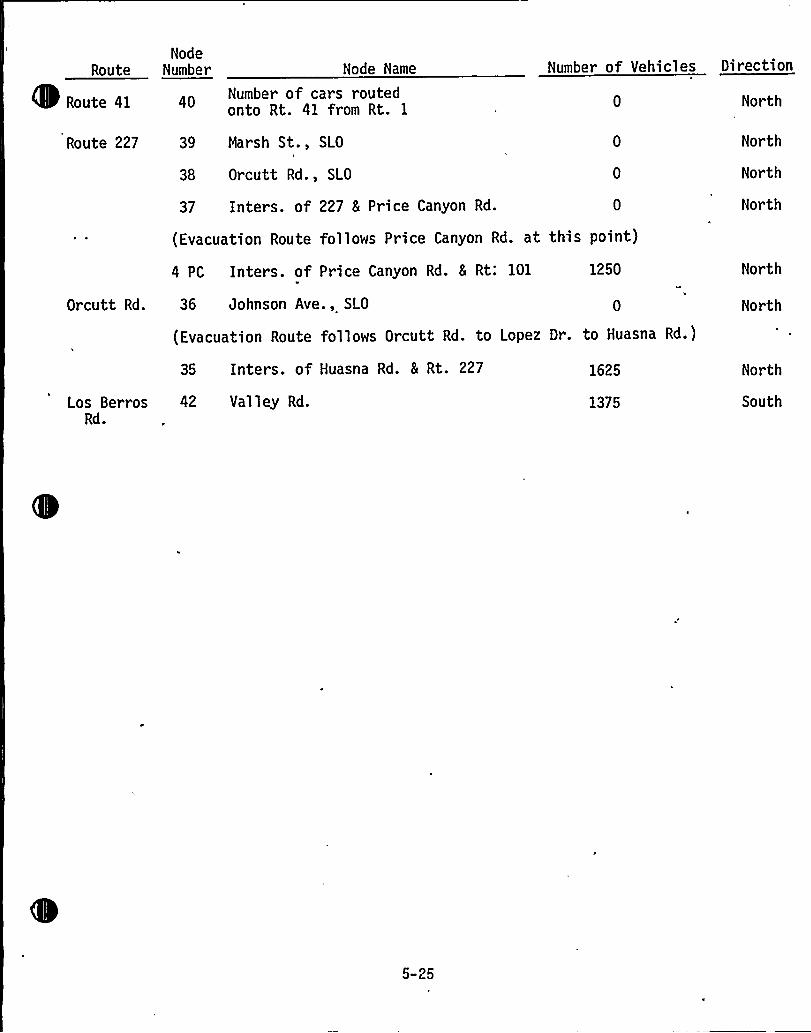
Route
Route 41
NodeNumber Node Name
Number of cars routedonto Rt. 41 from Rt. 1
Number of Vehicles Direction
North
Route 227 39 Marsh St., SLO
38 Orcutt Rd., SLO
37 Inters. of 227 8 Price Canyon Rd.
(Evacuation Route follows Price Canyon Rd. at this point)
North
North
North
4 PC Inters. of Price Canyon Rd. 8 Rt: 101
Orcutt Rd. 36 Johnson Ave., SLO
1250 North
North
(Evacuation Route follows Orcutt Rd. to Lopez Dr. to kuasna Rd.)
Los BerrosRd.
35 Inters. of kuasna Rd. & Rt. 227
42 Valley Rd.
1625
1375
North
South
5-25
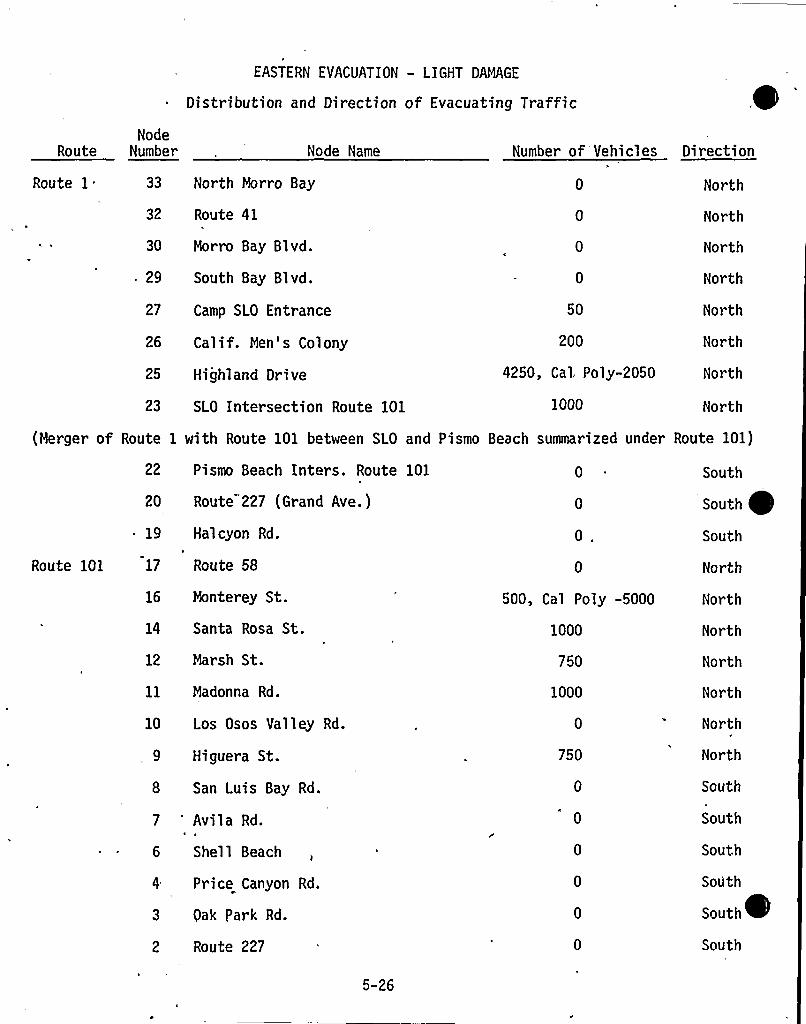
EASTERN EVACUATION - LIGHT DAMAGE
Distribution and Direction of Evacuating Traffic
NodeRoute Number Node Name Number of Vehicles Direction
Route 1 33 North Morro Bay
32 Route 41
30 Morro Bay Blvd.
29 South Bay Blvd.
27 Camp SLO Entrance
26 Calif. Men's Colony
25 Highland Drive
23 SLO Intersection Route 101
50
200
4250, Cal, Poly-2050
1000
North
North
North
North
North
North
North
North
(Merger of Route 1 with Route 101 between SLO and Pismo Beach summarized under Route 101)
22 Pismo Beach Inters. Route 101
20 Route 227 (Grand Ave.)
South
South
19
Route 101 17
Halcyon Rd.
Route 58
0. South
North
16 Monterey St.
14 Santa Rosa St.
12 Marsh St.
ll Madonna Rd.
10 Los Osos Valley Rd.
Higuera St.
8 San Luis Bay Rd.
7 'vila Rd.
6 Shell Beach
Price Canyon Rd.
3 Pak Park Rd.
2 Route 227
500, Cal Poly -5000
1000
750
1000
750
0
North
North
North
North
North
North
South
South
South
South
South
South
5-26
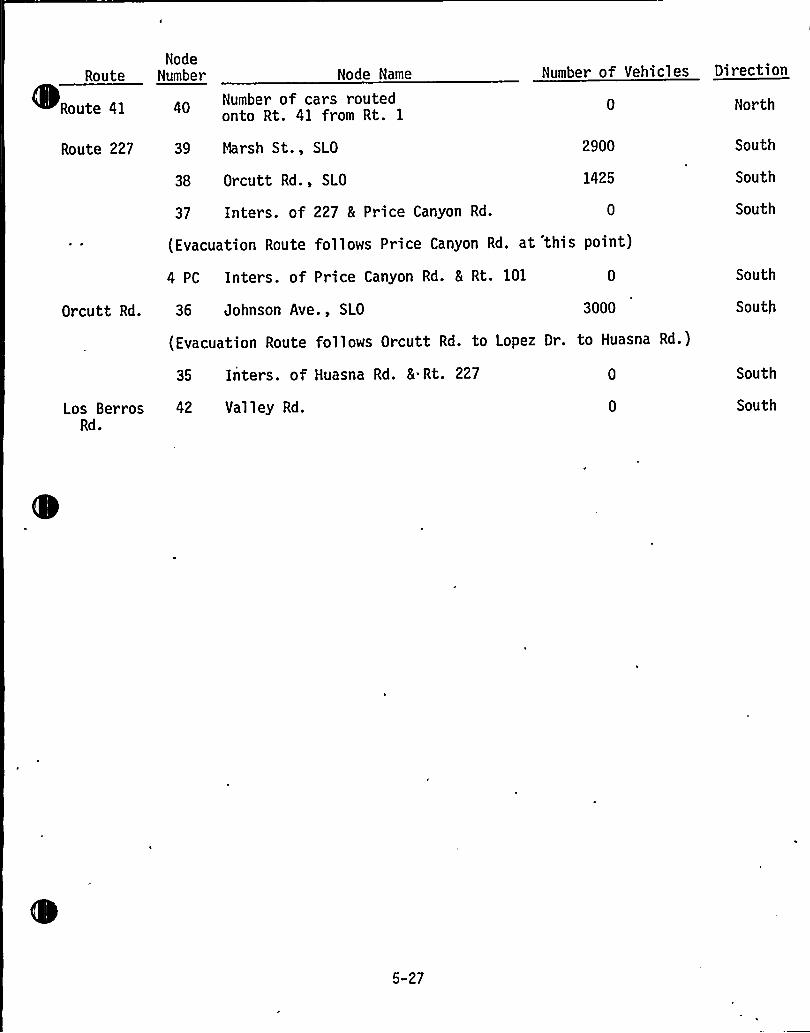
Route
Route 41
NodeNumber Node Name
Number of cars routedonto Rt . 41 from Rt . 1
Number of Vehicles Direction
North
Route 227 39 Marsh St., SLO
38 Orcutt Rd., SLO
37 Inters. of 227 8 Price Canyon Rd.
2900
1425
South
South
South
(Evacuation Route follows Price Canyon Rd. at 'this point)
4 PC Inters. of Price Canyon Rd. 8 Rt. 101 0 South
Orcutt Rd. 36 Johnson Ave., SLO 3000 South
Los Ber rosRd.
(Evacuation Route follows Orcutt Rd. to Lopez Dr. to Huasna Rd.)
35 Inters. of Huasna Rd. 5- Rt. 227
42 Valley Rd.
South
South
5-27
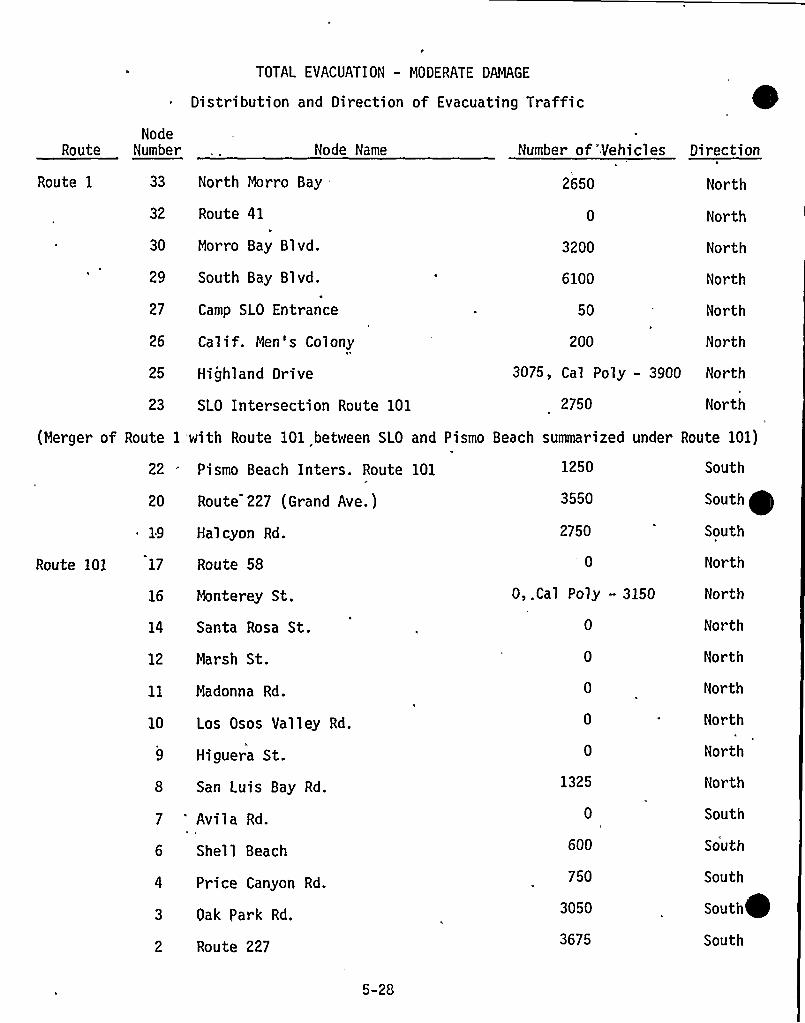
TOTAL EVACUATION - MODERATE DAMAGE
Distribution and Direction of Evacuating Traffic
NodeRoute Number Node Name Number of'Vehicles Direction
Route 1 33 North Morro Bay 2650 North
32
30
Route 41
Morro Bay Bl vd. 3200 North
0 North
29
26
South Bay Blvd.
Camp SLO Entrance
Calif. Men's Colony
6100
50
200
North
North
North
20
19
Route 101 17
16
Pismo Beach Inters. Route 101
Route 227 (Grand Ave.)
Halcyon Rd.
Route 58
Monterey St.
25 Highland Drive
23 SLO Intersection Route 101
(Merger of Route 1 with Route 101 between SLO and
3075, Cal Poly - 3900 North
North
Route 101)
South
South
South
North
North
2750
Pismo Beach summarized under
1250
3550
2750
0
O,,Cal Poly - 3150
14
12
10
Santa Rosa St.
Marsh St.
Madonna Rd.
Los Osos Valley Rd.
Higuera St.
San Luis Bay Rd.
Avila Rd.
1325
North
North
North
North
North
North
South
6 Shell Beach
Price Canyon Rd.
3 Oak Park Rd.
2 Route 227
600
750
3050
3675
South
South
South
South
5-28
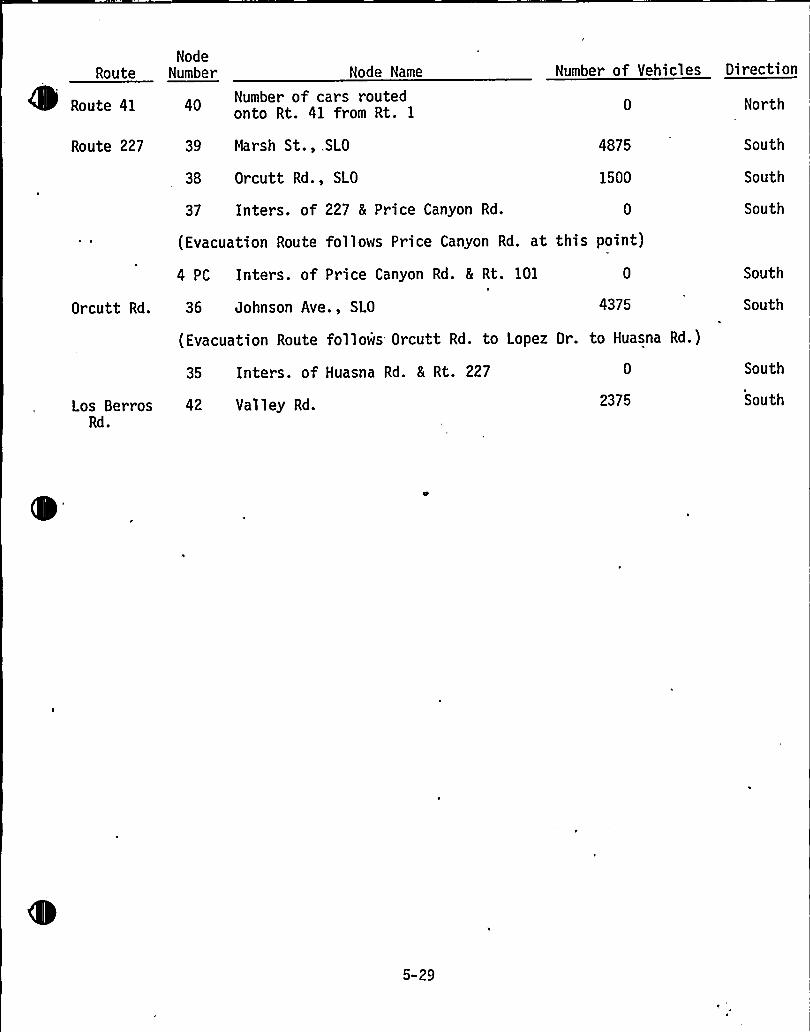
Route
Route 41
NodeNumber Node Name
Number of cars routedonto Rt. 41 from Rt. 1
Number of Vehicles Direction
North
Route 227 39 Marsh St , SLO
38 Orcutt Rd., SLO
37 Inters. of 227 5 Price Canyon Rd.
4875
1500
South
South
South
(Evacuation Route follows Price Canyon Rd. at this point)
Orcutt Rd.
Los BerrosRd.
4 PC Inters. of Price Canyon Rd. 5 Rt. 101k
36 Johnson Ave., SLO
(Evacuation Route follows- Orcutt Rd. to Lopez
35 Inters. of Huasna Rd. 8 Rt. 227
42 Valley Rd.
4375
Dr. to Huasna Rd.)
2375
South
South
South
South
5-29
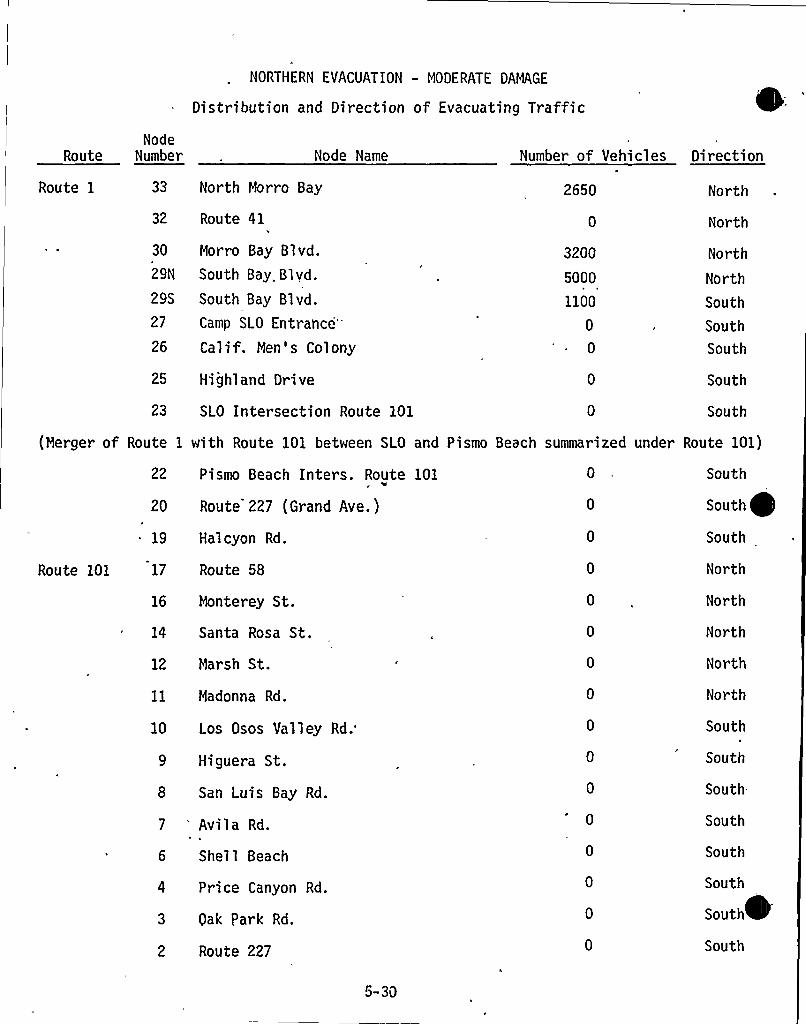
NORTHERN EVACUATION — MODERATE DAMAGE
Distribution and Direction of Evacuating Traffic
NodeRoute Number Node Name Number of Vehicles Direction
Route 1 33 North Morro Bay 2650 North
32
30
29N
29S
27
26
Route 41
Morro Bay Blvd.South Bay, Blvd.
South Bay Blvd.Camp SLO
Entrance'alif.
Men's Colony
3200
5000
1100
North
North
North
South
South
South
25 Highland Drive
23 SLO Intersection Route 101
South
South
{Merger of Route 1 with Route 101 between SLO and Pismo Beach summarized under Route 101)
22
20
Pismo Beach Inters. Route 101
Route 227 (Grand Ave.)
South
South
19 Halcyon Rd.
Route 101 17 Route 58
16 Monterey St.
14 Santa Rosa St.
12 Marsh St.
ll Madonna Rd.
10 Los Osos ValleyRd.'iguera
St.
8 San Luis Bay Rd.
'vila Rd.I
Shell Beach
4 Price Canyon Rd.
3 Pak Park Rd.
2 Route 227
0
South
North
North
North
North
North
South
South
South
South
South
South
South
South
5-30
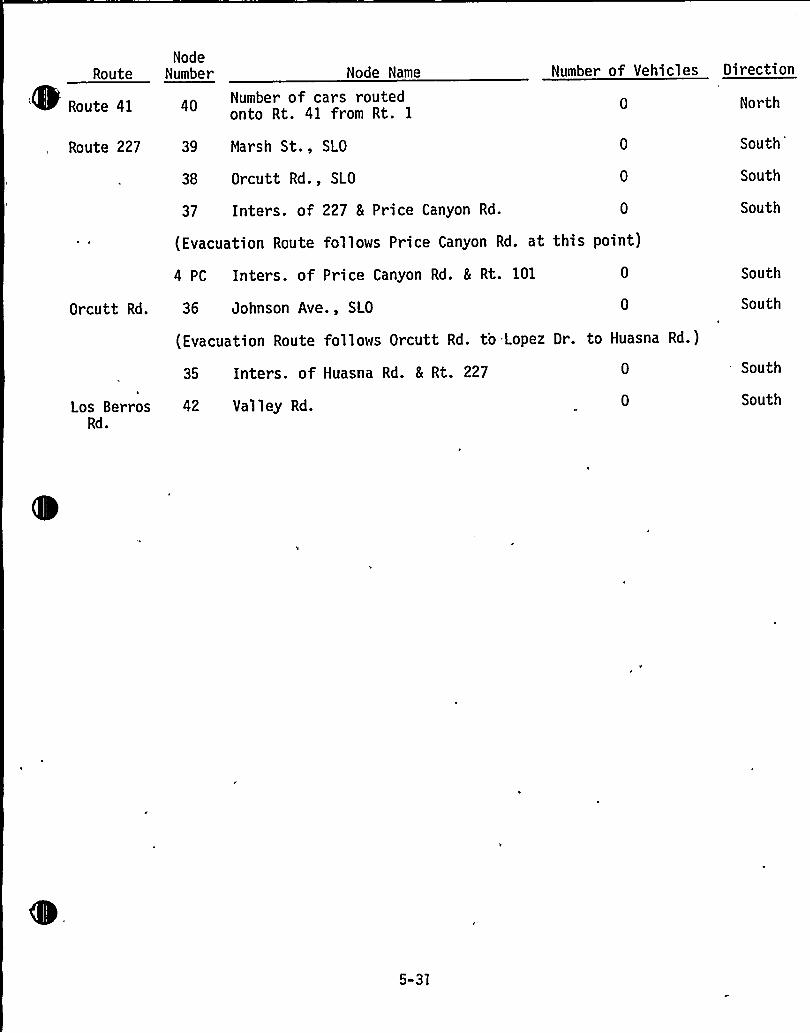
Route
Route 41
NodeNumber Node Name
Number of cars routedonto Rt. 41 from Rt. 1
Number of Vehicles Direction
North
Route 227 39 Marsh St., SLO
38 Orcutt Rd., SLO
37 Inters. of 227 8 Price Canyon Rd.
(Evacuation Route follows Price Canyon Rd. at this point)
4 PC Inters. of Price Canyon Rd. 8 Rt. 101
South'outh
South
South
Orcutt Rd. 36 Johnson Ave., SLO
(Evacuation Route follows Orcutt Rd. to Lopez Dr. to Huasna Rd.)
South
Los BerrosRd.
35 Inters. of Huasna Rd. 8 Rt. 227
42 Valley Rd.
South
South
5-31

SOUTHERN EVACUATION — MODERATE DAMAGE
Distribution and Direction of Evacuating Traffic
NodeRoute Number Node Name Number of Vehicles Direction
Route 1 33 North Morro Bay
32 Route 41
30 Morro Bay Blvd.
29 South Bay Blvd.
27 Camp SLO Entrance
26 Calif. Men's Colony
25 Highland Drive
23 SLO Intersection Route 101
0
0 ~
0
North
North
North
Nor th
North
North
North
North
22 Pismo Beach Inters. Route 101
(Merger of Route 1 with Route 101 between SLO and Pismo Beach summarized under Route 101)
South
20 Route 227 (Grand Ave.)
19 Halcyon Rd.
Route 101 17 Route 58
16 Monterey St.
14 Santa Rosa St.
12 Marsh St.
ll Madonna Rd.
10 Los Osos Valley Rd.
Higuera St.
8 San Luis Bay Rd.
'vila Rd.
Shell Beach
Price Canyon Rd.
3 Oak Park Rd.
2 Route 227
1625
1750
1325
925
2500
4750
4950
Sout
South
North
North
North
North
North
North
North
North
North
North
South
Sout
South
5-32

Route
Route 41
Route 227
NodeNumber Node Name
Number of cars routedonto Rt. 41 from Rt. 1
39 Marsh St., SLO
38 Orcutt Rd., SLO
37 Inters. of 227 8 Price Canyon Rd.
Number of Vehicles Direction
0 North
North
North
North
(Evacuation Route follows Price Canyon Rd. at this point)
4 PC Inters. of Price Canyon Rd. 8 Rt. 101
Orcutt Rd. 36 Johnson Ave., SLO
0 North
North
(Evacuation Route follows Orcutt Rd. to Lopez Dr. to Huasna Rd.)
Los BerrosRd.
35 Inters. of Huasna Rd. 8 Rt. 227
42 Valley Rd. 1500
North
South
5-33
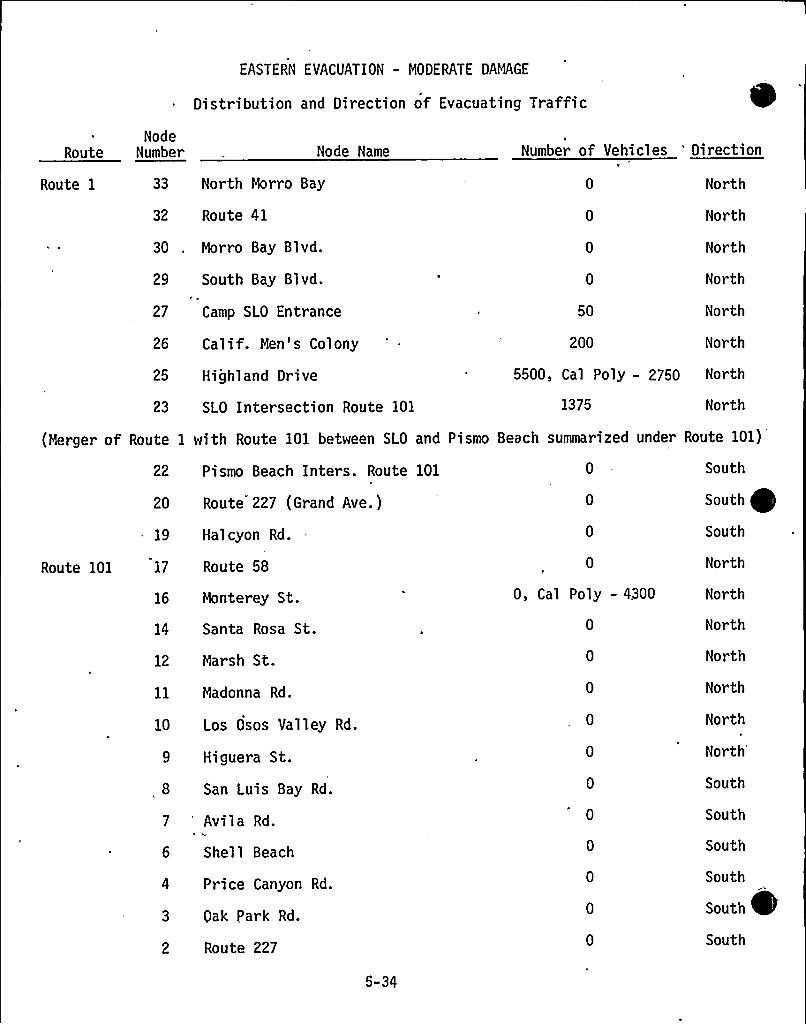
EASTERN EVACUATION — MODERATE DAMAGE
Distribution and Direction of Evacuating Traffic
NodeRoute Number Node Name
I
Number of Vehicles 'irection
29
27
South Bay Blvd.C
Camp SLO Entrance
Route 1 33 North Morro Bay
32 Route 41
30 . Morro Bay Blvd.
50 North
0 North
0 North
0 North
0 North
26 Cal if. Men ' Col ony 200 North
25 Highland Drive 5500, Cal Poly - 2750 North
23 SLO Intersection Route 101 1375 North
(Merger of Route 1 with Route 101 between SLO and Pismo Beach summarized under Route 101)
22 Pismo Beach Inters. Route 101
20 Route 227 (Grand Ave. )
19 Halcyon Rd.
South
South
South
Route 101 17 Route 58 0 North
16 Monterey St.
Santa Rosa St.
12 Marsh St.
ll Madonna Rd.
10 Los Osos Valley Rd.
Higuera St.
, 8 San Luis Bay Rd.
'vila Rd.
Shell Beach
Price Canyon Rd.
3 Oak Park Rd.
2 Route 227
0, Cal Poly - 4300
0
Nor th
North
North
North
North
North
South
South
South
South
South
South
5-34
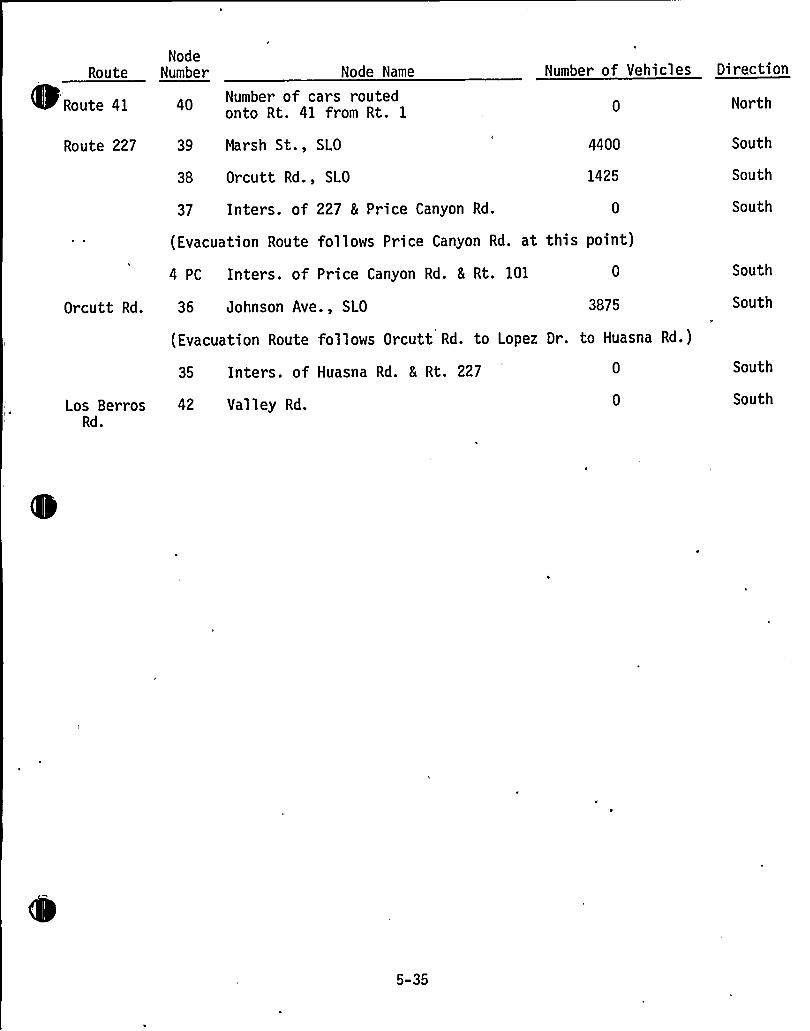
Route
Route 41
NodeNumber Node Name
Number of cars routedonto Rt. 41 from Rt. 1
Number of Vehicles Direction
0 North
Route 227 39 Marsh St., SLO
38 Orcutt Rd., SLO
37 Inters. of 227 5 Price Canyon Rd.
4400
1425
South
South
South
(Evacuation Route follows Price Canyon Rd. at this point)
4 PC Inters. of Price Canyon Rd. & Rt. 101 South
Orcutt Rd. 36 Johnson Ave., SLO 3875 South
Los BerrosRd.
(Evacuation Route follows Orcutt Rd. to Lopez Dr. to Huasna Rd.)
35 Inters. of Huasna Rd. 5 Rt. 227
42 Valley Rd.
South
South
5-35
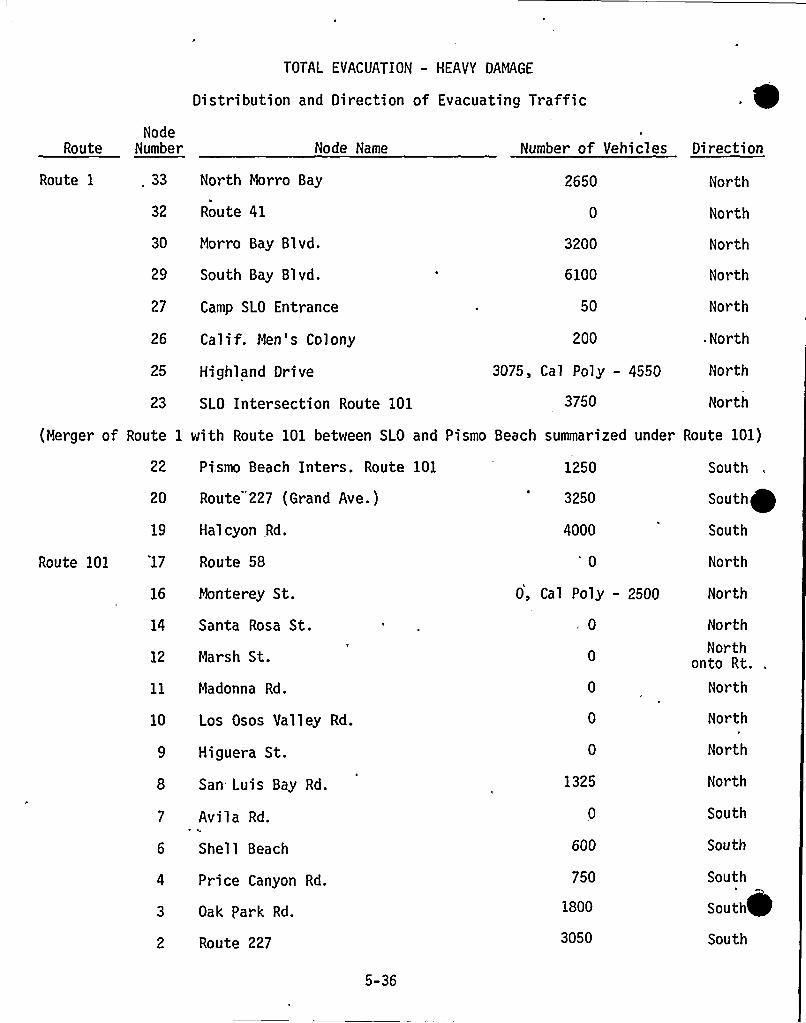
TOTAL EVACUATION - HEAVY DAMAGE
Distribution and Direction of Evacuating Traffic
NodeRoute Number Node Name Number of Vehicles Direction
Route 1 . 33
32
North Morro Bay
Route 41
2650 North
North
30 Morro Bay Blvd.
29 South Bay Blvd.
3200
6100
Nor th
North
27 Camp SLO Entrance 50 North
26 Calif. Men's Colony 200 .North
25 Highland Drive 3075, Cal Poly — 4550 North
23 SLO Intersection Route 101 3750 North
(Merger of Route 1 with Route 101 between SLO and Pismo Beach summarized under Route 101)
22 Pismo Beach Inters. Route 101
20 Route 227 (Grand Ave.)
19 Halcyon Rd.
Route 101 17 Route 58
16 Monterey St.
14 Santa Rosa St.
12 Marsh St.
ll Madonna Rd.
10 Los Osos Valley Rd.
Higuera St.
8 San Luis Bay Rd.
Avila Rd.r
Shell Beach
Price Canyon Rd.
3 Oak Park Rd.
2 Route 227
1250
3250
4000
0
0, Cal Poly - 2500
~ 0
1325
600
750
1800
3050
South
South
South
North
North
NorthNorth
onto Rt.
North
North
North
North
South
South
South
South
South
5-36
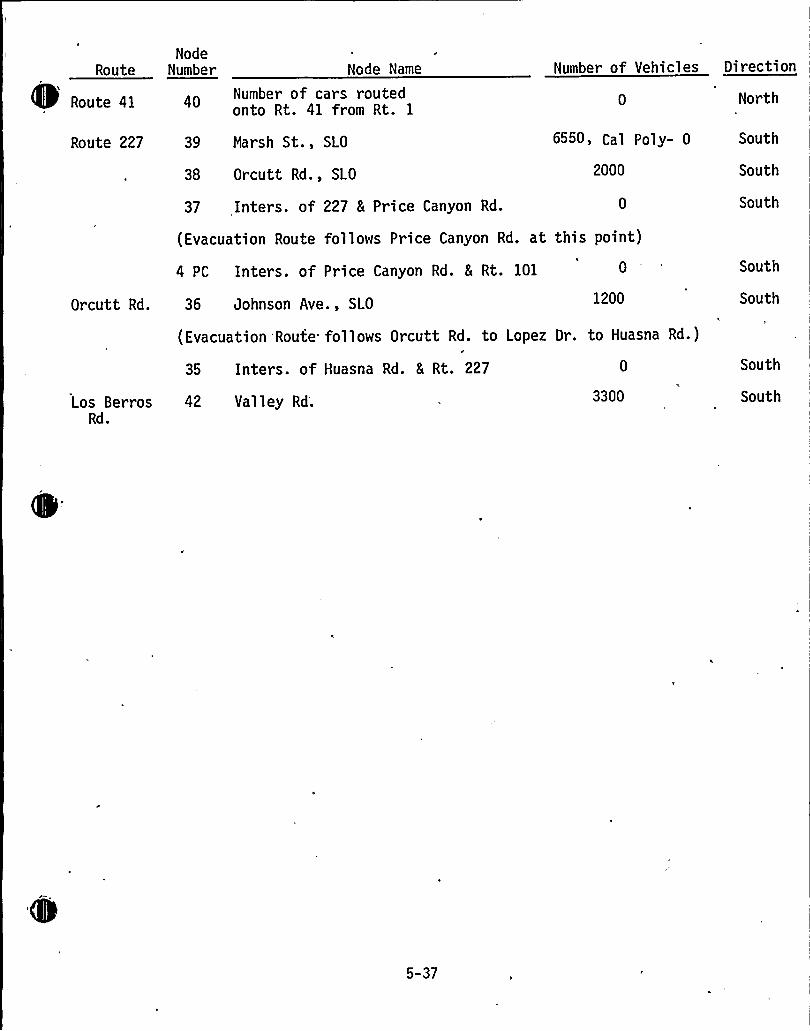
Route
Route 41
NodeNumber Node Name
Number of cars routedonto Rt. 41 from Rt. 1
Number of Vehicles Direction
North
Route 227 39 Marsh St., SLO
38 Orcutt Rd., SLO
37 Inters. of 227 8 Price Canyon Rd.
6550. Cal Poly- 0
2000
South
South
South
(Evacuation Route follows Price Canyon Rd. at this point)
4 PC Inters. of Price Canyon Rd. 8 Rt. 101 South
Orcutt Rd. 36 Johnson Ave., SLO
(Evacuation Route follows Orcutt Rd. to Lopezr
35 Inters. of Huasna Rd. 8 Rt. 227
1200
Dr. to Huasna Rd.)
South
South
Los BerrosRd.
42 Valley Rd; 3300 South
5-37
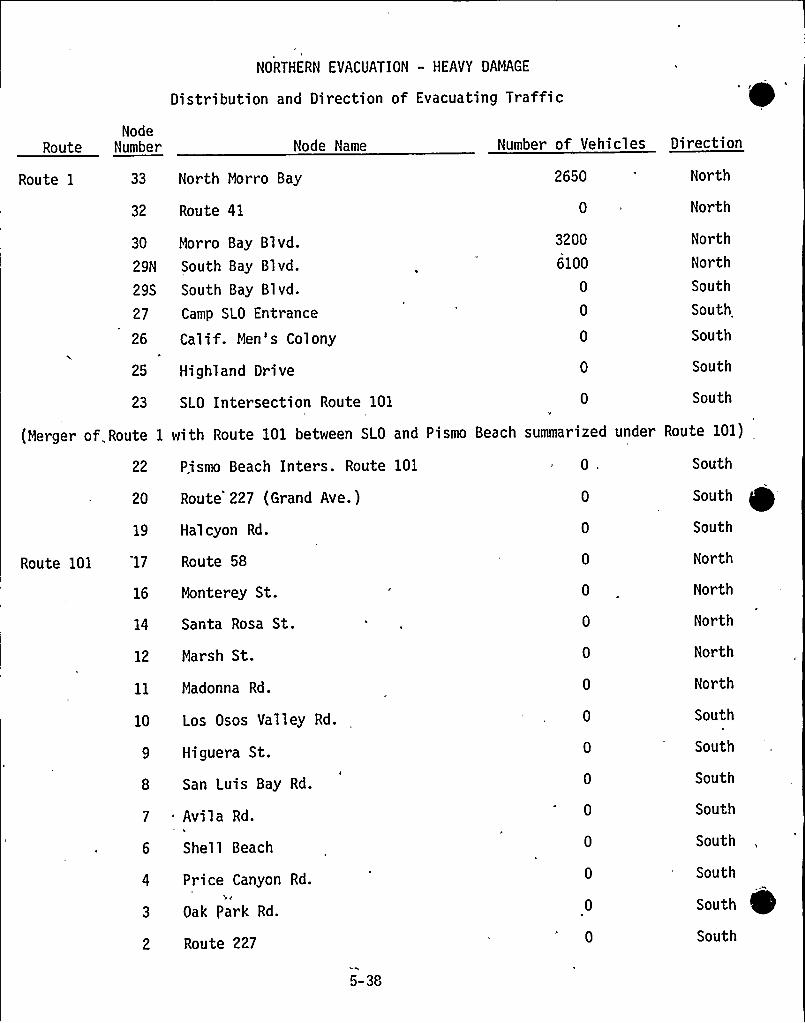
NORTHERN EVACUATION - HEAVY DAMAGE
Distribution and Direction of Evacuating Traffic
NodeRoute Number Node Name Number of Vehicles Direction
Route 1 33 North Morro Bay
32 Route 41
2650 North
North
30
29N
29S
27
26
25
Morro Bay Blvd.South Bay Blvd.
South Bay Blvd.
Camp SLO Entrance
Calif. Men's Colony
Highland Drive
3200
6100
North
North
South
South
South
South
23 SLO Intersection Route 101
(Merger of. Route 1 with Route 101 between SLO and
22 Pismo Beach Inters. Route 101
0
Pismo Beach summarized under
0.
South
Route 101)
South
Route 101
20 Route 227 (Grand Ave.)
19 Halcyon Rd.
17 Route 58
16 Monterey St.
14 Santa Rosa St.
12 Marsh St.
ll Madonna Rd.
10 Los Osos Valley Rd.
Higuera St.
San Luis Bay Rd.
Avi1 a Rd.
Shell Beach
Price Canyon Rd.me
Oak Park Rd.
2 Route 227
0
South
South
North
North
North
North
North
South
South
South
South
South
South
South
South
5-38
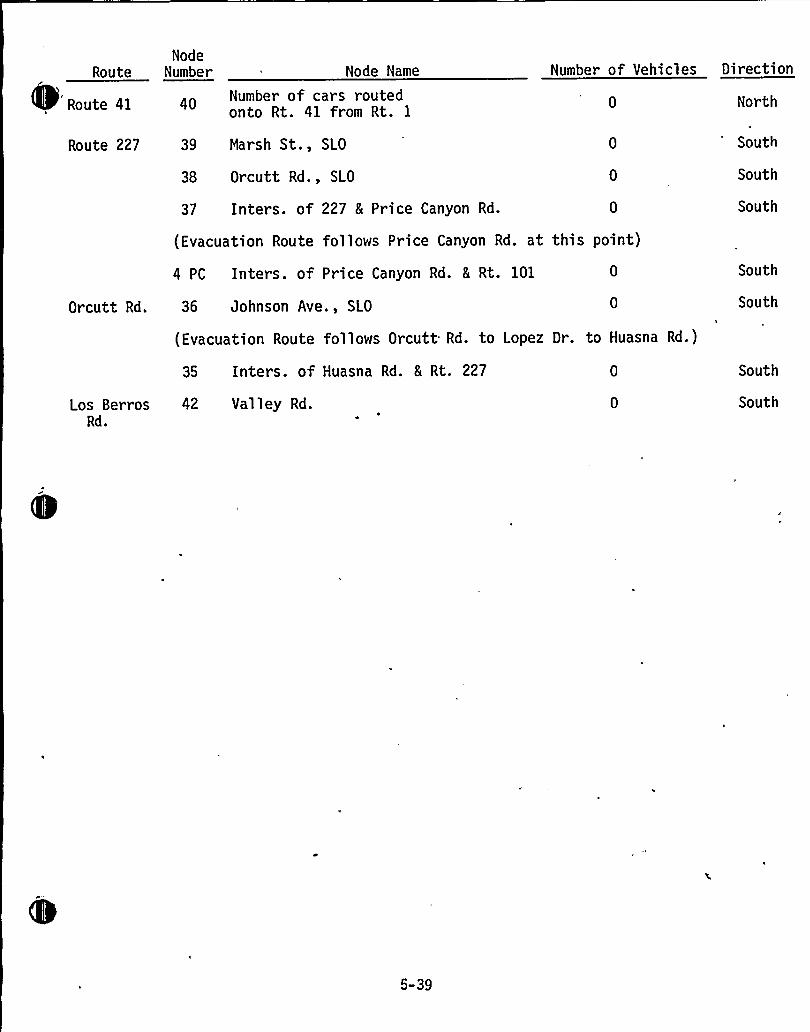
Route
Route 41
NodeNumber Node Name
Number of cars routedonto Rt. 41 from Rt. 1
Number of Vehicles Direction
North
Route 227 39 Marsh St., SLO
38 Orcutt Rd., SLO
37 Inters. of 227 & Price Canyon Rd.
(Evacuation Route follows Price Canyon Rd. at this point)
4 PC Inters. of Price Canyon Rd. 5 Rt. 101
South
South
South
South
Orcutt Rd. 36 Johnson Ave., SLO
(Evacuation Route follows Orcutt Rd. to Lopez Dr. to Huasna Rd.)
South
Los BerrosRd.
35 Inters. of Huasna Rd. 8 Rt. 227
42 Valley Rd.
South
South
5-39
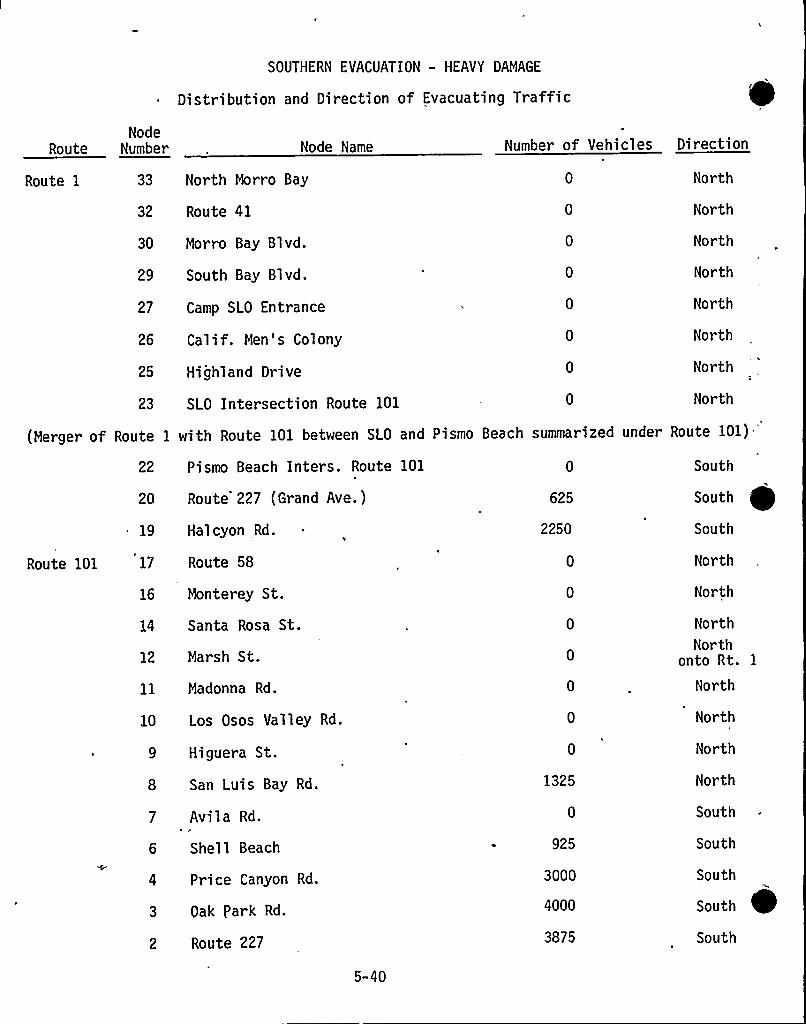
SOUTHERN EVACUATION - HEAVY DAMAGE
Distribution and Direction of Evacuating Traffic
NodeRoute Number Node Name Number of Vehicles Direction
Route 1 33 North Morro Bay
32 Route 41
30 Morro Bay Blvd.
29 South Bay Blvd.
27 Camp SLO Entrance
26 Calif. Men's Colony
25 Highland Drive
23 SLO Intersection Route 101
North
Nor th
North
North
North
North
North
North
(Merger of Route 1 with Route 101 between SLO and Pismo Beach summarized under Route 101)-
Route 101
22 Pismo Beach Inters. Route 101
20 Route 227 (Grand Ave. )
19 Halcyon Rd.
17 Route 58
16 Monterey St.
14 Santa Rosa St.
12 Marsh St.
ll Madonna Rd.
10 Los Osos Valley Rd.
Higuera St.
8 San Luis Bay Rd.
Avi1 a Rd.
Shell Beach
Price Canyon Rd.
3 Oak Park Rd.
2 Route 227
5-40
625
2250
1325
925
3000
4000
3875
South
South
South
North
North
NorthNorth
onto Rt. 1
North
North
North
North
South
South
South
South
South
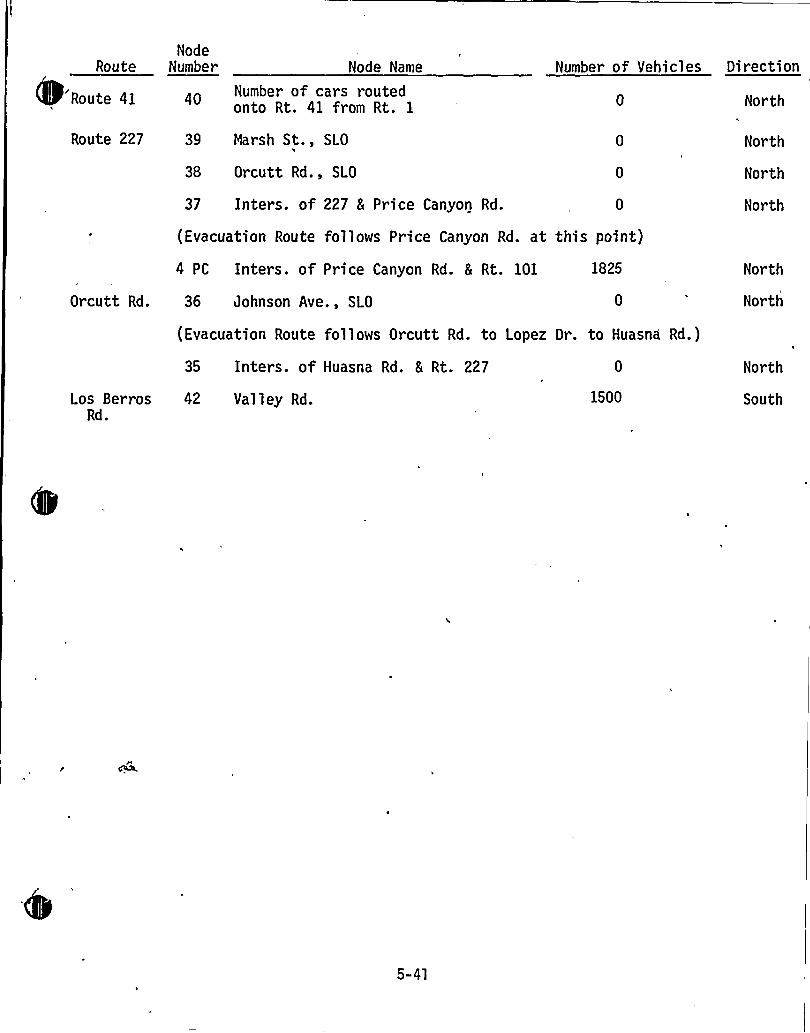
Route
Route 41
NodeNumber Node Name
Number of cars routedonto Rt. 41 from Rt. 1
Number of Vehicles Direction
North
Route 227 39 Marsh St., SLO
38 Orcutt Rd., SLO
37 Inters. of 227 5 Price Canyon Rd.
(Evacuation Route follows Price Canyon Rd. at this point)
North
North
North
4 PC Inters. of Price Canyon Rd. 5 Rt. 101
Orcutt Rd. 36 Johnson Ave., SLO
1825 North
North
(Evacuation Route follows Orcutt Rd. to Lopez Dr. to Huasna Rd.)
Los BerrosRd.
35 Inters. of Huasna Rd. 8 Rt. 227
42 Valley Rd. 1500
Nor th
South
5-41
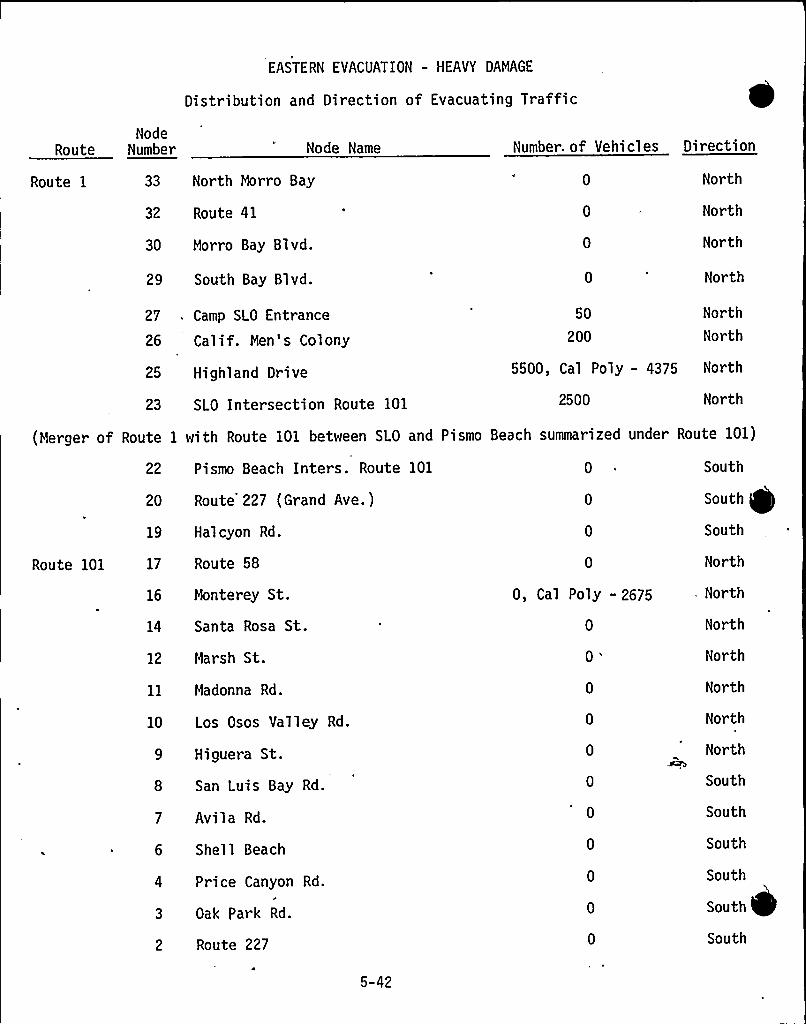
EASTERN EVACUATION - HEAVY DAMAGE
Distribution and Direction of Evacuating Traffic
NodeRoute Number Node Name Number. of Vehicles Direction
Route 1 33 North Morro Bay
32 Route 41
30 Morro Bay Blvd.
29 South Bay Blvd.
North
Nor th
North
North
27
26
. Camp SLO Entrance
Calif. Men's Colony
50
200
North
Nor th
25 Highland Drive
23 SLO Intersection Route 101 2500 North
5500, Cal Poly - 4375 North
(Merger of Route 1 with Route 101 between SLO and Pismo Beach summarized under Route 101)
22 Pismo Beach Inters. Route 101
20 Route 227 (Grand Ave.)
19 Halcyon Rd.
Route 101 17 Route 58
16 Monterey St.
14 Santa Rosa St.
12 Marsh St.
11 Madonna Rd.
10 Los Osos Valley Rd.
Higuera St.
8 San Luis Bay Rd.
7 Avila Rd.
6 Shell Beach
Price Canyon Rd.
Oak Park Rd.
2 Route 227
0
0, Cal Poly - 2675
0
South
South
South
North
North
North
North
North
North
North
South
South
South
South
South
South
5-42
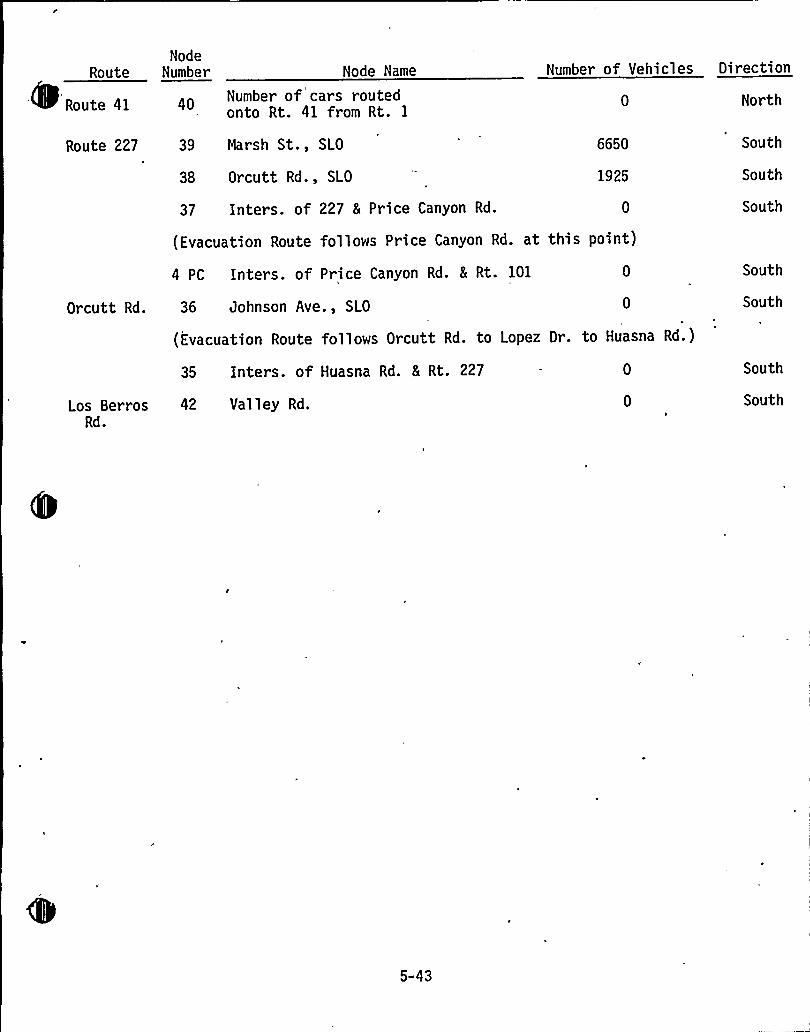
Route
Route 41
NodeNumber Node Name
Number of cars routedonto Rt. 41 from Rt. 1
Number of Vehicles Direction
0 North
Route 227 39 Marsh St., SLO
38 Orcutt Rd., SLO
37 Inters. of 227 5 Price Canyon Rd.
6650
1925
South
South
South
(Evacuation Route follows Price Canyon Rd. at this point)
4 PC Inters. of Price Canyon Rd. 5 Rt. 101
Orcutt Rd. 36 Johnson Ave., SLO
(Evacuation Route follows Orcutt Rd. to Lopez Dr. to Huasna Rd.)
South
South
Los BerrosRd.
35 Inters. of Huasna Rd. 5 Rt. 227
42 Valley Rd.
South
South
5-43

~, I'
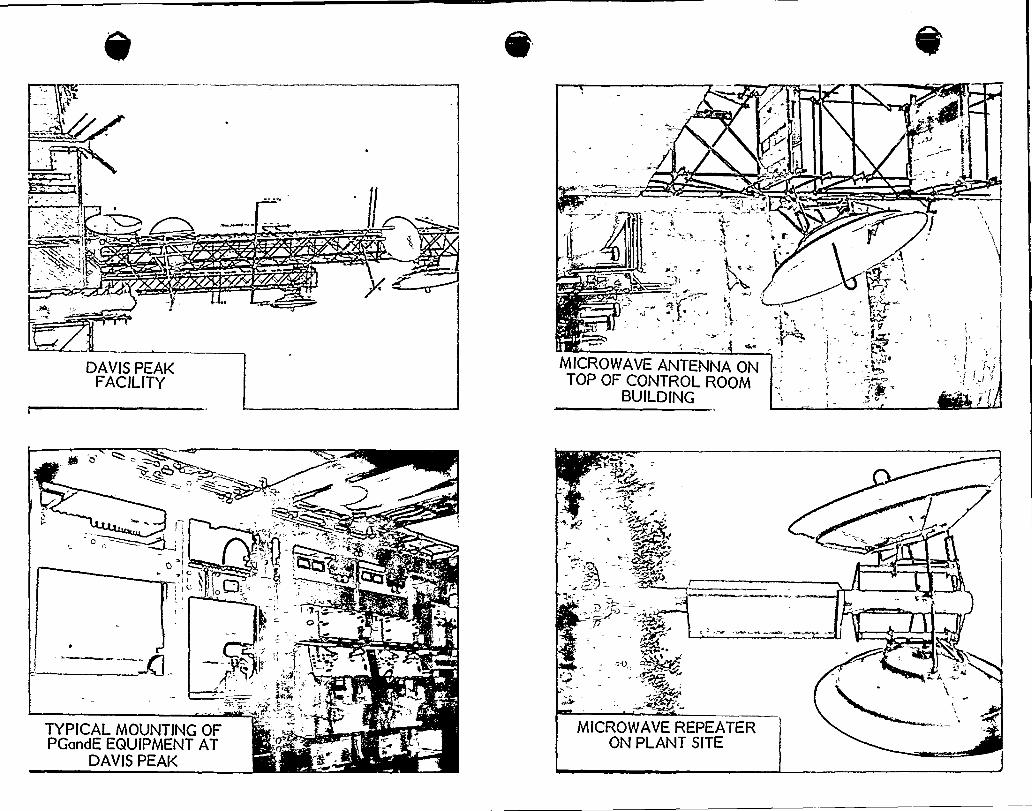
DAVIS PEAKFACILITY
MICROWAVE ANTENNA ONTOP OF CONTROL ROOM
BUILDING
'u >I /
gc
TYPICALMOUNTING OFPGandE EQUIPMENT AT
DAVIS PEAK
MICROWAVEREPEATERON PLANT SITE
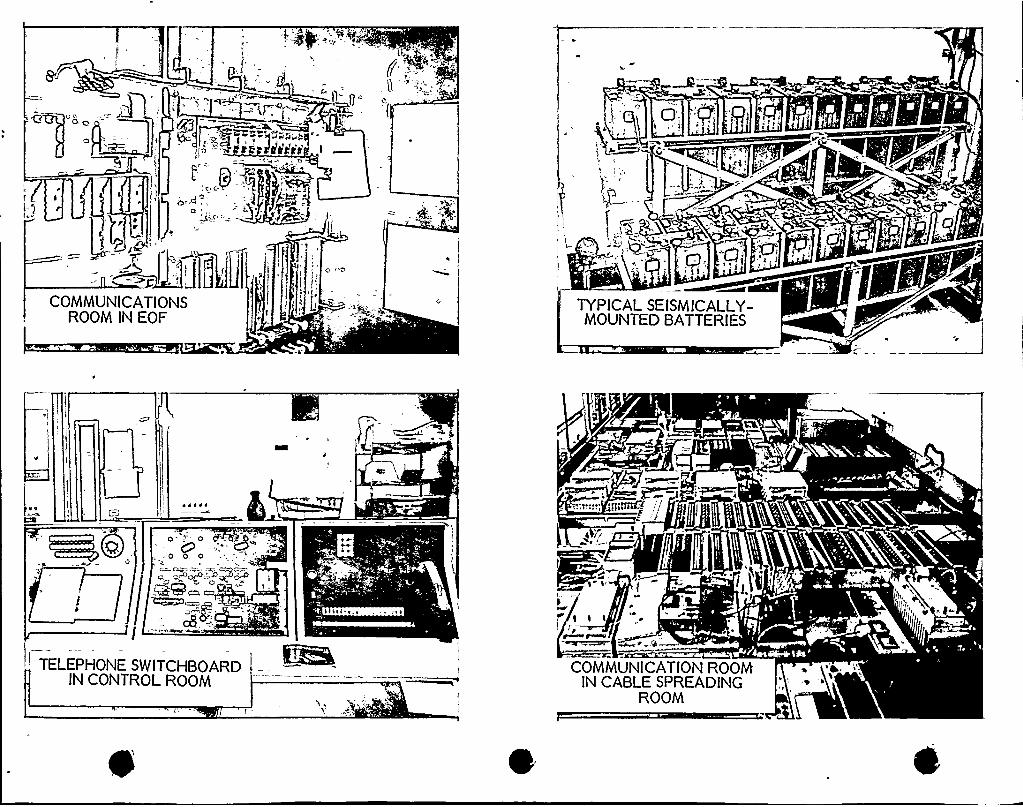
A'.
---..'1%COMMUNICATIONS
ROOM IN EOF
A~3*
i
TYPICALSEISMICALLY-MOUNTED BATTERIES
~ 0 ~ 4I
. ~Qa4Q
a8, =--
l »4 ~ . ~ . ~ << I
TELEPHONE SWITCHBOARDIN CONTROL ROOM
COMMUNICATIONROOIAIN CABLE SPREADING
ROOM
0