public street cctv: a psychometric study of social risk
TRANSCRIPT
1
CHAPTER 1
INTRODUCTION
There was of course no way of knowing whether you were being watched at any given moment...You had to live ... did live, from habit that became instinct ... in the assumption that … except in darkness, every movement [is] scrutinised (Orwell, 1954, p. 6).
1.1 Introduction
Orwell wrote Nineteen Eighty Four long before public street CCTV surveillance became relatively
common place within society; nevertheless, is Orwell’s novel relevant in today’s society? With current
infrared camera technology, even darkness cannot provide protection from surveillance. Public street
surveillance has grown enormously, and is becoming common place and increasingly popular within
society (Privacy International, 2002; Banisar & Davies, 2000; Maley, 2000; Norris & Armstrong, 1999;
Short & Ditton, 1998).
This chapter presents the background, significance and purpose of the study. Public street surveillance
risk perception issues are discussed, including the professionalism of the security industry, type and
extent of media coverage, the social risk perception of public street surveillance, public awareness,
privacy and civil concerns, legislation and changing technology. The research outcomes, research
questions and an overview of the method of study are given. This chapter concludes with the closed
circuit television (CCTV) domains and the study’s definition of terms.
1.2 Background of study
Public street surveillance is often portrayed as the all purpose security tool that will greatly enhance the
level of protection of personnel and asset against risk. The security industry prompts the high
performance of public street surveillance, with a typical example being “CCTV continues to be the
buzz word around the country, most councils look to the Brisbane experience for arguments to
convince ratepayers of the importance of the gadgetry” (Adam, 1998, p. 30). The media does not report
negative or ineffective system findings, instead only practitioner led claims of success (Norris &
Armstrong, 1999). It can be argued that the majority of CCTV media coverage is of a positive nature,

2
with little or virtually no adverse media coverage. This frequent positive media coverage increases the
introduction of public street surveillance into society (Brooks & Smith, 2002).
Research has shown that public street surveillance provides a decrease in levels of crime (Adam, 1998;
Horne, 1998); however, research has also shown that this may only be for a short period of time and
only in certain crime categories (Norris & Armstrong, 1999; Painter & Tilley, 1999; Ditton, 1999;
Short & Ditton, 1998; Waters, 1996; Brown, 1995; Tilley, 1993). Society views public street
surveillance as a social benefit, which outweighs the perceived social risk. Moreover, it can be argued
that society does not fully understand public street surveillance capability, as the layperson has only a
limited awareness and exposure of public street surveillance, reinforced through the media. This
restricted understanding may leave public street surveillance prone to sudden risk perception change,
towards possible adverse social risk perception. Therefore, it is important that there is a method to
measure social risk perception and hence, social acceptance of public street surveillance.
1.2.1 Risk perception issues
What issues could change the risk perception of society towards public street surveillance? It can be
argued that it will not be a single incident nor will it be immediate, but that changes will be slight and
extend over a period of time. Issues that could change the risk perception of public street surveillance
include:
� Professionalism of the security industry, as a concern raised by Tate (1997) and the way in which
the industry manages, operates and promotes all types of CCTV;
� Type and extent of media coverage of both CCTV and public street surveillance;
� Perceived and applied effectiveness of legislation to control both CCTV and public street
surveillance;
� Level of understanding individuals, groups and communities have of both CCTV and public street
surveillance;
� Level of protection both CCTV and public street surveillance actually provides or is perceived to
provide;
� Level of actually or perceived social control of both CCTV and public street surveillance; and
� Community concern over civil and privacy issues.
3
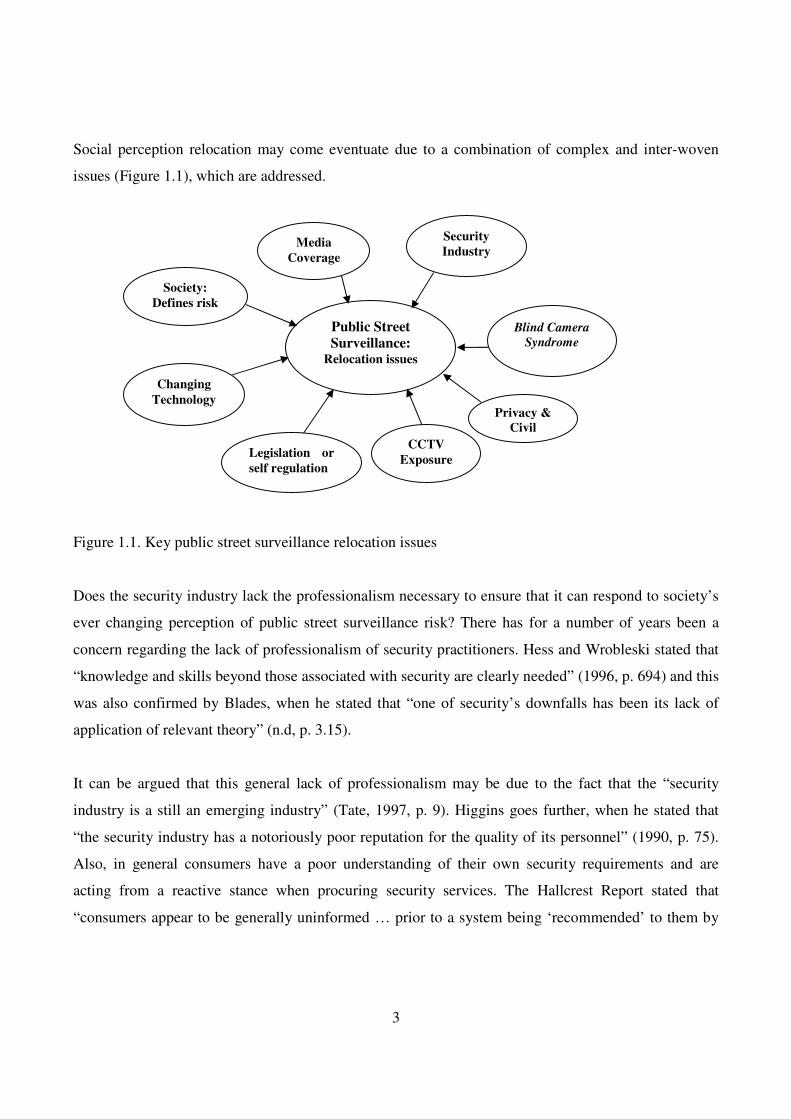
Social perception relocation may come eventuate due to a combination of complex and inter-woven
issues (Figure 1.1), which are addressed.
Figure 1.1. Key public street surveillance relocation issues
Does the security industry lack the professionalism necessary to ensure that it can respond to society’s
ever changing perception of public street surveillance risk? There has for a number of years been a
concern regarding the lack of professionalism of security practitioners. Hess and Wrobleski stated that
“knowledge and skills beyond those associated with security are clearly needed” (1996, p. 694) and this
was also confirmed by Blades, when he stated that “one of security’s downfalls has been its lack of
application of relevant theory” (n.d, p. 3.15).
It can be argued that this general lack of professionalism may be due to the fact that the “security
industry is a still an emerging industry” (Tate, 1997, p. 9). Higgins goes further, when he stated that
“the security industry has a notoriously poor reputation for the quality of its personnel” (1990, p. 75).
Also, in general consumers have a poor understanding of their own security requirements and are
acting from a reactive stance when procuring security services. The Hallcrest Report stated that
“consumers appear to be generally uninformed … prior to a system being ‘recommended’ to them by
Media Coverage
Public Street
Surveillance: Relocation issues
Security
Industry
Society:
Defines risk
Changing
Technology
Legislation or
self regulation
CCTV
Exposure
Blind Camera Syndrome
Privacy &
Civil
4
the alarm company” (Cunningham & Taylor, 1985, p. 252). There is a requirement to take a social
view of both CCTV and public street surveillance, as it may be claimed that the industry does not have
the necessary level of professionalism to achieve this.
Nevertheless, the expansion of public street surveillance has been unprecedented (Privacy
International, 2002; Norris & Armstrong, 1999; Banisar & Davies, 2000; Short & Ditton, 1998) and
will continue to increase. As Harowitz claimed “expenditure for CCTV equipment have tripled during
the 1990’s and are expected to increase 13% per year over the coming years” (2000, p. 43). This
expansion will increase public exposure and media attention, resulting in the public becoming far more
educated about public street surveillance and in particular, CCTV. The media will focuses on special
interest groups and dramatise issues, which will further highlight failures. As Covello, Sandman and
Slovic stated, “the media are prime transmitters of information on risks. … are generally more
interested in politics than in risk; more interested in simplicity than complexity; and more interested in
danger than safety” (1989, p. 303).
Does the public really understand public street surveillance? It can be argued that at the present
moment they do not. Waters stated that the “chilling effect of surveillance is difficult to quantify, but is
clearly recognised by the public” (1996, p. 1). However this view may be opposed, as the limited
research on the subject of CCTV has found that people feel safer within the coverage of public street
surveillance systems (Ditton, 1999). Also if public street surveillance is so chilling, why does society
continue to accept public street surveillance in their environment?
The general perception of public street surveillance is that the public support these systems, that it
improves safety and is a social concern only among the minority. But this social acceptance appears to
be reducing and is not robust (Painter & Tilley, 1999). In Dundee (UK), after public street surveillance
was installed in the city centre, a survey found that 96% of those surveyed thought that public street
surveillance would not infringe on civil liberties (Horne, 1998). Research by Ditton found that “67% …
did not mind being observed by street cameras” (1999, p. 1). However, a recent telephone survey found
that only 63% of adults favoured expanded public street surveillance (France, Green, Kerstetter, Black,
Salkever & Carney, 2001). Norris and Armstrong (1999) raised concern over these high levels of
5
public street surveillance support, demonstrating that the question context can reduce this level of
measured public support. Nevertheless, it does appear that the community supports public street
surveillance and considers it a social benefit, which outweighs the risk and therefore, proves
acceptable.
It can be argued that with increasing exposure to public street surveillance and a growing public
awareness, this view may alter. Slovic, Fischhoff and Lichtenstein reinforced this, when they stated that
the “frequent discovery of new hazards and the widespread publicity they receive is causing more and
more individuals to see themselves as the victims, rather than the beneficiaries, of technology” (1986,
p. 3). As Thompson discussed, “an individuals perception of … risk can change. So can the level of
risk that they are prepared to accept. These changes, which can be large, sudden and widely spread
within a population” (1982, p. 62). A number of authors have raised concern over the social affect of
CCTV surveillance (Ditton, 1999; Davies, 1998; Tomkins, 1998; Waters, 1996), as society defines its
own level of risk, not the expert or industry (Slovic, 1992).
Legislation provides little social protection against public street CCTV surveillance. Relevant Western
Australian legislation includes the Privacy Act 1988, Security & Related Activities (Control) Act 1996,
Evidence Act 1995 and the Surveillance Devices Act 1998. There was a belief that public street
surveillance privacy issues are covered by the Privacy Act 1988 (Privacy Commission Tenth Annual
Report, 1998). The Act does not provide protection, when Commonwealth government agencies are
“collecting, storing, using and disclosing personal information” (Privacy Commission, 1999). The
Australian Privacy Commission Tenth Annual Report stated that “Optical Surveillance” rated 6.9% of
enquires outside their jurisdiction (Privacy Commission, 1998, p. 45).
It can be argued that legislation generally lags behind social concerns and that society perceives
legislation as lacking in its ability to provide sufficient protection. As Slovic, et al., stated, the “gap
between perceived and desired risk levels suggest that people are not satisfied with the way the market
and other regulatory mechanisms have balanced risks and benefits” (1986, p. 5). The Select Committee
on Science and Technology summarised that “case law is too slow a process to generate the required
degree of legal confidence in time to keep pace with developments in digital imaging technology.”
6
(Home Office, 1998, Section 5.8). This leaves legislation lagging behind technology in general and
applied public street CCTV surveillance technology.
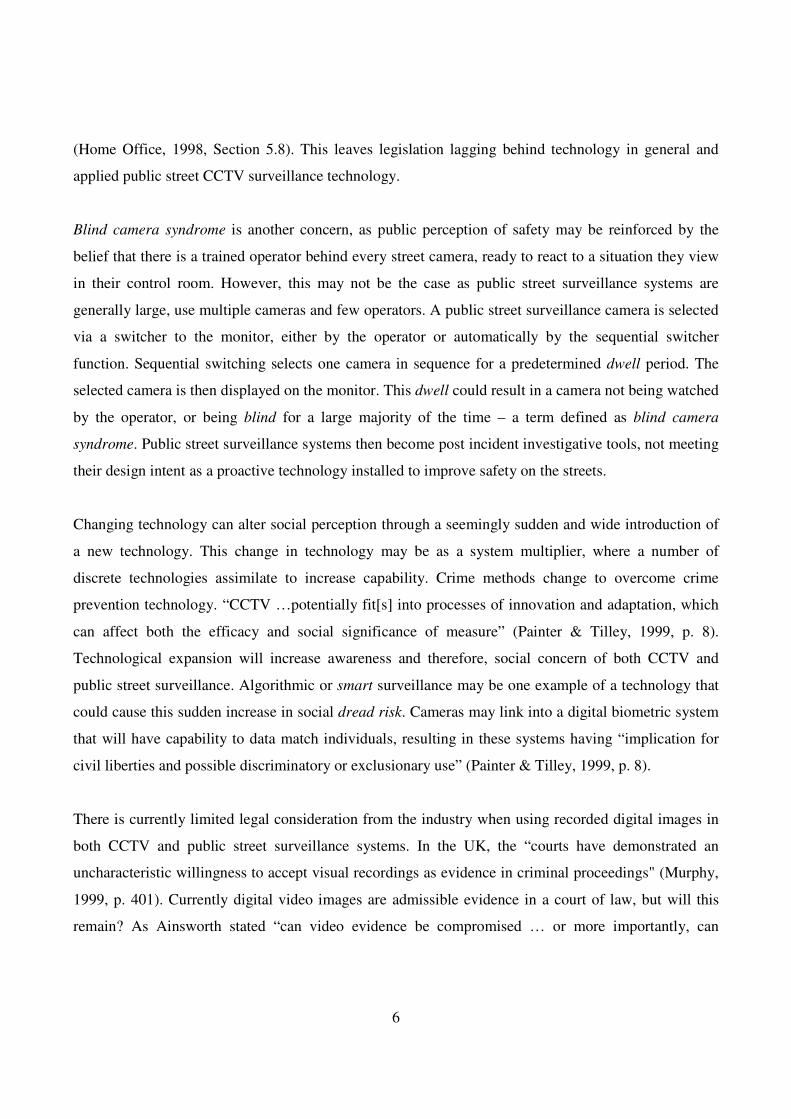
Blind camera syndrome is another concern, as public perception of safety may be reinforced by the
belief that there is a trained operator behind every street camera, ready to react to a situation they view
in their control room. However, this may not be the case as public street surveillance systems are
generally large, use multiple cameras and few operators. A public street surveillance camera is selected
via a switcher to the monitor, either by the operator or automatically by the sequential switcher
function. Sequential switching selects one camera in sequence for a predetermined dwell period. The
selected camera is then displayed on the monitor. This dwell could result in a camera not being watched
by the operator, or being blind for a large majority of the time – a term defined as blind camera
syndrome. Public street surveillance systems then become post incident investigative tools, not meeting
their design intent as a proactive technology installed to improve safety on the streets.
Changing technology can alter social perception through a seemingly sudden and wide introduction of
a new technology. This change in technology may be as a system multiplier, where a number of
discrete technologies assimilate to increase capability. Crime methods change to overcome crime
prevention technology. “CCTV …potentially fit[s] into processes of innovation and adaptation, which
can affect both the efficacy and social significance of measure” (Painter & Tilley, 1999, p. 8).
Technological expansion will increase awareness and therefore, social concern of both CCTV and
public street surveillance. Algorithmic or smart surveillance may be one example of a technology that
could cause this sudden increase in social dread risk. Cameras may link into a digital biometric system
that will have capability to data match individuals, resulting in these systems having “implication for
civil liberties and possible discriminatory or exclusionary use” (Painter & Tilley, 1999, p. 8).
There is currently limited legal consideration from the industry when using recorded digital images in
both CCTV and public street surveillance systems. In the UK, the “courts have demonstrated an
uncharacteristic willingness to accept visual recordings as evidence in criminal proceedings" (Murphy,
1999, p. 401). Currently digital video images are admissible evidence in a court of law, but will this
remain? As Ainsworth stated “can video evidence be compromised … or more importantly, can
7
alluding to this possibility raise the issue of reasonable doubt” (1997, p. 101). Rieger and Rode further
reinforced this issue when they stated that “it is likely that the susceptibility of digital images to
manipulation will lead to increasing doubt with respect to the authenticity of … images in the era of
digital data processing” (1999, p. 262).
For public street surveillance digital video images to remain admissible requires transparency of
process and a holistic approach in the management, application and use of public street surveillance
systems (Brooks, 2001). The Select Committee on Science and Technology indicated that there was no
problem with digital images for the courts, but raised concern over public awareness. Inasmuch that
Government should encourage the use of authentication techniques, technological measures are
adopted to authenticate images, procedural measures are applied, that there are no breaks in the audit
trail, that Government produces guidance on the use of data matching and “in particular the linking of
surveillance systems with other databases (1998, Chapter 5.14). With society increasing their
understanding of digital images, this raises social concerns regarding the integrity of digital video
images (Grundberg, cited in Mitchell, 1994).
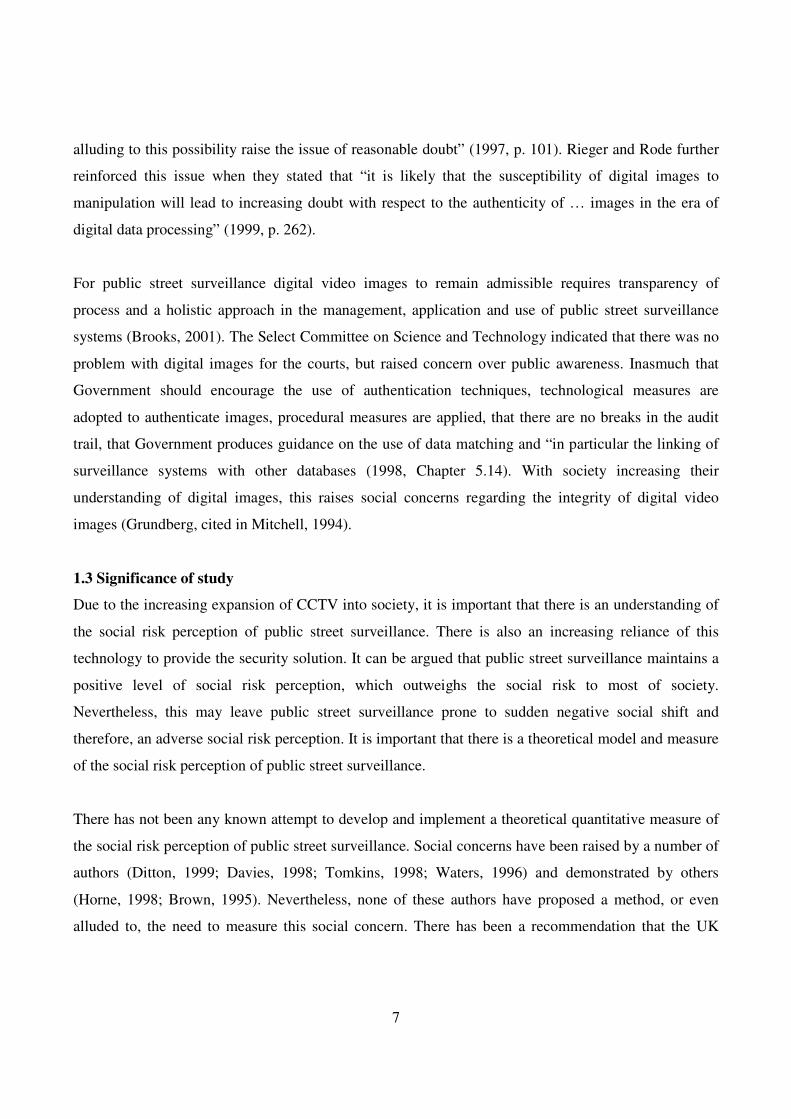
1.3 Significance of study
Due to the increasing expansion of CCTV into society, it is important that there is an understanding of
the social risk perception of public street surveillance. There is also an increasing reliance of this
technology to provide the security solution. It can be argued that public street surveillance maintains a
positive level of social risk perception, which outweighs the social risk to most of society.
Nevertheless, this may leave public street surveillance prone to sudden negative social shift and
therefore, an adverse social risk perception. It is important that there is a theoretical model and measure
of the social risk perception of public street surveillance.
There has not been any known attempt to develop and implement a theoretical quantitative measure of
the social risk perception of public street surveillance. Social concerns have been raised by a number of
authors (Ditton, 1999; Davies, 1998; Tomkins, 1998; Waters, 1996) and demonstrated by others
(Horne, 1998; Brown, 1995). Nevertheless, none of these authors have proposed a method, or even
alluded to, the need to measure this social concern. There has been a recommendation that the UK
8
Government commissions an independent study into the cost and effectiveness of public funded street
surveillance systems (Select Committee on Science & Technology, 1998, Chapter 5.11). This
recommendation has been implemented, with preliminary national evaluation on the implementation of
CCTV being published (Brandon, 2003).
There are numerous social issues that may change the risk perception of society towards both CCTV
and public street surveillance, and these are complex and inter-woven. Social change may come about
due to a combination of these issues, including media coverage, professionalism of the industry, blind
camera syndrome, ever increasing exposure of CCTV to society, legislation, changing technology and
how the security industry manages, operates and promotes public street surveillance. It would be
difficult to assess how each item may have an overall social affect. However, it may be argued that it
will not be a single incident or immediate, but that change will be slight and extended over a period of
time.
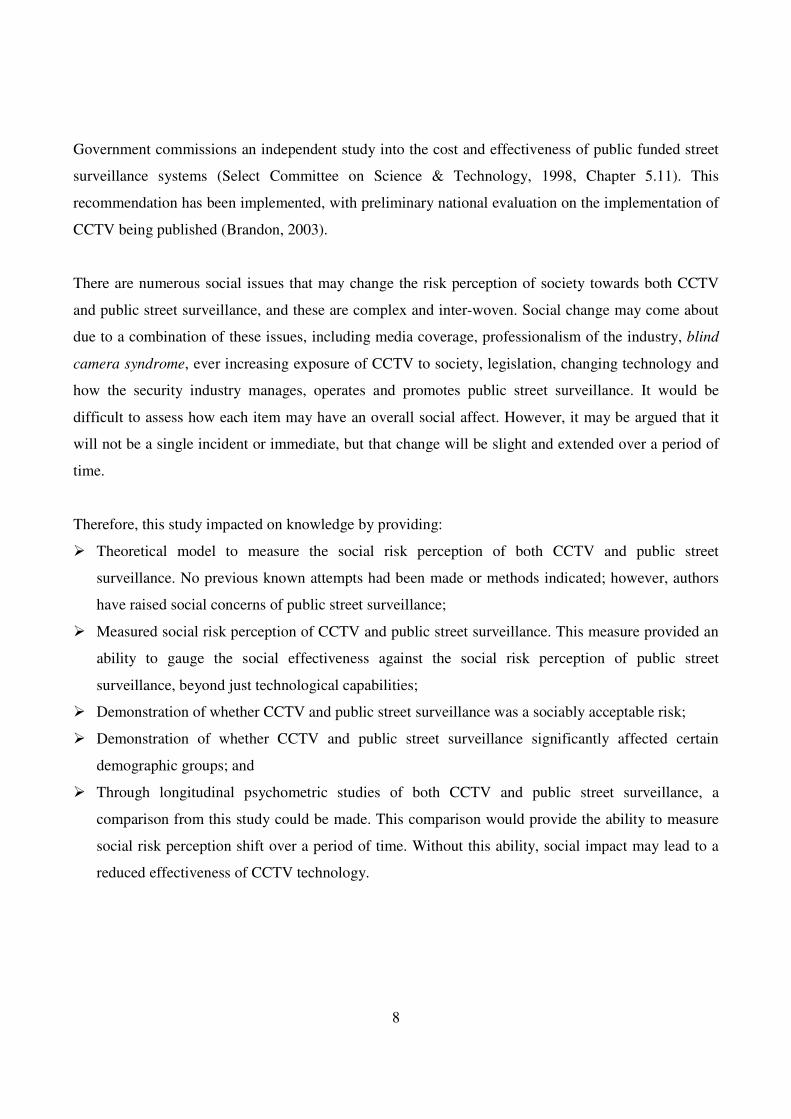
Therefore, this study impacted on knowledge by providing:
� Theoretical model to measure the social risk perception of both CCTV and public street
surveillance. No previous known attempts had been made or methods indicated; however, authors
have raised social concerns of public street surveillance;
� Measured social risk perception of CCTV and public street surveillance. This measure provided an
ability to gauge the social effectiveness against the social risk perception of public street
surveillance, beyond just technological capabilities;
� Demonstration of whether CCTV and public street surveillance was a sociably acceptable risk;
� Demonstration of whether CCTV and public street surveillance significantly affected certain
demographic groups; and
� Through longitudinal psychometric studies of both CCTV and public street surveillance, a
comparison from this study could be made. This comparison would provide the ability to measure
social risk perception shift over a period of time. Without this ability, social impact may lead to a
reduced effectiveness of CCTV technology.
9
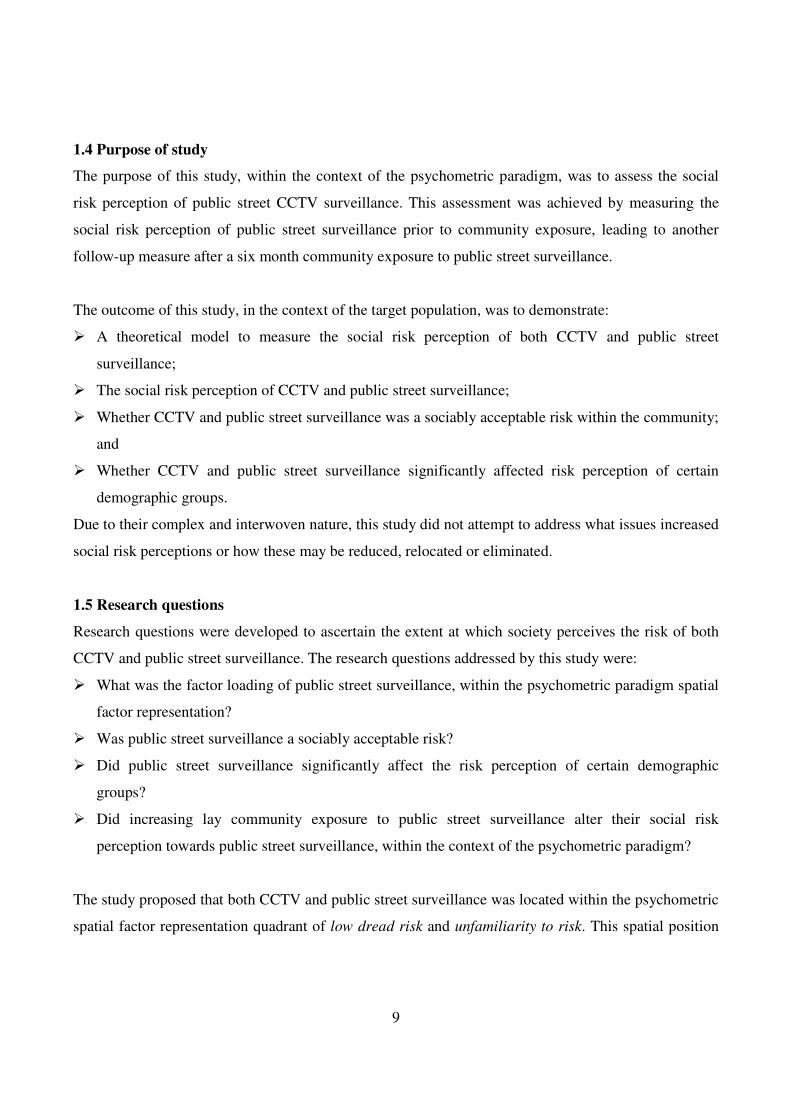
1.4 Purpose of study
The purpose of this study, within the context of the psychometric paradigm, was to assess the social
risk perception of public street CCTV surveillance. This assessment was achieved by measuring the
social risk perception of public street surveillance prior to community exposure, leading to another
follow-up measure after a six month community exposure to public street surveillance.
The outcome of this study, in the context of the target population, was to demonstrate:
� A theoretical model to measure the social risk perception of both CCTV and public street
surveillance;
� The social risk perception of CCTV and public street surveillance;
� Whether CCTV and public street surveillance was a sociably acceptable risk within the community;
and
� Whether CCTV and public street surveillance significantly affected risk perception of certain
demographic groups.
Due to their complex and interwoven nature, this study did not attempt to address what issues increased
social risk perceptions or how these may be reduced, relocated or eliminated.
1.5 Research questions
Research questions were developed to ascertain the extent at which society perceives the risk of both
CCTV and public street surveillance. The research questions addressed by this study were:
� What was the factor loading of public street surveillance, within the psychometric paradigm spatial
factor representation?
� Was public street surveillance a sociably acceptable risk?
� Did public street surveillance significantly affect the risk perception of certain demographic
groups?
� Did increasing lay community exposure to public street surveillance alter their social risk
perception towards public street surveillance, within the context of the psychometric paradigm?
The study proposed that both CCTV and public street surveillance was located within the psychometric
spatial factor representation quadrant of low dread risk and unfamiliarity to risk. This spatial position
10
defined public street surveillance as controllable, low risk to future generations and that exposure was
voluntary. However, that public street surveillance had an unknown capability, that the risk was not
observable, that the risk was new and delayed. This position demonstrated both CCTV and public street
surveillance as a low threat to society and socially acceptable. But when public street surveillance
exposure was increased, the risk perception of public street surveillance would shift to the
psychometric quadrant of high dread risk and familiar risk. This psychometric shift would increase the
perceived threat to society, making both CCTV and public street surveillance less sociably acceptable.
1.6 Overview of the study
The investigation used a number of methods to achieve the study outcomes. A number of draft and
pilot studies were completed to develop the research instrument, with the investigation using a pre and
post study methodology. The theoretical framework included the use of the psychometric paradigm,
which presented the data in a spatial factor representation. Further data analysis used multidimensional
scaling (MDS) techniques to elicit further underlying perceptions.
The theoretical framework used to assess the level of risk perception was the psychometric paradigm.
The psychometric paradigm is a method that attempts to assess and understand risk perception, and
therefore risk acceptance to activities and technologies. This method presented data results in a two
factor analytical representation, with the factor one axis being defined as dread risk and factor two axis
being defined as familiar risk. Dread risk was a dominating risk factor and can be made of various
independent research characteristics. These characteristics being controllability of risk, risk to future
generations and whether exposure to the risk was voluntary, which were found to be highly correlated
(Slovic, 1992, p. 121). The other factor was familiarity to risk, again comprising of various
characteristics being how observable was the risk, whether the risk was known to those exposed, age of
risk and immediacy of risk.
The measure of each factor defined the perceived level of risk towards certain activities or
technologies. A high sense of unfamiliarity to risk and dread risk may lead to an increase in the
perception of risk. Whereas familiarity to risk and a low sense of dread risk, may lead to a reduced
perception of risk. As the two factors alter within the community, so will the level of perceived risk for
11
certain activities or technologies felt within that community. This investigation used the term risk
perception, cognisant that it took the social psychology definition and included attitudes, beliefs and
judgements.
Multidimensional scaling (MDS) is a statistical technique within the area of multivariate data analysis.
MDS reduces complex dimensional data and presents these data in a spatial representation. The
reduction in data complexity, through presentation in dimensional space, allows hidden structure to be
shown in data. This demonstrates object proximity, with proximity being how similar or dissimilar
objects are or are perceived to be (Kruskal & Wish. 1978).
MDS commences with a set of objects, being the activities and technologies. The objects are paired and
dissimilarities measured. The distances between pairs of objects are placed within a half matrix format.
A configuration of points is sought in dimensional space, with each point representing an object. The
aim of MDS is to find a dimensional space configuration where the points distance match as close as
possible, the paired dissimilarities. The different notion of matching defines the different techniques of
MDS (Cox & Cox, 2000). MDS was used within the study as an additional statistical procedure to elicit
further underlying group and individual risk perceptions from the research data. As Wilford stated,
there has been a “lack of study on individual perceptions” (2002, p. 1). Primary MDS models used
were the Classical Euclidean Distance and Individual Differences (Weighted) Scaling (INDSCAL)
models.
Classical scaling treats dissimilarities as Euclidean distances. Young and Householder, in the 1930s,
demonstrated that a matrix of distances between points in Euclidean space can be preserved from point
coordinates (cited in Cox & Cox, 2000). This was further developed and made popular by Torgerson
(1952). While the INDSCAL model, developed by Carrol and Chang (1970), converts dissimilar data
into distance estimates. Weightings are found by least squares and individual distances are doubled
centred to produce matrices. Recurring least square is then applied, until convergence is achieved (Cox
& Cox, 2000).
12
The investigation developed a seven point Likert risk perception survey questionnaire, containing 60
questions. Three additional questions included the participant’s gender, age group and distance to the
centre of the geographical research nucleus. The survey questionnaire contained the five activities and
technologies of public street surveillance, radioactive waste, home swimming pools, drinking water
chlorination and coal mining disease. The additional four control activities and technologies not only
provide spatial relationship comparisons of where public street surveillance was located, but also
allowed a comparison of previous psychometric studies (Bouyer, Bagdassarian, Chaabanne and Mullet,
2001; Slovic, 1997). They were chosen, as according to Slovic (1997), they represent one object from
each quadrant of the spatial factor representation model.
The study target population (N=2106) were community members who lived and/or worked within
0.5km distance of Rockingham beachfront, within the City of Rockingham, Western Australia, and
were ≥16 years old at the time of survey. The sample participants (N=169) were random volunteers
selected from the target population. At the geographical nucleus of the target population, the shire
proposed the installation of a public street surveillance system. The pre study was completed before
this system was installed, with the post study completed approximately seven months after the system
had been installed.
Between the pre and post study phases, no additional crime prevention methods or environmental
improvements were made within the study area, improving the ability to isolate the social affect of the
public street surveillance system. The data analysis resulted in a number of significant interpretations.
These interpretations included the measured risk perception of public street surveillance, that public
street surveillance was a socially acceptable risk, that females feel safer with public street surveillance,
dominant risk perception characteristics, the changing social risk perception of public street
surveillance and why only limited change was demonstrated.
The investigation showed that the social risk perception of public street surveillance was low dread risk
and familiarity to risk. MDS supported this analysis, providing additional underlying dimensions and
presented public street surveillance with its own unique characteristics; namely, a low sense of
community risk perception and a low perceived community exposure to risk. Females presented a lower
13
social risk perception than males, a unique outcome in psychometric risk perception. This measure
appeared to indicate that females felt safer when public street surveillance was present. Age or distance
had no significant affect to the sense of risk perception.
From the characteristics of risk, the community risk perception of public street surveillance was
defined as a low risk to future generations, that exposure was voluntary, the risk was observable, that
the community understood the risk, that the risks were known and would be immediate. This resulted in
public street surveillance having a perceived low social risk perception, demonstrating a social benefit
that outweighed the perceived risk to the community.
Although within the study, it appeared that the community had a social concern over the ability to
ensure appropriate public street surveillance control. The risk characteristic of control located public
street surveillance towards a significantly higher dread, however, still within the familiarity to risk
quadrant. Therefore, it appeared that the community had and maintained a social concern over the
ability to ensure appropriate public street surveillance control.
1.7 Definition of terms
This section provides general definitions of terms related to the study.
Attitude. “Is a mental view” (Dictionary, 1992, p. 60) or a “relatively enduring predisposition to
respond in a reasonably consistent manner towards a person, object, situation, or idea” (Smith, 1998, p.
628).
Blind Camera Syndrome. Large CCTV systems can use many cameras connected to few monitors. A
camera is selected, via a switcher, to the monitor either by the operator or automatically by a sequential
switcher. Sequential switching selects one camera in sequence for a predetermined dwell period, where
that camera is displayed on the monitor. A lay person may perceive that there is a CCTV operator
watching every camera, ready to react to an incident. However, with many cameras being fed into a
single monitor, this could result in a camera not being watched by the operator for a large majority of
the time.
14
Closed Circuit Television (CCTV). Is “any instrument, apparatus, equipment, or other device that is
connected electronically from the image capture device to the display device, that is capable of being
used to visually observe an activity” (Adjusted by Brooks, D, from the Surveillance Devices Bill, 1997,
Part.1.3.1). With present technology, this allows the term to be expanded beyond a traditional
physically closed connection, to include system images that can be transmitted via the phone line, fibre
optic cable, wireless and micro wave transmission.
Digital Video Recorder. A CCTV recorder that compresses, saves, stores and sorts, in a binary format,
an analogue video image.
General Risk. Risk inflicted on others (Sjoberg & Fromn, 2001).
Intellectual Risk. An activity or technological risk that does not or is perceived not to have, the
possibility of causing direct harm to the person.
Multidimensional Scaling (MDS). A multivariate data analysis statistical technique, which reduces
complex dimensional data and presents data in a spatial format. The reduction in data complexity,
through presentation in dimensional space, allows hidden data structure. This presentation
demonstrates object proximity, with proximity being how similar or dissimilar objects are or are
perceived to be (Kruskal & Wish. 1978). Primary MDS models used were the Classical Euclidean
Distance and Individual Differences (Weighted) Scaling (INDSCAL) models.
Perception. An attitudinal awareness, feeling or understanding of a person’s surroundings gathered
from interpretation and categorisation through sensory mechanisms (Smith, 1998).
Physical Risk. An activity or technological risk that may have or is perceived to have, the possibility
of causing direct harm to the person.
Public Place. Is “open to all ... maintained at the expense of, serving, or for the use of a community ...
the community or people in general“ (Dictionary, 1992, p. 800). This definition includes shared areas,

15
which have no public restrictions i.e., roads, parks, car parks and general local or federal government
owned areas or buildings that have no access restriction placed on them.
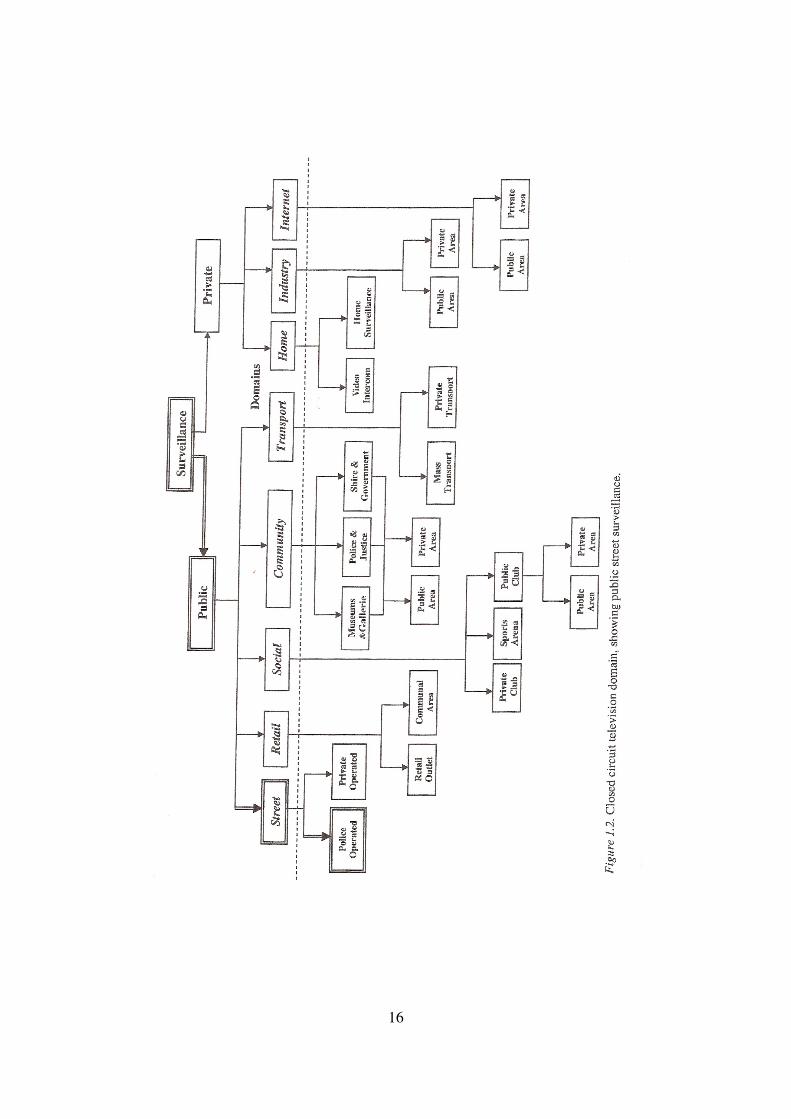
Public Street Surveillance. A CCTV system that is located within, or is able to view, a public place.
Within the study a CCTV domain was developed (Figure 1.2) to define the position of public street
surveillance.
Privacy Risk. See Intellectual Risk.
Psychometric Technique. A methodology that assesses social risk perception to the physical risk of
activities and technologies. It uses psychophysical scaling and multivariate analysis to produce a two
factor quantitative graph that represents a spatial comparison of activities and technologies.
Relocation. A changing social perception towards risk, which produces a spatial shift or move in an
activity or technology situated within the psychometric model.
Risk. The possibility of incurring loss, danger, hazard or misfortune. Risk comprises of a wide range of
cognitive beliefs, which extend beyond what a hazard consequence may be (Australian Standard
AS/NZS 4360, 1999).
Risk Perception. The investigation took the social psychology definition and included the attitudes,
beliefs and judgments of the group.
16
17
CHAPTER 2
REVIEW OF LITERATURE
2.1 Introduction
The literature review provides an analytical summary of related theories within risk, CCTV and
security. Risk includes the psychometric theory of social risk perception, which provided the
theoretical framework. Cultural theory of risk provided an opposing theory of social risk. Security,
CCTV and public street surveillance literature presented related social and technical issues of CCTV.
The CCTV section included the admissibility of digital images, technological changes, the
effectiveness of CCTV and social concerns regarding CCTV and public street surveillance. Finally,
theories of risk communication, developed from psychometric and cultural risk theories, conclude the
chapter.
2.2 Psychometric theory of risk
Psychometric theory of risk is a quantitative methodology of the study of human behavior. Slovic
(1997; 1992) developed a method, which was termed the “psychometric paradigm”, to study the social
risk perception and therefore, acceptance to risk to certain activities and technologies. As Slovic stated
“psychometric paradigm … uses psychophysical scaling and multivariate analysis techniques to
produce quantitative representations or cognitive maps of risk attitudes and perceptions” (1987, p. 281).
Psychometric risk results in a spatial two-factor analytical representation, with the factor one axis being
defined as dread risk and factor two axis being defined as familiarity to risk.
These factors represent the social risk perception to various activities and technologies. The
psychometric theory of risk perception presents “risk attitudes and perception” (Slovic, 1997, p. 234) of
the layperson or a “personality profile … [which] showed that every hazard had a unique pattern of
qualities” (Slovic, 1992, p. 121). Dread risk was a dominating risk factor and can be made of various
risk characteristics, which were found to be highly correlated. The other factor of familiarity to risk,
can again be made up of various characteristics (Slovic, 1992). This methodology had been developed
over the previous 40 years, beginning with the primary characterisation of risk as defined by Starr
(1969).
18
Starr (1969), in his paper titled “social benefit versus technological risk” was the forerunner in the
development of the psychometric paradigm. The intent of Starr’s work was to achieve a quantitative
analysis of the societal cost of technology, both direct and indirect. A single characteristic of the
psychometric paradigm was discussed, being whether the risk activity was voluntary or involuntary.
The paper produced some interesting outcomes; being that voluntary activities are roughly 1000 times
more acceptable, that the acceptability of risk appears proportional to the third power of the benefit and
that social acceptance is directly influenced by public awareness of that risk (Starr, 1969). Although a
recent study has shown that public awareness and social acceptance is not a linear relationship and that
the only relationship can be seen with direct risk, which increases risk perception (Paton, Smith &
Johnson, 2000).
One of the most significant findings within the psychometric paradigm was how lay people and experts
distinguish between perceived and actual risk. There is a mismatch in perception between the layperson
and the industry expert, resulting in a different perception and therefore, acceptance of risk to an
activity or technology. This mismatch comes about due to the utilisation of different language content,
that both groups may be attempting to solve different problems, that the risk process may be
manipulated to achieve their own outcomes, that they disagree about what is feasible and that
communication can fail between parties (Fischhoff, Slovic, & Lichtenstein, 1986). Psychometric
research has attempted to evaluate the difference between rational or expert risk and initiative or lay
risk (Shaw & Shaw, 2001).
Psychometric research argued that quantitative risk assessment could not provide the necessary holistic
methodology necessary to address the laypersons perception of risk (Slovic, Fischhoff, & Lichtenstein,
1986). This view was expanded to confirm that certain activities or outcomes were perceived as a
greater risk, even when the risk was of an equal or lesser actual risk. During this period, it was
highlighted that this method may not be valid in assessing an individual’s perception of risk as it
provides only social response. It has been concluded that social perception of risk is multidimensional
and based on several characteristics, namely technology, catastrophic potential, dreadness and severity
of consequence (Slovic, Fischhoff, & Lichtenstein, 1986).
19
Lope reinforced this risk perception mismatch, when he stated that “lay people do not understand
statistics well enough to make intelligent use of all this information” (1992, p. 57). He discussed public
perception and acceptance of risk statistics, and how these alter from that of experts. Lope (1992) came
to the conclusion that the public is more knowledgeable regarding risk, once they receive the relevant
information, being direct and to the point. Although this does not lead to lay people accepting risk,
becoming physically prepared or acting to reduce risks (Paton, Smith & Johnson, 2000). Lay people
“infer from an ability to cope with an (objectively) minor impact … a capability to deal with any future
occurrence. This attritional bias can result in their overestimating their perceived preparedness and/or
underestimating the risk” (Paton, Smith & Johnson, 2000, p. 88).
An expert views risk as synonymous with fatalities and therefore, their recitations of risk will have
little acceptance by the public. This leads onto the need for effective communication between experts
and lay people, with the outcome that risk assessment needs to be made in the real world, with both
political and social context, and that trust and accountability are important in this process (Slovic,
1997). Nevertheless, affect heuristic appears to demonstrate that this will still not provide the ability to
logically communicate risk. Affect heuristic supports “the theory that risk and benefit judgments are
casually determined, at least in part, by the overall affective evaluation” (Slovic, Finucane, Peters, &
MacGregor, 2002, pp. 12-13) and that society judges risk not on facts, but by what they think and how
they feel about the activity or technology.
Psychometric research continued to expand the characterisation of social risk into sixteen discrete
items, being dread, controllability, global catastrophic, consequence, equitable, individual, risk to
future generations, ability to reduce, risk decreasing, voluntary, familiar, observable, known to
exposed, effect immediate, age of risk and the knowledge of science. Studies showed that there were
different demographic risk acceptance between white males, white females, black males and black
females, with the conclusion that white males have a far higher acceptability to risk. That risk
perception was “influenced by the interplay of psychological, social and political factors ... [and that]
the reason the public often reject scientists risk assessment is a lack of trust” (Slovic, 1997, p. 237).
Although this has been opposed by recent research, which has found that there appears to be little
20
significant difference between gender depending on the activity or technology (Brooks & Smith, 2002;
Bouyer, Bagdassarian, Chaabanne & Mullet, 2001).
A concern, addressed in the background of the study (Section 1.2), was that social impacts have some
causal relationship to social risk perception. These impacts, whether driven by accidents, media
coverage, sabotage, product tampering, system failures, etc., have found to have a far greater or lesser
effect then what has traditionally been measured through loss of life, financial loss, etc. This traditional
methodology can be defined as classical risk management and assessment, as defined in the Australian
Standard AS4360:1999. A correlation can be made to such impacts, through the understanding of social
risk perception (Slovic, 1992). As Fineberg highlighted, risk assessors have to analyse risk beyond the
process of “translating the results … into non-technical terms” (1996, p. 8) to be effective.
Trust also became an important characterisation element in risk perception and was further developed,
in that trust displayed an asymmetrically principle weighted towards dread risk. Slovic (1997) stated
that trust destroying, as opposed to trust building, was more visible, had greater weighting, provided
more creditable media coverage and tended to reinforce and perpetuate distrust. This reinforced the
need to review risk communications (Section 2.5) and raised the issue of how the media can transmit
adverse social images and become a driving force behind risk relocation.
It can be argued that the theory of risk perception cannot be effective in measuring risk due to the
complex and multidimensional nature of risk. Lay people could not analyse these complex and
multidimensional issues and provide valid responses. Paton, Smith and Johnson supported this, as they
stated “Risk perception is a highly interpretive and dynamic process” (2000, p. 86) and that the
“measurement of risk perception, and the identification of the information used when making such
judgements, is complex” (2000, p. 86). Psychometric research has been criticised for assessing risk
perception as an objective reality and not taking a holistic approach, being either cultural or social
(Shaw & Shaw, 2001). However, numerous studies have been completed and these have continually
demonstrated that consistent and valid risk perception representations have resulted. Nevertheless, to
apply psychometric results across all cultural environments could prove invalid, as each culture may
have unique perceptions on the risk of each activity and technology.
21
It has been shown that greater exposure to risk will have an impact on a layperson’s risk perception.
This perception can be either direct (physical experience) or indirect exposure (media, peer). Paton, et
al., demonstrated that those exposed and had experienced a direct risk “exercised a positive influence
on risk perception” (2000, p. 87) and their perceived threat of the risk increased. Wilford (2002) argued
that it was the level of awareness that defined the level of risk perception, and that perception and
awareness are intrinsically linked. This appears to be supportive of affect heuristic, that society judge
risks not on facts, but by what they think and how they feel (Slovic, Finucane, Peters & MacGregor,
2002).
There have been numerous research studies, testing up to 90 activities and technologies, completed
throughout the world (Bouyer, Bagdassarian, Chaabanne & Mullet, 2001; Sjoberg & Fromm, 2001;
Slovic, 1997; Slovic, 1992). The activities and technologies researched and tested ranged from
radioactive waste, DNA technology, AIDS, randon, nuclear reactor accidents, microwave ovens,
smoking, caffeine, power mowers, downhill skiing, large dams, auto racing and commercial aviation.
Some of the most significant findings within these studies was that while an activity or technology was
seen to provide a social benefit which outweighs its social risk, then it will generally be an acceptable
risk (Brooks & Smith, 2002; Fischhoff, Nadai & Fischhoff, 2001; Sjoberg & Fromm, 2001; Slovic,
1997). Those risk perceptions were consistent, stable, and not primarily affected by their personnel
philosophy and anxiety (Bouyer, Bagdassarian, Chaabanne & Mullet, 2001; Slovic, 1997).
2.3 Cultural theories of risk
Cultural risk theory “attempts to address the wider cultural and political context of risk” (Shaw &
Shaw, 2001) and can be presented in either a two-dimensional model or expanded into three-
dimensions, using grid, group and the third dimension, manipulation (Thompson, 1982). Grid can be
defined as a group of rules and constraints that culture imposes on its people. Group emphasizes the
level of social interaction between people. Grid and group relationship presents a “fourfold typology of
ways of life, each reflecting a cohesive and coherent cluster of attitudes, beliefs and styles of
relationships” (Mars & Frosdick, 1997, p. 116). This relationship leads to five archetypal ways of life,
namely individualist, egalitarian, fatalist, hierarchy and hermit. These groups depend on each other to
22
support and maintain their way of life, but give rise to different perceptions of risk (Shaw & Shaw,
2001; Mars & Frosdick, 1997).
Cultural risk theory takes an opposing view on a primary finding of psychometric theory, being that
society defines risk, as cultural risk theory states that society is driven by predetermined cultural
constraints and that these are predictable (Douglas, 1990; Thompson, Ellis & Wildavsky, 1990).
Nevertheless, both psychometric and cultural risk theory concur that social risk perception can relocate.
As Thompson concluded, the “changed perception of risk results from a changed social context” (1982,
p. 59) and the grid/group theory showed that an individual and/or populations perception and
acceptance of risk can and does change.
Douglas and Wildavsky argued that risk and the level of social risk acceptance was based on cultural
“collective construct” (1983, p. 186) and that society can be divided into four groups, being market
individualist, hierarchies, sectarian and border claims. The group that generally highlights and voices
concern over risk within society are the border dwellers, due to their position outside normal
constraints. Douglas (1990) further defined the concept of social risk and how the concept can alter
depending on the time, place, perception and acceptance by a particular society or culture of the
concept of risk. Cultural process and dialogue, defines and accepts accountability, therefore it is the
context of risk that is important. In addition, cultural risk theory has been criticised as being to
restrictive, simplistic, static and has a limited ability to translate into empirical research (Shaw & Shaw,
2001; Mars & Frosdick, 1997). Douglas and Wildavsky concluded that in accord with psychometric
risk theory the selection of risk was a social process.
2.4 Security and public street CCTV surveillance
Security, CCTV and public street surveillance literature provided discussion on issues that could be one
of many multidimensional and complex issues (Section 1.2.1) that may have an effect on the social risk
perception of CCTV, or as a domain, public street surveillance. Issues included the admissibility of
digital images, technological changes, the effectiveness of CCTV and the social concerns raised by
authors on public street surveillance. There were a number of authors who expressed concerns over the
23
social aspect of public street surveillance and discussed what has been termed within this study,
attitudinal relocation issues.
Norris and Armstrong (1999) in their book titled “The maximum surveillance society: The rise of
CCTV” addresses some of the social concerns with CCTV. The two faces of surveillance were
discussed, being the protector and totalitarian rule. However, it may be argued that these two faces can
be defined as social benefit versus social risk. The selling of CCTV provided a critical review of
criminology studies in the social acceptance of CCTV and that public support of CCTV has been
skewed due to the framing of research instruments. This was supported by Ditton (cited in Painter &
Tilley, 1999, p. 7), where Ditton demonstrated that the support for CCTV can be influenced by the
context of the previous questions. The “general public support stands at between two-thirds and three-
quarters of those surveyed, although it may fall to below a half of those actually using city centre
space” (Norris & Armstrong, 1999, p. 62). This support was lower then generally accepted and raises
concern as half of those using a city centre appear to have a social concern over public street
surveillance.
Philips (1999) evaluated a number of studies that had evaluated the effectiveness of CTTV systems in
reducing crime, fear and improving safety. Philip’s used Tilley’s (1993) model of realist evaluation,
which focused on the functions and the environment of crime prevention measures. Issues of
displacement, the impact of CCTV on crime, personal and public crime, and the offenders perspective
were discussed. Finally, the impact of CCTV on the fear of crime and public attitudes are covered. The
paper concludes that in some aspects CCTV was effective in reducing crime, but that outcomes were
mixed for fear reduction and crimes against the person.
Today, with the interest in reality shows, CCTV and the media are well suited. Norris and Armstrong
(1999) referred to the visual medium and the media’s love affair with CCTV in which negative findings
are not reported by industry – only practitioner claims of success (1999, p. 205). This view supports the
media’s positive portrayal and support of public street surveillance, that public exposure and therefore
knowledge is media driven.
24
Norris and Armstrong (1999) researched who and what the operators on the streets were watching.
CCTV operators discriminated by age, race and gender, with young men being the main targets of
operators. This study found that females feel safer when within a public street surveillance system. It
can be argued that this was due to the perception that they were being covered by surveillance, with
help close at hand. However, Norris and Armstrong found that women accounted for only 7% of
primary persons placed under surveillance and that out of nearly 600 hours of surveillance tapes only
one woman was actively viewed as a protective measure (1999). “If social groups experience CCTV
surveillance as an extension of discriminatory and unjust policing, the consequential loss of legitimacy
may have disastrous consequence for social order” (Norris & Armstrong, 1999, p. 176).
The use of digital technology in CCTV is rapidly expanding. This expansion may be supported by
IndigoVision, when they stated that the “trend is clear, namely, that as computer processing power
increases and becomes cheaper, old analog technology is being replaced by improved digital systems.
… increasing numbers of CCTV equipment manufacturers are producing digital products” (2002, p. 5).
Due to this rapid expansion of digital technology within CCTV and a lack of holistic understanding in
the security industry, police and legal professions, it can be argued that this may become a key social
relocation issue. It can be further argued that this is particularly valid with digital video recorders and
the admissibility of digital evidence.
Murphy, in the “admissibility of CCTV evidence in criminal proceedings” (1999) examined the issue
of CCTV digital images and their admissibility within a court of law. Video admissibility has
developed from photographs to analogue video; nevertheless, CCTV has now taken a quantum leap in
the use of digital processed and stored video images. In the UK, the “courts have demonstrated an
uncharacteristic willingness to accept visual recordings as evidence in criminal proceedings” (Murphy,
1999, p. 401).
Currently digital video images are admissible evidence in a court of law and the Select Committee on
Science and Technology summarized that they found no difficulty for the courts on digital video
images (1998, Section 5.1). IndigoVision takes this further, stating that “existing UK legislation, House
of Lords Committee report and the recent Police Scientific Development Branch report are clear that
25
digital images are admissible as evidence in UK courts, provided that digital images are appropriately
authenticated” (2002, p. 11). However, the ability to provide this authentication has to be questioned
beyond just a technological method.
As Ainsworth stated “can video evidence be compromised … or more importantly, can alluding to this
possibility raise the issue of reasonable doubt” (1997, p. 101). Rieger and Rode further reinforced this
issue when they stated that “it is likely that the susceptibility of digital images to manipulation will lead
to increasing doubt with respect to the authenticity of … images in the era of digital data processing”
(1999, p. 262). With society increasing their understanding of digital images, this raises social concerns
regarding the integrity of digital CCTV images (Grundberg, cited in Mitchell, 1994) and that public
confidence will be lost through the perception of improper use (1998, Section 5.11).
For public street surveillance digital video images to remain admissible, will require transparency of
process and a holistic approach in the management, application and use of public street surveillance
systems (Brooks, 2001). As the Select Committee on Science and Technology summarised, there was
no problem with digital images for the courts. Nevertheless, there was a concern over public awareness,
authentication techniques, procedural measures, digital audit trail and that the UK Government
produces guidance on the use of data matching and “in particular the linking of surveillance systems
with other databases” (1998, Section 5.1-5.16). Ultimately, this will require a number of court
challenges, leading to definition and legal precedence, before any certainty of digital video image status
can be achieved.
A debate between Horne (1998) and Davies (1998) discussed whether CCTV should be introduced
within town and city centres. Horne argued that CCTV should be, whereas Davies argued against the
case. Social concerns over public street surveillance were discussed and that research studies generally
demonstrated that there was little concern shown by the public. This view supported the research
outcome, being that public street surveillance was a low dread and familiar social risk. However,
concern was raised over the introduction of surveillance into social life, like pubs, clubs and cinemas.
What was highlighted was that “people did not mind police viewing tapes, but they were strongly
opposed to access by security personnel” (Horne, 1998, p. 322) and this extended to the ability of staff
26
to select their own CCTV views and record. As Horne (1998) conceded, this goes against the majority
of public street surveillance system operations.
Davies (1998) questioned the ability of public street surveillance to be effective in the long term, the
subjective and political nature of public street surveillance installations and that there was no concern
for public privacy. However, Davies only used a single 1992 study as a source of reference. Both
Horne (1998) and Davies (1998) did address that there may be an underlying social concern over public
street surveillance, but did not offer any indications as to the level, nature or the need to measure this
social concern. Also, both authors only addressed a snapshot of social feeling, without considerations
for underlying and shifting social concerns. The Select Committee on Science and Technology did
recommend that the UK Government “commission a substantial, rigorous and independent study of the
cost and effectiveness of publicly funded surveillance systems” (1998, Section 5.11).
Waters (1996) discussed additional relocation issues, albeit in only a subjective manner, as there was
no research to justify his statements. However, he raised similar concerns as addressed in the
background of this study (Section 1.2). These concerns included the unchecked introduction of CCTV
within all parts of society, a general discussion on street surveillance, relevant legislation, law
enforcement justification for CCTV and social effects of surveillance. Waters (1996) also questioned a
secondary use of public street surveillance, the control and monitoring of minor social misdemeanours.
Waters stated that the “chilling effect of surveillance is difficult to quantify, but is clearly recognised
by the public” (1996, p. 1). It can be argued that this is not the case and that past studies do not
demonstrate this stance. The limited research in this area has found that people feel less anxious within
a public street surveillance system (Ditton, 1999). This investigation also demonstrated that public
street surveillance was a socially acceptable risk, primarily due to the social belief that the benefits
outweigh the social risk.
The ability of public street surveillance to remain effective and reduce crime over time has been
questioned by a number of authors (Ditton, 1999; Short & Ditton, 1998; Waters, 1996; Brown, 1995;
Tilley, 1993). In the paper titled “Town Centres: Three Case Studies” Brown (1995) discussed the
concerns that public street surveillance effectiveness had not been truly evaluated. That crime reduction
27
was short lived and that it only reduced some types of crimes over an extended period. Tilley (1993)
supported this issue, in that there was a reduction in the levels of crimes when the public street
surveillance systems were first installed; however, reductions were only in some crime categories and
faded over time. Also, that very few arrests followed from public street surveillance coverage.
The general perception of public street surveillance was that it improved safety, that people feel safer
when they were aware of public street surveillance (Ditton, 1999; Brown, 1995) and that there was
little evidence of opposition from the public regarding the public street surveillance systems (Tilley,
1993). In Dundee (UK), after public street surveillance was installed in the city center, a survey found
that 96% of those surveyed thought that public street surveillance would not infringe on civil liberties
(Horne, 1998). However, Brown did state that “one third of people were concerned with being
watched” (1995, p. 66), although little further considerations was given to this social issue. More recent
research by Ditton found that “67% … did not mind being observed by street cameras” (1999). In
addition, the Australian Privacy Commission stated “queries about the legality of video surveillance
were also common”, being rated 6.9% of all enquires outside their jurisdiction (1998, p. 43). However,
in general it appears that the public does view street surveillance as a benefit.
Davies (1992) in “Big Brother” discussed a holistic process of social surveillance, including privacy,
government agency roles, technology and information. Technologies also included smart cards,
biometrics, intelligent phone systems, computer matching and networks. The author discussed a model
termed the five zones of surveillance, being zone 1-restricted surveillance; zone 2-conditional
surveillance; zone 3-routine surveillance; zone 4-mass surveillance and zone 5-total surveillance. The
conclusion being that Australia is currently located within zone 4-mass surveillance. Davies stated that
this zoning model “is a simple five zone chart that shows the way surveillance and control influences
the life and environment of a community” (1992, p. 18). However, there was no demonstration as to
how these variables were defined, analysed, assigned or how this conclusion was reached. In general
the text appeared subjective, with little or no scientific evidence given, although it was produced by a
member of the media and could demonstrate what could become typical arguments for or against
CCTV and public street surveillance.
28
2.5 Theories of risk communication
This section examined specific texts on the theories of risk communication, particularly relevant in risk
perception relocation (Section 1.2.1). The theories of risk communication have developed from
classical risk theory, cultural and social risk. As with any method of communication, the appropriate
message must pass between the sender and receiver, which may be most prevalent for errors between
the expert and layperson. Risk communication must be cognisant of social and cultural risk perception.
Paton, Smith and Johnson (2000) discussed conceptual and methodological issues in risk
communications, demonstrating that perceived risk does not lead to risk preparation, irrespective of
media communication. Nevertheless, risk perception did increase when affected by direct risk
experience. DeJoy (1999) examined warning and risk effectiveness in society and stated that risk can
be divided into three main categories, namely threat-related expectations, outcome related expectations
and receiver characteristics. As found by Starr (1969) in the original psychometric risk perception
research, warning effectiveness increased with perceived hazardousness, although this opposed direct
risk perception found by Paton, et al., (2000). DeJoy (1999) highlighted how bias in risk perception
included overconfidence, optimism, availability, suppression, cost of compliance and receiver
characteristics. Receiver characteristics included familiarity, demographic factors and personality. A
number of these characteristics being shown through psychometric risk studies (Slovic, 1997; 1992).
As argued by psychometric risk theory, attitude and belief factors (expectations) affect how the
individual perceives and accepts risks.
Risk management has to be based on the ability to communicate the appropriate risk message. A
comparison between empirically and analytical methods of decision-making and assessment, to gauge
what method was most appropriate for the real world was studied by Larichev, Brown and Flanders
(1998). Two similar case studies of decision making were assessed, one by the Russian Government
and the other by the American Government. Three groups of criteria were taken into consideration,
being methodology, institutional and personal. Results detailed the difference in the analysis,
implementation and communication of quantitative and qualitative data. The outcome summarised that
risk communication must improve and that cultural differences must be taken into account.
29
What a number of authors (Paton, Smith & Johnson, 2000; Australian Standards, 1999; Yosie &
Herbst, 1998) have concluded and this was supported by both cultural and psychometric risk studies, is
the need to involve lay people and stakeholders in the risk management process. To be effective, there
has to be an inevitable and continual expansion of stakeholder involvement in risk decision-making. A
study by Yosie and Herbst examined some of the major reasons behind the need to involve
stakeholders, including “key issues, challenges associated with managing them, and analyses factors
shaping their future use” (1998, p. 1). From the examination of twenty nine case studies, the following
key observations and findings were highlighted. Social interest was becoming more interactive, current
stakeholder processes are generally not well managed, that there was a need to achieve a better match
between stakeholder and the solution, there was no specific agreement on the definition of a
stakeholder and that the stakeholders challenge the effectiveness of experts in the decision making
process.
The type and extent of media coverage given to public street surveillance could change the risk
perception of public street surveillance. The media will have a key role in risk communication and
therefore, risk relocation (Section 1.2.1). Dunwoody (1992) discussed how journalists select and
structure risk messages in his paper, titled “The media and public perceptions of risk: How journalists
frame risk stories.” The paper discussed two types of patterns that appeared in media coverage. The
first pattern being coverage does not mirror reality and the second, that risk stories contained very little
risk information. Dunwoody (1992) believed that this was due to two aspects that involved news
framing, individual knowledge of information relevant to risk and the journalistic occupational norms.
What was highlighted was the need for journalists to not only inform their reader, but also their need to
attract readers. This need was one of the reasons why journalists dramatise, simplify and play politics
with media coverage (Covello, Sandman & Slovic, 1989).
2.6 Conclusion
This chapter provided an analytical review of the literature relating to this study. The psychometric
theory of risk provided the theoretical framework and structure for the study, in which risk perception
can be presented in a quantitative two factor representation of dread risk and familiarity to risk.
Significant findings of psychometric risk being that there is a mismatch between the expert and
30
layperson’s perception of risk. Moreover, the psychometric method has been demonstrated in numerous
research studies, producing consistent and valid results.
Cultural risk provided an opposing theory on risk and attempts to address the holistic context of risk.
This takes an opposing view to psychometric risk theory, being that society defines risk. However, both
risk theories concur that risk perception in societies may change. The chapter concluded with risk
communication, which developed from classical, cultural and psychometric theories of risk. This
section discussed why the media dramatise, simplifies and plays politics, and that the media is a key
messenger in levels of social risk perception.
Security, CCTV and public street surveillance literature demonstrated that there was little research into
the social affect of public street surveillance. Authors have raised concern over public street
surveillance, but these have generally been limited and with little supporting scientific data. The media
is supportive of CCTV, with positive media coverage. Operationally, CCTV operators discriminate and
target young males, with women rarely actively monitored. This approach may reduce the crime
prevention ability of CCTV to protect women. In addition, digital CCTV is expanding; however, the
admissibility of digital evidence is still to be tested in a court of law.
Research has shown that CCTV can be effective in reducing crime, but that outcomes were mixed for
fear reduction and crimes against the person. It appeared that CCTV can only be effective in certain
environments and has to be applied in a holistic crime prevention package. Although this study has
demonstrated that this may not be the key issue, as public street surveillance appears to be meeting its
objective, making individuals and the community feel safer.
31
CHAPTER 3
THEORETICAL FRAMEWORK
3.1 Introduction
This chapter, theoretical framework, provides the structure for the study and theories supporting the
methodology. The study used psychometric risk perception (Section 3.2), which measures the social
risk perception to activities and technologies. The research variables, characteristics of risk and inter-
relationships are identified (Section 3.2).
The study proposed the spatial locality of public street surveillance risk perception within the
psychometric paradigm (Section 3.3). The term risk perception was expanded within the context of
both clinical and social psychology, as risk perception is used throughout the psychometric paradigm
(Section 3.4). Multidimensional scaling (MDS) is discussed (Section 3.5), being an additional method
to analyse and present proximity data in a spatial format. MDS supported and complemented the
psychometric paradigm technique. In addition, theories that supported the research methodologies used
within the study are presented (Section 3.6) and the chapter is finalised with a conclusion (Section 3.7).
3.2 Psychometric risk paradigm
Psychometric risk paradigm provided the measurement and assessment of the social risk perception of
public street surveillance. It is a method that attempts to assess and understand social risk perception
and therefore risk acceptance, to certain defined activities and technologies. As Slovic stated,
“psychometric paradigm uses psychophysical scaling and multivariate analysis techniques to produce
quantitative representations or cognitive maps of risk attitudes and perceptions” (1987, p. 281). The
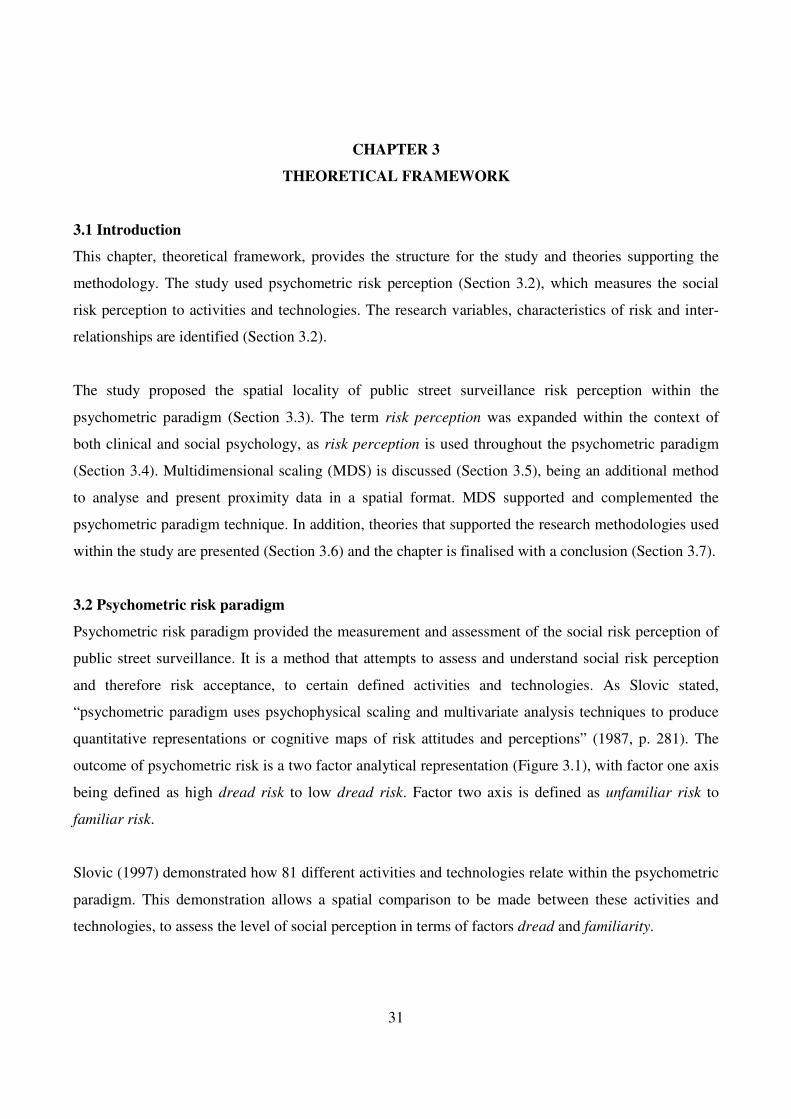
outcome of psychometric risk is a two factor analytical representation (Figure 3.1), with factor one axis
being defined as high dread risk to low dread risk. Factor two axis is defined as unfamiliar risk to
familiar risk.
Slovic (1997) demonstrated how 81 different activities and technologies relate within the psychometric
paradigm. This demonstration allows a spatial comparison to be made between these activities and
technologies, to assess the level of social perception in terms of factors dread and familiarity.
32
Figure 3.1. Psychometric paradigm: Location of 81 hazards
(Revised from Slovic, 1997, p. 236)
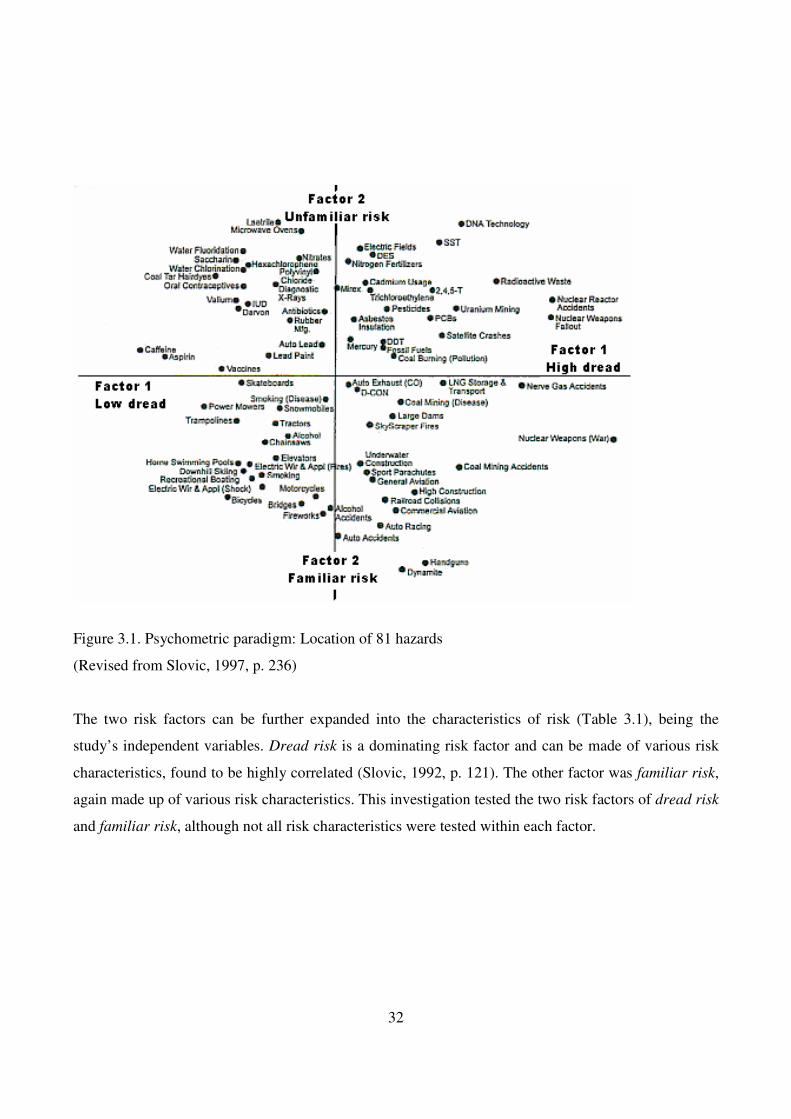
The two risk factors can be further expanded into the characteristics of risk (Table 3.1), being the
study’s independent variables. Dread risk is a dominating risk factor and can be made of various risk
characteristics, found to be highly correlated (Slovic, 1992, p. 121). The other factor was familiar risk,
again made up of various risk characteristics. This investigation tested the two risk factors of dread risk
and familiar risk, although not all risk characteristics were tested within each factor.
33
Table 3.1
Characteristics of risk
FACTOR 1 – Dread Risk FACTOR 2 - Familiar Risk Low dread High dread Familiar risk Unfamiliar risk e Controllable Uncontrollable Observable Not observable Not global catastrophic
Global catastrophic Known to those exposed
Unknown to those exposed
Consequence not fatal
Consequence fatal Effect immediate Effect delayed
Equitable Not equitable Old risk New risk Individual Catastrophic Risks known to
science Risks unknown to science
Low risk to future generations
High risk to future generations
Easily reduced Not easily reduced Risk decreasing Risk increasing Voluntary Involuntary
(Slovic, 1997, p. 236)
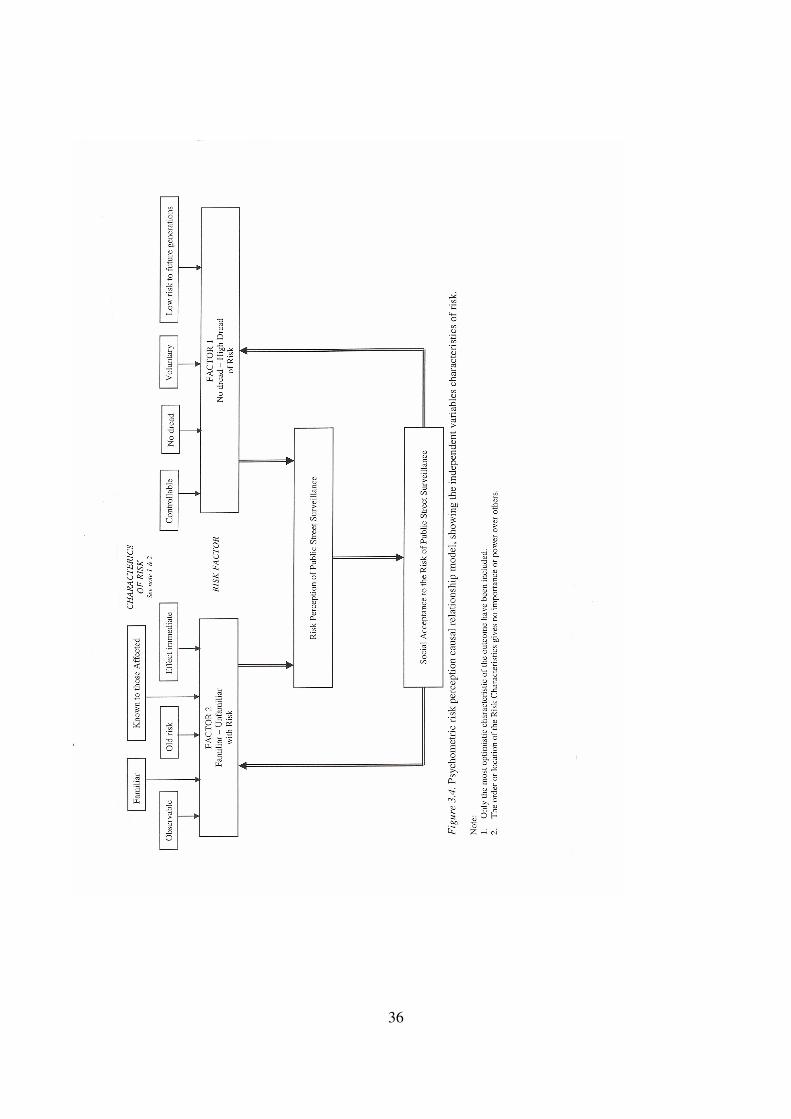
The theoretical framework (Figure 3.4) of the psychometric causal relationship model demonstrated the
relationship between the independent and dependent variables. Unlike previous psychometric research
studies, where up to twenty risk characteristics were tested, this study tested nine risk characteristics
(Table 3.2). These tested the dependant variable of social risk perception.
Table 3.2
Characteristics of risk: Independent research variables
FACTOR 1 - Dread Risk FACTOR 2 - Familiar Risk Low dread High dread Familiar Unfamiliar Controllable Uncontrollable Observable Not observable Low risk to future generations
High risk to future generations
Known to those exposed
Unknown to those exposed
Voluntary Involuntary Old risk New risk Effect immediate Effect delayed
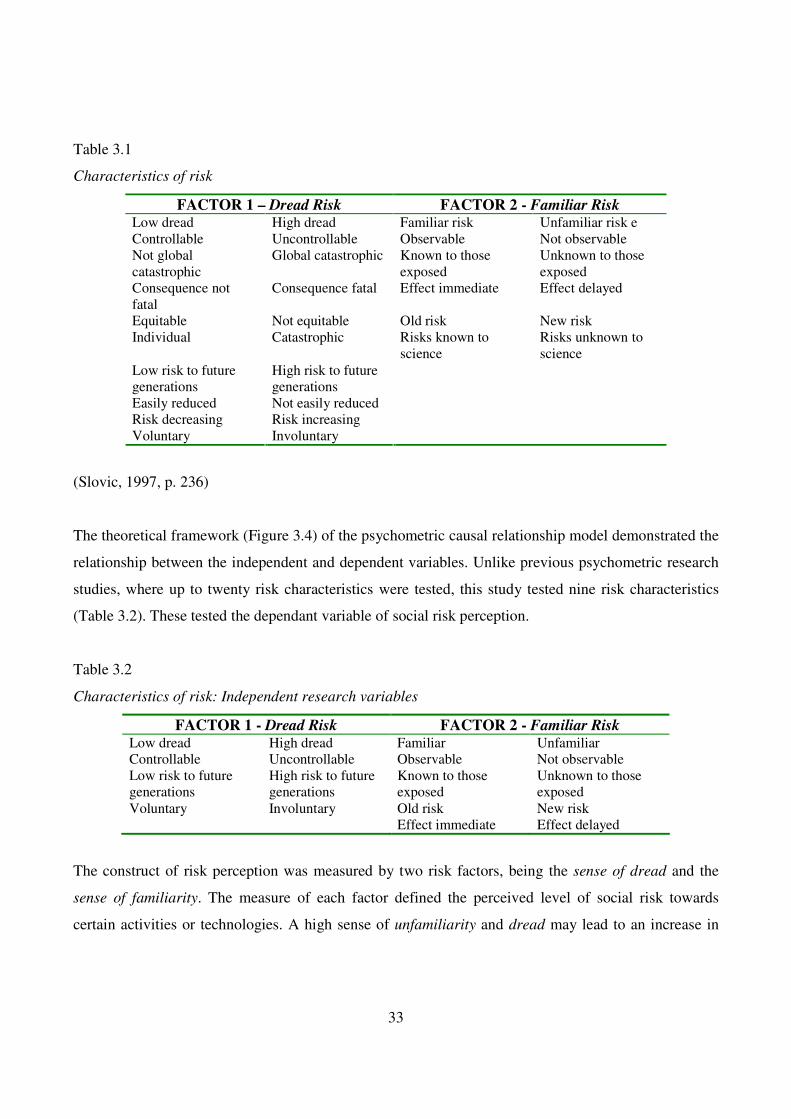
The construct of risk perception was measured by two risk factors, being the sense of dread and the
sense of familiarity. The measure of each factor defined the perceived level of social risk towards
certain activities or technologies. A high sense of unfamiliarity and dread may lead to an increase in
34
the perception of risk, whereas familiarity and a low sense of dread may lead to a reduced perception
of risk (Figure 3.2).
Figure 3.2. Risk perception factor model
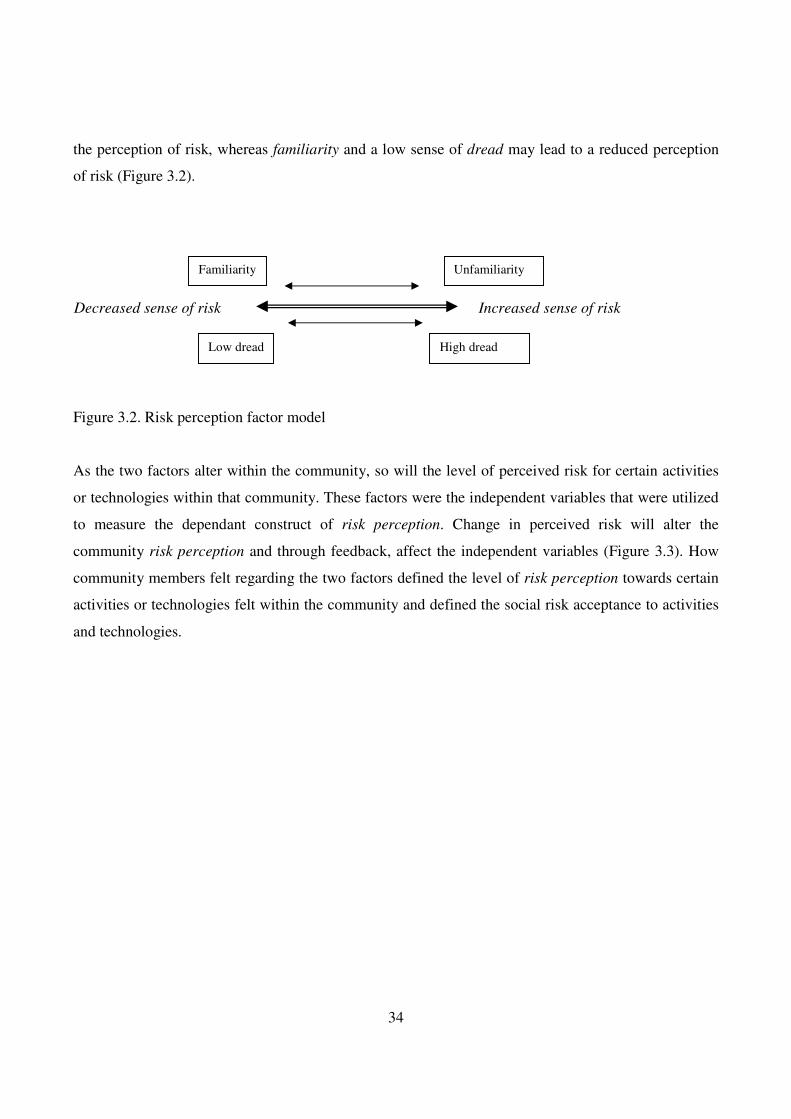
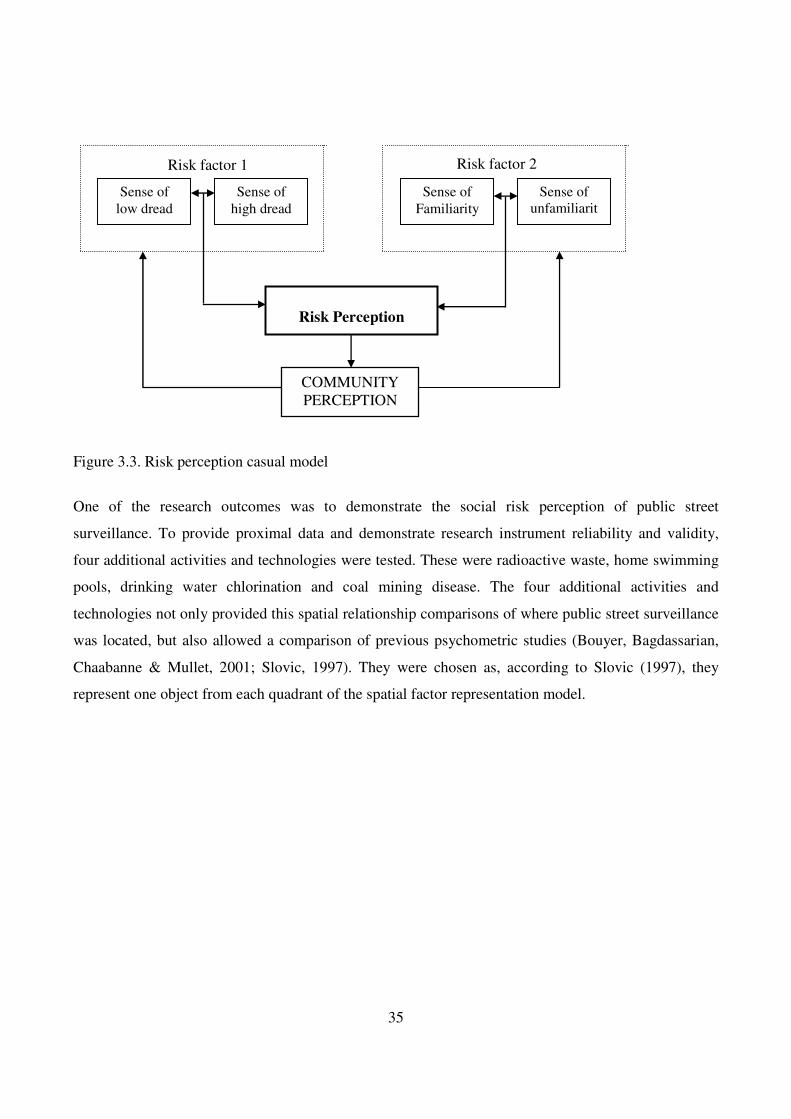
As the two factors alter within the community, so will the level of perceived risk for certain activities
or technologies within that community. These factors were the independent variables that were utilized
to measure the dependant construct of risk perception. Change in perceived risk will alter the
community risk perception and through feedback, affect the independent variables (Figure 3.3). How
community members felt regarding the two factors defined the level of risk perception towards certain
activities or technologies felt within the community and defined the social risk acceptance to activities
and technologies.
Increased sense of risk Decreased sense of risk
High dread Low dread
Unfamiliarity Familiarity
35
Figure 3.3. Risk perception casual model
One of the research outcomes was to demonstrate the social risk perception of public street
surveillance. To provide proximal data and demonstrate research instrument reliability and validity,
four additional activities and technologies were tested. These were radioactive waste, home swimming
pools, drinking water chlorination and coal mining disease. The four additional activities and
technologies not only provided this spatial relationship comparisons of where public street surveillance
was located, but also allowed a comparison of previous psychometric studies (Bouyer, Bagdassarian,
Chaabanne & Mullet, 2001; Slovic, 1997). They were chosen as, according to Slovic (1997), they
represent one object from each quadrant of the spatial factor representation model.
Sense of
low dread
Sense of
Familiarity
Risk Perception
COMMUNITY PERCEPTION
Sense of
high dread
Risk factor 1 Risk factor 2
Sense of unfamiliarit
y
36
37
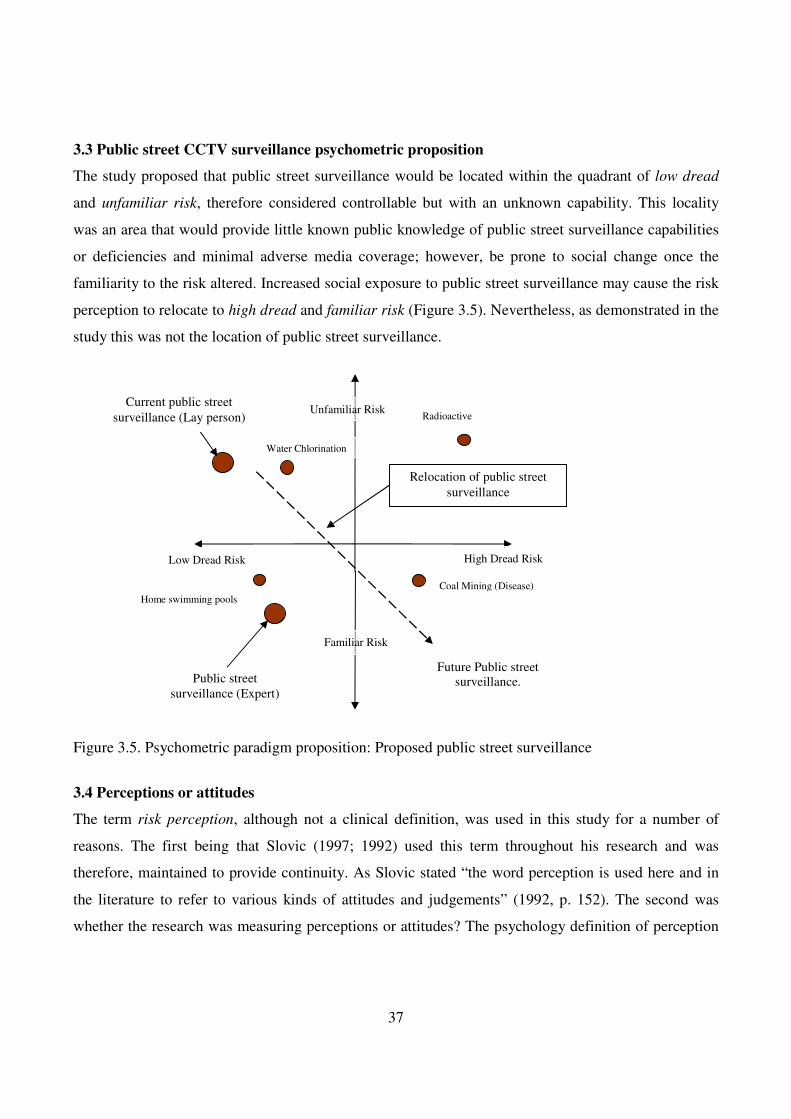
3.3 Public street CCTV surveillance psychometric proposition
The study proposed that public street surveillance would be located within the quadrant of low dread
and unfamiliar risk, therefore considered controllable but with an unknown capability. This locality
was an area that would provide little known public knowledge of public street surveillance capabilities
or deficiencies and minimal adverse media coverage; however, be prone to social change once the
familiarity to the risk altered. Increased social exposure to public street surveillance may cause the risk
perception to relocate to high dread and familiar risk (Figure 3.5). Nevertheless, as demonstrated in the
study this was not the location of public street surveillance.
Figure 3.5. Psychometric paradigm proposition: Proposed public street surveillance
3.4 Perceptions or attitudes
The term risk perception, although not a clinical definition, was used in this study for a number of
reasons. The first being that Slovic (1997; 1992) used this term throughout his research and was
therefore, maintained to provide continuity. As Slovic stated “the word perception is used here and in
the literature to refer to various kinds of attitudes and judgements” (1992, p. 152). The second was
whether the research was measuring perceptions or attitudes? The psychology definition of perception
Current public street
surveillance (Lay person)
Public street surveillance (Expert)
Future Public street surveillance.
Relocation of public street
surveillance
Unfamiliar Risk
Low Dread Risk High Dread Risk
Familiar Risk
Radioactive
Coal Mining (Disease)
Home swimming pools
Water Chlorination
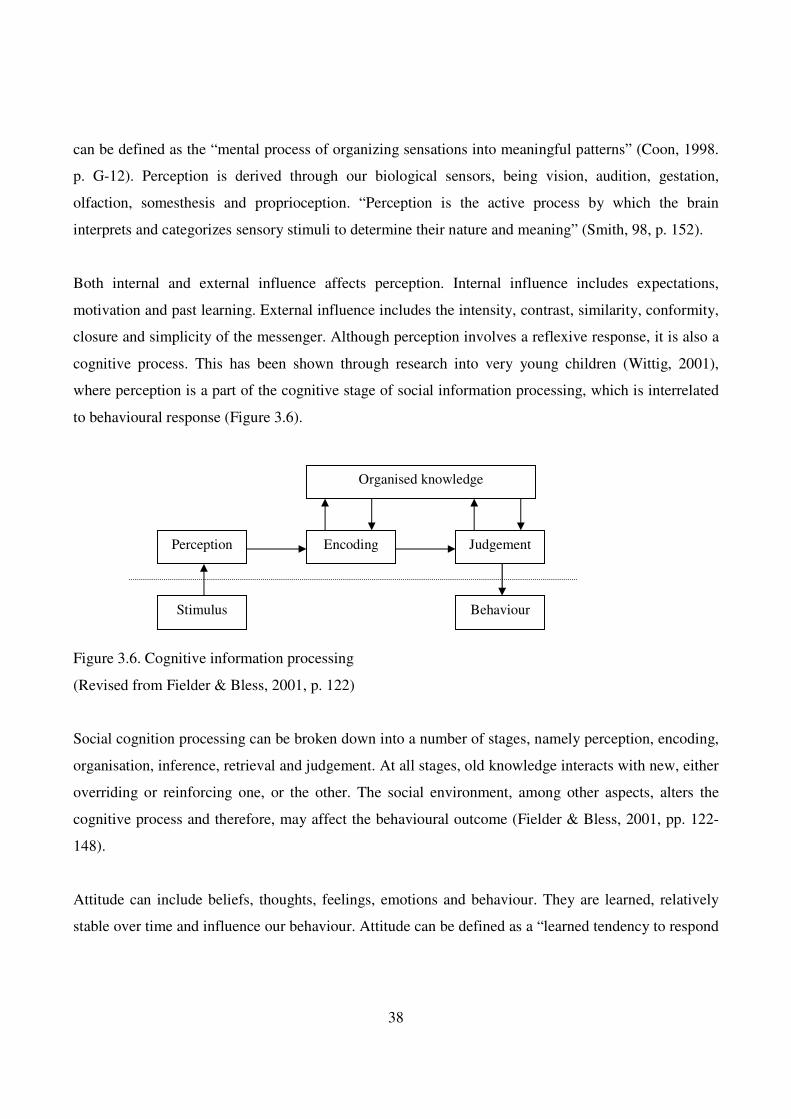
38
can be defined as the “mental process of organizing sensations into meaningful patterns” (Coon, 1998.
p. G-12). Perception is derived through our biological sensors, being vision, audition, gestation,
olfaction, somesthesis and proprioception. “Perception is the active process by which the brain
interprets and categorizes sensory stimuli to determine their nature and meaning” (Smith, 98, p. 152).
Both internal and external influence affects perception. Internal influence includes expectations,
motivation and past learning. External influence includes the intensity, contrast, similarity, conformity,
closure and simplicity of the messenger. Although perception involves a reflexive response, it is also a
cognitive process. This has been shown through research into very young children (Wittig, 2001),
where perception is a part of the cognitive stage of social information processing, which is interrelated
to behavioural response (Figure 3.6).
Figure 3.6. Cognitive information processing
(Revised from Fielder & Bless, 2001, p. 122)
Social cognition processing can be broken down into a number of stages, namely perception, encoding,
organisation, inference, retrieval and judgement. At all stages, old knowledge interacts with new, either
overriding or reinforcing one, or the other. The social environment, among other aspects, alters the
cognitive process and therefore, may affect the behavioural outcome (Fielder & Bless, 2001, pp. 122-
148).
Attitude can include beliefs, thoughts, feelings, emotions and behaviour. They are learned, relatively
stable over time and influence our behaviour. Attitude can be defined as a “learned tendency to respond
Stimulus
Perception Encoding Judgement
Behaviour
Organised knowledge

39
to people, objects, or institutions in a positive or negative way” (Coon, 98. p. G-2). Attitudes are made
up of a number of components, being cognitive (beliefs), affective (emotions, feelings) and behavioural
(action) component and are acquired through a complex process, but learned process.
Demarcation between attitude and perception cannot be made. Psychology defines these as two distinct
processes; however, within social psychology they are closely interrelated, demonstrated through social
psychology cognitive stages of information processing. As Fielder and Bless stated, “the different
processing stages, from perceptual input to behavioural output – are interdependent and characterised
by various feedback loops” (2001, p. 123). Psychology is the biological process that does not provide
this cognitive relationship. Social psychology however, views the interaction between the individual
and the group or society.
Perception and attitude are cognitive, affect each other and are interrelated. This relationship reduced
the ability to provide a clear and concise demarcation between perception and attitude. Slovic (1992)
did not attempt to segregate these terms, using the term risk perception to refer to both risk attitude and
risk perception. Therefore, the term risk perception was used throughout the study, cognisant that it
takes the social psychology definition which includes perception, attitudes and judgements.
Nevertheless, the research reviews the individual attitudes within a group or social environment.
3.5 Multidimensional scaling
Multidimensional scaling (MDS) is a statistical technique within the area of multivariate data analysis.
MDS reduces complex dimensional data and presents these data in a spatial representation. “This
ability to spatially represent a complex set of data is the major feature of MDS” (Smith, 1984, p. 89).
Cox and Cox define MDS as “the search for a low dimensional space, usually Euclidean, in which
points in the space represents the objects, … such that the distance between the points in space, …
match, as well as possible, the original dissimilarities” (2000, p. 1).
The reduction in data complexity, through presentation in dimensional space, allows hidden structure to
be shown in data. This presentation demonstrates object proximity, with proximity being the measure
of how similar or dissimilar the objects are perceived to be. “Proximity is a number which indicates
40
how similar or how different two objects are, or are perceived to be” (Kruskal & Wish. 1978, p. 7).
MDS was developed and theorised within behavioural science; however, is now used by many
disciplines (Cox & Cox) such as psychology to interpret perception, sociology to determine structure of
groups, anthropology to compare different cultural groups, economist to determine consumer reaction
to goods and educators, to research the structure of intelligence (Smith, 1984, p. 88).
MDS commences with a set of objects, being the activities and technologies. The objects are paired and
dissimilarities measured. The distances between pairs of objects are placed within a half matrix format.
A configuration of points is sought in dimensional space, with each point representing an object. The
aim of MDS is to find a dimensional space configuration where the points distance match as close as
possible, the paired dissimilarities. The different notion of matching defines the different techniques of
MDS (Cox & Cox, 2000). MDS was used within the study as an additional statistical procedure to elicit
further underlying group and individual risk perceptions from the research data. Primary MDS models
used were the Classical Euclidean Distance and Individual Differences (Weighted) Scaling
(INDSCAL) models.
3.5.1 Multidimensional scaling methods
Multidimensional scaling (MDS) includes a number of techniques, depending on the proposed analysis
and datum sets. Nevertheless, each technique has a set of n objects, with measured dissimilarities
between pairs of objects. Configuration of n points is sought in p dimensional space, with each point
nth representing an object. When the space configuration that the nth points distance match as close as
possible, the paired dissimilarities, MDS has achieved its aim.
Classical scaling treats dissimilarities as Euclidean distances. Young and Householder, in the 1930s,
developed this technique and demonstrated that a matrix of distances between points in Euclidean
space can be preserved from point coordinates. This approach was further developed and made popular
by Torgerson (1952). Metric least squares scaling again treats dissimilarities as Euclidean, but
transforms these as a continuous monotonic function. These methods are both metric scaling techniques
(Cox & Cox, 2000). The Euclidean distance algorithm is:
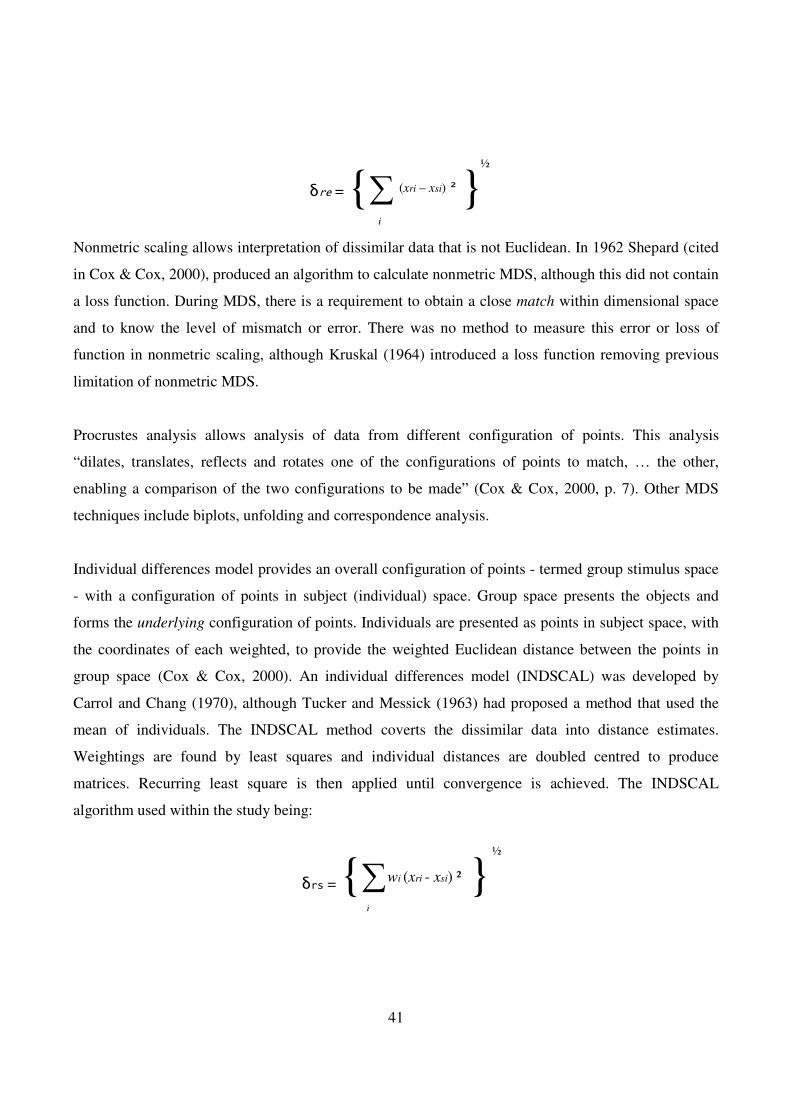
41
δre = {∑ }
Nonmetric scaling allows interpretation of dissimilar data that is not Euclidean. In 1962 Shepard (cited
in Cox & Cox, 2000), produced an algorithm to calculate nonmetric MDS, although this did not contain
a loss function. During MDS, there is a requirement to obtain a close match within dimensional space
and to know the level of mismatch or error. There was no method to measure this error or loss of
function in nonmetric scaling, although Kruskal (1964) introduced a loss function removing previous
limitation of nonmetric MDS.
Procrustes analysis allows analysis of data from different configuration of points. This analysis
“dilates, translates, reflects and rotates one of the configurations of points to match, … the other,
enabling a comparison of the two configurations to be made” (Cox & Cox, 2000, p. 7). Other MDS
techniques include biplots, unfolding and correspondence analysis.
Individual differences model provides an overall configuration of points - termed group stimulus space
- with a configuration of points in subject (individual) space. Group space presents the objects and
forms the underlying configuration of points. Individuals are presented as points in subject space, with
the coordinates of each weighted, to provide the weighted Euclidean distance between the points in
group space (Cox & Cox, 2000). An individual differences model (INDSCAL) was developed by
Carrol and Chang (1970), although Tucker and Messick (1963) had proposed a method that used the
mean of individuals. The INDSCAL method coverts the dissimilar data into distance estimates.
Weightings are found by least squares and individual distances are doubled centred to produce
matrices. Recurring least square is then applied until convergence is achieved. The INDSCAL
algorithm used within the study being:
δrs = {∑ }
½
i
(xri – xsi) ²
½
wi (xri - xsi) ²
i
42
MDS was used within the study as an additional statistical procedure to elicit further underlying risk
perceptions within the research data and support the psychometric paradigm analysis. MDS provided
“a way of reducing the data … to two dimensions representing the hidden structure of the data. By
finding key differences between … opposite ends of each dimension, we can attempt to develop
indicators of variables that can be measured” (Kruskal & Wish, 1978, p. 5). INDSCAL provided a
measure of subject space, through spatial representation, and also presented the angular separation and
vector length of the configuration of points, which can demonstrate “salience that the individual
attributes to each dimension of subject space” (Smith, 1984, p. 95). This method is referred to as the
Analysis of Angular Variation (ANAVA), which can be used to provide further analysis of difference
between groups (Mardia, 1972).
3.6 Research methodology
This section presents the primary research theories that supported the research methodologies used
within the study. These methods include the descriptive methodology, use of the Likert Scale to
measure the risk perception of the target population, and the assessment and selection of an appropriate
sampling size.
3.6.1 Methodology
A number of previous psychometric studies had used descriptive methodology to measure the
perception of risk (Bouyer, Bagdassarian, Chaabanne & Mullet, 2001; Slovic, 1992; Slovic 1997). The
descriptive method was suited to these types of studies and measured what existed through observation
(Gay, 1981). Observation views individuals and measures defined variables; however, does not attempt
to influence a response (Multivariate statistical analysis, n.d). This met the research objectives of the
study and was consistent with previous psychometric studies (Bouyer, Bagdassarian, Chaabanne &
Mullet, 2001; Slovic, 1997).
3.6.2 Likert scale
The risk perception of the five activities and technologies were tested using a qualitative test
instrument, using a seven point Likert Scale. The Likert Scale comprises of a number of statements that
weer designed to elicit the participant’s perception towards a particular topic (Aiken, 1997). The survey
43
questionnaire should be constructed with both positive and negative statements (Hopkins, 1990), with
the polarity realigned in the data analysis.
The Likert Scale was chosen for a number of reasons. Previous psychometric studies used this method
(Bouyer, Bagdassarian, Chaabanne & Mullet, 2001; Slovic, 1997) and the Likert Scale has been
applied extensively in opinion research. There is a robustness within the statements, as correctness was
not critically important, only that the participants could express their varying degrees of opinion (Best,
1981). The Likert Scale assigns a numerical value from strongly agree to strongly disagree statements.
The scale can be realigned to all positive values and the mean score from each participant and mean
total produced. This measure indicated the sense of risk perception for each factor dread risk and
familiarity to risk.
However, there are a number of possible errors with Likert Scales. The participants may not really
know what they feel, the nature of the issue may be abstract or they may never have considered the
issue. They may also only express their opinion, as opposed to their true feeling or perception (Best,
1981). The possible non-linear nature of the scale has also to be considered, as the scale may have
differing values for individuals. Finally, the Likert Scale does not provide an opportunity for wider
independent thought among the test participants, possibly restricting their response (Aiken, 1997).
Therefore, it was necessary to infer that the instrument was measuring perception, demonstrated by the
repeated and consistent results achieved.
3.6.3 Population sample size
Probability sampling supported the study, using simple random sampling techniques. Participants are
selected from within the population in a random, but defined method (Fink, 1995; Best, 1981). The
target population were community members within a defined geographical area, representative of the
population. National census data was utilized to provide population data. The census data can also
provide secondary analysis to statistically demonstrate that the target population is representative of the
population (Fink,1995; De Vaus, 1992).
44
To achieve a statistical valid sample of the population, Fink (1995) and Leedy (1989) indicated ≥30 per
cell and De Vaus (1993) 50 to 100 per cell. Consideration has to be taken for possible variations in
characteristics, with linear division through the cells. Although, there has to be a compromise between
sample size, cost, accuracy and the objectives of the study (De Vaus, 1993). The study used nine
research cells and sample size of 135 participants, producing ≥15 participants per cell. Nevertheless,
with linear variations in characteristics through the cells this could produce a possible sample size of
≥3.38 per cell. Although not achieving statistical appropriate sample size in each cell, the sample size
was deemed to be appropriate for the objectives of the study.
3.7 Conclusion
This chapter provided the theoretical framework for the study and theories supporting the methodology,
which included the psychometric paradigm, psychometric risk perception causal relationship model,
definition of the term risk perception, statistical analysis technique of MDS and primary theories that
supported the research methodologies.
The psychometric paradigm measures and assesses the social risk perception and therefore, risk
acceptance of activities and technologies. This presented risk perception as a two factor analytical
representation, with factor one defined as dread risk and factor two as familiarity to risk. The risk
factors are further expanded into the characteristics of risk, where nine characteristics were used as the
independent variables of social risk perception. The characteristics for dread risk being controllability
of risk, risk to future generations and whether exposure to the risk was voluntary. The familiarity to
risk characteristics being how observable was the risk, whether the risk was known to those exposed,
age of risk and immediacy of risk.
To provide proximal data, demonstrate research instrument reliability and validity, four additional
control activities and technologies were tested. These four control items were radioactive waste, home
swimming pools, drinking water chlorination and coal mining disease. The additional activities and
technologies not only provided spatial relationship comparisons of public street surveillance, but also
allowed a comparison of previous psychometric studies.
45
The term risk perception was used throughout the study. Slovic (1992; 1997) used this term in his
research and it was maintained to provide continuity. Also, the study measured not only perceptions,
but also attitudes and beliefs. Psychology defines perception and attitude as two distinct processes;
however, in social psychology they are closely interrelated. Perception and attitude are cognitive, affect
each other and are interrelated. Therefore, the term risk perception, was used cognisant that it refers to
the social psychology definition, which includes perceptions, attitudes and judgements.
Multidimensional scaling (MDS) is a statistical technique within the area of multivariate data analysis.
MDS reduces complex dimensional data and presents these data in a spatial representation. The
reduction in data complexity, through presentation in dimensional space, allows hidden structure to be
shown in data. This spatial presentation demonstrates object proximity, with proximity being how
similar or dissimilar objects are or are perceived to be.
MDS commences with a set of objects, which are paired and dissimilarities measured. The distances
between pairs of objects are placed in a half matrix format. Configurations of points are sought in
dimensional space, with each point representing an object. The aim of MDS is to find a dimensional
space configuration where the points distance match as close as possible, the paired dissimilarities. The
different notion of matching defines the different techniques of MDS. MDS was used within the study
as an additional statistical procedure to elicit further underlying group and individual risk perceptions.
MDS models used were the Classical Euclidean Distance and Individual Differences (Weighted)
Scaling (INDSCAL) models.
A number of psychometric studies had used descriptive studies and Likert Scales to measure the
perception of risk (Bouyer, Bagdassarian, Chaabanne & Mullet, 2001; Slovic, 1997; Slovic 1992).
Likert Scales had also been used extensively in opinion research (Best, 1981). Likert Scales comprise
of a number of statements that are designed to elicit the participant’s perceptions, with statements from
strongly agree to strongly disagree assigned numerical values. Nevertheless, Likert Scale could be
prone to errors, as participants may not know what they feel, the nature of the issue, the issue may be
abstract or the scale could limit wider independent response.
46
Probability sampling supported the study data collection, using simple random sampling techniques.
This technique involved selecting participants from within a population in a defined, but random
method (Fink, 1995; Best, 1981). The study used nine research cells and a sample size of 135
participants, producing ≥15 participants per cell. However, with linear variations in characteristics
through the cells this could produce a possible sample size of ≥3.38 per cell, deemed to be appropriate
for the objectives of the study.
47
CHAPTER 4
MATERIALS & METHOD
4.1 Introduction
This chapter provides a description on the methodology used within the research study. It presents the
target population (Section 4.2), study design (Section 4.3), research instrument (Section 4.4) and an
overview on how the collected data were analysed (Section 4.5). Draft pilot studies were performed to
assess the suitability of the research instrument and method of research (Section 4.6). This section
examines the development and assessment of the research instrument, with the pilot instrument validity
and reliability provided. The academic review of the research proposal and recommended research
changes to improve the study are discussed (Section 4.7).
Data collection methodology ensured a random collection of data (Section 4.8). A pilot study (N=20)
followed from the draft pilot studies and used target population participants (Section 4.9). This section
includes the pilot study demographics, instrument reliability and validity, pilot study spatial factor
representation, and final instrument modifications. Finally, research study limitations (Section 4.10)
and applied ethics (Section 4.11) complete this chapter.
4.2 Target population
The target population (N=2106) were community members who lived and/or worked within 0.5km
distance of Rockingham beachfront, within the City of Rockingham, Western Australia, and who were
≥16 years old at the time of survey. A sample of participants (N=135) were taken from the target
population. The research area is a prime tourist location within Rockingham and is used by both local
people and area visitors. The area comprises of mixed commercial, residential and tourist zones.
Commercial enterprise includes hospitality, retail and medical businesses. Residential zones are
generally medium to low density housing, ranging in value from A$80,000 to A$1,500,000, while
tourist attractions include a local museum, tourist bureau, markets, retail outlets, foreshore parks,
boardwalk, hospitality and the beach.
48
The local shire installed a public street surveillance system within the centre of the geographical target
population nucleus. This CCTV system comprised of two cameras placed at each end of Railway
Terrace (Appendix C, Geographical research location). The cameras were pan, tilt and zoom (PTZ)
cameras, controlled and recorded from the local Police Station, located approximately 2.5km from the
cameras and monitored via a microwave link. The public street surveillance operators consisted solely
of Police Officers. There was also an additional monitor, which repeated the Police monitoring and
located in the Rockingham Shire Security Manager’s office.
4.3 Study design
The study comprised an initial pre-survey, which presented the spatial loading of the participants as a
social group within the psychometric paradigm. Once the public street surveillance system had been
installed and operating for approximately six months, the post-survey was completed. Both pre and
post studies used the same survey instrument. To assess the suitability of the research methodology and
survey instrument additional pilot studies were completed, which included two draft pilot studies and a
final pilot study. The phases of the study (Figure 4.1) provided a structured approach to the
development and application of the research method.
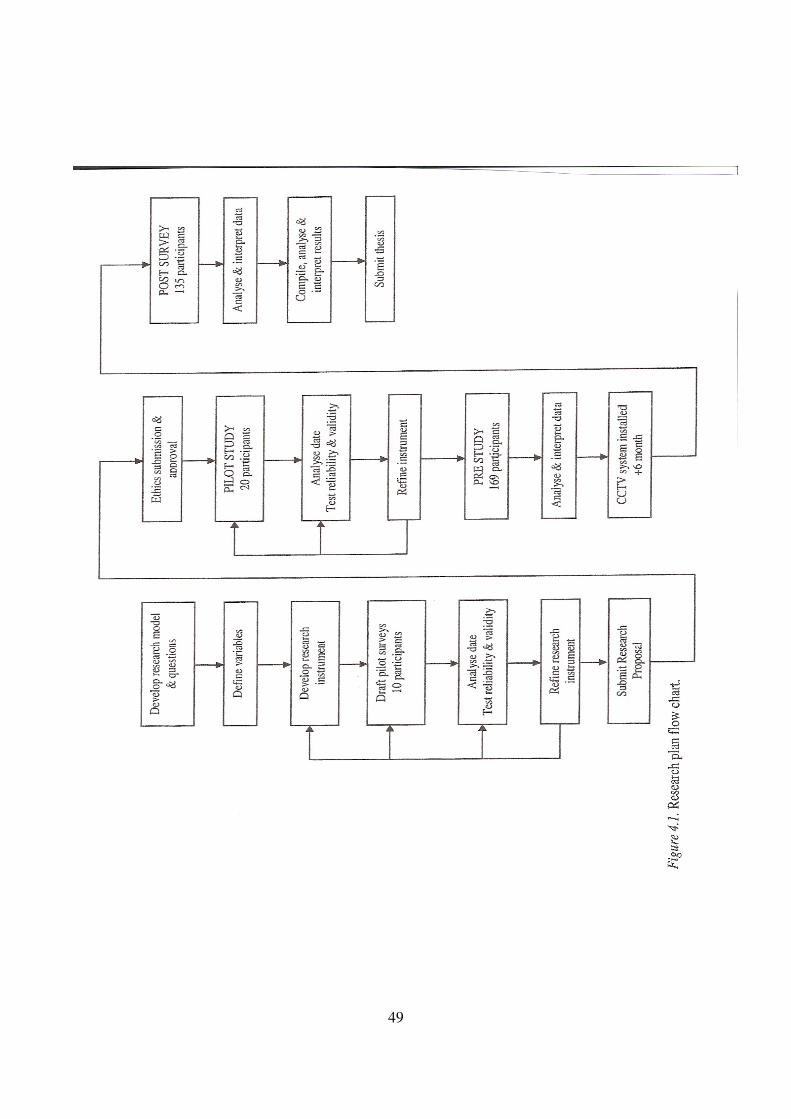
49
50
The study contained three distinct research items, being the introduction letter, general information
survey and the pre and post survey. The introduction letter provided research information to the
participants and contained the informed consent. The general information survey and pre/post survey
were combined into a single questionnaire. This questionnaire became the research instrument,
designed to gather the research data.
An introduction letter (Appendix A), stating the intent of the research, the researcher’s contact details
and ethical issues was supplied to the participant before any data was gathered. This introduction letter
highlighted that participation in the study was voluntary, that the participant could withdraw at any
point, that data collected would remain strictly confidential at all times, that data would not be used
outside this research, that the participant would not be named or identified in any manner within the
research thesis and that ethical approval had been given by Edith Cowan University. This letter also
included the consent form for the participant to sign.
4.4 Research instrument
The general information survey and pre/post survey were combined to provide a single research
instrument, being the survey questionnaire (Appendix B). This survey questionnaire contained two
distinct parts; Part 1 was the general information survey, with part 2 being the pre/post risk perception
survey.
4.4.1. Part 1: General survey
The general survey gathered specific data about the participants, namely gender, age group and
distance to the centre of the geographical research nucleus. It was designed to gather general
information, provide subgroups within the data results and to determine whether certain subgroups may
have been significantly more affected. It comprises of a total of 12 research cells, although with the
amalgamation of the group “distance to the centre of Rockingham” this was effectively reduced to nine
cells.
51
4.4.2. Part 2: Pre/post survey
The primary instrument within the study was the pre/post risk perception survey, using a seven point
Likert Scale. The draft pilot survey contained a total of five activities and/or technologies, with two
factors containing 10 questions per factor. This survey resulted in two questions for each selected risk
characteristic and a total of 20 questions per activity or technology. The final survey contained 12
questions per activity or technology, with six questions on each factor and one question on each risk
characteristic. This approach allowed analysis and subsequent selection of questions during the draft
pilot and pilot studies to improve the reliability and validity of the survey questionnaire. The survey
questionnaire was constructed with both positive and negative statements, in accordance with Hopkins
(1990), with the polarity realigned in the data analysis matrix. The matrix listed participants only as a
number, ensuring that there was no ability for participants to be identified at any point in the survey,
maintaining research ethics.
The survey questionnaire contained five activities and technologies, namely public street surveillance,
radioactive waste, home swimming pools, drinking water chlorination and coal mining disease. The
four additional activities and technologies were chosen, as according to Slovic (1997), they represented
one object from each quadrant of the spatial factor representation model. This approach provided
spatial relationship comparisons of where public street surveillance was located; moreover, allowed a
comparison of previous psychometric studies (Bouyer, Bagdassarian, Chaabanne & Mullet, 2001;
Slovic, 1997). The ability to provide a spatial match between longitudinal research studies further
supported the reliability and validity of the research instrument.
4.5 Data analysis
The collected data results were placed into a data analysis matrix, developed in Microsoft® Excel 97.
The negative polarity questions were reversed, to produce all positive outputs. Each measured activity
and technology had a summed mean total and standard deviation (SD) for each factor. The general
survey data were also converted into numerical data. For example, those participants whom current age
was 16-25 years old were assigned a “1”, those participants whom current age was 26-35 years old
were assigned a “2”, etc. This method allowed statistical analysis of the general survey data, which was
further analysed using SPSS statistical program (Table 4.1).
52
Table 4.1
Statistical analysis program
SPSS for Windows Student Version Release 10.0.5 (5 January 2000) Product limit to 50 cases, 1500 variables Copyright © SPSS Inc., 1989-1999
Relevant data were imported into the statistical program (SPSS) for data analysis. Data analysis,
beyond reliability and validity, included:
� Mean and SD between the pre survey, post survey, research cells, and activities and technologies.
� T tests (paired) to demonstrate significance differences between the pre survey, post survey and
research cells totals, at ≥95% confidence level.
� Spatial factor representation analysis and distribution of the mean and individual totals, to
demonstrate the location of activities and technologies.
� Multidimensional Scaling (MDS) Euclidean distance model of the total means to present the spatial
dimensional representation distribution of group space.
� Multidimensional Scaling (MDS) INDSCAL model of the individual means to present the spatial
dimensional representation distribution of group space.
� Spatial factor and dimensional representation analysis and distribution comparisons.
4.6 Overview of the pilot studies
Two draft pilot studies were performed to assess the suitability of the survey questionnaire and method
of research. These pilot studies developed and assessed the research instrument, allowed improvements
to be made to the survey questionnaire and ensured that the instrument was acceptable for progression
to the pilot study. In addition, the pilot studies demonstrated an acceptable validity and reliability result
of the survey questionnaire. During this phase changes were made to the survey questionnaire,
including the planned reduction in survey questions through the removal of poor questions,
rearrangement of the activities and technologies, and changes in semantics.
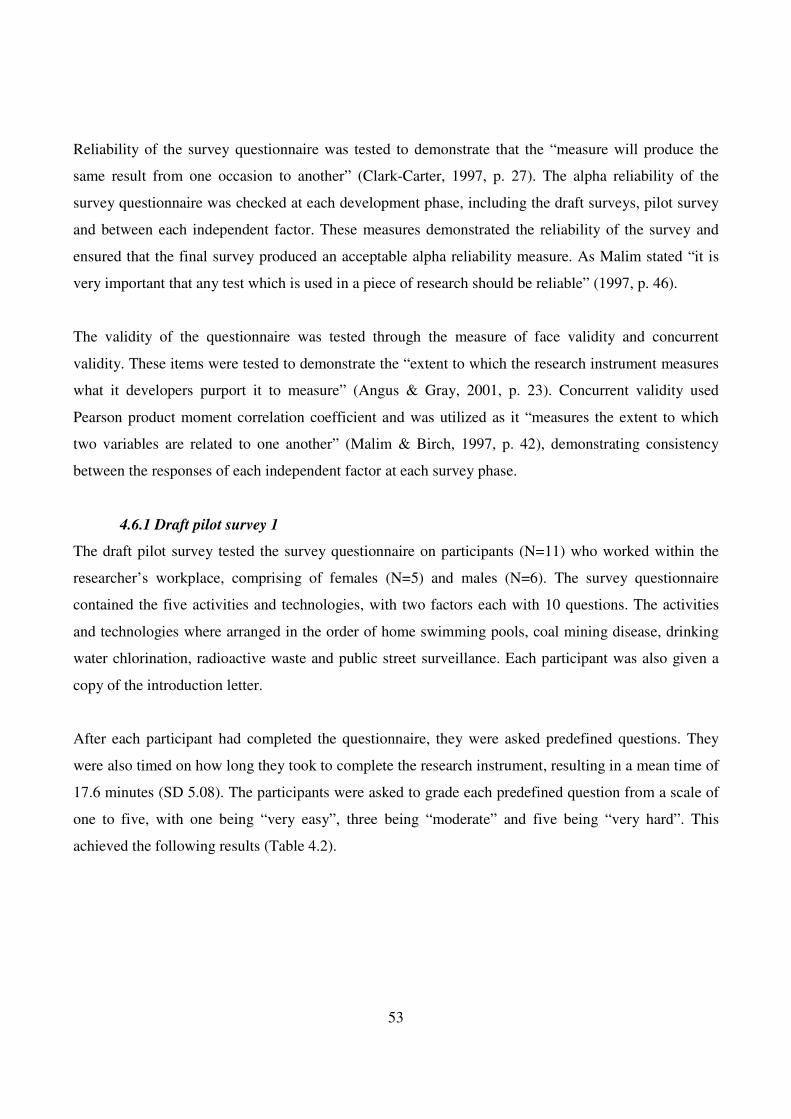
53
Reliability of the survey questionnaire was tested to demonstrate that the “measure will produce the
same result from one occasion to another” (Clark-Carter, 1997, p. 27). The alpha reliability of the
survey questionnaire was checked at each development phase, including the draft surveys, pilot survey
and between each independent factor. These measures demonstrated the reliability of the survey and
ensured that the final survey produced an acceptable alpha reliability measure. As Malim stated “it is
very important that any test which is used in a piece of research should be reliable” (1997, p. 46).
The validity of the questionnaire was tested through the measure of face validity and concurrent
validity. These items were tested to demonstrate the “extent to which the research instrument measures
what it developers purport it to measure” (Angus & Gray, 2001, p. 23). Concurrent validity used
Pearson product moment correlation coefficient and was utilized as it “measures the extent to which
two variables are related to one another” (Malim & Birch, 1997, p. 42), demonstrating consistency
between the responses of each independent factor at each survey phase.
4.6.1 Draft pilot survey 1
The draft pilot survey tested the survey questionnaire on participants (N=11) who worked within the
researcher’s workplace, comprising of females (N=5) and males (N=6). The survey questionnaire
contained the five activities and technologies, with two factors each with 10 questions. The activities
and technologies where arranged in the order of home swimming pools, coal mining disease, drinking
water chlorination, radioactive waste and public street surveillance. Each participant was also given a
copy of the introduction letter.
After each participant had completed the questionnaire, they were asked predefined questions. They
were also timed on how long they took to complete the research instrument, resulting in a mean time of
17.6 minutes (SD 5.08). The participants were asked to grade each predefined question from a scale of
one to five, with one being “very easy”, three being “moderate” and five being “very hard”. This
achieved the following results (Table 4.2).
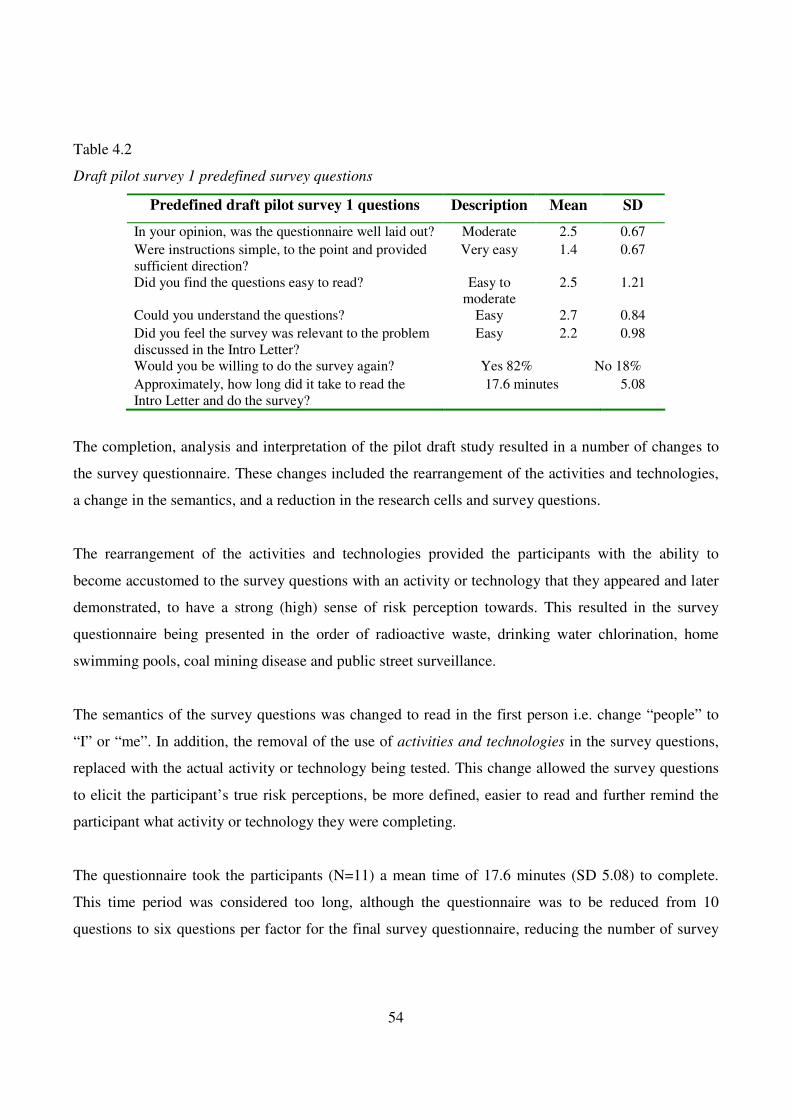
54
Table 4.2
Draft pilot survey 1 predefined survey questions
Predefined draft pilot survey 1 questions Description Mean SD
In your opinion, was the questionnaire well laid out? Moderate 2.5 0.67
Were instructions simple, to the point and provided sufficient direction?
Very easy 1.4 0.67
Did you find the questions easy to read? Easy to moderate
2.5 1.21
Could you understand the questions? Easy 2.7 0.84
Did you feel the survey was relevant to the problem discussed in the Intro Letter?
Easy 2.2 0.98
Would you be willing to do the survey again? Yes 82% No 18%
Approximately, how long did it take to read the Intro Letter and do the survey?
17.6 minutes 5.08
The completion, analysis and interpretation of the pilot draft study resulted in a number of changes to
the survey questionnaire. These changes included the rearrangement of the activities and technologies,
a change in the semantics, and a reduction in the research cells and survey questions.
The rearrangement of the activities and technologies provided the participants with the ability to
become accustomed to the survey questions with an activity or technology that they appeared and later
demonstrated, to have a strong (high) sense of risk perception towards. This resulted in the survey
questionnaire being presented in the order of radioactive waste, drinking water chlorination, home
swimming pools, coal mining disease and public street surveillance.
The semantics of the survey questions was changed to read in the first person i.e. change “people” to
“I” or “me”. In addition, the removal of the use of activities and technologies in the survey questions,
replaced with the actual activity or technology being tested. This change allowed the survey questions
to elicit the participant’s true risk perceptions, be more defined, easier to read and further remind the
participant what activity or technology they were completing.
The questionnaire took the participants (N=11) a mean time of 17.6 minutes (SD 5.08) to complete.
This time period was considered too long, although the questionnaire was to be reduced from 10
questions to six questions per factor for the final survey questionnaire, reducing the number of survey
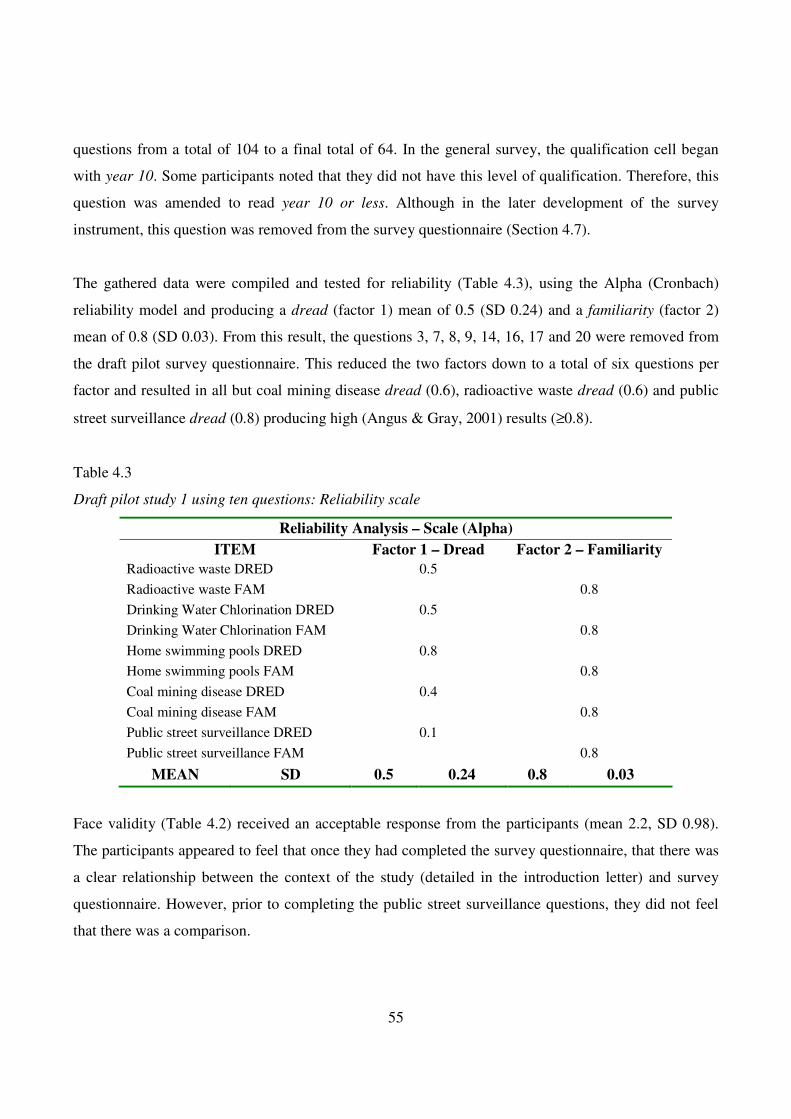
55
questions from a total of 104 to a final total of 64. In the general survey, the qualification cell began
with year 10. Some participants noted that they did not have this level of qualification. Therefore, this
question was amended to read year 10 or less. Although in the later development of the survey
instrument, this question was removed from the survey questionnaire (Section 4.7).
The gathered data were compiled and tested for reliability (Table 4.3), using the Alpha (Cronbach)
reliability model and producing a dread (factor 1) mean of 0.5 (SD 0.24) and a familiarity (factor 2)
mean of 0.8 (SD 0.03). From this result, the questions 3, 7, 8, 9, 14, 16, 17 and 20 were removed from
the draft pilot survey questionnaire. This reduced the two factors down to a total of six questions per
factor and resulted in all but coal mining disease dread (0.6), radioactive waste dread (0.6) and public
street surveillance dread (0.8) producing high (Angus & Gray, 2001) results (≥0.8).
Table 4.3
Draft pilot study 1 using ten questions: Reliability scale
Reliability Analysis – Scale (Alpha)
ITEM Factor 1 – Dread Factor 2 – Familiarity
Radioactive waste DRED 0.5
Radioactive waste FAM 0.8
Drinking Water Chlorination DRED 0.5
Drinking Water Chlorination FAM 0.8
Home swimming pools DRED 0.8
Home swimming pools FAM 0.8
Coal mining disease DRED 0.4
Coal mining disease FAM 0.8
Public street surveillance DRED 0.1
Public street surveillance FAM 0.8
MEAN SD 0.5 0.24 0.8 0.03
Face validity (Table 4.2) received an acceptable response from the participants (mean 2.2, SD 0.98).
The participants appeared to feel that once they had completed the survey questionnaire, that there was
a clear relationship between the context of the study (detailed in the introduction letter) and survey
questionnaire. However, prior to completing the public street surveillance questions, they did not feel
that there was a comparison.
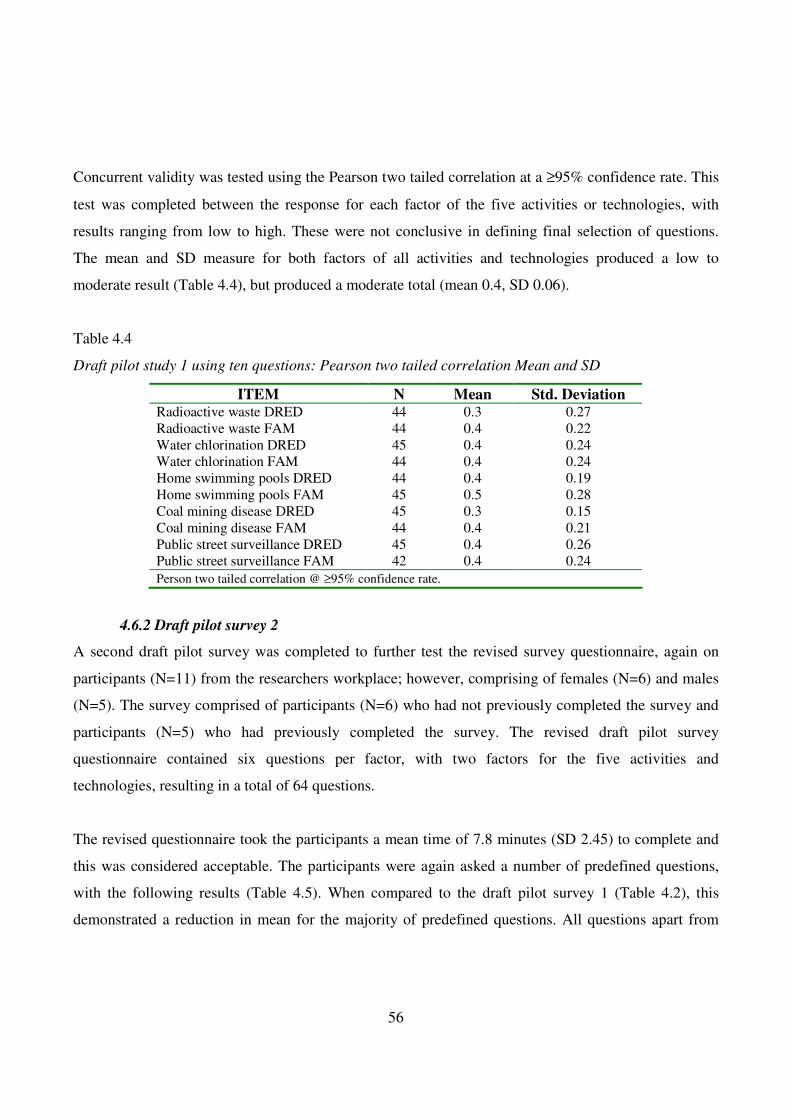
56
Concurrent validity was tested using the Pearson two tailed correlation at a ≥95% confidence rate. This
test was completed between the response for each factor of the five activities or technologies, with
results ranging from low to high. These were not conclusive in defining final selection of questions.
The mean and SD measure for both factors of all activities and technologies produced a low to
moderate result (Table 4.4), but produced a moderate total (mean 0.4, SD 0.06).
Table 4.4
Draft pilot study 1 using ten questions: Pearson two tailed correlation Mean and SD
ITEM N Mean Std. Deviation Radioactive waste DRED 44 0.3 0.27 Radioactive waste FAM 44 0.4 0.22 Water chlorination DRED 45 0.4 0.24 Water chlorination FAM 44 0.4 0.24 Home swimming pools DRED 44 0.4 0.19 Home swimming pools FAM 45 0.5 0.28 Coal mining disease DRED 45 0.3 0.15 Coal mining disease FAM 44 0.4 0.21 Public street surveillance DRED 45 0.4 0.26 Public street surveillance FAM 42 0.4 0.24
Person two tailed correlation @ ≥95% confidence rate.
4.6.2 Draft pilot survey 2
A second draft pilot survey was completed to further test the revised survey questionnaire, again on
participants (N=11) from the researchers workplace; however, comprising of females (N=6) and males
(N=5). The survey comprised of participants (N=6) who had not previously completed the survey and
participants (N=5) who had previously completed the survey. The revised draft pilot survey
questionnaire contained six questions per factor, with two factors for the five activities and
technologies, resulting in a total of 64 questions.
The revised questionnaire took the participants a mean time of 7.8 minutes (SD 2.45) to complete and
this was considered acceptable. The participants were again asked a number of predefined questions,
with the following results (Table 4.5). When compared to the draft pilot survey 1 (Table 4.2), this
demonstrated a reduction in mean for the majority of predefined questions. All questions apart from
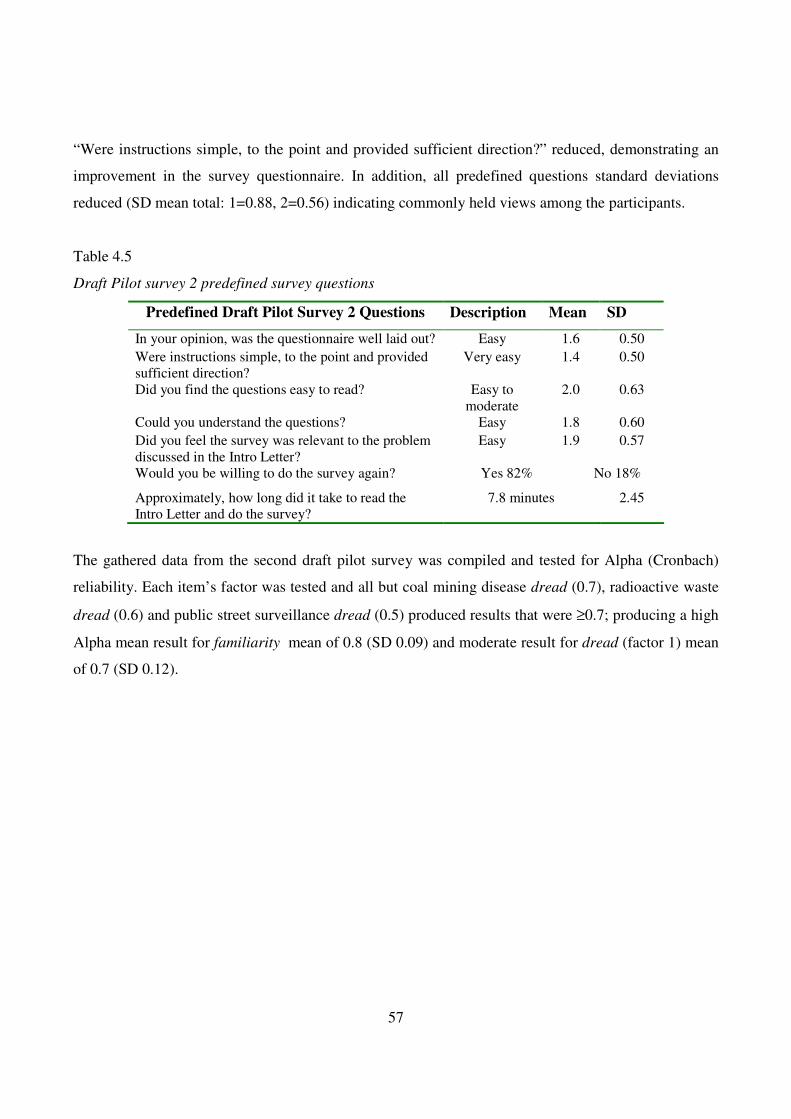
57
“Were instructions simple, to the point and provided sufficient direction?” reduced, demonstrating an
improvement in the survey questionnaire. In addition, all predefined questions standard deviations
reduced (SD mean total: 1=0.88, 2=0.56) indicating commonly held views among the participants.
Table 4.5
Draft Pilot survey 2 predefined survey questions
Predefined Draft Pilot Survey 2 Questions Description Mean SD
In your opinion, was the questionnaire well laid out? Easy 1.6 0.50
Were instructions simple, to the point and provided sufficient direction?
Very easy 1.4 0.50
Did you find the questions easy to read? Easy to moderate
2.0 0.63
Could you understand the questions? Easy 1.8 0.60
Did you feel the survey was relevant to the problem discussed in the Intro Letter?
Easy 1.9 0.57
Would you be willing to do the survey again? Yes 82% No 18%
Approximately, how long did it take to read the Intro Letter and do the survey?
7.8 minutes 2.45
The gathered data from the second draft pilot survey was compiled and tested for Alpha (Cronbach)
reliability. Each item’s factor was tested and all but coal mining disease dread (0.7), radioactive waste
dread (0.6) and public street surveillance dread (0.5) produced results that were ≥0.7; producing a high
Alpha mean result for familiarity mean of 0.8 (SD 0.09) and moderate result for dread (factor 1) mean
of 0.7 (SD 0.12).
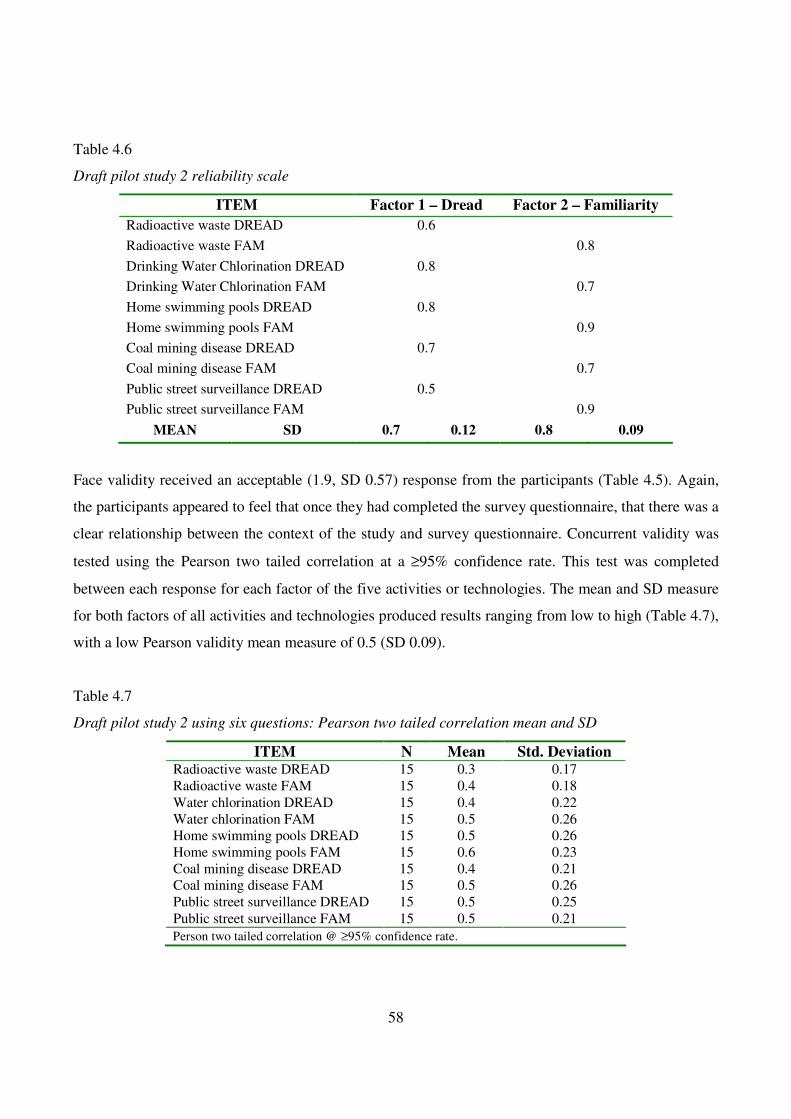
58
Table 4.6
Draft pilot study 2 reliability scale
ITEM Factor 1 – Dread Factor 2 – Familiarity
Radioactive waste DREAD 0.6
Radioactive waste FAM 0.8
Drinking Water Chlorination DREAD 0.8
Drinking Water Chlorination FAM 0.7
Home swimming pools DREAD 0.8
Home swimming pools FAM 0.9
Coal mining disease DREAD 0.7
Coal mining disease FAM 0.7
Public street surveillance DREAD 0.5
Public street surveillance FAM 0.9
MEAN SD 0.7 0.12 0.8 0.09
Face validity received an acceptable (1.9, SD 0.57) response from the participants (Table 4.5). Again,
the participants appeared to feel that once they had completed the survey questionnaire, that there was a
clear relationship between the context of the study and survey questionnaire. Concurrent validity was
tested using the Pearson two tailed correlation at a ≥95% confidence rate. This test was completed
between each response for each factor of the five activities or technologies. The mean and SD measure
for both factors of all activities and technologies produced results ranging from low to high (Table 4.7),
with a low Pearson validity mean measure of 0.5 (SD 0.09).
Table 4.7
Draft pilot study 2 using six questions: Pearson two tailed correlation mean and SD
ITEM N Mean Std. Deviation Radioactive waste DREAD 15 0.3 0.17 Radioactive waste FAM 15 0.4 0.18 Water chlorination DREAD 15 0.4 0.22 Water chlorination FAM 15 0.5 0.26 Home swimming pools DREAD 15 0.5 0.26 Home swimming pools FAM 15 0.6 0.23 Coal mining disease DREAD 15 0.4 0.21 Coal mining disease FAM 15 0.5 0.26 Public street surveillance DREAD 15 0.5 0.25 Public street surveillance FAM 15 0.5 0.21
Person two tailed correlation @ ≥95% confidence rate.
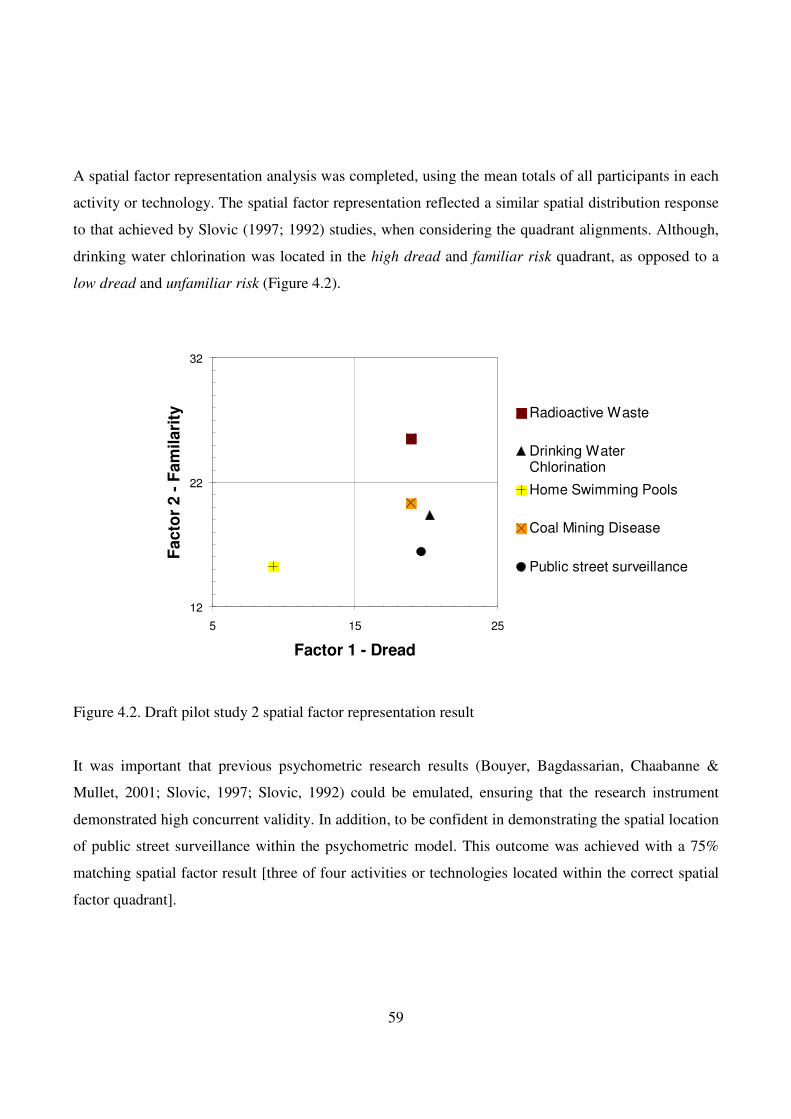
59
A spatial factor representation analysis was completed, using the mean totals of all participants in each
activity or technology. The spatial factor representation reflected a similar spatial distribution response
to that achieved by Slovic (1997; 1992) studies, when considering the quadrant alignments. Although,
drinking water chlorination was located in the high dread and familiar risk quadrant, as opposed to a
low dread and unfamiliar risk (Figure 4.2).
Figure 4.2. Draft pilot study 2 spatial factor representation result
It was important that previous psychometric research results (Bouyer, Bagdassarian, Chaabanne &
Mullet, 2001; Slovic, 1997; Slovic, 1992) could be emulated, ensuring that the research instrument
demonstrated high concurrent validity. In addition, to be confident in demonstrating the spatial location
of public street surveillance within the psychometric model. This outcome was achieved with a 75%
matching spatial factor result [three of four activities or technologies located within the correct spatial
factor quadrant].
12
22
32
5 15 25
Factor 1 - Dread
Facto
r 2 -
Fam
ilari
ty Radioactive Waste
Drinking WaterChlorination
Home Swimming Pools
Coal Mining Disease
Public street surveillance
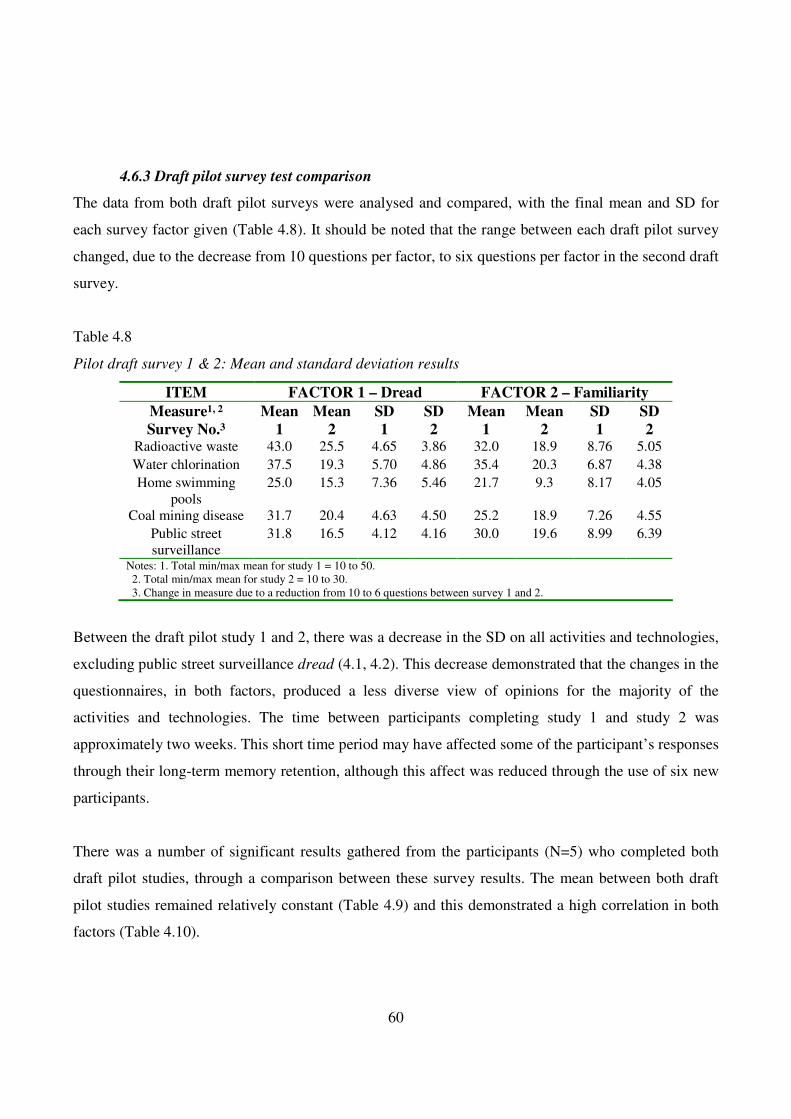
60
4.6.3 Draft pilot survey test comparison
The data from both draft pilot surveys were analysed and compared, with the final mean and SD for
each survey factor given (Table 4.8). It should be noted that the range between each draft pilot survey
changed, due to the decrease from 10 questions per factor, to six questions per factor in the second draft
survey.
Table 4.8
Pilot draft survey 1 & 2: Mean and standard deviation results
ITEM FACTOR 1 – Dread FACTOR 2 – Familiarity
Measure1, 2 Mean Mean SD SD Mean Mean SD SD
Survey No.3 1 2 1 2 1 2 1 2 Radioactive waste 43.0 25.5 4.65 3.86 32.0 18.9 8.76 5.05
Water chlorination 37.5 19.3 5.70 4.86 35.4 20.3 6.87 4.38
Home swimming pools
25.0 15.3 7.36 5.46 21.7 9.3 8.17 4.05
Coal mining disease 31.7 20.4 4.63 4.50 25.2 18.9 7.26 4.55
Public street surveillance
31.8 16.5 4.12 4.16 30.0 19.6 8.99 6.39
Notes: 1. Total min/max mean for study 1 = 10 to 50. 2. Total min/max mean for study 2 = 10 to 30. 3. Change in measure due to a reduction from 10 to 6 questions between survey 1 and 2.
Between the draft pilot study 1 and 2, there was a decrease in the SD on all activities and technologies,
excluding public street surveillance dread (4.1, 4.2). This decrease demonstrated that the changes in the
questionnaires, in both factors, produced a less diverse view of opinions for the majority of the
activities and technologies. The time between participants completing study 1 and study 2 was
approximately two weeks. This short time period may have affected some of the participant’s responses
through their long-term memory retention, although this affect was reduced through the use of six new
participants.
There was a number of significant results gathered from the participants (N=5) who completed both
draft pilot studies, through a comparison between these survey results. The mean between both draft
pilot studies remained relatively constant (Table 4.9) and this demonstrated a high correlation in both
factors (Table 4.10).
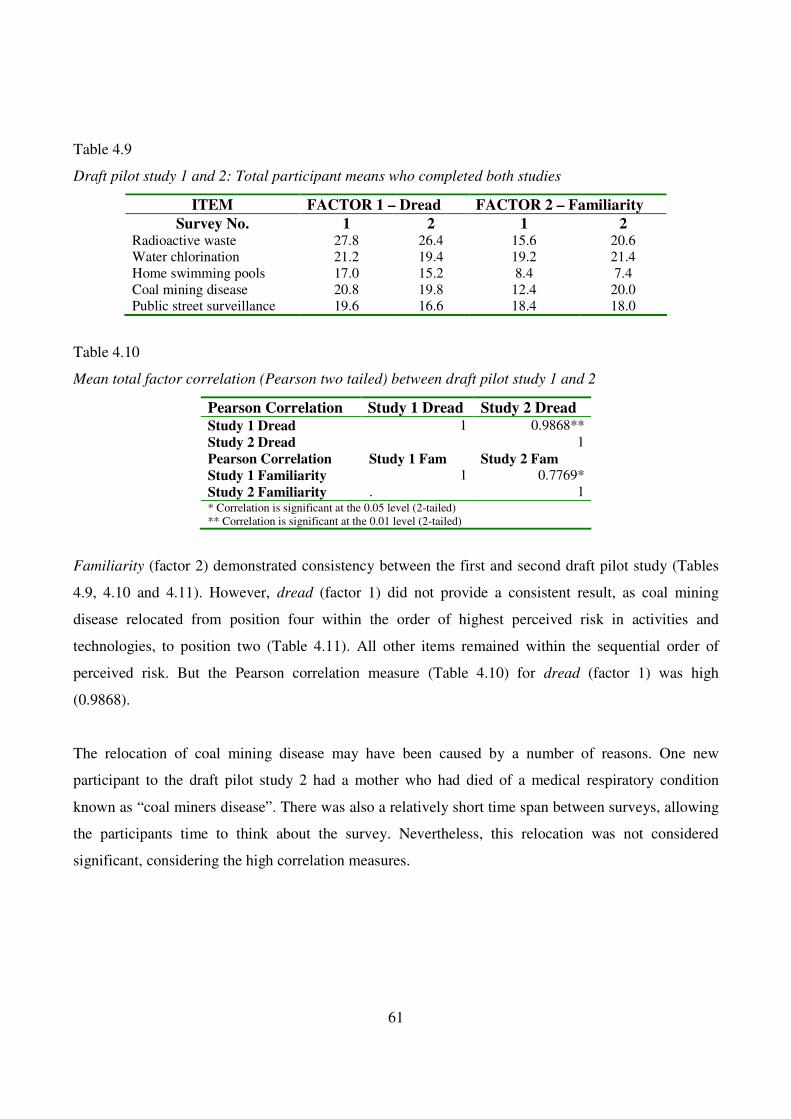
61
Table 4.9
Draft pilot study 1 and 2: Total participant means who completed both studies
ITEM FACTOR 1 – Dread FACTOR 2 – Familiarity
Survey No. 1 2 1 2 Radioactive waste 27.8 26.4 15.6 20.6 Water chlorination 21.2 19.4 19.2 21.4 Home swimming pools 17.0 15.2 8.4 7.4 Coal mining disease 20.8 19.8 12.4 20.0 Public street surveillance 19.6 16.6 18.4 18.0
Table 4.10
Mean total factor correlation (Pearson two tailed) between draft pilot study 1 and 2
Pearson Correlation Study 1 Dread Study 2 Dread
Study 1 Dread 1 0.9868**
Study 2 Dread 1
Pearson Correlation Study 1 Fam Study 2 Fam
Study 1 Familiarity 1 0.7769*
Study 2 Familiarity . 1 * Correlation is significant at the 0.05 level (2-tailed) ** Correlation is significant at the 0.01 level (2-tailed)
Familiarity (factor 2) demonstrated consistency between the first and second draft pilot study (Tables
4.9, 4.10 and 4.11). However, dread (factor 1) did not provide a consistent result, as coal mining
disease relocated from position four within the order of highest perceived risk in activities and
technologies, to position two (Table 4.11). All other items remained within the sequential order of
perceived risk. But the Pearson correlation measure (Table 4.10) for dread (factor 1) was high
(0.9868).
The relocation of coal mining disease may have been caused by a number of reasons. One new
participant to the draft pilot study 2 had a mother who had died of a medical respiratory condition
known as “coal miners disease”. There was also a relatively short time span between surveys, allowing
the participants time to think about the survey. Nevertheless, this relocation was not considered
significant, considering the high correlation measures.
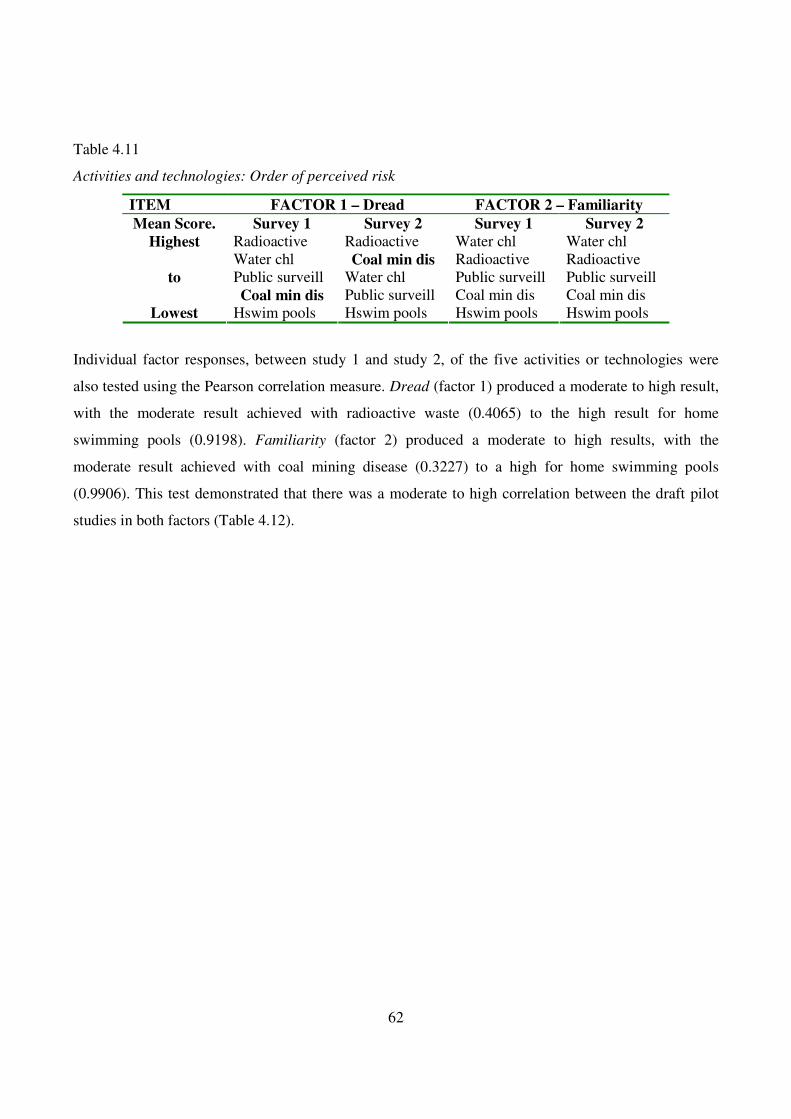
62
Table 4.11
Activities and technologies: Order of perceived risk
ITEM FACTOR 1 – Dread FACTOR 2 – Familiarity
Mean Score. Survey 1 Survey 2 Survey 1 Survey 2
Radioactive Radioactive Water chl Water chl Water chl Coal min dis Radioactive Radioactive Public surveill Water chl Public surveill Public surveill Coal min dis Public surveill Coal min dis Coal min dis
Highest
to
Lowest Hswim pools Hswim pools Hswim pools Hswim pools
Individual factor responses, between study 1 and study 2, of the five activities or technologies were
also tested using the Pearson correlation measure. Dread (factor 1) produced a moderate to high result,
with the moderate result achieved with radioactive waste (0.4065) to the high result for home
swimming pools (0.9198). Familiarity (factor 2) produced a moderate to high results, with the
moderate result achieved with coal mining disease (0.3227) to a high for home swimming pools
(0.9906). This test demonstrated that there was a moderate to high correlation between the draft pilot
studies in both factors (Table 4.12).
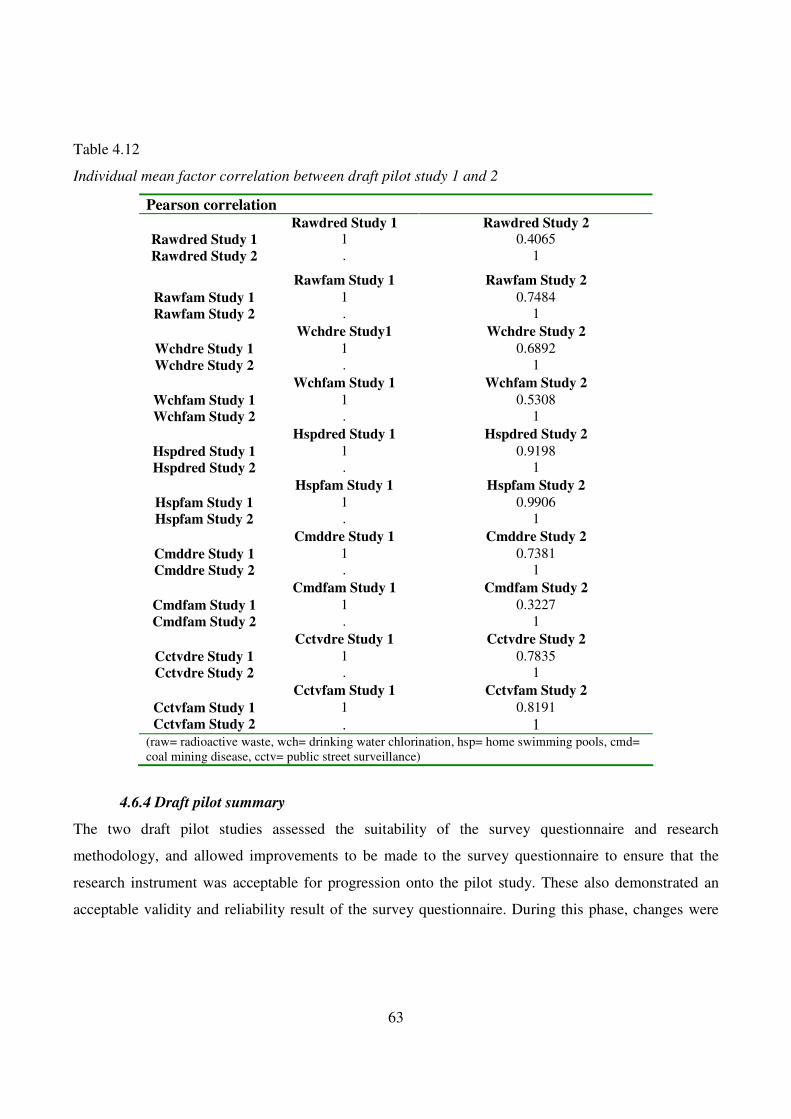
63
Table 4.12
Individual mean factor correlation between draft pilot study 1 and 2
Pearson correlation
Rawdred Study 1 Rawdred Study 2
Rawdred Study 1 1 0.4065
Rawdred Study 2 . 1
Rawfam Study 1 Rawfam Study 2
Rawfam Study 1 1 0.7484
Rawfam Study 2 . 1
Wchdre Study1 Wchdre Study 2
Wchdre Study 1 1 0.6892
Wchdre Study 2 . 1
Wchfam Study 1 Wchfam Study 2
Wchfam Study 1 1 0.5308
Wchfam Study 2 . 1
Hspdred Study 1 Hspdred Study 2
Hspdred Study 1 1 0.9198
Hspdred Study 2 . 1
Hspfam Study 1 Hspfam Study 2
Hspfam Study 1 1 0.9906
Hspfam Study 2 . 1
Cmddre Study 1 Cmddre Study 2
Cmddre Study 1 1 0.7381
Cmddre Study 2 . 1
Cmdfam Study 1 Cmdfam Study 2
Cmdfam Study 1 1 0.3227
Cmdfam Study 2 . 1
Cctvdre Study 1 Cctvdre Study 2
Cctvdre Study 1 1 0.7835
Cctvdre Study 2 . 1
Cctvfam Study 1 Cctvfam Study 2
Cctvfam Study 1 1 0.8191
Cctvfam Study 2 . 1 (raw= radioactive waste, wch= drinking water chlorination, hsp= home swimming pools, cmd= coal mining disease, cctv= public street surveillance)
4.6.4 Draft pilot summary
The two draft pilot studies assessed the suitability of the survey questionnaire and research
methodology, and allowed improvements to be made to the survey questionnaire to ensure that the
research instrument was acceptable for progression onto the pilot study. These also demonstrated an
acceptable validity and reliability result of the survey questionnaire. During this phase, changes were
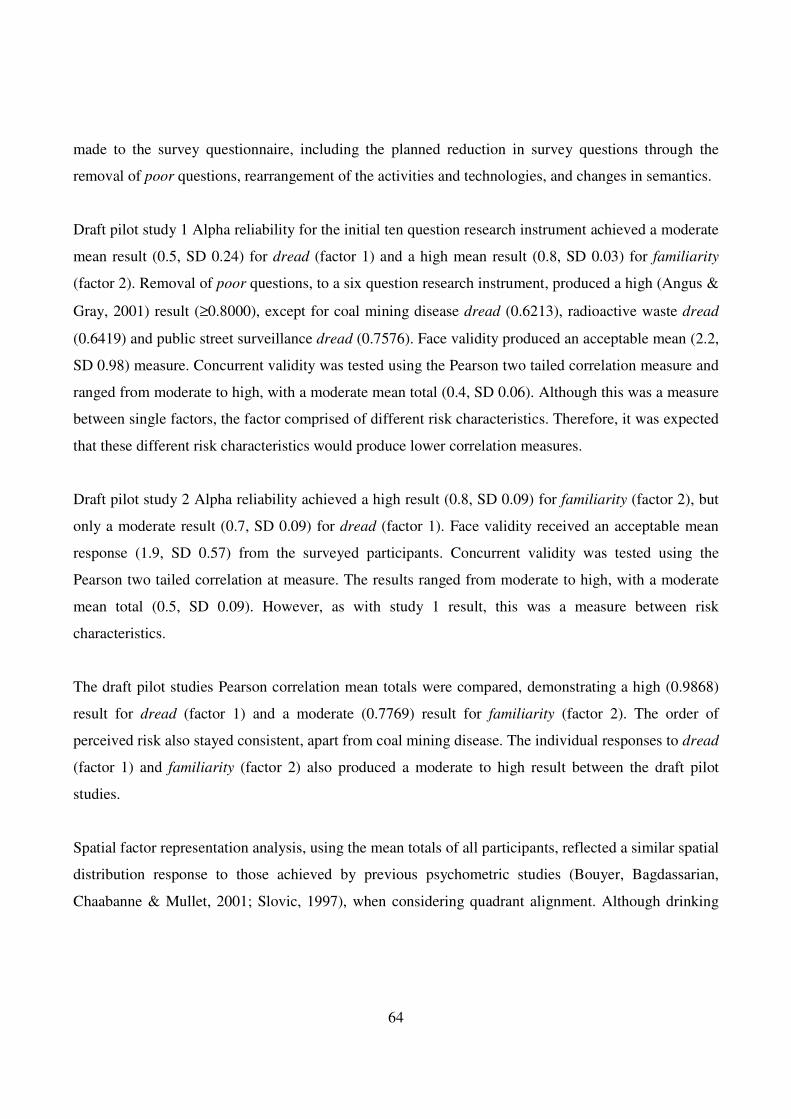
64
made to the survey questionnaire, including the planned reduction in survey questions through the
removal of poor questions, rearrangement of the activities and technologies, and changes in semantics.
Draft pilot study 1 Alpha reliability for the initial ten question research instrument achieved a moderate
mean result (0.5, SD 0.24) for dread (factor 1) and a high mean result (0.8, SD 0.03) for familiarity
(factor 2). Removal of poor questions, to a six question research instrument, produced a high (Angus &
Gray, 2001) result (≥0.8000), except for coal mining disease dread (0.6213), radioactive waste dread
(0.6419) and public street surveillance dread (0.7576). Face validity produced an acceptable mean (2.2,
SD 0.98) measure. Concurrent validity was tested using the Pearson two tailed correlation measure and
ranged from moderate to high, with a moderate mean total (0.4, SD 0.06). Although this was a measure
between single factors, the factor comprised of different risk characteristics. Therefore, it was expected
that these different risk characteristics would produce lower correlation measures.
Draft pilot study 2 Alpha reliability achieved a high result (0.8, SD 0.09) for familiarity (factor 2), but
only a moderate result (0.7, SD 0.09) for dread (factor 1). Face validity received an acceptable mean
response (1.9, SD 0.57) from the surveyed participants. Concurrent validity was tested using the
Pearson two tailed correlation at measure. The results ranged from moderate to high, with a moderate
mean total (0.5, SD 0.09). However, as with study 1 result, this was a measure between risk
characteristics.
The draft pilot studies Pearson correlation mean totals were compared, demonstrating a high (0.9868)
result for dread (factor 1) and a moderate (0.7769) result for familiarity (factor 2). The order of
perceived risk also stayed consistent, apart from coal mining disease. The individual responses to dread
(factor 1) and familiarity (factor 2) also produced a moderate to high result between the draft pilot
studies.
Spatial factor representation analysis, using the mean totals of all participants, reflected a similar spatial
distribution response to those achieved by previous psychometric studies (Bouyer, Bagdassarian,
Chaabanne & Mullet, 2001; Slovic, 1997), when considering quadrant alignment. Although drinking
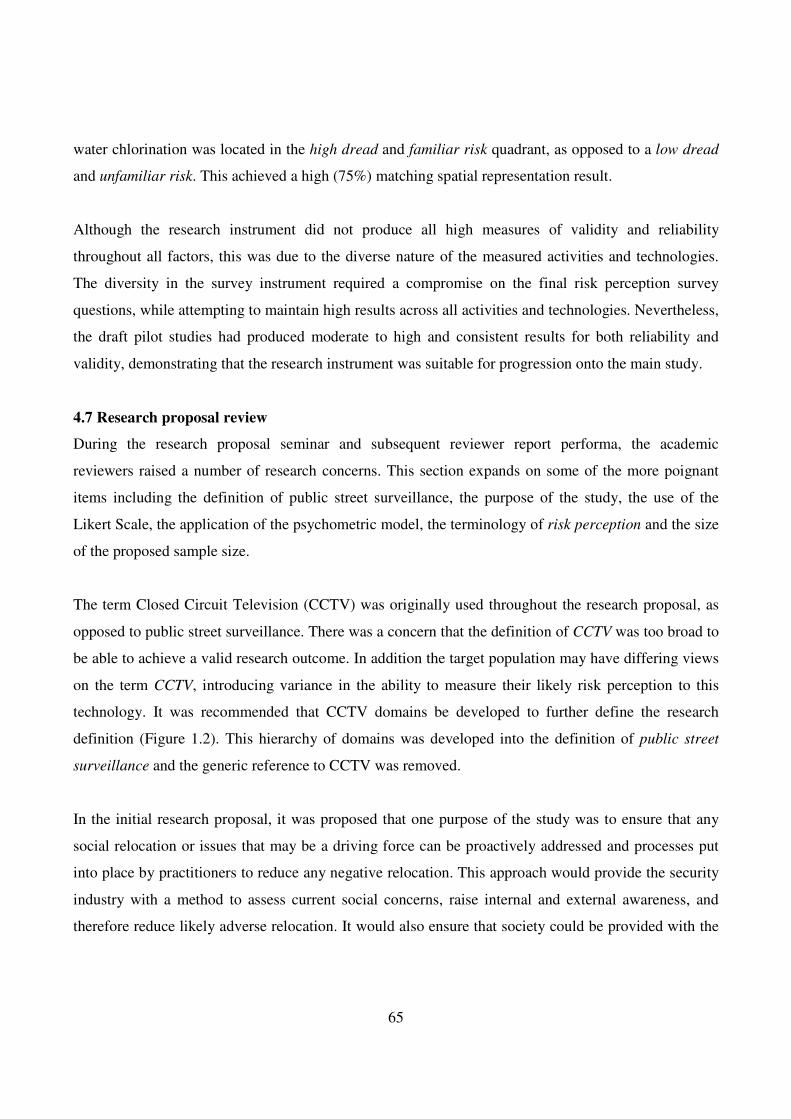
65
water chlorination was located in the high dread and familiar risk quadrant, as opposed to a low dread
and unfamiliar risk. This achieved a high (75%) matching spatial representation result.
Although the research instrument did not produce all high measures of validity and reliability
throughout all factors, this was due to the diverse nature of the measured activities and technologies.
The diversity in the survey instrument required a compromise on the final risk perception survey
questions, while attempting to maintain high results across all activities and technologies. Nevertheless,
the draft pilot studies had produced moderate to high and consistent results for both reliability and
validity, demonstrating that the research instrument was suitable for progression onto the main study.
4.7 Research proposal review
During the research proposal seminar and subsequent reviewer report performa, the academic
reviewers raised a number of research concerns. This section expands on some of the more poignant
items including the definition of public street surveillance, the purpose of the study, the use of the
Likert Scale, the application of the psychometric model, the terminology of risk perception and the size
of the proposed sample size.
The term Closed Circuit Television (CCTV) was originally used throughout the research proposal, as
opposed to public street surveillance. There was a concern that the definition of CCTV was too broad to
be able to achieve a valid research outcome. In addition the target population may have differing views
on the term CCTV, introducing variance in the ability to measure their likely risk perception to this
technology. It was recommended that CCTV domains be developed to further define the research
definition (Figure 1.2). This hierarchy of domains was developed into the definition of public street
surveillance and the generic reference to CCTV was removed.
In the initial research proposal, it was proposed that one purpose of the study was to ensure that any
social relocation or issues that may be a driving force can be proactively addressed and processes put
into place by practitioners to reduce any negative relocation. This approach would provide the security
industry with a method to assess current social concerns, raise internal and external awareness, and
therefore reduce likely adverse relocation. It would also ensure that society could be provided with the
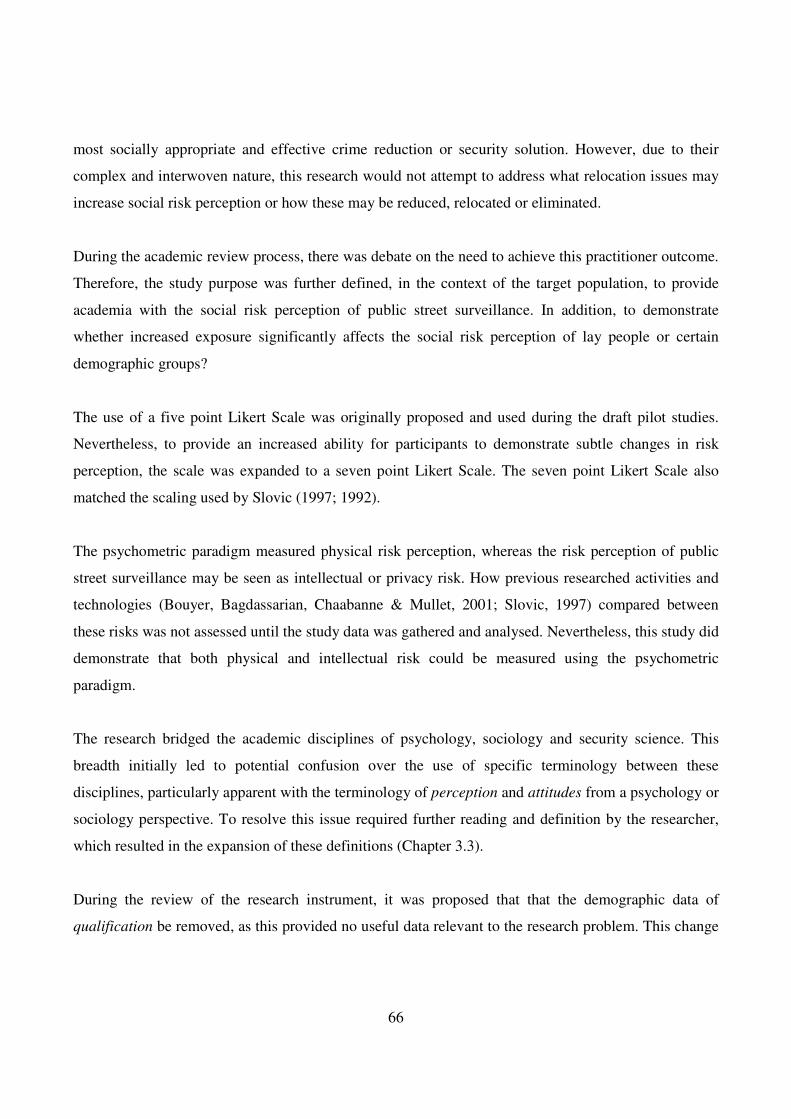
66
most socially appropriate and effective crime reduction or security solution. However, due to their
complex and interwoven nature, this research would not attempt to address what relocation issues may
increase social risk perception or how these may be reduced, relocated or eliminated.
During the academic review process, there was debate on the need to achieve this practitioner outcome.
Therefore, the study purpose was further defined, in the context of the target population, to provide
academia with the social risk perception of public street surveillance. In addition, to demonstrate
whether increased exposure significantly affects the social risk perception of lay people or certain
demographic groups?
The use of a five point Likert Scale was originally proposed and used during the draft pilot studies.
Nevertheless, to provide an increased ability for participants to demonstrate subtle changes in risk
perception, the scale was expanded to a seven point Likert Scale. The seven point Likert Scale also
matched the scaling used by Slovic (1997; 1992).
The psychometric paradigm measured physical risk perception, whereas the risk perception of public
street surveillance may be seen as intellectual or privacy risk. How previous researched activities and
technologies (Bouyer, Bagdassarian, Chaabanne & Mullet, 2001; Slovic, 1997) compared between
these risks was not assessed until the study data was gathered and analysed. Nevertheless, this study did
demonstrate that both physical and intellectual risk could be measured using the psychometric
paradigm.
The research bridged the academic disciplines of psychology, sociology and security science. This
breadth initially led to potential confusion over the use of specific terminology between these
disciplines, particularly apparent with the terminology of perception and attitudes from a psychology or
sociology perspective. To resolve this issue required further reading and definition by the researcher,
which resulted in the expansion of these definitions (Chapter 3.3).
During the review of the research instrument, it was proposed that that the demographic data of
qualification be removed, as this provided no useful data relevant to the research problem. This change
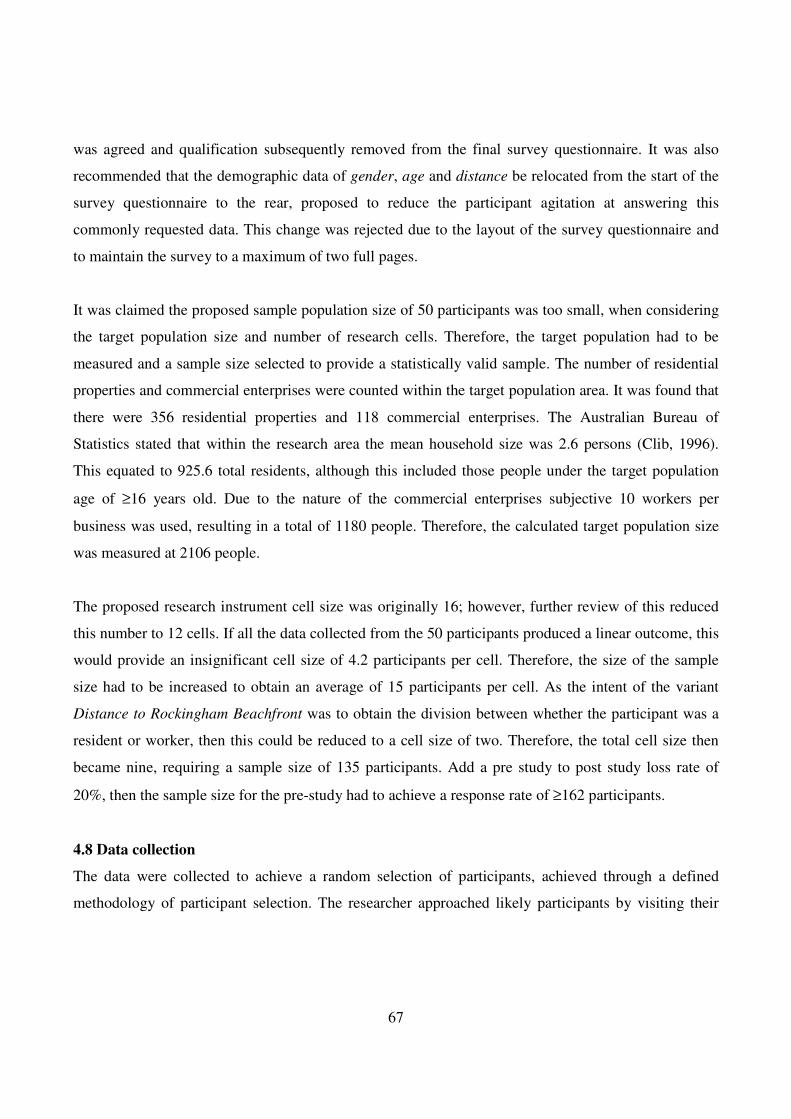
67
was agreed and qualification subsequently removed from the final survey questionnaire. It was also
recommended that the demographic data of gender, age and distance be relocated from the start of the
survey questionnaire to the rear, proposed to reduce the participant agitation at answering this
commonly requested data. This change was rejected due to the layout of the survey questionnaire and
to maintain the survey to a maximum of two full pages.
It was claimed the proposed sample population size of 50 participants was too small, when considering
the target population size and number of research cells. Therefore, the target population had to be
measured and a sample size selected to provide a statistically valid sample. The number of residential
properties and commercial enterprises were counted within the target population area. It was found that
there were 356 residential properties and 118 commercial enterprises. The Australian Bureau of
Statistics stated that within the research area the mean household size was 2.6 persons (Clib, 1996).
This equated to 925.6 total residents, although this included those people under the target population
age of ≥16 years old. Due to the nature of the commercial enterprises subjective 10 workers per
business was used, resulting in a total of 1180 people. Therefore, the calculated target population size
was measured at 2106 people.
The proposed research instrument cell size was originally 16; however, further review of this reduced
this number to 12 cells. If all the data collected from the 50 participants produced a linear outcome, this
would provide an insignificant cell size of 4.2 participants per cell. Therefore, the size of the sample
size had to be increased to obtain an average of 15 participants per cell. As the intent of the variant
Distance to Rockingham Beachfront was to obtain the division between whether the participant was a
resident or worker, then this could be reduced to a cell size of two. Therefore, the total cell size then
became nine, requiring a sample size of 135 participants. Add a pre study to post study loss rate of
20%, then the sample size for the pre-study had to achieve a response rate of ≥162 participants.
4.8 Data collection
The data were collected to achieve a random selection of participants, achieved through a defined
methodology of participant selection. The researcher approached likely participants by visiting their

68
business or residence and requesting their participation in the study, if they met the target population
criteria. The applied methodology is detailed below:
� Each approach began on the corner house of the proposed research street.
� From there, every third house was approached.
� The first person to answer the door, if they met the criteria, was requested to participate.
� If they refused or there is no response from that residence, the next house was approached.
� Once a participant volunteered, the cycle began again, with the following third house being
approached.
For business, the following process was used:
� Each approach began on the corner business of the proposed research street.
� Every second business was then approached.
� The first person to approach the researcher was requested to participate.
� If they refused or there was no response from that business, the next business was approached.
� Once a participant volunteered, the cycle began again, with the second business being approached.
If the participants provided an initial positive response and volunteered, they were given a copy of the
Introduction Letter to read. Once they had read this letter, they were asked if they understood the
research within the context of the letter, that participation was voluntary, that they can withdraw at
anytime during the survey and whether they have any further questions. They were then requested to
participate in the research. If they answered in the affirmative, they were requested to complete the
informed consent form. At this point they were given the Survey Questionnaire, with a stamped address
envelope. The participant then completed the questionnaire in their time and posted the completed
survey back to the researcher. This approach was altered from the initial proposed research method as a
better response was received, increasing the participation success rate and reducing the time taken by
the researcher to obtain completed surveys.
Although the researcher was present during the initial commitment by the participant to complete the
survey, the researcher gave no incentives, suggestions or ideas to the participants about how to answer
the questions. The only advice offered was to respond to the questions as honestly as possible and that
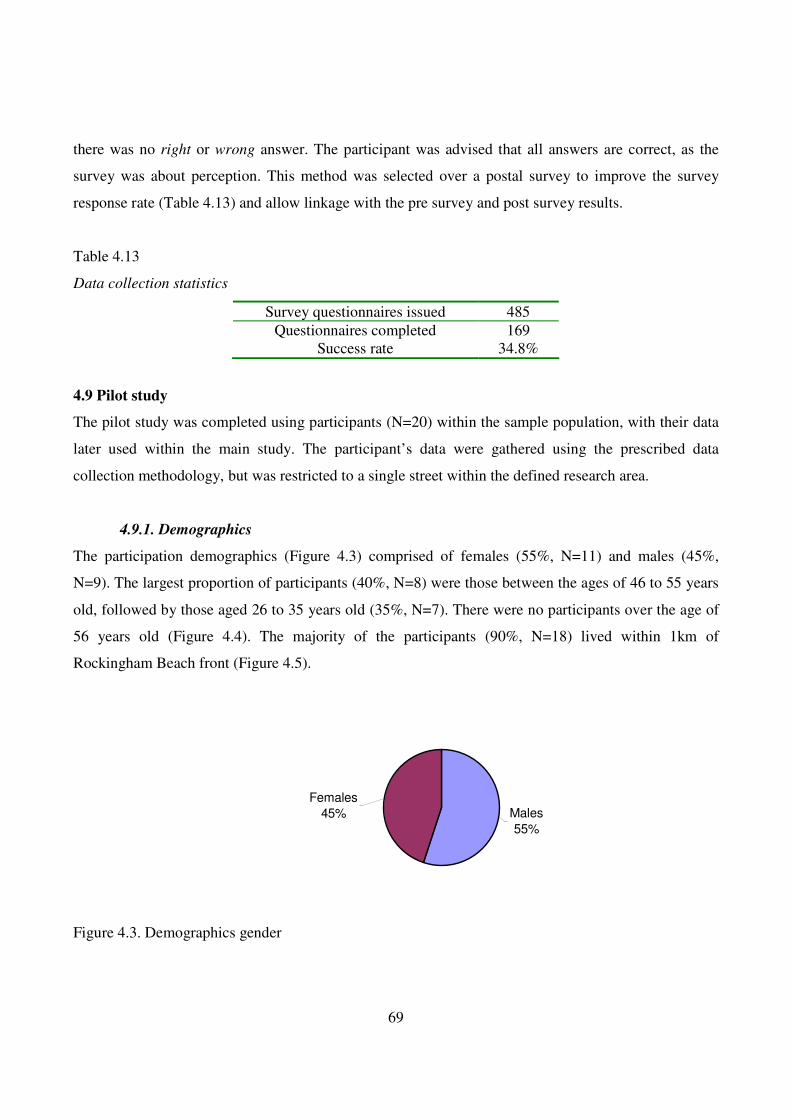
69
there was no right or wrong answer. The participant was advised that all answers are correct, as the
survey was about perception. This method was selected over a postal survey to improve the survey
response rate (Table 4.13) and allow linkage with the pre survey and post survey results.
Table 4.13
Data collection statistics
Survey questionnaires issued 485
Questionnaires completed 169 Success rate 34.8%
4.9 Pilot study
The pilot study was completed using participants (N=20) within the sample population, with their data
later used within the main study. The participant’s data were gathered using the prescribed data
collection methodology, but was restricted to a single street within the defined research area.
4.9.1. Demographics
The participation demographics (Figure 4.3) comprised of females (55%, N=11) and males (45%,
N=9). The largest proportion of participants (40%, N=8) were those between the ages of 46 to 55 years
old, followed by those aged 26 to 35 years old (35%, N=7). There were no participants over the age of
56 years old (Figure 4.4). The majority of the participants (90%, N=18) lived within 1km of
Rockingham Beach front (Figure 4.5).
Figure 4.3. Demographics gender
Females
45% Males
55%
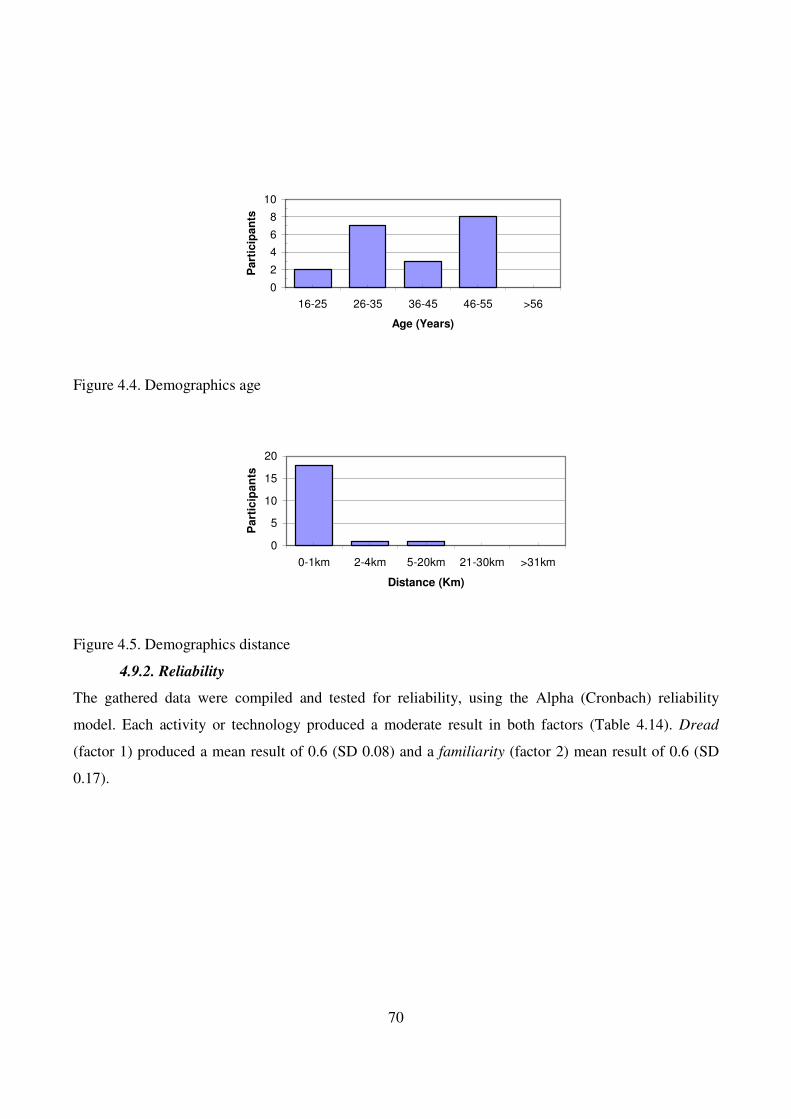
70
Figure 4.4. Demographics age
Figure 4.5. Demographics distance
4.9.2. Reliability
The gathered data were compiled and tested for reliability, using the Alpha (Cronbach) reliability
model. Each activity or technology produced a moderate result in both factors (Table 4.14). Dread
(factor 1) produced a mean result of 0.6 (SD 0.08) and a familiarity (factor 2) mean result of 0.6 (SD
0.17).
0
2
4
6
8
10
16-25 26-35 36-45 46-55 >56
Age (Years)
Part
icip
an
ts
0
5
10
15
20
0-1km 2-4km 5-20km 21-30km >31km
Distance (Km)
Pa
rtic
ipa
nts
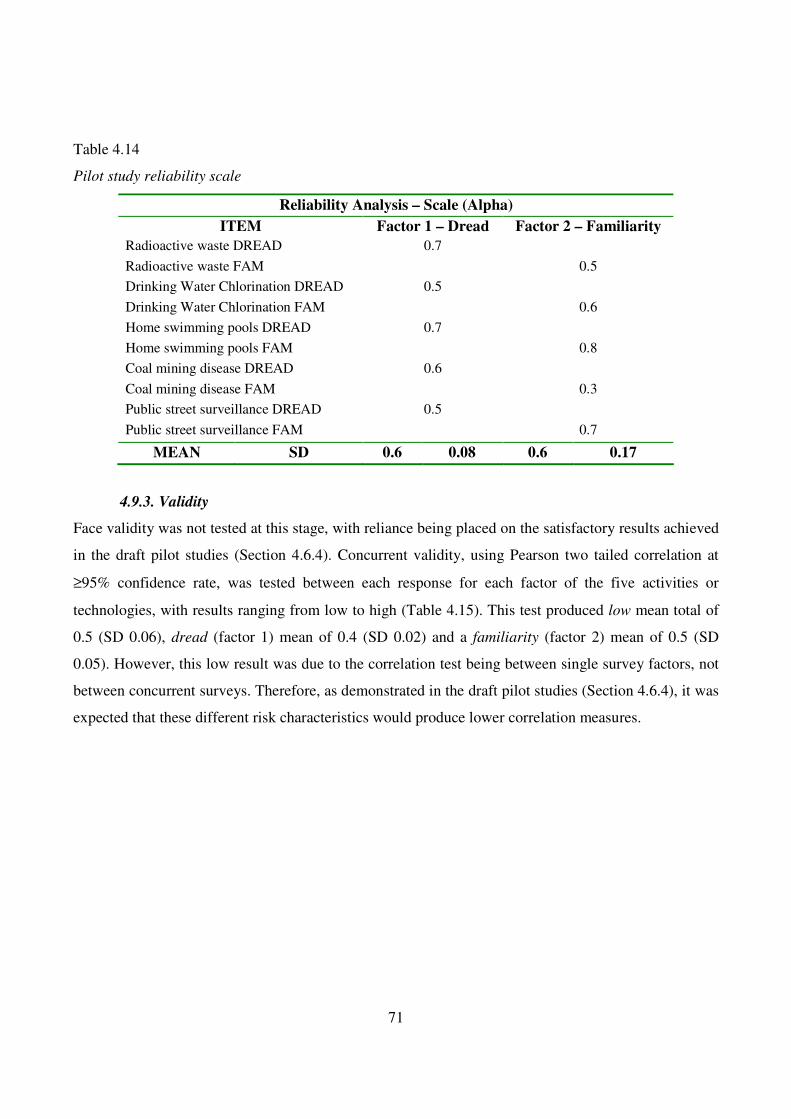
71
Table 4.14
Pilot study reliability scale
Reliability Analysis – Scale (Alpha)
ITEM Factor 1 – Dread Factor 2 – Familiarity
Radioactive waste DREAD 0.7
Radioactive waste FAM 0.5
Drinking Water Chlorination DREAD 0.5
Drinking Water Chlorination FAM 0.6
Home swimming pools DREAD 0.7
Home swimming pools FAM 0.8
Coal mining disease DREAD 0.6
Coal mining disease FAM 0.3
Public street surveillance DREAD 0.5
Public street surveillance FAM 0.7
MEAN SD 0.6 0.08 0.6 0.17
4.9.3. Validity
Face validity was not tested at this stage, with reliance being placed on the satisfactory results achieved
in the draft pilot studies (Section 4.6.4). Concurrent validity, using Pearson two tailed correlation at
≥95% confidence rate, was tested between each response for each factor of the five activities or
technologies, with results ranging from low to high (Table 4.15). This test produced low mean total of
0.5 (SD 0.06), dread (factor 1) mean of 0.4 (SD 0.02) and a familiarity (factor 2) mean of 0.5 (SD
0.05). However, this low result was due to the correlation test being between single survey factors, not
between concurrent surveys. Therefore, as demonstrated in the draft pilot studies (Section 4.6.4), it was
expected that these different risk characteristics would produce lower correlation measures.
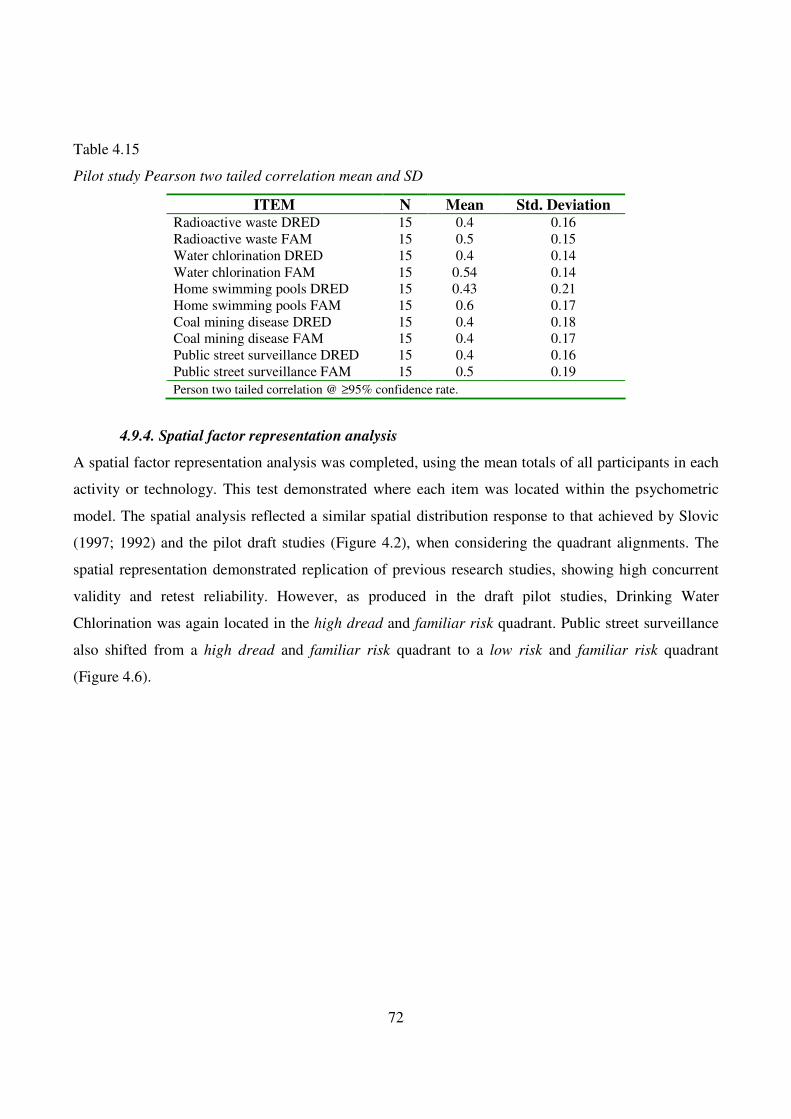
72
Table 4.15
Pilot study Pearson two tailed correlation mean and SD
ITEM N Mean Std. Deviation Radioactive waste DRED 15 0.4 0.16 Radioactive waste FAM 15 0.5 0.15 Water chlorination DRED 15 0.4 0.14 Water chlorination FAM 15 0.54 0.14 Home swimming pools DRED 15 0.43 0.21 Home swimming pools FAM 15 0.6 0.17 Coal mining disease DRED 15 0.4 0.18 Coal mining disease FAM 15 0.4 0.17 Public street surveillance DRED 15 0.4 0.16 Public street surveillance FAM 15 0.5 0.19
Person two tailed correlation @ ≥95% confidence rate.
4.9.4. Spatial factor representation analysis
A spatial factor representation analysis was completed, using the mean totals of all participants in each
activity or technology. This test demonstrated where each item was located within the psychometric
model. The spatial analysis reflected a similar spatial distribution response to that achieved by Slovic
(1997; 1992) and the pilot draft studies (Figure 4.2), when considering the quadrant alignments. The
spatial representation demonstrated replication of previous research studies, showing high concurrent
validity and retest reliability. However, as produced in the draft pilot studies, Drinking Water
Chlorination was again located in the high dread and familiar risk quadrant. Public street surveillance
also shifted from a high dread and familiar risk quadrant to a low risk and familiar risk quadrant
(Figure 4.6).
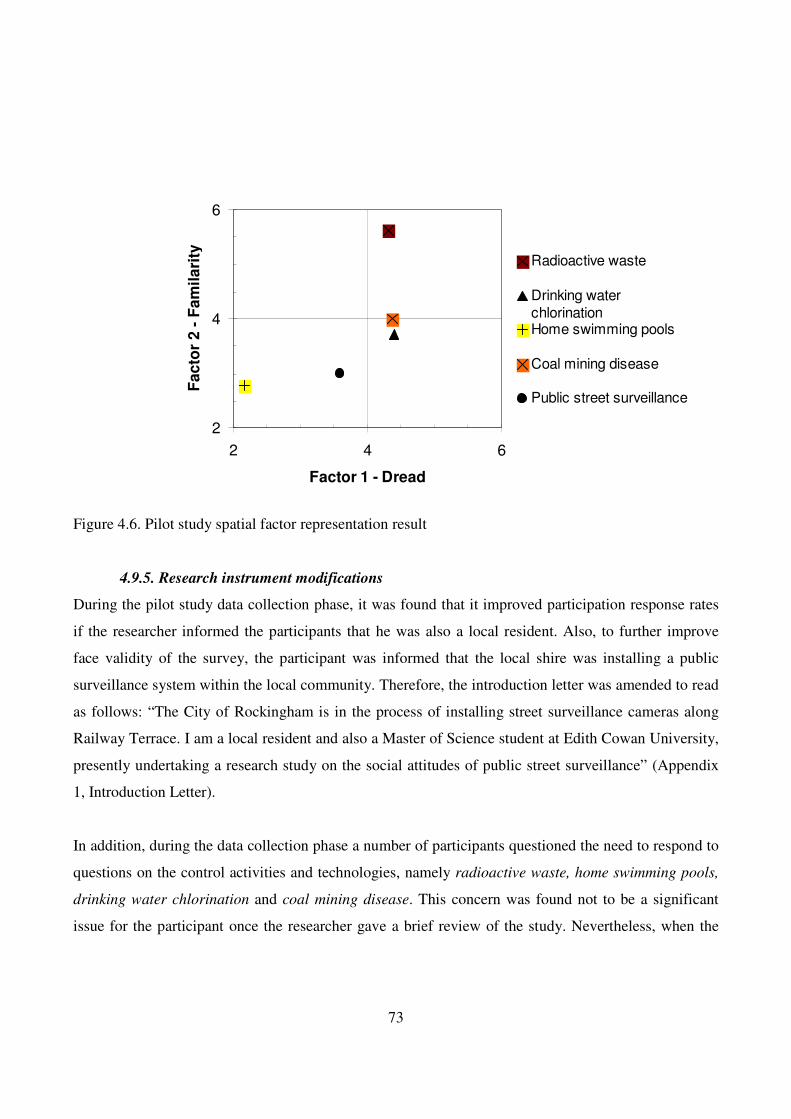
73
Figure 4.6. Pilot study spatial factor representation result
4.9.5. Research instrument modifications
During the pilot study data collection phase, it was found that it improved participation response rates
if the researcher informed the participants that he was also a local resident. Also, to further improve
face validity of the survey, the participant was informed that the local shire was installing a public
surveillance system within the local community. Therefore, the introduction letter was amended to read
as follows: “The City of Rockingham is in the process of installing street surveillance cameras along
Railway Terrace. I am a local resident and also a Master of Science student at Edith Cowan University,
presently undertaking a research study on the social attitudes of public street surveillance” (Appendix
1, Introduction Letter).
In addition, during the data collection phase a number of participants questioned the need to respond to
questions on the control activities and technologies, namely radioactive waste, home swimming pools,
drinking water chlorination and coal mining disease. This concern was found not to be a significant
issue for the participant once the researcher gave a brief review of the study. Nevertheless, when the
2
4
6
2 4 6
Factor 1 - Dread
Fa
cto
r 2
- F
am
ila
rity
Radioactive waste
Drinking water
chlorinationHome swimming pools
Coal mining disease
Public street surveillance
74
survey was left with the participants to complete in their own time, a small number of participants
expressed concern over responding to these additional questions. This issue was addressed during the
pilot study through the addition of two lines in the introduction letter, which stated that the “survey
contains questions regarding a number of other activities or technologies i.e. radioactive waste, etc.
These items have a known research location and are only used as a measure for public street
surveillance” (Appendix 1, Introduction Letter).
4.9.6. Summary
Comparison of Alpha reliability between the draft studies and pilot study was completed. Dread (factor
1) remained moderate and relatively constant (0.5, 0.7, 0.6). The pilot study dread (factor 1) SD, when
compared to the draft studies, reduced. Familiarity (factor 2) reduced throughout the studies (0.8, 0.8,
0.6), from a high to moderate result. Concurrent validity, using Pearson two tailed correlation, mean
individual responses remained consistently low throughout the studies caused by the correlation test
being autonomous, between risk characteristics and not between concurrent surveys. It was not possible
to test between surveys, due to the change between a five point Likert Scale in the pilot draft studies, to
a seven point Likert Scale for the pilot study. Nevertheless, the five point Likert draft pilot studies did
demonstrate a high correlation result.
Spatial factor representation of the draft pilot study 2 and pilot study demonstrated consistent
replication of results from previous studies (Bouyer, Bagdassarian, Chaabanne & Mullet, 2001; Slovic,
1997). This spatial representation indicated that the research instrument did produce acceptable
reliability and validity results. Also, as the draft pilot studies had also produced moderate to high
results, this demonstrated that the research instrument was suitable for progression onto the main study.
4.10 Study limitations
This section provides an overview on the limitations of the study. With the psychometric paradigm this
included the lay people assessment of the complex nature of risk, the measure of intellectual risk and
psychometric analysis. In addition, the research study instrument reliability and validity, diversity of
the activities and technologies, and the size of the public street surveillance system are considered.
75
4.10.1 Psychometric paradigm
There was concern raised in the ability of lay people to provide meaningful responses to what can be
very complex and multi-dimensional risk issues. As Slovic (1992, p. 119) stated “the questions
typically assess cognition – not actual behavior.” Nevertheless, ensuring that the survey questions were
as simple and clear as possible, that the survey instrument produced acceptable reliability and validity,
these limitations did not appear to compromise the results. This approach had been demonstrated by
previous studies consistent results and that this study replicated these results (Bouyer, Bagdassarian,
Chaabanne & Mullet, 2001; Slovic, 1997).
The psychometric paradigm assessed activities and technologies that could be a physical risk.
However, public street surveillance does not cause physical harm and can be seen more as a privacy
risk or intellectual risk. It was found that public street surveillance could be measured with perceived
physical risk activities and technologies, demonstrated through achieving consistent and valid results.
The psychometric paradigm measures risk perception in a social group context and does not assess
individual perception. Psychometric research has also been criticized for treating risk as purely
objective and not accounting for cultural or social bias, which are hidden in the quantitative analysis
and representation (Shaw & Shaw, 2001). These items were overcome through the application of
additional analysis techniques of MDS Euclidean and INDSCAL techniques.
MDS INDSCAL provided the measure of subject space, through spatial representation. This also
presented the angular separation and vector length of the configuration of points. This method is
referred to as the Analysis of Angular Variation (ANAVA), and can be utilized to measure and
demonstrate individual and group difference of subject space (Smith, 1984; Mardia, 1972). Although
this method of analysis would have been appropriate and further demonstrated outcomes, the final
investigation did not use this method of analysis.
4.10.2 Research study
The reliability measure of the research instrument could have been higher. The results achieved were
caused by a number of factors, being the length of the survey (Angus & Gray, 2001, p.26) and the
76
diverse activities and technologies tested. By measuring a total of five activities and technologies, this
increased the length of the survey. However, there was a self-imposed requirement to keep the number
of questions to a time commitment acceptable by the participants. This restriction reduced the possible
total number of activities and technologies, and also questions for each risk characteristic. Therefore,
measuring the five activities and technologies led to a compromise on the number of questions utilized,
which ultimately reduce the reliability.
Diversity also reduced both the reliability and validity of the research instrument, through the need to
compromise on question selection. Some activities and technologies produced high results, but others
produced only moderate results. The quandary was to select the best performing questions across all
technologies and activities. Nevertheless, it was considered that the ability to spatially represent the
activities and technologies, using all four quadrants, outweigh the possible disadvantages.
The measure of the additional four control activities and technologies facilitated the ability to be able to
confidently demonstrate the location of public street surveillance. This method led to a comprise
between demonstrating the spatial factor representation relationship or developing a statistically
reliable instrument, as the study tested a relatively low number of activities and technologies when
compared to other psychometric studies. Using the MDS technique, this low number of activities and
technologies reduced the ability for the data to produce and provide defined clusters (Kruskal & Wish,
1978, pp. 43-46) and increased the subjective interpretation of the dimensions, requiring further
validation to quantify and confirm the MDS dimensions of risk perception and perceived community
exposure to risk. With future studies, it may be appropriate to measure an increased number of
activities and technologies.
To achieve a statistical valid sample of the population, Fink (1995) and Leedy (1989) suggested ≥30
per cell and De Vaus (1993) 50 to 100 per cell. Consideration has to be taken for possible variations in
characteristics, with linear division throughout cells. The study used nine research cells and had a
calculated sample size of 135 participants, producing ≥15 participants per cell.
77
The study produced the expected ≥15 participants per cell in all cells, apart from distance 21-30km and
>31km from Rockingham Beach front. However, these cells had been combined with the other distance
cells for the design intent to extract those who worked or lived within the geographical research area.
This combination produced two distance cells, being 0-1km or >2km. According to Fink (1995) and
Leedy (1989) out of the nine cells, two did not meet a statistical valid sample, being those aged 16-25
and 26-35 years old. Nevertheless, reviewing the final demographic figures this could have only been
achieved through increasing the research area and/or population size.
The public street surveillance system comprised of two cameras within a central zone and at key
crossroads. There was limited public exposure of the system when installed, either through the
installation, media or signage of the system. They were also landscaped into the environment, through
being installed on existing poles or having similar poles to existing lighting. There was also no other
CPTED or crime prevention initiatives applied during the survey period. It could be argued that the
system may have been too small to produce a strong risk perception.
4.11 Research study ethics
A number of ethical issues were considered in the study, primarily the protection of participants taking
part in the study. It was a requirement that participation in the study was voluntary, that the researcher
disclosed their identity, that an overview of the study was given and that all participants were ≥16 years
old.
Although the questionnaire was designed to be as simple and easy to complete as possible, it was still
anticipated that some participants might have experienced some level of stress. To reduce this, it was
stated that no question could be answered incorrectly and that there were no right or wrong answers.
These issues were clearly detailed in the Introduction Letter. Participants were only selected if they
volunteered and if they complied with the target population criteria.
There were no financial incentives to complete the survey, bias or deception made during the
completion of the survey. It was made clear to the participant that they could withdraw from the study
at any time. Also, that their completed surveys would remain strictly in confidence, that they would not
78
be quoted or identified in any form within the report or that the survey information would be released
to any other person or organization.
It was also a requirement that collected data be restricted to the defined research period, any changes to
the research design which may have ethical implications or any unforeseen risk or actual harm arising
to participants be reported back to the committee. New research team members were to be registered
with the committee and annual reports were provided to the committee. All research complied with
Edith Cowan University ethics policy. Edith Cowan University Human Research Ethics Committee
gave the research study, based on the above processes, ethical approval to proceed.
79
CHAPTER 5
ANALYSIS
5.1 Introduction
This chapter presents the analysis of the investigation and resulting research data. A detailed analysis of
the target population is given (Section 5.2), reviewing the demographics of the participants. This
review is followed by the analysis of the pre study data (Section 5.3), post study data (Section 5.4) and
comparison of these data sets (Section 5.5). The study reliability and validity outcomes are presented
(Section 5.6). The chapter is concluded with a summary of the study analysis (Section 5.7).
The data analysis resulted in a number of significant findings. These outcomes included the measured
risk perception of public street surveillance within the psychometric paradigm and MDS, presenting a
unique risk perception measure. In addition, increased exposure to public street surveillance did not
change the social risk perception, although familiarity to risk provided a neutral response and risk
characteristic of control indicated a significant difference from factor dread risk.
5.2 Demographics
The gender research demographics (Figure 5.1) comprised of females (49.1%, N=83) and males
(50.3%, N=85), with one participant not responding (0.6%, N=1). The majority age group (Figure 5.2)
were those aged 56 years old or greater (31.4%, N=53), followed by those aged between 36 to 45 years
old (24.3%, N=41) and 46 to 55 years old (22.5%, N=38).
The majority of the participants (86.4%, N=146) worked and/or lived ≤4km from Rockingham
beachfront (Figure 5.3). These cohorts were divided by those who lived ≤1km (72.2%, N=122) and
those who lived 2km to 4km (14.2%, N=24) from Rockingham beachfront. In general, a large majority
of the participants (97.6%, N=165) worked and/or lived ≤20km from Rockingham beachfront.
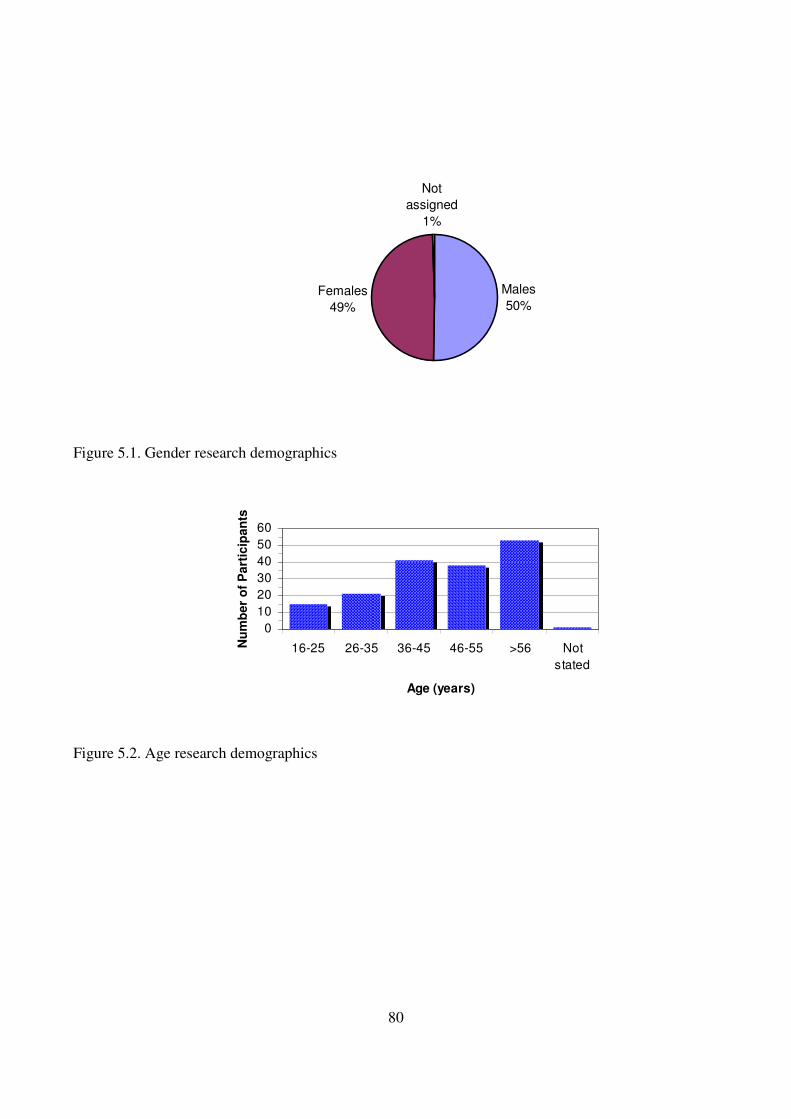
80
Figure 5.1. Gender research demographics
Figure 5.2. Age research demographics
0
10
20
30
40
50
60
16-25 26-35 36-45 46-55 >56 Not
stated
Age (years)
Nu
mb
er
of
Pa
rtic
ipa
nts
Males
50%
Not
assigned
1%
Females
49%
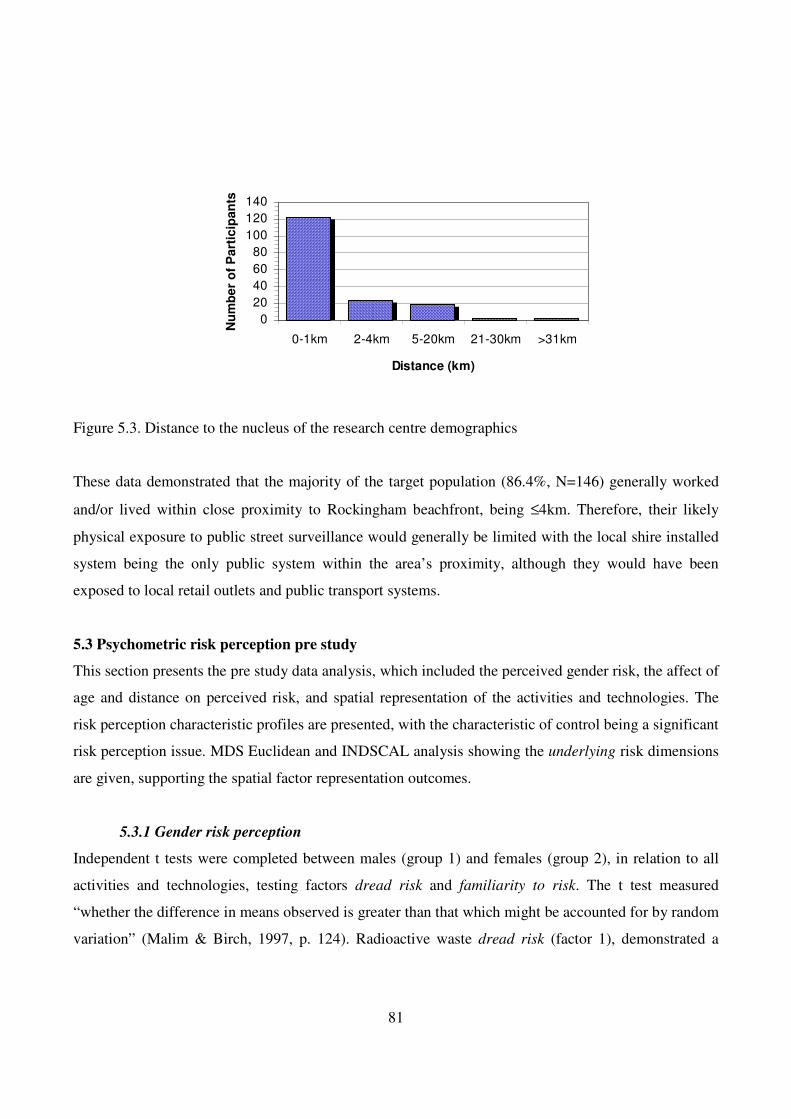
81
Figure 5.3. Distance to the nucleus of the research centre demographics
These data demonstrated that the majority of the target population (86.4%, N=146) generally worked
and/or lived within close proximity to Rockingham beachfront, being ≤4km. Therefore, their likely
physical exposure to public street surveillance would generally be limited with the local shire installed
system being the only public system within the area’s proximity, although they would have been
exposed to local retail outlets and public transport systems.
5.3 Psychometric risk perception pre study
This section presents the pre study data analysis, which included the perceived gender risk, the affect of
age and distance on perceived risk, and spatial representation of the activities and technologies. The
risk perception characteristic profiles are presented, with the characteristic of control being a significant
risk perception issue. MDS Euclidean and INDSCAL analysis showing the underlying risk dimensions
are given, supporting the spatial factor representation outcomes.
5.3.1 Gender risk perception
Independent t tests were completed between males (group 1) and females (group 2), in relation to all
activities and technologies, testing factors dread risk and familiarity to risk. The t test measured
“whether the difference in means observed is greater than that which might be accounted for by random
variation” (Malim & Birch, 1997, p. 124). Radioactive waste dread risk (factor 1), demonstrated a
0
20
40
60
80
100
120
140
0-1km 2-4km 5-20km 21-30km >31km
Distance (km)
Nu
mb
er
of
Pa
rtic
ipa
nts
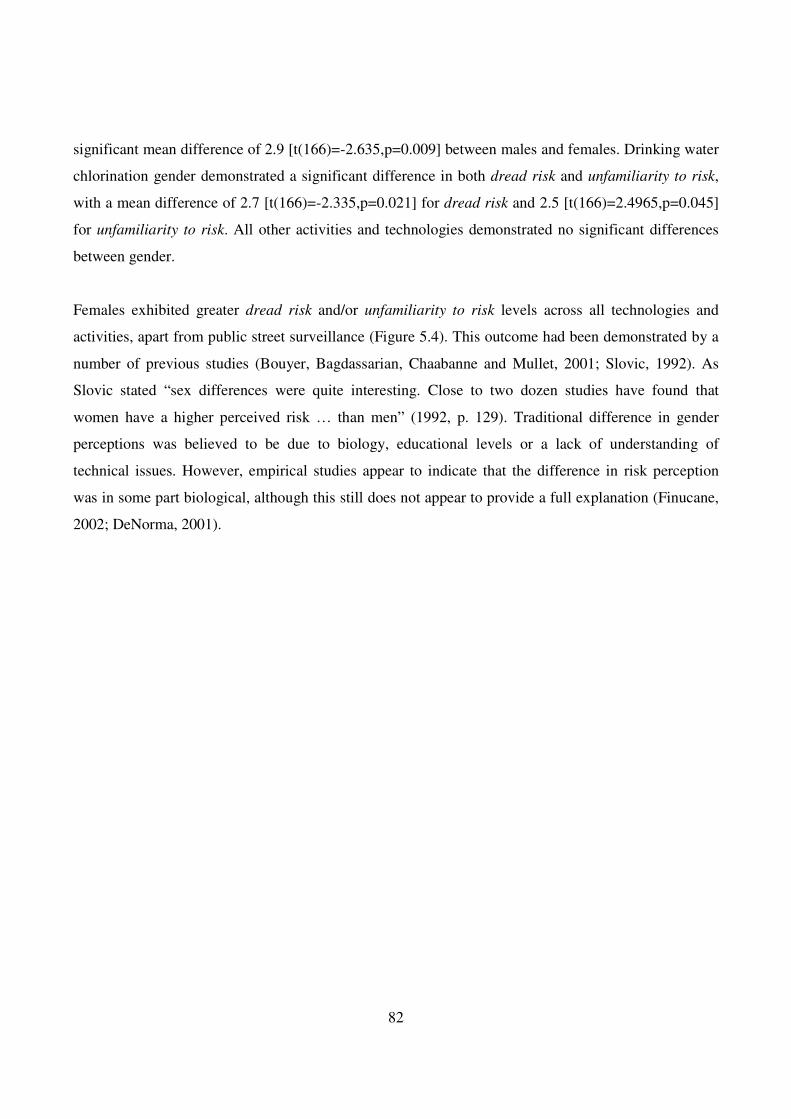
82
significant mean difference of 2.9 [t(166)=-2.635,p=0.009] between males and females. Drinking water
chlorination gender demonstrated a significant difference in both dread risk and unfamiliarity to risk,
with a mean difference of 2.7 [t(166)=-2.335,p=0.021] for dread risk and 2.5 [t(166)=2.4965,p=0.045]
for unfamiliarity to risk. All other activities and technologies demonstrated no significant differences
between gender.
Females exhibited greater dread risk and/or unfamiliarity to risk levels across all technologies and
activities, apart from public street surveillance (Figure 5.4). This outcome had been demonstrated by a
number of previous studies (Bouyer, Bagdassarian, Chaabanne and Mullet, 2001; Slovic, 1992). As
Slovic stated “sex differences were quite interesting. Close to two dozen studies have found that
women have a higher perceived risk … than men” (1992, p. 129). Traditional difference in gender
perceptions was believed to be due to biology, educational levels or a lack of understanding of
technical issues. However, empirical studies appear to indicate that the difference in risk perception
was in some part biological, although this still does not appear to provide a full explanation (Finucane,
2002; DeNorma, 2001).
83
Figure 5.4. Spatial representation between males and females
(Note: Large fonts = males; small fonts = females).
Nevertheless, for public street surveillance females demonstrated a lower sense of dread risk and
greater familiarity to risk than males. This outcome appeared to indicate that females not only feel safer
when public street surveillance was present, they felt public street surveillance was a social benefit
which outweighed the perceived risk. Therefore, females would support the introduction and
maintenance of public street surveillance systems.
Was this a common female risk perception of public street surveillance or a unique outcome of this
study? In previous studies females have consistently shown greater levels of risk perception than males
in all activities and technologies (Bouyer, Bagdassarian, Chaabanne and Mullet, 2001; DeNorma, 2001;
Slovic, 1992). Coal mining disease demonstrated an increase in unfamiliarity to risk (factor 2), but a
10
15
20
25
30
10 15 20 25 30 35 40
Factor 1 Dread
Facto
r 2 F
am
ilari
ty
Radioactive w aste males
Radioactive w aste females
Drinking w ater chlorination males
Drinking w ater chlorination females
Home sw imming pools males
Home sw imming pools females
Coal mining disease males
Coal mining disease females
Public street surveillance males
Public street surveillance females
84
lower dread risk (factor 1). All other activities and technologies showed females having a greater sense
of dread risk and unfamiliarity to risk than males; whereas, public street surveillance showed a lower
perceived risk in both factors of dread risk and familiarity to risk. This outcome appeared to
demonstrate that for females public street surveillance did increase the level of perceived safety.
5.3.2 Age risk perception
The level of risk perception did not appear to be related to age - as there was limited significant
difference between all age groups in all activities and technologies - with the only significant difference
being within radioactive waste and water chlorination. For radioactive waste, a significant [t(54)=-
2.513,p=0.015] mean difference of 4.5 was found between 16-25 year olds and 26-35 year olds. With
drinking water chlorination, those aged 36-45 years old and greater then 56 years old produced a
significant [t(92)=2.889,p=0.005] mean difference of 4.7. In addition, for public street surveillance the
sense of risk perception did not appear to be related to age. An outcome further demonstrated by the
spatial distribution of age, which presented the closest dimensional cluster of all tested activities and
technologies.
5.3.3 Distance risk perception
As with age, there was minimal significant difference in the perception of risk in the relationship of
how close the participant lived and/or worked to the nucleus of the public street surveillance centre.
The only significant differences were within the technology of radioactive waste familiarity to risk
(factor 2) and those who lived 0-1km and 2-4km away, producing a significant [t(144)=-
2.1060,p=0.0369] mean difference of 3.5, 21-30km and greater then 31km away, producing a
significant [t(2)=-19.7990,p=0.0025] mean difference of 14.0, and 2-4km and 21-30km away,
producing a significant [t(24)=2.4225,p=0.0233] mean difference of 11.1.
It appeared that the distance from the nucleus of the public street surveillance system did not cause any
significantly different in the sense of risk perception. As with age this outcome can be further
demonstrated by the spatial distribution, which again presented the closest dimensional cluster all
tested activities and technologies. Although, those who lived 21 to 30km from the nucleus (group 4,
N=2) did present a possible outlier and have not been considered due to the low statistical number.
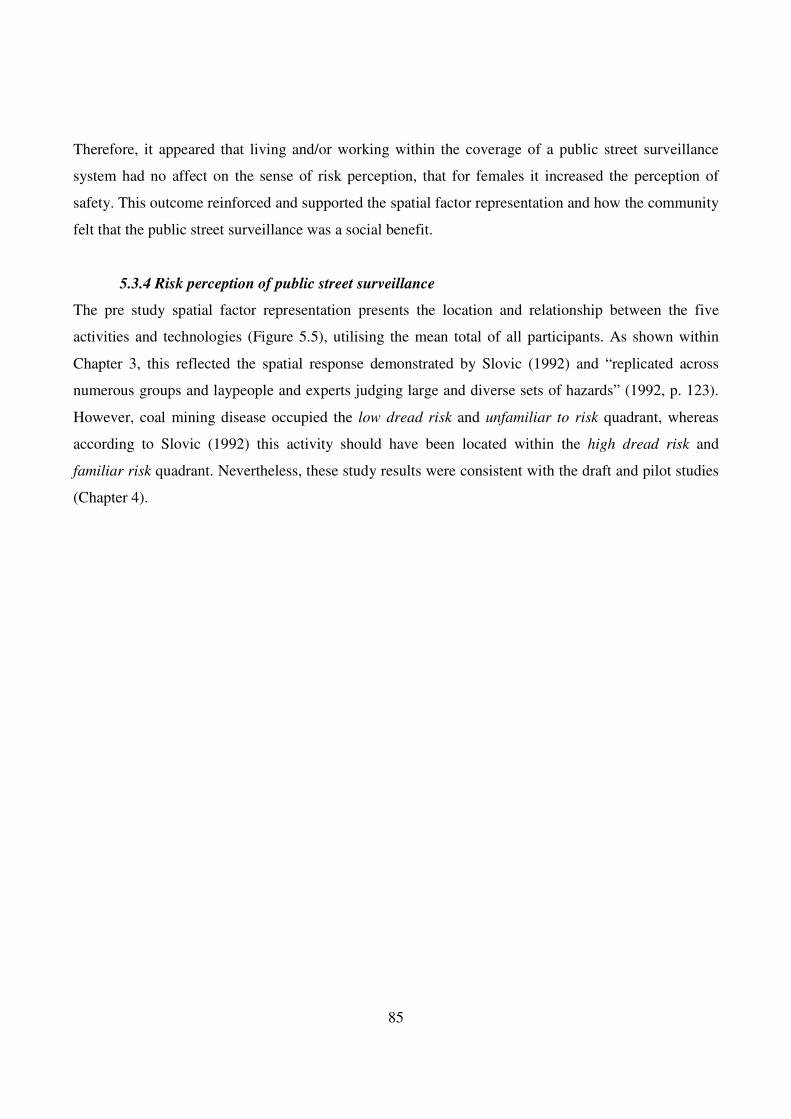
85
Therefore, it appeared that living and/or working within the coverage of a public street surveillance
system had no affect on the sense of risk perception, that for females it increased the perception of
safety. This outcome reinforced and supported the spatial factor representation and how the community
felt that the public street surveillance was a social benefit.
5.3.4 Risk perception of public street surveillance
The pre study spatial factor representation presents the location and relationship between the five
activities and technologies (Figure 5.5), utilising the mean total of all participants. As shown within
Chapter 3, this reflected the spatial response demonstrated by Slovic (1992) and “replicated across
numerous groups and laypeople and experts judging large and diverse sets of hazards” (1992, p. 123).
However, coal mining disease occupied the low dread risk and unfamiliar to risk quadrant, whereas
according to Slovic (1992) this activity should have been located within the high dread risk and
familiar risk quadrant. Nevertheless, these study results were consistent with the draft and pilot studies
(Chapter 4).
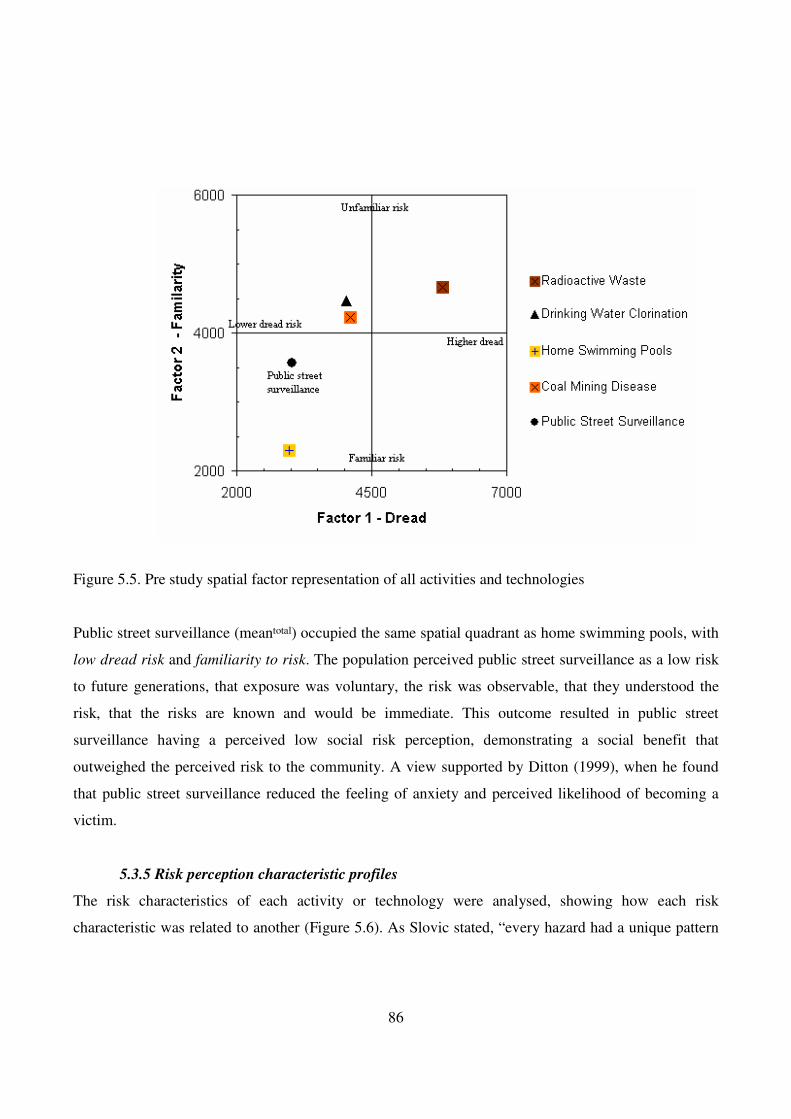
86
Figure 5.5. Pre study spatial factor representation of all activities and technologies
Public street surveillance (meantotal) occupied the same spatial quadrant as home swimming pools, with
low dread risk and familiarity to risk. The population perceived public street surveillance as a low risk
to future generations, that exposure was voluntary, the risk was observable, that they understood the
risk, that the risks are known and would be immediate. This outcome resulted in public street
surveillance having a perceived low social risk perception, demonstrating a social benefit that
outweighed the perceived risk to the community. A view supported by Ditton (1999), when he found
that public street surveillance reduced the feeling of anxiety and perceived likelihood of becoming a
victim.
5.3.5 Risk perception characteristic profiles
The risk characteristics of each activity or technology were analysed, showing how each risk
characteristic was related to another (Figure 5.6). As Slovic stated, “every hazard had a unique pattern
87
of qualities that appeared to be related to its perceived risk” (1992, p. 121). Where the characteristics
were separated ≥0.4 (mean) apart indicated a significant difference. This measure may be demonstrated
by the characteristic of dread risk, as all activities and technologies were significantly different to each
other.
Figure 5.6. Factor characteristic profiles of each activity and technology
Public street surveillance produced the lowest levels of dread risk and risk to future generations.
However, for the familiarity to risk characteristic public street surveillance was located close to the
centreline. This outcome may indicate a neutral risk perception, that the participants did not have
strong feelings or that little social thought had been given to public street surveillance. The
characteristic that presented further investigation was controllability. Controllability demonstrated a
significant [t(165)=21.7,p=0.0000] difference from dread risk, indicating that there was a social
concern over the ability to maintain appropriate public street surveillance control.
1
2
3
4
5
6
7
low
<dre
ad>
hig
hhig
h <
contr
olla
bili
ty>
low
low
<fu
ture
ris
k>
hig
hvolu
nta
ry <
> involu
nta
ryfa
mili
ar
<>
unfa
mili
ar
hig
h <
observ
able
> low
know
n <
> u
nknow
n
old
<risk>
new
imm
edia
te <
effect>
dela
yed
Radioactive w aste
Drinking w ater chlorination
Home sw imming pools
Coal mining disease
Public street surveillance
88
5.3.6 Public street surveillance control
Control of public street surveillance appeared to be a significant social concern. As Sjoberg and Fromm
(2001, pp. 427-439) found when testing information technology risk, general risk was higher then
personnel risk for all tested activities and technologies. General risk was defined as a risk inflicted on
others. Information technology risks had a wider gap between personnel risk and general risk, whereas
traffic accidents, greenhouse effect and ozone were closer in proximity. As Sjoberg and Fromm
concluded, this “closely related to the fact that people perceive little ability to protect themselves”
(2001, p. 438). A view supported by previous studies (Slovic, 1997) in the conclusion that the level of
perceived risk is dependent on the level of perceived control. Another supporting characteristic was
voluntariness; if exposure to risk was a choice - taken voluntarily - then the level of risk perception was
lower. An example of this may be the increased fear of flying as opposed to driving a vehicle, even
when flying is statistically safer.
Public street surveillance systems are operated, managed and controlled by either state or private
organisations. They are also, by their nature, within public and community centres. This investigation’s
public street surveillance system was owned by the Shire and operated by State Police Service, which
may remove the perceived ability of the community to have control of, or reduce exposure to, these
types of systems. Public street surveillance controllability produced a significantly lower result then
radioactive waste [t(163)=4.3969,p=0.000]; however, significantly greater result then home swimming
pools [t(163)=-2.6651,p=0.0085]. Extracting the characteristic of control located public street
surveillance towards a higher dread risk, but still within the familiar risk quadrant (Figure 5.7). The
mean difference between total dread risk (3.0277) and controllability (5.8916) was significant
[t(165)=21.7,p=0.0000]. This outcome demonstrated an increase in the social risk perception of dread
risk, in relation to the level of control that can be attributed to public street surveillance. It appeared
that the community had a social concern over the ability to ensure appropriate public street surveillance
control.
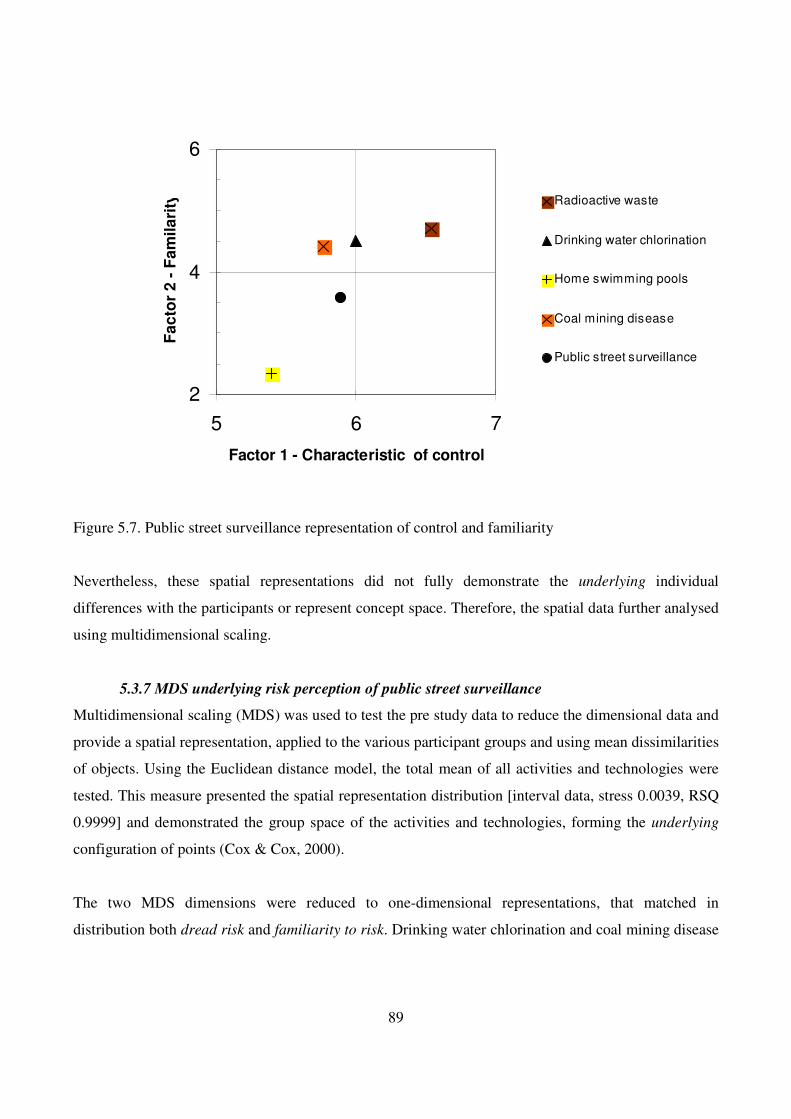
89
Figure 5.7. Public street surveillance representation of control and familiarity
Nevertheless, these spatial representations did not fully demonstrate the underlying individual
differences with the participants or represent concept space. Therefore, the spatial data further analysed
using multidimensional scaling.
5.3.7 MDS underlying risk perception of public street surveillance
Multidimensional scaling (MDS) was used to test the pre study data to reduce the dimensional data and
provide a spatial representation, applied to the various participant groups and using mean dissimilarities
of objects. Using the Euclidean distance model, the total mean of all activities and technologies were
tested. This measure presented the spatial representation distribution [interval data, stress 0.0039, RSQ
0.9999] and demonstrated the group space of the activities and technologies, forming the underlying
configuration of points (Cox & Cox, 2000).
The two MDS dimensions were reduced to one-dimensional representations, that matched in
distribution both dread risk and familiarity to risk. Drinking water chlorination and coal mining disease
2
4
6
5 6 7
Factor 1 - Characteristic of control
Fa
cto
r 2
- F
am
ila
rity Radioactive waste
Drinking water chlorination
Home swimming pools
Coal mining disease
Public street surveillance
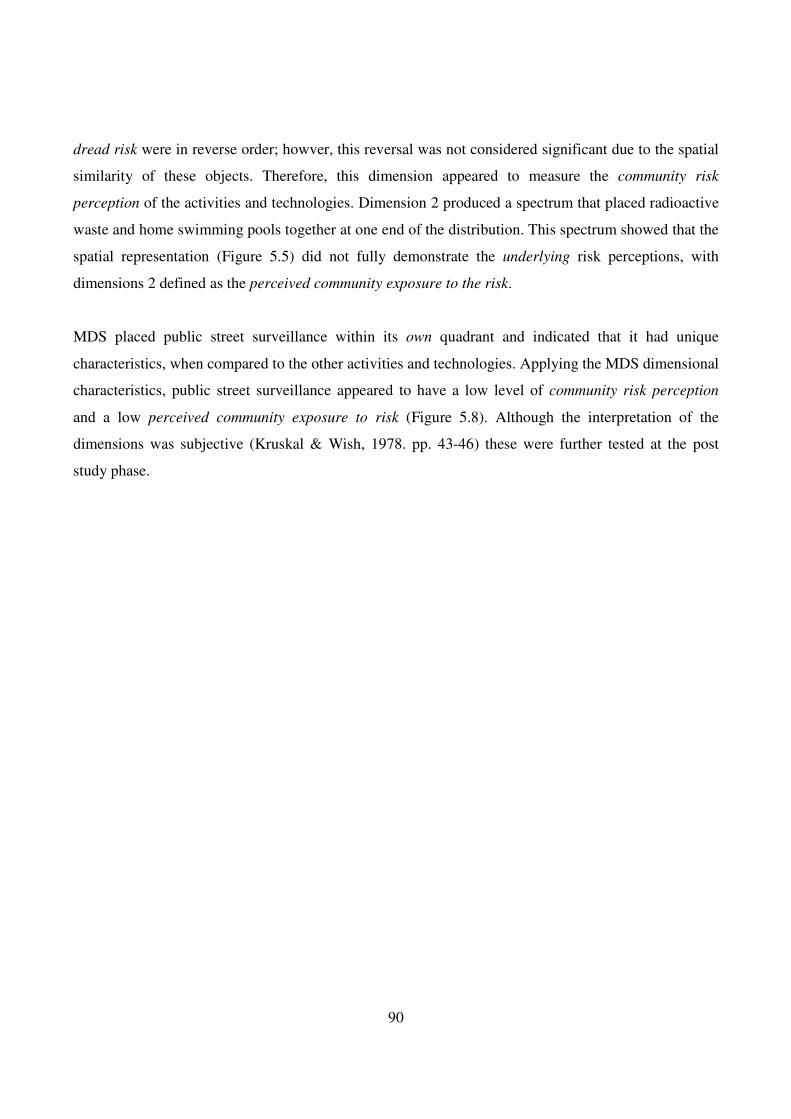
90
dread risk were in reverse order; howver, this reversal was not considered significant due to the spatial
similarity of these objects. Therefore, this dimension appeared to measure the community risk
perception of the activities and technologies. Dimension 2 produced a spectrum that placed radioactive
waste and home swimming pools together at one end of the distribution. This spectrum showed that the
spatial representation (Figure 5.5) did not fully demonstrate the underlying risk perceptions, with
dimensions 2 defined as the perceived community exposure to the risk.
MDS placed public street surveillance within its own quadrant and indicated that it had unique
characteristics, when compared to the other activities and technologies. Applying the MDS dimensional
characteristics, public street surveillance appeared to have a low level of community risk perception
and a low perceived community exposure to risk (Figure 5.8). Although the interpretation of the
dimensions was subjective (Kruskal & Wish, 1978. pp. 43-46) these were further tested at the post
study phase.
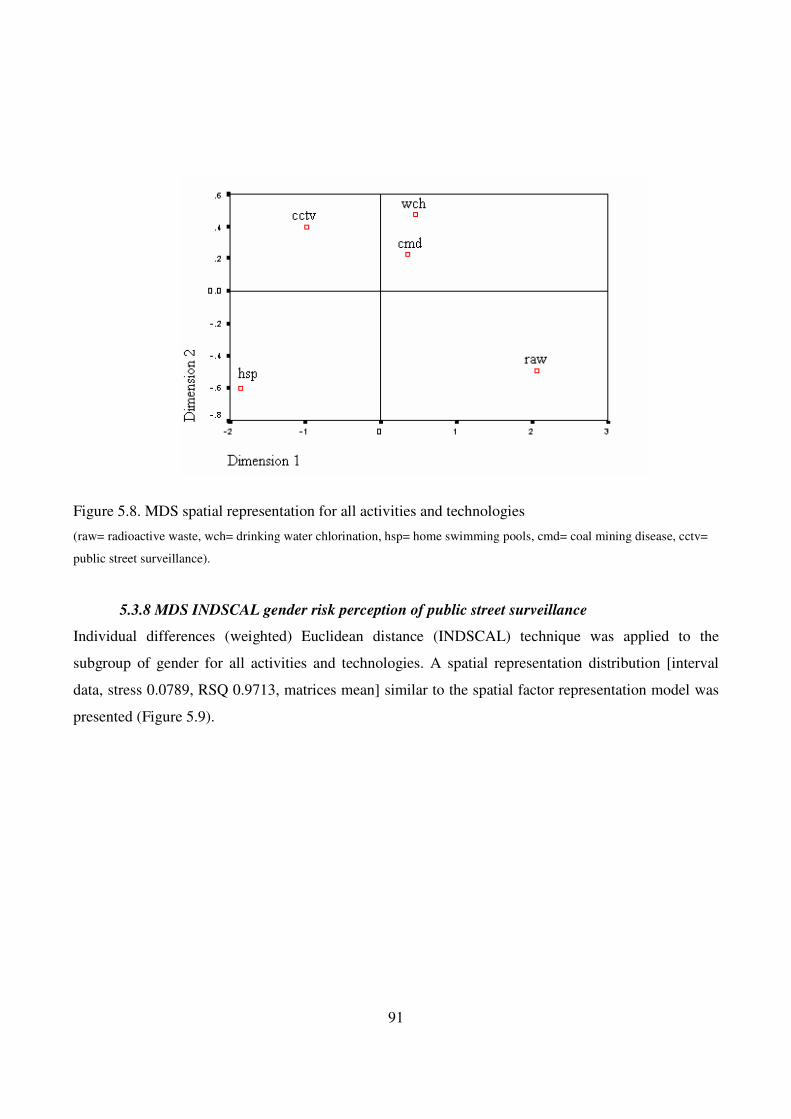
91
Figure 5.8. MDS spatial representation for all activities and technologies
(raw= radioactive waste, wch= drinking water chlorination, hsp= home swimming pools, cmd= coal mining disease, cctv=
public street surveillance).
5.3.8 MDS INDSCAL gender risk perception of public street surveillance
Individual differences (weighted) Euclidean distance (INDSCAL) technique was applied to the
subgroup of gender for all activities and technologies. A spatial representation distribution [interval
data, stress 0.0789, RSQ 0.9713, matrices mean] similar to the spatial factor representation model was
presented (Figure 5.9).
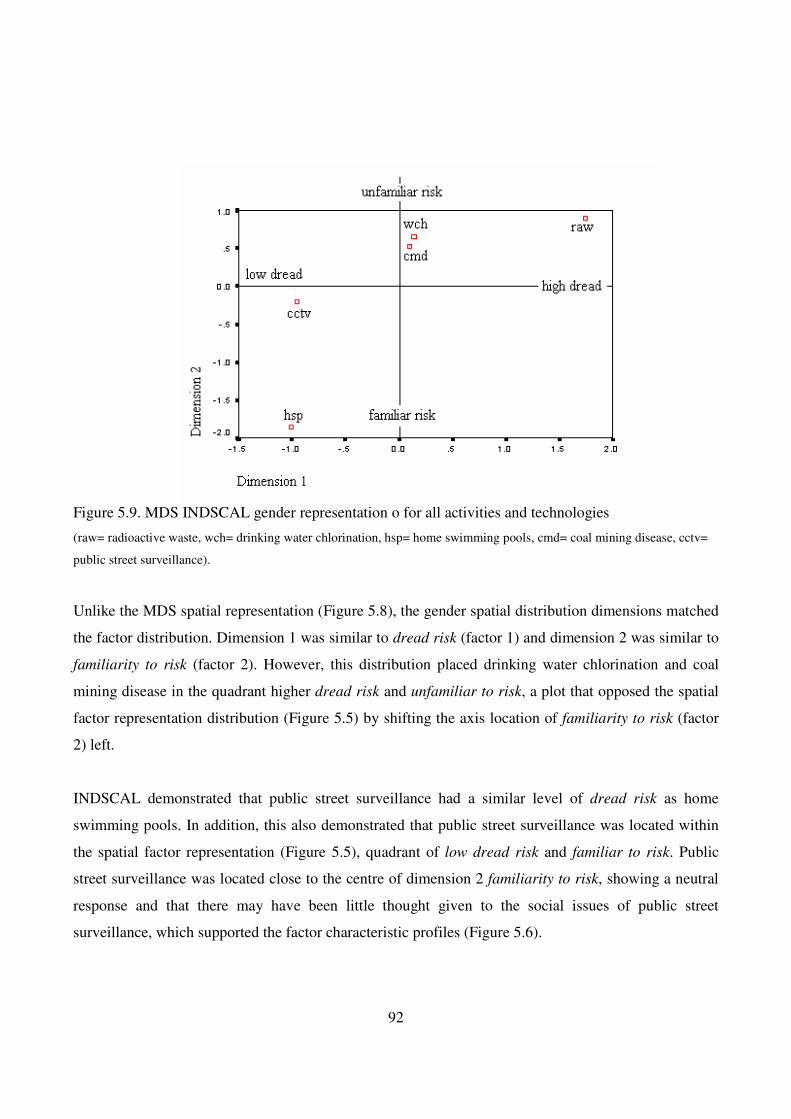
92
Figure 5.9. MDS INDSCAL gender representation o for all activities and technologies
(raw= radioactive waste, wch= drinking water chlorination, hsp= home swimming pools, cmd= coal mining disease, cctv=
public street surveillance).
Unlike the MDS spatial representation (Figure 5.8), the gender spatial distribution dimensions matched
the factor distribution. Dimension 1 was similar to dread risk (factor 1) and dimension 2 was similar to
familiarity to risk (factor 2). However, this distribution placed drinking water chlorination and coal
mining disease in the quadrant higher dread risk and unfamiliar to risk, a plot that opposed the spatial
factor representation distribution (Figure 5.5) by shifting the axis location of familiarity to risk (factor
2) left.
INDSCAL demonstrated that public street surveillance had a similar level of dread risk as home
swimming pools. In addition, this also demonstrated that public street surveillance was located within
the spatial factor representation (Figure 5.5), quadrant of low dread risk and familiar to risk. Public
street surveillance was located close to the centre of dimension 2 familiarity to risk, showing a neutral
response and that there may have been little thought given to the social issues of public street
surveillance, which supported the factor characteristic profiles (Figure 5.6).

93
5.3.9 Psychometric risk perception pre study conclusion
The pre study measured the social risk perception of public street surveillance, using psychometric and
MDS spatial representation techniques. The pre study investigation showed that the social risk
perception of public street surveillance was low dread risk and familiarity to risk. MDS supported this
analysis; however, provided additional underlying dimensions and presented public street surveillance
with its own unique characteristics. Public street surveillance had a low sense of community risk
perception and a low perceived community exposure to risk, demonstrating a social benefit that
outweighed the perceived risk to the community. An outcome supported by Ditton when he found that
“79% thought [public street surveillance] … would make people feel less likely that they would
become victims of crime” (1999). Therefore, the community would generally support the introduction
and maintenance of public street surveillance.
For public street surveillance, females presented a lower social risk perception than males, which
appeared to indicate that females feel safer when public street surveillance was present. For public
street surveillance, age did not have any significant affect to the sense of risk perception. Also, the
distance that a participant lived and/or worked from the nucleus of the public street surveillance did not
have any significant affect to the sense of risk perception. This outcome reinforced and supported the
spatial factor representation and that the community felt that the public street surveillance was a social
benefit.
Nevertheless, it appeared that the community had a social concern over the ability to ensure appropriate
control, with the characteristic of controllability being significantly higher than dread risk. However,
even when control was presented in a spatial representation, public street surveillance remained a low
dread and familiar risk, although familiarity to risk did provide a neutral response indicating that there
may have been little thought given to public street surveillance.
5.4 Psychometric risk perception post study
This section presents the post study analysis, with emphases on aspects that demonstrated differences
between the study phases. Analysis include the perceived risk between gender, the affect of age and
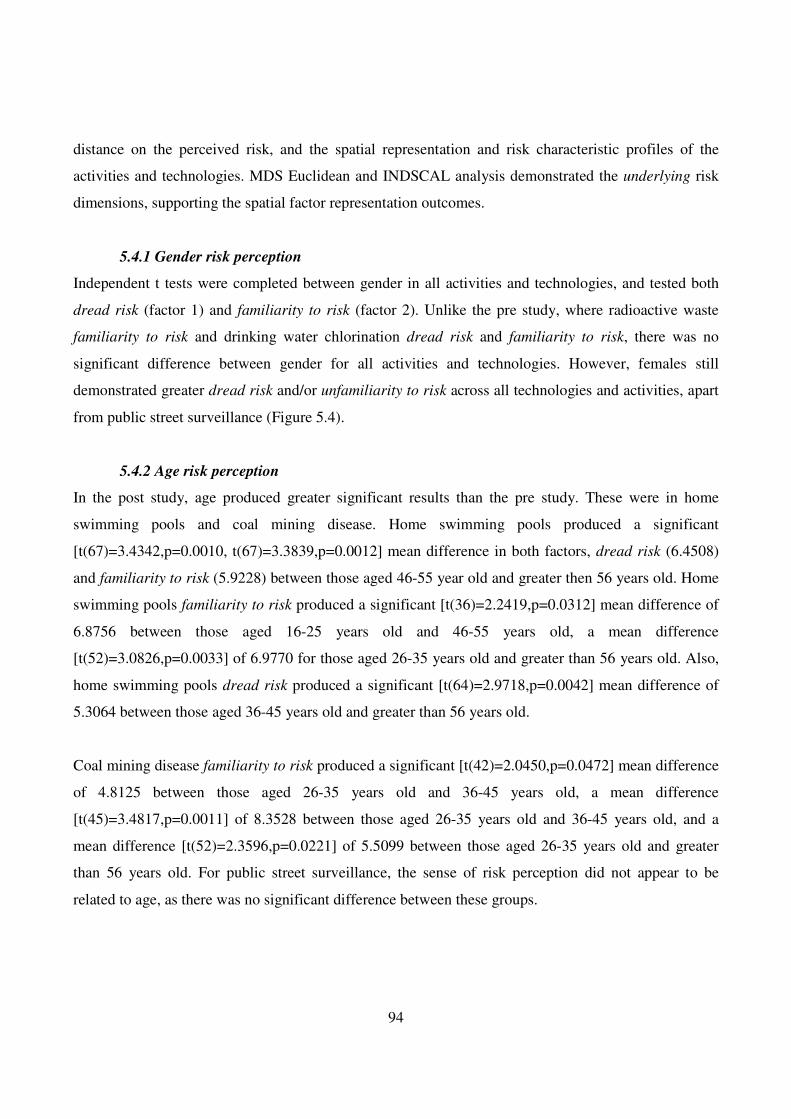
94
distance on the perceived risk, and the spatial representation and risk characteristic profiles of the
activities and technologies. MDS Euclidean and INDSCAL analysis demonstrated the underlying risk
dimensions, supporting the spatial factor representation outcomes.
5.4.1 Gender risk perception
Independent t tests were completed between gender in all activities and technologies, and tested both
dread risk (factor 1) and familiarity to risk (factor 2). Unlike the pre study, where radioactive waste
familiarity to risk and drinking water chlorination dread risk and familiarity to risk, there was no
significant difference between gender for all activities and technologies. However, females still
demonstrated greater dread risk and/or unfamiliarity to risk across all technologies and activities, apart
from public street surveillance (Figure 5.4).
5.4.2 Age risk perception
In the post study, age produced greater significant results than the pre study. These were in home
swimming pools and coal mining disease. Home swimming pools produced a significant
[t(67)=3.4342,p=0.0010, t(67)=3.3839,p=0.0012] mean difference in both factors, dread risk (6.4508)
and familiarity to risk (5.9228) between those aged 46-55 year old and greater then 56 years old. Home
swimming pools familiarity to risk produced a significant [t(36)=2.2419,p=0.0312] mean difference of
6.8756 between those aged 16-25 years old and 46-55 years old, a mean difference
[t(52)=3.0826,p=0.0033] of 6.9770 for those aged 26-35 years old and greater than 56 years old. Also,
home swimming pools dread risk produced a significant [t(64)=2.9718,p=0.0042] mean difference of
5.3064 between those aged 36-45 years old and greater than 56 years old.
Coal mining disease familiarity to risk produced a significant [t(42)=2.0450,p=0.0472] mean difference
of 4.8125 between those aged 26-35 years old and 36-45 years old, a mean difference
[t(45)=3.4817,p=0.0011] of 8.3528 between those aged 26-35 years old and 36-45 years old, and a
mean difference [t(52)=2.3596,p=0.0221] of 5.5099 between those aged 26-35 years old and greater
than 56 years old. For public street surveillance, the sense of risk perception did not appear to be
related to age, as there was no significant difference between these groups.
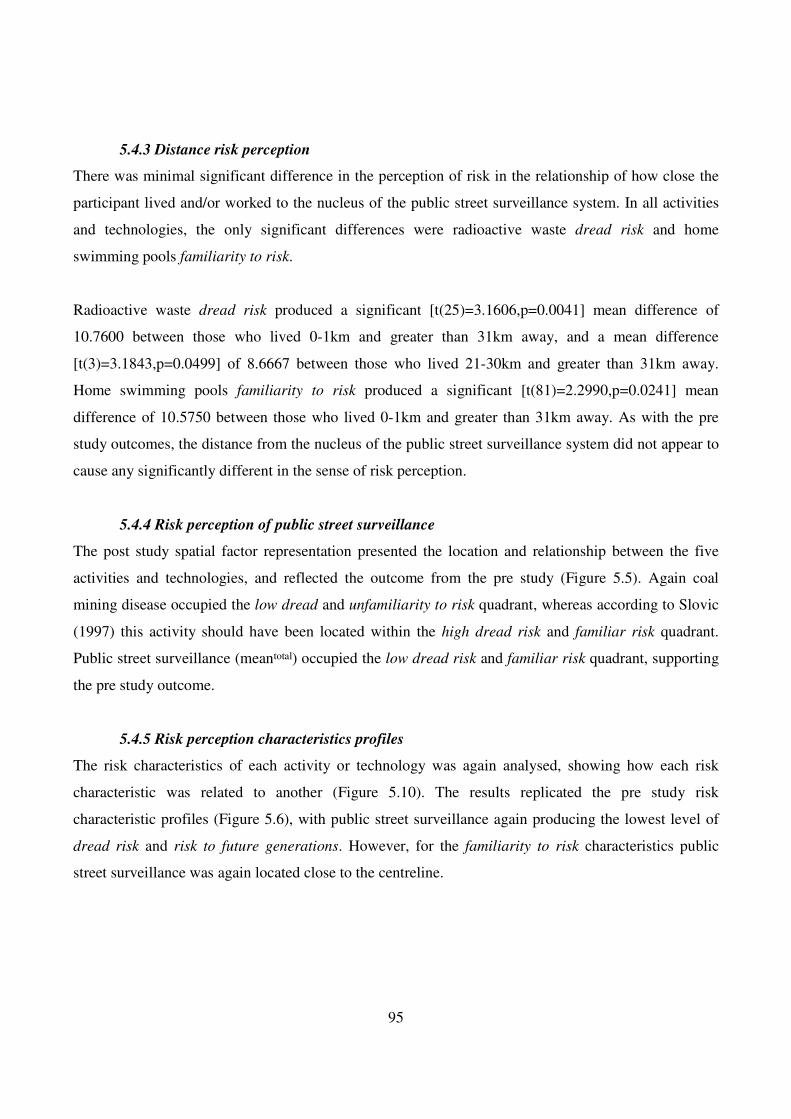
95
5.4.3 Distance risk perception
There was minimal significant difference in the perception of risk in the relationship of how close the
participant lived and/or worked to the nucleus of the public street surveillance system. In all activities
and technologies, the only significant differences were radioactive waste dread risk and home
swimming pools familiarity to risk.
Radioactive waste dread risk produced a significant [t(25)=3.1606,p=0.0041] mean difference of
10.7600 between those who lived 0-1km and greater than 31km away, and a mean difference
[t(3)=3.1843,p=0.0499] of 8.6667 between those who lived 21-30km and greater than 31km away.
Home swimming pools familiarity to risk produced a significant [t(81)=2.2990,p=0.0241] mean
difference of 10.5750 between those who lived 0-1km and greater than 31km away. As with the pre
study outcomes, the distance from the nucleus of the public street surveillance system did not appear to
cause any significantly different in the sense of risk perception.
5.4.4 Risk perception of public street surveillance
The post study spatial factor representation presented the location and relationship between the five
activities and technologies, and reflected the outcome from the pre study (Figure 5.5). Again coal
mining disease occupied the low dread and unfamiliarity to risk quadrant, whereas according to Slovic
(1997) this activity should have been located within the high dread risk and familiar risk quadrant.
Public street surveillance (meantotal) occupied the low dread risk and familiar risk quadrant, supporting
the pre study outcome.
5.4.5 Risk perception characteristics profiles
The risk characteristics of each activity or technology was again analysed, showing how each risk
characteristic was related to another (Figure 5.10). The results replicated the pre study risk
characteristic profiles (Figure 5.6), with public street surveillance again producing the lowest level of
dread risk and risk to future generations. However, for the familiarity to risk characteristics public
street surveillance was again located close to the centreline.
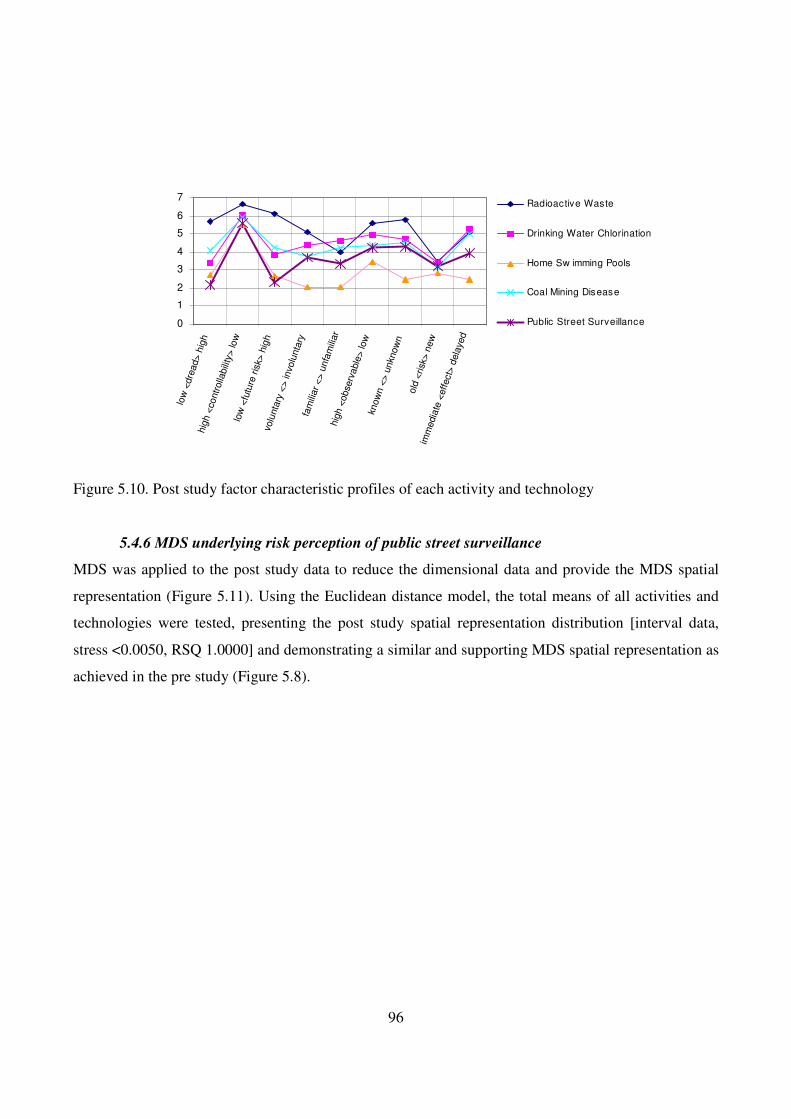
96
Figure 5.10. Post study factor characteristic profiles of each activity and technology
5.4.6 MDS underlying risk perception of public street surveillance
MDS was applied to the post study data to reduce the dimensional data and provide the MDS spatial
representation (Figure 5.11). Using the Euclidean distance model, the total means of all activities and
technologies were tested, presenting the post study spatial representation distribution [interval data,
stress <0.0050, RSQ 1.0000] and demonstrating a similar and supporting MDS spatial representation as
achieved in the pre study (Figure 5.8).
0
1
2
3
4
5
6
7
low
<dre
ad>
hig
hhig
h <
contr
olla
bili
ty> lo
wlo
w <
futu
re r
isk>
hig
hvo
lunta
ry <
> in
volu
nta
ryfa
mili
ar
<> u
nfa
mili
ar
hig
h <
obse
rvable
> low
know
n <
> u
nkn
ow
n
old
<risk
> n
ew
imm
edia
te <
effect>
dela
yed
Radioactive Waste
Drinking Water Chlorination
Home Sw imming Pools
Coal Mining Disease
Public Street Surveillance
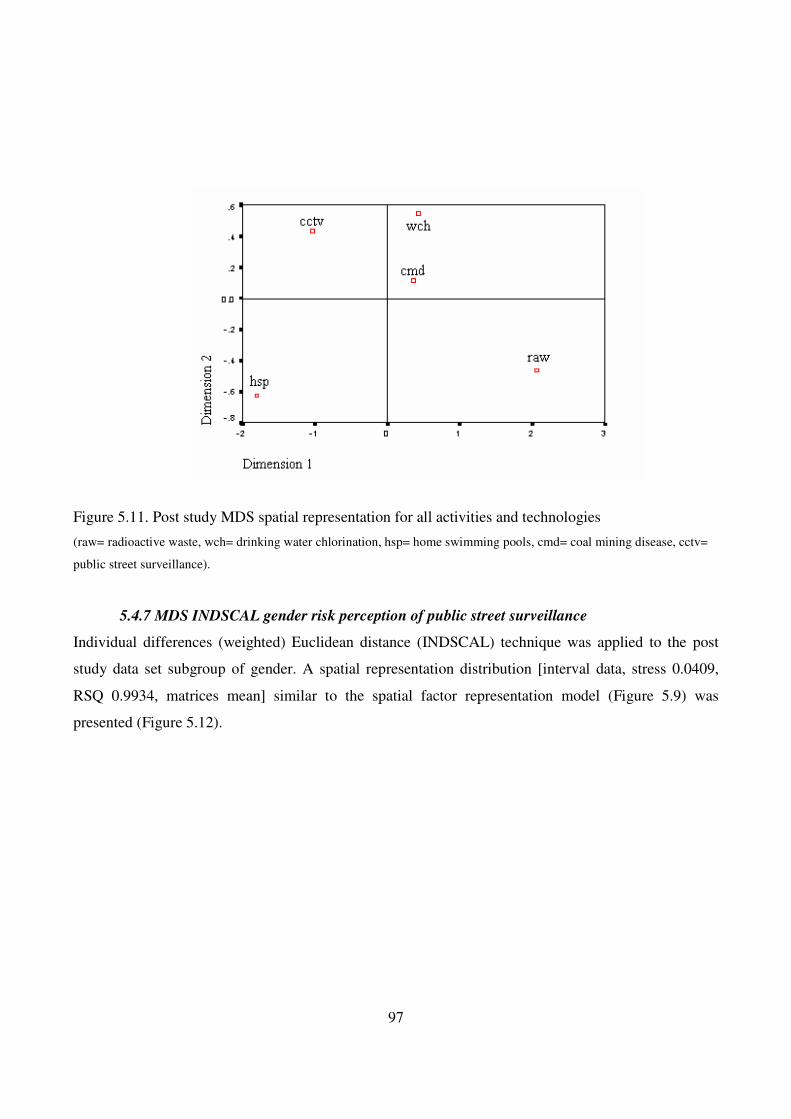
97
Figure 5.11. Post study MDS spatial representation for all activities and technologies
(raw= radioactive waste, wch= drinking water chlorination, hsp= home swimming pools, cmd= coal mining disease, cctv=
public street surveillance).
5.4.7 MDS INDSCAL gender risk perception of public street surveillance
Individual differences (weighted) Euclidean distance (INDSCAL) technique was applied to the post
study data set subgroup of gender. A spatial representation distribution [interval data, stress 0.0409,
RSQ 0.9934, matrices mean] similar to the spatial factor representation model (Figure 5.9) was
presented (Figure 5.12).
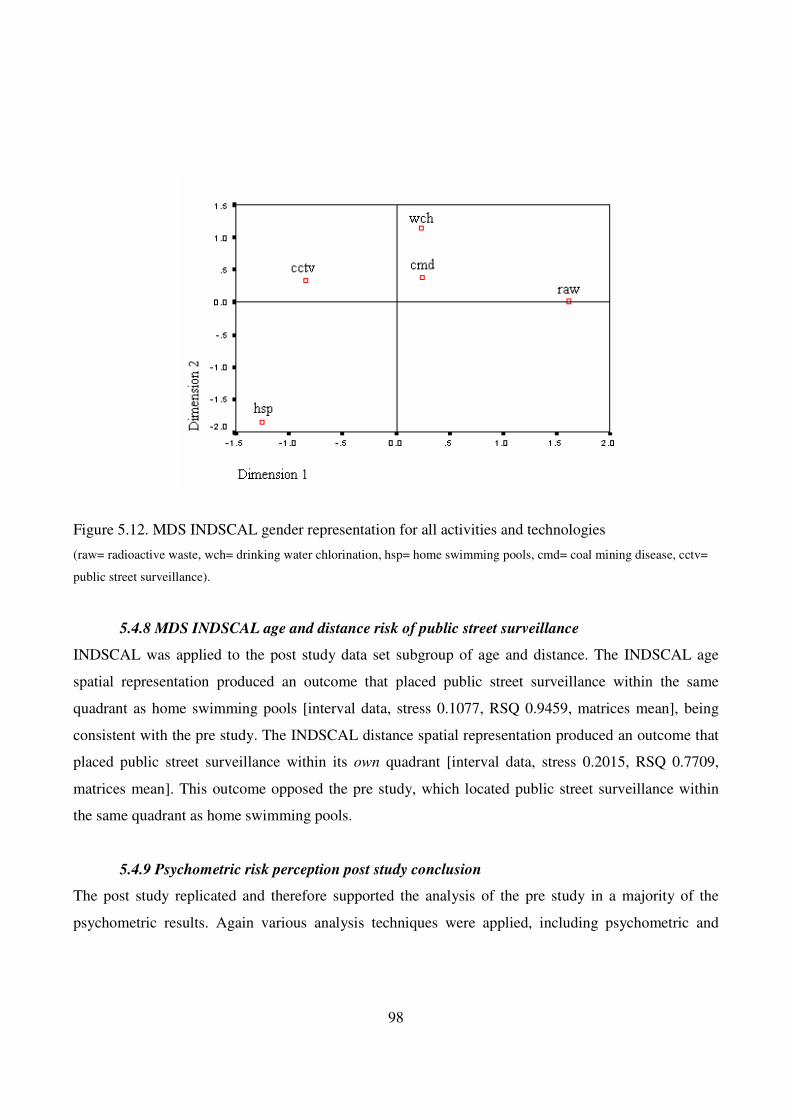
98
Figure 5.12. MDS INDSCAL gender representation for all activities and technologies
(raw= radioactive waste, wch= drinking water chlorination, hsp= home swimming pools, cmd= coal mining disease, cctv=
public street surveillance).
5.4.8 MDS INDSCAL age and distance risk of public street surveillance
INDSCAL was applied to the post study data set subgroup of age and distance. The INDSCAL age
spatial representation produced an outcome that placed public street surveillance within the same
quadrant as home swimming pools [interval data, stress 0.1077, RSQ 0.9459, matrices mean], being
consistent with the pre study. The INDSCAL distance spatial representation produced an outcome that
placed public street surveillance within its own quadrant [interval data, stress 0.2015, RSQ 0.7709,
matrices mean]. This outcome opposed the pre study, which located public street surveillance within
the same quadrant as home swimming pools.
5.4.9 Psychometric risk perception post study conclusion
The post study replicated and therefore supported the analysis of the pre study in a majority of the
psychometric results. Again various analysis techniques were applied, including psychometric and
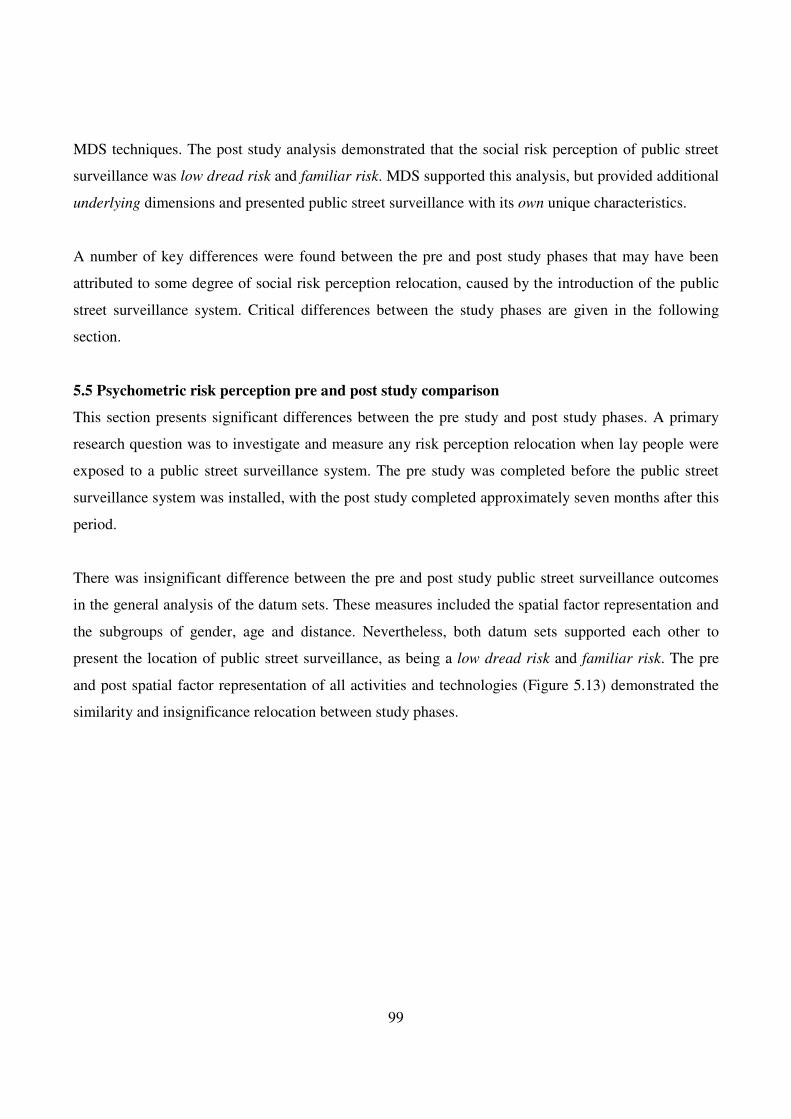
99
MDS techniques. The post study analysis demonstrated that the social risk perception of public street
surveillance was low dread risk and familiar risk. MDS supported this analysis, but provided additional
underlying dimensions and presented public street surveillance with its own unique characteristics.
A number of key differences were found between the pre and post study phases that may have been
attributed to some degree of social risk perception relocation, caused by the introduction of the public
street surveillance system. Critical differences between the study phases are given in the following
section.
5.5 Psychometric risk perception pre and post study comparison
This section presents significant differences between the pre study and post study phases. A primary
research question was to investigate and measure any risk perception relocation when lay people were
exposed to a public street surveillance system. The pre study was completed before the public street
surveillance system was installed, with the post study completed approximately seven months after this
period.
There was insignificant difference between the pre and post study public street surveillance outcomes
in the general analysis of the datum sets. These measures included the spatial factor representation and
the subgroups of gender, age and distance. Nevertheless, both datum sets supported each other to
present the location of public street surveillance, as being a low dread risk and familiar risk. The pre
and post spatial factor representation of all activities and technologies (Figure 5.13) demonstrated the
similarity and insignificance relocation between study phases.
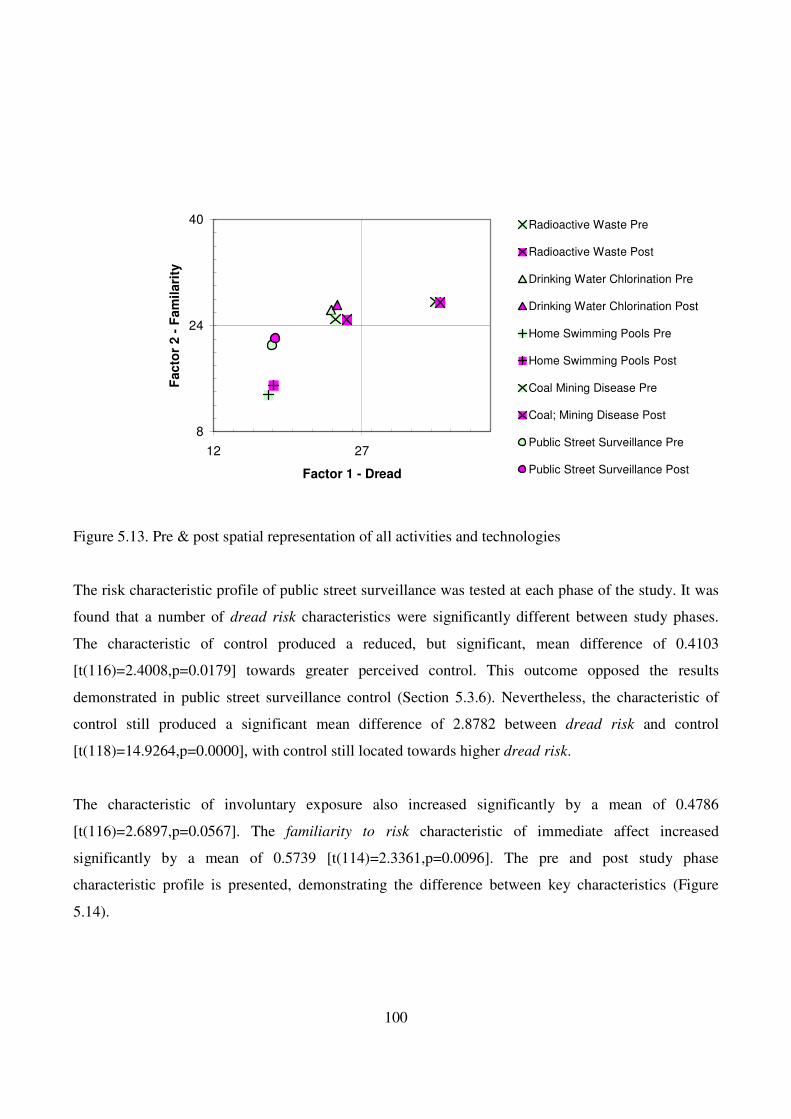
100
Figure 5.13. Pre & post spatial representation of all activities and technologies
The risk characteristic profile of public street surveillance was tested at each phase of the study. It was
found that a number of dread risk characteristics were significantly different between study phases.
The characteristic of control produced a reduced, but significant, mean difference of 0.4103
[t(116)=2.4008,p=0.0179] towards greater perceived control. This outcome opposed the results
demonstrated in public street surveillance control (Section 5.3.6). Nevertheless, the characteristic of
control still produced a significant mean difference of 2.8782 between dread risk and control
[t(118)=14.9264,p=0.0000], with control still located towards higher dread risk.
The characteristic of involuntary exposure also increased significantly by a mean of 0.4786
[t(116)=2.6897,p=0.0567]. The familiarity to risk characteristic of immediate affect increased
significantly by a mean of 0.5739 [t(114)=2.3361,p=0.0096]. The pre and post study phase
characteristic profile is presented, demonstrating the difference between key characteristics (Figure
5.14).
8
24
40
12 27
Factor 1 - Dread
Facto
r 2 -
Fam
ilari
ty
Radioactive Waste Pre
Radioactive Waste Post
Drinking Water Chlorination Pre
Drinking Water Chlorination Post
Home Swimming Pools Pre
Home Swimming Pools Post
Coal Mining Disease Pre
Coal; Mining Disease Post
Public Street Surveillance Pre
Public Street Surveillance Post
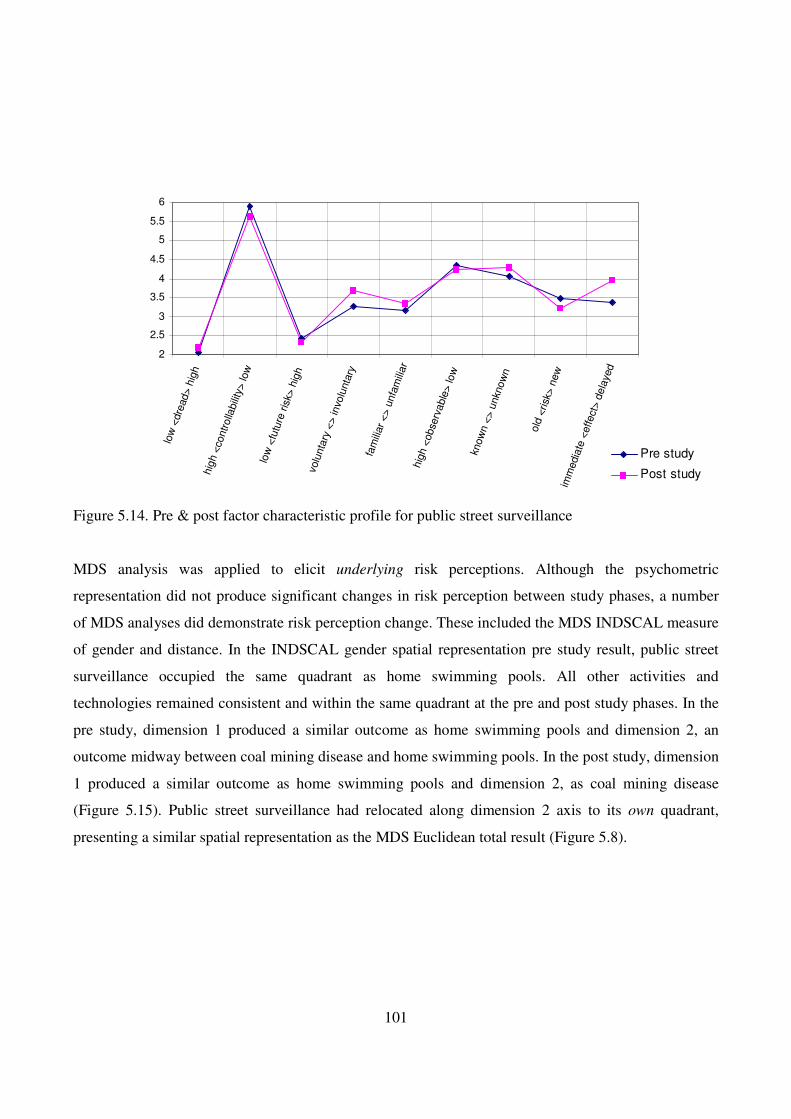
101
Figure 5.14. Pre & post factor characteristic profile for public street surveillance
MDS analysis was applied to elicit underlying risk perceptions. Although the psychometric
representation did not produce significant changes in risk perception between study phases, a number
of MDS analyses did demonstrate risk perception change. These included the MDS INDSCAL measure
of gender and distance. In the INDSCAL gender spatial representation pre study result, public street
surveillance occupied the same quadrant as home swimming pools. All other activities and
technologies remained consistent and within the same quadrant at the pre and post study phases. In the
pre study, dimension 1 produced a similar outcome as home swimming pools and dimension 2, an
outcome midway between coal mining disease and home swimming pools. In the post study, dimension
1 produced a similar outcome as home swimming pools and dimension 2, as coal mining disease
(Figure 5.15). Public street surveillance had relocated along dimension 2 axis to its own quadrant,
presenting a similar spatial representation as the MDS Euclidean total result (Figure 5.8).
2
2.5
3
3.5
4
4.5
5
5.5
6
low
<dre
ad> h
igh
hig
h <
contr
olla
bili
ty> lo
w
low
<fu
ture
ris
k> h
igh
volu
nta
ry <
> in
volu
nta
ry
fam
iliar
<> u
nfa
mili
ar
hig
h <
obse
rvable
> lo
w
know
n <
> u
nkn
ow
n
old
<risk
> n
ew
imm
edia
te <
effect
> d
ela
yed
Pre study
Post study
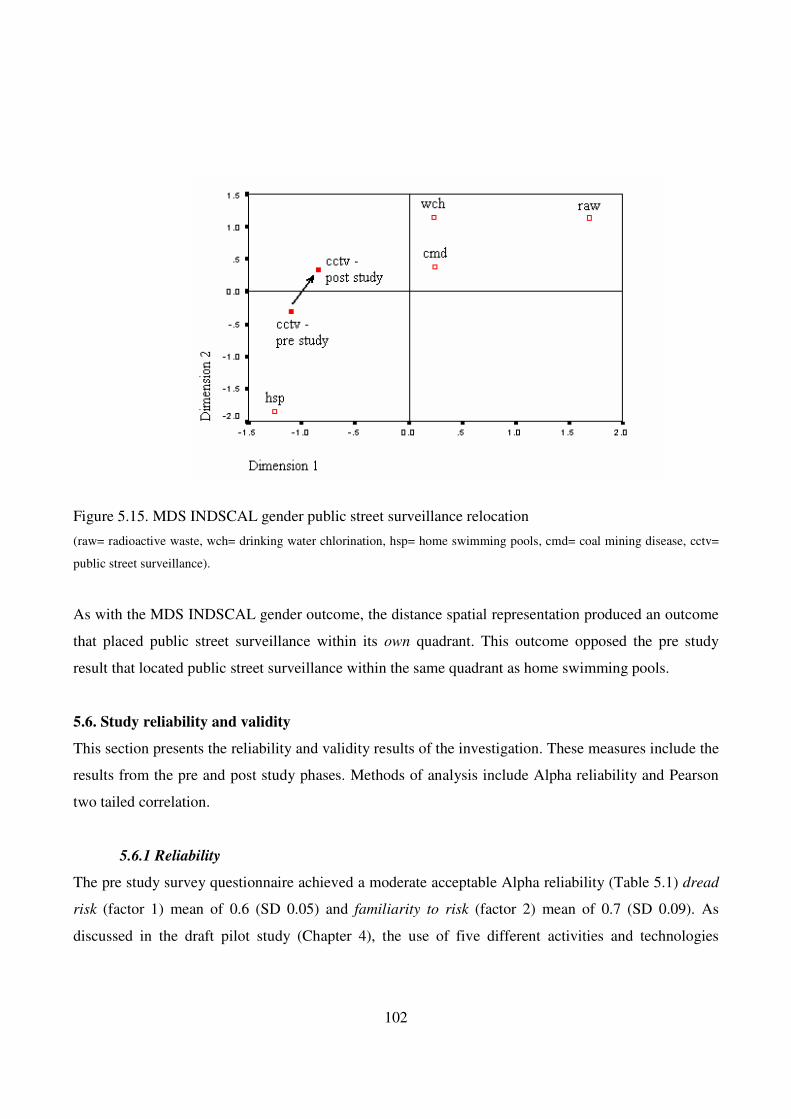
102
Figure 5.15. MDS INDSCAL gender public street surveillance relocation
(raw= radioactive waste, wch= drinking water chlorination, hsp= home swimming pools, cmd= coal mining disease, cctv=
public street surveillance).
As with the MDS INDSCAL gender outcome, the distance spatial representation produced an outcome
that placed public street surveillance within its own quadrant. This outcome opposed the pre study
result that located public street surveillance within the same quadrant as home swimming pools.
5.6. Study reliability and validity
This section presents the reliability and validity results of the investigation. These measures include the
results from the pre and post study phases. Methods of analysis include Alpha reliability and Pearson
two tailed correlation.
5.6.1 Reliability
The pre study survey questionnaire achieved a moderate acceptable Alpha reliability (Table 5.1) dread
risk (factor 1) mean of 0.6 (SD 0.05) and familiarity to risk (factor 2) mean of 0.7 (SD 0.09). As
discussed in the draft pilot study (Chapter 4), the use of five different activities and technologies
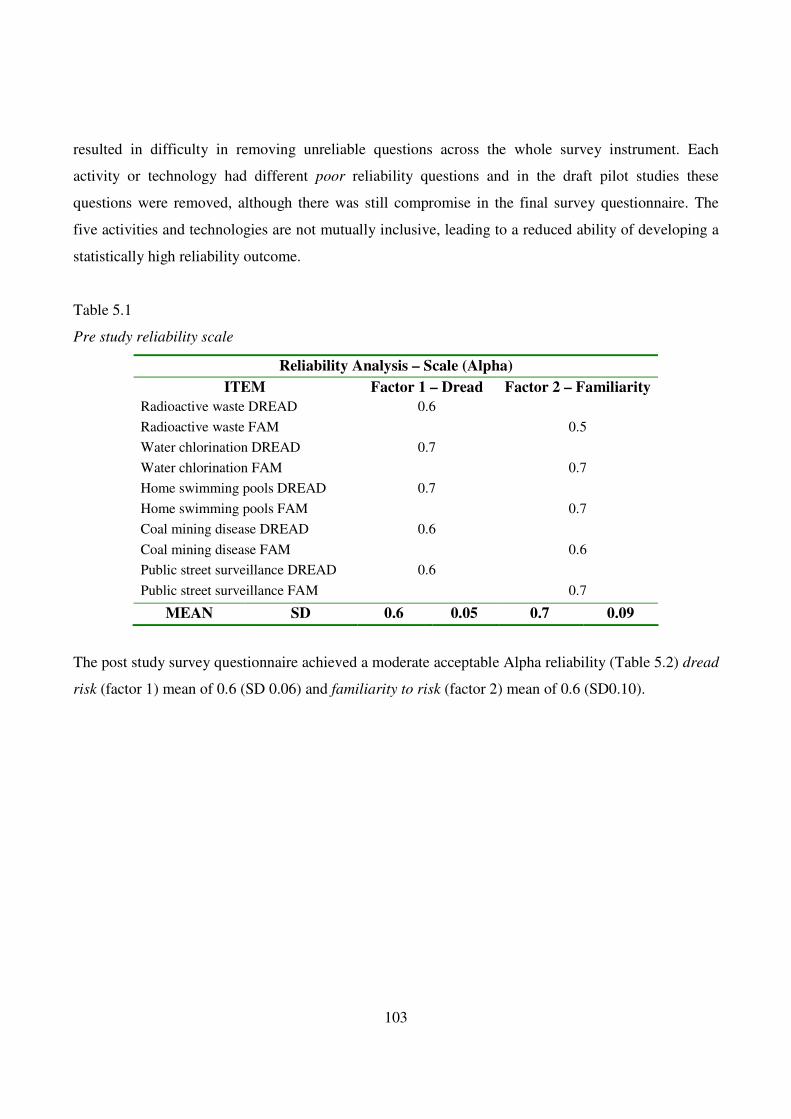
103
resulted in difficulty in removing unreliable questions across the whole survey instrument. Each
activity or technology had different poor reliability questions and in the draft pilot studies these
questions were removed, although there was still compromise in the final survey questionnaire. The
five activities and technologies are not mutually inclusive, leading to a reduced ability of developing a
statistically high reliability outcome.
Table 5.1
Pre study reliability scale
Reliability Analysis – Scale (Alpha)
ITEM Factor 1 – Dread Factor 2 – Familiarity
Radioactive waste DREAD 0.6
Radioactive waste FAM 0.5
Water chlorination DREAD 0.7
Water chlorination FAM 0.7
Home swimming pools DREAD 0.7
Home swimming pools FAM 0.7
Coal mining disease DREAD 0.6
Coal mining disease FAM 0.6
Public street surveillance DREAD 0.6
Public street surveillance FAM 0.7
MEAN SD 0.6 0.05 0.7 0.09
The post study survey questionnaire achieved a moderate acceptable Alpha reliability (Table 5.2) dread
risk (factor 1) mean of 0.6 (SD 0.06) and familiarity to risk (factor 2) mean of 0.6 (SD0.10).
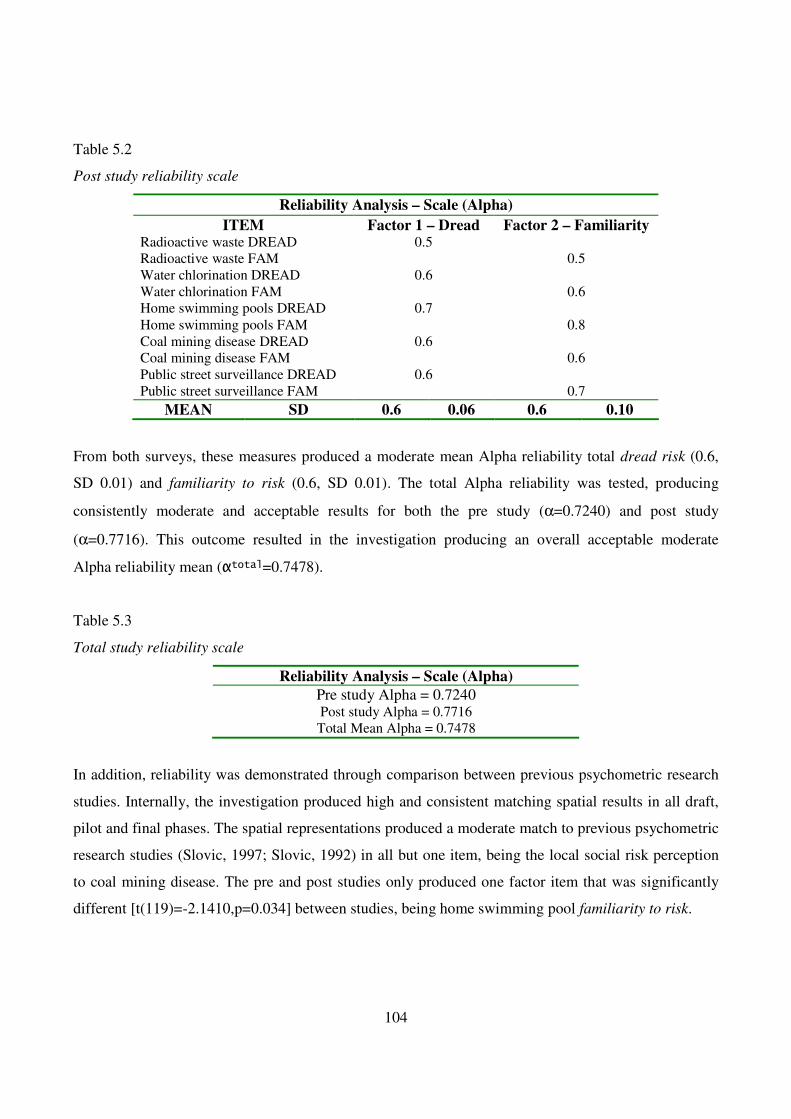
104
Table 5.2
Post study reliability scale
Reliability Analysis – Scale (Alpha)
ITEM Factor 1 – Dread Factor 2 – Familiarity Radioactive waste DREAD 0.5 Radioactive waste FAM 0.5 Water chlorination DREAD 0.6 Water chlorination FAM 0.6 Home swimming pools DREAD 0.7 Home swimming pools FAM 0.8 Coal mining disease DREAD 0.6 Coal mining disease FAM 0.6 Public street surveillance DREAD 0.6 Public street surveillance FAM 0.7
MEAN SD 0.6 0.06 0.6 0.10
From both surveys, these measures produced a moderate mean Alpha reliability total dread risk (0.6,
SD 0.01) and familiarity to risk (0.6, SD 0.01). The total Alpha reliability was tested, producing
consistently moderate and acceptable results for both the pre study (α=0.7240) and post study
(α=0.7716). This outcome resulted in the investigation producing an overall acceptable moderate
Alpha reliability mean (αtotal=0.7478).
Table 5.3
Total study reliability scale
Reliability Analysis – Scale (Alpha)
Pre study Alpha = 0.7240
Post study Alpha = 0.7716 Total Mean Alpha = 0.7478
In addition, reliability was demonstrated through comparison between previous psychometric research
studies. Internally, the investigation produced high and consistent matching spatial results in all draft,
pilot and final phases. The spatial representations produced a moderate match to previous psychometric
research studies (Slovic, 1997; Slovic, 1992) in all but one item, being the local social risk perception
to coal mining disease. The pre and post studies only produced one factor item that was significantly
different [t(119)=-2.1410,p=0.034] between studies, being home swimming pool familiarity to risk.
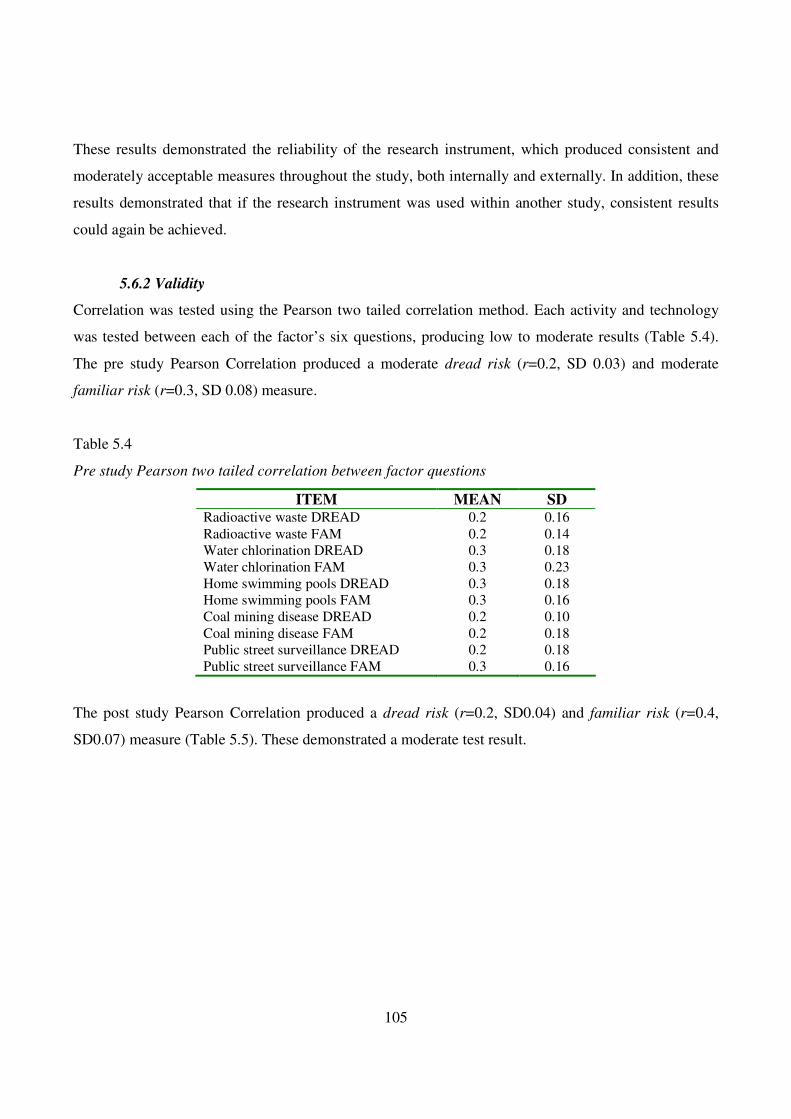
105
These results demonstrated the reliability of the research instrument, which produced consistent and
moderately acceptable measures throughout the study, both internally and externally. In addition, these
results demonstrated that if the research instrument was used within another study, consistent results
could again be achieved.
5.6.2 Validity
Correlation was tested using the Pearson two tailed correlation method. Each activity and technology
was tested between each of the factor’s six questions, producing low to moderate results (Table 5.4).
The pre study Pearson Correlation produced a moderate dread risk (r=0.2, SD 0.03) and moderate
familiar risk (r=0.3, SD 0.08) measure.
Table 5.4
Pre study Pearson two tailed correlation between factor questions
ITEM MEAN SD Radioactive waste DREAD 0.2 0.16 Radioactive waste FAM 0.2 0.14 Water chlorination DREAD 0.3 0.18 Water chlorination FAM 0.3 0.23 Home swimming pools DREAD 0.3 0.18 Home swimming pools FAM 0.3 0.16 Coal mining disease DREAD 0.2 0.10 Coal mining disease FAM 0.2 0.18 Public street surveillance DREAD 0.2 0.18 Public street surveillance FAM 0.3 0.16
The post study Pearson Correlation produced a dread risk (r=0.2, SD0.04) and familiar risk (r=0.4,
SD0.07) measure (Table 5.5). These demonstrated a moderate test result.
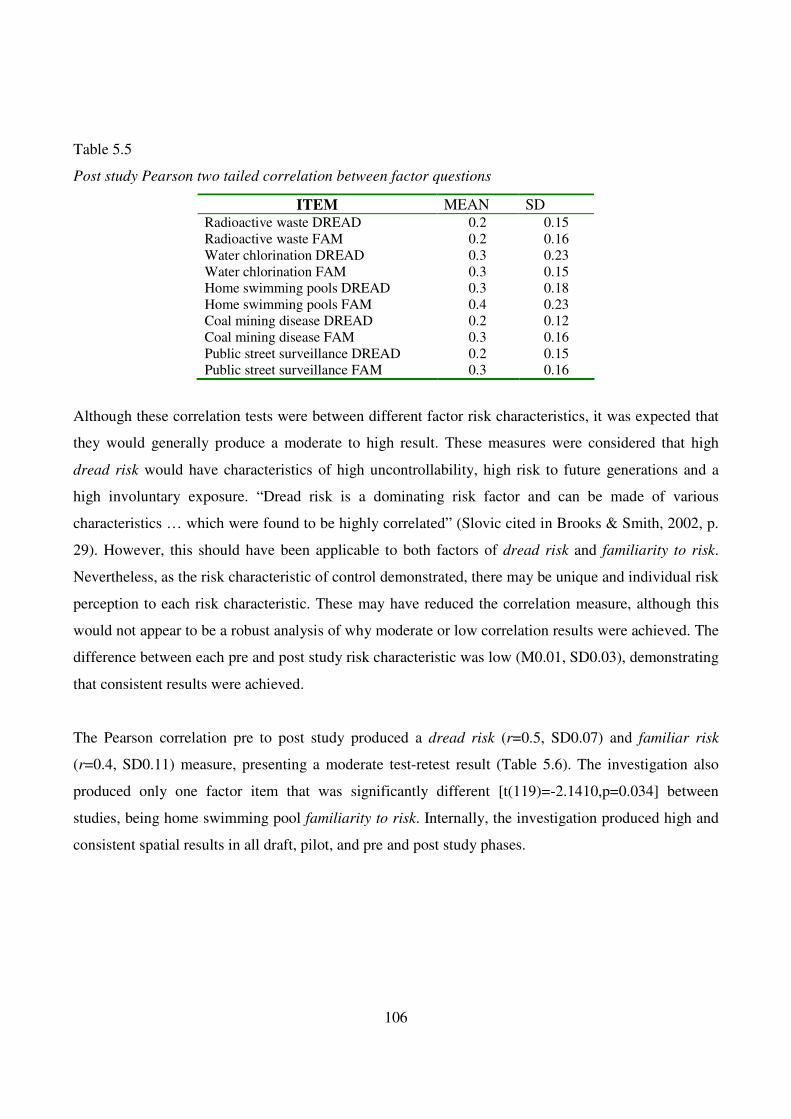
106
Table 5.5
Post study Pearson two tailed correlation between factor questions
ITEM MEAN SD Radioactive waste DREAD 0.2 0.15 Radioactive waste FAM 0.2 0.16 Water chlorination DREAD 0.3 0.23 Water chlorination FAM 0.3 0.15 Home swimming pools DREAD 0.3 0.18 Home swimming pools FAM 0.4 0.23 Coal mining disease DREAD 0.2 0.12 Coal mining disease FAM 0.3 0.16 Public street surveillance DREAD 0.2 0.15 Public street surveillance FAM 0.3 0.16
Although these correlation tests were between different factor risk characteristics, it was expected that
they would generally produce a moderate to high result. These measures were considered that high
dread risk would have characteristics of high uncontrollability, high risk to future generations and a
high involuntary exposure. “Dread risk is a dominating risk factor and can be made of various
characteristics … which were found to be highly correlated” (Slovic cited in Brooks & Smith, 2002, p.
29). However, this should have been applicable to both factors of dread risk and familiarity to risk.
Nevertheless, as the risk characteristic of control demonstrated, there may be unique and individual risk
perception to each risk characteristic. These may have reduced the correlation measure, although this
would not appear to be a robust analysis of why moderate or low correlation results were achieved. The
difference between each pre and post study risk characteristic was low (M0.01, SD0.03), demonstrating
that consistent results were achieved.
The Pearson correlation pre to post study produced a dread risk (r=0.5, SD0.07) and familiar risk
(r=0.4, SD0.11) measure, presenting a moderate test-retest result (Table 5.6). The investigation also
produced only one factor item that was significantly different [t(119)=-2.1410,p=0.034] between
studies, being home swimming pool familiarity to risk. Internally, the investigation produced high and
consistent spatial results in all draft, pilot, and pre and post study phases.
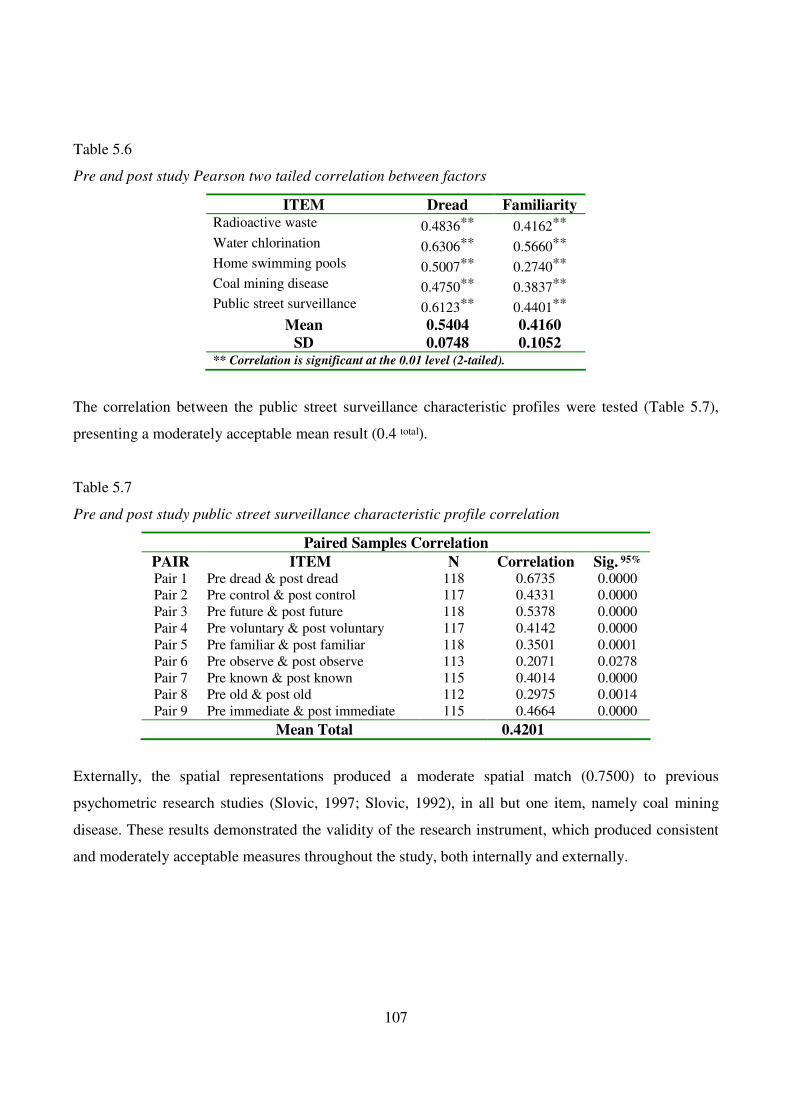
107
Table 5.6
Pre and post study Pearson two tailed correlation between factors
ITEM Dread Familiarity Radioactive waste 0.4836** 0.4162** Water chlorination 0.6306** 0.5660** Home swimming pools 0.5007** 0.2740** Coal mining disease 0.4750** 0.3837** Public street surveillance 0.6123** 0.4401**
Mean 0.5404 0.4160
SD 0.0748 0.1052 ** Correlation is significant at the 0.01 level (2-tailed).
The correlation between the public street surveillance characteristic profiles were tested (Table 5.7),
presenting a moderately acceptable mean result (0.4 total).
Table 5.7
Pre and post study public street surveillance characteristic profile correlation
Paired Samples Correlation
PAIR ITEM N Correlation Sig. 95% Pair 1 Pre dread & post dread 118 0.6735 0.0000 Pair 2 Pre control & post control 117 0.4331 0.0000 Pair 3 Pre future & post future 118 0.5378 0.0000 Pair 4 Pre voluntary & post voluntary 117 0.4142 0.0000 Pair 5 Pre familiar & post familiar 118 0.3501 0.0001 Pair 6 Pre observe & post observe 113 0.2071 0.0278 Pair 7 Pre known & post known 115 0.4014 0.0000 Pair 8 Pre old & post old 112 0.2975 0.0014 Pair 9 Pre immediate & post immediate 115 0.4664 0.0000
Mean Total 0.4201
Externally, the spatial representations produced a moderate spatial match (0.7500) to previous
psychometric research studies (Slovic, 1997; Slovic, 1992), in all but one item, namely coal mining
disease. These results demonstrated the validity of the research instrument, which produced consistent
and moderately acceptable measures throughout the study, both internally and externally.
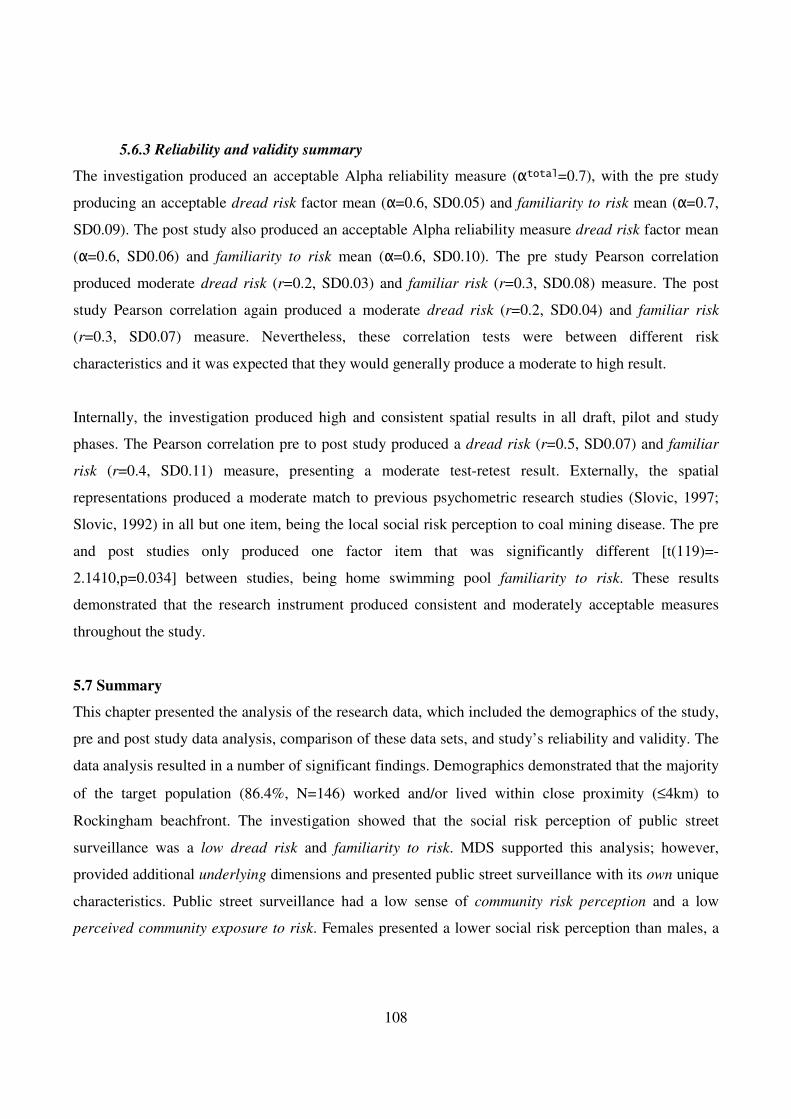
108
5.6.3 Reliability and validity summary
The investigation produced an acceptable Alpha reliability measure (αtotal=0.7), with the pre study
producing an acceptable dread risk factor mean (α=0.6, SD0.05) and familiarity to risk mean (α=0.7,
SD0.09). The post study also produced an acceptable Alpha reliability measure dread risk factor mean
(α=0.6, SD0.06) and familiarity to risk mean (α=0.6, SD0.10). The pre study Pearson correlation
produced moderate dread risk (r=0.2, SD0.03) and familiar risk (r=0.3, SD0.08) measure. The post
study Pearson correlation again produced a moderate dread risk (r=0.2, SD0.04) and familiar risk
(r=0.3, SD0.07) measure. Nevertheless, these correlation tests were between different risk
characteristics and it was expected that they would generally produce a moderate to high result.
Internally, the investigation produced high and consistent spatial results in all draft, pilot and study
phases. The Pearson correlation pre to post study produced a dread risk (r=0.5, SD0.07) and familiar
risk (r=0.4, SD0.11) measure, presenting a moderate test-retest result. Externally, the spatial
representations produced a moderate match to previous psychometric research studies (Slovic, 1997;
Slovic, 1992) in all but one item, being the local social risk perception to coal mining disease. The pre
and post studies only produced one factor item that was significantly different [t(119)=-
2.1410,p=0.034] between studies, being home swimming pool familiarity to risk. These results
demonstrated that the research instrument produced consistent and moderately acceptable measures
throughout the study.
5.7 Summary
This chapter presented the analysis of the research data, which included the demographics of the study,
pre and post study data analysis, comparison of these data sets, and study’s reliability and validity. The
data analysis resulted in a number of significant findings. Demographics demonstrated that the majority
of the target population (86.4%, N=146) worked and/or lived within close proximity (≤4km) to
Rockingham beachfront. The investigation showed that the social risk perception of public street
surveillance was a low dread risk and familiarity to risk. MDS supported this analysis; however,
provided additional underlying dimensions and presented public street surveillance with its own unique
characteristics. Public street surveillance had a low sense of community risk perception and a low
perceived community exposure to risk. Females presented a lower social risk perception than males, a
109
unique outcome in risk perception. Age or distance had no significant affect to the sense of risk
perception.
Through the characteristics of risk, the community risk perception of public street surveillance was
defined as a low risk to future generations, that exposure was voluntary, the risk was observable, that
the community understood the risk, that the risks were known and would be immediate. These
outcomes resulted in public street surveillance having a perceived low social risk perception,
demonstrating a social benefit that outweighed the perceived risk to the community. Nevertheless, it
appeared that the community had a social concern over the ability to ensure appropriate public street
surveillance control. The risk characteristic of control located public street surveillance towards a
significantly higher dread, however still within the familiarity to risk.
The study found that increased exposure did not change the social risk perception of lay people towards
public street surveillance, although increased risk perception between study phases for the risk
characteristics of controllability and involuntary exposure was demonstrated. In addition, the factor
familiarity to risk presented a neutral response, indicating that there may have been little thought given
to public street surveillance. These issues could drive and alter the social risk perception of public
street surveillance. This outcome appeared to be indicated within the MDS INDSCAL gender
representation after increased exposure, as public street surveillance relocated from a familiar risk to an
unfamiliar risk.
The study produced an acceptable Alpha reliability measure (αtotal=0.7), with the study phases
producing an acceptable dread risk factor mean (αpre=0.6; αpost=0.6) and familiarity to risk mean
(αpre=0.7; αpost=0.6). However, the Pearson correlation produced only moderate results, with a dread
risk (rpre=0.2; rpost=0.2) and familiarity to risk (rpre=0.3; rpos=0.3) measure. Nevertheless, these
correlation tests were between risk characteristics that could expect to generally produce higher results
(r≥0.7). Internally, the investigation produced high and consistent spatial results. The Pearson
correlation between phases produced a dread risk (r=0.5) and familiarity to risk (r=0.4) measure,
presenting moderate results. Externally, the spatial representations produced a moderate match to

110
previous psychometric studies. These results demonstrated that the research instrument produced
consistent and moderately acceptable measures throughout the study.
111
CHAPTER 6
INTERPRETATIONS
6.1 Introduction
This chapter presents interpretation of the data analyses, including the measured risk perception of
public street surveillance and dominant risk perception characteristics (Section 6.2). In addition, that
public street surveillance was a socially acceptable risk (Section 6.3), why females felt safer with
public street surveillance (Section 6.4), the changing social risk perception of public street surveillance
(Section 6.5) and why only limited risk perception change was demonstrated (Section 6.6). The study
outcomes (Section 6.7), limitations of outcomes (Section 6.8), areas for further research (Section 6.9)
and conclusions (Section 6.10) finalise the study.
6.2 The psychometric risk perception of public street surveillance
The investigation measured the social risk perception of public street surveillance, utilising
psychometric risk and Multidimensional Scaling (MDS) representation techniques. The psychometric
spatial factor representation demonstrated that public street surveillance occupied low dread risk and
familiarity to risk. MDS presented public street surveillance as a low community risk perception and a
low perceived community exposure to risk.
Public street surveillance (meantotal) was presented within the psychometric spatial representation and
occupied the same spatial quadrant as home swimming pools, within the quadrant of low dread risk and
familiarity to risk. Public street surveillance dread risk matched home swimming pools, with
familiarity to risk being located mid way between coal mining disease and home swimming pools. The
spatial representation of the control activities and technologies were supported by previous
psychometric studies (Bouyer, Bagdassarian, Chaabanne & Mullet, 2001; DeNorma, 2001; Slovic,
1997), reinforcing the measured position of public street surveillance.
MDS Euclidean distance technique also presented a spatial representation distribution. MDS
demonstrated the group space of the activities and technologies, and formed the underlying
configuration of points (Cox & Cox, 2000). The two MDS dimensions were reduced to one-
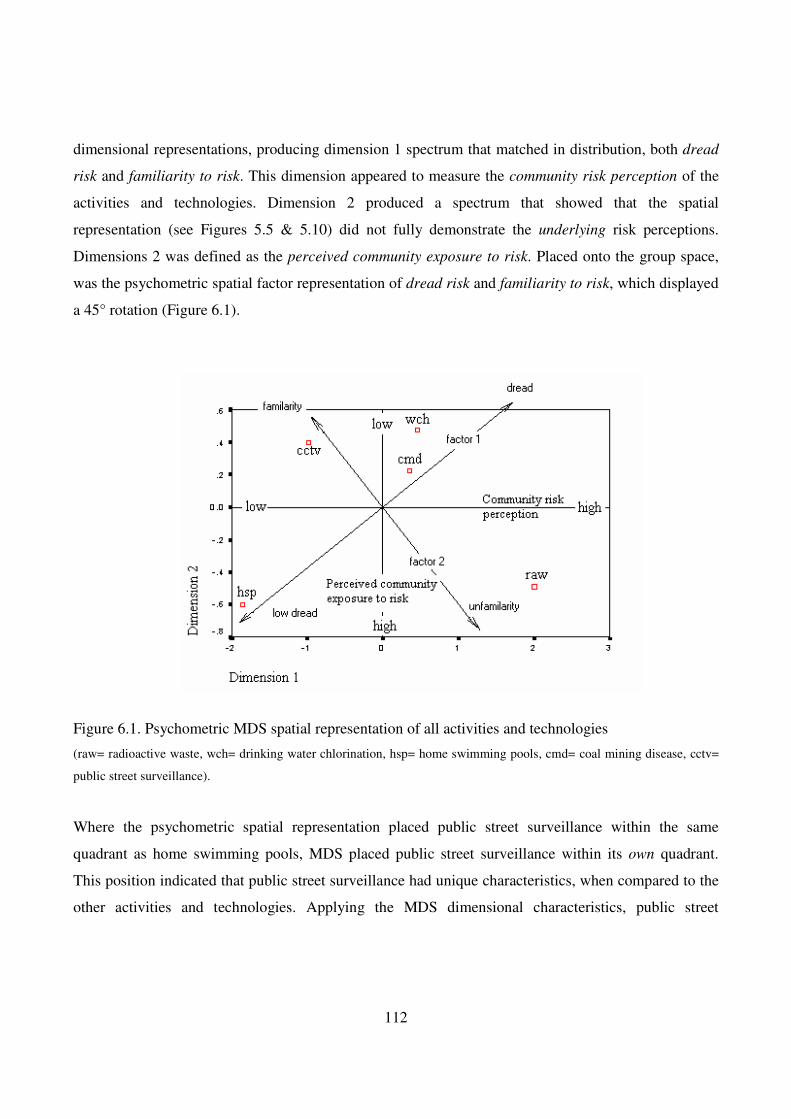
112
dimensional representations, producing dimension 1 spectrum that matched in distribution, both dread
risk and familiarity to risk. This dimension appeared to measure the community risk perception of the
activities and technologies. Dimension 2 produced a spectrum that showed that the spatial
representation (see Figures 5.5 & 5.10) did not fully demonstrate the underlying risk perceptions.
Dimensions 2 was defined as the perceived community exposure to risk. Placed onto the group space,
was the psychometric spatial factor representation of dread risk and familiarity to risk, which displayed
a 45° rotation (Figure 6.1).
Figure 6.1. Psychometric MDS spatial representation of all activities and technologies
(raw= radioactive waste, wch= drinking water chlorination, hsp= home swimming pools, cmd= coal mining disease, cctv=
public street surveillance).
Where the psychometric spatial representation placed public street surveillance within the same
quadrant as home swimming pools, MDS placed public street surveillance within its own quadrant.
This position indicated that public street surveillance had unique characteristics, when compared to the
other activities and technologies. Applying the MDS dimensional characteristics, public street
113
surveillance appeared to have a low level of risk perception and a low perceived community exposure to
risk.
INDSCAL demonstrated that public street surveillance had a similar level of dread risk as home
swimming pools. This measure also demonstrated that public street surveillance was located within the
spatial factor representation quadrant of low dread and familiar risk; however, that it had appeared to
relocate between studies toward an increased unfamiliarity to risk. Public street surveillance was
located close to the centre of dimension 2 familiarity to risk, showing a neutral response and that there
may have been little thought given to the social issues of public street surveillance. This position
supported the familiarity to risk characteristic profiles.
The ability of the psychometric model to measure intellectual risk was also demonstrated; intellectual
risk being an activity or technology that does not cause direct risk to the person. Previous studies of the
psychometric paradigm assessed activities and technologies that could be a physical risk (Bouyer,
Bagdassarian, Chaabanne & Mullet, 2001; DeNorma, 2001; Slovic, 1997). Nevertheless, public street
surveillance does not cause physical harm and can be seen more as a privacy risk or intellectual risk,
whereas radioactive waste, swimming pools, etc., can be perceived by a layperson as a physical risk. It
was found that an intellectual risk, with public street surveillance being considered this type of risk,
could be measured with perceived physical risk activities and technologies.
6.3 Is public street surveillance a sociably acceptable risk?
Public street surveillance (meantotal) occupied the same psychometric spatial quadrant as home
swimming pools, with a low dread risk and familiarity to risk. Through the characteristics of risk, the
community risk perception of public street surveillance can be defined as a low risk to future
generations, that exposure was voluntary, the risk was observable, that they understood the risk, that
the risks are known and would be immediate. This spatial position would support CCTV “apparent
public popularity of the measure” (Painter & Tilley, 1999, p. 2) and resulted in public street
surveillance having a perceived low social risk perception, demonstrating a social benefit that
outweighed the perceived risk to the community. Ditton (1999) supported this finding when he found
that that there “was a slight reduction in those who said they were anxious about becoming a victim of
114
crime” and went further when “79% thought [public street surveillance] … would make people feel
less likely that they would become victims of crime”. Painter and Tilley also stated that “public support
or acceptance for CCTV in public spaces … appears to be high” (1999, p. 7). Therefore, it can be stated
that public street surveillance system was an acceptable social risk.
MDS Euclidean distance model supported the psychometric spatial outcome, with public street
surveillance being located within the dimensional space of low level of risk perception and a low
perceived community exposure to risk. Nevertheless, MDS did produce a result that placed public street
surveillance within its own unique quadrant when compared to the other control activities and
technologies. This spatial position indicated that public street surveillance had unique characteristics
from the other activities and technologies. Therefore unlike the psychometric representation, this
produced an outcome that placed public street surveillance within an area that although acceptable,
may be prone to risk perception relocation.
The risk characteristic of controllability demonstrated a factor that could cause risk relocation.
Extracting the characteristic of control from dread risk located public street surveillance towards a
higher dread, but still within the familiarity to risk quadrant. In both phases of the study, the mean
difference between total dread risk and the characteristic of control was significant
[t(165)=21.7,p=0.0000; t(116)=2.4008,p=0.0179]. It appeared that the community had and maintained
a social concern over the ability to ensure appropriate public street surveillance control. Philips
supported this outcome, although did indicate that “fears about abuse and control may be alleviated by
the regulation of CCTV” (1999, p. 140). As Painter and Tilley stated “some feel uncomfortable at the
thought that their private out-of-doors actions may be focused on by surveillance specialists” (1999, p.
6). This view could include our everyday actions, not just illegal behaviour. The methodology of
surveillance targeting community members may become a social concern, intimated by this risk
characteristic of controllability. These issues have been raised by several authors in the past (Painter &
Tilley, 1999; Norris & Armstrong, 1999).
Public street surveillance produced the lowest level of dread and risk to future generations. However,
for the familiarity to risk characteristics, public street surveillance was located close to the centre. This
115
position may indicate neutral risk perception or that little social thought had been given to public street
surveillance. These results were replicated and supported in both phases of the study. Public street
surveillance did appear to demonstrate a social benefit in both the psychometric and MDS
representations, repeated in both phases of the investigation. However, there were a number of key
issues that could cause public street surveillance to relocate, primarily being the controllability of
public street surveillance. Nevertheless, public street surveillance did demonstrate that it was a sociable
acceptable risk which outweighed the social risk.
6.4 Public street surveillance risk perception demographic affect
The investigation demonstrated that public street surveillance did have an affect on the risk perception
of certain demographic groups, particularly apparent with gender risk perception. Females exhibited
greater dread risk and/or unfamiliarity to risk levels across all technologies and activities, excluding
public street surveillance. For the control items this had been demonstrated by a number of previous
studies (Bouyer, Bagdassarian, Chaabanne & Mullet, 2001; Slovic, 1997).
Brown (cited in Philips, 1999, p. 139) noted that “CCTV is unlikely to make women feel safer in town
centres.” However, public street surveillance gender spatial spread appeared to oppose this and also
provided a unique risk perception outcome. This measure appeared to demonstrate that females had a
lower dread risk and familiarity to risk for the technology of public street surveillance, with the result
consistently achieved in both study phases. Within the study, females not only felt safer when public
street surveillance was present, but that they felt that public street surveillance was a social benefit that
outweighed perceived risk. Traditional difference in gender risk perceptions was believed to be due to
biology, educational levels or a lack of understanding of technical issues. Empirical studies appear to
indicate that the difference in risk perception is in some part biological; however, this still does not
provide a full explanation (Finucane, 2002; DeNorma, 2001) although supports the findings of this
study.
The study found that females felt safer within a public street surveillance system. It can be argued that
this may be due to the perception that they were within a surveillance zone, with official help close at
hand. However, Norris and Armstrong found that women accounted for only 7% of primary persons
116
placed under surveillance and that out of nearly 600 hours of actual surveillance tapes, only one woman
was actively targeted as a protective measure (1999, p.172). Norris and Armstrong (1999) studied who
and what public street surveillance operators watched, and how operators discriminated by age, race
and gender, resulting in young men being their primary targets.
MDS INDSCAL gender provided a spatial representation distribution that appeared similar to the
psychometric spatial factor representation. Unlike the MDS spatial representation, the gender spatial
distribution dimensions matched the factor distribution. Dimension 1 was similar to dread risk and
dimension 2 was similar to familiarity to risk. Nevertheless, this distribution placed drinking water
chlorination and coal mining disease in the quadrant of higher dread and unfamiliar risk. This plot
adjusted the spatial factor representation distribution by shifting the axis location of familiarity to risk
(factor 2), supporting the spatial representation
Using the psychometric spatial representation, public street surveillance sense of risk perception did not
appear to be related to age or distance, which produced no significant difference and resulted in the
closest spatial cluster of all activities and technologies. The distance that the participants lived and/or
worked from the nucleus of the public street surveillance system did not induce any significant
difference in their sense of risk perception. Again, this factor presented the closest dimensional cluster
of all tested activities and technologies. Public street surveillance provided females with increased
levels of perceived safety. Therefore, it can be argued that females would support the introduction and
maintenance of public street surveillance systems. The factors of age or whether a layperson lived or
worked within the field of view of a public street surveillance system did not have any significant
affect.
6.5 Changing social risk perception of public street surveillance
The study research question proposed that public street surveillance was located within the
psychometric spatial factor representation quadrant of low dread risk and unfamiliarity to risk. This
spatial locality would have defined public street surveillance as controllable, a low risk to future
generations and that exposure was voluntary. However, public street surveillance had an unknown
capability, that the risk was not observable, and that the risk was new and delayed, resulting in public
117
street surveillance being perceived as an unknown threat, but socially acceptable. Nevertheless, when
public street surveillance exposure was increased, during and after the installation of the system, the
risk perception would relocate to the psychometric quadrant of higher dread risk and familiarity to risk.
This relocation may increase the perceived threat to society, making public street surveillance less
sociably acceptable.
The investigation measured the psychometric risk perception of public street surveillance and placed
public street surveillance within the same spatial quadrant as home swimming pools, being low dread
risk and familiarity to risk. MDS reinforced the psychometric spatial factor representation, presenting
public street surveillance as a low community risk perception and a low perceived community exposure
to risk (Figure 6.1). This result opposed the research question, locating public street surveillance in a
quadrant that was not expected at the beginning of the investigation. Also, within the psychometric
factor and MDS representations, increased exposure to public street surveillance did not appear to
cause any significant relocation of social risk perception.
However, MDS INDSCAL did demonstrate gender relocation. In addition, a number of findings did
indicate that public street surveillance risk perception did demonstrate relocation after increased lay
exposure, although there was limited statistical evidence to demonstrate a robust and high degree of
risk relocation. What appeared to demonstrate risk relocation were a number of the risk characteristics,
being those of controllability and involuntary exposure. Also, familiarity to risk presented a result close
to the spatial centreline.
Public street surveillance controllability produced a significant [t(165)=21.7,p=0.0000,
t(116)=2.4008,p=0.0179] difference in mean towards a higher dread result, although this still located
controllability within the lower dread risk quadrant. The difference between factor dread and the
characteristic of control was significant in both study phases. Also, the risk characteristic of involuntary
exposure increased significantly [t(116)=2.6897,p=0.0567]. It appeared that the community had and
maintained a social concern over the ability to ensure appropriate public street surveillance control.
118
Familiarity, in all risk characteristics for public street surveillance, was located close to the centre and
between study phases this did not change significantly. This locality appeared to indicate a neutral risk
perception towards public street surveillance, that the community did not at that time have strong views
on the system or that little social thought had actually been given to public street surveillance.
Increased awareness, through the media, increasing systems and better understanding of public street
surveillance may cause risk perception relocation.
Initial MDS INDSCAL gender spatial representation presented results placed public street surveillance
within the same quadrant as home swimming pools. Nevertheless, after increased exposure public
street surveillance relocated across dimension 1 to its own unique quadrant (see Figure 5.15). All other
activities and technologies remained consistent and within the same quadrant during the investigation.
Public street surveillance had relocated along dimension 2 axis, remaining a low dread risk, but
relocating from a familiar to an unfamiliar risk. This result appeared to demonstrate that there had been
social risk perception relocation during the investigation.
There were a number of key public street surveillance areas of concern, shown with the risk
characteristics of controllability and involuntary. Familiarity to risk produced a result that was neutral
in outcome, prone to increased awareness and therefore, risk relocation. In addition, MDS INDSCAL
provided gender relocation during the investigation, which may indicate that like all new technologies
public street surveillance has not yet found its true social risk perception measure. Painter and Tilley
supported this view when they stated that CCTV “public support is not necessarily robust” (1999, p. 5).
6.6 Limited changing social risk perception of public street surveillance
Community risk perceptions are defined by society and not the expert or industry (Brooks & Smith,
2002). To attempt or expect that the risk perception of public street surveillance would relocate with
increased exposure was naive in the initial research question. As discussed within the introduction
(Chapter 1), the issues that could change the social risk perception of public street surveillance are
complex and interwoven, and therefore, beyond the scope of this investigation. However in the context
of this study, there were some interesting aspects that may have led to this limited risk perception
119
relocation. Considering the research findings, it can be argued that the study would have been unlikely
to have demonstrated public street surveillance risk relocation within the research period.
The media are one, of many, driving forces behind the type and extent of coverage given to issues of
social risk. They dramatise issues, elevate social concerns, focus on minority groups, and expose and
propose individual fears as that of the general population. However current public street surveillance
“media coverage is of a positive nature, with little or virtually no adverse media coverage” (Brooks &
Smith, 2002, p. 28). The media does not appear to target public street surveillance as a social concern,
taking the community stance that it is a social benefit there to do good.
The local media comprises of two local community papers, which between them covered the public
street surveillance system twice. In each case this was due to the local city council filing a press release
on the newly installed public street surveillance system. The Sound Telegraph did discuss the
introduction of the council investment in the security cameras as “big brother is watching, but unlike
the television show this is a realistic situation” (Millimaci, 2002). The city council also has the City
Chronicle, which has covered the public street surveillance system twice. Therefore, locally there has
been relatively little media coverage of the measured system. In the state press during the period of the
study, the West Australian newspaper (Harvey, 2002) did one story on CCTV cameras, covering new
laws for nightclubs and their requirement to have camera surveillance. However, the story focused on
gay clubs and their attempt to get exceptions from the law due to privacy.
Therefore it could be argued that the media, being a driving force behind risk perception relocation, did
not provide the vehicle and that the media coverage of the public street surveillance did support the
measured social risk perception. Public street surveillance has a low perceived social risk, providing a
perceived benefit for the community and when raised with the community, generating little adverse
response. Painter and Tilley (1999) supported this, when they stated that “the mass media have raised
few critical questions.” Therefore, why would the media provide stories that are of little interest to the
public or increase their readership? Nevertheless, it can be argued that in the future the media will
address the more diverse social concerns, including the limited legislation protection against public
street surveillance systems. That changing technology may become a force multiplier, through digital
120
imaging, biometrics and data matching technology, and how effective or ineffective public street
surveillance is perceived to be in the future. These issues also raise social concerns over privacy and
civil liberties.
The public street surveillance system had little media coverage, the cameras blend in with the
streetscape and provide little visual indication that they exist (Appendix D). The city council security
manager felt that they should be as inconspicuous as possible (K. Ashfield, personal communication,
December 5, 2002) and has, after the system has been operating for over eight months, just proposed to
install signs that inform people using the area that they are under video surveillance. This approach has
led to limited increased awareness by the community using the area that they are now under public
street surveillance. The local Police Service monitor and operate the public street surveillance system;
however, they have not used the system to its full and recommended potential. The system should have
been used as a tool to reduce crime through deterrent, detection and apprehension. Through the media,
the effectiveness to apprehend criminals can be highlighted, raising the awareness of the public street
surveillance system. This approach has led to the public street surveillance system being relatively
ineffective in reducing crime, although there are no quantified statistics to demonstrate this outcome.
The community perceived the public street surveillance as a social benefit, which outweighed the social
risk. It could be argued that the investigation could never have achieved a measured change in social
risk perception in the current environment, unless additional research controls were applied to test
groups in an attempt to increase social awareness. This approach could have been achieved through
highlighting weakness in public street surveillance systems, their technical capability and presenting
recent research findings into effectiveness of public street surveillance systems against personal crime;
however, the ethical and study robustness of such an approach would have to be addressed.
6.7 Study outcomes
This section reviews and presents the outcomes of the study, demonstrating a number of key findings.
These include the ability of the theoretical model to measure and represent the social risk perception of
public street surveillance, that public street surveillance was a sociable acceptable risk, that both
121
intellectual and physical risks can be concurrently measured and that females presented a unique risk
perception measure.
6.7.1 What theoretical model can be used to measure the social risk perception of public
street surveillance?
By the use of the psychometric factor and MDS representation techniques, these models demonstrated
methods to measure the social risk perception of public street surveillance. The psychometric factor
model was shown to be both reliable (αtotal=0.7) and valid in measure, replicating previous risk
perception studies (Bouyer, Bagdassarian, Chaabanne & Mullet, 2001; DeNorma, 2001; Slovic, 1997).
This study also demonstrated that although public street surveillance may be seen as an intellectual or
privacy risk, as opposed to a physical or direct risk, that the psychometric model still appeared to
achieve a successful outcome in measuring this type of risk.
6.7.2 What was the social risk perception of public street surveillance?
The social risk perception of public street surveillance was found to be a low dread risk and familiarity
to risk. This spatial position placed public street surveillance within a similar risk domain as that
measured for home swimming pools, supported by INDSCAL. Moreover, the MDS Euclidean distance
model placed public street surveillance within its own quadrant, indicating that public street
surveillance had unique characteristics. Applying the MDS dimensional characteristics, public street
surveillance appeared to have a low level of risk perception and a low perceived community exposure to
risk.
6.7.3 Is public street surveillance a sociably acceptable risk?
The study demonstrated that public street surveillance was a socially acceptable risk, which outweighed
the perceived social risk to the community and that this outcome had been supported by previous
studies (Painter & Tilley, 1999; Ditton, 1999). This spatial position placed public street surveillance
into a domain that through the characteristics of risk, the community risk perception could be defined
as a low risk to future generations, that exposure was voluntary, the risk was observable, that the
community understood the risk, that the risks are known and would be immediate. Although with
familiarity to risk, there appeared to have been little social thought given to this factor of risk.
122
Nevertheless, there was a community concern over the ability of society to control public street
surveillance and therefore, CCTV. This view had been supported by previous studies (Philips, 1999;
Painter & Tilley, 1999). The media appeared to support the community’s risk perception, being non-
adversary in the representation of public street surveillance. However these issues may cause social
relocation, although public street surveillance was located in a non-adversarial position and likely to
remain within that position for some time. Finally, it can be argued that this outcome can be applied to
all domains of CCTV, not just public street surveillance.
6.7.4 Did public street surveillance significantly affect the risk perception of certain
demographic groups?
Females demonstrated a unique and significant demographic affect with the risk perception of public
street surveillance, being a lower dread risk and increased familiarity to risk. Previous studies (Slovic
1992; Slovic 1997) had shown that females generally have a higher dread and increased unfamiliarity
to risk to activities and technologies when compared to males. In addition, research has stated that
CCTV would be unlikely to improve the perception of safety for women (Philips, 1999). This result
appeared to demonstrate that this might not be the case. Public street surveillance produced a result that
demonstrated that females felt increased perceived levels of safety with this technology, and would
support and maintain public street surveillance systems. The factor of age or distance a person lived or
worked from a public street surveillance system appeared to have no affect on their level of risk
perception.
6.8 Limitations of outcomes
There were a number of areas that limited the study’s robust demonstration of the social risk perception
of public street surveillance. These limitations included restriction in the psychometric theoretical
model, MDS analysis, the research instrument reliability and validity, the size and exposure of the
public street surveillance system and a naive research question.
The ability of lay people to provide meaningful responses to what can be very complex and multi-
dimensional risk issues have to be questioned. With public street surveillance, it can be argued that the
123
participants gave these issues very little thought, which may have been demonstrated within the study’s
neutral response to the familiarity to risk factor. As Slovic (1992, p. 119) stated “the questions typically
assess cognition – not actual behaviour.”
The psychometric model measures social risk perception in a group context and does not assess
individual risk perception. Psychometric research has been criticised for treating risk as purely
objective and not accounting for cultural or social bias, which are hidden in the quantitative analysis
and representation (Shaw & Shaw, 2001). Within this investigation, this issue was reduced through the
application of additional analysis using MDS Euclidean and INDSCAL techniques. However this
limitation was not fully eliminated, as dissimilarity data collected at the individual level would be
required, resulting in a requirement for a revised research instrument.
MDS Euclidean distance model analysed a total of five activities and technologies, producing a data
matrix with ten parameters and data values. The total number of parameters estimated, being the
number of stimulus coordinates plus the number of weights, was large relative to the number of data
values in the data matrix. Therefore, the results may not have produced a high reliability measure, since
there may not have been enough data to precisely estimate the values of the parameters. To increase
reliability would require increased data values or reduced parameters (dimensions).
MDS INDSCAL provided the measure of subject space, through spatial representation. This measure
could also present the angular separation and vector length of the configuration of points – referred to
as the Analysis of Angular Variation (ANAVA) – which can be used to measure and demonstrate
individual and group difference of subject space (Smith, 1984; Mardia, 1972). Although this method of
analysis would have been appropriate and further demonstrated outcomes, the final investigation did
not use this method of analysis. By applying this technique, this may have increased the ability to
further demonstrate significant findings.
This study tested a relatively low number of activities and technologies when compared to other
psychometric studies. In addition, only a limited number of previous studies had used MDS analysis
techniques. MDS analysis allowed greater data interpretation, resulting in underlying dimensions of
124
public street surveillance. However, with MDS the low number of activities and technologies tested
reduced the ability for the data to produce and provide defined clusters (Kruskal & Wish, 78. pp. 43-
46) and increased the subjective interpretation of the MDS dimensions. This limitation will require
future validation to quantify and confirm the MDS dimensions of community risk perception and
perceived community exposure to risk.
The study only produced acceptable reliability and validity measures. These measures were particularly
relevant with the study achieving only moderate validity (correlation) outcome between phases of the
risk characteristics. However, with the inherent difficulty in achieving statistically high results across
diverse risks, high results may not be achievable. As Slovic stated “yes, I also found that reliabilities
were low for some of the scales. As I recall, knowledge (known/unknown) had quite low reliability.
Despite this limitation, the psychometric technique still seems able to produce useful results” (Personal
communication, September 9, 2002).
The results achieved were caused by a number of factors, being the length of the survey (Angus &
Gray, 2001, p. 26) and the diverse activities and technologies tested. By measuring a total of five
activities and technologies, this increased the length of the survey. Nevertheless, there was an imposed
requirement to keep the number of questions to a commitment acceptable by the participants. This
restriction reduced the possible total number of activities and technologies, and also questions for each
risk characteristic. Therefore, measuring the five activities and technologies led to a compromise on the
number of questions used, which ultimately reduce the reliability. Diversity also reduced both the
reliability and validity of the research instrument, through the need to comprise on question selection.
Some activities and technologies produced high results, but others produced only moderate results. The
quandary was to select the best performing questions across all technologies and activities.
The public street surveillance system comprised of only two cameras within the nucleus of the
community and these blended in with streetscape. There was also limited media exposure of the system
(Section 6.6). In addition, there was no other CPTED or other crime prevention initiatives applied
during the survey period, which may have reduced the security awareness within the research area,
although this may have been a research benefit through reduced variables. It could be argued that these
125
items may have limited the installation and operational exposure of the public street surveillance
system.
A research question proposed that increased public street surveillance exposure would cause increased
awareness, leading to some level of risk perception relocation. This demonstrated a naive research
question and it can be argued that due to the current location of public street surveillance, that the study
could not have measured any social risk relocation. There are complex and diverse factors that develop
and implements levels of social risk perception, limiting the ability of the study to demonstrated risk
perception relocation.
6.9 Further research
There are a number of key areas that could be applied in future research, not only in the risk perception
of CCTV or public street surveillance, but also in the measure of social risk perception. Therefore this
section has been divided into two; further research into psychometric risk techniques and the second,
CCTV and its domain of public street surveillance.
6.9.1 Psychometric techniques
As with this study, previous psychometric studies have demonstrated only moderate levels of reliability
(P.Slovic, personal communication, September 9, 2002), although the psychometric technique does
appear to demonstrate high levels of reliability in spatial outcomes. Nevertheless, the reason why the
psychometric model presents only moderate statistical reliability measures has to be investigated.
Therefore, it may be appropriate to attempt to test and understand why only moderate reliability levels
are achieved; as from a spatial representation perspective, results appear to be high and robust.
How the risk perception of an activity and technology develops, is cognitively implemented and alters
over time, requires investigation. These are complex and interwoven issues, but could be assessed
through risk communication. This understanding may enable improved methodologies to test, measure
and assess significant aspects that produce social risk perception levels, why lay people have these
perceived levels of risk and how they may react due to these perceived ideas.
126
Further MDS analysis should be applied to test the psychometric technique, to measure the underlying
risk perception of previous activities and technologies, and see how techniques compare and contrast.
Future studies could be structured specifically to gather and analysis the collection of dissimilar data at
the individual level. As Slovic stated “INDSCAL analysis indicates that our previous studies, relying
on factor analysis of group means, may have missed important individual differences in perceptions”
(1992, pp. 139-140). This increased application could only result in psychometric further maturing as a
technique to measure risk perception.
With this study, a relatively low number of activities and technologies were tested. With MDS, this low
number of activities and technologies reduced the ability for the data to produce and provide defined
clusters (Kruskal & Wish, 78. pp. 43-46) and increased the subjective interpretation of the MDS
dimensions. This restriction also limited the ability of the data set to produce only one or two
dimensions, again reducing interpretation. Therefore, future studies could increase the number of tested
activities and technologies. MDS INDSCAL provided the measure of subject space, through spatial
representation, and presented the angular separation and vector length of the configuration of points
(ANAVA). ANAVA can be used to measure and demonstrate individual and group difference of
subject space (Smith, 1984; Mardia, 1972), which could be used to reinforce MDS analysis and further
demonstrate results.
6.9.2 Public street surveillance
This study used a public street surveillance system that comprised of a relatively small and unobtrusive
system. Applying a similar study on a larger population and with a larger public street surveillance
system may produce more pronounced affects. Nevertheless, it can be argued that from the outcomes of
this study, further studies in the near future will only produce comparable results.
Other methodologies could be used to investigate the risk characteristic of control, given the critical
nature of this characteristic for public street surveillance. These may include focus groups or though the
application of control tests, with the aim to produce results that measure how significant this risk
characteristic is and what issues have the greatest affect. It may also demonstrate how awareness alters
risk perception levels within the psychometric technique.
127
The investigation measured the social risk perception within a group context. This bias may be an error
in the psychometric risk technique (Cox & Cox, 2001), although this was reduced thought the
application of MDS Euclidean and INDSCAL techniques. However this limitation was not fully
removed, as dissimilarity data collected at the individual level would be required, resulting in a revised
research instrument. Using dissimilar data at the individual level would allow a measure of the
individual underlying risk perception of public street surveillance. In addition, providing the ability to
further quantify the MDS dimensions of community risk perception and perceived community exposure
to risk.
Research into the diverse and complex issues that could alter the social risk perception of CCTV
(Chapter 1.2.1) could be applied. These issues include the level of actually or perceived social control
of CCTV and effectiveness of legislation. The community concern over CCTV civil and privacy issues.
The professionalism of the security industry (Tate, 1997) and how the industry manages, operates and
promotes CCTV. The type and extent of CCTV media coverage and the level of understanding
individuals, groups and communities have of CCTV. Finally, the level of protection CCTV actually
provides or is perceived to provide.
6.10 Conclusion
This chapter presented the interpretation of the research data. Key interpretation included the measured
risk perception of public street surveillance, that public street surveillance was a socially acceptable
risk, that females felt safer with public street surveillance, the changing social risk perception of public
street surveillance and why only limited change was demonstrated. Public street surveillance
psychometric risk perception was presented, along with the underlying MDS dimensions. The ability to
measure intellectual risk with physical risk was also demonstrated. This chapter concluded with the
study outcomes, study limitations and areas for further research.
The investigation indicated that the social risk perception of public street surveillance was low dread
risk and familiarity to risk. MDS supported this interpretation; however, provided additional underlying
dimensions and presented public street surveillance with its own unique characteristics. Public street
128
surveillance had a low sense of community risk perception and a low perceived community exposure to
risk. Females presented a lower social risk perception than males, a unique risk perception outcome.
This result appeared to indicate that females felt safer when public street surveillance was present.
Finally, the factors of age or distance had no significant affect to the sense of risk perception.
The community risk perception of public street surveillance was defined as a low risk to future
generations, that exposure was voluntary, the risk was observable, that the community understood the
risk, that the risks were known and would be immediate. This resulted in public street surveillance
having a perceived low social risk perception, demonstrating a social benefit that outweighed the
perceived risk to the community. Nevertheless, it appeared that the community had a social concern
over the ability to ensure appropriate public street surveillance control. The risk characteristic of
controllability located public street surveillance towards a significantly higher dread, but still a
familiarity to risk. Therefore, it appeared that the community had and maintained a social concern over
the ability to ensure appropriate public street surveillance control.
The ability of the psychometric risk model to measure intellectual risk with physical risk was
demonstrated, with intellectual risk being an activity or technology that does not cause direct personal
risk. Previous psychometric risk studies had only assessed activities and technologies that could be a
physical risk. It was found that an intellectual risk could be measured with perceived physical risk.
The study found that increased exposure did not change the social risk perception of lay people towards
public street surveillance. However, increased risk perception between study phases for the risk
characteristics of controllability and involuntary exposure was demonstrated. In addition, the factor
familiarity to risk provided a neutral response, indicating that there may have been little thought given
to public street surveillance. These issues could drive and alter the social risk perception of public
street surveillance. This result appeared to be indicated within the MDS INDSCAL gender
representation. After increased exposure, public street surveillance relocated from a familiar risk to an
unfamiliar risk. This relocation may indicate that like all new technologies, public street surveillance
has not yet found its true social risk perception measure and that public street surveillance support is
not necessarily defined or robust.
129
CCTV domain of public street surveillance presented a social benefit that outweighed the perceived
social risk. Public street surveillance was presented within a socially safe risk domain, accepted and
supported by the community and media. Nevertheless, as demonstrated within the study there were risk
characteristics that indicated that there are underlying social concerns over public street surveillance.
Social concerns could reposition public street surveillance from its current safe social risk position, to a
more adverse location. As the study proposed, the community supported public street surveillance but
how robust is this support?
130
REFERENCES
Adam. (1998, August). Security Australia, 18(7). Reed Business Information. Aiken, L.R. (1997). Psychological testing and assessment, (9 ed.). Boston: Allyn & Bacon. Ainsworth, T. (1997). The law and video. Proceeding of the International Carnahan Conference of
Security Technology: Security Technology. IEEE. Angus, M., & Gray, J. (2001). Research preparation: Methods of research. Edith Cowan University,
Perth. Australian Standard. (1999). Risk management AS/NZS 4360:1999. Sydney: Standards Association of
Australia. Banisar, D., & Davies, S. (2000). Video surveillance [on-line]. Retrieved 29 April 2002 from
http//www.austlii.edu.au/cgi-bin/disp.pl/au/jounals Best, J.W. (1981). Methods and tools of research. In Research in Education, (4 ed.). (pp.152-185).
Sydney: Prentice-Hall. Blades, A. (n.d). Security and risk management: The use of offender perspective studies. Unpublished
course notes. Edith Cowan University, Perth. Bouyer, M., Bagdassarian, S., Chaabanne, S., & Mullet, E. (2001). Personality correlates of risk
perception. Risk Analysis, 21(3). Brandon, G. (2003). National evaluation of CCTV: Early findings on scheme implementation –
effective practice guide. Scarman Centre National CCTV Evaluation Team. Home Office Development and Practice Report. Research, Development and Statistics Directorate.
Brooks, D.J. (2001). Is closed circuit television socially acceptable? A proposition for a psychometric
study. In H.Armstrong (Ed). Proceeding of the 5th
Australian Security Research Symposium. (pp.43-54). Edith Cowan University, Perth.
Brooks, D.J. (2001). Closed circuit television: Legal considerations for the security industry regarding
digital processed video images. In H.Armstrong (Ed). Proceedings of the 5th
Australian Security
Research Symposium. (pp.29-42). Edith Cowan University, Perth. Brooks, D.J., & Smith, C.L. (2002). Public street surveillance: A psychometric study on the perceived
social risk. In W.Hutchinson. (Ed). 3rd Australian information warfare and security conference
2002 proceedings. (pp.28-37). Edith Cowan University, Perth.
131
Brown, B. (1995). CCTV in town centres: Three case studies. Crime Detection and Prevention Series Paper 68. Home Office.
Carrol, J.D., & Chang, J.J. (1970). Analysis of individual differences in multidimensional scaling via
an n-way generalisation of “Eckart-Young” decomposition. Psychometrika, 35, 283-319. Clark-Carter, D. (1997). Doing quantitative psychological research: From design to report.
Psychology Press Ltd. Commonwealth Government. (1996). Australian census of population and housing. Clib. Australian
Bureau of Statistics. Coon, D. (1998). Introduction to psychology: Exploration and application, (8 ed.). Brooks Cole
Publishing. Covello, V.T., Sandman, P.M., & Slovic, P. (1989). Risk communication, risk statistics, and risk
comparisons. In V.T.Covello., D.B.McCallum., & M.T.Pavova. (Eds). Effective Risk
Communication, 4, (pp.297-357). New York: Plenum. Cox, T.F., & Cox, M.A.A. (2000). Multidimensional scaling. Monographs on Statistics and Applied
Probability: 88. Chapman & Hall/CRC. Cunningham, W.C., & Taylor, T.H. (1985). Private security and police in America. The Hallcrest
Report 1. Boston: Butterworth-Heinemann. Davies, S.G. (1998). The effectiveness of CCTV has been proven: Should CCTV be introduced into all
town and city centres. The case against: CCTV should not be introduced. International Journal
of Risk, Security and Crime Prevention, 377-331. DeJoy, D.M. (1999). Attitudes & beliefs. In Warnings and Risk Communication. Taylor and Frances. DeNorma, J. (2001). Mad cows, mad corn and mad communities: Why experts and lay people perceive
risk differently. Retreived 6 September 2002 from http://home.teleport.com/-or4think/pf_v6n2/MadCow.htm
DeVaus, D.A. (1992). Surveys in social research, (3 ed.). London: Allen & Unwin, UCL London Press. Dictionary. (1992). Dictionary and thesaurus. Sydney: Angus & Robertson, Harper Collins Publishers. Ditton, J. (1999). The effect of closed circuit television cameras on record crime rates and public
concern about crime in Glasgow. The Scottish Office Central Research Unit Main Findings, No.
30. Retrieved 29 April 2002 from http://www.scotcrim.u-net.com/reserachc2.htm Douglas, M. (1990). Risk as a forensic resource. Journal of the American Academy of Arts and Science.
Risk Volume 119(4).
132
Douglas, M., & Wildavsky, A.W. (1983). Risk and culture. University of California Press, Berkley. Dunwoody, S. (1992). The Media and public perceptions of risk: How journalists frame risk stories. In
D.W.Bromley., K.Segerson. (Eds). The Social Response to Environmental Risk: Policy
Formation in an Age of Uncertainty. (pp.75-100). London: Kluwer Academic Publishers. Fielder, K., & Bless, H. 2001. Social cognition. In M.Hewstone & W.Stroebe (Eds). Introduction to
Social Psychology. (pp.115-149). Blackwell Publishers. Fink, A. (1995). How to sample in surveys. SAGE Publications. Fineberg, H.V. (1996). Understanding risk: Informing decisions in a democratic society. National
Academy of Sciences, National Research Council. Retrieved from http://www.riskworld.com/Nreports/1996/risk_rpt/html/nr6aa045.htm
Finucane, M. (2002). Public perceptions of risk. Retrieved 6 September 2002 from
http://home.teleport.com/-or4think/pf_v6n2/Risk.htm Fischhoff, B. Nadai, A, & Fischhoff, I. (2001). Investing in frankenfirms: Predicting unacceptable
risks. The Journal of Psychology and Financial Markets, 2(2), 100-111. France, M., Green, H., Kerstetter, J., Black, J., Salkever , A., & Carney, D. (2001, November 5).
Privacy in an age of terror. Business Week, 39-46. Gay, L.R. (1981). Educational research: Competences for analysis and application, (2 ed.). Columbus:
Charles E. Merrill Publishers. Harowitz, S.L. (2000, January). A world of possibilities. Security Management, 44(1). ASIS
International. Harvey, B. (2002, January 12). Gay club fears cameras. The West Australian, p.3. Hess, K.M., & Wrobleski, H.M. (1996). Introduction to private security, (4 ed.). West Publishing
Company. Home Office, UK. (1998). Digital images as evidence. Select Committee on Science and Technology,
5th Report. Retrieved 17 July 2002 from http//www.parliament.the-staionary-office.co.uk/pa/Id199798
Hopkins, K.D. (1990). Educational and psychological measurement and evaluation. Boston: Prentice
and Hall.
133
Horne, CJ. (1998). The effectiveness of CCTV has been proven: Should CCTV be introduced into all town and city centres. The case against: CCTV should not be introduced. International Journal
of Risk, Security and Crime Prevention, 317-326. IndigoVision Ltd. (2002). Admissibility of digital images as evidence. IndigioVision Limited. Kruskal, J.B., & Wish, M. (1978). Multidimensional scaling. Sage University series no. 07-11.
Quantitative Applications in the Social Sciences, 11. London: Sage Publications. Larichev, O.I., Brown, R.V., & Flanders, N.E. (1998). Numerical and verbal decision analysis as
practical tools. Part II: General Comparison. Leedy, P.D. (1989). Practical research: planning and design, (4 ed.). New York: MacMillian
Publishing Company. Lopes, L.L. (1992). Risk perception and the perceived public. The social response to environmental
risk: Policy formation in an age of uncertainty. London: Kluwer Academic Publishers. Maley, P. (2000, August). CCTV: The unseen eye. GEN Magazine. pp.18-19. Malim, T., & Birch, A. (1997). Research methods and statistics. Macmillan Press Ltd. Mardia, K.V. 1972. Statistics of directional data. London: Academics Press. Mars, G., & Frosdick, S. (1997). Operationalising the theory of cultural complexity: A practical
approach to risk perceptions and workplace behaviours. International Journal of Risk, Security
and Crime Prevention, 115-129. Mitchell, W.J. (1994). The reconfigured eye: Visual truth in the post photographic era. London: MIT
Press. Millimaci, G. (2002, April 24). Council invests in security cameras. Sound Telegraph, p.2. Multivariate Statistical Analysis. (n.d). MAT5101 Course notes, week 1. Retrieved September 2002
from http://www-soem.ecu.edu.au/units/mat5101/BN1.doc Murphy, T. (1999). The admissibility of CCTV evidence in criminal proceedings. International Review
of Law, Computers & Technology, 13(3). Norris, C., & Armstrong, G. (1999). The maximum surveillance society: the rise of CCTV. Oxford:
Berg. Norris, C., & Armstrong, G. (1999). CCTV and the social structuring of surveillance. In K.Painter &
N.Tilley (Eds.), Surveillance of Public Space: CCTV, Street Lighting and Crime Prevention. (pp. 157-178). Crime Prevention Studies, 10. New York: Criminal Justice Press.
134
Orwell, G. (1954). Nineteen eighty four, London: Penguin Books. Paton, D., Smith, L., & Johnson, D.M. (2000). Volcanic Hazards: Risk perception and preparedness.
New Zealand Journal of Psychology, 29(2). Painter, K., & Tilley, N. (1999). Seeing and being seen to prevent crime. In K.Painter & N.Tilley
(Eds.). Surveillance of Public Space: CCTV, Street Lighting and Crime Prevention. (pp.1-13). Crime Prevention Studies, 10. New York: Criminal Justice Press.
Philips, C. (1999). A review of CCTV evaluations: Crime reduction effects and attitudes towards its
use. In K.Painter & N.Tilley (Eds.). Surveillance of Public Space: CCTV, Street Lighting and
Crime Prevention. (pp.123-156) Crime Prevention Studies, 10. New York: Criminal Justice Press.
Privacy Commission. (1998). Tenth annual report on the operation of the Privacy Act. Canberra:
Australian Publishing Services. Privacy Commission. (1999). Privacy brief. [on-line]. Retrieved 27 April 2002 from
http//www.privacy.gov.au Privacy International. (2002). Privacy international. [on-line]. Retrieved 29 April 2002 from
http//www.privacyinternational.org/issues/cctv/index.html Rieger, B., & Rode, H. (1999). Digital image recording for court related purposes. 33
rd Annual
Proceeding of the International Carnahan Conference of Security Technology. IEEE. Shaw, A., & Shaw, I. (2001). Risk research in a risk society. [on-line]. Research Policy and Planning,
The E Journal of the Social Services Group, 19(1), 2001. Retrieved 4 August 2002 from http//www.else.org.uk
Short, E., & Ditton, J. (1998). Seen and now heard: Talking to the targets of open street CCTV. British
Journal of Criminology, 38(3), 404-428. Sjoberg, L., & Fromm, J. (2001). Information technology risks as seen by the public. Risk Analysis,
21(3), 427-441. Slovic, P. (1987). Perception of risk. Science, 236, 280-285. Slovic, P. (1992). Perception of risk: Reflections on the psychometric paradigm. In S. Krimsky & D.
Golding (Eds.), Social Theories of Risk, (pp.117-152). Praeger Publishers. Slovic, P. (1997). Risk perception and trust. In V. Molak (Ed.), Fundamentals of Risk Analysis and
Risk Management. (pp. 233-245). CRC Press.
135
Slovic, P., Fischhoff, B., & Lichtenstein, S. (1986). The psychometric study of risk perception. In V.T. Covello., J. Menkes & J. Mumpower. (Eds.), Risk Evaluation and Management. (pp.3-24). New York: Plenum Press.
Slovic, P., Finucane, M., Peters., & MacGregor, D.G. (2002). The affect heuristic. In T. Gillovich, D.
Griffin, & D. Kahnemn, (Eds.), Intuitive Judgements: Heuristics and Biases. Cambridge: Cambridge University Press.
Smith, B.D. (1998). Psychology: science and understanding. McGraw-Hill. Smith, C.L. (1984). Learning astronomy and the organisation of astronomy concepts in semantic
memory. Doctoral dissertation, Murdoch University, Perth, Western Australia. Tate, P. (1997). Report on the security industry training. Western Australian Department of Training.
Western Australian Government Publishing. Thompson, M. (1982). A three dimensional model. In M. Douglas, (Ed), Essays in the Sociology of
Perception. (pp.29-63). London: Routledge and Kegan Paul. Thompson, M., Ellis, R., & Wildavsky, A. (1990). Cultural theory. Boulder: Westview Press. Tilley, N. (1993). Understanding car parks, crime and CCTV: Evaluation lessons from safer cities.
Police Research Group Crime Prevention Unit series paper no. 42. London: Home Office Police Department.
Tomkins, P.L. (1998, April). Panopticon: Technology, the individual and social control on the early
21st century. The Journal of the Royal United Institute for Defence Studies. Torgerson, W.S. (1952). Multidimensional scaling: 1. Theory and method. Psychometrika, 17, 401-
419. Tucker, L.R., & Messick, S. (1963). An individual differences model for multidimensional scaling.
Psychometrika, 28, 333-367. Waters, N. (1996). Street surveillance and privacy. [on-line]. Australasian Legal Information Institute.
Retrieved 27 April 2002 from http//www.austlii/ii.edu.au Western Australian State Government. (1999). Surveillance devices act of 1998. Perth: Western
Australian State Publishing Services. Wilford, S. (2002). Feeding the fire: How awareness affects perception. [on-line]. Retrieved 4 August
2002 from http//www.ccsr.cse.dmu.as.uk Wittig, A.F. (2001). Introduction to psychology, (2 ed.). McGraw-Hill.

136
Yosie, T.F., & Herbst, T.D. (1998). Using stakeholders processes in environmental decision making:
An evaluation of lessons learned, key issues and future challenges. [on-line]. Retrieved August 2002 from http://www.rsikworld.com.Nreport
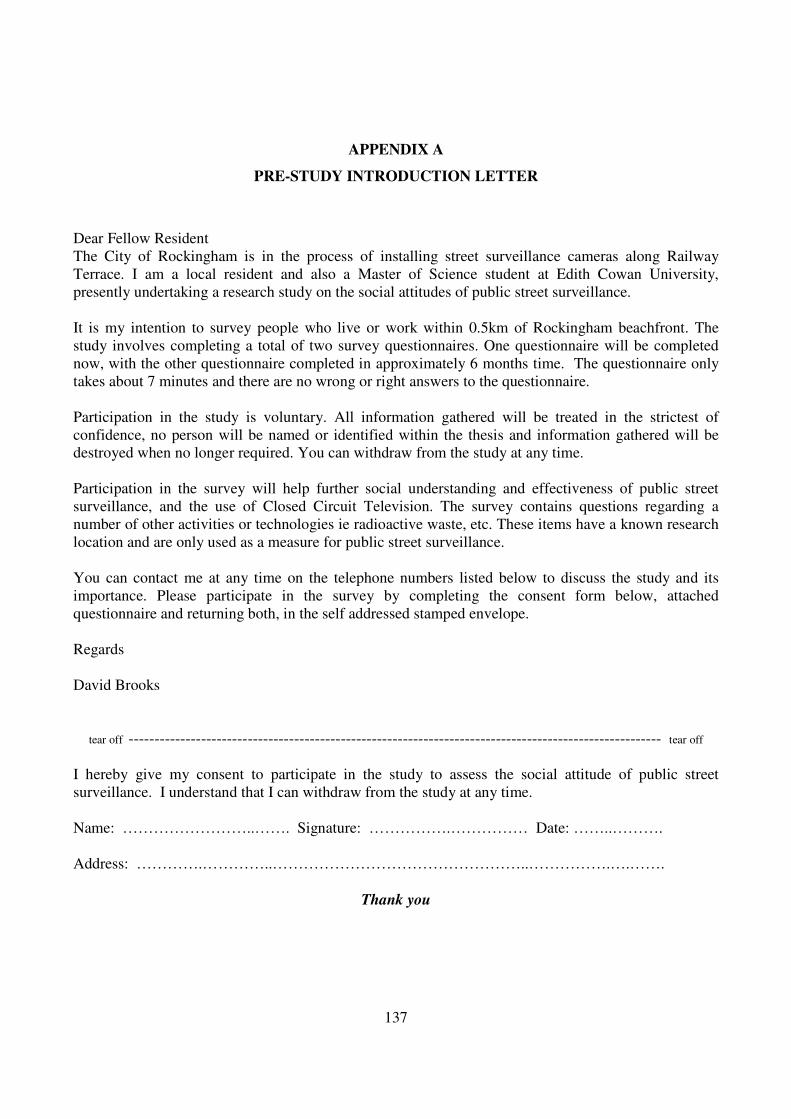
137
APPENDIX A
PRE-STUDY INTRODUCTION LETTER
Dear Fellow Resident The City of Rockingham is in the process of installing street surveillance cameras along Railway Terrace. I am a local resident and also a Master of Science student at Edith Cowan University, presently undertaking a research study on the social attitudes of public street surveillance. It is my intention to survey people who live or work within 0.5km of Rockingham beachfront. The study involves completing a total of two survey questionnaires. One questionnaire will be completed now, with the other questionnaire completed in approximately 6 months time. The questionnaire only takes about 7 minutes and there are no wrong or right answers to the questionnaire. Participation in the study is voluntary. All information gathered will be treated in the strictest of confidence, no person will be named or identified within the thesis and information gathered will be destroyed when no longer required. You can withdraw from the study at any time. Participation in the survey will help further social understanding and effectiveness of public street surveillance, and the use of Closed Circuit Television. The survey contains questions regarding a number of other activities or technologies ie radioactive waste, etc. These items have a known research location and are only used as a measure for public street surveillance. You can contact me at any time on the telephone numbers listed below to discuss the study and its importance. Please participate in the survey by completing the consent form below, attached questionnaire and returning both, in the self addressed stamped envelope. Regards David Brooks
tear off ------------------------------------------------------------------------------------------------------- tear off I hereby give my consent to participate in the study to assess the social attitude of public street surveillance. I understand that I can withdraw from the study at any time. Name: ……………………..……. Signature: …………….…………… Date: ……..………. Address: ………….…………..…………………………………………..…………….….…….
Thank you

138
APPENDIX B
SURVEY QUESTIONNAIRE
The questionnaire is divided into two parts.
Part 1 gathers some very general information about you. Part 2 is a psychometric study, or a study that attempts to assess how you currently feel about an activity or technology.
PART 1. GENERAL SURVEY
Please tick ONLY one box for each question. 1. Your sex is: Male Female 2. Your current age is:
16-25 26-35 36-45 46-55 Greater then 56 years 3. The distance from your primary place of residence to Rockingham beachfront is: 0-1km 2-4km 5-20km 21-30km Greater then 31km
PART 2. PSYCHOMETRIC SURVEY
Part 2 contains five activities or technologies. Answer how you feel about each statement in regard to that particular activity or technology. To answer each statement, requires you to place a single mark against each question.
If you Strongly Agree with that statement, mark 1. If you Strongly Disagree with that statement, mark 7.
Answer each question from your initial feeling about that statement. Do not dwell on each question and please complete ALL questions.
There are no wrong answers.

139
Radioactive Waste Strongly Agree 1 2 3 4 5 6 7 Strongly Disagree
Radioactive waste causes me fear. 1 2 3 4 5 6 7
It is my choice to be exposed to radioactive waste. 1 2 3 4 5 6 7
The risk of radioactive waste harms my future generations.
1 2 3 4 5 6 7
If I am exposed to radioactive waste, the risks are known immediately.
1 2 3 4 5 6 7
I know and understand the risk associated with radioactive waste.
1 2 3 4 5 6 7
Radioactive waste requires strong government regulation. 1 2 3 4 5 6 7
Strongly Agree 1 2 3 4 5 6 7 Strongly Disagree
I am well accustomed with the risk associated with radioactive waste.
1 2 3 4 5 6 7
The risk of radioactive waste is not understood or well known by science.
1 2 3 4 5 6 7
On a gut reaction, the risk of radioactive waste does not cause me dread.
1 2 3 4 5 6 7
I feel that the high risk with radioactive waste is not visible or transparent.
1 2 3 4 5 6 7
I know when I am exposed to the risk associated with radioactive waste.
1 2 3 4 5 6 7
If exposed to radioactive waste, it will affect me and my future generations.
1 2 3 4 5 6 7
Drinking Water Chlorination Strongly Agree 1 2 3 4 5 6 7 Strongly Disagree
Drinking water chlorination causes me fear. 1 2 3 4 5 6 7
It is my choice to be exposed to drinking water chlorination.
1 2 3 4 5 6 7
The risk of chlorinating drinking water harms my future generations.
1 2 3 4 5 6 7
If I am exposed to chlorination in drinking water, the risks are known immediately.
1 2 3 4 5 6 7
I know and understand the risk associated with chlorinating drinking water.
1 2 3 4 5 6 7
Chlorinating drinking water requires strong government regulation.
1 2 3 4 5 6 7
Strongly Agree 1 2 3 4 5 6 7 Strongly Disagree
I am well accustomed with the risk associated with drinking water chlorination.
1 2 3 4 5 6 7
The risk of chlorinating drinking water is not understood or well known by science.
1 2 3 4 5 6 7
On a gut reaction, the risk of drinking water chlorination does not cause me dread.
1 2 3 4 5 6 7

140
I feel that the high risk with chlorinating drinking water is not visible or transparent.
1 2 3 4 5 6 7
I know when I am exposed to the risk associated with drinking water chlorination.
1 2 3 4 5 6 7
If exposed to chlorinated drinking water, it will affect me and my future generations.
1 2 3 4 5 6 7
Home Swimming Pools Strongly Agree 1 2 3 4 5 6 7 Strongly Disagree
Home swimming pools cause me fear. 1 2 3 4 5 6 7
It is my choice to be exposed to home swimming pools. 1 2 3 4 5 6 7
The risk of home swimming pools, harms my future generations.
1 2 3 4 5 6 7
If I am exposed to home swimming pools, the risks are known immediately.
1 2 3 4 5 6 7
I know and understand the risk associated with home swimming pools.
1 2 3 4 5 6 7
Home swimming pools require strong government regulation.
1 2 3 4 5 6 7
Strongly Agree 1 2 3 4 5 6 7 Strongly Disagree
I am well accustomed with the risk associated with home swimming pools.
1 2 3 4 5 6 7
The risk of home swimming pools is not understood or well known by science.
1 2 3 4 5 6 7
On a gut reaction, the risk of home swimming pools do not cause me dread.
1 2 3 4 5 6 7
I feel that the high risk with home swimming pools are not visible or transparent.
1 2 3 4 5 6 7
I know when I am exposed to the risk associated with home swimming pools.
1 2 3 4 5 6 7
If exposed to home swimming pools, it will affect me and my future generations.
1 2 3 4 5 6 7
Coal Mining Disease Strongly Agree 1 2 3 4 5 6 7 Strongly Disagree
Coal mining disease causes me fear. 1 2 3 4 5 6 7
It is my choice to be exposed to coal mining disease. 1 2 3 4 5 6 7
The risk of coal mining disease harms my future generations.
1 2 3 4 5 6 7
If I am exposed to coal mining disease, the risks are known immediately.
1 2 3 4 5 6 7
I know and understand the risk associated with coal mining disease.
1 2 3 4 5 6 7
Coal mining disease requires strong government regulation.
1 2 3 4 5 6 7
Strongly Agree 1 2 3 4 5 6 7 Strongly Disagree

141
I am well accustomed with the risk associated with coal mining disease.
1 2 3 4 5 6 7
The risk of coal mining disease is not understood or well known by science.
1 2 3 4 5 6 7
On a gut reaction, the risk of coal mining disease does not cause me dread.
1 2 3 4 5 6 7
I feel that the high risk with coal mining disease is not visible or transparent.
1 2 3 4 5 6 7
I know when I am exposed to the risk associated with coal mining disease.
1 2 3 4 5 6 7
If exposed to coal mining disease, it will affect me and my future generations.
1 2 3 4 5 6 7
Public Street CCTV
Strongly Agree 1 2 3 4 5 6 7 Strongly Disagree
Public street surveillance causes me fear. 1 2 3 4 5 6 7
It is my choice to be exposed to public street surveillance.
1 2 3 4 5 6 7
The risk of public street surveillance, harms my future generations.
1 2 3 4 5 6 7
If I am exposed to public street surveillance, the risks are known immediately.
1 2 3 4 5 6 7
I know and understand the risk associated with public street surveillance.
1 2 3 4 5 6 7
Public street surveillance requires strong government regulation.
1 2 3 4 5 6 7
Strongly Agree 1 2 3 4 5 6 7 Strongly Disagree
I am well accustomed with the risk associated with public street surveillance.
1 2 3 4 5 6 7
The risk of public street surveillance is not understood or well known by science.
1 2 3 4 5 6 7
On a gut reaction, the risk of public street surveillance does not cause me dread.
1 2 3 4 5 6 7
I feel that the high risk with public street surveillance is not visible or transparent.
1 2 3 4 5 6 7
I know when I am exposed to the risk associated with public street surveillance.
1 2 3 4 5 6 7
If exposed to public street surveillance, it will affect me and my future generations.
1 2 3 4 5 6 7
Thank you for your time
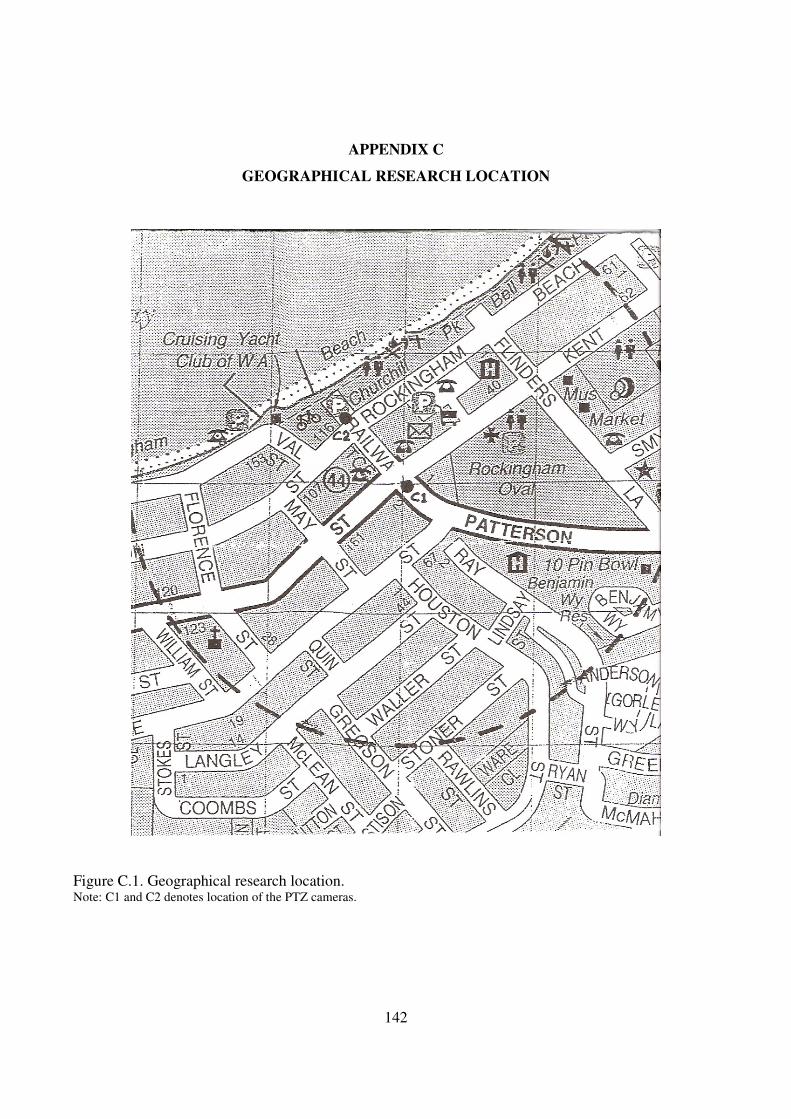
142
APPENDIX C
GEOGRAPHICAL RESEARCH LOCATION
Figure C.1. Geographical research location. Note: C1 and C2 denotes location of the PTZ cameras.
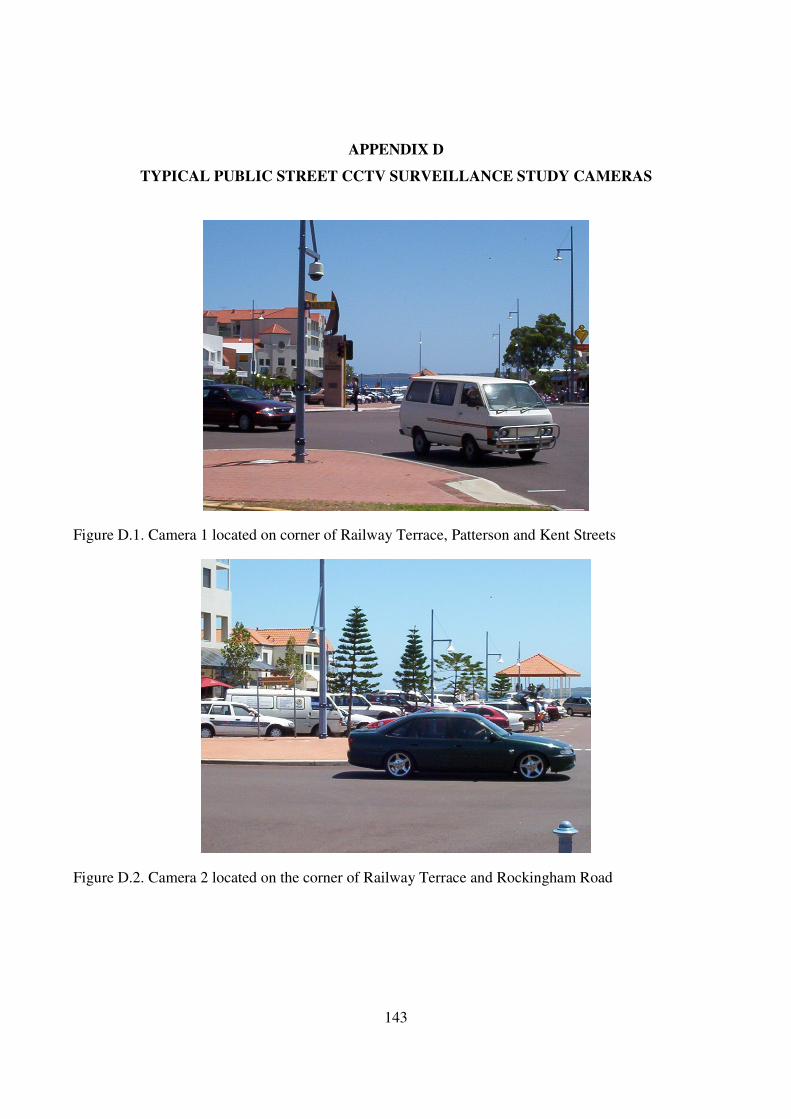
143
APPENDIX D
TYPICAL PUBLIC STREET CCTV SURVEILLANCE STUDY CAMERAS
Figure D.1. Camera 1 located on corner of Railway Terrace, Patterson and Kent Streets
Figure D.2. Camera 2 located on the corner of Railway Terrace and Rockingham Road

144
APPENDIX E
POST-STUDY INTRODUCTION LETTER
Dear Rockingham City Shire has now installed the public street surveillance system and it has been operating since just after you completed the original survey, six months ago. Can I take another short period of your time to complete this final survey? As a reminder, I am a local resident and also a Master of Science student at Edith Cowan University, presently undertaking a research study on the social attitudes of public street surveillance or Closed Circuit Television. Some interesting results were gathered from the original study and this final survey will confirm these findings. If you are interested in receiving a paper on the original results, please complete the attached slip below and return this with your completed survey. I will post this paper to you in September. Again, as a reminder, participation in the study is totally voluntary. All information gathered will be treated in the strictest of confidence, no person will be named or identified within the thesis and information gathered will be destroyed when no longer required. You can withdraw from the study at any time. Please feel free to contact me at any time on the telephone numbers listed below to discuss the study and its importance. Again, I thank you for your participation, it is most appreciated. Regards David Brooks tear off--------------------------------------------------------------------------------------------------- tear off Please send me a copy of your research findings detailing the original survey results based on our local public street surveillance system. Name: ……….………………………… Address: ………………………………………………………………………….……
Thank you