public enterprise reform in nigeria: evidence from the telecommunications industry
TRANSCRIPT

Public enterprise reform inNigeria: Evidence from the
telecommunications industry
By
Afeikhena JeromeDepartment of Economics
University of IbadanIbadan, Nigeria
AERC Research Paper 129African Economic Research Consortium, Nairobi
March 2002

© 2003, African Economic Research Consortium.
Published by: The African Economic Research ConsortiumP.O. Box 62882Nairobi, Kenya
Printed by: Modern Lithographic (K) LtdP.O. Box 52810Nairobi, Kenya
ISBN 9966-944-10-9
Contents
List of tablesList of figuresAcknowledgementsAbstract
1. Introduction 1
2. The structure of the Nigerian telecommunications industry 5
3. Review of related studies 9
4. Methodology 14
5. The reforms undertaken in NITEL 17
6. NITEL’s performance since deregulation 21
7. The empirical evidence 27
8. Conclusions 31
Notes 34References 37Appendixes 39

List of tables
1. Number of licenses issued top private operators 6
2. Profitability indicators for NITEL (1985–1995) 22
3. Growth in installed lines capacity and connected lines 24
4. Comparison of the major service quality indicators (1991–1995) 26
5. Total factor productivity growth in NITEL (1987–1995) 27
6. Decomposition of the fall in unit cost and simulation results 30
List of figures
1. The organization of the telecommunications sector in Nigeria 7
2. Post-commercialization organizational structure of NITEL 20
3. Profitability indicators for NITEL (1985–1995) 23
4. Installed capacity and connected lines for NITEL (1985–1993) 25
5. Total factor productivity for NITEL (1987–1995) 29

Acknowledgements
The helpful comments of resource persons in Group B, especially Shanta Devarajan,Mohsin Khan, Ibi Ajayi, Benno Ndulu and Steve O’Connell, are gratefully acknowledged.Akin Iwayemi and Patrick Edobor were kind enough to read an earlier draft. I would alsolike to thank Mr. A. Mashi, the Deputy General Manager (Corporate Affairs) of NITEL,and Mr. Dave Imoko, Head, Public Affairs, Nigerian Communications Commission, formaterials and sustained interest in the study. The comments of two anonymous refereesare also gratefully acknowledged. The study would not have been undertaken withoutthe financial support of the African Economic Research Consortium. The errors, however,are my responsibility.

Abstract
This study examines the qualitative and quantitative evidence relating to allocative andproductive efficiency in the publicly owned Nigerian Telecommunications Limited(NITEL) in the wake of its commercialization and the deregulation in 1992. Estimates ofchanges in internal efficiency using total factor productivity analysis suggest a substantialimprovement in efficiency as a result of the regime shift. Furthermore, the reformundertaken resulted in increased profitability, network expansion and modernization oftelecommunications services. However, the momentum generated by reform has provedimpossible to sustain. The industry is still characterized by under-investment and largeunmet demand. The study recommends greater private sector participation in the deliveryof telecommunications services in Nigeria, the introduction of competition in the sector,and the strengthening of ongoing reform efforts to embrace full privatization of NITELwith a view to overcoming protracted constraints on telecommunications performanceand growth.

PUBLIC ENTERPRISE REFORM IN NIGERIA: EVIDENCE FROM THE TELECOMMUNICATIONS INDUSTRY 1
1. Introduction
In recent years, several developing countries have embarked on the reform of publicenterprises, including privatization, within the framework of macroeconomic reform
and liberalization. More than 100 countries across every continent, most of themdeveloping, have privatized some of their state-owned enterprises (SOEs). Equally strikingis the volume of transactions. Between 1988 and 1993, over 26,000 privatizationtransactions with sales values exceeding US$50,000 each were recorded world-wide,generating a gross receipt of US$271 billion. Of these transactions, about 900 wereconducted in 1993 alone, against only about 60 in 1988. Developing and transitioneconomies accounted for much of this tremendous growth (Sader, 1995). Between 1988and 1994, developing countries around the world sold about 3,300 SOEs, with salesrevenue rising from only US$2.6 billion at the beginning of the period to a peak ofUS$29 billion in 1992 (Megyery and Sader, 1997).
The resort to privatization/commercialization was informed by several considerations.First, by 1985, the quantum of resources required to sustain the SOEs had become anunbearable burden on the affected nations. Second, it was envisaged that a carefullyplanned privatization programme would be an effective strategy for improving operationalefficiency, broadening share ownership, attracting foreign investment and reducing therole of the state where the private sector has the capabilities to operate more efficiently.Finally, since the beginning of the 1980s, privatization of public enterprises has becomea major policy tool in both developed and developing countries following the apparentlysuccessful privatization programme in Britain. Privatization gained considerablemomentum in developing countries given its endorsement by the multilateral financialinstitutions as a major plank of adjustment policies. The urge for privatization was furtherreinforced by the need to reduce government expenditure in the face of burgeoning fiscaldeficits, and was also in conformity with the resurgence of “economic liberalism” in thedevelopment literature.
Yet despite widespread privatization efforts, empirical evidence indicates that itsanticipated benefits are yet to be felt in African countries. Most studies have documentedthe relatively poor performance of SOE reform efforts in Africa compared with otherareas of the world in both relative and absolute terms (World Bank, 1996; Kikeri et al.,1992; Adam et al., 1995). However, only limited efforts have been made to identify thecauses and determinants of the uniquely unsatisfactory performance of SOE reform inAfrica relative to other environments.
As in most developing countries, the Nigerian economy until recently witnessed agrowing involvement of the state in economic activities. The expansion of state-owned
2 RESEARCH PAPER 129
enterprises (SOEs) into diverse economic activities was viewed as an important strategyfor fostering rapid economic growth and development. Massive foreign exchange earningsfrom crude oil, which exacerbated unbridled federal government investment in publicenterprises, reinforced this view. Thus, by 1990, there were over 1,500 public sectorenterprises in Nigeria, 600 of which were owned by the federal government, and the restby state and local governments (Jerome, 1995). The public enterprise sector excludingpetroleum accounted for about 15% of Nigeria’s gross domestic product in 1990.Unfortunately, most of the enterprises were poorly conceived and economically inefficient.They accumulated huge financial losses and absorbed a disproportionate share of domesticcredit.1 By 1985, they had become an intolerable burden on the budget, as they werebeing sustained through budgetary allocations from the treasury.
In the wake of the economic recession that began in 198l, following the collapse ofoil prices, the activities of public enterprises attracted more attention and underwentcloser scrutiny, much of it centring on their poor performance and the burden they imposedon government finance. The poor financial returns from these enterprises against thebackground of severe macroeconomic imbalance and public sector crisis precipitatedthe concern of government towards privatization.2
With the adoption of the structural adjustment programme (SAP) in 1986, SOEs cameinto the forefront as a major component of Nigeria’s economic reform process.Consequently, the Technical Committee on Privatization and Commercialization wasestablished in 1988 to implement the SOE reform component of SAP. In what appears tobe a uniquely comprehensive initiative, 101 enterprises in virtually all sectors were slatedfor total or partial privatization and another 35 for commercialization. Subsequently,public utilities such as Nigerian Telecommunications Limited (NITEL), the NigerianPostal Services, Nigerian Airways and the Nigerian Electric Power Authority, amongothers, were restructured and reoriented towards higher efficiency.
Nigeria is probably the only country in the world that carried out a hybrid programmeof privatization and commercialization simultaneously. The decree definedcommercialization as the reorganization of enterprises, wholly or partly owned by thegovernment, into profit making commercial ventures without subvention from thegovernment. The process entails explicit performance-based contracts with managers ofSOEs.3 In return for managers’ expanded power over pricing, procurement, productionand personnel, the enterprise is subjected to a hard budget, which entails cutting subsidiesand transfers.
The telecommunications industry in Nigeria also witnessed the deregulation oftelecommunications services in 1992 through the promulgation of NigerianCommunications Commission (NCC) Decree, No. 75 of 1992, introducing privateparticipation in the provision of telecommunications services in Nigeria, thus ending thestate-owned NITEL’s monopoly of the sector and ushering in competition.
Deregulation is expected to enhance efficiency in two ways. First is through thecurtailment of the inefficiency that arises as a result of regulation and isolation of firmsfrom actual and potential competition. Second, rents accruing to rent-seeking groupsbenefiting from regulation would be dissipated by a more competitive market environment(Winston, 1993). While much has been written about the experience of developed

PUBLIC ENTERPRISE REFORM IN NIGERIA: EVIDENCE FROM THE TELECOMMUNICATIONS INDUSTRY 3
economies with deregulation and privatization of public utilities (Oniki et al., 1992;Imai, 1994; Wellenius and Stern, 1994), there have been few studies on the experience ofdeveloping countries especially those in Africa. Yet, these economies are more vulnerableto disruptions associated with grossly inadequate provision of infrastructure services.What is the quantitative and qualitative evidence concerning allocative and productiveefficiency? To what extent have ex ante expectations and results been realized? Havereforms induced more rational and profitable investment? What lessons are to be learned?These are the issues that form the crux of this study.
In the main, this study examines the impetus for reform, what happened in the wakeof commercialization and deregulation, and the changes in the regulatory framework.The study also looks at the institutional details of the economic environment. Our choiceof the telecommunications sector arises because the industry presents some of the mostdifficult issues currently confronting microeconomic policy makers. Furthermore, it isthe most rapidly growing and technologically dynamic sector and the pressure to movethe sector out of its traditional public utility, monopoly status is being exerted all overthe world and is ultimately irresistible.
The study comprises eight sections. The structure of the Nigerian telecommunicationsindustry is examined in Section 2, while a review of related literature is undertaken inSection 3. Section 4 details the methodology and Section 5 chronicles the reformsundertaken in NITEL. Section 6 appraises the impact of deregulation on NITEL; theempirical results are presented in Section 7 and Section 8 concludes.
Justification for the study
Telecommunications infrastructure lies at the heart of the information economy.Countries lacking modern telecommunications infrastructure cannot compete
effectively in the global economy. Until the early 1980s, the telecommunications sectorwas viewed as the quintessential public utility. Economies of scale, combined with politicalsensitivity, created large entry barriers and externalities. Beginning from the 1980s,however, policy makers gradually began to recognize that telecommunications systemsare an essential infrastructure for economic development. As the economy broadens andbecomes critically dependent on vastly expanded flows of information,telecommunications acquires strategic importance for economic growth and development.Rapid innovations in telecommunications and information technology are lowering costs,creating new services and changing the cost structure of many industries. Driven byunrelenting technological and market forces, telecommunications has become one of theworld’s most dynamic sectors (Wellenius and Stern, 1994; Saunders et al., 1994).
In response to the need to overcome persistent shortfalls in telecommunicationsinvestments and performance, telecommunications restructuring has assumed a globaldimension and the wave of telecommunication reforms that began in the 1980s in a fewhighly developed economies quickly spread to several developing countries. By 1993,major reforms had been undertaken in at least 15 developing countries and a comparablenumber were in preparation (Wellenius and Stern, 1994). The impact of these new policy

4 RESEARCH PAPER 129
initiatives has been profound, but if the new pragmatism in telecommunications policyis to succeed, policy initiatives will need to be broadened and deepened.
Even though the International Telecommunications Union’s Harare Declarationcontained a commitment by several sub-Saharan African countries to increase privatesector participation in telecommunications, most governments have been reluctant toput this policy into practice. Six sub-Saharan4 countries have announced plans to privatizetheir national carriers, but only Guinea has actually implemented such a policy—althoughseveral others are believed to be considering this move (Mustafa et al., 1997). Thus, thetelecommunications sector in Africa is still predominantly state owned and has yet toshow the benefits from the transformation in pattern of ownership, market structure andprovision of service that is taking place world-wide. As a strategically important butrelatively neglected sector in sub-Saharan Africa, telecommunications is largelycharacterized by poor performance manifested in low profitability, large unmet demandfor services, poor technical and operational quality of service, and absence of new services.Economic studies for the International Telecommunications Union indicate that eachnew telephone line added in the region contributes approximately $4,500 to gross nationalproduct, a far higher contribution than in developed economies. The future oftelecommunications lies with private commercial provision of services under liberalregulatory environments.5 Against this background, a pertinent question today is howcan African countries begin to move this new pragmatism from the periphery to thecentre of the telecommunications reform agenda? There is a renewed clamour for aproper investigation of the underlying causes of this unacceptable scenario to enhancethe design or redesign of results-oriented telecommunications sector reform programmesin Africa.
This study intends to examine how to promote this shift on the basis of the experienceof several countries reforming their telecommunications sector. It recognizes, however,that there is no universally acceptable template for implementing telecommunicationsrestructuring. Although fairly universal policy issues and options face governmentsattempting to reform their telecommunications sectors, their relative importance, thesectoral solutions adopted and especially the strategies to implement them are highlycountry specific (Saunders et al., 1994).
Objectives of the study
The main objective of the study is to ascertain the quantitative and qualitative evidenceconcerning the efficiency and welfare improving effects of deregulation of the
telecommunications sector in Nigeria. The specific objectives of the study are:• To analyse the production structure of Nigerian telecommunications and estimate the
total factor productivity growth.• To decompose total factor productivity growth into scale economies and deregulation
effects with a view to estimating efficiency gains due to deregulation.• To assess the regulatory changes in the sector in the wake of commercialization.• To analyse the options for evolving a viable telecommunications sector in Nigeria.

PUBLIC ENTERPRISE REFORM IN NIGERIA: EVIDENCE FROM THE TELECOMMUNICATIONS INDUSTRY 5
2. The structure of the Nigeriantelecommunications industry
The provision of telecommunications services in Nigeria has until recently been thepreserve of public sector monopolies. Currently, the largest provider is NITEL, a
public limited liability company whose antecedent was Nigerian ExternalTelecommunications Limited (NET) established by Cables and Wireless of UnitedKingdom during the colonial era. The Nigerian government acquired 51% of the companyin 1962 and by 1972 had taken over the remaining 49%. The name of the company waschanged from Cables and Wireless incorporated to NET.
In December 1984, the telecommunications arm of Post and Telecommunications(P&T), a commercial department of the Ministry of Communications that had startedout as a postal branch of the British Post Office in 1851, was detached from its postalaffiliate and merged with NET to form NITEL, an autonomous public companyincorporated under the Companies Decree of 1968. NITEL officially commenced businesson 1 January 1985. At inception, the company inherited NET’s authorized share capitalof 4 million shares of N1.00 each with N2 million fully paid. The company wascommercialized and renamed NITEL Plc in 1992, although no public shareholding otherthan government is known to exist in it.
Prior to commercialization, NITEL operated as a very inefficient monopoly grapplingwith lack of clear policy direction, counterproductive bureaucratic red tape and a myriadof other problems. These problems led to suboptimal performance in all spheres of itsoperations, from inadequate infrastructure to very low quality customer service. Up to1991, access to telephone services was limited to about 20% of the population and areaof coverage. As at December 1991, there were about 450,000 direct exchange lines givingan average penetration level of about 1 line per 250 inhabitants as against InternationalTelecommunications Union recommendation of 1 line per 100 persons for developingnations. There were over 500,000 waiting applicants nationwide, while telex subscriberfigures stood at 7,985. These figures reflect poor capacity utilization since installedtelephone and telex capacities were over 500,000 and 15,000, respectively. The qualityof service was also poor and constant congestion of switching equipment led to long dialtone delays and very low call completion rates. On average, the call completion rates forlocal, long distance and incoming international calls were as low as 40, 40 and 45%,respectively, as against the expected 60 and 50% for local and international calls (Nwafor,1997).
Furthermore, an efficient billing system was lacking and in fact it was suspected thatabout 20% of subscribers did not receive bills, while only 7% of amounts generatedwere being collected. These factors culminated in consistent operating losses and lowreturns on investments as shown in its audited accounts, which recorded persistent losses.

6 RESEARCH PAPER 129
NITEL currently operates as a statutory monopoly for voice telephony and telexservices, although plans are being made to license a second carrier in 1998. Servicesother than voice telephony and telex are organized as separate subsidiaries. Other majoractors in the telecommunications industry as shown in Figure 1 are the Ministry ofCommunications, the Nigerian Communications Commission (NCC) and newly licensedprivate operators. The Ministry of Communications, which represents the government,determines policy and supervises NITEL (the incumbent operator), M-TEL and theNigerian Communications Commission (NCC), a regulatory organ. Created in 1992 toregulate the industry, NCC is responsible for the approval of standards as well as thelicensing and regulation of operators and service providers. The federal government,through the promulgation of Nigerian Communications Commission (NCC) Decree No.75 of 1992, introduced private participation in the provision of telecommunicationsservices in Nigeria. The second schedule of the decree listed telecommunications businessopen to private operators in different telecommunications service areas open tocompetition. Table 1 presents the category of services and numbers of licences issued.
The effect of these private operators is yet to be felt, but it must be noted that some ofthe licensed firms are bracing for the challenges of deregulation. Multi-
Table 1: Category of services and number of licences issued to private operators as atFebruary 1997
Service group Number of operators Percentage
Installation of terminal and other equipment 25 18.2Provision and operation of public payphones 10 7.3Provision and operation of public mobile 22 16.1communications- Cellular 5- Paging 17- Trunked radio -Provision and operation of private network links 32 23.4- Mobile satellite services -- Fixed telephony services 17- Fixed satellite services (VSAT) 15Provision and operation of communitytelecommunications 2 1.5Provision and operation of value added networks 40 29.2- Voice mail 13- E-mail 1- Internet (general services) 26Repair and maintenance of telecommunications 4 2.9equipmentCabling 2 1.5
Total 137 100.0
Source: Nigerian Communications Commission.

PUBLIC ENTERPRISE REFORM IN NIGERIA: EVIDENCE FROM THE TELECOMMUNICATIONS INDUSTRY 7
Figure 1: The organization of the telecommunications sector in Nigeria
Ministry ofCommunications
Utility ChargesCommission
NigerianCommunications
Commission
NITELM-TEL
Joint ventures New entrants
Policy making level
Regulatory level
Provision of services
Complementary andvalue added
providers
�
� �
�
�

8 RESEARCH PAPER 129
One of the newly licensed firms, signed an interconnectivity pact with NITEL on 7October 1997 thus breaking the jinx that has stalled interconnectivity for five years. TheMulti-Link Exchange has a capacity of 50,000 lines for Lagos alone, out of which theentire 10,000 lines being introduced initially are already subscribed. Some companieshave gone ahead to procure systems and put up elaborate management structures. Already,network development, financing and systems procurement deals are being concludedbetween private operators and foreign systems designers and sellers.6 The Nigerianprecedent of regulatory reform has influenced several other African countries such asTanzania and Zambia in establishing similar bodies.
The Utilities Charges Commission is currently responsible for the regulation ofNITEL’s tariff. The function is clearly an abnormality considering that telecommunicationsservices cannot be treated as utilities in the strict sense and the NCC can best performthis role. Other organizations that influence the telecommunications sector but cannot belocated in the official sectoral set-up include the Bureau for Public Enterprises and theMinistry of Finance.

PUBLIC ENTERPRISE REFORM IN NIGERIA: EVIDENCE FROM THE TELECOMMUNICATIONS INDUSTRY 9
3. Review of related studies
The phenomenal increase in the number of SOE reform programmes in both developedand developing economies has generated a lot of research interest in the last decade.
The bulk of the research efforts, however, are intuitive, mainly theoretical and countryspecific. They address why governments have opted for reforms, how reforms wereimplemented, the degree of implementation and the problems encountered (Onis, 1991;Ramandaham, 1989; Jerome, 1995). While these studies may be useful guides to policymakers on how to carry out successful state enterprise reform including privatization,they are deficient because they fail to address systematically how privatization has affectedthe performance of divested firms and they do not link outcomes to their causal factors.
Very few studies analyse the impact of public enterprise reform on profitability,productivity, exports, budgetary impacts, crowding out of the private sector, etc. Moreover,many of the studies also suffer from basic methodological deficiencies. For example,using cross-sectional data, Foreman-Peck and Manning (1988) conducted total factorproductivity analyses to compare the performance of British Telecom (BT), which wasprivatized in 1984, with the performance of five telecom firms in Europe. They concludedthat British Telecom is apparently less efficient than the companies in Norway andDenmark, but more efficient than those in Spain and Italy. Their finding is inconclusive,however, since ownership is by state in Norway, but mixed in Denmark, Spain and Italy.This methodology is incapable of linking variations in performance with the change inthe company’s ownership.
In a related study, Bishop and Kay (1988) compared the performance of a number ofprivatized firms in the United Kingdom (shipping, airline, gas, telecom, oil and automobileindustry) with another set of firms under state control (in rail, steel and postal sector)using several indicators, including revenue, employment, profit margin and total factorproductivity. Their finding is also inconclusive since both privatized and non-privatizedfirms experienced an upsurge in all the indicators used. Thus, the emphasis on privatizationas a means of enhancing efficiency is not supported by the evidence on the relativeperformance of private and public enterprises in the United Kingdom. It should be noted,however, that the study did not adjust for differences in the sectoral characteristics of thefirms analysed.
Galal et al. (1994) probably represents the most comprehensive study on the impactof privatization on efficiency and state budget. They examined the welfare consequencesof privatization in Chile, Malaysia, Mexico and the United Kingdom through a sampleof 12 firms covering telecommunications (three firms), airlines (four firms), electricity(two firms), a lottery company, and a port and transport company. The welfare implications

10 RESEARCH PAPER 129
were measured in terms of the impact of divestiture on major economic actors (thegovernment, consumers, buyers of firms and competitors). The study compared thepost-divestiture performance of the selected enterprises with what their performancewould have been without divestiture. Thus, a counterfactual scenario was created foreach enterprise, with the difference between the level of welfare under divestiture andthe counterfactual scenario attributed to divestiture. With the exception of Mexico Airlines,divestiture was found to improve world welfare in all the 12 cases. The expected streamof benefits to the society from divestiture was estimated at an annual average of 26%.This was attributed to several factors, including a dramatic increase in investment andimproved productivity in 9 of the 12 firms. In all but five cases, consumers wereconsiderably better off or unaffected. This study is deficient on two grounds, however.First, it omits countries typical of Africa, which are characterized by low per capitaincome, highly distorted markets and relatively weak institutional capabilities. Second,despite the scope and subtlety of the methodology used, the underlying assumptionswere highly tenuous, did not relate to the environmental realities and hence incompatiblewith the policy-oriented nature of the study.
The World Bank (1996) recently conducted a very innovative study on the politicaleconomy of state enterprise reform. The study investigated the economic problems thatarise when governments own and operate enterprises that could be managed by the privatesector and the political obstacles to reforms. It substantially advanced privatization beyondits current micro and macro studies to include meso level phenomena such as laws,regulations and institutions. The 12 countries constituting the sample for the study includedChile, China, the Czech Republic, Egypt, Ghana, India, Mexico, the Philippines andPoland. Others were the Republic of Korea, Senegal and Turkey. The study appraisescommon obstacles to reform and ways in which some countries have overcome them. Itreports a wide range of experience on the basis of which the performance of each countrywas assessed relative to the criteria established by the study team. At one extreme areChile, Korea and Mexico with success stories, and at the other are India, Senegal andTurkey with woeful results. The others were adjudged to have recorded mixed results.Ghana was the only marginally acceptable success story in Africa. The report therebyoffers guidance for successful SOE reform and suggests ways in which foreign assistancecan be harnessed to enhance the success of these reform efforts.
The report is flawed on several grounds, especially from an African perspective. First,the criteria for the inclusion of the countries in the sample were not explained. Second,regardless of the basis for the selection, the problems and issues identified in the samplecountries do not adequately reflect the situation in most African economies, in spite ofthe presence of Egypt, Ghana and Senegal in the sample of countries studied. Apart fromthe very limited coverage, there are several formidable obstacles confronting privatizationin Africa. These include the technically difficult nature of the privatization process, lackof transparency in the conduct of the exercise and absence of well-established capitalmarkets. The generalized analyses and findings do not hold sway as privatization inAfrica has been adopted against the background of extremely distressed economiccircumstances. It is therefore not surprising that privatization has failed to meetexpectations in several countries.

PUBLIC ENTERPRISE REFORM IN NIGERIA: EVIDENCE FROM THE TELECOMMUNICATIONS INDUSTRY 11
Several cross country and multiple industry studies have also been conducted,beginning with the pioneering study by Megginson et al. (1994). They compared thepre- and post-privatization financial and operating performance of 61 firms thatexperienced full or partial privatization through public share offerings from 32 industriesin 18 countries (6 developing and 12 industrialized) between 1961 and 1990. Severalfinancial indicators were examined, including mean and media level profitability, saleslevel, operating efficiency, capital investment, leverage (gearing) ratios and dividendpay-out figures. The study documents strong performance improvements undertakenwithout sacrificing employment security. After privatization most of the firms experiencedan upsurge in real sales, profitability, capital investment spending, operating efficiencyand labour force. While the study overcame the difficulty of obtaining comparable pre-and post-privatization data for a large, multinational, multi-industry sample of countries,it is unfortunately limited to mostly Organization for Economic Cooperation andDevelopment (OECD) and other developed countries. Moreover, the method ofprivatization was through the issuing of shares on the local stock exchange (often referredto as an “initial public offering”, or IPO). One could argue that since most of the casesreviewed came from industrialized settings, and that the IPO method is usually appliedto high-quality candidates, then the positive findings might not apply in non-industrializedcountries, or to firms divested by methods other than share issuing.
In a related study, D’Souza and Megginson (1998) compared the pre- and post-privatization performance of 78 firms from 25 countries privatized through public offeringbetween 1990 and 1994. The sample included 14 firms from banking, 21 in utilities and10 from telecommunications. The performance indicators are mean and median levels ofreturns on sales, employment, sales efficiency, capital expenditure/sales and debt/assets.The study represents a marked improvement on the earlier study on two counts. First, itincludes samples from 21 developing countries. Second, it also differentiates betweencompetitive and non-competitive sectors. The results are sufficiently robust for proponentsof privatization. Profitability increases significantly, although the increase is more inregulated or non-competitive industries, whereas operational efficiency increases less inthose cases indicating that a certain degree of market power is being exploited. Thestudy reports that employment increases in all cases and this is inconsistent with theliterature.
Boubakri and Cosset (1998) extended the analysis by looking at privatizationsconducted in developing countries. They examined transactions in 21 developingcountries—mainly middle income, but including Bangladesh, Jamaica, Nigeria, Pakistanand the Philippines. They document that privatized firms, on average, show significantincrease in profitability, operating efficiency, capital investment spending, real sales,employment levels and dividends. This study is quite encouraging for proponents ofprivatization, since it finds positive results in non-industrialized settings, arising from avariety of sales methods. However, the study also documents an important fact: the numberand degree of success of privatization are significantly associated with a country’s levelof income. The lower the income level of a country, the more difficult it will be to startprivatization, and the more likely it will be that results will be modest.
La Porta and López-de-Silanes (1997) analysed the performance of 218 enterprises

12 RESEARCH PAPER 129
in 26 sectors privatized in Mexico between 1982 and 1991 using seven broad indicators,including profitability, operating efficiency, employment, and wages and capital employed.Others were taxes, total output and prices. For each firm, they measured the change inany given indicator of performance by comparing its value in 1993 with its averagevalue of the four years preceding privatization (year t-4 to t-1). The study controlled formacroeconomic and industry factors by computing the same indicators for a sample ofprivate firms. It documents remarkable increases in profitability after privatization,underpinned by higher operating efficiency: on average, a 24-percentage-point increasein the ratio of operating income to sales, significant increases in profitability and output,and substantial decreases in unit costs and employment levels (though the blue-collarworkers who retained their jobs received large salary increases). The authors attribute57% of the performance improvement to productivity gains, 30% to laying off workersand 10% to price increases. They also document that deregulation—particularly theremoval of trade barriers and price controls—is associated with more rapid convergenceto industry performance using regression analysis.
Several sector specific studies have also been conducted on the outcome of reformingtelecommunications services, albeit in developed economies (Takano, 1992; Oniki etal., 1992; Imai, 1994; Foreman-Peck, 1991). Most of the studies on the impact of reformin the telecommunications sector have relied on total factor productivity analysis.Foreman-Peck (1991) appraised the success of the British privatization programme.Specifically the study examined whether the transformation in the telecommunicationssector altered or improved performance over that of the previous state regime. Estimatesof changes in internal efficiency were obtained by two methods: total factor productivityanalysis and econometric simulation. Both approaches suggest a substantial improvementin the productivity performance of the telecommunications industry after privatization.Takano (1992) examined the process, as well as benefits and losses stemming from thepartial privatization of Nippon Telegraph and Telephone Corporation (NTT), a governmentmonopoly producer of domestic telecommunications services in Japan. The studyevaluated the benefits to four important actors: NTT proper, stockholders, users andgovernment. The methodology adopted was to analyse in depth the changes that tookplace before and after privatization between 1985 and 1990. It estimated the overall netbenefit to be US$65.8 billion, with the largest gains accruing to the government andusers.
Oniki et al. (1992) assessed the impact of deregulation on NTT through improvedmanagement and operations by estimating a translog variable cost function for 1983–1989 fiscal years. According to the study, deregulation resulted in a cost reduction of1.31 or 2.29%, depending on the specification of the cost function adopted. In the samevein, Imai (1994) estimated the cost reduction associated with the 1985 deregulation ofinternational telephone services in Japan. The study estimated that NTT’s unit cost fellby a wide margin after deregulation (54.5%). The efficiency gain was fully passed on totelephone users in the form of user rates. The increment of consumers’ surplus wasestimated at 253.4 billion yen after deregulation.
Recent studies in the telecommunications sector seek to explore the regulatoryinstitutions of different countries using the new institutional economics (Levy and Spiller,

PUBLIC ENTERPRISE REFORM IN NIGERIA: EVIDENCE FROM THE TELECOMMUNICATIONS INDUSTRY 13
1996; Galal and Nauriyal, 1995). A common feature of these studies is lack of formalstatistical testing; rather, they rely on an analytical framework and systematically collectedand researched evidence. Levy and Spiller (1996) conducted a comparative analysis ofthe impact of core political and social institutions on regulatory structures and performancein the telecommunications industry in Jamaica, the United Kingdom, Chile, Argentinaand the Philippines. The study examines, among others, how each country resolved itsregulatory problems and explicates the relationship between regulatory outcomes andperformance.
Galal and Nauriyal (1995) explored the relationship among the outcomes of regulatoryreforms, regulatory incentives and government commitment on the basis of the recentregulatory experience of seven developing countries: Argentina, Chile, Jamaica, Malaysia,Mexico, the Philippines and Venezuela. They attempt to link the performance of thetelecom sector with the extent to which these countries successfully resolved theinformation asymmetry, pricing and contracting problems. Chile was found to be themost successful in resolving the information, incentives and commitment problemsthrough competition, benchmark pricing and embodying the regulation in a law that isdifficult to change. On the other hand, the Philippines was the least successful despiteover four years of private sector involvement in the telecom sector. Consequently, thesector continues to suffer from under-investment and low productivity. Other countrieshad mixed results.
The foregoing review suggests the paucity of empirical evidence to gauge the successof state enterprise reform programmes in African economies. The need for more empiricalstudies in this direction has become apparent in view of the desirability and even theinevitability of SOE reform as a major tool for meaningful and sustainable economicreform. It is necessary to identify the major factors that need to be considered to ensurean appropriate design and to facilitate successful implementation of SOE reform in Africa.
14 RESEARCH PAPER 129
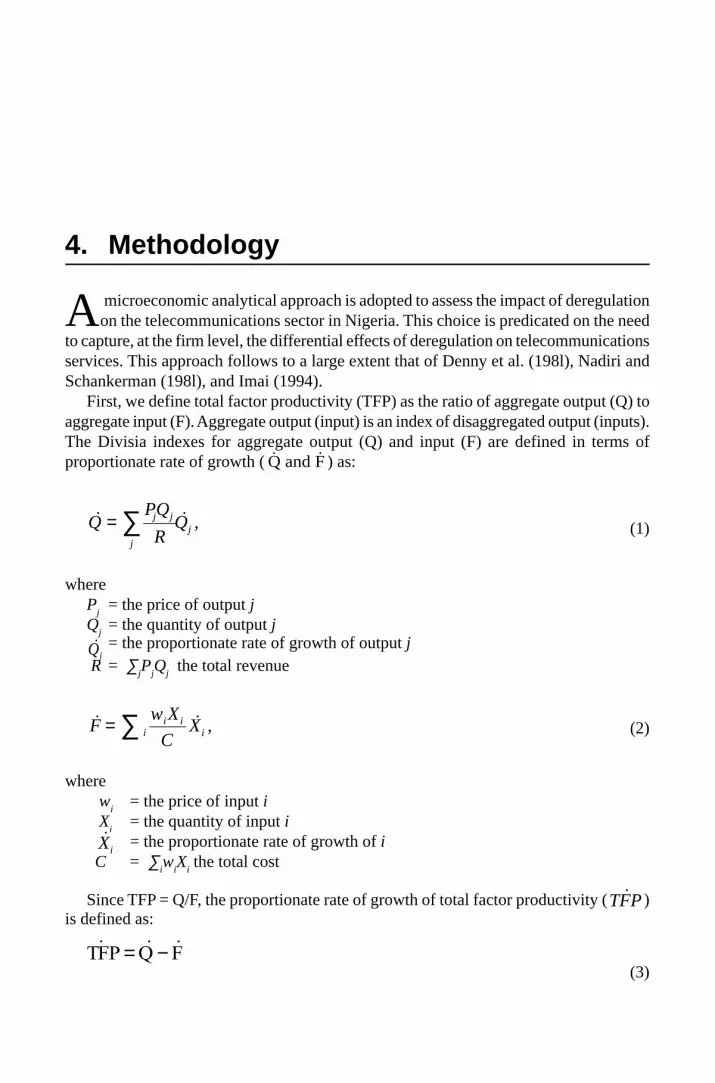
4. Methodology
A microeconomic analytical approach is adopted to assess the impact of deregulationon the telecommunications sector in Nigeria. This choice is predicated on the need
to capture, at the firm level, the differential effects of deregulation on telecommunicationsservices. This approach follows to a large extent that of Denny et al. (198l), Nadiri andSchankerman (198l), and Imai (1994).
First, we define total factor productivity (TFP) as the ratio of aggregate output (Q) toaggregate input (F). Aggregate output (input) is an index of disaggregated output (inputs).The Divisia indexes for aggregate output (Q) and input (F) are defined in terms ofproportionate rate of growth ( ˙ ˙Q and F ) as:
˙ ˙ ,QPQ
RQj j
jj= ∑ (1)
whereP
j= the price of output j
Qj
= the quantity of output j
Qj= the proportionate rate of growth of output j
R = ∑jP
jQ
j the total revenue
˙ ˙ ,Fw X
CXi
i ii= ∑ (2)
where w
i= the price of input i
Xi
= the quantity of input i Xi
= the proportionate rate of growth of i C = ∑
iw
iX
i the total cost
Since TFP = Q/F, the proportionate rate of growth of total factor productivity (TFP˙ )is defined as:
FQPFT &&& −= (3)

PUBLIC ENTERPRISE REFORM IN NIGERIA: EVIDENCE FROM THE TELECOMMUNICATIONS INDUSTRY 15
Equations 1-3 are defined in terms of instantaneous changes. For data obtained atyearly intervals, the most commonly used discrete approximation to the continuousformula (l and 2) is given by the Tornqvist approximations:
∆ log log( ) ( )log( ).QQ
Qr r
Q
Qt
tjt j t
jt
jtj
= = +−
−−
∑1
11
1
2 (4)
where
Qjt = the quantity of output produced in period t
rP Q
P Qjtjt jt
jt jtj
= ∑ the revenue share of output Qj in total revenue during period t; and
t and t-1 are adjacent observations.
∆ log log( ) ( )log( )FF
FS S
X
Xt
ti it it
it
it
= = +−
−−
∑1
11
12 (5)
whereX
it = the quantity of input X
i used in period t
Sw X
w Xiti i
i i i
= ∑ the cost share of input Xi in the total cost during period t
The corresponding discrete approximation to Equation 3 is provided by
∆ ∆ ∆TFP Q F= −log log(6)
Equation (6) is estimated to provide measures of TFP growth for NITEL.Conventional total factor productivity measures can only provide evidence of
overall increase in aggregate input. Since we intend to separate measures of productivityinto a number of effects, we then estimate the production structure of NITEL on the basisof the theory of duality between cost and production functions. The specification of thecost function follows the transcendental logarithmic form with two inputs, capital andnon-capital (materials and labour), and a single output, telecommunications service. Atime trend beginning in the year deregulation started is included to capture the effect ofderegulation on total cost. We anticipate that the coefficient of this variable must benegative, reflecting the improvement in management and operation prompted bycompetitive pressure.
InC = ao + aT + a
LInP
L + a
kInP
k + a
QInP
Q + 2 b
LL(InP
L)2 + 2bB
kk(InP
k)2
+ bLk
InPLInP
k + 2b
QQ(InQ)2 + b
LQInP
LInQ + b
kQInP
kInQ (7)

16 RESEARCH PAPER 129
whereC = total costT = time trend beginning in the year deregulation startedP
k = service price rental of capital
PL = price index of non-capital inputs
Partially differentiating the translog function (7) and using Shepherd’s lemma, weobtain the set of cost share equations:
SL = a
L + b
LLInP
L + b
LkInP
k + P
LQIn
Q (8a)
Sk = a
k + b
kkInP
k + b
kLInP
L + b
LQInQ (8b)
There are several parametric restrictions on the translog function. First, the cost functionmust be linearly homogenous in factor prices. Also, the Hessian matrix with respect toinput prices must be negative and semi-definite since the cost function is quasi-concavein input prices. Thus, a
L > 0 and a
k > 0
aL + a
L = 1 and Sb
LQ = Sb
LL = 0 (9)
Joint estimation of the cost function and share equations enhances the statisticalprecision of the estimates. We intend to estimate the system of equations comprising thecost function (7) and N-l of the cost share equations (8), using Zellner’s seeminglyunrelated regression technique (SURE).
We then decompose TFP growth into its component-output scale effect and thederegulation effect. Denny et al. (198l) developed a method of decomposing TFP usingthe estimated equations of the translog function.
Hence7:
TFP = [1 - aQ] Q - αT + Residual (10)
where TFP is total factor productivity growth, aQ is the elasticity of cost with respect
to output and αT is the elasticity of cost with respect to time, both obtained from estimatingEquation 7. NITEL’s total factor productivity growth for each year will be decomposedinto the scale effect, the deregulation effect and the residual, using Equation 10.

PUBLIC ENTERPRISE REFORM IN NIGERIA: EVIDENCE FROM THE TELECOMMUNICATIONS INDUSTRY 17
5. The reforms undertaken in NITEL
With the acceptance by both developed and developing countries of the inevitableneed to restructure the telecommunications sector as a response to the dynamics
of improved technology and the increased consumer demands that have characterizedthe last quarter of the century, various countries adopted reforms ranging from outrightprivatization to various forms of commercialization. All telecommunications reforms sofar involve some degree of change along four directions: (1) commercializing andseparating operations from government; (2) increasing the participation of privateenterprise; (3) restraining monopolies, diversifying supply of services and developingcompetition; and (4) shifting government responsibility from ownership and managementto policy and regulation (Wellenius and Stern, 1994). It is usually the practice to adopt amix of these four components.
In spite of the mounting difficulties of the public enterprise sector in Nigeria, pressuresfor its privatization were not felt until the mid 1980s with the onset of the structuraladjustment programme. In the enterprise restructuring and operational efficiency thatcharacterized the privatization drive in Nigeria, the poor performance of NITEL madethe organization a target for reform. Between 1988 and 1991, the Technical Committeeon Privatization and Commercialization (TCPC) carried out a comprehensive diagnosticappraisal of NITEL’s operations and adopted the commercialization option. For enterprisesthat were considered strategic, including NITEL, commercialization was a more viableoption. It was felt that this would increase competition, lead to greater managerialautonomy and improve the incentive structure through the eradication of some of theprincipal–agent problems. The culmination of the restructuring process was the signingof the performance contract with the federal government and TCPC on 22 May 1992.The performance contract spelled out details of the terms and conditions that govern therelationship between NITEL and its supervising ministry, the obligations of all parties,the removal of areas of conflict and controversy in their relationship, and the enthronementof autonomy. The contract was intended to be in force for an initial three-year periodwith annual performance reviews. To this end, it infused enhanced accountability andspecified the conditions that govern the financial relationship between the governmentand the management of the public enterprise. The trade-off of the newly won freedom ofmanagement without ministerial regulatory controls is the imposition of a hard budgetconstraint and the attainment of set targets. Under the new dispensation, NITEL wasdenied access to subsidies, privileges and other forms of soft capital that enabled it tocompete without improving efficiency.
The NITEL Corporate Plan 1992–2001, one of the principal documents for the

18 RESEARCH PAPER 129
commercialization exercise, outlined the qualitative and quantitative targets to be achievedby NITEL within the specified period. The performance agreement then laid out theperformance measurement criteria for NITEL, with targets for services (telephone, telex,telegraph and specialized services) and revenue clearly spelled out. Service targetsincluded network capacity, market penetration, exchange capacity, traffic volume andservice quality; revenue targets focused on collection, generation and profitability. Inview of its new stature as a commercial enterprise with a new capital structure, NITELhas an obligation to attain the minimum targets with internally generated revenue, fundsraised from local and international capital markets, and multilateral institutions with orwithout government guarantee. NITEL was expected not only to engage in competitionin a deregulated market environment but also to fix its prices and charges to enable it toearn profits. With these profits, it was expected to finance the necessary investments.
An integral component of operational autonomy from ministerial interference is thedebureaucratization of NITEL. Ministerial circulars relating to conditions of service andother operational matters no longer applied to staff of NITEL. The role of governmentand management was redefined. The government retained the right to appoint and removedirectors in accordance with the statutory right of shareholders and to appoint the chiefexecutive on the recommendation of the board of directors. The supervising ministry, onthe other hand, retained the right to nominate candidates for appointment of non-executivedirectors. The term of office of chief executives was fixed for an initial period of fouryears renewable for a second and final term of three years. In addition, the roles of theboard of directors were streamlined and properly defined. More importantly,commercialization was quickly followed by deregulation, which put an end to state-owned NITEL’s monopoly of the sector and ushered in the era of greater competition.NITEL thus had to restructure to meet not only with the obligations of commercializationbut also the dictates of deregulation and competition.
NITEL responded to the competitive environment by articulating a strategic planaimed at ensuring growth and retaining a greater market share. The company was re-registered as a public limited company (Plc) under the Companies and Allied MattersDecree of 1990 with a completely new capital structure of fully paid 55 million ordinaryshares of N100 each, giving an equity base of N5.5 billion and a new gearing ratio of 3:2.The company’s stature as a fully commercialized enterprise invariably meant greaterexpectation from government, customers and the general public. Consequently, anotherorganizational structure was considered necessary in order to meet these expectations(Nwafor, 1997). The new organizational structure, approved by the Board andimplemented in July 1992,8 addressed most of the problems of the structure designed byBritish Telecommunications Consultants (British Telecoms International) in 1985 andadopted in 1986.9 The new organization structure is presented in Figure 2. At the apex ofthe structure is the managing director/chief executive, assisted by four executive directors,responsible for planning all operations, finance and investments, administration andcorporate, and zonal administration.
The commercialization of NITEL has not proceeded very far. NITEL still operateslike the civil service, with functions organized within hierarchical and poorly coordinateddepartments and service provision organized along geographical lines corresponding toadministrative regions in the country.

PUBLIC ENTERPRISE REFORM IN NIGERIA: EVIDENCE FROM THE TELECOMMUNICATIONS INDUSTRY 19
The autonomy and provision of the contractual agreements entered into by NITEL atcommercialization have turned out to be on paper only. Government interference, policyinconsistencies as well as the rapid turnover of ministers and MDs/CEOs, and the resultantfrequent changes in policy directives are responsible for the failure to uphold, enforceand when required defend NITEL’s autonomy and the provisions of the performanceagreement.

20 RESEARCH PAPER 129
BO
AR
D
MA
NA
GIN
G D
IRE
CT
OR
/CH
IEF
EX
EC
UT
IVE
GE
NE
RA
L M
AN
AG
ER
LEG
AL/
SE
CR
ETA
RIA
T
DE
PU
TY
GE
NE
RA
L M
AN
AG
ER
CO
RP
OR
AT
E/P
UB
LIC
RE
LAT
ION
S
DE
PU
TY
GE
NE
RA
L M
AN
AG
ER
MA
NA
GE
ME
NT
INF
OR
MA
TIO
NS
ER
VIC
ES
DE
PU
TY
GE
NE
RA
L M
AN
AG
ER
(A
G)
INT
ER
NA
TIO
NA
L A
UD
IT
EX
EC
UT
IVE
DIR
EC
TO
RP
lann
ing
& O
pera
tions
Eng
r.E
XE
CU
TIV
E D
IRE
CT
OR
Fin
ance
and
Inve
stm
ent
EX
EC
UT
IVE
DIR
EC
TO
RA
dmin
. and
Cor
pora
teE
XE
CU
TIV
E D
IRE
CT
OR
Zon
al A
dmin
istr
atio
n
GE
NE
RA
LM
AN
AG
ER
Pla
nnin
g an
dde
velo
pmen
t
GE
NE
RA
LM
AN
AG
ER
Ope
ratio
ns
GE
NE
RA
LM
AN
AG
ER
Pro
ject
impl
emen
tatio
nan
d m
onito
ring
GE
NE
RA
LM
AN
AG
ER
Fin
anci
alac
coun
ting
GE
NE
RA
LM
AN
AG
ER
Inve
stm
ents
/tr
easu
ry
GE
NE
RA
LM
AN
AG
ER
Bud
get
plan
ning
sto
ckan
d co
stac
coun
ting
(cov
erin
g du
ties)
GE
NE
RA
LM
AN
AG
ER
Adm
in.
Tran
s.E
stat
e m
gt.
Util
ities
and
man
agem
ent
GE
NE
RA
LM
AN
AG
ER
Per
sonn
eltr
aini
ng a
ndm
anpo
wer
deve
lopm
ent
GE
NE
RA
LM
AN
AG
ER
Med
ical
indu
stria
lhe
alth
serv
ices
GE
NE
RA
LM
AN
AG
ER
Pur
chas
ing
and
supp
lies
GE
NE
RA
LM
AN
AG
ER
Long
dist
ance
com
mun
icat
ion
GE
NE
RA
LM
AN
AG
ER
Nor
th W
est
Zon
e
GE
NE
RA
LM
AN
AG
ER
Nor
th E
ast
Zon
e
GE
NE
RA
LM
AN
AG
ER
Sou
th W
est
Zon
e
GE
NE
RA
LM
AN
AG
ER
Sou
th E
ast
Zon
e
GE
NE
RA
LM
AN
AG
ER
Lago
s Z
one
Fig
ure
2:
Po
st-c
om
mer
cial
izat
ion
org
aniz
atio
n s
tru
ctu
re o
f N
ITE
L
Sou
rce:
Nig
eria
n Te
leco
mm
unic
atio
ns (
NIT
EL)
.
PUBLIC ENTERPRISE REFORM IN NIGERIA: EVIDENCE FROM THE TELECOMMUNICATIONS INDUSTRY 21
6. NITEL’s performance since deregulation
There are several motives for reforming public sector enterprises, prominent amongthem being the widespread dissatisfaction with the performance of SOEs. Many of
the normative rationales for establishing SOEs have become less convincing to policymakers, while patience with SOEs has worn thin in recent years especially in view oftheir unsatisfactory operational and financial performance. State enterprise reform findsits strongest argument in the claims that it will improve both allocative and productiveefficiency, and reduce the budgetary burden. It is being advocated primarily as a meansof improving the performance of the public sector (Cook and Kirkpatrick, 1988), but isalso expected to lessen the scope for political interference in the operation of reformedenterprises. In this section, we appraise the extent to which NITEL has met theseexpectations.
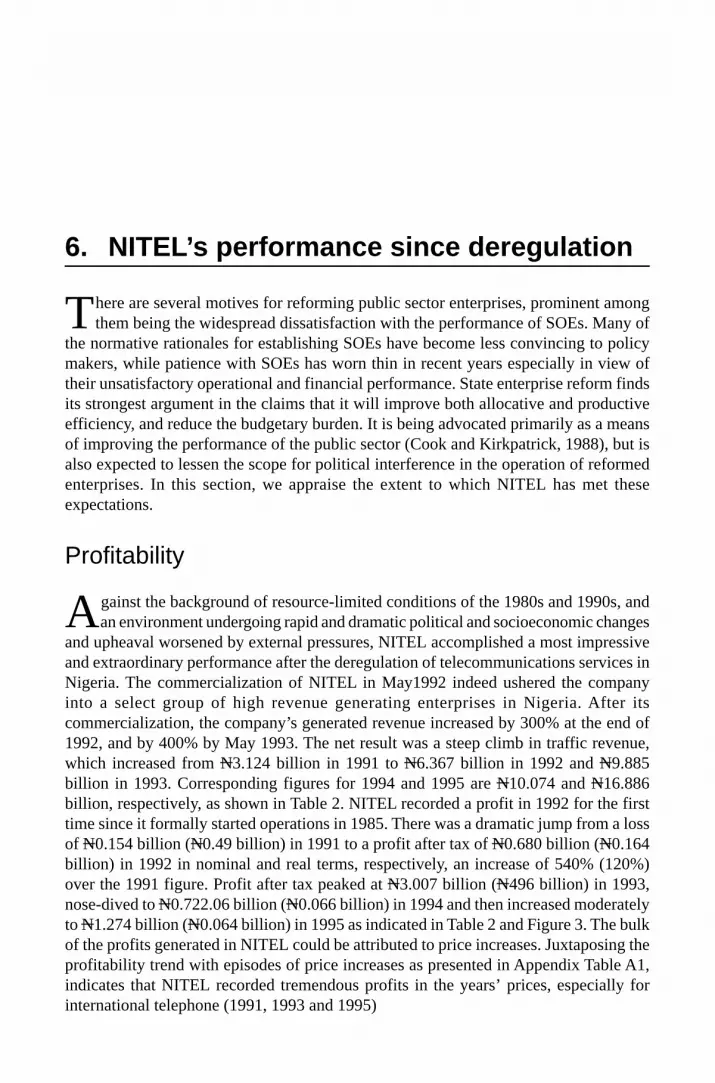
Profitability
Against the background of resource-limited conditions of the 1980s and 1990s, andan environment undergoing rapid and dramatic political and socioeconomic changes
and upheaval worsened by external pressures, NITEL accomplished a most impressiveand extraordinary performance after the deregulation of telecommunications services inNigeria. The commercialization of NITEL in May1992 indeed ushered the companyinto a select group of high revenue generating enterprises in Nigeria. After itscommercialization, the company’s generated revenue increased by 300% at the end of1992, and by 400% by May 1993. The net result was a steep climb in traffic revenue,which increased from N3.124 billion in 1991 to N6.367 billion in 1992 and N9.885billion in 1993. Corresponding figures for 1994 and 1995 are N10.074 and N16.886billion, respectively, as shown in Table 2. NITEL recorded a profit in 1992 for the firsttime since it formally started operations in 1985. There was a dramatic jump from a lossof N0.154 billion (N0.49 billion) in 1991 to a profit after tax of N0.680 billion (N0.164billion) in 1992 in nominal and real terms, respectively, an increase of 540% (120%)over the 1991 figure. Profit after tax peaked at N3.007 billion (N496 billion) in 1993,nose-dived to N0.722.06 billion (N0.066 billion) in 1994 and then increased moderatelyto N1.274 billion (N0.064 billion) in 1995 as indicated in Table 2 and Figure 3. The bulkof the profits generated in NITEL could be attributed to price increases. Juxtaposing theprofitability trend with episodes of price increases as presented in Appendix Table A1,indicates that NITEL recorded tremendous profits in the years’ prices, especially forinternational telephone (1991, 1993 and 1995)

22 RESEARCH PAPER 129
A clear distinction needs to be made between financial profitability and economicefficiency.10 An enterprise may increase its profits in a number of ways that are notbased on increase in efficiency and that may in fact mask a decline in efficiency.
The fiscal implication has also been positive as a result of reduction in the need foroperating subsidies and investment capital. In fact, NITEL has become an importantcontributor to the national treasury through annual tax flows.
Apart from the high level of revenue generated, other financial indicators also recordedtremendous growth. For example, total fixed assets increased from N5,525 billion in1992 to N9.235 billion in 1993, while earnings per share rose from 1.236k to 5.468kduring the same period. Abdulkadir (1996) attributed this favourable development toimproved connectivity and call completion rates, which gave rise to increased revenuegeneration and collection.
Table 2: Profitability indicators for NITEL (1985–1995)
Year Total % Total % Profit after % Profit after %traffic increase revenue increase tax N million increase tax N million increaserevenue N million (nominal) (real)
1985=100
1985 268.55 - 279.6 - -429.67 - -429.67 -1986 266.68 -0.70 273.6 -2.16 -1,427.13 -232.14 -1,047.05 58.961987 369.82 38.68 408.5 49.31 -942.07 33.99 -406.63 -98.351988 664.83 79.77 766.8 87.79 -586.37 37.75 -406.63 -29.821989 998.83 50.24 1,134.5 47.95 -1,615.27 -175.43 -715.67 43.181990 2,214.86 121.75 2,430.6 114.24 -1,799.85 -11.43 -720.22 0.631991 3,124.23 41.07 3,295.5 35.58 -154.38 91.42 -49.04 -1,368.661992 6,367.28 103.80 6,868.6 108.42 679.68 540.26 163.70 129.961993 9,885.13 55.25 10,130.2 47.49 3,007.25 392.95 496.00 67.001994 10,073.64 1.90 10,409.2 2.75 722.06 -75.99 66.62 -644.521995 16,885.94 67.63 17,378.4 66.95 1,274.27 76.48 64.10 -3.93
Notes: 1995 figures are from NITEL’s unaudited accounts for 1995.Source: Author’s calculation is from NITEL’s audited accounts.
Analogous to increased profitability is the increased funding of NITEL’s projectswith revenue generated from operations. In a bid to tackle the problems of ageingequipment, largely analogue facilities, and the attendant unreliable characteristics suchas delayed dialling tone, low call completion rates, billing and reconciliation problems,and inadequate network facilities, NITEL has invested over N100 billion of internallygenerated revenue on several projects mainly in the area of switching, external line plant,long distance communications and civil construction since 1992.
Pricing
Nevertheless, there has been a continuing upward review of tariffs sincecommercialization. Prior to commercialization, NITEL’s tariffs were very low and
did not reflect the cost of doing business. They had remained stagnant since 1972, changingonly in February 1988 when international calls were revised upward by 600%. In 1989,

PUBLIC ENTERPRISE REFORM IN NIGERIA: EVIDENCE FROM THE TELECOMMUNICATIONS INDUSTRY 23
however, NITEL submitted a proposal for tariff increases: 100% for installation charges,300% for rental charges and 200% for call charges. These rates were approved and becameeffective in 1990. In the same year, the domestic telephone rate (pulse unit) was increasedfrom 10k to 90k. These tariffs neither covered cost nor reflected economic realities,including the high inflationary trend and depreciation of the naira. Sincecommercialization, domestic telephone rates have been reviewed upward twice (1992and 1996) and international telephone rates four times (1992, 1993, 1995 and 1996), asshown in Appendix Table A1. This trend is not significantly different from what it obtainsin the telecommunications sectors of other developing countries where tariffs are usuallyadjusted for inflation. For example, while tariffs are reviewed less frequently in Chile(five years) and Mexico (four years), reviews in Argentina are semi-annual and inVenezuela quarterly (Galal and Nauriyal, 1995). Frequent revisions of tariffs are costlyto manage while at the same time creating disincentives by preventing the firm fromreaping interim benefits from cost savings. NITEL, however, currently operates a pricingscheme based on cost recovery.11 There is a growing recognition that this traditionalanalysis of historical accounting costs does not reflect current resource choices. Thisvariant of rate of returns regulation12 leads to a number of inefficiencies, including a biastowards capital investment and higher than optimal capital/labour ratios. Furthermore, itinduces firms to inflate costs, invest excessively and engage in cross subsidization byshifting costs from unregulated to regulated services (Galal and Nauriyal, 1995).
Figure 3: Profitability of indicators for NITEL (1985–1995)

24 RESEARCH PAPER 129
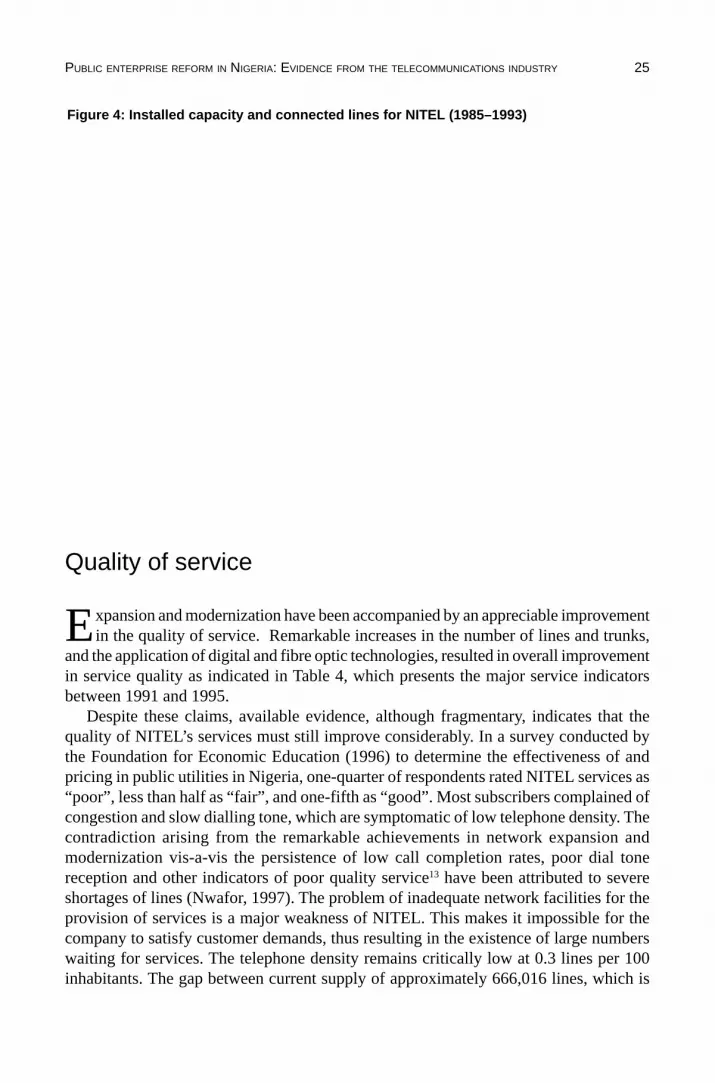
Expansion and modernization
With commercialization, NITEL set ambitious and challenging expansion andmodernization targets with a view to introducing an extensive range of state-of-
the-art technologies and diversified value-added services comparable to what is obtainablein countries with the most advanced telecommunications systems. The national networkexpansion and modernization was primarily aimed at satisfying telecommunicationsservice requirements in Nigeria, while the network digitalization was designed to achieveservice diversification as well as enhance service delivery.
In 1992, a total of 149,484 digital lines in 22,222 national and 10,000 internationaltrunks were added to the telephone network. The additional facilities increased thecountry’s telephone capacity from 450,516 lines in 1991 to 600,000 lines in 1992, anincrease of 33.3%. The performance in 1992 maintained the rising trend with 180,000new digital lines installed to increase the network capacity to 780,000 lines in 1993. Thecumulative effects of these developments were the introduction of digital facilities inAbuja (20,000 lines), Lagos (45,000 lines), Kaduna (10,000 lines), Minna (5,000 lines)and Ibadan (25,000 lines), among others. Expansion work is proceeding in variouslocations including Jos (20,000 lines), Bauchi (10,000 lines) and Maiduguri (5,000 lines).NITEL also extended its services to several rural communities with the installation ofdigital exchanges or the use of cellular phone technology.
Table 3: Growth in installed lines capacity and connected lines
Year 1985 1986 1987 1988 1989 1990 1991 1992 1993
Installed 295,370 308,350 335,698 360,518 385,788 404,400 450,516 600,000 780,000capacity
Connected 194,499 215,255 232,582 256,743 281,419 294,075 294,166 320,934 342,278
Source: Nigerian Telecommunications.
In the course of modernization, NITEL also introduced sophisticated new customer-located products to augment the basic telephone. It introduced modern mobile cellulartelephony in 1992 through a joint venture agreement signed with DigitalTelecommunications of the United States of America in June 1992 to provide cellularmobile radio services and manufacture terminal equipment and other accessories. Thenew company, known as Mobile Telecommunications Services (MTS), commencedoperations in October 1992 providing 10,000 cellular mobile telephone lines—whichwere instantly oversubscribed. NITEL has also established private networks using theINTELSAT and INMARSAT, and the computer oriented switch for international transfer(COSIT) for electronic mail. Other services provided in the modernization programmeinclude associated value added services like trunked radio, 15,000 voice mail lines andpaging system with an initial 100,000 pagers, multi-communications media services liketeleconferencing and packet switching, video and cardphones, videotext, voice phone,cable television, and data network services.
PUBLIC ENTERPRISE REFORM IN NIGERIA: EVIDENCE FROM THE TELECOMMUNICATIONS INDUSTRY 25
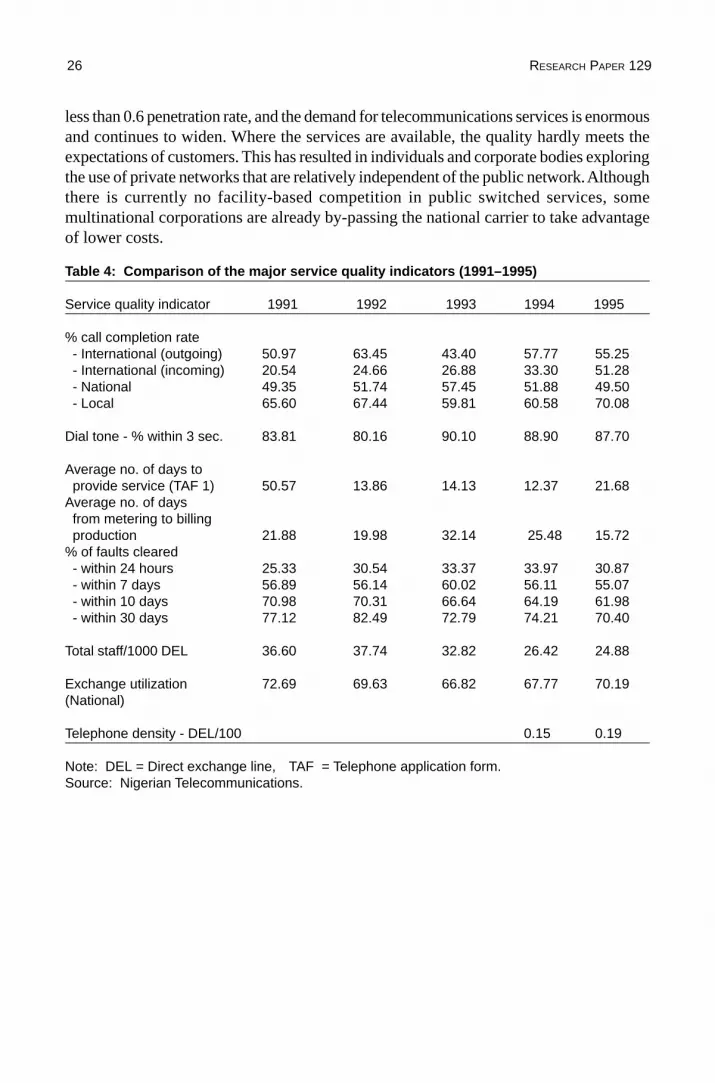
Quality of service
Expansion and modernization have been accompanied by an appreciable improvementin the quality of service. Remarkable increases in the number of lines and trunks,
and the application of digital and fibre optic technologies, resulted in overall improvementin service quality as indicated in Table 4, which presents the major service indicatorsbetween 1991 and 1995.
Despite these claims, available evidence, although fragmentary, indicates that thequality of NITEL’s services must still improve considerably. In a survey conducted bythe Foundation for Economic Education (1996) to determine the effectiveness of andpricing in public utilities in Nigeria, one-quarter of respondents rated NITEL services as“poor”, less than half as “fair”, and one-fifth as “good”. Most subscribers complained ofcongestion and slow dialling tone, which are symptomatic of low telephone density. Thecontradiction arising from the remarkable achievements in network expansion andmodernization vis-a-vis the persistence of low call completion rates, poor dial tonereception and other indicators of poor quality service13 have been attributed to severeshortages of lines (Nwafor, 1997). The problem of inadequate network facilities for theprovision of services is a major weakness of NITEL. This makes it impossible for thecompany to satisfy customer demands, thus resulting in the existence of large numberswaiting for services. The telephone density remains critically low at 0.3 lines per 100inhabitants. The gap between current supply of approximately 666,016 lines, which is
Figure 4: Installed capacity and connected lines for NITEL (1985–1993)
26 RESEARCH PAPER 129
less than 0.6 penetration rate, and the demand for telecommunications services is enormousand continues to widen. Where the services are available, the quality hardly meets theexpectations of customers. This has resulted in individuals and corporate bodies exploringthe use of private networks that are relatively independent of the public network. Althoughthere is currently no facility-based competition in public switched services, somemultinational corporations are already by-passing the national carrier to take advantageof lower costs.
Table 4: Comparison of the major service quality indicators (1991–1995)
Service quality indicator 1991 1992 1993 1994 1995
% call completion rate - International (outgoing) 50.97 63.45 43.40 57.77 55.25 - International (incoming) 20.54 24.66 26.88 33.30 51.28 - National 49.35 51.74 57.45 51.88 49.50 - Local 65.60 67.44 59.81 60.58 70.08
Dial tone - % within 3 sec. 83.81 80.16 90.10 88.90 87.70
Average no. of days to provide service (TAF 1) 50.57 13.86 14.13 12.37 21.68Average no. of days from metering to billing production 21.88 19.98 32.14 25.48 15.72% of faults cleared - within 24 hours 25.33 30.54 33.37 33.97 30.87 - within 7 days 56.89 56.14 60.02 56.11 55.07 - within 10 days 70.98 70.31 66.64 64.19 61.98 - within 30 days 77.12 82.49 72.79 74.21 70.40
Total staff/1000 DEL 36.60 37.74 32.82 26.42 24.88
Exchange utilization 72.69 69.63 66.82 67.77 70.19(National)
Telephone density - DEL/100 0.15 0.19
Note: DEL = Direct exchange line, TAF = Telephone application form.Source: Nigerian Telecommunications.

PUBLIC ENTERPRISE REFORM IN NIGERIA: EVIDENCE FROM THE TELECOMMUNICATIONS INDUSTRY 27
7. The empirical evidence
This section presents the assessment of the empirical effects of deregulation oftelecommunications services on NITEL. The estimates in internal efficiency are
obtained by productivity analysis. First, we examine changes in productive efficiency byestimating total factor productivity growth in NITEL.
Productivity measurement
The productivity measures are calculated from weighted indexes for the quantities ofeight outputs, and corresponding quantities of the various inputs used in production.
Specifically, these are a capital input index, material input index and labour input. Thedata construction method is presented in Appendix B.
Table 5 and Figure 5 present the index of output, input and total factor productivity.The aggregate output index posted an average growth rate of 3.46% over the period,with the highest figure recorded in 1991. The post-reform average of 2.8 was lower thanthe 3.99% attained in the pre-reform era, but the growth rate of aggregate input wasconsiderably lower. The aggregate rate was 0.85 on average, declining from 2.08 in the
Table 5: Total factor productivity growth in NITEL (1987–1995)
Year Aggregate output Aggregate input Total factor productivityindex (Q) index (I) index (TFP)
1987 2.69 10.77 (8.08)1988 (2.09) 6.94 (9.04)1989 (6.42) 10.39 3.971990 (4.00) (2.90) (1.10)1991 29.76 5.97 23.791992 2.75 1.41 1.341993 6.70 (1.39) 8.091994 3.77 (4.23) 7.991995 (2.02) 1.47 (3.49)Average 3.46 0.85 2.61Post-reform average 2.80 (0.68) 3.48Pre-reform average 3.99 2.08 1.91
Figures in parentheses indicate negative numbers.Source: Author’s calculations.

28 RESEARCH PAPER 129
pre-reform era to -0.68 in the post-reform period. One can infer that there is a positivecontribution to growth as a result of increased output share. The company was able toincrease the quantity of output more than the corresponding increase in the quantity ofinputs, including wages, factor rentals and intermediate inputs. The disproportionateincrease in output can also be attributed to a significant increase in fixed capital formation.
The productivity index is also presented in Table 5. As indicated in the table, there issubstantial variation in productivity growth across periods. Prior to reform, NITELrecorded negative increases in productivity growth except in 1989 and 1991, whenproductivity gains of 3.97% and 23.79%, respectively, were recorded. In the wake ofcommercialization and the deregulation of telecommunications services in 1992,productivity increases have been considerable, with an annual average of 3.48%. Theindex was positive for all the years except 1995, when a growth rate of -3.49% wasrecorded, indicating substantial gains in productive efficiency.14 The most significantimprovement in productivity was recorded in 1991, however, the year preceding reforms.This observation is consistent with the findings of Bishop and Kay (1989) that Britishmonopoly industries recorded the most significant improvements prior to reforms. Aplausible explanation for this accomplishment is the threat of competition. The reformsinitiated began to exert their toll on NITEL in 1991 as most staffers started to mend theirways in the fear that the enterprise would be privatized, thus resulting in loss of jobs. Thehigh productivity performance recorded since 1992 can be attributed to the fact thatNITEL was essentially a badly managed organization prior to commercialization. Therevenue earning capacity was heavily undermined by poor quality of service due to poormaintenance of the network as a result of lack of parts and proper maintenance systemsand procedures, both of which resulted in low revenue traffic. Other constraints to revenuegeneration were high billing inefficiencies and poor collection, high operating costs,staff inefficiencies, and high staff ratios.
In the key area of international traffic, only an estimated percentage of the traffic wasbilled due to technical and other reasons, prominent among which is fraudulent activitiesby NITEL staff. The conditions for reform in these vital areas, which were intended toput the company on a high revenue-generating track, were promoted bycommercialization. Productivity improvement can also be attributed to technologicalchange through digitalization and improved management and operations prompted bycompetitive pressure. There were substantial improvements in economic benefits flowingfrom the rapid introduction of commercial management with the ability to respond moreeffectively to the demand for services and better use of available resources. By 1995,however, the commercialization pressure had gone down considerably. The productivitydecline experienced in recent years can be attributed to slack. There is lack of innovationas long as NITEL is deemed to be performing satisfactorily. Of late NITEL has developeda crusty rigidity and complacency, indicating that the reforms undertaken have not beensustained.

PUBLIC ENTERPRISE REFORM IN NIGERIA: EVIDENCE FROM THE TELECOMMUNICATIONS INDUSTRY 29
Decomposition of productivity growth
Measured productivity growth will usually reflect a combination of causal factors.These are likely to include scale effects, technological change and short-term
disequilibria that may affect productive efficiency.Using Equation 10, we decompose TFP into the output scale effect, the deregulation
effect and the residual. Since the specified production function could not be estimatedbecause of data constraints, we experimented with the required coefficients from similarstudies and performed sensitivity analyses. Following Imai (1994), instead of decomposingTFP directly, we decompose the fall in NITEL’s unit cost.
The unit cost index is by definition the reciprocal of the total factor productivityindex. The estimated coefficients from Imai (1994), i.e., αT = -0.20 and αQ = 0.475,indicate increasing returns to scale. NITEL attained a 23.1% reduction in unit cost between1992 and 1995.
The results of the decomposition of the fall in unit costs are presented in Table 6. Ofthe 23.1% decline in unit cost as part of commercialization and deregulation, 19.6% and6% are attributable to the expansion of output and to deregulation, respectively. Weconducted some simulations with different parameter values and some of the results arepresented in Table 6. For example, assuming that αT = 0.1 since NITEL is relativelymore inefficient, the unit cost declined by 11.4%, of which 9.6% and 2.0% are attributableto output scale effect and deregulation, respectively, as shown in Table 6. On the otherhand, assuming αT = 0.7, the unit cost declines by 28.4%, of which 21.3% is attributableto scale effect and 6.9% to deregulation effect.
Figure 5: Total factor productivity for NITEL (1987–1995)

30 RESEARCH PAPER 129
Table 6: Decomposition of the fall in unit cost and simulation results
Value of αT Unit cost Output scale Deregulation Residualindex effect effect
1992–1995 0.2 (23.1) (19.7) (6) 0.41992–1995 0.1 (11) (9.6) (2.0) 01992–1995 0.7 (28.4) (21.3) (6.9) 0.2
Source: Author’s computation.
Our analysis indicates that scale effect has been the major dominant factor explainingobserved productivity growth in NITEL. Since commercialization in 1992, NITEL hasinvested heavily and made a modest difference in the quantity and quality of service.Modernization of equipment and introduction of new technology, which enabled thefirm to realize substantial economies of scale, accompanied expansion. Some of thetrunk cables are now made of fibre optic technology, which offers an almost unlimitedbandwidth. Some manual exchanges have been digitalized and replaced by semiautomaticand automatic switches. Reputable companies including Siemens provided the newtechnology.
There is weak evidence for deregulation since the net effect of deregulation onproductivity growth is found to be minimal. This finding, however, underscores the trueimpact of deregulation since part of the scale effect is due to deregulation. Correspondingoutput increase may have been an adaptive response to a new competitive environment.This conclusion is tentative, however, since we lack direct evidence on NITEL.
PUBLIC ENTERPRISE REFORM IN NIGERIA: EVIDENCE FROM THE TELECOMMUNICATIONS INDUSTRY 31
8. Conclusions
Initial attempts to reform the telecommunications sector in Nigeria have broughtencouraging results. The reforms yielded increased profitability, and greater
productivity. Network expansion and modernization was reflected in the expansion ofthe telecommunications system and availability of new services. Notwithstanding theseachievements, the sustainability of the improvements is in doubt as there are indicationsthat the reform undertaken in 1992 has lost momentum and there is real danger of policyreversal. These can be inferred from the non-renewal of the performance contract, whichwas due for revision and renewal in 1995, and the unabated ministerial interference inthe affairs of NITEL.
In spite of the results of modernization and expansion in the wake of commercialization,it is becoming increasingly clear that NITEL is incapable of meeting the needs of allusers. There is growing consensus that only competition and private participation willensure lasting improvements. The industry is still characterized by under-investmentand large unmet demand, not only for basic services but also for specialized servicesneeded by modern businesses to compete more effectively. Established and suppresseddemands currently stand at about 3 million telephone lines and 200,000 cellular lines.An estimated US$4 billion in investment funds will be required to meet these demands,while the waiting time for telephone connection is 3.5 years. This situation reveals thevast potentials in the industry and calls for greater private sector participation in thedelivery of telecommunications services in Nigeria. Given the slow pace of internalreform in NITEL, there is need to strengthen the reform efforts by moving down thecontinuum to embrace outright privatization of NITEL. With the bidding for a secondprovider of niche services almost at hand, NITEL is in no good stead at the moment tocompete in a deregulated industry. The second national carrier would drive NITEL outof business and create another virtual monopoly situation. To prepare the company forthe impending dispensation, the government may consider allowing internationaltelecommunications firms to buy into the company.15 This will create new opportunitiesas well as pressure to overcome protracted constraints on telecommunications performanceand growth.
The decision to license a second national carrier to provide local, long distance andinternational services is commendable. Competition in facilities will help to prod thedominant carrier into being more responsive to users’ needs. The presence of a facilitybased carrier as a competitive alternative may also promote rate realignment and a morerapid adjustment of the policies of the dominant carrier to the new environment. Allowingnew enterprises to supply services and networks can attract new sources of capital and

32 RESEARCH PAPER 129
management to the telecommunications sector, prompting rivalry among service providersin performance and prices. The success of deregulation can only be measured in terms offalling rates and improved service availability.
The issue of regulation and competition must be addressed with a view to attractingprivate participation and investment in telecommunications. Tardiness in undertakingregulatory change can have a negative effect on the economy through slow diffusion ofnew technologies and services, economic inefficiency, and retarded employment growthopportunities. In an environment characterized by scarcity of information, an establishedculture of ministerial interference, and political instability accompanying high turnoverof policies and policy makers, the regulatory authority must strive to take full control ofall operational issues: pricing, interconnectivity, service obligations and procedures forsettling disputes. The institutional framework must also change in tandem with reforms—notably with regard to property rights, enforcement of contracts and adjudication ofdisputes. Given these changes, policy emphasis should now be more on strengtheningthe regulatory and institutional framework.
Because of the monopolistic market structure in which NITEL operates, there is needto review the pricing formula currently in place with a view to granting the firm a fairrate of return while at the same time preventing consumer exploitation. A more appropriateapproach will be to set prices on the basis of incremental costs of expanding output inorder to maximize economic efficiency, taking into consideration the emerging potentialfor competitive supply. The literature is replete with guidelines for appropriate priceadjustments by reformed enterprises without exploiting clients. Price regulation in thetelecommunications sector has been accomplished in several ways. The most predominantare the rate of return regulation, price cap and benchmark pricing. Under rate of returnregulation, prices are set so that the firm can recover its costs and make a fair rate ofreturn on investment. Firms are in principle allowed to set their prices, subject to theoverall return constraint so that prices for different services reflect the different cost ofproviding these services. The regulators are expected to monitor the firm’s revenue,costs and capital stock to ensure that the firm remains within the imposed rate of returnceiling, an administratively sophisticated and burdensome task. The price cap system,also known as RPI-X regulation (retail price index minus an adjustable X factor), asadopted by the United Kingdom and Mexico, imposes a ceiling on the average tariffincrease for a pre-specified basket of services in which the firm has a monopoly. SinceRPI-X targets an umbrella of prices rather than the rate of return, the firm has an incentiveto pursue both efficiency and static gains. Finally, under benchmark regulation (e.g.,Chile), tariffs are set with reference to some yardstick other than actual cost. The yardstickcould be the incremental costs of an efficient firm, or the cost of a similar firm. It sharessome of the advantages of the RPI-X formula. Since the firm’s price is set against that ofan ideal firm, it can retain as profit all cost savings realized from superior performance,and it bears all the cost of inferior performance. However, it is quite demanding in thesense that the regulators are expected to be experts, and disputes can arise over thedefinition of an ideal firm. In spite of these limitations, the Chilean model is perhaps themost appropriate for Nigeria since it has a tendency to induce expansion in situationscharacterized by excess demand.

PUBLIC ENTERPRISE REFORM IN NIGERIA: EVIDENCE FROM THE TELECOMMUNICATIONS INDUSTRY 33
There is considerable scope for improving Nigeria’s telecommunications infrastructureby adopting the wireless mobile network, which is already witnessing unprecedentedgrowth in Africa as a result of competition buoyed by private ownerships and foreigninvestors, lower installation costs, and prepaid cards. The number of cellular subscribershas already surpassed conventional fixed lines in several economies, as shown in TableA2 in Appendix A. Uganda, for example, tripled its telephone network between 1995and 1999, from 0.21 telephone subscribers per 100 people to 0.67. More than 50% ofUganda’s population is now covered by mobile telecommunications and about 40 townshave been connected. Finally, the disparate rationales for reform are only justified ifreforming enterprises, albeit regulated, are insulated from arbitrary governmentintervention. The government must confine itself to limited and predetermined regulatorymechanisms free from interference. To curb such ad hoc interventions, there is need fora definite and well-understood assignment of responsibilities between the sector ministerand regulatory authorities.

34 RESEARCH PAPER 129
1. Between 1980 and 1985, Nigeria’s federal government invested N23.26 billion inpublic sector enterprises comprising N11.43 billion equity investment, N10.43billion direct loans and N1.4 billion guaranteed loans in local currency. At thesame time, subvention amounted to N11.6 billion while guaranteed loans in foreigncurrency were DM 2.1 billion, DEL 8.9 million and US$16.2 million. Against thehuge expenditure above, the federal government received a return on investmentof only N933.7 million and from subventions a repayment of only N67.96 million,with N25 million as interest. Overall, returns on investment of over N23 billionwas a paltry 3%, made up mainly of dividends from the banking and oil sectors.The government was thus not receiving a fair return on investment outlay.
2. Prior to the adoption of privatization as a major plank of adjustment in Nigeria,two previous presidential commissions were instituted to rationalize the operationsof public sector enterprises. These were the Onosode commission instituted in1981 and the Al-Hakim committee in 1984. The recommendations of thesecommissions were never implemented.
3. The influential World Bank publication, Bureaucrats in Business, reported thatperformance contracts were in use in 28 developing countries, largely in Asia andAfrica in the mid 1990s, although most of these contracts had little positive impact(World Bank, 1996: Chapter 3)
4. These countries are Congo, Côte d’Ivoire, Ghana, Guinea, South Africa andUganda.
5. The reasons evoked to justify state intervention in telecommunications no longerexist. Some of the recent developments obviating the justification for existence oflarge monopolies are technological advances that have reduced sunk costs andtherefore economies of scale and barriers to entry, the contestability of somesegments of this sector, and lessons from successful privatization in severalcountries.
6. Some of the firms bracing for the challenges of deregulation are NITTI CompanyLtd. (NCL), Wireless Telecoms Limited (WTL), Intercellular (Nig) Limited, EMIS(Nig) Ltd., United Telesys Nigeria (Ltd.), Starcoms (Nig) Ltd., and GPT Payphones
Notes

PUBLIC ENTERPRISE REFORM IN NIGERIA: EVIDENCE FROM THE TELECOMMUNICATIONS INDUSTRY 35
among others. NITTI Company is reputed to have awarded a contract to BritishTelecoms (BT) to supply 1 million telephone lines to Nigeria. Under thisarrangement, BT will build and operate the fixed line network for a period of fiveyears.
Wireless Telecoms is working in collaboration with Dumor TelecomsLimited of Dublin, Ireland, wholly owned by Motorola International, to introducethe digital handy phone cellular schedule for April. WTL recently placed an offerfor 5 million ordinary shares to raise N50 million. The 5 million ordinary sharesoffered at N70 each are being brokered by International Merchant Bank, ICONStockbrokers Limited, and Security Transaction and Trust Company Limited.Intercellular recently concluded a N540 million arrangement with Motorola tofacilitate the first phase of the supply of a digital switching system to supply about10,000 subscriber lines. It already has an equity base of N300 million and hassecured a supplier credit of US$3.5 million.
7. See Imai (1994) for the formal derivation of Equation 10.
8. The new structure was put together after consultations with several professionalbodies including the Nigeria Society of Engineers (NSE) and the Council ofRegistered Engineers (COREN). Seasoned technocrats, scientists and academicsalso served on committees for reorganization and commercialization of NITELand participated in preparing the structure.
9. Between 1985 and 1992, the organizational structure of NITEL was changed fourtimes. The implementation of the first reorganization exercise put up by BritishTelecoms following the merger in 1985 proved particularly difficult because itcalled for a drastic reduction of the large number of staff inherited by NITEL fromP&T and NET.
10. One may wish to determine the extent of inefficiency in NITEL using eitherstochastic frontiers or data envelope analysis (DEA). For methodological details,see Coelli (1995).
11. Tariffs are determined on the following basis:(a) Access charge: This is the cost charged to a customer for taking up a line. It
is a fixed charge built into the monthly bills of every customer irrespectiveof the use of the line.
(b) Capital costs: This consists of such items as cost of external line plant (ELP),switching costs, transmission costs, and cost of fixtures and fittings, all ofwhich are amortized over a period of time to obtain the charges to be madein the accounting period.
(c) Variable costs: This consists of such costs as salaries and wages, sundryexpenses, etc.

36 RESEARCH PAPER 129
These costs are computed for each accounting period. The addition of these costcomponents yields total cost. The total cost plus a mark-up margin (15–20%,depending on the prevailing interest rate) is then divided by the total number oflines in the system to obtain unit costs/pulse rate (in naira). The pulse rate is thencharged per minute of use and is also distance dependent, i.e., the farther thedistance, the higher the pulse rate. These charges or tariffs are subject to approvalby the Utilities Charges Commission.
12. Prices can be regulated using rate of returns regulation, price cap regulation orbenchmark regulation. Each of these pricing schemes has its own incentiveproperties. See Galal and Nauriyal (1995) for details.
13. It may be desirable to conduct a nationwide survey to determine several indicatorsof service quality, such as: the time it takes for a line to be connected, averageclearance time for reported faults, proportion of bills that are recovered early, howbills are transmitted, corruption among staff, and incidence of wrongly computedbills, among others.
14. Our productivity measurements must be interpreted with caution, however. Dennyet al. (1981) have pointed out the bias in TFP measures for regulated industrieswith economies of scale.
15. The Guardian editorial of Tuesday, 3 September 1997 suggested a spin-off ofNITEL’s operations into independent regional baby-tels. Telecommunications isnot perfectly contestable; moreover, such a step is uncommon in the sector. Theonly example is the United States, where the regional Bell operating companiescreated through divestiture will be permitted to compete in the provision of longdistance services with AT&T. This proposal is also not very attractive becauselarge operators are the most sought-after partners for consortia and the supply offoreign capital and expertise. Apart from the potential loss of scale economies,transaction costs will increase since each component organization would have tonegotiate interconnection agreements.

PUBLIC ENTERPRISE REFORM IN NIGERIA: EVIDENCE FROM THE TELECOMMUNICATIONS INDUSTRY 37
References
Abdulkadir, A. 1996. “Telecommunications development in Nigeria”. NITEL Journal,vol. 17: 30–32.
Adam, C., W. Cavendish and P.S. Mistry. 1992. Adjusting Privatization. Case Studiesfrom Developing Countries. London: James Curry.
Bishop, M. and J. Kay. 1988. Does Privatization Work? Lessons from the U.K. London:London Business School, Centre for Energy Policy.
Boubakri, N. and J. Cosset. 1998. “The financial and operating performance of newlyprivatized firms: Evidence from developing countries”. The Journal of Finance.vol. LIII, no. 3: 1081–1110.
Coelli, T.J. 1995. “Recent developments in frontier modelling and efficiencymeasurement”. Australian Journal of Agricultural Economics, vol. 39, no 3: 219–45.
Cook, P. and C. Kirkpatrick, eds. 1988. Privatization in Less Developed Countries. NewYork: Harvesters and Wheatsheaf.
Denny, M., M. Fuss and L. Waverman. 198l. “The measurement and interpretation oftotal factor productivity in regulated industries, with application to Canadiantelecommunications”. In C.G. Cowing and R.E. Stevenson, eds., ProductivityMeasurement in Regulated Industries. New York: Academy Press.
D’Souza, J. and W. Megginson. 1998. “The financial and operating performance ofprivatized firms during the 1990’s”. Mimeo. Department of Finance, Terry Collegeof Business, The University of Georgia, Athens, Georgia.
Federal Government of Nigeria. 1986. Structural Adjustment Programme, 1986–1988.Lagos.
Foreman-Peck, J. and D. Manning. 1988 “ How well is B.T. performing? An internationalcomparison of telecommunications total factor productivity growth”. Universityof New Castle, Department of Economics, Newcastle-upon-Tyne, England.
Foundation for Economic Education. 1996. “Effectiveness of, and pricing of public utilitiesin Nigeria”. Final Report Submitted to National Planning Commission. November.
Galal, A. 1994. “Regulation and commitment in the development of telecommunicationsin Chile”. Policy Research Working Paper, 1279. Washington, D.C.: The WorldBank
Galal, A. and B. Nauriyal. 1995. “Regulating telecommunications in developing countries:Outcomes, incentives and commitment”. Policy Research Working Paper, 1520.Washington, D.C.: The World Bank.
Imai, H. 1994. “Assessing the gains from deregulation in Japan’s internationaltelecommunications industry”. Working Paper No. 37. School of Oriental andAfrican Studies, University of London.

38 RESEARCH PAPER 129
Jerome, A. 1996. “Privatization in Nigeria: Expectations, illusion and reality”. In A.Ariyo, ed., Economic Reform and Macroeconomic Management in Nigeria. Ibadan:Ibadan University Press.
Kikeri, et al. 1992. “Privatization: Lessons of experience”. Country EconomicDepartment, The World Bank.
La Porta, R. and F. López-de-Silanes. 1997. “The benefits of privatization: Evidencefrom Mexico”. NBER Working Paper 6215.
Levy, B. and P.T. Spiller, eds. 1996. Regulations, Institutions, and Commitment.Cambridge: Cambridge University Press.
Megginston, W.L., et al. 1994. “The financial and operating performance of newlyprivatized firms: An international empirical analysis”. Journal of Finance, 49(2):403–452.
Megyery, K. and F. Sader. 1997. Facilitating Foreign Participation in Privatization,Foreign Investment Advisory Service, Occasional Paper 8. Washington, D.C.: TheWorld Bank.
Mustafa, M.A., B. Laidlaw and M. Brand. 1997. “Telecommunications policy for sub-Saharan Africa”. World Bank Discussion Paper No 353. Washington, D.C.: TheWorld Bank.
Nadiri, M.I. and M.A. Schankerman. 1981. “The structure of production, technologicalchange and the rate of growth of total factor productivity in the U.S. Bell system”.In C.G. Cowing and R.E. Stevenson, eds., Productivity Measurement in RegulatedIndustries. New York: Academy Press.
Nwafor, J.C. 1997. Telecommunications Development in Nigeria. NITEL Plc and theManagement of Accelerated Network Expansion and Modernization. A NITELPlc Publication.
Onis, Z. 1991. “The evolution of privatization in Turkey: The institutional context ofpublic enterprise reform”. International Journal on Middle East Studies, 23:163–76.
Oniki, H., T.H. Oum, R. Stevenson and Y. Zhang. 1992. “The productivity effects ofthe liberalization of Japanese telecommunication policy”. Mimeo.
Ramandaham, V. 1989. Privatization in Developing Countries. New York: Routledge.Sader, F. 1995. Privatizing Public Enterprises and Foreign Investment in Developing
Countries, 1988–93. Foreign Investment Advisory Service (FIAS) OccasionalPaper. Washington, D. C.: International Finance Corporation and the World Bank.
Saunders, R.J., et al. 1994. Telecommunications and Economic Development. Baltimore:The Johns Hopkins University Press.
Takano, Y. 1992. “Nippon Telegraph and Telephone privatization study”. Washington,D.C.: The World Bank.
Wellenius, B. and S. Stern. 1994. Implementing Reforms in the TelecommunicationsSector: Lessons of Experience. Washington, D.C.: The World Bank.
Winston, C. 1993. “Economic deregulation: Days of reckoning for microeconomists”.Journal of Economic Literature, 31 (3, September): 1263–89.
World Bank. 1996. Bureaucrats in Business: The Economics and Politics of GovernmentOwnership. New York: Oxford University Press.

PUBLIC ENTERPRISE REFORM IN NIGERIA: EVIDENCE FROM THE TELECOMMUNICATIONS INDUSTRY 39
Tab
le A
1: P
rice
(s)
of
pro
du
ct f
rom
198
4–19
97
Ser
vice
1985
1988
1990
1992
1993
1994
1995
1996
NN
NN
NN
NN
Dom
estic
tele
phon
e (p
ulse
uni
t)0.
100.
100.
90 (
1/2/
90)
1.40
(1/
8/92
)1.
401.
401.
401.
80 (
1/1/
96)
DE
L in
stal
latio
n pe
r lin
e10
0.0
500.
050
0.00
1,89
0.00
1,89
0.00
1,89
0.00
1,89
0.00
1,89
0.00
Rur
al D
EL
50.0
025
0.00
250.
001,
890.
001,
890.
001,
890.
001,
890.
001,
890.
00E
xter
nal e
xten
sion
rur
al D
EL
100.
0050
0.00
--
--
--
Inte
rnal
ext
ensi
on30
.00
97.5
025
0.00
250.
0025
0.00
250.
0025
0.00
250.
00P
rivat
e w
ire p
er K
m p
er a
nnum
200.
001,
000.
0070
0.00
700.
0070
0.00
700.
0095
0.00
950.
00T
P a
cces
s/an
num
/line
- P
rivat
e60
.00
60.0
024
0.00
600.
0060
0.00
- B
usin
ess
120.
0012
0.00
600.
001,
200.
001,
200.
00In
tern
atio
nal t
elep
hone
(pe
r m
in)
Zon
e:
Am
eric
a4.
0025
.00(
1/2/
85)
25.0
062
.00(
1/8/
92)
75.0
0(1/
4/93
)75
.00
170.
00(1
/8/9
5)22
0.00
(1/1
/96)
A
sia
& O
cean
ia3.
6025
.00
25.0
062
.00
75.0
075
.00
220.
0028
0.00
E
urop
e3.
0022
.00
22.0
060
.00
60.0
060
.00
170.
0022
0.00
A
fric
a2.
5016
.00
16.0
053
.00
62.0
062
.00
120.
0015
0.00
Te
lex
inst
alla
tion
per
line
300.
0050
0.00
500.
001,
890.
001,
890.
001,
890.
001,
890.
001,
890.
00
Tele
x re
ntal
(pe
r m
onth
)17
0.00
170.
0017
0.00
170.
0017
0.00
170.
0017
0.00
170.
00
Dom
estic
tele
x (p
er m
in)
0.05
0.05
0.90
1.40
1.40
1.40
1.40
1.90
Inte
rnat
iona
l tel
ex (
per
min
)Z
one:
A
mer
ica
4.00
20.0
020
.00
57.0
067
.00
67.0
016
0.00
220.
00
Asi
a &
Oce
ania
3.50
20.0
020
.00
57.0
067
.00
67.0
021
0.00
280.
00
Eur
ope
3.00
20.0
020
.00
52.0
060
.00
60.0
016
0.00
220.
00
Afr
ica
2.50
15.0
015
.00
49.0
057
.00
57.0
011
0.00
150.
00D
omes
tic te
legr
aph
O
rdin
ary
TG
per
wor
d0.
300.
300.
300.
250.
350.
350.
350.
50
Urg
ent t
eleg
ram
per
wor
d0.
060.
060.
060.
500.
600.
600.
601.
00
Gre
etin
g T
G p
er m
essa
ge0.
500.
600.
600.
500.
500.
500.
600.
50
Pre
ss T
G p
er 5
0wor
ds0.
300.
300.
300.
300.
300.
300.
300.
50
cont
inue
d....
.....
Ap
pen
dix
A:
Su
pp
lem
enta
ry t
able
s

40 RESEARCH PAPER 129Ta
ble
A1:
co
nti
nu
ed
Ser
vice
1985
1988
1990
1992
1993
1994
1995
1996
NN
NN
NN
NN
Inte
rnat
iona
l tel
egra
phZ
one:
A
mer
ica
0.64
1.62
5.00
10.0
013
.00
13.0
013
.00
20.0
0
Asi
a &
Oce
ania
0.40
1.26
5.00
10.0
013
.00
13.0
013
.00
20.0
0
Eur
ope
0.36
1.10
5.00
10.0
013
.00
13.0
013
.00
20.0
0
Afr
ica
0.42
1.62
5.00
10.0
013
.00
13.0
013
.00
20.0
0F
asci
mile
(pe
r pa
ge)
inte
rnat
iona
lZ
one:
A
mer
ica
7.50
50.0
060
.00
60.0
060
.00
60.0
017
0.00
220.
00
Asi
a &
Oce
ania
10.5
060
.00
60.0
060
.00
60.0
060
.00
220.
0028
0.00
E
urop
e-
60.0
060
.00
50.0
050
.00
50.0
012
0.00
150.
00
Afr
ica
9.50
60.0
060
.00
50.0
060
.00
60.0
017
0.00
220.
00In
tern
atio
nal t
elec
ast
Vid
eo/a
udio
/voi
ce64
5.00
4,09
5.00
4,09
5.00
4,09
5.00
4,09
5.00
4,09
5.00
4,09
5.00
4,09
5.00
- C
oord
inat
ion
(firs
t 10
min
)-
Ter
rest
rial s
egm
ent
33.0
022
0.00
220.
0022
0.00
220.
0022
0.00
220.
0022
0.00
- V
ideo
/aud
io (
1st 1
0 m
in)
Inte
rnat
iona
l lea
sed
circ
uit p
er a
nnum
- Q
uart
er s
peed
12,0
00.0
017
8,20
0.00
178,
200.
0019
0,81
3.00
190,
813.
0019
0,81
3.00
484,
620.
0014
,772
.00
- H
alf s
peed
20,0
00.0
029
7,00
0.00
297,
000.
0031
0,02
1.00
310,
021.
0031
0,02
1.00
808,
848.
009,
864.
00-
Ful
l spe
ed30
,000
.00
445,
500.
0044
5,50
0.00
477,
032.
0047
7,03
2.00
477,
032.
001,
211,
286.
005,
910.
00-
75
band
yr
33,0
00.0
049
0,05
0.00
490,
050.
0053
7,84
5.00
537,
845.
0053
7,84
5.00
1,33
2,50
0.00
16,2
50.0
0A
ltern
ate
voic
e da
ta/A
VD
9.6
km12
0,00
0.00
1,78
2,00
0.00
1,78
2,00
0.00
1,90
8,12
9.00
1,90
8,12
9.00
1,90
8,12
9.00
4,84
5,46
2.00
59,0
91.0
064
km25
2,00
0.00
10,3
32,0
00.0
012
6,00
0.00
Not
e: T
he c
alcu
latio
n an
d up
war
d re
view
of a
ll in
tern
atio
nal s
ervi
ces
wer
e ba
sed
on th
e of
ficia
l exc
hang
e ra
te a
s it
affe
cts
the
loca
l out
paym
ents
of N
ITE
L. A
cces
sch
arge
s re
plac
ed r
enta
l cha
rges
afte
r th
e re
view
of t
he p
rinci
ple
of ta
riffic
atio
n in
199
2.S
ourc
e: N
iger
ia T
elec
omm
unic
atio
ns L
imite
d.

PUBLIC ENTERPRISE REFORM IN NIGERIA: EVIDENCE FROM THE TELECOMMUNICATIONS INDUSTRY 41
Table A2: Economies with more mobile than fixed telephone subscribers at end of 1999
Economy Date mobile Mobile Fixed-line Total Mobile Fixed Totalovertook subscribers subscribers mobile density density density
fixed (000’) in (000’) in subscribers1999 1999 (%)
Cambodia 1993 89 28 76 0.81 0.25 1.07Finland Dec. 1998 3,445 2,856 55 66.70 55.29 121.99Paraguay May 1999 436 297 59 8.13 5.54 13.67Uganda July 1999 87 59 59 0.40 0.27 0.68Venezuela Aug. 1999 3,400 2,586 57 14.34 10.91 25.25Italy Sept. 1999 30,296 26,500 53 52.83 46.21 99.05Portugal Sept. 1999 4,671 4,230 52 6.81 42.39 89.20Côte d’Ivoire Oct. 1999 257 219 54 1.77 1.51 3.28Korea (Rep.) Nov. 1999 23,443 21,250 52 50.44 45.72 96.16
Source: ITU World Telecommunications Indicators Database.

42 RESEARCH PAPER 129
Appendix B: Data construction method
The required data include measures of aggregate output, and the quantities and prices oflabour, capital and materials for Nigerian Telecommunications Limited. The major sourcesof information are NITEL’s annual reports. Where the data are not sufficientlydisaggregated, recourse is made to NITEL’s trial balance accounts from which the annualreports were prepared.
1. Aggregate output indexThe output index was obtained following the Tornqvist procedure as the weighted index(based on the revenue shares) of eight types of output: telephone subscriber dial, telephonetrunk ticketed calls, international telephone, international telex, internal telex, internationaltelegram, internal telegram and a miscellaneous category representing othertelecommunications services. The output quantity indexes were constructed fromsubscriber dial (units), telephone trunk ticketed calls (paid minutes), internationaltelephone (paid minutes), international telex (paid minutes), internal telex (units),international telegram (words) and internal telegram (words). The operating revenuesfor each service are deflated using the price index for NITEL obtained from NigerianNational Accounts, Federal Office of Statistics, Lagos.
2. Aggregate input indexThis quantity index was obtained following the Tornqvist procedure as the weightedindex of adjusted total number of employees, the quantity index of materials and thecapital stock index. The weights are the aggregate expense shares of three inputs (labour,materials, and capital). Aggregate expenses are the sum of total wage payments, currentexpenses, the payment to NITEL for the use of its telecommunications facilities, and thevalue of capital service. The quantity index of materials was constructed by dividing thesum of current expenses and the payment to NITEL for the use of its telecommunicationsfacilities by the input price index for NITEL. NITEL annual reports list the number ofemployees each year. The quantity of labour is the quality adjusted person-hours actuallyworked excluding holidays. The capital stock index is the index of capital stock in constantprices.
The price of labour is the implicit price derived by dividing the quantity of labour bytotal employee expense. The price of materials is the implicit price obtained by dividingcurrent naira materials by constant materials. The service price of capital was obtainedby dividing the value of capital service by capital stock at the market value.

PUBLIC ENTERPRISE REFORM IN NIGERIA: EVIDENCE FROM THE TELECOMMUNICATIONS INDUSTRY 43
3. Capital stockOn the basis of the capital stock and depreciation data from annual reports and priceindexes, the series of capital stock in constant prices were constructed for three kinds ofcapital stock: production equipment, building and land. Capital stock is computed as thesum of capital stock at the end of the previous year and gross investment during thecurrent year net of depreciation, all in constant prices.
The value of capital service was computed for two types of capital. This is the sum of:(a) the theoretical return during the current year on capital stock (at the market value)held at the end of the previous year, and (b) depreciation of the capital stock. The valuesof capital service for the two types of capital stock were added up to obtain NITEL’svalue of capital service.
4. Total costTotal cost is the sum of nominal expenditures on labour and materials, and the product ofthe service price of capital and the value of the net stock of capital. The sum was deflatedby the price index for NITEL.

44 RESEARCH PAPER 129
Other publications in the AERC Research Papers Series:
Structural Adjustment Programmes and the Coffee Sector in Uganda, by Germina Ssemogerere, ResearchPaper 1.
Real Interest Rates and the Mobilization of Private Savings in Africa, by F.M. Mwega, S.M. Ngola and N.Mwangi, Research Paper 2.
Mobilizing Domestic Resources for Capital Formation in Ghana: The Role of Informal FinancialMarkets, by Ernest Aryeetey and Fritz Gockel, Research Paper 3.
The Informal Financial Sector and Macroeconomic Adjustment in Malawi, by C. Chipeta and M.L.C.Mkandawire, Research Paper 4.
The Effects of Non-Bank Financial Intermediaries on Demand for Money in Kenya, by S.M. Ndele,Research Paper 5.
Exchange Rate Policy and Macroeconomic Performance in Ghana, by C.D. Jebuni, N.K. Sowa and K.S.Tutu, Research Paper 6.
A Macroeconomic-Demographic Model for Ethiopia, by Asmerom Kidane, Research Paper 7.Macroeconomic Approach to External Debt: The Case of Nigeria, by S. Ibi Ajayi, Research Paper 8.The Real Exchange Rate and Ghana’s Agricultural Exports, by K. Yerfi Fosu, Research Paper 9.The Relationship between the Formal and Informal Sectors of the Financial Market in Ghana, by E.
Aryeetey, Research Paper 10.Financial System Regulation, Deregulation and Savings Mobilization in Nigeria, by A. Soyibo and F.
Adekanye, Research Paper 11.The Savings-Investment Process in Nigeria: An Empirical Study of the Supply Side, byA. Soyibo,
Research Paper 12.Growth and Foreign Debt: The Ethiopian Experience, 1964–86, by B. Degefe, Research Paper 13.Links between the Informal and Formal/Semi-Formal Financial Sectors in Malawi, by C. Chipeta and
M.L.C. Mkandawire, Research Paper 14.The Determinants of Fiscal Deficit and Fiscal Adjustment in Côte d’Ivoire, by O. Kouassy and B.
Bohoun, Research Paper 15.Small and Medium-Scale Enterprise Development in Nigeria, by D.E. Ekpenyong and M.O. Nyong,
Research Paper 16.The Nigerian Banking System in the Context of Policies of Financial Regulation and Deregulation, by A.
Soyibo and F. Adekanye, Research Paper 17.Scope, Structure and Policy Implications of Informal Financial Markets in Tanzania, by M. Hyuha, O.
Ndanshau and J.P. Kipokola, Research Paper 18.European Economic Integration and the Franc Zone: The Future of the CFA Franc After 1996. Part I:
Historical Background and a New Evaluation of Monetary Cooperation in the CFA Countries, byAllechi M’Bet and Madeleine Niamkey, Research Paper 19.
Revenue Productivity Implications of Tax Reform in Tanzania by Nehemiah E. Osoro, Research Paper 20.The Informal and Semi-formal Sectors in Ethiopia: A Study of the Iqqub, Iddir and Savings and Credit
Cooperatives, by Dejene Aredo, Research Paper 21.Inflationary Trends and Control in Ghana, by Nii K. Sowa and John K. Kwakye, Research Paper 22.Macroeconomic Constraints and Medium-Term Growth in Kenya: A Three-Gap Analysis, by F.M.
Mwega, N. Njuguna and K. Olewe-Ochilo, Research Paper 23.The Foreign Exchange Market and the Dutch Auction System in Ghana, by Cletus K. Dordunoo,
Research Paper 24.Exchange Rate Depreciation and the Structure of Sectoral Prices in Nigeria under an Alternative Pricing
Regime, 1986–89, by Olu Ajakaiye and Ode Ojowu, Research Paper 25.Exchange Rate Depreciation, Budget Deficit and Inflation - The Nigerian Experience, by F. Egwaikhide,
L. Chete and G. Falokun, Research Paper 26.Trade, Payments Liberalization and Economic Performance in Ghana, by C.D. Jebuni, A.D. Oduro and
K.A. Tutu, Research Paper 27.Constraints to the Development and Diversification of Non-Traditional Exports in Uganda, 1981–90, by
G. Ssemogerere and L.A. Kasekende, Research Paper 28.

PUBLIC ENTERPRISE REFORM IN NIGERIA: EVIDENCE FROM THE TELECOMMUNICATIONS INDUSTRY 45
Indices of Effective Exchange Rates: A Comparative Study of Ethiopia, Kenya and the Sudan, byAsmerom Kidane, Research Paper 29.
Monetary Harmonization in Southern Africa, by C. Chipeta and M.L.C. Mkandawire, Research Paper 30.Tanzania’s Trade with PTA Countries: A Special Emphasis on Non-Traditional Products, by Flora
Mndeme Musonda, Research Paper 31.Macroeconomic Adjustment, Trade and Growth: Policy Analysis Using a Macroeconomic Model of
Nigeria, by C. Soludo, Research Paper 32.Ghana: The Burden of Debt Service Payment under Structural Adjustment, by Barfour Osei, Research
Paper 33.Short-Run Macroeconomic Effects of Bank Lending Rates in Nigeria, 1987-91: A Computable General
Equilibrium Analysis, by D. Olu Ajakaiye, Research Paper 34.Capital Flight and External Debt in Nigeria, by S. Ibi Ajayi, Research Paper 35.Institutional Reforms and the Management of Exchange Rate Policy in Nigeria, by Kassey Odubogun,
Research Paper 36.The Role of Exchange Rate and Monetary Policy in the Monetary Approach to the Balance of Payments:
Evidence from Malawi, by Exley B.D. Silumbu, Research Paper 37.Tax Reforms in Tanzania: Motivations, Directions and Implications, by Nehemiah E. Osoro, Research
Paper 38.Money Supply Mechanisms in Nigeria, 1970–88, by Oluremi Ogun and Adeola Adenikinju, Research
Paper 39.Profiles and Determinants of Nigeria’s Balance of Payments: The Current Account Component, 1950–88,
by Joe U. Umo and Tayo Fakiyesi, Research Paper 40.Empirical Studies of Nigeria’s Foreign Exchange Parallel Market I: Price Behaviour and Rate Determi-
nation, by Melvin D. Ayogu, Research Paper 41.The Effects of Exchange Rate Policy on Cameroon’s Agricultural Competitiveness, by Aloysius Ajab
Amin, Research Paper 42.Policy Consistency and Inflation in Ghana, by Nii Kwaku Sowa, Research Paper 43.Fiscal Operations in a Depressed Economy: Nigeria, 1960-90, by Akpan H. Ekpo and John E. U.
Ndebbio, Research Paper 44.Foreign Exchange Bureaus in the Economy of Ghana, by Kofi A. Osei, Research Paper 45.The Balance of Payments as a Monetary Phenomenon: An Econometric Study of Zimbabwe’s Experience,
by Rogers Dhliwayo, Research Paper 46.Taxation of Financial Assets and Capital Market Development in Nigeria, by Eno L. Inanga and Chidozie
Emenuga, Research Paper 47.The Transmission of Savings to Investment in Nigeria, by Adedoyin Soyibo, Research Paper 48.A Statistical Analysis of Foreign Exchange Rate Behaviour in Nigeria’s Auction, by Genevesi O. Ogiogio,
Research Paper 49.The Behaviour of Income Velocity in Tanzania 1967–1994, by Michael O.A. Ndanshau, Research Paper
50.Consequences and Limitations of Recent Fiscal Policy in Côte d’Ivoire, by Kouassy Oussou and Bohoun
Bouabre, Research Paper 51.Effects of Inflation on Ivorian Fiscal Variables: An Econometric Investigation, by Eugene Kouassi,
Research Paper 52.European Economic Integration and the Franc Zone: The Future of the CFA Franc after 1999, Part II,
by Allechi M’Bet and Niamkey A. Madeleine, Research Paper 53.Exchange Rate Policy and Economic Reform in Ethiopia, by Asmerom Kidane, Research Paper 54.The Nigerian Foreign Exchange Market: Possibilities for Convergence in Exchange Rates, by P. Kassey
Garba, Research Paper 55.Mobilizing Domestic Resources for Economic Development in Nigeria: The Role of the Capital Market,
by Fidelis O. Ogwumike and Davidson A. Omole, Research Paper 56.Policy Modelling in Agriculture: Testing the Response of Agriculture to Adjustment Policies in Nigeria,
by Mike Kwanashie, Abdul-Ganiyu Garba and Isaac Ajilima, Research Paper 57.Price and Exchange Rate Dynamics in Kenya: An Empirical Investigation (1970–1993), by Njuguna S.
Ndung’u, Research Paper 58.
46 RESEARCH PAPER 129
Exchange Rate Policy and Inflation: The case of Uganda, by Barbara Mbire, Research Paper 59.Institutional, Traditional and Asset Pricing Characteristics of African Emerging Capital Markets, by Ino
L. Inanga and Chidozie Emenuga, Research Paper 60.Foreign Aid and Economic Performance in Tanzania, by Timothy S. Nyoni, Research Paper 61.Public Spending, Taxation and Deficits: What is the Tanzanian Evidence? by Nehemiah Osoro, Research
Paper 62.Adjustment Programmes and Agricultural Incentives in Sudan: A Comparative Study, by Nasredin A. Hag
Elamin and Elsheikh M. El Mak, Research Paper 63.Intra-industry Trade between Members of the PTA/COMESA Regional Trading Arrangement, by Flora
Mndeme Musonda, Research Paper 64.Fiscal Operations, Money Supply and Inflation in Tanzania, by A.A.L. Kilindo, Research Paper 65.Growth and Foreign Debt: The Ugandan Experience, by Barbara Mbire, Research Paper 66.Productivity of the Nigerian Tax System: 1970–1990, by Ademola Ariyo, Research Paper 67.Potentials for Diversifying Nigeria's Non-oil Exports to Non-Traditional Markets, by A. Osuntogun, C.C.
Edordu and B.O. Oramah, Research Paper 68.Empirical Studies of Nigeria’s Foreign Exchange Parallel Market II: Speculative Efficiency and Noisy
Trading, by Melvin Ayogu, Research Paper 69.Effects of Budget Deficits on the Current Account Balance in Nigeria: A Simulation Exercise, by Festus
O. Egwaikhide, Research Paper 70.Bank Performance and Supervision in Nigeria: Analysing the Transition to a Deregulated Economy, by
O.O. Sobodu and P.O. Akiode, Research Paper 71.Financial Sector Reforms and Interest Rate Liberalization: The Kenya Experience by R.W. Ngugi and
J.W. Kabubo, Research Paper 72.Local Government Fiscal Operations in Nigeria, by Akpan H. Ekpo and John E.U. Ndebbio, Research
Paper 73.Tax Reform and Revenue Productivity in Ghana, by Newman Kwadwo Kusi, Research Paper 74.Fiscal and Monetary Burden of Tanzania’s Corporate Bodies: The Case of Public Enterprises, by H.P.B.
Moshi, Research Paper 75.Analysis of Factors Affecting the Development of an Emerging Capital Market: The Case of the Ghana
Stock Market, by Kofi A. Osei, Research Paper 76.Ghana: Monetary Targeting and Economic Development, by Cletus K. Dordunoo and Alex Donkor,
Research Paper 77.The Nigerian Economy: Response of Agriculture to Adjustment Policies, by Mike Kwanashie, Isaac
Ajilima and Abdul-Ganiyu Garba, Research Paper 78.Agricultural Credit Under Economic Liberalization and Islamization in Sudan, by Adam B. Elhiraika and
Sayed A. Ahmed, Research Paper 79.Study of Data Collection Procedures, by Ademola Ariyo and Adebisi Adeniran, Research Paper 80.Tax Reform and Tax Yield in Malawi, by C. Chipeta, Research Paper 81.Real Exchange Rate Movements and Export Growth: Nigeria, 1960–1990, by Oluremi Ogun, Research
Paper 82.Macroeconomic Implications of Demographic Changes in Kenya, by Gabriel N. Kirori and Jamshed Ali,
Research Paper 83.An Empirical Evaluation of Trade Potential in the Economic Community of West African States, by E.
Olawale Ogunkola, Research Paper 84.Cameroon's Fiscal Policy and Economic Growth, by Aloysius Ajab Amin, Research Paper 85.Economic Liberalization and Privatization of Agricultural Marketing and Input Supply in Tanzania: A
Case Study of Cashewnuts, byNgila Mwase, Research Paper 86.Price, Exchange Rate Volatility and Nigeria’s Agricultural Trade Flows: A Dynamic Analysis, by A.A.
Adubi and F. Okunmadewa, Research Paper 87.The Impact of Interest Rate Liberalization on the Corporate Financing Strategies of Quoted Companies
in Nigeria, by Davidson A. Omole and Gabriel O. Falokun, Research Paper 88.The Impact of Government Policy on Macroeconomic Variables, by H.P.B. Moshi and A.A.L. Kilindo,
Research Paper 89.

PUBLIC ENTERPRISE REFORM IN NIGERIA: EVIDENCE FROM THE TELECOMMUNICATIONS INDUSTRY 47
External Debt and Economic Growth in Sub-Saharan African Countries: An Econometric Study, byMilton A. Iyoha, Research Paper 90.
Determinants of Imports in Nigeria: A Dynamic Specification, by Festus O. Egwaikhide, Research Paper91.
Macroeconomic Effects of VAT in Nigeria: A Computable General Equilibrium Analysis, by Prof. D. OluAjakaiye, Research Paper 92.
Exchange Rate Policy and Price Determination in Botswana, by Jacob K. Atta, Keith R. Jefferis, ItaMannathoko and Pelani Siwawa-Ndai, Research Paper 93.
Monetary and Exchange Rate Policy in Kenya, by Njuguna S. Ndung'u, Research Paper 94.Health Seeking Behaviour in the Reform Process for Rural Households: The Case of Mwea Division,
Kirinyaga District, Kenya, by Rose Ngugi, Research Paper 95.Trade and Exchange Rate Policy Options for the CFA Countries: Simulations with a CGE Model for
Cameroon, by Dominique Njinkeu and Ernest Bamou, Research Paper 96.Trade Liberalization and Economic Performance of Cameroon and Gabon, by Ernest Bamou, Research
Paper 97.Quality Jobs or Mass Employment, by Kwabia Boateng, Research Paper 98.Real Exchange Rate Price and Agricultural Supply Response in Ethiopia: The Case of Perennial Crops,
by Asmerom Kidane, Research Paper 99.Determinants of Private Investment Behaviour in Ghana, by Yaw Asante, Research Paper 100.An Analysis of the Implementation and Stability of Nigerian Agricultural Policies, 1970–1993, by P.
Kassey Garba, Research Paper 101.Poverty, Growth and Inequality in Nigeria: A Case Study, by Ben E. Aigbokhan, Research Paper 102.The Effect of Export Earnings Fluctuations on Capital Formation in Nigeria, by Godwin Akpokodje,
Research Paper 103.Nigeria: Towards an Optimal Macroeconomic Management of Public Capital, by Melvin D. Ayogu,
Research Paper 104.International Stock Market Linkages in Southern Africa, by K.R. Jefferis, C.C. Okeahalam and T.T.
Matome, Research Paper 105.An Empirical Analysis of Interest Rate Spread in Kenya, by Rose W. Ngugi, Research Paper 106The Parallel Foreign Exchange Market and Macroeconomic Performance in Ethiopia, by Derrese
Degefa, Research Paper 107.Market Structure, Liberalization and Performance in the Malawian Banking Industry, by Ephraim W.
Chirwa, Research Paper 108.Liberalization of the Foreign Exchange Market in Kenya and the Short-Term Capital Flows Problem, by
Njuguna S. Ndung'u, Research Paper 109.External Aid Inflows and the Real Exchange Rate in Ghana, by Harry A. Sackey, Research Paper 110.Formal and Informal Institutions’ Lending Policies and Access to Credit by Small-Scale Enterprises in
Kenya: An Empirical Assessment, by Rosemary Atieno, Research Paper 111.Financial Sector Reforms, Macroeconomic Instability and the Order of Economic Liberalization: The
Evidence From Nigeria, by Sylvanus I. Ikhide and Abayomi A. Alawode, Research Paper 112.The Second Economy and Tax Yield in Malawi, by C. Chipeta, Research Paper 113.Promoting Export Diversification in Cameroon: Toward Which Products, by Lydie T. Bamou, Research
Paper 114.Asset Pricing and Information Efficiency of the Ghana Stock Market, by Kofi A. Osei, Research Paper
115.An Examination of the Sources of Economic Growth in Cameroon, by Aloysius Ajab Amin, Research
Paper 116.Trade Liberalization and Technology Acquisition in the Manufacturing Sector: Evidence from Nigeria, by
Ayonrinde Folasade, Research Paper 117.Total Factor Productivity in Kenya: The Links with Trade Policy, by Joseph O. Onjala, Research Paper
118.Kenya Airways: A Case Study of Privatization, by Samuel Oyieke, Research Paper 119.Determinants of Agricultural Exports: The Case of Cameroon, by Daniel Gbetnkom and Sunday A. Khan,
Research Paper 120.

48 RESEARCH PAPER 129
Macroeconomic Modelling and Economic Policy Making: A Survey of Experience in Africa, by CharlesSoludo, Research Paper 121.
Determinants of Regional Poverty in Uganda, by Francis Okurut, Jonathan Odwee and Asaf Adebua,Research Paper 122.
Exchange Rate Policy and the Parallel Market for Foreign Currency in Burundi, by Janvier D.Nkurunziza, Research Paper 123.
Structural Adjustment, Poverty, and Economic Growth: An Analysis for Kenya, by Jane Kabubo-Mariaraand Tabitha W. Kiriti, Research Paper 124.
Liberalization and Implicit Government Finances in Sierra Leone, by Victor A.B. Davis, Research Paper125.
Productivity, Market Structure and Trade Liberalization in Nigeria, by Adeola F. Adenikinju and Louis N.Chete, Research paper 126.
Productivity Growth in Nigerian Manufacturing and Its Correlation to Trade Policy Regimes/Indexes(1962–1985), by Louis N. Chete and Adeola F. Adenikinju, Research paper 127.Financial Liberalization and Its Implications for the Domestic Financial System: The Case of Uganda, byLouis A. Kasekende and Michael Atingi-Ego, Research Paper 128.