prospects for ‘closing the gap’ in socioeconomic outcomes for indigenous australians?
TRANSCRIPT
Australian Economic History Reviewan Asia-Pacific Journal of Economic, Business & Social History
PROSPECTS FOR ‘CLOSING THE GAP’IN SOCIOECONOMIC OUTCOMES FOR
INDIGENOUS AUSTRALIANS?
By Jon C. Altman, Nicholas Biddle and Boyd H. Hunter*The Australian National University
Practical reconciliation’ and more recently ‘closing the gap’ havebeen put forward as frameworks on which to base and evaluatepolicies to address Indigenous disadvantage. This paper analysesnational-level census-based data to examine trends in Indigenouswellbeing since 1971. There has been steady improvement in mostsocioeconomic outcomes in the last 35 years; a finding at odds withthe current discourse of failure. Evidence of convergence betweenIndigenous and non-Indigenous outcomes, however, is not consis-tent. For some outcomes, relatively rapid convergence is predicted(within 25 years), but for the majority of outcomes, convergence isunlikely to occur within a generation, if at all.aehr_264 225..251
JEL categories: E24, I38, J15, N37
Keywords: Australia, aborigines, closing the gap, long-run social and economicchange, Torres Strait islanders
INTRODUCTION
The notion of ‘closing the gap’ between Indigenous and non-Indigenous lifeexpectancies has attracted considerable attention in Australia since the election ofthe Rudd Government in November 2007. The aim of this paper is twofold. The
* The data collection was partly funded through an Australian Research Council linkage projectwith the Australian Bureau of Statistics (LP0348733). An earlier version of a part of this paper waspresented to the 2007 Australian Institute of Aboriginal and Torres Strait Islander Studiesconference, Forty Years On: Political Transformation and Sustainability since the Referendum and into theFuture, and at a seminar given at the University of Wollongong. Comments were generously givenby Mike Dillon, Bill Fogarty, Melinda Hinkson, Melissa Johns, Will Sanders, John Taylor andtwo anonymous referees. While the support of the ABS is appreciated, this paper should in noway be attributed to the ABS.
Australian Economic History Review, Vol. 49, No. 3 November 2009ISSN 0004-8992 doi: 10.1111/j.1467-8446.2009.00264.x
225© 2009 The AuthorsJournal compilation © Blackwell Publishing Asia Pty Ltd and the Economic History Society of Australiaand New Zealand 2009
first is to examine national level data from the last eight censuses in order todocument the historical progress in ‘closing the gap’ across a range of broadsocioeconomic indicators that are often associated with health outcomes, andwhich may explain differences in life expectancy. The second is to make predic-tions about when statistical equality between Indigenous and non-IndigenousAustralians might be achieved if the historical trends that we identify were tocontinue. Before outlining the paper in more detail, it is worth considering theorigins of the notion of ‘closing the gap’, especially as it relates to Indigenouspolicy in Australia.
The precise origins of the term ‘closing the gap’ can probably be traced to thespecial programs of governments in New Zealand in the 1990s that sought totarget Maori and Pacific Islander disadvantaged groups with assistance.1 InAustralia, a similar policy of targeted assistance to Aboriginal and Torres StraitIslanders had come to prominence in the late 1980s with the Aboriginal Employ-ment Development Policy of the Bob Hawke Labor government committingto statistical equality in employment, income, and educational status betweenAboriginal and other Australians by the year 2000.2 There appears to be nosubstantive difference between ‘closing the gap’ and ‘statistical equality’; bothconcepts seek to eliminate socioeconomic disparities. This too was the intent ofthe John Howard Liberal government’s notion of ‘practical reconciliation’ thatcame to prominence after Howard’s election victory speech in October 1998. Asa policy framework, practical reconciliation sought to reduce Indigenous materialdisadvantage in the areas of health, housing, education, and employment.3 Thisgoal was closely aligned with a growing emphasis during the decade from 1998on mainstreaming or normalisation, but successive Howard governments werecareful not to stipulate precise timeframes for achieving such goals.4 A strong casecan be made that the goal of practical reconciliation, without any clearly specifiedtimeframes for achievement of such goals, was itself highly symbolic. It wasgood political rhetoric but did not provide a basis for a comprehensive policyframework.
It was only in the aftermath of the Northern Territory National EmergencyIntervention that the Howard government committed, in its last days, to concretetargets with its pledge to ‘stabilise, normalise and exit’ 73 prescribed communitiesin five years.5 Arguably, this pledge could be interpreted as a commitment toclose the gap within that time frame. In response to the federal intervention,the language of ‘Closing the Gap’ was adopted by the Northern Territory
1 Te Puni Kokiri, Gaps Between Maori and Non-Maori.2 Altman, Aboriginal Employment Equity.3 Altman, Practical reconciliation and new mainstreaming.4 Although the Productivity Commission was commissioned to provide biennial reports
on progress in addressing Indigenous disadvantage (Steering Committee for the Review ofGovernment Service Provision, Overcoming Indigenous Disadvantage).
5 Altman and Hinkson, Coercive Reconciliation. Prescribed communities are those identified by thelegislation enacting the Northern Territory Emergency Response.
Jon C. Altman, Nicholas Biddle and Boyd H. Hunter226
© 2009 The AuthorsJournal compilation © Blackwell Publishing Asia Pty Ltd and the Economic History Society of Australia
and New Zealand 2009
Government in August 2007 with its Closing the Gap of Indigenous Disadvantage: A
Generational Plan of Action.While in Opposition the current Prime Minister, Kevin Rudd, had already
supported a ‘Close the Gap’ campaign, championed by Oxfam, Get Up, Austra-lian for Native Title and Reconciliation and other Australian non-governmentorganisations, that focused on the 17-year life expectancy gap between Indigenousand non-Indigenous Australians.6 As part of the national apology to the StolenGenerations made on 13 February 2008, specific reference was also made toclosing the gap in Indigenous and other child mortality rates within set timeframes. In March 2008, Prime Minister Rudd signed a declaration of intentto eliminate the life expectancy gap between Indigenous and other Australianswithin a generation while in April of the same year he made a commitment tohave annual progress reports on meeting this target tabled in parliament.7 Whilethe term initially focused on the life expectancy gap, the concept has graduallychanged to encompass other forms of disadvantage; an acknowledgement thatsocial determinants are likely to be crucial factors driving the disparities betweenIndigenous and non-Indigenous health.8 As mentioned above, this paper sets outto do two things – each with some precedents in the recent research literature.
First, in 2004 we collaborated in an article that provided an historical accountof Indigenous socioeconomic change between 1971 and 2001.9 Examining dif-ferences between Indigenous and non-Indigenous socioeconomic outcomes hasbeen a policy research issue for one of us since 1971 Census data becameavailable.10 Tracking such change over time has been a core objective of theCentre for Aboriginal Economic Policy Research since its establishment in 1990.11
Such analysis has focused on absolute and relative change according to standardsocial indicators over time. Our initial aim is to update this time series with 2006Census data that became available late in 2007.
Second, and more innovatively, we use the emerging trends from data collectedin the last eight censuses to extrapolate when the existing statistical gap betweenIndigenous and non-Indigenous outcomes might close if current trends were tocontinue. We are not aware of such extrapolation being attempted across a similarnumber of variables. Previously projections tended to focus on short-run to
6 This figure is based on the ABS/Australian Institute of Health and Welfare publication The Healthand Welfare of Australia’s Aboriginal and Torres Strait Islander Peoples. Another figure is provided inVos et al., Burden of Disease and Injury. They estimate that the difference between Indigenous andnon-Indigenous life expectancy is around 13 years. A recent ABS publication estimates thedifference in life expectancy as being 11.8 years and 10.0 years for males and females respectively(ABS, Methods for Developing Life Tables). Clearly, the gap in life expectancy is very sensitive to themethod used.
7 See Oxfam press release, ‘Oxfam welcomes decision by Prime Minister Rudd to sign nine pointplan to end Aboriginal health crisis’, 20 March 2008, [Accessed 4 May 2009] Available fromURL http://www.oxfam.org.au/media.
8 Bronfenbrenner, Ecology of Human Development.9 Altman et al., Indigenous socioeconomic outcomes.10 Altman and Nieuwenhuysen, Economic Status of Australian Aborigines.11 See Rowse, Indigenous Futures, and Altman and Rowse, Indigenous affairs.
Prospects for ‘Closing the Gap’ 227
© 2009 The AuthorsJournal compilation © Blackwell Publishing Asia Pty Ltd and the Economic History Society of Australiaand New Zealand 2009
medium-term demographic change and population growth with most forecastsbeing used to predict the associated impacts on employment in reports with titleslike The Job Ahead and The Job Still Ahead.12 Earlier still, a number of publicationshad predicted that the Hawke government’s goal of statistical equality for Indig-enous Australians by 2000 was destined to fail for a number of reasons includinghistorical legacy, cultural difference, diversity of circumstances, geographic dis-tribution, and unanticipated rapid population growth.13
The likely success of the ‘closing the gap’ policy also depends on what happensin non-Indigenous Australia. Obviously ‘the gap’ is directly affected if the non-Indigenous benchmark changes, however, the ability of Indigenous outcomes toreach such benchmarks will also change with variations in social and economicconditions. An important consideration in this regard is variation in macroeco-nomic growth across the business cycle. Low skilled workers with little experience,a group that includes most Indigenous people, tend to be the last workers hired ina period of macroeconomic growth and the first workers shed in an economicdownturn. Businesses often rationalise this behaviour on the grounds that theywant to minimise turnover of their most experienced (and usually most highvalue-added) staff. The crucial point is that the ability to close the gap cannot besustained indefinitely as it depends on macroeconomic growth, which by defini-tion goes up and down with the business cycle. Therefore relative Indigenousoutcomes are likely to improve during sustained periods of economic growth, butall else being equal, relative outcomes tend to stagnate or get worse in recessionaryperiods of the cycle. This point is all the more important when one considers thecurrent period of uncertain global economic growth.
After discussing relevant methodological issues, the paper provides data oncurrently observed trends in Indigenous and non-Indigenous outcomes since1971. It is not possible to assume that there is always going to be convergence inoutcomes, so the following census-based analysis merely provides two scenariosfor estimating some temporal bounds on when the gap might be closed. Improv-ing the socioeconomic circumstances of a sub-population relative to the rest of thepopulation is a complex policy task. We focus on relatively optimistic scenarioswhere there is convergence as these provide evidence of what might happen in thefuture if all the ‘macro’ factors were working in the right direction to close the gap.The concluding section reflects on some of the issues arising from this analysis.
METHODOLOGICAL CONSIDERATIONS
The methodological challenges that arise when using official statistics fromthe census need to be made explicit. While we have learnt from our experience
12 Taylor and Altman, Job Ahead; Taylor and Hunter, Job Still Ahead; and Hunter et al., Future ofIndigenous work.
13 See Altman and Sanders, From exclusion to dependence; Gray and Tesfaghiorghis, Socialindicators of aboriginal population; Sanders, Destined to fail. These earlier analysis were notbased on forecasts, but rather argued on a priori grounds.
Jon C. Altman, Nicholas Biddle and Boyd H. Hunter228
© 2009 The AuthorsJournal compilation © Blackwell Publishing Asia Pty Ltd and the Economic History Society of Australia
and New Zealand 2009
of describing economic history, there are several issues that arise for anyresearcher undertaking systematic analysis of the national population ofIndigenous Australians.14
These caveats can be categorised into three groups: practical problems, meth-odological issues, and conceptual difficulties. One practical issue is that, over thepast 35 or so years, the size of the Indigenous population has increased dramati-cally. One reason is that Indigenous people have become increasingly confidentabout self-identifying as Indigenous since 1971. This means that one cannot be en-tirely sure that observed trends are due to real changes in outcomes rather than tochanges in composition of the population. Hunter argues that one could ignorethis issue, at least for some of the period we examine, because it does not have asignificant impact on socioeconomic outcomes of Indigenous cohorts relative tosimilar cohorts in the rest of the Australian population.15 Another practical problemis that changes in census questions and coding make it difficult to get precise com-parisons over time. The important thing here is that analysts should be transparentabout any assumptions they make in constructing trends. Most of the assumptionsused in this paper were outlined in Altman, Biddle and Hunter, but there are a fewrelated issues for the 2006 Census and these will be discussed below.16
A methodological issue is that the Australian Bureau of Statistics (ABS) didnot initially have a great deal of experience in collecting comprehensive statisticsabout Indigenous Australians before the 1971 Census. While the ABS has learntfrom its experiences over time, improved data coverage (and hence quality) mayitself alter observed trends. Conceptually two main issues need to be emphasised.
First, a person’s Indigenous and non-Indigenous status is primarily based onself-identification derived from a census form completed by individuals. Even herethere is some variation – in remote regions a special enumeration strategy isused that allows ABS staff to target Indigenous people and assist them in com-pleting specially designed Indigenous personal and household census forms.17
Thus the Indigenous sub-population used here (and generally) for comparativepurposes is a statistical aggregation of individuals who identify, or who are iden-tified as Indigenous, rather than a well-defined sociological category. Second, thesocial indicators that are drawn from census questions reflect the social norms ofthe dominant mainstream society. Arguably, a number of social indicators that weuse mean different things to Indigenous and non-Indigenous Australians.
Following Altman, Biddle, and Hunter, this paper focuses only on nationaltrends.18 The main shortcoming of this approach is that a national analysis losesthe diversity of geographic outcomes, like the local labour market conditions thatare likely to be particularly important in influencing changes in socioeconomicstatus. However, the benefit of a national analysis is that the problem of selective
14 Altman et al., Indigenous socioeconomic outcomes.15 Hunter, Validity of intercensal comparisons.16 Altman et al., Indigenous socioeconomic outcomes.17 Altman and Gray, Effects of CDEP scheme on economic status.18 Altman et al., Indigenous socioeconomic outcomes.
Prospects for ‘Closing the Gap’ 229
© 2009 The AuthorsJournal compilation © Blackwell Publishing Asia Pty Ltd and the Economic History Society of Australiaand New Zealand 2009

migration between regions will not undermine the robustness of the analysis.Another advantage of a national analysis is that it dilutes the possible impacts ofchanged Indigenous population composition. It is impossible to undertake rigor-ous sub-national analysis of trends over such a long time period because of thelarge regional variations in the unexplained component of Indigenous populationgrowth – that is the population growth related to increased self-identification andinter-marriage between Indigenous and non-Indigenous people. Settled parts ofAustralia are likely to have particularly large increases in the number of peoplewho now identify as Indigenous but did not do so in previous censuses.19
The main rationale for using a national approach is that current and formerFederal governments have all set their targets at this level. In terms of targetingpolicy and service delivery, regional based approaches are likely to be more usefuland there are some recent examples of this.20 However, in terms of evaluating pastpolicy and highlighting future prospects, a national approach is arguably moreappropriate.
We have selected robust variables based on the availability of historicallycomparable data and our previous experience in constructing such trends.21
There have been eight censuses between 1971 and 2006, but not all providereliable information about Indigenous Australians. The 1976 Census only analy-sed information on 50 per cent of the population (as a cost cutting measure) andis therefore difficult to compare with the other censuses. If nothing else 1976 datawill be less reliable and any trend calculated using those data are likely to beproblematic. The other consideration is that some data were not collected in allcensuses. For example, income data were not collected in 1971.22
A problem for comparative inter-censal analysis is that the questions asked andthe coding of responses changed significantly between censuses. Fortunately,the last three censuses have broadly comparable questions, and to a lesser extentcomparable coding, and provide the most reliable estimates of short-term trends.23
The down-side of using these short-run trends between 1996 and 2006 is that thisperiod falls entirely within the growth phase of the economic cycle. The extrapo-lation of trends usually requires more than a few observations, so whenever possiblewe also use the long-run trends based on information collected as far back as 1971.When no comparable data are available for earlier censuses before 1996, theearliest available valid data are used as the base from which to calculate trends.
Even where data were collected, they are not always available in a usable form.For censuses before 1996, we often had to rely on published data, which wereoften not sufficiently flexible to allow the calculation of comparable statistics. The
19 Ross, Population Issues.20 Biddle, Indigenous housing need; Biddle et al., Indigenous participation in labour markets.21 Altman et al., Indigenous socioeconomic outcomes.22 Altman and Nieuwenhuysen, Economic Status of Australian Aborigines.23 A possible exception is the data on private sector employment, which is provided in a slightly
different format in 2001 compared to either 1996 or 2006. This qualification, however, doesnot affect the validity of the trend estimated between 1996 and 2006.
Jon C. Altman, Nicholas Biddle and Boyd H. Hunter230
© 2009 The AuthorsJournal compilation © Blackwell Publishing Asia Pty Ltd and the Economic History Society of Australia
and New Zealand 2009
1986 Census is particularly problematic in this regard and was consequently notused here to estimate long-term trends in socioeconomic outcomes for Indigenousand other Australians.
TRENDS IN INDIGENOUS OUTCOMES SINCE 1971
The 2006 Census allows us to update the analysis in Altman, Biddle, and Hunterso that we can track changes in socioeconomic outcomes since 2001.24 This paperaugments the tables in the 2005 paper by including comparable data from the1996 and 2006 Censuses in order to provide detailed information on trends insocioeconomic outcomes for both Indigenous and non-Indigenous Australians.25
The following narrative provides a broad summary of this information docu-mented in Appendix A.
Labour force status
The early 1970s were characterised by some of the lowest unemployment ratesin Australia’s recorded history. In contrast, the stagflation of the mid-1970s andthe international recession of the early 1990s saw large increases in unemploy-ment that were particularly pronounced for the Indigenous population. Sincethat time unemployment has fallen for Indigenous and non-Indigenous groups inone of the longest unbroken period of economic expansion ever seen in Australia.Indigenous unemployment rates have very similar trends to non-Indigenous rates– the main differences arise from the Indigenous labour force being dispropor-tionately affected by the recessions of the early 1980s and 1990s.
A complicating factor for interpreting Indigenous labour force status isthe rapid expansion of the Indigenous-specific Community Development Em-ployment Program (CDEP). CDEP was devised by the Malcolm Fraser Liberalgovernment in 1977 when unemployment benefits were first being introduced toremote Indigenous communities.26 In the early 1980s, some ‘teething’ problemswith CDEP were addressed and the scheme began expanding. Notwithstanding
24 One possible exception is the data on private sector employment, which is in a slightly differentformat in 2001 compared to either 1996 or 2006. However, that does not affect the validity of thetrend estimated between 1996 and 2006.
25 There are minor differences between the pre-2006 estimates in the Appendix and those inAltman et al., Indigenous socioeconomic outcomes. These are rounding errors and are indicatedin the text.
26 See Sanders, CDEP Scheme in Australian Social Policy. The CDEP scheme began as an innovativeIndigenous-specific program that converted the notional equivalents of the unemploymentbenefit entitlements of Aboriginal people in remote areas within the social security system intogrants to Aboriginal organisations from the Commonwealth Department of Aboriginal Affairs.These grants were used by Indigenous organisations to employ nominal unemployment benefitrecipients in part-time work. The CDEP scheme was a response to the perceived social threat of‘sit-down’ money to Indigenous communities in the 1970s. Ironically, the scheme is now criticisedas one of the factors driving the social effects of prolonged welfare dependence.
Prospects for ‘Closing the Gap’ 231
© 2009 The AuthorsJournal compilation © Blackwell Publishing Asia Pty Ltd and the Economic History Society of Australiaand New Zealand 2009
its historical connection and early notional fiscal nexus with unemployment ben-efits, CDEP is regarded as employment for official statistical purposes (althoughthe census does not have a separate category for CDEP scheme participants in themainstream forms used predominantly in non-remote regions).
The incidence of CDEP increased only gradually and was a relatively minorinfluence on Indigenous employment until 1991. The scheme then expandedrapidly as a key element of the Aboriginal Employment Development Policy. Itreached the height of its significance in the period analysed in the 2001 Censuswhen it incorporated just over one-tenth (10.9 per cent) of the Indigenous adultpopulation aged 15 and over. It has declined quite markedly since that peak, andat the time of the 2006 Census employed fewer than 7.7 per cent of Indigenousadults.27
After 1991, the substantial growth in CDEP participation means that thedifference between Indigenous and non-Indigenous unemployment rates appearlower as more Indigenous unemployed are classified as employed once theytake up a place in a CDEP scheme. The estimated trends in Indigenous un-employment before 1991, however, are unlikely to be effected. The existence(and growth) of the CDEP scheme means that our scenarios of when the un-employment gap might be closed are relatively optimistic.
Another way to assess the labour market outcomes for Indigenous Australiansis the percentage of the population aged 15 years and over who are employed. Itwas only in 2006 that this ratio rose above that measured at the 1971 Censusfor the Indigenous population. This is not surprising since previous research hasshown that the low-skilled Indigenous labour force suffered severely from thecollapse in the demand for labour in the period of economic restructuring thatoccurred after the stagflation of the mid 1970s.28 However, the role of CDEP incausing poor Indigenous employment outcomes in recent public debates seemsto be challenged by the statistics presented here. The decline in the Indigenousemployment-population ratio occurred almost entirely before 1986; a periodbefore CDEP participation became a significant aspect of Indigenous labourmarket experience.
If one chose to consider CDEP participation as a form of welfare rather thanemployment, then Indigenous employment outcomes are substantially worsetoday than they were in the early 1970s.29 In contrast, non-Indigenous employ-ment improved, largely in the last three censuses. Again, the role of the CDEP
27 The 2006 CDEP participants are estimated from the Department of Employment and Work-place Relations (DEWR) annual report while the population estimate is derived from 2006Census Estimated Residential Population.
28 Fisk, Aboriginal Economy; Gray and Hunter, Analysis of labour market outcomes; and Hunter andGray, ‘Structure of indigenous employment’.
29 Hunter, Indigenous policy based on evidence and not hyperbole. It is unclear on what basis onewould make such a choice as most CDEP participants work for funding provided by the FederalGovernment. Such a classification would be akin to categorising public sector employment as aform of welfare.
Jon C. Altman, Nicholas Biddle and Boyd H. Hunter232
© 2009 The AuthorsJournal compilation © Blackwell Publishing Asia Pty Ltd and the Economic History Society of Australia
and New Zealand 2009
scheme in improving Indigenous employment tends to provide an optimisticestimate of convergence in this indicator.
Given that the CDEP complicates our estimates of trends in Indigenousemployment, it is instructive to exclude this form of employment and focus solelyon private sector employment. Indigenous private sector employment was par-ticularly affected by the structural adjustment in the Australian economy duringthe 1970s, especially the decline in the manufacturing and agricultural indus-tries.30 However, private sector employment has expanded considerably since1981 with the increase greater for Indigenous Australians than other Australians,especially in the last inter-censal period 2001–2006. While trends in private sectoremployment will not be influenced by the rise (and recent decline between 2001and 2006) in CDEP employment, it will be affected by the increased incidence ofprivatisation that became popular with Federal and State/Territory governmentssince the microeconomic reforms that began in the 1980s.31 Unless privatisationdisproportionately increases the number of low skilled jobs that employ manyIndigenous people, it is unlikely to substantially affect our estimated datefor ‘closing the employment gap’ between the Indigenous and non-Indigenouspopulations.
Labour force participation rates measure the percentage of the populationwho either work or look for work and is a key indicator of economic engagement.Participation rates increased up to 1991 for both Indigenous and other Austra-lians, largely as a result of increased participation of females. While there wassome improvement in relative participation of Indigenous population vis-à-vis
other Australians between 1971 and 1991, outcomes have tended to decline sincethat time as Indigenous participation has fallen at a time when overall labour forceparticipation is static.
Income status
One of the main benefits of employment is a higher income or improved accessto economic resources. Appendix A shows the trends in median personal incomesince 1981, the earliest year that robust income data were available. Medianpersonal income has gradually increased for the Indigenous population since1981, but the trend is not as consistent as it is for the non-Indigenous population,which saw a combination of stagnation and decline to 1996, but a large increasesince that time. Consequently, the relative income measure improved for Indig-enous people until 1996, but has since declined. Notwithstanding the increases inprivate sector employment for Indigenous people, the financial benefits of recentmacroeconomic growth in the last 10 years seem to be accruing disproportion-ately to the non-Indigenous population. This is consistent with the Australian
30 Altman and Nieuwenhuysen, Economic Status of Australian Aborigines.31 Quiggin, Great Expectations.
Prospects for ‘Closing the Gap’ 233
© 2009 The AuthorsJournal compilation © Blackwell Publishing Asia Pty Ltd and the Economic History Society of Australiaand New Zealand 2009
inequality literature that has shown larger increases at the top end of the incomedistribution, historically high asset prices and sustained, substantial profits forcompanies.32 Assets and profits are sources of income that Indigenous Australiansgenerally do not enjoy.
Household size, income, and home ownership
The average Australian household has been getting smaller over the period underreview. While Indigenous households remain substantially larger than otherAustralian households, their absolute size declined substantially towards thenon-Indigenous average, especially since 1991. The relative decline in Indigenoushousehold size, compared to non-Indigenous households was limited by theongoing demographic change that has reduced the size of many, or even most,Australian households.33 One potential positive implication of this is a loweringof the pressure on Indigenous housing stock, unless this historic decline is offset inthe future by population growth that outstrips growth in new housing stock.
One reason why the decline in Indigenous household size is important isthat household income is a major determinant of poverty; the more people in ahousehold, the greater the opportunity to pool resources for living expenses.Poverty studies routinely control for household size and composition to determinechanges in standard of living and welfare (using an ‘equivalence scale’ adjust-ment).34 At a purely mechanical level, average household income will decline witha fall in average household size; to the extent that this fall represents a decline inthe number of adults with a potential to earn income. Alternatively, the recentdecline in Indigenous fertility may entirely explain the fall in household size.35 Ifthis is the case, then welfare of Indigenous households will increase because ofthe decline in the number of dependents using household resources.36 While it isbeyond the scope of this paper to resolve such issues, they should be borne in mindwhen analysing changes in household income.
Raw household income fell for both Indigenous and non-Indigenous popu-lations to 1991, and then increased substantially. Given that average personalincome increased substantially for Indigenous Australians in the 10 years to 1991(while non-Indigenous personal income did not change that much), the decline inhousehold income is likely to be due to the declining household size. Another
32 Hunter, Trends in neighbourhood inequality; and Leigh, Long-run inequality series from taxdata.
33 Household sizes are larger in remote areas compared to non-remote areas, but recent declines inIndigenous household size is largest in absolute terms in remote areas; Hunter, Indigenous policybased on evidence and not hyperbole.
34 For example, Hunter, Indigenous and other Australia poverty; estimate ‘equivalised’ incomeby dividing household income by household size. There are more sophisticated measures thatcontrol for the composition of household, but discussion is beyond the scope of this paper.
35 Kinfu and Taylor, Components of indigenous population change.36 Where household welfare is measured using adjusted (equivalised) income.
Jon C. Altman, Nicholas Biddle and Boyd H. Hunter234
© 2009 The AuthorsJournal compilation © Blackwell Publishing Asia Pty Ltd and the Economic History Society of Australia
and New Zealand 2009
factor may be the relatively depressed labour market during the recession of theearly 1990s, which seemed to have particularly affected Indigenous employment.That is, some households would be disproportionately affected by the relativelylarge number of low-income people. This observation is more germane if onetakes into account that 6.8 per cent of Indigenous adults were employed in theCDEP in 1991. The increases in household income in the last two censuses arelikely to be influenced by buoyant labour market conditions and historically highreal wages, but it may also be associated with new generous transfers to allfamilies.37
The rate of home ownership has been stable for many years amongst thenon-Indigenous population at just over 70 per cent. If anything the incidence ofhome ownership has declined slightly in recent years with the widespread fall inaffordability associated with the rising house prices, especially in metropolitanareas.38 The Indigenous population living in a home owned by residents declinedsubstantially in the 20 years after 1971, but there has been steady increase since1991. Indeed, the incidence of Indigenous home ownership has been equivalentto or exceeded the 1971 level since the 1996 Census.
Education
Overall, Australians are more likely to gain a post-secondary school qualificationthan ever before. Indigenous Australians have matched this trend quite closelyand have even experienced a very small relative improvement in the incidenceof post-school qualifications. However, the income outcomes from post-schoolqualifications depend heavily on the type of qualification, with degrees fromuniversities having the largest overall economic benefits in terms of income andemployment.39 Unfortunately, proportionally far fewer Indigenous people securedegrees than other Australians. Hence, the trend in qualifications is not as positiveas first appearances suggest. Nonetheless, there has been steady gains in Indig-enous education participation and completion over the 35 years studied here.
The complexity of interpreting the change in educational outcomes is illus-trated in the recent National Report to Parliament on Indigenous Education andTraining. Although this report focuses on short-term trends, Indigenous studentsstudying at higher education declined in 2005 and was at its lowest level since theyear 2000 (p. 217).40 That report speculates that some potential students post-poned higher education studies to take advantage of the strong labour market and
37 The last 10 years have seen a substantial increase in transfers to families, especially families withchildren (e.g. Family Tax Benefits). However, given that the census measures pre-tax income, thisexplanation is only valid if the transfers occur outside the tax system (not as tax rebates) and hencecould be construed by respondents to the respective censuses as being part of their gross income.
38 Harding et al., Trends in Spatial Inequality.39 Biddle, Does it pay to go to school?40 Commonwealth of Australia, National Report.
Prospects for ‘Closing the Gap’ 235
© 2009 The AuthorsJournal compilation © Blackwell Publishing Asia Pty Ltd and the Economic History Society of Australiaand New Zealand 2009
that many students viewed vocational training as a means of taking advantage ofjob opportunities in buoyant industries (p. xxxi).
Health
One of the best measures of health status is life expectancy. Unfortunately, it is notpossible to present updated trends because the official method for estimatingIndigenous life expectancy has recently changed.41 The new method controlsfor changing rates of Indigenous self-identification between censuses, but it isdifficult to estimate long run trends because Indigenous life expectancy has tobe re-estimated for each inter-censal period. Despite this, Altman, Biddle, andHunter collated the extant comparable historical data to make an assessment oflong-run trends in life expectancy before 2001.42
Indigenous male life expectancy generally did not improve at the same rate asthat for non-Indigenous males; especially after 1991. Life expectancy for Indig-enous females was more variable. After substantial improvement between 1971and 1981, the relative life expectancies for Indigenous females declined graduallyfrom 1981 while the life expectancy for non-Indigenous females increasedsteadily.43
Health status can also be measured by a rough proxy that is assessed consis-tently for all the relevant censuses: the proportion of the population aged over55 years.44 The proportion of the population who can be characterised as ‘elderly’is an imperfect measure of health because it is also affected by the fertility rate,which determines the total population numbers in the denominator. Notwith-standing this, an increase in the proportion of the population who are elderly canbe construed as enhancing welfare if it represents either a decline in fertility or areduction in adult mortality. If fertility is the driving factor, then Indigenoushouseholds will benefit from a long-term reduction in age-related dependencyrates, which ultimately reduce the demands on household financial and infra-structural resources.
The percentage of the Indigenous population who were elderly between1971 and 1991 decreased, signalling a worsening outlook. After 1991, Indigenousoutcomes did not change relative to the non-Indigenous outcomes until the latestcensus. While the Indigenous demographic profile is not substantially differentto that in 1971, the non-Indigenous profile has changed to reflect the aging ofthe population in the last three and a half decades.
41 See the Bhat method in ABS, Altman, Practical reconciliation and new mainstreaming.42 Altman et al., Indigenous socioeconomic outcomes; Ross and Taylor, Comparison of Indigenous
Australians and New Zealand Maori.43 Most of the life expectancy estimates in Appendix A were rounded in Altman et al., Indigenous
socioeconomic outcomes. The Indigenous estimates for 1971 were taken from Smith, Aboriginalpopulation of Australia, p. 279. The small difference in male and female life expectancy wasprobably due to the high rates of Indigenous deaths in child birth.
44 Altman et al., Indigenous socioeconomic outcomes.
Jon C. Altman, Nicholas Biddle and Boyd H. Hunter236
© 2009 The AuthorsJournal compilation © Blackwell Publishing Asia Pty Ltd and the Economic History Society of Australia
and New Zealand 2009
Summarising long- and short-run trends
Given that there are well-founded concerns about the quality and consistency ofhistorical data on Indigenous people we use two methods to estimate the perioduntil the various ‘gaps’ in outcomes might be closed. The first set of estimates isbased on long-run trends that use as much information as is available and whichwe judge to be reliable and comparable. This uses data back to 1971. The secondset of projections estimate trends based on three observations from the post-1996period. These short run trends are provided because we can be reasonablyconfident that such data are reliable and relate to an Indigenous population whichis enumerated relatively comprehensively.45
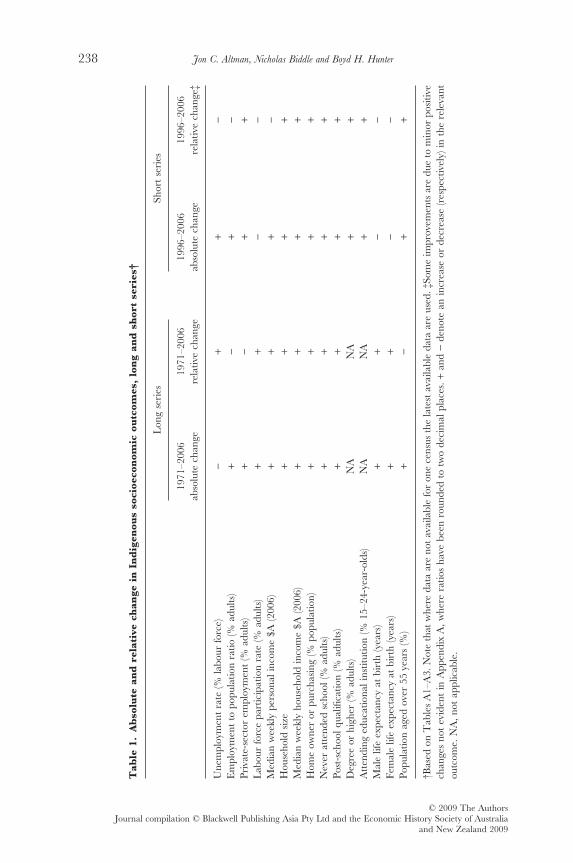
The results from Appendix A are also summarised in absolute and relativeterms in Table 1. This summary is provided according to changes observed forthe long series, 1971–2006 and for the short series 1996–2006. Absolute differ-ences are based on Table A1 data, and relative differences from Table A3 thatprovides Indigenous to non-Indigenous ratios.
Rather than distract the reader with excessive detail, the outcomes from thesestatistics are presented in Table 1 with a plus (+) to indicate improvement andwith a minus (-) to indicate decline in socioeconomic outcome. Our findings canbe briefly summarised as follows. For the longer series there are improvements in12 of 13 variables in absolute terms and 10 of 13 variables in relative terms. Forthe shorter, more statistically reliable series, there are improvements in absoluteterms for 12 of 15 comparable variables and in relative terms for nine of 15variables. In overall terms, both series suggest that in absolute and relative termsIndigenous socioeconomic outcomes have improved at the national level for mostvariables.46
These findings are very much at odds with the dominant discourse of policyfailure in Indigenous over the past 35 years. For example, there has been anunambiguous improvement (in both absolute and relative terms) for both thelong-run and short-run series in the areas of household size and income, homeownership and all the education outcomes. Table 1 indicates that improvementswere not always consistent for the short-run and long-run series for two crucialareas: labour force status and health. As discussed above the labour force trendsare affected by the growth of the CDEP scheme, but they are also affected by thelarge-scale structural adjustments in Australia which followed the reductions intariffs and other trade barriers that began in 1974 and which have continued withthe continuing internationalisation of the economy. Indigenous workers were and
45 Note, however, that there was a substantial divergence in 2006 between the national census count(about 450 000) and the comparable Estimated Resident Population for Indigenous Australians(512 000). There are even larger divergences at the sub-national level. For example, the PostEnumeration Survey estimated an undercount of 24 per cent in the Kimberley region of WesternAustralia and 19 per cent in the Northern Territory.
46 Two possible exceptions to this observation are for the labour force status and health.As indicated above, the estimated trends are complicated by the interactions of labour forceindicators with the macro-economy and measurement error for health proxies.
Prospects for ‘Closing the Gap’ 237
© 2009 The AuthorsJournal compilation © Blackwell Publishing Asia Pty Ltd and the Economic History Society of Australiaand New Zealand 2009
Tab
le1.
Ab
solu
tean
dre
lati
vech
ange
inIn
dig
enou
sso
cioe
con
omic
outc
omes
,lo
ng
and
shor
tse
ries
†
Lon
gse
ries
Shor
tse
ries
1971
–200
6ab
solu
tech
ange
1971
–200
6re
lativ
ech
ange
1996
–200
6ab
solu
tech
ange
1996
–200
6re
lativ
ech
ange
‡
Une
mpl
oym
ent
rate
(%la
bour
forc
e)-
++
-E
mpl
oym
ent
topo
pula
tion
ratio
(%ad
ults
)+
-+
-Pr
ivat
e-se
ctor
empl
oym
ent
(%ad
ults
)+
-+
+L
abou
rfo
rce
part
icip
atio
nra
te(%
adul
ts)
++
--
Med
ian
wee
kly
pers
onal
inco
me
$A(2
006)
++
+-
Hou
seho
ldsi
ze+
++
+M
edia
nw
eekl
yho
useh
old
inco
me
$A(2
006)
++
++
Hom
eow
ner
orpu
rcha
sing
(%po
pula
tion)
++
++
Nev
erat
tend
edsc
hool
(%ad
ults
)+
++
+Po
st-s
choo
lqua
lifica
tion
(%ad
ults
)+
++
+D
egre
eor
high
er(%
adul
ts)
NA
NA
++
Att
endi
nged
ucat
iona
lins
titut
ion
(%15
–24-
year
-old
s)N
AN
A+
+M
ale
life
expe
ctan
cyat
birt
h(y
ears
)+
+-
-Fe
mal
elif
eex
pect
ancy
atbi
rth
(yea
rs)
++
--
Popu
latio
nag
edov
er55
year
s(%
)+
-+
+
†Bas
edon
Tab
les
A1–
A3.
Not
eth
atw
here
data
are
nota
vaila
ble
for
one
cens
usth
ela
test
avai
labl
eda
taar
eus
ed.‡
Som
eim
prov
emen
tsar
edu
eto
min
orpo
sitiv
ech
ange
sno
tev
iden
tin
App
endi
xA
,whe
rera
tios
have
been
roun
ded
totw
ode
cim
alpl
aces
.+an
d-
deno
tean
incr
ease
orde
crea
se(r
espe
ctiv
ely)
inth
ere
leva
ntou
tcom
e.N
A,n
otap
plic
able
.
Jon C. Altman, Nicholas Biddle and Boyd H. Hunter238
© 2009 The AuthorsJournal compilation © Blackwell Publishing Asia Pty Ltd and the Economic History Society of Australia
and New Zealand 2009
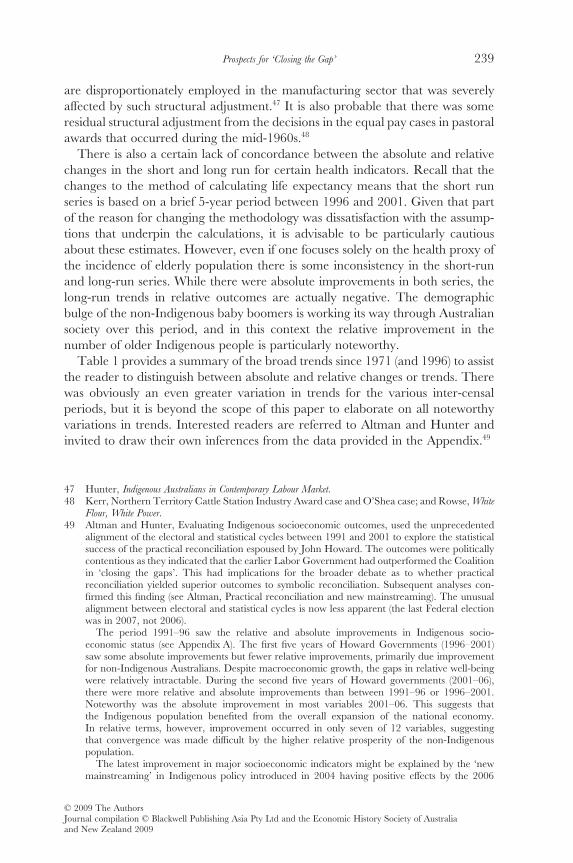
are disproportionately employed in the manufacturing sector that was severelyaffected by such structural adjustment.47 It is also probable that there was someresidual structural adjustment from the decisions in the equal pay cases in pastoralawards that occurred during the mid-1960s.48
There is also a certain lack of concordance between the absolute and relativechanges in the short and long run for certain health indicators. Recall that thechanges to the method of calculating life expectancy means that the short runseries is based on a brief 5-year period between 1996 and 2001. Given that partof the reason for changing the methodology was dissatisfaction with the assump-tions that underpin the calculations, it is advisable to be particularly cautiousabout these estimates. However, even if one focuses solely on the health proxy ofthe incidence of elderly population there is some inconsistency in the short-runand long-run series. While there were absolute improvements in both series, thelong-run trends in relative outcomes are actually negative. The demographicbulge of the non-Indigenous baby boomers is working its way through Australiansociety over this period, and in this context the relative improvement in thenumber of older Indigenous people is particularly noteworthy.
Table 1 provides a summary of the broad trends since 1971 (and 1996) to assistthe reader to distinguish between absolute and relative changes or trends. Therewas obviously an even greater variation in trends for the various inter-censalperiods, but it is beyond the scope of this paper to elaborate on all noteworthyvariations in trends. Interested readers are referred to Altman and Hunter andinvited to draw their own inferences from the data provided in the Appendix.49
47 Hunter, Indigenous Australians in Contemporary Labour Market.48 Kerr, Northern Territory Cattle Station Industry Award case and O’Shea case; and Rowse, White
Flour, White Power.49 Altman and Hunter, Evaluating Indigenous socioeconomic outcomes, used the unprecedented
alignment of the electoral and statistical cycles between 1991 and 2001 to explore the statisticalsuccess of the practical reconciliation espoused by John Howard. The outcomes were politicallycontentious as they indicated that the earlier Labor Government had outperformed the Coalitionin ‘closing the gaps’. This had implications for the broader debate as to whether practicalreconciliation yielded superior outcomes to symbolic reconciliation. Subsequent analyses con-firmed this finding (see Altman, Practical reconciliation and new mainstreaming). The unusualalignment between electoral and statistical cycles is now less apparent (the last Federal electionwas in 2007, not 2006).
The period 1991–96 saw the relative and absolute improvements in Indigenous socio-economic status (see Appendix A). The first five years of Howard Governments (1996–2001)saw some absolute improvements but fewer relative improvements, primarily due improvementfor non-Indigenous Australians. Despite macroeconomic growth, the gaps in relative well-beingwere relatively intractable. During the second five years of Howard governments (2001–06),there were more relative and absolute improvements than between 1991–96 or 1996–2001.Noteworthy was the absolute improvement in most variables 2001–06. This suggests thatthe Indigenous population benefited from the overall expansion of the national economy.In relative terms, however, improvement occurred in only seven of 12 variables, suggestingthat convergence was made difficult by the higher relative prosperity of the non-Indigenouspopulation.
The latest improvement in major socioeconomic indicators might be explained by the ‘newmainstreaming’ in Indigenous policy introduced in 2004 having positive effects by the 2006
Prospects for ‘Closing the Gap’ 239
© 2009 The AuthorsJournal compilation © Blackwell Publishing Asia Pty Ltd and the Economic History Society of Australiaand New Zealand 2009
CONVERGENCE AND THE PROSPECTS FOR CLOSING THE GAP
As indicated above, some of the data in Appendix A were not collected in 1971(e.g. income), while other data were either unavailable publicly or were notavailable in a consistent form for all censuses (e.g. private sector employment orhome ownership data). Notwithstanding such difficulties it is possible to estimatetrends for many of the data sets reported in Altman, Biddle, and Hunter.50 Inorder to estimate the prospect for closing the gap we have estimated the numberof years before a gap could be closed using trends identified in Appendix A overtwo time periods, 1971–2006 and 1996–2006.51 That is, using a simple (linear)projection of observed changes in relative outcomes, we estimate when Indig-enous indicators will be the same as those for other Australians.
Where the time series is not complete we use the trends based on the longestavailable period. Convergence is estimated as the number of years required toeliminate the gap between Indigenous and non-Indigenous Australians (where thegap is measured in relative terms) following current trends. In order to accountfor the variation in the longest period for which consistent data are available, thetrend estimates are calculated as the improvement in relative outcomes per year.This trend (or gradient) is projected forward to identify when the ‘gap’ betweenIndigenous and non-Indigenous indicators will be removed.
From an analytical perspective it is always risky to make excessively preciseclaims about long-range forecasts. While our analysis here does not present aformal time series analysis, readers should bear in mind that forecast errors alwaysincrease as the lead time becomes longer.52 Most forecasts become unreliablequite quickly and are rarely reliable beyond a decade. The unreliability of ourestimates of convergence is underscored by the fact that there is a divergencebetween Indigenous and non-Indigenous outcomes for several of the variablesexamined. Accordingly, our estimates must be interpreted as the possibility ofclosing the gap, if current trends continue. Our estimates are not a prediction ofwhat will happen, but rather a description of what may happen if current trendscontinue. Policy shifts, unpredicted demographic changes and economic circum-stances (including the current international financial crisis) are all likely to impacton what will actually occur into the future.
Not all trends in Indigenous and non-Indigenous outcomes converge. Indeed,divergence in outcomes can even occur if Indigenous outcomes are improving
Census. This is hard to credit because the two-year lead time is short, but this is a possibility.On the other hand, as economic growth continued during the last term of the Howard Gov-ernment some benefits may have eventually trickled down to Indigenous Australians.
50 Altman et al., Indigenous socioeconomic outcomes.51 The choice of base year impacts on the prospects and rate of convergence. For example, while the
broad conclusions remain the same whether 1981 is used as the base year rather than 1971, doingso results in convergence rather than divergence in employment, full-time employment andprivate sector employment. However, this convergence only occurred after a long time (71 years,50 years, and 44 years, respectively).
52 Armstrong, Principles of forecasting.
Jon C. Altman, Nicholas Biddle and Boyd H. Hunter240
© 2009 The AuthorsJournal compilation © Blackwell Publishing Asia Pty Ltd and the Economic History Society of Australia
and New Zealand 2009
in absolute terms, but such increases are not as large as those evident forother Australians. The main divergence in outcomes occurs in labour marketdata where Indigenous outcomes are improving slowly than the rate for otherAustralians. However, employment prospects is complicated by the effect ofCDEP and the disproportionate location of Indigenous people in regional andremote areas where labour market conditions are relatively depressed (aside frommining activity).
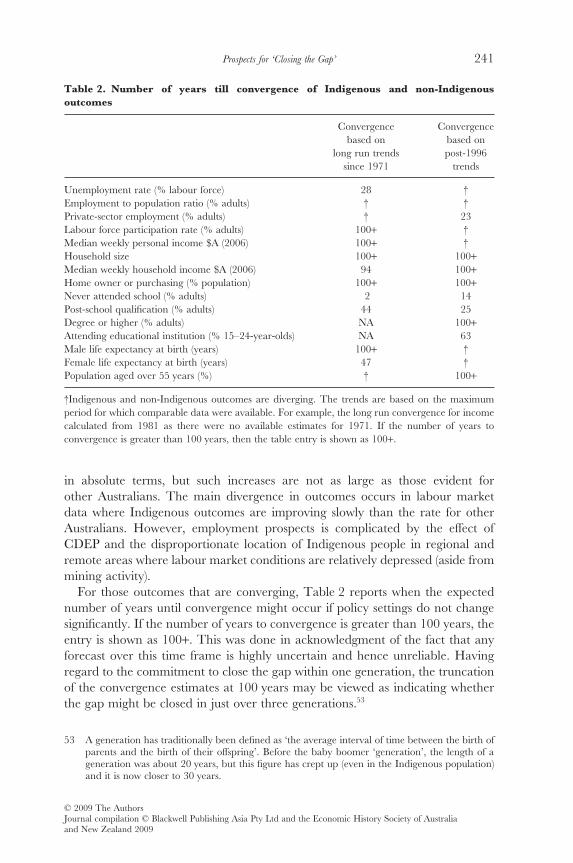
For those outcomes that are converging, Table 2 reports when the expectednumber of years until convergence might occur if policy settings do not changesignificantly. If the number of years to convergence is greater than 100 years, theentry is shown as 100+. This was done in acknowledgment of the fact that anyforecast over this time frame is highly uncertain and hence unreliable. Havingregard to the commitment to close the gap within one generation, the truncationof the convergence estimates at 100 years may be viewed as indicating whetherthe gap might be closed in just over three generations.53
53 A generation has traditionally been defined as ‘the average interval of time between the birth ofparents and the birth of their offspring’. Before the baby boomer ‘generation’, the length of ageneration was about 20 years, but this figure has crept up (even in the Indigenous population)and it is now closer to 30 years.
Table 2. Number of years till convergence of Indigenous and non-Indigenousoutcomes
Convergencebased on
long run trendssince 1971
Convergencebased onpost-1996
trends
Unemployment rate (% labour force) 28 †Employment to population ratio (% adults) † †Private-sector employment (% adults) † 23Labour force participation rate (% adults) 100+ †Median weekly personal income $A (2006) 100+ †Household size 100+ 100+Median weekly household income $A (2006) 94 100+Home owner or purchasing (% population) 100+ 100+Never attended school (% adults) 2 14Post-school qualification (% adults) 44 25Degree or higher (% adults) NA 100+Attending educational institution (% 15–24-year-olds) NA 63Male life expectancy at birth (years) 100+ †Female life expectancy at birth (years) 47 †Population aged over 55 years (%) † 100+
†Indigenous and non-Indigenous outcomes are diverging. The trends are based on the maximumperiod for which comparable data were available. For example, the long run convergence for incomecalculated from 1981 as there were no available estimates for 1971. If the number of years toconvergence is greater than 100 years, then the table entry is shown as 100+.
Prospects for ‘Closing the Gap’ 241
© 2009 The AuthorsJournal compilation © Blackwell Publishing Asia Pty Ltd and the Economic History Society of Australiaand New Zealand 2009
The long-run trends in unemployment rates indicate that Indigenous andnon-Indigenous outcomes will converge in 28 years around the year 2035. This isa potentially excessively optimistic scenario because it may be associated with therise of the CDEP scheme. Indeed, the more recent inter-censal trends show thatIndigenous and non-Indigenous unemployment rates are diverging – an obser-vation that might be associated with the relatively stagnant number of CDEPparticipants (at least in net terms between 1996 and 2006).
The employment to population ratios are diverging for both trend estimates.Convergence in employment and unemployment are obviously dependent onwhere Indigenous live, the structure of incentives facing individuals and organi-sations (who are making decisions on where to locate), as well as the state ofnational and regional economies. With respect to the latter, with the globaleconomic crisis and end to the long national economic boom, then low qualifiedand short-term workers are likely to be the first shed by firms whose profit marginsare being squeezed.
Indigenous private sector employment was been particularly depressed untilthe late 1980s. However, private sector jobs increased substantially for Indigenouspeople after 1996. This may reflect the tendency to privatise low skilled jobs inthe public sector, but it has been achieved despite the depressed labour marketconditions in regional Australia. While this recent improvement of Indigenousparticipation in the private sector is noteworthy, the estimated year to conver-gence of 23 years is likely to be excessively optimistic as it assumes sustainedeconomic growth at ‘pre-crisis’ levels.
Relative labour force participation rates improved for Indigenous Australiansafter 1971, but recent trends show that Indigenous people have been rather lesssuccessful in this crucial dimension of economic engagement since 1996. Themost optimistic scenario for the rate of long-run improvement in relative out-comes shows that the gap in labour force participations will not be eliminatedwithin the next century.
The convergence of individual income is only evident in the long-run trends.Even then convergence tends to be rather slow, with an estimated closing of thegap projected to take at least another 100 years. The lack of income convergenceevident from recent trends may be a reflection of growing national incomeinequality where low-income groups are not faring as well as the rest.54
The decline in Indigenous household sizes vis-à-vis other Australians offers arather more positive story. On current trends it will be at least three generationsbefore this gap is closed. However, this is one gap that we would be reasonablyconfident can be closed because the demographic and economic factors willtend to be mutually reinforcing. High educational outcomes and income tendsto be associated with smaller families. For example, human capital modelsmake a firm prediction of this result, largely due to the increasing opportunity
54 Especially the top 25 per cent of the distribution. See Leigh, Long-run inequality series from taxdata.
Jon C. Altman, Nicholas Biddle and Boyd H. Hunter242
© 2009 The AuthorsJournal compilation © Blackwell Publishing Asia Pty Ltd and the Economic History Society of Australia
and New Zealand 2009
cost of female time making work more attractive relative to home productionactivities.55
Median household incomes appear to be converging albeit rather slowly. Thelong run trends indicate that the gap will be closed in 94 years. In contrast, recenttrends seem to indicate that convergence will not occur for at least anothercentury. While the truth is likely to lie somewhere in between, the recent trendsillustrate the main problem with a paradigm based on closing the gap – namelythat the goal posts continually move. Indigenous household income has improved,but not as fast as that of non-Indigenous Australians. Note too that raw householdincome will converge faster than predicted in Table 2 because the size of Indig-enous households fell by more than non-Indigenous households thus reducing thenumber of people who could assist to close the gap in household income.
The predicted convergence in home ownership is estimated to take place inaround 100 years.56 It is probable that the rate of convergence will be closelylinked to the ability to improve Indigenous household incomes. The other rel-evant factors are the ability to resolve current transactions and administrativecosts that seem to impede the individuation of leases on Aboriginal-owned land.Unless such tenure issues are resolved, institutional barriers might result in thehome ownership gap being intractable.
The most optimistic prediction is for convergence in educational outcomes.The gap in never having attended school is predicted to close in between two and14 years depending on which trend is used. In recent years, almost all Indigenouschildren attend school at some stage. The main concerns are now about retentionrates and the quality of schooling and outcomes for those who are attending.
The predicted convergence in post-school qualification is also quite optimisticfor both projected trends; the gap may be closed within 25 and 44 years. Onereason for this relatively positive prediction is that such outcomes are amenableto fast policy action. For example, the mutual obligation regimes, which havebecome increasingly popular with government as a means of providing condi-tional welfare payments, reward recipients who return to their studies. However,it may become more difficult to improve outcomes as the quality of the initialeducational attainment becomes more central to performance. That is, it may bepossible to improve vocational training through Technical and Further EducationInstitutes in the short-run, but the ability to enhance the participation in univer-sities and other tertiary institutes may be limited by the quality of initial schooling.
Although we only have short-run trends for attendance of youth (aged15–24 years) at educational institutions, convergence in rates of attendance wouldnot occur for another 63 years. If we exclude secondary students to focus onpeople studying at tertiary educational institutions, convergence would not take
55 Becker et al., Human capital, fertility, and economic growth.56 Focusing on the proportion of Indigenous households who own their own home, the rate of
convergence in home ownership is slightly more optimistic. Indigenous outcomes will be the sameas non-Indigenous outcomes in about 80 years. This estimate is closer to the short-run estimatein Table 2 because that indicator is only available consistently since 1991.
Prospects for ‘Closing the Gap’ 243
© 2009 The AuthorsJournal compilation © Blackwell Publishing Asia Pty Ltd and the Economic History Society of Australiaand New Zealand 2009
place for over 100 years.57 The difficulty in achieving convergence for the moredemanding tertiary qualifications is confirmed by the gap in the incidence ofdegrees amongst Indigenous and non-Indigenous people is not predicted to closefor at least another century.58
As indicated above, the ABS recently changed the method of predicting lifeexpectancy for Indigenous people to take into account changing Indigenousidentification.59 Whatever its merits, the resulting figures are not strictly compa-rable with previous estimates and cannot be used to calculate long-run trends.Hence, we use the older unadjusted series to estimate trends in male and femalelife expectancy. On historical trends, and in the absence of significant and suc-cessful policy innovations, it is difficult to see the gap in male life expectancy beingremoved for at least another 100 years. Current trends are more optimistic interms of closing the gap in female life expectancy with the estimated convergencetaking 47 years. The more recent trends, however, seem to indicate that this isexceptionally optimistic as the relative gap increased between 1996 and 2001.
Our earlier analysis used the demographic proxy for health of the proportion ofpopulation aged 55 and over. This proxy is easy to calculate, though rather moredifficult to interpret. Nevertheless, the recent trend in this proxy indicate theestimated time to convergence of female life expectancy is too optimistic and theresources required to close the gap in life expectancies within one generation willnot be trivial.
CONCLUSION
For many years, governments in Australia have espoused a commitment toimproving Indigenous socioeconomic outcomes relative to the non-Indigenouspopulation using terms such as ‘statistical equality’, ‘practical reconciliation’, and‘closing the gap.’ The aim of this paper is to examine national level data from thelast eight censuses to assess the historical progress in achieving these aims andto make predictions about when convergence between Indigenous and non-Indigenous Australians might be achieved (if at all) were the historical trends weidentify to continue.
There has been steady improvement in a number of the socioeconomic out-comes considered. Very few, however, were predicted to converge relative tothe non-Indigenous population in the short to medium term. It is clear, therefore,that policies designed to close the gap between Indigenous and non-Indigenous
57 Only the long run trends have been calculated for this outcome between 1981 and 2001 becauseof data comparability issues.
58 This is also consistent with the post-1996 trends, that there will not be a convergence in year 10completion for another 17 years. By contrast, the convergence in year 12 completion will takemuch longer and will not occur for another 96 years.
59 See the Bhat method in ABS, Calculating Experimental Life Tables, and ABS/Australian Institute ofHealth and Welfare, Health and Welfare, p. 148.
Jon C. Altman, Nicholas Biddle and Boyd H. Hunter244
© 2009 The AuthorsJournal compilation © Blackwell Publishing Asia Pty Ltd and the Economic History Society of Australia
and New Zealand 2009
populations are intrinsically difficult to operationalise. This is likely to be due inpart to many of the underlying causes being inter-generational in nature. Forexample, Marmot and Wilkinson and many others have identified that life expect-ancy depends on what happens in early childhood when crucial decisions aremade by previous generations.60 Health outcomes are also likely to be dependenton social, cultural, and community contexts, and hence policies that address thesegaps must have a long-term focus and tackle problems at several levels.61
Official statistics based on mainstream social norms arguably do not capturethe extent of Indigenous alienation from mainstream Australia. There are manydifferent and interrelated dimensions of deprivation, social exclusion, and povertyfacing Indigenous Australians.62 Policies designed to redress the gap betweenIndigenous and non-Indigenous socioeconomic outcomes need to account for theinter-dependence between extant disadvantages and be informed by evidence onhow disadvantage evolves over the ‘life-cycles’ of individuals and communities.63
Ultimately, our analysis must be supplemented with qualitative and behav-ioural analyses that illustrate the complex developmental challenges facing Indig-enous Australians. Forecasts can become redundant quickly. For example, theshort-run forecasts of Indigenous labour force status in earlier studies were gen-erally accurate, but the medium term projections (10 years out) failed to anticipatethe prolonged economic boom.64 Even if behaviourally informed analyses wereconducted, they may demonstrate that process/rights-based issues and symbolismcan motivate and de-motivate people and hence lead to relatively better or pooreroutcomes than we predict. In that case, we need to expand our conception ofdisadvantage to include both practical and symbolic considerations rather thanview these two elements as constituting some sort of trade-off. In our opinion,there is no evidence of direct trade-off between practical and symbolic issues andsuch distinctions represent a false dichotomy.
A significant issue emerging in the literature is the difficulty to establish reliableand robust long-run trends. The caveats documented in this paper illustrate whyone has to be cautious about making strong predictions about when the gapbetween Indigenous and other Australians might be closed. The evidence pre-sented here indicates that it is probable that the long-run trends in Indigenoussocioeconomic status are positive, and hence, the recent dominant discourse ofpolicy failure in Indigenous affairs is wrong or over-stated.
Demographic transitions and increased identification is the imponderablefactor here. The change in official methodology of calculating life expectancy isan implicit recognition of the importance of such changes. Even if one is willingto suspend disbelief in the short-run it is more difficult to do this in the long run.
60 Marmot and Wilkinson, Social Determinants of Health.61 See Bronfenbrenner, Ecology of Human Development.62 See Daly and Smith, Indigenous Australian Children; Hunter, Three Nations: Not One; and Hunter,
Measuring social costs of unemployment.63 Hunter, Overcoming indigenous disadvantage.64 Hunter and Taylor, Indigenous employment forecasts.
Prospects for ‘Closing the Gap’ 245
© 2009 The AuthorsJournal compilation © Blackwell Publishing Asia Pty Ltd and the Economic History Society of Australiaand New Zealand 2009
The increased propensity to identify as Indigenous and the substantial ratesof intermarriage will mean that people who would historically be characterisedas non-Indigenous will be classified as Indigenous. If such people have socio-economic and demographic characteristics that are closer to the non-Indigenousprofile, then there is a built in tendency towards convergence.
Obviously there is likely to be substantial variation in regional outcomesbetween sub-national populations, but in broad terms there is less difference in theregional trends than one might expect.65 While the magnitude of the original ‘gap’can be rather different for some outcomes in remote and non-remote areas,especially for the economic indicators, the overall trends are remarkably similar.However, this may be because the standard remoteness classification hides morevariation than it explains. Recent analysis at a much smaller regional level showsvariation in trends in Indigenous outcomes over the most recent inter-censalperiod.66 For example, full-time private sector employment increased substantiallyfor the Indigenous population relative to the non-Indigenous population in Bris-bane and Perth, but declined in Sydney. For some types of analysis, therefore, itis important to concentrate on the region that delimits labour markets or otheroutcome measures.67 Whatever the trends, the underlying causes of the gap arelikely to be different in remote and non-remote Australia, and hence a regionallydifferentiated policy response is warranted.
By examining trends along non-Indigenous and Indigenous categories, itis clear that the ability of governments to ‘close the gap’ depends on what ishappening in the rest of the community. There are likely to be different andpotentially uneven impacts on Indigenous outcomes from the lower macroeco-nomic growth of the current financial crisis. On the one hand, if unskilled workersare the first to lose their jobs then this is likely to impact disproportionately onIndigenous employment outcomes and associated socioeconomic status. On theother hand, if job or income losses were confined to the financial sector, then thereis likely to be a minimal impact on the relative standing of Indigenous Australians.Another consideration is that global warming, and the policy response to curbgreenhouse gas emissions, may place additional constraints on economic growth.Any recession, whatever the source of the downturn, is likely to curtail a govern-ment’s capacity to directly achieve distributional goals such as ‘closing the gap’between Indigenous and other Australians.
As we enter a new political cycle in Indigenous affairs policy making it isimportant that some of the historical evidence presented here is not overlooked,especially during a period when the new discourse of policy-making emphasisesevidence rather than anecdote or ideology. We concur that the socioeconomicgap between Indigenous and other Australians remains unacceptably high. Whileour analysis suggests that at the national level there has been improvement in
65 Hunter, Indigenous policy based on evidence and not hyperbole.66 Biddle et al., Indigenous participation in labour markets.67 Taylor and Biddle, Locations of Indigenous Population Change.
Jon C. Altman, Nicholas Biddle and Boyd H. Hunter246
© 2009 The AuthorsJournal compilation © Blackwell Publishing Asia Pty Ltd and the Economic History Society of Australia
and New Zealand 2009
the three and a half decades to 2006, we also accept that the current rate ofimprovement is too slow. Nevertheless, using recent economic history as ourguide, we predict that it will take many years, possibly many generations, beforethe respective gaps are closed.
To conclude, we make two observations. First, the long lead times that we haveestimated to close the gap suggest that some fundamentally new approach mightbe needed to ensure structural change of such a degree as to significantly alter thetime frame we predict. One possibility is to require a fundamental reallocation ofproperty rights in resources that fully acknowledge the original ownership of thecountry.68 Another alternative is that a massive increase in investment in Indig-enous infrastructure and Indigenous people may eventually affect the persistentgaps. Second, we propose that a degree of policy realism and caution is requiredin new policy commitments. The only way to measure whether convergence inoutcomes actually occurs will be with the sorts of statistics that we have accessedhere, inadequate as they might be from a public policy or Indigenous perspective.These statistics will form the basis for assessing outcomes in closing the gaps; this isthe statistical evidence base that will constitute political accountability. Under suchcircumstances we would counsel that commitments to ‘reducing disparities’ mightbe a more realistic policy goal for the Rudd Government than ‘closing the gap’.
REFERENCES
ABS (2004) Calculating Experimental Life Tables for Use in Population Estimates and Projections of Aboriginal andTorres Straut Islander Australians. Demography Working Paper 2004/3, cat. no. 3106.0.55.003(Canberra: ABS).
ABS (2009) Assessment of Methods for Developing Life Tables for Aboriginal and Torres Strait Islander Australians.Discussion Paper, cat. no. 3302.0.55.002 (Canberra: ABS).
ABS/Australian Institute of Health and Welfare (2005) The Health and Welfare of Australia’s Aboriginal andTorres Strait Islander Peoples, 2005. Cat. no. 4704.0 (Canberra: ABS).
Altman, J. C., ed. (1991) Aboriginal Employment Equity by the Year 2000. CAEPR Research MonographNo. 2 (Canberra: CAEPR, The ANU).
Altman, J. C. (2004) Practical reconciliation and the new mainstreaming: will it make a difference toindigenous Australians? Dialogue, 23 (2), 35–46.
Altman, J. C., and Gray, M. C. (2000) The Effects of the CDEP Scheme on the Economic Status of IndigenousAustralians: Some Analyses Using the 1996 Census. CAEPR Discussion Paper No. 195 (Canberra:CAEPR, The ANU).
Altman, J. C., and Hinkson M., eds (2007) Coercive Reconciliation: Stabilise, Normalise and Exit AboriginalAustralia (Melbourne: Arena).
Altman, J. C., and Hunter, B. H. (2003) Evaluating Indigenous socioeconomic outcomes in theReconciliation Decade, 1991–2001. Economic Papers, 22 (4), 1–16.
Altman, J. C., and Nieuwenhuysen, J. (1979) The Economic Status of Australian Aborigines (Cambridge:Cambridge University Press).
Altman, J. C., and Rowse, T. (2005) Indigenous affairs. In: P. Saunders, and J. Walter, eds. Ideas andInfluence: Social Science and Public Policy in Australia (Sydney: UNSW Press).
68 A philosophical justification for this proposition can be based on Nozick, Anarchy, State, and Utopia,who mounts a case against addressing equity through redistribution. He argues that policy makersshould establish a clear set of property rights based on original possession.
Prospects for ‘Closing the Gap’ 247
© 2009 The AuthorsJournal compilation © Blackwell Publishing Asia Pty Ltd and the Economic History Society of Australiaand New Zealand 2009
Altman, J. C., and Sanders, W. (1991) From Exclusion to Dependence: Aborigines and the Welfare State inAustralia. CAEPR Discussion Paper No. 1 (Canberra: CAEPR, The ANU).
Altman, J. C., Biddle, N., and Hunter, B. H. (2005) A historical perspective on Indigenous socio-economic outcomes, 1971–2001. Australian Economic History Review 45, 273–95.
Armstrong, J. S., ed. (2001) Principles of Forecasting: A Handbook for Researchers and Practitioners (Norwell:Massachusetts Kluwer Academic Publishers).
Becker, G. S., Murphy, K. M., and Tamura, R. (1990) Human capital, fertility, and economic growth.Journal of Political Economy, 98, S12–37.
Biddle, N. (2007) Does it pay to go to school? The benefits of and participation in education ofindigenous Australians (Phd thesis) (Canberra: ANU).
Biddle, N. (2008) The Scale and Composition of Indigenous Housing Need, 2001–06. CAEPR Working PaperNo. 47 (Canberra: CAEPR, The ANU).
Biddle, N., Taylor, J., and Yap, M. (2008) Indigenous Participation in Regional Labour Markets – 2001 to2006. CAEPR Discussion Paper No. 288 (Canberra: CAEPR, The ANU).
Bronfenbrenner, U. (1979) The Ecology of Human Development (Cambridge, MA: Harvard UniversityPress).
Commonwealth of Australia (2007) National Report to Parliament on Indigenous Education and Training(Canberra: Department of Education, Employment and Workplace Relations).
Daly, A., and Smith, D. (2003) Reproducing Exclusion or Inclusion? Implications for the Wellbeing of IndigenousAustralian Children. CAEPR Discussion Paper No. 253 (Canberra: CAEPR, The ANU).
Fisk, E. K. (1985) The Aboriginal Economy in Town and Country (Sydney, George Allen and Unwin).Gray, A., and Tesfaghiorghis, H. (1991) Social Indicators of the Aboriginal Population of Australia. CAEPR
Discussion Paper No. 18 (Canberra: CAEPR, The ANU).Gray, M. C., and Hunter, B. H. (2002) A synthetic cohort analysis of labour market outcomes
of Indigenous and non-Indigenous Australians, 1986–96. Australian Economic Review, 35 (4),391–404.
Harding, A., Yap, M., and Lloyd, R. (2004) Trends in spatial inequality, 1996 to 2001. AMP.NATSEMIncome and Wealth Report, Issue 8, September (Sydney: AMP Financial Services and theNational Centre for Social and Economic Modelling Pty Limited). [Accessed 4 May 2009]Available from URL: http://www.amp.com.au/ampnatsemreports.
Hunter, B. H. (1998) Assessing the validity of intercensal comparisons of Indigenous Australians,1986–96. Journal of the Australian Population Association, 15, 51–67.
Hunter, B. H. (1999) Three Nations, Not One: Indigenous and Other Australian Poverty. CAEPR WorkingPaper No. 1 (Canberra: CAEPR, The ANU). [Accessed 4 May 2009] Available from URL:http://www.anu.edu.au/caepr/.
Hunter, B. H. (2000) Social Exclusion, Social Capital and Indigenous Australians: Measuring the Social Costsof Unemployment. CAEPR Discussion Paper No. 204 (Canberra: CAEPR, The ANU).
Hunter, B. H. (2003) Trends in neighbourhood inequality of Australian, Canadian and US cities sincethe 1970s. The Australian Economic History Review, 43, 22–44.
Hunter, B. H. (2004) Indigenous Australians in the Contemporary Labour Market. ABS cat. No.2052.0(Canberra: ABS).
Hunter, B. H. (2007a) Arguing over [the] remote control: Why Indigenous policy needs to be basedon evidence and not hyperbole. Economic Papers, 26, 44–63.
Hunter, B. H. (2007b) Cumulative causation and the productivity commission’s frameworkfor overcoming indigenous disadvantage? Paper presented at the Australian Social PolicyConference Social Policy Through the Life Course: Building Community Capacity and SocialResilience, 11–13 July, University of New South Wales, Sydney.
Hunter, B. H., and Gray, M. C. (1998) Recent changes in the Australian workforce: a focus onthe structure of Indigenous employment. Australian Bulletin of the of Labour, 24, 220–40.
Hunter, B. H., and Taylor, J. (2004) Indigenous employment forecasts: implications for reconciliation.Agenda: A Journal of Policy Analysis and Reform, 11, 179–92.
Hunter, B. H., Kennedy, S., and Biddle, N. (2004) Indigenous and other Australian poverty: revisitingthe importance of equivalence scales. The Economic Record, 80, 411–22.
Hunter, B. H., Kinfu, Y., and Taylor, J. (2003) The Future of Indigenous Work: Forecasts of Labour Force Statusto 2011. CAEPR Discussion Paper No. 251 (Canberra: CAEPR, The ANU).
Kerr, J. (1986) Recalling the northern territory cattle station industry award Case of 1965 and theO’Shea Case of 1969. In: H. R. Nicholls Society, ed. Arbitration in Contempt (Melbourne: H.R.Nicholls Society).
Jon C. Altman, Nicholas Biddle and Boyd H. Hunter248
© 2009 The AuthorsJournal compilation © Blackwell Publishing Asia Pty Ltd and the Economic History Society of Australia
and New Zealand 2009
Kinfu, Y., and Taylor, J. (2002) Estimating the Components of Indigenous Population Change: 1996–2001.CAEPR Discussion Paper No. 240 (Canberra: CAEPR, The ANU).
Leigh, A. (2005) Deriving long-run inequality series from tax data. The Economic Record, 81, S58–70.Marmot, M., and Wilkinson, R. G. (1999) Social Determinants of Health (New York: Oxford University
Press).Northern Territory Government (2007) Closing the Gap of Indigenous Disadvantage: A Generational Plan of
Action. Department of the Chief Minister, Darwin. [Accessed 26 March 2008.] Available fromURL: http://action.nt.gov.au/plan_of_action/docs/closing_the_gap.pdf.
Nozick, R. (1974) Anarchy, State, and Utopia (New York: Basic Books).Quiggin, J. (1996) Great Expectations: Microeconomic Reform and Australia (Sydney: Allen and Unwin).Ross, K. (1999) Occasional Paper: Population Issues, Indigenous Australians. Cat. no. 4708.0 (Canberra: ABS).Ross, K., and Taylor, J. (2002) Improving life expectancy and health status: a comparison of Indig-
enous Australians and New Zealand Maori. In: G. A. Carmichael, and A. Dharmalingam, eds.Populations of New Zealand and Australia at the Millenium: A Joint Special Issue of the Journal of PopulationResearch and the New Zealand Population Review (Canberra and Wellington: Australian PopulationAssociation and Population Association of New Zealand).
Rowse, T. (1998) White Flour, White Power: From Rations to Citizenship in Central Australia (Cambridge:Cambridge University Press).
Rowse, T. (2002) Indigenous Futures: Choice and Development for Aboriginal and Islander Australia (Sydney:UNSW Press).
Sanders, W. (1991) Destined to fail: the Hawke government’s pursuit of statistical equality in employ-ment and income status between Aborigines and other Australians by the year 2000 (or acautionary tale involving the new managerialism and social justice strategies). Australian AboriginalStudies, 1991 (2), 13–8.
Sanders, W. (1997) Opportunities and Problems Astride the Welfare/work Divide: The CDEP Scheme in AustralianSocial Policy. CAEPR Discussion Paper No. 141 (Canberra: CAEPR, The ANU).
Smith, L. R. (1980) The Aboriginal Population of Australia (Canberra: ANU Press).Steering Committee for the Review of Government Service Provision (2003) Overcoming Indigenous
Disadvantage: Key Indicators 2003 Report (Melbourne: Productivity Commission).Steering Committee for the Review of Government Service Provision (2005) Overcoming Indigenous
Disadvantage: Key Indicators 2005 Report (Melbourne: Productivity Commission).Steering Committee for the Review of Government Service Provision (2007) Overcoming Indigenous
Disadvantage: Key Indicators 2007 Report (Melbourne: Productivity Commission).Taylor, J., and Altman, J. C. (1997) The Job Ahead: Escalating Economic Costs of Indigenous Employment
Disparity, Office of Public Affairs (Canberra: ATSIC).Taylor, J., and Biddle, N. (2008) Locations of Indigenous Population Change: What Can we Say? CAEPR
Working Paper No. 43 (Canberra: CAEPR, The ANU).Taylor, J., and Hunter, B. H. (1998) The Job Still Ahead: Economic Costs of Continuing Indigenous Employment
Disparity (Canberra: Office of Public Affairs, ATSIC).Te Puni Kokiri (2000) Progress Towards Closing Social And Economic Gaps Between Maori And Non-Maori:
A Report To The Minister Of Maori Affairs (Wellington: Te Puni Kokiri).Vos, T., Barker, B., Stanley, L., and Lopez, A. (2007) The Burden of Disease and Injury in Aboriginal and
Torres Strait Islander Peoples 2003 (Brisbane: Centre for Burden of Disease and Cost-Effectiveness,School of Population Health The University of Queensland).
Prospects for ‘Closing the Gap’ 249
© 2009 The AuthorsJournal compilation © Blackwell Publishing Asia Pty Ltd and the Economic History Society of Australiaand New Zealand 2009
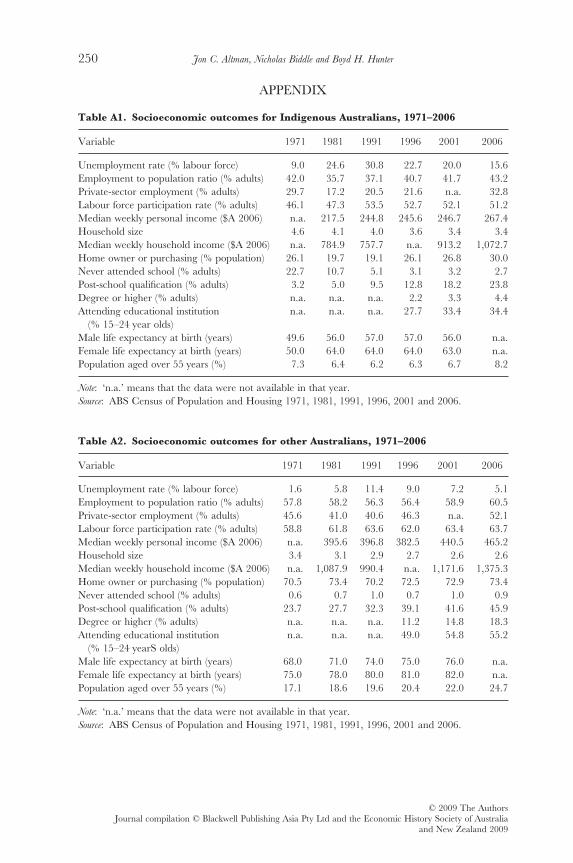
APPENDIX
Table A1. Socioeconomic outcomes for Indigenous Australians, 1971–2006
Variable 1971 1981 1991 1996 2001 2006
Unemployment rate (% labour force) 9.0 24.6 30.8 22.7 20.0 15.6Employment to population ratio (% adults) 42.0 35.7 37.1 40.7 41.7 43.2Private-sector employment (% adults) 29.7 17.2 20.5 21.6 n.a. 32.8Labour force participation rate (% adults) 46.1 47.3 53.5 52.7 52.1 51.2Median weekly personal income ($A 2006) n.a. 217.5 244.8 245.6 246.7 267.4Household size 4.6 4.1 4.0 3.6 3.4 3.4Median weekly household income ($A 2006) n.a. 784.9 757.7 n.a. 913.2 1,072.7Home owner or purchasing (% population) 26.1 19.7 19.1 26.1 26.8 30.0Never attended school (% adults) 22.7 10.7 5.1 3.1 3.2 2.7Post-school qualification (% adults) 3.2 5.0 9.5 12.8 18.2 23.8Degree or higher (% adults) n.a. n.a. n.a. 2.2 3.3 4.4Attending educational institution
(% 15–24 year olds)n.a. n.a. n.a. 27.7 33.4 34.4
Male life expectancy at birth (years) 49.6 56.0 57.0 57.0 56.0 n.a.Female life expectancy at birth (years) 50.0 64.0 64.0 64.0 63.0 n.a.Population aged over 55 years (%) 7.3 6.4 6.2 6.3 6.7 8.2
Note: ‘n.a.’ means that the data were not available in that year.Source: ABS Census of Population and Housing 1971, 1981, 1991, 1996, 2001 and 2006.
Table A2. Socioeconomic outcomes for other Australians, 1971–2006
Variable 1971 1981 1991 1996 2001 2006
Unemployment rate (% labour force) 1.6 5.8 11.4 9.0 7.2 5.1Employment to population ratio (% adults) 57.8 58.2 56.3 56.4 58.9 60.5Private-sector employment (% adults) 45.6 41.0 40.6 46.3 n.a. 52.1Labour force participation rate (% adults) 58.8 61.8 63.6 62.0 63.4 63.7Median weekly personal income ($A 2006) n.a. 395.6 396.8 382.5 440.5 465.2Household size 3.4 3.1 2.9 2.7 2.6 2.6Median weekly household income ($A 2006) n.a. 1,087.9 990.4 n.a. 1,171.6 1,375.3Home owner or purchasing (% population) 70.5 73.4 70.2 72.5 72.9 73.4Never attended school (% adults) 0.6 0.7 1.0 0.7 1.0 0.9Post-school qualification (% adults) 23.7 27.7 32.3 39.1 41.6 45.9Degree or higher (% adults) n.a. n.a. n.a. 11.2 14.8 18.3Attending educational institution
(% 15–24 yearS olds)n.a. n.a. n.a. 49.0 54.8 55.2
Male life expectancy at birth (years) 68.0 71.0 74.0 75.0 76.0 n.a.Female life expectancy at birth (years) 75.0 78.0 80.0 81.0 82.0 n.a.Population aged over 55 years (%) 17.1 18.6 19.6 20.4 22.0 24.7
Note: ‘n.a.’ means that the data were not available in that year.Source: ABS Census of Population and Housing 1971, 1981, 1991, 1996, 2001 and 2006.
Jon C. Altman, Nicholas Biddle and Boyd H. Hunter250
© 2009 The AuthorsJournal compilation © Blackwell Publishing Asia Pty Ltd and the Economic History Society of Australia
and New Zealand 2009
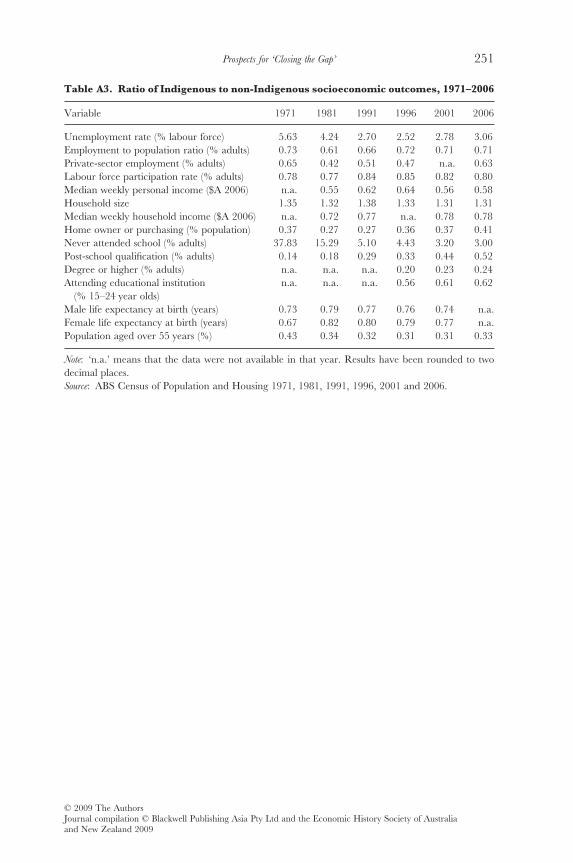
Table A3. Ratio of Indigenous to non-Indigenous socioeconomic outcomes, 1971–2006
Variable 1971 1981 1991 1996 2001 2006
Unemployment rate (% labour force) 5.63 4.24 2.70 2.52 2.78 3.06Employment to population ratio (% adults) 0.73 0.61 0.66 0.72 0.71 0.71Private-sector employment (% adults) 0.65 0.42 0.51 0.47 n.a. 0.63Labour force participation rate (% adults) 0.78 0.77 0.84 0.85 0.82 0.80Median weekly personal income ($A 2006) n.a. 0.55 0.62 0.64 0.56 0.58Household size 1.35 1.32 1.38 1.33 1.31 1.31Median weekly household income ($A 2006) n.a. 0.72 0.77 n.a. 0.78 0.78Home owner or purchasing (% population) 0.37 0.27 0.27 0.36 0.37 0.41Never attended school (% adults) 37.83 15.29 5.10 4.43 3.20 3.00Post-school qualification (% adults) 0.14 0.18 0.29 0.33 0.44 0.52Degree or higher (% adults) n.a. n.a. n.a. 0.20 0.23 0.24Attending educational institution
(% 15–24 year olds)n.a. n.a. n.a. 0.56 0.61 0.62
Male life expectancy at birth (years) 0.73 0.79 0.77 0.76 0.74 n.a.Female life expectancy at birth (years) 0.67 0.82 0.80 0.79 0.77 n.a.Population aged over 55 years (%) 0.43 0.34 0.32 0.31 0.31 0.33
Note: ‘n.a.’ means that the data were not available in that year. Results have been rounded to twodecimal places.Source: ABS Census of Population and Housing 1971, 1981, 1991, 1996, 2001 and 2006.
Prospects for ‘Closing the Gap’ 251
© 2009 The AuthorsJournal compilation © Blackwell Publishing Asia Pty Ltd and the Economic History Society of Australiaand New Zealand 2009