closing the gaps in florida's wildlife habitat
TRANSCRIPT
CLOSING THE GAPS INFLORIDA’S WILDLIFE HABITAT
CONSERVATION SYSTEM
Recommendations to meet minimum conservation goals fordeclining wildlife species and rare plant and animal communities.
James Cox, Randy Kautz, Maureen MacLaughlin, and Terry Gilbert
Office of Environmental Services
Florida Game and Fresh Water Fish Commission
620 South Meridian Street
Tallahassee, Florida 32399-1600
1994
will diminish greatly. Just as we now blame past generationsfor the extinction of the passenger pigeon, Carolina parakeet,and ivory-billed woodpecker, future Floridians will ultimatelyhold our generation responsible for the manner in which we conserve the species and natural resources that we inherit-ed. Perhaps the greatest insult we could ever bear would beto document the problems that threaten some of Florida’srarest plants and animals, propose solutions to theseproblems, and then fail to act with proper speed and resolve.
ACKNOWLEDGEMENTS
Many individuals contributed their valuable time towardsthe completion of this report. Ken Haddad and GailMcAuley, Florida Department of Environmental Protection,assisted in procuring the Landsat imagery used to create astatewide map of land cover. The quality of the land-covermap developed from Landsat imagery and used in mostanalyses was the result of the dedicated efforts of GregMauldin, Jessie Day, Khaleda Hatim, Doug Holman, andother personnel currently or formerly employed by theFlorida Department of Transportation. Lance Ham pilotedthe helicopter used during the land-cover classification workand was always willing to go the extra mile needed to com-plete the analyses within the brief time allowed. MarkKopeny assisted in the construction of range maps used inour abbreviated “gap analysis” (described in Section 6.3.4).We also owe thanks to staff of the Florida Natural AreasInventory and Florida Game and Fresh Water FishCommission who helped to develop and maintain importantdatabases describing the occurrence of rare species and natur-al communities throughout Florida. We are especially grate-ful to Dr. Allen Egbert and Colonel Robert Brantly for theirsupport for this project from beginning to end.
Extremely helpful comments on earlier drafts of thisreport were provided by a courageous group that perseveredthrough a somewhat byzantine structure and a mountain ofinfelicitous prose. We appreciate the constructive commentsand guidance provided by Brian Barnett, Jim Beever, JimBrady, Mike Delany, Kim Dryden, Diane Eggeman, JohnFitzpatrick, Phil Frank, Jeff Gore, Paul Gray, Brad Hartman,Tom Logan, Dave Maehr, Ken Meyer, Brian Millsap, PaulMoler, Frank Montalbano, Steve Nesbitt, Katy NeSmith,Larry Perrin, Mary Ann Poole, Doug Runde, Beth Stys, andJohn Wooding.
Finally, Sharon Arnold, Amber Ayers, and John Stysprovided invaluable assistance by helping to prepare thenumerous figures, cumbersome tables, and lengthy text forfinal publication. This report is a product of Florida’sNongame Wildlife Program.
FOREWORD
When Spanish anchors first dropped into Florida watersnearly 500 years ago, Florida was essentially one large naturepreserve that also supported a population of about 1,000,000native Americans. Wildlife at this time roamed freely across35 million acres in search of food, shelter, and water, whileindividual human settlements covered less area than mostmodern-day parking lots (and certainly occurred with lessregularity). The state’s road system in pre-Columbian timesconsisted of narrow foot paths that were used by panthers,bobcats, and black bears as frequently as by nativeAmericans, and the few human edifices present quickly gaveway to a surrounding landscape consisting of tall, majestictrees, most hundreds of years old, and extensive open prairiesand marshes.
Today, many species of wildlife are caught in a state ofsiege as the habitats needed to sustain wildlife populationsrapidly disappear. In just the last 50 years more than 8 mil-lion acres of forest and wetland habitats (about 24% of theState) were cleared to accommodate an expanding humanpopulation. This area is 16-times larger than our state’slargest national forest and exceeds the total land area foundsouth of approximately Port Charlotte. As Florida’s humanpopulation continues to grow towards an estimated 16 millionresidents by the year 2000, increasing demands will be placedon our remaining natural systems, and wildlife populationswill be forced into smaller and smaller areas as a result.
If wildlife populations are to persist in the face of suchsweeping changes, we must conserve a base of habitat that iscapable of sustaining wildlife populations far into the future.This habitat base should consist of preservation areas that are publicly owned and managed primarily for naturalconditions, but it must also include private lands where spe-cial land-use agreements are arranged that allow naturalresources to be conserved without sacrificing all private usesof the land.
Florida has succeeded in protecting many habitat areasthrough ambitious land acquisition and land-use planningefforts, but large gaps still exist in the statewide system ofwildlife conservation lands. For example, no existing conser-vation area is large enough to support a viable population ofFlorida panthers or Audubon’s crested caracaras.Furthermore, the habitat base provided to other rare speciesby existing conservation areas is dangerously small, andsome species (e.g., Florida black bear, American swallow-tailed kite, and short-tailed hawk) may be extirpated unlesswe enlarge the land base that can be managed on behalf ofwildlife. The gaps in the statewide system of wildlifeconservation areas identified in this report must be closed ifwe are to maintain these and other rare species as part of theFlorida landscape.
Although closing the gaps requires perseverance, money,education, and political and community support from today’sgeneration of decision makers, the results of these and otherplanning efforts will be most important to future generations.This fact might cause members of the current generation tofeel no sense of urgency. However, the next decade repre-sents a critical turning point in efforts to conserve habitat forseveral rare species. If we fail to act now, the chances of suc-cessfully maintaining species such as Florida panther,Audubon’s crested caracara, Florida black bear, and others
CLOSING THE GAPS IN FLORIDA’S WILDLIFE HABITAT CONSERVATION SYSTEM i
ii
TABLE OF CONTENTS
FOREWORD . . . . . . . . . . . . . . . . . . . . . . . . . . . . . . . . . . . . . . . . . . . . . . . . . . . . . . . . . . . . . . . . . . . . . . . . . . . . . . . . . . . . . . . . . . . . . . . . . . . . . . . . . . . . . . . . . . . . . . . . . . . . . . . . . . . . . . . . . . . . . . . . . . . . . . . . . . . . . . . . .iACKNOWLEDGEMENTS . . . . . . . . . . . . . . . . . . . . . . . . . . . . . . . . . . . . . . . . . . . . . . . . . . . . . . . . . . . . . . . . . . . . . . . . . . . . . . . . . . . . . . . . . . . . . . . . . . . . . . . . . . . . . . . . . . . . . . . . . . . . . . . . . . . . . . . . . . . .iTABLE OF CONTENTS . . . . . . . . . . . . . . . . . . . . . . . . . . . . . . . . . . . . . . . . . . . . . . . . . . . . . . . . . . . . . . . . . . . . . . . . . . . . . . . . . . . . . . . . . . . . . . . . . . . . . . . . . . . . . . . . . . . . . . . . . . . . . . . . . . . . . . . . . . . . . .iiEXECUTIVE SUMMARY . . . . . . . . . . . . . . . . . . . . . . . . . . . . . . . . . . . . . . . . . . . . . . . . . . . . . . . . . . . . . . . . . . . . . . . . . . . . . . . . . . . . . . . . . . . . . . . . . . . . . . . . . . . . . . . . . . . . . . . . . . . . . . . . . . . . . . . . . . .1ORGANIZATIONAL OVERVIEW . . . . . . . . . . . . . . . . . . . . . . . . . . . . . . . . . . . . . . . . . . . . . . . . . . . . . . . . . . . . . . . . . . . . . . . . . . . . . . . . . . . . . . . . . . . . . . . . . . . . . . . . . . . . . . . . . . . . . . . . . . . . . .2
SECTION 1. SCOPE AND SIGNIFICANCE OF THE PROBLEM . . . . . . . . . . . . . . . . . . . . . . . . . . . . . . . . . . . . . . . . . . . . . . . . . . . . . . . . . . . . . . . . . . . . . . . . . .3SECTION 1.1. COMPONENTS AND VALUE OF FLORIDA’S BIOLOGICAL DIVERSITY . . . . . . . . . . . . . . . . . . . . . . . . . . . . . . . .3SECTION 1.2. FACTORS CONTRIBUTING TO THE LOSS OF BIOLOGICAL DIVERSITY . . . . . . . . . . . . . . . . . . . . . . . . . . . . .4
SECTION 2. PROJECT ABSTRACT AND BRIEF DESCRIPTIONS OF REPORT SECTIONS . . . . . . . . . . . . . . . . . . . . . . . . . .7SECTION 2.1. OBJECTIVES AND GENERAL APPROACH . . . . . . . . . . . . . . . . . . . . . . . . . . . . . . . . . . . . . . . . . . . . . . . . . . . . . . . . . . . . . . . . . . . . . . . . . . . . . . . .7SECTION 2.2. OVERVIEW OF DATA SETS . . . . . . . . . . . . . . . . . . . . . . . . . . . . . . . . . . . . . . . . . . . . . . . . . . . . . . . . . . . . . . . . . . . . . . . . . . . . . . . . . . . . . . . . . . . . . . . . . . . . . . . . .7SECTION 2.3. POPULATION VIABILITY ANALYSIS . . . . . . . . . . . . . . . . . . . . . . . . . . . . . . . . . . . . . . . . . . . . . . . . . . . . . . . . . . . . . . . . . . . . . . . . . . . . . . . . . . . . . . . . .7SECTION 2.4. FOCAL SPECIES ANALYSIS AND DESIGNATION OF STRATEGIC HABITAT
CONSERVATION AREAS . . . . . . . . . . . . . . . . . . . . . . . . . . . . . . . . . . . . . . . . . . . . . . . . . . . . . . . . . . . . . . . . . . . . . . . . . . . . . . . . . . . . . . . . . . . . . . . . . . . . . . . . . . . . . .8SECTION 2.5. REGIONAL MAPS OF HOT SPOTS OF BIODIVERSITY . . . . . . . . . . . . . . . . . . . . . . . . . . . . . . . . . . . . . . . . . . . . . . . . . . . . . . . . . . . .9SECTION 2.6. USES OF PROJECT MAPS . . . . . . . . . . . . . . . . . . . . . . . . . . . . . . . . . . . . . . . . . . . . . . . . . . . . . . . . . . . . . . . . . . . . . . . . . . . . . . . . . . . . . . . . . . . . . . . . . . . . . . . . . . . .9SECTION 2.7. AVAILABILITY OF PROJECT MAPS . . . . . . . . . . . . . . . . . . . . . . . . . . . . . . . . . . . . . . . . . . . . . . . . . . . . . . . . . . . . . . . . . . . . . . . . . . . . . . . . . . . . . . . . . . .9
SECTION 3. DEVELOPMENT OF GEOGRAPHIC INFORMATION SYSTEMS DATA SETS . . . . . . . . . . . . . . . . . . . . . . . . .11SECTION 3.1. A STATEWIDE LAND-COVER MAP . . . . . . . . . . . . . . . . . . . . . . . . . . . . . . . . . . . . . . . . . . . . . . . . . . . . . . . . . . . . . . . . . . . . . . . . . . . . . . . . . . . . . . . . . .11SECTION 3.2. A STATEWIDE MAP OF CONSERVATION LANDS . . . . . . . . . . . . . . . . . . . . . . . . . . . . . . . . . . . . . . . . . . . . . . . . . . . . . . . . . . . . . . . . . . .11SECTION 3.3. OTHER GEOGRAPHIC DATA SETS . . . . . . . . . . . . . . . . . . . . . . . . . . . . . . . . . . . . . . . . . . . . . . . . . . . . . . . . . . . . . . . . . . . . . . . . . . . . . . . . . . . . . . . . . . .16
SECTION 4. DEVELOPMENT OF INFORMATION ON WILDLIFE SPECIES . . . . . . . . . . . . . . . . . . . . . . . . . . . . . . . . . . . . . . . . . . . . . . . . .19SECTION 4.1. SELECTION OF SPECIES FOR ANALYSIS . . . . . . . . . . . . . . . . . . . . . . . . . . . . . . . . . . . . . . . . . . . . . . . . . . . . . . . . . . . . . . . . . . . . . . . . . . . . . . . .19SECTION 4.2. DEVELOPMENT OF DISTRIBUTION INFORMATION . . . . . . . . . . . . . . . . . . . . . . . . . . . . . . . . . . . . . . . . . . . . . . . . . . . . . . . . . . . . .20
SECTION 5. ASSESSING POPULATION VIABILITY . . . . . . . . . . . . . . . . . . . . . . . . . . . . . . . . . . . . . . . . . . . . . . . . . . . . . . . . . . . . . . . . . . . . . . . . . . . . . . . . . . . . . . . . . .23SECTION 5.1. ENVIRONMENTAL VARIABILITY . . . . . . . . . . . . . . . . . . . . . . . . . . . . . . . . . . . . . . . . . . . . . . . . . . . . . . . . . . . . . . . . . . . . . . . . . . . . . . . . . . . . . . . . . . . .23SECTION 5.2. INBREEDING AND INBREEDING DEPRESSION . . . . . . . . . . . . . . . . . . . . . . . . . . . . . . . . . . . . . . . . . . . . . . . . . . . . . . . . . . . . . . . . . . . . .29SECTION 5.3. GUIDELINES FOR ESTABLISHING MINIMUM LEVELS OF SECURITY . . . . . . . . . . . . . . . . . . . . . . . . . . . . . . .31
SECTION 6. IDENTIFICATION OF GAPS IN FLORIDA’S WILDLIFE CONSERVATION SYSTEM . . . . . . . . . . . . .33SECTION 6.1. THEORY PERTINENT TO THE IDENTIFICATION AND DESIGN OF CONSERVATION AREAS . . . .33SECTION 6.2. ANALYSES OF INDIVIDUAL FOCAL SPECIES AND DEVELOPMENT OF SPECIES
CONSERVATION PLANS . . . . . . . . . . . . . . . . . . . . . . . . . . . . . . . . . . . . . . . . . . . . . . . . . . . . . . . . . . . . . . . . . . . . . . . . . . . . . . . . . . . . . . . . . . . . . . . . . . . . . . . . . . . .35Section 6.2.1. American Crocodile . . . . . . . . . . . . . . . . . . . . . . . . . . . . . . . . . . . . . . . . . . . . . . . . . . . . . . . . . . . . . . . . . . . . . . . . . . . . . . . . . . . . . . . . . . . . . . . . . . . . . . . . . . . . . . . . . .35Section 6.2.2. American Oystercatcher . . . . . . . . . . . . . . . . . . . . . . . . . . . . . . . . . . . . . . . . . . . . . . . . . . . . . . . . . . . . . . . . . . . . . . . . . . . . . . . . . . . . . . . . . . . . . . . . . . . . . . . . . . . .36Section 6.2.3. American Swallow-tailed Kite . . . . . . . . . . . . . . . . . . . . . . . . . . . . . . . . . . . . . . . . . . . . . . . . . . . . . . . . . . . . . . . . . . . . . . . . . . . . . . . . . . . . . . . . . . . . . . . . . .37Section 6.2.4. Atlantic and Gulf Salt Marsh Snakes . . . . . . . . . . . . . . . . . . . . . . . . . . . . . . . . . . . . . . . . . . . . . . . . . . . . . . . . . . . . . . . . . . . . . . . . . . . . . . . . . . . . . . . .38Section 6.2.5. Audubon’s Crested Caracara . . . . . . . . . . . . . . . . . . . . . . . . . . . . . . . . . . . . . . . . . . . . . . . . . . . . . . . . . . . . . . . . . . . . . . . . . . . . . . . . . . . . . . . . . . . . . . . . . . . . .39Section 6.2.6. Beach Mice . . . . . . . . . . . . . . . . . . . . . . . . . . . . . . . . . . . . . . . . . . . . . . . . . . . . . . . . . . . . . . . . . . . . . . . . . . . . . . . . . . . . . . . . . . . . . . . . . . . . . . . . . . . . . . . . . . . . . . . . . . . . . .44Section 6.2.7. Black-whiskered Vireo . . . . . . . . . . . . . . . . . . . . . . . . . . . . . . . . . . . . . . . . . . . . . . . . . . . . . . . . . . . . . . . . . . . . . . . . . . . . . . . . . . . . . . . . . . . . . . . . . . . . . . . . . . . . . .46Section 6.2.8. Bobcat . . . . . . . . . . . . . . . . . . . . . . . . . . . . . . . . . . . . . . . . . . . . . . . . . . . . . . . . . . . . . . . . . . . . . . . . . . . . . . . . . . . . . . . . . . . . . . . . . . . . . . . . . . . . . . . . . . . . . . . . . . . . . . . . . . . . . .47Section 6.2.9. Bog Frog . . . . . . . . . . . . . . . . . . . . . . . . . . . . . . . . . . . . . . . . . . . . . . . . . . . . . . . . . . . . . . . . . . . . . . . . . . . . . . . . . . . . . . . . . . . . . . . . . . . . . . . . . . . . . . . . . . . . . . . . . . . . . . . . . .47Section 6.2.10. Cuban Snowy Plover . . . . . . . . . . . . . . . . . . . . . . . . . . . . . . . . . . . . . . . . . . . . . . . . . . . . . . . . . . . . . . . . . . . . . . . . . . . . . . . . . . . . . . . . . . . . . . . . . . . . . . . . . . . . . .48Section 6.2.11. Florida Black Bear . . . . . . . . . . . . . . . . . . . . . . . . . . . . . . . . . . . . . . . . . . . . . . . . . . . . . . . . . . . . . . . . . . . . . . . . . . . . . . . . . . . . . . . . . . . . . . . . . . . . . . . . . . . . . . . . . .50Section 6.2.12. Florida Burrowing Owl . . . . . . . . . . . . . . . . . . . . . . . . . . . . . . . . . . . . . . . . . . . . . . . . . . . . . . . . . . . . . . . . . . . . . . . . . . . . . . . . . . . . . . . . . . . . . . . . . . . . . . . . . . .63Section 6.2.13. Florida Grasshopper Sparrow . . . . . . . . . . . . . . . . . . . . . . . . . . . . . . . . . . . . . . . . . . . . . . . . . . . . . . . . . . . . . . . . . . . . . . . . . . . . . . . . . . . . . . . . . . . . . . . .64Section 6.2.14. Florida Panther . . . . . . . . . . . . . . . . . . . . . . . . . . . . . . . . . . . . . . . . . . . . . . . . . . . . . . . . . . . . . . . . . . . . . . . . . . . . . . . . . . . . . . . . . . . . . . . . . . . . . . . . . . . . . . . . . . . . . . .64Section 6.2.15. Florida Sandhill Crane . . . . . . . . . . . . . . . . . . . . . . . . . . . . . . . . . . . . . . . . . . . . . . . . . . . . . . . . . . . . . . . . . . . . . . . . . . . . . . . . . . . . . . . . . . . . . . . . . . . . . . . . . . . .72Section 6.2.16. Florida Scrub Jay . . . . . . . . . . . . . . . . . . . . . . . . . . . . . . . . . . . . . . . . . . . . . . . . . . . . . . . . . . . . . . . . . . . . . . . . . . . . . . . . . . . . . . . . . . . . . . . . . . . . . . . . . . . . . . . . . . . .76Section 6.2.17. Florida Scrub Lizard . . . . . . . . . . . . . . . . . . . . . . . . . . . . . . . . . . . . . . . . . . . . . . . . . . . . . . . . . . . . . . . . . . . . . . . . . . . . . . . . . . . . . . . . . . . . . . . . . . . . . . . . . . . . . . .84Section 6.2.18. Fox Squirrels . . . . . . . . . . . . . . . . . . . . . . . . . . . . . . . . . . . . . . . . . . . . . . . . . . . . . . . . . . . . . . . . . . . . . . . . . . . . . . . . . . . . . . . . . . . . . . . . . . . . . . . . . . . . . . . . . . . . . . . . . .85Section 6.2.19. Gopher Tortoise . . . . . . . . . . . . . . . . . . . . . . . . . . . . . . . . . . . . . . . . . . . . . . . . . . . . . . . . . . . . . . . . . . . . . . . . . . . . . . . . . . . . . . . . . . . . . . . . . . . . . . . . . . . . . . . . . . . . . .86Section 6.2.20. Limpkin . . . . . . . . . . . . . . . . . . . . . . . . . . . . . . . . . . . . . . . . . . . . . . . . . . . . . . . . . . . . . . . . . . . . . . . . . . . . . . . . . . . . . . . . . . . . . . . . . . . . . . . . . . . . . . . . . . . . . . . . . . . . . . . . . .86Section 6.2.21. Mangrove Cuckoo . . . . . . . . . . . . . . . . . . . . . . . . . . . . . . . . . . . . . . . . . . . . . . . . . . . . . . . . . . . . . . . . . . . . . . . . . . . . . . . . . . . . . . . . . . . . . . . . . . . . . . . . . . . . . . . . . .92Section 6.2.22. Mottled Duck . . . . . . . . . . . . . . . . . . . . . . . . . . . . . . . . . . . . . . . . . . . . . . . . . . . . . . . . . . . . . . . . . . . . . . . . . . . . . . . . . . . . . . . . . . . . . . . . . . . . . . . . . . . . . . . . . . . . . . . . .93
FLORIDA GAME AND FRESH WATER FISH COMMISSION
CLOSING THE GAPS IN FLORIDA’S WILDLIFE HABITAT CONSERVATION SYSTEM
Section 6.2.23. Pine Barrens Treefrog . . . . . . . . . . . . . . . . . . . . . . . . . . . . . . . . . . . . . . . . . . . . . . . . . . . . . . . . . . . . . . . . . . . . . . . . . . . . . . . . . . . . . . . . . . . . . . . . . . . . . . . . . . . . .95Section 6.2.24. Piping Plover . . . . . . . . . . . . . . . . . . . . . . . . . . . . . . . . . . . . . . . . . . . . . . . . . . . . . . . . . . . . . . . . . . . . . . . . . . . . . . . . . . . . . . . . . . . . . . . . . . . . . . . . . . . . . . . . . . . . . . . . . .96Section 6.2.25. Red-cockaded Woodpecker . . . . . . . . . . . . . . . . . . . . . . . . . . . . . . . . . . . . . . . . . . . . . . . . . . . . . . . . . . . . . . . . . . . . . . . . . . . . . . . . . . . . . . . . . . . . . . . . . . . . .96Section 6.2.26. Seaside Sparrows . . . . . . . . . . . . . . . . . . . . . . . . . . . . . . . . . . . . . . . . . . . . . . . . . . . . . . . . . . . . . . . . . . . . . . . . . . . . . . . . . . . . . . . . . . . . . . . . . . . . . . . . . . . . . . . . . .101Section 6.2.27. Short-tailed Hawk . . . . . . . . . . . . . . . . . . . . . . . . . . . . . . . . . . . . . . . . . . . . . . . . . . . . . . . . . . . . . . . . . . . . . . . . . . . . . . . . . . . . . . . . . . . . . . . . . . . . . . . . . . . . . . . . .103Section 6.2.28. Snail Kite . . . . . . . . . . . . . . . . . . . . . . . . . . . . . . . . . . . . . . . . . . . . . . . . . . . . . . . . . . . . . . . . . . . . . . . . . . . . . . . . . . . . . . . . . . . . . . . . . . . . . . . . . . . . . . . . . . . . . . . . . . . . .104Section 6.2.29. Southeastern American Kestrel . . . . . . . . . . . . . . . . . . . . . . . . . . . . . . . . . . . . . . . . . . . . . . . . . . . . . . . . . . . . . . . . . . . . . . . . . . . . . . . . . . . . . . . . . . . . .105Section 6.2.30. Southern Bald Eagle . . . . . . . . . . . . . . . . . . . . . . . . . . . . . . . . . . . . . . . . . . . . . . . . . . . . . . . . . . . . . . . . . . . . . . . . . . . . . . . . . . . . . . . . . . . . . . . . . . . . . . . . . . . . .110Section 6.2.31. White-crowned Pigeon . . . . . . . . . . . . . . . . . . . . . . . . . . . . . . . . . . . . . . . . . . . . . . . . . . . . . . . . . . . . . . . . . . . . . . . . . . . . . . . . . . . . . . . . . . . . . . . . . . . . . . . . . .111Section 6.2.32. Wild Turkey . . . . . . . . . . . . . . . . . . . . . . . . . . . . . . . . . . . . . . . . . . . . . . . . . . . . . . . . . . . . . . . . . . . . . . . . . . . . . . . . . . . . . . . . . . . . . . . . . . . . . . . . . . . . . . . . . . . . . . . . . .114Section 6.2.33. Wilson’s Plover . . . . . . . . . . . . . . . . . . . . . . . . . . . . . . . . . . . . . . . . . . . . . . . . . . . . . . . . . . . . . . . . . . . . . . . . . . . . . . . . . . . . . . . . . . . . . . . . . . . . . . . . . . . . . . . . . . . . .114
SECTION 6.3. HABITAT CONSERVATION AREAS FOR OTHER ELEMENTS OF BIODIVERSITY . . . . . . . . . . . .115Section 6.3.1. Areas Supporting Globally Rare Plant Species . . . . . . . . . . . . . . . . . . . . . . . . . . . . . . . . . . . . . . . . . . . . . . . . . . . . . . . . . . . . . . . . . . . . . . . .115Section 6.3.2. Bat Maternity and Winter Roosting Caves . . . . . . . . . . . . . . . . . . . . . . . . . . . . . . . . . . . . . . . . . . . . . . . . . . . . . . . . . . . . . . . . . . . . . . . . . . . . . .119Section 6.3.3. Coastal Communities . . . . . . . . . . . . . . . . . . . . . . . . . . . . . . . . . . . . . . . . . . . . . . . . . . . . . . . . . . . . . . . . . . . . . . . . . . . . . . . . . . . . . . . . . . . . . . . . . . . . . . . . . . . . . .120Section 6.3.4. Gap Analysis . . . . . . . . . . . . . . . . . . . . . . . . . . . . . . . . . . . . . . . . . . . . . . . . . . . . . . . . . . . . . . . . . . . . . . . . . . . . . . . . . . . . . . . . . . . . . . . . . . . . . . . . . . . . . . . . . . . . . . . . . .121Section 6.3.5. Pine Rocklands . . . . . . . . . . . . . . . . . . . . . . . . . . . . . . . . . . . . . . . . . . . . . . . . . . . . . . . . . . . . . . . . . . . . . . . . . . . . . . . . . . . . . . . . . . . . . . . . . . . . . . . . . . . . . . . . . . . . . . .124Section 6.3.6. Prairie Birds . . . . . . . . . . . . . . . . . . . . . . . . . . . . . . . . . . . . . . . . . . . . . . . . . . . . . . . . . . . . . . . . . . . . . . . . . . . . . . . . . . . . . . . . . . . . . . . . . . . . . . . . . . . . . . . . . . . . . . . . . . .127Section 6.3.7. Sandhill Communities . . . . . . . . . . . . . . . . . . . . . . . . . . . . . . . . . . . . . . . . . . . . . . . . . . . . . . . . . . . . . . . . . . . . . . . . . . . . . . . . . . . . . . . . . . . . . . . . . . . . . . . . . . . .128Section 6.3.8. Scrub Communities . . . . . . . . . . . . . . . . . . . . . . . . . . . . . . . . . . . . . . . . . . . . . . . . . . . . . . . . . . . . . . . . . . . . . . . . . . . . . . . . . . . . . . . . . . . . . . . . . . . . . . . . . . . . . . . .129Section 6.3.9. Tropical Hardwood Hammock Communities . . . . . . . . . . . . . . . . . . . . . . . . . . . . . . . . . . . . . . . . . . . . . . . . . . . . . . . . . . . . . . . . . . . . . . . . . .132Section 6.3.10. Wetlands Important to Wading Birds . . . . . . . . . . . . . . . . . . . . . . . . . . . . . . . . . . . . . . . . . . . . . . . . . . . . . . . . . . . . . . . . . . . . . . . . . . . . . . . . . . . . .134
SECTION 7. CLOSING THE GAPS: AN AGGREGATE MAP OF IMPORTANT HABITATAREAS IN FLORIDA . . . . . . . . . . . . . . . . . . . . . . . . . . . . . . . . . . . . . . . . . . . . . . . . . . . . . . . . . . . . . . . . . . . . . . . . . . . . . . . . . . . . . . . . . . . . . . . . . . . . . . . . . . . . . . . . . . . . . . . . .137
SECTION 7.1. STRATEGIC HABITAT CONSERVATION AREAS IN FLORIDA . . . . . . . . . . . . . . . . . . . . . . . . . . . . . . . . . . . . . . . . . . . . .137SECTION 7.2. COMPARISON OF AGGREGATE MAP OF STRATEGIC HABITAT CONSERVATION AREAS
WITH OTHER MAPS OF NATURAL RESOURCES . . . . . . . . . . . . . . . . . . . . . . . . . . . . . . . . . . . . . . . . . . . . . . . . . . . . . . . . . . . . . . . . .142
SECTION 8. IDENTIFYING REGIONAL HOT SPOTS . . . . . . . . . . . . . . . . . . . . . . . . . . . . . . . . . . . . . . . . . . . . . . . . . . . . . . . . . . . . . . . . . . . . . . . . . . . . . . . . . . . . . . .147SECTION 8.1. MAPS OF REGIONAL HOT SPOTS . . . . . . . . . . . . . . . . . . . . . . . . . . . . . . . . . . . . . . . . . . . . . . . . . . . . . . . . . . . . . . . . . . . . . . . . . . . . . . . . . . . . . . . . . .147
Section 8.1.1. Apalachee Region . . . . . . . . . . . . . . . . . . . . . . . . . . . . . . . . . . . . . . . . . . . . . . . . . . . . . . . . . . . . . . . . . . . . . . . . . . . . . . . . . . . . . . . . . . . . . . . . . . . . . . . . . . . . . . . . . . .149Section 8.1.2. Central Florida Region . . . . . . . . . . . . . . . . . . . . . . . . . . . . . . . . . . . . . . . . . . . . . . . . . . . . . . . . . . . . . . . . . . . . . . . . . . . . . . . . . . . . . . . . . . . . . . . . . . . . . . . . . . .153Section 8.1.3. East Central Florida Region . . . . . . . . . . . . . . . . . . . . . . . . . . . . . . . . . . . . . . . . . . . . . . . . . . . . . . . . . . . . . . . . . . . . . . . . . . . . . . . . . . . . . . . . . . . . . . . . . . . .157Section 8.1.4. North Central Florida Region . . . . . . . . . . . . . . . . . . . . . . . . . . . . . . . . . . . . . . . . . . . . . . . . . . . . . . . . . . . . . . . . . . . . . . . . . . . . . . . . . . . . . . . . . . . . . . . . .161Section 8.1.5. Northeast Florida Region . . . . . . . . . . . . . . . . . . . . . . . . . . . . . . . . . . . . . . . . . . . . . . . . . . . . . . . . . . . . . . . . . . . . . . . . . . . . . . . . . . . . . . . . . . . . . . . . . . . . . . . .165Section 8.1.6. South Florida Region . . . . . . . . . . . . . . . . . . . . . . . . . . . . . . . . . . . . . . . . . . . . . . . . . . . . . . . . . . . . . . . . . . . . . . . . . . . . . . . . . . . . . . . . . . . . . . . . . . . . . . . . . . . . . .169Section 8.1.7. Southwest Florida Region . . . . . . . . . . . . . . . . . . . . . . . . . . . . . . . . . . . . . . . . . . . . . . . . . . . . . . . . . . . . . . . . . . . . . . . . . . . . . . . . . . . . . . . . . . . . . . . . . . . . . . .173Section 8.1.8. Tampa Bay Region . . . . . . . . . . . . . . . . . . . . . . . . . . . . . . . . . . . . . . . . . . . . . . . . . . . . . . . . . . . . . . . . . . . . . . . . . . . . . . . . . . . . . . . . . . . . . . . . . . . . . . . . . . . . . . . . .177Section 8.1.9. Treasure Coast Region . . . . . . . . . . . . . . . . . . . . . . . . . . . . . . . . . . . . . . . . . . . . . . . . . . . . . . . . . . . . . . . . . . . . . . . . . . . . . . . . . . . . . . . . . . . . . . . . . . . . . . . . . . . .181Section 8.1.10. West Florida Region . . . . . . . . . . . . . . . . . . . . . . . . . . . . . . . . . . . . . . . . . . . . . . . . . . . . . . . . . . . . . . . . . . . . . . . . . . . . . . . . . . . . . . . . . . . . . . . . . . . . . . . . . . . . .185Section 8.1.11. Withlacoochee Region . . . . . . . . . . . . . . . . . . . . . . . . . . . . . . . . . . . . . . . . . . . . . . . . . . . . . . . . . . . . . . . . . . . . . . . . . . . . . . . . . . . . . . . . . . . . . . . . . . . . . . . . . .189
SECTION 8.2. TECHNIQUES FOR PROTECTING VALUED NATURAL RESOURCES . . . . . . . . . . . . . . . . . . . . . . . . . . . . . . . . .191
LITERATURE CITATIONS . . . . . . . . . . . . . . . . . . . . . . . . . . . . . . . . . . . . . . . . . . . . . . . . . . . . . . . . . . . . . . . . . . . . . . . . . . . . . . . . . . . . . . . . . . . . . . . . . . . . . . . . . . . . . . . . . . . . . . . . . . . . . . . . . . . . .193APPENDICES . . . . . . . . . . . . . . . . . . . . . . . . . . . . . . . . . . . . . . . . . . . . . . . . . . . . . . . . . . . . . . . . . . . . . . . . . . . . . . . . . . . . . . . . . . . . . . . . . . . . . . . . . . . . . . . . . . . . . . . . . . . . . . . . . . . . . . . . . . . . . . . . . . . . . . . . . . .204
iii
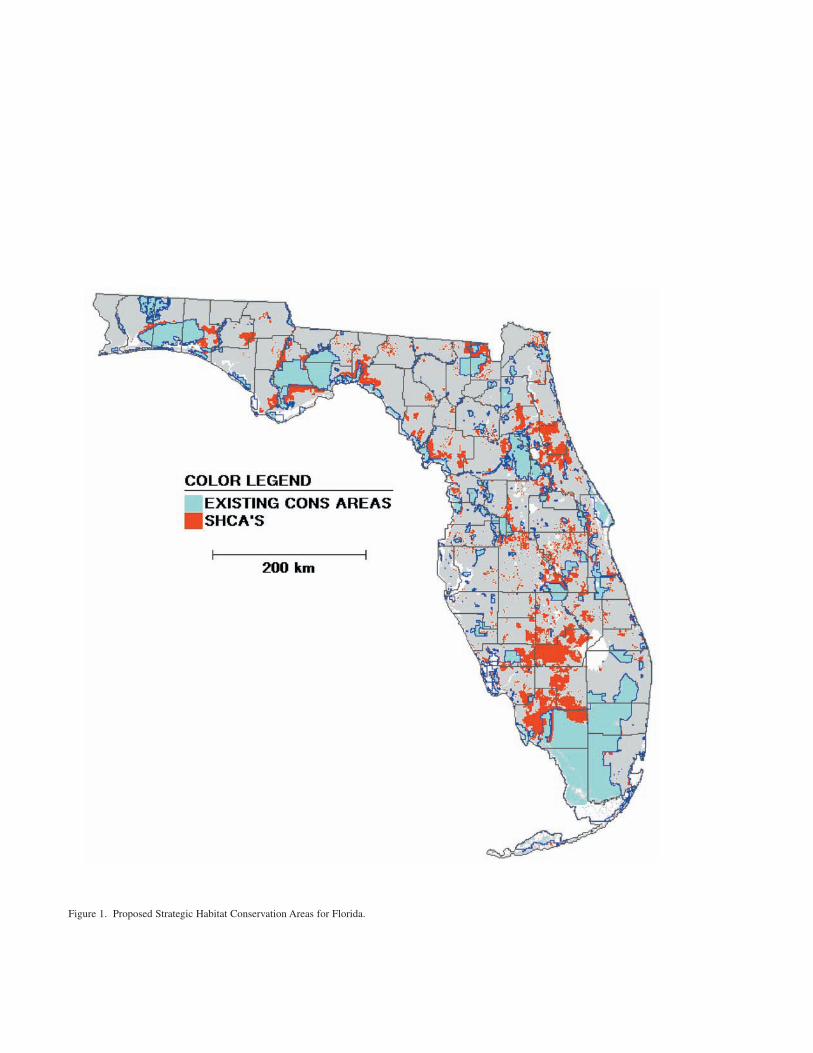
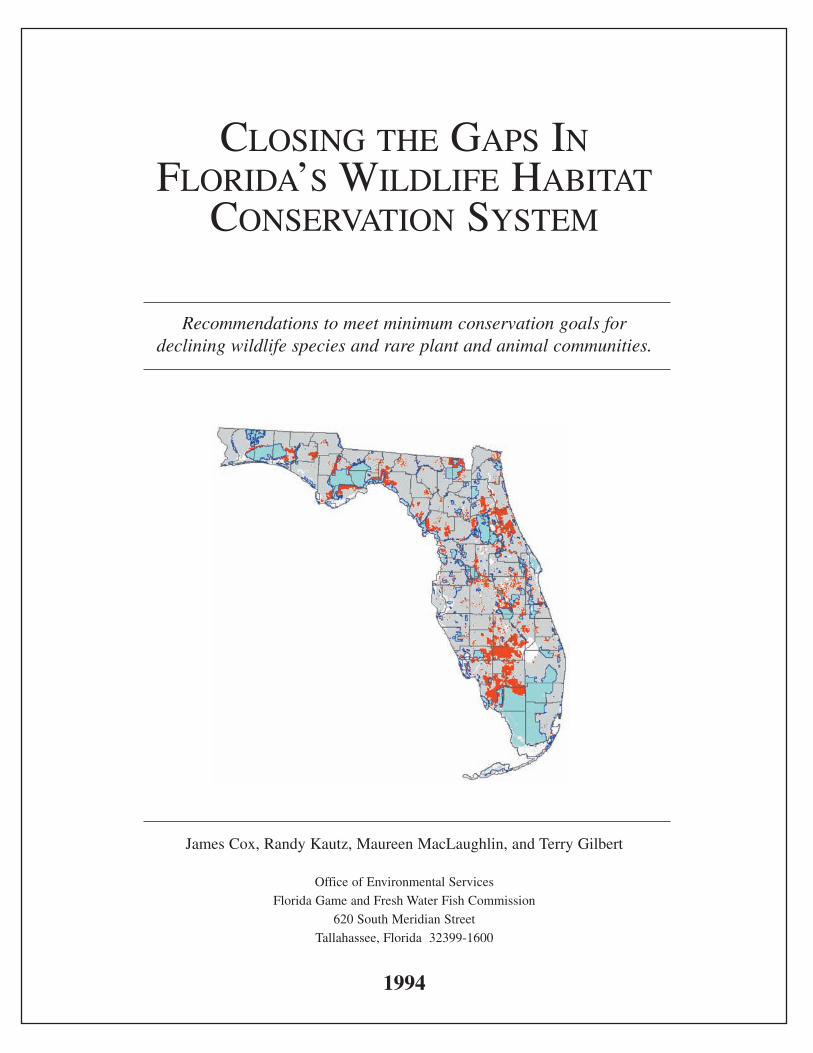
Figure 1. Proposed Strategic Habitat Conservation Areas for Florida.
EXECUTIVE SUMMARY
This report describes habitat areas in Florida that shouldbe conserved if key components of the state’s biologicaldiversity are to be maintained. The project employed a com-puterized Geographic Information System to manipulate geo-graphic data sets and create distribution maps for selectedspecies of wildlife, threatened species of plants, and rareplant communities. The geographic data sets used in the pro-ject included a statewide land-cover map derived fromLandsat satellite imagery; over 25,000 geographically refer-enced points documenting known occurrences of rare ani-mals, plants, and communities; digitized maps of public andprivate lands devoted to some extent to conservation; a digi-tized general soils map; a digitized map of the statewide roadnetwork; a digitized map of selected private lands; and adigitized map of county boundaries.
Drawing from techniques recently developed in the fields of wildlife management and conservation biology, theGeographic Information System was used to assess thedegree of security provided to rare species by the current sys-tem of conservation lands and to identify important habitatareas not currently protected. The lands recommended in thereport for additional protection are referred to as StrategicHabitat Conservation Areas and are displayed in Figure 1.Strategic Habitat Conservation Areas depict lands needed tomeet minimum conservation goals for the following:
* 30 species of wildlife inadequately protected by thecurrent system of conservation lands,
* high quality sandhill sites,* high quality scrub sites,* high quality pine rocklands sites,* high quality examples of tropical hardwood
hammocks,* bat maternity caves and winter roost caves,* wetlands important to the breeding success of eight
species of wading birds, and* lands important to the long-term survival of 105
globally rare species of plants.The Strategic Habitat Conservation Areas encompass
4.82 million acres, or approximately 13% of the land area ofFlorida. These lands are essential to providing some of thestate’s rarest animals, plants, and natural communities withthe land base necessary to sustain populations into the future.The existing system of conservation lands in Florida covers6.95 million acres, or 20% of the land area of the state. Thus,if all of the Strategic Habitat Conservation Areas were pro-tected, approximately 11.7 million acres, or about 33% of theland area of Florida, would fall into some type ofconservation land use.
It seems unlikely that all lands within the identifiedStrategic Habitat Conservation Areas will ever come underState ownership, even if all landowners were willing to sell.Since 1974, the State has spent an average of $1,182 per acreto purchase land for recreation, conservation, and historicalpreservation. At this rate, $5.7 billion would be needed topurchase all 4.82 million acres within the Strategic HabitatConservation Areas, much more than the $3.2 billion autho-rized under Preservation 2000. Fortunately, many of thelands within the Strategic Habitat Conservation Areas are inlow intensity land uses, such as silviculture and rangeland,that are compatible with the habitat conservation needs of
many species. In fact, the management of wildlife habitat onmany private lands has been excellent, and conservationmeasures should focus on maintaining existing land uses onprivate lands through positive incentives such as tax breaks,conservation easements, or cooperative agreements withlandowners. These techniques have the potential to provideadequate protection without the need for fee-simpleacquisition by the State.
During the course of this project, a large database ofknown locations of many animals, plants, and natural com-munities was assembled. A separate set of maps, referred toas Regional Biodiversity Hot Spots maps, was created todisplay as much of this information as possible within eachof the 11 Regional Planning Council regions of Florida. TheRegional Biodiversity Hot Spots maps display the following information:
* areas where large numbers of 52 selected speciesco-occur,
* areas supporting rare plant and wildlife communities,* over 25,000 known locations of rare plants, animals,
and natural communities,* county boundaries and conservation land boundaries,
and* coastal areas that support key components of
biological diversity.Each regional map is accompanied with a description
of the biological resources occurring in key areas within each region. The purpose of the Regional Biodiversity HotSpots maps is to convey more detailed information on theknown locations of as many components of biologicaldiversity as possible, regardless of whether or not they fallwithin proposed Strategic Habitat Conservation Areas, to help meet the need for conservation information at regionaland local levels.
The maps appearing in this report are intended to provide guidance to decision makers involved in public landacquisition, land use planning, development regulation, andother land conservation efforts. The maps represent our bestestimate of those Florida lands that require some form ofconservation to ensure that biodiversity is maintained forfuture generations. However, these maps represent only asnapshot of Florida’s conservation needs at one time. Forexample, the vegetation map used to create species distribu-tion maps was based on satellite imagery dated 1985-1989;the species occurrence information is current through 1991-1993, depending on the species; and the database of publicland boundaries extends only through 1992. As a conse-quence, some areas identified for protection may already bein public ownership or may no longer support the habitatfeatures or species predicted to occur there, and the mapsshould not be incorporated into law or rule as inviolate zonesin which no development may occur. Rather, the mapsshould be used as a layer of information when decisions aremade concerning land acquisition, land-use planning, anddevelopment regulation.
New data are continually being added to the project data-base as new parcels of land come into public ownership, newrecords of the locations of rare species become available, andmore up-to-date vegetation maps are created. As a result, thelatest versions of the project maps actually reside in the com-puter. Before using the maps in this report for detailed man-agement decisions, users should contact the Office of
CLOSING THE GAPS IN FLORIDA’S WILDLIFE HABITAT CONSERVATION SYSTEM 1
FLORIDA GAME AND FRESH WATER FISH COMMISSION2
Environmental Services, Florida Game and Fresh Water FishCommission, 620 South Meridian Street, Tallahassee, Florida,32399-1600, for the latest information. The maps presented inthis report are available in hard copy at a variety of scales andin digital formats for use in computer mapping packages.
ORGANIZATIONAL OVERVIEW
This document is intended for use by a broad audience ofdecision makers, concerned citizens, land-use planners, landmanagers, biologists, and others. We have organized thereport to suit these varied interests while also providing appro-priate technical information for those who seek more detail.Because of the complexity and scope of some of the analysesperformed, the report is not organized in the format of“Introduction, Methods, Results, and Discussion” traditionallyused in technical journals and reports. Instead, we chose tosubdivide the report into coherent sections that each may con-tain distinctive methods, results, and discussion elements.Literature citations and appendices follow the individual sec-tions. The Appendices contain lengthy tables and moredetailed information that is abbreviated elsewhere in thereport. Appendix 1 is especially important to note since itcontains the scientific names of all plant and animal taxa men-tioned in the text.
CLOSING THE GAPS IN FLORIDA’S WILDLIFE HABITAT CONSERVATION SYSTEM 3
SECTION 1.1. COMPONENTS ANDVALUE OF FLORIDA’S BIOLOGICAL DIVERSITY
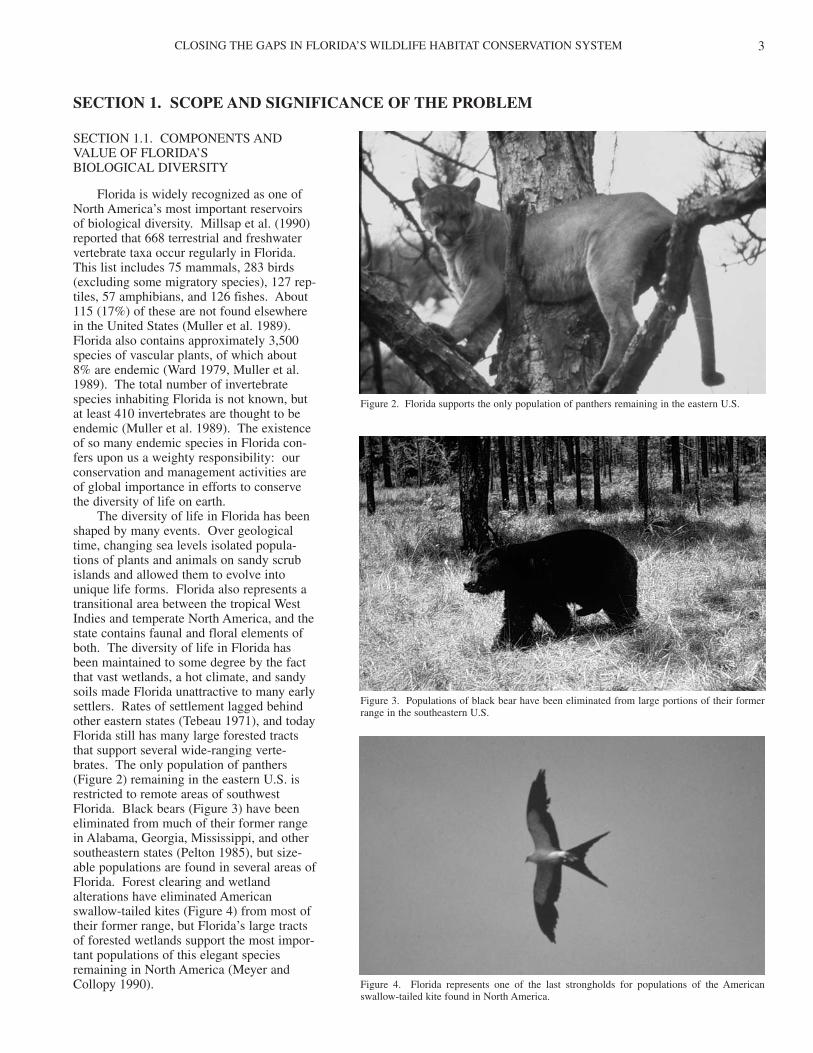
Florida is widely recognized as one ofNorth America’s most important reservoirsof biological diversity. Millsap et al. (1990)reported that 668 terrestrial and freshwatervertebrate taxa occur regularly in Florida.This list includes 75 mammals, 283 birds(excluding some migratory species), 127 rep-tiles, 57 amphibians, and 126 fishes. About115 (17%) of these are not found elsewherein the United States (Muller et al. 1989).Florida also contains approximately 3,500species of vascular plants, of which about8% are endemic (Ward 1979, Muller et al.1989). The total number of invertebratespecies inhabiting Florida is not known, butat least 410 invertebrates are thought to beendemic (Muller et al. 1989). The existenceof so many endemic species in Florida con-fers upon us a weighty responsibility: ourconservation and management activities areof global importance in efforts to conservethe diversity of life on earth.
The diversity of life in Florida has beenshaped by many events. Over geologicaltime, changing sea levels isolated popula-tions of plants and animals on sandy scrubislands and allowed them to evolve intounique life forms. Florida also represents atransitional area between the tropical WestIndies and temperate North America, and thestate contains faunal and floral elements ofboth. The diversity of life in Florida hasbeen maintained to some degree by the factthat vast wetlands, a hot climate, and sandysoils made Florida unattractive to many earlysettlers. Rates of settlement lagged behindother eastern states (Tebeau 1971), and todayFlorida still has many large forested tractsthat support several wide-ranging verte-brates. The only population of panthers(Figure 2) remaining in the eastern U.S. isrestricted to remote areas of southwestFlorida. Black bears (Figure 3) have beeneliminated from much of their former rangein Alabama, Georgia, Mississippi, and othersoutheastern states (Pelton 1985), but size-able populations are found in several areas ofFlorida. Forest clearing and wetlandalterations have eliminated Americanswallow-tailed kites (Figure 4) from most oftheir former range, but Florida’s large tractsof forested wetlands support the most impor-tant populations of this elegant speciesremaining in North America (Meyer andCollopy 1990).
SECTION 1. SCOPE AND SIGNIFICANCE OF THE PROBLEM
Figure 2. Florida supports the only population of panthers remaining in the eastern U.S.
Figure 3. Populations of black bear have been eliminated from large portions of their formerrange in the southeastern U.S.
Figure 4. Florida represents one of the last strongholds for populations of the Americanswallow-tailed kite found in North America.
FLORIDA GAME AND FRESH WATER FISH COMMISSION4
Florida is also biologically diverse in terms of the numberof recognized plant communities. The Florida Natural AreasInventory (1990) describes 81 natural communities that occurin Florida, 13 of which are endemic (Muller et al. 1989).Examples of rare or endemic Florida communities are coastalstrand, mangrove swamp, tropical hardwood hammock, pinerocklands, scrub, sandhill, and coral reef (Muller et al. 1989).Human activities have caused all of these communities todecline or to become significantly degraded in quality, and,just as several plants and animals are in jeopardy of extinctionin Florida, so too are these native communities at risk of dis-appearing forever.
The importance of maintaining the varied elements thatmake up Florida’s biological diversity can be measured alongmany scales. Norse et al. (1986) proposed that protecting nat-ural diversity is important because: (1) foods, medicines, andother products from living organisms are essential to humanexistence; (2) human welfare requires basic ecosystem ser-vices such as clean soil, water, and air; flood control; waterpurification; and amelioration of climatic conditions; (3)plants, animals, and natural landscapes have beneficial effectson human health and well-being; and (4) humans are ethicallybound to provide responsible stewardship over the planet they dominate.
The potential for future discoveries from native speciescannot be overstated, though it is often overlooked and alwaysundervalued economically. Approximately 1,500 new com-pounds are discovered each year from wild plants, and about300 of these have potential use in medicine. A relative of therare Florida yew, for example, produces a special group ofcompounds that offers the greatest hope of any new discoveryin the treatment of certain cancers (Land Acquisition AdvisoryCouncil 1991). The Lake Placid scrub mint, an endangeredplant found only in a small area of the Lake Wales Ridge inPolk and Highlands counties, was recently found to have apreviously unknown compound with potent insect repellantproperties (Eisner et al. 1990). Blood of the endangered WestIndian manatee has poor clotting capabilities, which may aidin research on hemophilia (Wilson 1988).
A diverse natural environment also plays an importanteconomic role that can be portrayed in terms that are perhapsmore easily grasped. More than 67% of Florida’s residentsparticipated in “nonconsumptive” natural resource activitiessuch as bird watching, nature study, canoeing, and hiking in1985. Each participant spent an average of $221 on food,lodging, transportation, field guides, binoculars, bird seed, andother items. Combining these figures, nature enthusiasts con-tributed $1.3 billion to Florida’s economy while enjoying thestate’s natural diversity (U.S. Fish and Wildlife Service1987a). Likewise, Florida residents participating in “con-sumptive” activities (e.g., hunting and fishing) contributedabout $3.8 billion to the state’s economy in 1985. If con-sumptive and nonconsumptive activities are combined, recre-ational activities associated with Florida’s diverse natural her-itage contributed $5.2 billion to the state’s economy in 1985.At the time, this was the second largest “industry” in Florida,and every indication is that this “industry” has expanded con-siderably in the years since 1985 (Duda 1987). Continuedrecreational opportunities such as these rely on a well func-tioning environment made up of myriad diverse elements.
Widespread support for protecting Florida’s environmenthas been documented repeatedly in various opinion polls
(Duda 1987). About 80% of the state’s residents believe thatdevelopment in fragile areas containing rare species should beprohibited (Duda 1987), and at least 60% of Floridians believethat spending on the environment should be increased.Quoting from a report by deHaven-Smith and Gatlin (1985):
“Overall, the Florida public is strongly supportive of thestate’s efforts to protect the environment and quality of life. The majority of respondents say that the naturalenvironment is deteriorating and that land-use regula-tions should be strengthened. Respondents overwhelm-ingly support stronger laws to prevent pollution and protect fish and wildlife ...”
Such statements help to describe the sentiments ofFloridians in quantitative terms, but perhaps the most impor-tant reason for maintaining native wildlife and natural habitatsrests along a dimension that has no price tag. The conserva-tion of natural areas and wildlife populations provides us withmany unparalleled experiences: the sight of a bald eagle soar-ing above rivers and lakes; the mysterious night sounds ofbarred owls and limpkins that slip from swamps and sloughs;the pursuit of fish and game in remote wilderness areas; thefresh, clean smell of pinewoods on a spring morning or thesharp, pungent aroma of a rosemary scrub. These and otherexperiences found only in the natural world quench a deep-seated human thirst for natural aesthetics and renew our linkswith the world around us. Although it is difficult to quantifythe extreme importance of these natural experiences, especial-ly to future generations, a loss of such opportunities will likelyentail a very dear price.
SECTION 1.2. FACTORS CONTRIBUTING TO THELOSS OF BIOLOGICAL DIVERSITY
Florida is a bustling urban and agricultural state with ahuman population fast approaching 14 million (Duda 1987).The unspoiled splendor discovered by early Europeans existsonly in scattered patches, and evidence of people can be foundat every turn. In addition to our resident population, Florida’ssandy beaches, sparkling waters, and subtropical climateattract 39 million visitors each year (Duda 1987). These visi-tors use airports, roads, shopping centers, restaurants, andmany other facilities that displace natural areas. The growthof Florida’s resident and tourist populations has led to a dra-matic destruction of forest and wetland areas. According todata available from the U.S. Forest Service (Kautz 1993),today’s Floridian sees a landscape that is 30% agricultural,13% urban, and only about 57% in some type of forested or“seminatural” land cover (Kautz 1993). However, only a por-tion of this latter category might be considered “natural” sincemost of our remaining forest and prairie lands are subjected tosome form of human disturbance.
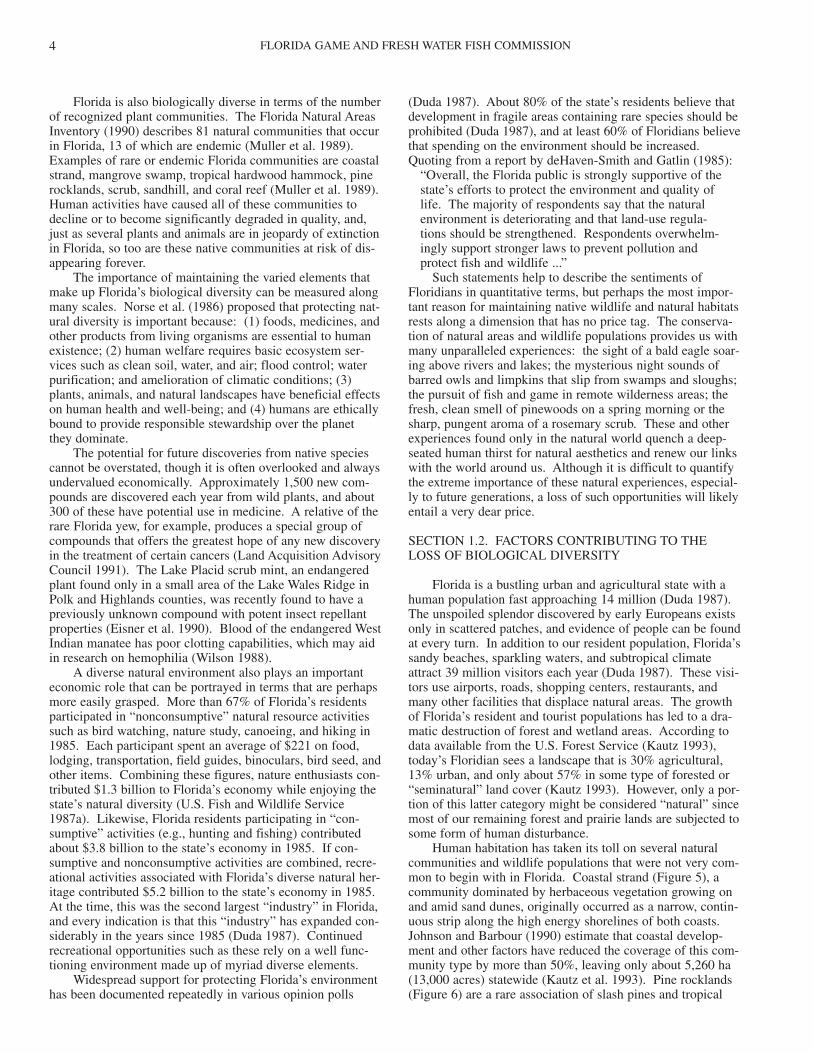
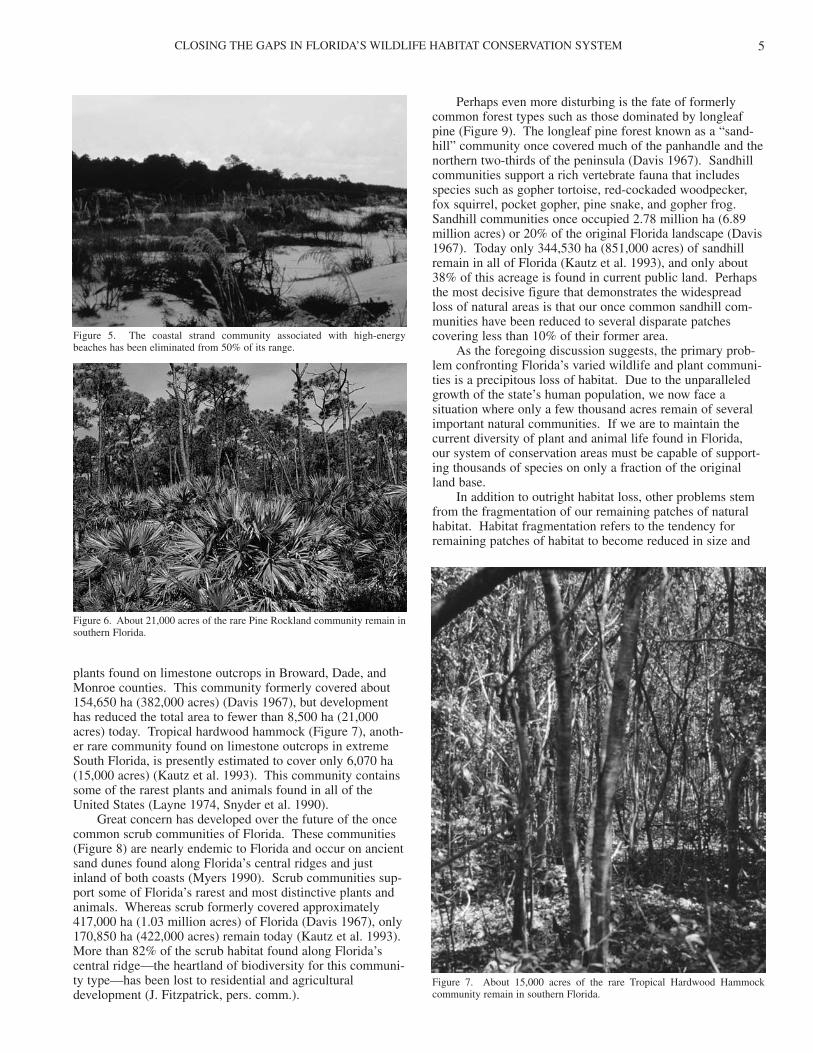
Human habitation has taken its toll on several naturalcommunities and wildlife populations that were not very com-mon to begin with in Florida. Coastal strand (Figure 5), acommunity dominated by herbaceous vegetation growing onand amid sand dunes, originally occurred as a narrow, contin-uous strip along the high energy shorelines of both coasts.Johnson and Barbour (1990) estimate that coastal develop-ment and other factors have reduced the coverage of this com-munity type by more than 50%, leaving only about 5,260 ha(13,000 acres) statewide (Kautz et al. 1993). Pine rocklands(Figure 6) are a rare association of slash pines and tropical
CLOSING THE GAPS IN FLORIDA’S WILDLIFE HABITAT CONSERVATION SYSTEM 5
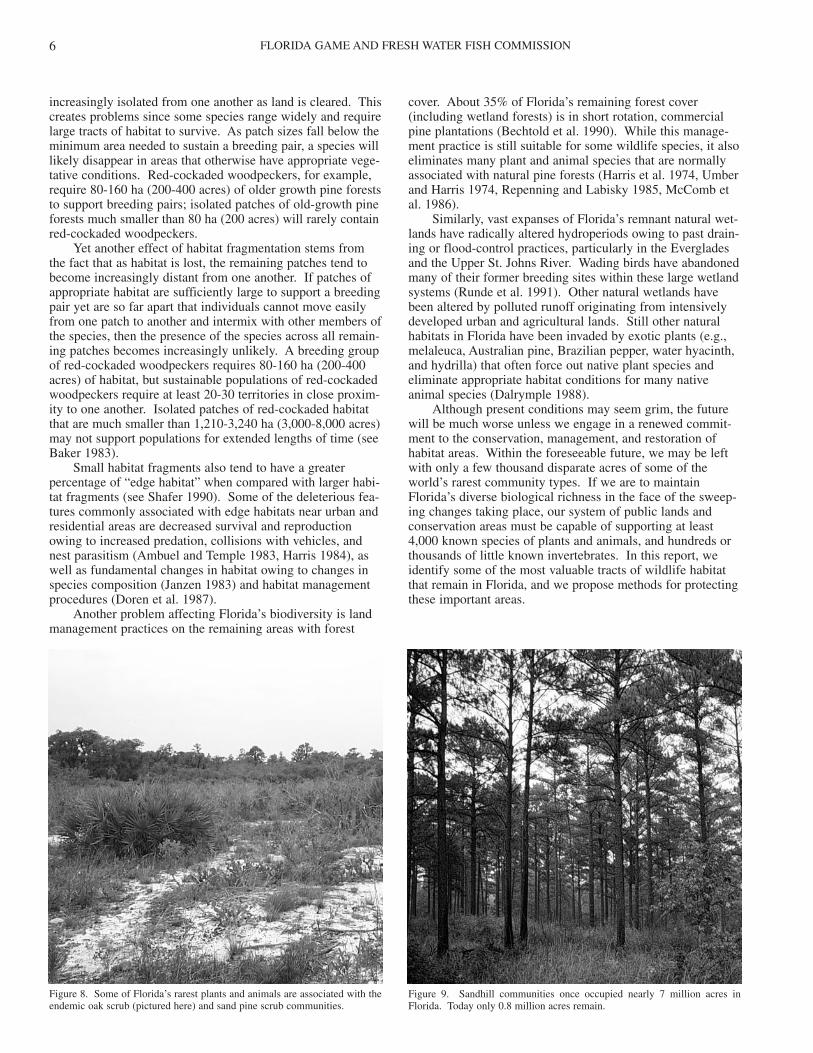
plants found on limestone outcrops in Broward, Dade, andMonroe counties. This community formerly covered about154,650 ha (382,000 acres) (Davis 1967), but developmenthas reduced the total area to fewer than 8,500 ha (21,000acres) today. Tropical hardwood hammock (Figure 7), anoth-er rare community found on limestone outcrops in extremeSouth Florida, is presently estimated to cover only 6,070 ha(15,000 acres) (Kautz et al. 1993). This community containssome of the rarest plants and animals found in all of theUnited States (Layne 1974, Snyder et al. 1990).
Great concern has developed over the future of the oncecommon scrub communities of Florida. These communities(Figure 8) are nearly endemic to Florida and occur on ancientsand dunes found along Florida’s central ridges and justinland of both coasts (Myers 1990). Scrub communities sup-port some of Florida’s rarest and most distinctive plants andanimals. Whereas scrub formerly covered approximately417,000 ha (1.03 million acres) of Florida (Davis 1967), only170,850 ha (422,000 acres) remain today (Kautz et al. 1993).More than 82% of the scrub habitat found along Florida’scentral ridge—the heartland of biodiversity for this communi-ty type—has been lost to residential and agriculturaldevelopment (J. Fitzpatrick, pers. comm.).
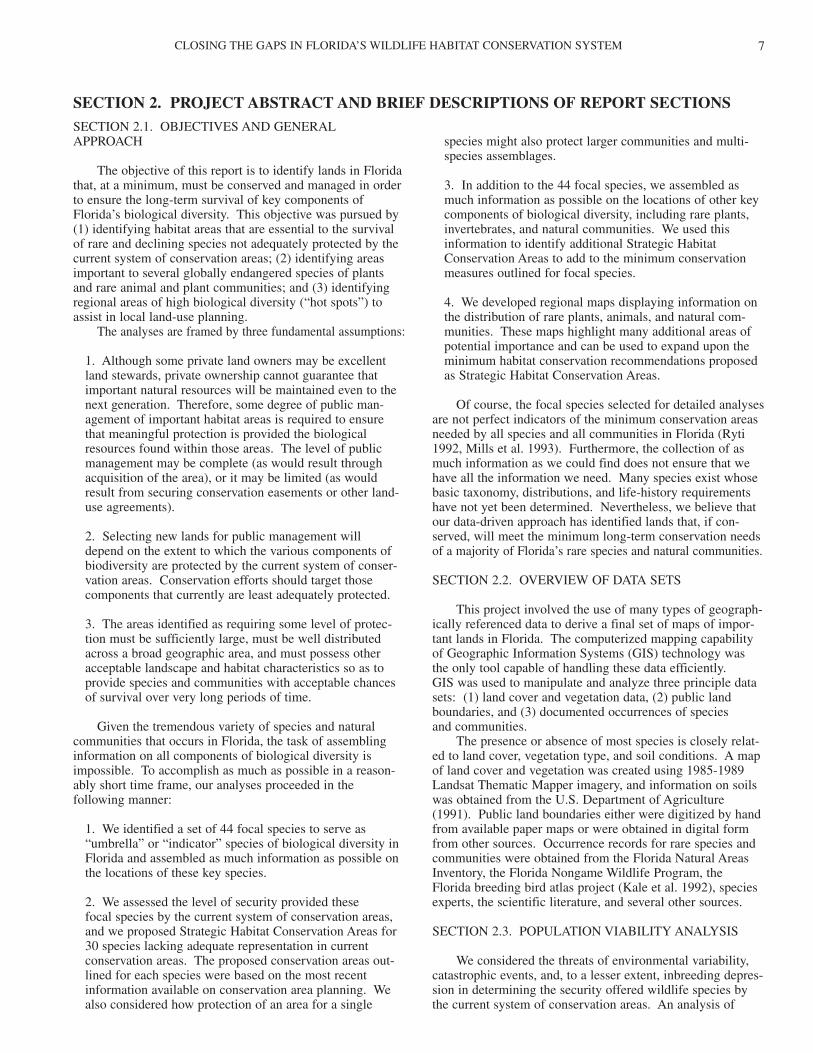
Perhaps even more disturbing is the fate of formerlycommon forest types such as those dominated by longleafpine (Figure 9). The longleaf pine forest known as a “sand-hill” community once covered much of the panhandle and thenorthern two-thirds of the peninsula (Davis 1967). Sandhillcommunities support a rich vertebrate fauna that includesspecies such as gopher tortoise, red-cockaded woodpecker,fox squirrel, pocket gopher, pine snake, and gopher frog.Sandhill communities once occupied 2.78 million ha (6.89million acres) or 20% of the original Florida landscape (Davis1967). Today only 344,530 ha (851,000 acres) of sandhillremain in all of Florida (Kautz et al. 1993), and only about38% of this acreage is found in current public land. Perhapsthe most decisive figure that demonstrates the widespreadloss of natural areas is that our once common sandhill com-munities have been reduced to several disparate patchescovering less than 10% of their former area.
As the foregoing discussion suggests, the primary prob-lem confronting Florida’s varied wildlife and plant communi-ties is a precipitous loss of habitat. Due to the unparalleledgrowth of the state’s human population, we now face asituation where only a few thousand acres remain of severalimportant natural communities. If we are to maintain thecurrent diversity of plant and animal life found in Florida,our system of conservation areas must be capable of support-ing thousands of species on only a fraction of the originalland base.
In addition to outright habitat loss, other problems stemfrom the fragmentation of our remaining patches of naturalhabitat. Habitat fragmentation refers to the tendency forremaining patches of habitat to become reduced in size and
Figure 5. The coastal strand community associated with high-energybeaches has been eliminated from 50% of its range.
Figure 6. About 21,000 acres of the rare Pine Rockland community remain insouthern Florida.
Figure 7. About 15,000 acres of the rare Tropical Hardwood Hammockcommunity remain in southern Florida.
FLORIDA GAME AND FRESH WATER FISH COMMISSION6
increasingly isolated from one another as land is cleared. Thiscreates problems since some species range widely and requirelarge tracts of habitat to survive. As patch sizes fall below theminimum area needed to sustain a breeding pair, a species willlikely disappear in areas that otherwise have appropriate vege-tative conditions. Red-cockaded woodpeckers, for example,require 80-160 ha (200-400 acres) of older growth pine foreststo support breeding pairs; isolated patches of old-growth pineforests much smaller than 80 ha (200 acres) will rarely containred-cockaded woodpeckers.
Yet another effect of habitat fragmentation stems fromthe fact that as habitat is lost, the remaining patches tend tobecome increasingly distant from one another. If patches ofappropriate habitat are sufficiently large to support a breedingpair yet are so far apart that individuals cannot move easilyfrom one patch to another and intermix with other members ofthe species, then the presence of the species across all remain-ing patches becomes increasingly unlikely. A breeding groupof red-cockaded woodpeckers requires 80-160 ha (200-400acres) of habitat, but sustainable populations of red-cockadedwoodpeckers require at least 20-30 territories in close proxim-ity to one another. Isolated patches of red-cockaded habitatthat are much smaller than 1,210-3,240 ha (3,000-8,000 acres)may not support populations for extended lengths of time (seeBaker 1983).
Small habitat fragments also tend to have a greaterpercentage of “edge habitat” when compared with larger habi-tat fragments (see Shafer 1990). Some of the deleterious fea-tures commonly associated with edge habitats near urban andresidential areas are decreased survival and reproductionowing to increased predation, collisions with vehicles, andnest parasitism (Ambuel and Temple 1983, Harris 1984), aswell as fundamental changes in habitat owing to changes inspecies composition (Janzen 1983) and habitat managementprocedures (Doren et al. 1987).
Another problem affecting Florida’s biodiversity is landmanagement practices on the remaining areas with forest
cover. About 35% of Florida’s remaining forest cover(including wetland forests) is in short rotation, commercialpine plantations (Bechtold et al. 1990). While this manage-ment practice is still suitable for some wildlife species, it alsoeliminates many plant and animal species that are normallyassociated with natural pine forests (Harris et al. 1974, Umberand Harris 1974, Repenning and Labisky 1985, McComb etal. 1986).
Similarly, vast expanses of Florida’s remnant natural wet-lands have radically altered hydroperiods owing to past drain-ing or flood-control practices, particularly in the Evergladesand the Upper St. Johns River. Wading birds have abandonedmany of their former breeding sites within these large wetlandsystems (Runde et al. 1991). Other natural wetlands havebeen altered by polluted runoff originating from intensivelydeveloped urban and agricultural lands. Still other naturalhabitats in Florida have been invaded by exotic plants (e.g.,melaleuca, Australian pine, Brazilian pepper, water hyacinth,and hydrilla) that often force out native plant species andeliminate appropriate habitat conditions for many nativeanimal species (Dalrymple 1988).
Although present conditions may seem grim, the futurewill be much worse unless we engage in a renewed commit-ment to the conservation, management, and restoration ofhabitat areas. Within the foreseeable future, we may be leftwith only a few thousand disparate acres of some of theworld’s rarest community types. If we are to maintainFlorida’s diverse biological richness in the face of the sweep-ing changes taking place, our system of public lands andconservation areas must be capable of supporting at least4,000 known species of plants and animals, and hundreds orthousands of little known invertebrates. In this report, weidentify some of the most valuable tracts of wildlife habitatthat remain in Florida, and we propose methods for protectingthese important areas.
Figure 8. Some of Florida’s rarest plants and animals are associated with theendemic oak scrub (pictured here) and sand pine scrub communities.
Figure 9. Sandhill communities once occupied nearly 7 million acres inFlorida. Today only 0.8 million acres remain.
SECTION 2.1. OBJECTIVES AND GENERALAPPROACH
The objective of this report is to identify lands in Floridathat, at a minimum, must be conserved and managed in orderto ensure the long-term survival of key components ofFlorida’s biological diversity. This objective was pursued by(1) identifying habitat areas that are essential to the survivalof rare and declining species not adequately protected by thecurrent system of conservation areas; (2) identifying areasimportant to several globally endangered species of plantsand rare animal and plant communities; and (3) identifyingregional areas of high biological diversity (“hot spots”) toassist in local land-use planning.
The analyses are framed by three fundamental assumptions:
1. Although some private land owners may be excellentland stewards, private ownership cannot guarantee thatimportant natural resources will be maintained even to thenext generation. Therefore, some degree of public man-agement of important habitat areas is required to ensurethat meaningful protection is provided the biologicalresources found within those areas. The level of publicmanagement may be complete (as would result throughacquisition of the area), or it may be limited (as wouldresult from securing conservation easements or other land-use agreements).
2. Selecting new lands for public management will depend on the extent to which the various components ofbiodiversity are protected by the current system of conser-vation areas. Conservation efforts should target thosecomponents that currently are least adequately protected.
3. The areas identified as requiring some level of protec-tion must be sufficiently large, must be well distributedacross a broad geographic area, and must possess otheracceptable landscape and habitat characteristics so as toprovide species and communities with acceptable chancesof survival over very long periods of time.
Given the tremendous variety of species and naturalcommunities that occurs in Florida, the task of assemblinginformation on all components of biological diversity isimpossible. To accomplish as much as possible in a reason-ably short time frame, our analyses proceeded in thefollowing manner:
1. We identified a set of 44 focal species to serve as“umbrella” or “indicator” species of biological diversity inFlorida and assembled as much information as possible onthe locations of these key species.
2. We assessed the level of security provided these focal species by the current system of conservation areas,and we proposed Strategic Habitat Conservation Areas for30 species lacking adequate representation in currentconservation areas. The proposed conservation areas out-lined for each species were based on the most recentinformation available on conservation area planning. Wealso considered how protection of an area for a single
species might also protect larger communities and multi-species assemblages.
3. In addition to the 44 focal species, we assembled asmuch information as possible on the locations of other keycomponents of biological diversity, including rare plants,invertebrates, and natural communities. We used thisinformation to identify additional Strategic HabitatConservation Areas to add to the minimum conservationmeasures outlined for focal species.
4. We developed regional maps displaying information onthe distribution of rare plants, animals, and natural com-munities. These maps highlight many additional areas ofpotential importance and can be used to expand upon theminimum habitat conservation recommendations proposedas Strategic Habitat Conservation Areas.
Of course, the focal species selected for detailed analysesare not perfect indicators of the minimum conservation areasneeded by all species and all communities in Florida (Ryti1992, Mills et al. 1993). Furthermore, the collection of asmuch information as we could find does not ensure that wehave all the information we need. Many species exist whosebasic taxonomy, distributions, and life-history requirementshave not yet been determined. Nevertheless, we believe thatour data-driven approach has identified lands that, if con-served, will meet the minimum long-term conservation needsof a majority of Florida’s rare species and natural communities.
SECTION 2.2. OVERVIEW OF DATA SETS
This project involved the use of many types of geograph-ically referenced data to derive a final set of maps of impor-tant lands in Florida. The computerized mapping capabilityof Geographic Information Systems (GIS) technology wasthe only tool capable of handling these data efficiently. GIS was used to manipulate and analyze three principle datasets: (1) land cover and vegetation data, (2) public landboundaries, and (3) documented occurrences of species and communities.
The presence or absence of most species is closely relat-ed to land cover, vegetation type, and soil conditions. A mapof land cover and vegetation was created using 1985-1989Landsat Thematic Mapper imagery, and information on soilswas obtained from the U.S. Department of Agriculture(1991). Public land boundaries either were digitized by handfrom available paper maps or were obtained in digital formfrom other sources. Occurrence records for rare species andcommunities were obtained from the Florida Natural AreasInventory, the Florida Nongame Wildlife Program, theFlorida breeding bird atlas project (Kale et al. 1992), speciesexperts, the scientific literature, and several other sources.
SECTION 2.3. POPULATION VIABILITY ANALYSIS
We considered the threats of environmental variability,catastrophic events, and, to a lesser extent, inbreeding depres-sion in determining the security offered wildlife species bythe current system of conservation areas. An analysis of
SECTION 2. PROJECT ABSTRACT AND BRIEF DESCRIPTIONS OF REPORT SECTIONS
CLOSING THE GAPS IN FLORIDA’S WILDLIFE HABITAT CONSERVATION SYSTEM 7
FLORIDA GAME AND FRESH WATER FISH COMMISSION8
population viability led to the conclusion that 10 populations,each consisting of at least 200 individuals, would provide aminimally acceptable level of security (i.e., be “viable”)against the threats posed by a fluctuating environment andinbreeding depression. This minimal level of security alsorequires that the 10 populations be distributed over a broadgeographic area to protect against catastrophic events that candecimate entire populations restricted to a single area.
SECTION 2.4. FOCAL SPECIES ANALYSIS AND DESIGNATION OF STRATEGIC HABITATCONSERVATION AREAS
Of the 542 taxa of terrestrial vertebrates listed by Millsapet al. (1990) as occurring regularly in Florida, 44 were select-ed for in-depth analyses (Table 1). Another 120 vertebratetaxa were analyzed either as part of multi-species assemblagesor as part of a “gap” analysis described in Section 6.3. The 44“focal species” were selected based on their utility as indica-tors of natural communities or because they require suitablehabitat conditions covering large areas. Statewide habitat anddistribution maps were created for each of the 44 focal speciesusing data on known locations of occurrence, information onthe land cover and vegetation types used by each species, andpublished or well documented information on the life-historyrequirements of the species.
Of the 44 species analyzed as focal species, only 40 wereconsidered suitable candidates for an assessment of the current
level of security provided by existing conservation areas. The four species whose security could not be assessed wereAmerican oystercatcher, Florida burrowing owl, pipingplover, and Wilson’s plover. Habitat distributions or popula-tion requirements for these species could not be accuratelydetermined (although some general recommendations areoffered). The three shorebirds were included later in a sepa-rate analysis of important coastal areas (Section 6.3.3).
For the 40 species whose security could be assessed,security was estimated using the species’ habitat and distribu-tion maps, public land boundaries, and literature-based densi-ty estimates. Focal species estimated as having fewer than 10protected populations consisting of at least 200 individualswere considered to lack an adequate base of habitat in the cur-rent system of conservation areas in Florida. Of the 40 focalspecies subjected to this analysis, 30 were found not to havethis minimum level of protection on public lands. The 30species lacking adequate representation were subjected todetailed analyses to identify new lands that must be conservedto satisfy their long-term conservation requirements. Theindividual maps of under-represented species were thenmerged into a single statewide map showing those areas ofgreatest concern (Figure 1).
Several other important aspects of biological diversitywere also added to the statewide map (Table 1). Conservationareas were identified for rare communities (e.g., scrub, tropi-cal hardwood hammocks, pine rocklands), rare plants, wadingbirds, and bat caves. Areas important to the conservation of
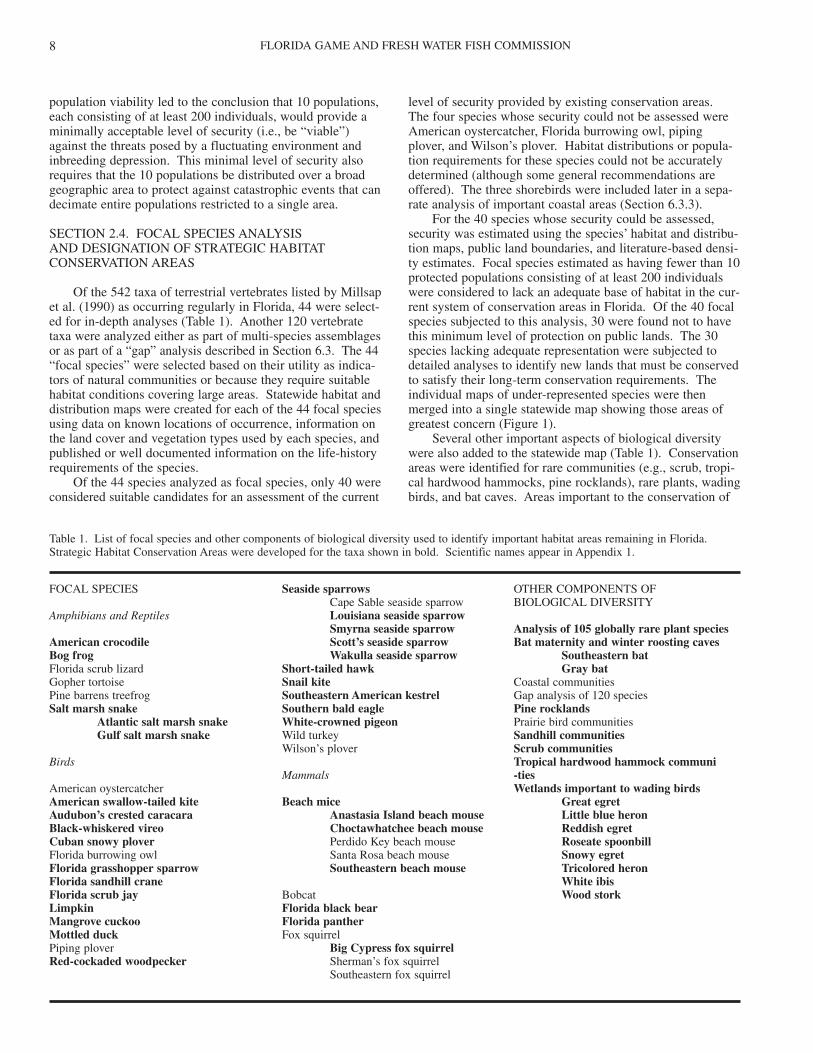
Table 1. List of focal species and other components of biological diversity used to identify important habitat areas remaining in Florida.Strategic Habitat Conservation Areas were developed for the taxa shown in bold. Scientific names appear in Appendix 1.
FOCAL SPECIES
Amphibians and Reptiles
American crocodileBog frogFlorida scrub lizardGopher tortoisePine barrens treefrogSalt marsh snake
Atlantic salt marsh snakeGulf salt marsh snake
Birds
American oystercatcherAmerican swallow-tailed kiteAudubon’s crested caracaraBlack-whiskered vireoCuban snowy ploverFlorida burrowing owlFlorida grasshopper sparrowFlorida sandhill craneFlorida scrub jayLimpkinMangrove cuckooMottled duckPiping ploverRed-cockaded woodpecker
Seaside sparrowsCape Sable seaside sparrowLouisiana seaside sparrowSmyrna seaside sparrowScott’s seaside sparrowWakulla seaside sparrow
Short-tailed hawkSnail kiteSoutheastern American kestrelSouthern bald eagleWhite-crowned pigeonWild turkeyWilson’s plover
Mammals
Beach miceAnastasia Island beach mouseChoctawhatchee beach mousePerdido Key beach mouseSanta Rosa beach mouseSoutheastern beach mouse
BobcatFlorida black bearFlorida pantherFox squirrel
Big Cypress fox squirrelSherman’s fox squirrelSoutheastern fox squirrel
OTHER COMPONENTS OFBIOLOGICAL DIVERSITY
Analysis of 105 globally rare plant speciesBat maternity and winter roosting caves
Southeastern batGray bat
Coastal communitiesGap analysis of 120 speciesPine rocklandsPrairie bird communitiesSandhill communitiesScrub communitiesTropical hardwood hammock communi-tiesWetlands important to wading birds
Great egretLittle blue heronReddish egretRoseate spoonbillSnowy egretTricolored heronWhite ibisWood stork
CLOSING THE GAPS IN FLORIDA’S WILDLIFE HABITAT CONSERVATION SYSTEM 9
these components of biological diversity are also shown asStrategic Habitat Conservation Areas in Figure 1.
SECTION 2.5. REGIONAL MAPS OF HOT SPOTSOF BIODIVERSITY
The data sets incorporated into the GIS used in this pro-ject provide valuable information on the distribution of natur-al resources throughout Florida. Such information would beof significant value to local land-use planning and in effortsto expand upon the minimum conservation requirements out-lined here. However, since many private and public entitieslack the computer equipment needed to process and storegeographic data sets in a meaningful manner, we createdregional maps showing three important features stored in theGIS. First, the individual habitat maps created for 44 focalspecies and rare natural communities were added together tohighlight areas within each region where potential habitatconditions for many species occurred. Second, recordsprocessed by the Florida Natural Areas Inventory, the FloridaGame and Fresh Water Fish Commission, and other sourceswere displayed to provide information on the location ofother natural resources in each region. Third, boundaries ofpublic lands were displayed to show the relationship betweennatural resources in each region and the distribution of exist-ing public ownerships. Although these regional maps mayappear to be complex, they portray much of the informationstored in the GIS in a manageable fashion.
SECTION 2.6. USES OF PROJECT MAPS
Project maps are intended to help guide land acquisition,land conservation, land-use planning, and regulatory programsat many levels. The maps represent our best estimate of thoseFlorida lands that require some form of conservation to ensurethat biodiversity is maintained for future generations.
The reader should be aware that the maps represent onlya snapshot of Florida’s conservation needs at one point intime. The data on which the maps are based are already out-dated, and they will become increasingly out of date as timegoes by. For example, the satellite imagery used for vegeta-tion mapping and habitat modeling was collected between1985 and 1989. Undoubtedly, some natural areas we identi-fied as needing protection have been destroyed during thetime it has taken to collect and analyze the data and publishthe results.
The temporal nature of the maps has two effects. First,because some areas identified as needing protection may nolonger support the habitat features or species expected tooccur there, these maps should not be incorporated into law orrule as inviolate zones in which no development may occur.Rather, the maps should be used as a layer of information inthe making of decisions concerning land acquisition, land-useplanning, and development regulation. Second, as time goesby, new parcels of land come into public ownership, new databecome available on the locations of rare species, and thecharacter of the Florida landscape changes. As a result, pro-ject maps are continually being updated with new information,and the latest version of the maps actually resides in the com-puter at the Office of Environmental Services. Therefore,before using the maps in this report for detailed managementdecisions, users should contact the Office of Environmental
Services at the address below for the latest information onlands currently recommended for protection.
SECTION 2.7. AVAILABILITY OF MAPS
In addition to the maps presented in this report, projectresults are available as hard copy maps at a variety of scalesand in digital formats for use in computer mapping packages.For more information on the availability of data sets, contactthe Office of Environmental Services, Florida Game andFresh Water Fish Commission, 620 S. Meridian St.,Tallahassee, FL, 32399-1600.
FLORIDA GAME AND FRESH WATER FISH COMMISSION10
Table 2. Cover types mapped for Florida based on Landsat Thematic Mapper data collected from 1985-89.
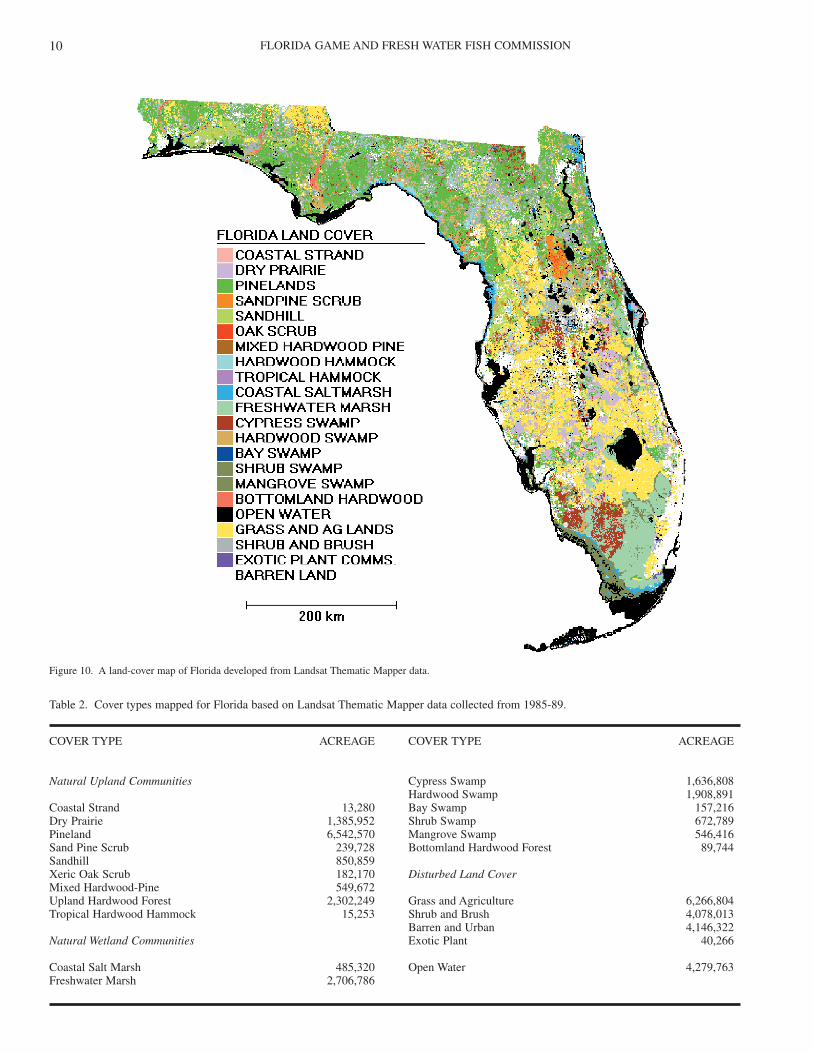
Figure 10. A land-cover map of Florida developed from Landsat Thematic Mapper data.
COVER TYPE ACREAGE
Natural Upland Communities
Coastal Strand 13,280Dry Prairie 1,385,952Pineland 6,542,570Sand Pine Scrub 239,728Sandhill 850,859Xeric Oak Scrub 182,170Mixed Hardwood-Pine 549,672Upland Hardwood Forest 2,302,249Tropical Hardwood Hammock 15,253
Natural Wetland Communities
Coastal Salt Marsh 485,320Freshwater Marsh 2,706,786
COVER TYPE ACREAGE
Cypress Swamp 1,636,808Hardwood Swamp 1,908,891 Bay Swamp 157,216Shrub Swamp 672,789Mangrove Swamp 546,416Bottomland Hardwood Forest 89,744
Disturbed Land Cover
Grass and Agriculture 6,266,804Shrub and Brush 4,078,013Barren and Urban 4,146,322Exotic Plant 40,266
Open Water 4,279,763
CLOSING THE GAPS IN FLORIDA’S WILDLIFE HABITAT CONSERVATION SYSTEM 11
SECTION 3.1. A STATEWIDE LAND-COVER MAP
This project relied on data and computer technologycapable of conducting fine-scale geographic analysis. One ofthe primary geographic data sets utilized was an up-to-datemap of land cover (Kautz et al. 1993). The land-cover map(Figure 10) was developed from Landsat satellite data col-lected from 1985-1989. A brief description of techniquesused to construct this map is presented here; more detailedinformation is found in Kautz et al. (1993).
Landsat satellite imagery was chosen because of thelarge area to be covered and the speed with which satelliteimagery could be obtained and processed. Landsat ThematicMapper (TM) data are collected using a predefined grid workof “pixels” (or picture elements). Each pixel is 30 m square.These 0.09-ha (0.25-acre) cells represent the theoretical limitsof resolution of Landsat TM data, but the true limits of reso-lution are somewhat larger.
A total of 22 land-cover types was processed for theseanalyses. These cover types (Table 2) correspond to otherland-cover classifications developed for Florida (e.g., Davis1967, Hartman 1978, Soil Conservation Service (undated),Florida Natural Areas Inventory 1990) and allow for high lev-els of accuracy. The cover types include 17 “natural” vegeta-tion types, 1 class for water, and 4 additional classes that aremost often associated with “disturbed” areas. We use quota-tion marks when referring to the “natural” and “disturbed”cover types presented in Table 2. Some “natural” cover types(e.g., commercial pine forests) may be heavily disturbed,while some “disturbed” areas occur naturally (e.g., sandbeaches may be classified as barren land). More thoroughdescriptions of each land-cover type appear in Appendix 2.
Landsat TM data were processed using ATLAS RemoteImaging System (Version 1.13) software, developed by DeltaData Systems, Inc. (131 Third St., Picayune, MS 39466).The Florida Department of Transportation performed theseanalyses under contract to the Florida Game and Fresh WaterFish Commission. Raw satellite data were obtained from theFlorida Department of Natural Resources. Because of thecomplexity of the analyses and the tremendous size of thedata sets, Landsat TM data were processed by multi-countyregions over a 3.5-year period. All or portions of 17 separateLandsat scenes were used with dates ranging from 1985 forthe Florida Keys to 1989 for portions of the panhandle (Kautzet al. 1993). Landsat imagery was georeferenced to theUniversal Transverse Mercator coordinate system for use as adata layer in the GIS.
Landsat imagery for each region was divided into small-er subscenes, and an unsupervised classification routine wasperformed for each subscene (Kautz et al. 1993). This classi-fication was compared with aerial photography and ancillarydata from a variety of sources to produce a preliminary land-cover map for each area. A total of 454 areas covering 1.10million ha (2.72 million acres, or 8% of the land area ofFlorida) was inspected using a helicopter equipped with aLoran-C unit. Inaccuracies observed in these field inspec-tions were corrected in the production of a final land-covermap for each subscene, and then each subscene was com-pared with neighboring subscenes to correct errors occurringacross subscene boundaries.
Kautz et al. (1993) did not formally analyze the accuracyof the land-cover map, but, based on field reports receivedsince the map was last edited, overall accuracy appears to bearound 80-90%. However, the accuracy varies by cover type.Oak scrub land cover, for example, proved difficult to distin-guish from the shrub and brush land cover, and sand pinescrub was sometimes confused with pineland cover. Theaccuracy of scrub identification was improved by digitizingscrub sites surveyed by Christman (1988), and commentsfrom map users indicate that most inaccuracies that remainare largely errors of omission (i.e., the scrub class containsscrub, but not all patches of scrub were detected). Accuratelymapping sandhill cover also presented problems. Sandhillsites with open stands of longleaf pine, minimal understoryvegetation, and dense ground cover were readily identifiedwith satellite imagery. Other areas that might be classified assandhill contained denser understories of oaks or denselystocked pine plantations growing on sandhill sites. Manysuch areas were classified as mixed pine-hardwood orpineland land cover. Bay swamp was also difficult to distin-guish from mixed hardwood swamp. We have not receivedextensive comments concerning the accuracy of the sandhilland bay swamp classes, but most errors are probably errors of omission.
A tally of all cover types mapped (Table 2) shows thatvegetated uplands covered 4.89 million ha (12.1 millionacres, or 35%), wetlands covered 3.32 million ha (8.2 millionacres, or 24%), and “disturbed” cover types covered 5.88 mil-lion ha (14.54 million acres, or 42%) of Florida around 1985-1989. Pinelands were the most abundant upland vegetationtype, covering 2.65 million ha (6.54 million acres, or 19%)and distributed primarily in the northern third of the peninsu-la and throughout the panhandle (Figure 10). Freshwatermarsh and wet prairies were the most abundant wetland vege-tation type, covering 1.10 million ha (2.72 million acres, or8%) and occurring mostly in south Florida.
SECTION 3.2. A STATEWIDE MAP OFCONSERVATION LANDS
Public lands capable of providing long-term protectionfor rare species include national parks, forests, wildliferefuges, and portions of military lands; state preserves,reserves, parks, and forests; state-owned wildlife manage-ment areas; water management district lands; county-ownednature preserves; and certain private lands owned by groupssuch as The Nature Conservancy, National Audubon Society,Florida Audubon Society, and other conservation entities.Our definition of “conservation lands” includes these variouspublic and private lands, but it does not include lands ownedby native Americans. While lands owned by nativeAmericans may contain important wildlife resources, thereare few legally binding agreements through which the impor-tant resources might be protected.
At the time that these analyses were initiated, there wasno comprehensive set of conservation land boundaries avail-able for Florida. We developed our map of conservationlands using four major sources: Florida Atlas and Gazetteer(DeLorme Mapping Company 1989), Florida Department ofTransportation county highway maps, county plat maps
SECTION 3. DEVELOPMENT OF GEOGRAPHIC INFORMATION SYSTEM DATA SETS
FLORIDA GAME AND FRESH WATER FISH COMMISSION12
(dated 1987-1990, Florida Plats, 1289 Bowan Blvd.,Clermont, Florida), and boundaries processed by the FloridaNatural Areas Inventory. The DeLorme and FloridaDepartment of Transportation county highway maps depictboundaries of many public lands at scales of 1:150,000 and1:126,720, respectively. Plat maps depict property owner-ships referenced to the township-range-section system usedfor property descriptions. Plat maps were obtained for 54Florida counties, and the boundaries of additional lands shownto be in public ownership were transferred by hand to countyhighway maps and then digitized. Boundaries obtained fromthe Florida Natural Areas Inventory were digitized from1:24,000 topographic maps.
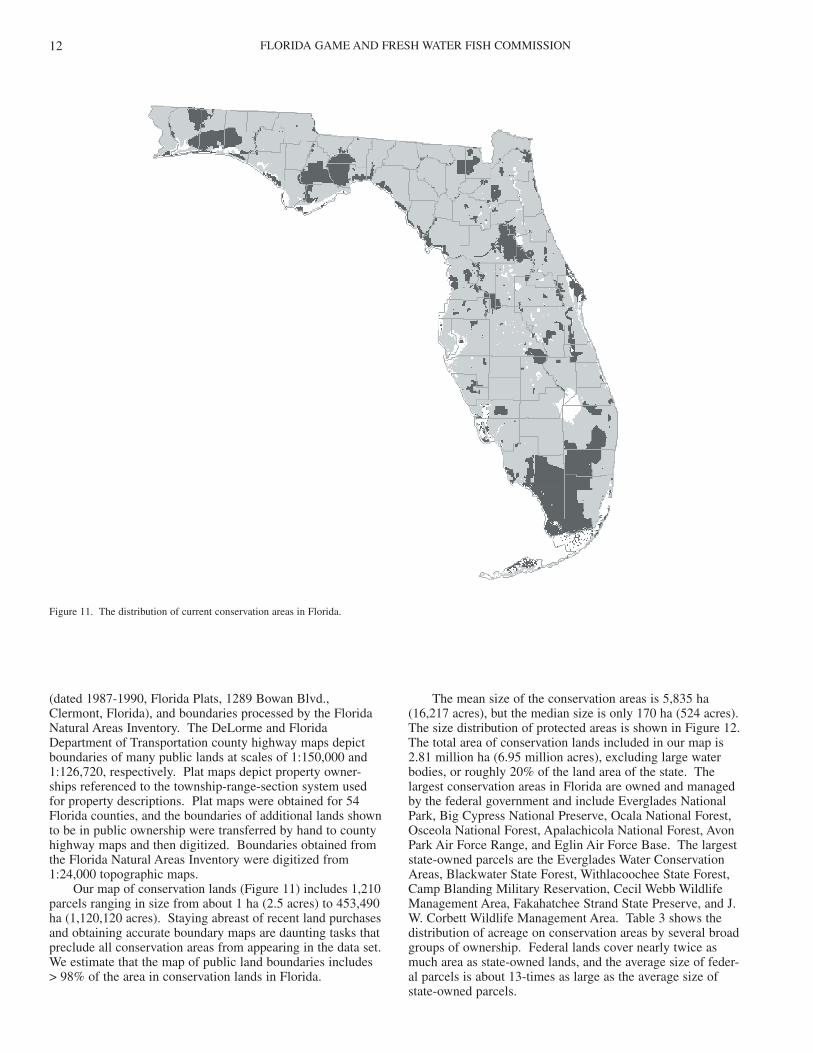
Our map of conservation lands (Figure 11) includes 1,210parcels ranging in size from about 1 ha (2.5 acres) to 453,490ha (1,120,120 acres). Staying abreast of recent land purchasesand obtaining accurate boundary maps are daunting tasks thatpreclude all conservation areas from appearing in the data set.We estimate that the map of public land boundaries includes> 98% of the area in conservation lands in Florida.
The mean size of the conservation areas is 5,835 ha(16,217 acres), but the median size is only 170 ha (524 acres).The size distribution of protected areas is shown in Figure 12.The total area of conservation lands included in our map is2.81 million ha (6.95 million acres), excluding large waterbodies, or roughly 20% of the land area of the state. Thelargest conservation areas in Florida are owned and managedby the federal government and include Everglades NationalPark, Big Cypress National Preserve, Ocala National Forest,Osceola National Forest, Apalachicola National Forest, AvonPark Air Force Range, and Eglin Air Force Base. The largeststate-owned parcels are the Everglades Water ConservationAreas, Blackwater State Forest, Withlacoochee State Forest,Camp Blanding Military Reservation, Cecil Webb WildlifeManagement Area, Fakahatchee Strand State Preserve, and J.W. Corbett Wildlife Management Area. Table 3 shows thedistribution of acreage on conservation areas by several broadgroups of ownership. Federal lands cover nearly twice asmuch area as state-owned lands, and the average size of feder-al parcels is about 13-times as large as the average size ofstate-owned parcels.
Figure 11. The distribution of current conservation areas in Florida.
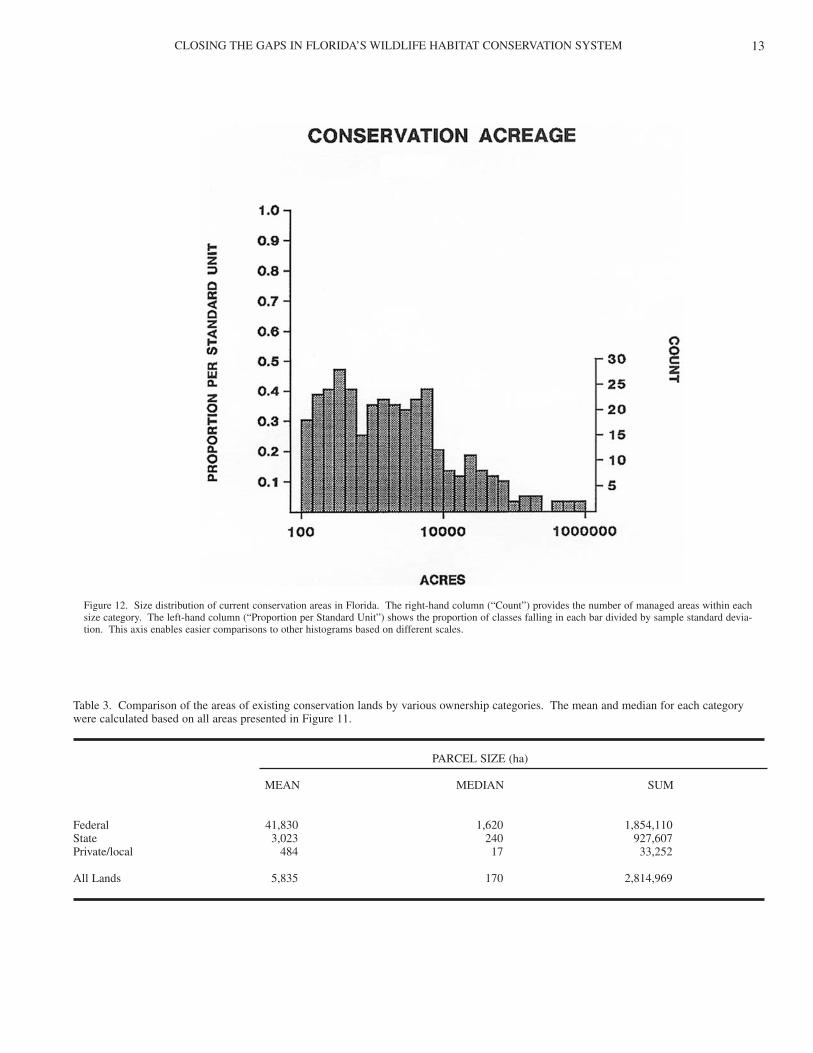
CLOSING THE GAPS IN FLORIDA’S WILDLIFE HABITAT CONSERVATION SYSTEM 13
Table 3. Comparison of the areas of existing conservation lands by various ownership categories. The mean and median for each categorywere calculated based on all areas presented in Figure 11.
PARCEL SIZE (ha)
MEAN MEDIAN SUM
Federal 41,830 1,620 1,854,110State 3,023 240 927,607Private/local 484 17 33,252
All Lands 5,835 170 2,814,969
Figure 12. Size distribution of current conservation areas in Florida. The right-hand column (“Count”) provides the number of managed areas within eachsize category. The left-hand column (“Proportion per Standard Unit”) shows the proportion of classes falling in each bar divided by sample standard devia-tion. This axis enables easier comparisons to other histograms based on different scales.
FLORIDA GAME AND FRESH WATER FISH COMMISSION14
The distribution of conservation areas among counties isvery uneven. Eight counties (DeSoto, Hardee, Hendry,Glades, Lafayette, Flagler, Gilchrist, and Calhoun) have < 1%of their total land area in some type of conservation area(Table 4). About half of the counties in Florida have < 10%of their total acreage in conservation areas, while thestatewide average is 15.2%. In sharp contrast, 5 counties(Monroe, Wakulla, Broward, Liberty, and Dade) have > 50%of their total area in conservation areas. The statewide medianfor the proportion of conservation lands within individualcounties is 8.6%. Figure 13 shows Florida counties catego-rized by the proportional acreage of conservation area thatthey contain.
An overlay of conservation land boundaries on theLandsat cover map produces an estimate of the area of variousplant communities currently protected in Florida (Table 5).At present, conservation lands hold 46.2% of Florida’sremaining wetlands, but only 19.6% of Florida’s remaining“natural” upland plant communities. Only 4.2% of the area on conservation lands falls into one of the “disturbed”cover types.
Based on percentages, the best represented upland covertype on conservation lands is sand pine scrub with about 75%of its remaining acreage within conservation lands (primarilyon the Ocala National Forest). Of Florida’s remaining xericcommunities, only 38.2% of the sandhill land cover and41.3% of the xeric oak scrub land cover are in public owner-ship. However, the quality of these protected xeric communi-ties varies widely. Over half of the coastal strand and tropicalhardwood hammock mapped by Kautz et al. (1993) occurs onconservation lands. Forests dominated by hardwoods (i.e., theupland hardwood forest and mixed pine-hardwood classes)appear to be among the least represented in comparison totheir acreage statewide (Table 5). In addition, only 16.6% ofthe 561,113 ha (1,385,950 acres) of dry prairie remaining inFlorida is found in current conservation lands.
Among wetland cover types, mangrove swamps are thebest represented in current conservation areas (79% ofstatewide total). Also well represented are freshwater marshes(62.3%), coastal salt marshes (60.0%), and shrub swamps(58.5%). The quality of many of these protected wetlandsvaries widely (Bildstein et al. 1991). The least represented wet-land types are forested wetlands such as mixed hardwood
Table 4. Percentages of existing conservation lands by individual Florida counties. Counties are arranged in ascending order.
PERCENTCOUNTY NAME CONSERVATION LAND
Desoto 0.1%Hardee 0.1%Hendry 0.2%Glades 0.2%Lafayette 0.5%Flagler 0.6%Gilchrist 0.6%Calhoun 0.8%Suwannee 1.2%St. Lucie 1.4%Nassau 1.4%Madison 1.7%Hamilton 1.8%Pinellas 1.9%Okeechobee 2.6%Jackson 2.9%Escambia 3.3%Seminole 3.4%Holmes 3.5%Hillsborough 3.5%Manatee 3.7%St. Johns 3.8%Gadsden 3.8%Martin 4.3%Washington 4.6%Union 5.3%Alachua 5.4%Bay 6.4%Jefferson 7.6%Polk 8.2%Gulf 8.4%Bradford 8.4%Putnam 8.6%Osceola 8.8%
PERCENTCOUNTY NAME CONSERVATION LAND
Highland 9.4%Pasco 10.4%Volusia 10.6%Taylor 10.9%Orange 11.2%Sarasota 11.6%Levy 11.8%Dixie 12.3%Duval 13.4%Franklin 14.9%Lake 15.4%Columbia 16.6%Lee 17.1%Clay 18.4%Indian River 19.3%Citrus 19.9%Sumter 21.8%Hernando 21.9%Palm Beach 23.4%Charlotte 23.6%Walton 24.7%Santa Rosa 26.8%Brevard 27.0%Baker 28.1%Leon 30.0%Marion 30.5%Collier 46.1%Okaloosa 48.7%Dade 56.2%Liberty 59.0%Broward 63.1%Wakulla 65.5%Monroe 79.1%
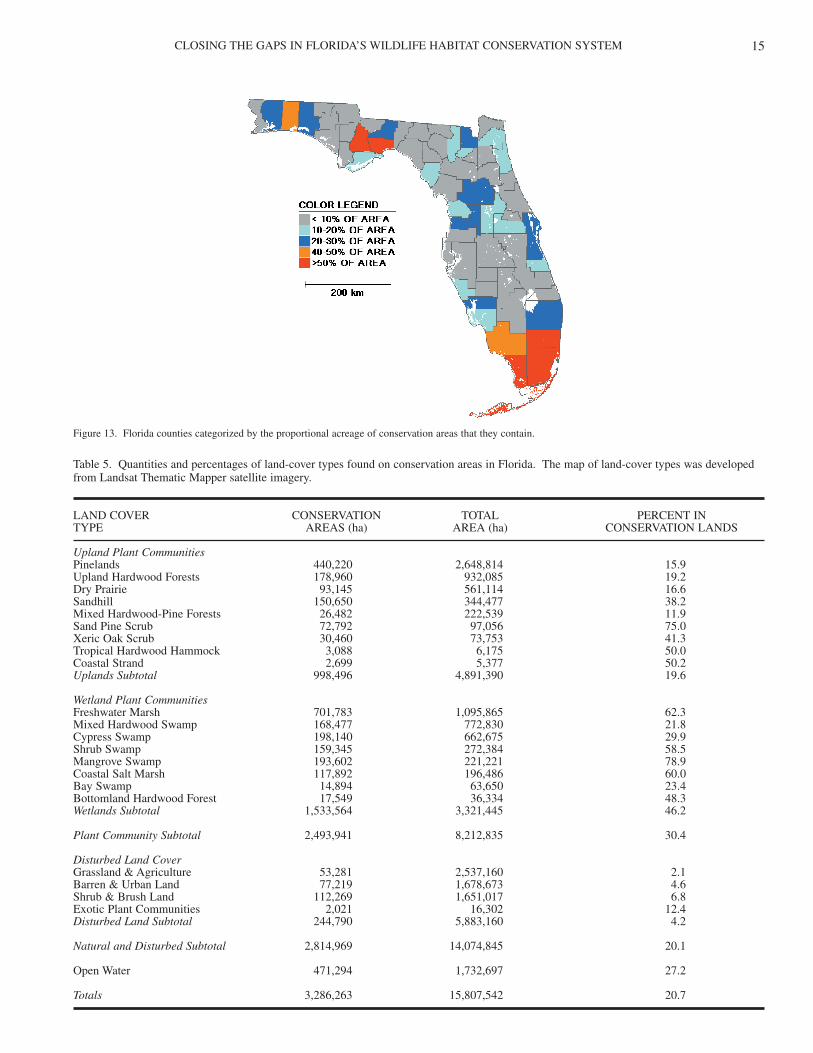
CLOSING THE GAPS IN FLORIDA’S WILDLIFE HABITAT CONSERVATION SYSTEM 15
Table 5. Quantities and percentages of land-cover types found on conservation areas in Florida. The map of land-cover types was developedfrom Landsat Thematic Mapper satellite imagery.
LAND COVER CONSERVATION TOTAL PERCENT INTYPE AREAS (ha) AREA (ha) CONSERVATION LANDS
Upland Plant CommunitiesPinelands 440,220 2,648,814 15.9Upland Hardwood Forests 178,960 932,085 19.2Dry Prairie 93,145 561,114 16.6Sandhill 150,650 344,477 38.2Mixed Hardwood-Pine Forests 26,482 222,539 11.9Sand Pine Scrub 72,792 97,056 75.0Xeric Oak Scrub 30,460 73,753 41.3Tropical Hardwood Hammock 3,088 6,175 50.0Coastal Strand 2,699 5,377 50.2Uplands Subtotal 998,496 4,891,390 19.6
Wetland Plant CommunitiesFreshwater Marsh 701,783 1,095,865 62.3Mixed Hardwood Swamp 168,477 772,830 21.8Cypress Swamp 198,140 662,675 29.9Shrub Swamp 159,345 272,384 58.5Mangrove Swamp 193,602 221,221 78.9Coastal Salt Marsh 117,892 196,486 60.0Bay Swamp 14,894 63,650 23.4Bottomland Hardwood Forest 17,549 36,334 48.3Wetlands Subtotal 1,533,564 3,321,445 46.2
Plant Community Subtotal 2,493,941 8,212,835 30.4
Disturbed Land CoverGrassland & Agriculture 53,281 2,537,160 2.1Barren & Urban Land 77,219 1,678,673 4.6Shrub & Brush Land 112,269 1,651,017 6.8Exotic Plant Communities 2,021 16,302 12.4Disturbed Land Subtotal 244,790 5,883,160 4.2
Natural and Disturbed Subtotal 2,814,969 14,074,845 20.1
Open Water 471,294 1,732,697 27.2
Totals 3,286,263 15,807,542 20.7
Figure 13. Florida counties categorized by the proportional acreage of conservation areas that they contain.
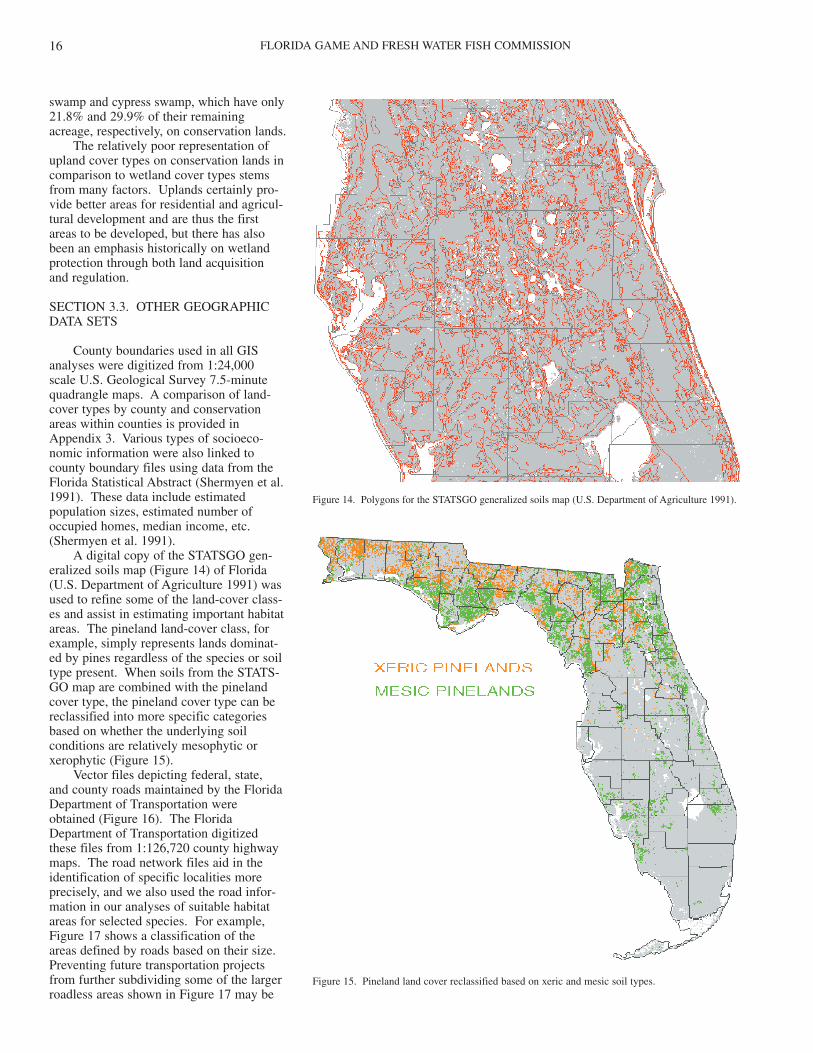
FLORIDA GAME AND FRESH WATER FISH COMMISSION16
swamp and cypress swamp, which have only21.8% and 29.9% of their remainingacreage, respectively, on conservation lands.
The relatively poor representation ofupland cover types on conservation lands incomparison to wetland cover types stemsfrom many factors. Uplands certainly pro-vide better areas for residential and agricul-tural development and are thus the firstareas to be developed, but there has alsobeen an emphasis historically on wetlandprotection through both land acquisitionand regulation.
SECTION 3.3. OTHER GEOGRAPHICDATA SETS
County boundaries used in all GISanalyses were digitized from 1:24,000 scale U.S. Geological Survey 7.5-minutequadrangle maps. A comparison of land-cover types by county and conservationareas within counties is provided inAppendix 3. Various types of socioeco-nomic information were also linked tocounty boundary files using data from theFlorida Statistical Abstract (Shermyen et al.1991). These data include estimatedpopulation sizes, estimated number ofoccupied homes, median income, etc.(Shermyen et al. 1991).
A digital copy of the STATSGO gen-eralized soils map (Figure 14) of Florida(U.S. Department of Agriculture 1991) wasused to refine some of the land-cover class-es and assist in estimating important habitatareas. The pineland land-cover class, forexample, simply represents lands dominat-ed by pines regardless of the species or soiltype present. When soils from the STATS-GO map are combined with the pinelandcover type, the pineland cover type can bereclassified into more specific categoriesbased on whether the underlying soilconditions are relatively mesophytic orxerophytic (Figure 15).
Vector files depicting federal, state,and county roads maintained by the FloridaDepartment of Transportation wereobtained (Figure 16). The FloridaDepartment of Transportation digitizedthese files from 1:126,720 county highwaymaps. The road network files aid in theidentification of specific localities moreprecisely, and we also used the road infor-mation in our analyses of suitable habitatareas for selected species. For example,Figure 17 shows a classification of the areas defined by roads based on their size.Preventing future transportation projectsfrom further subdividing some of the largerroadless areas shown in Figure 17 may be
Figure 14. Polygons for the STATSGO generalized soils map (U.S. Department of Agriculture 1991).
Figure 15. Pineland land cover reclassified based on xeric and mesic soil types.
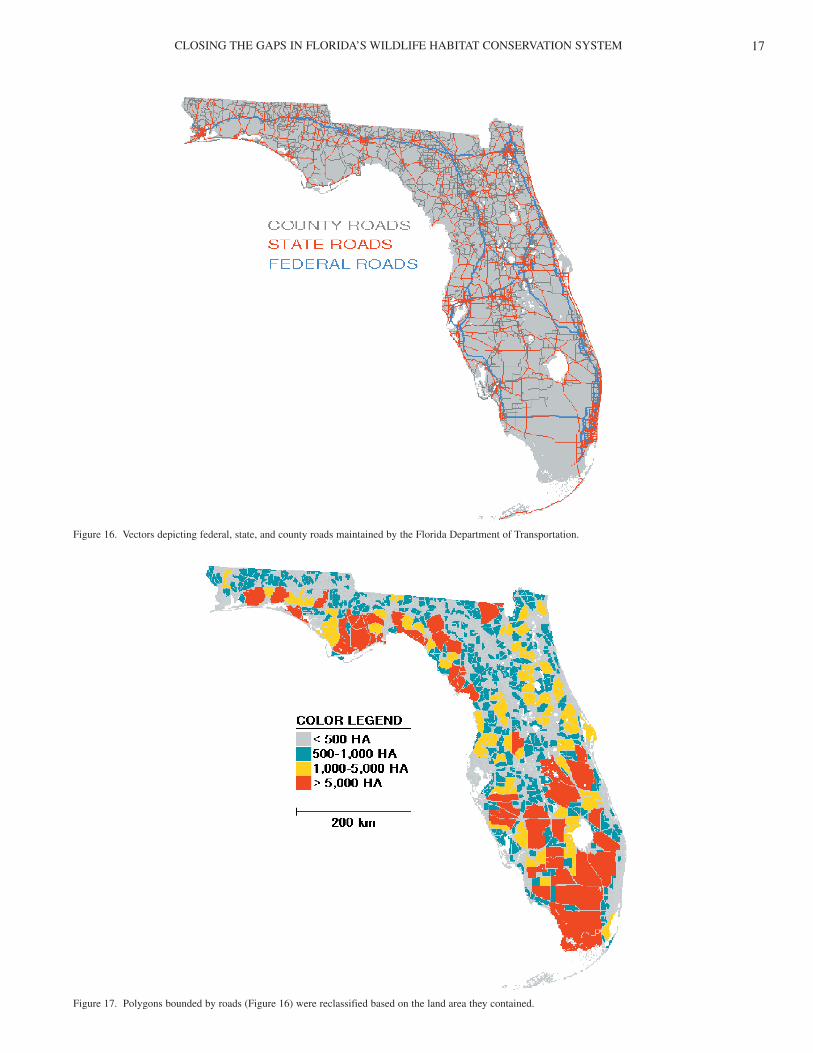
CLOSING THE GAPS IN FLORIDA’S WILDLIFE HABITAT CONSERVATION SYSTEM 17
Figure 16. Vectors depicting federal, state, and county roads maintained by the Florida Department of Transportation.
Figure 17. Polygons bounded by roads (Figure 16) were reclassified based on the land area they contained.
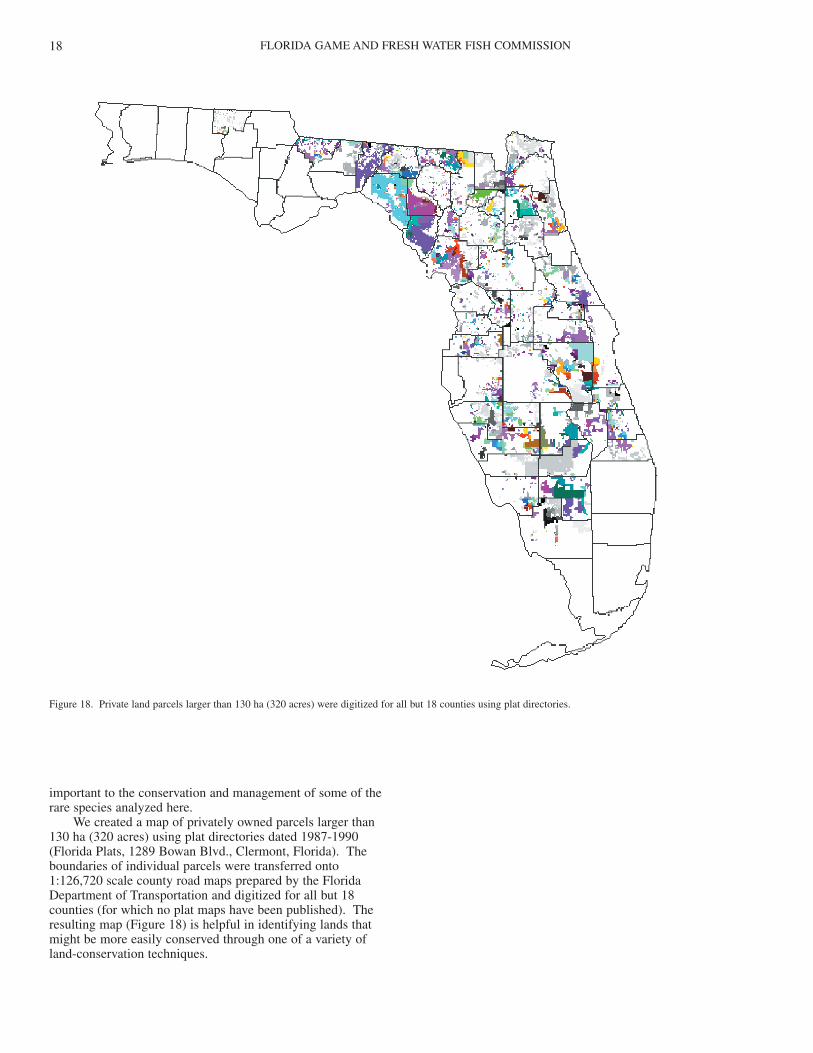
FLORIDA GAME AND FRESH WATER FISH COMMISSION18
important to the conservation and management of some of therare species analyzed here.
We created a map of privately owned parcels larger than130 ha (320 acres) using plat directories dated 1987-1990(Florida Plats, 1289 Bowan Blvd., Clermont, Florida). Theboundaries of individual parcels were transferred onto1:126,720 scale county road maps prepared by the FloridaDepartment of Transportation and digitized for all but 18counties (for which no plat maps have been published). Theresulting map (Figure 18) is helpful in identifying lands thatmight be more easily conserved through one of a variety ofland-conservation techniques.
Figure 18. Private land parcels larger than 130 ha (320 acres) were digitized for all but 18 counties using plat directories.
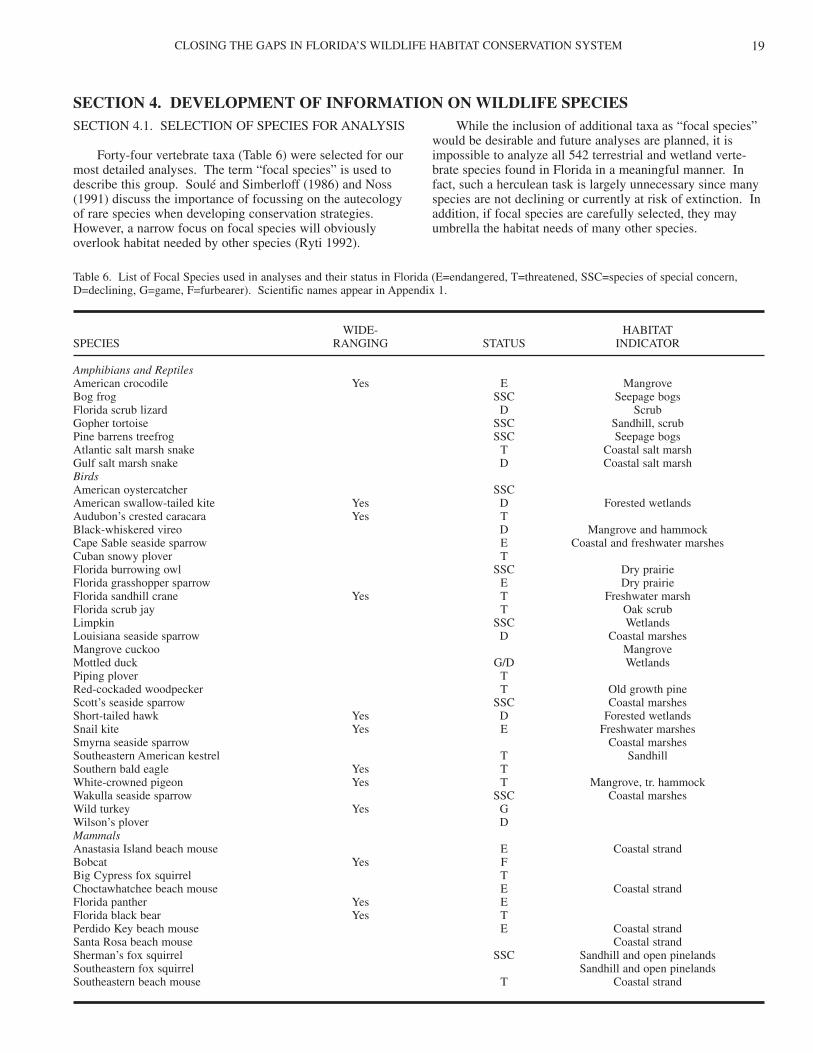
CLOSING THE GAPS IN FLORIDA’S WILDLIFE HABITAT CONSERVATION SYSTEM 19
SECTION 4.1. SELECTION OF SPECIES FOR ANALYSIS
Forty-four vertebrate taxa (Table 6) were selected for ourmost detailed analyses. The term “focal species” is used todescribe this group. Soulé and Simberloff (1986) and Noss(1991) discuss the importance of focussing on the autecologyof rare species when developing conservation strategies.However, a narrow focus on focal species will obviouslyoverlook habitat needed by other species (Ryti 1992).
While the inclusion of additional taxa as “focal species”would be desirable and future analyses are planned, it isimpossible to analyze all 542 terrestrial and wetland verte-brate species found in Florida in a meaningful manner. Infact, such a herculean task is largely unnecessary since manyspecies are not declining or currently at risk of extinction. Inaddition, if focal species are carefully selected, they mayumbrella the habitat needs of many other species.
SECTION 4. DEVELOPMENT OF INFORMATION ON WILDLIFE SPECIES
Table 6. List of Focal Species used in analyses and their status in Florida (E=endangered, T=threatened, SSC=species of special concern,D=declining, G=game, F=furbearer). Scientific names appear in Appendix 1.
WIDE- HABITATSPECIES RANGING STATUS INDICATOR
Amphibians and ReptilesAmerican crocodile Yes E MangroveBog frog SSC Seepage bogsFlorida scrub lizard D ScrubGopher tortoise SSC Sandhill, scrubPine barrens treefrog SSC Seepage bogsAtlantic salt marsh snake T Coastal salt marshGulf salt marsh snake D Coastal salt marshBirdsAmerican oystercatcher SSCAmerican swallow-tailed kite Yes D Forested wetlandsAudubon’s crested caracara Yes TBlack-whiskered vireo D Mangrove and hammockCape Sable seaside sparrow E Coastal and freshwater marshesCuban snowy plover TFlorida burrowing owl SSC Dry prairieFlorida grasshopper sparrow E Dry prairieFlorida sandhill crane Yes T Freshwater marshFlorida scrub jay T Oak scrubLimpkin SSC WetlandsLouisiana seaside sparrow D Coastal marshesMangrove cuckoo MangroveMottled duck G/D WetlandsPiping plover TRed-cockaded woodpecker T Old growth pineScott’s seaside sparrow SSC Coastal marshesShort-tailed hawk Yes D Forested wetlandsSnail kite Yes E Freshwater marshesSmyrna seaside sparrow Coastal marshesSoutheastern American kestrel T SandhillSouthern bald eagle Yes TWhite-crowned pigeon Yes T Mangrove, tr. hammockWakulla seaside sparrow SSC Coastal marshesWild turkey Yes GWilson’s plover DMammalsAnastasia Island beach mouse E Coastal strandBobcat Yes FBig Cypress fox squirrel TChoctawhatchee beach mouse E Coastal strandFlorida panther Yes EFlorida black bear Yes TPerdido Key beach mouse E Coastal strandSanta Rosa beach mouse Coastal strandSherman’s fox squirrel SSC Sandhill and open pinelandsSoutheastern fox squirrel Sandhill and open pinelandsSoutheastern beach mouse T Coastal strand
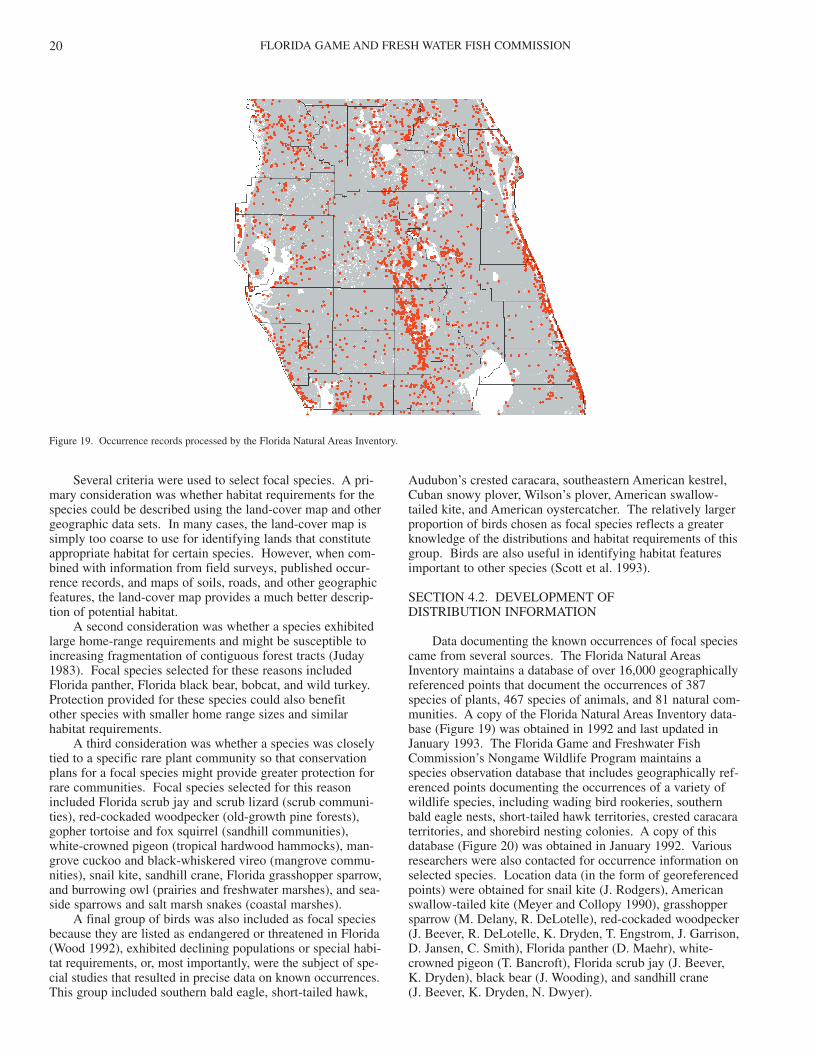
FLORIDA GAME AND FRESH WATER FISH COMMISSION20
Several criteria were used to select focal species. A pri-mary consideration was whether habitat requirements for thespecies could be described using the land-cover map and othergeographic data sets. In many cases, the land-cover map issimply too coarse to use for identifying lands that constituteappropriate habitat for certain species. However, when com-bined with information from field surveys, published occur-rence records, and maps of soils, roads, and other geographicfeatures, the land-cover map provides a much better descrip-tion of potential habitat.
A second consideration was whether a species exhibitedlarge home-range requirements and might be susceptible toincreasing fragmentation of contiguous forest tracts (Juday1983). Focal species selected for these reasons includedFlorida panther, Florida black bear, bobcat, and wild turkey.Protection provided for these species could also benefit other species with smaller home range sizes and similarhabitat requirements.
A third consideration was whether a species was closelytied to a specific rare plant community so that conservationplans for a focal species might provide greater protection forrare communities. Focal species selected for this reasonincluded Florida scrub jay and scrub lizard (scrub communi-ties), red-cockaded woodpecker (old-growth pine forests),gopher tortoise and fox squirrel (sandhill communities),white-crowned pigeon (tropical hardwood hammocks), man-grove cuckoo and black-whiskered vireo (mangrove commu-nities), snail kite, sandhill crane, Florida grasshopper sparrow,and burrowing owl (prairies and freshwater marshes), and sea-side sparrows and salt marsh snakes (coastal marshes).
A final group of birds was also included as focal speciesbecause they are listed as endangered or threatened in Florida(Wood 1992), exhibited declining populations or special habi-tat requirements, or, most importantly, were the subject of spe-cial studies that resulted in precise data on known occurrences.This group included southern bald eagle, short-tailed hawk,
Audubon’s crested caracara, southeastern American kestrel,Cuban snowy plover, Wilson’s plover, American swallow-tailed kite, and American oystercatcher. The relatively largerproportion of birds chosen as focal species reflects a greaterknowledge of the distributions and habitat requirements of thisgroup. Birds are also useful in identifying habitat featuresimportant to other species (Scott et al. 1993).
SECTION 4.2. DEVELOPMENT OFDISTRIBUTION INFORMATION
Data documenting the known occurrences of focal speciescame from several sources. The Florida Natural AreasInventory maintains a database of over 16,000 geographicallyreferenced points that document the occurrences of 387species of plants, 467 species of animals, and 81 natural com-munities. A copy of the Florida Natural Areas Inventory data-base (Figure 19) was obtained in 1992 and last updated inJanuary 1993. The Florida Game and Freshwater FishCommission’s Nongame Wildlife Program maintains aspecies observation database that includes geographically ref-erenced points documenting the occurrences of a variety ofwildlife species, including wading bird rookeries, southernbald eagle nests, short-tailed hawk territories, crested caracaraterritories, and shorebird nesting colonies. A copy of thisdatabase (Figure 20) was obtained in January 1992. Variousresearchers were also contacted for occurrence information onselected species. Location data (in the form of georeferencedpoints) were obtained for snail kite (J. Rodgers), Americanswallow-tailed kite (Meyer and Collopy 1990), grasshoppersparrow (M. Delany, R. DeLotelle), red-cockaded woodpecker(J. Beever, R. DeLotelle, K. Dryden, T. Engstrom, J. Garrison,D. Jansen, C. Smith), Florida panther (D. Maehr), white-crowned pigeon (T. Bancroft), Florida scrub jay (J. Beever,K. Dryden), black bear (J. Wooding), and sandhill crane (J. Beever, K. Dryden, N. Dwyer).
Figure 19. Occurrence records processed by the Florida Natural Areas Inventory.
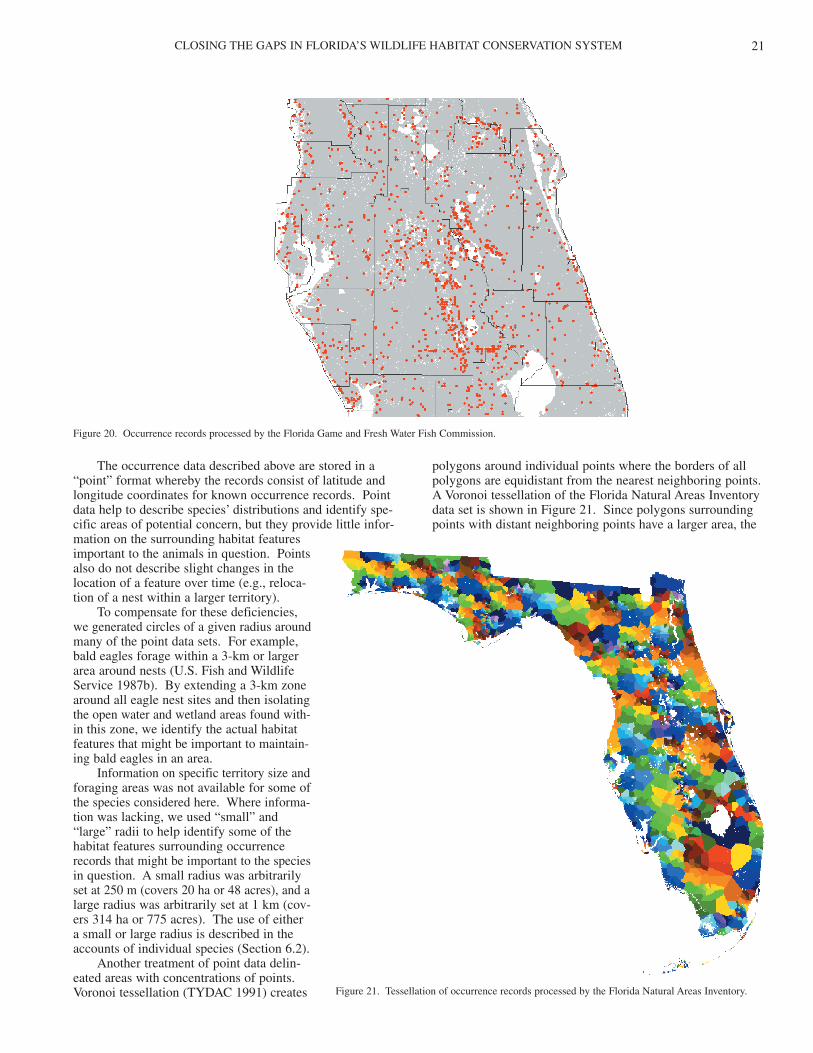
CLOSING THE GAPS IN FLORIDA’S WILDLIFE HABITAT CONSERVATION SYSTEM 21
The occurrence data described above are stored in a“point” format whereby the records consist of latitude andlongitude coordinates for known occurrence records. Pointdata help to describe species’ distributions and identify spe-cific areas of potential concern, but they provide little infor-mation on the surrounding habitat featuresimportant to the animals in question. Pointsalso do not describe slight changes in thelocation of a feature over time (e.g., reloca-tion of a nest within a larger territory).
To compensate for these deficiencies,we generated circles of a given radius aroundmany of the point data sets. For example,bald eagles forage within a 3-km or largerarea around nests (U.S. Fish and WildlifeService 1987b). By extending a 3-km zonearound all eagle nest sites and then isolatingthe open water and wetland areas found with-in this zone, we identify the actual habitatfeatures that might be important to maintain-ing bald eagles in an area.
Information on specific territory size andforaging areas was not available for some ofthe species considered here. Where informa-tion was lacking, we used “small” and“large” radii to help identify some of thehabitat features surrounding occurrencerecords that might be important to the speciesin question. A small radius was arbitrarilyset at 250 m (covers 20 ha or 48 acres), and alarge radius was arbitrarily set at 1 km (cov-ers 314 ha or 775 acres). The use of eithera small or large radius is described in theaccounts of individual species (Section 6.2).
Another treatment of point data delin-eated areas with concentrations of points.Voronoi tessellation (TYDAC 1991) creates
polygons around individual points where the borders of allpolygons are equidistant from the nearest neighboring points.A Voronoi tessellation of the Florida Natural Areas Inventorydata set is shown in Figure 21. Since polygons surroundingpoints with distant neighboring points have a larger area, the
Figure 20. Occurrence records processed by the Florida Game and Fresh Water Fish Commission.
Figure 21. Tessellation of occurrence records processed by the Florida Natural Areas Inventory.
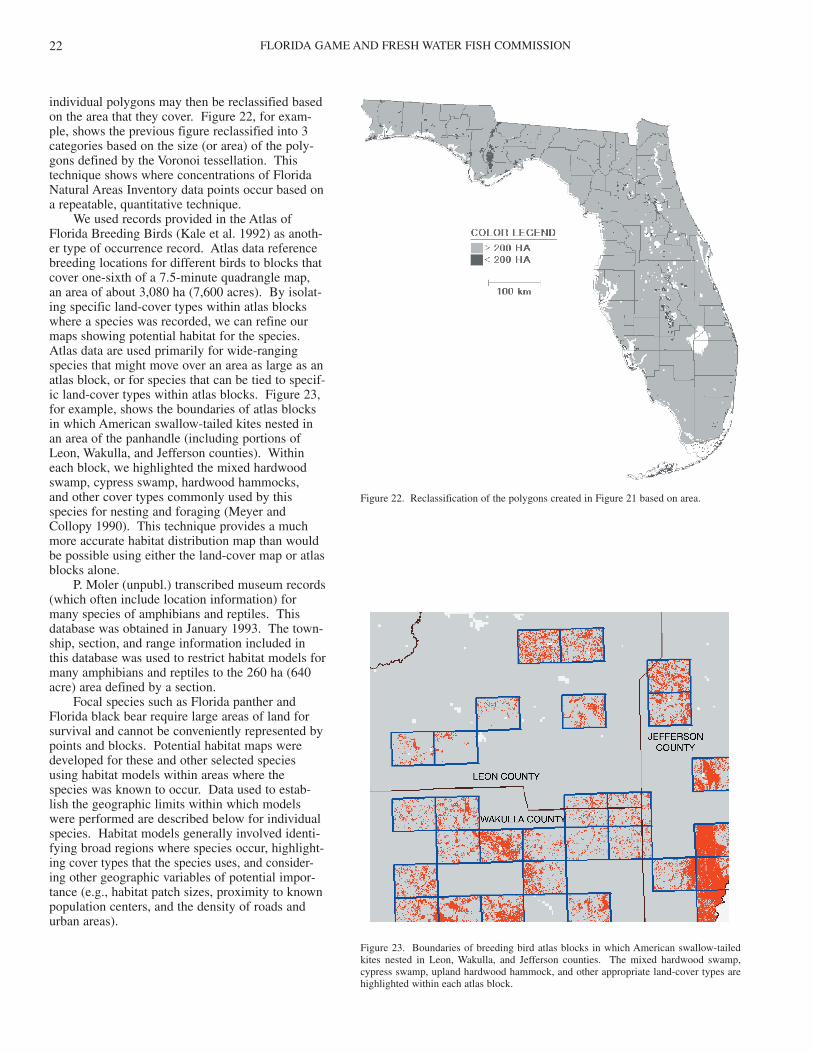
FLORIDA GAME AND FRESH WATER FISH COMMISSION22
individual polygons may then be reclassified basedon the area that they cover. Figure 22, for exam-ple, shows the previous figure reclassified into 3categories based on the size (or area) of the poly-gons defined by the Voronoi tessellation. Thistechnique shows where concentrations of FloridaNatural Areas Inventory data points occur based ona repeatable, quantitative technique.
We used records provided in the Atlas ofFlorida Breeding Birds (Kale et al. 1992) as anoth-er type of occurrence record. Atlas data referencebreeding locations for different birds to blocks thatcover one-sixth of a 7.5-minute quadrangle map,an area of about 3,080 ha (7,600 acres). By isolat-ing specific land-cover types within atlas blockswhere a species was recorded, we can refine ourmaps showing potential habitat for the species.Atlas data are used primarily for wide-rangingspecies that might move over an area as large as anatlas block, or for species that can be tied to specif-ic land-cover types within atlas blocks. Figure 23,for example, shows the boundaries of atlas blocksin which American swallow-tailed kites nested inan area of the panhandle (including portions ofLeon, Wakulla, and Jefferson counties). Withineach block, we highlighted the mixed hardwoodswamp, cypress swamp, hardwood hammocks,and other cover types commonly used by thisspecies for nesting and foraging (Meyer andCollopy 1990). This technique provides a muchmore accurate habitat distribution map than wouldbe possible using either the land-cover map or atlasblocks alone.
P. Moler (unpubl.) transcribed museum records(which often include location information) formany species of amphibians and reptiles. Thisdatabase was obtained in January 1993. The town-ship, section, and range information included inthis database was used to restrict habitat models formany amphibians and reptiles to the 260 ha (640acre) area defined by a section.
Focal species such as Florida panther andFlorida black bear require large areas of land forsurvival and cannot be conveniently represented bypoints and blocks. Potential habitat maps weredeveloped for these and other selected speciesusing habitat models within areas where thespecies was known to occur. Data used to estab-lish the geographic limits within which modelswere performed are described below for individualspecies. Habitat models generally involved identi-fying broad regions where species occur, highlight-ing cover types that the species uses, and consider-ing other geographic variables of potential impor-tance (e.g., habitat patch sizes, proximity to knownpopulation centers, and the density of roads andurban areas).
Figure 22. Reclassification of the polygons created in Figure 21 based on area.
Figure 23. Boundaries of breeding bird atlas blocks in which American swallow-tailedkites nested in Leon, Wakulla, and Jefferson counties. The mixed hardwood swamp,cypress swamp, upland hardwood hammock, and other appropriate land-cover types arehighlighted within each atlas block.
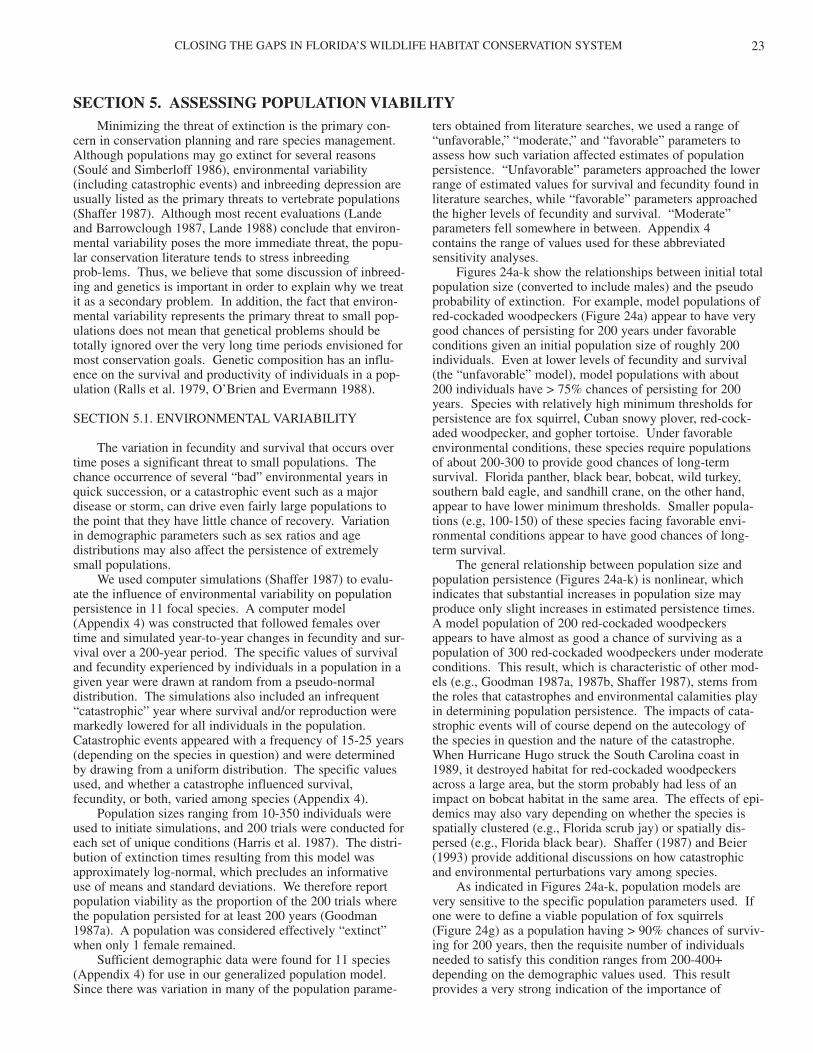
CLOSING THE GAPS IN FLORIDA’S WILDLIFE HABITAT CONSERVATION SYSTEM 23
Minimizing the threat of extinction is the primary con-cern in conservation planning and rare species management.Although populations may go extinct for several reasons(Soulé and Simberloff 1986), environmental variability(including catastrophic events) and inbreeding depression areusually listed as the primary threats to vertebrate populations(Shaffer 1987). Although most recent evaluations (Lande and Barrowclough 1987, Lande 1988) conclude that environ-mental variability poses the more immediate threat, the popu-lar conservation literature tends to stress inbreedingprob-lems. Thus, we believe that some discussion of inbreed-ing and genetics is important in order to explain why we treatit as a secondary problem. In addition, the fact that environ-mental variability represents the primary threat to small pop-ulations does not mean that genetical problems should betotally ignored over the very long time periods envisioned formost conservation goals. Genetic composition has an influ-ence on the survival and productivity of individuals in a pop-ulation (Ralls et al. 1979, O’Brien and Evermann 1988).
SECTION 5.1. ENVIRONMENTAL VARIABILITY
The variation in fecundity and survival that occurs overtime poses a significant threat to small populations. Thechance occurrence of several “bad” environmental years inquick succession, or a catastrophic event such as a majordisease or storm, can drive even fairly large populations tothe point that they have little chance of recovery. Variation in demographic parameters such as sex ratios and agedistributions may also affect the persistence of extremelysmall populations.
We used computer simulations (Shaffer 1987) to evalu-ate the influence of environmental variability on populationpersistence in 11 focal species. A computer model(Appendix 4) was constructed that followed females overtime and simulated year-to-year changes in fecundity and sur-vival over a 200-year period. The specific values of survivaland fecundity experienced by individuals in a population in agiven year were drawn at random from a pseudo-normaldistribution. The simulations also included an infrequent“catastrophic” year where survival and/or reproduction weremarkedly lowered for all individuals in the population.Catastrophic events appeared with a frequency of 15-25 years(depending on the species in question) and were determinedby drawing from a uniform distribution. The specific valuesused, and whether a catastrophe influenced survival,fecundity, or both, varied among species (Appendix 4).
Population sizes ranging from 10-350 individuals wereused to initiate simulations, and 200 trials were conducted foreach set of unique conditions (Harris et al. 1987). The distri-bution of extinction times resulting from this model wasapproximately log-normal, which precludes an informativeuse of means and standard deviations. We therefore reportpopulation viability as the proportion of the 200 trials wherethe population persisted for at least 200 years (Goodman1987a). A population was considered effectively “extinct”when only 1 female remained.
Sufficient demographic data were found for 11 species(Appendix 4) for use in our generalized population model.Since there was variation in many of the population parame-
ters obtained from literature searches, we used a range of“unfavorable,” “moderate,” and “favorable” parameters toassess how such variation affected estimates of populationpersistence. “Unfavorable” parameters approached the lowerrange of estimated values for survival and fecundity found inliterature searches, while “favorable” parameters approachedthe higher levels of fecundity and survival. “Moderate”parameters fell somewhere in between. Appendix 4 contains the range of values used for these abbreviatedsensitivity analyses.
Figures 24a-k show the relationships between initial totalpopulation size (converted to include males) and the pseudoprobability of extinction. For example, model populations ofred-cockaded woodpeckers (Figure 24a) appear to have verygood chances of persisting for 200 years under favorableconditions given an initial population size of roughly 200individuals. Even at lower levels of fecundity and survival(the “unfavorable” model), model populations with about 200 individuals have > 75% chances of persisting for 200years. Species with relatively high minimum thresholds forpersistence are fox squirrel, Cuban snowy plover, red-cock-aded woodpecker, and gopher tortoise. Under favorableenvironmental conditions, these species require populationsof about 200-300 to provide good chances of long-termsurvival. Florida panther, black bear, bobcat, wild turkey,southern bald eagle, and sandhill crane, on the other hand,appear to have lower minimum thresholds. Smaller popula-tions (e.g, 100-150) of these species facing favorable envi-ronmental conditions appear to have good chances of long-term survival.
The general relationship between population size andpopulation persistence (Figures 24a-k) is nonlinear, whichindicates that substantial increases in population size mayproduce only slight increases in estimated persistence times.A model population of 200 red-cockaded woodpeckersappears to have almost as good a chance of surviving as apopulation of 300 red-cockaded woodpeckers under moderateconditions. This result, which is characteristic of other mod-els (e.g., Goodman 1987a, 1987b, Shaffer 1987), stems fromthe roles that catastrophes and environmental calamities playin determining population persistence. The impacts of cata-strophic events will of course depend on the autecology ofthe species in question and the nature of the catastrophe.When Hurricane Hugo struck the South Carolina coast in1989, it destroyed habitat for red-cockaded woodpeckersacross a large area, but the storm probably had less of animpact on bobcat habitat in the same area. The effects of epi-demics may also vary depending on whether the species isspatially clustered (e.g., Florida scrub jay) or spatially dis-persed (e.g., Florida black bear). Shaffer (1987) and Beier(1993) provide additional discussions on how catastrophicand environmental perturbations vary among species.
As indicated in Figures 24a-k, population models arevery sensitive to the specific population parameters used. Ifone were to define a viable population of fox squirrels(Figure 24g) as a population having > 90% chances of surviv-ing for 200 years, then the requisite number of individualsneeded to satisfy this condition ranges from 200-400+depending on the demographic values used. This resultprovides a very strong indication of the importance of
SECTION 5. ASSESSING POPULATION VIABILITY
FLORIDA GAME AND FRESH WATER FISH COMMISSION24
Figure 24 (a-k). Relationships between initial population size and the chances of persisting for 200 years for model populations of 11 focal species (Model 1 =favorable environmental conditions; Model 2 = moderate environmental conditions; Model 3 = unfavorable environmental conditions).
Figure 24a.
Figure 24b.
CLOSING THE GAPS IN FLORIDA’S WILDLIFE HABITAT CONSERVATION SYSTEM 25
Figure 24 (a-k). Relationships between initial population size and the chances of persisting for 200 years for model populations of 11 focal species (Model 1 =favorable environmental conditions; Model 2 = moderate environmental conditions; Model 3 = unfavorable environmental conditions).
Figure 24c.
Figure 24d.
FLORIDA GAME AND FRESH WATER FISH COMMISSION26
Figure 24 (a-k). Relationships between initial population size and the chances of persisting for 200 years for model populations of 11 focal species (Model 1 =favorable environmental conditions; Model 2 = moderate environmental conditions; Model 3 = unfavorable environmental conditions).
Figure 24e.
Figure 24f.
CLOSING THE GAPS IN FLORIDA’S WILDLIFE HABITAT CONSERVATION SYSTEM 27
Figure 24 (a-k). Relationships between initial population size and the chances of persisting for 200 years for model populations of 11 focal species (Model 1 =favorable environmental conditions; Model 2 = moderate environmental conditions; Model 3 = unfavorable environmental conditions).
Figure 24g.
Figure 24h.
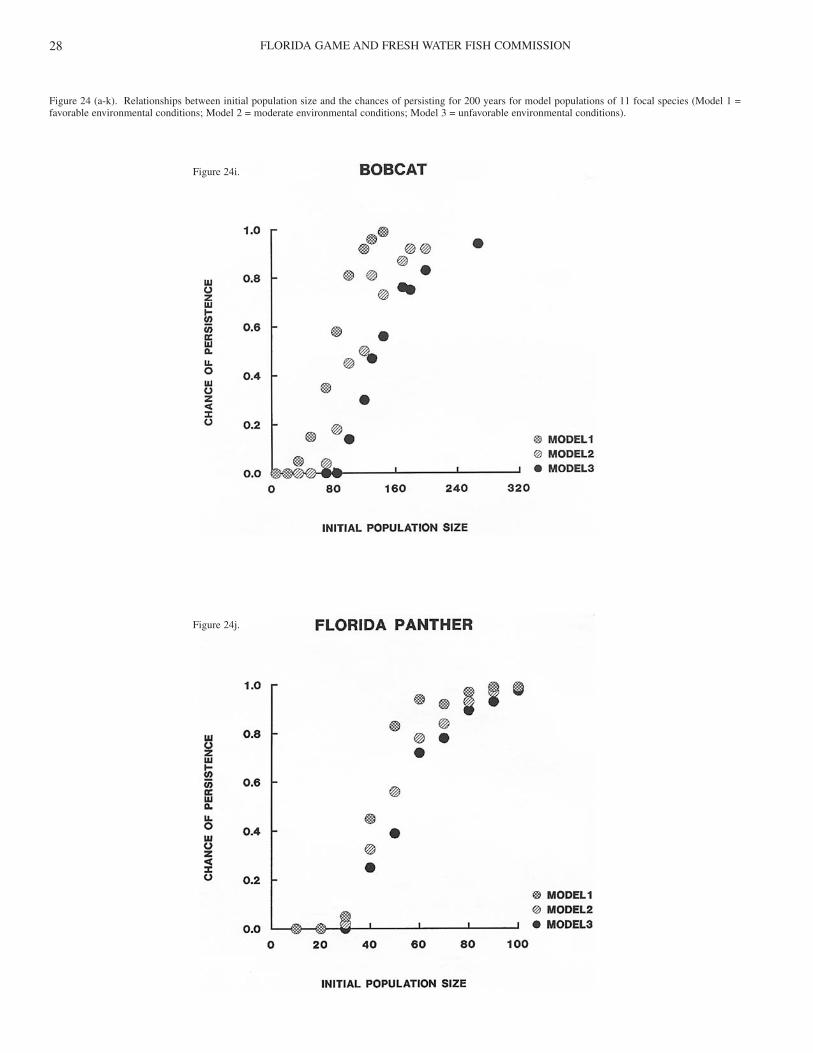
FLORIDA GAME AND FRESH WATER FISH COMMISSION28
Figure 24 (a-k). Relationships between initial population size and the chances of persisting for 200 years for model populations of 11 focal species (Model 1 =favorable environmental conditions; Model 2 = moderate environmental conditions; Model 3 = unfavorable environmental conditions).
Figure 24i.
Figure 24j.
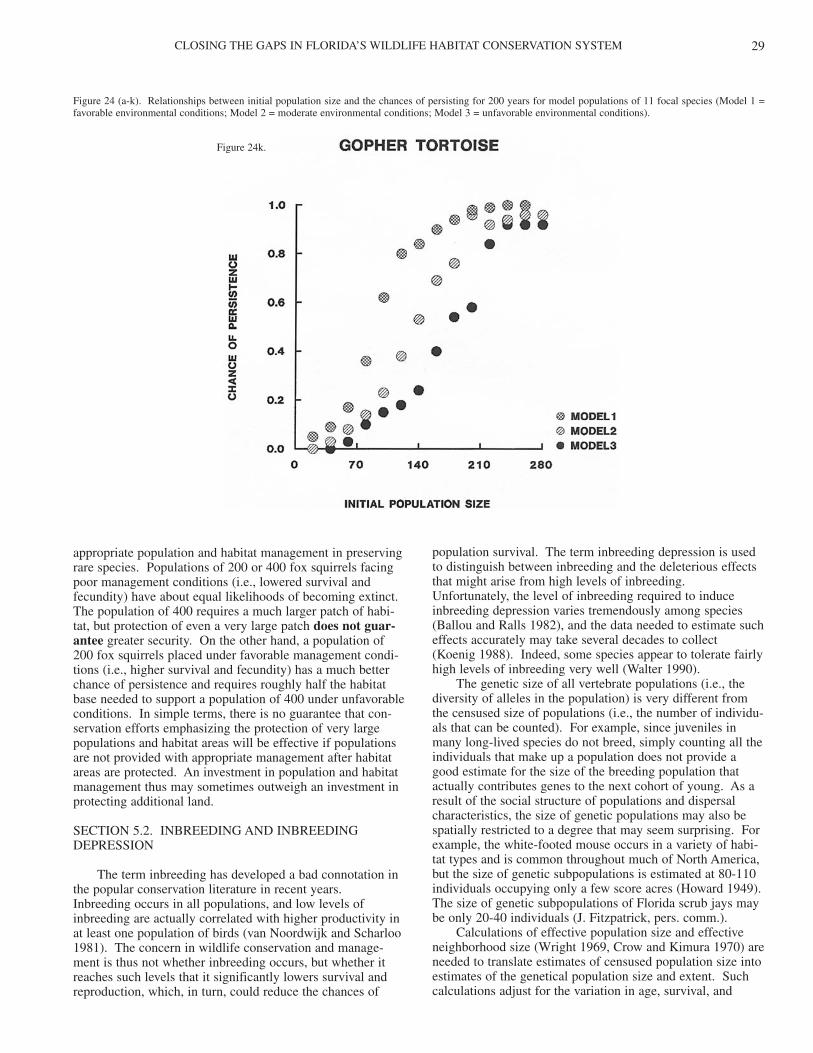
CLOSING THE GAPS IN FLORIDA’S WILDLIFE HABITAT CONSERVATION SYSTEM 29
appropriate population and habitat management in preservingrare species. Populations of 200 or 400 fox squirrels facingpoor management conditions (i.e., lowered survival andfecundity) have about equal likelihoods of becoming extinct.The population of 400 requires a much larger patch of habi-tat, but protection of even a very large patch does not guar-antee greater security. On the other hand, a population of200 fox squirrels placed under favorable management condi-tions (i.e., higher survival and fecundity) has a much betterchance of persistence and requires roughly half the habitatbase needed to support a population of 400 under unfavorableconditions. In simple terms, there is no guarantee that con-servation efforts emphasizing the protection of very largepopulations and habitat areas will be effective if populationsare not provided with appropriate management after habitatareas are protected. An investment in population and habitatmanagement thus may sometimes outweigh an investment inprotecting additional land.
SECTION 5.2. INBREEDING AND INBREEDINGDEPRESSION
The term inbreeding has developed a bad connotation inthe popular conservation literature in recent years.Inbreeding occurs in all populations, and low levels ofinbreeding are actually correlated with higher productivity inat least one population of birds (van Noordwijk and Scharloo1981). The concern in wildlife conservation and manage-ment is thus not whether inbreeding occurs, but whether itreaches such levels that it significantly lowers survival andreproduction, which, in turn, could reduce the chances of
population survival. The term inbreeding depression is usedto distinguish between inbreeding and the deleterious effectsthat might arise from high levels of inbreeding.Unfortunately, the level of inbreeding required to induceinbreeding depression varies tremendously among species(Ballou and Ralls 1982), and the data needed to estimate sucheffects accurately may take several decades to collect (Koenig 1988). Indeed, some species appear to tolerate fairlyhigh levels of inbreeding very well (Walter 1990).
The genetic size of all vertebrate populations (i.e., thediversity of alleles in the population) is very different fromthe censused size of populations (i.e., the number of individu-als that can be counted). For example, since juveniles inmany long-lived species do not breed, simply counting all theindividuals that make up a population does not provide agood estimate for the size of the breeding population thatactually contributes genes to the next cohort of young. As aresult of the social structure of populations and dispersalcharacteristics, the size of genetic populations may also bespatially restricted to a degree that may seem surprising. Forexample, the white-footed mouse occurs in a variety of habi-tat types and is common throughout much of North America,but the size of genetic subpopulations is estimated at 80-110individuals occupying only a few score acres (Howard 1949).The size of genetic subpopulations of Florida scrub jays maybe only 20-40 individuals (J. Fitzpatrick, pers. comm.).
Calculations of effective population size and effectiveneighborhood size (Wright 1969, Crow and Kimura 1970) areneeded to translate estimates of censused population size intoestimates of the genetical population size and extent. Suchcalculations adjust for the variation in age, survival, and
Figure 24 (a-k). Relationships between initial population size and the chances of persisting for 200 years for model populations of 11 focal species (Model 1 =favorable environmental conditions; Model 2 = moderate environmental conditions; Model 3 = unfavorable environmental conditions).
Figure 24k.
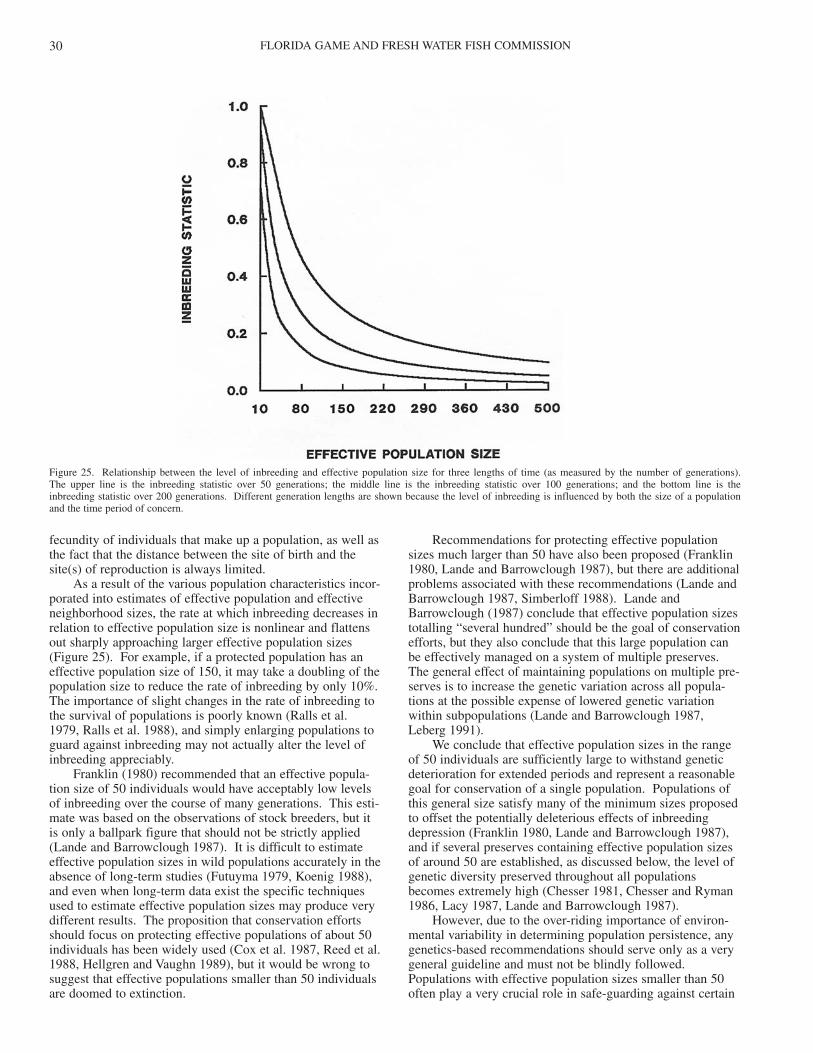
FLORIDA GAME AND FRESH WATER FISH COMMISSION30
fecundity of individuals that make up a population, as well asthe fact that the distance between the site of birth and thesite(s) of reproduction is always limited.
As a result of the various population characteristics incor-porated into estimates of effective population and effectiveneighborhood sizes, the rate at which inbreeding decreases inrelation to effective population size is nonlinear and flattensout sharply approaching larger effective population sizes(Figure 25). For example, if a protected population has aneffective population size of 150, it may take a doubling of thepopulation size to reduce the rate of inbreeding by only 10%.The importance of slight changes in the rate of inbreeding tothe survival of populations is poorly known (Ralls et al. 1979, Ralls et al. 1988), and simply enlarging populations toguard against inbreeding may not actually alter the level ofinbreeding appreciably.
Franklin (1980) recommended that an effective popula-tion size of 50 individuals would have acceptably low levelsof inbreeding over the course of many generations. This esti-mate was based on the observations of stock breeders, but itis only a ballpark figure that should not be strictly applied(Lande and Barrowclough 1987). It is difficult to estimateeffective population sizes in wild populations accurately in theabsence of long-term studies (Futuyma 1979, Koenig 1988),and even when long-term data exist the specific techniquesused to estimate effective population sizes may produce verydifferent results. The proposition that conservation effortsshould focus on protecting effective populations of about 50individuals has been widely used (Cox et al. 1987, Reed et al.1988, Hellgren and Vaughn 1989), but it would be wrong tosuggest that effective populations smaller than 50 individualsare doomed to extinction.
Recommendations for protecting effective populationsizes much larger than 50 have also been proposed (Franklin1980, Lande and Barrowclough 1987), but there are additionalproblems associated with these recommendations (Lande andBarrowclough 1987, Simberloff 1988). Lande andBarrowclough (1987) conclude that effective population sizestotalling “several hundred” should be the goal of conservationefforts, but they also conclude that this large population canbe effectively managed on a system of multiple preserves.The general effect of maintaining populations on multiple pre-serves is to increase the genetic variation across all popula-tions at the possible expense of lowered genetic variationwithin subpopulations (Lande and Barrowclough 1987,Leberg 1991).
We conclude that effective population sizes in the rangeof 50 individuals are sufficiently large to withstand geneticdeterioration for extended periods and represent a reasonablegoal for conservation of a single population. Populations ofthis general size satisfy many of the minimum sizes proposedto offset the potentially deleterious effects of inbreedingdepression (Franklin 1980, Lande and Barrowclough 1987),and if several preserves containing effective population sizesof around 50 are established, as discussed below, the level ofgenetic diversity preserved throughout all populationsbecomes extremely high (Chesser 1981, Chesser and Ryman1986, Lacy 1987, Lande and Barrowclough 1987).
However, due to the over-riding importance of environ-mental variability in determining population persistence, anygenetics-based recommendations should serve only as a verygeneral guideline and must not be blindly followed.Populations with effective population sizes smaller than 50often play a very crucial role in safe-guarding against certain
Figure 25. Relationship between the level of inbreeding and effective population size for three lengths of time (as measured by the number of generations). The upper line is the inbreeding statistic over 50 generations; the middle line is the inbreeding statistic over 100 generations; and the bottom line is theinbreeding statistic over 200 generations. Different generation lengths are shown because the level of inbreeding is influenced by both the size of a populationand the time period of concern.
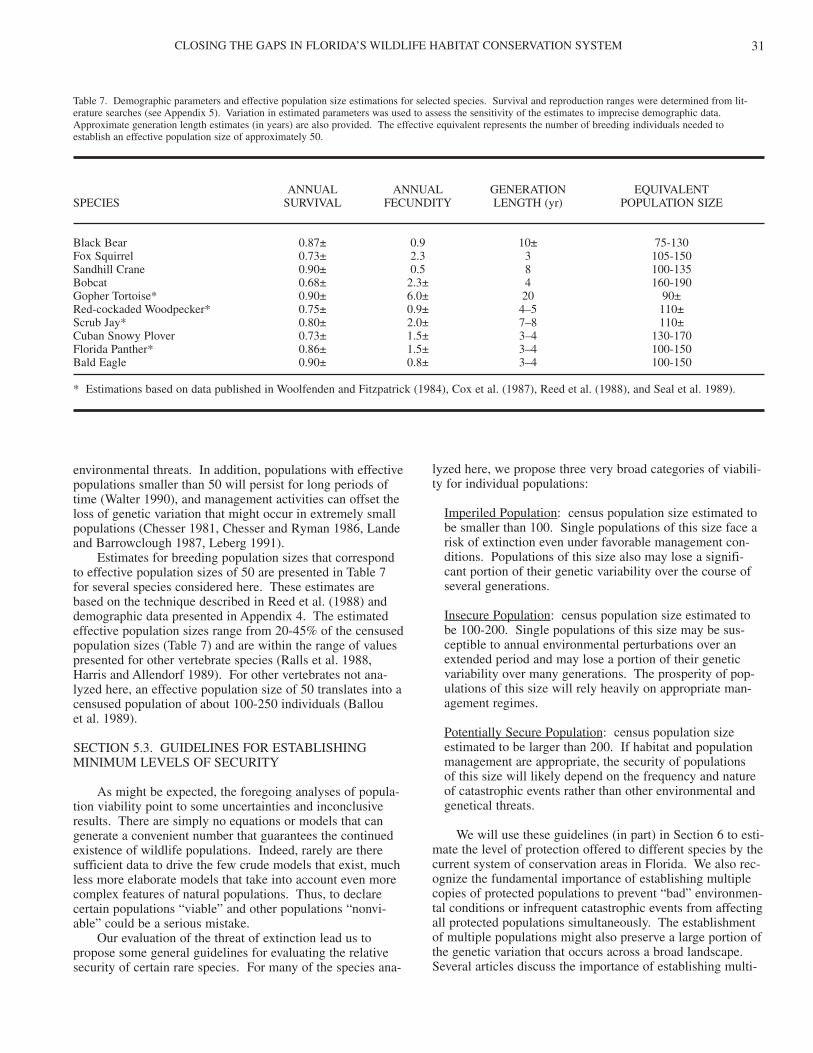
CLOSING THE GAPS IN FLORIDA’S WILDLIFE HABITAT CONSERVATION SYSTEM 31
environmental threats. In addition, populations with effectivepopulations smaller than 50 will persist for long periods oftime (Walter 1990), and management activities can offset theloss of genetic variation that might occur in extremely smallpopulations (Chesser 1981, Chesser and Ryman 1986, Landeand Barrowclough 1987, Leberg 1991).
Estimates for breeding population sizes that correspondto effective population sizes of 50 are presented in Table 7 for several species considered here. These estimates arebased on the technique described in Reed et al. (1988) anddemographic data presented in Appendix 4. The estimatedeffective population sizes range from 20-45% of the censusedpopulation sizes (Table 7) and are within the range of valuespresented for other vertebrate species (Ralls et al. 1988,Harris and Allendorf 1989). For other vertebrates not ana-lyzed here, an effective population size of 50 translates into acensused population of about 100-250 individuals (Ballou et al. 1989).
SECTION 5.3. GUIDELINES FOR ESTABLISHINGMINIMUM LEVELS OF SECURITY
As might be expected, the foregoing analyses of popula-tion viability point to some uncertainties and inconclusiveresults. There are simply no equations or models that cangenerate a convenient number that guarantees the continuedexistence of wildlife populations. Indeed, rarely are theresufficient data to drive the few crude models that exist, muchless more elaborate models that take into account even morecomplex features of natural populations. Thus, to declarecertain populations “viable” and other populations “nonvi-able” could be a serious mistake.
Our evaluation of the threat of extinction lead us topropose some general guidelines for evaluating the relativesecurity of certain rare species. For many of the species ana-
lyzed here, we propose three very broad categories of viabili-ty for individual populations:
Imperiled Population: census population size estimated tobe smaller than 100. Single populations of this size face arisk of extinction even under favorable management con-ditions. Populations of this size also may lose a signifi-cant portion of their genetic variability over the course ofseveral generations.
Insecure Population: census population size estimated tobe 100-200. Single populations of this size may be sus-ceptible to annual environmental perturbations over anextended period and may lose a portion of their geneticvariability over many generations. The prosperity of pop-ulations of this size will rely heavily on appropriate man-agement regimes.
Potentially Secure Population: census population sizeestimated to be larger than 200. If habitat and populationmanagement are appropriate, the security of populations of this size will likely depend on the frequency and natureof catastrophic events rather than other environmental andgenetical threats.
We will use these guidelines (in part) in Section 6 to esti-mate the level of protection offered to different species by thecurrent system of conservation areas in Florida. We also rec-ognize the fundamental importance of establishing multiplecopies of protected populations to prevent “bad” environmen-tal conditions or infrequent catastrophic events from affectingall protected populations simultaneously. The establishmentof multiple populations might also preserve a large portion ofthe genetic variation that occurs across a broad landscape.Several articles discuss the importance of establishing multi-
Table 7. Demographic parameters and effective population size estimations for selected species. Survival and reproduction ranges were determined from lit-erature searches (see Appendix 5). Variation in estimated parameters was used to assess the sensitivity of the estimates to imprecise demographic data.Approximate generation length estimates (in years) are also provided. The effective equivalent represents the number of breeding individuals needed to establish an effective population size of approximately 50.
ANNUAL ANNUAL GENERATION EQUIVALENTSPECIES SURVIVAL FECUNDITY LENGTH (yr) POPULATION SIZE
Black Bear 0.87± 0.9 10± 75-130Fox Squirrel 0.73± 2.3 3 105-150Sandhill Crane 0.90± 0.5 8 100-135Bobcat 0.68± 2.3± 4 160-190Gopher Tortoise* 0.90± 6.0± 20 90±Red-cockaded Woodpecker* 0.75± 0.9± 4–5 110±Scrub Jay* 0.80± 2.0± 7–8 110±Cuban Snowy Plover 0.73± 1.5± 3–4 130-170Florida Panther* 0.86± 1.5± 3–4 100-150Bald Eagle 0.90± 0.8± 3–4 100-150
* Estimations based on data published in Woolfenden and Fitzpatrick (1984), Cox et al. (1987), Reed et al. (1988), and Seal et al. 1989).
FLORIDA GAME AND FRESH WATER FISH COMMISSION32
ple populations (Soulé and Simberloff 1986, Goodman 1987b,Shaffer 1987, Lande and Barrowclough 1987, Harrison andQuinn 1989), but in simple terms multiplicity is analogous toplacing your eggs in several different baskets.
To satisfy requirements for multiplicity, we propose thatthe presence of 10 potentially secure populations also be usedto evaluate the relative security of populations of rare species.Even if the chances of persistence for a single population arearound 30% rather than 80%, the establishment of 10 indepen-dent populations could provide a > 90% chance of at least one(Figure 26) of the populations persisting (Quinn and Hastings1987). The conservation of 10 potentially secure populationswill also satisfy the recommendations developed by Landeand Barrowclough (1987) of protecting effective populationssizes totalling in the hundreds. This protective strategy willconserve > 95% of the extant genetic variation across all pop-ulations over the course of scores of generations (Ballou et al.1989). This protective strategy may also enable a portion ofthe genetic variation to be maintained within individual popu-lations (e.g., Manlove et al. 1979, Chesser et al. 1982,Osterhoff et al. 1983). The presence of 10 populations of 200individuals represents a sound conservation strategy where aminimum goal of protecting a viable collection of wild popu-lations is sought within an increasingly humanized landscape.
These general guidelines must not be applied blindly toall species. For example, the interaction of large numbers ofindividuals at many different breeding sites may be an impor-tant feature of the population biology of species such as wad-ing birds (Bildstein et al. 1991), and such features precludethe use of the proposed guideline. However, we believe theguideline represents a legitimate goal for several species,
especially since it seems unlikely that more accurate estimatesof acceptable security will be developed by the next genera-tion of research, except perhaps on a species-by-species basis.On the other hand, there are definite consequences in delayingconservation efforts until new procedures or better estimatesbecome available. As human populations continue to grow,many of the larger blocks of habitat remaining in Florida willlikely be eliminated within the next few years.
Proper habitat and population management is critical toguaranteeing that this or any other type of conservation strat-egy will work. Beneficial management techniques increaseaverage survival and fecundity within populations, and evenslight increases in survival and fecundity will greatly enhancethe chances that populations persist over time. The fate of allprotected populations ultimately rests on how well they aremanaged, and an investment in the management of protectedpopulations may sometimes outweigh an investment in theconservation of additional habitat.
The general guidelines may also be modified in certaincases based on more precise estimates of population viabilityor the amount of habitat available, or that can be restored, out-side of existing conservation areas. Populations smaller thanthe minimum standards set forth here are certainly “viable”over extremely long periods of time (Walter 1990). However,their viability will require much more careful monitoring,greater habitat and population management, and, ultimately,more luck than if the manageable populations were larger andmore numerous. The minimum desired goal of 10 populationsof at least 200 reflects a careful weighing of the informationavailable on population viability and the various costs andconstraints facing all conservation efforts.
Figure 26. Relationship between the number of managed populations and population persistence. Several different values for estimated chances of persistenceare shown. For example, the lowest curve represents the situation where each population has a 15% chance of survival. Two such populations would haveabout a 28% chance of at least one population surviving, and 10 populations would have >80% chance of at least one population surviving. The starting pointon the Y axis indicates the estimated chance of survival for a single population (e.g., 15%, 20%, 25%, and 30%).
CLOSING THE GAPS IN FLORIDA’S WILDLIFE HABITAT CONSERVATION SYSTEM 33
General guidelines for population sizes and numbersneeded to provide security against extinction (Section 5)allow us to evaluate the effectiveness of current conservationareas in providing adequate protection for Florida’s many rare species. Of interest, based on our stated targets, iswhether a minimum of 10 conservation areas exists withsufficient habitat to support potentially secure populations of200 or more individuals. We use this evaluation as a filter tohelp determine which species are in the greatest need ofadditional habitat conservation measures. As stated inSection 2.1, one of our primary assumptions is that habitatconservation efforts should focus on those species that areleast adequately protected by the current system of conserva-tion areas. Also important is the distribution of protectedpopulations across the known range of the taxon in questionand locations of patches of potential habitat outside of currentconservation areas.
No comprehensive surveys exist for most species ofwildlife on conservation areas throughout the state, much less on private lands. In fact, species such as Florida blackbear and Florida panther can be very difficult to census oververy large areas. Thus, we are forced to estimate populationsizes in current conservation areas indirectly using two piecesof information: (1) an estimate of the amount of habitatavailable within conservation areas, and (2) an estimate of thedensity of individuals in relation to appropriate habitat condi-tions. Samson et al. (1985) proposed the term “habitatcapacity” be used to describe this type of estimate since itmakes assumptions about densities of species in relation topotential habitat maps. Although there are some drawbacksto this approach (Samson et al. 1985, Verner et al. 1986),such an analysis is needed to help determine how to allocatethe limited monetary resources available for land conserva-tion in Florida.
When estimating population sizes based on indirect mea-sures, it is important to rely on known occurrences rather thancompletely unreferenced estimations of suitable habitat(Verner et al. 1986). Point and polygonal data documentingknown occurrences were used in conjunction with habitatmodels to estimate the distribution of available habitat. Theuse of documented occurrence information restricted the areaover which models were applied but greatly improved theiraccuracy. The specific combinations of data sets and GISoperations are discussed separately for each species.
SECTION 6.1. THEORY PERTINENT TO THEIDENTIFICATION AND DESIGN OFCONSERVATION AREAS
When the potential habitat within existing conservationareas fell short of the amount needed to support 10 popula-tions of roughly 200 individuals, conservation plans weredeveloped to increase the habitat that effectively could bemanaged for the species in question. Development of suchplans leads to an area of conservation biology with conflict-ing opinions. Is it best to establish a single large or severalsmall preserves? When and where will corridors be neededto help facilitate population interchange? We outline ourplanning philosophy below. The habitat conservation plans
developed in this section focus on the autecology of eachspecies and on attaining acceptable levels of security usingthe habitat available. Foremost in our considerations indeveloping minimum habitat conservation recommendationswas the need to maintain existing populations and the variousecological processes most important to these populations.Protecting every individual within a population may not be aprimary concern (except in the case of extremely rarespecies), nor is it critically important at this stage to considerhabitat areas well outside the region where core populationfunctions are played out.
Our approach of designing conservation plans that favorthe protection of core populations at the expense of someindividuals can perhaps be demonstrated by an extremeexample. When a green-tailed towhee showed up in Floridain 1989 (Florida Ornithological Society 1992), the event didnot lead to a call to establish a new conservation area for thisvery rare bird (from a Florida perspective). Nobody pro-posed a network of corridors or stepping-stone preserves sothat other green-tailed towhees could find their way toFlorida in the future. The circumstances that led to thearrival of this individual in Florida constituted an extreme“outlier.” Attempts to separate unusual dispersal events andoccurrence records from those events that are more essentialto population persistence may be difficult because the biolog-ical literature often highlights the unusual (Endler 1972).However, we attempt to stress the processes most importantto core population dynamics throughout this section by con-sidering the dispersal capabilities of individual species andconcentrations of occurrence records and potential habitat.
One of the most important reasons for focussing on corepopulation areas is the potential monetary cost behind allconservation efforts. As Harris (1985) notes, we can neverbuy and protect everything. Land-acquisition spending inFlorida may amount to $3.2 billion over the next decade.Based on the average cost of around $2,919 per ha (2.47acres) expended by the Conservation and Recreation LandsProgram prior to 1992 (Anon. 1992), we might expect theseland-acquisition efforts to secure an additional 1,096,200 ha(2.7 million acres). While this may seem like a significantamount of land, it will increase the acreage of conservationlands in Florida by only about 28%, taking the statewide totalfrom about 2.8 million ha (7.0 million acres) to 4.0 million ha(10.0 million acres). If we are to conserve and manage4,000+ species on a habitat base of about 4.0 million ha, landconservation efforts must efficiently, as well as meaningfully,enhance the chances of population persistence.
Some researchers focus conservation efforts towardsspecies rich areas (Scott et al. 1993), and a criticism thatmight be leveled at the focal species habitat conservationplans developed below is that the plans may not adequatelytreat communities, ecosystems, or higher-level aggregates ofspecies (Noss 1991, Ryti 1992). We attempt to address thiscriticism in three ways. First, most of the species selected foranalysis have large home range requirements. Habitat protec-tion strategies developed for these species may umbrella thehabitat requirements of other species with narrow habitatrequirements and smaller home range sizes (Eisenberg 1980,East 1981; but see Gilbert 1980, Ryti 1991). Second, a num-
SECTION 6. IDENTIFICATION OF GAPS IN FLORIDA’S WILDLIFE CONSERVATIONSYSTEMS
FLORIDA GAME AND FRESH WATER FISH COMMISSION34
ber of protective options is presented for each focal specieslacking adequate habitat in current conservation areas. Wethen stress habitat conservation options that benefit otherspecies or features. That is, habitat conservation strategiesproposed for each species are developed in relation to otherspecies and information in our database, and, as shown in var-ious tables presented in the discussions of individual focalspecies, the habitat conservation plans developed here mayprovide benefits to a much larger group of species. Third, inSection 6.3 we discuss and incorporate information developedfor several rare community types (e.g., tropical hardwoodhammocks, sandhill, pine rocklands, coastal areas, and xericoak scrub), rare plant species, and higher-level assemblages ofrare wildlife species.
We also point out that conservation strategies based onecosystems, communities, and species richness (e.g., Scott etal. 1993) are not without their own sets of serious problems(Simberloff and Abele 1976, Graves and Gotelli 1983,Zimmerman and Bierregaard 1986). For example, a widelydistributed archipelago of 50 patches of sandhill habitat, eachabout 100 acres in size, might effectively protect 95% of thespecies that make up this community. However, this preservestrategy will not adequately protect viable populations ofspecies such as indigo snake, red-cockaded woodpecker, orfox squirrel since individual conservation areas for thesespecies must be a minimum of several thousand acres beforethey will be very effective over long periods of time.
Wildlife corridors, preserves arranged as stepping stones,and other strategies that emphasize the geographical place-ment of conservation areas have become increasingly populartools in efforts to combat habitat fragmentation (Harris 1984,Harris 1985, Noss and Harris 1986). Assessing the effective-ness of such geographical arrangements is more complex thansometimes realized (Simberloff and Cox 1987, Soulé andGilpin 1991, Simberloff et al. 1992), and the benefits providedby corridors or stepping stone preserves, independent of habi-tat, may also be provided by large preserves (Soulé and Gilpin1991, Simberloff et al. 1992). Soulé and Gilpin (1991) ana-lyzed corridor capability and suggested that “corridors,regardless of how effective they may be, can never replacelarge reserves for the protection of ecosystems and species.”
A few examples provide some indication of the compli-cated assessments that corridor placement may entail.Corridors of appropriate habitat have been shown to be impor-tant in several instances. Maehr (1990) described the use of acorridor by Florida panthers in southwest Florida, while Beier(1993) described the importance of panther corridors in south-ern California in allowing immigration to occur into an areasupporting a small population. J. Wooding (pers. comm.)described movement of black bears through a potential corri-dor in northeast Florida. A large block of black bear habitat inVolusia, St. Johns, and Flagler counties lies in close proximityto the large block of black bear habitat found on the OcalaNational Forest. In 1989, two black bears were recorded mov-ing between these two large blocks of habitat using an areanear Crescent Lake.
In other cases, the value of corridors has not been firmlyestablished. Thomas et al. (1990) found that dispersing spot-ted owls did not frequently use the corridors left behind afterlogging. More importantly, forest corridors were surroundedby large open spaces, which provided suitable habitat condi-tions for great horned owls, a predator of spotted owls.
Mortality among dispersing spotted owls was very high inareas where thin corridors were provided. The fact that corri-dors may enhance populations of certain predators and pro-duce high rates of mortality has been noted in several studies(Soulé and Gilpin 1991, Simberloff et al. 1992).
Noon (1992) tested corridor use by small vertebrates andfound that < 30% of the individuals used the corridors understudy. The remaining individuals dispersed into the hostilesurrounding habitats and died. This raises a question: if cor-ridors provided safe conduit for only 30% of the dispersingindividuals, is there another conservation strategy that mightprotect 50% of the dispersing individuals and be of potentiallyhigher value? The conservation of large blocks of habitat sur-rounding an area may in some cases provide better protectionfor whole populations.
We take steps to maximize the benefits from geographicalplacement of proposed conservation areas and minimize thepotential drawbacks. First, we stipulate that conservationareas designed to foster movement must lie within frequentlyreported dispersal distances for the species in question. Wecompiled information on dispersal distances from publishedreports, and we selected the minimum distances that wouldencompass approximately 70% of the published dispersal dis-tances for each species. For example, the observation of a sin-gle juvenile black bear moving 120 km (Maehr et al. 1988)does not mean that a 120-km habitat corridor will permit bearsto move frequently between patches of habitat. Fewer than5% of the reported dispersal events for black bears are > 100km, and most (ca. 70%) are < 60 km (Alt 1979, Rogers 1987,Maehr et al. 1988, Wooding and Hardisky 1988).Furthermore, the distances across which a black bear dispers-es, establishes a territory, and successfully reproduces is cer-tainly much smaller than the distance over which all blackbears simply disperse. Dispersal events are often random indirection; individuals dispersing long distances often havelower rates of survival than individuals dispersing shorter dis-tances; and reproduction for dispersing individuals may belower (Endler 1972).
Second, we also considered the size of the populationswhen evaluating the potential benefits of the geographicalplacement of conservation areas. Connecting a larger popula-tion to a much smaller population would help to sustain thesmaller population (Beier 1993), and connecting two smallpopulations might provide each with higher chances of sur-vival than either population has if isolated (Goodman 1983).However, the benefits of connecting two very small or twovery large populations are less clear. In cases where two verysmall populations are connected by virtue of a corridor orsome stepping-stone arrangement of conservation areas, noamount of interchange can totally alleviate the potential prob-lem of inbreeding depression (Chesser 1981). A single largepopulation of 40 will have a slightly lower level of inbreedingthan two populations of 20 individuals, but the importance ofthis lower level of inbreeding may not be significant overmany generations. With respect to connecting two largepopulations, Soulé and Gilpin (1991) note that it may beunnecessary to consider the capabilities of corridors to facili-tate movement when the corridor will link two presumablyviable populations.
Third, we consider carefully whether a focal species islikely to use conservation areas designed to foster movementbased on literature information, where available. Black bears
CLOSING THE GAPS IN FLORIDA’S WILDLIFE HABITAT CONSERVATION SYSTEM 35
appear to rely on forested wetlands as they disperse (Weaver et al. 1990), but they may also move without refer-ence to land-cover features once outside of familiar territory(Maehr et al. 1988). Black bears likely require broaderhabitat areas rather than thin corridors if connecting distantpopulations is a goal. Florida panthers may use forestedhabitats that are about 10 km long and only 1 km wide asmovement corridors (Maehr 1990). On the other hand,many birds, insects, and mammals may be able to traversebroad areas without corridors or appropriate habitat in theinterstitial area.
Finally, we required that corridors, stepping stones,and other types of linkages do more than simply foster movement. Areas that constitute valuable habitat and alsofacilitate movement among conservation areas represent better investments than those protected simply to helpanimals move.
Several researchers (Simberloff and Abele 1976, Gilpin1987, Goodman 1987a) point to the potential benefits ofestablishing many small preserves rather than a few verylarge preserves. Our method of incorporating this recom-mendation is to focus attention on providing a broad geo-graphic distribution and multiple conservation areas that support potentially secure populations. We rely on theanalyses of population viability to determine when it mightbe better to bolster a local population by extending theboundaries of a preserve, or protect nearby patches orcorridors of habitat to facilitate movement, versus theimportance of enhancing the geographic distribution andnumber of protected populations with new isolatedconservation areas.
Noss (1983) argues that a regional landscape perspec-tive is needed to produce effective conservation strategies,and we agree with this. The external threat posed to pro-tected areas is very real (Janzen 1983, Janzen 1986,Laurance 1991), and changes to surrounding areas in Florida have substantially influenced survival and reproduc-tive characteristics within protected populations (Humphreyand Barbour 1979, Spalding 1991, Dwyer and Tanner 1992). However, we wonder how effective a strictly land-scape perspective can be since it is impossible to define theextent of landscape parameters that might influence a man-aged population or to anticipate all the future changes thatmight occur. The full range of landscape-level threatsincludes rising sea levels, climate change, encroachment ofexotic species (Loope 1992), mercury contamination(Spalding 1991), altered hydrology (Bildstein et al. 1991),and many others. It also may be difficult to define the land-scape requirements of some (possibly many) animal species(Dueser et al. 1988).
SECTION 6.2 ANALYSES OF INDIVIDUAL FOCALSPECIES AND DEVELOPMENT OF SPECIESCONSERVATION PLANS
This section presents the techniques, data sets, andanalyses used to create habitat distribution maps for focalspecies. These maps were used to assess the quantity ofhabitat provided each species by the current system of con-servation areas in Florida. When the habitat found in cur-rent conservation areas fell short of the minimum quantitydeemed acceptable (i.e., sufficient habitat to sustain at least
10 populations of 200 or more individuals), the habitat dis-tribution maps were used in combination with other infor-mation to identify important habitat areas lying outside ofexisting conservation areas. In Section 7.1, the importanthabitat areas identified for individual species are merged with the important habitat areas identified for rare commu-nities and plants to produce a single map showing some ofthe most important lands outside existing conservation areasin Florida.
The habitat areas identified for each species are calledStrategic Habitat Conservation Areas due to their impor-tance in providing some of Florida’s rarest species with thebase of habitat needed for long-term persistence. However,owing to the constantly changing nature of the Florida land-scape, the Strategic Habitat Conservation Areas should beconsidered as general guidelines for new habitat conserva-tion initiatives. Some of the areas highlighted may have been converted to shopping malls, orange groves, or four-lane highways since the land-cover map was created. Stillother areas may have been brought into public ownershipsince the boundaries of public lands were processed. Further updates are planned.
Section 6.2.1. American CrocodileThe habitat distribution map for the American crocodile
was developed by isolating the mangrove, coastal salt marsh, and freshwater marsh cover types within the knownbreeding range of the species (Moler 1992b). This areaincludes the mainland shoreline of southern Biscayne Bay(Turkey Point), west to Cape Sable, the bay-side shoreline of North Key Largo, and islands in Florida Bay (Moler1992b). Records of nesting locations collected by P. Molerand F. Mazzotti and processed by the Florida Natural AreasInventory were also used to identify important nesting loca-tions more specifically. No recent breeding records exist for either the lower Florida keys or the west Gulf coast area,although crocodiles are occasionally seen in these areas(Moler 1992b).
The population of American crocodiles in Florida con-sists of fewer than 500 individuals and only approximately 30breeding females (Moler 1992b). This small population alsohas an extremely limited geographic distribution, making itvulnerable to catastrophic events. The combination of smallpopulation size and limited geographic distribution makes itimperative that no further reduction in habitat quantity orquality be allowed (Moler 1992b). The habitat distributionmap developed for this species is shown in Figure 27. Allhabitat areas that fall outside of current conservation landsare proposed as a Strategic Habitat Conservation Area for thisspecies. The proposed Strategic Habitat Conservation Areaconsists of wetlands where regulatory provisions could beapplied to maintain appropriate habitat.
In addition to conservation of the wetland areas shown in Figure 27, two other management activities could assist in the management of this small population. The greatestknown source of mortality is collisions with vehicles alongU.S. Highway 1, which runs through the heart of the docu-mented breeding range (Moler 1992b). Steps to correct thisproblem are desperately needed. Moler (1992b) recom-mends the construction of box culverts with sufficient clear-ance to allow for their utilization by crocodiles. Anothermanagement recommendation is to reduce human recre-
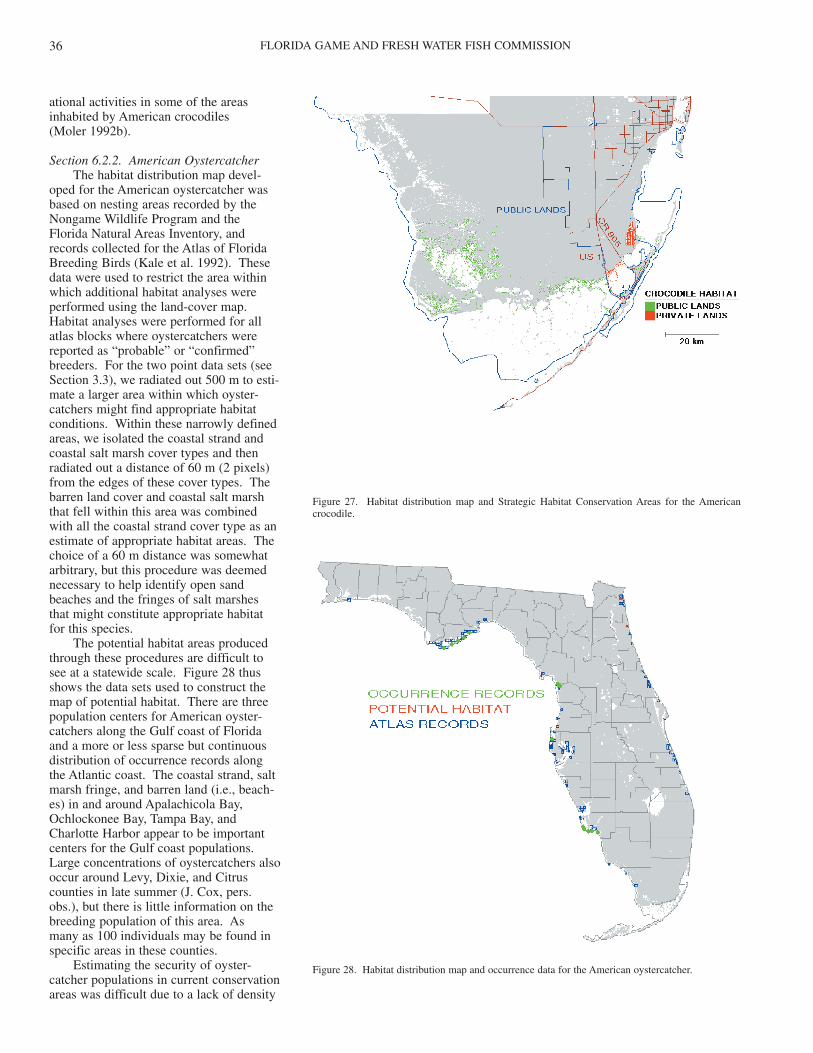
FLORIDA GAME AND FRESH WATER FISH COMMISSION36
ational activities in some of the areasinhabited by American crocodiles (Moler 1992b).
Section 6.2.2. American OystercatcherThe habitat distribution map devel-
oped for the American oystercatcher wasbased on nesting areas recorded by theNongame Wildlife Program and theFlorida Natural Areas Inventory, andrecords collected for the Atlas of FloridaBreeding Birds (Kale et al. 1992). Thesedata were used to restrict the area withinwhich additional habitat analyses wereperformed using the land-cover map.Habitat analyses were performed for allatlas blocks where oystercatchers werereported as “probable” or “confirmed”breeders. For the two point data sets (seeSection 3.3), we radiated out 500 m to esti-mate a larger area within which oyster-catchers might find appropriate habitatconditions. Within these narrowly definedareas, we isolated the coastal strand andcoastal salt marsh cover types and thenradiated out a distance of 60 m (2 pixels)from the edges of these cover types. Thebarren land cover and coastal salt marshthat fell within this area was combinedwith all the coastal strand cover type as anestimate of appropriate habitat areas. Thechoice of a 60 m distance was somewhatarbitrary, but this procedure was deemednecessary to help identify open sandbeaches and the fringes of salt marshesthat might constitute appropriate habitatfor this species.
The potential habitat areas producedthrough these procedures are difficult tosee at a statewide scale. Figure 28 thusshows the data sets used to construct themap of potential habitat. There are threepopulation centers for American oyster-catchers along the Gulf coast of Floridaand a more or less sparse but continuousdistribution of occurrence records alongthe Atlantic coast. The coastal strand, saltmarsh fringe, and barren land (i.e., beach-es) in and around Apalachicola Bay,Ochlockonee Bay, Tampa Bay, andCharlotte Harbor appear to be importantcenters for the Gulf coast populations.Large concentrations of oystercatchers alsooccur around Levy, Dixie, and Citruscounties in late summer (J. Cox, pers.obs.), but there is little information on thebreeding population of this area. As many as 100 individuals may be found inspecific areas in these counties.
Estimating the security of oyster-catcher populations in current conservationareas was difficult due to a lack of density
Figure 27. Habitat distribution map and Strategic Habitat Conservation Areas for the Americancrocodile.
Figure 28. Habitat distribution map and occurrence data for the American oystercatcher.
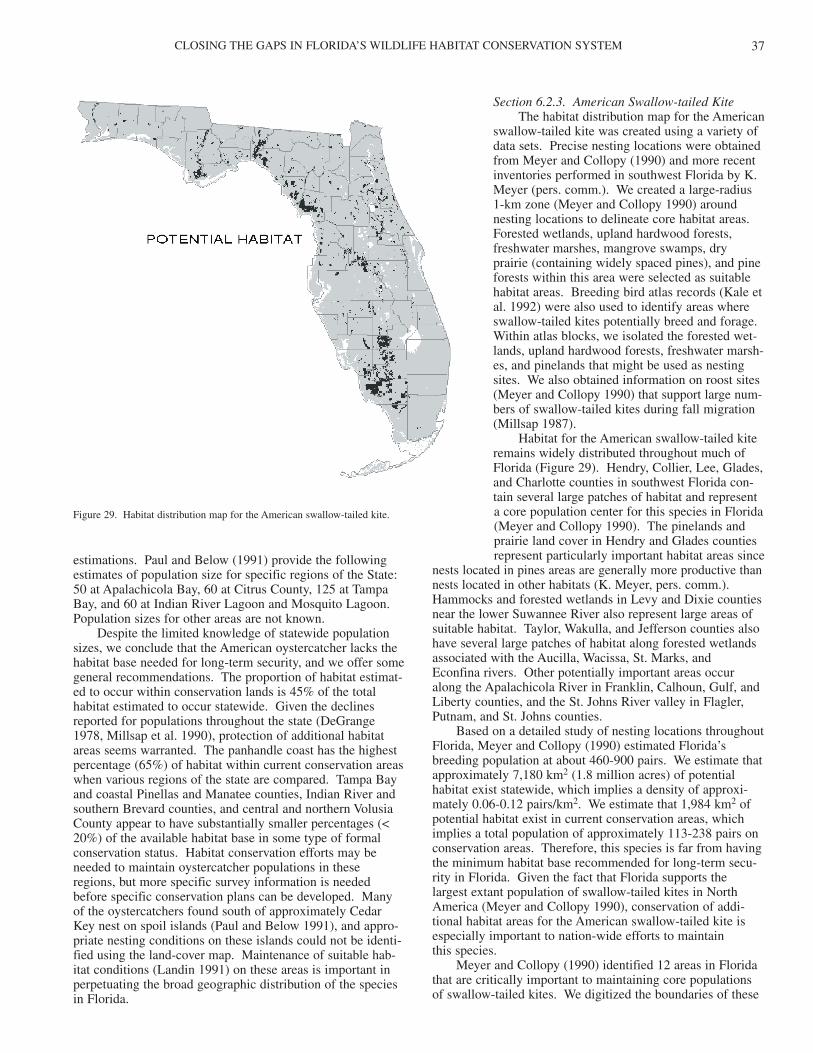
CLOSING THE GAPS IN FLORIDA’S WILDLIFE HABITAT CONSERVATION SYSTEM 37
estimations. Paul and Below (1991) provide the followingestimates of population size for specific regions of the State:50 at Apalachicola Bay, 60 at Citrus County, 125 at TampaBay, and 60 at Indian River Lagoon and Mosquito Lagoon.Population sizes for other areas are not known.
Despite the limited knowledge of statewide populationsizes, we conclude that the American oystercatcher lacks thehabitat base needed for long-term security, and we offer somegeneral recommendations. The proportion of habitat estimat-ed to occur within conservation lands is 45% of the totalhabitat estimated to occur statewide. Given the declinesreported for populations throughout the state (DeGrange1978, Millsap et al. 1990), protection of additional habitatareas seems warranted. The panhandle coast has the highestpercentage (65%) of habitat within current conservation areaswhen various regions of the state are compared. Tampa Bayand coastal Pinellas and Manatee counties, Indian River andsouthern Brevard counties, and central and northern VolusiaCounty appear to have substantially smaller percentages (<20%) of the available habitat base in some type of formalconservation status. Habitat conservation efforts may beneeded to maintain oystercatcher populations in theseregions, but more specific survey information is neededbefore specific conservation plans can be developed. Manyof the oystercatchers found south of approximately CedarKey nest on spoil islands (Paul and Below 1991), and appro-priate nesting conditions on these islands could not be identi-fied using the land-cover map. Maintenance of suitable hab-itat conditions (Landin 1991) on these areas is important inperpetuating the broad geographic distribution of the speciesin Florida.
Section 6.2.3. American Swallow-tailed KiteThe habitat distribution map for the American
swallow-tailed kite was created using a variety ofdata sets. Precise nesting locations were obtainedfrom Meyer and Collopy (1990) and more recentinventories performed in southwest Florida by K.Meyer (pers. comm.). We created a large-radius 1-km zone (Meyer and Collopy 1990) aroundnesting locations to delineate core habitat areas.Forested wetlands, upland hardwood forests,freshwater marshes, mangrove swamps, dryprairie (containing widely spaced pines), and pineforests within this area were selected as suitablehabitat areas. Breeding bird atlas records (Kale etal. 1992) were also used to identify areas whereswallow-tailed kites potentially breed and forage.Within atlas blocks, we isolated the forested wet-lands, upland hardwood forests, freshwater marsh-es, and pinelands that might be used as nestingsites. We also obtained information on roost sites(Meyer and Collopy 1990) that support large num-bers of swallow-tailed kites during fall migration(Millsap 1987).
Habitat for the American swallow-tailed kiteremains widely distributed throughout much ofFlorida (Figure 29). Hendry, Collier, Lee, Glades,and Charlotte counties in southwest Florida con-tain several large patches of habitat and representa core population center for this species in Florida(Meyer and Collopy 1990). The pinelands andprairie land cover in Hendry and Glades countiesrepresent particularly important habitat areas since
nests located in pines areas are generally more productive thannests located in other habitats (K. Meyer, pers. comm.).Hammocks and forested wetlands in Levy and Dixie countiesnear the lower Suwannee River also represent large areas ofsuitable habitat. Taylor, Wakulla, and Jefferson counties alsohave several large patches of habitat along forested wetlandsassociated with the Aucilla, Wacissa, St. Marks, and Econfina rivers. Other potentially important areas occuralong the Apalachicola River in Franklin, Calhoun, Gulf, andLiberty counties, and the St. Johns River valley in Flagler,Putnam, and St. Johns counties.
Based on a detailed study of nesting locations throughoutFlorida, Meyer and Collopy (1990) estimated Florida’sbreeding population at about 460-900 pairs. We estimate thatapproximately 7,180 km2 (1.8 million acres) of potentialhabitat exist statewide, which implies a density of approxi-mately 0.06-0.12 pairs/km2. We estimate that 1,984 km2 ofpotential habitat exist in current conservation areas, whichimplies a total population of approximately 113-238 pairs onconservation areas. Therefore, this species is far from havingthe minimum habitat base recommended for long-term secu-rity in Florida. Given the fact that Florida supports thelargest extant population of swallow-tailed kites in NorthAmerica (Meyer and Collopy 1990), conservation of addi-tional habitat areas for the American swallow-tailed kite isespecially important to nation-wide efforts to maintain this species.
Meyer and Collopy (1990) identified 12 areas in Floridathat are critically important to maintaining core populationsof swallow-tailed kites. We digitized the boundaries of these
Figure 29. Habitat distribution map for the American swallow-tailed kite.
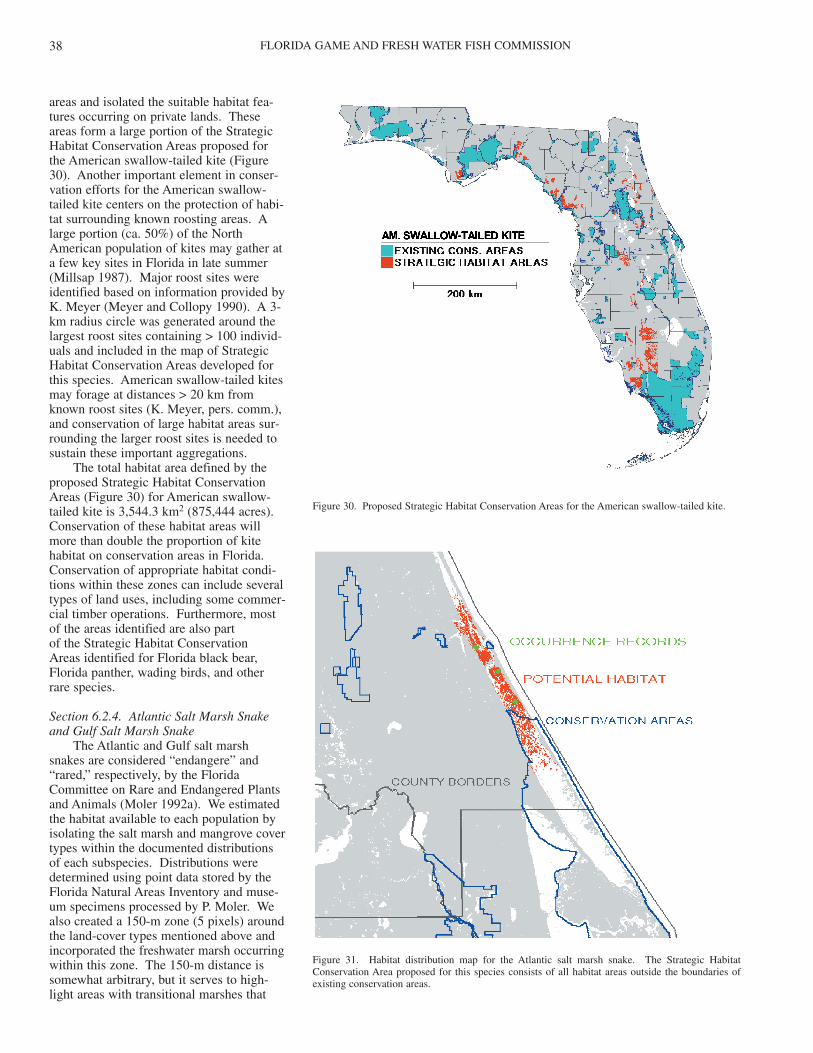
FLORIDA GAME AND FRESH WATER FISH COMMISSION38
areas and isolated the suitable habitat fea-tures occurring on private lands. Theseareas form a large portion of the StrategicHabitat Conservation Areas proposed forthe American swallow-tailed kite (Figure30). Another important element in conser-vation efforts for the American swallow-tailed kite centers on the protection of habi-tat surrounding known roosting areas. Alarge portion (ca. 50%) of the NorthAmerican population of kites may gather ata few key sites in Florida in late summer(Millsap 1987). Major roost sites wereidentified based on information provided byK. Meyer (Meyer and Collopy 1990). A 3-km radius circle was generated around thelargest roost sites containing > 100 individ-uals and included in the map of StrategicHabitat Conservation Areas developed forthis species. American swallow-tailed kitesmay forage at distances > 20 km fromknown roost sites (K. Meyer, pers. comm.),and conservation of large habitat areas sur-rounding the larger roost sites is needed tosustain these important aggregations.
The total habitat area defined by theproposed Strategic Habitat ConservationAreas (Figure 30) for American swallow-tailed kite is 3,544.3 km2 (875,444 acres).Conservation of these habitat areas willmore than double the proportion of kitehabitat on conservation areas in Florida.Conservation of appropriate habitat condi-tions within these zones can include severaltypes of land uses, including some commer-cial timber operations. Furthermore, mostof the areas identified are also part of the Strategic Habitat Conservation Areas identified for Florida black bear,Florida panther, wading birds, and otherrare species.
Section 6.2.4. Atlantic Salt Marsh Snakeand Gulf Salt Marsh Snake
The Atlantic and Gulf salt marshsnakes are considered “endangere” and“rared,” respectively, by the FloridaCommittee on Rare and Endangered Plantsand Animals (Moler 1992a). We estimatedthe habitat available to each population byisolating the salt marsh and mangrove covertypes within the documented distributionsof each subspecies. Distributions weredetermined using point data stored by theFlorida Natural Areas Inventory and muse-um specimens processed by P. Moler. Wealso created a 150-m zone (5 pixels) aroundthe land-cover types mentioned above andincorporated the freshwater marsh occurringwithin this zone. The 150-m distance issomewhat arbitrary, but it serves to high-light areas with transitional marshes that
Figure 30. Proposed Strategic Habitat Conservation Areas for the American swallow-tailed kite.
Figure 31. Habitat distribution map for the Atlantic salt marsh snake. The Strategic HabitatConservation Area proposed for this species consists of all habitat areas outside the boundaries ofexisting conservation areas.
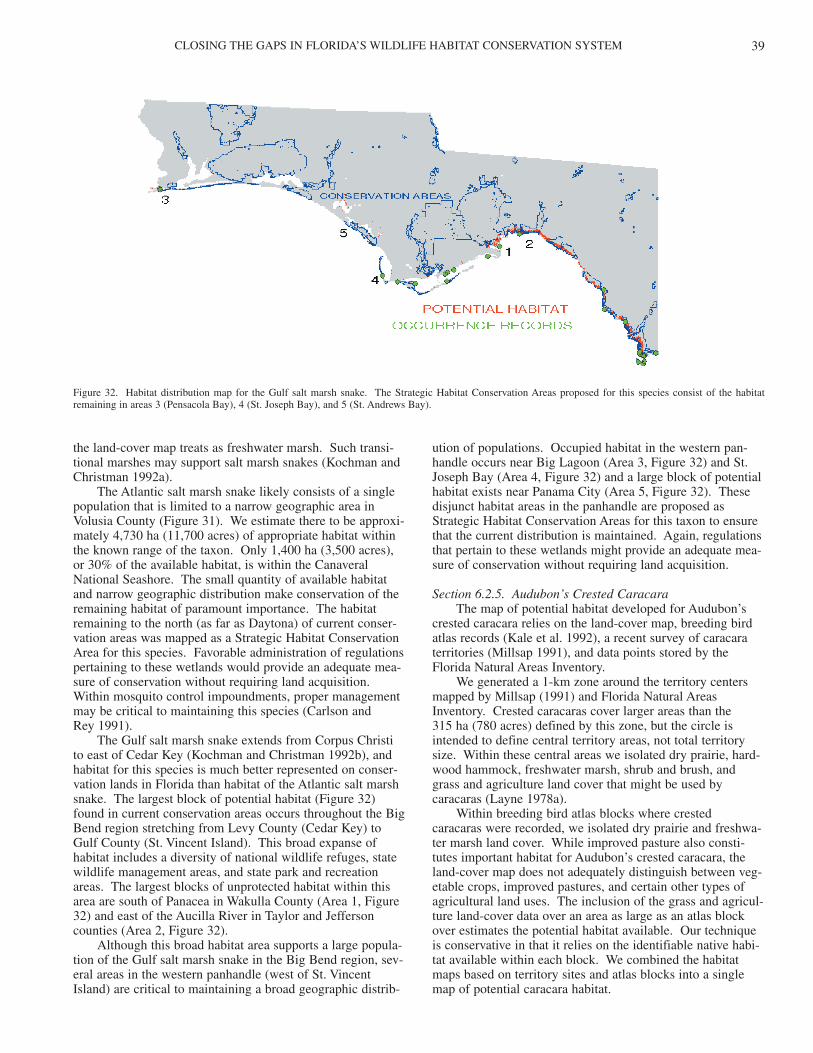
CLOSING THE GAPS IN FLORIDA’S WILDLIFE HABITAT CONSERVATION SYSTEM 39
the land-cover map treats as freshwater marsh. Such transi-tional marshes may support salt marsh snakes (Kochman andChristman 1992a).
The Atlantic salt marsh snake likely consists of a singlepopulation that is limited to a narrow geographic area inVolusia County (Figure 31). We estimate there to be approxi-mately 4,730 ha (11,700 acres) of appropriate habitat withinthe known range of the taxon. Only 1,400 ha (3,500 acres),or 30% of the available habitat, is within the CanaveralNational Seashore. The small quantity of available habitatand narrow geographic distribution make conservation of theremaining habitat of paramount importance. The habitatremaining to the north (as far as Daytona) of current conser-vation areas was mapped as a Strategic Habitat ConservationArea for this species. Favorable administration of regulationspertaining to these wetlands would provide an adequate mea-sure of conservation without requiring land acquisition.Within mosquito control impoundments, proper managementmay be critical to maintaining this species (Carlson and Rey 1991).
The Gulf salt marsh snake extends from Corpus Christito east of Cedar Key (Kochman and Christman 1992b), andhabitat for this species is much better represented on conser-vation lands in Florida than habitat of the Atlantic salt marshsnake. The largest block of potential habitat (Figure 32)found in current conservation areas occurs throughout the BigBend region stretching from Levy County (Cedar Key) toGulf County (St. Vincent Island). This broad expanse ofhabitat includes a diversity of national wildlife refuges, statewildlife management areas, and state park and recreationareas. The largest blocks of unprotected habitat within thisarea are south of Panacea in Wakulla County (Area 1, Figure32) and east of the Aucilla River in Taylor and Jeffersoncounties (Area 2, Figure 32).
Although this broad habitat area supports a large popula-tion of the Gulf salt marsh snake in the Big Bend region, sev-eral areas in the western panhandle (west of St. VincentIsland) are critical to maintaining a broad geographic distrib-
ution of populations. Occupied habitat in the western pan-handle occurs near Big Lagoon (Area 3, Figure 32) and St.Joseph Bay (Area 4, Figure 32) and a large block of potentialhabitat exists near Panama City (Area 5, Figure 32). Thesedisjunct habitat areas in the panhandle are proposed asStrategic Habitat Conservation Areas for this taxon to ensurethat the current distribution is maintained. Again, regulationsthat pertain to these wetlands might provide an adequate mea-sure of conservation without requiring land acquisition.
Section 6.2.5. Audubon’s Crested CaracaraThe map of potential habitat developed for Audubon’s
crested caracara relies on the land-cover map, breeding birdatlas records (Kale et al. 1992), a recent survey of caracaraterritories (Millsap 1991), and data points stored by theFlorida Natural Areas Inventory.
We generated a 1-km zone around the territory centersmapped by Millsap (1991) and Florida Natural AreasInventory. Crested caracaras cover larger areas than the 315 ha (780 acres) defined by this zone, but the circle isintended to define central territory areas, not total territorysize. Within these central areas we isolated dry prairie, hard-wood hammock, freshwater marsh, shrub and brush, andgrass and agriculture land cover that might be used bycaracaras (Layne 1978a).
Within breeding bird atlas blocks where crestedcaracaras were recorded, we isolated dry prairie and freshwa-ter marsh land cover. While improved pasture also consti-tutes important habitat for Audubon’s crested caracara, theland-cover map does not adequately distinguish between veg-etable crops, improved pastures, and certain other types ofagricultural land uses. The inclusion of the grass and agricul-ture land-cover data over an area as large as an atlas blockover estimates the potential habitat available. Our techniqueis conservative in that it relies on the identifiable native habi-tat available within each block. We combined the habitatmaps based on territory sites and atlas blocks into a singlemap of potential caracara habitat.
Figure 32. Habitat distribution map for the Gulf salt marsh snake. The Strategic Habitat Conservation Areas proposed for this species consist of the habitatremaining in areas 3 (Pensacola Bay), 4 (St. Joseph Bay), and 5 (St. Andrews Bay).
FLORIDA GAME AND FRESH WATER FISH COMMISSION40
The map of potential habitat forAudubon’s crested caracara (Figure 33)shows several large blocks of potentialhabitat in south central Florida. The totalgeographic range covered by this species isvery small, however, and is restrictedessentially to a 10-county area extendingfrom the southern edge of LakeOkeechobee to approximately the northernedge of Lake Tohopekaliga. The largestblocks of potential habitat occur in Glades,Osceola, and Okeechobee counties.
Layne’s (1978a) estimate for the sizeof Florida’s breeding population ofAudubon’s crested caracaras is fewer than200 breeding pairs. A comparison ofmapped territories with existingconservation lands shows that no existingconservation area currently holds more than four territories, and only 20 territoriesare known to occur on establishedconservation areas in Florida. This species obviously lacks adequate represen-tation on Florida’s current system ofconservation areas.
To develop conservation strategies forthis species, we used two valuation indices.First, we identified concentrations of terri-tories mapped by Millsap (1991) and theFlorida Natural Areas Inventory by creat-ing a Voronoi diagram from these point data sets. Polygons smaller than 4,050 ha(10,000 acres) were assigned a score of 2(indicating a higher density of territories)and polygons larger than 4,050 ha (10,000acres) were assigned a score of 1 (indicat-ing a lower density of territories). Theresulting map is shown in Figure 34.
For a second index, we considered thedistribution of large landownerships withinthe known range of crested caracaras.Large landownerships do not necessarilyrepresent caracara “habitat,” but largelandownerships tend to contain habitat andlandscape features sought by caracaras(Layne 1978a). We cross tabulated our ini-tial map of crested caracara habitat by ourmap of large landownerships throughoutcentral Florida. Private single-ownershipparcels with at least 100 ha (250 acres) butnot more than 1,000 ha (2,470 acres) ofpotential habitat, were assigned a score of1. Private, single-ownership parcels withmore than 1,000 ha (2,470 acres) of poten-tial habitat were assigned a score of 2. Theresulting map is shown as Figure 35.
When these two maps were overlaidand restricted to the areas of potential habi-tat (Figure 36), the highest scoring habitatareas were found in Okeechobee,Highlands, and Glades counties. Gladesand Highlands counties have the largest
Figure 33. Habitat distribution map for Audubon’s crested caracara.
Figure 34. Concentrations of territory centers of Audubon’s crested caracara. Concentrations weredetermined using a Voronoi tessellation.
CLOSING THE GAPS IN FLORIDA’S WILDLIFE HABITAT CONSERVATION SYSTEM 41
Figure 35. Large landownerships classified by the quantity of caracara habitat. Class 1 lands contain <1,000 ha (2,470 acres); class 2 areas contain >1,000 ha.
Figure 36. Combination of Figure 34 and Figure 35 to score the potential value of crested caracara habitat.
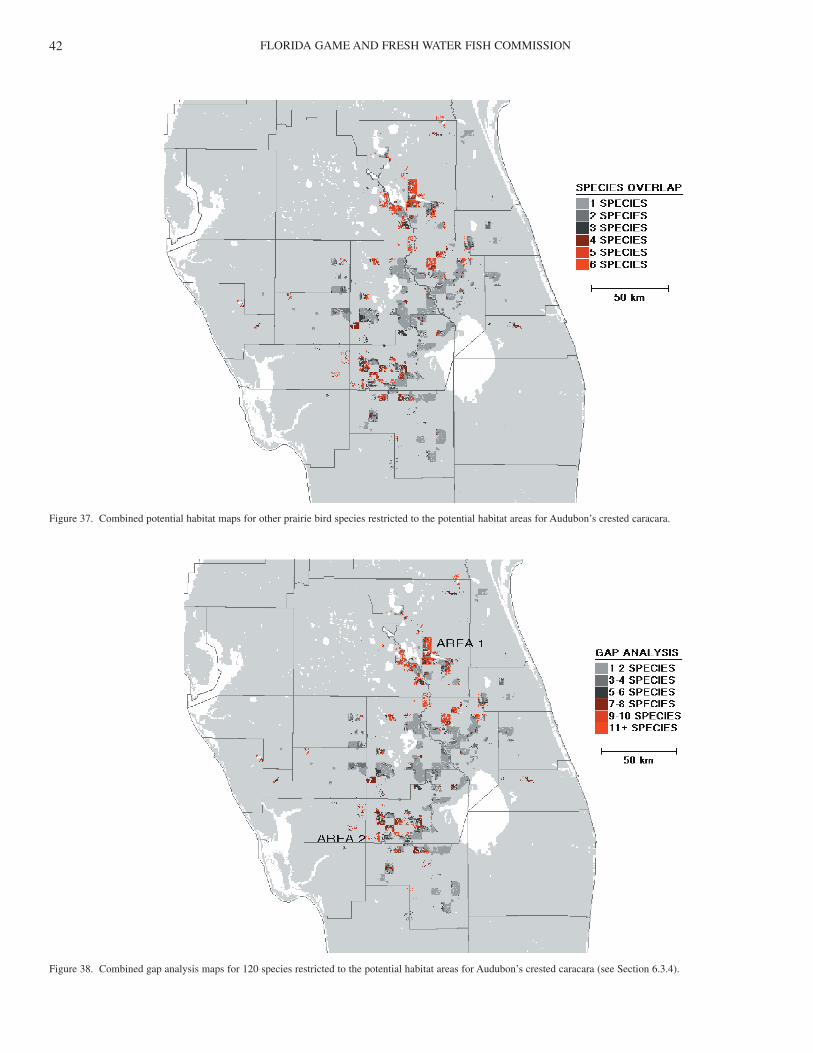
FLORIDA GAME AND FRESH WATER FISH COMMISSION42
Figure 37. Combined potential habitat maps for other prairie bird species restricted to the potential habitat areas for Audubon’s crested caracara.
Figure 38. Combined gap analysis maps for 120 species restricted to the potential habitat areas for Audubon’s crested caracara (see Section 6.3.4).
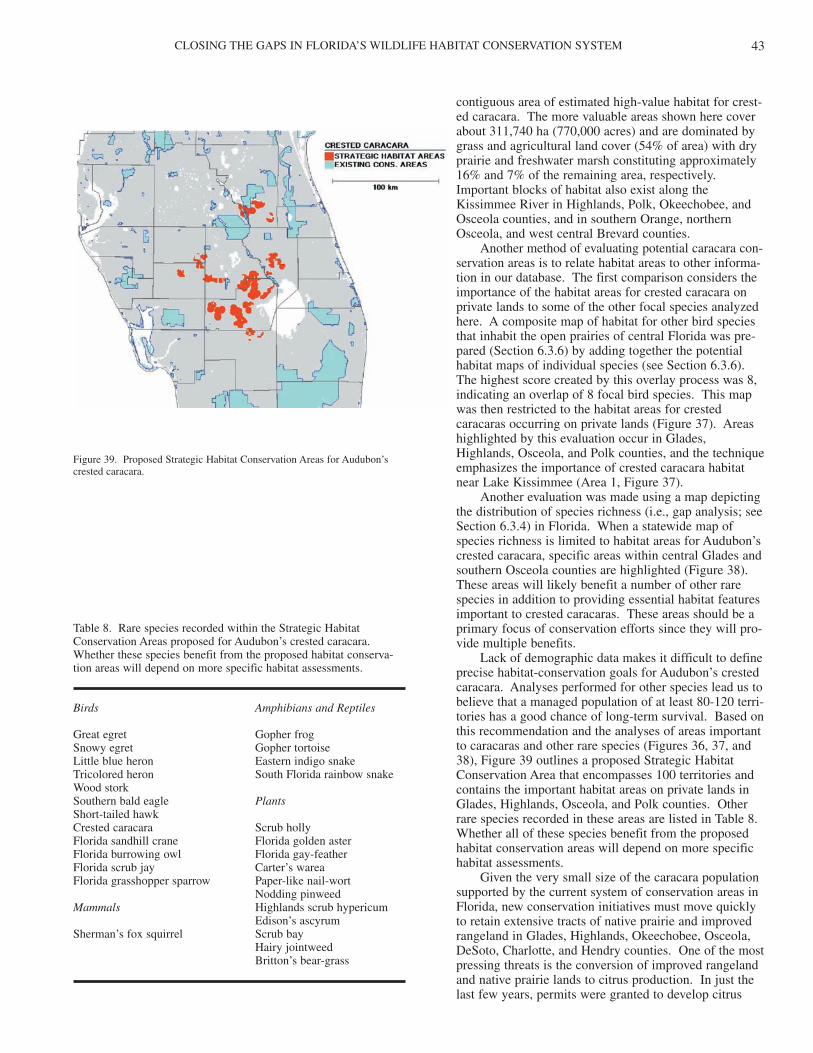
CLOSING THE GAPS IN FLORIDA’S WILDLIFE HABITAT CONSERVATION SYSTEM 43
Table 8. Rare species recorded within the Strategic HabitatConservation Areas proposed for Audubon’s crested caracara.Whether these species benefit from the proposed habitat conserva-tion areas will depend on more specific habitat assessments.
Birds Amphibians and Reptiles
Great egret Gopher frogSnowy egret Gopher tortoiseLittle blue heron Eastern indigo snakeTricolored heron South Florida rainbow snakeWood storkSouthern bald eagle PlantsShort-tailed hawkCrested caracara Scrub hollyFlorida sandhill crane Florida golden asterFlorida burrowing owl Florida gay-featherFlorida scrub jay Carter’s wareaFlorida grasshopper sparrow Paper-like nail-wort
Nodding pinweedMammals Highlands scrub hypericum
Edison’s ascyrumSherman’s fox squirrel Scrub bay
Hairy jointweedBritton’s bear-grass
contiguous area of estimated high-value habitat for crest-ed caracara. The more valuable areas shown here coverabout 311,740 ha (770,000 acres) and are dominated bygrass and agricultural land cover (54% of area) with dryprairie and freshwater marsh constituting approximately16% and 7% of the remaining area, respectively.Important blocks of habitat also exist along theKissimmee River in Highlands, Polk, Okeechobee, andOsceola counties, and in southern Orange, northernOsceola, and west central Brevard counties.
Another method of evaluating potential caracara con-servation areas is to relate habitat areas to other informa-tion in our database. The first comparison considers theimportance of the habitat areas for crested caracara onprivate lands to some of the other focal species analyzedhere. A composite map of habitat for other bird speciesthat inhabit the open prairies of central Florida was pre-pared (Section 6.3.6) by adding together the potentialhabitat maps of individual species (see Section 6.3.6).The highest score created by this overlay process was 8,indicating an overlap of 8 focal bird species. This mapwas then restricted to the habitat areas for crestedcaracaras occurring on private lands (Figure 37). Areashighlighted by this evaluation occur in Glades,Highlands, Osceola, and Polk counties, and the techniqueemphasizes the importance of crested caracara habitatnear Lake Kissimmee (Area 1, Figure 37).
Another evaluation was made using a map depictingthe distribution of species richness (i.e., gap analysis; seeSection 6.3.4) in Florida. When a statewide map ofspecies richness is limited to habitat areas for Audubon’scrested caracara, specific areas within central Glades andsouthern Osceola counties are highlighted (Figure 38).These areas will likely benefit a number of other rarespecies in addition to providing essential habitat featuresimportant to crested caracaras. These areas should be aprimary focus of conservation efforts since they will pro-vide multiple benefits.
Lack of demographic data makes it difficult to defineprecise habitat-conservation goals for Audubon’s crestedcaracara. Analyses performed for other species lead us tobelieve that a managed population of at least 80-120 terri-tories has a good chance of long-term survival. Based onthis recommendation and the analyses of areas importantto caracaras and other rare species (Figures 36, 37, and38), Figure 39 outlines a proposed Strategic HabitatConservation Area that encompasses 100 territories andcontains the important habitat areas on private lands inGlades, Highlands, Osceola, and Polk counties. Otherrare species recorded in these areas are listed in Table 8.Whether all of these species benefit from the proposedhabitat conservation areas will depend on more specifichabitat assessments.
Given the very small size of the caracara populationsupported by the current system of conservation areas inFlorida, new conservation initiatives must move quicklyto retain extensive tracts of native prairie and improvedrangeland in Glades, Highlands, Okeechobee, Osceola,DeSoto, Charlotte, and Hendry counties. One of the mostpressing threats is the conversion of improved rangelandand native prairie lands to citrus production. In just thelast few years, permits were granted to develop citrus
Figure 39. Proposed Strategic Habitat Conservation Areas for Audubon’s crested caracara.
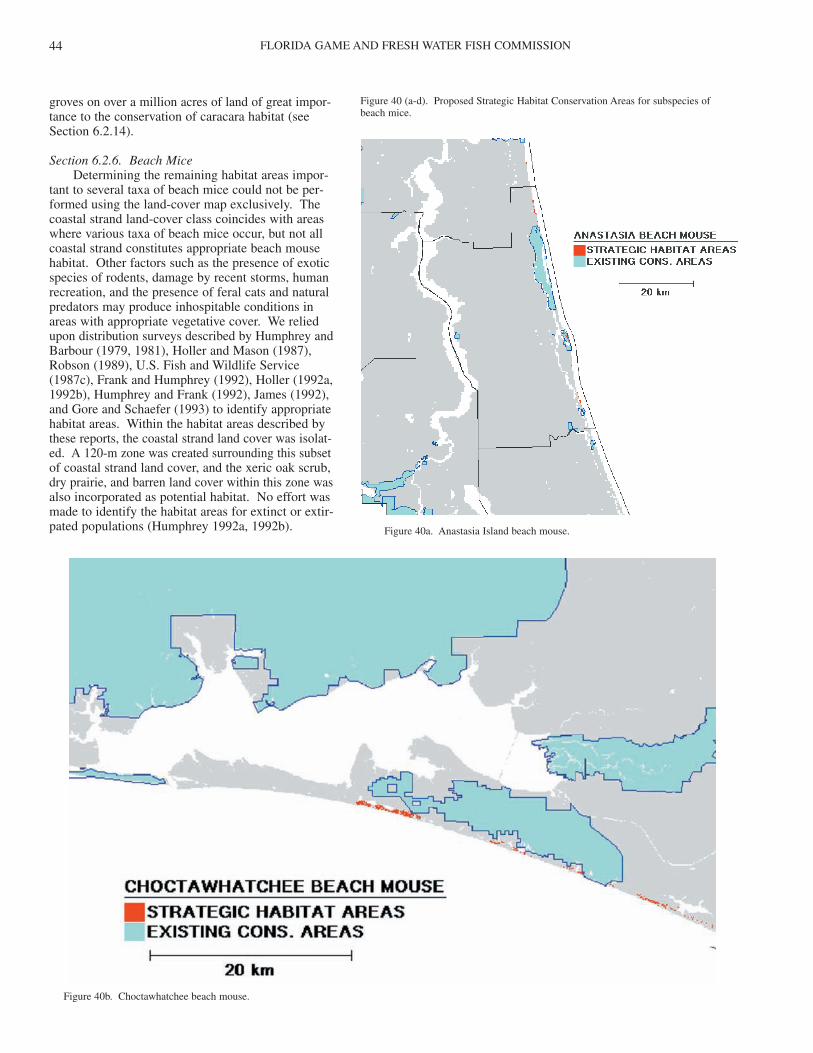
FLORIDA GAME AND FRESH WATER FISH COMMISSION44
groves on over a million acres of land of great impor-tance to the conservation of caracara habitat (seeSection 6.2.14).
Section 6.2.6. Beach MiceDetermining the remaining habitat areas impor-
tant to several taxa of beach mice could not be per-formed using the land-cover map exclusively. Thecoastal strand land-cover class coincides with areaswhere various taxa of beach mice occur, but not allcoastal strand constitutes appropriate beach mousehabitat. Other factors such as the presence of exoticspecies of rodents, damage by recent storms, humanrecreation, and the presence of feral cats and naturalpredators may produce inhospitable conditions inareas with appropriate vegetative cover. We reliedupon distribution surveys described by Humphrey andBarbour (1979, 1981), Holler and Mason (1987),Robson (1989), U.S. Fish and Wildlife Service(1987c), Frank and Humphrey (1992), Holler (1992a,1992b), Humphrey and Frank (1992), James (1992),and Gore and Schaefer (1993) to identify appropriatehabitat areas. Within the habitat areas described bythese reports, the coastal strand land cover was isolat-ed. A 120-m zone was created surrounding this subsetof coastal strand land cover, and the xeric oak scrub,dry prairie, and barren land cover within this zone wasalso incorporated as potential habitat. No effort wasmade to identify the habitat areas for extinct or extir-pated populations (Humphrey 1992a, 1992b).
Figure 40 (a-d). Proposed Strategic Habitat Conservation Areas for subspecies of beach mice.
Figure 40a. Anastasia Island beach mouse.
Figure 40b. Choctawhatchee beach mouse.
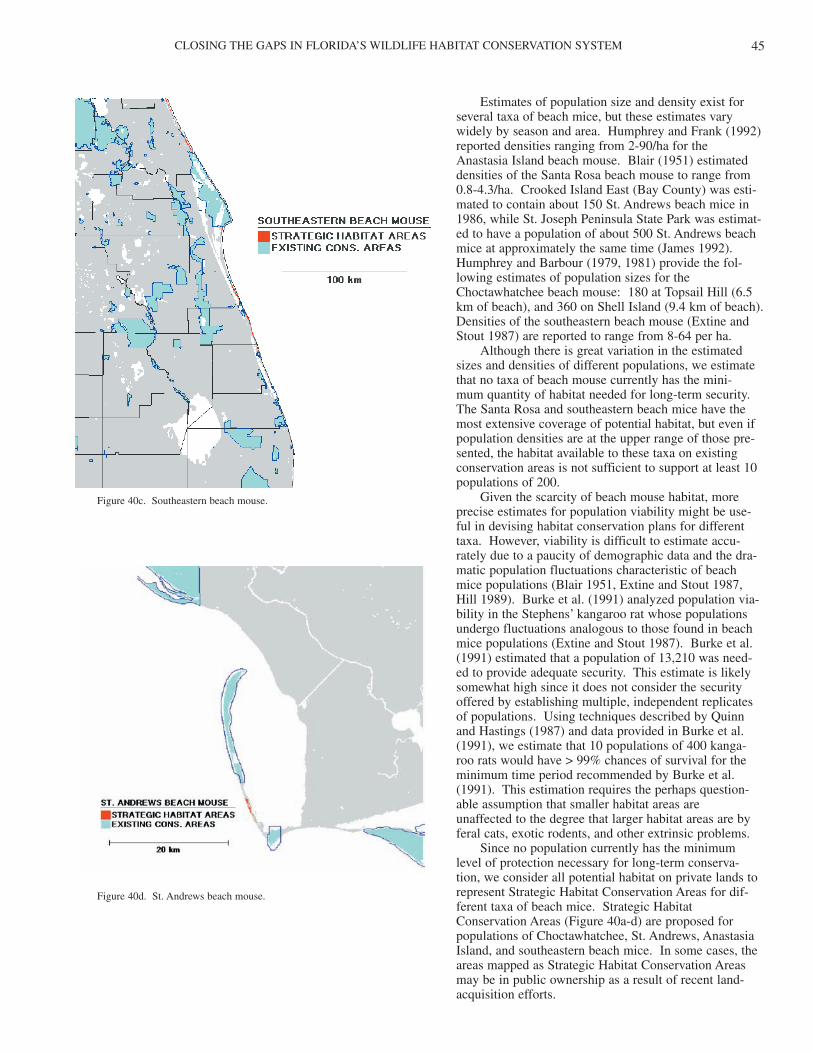
CLOSING THE GAPS IN FLORIDA’S WILDLIFE HABITAT CONSERVATION SYSTEM 45
Estimates of population size and density exist forseveral taxa of beach mice, but these estimates varywidely by season and area. Humphrey and Frank (1992)reported densities ranging from 2-90/ha for the Anastasia Island beach mouse. Blair (1951) estimateddensities of the Santa Rosa beach mouse to range from0.8-4.3/ha. Crooked Island East (Bay County) was esti-mated to contain about 150 St. Andrews beach mice in1986, while St. Joseph Peninsula State Park was estimat-ed to have a population of about 500 St. Andrews beachmice at approximately the same time (James 1992).Humphrey and Barbour (1979, 1981) provide the fol-lowing estimates of population sizes for theChoctawhatchee beach mouse: 180 at Topsail Hill (6.5km of beach), and 360 on Shell Island (9.4 km of beach).Densities of the southeastern beach mouse (Extine andStout 1987) are reported to range from 8-64 per ha.
Although there is great variation in the estimatedsizes and densities of different populations, we estimatethat no taxa of beach mouse currently has the mini-mum quantity of habitat needed for long-term security.The Santa Rosa and southeastern beach mice have themost extensive coverage of potential habitat, but even ifpopulation densities are at the upper range of those pre-sented, the habitat available to these taxa on existingconservation areas is not sufficient to support at least 10populations of 200.
Given the scarcity of beach mouse habitat, moreprecise estimates for population viability might be use-ful in devising habitat conservation plans for differenttaxa. However, viability is difficult to estimate accu-rately due to a paucity of demographic data and the dra-matic population fluctuations characteristic of beachmice populations (Blair 1951, Extine and Stout 1987,Hill 1989). Burke et al. (1991) analyzed population via-bility in the Stephens’ kangaroo rat whose populationsundergo fluctuations analogous to those found in beachmice populations (Extine and Stout 1987). Burke et al.(1991) estimated that a population of 13,210 was need-ed to provide adequate security. This estimate is likelysomewhat high since it does not consider the securityoffered by establishing multiple, independent replicatesof populations. Using techniques described by Quinnand Hastings (1987) and data provided in Burke et al.(1991), we estimate that 10 populations of 400 kanga-roo rats would have > 99% chances of survival for theminimum time period recommended by Burke et al.(1991). This estimation requires the perhaps question-able assumption that smaller habitat areas are unaffected to the degree that larger habitat areas are byferal cats, exotic rodents, and other extrinsic problems.
Since no population currently has the minimum level of protection necessary for long-term conserva-tion, we consider all potential habitat on private lands torepresent Strategic Habitat Conservation Areas for dif-ferent taxa of beach mice. Strategic HabitatConservation Areas (Figure 40a-d) are proposed forpopulations of Choctawhatchee, St. Andrews, AnastasiaIsland, and southeastern beach mice. In some cases, theareas mapped as Strategic Habitat Conservation Areasmay be in public ownership as a result of recent land-acquisition efforts.
Figure 40c. Southeastern beach mouse.
Figure 40d. St. Andrews beach mouse.
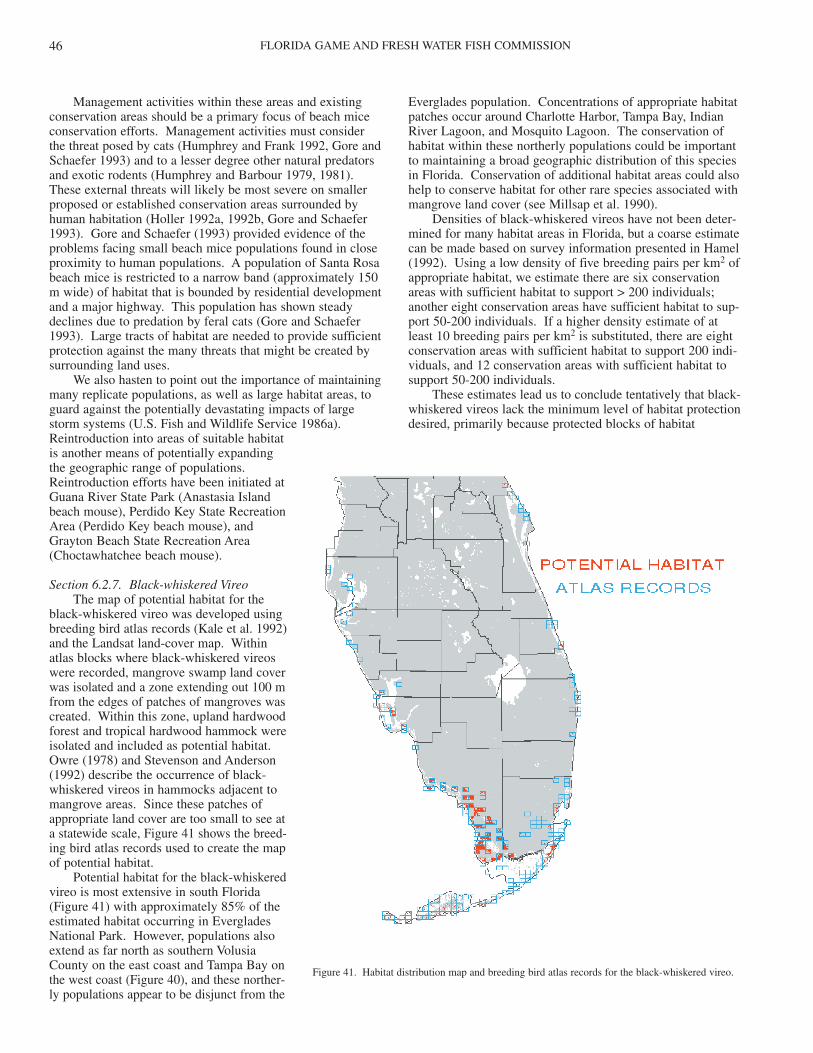
FLORIDA GAME AND FRESH WATER FISH COMMISSION46
Management activities within these areas and existingconservation areas should be a primary focus of beach miceconservation efforts. Management activities must considerthe threat posed by cats (Humphrey and Frank 1992, Gore andSchaefer 1993) and to a lesser degree other natural predatorsand exotic rodents (Humphrey and Barbour 1979, 1981).These external threats will likely be most severe on smallerproposed or established conservation areas surrounded byhuman habitation (Holler 1992a, 1992b, Gore and Schaefer1993). Gore and Schaefer (1993) provided evidence of theproblems facing small beach mice populations found in closeproximity to human populations. A population of Santa Rosabeach mice is restricted to a narrow band (approximately 150m wide) of habitat that is bounded by residential developmentand a major highway. This population has shown steadydeclines due to predation by feral cats (Gore and Schaefer1993). Large tracts of habitat are needed to provide sufficientprotection against the many threats that might be created bysurrounding land uses.
We also hasten to point out the importance of maintainingmany replicate populations, as well as large habitat areas, toguard against the potentially devastating impacts of largestorm systems (U.S. Fish and Wildlife Service 1986a).Reintroduction into areas of suitable habitatis another means of potentially expandingthe geographic range of populations.Reintroduction efforts have been initiated atGuana River State Park (Anastasia Islandbeach mouse), Perdido Key State RecreationArea (Perdido Key beach mouse), andGrayton Beach State Recreation Area(Choctawhatchee beach mouse).
Section 6.2.7. Black-whiskered VireoThe map of potential habitat for the
black-whiskered vireo was developed usingbreeding bird atlas records (Kale et al. 1992)and the Landsat land-cover map. Withinatlas blocks where black-whiskered vireoswere recorded, mangrove swamp land coverwas isolated and a zone extending out 100 mfrom the edges of patches of mangroves wascreated. Within this zone, upland hardwoodforest and tropical hardwood hammock wereisolated and included as potential habitat.Owre (1978) and Stevenson and Anderson(1992) describe the occurrence of black-whiskered vireos in hammocks adjacent tomangrove areas. Since these patches ofappropriate land cover are too small to see ata statewide scale, Figure 41 shows the breed-ing bird atlas records used to create the mapof potential habitat.
Potential habitat for the black-whiskeredvireo is most extensive in south Florida(Figure 41) with approximately 85% of theestimated habitat occurring in EvergladesNational Park. However, populations alsoextend as far north as southern VolusiaCounty on the east coast and Tampa Bay onthe west coast (Figure 40), and these norther-ly populations appear to be disjunct from the
Everglades population. Concentrations of appropriate habitatpatches occur around Charlotte Harbor, Tampa Bay, IndianRiver Lagoon, and Mosquito Lagoon. The conservation ofhabitat within these northerly populations could be importantto maintaining a broad geographic distribution of this speciesin Florida. Conservation of additional habitat areas could alsohelp to conserve habitat for other rare species associated withmangrove land cover (see Millsap et al. 1990).
Densities of black-whiskered vireos have not been deter-mined for many habitat areas in Florida, but a coarse estimatecan be made based on survey information presented in Hamel(1992). Using a low density of five breeding pairs per km2 ofappropriate habitat, we estimate there are six conservationareas with sufficient habitat to support > 200 individuals;another eight conservation areas have sufficient habitat to sup-port 50-200 individuals. If a higher density estimate of atleast 10 breeding pairs per km2 is substituted, there are eightconservation areas with sufficient habitat to support 200 indi-viduals, and 12 conservation areas with sufficient habitat tosupport 50-200 individuals.
These estimates lead us to conclude tentatively that black-whiskered vireos lack the minimum level of habitat protectiondesired, primarily because protected blocks of habitat
Figure 41. Habitat distribution map and breeding bird atlas records for the black-whiskered vireo.
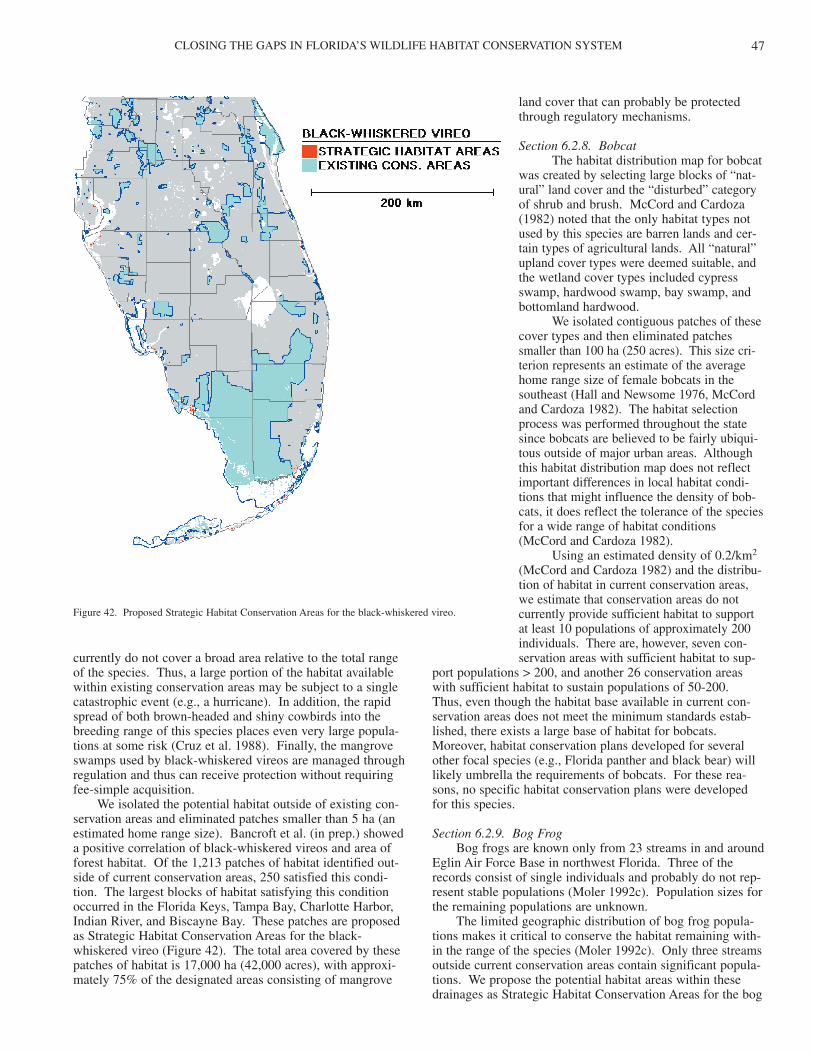
CLOSING THE GAPS IN FLORIDA’S WILDLIFE HABITAT CONSERVATION SYSTEM 47
land cover that can probably be protectedthrough regulatory mechanisms.
Section 6.2.8. Bobcat The habitat distribution map for bobcat
was created by selecting large blocks of “nat-ural” land cover and the “disturbed” categoryof shrub and brush. McCord and Cardoza(1982) noted that the only habitat types notused by this species are barren lands and cer-tain types of agricultural lands. All “natural”upland cover types were deemed suitable, andthe wetland cover types included cypressswamp, hardwood swamp, bay swamp, andbottomland hardwood.
We isolated contiguous patches of thesecover types and then eliminated patchessmaller than 100 ha (250 acres). This size cri-terion represents an estimate of the averagehome range size of female bobcats in thesoutheast (Hall and Newsome 1976, McCordand Cardoza 1982). The habitat selectionprocess was performed throughout the statesince bobcats are believed to be fairly ubiqui-tous outside of major urban areas. Althoughthis habitat distribution map does not reflectimportant differences in local habitat condi-tions that might influence the density of bob-cats, it does reflect the tolerance of the speciesfor a wide range of habitat conditions(McCord and Cardoza 1982).
Using an estimated density of 0.2/km2
(McCord and Cardoza 1982) and the distribu-tion of habitat in current conservation areas,we estimate that conservation areas do notcurrently provide sufficient habitat to supportat least 10 populations of approximately 200individuals. There are, however, seven con-servation areas with sufficient habitat to sup-
port populations > 200, and another 26 conservation areaswith sufficient habitat to sustain populations of 50-200.Thus, even though the habitat base available in current con-servation areas does not meet the minimum standards estab-lished, there exists a large base of habitat for bobcats.Moreover, habitat conservation plans developed for severalother focal species (e.g., Florida panther and black bear) willlikely umbrella the requirements of bobcats. For these rea-sons, no specific habitat conservation plans were developedfor this species.
Section 6.2.9. Bog Frog Bog frogs are known only from 23 streams in and around
Eglin Air Force Base in northwest Florida. Three of therecords consist of single individuals and probably do not rep-resent stable populations (Moler 1992c). Population sizes forthe remaining populations are unknown.
The limited geographic distribution of bog frog popula-tions makes it critical to conserve the habitat remaining with-in the range of the species (Moler 1992c). Only three streamsoutside current conservation areas contain significant popula-tions. We propose the potential habitat areas within thesedrainages as Strategic Habitat Conservation Areas for the bog
Figure 42. Proposed Strategic Habitat Conservation Areas for the black-whiskered vireo.
currently do not cover a broad area relative to the total rangeof the species. Thus, a large portion of the habitat availablewithin existing conservation areas may be subject to a singlecatastrophic event (e.g., a hurricane). In addition, the rapidspread of both brown-headed and shiny cowbirds into thebreeding range of this species places even very large popula-tions at some risk (Cruz et al. 1988). Finally, the mangroveswamps used by black-whiskered vireos are managed throughregulation and thus can receive protection without requiringfee-simple acquisition.
We isolated the potential habitat outside of existing con-servation areas and eliminated patches smaller than 5 ha (anestimated home range size). Bancroft et al. (in prep.) showeda positive correlation of black-whiskered vireos and area offorest habitat. Of the 1,213 patches of habitat identified out-side of current conservation areas, 250 satisfied this condi-tion. The largest blocks of habitat satisfying this conditionoccurred in the Florida Keys, Tampa Bay, Charlotte Harbor,Indian River, and Biscayne Bay. These patches are proposedas Strategic Habitat Conservation Areas for the black-whiskered vireo (Figure 42). The total area covered by thesepatches of habitat is 17,000 ha (42,000 acres), with approxi-mately 75% of the designated areas consisting of mangrove
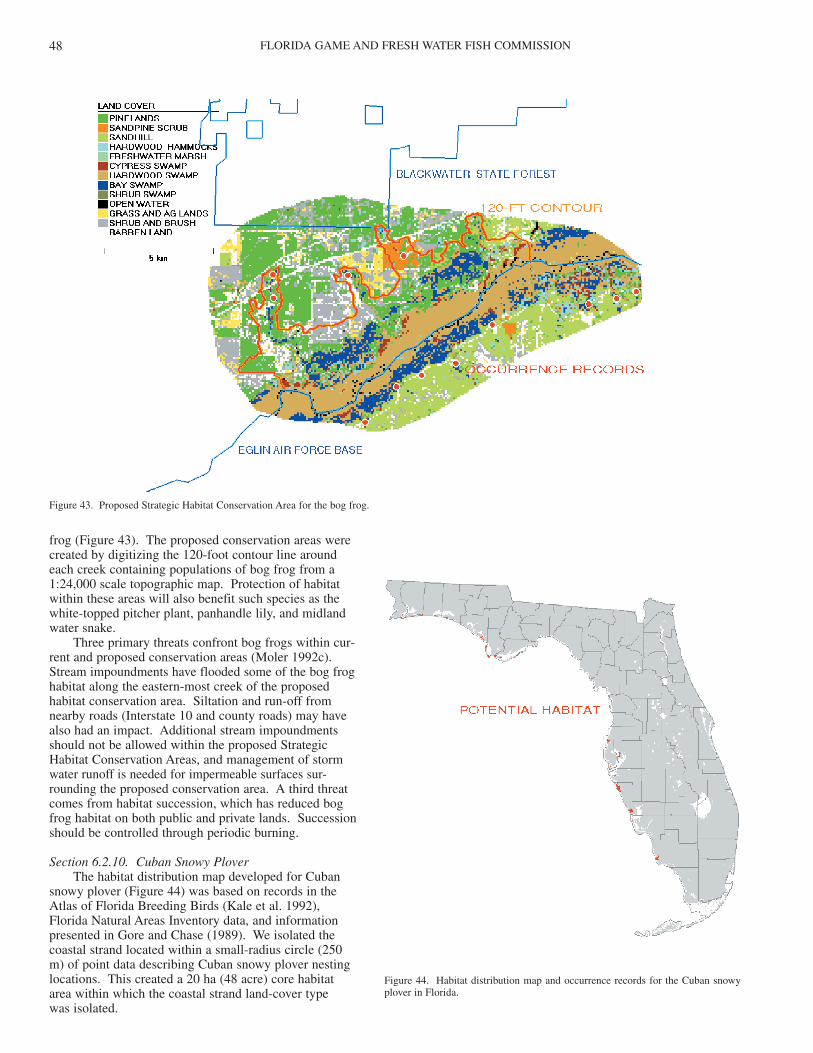
FLORIDA GAME AND FRESH WATER FISH COMMISSION48
frog (Figure 43). The proposed conservation areas werecreated by digitizing the 120-foot contour line aroundeach creek containing populations of bog frog from a1:24,000 scale topographic map. Protection of habitatwithin these areas will also benefit such species as thewhite-topped pitcher plant, panhandle lily, and midlandwater snake.
Three primary threats confront bog frogs within cur-rent and proposed conservation areas (Moler 1992c).Stream impoundments have flooded some of the bog froghabitat along the eastern-most creek of the proposedhabitat conservation area. Siltation and run-off fromnearby roads (Interstate 10 and county roads) may havealso had an impact. Additional stream impoundmentsshould not be allowed within the proposed StrategicHabitat Conservation Areas, and management of stormwater runoff is needed for impermeable surfaces sur-rounding the proposed conservation area. A third threatcomes from habitat succession, which has reduced bogfrog habitat on both public and private lands. Successionshould be controlled through periodic burning.
Section 6.2.10. Cuban Snowy PloverThe habitat distribution map developed for Cuban
snowy plover (Figure 44) was based on records in theAtlas of Florida Breeding Birds (Kale et al. 1992),Florida Natural Areas Inventory data, and informationpresented in Gore and Chase (1989). We isolated thecoastal strand located within a small-radius circle (250m) of point data describing Cuban snowy plover nestinglocations. This created a 20 ha (48 acre) core habitatarea within which the coastal strand land-cover type was isolated.
Figure 43. Proposed Strategic Habitat Conservation Area for the bog frog.
Figure 44. Habitat distribution map and occurrence records for the Cuban snowyplover in Florida.
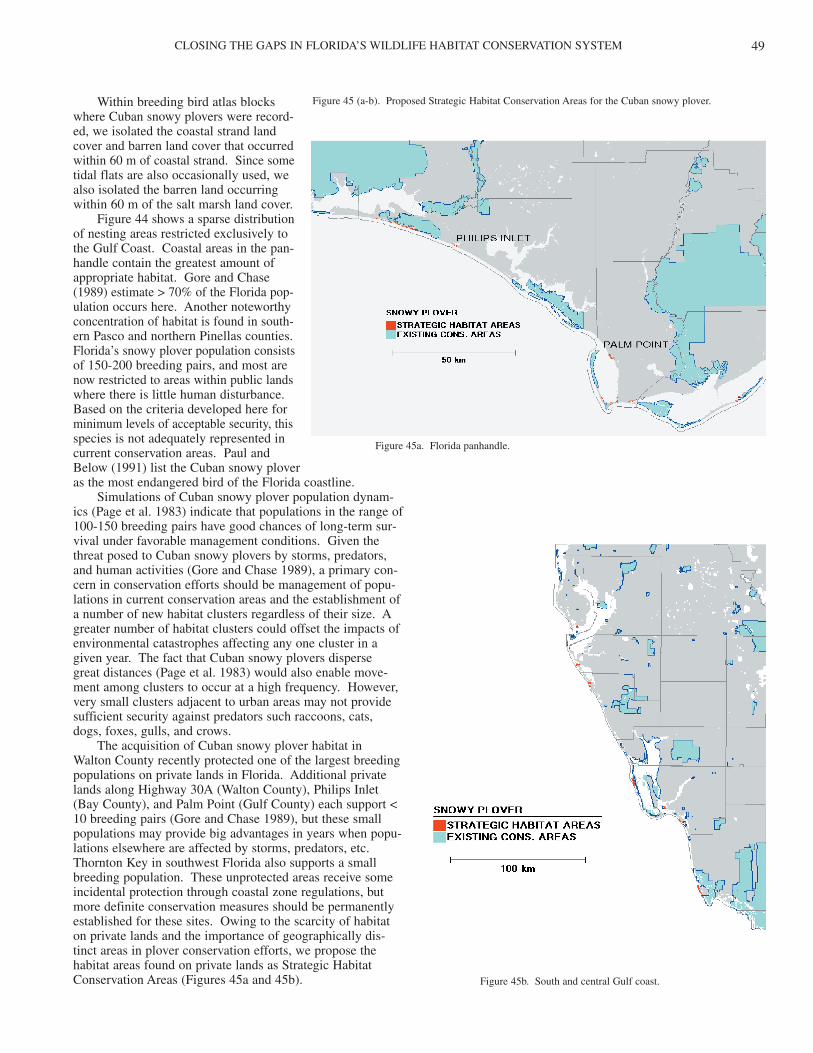
CLOSING THE GAPS IN FLORIDA’S WILDLIFE HABITAT CONSERVATION SYSTEM 49
Within breeding bird atlas blockswhere Cuban snowy plovers were record-ed, we isolated the coastal strand landcover and barren land cover that occurredwithin 60 m of coastal strand. Since sometidal flats are also occasionally used, wealso isolated the barren land occurringwithin 60 m of the salt marsh land cover.
Figure 44 shows a sparse distributionof nesting areas restricted exclusively tothe Gulf Coast. Coastal areas in the pan-handle contain the greatest amount ofappropriate habitat. Gore and Chase(1989) estimate > 70% of the Florida pop-ulation occurs here. Another noteworthyconcentration of habitat is found in south-ern Pasco and northern Pinellas counties.Florida’s snowy plover population consistsof 150-200 breeding pairs, and most arenow restricted to areas within public landswhere there is little human disturbance.Based on the criteria developed here forminimum levels of acceptable security, thisspecies is not adequately represented incurrent conservation areas. Paul andBelow (1991) list the Cuban snowy ploveras the most endangered bird of the Florida coastline.
Simulations of Cuban snowy plover population dynam-ics (Page et al. 1983) indicate that populations in the range of100-150 breeding pairs have good chances of long-term sur-vival under favorable management conditions. Given thethreat posed to Cuban snowy plovers by storms, predators,and human activities (Gore and Chase 1989), a primary con-cern in conservation efforts should be management of popu-lations in current conservation areas and the establishment ofa number of new habitat clusters regardless of their size. Agreater number of habitat clusters could offset the impacts ofenvironmental catastrophes affecting any one cluster in agiven year. The fact that Cuban snowy plovers disperse great distances (Page et al. 1983) would also enable move-ment among clusters to occur at a high frequency. However,very small clusters adjacent to urban areas may not providesufficient security against predators such raccoons, cats,dogs, foxes, gulls, and crows.
The acquisition of Cuban snowy plover habitat in Walton County recently protected one of the largest breedingpopulations on private lands in Florida. Additional privatelands along Highway 30A (Walton County), Philips Inlet(Bay County), and Palm Point (Gulf County) each support <10 breeding pairs (Gore and Chase 1989), but these smallpopulations may provide big advantages in years when popu-lations elsewhere are affected by storms, predators, etc.Thornton Key in southwest Florida also supports a smallbreeding population. These unprotected areas receive someincidental protection through coastal zone regulations, butmore definite conservation measures should be permanentlyestablished for these sites. Owing to the scarcity of habitaton private lands and the importance of geographically dis-tinct areas in plover conservation efforts, we propose thehabitat areas found on private lands as Strategic HabitatConservation Areas (Figures 45a and 45b).
Figure 45a. Florida panhandle.
Figure 45 (a-b). Proposed Strategic Habitat Conservation Areas for the Cuban snowy plover.
Figure 45b. South and central Gulf coast.
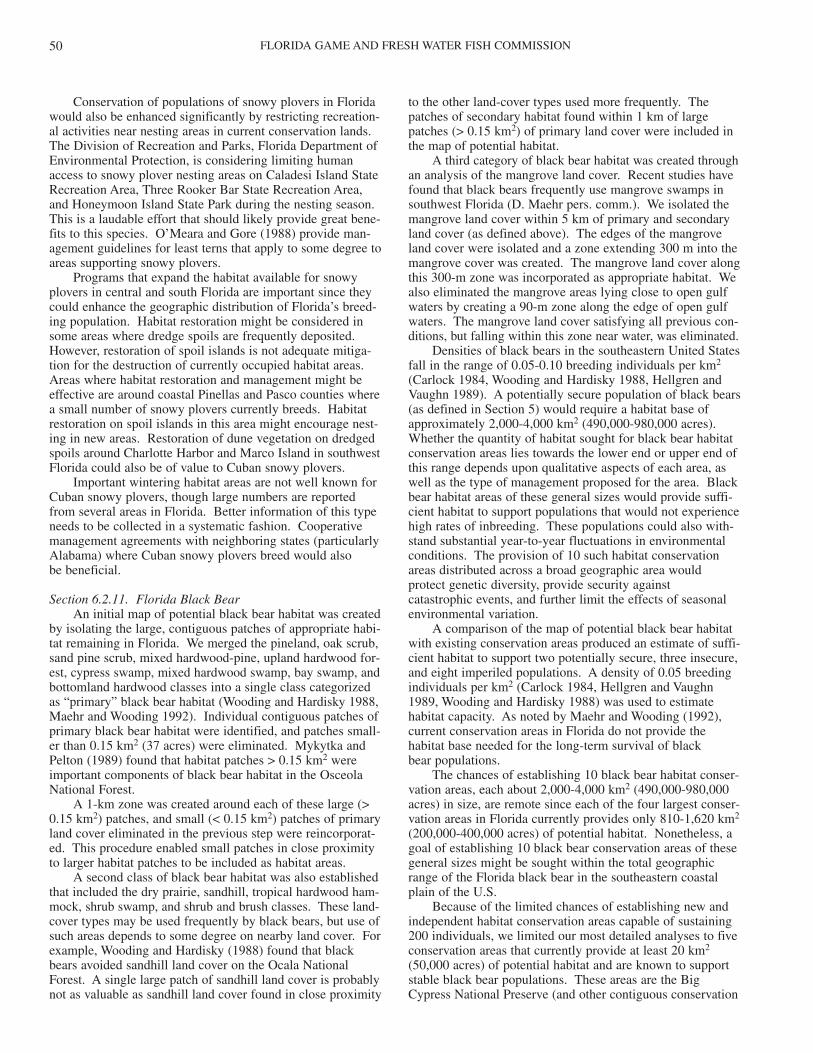
FLORIDA GAME AND FRESH WATER FISH COMMISSION50
Conservation of populations of snowy plovers in Floridawould also be enhanced significantly by restricting recreation-al activities near nesting areas in current conservation lands.The Division of Recreation and Parks, Florida Department ofEnvironmental Protection, is considering limiting humanaccess to snowy plover nesting areas on Caladesi Island StateRecreation Area, Three Rooker Bar State Recreation Area,and Honeymoon Island State Park during the nesting season.This is a laudable effort that should likely provide great bene-fits to this species. O’Meara and Gore (1988) provide man-agement guidelines for least terns that apply to some degree toareas supporting snowy plovers.
Programs that expand the habitat available for snowyplovers in central and south Florida are important since theycould enhance the geographic distribution of Florida’s breed-ing population. Habitat restoration might be considered insome areas where dredge spoils are frequently deposited.However, restoration of spoil islands is not adequate mitiga-tion for the destruction of currently occupied habitat areas.Areas where habitat restoration and management might beeffective are around coastal Pinellas and Pasco counties wherea small number of snowy plovers currently breeds. Habitatrestoration on spoil islands in this area might encourage nest-ing in new areas. Restoration of dune vegetation on dredgedspoils around Charlotte Harbor and Marco Island in southwestFlorida could also be of value to Cuban snowy plovers.
Important wintering habitat areas are not well known forCuban snowy plovers, though large numbers are reportedfrom several areas in Florida. Better information of this typeneeds to be collected in a systematic fashion. Cooperativemanagement agreements with neighboring states (particularlyAlabama) where Cuban snowy plovers breed would also be beneficial.
Section 6.2.11. Florida Black BearAn initial map of potential black bear habitat was created
by isolating the large, contiguous patches of appropriate habi-tat remaining in Florida. We merged the pineland, oak scrub,sand pine scrub, mixed hardwood-pine, upland hardwood for-est, cypress swamp, mixed hardwood swamp, bay swamp, andbottomland hardwood classes into a single class categorizedas “primary” black bear habitat (Wooding and Hardisky 1988,Maehr and Wooding 1992). Individual contiguous patches ofprimary black bear habitat were identified, and patches small-er than 0.15 km2 (37 acres) were eliminated. Mykytka andPelton (1989) found that habitat patches > 0.15 km2 wereimportant components of black bear habitat in the OsceolaNational Forest.
A 1-km zone was created around each of these large (>0.15 km2) patches, and small (< 0.15 km2) patches of primaryland cover eliminated in the previous step were reincorporat-ed. This procedure enabled small patches in close proximityto larger habitat patches to be included as habitat areas.
A second class of black bear habitat was also establishedthat included the dry prairie, sandhill, tropical hardwood ham-mock, shrub swamp, and shrub and brush classes. These land-cover types may be used frequently by black bears, but use ofsuch areas depends to some degree on nearby land cover. Forexample, Wooding and Hardisky (1988) found that blackbears avoided sandhill land cover on the Ocala NationalForest. A single large patch of sandhill land cover is probablynot as valuable as sandhill land cover found in close proximity
to the other land-cover types used more frequently. Thepatches of secondary habitat found within 1 km of largepatches (> 0.15 km2) of primary land cover were included inthe map of potential habitat.
A third category of black bear habitat was created throughan analysis of the mangrove land cover. Recent studies havefound that black bears frequently use mangrove swamps insouthwest Florida (D. Maehr pers. comm.). We isolated themangrove land cover within 5 km of primary and secondaryland cover (as defined above). The edges of the mangroveland cover were isolated and a zone extending 300 m into themangrove cover was created. The mangrove land cover alongthis 300-m zone was incorporated as appropriate habitat. Wealso eliminated the mangrove areas lying close to open gulfwaters by creating a 90-m zone along the edge of open gulfwaters. The mangrove land cover satisfying all previous con-ditions, but falling within this zone near water, was eliminated.
Densities of black bears in the southeastern United Statesfall in the range of 0.05-0.10 breeding individuals per km2
(Carlock 1984, Wooding and Hardisky 1988, Hellgren andVaughn 1989). A potentially secure population of black bears(as defined in Section 5) would require a habitat base ofapproximately 2,000-4,000 km2 (490,000-980,000 acres).Whether the quantity of habitat sought for black bear habitatconservation areas lies towards the lower end or upper end ofthis range depends upon qualitative aspects of each area, aswell as the type of management proposed for the area. Blackbear habitat areas of these general sizes would provide suffi-cient habitat to support populations that would not experiencehigh rates of inbreeding. These populations could also with-stand substantial year-to-year fluctuations in environmentalconditions. The provision of 10 such habitat conservationareas distributed across a broad geographic area wouldprotect genetic diversity, provide security against catastrophic events, and further limit the effects of seasonalenvironmental variation.
A comparison of the map of potential black bear habitatwith existing conservation areas produced an estimate of suffi-cient habitat to support two potentially secure, three insecure,and eight imperiled populations. A density of 0.05 breedingindividuals per km2 (Carlock 1984, Hellgren and Vaughn1989, Wooding and Hardisky 1988) was used to estimatehabitat capacity. As noted by Maehr and Wooding (1992),current conservation areas in Florida do not provide thehabitat base needed for the long-term survival of black bear populations.
The chances of establishing 10 black bear habitat conser-vation areas, each about 2,000-4,000 km2 (490,000-980,000acres) in size, are remote since each of the four largest conser-vation areas in Florida currently provides only 810-1,620 km2
(200,000-400,000 acres) of potential habitat. Nonetheless, agoal of establishing 10 black bear conservation areas of thesegeneral sizes might be sought within the total geographicrange of the Florida black bear in the southeastern coastalplain of the U.S.
Because of the limited chances of establishing new andindependent habitat conservation areas capable of sustaining200 individuals, we limited our most detailed analyses to fiveconservation areas that currently provide at least 20 km2
(50,000 acres) of potential habitat and are known to supportstable black bear populations. These areas are the BigCypress National Preserve (and other contiguous conservation
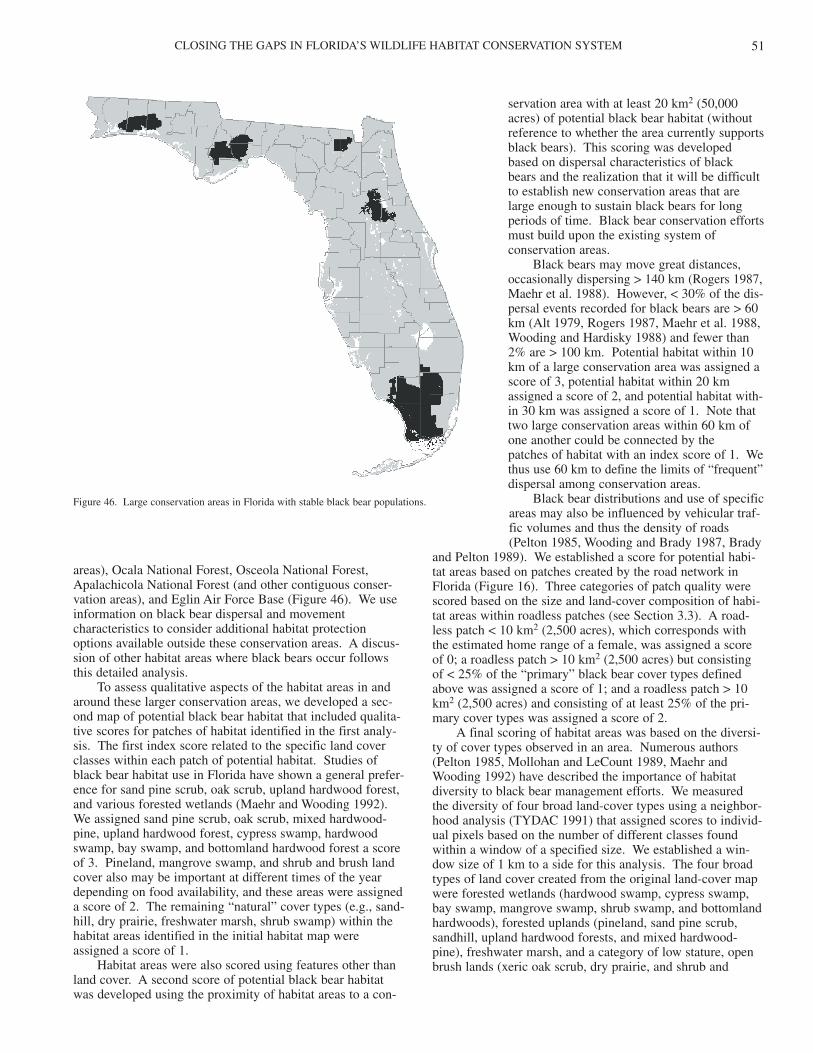
CLOSING THE GAPS IN FLORIDA’S WILDLIFE HABITAT CONSERVATION SYSTEM 51
areas), Ocala National Forest, Osceola National Forest,Apalachicola National Forest (and other contiguous conser-vation areas), and Eglin Air Force Base (Figure 46). We useinformation on black bear dispersal and movement characteristics to consider additional habitat protectionoptions available outside these conservation areas. A discus-sion of other habitat areas where black bears occur followsthis detailed analysis.
To assess qualitative aspects of the habitat areas in andaround these larger conservation areas, we developed a sec-ond map of potential black bear habitat that included qualita-tive scores for patches of habitat identified in the first analy-sis. The first index score related to the specific land coverclasses within each patch of potential habitat. Studies ofblack bear habitat use in Florida have shown a general prefer-ence for sand pine scrub, oak scrub, upland hardwood forest,and various forested wetlands (Maehr and Wooding 1992).We assigned sand pine scrub, oak scrub, mixed hardwood-pine, upland hardwood forest, cypress swamp, hardwoodswamp, bay swamp, and bottomland hardwood forest a scoreof 3. Pineland, mangrove swamp, and shrub and brush landcover also may be important at different times of the yeardepending on food availability, and these areas were assigneda score of 2. The remaining “natural” cover types (e.g., sand-hill, dry prairie, freshwater marsh, shrub swamp) within thehabitat areas identified in the initial habitat map wereassigned a score of 1.
Habitat areas were also scored using features other thanland cover. A second score of potential black bear habitatwas developed using the proximity of habitat areas to a con-
servation area with at least 20 km2 (50,000acres) of potential black bear habitat (withoutreference to whether the area currently supportsblack bears). This scoring was developedbased on dispersal characteristics of blackbears and the realization that it will be difficultto establish new conservation areas that arelarge enough to sustain black bears for longperiods of time. Black bear conservation effortsmust build upon the existing system ofconservation areas.
Black bears may move great distances,occasionally dispersing > 140 km (Rogers 1987,Maehr et al. 1988). However, < 30% of the dis-persal events recorded for black bears are > 60km (Alt 1979, Rogers 1987, Maehr et al. 1988,Wooding and Hardisky 1988) and fewer than2% are > 100 km. Potential habitat within 10km of a large conservation area was assigned ascore of 3, potential habitat within 20 kmassigned a score of 2, and potential habitat with-in 30 km was assigned a score of 1. Note thattwo large conservation areas within 60 km ofone another could be connected by the patches of habitat with an index score of 1. Wethus use 60 km to define the limits of “frequent”dispersal among conservation areas.
Black bear distributions and use of specificareas may also be influenced by vehicular traf-fic volumes and thus the density of roads(Pelton 1985, Wooding and Brady 1987, Brady
and Pelton 1989). We established a score for potential habi-tat areas based on patches created by the road network inFlorida (Figure 16). Three categories of patch quality werescored based on the size and land-cover composition of habi-tat areas within roadless patches (see Section 3.3). A road-less patch < 10 km2 (2,500 acres), which corresponds withthe estimated home range of a female, was assigned a scoreof 0; a roadless patch > 10 km2 (2,500 acres) but consistingof < 25% of the “primary” black bear cover types definedabove was assigned a score of 1; and a roadless patch > 10km2 (2,500 acres) and consisting of at least 25% of the pri-mary cover types was assigned a score of 2.
A final scoring of habitat areas was based on the diversi-ty of cover types observed in an area. Numerous authors(Pelton 1985, Mollohan and LeCount 1989, Maehr andWooding 1992) have described the importance of habitatdiversity to black bear management efforts. We measured the diversity of four broad land-cover types using a neighbor-hood analysis (TYDAC 1991) that assigned scores to individ-ual pixels based on the number of different classes foundwithin a window of a specified size. We established a win-dow size of 1 km to a side for this analysis. The four broadtypes of land cover created from the original land-cover mapwere forested wetlands (hardwood swamp, cypress swamp,bay swamp, mangrove swamp, shrub swamp, and bottomlandhardwoods), forested uplands (pineland, sand pine scrub,sandhill, upland hardwood forests, and mixed hardwood-pine), freshwater marsh, and a category of low stature, openbrush lands (xeric oak scrub, dry prairie, and shrub and
Figure 46. Large conservation areas in Florida with stable black bear populations.
FLORIDA GAME AND FRESH WATER FISH COMMISSION52
brush). Pixels with at least three of these broad cover typeswithin 1 km were assigned a score of 2. Pixels with two orfewer classes were assigned a score of 1.
Simple addition of the four maps with index scores result-ed in a map with scores ranging from 0-10 (Figure 47). Theaggregate map scores Florida’s remaining large forested tractsbased on their land-cover composition, their proximity tolarge public lands, their position in a landscape of roads, andthe diversity of four broad land-cover types within 1 km.When describing the “habitat quality” of different areas, weare referencing this map. Patches with the highest scoresoccur within 10 km of large public lands, are part of a largeroadless patch with primary land cover, and also contain adiversity of other broad land-cover features nearby. Thelargest area with high index scores (> 6) surrounds theApalachicola National Forest and extends along the Big Bendarea in Jefferson and Taylor counties.
Below we review the habitat features within the vicinity(< 30 km) of the five large public land holdings containing atleast 20 km2 (50,000 acres) of habitat and supporting knownblack bear populations. Other areas where black bears areoccasionally observed, and smaller conservation areas thatcurrently support black bear populations but were not consid-ered in association with these larger conservation areas, arediscussed later. We then develop more specific minimum rec-ommendations for the conservation of black bear habitat in
Florida by considering (1) the need toestablish habitat conservation areas in therange of 2,024-3,240 km2 (490,000-980,000 acres); (2) the need to preserve abroad geographic distribution of managedblack bear populations; and (3) an interestin conserving habitat areas important toboth black bears and other rare species.
Region 1. Big Cypress NationalPreserve and Surroundings
The important features of the habitat in and surrounding the Big CypressNational Preserve include the small num-ber of major roads (Figure 48), several large tracts of forested lands on nearby private land holdings, and the presence ofseveral large conservation areas.Contiguous conservation areas (Big Cypress National Preserve, Florida Panther National Wildlife Refuge,Fakahatchee Strand State Preserve,Audubon Corkscrew Sanctuary, Collier-Seminole State Park, and portions ofEverglades National Park) contain an esti-mated 2,100 km2 (518,550 acres) ofpotential bear habitat with > 80% of thehabitat areas scoring > 8 on the qualitativeindex map. These areas have the capacityto support about 105-210 breeding indi-viduals assuming an average density of0.05-0.1/km2.
Although current conservation areas in this region satisfy our minimum recom-mendations for a single managed area,
conservation of additional habitat will provide greater securityfor black bear populations statewide since it will be impossi-ble to secure sufficient habitat for a total of 10 managed popu-lations. Increasing the habitat base that can be effectivelymanaged to approximately 1,000 km2 (247,000 acres) wouldprovide sufficient habitat to sustain a population (150-300breeding individuals) capable of long-term survival evenunder very harsh environmental conditions. The largest con-tiguous blocks of high-quality habitat (based on index scores)outside of conservation areas are found west of theFakahatchee Strand State Preserve and to the northeast of theBig Cypress National Preserve. There are approximately 607km2 (150,000 acres) of high quality habitat (index score > 7)northeast of the Big Cypress National Preserve (Area 1,Figure 48). An additional 235 km2 (58,124 acres) of highquality habitat is found extending north of Interstate 75 toCorkscrew Swamp Sanctuary and east of EvergladesBoulevard (Area 2, Figure 48). The Corkscrew SwampSanctuary contains an additional 40.5 km2 (10,000 acres) ofpotential habitat (Area 3, Figure 48). The area west ofFakahatchee Strand State Preserve, north of Tamiami Trail,and east of State Road 951 contains 31.5 km2 (77,928 acres)of high quality habitat (Area 4, Figure 48).
Conservation of habitat areas immediately north of BigCypress National Preserve, areas surrounding CorkscrewSwamp Sanctuary, and the forested tracts that connect this
Figure 47. Qualitative measures of the potential habitat available to black bears in Florida. Habitatscores are based on proximity to existing conservation areas, size of roadless area, diversity of covertypes, and the presence of specific cover types.
CLOSING THE GAPS IN FLORIDA’S WILDLIFE HABITAT CONSERVATION SYSTEM 53
block of habitat with forested areas to thesouth may be among the more importanttracts within the immediate area surround-ing the Big Cypress National Preserve.Much of the area shown in Figure 48 tothe northeast of Big Cypress NationalPreserve is scheduled to come into publicownership in the near future.Conservation of some of the high-qualityhabitat in other areas may prove difficultgiven the rate at which residential andagricultural development is occurring.However, chances of conserving an addi-tional 1,000 km2 (247,000 acres) are highif undertaken quickly, and some of thearea might be conserved through conser-vation easements, land-use agreements, orother methods.
Region 2. Ocala National Forest
Approximately 1,649 km2 (407,500acres) of black bear habitat were mappedwithin the Ocala National Forest, LakeWoodruff National Wildlife Refuge, andcontiguous conservation areas to the westand southwest. This area could supportan estimated 82-165 breeding individuals.There are an additional 3,643 km2
(900,000 acres) of high quality (indexscore > 7), unprotected black bear habitatwithin 30 km of the Ocala National Forest (Figure 49). These habitat areascould provide sufficient habitat to sup-port a population with high chances oflong-term survival. However, the area isalso heavily crossed by roads, and > 60black bears have died from collisions with vehicles in this area within the lastdecade (Wooding and Brady 1987, T.Gilbert pers. comm.). Construction ofwildlife underpasses (see Foster andHumphrey 1993) could help to reducesome black bear mortality, but conserva-tion of habitat acreage towards the upperend of the range estimated (i.e., 3,200km2, 800,000 acres) might also provide apopulation large enough to offset currentlevels of road mortality.
Commercial timber lands to the east,north, and west of the Ocala NationalForest (and extending to southern DuvalCounty) make up a large portion of theblack bear habitat surrounding the OcalaNational Forest. Documented dispersal(Wooding unpubl.) has occurred from the Ocala National Forest into forestedlands in St. Johns, Brevard, Volusia, andFlagler counties through an area betweenPalatka and Crescent Lake (Area 1,Figure 49). Conservation of habitat along this corridor would enable black
Figure 48. Potential black bear habitat in and around the Big Cypress National Preserve. Numberedareas are referenced in the text.
Figure 49. Potential black bear habitat in and around the Ocala National Forest. Numbered areas arereferenced in the text.
FLORIDA GAME AND FRESH WATER FISH COMMISSION54
bears to continue to move into the large block of habitatextending throughout Volusia, Brevard, St. Johns, and Flaglercounties (Area 2, Figure 49). However, conservation of alarge block of black bear habitat in Volusia, Brevard, St.Johns, and Flagler counties is required for the conservation ofthis corridor to have any meaning. Black bears also likelymove from the Ocala National Forest into these private forestlands using an area between DeLeon Springs and Seville(Volusia County) (Area 3, Figure 49).
Several conservation areas to the south of the OcalaNational Forest contain black bear habitat yet are not currentlycontiguous with protected habitat on the forest. Public landsalong the Wekiva River (e.g., Rock Springs Run, WekivaRiver State Park) (Area 4, Figure 49) contain approximately121 km2 (30,000 acres) of black bear habitat and have thecapacity to support 6-12 black bears. The total acreage ofblack bear habitat along the Wekiva River (including unpro-tected private lands) is about 536 km2 (135,000 acres).Conservation of the black bear habitat on private lands in thisarea would significantly enhance the overall security of theOcala black bear population, however conservation of addi-tional habitat elsewhere surrounding the Ocala National Forestwill also be needed.
Region 3. Osceola National Forest and Surroundings
To evaluate the habitat available to black bears in andaround the Osceola National Forest, we obtained a classifiedland-cover map of Georgia developed from Landsat ThematicMapper data collected in 1989 (ERDAS, 2801 BufordHighway, Suite 300, Atlanta, Georgia, 30329). The proce-dures performed for the Georgia land cover data were identi-
cal to those described earlier for the Florida land-cover data.Results for an area centered on the Osceola National Forestare presented in Figure 50.
The Osceola National Forest (including the PinhookSwamp section; Area 1, Figure 50) provides 638 km2
(157,700 acres) of black bear habitat, the smallest quantity ofany of the five conservation areas in Florida with stable blackbear populations. We estimate this area could support 32-64breeding individuals. An additional 6,147 km2 (1.5 millionacres) of habitat occurs within the larger area of south Georgiaand north Florida shown in Figure 50, and roughly 70% ofthis area has an index score > 8. Other large conservationareas within 30 km of the Osceola National Forest includeRaiford Prison with 68 km2 (17,000 acres) of habitat, and theOkefenokee National Wildlife Refuge, which contains 980km2 (241,810 acres) of black bear habitat. Habitat availableon the Okefenokee National Wildlife Refuge could supportapproximately 50-100 black bears.
The black bear habitat available on either the OsceolaNational Forest and Okefenokee National Wildlife Refugewould not support the estimated number of bears needed forlong-term survival. Conservation of an additional 1,000 km2
(247,000 acres) of black bear habitat on the private lands lyingbetween these two areas could establish a total habitat base of2,630 km2 (648,600 acres) and would significantly enhancethe chances of long-term survival of both populations.Conservation of private lands in this area would also help tosecure one of the largest forested wetland areas in the south-eastern U.S. Some of the more important areas that are cur-rently unprotected lie to the east and northeast of the OsceolaNational Forest, including Moccasin Swamp, Cross Branch,and the North Prong of the St. Mary’s River (Area 1, Figure
Figure 50. Potential black bear habitat in and around the Osceola National Forest and Okefenokee National Wildlife Refuge. Numbered areas are referenced inthe text.
CLOSING THE GAPS IN FLORIDA’S WILDLIFE HABITAT CONSERVATION SYSTEM 55
50). Areas just to the north and west of the current bound-aries of the Pinhook Swamp portion of the Osceola NationalForest also appear important (Area 2, Figure 50). Areasextending west of the southwest corner of the OkefenokeeNational Wildlife Refuge to U.S. 94 also appear very impor-tant, as do areas east of the southeast corner of the refuge andextending south of U.S. 94.
Region 4. Apalachicola National Forest and Surroundings
There are roughly 10,930 km2 (2.7 million acres) ofpotential black bear habitat extending from the Aucilla Riverwest through the southern portions of Jefferson and Leoncounties, and throughout most of Wakulla, Franklin, andLiberty counties (Figure 51). Most of the habitat has a quali-tative index score > 7. At least 4,048 km2 (1 million acres)fall within 30 km of the Apalachicola National Forest, and weestimate that this broad area of public and private lands hasthe capacity to support 200-400 black bears. Features of theregion that make it particularly attractive to black bear con-servation include the distribution of large public land hold-ings, the absence of major roads, and several large tracts ofprivate timber lands with sparse human populations.
Public lands in this region encompass a large portion ofthe potential black bear habitat. The contiguous portions ofthe Apalachicola National Forest, Apalachicola River Wildlife and Environmental Area, and St. Marks NationalWildlife Refuge (Area 1, Figure 51) contain roughly 2,744km2 (678,000 acres) of habitat, while the contiguous portionsof St. Marks National Wildlife Refuge, Aucilla WildlifeManagement Area, and Aucilla State Reserve (Area 2, Figure
51) contain an additional 108 km2 (26,700 acres). Weestimate that these public management areas can supportapproximately 140-280 and 5-10 black bears, respectively.Tyndall Air Force base in the southwestern portion of the areacon-tains approximately 109 km2 (27,000 acres) of habitat,enough to support roughly 5-10 black bears.
Although current conservation areas in this region satisfyour minimum recommendations for a single managed area,conservation of additional habitat may provide greater securi-ty for black bear populations statewide since it will be impos-sible to secure sufficient habitat for a total of 10 managedpopulations. Unprotected potential habitat shown north andwest of Lake Talquin encompasses roughly 784 km2 (193,800acres; Area 3, Figure 51), but this area contains a large num-ber of home sites and has many roads. Areas to the west ofLake Talquin along Telogia Creek (Area 4, Figure 51) provideapproximately 1,012 km2 (250,000 acres) of potential habitatwith much lower human densities. Private lands along theApalachicola River (Area 5, Figure 51) contain roughly 1,115km2 (275,600 acres) of potential black bear habitat and arenot subjected to high levels of human disturbance. Privatelands in Wakulla County (Area 6, Figure 51) contain roughly624 km2 (154,200 acres) of potential black bear habitat, butmuch of this area is undergoing residential development. Theremote region around Tate’s Hell Swamp (Area 7, Figure 51)contains approximately 781 km2 (193,600 acres) of potentialblack bear habitat. Radio telemetry data collected by S.Siebert (pers. comm.) show that some of the more importantareas in this region lie around the New and Crooked rivers andSt. James Island. The large forested wetlands along the
Figure 51. Potential black bear habitat in and around the Apalachicola National Forest and St. Marks National Wildlife Refuge. Numbered areas are referencedin the text.
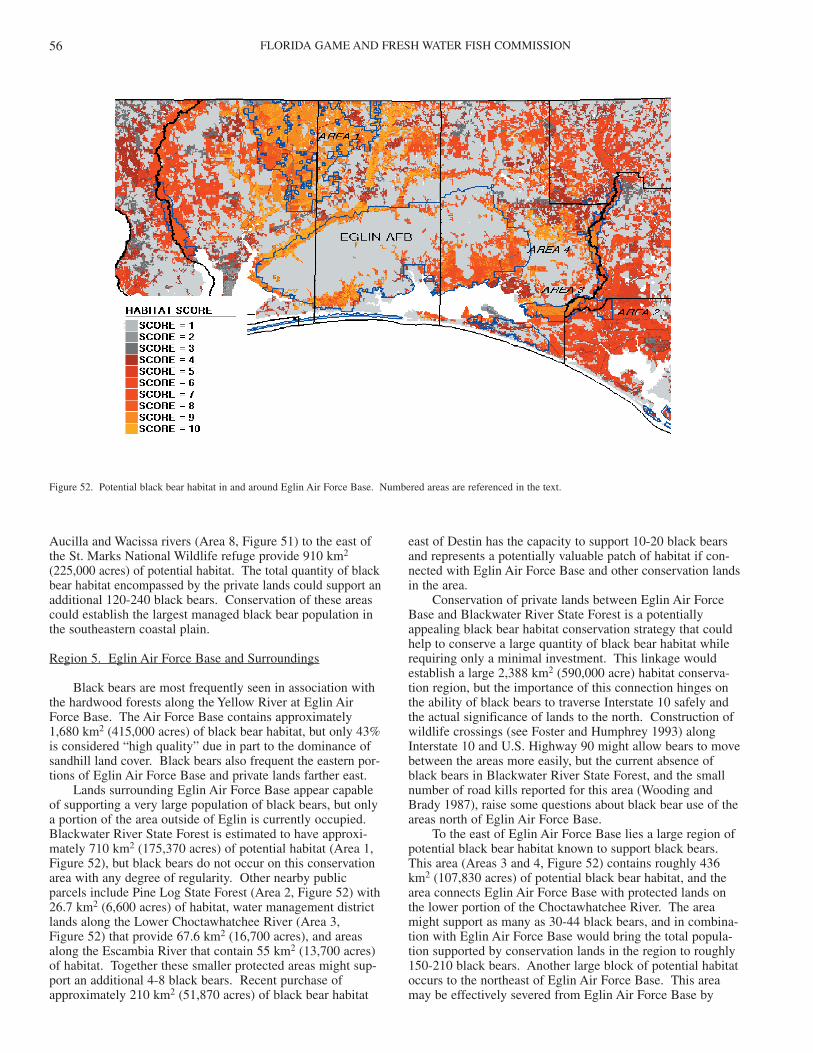
FLORIDA GAME AND FRESH WATER FISH COMMISSION56
Aucilla and Wacissa rivers (Area 8, Figure 51) to the east ofthe St. Marks National Wildlife refuge provide 910 km2
(225,000 acres) of potential habitat. The total quantity of blackbear habitat encompassed by the private lands could support anadditional 120-240 black bears. Conservation of these areascould establish the largest managed black bear population inthe southeastern coastal plain.
Region 5. Eglin Air Force Base and Surroundings
Black bears are most frequently seen in association withthe hardwood forests along the Yellow River at Eglin AirForce Base. The Air Force Base contains approximately1,680 km2 (415,000 acres) of black bear habitat, but only 43%is considered “high quality” due in part to the dominance ofsandhill land cover. Black bears also frequent the eastern por-tions of Eglin Air Force Base and private lands farther east.
Lands surrounding Eglin Air Force Base appear capableof supporting a very large population of black bears, but onlya portion of the area outside of Eglin is currently occupied.Blackwater River State Forest is estimated to have approxi-mately 710 km2 (175,370 acres) of potential habitat (Area 1,Figure 52), but black bears do not occur on this conservationarea with any degree of regularity. Other nearby publicparcels include Pine Log State Forest (Area 2, Figure 52) with26.7 km2 (6,600 acres) of habitat, water management districtlands along the Lower Choctawhatchee River (Area 3,Figure 52) that provide 67.6 km2 (16,700 acres), and areasalong the Escambia River that contain 55 km2 (13,700 acres)of habitat. Together these smaller protected areas might sup-port an additional 4-8 black bears. Recent purchase ofapproximately 210 km2 (51,870 acres) of black bear habitat
east of Destin has the capacity to support 10-20 black bearsand represents a potentially valuable patch of habitat if con-nected with Eglin Air Force Base and other conservation landsin the area.
Conservation of private lands between Eglin Air ForceBase and Blackwater River State Forest is a potentiallyappealing black bear habitat conservation strategy that couldhelp to conserve a large quantity of black bear habitat whilerequiring only a minimal investment. This linkage wouldestablish a large 2,388 km2 (590,000 acre) habitat conserva-tion region, but the importance of this connection hinges onthe ability of black bears to traverse Interstate 10 safely andthe actual significance of lands to the north. Construction ofwildlife crossings (see Foster and Humphrey 1993) alongInterstate 10 and U.S. Highway 90 might allow bears to movebetween the areas more easily, but the current absence ofblack bears in Blackwater River State Forest, and the smallnumber of road kills reported for this area (Wooding andBrady 1987), raise some questions about black bear use of theareas north of Eglin Air Force Base.
To the east of Eglin Air Force Base lies a large region ofpotential black bear habitat known to support black bears.This area (Areas 3 and 4, Figure 52) contains roughly 436km2 (107,830 acres) of potential black bear habitat, and thearea connects Eglin Air Force Base with protected lands onthe lower portion of the Choctawhatchee River. The areamight support as many as 30-44 black bears, and in combina-tion with Eglin Air Force Base would bring the total popula-tion supported by conservation lands in the region to roughly150-210 black bears. Another large block of potential habitatoccurs to the northeast of Eglin Air Force Base. This areamay be effectively severed from Eglin Air Force Base by
Figure 52. Potential black bear habitat in and around Eglin Air Force Base. Numbered areas are referenced in the text.
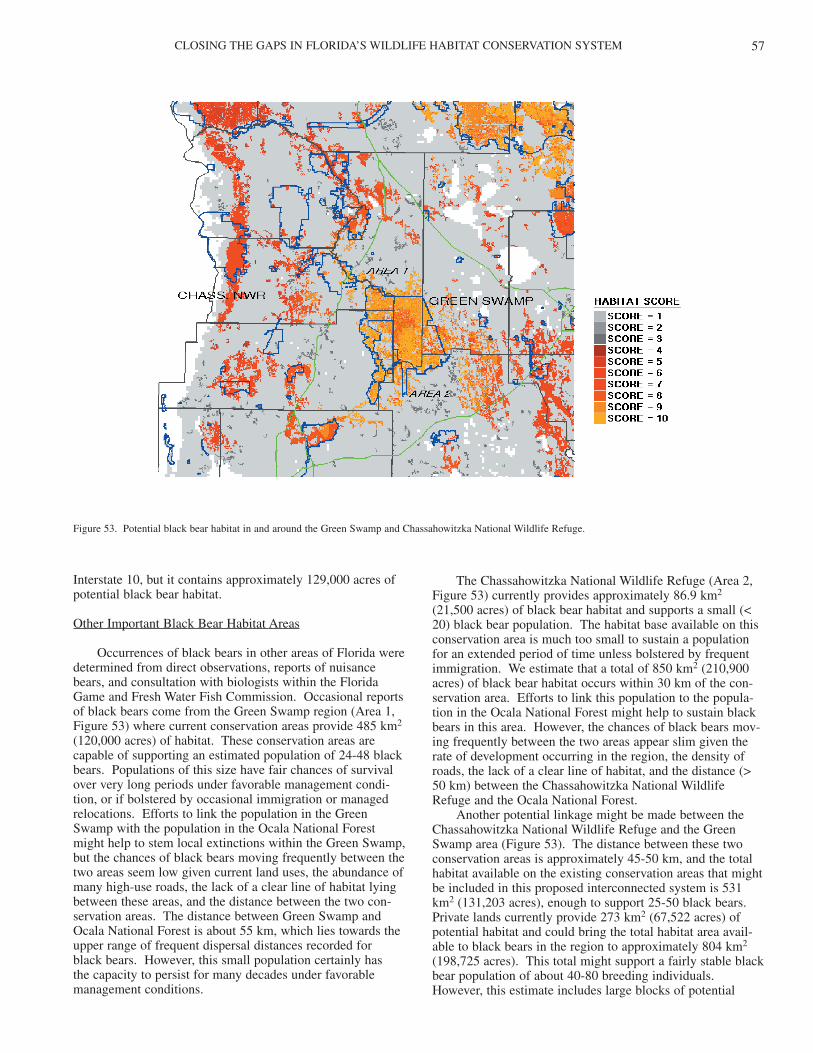
CLOSING THE GAPS IN FLORIDA’S WILDLIFE HABITAT CONSERVATION SYSTEM 57
Interstate 10, but it contains approximately 129,000 acres ofpotential black bear habitat.
Other Important Black Bear Habitat Areas
Occurrences of black bears in other areas of Florida weredetermined from direct observations, reports of nuisancebears, and consultation with biologists within the FloridaGame and Fresh Water Fish Commission. Occasional reportsof black bears come from the Green Swamp region (Area 1,Figure 53) where current conservation areas provide 485 km2
(120,000 acres) of habitat. These conservation areas arecapable of supporting an estimated population of 24-48 blackbears. Populations of this size have fair chances of survivalover very long periods under favorable management condi-tion, or if bolstered by occasional immigration or managedrelocations. Efforts to link the population in the GreenSwamp with the population in the Ocala National Forestmight help to stem local extinctions within the Green Swamp,but the chances of black bears moving frequently between thetwo areas seem low given current land uses, the abundance ofmany high-use roads, the lack of a clear line of habitat lyingbetween these areas, and the distance between the two con-servation areas. The distance between Green Swamp andOcala National Forest is about 55 km, which lies towards theupper range of frequent dispersal distances recorded for black bears. However, this small population certainly has the capacity to persist for many decades under favorablemanagement conditions.
The Chassahowitzka National Wildlife Refuge (Area 2,Figure 53) currently provides approximately 86.9 km2
(21,500 acres) of black bear habitat and supports a small (<20) black bear population. The habitat base available on thisconservation area is much too small to sustain a populationfor an extended period of time unless bolstered by frequentimmigration. We estimate that a total of 850 km2 (210,900acres) of black bear habitat occurs within 30 km of the con-servation area. Efforts to link this population to the popula-tion in the Ocala National Forest might help to sustain blackbears in this area. However, the chances of black bears mov-ing frequently between the two areas appear slim given therate of development occurring in the region, the density ofroads, the lack of a clear line of habitat, and the distance (>50 km) between the Chassahowitzka National WildlifeRefuge and the Ocala National Forest.
Another potential linkage might be made between theChassahowitzka National Wildlife Refuge and the GreenSwamp area (Figure 53). The distance between these twoconservation areas is approximately 45-50 km, and the totalhabitat available on the existing conservation areas that mightbe included in this proposed interconnected system is 531km2 (131,203 acres), enough to support 25-50 black bears.Private lands currently provide 273 km2 (67,522 acres) ofpotential habitat and could bring the total habitat area avail-able to black bears in the region to approximately 804 km2
(198,725 acres). This total might support a fairly stable blackbear population of about 40-80 breeding individuals.However, this estimate includes large blocks of potential
Figure 53. Potential black bear habitat in and around the Green Swamp and Chassahowitzka National Wildlife Refuge.
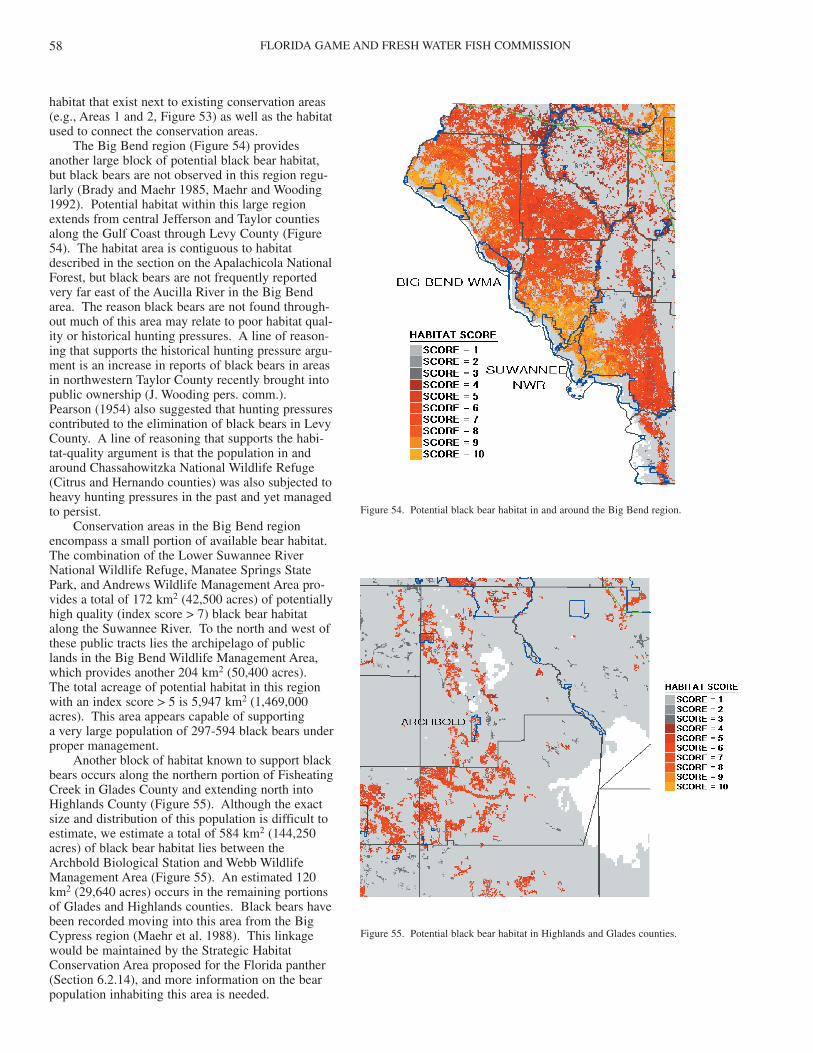
FLORIDA GAME AND FRESH WATER FISH COMMISSION58
habitat that exist next to existing conservation areas(e.g., Areas 1 and 2, Figure 53) as well as the habitatused to connect the conservation areas.
The Big Bend region (Figure 54) providesanother large block of potential black bear habitat,but black bears are not observed in this region regu-larly (Brady and Maehr 1985, Maehr and Wooding1992). Potential habitat within this large regionextends from central Jefferson and Taylor countiesalong the Gulf Coast through Levy County (Figure54). The habitat area is contiguous to habitatdescribed in the section on the Apalachicola NationalForest, but black bears are not frequently reportedvery far east of the Aucilla River in the Big Bendarea. The reason black bears are not found through-out much of this area may relate to poor habitat qual-ity or historical hunting pressures. A line of reason-ing that supports the historical hunting pressure argu-ment is an increase in reports of black bears in areasin northwestern Taylor County recently brought intopublic ownership (J. Wooding pers. comm.).Pearson (1954) also suggested that hunting pressurescontributed to the elimination of black bears in LevyCounty. A line of reasoning that supports the habi-tat-quality argument is that the population in andaround Chassahowitzka National Wildlife Refuge(Citrus and Hernando counties) was also subjected toheavy hunting pressures in the past and yet managedto persist.
Conservation areas in the Big Bend regionencompass a small portion of available bear habitat.The combination of the Lower Suwannee RiverNational Wildlife Refuge, Manatee Springs StatePark, and Andrews Wildlife Management Area pro-vides a total of 172 km2 (42,500 acres) of potentiallyhigh quality (index score > 7) black bear habitatalong the Suwannee River. To the north and west ofthese public tracts lies the archipelago of publiclands in the Big Bend Wildlife Management Area,which provides another 204 km2 (50,400 acres).The total acreage of potential habitat in this regionwith an index score > 5 is 5,947 km2 (1,469,000acres). This area appears capable of supporting a very large population of 297-594 black bears underproper management.
Another block of habitat known to support blackbears occurs along the northern portion of FisheatingCreek in Glades County and extending north intoHighlands County (Figure 55). Although the exactsize and distribution of this population is difficult toestimate, we estimate a total of 584 km2 (144,250acres) of black bear habitat lies between theArchbold Biological Station and Webb WildlifeManagement Area (Figure 55). An estimated 120km2 (29,640 acres) occurs in the remaining portionsof Glades and Highlands counties. Black bears havebeen recorded moving into this area from the BigCypress region (Maehr et al. 1988). This linkagewould be maintained by the Strategic HabitatConservation Area proposed for the Florida panther(Section 6.2.14), and more information on the bearpopulation inhabiting this area is needed.
Figure 54. Potential black bear habitat in and around the Big Bend region.
Figure 55. Potential black bear habitat in Highlands and Glades counties.
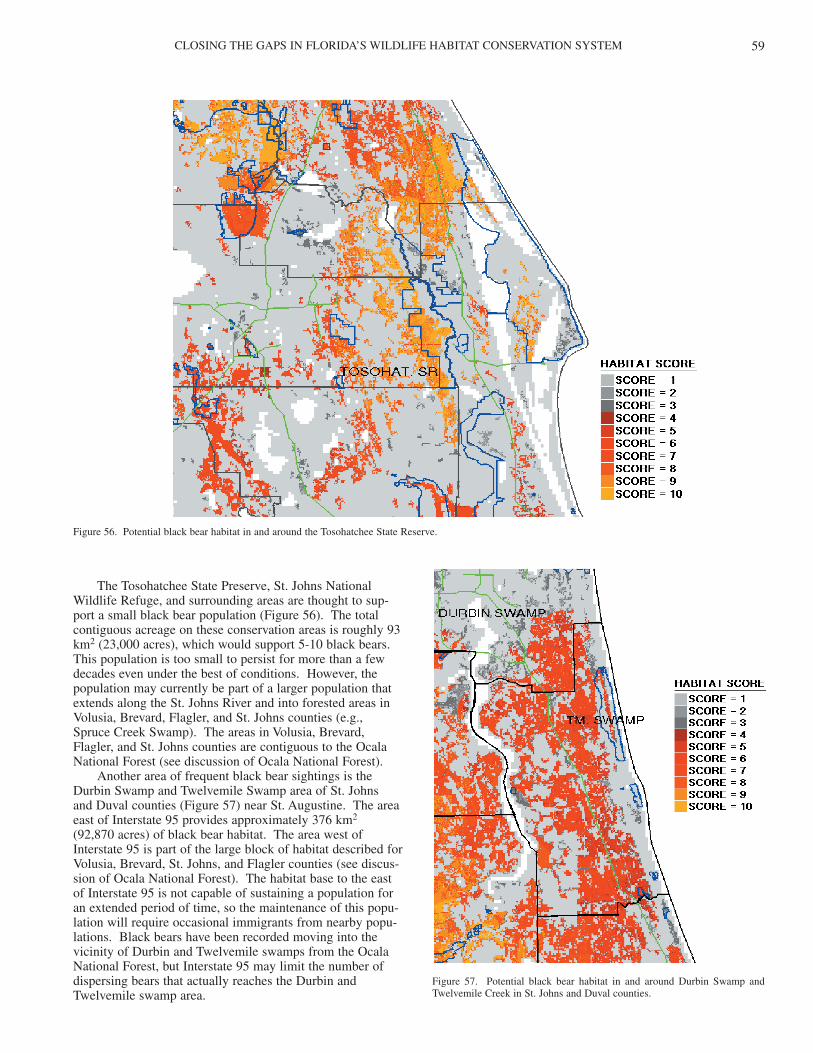
CLOSING THE GAPS IN FLORIDA’S WILDLIFE HABITAT CONSERVATION SYSTEM 59
The Tosohatchee State Preserve, St. Johns NationalWildlife Refuge, and surrounding areas are thought to sup-port a small black bear population (Figure 56). The totalcontiguous acreage on these conservation areas is roughly 93km2 (23,000 acres), which would support 5-10 black bears.This population is too small to persist for more than a fewdecades even under the best of conditions. However, thepopulation may currently be part of a larger population thatextends along the St. Johns River and into forested areas inVolusia, Brevard, Flagler, and St. Johns counties (e.g.,Spruce Creek Swamp). The areas in Volusia, Brevard,Flagler, and St. Johns counties are contiguous to the OcalaNational Forest (see discussion of Ocala National Forest).
Another area of frequent black bear sightings is theDurbin Swamp and Twelvemile Swamp area of St. Johns and Duval counties (Figure 57) near St. Augustine. The areaeast of Interstate 95 provides approximately 376 km2
(92,870 acres) of black bear habitat. The area west ofInterstate 95 is part of the large block of habitat described forVolusia, Brevard, St. Johns, and Flagler counties (see discus-sion of Ocala National Forest). The habitat base to the eastof Interstate 95 is not capable of sustaining a population foran extended period of time, so the maintenance of this popu-lation will require occasional immigrants from nearby popu-lations. Black bears have been recorded moving into thevicinity of Durbin and Twelvemile swamps from the OcalaNational Forest, but Interstate 95 may limit the number ofdispersing bears that actually reaches the Durbin andTwelvemile swamp area.
Figure 56. Potential black bear habitat in and around the Tosohatchee State Reserve.
Figure 57. Potential black bear habitat in and around Durbin Swamp andTwelvemile Creek in St. Johns and Duval counties.
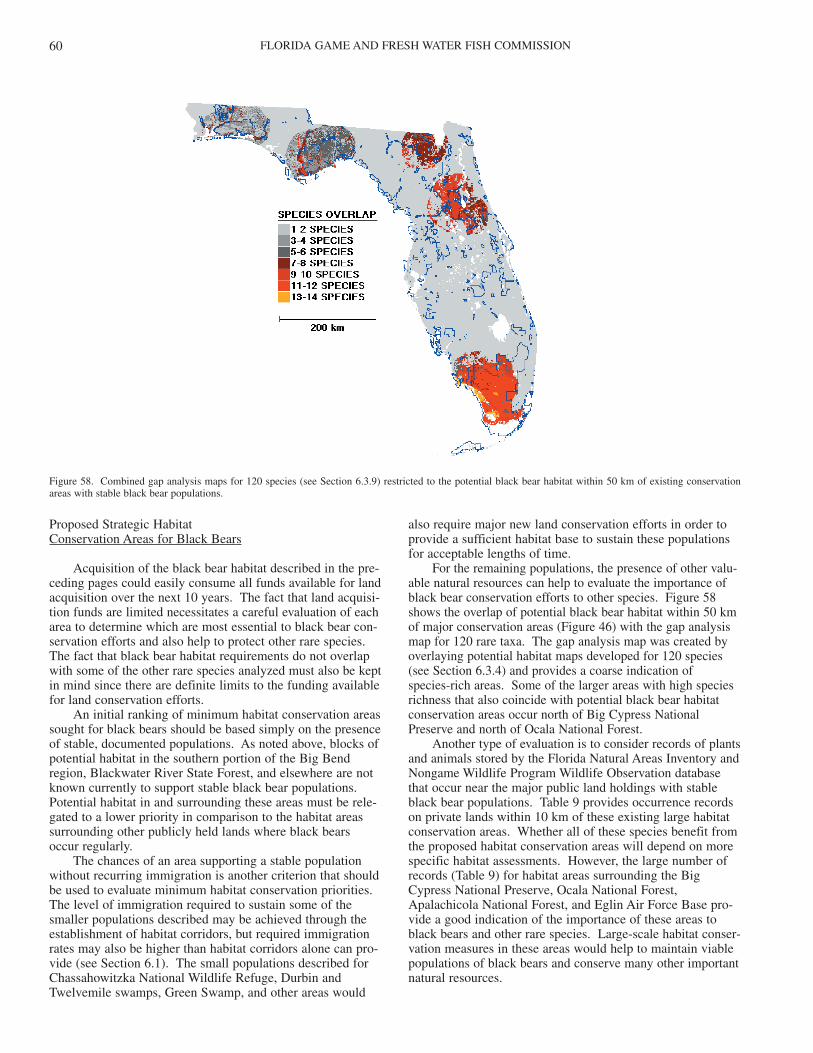
FLORIDA GAME AND FRESH WATER FISH COMMISSION60
Proposed Strategic HabitatConservation Areas for Black Bears
Acquisition of the black bear habitat described in the pre-ceding pages could easily consume all funds available for landacquisition over the next 10 years. The fact that land acquisi-tion funds are limited necessitates a careful evaluation of eacharea to determine which are most essential to black bear con-servation efforts and also help to protect other rare species.The fact that black bear habitat requirements do not overlapwith some of the other rare species analyzed must also be keptin mind since there are definite limits to the funding availablefor land conservation efforts.
An initial ranking of minimum habitat conservation areassought for black bears should be based simply on the presenceof stable, documented populations. As noted above, blocks ofpotential habitat in the southern portion of the Big Bendregion, Blackwater River State Forest, and elsewhere are notknown currently to support stable black bear populations.Potential habitat in and surrounding these areas must be rele-gated to a lower priority in comparison to the habitat areassurrounding other publicly held lands where black bearsoccur regularly.
The chances of an area supporting a stable populationwithout recurring immigration is another criterion that shouldbe used to evaluate minimum habitat conservation priorities.The level of immigration required to sustain some of thesmaller populations described may be achieved through theestablishment of habitat corridors, but required immigrationrates may also be higher than habitat corridors alone can pro-vide (see Section 6.1). The small populations described forChassahowitzka National Wildlife Refuge, Durbin andTwelvemile swamps, Green Swamp, and other areas would
also require major new land conservation efforts in order toprovide a sufficient habitat base to sustain these populationsfor acceptable lengths of time.
For the remaining populations, the presence of other valu-able natural resources can help to evaluate the importance ofblack bear conservation efforts to other species. Figure 58shows the overlap of potential black bear habitat within 50 kmof major conservation areas (Figure 46) with the gap analysismap for 120 rare taxa. The gap analysis map was created byoverlaying potential habitat maps developed for 120 species(see Section 6.3.4) and provides a coarse indication of species-rich areas. Some of the larger areas with high speciesrichness that also coincide with potential black bear habitatconservation areas occur north of Big Cypress NationalPreserve and north of Ocala National Forest.
Another type of evaluation is to consider records of plantsand animals stored by the Florida Natural Areas Inventory andNongame Wildlife Program Wildlife Observation databasethat occur near the major public land holdings with stableblack bear populations. Table 9 provides occurrence recordson private lands within 10 km of these existing large habitatconservation areas. Whether all of these species benefit fromthe proposed habitat conservation areas will depend on morespecific habitat assessments. However, the large number ofrecords (Table 9) for habitat areas surrounding the BigCypress National Preserve, Ocala National Forest,Apalachicola National Forest, and Eglin Air Force Base pro-vide a good indication of the importance of these areas toblack bears and other rare species. Large-scale habitat conser-vation measures in these areas would help to maintain viablepopulations of black bears and conserve many other importantnatural resources.
Figure 58. Combined gap analysis maps for 120 species (see Section 6.3.9) restricted to the potential black bear habitat within 50 km of existing conservationareas with stable black bear populations.
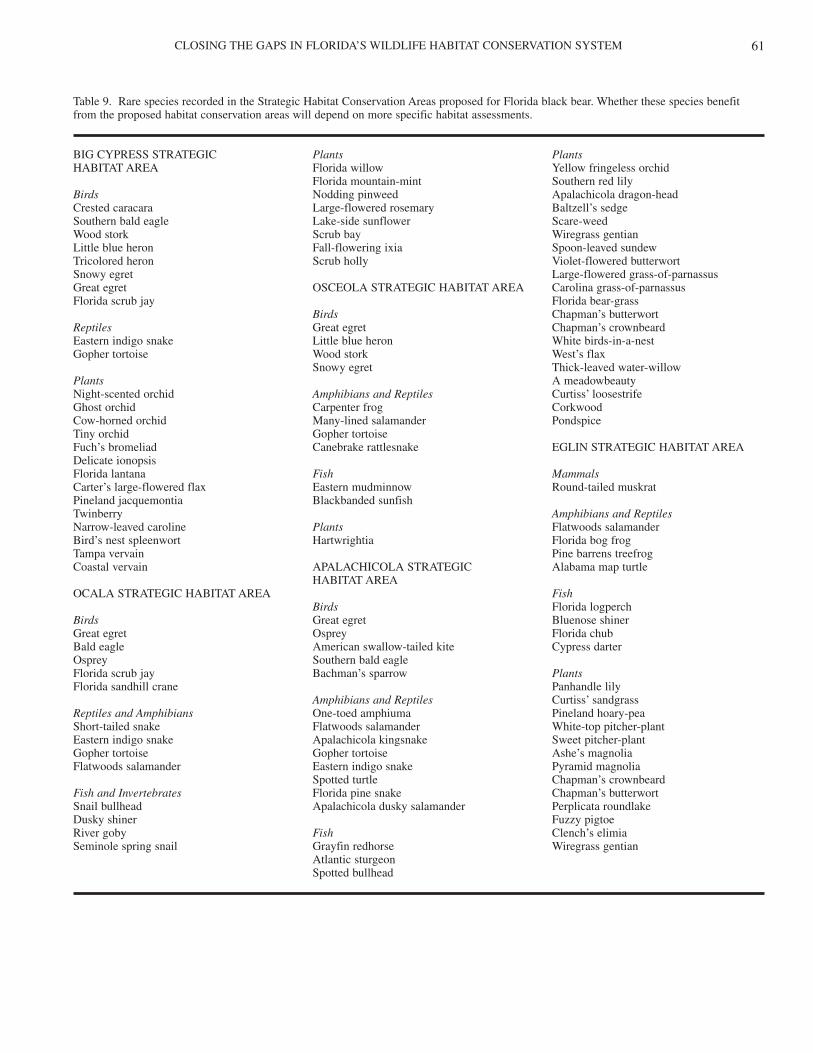
CLOSING THE GAPS IN FLORIDA’S WILDLIFE HABITAT CONSERVATION SYSTEM 61
Table 9. Rare species recorded in the Strategic Habitat Conservation Areas proposed for Florida black bear. Whether these species benefitfrom the proposed habitat conservation areas will depend on more specific habitat assessments.
BIG CYPRESS STRATEGIC Plants PlantsHABITAT AREA Florida willow Yellow fringeless orchid
Florida mountain-mint Southern red lilyBirds Nodding pinweed Apalachicola dragon-headCrested caracara Large-flowered rosemary Baltzell’s sedgeSouthern bald eagle Lake-side sunflower Scare-weedWood stork Scrub bay Wiregrass gentianLittle blue heron Fall-flowering ixia Spoon-leaved sundewTricolored heron Scrub holly Violet-flowered butterwortSnowy egret Large-flowered grass-of-parnassusGreat egret OSCEOLA STRATEGIC HABITAT AREA Carolina grass-of-parnassusFlorida scrub jay Florida bear-grass
Birds Chapman’s butterwortReptiles Great egret Chapman’s crownbeardEastern indigo snake Little blue heron White birds-in-a-nestGopher tortoise Wood stork West’s flax
Snowy egret Thick-leaved water-willowPlants A meadowbeautyNight-scented orchid Amphibians and Reptiles Curtiss’ loosestrifeGhost orchid Carpenter frog CorkwoodCow-horned orchid Many-lined salamander PondspiceTiny orchid Gopher tortoiseFuch’s bromeliad Canebrake rattlesnake EGLIN STRATEGIC HABITAT AREADelicate ionopsisFlorida lantana Fish MammalsCarter’s large-flowered flax Eastern mudminnow Round-tailed muskratPineland jacquemontia Blackbanded sunfishTwinberry Amphibians and ReptilesNarrow-leaved caroline Plants Flatwoods salamanderBird’s nest spleenwort Hartwrightia Florida bog frogTampa vervain Pine barrens treefrogCoastal vervain APALACHICOLA STRATEGIC Alabama map turtle
HABITAT AREAOCALA STRATEGIC HABITAT AREA Fish
Birds Florida logperchBirds Great egret Bluenose shinerGreat egret Osprey Florida chubBald eagle American swallow-tailed kite Cypress darterOsprey Southern bald eagleFlorida scrub jay Bachman’s sparrow PlantsFlorida sandhill crane Panhandle lily
Amphibians and Reptiles Curtiss’ sandgrassReptiles and Amphibians One-toed amphiuma Pineland hoary-peaShort-tailed snake Flatwoods salamander White-top pitcher-plantEastern indigo snake Apalachicola kingsnake Sweet pitcher-plantGopher tortoise Gopher tortoise Ashe’s magnoliaFlatwoods salamander Eastern indigo snake Pyramid magnolia
Spotted turtle Chapman’s crownbeardFish and Invertebrates Florida pine snake Chapman’s butterwortSnail bullhead Apalachicola dusky salamander Perplicata roundlakeDusky shiner Fuzzy pigtoeRiver goby Fish Clench’s elimiaSeminole spring snail Grayfin redhorse Wiregrass gentian
Atlantic sturgeonSpotted bullhead
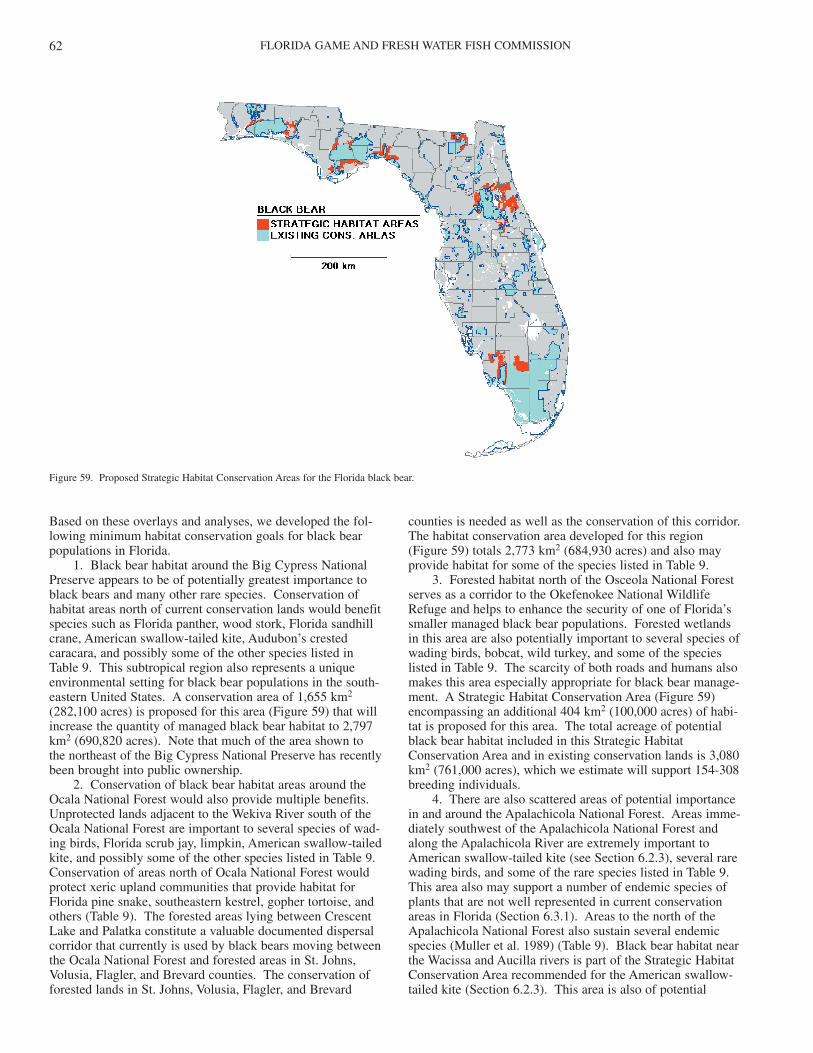
FLORIDA GAME AND FRESH WATER FISH COMMISSION62
Based on these overlays and analyses, we developed the fol-lowing minimum habitat conservation goals for black bearpopulations in Florida.
1. Black bear habitat around the Big Cypress NationalPreserve appears to be of potentially greatest importance toblack bears and many other rare species. Conservation ofhabitat areas north of current conservation lands would benefitspecies such as Florida panther, wood stork, Florida sandhillcrane, American swallow-tailed kite, Audubon’s crestedcaracara, and possibly some of the other species listed inTable 9. This subtropical region also represents a uniqueenvironmental setting for black bear populations in the south-eastern United States. A conservation area of 1,655 km2
(282,100 acres) is proposed for this area (Figure 59) that willincrease the quantity of managed black bear habitat to 2,797km2 (690,820 acres). Note that much of the area shown tothe northeast of the Big Cypress National Preserve has recentlybeen brought into public ownership.
2. Conservation of black bear habitat areas around theOcala National Forest would also provide multiple benefits.Unprotected lands adjacent to the Wekiva River south of theOcala National Forest are important to several species of wad-ing birds, Florida scrub jay, limpkin, American swallow-tailedkite, and possibly some of the other species listed in Table 9.Conservation of areas north of Ocala National Forest wouldprotect xeric upland communities that provide habitat forFlorida pine snake, southeastern kestrel, gopher tortoise, andothers (Table 9). The forested areas lying between CrescentLake and Palatka constitute a valuable documented dispersalcorridor that currently is used by black bears moving betweenthe Ocala National Forest and forested areas in St. Johns,Volusia, Flagler, and Brevard counties. The conservation offorested lands in St. Johns, Volusia, Flagler, and Brevard
counties is needed as well as the conservation of this corridor.The habitat conservation area developed for this region(Figure 59) totals 2,773 km2 (684,930 acres) and also mayprovide habitat for some of the species listed in Table 9.
3. Forested habitat north of the Osceola National Forestserves as a corridor to the Okefenokee National WildlifeRefuge and helps to enhance the security of one of Florida’ssmaller managed black bear populations. Forested wetlandsin this area are also potentially important to several species ofwading birds, bobcat, wild turkey, and some of the specieslisted in Table 9. The scarcity of both roads and humans alsomakes this area especially appropriate for black bear manage-ment. A Strategic Habitat Conservation Area (Figure 59)encompassing an additional 404 km2 (100,000 acres) of habi-tat is proposed for this area. The total acreage of potentialblack bear habitat included in this Strategic HabitatConservation Area and in existing conservation lands is 3,080km2 (761,000 acres), which we estimate will support 154-308breeding individuals.
4. There are also scattered areas of potential importancein and around the Apalachicola National Forest. Areas imme-diately southwest of the Apalachicola National Forest andalong the Apalachicola River are extremely important toAmerican swallow-tailed kite (see Section 6.2.3), several rarewading birds, and some of the rare species listed in Table 9.This area also may support a number of endemic species ofplants that are not well represented in current conservationareas in Florida (Section 6.3.1). Areas to the north of theApalachicola National Forest also sustain several endemicspecies (Muller et al. 1989) (Table 9). Black bear habitat nearthe Wacissa and Aucilla rivers is part of the Strategic HabitatConservation Area recommended for the American swallow-tailed kite (Section 6.2.3). This area is also of potential
Figure 59. Proposed Strategic Habitat Conservation Areas for the Florida black bear.
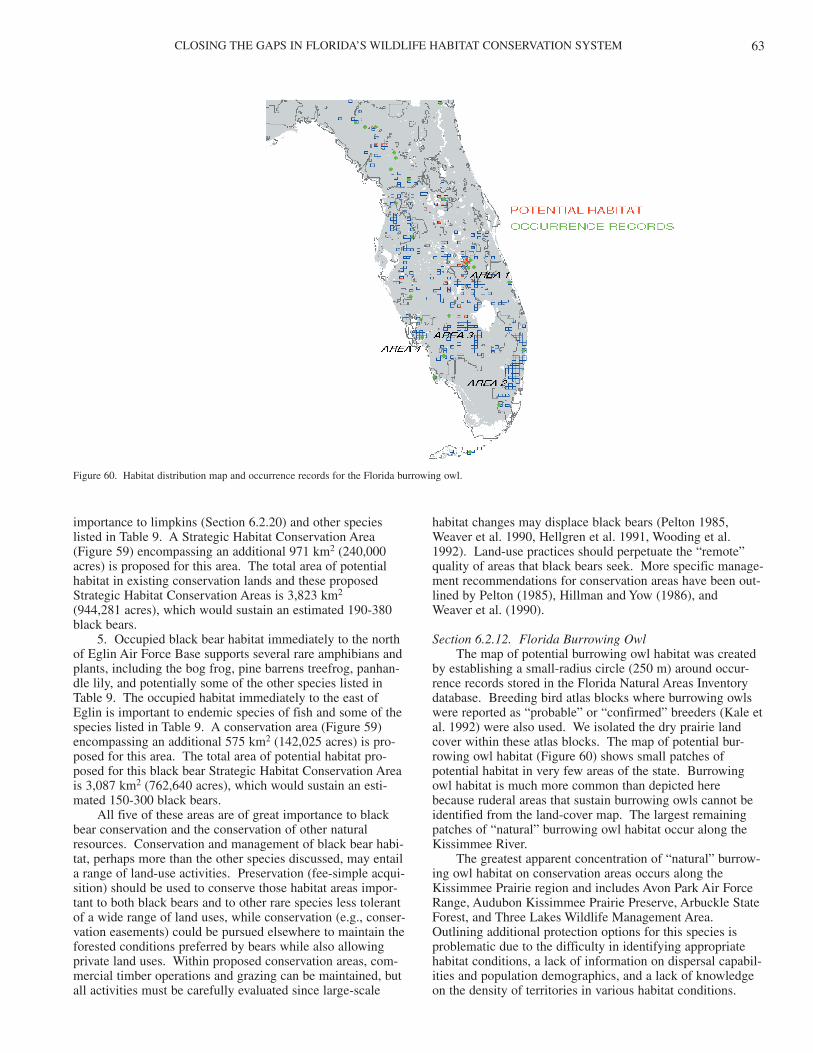
CLOSING THE GAPS IN FLORIDA’S WILDLIFE HABITAT CONSERVATION SYSTEM 63
importance to limpkins (Section 6.2.20) and other specieslisted in Table 9. A Strategic Habitat Conservation Area(Figure 59) encompassing an additional 971 km2 (240,000acres) is proposed for this area. The total area of potentialhabitat in existing conservation lands and these proposedStrategic Habitat Conservation Areas is 3,823 km2
(944,281 acres), which would sustain an estimated 190-380black bears.
5. Occupied black bear habitat immediately to the northof Eglin Air Force Base supports several rare amphibians andplants, including the bog frog, pine barrens treefrog, panhan-dle lily, and potentially some of the other species listed inTable 9. The occupied habitat immediately to the east ofEglin is important to endemic species of fish and some of thespecies listed in Table 9. A conservation area (Figure 59)encompassing an additional 575 km2 (142,025 acres) is pro-posed for this area. The total area of potential habitat pro-posed for this black bear Strategic Habitat Conservation Areais 3,087 km2 (762,640 acres), which would sustain an esti-mated 150-300 black bears.
All five of these areas are of great importance to blackbear conservation and the conservation of other naturalresources. Conservation and management of black bear habi-tat, perhaps more than the other species discussed, may entaila range of land-use activities. Preservation (fee-simple acqui-sition) should be used to conserve those habitat areas impor-tant to both black bears and to other rare species less tolerantof a wide range of land uses, while conservation (e.g., conser-vation easements) could be pursued elsewhere to maintain theforested conditions preferred by bears while also allowingprivate land uses. Within proposed conservation areas, com-mercial timber operations and grazing can be maintained, butall activities must be carefully evaluated since large-scale
habitat changes may displace black bears (Pelton 1985,Weaver et al. 1990, Hellgren et al. 1991, Wooding et al.1992). Land-use practices should perpetuate the “remote”quality of areas that black bears seek. More specific manage-ment recommendations for conservation areas have been out-lined by Pelton (1985), Hillman and Yow (1986), and Weaver et al. (1990).
Section 6.2.12. Florida Burrowing OwlThe map of potential burrowing owl habitat was created
by establishing a small-radius circle (250 m) around occur-rence records stored in the Florida Natural Areas Inventorydatabase. Breeding bird atlas blocks where burrowing owlswere reported as “probable” or “confirmed” breeders (Kale etal. 1992) were also used. We isolated the dry prairie landcover within these atlas blocks. The map of potential bur-rowing owl habitat (Figure 60) shows small patches ofpotential habitat in very few areas of the state. Burrowingowl habitat is much more common than depicted herebecause ruderal areas that sustain burrowing owls cannot beidentified from the land-cover map. The largest remainingpatches of “natural” burrowing owl habitat occur along theKissimmee River.
The greatest apparent concentration of “natural” burrow-ing owl habitat on conservation areas occurs along theKissimmee Prairie region and includes Avon Park Air ForceRange, Audubon Kissimmee Prairie Preserve, Arbuckle StateForest, and Three Lakes Wildlife Management Area.Outlining additional protection options for this species isproblematic due to the difficulty in identifying appropriatehabitat conditions, a lack of information on dispersal capabil-ities and population demographics, and a lack of knowledgeon the density of territories in various habitat conditions.
Figure 60. Habitat distribution map and occurrence records for the Florida burrowing owl.
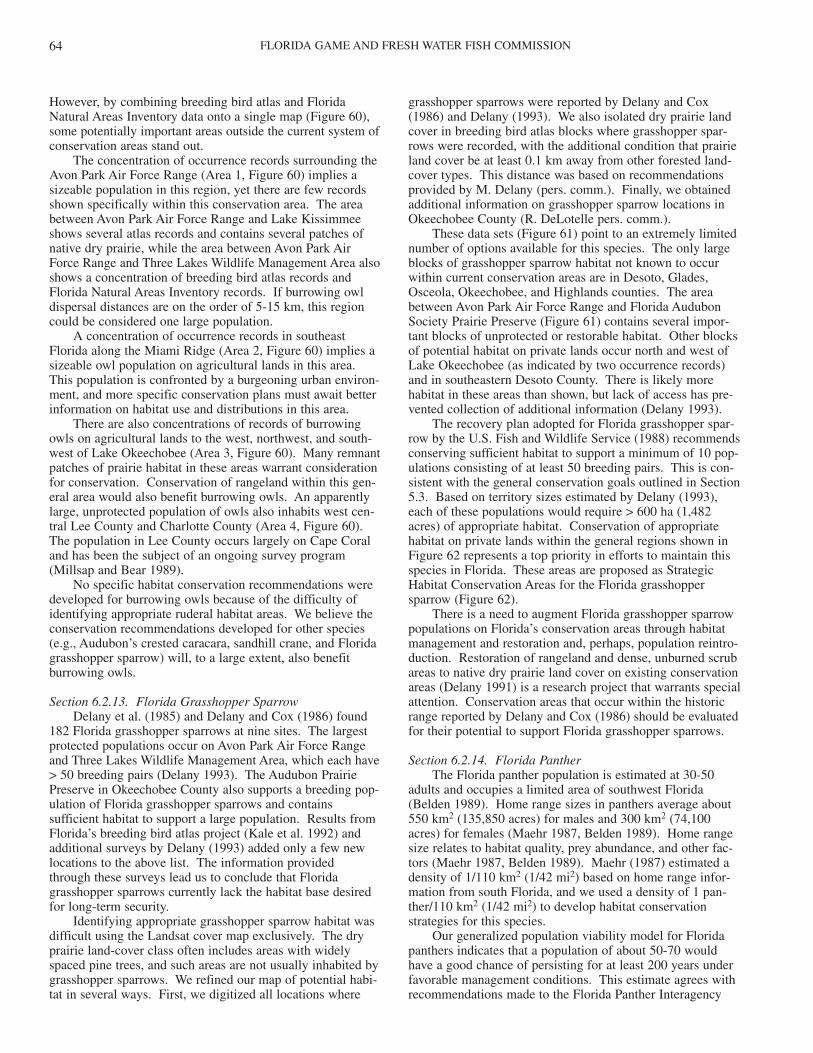
FLORIDA GAME AND FRESH WATER FISH COMMISSION64
However, by combining breeding bird atlas and FloridaNatural Areas Inventory data onto a single map (Figure 60),some potentially important areas outside the current system ofconservation areas stand out.
The concentration of occurrence records surrounding theAvon Park Air Force Range (Area 1, Figure 60) implies asizeable population in this region, yet there are few recordsshown specifically within this conservation area. The areabetween Avon Park Air Force Range and Lake Kissimmeeshows several atlas records and contains several patches ofnative dry prairie, while the area between Avon Park AirForce Range and Three Lakes Wildlife Management Area alsoshows a concentration of breeding bird atlas records andFlorida Natural Areas Inventory records. If burrowing owldispersal distances are on the order of 5-15 km, this regioncould be considered one large population.
A concentration of occurrence records in southeastFlorida along the Miami Ridge (Area 2, Figure 60) implies asizeable owl population on agricultural lands in this area.This population is confronted by a burgeoning urban environ-ment, and more specific conservation plans must await betterinformation on habitat use and distributions in this area.
There are also concentrations of records of burrowingowls on agricultural lands to the west, northwest, and south-west of Lake Okeechobee (Area 3, Figure 60). Many remnantpatches of prairie habitat in these areas warrant considerationfor conservation. Conservation of rangeland within this gen-eral area would also benefit burrowing owls. An apparentlylarge, unprotected population of owls also inhabits west cen-tral Lee County and Charlotte County (Area 4, Figure 60).The population in Lee County occurs largely on Cape Coraland has been the subject of an ongoing survey program(Millsap and Bear 1989).
No specific habitat conservation recommendations weredeveloped for burrowing owls because of the difficulty ofidentifying appropriate ruderal habitat areas. We believe theconservation recommendations developed for other species(e.g., Audubon’s crested caracara, sandhill crane, and Floridagrasshopper sparrow) will, to a large extent, also benefitburrowing owls.
Section 6.2.13. Florida Grasshopper SparrowDelany et al. (1985) and Delany and Cox (1986) found
182 Florida grasshopper sparrows at nine sites. The largestprotected populations occur on Avon Park Air Force Rangeand Three Lakes Wildlife Management Area, which each have> 50 breeding pairs (Delany 1993). The Audubon PrairiePreserve in Okeechobee County also supports a breeding pop-ulation of Florida grasshopper sparrows and containssufficient habitat to support a large population. Results fromFlorida’s breeding bird atlas project (Kale et al. 1992) andadditional surveys by Delany (1993) added only a few newlocations to the above list. The information provided through these surveys lead us to conclude that Floridagrasshopper sparrows currently lack the habitat base desiredfor long-term security.
Identifying appropriate grasshopper sparrow habitat wasdifficult using the Landsat cover map exclusively. The dryprairie land-cover class often includes areas with widelyspaced pine trees, and such areas are not usually inhabited bygrasshopper sparrows. We refined our map of potential habi-tat in several ways. First, we digitized all locations where
grasshopper sparrows were reported by Delany and Cox(1986) and Delany (1993). We also isolated dry prairie landcover in breeding bird atlas blocks where grasshopper spar-rows were recorded, with the additional condition that prairieland cover be at least 0.1 km away from other forested land-cover types. This distance was based on recommendationsprovided by M. Delany (pers. comm.). Finally, we obtainedadditional information on grasshopper sparrow locations inOkeechobee County (R. DeLotelle pers. comm.).
These data sets (Figure 61) point to an extremely limitednumber of options available for this species. The only largeblocks of grasshopper sparrow habitat not known to occurwithin current conservation areas are in Desoto, Glades,Osceola, Okeechobee, and Highlands counties. The areabetween Avon Park Air Force Range and Florida AudubonSociety Prairie Preserve (Figure 61) contains several impor-tant blocks of unprotected or restorable habitat. Other blocksof potential habitat on private lands occur north and west ofLake Okeechobee (as indicated by two occurrence records)and in southeastern Desoto County. There is likely morehabitat in these areas than shown, but lack of access has pre-vented collection of additional information (Delany 1993).
The recovery plan adopted for Florida grasshopper spar-row by the U.S. Fish and Wildlife Service (1988) recommendsconserving sufficient habitat to support a minimum of 10 pop-ulations consisting of at least 50 breeding pairs. This is con-sistent with the general conservation goals outlined in Section5.3. Based on territory sizes estimated by Delany (1993),each of these populations would require > 600 ha (1,482acres) of appropriate habitat. Conservation of appropriatehabitat on private lands within the general regions shown inFigure 62 represents a top priority in efforts to maintain thisspecies in Florida. These areas are proposed as StrategicHabitat Conservation Areas for the Florida grasshoppersparrow (Figure 62).
There is a need to augment Florida grasshopper sparrowpopulations on Florida’s conservation areas through habitatmanagement and restoration and, perhaps, population reintro-duction. Restoration of rangeland and dense, unburned scrubareas to native dry prairie land cover on existing conservationareas (Delany 1991) is a research project that warrants specialattention. Conservation areas that occur within the historicrange reported by Delany and Cox (1986) should be evaluatedfor their potential to support Florida grasshopper sparrows.
Section 6.2.14. Florida PantherThe Florida panther population is estimated at 30-50
adults and occupies a limited area of southwest Florida(Belden 1989). Home range sizes in panthers average about550 km2 (135,850 acres) for males and 300 km2 (74,100acres) for females (Maehr 1987, Belden 1989). Home rangesize relates to habitat quality, prey abundance, and other fac-tors (Maehr 1987, Belden 1989). Maehr (1987) estimated adensity of 1/110 km2 (1/42 mi2) based on home range infor-mation from south Florida, and we used a density of 1 pan-ther/110 km2 (1/42 mi2) to develop habitat conservationstrategies for this species.
Our generalized population viability model for Floridapanthers indicates that a population of about 50-70 wouldhave a good chance of persisting for at least 200 years underfavorable management conditions. This estimate agrees withrecommendations made to the Florida Panther Interagency
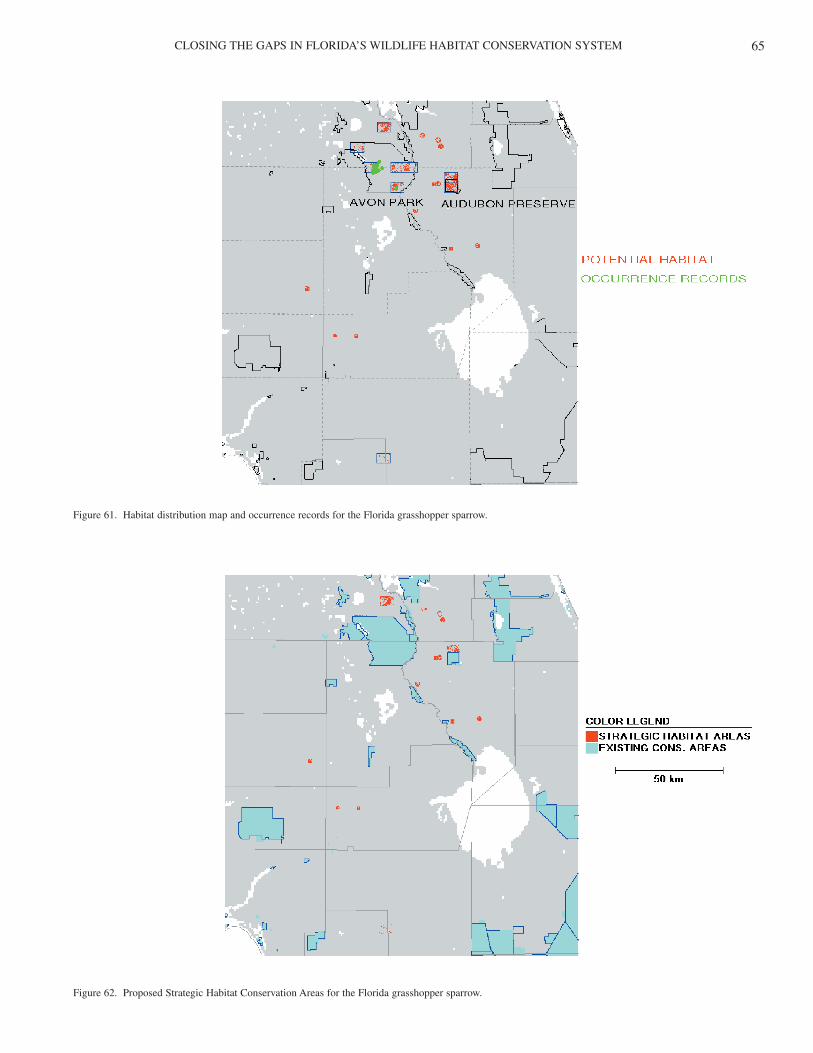
CLOSING THE GAPS IN FLORIDA’S WILDLIFE HABITAT CONSERVATION SYSTEM 65
Figure 61. Habitat distribution map and occurrence records for the Florida grasshopper sparrow.
Figure 62. Proposed Strategic Habitat Conservation Areas for the Florida grasshopper sparrow.
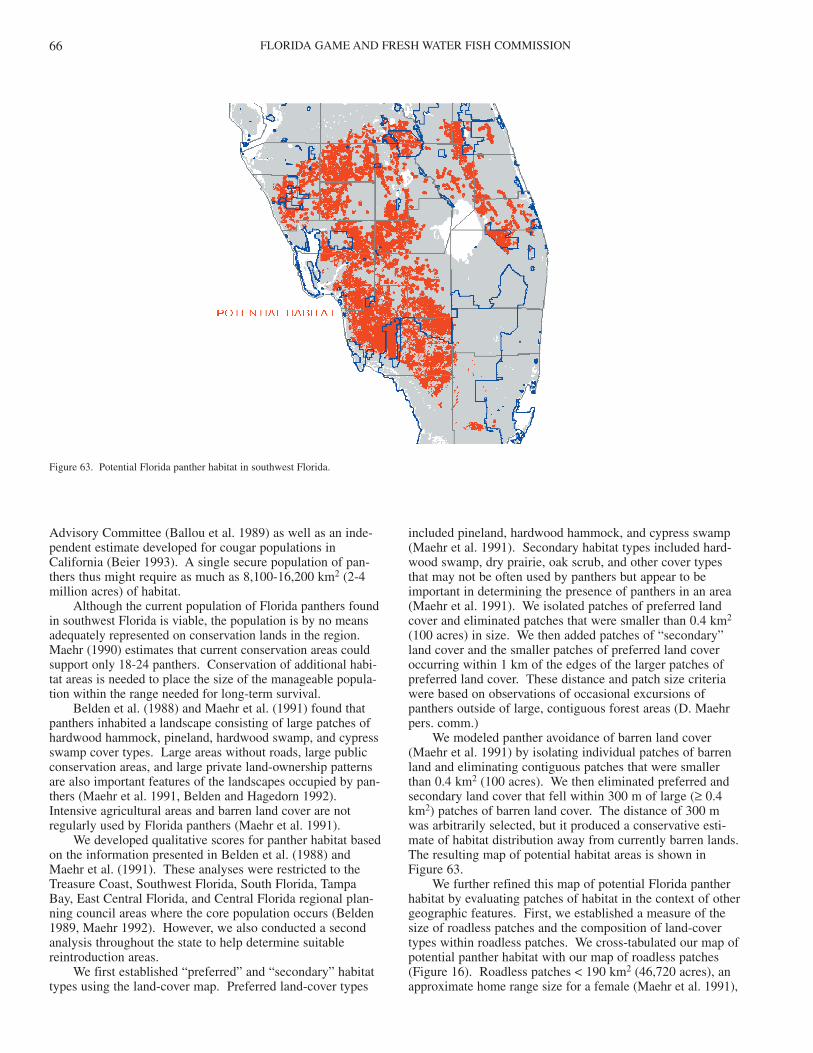
FLORIDA GAME AND FRESH WATER FISH COMMISSION66
Advisory Committee (Ballou et al. 1989) as well as an inde-pendent estimate developed for cougar populations inCalifornia (Beier 1993). A single secure population of pan-thers thus might require as much as 8,100-16,200 km2 (2-4million acres) of habitat.
Although the current population of Florida panthers foundin southwest Florida is viable, the population is by no meansadequately represented on conservation lands in the region.Maehr (1990) estimates that current conservation areas couldsupport only 18-24 panthers. Conservation of additional habi-tat areas is needed to place the size of the manageable popula-tion within the range needed for long-term survival.
Belden et al. (1988) and Maehr et al. (1991) found thatpanthers inhabited a landscape consisting of large patches ofhardwood hammock, pineland, hardwood swamp, and cypressswamp cover types. Large areas without roads, large publicconservation areas, and large private land-ownership patternsare also important features of the landscapes occupied by pan-thers (Maehr et al. 1991, Belden and Hagedorn 1992).Intensive agricultural areas and barren land cover are notregularly used by Florida panthers (Maehr et al. 1991).
We developed qualitative scores for panther habitat basedon the information presented in Belden et al. (1988) andMaehr et al. (1991). These analyses were restricted to theTreasure Coast, Southwest Florida, South Florida, TampaBay, East Central Florida, and Central Florida regional plan-ning council areas where the core population occurs (Belden1989, Maehr 1992). However, we also conducted a secondanalysis throughout the state to help determine suitablereintroduction areas.
We first established “preferred” and “secondary” habitattypes using the land-cover map. Preferred land-cover types
included pineland, hardwood hammock, and cypress swamp(Maehr et al. 1991). Secondary habitat types included hard-wood swamp, dry prairie, oak scrub, and other cover typesthat may not be often used by panthers but appear to beimportant in determining the presence of panthers in an area(Maehr et al. 1991). We isolated patches of preferred landcover and eliminated patches that were smaller than 0.4 km2
(100 acres) in size. We then added patches of “secondary”land cover and the smaller patches of preferred land coveroccurring within 1 km of the edges of the larger patches ofpreferred land cover. These distance and patch size criteriawere based on observations of occasional excursions ofpanthers outside of large, contiguous forest areas (D. Maehrpers. comm.)
We modeled panther avoidance of barren land cover(Maehr et al. 1991) by isolating individual patches of barrenland and eliminating contiguous patches that were smallerthan 0.4 km2 (100 acres). We then eliminated preferred andsecondary land cover that fell within 300 m of large (≥ 0.4km2) patches of barren land cover. The distance of 300 mwas arbitrarily selected, but it produced a conservative esti-mate of habitat distribution away from currently barren lands.The resulting map of potential habitat areas is shown inFigure 63.
We further refined this map of potential Florida pantherhabitat by evaluating patches of habitat in the context of othergeographic features. First, we established a measure of thesize of roadless patches and the composition of land-covertypes within roadless patches. We cross-tabulated our map ofpotential panther habitat with our map of roadless patches(Figure 16). Roadless patches < 190 km2 (46,720 acres), anapproximate home range size for a female (Maehr et al. 1991),
Figure 63. Potential Florida panther habitat in southwest Florida.
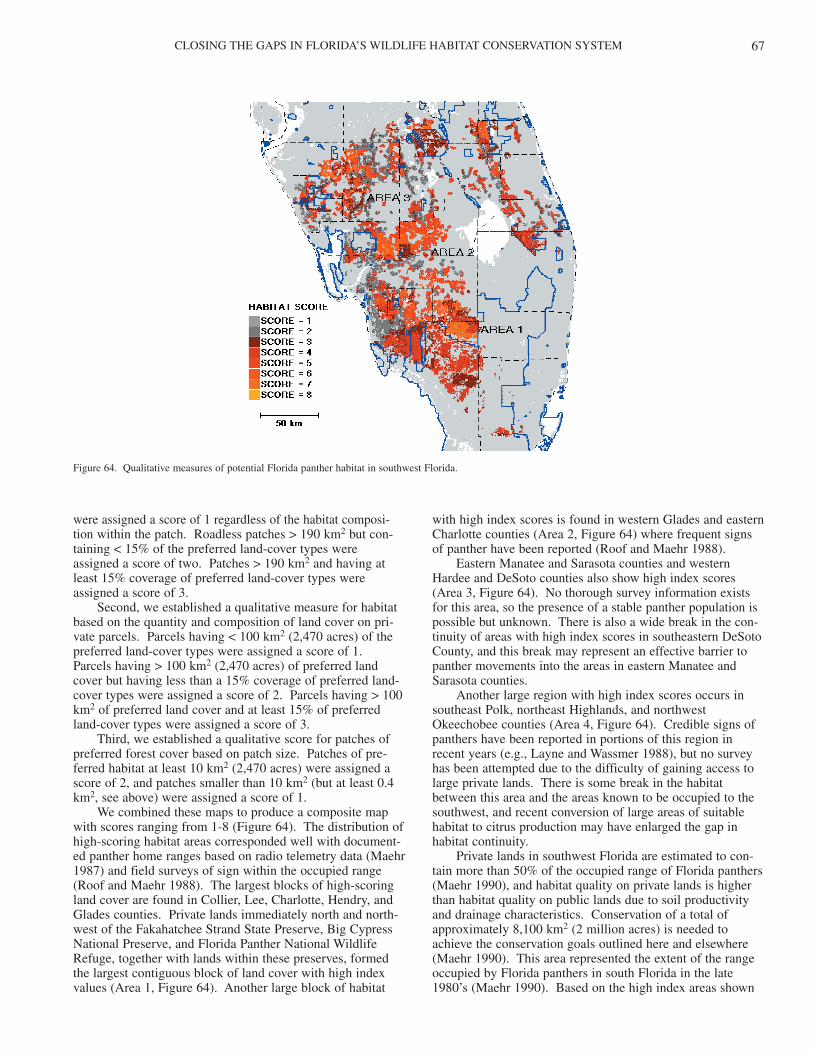
CLOSING THE GAPS IN FLORIDA’S WILDLIFE HABITAT CONSERVATION SYSTEM 67
were assigned a score of 1 regardless of the habitat composi-tion within the patch. Roadless patches > 190 km2 but con-taining < 15% of the preferred land-cover types wereassigned a score of two. Patches > 190 km2 and having atleast 15% coverage of preferred land-cover types wereassigned a score of 3.
Second, we established a qualitative measure for habitatbased on the quantity and composition of land cover on pri-vate parcels. Parcels having < 100 km2 (2,470 acres) of thepreferred land-cover types were assigned a score of 1.Parcels having > 100 km2 (2,470 acres) of preferred landcover but having less than a 15% coverage of preferred land-cover types were assigned a score of 2. Parcels having > 100km2 of preferred land cover and at least 15% of preferredland-cover types were assigned a score of 3.
Third, we established a qualitative score for patches ofpreferred forest cover based on patch size. Patches of pre-ferred habitat at least 10 km2 (2,470 acres) were assigned ascore of 2, and patches smaller than 10 km2 (but at least 0.4km2, see above) were assigned a score of 1.
We combined these maps to produce a composite mapwith scores ranging from 1-8 (Figure 64). The distribution ofhigh-scoring habitat areas corresponded well with document-ed panther home ranges based on radio telemetry data (Maehr1987) and field surveys of sign within the occupied range(Roof and Maehr 1988). The largest blocks of high-scoringland cover are found in Collier, Lee, Charlotte, Hendry, andGlades counties. Private lands immediately north and north-west of the Fakahatchee Strand State Preserve, Big CypressNational Preserve, and Florida Panther National WildlifeRefuge, together with lands within these preserves, formedthe largest contiguous block of land cover with high indexvalues (Area 1, Figure 64). Another large block of habitat
with high index scores is found in western Glades and easternCharlotte counties (Area 2, Figure 64) where frequent signsof panther have been reported (Roof and Maehr 1988).
Eastern Manatee and Sarasota counties and westernHardee and DeSoto counties also show high index scores(Area 3, Figure 64). No thorough survey information existsfor this area, so the presence of a stable panther population ispossible but unknown. There is also a wide break in the con-tinuity of areas with high index scores in southeastern DeSotoCounty, and this break may represent an effective barrier topanther movements into the areas in eastern Manatee andSarasota counties.
Another large region with high index scores occurs insoutheast Polk, northeast Highlands, and northwestOkeechobee counties (Area 4, Figure 64). Credible signs ofpanthers have been reported in portions of this region inrecent years (e.g., Layne and Wassmer 1988), but no surveyhas been attempted due to the difficulty of gaining access tolarge private lands. There is some break in the habitatbetween this area and the areas known to be occupied to thesouthwest, and recent conversion of large areas of suitablehabitat to citrus production may have enlarged the gap inhabitat continuity.
Private lands in southwest Florida are estimated to con-tain more than 50% of the occupied range of Florida panthers(Maehr 1990), and habitat quality on private lands is higherthan habitat quality on public lands due to soil productivityand drainage characteristics. Conservation of a total ofapproximately 8,100 km2 (2 million acres) is needed toachieve the conservation goals outlined here and elsewhere(Maehr 1990). This area represented the extent of the rangeoccupied by Florida panthers in south Florida in the late1980’s (Maehr 1990). Based on the high index areas shown
Figure 64. Qualitative measures of potential Florida panther habitat in southwest Florida.
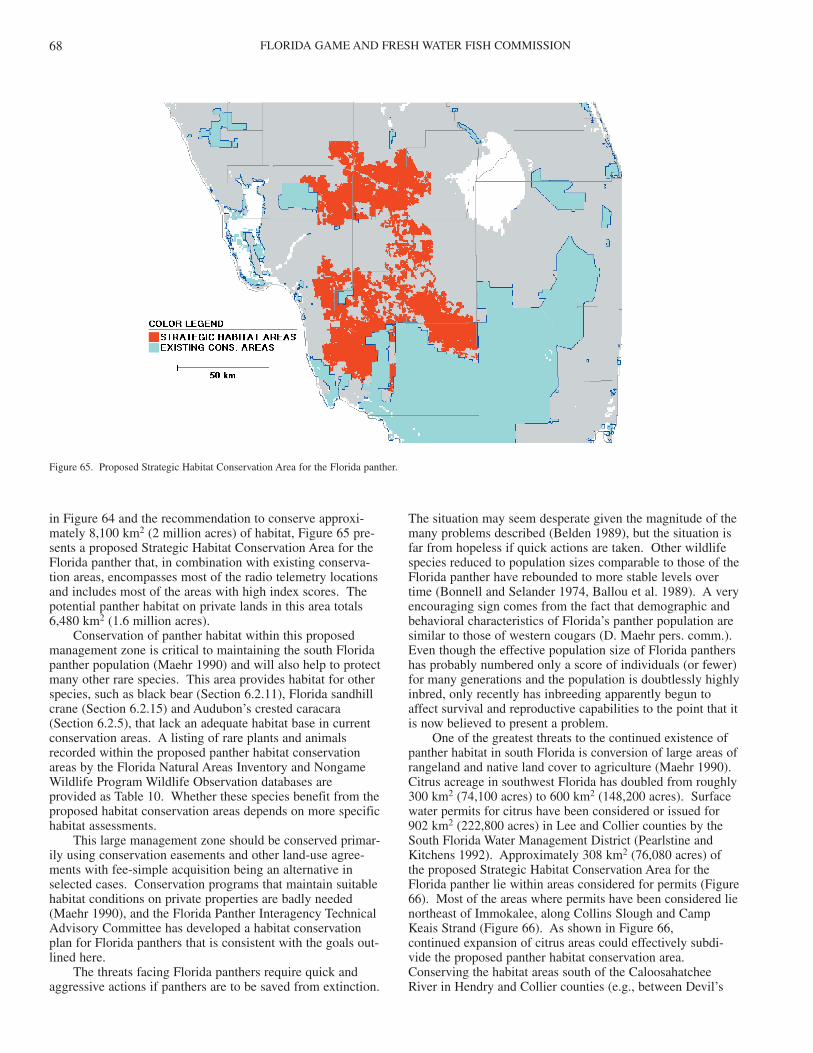
FLORIDA GAME AND FRESH WATER FISH COMMISSION68
in Figure 64 and the recommendation to conserve approxi-mately 8,100 km2 (2 million acres) of habitat, Figure 65 pre-sents a proposed Strategic Habitat Conservation Area for theFlorida panther that, in combination with existing conserva-tion areas, encompasses most of the radio telemetry locationsand includes most of the areas with high index scores. Thepotential panther habitat on private lands in this area totals6,480 km2 (1.6 million acres).
Conservation of panther habitat within this proposedmanagement zone is critical to maintaining the south Floridapanther population (Maehr 1990) and will also help to protectmany other rare species. This area provides habitat for otherspecies, such as black bear (Section 6.2.11), Florida sandhillcrane (Section 6.2.15) and Audubon’s crested caracara(Section 6.2.5), that lack an adequate habitat base in currentconservation areas. A listing of rare plants and animalsrecorded within the proposed panther habitat conservationareas by the Florida Natural Areas Inventory and NongameWildlife Program Wildlife Observation databases areprovided as Table 10. Whether these species benefit from theproposed habitat conservation areas depends on more specifichabitat assessments.
This large management zone should be conserved primar-ily using conservation easements and other land-use agree-ments with fee-simple acquisition being an alternative inselected cases. Conservation programs that maintain suitablehabitat conditions on private properties are badly needed(Maehr 1990), and the Florida Panther Interagency TechnicalAdvisory Committee has developed a habitat conservationplan for Florida panthers that is consistent with the goals out-lined here.
The threats facing Florida panthers require quick andaggressive actions if panthers are to be saved from extinction.
The situation may seem desperate given the magnitude of themany problems described (Belden 1989), but the situation isfar from hopeless if quick actions are taken. Other wildlifespecies reduced to population sizes comparable to those of theFlorida panther have rebounded to more stable levels overtime (Bonnell and Selander 1974, Ballou et al. 1989). A veryencouraging sign comes from the fact that demographic andbehavioral characteristics of Florida’s panther population aresimilar to those of western cougars (D. Maehr pers. comm.).Even though the effective population size of Florida panthershas probably numbered only a score of individuals (or fewer)for many generations and the population is doubtlessly highlyinbred, only recently has inbreeding apparently begun toaffect survival and reproductive capabilities to the point that itis now believed to present a problem.
One of the greatest threats to the continued existence ofpanther habitat in south Florida is conversion of large areas ofrangeland and native land cover to agriculture (Maehr 1990).Citrus acreage in southwest Florida has doubled from roughly300 km2 (74,100 acres) to 600 km2 (148,200 acres). Surfacewater permits for citrus have been considered or issued for902 km2 (222,800 acres) in Lee and Collier counties by theSouth Florida Water Management District (Pearlstine andKitchens 1992). Approximately 308 km2 (76,080 acres) ofthe proposed Strategic Habitat Conservation Area for theFlorida panther lie within areas considered for permits (Figure66). Most of the areas where permits have been considered lienortheast of Immokalee, along Collins Slough and CampKeais Strand (Figure 66). As shown in Figure 66,continued expansion of citrus areas could effectively subdi-vide the proposed panther habitat conservation area.Conserving the habitat areas south of the CaloosahatcheeRiver in Hendry and Collier counties (e.g., between Devil’s
Figure 65. Proposed Strategic Habitat Conservation Area for the Florida panther.
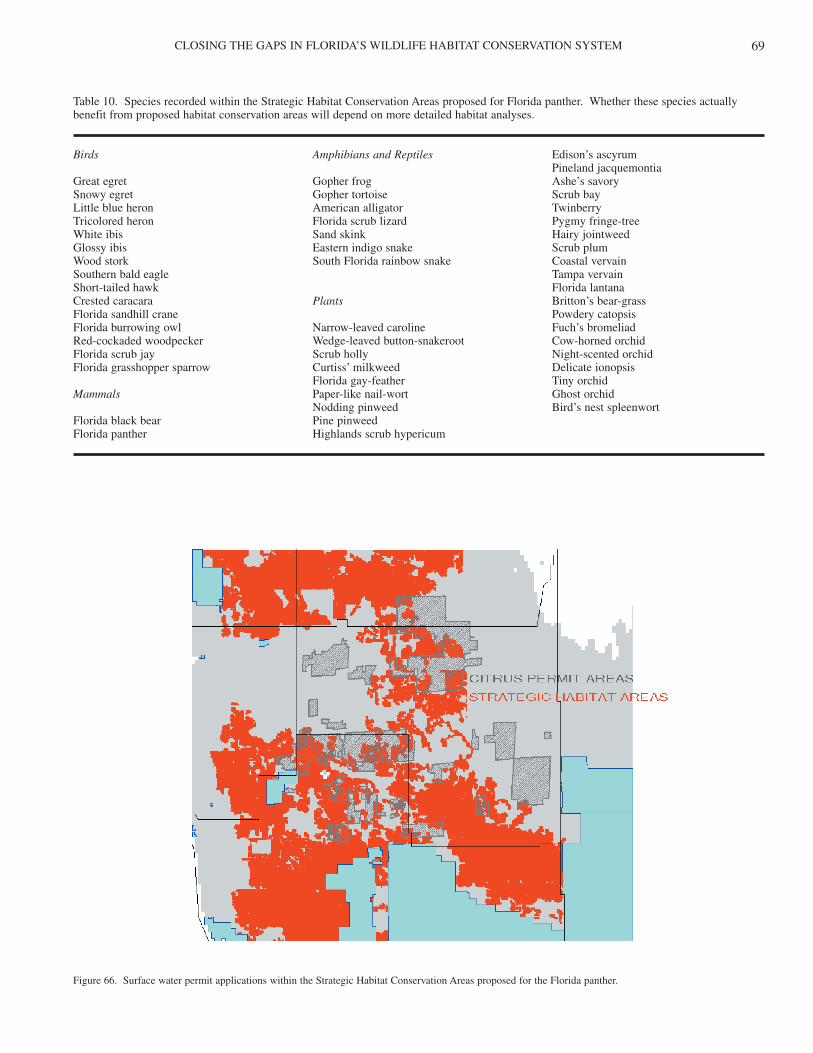
CLOSING THE GAPS IN FLORIDA’S WILDLIFE HABITAT CONSERVATION SYSTEM 69
Table 10. Species recorded within the Strategic Habitat Conservation Areas proposed for Florida panther. Whether these species actuallybenefit from proposed habitat conservation areas will depend on more detailed habitat analyses.
Birds Amphibians and Reptiles Edison’s ascyrumPineland jacquemontia
Great egret Gopher frog Ashe’s savorySnowy egret Gopher tortoise Scrub bayLittle blue heron American alligator TwinberryTricolored heron Florida scrub lizard Pygmy fringe-treeWhite ibis Sand skink Hairy jointweedGlossy ibis Eastern indigo snake Scrub plumWood stork South Florida rainbow snake Coastal vervainSouthern bald eagle Tampa vervainShort-tailed hawk Florida lantanaCrested caracara Plants Britton’s bear-grassFlorida sandhill crane Powdery catopsisFlorida burrowing owl Narrow-leaved caroline Fuch’s bromeliadRed-cockaded woodpecker Wedge-leaved button-snakeroot Cow-horned orchidFlorida scrub jay Scrub holly Night-scented orchidFlorida grasshopper sparrow Curtiss’ milkweed Delicate ionopsis
Florida gay-feather Tiny orchidMammals Paper-like nail-wort Ghost orchid
Nodding pinweed Bird’s nest spleenwortFlorida black bear Pine pinweedFlorida panther Highlands scrub hypericum
Figure 66. Surface water permit applications within the Strategic Habitat Conservation Areas proposed for the Florida panther.
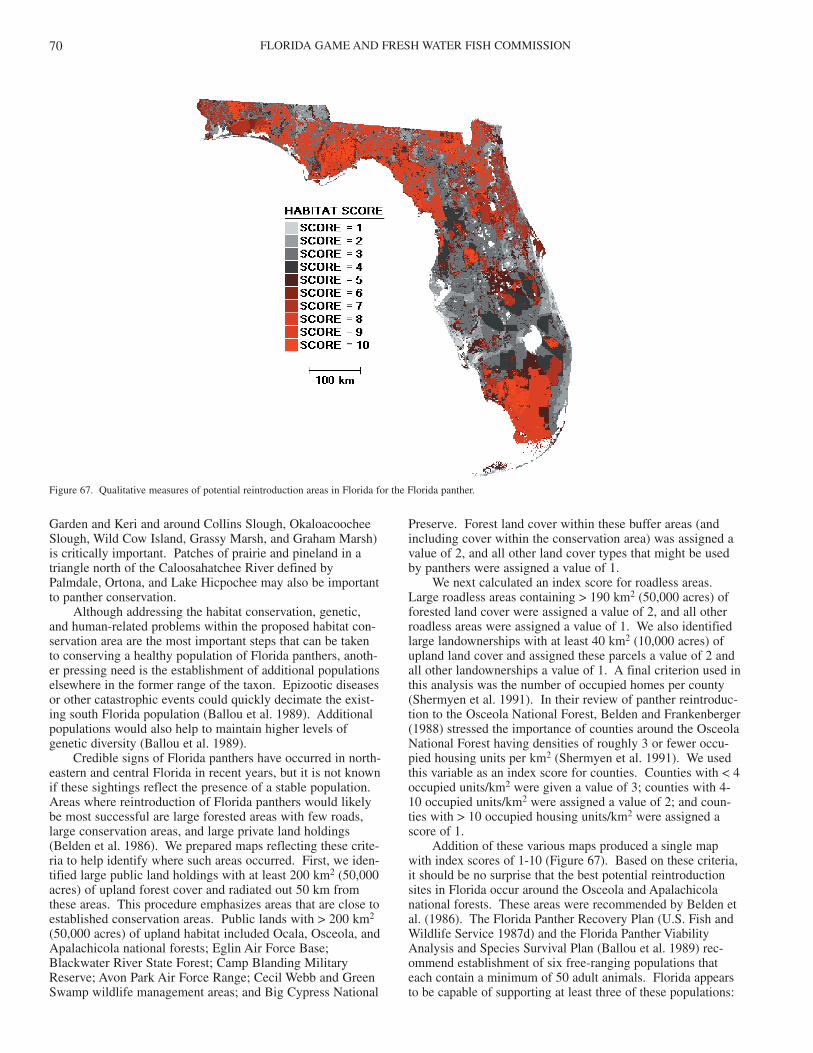
FLORIDA GAME AND FRESH WATER FISH COMMISSION70
Garden and Keri and around Collins Slough, OkaloacoocheeSlough, Wild Cow Island, Grassy Marsh, and Graham Marsh)is critically important. Patches of prairie and pineland in atriangle north of the Caloosahatchee River defined byPalmdale, Ortona, and Lake Hicpochee may also be importantto panther conservation.
Although addressing the habitat conservation, genetic,and human-related problems within the proposed habitat con-servation area are the most important steps that can be takento conserving a healthy population of Florida panthers, anoth-er pressing need is the establishment of additional populationselsewhere in the former range of the taxon. Epizootic diseasesor other catastrophic events could quickly decimate the exist-ing south Florida population (Ballou et al. 1989). Additionalpopulations would also help to maintain higher levels ofgenetic diversity (Ballou et al. 1989).
Credible signs of Florida panthers have occurred in north-eastern and central Florida in recent years, but it is not knownif these sightings reflect the presence of a stable population.Areas where reintroduction of Florida panthers would likelybe most successful are large forested areas with few roads,large conservation areas, and large private land holdings(Belden et al. 1986). We prepared maps reflecting these crite-ria to help identify where such areas occurred. First, we iden-tified large public land holdings with at least 200 km2 (50,000acres) of upland forest cover and radiated out 50 km fromthese areas. This procedure emphasizes areas that are close toestablished conservation areas. Public lands with > 200 km2
(50,000 acres) of upland habitat included Ocala, Osceola, andApalachicola national forests; Eglin Air Force Base;Blackwater River State Forest; Camp Blanding MilitaryReserve; Avon Park Air Force Range; Cecil Webb and GreenSwamp wildlife management areas; and Big Cypress National
Preserve. Forest land cover within these buffer areas (andincluding cover within the conservation area) was assigned avalue of 2, and all other land cover types that might be usedby panthers were assigned a value of 1.
We next calculated an index score for roadless areas.Large roadless areas containing > 190 km2 (50,000 acres) offorested land cover were assigned a value of 2, and all otherroadless areas were assigned a value of 1. We also identifiedlarge landownerships with at least 40 km2 (10,000 acres) ofupland land cover and assigned these parcels a value of 2 andall other landownerships a value of 1. A final criterion used inthis analysis was the number of occupied homes per county(Shermyen et al. 1991). In their review of panther reintroduc-tion to the Osceola National Forest, Belden and Frankenberger(1988) stressed the importance of counties around the OsceolaNational Forest having densities of roughly 3 or fewer occu-pied housing units per km2 (Shermyen et al. 1991). We usedthis variable as an index score for counties. Counties with < 4occupied units/km2 were given a value of 3; counties with 4-10 occupied units/km2 were assigned a value of 2; and coun-ties with > 10 occupied housing units/km2 were assigned ascore of 1.
Addition of these various maps produced a single mapwith index scores of 1-10 (Figure 67). Based on these criteria,it should be no surprise that the best potential reintroductionsites in Florida occur around the Osceola and Apalachicolanational forests. These areas were recommended by Belden etal. (1986). The Florida Panther Recovery Plan (U.S. Fish andWildlife Service 1987d) and the Florida Panther ViabilityAnalysis and Species Survival Plan (Ballou et al. 1989) rec-ommend establishment of six free-ranging populations thateach contain a minimum of 50 adult animals. Florida appearsto be capable of supporting at least three of these populations:
Figure 67. Qualitative measures of potential reintroduction areas in Florida for the Florida panther.
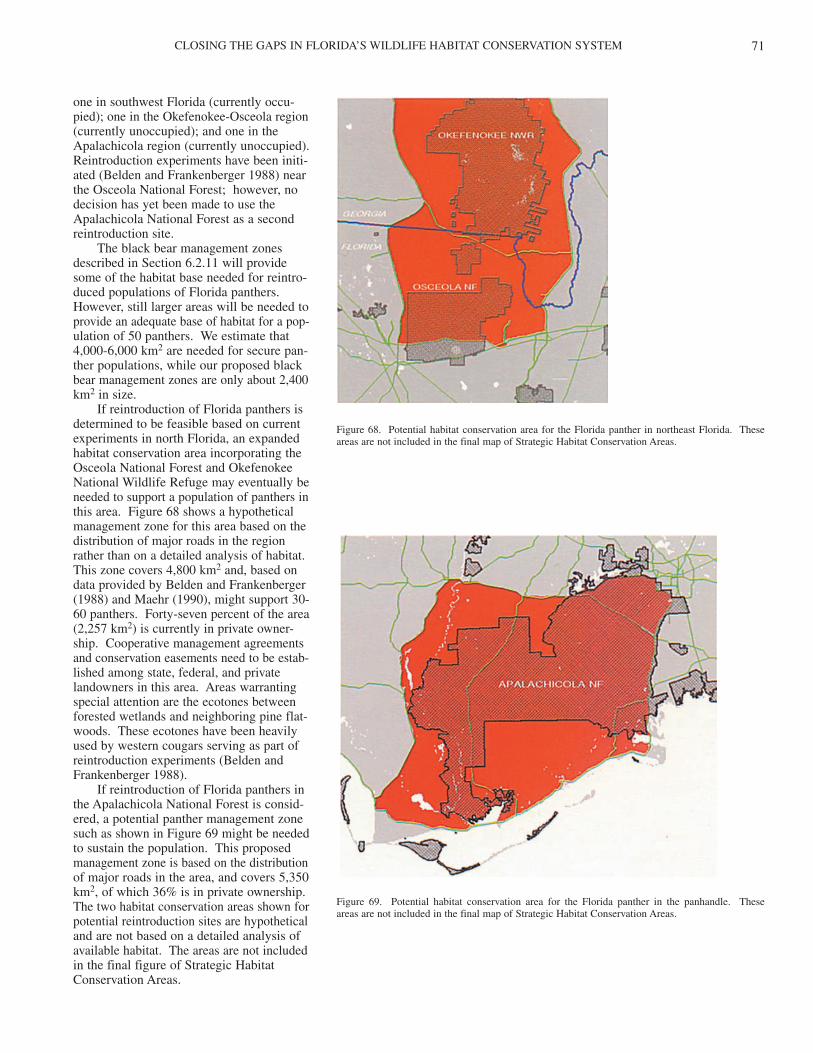
CLOSING THE GAPS IN FLORIDA’S WILDLIFE HABITAT CONSERVATION SYSTEM 71
one in southwest Florida (currently occu-pied); one in the Okefenokee-Osceola region(currently unoccupied); and one in theApalachicola region (currently unoccupied).Reintroduction experiments have been initi-ated (Belden and Frankenberger 1988) nearthe Osceola National Forest; however, nodecision has yet been made to use theApalachicola National Forest as a secondreintroduction site.
The black bear management zonesdescribed in Section 6.2.11 will providesome of the habitat base needed for reintro-duced populations of Florida panthers.However, still larger areas will be needed toprovide an adequate base of habitat for a pop-ulation of 50 panthers. We estimate that4,000-6,000 km2 are needed for secure pan-ther populations, while our proposed blackbear management zones are only about 2,400km2 in size.
If reintroduction of Florida panthers isdetermined to be feasible based on currentexperiments in north Florida, an expandedhabitat conservation area incorporating theOsceola National Forest and OkefenokeeNational Wildlife Refuge may eventually beneeded to support a population of panthers inthis area. Figure 68 shows a hypotheticalmanagement zone for this area based on thedistribution of major roads in the regionrather than on a detailed analysis of habitat.This zone covers 4,800 km2 and, based ondata provided by Belden and Frankenberger(1988) and Maehr (1990), might support 30-60 panthers. Forty-seven percent of the area(2,257 km2) is currently in private owner-ship. Cooperative management agreementsand conservation easements need to be estab-lished among state, federal, and privatelandowners in this area. Areas warrantingspecial attention are the ecotones betweenforested wetlands and neighboring pine flat-woods. These ecotones have been heavilyused by western cougars serving as part ofreintroduction experiments (Belden andFrankenberger 1988).
If reintroduction of Florida panthers inthe Apalachicola National Forest is consid-ered, a potential panther management zonesuch as shown in Figure 69 might be neededto sustain the population. This proposedmanagement zone is based on the distributionof major roads in the area, and covers 5,350km2, of which 36% is in private ownership.The two habitat conservation areas shown forpotential reintroduction sites are hypotheticaland are not based on a detailed analysis ofavailable habitat. The areas are not includedin the final figure of Strategic HabitatConservation Areas.
Figure 68. Potential habitat conservation area for the Florida panther in northeast Florida. Theseareas are not included in the final map of Strategic Habitat Conservation Areas.
Figure 69. Potential habitat conservation area for the Florida panther in the panhandle. These areas are not included in the final map of Strategic Habitat Conservation Areas.
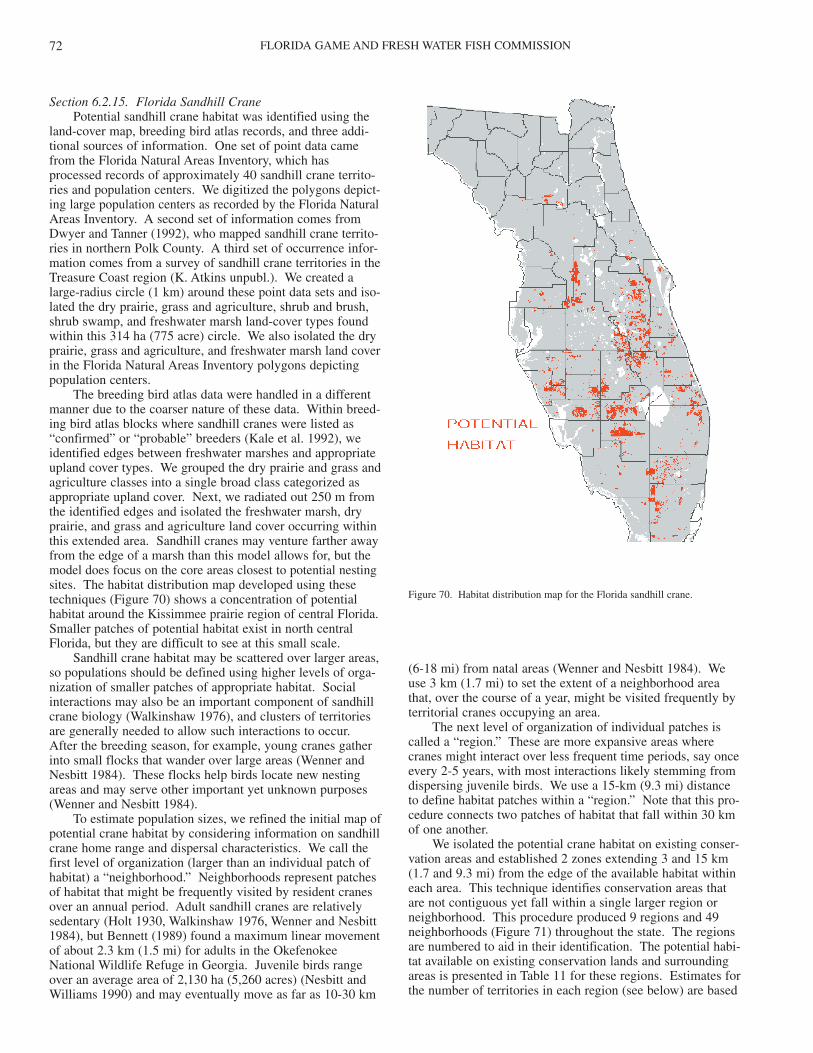
FLORIDA GAME AND FRESH WATER FISH COMMISSION72
Section 6.2.15. Florida Sandhill CranePotential sandhill crane habitat was identified using the
land-cover map, breeding bird atlas records, and three addi-tional sources of information. One set of point data camefrom the Florida Natural Areas Inventory, which hasprocessed records of approximately 40 sandhill crane territo-ries and population centers. We digitized the polygons depict-ing large population centers as recorded by the Florida NaturalAreas Inventory. A second set of information comes fromDwyer and Tanner (1992), who mapped sandhill crane territo-ries in northern Polk County. A third set of occurrence infor-mation comes from a survey of sandhill crane territories in theTreasure Coast region (K. Atkins unpubl.). We created alarge-radius circle (1 km) around these point data sets and iso-lated the dry prairie, grass and agriculture, shrub and brush,shrub swamp, and freshwater marsh land-cover types foundwithin this 314 ha (775 acre) circle. We also isolated the dryprairie, grass and agriculture, and freshwater marsh land coverin the Florida Natural Areas Inventory polygons depictingpopulation centers.
The breeding bird atlas data were handled in a differentmanner due to the coarser nature of these data. Within breed-ing bird atlas blocks where sandhill cranes were listed as“confirmed” or “probable” breeders (Kale et al. 1992), weidentified edges between freshwater marshes and appropriateupland cover types. We grouped the dry prairie and grass andagriculture classes into a single broad class categorized asappropriate upland cover. Next, we radiated out 250 m fromthe identified edges and isolated the freshwater marsh, dryprairie, and grass and agriculture land cover occurring withinthis extended area. Sandhill cranes may venture farther awayfrom the edge of a marsh than this model allows for, but themodel does focus on the core areas closest to potential nestingsites. The habitat distribution map developed using thesetechniques (Figure 70) shows a concentration of potentialhabitat around the Kissimmee prairie region of central Florida.Smaller patches of potential habitat exist in north centralFlorida, but they are difficult to see at this small scale.
Sandhill crane habitat may be scattered over larger areas,so populations should be defined using higher levels of orga-nization of smaller patches of appropriate habitat. Socialinteractions may also be an important component of sandhillcrane biology (Walkinshaw 1976), and clusters of territoriesare generally needed to allow such interactions to occur.After the breeding season, for example, young cranes gatherinto small flocks that wander over large areas (Wenner andNesbitt 1984). These flocks help birds locate new nestingareas and may serve other important yet unknown purposes(Wenner and Nesbitt 1984).
To estimate population sizes, we refined the initial map ofpotential crane habitat by considering information on sandhillcrane home range and dispersal characteristics. We call thefirst level of organization (larger than an individual patch ofhabitat) a “neighborhood.” Neighborhoods represent patchesof habitat that might be frequently visited by resident cranesover an annual period. Adult sandhill cranes are relativelysedentary (Holt 1930, Walkinshaw 1976, Wenner and Nesbitt1984), but Bennett (1989) found a maximum linear movementof about 2.3 km (1.5 mi) for adults in the OkefenokeeNational Wildlife Refuge in Georgia. Juvenile birds rangeover an average area of 2,130 ha (5,260 acres) (Nesbitt andWilliams 1990) and may eventually move as far as 10-30 km
(6-18 mi) from natal areas (Wenner and Nesbitt 1984). Weuse 3 km (1.7 mi) to set the extent of a neighborhood areathat, over the course of a year, might be visited frequently byterritorial cranes occupying an area.
The next level of organization of individual patches iscalled a “region.” These are more expansive areas wherecranes might interact over less frequent time periods, say onceevery 2-5 years, with most interactions likely stemming fromdispersing juvenile birds. We use a 15-km (9.3 mi) distanceto define habitat patches within a “region.” Note that this pro-cedure connects two patches of habitat that fall within 30 kmof one another.
We isolated the potential crane habitat on existing conser-vation areas and established 2 zones extending 3 and 15 km(1.7 and 9.3 mi) from the edge of the available habitat withineach area. This technique identifies conservation areas thatare not contiguous yet fall within a single larger region orneighborhood. This procedure produced 9 regions and 49neighborhoods (Figure 71) throughout the state. The regionsare numbered to aid in their identification. The potential habi-tat available on existing conservation lands and surroundingareas is presented in Table 11 for these regions. Estimates forthe number of territories in each region (see below) are based
Figure 70. Habitat distribution map for the Florida sandhill crane.
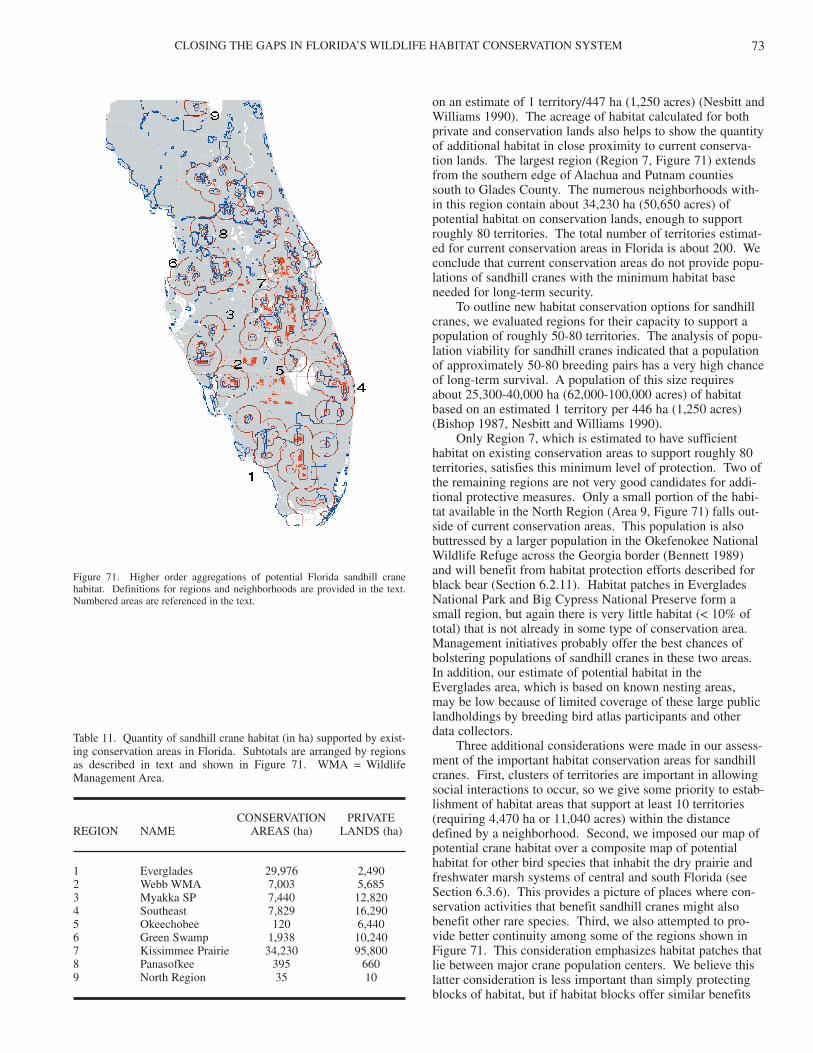
CLOSING THE GAPS IN FLORIDA’S WILDLIFE HABITAT CONSERVATION SYSTEM 73
on an estimate of 1 territory/447 ha (1,250 acres) (Nesbitt andWilliams 1990). The acreage of habitat calculated for bothprivate and conservation lands also helps to show the quantityof additional habitat in close proximity to current conserva-tion lands. The largest region (Region 7, Figure 71) extendsfrom the southern edge of Alachua and Putnam countiessouth to Glades County. The numerous neighborhoods with-in this region contain about 34,230 ha (50,650 acres) ofpotential habitat on conservation lands, enough to supportroughly 80 territories. The total number of territories estimat-ed for current conservation areas in Florida is about 200. Weconclude that current conservation areas do not provide popu-lations of sandhill cranes with the minimum habitat baseneeded for long-term security.
To outline new habitat conservation options for sandhillcranes, we evaluated regions for their capacity to support apopulation of roughly 50-80 territories. The analysis of popu-lation viability for sandhill cranes indicated that a populationof approximately 50-80 breeding pairs has a very high chanceof long-term survival. A population of this size requiresabout 25,300-40,000 ha (62,000-100,000 acres) of habitatbased on an estimated 1 territory per 446 ha (1,250 acres)(Bishop 1987, Nesbitt and Williams 1990).
Only Region 7, which is estimated to have sufficienthabitat on existing conservation areas to support roughly 80territories, satisfies this minimum level of protection. Two ofthe remaining regions are not very good candidates for addi-tional protective measures. Only a small portion of the habi-tat available in the North Region (Area 9, Figure 71) falls out-side of current conservation areas. This population is alsobuttressed by a larger population in the Okefenokee NationalWildlife Refuge across the Georgia border (Bennett 1989)and will benefit from habitat protection efforts described forblack bear (Section 6.2.11). Habitat patches in EvergladesNational Park and Big Cypress National Preserve form asmall region, but again there is very little habitat (< 10% oftotal) that is not already in some type of conservation area.Management initiatives probably offer the best chances ofbolstering populations of sandhill cranes in these two areas.In addition, our estimate of potential habitat in the Everglades area, which is based on known nesting areas,may be low because of limited coverage of these large publiclandholdings by breeding bird atlas participants and otherdata collectors.
Three additional considerations were made in our assess-ment of the important habitat conservation areas for sandhillcranes. First, clusters of territories are important in allowingsocial interactions to occur, so we give some priority to estab-lishment of habitat areas that support at least 10 territories(requiring 4,470 ha or 11,040 acres) within the distancedefined by a neighborhood. Second, we imposed our map ofpotential crane habitat over a composite map of potentialhabitat for other bird species that inhabit the dry prairie andfreshwater marsh systems of central and south Florida (seeSection 6.3.6). This provides a picture of places where con-servation activities that benefit sandhill cranes might alsobenefit other rare species. Third, we also attempted to pro-vide better continuity among some of the regions shown inFigure 71. This consideration emphasizes habitat patches thatlie between major crane population centers. We believe thislatter consideration is less important than simply protectingblocks of habitat, but if habitat blocks offer similar benefits
Figure 71. Higher order aggregations of potential Florida sandhill cranehabitat. Definitions for regions and neighborhoods are provided in the text.Numbered areas are referenced in the text.
Table 11. Quantity of sandhill crane habitat (in ha) supported by exist-ing conservation areas in Florida. Subtotals are arranged by regionsas described in text and shown in Figure 71. WMA = WildlifeManagement Area.
CONSERVATION PRIVATE REGION NAME AREAS (ha) LANDS (ha)
1 Everglades 29,976 2,4902 Webb WMA 7,003 5,6853 Myakka SP 7,440 12,8204 Southeast 7,829 16,2905 Okeechobee 120 6,4406 Green Swamp 1,938 10,2407 Kissimmee Prairie 34,230 95,8008 Panasofkee 395 6609 North Region 35 10
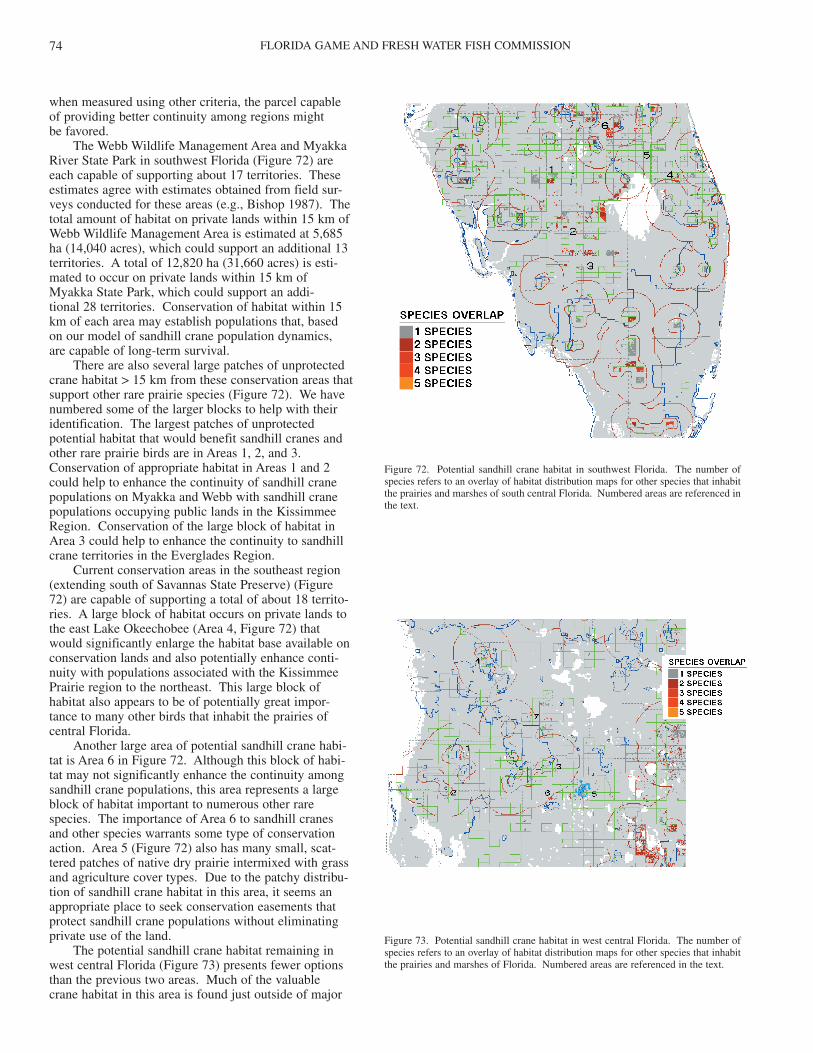
FLORIDA GAME AND FRESH WATER FISH COMMISSION74
when measured using other criteria, the parcel capable of providing better continuity among regions might be favored.
The Webb Wildlife Management Area and MyakkaRiver State Park in southwest Florida (Figure 72) areeach capable of supporting about 17 territories. Theseestimates agree with estimates obtained from field sur-veys conducted for these areas (e.g., Bishop 1987). Thetotal amount of habitat on private lands within 15 km ofWebb Wildlife Management Area is estimated at 5,685ha (14,040 acres), which could support an additional 13territories. A total of 12,820 ha (31,660 acres) is esti-mated to occur on private lands within 15 km of Myakka State Park, which could support an addi-tional 28 territories. Conservation of habitat within 15km of each area may establish populations that, based on our model of sandhill crane population dynamics,are capable of long-term survival.
There are also several large patches of unprotectedcrane habitat > 15 km from these conservation areas thatsupport other rare prairie species (Figure 72). We havenumbered some of the larger blocks to help with theiridentification. The largest patches of unprotectedpotential habitat that would benefit sandhill cranes andother rare prairie birds are in Areas 1, 2, and 3.Conservation of appropriate habitat in Areas 1 and 2could help to enhance the continuity of sandhill cranepopulations on Myakka and Webb with sandhill cranepopulations occupying public lands in the KissimmeeRegion. Conservation of the large block of habitat inArea 3 could help to enhance the continuity to sandhillcrane territories in the Everglades Region.
Current conservation areas in the southeast region(extending south of Savannas State Preserve) (Figure 72) are capable of supporting a total of about 18 territo-ries. A large block of habitat occurs on private lands tothe east Lake Okeechobee (Area 4, Figure 72) that would significantly enlarge the habitat base available onconservation lands and also potentially enhance conti-nuity with populations associated with the KissimmeePrairie region to the northeast. This large block ofhabitat also appears to be of potentially great impor-tance to many other birds that inhabit the prairies ofcentral Florida.
Another large area of potential sandhill crane habi-tat is Area 6 in Figure 72. Although this block of habi-tat may not significantly enhance the continuity amongsandhill crane populations, this area represents a largeblock of habitat important to numerous other rarespecies. The importance of Area 6 to sandhill cranes and other species warrants some type of conservationaction. Area 5 (Figure 72) also has many small, scat-tered patches of native dry prairie intermixed with grassand agriculture cover types. Due to the patchy distribu-tion of sandhill crane habitat in this area, it seems anappropriate place to seek conservation easements thatprotect sandhill crane populations without eliminatingprivate use of the land.
The potential sandhill crane habitat remaining inwest central Florida (Figure 73) presents fewer optionsthan the previous two areas. Much of the valuable crane habitat in this area is found just outside of major
Figure 72. Potential sandhill crane habitat in southwest Florida. The number ofspecies refers to an overlay of habitat distribution maps for other species that inhabitthe prairies and marshes of south central Florida. Numbered areas are referenced inthe text.
Figure 73. Potential sandhill crane habitat in west central Florida. The number ofspecies refers to an overlay of habitat distribution maps for other species that inhabitthe prairies and marshes of Florida. Numbered areas are referenced in the text.
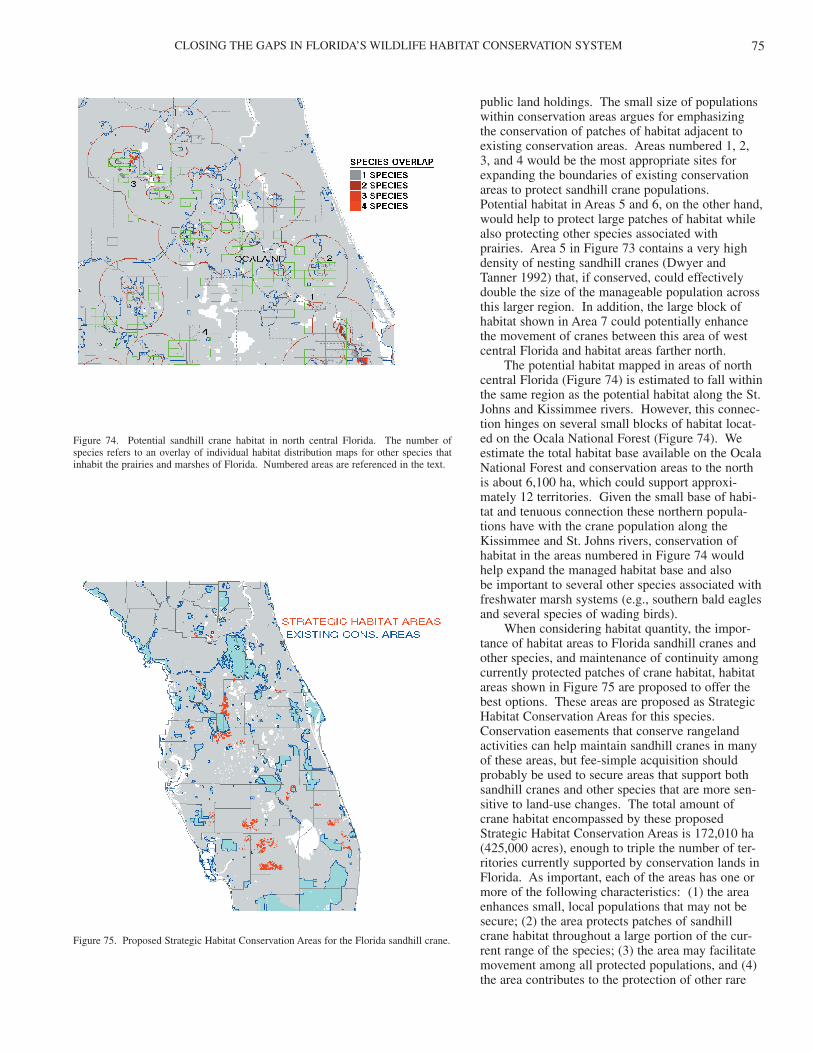
CLOSING THE GAPS IN FLORIDA’S WILDLIFE HABITAT CONSERVATION SYSTEM 75
public land holdings. The small size of populationswithin conservation areas argues for emphasizing the conservation of patches of habitat adjacent toexisting conservation areas. Areas numbered 1, 2,3, and 4 would be the most appropriate sites forexpanding the boundaries of existing conservationareas to protect sandhill crane populations. Potential habitat in Areas 5 and 6, on the other hand,would help to protect large patches of habitat whilealso protecting other species associated with prairies. Area 5 in Figure 73 contains a very highdensity of nesting sandhill cranes (Dwyer andTanner 1992) that, if conserved, could effectivelydouble the size of the manageable population acrossthis larger region. In addition, the large block ofhabitat shown in Area 7 could potentially enhancethe movement of cranes between this area of westcentral Florida and habitat areas farther north.
The potential habitat mapped in areas of northcentral Florida (Figure 74) is estimated to fall withinthe same region as the potential habitat along the St.Johns and Kissimmee rivers. However, this connec-tion hinges on several small blocks of habitat locat-ed on the Ocala National Forest (Figure 74). Weestimate the total habitat base available on the OcalaNational Forest and conservation areas to the northis about 6,100 ha, which could support approxi-mately 12 territories. Given the small base of habi-tat and tenuous connection these northern popula-tions have with the crane population along theKissimmee and St. Johns rivers, conservation ofhabitat in the areas numbered in Figure 74 wouldhelp expand the managed habitat base and also be important to several other species associated withfreshwater marsh systems (e.g., southern bald eaglesand several species of wading birds).
When considering habitat quantity, the impor-tance of habitat areas to Florida sandhill cranes andother species, and maintenance of continuity amongcurrently protected patches of crane habitat, habitatareas shown in Figure 75 are proposed to offer thebest options. These areas are proposed as StrategicHabitat Conservation Areas for this species.Conservation easements that conserve rangelandactivities can help maintain sandhill cranes in manyof these areas, but fee-simple acquisition shouldprobably be used to secure areas that support bothsandhill cranes and other species that are more sen-sitive to land-use changes. The total amount ofcrane habitat encompassed by these proposedStrategic Habitat Conservation Areas is 172,010 ha(425,000 acres), enough to triple the number of ter-ritories currently supported by conservation lands inFlorida. As important, each of the areas has one ormore of the following characteristics: (1) the areaenhances small, local populations that may not besecure; (2) the area protects patches of sandhillcrane habitat throughout a large portion of the cur-rent range of the species; (3) the area may facilitatemovement among all protected populations, and (4)the area contributes to the protection of other rare
Figure 74. Potential sandhill crane habitat in north central Florida. The number ofspecies refers to an overlay of individual habitat distribution maps for other species thatinhabit the prairies and marshes of Florida. Numbered areas are referenced in the text.
Figure 75. Proposed Strategic Habitat Conservation Areas for the Florida sandhill crane.
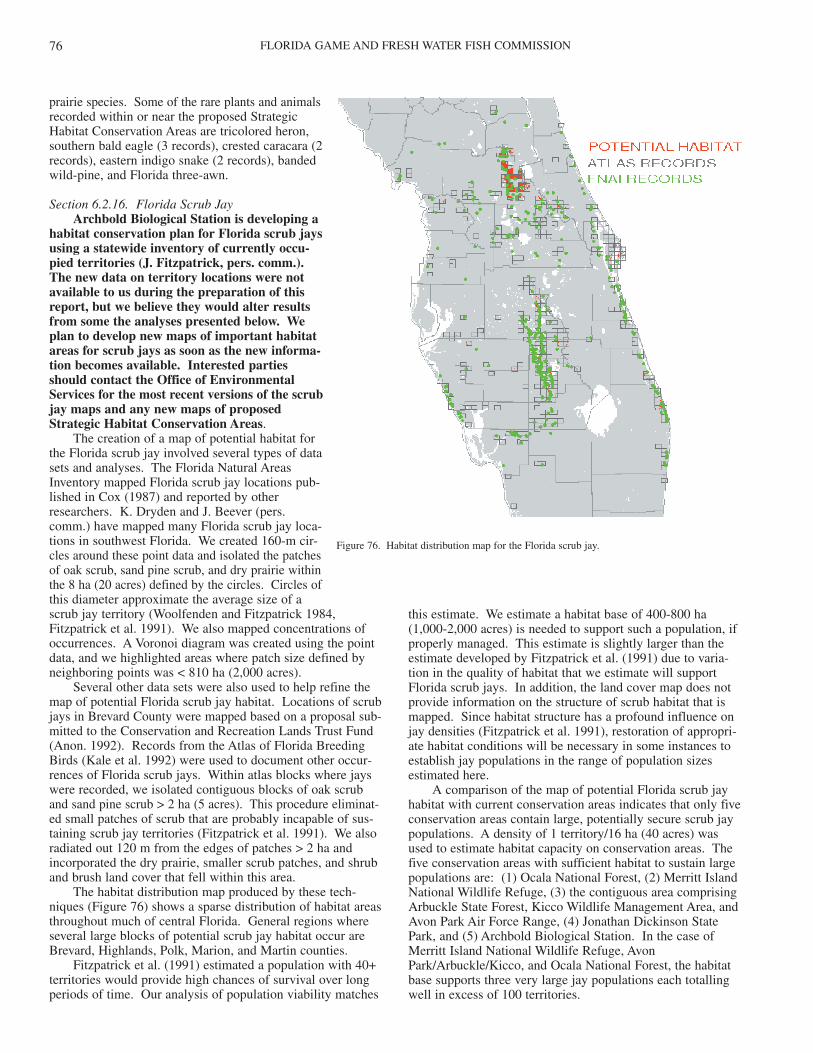
FLORIDA GAME AND FRESH WATER FISH COMMISSION76
prairie species. Some of the rare plants and animalsrecorded within or near the proposed StrategicHabitat Conservation Areas are tricolored heron,southern bald eagle (3 records), crested caracara (2records), eastern indigo snake (2 records), bandedwild-pine, and Florida three-awn.
Section 6.2.16. Florida Scrub JayArchbold Biological Station is developing a
habitat conservation plan for Florida scrub jaysusing a statewide inventory of currently occu-pied territories (J. Fitzpatrick, pers. comm.).The new data on territory locations were notavailable to us during the preparation of thisreport, but we believe they would alter resultsfrom some the analyses presented below. Weplan to develop new maps of important habitatareas for scrub jays as soon as the new informa-tion becomes available. Interested partiesshould contact the Office of EnvironmentalServices for the most recent versions of the scrubjay maps and any new maps of proposedStrategic Habitat Conservation Areas.
The creation of a map of potential habitat forthe Florida scrub jay involved several types of datasets and analyses. The Florida Natural AreasInventory mapped Florida scrub jay locations pub-lished in Cox (1987) and reported by otherresearchers. K. Dryden and J. Beever (pers.comm.) have mapped many Florida scrub jay loca-tions in southwest Florida. We created 160-m cir-cles around these point data and isolated the patchesof oak scrub, sand pine scrub, and dry prairie withinthe 8 ha (20 acres) defined by the circles. Circles ofthis diameter approximate the average size of ascrub jay territory (Woolfenden and Fitzpatrick 1984,Fitzpatrick et al. 1991). We also mapped concentrations ofoccurrences. A Voronoi diagram was created using the pointdata, and we highlighted areas where patch size defined byneighboring points was < 810 ha (2,000 acres).
Several other data sets were also used to help refine themap of potential Florida scrub jay habitat. Locations of scrubjays in Brevard County were mapped based on a proposal sub-mitted to the Conservation and Recreation Lands Trust Fund(Anon. 1992). Records from the Atlas of Florida BreedingBirds (Kale et al. 1992) were used to document other occur-rences of Florida scrub jays. Within atlas blocks where jayswere recorded, we isolated contiguous blocks of oak scruband sand pine scrub > 2 ha (5 acres). This procedure eliminat-ed small patches of scrub that are probably incapable of sus-taining scrub jay territories (Fitzpatrick et al. 1991). We alsoradiated out 120 m from the edges of patches > 2 ha andincorporated the dry prairie, smaller scrub patches, and shruband brush land cover that fell within this area.
The habitat distribution map produced by these tech-niques (Figure 76) shows a sparse distribution of habitat areasthroughout much of central Florida. General regions whereseveral large blocks of potential scrub jay habitat occur areBrevard, Highlands, Polk, Marion, and Martin counties.
Fitzpatrick et al. (1991) estimated a population with 40+territories would provide high chances of survival over longperiods of time. Our analysis of population viability matches
this estimate. We estimate a habitat base of 400-800 ha(1,000-2,000 acres) is needed to support such a population, ifproperly managed. This estimate is slightly larger than theestimate developed by Fitzpatrick et al. (1991) due to varia-tion in the quality of habitat that we estimate will supportFlorida scrub jays. In addition, the land cover map does notprovide information on the structure of scrub habitat that ismapped. Since habitat structure has a profound influence onjay densities (Fitzpatrick et al. 1991), restoration of appropri-ate habitat conditions will be necessary in some instances toestablish jay populations in the range of population sizesestimated here.
A comparison of the map of potential Florida scrub jayhabitat with current conservation areas indicates that only fiveconservation areas contain large, potentially secure scrub jaypopulations. A density of 1 territory/16 ha (40 acres) wasused to estimate habitat capacity on conservation areas. Thefive conservation areas with sufficient habitat to sustain largepopulations are: (1) Ocala National Forest, (2) Merritt IslandNational Wildlife Refuge, (3) the contiguous area comprisingArbuckle State Forest, Kicco Wildlife Management Area, andAvon Park Air Force Range, (4) Jonathan Dickinson StatePark, and (5) Archbold Biological Station. In the case ofMerritt Island National Wildlife Refuge, AvonPark/Arbuckle/Kicco, and Ocala National Forest, the habitatbase supports three very large jay populations each totallingwell in excess of 100 territories.
Figure 76. Habitat distribution map for the Florida scrub jay.
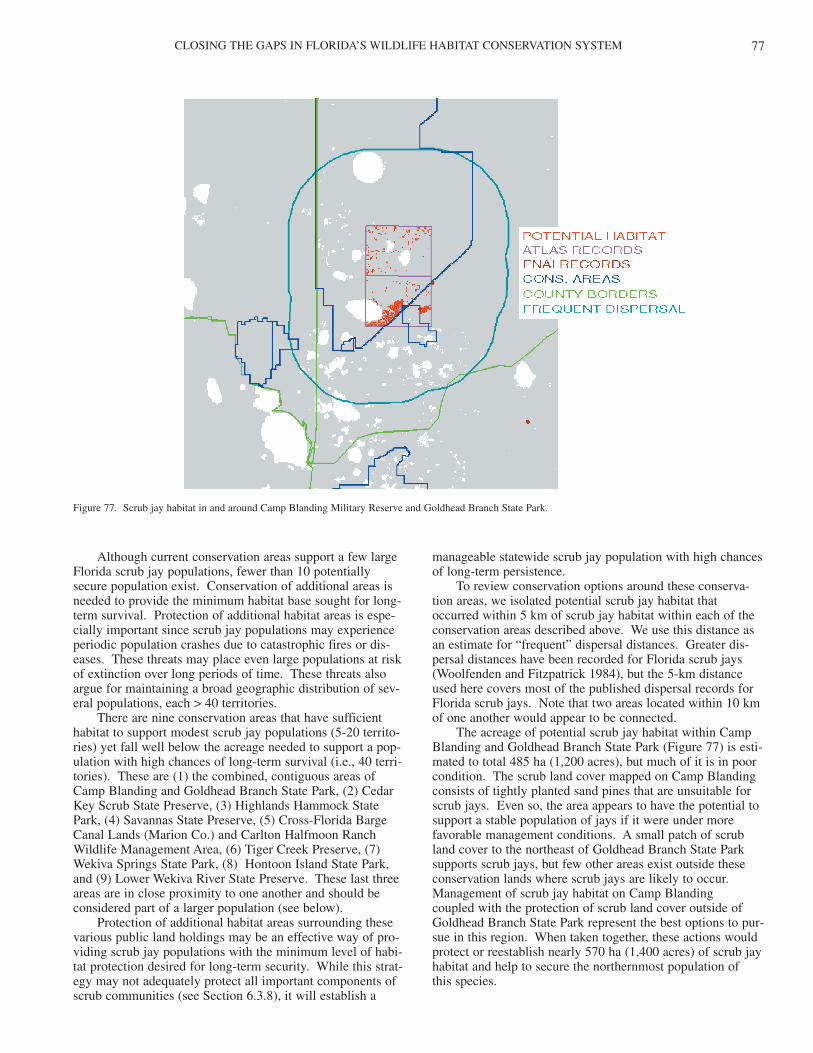
CLOSING THE GAPS IN FLORIDA’S WILDLIFE HABITAT CONSERVATION SYSTEM 77
Although current conservation areas support a few largeFlorida scrub jay populations, fewer than 10 potentiallysecure population exist. Conservation of additional areas isneeded to provide the minimum habitat base sought for long-term survival. Protection of additional habitat areas is espe-cially important since scrub jay populations may experienceperiodic population crashes due to catastrophic fires or dis-eases. These threats may place even large populations at riskof extinction over long periods of time. These threats alsoargue for maintaining a broad geographic distribution of sev-eral populations, each > 40 territories.
There are nine conservation areas that have sufficienthabitat to support modest scrub jay populations (5-20 territo-ries) yet fall well below the acreage needed to support a pop-ulation with high chances of long-term survival (i.e., 40 terri-tories). These are (1) the combined, contiguous areas ofCamp Blanding and Goldhead Branch State Park, (2) CedarKey Scrub State Preserve, (3) Highlands Hammock StatePark, (4) Savannas State Preserve, (5) Cross-Florida BargeCanal Lands (Marion Co.) and Carlton Halfmoon RanchWildlife Management Area, (6) Tiger Creek Preserve, (7)Wekiva Springs State Park, (8) Hontoon Island State Park,and (9) Lower Wekiva River State Preserve. These last threeareas are in close proximity to one another and should beconsidered part of a larger population (see below).
Protection of additional habitat areas surrounding thesevarious public land holdings may be an effective way of pro-viding scrub jay populations with the minimum level of habi-tat protection desired for long-term security. While this strat-egy may not adequately protect all important components ofscrub communities (see Section 6.3.8), it will establish a
manageable statewide scrub jay population with high chancesof long-term persistence.
To review conservation options around these conserva-tion areas, we isolated potential scrub jay habitat thatoccurred within 5 km of scrub jay habitat within each of theconservation areas described above. We use this distance asan estimate for “frequent” dispersal distances. Greater dis-persal distances have been recorded for Florida scrub jays(Woolfenden and Fitzpatrick 1984), but the 5-km distanceused here covers most of the published dispersal records forFlorida scrub jays. Note that two areas located within 10 kmof one another would appear to be connected.
The acreage of potential scrub jay habitat within CampBlanding and Goldhead Branch State Park (Figure 77) is esti-mated to total 485 ha (1,200 acres), but much of it is in poorcondition. The scrub land cover mapped on Camp Blandingconsists of tightly planted sand pines that are unsuitable forscrub jays. Even so, the area appears to have the potential tosupport a stable population of jays if it were under morefavorable management conditions. A small patch of scrubland cover to the northeast of Goldhead Branch State Parksupports scrub jays, but few other areas exist outside theseconservation lands where scrub jays are likely to occur.Management of scrub jay habitat on Camp Blanding coupled with the protection of scrub land cover outside ofGoldhead Branch State Park represent the best options to pur-sue in this region. When taken together, these actions wouldprotect or reestablish nearly 570 ha (1,400 acres) of scrub jayhabitat and help to secure the northernmost population of this species.
Figure 77. Scrub jay habitat in and around Camp Blanding Military Reserve and Goldhead Branch State Park.
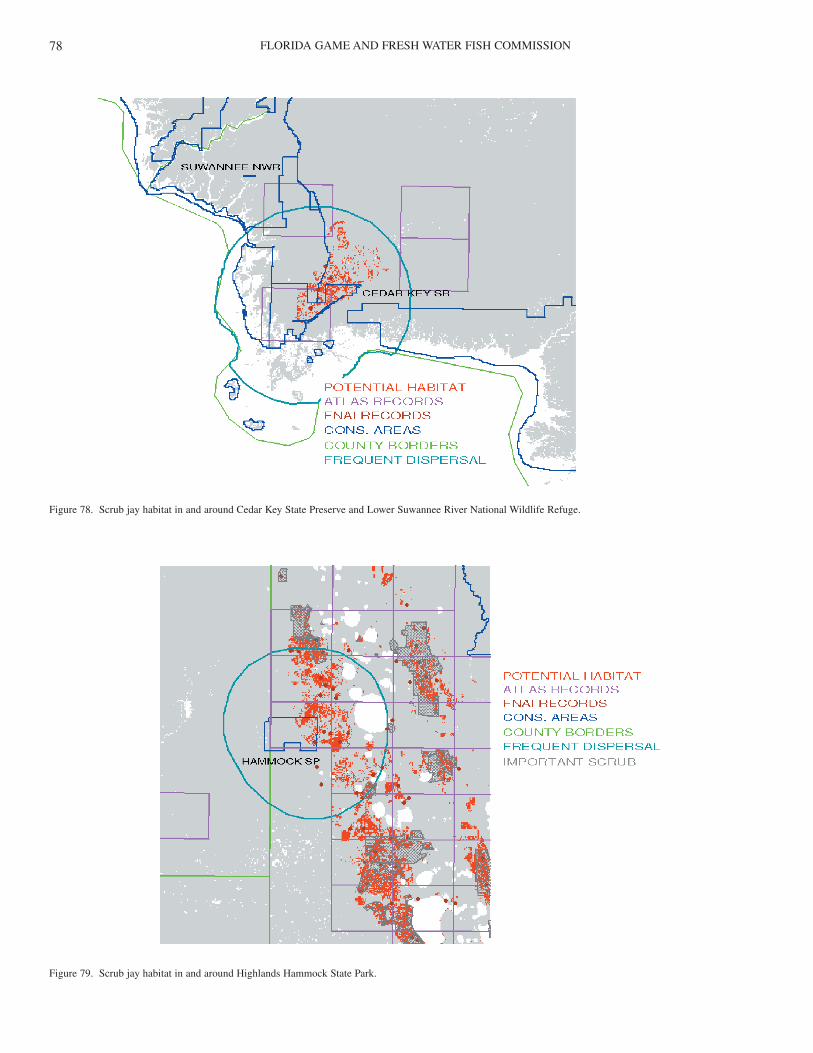
FLORIDA GAME AND FRESH WATER FISH COMMISSION78
Figure 78. Scrub jay habitat in and around Cedar Key State Preserve and Lower Suwannee River National Wildlife Refuge.
Figure 79. Scrub jay habitat in and around Highlands Hammock State Park.
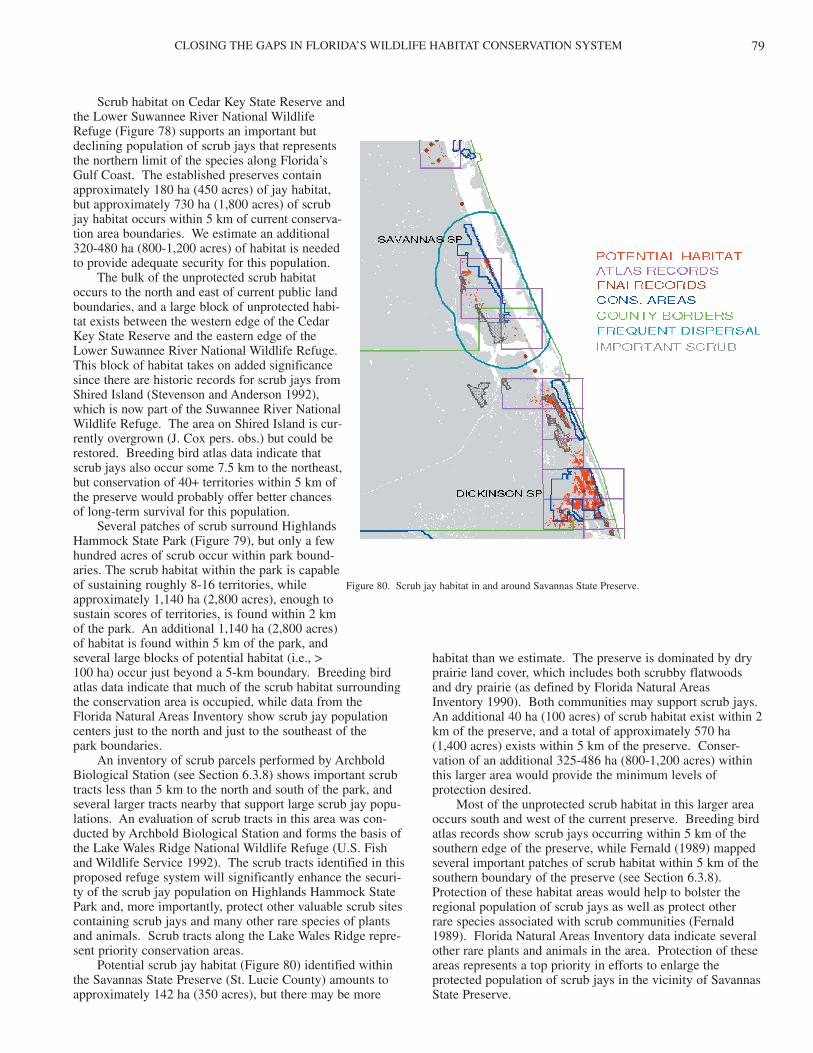
CLOSING THE GAPS IN FLORIDA’S WILDLIFE HABITAT CONSERVATION SYSTEM 79
Scrub habitat on Cedar Key State Reserve and the Lower Suwannee River National WildlifeRefuge (Figure 78) supports an important butdeclining population of scrub jays that representsthe northern limit of the species along Florida’sGulf Coast. The established preserves containapproximately 180 ha (450 acres) of jay habitat,but approximately 730 ha (1,800 acres) of scrubjay habitat occurs within 5 km of current conserva-tion area boundaries. We estimate an additional320-480 ha (800-1,200 acres) of habitat is neededto provide adequate security for this population.
The bulk of the unprotected scrub habitatoccurs to the north and east of current public landboundaries, and a large block of unprotected habi-tat exists between the western edge of the CedarKey State Reserve and the eastern edge of theLower Suwannee River National Wildlife Refuge.This block of habitat takes on added significancesince there are historic records for scrub jays fromShired Island (Stevenson and Anderson 1992),which is now part of the Suwannee River NationalWildlife Refuge. The area on Shired Island is cur-rently overgrown (J. Cox pers. obs.) but could berestored. Breeding bird atlas data indicate thatscrub jays also occur some 7.5 km to the northeast,but conservation of 40+ territories within 5 km ofthe preserve would probably offer better chancesof long-term survival for this population.
Several patches of scrub surround HighlandsHammock State Park (Figure 79), but only a fewhundred acres of scrub occur within park bound-aries. The scrub habitat within the park is capableof sustaining roughly 8-16 territories, whileapproximately 1,140 ha (2,800 acres), enough tosustain scores of territories, is found within 2 kmof the park. An additional 1,140 ha (2,800 acres)of habitat is found within 5 km of the park, andseveral large blocks of potential habitat (i.e., >100 ha) occur just beyond a 5-km boundary. Breeding birdatlas data indicate that much of the scrub habitat surroundingthe conservation area is occupied, while data from the Florida Natural Areas Inventory show scrub jay populationcenters just to the north and just to the southeast of the park boundaries.
An inventory of scrub parcels performed by ArchboldBiological Station (see Section 6.3.8) shows important scrubtracts less than 5 km to the north and south of the park, andseveral larger tracts nearby that support large scrub jay popu-lations. An evaluation of scrub tracts in this area was con-ducted by Archbold Biological Station and forms the basis ofthe Lake Wales Ridge National Wildlife Refuge (U.S. Fishand Wildlife Service 1992). The scrub tracts identified in thisproposed refuge system will significantly enhance the securi-ty of the scrub jay population on Highlands Hammock StatePark and, more importantly, protect other valuable scrub sitescontaining scrub jays and many other rare species of plantsand animals. Scrub tracts along the Lake Wales Ridge repre-sent priority conservation areas.
Potential scrub jay habitat (Figure 80) identified withinthe Savannas State Preserve (St. Lucie County) amounts toapproximately 142 ha (350 acres), but there may be more
Figure 80. Scrub jay habitat in and around Savannas State Preserve.
habitat than we estimate. The preserve is dominated by dryprairie land cover, which includes both scrubby flatwoodsand dry prairie (as defined by Florida Natural Areas Inventory 1990). Both communities may support scrub jays.An additional 40 ha (100 acres) of scrub habitat exist within 2km of the preserve, and a total of approximately 570 ha(1,400 acres) exists within 5 km of the preserve. Conser-vation of an additional 325-486 ha (800-1,200 acres) withinthis larger area would provide the minimum levels ofprotection desired.
Most of the unprotected scrub habitat in this larger areaoccurs south and west of the current preserve. Breeding birdatlas records show scrub jays occurring within 5 km of thesouthern edge of the preserve, while Fernald (1989) mappedseveral important patches of scrub habitat within 5 km of thesouthern boundary of the preserve (see Section 6.3.8).Protection of these habitat areas would help to bolster theregional population of scrub jays as well as protect other rare species associated with scrub communities (Fernald1989). Florida Natural Areas Inventory data indicate severalother rare plants and animals in the area. Protection of theseareas represents a top priority in efforts to enlarge theprotected population of scrub jays in the vicinity of SavannasState Preserve.
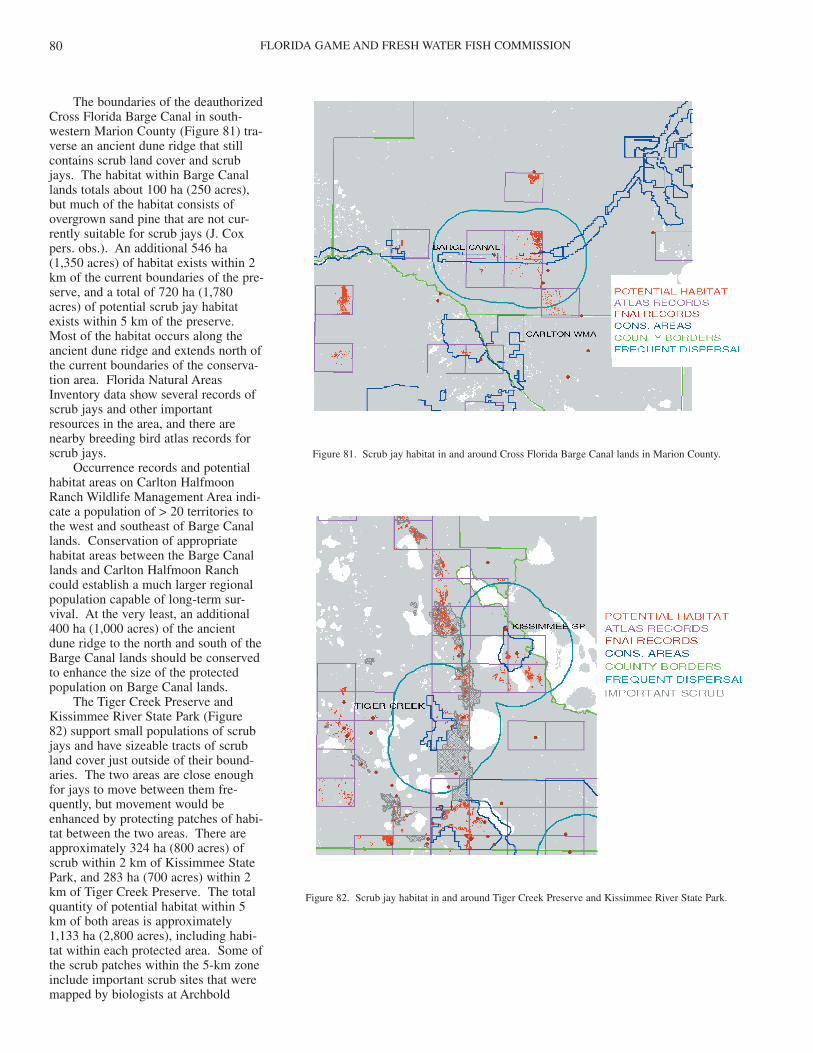
FLORIDA GAME AND FRESH WATER FISH COMMISSION80
The boundaries of the deauthorizedCross Florida Barge Canal in south-western Marion County (Figure 81) tra-verse an ancient dune ridge that stillcontains scrub land cover and scrubjays. The habitat within Barge Canallands totals about 100 ha (250 acres),but much of the habitat consists ofovergrown sand pine that are not cur-rently suitable for scrub jays (J. Coxpers. obs.). An additional 546 ha (1,350 acres) of habitat exists within 2km of the current boundaries of the pre-serve, and a total of 720 ha (1,780 acres) of potential scrub jay habitatexists within 5 km of the preserve.Most of the habitat occurs along theancient dune ridge and extends north ofthe current boundaries of the conserva-tion area. Florida Natural AreasInventory data show several records ofscrub jays and other important resources in the area, and there arenearby breeding bird atlas records forscrub jays.
Occurrence records and potentialhabitat areas on Carlton HalfmoonRanch Wildlife Management Area indi-cate a population of > 20 territories tothe west and southeast of Barge Canallands. Conservation of appropriatehabitat areas between the Barge Canallands and Carlton Halfmoon Ranchcould establish a much larger regionalpopulation capable of long-term sur-vival. At the very least, an additional400 ha (1,000 acres) of the ancient dune ridge to the north and south of theBarge Canal lands should be conservedto enhance the size of the protectedpopulation on Barge Canal lands.
The Tiger Creek Preserve andKissimmee River State Park (Figure 82) support small populations of scrubjays and have sizeable tracts of scrubland cover just outside of their bound-aries. The two areas are close enoughfor jays to move between them fre-quently, but movement would beenhanced by protecting patches of habi-tat between the two areas. There areapproximately 324 ha (800 acres) ofscrub within 2 km of Kissimmee StatePark, and 283 ha (700 acres) within 2km of Tiger Creek Preserve. The totalquantity of potential habitat within 5 km of both areas is approximately 1,133 ha (2,800 acres), including habi-tat within each protected area. Some ofthe scrub patches within the 5-km zoneinclude important scrub sites that weremapped by biologists at Archbold
Figure 81. Scrub jay habitat in and around Cross Florida Barge Canal lands in Marion County.
Figure 82. Scrub jay habitat in and around Tiger Creek Preserve and Kissimmee River State Park.
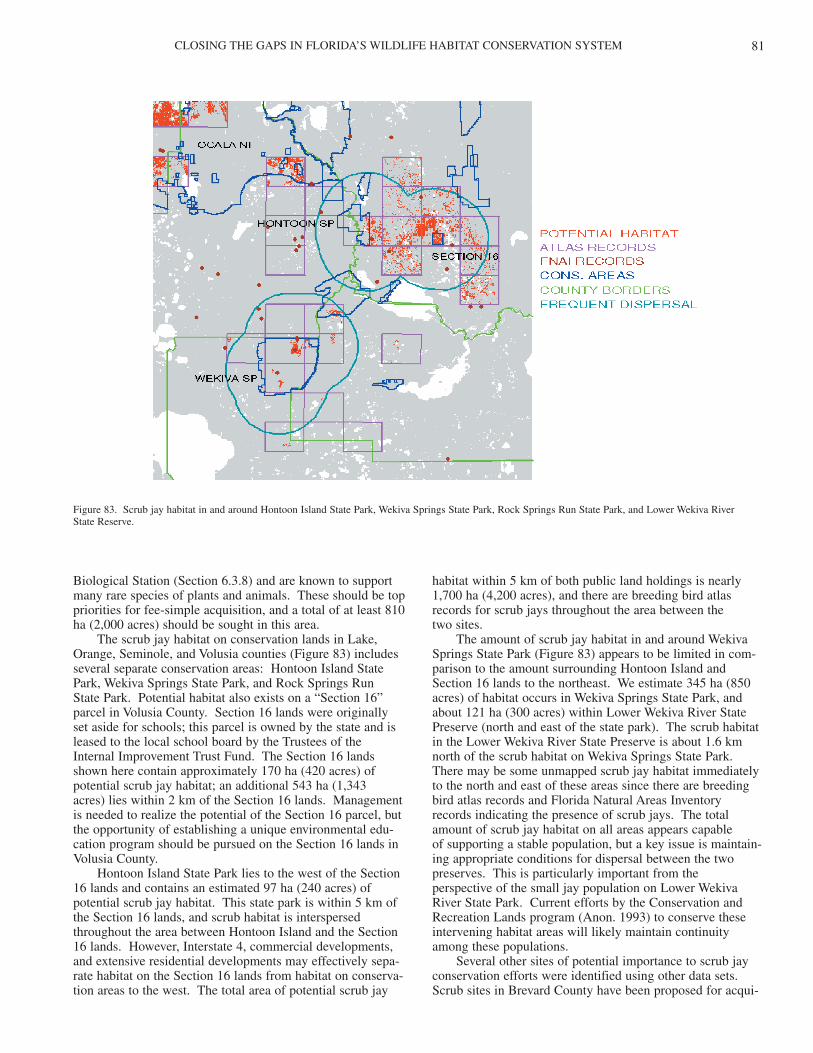
CLOSING THE GAPS IN FLORIDA’S WILDLIFE HABITAT CONSERVATION SYSTEM 81
Biological Station (Section 6.3.8) and are known to supportmany rare species of plants and animals. These should be toppriorities for fee-simple acquisition, and a total of at least 810ha (2,000 acres) should be sought in this area.
The scrub jay habitat on conservation lands in Lake,Orange, Seminole, and Volusia counties (Figure 83) includesseveral separate conservation areas: Hontoon Island StatePark, Wekiva Springs State Park, and Rock Springs Run State Park. Potential habitat also exists on a “Section 16”parcel in Volusia County. Section 16 lands were originallyset aside for schools; this parcel is owned by the state and isleased to the local school board by the Trustees of theInternal Improvement Trust Fund. The Section 16 landsshown here contain approximately 170 ha (420 acres) ofpotential scrub jay habitat; an additional 543 ha (1,343 acres) lies within 2 km of the Section 16 lands. Managementis needed to realize the potential of the Section 16 parcel, butthe opportunity of establishing a unique environmental edu-cation program should be pursued on the Section 16 lands inVolusia County.
Hontoon Island State Park lies to the west of the Section16 lands and contains an estimated 97 ha (240 acres) ofpotential scrub jay habitat. This state park is within 5 km ofthe Section 16 lands, and scrub habitat is interspersedthroughout the area between Hontoon Island and the Section16 lands. However, Interstate 4, commercial developments,and extensive residential developments may effectively sepa-rate habitat on the Section 16 lands from habitat on conserva-tion areas to the west. The total area of potential scrub jay
habitat within 5 km of both public land holdings is nearly1,700 ha (4,200 acres), and there are breeding bird atlasrecords for scrub jays throughout the area between the two sites.
The amount of scrub jay habitat in and around WekivaSprings State Park (Figure 83) appears to be limited in com-parison to the amount surrounding Hontoon Island andSection 16 lands to the northeast. We estimate 345 ha (850acres) of habitat occurs in Wekiva Springs State Park, andabout 121 ha (300 acres) within Lower Wekiva River StatePreserve (north and east of the state park). The scrub habitatin the Lower Wekiva River State Preserve is about 1.6 kmnorth of the scrub habitat on Wekiva Springs State Park.There may be some unmapped scrub jay habitat immediatelyto the north and east of these areas since there are breedingbird atlas records and Florida Natural Areas Inventory records indicating the presence of scrub jays. The totalamount of scrub jay habitat on all areas appears capable of supporting a stable population, but a key issue is maintain-ing appropriate conditions for dispersal between the twopreserves. This is particularly important from the perspective of the small jay population on Lower WekivaRiver State Park. Current efforts by the Conservation andRecreation Lands program (Anon. 1993) to conserve theseintervening habitat areas will likely maintain continuityamong these populations.
Several other sites of potential importance to scrub jayconservation efforts were identified using other data sets.Scrub sites in Brevard County have been proposed for acqui-
Figure 83. Scrub jay habitat in and around Hontoon Island State Park, Wekiva Springs State Park, Rock Springs Run State Park, and Lower Wekiva River State Reserve.
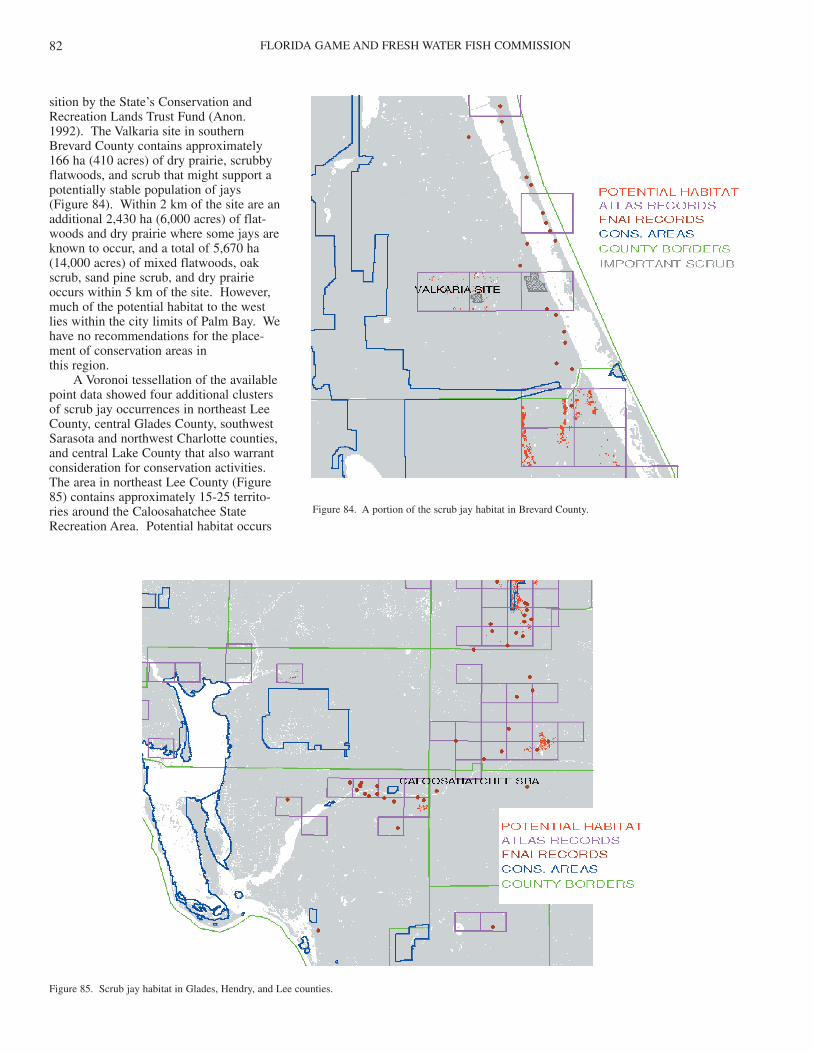
FLORIDA GAME AND FRESH WATER FISH COMMISSION82
sition by the State’s Conservation andRecreation Lands Trust Fund (Anon. 1992). The Valkaria site in southernBrevard County contains approximately166 ha (410 acres) of dry prairie, scrubbyflatwoods, and scrub that might support apotentially stable population of jays (Figure 84). Within 2 km of the site are anadditional 2,430 ha (6,000 acres) of flat-woods and dry prairie where some jays areknown to occur, and a total of 5,670 ha(14,000 acres) of mixed flatwoods, oakscrub, sand pine scrub, and dry prairieoccurs within 5 km of the site. However,much of the potential habitat to the westlies within the city limits of Palm Bay. Wehave no recommendations for the place-ment of conservation areas in this region.
A Voronoi tessellation of the availablepoint data showed four additional clustersof scrub jay occurrences in northeast LeeCounty, central Glades County, southwestSarasota and northwest Charlotte counties,and central Lake County that also warrantconsideration for conservation activities.The area in northeast Lee County (Figure85) contains approximately 15-25 territo-ries around the Caloosahatchee StateRecreation Area. Potential habitat occurs
Figure 84. A portion of the scrub jay habitat in Brevard County.
Figure 85. Scrub jay habitat in Glades, Hendry, and Lee counties.
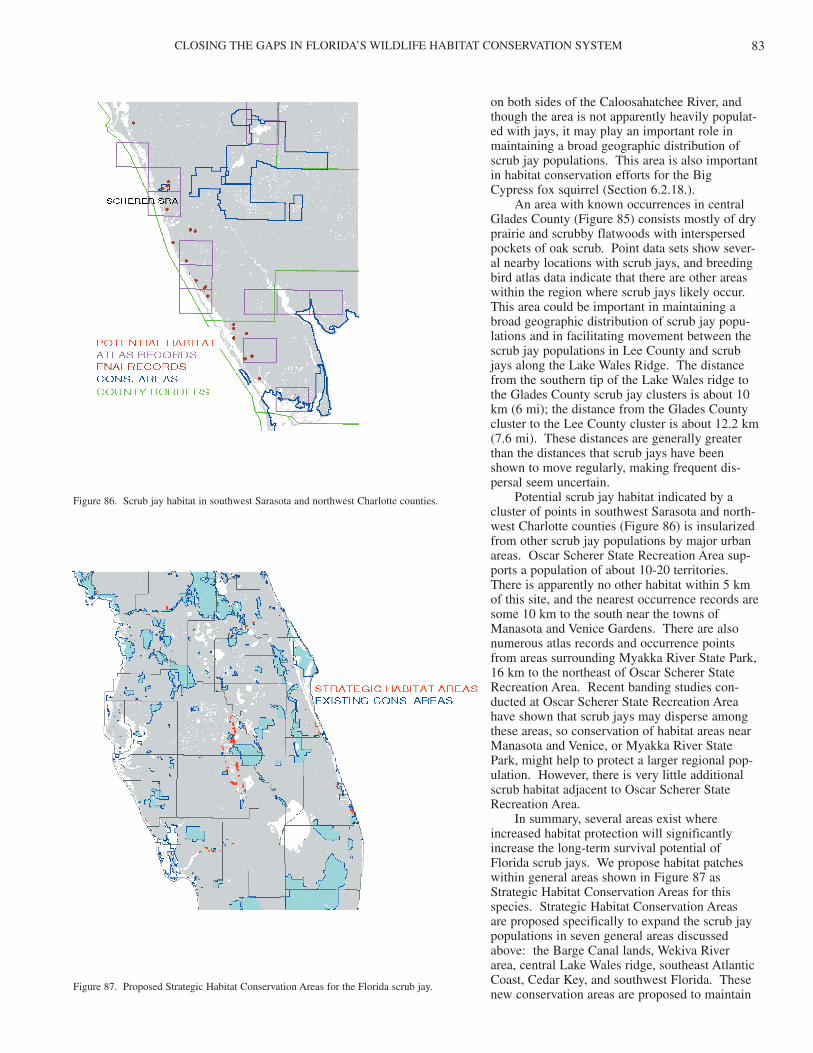
CLOSING THE GAPS IN FLORIDA’S WILDLIFE HABITAT CONSERVATION SYSTEM 83
on both sides of the Caloosahatchee River, andthough the area is not apparently heavily populat-ed with jays, it may play an important role inmaintaining a broad geographic distribution ofscrub jay populations. This area is also importantin habitat conservation efforts for the Big Cypress fox squirrel (Section 6.2.18.).
An area with known occurrences in centralGlades County (Figure 85) consists mostly of dryprairie and scrubby flatwoods with interspersedpockets of oak scrub. Point data sets show sever-al nearby locations with scrub jays, and breedingbird atlas data indicate that there are other areaswithin the region where scrub jays likely occur.This area could be important in maintaining abroad geographic distribution of scrub jay popu-lations and in facilitating movement between thescrub jay populations in Lee County and scrubjays along the Lake Wales Ridge. The distancefrom the southern tip of the Lake Wales ridge tothe Glades County scrub jay clusters is about 10km (6 mi); the distance from the Glades Countycluster to the Lee County cluster is about 12.2 km(7.6 mi). These distances are generally greaterthan the distances that scrub jays have been shown to move regularly, making frequent dis-persal seem uncertain.
Potential scrub jay habitat indicated by acluster of points in southwest Sarasota and north-west Charlotte counties (Figure 86) is insularizedfrom other scrub jay populations by major urbanareas. Oscar Scherer State Recreation Area sup-ports a population of about 10-20 territories.There is apparently no other habitat within 5 kmof this site, and the nearest occurrence records aresome 10 km to the south near the towns ofManasota and Venice Gardens. There are alsonumerous atlas records and occurrence points from areas surrounding Myakka River State Park,16 km to the northeast of Oscar Scherer StateRecreation Area. Recent banding studies con-ducted at Oscar Scherer State Recreation Areahave shown that scrub jays may disperse amongthese areas, so conservation of habitat areas nearManasota and Venice, or Myakka River State Park, might help to protect a larger regional pop-ulation. However, there is very little additionalscrub habitat adjacent to Oscar Scherer StateRecreation Area.
In summary, several areas exist whereincreased habitat protection will significantlyincrease the long-term survival potential of Florida scrub jays. We propose habitat patcheswithin general areas shown in Figure 87 asStrategic Habitat Conservation Areas for thisspecies. Strategic Habitat Conservation Areas are proposed specifically to expand the scrub jaypopulations in seven general areas discussedabove: the Barge Canal lands, Wekiva River area, central Lake Wales ridge, southeast AtlanticCoast, Cedar Key, and southwest Florida. Thesenew conservation areas are proposed to maintain
Figure 86. Scrub jay habitat in southwest Sarasota and northwest Charlotte counties.
Figure 87. Proposed Strategic Habitat Conservation Areas for the Florida scrub jay.
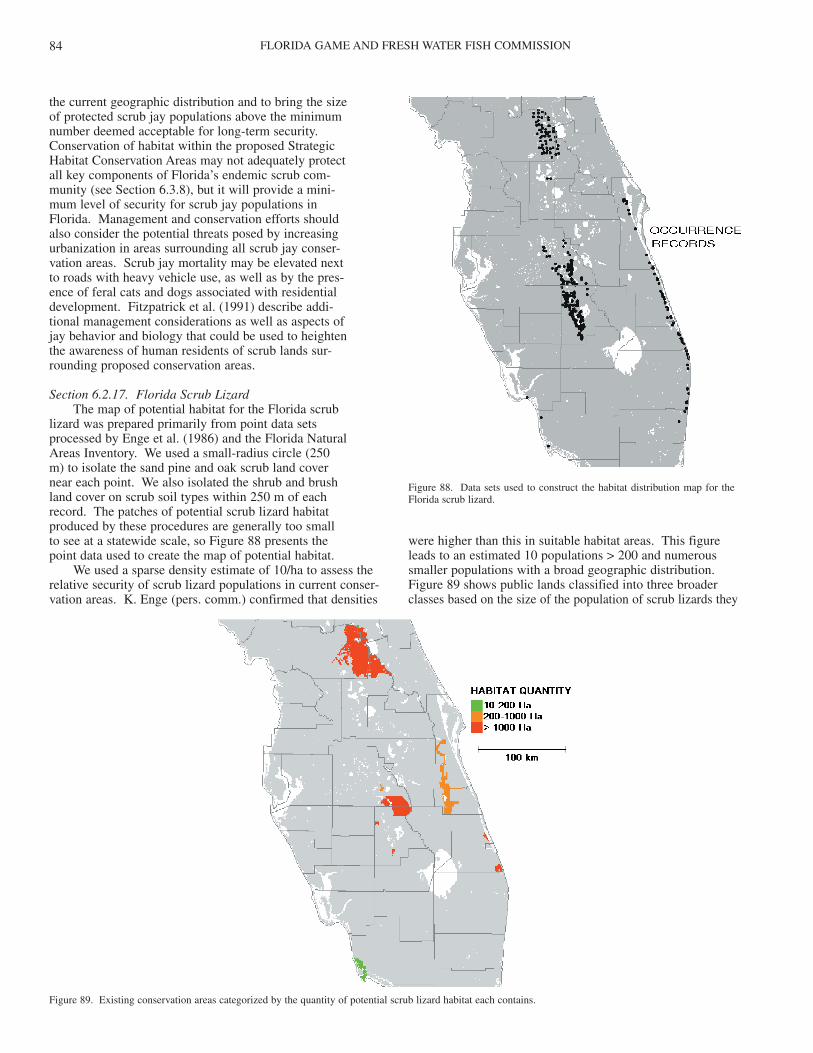
FLORIDA GAME AND FRESH WATER FISH COMMISSION84
the current geographic distribution and to bring the sizeof protected scrub jay populations above the minimumnumber deemed acceptable for long-term security.Conservation of habitat within the proposed StrategicHabitat Conservation Areas may not adequately protectall key components of Florida’s endemic scrub com-munity (see Section 6.3.8), but it will provide a mini-mum level of security for scrub jay populations inFlorida. Management and conservation efforts shouldalso consider the potential threats posed by increasingurbanization in areas surrounding all scrub jay conser-vation areas. Scrub jay mortality may be elevated next to roads with heavy vehicle use, as well as by the pres-ence of feral cats and dogs associated with residentialdevelopment. Fitzpatrick et al. (1991) describe addi-tional management considerations as well as aspects ofjay behavior and biology that could be used to heightenthe awareness of human residents of scrub lands sur-rounding proposed conservation areas.
Section 6.2.17. Florida Scrub LizardThe map of potential habitat for the Florida scrub
lizard was prepared primarily from point data setsprocessed by Enge et al. (1986) and the Florida NaturalAreas Inventory. We used a small-radius circle (250 m) to isolate the sand pine and oak scrub land cover near each point. We also isolated the shrub and brushland cover on scrub soil types within 250 m of eachrecord. The patches of potential scrub lizard habitatproduced by these procedures are generally too small to see at a statewide scale, so Figure 88 presents the point data used to create the map of potential habitat.
We used a sparse density estimate of 10/ha to assess therelative security of scrub lizard populations in current conser-vation areas. K. Enge (pers. comm.) confirmed that densities
were higher than this in suitable habitat areas. This figureleads to an estimated 10 populations > 200 and numeroussmaller populations with a broad geographic distribution.Figure 89 shows public lands classified into three broaderclasses based on the size of the population of scrub lizards they
Figure 88. Data sets used to construct the habitat distribution map for theFlorida scrub lizard.
Figure 89. Existing conservation areas categorized by the quantity of potential scrub lizard habitat each contains.
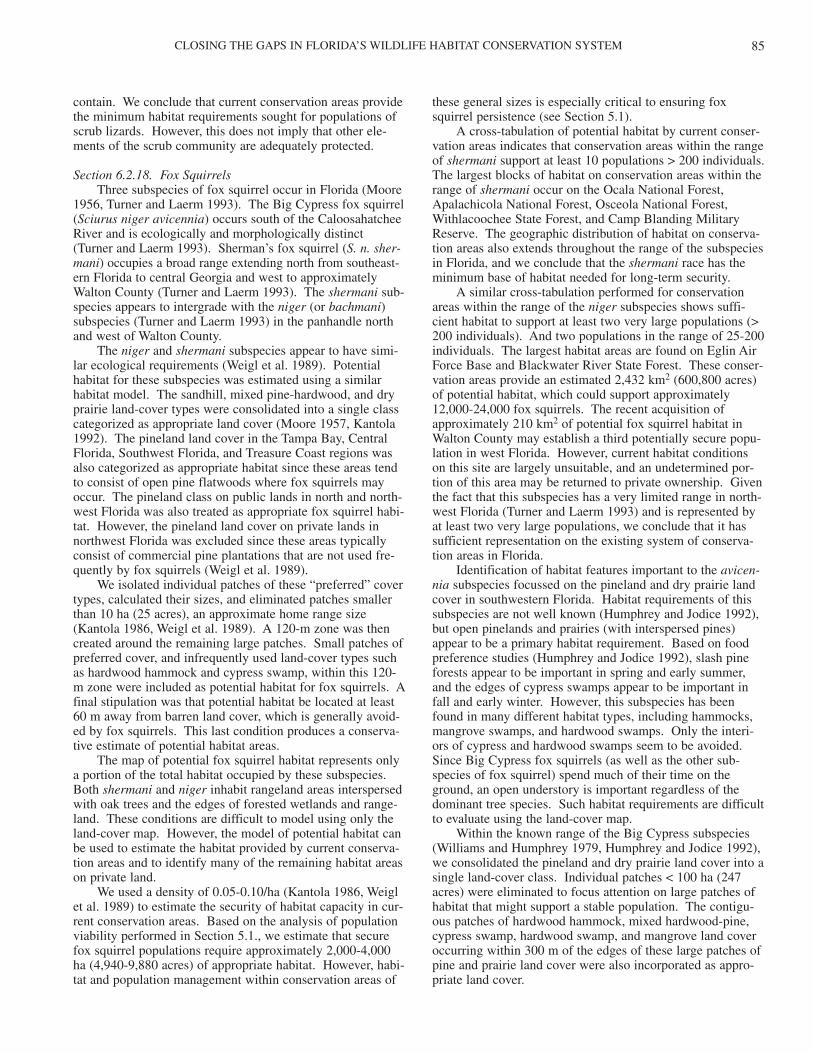
CLOSING THE GAPS IN FLORIDA’S WILDLIFE HABITAT CONSERVATION SYSTEM 85
contain. We conclude that current conservation areas providethe minimum habitat requirements sought for populations ofscrub lizards. However, this does not imply that other ele-ments of the scrub community are adequately protected.
Section 6.2.18. Fox SquirrelsThree subspecies of fox squirrel occur in Florida (Moore
1956, Turner and Laerm 1993). The Big Cypress fox squirrel(Sciurus niger avicennia) occurs south of the CaloosahatcheeRiver and is ecologically and morphologically distinct(Turner and Laerm 1993). Sherman’s fox squirrel (S. n. sher-mani) occupies a broad range extending north from southeast-ern Florida to central Georgia and west to approximatelyWalton County (Turner and Laerm 1993). The shermani sub-species appears to intergrade with the niger (or bachmani)subspecies (Turner and Laerm 1993) in the panhandle northand west of Walton County.
The niger and shermani subspecies appear to have simi-lar ecological requirements (Weigl et al. 1989). Potentialhabitat for these subspecies was estimated using a similarhabitat model. The sandhill, mixed pine-hardwood, and dryprairie land-cover types were consolidated into a single classcategorized as appropriate land cover (Moore 1957, Kantola1992). The pineland land cover in the Tampa Bay, CentralFlorida, Southwest Florida, and Treasure Coast regions wasalso categorized as appropriate habitat since these areas tendto consist of open pine flatwoods where fox squirrels mayoccur. The pineland class on public lands in north and north-west Florida was also treated as appropriate fox squirrel habi-tat. However, the pineland land cover on private lands innorthwest Florida was excluded since these areas typicallyconsist of commercial pine plantations that are not used fre-quently by fox squirrels (Weigl et al. 1989).
We isolated individual patches of these “preferred” covertypes, calculated their sizes, and eliminated patches smallerthan 10 ha (25 acres), an approximate home range size(Kantola 1986, Weigl et al. 1989). A 120-m zone was thencreated around the remaining large patches. Small patches ofpreferred cover, and infrequently used land-cover types suchas hardwood hammock and cypress swamp, within this 120-m zone were included as potential habitat for fox squirrels. Afinal stipulation was that potential habitat be located at least60 m away from barren land cover, which is generally avoid-ed by fox squirrels. This last condition produces a conserva-tive estimate of potential habitat areas.
The map of potential fox squirrel habitat represents onlya portion of the total habitat occupied by these subspecies.Both shermani and niger inhabit rangeland areas interspersedwith oak trees and the edges of forested wetlands and range-land. These conditions are difficult to model using only theland-cover map. However, the model of potential habitat canbe used to estimate the habitat provided by current conserva-tion areas and to identify many of the remaining habitat areason private land.
We used a density of 0.05-0.10/ha (Kantola 1986, Weiglet al. 1989) to estimate the security of habitat capacity in cur-rent conservation areas. Based on the analysis of populationviability performed in Section 5.1., we estimate that securefox squirrel populations require approximately 2,000-4,000ha (4,940-9,880 acres) of appropriate habitat. However, habi-tat and population management within conservation areas of
these general sizes is especially critical to ensuring foxsquirrel persistence (see Section 5.1).
A cross-tabulation of potential habitat by current conser-vation areas indicates that conservation areas within the rangeof shermani support at least 10 populations > 200 individuals.The largest blocks of habitat on conservation areas within therange of shermani occur on the Ocala National Forest,Apalachicola National Forest, Osceola National Forest,Withlacoochee State Forest, and Camp Blanding MilitaryReserve. The geographic distribution of habitat on conserva-tion areas also extends throughout the range of the subspeciesin Florida, and we conclude that the shermani race has theminimum base of habitat needed for long-term security.
A similar cross-tabulation performed for conservationareas within the range of the niger subspecies shows suffi-cient habitat to support at least two very large populations (>200 individuals). And two populations in the range of 25-200individuals. The largest habitat areas are found on Eglin AirForce Base and Blackwater River State Forest. These conser-vation areas provide an estimated 2,432 km2 (600,800 acres)of potential habitat, which could support approximately12,000-24,000 fox squirrels. The recent acquisition ofapproximately 210 km2 of potential fox squirrel habitat inWalton County may establish a third potentially secure popu-lation in west Florida. However, current habitat conditionson this site are largely unsuitable, and an undetermined por-tion of this area may be returned to private ownership. Giventhe fact that this subspecies has a very limited range in north-west Florida (Turner and Laerm 1993) and is represented byat least two very large populations, we conclude that it hassufficient representation on the existing system of conserva-tion areas in Florida.
Identification of habitat features important to the avicen-nia subspecies focussed on the pineland and dry prairie landcover in southwestern Florida. Habitat requirements of thissubspecies are not well known (Humphrey and Jodice 1992),but open pinelands and prairies (with interspersed pines)appear to be a primary habitat requirement. Based on foodpreference studies (Humphrey and Jodice 1992), slash pineforests appear to be important in spring and early summer,and the edges of cypress swamps appear to be important infall and early winter. However, this subspecies has beenfound in many different habitat types, including hammocks,mangrove swamps, and hardwood swamps. Only the interi-ors of cypress and hardwood swamps seem to be avoided.Since Big Cypress fox squirrels (as well as the other sub-species of fox squirrel) spend much of their time on theground, an open understory is important regardless of thedominant tree species. Such habitat requirements are difficultto evaluate using the land-cover map.
Within the known range of the Big Cypress subspecies(Williams and Humphrey 1979, Humphrey and Jodice 1992),we consolidated the pineland and dry prairie land cover into asingle land-cover class. Individual patches < 100 ha (247acres) were eliminated to focus attention on large patches ofhabitat that might support a stable population. The contigu-ous patches of hardwood hammock, mixed hardwood-pine,cypress swamp, hardwood swamp, and mangrove land coveroccurring within 300 m of the edges of these large patches ofpine and prairie land cover were also incorporated as appro-priate land cover.
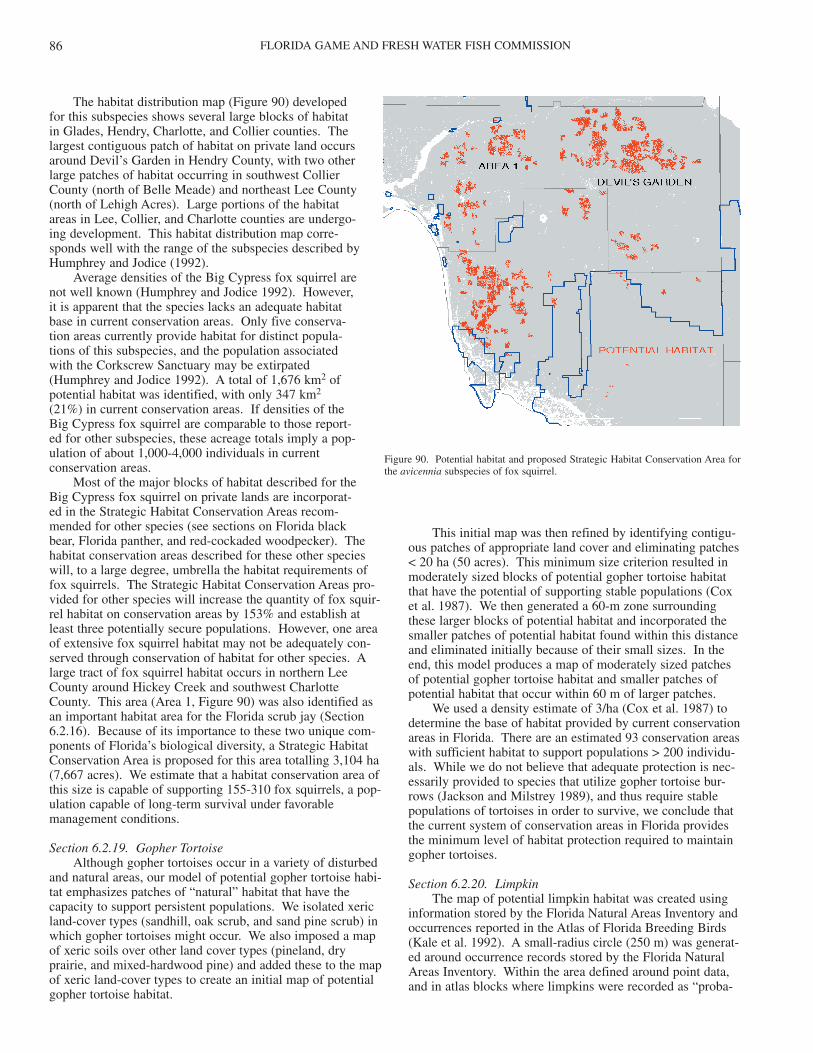
FLORIDA GAME AND FRESH WATER FISH COMMISSION86
The habitat distribution map (Figure 90) developedfor this subspecies shows several large blocks of habitatin Glades, Hendry, Charlotte, and Collier counties. Thelargest contiguous patch of habitat on private land occursaround Devil’s Garden in Hendry County, with two otherlarge patches of habitat occurring in southwest CollierCounty (north of Belle Meade) and northeast Lee County(north of Lehigh Acres). Large portions of the habitatareas in Lee, Collier, and Charlotte counties are undergo-ing development. This habitat distribution map corre-sponds well with the range of the subspecies described byHumphrey and Jodice (1992).
Average densities of the Big Cypress fox squirrel arenot well known (Humphrey and Jodice 1992). However,it is apparent that the species lacks an adequate habitatbase in current conservation areas. Only five conserva-tion areas currently provide habitat for distinct popula-tions of this subspecies, and the population associatedwith the Corkscrew Sanctuary may be extirpated(Humphrey and Jodice 1992). A total of 1,676 km2 ofpotential habitat was identified, with only 347 km2
(21%) in current conservation areas. If densities of theBig Cypress fox squirrel are comparable to those report-ed for other subspecies, these acreage totals imply a pop-ulation of about 1,000-4,000 individuals in currentconservation areas.
Most of the major blocks of habitat described for theBig Cypress fox squirrel on private lands are incorporat-ed in the Strategic Habitat Conservation Areas recom-mended for other species (see sections on Florida blackbear, Florida panther, and red-cockaded woodpecker). Thehabitat conservation areas described for these other specieswill, to a large degree, umbrella the habitat requirements offox squirrels. The Strategic Habitat Conservation Areas pro-vided for other species will increase the quantity of fox squir-rel habitat on conservation areas by 153% and establish atleast three potentially secure populations. However, one areaof extensive fox squirrel habitat may not be adequately con-served through conservation of habitat for other species. Alarge tract of fox squirrel habitat occurs in northern LeeCounty around Hickey Creek and southwest CharlotteCounty. This area (Area 1, Figure 90) was also identified asan important habitat area for the Florida scrub jay (Section6.2.16). Because of its importance to these two unique com-ponents of Florida’s biological diversity, a Strategic HabitatConservation Area is proposed for this area totalling 3,104 ha(7,667 acres). We estimate that a habitat conservation area ofthis size is capable of supporting 155-310 fox squirrels, a pop-ulation capable of long-term survival under favorablemanagement conditions.
Section 6.2.19. Gopher TortoiseAlthough gopher tortoises occur in a variety of disturbed
and natural areas, our model of potential gopher tortoise habi-tat emphasizes patches of “natural” habitat that have thecapacity to support persistent populations. We isolated xericland-cover types (sandhill, oak scrub, and sand pine scrub) inwhich gopher tortoises might occur. We also imposed a mapof xeric soils over other land cover types (pineland, dryprairie, and mixed-hardwood pine) and added these to the mapof xeric land-cover types to create an initial map of potentialgopher tortoise habitat.
This initial map was then refined by identifying contigu-ous patches of appropriate land cover and eliminating patches< 20 ha (50 acres). This minimum size criterion resulted inmoderately sized blocks of potential gopher tortoise habitatthat have the potential of supporting stable populations (Coxet al. 1987). We then generated a 60-m zone surroundingthese larger blocks of potential habitat and incorporated thesmaller patches of potential habitat found within this distanceand eliminated initially because of their small sizes. In theend, this model produces a map of moderately sized patchesof potential gopher tortoise habitat and smaller patches ofpotential habitat that occur within 60 m of larger patches.
We used a density estimate of 3/ha (Cox et al. 1987) todetermine the base of habitat provided by current conservationareas in Florida. There are an estimated 93 conservation areaswith sufficient habitat to support populations > 200 individu-als. While we do not believe that adequate protection is nec-essarily provided to species that utilize gopher tortoise bur-rows (Jackson and Milstrey 1989), and thus require stablepopulations of tortoises in order to survive, we conclude thatthe current system of conservation areas in Florida providesthe minimum level of habitat protection required to maintaingopher tortoises.
Section 6.2.20. LimpkinThe map of potential limpkin habitat was created using
information stored by the Florida Natural Areas Inventory andoccurrences reported in the Atlas of Florida Breeding Birds(Kale et al. 1992). A small-radius circle (250 m) was generat-ed around occurrence records stored by the Florida NaturalAreas Inventory. Within the area defined around point data,and in atlas blocks where limpkins were recorded as “proba-
Figure 90. Potential habitat and proposed Strategic Habitat Conservation Area forthe avicennia subspecies of fox squirrel.
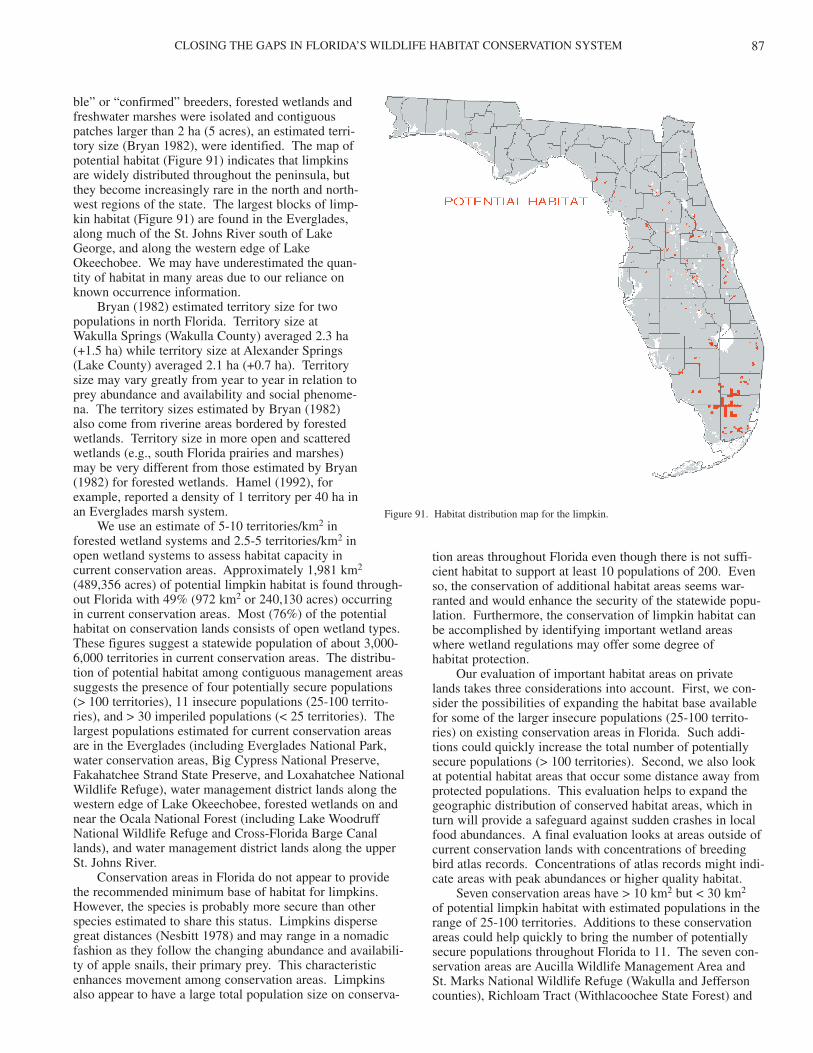
CLOSING THE GAPS IN FLORIDA’S WILDLIFE HABITAT CONSERVATION SYSTEM 87
tion areas throughout Florida even though there is not suffi-cient habitat to support at least 10 populations of 200. Evenso, the conservation of additional habitat areas seems war-ranted and would enhance the security of the statewide popu-lation. Furthermore, the conservation of limpkin habitat canbe accomplished by identifying important wetland areaswhere wetland regulations may offer some degree of habitat protection.
Our evaluation of important habitat areas on privatelands takes three considerations into account. First, we con-sider the possibilities of expanding the habitat base availablefor some of the larger insecure populations (25-100 territo-ries) on existing conservation areas in Florida. Such addi-tions could quickly increase the total number of potentiallysecure populations (> 100 territories). Second, we also lookat potential habitat areas that occur some distance away fromprotected populations. This evaluation helps to expand thegeographic distribution of conserved habitat areas, which inturn will provide a safeguard against sudden crashes in localfood abundances. A final evaluation looks at areas outside ofcurrent conservation lands with concentrations of breedingbird atlas records. Concentrations of atlas records might indi-cate areas with peak abundances or higher quality habitat.
Seven conservation areas have > 10 km2 but < 30 km2
of potential limpkin habitat with estimated populations in therange of 25-100 territories. Additions to these conservationareas could help quickly to bring the number of potentiallysecure populations throughout Florida to 11. The seven con-servation areas are Aucilla Wildlife Management Area and St. Marks National Wildlife Refuge (Wakulla and Jeffersoncounties), Richloam Tract (Withlacoochee State Forest) and
ble” or “confirmed” breeders, forested wetlands andfreshwater marshes were isolated and contiguouspatches larger than 2 ha (5 acres), an estimated terri-tory size (Bryan 1982), were identified. The map ofpotential habitat (Figure 91) indicates that limpkinsare widely distributed throughout the peninsula, butthey become increasingly rare in the north and north-west regions of the state. The largest blocks of limp-kin habitat (Figure 91) are found in the Everglades,along much of the St. Johns River south of LakeGeorge, and along the western edge of LakeOkeechobee. We may have underestimated the quan-tity of habitat in many areas due to our reliance onknown occurrence information.
Bryan (1982) estimated territory size for twopopulations in north Florida. Territory size atWakulla Springs (Wakulla County) averaged 2.3 ha(+1.5 ha) while territory size at Alexander Springs(Lake County) averaged 2.1 ha (+0.7 ha). Territorysize may vary greatly from year to year in relation toprey abundance and availability and social phenome-na. The territory sizes estimated by Bryan (1982)also come from riverine areas bordered by forestedwetlands. Territory size in more open and scatteredwetlands (e.g., south Florida prairies and marshes)may be very different from those estimated by Bryan(1982) for forested wetlands. Hamel (1992), forexample, reported a density of 1 territory per 40 ha inan Everglades marsh system.
We use an estimate of 5-10 territories/km2 inforested wetland systems and 2.5-5 territories/km2 inopen wetland systems to assess habitat capacity in current conservation areas. Approximately 1,981 km2
(489,356 acres) of potential limpkin habitat is found through-out Florida with 49% (972 km2 or 240,130 acres) occurringin current conservation areas. Most (76%) of the potentialhabitat on conservation lands consists of open wetland types.These figures suggest a statewide population of about 3,000-6,000 territories in current conservation areas. The distribu-tion of potential habitat among contiguous management areassuggests the presence of four potentially secure populations(> 100 territories), 11 insecure populations (25-100 territo-ries), and > 30 imperiled populations (< 25 territories). Thelargest populations estimated for current conservation areasare in the Everglades (including Everglades National Park,water conservation areas, Big Cypress National Preserve,Fakahatchee Strand State Preserve, and Loxahatchee NationalWildlife Refuge), water management district lands along thewestern edge of Lake Okeechobee, forested wetlands on andnear the Ocala National Forest (including Lake WoodruffNational Wildlife Refuge and Cross-Florida Barge Canallands), and water management district lands along the upperSt. Johns River.
Conservation areas in Florida do not appear to providethe recommended minimum base of habitat for limpkins.However, the species is probably more secure than otherspecies estimated to share this status. Limpkins dispersegreat distances (Nesbitt 1978) and may range in a nomadicfashion as they follow the changing abundance and availabili-ty of apple snails, their primary prey. This characteristicenhances movement among conservation areas. Limpkinsalso appear to have a large total population size on conserva-
Figure 91. Habitat distribution map for the limpkin.
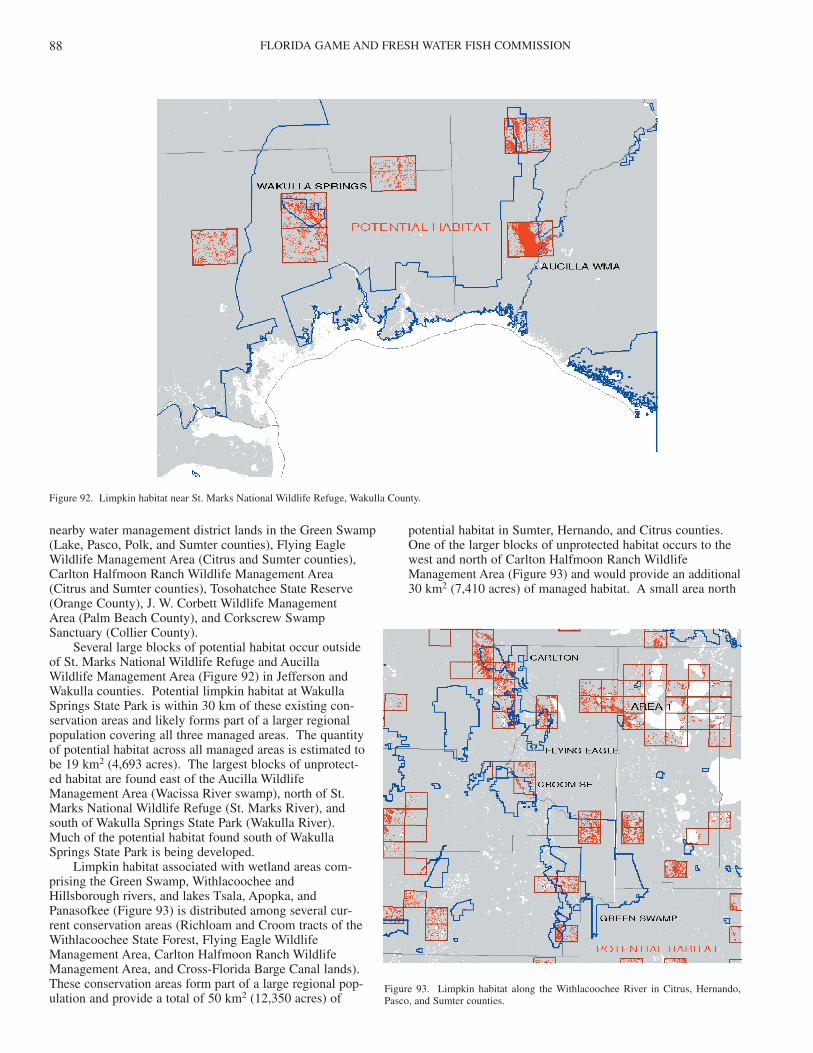
FLORIDA GAME AND FRESH WATER FISH COMMISSION88
nearby water management district lands in the Green Swamp(Lake, Pasco, Polk, and Sumter counties), Flying EagleWildlife Management Area (Citrus and Sumter counties),Carlton Halfmoon Ranch Wildlife Management Area (Citrus and Sumter counties), Tosohatchee State Reserve(Orange County), J. W. Corbett Wildlife Management Area (Palm Beach County), and Corkscrew SwampSanctuary (Collier County).
Several large blocks of potential habitat occur outsideof St. Marks National Wildlife Refuge and AucillaWildlife Management Area (Figure 92) in Jefferson andWakulla counties. Potential limpkin habitat at WakullaSprings State Park is within 30 km of these existing con-servation areas and likely forms part of a larger regionalpopulation covering all three managed areas. The quantityof potential habitat across all managed areas is estimated tobe 19 km2 (4,693 acres). The largest blocks of unprotect-ed habitat are found east of the Aucilla WildlifeManagement Area (Wacissa River swamp), north of St.Marks National Wildlife Refuge (St. Marks River), andsouth of Wakulla Springs State Park (Wakulla River).Much of the potential habitat found south of WakullaSprings State Park is being developed.
Limpkin habitat associated with wetland areas com-prising the Green Swamp, Withlacoochee andHillsborough rivers, and lakes Tsala, Apopka, andPanasofkee (Figure 93) is distributed among several cur-rent conservation areas (Richloam and Croom tracts of theWithlacoochee State Forest, Flying Eagle WildlifeManagement Area, Carlton Halfmoon Ranch WildlifeManagement Area, and Cross-Florida Barge Canal lands).These conservation areas form part of a large regional pop-ulation and provide a total of 50 km2 (12,350 acres) of
potential habitat in Sumter, Hernando, and Citrus counties.One of the larger blocks of unprotected habitat occurs to thewest and north of Carlton Halfmoon Ranch WildlifeManagement Area (Figure 93) and would provide an additional30 km2 (7,410 acres) of managed habitat. A small area north
Figure 92. Limpkin habitat near St. Marks National Wildlife Refuge, Wakulla County.
Figure 93. Limpkin habitat along the Withlacoochee River in Citrus, Hernando,Pasco, and Sumter counties.
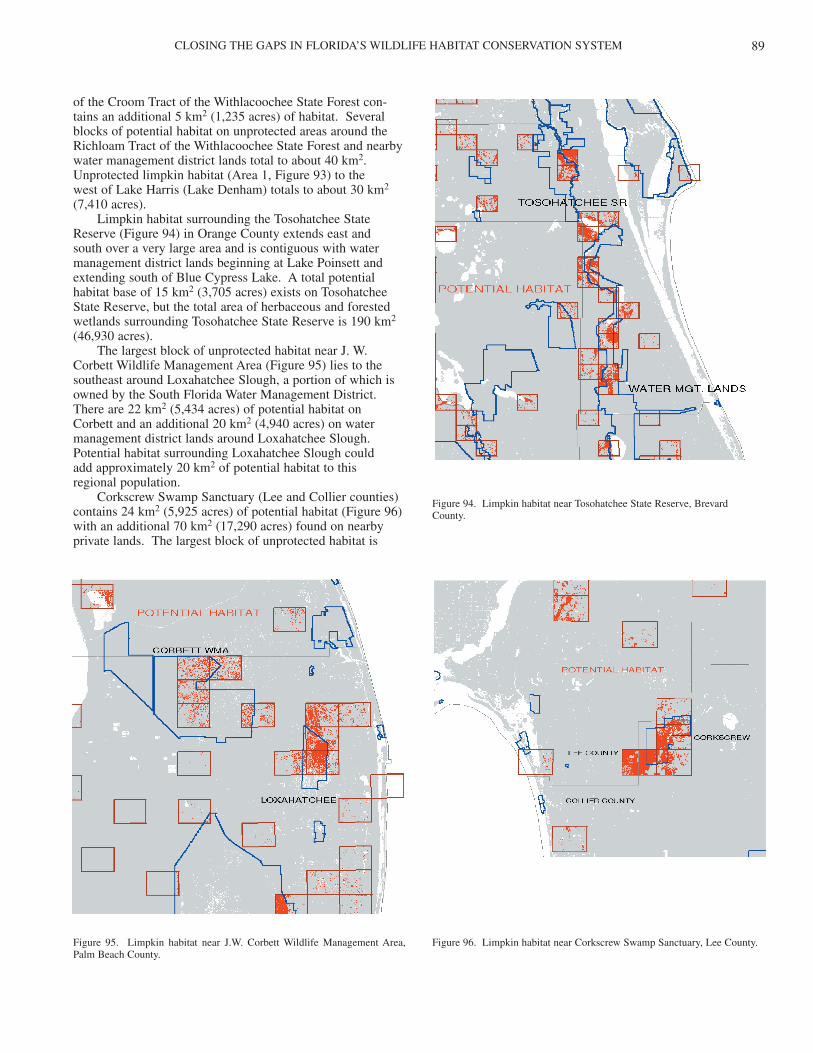
CLOSING THE GAPS IN FLORIDA’S WILDLIFE HABITAT CONSERVATION SYSTEM 89
of the Croom Tract of the Withlacoochee State Forest con-tains an additional 5 km2 (1,235 acres) of habitat. Severalblocks of potential habitat on unprotected areas around theRichloam Tract of the Withlacoochee State Forest and nearbywater management district lands total to about 40 km2.Unprotected limpkin habitat (Area 1, Figure 93) to the west of Lake Harris (Lake Denham) totals to about 30 km2
(7,410 acres).Limpkin habitat surrounding the Tosohatchee State
Reserve (Figure 94) in Orange County extends east and south over a very large area and is contiguous with watermanagement district lands beginning at Lake Poinsett andextending south of Blue Cypress Lake. A total potentialhabitat base of 15 km2 (3,705 acres) exists on TosohatcheeState Reserve, but the total area of herbaceous and forestedwetlands surrounding Tosohatchee State Reserve is 190 km2
(46,930 acres).The largest block of unprotected habitat near J. W.
Corbett Wildlife Management Area (Figure 95) lies to thesoutheast around Loxahatchee Slough, a portion of which isowned by the South Florida Water Management District.There are 22 km2 (5,434 acres) of potential habitat on Corbett and an additional 20 km2 (4,940 acres) on watermanagement district lands around Loxahatchee Slough.Potential habitat surrounding Loxahatchee Slough could add approximately 20 km2 of potential habitat to this regional population.
Corkscrew Swamp Sanctuary (Lee and Collier counties)contains 24 km2 (5,925 acres) of potential habitat (Figure 96)with an additional 70 km2 (17,290 acres) found on nearbyprivate lands. The largest block of unprotected habitat is
Figure 94. Limpkin habitat near Tosohatchee State Reserve, Brevard County.
Figure 95. Limpkin habitat near J.W. Corbett Wildlife Management Area,Palm Beach County.
Figure 96. Limpkin habitat near Corkscrew Swamp Sanctuary, Lee County.
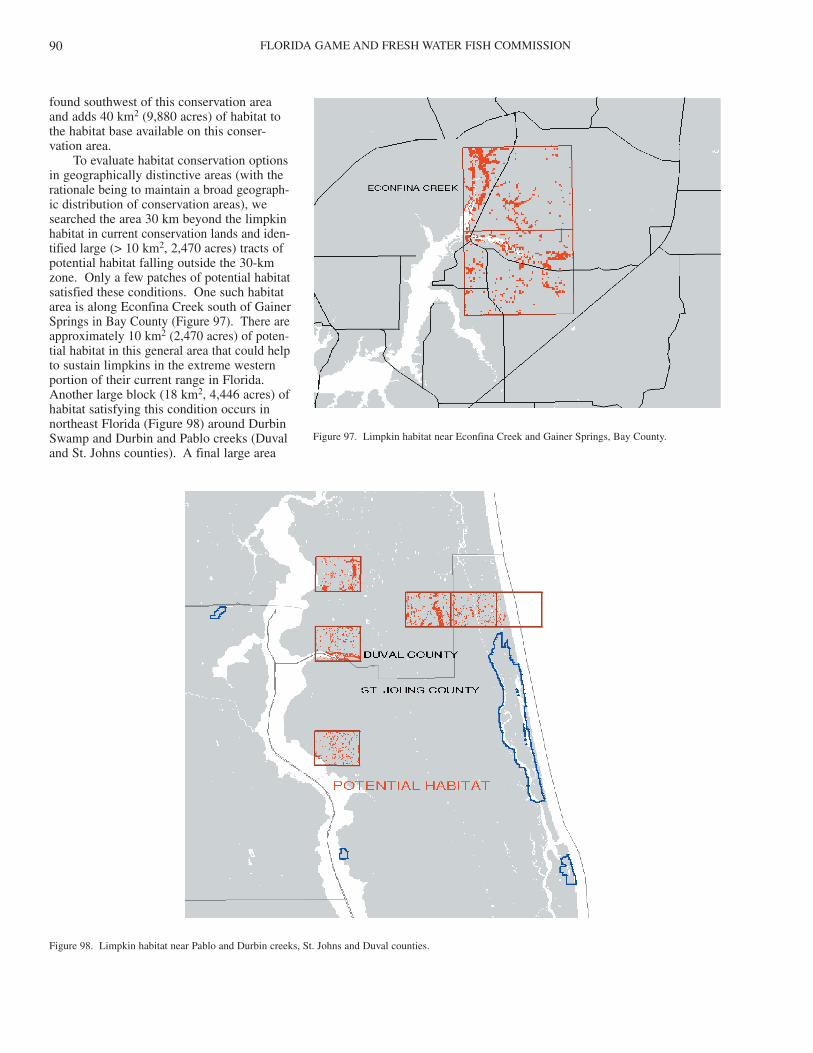
FLORIDA GAME AND FRESH WATER FISH COMMISSION90
found southwest of this conservation areaand adds 40 km2 (9,880 acres) of habitat tothe habitat base available on this conser-vation area.
To evaluate habitat conservation optionsin geographically distinctive areas (with therationale being to maintain a broad geograph-ic distribution of conservation areas), wesearched the area 30 km beyond the limpkinhabitat in current conservation lands and iden-tified large (> 10 km2, 2,470 acres) tracts ofpotential habitat falling outside the 30-kmzone. Only a few patches of potential habitatsatisfied these conditions. One such habitatarea is along Econfina Creek south of GainerSprings in Bay County (Figure 97). There areapproximately 10 km2 (2,470 acres) of poten-tial habitat in this general area that could helpto sustain limpkins in the extreme westernportion of their current range in Florida.Another large block (18 km2, 4,446 acres) ofhabitat satisfying this condition occurs innortheast Florida (Figure 98) around DurbinSwamp and Durbin and Pablo creeks (Duvaland St. Johns counties). A final large area
Figure 97. Limpkin habitat near Econfina Creek and Gainer Springs, Bay County.
Figure 98. Limpkin habitat near Pablo and Durbin creeks, St. Johns and Duval counties.
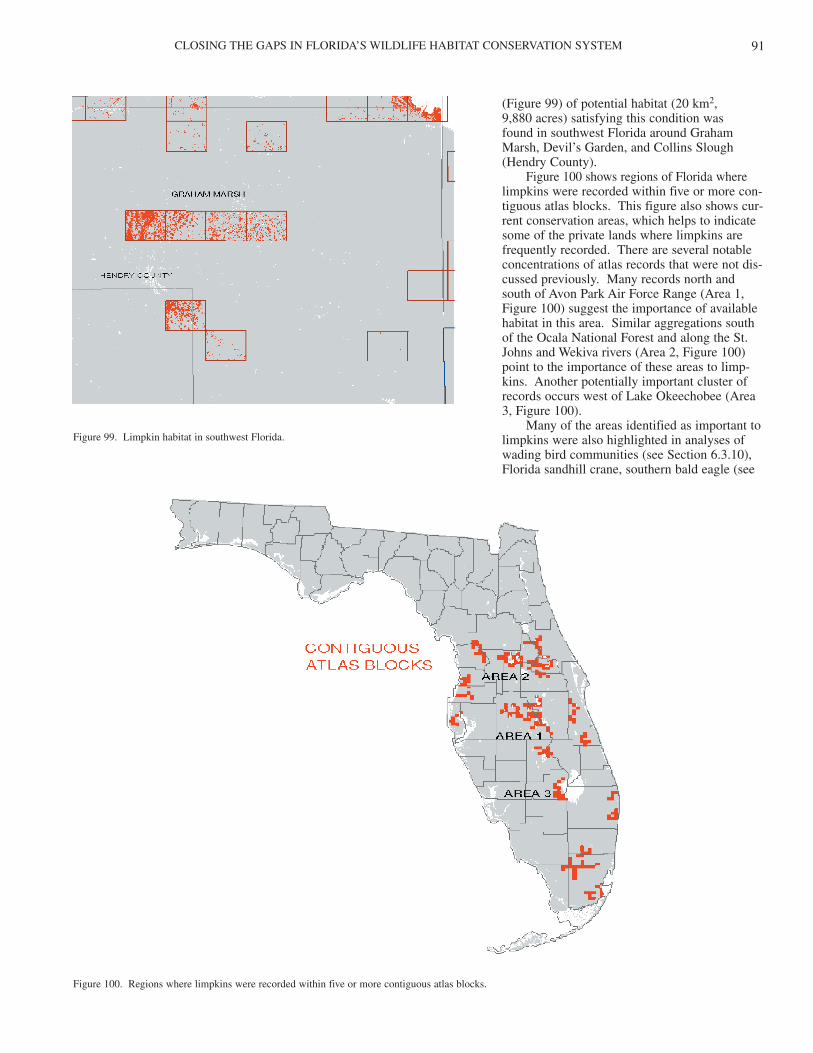
CLOSING THE GAPS IN FLORIDA’S WILDLIFE HABITAT CONSERVATION SYSTEM 91
(Figure 99) of potential habitat (20 km2,9,880 acres) satisfying this condition was found in southwest Florida around GrahamMarsh, Devil’s Garden, and Collins Slough(Hendry County).
Figure 100 shows regions of Florida wherelimpkins were recorded within five or more con-tiguous atlas blocks. This figure also shows cur-rent conservation areas, which helps to indicatesome of the private lands where limpkins arefrequently recorded. There are several notableconcentrations of atlas records that were not dis-cussed previously. Many records north andsouth of Avon Park Air Force Range (Area 1,Figure 100) suggest the importance of availablehabitat in this area. Similar aggregations southof the Ocala National Forest and along the St.Johns and Wekiva rivers (Area 2, Figure 100)point to the importance of these areas to limp-kins. Another potentially important cluster ofrecords occurs west of Lake Okeechobee (Area3, Figure 100).
Many of the areas identified as important tolimpkins were also highlighted in analyses ofwading bird communities (see Section 6.3.10),Florida sandhill crane, southern bald eagle (see
Figure 99. Limpkin habitat in southwest Florida.
Figure 100. Regions where limpkins were recorded within five or more contiguous atlas blocks.
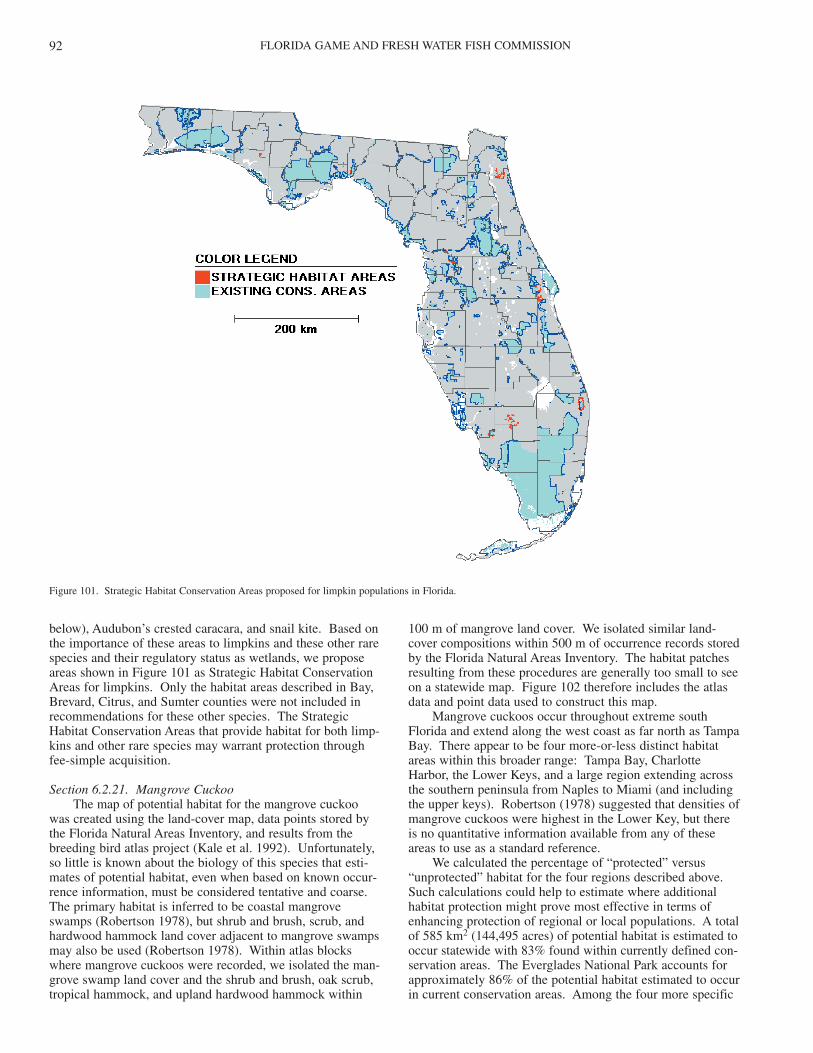
FLORIDA GAME AND FRESH WATER FISH COMMISSION92
below), Audubon’s crested caracara, and snail kite. Based onthe importance of these areas to limpkins and these other rarespecies and their regulatory status as wetlands, we proposeareas shown in Figure 101 as Strategic Habitat ConservationAreas for limpkins. Only the habitat areas described in Bay,Brevard, Citrus, and Sumter counties were not included inrecommendations for these other species. The StrategicHabitat Conservation Areas that provide habitat for both limp-kins and other rare species may warrant protection throughfee-simple acquisition.
Section 6.2.21. Mangrove CuckooThe map of potential habitat for the mangrove cuckoo
was created using the land-cover map, data points stored bythe Florida Natural Areas Inventory, and results from thebreeding bird atlas project (Kale et al. 1992). Unfortunately,so little is known about the biology of this species that esti-mates of potential habitat, even when based on known occur-rence information, must be considered tentative and coarse.The primary habitat is inferred to be coastal mangroveswamps (Robertson 1978), but shrub and brush, scrub, andhardwood hammock land cover adjacent to mangrove swampsmay also be used (Robertson 1978). Within atlas blockswhere mangrove cuckoos were recorded, we isolated the man-grove swamp land cover and the shrub and brush, oak scrub,tropical hammock, and upland hardwood hammock within
100 m of mangrove land cover. We isolated similar land-cover compositions within 500 m of occurrence records storedby the Florida Natural Areas Inventory. The habitat patchesresulting from these procedures are generally too small to seeon a statewide map. Figure 102 therefore includes the atlasdata and point data used to construct this map.
Mangrove cuckoos occur throughout extreme southFlorida and extend along the west coast as far north as TampaBay. There appear to be four more-or-less distinct habitatareas within this broader range: Tampa Bay, CharlotteHarbor, the Lower Keys, and a large region extending acrossthe southern peninsula from Naples to Miami (and includingthe upper keys). Robertson (1978) suggested that densities ofmangrove cuckoos were highest in the Lower Key, but thereis no quantitative information available from any of theseareas to use as a standard reference.
We calculated the percentage of “protected” versus“unprotected” habitat for the four regions described above.Such calculations could help to estimate where additionalhabitat protection might prove most effective in terms ofenhancing protection of regional or local populations. A totalof 585 km2 (144,495 acres) of potential habitat is estimated tooccur statewide with 83% found within currently defined con-servation areas. The Everglades National Park accounts forapproximately 86% of the potential habitat estimated to occurin current conservation areas. Among the four more specific
Figure 101. Strategic Habitat Conservation Areas proposed for limpkin populations in Florida.
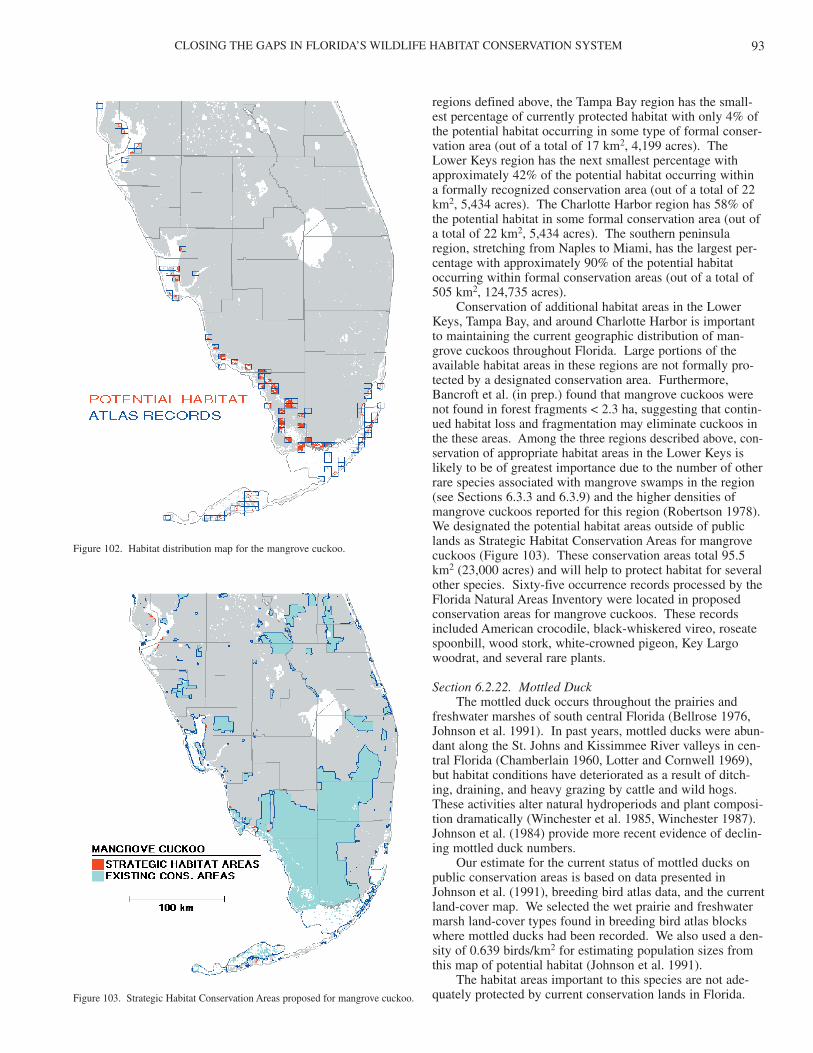
CLOSING THE GAPS IN FLORIDA’S WILDLIFE HABITAT CONSERVATION SYSTEM 93
regions defined above, the Tampa Bay region has the small-est percentage of currently protected habitat with only 4% ofthe potential habitat occurring in some type of formal conser-vation area (out of a total of 17 km2, 4,199 acres). TheLower Keys region has the next smallest percentage withapproximately 42% of the potential habitat occurring within a formally recognized conservation area (out of a total of 22km2, 5,434 acres). The Charlotte Harbor region has 58% ofthe potential habitat in some formal conservation area (out ofa total of 22 km2, 5,434 acres). The southern peninsularegion, stretching from Naples to Miami, has the largest per-centage with approximately 90% of the potential habitatoccurring within formal conservation areas (out of a total of505 km2, 124,735 acres).
Conservation of additional habitat areas in the LowerKeys, Tampa Bay, and around Charlotte Harbor is importantto maintaining the current geographic distribution of man-grove cuckoos throughout Florida. Large portions of theavailable habitat areas in these regions are not formally pro-tected by a designated conservation area. Furthermore,Bancroft et al. (in prep.) found that mangrove cuckoos werenot found in forest fragments < 2.3 ha, suggesting that contin-ued habitat loss and fragmentation may eliminate cuckoos inthe these areas. Among the three regions described above, con-servation of appropriate habitat areas in the Lower Keys islikely to be of greatest importance due to the number of otherrare species associated with mangrove swamps in the region(see Sections 6.3.3 and 6.3.9) and the higher densities ofmangrove cuckoos reported for this region (Robertson 1978).We designated the potential habitat areas outside of publiclands as Strategic Habitat Conservation Areas for mangrovecuckoos (Figure 103). These conservation areas total 95.5km2 (23,000 acres) and will help to protect habitat for severalother species. Sixty-five occurrence records processed by theFlorida Natural Areas Inventory were located in proposedconservation areas for mangrove cuckoos. These recordsincluded American crocodile, black-whiskered vireo, roseatespoonbill, wood stork, white-crowned pigeon, Key Largowoodrat, and several rare plants.
Section 6.2.22. Mottled DuckThe mottled duck occurs throughout the prairies and
freshwater marshes of south central Florida (Bellrose 1976,Johnson et al. 1991). In past years, mottled ducks were abun-dant along the St. Johns and Kissimmee River valleys in cen-tral Florida (Chamberlain 1960, Lotter and Cornwell 1969),but habitat conditions have deteriorated as a result of ditch-ing, draining, and heavy grazing by cattle and wild hogs.These activities alter natural hydroperiods and plant composi-tion dramatically (Winchester et al. 1985, Winchester 1987).Johnson et al. (1984) provide more recent evidence of declin-ing mottled duck numbers.
Our estimate for the current status of mottled ducks onpublic conservation areas is based on data presented inJohnson et al. (1991), breeding bird atlas data, and the currentland-cover map. We selected the wet prairie and freshwatermarsh land-cover types found in breeding bird atlas blockswhere mottled ducks had been recorded. We also used a den-sity of 0.639 birds/km2 for estimating population sizes fromthis map of potential habitat (Johnson et al. 1991).
The habitat areas important to this species are not ade-quately protected by current conservation lands in Florida.
Figure 102. Habitat distribution map for the mangrove cuckoo.
Figure 103. Strategic Habitat Conservation Areas proposed for mangrove cuckoo.
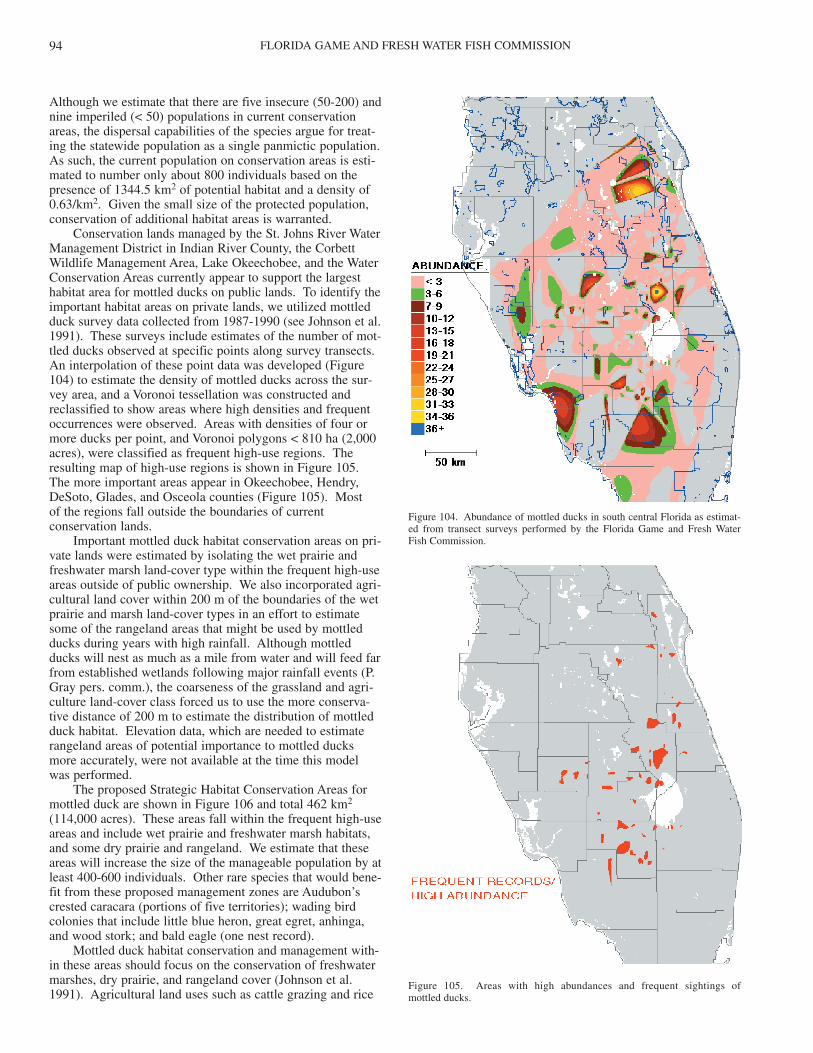
FLORIDA GAME AND FRESH WATER FISH COMMISSION94
Although we estimate that there are five insecure (50-200) andnine imperiled (< 50) populations in current conservationareas, the dispersal capabilities of the species argue for treat-ing the statewide population as a single panmictic population.As such, the current population on conservation areas is esti-mated to number only about 800 individuals based on thepresence of 1344.5 km2 of potential habitat and a density of0.63/km2. Given the small size of the protected population,conservation of additional habitat areas is warranted.
Conservation lands managed by the St. Johns River WaterManagement District in Indian River County, the CorbettWildlife Management Area, Lake Okeechobee, and the WaterConservation Areas currently appear to support the largesthabitat area for mottled ducks on public lands. To identify theimportant habitat areas on private lands, we utilized mottledduck survey data collected from 1987-1990 (see Johnson et al.1991). These surveys include estimates of the number of mot-tled ducks observed at specific points along survey transects.An interpolation of these point data was developed (Figure104) to estimate the density of mottled ducks across the sur-vey area, and a Voronoi tessellation was constructed andreclassified to show areas where high densities and frequentoccurrences were observed. Areas with densities of four ormore ducks per point, and Voronoi polygons < 810 ha (2,000acres), were classified as frequent high-use regions. Theresulting map of high-use regions is shown in Figure 105.The more important areas appear in Okeechobee, Hendry,DeSoto, Glades, and Osceola counties (Figure 105). Most of the regions fall outside the boundaries of current conservation lands.
Important mottled duck habitat conservation areas on pri-vate lands were estimated by isolating the wet prairie andfreshwater marsh land-cover type within the frequent high-useareas outside of public ownership. We also incorporated agri-cultural land cover within 200 m of the boundaries of the wetprairie and marsh land-cover types in an effort to estimatesome of the rangeland areas that might be used by mottledducks during years with high rainfall. Although mottledducks will nest as much as a mile from water and will feed farfrom established wetlands following major rainfall events (P.Gray pers. comm.), the coarseness of the grassland and agri-culture land-cover class forced us to use the more conserva-tive distance of 200 m to estimate the distribution of mottledduck habitat. Elevation data, which are needed to estimaterangeland areas of potential importance to mottled ducksmore accurately, were not available at the time this modelwas performed.
The proposed Strategic Habitat Conservation Areas formottled duck are shown in Figure 106 and total 462 km2
(114,000 acres). These areas fall within the frequent high-useareas and include wet prairie and freshwater marsh habitats,and some dry prairie and rangeland. We estimate that theseareas will increase the size of the manageable population by atleast 400-600 individuals. Other rare species that would bene-fit from these proposed management zones are Audubon’scrested caracara (portions of five territories); wading birdcolonies that include little blue heron, great egret, anhinga,and wood stork; and bald eagle (one nest record).
Mottled duck habitat conservation and management with-in these areas should focus on the conservation of freshwatermarshes, dry prairie, and rangeland cover (Johnson et al.1991). Agricultural land uses such as cattle grazing and rice
Figure 104. Abundance of mottled ducks in south central Florida as estimat-ed from transect surveys performed by the Florida Game and Fresh Water Fish Commission.
Figure 105. Areas with high abundances and frequent sightings of mottled ducks.
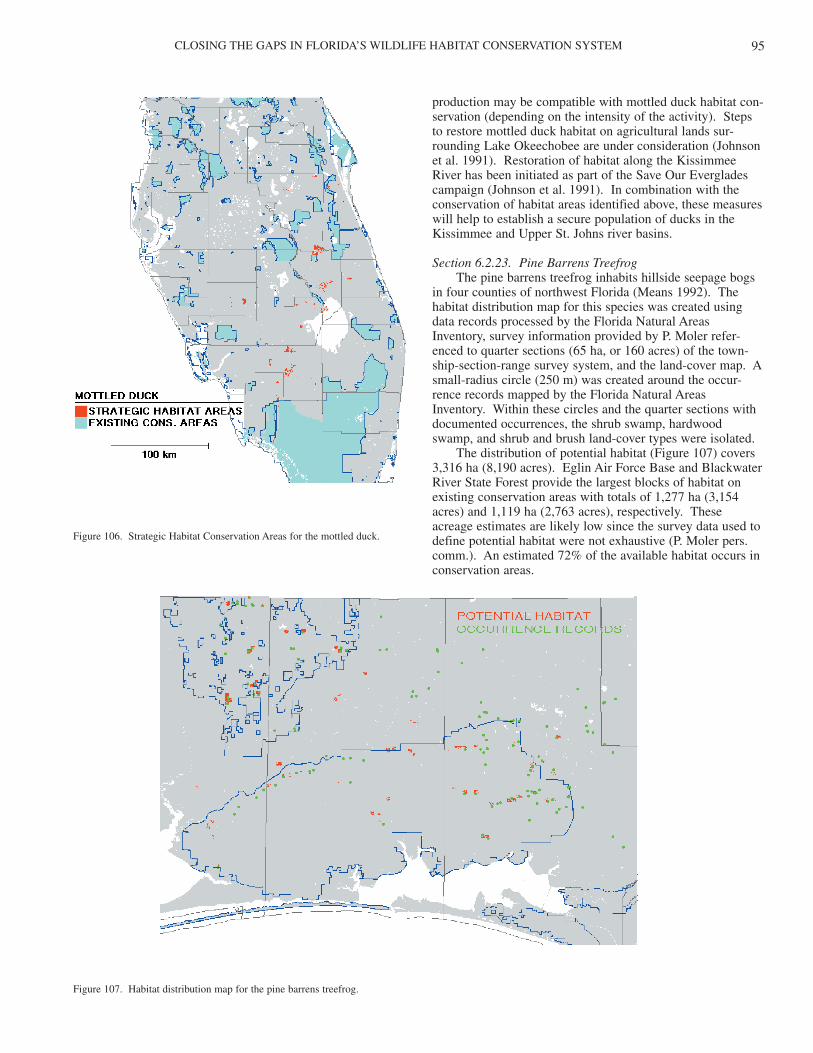
CLOSING THE GAPS IN FLORIDA’S WILDLIFE HABITAT CONSERVATION SYSTEM 95
production may be compatible with mottled duck habitat con-servation (depending on the intensity of the activity). Stepsto restore mottled duck habitat on agricultural lands sur-rounding Lake Okeechobee are under consideration (Johnsonet al. 1991). Restoration of habitat along the KissimmeeRiver has been initiated as part of the Save Our Evergladescampaign (Johnson et al. 1991). In combination with theconservation of habitat areas identified above, these measureswill help to establish a secure population of ducks in theKissimmee and Upper St. Johns river basins.
Section 6.2.23. Pine Barrens TreefrogThe pine barrens treefrog inhabits hillside seepage bogs
in four counties of northwest Florida (Means 1992). Thehabitat distribution map for this species was created usingdata records processed by the Florida Natural AreasInventory, survey information provided by P. Moler refer-enced to quarter sections (65 ha, or 160 acres) of the town-ship-section-range survey system, and the land-cover map. Asmall-radius circle (250 m) was created around the occur-rence records mapped by the Florida Natural Areas Inventory. Within these circles and the quarter sections withdocumented occurrences, the shrub swamp, hardwoodswamp, and shrub and brush land-cover types were isolated.
The distribution of potential habitat (Figure 107) covers3,316 ha (8,190 acres). Eglin Air Force Base and BlackwaterRiver State Forest provide the largest blocks of habitat onexisting conservation areas with totals of 1,277 ha (3,154acres) and 1,119 ha (2,763 acres), respectively. Theseacreage estimates are likely low since the survey data used todefine potential habitat were not exhaustive (P. Moler pers.comm.). An estimated 72% of the available habitat occurs inconservation areas.
Figure 106. Strategic Habitat Conservation Areas for the mottled duck.
Figure 107. Habitat distribution map for the pine barrens treefrog.
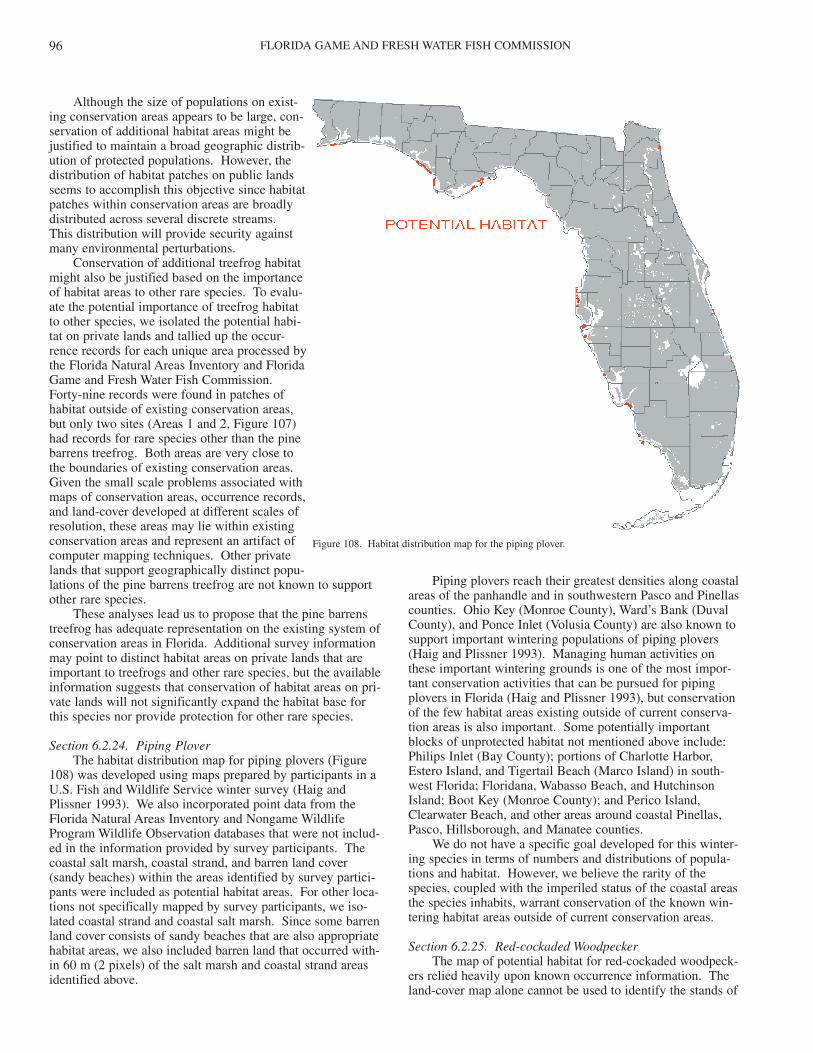
FLORIDA GAME AND FRESH WATER FISH COMMISSION96
Piping plovers reach their greatest densities along coastalareas of the panhandle and in southwestern Pasco and Pinellascounties. Ohio Key (Monroe County), Ward’s Bank (DuvalCounty), and Ponce Inlet (Volusia County) are also known tosupport important wintering populations of piping plovers(Haig and Plissner 1993). Managing human activities onthese important wintering grounds is one of the most impor-tant conservation activities that can be pursued for pipingplovers in Florida (Haig and Plissner 1993), but conservationof the few habitat areas existing outside of current conserva-tion areas is also important. Some potentially importantblocks of unprotected habitat not mentioned above include:Philips Inlet (Bay County); portions of Charlotte Harbor,Estero Island, and Tigertail Beach (Marco Island) in south-west Florida; Floridana, Wabasso Beach, and HutchinsonIsland; Boot Key (Monroe County); and Perico Island,Clearwater Beach, and other areas around coastal Pinellas,Pasco, Hillsborough, and Manatee counties.
We do not have a specific goal developed for this winter-ing species in terms of numbers and distributions of popula-tions and habitat. However, we believe the rarity of thespecies, coupled with the imperiled status of the coastal areasthe species inhabits, warrant conservation of the known win-tering habitat areas outside of current conservation areas.
Section 6.2.25. Red-cockaded WoodpeckerThe map of potential habitat for red-cockaded woodpeck-
ers relied heavily upon known occurrence information. Theland-cover map alone cannot be used to identify the stands of
Although the size of populations on exist-ing conservation areas appears to be large, con-servation of additional habitat areas might bejustified to maintain a broad geographic distrib-ution of protected populations. However, thedistribution of habitat patches on public landsseems to accomplish this objective since habitatpatches within conservation areas are broadlydistributed across several discrete streams. This distribution will provide security againstmany environmental perturbations.
Conservation of additional treefrog habitatmight also be justified based on the importanceof habitat areas to other rare species. To evalu-ate the potential importance of treefrog habitatto other species, we isolated the potential habi-tat on private lands and tallied up the occur-rence records for each unique area processed bythe Florida Natural Areas Inventory and FloridaGame and Fresh Water Fish Commission.Forty-nine records were found in patches ofhabitat outside of existing conservation areas,but only two sites (Areas 1 and 2, Figure 107)had records for rare species other than the pinebarrens treefrog. Both areas are very close tothe boundaries of existing conservation areas.Given the small scale problems associated withmaps of conservation areas, occurrence records,and land-cover developed at different scales ofresolution, these areas may lie within existingconservation areas and represent an artifact ofcomputer mapping techniques. Other privatelands that support geographically distinct popu-lations of the pine barrens treefrog are not known to supportother rare species.
These analyses lead us to propose that the pine barrenstreefrog has adequate representation on the existing system ofconservation areas in Florida. Additional survey informationmay point to distinct habitat areas on private lands that areimportant to treefrogs and other rare species, but the availableinformation suggests that conservation of habitat areas on pri-vate lands will not significantly expand the habitat base forthis species nor provide protection for other rare species.
Section 6.2.24. Piping PloverThe habitat distribution map for piping plovers (Figure
108) was developed using maps prepared by participants in aU.S. Fish and Wildlife Service winter survey (Haig andPlissner 1993). We also incorporated point data from theFlorida Natural Areas Inventory and Nongame WildlifeProgram Wildlife Observation databases that were not includ-ed in the information provided by survey participants. Thecoastal salt marsh, coastal strand, and barren land cover(sandy beaches) within the areas identified by survey partici-pants were included as potential habitat areas. For other loca-tions not specifically mapped by survey participants, we iso-lated coastal strand and coastal salt marsh. Since some barrenland cover consists of sandy beaches that are also appropriatehabitat areas, we also included barren land that occurred with-in 60 m (2 pixels) of the salt marsh and coastal strand areasidentified above.
Figure 108. Habitat distribution map for the piping plover.
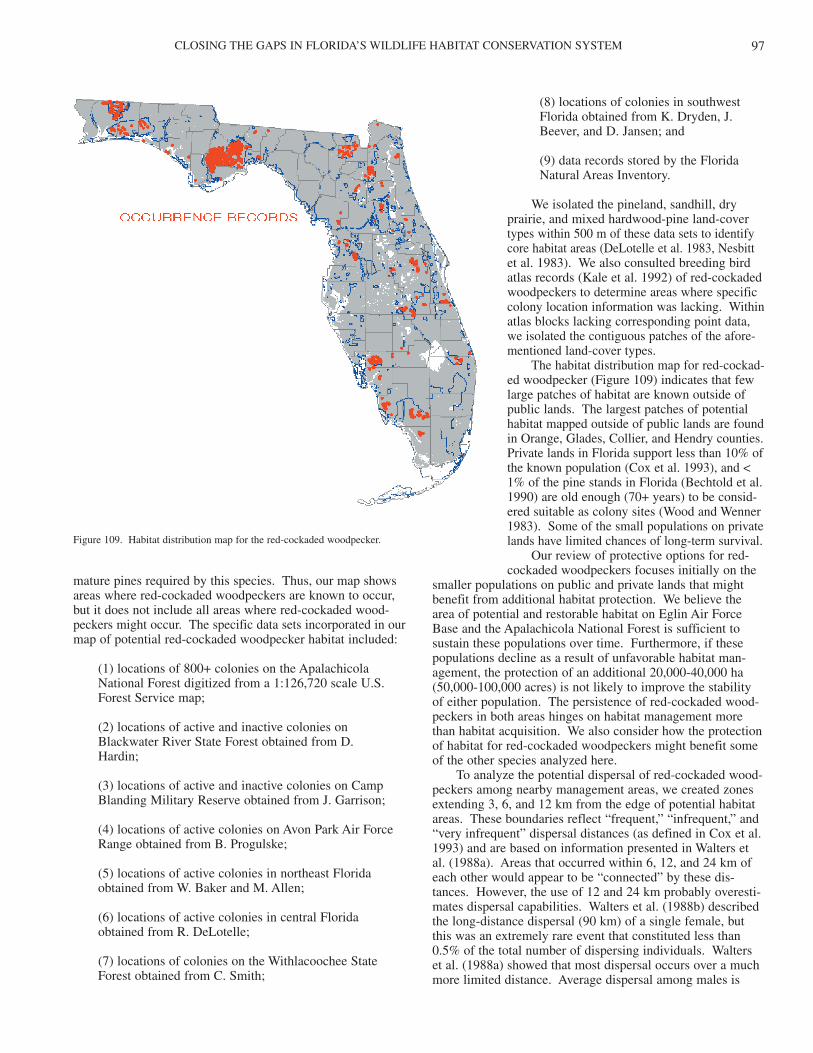
CLOSING THE GAPS IN FLORIDA’S WILDLIFE HABITAT CONSERVATION SYSTEM 97
mature pines required by this species. Thus, our map showsareas where red-cockaded woodpeckers are known to occur,but it does not include all areas where red-cockaded wood-peckers might occur. The specific data sets incorporated in ourmap of potential red-cockaded woodpecker habitat included:
(1) locations of 800+ colonies on the ApalachicolaNational Forest digitized from a 1:126,720 scale U.S.Forest Service map;
(2) locations of active and inactive colonies onBlackwater River State Forest obtained from D. Hardin;
(3) locations of active and inactive colonies on CampBlanding Military Reserve obtained from J. Garrison;
(4) locations of active colonies on Avon Park Air ForceRange obtained from B. Progulske;
(5) locations of active colonies in northeast Floridaobtained from W. Baker and M. Allen;
(6) locations of active colonies in central Floridaobtained from R. DeLotelle;
(7) locations of colonies on the Withlacoochee StateForest obtained from C. Smith;
(8) locations of colonies in southwestFlorida obtained from K. Dryden, J.Beever, and D. Jansen; and
(9) data records stored by the FloridaNatural Areas Inventory.
We isolated the pineland, sandhill, dryprairie, and mixed hardwood-pine land-covertypes within 500 m of these data sets to identifycore habitat areas (DeLotelle et al. 1983, Nesbittet al. 1983). We also consulted breeding birdatlas records (Kale et al. 1992) of red-cockadedwoodpeckers to determine areas where specificcolony location information was lacking. Withinatlas blocks lacking corresponding point data,we isolated the contiguous patches of the afore-mentioned land-cover types.
The habitat distribution map for red-cockad-ed woodpecker (Figure 109) indicates that fewlarge patches of habitat are known outside ofpublic lands. The largest patches of potentialhabitat mapped outside of public lands are foundin Orange, Glades, Collier, and Hendry counties.Private lands in Florida support less than 10% ofthe known population (Cox et al. 1993), and <1% of the pine stands in Florida (Bechtold et al.1990) are old enough (70+ years) to be consid-ered suitable as colony sites (Wood and Wenner1983). Some of the small populations on privatelands have limited chances of long-term survival.
Our review of protective options for red-cockaded woodpeckers focuses initially on the
smaller populations on public and private lands that mightbenefit from additional habitat protection. We believe thearea of potential and restorable habitat on Eglin Air ForceBase and the Apalachicola National Forest is sufficient tosustain these populations over time. Furthermore, if thesepopulations decline as a result of unfavorable habitat man-agement, the protection of an additional 20,000-40,000 ha(50,000-100,000 acres) is not likely to improve the stabilityof either population. The persistence of red-cockaded wood-peckers in both areas hinges on habitat management morethan habitat acquisition. We also consider how the protectionof habitat for red-cockaded woodpeckers might benefit someof the other species analyzed here.
To analyze the potential dispersal of red-cockaded wood-peckers among nearby management areas, we created zonesextending 3, 6, and 12 km from the edge of potential habitatareas. These boundaries reflect “frequent,” “infrequent,” and“very infrequent” dispersal distances (as defined in Cox et al.1993) and are based on information presented in Walters etal. (1988a). Areas that occurred within 6, 12, and 24 km ofeach other would appear to be “connected” by these dis-tances. However, the use of 12 and 24 km probably overesti-mates dispersal capabilities. Walters et al. (1988b) describedthe long-distance dispersal (90 km) of a single female, butthis was an extremely rare event that constituted less than0.5% of the total number of dispersing individuals. Walterset al. (1988a) showed that most dispersal occurs over a muchmore limited distance. Average dispersal among males is
Figure 109. Habitat distribution map for the red-cockaded woodpecker.
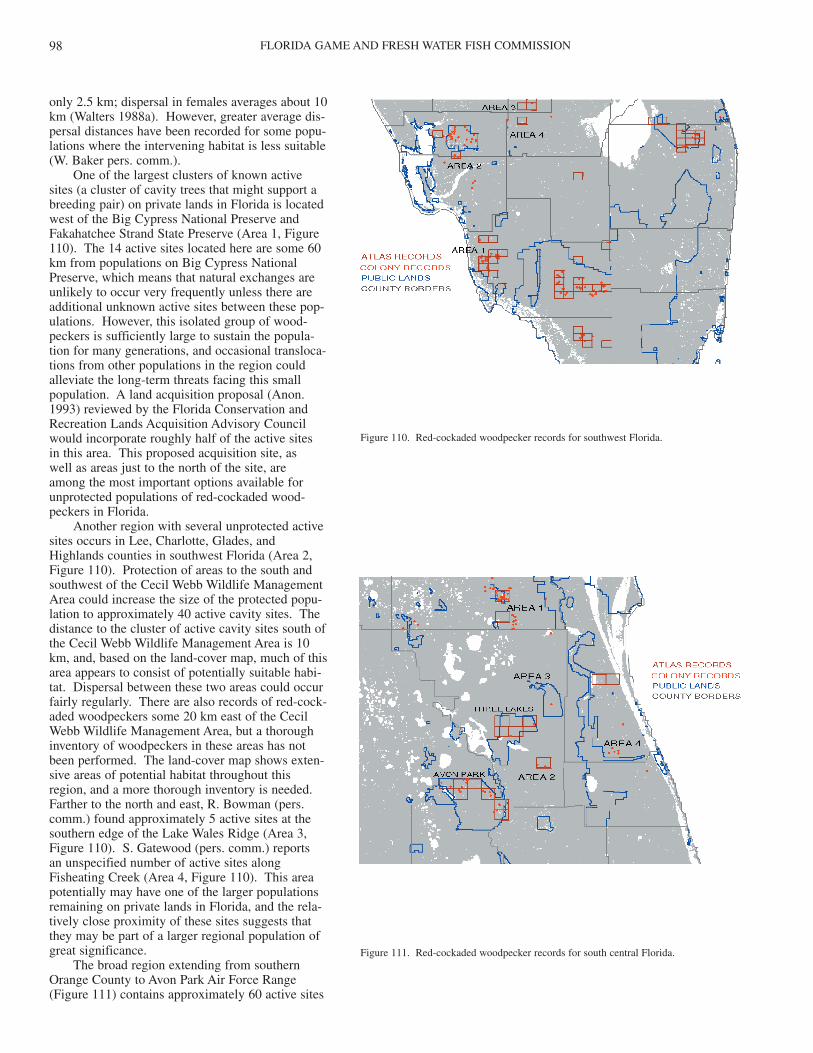
FLORIDA GAME AND FRESH WATER FISH COMMISSION98
only 2.5 km; dispersal in females averages about 10km (Walters 1988a). However, greater average dis-persal distances have been recorded for some popu-lations where the intervening habitat is less suitable(W. Baker pers. comm.).
One of the largest clusters of known activesites (a cluster of cavity trees that might support abreeding pair) on private lands in Florida is locatedwest of the Big Cypress National Preserve andFakahatchee Strand State Preserve (Area 1, Figure110). The 14 active sites located here are some 60km from populations on Big Cypress NationalPreserve, which means that natural exchanges areunlikely to occur very frequently unless there areadditional unknown active sites between these pop-ulations. However, this isolated group of wood-peckers is sufficiently large to sustain the popula-tion for many generations, and occasional transloca-tions from other populations in the region couldalleviate the long-term threats facing this smallpopulation. A land acquisition proposal (Anon.1993) reviewed by the Florida Conservation andRecreation Lands Acquisition Advisory Councilwould incorporate roughly half of the active sites in this area. This proposed acquisition site, as well as areas just to the north of the site, are among the most important options available forunprotected populations of red-cockaded wood-peckers in Florida.
Another region with several unprotected activesites occurs in Lee, Charlotte, Glades, andHighlands counties in southwest Florida (Area 2,Figure 110). Protection of areas to the south andsouthwest of the Cecil Webb Wildlife ManagementArea could increase the size of the protected popu-lation to approximately 40 active cavity sites. Thedistance to the cluster of active cavity sites south ofthe Cecil Webb Wildlife Management Area is 10km, and, based on the land-cover map, much of thisarea appears to consist of potentially suitable habi-tat. Dispersal between these two areas could occurfairly regularly. There are also records of red-cock-aded woodpeckers some 20 km east of the CecilWebb Wildlife Management Area, but a thoroughinventory of woodpeckers in these areas has notbeen performed. The land-cover map shows exten-sive areas of potential habitat throughout thisregion, and a more thorough inventory is needed.Farther to the north and east, R. Bowman (pers.comm.) found approximately 5 active sites at thesouthern edge of the Lake Wales Ridge (Area 3,Figure 110). S. Gatewood (pers. comm.) reports an unspecified number of active sites alongFisheating Creek (Area 4, Figure 110). This areapotentially may have one of the larger populationsremaining on private lands in Florida, and the rela-tively close proximity of these sites suggests thatthey may be part of a larger regional population ofgreat significance.
The broad region extending from southernOrange County to Avon Park Air Force Range(Figure 111) contains approximately 60 active sites
Figure 110. Red-cockaded woodpecker records for southwest Florida.
Figure 111. Red-cockaded woodpecker records for south central Florida.
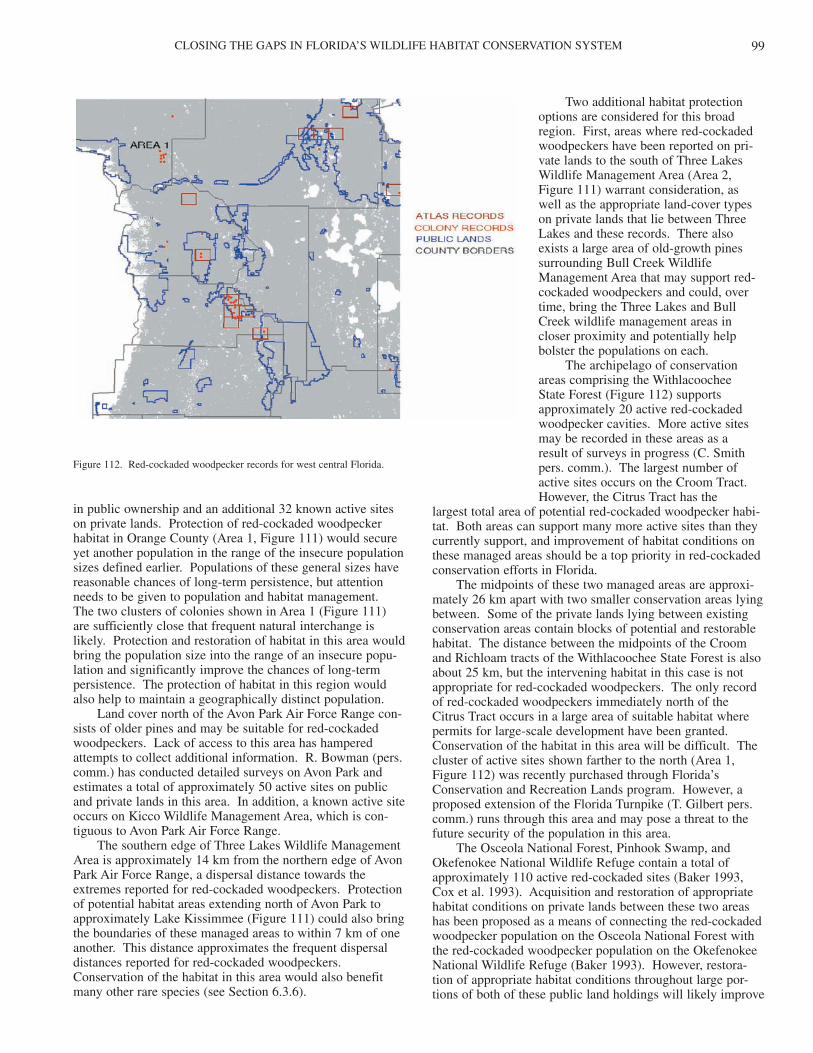
CLOSING THE GAPS IN FLORIDA’S WILDLIFE HABITAT CONSERVATION SYSTEM 99
in public ownership and an additional 32 known active siteson private lands. Protection of red-cockaded woodpeckerhabitat in Orange County (Area 1, Figure 111) would secureyet another population in the range of the insecure populationsizes defined earlier. Populations of these general sizes havereasonable chances of long-term persistence, but attentionneeds to be given to population and habitat management.The two clusters of colonies shown in Area 1 (Figure 111)are sufficiently close that frequent natural interchange islikely. Protection and restoration of habitat in this area wouldbring the population size into the range of an insecure popu-lation and significantly improve the chances of long-termpersistence. The protection of habitat in this region wouldalso help to maintain a geographically distinct population.
Land cover north of the Avon Park Air Force Range con-sists of older pines and may be suitable for red-cockadedwoodpeckers. Lack of access to this area has hamperedattempts to collect additional information. R. Bowman (pers.comm.) has conducted detailed surveys on Avon Park andestimates a total of approximately 50 active sites on publicand private lands in this area. In addition, a known active siteoccurs on Kicco Wildlife Management Area, which is con-tiguous to Avon Park Air Force Range.
The southern edge of Three Lakes Wildlife ManagementArea is approximately 14 km from the northern edge of AvonPark Air Force Range, a dispersal distance towards theextremes reported for red-cockaded woodpeckers. Protectionof potential habitat areas extending north of Avon Park toapproximately Lake Kissimmee (Figure 111) could also bringthe boundaries of these managed areas to within 7 km of oneanother. This distance approximates the frequent dispersaldistances reported for red-cockaded woodpeckers.Conservation of the habitat in this area would also benefitmany other rare species (see Section 6.3.6).
Two additional habitat protectionoptions are considered for this broadregion. First, areas where red-cockadedwoodpeckers have been reported on pri-vate lands to the south of Three LakesWildlife Management Area (Area 2,Figure 111) warrant consideration, aswell as the appropriate land-cover typeson private lands that lie between ThreeLakes and these records. There alsoexists a large area of old-growth pinessurrounding Bull Creek WildlifeManagement Area that may support red-cockaded woodpeckers and could, overtime, bring the Three Lakes and BullCreek wildlife management areas incloser proximity and potentially helpbolster the populations on each.
The archipelago of conservationareas comprising the Withlacoochee State Forest (Figure 112) supportsapproximately 20 active red-cockadedwoodpecker cavities. More active sitesmay be recorded in these areas as a result of surveys in progress (C. Smithpers. comm.). The largest number ofactive sites occurs on the Croom Tract.However, the Citrus Tract has the
largest total area of potential red-cockaded woodpecker habi-tat. Both areas can support many more active sites than theycurrently support, and improvement of habitat conditions onthese managed areas should be a top priority in red-cockadedconservation efforts in Florida.
The midpoints of these two managed areas are approxi-mately 26 km apart with two smaller conservation areas lyingbetween. Some of the private lands lying between existingconservation areas contain blocks of potential and restorablehabitat. The distance between the midpoints of the Croomand Richloam tracts of the Withlacoochee State Forest is alsoabout 25 km, but the intervening habitat in this case is notappropriate for red-cockaded woodpeckers. The only recordof red-cockaded woodpeckers immediately north of theCitrus Tract occurs in a large area of suitable habitat wherepermits for large-scale development have been granted.Conservation of the habitat in this area will be difficult. Thecluster of active sites shown farther to the north (Area 1,Figure 112) was recently purchased through Florida’sConservation and Recreation Lands program. However, aproposed extension of the Florida Turnpike (T. Gilbert pers.comm.) runs through this area and may pose a threat to thefuture security of the population in this area.
The Osceola National Forest, Pinhook Swamp, andOkefenokee National Wildlife Refuge contain a total ofapproximately 110 active red-cockaded sites (Baker 1993,Cox et al. 1993). Acquisition and restoration of appropriatehabitat conditions on private lands between these two areashas been proposed as a means of connecting the red-cockadedwoodpecker population on the Osceola National Forest withthe red-cockaded woodpecker population on the OkefenokeeNational Wildlife Refuge (Baker 1993). However, restora-tion of appropriate habitat conditions throughout large por-tions of both of these public land holdings will likely improve
Figure 112. Red-cockaded woodpecker records for west central Florida.
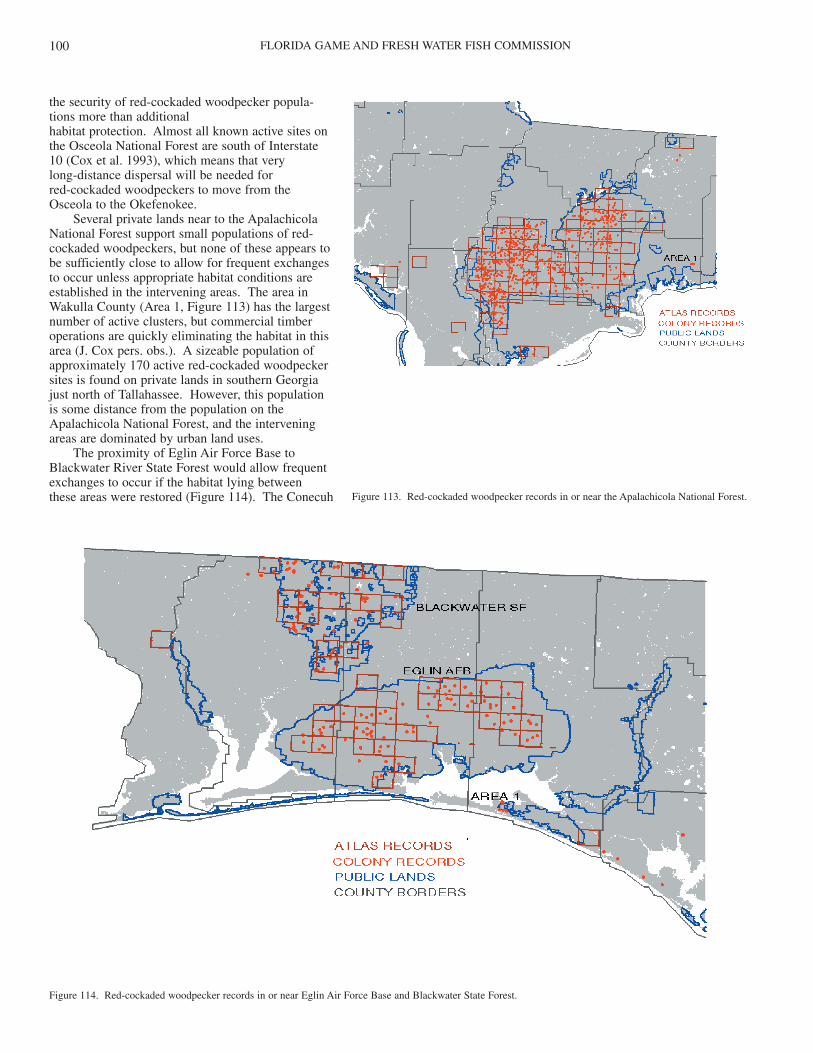
FLORIDA GAME AND FRESH WATER FISH COMMISSION100
the security of red-cockaded woodpecker popula-tions more than additional habitat protection. Almost all known active sites onthe Osceola National Forest are south of Interstate10 (Cox et al. 1993), which means that very long-distance dispersal will be needed for red-cockaded woodpeckers to move from theOsceola to the Okefenokee.
Several private lands near to the ApalachicolaNational Forest support small populations of red-cockaded woodpeckers, but none of these appears tobe sufficiently close to allow for frequent exchangesto occur unless appropriate habitat conditions areestablished in the intervening areas. The area inWakulla County (Area 1, Figure 113) has the largestnumber of active clusters, but commercial timberoperations are quickly eliminating the habitat in thisarea (J. Cox pers. obs.). A sizeable population ofapproximately 170 active red-cockaded woodpeckersites is found on private lands in southern Georgiajust north of Tallahassee. However, this populationis some distance from the population on theApalachicola National Forest, and the interveningareas are dominated by urban land uses.
The proximity of Eglin Air Force Base toBlackwater River State Forest would allow frequentexchanges to occur if the habitat lying betweenthese areas were restored (Figure 114). The Conecuh Figure 113. Red-cockaded woodpecker records in or near the Apalachicola National Forest.
Figure 114. Red-cockaded woodpecker records in or near Eglin Air Force Base and Blackwater State Forest.
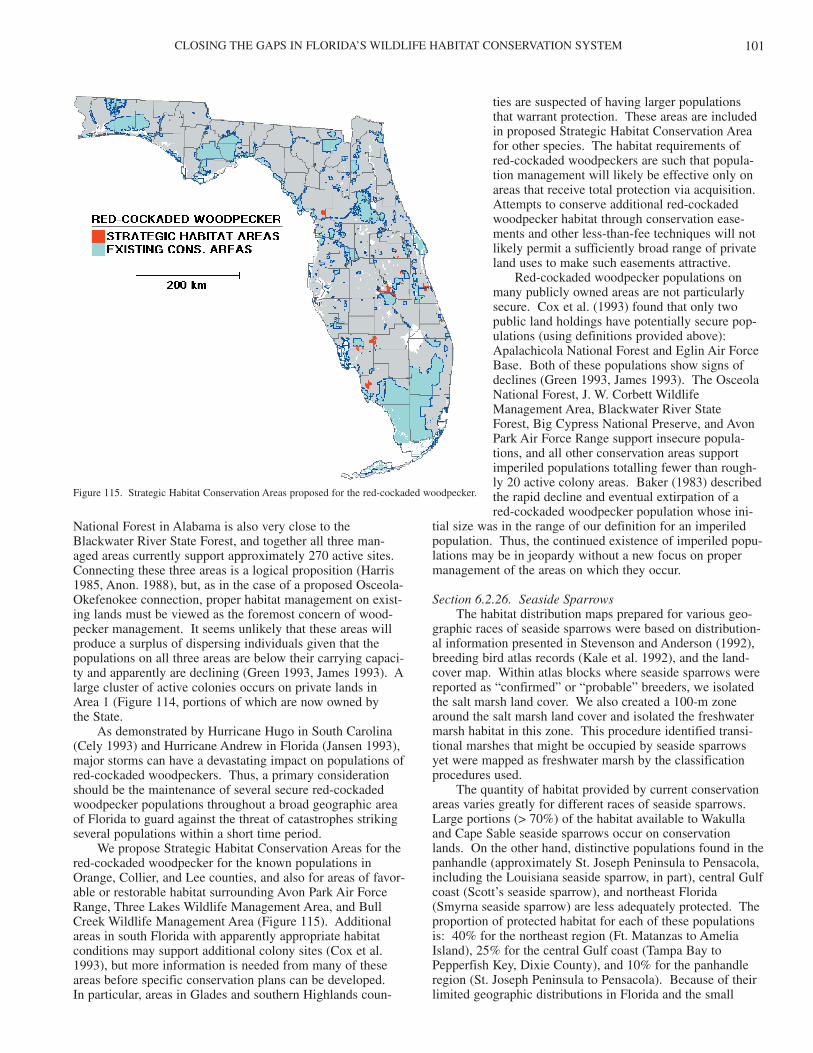
CLOSING THE GAPS IN FLORIDA’S WILDLIFE HABITAT CONSERVATION SYSTEM 101
National Forest in Alabama is also very close to theBlackwater River State Forest, and together all three man-aged areas currently support approximately 270 active sites.Connecting these three areas is a logical proposition (Harris1985, Anon. 1988), but, as in the case of a proposed Osceola-Okefenokee connection, proper habitat management on exist-ing lands must be viewed as the foremost concern of wood-pecker management. It seems unlikely that these areas willproduce a surplus of dispersing individuals given that thepopulations on all three areas are below their carrying capaci-ty and apparently are declining (Green 1993, James 1993). Alarge cluster of active colonies occurs on private lands inArea 1 (Figure 114, portions of which are now owned by the State.
As demonstrated by Hurricane Hugo in South Carolina(Cely 1993) and Hurricane Andrew in Florida (Jansen 1993),major storms can have a devastating impact on populations ofred-cockaded woodpeckers. Thus, a primary considerationshould be the maintenance of several secure red-cockadedwoodpecker populations throughout a broad geographic areaof Florida to guard against the threat of catastrophes strikingseveral populations within a short time period.
We propose Strategic Habitat Conservation Areas for thered-cockaded woodpecker for the known populations inOrange, Collier, and Lee counties, and also for areas of favor-able or restorable habitat surrounding Avon Park Air ForceRange, Three Lakes Wildlife Management Area, and BullCreek Wildlife Management Area (Figure 115). Additionalareas in south Florida with apparently appropriate habitatconditions may support additional colony sites (Cox et al.1993), but more information is needed from many of theseareas before specific conservation plans can be developed. In particular, areas in Glades and southern Highlands coun-
ties are suspected of having larger populations that warrant protection. These areas are includedin proposed Strategic Habitat Conservation Areafor other species. The habitat requirements ofred-cockaded woodpeckers are such that popula-tion management will likely be effective only onareas that receive total protection via acquisition.Attempts to conserve additional red-cockadedwoodpecker habitat through conservation ease-ments and other less-than-fee techniques will notlikely permit a sufficiently broad range of privateland uses to make such easements attractive.
Red-cockaded woodpecker populations onmany publicly owned areas are not particularlysecure. Cox et al. (1993) found that only twopublic land holdings have potentially secure pop-ulations (using definitions provided above):Apalachicola National Forest and Eglin Air ForceBase. Both of these populations show signs ofdeclines (Green 1993, James 1993). The OsceolaNational Forest, J. W. Corbett WildlifeManagement Area, Blackwater River State Forest, Big Cypress National Preserve, and AvonPark Air Force Range support insecure popula-tions, and all other conservation areas supportimperiled populations totalling fewer than rough-ly 20 active colony areas. Baker (1983) describedthe rapid decline and eventual extirpation of a red-cockaded woodpecker population whose ini-
tial size was in the range of our definition for an imperiledpopulation. Thus, the continued existence of imperiled popu-lations may be in jeopardy without a new focus on propermanagement of the areas on which they occur.
Section 6.2.26. Seaside SparrowsThe habitat distribution maps prepared for various geo-
graphic races of seaside sparrows were based on distribution-al information presented in Stevenson and Anderson (1992),breeding bird atlas records (Kale et al. 1992), and the land-cover map. Within atlas blocks where seaside sparrows werereported as “confirmed” or “probable” breeders, we isolatedthe salt marsh land cover. We also created a 100-m zonearound the salt marsh land cover and isolated the freshwatermarsh habitat in this zone. This procedure identified transi-tional marshes that might be occupied by seaside sparrowsyet were mapped as freshwater marsh by the classificationprocedures used.
The quantity of habitat provided by current conservationareas varies greatly for different races of seaside sparrows.Large portions (> 70%) of the habitat available to Wakullaand Cape Sable seaside sparrows occur on conservationlands. On the other hand, distinctive populations found in thepanhandle (approximately St. Joseph Peninsula to Pensacola,including the Louisiana seaside sparrow, in part), central Gulfcoast (Scott’s seaside sparrow), and northeast Florida(Smyrna seaside sparrow) are less adequately protected. Theproportion of protected habitat for each of these populationsis: 40% for the northeast region (Ft. Matanzas to AmeliaIsland), 25% for the central Gulf coast (Tampa Bay toPepperfish Key, Dixie County), and 10% for the panhandleregion (St. Joseph Peninsula to Pensacola). Because of theirlimited geographic distributions in Florida and the small
Figure 115. Strategic Habitat Conservation Areas proposed for the red-cockaded woodpecker.
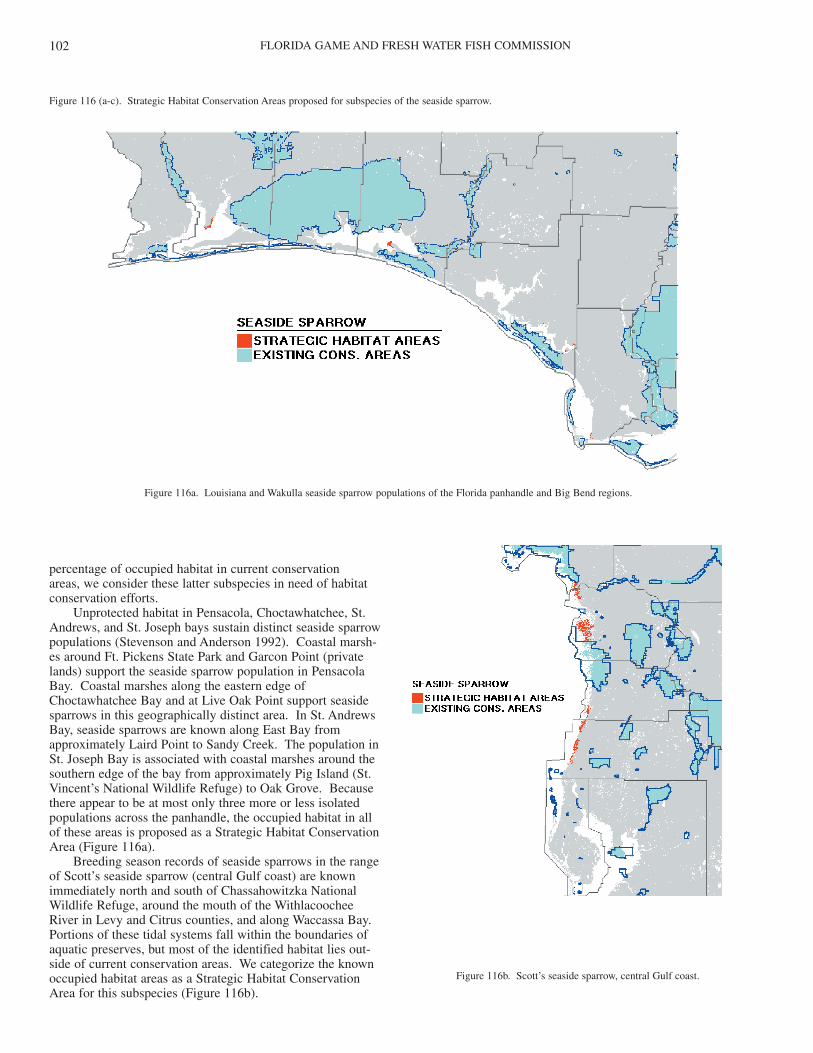
FLORIDA GAME AND FRESH WATER FISH COMMISSION102
percentage of occupied habitat in current conservation areas, we consider these latter subspecies in need of habitatconservation efforts.
Unprotected habitat in Pensacola, Choctawhatchee, St.Andrews, and St. Joseph bays sustain distinct seaside sparrowpopulations (Stevenson and Anderson 1992). Coastal marsh-es around Ft. Pickens State Park and Garcon Point (privatelands) support the seaside sparrow population in PensacolaBay. Coastal marshes along the eastern edge ofChoctawhatchee Bay and at Live Oak Point support seasidesparrows in this geographically distinct area. In St. AndrewsBay, seaside sparrows are known along East Bay fromapproximately Laird Point to Sandy Creek. The population inSt. Joseph Bay is associated with coastal marshes around thesouthern edge of the bay from approximately Pig Island (St.Vincent’s National Wildlife Refuge) to Oak Grove. Becausethere appear to be at most only three more or less isolatedpopulations across the panhandle, the occupied habitat in allof these areas is proposed as a Strategic Habitat ConservationArea (Figure 116a).
Breeding season records of seaside sparrows in the rangeof Scott’s seaside sparrow (central Gulf coast) are knownimmediately north and south of Chassahowitzka NationalWildlife Refuge, around the mouth of the WithlacoocheeRiver in Levy and Citrus counties, and along Waccassa Bay.Portions of these tidal systems fall within the boundaries ofaquatic preserves, but most of the identified habitat lies out-side of current conservation areas. We categorize the knownoccupied habitat areas as a Strategic Habitat ConservationArea for this subspecies (Figure 116b).
Figure 116 (a-c). Strategic Habitat Conservation Areas proposed for subspecies of the seaside sparrow.
Figure 116a. Louisiana and Wakulla seaside sparrow populations of the Florida panhandle and Big Bend regions.
Figure 116b. Scott’s seaside sparrow, central Gulf coast.
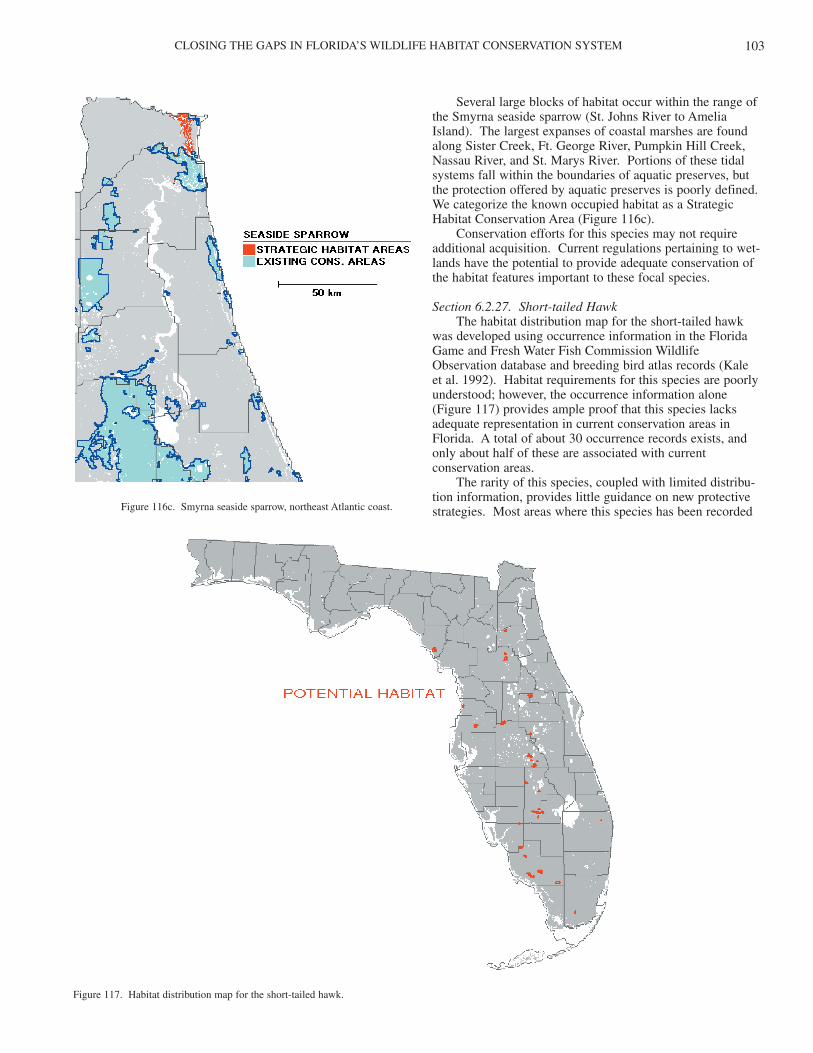
CLOSING THE GAPS IN FLORIDA’S WILDLIFE HABITAT CONSERVATION SYSTEM 103
Several large blocks of habitat occur within the range ofthe Smyrna seaside sparrow (St. Johns River to AmeliaIsland). The largest expanses of coastal marshes are foundalong Sister Creek, Ft. George River, Pumpkin Hill Creek,Nassau River, and St. Marys River. Portions of these tidalsystems fall within the boundaries of aquatic preserves, butthe protection offered by aquatic preserves is poorly defined.We categorize the known occupied habitat as a StrategicHabitat Conservation Area (Figure 116c).
Conservation efforts for this species may not requireadditional acquisition. Current regulations pertaining to wet-lands have the potential to provide adequate conservation ofthe habitat features important to these focal species.
Section 6.2.27. Short-tailed HawkThe habitat distribution map for the short-tailed hawk
was developed using occurrence information in the FloridaGame and Fresh Water Fish Commission WildlifeObservation database and breeding bird atlas records (Kale et al. 1992). Habitat requirements for this species are poorlyunderstood; however, the occurrence information alone(Figure 117) provides ample proof that this species lacksadequate representation in current conservation areas inFlorida. A total of about 30 occurrence records exists, andonly about half of these are associated with currentconservation areas.
The rarity of this species, coupled with limited distribu-tion information, provides little guidance on new protectivestrategies. Most areas where this species has been recordedFigure 116c. Smyrna seaside sparrow, northeast Atlantic coast.
Figure 117. Habitat distribution map for the short-tailed hawk.
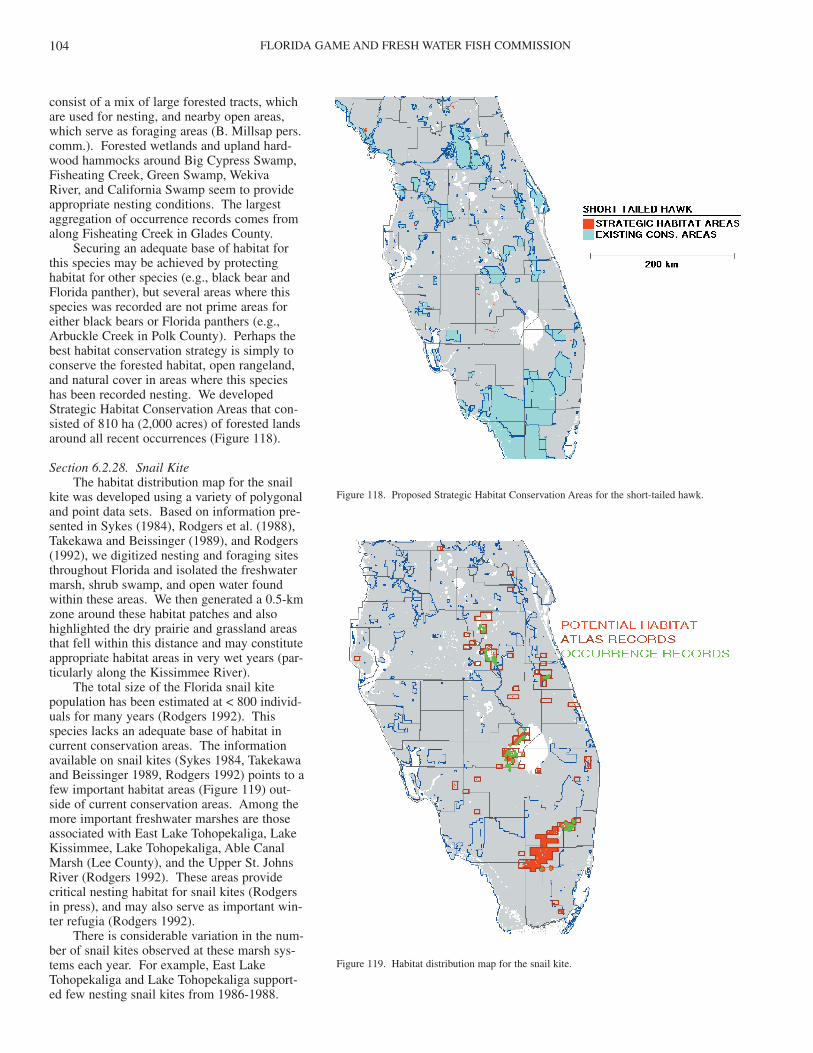
FLORIDA GAME AND FRESH WATER FISH COMMISSION104
consist of a mix of large forested tracts, whichare used for nesting, and nearby open areas,which serve as foraging areas (B. Millsap pers.comm.). Forested wetlands and upland hard-wood hammocks around Big Cypress Swamp,Fisheating Creek, Green Swamp, WekivaRiver, and California Swamp seem to provideappropriate nesting conditions. The largestaggregation of occurrence records comes fromalong Fisheating Creek in Glades County.
Securing an adequate base of habitat forthis species may be achieved by protectinghabitat for other species (e.g., black bear andFlorida panther), but several areas where thisspecies was recorded are not prime areas foreither black bears or Florida panthers (e.g.,Arbuckle Creek in Polk County). Perhaps thebest habitat conservation strategy is simply toconserve the forested habitat, open rangeland,and natural cover in areas where this specieshas been recorded nesting. We developedStrategic Habitat Conservation Areas that con-sisted of 810 ha (2,000 acres) of forested landsaround all recent occurrences (Figure 118).
Section 6.2.28. Snail KiteThe habitat distribution map for the snail
kite was developed using a variety of polygonaland point data sets. Based on information pre-sented in Sykes (1984), Rodgers et al. (1988),Takekawa and Beissinger (1989), and Rodgers(1992), we digitized nesting and foraging sitesthroughout Florida and isolated the freshwatermarsh, shrub swamp, and open water foundwithin these areas. We then generated a 0.5-kmzone around these habitat patches and alsohighlighted the dry prairie and grassland areasthat fell within this distance and may constituteappropriate habitat areas in very wet years (par-ticularly along the Kissimmee River).
The total size of the Florida snail kitepopulation has been estimated at < 800 individ-uals for many years (Rodgers 1992). Thisspecies lacks an adequate base of habitat incurrent conservation areas. The informationavailable on snail kites (Sykes 1984, Takekawaand Beissinger 1989, Rodgers 1992) points to afew important habitat areas (Figure 119) out-side of current conservation areas. Among themore important freshwater marshes are thoseassociated with East Lake Tohopekaliga, LakeKissimmee, Lake Tohopekaliga, Able CanalMarsh (Lee County), and the Upper St. JohnsRiver (Rodgers 1992). These areas providecritical nesting habitat for snail kites (Rodgersin press), and may also serve as important win-ter refugia (Rodgers 1992).
There is considerable variation in the num-ber of snail kites observed at these marsh sys-tems each year. For example, East LakeTohopekaliga and Lake Tohopekaliga support-ed few nesting snail kites from 1986-1988.
Figure 118. Proposed Strategic Habitat Conservation Areas for the short-tailed hawk.
Figure 119. Habitat distribution map for the snail kite.
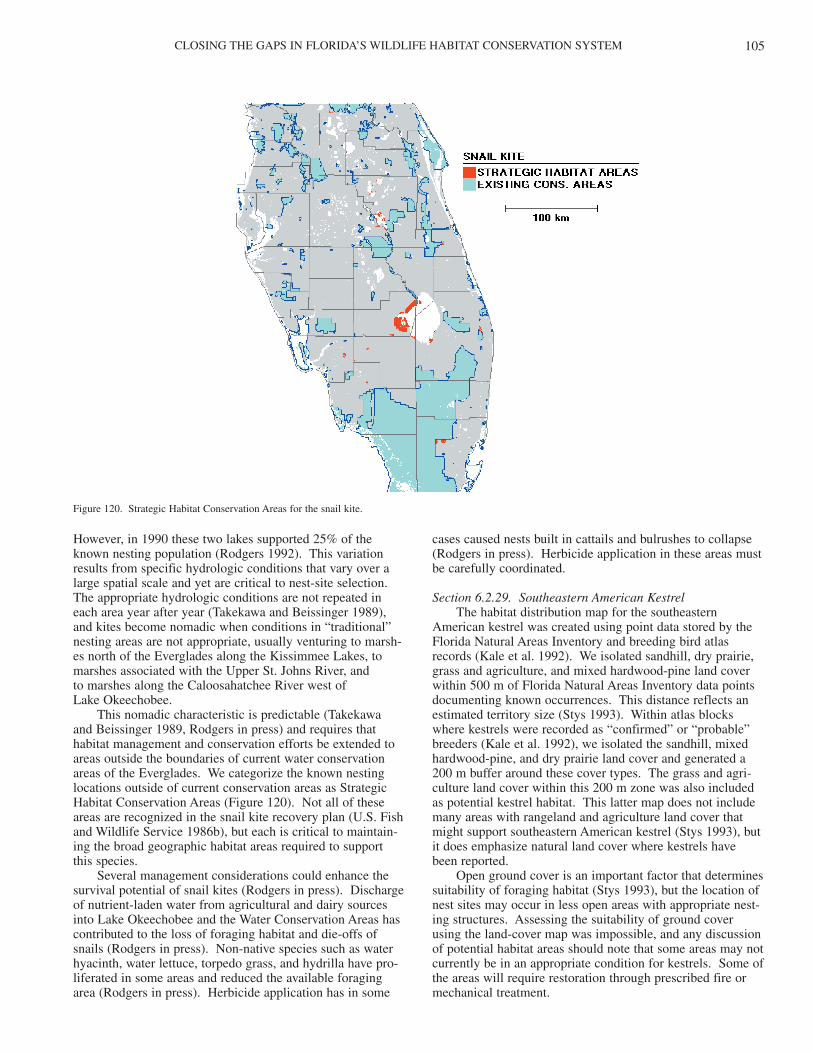
CLOSING THE GAPS IN FLORIDA’S WILDLIFE HABITAT CONSERVATION SYSTEM 105
However, in 1990 these two lakes supported 25% of theknown nesting population (Rodgers 1992). This variationresults from specific hydrologic conditions that vary over alarge spatial scale and yet are critical to nest-site selection.The appropriate hydrologic conditions are not repeated ineach area year after year (Takekawa and Beissinger 1989),and kites become nomadic when conditions in “traditional”nesting areas are not appropriate, usually venturing to marsh-es north of the Everglades along the Kissimmee Lakes, tomarshes associated with the Upper St. Johns River, and to marshes along the Caloosahatchee River west of Lake Okeechobee.
This nomadic characteristic is predictable (Takekawa and Beissinger 1989, Rodgers in press) and requires thathabitat management and conservation efforts be extended toareas outside the boundaries of current water conservationareas of the Everglades. We categorize the known nestinglocations outside of current conservation areas as StrategicHabitat Conservation Areas (Figure 120). Not all of theseareas are recognized in the snail kite recovery plan (U.S. Fishand Wildlife Service 1986b), but each is critical to maintain-ing the broad geographic habitat areas required to supportthis species.
Several management considerations could enhance thesurvival potential of snail kites (Rodgers in press). Dischargeof nutrient-laden water from agricultural and dairy sourcesinto Lake Okeechobee and the Water Conservation Areas hascontributed to the loss of foraging habitat and die-offs ofsnails (Rodgers in press). Non-native species such as waterhyacinth, water lettuce, torpedo grass, and hydrilla have pro-liferated in some areas and reduced the available foragingarea (Rodgers in press). Herbicide application has in some
cases caused nests built in cattails and bulrushes to collapse(Rodgers in press). Herbicide application in these areas mustbe carefully coordinated.
Section 6.2.29. Southeastern American KestrelThe habitat distribution map for the southeastern
American kestrel was created using point data stored by theFlorida Natural Areas Inventory and breeding bird atlasrecords (Kale et al. 1992). We isolated sandhill, dry prairie,grass and agriculture, and mixed hardwood-pine land coverwithin 500 m of Florida Natural Areas Inventory data pointsdocumenting known occurrences. This distance reflects anestimated territory size (Stys 1993). Within atlas blockswhere kestrels were recorded as “confirmed” or “probable”breeders (Kale et al. 1992), we isolated the sandhill, mixedhardwood-pine, and dry prairie land cover and generated a200 m buffer around these cover types. The grass and agri-culture land cover within this 200 m zone was also includedas potential kestrel habitat. This latter map does not includemany areas with rangeland and agriculture land cover thatmight support southeastern American kestrel (Stys 1993), butit does emphasize natural land cover where kestrels have been reported.
Open ground cover is an important factor that determinessuitability of foraging habitat (Stys 1993), but the location ofnest sites may occur in less open areas with appropriate nest-ing structures. Assessing the suitability of ground coverusing the land-cover map was impossible, and any discussionof potential habitat areas should note that some areas may notcurrently be in an appropriate condition for kestrels. Some ofthe areas will require restoration through prescribed fire ormechanical treatment.
Figure 120. Strategic Habitat Conservation Areas for the snail kite.
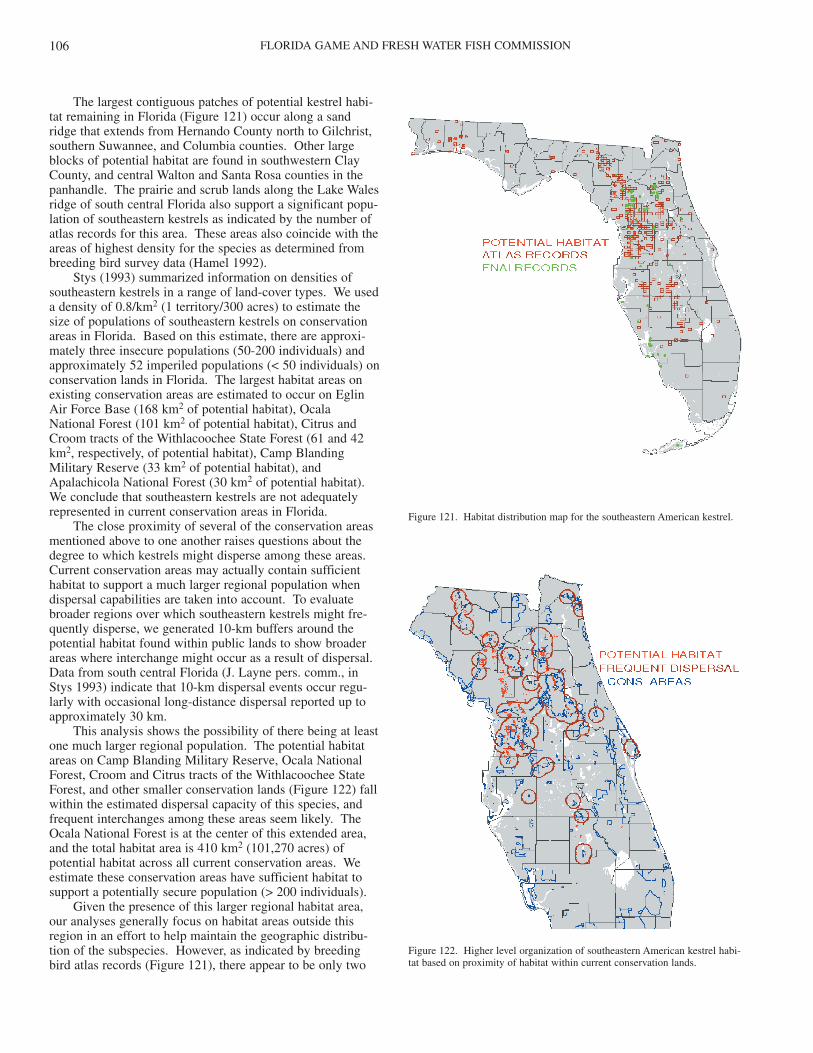
FLORIDA GAME AND FRESH WATER FISH COMMISSION106
The largest contiguous patches of potential kestrel habi-tat remaining in Florida (Figure 121) occur along a sandridge that extends from Hernando County north to Gilchrist,southern Suwannee, and Columbia counties. Other largeblocks of potential habitat are found in southwestern ClayCounty, and central Walton and Santa Rosa counties in thepanhandle. The prairie and scrub lands along the Lake Walesridge of south central Florida also support a significant popu-lation of southeastern kestrels as indicated by the number ofatlas records for this area. These areas also coincide with theareas of highest density for the species as determined frombreeding bird survey data (Hamel 1992).
Stys (1993) summarized information on densities ofsoutheastern kestrels in a range of land-cover types. We useda density of 0.8/km2 (1 territory/300 acres) to estimate thesize of populations of southeastern kestrels on conservationareas in Florida. Based on this estimate, there are approxi-mately three insecure populations (50-200 individuals) andapproximately 52 imperiled populations (< 50 individuals) onconservation lands in Florida. The largest habitat areas onexisting conservation areas are estimated to occur on EglinAir Force Base (168 km2 of potential habitat), Ocala National Forest (101 km2 of potential habitat), Citrus andCroom tracts of the Withlacoochee State Forest (61 and 42km2, respectively, of potential habitat), Camp BlandingMilitary Reserve (33 km2 of potential habitat), andApalachicola National Forest (30 km2 of potential habitat).We conclude that southeastern kestrels are not adequatelyrepresented in current conservation areas in Florida.
The close proximity of several of the conservation areasmentioned above to one another raises questions about thedegree to which kestrels might disperse among these areas.Current conservation areas may actually contain sufficienthabitat to support a much larger regional population whendispersal capabilities are taken into account. To evaluatebroader regions over which southeastern kestrels might fre-quently disperse, we generated 10-km buffers around thepotential habitat found within public lands to show broaderareas where interchange might occur as a result of dispersal.Data from south central Florida (J. Layne pers. comm., inStys 1993) indicate that 10-km dispersal events occur regu-larly with occasional long-distance dispersal reported up toapproximately 30 km.
This analysis shows the possibility of there being at leastone much larger regional population. The potential habitatareas on Camp Blanding Military Reserve, Ocala NationalForest, Croom and Citrus tracts of the Withlacoochee StateForest, and other smaller conservation lands (Figure 122) fallwithin the estimated dispersal capacity of this species, andfrequent interchanges among these areas seem likely. TheOcala National Forest is at the center of this extended area,and the total habitat area is 410 km2 (101,270 acres) ofpotential habitat across all current conservation areas. Weestimate these conservation areas have sufficient habitat tosupport a potentially secure population (> 200 individuals).
Given the presence of this larger regional habitat area,our analyses generally focus on habitat areas outside thisregion in an effort to help maintain the geographic distribu-tion of the subspecies. However, as indicated by breedingbird atlas records (Figure 121), there appear to be only two
Figure 121. Habitat distribution map for the southeastern American kestrel.
Figure 122. Higher level organization of southeastern American kestrel habi-tat based on proximity of habitat within current conservation lands.
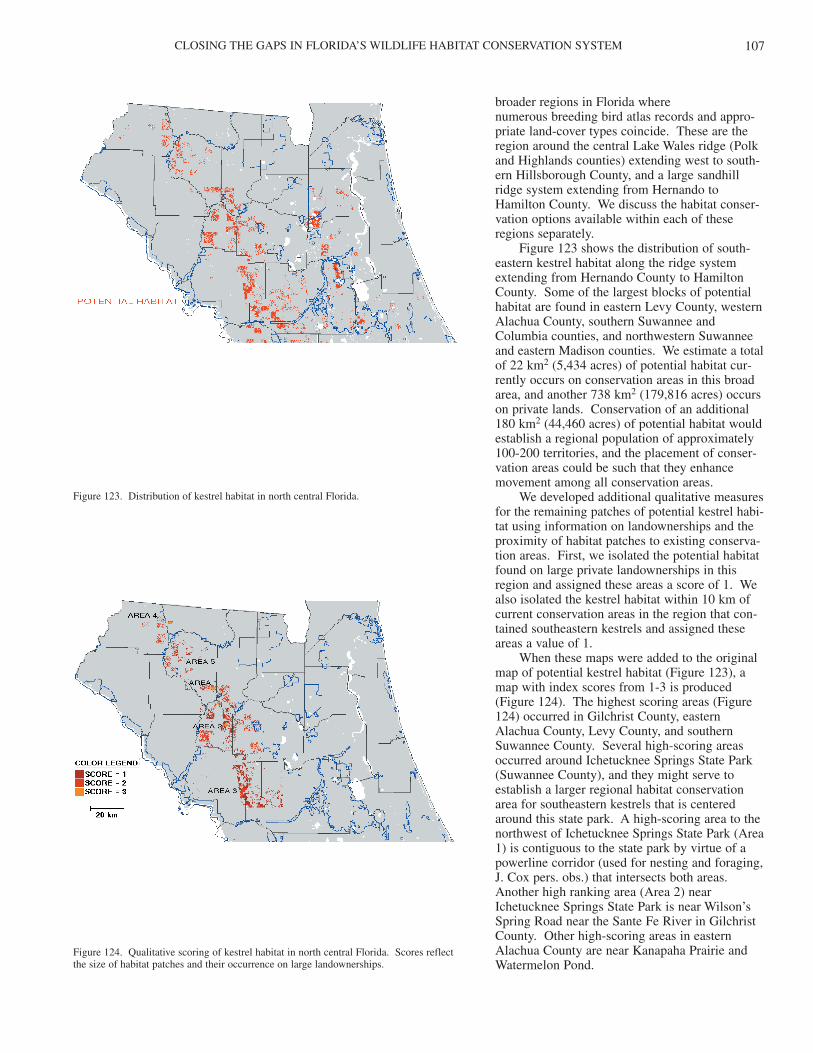
CLOSING THE GAPS IN FLORIDA’S WILDLIFE HABITAT CONSERVATION SYSTEM 107
broader regions in Florida where numerous breeding bird atlas records and appro-priate land-cover types coincide. These are theregion around the central Lake Wales ridge (Polkand Highlands counties) extending west to south-ern Hillsborough County, and a large sandhillridge system extending from Hernando toHamilton County. We discuss the habitat conser-vation options available within each of theseregions separately.
Figure 123 shows the distribution of south-eastern kestrel habitat along the ridge systemextending from Hernando County to HamiltonCounty. Some of the largest blocks of potentialhabitat are found in eastern Levy County, westernAlachua County, southern Suwannee andColumbia counties, and northwestern Suwanneeand eastern Madison counties. We estimate a totalof 22 km2 (5,434 acres) of potential habitat cur-rently occurs on conservation areas in this broadarea, and another 738 km2 (179,816 acres) occurson private lands. Conservation of an additional180 km2 (44,460 acres) of potential habitat wouldestablish a regional population of approximately100-200 territories, and the placement of conser-vation areas could be such that they enhancemovement among all conservation areas.
We developed additional qualitative measuresfor the remaining patches of potential kestrel habi-tat using information on landownerships and theproximity of habitat patches to existing conserva-tion areas. First, we isolated the potential habitatfound on large private landownerships in thisregion and assigned these areas a score of 1. Wealso isolated the kestrel habitat within 10 km ofcurrent conservation areas in the region that con-tained southeastern kestrels and assigned theseareas a value of 1.
When these maps were added to the originalmap of potential kestrel habitat (Figure 123), amap with index scores from 1-3 is produced(Figure 124). The highest scoring areas (Figure124) occurred in Gilchrist County, easternAlachua County, Levy County, and southernSuwannee County. Several high-scoring areasoccurred around Ichetucknee Springs State Park(Suwannee County), and they might serve toestablish a larger regional habitat conservationarea for southeastern kestrels that is centeredaround this state park. A high-scoring area to thenorthwest of Ichetucknee Springs State Park (Area1) is contiguous to the state park by virtue of apowerline corridor (used for nesting and foraging,J. Cox pers. obs.) that intersects both areas.Another high ranking area (Area 2) nearIchetucknee Springs State Park is near Wilson’sSpring Road near the Sante Fe River in GilchristCounty. Other high-scoring areas in easternAlachua County are near Kanapaha Prairie andWatermelon Pond.
Figure 123. Distribution of kestrel habitat in north central Florida.
Figure 124. Qualitative scoring of kestrel habitat in north central Florida. Scores reflectthe size of habitat patches and their occurrence on large landownerships.
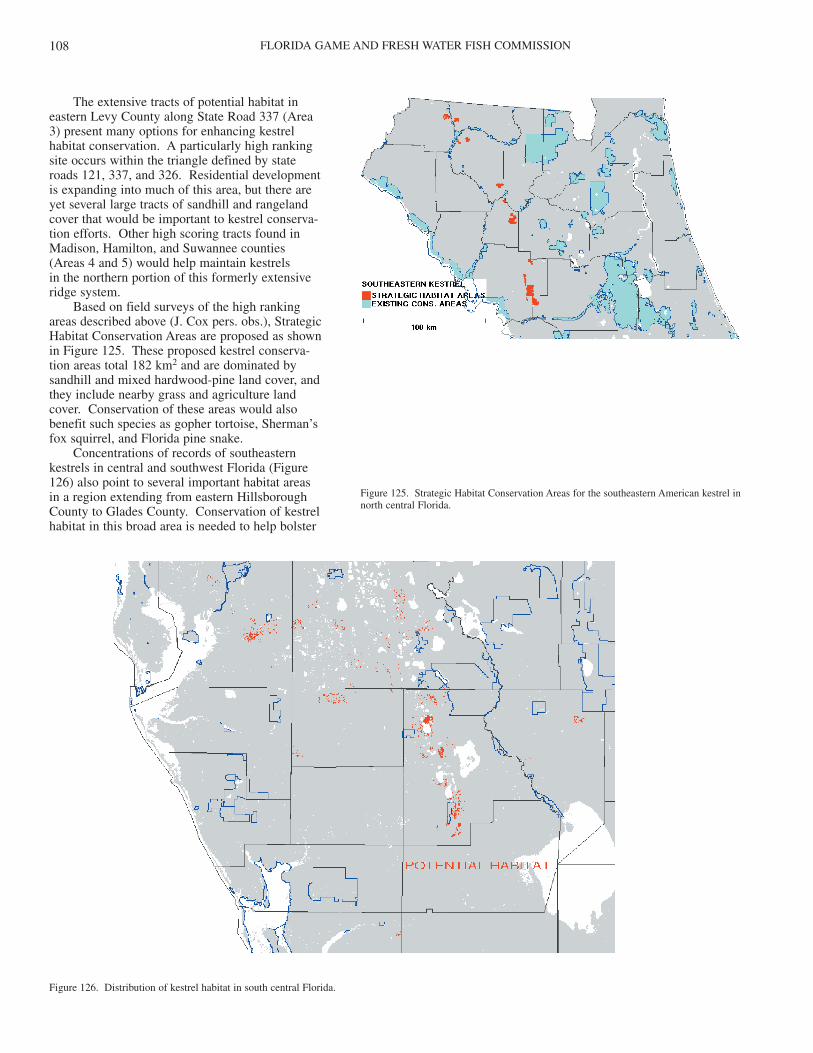
FLORIDA GAME AND FRESH WATER FISH COMMISSION108
The extensive tracts of potential habitat ineastern Levy County along State Road 337 (Area3) present many options for enhancing kestrelhabitat conservation. A particularly high rankingsite occurs within the triangle defined by stateroads 121, 337, and 326. Residential developmentis expanding into much of this area, but there areyet several large tracts of sandhill and rangelandcover that would be important to kestrel conserva-tion efforts. Other high scoring tracts found inMadison, Hamilton, and Suwannee counties(Areas 4 and 5) would help maintain kestrels in the northern portion of this formerly extensiveridge system.
Based on field surveys of the high rankingareas described above (J. Cox pers. obs.), StrategicHabitat Conservation Areas are proposed as shownin Figure 125. These proposed kestrel conserva-tion areas total 182 km2 and are dominated bysandhill and mixed hardwood-pine land cover, andthey include nearby grass and agriculture landcover. Conservation of these areas would alsobenefit such species as gopher tortoise, Sherman’sfox squirrel, and Florida pine snake.
Concentrations of records of southeasternkestrels in central and southwest Florida (Figure126) also point to several important habitat areasin a region extending from eastern HillsboroughCounty to Glades County. Conservation of kestrelhabitat in this broad area is needed to help bolster
Figure 125. Strategic Habitat Conservation Areas for the southeastern American kestrel innorth central Florida.
Figure 126. Distribution of kestrel habitat in south central Florida.
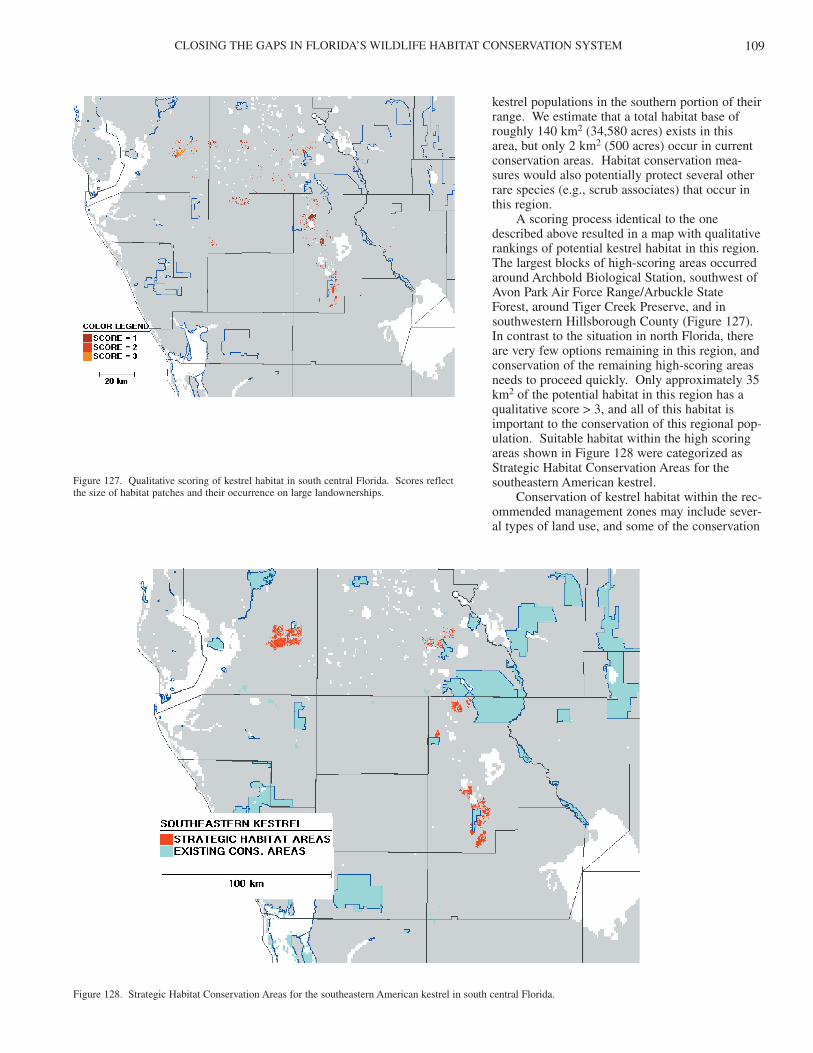
CLOSING THE GAPS IN FLORIDA’S WILDLIFE HABITAT CONSERVATION SYSTEM 109
kestrel populations in the southern portion of theirrange. We estimate that a total habitat base ofroughly 140 km2 (34,580 acres) exists in this area, but only 2 km2 (500 acres) occur in currentconservation areas. Habitat conservation mea-sures would also potentially protect several otherrare species (e.g., scrub associates) that occur inthis region.
A scoring process identical to the onedescribed above resulted in a map with qualitativerankings of potential kestrel habitat in this region.The largest blocks of high-scoring areas occurredaround Archbold Biological Station, southwest ofAvon Park Air Force Range/Arbuckle State Forest, around Tiger Creek Preserve, and insouthwestern Hillsborough County (Figure 127).In contrast to the situation in north Florida, thereare very few options remaining in this region, andconservation of the remaining high-scoring areasneeds to proceed quickly. Only approximately 35km2 of the potential habitat in this region has aqualitative score > 3, and all of this habitat isimportant to the conservation of this regional pop-ulation. Suitable habitat within the high scoringareas shown in Figure 128 were categorized asStrategic Habitat Conservation Areas for thesoutheastern American kestrel.
Conservation of kestrel habitat within the rec-ommended management zones may include sever-al types of land use, and some of the conservation
Figure 127. Qualitative scoring of kestrel habitat in south central Florida. Scores reflectthe size of habitat patches and their occurrence on large landownerships.
Figure 128. Strategic Habitat Conservation Areas for the southeastern American kestrel in south central Florida.
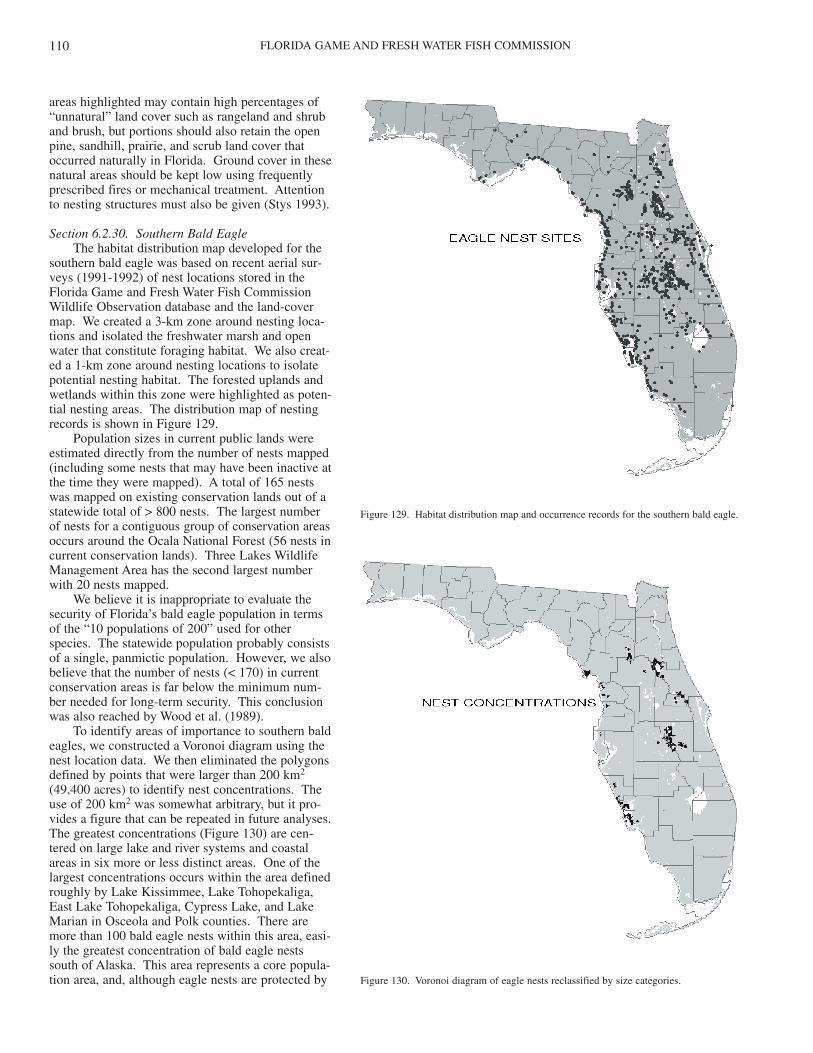
FLORIDA GAME AND FRESH WATER FISH COMMISSION110
areas highlighted may contain high percentages of“unnatural” land cover such as rangeland and shruband brush, but portions should also retain the openpine, sandhill, prairie, and scrub land cover thatoccurred naturally in Florida. Ground cover in thesenatural areas should be kept low using frequentlyprescribed fires or mechanical treatment. Attentionto nesting structures must also be given (Stys 1993).
Section 6.2.30. Southern Bald EagleThe habitat distribution map developed for the
southern bald eagle was based on recent aerial sur-veys (1991-1992) of nest locations stored in theFlorida Game and Fresh Water Fish CommissionWildlife Observation database and the land-covermap. We created a 3-km zone around nesting loca-tions and isolated the freshwater marsh and openwater that constitute foraging habitat. We also creat-ed a 1-km zone around nesting locations to isolatepotential nesting habitat. The forested uplands andwetlands within this zone were highlighted as poten-tial nesting areas. The distribution map of nestingrecords is shown in Figure 129.
Population sizes in current public lands wereestimated directly from the number of nests mapped(including some nests that may have been inactive atthe time they were mapped). A total of 165 nestswas mapped on existing conservation lands out of astatewide total of > 800 nests. The largest numberof nests for a contiguous group of conservation areasoccurs around the Ocala National Forest (56 nests incurrent conservation lands). Three Lakes WildlifeManagement Area has the second largest numberwith 20 nests mapped.
We believe it is inappropriate to evaluate thesecurity of Florida’s bald eagle population in termsof the “10 populations of 200” used for otherspecies. The statewide population probably consistsof a single, panmictic population. However, we alsobelieve that the number of nests (< 170) in currentconservation areas is far below the minimum num-ber needed for long-term security. This conclusionwas also reached by Wood et al. (1989).
To identify areas of importance to southern baldeagles, we constructed a Voronoi diagram using thenest location data. We then eliminated the polygonsdefined by points that were larger than 200 km2
(49,400 acres) to identify nest concentrations. Theuse of 200 km2 was somewhat arbitrary, but it pro-vides a figure that can be repeated in future analyses.The greatest concentrations (Figure 130) are cen-tered on large lake and river systems and coastalareas in six more or less distinct areas. One of thelargest concentrations occurs within the area definedroughly by Lake Kissimmee, Lake Tohopekaliga,East Lake Tohopekaliga, Cypress Lake, and LakeMarian in Osceola and Polk counties. There aremore than 100 bald eagle nests within this area, easi-ly the greatest concentration of bald eagle nestssouth of Alaska. This area represents a core popula-tion area, and, although eagle nests are protected by
Figure 129. Habitat distribution map and occurrence records for the southern bald eagle.
Figure 130. Voronoi diagram of eagle nests reclassified by size categories.
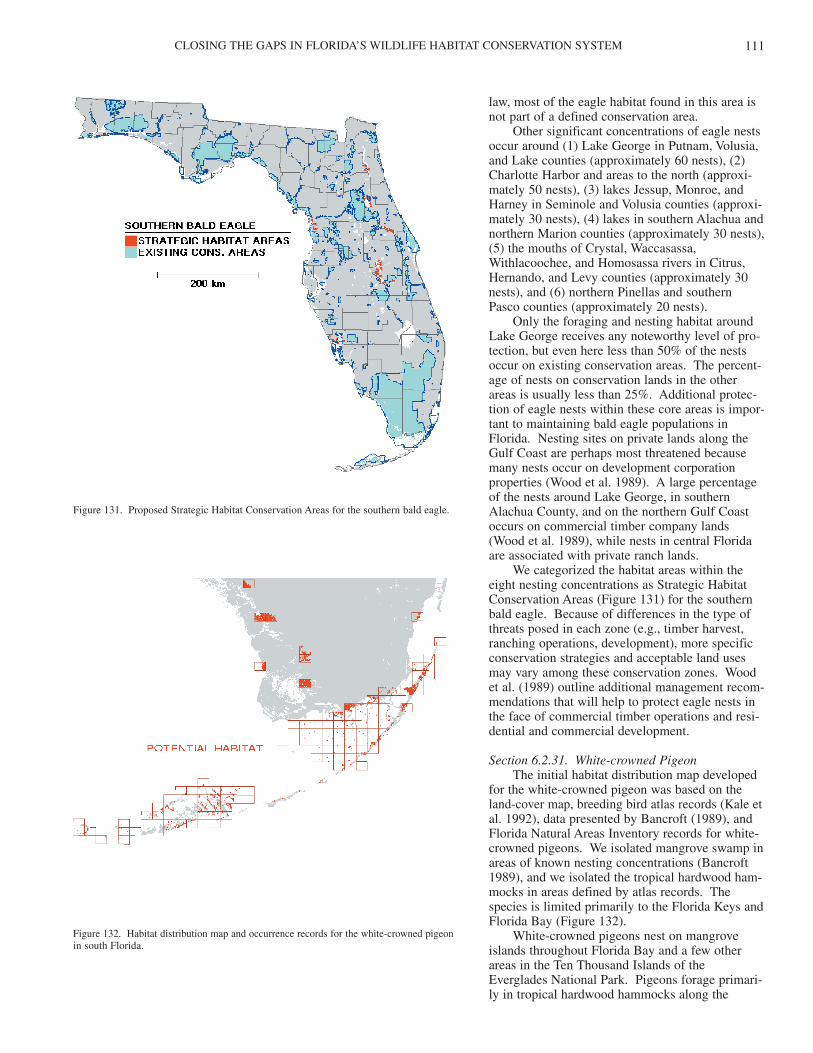
CLOSING THE GAPS IN FLORIDA’S WILDLIFE HABITAT CONSERVATION SYSTEM 111
law, most of the eagle habitat found in this area isnot part of a defined conservation area.
Other significant concentrations of eagle nestsoccur around (1) Lake George in Putnam, Volusia,and Lake counties (approximately 60 nests), (2)Charlotte Harbor and areas to the north (approxi-mately 50 nests), (3) lakes Jessup, Monroe, andHarney in Seminole and Volusia counties (approxi-mately 30 nests), (4) lakes in southern Alachua andnorthern Marion counties (approximately 30 nests),(5) the mouths of Crystal, Waccasassa,Withlacoochee, and Homosassa rivers in Citrus,Hernando, and Levy counties (approximately 30nests), and (6) northern Pinellas and southernPasco counties (approximately 20 nests).
Only the foraging and nesting habitat aroundLake George receives any noteworthy level of pro-tection, but even here less than 50% of the nestsoccur on existing conservation areas. The percent-age of nests on conservation lands in the otherareas is usually less than 25%. Additional protec-tion of eagle nests within these core areas is impor-tant to maintaining bald eagle populations inFlorida. Nesting sites on private lands along theGulf Coast are perhaps most threatened becausemany nests occur on development corporationproperties (Wood et al. 1989). A large percentageof the nests around Lake George, in southernAlachua County, and on the northern Gulf Coastoccurs on commercial timber company lands(Wood et al. 1989), while nests in central Floridaare associated with private ranch lands.
We categorized the habitat areas within theeight nesting concentrations as Strategic HabitatConservation Areas (Figure 131) for the southernbald eagle. Because of differences in the type ofthreats posed in each zone (e.g., timber harvest,ranching operations, development), more specificconservation strategies and acceptable land usesmay vary among these conservation zones. Woodet al. (1989) outline additional management recom-mendations that will help to protect eagle nests inthe face of commercial timber operations and resi-dential and commercial development.
Section 6.2.31. White-crowned PigeonThe initial habitat distribution map developed
for the white-crowned pigeon was based on theland-cover map, breeding bird atlas records (Kale etal. 1992), data presented by Bancroft (1989), andFlorida Natural Areas Inventory records for white-crowned pigeons. We isolated mangrove swamp inareas of known nesting concentrations (Bancroft1989), and we isolated the tropical hardwood ham-mocks in areas defined by atlas records. Thespecies is limited primarily to the Florida Keys andFlorida Bay (Figure 132).
White-crowned pigeons nest on mangroveislands throughout Florida Bay and a few otherareas in the Ten Thousand Islands of theEverglades National Park. Pigeons forage primari-ly in tropical hardwood hammocks along the
Figure 131. Proposed Strategic Habitat Conservation Areas for the southern bald eagle.
Figure 132. Habitat distribution map and occurrence records for the white-crowned pigeonin south Florida.
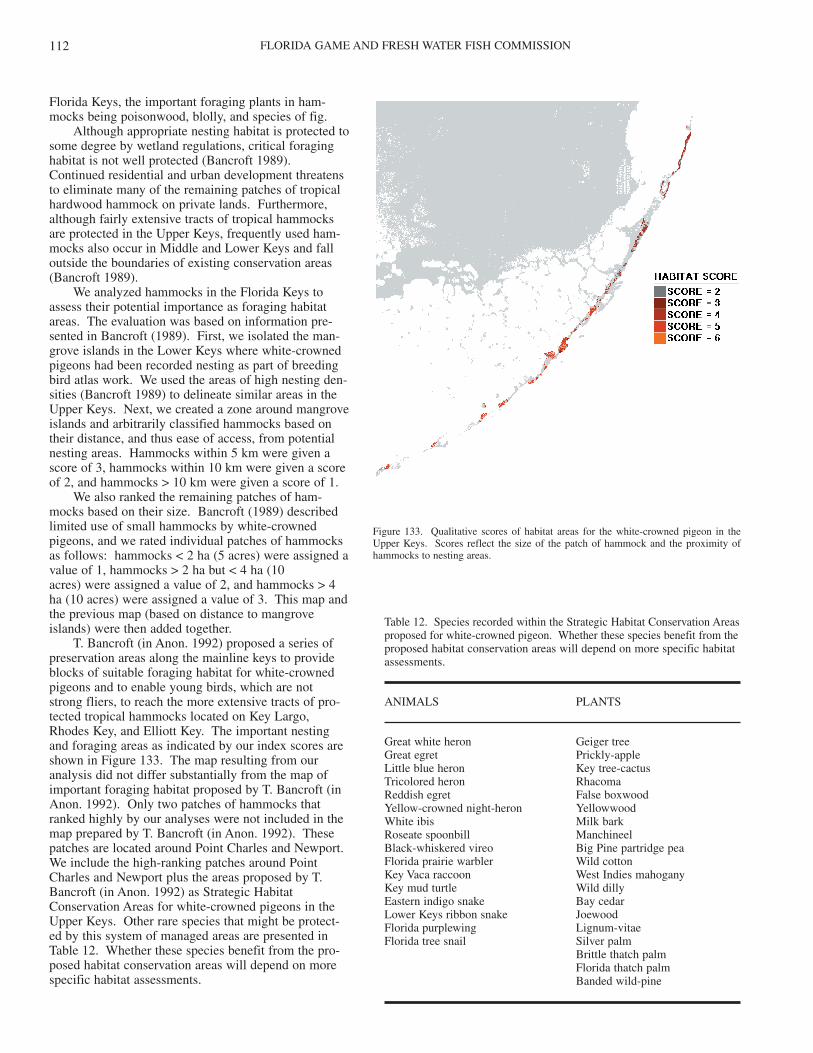
FLORIDA GAME AND FRESH WATER FISH COMMISSION112
Florida Keys, the important foraging plants in ham-mocks being poisonwood, blolly, and species of fig.
Although appropriate nesting habitat is protected tosome degree by wetland regulations, critical foraginghabitat is not well protected (Bancroft 1989).Continued residential and urban development threatensto eliminate many of the remaining patches of tropicalhardwood hammock on private lands. Furthermore,although fairly extensive tracts of tropical hammocksare protected in the Upper Keys, frequently used ham-mocks also occur in Middle and Lower Keys and falloutside the boundaries of existing conservation areas(Bancroft 1989).
We analyzed hammocks in the Florida Keys toassess their potential importance as foraging habitatareas. The evaluation was based on information pre-sented in Bancroft (1989). First, we isolated the man-grove islands in the Lower Keys where white-crownedpigeons had been recorded nesting as part of breedingbird atlas work. We used the areas of high nesting den-sities (Bancroft 1989) to delineate similar areas in theUpper Keys. Next, we created a zone around mangroveislands and arbitrarily classified hammocks based ontheir distance, and thus ease of access, from potentialnesting areas. Hammocks within 5 km were given ascore of 3, hammocks within 10 km were given a scoreof 2, and hammocks > 10 km were given a score of 1.
We also ranked the remaining patches of ham-mocks based on their size. Bancroft (1989) describedlimited use of small hammocks by white-crownedpigeons, and we rated individual patches of hammocksas follows: hammocks < 2 ha (5 acres) were assigned avalue of 1, hammocks > 2 ha but < 4 ha (10 acres) were assigned a value of 2, and hammocks > 4ha (10 acres) were assigned a value of 3. This map andthe previous map (based on distance to mangroveislands) were then added together.
T. Bancroft (in Anon. 1992) proposed a series ofpreservation areas along the mainline keys to provideblocks of suitable foraging habitat for white-crownedpigeons and to enable young birds, which are notstrong fliers, to reach the more extensive tracts of pro-tected tropical hammocks located on Key Largo,Rhodes Key, and Elliott Key. The important nestingand foraging areas as indicated by our index scores areshown in Figure 133. The map resulting from ouranalysis did not differ substantially from the map ofimportant foraging habitat proposed by T. Bancroft (inAnon. 1992). Only two patches of hammocks thatranked highly by our analyses were not included in themap prepared by T. Bancroft (in Anon. 1992). Thesepatches are located around Point Charles and Newport.We include the high-ranking patches around PointCharles and Newport plus the areas proposed by T.Bancroft (in Anon. 1992) as Strategic HabitatConservation Areas for white-crowned pigeons in theUpper Keys. Other rare species that might be protect-ed by this system of managed areas are presented inTable 12. Whether these species benefit from the pro-posed habitat conservation areas will depend on morespecific habitat assessments.
Figure 133. Qualitative scores of habitat areas for the white-crowned pigeon in theUpper Keys. Scores reflect the size of the patch of hammock and the proximity ofhammocks to nesting areas.
Table 12. Species recorded within the Strategic Habitat Conservation Areasproposed for white-crowned pigeon. Whether these species benefit from theproposed habitat conservation areas will depend on more specific habitatassessments.
ANIMALS PLANTS
Great white heron Geiger treeGreat egret Prickly-appleLittle blue heron Key tree-cactusTricolored heron RhacomaReddish egret False boxwoodYellow-crowned night-heron YellowwoodWhite ibis Milk barkRoseate spoonbill ManchineelBlack-whiskered vireo Big Pine partridge peaFlorida prairie warbler Wild cottonKey Vaca raccoon West Indies mahoganyKey mud turtle Wild dillyEastern indigo snake Bay cedarLower Keys ribbon snake JoewoodFlorida purplewing Lignum-vitaeFlorida tree snail Silver palm
Brittle thatch palmFlorida thatch palmBanded wild-pine
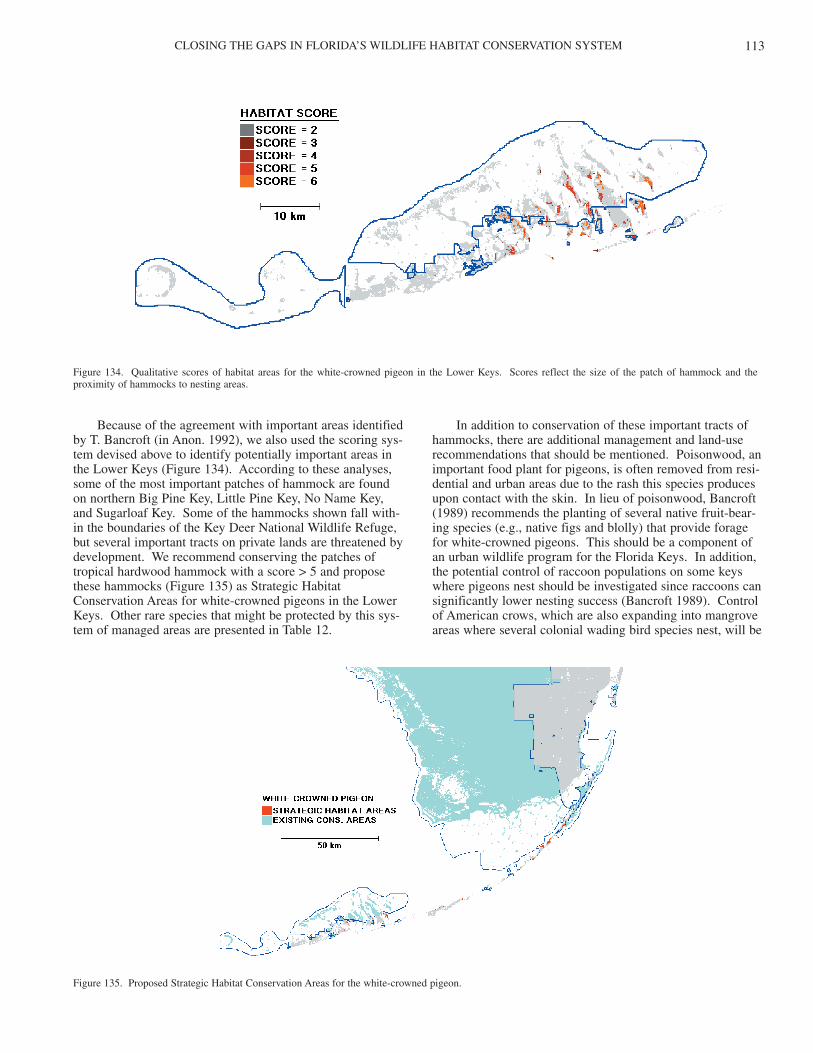
CLOSING THE GAPS IN FLORIDA’S WILDLIFE HABITAT CONSERVATION SYSTEM 113
Because of the agreement with important areas identifiedby T. Bancroft (in Anon. 1992), we also used the scoring sys-tem devised above to identify potentially important areas inthe Lower Keys (Figure 134). According to these analyses,some of the most important patches of hammock are foundon northern Big Pine Key, Little Pine Key, No Name Key,and Sugarloaf Key. Some of the hammocks shown fall with-in the boundaries of the Key Deer National Wildlife Refuge,but several important tracts on private lands are threatened bydevelopment. We recommend conserving the patches oftropical hardwood hammock with a score > 5 and proposethese hammocks (Figure 135) as Strategic HabitatConservation Areas for white-crowned pigeons in the LowerKeys. Other rare species that might be protected by this sys-tem of managed areas are presented in Table 12.
In addition to conservation of these important tracts ofhammocks, there are additional management and land-userecommendations that should be mentioned. Poisonwood, animportant food plant for pigeons, is often removed from resi-dential and urban areas due to the rash this species producesupon contact with the skin. In lieu of poisonwood, Bancroft(1989) recommends the planting of several native fruit-bear-ing species (e.g., native figs and blolly) that provide foragefor white-crowned pigeons. This should be a component ofan urban wildlife program for the Florida Keys. In addition,the potential control of raccoon populations on some keyswhere pigeons nest should be investigated since raccoons cansignificantly lower nesting success (Bancroft 1989). Controlof American crows, which are also expanding into mangroveareas where several colonial wading bird species nest, will be
Figure 134. Qualitative scores of habitat areas for the white-crowned pigeon in the Lower Keys. Scores reflect the size of the patch of hammock and theproximity of hammocks to nesting areas.
Figure 135. Proposed Strategic Habitat Conservation Areas for the white-crowned pigeon.
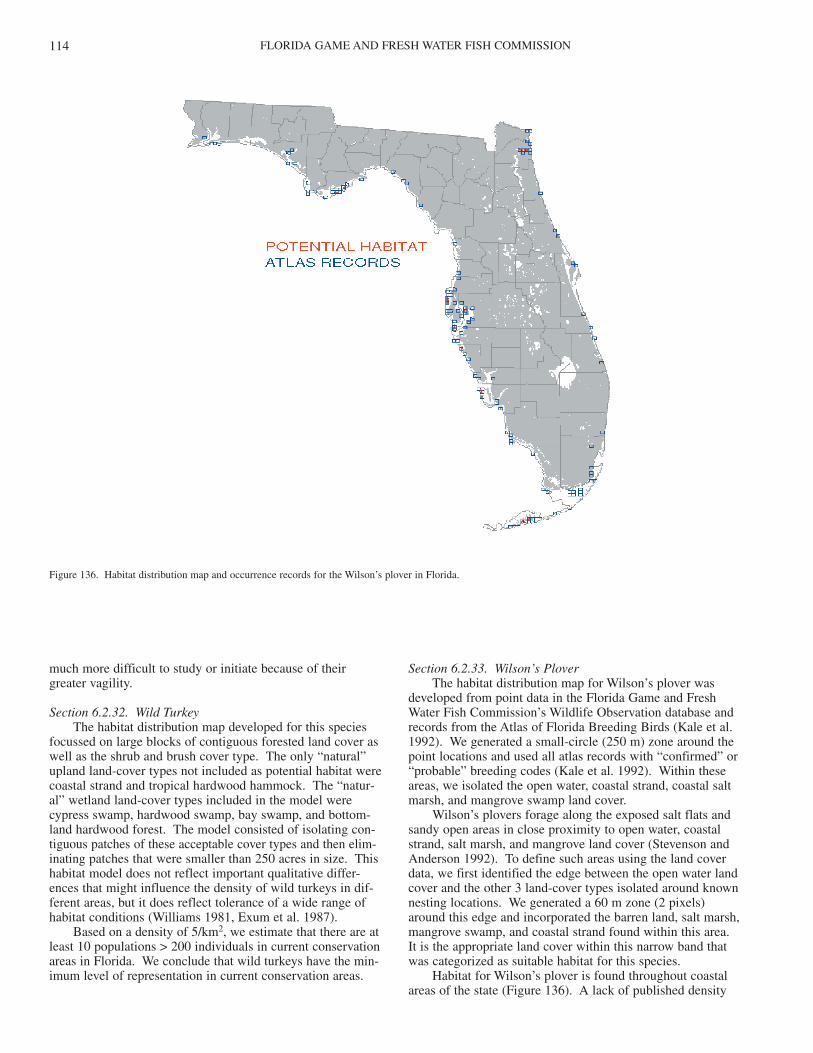
FLORIDA GAME AND FRESH WATER FISH COMMISSION114
much more difficult to study or initiate because of theirgreater vagility.
Section 6.2.32. Wild TurkeyThe habitat distribution map developed for this species
focussed on large blocks of contiguous forested land cover aswell as the shrub and brush cover type. The only “natural”upland land-cover types not included as potential habitat werecoastal strand and tropical hardwood hammock. The “natur-al” wetland land-cover types included in the model werecypress swamp, hardwood swamp, bay swamp, and bottom-land hardwood forest. The model consisted of isolating con-tiguous patches of these acceptable cover types and then elim-inating patches that were smaller than 250 acres in size. Thishabitat model does not reflect important qualitative differ-ences that might influence the density of wild turkeys in dif-ferent areas, but it does reflect tolerance of a wide range ofhabitat conditions (Williams 1981, Exum et al. 1987).
Based on a density of 5/km2, we estimate that there are atleast 10 populations > 200 individuals in current conservationareas in Florida. We conclude that wild turkeys have the min-imum level of representation in current conservation areas.
Section 6.2.33. Wilson’s PloverThe habitat distribution map for Wilson’s plover was
developed from point data in the Florida Game and FreshWater Fish Commission’s Wildlife Observation database andrecords from the Atlas of Florida Breeding Birds (Kale et al.1992). We generated a small-circle (250 m) zone around thepoint locations and used all atlas records with “confirmed” or“probable” breeding codes (Kale et al. 1992). Within theseareas, we isolated the open water, coastal strand, coastal saltmarsh, and mangrove swamp land cover.
Wilson’s plovers forage along the exposed salt flats andsandy open areas in close proximity to open water, coastalstrand, salt marsh, and mangrove land cover (Stevenson andAnderson 1992). To define such areas using the land coverdata, we first identified the edge between the open water landcover and the other 3 land-cover types isolated around knownnesting locations. We generated a 60 m zone (2 pixels)around this edge and incorporated the barren land, salt marsh,mangrove swamp, and coastal strand found within this area.It is the appropriate land cover within this narrow band thatwas categorized as suitable habitat for this species.
Habitat for Wilson’s plover is found throughout coastalareas of the state (Figure 136). A lack of published density
Figure 136. Habitat distribution map and occurrence records for the Wilson’s plover in Florida.
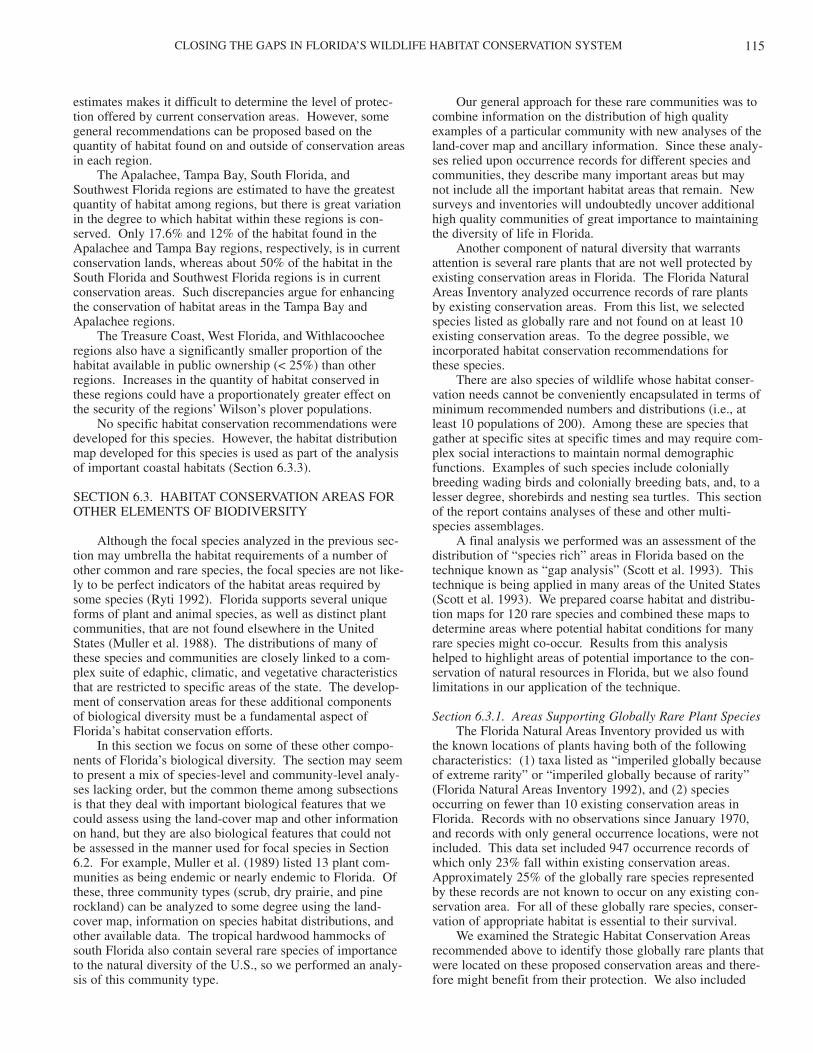
CLOSING THE GAPS IN FLORIDA’S WILDLIFE HABITAT CONSERVATION SYSTEM 115
estimates makes it difficult to determine the level of protec-tion offered by current conservation areas. However, somegeneral recommendations can be proposed based on thequantity of habitat found on and outside of conservation areasin each region.
The Apalachee, Tampa Bay, South Florida, andSouthwest Florida regions are estimated to have the greatestquantity of habitat among regions, but there is great variationin the degree to which habitat within these regions is con-served. Only 17.6% and 12% of the habitat found in theApalachee and Tampa Bay regions, respectively, is in currentconservation lands, whereas about 50% of the habitat in theSouth Florida and Southwest Florida regions is in currentconservation areas. Such discrepancies argue for enhancingthe conservation of habitat areas in the Tampa Bay andApalachee regions.
The Treasure Coast, West Florida, and Withlacoocheeregions also have a significantly smaller proportion of thehabitat available in public ownership (< 25%) than otherregions. Increases in the quantity of habitat conserved inthese regions could have a proportionately greater effect onthe security of the regions’ Wilson’s plover populations.
No specific habitat conservation recommendations weredeveloped for this species. However, the habitat distributionmap developed for this species is used as part of the analysisof important coastal habitats (Section 6.3.3).
SECTION 6.3. HABITAT CONSERVATION AREAS FOROTHER ELEMENTS OF BIODIVERSITY
Although the focal species analyzed in the previous sec-tion may umbrella the habitat requirements of a number ofother common and rare species, the focal species are not like-ly to be perfect indicators of the habitat areas required bysome species (Ryti 1992). Florida supports several uniqueforms of plant and animal species, as well as distinct plantcommunities, that are not found elsewhere in the UnitedStates (Muller et al. 1988). The distributions of many ofthese species and communities are closely linked to a com-plex suite of edaphic, climatic, and vegetative characteristicsthat are restricted to specific areas of the state. The develop-ment of conservation areas for these additional componentsof biological diversity must be a fundamental aspect ofFlorida’s habitat conservation efforts.
In this section we focus on some of these other compo-nents of Florida’s biological diversity. The section may seemto present a mix of species-level and community-level analy-ses lacking order, but the common theme among subsectionsis that they deal with important biological features that wecould assess using the land-cover map and other informationon hand, but they are also biological features that could notbe assessed in the manner used for focal species in Section6.2. For example, Muller et al. (1989) listed 13 plant com-munities as being endemic or nearly endemic to Florida. Ofthese, three community types (scrub, dry prairie, and pinerockland) can be analyzed to some degree using the land-cover map, information on species habitat distributions, andother available data. The tropical hardwood hammocks ofsouth Florida also contain several rare species of importanceto the natural diversity of the U.S., so we performed an analy-sis of this community type.
Our general approach for these rare communities was tocombine information on the distribution of high qualityexamples of a particular community with new analyses of theland-cover map and ancillary information. Since these analy-ses relied upon occurrence records for different species andcommunities, they describe many important areas but maynot include all the important habitat areas that remain. Newsurveys and inventories will undoubtedly uncover additionalhigh quality communities of great importance to maintainingthe diversity of life in Florida.
Another component of natural diversity that warrantsattention is several rare plants that are not well protected byexisting conservation areas in Florida. The Florida NaturalAreas Inventory analyzed occurrence records of rare plantsby existing conservation areas. From this list, we selectedspecies listed as globally rare and not found on at least 10existing conservation areas. To the degree possible, weincorporated habitat conservation recommendations for these species.
There are also species of wildlife whose habitat conser-vation needs cannot be conveniently encapsulated in terms ofminimum recommended numbers and distributions (i.e., atleast 10 populations of 200). Among these are species thatgather at specific sites at specific times and may require com-plex social interactions to maintain normal demographicfunctions. Examples of such species include coloniallybreeding wading birds and colonially breeding bats, and, to alesser degree, shorebirds and nesting sea turtles. This sectionof the report contains analyses of these and other multi-species assemblages.
A final analysis we performed was an assessment of thedistribution of “species rich” areas in Florida based on thetechnique known as “gap analysis” (Scott et al. 1993). Thistechnique is being applied in many areas of the United States(Scott et al. 1993). We prepared coarse habitat and distribu-tion maps for 120 rare species and combined these maps todetermine areas where potential habitat conditions for manyrare species might co-occur. Results from this analysishelped to highlight areas of potential importance to the con-servation of natural resources in Florida, but we also foundlimitations in our application of the technique.
Section 6.3.1. Areas Supporting Globally Rare Plant SpeciesThe Florida Natural Areas Inventory provided us with
the known locations of plants having both of the followingcharacteristics: (1) taxa listed as “imperiled globally becauseof extreme rarity” or “imperiled globally because of rarity”(Florida Natural Areas Inventory 1992), and (2) speciesoccurring on fewer than 10 existing conservation areas inFlorida. Records with no observations since January 1970,and records with only general occurrence locations, were notincluded. This data set included 947 occurrence records ofwhich only 23% fall within existing conservation areas.Approximately 25% of the globally rare species representedby these records are not known to occur on any existing con-servation area. For all of these globally rare species, conser-vation of appropriate habitat is essential to their survival.
We examined the Strategic Habitat Conservation Areasrecommended above to identify those globally rare plants thatwere located on these proposed conservation areas and there-fore might benefit from their protection. We also included
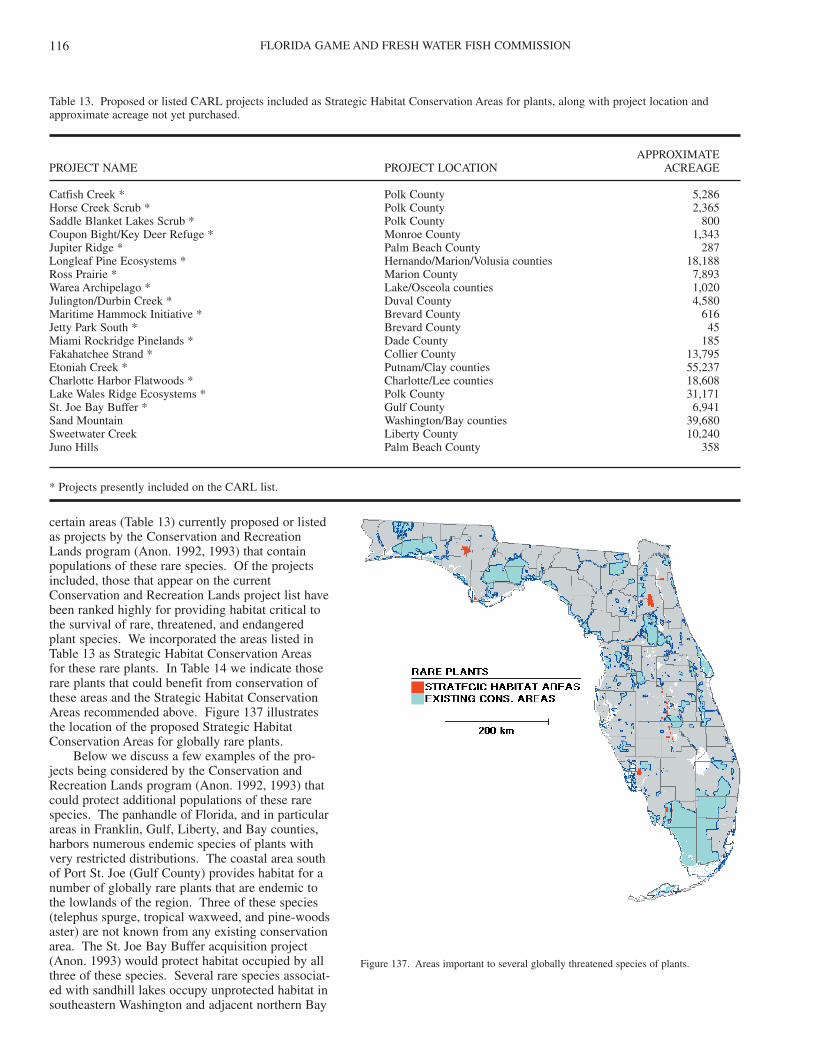
FLORIDA GAME AND FRESH WATER FISH COMMISSION116
certain areas (Table 13) currently proposed or listedas projects by the Conservation and RecreationLands program (Anon. 1992, 1993) that containpopulations of these rare species. Of the projectsincluded, those that appear on the currentConservation and Recreation Lands project list havebeen ranked highly for providing habitat critical tothe survival of rare, threatened, and endangeredplant species. We incorporated the areas listed inTable 13 as Strategic Habitat Conservation Areas for these rare plants. In Table 14 we indicate thoserare plants that could benefit from conservation ofthese areas and the Strategic Habitat ConservationAreas recommended above. Figure 137 illustratesthe location of the proposed Strategic HabitatConservation Areas for globally rare plants.
Below we discuss a few examples of the pro-jects being considered by the Conservation andRecreation Lands program (Anon. 1992, 1993) thatcould protect additional populations of these rarespecies. The panhandle of Florida, and in particularareas in Franklin, Gulf, Liberty, and Bay counties,harbors numerous endemic species of plants withvery restricted distributions. The coastal area southof Port St. Joe (Gulf County) provides habitat for anumber of globally rare plants that are endemic tothe lowlands of the region. Three of these species(telephus spurge, tropical waxweed, and pine-woodsaster) are not known from any existing conservationarea. The St. Joe Bay Buffer acquisition project(Anon. 1993) would protect habitat occupied by allthree of these species. Several rare species associat-ed with sandhill lakes occupy unprotected habitat insoutheastern Washington and adjacent northern Bay
Table 13. Proposed or listed CARL projects included as Strategic Habitat Conservation Areas for plants, along with project location andapproximate acreage not yet purchased.
APPROXIMATE PROJECT NAME PROJECT LOCATION ACREAGE
Catfish Creek * Polk County 5,286Horse Creek Scrub * Polk County 2,365Saddle Blanket Lakes Scrub * Polk County 800Coupon Bight/Key Deer Refuge * Monroe County 1,343Jupiter Ridge * Palm Beach County 287Longleaf Pine Ecosystems * Hernando/Marion/Volusia counties 18,188Ross Prairie * Marion County 7,893Warea Archipelago * Lake/Osceola counties 1,020Julington/Durbin Creek * Duval County 4,580Maritime Hammock Initiative * Brevard County 616Jetty Park South * Brevard County 45Miami Rockridge Pinelands * Dade County 185Fakahatchee Strand * Collier County 13,795Etoniah Creek * Putnam/Clay counties 55,237Charlotte Harbor Flatwoods * Charlotte/Lee counties 18,608Lake Wales Ridge Ecosystems * Polk County 31,171St. Joe Bay Buffer * Gulf County 6,941Sand Mountain Washington/Bay counties 39,680Sweetwater Creek Liberty County 10,240Juno Hills Palm Beach County 358
* Projects presently included on the CARL list.
Figure 137. Areas important to several globally threatened species of plants.
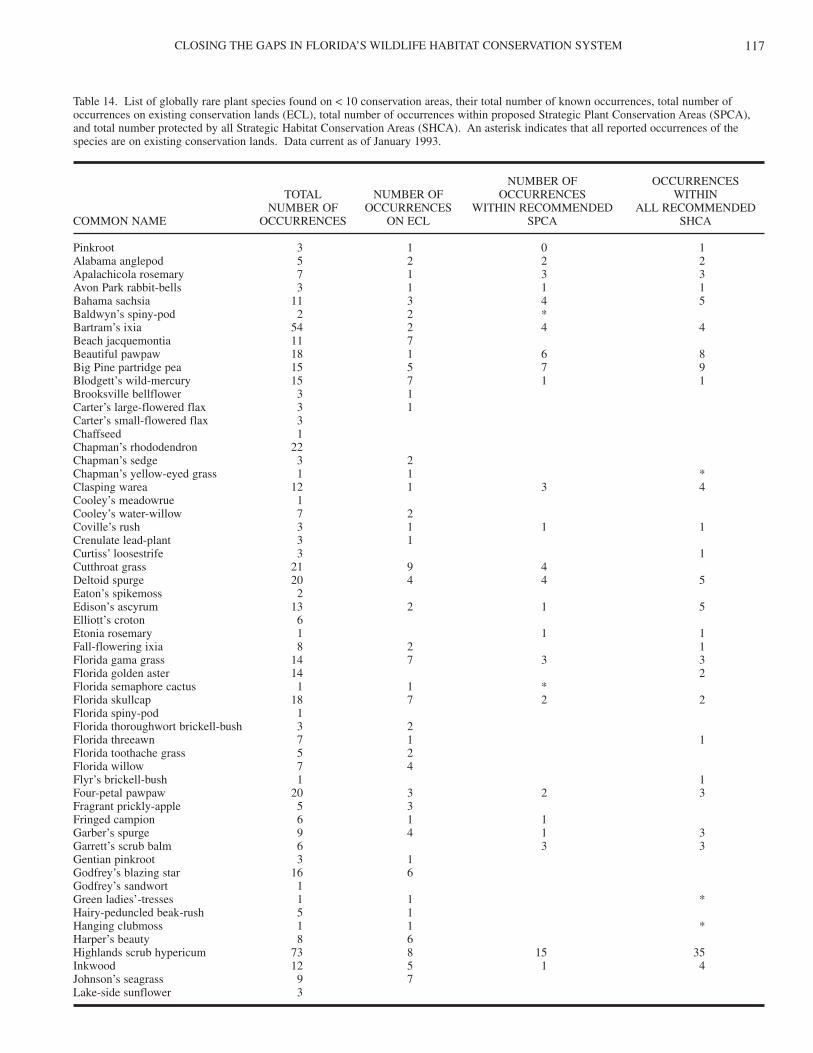
CLOSING THE GAPS IN FLORIDA’S WILDLIFE HABITAT CONSERVATION SYSTEM 117
Table 14. List of globally rare plant species found on < 10 conservation areas, their total number of known occurrences, total number ofoccurrences on existing conservation lands (ECL), total number of occurrences within proposed Strategic Plant Conservation Areas (SPCA),and total number protected by all Strategic Habitat Conservation Areas (SHCA). An asterisk indicates that all reported occurrences of thespecies are on existing conservation lands. Data current as of January 1993.
NUMBER OF OCCURRENCESTOTAL NUMBER OF OCCURRENCES WITHIN
NUMBER OF OCCURRENCES WITHIN RECOMMENDED ALL RECOMMENDEDCOMMON NAME OCCURRENCES ON ECL SPCA SHCA
Pinkroot 3 1 0 1Alabama anglepod 5 2 2 2Apalachicola rosemary 7 1 3 3Avon Park rabbit-bells 3 1 1 1Bahama sachsia 11 3 4 5Baldwyn’s spiny-pod 2 2 *Bartram’s ixia 54 2 4 4Beach jacquemontia 11 7Beautiful pawpaw 18 1 6 8Big Pine partridge pea 15 5 7 9Blodgett’s wild-mercury 15 7 1 1Brooksville bellflower 3 1Carter’s large-flowered flax 3 1Carter’s small-flowered flax 3Chaffseed 1Chapman’s rhododendron 22Chapman’s sedge 3 2Chapman’s yellow-eyed grass 1 1 *Clasping warea 12 1 3 4Cooley’s meadowrue 1Cooley’s water-willow 7 2Coville’s rush 3 1 1 1Crenulate lead-plant 3 1Curtiss’ loosestrife 3 1Cutthroat grass 21 9 4Deltoid spurge 20 4 4 5Eaton’s spikemoss 2Edison’s ascyrum 13 2 1 5Elliott’s croton 6Etonia rosemary 1 1 1Fall-flowering ixia 8 2 1Florida gama grass 14 7 3 3Florida golden aster 14 2Florida semaphore cactus 1 1 *Florida skullcap 18 7 2 2Florida spiny-pod 1Florida thoroughwort brickell-bush 3 2Florida threeawn 7 1 1Florida toothache grass 5 2Florida willow 7 4Flyr’s brickell-bush 1 1Four-petal pawpaw 20 3 2 3Fragrant prickly-apple 5 3Fringed campion 6 1 1Garber’s spurge 9 4 1 3Garrett’s scrub balm 6 3 3Gentian pinkroot 3 1Godfrey’s blazing star 16 6Godfrey’s sandwort 1Green ladies’-tresses 1 1 *Hairy-peduncled beak-rush 5 1Hanging clubmoss 1 1 *Harper’s beauty 8 6Highlands scrub hypericum 73 8 15 35Inkwood 12 5 1 4Johnson’s seagrass 9 7Lake-side sunflower 3

FLORIDA GAME AND FRESH WATER FISH COMMISSION118
Table 14. List of globally rare plant species found on < 10 conservation areas, (continued).
NUMBER OF OCCURRENCESTOTAL NUMBER OF OCCURRENCES WITHIN
NUMBER OF OCCURRENCES WITHIN RECOMMENDED ALL RECOMMENDEDCOMMON NAME OCCURRENCES ON ECL SPCA SHCA
Lakela’s mint 4 1Large-flowered grass-of-parnassus 5 5 *Lewton’s polygala 23 5 5 5Longspurred mint 12 5 4 4Miccosukee gooseberry 2Nodding catopsis 1 1 *Nuttall’s rayless goldenrod 1 1 *Ocala vetch 1 1 *Okeechobee gourd 1 1Panhandle spiderlily 16 8 1 2Pine pinweed 7 2 2 3Pine-woods aster 39Pinelands spurge 2 1Porter’s broad-leaved spurge 3 2Porter’s broom spurge 11 4 4 5Porter’s hairy-podded spurge 2 2 *Purple balduina 3 1Quillwort yellow-eyed grass 4 1Rain lily 1 1 *Rock Key devil’s-claws 1Rocklands morning-glory 4 3Rough strongbark 1Rugel’s pawpaw 6Sand flax 12 2 6 9Sand-dune spurge 10 5Sanibel lovegrass 11 1Scrub bluestem 33 1 11 17Scrub lupine 37 2 1 4Scrub mint 9 1 2 2Scrub ziziphus 1 1 *Small-flowered lily-thorn 1 1 *Smooth-barked St. John’s-wort 29 2 2Southern marshallia 1 1 *Star anise 11 7 1 3Tampa vervain 14 4 1Telephus spurge 24 4 4Tennessee leafcup 1 1 *Three-spined prickly-pear 4 2 1 1Tiny polygala 6 2Tropical waxweed 18 1 1Variable-leaf crownbeard 5 2 1 1Variable-leaved Indian-plantain 3 1Wagner’s spleenwort 1 1 *Wedge spurge 4 1 3 3Wedge-leaved button-snakeroot 19 1 6 13West’s flax 10 3Wild potato morning-glory 3 2Wright’s anemia 1
Total 947 214 124 199
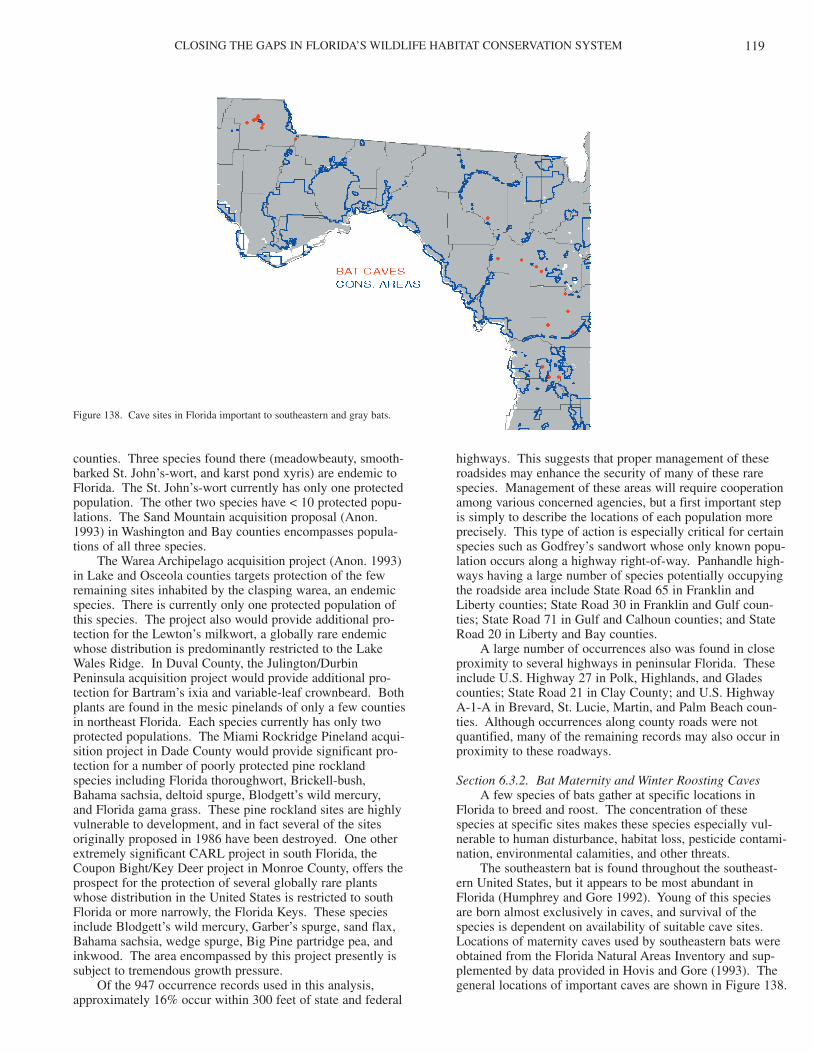
CLOSING THE GAPS IN FLORIDA’S WILDLIFE HABITAT CONSERVATION SYSTEM 119
counties. Three species found there (meadowbeauty, smooth-barked St. John’s-wort, and karst pond xyris) are endemic toFlorida. The St. John’s-wort currently has only one protectedpopulation. The other two species have < 10 protected popu-lations. The Sand Mountain acquisition proposal (Anon.1993) in Washington and Bay counties encompasses popula-tions of all three species.
The Warea Archipelago acquisition project (Anon. 1993)in Lake and Osceola counties targets protection of the fewremaining sites inhabited by the clasping warea, an endemicspecies. There is currently only one protected population ofthis species. The project also would provide additional pro-tection for the Lewton’s milkwort, a globally rare endemicwhose distribution is predominantly restricted to the LakeWales Ridge. In Duval County, the Julington/DurbinPeninsula acquisition project would provide additional pro-tection for Bartram’s ixia and variable-leaf crownbeard. Bothplants are found in the mesic pinelands of only a few countiesin northeast Florida. Each species currently has only twoprotected populations. The Miami Rockridge Pineland acqui-sition project in Dade County would provide significant pro-tection for a number of poorly protected pine rocklandspecies including Florida thoroughwort, Brickell-bush,Bahama sachsia, deltoid spurge, Blodgett’s wild mercury,and Florida gama grass. These pine rockland sites are highlyvulnerable to development, and in fact several of the sitesoriginally proposed in 1986 have been destroyed. One otherextremely significant CARL project in south Florida, theCoupon Bight/Key Deer project in Monroe County, offers theprospect for the protection of several globally rare plantswhose distribution in the United States is restricted to southFlorida or more narrowly, the Florida Keys. These speciesinclude Blodgett’s wild mercury, Garber’s spurge, sand flax,Bahama sachsia, wedge spurge, Big Pine partridge pea, andinkwood. The area encompassed by this project presently issubject to tremendous growth pressure.
Of the 947 occurrence records used in this analysis,approximately 16% occur within 300 feet of state and federal
highways. This suggests that proper management of theseroadsides may enhance the security of many of these rarespecies. Management of these areas will require cooperationamong various concerned agencies, but a first important stepis simply to describe the locations of each population moreprecisely. This type of action is especially critical for certainspecies such as Godfrey’s sandwort whose only known popu-lation occurs along a highway right-of-way. Panhandle high-ways having a large number of species potentially occupyingthe roadside area include State Road 65 in Franklin andLiberty counties; State Road 30 in Franklin and Gulf coun-ties; State Road 71 in Gulf and Calhoun counties; and StateRoad 20 in Liberty and Bay counties.
A large number of occurrences also was found in closeproximity to several highways in peninsular Florida. Theseinclude U.S. Highway 27 in Polk, Highlands, and Gladescounties; State Road 21 in Clay County; and U.S. HighwayA-1-A in Brevard, St. Lucie, Martin, and Palm Beach coun-ties. Although occurrences along county roads were notquantified, many of the remaining records may also occur inproximity to these roadways.
Section 6.3.2. Bat Maternity and Winter Roosting CavesA few species of bats gather at specific locations in
Florida to breed and roost. The concentration of thesespecies at specific sites makes these species especially vul-nerable to human disturbance, habitat loss, pesticide contami-nation, environmental calamities, and other threats.
The southeastern bat is found throughout the southeast-ern United States, but it appears to be most abundant inFlorida (Humphrey and Gore 1992). Young of this speciesare born almost exclusively in caves, and survival of thespecies is dependent on availability of suitable cave sites.Locations of maternity caves used by southeastern bats wereobtained from the Florida Natural Areas Inventory and sup-plemented by data provided in Hovis and Gore (1993). Thegeneral locations of important caves are shown in Figure 138.
Figure 138. Cave sites in Florida important to southeastern and gray bats.
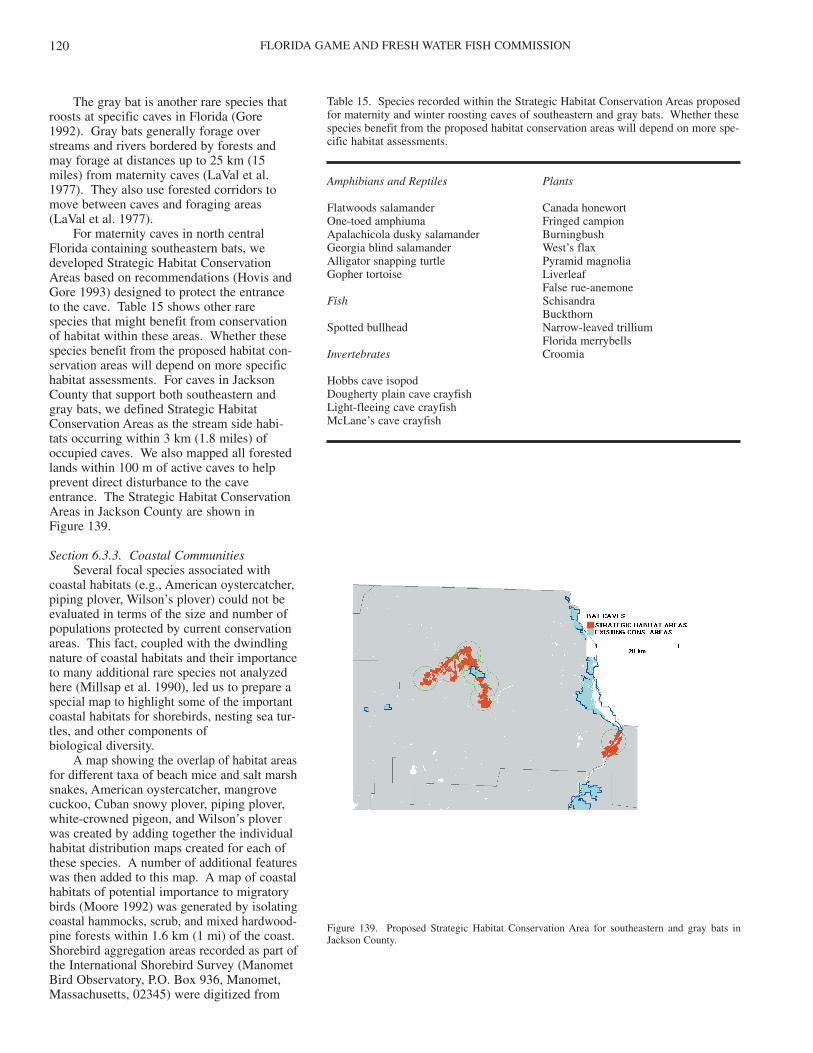
FLORIDA GAME AND FRESH WATER FISH COMMISSION120
The gray bat is another rare species thatroosts at specific caves in Florida (Gore1992). Gray bats generally forage overstreams and rivers bordered by forests andmay forage at distances up to 25 km (15miles) from maternity caves (LaVal et al.1977). They also use forested corridors tomove between caves and foraging areas(LaVal et al. 1977).
For maternity caves in north centralFlorida containing southeastern bats, wedeveloped Strategic Habitat ConservationAreas based on recommendations (Hovis andGore 1993) designed to protect the entranceto the cave. Table 15 shows other rare species that might benefit from conservationof habitat within these areas. Whether thesespecies benefit from the proposed habitat con-servation areas will depend on more specifichabitat assessments. For caves in JacksonCounty that support both southeastern andgray bats, we defined Strategic HabitatConservation Areas as the stream side habi-tats occurring within 3 km (1.8 miles) ofoccupied caves. We also mapped all forestedlands within 100 m of active caves to helpprevent direct disturbance to the caveentrance. The Strategic Habitat ConservationAreas in Jackson County are shown in Figure 139.
Section 6.3.3. Coastal CommunitiesSeveral focal species associated with
coastal habitats (e.g., American oystercatcher,piping plover, Wilson’s plover) could not beevaluated in terms of the size and number ofpopulations protected by current conservationareas. This fact, coupled with the dwindlingnature of coastal habitats and their importanceto many additional rare species not analyzedhere (Millsap et al. 1990), led us to prepare aspecial map to highlight some of the importantcoastal habitats for shorebirds, nesting sea tur-tles, and other components of biological diversity.
A map showing the overlap of habitat areasfor different taxa of beach mice and salt marshsnakes, American oystercatcher, mangrovecuckoo, Cuban snowy plover, piping plover,white-crowned pigeon, and Wilson’s ploverwas created by adding together the individualhabitat distribution maps created for each ofthese species. A number of additional featureswas then added to this map. A map of coastalhabitats of potential importance to migratorybirds (Moore 1992) was generated by isolatingcoastal hammocks, scrub, and mixed hardwood-pine forests within 1.6 km (1 mi) of the coast.Shorebird aggregation areas recorded as part ofthe International Shorebird Survey (ManometBird Observatory, P.O. Box 936, Manomet,Massachusetts, 02345) were digitized from
Table 15. Species recorded within the Strategic Habitat Conservation Areas proposedfor maternity and winter roosting caves of southeastern and gray bats. Whether thesespecies benefit from the proposed habitat conservation areas will depend on more spe-cific habitat assessments.
Amphibians and Reptiles Plants
Flatwoods salamander Canada honewortOne-toed amphiuma Fringed campionApalachicola dusky salamander BurningbushGeorgia blind salamander West’s flaxAlligator snapping turtle Pyramid magnoliaGopher tortoise Liverleaf
False rue-anemoneFish Schisandra
BuckthornSpotted bullhead Narrow-leaved trillium
Florida merrybellsInvertebrates Croomia
Hobbs cave isopodDougherty plain cave crayfishLight-fleeing cave crayfishMcLane’s cave crayfish
Figure 139. Proposed Strategic Habitat Conservation Area for southeastern and gray bats inJackson County.
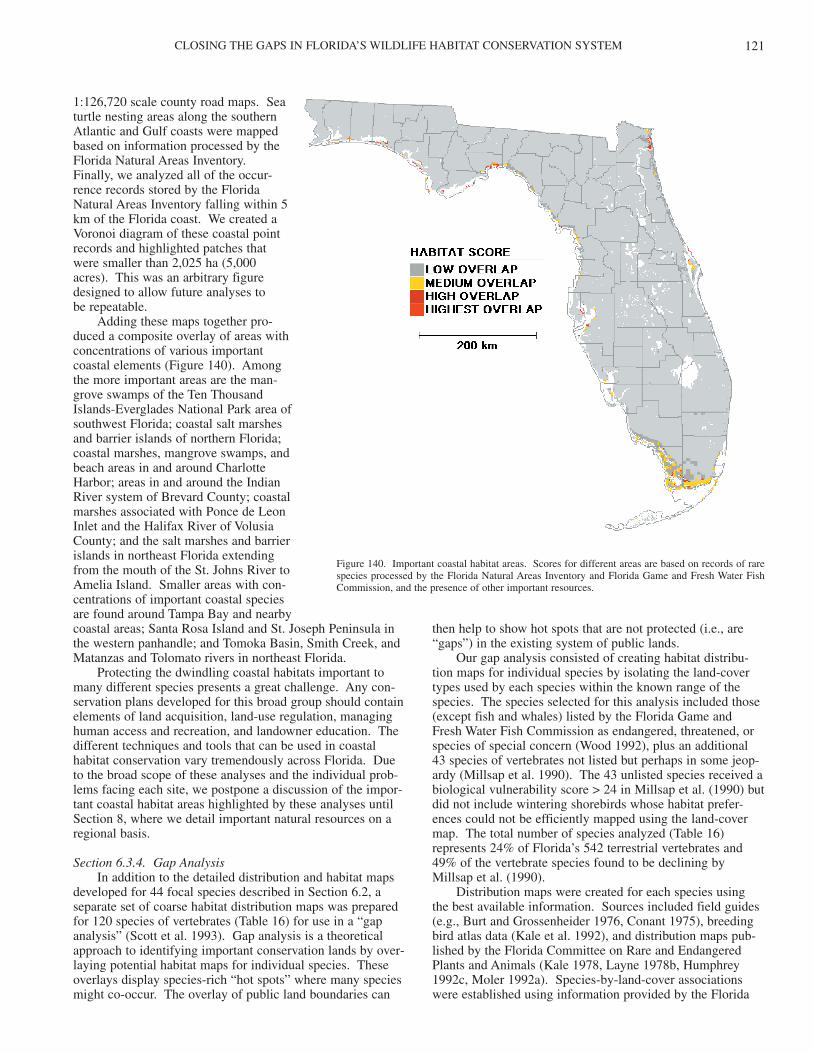
CLOSING THE GAPS IN FLORIDA’S WILDLIFE HABITAT CONSERVATION SYSTEM 121
then help to show hot spots that are not protected (i.e., are“gaps”) in the existing system of public lands.
Our gap analysis consisted of creating habitat distribu-tion maps for individual species by isolating the land-covertypes used by each species within the known range of thespecies. The species selected for this analysis included those(except fish and whales) listed by the Florida Game andFresh Water Fish Commission as endangered, threatened, orspecies of special concern (Wood 1992), plus an additional43 species of vertebrates not listed but perhaps in some jeop-ardy (Millsap et al. 1990). The 43 unlisted species received abiological vulnerability score > 24 in Millsap et al. (1990) butdid not include wintering shorebirds whose habitat prefer-ences could not be efficiently mapped using the land-covermap. The total number of species analyzed (Table 16)represents 24% of Florida’s 542 terrestrial vertebrates and49% of the vertebrate species found to be declining byMillsap et al. (1990).
Distribution maps were created for each species usingthe best available information. Sources included field guides(e.g., Burt and Grossenheider 1976, Conant 1975), breedingbird atlas data (Kale et al. 1992), and distribution maps pub-lished by the Florida Committee on Rare and EndangeredPlants and Animals (Kale 1978, Layne 1978b, Humphrey1992c, Moler 1992a). Species-by-land-cover associationswere established using information provided by the Florida
1:126,720 scale county road maps. Seaturtle nesting areas along the southernAtlantic and Gulf coasts were mappedbased on information processed by theFlorida Natural Areas Inventory.Finally, we analyzed all of the occur-rence records stored by the FloridaNatural Areas Inventory falling within 5km of the Florida coast. We created aVoronoi diagram of these coastal pointrecords and highlighted patches thatwere smaller than 2,025 ha (5,000acres). This was an arbitrary figuredesigned to allow future analyses to be repeatable.
Adding these maps together pro-duced a composite overlay of areas withconcentrations of various importantcoastal elements (Figure 140). Amongthe more important areas are the man-grove swamps of the Ten ThousandIslands-Everglades National Park area ofsouthwest Florida; coastal salt marshesand barrier islands of northern Florida;coastal marshes, mangrove swamps, andbeach areas in and around CharlotteHarbor; areas in and around the IndianRiver system of Brevard County; coastalmarshes associated with Ponce de LeonInlet and the Halifax River of VolusiaCounty; and the salt marshes and barrierislands in northeast Florida extendingfrom the mouth of the St. Johns River toAmelia Island. Smaller areas with con-centrations of important coastal speciesare found around Tampa Bay and nearbycoastal areas; Santa Rosa Island and St. Joseph Peninsula inthe western panhandle; and Tomoka Basin, Smith Creek, andMatanzas and Tolomato rivers in northeast Florida.
Protecting the dwindling coastal habitats important tomany different species presents a great challenge. Any con-servation plans developed for this broad group should containelements of land acquisition, land-use regulation, managinghuman access and recreation, and landowner education. Thedifferent techniques and tools that can be used in coastalhabitat conservation vary tremendously across Florida. Dueto the broad scope of these analyses and the individual prob-lems facing each site, we postpone a discussion of the impor-tant coastal habitat areas highlighted by these analyses untilSection 8, where we detail important natural resources on aregional basis.
Section 6.3.4. Gap AnalysisIn addition to the detailed distribution and habitat maps
developed for 44 focal species described in Section 6.2, aseparate set of coarse habitat distribution maps was preparedfor 120 species of vertebrates (Table 16) for use in a “gapanalysis” (Scott et al. 1993). Gap analysis is a theoreticalapproach to identifying important conservation lands by over-laying potential habitat maps for individual species. Theseoverlays display species-rich “hot spots” where many speciesmight co-occur. The overlay of public land boundaries can
Figure 140. Important coastal habitat areas. Scores for different areas are based on records of rarespecies processed by the Florida Natural Areas Inventory and Florida Game and Fresh Water FishCommission, and the presence of other important resources.
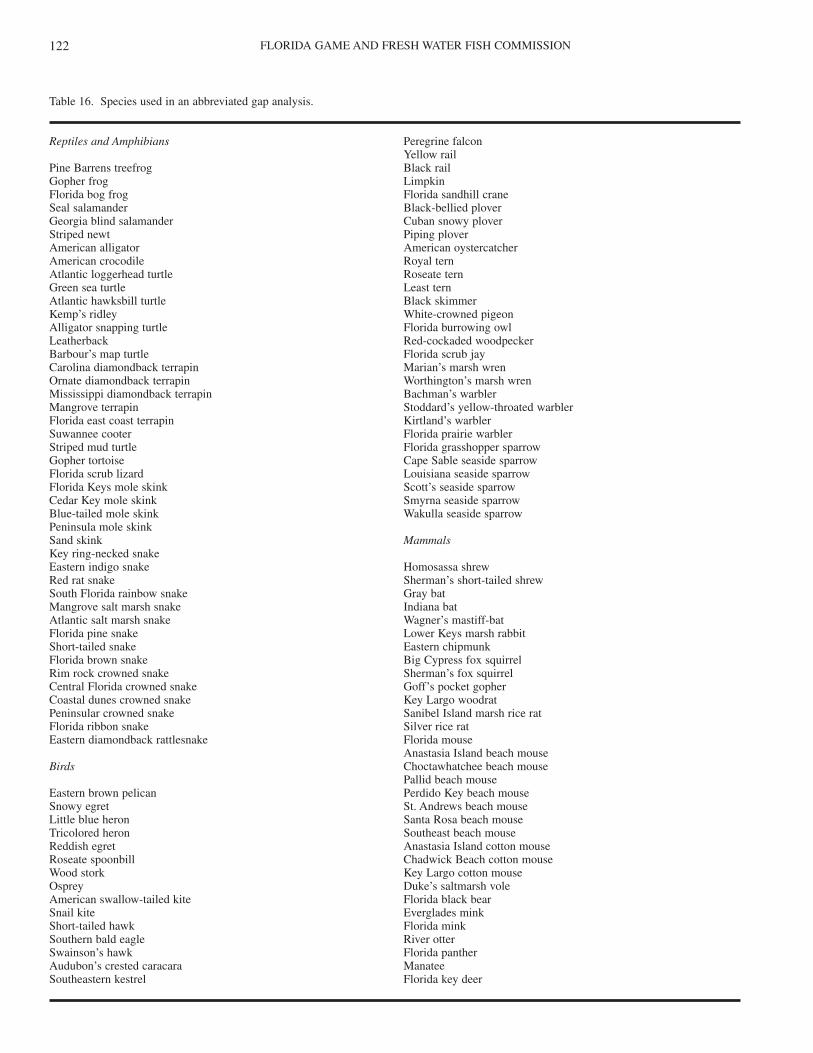
FLORIDA GAME AND FRESH WATER FISH COMMISSION122
Table 16. Species used in an abbreviated gap analysis.
Reptiles and Amphibians Peregrine falconYellow rail
Pine Barrens treefrog Black railGopher frog LimpkinFlorida bog frog Florida sandhill craneSeal salamander Black-bellied ploverGeorgia blind salamander Cuban snowy ploverStriped newt Piping ploverAmerican alligator American oystercatcherAmerican crocodile Royal ternAtlantic loggerhead turtle Roseate ternGreen sea turtle Least ternAtlantic hawksbill turtle Black skimmerKemp’s ridley White-crowned pigeonAlligator snapping turtle Florida burrowing owlLeatherback Red-cockaded woodpeckerBarbour’s map turtle Florida scrub jayCarolina diamondback terrapin Marian’s marsh wrenOrnate diamondback terrapin Worthington’s marsh wrenMississippi diamondback terrapin Bachman’s warblerMangrove terrapin Stoddard’s yellow-throated warblerFlorida east coast terrapin Kirtland’s warblerSuwannee cooter Florida prairie warblerStriped mud turtle Florida grasshopper sparrowGopher tortoise Cape Sable seaside sparrowFlorida scrub lizard Louisiana seaside sparrowFlorida Keys mole skink Scott’s seaside sparrowCedar Key mole skink Smyrna seaside sparrowBlue-tailed mole skink Wakulla seaside sparrowPeninsula mole skinkSand skink MammalsKey ring-necked snakeEastern indigo snake Homosassa shrewRed rat snake Sherman’s short-tailed shrewSouth Florida rainbow snake Gray batMangrove salt marsh snake Indiana batAtlantic salt marsh snake Wagner’s mastiff-batFlorida pine snake Lower Keys marsh rabbitShort-tailed snake Eastern chipmunkFlorida brown snake Big Cypress fox squirrelRim rock crowned snake Sherman’s fox squirrelCentral Florida crowned snake Goff’s pocket gopherCoastal dunes crowned snake Key Largo woodratPeninsular crowned snake Sanibel Island marsh rice ratFlorida ribbon snake Silver rice ratEastern diamondback rattlesnake Florida mouse
Anastasia Island beach mouseBirds Choctawhatchee beach mouse
Pallid beach mouseEastern brown pelican Perdido Key beach mouseSnowy egret St. Andrews beach mouseLittle blue heron Santa Rosa beach mouseTricolored heron Southeast beach mouseReddish egret Anastasia Island cotton mouseRoseate spoonbill Chadwick Beach cotton mouseWood stork Key Largo cotton mouseOsprey Duke’s saltmarsh voleAmerican swallow-tailed kite Florida black bearSnail kite Everglades minkShort-tailed hawk Florida minkSouthern bald eagle River otterSwainson’s hawk Florida pantherAudubon’s crested caracara ManateeSoutheastern kestrel Florida key deer
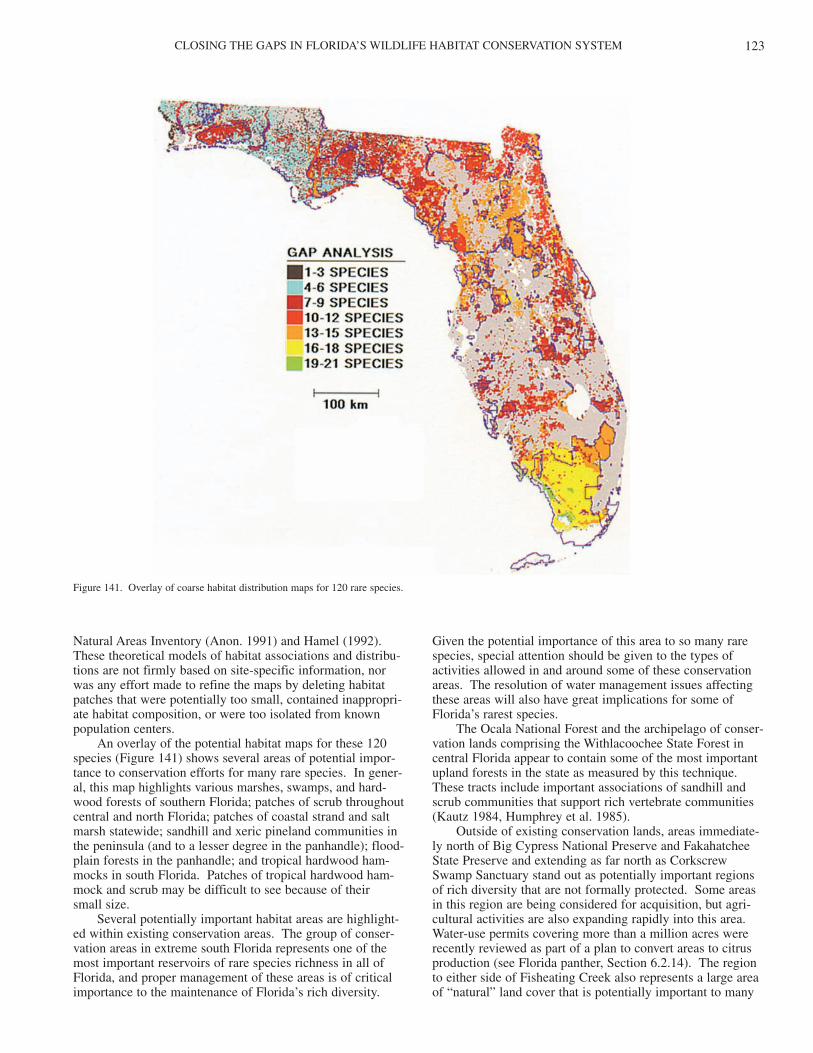
CLOSING THE GAPS IN FLORIDA’S WILDLIFE HABITAT CONSERVATION SYSTEM 123
Natural Areas Inventory (Anon. 1991) and Hamel (1992).These theoretical models of habitat associations and distribu-tions are not firmly based on site-specific information, norwas any effort made to refine the maps by deleting habitatpatches that were potentially too small, contained inappropri-ate habitat composition, or were too isolated from knownpopulation centers.
An overlay of the potential habitat maps for these 120species (Figure 141) shows several areas of potential impor-tance to conservation efforts for many rare species. In gener-al, this map highlights various marshes, swamps, and hard-wood forests of southern Florida; patches of scrub throughoutcentral and north Florida; patches of coastal strand and saltmarsh statewide; sandhill and xeric pineland communities inthe peninsula (and to a lesser degree in the panhandle); flood-plain forests in the panhandle; and tropical hardwood ham-mocks in south Florida. Patches of tropical hardwood ham-mock and scrub may be difficult to see because of their small size.
Several potentially important habitat areas are highlight-ed within existing conservation areas. The group of conser-vation areas in extreme south Florida represents one of themost important reservoirs of rare species richness in all ofFlorida, and proper management of these areas is of criticalimportance to the maintenance of Florida’s rich diversity.
Given the potential importance of this area to so many rarespecies, special attention should be given to the types ofactivities allowed in and around some of these conservationareas. The resolution of water management issues affectingthese areas will also have great implications for some ofFlorida’s rarest species.
The Ocala National Forest and the archipelago of conser-vation lands comprising the Withlacoochee State Forest incentral Florida appear to contain some of the most importantupland forests in the state as measured by this technique.These tracts include important associations of sandhill andscrub communities that support rich vertebrate communities(Kautz 1984, Humphrey et al. 1985).
Outside of existing conservation lands, areas immediate-ly north of Big Cypress National Preserve and FakahatcheeState Preserve and extending as far north as CorkscrewSwamp Sanctuary stand out as potentially important regionsof rich diversity that are not formally protected. Some areasin this region are being considered for acquisition, but agri-cultural activities are also expanding rapidly into this area.Water-use permits covering more than a million acres wererecently reviewed as part of a plan to convert areas to citrusproduction (see Florida panther, Section 6.2.14). The regionto either side of Fisheating Creek also represents a large areaof “natural” land cover that is potentially important to many
Figure 141. Overlay of coarse habitat distribution maps for 120 rare species.
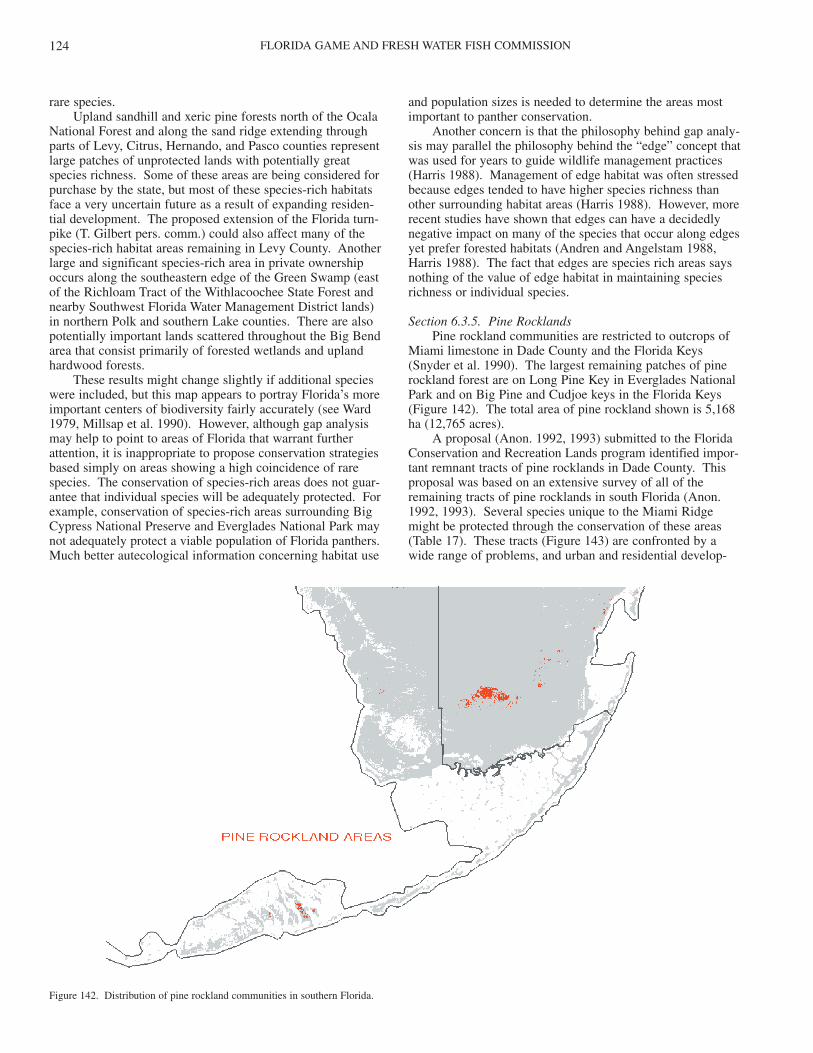
FLORIDA GAME AND FRESH WATER FISH COMMISSION124
rare species.Upland sandhill and xeric pine forests north of the Ocala
National Forest and along the sand ridge extending throughparts of Levy, Citrus, Hernando, and Pasco counties representlarge patches of unprotected lands with potentially greatspecies richness. Some of these areas are being considered forpurchase by the state, but most of these species-rich habitatsface a very uncertain future as a result of expanding residen-tial development. The proposed extension of the Florida turn-pike (T. Gilbert pers. comm.) could also affect many of thespecies-rich habitat areas remaining in Levy County. Anotherlarge and significant species-rich area in private ownershipoccurs along the southeastern edge of the Green Swamp (eastof the Richloam Tract of the Withlacoochee State Forest andnearby Southwest Florida Water Management District lands)in northern Polk and southern Lake counties. There are alsopotentially important lands scattered throughout the Big Bendarea that consist primarily of forested wetlands and uplandhardwood forests.
These results might change slightly if additional specieswere included, but this map appears to portray Florida’s moreimportant centers of biodiversity fairly accurately (see Ward1979, Millsap et al. 1990). However, although gap analysismay help to point to areas of Florida that warrant furtherattention, it is inappropriate to propose conservation strategiesbased simply on areas showing a high coincidence of rarespecies. The conservation of species-rich areas does not guar-antee that individual species will be adequately protected. Forexample, conservation of species-rich areas surrounding BigCypress National Preserve and Everglades National Park maynot adequately protect a viable population of Florida panthers.Much better autecological information concerning habitat use
and population sizes is needed to determine the areas mostimportant to panther conservation.
Another concern is that the philosophy behind gap analy-sis may parallel the philosophy behind the “edge” concept thatwas used for years to guide wildlife management practices(Harris 1988). Management of edge habitat was often stressedbecause edges tended to have higher species richness thanother surrounding habitat areas (Harris 1988). However, morerecent studies have shown that edges can have a decidedlynegative impact on many of the species that occur along edgesyet prefer forested habitats (Andren and Angelstam 1988,Harris 1988). The fact that edges are species rich areas saysnothing of the value of edge habitat in maintaining speciesrichness or individual species.
Section 6.3.5. Pine RocklandsPine rockland communities are restricted to outcrops of
Miami limestone in Dade County and the Florida Keys(Snyder et al. 1990). The largest remaining patches of pinerockland forest are on Long Pine Key in Everglades NationalPark and on Big Pine and Cudjoe keys in the Florida Keys(Figure 142). The total area of pine rockland shown is 5,168ha (12,765 acres).
A proposal (Anon. 1992, 1993) submitted to the FloridaConservation and Recreation Lands program identified impor-tant remnant tracts of pine rocklands in Dade County. Thisproposal was based on an extensive survey of all of theremaining tracts of pine rocklands in south Florida (Anon.1992, 1993). Several species unique to the Miami Ridgemight be protected through the conservation of these areas(Table 17). These tracts (Figure 143) are confronted by awide range of problems, and urban and residential develop-
Figure 142. Distribution of pine rockland communities in southern Florida.
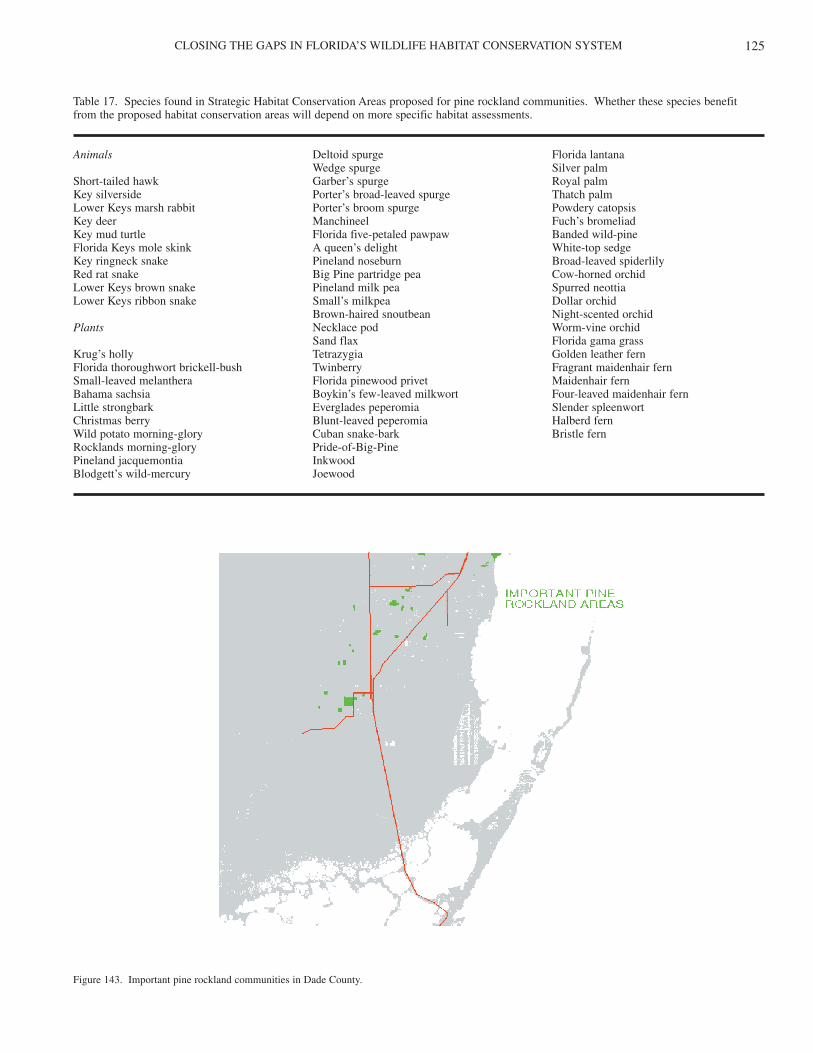
CLOSING THE GAPS IN FLORIDA’S WILDLIFE HABITAT CONSERVATION SYSTEM 125
Table 17. Species found in Strategic Habitat Conservation Areas proposed for pine rockland communities. Whether these species benefit from the proposed habitat conservation areas will depend on more specific habitat assessments.
Animals Deltoid spurge Florida lantanaWedge spurge Silver palm
Short-tailed hawk Garber’s spurge Royal palmKey silverside Porter’s broad-leaved spurge Thatch palmLower Keys marsh rabbit Porter’s broom spurge Powdery catopsisKey deer Manchineel Fuch’s bromeliadKey mud turtle Florida five-petaled pawpaw Banded wild-pineFlorida Keys mole skink A queen’s delight White-top sedgeKey ringneck snake Pineland noseburn Broad-leaved spiderlilyRed rat snake Big Pine partridge pea Cow-horned orchidLower Keys brown snake Pineland milk pea Spurred neottiaLower Keys ribbon snake Small’s milkpea Dollar orchid
Brown-haired snoutbean Night-scented orchidPlants Necklace pod Worm-vine orchid
Sand flax Florida gama grassKrug’s holly Tetrazygia Golden leather fernFlorida thoroughwort brickell-bush Twinberry Fragrant maidenhair fernSmall-leaved melanthera Florida pinewood privet Maidenhair fernBahama sachsia Boykin’s few-leaved milkwort Four-leaved maidenhair fernLittle strongbark Everglades peperomia Slender spleenwortChristmas berry Blunt-leaved peperomia Halberd fernWild potato morning-glory Cuban snake-bark Bristle fernRocklands morning-glory Pride-of-Big-PinePineland jacquemontia InkwoodBlodgett’s wild-mercury Joewood
Figure 143. Important pine rockland communities in Dade County.
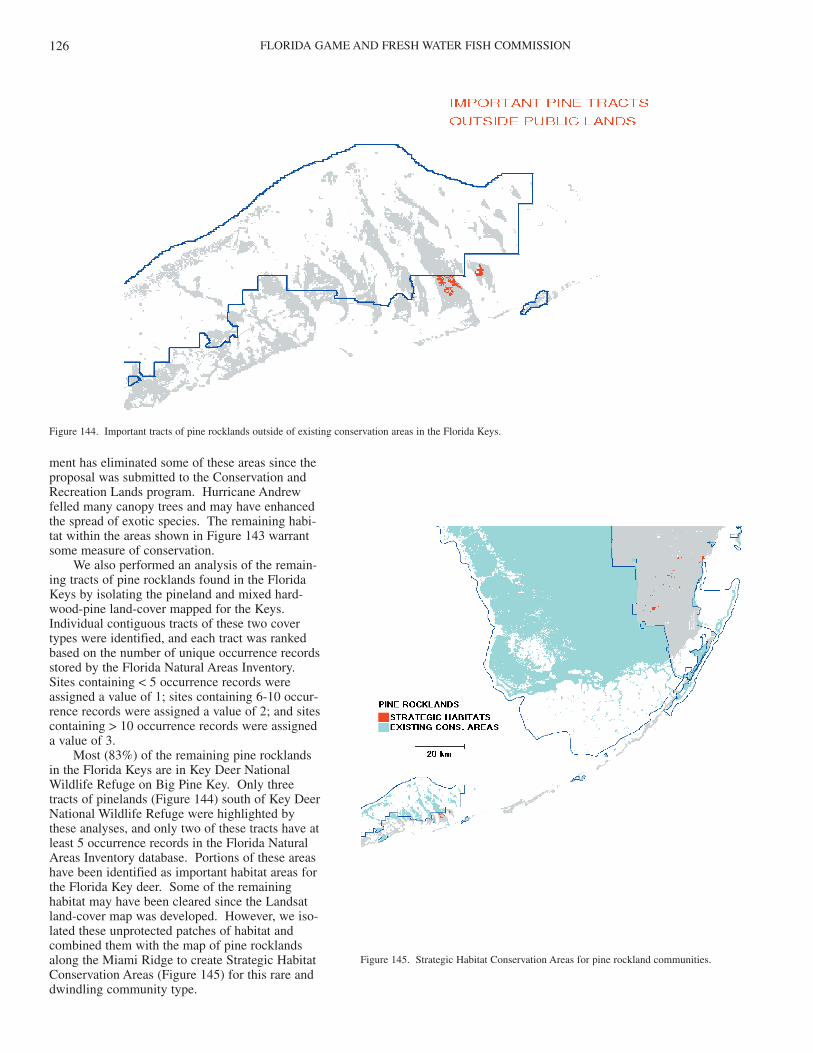
FLORIDA GAME AND FRESH WATER FISH COMMISSION126
ment has eliminated some of these areas since theproposal was submitted to the Conservation andRecreation Lands program. Hurricane Andrewfelled many canopy trees and may have enhancedthe spread of exotic species. The remaining habi-tat within the areas shown in Figure 143 warrantsome measure of conservation.
We also performed an analysis of the remain-ing tracts of pine rocklands found in the FloridaKeys by isolating the pineland and mixed hard-wood-pine land-cover mapped for the Keys.Individual contiguous tracts of these two covertypes were identified, and each tract was rankedbased on the number of unique occurrence recordsstored by the Florida Natural Areas Inventory.Sites containing < 5 occurrence records wereassigned a value of 1; sites containing 6-10 occur-rence records were assigned a value of 2; and sitescontaining > 10 occurrence records were assigneda value of 3.
Most (83%) of the remaining pine rocklandsin the Florida Keys are in Key Deer NationalWildlife Refuge on Big Pine Key. Only threetracts of pinelands (Figure 144) south of Key DeerNational Wildlife Refuge were highlighted bythese analyses, and only two of these tracts have atleast 5 occurrence records in the Florida NaturalAreas Inventory database. Portions of these areashave been identified as important habitat areas forthe Florida Key deer. Some of the remaininghabitat may have been cleared since the Landsatland-cover map was developed. However, we iso-lated these unprotected patches of habitat andcombined them with the map of pine rocklandsalong the Miami Ridge to create Strategic HabitatConservation Areas (Figure 145) for this rare anddwindling community type.
Figure 144. Important tracts of pine rocklands outside of existing conservation areas in the Florida Keys.
Figure 145. Strategic Habitat Conservation Areas for pine rockland communities.
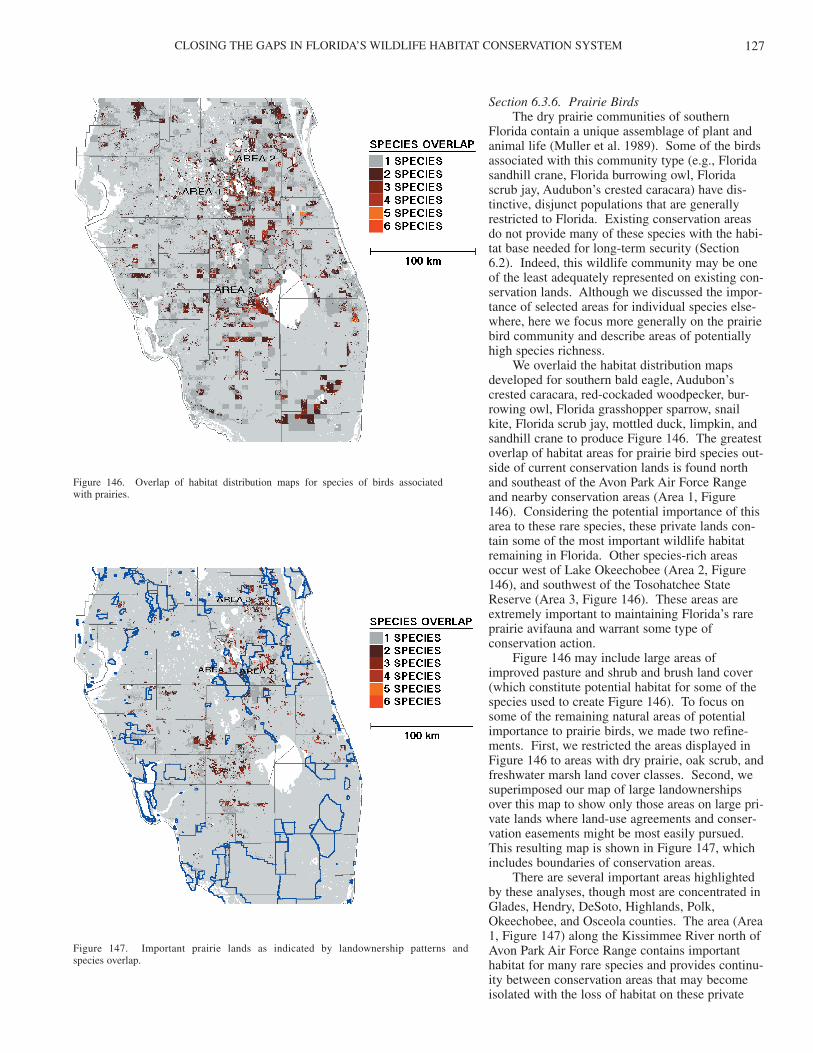
CLOSING THE GAPS IN FLORIDA’S WILDLIFE HABITAT CONSERVATION SYSTEM 127
Section 6.3.6. Prairie BirdsThe dry prairie communities of southern
Florida contain a unique assemblage of plant andanimal life (Muller et al. 1989). Some of the birdsassociated with this community type (e.g., Floridasandhill crane, Florida burrowing owl, Floridascrub jay, Audubon’s crested caracara) have dis-tinctive, disjunct populations that are generallyrestricted to Florida. Existing conservation areasdo not provide many of these species with the habi-tat base needed for long-term security (Section6.2). Indeed, this wildlife community may be oneof the least adequately represented on existing con-servation lands. Although we discussed the impor-tance of selected areas for individual species else-where, here we focus more generally on the prairiebird community and describe areas of potentiallyhigh species richness.
We overlaid the habitat distribution mapsdeveloped for southern bald eagle, Audubon’scrested caracara, red-cockaded woodpecker, bur-rowing owl, Florida grasshopper sparrow, snailkite, Florida scrub jay, mottled duck, limpkin, andsandhill crane to produce Figure 146. The greatestoverlap of habitat areas for prairie bird species out-side of current conservation lands is found northand southeast of the Avon Park Air Force Rangeand nearby conservation areas (Area 1, Figure146). Considering the potential importance of thisarea to these rare species, these private lands con-tain some of the most important wildlife habitatremaining in Florida. Other species-rich areasoccur west of Lake Okeechobee (Area 2, Figure146), and southwest of the Tosohatchee StateReserve (Area 3, Figure 146). These areas areextremely important to maintaining Florida’s rareprairie avifauna and warrant some type ofconservation action.
Figure 146 may include large areas ofimproved pasture and shrub and brush land cover(which constitute potential habitat for some of thespecies used to create Figure 146). To focus onsome of the remaining natural areas of potentialimportance to prairie birds, we made two refine-ments. First, we restricted the areas displayed inFigure 146 to areas with dry prairie, oak scrub, andfreshwater marsh land cover classes. Second, wesuperimposed our map of large landownershipsover this map to show only those areas on large pri-vate lands where land-use agreements and conser-vation easements might be most easily pursued.This resulting map is shown in Figure 147, whichincludes boundaries of conservation areas.
There are several important areas highlightedby these analyses, though most are concentrated inGlades, Hendry, DeSoto, Highlands, Polk,Okeechobee, and Osceola counties. The area (Area1, Figure 147) along the Kissimmee River north ofAvon Park Air Force Range contains importanthabitat for many rare species and provides continu-ity between conservation areas that may becomeisolated with the loss of habitat on these private
Figure 146. Overlap of habitat distribution maps for species of birds associated with prairies.
Figure 147. Important prairie lands as indicated by landownership patterns and species overlap.
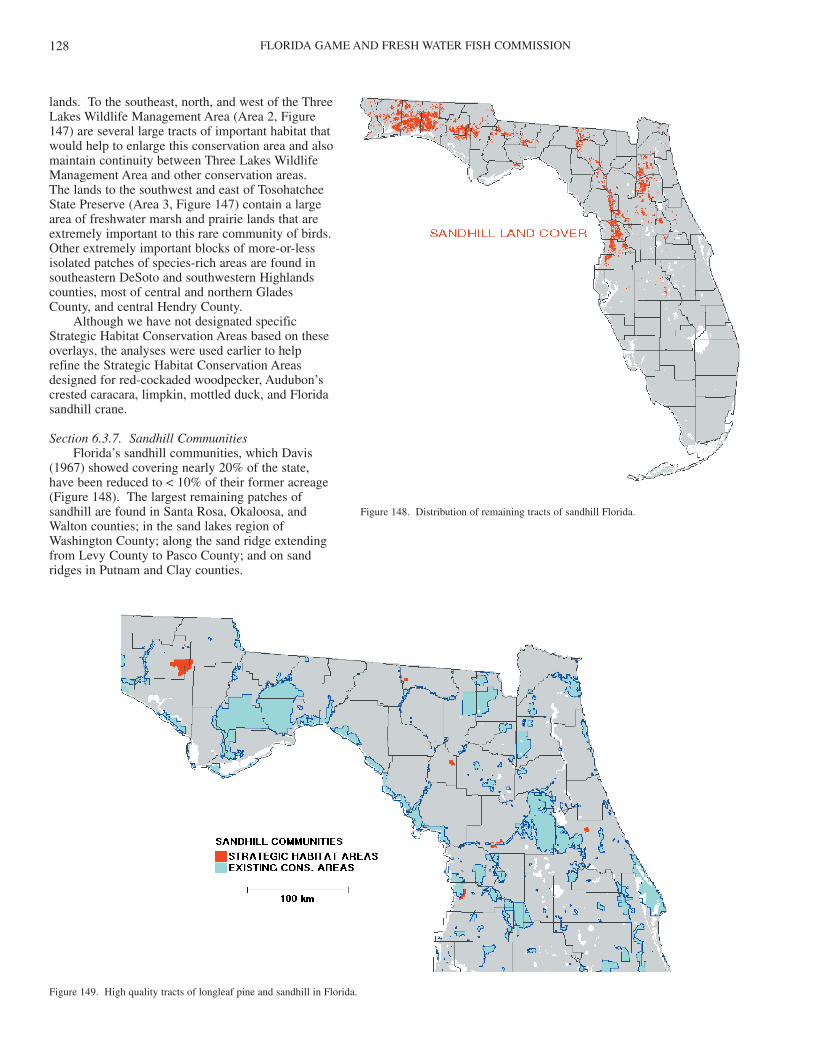
FLORIDA GAME AND FRESH WATER FISH COMMISSION128
lands. To the southeast, north, and west of the ThreeLakes Wildlife Management Area (Area 2, Figure147) are several large tracts of important habitat thatwould help to enlarge this conservation area and alsomaintain continuity between Three Lakes WildlifeManagement Area and other conservation areas.The lands to the southwest and east of TosohatcheeState Preserve (Area 3, Figure 147) contain a largearea of freshwater marsh and prairie lands that areextremely important to this rare community of birds.Other extremely important blocks of more-or-lessisolated patches of species-rich areas are found insoutheastern DeSoto and southwestern Highlandscounties, most of central and northern GladesCounty, and central Hendry County.
Although we have not designated specificStrategic Habitat Conservation Areas based on theseoverlays, the analyses were used earlier to helprefine the Strategic Habitat Conservation Areasdesigned for red-cockaded woodpecker, Audubon’scrested caracara, limpkin, mottled duck, and Floridasandhill crane.
Section 6.3.7. Sandhill CommunitiesFlorida’s sandhill communities, which Davis
(1967) showed covering nearly 20% of the state,have been reduced to < 10% of their former acreage(Figure 148). The largest remaining patches ofsandhill are found in Santa Rosa, Okaloosa, andWalton counties; in the sand lakes region ofWashington County; along the sand ridge extendingfrom Levy County to Pasco County; and on sandridges in Putnam and Clay counties.
Figure 148. Distribution of remaining tracts of sandhill Florida.
Figure 149. High quality tracts of longleaf pine and sandhill in Florida.
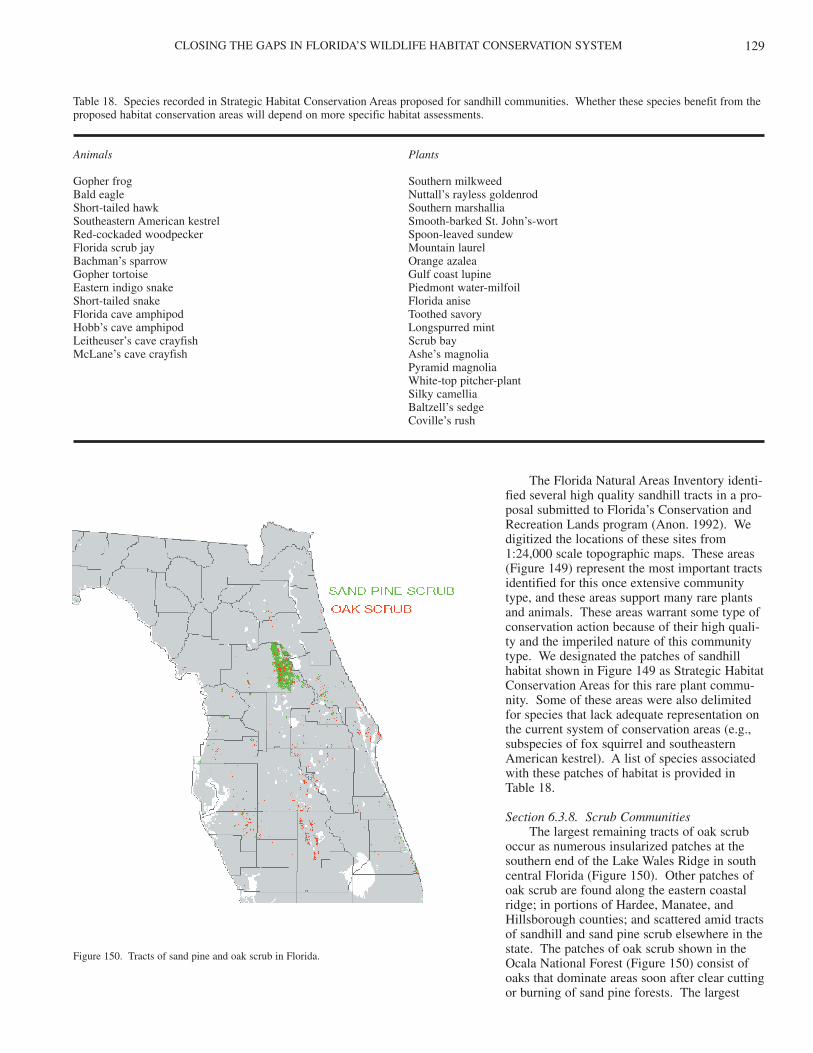
CLOSING THE GAPS IN FLORIDA’S WILDLIFE HABITAT CONSERVATION SYSTEM 129
The Florida Natural Areas Inventory identi-fied several high quality sandhill tracts in a pro-posal submitted to Florida’s Conservation andRecreation Lands program (Anon. 1992). Wedigitized the locations of these sites from 1:24,000 scale topographic maps. These areas(Figure 149) represent the most important tractsidentified for this once extensive communitytype, and these areas support many rare plantsand animals. These areas warrant some type ofconservation action because of their high quali-ty and the imperiled nature of this communitytype. We designated the patches of sandhillhabitat shown in Figure 149 as Strategic HabitatConservation Areas for this rare plant commu-nity. Some of these areas were also delimitedfor species that lack adequate representation onthe current system of conservation areas (e.g.,subspecies of fox squirrel and southeasternAmerican kestrel). A list of species associatedwith these patches of habitat is provided inTable 18.
Section 6.3.8. Scrub CommunitiesThe largest remaining tracts of oak scrub
occur as numerous insularized patches at thesouthern end of the Lake Wales Ridge in southcentral Florida (Figure 150). Other patches ofoak scrub are found along the eastern coastalridge; in portions of Hardee, Manatee, andHillsborough counties; and scattered amid tractsof sandhill and sand pine scrub elsewhere in thestate. The patches of oak scrub shown in theOcala National Forest (Figure 150) consist ofoaks that dominate areas soon after clear cuttingor burning of sand pine forests. The largest
Table 18. Species recorded in Strategic Habitat Conservation Areas proposed for sandhill communities. Whether these species benefit from theproposed habitat conservation areas will depend on more specific habitat assessments.
Animals Plants
Gopher frog Southern milkweedBald eagle Nuttall’s rayless goldenrodShort-tailed hawk Southern marshalliaSoutheastern American kestrel Smooth-barked St. John’s-wortRed-cockaded woodpecker Spoon-leaved sundewFlorida scrub jay Mountain laurelBachman’s sparrow Orange azaleaGopher tortoise Gulf coast lupineEastern indigo snake Piedmont water-milfoilShort-tailed snake Florida aniseFlorida cave amphipod Toothed savoryHobb’s cave amphipod Longspurred mintLeitheuser’s cave crayfish Scrub bayMcLane’s cave crayfish Ashe’s magnolia
Pyramid magnoliaWhite-top pitcher-plantSilky camelliaBaltzell’s sedgeCoville’s rush
Figure 150. Tracts of sand pine and oak scrub in Florida.
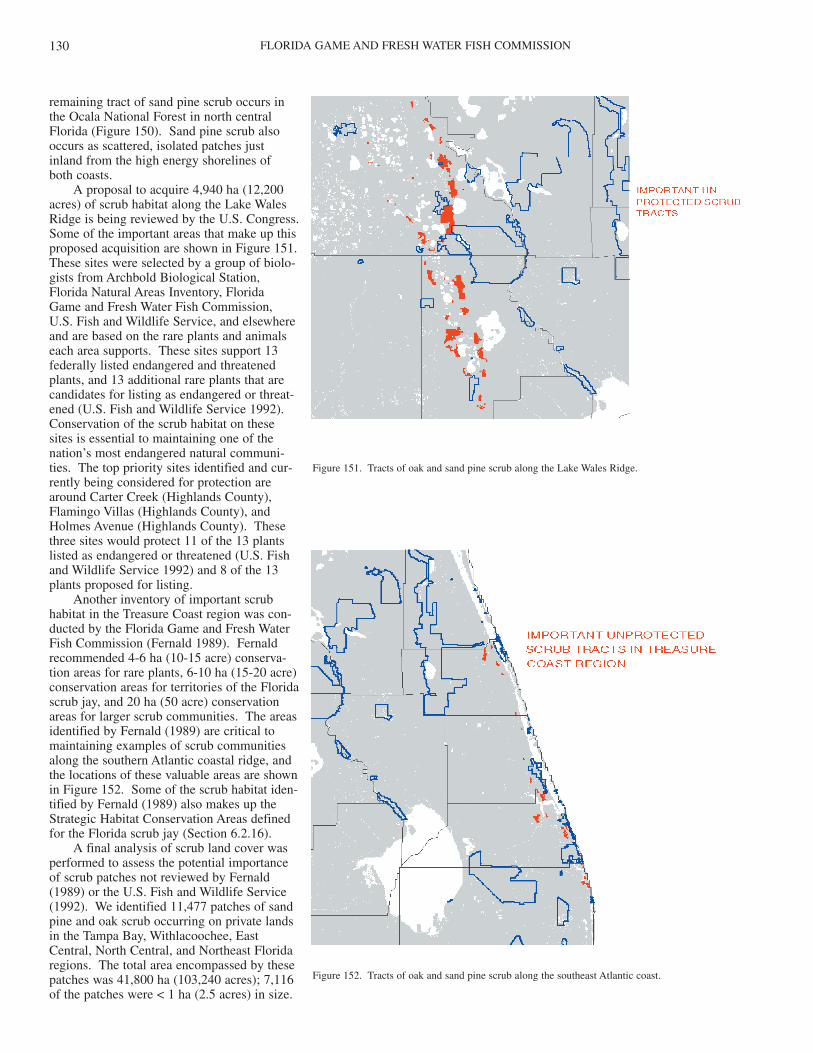
FLORIDA GAME AND FRESH WATER FISH COMMISSION130
remaining tract of sand pine scrub occurs inthe Ocala National Forest in north centralFlorida (Figure 150). Sand pine scrub alsooccurs as scattered, isolated patches justinland from the high energy shorelines of both coasts.
A proposal to acquire 4,940 ha (12,200acres) of scrub habitat along the Lake WalesRidge is being reviewed by the U.S. Congress.Some of the important areas that make up thisproposed acquisition are shown in Figure 151.These sites were selected by a group of biolo-gists from Archbold Biological Station,Florida Natural Areas Inventory, FloridaGame and Fresh Water Fish Commission,U.S. Fish and Wildlife Service, and elsewhereand are based on the rare plants and animalseach area supports. These sites support 13federally listed endangered and threatenedplants, and 13 additional rare plants that arecandidates for listing as endangered or threat-ened (U.S. Fish and Wildlife Service 1992).Conservation of the scrub habitat on thesesites is essential to maintaining one of thenation’s most endangered natural communi-ties. The top priority sites identified and cur-rently being considered for protection arearound Carter Creek (Highlands County),Flamingo Villas (Highlands County), andHolmes Avenue (Highlands County). Thesethree sites would protect 11 of the 13 plantslisted as endangered or threatened (U.S. Fishand Wildlife Service 1992) and 8 of the 13plants proposed for listing.
Another inventory of important scrubhabitat in the Treasure Coast region was con-ducted by the Florida Game and Fresh WaterFish Commission (Fernald 1989). Fernaldrecommended 4-6 ha (10-15 acre) conserva-tion areas for rare plants, 6-10 ha (15-20 acre)conservation areas for territories of the Floridascrub jay, and 20 ha (50 acre) conservationareas for larger scrub communities. The areasidentified by Fernald (1989) are critical tomaintaining examples of scrub communitiesalong the southern Atlantic coastal ridge, andthe locations of these valuable areas are shownin Figure 152. Some of the scrub habitat iden-tified by Fernald (1989) also makes up theStrategic Habitat Conservation Areas definedfor the Florida scrub jay (Section 6.2.16).
A final analysis of scrub land cover wasperformed to assess the potential importanceof scrub patches not reviewed by Fernald(1989) or the U.S. Fish and Wildlife Service(1992). We identified 11,477 patches of sandpine and oak scrub occurring on private landsin the Tampa Bay, Withlacoochee, EastCentral, North Central, and Northeast Floridaregions. The total area encompassed by thesepatches was 41,800 ha (103,240 acres); 7,116of the patches were < 1 ha (2.5 acres) in size.
Figure 151. Tracts of oak and sand pine scrub along the Lake Wales Ridge.
Figure 152. Tracts of oak and sand pine scrub along the southeast Atlantic coast.
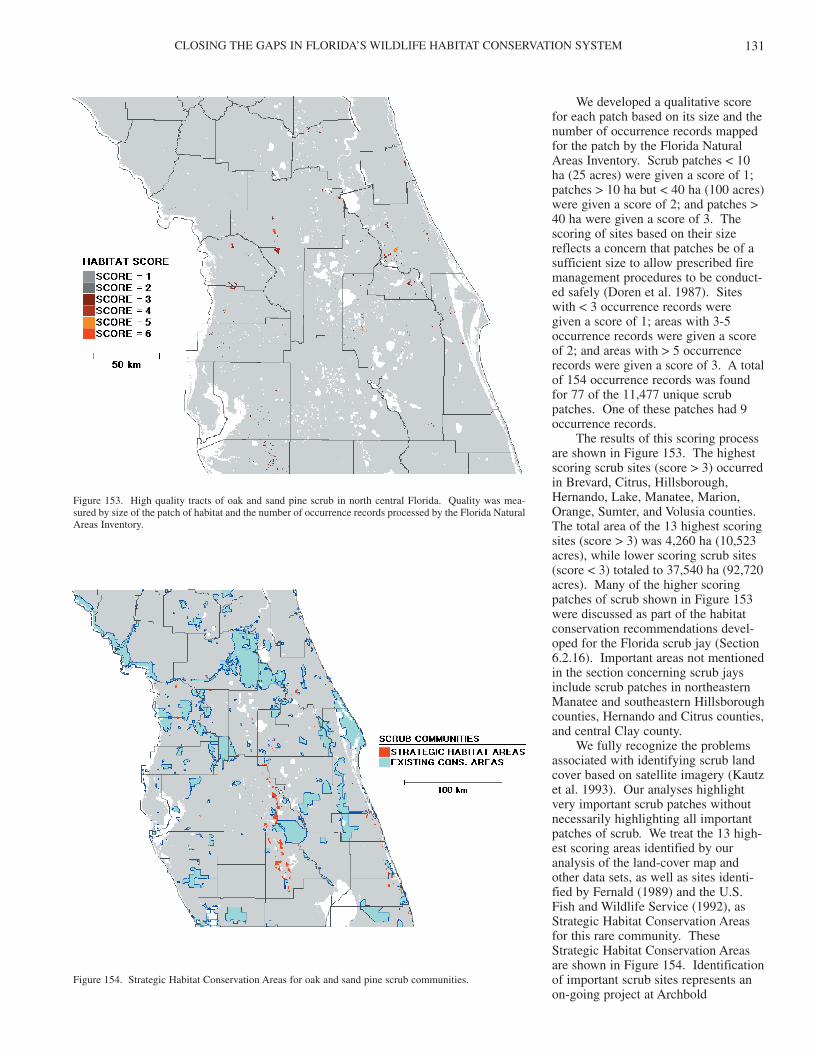
CLOSING THE GAPS IN FLORIDA’S WILDLIFE HABITAT CONSERVATION SYSTEM 131
We developed a qualitative scorefor each patch based on its size and thenumber of occurrence records mappedfor the patch by the Florida NaturalAreas Inventory. Scrub patches < 10ha (25 acres) were given a score of 1;patches > 10 ha but < 40 ha (100 acres)were given a score of 2; and patches >40 ha were given a score of 3. Thescoring of sites based on their sizereflects a concern that patches be of asufficient size to allow prescribed firemanagement procedures to be conduct-ed safely (Doren et al. 1987). Siteswith < 3 occurrence records were given a score of 1; areas with 3-5occurrence records were given a scoreof 2; and areas with > 5 occurrencerecords were given a score of 3. A totalof 154 occurrence records was foundfor 77 of the 11,477 unique scrubpatches. One of these patches had 9occurrence records.
The results of this scoring processare shown in Figure 153. The highestscoring scrub sites (score > 3) occurredin Brevard, Citrus, Hillsborough,Hernando, Lake, Manatee, Marion,Orange, Sumter, and Volusia counties.The total area of the 13 highest scoringsites (score > 3) was 4,260 ha (10,523acres), while lower scoring scrub sites(score < 3) totaled to 37,540 ha (92,720acres). Many of the higher scoringpatches of scrub shown in Figure 153were discussed as part of the habitatconservation recommendations devel-oped for the Florida scrub jay (Section6.2.16). Important areas not mentionedin the section concerning scrub jaysinclude scrub patches in northeasternManatee and southeastern Hillsboroughcounties, Hernando and Citrus counties,and central Clay county.
We fully recognize the problemsassociated with identifying scrub landcover based on satellite imagery (Kautzet al. 1993). Our analyses highlightvery important scrub patches withoutnecessarily highlighting all importantpatches of scrub. We treat the 13 high-est scoring areas identified by ouranalysis of the land-cover map andother data sets, as well as sites identi-fied by Fernald (1989) and the U.S.Fish and Wildlife Service (1992), asStrategic Habitat Conservation Areasfor this rare community. TheseStrategic Habitat Conservation Areasare shown in Figure 154. Identificationof important scrub sites represents anon-going project at Archbold
Figure 153. High quality tracts of oak and sand pine scrub in north central Florida. Quality was mea-sured by size of the patch of habitat and the number of occurrence records processed by the Florida NaturalAreas Inventory.
Figure 154. Strategic Habitat Conservation Areas for oak and sand pine scrub communities.
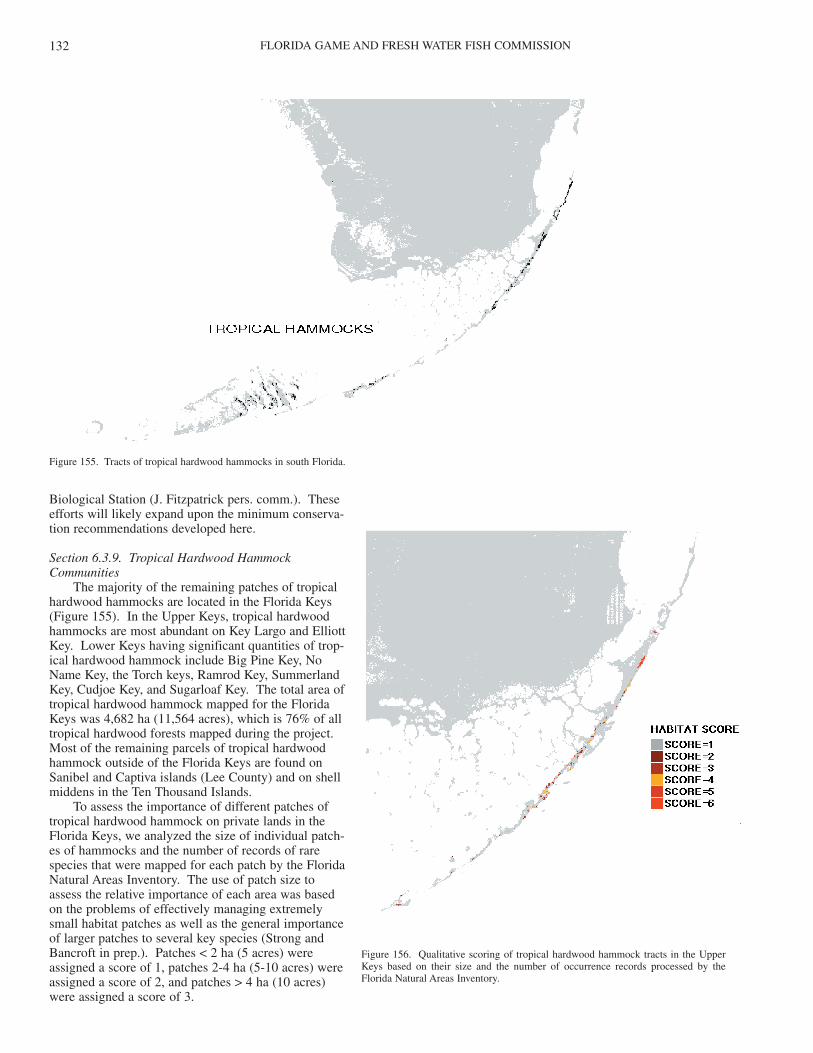
FLORIDA GAME AND FRESH WATER FISH COMMISSION132
Biological Station (J. Fitzpatrick pers. comm.). Theseefforts will likely expand upon the minimum conserva-tion recommendations developed here.
Section 6.3.9. Tropical Hardwood HammockCommunities
The majority of the remaining patches of tropicalhardwood hammocks are located in the Florida Keys(Figure 155). In the Upper Keys, tropical hardwoodhammocks are most abundant on Key Largo and ElliottKey. Lower Keys having significant quantities of trop-ical hardwood hammock include Big Pine Key, NoName Key, the Torch keys, Ramrod Key, SummerlandKey, Cudjoe Key, and Sugarloaf Key. The total area oftropical hardwood hammock mapped for the FloridaKeys was 4,682 ha (11,564 acres), which is 76% of alltropical hardwood forests mapped during the project.Most of the remaining parcels of tropical hardwoodhammock outside of the Florida Keys are found onSanibel and Captiva islands (Lee County) and on shellmiddens in the Ten Thousand Islands.
To assess the importance of different patches oftropical hardwood hammock on private lands in theFlorida Keys, we analyzed the size of individual patch-es of hammocks and the number of records of rarespecies that were mapped for each patch by the FloridaNatural Areas Inventory. The use of patch size toassess the relative importance of each area was basedon the problems of effectively managing extremelysmall habitat patches as well as the general importanceof larger patches to several key species (Strong andBancroft in prep.). Patches < 2 ha (5 acres) wereassigned a score of 1, patches 2-4 ha (5-10 acres) wereassigned a score of 2, and patches > 4 ha (10 acres)were assigned a score of 3.
Figure 155. Tracts of tropical hardwood hammocks in south Florida.
Figure 156. Qualitative scoring of tropical hardwood hammock tracts in the UpperKeys based on their size and the number of occurrence records processed by theFlorida Natural Areas Inventory.
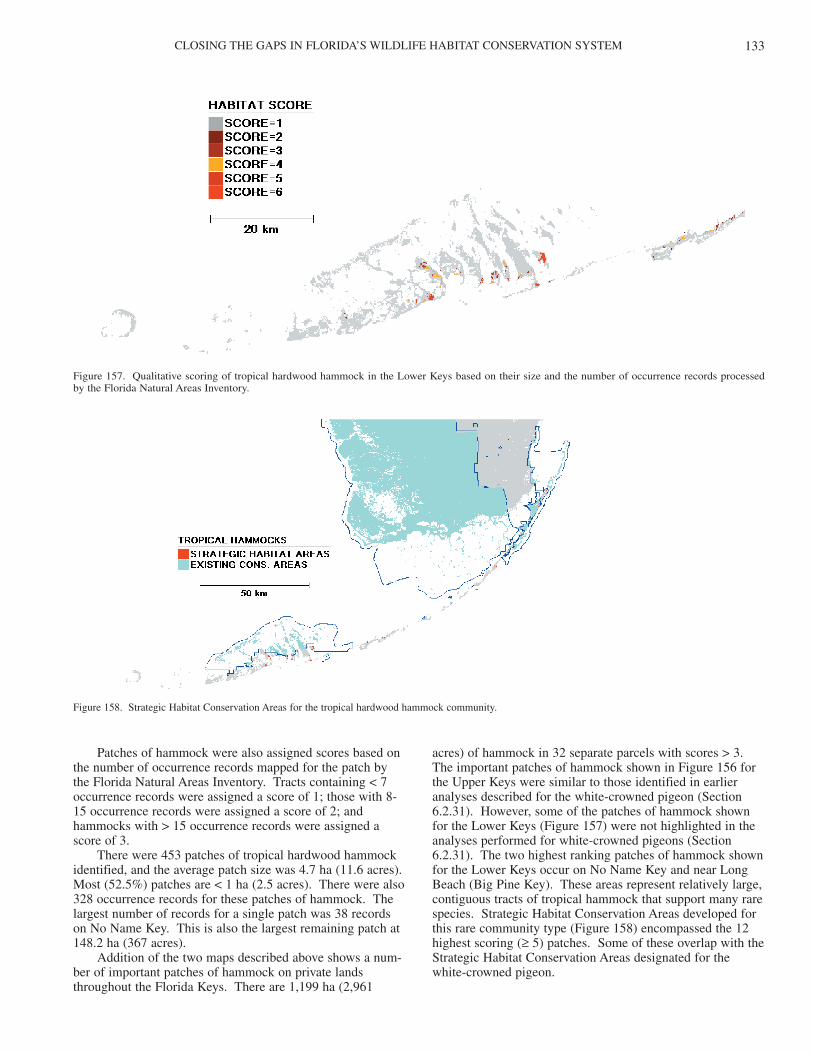
CLOSING THE GAPS IN FLORIDA’S WILDLIFE HABITAT CONSERVATION SYSTEM 133
Patches of hammock were also assigned scores based onthe number of occurrence records mapped for the patch bythe Florida Natural Areas Inventory. Tracts containing < 7occurrence records were assigned a score of 1; those with 8-15 occurrence records were assigned a score of 2; andhammocks with > 15 occurrence records were assigned ascore of 3.
There were 453 patches of tropical hardwood hammockidentified, and the average patch size was 4.7 ha (11.6 acres).Most (52.5%) patches are < 1 ha (2.5 acres). There were also328 occurrence records for these patches of hammock. Thelargest number of records for a single patch was 38 recordson No Name Key. This is also the largest remaining patch at148.2 ha (367 acres).
Addition of the two maps described above shows a num-ber of important patches of hammock on private landsthroughout the Florida Keys. There are 1,199 ha (2,961
acres) of hammock in 32 separate parcels with scores > 3.The important patches of hammock shown in Figure 156 forthe Upper Keys were similar to those identified in earlieranalyses described for the white-crowned pigeon (Section6.2.31). However, some of the patches of hammock shownfor the Lower Keys (Figure 157) were not highlighted in theanalyses performed for white-crowned pigeons (Section6.2.31). The two highest ranking patches of hammock shownfor the Lower Keys occur on No Name Key and near LongBeach (Big Pine Key). These areas represent relatively large,contiguous tracts of tropical hammock that support many rarespecies. Strategic Habitat Conservation Areas developed forthis rare community type (Figure 158) encompassed the 12highest scoring (≥ 5) patches. Some of these overlap with theStrategic Habitat Conservation Areas designated for thewhite-crowned pigeon.
Figure 157. Qualitative scoring of tropical hardwood hammock in the Lower Keys based on their size and the number of occurrence records processed by the Florida Natural Areas Inventory.
Figure 158. Strategic Habitat Conservation Areas for the tropical hardwood hammock community.
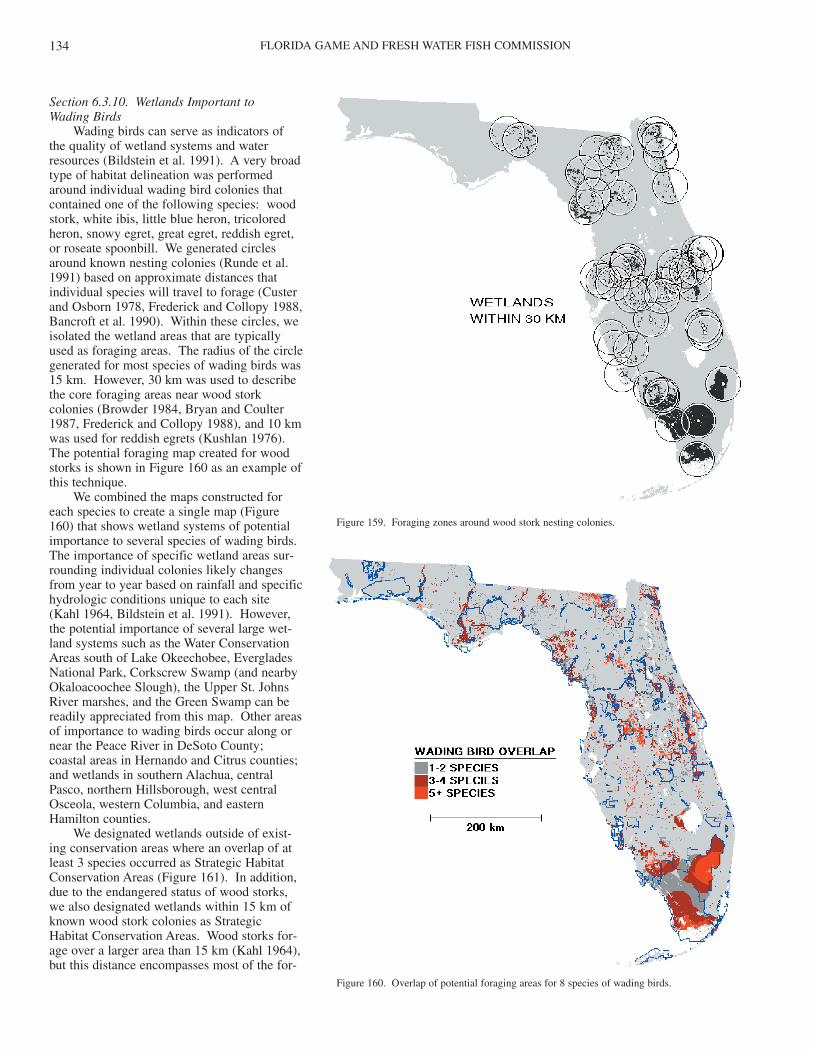
FLORIDA GAME AND FRESH WATER FISH COMMISSION134
Section 6.3.10. Wetlands Important to Wading Birds
Wading birds can serve as indicators ofthe quality of wetland systems and waterresources (Bildstein et al. 1991). A very broadtype of habitat delineation was performedaround individual wading bird colonies thatcontained one of the following species: woodstork, white ibis, little blue heron, tricoloredheron, snowy egret, great egret, reddish egret,or roseate spoonbill. We generated circlesaround known nesting colonies (Runde et al.1991) based on approximate distances thatindividual species will travel to forage (Custerand Osborn 1978, Frederick and Collopy 1988,Bancroft et al. 1990). Within these circles, weisolated the wetland areas that are typicallyused as foraging areas. The radius of the circlegenerated for most species of wading birds was15 km. However, 30 km was used to describethe core foraging areas near wood storkcolonies (Browder 1984, Bryan and Coulter1987, Frederick and Collopy 1988), and 10 kmwas used for reddish egrets (Kushlan 1976).The potential foraging map created for woodstorks is shown in Figure 160 as an example ofthis technique.
We combined the maps constructed foreach species to create a single map (Figure160) that shows wetland systems of potentialimportance to several species of wading birds.The importance of specific wetland areas sur-rounding individual colonies likely changesfrom year to year based on rainfall and specifichydrologic conditions unique to each site(Kahl 1964, Bildstein et al. 1991). However,the potential importance of several large wet-land systems such as the Water ConservationAreas south of Lake Okeechobee, EvergladesNational Park, Corkscrew Swamp (and nearbyOkaloacoochee Slough), the Upper St. JohnsRiver marshes, and the Green Swamp can bereadily appreciated from this map. Other areasof importance to wading birds occur along ornear the Peace River in DeSoto County;coastal areas in Hernando and Citrus counties;and wetlands in southern Alachua, centralPasco, northern Hillsborough, west centralOsceola, western Columbia, and easternHamilton counties.
We designated wetlands outside of exist-ing conservation areas where an overlap of atleast 3 species occurred as Strategic HabitatConservation Areas (Figure 161). In addition,due to the endangered status of wood storks,we also designated wetlands within 15 km ofknown wood stork colonies as StrategicHabitat Conservation Areas. Wood storks for-age over a larger area than 15 km (Kahl 1964),but this distance encompasses most of the for-
Figure 159. Foraging zones around wood stork nesting colonies.
Figure 160. Overlap of potential foraging areas for 8 species of wading birds.
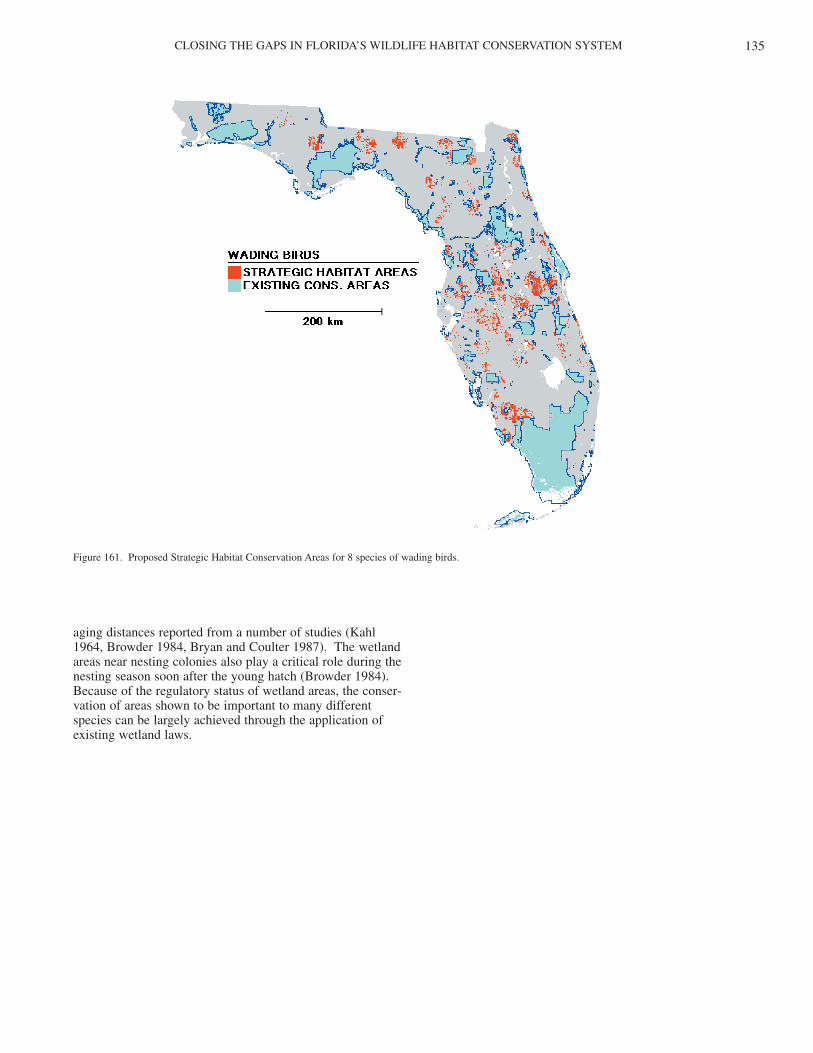
CLOSING THE GAPS IN FLORIDA’S WILDLIFE HABITAT CONSERVATION SYSTEM 135
aging distances reported from a number of studies (Kahl1964, Browder 1984, Bryan and Coulter 1987). The wetlandareas near nesting colonies also play a critical role during thenesting season soon after the young hatch (Browder 1984).Because of the regulatory status of wetland areas, the conser-vation of areas shown to be important to many differentspecies can be largely achieved through the application ofexisting wetland laws.
Figure 161. Proposed Strategic Habitat Conservation Areas for 8 species of wading birds.

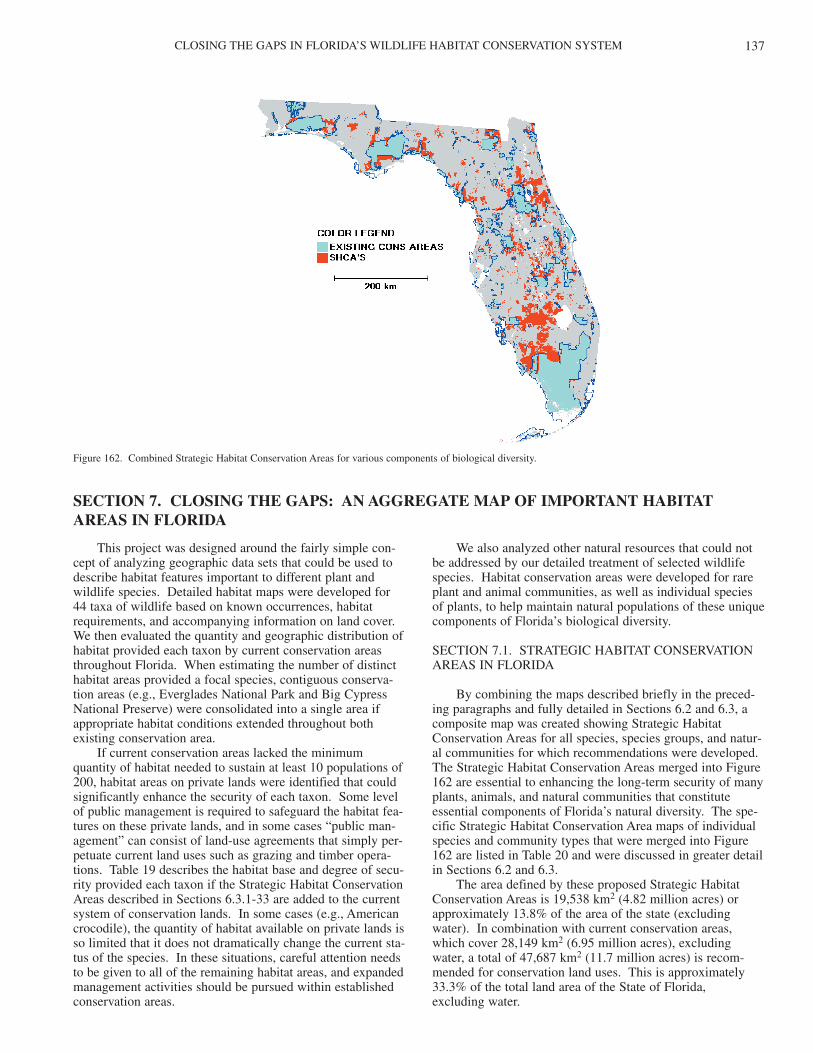
CLOSING THE GAPS IN FLORIDA’S WILDLIFE HABITAT CONSERVATION SYSTEM 137
This project was designed around the fairly simple con-cept of analyzing geographic data sets that could be used todescribe habitat features important to different plant andwildlife species. Detailed habitat maps were developed for44 taxa of wildlife based on known occurrences, habitatrequirements, and accompanying information on land cover.We then evaluated the quantity and geographic distribution ofhabitat provided each taxon by current conservation areasthroughout Florida. When estimating the number of distincthabitat areas provided a focal species, contiguous conserva-tion areas (e.g., Everglades National Park and Big CypressNational Preserve) were consolidated into a single area ifappropriate habitat conditions extended throughout bothexisting conservation area.
If current conservation areas lacked the minimumquantity of habitat needed to sustain at least 10 populations of200, habitat areas on private lands were identified that couldsignificantly enhance the security of each taxon. Some levelof public management is required to safeguard the habitat fea-tures on these private lands, and in some cases “public man-agement” can consist of land-use agreements that simply per-petuate current land uses such as grazing and timber opera-tions. Table 19 describes the habitat base and degree of secu-rity provided each taxon if the Strategic Habitat ConservationAreas described in Sections 6.3.1-33 are added to the currentsystem of conservation lands. In some cases (e.g., Americancrocodile), the quantity of habitat available on private lands isso limited that it does not dramatically change the current sta-tus of the species. In these situations, careful attention needsto be given to all of the remaining habitat areas, and expandedmanagement activities should be pursued within establishedconservation areas.
We also analyzed other natural resources that could notbe addressed by our detailed treatment of selected wildlifespecies. Habitat conservation areas were developed for rareplant and animal communities, as well as individual speciesof plants, to help maintain natural populations of these uniquecomponents of Florida’s biological diversity.
SECTION 7.1. STRATEGIC HABITAT CONSERVATIONAREAS IN FLORIDA
By combining the maps described briefly in the preced-ing paragraphs and fully detailed in Sections 6.2 and 6.3, acomposite map was created showing Strategic HabitatConservation Areas for all species, species groups, and natur-al communities for which recommendations were developed.The Strategic Habitat Conservation Areas merged into Figure162 are essential to enhancing the long-term security of manyplants, animals, and natural communities that constituteessential components of Florida’s natural diversity. The spe-cific Strategic Habitat Conservation Area maps of individualspecies and community types that were merged into Figure162 are listed in Table 20 and were discussed in greater detailin Sections 6.2 and 6.3.
The area defined by these proposed Strategic HabitatConservation Areas is 19,538 km2 (4.82 million acres) orapproximately 13.8% of the area of the state (excludingwater). In combination with current conservation areas,which cover 28,149 km2 (6.95 million acres), excludingwater, a total of 47,687 km2 (11.7 million acres) is recom-mended for conservation land uses. This is approximately33.3% of the total land area of the State of Florida,excluding water.
SECTION 7. CLOSING THE GAPS: AN AGGREGATE MAP OF IMPORTANT HABITATAREAS IN FLORIDA
Figure 162. Combined Strategic Habitat Conservation Areas for various components of biological diversity.
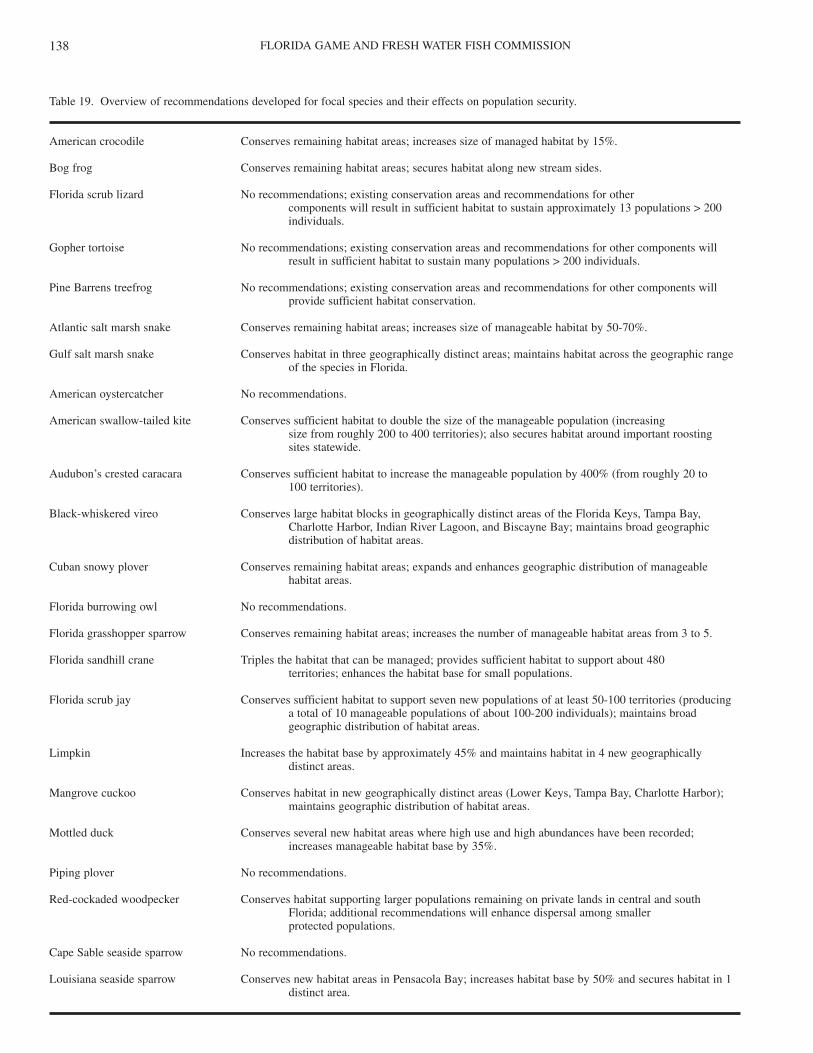
FLORIDA GAME AND FRESH WATER FISH COMMISSION138
Table 19. Overview of recommendations developed for focal species and their effects on population security.
American crocodile Conserves remaining habitat areas; increases size of managed habitat by 15%.
Bog frog Conserves remaining habitat areas; secures habitat along new stream sides.
Florida scrub lizard No recommendations; existing conservation areas and recommendations for other components will result in sufficient habitat to sustain approximately 13 populations > 200individuals.
Gopher tortoise No recommendations; existing conservation areas and recommendations for other components will result in sufficient habitat to sustain many populations > 200 individuals.
Pine Barrens treefrog No recommendations; existing conservation areas and recommendations for other components will provide sufficient habitat conservation.
Atlantic salt marsh snake Conserves remaining habitat areas; increases size of manageable habitat by 50-70%.
Gulf salt marsh snake Conserves habitat in three geographically distinct areas; maintains habitat across the geographic range of the species in Florida.
American oystercatcher No recommendations.
American swallow-tailed kite Conserves sufficient habitat to double the size of the manageable population (increasing size from roughly 200 to 400 territories); also secures habitat around important roosting sites statewide.
Audubon’s crested caracara Conserves sufficient habitat to increase the manageable population by 400% (from roughly 20 to 100 territories).
Black-whiskered vireo Conserves large habitat blocks in geographically distinct areas of the Florida Keys, Tampa Bay,Charlotte Harbor, Indian River Lagoon, and Biscayne Bay; maintains broad geographic distribution of habitat areas.
Cuban snowy plover Conserves remaining habitat areas; expands and enhances geographic distribution of manageable habitat areas.
Florida burrowing owl No recommendations.
Florida grasshopper sparrow Conserves remaining habitat areas; increases the number of manageable habitat areas from 3 to 5.
Florida sandhill crane Triples the habitat that can be managed; provides sufficient habitat to support about 480 territories; enhances the habitat base for small populations.
Florida scrub jay Conserves sufficient habitat to support seven new populations of at least 50-100 territories (producing a total of 10 manageable populations of about 100-200 individuals); maintains broadgeographic distribution of habitat areas.
Limpkin Increases the habitat base by approximately 45% and maintains habitat in 4 new geographically distinct areas.
Mangrove cuckoo Conserves habitat in new geographically distinct areas (Lower Keys, Tampa Bay, Charlotte Harbor); maintains geographic distribution of habitat areas.
Mottled duck Conserves several new habitat areas where high use and high abundances have been recorded; increases manageable habitat base by 35%.
Piping plover No recommendations.
Red-cockaded woodpecker Conserves habitat supporting larger populations remaining on private lands in central and south Florida; additional recommendations will enhance dispersal among smaller protected populations.
Cape Sable seaside sparrow No recommendations.
Louisiana seaside sparrow Conserves new habitat areas in Pensacola Bay; increases habitat base by 50% and secures habitat in 1 distinct area.
CLOSING THE GAPS IN FLORIDA’S WILDLIFE HABITAT CONSERVATION SYSTEM 139
Table 19. Overview of recommendations developed for focal species and their effects on population security (continued).
Smyrna seaside sparrow Conserves new habitat areas in northeast Florida; increases manageable habitat base by 75% and maintains habitat areas across a broad geographic region.
Scott’s seaside sparrow Conserves new habitat areas in west central Florida; increases manageable habitat base by 70% and maintains habitat areas across a broad geographic region.
Wakulla seaside sparrow Conserves occupied habitat in two new geographically distinct areas of the panhandle; maintains the geographic distribution of habitat areas.
Short-tailed hawk Conserves documented habitat areas; increases the manageable base of habitat by 200%.
Snail kite Conserves documented habitat areas; maintains habitat areas in geographically distinct areas of central and southwest Florida.
Southeastern American kestrel Conserves habitat in new geographically distinct areas; increases manageable habitat by approximately 45%.
Southern bald eagle Conserves habitat in major nest concentration sites; in combination with recommendations developed for other species, proposed conservation areas will increase number of territories on management areas from 170 to approximately 300.
White-crowned pigeon Conserves new foraging habitat areas in the Upper and Lower Keys. Increases the quantity of foraging habitat by approximately 35% and maintains foraging habitat across a broad geographic area.
Wild turkey No recommendations. Recommendations developed for other components will add sufficient habitat to sustain many populations > 200 individuals.
Wilson’s plover No recommendations.
Anastasia Island beach mouse Conserves remaining habitat areas; enhances geographic distribution of manageable habitat areas.
Choctawhatchee beach mouse Conserves remaining habitat areas; expands habitat available to existing populations and brings the number of manageable habitat areas to three.
Perdido Key beach mouse No recommendations.
Santa Rosa beach mouse No recommendations.
Southeastern beach mouse Conserves remaining habitat areas; expands habitat available to existing populations and establishes habitat for geographically distinct area.
Bobcat No specific recommendations; recommendations developed for other species will result in many manageable populations > 200 individuals.
Florida black bear Conserves sufficient habitat to sustain at least 5 populations > 200; increases base of habitat by approximately 65%; provides blocks of habitat and corridors that expand area available to existing populations.
Florida panther Conserves sufficient habitat to sustain a population of 50-60 individuals.
Mangrove fox squirrel Conserves sufficient habitat to support at least one new population in a geographically distinct area; recommendations for other species will secure sufficient habitat to sustain at least four populations > 200 individuals.
Sherman’s fox squirrel No specific recommendations; recommendations developed for other species will provide sufficient habitat to sustain > 10 populations of 200 individuals.
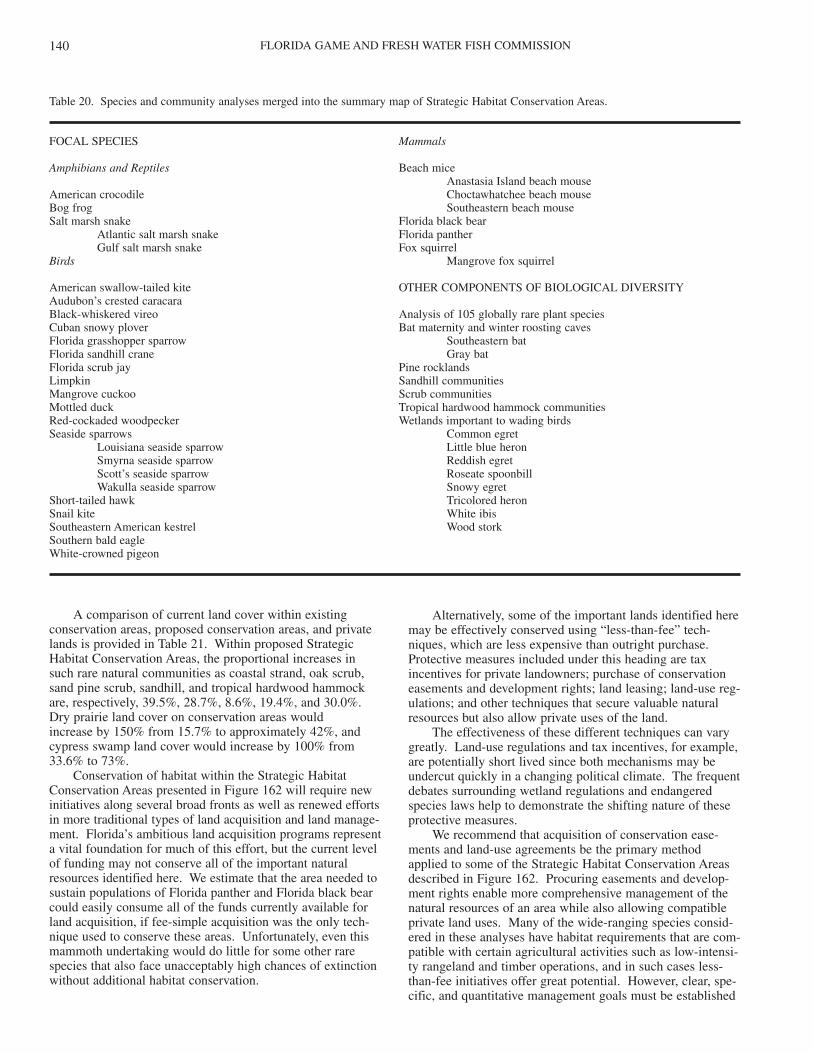
FLORIDA GAME AND FRESH WATER FISH COMMISSION140
A comparison of current land cover within existingconservation areas, proposed conservation areas, and privatelands is provided in Table 21. Within proposed StrategicHabitat Conservation Areas, the proportional increases insuch rare natural communities as coastal strand, oak scrub,sand pine scrub, sandhill, and tropical hardwood hammockare, respectively, 39.5%, 28.7%, 8.6%, 19.4%, and 30.0%.Dry prairie land cover on conservation areas would increase by 150% from 15.7% to approximately 42%, andcypress swamp land cover would increase by 100% from33.6% to 73%.
Conservation of habitat within the Strategic HabitatConservation Areas presented in Figure 162 will require newinitiatives along several broad fronts as well as renewed effortsin more traditional types of land acquisition and land manage-ment. Florida’s ambitious land acquisition programs representa vital foundation for much of this effort, but the current levelof funding may not conserve all of the important naturalresources identified here. We estimate that the area needed tosustain populations of Florida panther and Florida black bearcould easily consume all of the funds currently available forland acquisition, if fee-simple acquisition was the only tech-nique used to conserve these areas. Unfortunately, even thismammoth undertaking would do little for some other rarespecies that also face unacceptably high chances of extinctionwithout additional habitat conservation.
Alternatively, some of the important lands identified heremay be effectively conserved using “less-than-fee” tech-niques, which are less expensive than outright purchase.Protective measures included under this heading are taxincentives for private landowners; purchase of conservationeasements and development rights; land leasing; land-use reg-ulations; and other techniques that secure valuable naturalresources but also allow private uses of the land.
The effectiveness of these different techniques can varygreatly. Land-use regulations and tax incentives, for example,are potentially short lived since both mechanisms may beundercut quickly in a changing political climate. The frequentdebates surrounding wetland regulations and endangeredspecies laws help to demonstrate the shifting nature of theseprotective measures.
We recommend that acquisition of conservation ease-ments and land-use agreements be the primary methodapplied to some of the Strategic Habitat Conservation Areasdescribed in Figure 162. Procuring easements and develop-ment rights enable more comprehensive management of thenatural resources of an area while also allowing compatibleprivate land uses. Many of the wide-ranging species consid-ered in these analyses have habitat requirements that are com-patible with certain agricultural activities such as low-intensi-ty rangeland and timber operations, and in such cases less-than-fee initiatives offer great potential. However, clear, spe-cific, and quantitative management goals must be established
Table 20. Species and community analyses merged into the summary map of Strategic Habitat Conservation Areas.
FOCAL SPECIES Mammals
Amphibians and Reptiles Beach miceAnastasia Island beach mouse
American crocodile Choctawhatchee beach mouseBog frog Southeastern beach mouseSalt marsh snake Florida black bear
Atlantic salt marsh snake Florida pantherGulf salt marsh snake Fox squirrel
Birds Mangrove fox squirrel
American swallow-tailed kite OTHER COMPONENTS OF BIOLOGICAL DIVERSITYAudubon’s crested caracaraBlack-whiskered vireo Analysis of 105 globally rare plant speciesCuban snowy plover Bat maternity and winter roosting cavesFlorida grasshopper sparrow Southeastern batFlorida sandhill crane Gray batFlorida scrub jay Pine rocklandsLimpkin Sandhill communitiesMangrove cuckoo Scrub communitiesMottled duck Tropical hardwood hammock communitiesRed-cockaded woodpecker Wetlands important to wading birdsSeaside sparrows Common egret
Louisiana seaside sparrow Little blue heronSmyrna seaside sparrow Reddish egretScott’s seaside sparrow Roseate spoonbillWakulla seaside sparrow Snowy egret
Short-tailed hawk Tricolored heronSnail kite White ibisSoutheastern American kestrel Wood storkSouthern bald eagleWhite-crowned pigeon
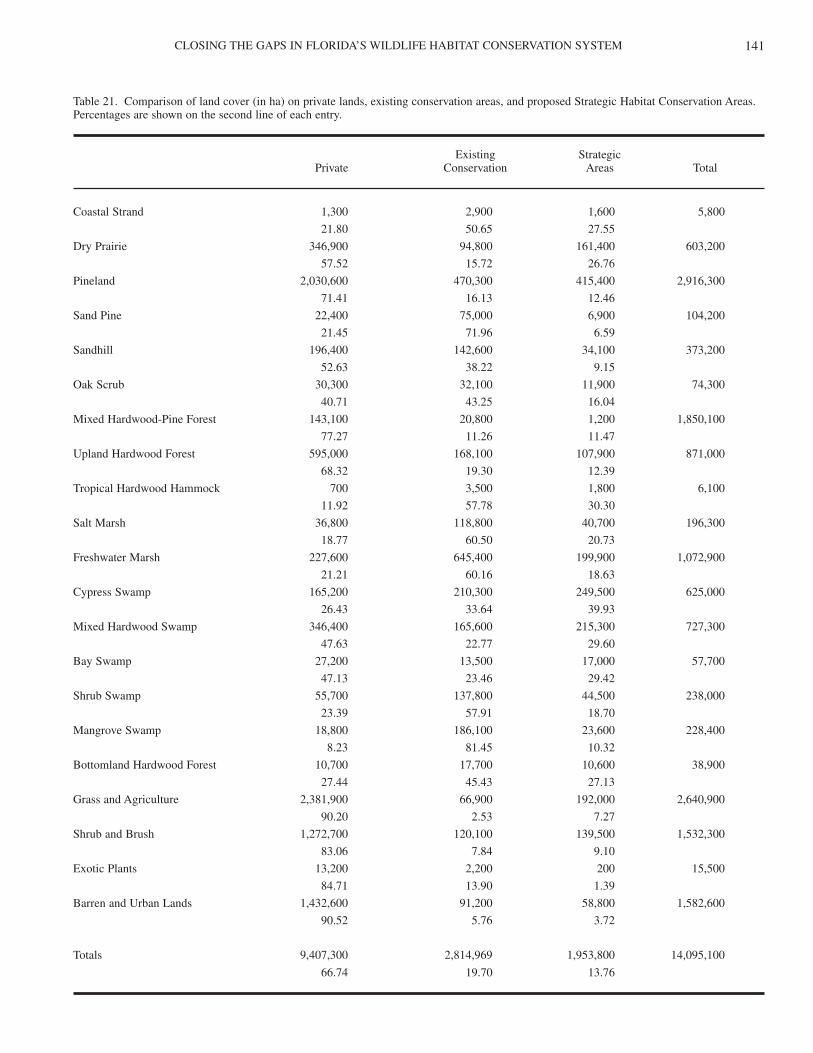
CLOSING THE GAPS IN FLORIDA’S WILDLIFE HABITAT CONSERVATION SYSTEM 141
Table 21. Comparison of land cover (in ha) on private lands, existing conservation areas, and proposed Strategic Habitat Conservation Areas.Percentages are shown on the second line of each entry.
Existing StrategicPrivate Conservation Areas Total
Coastal Strand 1,300 2,900 1,600 5,800
21.80 50.65 27.55
Dry Prairie 346,900 94,800 161,400 603,200
57.52 15.72 26.76
Pineland 2,030,600 470,300 415,400 2,916,300
71.41 16.13 12.46
Sand Pine 22,400 75,000 6,900 104,200
21.45 71.96 6.59
Sandhill 196,400 142,600 34,100 373,200
52.63 38.22 9.15
Oak Scrub 30,300 32,100 11,900 74,300
40.71 43.25 16.04
Mixed Hardwood-Pine Forest 143,100 20,800 1,200 1,850,100
77.27 11.26 11.47
Upland Hardwood Forest 595,000 168,100 107,900 871,000
68.32 19.30 12.39
Tropical Hardwood Hammock 700 3,500 1,800 6,100
11.92 57.78 30.30
Salt Marsh 36,800 118,800 40,700 196,300
18.77 60.50 20.73
Freshwater Marsh 227,600 645,400 199,900 1,072,900
21.21 60.16 18.63
Cypress Swamp 165,200 210,300 249,500 625,000
26.43 33.64 39.93
Mixed Hardwood Swamp 346,400 165,600 215,300 727,300
47.63 22.77 29.60
Bay Swamp 27,200 13,500 17,000 57,700
47.13 23.46 29.42
Shrub Swamp 55,700 137,800 44,500 238,000
23.39 57.91 18.70
Mangrove Swamp 18,800 186,100 23,600 228,400
8.23 81.45 10.32
Bottomland Hardwood Forest 10,700 17,700 10,600 38,900
27.44 45.43 27.13
Grass and Agriculture 2,381,900 66,900 192,000 2,640,900
90.20 2.53 7.27
Shrub and Brush 1,272,700 120,100 139,500 1,532,300
83.06 7.84 9.10
Exotic Plants 13,200 2,200 200 15,500
84.71 13.90 1.39
Barren and Urban Lands 1,432,600 91,200 58,800 1,582,600
90.52 5.76 3.72
Totals 9,407,300 2,814,969 1,953,800 14,095,100
66.74 19.70 13.76
FLORIDA GAME AND FRESH WATER FISH COMMISSION142
for these techniques to be effective, and methods for monitor-ing management agreements must also be developed.Another option that might be attractive in a limited number ofcases is public acquisition of land and then leasing the landback to the original title holder for certain agricultural orrecreational operations.
Funds available through the state’s various land acquisi-tion programs are not often used for some of these “less-than-fee” conservation strategies because of the high cost of ease-ments, difficulty of monitoring and enforcing easements, andlack of public access. Nevertheless, we recommend that con-servation easements be further examined in appropriate areas.Some of the areas that might be appropriate are describedmore specifically in sections dealing with Florida black bear(Section 6.2.11), Florida panther (Section 6.2.14), Floridasandhill crane (Section 6.2.15), and Audubon’s crestedcaracara (Section 6.2.5). Although there will likely beinstances where the protection provided by conservationeasements proves to be less than complete, the sheer area ofhabitat that needs to be conserved, coupled with the limitedfunds available, require that we explore these possibilitiesmore completely.
Additional funds for habitat management and restorationwill also be needed since a system of conservation areas cannot be left idle if it is to provide adequate protection for therare plant and animal species it is designed to support.Ongoing habitat management is critically needed once land isprotected, and the annual cost of managing state lands inFlorida could exceed $180 million assuming that federal landsmake up about 40% of the total conservation land base, con-servation easements on private lands make up about 30% ofthe land base, and land-management costs on the remainingstate-owned lands are about $20 per acre per year (Anon.1992, Anon. 1993). While this may seem like a substantialyearly payment, the importance of management cannot beignored. In fact, the fate of all rare species will ultimately bedetermined by the quality of ongoing habitat management.
Most areas in public ownership are managed for multipleuses (e.g., recreation, conservation, timber production), butmultiple use often translates into multiple conflicts as diverseinterests vie for the natural resources provided by publiclymanaged lands. Given the critical importance of many stateforests, wildlife management areas, and state recreation areasto the maintenance of secure populations of rare species inFlorida, more explicit guidelines for handling these conflictsmay be necessary.
Another aspect of wildlife conservation and managementthat requires greater attention is the protection of conservationareas from usurpation for other public and private uses.Public lands originally conserved for their important naturalresources often serve as magnets for powerline corridors, roadrights-of-way, and other public and private ventures becauseof the reduced costs of purchasing land and easements.Among the many examples of problems of this nature are theconstruction of a four-lane road through rare scrub habitat in astate park in the Florida panhandle, the proposed constructionof a power transmission line through a wildlife managementarea in southwest Florida, the proposed construction of a turn-pike through several conservation areas in north centralFlorida, and the proposed construction of a turnpike throughvaluable habitat on public lands in Levy County. Although itseems somewhat incongruous that “protected” natural areas
are appropriated in such a manner, the legal power to preventsuch acts is often weak. We recommend that increased atten-tion be given to this problem and that a more formal processbe established to dedicate public lands and selected wetlandsystems to a statewide system of habitat conservation areas.Public lands and wetlands that are dedicated to a statewidesystem of conservation areas should be appropriated for otherland uses only under very narrowly defined conditions.
The establishment of proposed wildlife conservationareas has economic implications for some local governments.The average increase in the percentage of conservation areasin each county is 10.9%, but the percentage of conservationlands in several counties would increase by more than 20%(Table 22). These counties are Baker, Charlotte, Collier,Flagler, Glades, Hendry, Highland, Lee, Osceola, Polk,Putnam and Volusia counties. If the percentages for all formsof conservation areas shown in Figure 162 are combined (e.g.,current conservation areas and proposed conservation areas),then 12 counties would have > 40% of their total land area(exclusive of water) available for less restrictive land uses.These are Baker, Charlotte, Collier, Dade, Flagler, Franklin,Glades, Liberty, Monroe, Okaloosa, Wakulla, and Waltoncounties. Concerns over the loss of ad valorem taxes mightneed to be addressed in some counties where a significant pro-portion of the total land base is included as one of theStrategic Habitat Conservation Areas shown in Figure 162.However, conservation of habitat in the identified areas doesnot imply a complete economic drain. Outdoor recreationopportunities, compatible timber and agricultural activities,and other revenue generating activities allowed in most pro-posed conservation areas constitute a significant source ofincome. Local businesses in some areas have even begun topromote the “wilderness” aspect of their area (TallahasseeDemocrat, May 19, 1991). Moreover, designated conserva-tion areas do not require the infrastructure that often places agreat burden on local governments. Proposed conservationareas will not require new schools, new roads, new sewagetreatment plants, new water supply systems, new electric facil-ities, and extensive police and fire protection.
SECTION 7.2. COMPARISON OF AGGREGATE MAP OFSTRATEGIC HABITAT CONSERVATION AREAS WITHOTHER MAPS OF NATURAL RESOURCES
The Nature Conservancy, Florida Department of NaturalResources, and Florida Audubon Society convened 40 biolo-gists in January, 1991, for the purpose of outlining importantecological resources in Florida. The map developed at thismeeting was transferred to a 1:500,000 scale map of Floridaand digitized by the Florida Natural Areas Inventory (Figure163). The total recommended area for protection encom-passed by this map (also known as the “charette” map) isroughly 29,350 km2 (7.25 million acres), with 10,930 km2
(2.7 million acres) falling into the highest priority category.Although the coarse scale at which the charette map was
digitized (1:500,000) makes it difficult to make precise com-parisons to Figure 162, the degree of overlap between thecharette map and Figure 162 is less than might be expected.Only 37% of the Strategic Habitat Conservation Areas wehave defined for rare plants and animals are included in thecharette map, and only 4,210 km2 (1.04 million acres) coin-cide with the highest priority category in the charette map.
CLOSING THE GAPS IN FLORIDA’S WILDLIFE HABITAT CONSERVATION SYSTEM 143
Table 22. Acreages of existing conservation lands and proposed Strategic Habitat Conservation Areas (SHCA) for individual Florida counties. The percentage of total area of each county is provided in parentheses.
Existing Proposed Existing ProposedCounty Conservation Lands SHCAs County Conservation Lands SHCAs
Alachua 32,604 (5.48) 33,839 (5.69) Lake 115,102 (17.56) 115,843 (17.67)
Baker 105,222 (28.15) 117,819 (31.47) Lee 21,489 (4.28) 120,783 (23.97)
Bay 35,321 (7.19) 14,573 (2.99) Leon 131,404 (29.67) 34,580 (7.79)
Bradford 16,055 (8.39) 741 (0.42) Levy 74,841 (10.44) 129,181 (18.01)
Brevard 181,051 (27.16) 99,788 (14.95) Liberty 319,865 (59.27) 79,781 (14.79)
Broward 483,626 (63.52) 5,681 (0.74) Madison 6,916 (1.55) 38,532(8.54)
Calhoun 247 (0.00) 37,297 (10.16) Manatee 22,477 (4.83) 14,326 (3.07)
Citrus 74,841 (19.22) 41,743 (10.71) Marion 316,160 (30.80) 90,896 (8.85)
Charlotte 69,407 (15.61) 143,754 (32.37) Martin 20,007 (5.65) 31,369 (8.85)
Clay 70,889 (18.56) 17,043 (4.45) Monroe 579,215 (91.46) 18,772 (2.98)
Collier 594,035 (46.21) 488,072 (37.96) Nassau 6,422 (1.52) 39,767 (9.54)
Columbia 82,992 (16.50) 56,316 (11.19) Okaloosa 320,853 (53.44) 16,055 (2.66)
Dade 698,269 (56.33) 23,959 (1.93) Okeechobee 16,549 (3.36) 89,908 (18.22)
Desoto 0 (0.00) 78,052 (18.79) Orange 68,419 (11.78) 46,930 (8.08)
Dixie 41,743 (9.35) 48,412 (10.82) Osceola 86,450 (9.68) 224,770 (25.18)
Duval 65,208 (13.06) 36,309 (7.24) Palm Beach 333,697 (26.72) 26,182 (2.09)
Escambia 15,560 (3.69) 247 (0.07) Pasco 50,388 (10.72) 58,539 (12.42)
Flagler 2,223 (0.74) 183,027 (59.12) Pinellas 3,211 (1.76) 6,916 (3.97)
Franklin 75,335 (21.55) 108,927 (31.18) Polk 102,999 (8.68) 244,530 (20.63)
Gadsden 13,338 (4.03) 3,952 (1.19) Putnam 50,635 (10.60) 135,109 (28.21)
Gilchrist 1,482 (0.63) 18,525 (8.21) St. Johns 13,585 (3.42) 45,448 (11.32)
Glades 494 (0.10) 393,965 (69.61) St. Lucie 5,187 (0.01) 27,417 (7.60)
Gulf 34,086 (9.56) 49,400 (13.88) Santa Rosa 208,715 (31.89) 26,923 (4.13)
Hamilton 6,916 (2.08) 16,549 (5.07) Sarasota 43,719 (12.23) 21,983 (6.14)
Hardee 247 (0.00) 33,839 (8.40) Seminole 7,410 (3.73) 11,609 (5.96)
Hendry 1,482 (0.18) 263,549 (35.39) Sumter 82,004 (22.53) 22,230 (6.10)
Hernando 61,750 (20.11) 10,374 (3.40) Suwannee 5,928 (1.36) 9,386 (2.10)
Highland 62,491 (9.57) 157,339 (24.09) Taylor 62,491 (9.48) 80,275 (12.17)
Hillsborough 25,688 (3.93) 44,213 (6.79) Union 8,892 (5.58) 1,729 (1.16)
Holmes 2,223 (0.01) 741 (0.20) Volusia 69,160 (9.56) 181,051 (25.04)
Indian River 60.762 (19.04) 19,266 (6.02) Wakulla 271,206 (69.24) 21,489 (5.50)
Jackson 13,338 (2.20) 20,254 (3.38) Walton 184,756 (27.15) 99,788 (14.67)
Jefferson 30,628 (8.05) 74,594 (19.62) Washington 17,537 (4.56) 46,189 (11.94)
Lafayette 988 (0.26) 21,736 (6.19)
FLORIDA GAME AND FRESH WATER FISH COMMISSION144
The Strategic Habitat Conservation Areas proposed inFigure 162 will conserve habitat for many other naturalresources. Many of the species that benefit from these conser-vation areas are listed in Sections 6.2.1-6.3.11. However, anevaluation of the different taxa tracked by the Florida NaturalAreas Inventory provides a better indication of the extent towhich the proposed Strategic Habitat Conservation Areasprotect the full diversity of life in Florida. The FloridaNatural Areas Inventory maintains records for 715 plant andanimal taxa and other natural features such as natural commu-nities. We selected the plant and animal taxa that are followedby the Florida Natural Areas Inventory and determined theirpresence on existing conservation areas and the proposedStrategic Habitat Conservation Areas. The Strategic HabitatConservation Areas proposed here will establish a habitat basefor 76 taxa that currently have no records from existing con-servation areas, and when proposed Strategic HabitatConservation Areas are combined with existing conservationareas, only 111 taxa followed by the Florida Natural AreasInventory lack at least one occurrence record from an existingor proposed conservation area (Table 23). If fish are taken outof this tally due to the fact that water areas were excludedfrom the mapping of Strategic Habitat Conservation Areas,proposed and existing conservation areas miss only 96 of thetaxa followed by the Florida Natural Areas Inventory. When
considering the fact that several of the vertebrate species (e.g.,salt marsh vole) listed in Table 23 are believed to occur onsome existing conservation areas in Florida yet are not record-ed for these areas in the Florida Natural Areas Inventory data-base, the proposed habitat conservation areas appear to sup-port most of the rare higher vertebrates monitored by theFlorida Natural Areas Inventory.
The proposed Strategic Habitat Conservation Areas andexisting habitat conservation areas appear to miss severalinvertebrates, fishes, and some plants. More specific habitatconservation strategies should be developed for these ele-ments of Florida’s biological diversity. However, we notethat some of the plants shown in Table 23 are not consideredglobally rare or threatened by the Florida Natural AreasInventory. In addition, the absence of records of fish oftenresulted from the exclusion of water areas when mappingmany of the proposed Strategic Habitat Conservation Areas.The Florida Natural Areas Inventory has begun to analyzeadditional conservation areas for some of these rare plants,and the Florida Game and Fresh Water Fish Commissionplans to analyze several of the rare fish shown in Table 23.
Figure 163. Map of important natural resources based on the “charette” map.
CLOSING THE GAPS IN FLORIDA’S WILDLIFE HABITAT CONSERVATION SYSTEM 145
Table 23. Records in the Florida Natural Areas Inventory database that do not have occurrence records within existing conservation areas or proposed Strategic Habitat Conservation Areas.
Amphibians and Reptiles Oval pigtoeSouthern creekmussel
Seal salamander Florida tree snailHawksbill sea turtle Stock Island tree snailAtlantic ridley sea turtle Blue Spring aphaostraconLeatherback sea turtle Fenney Spring aphaostraconGulf coast smooth softshell turtle Helicoid Spring snail
Enterprise Spring snailBirds Ponderosa Spring snail
Wekiwa Spring snailMangrove clapper railRoseate tern PlantsAmerican redstartWorm-eating warbler Apalachicola river aster
Balsam torchwoodFish Broad-leaved nodding-caps
BuckthornSea lamprey Carter’s small-flowered flaxShortnose sturgeon Carex microdontaAlligator gar ChaffseedBluehead chub Chapman’s skeletongrassRough shiner Cooley’s meadowrueBluestripe shiner Craighead’s nodding-capsStriped shiner Creeping-leaf stalkgrassRiver redhorse Crenulate lead-plantLake Eustis pupfish Cuban snake-barkSaltmarsh topminnow Cucumber magnoliaShoal bass Devil’s shoestringCrystal darter Dwarf spleenwortSaddleback darter Eastern purple coneflowerStriped croaker Eaton’s spikemossKey blenny Florida crabgrass
Florida pondweedMammals Giant water-dropwort
Godfrey’s sandwortBig brown bat Hairy beach sunflowerHoary bat Hay scented fernSaltmarsh vole Heart-leaved willow
Key tree-cactusInvertebrates Lakela’s pinweed
Large whorled pogoniaCaecidotea parva (a cave isopod) Little-peopleCrangonyx sp. (undescribed cave amphipod) Miami palmettoPalm Springs cave crayfish Mexican tear-thumbRed-eyed cave crayfish Miccosukee gooseberryOrange Lake cave crayfish Pine-woods asterMiller’s cave crayfish Pine-woods bluestemTroglocambarus sp. (undescribed cave crayfish) PinesapSquirrel Chimney cave shrimp Rock Key devil’s-clawsFlorida atala butterfly Rugel’s pawpawSandhilll clubtail Rough strongbarkTawny sand clubtail Shade betonyMaidencane cruiser ShootingstarTriangle floater Sleeping beauty water-lilyFat threeridge Tallahassee hedge-nettleFlat floater Turk’s cap lilyApalachicola floater Wedglet fernRayed creekshell West Florida cowlilyNarrow pigtoe White baneberryRound pearlshell Winter grape-fernSouthern pocketbook Wright’s anemiaGulf moccasinshell Yellow-rootBankclimber

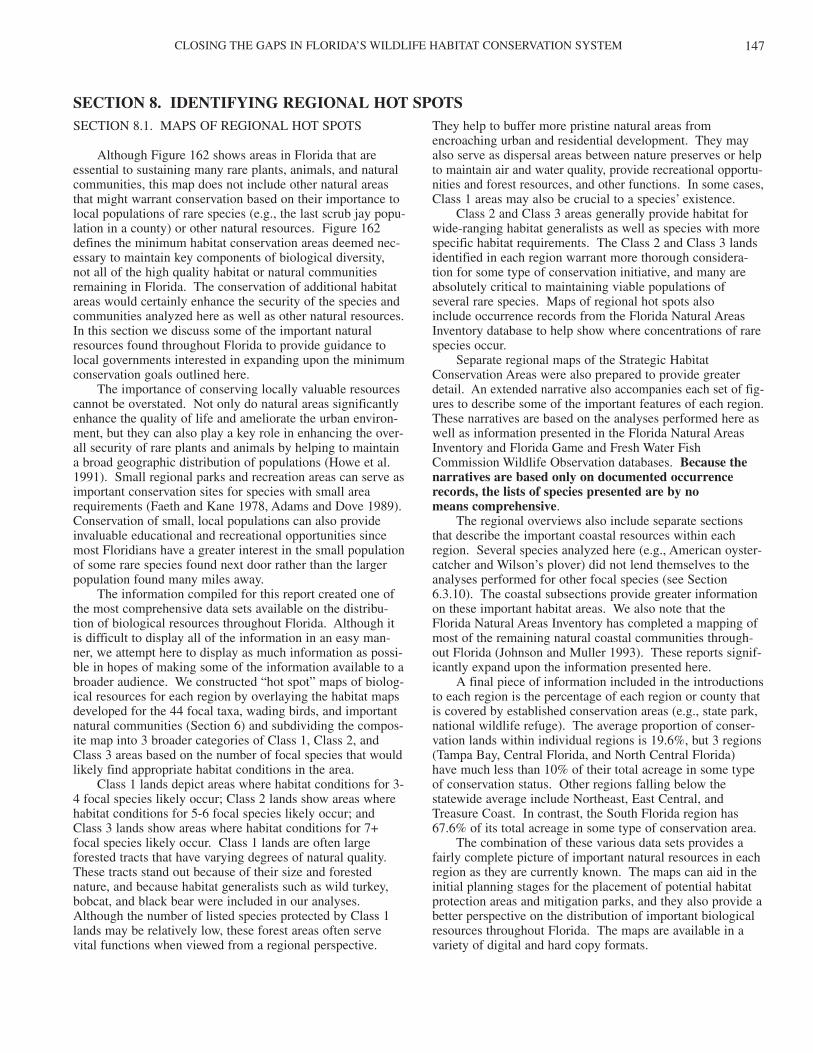
CLOSING THE GAPS IN FLORIDA’S WILDLIFE HABITAT CONSERVATION SYSTEM 147
SECTION 8.1. MAPS OF REGIONAL HOT SPOTS
Although Figure 162 shows areas in Florida that areessential to sustaining many rare plants, animals, and naturalcommunities, this map does not include other natural areasthat might warrant conservation based on their importance tolocal populations of rare species (e.g., the last scrub jay popu-lation in a county) or other natural resources. Figure 162defines the minimum habitat conservation areas deemed nec-essary to maintain key components of biological diversity,not all of the high quality habitat or natural communitiesremaining in Florida. The conservation of additional habitatareas would certainly enhance the security of the species andcommunities analyzed here as well as other natural resources.In this section we discuss some of the important naturalresources found throughout Florida to provide guidance tolocal governments interested in expanding upon the minimumconservation goals outlined here.
The importance of conserving locally valuable resourcescannot be overstated. Not only do natural areas significantlyenhance the quality of life and ameliorate the urban environ-ment, but they can also play a key role in enhancing the over-all security of rare plants and animals by helping to maintaina broad geographic distribution of populations (Howe et al.1991). Small regional parks and recreation areas can serve asimportant conservation sites for species with small arearequirements (Faeth and Kane 1978, Adams and Dove 1989).Conservation of small, local populations can also provideinvaluable educational and recreational opportunities sincemost Floridians have a greater interest in the small populationof some rare species found next door rather than the largerpopulation found many miles away.
The information compiled for this report created one ofthe most comprehensive data sets available on the distribu-tion of biological resources throughout Florida. Although itis difficult to display all of the information in an easy man-ner, we attempt here to display as much information as possi-ble in hopes of making some of the information available to abroader audience. We constructed “hot spot” maps of biolog-ical resources for each region by overlaying the habitat mapsdeveloped for the 44 focal taxa, wading birds, and importantnatural communities (Section 6) and subdividing the compos-ite map into 3 broader categories of Class 1, Class 2, andClass 3 areas based on the number of focal species that wouldlikely find appropriate habitat conditions in the area.
Class 1 lands depict areas where habitat conditions for 3-4 focal species likely occur; Class 2 lands show areas wherehabitat conditions for 5-6 focal species likely occur; andClass 3 lands show areas where habitat conditions for 7+focal species likely occur. Class 1 lands are often largeforested tracts that have varying degrees of natural quality.These tracts stand out because of their size and forestednature, and because habitat generalists such as wild turkey,bobcat, and black bear were included in our analyses.Although the number of listed species protected by Class 1lands may be relatively low, these forest areas often servevital functions when viewed from a regional perspective.
They help to buffer more pristine natural areas fromencroaching urban and residential development. They mayalso serve as dispersal areas between nature preserves or helpto maintain air and water quality, provide recreational opportu-nities and forest resources, and other functions. In some cases,Class 1 areas may also be crucial to a species’ existence.
Class 2 and Class 3 areas generally provide habitat forwide-ranging habitat generalists as well as species with morespecific habitat requirements. The Class 2 and Class 3 landsidentified in each region warrant more thorough considera-tion for some type of conservation initiative, and many areabsolutely critical to maintaining viable populations ofseveral rare species. Maps of regional hot spots also include occurrence records from the Florida Natural AreasInventory database to help show where concentrations of rarespecies occur.
Separate regional maps of the Strategic HabitatConservation Areas were also prepared to provide greaterdetail. An extended narrative also accompanies each set of fig-ures to describe some of the important features of each region.These narratives are based on the analyses performed here aswell as information presented in the Florida Natural AreasInventory and Florida Game and Fresh Water FishCommission Wildlife Observation databases. Because thenarratives are based only on documented occurrencerecords, the lists of species presented are by no means comprehensive.
The regional overviews also include separate sectionsthat describe the important coastal resources within eachregion. Several species analyzed here (e.g., American oyster-catcher and Wilson’s plover) did not lend themselves to theanalyses performed for other focal species (see Section6.3.10). The coastal subsections provide greater informationon these important habitat areas. We also note that theFlorida Natural Areas Inventory has completed a mapping ofmost of the remaining natural coastal communities through-out Florida (Johnson and Muller 1993). These reports signif-icantly expand upon the information presented here.
A final piece of information included in the introductionsto each region is the percentage of each region or county thatis covered by established conservation areas (e.g., state park,national wildlife refuge). The average proportion of conser-vation lands within individual regions is 19.6%, but 3 regions(Tampa Bay, Central Florida, and North Central Florida) have much less than 10% of their total acreage in some typeof conservation status. Other regions falling below thestatewide average include Northeast, East Central, andTreasure Coast. In contrast, the South Florida region has67.6% of its total acreage in some type of conservation area.
The combination of these various data sets provides afairly complete picture of important natural resources in eachregion as they are currently known. The maps can aid in theinitial planning stages for the placement of potential habitatprotection areas and mitigation parks, and they also provide abetter perspective on the distribution of important biologicalresources throughout Florida. The maps are available in avariety of digital and hard copy formats.
SECTION 8. IDENTIFYING REGIONAL HOT SPOTS
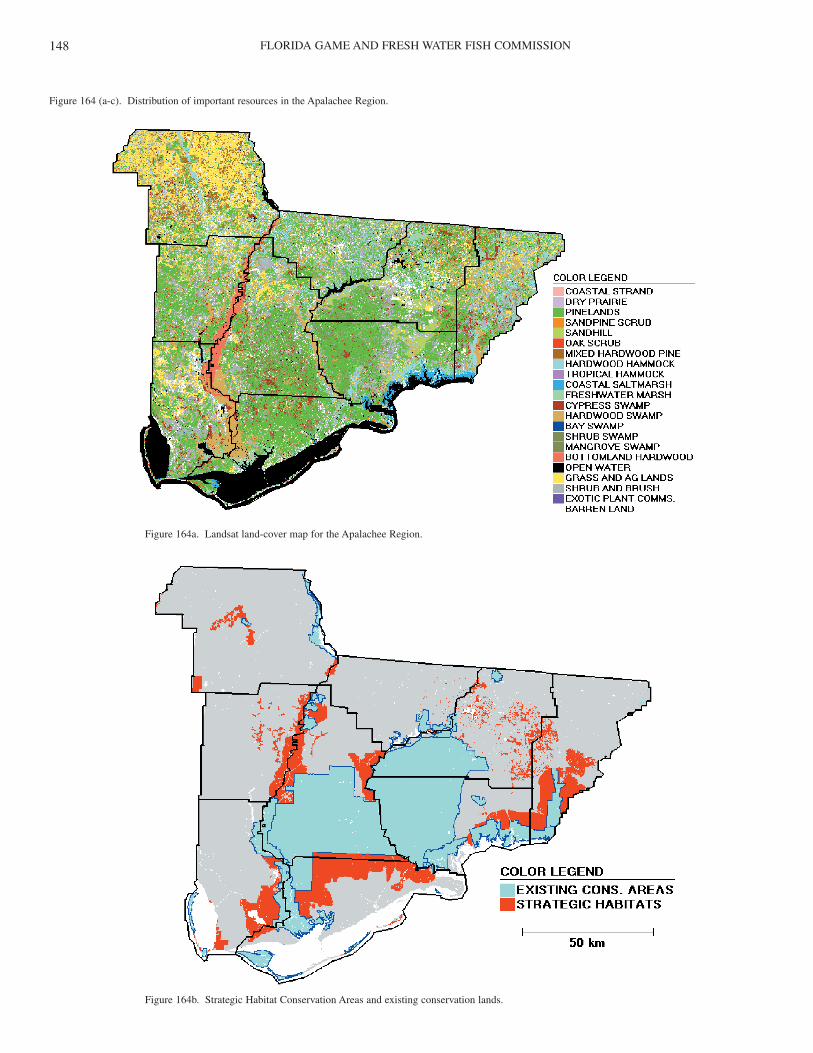
FLORIDA GAME AND FRESH WATER FISH COMMISSION148
Figure 164 (a-c). Distribution of important resources in the Apalachee Region.
Figure 164a. Landsat land-cover map for the Apalachee Region.
Figure 164b. Strategic Habitat Conservation Areas and existing conservation lands.
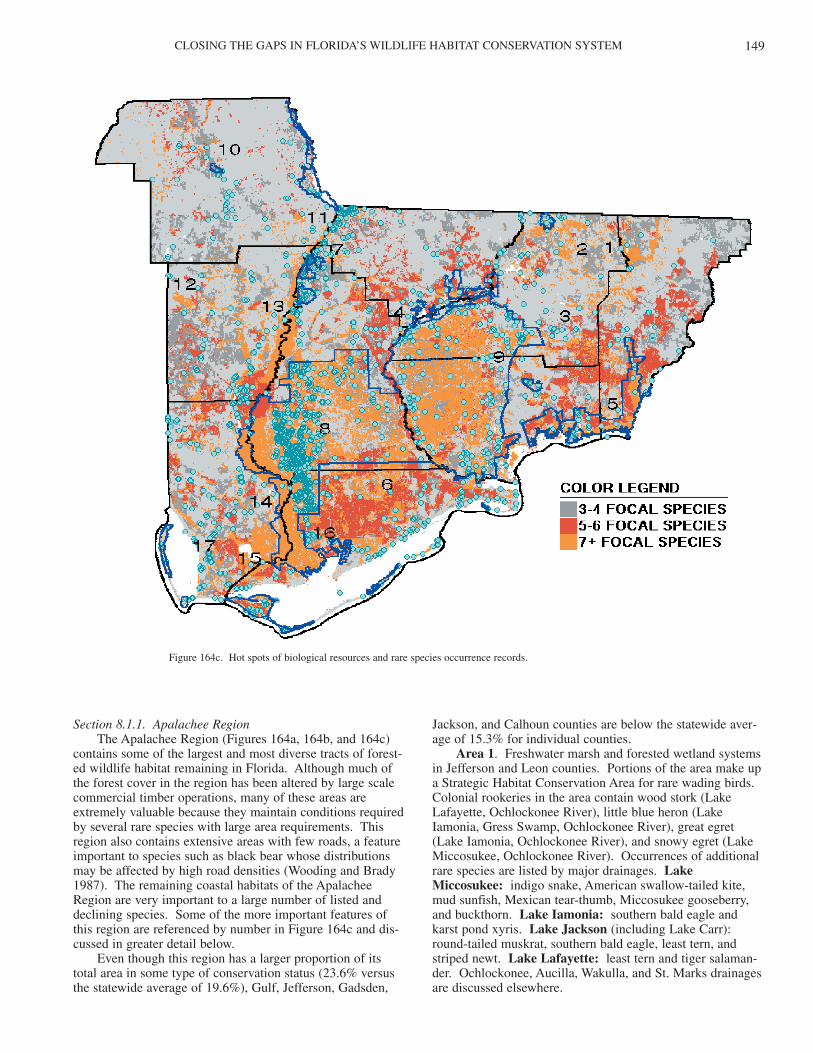
CLOSING THE GAPS IN FLORIDA’S WILDLIFE HABITAT CONSERVATION SYSTEM 149
Section 8.1.1. Apalachee RegionThe Apalachee Region (Figures 164a, 164b, and 164c)
contains some of the largest and most diverse tracts of forest-ed wildlife habitat remaining in Florida. Although much ofthe forest cover in the region has been altered by large scalecommercial timber operations, many of these areas areextremely valuable because they maintain conditions requiredby several rare species with large area requirements. Thisregion also contains extensive areas with few roads, a featureimportant to species such as black bear whose distributionsmay be affected by high road densities (Wooding and Brady1987). The remaining coastal habitats of the ApalacheeRegion are very important to a large number of listed anddeclining species. Some of the more important features ofthis region are referenced by number in Figure 164c and dis-cussed in greater detail below.
Even though this region has a larger proportion of itstotal area in some type of conservation status (23.6% versusthe statewide average of 19.6%), Gulf, Jefferson, Gadsden,
Jackson, and Calhoun counties are below the statewide aver-age of 15.3% for individual counties.
Area 1. Freshwater marsh and forested wetland systemsin Jefferson and Leon counties. Portions of the area make upa Strategic Habitat Conservation Area for rare wading birds.Colonial rookeries in the area contain wood stork (LakeLafayette, Ochlockonee River), little blue heron (LakeIamonia, Gress Swamp, Ochlockonee River), great egret(Lake Iamonia, Ochlockonee River), and snowy egret (LakeMiccosukee, Ochlockonee River). Occurrences of additionalrare species are listed by major drainages. LakeMiccosukee: indigo snake, American swallow-tailed kite,mud sunfish, Mexican tear-thumb, Miccosukee gooseberry,and buckthorn. Lake Iamonia: southern bald eagle andkarst pond xyris. Lake Jackson (including Lake Carr):round-tailed muskrat, southern bald eagle, least tern, andstriped newt. Lake Lafayette: least tern and tiger salaman-der. Ochlockonee, Aucilla, Wakulla, and St. Marks drainagesare discussed elsewhere.
Figure 164c. Hot spots of biological resources and rare species occurrence records.
FLORIDA GAME AND FRESH WATER FISH COMMISSION150
Area 2. Areas of mixed hardwood-pine, upland hard-wood forest, and pine forest in north Jefferson and Leon coun-ties. Selected areas support southeastern shrew, red-cockadedwoodpecker (3 active sites, 15 inactive sites), southeasternAmerican kestrel, Cooper’s hawk, gopher tortoise, easternindigo snake, Florida pine snake, Florida mountain-mint, andturk’s cap lily.
Area 3. Extensive tract of sandhill land cover southeastof Tallahassee. Species associated with this area include foxsquirrel, southern bald eagle, southeastern American kestrel,gopher tortoise, eastern indigo snake, Florida pine snake,gopher frog, and bent golden aster. Much of the area wasrecently logged. An aquatic cave to the south of the area sup-ports the Woodville cave crayfish.
Area 4. Ochlockonee River basin and tributaries in Leon,Liberty, and south Gadsden counties. Portions of the areamake up a Strategic Habitat Conservation Area for Floridablack bear. Occurrences of other species are listed by majordrainages. Ochlockonee River: round-tailed muskrat, south-ern bald eagle, red-cockaded woodpecker, wood stork (nestingcolony), little blue heron (nesting colony), southern bald eagle(3 nest records), American swallow-tailed kite, gopher tor-toise, Suwannee cooter, alligator snapping turtle, eastern indi-go snake, one-toed amphiuma, Apalachicola dusky salaman-der, Suwannee bass, bannerfin shiner, spotted bullhead,Atlantic sturgeon, Ashe’s magnolia, wiregrass gentian, scare-weed, bent golden aster, and purple bankclimber. BearCreek (Gadsden County): American swallow-tailed kite,copperhead, eastern indigo snake, gopher tortoise, and Floridaanise. Oklawaha Creek (Gadsden County): American swal-low-tailed kite, Cooper’s hawk, one-toed amphiuma,Apalachicola dusky salamander, Chapman’s rhododendron.Hammock Creek (Gadsden County): bent golden aster andChapman’s rhododendron. Telogia Creek (Gadsden andLiberty counties): swallow-tailed kite, Florida pine snake,Apalachicola dusky salamander, and dusky shiner.
Area 5. Spring-fed rivers and forested wetlands inWakulla and Jefferson counties. Portions of these areas con-stitute a Strategic Habitat Conservation Area for Florida blackbear, American swallow-tailed kite, and limpkin. Additionaloccurrences of rare species are listed by major drainages.Aucilla and Wacissa rivers (including Bailey Mill Creek):limpkin, eastern indigo snake, American alligator, Suwanneecooter, alligator snapping turtle, one-toed amphiuma, duskyshiner, blackbanded sunfish, eastern mudminnow, easternmud sunfish, Florida willow, corkwood, Flyr’s brickell-bush,and Horst’s cave crayfish. St. Marks River (including BlackCreek): West Indian manatee, eastern indigo snake, tiger sala-mander, one-toed amphiuma, and dusky shiner. WakullaRiver (north of confluence with St. Marks): West Indianmanatee, osprey, Florida pine snake, eastern indigo snake,alligator snapping turtle, gopher tortoise, dusky shiner, andWoodville cave crayfish.
Area 6. Remote forest areas in Franklin County.Portions of the area constitute a Strategic HabitatConservation Area for Florida black bear. Other rare speciesrecorded for the area include little blue heron (rookery),osprey, Bachman’s sparrow, Florida pine snake, indigo snake,alligator snapping turtle, flatwoods salamander, Barbour’s
map turtle, violet flowered butterwort, wiregrass gentian,white-topped pitcher plant, pinewoods bluestem, meadow-beauty, and Florida bear-grass.
Area 7. Bluffs and ravines along the east bank of theApalachicola River (Liberty and Jackson counties), an impor-tant area of high endemism (Ward 1979, Muller et al. 1989).Portions of the area constitute a Strategic HabitatConservation Area for Florida black bear. Rare animalspecies recorded in this region include southern bald eagle,alligator snapping turtle, Barbour’s map turtle, Suwanneecooter, gopher tortoise, copperhead, eastern indigo snake,Florida pine snake, one-toed amphiuma, four-toed salaman-der, Apalachicola dusky salamander, and goldstripe darter.This region supports several endemic species of plants. Someof the rarest plant species in the area are croomia, Floridayew, Florida torreya, schisandra, Baltzell’s sedge, pyramidmagnolia, fringed campion, Ashe’s magnolia, halberd-leavedyellow violet, Indian cucumber root, Alabama angelpod,Florida spiney pod, rattlesnake plantain, trailing arbutus,buckthorn, wild hydrangea, Carolina lily, American bladder-nut, false hellebore, orange azalea, toothed savory, narrow-leaved trillium, Carolina lily, Apalachicola wild indigo,Apalachicola rosemary, Marianna columbine, Florida anise,and trout lily.
Area 8. West half of Apalachicola National Forest,Liberty County. A mix of cypress swamp, hardwood forest,pinewood savannas, and longleaf pine forests grading intoApalachicola River floodplain forests. Portions of the areaconstitute a Strategic Habitat Conservation Area for Floridablack bear. Occurrence records of additional rare speciesinclude fox squirrel, red-cockaded woodpecker, Cooper’shawk, American swallow-tailed kite, Florida pine snake,Apalachicola kingsnake, alligator snapping turtle, Barbour’smap turtle, gopher tortoise, flatwoods salamander, coal skink,Piedmont water-milfoil, large-flowered grass-of-parnassus,bog-button, Carolina grass-of-parnassus, southern milkweed,mock pennyroyal, Chapman’s crownbeard, birds-in-a-nest,Chapman’s butterwort, meadowbeauty, Harper’s beauty, vio-let-flowered butterwort, panhandle spiderlily, Drummond’syellow-eyed grass, Apalachicola dragon-head, thick-leavedwater-willow, Florida skullcap, West’s flax, Florida skullcap,and Florida bear-grass.
Area 9. East half of the Apalachicola National Forest(Wakulla District). Extensive area of sandhill land cover andkarst topography containing sinkholes and terrestrial caves,grading into mesic pinelands and hardwood forests. Rarespecies recorded in the area include black bear, gray bat, red-cockaded woodpecker, gopher tortoise, alligator snapping tur-tle, gopher frog, Florida pine snake, Apalachicola king snake,eastern indigo snake, striped newt, Apalachicola dusky sala-mander, one-toed amphiuma, spotted bullhead, dusky shiner,slender-leaved dragon-head, Chapman’s butterwort, bentgolden aster, Godfrey’s blazing star, Ashe’s magnolia, wire-grass gentian, scare-weed, southern red lily, mock pennyroyal,southern milkweed, panhandle meadowbeauty, karst pondxyris, and Woodville cave crayfish.
Area 10. Forested areas near Marianna. Portions consti-tute a Strategic Habitat Conservation Area for bat maternitycaves. Other rare species recorded for the area include great
CLOSING THE GAPS IN FLORIDA’S WILDLIFE HABITAT CONSERVATION SYSTEM 151
egret (rookery), Cooper’s hawk, alligator snapping turtle,Barbour’s map turtle, one-toed amphiuma, dusky shiner, flat-woods salamander, spotted bullhead, false rue-anemone, vir-gin’s bower, Barbara’s buttons, wood spurge, Tennesseeleafcup, pinnate-lobed rudbeckia, Marianna columbine, heart-leaved willow, Hobb’s cave isopod, Dougherty Plain cavecrayfish, and Georgia blind salamander.
Area 11. Ocheesee Pond and west floodplain ofApalachicola River, Jackson County. Portions of the area areproposed as a Strategic Habitat Conservation Area for rarewading birds and bats. Species recorded in the area includeAmerican swallow-tailed kite, southern bald eagle, little blueheron (rookery), yellow-crowned night-heron (rookery), indi-go snake, copperhead, gopher frog, flatwoods salamander,one-toed amphiuma, pinewoods bluestem, West’s flax, ameadowbeauty, and Florida torreya (at Ocheesee Pond).Wood storks have become increasingly common at OcheeseePond in recent years and many now breed in the vicinity (J.Cox pers. obs.).
Area 12. Sandhill land cover in and around ChipolaExperimental Forest. Species recorded in the area includefox squirrel, southeastern American kestrel, gopher tortoise,gopher frog, and Apalachicola dusky salamander (Fourmile Creek).
Area 13. Forested areas around Apalachicola andChipola rivers, Calhoun County. Portions of the area areproposed as a Strategic Habitat Conservation Area for Floridablack bear and rare wading birds. Other rare species recordedin the area include American swallow-tailed kite, easternindigo snake, Florida pine snake, Alligator snapping turtle,one-toed amphiuma, flatwoods salamander, spotted bullhead,Chapman’s crownbeard, pine-woods aster, wiregrass gentian, Apalachicola dragon-head, gentian pinkroot, andmock pennyroyal.
Area 14. Forested areas around the Apalachicola River,Gulf County. Portions of the area are proposed as a StrategicHabitat Conservation Area for Florida black bear, rare wad-ing birds, and American swallow-tailed kite. Other rarespecies recorded for the area include Cooper’s hawk, south-ern bald eagle, flatwoods salamander, spotted bullhead,Chapman’s crownbeard, violet-flowered butterwort, southernmilkweed, West’s flax, Apalachicola dragon-head, gentianpinkroot, mock pennyroyal, and thick-leaved water-willow.
Area 15. Forested lands surrounding Lake Wimico.Portions of the area are proposed as a Strategic HabitatConservation Area for American swallow-tailed kite. Otherrare species recorded in the area include southern bald eagle,coal skink, and panhandle spider lily.
Area 16. Forested areas along the Apalachicola River,Franklin County. Portions of the area constitute a StrategicHabitat Conservation Area for Florida black bear andAmerican swallow-tailed kite. Other rare species recorded inthe area include osprey, yellow-crowned night-heron, leastbittern, Alligator snapping turtle, Barbour’s map turtle, cork-wood, Carolina grass-of-parnassus, southern milkweed, mockpennyroyal, and Chapman’s crownbeard.
Area 17. Ward’s Ridge and flatwoods near St. Joe Bay. Portions of the area make up a Strategic HabitatConservation Area for several rare species of plants. Rare
species recorded in the area include Florida black bear, red-cockaded woodpecker, little blue heron (rookery), thick-leaved water-willow, wiregrass gentian, Chapman’s crown-beard, and telephus spurge.
Coastal Areas of Gulf County. Occurrences of rarespecies are listed by more specific geographic areas. St.Joseph Peninsula: St. Andrews beach mouse, Cuban snowyplover, piping plover, Wilson’s plover, black skimmer,American oystercatcher, least tern, shorebird aggregationarea, Gulf salt marsh snake, and loggerhead sea turtle. CapeSan Blas: Cuban snowy plover, piping plover, Wilson’splover, American oystercatcher, shorebird aggregation area,and Gulf coast lupine. St. Joseph Bay: portions of areamake up a Strategic Habitat Conservation Area for westernpopulations of seaside sparrow and Gulf salt marsh snake.Other rare species recorded in the area include American oys-tercatcher, sandwich tern, least tern, and loggerhead sea tur-tle. St. Vincent’s National Wildlife Refuge: Cuban snowyplover, piping plover, southern bald eagle, osprey, least bit-tern, black rail, Wakulla seaside sparrow, Gulf salt marshsnake, corkwood, and Gulf coast lupine.
Coastal Areas of Franklin County. Rare species arelisted by more specific geographic areas. Little St. GeorgeIsland: Cuban snowy plover (nesting), osprey, shorebirdaggregation area. St. George Island Causeway: nestingAmerican oystercatcher, least tern, Wilson’s plover, blackskimmer, and gull-billed tern. St. George Island (includesSt. George Island State Park): piping plover, Cuban snowyplover (nesting), least tern (nesting), American oystercatcher,osprey, peregrine falcon (migratory), shorebird aggregationarea, Gulf salt marsh snake, and Gulf coast lupine. DogIsland: American oystercatcher, Cuban snowy plover (nest-ing), piping plover, black skimmer, least tern (nesting),black-crowned night-heron, reddish egret, and Gulf coastlupine. Lanark Reef: black skimmer (nesting), Americanoystercatcher (nesting), Cuban snowy plover, piping plover,and great egret (rookery). Apalachicola Bay mainland:round-tailed muskrat, piping plover, least tern, American oys-tercatcher, eastern indigo snake, flatwoods salamander,Apalachicola king snake, Gulf salt marsh snake, large-leavedjoint-weed, Gulf coast lupine, Godfrey’s blazing star, andwhite-topped pitcher plant. Bald and Turkey Point: leasttern (nesting), piping plover, Cuban snowy plover (nesting),American oystercatcher (nesting), black skimmer, shorebirdaggregation area, Gulf salt marsh snake, Godfrey’s blazingstar, and Gulf coast lupine.
Coastal Areas of Wakulla and Jefferson Counties.Rare species are listed by more specific geographic areas.Dickerson Bay, Piney Island, and Oyster Bay: black rail,Wakulla seaside sparrow, American oystercatcher (nesting),least tern, black-crowned night-heron, Wilson’s plover (nest-ing), southern bald eagle, osprey, wood stork (foraging areas), shorebird aggregation area. St. Marks NationalWildlife Refuge: West Indian manatee, round-tailedmuskrat, southern bald eagle, black rail, Wakulla seasidesparrow, American oystercatcher, Wilson’s plover, least tern(nesting), black-crowned night-heron, spotted turtle, Gulf saltmarsh snake, and shorebird aggregation area.
FLORIDA GAME AND FRESH WATER FISH COMMISSION152
Figure 165 (a-c). Distribution of important resources in the Central Florida Region.
Figure 165a. Landsat land-cover map for the Central Florida Region.
Figure 165b. Strategic Habitat Conservation Areas and existing conservation lands.
CLOSING THE GAPS IN FLORIDA’S WILDLIFE HABITAT CONSERVATION SYSTEM 153
Section 8.1.2. Central Florida RegionThe Central Florida Region (Figures 165a, 165b, and
165c) has one of the smallest percentages (5.6%) of conserva-tion lands of any region in Florida (statewide average is19.6%). Highlands, Polk, Okeechobee, DeSoto, and Hardeecounties all have a much smaller percentage of conservationlands than the statewide average for individual counties. Insharp contrast to these figures lies the fact that this regioncontains some of the rarest and most biologically rich landsremaining in Florida. The region contains Strategic HabitatConservation Areas for southern bald eagle, Florida scrub jay,Florida sandhill crane, Audubon’s crested caracara, Floridagrasshopper sparrow, red-cockaded woodpecker, wood storksand other rare wading birds, and endemic scrub communities.Most of the important remaining natural areas are threatenedby expanding citrus operations, phosphate mining, and resi-dential development. Some of the more important features ofthis region are referenced by number in Figure 165c anddiscussed in greater detail below.
Area 1. Strategic Habitat Conservation Areas for scrubcommunities in Polk County. Occurrences of rare species arelisted by more specific geographic areas (generally progress-ing north to south). East Horse Creek Scrub: Florida scrubjay, Lewton’s polygala, and Florida willow. Snell CreekScrub: gopher tortoise, Carter’s warea, and Florida scrubbay. Lake Marion Scrub: Florida scrub jay and southernbald eagle. Deer Lake Scrub: southern bald eagle. LakePierce/Big Gum Lake Scrub: southern bald eagle, Floridascrub jay, gopher tortoise, scrub buckwheat, cutthroat grass,and paper-like nail-wort. North Lake Wales Scrub: Floridabonamia. Lake Weohyakapka Scrub: southern bald eagle,cutthroat grass, scrub plum, scrub bay, Curtiss’ milkweed,Florida gay-feather, and Florida bonamia. Tiger CreekScrub (see also Areas 2 and 3 below): short-tailed hawk,Florida scrub jay, gopher tortoise, Florida scrub lizard, scrubplum, Florida bonamia, scrub holly, and Britton’s bear-grass.Sunray Deli Estates: Florida scrub jay, Florida scrub lizard,gopher tortoise, peninsular tiger beetle, Small’s jointweed,
Figure 165c. Hot spots of biological resources and rare species occurrence records.
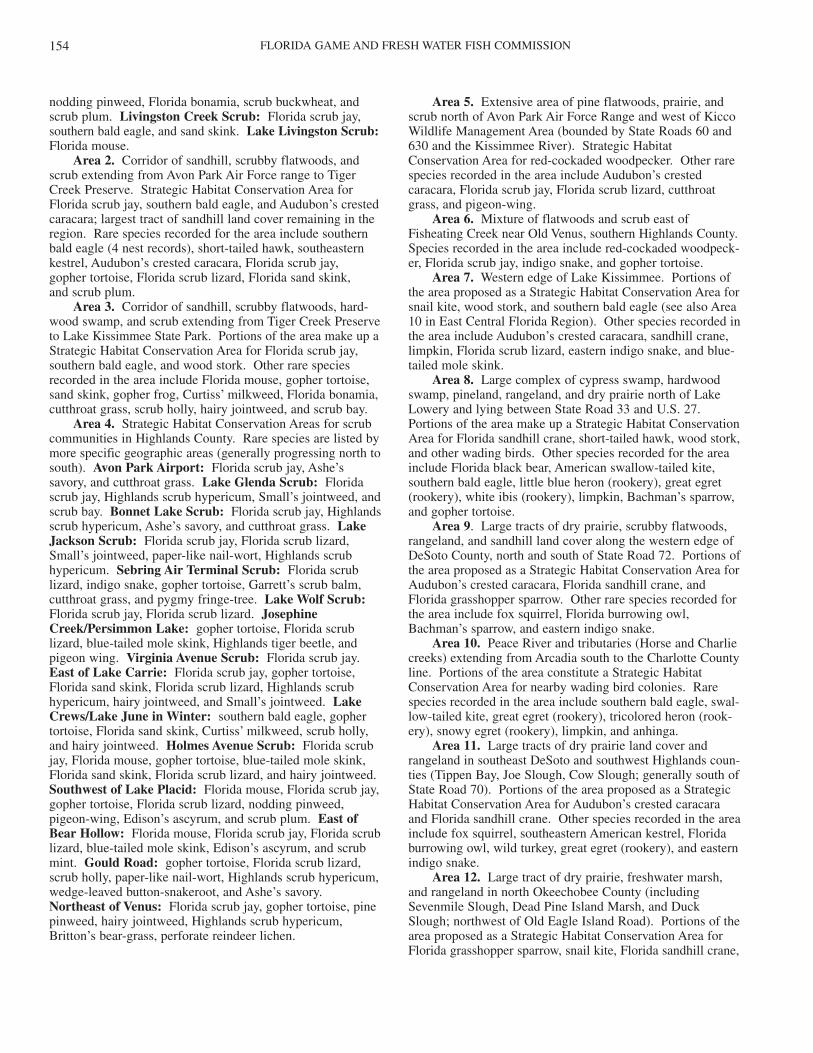
FLORIDA GAME AND FRESH WATER FISH COMMISSION154
nodding pinweed, Florida bonamia, scrub buckwheat, andscrub plum. Livingston Creek Scrub: Florida scrub jay,southern bald eagle, and sand skink. Lake Livingston Scrub:Florida mouse.
Area 2. Corridor of sandhill, scrubby flatwoods, andscrub extending from Avon Park Air Force range to TigerCreek Preserve. Strategic Habitat Conservation Area forFlorida scrub jay, southern bald eagle, and Audubon’s crestedcaracara; largest tract of sandhill land cover remaining in theregion. Rare species recorded for the area include southernbald eagle (4 nest records), short-tailed hawk, southeasternkestrel, Audubon’s crested caracara, Florida scrub jay,gopher tortoise, Florida scrub lizard, Florida sand skink,and scrub plum.
Area 3. Corridor of sandhill, scrubby flatwoods, hard-wood swamp, and scrub extending from Tiger Creek Preserveto Lake Kissimmee State Park. Portions of the area make up aStrategic Habitat Conservation Area for Florida scrub jay,southern bald eagle, and wood stork. Other rare speciesrecorded in the area include Florida mouse, gopher tortoise,sand skink, gopher frog, Curtiss’ milkweed, Florida bonamia,cutthroat grass, scrub holly, hairy jointweed, and scrub bay.
Area 4. Strategic Habitat Conservation Areas for scrubcommunities in Highlands County. Rare species are listed bymore specific geographic areas (generally progressing north tosouth). Avon Park Airport: Florida scrub jay, Ashe’ssavory, and cutthroat grass. Lake Glenda Scrub: Floridascrub jay, Highlands scrub hypericum, Small’s jointweed, andscrub bay. Bonnet Lake Scrub: Florida scrub jay, Highlandsscrub hypericum, Ashe’s savory, and cutthroat grass. LakeJackson Scrub: Florida scrub jay, Florida scrub lizard,Small’s jointweed, paper-like nail-wort, Highlands scrubhypericum. Sebring Air Terminal Scrub: Florida scrublizard, indigo snake, gopher tortoise, Garrett’s scrub balm,cutthroat grass, and pygmy fringe-tree. Lake Wolf Scrub:Florida scrub jay, Florida scrub lizard. JosephineCreek/Persimmon Lake: gopher tortoise, Florida scrublizard, blue-tailed mole skink, Highlands tiger beetle, andpigeon wing. Virginia Avenue Scrub: Florida scrub jay.East of Lake Carrie: Florida scrub jay, gopher tortoise,Florida sand skink, Florida scrub lizard, Highlands scrubhypericum, hairy jointweed, and Small’s jointweed. LakeCrews/Lake June in Winter: southern bald eagle, gophertortoise, Florida sand skink, Curtiss’ milkweed, scrub holly,and hairy jointweed. Holmes Avenue Scrub: Florida scrubjay, Florida mouse, gopher tortoise, blue-tailed mole skink,Florida sand skink, Florida scrub lizard, and hairy jointweed.Southwest of Lake Placid: Florida mouse, Florida scrub jay,gopher tortoise, Florida scrub lizard, nodding pinweed,pigeon-wing, Edison’s ascyrum, and scrub plum. East ofBear Hollow: Florida mouse, Florida scrub jay, Florida scrublizard, blue-tailed mole skink, Edison’s ascyrum, and scrubmint. Gould Road: gopher tortoise, Florida scrub lizard,scrub holly, paper-like nail-wort, Highlands scrub hypericum,wedge-leaved button-snakeroot, and Ashe’s savory.Northeast of Venus: Florida scrub jay, gopher tortoise, pinepinweed, hairy jointweed, Highlands scrub hypericum,Britton’s bear-grass, perforate reindeer lichen.
Area 5. Extensive area of pine flatwoods, prairie, andscrub north of Avon Park Air Force Range and west of KiccoWildlife Management Area (bounded by State Roads 60 and630 and the Kissimmee River). Strategic HabitatConservation Area for red-cockaded woodpecker. Other rarespecies recorded in the area include Audubon’s crestedcaracara, Florida scrub jay, Florida scrub lizard, cutthroatgrass, and pigeon-wing.
Area 6. Mixture of flatwoods and scrub east ofFisheating Creek near Old Venus, southern Highlands County.Species recorded in the area include red-cockaded woodpeck-er, Florida scrub jay, indigo snake, and gopher tortoise.
Area 7. Western edge of Lake Kissimmee. Portions ofthe area proposed as a Strategic Habitat Conservation Area forsnail kite, wood stork, and southern bald eagle (see also Area10 in East Central Florida Region). Other species recorded inthe area include Audubon’s crested caracara, sandhill crane,limpkin, Florida scrub lizard, eastern indigo snake, and blue-tailed mole skink.
Area 8. Large complex of cypress swamp, hardwoodswamp, pineland, rangeland, and dry prairie north of LakeLowery and lying between State Road 33 and U.S. 27.Portions of the area make up a Strategic Habitat ConservationArea for Florida sandhill crane, short-tailed hawk, wood stork,and other wading birds. Other species recorded for the areainclude Florida black bear, American swallow-tailed kite,southern bald eagle, little blue heron (rookery), great egret(rookery), white ibis (rookery), limpkin, Bachman’s sparrow,and gopher tortoise.
Area 9. Large tracts of dry prairie, scrubby flatwoods,rangeland, and sandhill land cover along the western edge ofDeSoto County, north and south of State Road 72. Portions ofthe area proposed as a Strategic Habitat Conservation Area forAudubon’s crested caracara, Florida sandhill crane, andFlorida grasshopper sparrow. Other rare species recorded forthe area include fox squirrel, Florida burrowing owl,Bachman’s sparrow, and eastern indigo snake.
Area 10. Peace River and tributaries (Horse and Charliecreeks) extending from Arcadia south to the Charlotte Countyline. Portions of the area constitute a Strategic HabitatConservation Area for nearby wading bird colonies. Rarespecies recorded in the area include southern bald eagle, swal-low-tailed kite, great egret (rookery), tricolored heron (rook-ery), snowy egret (rookery), limpkin, and anhinga.
Area 11. Large tracts of dry prairie land cover andrangeland in southeast DeSoto and southwest Highlands coun-ties (Tippen Bay, Joe Slough, Cow Slough; generally south ofState Road 70). Portions of the area proposed as a StrategicHabitat Conservation Area for Audubon’s crested caracaraand Florida sandhill crane. Other species recorded in the areainclude fox squirrel, southeastern American kestrel, Floridaburrowing owl, wild turkey, great egret (rookery), and easternindigo snake.
Area 12. Large tract of dry prairie, freshwater marsh,and rangeland in north Okeechobee County (includingSevenmile Slough, Dead Pine Island Marsh, and DuckSlough; northwest of Old Eagle Island Road). Portions of thearea proposed as a Strategic Habitat Conservation Area forFlorida grasshopper sparrow, snail kite, Florida sandhill crane,
CLOSING THE GAPS IN FLORIDA’S WILDLIFE HABITAT CONSERVATION SYSTEM 155
and Audubon’s crested caracara. Other species reported inthe area include fox squirrel, Florida burrowing owl, south-eastern American kestrel, great egret (rookery), peregrine fal-con, wild turkey, eastern indigo snake, and gopher tortoise.
Area 13. Forested wetlands, dry prairie, upland hard-wood forests, and rangeland around Jim Green and Fort Drumcreeks (east of U.S. 441, north and south of State Road 68).Portions of the area make up Strategic Habitat ConservationAreas for Audubon’s crested caracara and Florida sandhillcrane. Other rare species recorded from the area include foxsquirrel, American swallow-tailed kite, southeastern kestrel,wild turkey, anhinga, eastern indigo snake, great egret (rook-ery), gopher tortoise, and mole kingsnake.
FLORIDA GAME AND FRESH WATER FISH COMMISSION156
Figure 166 (a-c). Distribution of important resources in the East Central Florida Region.
Figure 166a. Landsat land-cover map for the East Central Florida Region.
Figure 166b. Strategic Habitat Conservation Areas and existing conservation lands.
CLOSING THE GAPS IN FLORIDA’S WILDLIFE HABITAT CONSERVATION SYSTEM 157
Section 8.1.3. East Central Florida RegionThe tremendous growth of this region’s human popula-
tion in recent years has resulted in the spread of residentialand urban areas throughout the region. Prior to this period ofrapid urbanization, agricultural practices had eliminated largeacreages of native upland communities such as sandhill,scrub, and pine flatwoods. Despite these changes, there aremany private tracts that provide important habitat for severalrare species of wildlife (Figures 166a, 166b, and 166c). Infact, our analyses indicate that some of the state’s most sig-nificant wildlife habitat is found in this region, particularlythe freshwater marshes, forested wetlands, mesic pinelands,and dry prairies that characterize much of the eastern half ofthe region. Some of the more important features of thisregion are referenced by number in Figure 166c and dis-cussed in greater detail below. The percentage of conserva-tion lands in the region (14.1%) falls well below thestatewide average (19.6%). Counties that fall below thestatewide average for individual counties (15.6%) are Orange, Volusia, Seminole, and Osceola.
Area 1. Forest lands (including sandhill, scrub, and pineflatwoods) along the east and south edge of Lake George,extending eastward to State Road 11 (see also Area 2).Portions of the area make up a Strategic Habitat ConservationArea for southern bald eagle and Florida black bear.Especially important are forest lands east and west of U.S.Highway 17 from Pierson to Bakerstown and Barberville to DeLeon Springs. Other rare species recorded in the area include limpkin, gopher tortoise, indigo snake, and scrub holly.
Area 2. Extensive forested area north and south ofInterstate 4, east of Interstate 95, and extending south to LakeHarney (see also Area 5). Portions of the area represent aStrategic Habitat Conservation Area for Florida black bear,American swallow-tailed kite, wading birds (snowy egret,great egret, wood stork, and little blue heron), and southernbald eagle. Other species recorded in the area include wildturkey, limpkin, mottled duck, gopher tortoise, scrub holly,fall-flowering ixia, Curtiss’ sandgrass, nodding pinweed,large-flowered rosemary, and Rugel’s pawpaw.
Figure 166c. Hot spots of biological resources and rare species occurrence records.
FLORIDA GAME AND FRESH WATER FISH COMMISSION158
Area 3. Patches of sand pine scrub, sandhill, and oakscrub around Deltona, extending northeast along U.S. 400,and east to Blue Springs State Park. Portions of the area makeup a Strategic Habitat Conservation Area for Florida scrubjay. Other rare species recorded in the area include Curtiss’milkweed and scrub bay.
Area 4. Forested wetlands along the St. Johns andWekiva river systems (east from Lake Norris). Portions of thearea make up a Strategic Habitat Conservation Area forFlorida black bear, southern bald eagle, and American swal-low-tailed kite. Other species recorded in the area includemottled duck, Florida scrub jay, limpkin, anhinga, gopher tor-toise, great egret (rookery), little blue heron (rookery), easternindigo snake, and bluenose shiner.
Area 5. Forested wetlands and marshes east of St. JohnsRiver, Lake Poinsett north to State Road 46 (includesTosohatchee State Reserve and St. Johns River NationalWildlife Refuge). Portions of the area proposed as a StrategicHabitat Conservation Area for Audubon’s crested caracara,snail kite, and wading birds. Other rare species recorded inthe area include fox squirrel, great egret (rookery), mottledduck, limpkin, American swallow-tailed kite, wild turkey,southern bald eagle, black rail, gopher tortoise, and fall-flowering ixia.
Area 6. Small tracts of scrub and sandhill west of LakeApopka and near Ferndale and Davenport. The area is impor-tant to rare plants such as warea, bonamia, and scrub bay.
Area 7. North central Osceola and south central Orangecounties, east of St. Cloud (Econlockhatchee River Swampand surroundings, including Big Bend Swamp, Lake Conlin,and Four-mile Swamp). Portions of the area make up aStrategic Habitat Conservation Area for Audubon’s crestedcaracara, Florida sandhill crane, red-cockaded woodpecker,mottled duck, wood stork, and other colonial wading birds.Additional rare species recorded in the area include bobcat,southern bald eagle, American swallow-tailed kite, southeast-ern American kestrel, limpkin, little blue heron (rookery),snowy egret (rookery), white ibis (rookery), great egret (rook-ery), wild turkey, eastern indigo snake, gopher tortoise, andnodding pinweed.
Area 8. Rangeland, prairie, and freshwater marsh insouth central Osceola County, west of Kenansville. Portionsof the area make up Strategic Habitat Conservation Areas forFlorida grasshopper sparrow and Audubon’s crested caracara.Other rare species found in the area include fox squirrel,Florida burrowing owl, and Florida sandhill crane.
Area 9. Forested and herbaceous wetlands surroundingWater Management District conservation lands in BrevardCounty (includes areas southwest of Lake Poinsett and west ofLake Winder; see areas 7 and 8 above). Portions of the areaproposed as a Strategic Habitat Conservation Area for woodstork, Audubon’s crested caracara, American swallow-tailedkite (late-summer roosts), snail kite, and mottled duck. Otherrare species are listed by major drainage basins. Wolf Creek:southern bald eagle. Jane Green Creek: see Area 8. CoxCreek: wood stork (rookery), snowy egret (rookery),southern bald eagle, and American swallow-tailed kite (latesummer roost).
Area 10. Lakes Kissimmee, Marian, Tohopekaliga, EastLake Tohopekaliga, Reedy Creek, Cobb Marsh, Lake Russell,and nearby upland areas. Portions of the area make up aStrategic Habitat Conservation Area for wood stork, mottledduck, snail kite, and southern bald eagle. Other rare speciesare listed by individual lakes. Lake Kissimmee and LakeHatchineha: great egret (rookery), snail kite, southern baldeagle, Audubon’s crested caracara, mottled duck, and limpkin.Cypress Lake/Reedy Creek: Florida mouse, wood stork(rookery), southern bald eagle (10 nests), eastern indigosnake, limpkin, Audubon’s crested caracara, Florida burrow-ing owl, gopher tortoise, gopher frog, Florida sand skink,Florida scrub lizard (portions of area recently secured as partof Reedy Creek/Lake Marion Creek Mitigation Site). LakeTohopekaliga: snail kite, southern bald eagle (30 nests), andgopher tortoise. East Lake Tohopekaliga: snail kite, greategret, and southern bald eagle. Lake Gentry, Big BendMarsh, Brick Lake, and Alligator Lake (see also Area 6above): southern bald eagle, Audubon’s crested caracara,eastern indigo snake, gopher tortoise, and scrub bay. LakeMarian: Florida black bear, fox squirrel, snail kite,Audubon’s crested caracara, Florida sandhill crane, Floridaburrowing owl, and southern bald eagle (15 nests).
Area 11. Areas surrounding Bull Creek WildlifeManagement Area; east of U.S. 441, south of U.S. 192,extending east to St. Johns River along Jane Green Creek.Portions of the area make up a Strategic Habitat ConservationArea for wood stork, mottled duck, American swallow-tailedkite (late summer roost area), red-cockaded woodpecker, andAudubon’s crested caracara. Other rare species recordedinclude bobcat, Florida burrowing owl, limpkin, wild turkey, Florida sandhill crane, eastern indigo snake, andshort-leaved rosemary.
Coastal Areas of Volusia County. Rare species are list-ed by geographic areas. Tomoka Basin (east of Old DixieHighway, including Tomoka State Park): least tern (nesting),Florida scrub jay, and gopher tortoise. Port Orange: brownpelican, great blue heron, and black-crowned night-heronnesting colonies. Harbor Oaks to New Smyrna Beach:Strategic Habitat Conservation Area for Atlantic salt marshsnake and winter concentrations of piping plover and othershorebirds (Ponce Inlet, Matanzas, Smyrna Dunes, and U.S.Coast Guard station); rare species include least tern (nesting),Wilson’s plover, black skimmer, and sand-dune spurge. NewSmyrna Beach to Cedar Island: Strategic HabitatConservation Area for Atlantic salt marsh snake and woodstork and other wading birds; rare species include snowy egret(rookery), little blue heron (rookery), mountain mullet, andbalsam torchwood. Canaveral National Seashore: woodstork (rookery), black-crowned night-heron (rookery), south-ern bald eagle, shorebird aggregation areas (several), greenturtle, hand fern, and coastal vervain.
Coastal Areas of North Brevard County. Rare speciesare listed by more specific geographic areas. Scottsmoor toTitusville: patches of coastal scrub (near Mims) and ham-mock (Turnbull Hammock); rare species recorded in the areainclude Florida scrub jay, southern bald eagle, eastern indigosnake, large-flowered rosemary, Curtiss’ milkweed, scrub bay, and nodding pinweed. Merritt Island National Wildlife
CLOSING THE GAPS IN FLORIDA’S WILDLIFE HABITAT CONSERVATION SYSTEM 159
Refuge/Kennedy Space Center/Banana River AquaticPreserve: portions of the area make up a Strategic HabitatConservation Area for several wading birds; rare speciesinclude West Indian manatee (congregation area), southeast-ern beach mouse, wood stork (rookery), white ibis (rookery),glossy ibis (rookery), snowy egret (rookery), great egret(rookery), black-crowned night-heron (rookery), reddish egret (rookery), roseate spoonbill (rookery), tricolored heron(rookery), Florida scrub jay, southern bald eagle, Wilson’splover, least tern (2 nesting colonies), pine snake, molekingsnake, gopher tortoise, green turtle, leatherback turtle,hawksbill turtle, Curtiss’ sandgrass, brown-haired snout-bean, coastal vervain, nodding pinweed, sea lavender, andbeach star. Merritt Island (north of Barge Canal Pier): mix-ture of scrub and scrubby flatwoods; species include Floridascrub jay, gopher tortoise, and Curtiss’ sandgrass. Artesia:Florida scrub jay, least tern (nesting colony), black skimmer(nesting colony), and coastal vervain. Indian River City toBellwood: patches of scrubby flatwoods and coastal ham-mocks; species include Florida scrub jays, indigo snake, handfern, Tampa vervain, and large-flowered rosemary.Dellespine to Cocoa: large area of scrubby flatwoods con-taining Florida scrub jay, southern bald eagle, and Floridascrub lizard.
Coastal Areas of South Brevard County. Species arelisted by more specific geographic areas. Pineda: Floridascrub lizard and Florida scrub jay. Georgiana and HortiPoint: Florida scrub jay and Florida scrub lizard. SatelliteBeach (includes portions of proposed Archie Carr NationalWildlife Refuge): Florida scrub jay, leatherback turtle, greenturtle. Eau Gallie: gopher tortoise and Florida scrub jay.Cape Malabar: Florida scrub jay, tricolored heron (rook-ery), great egret (rookery), and least tern (nesting colony).Coconut Point (areas north to Spessard Holland Park andsouth to Floridana Beach, includes portions of proposedArchie Carr National Wildlife Refuge): tricolored heron(rookery), least tern, black skimmer, leatherback turtle, greenturtle, gopher tortoise, rivulus, coastal vervain, necklace pod,brown-haired snoutbean, Florida lantana, prickly apple.Long Point Park/Sebastian Inlet State Recreation Area(including Matthew’s Cove): reddish egret (rookery), blackskimmer (nesting), royal tern (nesting), shorebird aggregationarea, eastern indigo snake, Florida lantana, prickly apple,coastal strand, terrestrial peperomia, and necklace pod.
FLORIDA GAME AND FRESH WATER FISH COMMISSION160
Figure 167 (a-c). Distribution of important resources in the North Central Florida Region.
Figure 167a. Landsat land-cover map for the North Central Florida Region.
Figure 167b. Strategic Habitat Conservation Areas and existing conservation lands.
CLOSING THE GAPS IN FLORIDA’S WILDLIFE HABITAT CONSERVATION SYSTEM 161
Section 8.1.4. North Central Florida RegionThe area encompassed by the North Central Florida
Region includes extensive tracts of pineland, upland hard-wood forest, hardwood swamp, cypress swamp, and coastalsalt marsh (Figure 167a, 167b, and 167c). The natural qualityof many of these areas has been affected by commercial tim-ber operations, but these large forested areas provide impor-tant habitat for wide-ranging species such as black bear, bob-cat, American swallow-tailed kite, and wild turkey. The lowdensity of major roads throughout the eastern portion of theregion is also beneficial. A few small patches of rare, xericupland land-cover types, such as sandhill and oak scrub,remain scattered throughout the region, but most of thesecover types have been converted to agricultural land uses.Some of the more important features of this region are refer-enced by number in Figure 167c and discussed in greaterdetail below.
The quantity of conservation land in this region is pro-portionately less than the quantity found in other regions ofFlorida. Only 6.4% of the total land area is in some type ofconservation status, compared to a statewide average of19.6%. Dixie, Taylor, Lafayette, Madison, Bradford,Alachua, Hamilton, Union, and Gilchrist counties all containa smaller percentage of conservation lands than the statewideaverage for individual counties (15.6%).
Area 1. Forested areas in Dixie and Lafayette counties.Portions of these areas are proposed as Strategic HabitatConservation Areas for American swallow-tailed kite, short-tailed hawk, and several species of wading birds (great egret,little blue heron, tricolored heron, white ibis, and woodstork). Occurrences of rare species are listed by more specif-ic geographic areas. Lower Suwannee River: great egret(two rookeries), wood stork (rookery), yellow-crowned night-heron (several small rookeries), limpkin, American swallow-
Figure 167c. Hot spots of biological resources and rare species occurrence records.
FLORIDA GAME AND FRESH WATER FISH COMMISSION162
tailed kite (breeding and a late-summer roost), gopher tortoise,eastern indigo snake, striped newt, Florida pine snake,Atlantic sturgeon, Suwannee bass, and cedar elm. CaliforniaSwamp: American swallow-tailed kite, short-tailed hawk,yellow-crowned night-heron (small rookeries), little blueheron, and Texas anemone. Pumpkin Swamp: Americanswallow-tailed kite, little blue heron (rookery), great egret(rookery), eastern indigo snake, and Texas anemone.Steinhatchee River: great egret, American swallow-tailedkite, limpkin, Cooper’s hawk, short-tailed hawk, eastern indi-go snake, gopher tortoise, pine wood dainties. MallorySwamp: American swallow-tailed kite, great egret, limpkin,and mud sunfish.
Area 2. Large forested tracts in Taylor County. Most ofthe “natural” land cover has been altered by commercial tim-ber operations, but portions of these areas are proposed as aStrategic Habitat Conservation Area for American swallow-tailed kite and Florida black bear. Occurrences of rare speciesare listed by more specific geographic areas. SteinhatcheeRiver (including Rocky and Boggy creeks): American swal-low-tailed kite, eastern indigo snake, pine wood dainties, andTexas anemone. Spring Warrior Swamp and SpringWarrior Creek: American swallow-tailed kite, gopher tor-toise, pondspice, and Godfrey’s golden aster. Thomas MillIsland/Regular Creek/Fenholloway River: American swal-low-tailed kite, great egret (rookery), Cooper’s hawk, andeastern indigo snake. Econfina River: Florida black bearand American swallow-tailed kite. San Pedro Bay:American swallow-tailed kite, Florida sandhill crane, greategret, little blue heron, gopher tortoise, Florida pine snake,and mud sunfish. Aucilla River: Cooper’s hawk, Americanswallow-tailed kite, Florida black bear, yellow-crowned night-heron, and gopher tortoise.
Area 3. Forested tracts in east and south MadisonCounty. Portions of this area are proposed as a StrategicHabitat Conservation Area for rare wading birds such as woodstork, white ibis, great egret, snowy egret, and little blueheron. Wading bird rookeries are located primarily in theeastern and southern portions of the county, but birds foragethroughout the area. Additional rare species are listed by spe-cific geographic areas. Hixtown Swamp: Florida sandhillcrane, little blue heron (rookery), great egret (rookery), gophertortoise, and incised groove-bur. Aucilla River (includingLittle Aucilla River, Alligator and Rocky creeks, and JohannaLake): Florida black bear, great egret (rookery), little blueheron (rookery), white ibis (rookery), American swallow-tailed kite, limpkin, and eastern mudminnow. EconfinaRiver: great egret (rookery). Dobson Pond: little blue heron(rookery) and tricolored heron (rookery). Grassy Pond:great egret (rookery) and Florida pine snake. San Pedro Bay:great egret (rookery), little blue heron (rookery), eastern indi-go snake, and gopher tortoise.
Area 4. Mixture of agricultural lands and xeric uplandcommunities in Madison, Suwannee, Lafayette, Columbia,Gilchrist, and Alachua counties. Rare species are listed bymore specific geographic areas. Northeast Madison County(area approximately defined by State Road 53, U.S. 90, andthe county border): southeastern American kestrel, Cooper’shawk, eastern indigo snake, Florida pine snake, and gopher
tortoise. Blue Springs (Hamilton County): southeasternAmerican kestrel, Bachman’s sparrow, red-cockaded wood-pecker, and gopher tortoise. Site 1 North of Branford (northand south of State Road 247 and centered at the intersection ofCross County Road and Sand Hill Road): fox squirrel, south-eastern American kestrel, Florida burrowing owl, gopher tor-toise, Florida pine snake, and eastern indigo snake. Site 2North of Branford (east of State Road 249, north of BrannenRoad): southeastern American kestrel, Cooper’s hawk,gopher tortoise, and Florida pine snake; also in vicinity is acave formerly used by southeastern bats. Site North of Bell(primarily between County Road 340 and County Road 138):fox squirrel, Bachman’s sparrow, Florida pine snake, short-tailed snake, and gopher tortoise. East of Craggs (patches ofsandhill between County Road 232 and 340): southeasternAmerican kestrel, Bachman’s sparrow, gopher tortoise,Florida pine snake, and eastern indigo snake.
Area 5. Terrestrial caves in Gilchrist, Suwannee, andAlachua counties (including portions of Area 4 above). Areasimmediately surrounding these caves proposed as a StrategicHabitat Conservation Area for southeastern bats. Additionalrecords from these caves include light-fleeing cave crayfishand Hobbs’ cave isopod.
Area 6. Wetlands and surrounding areas in southAlachua County. Portions included as Strategic HabitatConservation Areas for Florida sandhill crane, southern baldeagle, and several rare wading birds (wood stork, little blueheron, great egret, yellow-crowned night-heron, and tricoloredheron). Other species are listed by major drainage basins.Paynes Prairie: round-tailed muskrat, limpkin, gopher tor-toise, eastern indigo snake, tiger salamander, and virgin’sbower. Levy and Kanapaha Prairies: fox squirrel, south-eastern American kestrel, limpkin, gopher tortoise, Floridapine snake, and eastern indigo snake. Orange and LochloosaLakes: Florida black bear, osprey, limpkin, gopher tortoise,eastern indigo snake, and blackbanded sunfish. Newnan’sLake and Lochloosa Creek: southeastern weasel, fox squir-rel, osprey, limpkin, gopher tortoise, short-tailed snake, spot-ted turtle, flatwoods salamander, striped newt, and loose-coiled snail.
Area 7. Forested areas along Santa Fe, Withlacoochee,and Suwannee rivers and Olustee Creek. Rare species record-ed within 100 m of these water bodies are grouped by county.Alachua: canebrake rattlesnake, Suwannee cooter, andSuwannee bass. Bradford: Florida pine snake. Columbia:American swallow-tailed kite (summer roost), canebrake rat-tlesnake, gopher tortoise, Suwannee cooter, Suwannee bass,Florida willow, and sand grain snail. Gilchrist: Americanswallow-tailed kite (summer roost), Florida pine snake,Suwannee cooter, spotted bullhead, Suwannee bass, cedarelm, pallid cave crayfish, Florida cave amphipod, and Hobbs’cave amphipod. Hamilton: great egret (rookery), easternindigo snake, gopher tortoise, Suwannee cooter, alligatorsnapping turtle, mountain mullet, Suwannee bass, and pallidcave crayfish. Lafayette: white ibis (rookery), little blueheron (rookery), great egret (rookery), hairy woodpecker,Suwannee bass, Suwannee cooter, spotted bullhead, and pallidcave crayfish. Madison: Suwannee bass, cedar elm, and pal-lid cave crayfish. Suwannee: Suwannee cooter, cedar elm,
CLOSING THE GAPS IN FLORIDA’S WILDLIFE HABITAT CONSERVATION SYSTEM 163
Florida willow, and pallid cave crayfish. Union: alligatorsnapping turtle.
Area 8. Area around Osceola National Forest (Hamiltonand Columbia counties). Portions of the area make up aStrategic Habitat Conservation Area for Florida black bearand several wading birds (white ibis, wood stork, and littleblue heron). Due to a lack of survey data, only 3 additionalspecies are known for this area based on information storedin the Florida Natural Areas Inventory, Nongame WildlifeProgram Wildlife Observation, and breeding bird atlas data-bases. These are gopher tortoise, red-cockaded woodpecker,and eastern mudminnow. The more important habitat areasfor black bears are areas east of U.S. 41 (Sandlin Bay,Pinhook Swamp, and Impassable Bay). Other importantareas lie in the Northeast Region and Georgia (see Floridablack bear, Section 6.2.11).
Coastal Areas of Taylor County. Records of rarespecies are listed by more specific geographic areas. CountyLine to Spring Warrior Creek: southern bald eagle,osprey, Wakulla seaside sparrow, shorebird aggregation areas(Smith McCallah Creek), eastern indigo snake, gopher tor-toise, and corkwood. Spring Warrior Creek toSteinhatchee: West Indian manatee, southern bald eagle,black rail, piping plover, shorebird aggregation areas (Adam’s Beach, Dekle Beach, Keaton Beach, and Hagen’sCove), and eastern indigo snake.
Coastal Areas of Dixie County: Records of rarespecies are listed by more specific geographic areas. Jena toPepperfish Keys: southern bald eagle, Wakulla seaside spar-row, white ibis (rookery), black rail, Gulf salt marsh snake,and corkwood. Pepperfish Keys to Suwannee: southernbald eagle, American oystercatcher, Scott’s seaside sparrow,shorebird aggregation area, and Gulf salt marsh snake.
FLORIDA GAME AND FRESH WATER FISH COMMISSION164
Figure 168 (a-c). Distribution of important resources in the Northeast Florida Region.
Figure 168a. Landsat land-cover map for the Northeast Florida Region.
Figure 168b. Strategic Habitat Conservation Areas and existing conservation lands.
CLOSING THE GAPS IN FLORIDA’S WILDLIFE HABITAT CONSERVATION SYSTEM 165
Section 8.1.5. Northeast Florida RegionThe Northeast Florida Region contains a diverse mixture
of land-cover types (Figures 168a, 168b, and 168c) and sever-al large forested areas that support rare, wide-ranging speciessuch as Florida black bear, bobcat, wild turkey, and Americanswallow-tailed kite. Large tracts of xeric upland communities(sandhill and scrub) in Clay and Putnam counties are alsoextremely important to a large number of rare vertebrates (seeAreas 1 and 3 described below). The percentage of conserva-tion lands in this region (11.9%) is well below the statewideaverage of 19.6%. Individual counties lower than thestatewide average (15.6%) are Putnam, Duval, Nassau, andFlagler counties. Some of the more important features of thisregion are referenced by number in Figure 168c and dis-cussed in greater detail below.
Area 1. Upland areas in Putnam County. Importantareas for Florida sandhill crane and southeastern Americankestrel. Other species are listed by more specific geographicareas. Northeast of McMeekin (defined by State Roads 21,
26, 20, and 315): round-tailed muskrat, fox squirrel, Floridamouse, southern bald eagle, eastern indigo snake, Floridapine snake, gopher tortoise, striped newt, gopher frog, rose-mary wolf spider, and spoon-leaved sundew. Southeast ofMcMeekin (defined by State Roads 200, 20, and 315): foxsquirrel, Florida sandhill crane, short-tailed hawk, southernbald eagle, gopher tortoise, spotted turtle, Florida pine snake,eastern indigo snake, dusky shiner, rosemary wolf spider,Florida mountain-mint, and Florida willow. Southeast ofGeorges Lake (areas around Rice Creek, Etonia Creek, andSimms Creek): Florida scrub jay, southern bald eagle,Cooper’s hawk, eastern indigo snake, Etonia rosemary,gopher tortoise, Bartram’s ixia, and Black Creek crayfish.
Area 2. Mixed forests in south central Putnam County(Rice Creek, Cow Heaven Bay, and Sweetwater, Paley, andDeep creeks). Portions of the area make up a StrategicHabitat Conservation Area for the Florida black bear. Otherrare species include Florida mouse, southeastern Americankestrel, American swallow-tailed kite, Florida scrub jay,
Figure 168c. Hot spots of biological resources and rare species occurrence records.
FLORIDA GAME AND FRESH WATER FISH COMMISSION166
southern bald eagle, short-tailed hawk, little blue heron (rook-ery), limpkin, gopher tortoise, short-tailed snake, eastern indi-go snake, Florida scrub lizard, short-tailed snake, gopher frog,tesselated darter, snail bullhead, and Florida willow.
Area 3. Sandhill and xeric uplands in Clay County.Portions constitute Strategic Habitat Conservation Areas forthe Florida scrub jay and Florida sandhill crane. Other rarespecies are listed by more precise geographic areas. CampBlanding Wildlife Management Area, Goldhead BranchState Park, and Surroundings (particularly to the south):red-cockaded woodpecker, southeastern American kestrel,Florida scrub jay, little blue heron (rookery), eastern indigosnake, Florida pine snake, gopher tortoise, gopher frog,Florida spiny-pod, Curtiss’ milkweed, Chapman’s rhododen-dron, pondspice, St. John’s-Susan, Bartram’s ixia, hartwright-ia, incised groove-bur, and Florida mountain mint. South ofPenney Farms (either side of Saunders Road): Florida blackbear, Cooper’s hawk, Bartram’s ixia, and hartwrightia. Northof Penney Farms (south of State Road 21): southern baldeagle, southeastern American kestrel, Cooper’s hawk, St.John’s-Susan, Florida mountain mint, Bartram’s ixia, vari-able-leaf crownbeard, and slender-leaf dragonhead. BlackCreek (north of State Road 21, north of Camp Blanding):Cooper’s hawk, Bartram’s ixia, hartwrightia, and variable-leaf crownbeard.
Area 4. Wetlands and forested areas of south centralFlagler County (south of State Road 305, around LakeDisston, Cody, and east to Interstate 95; contiguous to impor-tant forested lands described in the East Central Region).Portions of the area make up a Strategic Habitat ConservationArea for the Florida black bear, American swallow-tailed kite,and rare wading birds. Limpkin and southeastern Americankestrel have also been recorded in the area.
Area 5. Forested lands in southeast Putnam and east St.Johns counties. Portions of the area are proposed as aStrategic Habitat Conservation Area for Florida black bear,southern bald eagle, and American swallow-tailed kite.Additional rare species are listed by major drainages.Murphy and Dunns Creeks, Crescent Lake (and smallertributaries): Florida black bear (dispersal corridor), Americanswallow-tailed kite, white ibis (rookery), little blue heron(rookery), limpkin, and gopher tortoise. Hell Cat Bay (con-tiguous to Area 4 above): American swallow-tailed kite.Deep Creek: southern bald eagle, American swallow-tailedkite, great egret (rookery), little blue heron (rookery), St.John’s Susan, and Florida mountain-mint.
Area 6. Wetland areas in east St. Johns County (FishSwamp, Cracker Branch, and Pellicer Creek). Portions of thearea are proposed as a Strategic Habitat Conservation Area forwood stork and other rare wading birds (e.g., little blueheron). American swallow-tailed kite also recorded from the area.
Area 7. Forested areas in southeast Duval and northwestFlagler counties that constitute a Strategic HabitatConservation Area for wood stork and other rare wadingbirds. Other rare species are listed by major drainage basins.Twelvemile Swamp and Snowden Bay (Guana RiverWildlife Management Area and Guana River State Park):Florida black bear, American swallow-tailed kite, little blue
heron (rookery), wood stork (rookery), white ibis (rookery),eastern indigo snake, and Bartram’s ixia. Durbin Swampand Pablo Creek (see coastal areas below): red-cockadedwoodpecker, wood stork (rookery), southern bald eagle, limp-kin, gopher tortoise, Florida pine snake, and eastern indigosnake. Julington Creek: American swallow-tailed kite, yel-low-crowned night-heron, southern red lily, variable leafcrownbeard, and Bartram’s ixia.
Area 8. Large forested area north of Osceola NationalForest. Portions of the area make up a Strategic HabitatConservation Area for Florida black bear (particularlyMoccasin Swamp, Cross Branch, North Prong of the St.Marys River) and rare wading birds (wood stork, white ibis,great egret, and little blue heron). Other species recorded inthe area include Florida sandhill crane, American swallow-tailed kite, canebrake rattlesnake, carpenter frog, eastern mud-minnow, and black-banded sunfish.
Area 9. Northwest Nassau County. Rare species arelisted by specific geographic areas. St. Marys River, OrangeBluff to Hampton Lake: American swallow-tailed kite, red-cockaded woodpecker, eastern indigo snake, gopher tortoise,purple balduina, hartwrightia, heartleaf, and Florida toothachegrass. Cabbage and Clark’s Creeks: American swallow-tailed kite. Hilliard: southeastern weasel, southeasternAmerican kestrel, and many-lined salamander. Callahan:eastern indigo snake, hartwrightia, spoon-flower, and purple balduina.
Area 10. Areas around Nassau and St. Marys’ Rivers,Nassau County. Portions of the area represent a StrategicHabitat Conservation Area for wood stork and Smyrna seasidesparrow. Other rare species are listed by major drainages (butsee also coastal areas described below). Nassau River(Smith’s Point east to Nassauville, including McQueenCreek): West Indian manatee, wood stork (rookery), snowyegret (rookery), great egret (rookery), little blue heron (rook-ery), southeastern kestrel, limpkin, seaside sparrow, andgopher tortoise. Alligator and Mills Creeks: foraging areasfor wading birds. Little St. Marys River and WilderSwamp: canebrake rattlesnake and eastern indigo snake. St.Marys River (Kings Ferry to Tiger Island): great egret (rook-ery), great blue heron (rookery), foraging areas for wadingbirds, seaside sparrow, eastern indigo snake, gopher tortoise,and Florida toothache grass. Pumpkin Hill Creek: woodstork (2 rookeries), great egret (2 rookeries), and Smyrna sea-side sparrow.
Coastal Areas of Flagler and St. Johns Counties.Several important patches of natural land cover on privatelands north of Marineland (St. Johns/Flagler border), aroundPalm Coast, north of Ft. Matanzas National Monument, andsouth of Anastasia Island State Recreation Area. Rare speciesare listed by more specific areas. Palm Coast South toFlagler Beach State Recreation Area: Florida scrub jay(Flagler Beach State Recreation Area), leatherback turtle,shorebird aggregation areas, and coastal vervain. Palm CoastNorth to Marineland (including Washington Oaks): Floridascrub jay, gopher tortoise, eastern indigo snake, yellow hibis-cus, and coastal vervain. Marineland to Crescent Beach(including Ft. Matanzas): Anastasia Island beach mouse,Atlantic salt marsh mink, Wilson’s plover, black skimmer,
CLOSING THE GAPS IN FLORIDA’S WILDLIFE HABITAT CONSERVATION SYSTEM 167
piping plover, American oystercatcher, shorebird aggrega-tions (Matanzas Inlet, Salt Run, St. Augustine), gopher tor-toise, and eastern indigo snake. Crescent Beach toAnastasia Island: West Indian manatee, Anastasia Islandbeach mouse (Anastasia Plaza and north of Vergassi Road),least tern (nesting), eastern indigo snake, and mountain mul-let. Vilano Beach to Ponte Vedra Beach: southern baldeagle, wood stork, great egret, Florida pine snake, sand-dunespurge, and coastal vervain.
Coastal Areas of Duval and Nassau Counties. Saltmarshes to the north are important to several rare wadingbirds. Other species are listed by specific geographic areas.Manhatten Beach: no occurrence records, potentiallyimportant areas of coastal dune, maritime hammocks, andgrasslands. Blount and Nearby Islands: southern baldeagle, great egret (rookery), least tern (nesting), seaside spar-row, shorebird aggregation area, and gopher tortoise. Ward’s Bank (Hugenot Park, Mayport Jetties): Wilson’splover, black skimmer (nesting), royal tern, least tern, pipingplover, American oystercatcher, and shorebird aggregationarea. Ft. George Island/Talbot Islands: least tern (nesting),shorebird aggregation areas (Little Talbot), gopher tortoise,loggerhead turtle, eastern indigo snake, terrestrial peperomia,southern lip fern, and green ladies-tresses. Amelia Island,South Amelia River, and Fernandina Beach: West Indianmanatee congregation area, Smyrna seaside sparrow, leasttern (nesting), shorebird aggregations (Ft. Clinch Jetty,Amelia Island drawbridge, Amelia Island, north shore of Ft.Clinch), and gopher tortoise.
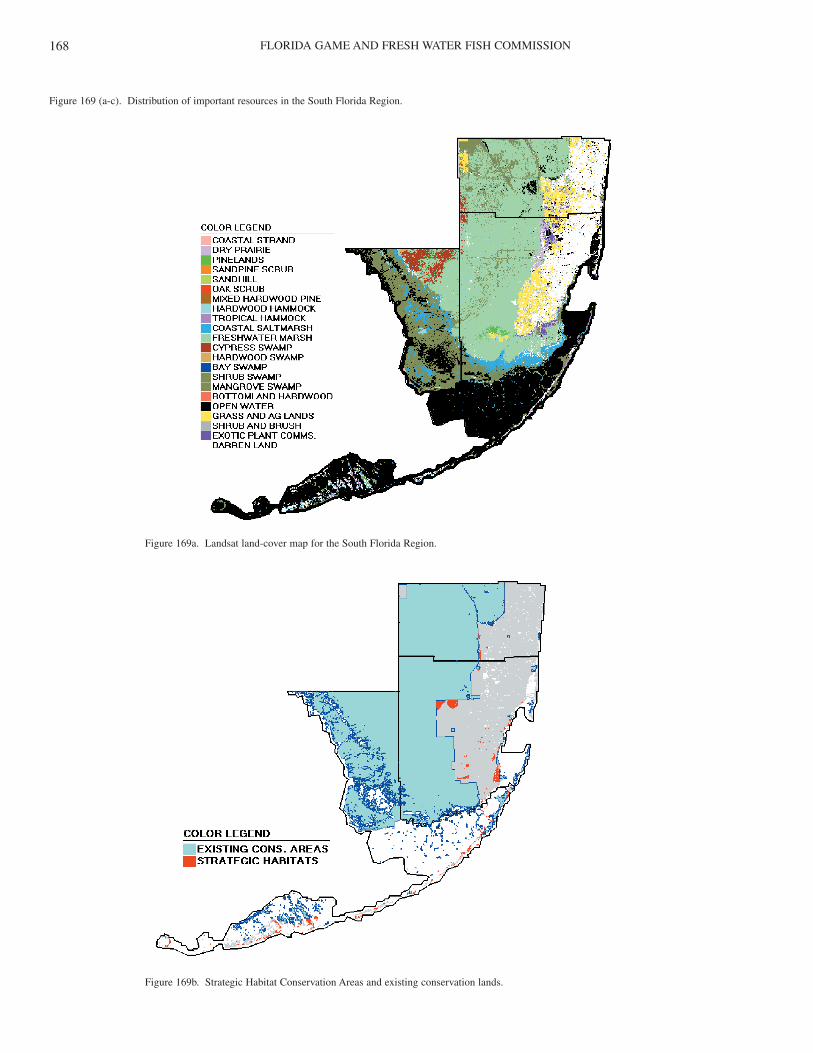
FLORIDA GAME AND FRESH WATER FISH COMMISSION168
Figure 169 (a-c). Distribution of important resources in the South Florida Region.
Figure 169a. Landsat land-cover map for the South Florida Region.
Figure 169b. Strategic Habitat Conservation Areas and existing conservation lands.
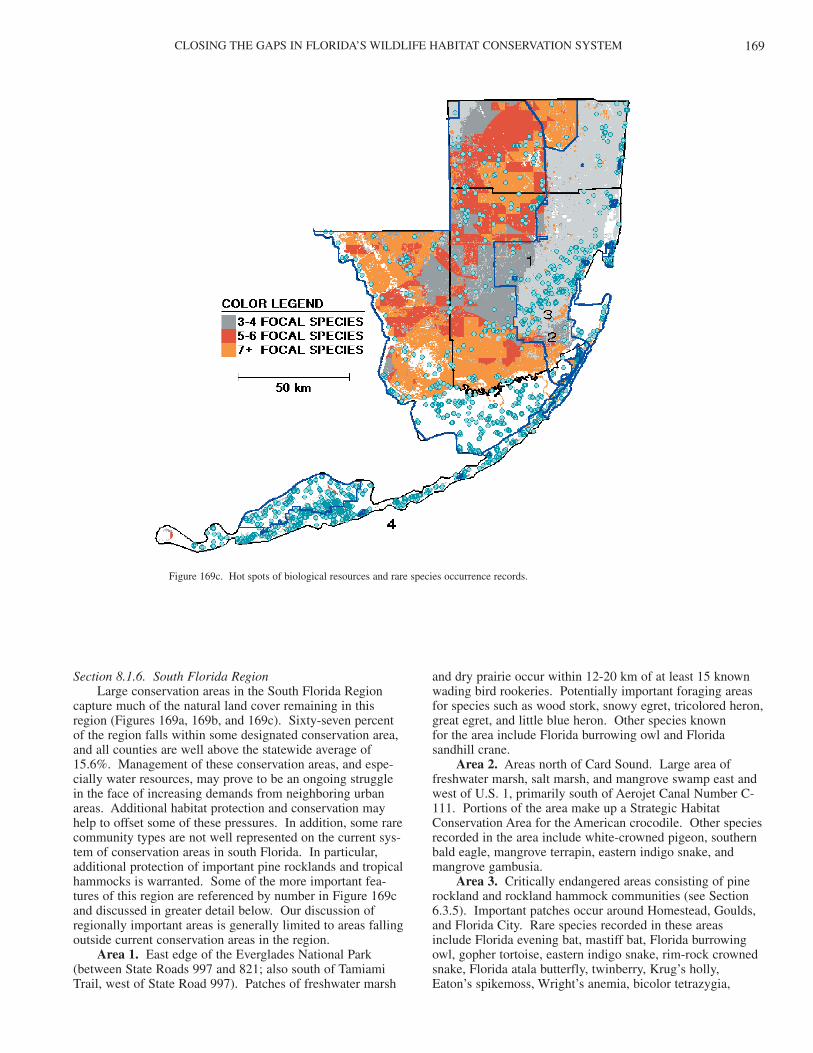
CLOSING THE GAPS IN FLORIDA’S WILDLIFE HABITAT CONSERVATION SYSTEM 169
Section 8.1.6. South Florida RegionLarge conservation areas in the South Florida Region
capture much of the natural land cover remaining in thisregion (Figures 169a, 169b, and 169c). Sixty-seven percentof the region falls within some designated conservation area,and all counties are well above the statewide average of15.6%. Management of these conservation areas, and espe-cially water resources, may prove to be an ongoing strugglein the face of increasing demands from neighboring urbanareas. Additional habitat protection and conservation mayhelp to offset some of these pressures. In addition, some rarecommunity types are not well represented on the current sys-tem of conservation areas in south Florida. In particular,additional protection of important pine rocklands and tropicalhammocks is warranted. Some of the more important fea-tures of this region are referenced by number in Figure 169cand discussed in greater detail below. Our discussion ofregionally important areas is generally limited to areas fallingoutside current conservation areas in the region.
Area 1. East edge of the Everglades National Park(between State Roads 997 and 821; also south of TamiamiTrail, west of State Road 997). Patches of freshwater marsh
and dry prairie occur within 12-20 km of at least 15 knownwading bird rookeries. Potentially important foraging areasfor species such as wood stork, snowy egret, tricolored heron,great egret, and little blue heron. Other species known for the area include Florida burrowing owl and Floridasandhill crane.
Area 2. Areas north of Card Sound. Large area offreshwater marsh, salt marsh, and mangrove swamp east andwest of U.S. 1, primarily south of Aerojet Canal Number C-111. Portions of the area make up a Strategic HabitatConservation Area for the American crocodile. Other speciesrecorded in the area include white-crowned pigeon, southernbald eagle, mangrove terrapin, eastern indigo snake, andmangrove gambusia.
Area 3. Critically endangered areas consisting of pinerockland and rockland hammock communities (see Section6.3.5). Important patches occur around Homestead, Goulds,and Florida City. Rare species recorded in these areasinclude Florida evening bat, mastiff bat, Florida burrowingowl, gopher tortoise, eastern indigo snake, rim-rock crownedsnake, Florida atala butterfly, twinberry, Krug’s holly,Eaton’s spikemoss, Wright’s anemia, bicolor tetrazygia,
Figure 169c. Hot spots of biological resources and rare species occurrence records.
FLORIDA GAME AND FRESH WATER FISH COMMISSION170
Bahama brake, pineland jacquemontia, Florida five-petaledleaf-flower, silver palm, Florida gama grass, a queen’s delight,Porter’s broom spurge, Small’s milkpea, Florida lantana,Boykin’s few-leaved milkwort, Florida thoroughwort brickell-bush, Florida pinewood privet, wild potato morning-glory,Bahama sachsia, rocklands morning-glory, pineland noseburn,Porter’s broad-leaved spurge, small-leaved melanthera, white-top sedge, little strongbark, coastal vervain, Blodgett’s wild-mercury, fragrant maidenhair fern, Florida bristle fern, Ames’halberd fern, brittle maidenhair fern, powdery catopsis, many-flowered catopsis, Fuch’s bromeliad, night-scented orchid,banded wild-pine, Cuban snake-bark, spurred neottia, deltoidspurge, Florida thatch palm, deltoid spurge, sand flax, blunt-leaved peperomia, Florida bristle fern, brown-haired snout-bean, Okeechobee gourd, Garber’s spurge, tiny polygala, cow-horned orchid, golden leather fern, slender spleenwort, dollarorchid, Carter’s small-flowered flax.
Area 4. Tropical hardwood hammocks, pinelands, andmangrove islands of the Florida Keys. Some of the moreimportant tracts occur on Key Largo and Elliott Key; and onBig Pine Key, No Name Key, the Torch keys, Ramrod Key,Summerland Key, Cudjoe Key, and Sugarloaf Key in theLower Keys. A series of tropical hardwood hammocks in themainline Keys make up a Strategic Habitat Conservation Areafor white-crowned pigeon. An important raptor roost siteoccurs on Boot Key; Ohio Key is important to wintering pip-ing plovers; hammocks and mangrove swamps often areimportant wintering and stop-over habitat areas for neotropi-cal migrants. Several vertebrate species also have unique, dis-junct populations in the Lower Keys. These includeAmerican alligator, striped mud turtle, Big Pine ringnecksnake, red rat snake, brown snake, Florida ribbon snake,Lower Keys marsh rabbit, Key deer, Florida mole skink, andKey silverside.
Coastal Areas in Broward County. Due to tremendousurban development, some coastal records may be dated.Occurrences are listed by precise geographic areas. HillsboroBeach: maritime beach star. Fisherman’s Wharf Pier (andnearby areas): burrowing four-o’clock and beach jacquemon-tia. South Anglin’s Pier: green turtle and loggerhead turtlenesting records. Hugh Taylor Birch State Park: gopher tor-toise, broad-leaved spider lily, golden leather fern, necklacepod, large-flowered rosemary, and silver palm. John LloydState Recreation Area: least tern (nesting), shorebird aggre-gation area (and at nearby West Lake Park), burrowing four-o’clock, beach-star, and sea lavender.
Coastal Areas in Dade County. Due to tremendousurban development, some coastal records may be dated.Occurrences are listed by precise geographic areas. OletaRiver State Park: black-crowned night-heron, mangrovegambusia, coastal vervain, Florida lantana; shorebird aggrega-tion area at nearby Greynolds Park seawall. Fisher Key,Virginia Key, Key Biscayne: southern bald eagle, pipingplover, royal tern, loggerhead turtle, rivulus, spottail goby,broad-leaved spiderlily, Florida lantana, necklace pod, beach-star, prickly ash, silver palm, burrowing four-o’clock, andJohnson’s seagrass; shorebird aggregation areas (West Bearcut, Seaquarium flats, and Virginia Key). MathesonHammock County Park and Chapman Field Park (and pri-
vate lands north and south): mangrove gambusia, slenderspleenwort, mountain mullet, rim-rock crowned snake, and lit-tle strongbark; shorebird aggregation areas (Matheson Park,Black Point Park, and Homestead Bayfront Park), and severalpine rockland associates (see Area 3) on eastern Cutler Ridge.

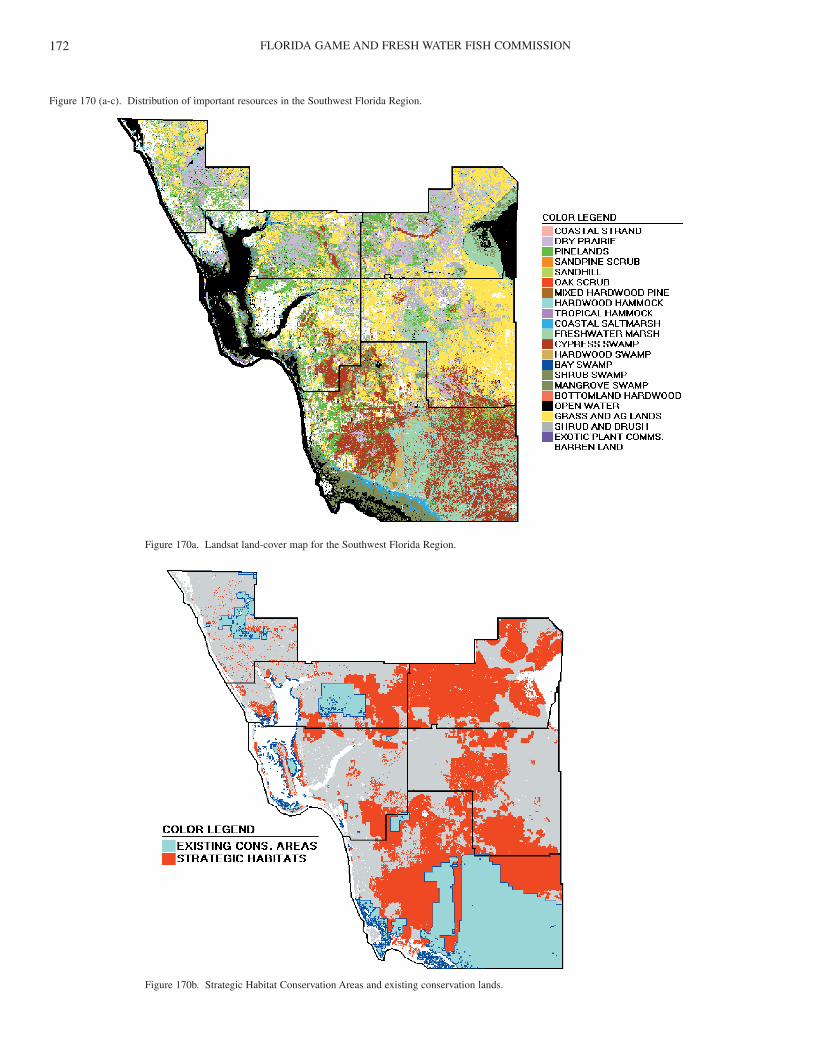
FLORIDA GAME AND FRESH WATER FISH COMMISSION172
Figure 170 (a-c). Distribution of important resources in the Southwest Florida Region.
Figure 170a. Landsat land-cover map for the Southwest Florida Region.
Figure 170b. Strategic Habitat Conservation Areas and existing conservation lands.
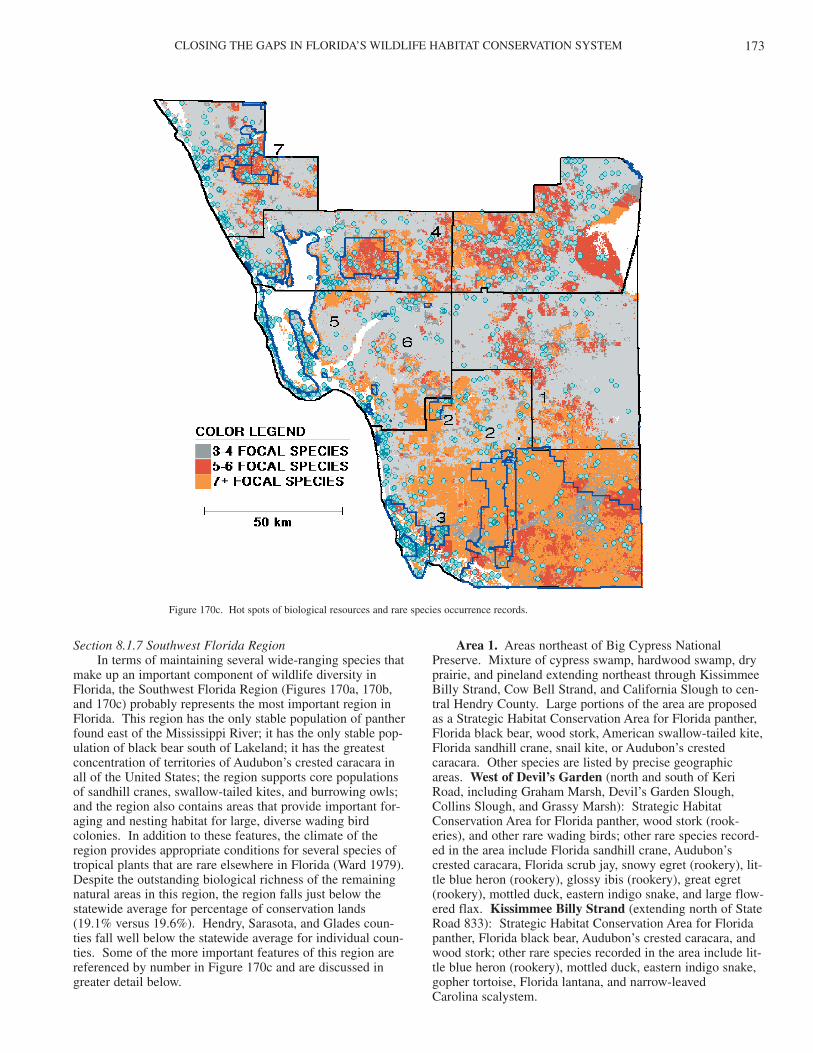
CLOSING THE GAPS IN FLORIDA’S WILDLIFE HABITAT CONSERVATION SYSTEM 173
Area 1. Areas northeast of Big Cypress NationalPreserve. Mixture of cypress swamp, hardwood swamp, dryprairie, and pineland extending northeast through KissimmeeBilly Strand, Cow Bell Strand, and California Slough to cen-tral Hendry County. Large portions of the area are proposedas a Strategic Habitat Conservation Area for Florida panther,Florida black bear, wood stork, American swallow-tailed kite,Florida sandhill crane, snail kite, or Audubon’s crestedcaracara. Other species are listed by precise geographicareas. West of Devil’s Garden (north and south of KeriRoad, including Graham Marsh, Devil’s Garden Slough,Collins Slough, and Grassy Marsh): Strategic HabitatConservation Area for Florida panther, wood stork (rook-eries), and other rare wading birds; other rare species record-ed in the area include Florida sandhill crane, Audubon’scrested caracara, Florida scrub jay, snowy egret (rookery), lit-tle blue heron (rookery), glossy ibis (rookery), great egret(rookery), mottled duck, eastern indigo snake, and large flow-ered flax. Kissimmee Billy Strand (extending north of StateRoad 833): Strategic Habitat Conservation Area for Floridapanther, Florida black bear, Audubon’s crested caracara, andwood stork; other rare species recorded in the area include lit-tle blue heron (rookery), mottled duck, eastern indigo snake,gopher tortoise, Florida lantana, and narrow-leaved Carolina scalystem.
Section 8.1.7 Southwest Florida RegionIn terms of maintaining several wide-ranging species that
make up an important component of wildlife diversity inFlorida, the Southwest Florida Region (Figures 170a, 170b,and 170c) probably represents the most important region inFlorida. This region has the only stable population of pantherfound east of the Mississippi River; it has the only stable pop-ulation of black bear south of Lakeland; it has the greatestconcentration of territories of Audubon’s crested caracara inall of the United States; the region supports core populationsof sandhill cranes, swallow-tailed kites, and burrowing owls;and the region also contains areas that provide important for-aging and nesting habitat for large, diverse wading birdcolonies. In addition to these features, the climate of theregion provides appropriate conditions for several species oftropical plants that are rare elsewhere in Florida (Ward 1979).Despite the outstanding biological richness of the remainingnatural areas in this region, the region falls just below thestatewide average for percentage of conservation lands(19.1% versus 19.6%). Hendry, Sarasota, and Glades coun-ties fall well below the statewide average for individual coun-ties. Some of the more important features of this region arereferenced by number in Figure 170c and are discussed ingreater detail below.
Figure 170c. Hot spots of biological resources and rare species occurrence records.
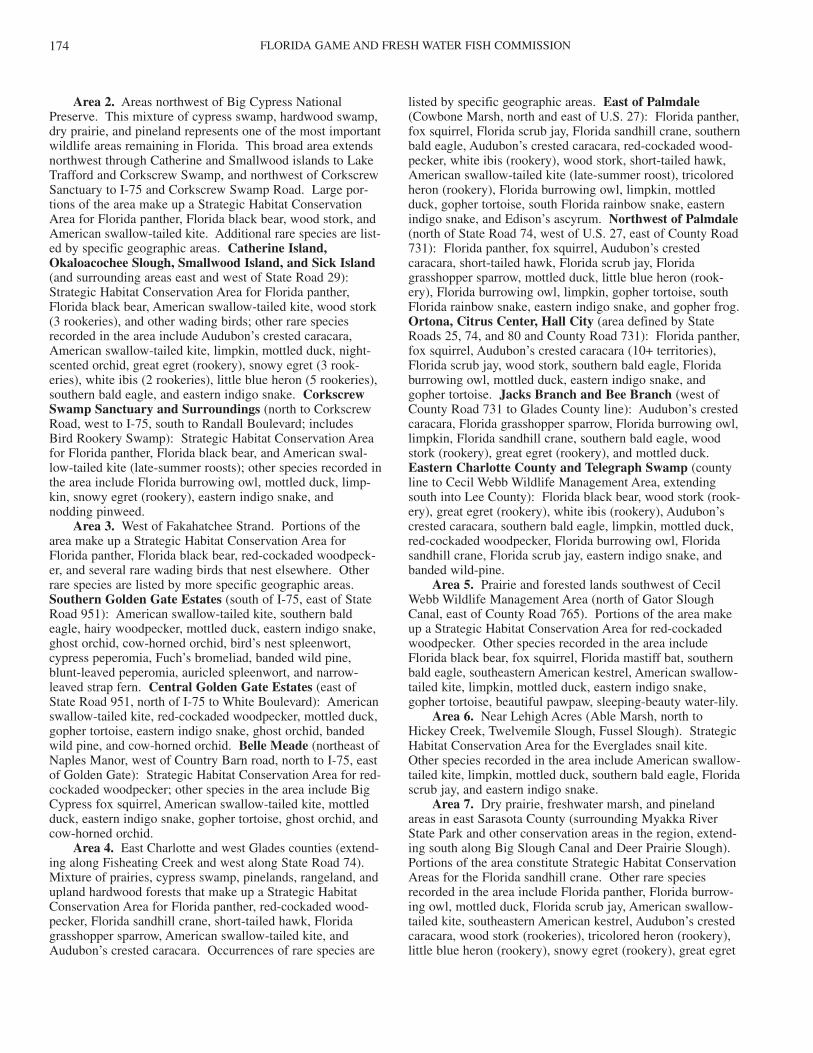
FLORIDA GAME AND FRESH WATER FISH COMMISSION174
Area 2. Areas northwest of Big Cypress NationalPreserve. This mixture of cypress swamp, hardwood swamp,dry prairie, and pineland represents one of the most importantwildlife areas remaining in Florida. This broad area extendsnorthwest through Catherine and Smallwood islands to LakeTrafford and Corkscrew Swamp, and northwest of CorkscrewSanctuary to I-75 and Corkscrew Swamp Road. Large por-tions of the area make up a Strategic Habitat ConservationArea for Florida panther, Florida black bear, wood stork, andAmerican swallow-tailed kite. Additional rare species are list-ed by specific geographic areas. Catherine Island,Okaloacochee Slough, Smallwood Island, and Sick Island(and surrounding areas east and west of State Road 29):Strategic Habitat Conservation Area for Florida panther,Florida black bear, American swallow-tailed kite, wood stork(3 rookeries), and other wading birds; other rare speciesrecorded in the area include Audubon’s crested caracara,American swallow-tailed kite, limpkin, mottled duck, night-scented orchid, great egret (rookery), snowy egret (3 rook-eries), white ibis (2 rookeries), little blue heron (5 rookeries),southern bald eagle, and eastern indigo snake. CorkscrewSwamp Sanctuary and Surroundings (north to CorkscrewRoad, west to I-75, south to Randall Boulevard; includes Bird Rookery Swamp): Strategic Habitat Conservation Areafor Florida panther, Florida black bear, and American swal-low-tailed kite (late-summer roosts); other species recorded inthe area include Florida burrowing owl, mottled duck, limp-kin, snowy egret (rookery), eastern indigo snake, and nodding pinweed.
Area 3. West of Fakahatchee Strand. Portions of thearea make up a Strategic Habitat Conservation Area forFlorida panther, Florida black bear, red-cockaded woodpeck-er, and several rare wading birds that nest elsewhere. Otherrare species are listed by more specific geographic areas.Southern Golden Gate Estates (south of I-75, east of StateRoad 951): American swallow-tailed kite, southern baldeagle, hairy woodpecker, mottled duck, eastern indigo snake,ghost orchid, cow-horned orchid, bird’s nest spleenwort,cypress peperomia, Fuch’s bromeliad, banded wild pine,blunt-leaved peperomia, auricled spleenwort, and narrow-leaved strap fern. Central Golden Gate Estates (east ofState Road 951, north of I-75 to White Boulevard): Americanswallow-tailed kite, red-cockaded woodpecker, mottled duck,gopher tortoise, eastern indigo snake, ghost orchid, bandedwild pine, and cow-horned orchid. Belle Meade (northeast ofNaples Manor, west of Country Barn road, north to I-75, eastof Golden Gate): Strategic Habitat Conservation Area for red-cockaded woodpecker; other species in the area include BigCypress fox squirrel, American swallow-tailed kite, mottledduck, eastern indigo snake, gopher tortoise, ghost orchid, andcow-horned orchid.
Area 4. East Charlotte and west Glades counties (extend-ing along Fisheating Creek and west along State Road 74).Mixture of prairies, cypress swamp, pinelands, rangeland, andupland hardwood forests that make up a Strategic HabitatConservation Area for Florida panther, red-cockaded wood-pecker, Florida sandhill crane, short-tailed hawk, Floridagrasshopper sparrow, American swallow-tailed kite, andAudubon’s crested caracara. Occurrences of rare species are
listed by specific geographic areas. East of Palmdale(Cowbone Marsh, north and east of U.S. 27): Florida panther,fox squirrel, Florida scrub jay, Florida sandhill crane, southernbald eagle, Audubon’s crested caracara, red-cockaded wood-pecker, white ibis (rookery), wood stork, short-tailed hawk,American swallow-tailed kite (late-summer roost), tricoloredheron (rookery), Florida burrowing owl, limpkin, mottledduck, gopher tortoise, south Florida rainbow snake, easternindigo snake, and Edison’s ascyrum. Northwest of Palmdale(north of State Road 74, west of U.S. 27, east of County Road731): Florida panther, fox squirrel, Audubon’s crestedcaracara, short-tailed hawk, Florida scrub jay, Floridagrasshopper sparrow, mottled duck, little blue heron (rook-ery), Florida burrowing owl, limpkin, gopher tortoise, southFlorida rainbow snake, eastern indigo snake, and gopher frog.Ortona, Citrus Center, Hall City (area defined by StateRoads 25, 74, and 80 and County Road 731): Florida panther,fox squirrel, Audubon’s crested caracara (10+ territories),Florida scrub jay, wood stork, southern bald eagle, Floridaburrowing owl, mottled duck, eastern indigo snake, andgopher tortoise. Jacks Branch and Bee Branch (west ofCounty Road 731 to Glades County line): Audubon’s crestedcaracara, Florida grasshopper sparrow, Florida burrowing owl,limpkin, Florida sandhill crane, southern bald eagle, woodstork (rookery), great egret (rookery), and mottled duck.Eastern Charlotte County and Telegraph Swamp (countyline to Cecil Webb Wildlife Management Area, extendingsouth into Lee County): Florida black bear, wood stork (rook-ery), great egret (rookery), white ibis (rookery), Audubon’scrested caracara, southern bald eagle, limpkin, mottled duck,red-cockaded woodpecker, Florida burrowing owl, Floridasandhill crane, Florida scrub jay, eastern indigo snake, andbanded wild-pine.
Area 5. Prairie and forested lands southwest of CecilWebb Wildlife Management Area (north of Gator SloughCanal, east of County Road 765). Portions of the area makeup a Strategic Habitat Conservation Area for red-cockadedwoodpecker. Other species recorded in the area includeFlorida black bear, fox squirrel, Florida mastiff bat, southernbald eagle, southeastern American kestrel, American swallow-tailed kite, limpkin, mottled duck, eastern indigo snake,gopher tortoise, beautiful pawpaw, sleeping-beauty water-lily.
Area 6. Near Lehigh Acres (Able Marsh, north toHickey Creek, Twelvemile Slough, Fussel Slough). StrategicHabitat Conservation Area for the Everglades snail kite.Other species recorded in the area include American swallow-tailed kite, limpkin, mottled duck, southern bald eagle, Floridascrub jay, and eastern indigo snake.
Area 7. Dry prairie, freshwater marsh, and pinelandareas in east Sarasota County (surrounding Myakka RiverState Park and other conservation areas in the region, extend-ing south along Big Slough Canal and Deer Prairie Slough).Portions of the area constitute Strategic Habitat ConservationAreas for the Florida sandhill crane. Other rare speciesrecorded in the area include Florida panther, Florida burrow-ing owl, mottled duck, Florida scrub jay, American swallow-tailed kite, southeastern American kestrel, Audubon’s crestedcaracara, wood stork (rookeries), tricolored heron (rookery),little blue heron (rookery), snowy egret (rookery), great egret
CLOSING THE GAPS IN FLORIDA’S WILDLIFE HABITAT CONSERVATION SYSTEM 175
(rookery), least bittern, limpkin, Bachman’s sparrow, gophertortoise, eastern indigo snake, gopher frog, and sleeping-beauty water-lily.
Coastal Areas of Sarasota County. Occurrences of rare species are listed by more specific geographic areas.Longboat Key: shorebird aggregation area (Beer CanIsland), Sanibel lovegrass, and prickly-apple. Lido Key:Cuban snowy plover, shorebird aggregation areas (LidoBeach and south end), Sanibel lovegrass, and hairy beachsunflower. Little Sarasota Bay: West Indian manatee con-gregation area and southern bald eagle. Siesta Key (north ofPoint O’Rocks and Turtle Beach): least tern (nesting), shore-bird aggregation area (Midnight Pass), Sanibel lovegrass, andhairy beach sunflower. Casey Key: loggerhead turtle nest-ing area, shorebird aggregation area (Midnight Pass and nearCounty Road 789), Sanibel lovegrass. North of VeniceAirport: Florida scrub jay. Brohard and Caspersen ParkBeaches: coastal forests important to migratory birds.Manasota Key (around Manasota): loggerhead turtle (nest-ing area), shorebird aggregation area (north beach), andprickly-apple. Lemon Bay: southern bald eagle.
Coastal Areas of Charlotte County. Portions of thearea make up Strategic Habitat Conservation Areas for south-ern bald eagle and Cuban snowy plover. Additional occur-rences of rare species are listed by specific areas. ManasotaKey (including Charlotte Beach State Recreation Area): log-gerhead turtle (nesting area), gopher tortoise, necklace pod,and coastal dunes and forests important to migratory birds;shorebird aggregation areas (Charlotte Beach StateRecreation Area and Palm Island Resort). Grove City:southern bald eagle and Florida pine snake. Don PedroIsland: Cuban snowy plover and coastal grasslands andforests important to migratory birds. Buck Creek: Floridascrub jay and southern bald eagle. Placida: brown pelican(rookery), Florida scrub jay, tricolored heron (rookery).Gasparilla Island: gopher tortoise, prickly apple, andcoastal forests important to migratory birds. GasparillaSound: great egret (rookeries). Catfish and WhiddenCreek Area: southern bald eagle. El Jobean: southern bald eagle. Peace River, Charlotte Harbor: West Indianmanatee, southern bald eagle. Charlotte Harbor:Atlantic sturgeon.
Coastal Areas of Lee County. Portions of the area areincluded in Strategic Habitat Conservation Areas for southernbald eagle. Additional occurrences of rare species are listedby specific geographic areas. Gasparilla Island/BocaGrande: southern bald eagle and shorebird aggregation area.Cayo Costa (including Cayo Costa State Park and nearbyislands in Pine Island Sound): piping plover, southern baldeagle (4 nests), least tern (nesting), snowy egret (rookery),great egret (rookery), little blue heron (rookery), brown peli-can (rookery), shorebird aggregation area (Cayo Costa StatePreserve), gopher tortoise, loggerhead turtle (nesting), joe-wood, spiny hackberry, Florida lantana, banded wild-pine,and prickly apple. North Captiva Island (including CayoCosta State Preserve): piping plover, shorebird aggregationarea, gopher tortoise, Sanibel lovegrass, and joewood.Captiva Island: shorebird aggregation area, loggerhead tur-tle, gopher tortoise, eastern indigo snake, prickly-apple,
joewood, and necklace pod. Sanibel Island (including DingDarling National Wildlife Refuge): insular cotton rat,Sanibel Island rice rat, southern bald eagle, piping plover,least tern (nesting), great egret (rookery), brown pelican(rookery), black-crowned night-heron (rookery), white ibis(rookery), shorebird aggregation area (Gulf and bay sides),gopher tortoise, eastern indigo snake, loggerhead turtle,Florida pinewood privet, necklace pod, hackberry, Sanibellovegrass, and sand-dune spurge. Pine Island (and LittlePine Island and Matlacha Pass): insular cotton rat, southernbald eagle (Strategic Habitat Conservation Area), magnificentfrigatebird, brown pelican (3 rookeries), snowy egret (rook-ery), white ibis (rookery), tricolored heron (rookery), shore-bird aggregation area (Little Bokeelia Island), eastern indigosnake, broad-leaved spiderlily, hackberry, and beautiful paw-paw. Punta Rassa (and islands to west): black skimmer(nesting), least tern (nesting), brown pelican (rookery), andshorebird aggregation area. Ft. Myers Beach: Florida scrublizard. Estero Island and Estero Bay: brown pelican (rook-ery), tricolored heron (rookery), snowy egret (rookery), greategret (rookery), black skimmer (nesting), least tern (nesting),Cuban snowy plover, piping plover, southern bald eagle, andshorebird aggregation areas (Little Estero Island CriticalWildlife Area, south end and east end of Carl Johnson Park).
Coastal Areas of Collier County. Occurrences of rarespecies are listed by specific geographic areas. BarefootBeach State Preserve and Delnor-Wiggins Pass StateRecreation Area: black-whiskered vireo, southern baldeagle, least tern, shorebird aggregation area (Wiggins Pass),gopher tortoise, loggerhead turtle, and sand-dune spurge.North Naples (south of County Road 862): gopher tortoiseand rivulus. Naples Municipal Pier (and nearby areas):southern bald eagle, shorebird aggregation area (Naples Bay).Dollar Bay and Gordon Pass: southern bald eagle, shore-bird aggregation area, gopher tortoise, banded wild-pine,broad-leaved spider lily, nodding pinweed, and golden leatherfern. Rookery Bay/Big and Little Marco Passes/JohnsonBay: Florida black bear, peregrine falcon, yellow-crownednight-heron (rookery), least tern (nesting), snowy plover(nesting), brown pelican (rookery), shorebird aggregationarea, loggerhead turtle, gopher tortoise, and banded wild-pine. Tigertail Beach/Marco Island: black skimmer (nest-ing), snowy plover (nesting), great white heron, Florida bur-rowing owl, American oystercatcher, southern bald eagle,shorebird aggregation areas (Tigertail Beach, North MarcoIsland, and Marco River), gopher tortoise, Florida scrublizard, rivulus, sand-dune spurge, necklace pod, goldenleather fern, southern lip fern, hackberry, and banded wild-pine. Barfield Bay/Caxambas Pass: piping plover, brownpelican (rookery), southern bald eagle, least tern (nesting),shorebird aggregation areas (Caxambas Pass east and west),broad-leaved spiderlily, banded wild-pine, and scrub bay.Helen Key, Kice Island, and Cape Romano: southern baldeagle, least tern (nesting), peregrine falcon, shorebird aggre-gation areas (Kice Island, Cape Romano, Coon Key), andloggerhead turtle (nesting area). Ten Thousand Islands: adiscussion of this area is omitted due to its protected status.
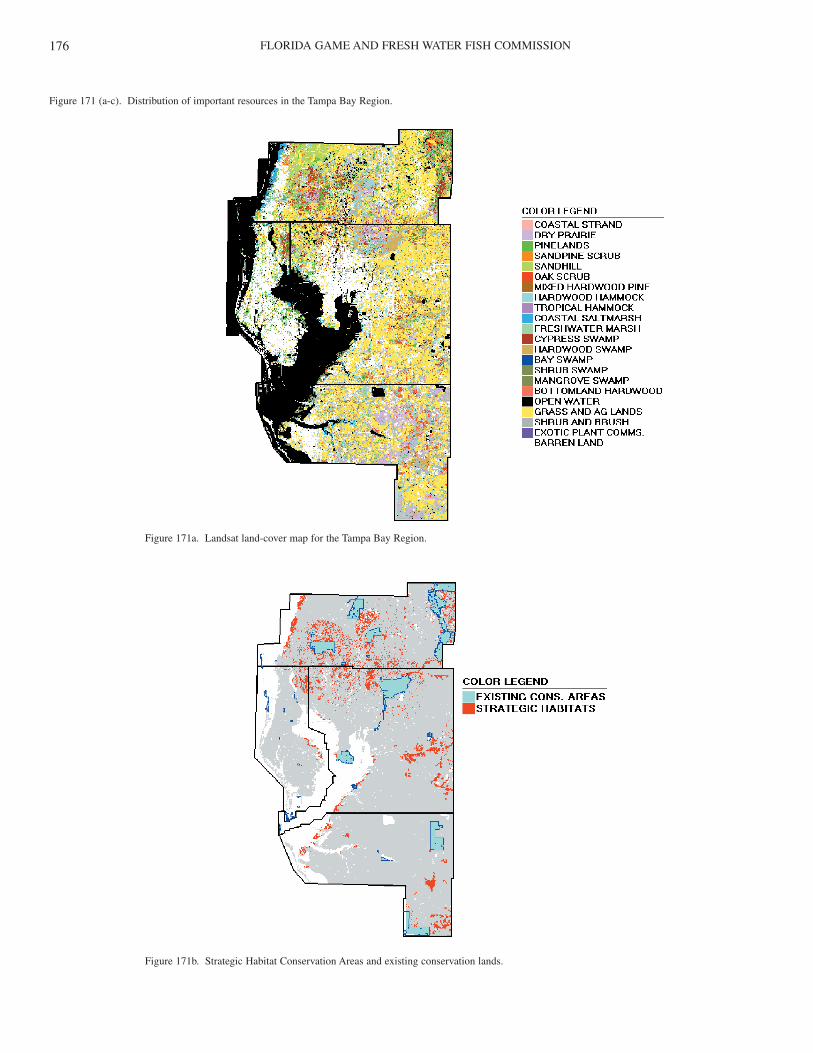
FLORIDA GAME AND FRESH WATER FISH COMMISSION176
Figure 171 (a-c). Distribution of important resources in the Tampa Bay Region.
Figure 171a. Landsat land-cover map for the Tampa Bay Region.
Figure 171b. Strategic Habitat Conservation Areas and existing conservation lands.
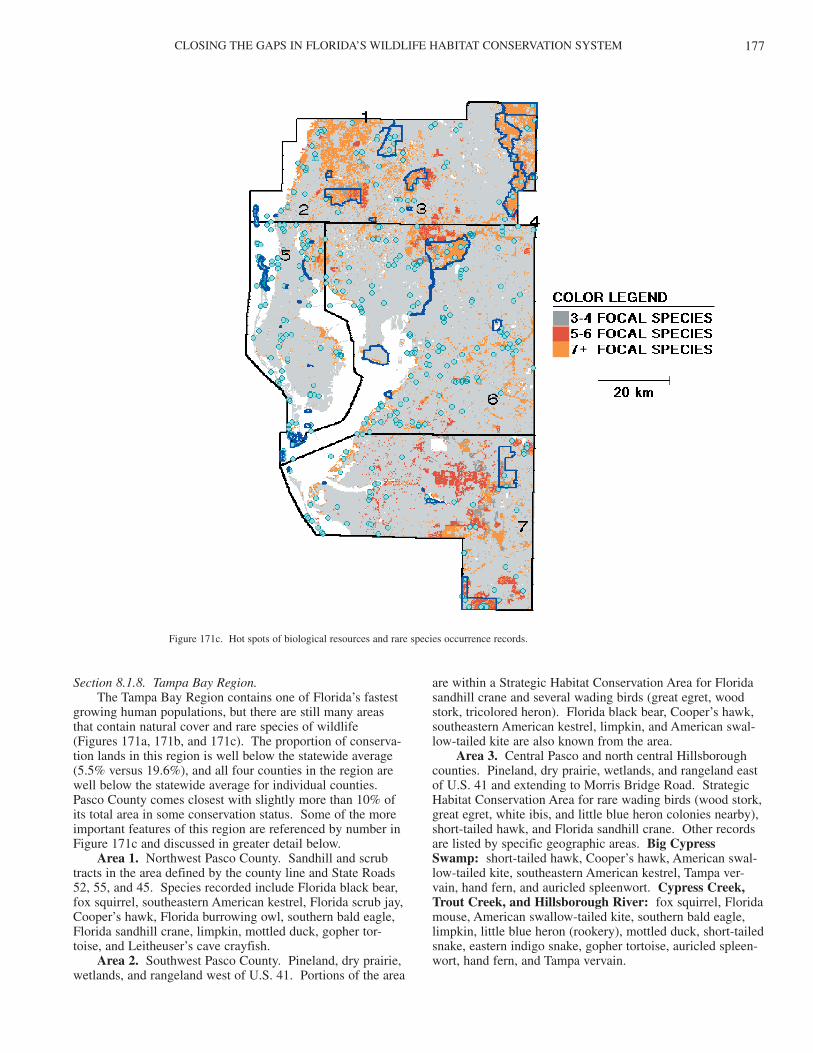
CLOSING THE GAPS IN FLORIDA’S WILDLIFE HABITAT CONSERVATION SYSTEM 177
Section 8.1.8. Tampa Bay Region.The Tampa Bay Region contains one of Florida’s fastest
growing human populations, but there are still many areasthat contain natural cover and rare species of wildlife(Figures 171a, 171b, and 171c). The proportion of conserva-tion lands in this region is well below the statewide average(5.5% versus 19.6%), and all four counties in the region arewell below the statewide average for individual counties.Pasco County comes closest with slightly more than 10% ofits total area in some conservation status. Some of the moreimportant features of this region are referenced by number inFigure 171c and discussed in greater detail below.
Area 1. Northwest Pasco County. Sandhill and scrubtracts in the area defined by the county line and State Roads52, 55, and 45. Species recorded include Florida black bear,fox squirrel, southeastern American kestrel, Florida scrub jay,Cooper’s hawk, Florida burrowing owl, southern bald eagle,Florida sandhill crane, limpkin, mottled duck, gopher tor-toise, and Leitheuser’s cave crayfish.
Area 2. Southwest Pasco County. Pineland, dry prairie,wetlands, and rangeland west of U.S. 41. Portions of the area
are within a Strategic Habitat Conservation Area for Floridasandhill crane and several wading birds (great egret, woodstork, tricolored heron). Florida black bear, Cooper’s hawk,southeastern American kestrel, limpkin, and American swal-low-tailed kite are also known from the area.
Area 3. Central Pasco and north central Hillsboroughcounties. Pineland, dry prairie, wetlands, and rangeland eastof U.S. 41 and extending to Morris Bridge Road. StrategicHabitat Conservation Area for rare wading birds (wood stork,great egret, white ibis, and little blue heron colonies nearby),short-tailed hawk, and Florida sandhill crane. Other recordsare listed by specific geographic areas. Big CypressSwamp: short-tailed hawk, Cooper’s hawk, American swal-low-tailed kite, southeastern American kestrel, Tampa ver-vain, hand fern, and auricled spleenwort. Cypress Creek,Trout Creek, and Hillsborough River: fox squirrel, Floridamouse, American swallow-tailed kite, southern bald eagle,limpkin, little blue heron (rookery), mottled duck, short-tailedsnake, eastern indigo snake, gopher tortoise, auricled spleen-wort, hand fern, and Tampa vervain.
Figure 171c. Hot spots of biological resources and rare species occurrence records.
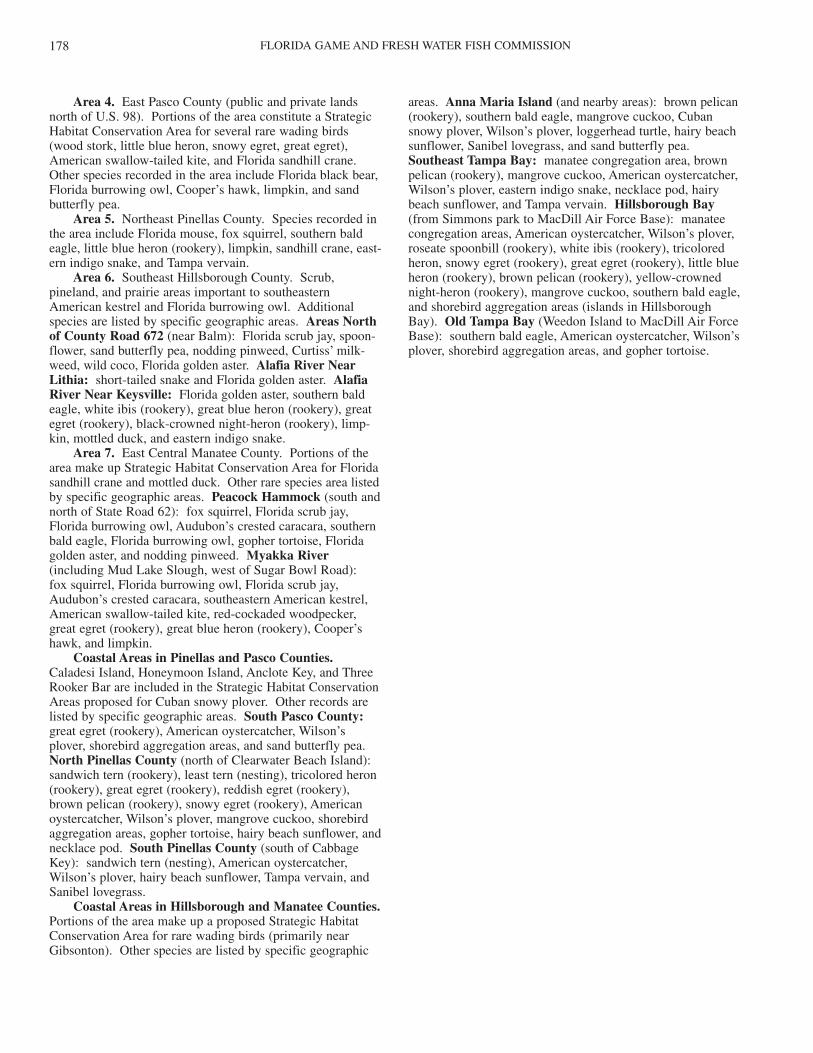
FLORIDA GAME AND FRESH WATER FISH COMMISSION178
Area 4. East Pasco County (public and private landsnorth of U.S. 98). Portions of the area constitute a StrategicHabitat Conservation Area for several rare wading birds(wood stork, little blue heron, snowy egret, great egret),American swallow-tailed kite, and Florida sandhill crane.Other species recorded in the area include Florida black bear,Florida burrowing owl, Cooper’s hawk, limpkin, and sandbutterfly pea.
Area 5. Northeast Pinellas County. Species recorded inthe area include Florida mouse, fox squirrel, southern baldeagle, little blue heron (rookery), limpkin, sandhill crane, east-ern indigo snake, and Tampa vervain.
Area 6. Southeast Hillsborough County. Scrub,pineland, and prairie areas important to southeasternAmerican kestrel and Florida burrowing owl. Additionalspecies are listed by specific geographic areas. Areas Northof County Road 672 (near Balm): Florida scrub jay, spoon-flower, sand butterfly pea, nodding pinweed, Curtiss’ milk-weed, wild coco, Florida golden aster. Alafia River NearLithia: short-tailed snake and Florida golden aster. AlafiaRiver Near Keysville: Florida golden aster, southern baldeagle, white ibis (rookery), great blue heron (rookery), greategret (rookery), black-crowned night-heron (rookery), limp-kin, mottled duck, and eastern indigo snake.
Area 7. East Central Manatee County. Portions of thearea make up Strategic Habitat Conservation Area for Floridasandhill crane and mottled duck. Other rare species area listedby specific geographic areas. Peacock Hammock (south andnorth of State Road 62): fox squirrel, Florida scrub jay,Florida burrowing owl, Audubon’s crested caracara, southernbald eagle, Florida burrowing owl, gopher tortoise, Floridagolden aster, and nodding pinweed. Myakka River(including Mud Lake Slough, west of Sugar Bowl Road):fox squirrel, Florida burrowing owl, Florida scrub jay,Audubon’s crested caracara, southeastern American kestrel,American swallow-tailed kite, red-cockaded woodpecker,great egret (rookery), great blue heron (rookery), Cooper’shawk, and limpkin.
Coastal Areas in Pinellas and Pasco Counties.Caladesi Island, Honeymoon Island, Anclote Key, and ThreeRooker Bar are included in the Strategic Habitat ConservationAreas proposed for Cuban snowy plover. Other records arelisted by specific geographic areas. South Pasco County:great egret (rookery), American oystercatcher, Wilson’splover, shorebird aggregation areas, and sand butterfly pea.North Pinellas County (north of Clearwater Beach Island):sandwich tern (rookery), least tern (nesting), tricolored heron(rookery), great egret (rookery), reddish egret (rookery),brown pelican (rookery), snowy egret (rookery), Americanoystercatcher, Wilson’s plover, mangrove cuckoo, shorebirdaggregation areas, gopher tortoise, hairy beach sunflower, andnecklace pod. South Pinellas County (south of CabbageKey): sandwich tern (nesting), American oystercatcher,Wilson’s plover, hairy beach sunflower, Tampa vervain, andSanibel lovegrass.
Coastal Areas in Hillsborough and Manatee Counties.Portions of the area make up a proposed Strategic HabitatConservation Area for rare wading birds (primarily nearGibsonton). Other species are listed by specific geographic
areas. Anna Maria Island (and nearby areas): brown pelican(rookery), southern bald eagle, mangrove cuckoo, Cubansnowy plover, Wilson’s plover, loggerhead turtle, hairy beachsunflower, Sanibel lovegrass, and sand butterfly pea.Southeast Tampa Bay: manatee congregation area, brownpelican (rookery), mangrove cuckoo, American oystercatcher,Wilson’s plover, eastern indigo snake, necklace pod, hairybeach sunflower, and Tampa vervain. Hillsborough Bay(from Simmons park to MacDill Air Force Base): manateecongregation areas, American oystercatcher, Wilson’s plover,roseate spoonbill (rookery), white ibis (rookery), tricoloredheron, snowy egret (rookery), great egret (rookery), little blueheron (rookery), brown pelican (rookery), yellow-crownednight-heron (rookery), mangrove cuckoo, southern bald eagle,and shorebird aggregation areas (islands in HillsboroughBay). Old Tampa Bay (Weedon Island to MacDill Air ForceBase): southern bald eagle, American oystercatcher, Wilson’splover, shorebird aggregation areas, and gopher tortoise.

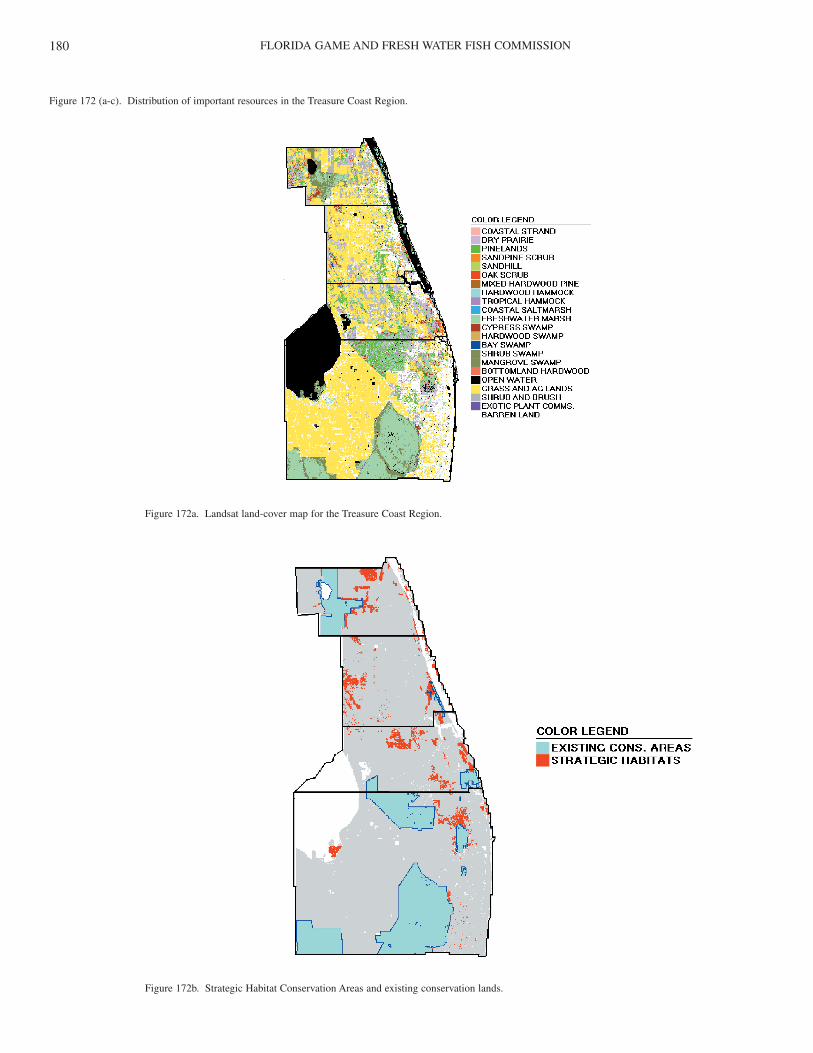
FLORIDA GAME AND FRESH WATER FISH COMMISSION180
Figure 172 (a-c). Distribution of important resources in the Treasure Coast Region.
Figure 172a. Landsat land-cover map for the Treasure Coast Region.
Figure 172b. Strategic Habitat Conservation Areas and existing conservation lands.
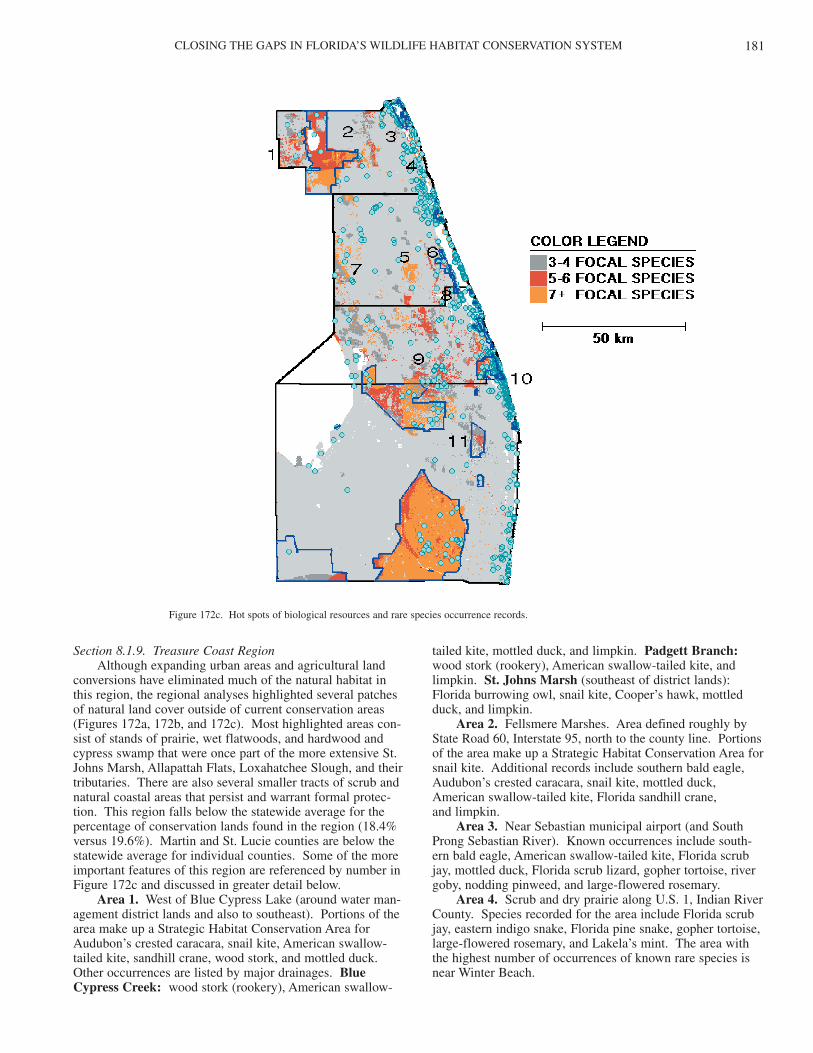
CLOSING THE GAPS IN FLORIDA’S WILDLIFE HABITAT CONSERVATION SYSTEM 181
Section 8.1.9. Treasure Coast RegionAlthough expanding urban areas and agricultural land
conversions have eliminated much of the natural habitat inthis region, the regional analyses highlighted several patchesof natural land cover outside of current conservation areas(Figures 172a, 172b, and 172c). Most highlighted areas con-sist of stands of prairie, wet flatwoods, and hardwood andcypress swamp that were once part of the more extensive St.Johns Marsh, Allapattah Flats, Loxahatchee Slough, and theirtributaries. There are also several smaller tracts of scrub andnatural coastal areas that persist and warrant formal protec-tion. This region falls below the statewide average for thepercentage of conservation lands found in the region (18.4%versus 19.6%). Martin and St. Lucie counties are below thestatewide average for individual counties. Some of the moreimportant features of this region are referenced by number inFigure 172c and discussed in greater detail below.
Area 1. West of Blue Cypress Lake (around water man-agement district lands and also to southeast). Portions of thearea make up a Strategic Habitat Conservation Area forAudubon’s crested caracara, snail kite, American swallow-tailed kite, sandhill crane, wood stork, and mottled duck.Other occurrences are listed by major drainages. BlueCypress Creek: wood stork (rookery), American swallow-
tailed kite, mottled duck, and limpkin. Padgett Branch:wood stork (rookery), American swallow-tailed kite, andlimpkin. St. Johns Marsh (southeast of district lands):Florida burrowing owl, snail kite, Cooper’s hawk, mottledduck, and limpkin.
Area 2. Fellsmere Marshes. Area defined roughly byState Road 60, Interstate 95, north to the county line. Portionsof the area make up a Strategic Habitat Conservation Area forsnail kite. Additional records include southern bald eagle,Audubon’s crested caracara, snail kite, mottled duck,American swallow-tailed kite, Florida sandhill crane,and limpkin.
Area 3. Near Sebastian municipal airport (and SouthProng Sebastian River). Known occurrences include south-ern bald eagle, American swallow-tailed kite, Florida scrubjay, mottled duck, Florida scrub lizard, gopher tortoise, rivergoby, nodding pinweed, and large-flowered rosemary.
Area 4. Scrub and dry prairie along U.S. 1, Indian RiverCounty. Species recorded for the area include Florida scrubjay, eastern indigo snake, Florida pine snake, gopher tortoise,large-flowered rosemary, and Lakela’s mint. The area withthe highest number of occurrences of known rare species isnear Winter Beach.
Figure 172c. Hot spots of biological resources and rare species occurrence records.
FLORIDA GAME AND FRESH WATER FISH COMMISSION182
Area 5. Areas near Carlton. Records of fox squirrel andeastern indigo snake from this area.
Area 6. North and west of Savannas State Preserve.Freshwater marsh, dry prairie, scrub, and scrubby flatwoods(also south and west around County Roads 732 and 723).Portions of this area make up a proposed Strategic HabitatConservation Area for Florida scrub jay and Florida sandhillcrane. Other species recorded for the area include fox squir-rel, snowy egret (rookery), mottled duck, snail kite, Floridapine snake, Florida scrub lizard, four-petal pawpaw, large-flowered rosemary, Florida three-awn, Piedmont jointgrass,and fragrant prickly apple.
Area 7. West St. Lucie County. Remnant freshwatermarsh, xeric pines, dry prairie, and hardwood swamps northand south of State Road 70. Portions of the area make up aproposed Strategic Habitat Conservation Area for wood stork,white ibis, great blue heron, little blue heron, and snowy egret,which nest in nearby rookeries. Other rare species recordedinclude Audubon’s crested caracara, southeastern kestrel,American swallow-tailed kite, mottled duck, Floridaburrowing owl, and limpkin.
Area 8. Remnant patches of scrub and dry prairie innorth Martin County (particularly areas south of SavannasState Preserve; see Area 6 above) and north and south ofJonathan Dickinson State Park. Portions of this area make upa proposed Strategic Habitat Conservation Area for Floridascrub jays. Other rare species are listed by more specific geo-graphic areas. Near Jonathan Dickinson State Park:Florida scrub jay, Florida sandhill crane, gopher tortoise,Florida scrub lizard, large-flowered rosemary, perforate rein-deer lichen, Piedmont jointgrass, sand-dune spurge, Curtiss’milkweed, and nodding pinweed. Between Interstate 95 andFlorida Turnpike: Great egret, Carter’s large-flowered flax,and Florida threeawn.
Area 9. Northeast of J. W. Corbett Wildlife ManagementArea. Wet flatwoods, prairie, and freshwater marsh importantto several rare species. Records for this area include greategret (rookery), mottled duck, limpkin, and Florida threeawn.
Area 10. Northeast Palm Beach County. Remnant scrubpatches (see Fernald 1989). Records for the area includeFlorida mouse, Florida scrub jay, gopher tortoise, scrub bay,large-flowered rosemary, and four-petal pawpaw.
Area 11. Southeast and east of J. W. Corbett WildlifeManagement Area (including Loxahatchee Slough). Portionsof this area make up a Strategic Habitat Conservation Area forlimpkins and short-tailed hawk. Other records for the areainclude great egret (rookery), American swallow-tailed kite,snail kite, mottled duck, gopher tortoise, indigo snake, andFlorida three-awn.
Coastal Areas in Palm Beach County. Most recordsoccur in the northern third of the county. Records are listedby specific geographic areas. South of Lake Worth Pier:least tern (nesting), black-whiskered vireo, loggerhead turtle(nesting), sea lavender, burrowing four-o’clock, and beachjacquemontia. MacArthur State Recreation Area:leatherback turtle, hand fern, Johnson’s seagrass, sea lavender,and burrowing four-o’clock. North of Lake Worth BeachPier (including Jupiter ridge scrub): manatee congregationareas, Florida scrub jay, least tern, black-whiskered vireo,
shorebird aggregation areas, hawksbill turtle, loggerhead tur-tle, gopher tortoise, beach jacquemontia, necklace pod, bur-rowing four-o’clock, dancing lady orchid, coastal vervain,spottail goby, and four-petal pawpaw.
Coastal Areas in Martin County. Rare species are list-ed by specific geographic areas. County Line to St. LucieInlet (Hobe Sound National Wildlife Refuge, in part): black-whiskered vireo, Wilson’s plover, shorebird aggregation area(west of Sailfish Point and St. Lucie Inlet State Park),leatherback turtle, green turtle, necklace pod, Johnson’s sea-grass, beach-star, and sea lavender. St. Lucie River (includ-ing North and South forks): least tern (nesting), black skim-mer (nesting), southern bald eagle, and shorebird aggregationarea. St. Lucie Inlet to Jensen Beach Park: snowy egret(rookery), Wilson’s plover, gopher tortoise, beach star, neck-lace pod, and sea lavender.
Coastal Areas in St. Lucie County. Most records occursouth of Middle Point (near Douglas Memorial Park).Occurrences are listed by specific geographic areas. CountyLine to Ft. Pierce Inlet (Herman’s Bay Beach Access): leasttern (nesting), black skimmer (nesting), black-whiskeredvireo, shorebird aggregation area (near Middle Point andsouth of Ft. Pierce), leatherback turtle, striped croaker, coastalvervain, coastal hoary pea, sea lavender, burrowing four-o’clock, Johnson’s seagrass, beach star, necklace pod, and sealavender. Ft. Pierce Inlet to County Line: southeasternbeach mouse, brown pelican (rookery), peregrine falcon(migratory), osprey, black-whiskered vireo, shorebird aggre-gation area (Ft. Pierce Inlet Recreation Area), eastern indigosnake, Florida scrub lizard, necklace pod, sand-dune spurge,and Johnson’s seagrass.
Coastal Areas in Indian River County. Portions makeup a Strategic Habitat Conservation Area for rare wadingbirds and southeastern beach mouse (beginning at approxi-mately Wabasso Beach). Other rare species are listed by spe-cific geographic areas. South County Line to Vero Beach:manatee congregation area, southeastern beach mouse (poten-tial habitat), reddish egret (rookery), snowy egret (rookery),shorebird aggregation area (South Beach Park), and mangroverivulus. South Wabasso Beach to North County Line:southeastern beach mouse, great egret (rookery), white ibis(rookery), tricolored heron (rookery), black-crowned night-heron (rookery), snowy egret (rookery), least tern (nesting),black skimmer (nesting), brown pelican (rookery), osprey,shorebird aggregation area (Wabasso Beach and south side ofSebastian Inlet), eastern indigo snake, leatherback turtle (pro-posed Archie Carr National Wildlife Refuge), Florida scrublizard, rivulus, coastal vervain, coastal hoary pea, pricklyapple, large-flowered rosemary, and nodding pinweed.

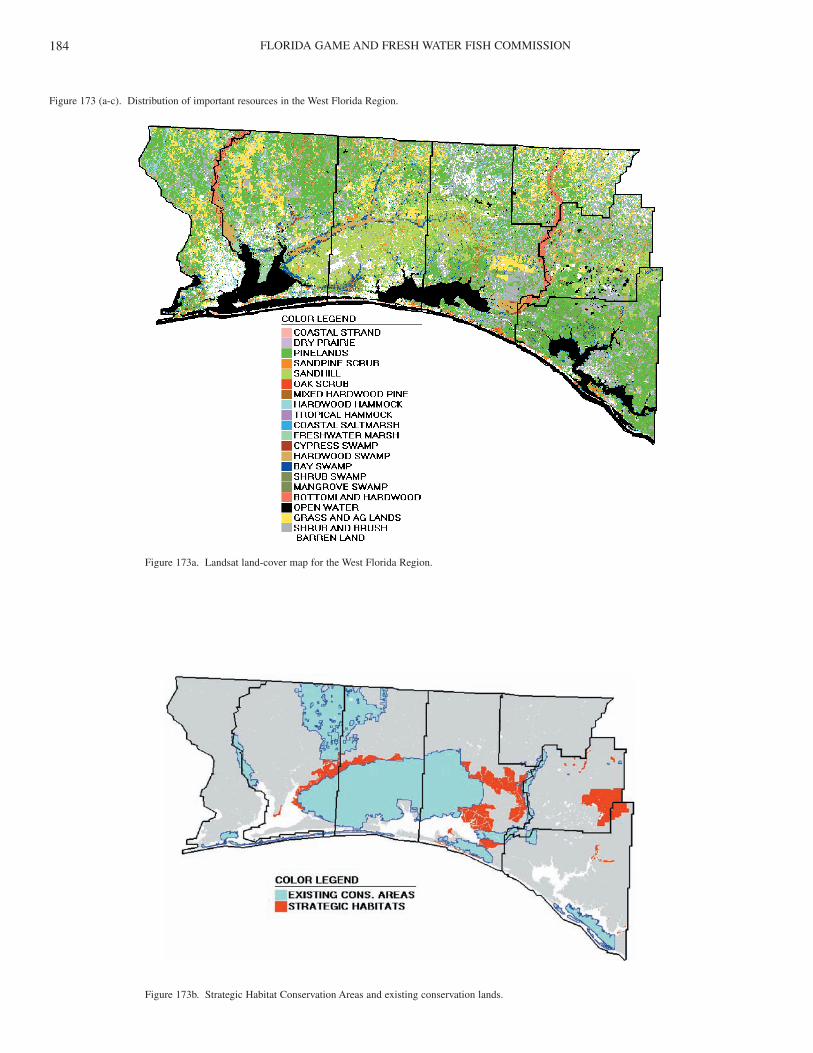
FLORIDA GAME AND FRESH WATER FISH COMMISSION184
Figure 173 (a-c). Distribution of important resources in the West Florida Region.
Figure 173a. Landsat land-cover map for the West Florida Region.
Figure 173b. Strategic Habitat Conservation Areas and existing conservation lands.
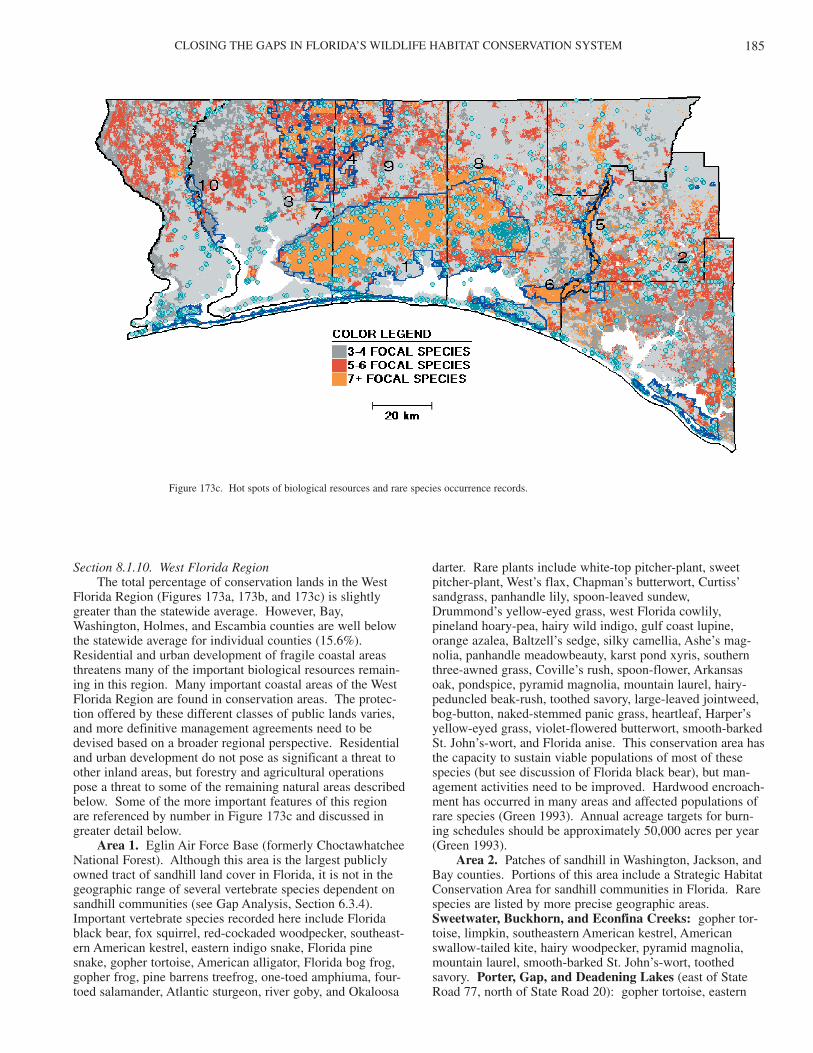
CLOSING THE GAPS IN FLORIDA’S WILDLIFE HABITAT CONSERVATION SYSTEM 185
Section 8.1.10. West Florida RegionThe total percentage of conservation lands in the West
Florida Region (Figures 173a, 173b, and 173c) is slightlygreater than the statewide average. However, Bay,Washington, Holmes, and Escambia counties are well belowthe statewide average for individual counties (15.6%).Residential and urban development of fragile coastal areasthreatens many of the important biological resources remain-ing in this region. Many important coastal areas of the WestFlorida Region are found in conservation areas. The protec-tion offered by these different classes of public lands varies,and more definitive management agreements need to bedevised based on a broader regional perspective. Residentialand urban development do not pose as significant a threat toother inland areas, but forestry and agricultural operationspose a threat to some of the remaining natural areas describedbelow. Some of the more important features of this regionare referenced by number in Figure 173c and discussed ingreater detail below.
Area 1. Eglin Air Force Base (formerly ChoctawhatcheeNational Forest). Although this area is the largest publiclyowned tract of sandhill land cover in Florida, it is not in thegeographic range of several vertebrate species dependent onsandhill communities (see Gap Analysis, Section 6.3.4).Important vertebrate species recorded here include Floridablack bear, fox squirrel, red-cockaded woodpecker, southeast-ern American kestrel, eastern indigo snake, Florida pinesnake, gopher tortoise, American alligator, Florida bog frog,gopher frog, pine barrens treefrog, one-toed amphiuma, four-toed salamander, Atlantic sturgeon, river goby, and Okaloosa
darter. Rare plants include white-top pitcher-plant, sweetpitcher-plant, West’s flax, Chapman’s butterwort, Curtiss’sandgrass, panhandle lily, spoon-leaved sundew,Drummond’s yellow-eyed grass, west Florida cowlily,pineland hoary-pea, hairy wild indigo, gulf coast lupine,orange azalea, Baltzell’s sedge, silky camellia, Ashe’s mag-nolia, panhandle meadowbeauty, karst pond xyris, southernthree-awned grass, Coville’s rush, spoon-flower, Arkansasoak, pondspice, pyramid magnolia, mountain laurel, hairy-peduncled beak-rush, toothed savory, large-leaved jointweed,bog-button, naked-stemmed panic grass, heartleaf, Harper’syellow-eyed grass, violet-flowered butterwort, smooth-barkedSt. John’s-wort, and Florida anise. This conservation area hasthe capacity to sustain viable populations of most of thesespecies (but see discussion of Florida black bear), but man-agement activities need to be improved. Hardwood encroach-ment has occurred in many areas and affected populations ofrare species (Green 1993). Annual acreage targets for burn-ing schedules should be approximately 50,000 acres per year(Green 1993).
Area 2. Patches of sandhill in Washington, Jackson, andBay counties. Portions of this area include a Strategic HabitatConservation Area for sandhill communities in Florida. Rarespecies are listed by more precise geographic areas.Sweetwater, Buckhorn, and Econfina Creeks: gopher tor-toise, limpkin, southeastern American kestrel, Americanswallow-tailed kite, hairy woodpecker, pyramid magnolia,mountain laurel, smooth-barked St. John’s-wort, toothedsavory. Porter, Gap, and Deadening Lakes (east of StateRoad 77, north of State Road 20): gopher tortoise, eastern
Figure 173c. Hot spots of biological resources and rare species occurrence records.
FLORIDA GAME AND FRESH WATER FISH COMMISSION186
indigo snake, Florida pine snake, gopher frog, toothed savory,white-topped pitcher plant, Harper’s yellow-eyed grass, pan-handle meadowbeauty, smooth-barked St. John’s-wort, andGulf coast lupine. Hicks, Lucas, and Big Blue Lakes (westof State Road 77, east of State Road 79, north of State Road20): eastern indigo snake (several records), gopher tortoise(several records), smooth-barked St. John’s-wort, panhandlemeadowbeauty, silky camellia, karst pond xyris, Piedmontwater-milfoil, pyramid magnolia, heartleaf, and mountain lau-rel. Court Martial and White Western Lakes (east of StateRoad 79 and south of State Road 20): Cooper’s hawk, hairywoodpecker, gopher tortoise, eastern indigo snake, white-topped pitcher plant, smooth-barked St. John’s-wort, Cruise’sgolden aster, gulf coast lupine, panhandle meadowbeauty, andkarst pond xyris.
Area 3. Patches of sandhill and xeric pinelands west and southwest of Blackwater River State Forest (east andwest of U.S. 191). Rare species are listed by precise geo-graphic regions. South of Springhill (surrounding East Forkand Big Coldwater creeks): fox squirrel, southeasternAmerican kestrel, hairy woodpecker, Cooper’s hawk, gophertortoise, hairy-peduncled beak-rush, and panhandle lily.South of Berrydale (surrounding East Fork and Manningcreeks): southeastern American kestrel, gopher tortoise, flat-woods salamander, hairy-peduncled beak rush, and service-berry holly.
Area 4. Blackwater River State Forest. Important conser-vation area that supports several rare species. Species recordedfor the area include eastern chipmunk, red-cockaded wood-pecker, gopher tortoise, Florida pine snake, eastern indigosnake, tiger salamander, pine barrens treefrog, black-tip shiner,panhandle lily, white-top pitcher-plant, orange azalea, spoon-leaved sundew, hummingbird flower, yellow fringeless orchid,southern red lily, sweet pitcher-plant, Say’s spike-tail dragon-fly, Harper’s yellow-eyed grass, bog-button, Chapman’s butter-wort, yellow-eyed grass, and meadowbeauty.
Area 5. Upper Choctawhatchee River and HolmesCreek. Wetland areas associated with these rivers, and theisolated wetlands that lie between these rivers, are importantforaging areas for nearby wading bird rookeries consisting ofgreat egret, snowy egret, little blue heron, and white ibis.Other species are reported by major drainages.Choctawhatchee River (north of Caryville): eastern chip-munk, short-tailed hawk, Cooper’s hawk, black-tip shiner,cypress darter, Florida logperch, Florida chub, Clench’s elim-ia, and wild indigo. Holmes Creek North (Interstate 10south to Vernon): bluenose shiner, dusky shiner, Clench’selimia, Washington thorn, and variable-leaved Indian-plan-tain. Holmes Creek and Choctawhatchee River South(confluence south of Vernon and Barker Store): Americanswallow-tailed kite, limpkin, goldstripe darter, Florida log-perch, orange azalea, yellow cowlily, variable-leaved Indian-plantain, and Ashe’s magnolia. Lands BetweenChoctawhatchee River and Holmes Creek (WashingtonCounty): white ibis (rookery), great egret (rookery), anhinga(rookery), flatwoods salamander, and serviceberry holly.Wright’s and Tenmile Creeks: black-tip shiner, fuzzy pig-toe, variable-leaved Indian-plantain, and southern sandshell.
Area 6. Lower Choctawhatchee River. Portions of thearea are included in a Strategic Habitat Conservation Area forFlorida black bear. Other species are listed by precise geo-graphic areas. South of State Road 20 (including BlackCreek and nearby Pine Log State Forest): round-tailedmuskrat, little blue heron (rookery), white ibis (rookery),American swallow-tailed kite, hairy woodpecker, gopher tor-toise, coal skink, flatwoods salamander, one-toed amphiuma,Florida logperch, white-topped pitcher-plant, Apalachicoladragon-head, Curtiss’ sandgrass, and Chapman’s crownbeard.North of State Road 20: Cooper’s hawk, hairy woodpecker,Florida logperch, orange azalea, variable-leaved Indian-plan-tain, fluted elephant-ear, smooth-barked St. John’s-wort, andsouthern sandshell.
Area 7. Weaver, Garnier, Julian Mill, and Burnt Grocerycreeks. Strategic Habitat Conservation Area for the Floridabog frog and Florida black bear. Other rare species recordedalong these creeks include American swallow-tailed kite,Florida pine snake, flatwoods salamander, black-mouth shiner,panhandle lily, hairy wild indigo, and sweet pitcher-plant.
Area 8. Large area of sandhill land cover northeast ofEglin Air Force Base (north of I-10, east of Dorcas). Rarespecies recorded for this area include southeastern Americankestrel, gopher tortoise, pine barrens treefrog, eastern indigosnake, Florida pine snake, Florida panhandle lily, and yellowfringeless orchid.
Area 9. Yellow River, east of Blackwater River StateForest (north and south of State Road 2). Rare species record-ed in this area include eastern chipmunk, gopher tortoise, pinebarrens treefrog, panhandle lily, and Coville’s rush.
Area 10. Floodplain forests of the Escambia River andits tributaries. Rare species are listed by specific geographicareas. North Escambia River and Escambia Creek (northof Chumuckla Springs): eastern chipmunk, American swal-low-tailed kite, Alabama map turtle, Gulf coast smooth soft-shell, alligator gar, cypress darter, Florida chub, black-tipshiner, cypress minnow, crystal darter, saddle-back darter,orange azalea, heartleaf, southern pocketbook, flat floater, andnarrow pigtoe. Canoe Creek: American swallow-tailed kite,copperhead, seal salamander, rough shiner, bluenose shiner,striped shiner, harlequin darter, and saddle-back darter. SouthEscambia River (south of Chumuckla Springs): Americanswallow-tailed kite, Cooper’s hawk, indigo snake, river red-horse, starhead topminnow, cypress darter, cypress minnow,Florida chub, Florida logperch, panhandle lily, mountainlaurel, Florida anise, and narrow pigtoe.
Coastal Areas of Escambia County. Importantresources are listed by precise geographic areas. PerdidoKey State Preserve and Private Lands to West: least tern(nesting), Godfrey’s golden aster; patches of scrub and coastalstrand on private lands west of Perdido Key State RecreationArea support Godfrey’s golden aster and are important tomigratory birds. Big Lagoon State Recreation Area:Cruise’s golden aster, black skimmer (nesting), Godfrey’sgolden aster, and salt marsh topminnow. Pensacola NavalAir Station: Wilson’s plover, spoon-flower sundew, white-topped pitcher plant, Godfrey’s golden aster, large-leavedjointweed, Gulf rockrose, and Carolina lilaeopsis. GulfIsland National Seashore (Perdido Key portion): least tern
CLOSING THE GAPS IN FLORIDA’S WILDLIFE HABITAT CONSERVATION SYSTEM 187
(nesting), Wilson’s plover, Cuban snowy plover, Godfrey’sgolden aster, and Gulf rockrose; coastal scrub and grasslandsimportant to migratory birds. Ft. Pickens State Park (SantaRosa Island): Santa Rosa Island beach mouse, Cuban snowyplover, piping plover, gopher tortoise; coastal grasslands,scrub, and mesic and scrubby flatwoods of value to coastalmigrants; least tern (nesting) at Pensacola Beach. GulfIsland National Seashore (Pensacola Beach to NavarreBeach): Santa Rosa Island beach mouse, American oyster-catcher (rare in western panhandle), Cuban snowy plover,piping plover, least tern (nesting), black skimmer (nesting;east of Langdon Beach), shorebird aggregation areas,Cruise’s golden aster, and Godfrey’s golden aster; coastal grasslands and maritime hammocks important tomigratory birds.
Coastal Areas of Walton and Santa Rosa Counties.Important resources are listed by more specific geographicareas. Santa Rosa Island National Seashore and Eglin AirForce Base (Navarre Beach to Destin): Santa Rosa beachmouse, Cuban snowy plover, piping plover, least tern (nest-ing colonies), black skimmer (Ocean City), shorebird aggre-gation areas, green turtle, Cruise’s golden aster, Godfrey’sgolden aster, perforate reindeer lichen, Gulf rockrose; coastalgrasslands, scrub, and mesic flatwoods important to migrato-ry. Moreno Point: indigo snake, Curtiss’ sandgrass,large-leaved jointweed, and Gulf coast lupine. HendersonBeach State Recreation Area: gopher tortoise, large-leavedjointweed, Gulf coast lupine; coastal grasslands important tomigratory birds. Four Prong Lake (and private lands toeast): panhandle meadowbeauty and Curtiss’ sandgrass.Topsail Hill (mix of private and recently acquired publiclands): Choctawhatchee beach mouse, Cuban snowy plover,piping plover, red-cockaded woodpecker, gopher tortoise,Curtiss’ sandgrass, spoon-leaved sundew, Gulf coast lupine;coastal strand, grasslands, and mesic flatwoods important tomigratory birds. Four Mile Point (private lands): gophertortoise, red-cockaded woodpecker, southern red lily. PointWashington (mix of private and public lands, includes BlueMountain Beach): round-tailed muskrat, red-cockaded wood-pecker, Strategic Habitat Conservation Area for western sea-side sparrows (also at Fluffy Landing across ChoctawhatcheeBay), gopher tortoise, southern red lily, Gulf coast lupine,large-leaved jointweed, Curtiss’ sandgrass, panhandle spiderlily; coastal scrub and scrubby pinelands important to migra-tory birds. Grayton Beach State Recreation Area:Strategic Habitat Conservation Area for Choctawhatcheebeach mouse (includes private lands), least tern, gopher tor-toise, large-leaved jointweed, Godfrey’s golden aster,Cruise’s golden aster, Gulf coast lupine; coastal scrub, mar-itime hammock, and beach dune habitats important to migra-tory birds. Seagrove Beach: private tract of coastal strandand scrub to the east constitutes critical habitat for theChoctawhatchee beach mouse. Deer Lake (private lands):least tern (nesting), Cuban snowy plover, piping plover,shorebird aggregation area, large-leaved jointweed,Godfrey’s golden aster, Gulf coast lupine; coastal scrub habi-tat. Inlet Beach (private lands): piping plover, black skim-mer, Gulf coast lupine, southern red lily; coastal grassland,scrub, and maritime hammock important to migratory birds.
Coastal Areas of Bay County. Important resources arelisted by more precise geographic areas. Powell Lake:Strategic Habitat Conservation Area for Cuban snowy plover;other species include Godfrey’s golden aster, Gulf coastlupine, and large-leaved jointweed. Panama City Beach(private lands north of U.S. Highway 98): historic record forred-cockaded woodpecker, Chapman’s crownbeard, andsouthern red lily. St. Andrews Bay: black skimmer,Strategic Habitat Conservation Areas for western seasidesparrows (coastal marshes along Easy Bay); other speciesinclude Wilson’s plover (West Bay Point, North Bay, andGoose Point), southern bald eagle, and shorebird aggregationareas. Tyndall Air Force Base/St. Andrews StateRecreation Area: Strategic Habitat Conservation Area forSt. Andrews beach mouse; piping plover, Cuban snowyplover, Wilson’s plover, black skimmer, least tern, least bit-tern, sandwich tern, Wilson’s plover, loggerhead turtle,southern red lily, Harper’s yellow-eyed grass, Drummond’syellow-eyed grass, Gulf coast lupine, Godfrey’s golden aster,Gulf rockrose, Chapman’s butterwort, Chapman’s crown-beard, giant water-dropwort, and southern milkweed; coastalhabitats also important to migratory birds.
FLORIDA GAME AND FRESH WATER FISH COMMISSION188
Figure 174 (a-c). Distribution of important resources in the Withlacoochee Region.
Figure 174a. Landsat land-cover map for the Withlacoochee Region.
Figure 174b. Strategic Habitat Conservation Areas and existing conservation lands.
CLOSING THE GAPS IN FLORIDA’S WILDLIFE HABITAT CONSERVATION SYSTEM 189
Section 8.1.11. Withlacoochee RegionSome of Florida’s best remaining examples of natural
sandhill and scrub are found in the Withlacoochee region(Figures 174a, 174b, and 174c). Throughout Levy, Citrus,Hernando, Marion, and Sumter counties, sizeable tracts ofthese dwindling natural communities still exist, and many arehigh in quality. However, most such areas are being devel-oped or else have undergone the permitting process requiredfor large-scale developments, and logging has removed thetrees from some of these areas. The prospects for adequatelyprotecting the remaining patches of these rare communitytypes dwindle each day. The proportion of land in theWithlacoochee region in some type of conservation status(22.1%) is slightly higher than the statewide average (19.6%).However, Levy County, with only 11.8% of its total acreagein some type of conservation area, is well below the statewideaverage of 15.2% for Florida counties. The remaining coun-ties in the region are above the statewide average. Some ofthe more important features of this region are referenced bynumber in Figure 174c and discussed in greater detail below.
Area 1. Southwest Marion County. Large tracts ofsandhill land cover that are threatened by expanding urbandevelopment. Many of the important areas described belowhave received permits for large-scale development projects,but smaller preservation areas may be feasible and are veryimportant to species such as Florida scrub jay, southeasternkestrel, and southeastern bat. Species occurrences are listedby more specific geographic areas. Near Barge CanalLands (Marion Oaks, near County Roads 484 and 200):Strategic Habitat Conservation Area for Florida scrub jay andsoutheastern American kestrel; other species include foxsquirrel, Florida sandhill crane, Bachman’s sparrow, short-tailed snake, gopher tortoise, gopher frog, Florida scrublizard, scrub bay, and longspurred mint. Westwood Acres(area defined by County Road 328 and State Roads 40 and54): fox squirrel, southeastern kestrel, Florida pine snake,gopher tortoise, and gopher frog. Rolling Hills: fox squirrel,southeastern American kestrel, Florida pine snake, gophertortoise, and gopher frog. Rainbow Lake Estates: foxsquirrel, Cooper’s hawk, southeastern American kestrel,gopher tortoise, and gopher frog.
Figure 174c. Hot spots of biological resources and rare species occurrence records.
FLORIDA GAME AND FRESH WATER FISH COMMISSION190
Area 2. Levy County sandhills. Large sandhill tractsstretching from Romeo (Marion County) to Fanning Springs.Occurrences of rare species are listed by more specific geo-graphic areas. South of Williston Highlands (from CountyRoad 316 south, east, and west of County Road 121; includingLake Stafford): fox squirrel, Bachman’s sparrow, Cooper’shawk, southeastern American kestrel, Florida burrowing owl,red-cockaded woodpecker, Florida sandhill crane, Florida bur-rowing owl, Florida pine snake, eastern indigo snake, gophertortoise, and gopher frog. Williston Heights to Alternate 27(west of County Road 121): fox squirrel, southeasternAmerican kestrel, Florida burrowing owl, gopher tortoise, andFlorida pine snake. Bronson and Surroundings (north ofAlternate 27 to county line): fox squirrel, southeasternAmerican kestrel, Florida sandhill crane, Florida scrub jay,Florida burrowing owl, eastern indigo snake, Florida pinesnake, and gopher tortoise.
Area 3. Wetlands in northeast Levy County (WaccasassaRiver, Station Pond, etc). Strategic Habitat ConservationArea for wood stork, other rare wading birds (little blue heronand snowy egret), and Florida sandhill crane. Mottled duckalso recorded in this area.
Area 4. Tracts of oak scrub and xeric upland hardwoodforest near Cedar Key State Preserve. Portions of the areamake up a Strategic Habitat Conservation Area for the Floridascrub jay. Other rare species recorded in unprotected areasinclude gopher tortoise and eastern indigo snake.
Area 5. West Levy County. Areas of hardwood swamp,pinelands, and upland hardwood forest along the SuwanneeRiver (unprotected areas are east of County Road 347).Portions of this area are included in a Strategic HabitatConservation Area designed for the American swallow-tailedkite. Other species recorded on unprotected lands in this areainclude little blue heron (rookery), limpkin, Florida pinesnake, and gopher tortoise.
Area 6. East Levy County. Pinelands, upland hardwoodforest, cypress swamp, and hardwood swamp surroundingGulf Hammock, Devil’s Hammock, Otter Creek, andWaccasassa River. Portions of this area are part of theStrategic Habitat Conservation Area proposed for theAmerican swallow-tailed kite and red-cockaded woodpecker.Additional rare species occur in the following geographicareas. Gulf Hammock: southeastern weasel, Gulf salt marshmink, southern bald eagle, little blue heron (rookery), greategret (rookery), eastern indigo snake, one-toed amphiuma,Gulf hammock dwarf siren, Texas anemone, pine-wood dain-ties, pinkroot, Florida water-parsnip, cedar elm, corkwood,and slender-leaved dragonhead. West of Otter Creek (RockyHammock, south State Road 24): fox squirrel, southeasternweasel, Cooper’s hawk, gopher tortoise, eastern indigo snake,Florida pine snake, one-toed amphiuma, slender-leaved drag-onhead. East of Otter Creek: Florida black bear, wood stork(rookery), little blue heron (rookery), eastern indigo snake,and gopher tortoise.
Area 7. North of Lebanon. Old-growth pine forests thatsupport fox squirrel, red-cockaded woodpecker, eastern indigosnake, gopher tortoise, and pine-wood dainties.
Area 8. South and east of Chassahowitzka NationalWildlife Refuge (east of U.S. 98). High quality tracts of sand-
hill, upland hardwood forest, and hardwood swamp landcover. Species recorded in the area include black bear, foxsquirrel, Cooper’s hawk, short-tailed hawk, southeasternAmerican kestrel, southern bald eagle, American swallow-tailed kite, limpkin, hairy woodpecker, Florida scrub jay,Florida sandhill crane, white ibis (rookery), great egret (rook-ery), gopher tortoise, one-toed amphiuma, Hobbs’ caveamphipod, Leitheuser’s cave crayfish, McLane’s cave cray-fish, sand butterfly pea, and pine pinweed.
Area 9. Central Hernando County. Mixture of sandhill,mixed pine-hardwood, upland hardwood hammock, pineland,and forested and herbaceous wetland types. Occurrences arelisted by specific geographic areas. South of CortezBoulevard (west of U.S. 41): fox squirrel, Florida sandhillcrane, Florida burrowing owl, southeastern American kestrel,limpkin, mottled duck, gopher tortoise, Leitheuser’s cavecrayfish, and pine pinweed. North of Cortez Boulevard(around Bailey Hill and County Road 491): fox squirrel,gopher tortoise, Florida sandhill crane, mottled duck, limpkin,white ibis (rookery), snowy egret (rookery), Florida burrow-ing owl, and southeastern American kestrel.
Area 10. Southeast Hernando and south Sumter counties.Forested wetlands and mesic pinelands (south of State Road50) associated with Green Swamp and the WithlacoocheeRiver. Strategic Habitat Conservation Areas for limpkin andseveral species of wading birds (breeding colonies containwhite ibis, wood stork, little blue heron, great egret, andsnowy egret) and Florida sandhill crane. Other speciesrecorded for the area include Florida black bear, fox squirrel,Florida long-tailed weasel, American swallow-tailed kite, baldeagle, southeastern American kestrel, southern bald eagle,mottled duck, gopher tortoise, and terrestrial peperomia.
Area 11. North Sumter County. Diverse mixture of sandpine scrub, oak scrub, sandhill, freshwater marsh, and forestedwetlands in close proximity. Portions of the area constitute aStrategic Habitat Conservation Area for Florida scrub jay andrare species of wading birds (little blue heron, white ibis,snowy egret, and great egret). Occurrences of rare species arelisted by specific geographic areas. North of State Road 44(east of Carlton Halfmoon Ranch): Florida scrub jay, south-eastern American kestrel, and gopher tortoise. LakePanasoffkee (south of State Road 44): southern bald eagle,Florida scrub jay, limpkin, and little blue heron (rookery).Wildwood (and nearby areas): little blue heron (rookeries),snowy egret (rookeries), tricolored heron (rookery), limpkin,and southeastern American kestrel.
Area 12. Lake Tsala Apopka (Citrus County). StrategicHabitat Conservation Area for limpkin and several rare wadingbirds (white ibis, wood stork, tricolored heron, little blue heron,snowy egret, and great egret) associated with nearby breedingcolonies. Important patches of unprotected habitat occur southof State Road 48 (near Bayhill and extending south to Pineola),east of Floral City, and northwest of Carlson. Other rarespecies recorded in the area include southern bald eagle,American swallow-tailed kite, Florida sandhill crane, limpkin,gopher tortoise, nodding caps, creeping-leaf stalkgrass, brittlemaidenhair fern, and dwarf spleenwort.
Area 13. Broad area containing a mixture of rangelandand small forest tracts in north and west Marion County (gen-
CLOSING THE GAPS IN FLORIDA’S WILDLIFE HABITAT CONSERVATION SYSTEM 191
erally north of U.S. 27). Rare species recorded in the areainclude fox squirrel, southeastern American kestrel, Floridasandhill crane, Florida burrowing owl, Florida scrub jay,Florida pine snake, Florida mountain-mint.
Area 14. West of Ocala National Forest. Broad area ofpineland, upland hardwood forest, cypress swamp, hardwoodswamp, and rangeland. Strategic Habitat Conservation Areafor Florida black bear. Other rare species are listed by specificgeographic areas. North of Ft. McCoy (north of CountyRoad 316, east of County Roads 318 and 200A, includingBlacksink Prairie): Florida scrub jay, Florida sandhill crane,southeastern American kestrel, limpkin, American swallow-tailed kite, white ibis (rookery), little blue heron (rookery),eastern indigo snake, gopher tortoise, gopher frog, and Ashe’ssavory. South of Ft. McCoy (east of County Road 200A,north of State Road 40, including Indian Lake and Grassyprairies): southeastern weasel, fox squirrel, hoary bat,American swallow-tailed kite, southeastern American kestrel,Florida sandhill crane, limpkin, least bittern, little blue heron(rookery), Florida pine snake, gopher frog, gopher tortoise,Florida pine snake, Florida scrub lizard, flatwoods salamander,tiger salamander, snail bullhead, and Florida cave amphipod.
Area 15. Sandhill and scrub land cover in central CitrusCounty (including Withlacoochee State Forest). Occurrencesare listed by specific geographic areas. CitrusSprings/Beverly Hills (north of State Road 44): fox squirrel,southeastern American kestrel, red-cockaded woodpecker,southern bald eagle. West of Lecanto: fox squirrel, Floridamouse, southeastern American kestrel, Florida burrowingowl, gopher tortoise, gopher frog, eastern indigo snake, short-tailed snake, southern lip fern, green ladies’-tresses, and wildcoco. South of Cleveland Boulevard: fox squirrel, Floridaburrowing owl, southeastern American kestrel, gopher tor-toise, and short-tailed snake. Withlacoochee State Forest,Citrus Tract: fox squirrel, red-cockaded woodpecker, south-eastern American kestrel, scrub bay, eastern indigo snake,short-tailed snake, incised groove-bur, and green ladies’-tresses. East of Citrus Tract (south of Inverness): foxsquirrel, southeastern bat (maternity cave), southern baldeagle, southeastern American kestrel, eastern indigo snake,and Hobbs’ cave amphipod.
Coastal Areas of Levy County. Portions of the areaconstitute Strategic Habitat Conservation Areas for severalrare wading birds and Scott’s seaside sparrow. Occurrencesof rare additional species are listed by specific geographicareas. Horseshoe Beach to Cedar Keys (includes LowerSuwannee River National Wildlife Refuge): Cedar keys mole skink, Gulf salt marsh mink, American oystercatcher,least tern, shorebird aggregation areas (spoil islands and oys-ter bars throughout the area), southern bald eagle, brown peli-can (rookery), white ibis (rookery), great egret (rookery), sea-side sparrow, Gulf salt marsh snake, Atlantic sturgeon,smooth beach sunflower, and maritime hammocks importantto migratory birds. Cedar Keys to Yankeetown: salt marshvole, southern bald eagle, Wilson’s plover, black skimmer(nesting), shorebird aggregation areas (oyster bars and spoilislands throughout the area), seaside sparrow (StrategicHabitat Conservation Area at Withlacoochee Bay).
Coastal Areas of Citrus and Hernando Counties.Portions of these counties constitute a Strategic HabitatConservation Area for the southern bald eagle and seasidesparrow. Occurrences of rare additional species are listed byspecific geographic areas. Crystal Bay (Chambers Island toOzello): West Indian manatee congregation areas, least tern(nesting areas), American oystercatcher, southern bald eagle,seaside sparrow, tricolored heron (rookeries), great egret(rookeries). St. Martins River/Homosassa Bay/PompanoKey: West Indian manatee congregation areas, seaside spar-row, southern bald eagle, Tampa vervain. HernandoCounty: southern bald eagle, little blue heron (rookery), tri-colored heron (rookery), Wilson’s plover, American oyster-catcher, and seaside sparrow.
SECTION 8.2. TECHNIQUES FOR PROTECTINGVALUED NATURAL RESOURCES
The resource maps described for each region provide aquick guide to locally important wildlife habitats and othernatural resources. Digital copies of these maps are availablefor use in a wide range of local land-use planning efforts.Incorporating these data into a geographical information sys-tem or other computerized mapping program permits a quickinitial review of current land uses, proposed land usechanges, proposed road projects, and a variety of other appli-cations. These data sets can be provided in either SPANS orERDAS formats.
Among the various instruments that might be used toexpand upon the minimum habitat conservation goals out-lined in this document are land acquisition, partial develop-ment, transfer of development rights, recreation and conser-vation easements, and “green lining.” Land acquisition andthe purchase of conservation easements are perhaps the mosteffective and least controversial of these techniques, and atleast 20 Florida counties are considering or have establishedlocal land acquisition programs. The focus of such programsis typically environmentally sensitive or endangered landsand recreation lands. County programs range in magnitudefrom $2-100 million with a mean of about $30 million andare typically based on ad valorem tax increases. Severalcities also have active land acquisition programs (e.g., BocaRaton and Tallahassee).
Local governments and regional planning councils playan important role in natural resource protection within theirrespective jurisdictions. Under the Developments ofRegional Impact (DRI) program, local governments mustconsider whether “the development will have a favorable orunfavorable impact on the environment and natural and his-torical resources of the region.” Local governments have atleast two other sources of authority for enacting environmen-tal protection requirements. First, cities and counties havehome rule powers granted by the Florida Constitution(Article VIII). Second, local governments also have compre-hensive planning and regulatory powers set forth in the LocalGovernment Comprehensive Planning and Land Development Regulation Act (Chapter 163.3161 FloridaStatutes). These same acts also grant powers to individualsresiding within the areas of jurisdiction.
FLORIDA GAME AND FRESH WATER FISH COMMISSION192
A useful habitat conservation technique that has grownout of regional and local government growth managementefforts is off-site mitigation. Through this process, landdevelopment projects are required to contribute funds to “mit-igation banks” that are used to purchase valuable lands sepa-rate from the impact areas. The Florida Game and FreshWater Fish Commission has established three off-site mitiga-tion “parks” primarily for upland habitats and species. Off-site mitigation banks are often selected in consultation withother conservation groups, and funds are also secured to pro-vide for the long-term management of the areas. Off-site miti-gation is an important option to consider when biologicalresources in an area are of local significance, yet not critical tomaintaining statewide populations of rare species.
A thorough description of other land conservation tech-niques goes beyond the scope of this document, but brief men-tion is made here to provide references to more lengthy dis-cussion of some of these topics. Diehl and Barrett (1988) pre-pared a manual on conservation easements that includes adiscussion of the problems inherent in these procedures.Brenneman and Bates (1984) describe methods for establish-ing a local land trust that can help to secure conservation ease-ments. The transfer of development rights has been applied inseveral areas of the country (Banach and Canavan 1987,Conant and Pizor 1988) with apparent success. Green lininghas been used in the Pinelands National Reserve in NewJersey (Corbett 1983). Land banking, which involves landacquisition by government for future use or disposal withoutadvance specification of the purpose of the acquisition (Strong1979), may also occasionally be used as a method for protect-ing valued natural resources.
CLOSING THE GAPS IN FLORIDA’S WILDLIFE HABITAT CONSERVATION SYSTEM 193
LITERATURE CITATIONS Bancroft, T. (project director). 1989. Relationship betweenthe reproductive ecology of the white-crowned pigeon andthe fruiting phenology of tropical hardwood hammocktrees. Final report. Project Number GFC-86-031. FloridaGame and Fresh Water Fish Commission, Tallahassee,Florida.
Bancroft, G. T., S. D. Jewel, and A. M. Strong. 1990.Foraging and nesting ecology of herons in the LowerEverglades relative to water conditions. Final Report.Environmental Sciences Division, South Florida WaterManagement District, West Palm Beach, Florida.
Bancroft, G. T., A. Strong, and M. Carrington. In prepara-tion. Deforestation and its effects on forest nesting birdsin the Florida Keys. National Audubon Society, Miami,Florida.
Bechtold, W. A., M. J. Brown, and R. M. Sheffield. 1990.Florida’s forests, 1987. Resource Bulletin SE-62.U.S.D.A. Forest Service, Southeastern Forest ExperimentStation, Asheville, North Carolina.
Beier, P. 1993. Determining minimum habitat areas and habi-tat corridors for cougars. Conservation Biology 7:94-108.
Belden, R. C. 1989. The Florida panther. Pages 515-532 inAudubon 1988/1989 Wildlife Report. National AudubonSociety, New York, New York.
Belden, R. C., T. C. Hines, and T. H. Logan. 1986. Floridapanther re-establishment. A discussion of the issues.Final performance report. Florida Game and Fresh WaterFish Commission, Tallahassee, Florida.
Belden, R. C., W. B. Frankenberger, R. T. McBride, and S. T.Schwikert. 1988. Panther habitat use in southern Florida.Journal Wildlife Management 52:660-663.
Belden, R. C., and W. Frankenberger. 1988. Florida panthercaptive breeding/reintroduction feasibility. AnnualPerformance Report. Florida Game and Fresh Water FishCommission, Tallahassee, Florida.
Belden, R. C., and B. Hagedorn. 1992. Feasibility of translo-cating panthers into northern Florida. Final performancereport. Florida Game and Fresh Water Fish Commission,Tallahassee, Florida.
Bellrose, F. C. 1976. Ducks, geese, and swans of NorthAmerica. Stackpole Books, Harrisburg, Pennsylvania.
Bennett, A. J. 1989. Movements and home ranges of Floridasandhill cranes. Journal of Wildlife Management 53:830-836.
Bildstein, K. L., G. T. Bancroft, P. J. Dugan, D. H. Gordon,R. M. Erwin, E. Nol, C. Payne, and S. E. Senner. 1991.Approaches to the conservation of coastal wetlands in thewestern hemisphere. Wilson Bulletin 103:218-254
Adams, L. W., and L. E. Dove. 1989. Wildlife reserves andcorridors in the urban environment. U.S. Department ofthe Interior, Fish and Wildlife Service, Washington, D.C.
Alt, G. 1979. Dispersal patterns of black bears in northeast-ern Pennsylvania—a preliminary report. Pages 186-199in Hugie, R. D. (ed.). Fourth Eastern Black BearWorkshop, Bangor, Maine.
Ambuel, B., and S. Temple. 1983. Area-dependent changesin bird communities and vegetation of southern Wisconsinforests. Ecology 64:1057-1068.
Andren, H., and P. Angelstam. 1988. Elevated predationrates as an edge effect in habitat islands: experimental evi-dence. Ecology 69:544-547.
Anonymous. 1988. Blackwater-Eglin Connector. File No.880131-57-1, Conservation and Recreation LandsProgram. Florida Department of Natural Resources,Tallahassee, Florida.
Anonymous. 1991. A species by county by habitat matrix.Florida Natural Areas Inventory, Tallahassee, Florida.
Anonymous. 1992. Conservation and recreation lands pro-gram annual report. Office of Land Use Planning andBiological Services, Florida Department of NaturalResources, Tallahassee, Florida.
Anonymous. 1993. Conservation and recreation lands pro-gram annual report. Office of Land Use Planning andBiological Services, Florida Department of NaturalResources, Tallahassee, Florida.
Baker, W. W. 1983. Decline and extirpation of a populationof red-cockaded woodpeckers in northwest Florida. Pages51-58 in Wood, D. A. (ed.). Red-cockaded woodpeckersymposium II. Florida Game and Fresh Water FishCommission, Tallahassee, Florida.
Baker, W. W. 1993. Status and distribution of the red-cock-aded woodpecker in Georgia: a 1992 update. Proceedingsof the third red-cockaded woodpecker symposium. U.S.Fish and Wildlife Service, Atlanta, Georgia.
Ballou, J., and K. Ralls. 1982. Inbreeding and juvenile mor-tality in small populations of ungulates: a detailed analy-sis. Biological Conservation 24:239-272.
Ballou, J. D., T. J. Foose, R. C. Lacy, and U. S. Seal. 1989.Florida panther (Felis concolor coryi). Population viabili-ty analysis and recommendations. Captive BreedingSpecialist Group, Species Survival Commission, I.U.C.N.,Gland, Switzerland.
Banach, M., and D. Canavan. 1987. Montgomery Countyagricultural preservation program. Pages 244-268 inBrower, D., and D. Carol (eds.). Managing land-use con-flicts: case studies in special area management. DukeUniversity Press, Durham, North Carolina.
FLORIDA GAME AND FRESH WATER FISH COMMISSION194
Bishop, M. 1987. Selection of potential reintroduction sitesand foster parents for whooping crane reintroduction.Final performance report. Florida Game and Fresh WaterFish Commission, Tallahassee, Florida.
Blair, W. F. 1951. Population structure, social behavior, andenvironmental relations in a natural population of the beachmouse Peromyscus polionotus leucocephalus.Contributions of the Laboratory of Vertebrate Biology,University of Michigan 48:1-47.
Bonnel, M. L., and R. K. Selander. 1974. Elephant seals:Genetic variation and near extinction. Science 184:908-909.
Brady, A. J., and M. R. Pelton. 1989. Effects of roads onblack bear movements in western North Carolina. WildlifeSociety Bulletin 17:5-10.
Brady, J. R., and D. S. Maehr. 1985. Distribution of blackbears in Florida. Florida Field Naturalist 13:1-7.
Brenneman, R. L., and S. M. Bates (eds.). 1984. Land-savingaction. Island Press, Covelo, California.
Browder, J. 1984. Wood stork feeding areas in southwestFlorida. Florida Field Naturalist 12:81-96.
Bryan, D. 1982. Social organization and territoriality in thelimpkin. M.S. Thesis. Florida State University,Tallahassee, Florida.
Bryan, A. L., Jr., and M. Coulter. 1987. Foraging flight char-acteristics of wood storks in east-central Georgia, U.S.A.Colonial Waterbirds 10:157-161.
Burke, R. L., J. Tasse, C. Badgley, S. R. Jones, N. Fishbein, S.Phillips, and M. E. Soulé. 1991. Conservation of theStephens’ kangaroo rat (Dipodomys stephensi): planningfor persistence. Bulletin of the Southern CaliforniaAcademy of Science 90(1):10-40.
Burt, W. H., and R. P. Grossenheider. 1976. A field guide tothe mammals. Houghton Mifflin Company, Boston,Massachusetts.
Carlock, D. M. 1984. Georgia status report. Pages 3-4 inMaehr, D., and J. R. Brady (eds.). Proceedings of the east-ern workshop on black bear management and research 7.Florida Game and Fresh Water Fish Commission,Tallahassee, Florida.
Carlson, D., and J. Rey. 1991. Multipurpose management ofFlorida’s mosquito control impoundments. Pages 163-177in Jennings, D. (compiler). Proceedings of the coastalnongame workshop. U.S. Fish and Wildlife Service,Atlanta, Georgia.
Cely, J. 1993. Status of the red-cockaded woodpecker inSouth Carolina. Proceedings of the third red-cockadedwoodpecker symposium. U.S. Fish and Wildlife Service,Atlanta, Georgia.
Chamberlain, E. B., Jr. 1960. Florida waterfowl populations,habitats and management. Technical Bulletin 7. FloridaGame and Fresh Water Fish Commission, Tallahassee,Florida.
Chesser, R. 1981. Chapter 4. Isolation by distance: relation-ship to the management of genetic resources. Pages 66-77in Schoenwald-Cox, C., S. Chambers, B. MacBryde, and L.Thomas (eds.). Genetics and conservation. A reference formanaging wild animals and plant populations. BenjaminCummings Publishing Company, Menlo Park, California.
Chesser, R., C. Reuterwall, and N. Ryman. 1982. Geneticdifferentiation of Scandinavian moose (Alces alces alces)populations over short geographical distances. Oikos39:125-130
Chesser, R. K., and N. Ryman. 1986. Inbreeding as a strate-gy in subdivided populations. Evolution 40:616-624.
Christman, S. P. 1988. Endemism and Florida’s interior sandpine scrub. Final Report. GFC-81-101. Florida Game andFresh Water Fish Commission, Tallahassee, Florida.
Conant, R. 1975. Reptiles and amphibians of east centralNorth America. Third Edition. Houghton MifflinCompany, Boston, Massachusetts.
Conant, H. K., and P. J. Pizor. 1988. Economic and fiscalsupport programs. Pages 232-258 in Collins, B. R., and E.W. Russel (eds.). Protecting the New Jersey Pinelands: anew direction in landuse management. Rutgers UniversityPress, New Brunswick, New Jersey.
Corbett, M. R. 1983. Greenline parks: land conservationtrends for the eighties and beyond. National Parks andConservation Association, Washington, D.C.
Cox, J. A. 1987. Status and distribution of the Florida scrubjay. Florida Ornithological Society Special PublicationNo. 3.
Cox, J., W. R. Baker, and D. Wood. 1993. Status and distrib-ution of the red-cockaded woodpecker in Florida: a 1992update. Proceedings of the third red-cockaded woodpeckersymposium. U.S. Fish and Wildlife Service, Atlanta,Georgia.
Cox, J., D. Inkey, and R. Kautz. 1987. Ecology and habitatprotection needs of gopher tortoise (Gopherus polyphemus)populations found on lands slated for large-scale develop-ments in Florida. Nongame Wildlife Program TechnicalReport 4. Florida Game and Fresh Water FishCommission, Tallahassee, Florida.
Crow, J. F., and M. Kimura. 1970. An introduction to popu-lation genetics theory. Harper and Row PublishingCompany, New York, New York.
Cruz, A., T. Manolis, and J. Wiley. 1988. The shiny cow-bird: a brood parasite expanding its range in the Caribbeanregion. Ornithological Monographs 36:607-620.
CLOSING THE GAPS IN FLORIDA’S WILDLIFE HABITAT CONSERVATION SYSTEM 195
Custer, T. W., and R. G. Osborn. 1978. Feeding-sitedescription of three heron species near Beaufort, NorthCarolina. Pages 255-360 in Sprunt, A., IV, J. C. Ogden,and S. Winckler (eds.). Wading birds. National AudubonSociety Research Report 7. National Audubon Society,New York, New York.
Dalrymple, G. H. 1988. The herptofauna of Long Pine Key,Everglades National Park, in relation to vegetation andhydrology. Pages 72-86 in Szaro, R. C., K. E. Severson,and D. R. Patton (technical coordinators). Management ofamphibians, reptiles, and small mammals in NorthAmerica. General Technical Report RM-166. U.S. Forest Service, Ft. Collins, Colorado.
Davis, J. H. 1967. General map of natural vegetation ofFlorida. Circular S-178. Agricultural Experiment Station,Institute of Food and Agricultural Science, University ofFlorida, Gainesville, Florida.
DeGange, A. R. 1978. American oystercatcher. Pages 37-39 in Kale, H. W., II (ed.). Rare and endangered biota ofFlorida. Volume 2. Birds. University Presses of Florida,Gainesville, Florida.
deHaven-Smith, L., and D. Gatlin. 1985. The Florida voter.Florida Environment and Urban Issues 12(3):14-18.
Delany, M. 1991. Florida grasshopper sparrow habitat man-agement needs. Final performance report. Study No.7513. Florida Game and Fresh Water Fish Commission,Tallahassee, Florida.
Delany, M. 1993. Florida grasshopper sparrow populationsurvey. Final performance report. Study No. 7514.Florida Game and Fresh Water Fish Commission,Tallahassee, Florida.
Delany, M., and J. Cox. 1986. Florida grasshopper sparrowbreeding distribution and abundance in 1984. FloridaField Naturalist 14:100-104.
Delany, M., H. Stevenson, and R. McCracken. 1985.Distribution, abundance, and habitat of the Floridagrasshopper sparrow. Journal of Wildlife Management49:626-631.
Delorme Mapping Company. 1989. Florida atlas andgazetteer. Third edition. DeLorme Mapping Company,Freeport, Maine.
DeLotelle, R., J. Newman, and A. Jerauld. 1983. Habitat useby red-cockaded woodpeckers in central Florida. Pages59-67 in Wood, D. (ed.). Proceedings. Red-cockadedwoodpecker symposium II. Florida Game and FreshWater Fish Commission, Tallahassee, Florida.
Diehl, J., and T. Barrett. 1988. The conservation easementhandbook. The Land Trust Exchange and The Trust forPublic Land, Alexandria, Virginia.
Doren, R. F., D. R. Richardson, and R. E. Roberts. 1987.Prescribed burning of the sand pine scrub community:Yamato scrub, a test case. Florida Scientist 50:184-192.
Duda, M. D. 1987. Floridians and wildlife. Sociologicalimplications for wildlife conservation in Florida.Nongame Wildlife Program Technical Report No. 2.Florida Game and Fresh Water Fish Commission,Tallahassee, Florida.
Dueser, R. D., J. L. Dooley, Jr., and G. J. Taylor. 1988.Habitat structure, forest composition, and landscapedimensions as components of habitat suitability for theDelmarva fox squirrel. Pages 414-421 in Szaro, R. C., K.E. Severson, and D. R. Patton (technical coordinators).Management of amphibians, reptiles, and small mammalsin North America. General Technical Report RM-166.U.S. Forest Service, Ft. Collins, Colorado.
Dwyer, N., and G. Tanner. 1992. Nesting success in Floridasandhill cranes. Wilson Bulletin 104:2231.
East, R. 1981. Area requirements and conservation status oflarge African mammals. Nyala 7:3-20.
Eisenberg, J. 1980. The density of biomass of tropical mam-mals. Pages 25-55 in Soulé, M., and B. Wilcox (eds.).Conservation biology: an evolutionary-ecological per-spective. Sinauer Associates, Inc., Sunderland,Massachusetts.
Eisner, T., K. D. McCormick, M. Sakaino, M. Eisner, S. R.Smedley, D. J. Aneshansley, M. Deyrup, R. L. Myers, andH. Meinwald. 1990. Chemical defense of a rare mintplant. Chemoecology 1:30-37.
Endler, J. 1972. Geographic variation, speciation, andclines. Princeton Monographs in Population Biology 10.Princeton University Press, Princeton, New Jersey.
Enge, K., M. Bentzien, and H. F. Percival. 1986. Floridascrub lizard status survey. Florida Cooperative Fish andWildlife Research Unit Technical Report No. 26.University of Florida, Gainesville, Florida.
Extine, D., and J. Stout. 1987. Dispersion and habitat occu-pancy of the beach mouse, Peromyscus polionotusniveiventris. Journal of Mammalogy 68:297-304.
Exum, J. H., J. A. McGliney, D. W. Speake, J. L. Buckner,and F. M. Stanley. 1987. Ecology of the eastern wildturkey in an intensively managed pine forest in southernAlabama. Bulletin of the Tall Timbers Research Station23:1-78.
Faeth, S. H., and T. C. Kane. 1978. Urban biogeography:city parks as islands for Diptera and Coleoptera.Oecologia 32:127-133.
FLORIDA GAME AND FRESH WATER FISH COMMISSION196
Fernald, R. 1989. Coastal xeric scrub communities of theTreasure Coast Region, Florida: A summary of their distri-bution and ecology, with guidelines for their preservationand management. Nongame Wildlife Program TechnicalReport No. 6. Florida Game and Fresh Water FishCommission, Tallahassee, Florida.
Fitzpatrick, J., G. Woolfenden, and M. Kopeny. 1991.Ecology and development-related habitat requirements ofthe Florida scrub jay (Aphelocoma coerulescenscoerulescens). Nongame Wildlife Program TechnicalReport No. 8. Florida Game and Fresh Water FishCommission, Tallahassee, Florida.
Florida Natural Areas Inventory. 1990. Guide to the naturalcommunities of Florida. Florida Natural Areas Inventory,Tallahassee, Florida.
Florida Natural Areas Inventory. 1992. Element rank expla-nations. Florida Natural Areas Inventory, Tallahassee,Florida.
Florida Ornithological Society. 1992. Field observation com-mittee winter report. Florida Field Naturalist 20:73-78.
Foster, M., and S. Humphrey. 1993. Effectiveness of wildlifecrossings in reducing animal/auto collisions on Interstate75, Big Cypress Swamp, Florida. Final Report. FloridaGame and Fresh Water Fish Commission, Tallahassee,Florida.
Frank, P., and S. Humphrey. 1992. Anastasia Island beachmouse study. Final Report. Florida Game and FreshWater Fish Commission, Tallahassee, Florida.
Franklin, I. 1980. Evolutionary change in small populations.Pages 135-149 in Soulé, M., and B. Wilcox (eds.).Conservation biology: an evolutionary-ecological perspec-tive. Sinauer Associates, Sunderland, Massachusetts.
Frederick, P., and M. Collopy. 1988. Reproductive ecologyof wading birds in relation to water conditions in theFlorida Everglades. Technical Report No. 30. FloridaCooperative Fish and Wildlife Research Unit, School ofForest Resources and Conservation, University of Florida,Gainesville, Florida.
Futuyma, D. 1979. Evolutionary biology. SinauerAssociates, Inc., Sunderland, Massachusetts.
Gilbert, L. 1980. Food web organization and the conserva-tion of neotropical diversity. Pages 11-33 in Soulé, M.,and B. Wilcox (eds.). Conservation biology: an evolution-ary-ecological perspective. Sinauer Associates, Inc.,Sunderland, Massachusetts.
Gilpin, M. E. 1987. Spatial structure and population vulner-ability. Pages 125-139 in Soulé, M. (ed.). Viable popula-tions for conservation. Cambridge University Press,Cambridge, Massachusetts.
Goodman, D. 1987a. Consideration of stochastic demogra-phy in the design and management of biological reserves.Natural Resources Modeling 1:205-234.
Goodman, D. 1987b. The demography of chance extinction.Pages 11-34 in Soulé, M. (ed.). Viable populations forconservation. Cambridge University Press, Cambridge,Massachusetts.
Gore, J. 1992. Gray bat. Myotis grisescens. Pages 63-70 inHumphrey, S. (ed.). Rare and endangered biota of Florida.Volume 1. Mammals. University Press of Florida,Gainesville, Florida.
Gore, J., and C. Chase, III. 1989. Snowy plover breeding dis-tribution. Final performance report. Florida Game andFresh Water Fish Commission, Tallahassee, Florida.
Gore, J., and T. Schaefer. 1993. Santa Rosa beach mousesurvey. Annual performance report. Florida Game andFresh Water Fish Commission, Tallahassee, Florida.
Graves, G., and N. Gotelli. 1983. Neotropical land-bridgeavifaunas: new approaches to null hypotheses inbiogeography. Oikos 41:322-333.
Green, D. 1993. Overview of red-cockaded woodpeckerhabitat on Eglin Air Force Base. Florida Department ofNatural Resources, Resource Management Notes 5(2):22.
Haig, S., and J. Plissner. 1993. Distribution and abundanceof piping plovers: results and implications of the 1991international census. Condor 95:145-156.
Hall, H., and J. Newsome. 1976. Summer home ranges andmovements of bobcats in bottomland hardwoods of south-ern Louisiana. Proceedings of the Annual Conference ofthe Southeastern Association Fish and Wildlife Agencies 30:427-436.
Hamel, P. 1992. The land manager’s guide to the birds of thesouth. General Technical Report SE-22. U.S. ForestService, Atlanta, Georgia.
Harris, L. D. 1984. The fragmented forest; island biogeo-graphic theory and the preservation of biotic diversity.University of Chicago Press, Chicago, Illinois.
Harris, L. D. 1985. Conservation corridors: A highway sys-tem for wildlife. ENFO Report 85-5. EnvironmentalInformation Center of the Florida ConservationFoundation, Inc., Winter Park, Florida.
Harris, L. D. 1988. Edge effects and conservation of bioticdiversity. Conservation Biology 2:330-332.
Harris, L. D. , L. D. White, J. E. Johnston, and D. G.Milchunas. 1974. Impact of forest plantations on NorthFlorida wildlife and habitat. Proceedings of the AnnualConference of the Southeastern Association of Game andFish Commissioners 38:87-96.
CLOSING THE GAPS IN FLORIDA’S WILDLIFE HABITAT CONSERVATION SYSTEM 197
Harris, R., and F. W. Allendorf. 1989. Genetically effectivepopulation sizes of large mammals: assessment of estima-tors. Conservation Biology 2:181-191.
Harris, R. B., L. A. Maguire, and M. L. Shaffer. 1987.Sample sizes for minimum viable population estimation.Conservation Biology 1:72-76.
Harrison, S., and J. F. Quinn. 1989. Correlated environ-ments and the persistence of metapopulations. Oikos56:293-298.
Hartman, B. J. 1978. Description of major terrestrial andwetland habitats of Florida. Pages xvi-xix in Kale, H. W.,II. (ed.). Rare and endangered biota of Florida. Volumetwo. Birds. University Presses of Florida, Gainesville,Florida.
Hellgren, E. C., and M. R. Vaughn. 1989. Demographicanalysis of a black bear population in the Great DismalSwamp. Journal of Wildlife Management 53:969-977.
Hellgren, E. C., M. R. Vaughan, and D. F. Stauffer. 1991.Macrohabitat use by black bears in a southeastern wetland.Journal of Wildlife Management 55:442-448.
Hill, E. A. 1989. Population dynamics, habitat, and distribu-tion of the Alabama beach mouse. M.S. thesis, AuburnUniversity, Auburn, Alabama.
Hillman, L. L., and D. L. Yow. 1986. Timber managementfor black bear. Proceedings of the Eastern Workshop onBlack Bear Research and Management 8:125-136.
Hiscock, J. W. 1986. Protecting national park system bufferzones: existing, proposed, and suggested authority.Journal of Energy Law Policy 7:35-94.
Holler, N. 1992a. Choctawhatchee beach mouse.Peromyscus polionotus allophrys. Pages 76-86 inHumphrey, S. (ed). Rare and endangered biota of Florida.Volume 1. Mammals. University Press of Florida,Gainesville, Florida.
Holler, N. 1992b. Perdido Key beach mouse. Peromyscuspolionotus trissyllepsis. Pages 102-109 in Humphrey, S.(ed.). Rare and endangered biota of Florida. Volume 1.Mammals. University Press of Florida, Gainesville,Florida.
Holler, N. R., and D. W. Mason. 1987. Reestablishment ofPerdido Key and Choctawhatchee beach mice into areas ofunoccupied critical habitat. Journal of the AlabamaAcademy of Science 58:66.
Holt, E. G. 1930. Nesting of the sandhill crane in Florida.Wilson Bulletin 42:163-183.
Hovis, J., and J. Gore. 1993. Southeastern bat maternitycaves. A proposal to the Conservation and RecreationLands Committee. Florida Game and Fresh Water FishCommission, Tallahassee, Florida.
Howard, W. E. 1949. Dispersal, amount of inbreeding, andlongevity in a local population of prairie deer mice on theGeorge Reserve, southern Michigan. Contributions to theLaboratory of Vertebrate Biology, University of Michigan43:1-50.
Howe, R., G. Davis, and V. Mosca. 1991. The demographicsignificance of “sink” populations. BiologicalConservation 57:239-255.
Humphrey, S. R. 1992a. Pallid beach mouse. Peromyscuspolionotus decoloratus. Recently extinct. Pages 19-23 inHumphrey, S. (ed.). Rare and endangered biota ofFlorida. Volume 1. Mammals. University Press ofFlorida, Gainesville, Florida.
Humphrey, S. R. 1992b. Chadwick Beach cotton mouse.Peromyscus polionotus decoloratus. Recently extinct.Pages 24-28 in Humphrey, S. (ed.). Rare and endangeredbiota of Florida. Volume 1. Mammals. University Pressof Florida, Gainesville, Florida.
Humphrey, S. R. (ed.). 1992c. Rare and endangered biota ofFlorida. Volume I. Mammals. University Press ofFlorida, Gainesville, Florida.
Humphrey, S. R., and D. B. Barbour. 1979. Status and habi-tat of eight kinds of endangered and threatened rodents inFlorida. Special Scientific Report No. 2. Florida StateMuseum, University of Florida, Gainesville, Florida.
Humphrey, S. R., and D. Barbour. 1981. Status and habitatof three subspecies of Peromyscus polionotus in Florida.Journal of Mammalogy 62:840-844.
Humphrey, S. R., J. F. Eisenberg, and R. Franz. 1985.Possibilities for restoring wildlife of a longleaf pine savan-na in an abandoned citrus grove. Wildlife Society Bulletin13:487-496.
Humphrey, S. R., and P. Frank. 1992. Anastasia Islandbeach mouse. Peromyscus polionotus phasma. Pages 94-101 in Humphrey, S. (ed.). Rare and endangered biota ofFlorida. Volume 1. Mammals. University Press ofFlorida, Gainesville, Florida.
Humphrey, S. R., and J. Gore. 1992. Southeastern brownbat. Myotis austroriparius. Pages 335-243 in Humphrey,S. (ed.). Rare and endangered biota of Florida. Volume 1.Mammals. University Press of Florida, Gainesville,Florida.
Humphrey, S. R., and P. G. R. Jodice. 1992. Big Cypressfox squirrel. Sciurus niger avicennia. Pages 224-233 inHumphrey, S. (ed.). Rare and endangered biota ofFlorida. Volume I. Mammals. University Press ofFlorida, Gainesville, Florida.
FLORIDA GAME AND FRESH WATER FISH COMMISSION198
Jackson, D., and E. Milstrey. 1989. The fauna of gopher tor-toise burrows. Pages 86-98 in Diemer, J., D. Jackson, J.Landers, J. Layne, and D. Wood (eds.). Proceedings:gopher tortoise relocation symposium. Nongame WildlifeProgram Technical Report No. 5. Florida Game and FreshWater Fish Commission, Tallahassee, Florida.
James, F. C. 1992. St. Andrews beach mouse. Peromyscuspolionotus peninsularis. Pages 87-93 in Humphrey, S.(ed.). Rare and endangered biota of Florida. Volume 1.Mammals. University Press of Florida, Gainesville,Florida.
James, F. C. 1993. Status of the red-cockaded woodpeckeron the Apalachicola National Forest. Proceedings of thethird red-cockaded woodpecker symposium. U.S. Fishand Wildlife Service, Atlanta, Georgia.
Jansen, D. 1993. Status of the red-cockaded woodpecker inthe Big Cypress National Preserve. Proceedings of thethird red-cockaded woodpecker symposium. U.S. Fishand Wildlife Service, Atlanta, Georgia.
Janzen, D. 1983. No park is an island: increase ininterference from outside as park size decreases. Oikos41:402-410.
Janzen, D. 1986. The external threat. Pages 286-303 inSoulé, M. (ed.). Conservation biology: the science ofscarcity and diversity. Sinauer Associates, Inc.,Sunderland, Massachusetts.
Johnson, A. F., and M. G. Barbour. 1990. Dunes and mari-time forests. Pages 249-480 in Myers, R., and J. Ewel(eds.). Ecosystems of Florida. University of CentralFlorida Press, Orlando, Florida.
Johnson, A. F., and J. Muller. 1993. An assessment ofFlorida’s remaining coastal upland natural communities:final summary report. Florida Natural Areas Inventory,Tallahassee, Florida.
Johnson, F. A., F. Montalbano, and T. Hines. 1984.Population dynamics and status of the mottled duck inFlorida. Journal of Wildlife Management 48:1137-1143.
Johnson, F. A., F. Montalbano, J. Truitt, and D. Eggeman.1991. Distribution, abundance, and habitat preferences ofmottled ducks in Florida. Journal of Wildlife Management55:476-487.
Juday, G. P. 1983. The problem of large mammals in naturalareas selection: examples from the Alaska ecologicalreserves system. Natural Areas Journal 3:24-30.
Kahl, M. 1964. Food ecology of the wood stork (Mycteriaamericana) in Florida. Ecological Monographs 34:97-117.
Kale, H. W., II (ed.). 1978. Rare and endangered biota ofFlorida. Volume two. Birds. University Presses ofFlorida, Gainesville, Florida.
Kale, H. W., II, B. Pranty, B. Stith, and W. Biggs. 1992. Anatlas of Florida’s breeding birds. Final report. NongameWildlife Program, Florida Game and Fresh Water FishCommission, Tallahassee, Florida.
Kantola, A. T. 1986. Fox squirrel home range and mast cropsin Florida. M.S. thesis, University of Florida, Gainesville.
Kantola, A. T. 1992. Sherman’s fox squirrel. Sciurus nigershermani. Pages 234-241 in Humphrey, S. (ed.). Rare andendangered biota of Florida. Volume 1. Mammals.University Press of Florida, Gainesville, Florida.
Kautz, R. S. 1984. Criteria for evaluating impacts of devel-opment on wildlife habitats. Proceedings of the AnnualConference of the Southeastern Association of Fish andWildlife Agencies 38:121-136.
Kautz, R. S. 1993. Trends in Florida wildlife habitat 1936-1987. Florida Scientist 56:7-24.
Kautz, R. S., D. T. Gilbert, and G. M. Mauldin. 1993.Vegetative cover in Florida based on 1985-1989 LandsatThematic Mapper imagery. Florida Scientist 56:135-154.
Keiter, R. B. 1985. On protecting the national parks from theexternal threats dilemma. Land and Water Law Review20:255-420.
Keiter, R. B., and W. A. Hubert. 1987. Legal considerationin challenging external threats to Glacier National Park,Montana, U.S.A. Environmental Management 11:121-126.
Kochman, H., and S. Christman. 1992a. Atlantic salt marshsnake. Nerodia clarkii taeniata. Pages 111-116 in Moler,P. (ed.). Rare and endangered biota of Florida. VolumeIII. Amphibians and reptiles. University Press of Florida,Gainesville, Florida.
Kochman, H., and S. Christman. 1992b. Gulf salt marshsnake. Nerodia clarkii clarkii. Pages 237-241 in Moler, P.(ed.). Rare and endangered biota of Florida. Volume III.Amphibians and reptiles. University Press of Florida,Gainesville, Florida.
Koenig, W. 1988. On determination of viable population sizein birds and mammals. Wildlife Society Bulletin 16:230-234.
Kushlan, J. 1976. Feeding behavior of North Americanherons. Auk 96:114-122.
Lacy, R. C. 1987. Loss of genetic diversity from managedpopulations: interacting effects of drift, mutation, immi-gration, selection, and population subdivision.Conservation Biology 1:143-158.
Land Acquisition Advisory Council. 1991. Addendum 6.Final report. Florida Preservation 2000 needs assessment,land management needs and costs committee. FloridaDepartment of Natural Resources, Tallahassee, Florida.
CLOSING THE GAPS IN FLORIDA’S WILDLIFE HABITAT CONSERVATION SYSTEM 199
Lande, R. 1988. Genetics and demography in biologicalconservation. Science 241:1455-1460.
Lande, R., and G. Barrowclough. 1987. Effective populationsize, genetic variation, and their use in population man-agement. Pages 87-124 in Soulé, M. (ed.). Viable popula-tions for conservation. Cambridge University Press,Cambridge, Massachusetts.
Landin, M. 1991. Need, construction, and management ofdredged material islands for wildlife. Pages 99-117 inJennings, D. (compiler). Proceedings of the coastalnongame workshop. U.S. Fish and Wildlife Service,Atlanta, Georgia.
Laurance, W. F. 1991. Edge effects in tropical forest frag-ments: application of a model for the design of naturereserves. Biological Conservation 57:205-219.
LaVal, R. K., R. L. Clawson, M. L. LaVal, and W. Caire.1977. Foraging behavior and nocturnal activity patterns ofMissouri bats, with special emphasis on the endangeredspecies Myotis grisescens and Myotis sodalis. Journal ofMammalogy 58:592-599.
Layne, J. N. 1974. The land mammals of south Florida.Pages 386-413 in Gleason, P. (ed.). Environments ofsouth Florida: present and past. Miami GeologicalSociety Memoir No. 2, Miami, Florida.
Layne, J. N. 1978a. Audubon’s crested caracara. Pages 34-36 in Kale, H. W., II (ed.). Rare and endangered biota ofFlorida. Volume two. Birds. University Presses ofFlorida, Gainesville, Florida.
Layne, J. N. (ed.). 1978b. Rare and endangered biota ofFlorida. Volume one. Mammals. University Presses ofFlorida, Gainesville, Florida.
Layne, J. N., and D. A. Wassmer. 1988. Records of the pan-ther in Highlands County, Florida. Florida FieldNaturalist 16:70-72.
Leberg, P. 1991. Influence of fragmentation and bottleneckson genetic divergence of wild turkey populations.Conservation Biology 5:522-530.
Loope, L. L. 1992. An overview of problems with intro-duced plant species in national parks and reserves of theUnited States. Pages 115-137 in Stone, C. P., S. W.Smith, and H. T. Tunison (eds.). Alien plant invasions inHawaii: management and research in near-native ecosys-tems. Cooperative National Park Resources Studies Unit,University of Hawaii, Honolulu.
Lotter, C. F., and G. W. Cornwell. 1969. Comparison of air-plane, airboat, and helicopter censusing Florida ducks,Anas platyrhynchos fulvigula. Proceedings of the AnnualConference of the Southeastern Association of Game andFish Commissioners 23:97-101.
Maehr, D. S. 1987. Florida panther movements, social orga-nization, and habitat utilization. Annual performancereport (E-1-11). Florida Game and Fresh Water FishCommission, Tallahassee, Florida.
Maehr, D. S. 1990. The Florida panther and private lands.Conservation Biology 4:167-170.
Maehr, D. S. 1992. Florida panther. Felis concolor coryi.Pages 176-189 in Humphrey, S. (ed.). Rare and endan-gered biota of Florida. Volume I. Mammals. UniversityPress of Florida, Gainesville, Florida.
Maehr, D. S., E. D. Land, and J. C. Roof. 1991. Florida pan-thers. National Geographic Research and Exploration7:414-431.
Maehr, D. S., J. N. Layne, E. D. Land, J. W. McCown, and J.Roof. 1988. Long distance movement of a Florida blackbear. Florida Field Naturalist 16:1-6.
Maehr, D. S., and J. Wooding 1992. Florida black bear.Ursus americanus floridanus. Pages 265-275 inHumphrey, S. (ed.). Rare and Endangered Biota ofFlorida. Volume I. Mammals. University Press ofFlorida, Gainesville, Florida.
Malecot, G. 1975. Heterozygosity and relationship in regu-larly subdivided populations. Theoretical PopulationBiology 8:212-241.
Manlove, R., P. Ramsey, J. Avise, and M. Smith. 1979.Genetics of white-tailed deer in South Carolina. Journalof Wildlife Management 43:136-142.
McComb, W. C., S. A. Bonney, R. M. Sheffield, and N. D.Cost. 1986. Den tree characteristics and abundance inFlorida and South Carolina. Journal of WildlifeManagement 50:584-591.
McCord, C., and J. Cardoza. 1982. Chapter 39. Bobcat andlynx. Pages 728-766 in Chapman, J., and G. Feldhamer(eds.). Wild mammals of North America. University ofChicago Press, Chicago, Illinois.
Means, D. 1992. Pine barrens treefrog. Hyla andersoni.Pages 20-25 in Moler, P. (ed.). Rare and endangered biotaof Florida. Volume III. Amphibians and reptiles.University Press of Florida, Gainesville, Florida.
Meyer, K., and M. W. Collopy. 1990. Status, distribution,and habitat requirements of the American swallow-tailedkite (Elanoides forficatus) in Florida. Final report.Nongame Wildlife Program, Florida Game and FreshWater Fish Commission, Tallahassee, Florida.
Mills, L., M. Soulé, and D. Doak. 1993. The keystone-species concept in ecology and conservation. BioScience43:219-224.
FLORIDA GAME AND FRESH WATER FISH COMMISSION200
Millsap, B. 1987. Summer concentration of American swal-low-tailed kites at Lake Okeechobee, Florida, with com-ments on post-breeding movements. Florida FieldNaturalist 15:85-92.
Millsap, B. 1991. Crested caracara population survey. Finalprogress report. Florida Game and Fresh Water FishCommission, Tallahassee, Florida.
Millsap, B., and C. Bear. 1989. Annual performance report.Cape Coral burrowing owl population monitoring. FloridaGame and Fresh Water Fish Commission, Tallahassee,Florida.
Millsap, B., J. Gore, D. Runde, and S. Cerulean. 1990.Setting priorities for the conservation of fish and wildlifespecies in Florida. Wildlife Monographs 111.
Moler, P. E. (ed.). 1992a. Rare and endangered biota ofFlorida. Volume III. Amphibians and reptiles. UniversityPress of Florida, Gainesville, Florida.
Moler P. 1992b. American crocodile. Crocodylus acutus.Pages 83-89 in Moler, P. E. (ed.). Rare and endangeredbiota of Florida. Volume III. Amphibians and reptiles.University Press of Florida, Gainesville, Florida.
Moler P. 1992c. Florida bog frog. Rana okaloosae. Pages30-33 in Moler, P. E. (ed.). Rare and endangered biota ofFlorida. Volume III. Amphibians and reptiles. UniversityPress of Florida, Gainesville, Florida.
Mollohan, C., and A. LeCount. 1989. Problems of maintain-ing a viable black bear population in a fragmented forest.Pages 149-159 in Tecle, A., W. Covington, and R. Hamre(technical coordinators). Multi-resource management ofponderosa pine forests. General Technical Report RM-185. U.S. Forest Service, Ft. Collins, Colorado.
Moore, F. 1992. Migrant songbirds at a stopover site inMississippi. Wilson Bulletin 104:32-40.
Moore, J. C. 1956. Variation in the fox squirrel in Florida.American Midland Naturalist 55:41-56.
Moore, J. C. 1957. The natural history of the fox squirrelSciurus niger shermani. Bulletin of the American Museumof Natural History 113:1-71.
Muller, J. W., E. D. Hardin, D. R. Jackson, S. E. Gatewood,and N. Caire. 1989. Summary report on the vascularplants, animals, and plant communities endemic to Florida.Nongame Wildlife Program Technical Report No. 7,Florida Game and Fresh Water Fish Commission,Tallahassee, Florida.
Myers, R. L. 1990. Scrub and high pine. Pages 150-193 inMyers, R., and J. Ewel (eds.). Ecosystems of Florida.University of Central Florida Press, Orlando, Florida.
Mykytka, J., and M. Pelton. 1989. Management strategies forFlorida black bears based on home range habitat composi-tion. International Conference on Bear Research andManagement 8:161-167.
Nesbitt, S. 1978. Limpkin. Pages 7-88 in Kale, H. W., II(ed.). Rare and endangered biota of Florida. Volume two.Birds. University Presses of Florida, Gainesville, Florida.
Nesbitt, S., and J. Carpenter. 1993. Survival and movementsof greater sandhill cranes experimentally released inFlorida. Journal of Wildlife Management 57:673-679.
Nesbitt, S., A. Jerauld, and B. Harris. 1983. Red-cockadedwoodpecker summer range sizes in southwest Florida.Pages 68-71 in Wood, D. (ed.). Proceedings: red-cockad-ed woodpecker symposium II. Florida Game and FreshWater Fish Commission, Tallahassee, Florida.
Nesbitt, S., and K. Williams. 1990. Home range and habitatuse of Florida sandhill cranes. Journal of WildlifeManagement 25:92-96.
Noon, B. 1992. Corridor use by small vertebrates. Bulletinof the Ecological Society of America 73:247.
Norse, E. A., K. L. Rosenbaum, D. S. Wilcove, B. A. Wilcox,W. H. Romme, D. W. Johnston, and M. L. Stout. 1986.Conserving biological diversity in our National Forests.The Wilderness Society, Washington D.C.
Noss, R. 1983. A regional landscape approach to maintaindiversity. BioScience 3:700-706.
Noss, R. 1991. From endangered species to biodiversity.Pages 227-246 in Kohm, K. (ed.). Balancing on the brinkof extinction. Island Press, Washington, D.C.
Noss, R., and L. Harris. 1986. Nodes, networks, andMUM’s: Preserving diversity at all scales. EnvironmentalManagement 10:299-309.
O’Brien, S., and J. Evermann. 1988. Interactive influence ofinfectious diseases and genetic diversity in natural popula-tions. Trends in Ecology and Evolution 3:254-259.
O’Meara, T., and J. Gore. 1988. Guidelines for conservationand management of least tern colonies in Florida.Nongame Wildlife Program, Florida Game and FreshWater Fish Commission, Tallahassee, Florida.
Osterhoff, D., R. Schoeman, J. Op’t Hof, and E. Young.1983. Genetic differentiation of the African elephant in theKruger National Park. South African Journal of Science70:245-247.
Owre, O. 1978. Black-whiskered vireo. Pages 59-61 inKale, H. W., II (ed.). Rare and endangered biota ofFlorida. Volume two. Birds. University Presses ofFlorida, Gainesville, Florida.
CLOSING THE GAPS IN FLORIDA’S WILDLIFE HABITAT CONSERVATION SYSTEM 201
Page, G., L. Stenzel, D. Winkler, and C. Swarth. 1983.Spacing out at Mono Lake: breeding success, nest densi-ty, and predation in the snowy plover. Auk 100:13-24.
Paul, R., and T. Below. 1991. Populations, distribution,habitats, and migration of gulls, terns, and shorebirds incoastal Florida: an overview. Pages 66-75 in Jennings, D.(compiler). Proceedings of the coastal nongame work-shop. U.S. Fish and Wildlife Service, Atlanta, Georgia.
Pearlstine, L., and W. Kitchens. 1992. Boundaries and statusof permitted citrus areas. Pages 19-25 in An evaluation ofthe regional effects of new citrus development on the eco-logical integrity of wildlife resources in southwest Florida.Volume II. Contract #C89-0186. South Florida WaterManagement District, West Palm Beach, Florida.
Pearson, P. 1954. Mammals of Gulf Hammock, LevyCounty, Florida. American Midland Naturalist 51:468-480.
Pelton, M. R. 1985. Habitat needs of black bears in the East.Pages 49-53 in Kulhavy, D. L., and R. N. Conner, (eds.).Wilderness and natural areas in the eastern United States:a management challenge. Center for Applied Studies,Stephen F. Austin State University, Nacogdoches, Texas.
Peroni, P. A., and W. G. Abrahamson. 1985. Post-settlementvegetation loss on the southern Lake Wales Ridge,Florida. Palmetto 5:6-7.
Quinn, J. F., and A. Hastings. 1987. Extinction in subdivid-ed habitats. Conservation Biology 1:198-208.
Ralls, K., J. Ballou, and A. Templeton. 1988. Estimates oflethal equivalents and the cost of inbreeding in mammals.Conservation Biology 2:185-193.
Ralls, K., K. Bruger, and J. D. Ballou. 1979. Inbreeding andjuvenile mortality in small populations of ungulates.Science 206:1101-1103.
Reed, J. M., P. D. Doerr, and J. R. Walters. 1988. Minimumviable population size of the red-cockaded woodpecker.Journal of Wildlife Management 50:239-247.
Repenning, R. W., and R. F. Labisky. 1985. Effects of even-age timber management on bird communities of the lon-gleaf pine forest in northern Florida. Journal of WildlifeManagement 49:1088-1098.
Robertson, W., Jr. 1978. Mangrove cuckoo. Pages 57-58 inKale, H. W., II (ed.). Rare and endangered biota ofFlorida. Volume two. Birds. University Presses ofFlorida, Gainesville, Florida.
Robson, M. S. 1989. Southeastern beach mouse survey.Final performance report. Florida Game and FreshwaterFish Commission, Tallahassee, Florida.
Rodgers, J. 1992. Annual snail kite survey and habitatassessment. Final Report. Florida Game and Fresh WaterFish Commission, Tallahassee, Florida.
Rodgers, J. In prep. Snail kite. In Rodgers, J. (ed.). Rareand endangered biota of Florida. Volume 4. Birds.University Press of Florida, Gainesville, Florida.
Rodgers, J., S. Schwikert, and A. Wenner. 1988. The statusof the snail kite in central and south Florida: 1981-1985.American Birds 42:30-35.
Rogers, L. 1987. Effects of food supply and kinship onsocial behavior, movements, and population growth ofblack bears in northern Minnesota. Wildlife Monographs97.
Roof, J. C., and D. S. Maehr. 1988. Sign surveys for Floridapanthers in peripheral areas of their known range. FloridaField Naturalist 16:81-85.
Runde, D., J. Gore, J. Hovis, M. Robson, and P. Southall.1991. Florida atlas of breeding sites for herons and theirallies: update 1986-1989. Nongame Wildlife ProgramTechnical Report No. 10. Florida Game and Fresh WaterFish Commission, Tallahassee, Florida.
Ryti, R. 1992. Effect of the focal taxon on the selection ofnature reserves. Ecological Applications 2:404-410.
Samson, F., F. Perez-Trejo, H. Salwasser, and T. Russ. 1985.On determining and managing minimum population size.Wildlife Society Bulletin 13:425-533.
Scott, J. M., F. Davis, B. Csuti, R. Noss, B. Butterfield, C.Groves, H. Anderson, S. Caicco, F. D’Erichia, T.Edwards, Jr., J. Ullman, and R. Wright. 1993. Gap analy-sis: a geographic approach to protection of biologicaldiversity. Wildlife Monographs 123.
Shaffer, M. 1981. Minimum population sizes for speciesconservation. BioScience 31:131-134.
Shaffer, M. 1987. Minimum viable populations: copingwith uncertainty. Pages 69-86 in Soulé, M. (ed.). Viablepopulations for conservation. Cambridge UniversityPress, Cambridge, Massachusetts.
Shermyen, A. H., S. S. Floyd, G. H. Thompson, and D. A.Evans (eds). 1991. Florida statistical abstract.University Press of Florida, Gainesville, Florida.
Simberloff, D. 1988. The contribution of population andcommunity biology to conservation science. AnnualReview of Ecology and Systematics 19:473-511.
Simberloff, D., and L. Abele. 1976. Island biogeographytheory and conservation practice. Science 191:285-286.
Simberloff, D., and J. Cox. 1987. Consequences and costs ofconservation corridors. Conservation Biology 1:63-71.
FLORIDA GAME AND FRESH WATER FISH COMMISSION202
Simberloff, D., J. Farr, J. Cox, and D. Mehlman. 1992.Movement corridors: conservation bargains or poor invest-ments? Conservation Biology 6:492-503.
Snyder, J. R., M. Herndon, and W. B. Robertson, Jr. 1990.South Florida rockland. Pages 230-277 in Myers, R., andJ. Ewel (eds.). Ecosystems of Florida. University ofCentral Florida Press, Orlando, Florida.
Soil Conservation Service. Undated. 26 ecological communi-ties of Florida. U.S. Department of Agriculture, FortWorth, Texas.
Soulé, M. E., and M. Gilpin. 1991. The theory of wildlifecorridor capability. Pages 3-8 in Saunders, D., and R. J.Hobbs (eds.). The role of corridors in nature conservation.Surrey Beatty and Sons, Sydney, Australia.
Soulé, M. E., and D. Simberloff. 1986. What do genetics andecology tell us about the design of nature preserves?Biological Conservation 35:19-40.
Spalding, M. 1991. Water bird diseases. Pages 177-181 inJennings, D. (compiler). Proceedings of the coastalnongame workshop. U.S. Fish and Wildlife Service,Atlanta, Georgia.
Stevenson, H., and B. Anderson. 1992. Florida birds. Finalproject report. Florida Game and Fresh Water FishCommission, Tallahassee, Florida.
Strong, A., 1979. Land banking: European reality, Americanprospect. John Hopkins University Press, Baltimore,Maryland.
Strong, A., and T. Bancroft. In prep. Patterns of deforestationand fragmentation of mangrove and deciduous seasonalforests in the Upper Florida Keys. National AudubonSociety, Tavernier, Florida.
Stys, B. 1993. Ecology and habitat protection needs of thesoutheastern American kestrel (Falco sparverius paulus)on large-scale development sites in Florida. NongameWildlife Technical Report No. 13. Florida Game andFresh Water Fish Commission, Tallahassee, Florida.
Sykes, P. W., Jr. 1984. The range of the Everglade snail kiteand its history in Florida. Bulletin of the Florida StateMuseum, Biological Sciences 29:211-264.
Takekawa, J. E., and S. R. Beissinger. 1989. Cyclic drought,dispersal, and the conservation of the snail kite in Florida:lessons in critical habitat. Conservation Biology 3:302-311.
Tebeau, C. W. 1971. A history of Florida. University ofMiami Press, Coral Gables, Florida.
Thomas, J. W., E. D. Forsman, J. B. Lint, E. C. Meslow, B. R.Noon, and J. Verner. 1990. A conservation strategy forthe northern spotted owl. U.S. Department of Agricultureand U.S. Department of the Interior, Portland, Oregon.
Turner, D., and J. Laerm. 1993. Systematic relationships ofpopulations of the fox squirrel (Sciurus niger) in the south-eastern United States. Pages 21-37 in N. Moncried, J.Edwards, and P. Tappe (eds.). Proceedings of the secondsymposium on southeastern fox squirrels, Sciurus niger.Virginia Museum of Natural History Special PublicationNo. 1. Martinsville, Virginia.
TYDAC. 1991. SPANS spatial analysis system. InteraTydac Technologies, Inc., Ottawa, Canada.
Umber, R. W., and L. D. Harris. 1974. Effects of intensiveforestry on succession and wildlife in Florida sandhills.Proceedings of the Annual Conference of the SoutheasternAssociation of Game and Fish Commissioners 28:686-693.
U.S. Department of Agriculture. 1991. State soil geographicdatabase (STATSGO). Data users guide. SoilConservation Service, National Soil Survey Center,Lincoln, Nebraska.
U.S. Fish and Wildlife Service. 1986a. Hurricanes damagesoutheastern beach mouse habitat. Endangered SpeciesTechnical Bulletin 11:7-8.
U.S. Fish and Wildlife Service. 1986b. Everglade kite(Rostrhamus sociabilis plumbeus, Ridgway) revised recov-ery plan. U.S. Fish and Wildlife Service, Atlanta,Georgia.
U.S. Fish and Wildlife Service. 1987a. 1985 national surveyof fishing, hunting, and wildlife-associated recreation,Florida. U.S. Department of the Interior and U.S.Department of Commerce, Bureau of the Census,Washington, D.C.
U.S. Fish and Wildlife Service. 1987b. Habitat managementguidelines for the bald eagle in the southeast region. Thirdrevision. U.S. Fish and Wildlife Service, Atlanta,Georgia.
U.S. Fish and Wildlife Service. 1987c. Recovery plan forthe Alabama beach mouse (Peromyscus polionotus ammo-bates), Perdido Key beach mouse (P. p. trissyllepsis), andChoctawhatchee beach mouse (P. p. allophrys). U.S. Fishand Wildlife Service, Atlanta, Georgia.
U.S. Fish and Wildlife Service. 1987d. Recovery plan forthe Florida panther. U.S. Fish and Wildlife Service,Atlanta, Georgia.
U.S. Fish and Wildlife Service. 1988. Recovery plan forFlorida grasshopper sparrow. U.S. Fish and WildlifeService, Atlanta, Georgia.
U.S. Fish and Wildlife Service. 1992. Proposed establish-ment of Lake Wales Ridge National Wildlife Refuge.Draft environmental assessment and land protection plan.U.S. Fish and Wildlife Service, Atlanta, Georgia.
van Noordwijk, A. J., and W. Scharloo. 1981. Inbreeding inan island population of the great tit. Evolution 35:674-688.
CLOSING THE GAPS IN FLORIDA’S WILDLIFE HABITAT CONSERVATION SYSTEM 203
Verner, J., M. L. Morrison, and C. J. Ralph. 1986. Wildlife2000. Modeling habitat relationships of terrestrial verte-brates. University of Wisconsin Press, Madison,Wisconsin.
Walkinshaw, L. H. 1976. The sandhill crane on and near theKissimmee Prairie, Florida. Pages 1-18 in Lewis, J. (ed.).Proceedings of the international crane workshop.Oklahoma State University Publication and Printing,Stillwater, Oklahoma.
Walter, H. S. 1990. Small viable populations: the red-tailedhawk of Socorro Island. Conservation Biology 4:441-443.
Walters, J. R., P. D. Doerr, and J. H. Carter III. 1988a. Thecooperative breeding system of the red-cockaded wood-pecker. Ethology 78:275-305.
Walters, J. R., S. K. Hansen, J. H. Carter, III, P. D. Manor,and R. J. Blue. 1988b. Long-distance dispersal of anadult red-cockaded woodpecker. Wilson Bulletin100:494-496.
Ward, D. (ed.). 1979. Rare and endangered biota of Florida.Volume five. Plants. University Presses of Florida,Gainesville, Florida.
Weaver, K. M., D. T. Tabberer, L. U. Moore, Jr., G. A.Chandler, J. C. Posey, and M. R. Pelton. 1990.Bottomland forest management for black bears inLouisiana. Proceedings of the Annual Conference of theSoutheastern Association of Fish and Wildlife Agencies44:342-350.
Weigl, P. D., M. A. Steele, L. J. Sherman, J. C. Ha, and T. S.Sharpe. 1989. The ecology of the fox squirrel (Sciurusniger) in North Carolina: implications for survival in theSoutheast. Bulletin of the Tall Timbers Research Station24:1-93.
Wenner, A. S., and S. A. Nesbitt. 1984. The fate of translo-cated sandhill cranes after 10 years. Florida FieldNaturalist 12:19-20.
Williams, K. S., and S. R. Humphrey. 1979. Distributionand status of the endangered Big Cypress fox squirrel(Sciurus niger avicennia) in Florida. Florida Scientist42:201-205.
Williams, L. 1981. The book of the wild turkey. WinchesterPress, Tulsa, Oklahoma.
Wilson, E. 1988. The current state of biological diversity.Pages 3-18 in Wilson, E. (ed.). Biodiversity. NationalAcademic Press, Washington, D.C.
Winchester, B. H. 1987. Hydroecology of wetlands on theRingling MacArthur Reserve. Technical Report 2, CH2MHill, Inc., Gainesville, Florida.
Winchester, B. H., J. S. Bays, J. C. Higman, and R. L.Knight. 1985. Physiography and vegetation zonation ofshallow emergent marshes in southeastern Florida.Wetlands 5:99-118.
Wood, D. A. 1992. Official list of endangered and potential-ly endangered fauna and flora in Florida. Florida Gameand Fresh Water Fish Commission, Tallahassee, Florida.
Wood, P. W., T. C. Edwards, Jr., and M. W. Collopy. 1989.Distribution, ownership status, and habitat characteristicsof bald eagle nest sites in Florida. Nongame WildlifeProgram final report. Florida Game and Fresh Water FishCommission, Tallahassee, Florida.
Wood, D. A., and S. Wenner. 1983. Status of the red-cock-aded woodpecker in Florida: 1983 update. Pages 89-91in Wood, D. (ed.). Proceedings: red-cockaded woodpeckersymposium II. Florida Game and Fresh Water FishCommission, Tallahassee, Florida.
Wooding, J. B. Unpublished. Possible black bear dispersalcorridor. Florida Game and Fresh Water FishCommission, Tallahassee, Florida.
Wooding, J. B., and J. R. Brady. 1987. Black bear roadkillsin Florida. Proceedings of the Annual Conference of theSoutheastern Association Fish and Wildlife Agencies41:438-442.
Wooding, J. B., and T. S. Hardisky. 1988. Black bear habi-tat study. Final performance report W-41-35. FloridaGame and Fresh Water Fish Commission, Tallahassee,Florida.
Wooding, J. B., S. M. Shea, M. L. Richardson, and D. Y.Dowling. 1992. Movements of a female black bear innorthwestern Florida. Florida Field Naturalist 20:46-48.
Woolfenden, G., and J. Fitzpatrick. 1984. The Florida scrubjay: demography of a cooperative-breeding bird.Princeton University Press, Princeton, New Jersey.
Wright, S. 1969. Evolution and the genetics of populations.Volume 2. The theory of gene frequencies. University ofChicago Press, Chicago, Illinois.
Zimmerman, B., and R. Bierregaard. 1986. Relevance of theequilibrium theory of island biogeography and species-area relations to conservation with a case from Amazona.Journal of Biogeography 13:133-143.
FLORIDA GAME AND FRESH WATER FISH COMMISSION204
APPENDICES
APPENDIX 1. Common and scientific names of species that appear in the text.
FISH
Mud sunfish Acantharchus pomotisShortnose sturgeon Acipenser brevirostrumAtlantic sturgeon Acipenser oxyrhynchusMountain mullet Agonostomus monticolaSnail bullhead Ameiurus brunneusSpotted bullhead Ameiurus serracanthusAlligator gar Atractosteus spatulaRiver goby Awaous tajasicaStriped croaker Bairdiella sanctaeluciaeCrystal darter Crystallaria asprellaBluestripe shiner Cyprinella callitaeniaBannerfin shiner Cyprinella leedsiLake Eustis pupfish Cyprinodon variegatus hubbsiFlorida Keys sheepshead minnow Cyprinodon variegatusBlackbanded sunfish Enneacanthus chaetodonHarlequin darter Etheostoma histrioOkaloosa darter Etheostoma okaloosaeTessellated darter Etheostoma olmstediGoldstripe darter Etheostoma parvipinneCypress darter Etheostoma proeliareFlorida chub Extrarius sp.Blair’s starhead topminnow Fundulus blairaeSouthern gulf killifish Fundulus grandis saguanusSaltmarsh topminnow Fundulus jenkinsiFlorida Keys southern longnose killifish Fundulus similisMangrove gambusia Gambusia rhizophoraeSpottail goby Gobionellus stigmaturusCypress minnow Hybognathus hayiFlorida Keys rainwater killifish Lucania parvaStriped shiner Luxilus chrysocephalusBandfin shiner Luxilus zonistiusBlacktip shiner Lythrurus atrapiculusKey silverside Menidia conchorumOpossum pipefish Microphis brachyurusSuwannee bass Micropterus notiusShoal bass Micropterus sp.River redhorse Moxostoma carinatumGrayfin redhorse Moxostoma sp.Bluehead chub Nocomis leptocephalusRough shiner Notropis baileyiDusky shiner Notropis cummingsaeBlackmouth shiner Notropis melanostomusFlorida logperch Percina sp.Saddleback darter Percina vigilSea lamprey Petromyzon marinusFlorida Keys sailfin molly Poecilia latipinnaBluenose shiner Pteronotropis welakaMangrove rivulus Rivulus marmoratusKey blenny Starksia starckiEastern mudminnow Umbra pygmaea
AMPHIBIANS
Flatwoods salamander Ambystoma cingulatumTiger salamander Ambystoma tigrinumOne-toed amphiuma Amphiuma pholeterApalachicola dusky salamander Desmognathus apalachicolaeSeal salamander Desmognathus monticolaGeorgia blind salamander Haideotriton wallaceiFour-toed salamander Hemidactylium scutatumPine barrens treefrog Hyla andersoniiStriped newt Notophthalmus perstriatus
CLOSING THE GAPS IN FLORIDA’S WILDLIFE HABITAT CONSERVATION SYSTEM 205
Gulf hammock dwarf siren Pseudobranchus striatus lustricolusGopher frog Rana capitoFlorida bog frog Rana okaloosaeCarpenter frog Rana virgatipesMany-lined salamander Stereochilus marginatus
REPTILES
Copperhead Agkistrodon contortrixAmerican alligator Alligator mississippiensisGulf coast smooth softshell Apalone mutica calvataLoggerhead Caretta carettaGreen turtle Chelonia mydasSpotted turtle Clemmys guttataAmerican crocodile Crocodylus acutusCanebrake rattlesnake Crotalus horridusLeatherback turtle Dermochelys coriaceaKey ringneck snake Diadophis punctatus acricusEastern indigo snake Drymarchon corais couperiLower Keys red rat snake Elaphe guttataHawksbill Eretmochelys imbricataCoal skink Eumeces anthracinusFlorida Keys mole skink Eumeces egregius egregiusCedar Keys mole skink Eumeces egregius insularisBlue-tailed mole skink Eumeces egregius lividusSouth Florida rainbow snake Farancia erytrogramma seminolaGopher tortoise Gopherus polyphemusBarbour’s map turtle Graptemys barbouriKey mud turtle Kinosternon bauriiMole kingsnake Lampropeltis calligasterApalachicola kingsnake Lampropeltis getula goiniAtlantic ridley Lepidochelys kempiiAlligator snapping turtle Macroclemys temminckiiMangrove terrapin Malaclemys terrapin rhizophorarumSand skink Neoseps reynoldsiGulf salt marsh snake Nerodia clarkii clarkiiAtlantic salt marsh snake Nerodia clarkii taeniataMississippi green water snake Nerodia cyclopionMidland water snake Nerodia sipedon pleuralisFlorida pine snake Pituophis melanoleucus mugitusSuwannee cooter Pseudemys concinna suwanniensisFlorida scrub lizard Sceloporus woodiShort-tailed snake Stilosoma extenuatumLower Keys brown snake Storeria dekayiRim rock crowned snake Tantilla ooliticaLower Keys ribbon snake Thamnophis sauritus
BIRDS
Cooper’s hawk Accipiter cooperiiBachman’s sparrow Aimophila aestivalisRoseate spoonbill Ajaia ajajaLouisiana seaside sparrow Ammodramus maritimus fisheriWakulla seaside sparrow Ammodramus maritimus juncicolusCape Sable seaside sparrow Ammodramus maritimus mirabilisDusky seaside sparrow Ammodramus maritimus nigrescensSmyrna seaside sparrow Ammodramus maritimus pelonotusScott’s seaside sparrow Ammodramus maritimus peninsulaeFlorida grasshopper sparrow Ammodramus savannarum floridanusBrown noddy Anous stolidusFlorida scrub jay Aphelocoma coerulescens coerulescensLimpkin Aramus guaraunaGreat white heron Ardea herodias occidentalisFlorida burrowing owl Athene cunicularia floridanaShort-tailed hawk Buteo brachyurusIvory-billed woodpecker Campephilus principalisGreat egret Casmerodius albusSnowy plover Charadrius alexandrinus
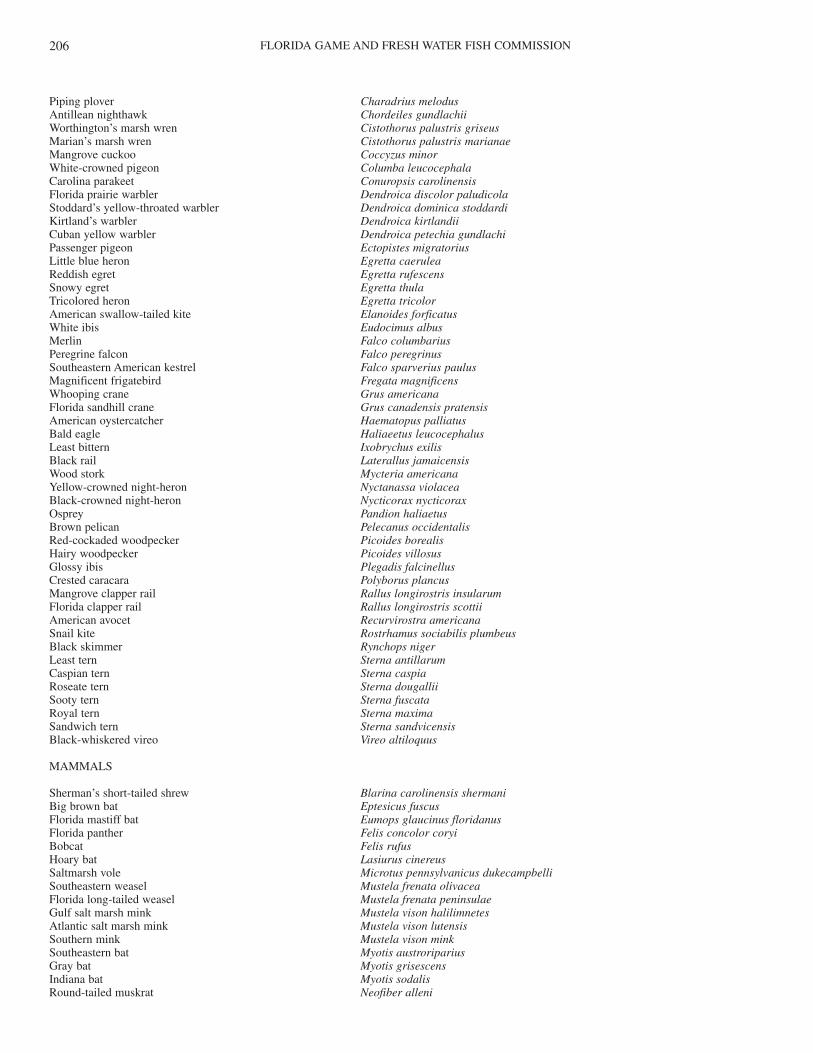
FLORIDA GAME AND FRESH WATER FISH COMMISSION206
Piping plover Charadrius melodusAntillean nighthawk Chordeiles gundlachiiWorthington’s marsh wren Cistothorus palustris griseusMarian’s marsh wren Cistothorus palustris marianaeMangrove cuckoo Coccyzus minorWhite-crowned pigeon Columba leucocephalaCarolina parakeet Conuropsis carolinensisFlorida prairie warbler Dendroica discolor paludicolaStoddard’s yellow-throated warbler Dendroica dominica stoddardiKirtland’s warbler Dendroica kirtlandiiCuban yellow warbler Dendroica petechia gundlachiPassenger pigeon Ectopistes migratoriusLittle blue heron Egretta caeruleaReddish egret Egretta rufescensSnowy egret Egretta thulaTricolored heron Egretta tricolorAmerican swallow-tailed kite Elanoides forficatusWhite ibis Eudocimus albusMerlin Falco columbariusPeregrine falcon Falco peregrinusSoutheastern American kestrel Falco sparverius paulusMagnificent frigatebird Fregata magnificensWhooping crane Grus americanaFlorida sandhill crane Grus canadensis pratensisAmerican oystercatcher Haematopus palliatusBald eagle Haliaeetus leucocephalusLeast bittern Ixobrychus exilisBlack rail Laterallus jamaicensisWood stork Mycteria americanaYellow-crowned night-heron Nyctanassa violaceaBlack-crowned night-heron Nycticorax nycticoraxOsprey Pandion haliaetusBrown pelican Pelecanus occidentalisRed-cockaded woodpecker Picoides borealisHairy woodpecker Picoides villosusGlossy ibis Plegadis falcinellusCrested caracara Polyborus plancusMangrove clapper rail Rallus longirostris insularumFlorida clapper rail Rallus longirostris scottiiAmerican avocet Recurvirostra americanaSnail kite Rostrhamus sociabilis plumbeusBlack skimmer Rynchops nigerLeast tern Sterna antillarumCaspian tern Sterna caspiaRoseate tern Sterna dougalliiSooty tern Sterna fuscataRoyal tern Sterna maximaSandwich tern Sterna sandvicensisBlack-whiskered vireo Vireo altiloquus
MAMMALS
Sherman’s short-tailed shrew Blarina carolinensis shermaniBig brown bat Eptesicus fuscusFlorida mastiff bat Eumops glaucinus floridanusFlorida panther Felis concolor coryiBobcat Felis rufusHoary bat Lasiurus cinereusSaltmarsh vole Microtus pennsylvanicus dukecampbelliSoutheastern weasel Mustela frenata olivaceaFlorida long-tailed weasel Mustela frenata peninsulaeGulf salt marsh mink Mustela vison halilimnetesAtlantic salt marsh mink Mustela vison lutensisSouthern mink Mustela vison minkSoutheastern bat Myotis austroripariusGray bat Myotis grisescensIndiana bat Myotis sodalisRound-tailed muskrat Neofiber alleni
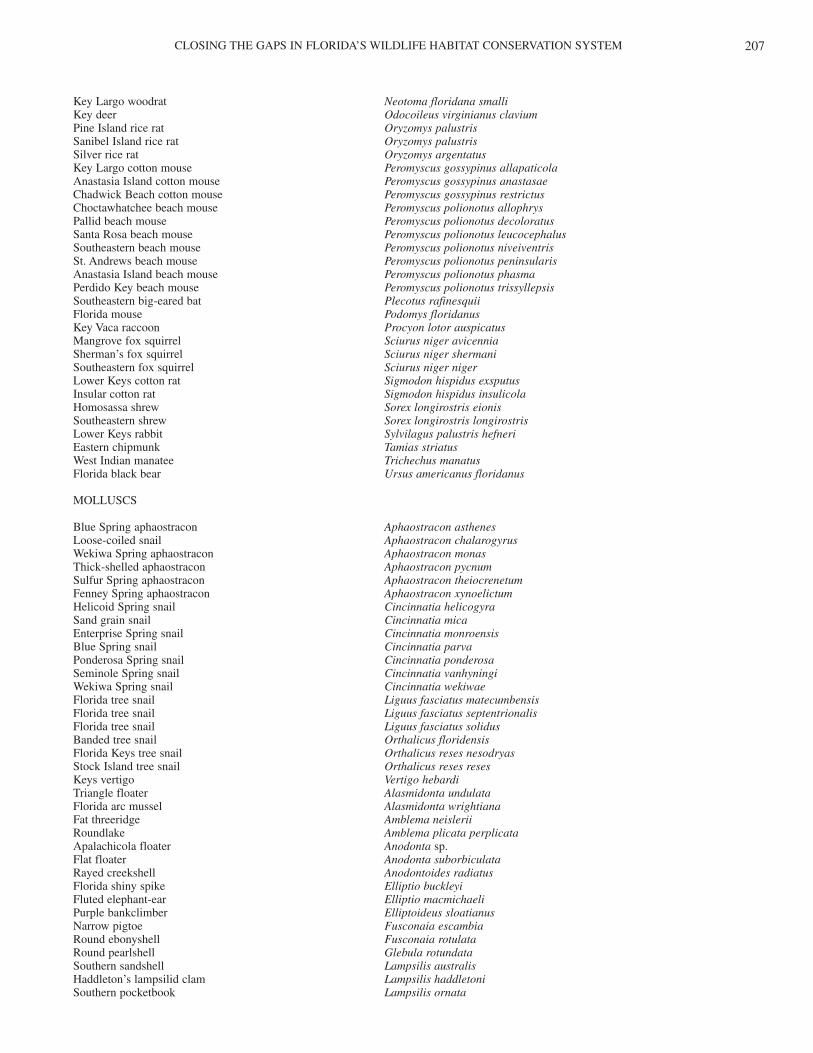
CLOSING THE GAPS IN FLORIDA’S WILDLIFE HABITAT CONSERVATION SYSTEM 207
Key Largo woodrat Neotoma floridana smalliKey deer Odocoileus virginianus claviumPine Island rice rat Oryzomys palustrisSanibel Island rice rat Oryzomys palustrisSilver rice rat Oryzomys argentatusKey Largo cotton mouse Peromyscus gossypinus allapaticolaAnastasia Island cotton mouse Peromyscus gossypinus anastasaeChadwick Beach cotton mouse Peromyscus gossypinus restrictusChoctawhatchee beach mouse Peromyscus polionotus allophrysPallid beach mouse Peromyscus polionotus decoloratusSanta Rosa beach mouse Peromyscus polionotus leucocephalusSoutheastern beach mouse Peromyscus polionotus niveiventrisSt. Andrews beach mouse Peromyscus polionotus peninsularisAnastasia Island beach mouse Peromyscus polionotus phasmaPerdido Key beach mouse Peromyscus polionotus trissyllepsisSoutheastern big-eared bat Plecotus rafinesquiiFlorida mouse Podomys floridanusKey Vaca raccoon Procyon lotor auspicatusMangrove fox squirrel Sciurus niger avicenniaSherman’s fox squirrel Sciurus niger shermaniSoutheastern fox squirrel Sciurus niger nigerLower Keys cotton rat Sigmodon hispidus exsputusInsular cotton rat Sigmodon hispidus insulicolaHomosassa shrew Sorex longirostris eionisSoutheastern shrew Sorex longirostris longirostrisLower Keys rabbit Sylvilagus palustris hefneriEastern chipmunk Tamias striatusWest Indian manatee Trichechus manatusFlorida black bear Ursus americanus floridanus
MOLLUSCS
Blue Spring aphaostracon Aphaostracon asthenesLoose-coiled snail Aphaostracon chalarogyrusWekiwa Spring aphaostracon Aphaostracon monasThick-shelled aphaostracon Aphaostracon pycnumSulfur Spring aphaostracon Aphaostracon theiocrenetumFenney Spring aphaostracon Aphaostracon xynoelictumHelicoid Spring snail Cincinnatia helicogyraSand grain snail Cincinnatia micaEnterprise Spring snail Cincinnatia monroensisBlue Spring snail Cincinnatia parvaPonderosa Spring snail Cincinnatia ponderosaSeminole Spring snail Cincinnatia vanhyningiWekiwa Spring snail Cincinnatia wekiwaeFlorida tree snail Liguus fasciatus matecumbensisFlorida tree snail Liguus fasciatus septentrionalisFlorida tree snail Liguus fasciatus solidusBanded tree snail Orthalicus floridensisFlorida Keys tree snail Orthalicus reses nesodryasStock Island tree snail Orthalicus reses resesKeys vertigo Vertigo hebardiTriangle floater Alasmidonta undulataFlorida arc mussel Alasmidonta wrightianaFat threeridge Amblema neisleriiRoundlake Amblema plicata perplicataApalachicola floater Anodonta sp.Flat floater Anodonta suborbiculataRayed creekshell Anodontoides radiatusFlorida shiny spike Elliptio buckleyiFluted elephant-ear Elliptio macmichaeliPurple bankclimber Elliptoideus sloatianusNarrow pigtoe Fusconaia escambiaRound ebonyshell Fusconaia rotulataRound pearlshell Glebula rotundataSouthern sandshell Lampsilis australisHaddleton’s lampsilid clam Lampsilis haddletoniSouthern pocketbook Lampsilis ornata
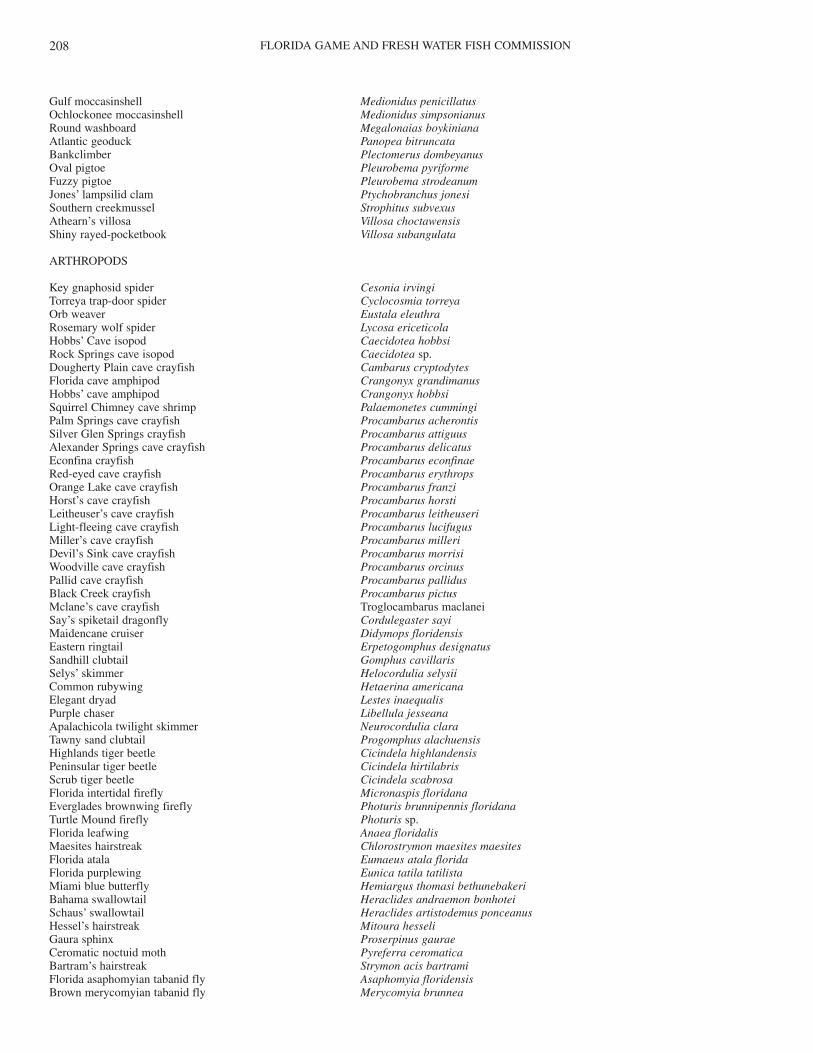
FLORIDA GAME AND FRESH WATER FISH COMMISSION208
Gulf moccasinshell Medionidus penicillatusOchlockonee moccasinshell Medionidus simpsonianusRound washboard Megalonaias boykinianaAtlantic geoduck Panopea bitruncataBankclimber Plectomerus dombeyanusOval pigtoe Pleurobema pyriformeFuzzy pigtoe Pleurobema strodeanumJones’ lampsilid clam Ptychobranchus jonesiSouthern creekmussel Strophitus subvexusAthearn’s villosa Villosa choctawensisShiny rayed-pocketbook Villosa subangulata
ARTHROPODS
Key gnaphosid spider Cesonia irvingiTorreya trap-door spider Cyclocosmia torreyaOrb weaver Eustala eleuthraRosemary wolf spider Lycosa ericeticolaHobbs’ Cave isopod Caecidotea hobbsiRock Springs cave isopod Caecidotea sp.Dougherty Plain cave crayfish Cambarus cryptodytesFlorida cave amphipod Crangonyx grandimanusHobbs’ cave amphipod Crangonyx hobbsiSquirrel Chimney cave shrimp Palaemonetes cummingiPalm Springs cave crayfish Procambarus acherontisSilver Glen Springs crayfish Procambarus attiguusAlexander Springs cave crayfish Procambarus delicatusEconfina crayfish Procambarus econfinaeRed-eyed cave crayfish Procambarus erythropsOrange Lake cave crayfish Procambarus franziHorst’s cave crayfish Procambarus horstiLeitheuser’s cave crayfish Procambarus leitheuseriLight-fleeing cave crayfish Procambarus lucifugusMiller’s cave crayfish Procambarus milleriDevil’s Sink cave crayfish Procambarus morrisiWoodville cave crayfish Procambarus orcinusPallid cave crayfish Procambarus pallidusBlack Creek crayfish Procambarus pictusMclane’s cave crayfish Troglocambarus maclaneiSay’s spiketail dragonfly Cordulegaster sayiMaidencane cruiser Didymops floridensisEastern ringtail Erpetogomphus designatusSandhill clubtail Gomphus cavillarisSelys’ skimmer Helocordulia selysiiCommon rubywing Hetaerina americanaElegant dryad Lestes inaequalisPurple chaser Libellula jesseanaApalachicola twilight skimmer Neurocordulia claraTawny sand clubtail Progomphus alachuensisHighlands tiger beetle Cicindela highlandensisPeninsular tiger beetle Cicindela hirtilabrisScrub tiger beetle Cicindela scabrosaFlorida intertidal firefly Micronaspis floridanaEverglades brownwing firefly Photuris brunnipennis floridanaTurtle Mound firefly Photuris sp.Florida leafwing Anaea floridalisMaesites hairstreak Chlorostrymon maesites maesitesFlorida atala Eumaeus atala floridaFlorida purplewing Eunica tatila tatilistaMiami blue butterfly Hemiargus thomasi bethunebakeriBahama swallowtail Heraclides andraemon bonhoteiSchaus’ swallowtail Heraclides artistodemus ponceanusHessel’s hairstreak Mitoura hesseliGaura sphinx Proserpinus gauraeCeromatic noctuid moth Pyreferra ceromaticaBartram’s hairstreak Strymon acis bartramiFlorida asaphomyian tabanid fly Asaphomyia floridensisBrown merycomyian tabanid fly Merycomyia brunnea
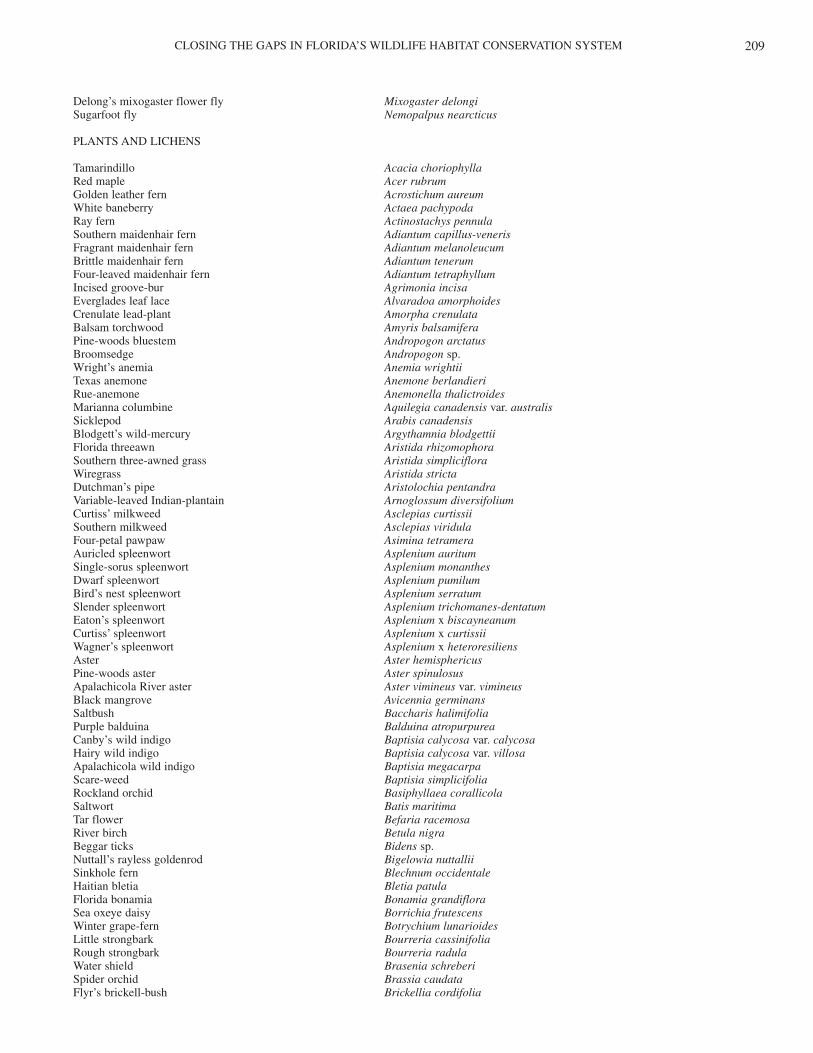
CLOSING THE GAPS IN FLORIDA’S WILDLIFE HABITAT CONSERVATION SYSTEM 209
Delong’s mixogaster flower fly Mixogaster delongiSugarfoot fly Nemopalpus nearcticus
PLANTS AND LICHENS
Tamarindillo Acacia choriophyllaRed maple Acer rubrumGolden leather fern Acrostichum aureumWhite baneberry Actaea pachypodaRay fern Actinostachys pennulaSouthern maidenhair fern Adiantum capillus-venerisFragrant maidenhair fern Adiantum melanoleucumBrittle maidenhair fern Adiantum tenerumFour-leaved maidenhair fern Adiantum tetraphyllumIncised groove-bur Agrimonia incisaEverglades leaf lace Alvaradoa amorphoidesCrenulate lead-plant Amorpha crenulataBalsam torchwood Amyris balsamiferaPine-woods bluestem Andropogon arctatusBroomsedge Andropogon sp.Wright’s anemia Anemia wrightiiTexas anemone Anemone berlandieriRue-anemone Anemonella thalictroidesMarianna columbine Aquilegia canadensis var. australisSicklepod Arabis canadensisBlodgett’s wild-mercury Argythamnia blodgettiiFlorida threeawn Aristida rhizomophoraSouthern three-awned grass Aristida simplicifloraWiregrass Aristida strictaDutchman’s pipe Aristolochia pentandraVariable-leaved Indian-plantain Arnoglossum diversifoliumCurtiss’ milkweed Asclepias curtissiiSouthern milkweed Asclepias viridulaFour-petal pawpaw Asimina tetrameraAuricled spleenwort Asplenium auritumSingle-sorus spleenwort Asplenium monanthesDwarf spleenwort Asplenium pumilumBird’s nest spleenwort Asplenium serratumSlender spleenwort Asplenium trichomanes-dentatumEaton’s spleenwort Asplenium x biscayneanumCurtiss’ spleenwort Asplenium x curtissiiWagner’s spleenwort Asplenium x heteroresiliensAster Aster hemisphericusPine-woods aster Aster spinulosusApalachicola River aster Aster vimineus var. vimineusBlack mangrove Avicennia germinansSaltbush Baccharis halimifoliaPurple balduina Balduina atropurpureaCanby’s wild indigo Baptisia calycosa var. calycosaHairy wild indigo Baptisia calycosa var. villosaApalachicola wild indigo Baptisia megacarpaScare-weed Baptisia simplicifoliaRockland orchid Basiphyllaea corallicolaSaltwort Batis maritimaTar flower Befaria racemosaRiver birch Betula nigraBeggar ticks Bidens sp.Nuttall’s rayless goldenrod Bigelowia nuttalliiSinkhole fern Blechnum occidentaleHaitian bletia Bletia patulaFlorida bonamia Bonamia grandifloraSea oxeye daisy Borrichia frutescensWinter grape-fern Botrychium lunarioidesLittle strongbark Bourreria cassinifoliaRough strongbark Bourreria radulaWater shield Brasenia schreberiSpider orchid Brassia caudataFlyr’s brickell-bush Brickellia cordifolia
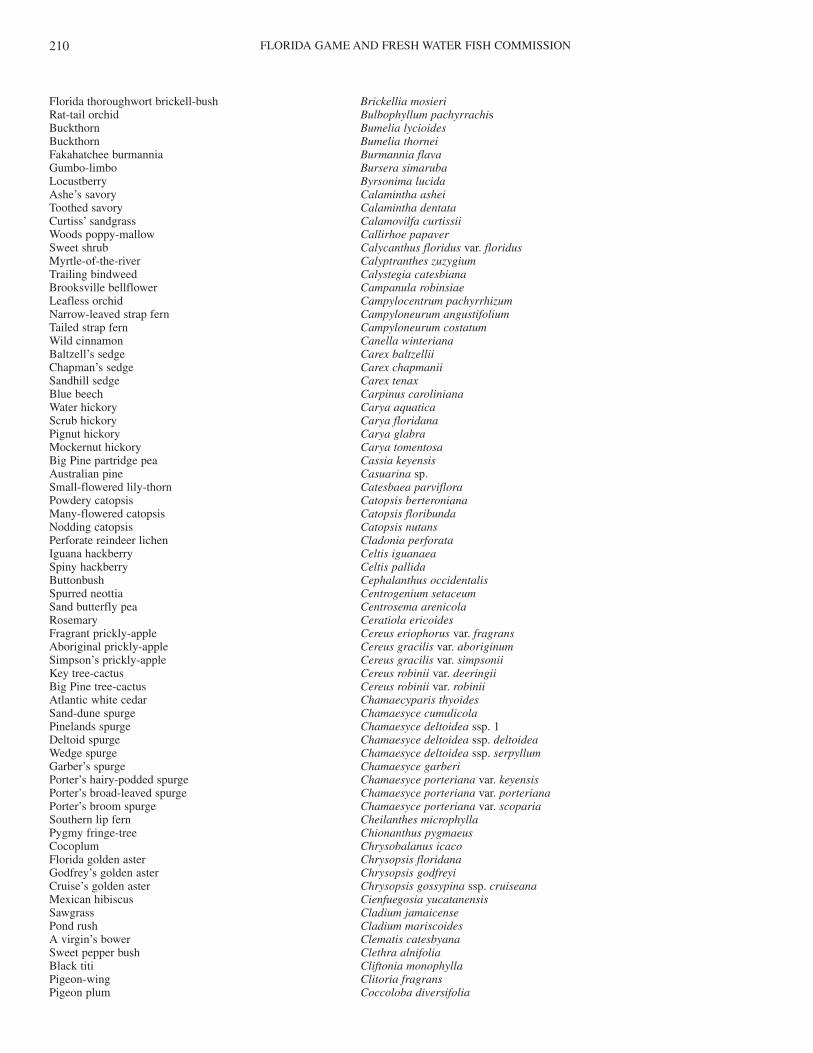
FLORIDA GAME AND FRESH WATER FISH COMMISSION210
Florida thoroughwort brickell-bush Brickellia mosieriRat-tail orchid Bulbophyllum pachyrrachisBuckthorn Bumelia lycioidesBuckthorn Bumelia thorneiFakahatchee burmannia Burmannia flavaGumbo-limbo Bursera simarubaLocustberry Byrsonima lucidaAshe’s savory Calamintha asheiToothed savory Calamintha dentataCurtiss’ sandgrass Calamovilfa curtissiiWoods poppy-mallow Callirhoe papaverSweet shrub Calycanthus floridus var. floridusMyrtle-of-the-river Calyptranthes zuzygiumTrailing bindweed Calystegia catesbianaBrooksville bellflower Campanula robinsiaeLeafless orchid Campylocentrum pachyrrhizumNarrow-leaved strap fern Campyloneurum angustifoliumTailed strap fern Campyloneurum costatumWild cinnamon Canella winterianaBaltzell’s sedge Carex baltzelliiChapman’s sedge Carex chapmaniiSandhill sedge Carex tenaxBlue beech Carpinus carolinianaWater hickory Carya aquaticaScrub hickory Carya floridanaPignut hickory Carya glabraMockernut hickory Carya tomentosaBig Pine partridge pea Cassia keyensisAustralian pine Casuarina sp.Small-flowered lily-thorn Catesbaea parvifloraPowdery catopsis Catopsis berteronianaMany-flowered catopsis Catopsis floribundaNodding catopsis Catopsis nutansPerforate reindeer lichen Cladonia perforataIguana hackberry Celtis iguanaeaSpiny hackberry Celtis pallidaButtonbush Cephalanthus occidentalisSpurred neottia Centrogenium setaceumSand butterfly pea Centrosema arenicolaRosemary Ceratiola ericoidesFragrant prickly-apple Cereus eriophorus var. fragransAboriginal prickly-apple Cereus gracilis var. aboriginumSimpson’s prickly-apple Cereus gracilis var. simpsoniiKey tree-cactus Cereus robinii var. deeringiiBig Pine tree-cactus Cereus robinii var. robiniiAtlantic white cedar Chamaecyparis thyoidesSand-dune spurge Chamaesyce cumulicolaPinelands spurge Chamaesyce deltoidea ssp. 1Deltoid spurge Chamaesyce deltoidea ssp. deltoideaWedge spurge Chamaesyce deltoidea ssp. serpyllumGarber’s spurge Chamaesyce garberiPorter’s hairy-podded spurge Chamaesyce porteriana var. keyensisPorter’s broad-leaved spurge Chamaesyce porteriana var. porterianaPorter’s broom spurge Chamaesyce porteriana var. scopariaSouthern lip fern Cheilanthes microphyllaPygmy fringe-tree Chionanthus pygmaeusCocoplum Chrysobalanus icacoFlorida golden aster Chrysopsis floridanaGodfrey’s golden aster Chrysopsis godfreyiCruise’s golden aster Chrysopsis gossypina ssp. cruiseanaMexican hibiscus Cienfuegosia yucatanensisSawgrass Cladium jamaicensePond rush Cladium mariscoidesA virgin’s bower Clematis catesbyanaSweet pepper bush Clethra alnifoliaBlack titi Cliftonia monophyllaPigeon-wing Clitoria fragransPigeon plum Coccoloba diversifolia
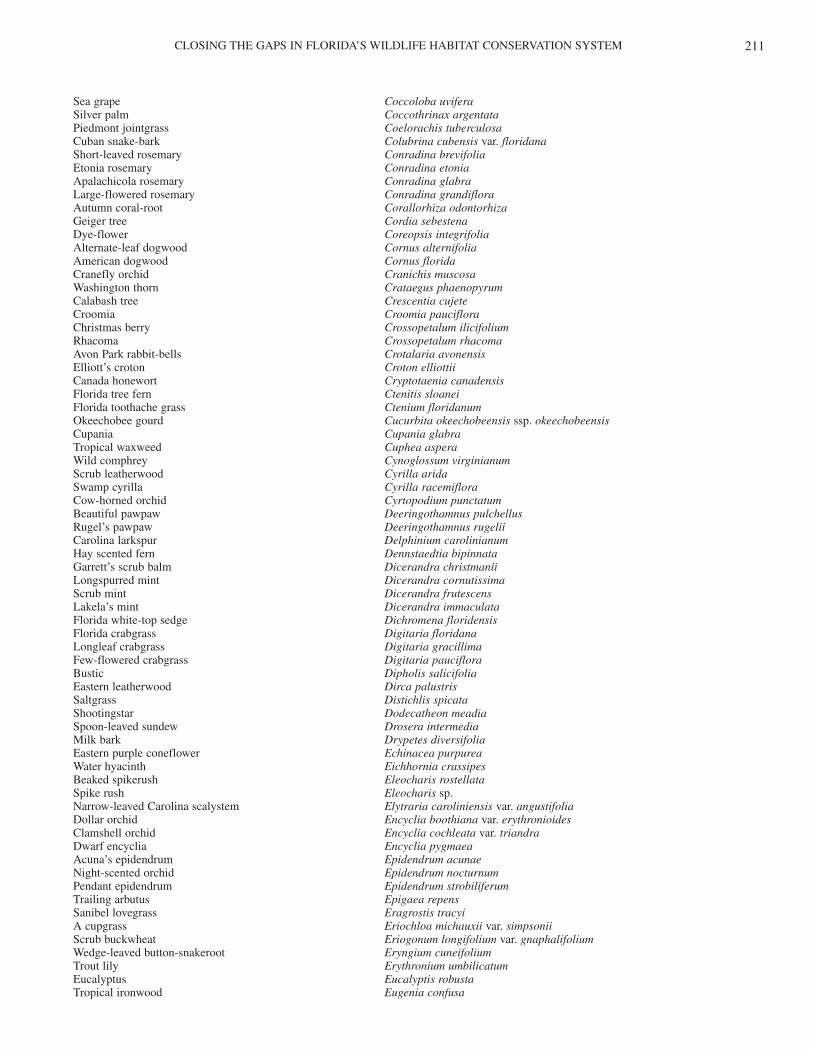
CLOSING THE GAPS IN FLORIDA’S WILDLIFE HABITAT CONSERVATION SYSTEM 211
Sea grape Coccoloba uviferaSilver palm Coccothrinax argentataPiedmont jointgrass Coelorachis tuberculosaCuban snake-bark Colubrina cubensis var. floridanaShort-leaved rosemary Conradina brevifoliaEtonia rosemary Conradina etoniaApalachicola rosemary Conradina glabraLarge-flowered rosemary Conradina grandifloraAutumn coral-root Corallorhiza odontorhizaGeiger tree Cordia sebestenaDye-flower Coreopsis integrifoliaAlternate-leaf dogwood Cornus alternifoliaAmerican dogwood Cornus floridaCranefly orchid Cranichis muscosaWashington thorn Crataegus phaenopyrumCalabash tree Crescentia cujeteCroomia Croomia paucifloraChristmas berry Crossopetalum ilicifoliumRhacoma Crossopetalum rhacomaAvon Park rabbit-bells Crotalaria avonensisElliott’s croton Croton elliottiiCanada honewort Cryptotaenia canadensisFlorida tree fern Ctenitis sloaneiFlorida toothache grass Ctenium floridanumOkeechobee gourd Cucurbita okeechobeensis ssp. okeechobeensisCupania Cupania glabraTropical waxweed Cuphea asperaWild comphrey Cynoglossum virginianumScrub leatherwood Cyrilla aridaSwamp cyrilla Cyrilla racemifloraCow-horned orchid Cyrtopodium punctatumBeautiful pawpaw Deeringothamnus pulchellusRugel’s pawpaw Deeringothamnus rugeliiCarolina larkspur Delphinium carolinianumHay scented fern Dennstaedtia bipinnataGarrett’s scrub balm Dicerandra christmaniiLongspurred mint Dicerandra cornutissimaScrub mint Dicerandra frutescensLakela’s mint Dicerandra immaculataFlorida white-top sedge Dichromena floridensisFlorida crabgrass Digitaria floridanaLongleaf crabgrass Digitaria gracillimaFew-flowered crabgrass Digitaria paucifloraBustic Dipholis salicifoliaEastern leatherwood Dirca palustrisSaltgrass Distichlis spicataShootingstar Dodecatheon meadiaSpoon-leaved sundew Drosera intermediaMilk bark Drypetes diversifoliaEastern purple coneflower Echinacea purpureaWater hyacinth Eichhornia crassipesBeaked spikerush Eleocharis rostellataSpike rush Eleocharis sp.Narrow-leaved Carolina scalystem Elytraria caroliniensis var. angustifoliaDollar orchid Encyclia boothiana var. erythronioidesClamshell orchid Encyclia cochleata var. triandraDwarf encyclia Encyclia pygmaeaAcuna’s epidendrum Epidendrum acunaeNight-scented orchid Epidendrum nocturnumPendant epidendrum Epidendrum strobiliferumTrailing arbutus Epigaea repensSanibel lovegrass Eragrostis tracyiA cupgrass Eriochloa michauxii var. simpsoniiScrub buckwheat Eriogonum longifolium var. gnaphalifoliumWedge-leaved button-snakeroot Eryngium cuneifoliumTrout lily Erythronium umbilicatumEucalyptus Eucalyptis robustaTropical ironwood Eugenia confusa
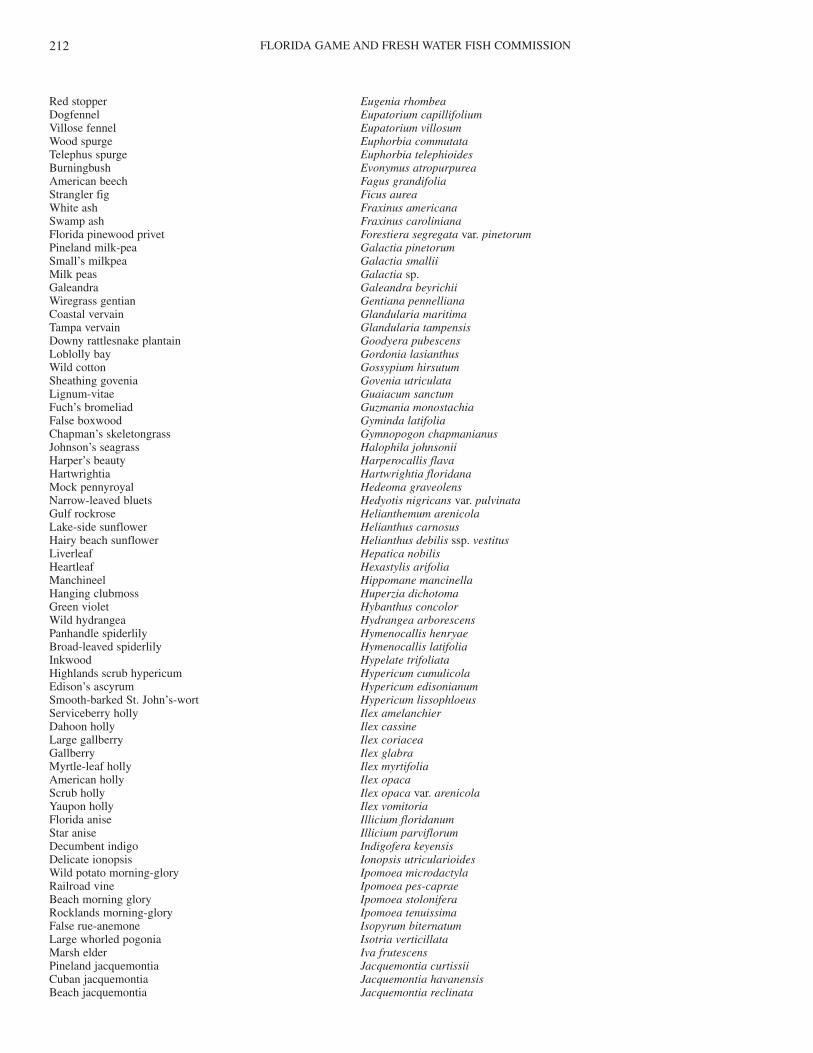
FLORIDA GAME AND FRESH WATER FISH COMMISSION212
Red stopper Eugenia rhombeaDogfennel Eupatorium capillifoliumVillose fennel Eupatorium villosumWood spurge Euphorbia commutataTelephus spurge Euphorbia telephioidesBurningbush Evonymus atropurpureaAmerican beech Fagus grandifoliaStrangler fig Ficus aureaWhite ash Fraxinus americanaSwamp ash Fraxinus carolinianaFlorida pinewood privet Forestiera segregata var. pinetorumPineland milk-pea Galactia pinetorumSmall’s milkpea Galactia smalliiMilk peas Galactia sp.Galeandra Galeandra beyrichiiWiregrass gentian Gentiana pennellianaCoastal vervain Glandularia maritimaTampa vervain Glandularia tampensisDowny rattlesnake plantain Goodyera pubescensLoblolly bay Gordonia lasianthusWild cotton Gossypium hirsutumSheathing govenia Govenia utriculataLignum-vitae Guaiacum sanctumFuch’s bromeliad Guzmania monostachiaFalse boxwood Gyminda latifoliaChapman’s skeletongrass Gymnopogon chapmanianusJohnson’s seagrass Halophila johnsoniiHarper’s beauty Harperocallis flavaHartwrightia Hartwrightia floridanaMock pennyroyal Hedeoma graveolensNarrow-leaved bluets Hedyotis nigricans var. pulvinataGulf rockrose Helianthemum arenicolaLake-side sunflower Helianthus carnosusHairy beach sunflower Helianthus debilis ssp. vestitusLiverleaf Hepatica nobilisHeartleaf Hexastylis arifoliaManchineel Hippomane mancinellaHanging clubmoss Huperzia dichotomaGreen violet Hybanthus concolorWild hydrangea Hydrangea arborescensPanhandle spiderlily Hymenocallis henryaeBroad-leaved spiderlily Hymenocallis latifoliaInkwood Hypelate trifoliataHighlands scrub hypericum Hypericum cumulicolaEdison’s ascyrum Hypericum edisonianumSmooth-barked St. John’s-wort Hypericum lissophloeusServiceberry holly Ilex amelanchierDahoon holly Ilex cassineLarge gallberry Ilex coriaceaGallberry Ilex glabraMyrtle-leaf holly Ilex myrtifoliaAmerican holly Ilex opacaScrub holly Ilex opaca var. arenicolaYaupon holly Ilex vomitoriaFlorida anise Illicium floridanumStar anise Illicium parviflorumDecumbent indigo Indigofera keyensisDelicate ionopsis Ionopsis utricularioidesWild potato morning-glory Ipomoea microdactylaRailroad vine Ipomoea pes-capraeBeach morning glory Ipomoea stoloniferaRocklands morning-glory Ipomoea tenuissimaFalse rue-anemone Isopyrum biternatumLarge whorled pogonia Isotria verticillataMarsh elder Iva frutescensPineland jacquemontia Jacquemontia curtissiiCuban jacquemontia Jacquemontia havanensisBeach jacquemontia Jacquemontia reclinata
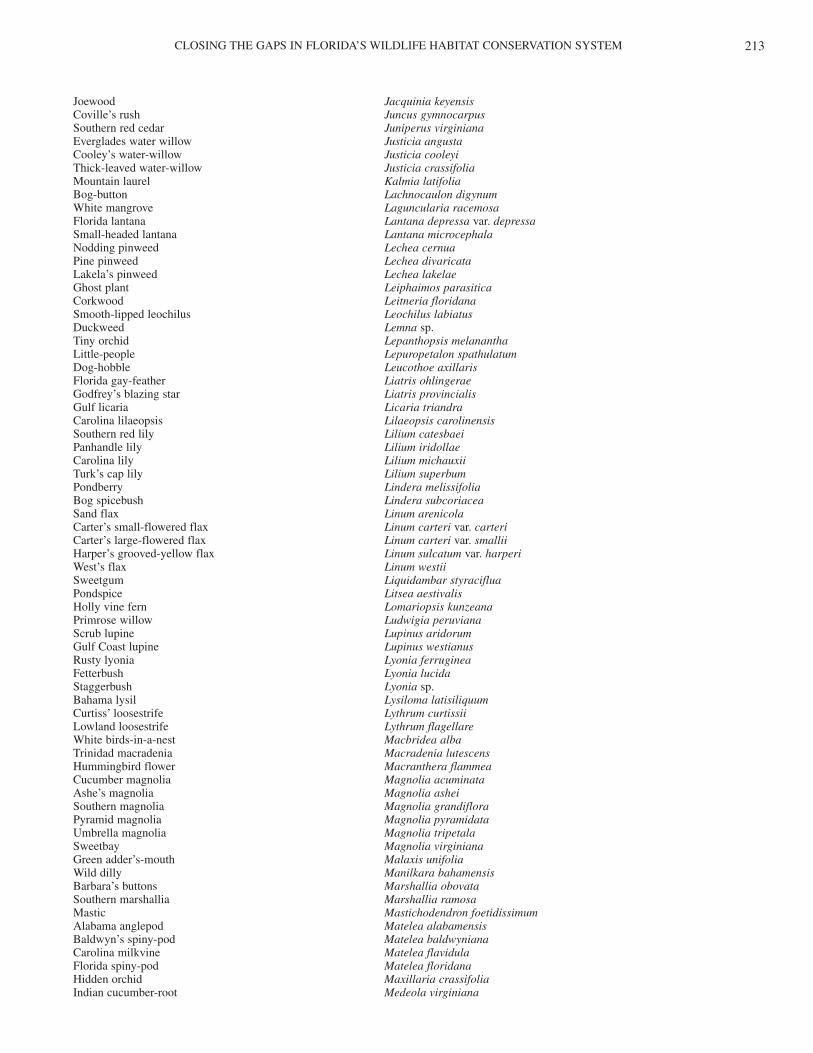
CLOSING THE GAPS IN FLORIDA’S WILDLIFE HABITAT CONSERVATION SYSTEM 213
Joewood Jacquinia keyensisCoville’s rush Juncus gymnocarpusSouthern red cedar Juniperus virginianaEverglades water willow Justicia angustaCooley’s water-willow Justicia cooleyiThick-leaved water-willow Justicia crassifoliaMountain laurel Kalmia latifoliaBog-button Lachnocaulon digynumWhite mangrove Laguncularia racemosaFlorida lantana Lantana depressa var. depressaSmall-headed lantana Lantana microcephalaNodding pinweed Lechea cernuaPine pinweed Lechea divaricataLakela’s pinweed Lechea lakelaeGhost plant Leiphaimos parasiticaCorkwood Leitneria floridanaSmooth-lipped leochilus Leochilus labiatusDuckweed Lemna sp.Tiny orchid Lepanthopsis melananthaLittle-people Lepuropetalon spathulatumDog-hobble Leucothoe axillarisFlorida gay-feather Liatris ohlingeraeGodfrey’s blazing star Liatris provincialisGulf licaria Licaria triandraCarolina lilaeopsis Lilaeopsis carolinensisSouthern red lily Lilium catesbaeiPanhandle lily Lilium iridollaeCarolina lily Lilium michauxiiTurk’s cap lily Lilium superbumPondberry Lindera melissifoliaBog spicebush Lindera subcoriaceaSand flax Linum arenicolaCarter’s small-flowered flax Linum carteri var. carteriCarter’s large-flowered flax Linum carteri var. smalliiHarper’s grooved-yellow flax Linum sulcatum var. harperiWest’s flax Linum westiiSweetgum Liquidambar styracifluaPondspice Litsea aestivalisHolly vine fern Lomariopsis kunzeanaPrimrose willow Ludwigia peruvianaScrub lupine Lupinus aridorumGulf Coast lupine Lupinus westianusRusty lyonia Lyonia ferrugineaFetterbush Lyonia lucidaStaggerbush Lyonia sp.Bahama lysil Lysiloma latisiliquumCurtiss’ loosestrife Lythrum curtissiiLowland loosestrife Lythrum flagellareWhite birds-in-a-nest Macbridea albaTrinidad macradenia Macradenia lutescensHummingbird flower Macranthera flammeaCucumber magnolia Magnolia acuminataAshe’s magnolia Magnolia asheiSouthern magnolia Magnolia grandifloraPyramid magnolia Magnolia pyramidataUmbrella magnolia Magnolia tripetalaSweetbay Magnolia virginianaGreen adder’s-mouth Malaxis unifoliaWild dilly Manilkara bahamensisBarbara’s buttons Marshallia obovataSouthern marshallia Marshallia ramosaMastic Mastichodendron foetidissimumAlabama anglepod Matelea alabamensisBaldwyn’s spiny-pod Matelea baldwynianaCarolina milkvine Matelea flavidulaFlorida spiny-pod Matelea floridanaHidden orchid Maxillaria crassifoliaIndian cucumber-root Medeola virginiana
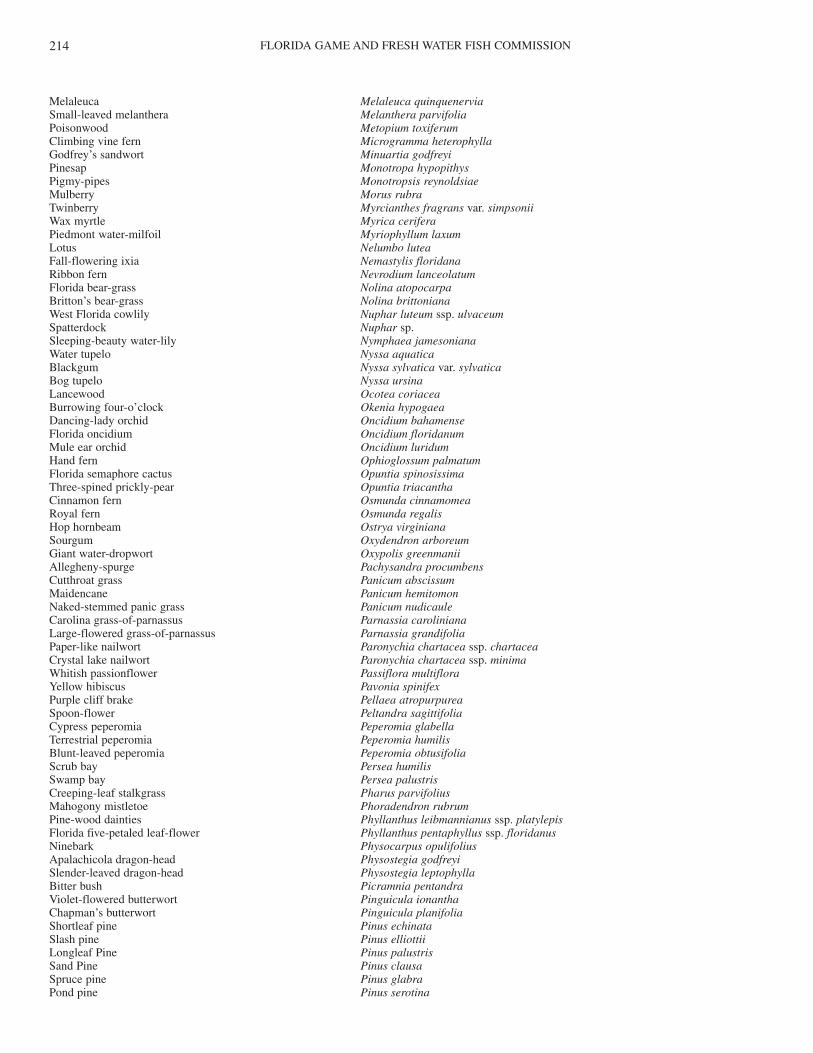
FLORIDA GAME AND FRESH WATER FISH COMMISSION214
Melaleuca Melaleuca quinquenerviaSmall-leaved melanthera Melanthera parvifoliaPoisonwood Metopium toxiferumClimbing vine fern Microgramma heterophyllaGodfrey’s sandwort Minuartia godfreyiPinesap Monotropa hypopithysPigmy-pipes Monotropsis reynoldsiaeMulberry Morus rubraTwinberry Myrcianthes fragrans var. simpsoniiWax myrtle Myrica ceriferaPiedmont water-milfoil Myriophyllum laxumLotus Nelumbo luteaFall-flowering ixia Nemastylis floridanaRibbon fern Nevrodium lanceolatumFlorida bear-grass Nolina atopocarpaBritton’s bear-grass Nolina brittonianaWest Florida cowlily Nuphar luteum ssp. ulvaceumSpatterdock Nuphar sp.Sleeping-beauty water-lily Nymphaea jamesonianaWater tupelo Nyssa aquaticaBlackgum Nyssa sylvatica var. sylvaticaBog tupelo Nyssa ursinaLancewood Ocotea coriaceaBurrowing four-o’clock Okenia hypogaeaDancing-lady orchid Oncidium bahamenseFlorida oncidium Oncidium floridanumMule ear orchid Oncidium luridumHand fern Ophioglossum palmatumFlorida semaphore cactus Opuntia spinosissimaThree-spined prickly-pear Opuntia triacanthaCinnamon fern Osmunda cinnamomeaRoyal fern Osmunda regalisHop hornbeam Ostrya virginianaSourgum Oxydendron arboreumGiant water-dropwort Oxypolis greenmaniiAllegheny-spurge Pachysandra procumbensCutthroat grass Panicum abscissumMaidencane Panicum hemitomonNaked-stemmed panic grass Panicum nudicauleCarolina grass-of-parnassus Parnassia carolinianaLarge-flowered grass-of-parnassus Parnassia grandifoliaPaper-like nailwort Paronychia chartacea ssp. chartaceaCrystal lake nailwort Paronychia chartacea ssp. minimaWhitish passionflower Passiflora multifloraYellow hibiscus Pavonia spinifexPurple cliff brake Pellaea atropurpureaSpoon-flower Peltandra sagittifoliaCypress peperomia Peperomia glabellaTerrestrial peperomia Peperomia humilisBlunt-leaved peperomia Peperomia obtusifoliaScrub bay Persea humilisSwamp bay Persea palustrisCreeping-leaf stalkgrass Pharus parvifoliusMahogony mistletoe Phoradendron rubrumPine-wood dainties Phyllanthus leibmannianus ssp. platylepisFlorida five-petaled leaf-flower Phyllanthus pentaphyllus ssp. floridanusNinebark Physocarpus opulifoliusApalachicola dragon-head Physostegia godfreyiSlender-leaved dragon-head Physostegia leptophyllaBitter bush Picramnia pentandraViolet-flowered butterwort Pinguicula ionanthaChapman’s butterwort Pinguicula planifoliaShortleaf pine Pinus echinataSlash pine Pinus elliottiiLongleaf Pine Pinus palustrisSand Pine Pinus clausaSpruce pine Pinus glabraPond pine Pinus serotina
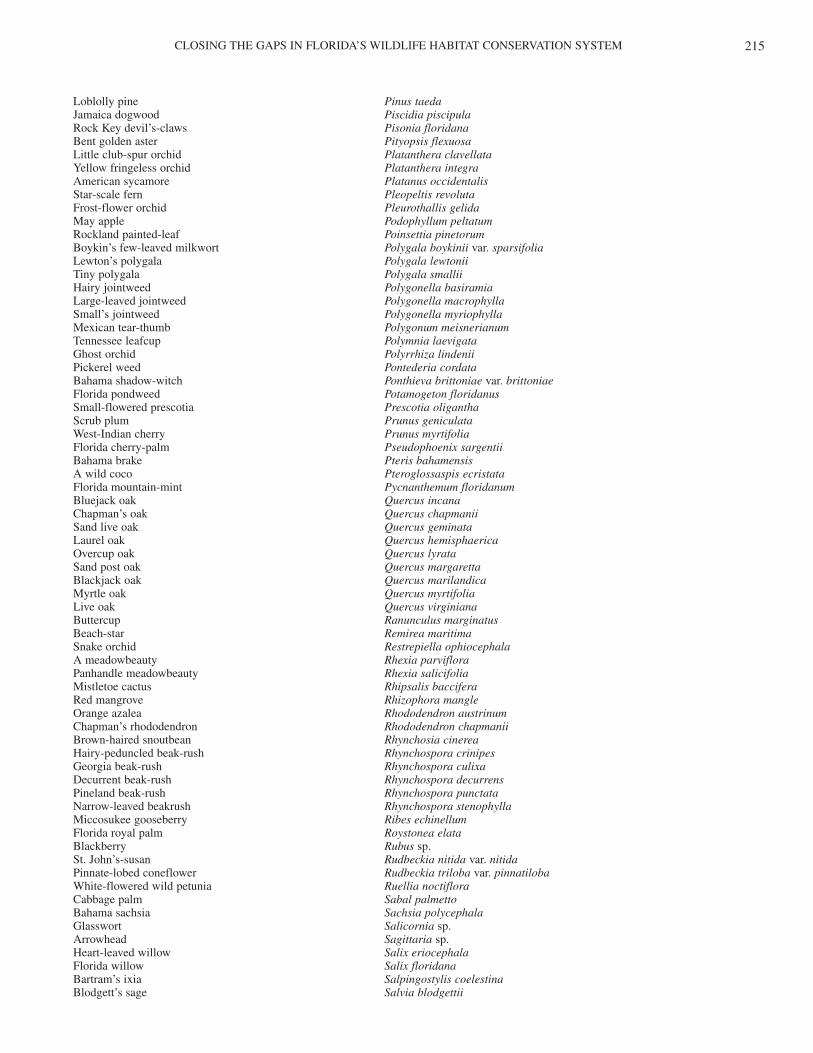
CLOSING THE GAPS IN FLORIDA’S WILDLIFE HABITAT CONSERVATION SYSTEM 215
Loblolly pine Pinus taedaJamaica dogwood Piscidia piscipulaRock Key devil’s-claws Pisonia floridanaBent golden aster Pityopsis flexuosaLittle club-spur orchid Platanthera clavellataYellow fringeless orchid Platanthera integraAmerican sycamore Platanus occidentalisStar-scale fern Pleopeltis revolutaFrost-flower orchid Pleurothallis gelidaMay apple Podophyllum peltatumRockland painted-leaf Poinsettia pinetorumBoykin’s few-leaved milkwort Polygala boykinii var. sparsifoliaLewton’s polygala Polygala lewtoniiTiny polygala Polygala smalliiHairy jointweed Polygonella basiramiaLarge-leaved jointweed Polygonella macrophyllaSmall’s jointweed Polygonella myriophyllaMexican tear-thumb Polygonum meisnerianumTennessee leafcup Polymnia laevigataGhost orchid Polyrrhiza lindeniiPickerel weed Pontederia cordataBahama shadow-witch Ponthieva brittoniae var. brittoniaeFlorida pondweed Potamogeton floridanusSmall-flowered prescotia Prescotia oliganthaScrub plum Prunus geniculataWest-Indian cherry Prunus myrtifoliaFlorida cherry-palm Pseudophoenix sargentiiBahama brake Pteris bahamensisA wild coco Pteroglossaspis ecristataFlorida mountain-mint Pycnanthemum floridanumBluejack oak Quercus incanaChapman’s oak Quercus chapmaniiSand live oak Quercus geminataLaurel oak Quercus hemisphaericaOvercup oak Quercus lyrataSand post oak Quercus margarettaBlackjack oak Quercus marilandicaMyrtle oak Quercus myrtifoliaLive oak Quercus virginianaButtercup Ranunculus marginatusBeach-star Remirea maritimaSnake orchid Restrepiella ophiocephalaA meadowbeauty Rhexia parvifloraPanhandle meadowbeauty Rhexia salicifoliaMistletoe cactus Rhipsalis bacciferaRed mangrove Rhizophora mangleOrange azalea Rhododendron austrinumChapman’s rhododendron Rhododendron chapmaniiBrown-haired snoutbean Rhynchosia cinereaHairy-peduncled beak-rush Rhynchospora crinipesGeorgia beak-rush Rhynchospora culixaDecurrent beak-rush Rhynchospora decurrensPineland beak-rush Rhynchospora punctataNarrow-leaved beakrush Rhynchospora stenophyllaMiccosukee gooseberry Ribes echinellumFlorida royal palm Roystonea elataBlackberry Rubus sp.St. John’s-susan Rudbeckia nitida var. nitidaPinnate-lobed coneflower Rudbeckia triloba var. pinnatilobaWhite-flowered wild petunia Ruellia noctifloraCabbage palm Sabal palmettoBahama sachsia Sachsia polycephalaGlasswort Salicornia sp.Arrowhead Sagittaria sp.Heart-leaved willow Salix eriocephalaFlorida willow Salix floridanaBartram’s ixia Salpingostylis coelestinaBlodgett’s sage Salvia blodgettii
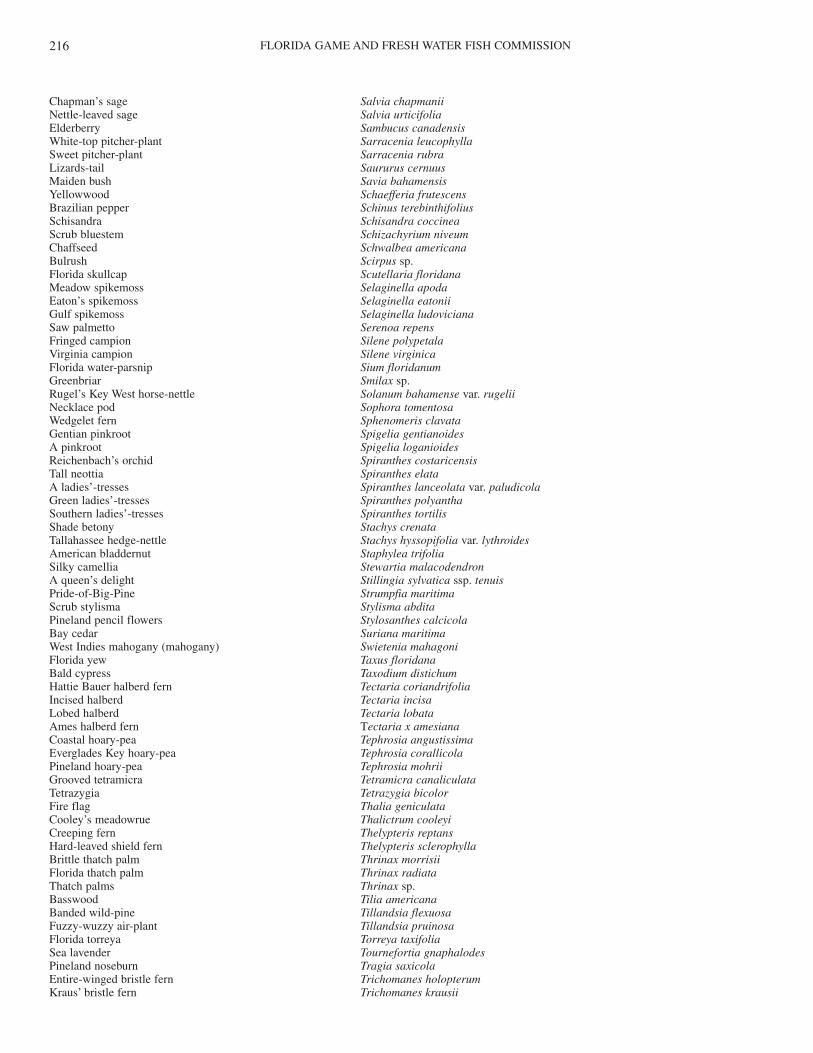
FLORIDA GAME AND FRESH WATER FISH COMMISSION216
Chapman’s sage Salvia chapmaniiNettle-leaved sage Salvia urticifoliaElderberry Sambucus canadensisWhite-top pitcher-plant Sarracenia leucophyllaSweet pitcher-plant Sarracenia rubraLizards-tail Saururus cernuusMaiden bush Savia bahamensisYellowwood Schaefferia frutescensBrazilian pepper Schinus terebinthifoliusSchisandra Schisandra coccineaScrub bluestem Schizachyrium niveumChaffseed Schwalbea americanaBulrush Scirpus sp.Florida skullcap Scutellaria floridanaMeadow spikemoss Selaginella apodaEaton’s spikemoss Selaginella eatoniiGulf spikemoss Selaginella ludovicianaSaw palmetto Serenoa repensFringed campion Silene polypetalaVirginia campion Silene virginicaFlorida water-parsnip Sium floridanumGreenbriar Smilax sp.Rugel’s Key West horse-nettle Solanum bahamense var. rugeliiNecklace pod Sophora tomentosaWedgelet fern Sphenomeris clavataGentian pinkroot Spigelia gentianoidesA pinkroot Spigelia loganioidesReichenbach’s orchid Spiranthes costaricensisTall neottia Spiranthes elataA ladies’-tresses Spiranthes lanceolata var. paludicolaGreen ladies’-tresses Spiranthes polyanthaSouthern ladies’-tresses Spiranthes tortilisShade betony Stachys crenataTallahassee hedge-nettle Stachys hyssopifolia var. lythroidesAmerican bladdernut Staphylea trifoliaSilky camellia Stewartia malacodendronA queen’s delight Stillingia sylvatica ssp. tenuisPride-of-Big-Pine Strumpfia maritimaScrub stylisma Stylisma abditaPineland pencil flowers Stylosanthes calcicolaBay cedar Suriana maritimaWest Indies mahogany (mahogany) Swietenia mahagoniFlorida yew Taxus floridanaBald cypress Taxodium distichumHattie Bauer halberd fern Tectaria coriandrifoliaIncised halberd Tectaria incisaLobed halberd Tectaria lobataAmes halberd fern Tectaria x amesianaCoastal hoary-pea Tephrosia angustissimaEverglades Key hoary-pea Tephrosia corallicolaPineland hoary-pea Tephrosia mohriiGrooved tetramicra Tetramicra canaliculataTetrazygia Tetrazygia bicolorFire flag Thalia geniculataCooley’s meadowrue Thalictrum cooleyiCreeping fern Thelypteris reptansHard-leaved shield fern Thelypteris sclerophyllaBrittle thatch palm Thrinax morrisiiFlorida thatch palm Thrinax radiataThatch palms Thrinax sp.Basswood Tilia americanaBanded wild-pine Tillandsia flexuosaFuzzy-wuzzy air-plant Tillandsia pruinosaFlorida torreya Torreya taxifoliaSea lavender Tournefortia gnaphalodesPineland noseburn Tragia saxicolaEntire-winged bristle fern Trichomanes holopterumKraus’ bristle fern Trichomanes krausii
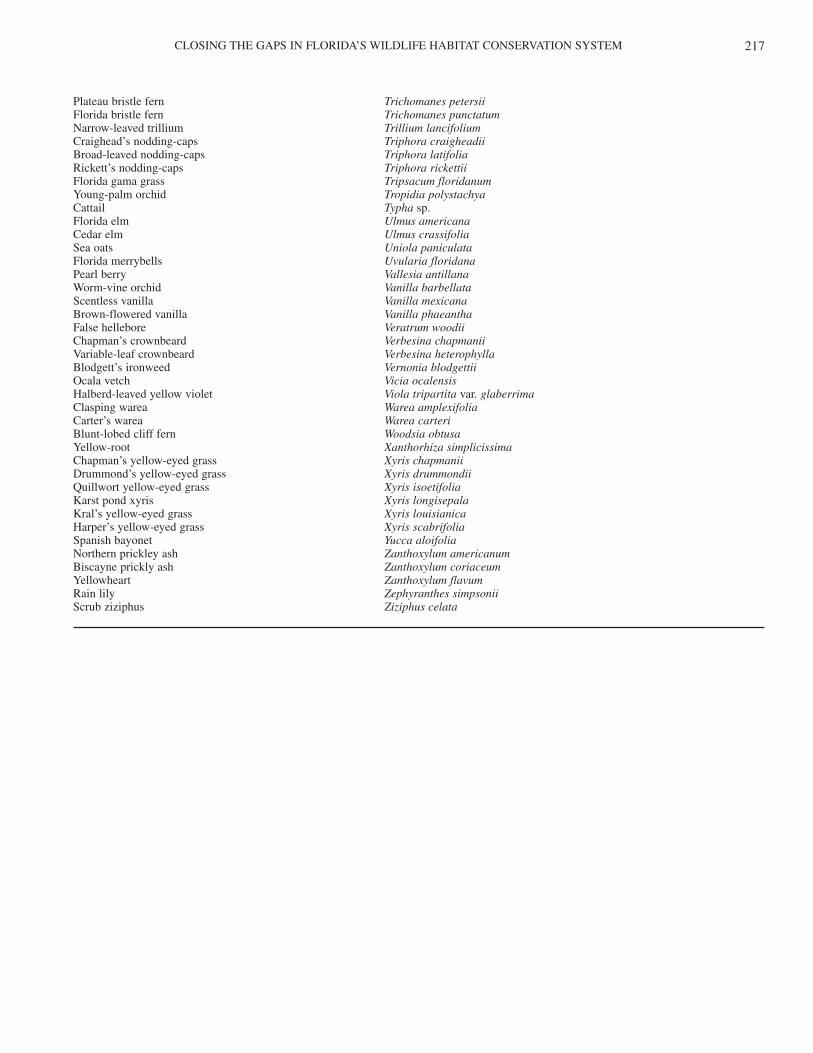
CLOSING THE GAPS IN FLORIDA’S WILDLIFE HABITAT CONSERVATION SYSTEM 217
Plateau bristle fern Trichomanes petersiiFlorida bristle fern Trichomanes punctatumNarrow-leaved trillium Trillium lancifoliumCraighead’s nodding-caps Triphora craigheadiiBroad-leaved nodding-caps Triphora latifoliaRickett’s nodding-caps Triphora rickettiiFlorida gama grass Tripsacum floridanumYoung-palm orchid Tropidia polystachyaCattail Typha sp.Florida elm Ulmus americanaCedar elm Ulmus crassifoliaSea oats Uniola paniculataFlorida merrybells Uvularia floridanaPearl berry Vallesia antillanaWorm-vine orchid Vanilla barbellataScentless vanilla Vanilla mexicanaBrown-flowered vanilla Vanilla phaeanthaFalse hellebore Veratrum woodiiChapman’s crownbeard Verbesina chapmaniiVariable-leaf crownbeard Verbesina heterophyllaBlodgett’s ironweed Vernonia blodgettiiOcala vetch Vicia ocalensisHalberd-leaved yellow violet Viola tripartita var. glaberrimaClasping warea Warea amplexifoliaCarter’s warea Warea carteriBlunt-lobed cliff fern Woodsia obtusaYellow-root Xanthorhiza simplicissimaChapman’s yellow-eyed grass Xyris chapmaniiDrummond’s yellow-eyed grass Xyris drummondiiQuillwort yellow-eyed grass Xyris isoetifoliaKarst pond xyris Xyris longisepalaKral’s yellow-eyed grass Xyris louisianicaHarper’s yellow-eyed grass Xyris scabrifoliaSpanish bayonet Yucca aloifoliaNorthern prickley ash Zanthoxylum americanumBiscayne prickly ash Zanthoxylum coriaceumYellowheart Zanthoxylum flavumRain lily Zephyranthes simpsoniiScrub ziziphus Ziziphus celata
FLORIDA GAME AND FRESH WATER FISH COMMISSION218
The Landsat classifications were grouped into general cate-gories that corresponded to classifications presented by Davis (1967),Hartman (1978), and Soil Conservation Service (undated). The spe-cific types of plant communities mapped in this project were basedon: (1) the ability to map the communities accurately using satellitedata and image classification techniques; (2) the importance of vari-ous land-cover types to different wildlife species; and (3) the need tocomplete the statewide vegetation mapping effort within a three-yeartime period.
A. UPLAND PLANT COMMUNITIES
Coastal Strand. Coastal strand occurs on well drained sandysoils and includes the typical zoned vegetation of the upper beach,nearby dunes, and coastal rock formations. Coastal strand generallyoccurs in a narrow band parallel to open waters of the Atlantic Oceanor Gulf of Mexico, and along the shores of some saline bays orsounds in both north and south Florida. This community occupiesareas formed along high energy shorelines, and is influenced bywind, waves, and salt spray. Vegetation within this community typi-cally consists of low growing vines, grasses, and herbaceous plantswith very few small trees or large shrubs. Pioneer or early succes-sional herbaceous vegetation characterizes the foredune and upperbeach, while a gradual change to woody plant species occurs in moreprotected areas landward. Typical plant species include beach morn-ing glory, railroad vine, sea oats, saw palmetto, spanish bayonet,yaupon holly, and wax myrtle. Sea grape, cocoplum, and other tropi-cal species are also found in this land-cover type in southern Florida.The coastal strand community only includes the zone of early succes-sional vegetation that lies between the upper beach, and more highlydeveloped communities landward. Adjacent or contiguous commu-nity types such as xeric oak scrubs, pinelands, or hardwood forestswere classified and mapped respectively.
Dry Prairie. Dry prairies are large native grass and shrub landsthat occur on flat terrain interspersed with scattered cypress domesand strands, bayheads, isolated freshwater marshes, and hardwoodhammocks. This community is characterized by many species ofgrasses, sedges, herbs, and shrubs, including saw palmetto, fetter-bush, staggerbush, tar flower, gallberry, wiregrass, carpet grasses,and various types of bluestem grasses. The largest areas of thesetreeless plains historically occurred just north of Lake Okeechobee,and they were subject to frequent fires. Many of these areas havebeen converted to improved pasture. In central and south Florida,palmetto prairies, which consist of former pine flatwoods where theoverstory trees have been thinned or removed, are also included inthis category. These sites contain scattered pines that cover less than15% of an area.
Pinelands. The pinelands category includes several more spe-cific groups of north and south Florida pine flatwoods, south Floridapine rocklands, and, reluctantly, commercial pine plantations. Pineflatwoods occur on flat sandy terrain where the overstory is charac-terized by longleaf pine, slash pine, or pond pine. Generally, flat-woods dominated by longleaf pine occur on well drained sites, pondpine is found in poorly drained areas, and slash pine occupies inter-mediate or moderately moist areas. The understory and ground coverwithin these 3 communities are somewhat similar and include severalcommon species such as saw palmetto, gallberry, wax myrtle, and awide variety of grasses and herbs. Wiregrass and runner oak domi-nate longleaf pine sites, fetterbush and bay trees are found in pondpine areas, while saw palmetto, gallberry, and rusty lyonia occupyslash pine flatwoods sites. Cypress domes, bayheads, titi swamps,and freshwater marshes are commonly interspersed in isolated
depressions throughout this community type, and fire is a majorsource of natural disturbance. An additional pine flatwoods foresttype occurs in extreme south Florida on rocklands where the oversto-ry is the south Florida variety of slash pine, and tropical hardwoodspecies occur in the understory. Scrubby flatwoods are anotherpineland type that occur on drier ridges, and on or near old coastaldunes. Longleaf pine or slash pine dominate the overstory, while theground cover is similar to the xeric oak scrub community.
Commercial pine plantations are also reluctantly included in thepinelands association. This class includes predominately plantedslash pine, although longleaf pine and loblolly pine tracts also mayfall under this classification. Sand pine plantations, which have beenplanted on prepared sandhill sites in the north Florida panhandle,may also be included in this category. An acceptably accurate sepa-ration of areas consisting of densely stocked native flatwoods andareas consisting of less densely stocked pine stands with a closedcanopy was not consistently possible.
Sand Pine Scrub. Sand pine scrub occurs on well-drained,sorted, sterile sands deposited along former shorelines and islands ofancient seas. This xeric plant community is dominated by an over-story of sand pine and has an understory of myrtle oak, Chapman’soak, sand-live oak, and scrub holly. Ground cover is usually sparseto absent, especially in mature stands, and rosemary and lichensoccur in some open areas. Sites within the Ocala National Forestwhich have an overstory of direct seeded sand pine, and an intactunderstory of characteristic xeric scrub oaks, are also included in thiscategory. Fire is an important ecological management tool, and com-monly results in even-aged stands within regenerated sites. The dis-tribution of this community type is almost entirely restricted to with-in the state of Florida.
Sandhill. Sandhill communities occur in areas of rolling terrainon deep, well-drained, white to yellow, sterile sands. This xericcommunity is dominated by an overstory of scattered longleaf pine,along with an understory of turkey oak and bluejack oak. The park-like ground cover consists of various grasses and herbs, includingwiregrass, partridge pea, beggars tick, milk pea, queen’s delight, andothers. Fire is an important factor in controlling hardwood competi-tion and other aspects of sandhill ecology. Although many of thesesites throughout the state have been modified through the selective orsevere cutting of longleaf pine, these areas are still included in thesandhill category.
Xeric Oak Scrub. Oak scrub is a hardwood community typi-cally consisting of clumped patches of low growing oaks interspersedwith bare areas of white sand. This community occurs on areas ofdeep, well-washed, sterile sands, and it is the same understory com-plex of scrubby oaks and other ground cover species that occurs inthe sand pine scrub community. This condition frequently occurswhen the short time periods between severe fires results in the com-plete removal of sand pine as an overstory species. Also included inthis category are sites within the Ocala National Forest which havebeen clearcut, and are sometimes dominated during the first one tofive years by the xeric oak scrub association. The xeric oak scrubcommunity is dominated by myrtle oak, Chapman’s oak, sand-liveoak, scrub holly, scrub plum, scrub hickory, rosemary, and saw pal-metto. Fire is important in setting back plant succession andmaintaining viable oak scrubs.
Mixed Hardwood-Pine Forest. This community is the south-ern extension of the Piedmont southern mixed hardwoods, and occursmainly on the clay soils on the northern panhandle. Younger stands
APPENDIX 2. Description of land-cover classification developed for the landsat habitat mapping project.
CLOSING THE GAPS IN FLORIDA’S WILDLIFE HABITAT CONSERVATION SYSTEM 219
may be predominantly pines, while a complex of various hardwoodsbecome co-dominant as the system matures over time through plantsuccession. The overstory consists of shortleaf and loblolly pine,American beech, mockernut hickory, southern red oak, water oak,American holly, and dogwood. Also included in this category areless specific upland forests that occur statewide and contain a mix-ture of conifers and hardwoods as the co-dominant overstory com-ponent. These communities may contain longleaf pine, slash pine,and loblolly pine in mixed association with live oak, laurel oak, andwater oak, together with other hardwood species
Hardwood Hammocks and Forests. This class includes themajor upland hardwood associations that occur statewide on fairlyrich sandy soils. Variations in species composition, and the local orspatial distributions of these communities are due in part to differ-ences in soil moisture regimes, soil types, and geographic locationwithin the state. The major variations within this association aremesic hammocks, xeric hammocks, coastal and hydric hammocks,and live oak or cabbage palm hammocks.
The mesic hammock community represents the climax vegeta-tion type within many areas of northern and central Florida.Characteristic species in the extreme north include American beech,southern magnolia, Shumard oak, white oak, mockernut hickory,pignut hickory, sourgum, basswood, whiteash, mulberry, and spruce pine. Mesic hammocks of the peninsula are less diverse dueto the absence of hardwood species which are adapted to morenortherly climates, and are characterized by laurel oak, hop horn-beam, blue-beech, sweetgum, cabbage palm, American holly, andsouthern magnolia. Xeric hammocks occur on deep, well-drained,sandy soils where fire has been absent for long periods of time.These open, dry hammocks contain live oak, sand-live oak,bluejack oak, blackjack oak, southern red oak, sand-post oak, andpignut hickory.
Coastal and hydric hammocks are relatively wet hardwoodforests that are found between uplands and true wetlands. Thesesometimes seasonally wet forests are associated with some non-allu-vial peninsula streams, scattered broad lowlands, and are also foundin a narrow band along parts of the Gulf and Atlantic coasts wherethey often extend to the edge of coastal salt marshes. These com-munities contain water oak, red maple, Florida elm, cabbage palm,red cedar, blue-beech, and sweetgum. Live oak and cabbage palmhammocks are often found bordering large lakes and rivers, and aredistributed throughout the prairie region of south central Florida andextend northward in the St. John’s River basin. These communitiesmay occur as mixed stands of oak and palm, or one of these speciescan completely dominate an area.
Tropical Hardwood Hammock. These upland hardwoodforests occur in extreme south Florida and are characterized by treeand shrub species on the northern edge of a range which extendssouthward into the Caribbean. These communities are sparsely dis-tributed along coastal uplands south of a line from about Vero Beach on the Atlantic coast to Sarasota on the Gulf coast. Theyoccur on many tree islands in the Everglades and on uplandsthroughout the Florida Keys. This cold-sensitive tropical communi-ty has very high plant species diversity, sometimes containing over35 species of trees and about 65 species of shrubs. Characteristictropical plants include strangler fig, gumbo-limbo, mastic, bustic,lancewood, ironwoods, poisonwood, pigeon plum, Jamaica dog-wood, and Bahama lysiloma. Live oak and cabbage palm are alsosometimes found within this community. Tropical hammocks in theFlorida Keys may also contain several plants, including lignumvitae, mahogany, thatch palms, and manchineel, which are extreme-ly rare within the United States.
B. WETLAND PLANT COMMUNITIES
Coastal Salt Marshes. These herbaceous and shrubby wetlandcommunities occur statewide in brackish waters along protected lowenergy estuarine shorelines of the Atlantic and Gulf coasts. Thelargest continuous areas of salt marsh occur north of the range ofmangroves, and border tidal creeks, bays, and sounds. Salt marshesare sometimes interspersed within mangrove areas, and also occur asa transition zone between freshwater marshes and mangrove forestssuch as in the Ten Thousand Islands area along the southwestFlorida coast. Plant distribution within salt marshes is largelydependent on the degree of tidal inundation, and many large areasare completely dominated by one species. Generally, smooth cord-grass typically occupies the lowest elevations immediately adjacentto tidal creeks and pools, while black needlerush dominates less fre-quently inundated zones. The highest elevations form transitionalareas characterized by glasswort, saltwort, saltgrass, sea oxeye daisy, marsh elder, and saltbush. For the purposes of this project,cordgrass, needlerush, and transitional or high salt marshes are col-lectively mapped as this single category.
Freshwater Marsh and Wet Prairie. These wetland commu-nities are dominated by a wide assortment of herbaceous plantspecies growing on sand, clay, marl, and organic soils in areas ofvariable water depths and inundation regimes. Generally, freshwa-ter marshes occur in deeper, more strongly inundated situations andare characterized by tall emergent and floating-leaved species.Freshwater marshes occur within depressions, along broad, shallowlake and river shorelines, and are scattered in open areas withinhardwood and cypress swamps. Also, other portions of freshwaterlakes, rivers, and canals which are dominated by floating-leavedplants such as lotus, spatterdock, duck weed, and water hyacinthsare included in this category. Wet prairies commonly occur in shal-low, periodically inundated areas and are usually dominated byaquatic grasses, sedges, and their associates. Wet prairies occur asscattered, shallow depressions within dry prairie areas and on marlprairie areas in south Florida. Also included in this category areareas in southwest Florida with scattered dwarf cypress having lessthan 20% canopy coverage, and a dense ground cover of freshwatermarsh plants. Marshes and wet prairies are dominated by variouscombinations of pickerel weed, sawgrass, maidencane, arrowhead,fire flag, cattail, spike rush, bulrush, white water lily, water shield,and various sedges. Many marsh or wet prairie types, such as saw-grass marsh or maidencane prairie, have been described and so-named based on their dominant plant species.
Cypress Swamp. These regularly inundated wetlands form aforested border along large rivers, creeks, and lakes, or occur indepressions as circular domes or linear strands. These communitiesare strongly dominated by either bald cypress or pond cypress, withvery low numbers of scattered black gum, red maple, and sweetbay.Understory and ground cover are usually sparse due to frequentflooding but sometimes include such species as buttonbush, lizard’s-tail, and various ferns.
Mixed Hardwood Swamp. These wooded wetland communi-ties are composed of either pure stands of hardwoods, or occur as amixture of hardwoods and cypress. This association of wetland-adapted trees occurs throughout the state on organic soils and formsthe forested floodplain of non-alluvial rivers, creeks, and broad lakebasins. Tree species include a mixed overstory containing blackgum, water tupelo, bald cypress, dahoon holly, red maple, swampash, cabbage palm, and sweetbay.
Bottomland Hardwood Forest. These wetland forests arecomposed of a diverse assortment of hydric hardwoods which occuron the rich alluvial soils of silt and clay deposited along several pan-handle rivers including the Apalachicola. These communities are
FLORIDA GAME AND FRESH WATER FISH COMMISSION220
characterized by an overstory that includes water hickory, overcupoak, swamp chestnut oak, river birch, American sycamore, redmaple, Florida elm, bald cypress, blue beech, and swamp ash.
Bay Swamp. These hardwood swamps contain broadleaf ever-green trees that occur in shallow, stagnant drainages or depressionsoften found within pine flatwoods, or at the base of sandy ridgeswhere seepage maintains constantly wet soils. The soils, which areusually covered by an abundant layer of leaf litter, are mostly acidicpeat or muck which remain saturated for long periods but over whichlittle water level fluctuation occurs. Overstory trees within bayheadsare dominated by sweetbay, swamp bay, and loblolly bay.Depending on the location within the state, other species includingpond pine, slash pine, blackgum, cypress, and Atlantic white cedarcan occur as scattered individuals, but bay trees dominate the canopyand characterize the community. Understory and ground coverspecies may include dahoon holly, wax myrtle, fetterbush, greenbri-ar, royal fern, cinnamon fern, and sphagnum moss.
Shrub Swamp. Shrub swamps are wetland communities domi-nated by dense, low-growing, woody shrubs or small trees. Shrubswamps are usually characteristic of wetland areas that are experi-encing environmental change, and are early to mid-successional inspecies complement and structure. These changes are a result of nat-ural or man-induced perturbations due to increased or decreasedhydroperiod, fire, clear cutting or land clearing, and siltation. Shrubswamps statewide may be dominated by one species, such as willow,or an array of opportunistic plants may form a dense, low canopy.Common species include willow, wax myrtle, primrose willow, but-tonbush, and saplings of red maple, sweetbay, black gum, and otherhydric tree species indicative of wooded wetlands.
In northern Florida, some shrub swamps are a fire-maintainedsubclimax of bay swamps. These dense shrubby areas aredominated by black titi, swamp cyrilla, fetterbush, sweet pepperbush,doghhobble, large gallberry, and myrtle-leaf holly.
Mangrove Swamp. These dense, brackish water swamps occuralong low-energy shorelines and in protected, tidally influenced baysof southern Florida. This community is composed of freeze-sensitivetree species that are distributed south of a line from Cedar Key on theGulf coast to St. Augustine on the Atlantic coast. These swamp com-munities are usually dominated by red, black, and white mangrovesthat progress in a sere from seaward to landward areas, respectively,while buttonwood trees occur in areas above high tide. Openings andtransitional areas in mangrove swamps sometimes contain glasswort,saltwort, and other salt marsh species. All three major species ofmangroves are mapped as a single class with no effort made to differ-entiate these species into separate zones.
C. OPEN WATER
Open Water. This community is comprised of the open waterareas of inland freshwater lakes, ponds, rivers, and creeks, and thebrackish and saline waters of estuaries, bays, tidal creeks, the Gulf ofMexico, and the Atlantic Ocean.
D. DISTURBED COMMUNITIES
Grassland and Agriculture. These areas are dominated bylow-growing herbaceous vegetative cover on intensively managedsites such as row crops, improved pastures, lawns, golf courses, roadshoulders, cemeteries, or weedy, fallow agricultural fields, etc. Thisvery early successional category includes all sites with herbaceousvegetation during the time period between bare ground and the shruband brush stage, as well as agricultural fiends of all types.
Shrub and Brushland. This association includes a variety ofsituations where natural upland community types have been recentlydisturbed through clear-cutting commercial pinelands, land clearing,or fire, and are recovering through natural successional processes.This type could be characterized as an early condition of old fieldsuccession, and the community is dominated by various shrubs, treesaplings, and lesser amounts of grasses and herbs. Common speciesinclude wax myrtle, saltbush, sumac, elderberry, saw palmetto,blackberry, gallberry, fetterbush, staggerbush, broomsedge, and dogfennel, together with oak, pine, and other tree seedlings or saplings.
Exotic Plant Communities. Upland and wetland areas domi-nated by non-native trees that were planted or have escaped andinvaded native plant communities. These exotics include melaleuca,Australian pine, Brazilian pepper, and eucalyptus.
Barren and Urban Land. This class includes highly reflectiveunvegetated areas such as roads, beaches, active strip mines, tilledagricultural sites, and cleared land on sandy soils. Unvegetated sites in urban areas, which include rooftops of buildings, athleticfields, landfills, and parking lots, etc., are also included in thiscategory. Vegetated tracts within urban areas are classified andmapped according to their predominate vegetation cover or plantcommunity type.
CLOSING THE GAPS IN FLORIDA’S WILDLIFE HABITAT CONSERVATION SYSTEM 221
APPENDIX 3. Tabulation of land cover types by county and conservation lands within counties. Area figures are in square kilometers. There are approximately 247 acres per square kilometer. The figures are divided into three tables for (1) “natural” upland cover types, (2)“natural” wetland cover types, and (3) “disturbed” cover types.
Appendix 3, Table 1. Natural upland cover types.
Coastal Dry Sand pine Xeric Mixed HW Hardwood TropicalStrand Prairie Pinelands Scrub Sandhill Oak Scrub Pines Hammocks Hammocks
NASSAU 4 0 811 0 1 3 7 82 0Conservation Lands 1 0 9 0 0 0 0 3 0
MADISON 0 0 622 0 0 0 0 150 0Conservation Lands 0 0 21 0 0 0 0 4 0
HAMILTON 0 0 596 0 0 0 0 127 0Conservation Lands 0 0 14 0 0 0 0 6 0
COLUMBIA 0 0 823 0 9 0 0 110 0Conservation Lands 0 0 245 0 3 0 0 16 0
BAKER 0 0 746 0 0 0 0 0 0Conservation Lands 0 0 243 0 0 0 0 0 0
DUVAL 1 7 738 0 17 8 26 62 0Conservation Lands 1 1 76 0 0 7 1 15 0
SUWANNEE 0 0 467 0 54 0 0 210 0Conservation Lands 0 0 3 0 5 0 0 10 0
TAYLOR 0 0 1245 0 0 0 0 254 0Conservation Lands 0 0 39 0 0 0 0 120 0
LAFAYETTE 0 0 738 0 2 0 0 65 0Conservation Lands 0 0 0 0 1 0 0 4 0
ST. JOHNS 1 3 621 0 12 3 50 127 0Conservation Lands 0 0 3 0 0 0 7 16 0
CLAY 0 0 675 3 175 9 14 70 0Conservation Lands 0 0 124 2 68 2 4 9 0
UNION 0 0 278 0 0 0 0 15 0Conservation Lands 0 0 17 0 0 0 0 0 0
BRADFORD 0 0 289 0 6 0 0 23 0Conservation Lands 0 0 24 0 0 0 0 1 0
ALACHUA 0 0 671 0 33 0 2 254 0Conservation Lands 0 0 21 0 0 0 2 26 0
GILCHRIST 0 0 224 0 62 0 0 61 0Conservation Lands 0 0 0 0 0 0 0 4 0
DIXIE 0 0 715 0 0 0 0 119 0Conservation Lands 0 0 18 0 0 0 0 18 0
PUTNAM 0 1 623 29 250 8 12 179 0Conservation Lands 0 0 55 27 30 5 1 13 0
FLAGLER 0 2 578 1 0 3 3 48 0Conservation Lands 0 0 1 0 0 0 0 1 0
LEVY 0 0 1062 0 246 10 128 212 0Conservation Lands 0 0 39 0 0 5 7 42 0
MARION 0 0 531 683 421 160 195 149 0Conservation Lands 0 0 67 655 136 151 39 42 0
VOLUSIA 1 124 835 46 8 26 71 197 0Conservation Lands 1 15 33 3 0 4 3 21 0
LAKE 0 30 156 68 73 19 9 143 0Conservation Lands 0 22 64 63 60 14 2 16 0
CITRUS 0 0 75 12 485 9 30 194 0Conservation Lands 0 0 7 1 126 5 6 32 0
SUMTER 0 2 104 12 39 1 44 111 0Conservation Lands 0 2 73 0 5 1 12 28 0
SEMINOLE 0 24 73 7 2 17 1 93 0Conservation Lands 0 0 6 0 0 2 0 1 0
BREVARD 2 203 298 4 0 49 0 136 0Conservation Lands 1 80 12 0 0 35 0 57 0
ORANGE 0 315 278 18 16 14 6 94 0Conservation Lands 0 16 58 4 10 1 1 25 0
HERNANDO 0 0 90 12 304 2 110 137 0Conservation Lands 0 0 28 0 62 0 19 32 0
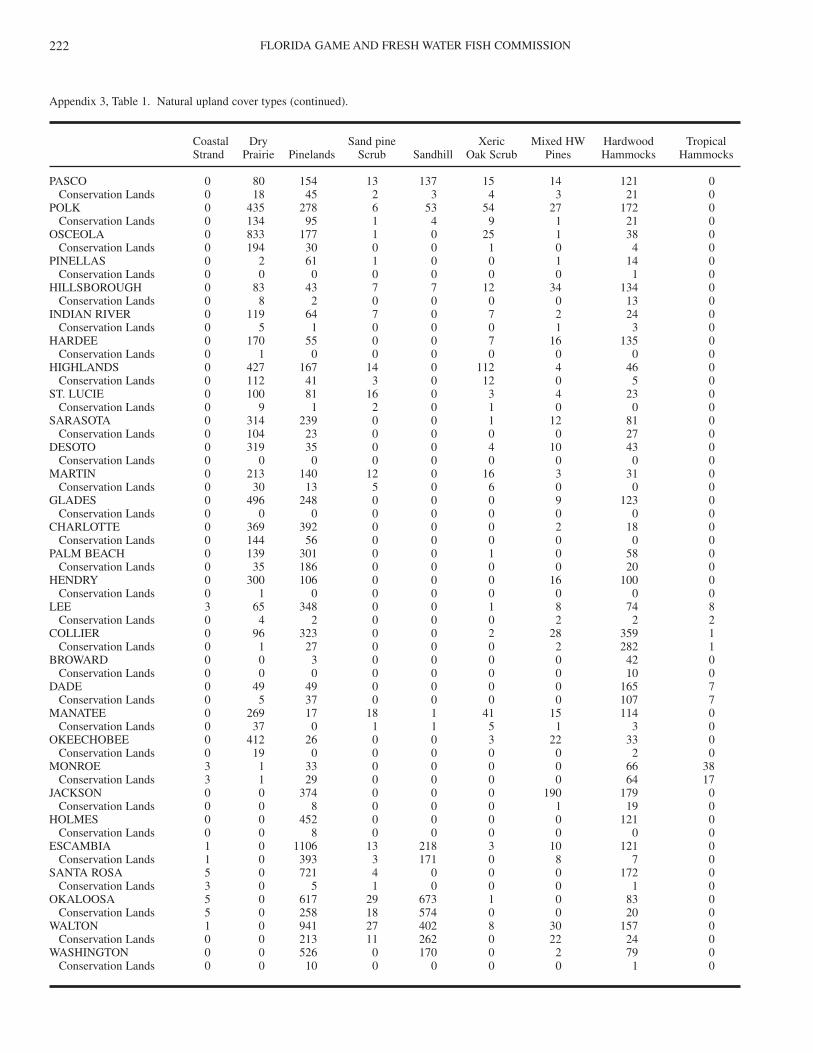
FLORIDA GAME AND FRESH WATER FISH COMMISSION222
Appendix 3, Table 1. Natural upland cover types (continued).
Coastal Dry Sand pine Xeric Mixed HW Hardwood TropicalStrand Prairie Pinelands Scrub Sandhill Oak Scrub Pines Hammocks Hammocks
PASCO 0 80 154 13 137 15 14 121 0Conservation Lands 0 18 45 2 3 4 3 21 0
POLK 0 435 278 6 53 54 27 172 0Conservation Lands 0 134 95 1 4 9 1 21 0
OSCEOLA 0 833 177 1 0 25 1 38 0Conservation Lands 0 194 30 0 0 1 0 4 0
PINELLAS 0 2 61 1 0 0 1 14 0Conservation Lands 0 0 0 0 0 0 0 1 0
HILLSBOROUGH 0 83 43 7 7 12 34 134 0Conservation Lands 0 8 2 0 0 0 0 13 0
INDIAN RIVER 0 119 64 7 0 7 2 24 0Conservation Lands 0 5 1 0 0 0 1 3 0
HARDEE 0 170 55 0 0 7 16 135 0Conservation Lands 0 1 0 0 0 0 0 0 0
HIGHLANDS 0 427 167 14 0 112 4 46 0Conservation Lands 0 112 41 3 0 12 0 5 0
ST. LUCIE 0 100 81 16 0 3 4 23 0Conservation Lands 0 9 1 2 0 1 0 0 0
SARASOTA 0 314 239 0 0 1 12 81 0Conservation Lands 0 104 23 0 0 0 0 27 0
DESOTO 0 319 35 0 0 4 10 43 0Conservation Lands 0 0 0 0 0 0 0 0 0
MARTIN 0 213 140 12 0 16 3 31 0Conservation Lands 0 30 13 5 0 6 0 0 0
GLADES 0 496 248 0 0 0 9 123 0Conservation Lands 0 0 0 0 0 0 0 0 0
CHARLOTTE 0 369 392 0 0 0 2 18 0Conservation Lands 0 144 56 0 0 0 0 0 0
PALM BEACH 0 139 301 0 0 1 0 58 0Conservation Lands 0 35 186 0 0 0 0 20 0
HENDRY 0 300 106 0 0 0 16 100 0Conservation Lands 0 1 0 0 0 0 0 0 0
LEE 3 65 348 0 0 1 8 74 8Conservation Lands 0 4 2 0 0 0 2 2 2
COLLIER 0 96 323 0 0 2 28 359 1Conservation Lands 0 1 27 0 0 0 2 282 1
BROWARD 0 0 3 0 0 0 0 42 0Conservation Lands 0 0 0 0 0 0 0 10 0
DADE 0 49 49 0 0 0 0 165 7Conservation Lands 0 5 37 0 0 0 0 107 7
MANATEE 0 269 17 18 1 41 15 114 0Conservation Lands 0 37 0 1 1 5 1 3 0
OKEECHOBEE 0 412 26 0 0 3 22 33 0Conservation Lands 0 19 0 0 0 0 0 2 0
MONROE 3 1 33 0 0 0 0 66 38Conservation Lands 3 1 29 0 0 0 0 64 17
JACKSON 0 0 374 0 0 0 190 179 0Conservation Lands 0 0 8 0 0 0 1 19 0
HOLMES 0 0 452 0 0 0 0 121 0Conservation Lands 0 0 8 0 0 0 0 0 0
ESCAMBIA 1 0 1106 13 218 3 10 121 0Conservation Lands 1 0 393 3 171 0 8 7 0
SANTA ROSA 5 0 721 4 0 0 0 172 0Conservation Lands 3 0 5 1 0 0 0 1 0
OKALOOSA 5 0 617 29 673 1 0 83 0Conservation Lands 5 0 258 18 574 0 0 20 0
WALTON 1 0 941 27 402 8 30 157 0Conservation Lands 0 0 213 11 262 0 22 24 0
WASHINGTON 0 0 526 0 170 0 2 79 0Conservation Lands 0 0 10 0 0 0 0 1 0
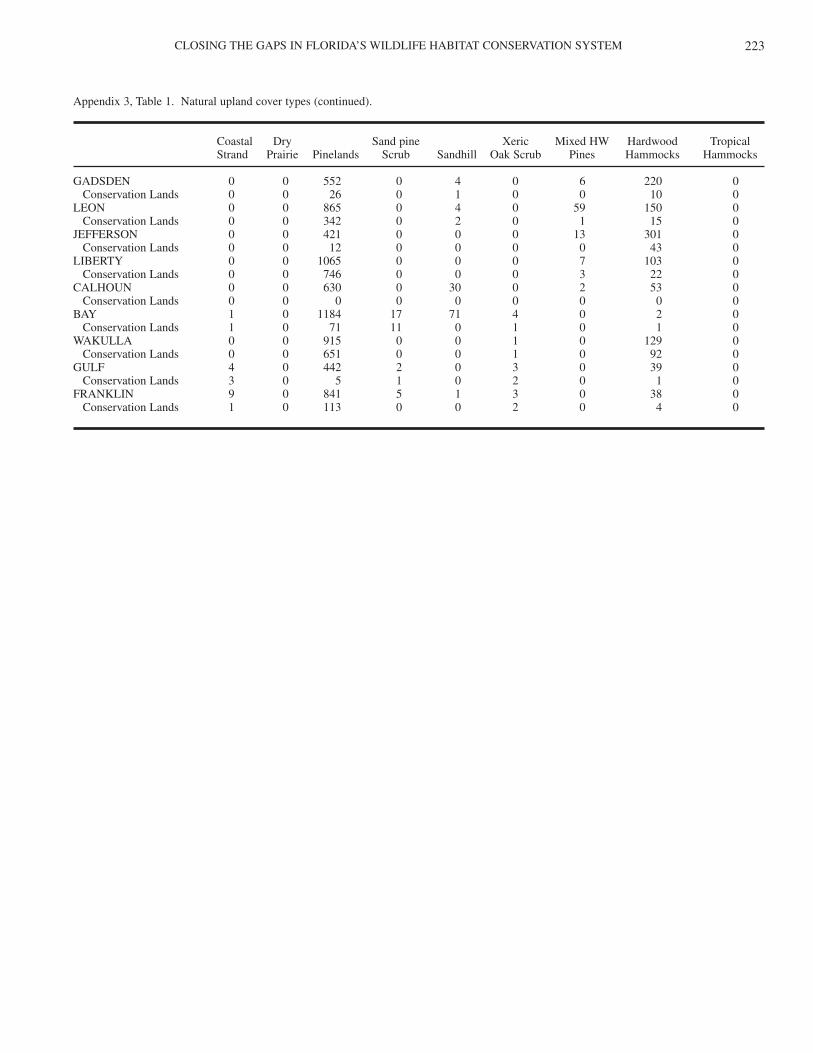
CLOSING THE GAPS IN FLORIDA’S WILDLIFE HABITAT CONSERVATION SYSTEM 223
Appendix 3, Table 1. Natural upland cover types (continued).
Coastal Dry Sand pine Xeric Mixed HW Hardwood TropicalStrand Prairie Pinelands Scrub Sandhill Oak Scrub Pines Hammocks Hammocks
GADSDEN 0 0 552 0 4 0 6 220 0Conservation Lands 0 0 26 0 1 0 0 10 0
LEON 0 0 865 0 4 0 59 150 0Conservation Lands 0 0 342 0 2 0 1 15 0
JEFFERSON 0 0 421 0 0 0 13 301 0Conservation Lands 0 0 12 0 0 0 0 43 0
LIBERTY 0 0 1065 0 0 0 7 103 0Conservation Lands 0 0 746 0 0 0 3 22 0
CALHOUN 0 0 630 0 30 0 2 53 0Conservation Lands 0 0 0 0 0 0 0 0 0
BAY 1 0 1184 17 71 4 0 2 0Conservation Lands 1 0 71 11 0 1 0 1 0
WAKULLA 0 0 915 0 0 1 0 129 0Conservation Lands 0 0 651 0 0 1 0 92 0
GULF 4 0 442 2 0 3 0 39 0Conservation Lands 3 0 5 1 0 2 0 1 0
FRANKLIN 9 0 841 5 1 3 0 38 0Conservation Lands 1 0 113 0 0 2 0 4 0
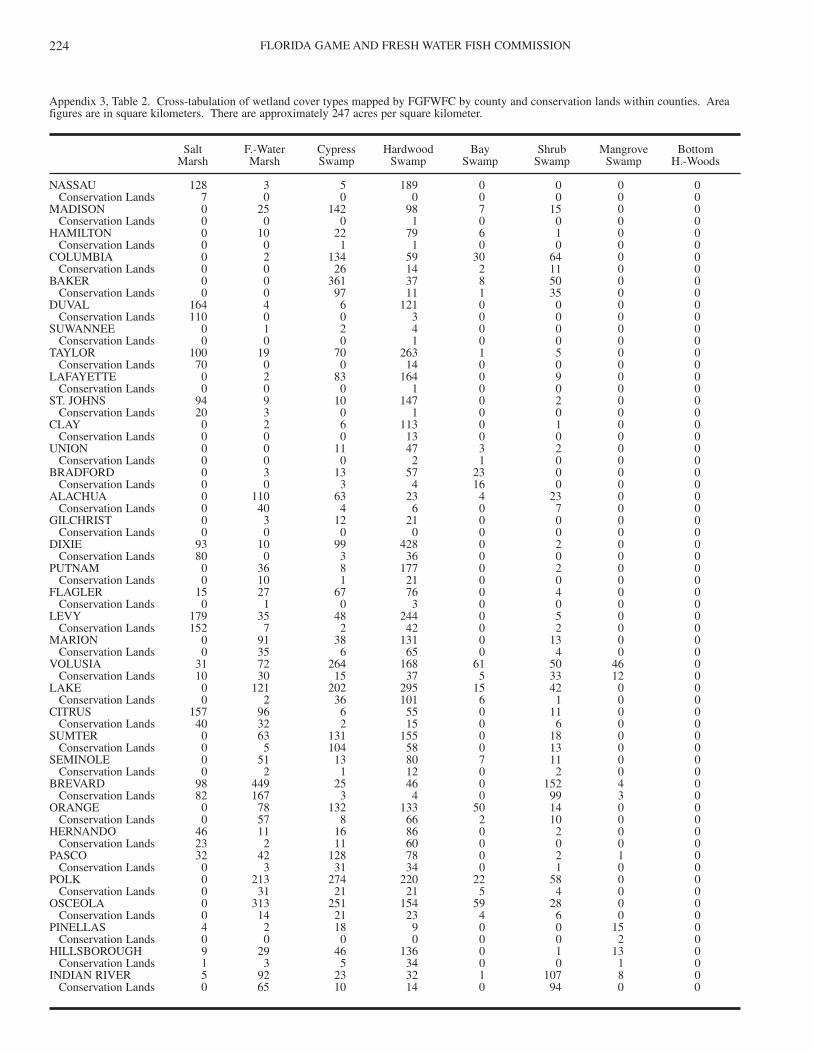
FLORIDA GAME AND FRESH WATER FISH COMMISSION224
Appendix 3, Table 2. Cross-tabulation of wetland cover types mapped by FGFWFC by county and conservation lands within counties. Areafigures are in square kilometers. There are approximately 247 acres per square kilometer.
Salt F.-Water Cypress Hardwood Bay Shrub Mangrove BottomMarsh Marsh Swamp Swamp Swamp Swamp Swamp H.-Woods
NASSAU 128 3 5 189 0 0 0 0Conservation Lands 7 0 0 0 0 0 0 0
MADISON 0 25 142 98 7 15 0 0Conservation Lands 0 0 0 1 0 0 0 0
HAMILTON 0 10 22 79 6 1 0 0Conservation Lands 0 0 1 1 0 0 0 0
COLUMBIA 0 2 134 59 30 64 0 0Conservation Lands 0 0 26 14 2 11 0 0
BAKER 0 0 361 37 8 50 0 0Conservation Lands 0 0 97 11 1 35 0 0
DUVAL 164 4 6 121 0 0 0 0Conservation Lands 110 0 0 3 0 0 0 0
SUWANNEE 0 1 2 4 0 0 0 0Conservation Lands 0 0 0 1 0 0 0 0
TAYLOR 100 19 70 263 1 5 0 0Conservation Lands 70 0 0 14 0 0 0 0
LAFAYETTE 0 2 83 164 0 9 0 0Conservation Lands 0 0 0 1 0 0 0 0
ST. JOHNS 94 9 10 147 0 2 0 0Conservation Lands 20 3 0 1 0 0 0 0
CLAY 0 2 6 113 0 1 0 0Conservation Lands 0 0 0 13 0 0 0 0
UNION 0 0 11 47 3 2 0 0Conservation Lands 0 0 0 2 1 0 0 0
BRADFORD 0 3 13 57 23 0 0 0Conservation Lands 0 0 3 4 16 0 0 0
ALACHUA 0 110 63 23 4 23 0 0Conservation Lands 0 40 4 6 0 7 0 0
GILCHRIST 0 3 12 21 0 0 0 0Conservation Lands 0 0 0 0 0 0 0 0
DIXIE 93 10 99 428 0 2 0 0Conservation Lands 80 0 3 36 0 0 0 0
PUTNAM 0 36 8 177 0 2 0 0Conservation Lands 0 10 1 21 0 0 0 0
FLAGLER 15 27 67 76 0 4 0 0Conservation Lands 0 1 0 3 0 0 0 0
LEVY 179 35 48 244 0 5 0 0Conservation Lands 152 7 2 42 0 2 0 0
MARION 0 91 38 131 0 13 0 0Conservation Lands 0 35 6 65 0 4 0 0
VOLUSIA 31 72 264 168 61 50 46 0Conservation Lands 10 30 15 37 5 33 12 0
LAKE 0 121 202 295 15 42 0 0Conservation Lands 0 2 36 101 6 1 0 0
CITRUS 157 96 6 55 0 11 0 0Conservation Lands 40 32 2 15 0 6 0 0
SUMTER 0 63 131 155 0 18 0 0Conservation Lands 0 5 104 58 0 13 0 0
SEMINOLE 0 51 13 80 7 11 0 0Conservation Lands 0 2 1 12 0 2 0 0
BREVARD 98 449 25 46 0 152 4 0Conservation Lands 82 167 3 4 0 99 3 0
ORANGE 0 78 132 133 50 14 0 0Conservation Lands 0 57 8 66 2 10 0 0
HERNANDO 46 11 16 86 0 2 0 0Conservation Lands 23 2 11 60 0 0 0 0
PASCO 32 42 128 78 0 2 1 0Conservation Lands 0 3 31 34 0 1 0 0
POLK 0 213 274 220 22 58 0 0Conservation Lands 0 31 21 21 5 4 0 0
OSCEOLA 0 313 251 154 59 28 0 0Conservation Lands 0 14 21 23 4 6 0 0
PINELLAS 4 2 18 9 0 0 15 0Conservation Lands 0 0 0 0 0 0 2 0
HILLSBOROUGH 9 29 46 136 0 1 13 0Conservation Lands 1 3 5 34 0 0 1 0
INDIAN RIVER 5 92 23 32 1 107 8 0Conservation Lands 0 65 10 14 0 94 0 0
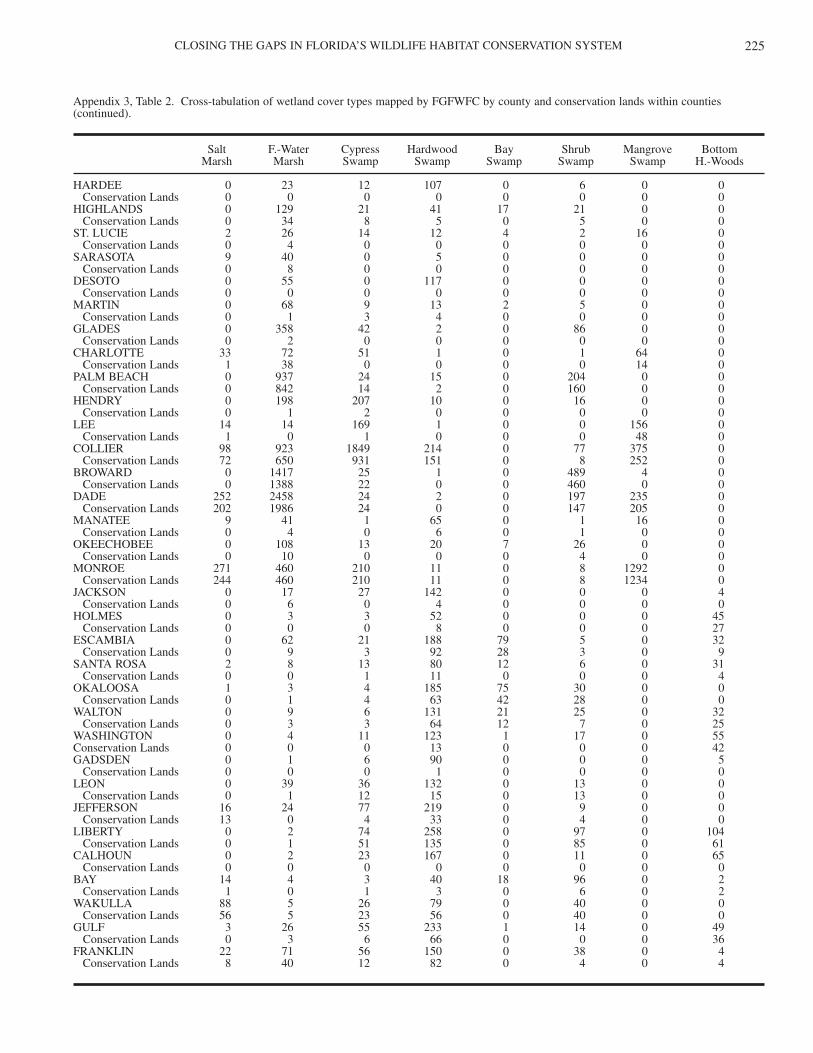
CLOSING THE GAPS IN FLORIDA’S WILDLIFE HABITAT CONSERVATION SYSTEM 225
Appendix 3, Table 2. Cross-tabulation of wetland cover types mapped by FGFWFC by county and conservation lands within counties(continued).
Salt F.-Water Cypress Hardwood Bay Shrub Mangrove BottomMarsh Marsh Swamp Swamp Swamp Swamp Swamp H.-Woods
HARDEE 0 23 12 107 0 6 0 0Conservation Lands 0 0 0 0 0 0 0 0
HIGHLANDS 0 129 21 41 17 21 0 0Conservation Lands 0 34 8 5 0 5 0 0
ST. LUCIE 2 26 14 12 4 2 16 0Conservation Lands 0 4 0 0 0 0 0 0
SARASOTA 9 40 0 5 0 0 0 0Conservation Lands 0 8 0 0 0 0 0 0
DESOTO 0 55 0 117 0 0 0 0Conservation Lands 0 0 0 0 0 0 0 0
MARTIN 0 68 9 13 2 5 0 0Conservation Lands 0 1 3 4 0 0 0 0
GLADES 0 358 42 2 0 86 0 0Conservation Lands 0 2 0 0 0 0 0 0
CHARLOTTE 33 72 51 1 0 1 64 0Conservation Lands 1 38 0 0 0 0 14 0
PALM BEACH 0 937 24 15 0 204 0 0Conservation Lands 0 842 14 2 0 160 0 0
HENDRY 0 198 207 10 0 16 0 0Conservation Lands 0 1 2 0 0 0 0 0
LEE 14 14 169 1 0 0 156 0Conservation Lands 1 0 1 0 0 0 48 0
COLLIER 98 923 1849 214 0 77 375 0Conservation Lands 72 650 931 151 0 8 252 0
BROWARD 0 1417 25 1 0 489 4 0Conservation Lands 0 1388 22 0 0 460 0 0
DADE 252 2458 24 2 0 197 235 0Conservation Lands 202 1986 24 0 0 147 205 0
MANATEE 9 41 1 65 0 1 16 0Conservation Lands 0 4 0 6 0 1 0 0
OKEECHOBEE 0 108 13 20 7 26 0 0Conservation Lands 0 10 0 0 0 4 0 0
MONROE 271 460 210 11 0 8 1292 0Conservation Lands 244 460 210 11 0 8 1234 0
JACKSON 0 17 27 142 0 0 0 4Conservation Lands 0 6 0 4 0 0 0 0
HOLMES 0 3 3 52 0 0 0 45Conservation Lands 0 0 0 8 0 0 0 27
ESCAMBIA 0 62 21 188 79 5 0 32Conservation Lands 0 9 3 92 28 3 0 9
SANTA ROSA 2 8 13 80 12 6 0 31Conservation Lands 0 0 1 11 0 0 0 4
OKALOOSA 1 3 4 185 75 30 0 0Conservation Lands 0 1 4 63 42 28 0 0
WALTON 0 9 6 131 21 25 0 32Conservation Lands 0 3 3 64 12 7 0 25
WASHINGTON 0 4 11 123 1 17 0 55Conservation Lands 0 0 0 13 0 0 0 42GADSDEN 0 1 6 90 0 0 0 5
Conservation Lands 0 0 0 1 0 0 0 0LEON 0 39 36 132 0 13 0 0
Conservation Lands 0 1 12 15 0 13 0 0JEFFERSON 16 24 77 219 0 9 0 0
Conservation Lands 13 0 4 33 0 4 0 0LIBERTY 0 2 74 258 0 97 0 104
Conservation Lands 0 1 51 135 0 85 0 61CALHOUN 0 2 23 167 0 11 0 65
Conservation Lands 0 0 0 0 0 0 0 0BAY 14 4 3 40 18 96 0 2
Conservation Lands 1 0 1 3 0 6 0 2WAKULLA 88 5 26 79 0 40 0 0
Conservation Lands 56 5 23 56 0 40 0 0GULF 3 26 55 233 1 14 0 49
Conservation Lands 0 3 6 66 0 0 0 36FRANKLIN 22 71 56 150 0 38 0 4
Conservation Lands 8 40 12 82 0 4 0 4
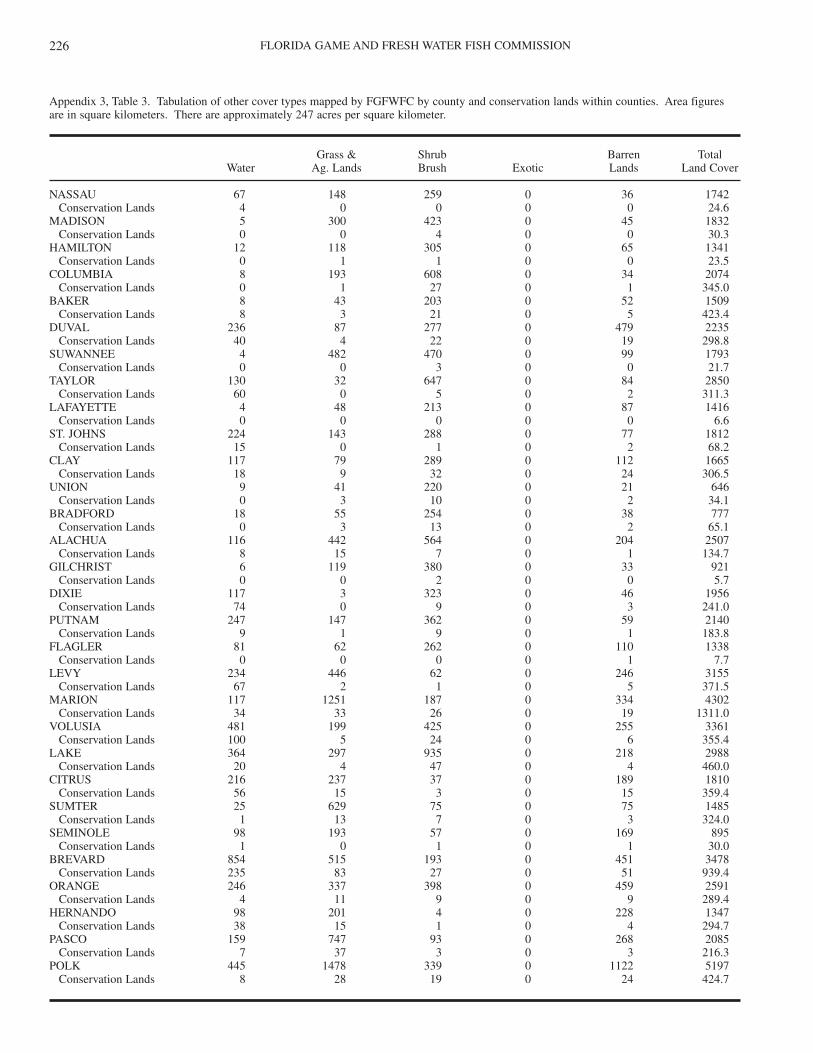
FLORIDA GAME AND FRESH WATER FISH COMMISSION226
Appendix 3, Table 3. Tabulation of other cover types mapped by FGFWFC by county and conservation lands within counties. Area figuresare in square kilometers. There are approximately 247 acres per square kilometer.
Grass & Shrub Barren TotalWater Ag. Lands Brush Exotic Lands Land Cover
NASSAU 67 148 259 0 36 1742Conservation Lands 4 0 0 0 0 24.6
MADISON 5 300 423 0 45 1832Conservation Lands 0 0 4 0 0 30.3
HAMILTON 12 118 305 0 65 1341Conservation Lands 0 1 1 0 0 23.5
COLUMBIA 8 193 608 0 34 2074Conservation Lands 0 1 27 0 1 345.0
BAKER 8 43 203 0 52 1509Conservation Lands 8 3 21 0 5 423.4
DUVAL 236 87 277 0 479 2235Conservation Lands 40 4 22 0 19 298.8
SUWANNEE 4 482 470 0 99 1793Conservation Lands 0 0 3 0 0 21.7
TAYLOR 130 32 647 0 84 2850Conservation Lands 60 0 5 0 2 311.3
LAFAYETTE 4 48 213 0 87 1416Conservation Lands 0 0 0 0 0 6.6
ST. JOHNS 224 143 288 0 77 1812Conservation Lands 15 0 1 0 2 68.2
CLAY 117 79 289 0 112 1665Conservation Lands 18 9 32 0 24 306.5
UNION 9 41 220 0 21 646Conservation Lands 0 3 10 0 2 34.1
BRADFORD 18 55 254 0 38 777Conservation Lands 0 3 13 0 2 65.1
ALACHUA 116 442 564 0 204 2507Conservation Lands 8 15 7 0 1 134.7
GILCHRIST 6 119 380 0 33 921Conservation Lands 0 0 2 0 0 5.7
DIXIE 117 3 323 0 46 1956Conservation Lands 74 0 9 0 3 241.0
PUTNAM 247 147 362 0 59 2140Conservation Lands 9 1 9 0 1 183.8
FLAGLER 81 62 262 0 110 1338Conservation Lands 0 0 0 0 1 7.7
LEVY 234 446 62 0 246 3155Conservation Lands 67 2 1 0 5 371.5
MARION 117 1251 187 0 334 4302Conservation Lands 34 33 26 0 19 1311.0
VOLUSIA 481 199 425 0 255 3361Conservation Lands 100 5 24 0 6 355.4
LAKE 364 297 935 0 218 2988Conservation Lands 20 4 47 0 4 460.0
CITRUS 216 237 37 0 189 1810Conservation Lands 56 15 3 0 15 359.4
SUMTER 25 629 75 0 75 1485Conservation Lands 1 13 7 0 3 324.0
SEMINOLE 98 193 57 0 169 895Conservation Lands 1 0 1 0 1 30.0
BREVARD 854 515 193 0 451 3478Conservation Lands 235 83 27 0 51 939.4
ORANGE 246 337 398 0 459 2591Conservation Lands 4 11 9 0 9 289.4
HERNANDO 98 201 4 0 228 1347Conservation Lands 38 15 1 0 4 294.7
PASCO 159 747 93 0 268 2085Conservation Lands 7 37 3 0 3 216.3
POLK 445 1478 339 0 1122 5197Conservation Lands 8 28 19 0 24 424.7
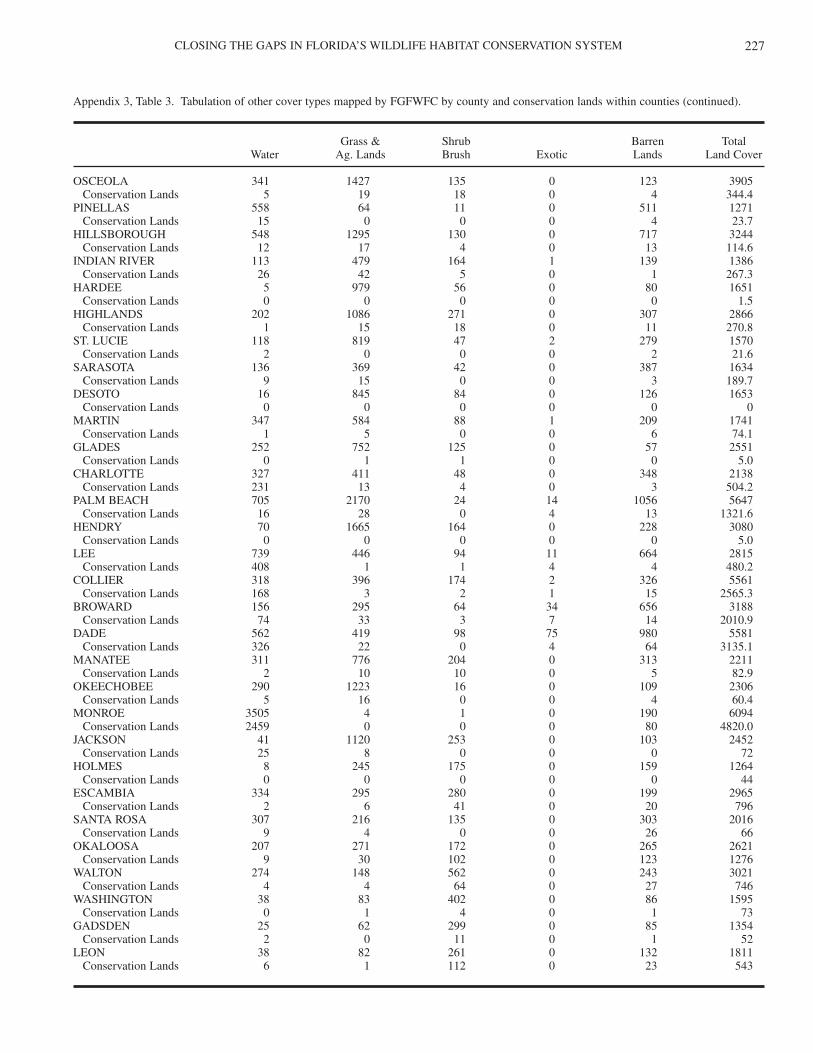
CLOSING THE GAPS IN FLORIDA’S WILDLIFE HABITAT CONSERVATION SYSTEM 227
Appendix 3, Table 3. Tabulation of other cover types mapped by FGFWFC by county and conservation lands within counties (continued).
Grass & Shrub Barren TotalWater Ag. Lands Brush Exotic Lands Land Cover
OSCEOLA 341 1427 135 0 123 3905Conservation Lands 5 19 18 0 4 344.4
PINELLAS 558 64 11 0 511 1271Conservation Lands 15 0 0 0 4 23.7
HILLSBOROUGH 548 1295 130 0 717 3244Conservation Lands 12 17 4 0 13 114.6
INDIAN RIVER 113 479 164 1 139 1386Conservation Lands 26 42 5 0 1 267.3
HARDEE 5 979 56 0 80 1651Conservation Lands 0 0 0 0 0 1.5
HIGHLANDS 202 1086 271 0 307 2866Conservation Lands 1 15 18 0 11 270.8
ST. LUCIE 118 819 47 2 279 1570Conservation Lands 2 0 0 0 2 21.6
SARASOTA 136 369 42 0 387 1634Conservation Lands 9 15 0 0 3 189.7
DESOTO 16 845 84 0 126 1653Conservation Lands 0 0 0 0 0 0
MARTIN 347 584 88 1 209 1741Conservation Lands 1 5 0 0 6 74.1
GLADES 252 752 125 0 57 2551Conservation Lands 0 1 1 0 0 5.0
CHARLOTTE 327 411 48 0 348 2138Conservation Lands 231 13 4 0 3 504.2
PALM BEACH 705 2170 24 14 1056 5647Conservation Lands 16 28 0 4 13 1321.6
HENDRY 70 1665 164 0 228 3080Conservation Lands 0 0 0 0 0 5.0
LEE 739 446 94 11 664 2815Conservation Lands 408 1 1 4 4 480.2
COLLIER 318 396 174 2 326 5561Conservation Lands 168 3 2 1 15 2565.3
BROWARD 156 295 64 34 656 3188Conservation Lands 74 33 3 7 14 2010.9
DADE 562 419 98 75 980 5581Conservation Lands 326 22 0 4 64 3135.1
MANATEE 311 776 204 0 313 2211Conservation Lands 2 10 10 0 5 82.9
OKEECHOBEE 290 1223 16 0 109 2306Conservation Lands 5 16 0 0 4 60.4
MONROE 3505 4 1 0 190 6094Conservation Lands 2459 0 0 0 80 4820.0
JACKSON 41 1120 253 0 103 2452Conservation Lands 25 8 0 0 0 72
HOLMES 8 245 175 0 159 1264Conservation Lands 0 0 0 0 0 44
ESCAMBIA 334 295 280 0 199 2965Conservation Lands 2 6 41 0 20 796
SANTA ROSA 307 216 135 0 303 2016Conservation Lands 9 4 0 0 26 66
OKALOOSA 207 271 172 0 265 2621Conservation Lands 9 30 102 0 123 1276
WALTON 274 148 562 0 243 3021Conservation Lands 4 4 64 0 27 746
WASHINGTON 38 83 402 0 86 1595Conservation Lands 0 1 4 0 1 73
GADSDEN 25 62 299 0 85 1354Conservation Lands 2 0 11 0 1 52
LEON 38 82 261 0 132 1811Conservation Lands 6 1 112 0 23 543
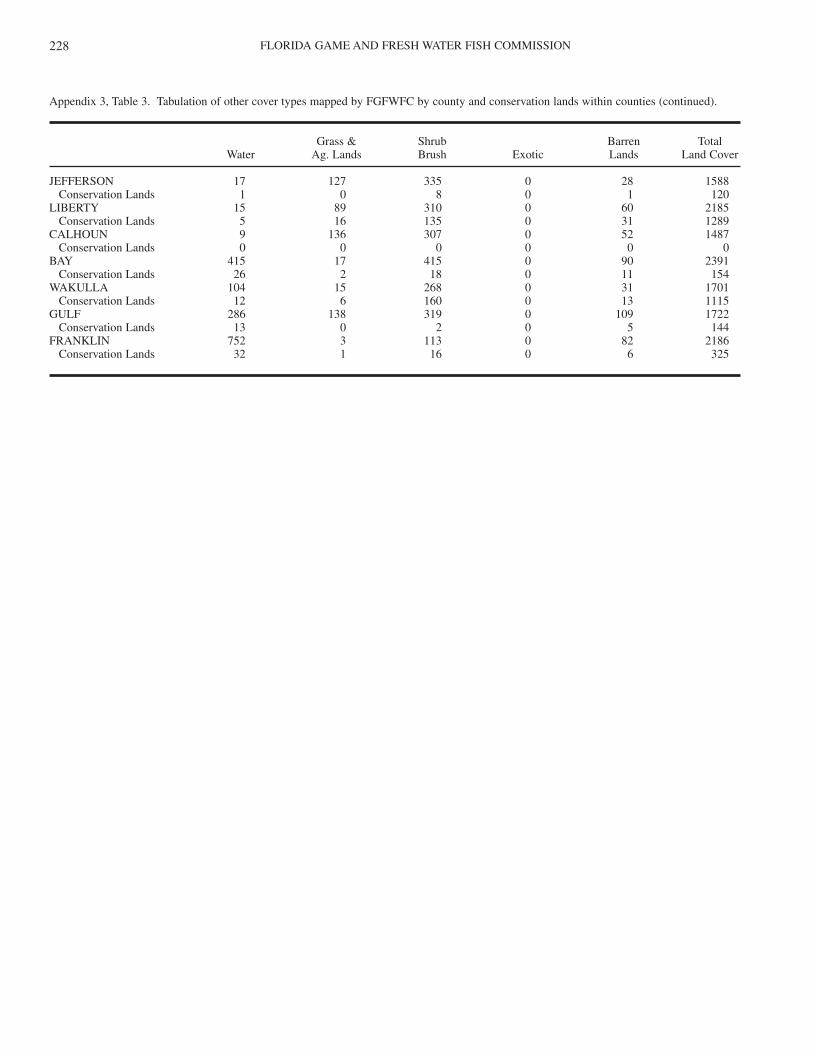
FLORIDA GAME AND FRESH WATER FISH COMMISSION228
Appendix 3, Table 3. Tabulation of other cover types mapped by FGFWFC by county and conservation lands within counties (continued).
Grass & Shrub Barren TotalWater Ag. Lands Brush Exotic Lands Land Cover
JEFFERSON 17 127 335 0 28 1588Conservation Lands 1 0 8 0 1 120
LIBERTY 15 89 310 0 60 2185Conservation Lands 5 16 135 0 31 1289
CALHOUN 9 136 307 0 52 1487Conservation Lands 0 0 0 0 0 0
BAY 415 17 415 0 90 2391Conservation Lands 26 2 18 0 11 154
WAKULLA 104 15 268 0 31 1701Conservation Lands 12 6 160 0 13 1115
GULF 286 138 319 0 109 1722Conservation Lands 13 0 2 0 5 144
FRANKLIN 752 3 113 0 82 2186Conservation Lands 32 1 16 0 6 325
CLOSING THE GAPS IN FLORIDA’S WILDLIFE HABITAT CONSERVATION SYSTEM 229
APPENDIX 4. A population simulation model written in BASIC language and used to measure the threat posed to small populations byenvironmental variability and infrequent catastrophes.
1 dim sddrep(200)2 dim sddsur(200)3 dim age(200)4 dim sur(200)5 dim rep(200)6 dim n(200)7 dim cvrep(200)8 dim cvsur(200)9 dim sdsur(200)10dim sdrep(200) 11dim newrep(200)12dim newn(200)13dim newsur(200)14dim temp(200)15dim trial(500)16dim yrr(500)17dim varyr(500)18dim regsurf(200)19dim means(200)20dim prop(200)27print28print29print “ ****************************************************”40print “ *This is a population simulation model for *”50print “ *use in estimating extinction probabilities. *”57print “ *Up to 250 trials may be executed. *”60print “ * *”70print “ *The information needed to run the model *”75print “ *includes demographic data from a file *”80print “ *in the same directory as this program. An *”85print “ *example of the structure of this file is *”90print “ *provide in the READ.ME file on the disk. *”130 print “ * *”210 print “ *The output from the model is the pro- *”220 print “ *portion of trials persisting for 200 *”230 print “ *years. This information is written to a *”240 print “ *file that can be later read using a word- *”245 print “ *processor or the DOS TYPE command. This *”250 print “ *program also allows you to increment *”255 print “ *population sizes automatically or to conduct *”256 print “ *a single series of trials.*”270 print “****************************************************”280 print320 print321 input “What is the name of the demographic input file” ; flnm1$325 cls 0335 print340 print “Here are the first 10 lines of data as read from “flnm1$”.”355 print360 open flnm1$ for input as #1371 print382 print “SURV”,”REPRO”,”CV SUR”,”CV REP”,”PROPORTION”399 let tick = 0400 for i = 1 to 100 410if eof(1) then goto 470420input #1, age(i),sur(i),rep(i),cvsur(i),cvrep(i),prop(i)430if age(i) < 10 then print sur(i),rep(i),cvsur(i),cvrep(i),prop(i)440if sur(i) + rep(i) = 0 then goto 470455 let tick = tick + 1460 next i470 print473 input “Hit RETURN to continue....” , kklop480 print485 let cumsurf = 1
FLORIDA GAME AND FRESH WATER FISH COMMISSION230
486 let numf = 0487 let denf = 0490 print500 print “Here are demographic parameters for the data file you have”510 print “submitted.”520 for i = 1 to tick530 let cumsurf = cumsurf*sur(i)540 let regsurf(i) = cumsurf550 let numf = (age(i)*cumsurf*rep(i)) + numf560 let denf = (cumsurf*rep(i)) + denf570 next i580 let genf = numf/denf590 print595 print “—————————————————————”596 print600 print “Approx. Gen. Length: “ , genf610 print620 print “Intrinsic R: “ , log(denf)/genf630 print640 print “Instantaneous r: “ , 2.718^(log(denf)/genf)650 print653 if log(denf)/genf > .1 then print “Warning — population may explode.”655 if log(denf)/genf > .1 then print “Intrinsic r is high.”657 print658 print “___________________________________________”659 print660 input “You may want to write these down. Hit a key to continue...” , jk680 cls 02000 print2030 input “What is the extinction threshold” ; xx2040 print2052 input “How many trials do you want” ; zz2063 print2074 input “What is the initial population size” ; mike2085 print2097 print “Type 1 to have the model increment populations for you.”2108 input “Type 0 to conduct a single run....” , kkl2110 if kkl <> 1 then let zztop = 22111 if kkl <> 1 then goto 22152112 print2113 input “What is the name of the file for the summary output” ; flnm3$2114 open “A”,#3,flnm3$2210 print2211 print “How many increments would you like (e.g., entering a 5 will”2212 input “increment the population size 5 times?” ; zztop2213 print2214 input “How large should each increment be (e.g., 20 individuals)” , stttp2215 cls 02216 print “You may also prescribe a frequency for a catastrophic year and the”2217 print “reduction in reproduction and survival associated with such rare”2218 print “events.”2220 print2221 print “What is the frequency of catastrophic events (use fractions,”2222 input “e.g., 0.05 for 1/20, or 0 for no catastrophe)” ; incat2223 if incat = 0 then goto 22402224 print2225 print “The reduction in survival and reproduction is calculated as a”2226 print “percentage of normal reproduction and survival. If you want to”2227 print “model a reduction in one without affecting the other, enter 1.0”2228 print “for either of the following questions.”2230 print2232 print “What is the reduction in survival during a catastrophic year?”2234 input “If you enter 0.75, it will reduce survival by 25%.” ; insur2235 print2236 input “And now reproduction (e.g., 0.75 for 25% reduction)” ; inrep2240 for value = 1 to zztop 2242 print2243 open “A”,#2,”temp.dat”
CLOSING THE GAPS IN FLORIDA’S WILDLIFE HABITAT CONSERVATION SYSTEM 231
2244 for i = 0 to tick 2245let sdsur(i) = cvsur(i)*sur(i)2246let sdrep(i) = cvrep(i)*rep(i)2247 next i2248 rem total up the population to provide carrying capacity limits2249 rem carrying capacity can be disabled by remark statement next 3 lines2250 rem let totnn = 0 2251 rem for i = 1 to tick2252 rem let n(i) = mike*prop(i)2253 let totnn = n(i) + totnn2256 next i 2260 let limit1 = totnn2261 let limit2 = 2*totnn2262 let limit3 = 3*totnn2263 let limit4 = 4*totnn2264 let limit5 = 5*totnn2265 let limit6 = 6*totnn2266 let limit7 = 7*totnn2267 let totnnn = totnn2270 for trial = 1 to zz2275 print “Simulation underway for population size of “totnn”.”2280 print “Completing trial “trial2281 for i = 1 to tick2282 let n(i) = mike * prop(i)2283 next i2284 let propsur = 02285 rem this begins the simulation2290for yr = 1 to 1102292 let cat = 12293 let catrep = 12294 let catsur = 12295 if incat = 0 then goto 23082296 randomize timer2297 let cat = rnd2300 if cat <= incat then let catrep = inrep2301 if cat <= incat then let catsur = insur2308 rem this is the reproduction loop2309 let totad = 02310 let totrep = 02315 let totn = 02320 for i = 1 to tick2325 randomize timer2326 let rnum = nrnd2327 if rnum = 0 then goto 23252335 let sddrep(i) = (rnum*sdrep(i))2340 let t = rnd2345 if t < 0.500001 then let sddrep(i) = 0 - sddrep(i)2350 if t >= 0.500001 then let sddrep(i) = sddrep(i)2360 let newrep(i) = catrep*(rep(i) + sddrep(i))2365 if newrep(i) < 0 then let newrep(i) = 0 2380 let newn(i) = n(i)*newrep(i)2400 let totrep = totrep + newn(i)2401 let totad = n(i) + totad2402 next i2403 rem culling young from the population based on carrying capacity2404 let totn = totad + totrep2405 if totn > limit7 then let totrep = (rnd)/7*(totad)2406 if totn > limit7 then goto 24302407 if totn > limit6 then let totrep = (rnd)/6*(totad)2408 if totn > limit6 then goto 24302409 if totn > limit5 then let totrep = (rnd)/5*(totad)2410 if totn > limit5 then goto 24302411 if totn > limit4 then let totrep = (rnd)/4*(totad)2412 if totn > limit4 then goto 24302414 if totn > limit3 then let totrep = (rnd)/3*(totad)2415 if totn > limit3 then goto 24302416 if totn > limit2 then let totrep = (rnd)/2*(totad)2417 if totn > limit2 then goto 2430
FLORIDA GAME AND FRESH WATER FISH COMMISSION232
2418 if totn > limit1 then let totrep = (rnd)*(totad)2430 let totn = totrep + totad2435 let n(1) = int(totrep)2436 if ch <> 1 then goto 24402437 rem write#3,trial,yr,totad,n(1)2440 rem this is the survival loop for this year2445 for i = 1 to tick2450 randomize timer2452 let rnum = nrnd2453 if rnum = 0 then goto 24502470 let sddsur(i) = (rnum*sdsur(i))2480 let t = rnd2490 if t < 0.500001 then let sddsur(i) = 0 - sddsur(i)2500 if t <= 0.500001 then let sddsur(i) = sddsur(i)2510 let newsur(i) = catsur*(1.2*(sur(i))) + sddsur(i)2515 if newsur(i) > 1 then let newsur(i) = 12516 if i > 1 then let mean = newsur(i) + mean2520 let newn(i) = int(n(i)*newsur(i))2540 next i2550 rem advance all of the age classes by 12560 let tick2 = tick - 12565 let q = 02570 for i = 1 to tick22575 let q = i + 12580 let n(q) = newn(i)2590 next i2650 rem total up the new population to see if extinct2655 let newtot = 02660 for i = 1 to tick2670 let newtot = newtot + n(i)2680 next i2685 let n = newtot2688 let endyr = yr - 12690 if n < xx then goto 27402730next yr2740write#2,trial,endyr2741 cls 02745 close #12755 open flnm1$ for input as #12760 for i = 1 to 210 2770if eof(1) then goto 28202780input #1, age(i),sur(i),rep(i),cvsur(i),cvrep(i),prop(i)2800if sur(i) + rep(i) = 0 then goto 28202810 next i2820 next trial2845 close #22850 open “temp.dat” for input as #22855 let sumyr = 02856 let totvar = 02860 for i = 1 to zz2865 if eof(2) then goto 28902870 input #2,trial(i),yrr(i)2871 if yrr(i) >= 100 then propsur = propsur + 12875 let sumyr = (yrr(i) - 1) + sumyr2880 next i2885 if zz <= 1 then goto 29702890 let meanyr = sumyr/zz2900 for i = 1 to zz2910 let varyr(i) = ((meanyr - yrr(i))^2)2920 let totvar = totvar + varyr(i)2925 next i2926 print “—————————————————————————”2927 print2928 print “The simulation is complete.”2929 print 2930 print “Mean Extinction times and s.d.’s for this run are:”2940 print2950 print “Mean: “meanyr,,”SD: “(totvar/(zz-1))^.5
CLOSING THE GAPS IN FLORIDA’S WILDLIFE HABITAT CONSERVATION SYSTEM 233
2960 print2961 let vart = 1.96*((totvar/zz-1))^.52965 print “Appox. 95% interval: “ meanyr+vart,meanyr-vart2966 print2967 let prrr = propsur/zz2968 print “The proportion making it 100 years was “propsur/zz”.”2969 print2970 print “The initial population size was “totnn”.”2971 print2973 print “————————————————————————-”2975 close #22978 kill “temp.dat”2979 if kkl <> 1 then goto 29852980 write#3,totnn,prrr,meanyr,vart2981 if prrr > 0.95 then goto 29842982 let mike = mike + stttp2983 next value2984 close #32985 print2986 if kkl <> 1 then print “Type 1 to run a new initial population size.”2990 input “Hit 0 to exit the program to DOS.” , mkj3000 if mkj = 1 then goto 4703010 stop
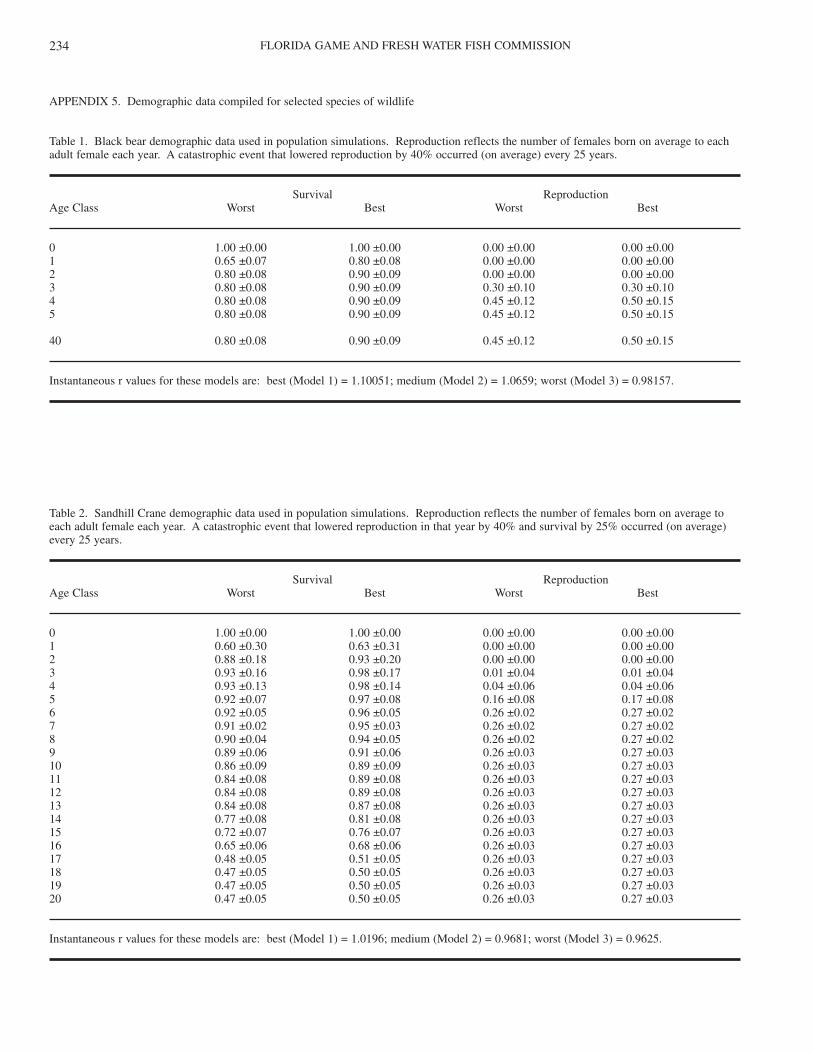
FLORIDA GAME AND FRESH WATER FISH COMMISSION234
APPENDIX 5. Demographic data compiled for selected species of wildlife
Table 1. Black bear demographic data used in population simulations. Reproduction reflects the number of females born on average to eachadult female each year. A catastrophic event that lowered reproduction by 40% occurred (on average) every 25 years.
Survival ReproductionAge Class Worst Best Worst Best
0 1.00 ±0.00 1.00 ±0.00 0.00 ±0.00 0.00 ±0.001 0.65 ±0.07 0.80 ±0.08 0.00 ±0.00 0.00 ±0.002 0.80 ±0.08 0.90 ±0.09 0.00 ±0.00 0.00 ±0.003 0.80 ±0.08 0.90 ±0.09 0.30 ±0.10 0.30 ±0.104 0.80 ±0.08 0.90 ±0.09 0.45 ±0.12 0.50 ±0.155 0.80 ±0.08 0.90 ±0.09 0.45 ±0.12 0.50 ±0.15
40 0.80 ±0.08 0.90 ±0.09 0.45 ±0.12 0.50 ±0.15
Instantaneous r values for these models are: best (Model 1) = 1.10051; medium (Model 2) = 1.0659; worst (Model 3) = 0.98157.
Table 2. Sandhill Crane demographic data used in population simulations. Reproduction reflects the number of females born on average toeach adult female each year. A catastrophic event that lowered reproduction in that year by 40% and survival by 25% occurred (on average)every 25 years.
Survival ReproductionAge Class Worst Best Worst Best
0 1.00 ±0.00 1.00 ±0.00 0.00 ±0.00 0.00 ±0.001 0.60 ±0.30 0.63 ±0.31 0.00 ±0.00 0.00 ±0.002 0.88 ±0.18 0.93 ±0.20 0.00 ±0.00 0.00 ±0.003 0.93 ±0.16 0.98 ±0.17 0.01 ±0.04 0.01 ±0.044 0.93 ±0.13 0.98 ±0.14 0.04 ±0.06 0.04 ±0.065 0.92 ±0.07 0.97 ±0.08 0.16 ±0.08 0.17 ±0.086 0.92 ±0.05 0.96 ±0.05 0.26 ±0.02 0.27 ±0.027 0.91 ±0.02 0.95 ±0.03 0.26 ±0.02 0.27 ±0.028 0.90 ±0.04 0.94 ±0.05 0.26 ±0.02 0.27 ±0.029 0.89 ±0.06 0.91 ±0.06 0.26 ±0.03 0.27 ±0.0310 0.86 ±0.09 0.89 ±0.09 0.26 ±0.03 0.27 ±0.0311 0.84 ±0.08 0.89 ±0.08 0.26 ±0.03 0.27 ±0.0312 0.84 ±0.08 0.89 ±0.08 0.26 ±0.03 0.27 ±0.0313 0.84 ±0.08 0.87 ±0.08 0.26 ±0.03 0.27 ±0.0314 0.77 ±0.08 0.81 ±0.08 0.26 ±0.03 0.27 ±0.0315 0.72 ±0.07 0.76 ±0.07 0.26 ±0.03 0.27 ±0.0316 0.65 ±0.06 0.68 ±0.06 0.26 ±0.03 0.27 ±0.0317 0.48 ±0.05 0.51 ±0.05 0.26 ±0.03 0.27 ±0.0318 0.47 ±0.05 0.50 ±0.05 0.26 ±0.03 0.27 ±0.0319 0.47 ±0.05 0.50 ±0.05 0.26 ±0.03 0.27 ±0.0320 0.47 ±0.05 0.50 ±0.05 0.26 ±0.03 0.27 ±0.03
Instantaneous r values for these models are: best (Model 1) = 1.0196; medium (Model 2) = 0.9681; worst (Model 3) = 0.9625.
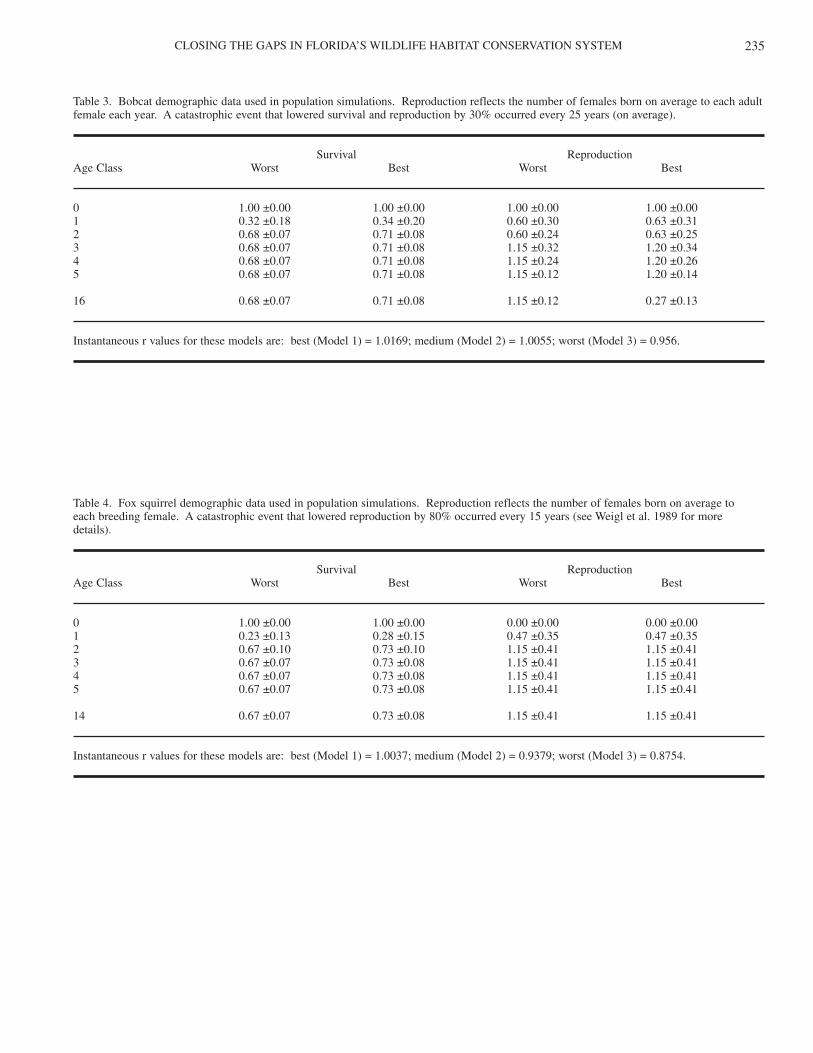
CLOSING THE GAPS IN FLORIDA’S WILDLIFE HABITAT CONSERVATION SYSTEM 235
Table 3. Bobcat demographic data used in population simulations. Reproduction reflects the number of females born on average to each adultfemale each year. A catastrophic event that lowered survival and reproduction by 30% occurred every 25 years (on average).
Survival ReproductionAge Class Worst Best Worst Best
0 1.00 ±0.00 1.00 ±0.00 1.00 ±0.00 1.00 ±0.001 0.32 ±0.18 0.34 ±0.20 0.60 ±0.30 0.63 ±0.312 0.68 ±0.07 0.71 ±0.08 0.60 ±0.24 0.63 ±0.253 0.68 ±0.07 0.71 ±0.08 1.15 ±0.32 1.20 ±0.344 0.68 ±0.07 0.71 ±0.08 1.15 ±0.24 1.20 ±0.265 0.68 ±0.07 0.71 ±0.08 1.15 ±0.12 1.20 ±0.14
16 0.68 ±0.07 0.71 ±0.08 1.15 ±0.12 0.27 ±0.13
Instantaneous r values for these models are: best (Model 1) = 1.0169; medium (Model 2) = 1.0055; worst (Model 3) = 0.956.
Table 4. Fox squirrel demographic data used in population simulations. Reproduction reflects the number of females born on average to each breeding female. A catastrophic event that lowered reproduction by 80% occurred every 15 years (see Weigl et al. 1989 for more details).
Survival ReproductionAge Class Worst Best Worst Best
0 1.00 ±0.00 1.00 ±0.00 0.00 ±0.00 0.00 ±0.001 0.23 ±0.13 0.28 ±0.15 0.47 ±0.35 0.47 ±0.352 0.67 ±0.10 0.73 ±0.10 1.15 ±0.41 1.15 ±0.413 0.67 ±0.07 0.73 ±0.08 1.15 ±0.41 1.15 ±0.414 0.67 ±0.07 0.73 ±0.08 1.15 ±0.41 1.15 ±0.415 0.67 ±0.07 0.73 ±0.08 1.15 ±0.41 1.15 ±0.41
14 0.67 ±0.07 0.73 ±0.08 1.15 ±0.41 1.15 ±0.41
Instantaneous r values for these models are: best (Model 1) = 1.0037; medium (Model 2) = 0.9379; worst (Model 3) = 0.8754.
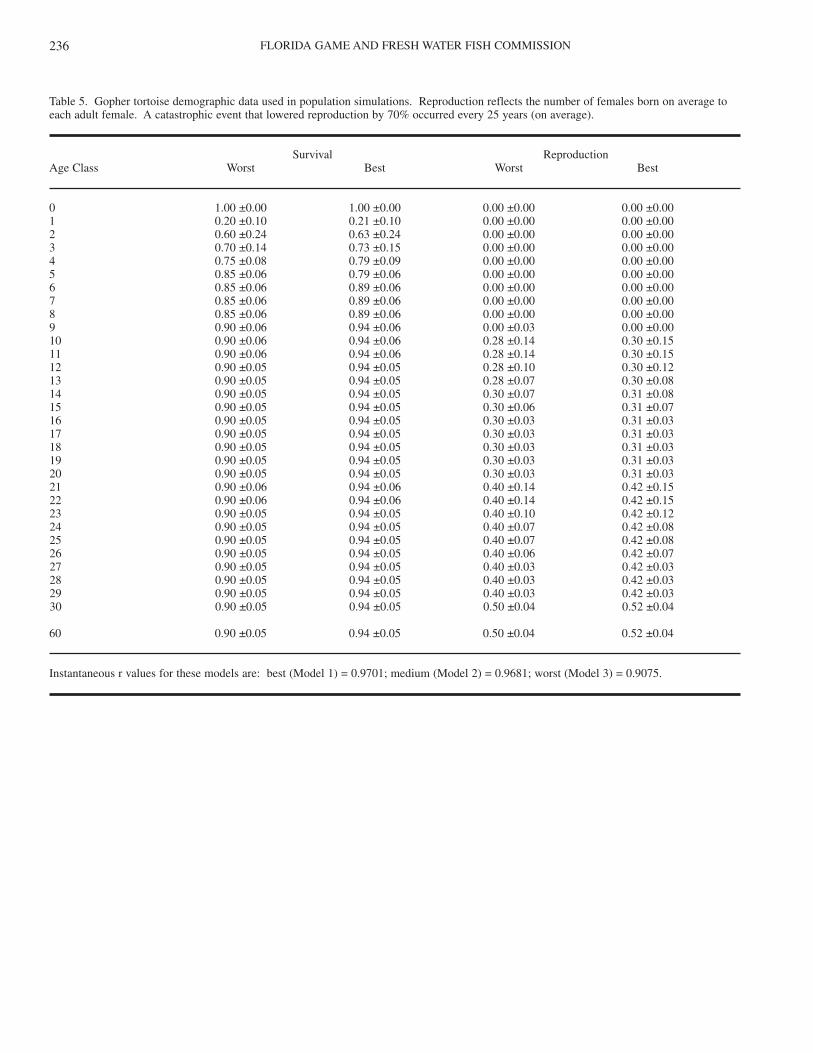
FLORIDA GAME AND FRESH WATER FISH COMMISSION236
Table 5. Gopher tortoise demographic data used in population simulations. Reproduction reflects the number of females born on average toeach adult female. A catastrophic event that lowered reproduction by 70% occurred every 25 years (on average).
Survival ReproductionAge Class Worst Best Worst Best
0 1.00 ±0.00 1.00 ±0.00 0.00 ±0.00 0.00 ±0.001 0.20 ±0.10 0.21 ±0.10 0.00 ±0.00 0.00 ±0.002 0.60 ±0.24 0.63 ±0.24 0.00 ±0.00 0.00 ±0.003 0.70 ±0.14 0.73 ±0.15 0.00 ±0.00 0.00 ±0.004 0.75 ±0.08 0.79 ±0.09 0.00 ±0.00 0.00 ±0.005 0.85 ±0.06 0.79 ±0.06 0.00 ±0.00 0.00 ±0.006 0.85 ±0.06 0.89 ±0.06 0.00 ±0.00 0.00 ±0.007 0.85 ±0.06 0.89 ±0.06 0.00 ±0.00 0.00 ±0.008 0.85 ±0.06 0.89 ±0.06 0.00 ±0.00 0.00 ±0.009 0.90 ±0.06 0.94 ±0.06 0.00 ±0.03 0.00 ±0.0010 0.90 ±0.06 0.94 ±0.06 0.28 ±0.14 0.30 ±0.1511 0.90 ±0.06 0.94 ±0.06 0.28 ±0.14 0.30 ±0.1512 0.90 ±0.05 0.94 ±0.05 0.28 ±0.10 0.30 ±0.1213 0.90 ±0.05 0.94 ±0.05 0.28 ±0.07 0.30 ±0.0814 0.90 ±0.05 0.94 ±0.05 0.30 ±0.07 0.31 ±0.0815 0.90 ±0.05 0.94 ±0.05 0.30 ±0.06 0.31 ±0.0716 0.90 ±0.05 0.94 ±0.05 0.30 ±0.03 0.31 ±0.0317 0.90 ±0.05 0.94 ±0.05 0.30 ±0.03 0.31 ±0.0318 0.90 ±0.05 0.94 ±0.05 0.30 ±0.03 0.31 ±0.0319 0.90 ±0.05 0.94 ±0.05 0.30 ±0.03 0.31 ±0.0320 0.90 ±0.05 0.94 ±0.05 0.30 ±0.03 0.31 ±0.0321 0.90 ±0.06 0.94 ±0.06 0.40 ±0.14 0.42 ±0.1522 0.90 ±0.06 0.94 ±0.06 0.40 ±0.14 0.42 ±0.1523 0.90 ±0.05 0.94 ±0.05 0.40 ±0.10 0.42 ±0.1224 0.90 ±0.05 0.94 ±0.05 0.40 ±0.07 0.42 ±0.0825 0.90 ±0.05 0.94 ±0.05 0.40 ±0.07 0.42 ±0.0826 0.90 ±0.05 0.94 ±0.05 0.40 ±0.06 0.42 ±0.0727 0.90 ±0.05 0.94 ±0.05 0.40 ±0.03 0.42 ±0.0328 0.90 ±0.05 0.94 ±0.05 0.40 ±0.03 0.42 ±0.0329 0.90 ±0.05 0.94 ±0.05 0.40 ±0.03 0.42 ±0.0330 0.90 ±0.05 0.94 ±0.05 0.50 ±0.04 0.52 ±0.04
60 0.90 ±0.05 0.94 ±0.05 0.50 ±0.04 0.52 ±0.04
Instantaneous r values for these models are: best (Model 1) = 0.9701; medium (Model 2) = 0.9681; worst (Model 3) = 0.9075.
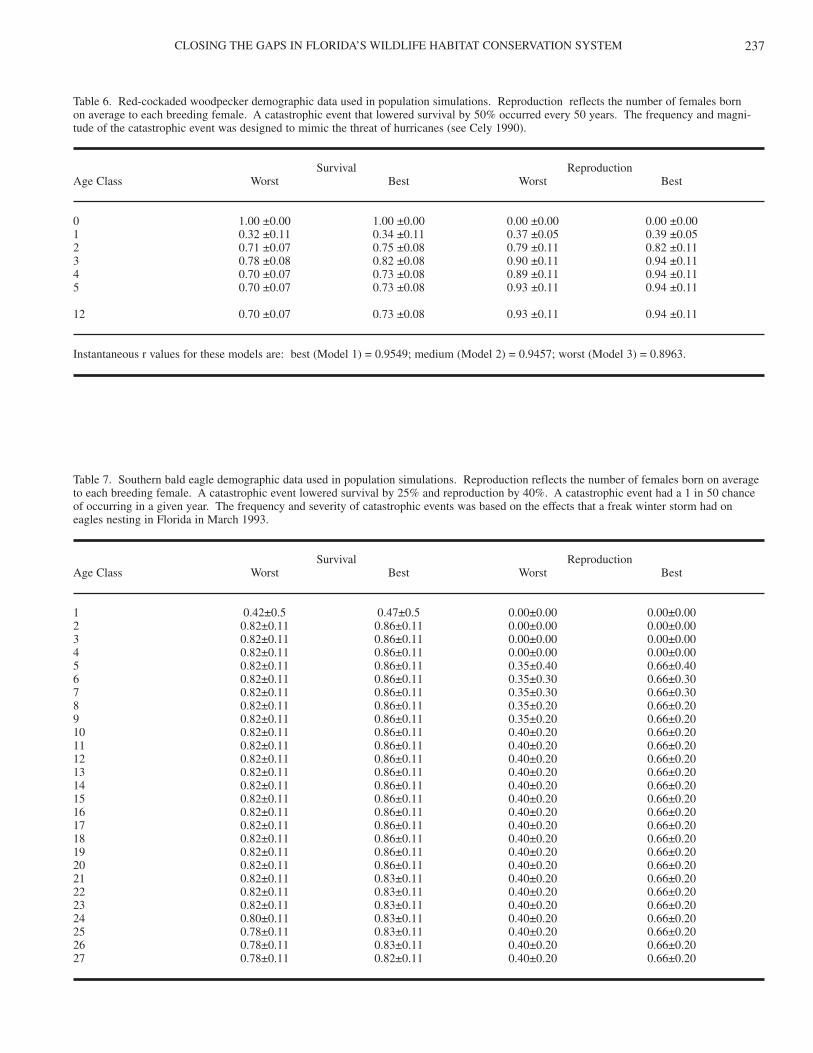
CLOSING THE GAPS IN FLORIDA’S WILDLIFE HABITAT CONSERVATION SYSTEM 237
Table 6. Red-cockaded woodpecker demographic data used in population simulations. Reproduction reflects the number of females born on average to each breeding female. A catastrophic event that lowered survival by 50% occurred every 50 years. The frequency and magni-tude of the catastrophic event was designed to mimic the threat of hurricanes (see Cely 1990).
Survival ReproductionAge Class Worst Best Worst Best
0 1.00 ±0.00 1.00 ±0.00 0.00 ±0.00 0.00 ±0.001 0.32 ±0.11 0.34 ±0.11 0.37 ±0.05 0.39 ±0.052 0.71 ±0.07 0.75 ±0.08 0.79 ±0.11 0.82 ±0.113 0.78 ±0.08 0.82 ±0.08 0.90 ±0.11 0.94 ±0.114 0.70 ±0.07 0.73 ±0.08 0.89 ±0.11 0.94 ±0.115 0.70 ±0.07 0.73 ±0.08 0.93 ±0.11 0.94 ±0.11
12 0.70 ±0.07 0.73 ±0.08 0.93 ±0.11 0.94 ±0.11
Instantaneous r values for these models are: best (Model 1) = 0.9549; medium (Model 2) = 0.9457; worst (Model 3) = 0.8963.
Table 7. Southern bald eagle demographic data used in population simulations. Reproduction reflects the number of females born on averageto each breeding female. A catastrophic event lowered survival by 25% and reproduction by 40%. A catastrophic event had a 1 in 50 chanceof occurring in a given year. The frequency and severity of catastrophic events was based on the effects that a freak winter storm had oneagles nesting in Florida in March 1993.
Survival ReproductionAge Class Worst Best Worst Best
1 0.42±0.5 0.47±0.5 0.00±0.00 0.00±0.002 0.82±0.11 0.86±0.11 0.00±0.00 0.00±0.003 0.82±0.11 0.86±0.11 0.00±0.00 0.00±0.004 0.82±0.11 0.86±0.11 0.00±0.00 0.00±0.005 0.82±0.11 0.86±0.11 0.35±0.40 0.66±0.406 0.82±0.11 0.86±0.11 0.35±0.30 0.66±0.307 0.82±0.11 0.86±0.11 0.35±0.30 0.66±0.308 0.82±0.11 0.86±0.11 0.35±0.20 0.66±0.209 0.82±0.11 0.86±0.11 0.35±0.20 0.66±0.2010 0.82±0.11 0.86±0.11 0.40±0.20 0.66±0.2011 0.82±0.11 0.86±0.11 0.40±0.20 0.66±0.2012 0.82±0.11 0.86±0.11 0.40±0.20 0.66±0.2013 0.82±0.11 0.86±0.11 0.40±0.20 0.66±0.2014 0.82±0.11 0.86±0.11 0.40±0.20 0.66±0.2015 0.82±0.11 0.86±0.11 0.40±0.20 0.66±0.2016 0.82±0.11 0.86±0.11 0.40±0.20 0.66±0.2017 0.82±0.11 0.86±0.11 0.40±0.20 0.66±0.2018 0.82±0.11 0.86±0.11 0.40±0.20 0.66±0.2019 0.82±0.11 0.86±0.11 0.40±0.20 0.66±0.2020 0.82±0.11 0.86±0.11 0.40±0.20 0.66±0.2021 0.82±0.11 0.83±0.11 0.40±0.20 0.66±0.2022 0.82±0.11 0.83±0.11 0.40±0.20 0.66±0.2023 0.82±0.11 0.83±0.11 0.40±0.20 0.66±0.2024 0.80±0.11 0.83±0.11 0.40±0.20 0.66±0.2025 0.78±0.11 0.83±0.11 0.40±0.20 0.66±0.2026 0.78±0.11 0.83±0.11 0.40±0.20 0.66±0.2027 0.78±0.11 0.82±0.11 0.40±0.20 0.66±0.20
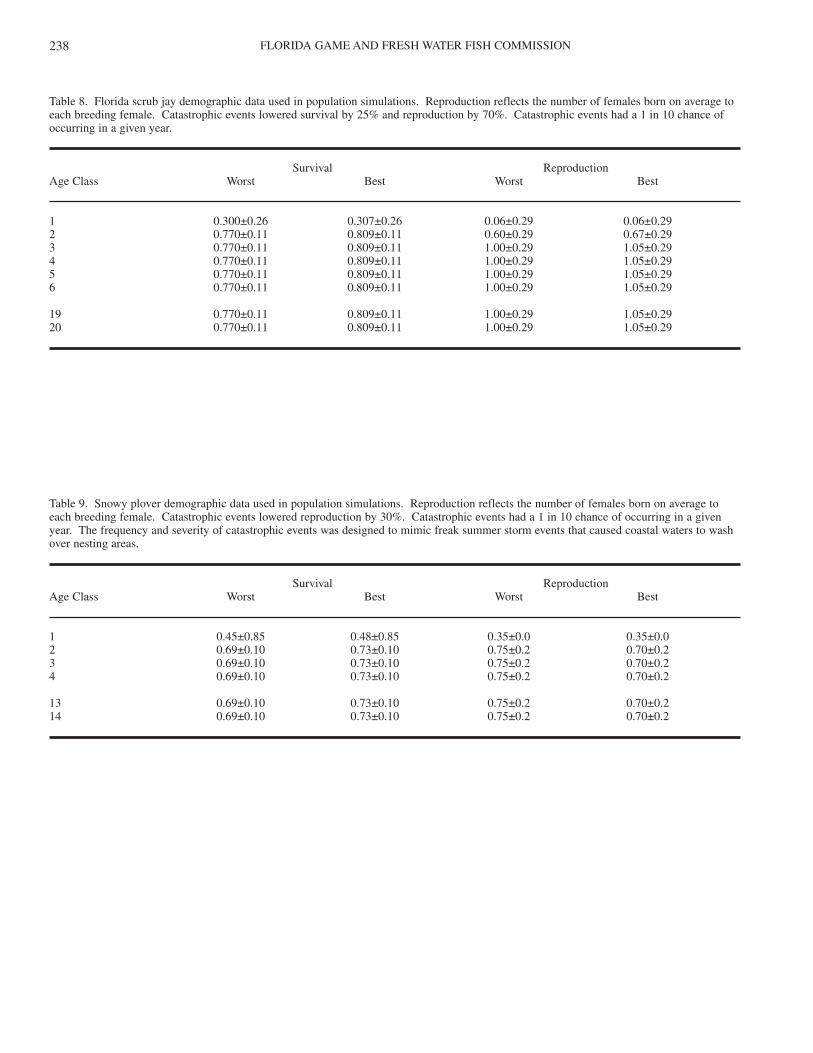
FLORIDA GAME AND FRESH WATER FISH COMMISSION238
Table 8. Florida scrub jay demographic data used in population simulations. Reproduction reflects the number of females born on average toeach breeding female. Catastrophic events lowered survival by 25% and reproduction by 70%. Catastrophic events had a 1 in 10 chance ofoccurring in a given year.
Survival ReproductionAge Class Worst Best Worst Best
1 0.300±0.26 0.307±0.26 0.06±0.29 0.06±0.292 0.770±0.11 0.809±0.11 0.60±0.29 0.67±0.293 0.770±0.11 0.809±0.11 1.00±0.29 1.05±0.294 0.770±0.11 0.809±0.11 1.00±0.29 1.05±0.295 0.770±0.11 0.809±0.11 1.00±0.29 1.05±0.296 0.770±0.11 0.809±0.11 1.00±0.29 1.05±0.29
19 0.770±0.11 0.809±0.11 1.00±0.29 1.05±0.2920 0.770±0.11 0.809±0.11 1.00±0.29 1.05±0.29
Table 9. Snowy plover demographic data used in population simulations. Reproduction reflects the number of females born on average toeach breeding female. Catastrophic events lowered reproduction by 30%. Catastrophic events had a 1 in 10 chance of occurring in a givenyear. The frequency and severity of catastrophic events was designed to mimic freak summer storm events that caused coastal waters to washover nesting areas.
Survival ReproductionAge Class Worst Best Worst Best
1 0.45±0.85 0.48±0.85 0.35±0.0 0.35±0.02 0.69±0.10 0.73±0.10 0.75±0.2 0.70±0.23 0.69±0.10 0.73±0.10 0.75±0.2 0.70±0.24 0.69±0.10 0.73±0.10 0.75±0.2 0.70±0.2
13 0.69±0.10 0.73±0.10 0.75±0.2 0.70±0.214 0.69±0.10 0.73±0.10 0.75±0.2 0.70±0.2
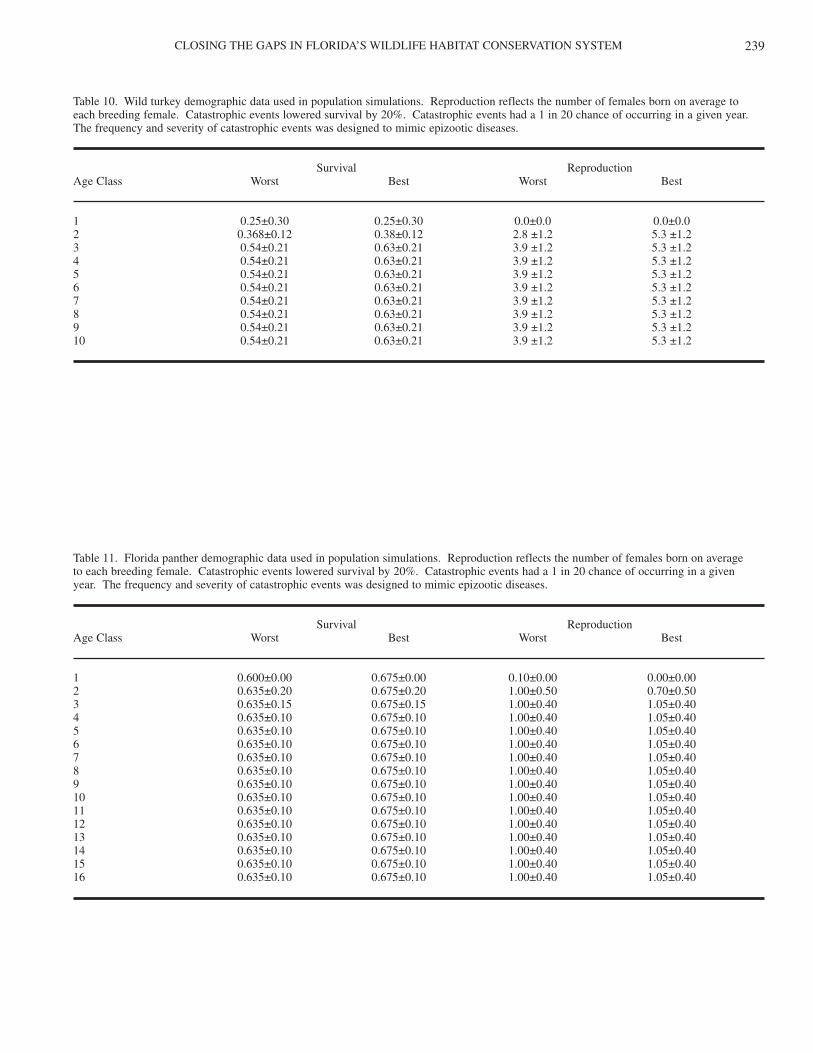
CLOSING THE GAPS IN FLORIDA’S WILDLIFE HABITAT CONSERVATION SYSTEM 239
Table 10. Wild turkey demographic data used in population simulations. Reproduction reflects the number of females born on average to each breeding female. Catastrophic events lowered survival by 20%. Catastrophic events had a 1 in 20 chance of occurring in a given year.The frequency and severity of catastrophic events was designed to mimic epizootic diseases.
Survival ReproductionAge Class Worst Best Worst Best
1 0.25±0.30 0.25±0.30 0.0±0.0 0.0±0.02 0.368±0.12 0.38±0.12 2.8 ±1.2 5.3 ±1.23 0.54±0.21 0.63±0.21 3.9 ±1.2 5.3 ±1.24 0.54±0.21 0.63±0.21 3.9 ±1.2 5.3 ±1.25 0.54±0.21 0.63±0.21 3.9 ±1.2 5.3 ±1.26 0.54±0.21 0.63±0.21 3.9 ±1.2 5.3 ±1.27 0.54±0.21 0.63±0.21 3.9 ±1.2 5.3 ±1.28 0.54±0.21 0.63±0.21 3.9 ±1.2 5.3 ±1.29 0.54±0.21 0.63±0.21 3.9 ±1.2 5.3 ±1.210 0.54±0.21 0.63±0.21 3.9 ±1.2 5.3 ±1.2
Table 11. Florida panther demographic data used in population simulations. Reproduction reflects the number of females born on average to each breeding female. Catastrophic events lowered survival by 20%. Catastrophic events had a 1 in 20 chance of occurring in a given year. The frequency and severity of catastrophic events was designed to mimic epizootic diseases.
Survival ReproductionAge Class Worst Best Worst Best
1 0.600±0.00 0.675±0.00 0.10±0.00 0.00±0.002 0.635±0.20 0.675±0.20 1.00±0.50 0.70±0.503 0.635±0.15 0.675±0.15 1.00±0.40 1.05±0.404 0.635±0.10 0.675±0.10 1.00±0.40 1.05±0.405 0.635±0.10 0.675±0.10 1.00±0.40 1.05±0.406 0.635±0.10 0.675±0.10 1.00±0.40 1.05±0.407 0.635±0.10 0.675±0.10 1.00±0.40 1.05±0.408 0.635±0.10 0.675±0.10 1.00±0.40 1.05±0.409 0.635±0.10 0.675±0.10 1.00±0.40 1.05±0.4010 0.635±0.10 0.675±0.10 1.00±0.40 1.05±0.4011 0.635±0.10 0.675±0.10 1.00±0.40 1.05±0.4012 0.635±0.10 0.675±0.10 1.00±0.40 1.05±0.4013 0.635±0.10 0.675±0.10 1.00±0.40 1.05±0.4014 0.635±0.10 0.675±0.10 1.00±0.40 1.05±0.4015 0.635±0.10 0.675±0.10 1.00±0.40 1.05±0.4016 0.635±0.10 0.675±0.10 1.00±0.40 1.05±0.40
This Agency does not allowdiscrimination by race, color, nationality, sex, or handicap.If you believe you have been discriminated against in any
program, activity or facility of this agency, write to:Florida Game and Fresh Water Fish Commission,
620 S. Meridian St.,Tallahassee, FL 32399-1600, or to
Office for Human Relations,USFWS, Dept. of Interior,Washington, D.C. 20240