project title: response of the bering sea integrated circulation-ice-ecosystem to past
TRANSCRIPT

NPRB Proposal Summary PageNPRB Use Only
Reference No: 15 Date Submitted: December 9, 2005Date Received: December 8, 2005
(To be filled in by applicant)
Project Title: Response of the Bering Sea Integrated Circulation-Ice-Ecosystem to Past(1955-2005) and Future (2005-2055) Forcing by Climate and the Adjacent NorthPacific and Arctic Oceans
Project Period: From June 2006 To May 2008
Name, Address, Telephone Number and Email Address of Applicant:Dr. Richard T. BarberDuke University135 Duke Marine Lab Road, Beaufort, North Carolina, 28516, United [email protected]
Principal Investigator(s): (Include name, affiliation and email address):Dr. Fei Chai , University of Maine, [email protected]. Yi Chao , Jet Propulsion Laboratory, Calif. Insti. of Technology, [email protected]. James C. McWilliams , University of California, Los Angeles, [email protected]. Son V. Nghiem , Jet Propulsion Laboratory, Calif. Inst. of Tech.,[email protected] de Charon , Bigelow Laboratory for Ocean Sciences, [email protected]
Research Priority and Subcategory:Primary 1 Bering Sea Integrated Ecosystem Research ProgramSecondary 2.a Ocean Monitoring
Summary of Proposed Work (250 words or less):To contribute to the development of an Integrated Ecosystem Research Program (IERP) for theBering Sea, we propose to perform retrospective (1955-2005) and future (2005-2055) model analysesof the Bering Sea integrated ice ecosystem response to forcing by climate and the adjacent NorthPacific and Arctic Oceans. The objective is to identify the climatic, oceanic and ice processes thatregulate timing, quantity and quality of the Bering Sea spring bloom, which is essential forrecruitment of a strong year class of young fish. The retrospective analysis, based on actualobservations, will focus on variability in the seasonal, annual and decadal forcing that affectsecosystem properties. The future analysis will be forced by output from ocean/atmosphere modelsforced with (and without) increasing carbon dioxide in the atmosphere. The high resolution ROMSphysical model for the Bering Sea will interface with a sea ice model as well as the CoSINEecosystem model, a 12 component model used by our group in previous studies in the equatorial andNorth Pacific Ocean. Adding an independent ice model and direct ice observations to the existingROMS CoSINE model analyses will provide greatly improved predictive understanding of theBering Sea integrated circulation ice ecosystem. Results of this project will be made availablethrough a user friendly, web based interface to provide dramatic and useful new graphic animationsthat will captivate and inform local inhabitants, students, general public, resource managers andfisheries scientists.
Funding:Total NPRB Funding Requested: $600,000.00 (Duke University)
Total Matching Funds Used: $0.00
Legally Binding Authorizing Signature and Affiliation:
_________________________________________________________________
1
2 3
4
5 6 7 8 9
10 11 12 13 14 15 16 17 18 19 20
21 22 23 24 25
26 27 28 29 30 31 32 33 34 35 36 37 38
39 40 41 42
43 44 45 46 47
RESEARCH PLAN
A. Project Title: Response of the Bering Sea Integrated Circulation-Ice-Ecosystem to Past (1955-2005) and Future (2005-2055) Forcing by Climate and Adjacent North Pacific and Arctic Oceans
Short Title: Response of Bering Sea Ecosystem to Past and Future Climate Forcing
B. Proposal Summary: To contribute to the development of an Integrated Ecosystem Research Program (IERP) for the Bering Sea, we propose to perform retrospective (1955-2005) and future (2005-2055) model analyses of the Bering Sea integrated ice ecosystem response to forcing by climate and the adjacent North Pacific and Arctic Oceans. The objective is to identify the climatic, oceanic and ice processes that regulate timing, quantity and quality of the Bering Sea spring bloom, which is essential for recruitment of a strong year class of young fish. The retrospective analysis, based on actual observations, will focus on variability in the seasonal, annual and decadal forcing that affects ecosystem properties. The future analysis will be forced by output from ocean/atmosphere models forced with (and without) increasing carbon dioxide in the atmosphere. The high resolution ROMS physical model for the Bering Sea will interface with a sea ice model as well as the CoSINE ecosystem model, a 12 component model used by our group in previous studies in the equatorial and North Pacific Ocean. Adding an independent ice model and direct ice observations to the existing ROMS CoSINE model analyses will provide greatly improved predictive understanding of the Bering Sea integrated circulation ice ecosystem. Results of this project will be made available through a user friendly, web based interface to provide dramatic and useful new graphic animations that will captivate and inform local inhabitants, students, general public, resource managers and fisheries scientists.
C. Project Responsiveness to NPRB Research Priorities To address the research priority of the Bering Sea Integrated Ecosystem Research Program identified in the NPRB Request for Proposals for 2006, we will perform retrospective and future model analyses using our well-tested 3D ocean general circulation model (OGCM) which is coupled to both ice and ecosystem dynamics through the lower trophic levels to the mesozooplankton level. Specifically, we will address the following questions:
b. Are the physical and chemical attributes of the ecosystem changing in response to climate change? If so, how? The retrospective model will be forced by observed climate variables and will resolve with high resolution the physical and nutrient attributes of the Bering Sea ecosystem.
c. Is lower trophic level production (quantity and form) changing in response to climate change? If so, how? In the retrospective analyses the physical and nutrient attributes force the 12-component model that resolves two classes of phytoplankton, two classes of zooplankton and export to higher trophic levels and deep water.
d. What are the principal processes controlling energy pathways in the Bering Sea? What is the role of climate change in these processes? This 12-component model has demonstrated the ability to reproduce shifts from food webs dominated by the microbial loop to those dominated by larger diatoms and mesozooplankton. By inference we can investigate, if not determine, the physical conditions that shift the food web towards a jelly dominated system and away from the more productive grazing food web (Broeder et al., 2002).
A second priority we will address is Ocean Monitoring, part a of the General Research Priorities on Ecosystem Components. We will deliver a new satellite-derived data product to monitor sea ice in the Bering Sea, which is a critical factor in regulating the quantity and form of lower trophic level production.
Results of both the retrospective analysis and future projections will be made available through a user-friendly web-based interface from which researchers, resource managers, local people and the public can benefit. Operational use of this integrated circulation-ice-ecosystem model will provide a context for interpreting observations from long-term monitoring of biophysical parameters, phytoplankton and zooplankton. The time is right for integration of long-term monitoring observations into multi-scale
1

48 49
50
51 52 53 54 55 56 57 58 59 60 61 62 63 64 65 66 67 68 69 70
71 72 73 74 75 76 77
78 79 80 81 82 83 84 85 86
87 88 89
90 91 92 93 94
coupled physical-ecosystem models to enable forecasting of the lower trophic level production response to physical variability in the Bering Sea ecosystem with enough lead time to be useful.
D. Project Design and Conceptual Approach
D-1. Introduction The Bering Sea/Aleutian Island Large Marine Ecosystem (LME) is a study in contradictions. In 2003 Alaska led the US in volume of fish caught (2.4 x 10⁶ mt) and value of landings (~$990 million) (NOAA, 2004) and, at the same time, this LME has been altered the most by global warming (Hunt et al., 2002) and is the LME predicted to change the most in the coming decades (Sarmiento et al., 2004). Still more intriguing, the subarctic North Pacific has experienced more profound biological changes in recent decades (Bailey et al., 2005; Duffy-Anderson et al., 2005). A regime shift that affected many species of various trophic levels took place in 1976/77, coinciding with phase changes of the Pacific Decadal Oscillation (PDO) (Mantua et al., 1997; Hollowed et al., 2001; Chavez et al., 2003). ENSO variability propagated along the eastern Pacific boundary from the equatorial region also drives relatively strong variability in productivity and recruitment success. Here is the enigma: this LME is impressively productive, extremely valuable, highly variable (in both physics and biological composition) and significantly impacted by climate change. No other LME exhibits such a combination of extremes. Is the variability of the Bering Sea/Aleutian Island LME related to its resiliency and economic value (Edwards and Richardson, 2004)? To provide effective management and sustainable use of the extremely valuable resources it holds, society needs a much improved understanding of the North Pacific and Bering Sea ecosystems. An integrated ecosystem research program is the best approach we know of to attain that improved understanding, but integrated ecosystem work requires new research alliances that bring together a wide range of expertise. The Bering Sea Integrated Research Program is an important opportunity to start the complex process of monitoring, data assimilation, modeling, synthesis and forecasting using our powerful new observing and computational tools.
D-2. Research Approach and Scientific Objectives This project will exploit satellite remote sensing platforms and massively parallel supercomputers to run high-resolution physical circulation models that interface with ice dynamics models and a 12-compartment ecosystem model for the Bering Sea and its adjacent North Pacific and Arctic Oceans. The long-range goal of the project is to forecast the productivity of the Bering Sea ecosystem with enough lead time to be useful to society (Goddard et al., 2001), but that goal can only be realized after completion of the following series of research accomplishments:
• A coupled circulation-ice-ecosystem model in the Bering Sea and adjacent North Pacific and Arctic Oceans
• A decade-long (1999-2008) satellite-derived high resolution (25-km) data set of vector winds over the ice-free ocean and sea-ice properties
• A 50-year (1955-2005) retrospective analysis of the Bering Sea integrated circulation-ice-ecosystem in response to the forcing by climate and adjacent North Pacific and Arctic Oceans
• A 50-year (2005-2055) projection of the Bering Sea integrated circulation-ice-ecosystem in response to future climate change including both natural climate variability and anthropogenic climate change
A further objective is, through our education and outreach program, to distribute data and model products, including animations, through our web site to local inhabitants, students, general public, resource managers and fisheries scientists, and to complete manuscripts for peer-reviewed journal publications.
We are particularly motivated by the challenge of merging six resources: 1) an abundance of newly available remote and in situ observations, 2) advances in model resolution in time and space, 3) success in coupling observations and modeling with data assimilation, 4) recent experience in nested modeling, 5) greatly increased ecosystem model complexity, and 6) routine access to massively parallel supercomputers and mass storage. The time is right to bring the power of these advances to bear on
2
modeling the Bering Sea integrated circulation-ice-ecosystem, and the team members assembled on this project have had experience and success in each of these resource areas.
95 96
97
98 99
100 101 102
103 104 105 106 107 108
109 110 111 112 113 114
115
117 118
119
120 121 122 123 124 125 126 127 128 129 130 131 132 133
134 135 136 137 138
139 140 141 142
D-3. Modeling the Bering Sea Integrated Circulation-Ice-Ecosystem
D-3.1 Modeling the Bering Sea Circulation and Variability The Bering Sea circulation and variability will be modeled by a 3D ocean general circulation model known as the Regional Ocean Modeling System (ROMS). ROMS is a community model designed for coastal application; during the past decade, the UCLA ROMS group has developed a number of ROMS configurations for the Pacific Ocean and US West coast (Shchepetkin and McWilliams, 1998; Marchesiello et al., 2003).
Our early work with a 50-km Pacific basin-scale ROMS configuration has shown that it can reproduce both the climatological seasonal cycle and interannual-to-decadal variabilities (Wang and Chao, 2004). When forced by air-sea fluxes derived from NCEP reanalysis during 1990s, ROMS is able to realistically reproduce the evolution of El Niño and La Niña during the 1990s as well as the strong 1997-1998 El Niño with multiple Kelvin waves propagating eastward along the equator. Several weak warm events in the early 1990s are also reproduced by ROMS.
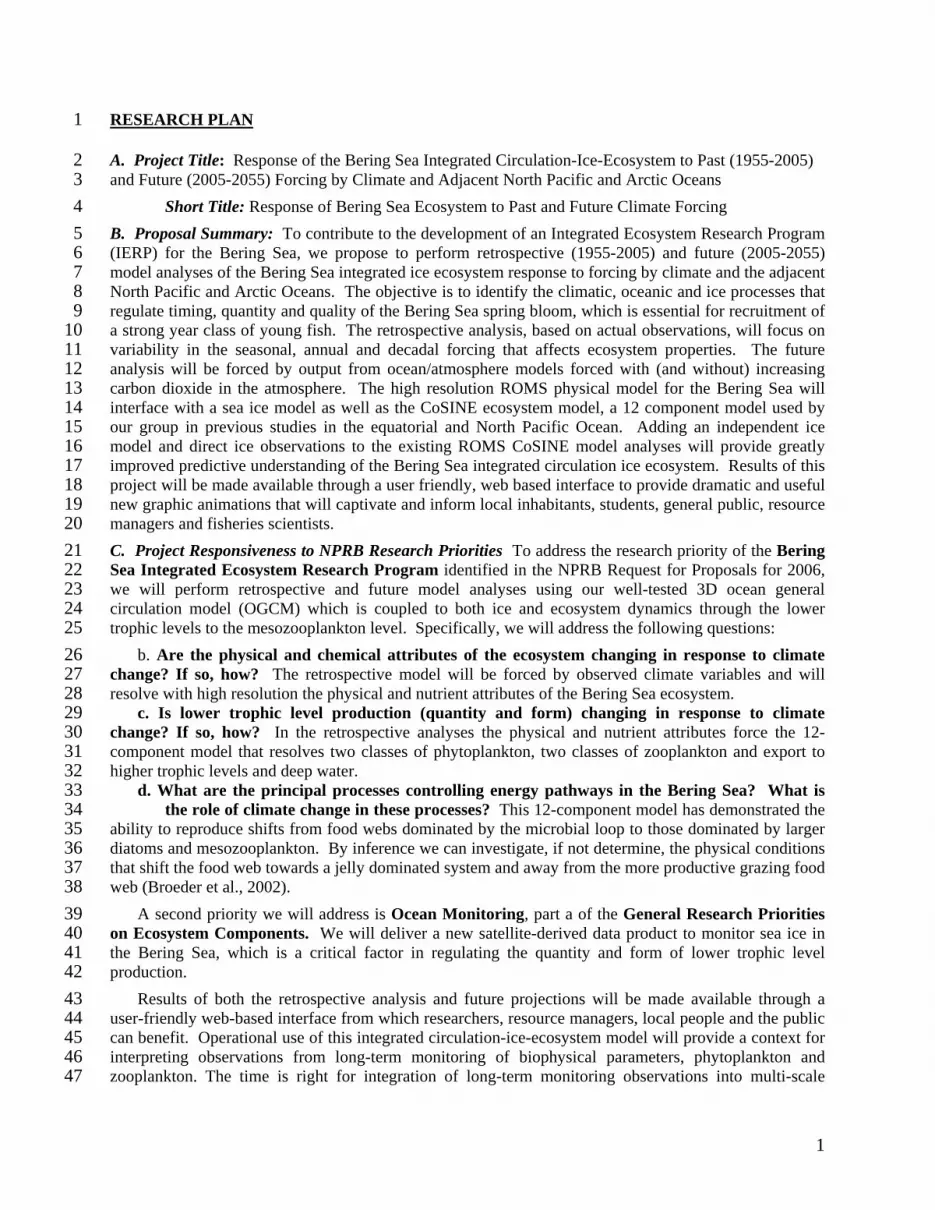
Recently, we increased the Pacific basin-scale ROMS resolution from 50 km to 12.5 km to resolve major boundary currents (e.g., the Kuroshio Current, the California Current, the Peru Coastal Upwelling) and processes related to mesoscale eddies. At this resolution, the Tropical Instability Waves (TIWs) near the equator are clearly reproduced. Pronounced eddy features are seen in many places near the western and eastern boundary current. The Alaska coastal current is clearly evident as part of the subpolar gyre in the Gulf of Alaska (Fig. 1).
116
As part of the AOOS (Alaska Ocean Observing System) pilot study to contribute to the Prince William Sound (PWS) Ocean Observing System (PWSOOS), we developed a 3-level nested ROMS configuration for PWS (Fig. 2) at 9-km, 3-km, and 1-km, respectively. These three ROMS systems are nested as a single system and run simultaneously exchanging boundary conditions at every time step of the coarser grid. The interactions between the two components are twofold: the lateral
boundary conditions for the fine grid are supplied by the coarse-grid solution, while the latter is updated from the fine grid solution in the area covered by both grids (Blayo and Debreu, 1999). Long-term simulations have been made to obtain the equilibrium solution (Marchesiello et al., 2003). The embedded solution shows no discontinuities at the nested domain boundary and a valid representation of the upwelling structure, at a computing cost only slightly greater than for the inner region alone.
Figure 1. The snapshot of sea surface temperature simulated by a 12.5-km Pacific Ocean ROMS.
The proposed Being Sea system analysis will use a similar approach of nested ROMS configuration. Using the 12.5-km Pacific basin-scale ROMS to provide the needed boundary condition in the offline setting, the Bering Sea ROMS will have three online nested levels with resolutions of 9-km, 3-km, and 1-km, respectively. The 9-km ROMS domain will cover part of the North Pacific and Arctic Oceans
3

explicitly resolving the coupled circulation-ice processes. High resolution on the order of 1-km is required in the inner nested domain to resolve the complex processes near the shelf break region and its
interactions with the deep ocean.
143 144
145
the ice exhibits nearly rigid behavior. Because the time discretizatio164 165 166 167 168 169 170
llor 171 172 173 174 175 176 177
iginal developer of this ROMS ice modeling component. For 178 179 180 181 182 183 184 185
led Circulation-Ice Model The regional ROMS 186 187
Figure 2. Snapshots of sea surface temperature simulated by the 3-level nested ROMS over the Prince William Sound and nearby Alaska coastal oceans.
D-3.2 Integrating Sea Ice into the Circulation Model A dynamic-thermodynamic sea-ice modeling component has been developed recently within the framework of ROMS (Budgell, 2005). The ice dynamics are based upon an elastic-viscous-plastic (EVP) rheology after Hunke (2001). The EVP scheme is based on a time-splitting approach whereby short elastic time steps are used to regularize the solution when
n uses explicit time-stepping, the ice dynamics are readily parallelizable and thus computationally efficient. Employing linearization of viscosities about sea ice velocities at every elastic (short) time step, as recommended by Hunke (2001), has the desirable property of maintaining the ice internal stress state on or in the plastic yield curve. That is, the ice deforms as a plastic material unless it is in a rigid state. Another desirable property of the Hunke (2001) linearization is that the EVP ice dynamics are found to provide a good transient response to rapidly varying winds as well as to inertial and tidal dynamics, particularly in the marginal ice zone.
The ice thermodynamics are based on those of Mellor and Kantha (1989) and Hakkinen and Me(1992). Two ice layers and a single snow layer are used in solving the heat conduction equation. The snow layer possesses no heat content, but is, in effect, an insulating layer. Surface melt ponds are included in the ice thermodynamics. A molecular sub-layer (Mellor et al., 1989) separates the bottom of the ice cover from the upper ocean. The inclusion of the molecular sub-layer was found to produce much more realistic freezing and melting rates than if the ice-ocean heat flux is based purely on the ice bottom-ocean upper layer temperature difference.
Our collaborator, Dr. Budgell, is the orthe proposed effort, a postdoctoral researcher will be hired at UCLA to work with Dr. Budgell on the ROMS ice modeling. Dr. Budgell has evaluated the performance of the ROMS ice model in the Barents Sea using available observations. With large portions covered by ice for much of the year, the Barents Sea exhibits complex processes of ice drift, melting and freezing upon the ocean fields. To resolve these important but complex processes, the dynamic-thermodynamic sea ice module has to be coupled with a high resolution regional ocean that resolves all circulation features including both the deep ocean and coastal circulation processes as well as tidal variability.
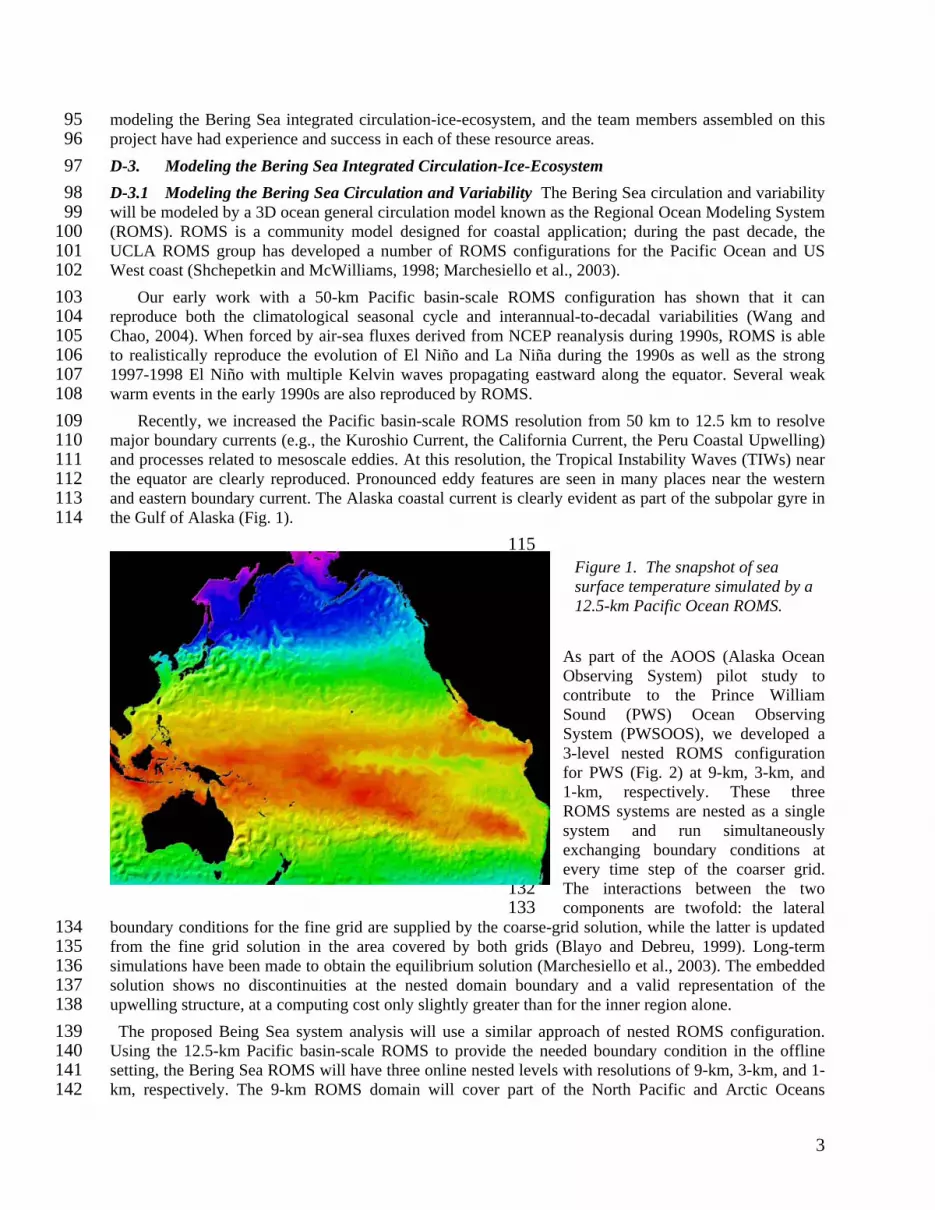
D-3.3 Integrating Ecosystem Processes Into the Coupmodel for the Bering Sea, including sea ice dynamics, will include ecosystem model dynamics based on the CoSINE (Carbon, Si(OH)4, Nitrogen Ecosystem) ecosystem model developed through a collaboration between Chai and Dugdale (Chai et al., 2002; Dugdale et al., 2002), Fig. 3. The CoSINE model includes silicate, nitrate and ammonium, two phytoplankton groups, two zooplankton grazers, two detrital pools,
188 189 190
4
TCO2 and recently oxygen has been added to constrain remineralization processes in the model. The CoSINE model has been applied to the North Pacific (Chai et al., 2003), the equatorial Pacific (Jiang et al., 2003) and the California coastal upwelling system (Klein 2003; Chai et al., in prep.). Below the euphotic zone, sinking particulate organic matter is converted to inorganic nutrients by a regeneration process similar to the one used by Chai et al. (1996), in which organic matter decays to ammonium and then is nitrified to NO
191 192 193 194 195 196 197 198
199 200 201 202 203 204 205 206 207 208 209 210 211 212 213 214 215 216 217 218 219 220 221 222 223
igure 3. The coupled model as described in section D-3.3. Black arrows show the path of N; dashed 224 225 226
lysis during the 1990s with the 50-km 227 228 229 230 231 232 233 234 235 236 237 238 239
3. Incorporating oxygen into the biogeochemical model adds extra constraints on the treatment of regeneration processes in the model, and there are many dissolved oxygen measurements for the Bering Sea.
FecalPellet
Sinking PhysicalModel
Nitrate[NO3]
Advaction& Mixing
SmallPhytoplankton
[P1]NO3
Uptake
Micro-Zooplankton
[Z1]Grazing
Ammonium[NH4]
Excretion
NH4Uptake
Detritus-N[DN]
Silicate[Si(OH)4]
Diatoms[P2]
SiUptake
N-Uptake
Meso-zooplankton
[Z2]
Sinking
Detritus-Si[DSi]
GrazingFecalPellet
Sinking
Predation
Lost
Total CO2[TCO2]
BiologicalUptake
Air-Sea Exchange
Physical-Biogeochemical Model
IronIron
IronIron
Fred arrows show the path of Si; and dotted blue arrows show the path of CO2. At the points indicated in blue-green the uptake rates are a function of iron availability.
Our group has performed a preliminary retrospective anaPacific basin-scale ROMS including the Bering Sea. Fig. 4 shows the modeled surface chlorophyll for the Bering Sea region averaged during the phytoplankton spring bloom period over four years (1997- 2000). Even at 50-km resolution, the coupled circulation-ecosystem ROMS is able to capture the phytoplankton spring bloom dynamics, and reproduces the west-east gradient of phytoplankton biomass. Fig. 5 shows the time series of the modeled surface chlorophyll for this four-year period. During 1997, the spring bloom tends to start early and be weaker compare to other three years. The spring bloom is the strongest during 1998, and the model seems to be able to reproduce the double peaks of the phytoplankton biomass, which has been observed for this region. The dynamical processes controlling the timing and intensity of phytoplankton blooms from year to year are currently being investigated using the 3D retrospective analysis fields from the coupled circulation-ecosystem ROMS, which is able to capture the 1997-98 climate regime shift in the Pacific Ocean that causes stronger and later spring phytoplankton blooms after 1997.
5

D-4. Satellite-Derived Ocean Vector Wind and Sea Ice Data Products The scatterometer measurements collected by QuikSCAT can be used to estimate wind conditions over the ice-free ocean and the sea-ice properties including melting and freezing conditions. With a sun-synchronous orbit and wide swaths of 1400 and 1800 km on both sides of the satellite (Tsai et al., 2000), QuikSCAT can cover the Arctic Ocean twice per
Figure 4. ROMS simulated surface chlorophyll averaged over a 4-year period (1997-2000).
253 254 255 256 257 258
259
day. QuikSCAT has been collecting global data since its launch in 1999 and, with the recently approved extension by NASA, there will be a decade-long QuikSCAT global time series by the end of the proposed effort. Given the dramatic change observed recently over the Arctic, particularly the Bering Sea, such a decade-long ocean wind and sea ice data product will be critical for assessing the response of the Bering Sea to past and future climate forcing, and is probably the only way to evaluate the coupled circulation-ice models being developed within this Bering Sea Integrated Ecosystem Research program.
Using QuikSCAT data to estimate wind over the ice-free ocean has been well developed (see http://winds.jpl.nasa.gov ). Recently, we have developed an innovative approach for using these data to map sea ice classes, extent and melt area, and to assess melt timing. Results were verified during the Sea-Ice Remote Sensing and Modeling validation campaign (Nghiem, 2003) jointly carried out by JPL, the U.S. National Ice Center, and the NRL using the USCG icebreaker Healy in October-November 2001, and Arctic and Barents Sea results, in particular, were recently published (Nghiem et al., 2005). The QuikSCAT algorithm has been applied to mapping Arctic sea ice and verified with passive microwave
radiometer and field observations (Nghiem, 2003).
260 261 262 263 264 265
266 267
269 270 271 272 273 274 275 276 277 278 279
281 282
283 284 285 286 287 288
268
We will select optimum parameters selected for sea-ice detection and mapping in the Bering Sea and adjacent North Pacific and Arctic Oceans for iceHH, iceVH, and iceFA. The algorithm is robust and is applicable over a wide range of wind speeds and over melted sea-ice surfaces. However, a small
residual number of open-water pixels may be misidentified as ice. Thus, we propose to develop a filtering algorithm based on the differences in classification stability between ice-covered and ice-free surfaces. Ice classes are delineated using backscatter ranges for perennial (multi-year) sea ice, seasonal (first-year) sea ice, and mixed ice (thin ice, pancake ice, frost flowers, and a mixture of broken first-year and multi-year floes). We will also determine the timing of melt onset and freeze-up over sea ice, melt duration, positive degree days, and area of melt surfaces (Nghiem et al., 2001). Early results from the
280
Jan. April Aug. Dec
1997
199820001999(B)
Figure 5. Time series of the ROMS simulated chlorophyll averaged over the Bering Sea region for 1997, 1998, 1999 and 2000.
6

289 290 291 292 293 294 295 296 297 298
above-described sea ice algorithm are presented in Fig. 6 over the Bering Sea, the Chukchi Sea, the Beaufort Sea, and the East Siberian Sea. Sea ice classes and ice surface melt are mapped together with QuikSCAT wind vectors over ice-free surfaces from October 2004 to March 2005. Perennial sea ice (white areas) was stable and located at the same latitudes as seen in Fig. 6. The first five maps (10/25/2004-3/1/2005) show growth of first-year and mixed ice and advance of the sea ice edge southward together with mostly northerly winds. The map on 3/14/2005 (Fig. 6, second row, right panel) shows southerly winds and the melting on sea ice (red areas) caused by warm air advection from the south. As the wind direction reversed, cold northerly winds refroze sea ice (map on 3/17/2005, left panel, third row, Fig. 6). The melting and refreezing process is controlled by temperature and wind which are monitored by QuikSCAT on a daily basis.
299
300
301 302 303
304 305 306
Figure 6. Maps of sea ice cover and wind field, both derived from QuikSCAT data in 10/2004-03/2005.
By the end of this proposed effort, we will produce a decade long (1999-2008) satellite-derived product describing both the ice-free wind and sea-ice properties including melting and freezing conditions, which can be used for model evaluation as well as data assimilation.
7

307
308 309 310 311 312
313 314 315 316 317 318 319 320 321 322 323 324 325 326 327
328 329 330 331 332 333
334 335 336 337 338 339 340
341 342 343 344 345 346 347 348 349 350
351
D-5. Data Assimilation, Retrospective Analysis and Future Climate Projections
A unique aspect of this proposal is the combination of a coupled circulation-ice-ecosystem model with advanced data assimilation, consisting of data quality control, data analysis and data-model integration. This systematic method produces retrospective analyses using all of the historical data. Validation of the coupled circulation-ice-ecosystem model against observations during the retrospective period is necessary before addressing the response of the Bering Sea ecosystem to future climate change.
D-5.1 Data Assimilation The data assimilation scheme is based on the 3D variational method (3DVAR) and is capable of assimilating both in situ and satellite observations. The goal of 3DVAR is to generate the best estimate of the ocean state by using the model forecast and all of the available observations. Assimilation of satellite-based remote sensing measurements into advanced numerical oceanic models is a challenging task. This is mostly because the satellite only measures ocean surface properties, and most satellites provide measurements only along certain orbital tracks, leaving data gaps between tracks. The basic requirement of a data assimilation system is to spread information along satellite tracks to these data gap regions, and penetrate information from surface to deep water. This is mostly accomplished through error covariance. Thus, the success of our 3DVAR data assimilation system hinges on the construction and use of accurate 3D correlations and dynamical constraints. We have developed a new method based on the Kronecker product for construction of three-dimensional error self-correlation and cross-correlation. Since inhomogeneous and anisotropic error correlations are constructed by implementation of the new method, the ROMS-3DVAR system has the capability to assimilate observed sea surface temperatures (SSTs) and sea surface heights from different satellites, and a variety of in situ observations that are characterized by sporadic and irregular distributions.
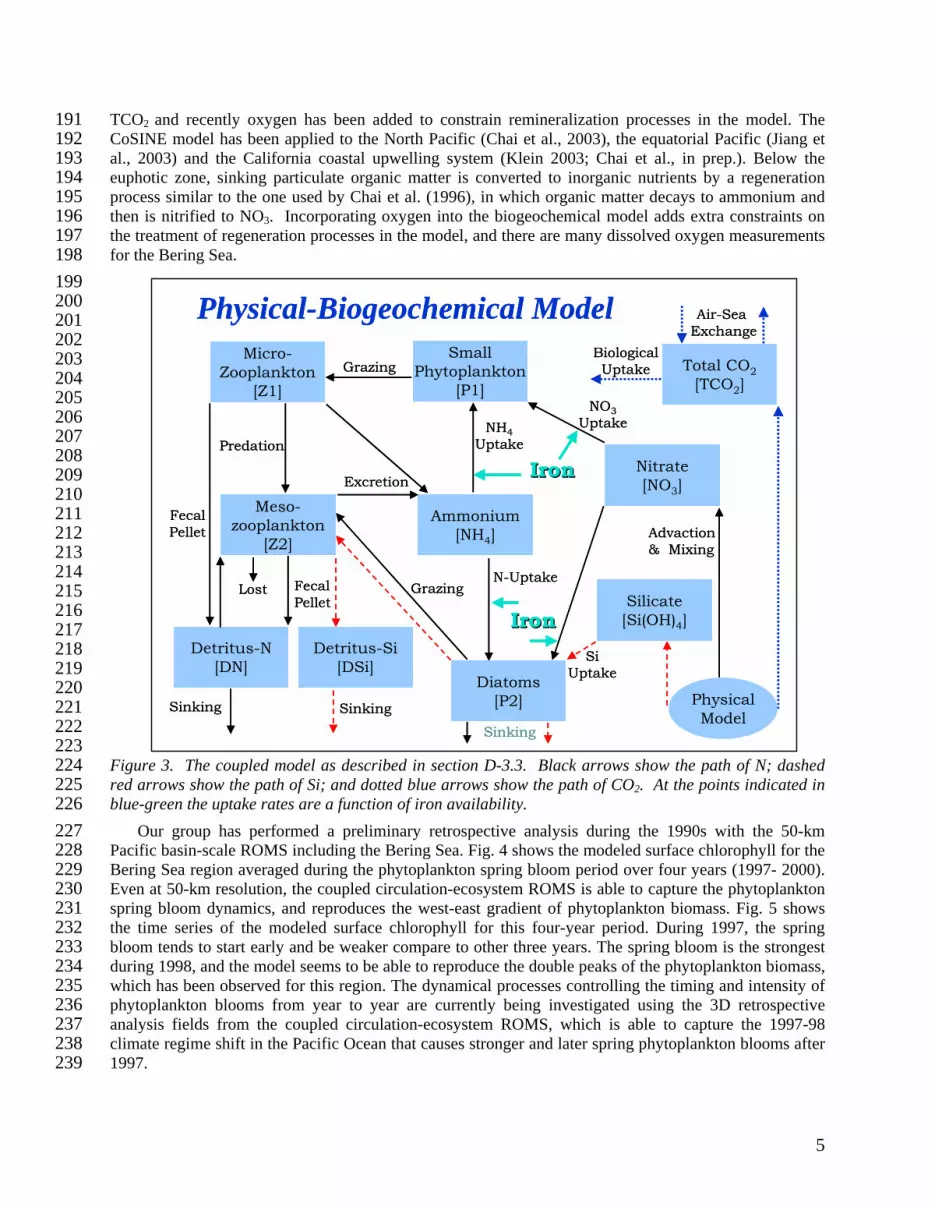
D-5.2 Retrospective Analysis (1955-2005) Using the Pacific basin-scale ROMS at 12.5-km, we performed a preliminary retrospective analysis during the 1990s forced by daily air-sea fluxes from NCEP reanalysis. After removing the seasonal cycle, the dominant mode of variability is the PDO and our Pacific ROMS realistically reproduced the regime shift around 1998/1999 (Fig. 7). The classical PDO spatial pattern is reproduced with high sea level and warm temperatures in the NW Pacific and low sea level and cold temperatures in the Bering Sea as well as in the Gulf of Alaska and off the US west coast.
Encouraged by the good agreement between our circulation model output and the observations, we will extend the retrospective analysis to the 50-year period of 1955-2005 using the NCEP reanalysis data. Once we evaluate the circulation results with observations, we will bring in the ecosystem and ice components to produce an integrated circulation-ice-ecosystem retrospective analysis. For the retrospective analysis using the fine resolution Bering Sea model, fine-scale wind forcing from mesoscale atmospheric models will enhance resolution and provide perhaps better understanding of the variable pollock recruitment (Davis, 2001; Bailey, 2002; Stabeno et al., 2004).
D-5.3 Future Climate Projections (2005-2055) The PI (Barber) has participated in a project to determine the ocean ecosystem response to climate change from 1850-2050 (Sarmiento et al., 2004). The most robust result from that study is that the marginal sea ice zone and subpolar regions are the regions that will be most affected by global ocean warming, that the changes in the northern hemisphere will exceed those in the southern, and that the changes in the North Pacific will exceed those in the North Atlantic. Based on these considerations, the subarctic Pacific Ocean is the most important test bed for the study of link between global change and oceanography, fisheries and biogeochemical cycling. Despite using an empirical relationship to link physical forcing with biomass and productivity, the Sarmiento et al. (2004) study provided a first step toward a prognostic approach to addressing the response of ocean ecosystems to future climate change.
8
352 353 354 355
356 357 358 359 360 361
362 363 364 365 366 367 368 369 370 371 372 373
Figure 7. The first Empirical Orthogonal Functions (EOFs) for the North Pacific including the Bering Sea. Top panel shows the spatial maps for the TOPEX/Poseidon observations (left) and ROMS simulation, while the bottom panel shows the corresponding time series.
In the project proposed here, we use a range of coupled climate models designed to investigate the response of the physical ocean-atmosphere system to increased greenhouse gases and aerosols, including the six climate models of the Sarmiento et al. (2004) study. All of these models use the standard IPCC radiative forcing scenario resulting from greenhouse gas and sulfate aerosols, and are run to 2050. This set of six climate models is reasonably representative of the overall range of climate responses summarized in the IPCC 2001 Third Assessment Report.
These simulations project 1) oceanic temperature increases; 2) dramatic changes in oceanic stratification, circulation, and convective overturning; and 3) changes in cloud cover and sea ice and thus light supply to the surface ocean. Warming and reduced light supply affect primary productivity directly directly, while increased stability (and reduced vertical exchange) can affect lower trophic level productivity in two opposite ways. In nutrient limited regions, increased stability reduces nutrient supply; while in light limited, high latitude regions, it increases the light supply and significantly extends the duration of the growing season. In the Bering Sea ecosystem both processes could be at work, but results of the Sarmiento et al. (2004) study point to a 15% increase in primary productivity rate as a result of increased growing season while, at the same time, area of the marginal sea ice zone is reduced to by 45%. The coupled circulation-ice-ecosystem model of the proposed project, forced by climate model projections of 2005-2055, will provide an improved mechanistic measure of the Bering Sea ecosystem response to future climate change.
9
D-6. Outreach and Education Our proposal team will cooperate with the NPRB and its education and outreach coordinator. With a dedicated budget of $7000/year, Annette deCharon, senior Science Educator from Bigelow Laboratory for Ocean Sciences, will serve for this project as the interface between our team and the NPRB education and outreach coordinator. We will augment the project’s data servers by developing materials designed for interpretation of the project and research results to the local inhabitants, students, general public, resource managers and fisheries scientists. For example, simulations will enable students to engage in activities beyond their classroom walls and beyond their classroom time frame. We will add data and content to an existing innovative data-rich module "Phytopia: Upwelling Zones" (
374 375 376 377 378 379 380 381
http://www.bigelow.org/upwelling ). Its scope, design and content are perfectly matched with the project's basin-scale (i.e., North Pacific) and regional (i.e., Gulf of Alaska) contexts. Data and models will be directly integrated into existing interactive tools that allow students to track and analyze a breadth of environmental information. For formal educators, provided rubrics will help educators differentiate among Basic, Proficient, and Advanced student understanding. Moreover, all concepts will be aligned with National Science Education Standards (NRC, 1996) and nationwide efforts to improve "Ocean Literacy" (National Geographic Society et al, 2005). Evaluation of our products will be done in close collaboration with NSF's Centers for Ocean Sciences Education Excellence (COSEE) program, specifically COSEE-Ocean Systems (OS).
382 383 384 385 386 387 388 389 390
391 392 393 394 395
As part of the outreach effort, we will make available the model output and other information products to three user communities: the research community, particularly modelers focusing on higher trophic level abundance and variability; resource managers; and education and public outreach. Using the Live Access Server (LAS), we have extensive experience developing user-friendly web servers where users can retrieve data, perform data analysis, and visualize the time evolution of the 3D model output (e.g., http://ourocean.jpl.nasa.gov/las/servlets/dataset ). 396
397 398 399 400 401 402 403
404 405 406 407 408 409 410 411
412
E. Project Management Barber, Chai, and Chao have a long history of successful collaboration: Barber is currently the PI of a NASA funded interdisciplinary science project on coupled circulation-ecosystem modeling with Chai and Chao as co-PIs. Chao and McWilliams have been implementing a ROMS-based circulation forecast system for the Prince William Sound Ocean Observing System (PWSOOS), a pilot testbed for the Alaska Ocean Observing System (AOOS); the Southern California Coastal Ocean Observing System (SCCOOS); and the Central and Northern California Ocean Observing System (CeNCOOS).
In addition to frequent email exchanges, the project team has monthly telephone and web conferences. The entire project team also will meet every January before or after the annual Alaska Marine Science Symposium. Barber has overall responsibility for accomplishment of milestones (data products, publication and outreach) and, as needed, will represent the project at NPRB meetings. Barber and Chai are responsible for ecosystem modeling component, concentrating on nutrients and lower trophic level ecosystem dynamics; Chao and McWilliams are responsible for the coupled circulation-ice modeling in collaboration with Budgell, who developed the original ROMS ice model; and Nghiem is responsible for the satellite-derived ice data products.
The following measurable milestones will track and evaluate project performance:
Jul 2006: Begin project; have initial team meeting; set up the project web site. Dec 2006: Finalize the configuration for circulation, ice and ecosystem modeling components. Jan 2007 Present preliminary results at the Alaska Marine Science Symposium 2007; conduct project
meeting to coordinate work and progress. Jun 2007 Complete the implementation of data assimilation, development of the sea-ice data set, and
the assembly of other ancillary data sets. Dec 2007 Use the circulation-ice-ecosystem model to perform retrospective analysis of the Bering Sea
response to forcing of 1955-2005. Jan 2008 Present preliminary results at the Alaska Marine Science Symposium 2008; conduct project
meeting to coordinate work and progress.
10

Jun 2008 Perform future analysis of the Bering Sea integrated circulation-ice-ecosystem response to forcing of 2005-2055.
Jul 2008 Distribute data and model products, including animations, through our web site to local inhabitants, students, general public, resource managers and fisheries scientists; complete manuscripts for peer-reviewed journal publications; submit the final project report to NPRB.
F. Project Costs Projects costs are $600,000 over a period of 2 years. The cost details are shown in the NPRB Budget Summary Form and Budget Narrative. The JPL cost is included in the UCLA subcontract because the technical work will be conducted at the newly established joint JPL-UCLA institute. No capital equipment is requested. The proposed work will be accomplished using the NASA Advanced Supercomputing facility (
413 414 415 416
http://www.nas.nasa.gov/) and the supercomputing facility at Jet Propulsion Laboratory (
417 http://sc.jpl.nasa.gov) at no cost to this proposal. The data processing and analysis of model
output will be carried out at JPL on a dedicated 16-processor SGI ALtix computer in Chao’s computer laboratory; and data archives will be provided by the JPL StorageTek tape system with 300 TeraBytes of storage capacity. As this resource will be provided at no cost to the proposal, it represents a large saving to the NPRB project.
418 419 420 421 422
423 424 425 426 427 428 429 430 431 432 433 434 435 436 437 438 439 440 441 442 443 444 445 446 447 448 449 450 451 452 453 454 455
References Bailey, K.M. 2002: Complex processes in the survival of walleye pollock larvae and forecasting
implications. Fisheries Science 68, Supplement 1, pp. 202-205. Bailey, K.M., 2000: Shifting control of recruitment of walleye pollock (Theragra chalcogramma) after a
major climate and ecosystem change, Marine Ecology-Progress Series 198, pp. 215–224. Bailey, K.M., Ciannelli, L. , Bond, N.A. , Belgrano, A. , Stenseth, N.C., 2005: Recruitment of walleye
pollock in a physically and biologically complex ecosystem: A new perspective. Progress In Oceanography 67, pp.24-42.
Blayo, E. and L. Debreu, 1999: Adaptative mesh refinement for finite-difference ocean models: first experiments. J. Phys. Oceanogr. 29, 1239-1250.
Broeder, R.D.,H. Sugisaki, G.L. Hunt, 2002. Increases in jellyfish biomass in the Bering: implications for the ecosystem. Marine Ecology Progress Series 233, pp.89-103.
Budgell, W.P., 2005: Numerical simulation of ice-ocean variability in the Barents Sea region towards dynamical downscaling. Ocean Dynamics, doi 10.1007/s10236-005-0008-3.
Chai et al. (in prep.): Ecosystem Modeling of the Central California Coastal Upwelling System. To be submitted to JGR - Oceans.
Chai, F., M. Jiang, R.T. Barber, R.C. Dugdale, and Y. Chao, 2003: Interdecadal variation of the transition zone chlorophyll front, a physical-biological model simulation between 1960 and 1990. J of Oceanogr. 59, 461-475.
Chai, F., R.C. Dugdale, T-H Peng, F. P. Wilkerson, and R. T. Barber, 2002: One Dimensional Ecosystem Model of the Equatorial Pacific Upwelling System, Part I: Model Development and Silicon and Nitrogen Cycle. Deep-Sea Res. II 49, 2713-2745.
Chai, F., R.T. Barber, and S.T. Lindley, 1996: Origin and maintenance of high nutrient condition in the equatorial Pacific. Deep-Sea Res. II 42, 1031-1064.
Chavez, F.P., J. Ryan, S. Lluch-Cota, and M. Ñiquen C., 2003: From anchovies to sardines and back: Multidecadal change in the Pacific Ocean. Science 299, 217-221.
Ciannelli L., K.S. Chan, K.M. Bailey and N.C. Stenseth, 2004: Nonadditive effects of the environment on the survival of a large marine fish population. Ecology 85, pp. 3418–3427.
Cohn, S., A. da Silva, J. Guo, M. Sienkiewicz, & D. Lamich, 1998: Assessing the effects of data selection with the DAO Physical-Space Statistical Analysis System. Mon. Wea. Rev. 126, 2913-2926.
Duffy-Anderson, J.T., K. Bailey, L. Ciannelli, P. Cury, A. Belgrano and N.C. Stenseth, 2005: Phase transitions and climate-environmental variability in marine fish recruitment processes. Ecological Complexity 2, pp. 205–218.
11
456 457 458 459 460 461 462 463 464 465 466 467 468 469 470 471 472 473 474 475 476 477 478 479 480 481 482 483 484
Dugdale, R.C., R.T. Barber, F. Chai, T-H Peng, and F.P. Wilkerson, 2002: One Dimensional Ecosystem Model of the Equatorial Pacific Upwelling System, Part II: Sensitivity Analysis and Comparison with JGOFS EqPac Data.. Deep-Sea Res. II 49, 2746-2762.
Edwards, M., and A.J. Richardson, 2004: Impact of climate change on marine pelagic phenology and trophic mismatch. Nature 430, pp. 881–884.
Goddard, L., S.J. Mason, S.E. Zebiak, C.F. Ropelewski, R. Basher and M.A. Cane, 2001: Current approaches to seasonal-to-interannual climate predictions. Inter. J. of Climatology 21, pp. 1111–1152.
Hakkinen, S., and G. L. Mellor, 1992: Modeling the seasonal variability of a coupled arctic ice-ocean system. J. Geophys. Res. 97, 20285-20304.
Hollowed, A.B., S.R. Hare and W.S. Wooster, 2001: Pacific basin climate variability and patterns of Northeast Pacific marine fish production. Progress in Oceanography 49 , pp. 257–282.
Hunke, E., 2001: Viscous-plastic sea ice dynamics with the EVP model: linearization issues, J. Comput. Phys. 170, 18-38.
Hunt Jr., G.L., P. Stabeno, G. Walters, E. Sinclair, R.D. Brodeur and J.M. Napp, 2002: Climate change and control of the southeastern Bering Sea pelagic ecosystem. Deep-Sea Res. II 49, pp. 5821–5854.
Jiang, M-S, F. Chai, R.C. Dugdale, F.P. Wilkerson, T-H Peng and R.T. Barber, 2003: A nitrate and silicate budget in the equatorial Pacific Ocean. Deep-Sea Res. II 50, 2971-2996.
Klein, L. (2003): An ecosystem dynamical modeling study of Monterey Bay, California. M.S. Thesis, University of Maine.
Li Z., and I. M. Navon, 2000: Optimality of 4D-Var and its relationship with the Kalman filter and Kalman smoother. Quarterly J. of the Royal Meteorological Society 127, 661-684.
Mantua, N. J., Hare, S. R., Zhang, Y., Wallace, J. M., Francis, R. C., 1997: A Pacific interdecadal climate oscillation with impacts on salmon production. Bull of the American Meteol SoC. 78, 1069-1079.
Marchesiello, P., J.C. McWilliams, and A. Shchepetkin, 2003: Equilibrium structure and dynamics of the California Current System. J. Phys. Ocean. 33, 753-783.
Mellor, G.L., and L. Kantha, 1989: An ice-ocean coupled model. J. Geophys. Res. 94, 100937-100954. Mellor, G.L., M. Steele and M.G. McPhee, 1989: The role of the molecular sub-layer in the melting or
freezing of sea-ice. J. Phys. Oceanogr., 19, 139-147. 485 486 487 488 489 490 491 492
Nat.Geog.Soc., 2005: http://www.ngsednet.org/community/resource_uploads/ReportonOceanLiteracy.pdf Nghiem, S. V., 2003: Arctic Field Validation Campaign for Satellite Remote Sensing of Sea Ice. Jet
Propulsion Laboratory Doc. D-26211, California Inst. Tech., Pasadena, California, 44 pp. Nghiem, S. V., K. Steffen, R. Kwok, and W.Y. Tsai, 2001: Detection of snow melt regions on the
Greenland ice sheet using diurnal backscatter change. J. Glac. 47, 539-547. Nghiem, S. V., M. L. Van Woert, and G. Neumann, 2005: Rapid formation of a sea ice barrier east of
Svalbard. J. Geophys. Res. 110, C11013, doi:10.1029/2004JC002654. NOAA-NMFS. 2004: Fisheries of the United States, 2003. US GPO, Washington, DC. 124 pp.
493 494 495 496 497 498 499 500 501 502 503 504
NRC, 1996: National Science Education Standards. http://www.nap.edu/openbook/0309053269/html/ Sarmiento, J.L., et al., 2004: Response of ocean ecosystems to climate warming. Global Biogeo. Cycles
18: GB3003, doi:10.1029/2003GB002134. Shchepetkin, A., and J.C. McWilliams, 1998: Quasi-monotone advection schemes based on explicit
locally adaptive dissipation. Monthly Weather Rev, 126, 1541-1580. Stabeno, P.J., N.A. Bond, A.J. Herman, C.W. Mordy and J.E. Overland, 2004: Meteorology and
oceanography of the northern Gulf of Alaska, Continental Shelf Research 24, pp. 859–897. Tsai, W.-Y., S. V. Nghiem, J. N. Huddleston, M. W. Spencer, B. W. Stiles, and R. D. West, 2000:
Polarimetric scatterometry: A promising technique for improving ocean surface wind measurements, IEEE Trans. Geosci. Remote Sens. 38(4), 1903-1921.
Wang, X., and Y. Chao, 2004: Simulated Sea Surface Salinity Variability in the Tropical Pacific, Geophysical Research Letters 31, L02302, doi:10.1029/2003GL018.
12