project design document
TRANSCRIPT
PROJECT DESIGN DOCUMENT FORM (CDM-SSC-PDD) - Version 03
CDM – Executive Board Page 1
CLEAN DEVELOPMENT MECHANISM
PROJECT DESIGN DOCUMENT FORM (CDM-SSC-PDD)
Version 03 - in effect as of: 22 December 2006
CONTENTS
A. General description of the small scale project activity
B. Application of a baseline and monitoring methodology
C. Duration of the project activity / crediting period
D. Environmental impacts
E. Stakeholders’ comments
Annexes
Annex 1: Contact information on participants in the proposed small-scale project activity
Annex 2: Information regarding public funding
Annex 3: Baseline information
Annex 4: Monitoring Information
PROJECT DESIGN DOCUMENT FORM (CDM-SSC-PDD) - Version 03
CDM – Executive Board Page 2
SECTION A. General description of small-scale project activity
A.1 Title of the small-scale project activity:
Sayan 14.896 MWe Small Scale Power Project, Turkey
Document Version: 04
Date of completion: 16 March 2012
A.2. Description of the small-scale project activity:
Karel Elektrik Üretim A.Ş. (Karel) plans to invest into a Greenfield small scale hydro power plant i.e. Sayan
HEPP (“Sayan”) to generate electricity and to feed it into the public grid. Sayan project shall be registered
as a Voluntary Emission Reduction project in order to enable the project implementation by means of
financial inflows coming from the credits sale. Because of its significant contribution to climate protection
and to sustainable development in the region, this project is expected to fulfill the requirements of the Gold
Standard.
Installed Capacity of Sayan HEPP is 14.896 MWe and annual energy yield is estimated to be 48,300 MWh.
Proposed project activity will generate electricity using renewable small scale hydro energy and will transfer
to the national electricity system (grid).
The project will help Turkey to stimulate and commercialize the use of grid connected renewable energy
technologies and markets. Furthermore, the project will demonstrate the viability of grid connected small
scale projects which can support improved energy security, improved air quality, alternative sustainable
energy futures, improved local livelihoods and sustainable renewable energy industry development. The
specific goals of the project are to:
reduce greenhouse gas emissions in Turkey compared to the business-as-usual scenario;
help to stimulate the growth of the small scale hydro power industry in Turkey;
create local employment during the construction and the operation phase of the small hydro project;
reduce other pollutants resulting from power generation industry in Turkey, compared to a business-
as-usual scenario;
help to reduce Turkeys increasing energy deficit;
and differentiate the electricity generation mix and reduce import dependency.
The emission reductions will be generated by substituting electricity produced from the conventional mix
representing electricity generation for the Turkish grid, which to a relevant extent depends on fossil fuels.
The emission reductions will be calculated based on the Combined Margin (CM) emission factor.
Other than the objective of climate change mitigation through significant reduction in greenhouse gas
(GHG) emissions, the project has been carried out to provide social and economical contribution to the
region in a sustainable way. The benefits that will be gained by the realization of the project compared to the
business-as-usual scenario can be summarized under four main indicators:
PROJECT DESIGN DOCUMENT FORM (CDM-SSC-PDD) - Version 03
CDM – Executive Board Page 3
Environmental
In the absence of the project activity, an equivalent amount of electricity would have to be generated from
the power plants connected to the grid, majority of which are based on fossil fuels. Thus the project is
replacing the anthropogenic emissions (CO2, CH4) and other pollutants (SOX, NOX, particulate matters)
occurring from extraction, processing, transportation and burning of fossil fuels for power generation
connected to the national grid. Also, by reduction in the consumption of these fuels, it contributes to
conservation of water, soil, plant and animal ecosystems and transfers these natural resources and also the
additional supply of these primary energy sources to the future generations. Moreover, forest guards will use
water from weir of Sayan HPP in case of any fire close to the project area.
Economical
The project will help to accelerate the growth of the small scale hydro power industry and stimulate the
designation and production of renewable energy technologies in Turkey. Other entrepreneurs irrespective of
sector will be encouraged to invest in small scale hydro power. It will assist to reduce Turkey’s increasing
energy deficit and diversify the electricity generation mix while reducing import dependency. Rural
development will be maintained in the areas around the project site by providing infrastructural investments
to these remote villages.
Social
The project will enhance local employment during the construction and the operation phase of the small
scale hydro project and result in alleviation of poverty and unemployment by increased job opportunities in
a diversified range from engineers to simple workers in the vicinity of the project area. According to current
planning 100 of 150 workers during construction and 10 of 15 worker during operation will be employed
from project region. Construction materials for the foundations, cables and other auxiliary equipment will
preferentially be sourced locally. Rural electrification will be more reliable, available and cost efficient
thanks to the decreasing distances between the generation and consumption points. The most important
benefit of the project to the local society will be supplying drinking water to İmirhan settlement where there
is no water infrastructure yet. Also, project developer has already constructed a bridge connecting İmirhan
settlement and Bağdaş village. Before this bridge, villagers from Bağdaş had to use much longer path to
arrive İmirhan settlement with around 100 km driving, but after their distance has been shortened to only
around 15 km.
Technological
Implementation of the proposed project will contribute to wider deployment of small scale hydro power
technology on the local and national level. It will demonstrate the viability of grid connected small scale
hydro projects, which will support improved energy security, alternative sustainable energy, and also
renewable energy industry development.
The “do no harm assessment“ table and “sustainable development“ matrix in the Gold Standard Passport
provide detail information about the project’s contribution to sustainable development in the light of Local
Stakeholder Consultation meeting results and Environmental Impact Assessment report. The results from the
in-depth assessment of environmental and social impacts confirm the positive influence of the project on all
the discussed domains.
A.3. Project participants:
Name of Party involved (*)
((host) indicates a host Party)
Private and/or public entity(ies) project
participants (*)
(as applicable)
Kindly indicate if the
Party involved wishes
to be considered as
PROJECT DESIGN DOCUMENT FORM (CDM-SSC-PDD) - Version 03
CDM – Executive Board Page 4
project participant
(Yes/No)
Turkey (host country) Karel Elektrik Üretim A.Ş. (private) No
Karel Elektrik Üretim A.Ş. is private project developer and owner of the project.
The Republic of Turkey is the host country. Turkey ratified the Kyoto Protocol (on 5th February of 2009)
and put in effect on 13th May 2009
1. Turkish National Focal Point to the UNFCCC is the Ministry of
Environment and Forestry2.
A.4. Technical description of the small-scale project activity:
A.4.1. Location of the small-scale project activity:
A.4.1.1. Host Party(ies):
The host country is Republic of Turkey.
A.4.1.2. Region/State/Province etc.:
The project will be in Mediterranean Region (South of Turkey) and province of Osmaniye.
A.4.1.3. City/Town/Community etc:
The project will be situated in the district of Kadirli and near İmirhan settlement of Tahta village.
A.4.1.4. Details of physical location, including information allowing the unique
identification of this small-scale project activity :
The project site is located Savrun River in Kadirli district of Osmaniye city in Turkey. The project area is in
hilly areas and there are scattered trees. There are not any agricultural activities on proposed project area.
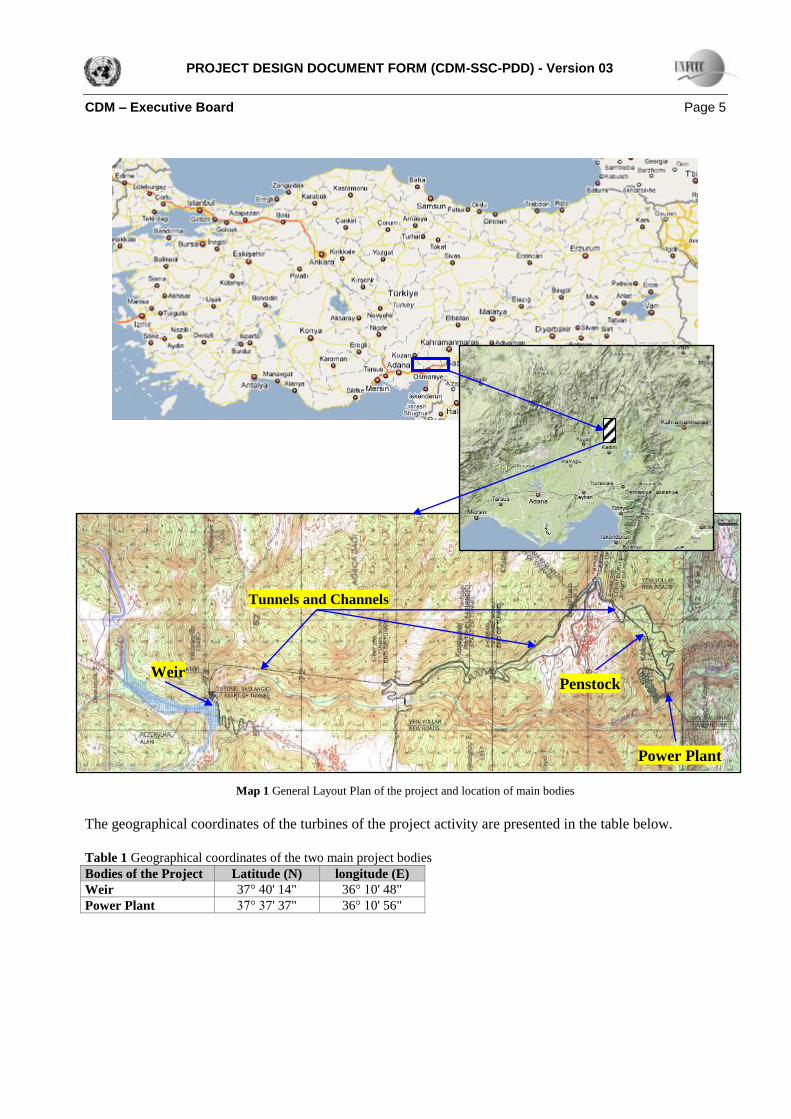
Location of the project and the specific positions of the weir and power plant of planned small scale hydro
are presented on the following map.
1 See, Official Gazette:
http://rega.basbakanlik.gov.tr/main.aspx?home=http://rega.basbakanlik.gov.tr/eskiler/2009/05/20090513.htm&main=http://rega.basb
akanlik.gov.tr/eskiler/2009/05/20090513.htm (link in ‘Milletlerararı Sözleşme’ part) 2 See, UNFCCC, list of the National Focal Points: http://maindb.unfccc.int/public/nfp.pl?mode=wim
PROJECT DESIGN DOCUMENT FORM (CDM-SSC-PDD) - Version 03
CDM – Executive Board Page 5
Map 1 General Layout Plan of the project and location of main bodies
The geographical coordinates of the turbines of the project activity are presented in the table below.
Table 1 Geographical coordinates of the two main project bodies
Bodies of the Project Latitude (N) longitude (E)
Weir 37° 40' 14" 36° 10' 48"
Power Plant 37° 37' 37" 36° 10' 56"
Weir
Tunnels and Channels
Penstock
Power Plant
PROJECT DESIGN DOCUMENT FORM (CDM-SSC-PDD) - Version 03
CDM – Executive Board Page 6
A.4.2. Type and category(ies) and technology/measure of the small-scale project activity:
The project type is ‘Type (I): Renewable energy projects’ and project category is ‘D.Electricity generation
for a system’.
The 14.896 MWe Sayan HEPP will use potential energy of water to produce electricity and transmit to the
national grid. The project activity will be located in elevation interval of 1,230 and 880 m and will be
located on Savrun River. The water will be directed to tunnels and channels via weir and water intake
structures, and then will be felt down through penstock to rotate the two turbines and generate electricity in
two generators. Net head to be utilized in this project will be 340.85 m, and project design flow rate is 5.0
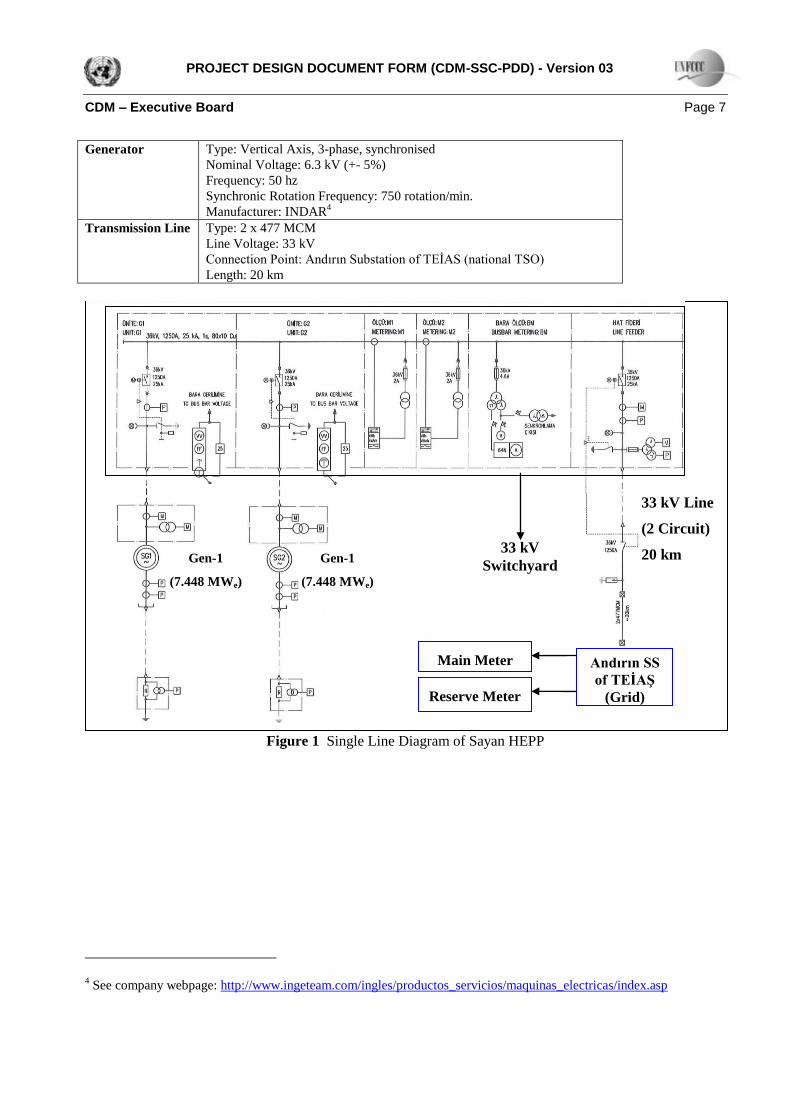
m3/s. Turbine type will be vertical-axis Pelton (an illustration of this Pelton turbine is given in Figure 2)
which is the best fit for this head and flow rate. Generated electricity will be fed into national grid with
connection to Andırın SS via 20 km long double circuit 33 kV overhead lines from switchyard which will be
built near to power plant. The total annual electricity production of the project activity is expected to be
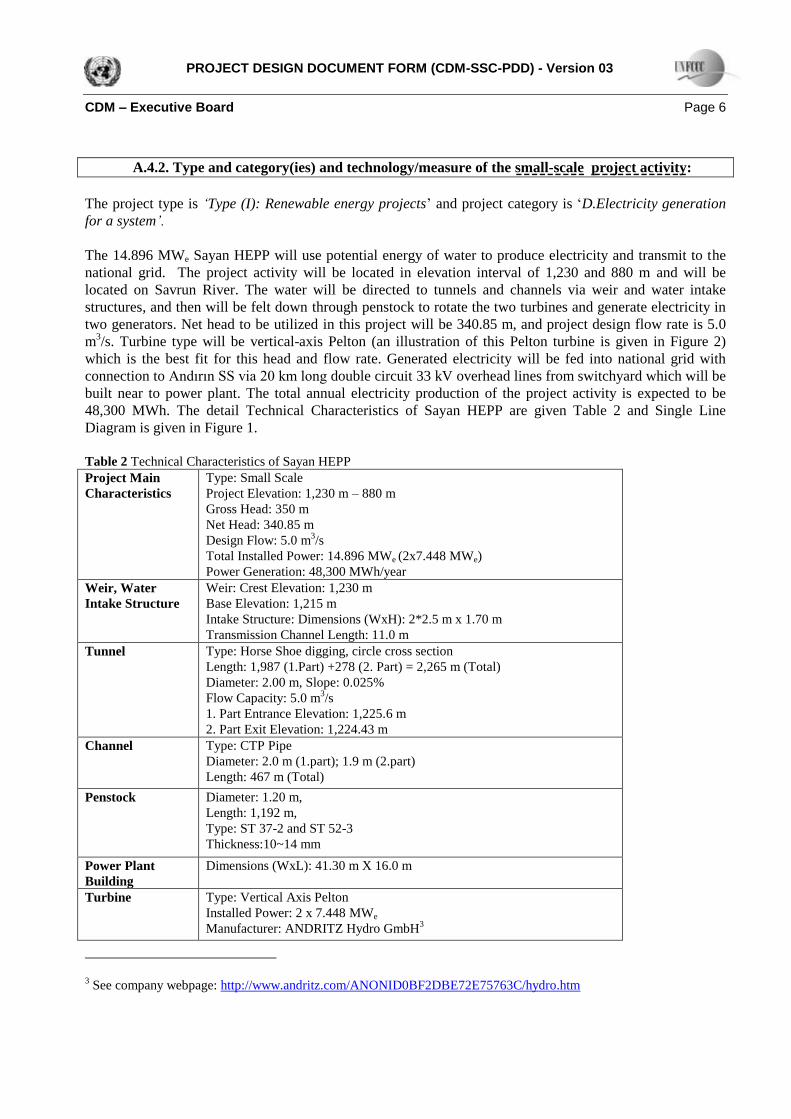
48,300 MWh. The detail Technical Characteristics of Sayan HEPP are given Table 2 and Single Line
Diagram is given in Figure 1.
Table 2 Technical Characteristics of Sayan HEPP
Project Main
Characteristics
Type: Small Scale
Project Elevation: 1,230 m – 880 m
Gross Head: 350 m
Net Head: 340.85 m
Design Flow: 5.0 m3/s
Total Installed Power: 14.896 MWe (2x7.448 MWe)
Power Generation: 48,300 MWh/year
Weir, Water
Intake Structure
Weir: Crest Elevation: 1,230 m
Base Elevation: 1,215 m
Intake Structure: Dimensions (WxH): 2*2.5 m x 1.70 m
Transmission Channel Length: 11.0 m
Tunnel Type: Horse Shoe digging, circle cross section
Length: 1,987 (1.Part) +278 (2. Part) = 2,265 m (Total)
Diameter: 2.00 m, Slope: 0.025%
Flow Capacity: 5.0 m3/s
1. Part Entrance Elevation: 1,225.6 m
2. Part Exit Elevation: 1,224.43 m
Channel Type: CTP Pipe
Diameter: 2.0 m (1.part); 1.9 m (2.part)
Length: 467 m (Total)
Penstock Diameter: 1.20 m,
Length: 1,192 m,
Type: ST 37-2 and ST 52-3
Thickness:10~14 mm
Power Plant
Building
Dimensions (WxL): 41.30 m X 16.0 m
Turbine Type: Vertical Axis Pelton
Installed Power: 2 x 7.448 MWe
Manufacturer: ANDRITZ Hydro GmbH3
3 See company webpage: http://www.andritz.com/ANONID0BF2DBE72E75763C/hydro.htm
PROJECT DESIGN DOCUMENT FORM (CDM-SSC-PDD) - Version 03
CDM – Executive Board Page 7
Generator Type: Vertical Axis, 3-phase, synchronised
Nominal Voltage: 6.3 kV (+- 5%)
Frequency: 50 hz
Synchronic Rotation Frequency: 750 rotation/min.
Manufacturer: INDAR4
Transmission Line Type: 2 x 477 MCM
Line Voltage: 33 kV
Connection Point: Andırın Substation of TEİAS (national TSO)
Length: 20 km
Figure 1 Single Line Diagram of Sayan HEPP
4 See company webpage: http://www.ingeteam.com/ingles/productos_servicios/maquinas_electricas/index.asp
Main Meter
Reserve Meter
Gen-1
(7.448 MWe)
33 kV
Switchyard
33 kV Line
(2 Circuit)
20 km
Andırın SS
of TEİAŞ
(Grid)
Gen-1
(7.448 MWe)
PROJECT DESIGN DOCUMENT FORM (CDM-SSC-PDD) - Version 03
CDM – Executive Board Page 8
Figure 2 An illustration of Pelton Hydro Turbine
Harnessing the hydro energy to generate electricity with electromechanical equipments (turbine and
generator systems) is reliable and proven technology and being widely used in the world. Therefore,
environmentally safe and sound technology and know how is being applied by the project activity interalia
technology transfer. Andritz Hydro is a well known turbine manufacturer. Project developer considered
efficiency, reliability and experience of turbine provider during selection.
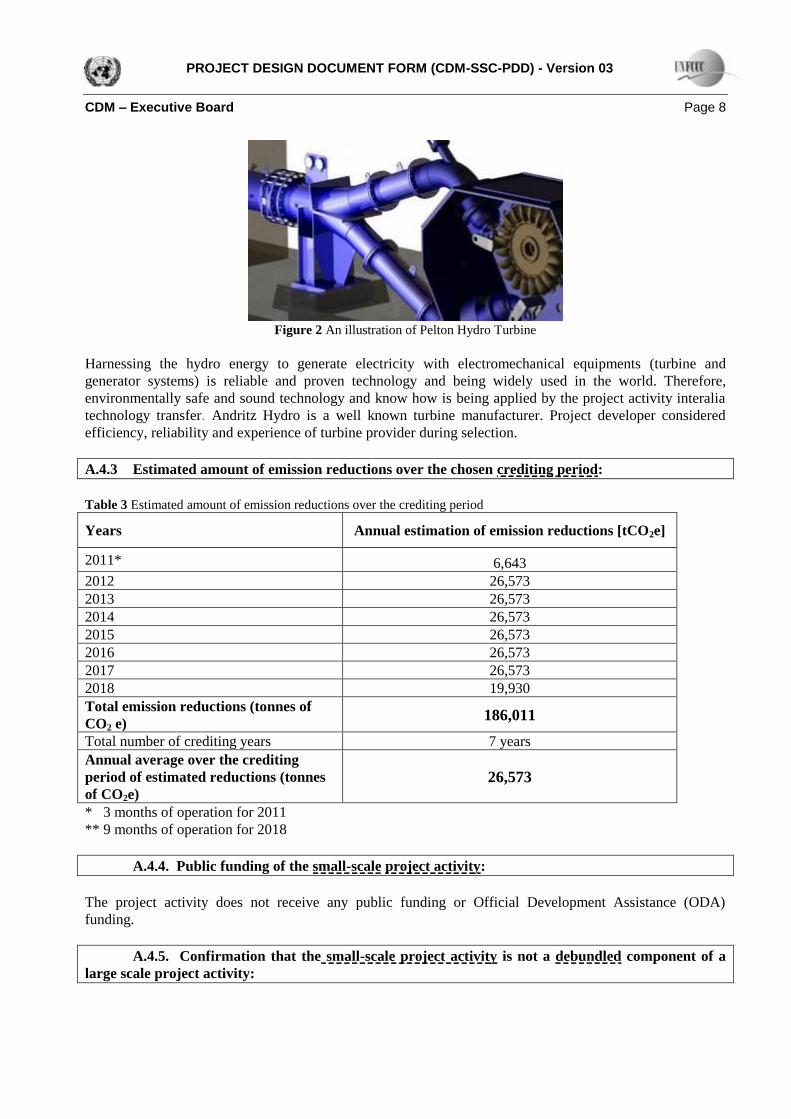
A.4.3 Estimated amount of emission reductions over the chosen crediting period:
Table 3 Estimated amount of emission reductions over the crediting period
Years Annual estimation of emission reductions [tCO2e]
2011* 6,643
2012 26,573
2013 26,573
2014 26,573
2015 26,573
2016 26,573
2017 26,573
2018 19,930
Total emission reductions (tonnes of
CO2 e) 186,011
Total number of crediting years 7 years
Annual average over the crediting
period of estimated reductions (tonnes
of CO2e)
26,573
* 3 months of operation for 2011
** 9 months of operation for 2018
A.4.4. Public funding of the small-scale project activity:
The project activity does not receive any public funding or Official Development Assistance (ODA)
funding.
A.4.5. Confirmation that the small-scale project activity is not a debundled component of a
large scale project activity:
PROJECT DESIGN DOCUMENT FORM (CDM-SSC-PDD) - Version 03
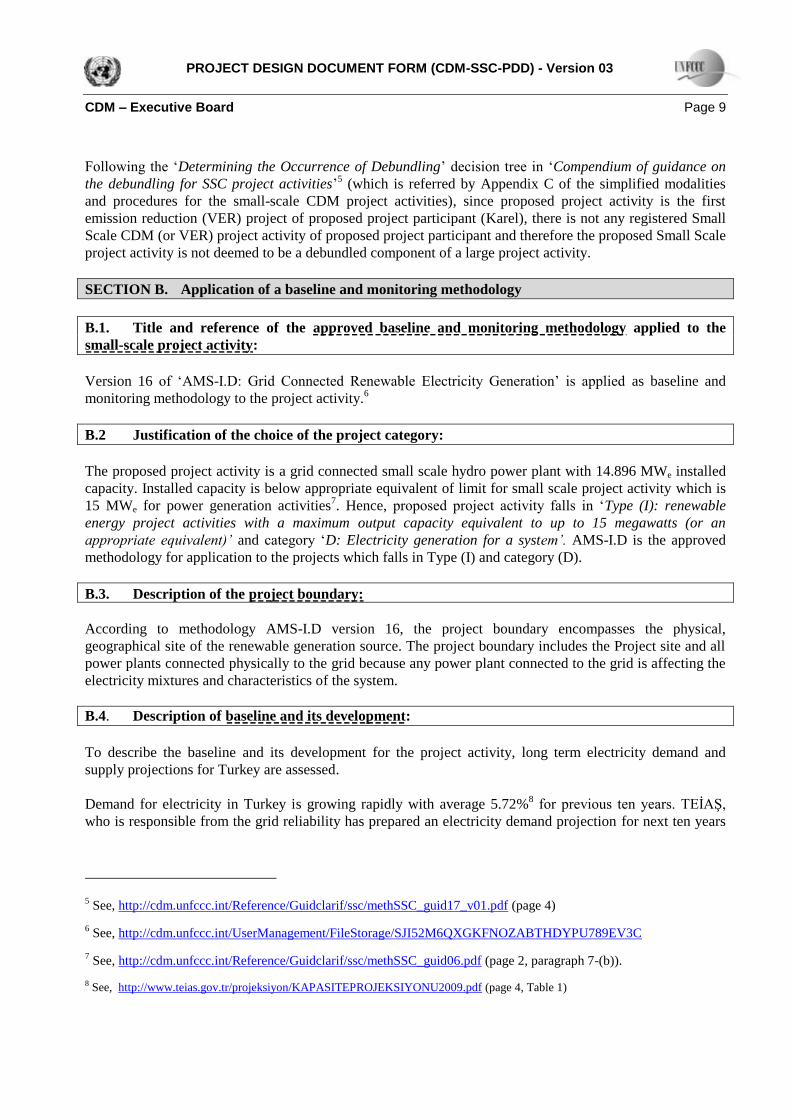
CDM – Executive Board Page 9
Following the ‘Determining the Occurrence of Debundling’ decision tree in ‘Compendium of guidance on
the debundling for SSC project activities’5 (which is referred by Appendix C of the simplified modalities
and procedures for the small-scale CDM project activities), since proposed project activity is the first
emission reduction (VER) project of proposed project participant (Karel), there is not any registered Small
Scale CDM (or VER) project activity of proposed project participant and therefore the proposed Small Scale
project activity is not deemed to be a debundled component of a large project activity.
SECTION B. Application of a baseline and monitoring methodology
B.1. Title and reference of the approved baseline and monitoring methodology applied to the
small-scale project activity:
Version 16 of ‘AMS-I.D: Grid Connected Renewable Electricity Generation’ is applied as baseline and
monitoring methodology to the project activity.6
B.2 Justification of the choice of the project category:
The proposed project activity is a grid connected small scale hydro power plant with 14.896 MWe installed
capacity. Installed capacity is below appropriate equivalent of limit for small scale project activity which is
15 MWe for power generation activities7. Hence, proposed project activity falls in ‘Type (I): renewable
energy project activities with a maximum output capacity equivalent to up to 15 megawatts (or an
appropriate equivalent)’ and category ‘D: Electricity generation for a system’. AMS-I.D is the approved
methodology for application to the projects which falls in Type (I) and category (D).
B.3. Description of the project boundary:
According to methodology AMS-I.D version 16, the project boundary encompasses the physical,
geographical site of the renewable generation source. The project boundary includes the Project site and all
power plants connected physically to the grid because any power plant connected to the grid is affecting the
electricity mixtures and characteristics of the system.
B.4. Description of baseline and its development:
To describe the baseline and its development for the project activity, long term electricity demand and
supply projections for Turkey are assessed.
Demand for electricity in Turkey is growing rapidly with average 5.72%8 for previous ten years. TEİAŞ,
who is responsible from the grid reliability has prepared an electricity demand projection for next ten years
5 See, http://cdm.unfccc.int/Reference/Guidclarif/ssc/methSSC_guid17_v01.pdf (page 4)
6 See, http://cdm.unfccc.int/UserManagement/FileStorage/SJI52M6QXGKFNOZABTHDYPU789EV3C
7 See, http://cdm.unfccc.int/Reference/Guidclarif/ssc/methSSC_guid06.pdf (page 2, paragraph 7-(b)).
8 See, http://www.teias.gov.tr/projeksiyon/KAPASITEPROJEKSIYONU2009.pdf (page 4, Table 1)
PROJECT DESIGN DOCUMENT FORM (CDM-SSC-PDD) - Version 03
CDM – Executive Board Page 10
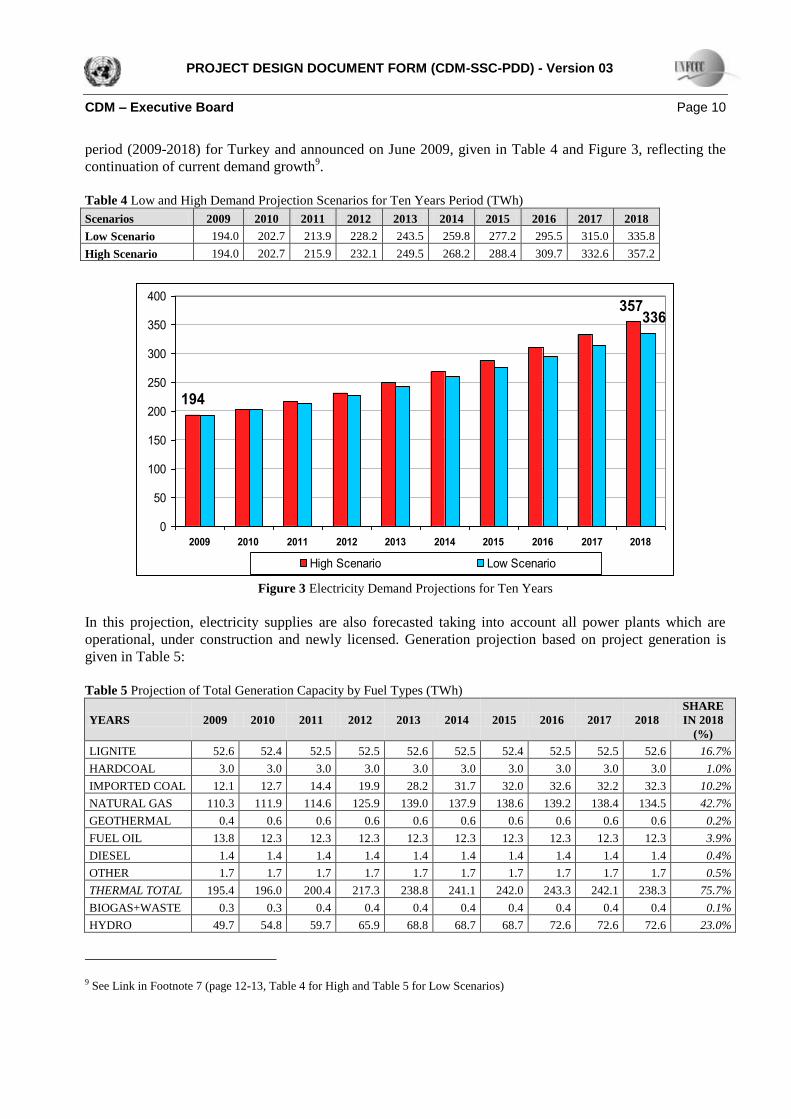
period (2009-2018) for Turkey and announced on June 2009, given in Table 4 and Figure 3, reflecting the
continuation of current demand growth9.
Table 4 Low and High Demand Projection Scenarios for Ten Years Period (TWh)
Scenarios 2009 2010 2011 2012 2013 2014 2015 2016 2017 2018
Low Scenario 194.0 202.7 213.9 228.2 243.5 259.8 277.2 295.5 315.0 335.8
High Scenario 194.0 202.7 215.9 232.1 249.5 268.2 288.4 309.7 332.6 357.2
357
194
336
0
50
100
150
200
250
300
350
400
2009 2010 2011 2012 2013 2014 2015 2016 2017 2018
High Scenario Low Scenario
Figure 3 Electricity Demand Projections for Ten Years
In this projection, electricity supplies are also forecasted taking into account all power plants which are
operational, under construction and newly licensed. Generation projection based on project generation is
given in Table 5:
Table 5 Projection of Total Generation Capacity by Fuel Types (TWh)
YEARS 2009 2010 2011 2012 2013 2014 2015 2016 2017 2018
SHARE
IN 2018
(%)
LIGNITE 52.6 52.4 52.5 52.5 52.6 52.5 52.4 52.5 52.5 52.6 16.7%
HARDCOAL 3.0 3.0 3.0 3.0 3.0 3.0 3.0 3.0 3.0 3.0 1.0%
IMPORTED COAL 12.1 12.7 14.4 19.9 28.2 31.7 32.0 32.6 32.2 32.3 10.2%
NATURAL GAS 110.3 111.9 114.6 125.9 139.0 137.9 138.6 139.2 138.4 134.5 42.7%
GEOTHERMAL 0.4 0.6 0.6 0.6 0.6 0.6 0.6 0.6 0.6 0.6 0.2%
FUEL OIL 13.8 12.3 12.3 12.3 12.3 12.3 12.3 12.3 12.3 12.3 3.9%
DIESEL 1.4 1.4 1.4 1.4 1.4 1.4 1.4 1.4 1.4 1.4 0.4%
OTHER 1.7 1.7 1.7 1.7 1.7 1.7 1.7 1.7 1.7 1.7 0.5%
THERMAL TOTAL 195.4 196.0 200.4 217.3 238.8 241.1 242.0 243.3 242.1 238.3 75.7%
BIOGAS+WASTE 0.3 0.3 0.4 0.4 0.4 0.4 0.4 0.4 0.4 0.4 0.1%
HYDRO 49.7 54.8 59.7 65.9 68.8 68.7 68.7 72.6 72.6 72.6 23.0%
9 See Link in Footnote 7 (page 12-13, Table 4 for High and Table 5 for Low Scenarios)
PROJECT DESIGN DOCUMENT FORM (CDM-SSC-PDD) - Version 03
CDM – Executive Board Page 11
WIND 1.6 2.4 3.2 3.7 3.7 3.7 3.7 3.7 3.7 3.7 1.2%
TOTAL 246.9 253.5 263.6 287.3 311.6 313.9 314.8 320.0 318.8 315.0 100.0%
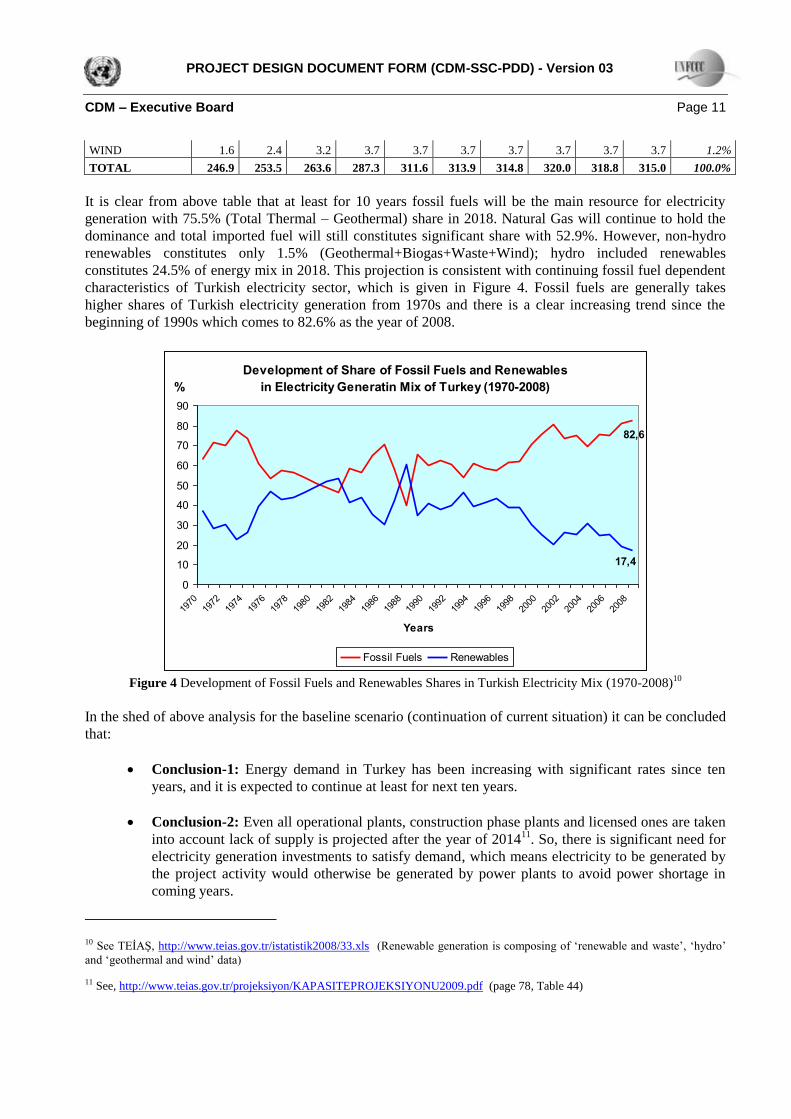
It is clear from above table that at least for 10 years fossil fuels will be the main resource for electricity
generation with 75.5% (Total Thermal – Geothermal) share in 2018. Natural Gas will continue to hold the
dominance and total imported fuel will still constitutes significant share with 52.9%. However, non-hydro
renewables constitutes only 1.5% (Geothermal+Biogas+Waste+Wind); hydro included renewables
constitutes 24.5% of energy mix in 2018. This projection is consistent with continuing fossil fuel dependent
characteristics of Turkish electricity sector, which is given in Figure 4. Fossil fuels are generally takes
higher shares of Turkish electricity generation from 1970s and there is a clear increasing trend since the
beginning of 1990s which comes to 82.6% as the year of 2008.
Development of Share of Fossil Fuels and Renewables
in Electricity Generatin Mix of Turkey (1970-2008)
82,6
17,4
0
10
20
30
40
50
60
70
80
90
1970
1972
1974
1976
1978
1980
1982
1984
1986
1988
1990
1992
1994
1996
1998
2000
2002
2004
2006
2008
Years
%
Fossil Fuels Renewables
Figure 4 Development of Fossil Fuels and Renewables Shares in Turkish Electricity Mix (1970-2008)
10
In the shed of above analysis for the baseline scenario (continuation of current situation) it can be concluded
that:
Conclusion-1: Energy demand in Turkey has been increasing with significant rates since ten
years, and it is expected to continue at least for next ten years.
Conclusion-2: Even all operational plants, construction phase plants and licensed ones are taken
into account lack of supply is projected after the year of 201411
. So, there is significant need for
electricity generation investments to satisfy demand, which means electricity to be generated by
the project activity would otherwise be generated by power plants to avoid power shortage in
coming years.
10 See TEİAŞ, http://www.teias.gov.tr/istatistik2008/33.xls (Renewable generation is composing of ‘renewable and waste’, ‘hydro’
and ‘geothermal and wind’ data)
11 See, http://www.teias.gov.tr/projeksiyon/KAPASITEPROJEKSIYONU2009.pdf (page 78, Table 44)
PROJECT DESIGN DOCUMENT FORM (CDM-SSC-PDD) - Version 03
CDM – Executive Board Page 12
Conclusion-3: Fossil fuels will hold the dominance in generation mix for at least midterm period
(till the end of 2018) with 75% share. Hydro included renewables will remain low with 24.5%
share and non-hydro energy contribution will stay negligible with only 1.5% of total share by the
end of that period. This also shows that most of new capacity additions will be fossil fuel fired
power plants.
CM calculations for baseline scenario are given in B.6 section of this document.
B.5. Description of how the anthropogenic emissions of GHG by sources are reduced below those
that would have occurred in the absence of the registered small-scale CDM project activity:
For the explanation of how and why the project activity leads to emission reductions that are additional to
what would have occurred in the absence of the project activity “Tool for the demonstration and assessment
of additionality version 05.2 ”12
(Tool), which defines a step-wise approach to be applied to the proposed
project is used.
Step 1. Identification of alternatives to the project activity consistent with current laws and regulations.
Sub-step 1a. Alternatives to the project activity
To identify the realistic and credible alternative scenario(s) for project participants, scenarios in the Tool are
assessed:
a) The proposed project activity undertaken without being registered as a GS VER project activity
This alternative is realistic and credible as Karel may undertake project activity if he sees no risk for project
and/or if the project turns out to be financially attractive without GS VER credit income. However,
investments analyze shows that the project is not economically feasible without GS VER credit income.
Detail information is given in Step-2c and 2d.
b) Other realistic and credible alternative scenario(s) to the proposed GS VER project activity scenario
that deliver electricity with comparable quality, properties and application areas, taking into account,
where relevant, examples of scenarios identified in the underlying methodology;
The project activity is power generation activity without any greenhouse gas emission harnessing the energy
of the wind. Being a private entity, Karel doesn’t have to invest power investments even proposed project
activity. Also, since Karel has licence only for hydro power investment for electricity generation, other
project activities delivering same electricity is not realistic for project participant.
c) Continuation of the current situation, i.e. Sayan HEPP is not built
The decision in favour or against a project investment depends on the expected revenues and risks, like for
every other private investment. Investment decisions other than Sayan HEPP are independent from the
question whether Sayan HEPP is built or not. This alternative is also realistic and credible.
12 See,, http://cdm.unfccc.int/methodologies/PAmethodologies/tools/am-tool-01-v5.2.pdf
PROJECT DESIGN DOCUMENT FORM (CDM-SSC-PDD) - Version 03
CDM – Executive Board Page 13
According to baseline scenario which is described in B.4, there is a need for energy investment to satisfy
increasing demand and if the Sayan HEPP is not built, the same amount of energy will be supplied by other
private investors to the grid. Forecasts shows that electricity supplied in the absence of Sayan HEPP will be
mainly based on fossil fuels as the projections for the year of 2018 forecasts 75% share for fossil fuels in the
energy mix.
Therefore, two realistic and credible alternative scenarios are identified for the project activity:
a) The proposed project activity undertaken without being registered as a GS VER project activity.
b) Continuation of the current situation, i.e. Sayan HEPP is not built.
Sub-step 1b. Consistency with mandatory laws and regulations
Both alternatives are (building or not building the project activity) in compliance with the following
identified applicable mandatory laws and regulations:
(1) Electricity Market Law13
(2) Law on Utilization of Renewable Energy Resources for the Purpose of Generating Electricity Energy14
(3) Environment Law15
(4) By-Law On Environmental Impact Assessment (EIA)16
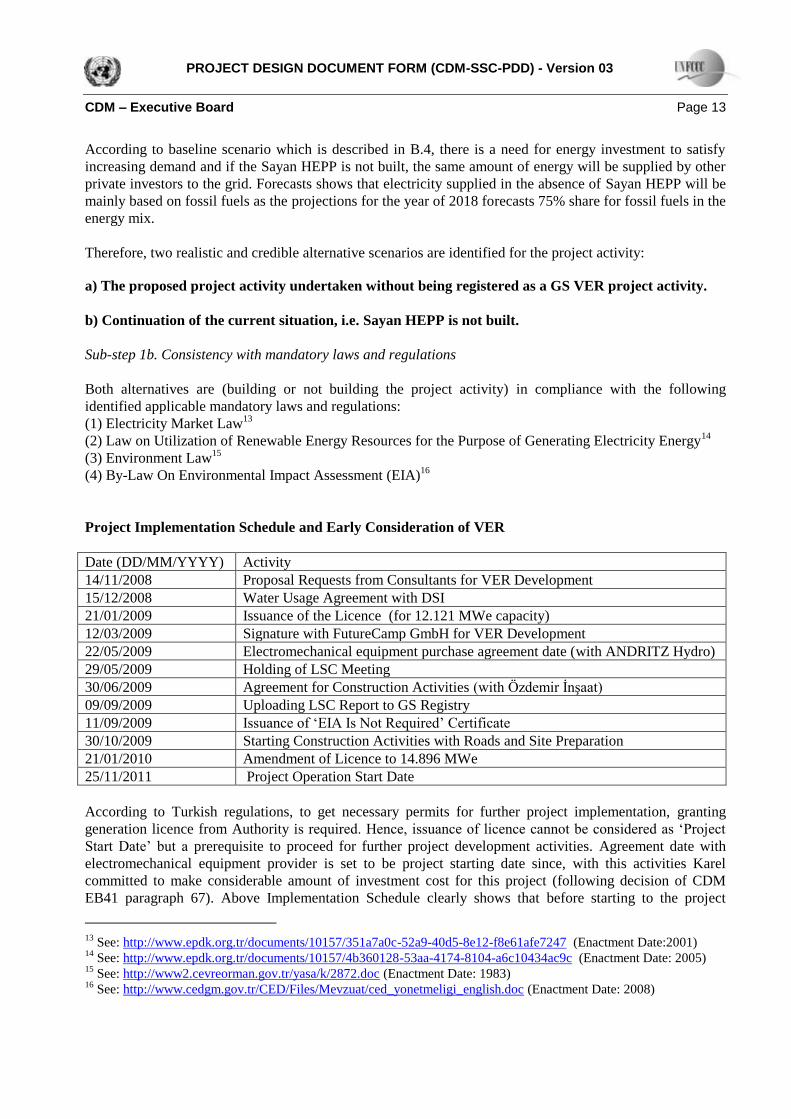
Project Implementation Schedule and Early Consideration of VER
Date (DD/MM/YYYY) Activity
14/11/2008 Proposal Requests from Consultants for VER Development
15/12/2008 Water Usage Agreement with DSI
21/01/2009 Issuance of the Licence (for 12.121 MWe capacity)
12/03/2009 Signature with FutureCamp GmbH for VER Development
22/05/2009 Electromechanical equipment purchase agreement date (with ANDRITZ Hydro)
29/05/2009 Holding of LSC Meeting
30/06/2009 Agreement for Construction Activities (with Özdemir İnşaat)
09/09/2009 Uploading LSC Report to GS Registry
11/09/2009 Issuance of ‘EIA Is Not Required’ Certificate
30/10/2009 Starting Construction Activities with Roads and Site Preparation
21/01/2010 Amendment of Licence to 14.896 MWe
25/11/2011 Project Operation Start Date
According to Turkish regulations, to get necessary permits for further project implementation, granting
generation licence from Authority is required. Hence, issuance of licence cannot be considered as ‘Project
Start Date’ but a prerequisite to proceed for further project development activities. Agreement date with
electromechanical equipment provider is set to be project starting date since, with this activities Karel
committed to make considerable amount of investment cost for this project (following decision of CDM
EB41 paragraph 67). Above Implementation Schedule clearly shows that before starting to the project
13
See: http://www.epdk.org.tr/documents/10157/351a7a0c-52a9-40d5-8e12-f8e61afe7247 (Enactment Date:2001) 14
See: http://www.epdk.org.tr/documents/10157/4b360128-53aa-4174-8104-a6c10434ac9c (Enactment Date: 2005) 15
See: http://www2.cevreorman.gov.tr/yasa/k/2872.doc (Enactment Date: 1983) 16
See: http://www.cedgm.gov.tr/CED/Files/Mevzuat/ced_yonetmeligi_english.doc (Enactment Date: 2008)
PROJECT DESIGN DOCUMENT FORM (CDM-SSC-PDD) - Version 03
CDM – Executive Board Page 14
activity, Karel started to analysis of revenue from VER credit sale, decided to get consultancy for VER
development and signed contract with a carbon consultant and held LSC Meeting before the starting to
physical construction on site.
Aforementioned schedule shows us that Karel started to consideration of VER from the beginning of the
project implementation and VER Revenue has decisive impact on decision of proceeding to the project.
In the following, the investment analysis is applied to clearly demonstrate that the project activity is unlikely
to be financially/economically attractive without the revenue from the sale of VERs..
Step 2. Investment analysis
Sub-step 2a: Appropriate analysis method
With the help of the investment analysis it shall be demonstrated that the proposed project activity is not
economically or financially feasible without the revenue from the sale of VERs. Therefore, the benchmark
analysis shall be applied, as there is no alternative project activity for a comparison of the attractiveness of
an investment.
Sub-step 2b: Option III: Benchmark analysis
As a common means to evaluate the attractiveness of investment projects and compare them with possible
alternatives, the IRR (Internal Rate of Return) shall be used.
According to the Tool, benchmark for investment analysis can be driven from ‘Estimates of the cost of
financing and required return on capital based on bankers views and private equity investors/funds’. As a
banker view, according to Worldbank loan appraisal document17
, threshold equity IRR for small scale hydro
power investments (i.e. required returns of equity for small hydro power investors) in Turkey is 15%.
Sub-step 2c: Calculation and comparison of the IRR
In the paragraph 11 of the ‘Guidance on the Assessment of Investment Analysis’18
, it is stated that:
‘Required/expected returns on equity are appropriate benchmarks for an equity IRR’. Since, benchmark
identified in the Sub-step 2b is required/expected returns on equity, equity IRR (before tax) of the project
activity shall be calculated for comparison.
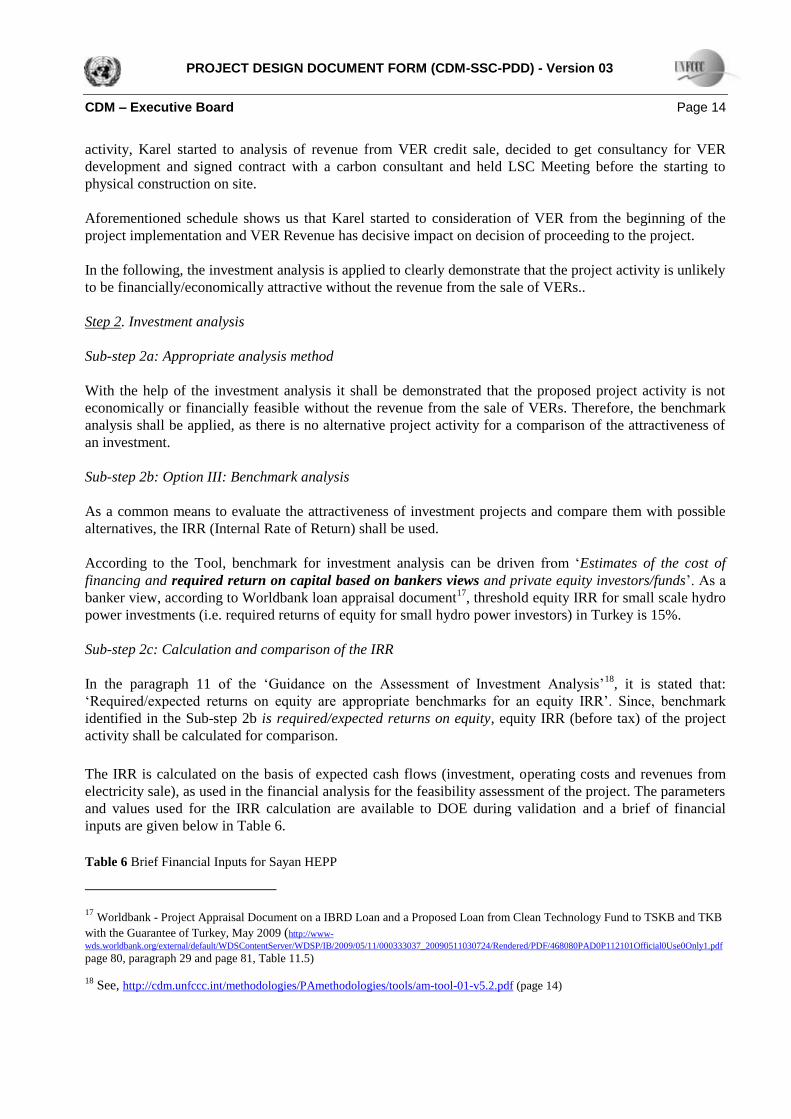
The IRR is calculated on the basis of expected cash flows (investment, operating costs and revenues from
electricity sale), as used in the financial analysis for the feasibility assessment of the project. The parameters
and values used for the IRR calculation are available to DOE during validation and a brief of financial
inputs are given below in Table 6.
Table 6 Brief Financial Inputs for Sayan HEPP
17 Worldbank - Project Appraisal Document on a IBRD Loan and a Proposed Loan from Clean Technology Fund to TSKB and TKB
with the Guarantee of Turkey, May 2009 (http://www-
wds.worldbank.org/external/default/WDSContentServer/WDSP/IB/2009/05/11/000333037_20090511030724/Rendered/PDF/468080PAD0P112101Official0Use0Only1.pdf
page 80, paragraph 29 and page 81, Table 11.5)
18 See, http://cdm.unfccc.int/methodologies/PAmethodologies/tools/am-tool-01-v5.2.pdf (page 14)
PROJECT DESIGN DOCUMENT FORM (CDM-SSC-PDD) - Version 03
CDM – Executive Board Page 15
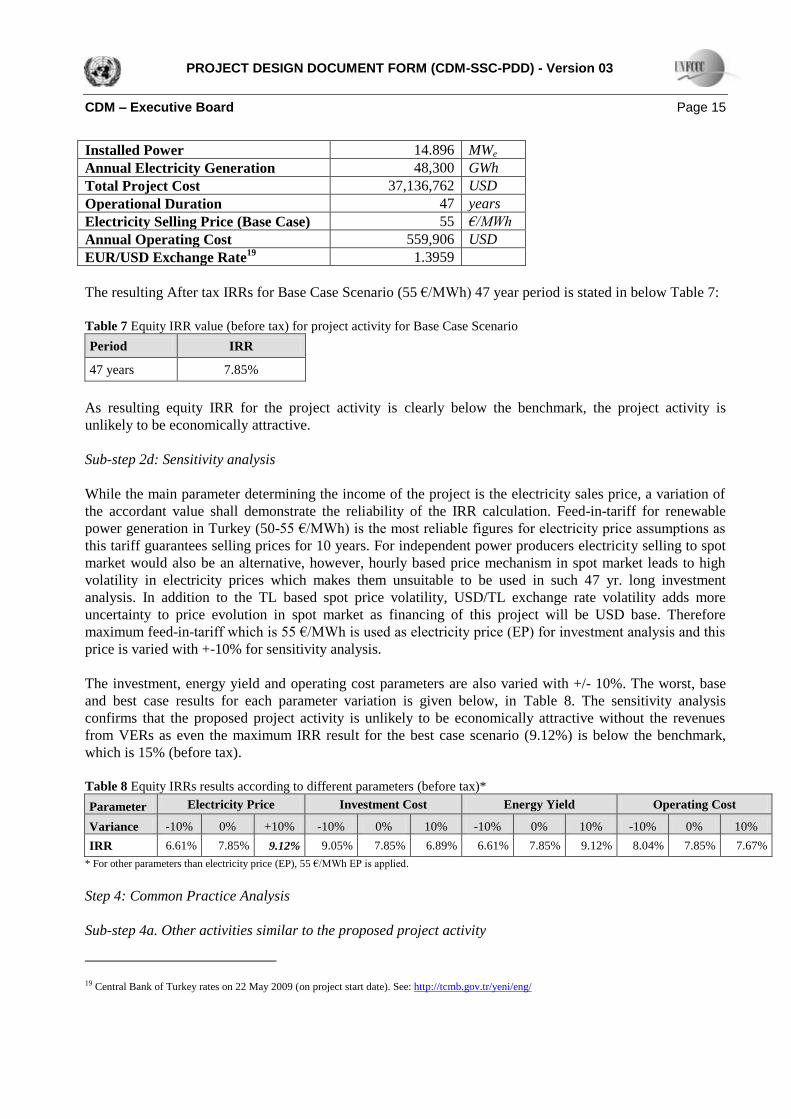
Installed Power 14.896 MWe
Annual Electricity Generation 48,300 GWh
Total Project Cost 37,136,762 USD
Operational Duration 47 years
Electricity Selling Price (Base Case) 55 €/MWh
Annual Operating Cost 559,906 USD
EUR/USD Exchange Rate19
1.3959
The resulting After tax IRRs for Base Case Scenario (55 €/MWh) 47 year period is stated in below Table 7:
Table 7 Equity IRR value (before tax) for project activity for Base Case Scenario
Period IRR
47 years 7.85%
As resulting equity IRR for the project activity is clearly below the benchmark, the project activity is
unlikely to be economically attractive.
Sub-step 2d: Sensitivity analysis
While the main parameter determining the income of the project is the electricity sales price, a variation of
the accordant value shall demonstrate the reliability of the IRR calculation. Feed-in-tariff for renewable
power generation in Turkey (50-55 €/MWh) is the most reliable figures for electricity price assumptions as
this tariff guarantees selling prices for 10 years. For independent power producers electricity selling to spot
market would also be an alternative, however, hourly based price mechanism in spot market leads to high
volatility in electricity prices which makes them unsuitable to be used in such 47 yr. long investment
analysis. In addition to the TL based spot price volatility, USD/TL exchange rate volatility adds more
uncertainty to price evolution in spot market as financing of this project will be USD base. Therefore
maximum feed-in-tariff which is 55 €/MWh is used as electricity price (EP) for investment analysis and this
price is varied with +-10% for sensitivity analysis.
The investment, energy yield and operating cost parameters are also varied with +/- 10%. The worst, base
and best case results for each parameter variation is given below, in Table 8. The sensitivity analysis
confirms that the proposed project activity is unlikely to be economically attractive without the revenues
from VERs as even the maximum IRR result for the best case scenario (9.12%) is below the benchmark,
which is 15% (before tax).
Table 8 Equity IRRs results according to different parameters (before tax)*
Parameter Electricity Price Investment Cost Energy Yield Operating Cost
Variance -10% 0% +10% -10% 0% 10% -10% 0% 10% -10% 0% 10%
IRR 6.61% 7.85% 9.12% 9.05% 7.85% 6.89% 6.61% 7.85% 9.12% 8.04% 7.85% 7.67%
* For other parameters than electricity price (EP), 55 €/MWh EP is applied.
Step 4: Common Practice Analysis
Sub-step 4a. Other activities similar to the proposed project activity
19 Central Bank of Turkey rates on 22 May 2009 (on project start date). See: http://tcmb.gov.tr/yeni/eng/
PROJECT DESIGN DOCUMENT FORM (CDM-SSC-PDD) - Version 03
CDM – Executive Board Page 16
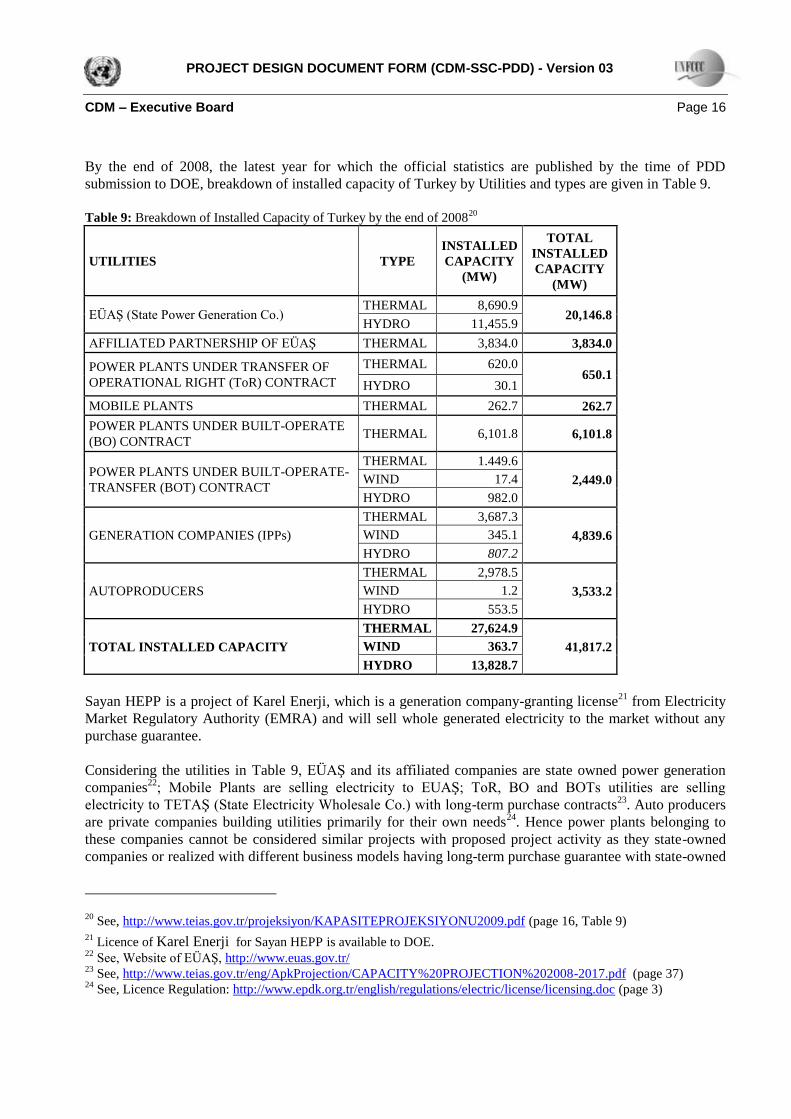
By the end of 2008, the latest year for which the official statistics are published by the time of PDD
submission to DOE, breakdown of installed capacity of Turkey by Utilities and types are given in Table 9.
Table 9: Breakdown of Installed Capacity of Turkey by the end of 2008
20
UTILITIES TYPE
INSTALLED
CAPACITY
(MW)
TOTAL
INSTALLED
CAPACITY
(MW)
EÜAŞ (State Power Generation Co.) THERMAL 8,690.9
20,146.8 HYDRO 11,455.9
AFFILIATED PARTNERSHIP OF EÜAŞ THERMAL 3,834.0 3,834.0
POWER PLANTS UNDER TRANSFER OF
OPERATIONAL RIGHT (ToR) CONTRACT
THERMAL 620.0 650.1
HYDRO 30.1
MOBILE PLANTS THERMAL 262.7 262.7
POWER PLANTS UNDER BUILT-OPERATE
(BO) CONTRACT THERMAL 6,101.8 6,101.8
POWER PLANTS UNDER BUILT-OPERATE-
TRANSFER (BOT) CONTRACT
THERMAL 1.449.6
2,449.0 WIND 17.4
HYDRO 982.0
GENERATION COMPANIES (IPPs)
THERMAL 3,687.3
4,839.6 WIND 345.1
HYDRO 807.2
AUTOPRODUCERS
THERMAL 2,978.5
3,533.2 WIND 1.2
HYDRO 553.5
TOTAL INSTALLED CAPACITY
THERMAL 27,624.9
41,817.2 WIND 363.7
HYDRO 13,828.7
Sayan HEPP is a project of Karel Enerji, which is a generation company-granting license21
from Electricity
Market Regulatory Authority (EMRA) and will sell whole generated electricity to the market without any
purchase guarantee.
Considering the utilities in Table 9, EÜAŞ and its affiliated companies are state owned power generation
companies22
; Mobile Plants are selling electricity to EUAŞ; ToR, BO and BOTs utilities are selling
electricity to TETAŞ (State Electricity Wholesale Co.) with long-term purchase contracts23
. Auto producers
are private companies building utilities primarily for their own needs24
. Hence power plants belonging to
these companies cannot be considered similar projects with proposed project activity as they state-owned
companies or realized with different business models having long-term purchase guarantee with state-owned
20 See, http://www.teias.gov.tr/projeksiyon/KAPASITEPROJEKSIYONU2009.pdf (page 16, Table 9)
21 Licence of Karel Enerji for Sayan HEPP is available to DOE.
22 See, Website of EÜAŞ, http://www.euas.gov.tr/
23 See, http://www.teias.gov.tr/eng/ApkProjection/CAPACITY%20PROJECTION%202008-2017.pdf (page 37)
24 See, Licence Regulation: http://www.epdk.org.tr/english/regulations/electric/license/licensing.doc (page 3)
PROJECT DESIGN DOCUMENT FORM (CDM-SSC-PDD) - Version 03
CDM – Executive Board Page 17
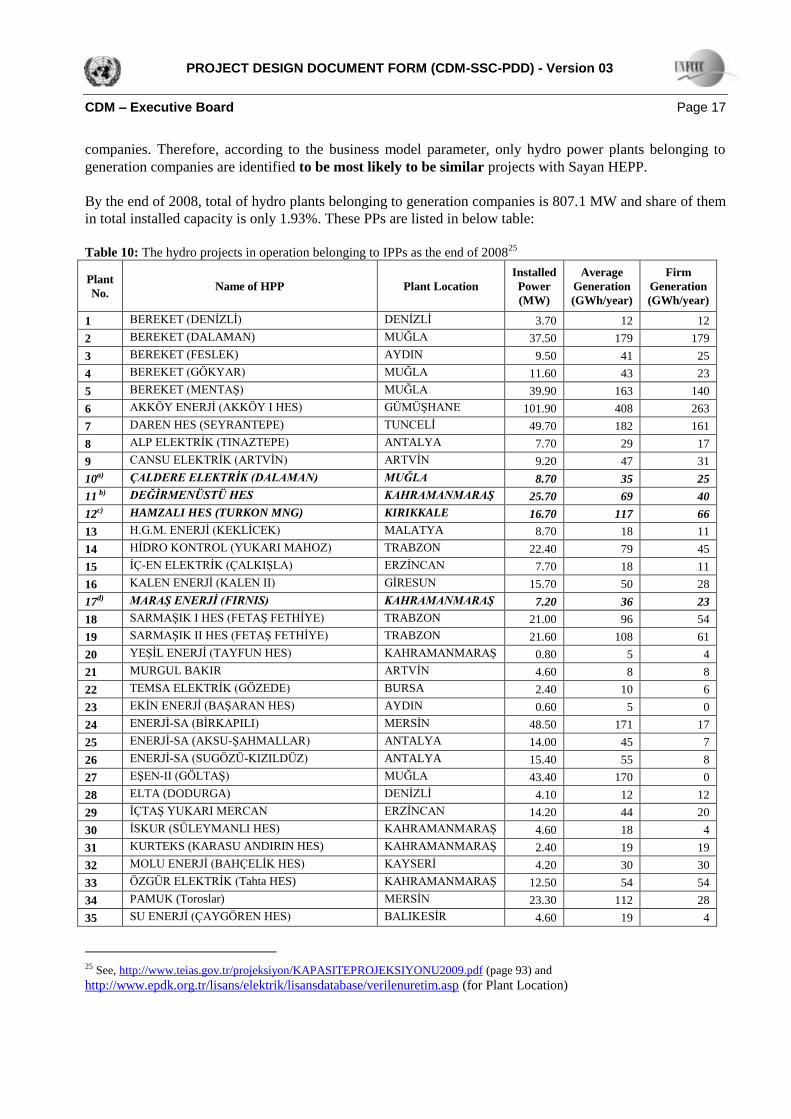
companies. Therefore, according to the business model parameter, only hydro power plants belonging to
generation companies are identified to be most likely to be similar projects with Sayan HEPP.
By the end of 2008, total of hydro plants belonging to generation companies is 807.1 MW and share of them
in total installed capacity is only 1.93%. These PPs are listed in below table:
Table 10: The hydro projects in operation belonging to IPPs as the end of 2008
25
Plant
No. Name of HPP Plant Location
Installed
Power
(MW)
Average
Generation
(GWh/year)
Firm
Generation
(GWh/year)
1 BEREKET (DENİZLİ) DENİZLİ 3.70 12 12
2 BEREKET (DALAMAN) MUĞLA 37.50 179 179
3 BEREKET (FESLEK) AYDIN 9.50 41 25
4 BEREKET (GÖKYAR) MUĞLA 11.60 43 23
5 BEREKET (MENTAŞ) MUĞLA 39.90 163 140
6 AKKÖY ENERJİ (AKKÖY I HES) GÜMÜŞHANE 101.90 408 263
7 DAREN HES (SEYRANTEPE) TUNCELİ 49.70 182 161
8 ALP ELEKTRİK (TINAZTEPE) ANTALYA 7.70 29 17
9 CANSU ELEKTRİK (ARTVİN) ARTVİN 9.20 47 31
10a) ÇALDERE ELEKTRİK (DALAMAN) MUĞLA 8.70 35 25
11 b) DEĞİRMENÜSTÜ HES KAHRAMANMARAŞ 25.70 69 40
12c) HAMZALI HES (TURKON MNG) KIRIKKALE 16.70 117 66
13 H.G.M. ENERJİ (KEKLİCEK) MALATYA 8.70 18 11
14 HİDRO KONTROL (YUKARI MAHOZ) TRABZON 22.40 79 45
15 İÇ-EN ELEKTRİK (ÇALKIŞLA) ERZİNCAN 7.70 18 11
16 KALEN ENERJİ (KALEN II) GİRESUN 15.70 50 28
17d) MARAŞ ENERJİ (FIRNIS) KAHRAMANMARAŞ 7.20 36 23
18 SARMAŞIK I HES (FETAŞ FETHİYE) TRABZON 21.00 96 54
19 SARMAŞIK II HES (FETAŞ FETHİYE) TRABZON 21.60 108 61
20 YEŞİL ENERJİ (TAYFUN HES) KAHRAMANMARAŞ 0.80 5 4
21 MURGUL BAKIR ARTVİN 4.60 8 8
22 TEMSA ELEKTRİK (GÖZEDE) BURSA 2.40 10 6
23 EKİN ENERJİ (BAŞARAN HES) AYDIN 0.60 5 0
24 ENERJİ-SA (BİRKAPILI) MERSİN 48.50 171 17
25 ENERJİ-SA (AKSU-ŞAHMALLAR) ANTALYA 14.00 45 7
26 ENERJİ-SA (SUGÖZÜ-KIZILDÜZ) ANTALYA 15.40 55 8
27 EŞEN-II (GÖLTAŞ) MUĞLA 43.40 170 0
28 ELTA (DODURGA) DENİZLİ 4.10 12 12
29 İÇTAŞ YUKARI MERCAN ERZİNCAN 14.20 44 20
30 İSKUR (SÜLEYMANLI HES) KAHRAMANMARAŞ 4.60 18 4
31 KURTEKS (KARASU ANDIRIN HES) KAHRAMANMARAŞ 2.40 19 19
32 MOLU ENERJİ (BAHÇELİK HES) KAYSERİ 4.20 30 30
33 ÖZGÜR ELEKTRİK (Tahta HES) KAHRAMANMARAŞ 12.50 54 54
34 PAMUK (Toroslar) MERSİN 23.30 112 28
35 SU ENERJİ (ÇAYGÖREN HES) BALIKESİR 4.60 19 4
25 See, http://www.teias.gov.tr/projeksiyon/KAPASITEPROJEKSIYONU2009.pdf (page 93) and
http://www.epdk.org.tr/lisans/elektrik/lisansdatabase/verilenuretim.asp (for Plant Location)
PROJECT DESIGN DOCUMENT FORM (CDM-SSC-PDD) - Version 03
CDM – Executive Board Page 18
36e) TEKTUĞ-KARGILIK KAHRAMANMARAŞ 23.90 83 19
37f) TEKTUĞ-KALEALTI HES OSMANİYE 15.00 52 11
38 TEKTUĞ-KEBANDERESİ ELAZIĞ 5.00 32 20
39 YAPISAN HACILAR MALATYA 13.30 90 54
40 YPM ALTINTEPE HES SİVAS 4.00 18 10
41 YPM BEYPINAR HES SİVAS 3.60 18 9
42 YPM KONAK HES SİVAS 4.00 19 10
43 BEYKÖY ESKİŞEHİR 16.80 87 87
44 KUZGUN ERZURUM 20.90 36 0
45 TERCAN ERZİNCAN 15.00 51 28
46 ATAKÖY TOKAT 5.50 8 8
47 ÇILDIR KARS 15.40 30 20
48 İKİZDERE RİZE 18.60 110 100
49 MERCAN TUNCELİ 20.40 78 48
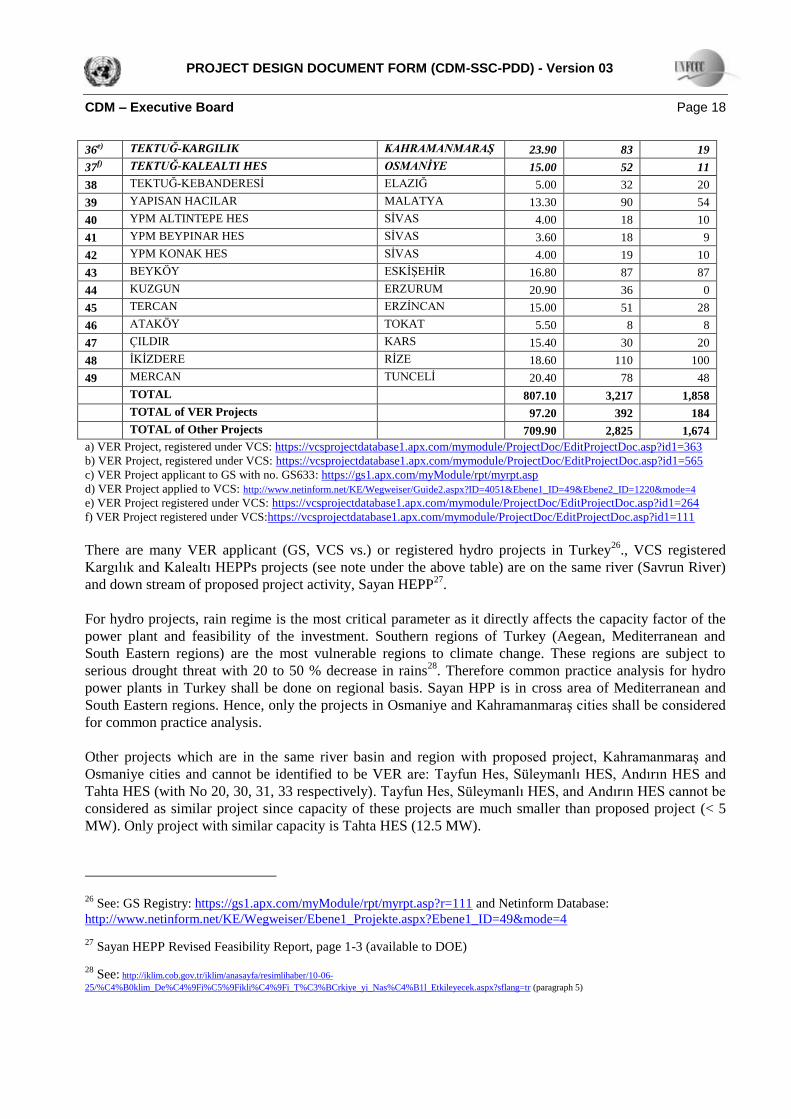
TOTAL 807.10 3,217 1,858
TOTAL of VER Projects 97.20 392 184
TOTAL of Other Projects 709.90 2,825 1,674
a) VER Project, registered under VCS: https://vcsprojectdatabase1.apx.com/mymodule/ProjectDoc/EditProjectDoc.asp?id1=363
b) VER Project, registered under VCS: https://vcsprojectdatabase1.apx.com/mymodule/ProjectDoc/EditProjectDoc.asp?id1=565
c) VER Project applicant to GS with no. GS633: https://gs1.apx.com/myModule/rpt/myrpt.asp
d) VER Project applied to VCS: http://www.netinform.net/KE/Wegweiser/Guide2.aspx?ID=4051&Ebene1_ID=49&Ebene2_ID=1220&mode=4
e) VER Project registered under VCS: https://vcsprojectdatabase1.apx.com/mymodule/ProjectDoc/EditProjectDoc.asp?id1=264
f) VER Project registered under VCS:https://vcsprojectdatabase1.apx.com/mymodule/ProjectDoc/EditProjectDoc.asp?id1=111
There are many VER applicant (GS, VCS vs.) or registered hydro projects in Turkey26
., VCS registered
Kargılık and Kalealtı HEPPs projects (see note under the above table) are on the same river (Savrun River)
and down stream of proposed project activity, Sayan HEPP27
.
For hydro projects, rain regime is the most critical parameter as it directly affects the capacity factor of the
power plant and feasibility of the investment. Southern regions of Turkey (Aegean, Mediterranean and
South Eastern regions) are the most vulnerable regions to climate change. These regions are subject to
serious drought threat with 20 to 50 % decrease in rains28
. Therefore common practice analysis for hydro
power plants in Turkey shall be done on regional basis. Sayan HPP is in cross area of Mediterranean and
South Eastern regions. Hence, only the projects in Osmaniye and Kahramanmaraş cities shall be considered
for common practice analysis.
Other projects which are in the same river basin and region with proposed project, Kahramanmaraş and
Osmaniye cities and cannot be identified to be VER are: Tayfun Hes, Süleymanlı HES, Andırın HES and
Tahta HES (with No 20, 30, 31, 33 respectively). Tayfun Hes, Süleymanlı HES, and Andırın HES cannot be
considered as similar project since capacity of these projects are much smaller than proposed project (< 5
MW). Only project with similar capacity is Tahta HES (12.5 MW).
26 See: GS Registry: https://gs1.apx.com/myModule/rpt/myrpt.asp?r=111 and Netinform Database:
http://www.netinform.net/KE/Wegweiser/Ebene1_Projekte.aspx?Ebene1_ID=49&mode=4
27 Sayan HEPP Revised Feasibility Report, page 1-3 (available to DOE)
28 See: http://iklim.cob.gov.tr/iklim/anasayfa/resimlihaber/10-06-
25/%C4%B0klim_De%C4%9Fi%C5%9Fikli%C4%9Fi_T%C3%BCrkiye_yi_Nas%C4%B1l_Etkileyecek.aspx?sflang=tr (paragraph 5)
PROJECT DESIGN DOCUMENT FORM (CDM-SSC-PDD) - Version 03
CDM – Executive Board Page 19
Sub-step 4b: Discuss any similar options that are occurring
As comprehensively discussed and demonstrated in Sub-step 4a, only one project is identified to be similar
with proposed project activity, which is Tahta HES. However, no project specific information is identified
for this project to discuss the similarity with the proposed project activity. Unlike other renewable
technologies (such as wind, solar and biomass), for small hydro projects mechanical equipment cost share in
total investment is low with 25%29
. Hence, for a typical small scale hydro project, site specific costs
(construction, connection to the grid) have dominant affect on feasibility of the project. As this information
is not available, similarities cannot be discussed. On the other hand, existence of one similar project doesn’t
enough to deem the project activity is common practice and taking into account the considerably lower share
of most likely similar projects listed in Table 10, in total installed capacity (1.93%), we can conclude that
the project activity is not common practice and therefore additional.
B.6. Emission reductions:
B.6.1. Explanation of methodological choices:
According to applied methodology, AMS-I.D. (page 2), the baseline is the kWh produced by the renewable
generating unit multiplied by an emission coefficient (measured in kg CO2e/kWh or tCO2e/MWh) calculated
in a transparent and conservative manner.
Stepwise approach of ‘Tool to calculate the emission factor for an electricity system (version 02)’30
is used
to find this combined margin (emission coefficient) as described below:
Step 1: Identify the relevant electric power system
There are 21 regional distribution regions in Turkey but no regional transmission system is defined. In
Article 20 of License Regulation it is stated that ‘TEIAS shall be in charge of all transmission activities to
be performed over the existing transmission facilities and those to be constructed as well as the activities
pertaining to the operation of national transmission system via the National Load Dispatch Center and the
regional load dispatch centers connected to this center and the operation of Market Financial
Reconciliation Center31
’. As it can be understood from this phrase, only one transmission system which is
national transmission system is defined and only TEİAŞ is in the charge of all transmission system related
activities. Moreover, a communication with representative of TEIAS which indicates that: “There are not
significant transmission constraints in the national grid system which is preventing dispatch of already
connected power plants” is submitted to the DOE. Therefore, the national grid is used as electric power
system for project activity. The national grid of Turkey is connected to the electricity systems of
neighbouring countries. Complying with the rules of the tool, the emission factor for imports from
neighbouring countries is considered 0 (zero) tCO2/MWh for determining the OM.
30 See, http://cdm.unfccc.int/methodologies/PAmethodologies/tools/am-tool-07-v2.pdf
31 See, http://www.epdk.org.tr/english/regulations/electric/license/licensing.doc (page 21)
PROJECT DESIGN DOCUMENT FORM (CDM-SSC-PDD) - Version 03
CDM – Executive Board Page 20
There is no information about interconnected transmission capacity investments, as TEİAŞ, who operates
the grid, also didn’t take into account imports-exports for electricity capacity projections.32
Because of that,
for BM calculation transmission capacity is not considered.
Step 2: Choose whether to include off-grid power plants in the project electricity system (optional)
According to Tool project participants may choose between the following two options to calculate the
operating margin and build margin emission factor:
Option I: Only grid power plants are included in the calculation.
Option II: Both grid power plants and off-grid power plants are included
For this project Option I is chosen.
Step 3: Select an operating margin (OM) method
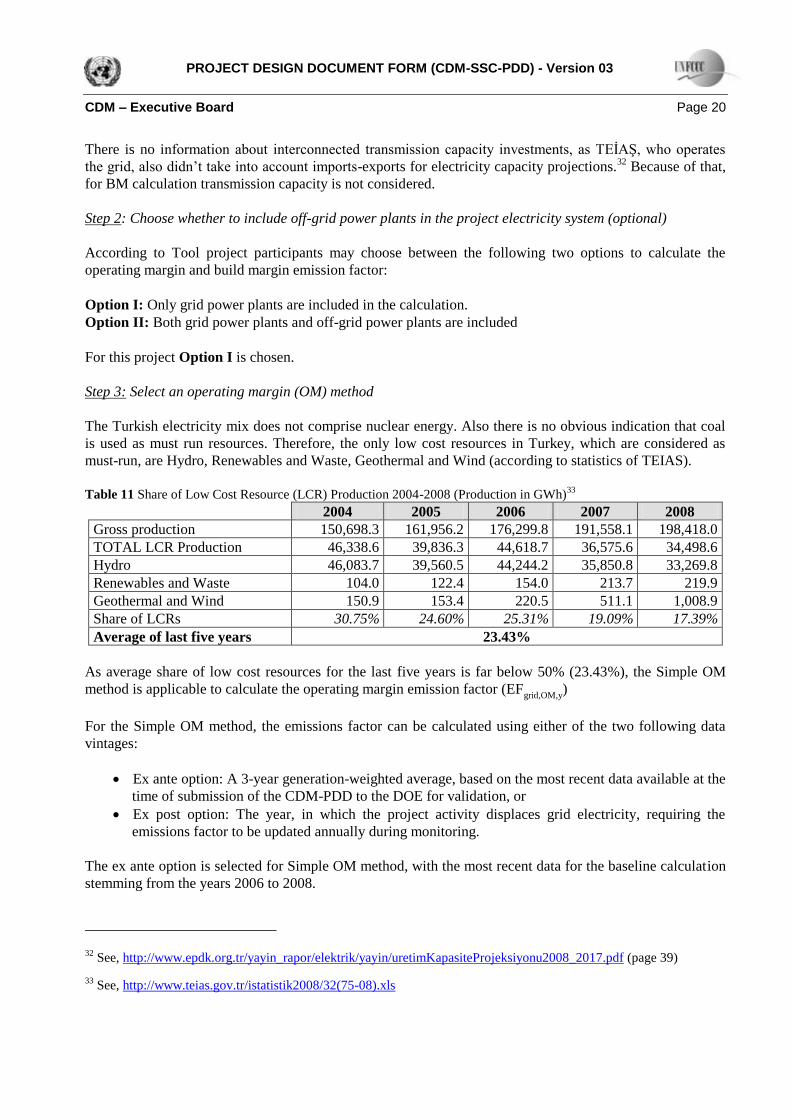
The Turkish electricity mix does not comprise nuclear energy. Also there is no obvious indication that coal
is used as must run resources. Therefore, the only low cost resources in Turkey, which are considered as
must-run, are Hydro, Renewables and Waste, Geothermal and Wind (according to statistics of TEIAS).
Table 11 Share of Low Cost Resource (LCR) Production 2004-2008 (Production in GWh)
33
2004 2005 2006 2007 2008
Gross production 150,698.3 161,956.2 176,299.8 191,558.1 198,418.0
TOTAL LCR Production 46,338.6 39,836.3 44,618.7 36,575.6 34,498.6
Hydro 46,083.7 39,560.5 44,244.2 35,850.8 33,269.8
Renewables and Waste 104.0 122.4 154.0 213.7 219.9
Geothermal and Wind 150.9 153.4 220.5 511.1 1,008.9
Share of LCRs 30.75% 24.60% 25.31% 19.09% 17.39%
Average of last five years 23.43%
As average share of low cost resources for the last five years is far below 50% (23.43%), the Simple OM
method is applicable to calculate the operating margin emission factor (EFgrid,OM,y
)
For the Simple OM method, the emissions factor can be calculated using either of the two following data
vintages:
Ex ante option: A 3-year generation-weighted average, based on the most recent data available at the
time of submission of the CDM-PDD to the DOE for validation, or
Ex post option: The year, in which the project activity displaces grid electricity, requiring the
emissions factor to be updated annually during monitoring.
The ex ante option is selected for Simple OM method, with the most recent data for the baseline calculation
stemming from the years 2006 to 2008.
32 See, http://www.epdk.org.tr/yayin_rapor/elektrik/yayin/uretimKapasiteProjeksiyonu2008_2017.pdf (page 39)
33 See, http://www.teias.gov.tr/istatistik2008/32(75-08).xls
PROJECT DESIGN DOCUMENT FORM (CDM-SSC-PDD) - Version 03
CDM – Executive Board Page 21
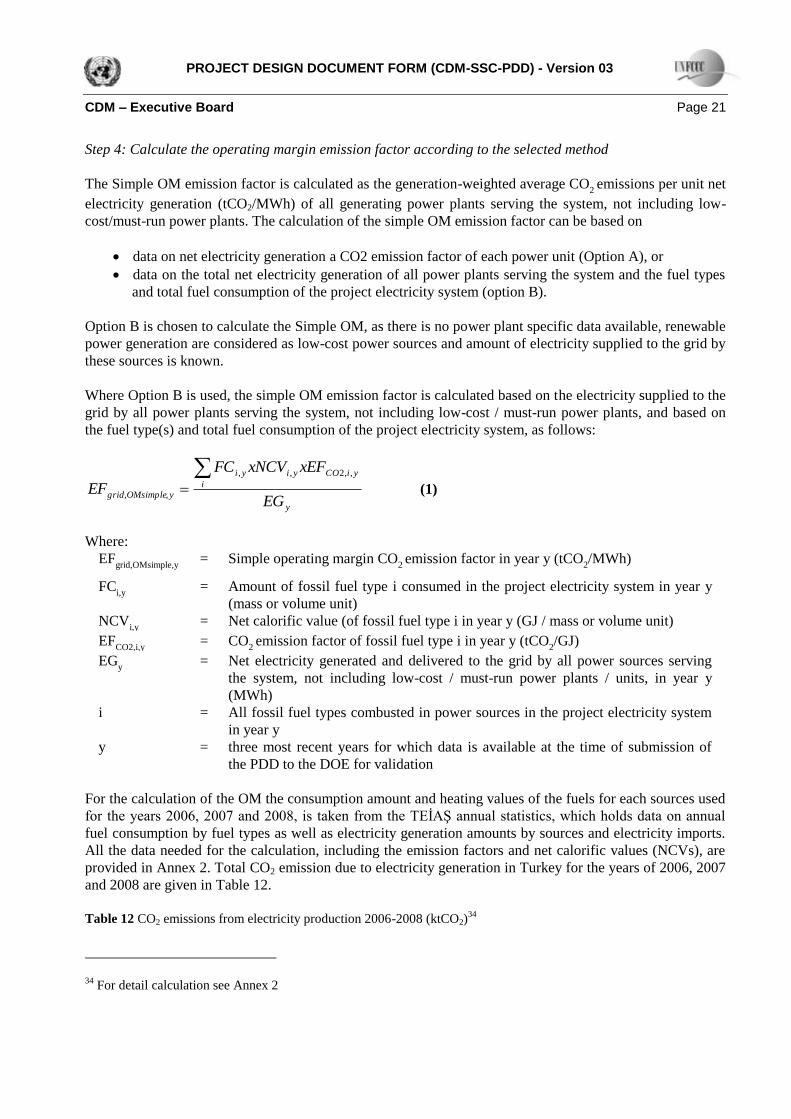
Step 4: Calculate the operating margin emission factor according to the selected method
The Simple OM emission factor is calculated as the generation-weighted average CO2 emissions per unit net
electricity generation (tCO2/MWh) of all generating power plants serving the system, not including low-
cost/must-run power plants. The calculation of the simple OM emission factor can be based on
data on net electricity generation a CO2 emission factor of each power unit (Option A), or
data on the total net electricity generation of all power plants serving the system and the fuel types
and total fuel consumption of the project electricity system (option B).
Option B is chosen to calculate the Simple OM, as there is no power plant specific data available, renewable
power generation are considered as low-cost power sources and amount of electricity supplied to the grid by
these sources is known.
Where Option B is used, the simple OM emission factor is calculated based on the electricity supplied to the
grid by all power plants serving the system, not including low-cost / must-run power plants, and based on
the fuel type(s) and total fuel consumption of the project electricity system, as follows:
y
i
yiCOyiyi
yOMsimplegridEG
xEFxNCVFC
EF
,,2,,
,, (1)
Where:
EFgrid,OMsimple,y
= Simple operating margin CO2 emission factor in year y (tCO
2/MWh)
FCi,y
= Amount of fossil fuel type i consumed in the project electricity system in year y
(mass or volume unit)
NCVi,y
= Net calorific value (of fossil fuel type i in year y (GJ / mass or volume unit)
EFCO2,i,y
= CO2 emission factor of fossil fuel type i in year y (tCO
2/GJ)
EGy = Net electricity generated and delivered to the grid by all power sources serving
the system, not including low-cost / must-run power plants / units, in year y
(MWh)
i = All fossil fuel types combusted in power sources in the project electricity system
in year y
y = three most recent years for which data is available at the time of submission of
the PDD to the DOE for validation
For the calculation of the OM the consumption amount and heating values of the fuels for each sources used
for the years 2006, 2007 and 2008, is taken from the TEİAŞ annual statistics, which holds data on annual
fuel consumption by fuel types as well as electricity generation amounts by sources and electricity imports.
All the data needed for the calculation, including the emission factors and net calorific values (NCVs), are
provided in Annex 2. Total CO2 emission due to electricity generation in Turkey for the years of 2006, 2007
and 2008 are given in Table 12.
Table 12 CO2 emissions from electricity production 2006-2008 (ktCO2)
34
34 For detail calculation see Annex 2
PROJECT DESIGN DOCUMENT FORM (CDM-SSC-PDD) - Version 03
CDM – Executive Board Page 22
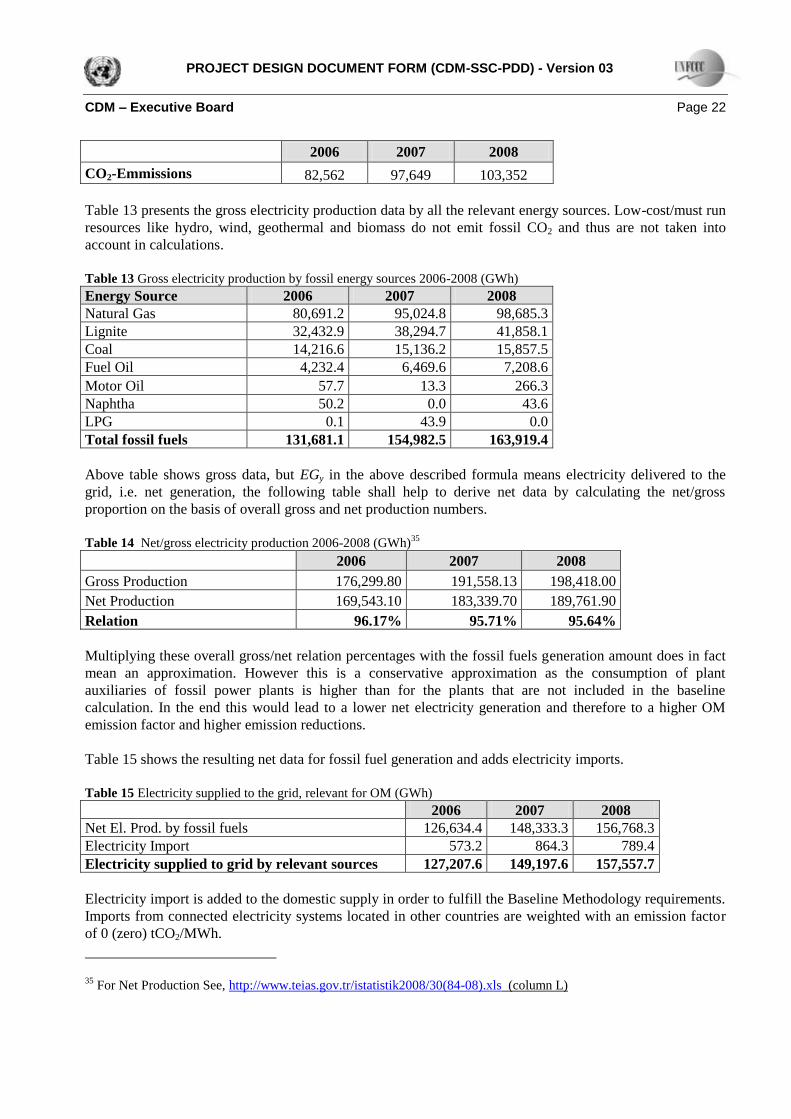
2006 2007 2008
CO2-Emmissions 82,562 97,649 103,352
Table 13 presents the gross electricity production data by all the relevant energy sources. Low-cost/must run
resources like hydro, wind, geothermal and biomass do not emit fossil CO2 and thus are not taken into
account in calculations.
Table 13 Gross electricity production by fossil energy sources 2006-2008 (GWh)
Energy Source 2006 2007 2008
Natural Gas 80,691.2 95,024.8 98,685.3
Lignite 32,432.9 38,294.7 41,858.1
Coal 14,216.6 15,136.2 15,857.5
Fuel Oil 4,232.4 6,469.6 7,208.6
Motor Oil 57.7 13.3 266.3
Naphtha 50.2 0.0 43.6
LPG 0.1 43.9 0.0
Total fossil fuels 131,681.1 154,982.5 163,919.4
Above table shows gross data, but EGy in the above described formula means electricity delivered to the
grid, i.e. net generation, the following table shall help to derive net data by calculating the net/gross
proportion on the basis of overall gross and net production numbers.
Table 14 Net/gross electricity production 2006-2008 (GWh)
35
2006 2007 2008
Gross Production 176,299.80 191,558.13 198,418.00
Net Production 169,543.10 183,339.70 189,761.90
Relation 96.17% 95.71% 95.64%
Multiplying these overall gross/net relation percentages with the fossil fuels generation amount does in fact
mean an approximation. However this is a conservative approximation as the consumption of plant
auxiliaries of fossil power plants is higher than for the plants that are not included in the baseline
calculation. In the end this would lead to a lower net electricity generation and therefore to a higher OM
emission factor and higher emission reductions.
Table 15 shows the resulting net data for fossil fuel generation and adds electricity imports.
Table 15 Electricity supplied to the grid, relevant for OM (GWh)
2006 2007 2008
Net El. Prod. by fossil fuels 126,634.4 148,333.3 156,768.3
Electricity Import 573.2 864.3 789.4
Electricity supplied to grid by relevant sources 127,207.6 149,197.6 157,557.7
Electricity import is added to the domestic supply in order to fulfill the Baseline Methodology requirements.
Imports from connected electricity systems located in other countries are weighted with an emission factor
of 0 (zero) tCO2/MWh.
35 For Net Production See, http://www.teias.gov.tr/istatistik2008/30(84-08).xls (column L)
PROJECT DESIGN DOCUMENT FORM (CDM-SSC-PDD) - Version 03
CDM – Executive Board Page 23
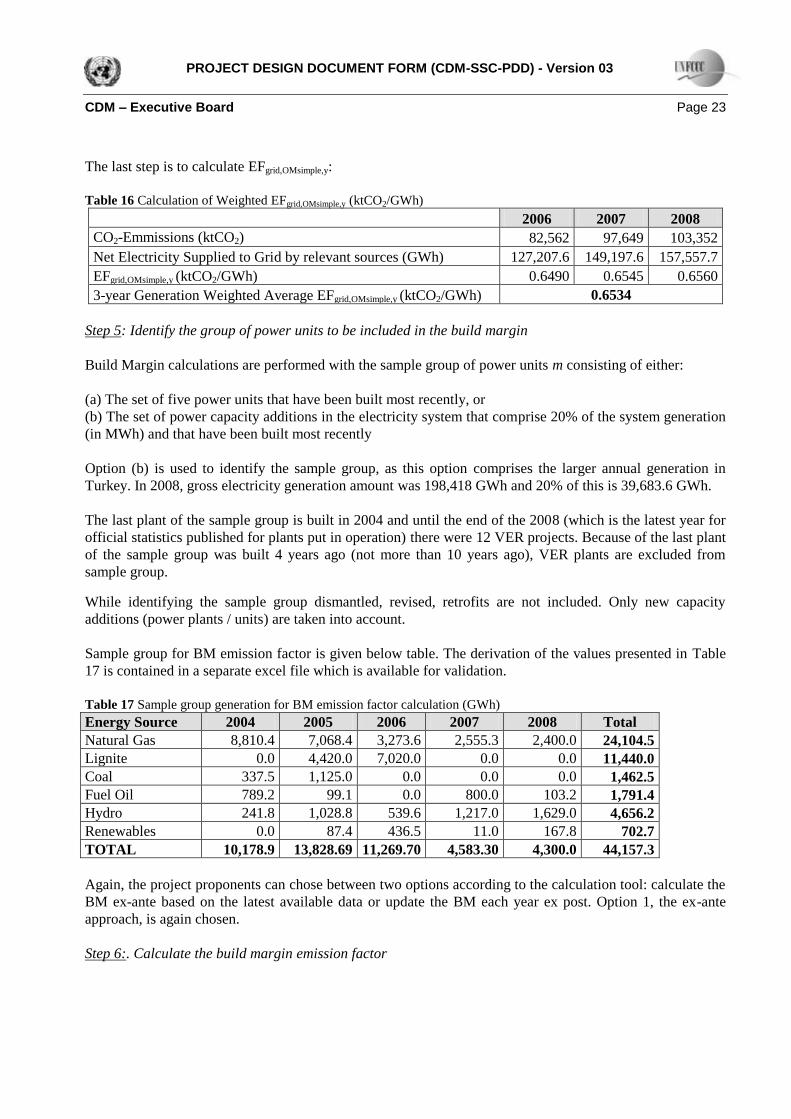
The last step is to calculate EFgrid,OMsimple,y:
Table 16 Calculation of Weighted EFgrid,OMsimple,y (ktCO2/GWh)
2006 2007 2008
CO2-Emmissions (ktCO2) 82,562 97,649 103,352
Net Electricity Supplied to Grid by relevant sources (GWh) 127,207.6 149,197.6 157,557.7
EFgrid,OMsimple,y (ktCO2/GWh) 0.6490 0.6545 0.6560
3-year Generation Weighted Average EFgrid,OMsimple,y (ktCO2/GWh) 0.6534
Step 5: Identify the group of power units to be included in the build margin
Build Margin calculations are performed with the sample group of power units m consisting of either:
(a) The set of five power units that have been built most recently, or
(b) The set of power capacity additions in the electricity system that comprise 20% of the system generation
(in MWh) and that have been built most recently
Option (b) is used to identify the sample group, as this option comprises the larger annual generation in
Turkey. In 2008, gross electricity generation amount was 198,418 GWh and 20% of this is 39,683.6 GWh.
The last plant of the sample group is built in 2004 and until the end of the 2008 (which is the latest year for
official statistics published for plants put in operation) there were 12 VER projects. Because of the last plant
of the sample group was built 4 years ago (not more than 10 years ago), VER plants are excluded from
sample group.
While identifying the sample group dismantled, revised, retrofits are not included. Only new capacity
additions (power plants / units) are taken into account.
Sample group for BM emission factor is given below table. The derivation of the values presented in Table
17 is contained in a separate excel file which is available for validation.
Table 17 Sample group generation for BM emission factor calculation (GWh)
Energy Source 2004 2005 2006 2007 2008 Total
Natural Gas 8,810.4 7,068.4 3,273.6 2,555.3 2,400.0 24,104.5
Lignite 0.0 4,420.0 7,020.0 0.0 0.0 11,440.0
Coal 337.5 1,125.0 0.0 0.0 0.0 1,462.5
Fuel Oil 789.2 99.1 0.0 800.0 103.2 1,791.4
Hydro 241.8 1,028.8 539.6 1,217.0 1,629.0 4,656.2
Renewables 0.0 87.4 436.5 11.0 167.8 702.7
TOTAL 10,178.9 13,828.69 11,269.70 4,583.30 4,300.0 44,157.3
Again, the project proponents can chose between two options according to the calculation tool: calculate the
BM ex-ante based on the latest available data or update the BM each year ex post. Option 1, the ex-ante
approach, is again chosen.
Step 6:. Calculate the build margin emission factor
PROJECT DESIGN DOCUMENT FORM (CDM-SSC-PDD) - Version 03
CDM – Executive Board Page 24
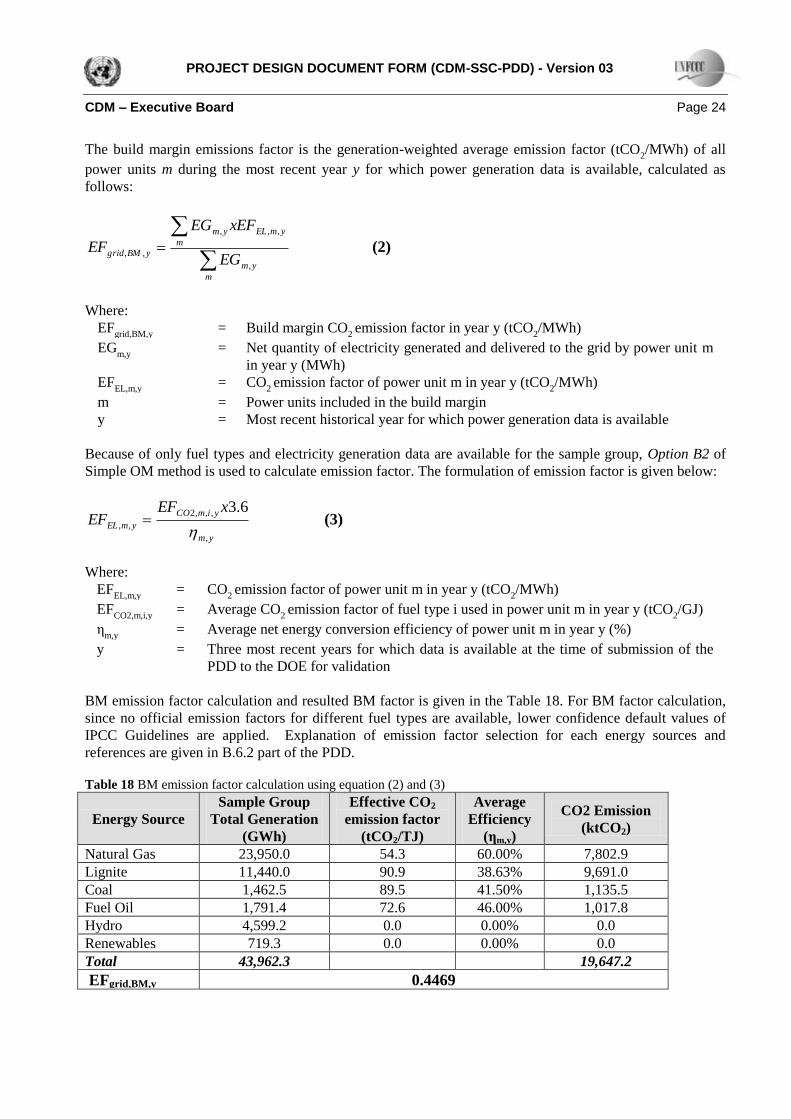
The build margin emissions factor is the generation-weighted average emission factor (tCO2/MWh) of all
power units m during the most recent year y for which power generation data is available, calculated as
follows:
m
ym
m
ymELym
yBMgridEG
xEFEG
EF,
,,,
,, (2)
Where:
EFgrid,BM,y
= Build margin CO2 emission factor in year y (tCO
2/MWh)
EGm,y
= Net quantity of electricity generated and delivered to the grid by power unit m
in year y (MWh)
EFEL,m,y
= CO2 emission factor of power unit m in year y (tCO
2/MWh)
m = Power units included in the build margin
y = Most recent historical year for which power generation data is available
Because of only fuel types and electricity generation data are available for the sample group, Option B2 of
Simple OM method is used to calculate emission factor. The formulation of emission factor is given below:
ym
yimCO
ymEL
xEFEF
,
,,,2
,,
6.3
(3)
Where:
EFEL,m,y
= CO2 emission factor of power unit m in year y (tCO
2/MWh)
EFCO2,m,i,y
= Average CO2 emission factor of fuel type i used in power unit m in year y (tCO
2/GJ)
ηm,y
= Average net energy conversion efficiency of power unit m in year y (%)
y = Three most recent years for which data is available at the time of submission of the
PDD to the DOE for validation
BM emission factor calculation and resulted BM factor is given in the Table 18. For BM factor calculation,
since no official emission factors for different fuel types are available, lower confidence default values of
IPCC Guidelines are applied. Explanation of emission factor selection for each energy sources and
references are given in B.6.2 part of the PDD.
Table 18 BM emission factor calculation using equation (2) and (3)
Energy Source
Sample Group
Total Generation
(GWh)
Effective CO2
emission factor
(tCO2/TJ)
Average
Efficiency
(ηm,y)
CO2 Emission
(ktCO2)
Natural Gas 23,950.0 54.3 60.00% 7,802.9
Lignite 11,440.0 90.9 38.63% 9,691.0
Coal 1,462.5 89.5 41.50% 1,135.5
Fuel Oil 1,791.4 72.6 46.00% 1,017.8
Hydro 4,599.2 0.0 0.00% 0.0
Renewables 719.3 0.0 0.00% 0.0
Total 43,962.3 19,647.2
EFgrid,BM,y 0.4469
PROJECT DESIGN DOCUMENT FORM (CDM-SSC-PDD) - Version 03
CDM – Executive Board Page 25
(tCO2/MWh)
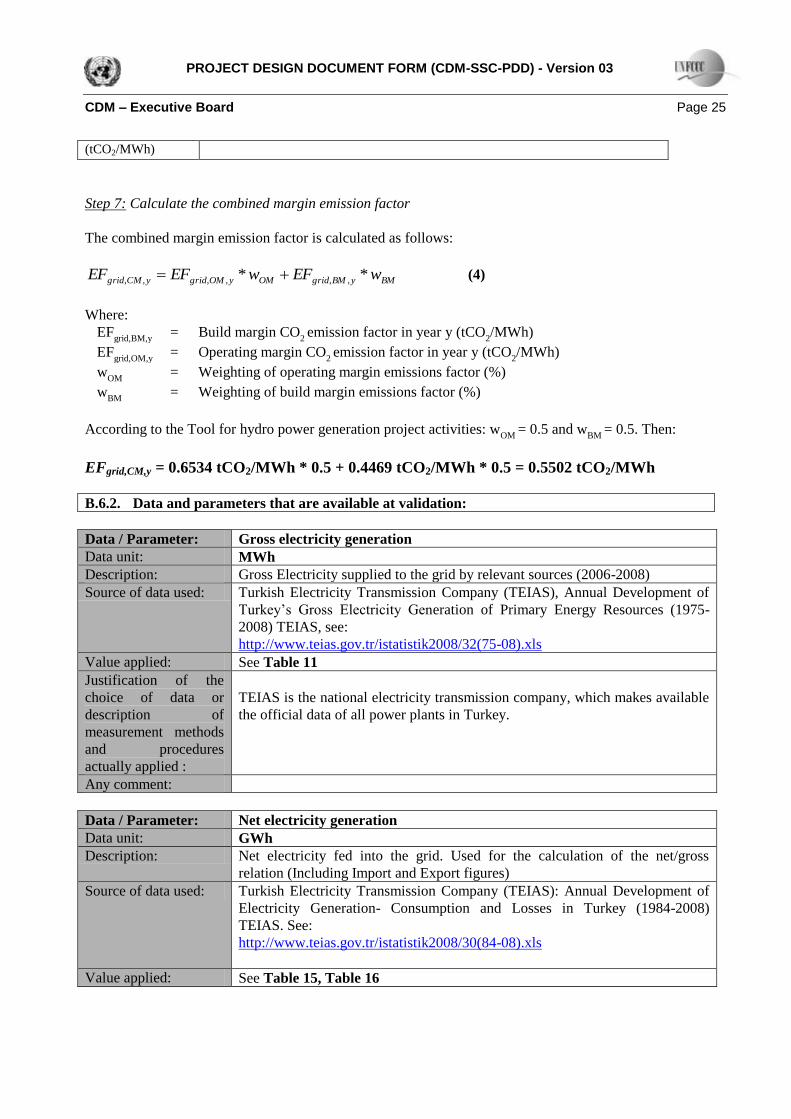
Step 7: Calculate the combined margin emission factor
The combined margin emission factor is calculated as follows:
BMyBMgridOMyOMgridyCMgrid wEFwEFEF ** ,,,,,, (4)
Where:
EFgrid,BM,y
= Build margin CO2 emission factor in year y (tCO
2/MWh)
EFgrid,OM,y
= Operating margin CO2 emission factor in year y (tCO
2/MWh)
wOM
= Weighting of operating margin emissions factor (%)
wBM
= Weighting of build margin emissions factor (%)
According to the Tool for hydro power generation project activities: wOM
= 0.5 and wBM
= 0.5. Then:
EFgrid,CM,y = 0.6534 tCO2/MWh * 0.5 + 0.4469 tCO2/MWh * 0.5 = 0.5502 tCO2/MWh
B.6.2. Data and parameters that are available at validation:
Data / Parameter: Gross electricity generation
Data unit: MWh
Description: Gross Electricity supplied to the grid by relevant sources (2006-2008)
Source of data used: Turkish Electricity Transmission Company (TEIAS), Annual Development of
Turkey’s Gross Electricity Generation of Primary Energy Resources (1975-
2008) TEIAS, see:
http://www.teias.gov.tr/istatistik2008/32(75-08).xls
Value applied: See Table 11
Justification of the
choice of data or
description of
measurement methods
and procedures
actually applied :
TEIAS is the national electricity transmission company, which makes available
the official data of all power plants in Turkey.
Any comment:
Data / Parameter: Net electricity generation
Data unit: GWh
Description: Net electricity fed into the grid. Used for the calculation of the net/gross
relation (Including Import and Export figures)
Source of data used: Turkish Electricity Transmission Company (TEIAS): Annual Development of
Electricity Generation- Consumption and Losses in Turkey (1984-2008)
TEIAS. See:
http://www.teias.gov.tr/istatistik2008/30(84-08).xls
Value applied: See Table 15, Table 16
PROJECT DESIGN DOCUMENT FORM (CDM-SSC-PDD) - Version 03
CDM – Executive Board Page 26
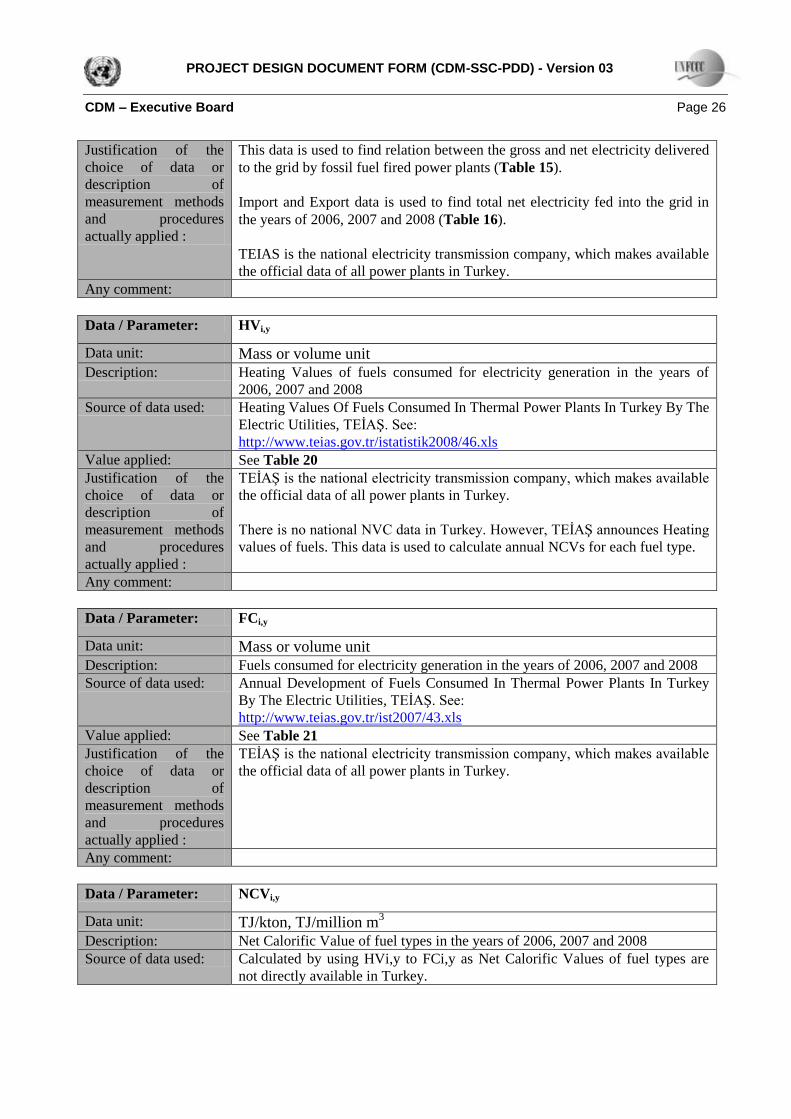
Justification of the
choice of data or
description of
measurement methods
and procedures
actually applied :
This data is used to find relation between the gross and net electricity delivered
to the grid by fossil fuel fired power plants (Table 15).
Import and Export data is used to find total net electricity fed into the grid in
the years of 2006, 2007 and 2008 (Table 16).
TEIAS is the national electricity transmission company, which makes available
the official data of all power plants in Turkey.
Any comment:
Data / Parameter: HVi,y
Data unit: Mass or volume unit
Description: Heating Values of fuels consumed for electricity generation in the years of
2006, 2007 and 2008
Source of data used: Heating Values Of Fuels Consumed In Thermal Power Plants In Turkey By The
Electric Utilities, TEİAŞ. See:
http://www.teias.gov.tr/istatistik2008/46.xls
Value applied: See Table 20
Justification of the
choice of data or
description of
measurement methods
and procedures
actually applied :
TEİAŞ is the national electricity transmission company, which makes available
the official data of all power plants in Turkey.
There is no national NVC data in Turkey. However, TEİAŞ announces Heating
values of fuels. This data is used to calculate annual NCVs for each fuel type.
Any comment:
Data / Parameter: FCi,y
Data unit: Mass or volume unit
Description: Fuels consumed for electricity generation in the years of 2006, 2007 and 2008
Source of data used: Annual Development of Fuels Consumed In Thermal Power Plants In Turkey
By The Electric Utilities, TEİAŞ. See:
http://www.teias.gov.tr/ist2007/43.xls
Value applied: See Table 21
Justification of the
choice of data or
description of
measurement methods
and procedures
actually applied :
TEİAŞ is the national electricity transmission company, which makes available
the official data of all power plants in Turkey.
Any comment:
Data / Parameter: NCVi,y
Data unit: TJ/kton, TJ/million m3
Description: Net Calorific Value of fuel types in the years of 2006, 2007 and 2008
Source of data used: Calculated by using HVi,y to FCi,y as Net Calorific Values of fuel types are
not directly available in Turkey.
PROJECT DESIGN DOCUMENT FORM (CDM-SSC-PDD) - Version 03
CDM – Executive Board Page 27
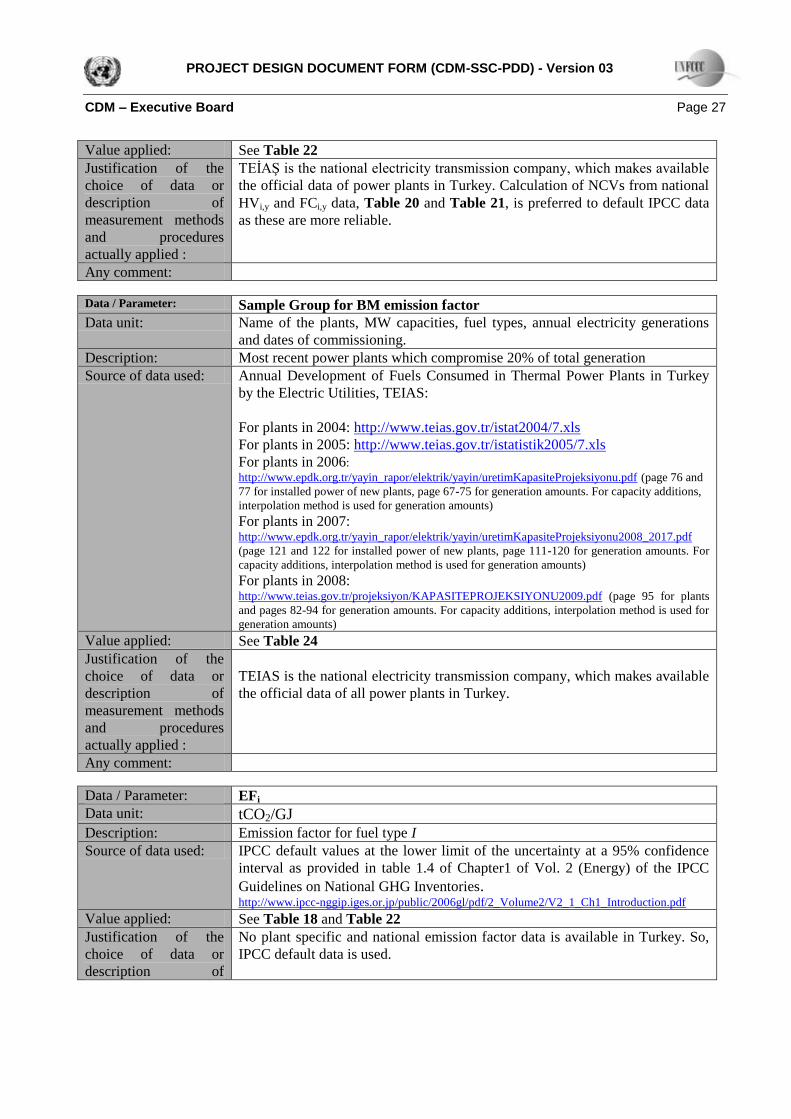
Value applied: See Table 22
Justification of the
choice of data or
description of
measurement methods
and procedures
actually applied :
TEİAŞ is the national electricity transmission company, which makes available
the official data of power plants in Turkey. Calculation of NCVs from national
HVi,y and FCi,y data, Table 20 and Table 21, is preferred to default IPCC data
as these are more reliable.
Any comment:
Data / Parameter: Sample Group for BM emission factor
Data unit: Name of the plants, MW capacities, fuel types, annual electricity generations
and dates of commissioning.
Description: Most recent power plants which compromise 20% of total generation
Source of data used: Annual Development of Fuels Consumed in Thermal Power Plants in Turkey
by the Electric Utilities, TEIAS:
For plants in 2004: http://www.teias.gov.tr/istat2004/7.xls
For plants in 2005: http://www.teias.gov.tr/istatistik2005/7.xls
For plants in 2006:
http://www.epdk.org.tr/yayin_rapor/elektrik/yayin/uretimKapasiteProjeksiyonu.pdf (page 76 and
77 for installed power of new plants, page 67-75 for generation amounts. For capacity additions,
interpolation method is used for generation amounts)
For plants in 2007: http://www.epdk.org.tr/yayin_rapor/elektrik/yayin/uretimKapasiteProjeksiyonu2008_2017.pdf
(page 121 and 122 for installed power of new plants, page 111-120 for generation amounts. For
capacity additions, interpolation method is used for generation amounts) For plants in 2008: http://www.teias.gov.tr/projeksiyon/KAPASITEPROJEKSIYONU2009.pdf (page 95 for plants
and pages 82-94 for generation amounts. For capacity additions, interpolation method is used for
generation amounts)
Value applied: See Table 24
Justification of the
choice of data or
description of
measurement methods
and procedures
actually applied :
TEIAS is the national electricity transmission company, which makes available
the official data of all power plants in Turkey.
Any comment:
Data / Parameter: EFi
Data unit: tCO2/GJ
Description: Emission factor for fuel type I
Source of data used: IPCC default values at the lower limit of the uncertainty at a 95% confidence
interval as provided in table 1.4 of Chapter1 of Vol. 2 (Energy) of the IPCC
Guidelines on National GHG Inventories. http://www.ipcc-nggip.iges.or.jp/public/2006gl/pdf/2_Volume2/V2_1_Ch1_Introduction.pdf
Value applied: See Table 18 and Table 22
Justification of the
choice of data or
description of
No plant specific and national emission factor data is available in Turkey. So,
IPCC default data is used.
PROJECT DESIGN DOCUMENT FORM (CDM-SSC-PDD) - Version 03
CDM – Executive Board Page 28
measurement methods
and procedures
actually applied :
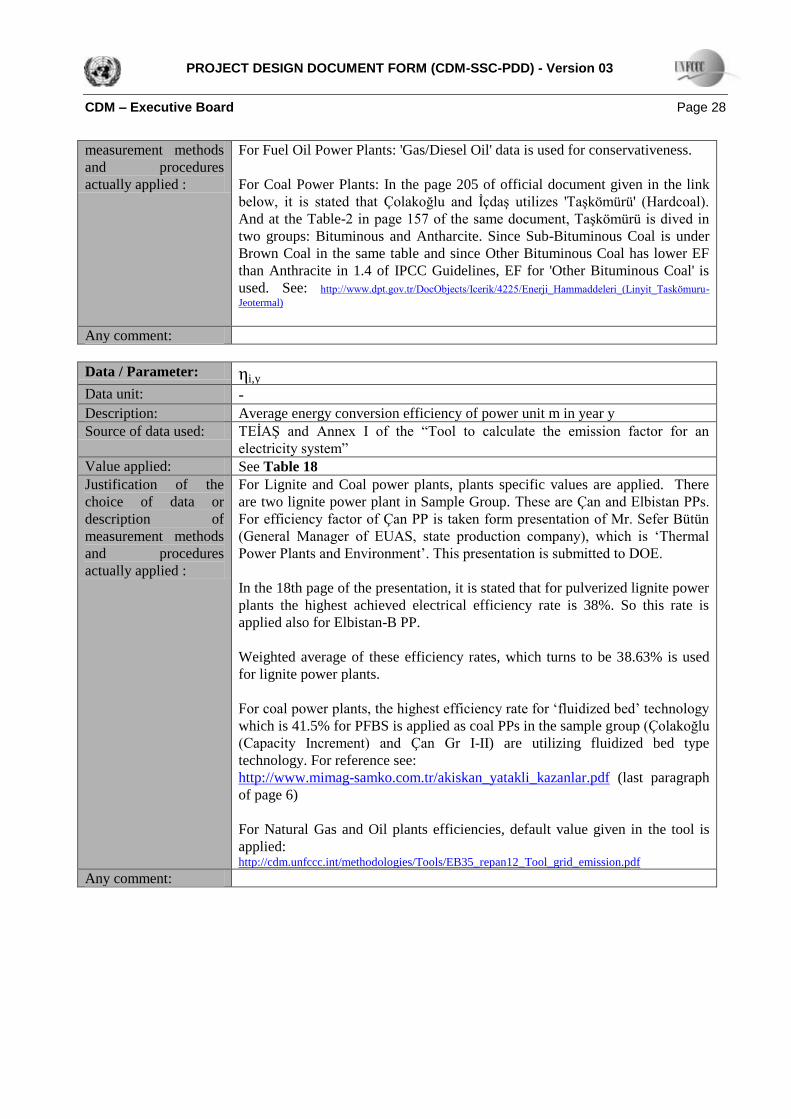
For Fuel Oil Power Plants: 'Gas/Diesel Oil' data is used for conservativeness.
For Coal Power Plants: In the page 205 of official document given in the link
below, it is stated that Çolakoğlu and İçdaş utilizes 'Taşkömürü' (Hardcoal).
And at the Table-2 in page 157 of the same document, Taşkömürü is dived in
two groups: Bituminous and Antharcite. Since Sub-Bituminous Coal is under
Brown Coal in the same table and since Other Bituminous Coal has lower EF
than Anthracite in 1.4 of IPCC Guidelines, EF for 'Other Bituminous Coal' is
used. See: http://www.dpt.gov.tr/DocObjects/Icerik/4225/Enerji_Hammaddeleri_(Linyit_Taskömuru-
Jeotermal)
Any comment:
Data / Parameter: ηi,y Data unit: -
Description: Average energy conversion efficiency of power unit m in year y
Source of data used: TEİAŞ and Annex I of the “Tool to calculate the emission factor for an
electricity system” Value applied: See Table 18
Justification of the
choice of data or
description of
measurement methods
and procedures
actually applied :
For Lignite and Coal power plants, plants specific values are applied. There
are two lignite power plant in Sample Group. These are Çan and Elbistan PPs.
For efficiency factor of Çan PP is taken form presentation of Mr. Sefer Bütün
(General Manager of EUAS, state production company), which is ‘Thermal
Power Plants and Environment’. This presentation is submitted to DOE.
In the 18th page of the presentation, it is stated that for pulverized lignite power
plants the highest achieved electrical efficiency rate is 38%. So this rate is
applied also for Elbistan-B PP.
Weighted average of these efficiency rates, which turns to be 38.63% is used
for lignite power plants.
For coal power plants, the highest efficiency rate for ‘fluidized bed’ technology
which is 41.5% for PFBS is applied as coal PPs in the sample group (Çolakoğlu
(Capacity Increment) and Çan Gr I-II) are utilizing fluidized bed type
technology. For reference see:
http://www.mimag-samko.com.tr/akiskan_yatakli_kazanlar.pdf (last paragraph
of page 6)
For Natural Gas and Oil plants efficiencies, default value given in the tool is
applied: http://cdm.unfccc.int/methodologies/Tools/EB35_repan12_Tool_grid_emission.pdf
Any comment:
PROJECT DESIGN DOCUMENT FORM (CDM-SSC-PDD) - Version 03
CDM – Executive Board Page 29
B.6.3 Ex-ante calculation of emission reductions:
Emission reductions are calculated as follows:
ERy = BEy − PEy − LEy (5)
Where:
ERy = Emission reductions in year y (tCO2/yr).
BEy = Baseline emissions in year y (tCO2/yr).
PEy = Project emissions in year y (tCO2/yr).
LEy = Leakage emissions in year y (tCO2/yr).
Project emissions
Project emissions are calculated as follows:
PEy= PEFF,y+ PEGP,y +PEHP,y
Where:
PEy = Project emissions in year y (tCO2e/yr)
PEFF,y = project emissions from fossil fuel consumption in year y (tCO2/yr)
PEGP,y = Project emissions from the operation of geothermal power plants due to the release of non-
condensable gases in year y
PEHP, = Project emissions from water reservoirs of hydro power plants in year y (tCO2e/yr)
PEFF,y is zero as there will be no fossil fuel consumption to generate electricity and PEGP,y is zero as the
project is not a geothermal project activity.
In order to calculate project emissions from water reservoir of the plant, power density should be calculated.
The power density of the project activity (PD) is calculated as follows:
PD = CapPJ- CapBL
APJ- ABL
PD = Power density of the project activity
CapPJ = Installed capacity of the hydro power plant after the implementation of the project activity
CapBL = Installed capacity of the hydro power plant before the implementation of the project activity (W).
For the new hydro power plants, this value is zero
APJ = Area of the reservoir measured in the surface of the water, after the implementation of the project
activity when reservoir is full (m2)
ABL = Area of the reservoir measured in the surface of the water, before the implementation of the
project activity, when the reservoir is full (m2). For new reservoirs, this value is zero.
As the project acitivity is not extension of another project, CapBL and ABL are zero, then
PROJECT DESIGN DOCUMENT FORM (CDM-SSC-PDD) - Version 03
CDM – Executive Board Page 30
PD = CapPJ
APJ
As in the case of Sayan project, there will be construction of one small weir. The new reservoir area created
by this weir is 140,000 m2. As the installed capacity of the project is 14,896,000 W (14.896 MWe), the
power density of the project becomes 106.4 W/m2 (14,896,000/140,000). According to the tool (page 7), for
the projects having power density more than 10 W/m2 threshold is zero. Hence, the project emission (PEy) is
zero.
Leakage
The energy generating equipment is not transferred from or to another activity. Therefore leakage does not
have to be taken into account and is taken as 0 tCO2/year.
Then:
ERy = BEy
Baseline emissions
Baseline emissions include only CO2 emissions from electricity generation in fossil fuel fired power plants
that are displaced due to the project activity, calculated as follows:
BEy = (EGy - EGbaseline) x EFgrid,CM,y (6)
Where:
BEy = Baseline emissions in year y (tCO2/yr).
EGy = Electricity supplied by the project activity to the grid (MWh).
EGbaseline = Baseline electricity supplied to the grid in the case of modified or retrofit facilities (MWh).
For new power plants this value is taken as zero.
EFgrid,CM,y = Combined margin CO2 emission factor for grid connected power generation in year y
calculated using the latest version of the “Tool to calculate the emission factor for an electricity system”.
The project activity is the installation of a new grid-connected renewable power plant so, EGbaseline = 0
Then:
ERy = BEy = EGy * EFgrid,CM, = 48,300 MWh/year * 0.5502 tCO2/MWh = 26,573 tCO2/year.
B.6.4 Summary of the ex-ante estimation of emission reductions:
Year
Estimation of project
activity emissions
(tonnes of CO2e)
Estimation of
baseline emissions
(tonnes of CO2e)
Estimation of
leakage
(tonnes of CO2e)
Estimation of overall
emission reductions
(tonnes of CO2e)
2011* 0 6,643 0 6,643
2012 0 26,573 0 26,573
2013 0 26,573 0 26,573
2014 0 26,573 0 26,573
PROJECT DESIGN DOCUMENT FORM (CDM-SSC-PDD) - Version 03
CDM – Executive Board Page 31
2015 0 26,573 0 26,573
2016 0 26,573 0 26,573
2017 0 26,573 0 26,573
2018** 0 19,930 0 19,930
Total 0 186,011 0 186,011
* 3 months operation in 2011
** 9 months operation in 2018
B.7 Application of a monitoring methodology and description of the monitoring plan:
B.7.1 Data and parameters monitored:
Data / Parameter: EG
Data unit: MWh
Description: Net electricity delivered to the grid
Source of data to be
used:
The data from the Electricity Meter are the basis for the monthly invoice. For
monitoring and cross check, the monthly invoice – exactly the field where net
electricity supplied to the grid is stated – shall be used as source of data.
Value of data 48,300 MWh/year
Description of
measurement methods
and procedures to be
applied:
• Regarding the electricity meters: two meters will be placed (one main and one
reserve). The fact that two meters are installed in a redundant manner keeps the
uncertainty level of the only parameter for baseline calculation low. High data
quality of this parameter is not only in the interest of the emission reduction
monitoring, but paramount for the business relation between the plant operator
and the electricity buyer.
• Measured hourly and readings monthly: On every month’s last day, the
production index will be taken from the main as well as the reserve meter:
“The meters included in the metering system configuration of the settlement
aggregation entities registered on the names of the market participants shall be
read monthly, within the first 4 (four) days of the month, by TEIAS and/or
distribution licensees with participation of the market participant’s
representative and the meter reading values shall be submitted to MFSC.
The MFSC shall monthly update the list of meters that need to be read as part of
the settlement process to reflect new registrants and updates in existing
registrations, and send them to TEIAS and the distribution licensees.
The (a) energy withdrawn from the system in kWh, and (b) active energy
supplied to the system in kWh for each settlement period of the related invoicing
period shall be read from the registered meters.”
• A protocol, which shows the measured data (including electricity amount
supplied by the plant and received from the grid) will be signed from the HEPP
Staff and a responsible person from the State Authorities (TEİAŞ – Turkish
Electricity Transmission Company)
PROJECT DESIGN DOCUMENT FORM (CDM-SSC-PDD) - Version 03
CDM – Executive Board Page 32
• This protocol will be sent to Ankara to Market Financial Settlement Center
(PMUM in Turkish-PMUM is a governmental organization and is responsible for
electricity market settlement).
• PMUM checks the correctness of the protocol and prepares the invoice until
18th of the following month (PMUM invoices their services like electricity
balancing and settlement operations)
• In reference to the checked data from the protocol and the PMUM invoice,
Karel can prepare the invoice for the produced energy.
• Since the meters are reading electricity supplied to the system and withdrawn
from the system separately, the net electricity amount supplied to the grid will be
calculated by electricity supplied minus electricity withdrawn.
Thus with this procedure is monitored sufficient and no extra Monitoring has to
be implemented.
The above described measurement method follows Article 52 of the official
regulation “Electricity Market Balancing And Settlement Regulation”36
.
QA/QC procedures to
be applied:
As stated at the end of the first paragraph of A.4.2 part of this PDD (page 6,
Figure 1) Sayan HEPP will be connected to the grid with 33 kV voltage level.
According to the first paragraph of the sub clause b) of Provisional Article 4 of
the 'Communiqué Regarding the Meters to be used in the Electricity Market '37
(Communiqué):
‘2. The measurement points of the generation facilities connected to the
transmission system transformers over 36kV or lower lines shall be at the entry
side of the step down transformers of the generation facilities.’
According to the Article 2 of the Communiqué: ‘The meters to be used in the
electricity market shall be compliant with the standards of Turkish Standards
Institute or IEC and have obtained “Type and System Approval” certificate
from the Ministry of Trade and Industry.’ Therefore, Ministry of Trade and
Industry (Ministry) is responsible from control and calibration of the meters.
Paragraph b) of the Article 9 of the 'Regulation of Metering and Testing of
Metering Systems'38
(Regulation) of Ministry states that: ‘ b) Periodic tests of
meters of electricity, water, coal gas, natural gas and current and voltage
transformers are done every 10 years.’ Therefore periodic calibration of the
meters will be done every 10 years.
Also according to Article 67 (page 20) of this regulation, the calibration shall be
36 See, http://www.epdk.org.tr/english/regulations/electric/balancing/balancing.doc (page 50)
37 See, http://www.epdk.org.tr/english/regulations/electric/meters.doc, (page 6)
38 See, http://www.sanayi.gov.tr/download/osgm/olcu_aletleri_muayene_yonetmelik.zip (page 2)
PROJECT DESIGN DOCUMENT FORM (CDM-SSC-PDD) - Version 03
CDM – Executive Board Page 33
done in calibration stations which have been tested and approved by Ministry of
Trade and Industry. Article 10 d) of Communiqué requires the meters shall be
three phase four wire and Article 64 of Regulation clearly states how calibration
shall be performed for this kind of meters.
According to Article 3 of System Usage Agreement39
done by Karel and TEIAS;
other than periodic tests, if a party alleges the meters are not working
appropriately tests of the meters will be done by presence of both parties. If, after
controls, it is seen that the meter is not working appropriately, the measurements
of reserve meters are taken into account beginning from date both meters are
reading the same (page 3, 2-c)
As above mentioned, the data acquisition and management and quality assurance
procedures that are anyway in place, no additional procedures have to be
established for the monitoring plan.
Any comment:
Data / Parameter: CapPJ
Data unit: W
Description: Installed capacity of the hydro power plant after the implementation of the
project activity
Source of data to be
used:
Turbine/Generator Supply Agreement
Value of data applied
for the purpose of
calculating expected
emission reductions
14,896,000 W (14.896 MW)
Description of
measurement methods
and procedures to be
applied:
Cross-checking of instrument specifications of the installed turbines/generators
(MW) and the indication in the PD.
QA/QC procedures to
be applied:
Yearly
Any comment:
Data / Parameter: APJ
Data unit: m2
Description: Area of the reservoir measured in the surface of the water, after implementation
of the project activity, when reservoir full
Source of data to be
used:
Technical drawings from consultants.
Value of data applied
for the purpose of
calculating expected
emission reductions
140,000 m2.
39 See, http://www.teias.gov.tr/sistemkullanim1.doc , (page 3, 2-b)
PROJECT DESIGN DOCUMENT FORM (CDM-SSC-PDD) - Version 03
CDM – Executive Board Page 34
Description of
measurement methods
and procedures to be
applied:
Measured from one of the ways of topographical surveys / maps, satellite
pictures.
QA/QC procedures to
be applied:
Yearly
Any comment:
B.7.2 Description of the monitoring plan:
Monitoring methodology and plan as per item 5 in page 9 of “Type AMS I.D. Grid connected renewable
electricity generation” (Version 16) states that:
o Measurements are undertaken using energy meters. Calibration should be undertaken as prescribed
in the relevant paragraph of General Guidelines to SSC Methodologies. If applicable, measurement
results shall be cross checked with records for sold/purchased electricity (e.g., invoices/receipts)
o The net electricity export/supplied to a grid is the difference between the measured quantities of the
grid electricity export and the import. If applicable, cross check net electricity supplied to a grid as
gross energy generation in the project activity power plant minus the auxiliary/station electricity
consumption, technical losses and electricity import from the grid to the project power plant
measured at the grid interface/connection used for billing purposes.
Furthermore, according to the general requirements stated in the Appendix B, “General Guidance to SSC
CDM Methodologies”40
(page 4, paragraph 17), the project participants shall:
o “Electronically archive all data collected as part of monitoring for a period of two years from the
end of the crediting period;
o Data variables that are most directly related to the emission reductions (e.g. quantity of the fuel
inputs, the amount of heat or electricity produced, gas captured) should be measured continuously. Data
elements that are generally constant and indirectly related to the emission reductions (e.g. emission factors,
calorific value, system efficiencies) should be measured or calculated at least once in an year, unless
detailed specifications are provided as part of the indicated methodology;
o Measuring equipment should be certified to national or IEC standards and calibrated according to
the national standards and reference points or IEC standards and recalibrated at appropriate intervals
according to manufacturer specifications, but at least once in 3 years;
o The measured data with high levels of uncertainty or without adequate calibration should be
compared with location/national data and commercial data to ensure consistency;
o Wherever a statistical sample is proposed for monitoring, the sample should be representative of the
population and should have a minimum level of confidence of one times the standard deviation (one sigma),
unless detailed specifications are provided as part of the indicated methodology. “
The actual emission reductions will be ex-post verified, based on the data collected during monitoring.
B.7.2.1. Monitoring of the emissions in the project scenario and the baseline scenario
40 See, http://cdm.unfccc.int/Reference/Guidclarif/ssc/methSSC_guid06.pdf (page 3)
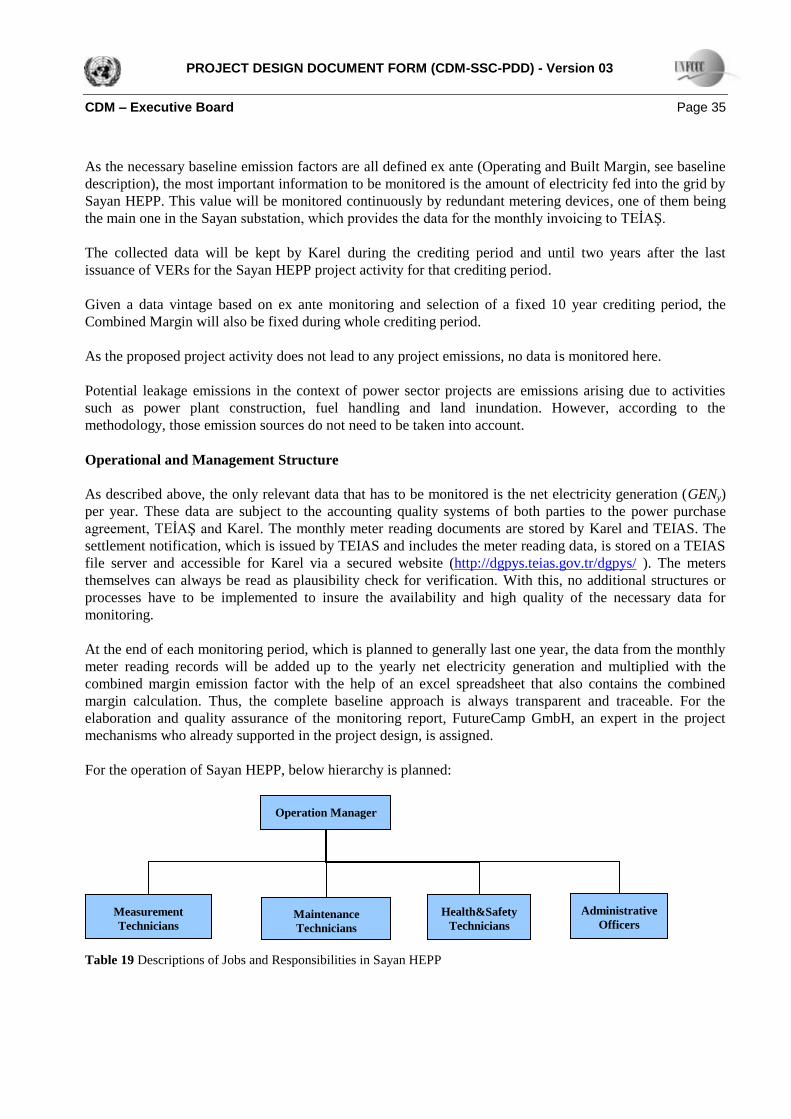
PROJECT DESIGN DOCUMENT FORM (CDM-SSC-PDD) - Version 03
CDM – Executive Board Page 35
As the necessary baseline emission factors are all defined ex ante (Operating and Built Margin, see baseline
description), the most important information to be monitored is the amount of electricity fed into the grid by
Sayan HEPP. This value will be monitored continuously by redundant metering devices, one of them being
the main one in the Sayan substation, which provides the data for the monthly invoicing to TEİAŞ.
The collected data will be kept by Karel during the crediting period and until two years after the last
issuance of VERs for the Sayan HEPP project activity for that crediting period.
Given a data vintage based on ex ante monitoring and selection of a fixed 10 year crediting period, the
Combined Margin will also be fixed during whole crediting period.
As the proposed project activity does not lead to any project emissions, no data is monitored here.
Potential leakage emissions in the context of power sector projects are emissions arising due to activities
such as power plant construction, fuel handling and land inundation. However, according to the
methodology, those emission sources do not need to be taken into account.
Operational and Management Structure
As described above, the only relevant data that has to be monitored is the net electricity generation (GENy)
per year. These data are subject to the accounting quality systems of both parties to the power purchase
agreement, TEİAŞ and Karel. The monthly meter reading documents are stored by Karel and TEIAS. The
settlement notification, which is issued by TEIAS and includes the meter reading data, is stored on a TEIAS
file server and accessible for Karel via a secured website (http://dgpys.teias.gov.tr/dgpys/ ). The meters
themselves can always be read as plausibility check for verification. With this, no additional structures or
processes have to be implemented to insure the availability and high quality of the necessary data for
monitoring.
At the end of each monitoring period, which is planned to generally last one year, the data from the monthly
meter reading records will be added up to the yearly net electricity generation and multiplied with the
combined margin emission factor with the help of an excel spreadsheet that also contains the combined
margin calculation. Thus, the complete baseline approach is always transparent and traceable. For the
elaboration and quality assurance of the monitoring report, FutureCamp GmbH, an expert in the project
mechanisms who already supported in the project design, is assigned.
For the operation of Sayan HEPP, below hierarchy is planned:
Table 19 Descriptions of Jobs and Responsibilities in Sayan HEPP
Operation Manager
Measurement
Technicians
Administrative
Officers Health&Safety
Technicians Maintenance
Technicians
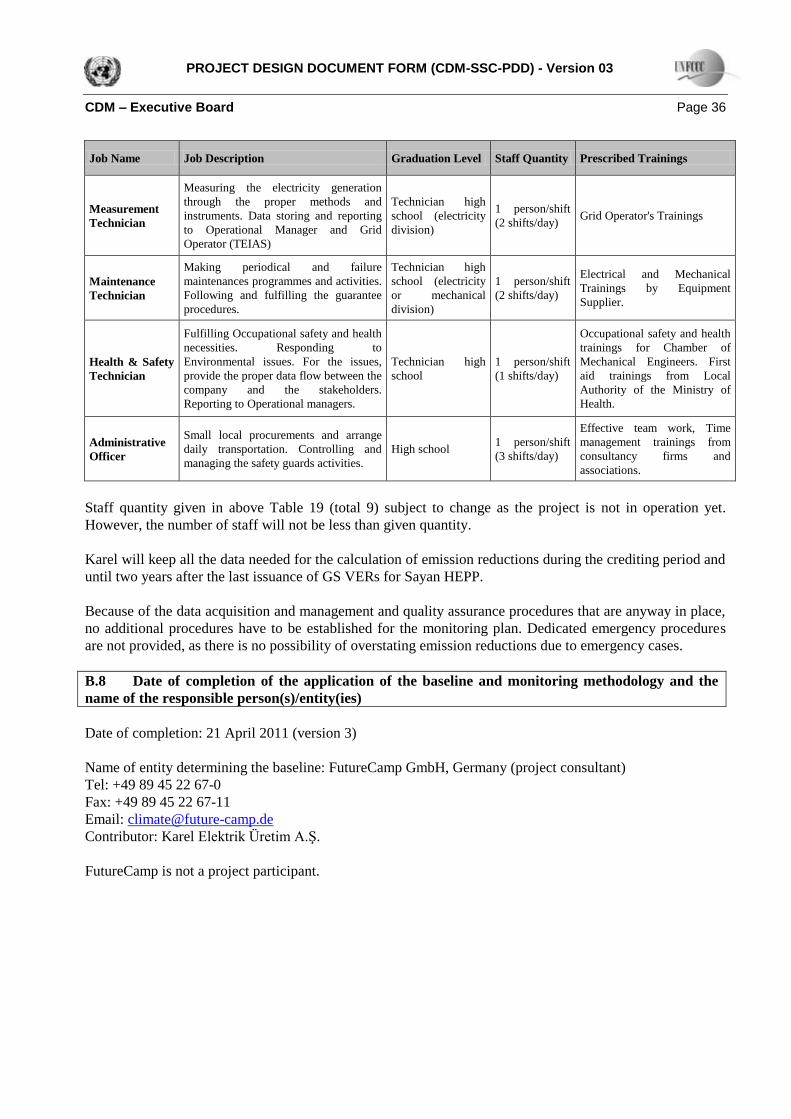
PROJECT DESIGN DOCUMENT FORM (CDM-SSC-PDD) - Version 03
CDM – Executive Board Page 36
Job Name Job Description Graduation Level Staff Quantity Prescribed Trainings
Measurement
Technician
Measuring the electricity generation
through the proper methods and
instruments. Data storing and reporting
to Operational Manager and Grid
Operator (TEIAS)
Technician high
school (electricity
division)
1 person/shift
(2 shifts/day) Grid Operator's Trainings
Maintenance
Technician
Making periodical and failure
maintenances programmes and activities.
Following and fulfilling the guarantee
procedures.
Technician high
school (electricity
or mechanical
division)
1 person/shift
(2 shifts/day)
Electrical and Mechanical
Trainings by Equipment
Supplier.
Health & Safety
Technician
Fulfilling Occupational safety and health
necessities. Responding to
Environmental issues. For the issues,
provide the proper data flow between the
company and the stakeholders.
Reporting to Operational managers.
Technician high
school
1 person/shift
(1 shifts/day)
Occupational safety and health
trainings for Chamber of
Mechanical Engineers. First
aid trainings from Local
Authority of the Ministry of
Health.
Administrative
Officer
Small local procurements and arrange
daily transportation. Controlling and
managing the safety guards activities.
High school 1 person/shift
(3 shifts/day)
Effective team work, Time
management trainings from
consultancy firms and
associations.
Staff quantity given in above Table 19 (total 9) subject to change as the project is not in operation yet.
However, the number of staff will not be less than given quantity.
Karel will keep all the data needed for the calculation of emission reductions during the crediting period and
until two years after the last issuance of GS VERs for Sayan HEPP.
Because of the data acquisition and management and quality assurance procedures that are anyway in place,
no additional procedures have to be established for the monitoring plan. Dedicated emergency procedures
are not provided, as there is no possibility of overstating emission reductions due to emergency cases.
B.8 Date of completion of the application of the baseline and monitoring methodology and the
name of the responsible person(s)/entity(ies)
Date of completion: 21 April 2011 (version 3)
Name of entity determining the baseline: FutureCamp GmbH, Germany (project consultant)
Tel: +49 89 45 22 67-0
Fax: +49 89 45 22 67-11
Email: [email protected]
Contributor: Karel Elektrik Üretim A.Ş.
FutureCamp is not a project participant.
PROJECT DESIGN DOCUMENT FORM (CDM-SSC-PDD) - Version 03
CDM – Executive Board Page 37
SECTION C. Duration of the project activity / crediting period
C.1 Duration of the project activity:
C.1.1. Starting date of the project activity:
Starting date of the project activity is 22/05/2009 which is agreement date with electromechanical
equipment provider.
C.1.2. Expected operational lifetime of the project activity:
The expected lifetime of the project activity is 47 years.
C.2 Choice of the crediting period and related information:
C.2.1. Renewable crediting period
C.2.1.1. Starting date of the first crediting period:
01/09/2011.
C.2.1.2. Length of the first crediting period:
7 years, 0 months.
C.2.2. Fixed crediting period:
The fixed crediting period is not applicable.
C.2.2.1. Starting date:
N/A
C.2.2.2. Length:
N/A
PROJECT DESIGN DOCUMENT FORM (CDM-SSC-PDD) - Version 03
CDM – Executive Board Page 38
SECTION D. Environmental impacts
D.1. If required by the host Party, documentation on the analysis of the environmental impacts of
the project activity:
The regional environmental authority confirmed with a certificate41
that an official Environmental Impact
Assessment (EIA) is not required for the proposed project. The need for an EIA is checked by the regional
authority on a project specific base taking into account a project specific information file and considering
local conditions.
All potential environmental issues were discussed in detail on the stakeholder consultation and no objections
or critical opinions were received. The evaluation of social and environmental indicators regarding the
project is based on the Sustainable Development Assessment Matrix provided in the Local Stakeholder
Consultation Report as well as on common sense regarding the small scale hydro power plant technology.
This analysis confirmed no EIA is necessary. No negative or critical indicators were identified. The total
score of the Sustainable Development Assessment Matrix is +4.
Special Guidance for Run of River Projects:
Gold Standard further requires the assessment of WCD (World Commission on Dams) guidelines for run
of river projects42
. Discussion of these additional aspects is provided in Annex 3 of GS Passport.
D.2. If environmental impacts are considered significant by the project participants or the host
Party, please provide conclusions and all references to support documentation of an environmental
impact assessment undertaken in accordance with the procedures as required by the host Party:
There have not been identified any significant environmental impacts of the project.
41 Available to DOE during validation.
42 Gold Standard v2, Annex C, Table C.2
PROJECT DESIGN DOCUMENT FORM (CDM-SSC-PDD) - Version 03
CDM – Executive Board Page 39
SECTION E. Stakeholders’ comments
E.1. Brief description how comments by local stakeholders have been invited and compiled:
The stakeholders were actively invited to the stakeholder consultation meeting by:
o Invitation letter;
o Invitation in the local newspaper;
o Invitation in the national newspaper;
o Invitation on İmirhan Settlement Coffehouse.
The stakeholder meeting was held on 29th May of 2009 at İmirhan Settlement of Tahta Village, Kadirli /
Osmaniye. At the meeting besides project developers, there were Director of State Meteorological Service
Osmaniye, one gendarmerie captains representing the governor of Kadirli, Mayor of Tahta Village and many
participants from the village and settlement. The number of total participants was more than 40, however, 20
of them signed the participation list. Gold Standard local expert and supporter of Gold Standard
Organizations i.e. WWF, Greenpeace and REC Turkey have been informed about project.
The place of meeting was chosen to be the closest place to the project area and all local people are informed
about meeting in advance by coffeehouse, municipality announcements and local newspaper
announcements. Additionally, one week before meeting village had been visited and announcement of
upcoming meeting had been done. With an announcement in national newspaper the number of participants
has increased.
Before presentation, agenda of the meeting and non-technical PDD was distributed to the participants for
broader view. Project presentation and description was made by representative of FutureCamp Turkey
including information about project developers, the technology and operation of the power plant, estimated
emission reduction amount of the plant, the importance of revenue from emission reduction, information
about Gold Standard and the project characteristics which makes this project different from other power
plant projects in Turkey. Before passing to blind sustainable development exercise, question and comments
were taken from participants about further clarification of project.
After clarification of the project with answering questions, he presented blind sustainable exercise to the
participants and wanted them to comment on each indicator as positive, negative and neutral. After
presentation some questions were raised by participants, which were answered by project coordinator Mr.
Erol Karaduman and presenter. The questions and answers are given in section ii.Assessment of Comments
part of LSC report. All questions received and minutes of the meeting were recorded. Questions and
comments raised by participants were addressed in assessment of comments part.
One of the most important issue that raised by the villagers in the meeting was that the village has limited
access to clean water. Although there is clean water in the village, this water is very limited and there is no
connection to every house. Mayor of village has claimed that they have a project and with this project it
could be possible to for them to have adequate water in the village. For this they have offered that project
developer could help them for such a project. Representative of project developer has positively evaluated
this offer and would like to see the project.
Additionally, project developer has explained another positive effect of the project which is a construction
of road passing nearby the village and connecting two close villages. In usual case habitants were using a
more long way to reach from one village to other. Although there is a project by Villages Development
PROJECT DESIGN DOCUMENT FORM (CDM-SSC-PDD) - Version 03
CDM – Executive Board Page 40
Institution (KÖYDES) which is aiming to open for a new road, the project cannot be realized because of
lack of finance. With project development they will have opportunities to use the road opened by project
activity and have a shorter road to reach the village. This is one more positive effect of the project in which
villagers are looking forward to have.
The meeting was closed by a general support from participants and goodwill.
Detailed information regarding the stakeholder consultation and the stakeholders’ comments is provided in
the extra document Local Stakeholder Consultation (LSC) Report, which is also available to DOE.
E.2. Summary of the comments received:
10 original evaluation forms as well as translation version in English are attached in Annex 2 of the LSC
Report.
The overall feedback to the organized consultation, and what follows to the project, has been very positive.
The stakeholders consider the project environmental-friendly, which can provide clean energy, help the
villages, and provide new employment possibilities in the region. Detail information regarding the
stakeholders’ feedback and comments is provided in the LSC Report.
The stakeholders didn’t raise any concerns except demands for clean water supply, new road, local
employment, and affects of project on dust emission. The concern of local employment and new road was
answered clearly by project coordinator as there will be priority to employ local people for project works
and they will invest for the road to connect to villages. Regarding clean water supply, project developer will
evaluate clean water project which was prepared by villages. If it is possible project developer will support
villagers to realize the clean water project. The concern regarding dust emission, it was explained during the
meeting that Sayan HEPP will not cause any negative effect to their agricultural activities following related
regulations to lower dust emission.
Therefore, no concern was raised during the meeting which necessitates revisiting sustainability assessment.
All comments and questions from stakeholders were considered as serious and reasonable. An adequate
answer has been provided. There have not been raised any critical comments nor objections for the project
implementation. Detailed table with all stakeholder comments and the responses is provided in the Section
B.5 of Stakeholder Consultation Report.
E.3. Report on how due account was taken of any comments received:
The stakeholders have not raised any concerns, any important suggestions and negative opinion regarding
the project, which may necessitate revisiting sustainability assessment. Concern of local employment and
affects to the agricultural activities are evaluated and they are adequate answers have been provided. Since,
the project area is plain without any agricultural activity there will be no negative effect. Also, project
developer has stated his intention and sensitivity about local employment for this project. Therefore
sustainable assessment is not going to be revisited as well as no alteration in project design will be done.
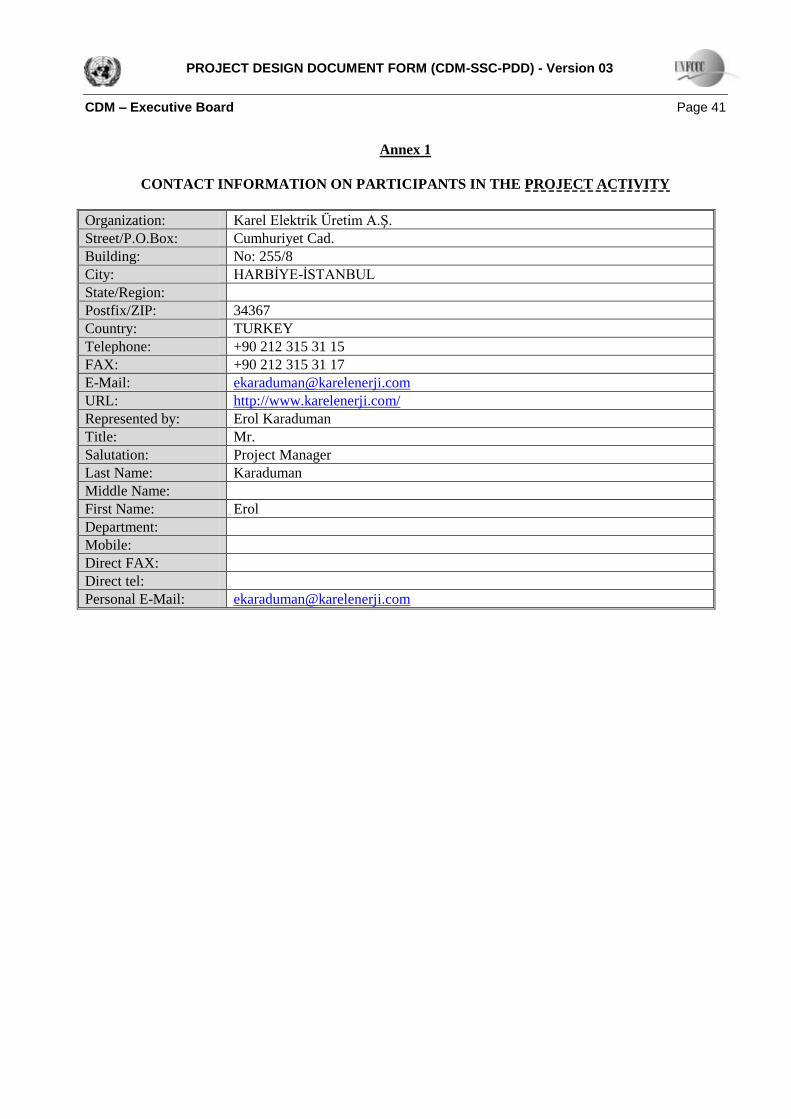
PROJECT DESIGN DOCUMENT FORM (CDM-SSC-PDD) - Version 03
CDM – Executive Board Page 41
Annex 1
CONTACT INFORMATION ON PARTICIPANTS IN THE PROJECT ACTIVITY
Organization: Karel Elektrik Üretim A.Ş.
Street/P.O.Box: Cumhuriyet Cad.
Building: No: 255/8
City: HARBİYE-İSTANBUL
State/Region:
Postfix/ZIP: 34367
Country: TURKEY
Telephone: +90 212 315 31 15
FAX: +90 212 315 31 17
E-Mail: [email protected]
URL: http://www.karelenerji.com/
Represented by: Erol Karaduman
Title: Mr.
Salutation: Project Manager
Last Name: Karaduman
Middle Name:
First Name: Erol
Department:
Mobile:
Direct FAX:
Direct tel:
Personal E-Mail: [email protected]
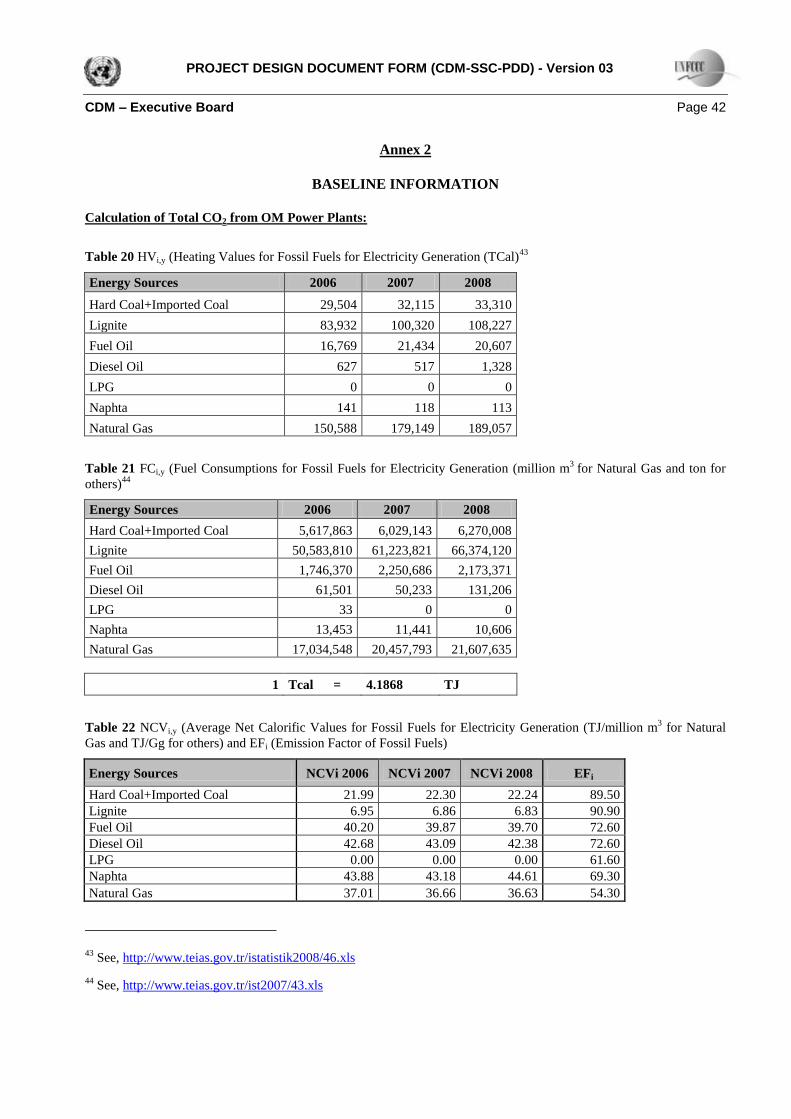
PROJECT DESIGN DOCUMENT FORM (CDM-SSC-PDD) - Version 03
CDM – Executive Board Page 42
Annex 2
BASELINE INFORMATION
Calculation of Total CO2 from OM Power Plants:
Table 20 HVi,y (Heating Values for Fossil Fuels for Electricity Generation (TCal)43
Energy Sources 2006 2007 2008
Hard Coal+Imported Coal 29,504 32,115 33,310
Lignite 83,932 100,320 108,227
Fuel Oil 16,769 21,434 20,607
Diesel Oil 627 517 1,328
LPG 0 0 0
Naphta 141 118 113
Natural Gas 150,588 179,149 189,057
Table 21 FCi,y (Fuel Consumptions for Fossil Fuels for Electricity Generation (million m3
for Natural Gas and ton for
others)44
Energy Sources 2006 2007 2008
Hard Coal+Imported Coal 5,617,863 6,029,143 6,270,008
Lignite 50,583,810 61,223,821 66,374,120
Fuel Oil 1,746,370 2,250,686 2,173,371
Diesel Oil 61,501 50,233 131,206
LPG 33 0 0
Naphta 13,453 11,441 10,606
Natural Gas 17,034,548 20,457,793 21,607,635
1 Tcal = 4.1868 TJ
Table 22 NCVi,y (Average Net Calorific Values for Fossil Fuels for Electricity Generation (TJ/million m3 for Natural
Gas and TJ/Gg for others) and EFi (Emission Factor of Fossil Fuels)
Energy Sources NCVi 2006 NCVi 2007 NCVi 2008 EFi
Hard Coal+Imported Coal 21.99 22.30 22.24 89.50
Lignite 6.95 6.86 6.83 90.90
Fuel Oil 40.20 39.87 39.70 72.60
Diesel Oil 42.68 43.09 42.38 72.60
LPG 0.00 0.00 0.00 61.60
Naphta 43.88 43.18 44.61 69.30
Natural Gas 37.01 36.66 36.63 54.30
43 See, http://www.teias.gov.tr/istatistik2008/46.xls
44 See, http://www.teias.gov.tr/ist2007/43.xls
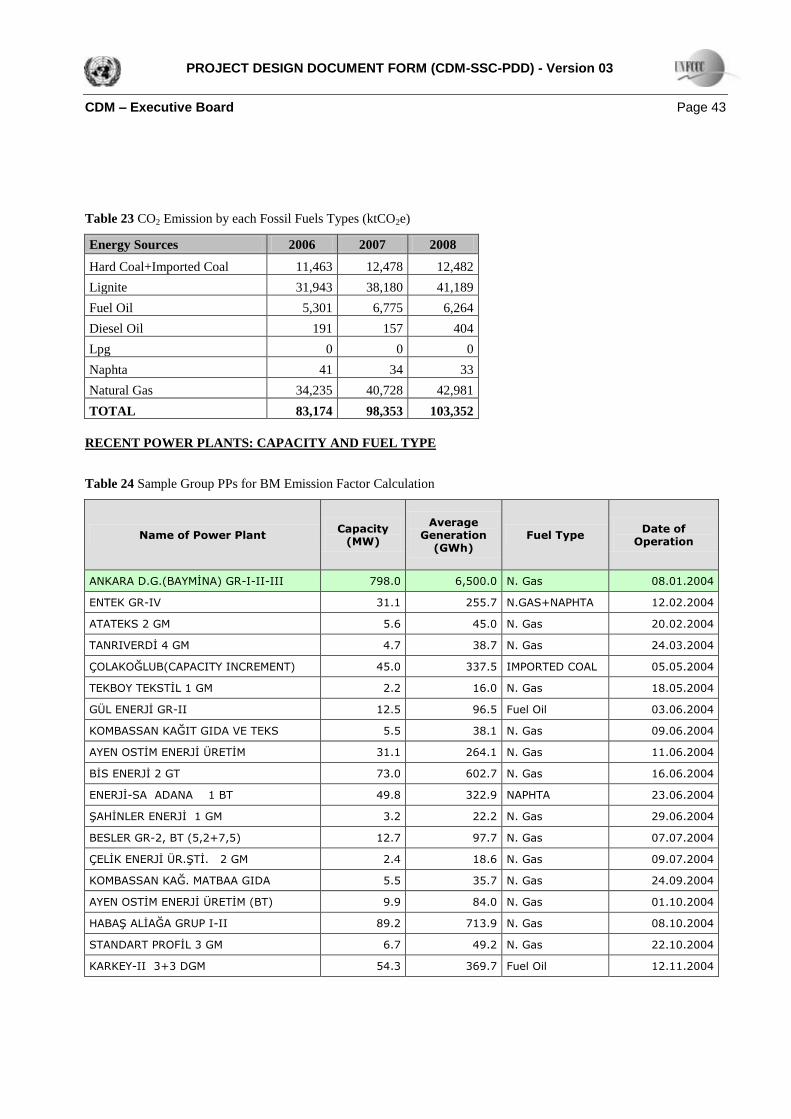
PROJECT DESIGN DOCUMENT FORM (CDM-SSC-PDD) - Version 03
CDM – Executive Board Page 43
Table 23 CO2 Emission by each Fossil Fuels Types (ktCO2e)
Energy Sources 2006 2007 2008
Hard Coal+Imported Coal 11,463 12,478 12,482
Lignite 31,943 38,180 41,189
Fuel Oil 5,301 6,775 6,264
Diesel Oil 191 157 404
Lpg 0 0 0
Naphta 41 34 33
Natural Gas 34,235 40,728 42,981
TOTAL 83,174 98,353 103,352
RECENT POWER PLANTS: CAPACITY AND FUEL TYPE
Table 24 Sample Group PPs for BM Emission Factor Calculation
Name of Power Plant Capacity
(MW)
Average Generation
(GWh) Fuel Type
Date of Operation
ANKARA D.G.(BAYMİNA) GR-I-II-III 798.0 6,500.0 N. Gas 08.01.2004
ENTEK GR-IV 31.1 255.7 N.GAS+NAPHTA 12.02.2004
ATATEKS 2 GM 5.6 45.0 N. Gas 20.02.2004
TANRIVERDİ 4 GM 4.7 38.7 N. Gas 24.03.2004
ÇOLAKOĞLUB(CAPACITY INCREMENT) 45.0 337.5 IMPORTED COAL 05.05.2004
TEKBOY TEKSTİL 1 GM 2.2 16.0 N. Gas 18.05.2004
GÜL ENERJİ GR-II 12.5 96.5 Fuel Oil 03.06.2004
KOMBASSAN KAĞIT GIDA VE TEKS 5.5 38.1 N. Gas 09.06.2004
AYEN OSTİM ENERJİ ÜRETİM 31.1 264.1 N. Gas 11.06.2004
BİS ENERJİ 2 GT 73.0 602.7 N. Gas 16.06.2004
ENERJİ-SA ADANA 1 BT 49.8 322.9 NAPHTA 23.06.2004
ŞAHİNLER ENERJİ 1 GM 3.2 22.2 N. Gas 29.06.2004
BESLER GR-2, BT (5,2+7,5) 12.7 97.7 N. Gas 07.07.2004
ÇELİK ENERJİ ÜR.ŞTİ. 2 GM 2.4 18.6 N. Gas 09.07.2004
KOMBASSAN KAĞ. MATBAA GIDA 5.5 35.7 N. Gas 24.09.2004
AYEN OSTİM ENERJİ ÜRETİM (BT) 9.9 84.0 N. Gas 01.10.2004
HABAŞ ALİAĞA GRUP I-II 89.2 713.9 N. Gas 08.10.2004
STANDART PROFİL 3 GM 6.7 49.2 N. Gas 22.10.2004
KARKEY-II 3+3 DGM 54.3 369.7 Fuel Oil 12.11.2004
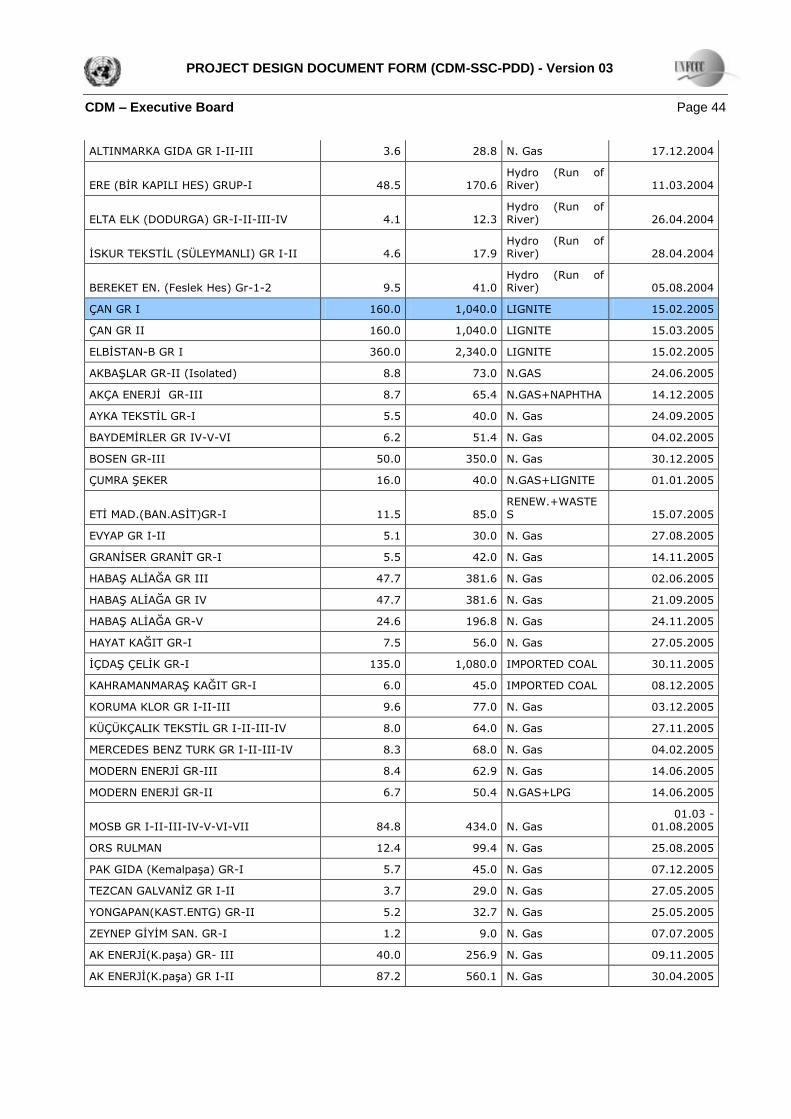
PROJECT DESIGN DOCUMENT FORM (CDM-SSC-PDD) - Version 03
CDM – Executive Board Page 44
ALTINMARKA GIDA GR I-II-III 3.6 28.8 N. Gas 17.12.2004
ERE (BİR KAPILI HES) GRUP-I 48.5 170.6 Hydro (Run of River) 11.03.2004
ELTA ELK (DODURGA) GR-I-II-III-IV 4.1 12.3 Hydro (Run of River) 26.04.2004
İSKUR TEKSTİL (SÜLEYMANLI) GR I-II 4.6 17.9 Hydro (Run of River) 28.04.2004
BEREKET EN. (Feslek Hes) Gr-1-2 9.5 41.0 Hydro (Run of River) 05.08.2004
ÇAN GR I 160.0 1,040.0 LIGNITE 15.02.2005
ÇAN GR II 160.0 1,040.0 LIGNITE 15.03.2005
ELBİSTAN-B GR I 360.0 2,340.0 LIGNITE 15.02.2005
AKBAŞLAR GR-II (Isolated) 8.8 73.0 N.GAS 24.06.2005
AKÇA ENERJİ GR-III 8.7 65.4 N.GAS+NAPHTHA 14.12.2005
AYKA TEKSTİL GR-I 5.5 40.0 N. Gas 24.09.2005
BAYDEMİRLER GR IV-V-VI 6.2 51.4 N. Gas 04.02.2005
BOSEN GR-III 50.0 350.0 N. Gas 30.12.2005
ÇUMRA ŞEKER 16.0 40.0 N.GAS+LIGNITE 01.01.2005
ETİ MAD.(BAN.ASİT)GR-I 11.5 85.0 RENEW.+WASTES 15.07.2005
EVYAP GR I-II 5.1 30.0 N. Gas 27.08.2005
GRANİSER GRANİT GR-I 5.5 42.0 N. Gas 14.11.2005
HABAŞ ALİAĞA GR III 47.7 381.6 N. Gas 02.06.2005
HABAŞ ALİAĞA GR IV 47.7 381.6 N. Gas 21.09.2005
HABAŞ ALİAĞA GR-V 24.6 196.8 N. Gas 24.11.2005
HAYAT KAĞIT GR-I 7.5 56.0 N. Gas 27.05.2005
İÇDAŞ ÇELİK GR-I 135.0 1,080.0 IMPORTED COAL 30.11.2005
KAHRAMANMARAŞ KAĞIT GR-I 6.0 45.0 IMPORTED COAL 08.12.2005
KORUMA KLOR GR I-II-III 9.6 77.0 N. Gas 03.12.2005
KÜÇÜKÇALIK TEKSTİL GR I-II-III-IV 8.0 64.0 N. Gas 27.11.2005
MERCEDES BENZ TURK GR I-II-III-IV 8.3 68.0 N. Gas 04.02.2005
MODERN ENERJİ GR-III 8.4 62.9 N. Gas 14.06.2005
MODERN ENERJİ GR-II 6.7 50.4 N.GAS+LPG 14.06.2005
MOSB GR I-II-III-IV-V-VI-VII 84.8 434.0 N. Gas 01.03 -
01.08.2005
ORS RULMAN 12.4 99.4 N. Gas 25.08.2005
PAK GIDA (Kemalpaşa) GR-I 5.7 45.0 N. Gas 07.12.2005
TEZCAN GALVANİZ GR I-II 3.7 29.0 N. Gas 27.05.2005
YONGAPAN(KAST.ENTG) GR-II 5.2 32.7 N. Gas 25.05.2005
ZEYNEP GİYİM SAN. GR-I 1.2 9.0 N. Gas 07.07.2005
AK ENERJİ(K.paşa) GR- III 40.0 256.9 N. Gas 09.11.2005
AK ENERJİ(K.paşa) GR I-II 87.2 560.1 N. Gas 30.04.2005
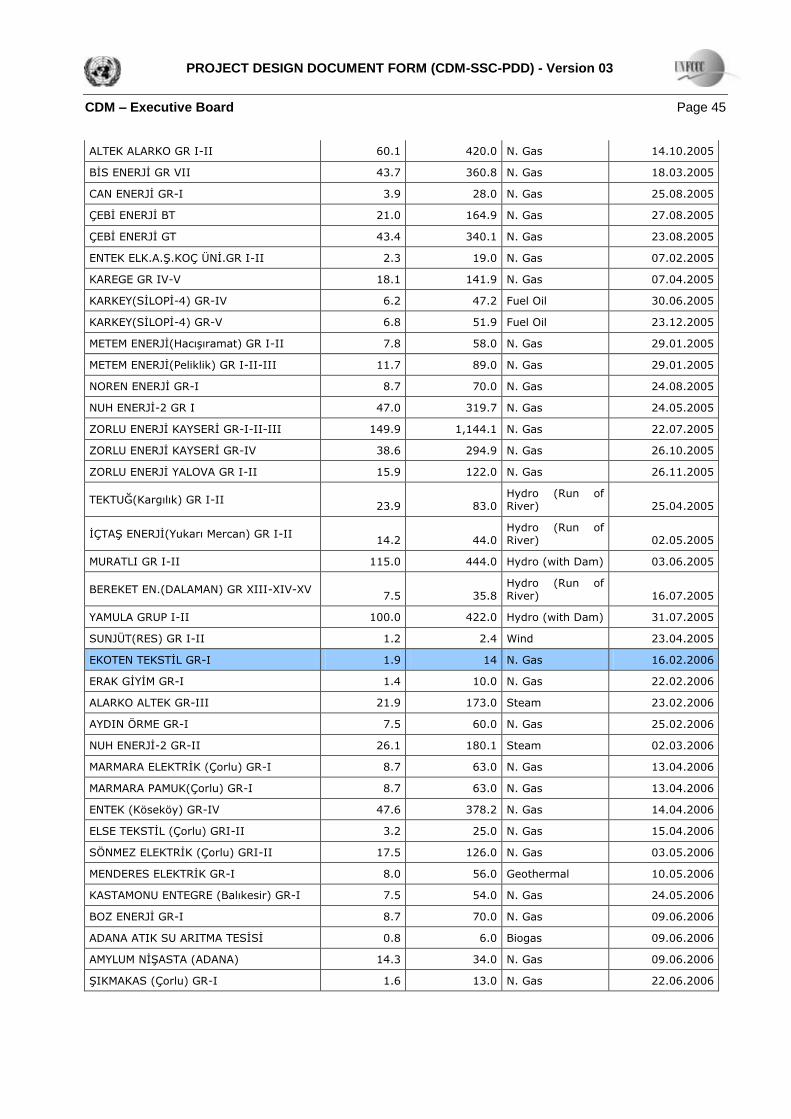
PROJECT DESIGN DOCUMENT FORM (CDM-SSC-PDD) - Version 03
CDM – Executive Board Page 45
ALTEK ALARKO GR I-II 60.1 420.0 N. Gas 14.10.2005
BİS ENERJİ GR VII 43.7 360.8 N. Gas 18.03.2005
CAN ENERJİ GR-I 3.9 28.0 N. Gas 25.08.2005
ÇEBİ ENERJİ BT 21.0 164.9 N. Gas 27.08.2005
ÇEBİ ENERJİ GT 43.4 340.1 N. Gas 23.08.2005
ENTEK ELK.A.Ş.KOÇ ÜNİ.GR I-II 2.3 19.0 N. Gas 07.02.2005
KAREGE GR IV-V 18.1 141.9 N. Gas 07.04.2005
KARKEY(SİLOPİ-4) GR-IV 6.2 47.2 Fuel Oil 30.06.2005
KARKEY(SİLOPİ-4) GR-V 6.8 51.9 Fuel Oil 23.12.2005
METEM ENERJİ(Hacışıramat) GR I-II 7.8 58.0 N. Gas 29.01.2005
METEM ENERJİ(Peliklik) GR I-II-III 11.7 89.0 N. Gas 29.01.2005
NOREN ENERJİ GR-I 8.7 70.0 N. Gas 24.08.2005
NUH ENERJİ-2 GR I 47.0 319.7 N. Gas 24.05.2005
ZORLU ENERJİ KAYSERİ GR-I-II-III 149.9 1,144.1 N. Gas 22.07.2005
ZORLU ENERJİ KAYSERİ GR-IV 38.6 294.9 N. Gas 26.10.2005
ZORLU ENERJİ YALOVA GR I-II 15.9 122.0 N. Gas 26.11.2005
TEKTUĞ(Kargılık) GR I-II 23.9 83.0
Hydro (Run of River) 25.04.2005
İÇTAŞ ENERJİ(Yukarı Mercan) GR I-II 14.2 44.0
Hydro (Run of River) 02.05.2005
MURATLI GR I-II 115.0 444.0 Hydro (with Dam) 03.06.2005
BEREKET EN.(DALAMAN) GR XIII-XIV-XV 7.5 35.8
Hydro (Run of River) 16.07.2005
YAMULA GRUP I-II 100.0 422.0 Hydro (with Dam) 31.07.2005
SUNJÜT(RES) GR I-II 1.2 2.4 Wind 23.04.2005
EKOTEN TEKSTİL GR-I 1.9 14 N. Gas 16.02.2006
ERAK GİYİM GR-I 1.4 10.0 N. Gas 22.02.2006
ALARKO ALTEK GR-III 21.9 173.0 Steam 23.02.2006
AYDIN ÖRME GR-I 7.5 60.0 N. Gas 25.02.2006
NUH ENERJİ-2 GR-II 26.1 180.1 Steam 02.03.2006
MARMARA ELEKTRİK (Çorlu) GR-I 8.7 63.0 N. Gas 13.04.2006
MARMARA PAMUK(Çorlu) GR-I 8.7 63.0 N. Gas 13.04.2006
ENTEK (Köseköy) GR-IV 47.6 378.2 N. Gas 14.04.2006
ELSE TEKSTİL (Çorlu) GRI-II 3.2 25.0 N. Gas 15.04.2006
SÖNMEZ ELEKTRİK (Çorlu) GRI-II 17.5 126.0 N. Gas 03.05.2006
MENDERES ELEKTRİK GR-I 8.0 56.0 Geothermal 10.05.2006
KASTAMONU ENTEGRE (Balıkesir) GR-I 7.5 54.0 N. Gas 24.05.2006
BOZ ENERJİ GR-I 8.7 70.0 N. Gas 09.06.2006
ADANA ATIK SU ARITMA TESİSİ 0.8 6.0 Biogas 09.06.2006
AMYLUM NİŞASTA (ADANA) 14.3 34.0 N. Gas 09.06.2006
ŞIKMAKAS (Çorlu) GR-I 1.6 13.0 N. Gas 22.06.2006
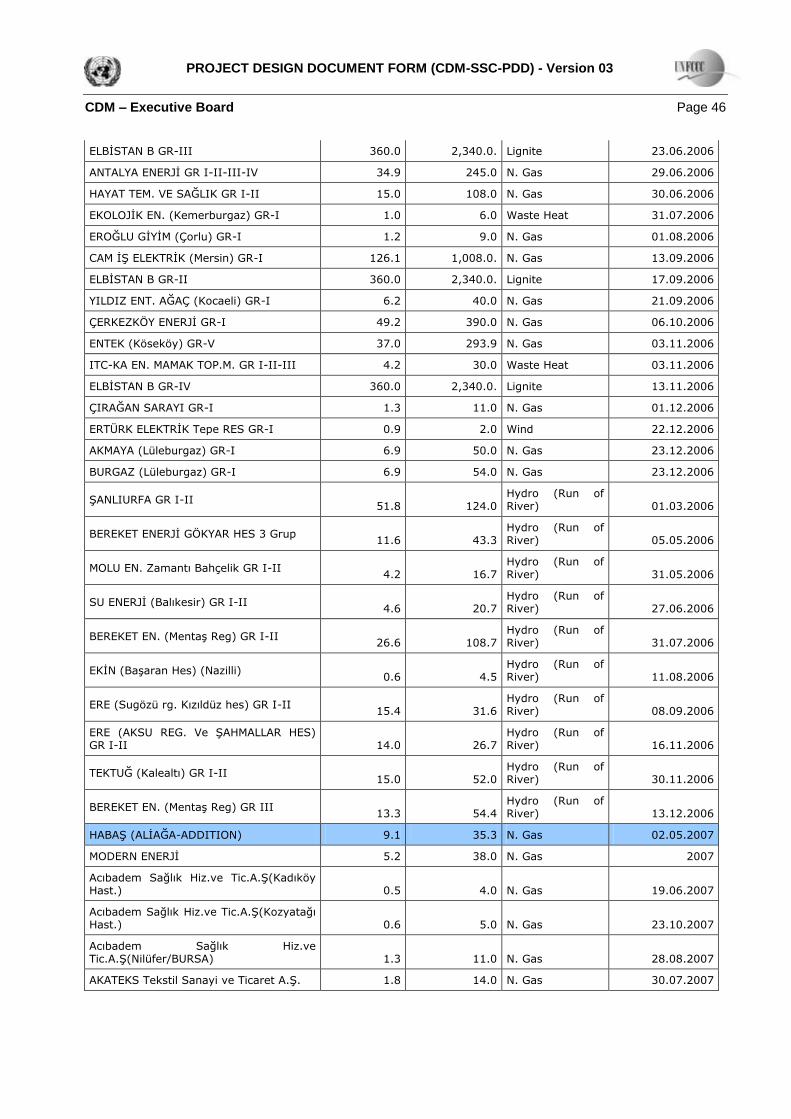
PROJECT DESIGN DOCUMENT FORM (CDM-SSC-PDD) - Version 03
CDM – Executive Board Page 46
ELBİSTAN B GR-III 360.0 2,340.0. Lignite 23.06.2006
ANTALYA ENERJİ GR I-II-III-IV 34.9 245.0 N. Gas 29.06.2006
HAYAT TEM. VE SAĞLIK GR I-II 15.0 108.0 N. Gas 30.06.2006
EKOLOJİK EN. (Kemerburgaz) GR-I 1.0 6.0 Waste Heat 31.07.2006
EROĞLU GİYİM (Çorlu) GR-I 1.2 9.0 N. Gas 01.08.2006
CAM İŞ ELEKTRİK (Mersin) GR-I 126.1 1,008.0. N. Gas 13.09.2006
ELBİSTAN B GR-II 360.0 2,340.0. Lignite 17.09.2006
YILDIZ ENT. AĞAÇ (Kocaeli) GR-I 6.2 40.0 N. Gas 21.09.2006
ÇERKEZKÖY ENERJİ GR-I 49.2 390.0 N. Gas 06.10.2006
ENTEK (Köseköy) GR-V 37.0 293.9 N. Gas 03.11.2006
ITC-KA EN. MAMAK TOP.M. GR I-II-III 4.2 30.0 Waste Heat 03.11.2006
ELBİSTAN B GR-IV 360.0 2,340.0. Lignite 13.11.2006
ÇIRAĞAN SARAYI GR-I 1.3 11.0 N. Gas 01.12.2006
ERTÜRK ELEKTRİK Tepe RES GR-I 0.9 2.0 Wind 22.12.2006
AKMAYA (Lüleburgaz) GR-I 6.9 50.0 N. Gas 23.12.2006
BURGAZ (Lüleburgaz) GR-I 6.9 54.0 N. Gas 23.12.2006
ŞANLIURFA GR I-II 51.8 124.0
Hydro (Run of River) 01.03.2006
BEREKET ENERJİ GÖKYAR HES 3 Grup 11.6 43.3
Hydro (Run of River) 05.05.2006
MOLU EN. Zamantı Bahçelik GR I-II 4.2 16.7
Hydro (Run of River) 31.05.2006
SU ENERJİ (Balıkesir) GR I-II 4.6 20.7
Hydro (Run of River) 27.06.2006
BEREKET EN. (Mentaş Reg) GR I-II 26.6 108.7
Hydro (Run of River) 31.07.2006
EKİN (Başaran Hes) (Nazilli) 0.6 4.5
Hydro (Run of River) 11.08.2006
ERE (Sugözü rg. Kızıldüz hes) GR I-II 15.4 31.6
Hydro (Run of River) 08.09.2006
ERE (AKSU REG. Ve ŞAHMALLAR HES) GR I-II 14.0 26.7
Hydro (Run of River) 16.11.2006
TEKTUĞ (Kalealtı) GR I-II 15.0 52.0
Hydro (Run of River) 30.11.2006
BEREKET EN. (Mentaş Reg) GR III 13.3 54.4
Hydro (Run of River) 13.12.2006
HABAŞ (ALİAĞA-ADDITION) 9.1 35.3 N. Gas 02.05.2007
MODERN ENERJİ 5.2 38.0 N. Gas 2007
Acıbadem Sağlık Hiz.ve Tic.A.Ş(Kadıköy Hast.) 0.5 4.0 N. Gas 19.06.2007
Acıbadem Sağlık Hiz.ve Tic.A.Ş(Kozyatağı Hast.) 0.6 5.0 N. Gas 23.10.2007
Acıbadem Sağlık Hiz.ve Tic.A.Ş(Nilüfer/BURSA) 1.3 11.0 N. Gas 28.08.2007
AKATEKS Tekstil Sanayi ve Ticaret A.Ş. 1.8 14.0 N. Gas 30.07.2007
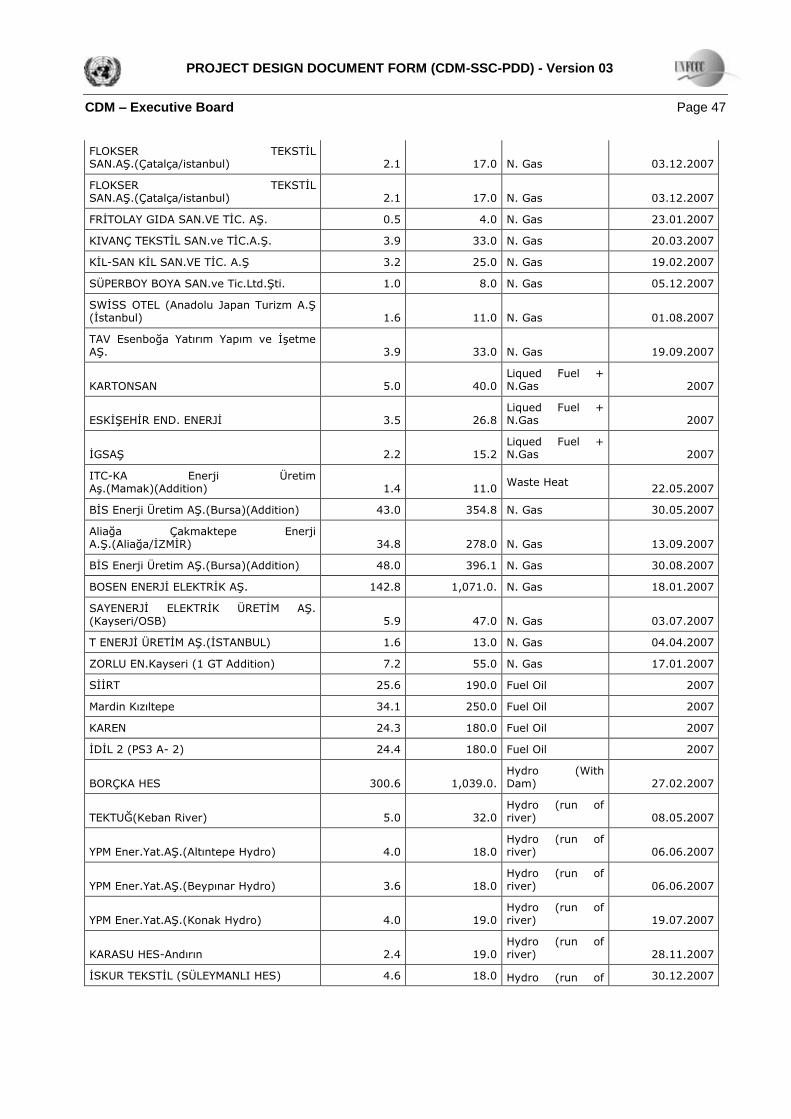
PROJECT DESIGN DOCUMENT FORM (CDM-SSC-PDD) - Version 03
CDM – Executive Board Page 47
FLOKSER TEKSTİL SAN.AŞ.(Çatalça/istanbul) 2.1 17.0 N. Gas 03.12.2007
FLOKSER TEKSTİL SAN.AŞ.(Çatalça/istanbul) 2.1 17.0 N. Gas 03.12.2007
FRİTOLAY GIDA SAN.VE TİC. AŞ. 0.5 4.0 N. Gas 23.01.2007
KIVANÇ TEKSTİL SAN.ve TİC.A.Ş. 3.9 33.0 N. Gas 20.03.2007
KİL-SAN KİL SAN.VE TİC. A.Ş 3.2 25.0 N. Gas 19.02.2007
SÜPERBOY BOYA SAN.ve Tic.Ltd.Şti. 1.0 8.0 N. Gas 05.12.2007
SWİSS OTEL (Anadolu Japan Turizm A.Ş (İstanbul) 1.6 11.0 N. Gas 01.08.2007
TAV Esenboğa Yatırım Yapım ve İşetme AŞ. 3.9 33.0 N. Gas 19.09.2007
KARTONSAN 5.0 40.0 Liqued Fuel + N.Gas 2007
ESKİŞEHİR END. ENERJİ 3.5 26.8 Liqued Fuel + N.Gas 2007
İGSAŞ 2.2 15.2 Liqued Fuel + N.Gas 2007
ITC-KA Enerji Üretim Aş.(Mamak)(Addition) 1.4 11.0
Waste Heat 22.05.2007
BİS Enerji Üretim AŞ.(Bursa)(Addition) 43.0 354.8 N. Gas 30.05.2007
Aliağa Çakmaktepe Enerji A.Ş.(Aliağa/İZMİR) 34.8 278.0 N. Gas 13.09.2007
BİS Enerji Üretim AŞ.(Bursa)(Addition) 48.0 396.1 N. Gas 30.08.2007
BOSEN ENERJİ ELEKTRİK AŞ. 142.8 1,071.0. N. Gas 18.01.2007
SAYENERJİ ELEKTRİK ÜRETİM AŞ. (Kayseri/OSB) 5.9 47.0 N. Gas 03.07.2007
T ENERJİ ÜRETİM AŞ.(İSTANBUL) 1.6 13.0 N. Gas 04.04.2007
ZORLU EN.Kayseri (1 GT Addition) 7.2 55.0 N. Gas 17.01.2007
SİİRT 25.6 190.0 Fuel Oil 2007
Mardin Kızıltepe 34.1 250.0 Fuel Oil 2007
KAREN 24.3 180.0 Fuel Oil 2007
İDİL 2 (PS3 A- 2) 24.4 180.0 Fuel Oil 2007
BORÇKA HES 300.6 1,039.0. Hydro (With Dam) 27.02.2007
TEKTUĞ(Keban River) 5.0 32.0 Hydro (run of river) 08.05.2007
YPM Ener.Yat.AŞ.(Altıntepe Hydro) 4.0 18.0 Hydro (run of river) 06.06.2007
YPM Ener.Yat.AŞ.(Beypınar Hydro) 3.6 18.0 Hydro (run of river) 06.06.2007
YPM Ener.Yat.AŞ.(Konak Hydro) 4.0 19.0 Hydro (run of river) 19.07.2007
KARASU HES-Andırın 2.4 19.0 Hydro (run of river) 28.11.2007
İSKUR TEKSTİL (SÜLEYMANLI HES) 4.6 18.0 Hydro (run of 30.12.2007
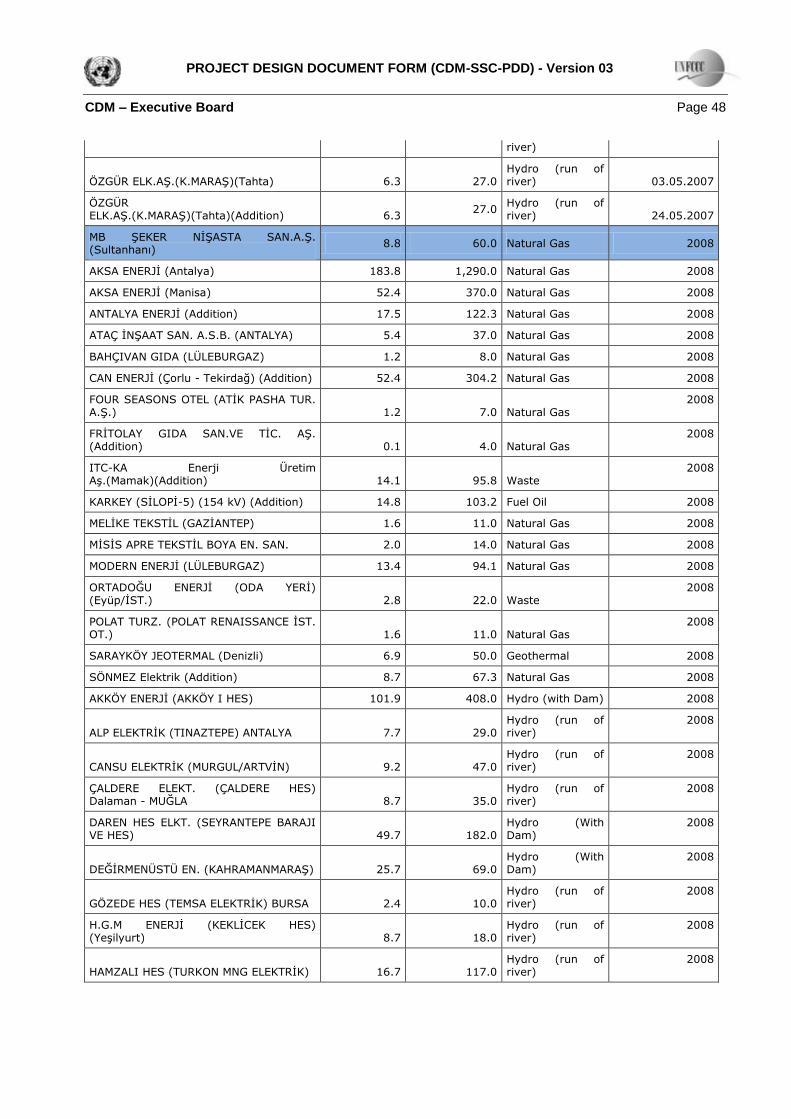
PROJECT DESIGN DOCUMENT FORM (CDM-SSC-PDD) - Version 03
CDM – Executive Board Page 48
river)
ÖZGÜR ELK.AŞ.(K.MARAŞ)(Tahta) 6.3 27.0 Hydro (run of river) 03.05.2007
ÖZGÜR ELK.AŞ.(K.MARAŞ)(Tahta)(Addition) 6.3
27.0 Hydro (run of river) 24.05.2007
MB ŞEKER NİŞASTA SAN.A.Ş. (Sultanhanı) 8.8 60.0 Natural Gas 2008
AKSA ENERJİ (Antalya) 183.8 1,290.0 Natural Gas 2008
AKSA ENERJİ (Manisa) 52.4 370.0 Natural Gas 2008
ANTALYA ENERJİ (Addition) 17.5 122.3 Natural Gas 2008
ATAÇ İNŞAAT SAN. A.S.B. (ANTALYA) 5.4 37.0 Natural Gas 2008
BAHÇIVAN GIDA (LÜLEBURGAZ) 1.2 8.0 Natural Gas 2008
CAN ENERJİ (Çorlu - Tekirdağ) (Addition) 52.4 304.2 Natural Gas 2008
FOUR SEASONS OTEL (ATİK PASHA TUR. A.Ş.) 1.2 7.0 Natural Gas
2008
FRİTOLAY GIDA SAN.VE TİC. AŞ. (Addition) 0.1 4.0 Natural Gas
2008
ITC-KA Enerji Üretim Aş.(Mamak)(Addition) 14.1 95.8 Waste
2008
KARKEY (SİLOPİ-5) (154 kV) (Addition) 14.8 103.2 Fuel Oil 2008
MELİKE TEKSTİL (GAZİANTEP) 1.6 11.0 Natural Gas 2008
MİSİS APRE TEKSTİL BOYA EN. SAN. 2.0 14.0 Natural Gas 2008
MODERN ENERJİ (LÜLEBURGAZ) 13.4 94.1 Natural Gas 2008
ORTADOĞU ENERJİ (ODA YERİ) (Eyüp/İST.) 2.8 22.0 Waste
2008
POLAT TURZ. (POLAT RENAISSANCE İST. OT.) 1.6 11.0 Natural Gas
2008
SARAYKÖY JEOTERMAL (Denizli) 6.9 50.0 Geothermal 2008
SÖNMEZ Elektrik (Addition) 8.7 67.3 Natural Gas 2008
AKKÖY ENERJİ (AKKÖY I HES) 101.9 408.0 Hydro (with Dam) 2008
ALP ELEKTRİK (TINAZTEPE) ANTALYA 7.7 29.0 Hydro (run of river)
2008
CANSU ELEKTRİK (MURGUL/ARTVİN) 9.2 47.0 Hydro (run of river)
2008
ÇALDERE ELEKT. (ÇALDERE HES) Dalaman - MUĞLA 8.7 35.0
Hydro (run of river)
2008
DAREN HES ELKT. (SEYRANTEPE BARAJI VE HES) 49.7 182.0
Hydro (With Dam)
2008
DEĞİRMENÜSTÜ EN. (KAHRAMANMARAŞ) 25.7 69.0 Hydro (With Dam)
2008
GÖZEDE HES (TEMSA ELEKTRİK) BURSA 2.4 10.0 Hydro (run of river)
2008
H.G.M ENERJİ (KEKLİCEK HES) (Yeşilyurt) 8.7 18.0
Hydro (run of river)
2008
HAMZALI HES (TURKON MNG ELEKTRİK) 16.7 117.0 Hydro (run of river)
2008
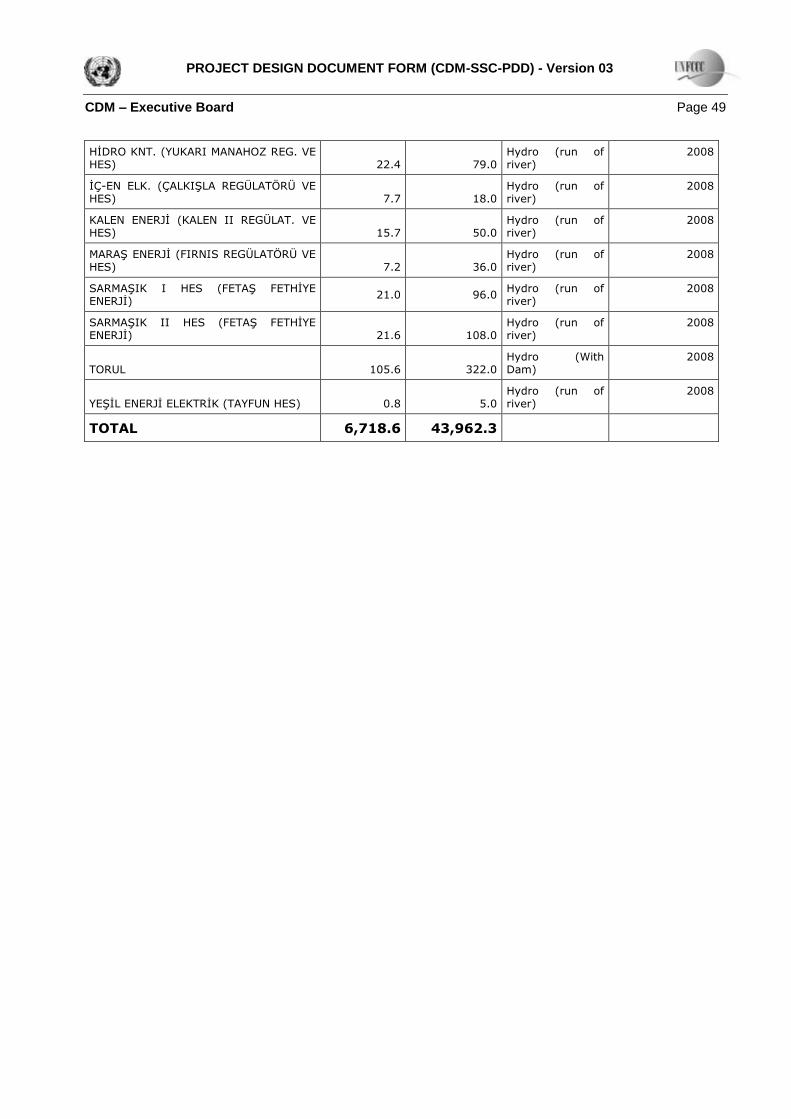
PROJECT DESIGN DOCUMENT FORM (CDM-SSC-PDD) - Version 03
CDM – Executive Board Page 49
HİDRO KNT. (YUKARI MANAHOZ REG. VE HES) 22.4 79.0
Hydro (run of river)
2008
İÇ-EN ELK. (ÇALKIŞLA REGÜLATÖRÜ VE HES) 7.7 18.0
Hydro (run of river)
2008
KALEN ENERJİ (KALEN II REGÜLAT. VE HES) 15.7 50.0
Hydro (run of river)
2008
MARAŞ ENERJİ (FIRNIS REGÜLATÖRÜ VE HES) 7.2 36.0
Hydro (run of river)
2008
SARMAŞIK I HES (FETAŞ FETHİYE ENERJİ) 21.0 96.0 Hydro (run of
river) 2008
SARMAŞIK II HES (FETAŞ FETHİYE ENERJİ) 21.6 108.0
Hydro (run of river)
2008
TORUL 105.6 322.0 Hydro (With Dam)
2008
YEŞİL ENERJİ ELEKTRİK (TAYFUN HES) 0.8 5.0 Hydro (run of river)
2008
TOTAL 6,718.6 43,962.3

PROJECT DESIGN DOCUMENT FORM (CDM-SSC-PDD) - Version 03
CDM – Executive Board Page 50
Annex 3
MONITORING INFORMATION
- - - - -