clean development mechanism project design document form
TRANSCRIPT

GOLD STANDARD MICRO-SCALE SCHEME PROJECT DESIGN DOCUMENT FORM - Version 01
1
Gold Standard Micro Scale Scheme
PROJECT DESIGN DOCUMENT FORM
Version 01 - in effect as of: November 2011
CONTENTS
A. General description of the micro scale project activity
B. Application of an existing or new baseline and monitoring methodology
C. Duration of the project activity and crediting period
D. Stakeholders’ comments
Annexes
Annex 1: Contact information on participants in the proposed micro scale project activity
Annex 2: Information regarding Public Funding
Annex 3: Baseline information
Annex 4: Monitoring and usage information
Annex 5: PFT information
Annex 6: Beneficiary identification serial number plate example
GOLD STANDARD MICRO-SCALE SCHEME PROJECT DESIGN DOCUMENT FORM - Version 01
2
SECTION A. General description of micro-scale project activity
A.1 Title of the micro-scale project activity:
>> title
YGF Mangshi household biogas tank project.
>> date & version of the PDD
12th September, 2012. Version 2.
26th September, 2012. Version 3.
11th March, 2013. Version 4.
5th December, 2013. Version 5.
13th June 2014 Version 6
>>summary of the project activity
The micro-scale domestic biodigester emission reduction project which is proposed by Yunnan Green
Environment Development Foundation (hereinafter to be referred as YGF) will be implemented in three
townships within Mangshi municipality, Dehong prefecture, Yunnan province, China. 1,200 households
will be equipped with biodigesters within 3 years from 2011 to 2014. The implementation of the project
will not only provide a free and renewable energy to the farmers, but also reduce time spent collecting
firewood, shorten cooking time and significantly decrease production of smoke while cooking. In addition,
by reducing the consumption of fossil fuels and firewood, the project will also benefit the local
environment.
A.2. Project participants:
>>
Name of Party involved
((Host) indicates a host
Party)
Private and/or public entities
project participants (As
applicable)
Kindly indicate if the Party
involved wishes to be considered
as project participant (Yes/No)
People’s Republic of China Yunnan Green Environment
Development Foundation (Project
Coordinator)
No
People’s Republic of China Mangshi Animal Husbandry and
Veterinary Bureau (Project
implementation party)
No
France Initiative Développement (Project
developer)
No
A.3 Description of the micro-scale project activity:
A.3.1. Location of the micro-scale project activity:
GOLD STANDARD MICRO-SCALE SCHEME PROJECT DESIGN DOCUMENT FORM - Version 01
3
A.3.1.1. Host Country:
People’s Republic of China
A.3.1.2. Region/State/Province etc:
Yunnan province
A.3.1.3. City/Town/Community etc:
Dehong prefecture, Mangshi municipality
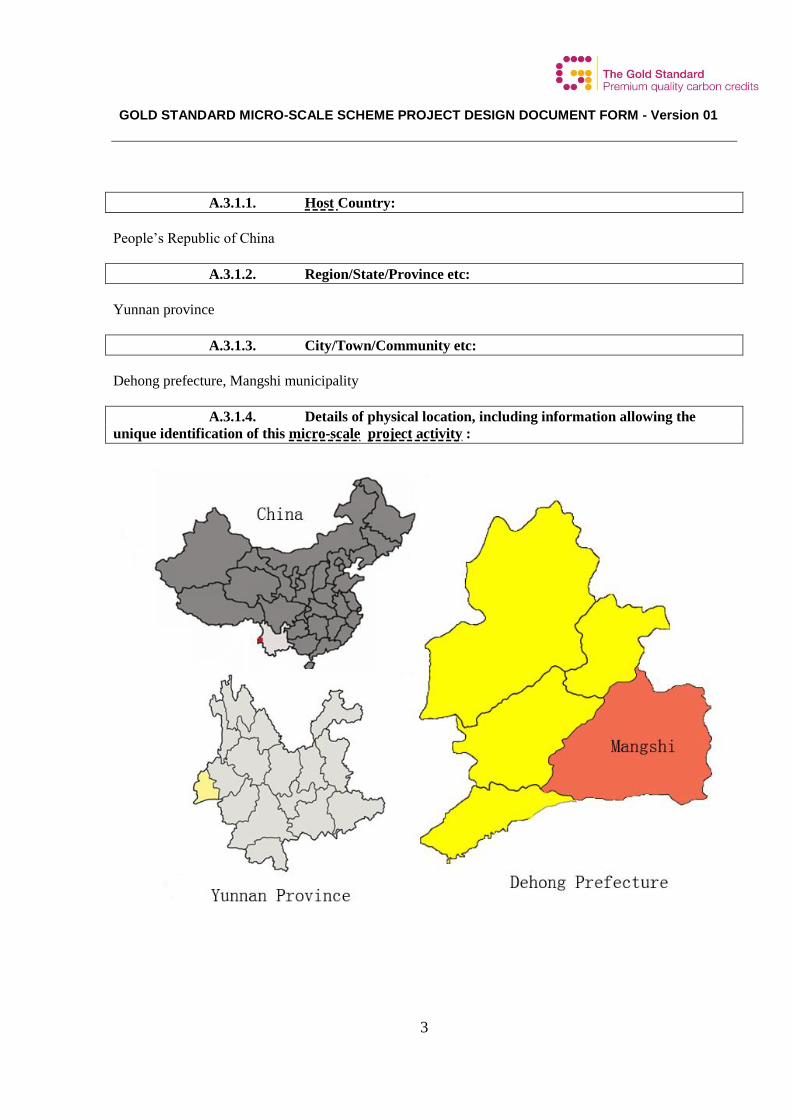
A.3.1.4. Details of physical location, including information allowing the
unique identification of this micro-scale project activity :
GOLD STANDARD MICRO-SCALE SCHEME PROJECT DESIGN DOCUMENT FORM - Version 01
4
Every biogas tanks will be installed within 3 townships of Mangshi municipality in Dehong prefecture,
Yunnan province, China. Below are the project villages within the 3 townships and their coordinates:
Province Prefecture / City Township Coordinates1
Yunnan Dehong / Mangshi
Zhefang 24° 15' 20.20" N, 98° 16' 46.92" E
Xuangang 24° 26' 51.28" N, 98° 26' 25.66" E
Fengpin 24° 23' 53.06" N, 98° 30' 59.43" E
The coordinates represent the central point of each township. One township has several administrative
villages which contains several groups (natural villages).
Each beneficiary will be given a unique identification number. An electronic list of all the beneficiaries
with their name, identification number and name of the village will be created and archived until two
years after the end of the crediting period.
A.3.2. Description including technology and/or measure of the micro-scale project activity:
Type
Type I. Renewable energy projects / Category: I.C Thermal Energy for the User
Type III. Other project activities/ Category III.M Methane recovery
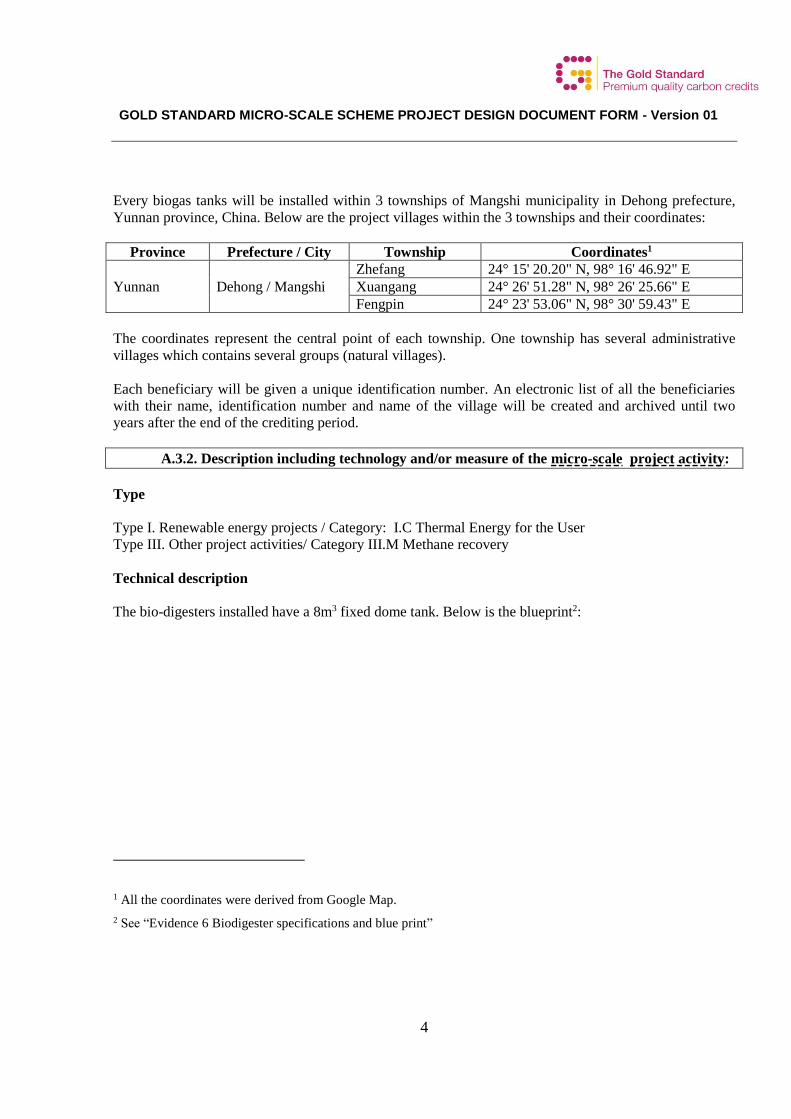
Technical description
The bio-digesters installed have a 8m3 fixed dome tank. Below is the blueprint2:
1 All the coordinates were derived from Google Map.
2 See “Evidence 6 Biodigester specifications and blue print”
GOLD STANDARD MICRO-SCALE SCHEME PROJECT DESIGN DOCUMENT FORM - Version 01
5
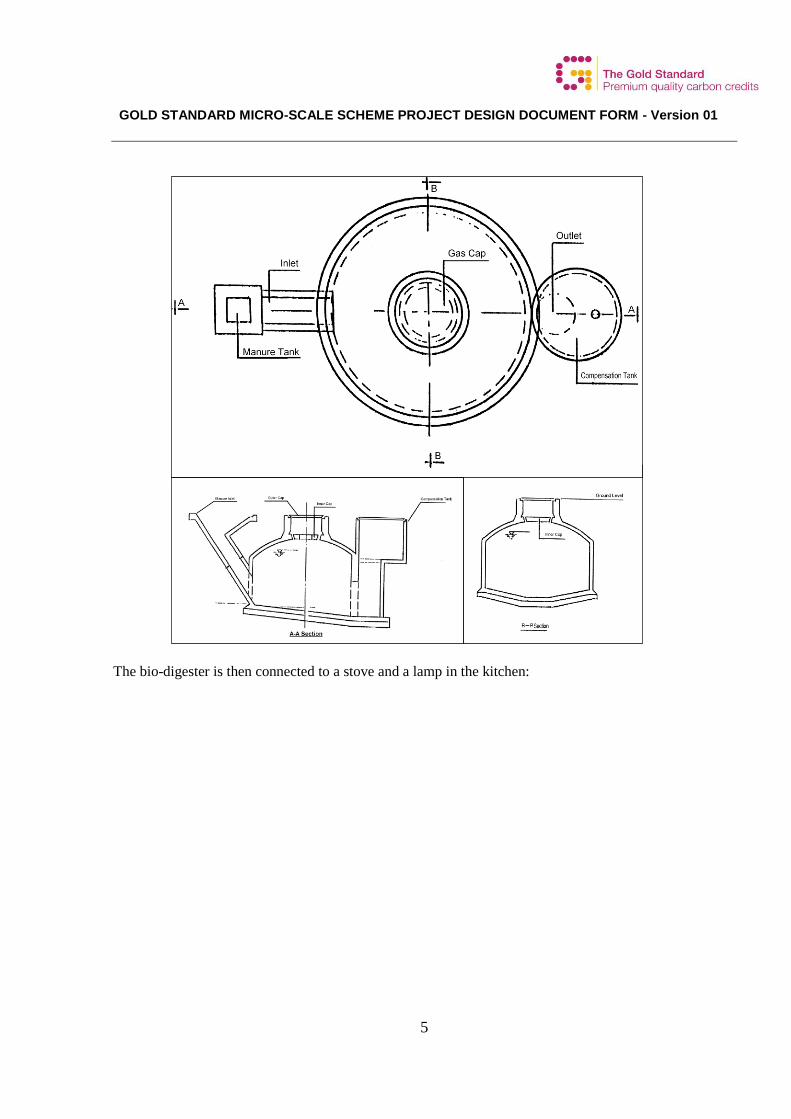
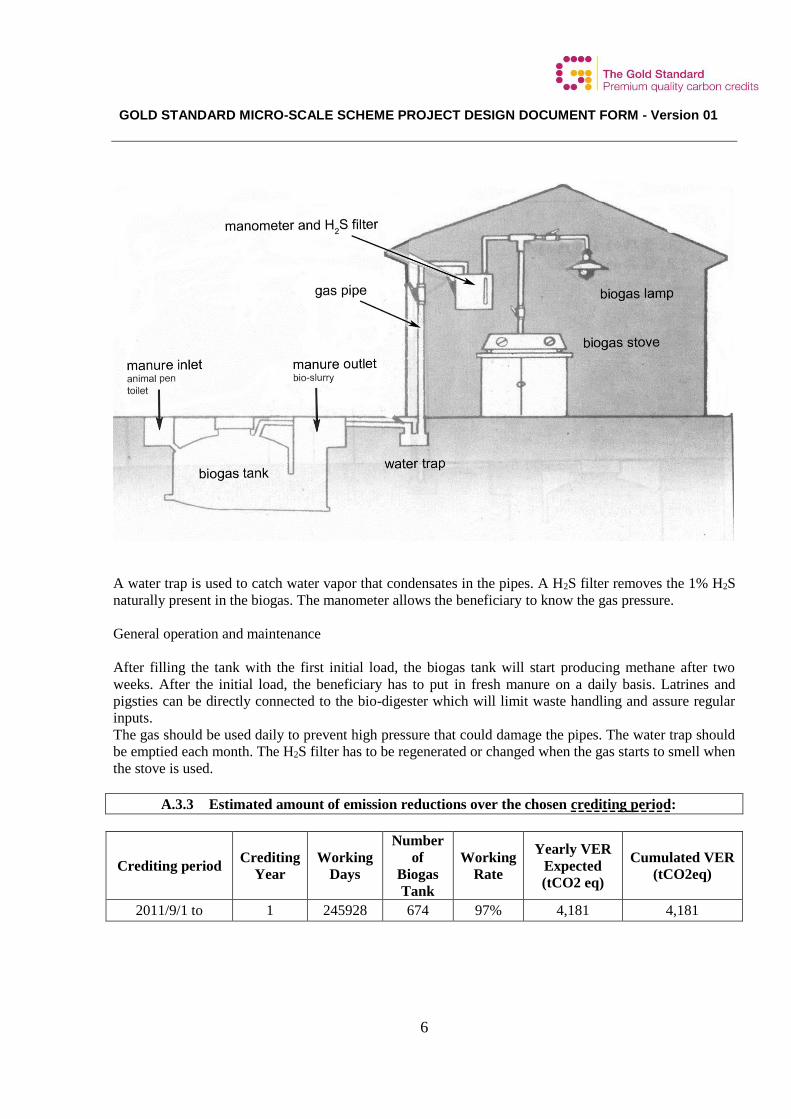
The bio-digester is then connected to a stove and a lamp in the kitchen:
GOLD STANDARD MICRO-SCALE SCHEME PROJECT DESIGN DOCUMENT FORM - Version 01
6
A water trap is used to catch water vapor that condensates in the pipes. A H2S filter removes the 1% H2S
naturally present in the biogas. The manometer allows the beneficiary to know the gas pressure.
General operation and maintenance
After filling the tank with the first initial load, the biogas tank will start producing methane after two
weeks. After the initial load, the beneficiary has to put in fresh manure on a daily basis. Latrines and
pigsties can be directly connected to the bio-digester which will limit waste handling and assure regular
inputs.
The gas should be used daily to prevent high pressure that could damage the pipes. The water trap should
be emptied each month. The H2S filter has to be regenerated or changed when the gas starts to smell when
the stove is used.
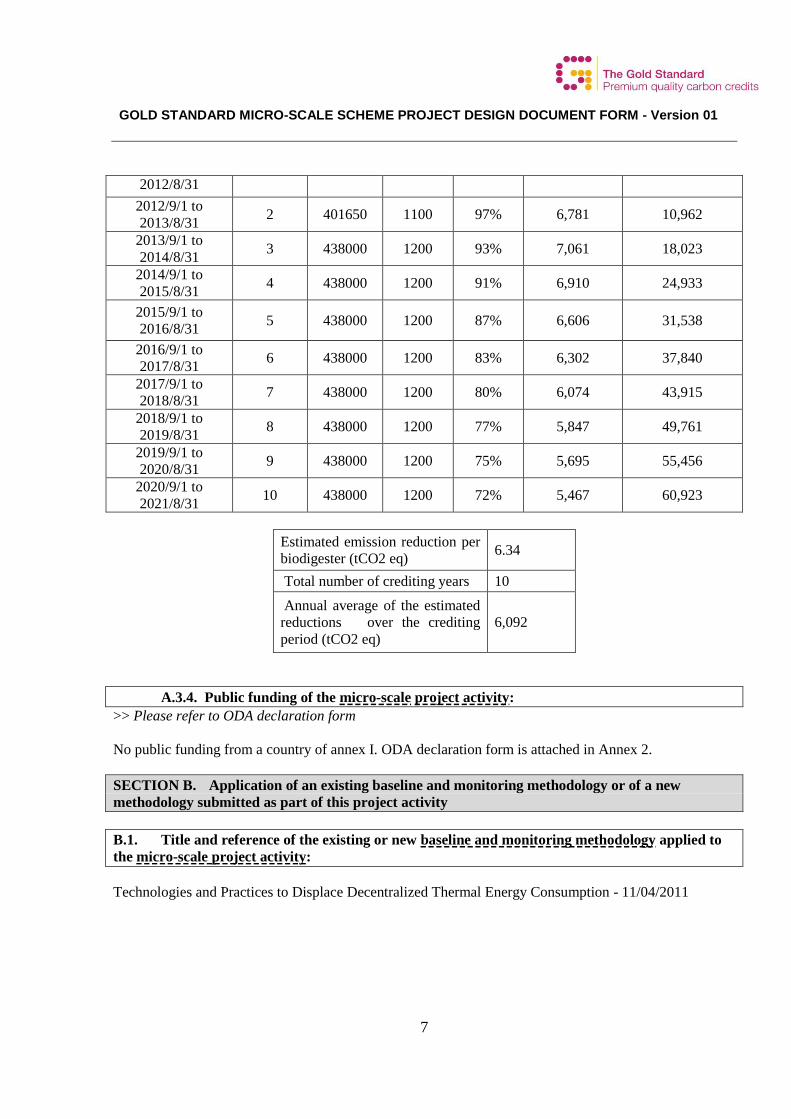
A.3.3 Estimated amount of emission reductions over the chosen crediting period:
Crediting period Crediting
Year
Working
Days
Number
of
Biogas
Tank
Working
Rate
Yearly VER
Expected
(tCO2 eq)
Cumulated VER
(tCO2eq)
2011/9/1 to 1 245928 674 97% 4,181 4,181
GOLD STANDARD MICRO-SCALE SCHEME PROJECT DESIGN DOCUMENT FORM - Version 01
7
2012/8/31
2012/9/1 to
2013/8/31 2 401650 1100 97% 6,781 10,962
2013/9/1 to
2014/8/31 3 438000 1200 93% 7,061 18,023
2014/9/1 to
2015/8/31 4 438000 1200 91% 6,910 24,933
2015/9/1 to
2016/8/31 5 438000 1200 87% 6,606 31,538
2016/9/1 to
2017/8/31 6 438000 1200 83% 6,302 37,840
2017/9/1 to
2018/8/31 7 438000 1200 80% 6,074 43,915
2018/9/1 to
2019/8/31 8 438000 1200 77% 5,847 49,761
2019/9/1 to
2020/8/31 9 438000 1200 75% 5,695 55,456
2020/9/1 to
2021/8/31 10 438000 1200 72% 5,467 60,923
Estimated emission reduction per
biodigester (tCO2 eq) 6.34
Total number of crediting years 10
Annual average of the estimated
reductions over the crediting
period (tCO2 eq)
6,092
A.3.4. Public funding of the micro-scale project activity:
>> Please refer to ODA declaration form
No public funding from a country of annex I. ODA declaration form is attached in Annex 2.
SECTION B. Application of an existing baseline and monitoring methodology or of a new
methodology submitted as part of this project activity
B.1. Title and reference of the existing or new baseline and monitoring methodology applied to
the micro-scale project activity:
Technologies and Practices to Displace Decentralized Thermal Energy Consumption - 11/04/2011
GOLD STANDARD MICRO-SCALE SCHEME PROJECT DESIGN DOCUMENT FORM - Version 01
8
B.2 Justification of the choice of the methodology and applicability:
1. The project boundary can be clearly identified (see B.3.), and the technology counted in the project
are not included in another voluntary market or CDM project activity. As the local project
implementer, Mangshi Animal Husbandry and Veterinary Bureau is the only party that carry out
domestic biogas projects in the targeted area. They assure that the biodigesters and its ERs which
will be included in the project will not be included in other carbon emission reduction project now or
in the future3. A beneficiary identification system is introduced by labelling each biodigester with a
unique serial number metal plate (see example in Annex 6). This number will be the identification
code for each of the beneficiaries during the full project cycle such as beneficiary list, baseline and
monitoring survey.
2. The project activity is type I, as the biogas is produced with animal manure and human excrement,
which are renewable. The biogas tanks are connected to a biogas stove in the households’
kitchen, thereby supplying the user with thermal energy. The nominal thermal power of each cook
stove with a double burner installed is 6.6 kWth, while that of a stove with a single burner is 3.3 kWth4.
This is far less than the threshold of 150kW per unit, which is defined in the applicability section of
the TPDDTEC methodology. In this project, both types of cook stove can be used. 1,200 biogas cook
stoves will be installed so that the total installed power will be less than 7.8 MWth.
According to the guidelines, the small scale limit for projects under category I (renewable energy) is
15MW of electrical power or an appropriate equivalent. It is stated that an appropriate equivalent is
45 MW of thermal power. The limit for projects under category III is 60ktCO2e/year. Here, the
average estimated ER per year is 6,092 tCO2e, placing the project in the small scale category. For
both categories I and II, the project falls under the small scale category.
According to GS rules, the claimed average amount of ER will be less than 10000 t CO2e per year,
so the project falls into the Gold Standard micro-scale category.
3. The use of the old fire wood stove baseline technology as supplementary support is encouraged to be
removed gradually during the development of the project. According to the baseline survey, 11.86
kg/day firewood consumption per household was observed, whereas in the first year’s monitoring
survey, the value significantly decreased to 1.47 kg/day, which is an 88% reduction. For the number
of firewood using household, biogas helps 60% families (41 households out of 70 households which
have been surveyed) stop using firewood for their cooking activities and no alternative fuel using
leakage has been found. Considering the burden of collecting firewood and time consumed, it is
encouraging that villagers switch from firewood to biogas. The firewood stove cannot be removed
easily because it is made of concrete.
3 See “Evidence 1. ER no double counting guarantee”
4 See “Evidence 10 biogas stove specifications”
GOLD STANDARD MICRO-SCALE SCHEME PROJECT DESIGN DOCUMENT FORM - Version 01
9
4. For ER ownership rights, all the users of the biodigester have surrounded their ER ownership rights
to the project CME: Yunnan Green Environment Development Foundation5.
5. Domestic biogas projects are in compliance with relevant Gold Standard specific requirements for
biomass related project activities, as defined in Gold Standard Toolkit Annex C: Project type:
Improved distributed heating and cooking devices and distributed micro-scale electricity generation
units, shall provide The Gold Standard Foundation with a clear description of the transfer of credits
ownership all along the investment chain, and with evidence that end - users are aware of and willing
to give up their rights on emission reductions. (See item above).
Furthermore, the indoor air pollution (IAP) levels are not worsened compared to the baseline. There
is adequate scientific evidence6 that the use of biogas will greatly improve indoor air quality as
compared to the baseline firewood stove. And greenhouse gases emitted by the project fuel/stove
combination are estimated with adequate precision (See page 20, Statistical Analysis). The
technology of the project enables a switch from firewood stove to biogas stove. However, the
baseline firewood stove is still a compensation heat source when the need cannot be fulfilled by
biogas alone.
B.3. Description of the project boundary:
Project’s geographical boundary
See A.4.1.4.
Greenhouse gas (GHG) taken into account in the project
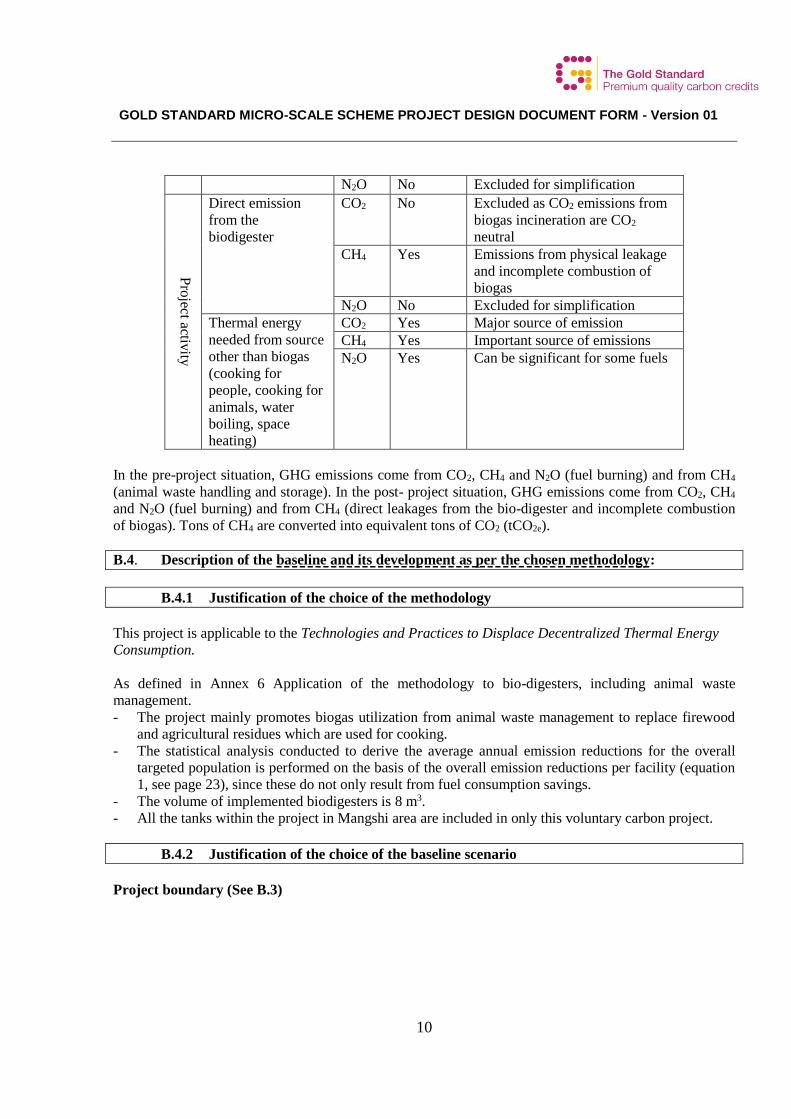
Here is a summary for the three main GHG, carbon dioxide CO2, methane CH4 and N2O
Source Gas Included Justification / Explanation
Baselin
e
Thermal energy
need (cooking for
people, cooking for
animal, water
boiling, space
heating)
CO2 Yes Major source of emission
CH4 Yes Important source of emissions
N2O Yes Can be significant for some fuels
Animal waste
handling and
storage
CO2 No Excluded as CO2 emissions from
animal waste are CO2 neutral
CH4 Yes Major source of emission
5 See “Evidence 11 carbon credit wavier example” 6 http://www.india-server.com/news/updated-biogas-technology-to-save-lives-25191.html
http://www.thebioenergysite.com/news/808/smokefree-biogas-the-latest-rage
GOLD STANDARD MICRO-SCALE SCHEME PROJECT DESIGN DOCUMENT FORM - Version 01
10
N2O No Excluded for simplification
Pro
ject activity
Direct emission
from the
biodigester
CO2 No Excluded as CO2 emissions from
biogas incineration are CO2
neutral
CH4 Yes Emissions from physical leakage
and incomplete combustion of
biogas
N2O No Excluded for simplification
Thermal energy
needed from source
other than biogas
(cooking for
people, cooking for
animals, water
boiling, space
heating)
CO2 Yes Major source of emission
CH4 Yes Important source of emissions
N2O Yes Can be significant for some fuels
In the pre-project situation, GHG emissions come from CO2, CH4 and N2O (fuel burning) and from CH4
(animal waste handling and storage). In the post- project situation, GHG emissions come from CO2, CH4
and N2O (fuel burning) and from CH4 (direct leakages from the bio-digester and incomplete combustion
of biogas). Tons of CH4 are converted into equivalent tons of CO2 (tCO2e).
B.4. Description of the baseline and its development as per the chosen methodology:
B.4.1 Justification of the choice of the methodology
This project is applicable to the Technologies and Practices to Displace Decentralized Thermal Energy
Consumption.
As defined in Annex 6 Application of the methodology to bio-digesters, including animal waste
management.
- The project mainly promotes biogas utilization from animal waste management to replace firewood
and agricultural residues which are used for cooking.
- The statistical analysis conducted to derive the average annual emission reductions for the overall
targeted population is performed on the basis of the overall emission reductions per facility (equation
1, see page 23), since these do not only result from fuel consumption savings.
- The volume of implemented biodigesters is 8 m3.
- All the tanks within the project in Mangshi area are included in only this voluntary carbon project.
B.4.2 Justification of the choice of the baseline scenario
Project boundary (See B.3)
GOLD STANDARD MICRO-SCALE SCHEME PROJECT DESIGN DOCUMENT FORM - Version 01
11
Selection of baseline and project scenarios
- 106 baseline surveys were conducted in all 3 townships within the project boundary. Findings reveal
that 100% of the households were using both firewood and electricity. Therefore the project has only
one baseline scenario--that beneficiaries use both firewood and electricity before the introduction of
biodigester.
In this scenario, farmers don’t heat their house since the project area is a sub-tropical area (annual
mean temperature is 19.8℃7). Thus, there is no seasonal pattern for the baseline/project scenario. The
KPT will only be carried out once in August every two years of the ten crediting years. Monitoring
survey (qualitative) and Usage survey will be carried every year.
- No suppressed demand is considered for this project. This is conservative.
- Only one kind of stove is promoted in the VPA, so there is only one project scenario.
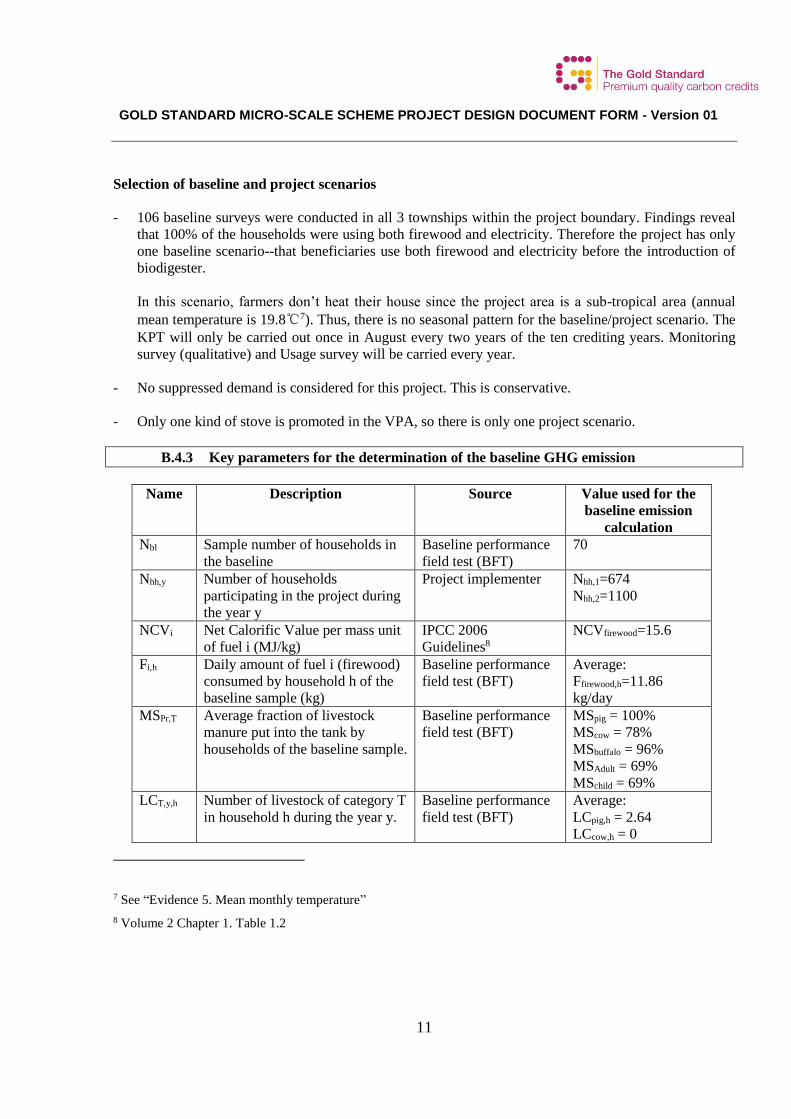
B.4.3 Key parameters for the determination of the baseline GHG emission
Name Description Source Value used for the
baseline emission
calculation
Nbl Sample number of households in
the baseline
Baseline performance
field test (BFT)
70
Nhh,y Number of households
participating in the project during
the year y
Project implementer Nhh,1=674
Nhh,2=1100
NCVi Net Calorific Value per mass unit
of fuel i (MJ/kg)
IPCC 2006
Guidelines8
NCVfirewood=15.6
Fi,h Daily amount of fuel i (firewood)
consumed by household h of the
baseline sample (kg)
Baseline performance
field test (BFT)
Average:
Ffirewood,h=11.86
kg/day
MSPr,T Average fraction of livestock
manure put into the tank by
households of the baseline sample.
Baseline performance
field test (BFT)
MSpig = 100%
MScow = 78%
MSbuffalo = 96%
MSAdult = 69%
MSchild = 69%
LCT,y,h Number of livestock of category T
in household h during the year y.
Baseline performance
field test (BFT)
Average:
LCpig,h = 2.64
LCcow,h = 0
7 See “Evidence 5. Mean monthly temperature”
8 Volume 2 Chapter 1. Table 1.2
GOLD STANDARD MICRO-SCALE SCHEME PROJECT DESIGN DOCUMENT FORM - Version 01
12
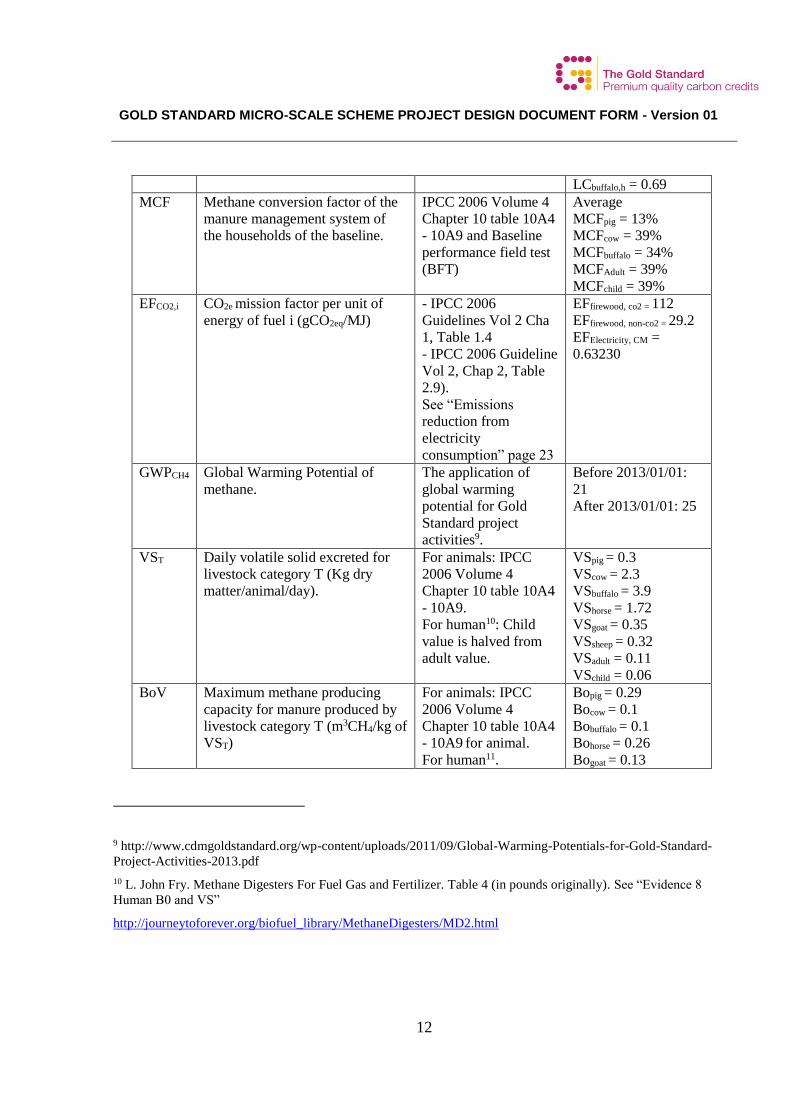
LCbuffalo,h = 0.69
MCF Methane conversion factor of the
manure management system of
the households of the baseline.
IPCC 2006 Volume 4
Chapter 10 table 10A4
- 10A9 and Baseline
performance field test
(BFT)
Average
MCFpig = 13%
MCFcow = 39%
MCFbuffalo = 34%
MCFAdult = 39%
MCFchild = 39%
EFCO2,i CO2e mission factor per unit of
energy of fuel i (gCO2eq/MJ)
- IPCC 2006
Guidelines Vol 2 Cha
1, Table 1.4
- IPCC 2006 Guideline
Vol 2, Chap 2, Table
2.9).
See “Emissions
reduction from
electricity
consumption” page 23
EFfirewood, co2 = 112
EFfirewood, non-co2 = 29.2
EFElectricity, CM =
0.63230
GWPCH4 Global Warming Potential of
methane.
The application of
global warming
potential for Gold
Standard project
activities9.
Before 2013/01/01:
21
After 2013/01/01: 25
VST Daily volatile solid excreted for
livestock category T (Kg dry
matter/animal/day).
For animals: IPCC
2006 Volume 4
Chapter 10 table 10A4
- 10A9.
For human10: Child
value is halved from
adult value.
VSpig = 0.3
VScow = 2.3
VSbuffalo = 3.9
VShorse = 1.72
VSgoat = 0.35
VSsheep = 0.32
VSadult = 0.11
VSchild = 0.06
BoV Maximum methane producing
capacity for manure produced by
livestock category T (m3CH4/kg of
VST)
For animals: IPCC
2006 Volume 4
Chapter 10 table 10A4
- 10A9 for animal.
For human11.
Bopig = 0.29
Bocow = 0.1
Bobuffalo = 0.1
Bohorse = 0.26
Bogoat = 0.13
9 http://www.cdmgoldstandard.org/wp-content/uploads/2011/09/Global-Warming-Potentials-for-Gold-Standard-
Project-Activities-2013.pdf
10 L. John Fry. Methane Digesters For Fuel Gas and Fertilizer. Table 4 (in pounds originally). See “Evidence 8
Human B0 and VS”
http://journeytoforever.org/biofuel_library/MethaneDigesters/MD2.html
GOLD STANDARD MICRO-SCALE SCHEME PROJECT DESIGN DOCUMENT FORM - Version 01
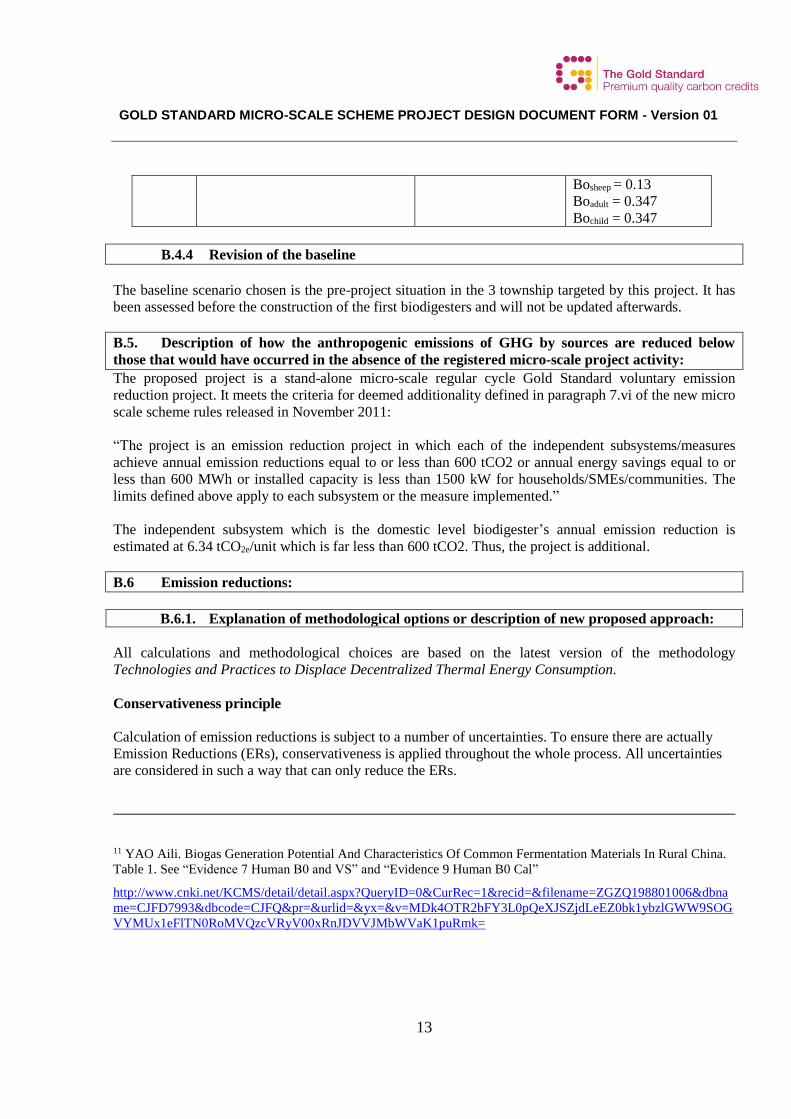
13
Bosheep = 0.13
Boadult = 0.347
Bochild = 0.347
B.4.4 Revision of the baseline
The baseline scenario chosen is the pre-project situation in the 3 township targeted by this project. It has
been assessed before the construction of the first biodigesters and will not be updated afterwards.
B.5. Description of how the anthropogenic emissions of GHG by sources are reduced below
those that would have occurred in the absence of the registered micro-scale project activity:
The proposed project is a stand-alone micro-scale regular cycle Gold Standard voluntary emission
reduction project. It meets the criteria for deemed additionality defined in paragraph 7.vi of the new micro
scale scheme rules released in November 2011:
“The project is an emission reduction project in which each of the independent subsystems/measures
achieve annual emission reductions equal to or less than 600 tCO2 or annual energy savings equal to or
less than 600 MWh or installed capacity is less than 1500 kW for households/SMEs/communities. The
limits defined above apply to each subsystem or the measure implemented.”
The independent subsystem which is the domestic level biodigester’s annual emission reduction is
estimated at 6.34 tCO2e/unit which is far less than 600 tCO2. Thus, the project is additional.
B.6 Emission reductions:
B.6.1. Explanation of methodological options or description of new proposed approach:
All calculations and methodological choices are based on the latest version of the methodology
Technologies and Practices to Displace Decentralized Thermal Energy Consumption.
Conservativeness principle
Calculation of emission reductions is subject to a number of uncertainties. To ensure there are actually
Emission Reductions (ERs), conservativeness is applied throughout the whole process. All uncertainties
are considered in such a way that can only reduce the ERs.
11 YAO Aili. Biogas Generation Potential And Characteristics Of Common Fermentation Materials In Rural China.
Table 1. See “Evidence 7 Human B0 and VS” and “Evidence 9 Human B0 Cal”
http://www.cnki.net/KCMS/detail/detail.aspx?QueryID=0&CurRec=1&recid=&filename=ZGZQ198801006&dbna
me=CJFD7993&dbcode=CJFQ&pr=&urlid=&yx=&v=MDk4OTR2bFY3L0pQeXJSZjdLeEZ0bk1ybzlGWW9SOG
VYMUx1eFlTN0RoMVQzcVRyV00xRnJDVVJMbWVaK1puRmk=
GOLD STANDARD MICRO-SCALE SCHEME PROJECT DESIGN DOCUMENT FORM - Version 01
14
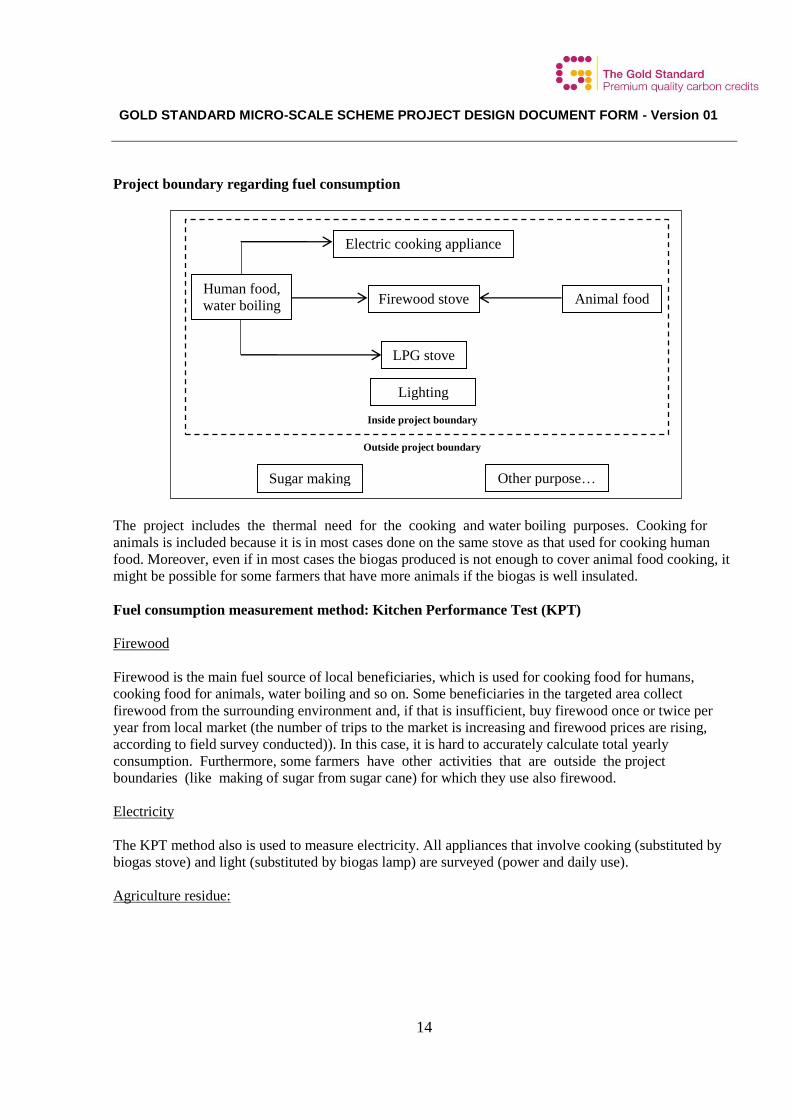
Project boundary regarding fuel consumption
The project includes the thermal need for the cooking and water boiling purposes. Cooking for
animals is included because it is in most cases done on the same stove as that used for cooking human
food. Moreover, even if in most cases the biogas produced is not enough to cover animal food cooking, it
might be possible for some farmers that have more animals if the biogas is well insulated.
Fuel consumption measurement method: Kitchen Performance Test (KPT)
Firewood
Firewood is the main fuel source of local beneficiaries, which is used for cooking food for humans,
cooking food for animals, water boiling and so on. Some beneficiaries in the targeted area collect
firewood from the surrounding environment and, if that is insufficient, buy firewood once or twice per
year from local market (the number of trips to the market is increasing and firewood prices are rising,
according to field survey conducted)). In this case, it is hard to accurately calculate total yearly
consumption. Furthermore, some farmers have other activities that are outside the project
boundaries (like making of sugar from sugar cane) for which they use also firewood.
Electricity
The KPT method also is used to measure electricity. All appliances that involve cooking (substituted by
biogas stove) and light (substituted by biogas lamp) are surveyed (power and daily use).
Agriculture residue:
LPG stove
Lighting
Inside project boundary
Outside project boundary
Sugar making Other purpose…
Human food,
water boiling Firewood stove
Electric cooking appliance
Animal food
GOLD STANDARD MICRO-SCALE SCHEME PROJECT DESIGN DOCUMENT FORM - Version 01
15
The agricultural residues are used for different purpose by the farmers: feeding animals, as a litter in
animal pen, mixed with dung to make manure or as a fuel for thermal needs. Agricultural residues are
often not used as a fuel source for cooking in general, but rather merely just to start the stove. For those
reasons an accurate monitoring of agricultural waste consumption is not really feasible. Since the
production of agricultural residue is not changed by the project activity, the efficient energy
produced by those residues in both baseline and project is strictly the same. Because of this, we decided
not to take agricultural waste consumption into account for both the baseline and the project. Furthermore,
agricultural residues are considered a renewable source of biomass, so burning them does not increase the
Green House Gases in the atmosphere on the long term.
Sampling design
The multi stage sampling is applied to this project. Among the 49 group of the area targeted, 7 groups
have been chosen randomly (simple random sampling). Among those groups, 13% of the households
targeted by the project were selected for a KPT (by simple random sampling in each group). So a total of
70 surveys were done (106 for baseline survey and monitoring survey).
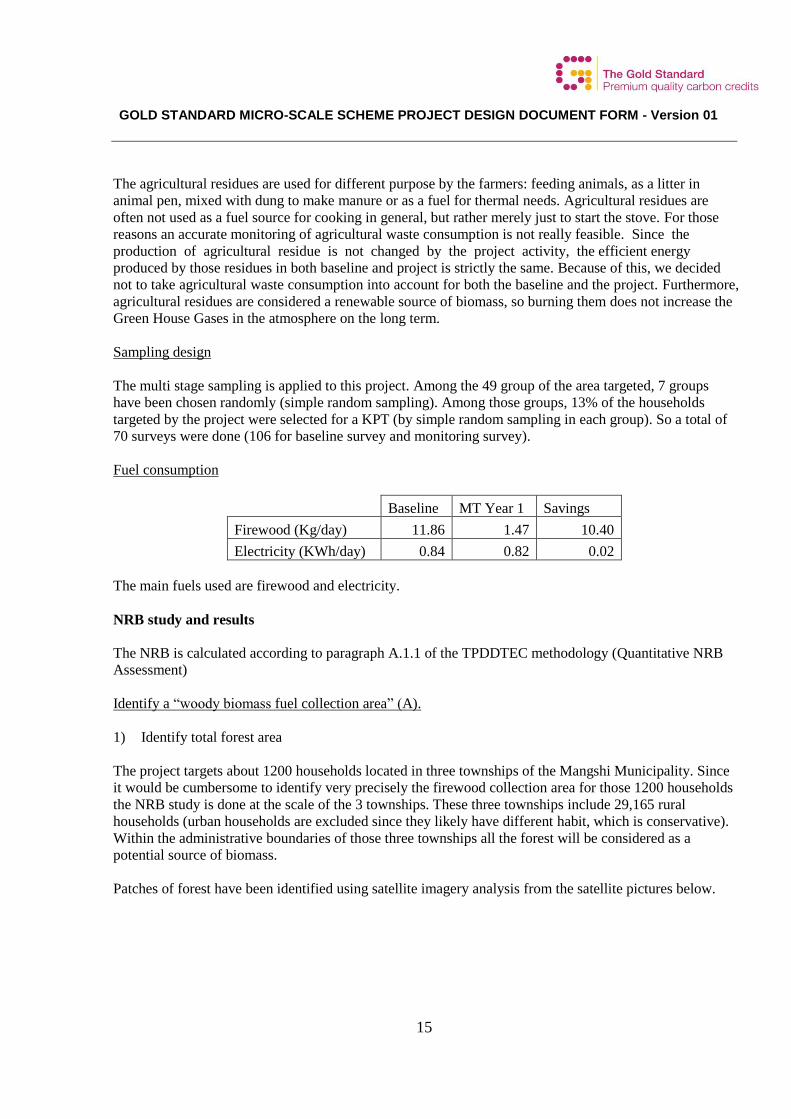
Fuel consumption
Baseline MT Year 1 Savings
Firewood (Kg/day) 11.86 1.47 10.40
Electricity (KWh/day) 0.84 0.82 0.02
The main fuels used are firewood and electricity.
NRB study and results
The NRB is calculated according to paragraph A.1.1 of the TPDDTEC methodology (Quantitative NRB
Assessment)
Identify a “woody biomass fuel collection area” (A).
1) Identify total forest area
The project targets about 1200 households located in three townships of the Mangshi Municipality. Since
it would be cumbersome to identify very precisely the firewood collection area for those 1200 households
the NRB study is done at the scale of the 3 townships. These three townships include 29,165 rural
households (urban households are excluded since they likely have different habit, which is conservative).
Within the administrative boundaries of those three townships all the forest will be considered as a
potential source of biomass.
Patches of forest have been identified using satellite imagery analysis from the satellite pictures below.
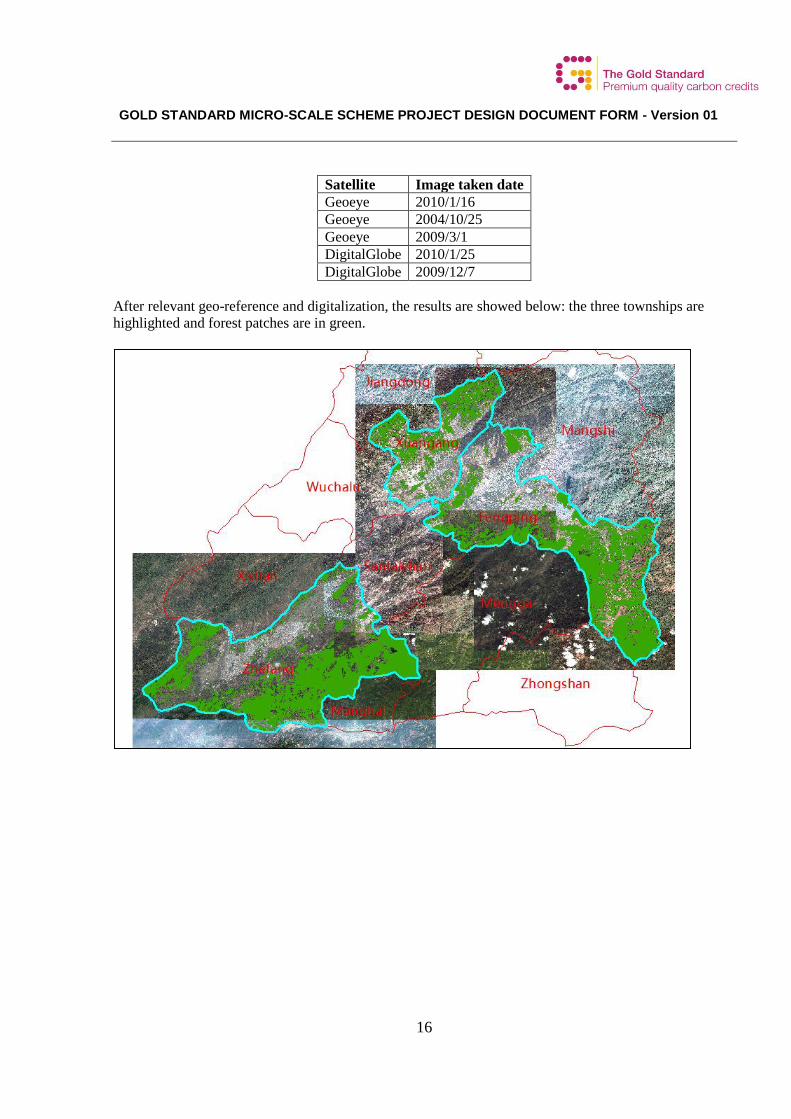
GOLD STANDARD MICRO-SCALE SCHEME PROJECT DESIGN DOCUMENT FORM - Version 01
16
Satellite Image taken date
Geoeye 2010/1/16
Geoeye 2004/10/25
Geoeye 2009/3/1
DigitalGlobe 2010/1/25
DigitalGlobe 2009/12/7
After relevant geo-reference and digitalization, the results are showed below: the three townships are
highlighted and forest patches are in green.
GOLD STANDARD MICRO-SCALE SCHEME PROJECT DESIGN DOCUMENT FORM - Version 01
17
After calculating by GIS software, the results are shown in the table below:
Township Forest area
(ha)
Xuangang 6607.01
Fengping 8895.93
Zhefang 7187.81
2) Calculating the forest area for firewood using
According to several forest policies and local realities, the actual ratio of forest area which can be
collected by rural households as firewood out of total forest area was provided by Mangshi Animal
Husbandry and Veterinary Bureau12. Thus, the firewood collecting forest area is showing in the table
below:
Township Total forest
area (ha)
Firewood collecting forest area
ratio out of total forest area
(official source)
Firewood collecting forest
area (ha)
Xuangang 6,607.01 51.40% 3,396.01
Fengping 8,895.93 50.20% 4,465.76
Zhefang 7,187.81 44.80% 3,220.14
Total 22,690.76
11,081.90
Determination of woody biomass mean annual increment (MAI).
A scientific paper13, dedicated to forest plantations, provides local growth curves for the following cases:
- Pinus yunnanensis
- Pinus armandii
- Cunninghamia lanceolate & Cryptomeria fortune
- Conifers
- Broadleaf trees
- Conifers and broadleaf trees
The first 3 plantation types are species-specific categories while the 3 last types are conifers and broader
ones.
12 See “Evidence 12. firewood collecting forest area ratio” 13
Chen Xiangang, Zhang Xiaoquan, Zhang Yiping, Wan Chengbin. Carbon sequestration potential of the stands
under the Grain for Green Program in Yunnan Province, China. Forest Ecology and Management (2009).
http://sourcedb.cas.cn/sourcedb_xtbg_cas/zw/lw/200908/P020090826329047219983.pdf
GOLD STANDARD MICRO-SCALE SCHEME PROJECT DESIGN DOCUMENT FORM - Version 01
18
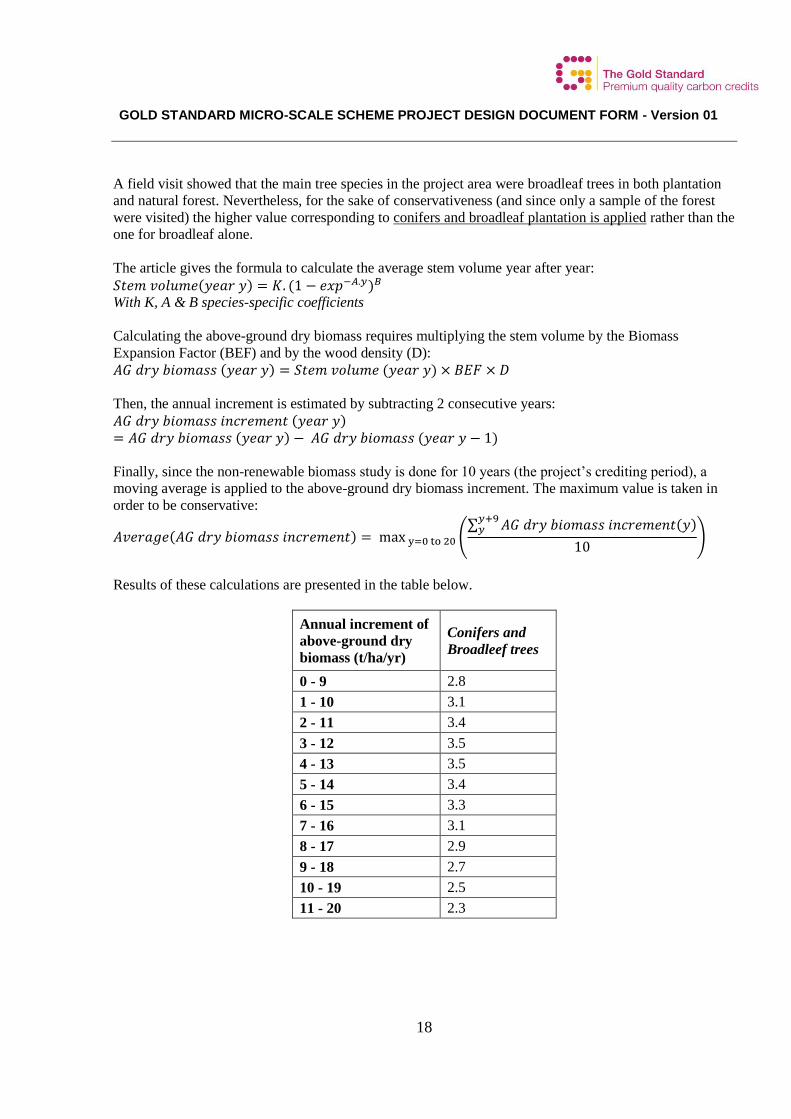
A field visit showed that the main tree species in the project area were broadleaf trees in both plantation
and natural forest. Nevertheless, for the sake of conservativeness (and since only a sample of the forest
were visited) the higher value corresponding to conifers and broadleaf plantation is applied rather than the
one for broadleaf alone.
The article gives the formula to calculate the average stem volume year after year:
𝑆𝑡𝑒𝑚 𝑣𝑜𝑙𝑢𝑚𝑒(𝑦𝑒𝑎𝑟 𝑦) = 𝐾. (1 − 𝑒𝑥𝑝−𝐴.𝑦)𝐵 With K, A & B species-specific coefficients
Calculating the above-ground dry biomass requires multiplying the stem volume by the Biomass
Expansion Factor (BEF) and by the wood density (D):
𝐴𝐺 𝑑𝑟𝑦 𝑏𝑖𝑜𝑚𝑎𝑠𝑠 (𝑦𝑒𝑎𝑟 𝑦) = 𝑆𝑡𝑒𝑚 𝑣𝑜𝑙𝑢𝑚𝑒 (𝑦𝑒𝑎𝑟 𝑦) × 𝐵𝐸𝐹 × 𝐷
Then, the annual increment is estimated by subtracting 2 consecutive years:
𝐴𝐺 𝑑𝑟𝑦 𝑏𝑖𝑜𝑚𝑎𝑠𝑠 𝑖𝑛𝑐𝑟𝑒𝑚𝑒𝑛𝑡 (𝑦𝑒𝑎𝑟 𝑦)= 𝐴𝐺 𝑑𝑟𝑦 𝑏𝑖𝑜𝑚𝑎𝑠𝑠 (𝑦𝑒𝑎𝑟 𝑦) − 𝐴𝐺 𝑑𝑟𝑦 𝑏𝑖𝑜𝑚𝑎𝑠𝑠 (𝑦𝑒𝑎𝑟 𝑦 − 1)
Finally, since the non-renewable biomass study is done for 10 years (the project’s crediting period), a
moving average is applied to the above-ground dry biomass increment. The maximum value is taken in
order to be conservative:
𝐴𝑣𝑒𝑟𝑎𝑔𝑒(𝐴𝐺 𝑑𝑟𝑦 𝑏𝑖𝑜𝑚𝑎𝑠𝑠 𝑖𝑛𝑐𝑟𝑒𝑚𝑒𝑛𝑡) = max y=0 to 20 (∑ 𝐴𝐺 𝑑𝑟𝑦 𝑏𝑖𝑜𝑚𝑎𝑠𝑠 𝑖𝑛𝑐𝑟𝑒𝑚𝑒𝑛𝑡(𝑦)𝑦+9
𝑦
10)
Results of these calculations are presented in the table below.
Annual increment of
above-ground dry
biomass (t/ha/yr)
Conifers and
Broadleef trees
0 - 9 2.8
1 - 10 3.1
2 - 11 3.4
3 - 12 3.5
4 - 13 3.5
5 - 14 3.4
6 - 15 3.3
7 - 16 3.1
8 - 17 2.9
9 - 18 2.7
10 - 19 2.5
11 - 20 2.3
GOLD STANDARD MICRO-SCALE SCHEME PROJECT DESIGN DOCUMENT FORM - Version 01
19
12 - 21 2.1
13 - 22 1.9
14 - 23 1.8
15 - 24 1.6
16 - 25 1.4
17 - 26 1.3
18 - 27 1.2
19 - 28 1.0
20 - 29 0.9
MAX 3.5
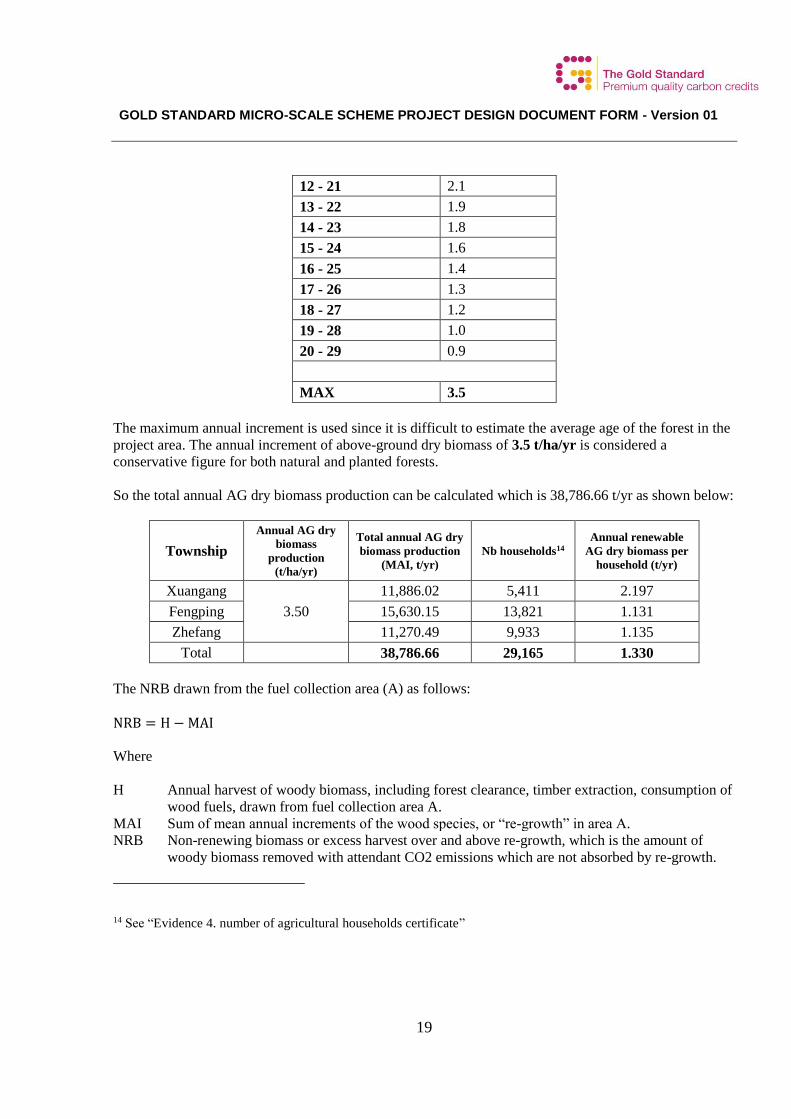
The maximum annual increment is used since it is difficult to estimate the average age of the forest in the
project area. The annual increment of above-ground dry biomass of 3.5 t/ha/yr is considered a
conservative figure for both natural and planted forests.
So the total annual AG dry biomass production can be calculated which is 38,786.66 t/yr as shown below:
Township
Annual AG dry
biomass
production
(t/ha/yr)
Total annual AG dry
biomass production
(MAI, t/yr)
Nb households14
Annual renewable
AG dry biomass per
household (t/yr)
Xuangang
3.50
11,886.02 5,411 2.197
Fengping 15,630.15 13,821 1.131
Zhefang 11,270.49 9,933 1.135
Total
38,786.66 29,165 1.330
The NRB drawn from the fuel collection area (A) as follows:
NRB = H − MAI
Where
H Annual harvest of woody biomass, including forest clearance, timber extraction, consumption of
wood fuels, drawn from fuel collection area A.
MAI Sum of mean annual increments of the wood species, or “re-growth” in area A.
NRB Non-renewing biomass or excess harvest over and above re-growth, which is the amount of
woody biomass removed with attendant CO2 emissions which are not absorbed by re-growth.
14 See “Evidence 4. number of agricultural households certificate”
GOLD STANDARD MICRO-SCALE SCHEME PROJECT DESIGN DOCUMENT FORM - Version 01
20
That is:
H = (11.86 kg/day * 365 days / 1000) * 29,165 households = 126,285.07 t/yr
MAI = 38,786.66 t/yr
NRB = 126,285.07 - 38,786.66 = 87,498.41 t/yr
The fraction fNRB is:
𝑓𝑁𝑅𝐵 = (𝑁𝑅𝐵/𝐻)
As a result,
fNRB = (87,498.41/126,285.07) = 69.29%
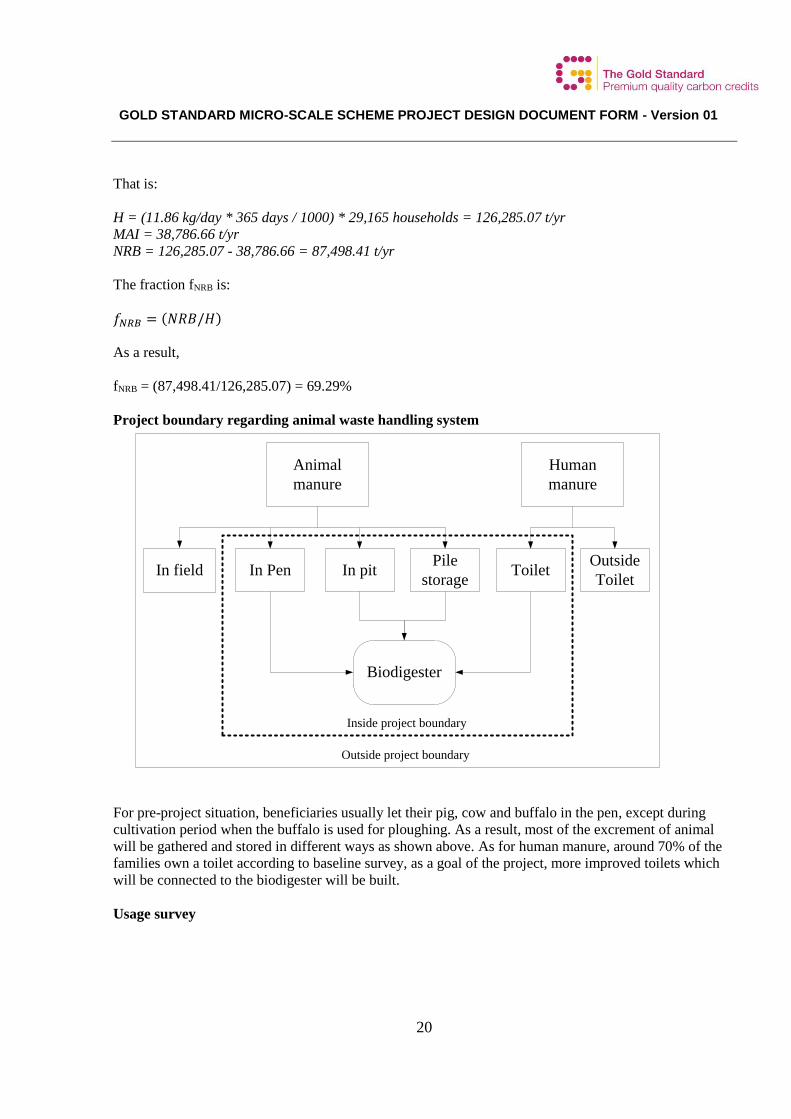
Project boundary regarding animal waste handling system
Animal
manure
Human
manure
Biodigester
In pitIn field In PenPile
storageToilet
Outside
Toilet
Inside project boundary
Outside project boundary
For pre-project situation, beneficiaries usually let their pig, cow and buffalo in the pen, except during
cultivation period when the buffalo is used for ploughing. As a result, most of the excrement of animal
will be gathered and stored in different ways as shown above. As for human manure, around 70% of the
families own a toilet according to baseline survey, as a goal of the project, more improved toilets which
will be connected to the biodigester will be built.
Usage survey
GOLD STANDARD MICRO-SCALE SCHEME PROJECT DESIGN DOCUMENT FORM - Version 01
21
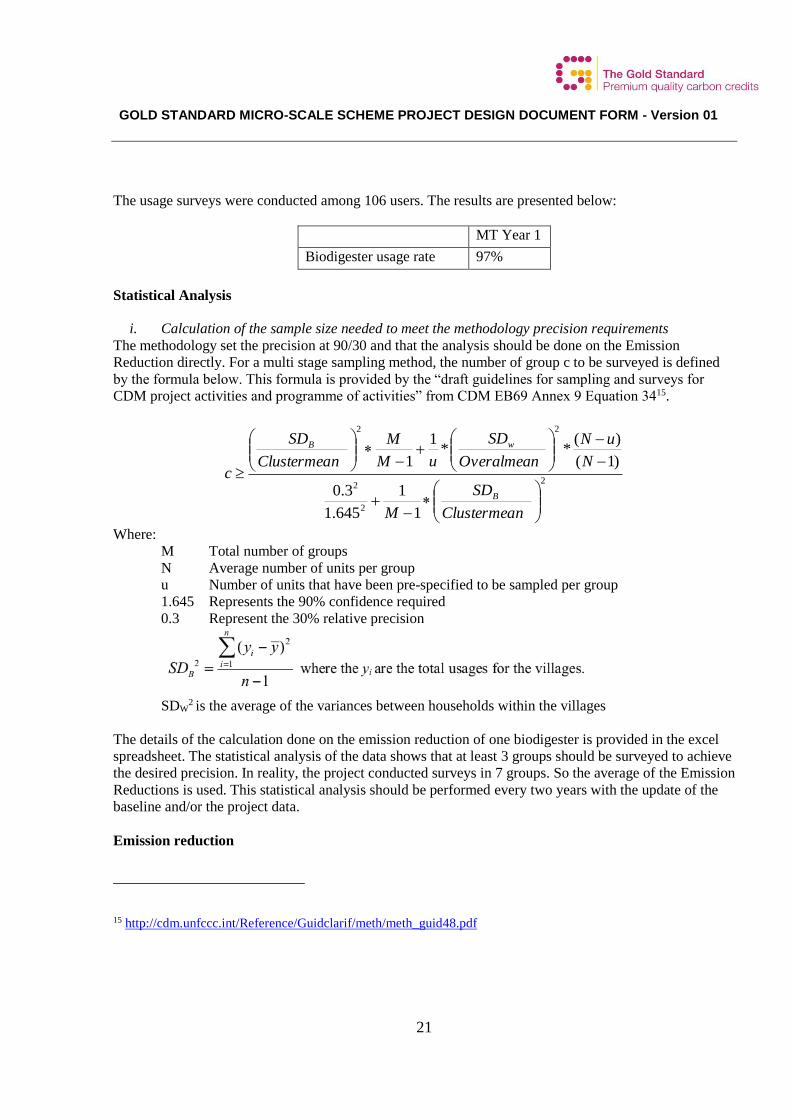
The usage surveys were conducted among 106 users. The results are presented below:
MT Year 1
Biodigester usage rate 97%
Statistical Analysis
i. Calculation of the sample size needed to meet the methodology precision requirements
The methodology set the precision at 90/30 and that the analysis should be done on the Emission
Reduction directly. For a multi stage sampling method, the number of group c to be surveyed is defined
by the formula below. This formula is provided by the “draft guidelines for sampling and surveys for
CDM project activities and programme of activities” from CDM EB69 Annex 9 Equation 3415.
2
2
2
22
1
1
645.1
3.0
)1(
)(**
1
1
nClustermea
SD
M
N
uN
Overalmean
SD
uM
M
nClustermea
SD
c
B
wB
Where:
M Total number of groups
N Average number of units per group
u Number of units that have been pre-specified to be sampled per group
1.645 Represents the 90% confidence required
0.3 Represent the 30% relative precision
SDW
2 is the average of the variances between households within the villages
The details of the calculation done on the emission reduction of one biodigester is provided in the excel
spreadsheet. The statistical analysis of the data shows that at least 3 groups should be surveyed to achieve
the desired precision. In reality, the project conducted surveys in 7 groups. So the average of the Emission
Reductions is used. This statistical analysis should be performed every two years with the update of the
baseline and/or the project data.
Emission reduction
15 http://cdm.unfccc.int/Reference/Guidclarif/meth/meth_guid48.pdf
GOLD STANDARD MICRO-SCALE SCHEME PROJECT DESIGN DOCUMENT FORM - Version 01
22
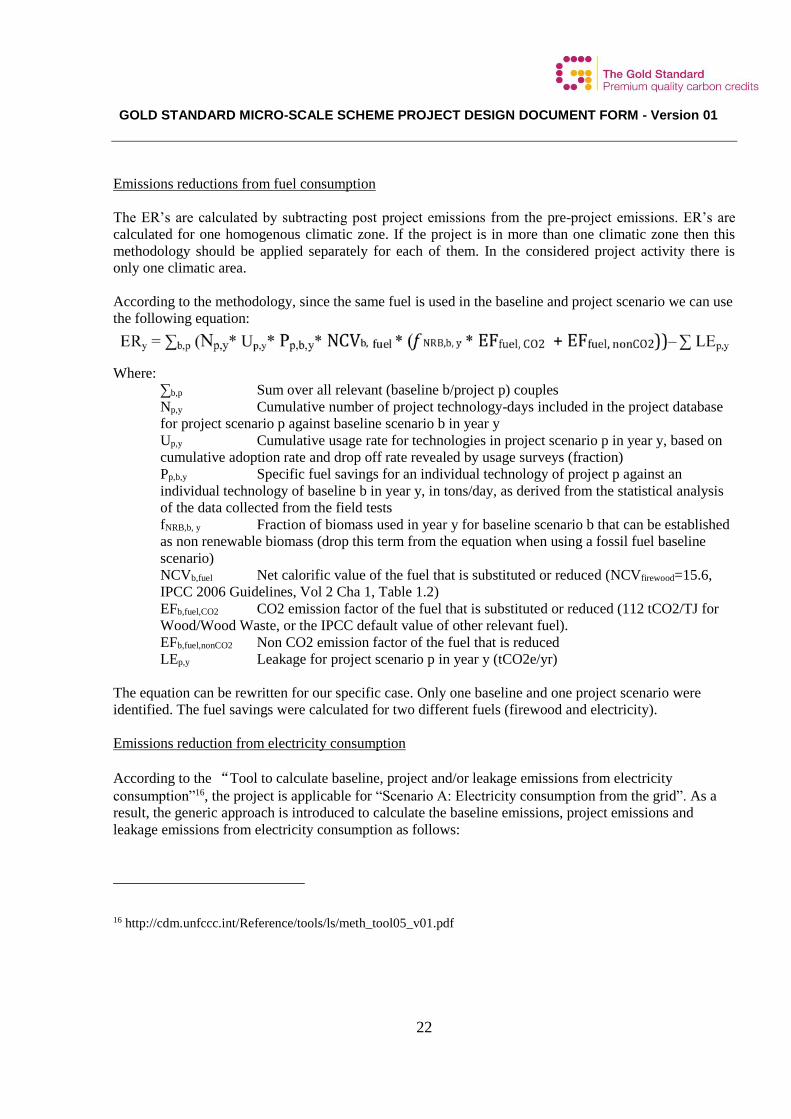
Emissions reductions from fuel consumption
The ER’s are calculated by subtracting post project emissions from the pre-project emissions. ER’s are
calculated for one homogenous climatic zone. If the project is in more than one climatic zone then this
methodology should be applied separately for each of them. In the considered project activity there is
only one climatic area.
According to the methodology, since the same fuel is used in the baseline and project scenario we can use
the following equation:
Where:
∑b,p Sum over all relevant (baseline b/project p) couples
Np,y Cumulative number of project technology-days included in the project database
for project scenario p against baseline scenario b in year y
Up,y Cumulative usage rate for technologies in project scenario p in year y, based on
cumulative adoption rate and drop off rate revealed by usage surveys (fraction)
Pp,b,y Specific fuel savings for an individual technology of project p against an
individual technology of baseline b in year y, in tons/day, as derived from the statistical analysis
of the data collected from the field tests
fNRB,b, y Fraction of biomass used in year y for baseline scenario b that can be established
as non renewable biomass (drop this term from the equation when using a fossil fuel baseline
scenario)
NCVb,fuel Net calorific value of the fuel that is substituted or reduced (NCVfirewood=15.6,
IPCC 2006 Guidelines, Vol 2 Cha 1, Table 1.2)
EFb,fuel,CO2 CO2 emission factor of the fuel that is substituted or reduced (112 tCO2/TJ for
Wood/Wood Waste, or the IPCC default value of other relevant fuel).
EFb,fuel,nonCO2 Non CO2 emission factor of the fuel that is reduced
LEp,y Leakage for project scenario p in year y (tCO2e/yr)
The equation can be rewritten for our specific case. Only one baseline and one project scenario were
identified. The fuel savings were calculated for two different fuels (firewood and electricity).
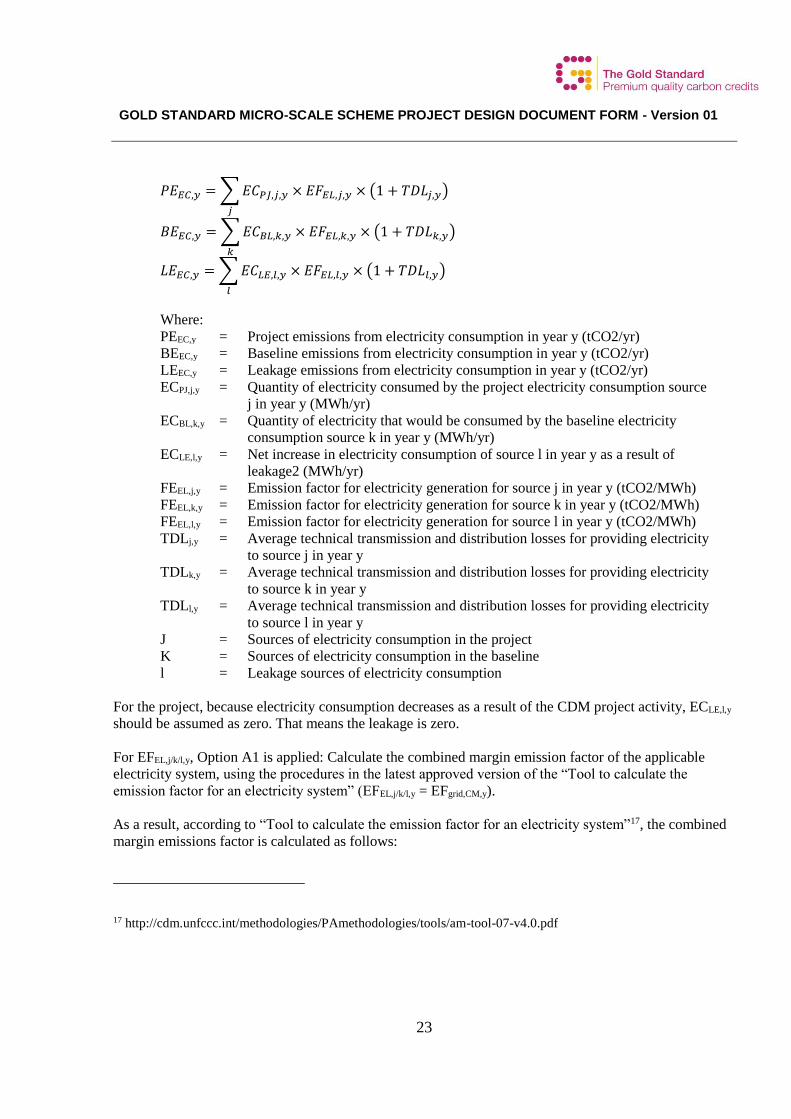
Emissions reduction from electricity consumption
According to the “Tool to calculate baseline, project and/or leakage emissions from electricity
consumption”16, the project is applicable for “Scenario A: Electricity consumption from the grid”. As a
result, the generic approach is introduced to calculate the baseline emissions, project emissions and
leakage emissions from electricity consumption as follows:
16 http://cdm.unfccc.int/Reference/tools/ls/meth_tool05_v01.pdf
GOLD STANDARD MICRO-SCALE SCHEME PROJECT DESIGN DOCUMENT FORM - Version 01
23
𝑃𝐸𝐸𝐶,𝑦 = ∑ 𝐸𝐶𝑃𝐽,𝑗,𝑦
𝑗
× 𝐸𝐹𝐸𝐿,𝑗,𝑦 × (1 + 𝑇𝐷𝐿𝑗,𝑦)
𝐵𝐸𝐸𝐶,𝑦 = ∑ 𝐸𝐶𝐵𝐿,𝑘,𝑦
𝑘
× 𝐸𝐹𝐸𝐿,𝑘,𝑦 × (1 + 𝑇𝐷𝐿𝑘,𝑦)
𝐿𝐸𝐸𝐶,𝑦 = ∑ 𝐸𝐶𝐿𝐸,𝑙,𝑦
𝑙
× 𝐸𝐹𝐸𝐿,𝑙,𝑦 × (1 + 𝑇𝐷𝐿𝑙,𝑦)
Where:
PEEC,y = Project emissions from electricity consumption in year y (tCO2/yr)
BEEC,y = Baseline emissions from electricity consumption in year y (tCO2/yr)
LEEC,y = Leakage emissions from electricity consumption in year y (tCO2/yr)
ECPJ,j,y = Quantity of electricity consumed by the project electricity consumption source
j in year y (MWh/yr)
ECBL,k,y = Quantity of electricity that would be consumed by the baseline electricity
consumption source k in year y (MWh/yr)
ECLE,l,y = Net increase in electricity consumption of source l in year y as a result of
leakage2 (MWh/yr)
FEEL,j,y = Emission factor for electricity generation for source j in year y (tCO2/MWh)
FEEL,k,y = Emission factor for electricity generation for source k in year y (tCO2/MWh)
FEEL,l,y = Emission factor for electricity generation for source l in year y (tCO2/MWh)
TDLj,y = Average technical transmission and distribution losses for providing electricity
to source j in year y
TDLk,y = Average technical transmission and distribution losses for providing electricity
to source k in year y
TDLl,y = Average technical transmission and distribution losses for providing electricity
to source l in year y
J = Sources of electricity consumption in the project
K = Sources of electricity consumption in the baseline
l = Leakage sources of electricity consumption
For the project, because electricity consumption decreases as a result of the CDM project activity, ECLE,l,y
should be assumed as zero. That means the leakage is zero.
For EFEL,j/k/l,y, Option A1 is applied: Calculate the combined margin emission factor of the applicable
electricity system, using the procedures in the latest approved version of the “Tool to calculate the
emission factor for an electricity system” (EFEL,j/k/l,y = EFgrid,CM,y).
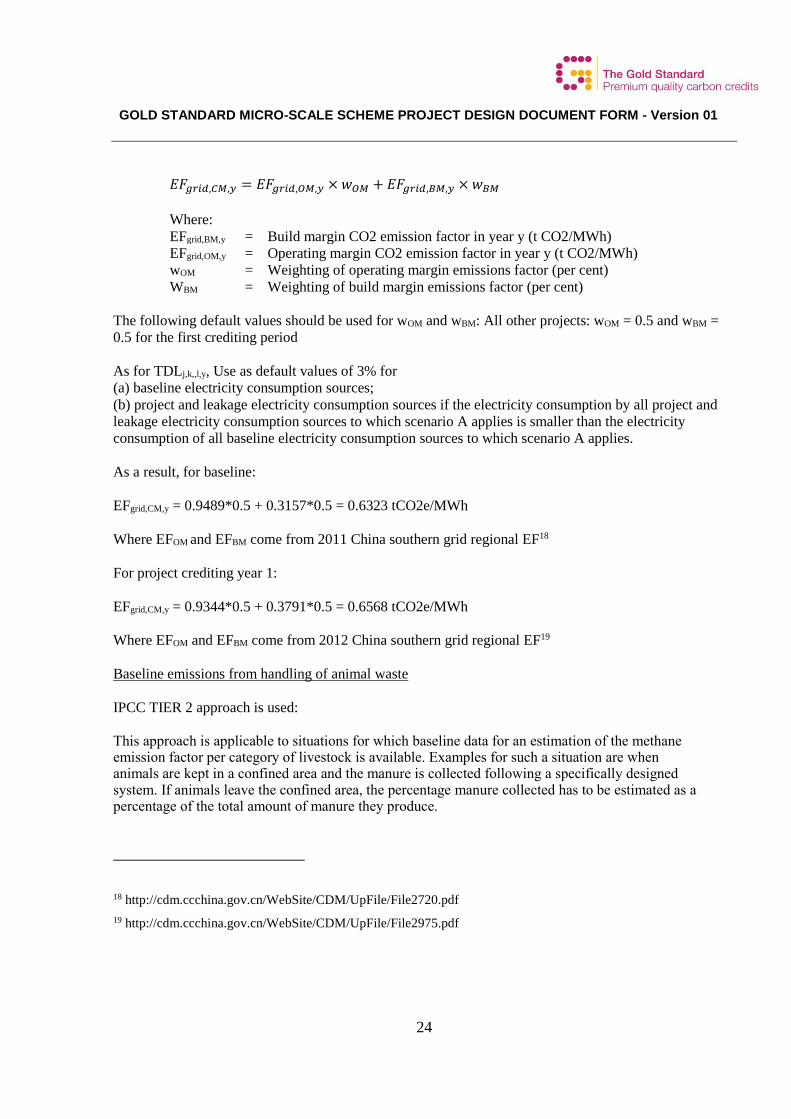
As a result, according to “Tool to calculate the emission factor for an electricity system”17, the combined
margin emissions factor is calculated as follows:
17 http://cdm.unfccc.int/methodologies/PAmethodologies/tools/am-tool-07-v4.0.pdf
GOLD STANDARD MICRO-SCALE SCHEME PROJECT DESIGN DOCUMENT FORM - Version 01
24
𝐸𝐹𝑔𝑟𝑖𝑑,𝐶𝑀,𝑦 = 𝐸𝐹𝑔𝑟𝑖𝑑,𝑂𝑀,𝑦 × 𝑤𝑂𝑀 + 𝐸𝐹𝑔𝑟𝑖𝑑,𝐵𝑀,𝑦 × 𝑤𝐵𝑀
Where:
EFgrid,BM,y = Build margin CO2 emission factor in year y (t CO2/MWh)
EFgrid,OM,y = Operating margin CO2 emission factor in year y (t CO2/MWh)
wOM = Weighting of operating margin emissions factor (per cent)
WBM = Weighting of build margin emissions factor (per cent)
The following default values should be used for wOM and wBM: All other projects: wOM = 0.5 and wBM =
0.5 for the first crediting period
As for TDLj,k,,l,y, Use as default values of 3% for
(a) baseline electricity consumption sources;
(b) project and leakage electricity consumption sources if the electricity consumption by all project and
leakage electricity consumption sources to which scenario A applies is smaller than the electricity
consumption of all baseline electricity consumption sources to which scenario A applies.
As a result, for baseline:
EFgrid,CM,y = 0.9489*0.5 + 0.3157*0.5 = 0.6323 tCO2e/MWh
Where EFOM and EFBM come from 2011 China southern grid regional EF18
For project crediting year 1:
EFgrid,CM,y = 0.9344*0.5 + 0.3791*0.5 = 0.6568 tCO2e/MWh
Where EFOM and EFBM come from 2012 China southern grid regional EF19
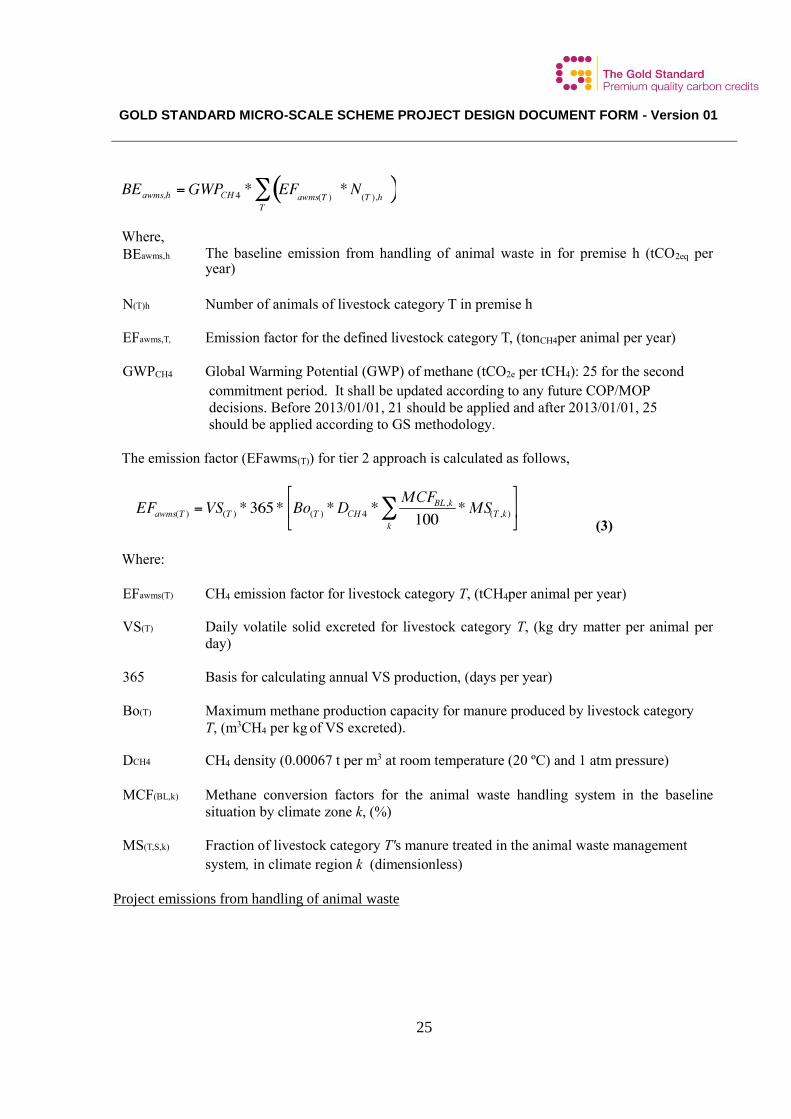
Baseline emissions from handling of animal waste
IPCC TIER 2 approach is used:
This approach is applicable to situations for which baseline data for an estimation of the methane emission factor per category of livestock is available. Examples for such a situation are when animals are kept in a confined area and the manure is collected following a specifically designed system. If animals leave the confined area, the percentage manure collected has to be estimated as a percentage of the total amount of manure they produce.
18 http://cdm.ccchina.gov.cn/WebSite/CDM/UpFile/File2720.pdf
19 http://cdm.ccchina.gov.cn/WebSite/CDM/UpFile/File2975.pdf
GOLD STANDARD MICRO-SCALE SCHEME PROJECT DESIGN DOCUMENT FORM - Version 01
25
Where,
BEawms,h The baseline emission from handling of animal waste in for premise h (tCO2eq per year)
N(T)h Number of animals of livestock category T in premise h
EFawms,T, Emission factor for the defined livestock category T, (tonCH4per animal per year)
GWPCH4 Global Warming Potential (GWP) of methane (tCO2e per tCH4): 25 for the second
commitment period. It shall be updated according to any future COP/MOP
decisions. Before 2013/01/01, 21 should be applied and after 2013/01/01, 25
should be applied according to GS methodology.
The emission factor (EFawms(T)) for tier 2 approach is calculated as follows,
(3)
Where:
EFawms(T) CH4 emission factor for livestock category T, (tCH4per animal per year)
VS(T) Daily volatile solid excreted for livestock category T, (kg dry matter per animal per
day)
365 Basis for calculating annual VS production, (days per year)
Bo(T) Maximum methane production capacity for manure produced by livestock category
T, (m3CH4 per kg of VS excreted).
DCH4 CH4 density (0.00067 t per m3 at room temperature (20 ºC) and 1 atm pressure)
MCF(BL,k) Methane conversion factors for the animal waste handling system in the baseline
situation by climate zone k, (%)
MS(T,S,k) Fraction of livestock category T's manure treated in the animal waste management
system, in climate region k (dimensionless)
Project emissions from handling of animal waste
GOLD STANDARD MICRO-SCALE SCHEME PROJECT DESIGN DOCUMENT FORM - Version 01
26
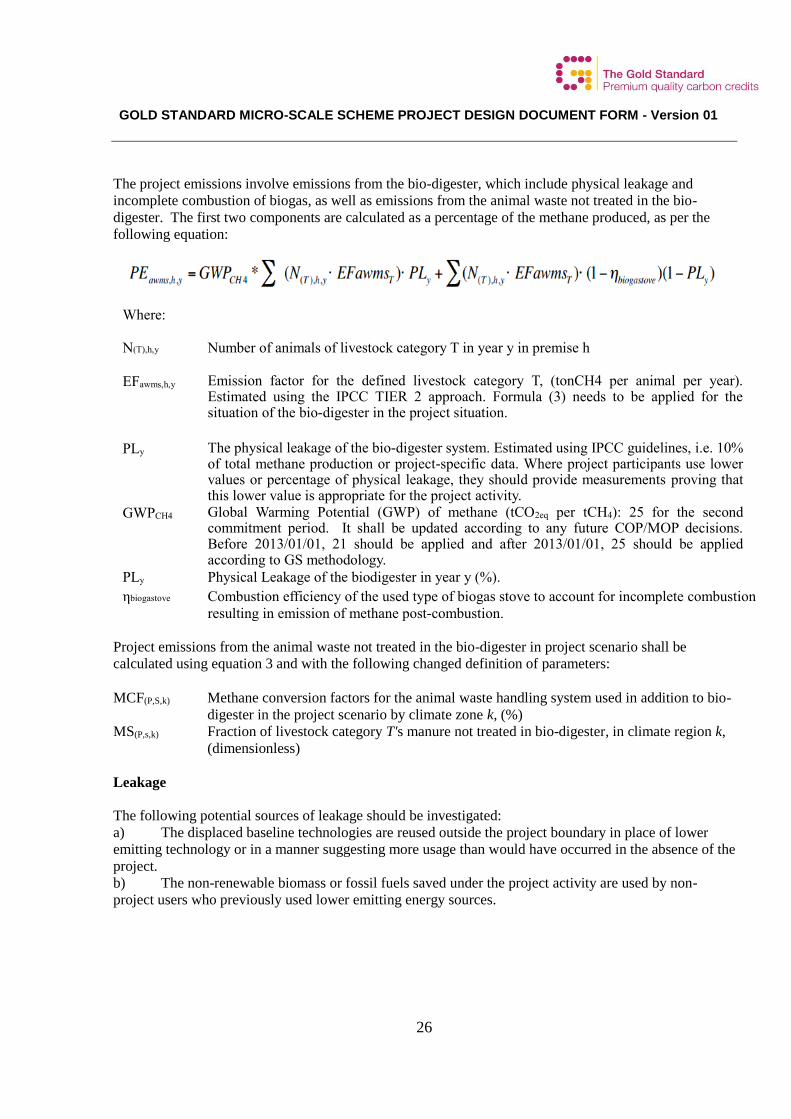
The project emissions involve emissions from the bio-digester, which include physical leakage and
incomplete combustion of biogas, as well as emissions from the animal waste not treated in the bio-
digester. The first two components are calculated as a percentage of the methane produced, as per the
following equation:
Project emissions from the animal waste not treated in the bio-digester in project scenario shall be
calculated using equation 3 and with the following changed definition of parameters:
MCF(P,S,k) Methane conversion factors for the animal waste handling system used in addition to bio-
digester in the project scenario by climate zone k, (%)
MS(P,s,k) Fraction of livestock category T's manure not treated in bio-digester, in climate region k,
(dimensionless)
Leakage
The following potential sources of leakage should be investigated:
a) The displaced baseline technologies are reused outside the project boundary in place of lower
emitting technology or in a manner suggesting more usage than would have occurred in the absence of the
project.
b) The non-renewable biomass or fossil fuels saved under the project activity are used by non-
project users who previously used lower emitting energy sources.
Where:
N(T),h,y Number of animals of livestock category T in year y in premise h
EFawms,h,y Emission factor for the defined livestock category T, (tonCH4 per animal per year). Estimated using the IPCC TIER 2 approach. Formula (3) needs to be applied for the situation of the bio-digester in the project situation.
PLy The physical leakage of the bio-digester system. Estimated using IPCC guidelines, i.e. 10% of total methane production or project-specific data. Where project participants use lower values or percentage of physical leakage, they should provide measurements proving that this lower value is appropriate for the project activity.
GWPCH4 Global Warming Potential (GWP) of methane (tCO2eq per tCH4): 25 for the second commitment period. It shall be updated according to any future COP/MOP decisions. Before 2013/01/01, 21 should be applied and after 2013/01/01, 25 should be applied according to GS methodology.
PLy Physical Leakage of the biodigester in year y (%).
ηbiogastove Combustion efficiency of the used type of biogas stove to account for incomplete combustion
resulting in emission of methane post-combustion.
GOLD STANDARD MICRO-SCALE SCHEME PROJECT DESIGN DOCUMENT FORM - Version 01
27
c) The project significantly impacts the NRB fraction within an area where other CDM or VER
project activities account for NRB fraction in their baseline scenario.
d) The project population compensates for loss of the space heating effect of inefficient technology
by adopting some other form of heating or by retaining some use of inefficient technology
e) By virtue of promotion and marketing of a new technology with high efficiency, the project
stimulates substitution within households who commonly used a technology with relatively lower
emissions, in cases where such a trend is not eligible as an evolving baseline.
However, for such a micro-scale project, 5% of the total ERs is considered as the leakage for simplicity.
B.6.2. Data and parameters that are available at validation:
Data / Parameter: EFb,CO2
Data unit: tCO2/TJ or tCO2/t_fuel
Description: CO2 emission factor arising from use of fuels in baseline scenario
Source of data used: IPCC defaults, credible published literature, project-relevant measurement
reports, or project-specific field tests prior to first verification.
Value applied: EFfw,CO2= 112 tCO2/TJ; EFelec=632.3 tCO2/GWh
Justification of the
choice of data or
description of
measurement methods
and procedures actually
applied:
For firewood and coal, the IPCC 2006 (Vol 2, Chap 2, Table 2.5) data have
been applied.
For electricity, the value is calculated by using the CDM “tool to calculate the
emission factor for an electricity system” version 2 with
- OM2011 = 0.9489 tCO2e/MWh
- BM2011 = 0.3157 tCO2e/MWh
These two parameters are the value indicated by the DNA for the South China
Power Grid in 201120.
Any comment: If EF is in units of tCO2/t_fuel, remove NCV term from emission calculations.
Term can include a combination of emission factors from fuel production,
transport, and use.
Data / Parameter: EFb, nonCO2
Data unit: tCO2/TJ or tCO2/t_fuel
Description: Non-CO2 emission factor arising from use of fuels in baseline scenario
Source of data used: IPCC defaults, credible published literature, project-relevant measurement
reports, or project-specific field tests prior to first verification
Value applied: EFfw,nonCO2= 29.2 tCO2/TJ
Justification of the
choice of data or
For firewood, the IPCC 2006 (Vol 2, Chap 2, Table 2.9) data have been
applied.
20 http://cdm.ccchina.gov.cn/WebSite/CDM/UpFile/File2720.pdf
GOLD STANDARD MICRO-SCALE SCHEME PROJECT DESIGN DOCUMENT FORM - Version 01
28
description of
measurement methods
and procedures actually
applied:
Any comment: Term can include a combination of emission factors from fuel production,
transport, and use.
Data / Parameter: EFp,CO2
Data unit: tCO2/TJ or tCO2/t_fuel
Description: CO2 emission factor arising from use of fuels in project scenario
Source of data used: IPCC defaults, credible published literature, project-relevant measurement
reports, or project-specific field tests prior to first verification. In the case of
project fuels being renewable biomass, project-relevant or project-specific
field tests are mandatory (project –relevant field tests are those not undertaken
for the proposed project but which directly reflect project conditions).
Value applied: EFfw,CO2= 112 tCO2/TJ; EFelec=656.75 tCO2/GWh
Justification of the
choice of data or
description of
measurement methods
and procedures actually
applied:
For firewood and coal, the IPCC 2006 data have been applied.
For electricity, the value is coming from the application of the CDM “tool to
calculate the emission factor for an electricity system” version 2 with
- OM = 0.9344 tCO2e/MWh
- BM = 0.3791 tCO2e/MWh
These two parameters are the value indicated by the DNA for the South China
Power Grid in 201221.
Any comment: If EF is in units of tCO2/t_fuel, remove NCV term from emission calculations.
Term can include a combination of emission factors from fuel production,
transport, and use. This has same value as EFbaseline in projects which reduce
use of the same fuel.
Data / Parameter: EFp, nonCO2
Data unit: tCO2/TJ or tCO2/t_fuel
Description: Non-CO2 emission factor arising from use of fuels in project scenario
Source of data used: IPCC defaults, credible published literature, project-relevant measurement
reports, or project-specific field tests prior to first verification. In the case of
project fuels being renewable biomass, project-relevant or project-specific
field tests are mandatory (project –relevant field tests are those not undertaken
for the proposed project but which directly reflect project conditions).
Value applied: EFfw,nonCO2= 29.2 tCO2/TJ
Justification of the
choice of data or
For firewood, the IPCC 2006 (Vol 2, Chap 2, Table 2.9) data have been
applied.
21 http://cdm.ccchina.gov.cn/WebSite/CDM/UpFile/File2975.pdf
GOLD STANDARD MICRO-SCALE SCHEME PROJECT DESIGN DOCUMENT FORM - Version 01
29
description of
measurement methods
and procedures actually
applied:
Any comment: Term can include a combination of emission factors from fuel production,
transport, and use. This has same value as EFbaseline in projects which reduce
use of the same fuel.
Data / Parameter: NCVb
Data unit: TJ/ton
Description: Net calorific value of the fuels used in the baseline
Source of data used: IPCC defaults, project-relevant measurement reports, or project-specific
testing
Value applied: NCVfw = 15.6 TJ/Kt
Justification of the
choice of data or
description of
measurement methods
and procedures actually
applied:
IPCC 2006 Guidelines, Vol 2 Cha 1, Table 1.2
Any comment: If EF is in units of tCO2/t_fuel, remove NCV term from emission calculations.
Data / Parameter: NCVp
Data unit: TJ/ton
Description: Net calorific value of the fuels used in the project
Source of data used: IPCC defaults, project-relevant measurement reports, or project-specific
testing
Value applied: NCVfw = 15.6 TJ/Kt;
Justification of the
choice of data or
description of
measurement methods
and procedures actually
applied:
IPCC 2006 Guidelines, Vol 2 Cha 1, Table 1.2
Any comment: If EF is in units of tCO2/t_fuel, remove NCV term from emission calculations.
This has same value as NCV baseline in projects which reduce use of the
same fuel.
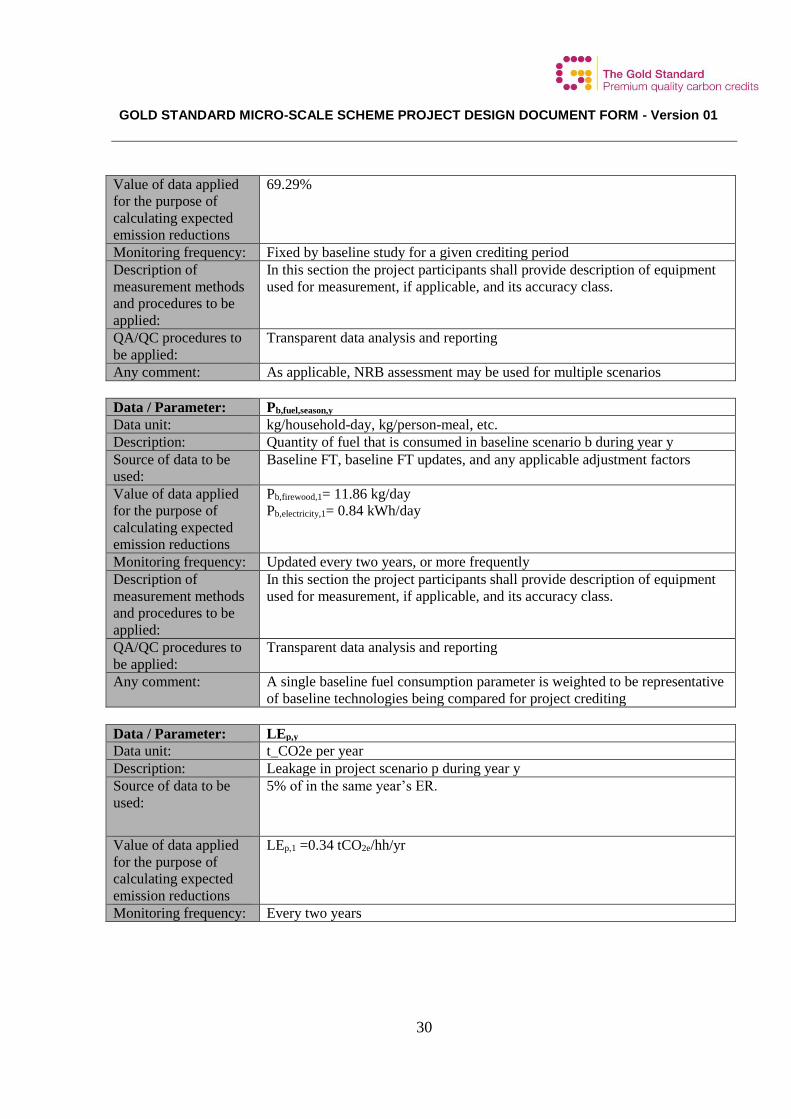
Data / Parameter: fNRB,i,y
Data unit: Fractional non-renewability
Description: Non-renewability status of woody biomass fuel in scenario i during year y
Source of data to be
used:
Applicable NRB assessment
GOLD STANDARD MICRO-SCALE SCHEME PROJECT DESIGN DOCUMENT FORM - Version 01
30
Value of data applied
for the purpose of
calculating expected
emission reductions
69.29%
Monitoring frequency: Fixed by baseline study for a given crediting period
Description of
measurement methods
and procedures to be
applied:
In this section the project participants shall provide description of equipment
used for measurement, if applicable, and its accuracy class.
QA/QC procedures to
be applied:
Transparent data analysis and reporting
Any comment: As applicable, NRB assessment may be used for multiple scenarios
Data / Parameter: Pb,fuel,season,y
Data unit: kg/household-day, kg/person-meal, etc.
Description: Quantity of fuel that is consumed in baseline scenario b during year y
Source of data to be
used:
Baseline FT, baseline FT updates, and any applicable adjustment factors
Value of data applied
for the purpose of
calculating expected
emission reductions
Pb,firewood,1= 11.86 kg/day
Pb,electricity,1= 0.84 kWh/day
Monitoring frequency: Updated every two years, or more frequently
Description of
measurement methods
and procedures to be
applied:
In this section the project participants shall provide description of equipment
used for measurement, if applicable, and its accuracy class.
QA/QC procedures to
be applied:
Transparent data analysis and reporting
Any comment: A single baseline fuel consumption parameter is weighted to be representative
of baseline technologies being compared for project crediting
Data / Parameter: LEp,y
Data unit: t_CO2e per year
Description: Leakage in project scenario p during year y
Source of data to be
used:
5% of in the same year’s ER.
Value of data applied
for the purpose of
calculating expected
emission reductions
LEp,1 =0.34 tCO2e/hh/yr
Monitoring frequency: Every two years
GOLD STANDARD MICRO-SCALE SCHEME PROJECT DESIGN DOCUMENT FORM - Version 01
31
Description of
measurement methods
and procedures to be
applied:
In this section the project participants shall provide description of equipment
used for measurement, if applicable, and its accuracy class.
QA/QC procedures to
be applied:
Transparent data analysis and reporting
Any comment: Aggregate leakage can be assessed for multiple project scenarios, if
appropriate
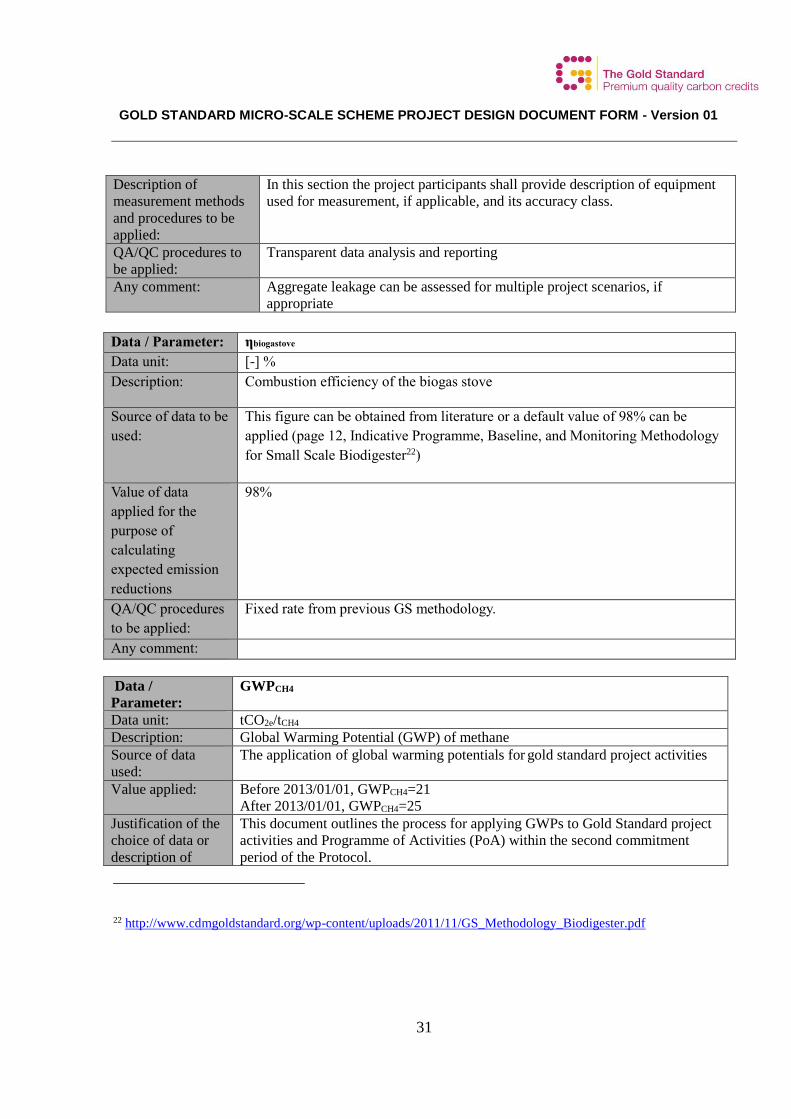
Data / Parameter: ηbiogastove
Data unit: [-] %
Description: Combustion efficiency of the biogas stove
Source of data to be
used:
This figure can be obtained from literature or a default value of 98% can be
applied (page 12, Indicative Programme, Baseline, and Monitoring Methodology
for Small Scale Biodigester22)
Value of data
applied for the
purpose of
calculating
expected emission
reductions
98%
QA/QC procedures
to be applied:
Fixed rate from previous GS methodology.
Any comment:
Data /
Parameter:
GWPCH4
Data unit: tCO2e/tCH4
Description: Global Warming Potential (GWP) of methane
Source of data
used:
The application of global warming potentials for gold standard project activities
Value applied: Before 2013/01/01, GWPCH4=21
After 2013/01/01, GWPCH4=25
Justification of the
choice of data or
description of
This document outlines the process for applying GWPs to Gold Standard project
activities and Programme of Activities (PoA) within the second commitment
period of the Protocol.
22 http://www.cdmgoldstandard.org/wp-content/uploads/2011/11/GS_Methodology_Biodigester.pdf
GOLD STANDARD MICRO-SCALE SCHEME PROJECT DESIGN DOCUMENT FORM - Version 01
32
measurement
methods and
procedures actually
applied :
Any comment:
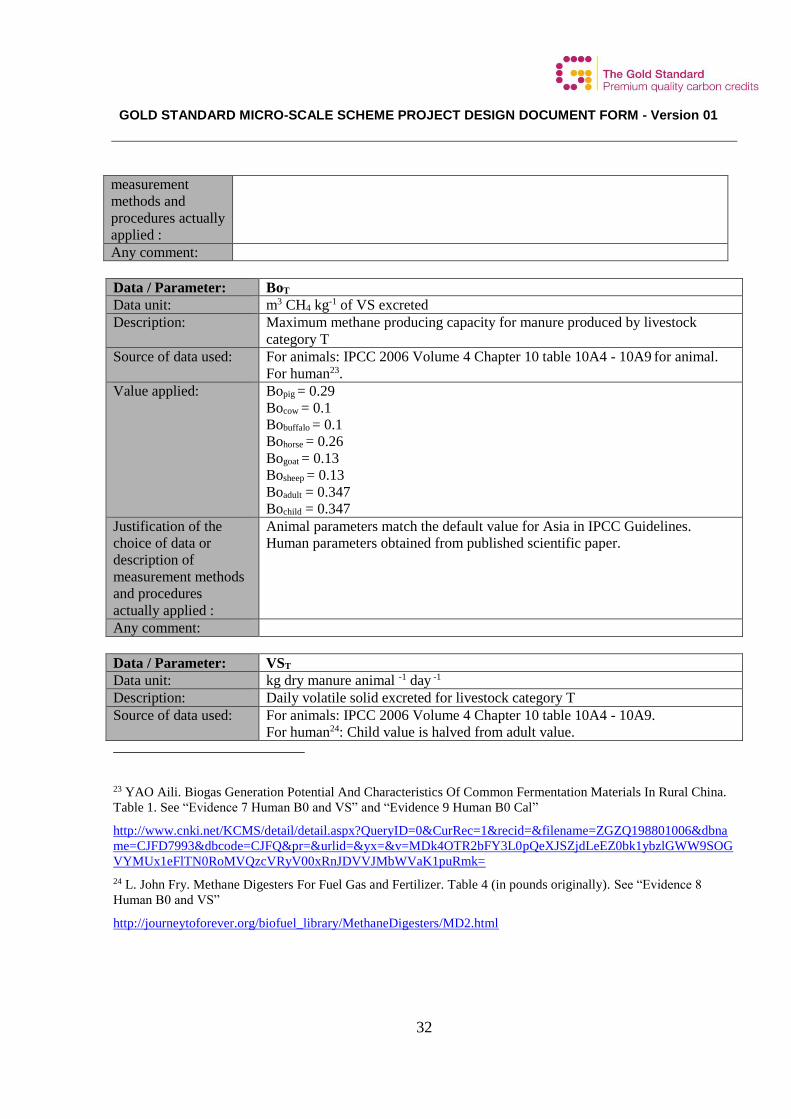
Data / Parameter: BoT
Data unit: m3 CH4 kg-1 of VS excreted
Description: Maximum methane producing capacity for manure produced by livestock
category T
Source of data used: For animals: IPCC 2006 Volume 4 Chapter 10 table 10A4 - 10A9 for animal.
For human23.
Value applied: Bopig = 0.29
Bocow = 0.1
Bobuffalo = 0.1
Bohorse = 0.26
Bogoat = 0.13
Bosheep = 0.13
Boadult = 0.347
Bochild = 0.347
Justification of the
choice of data or
description of
measurement methods
and procedures
actually applied :
Animal parameters match the default value for Asia in IPCC Guidelines.
Human parameters obtained from published scientific paper.
Any comment:
Data / Parameter: VST
Data unit: kg dry manure animal -1 day -1
Description: Daily volatile solid excreted for livestock category T
Source of data used: For animals: IPCC 2006 Volume 4 Chapter 10 table 10A4 - 10A9.
For human24: Child value is halved from adult value.
23 YAO Aili. Biogas Generation Potential And Characteristics Of Common Fermentation Materials In Rural China.
Table 1. See “Evidence 7 Human B0 and VS” and “Evidence 9 Human B0 Cal”
http://www.cnki.net/KCMS/detail/detail.aspx?QueryID=0&CurRec=1&recid=&filename=ZGZQ198801006&dbna
me=CJFD7993&dbcode=CJFQ&pr=&urlid=&yx=&v=MDk4OTR2bFY3L0pQeXJSZjdLeEZ0bk1ybzlGWW9SOG
VYMUx1eFlTN0RoMVQzcVRyV00xRnJDVVJMbWVaK1puRmk=
24 L. John Fry. Methane Digesters For Fuel Gas and Fertilizer. Table 4 (in pounds originally). See “Evidence 8
Human B0 and VS”
http://journeytoforever.org/biofuel_library/MethaneDigesters/MD2.html
GOLD STANDARD MICRO-SCALE SCHEME PROJECT DESIGN DOCUMENT FORM - Version 01
33
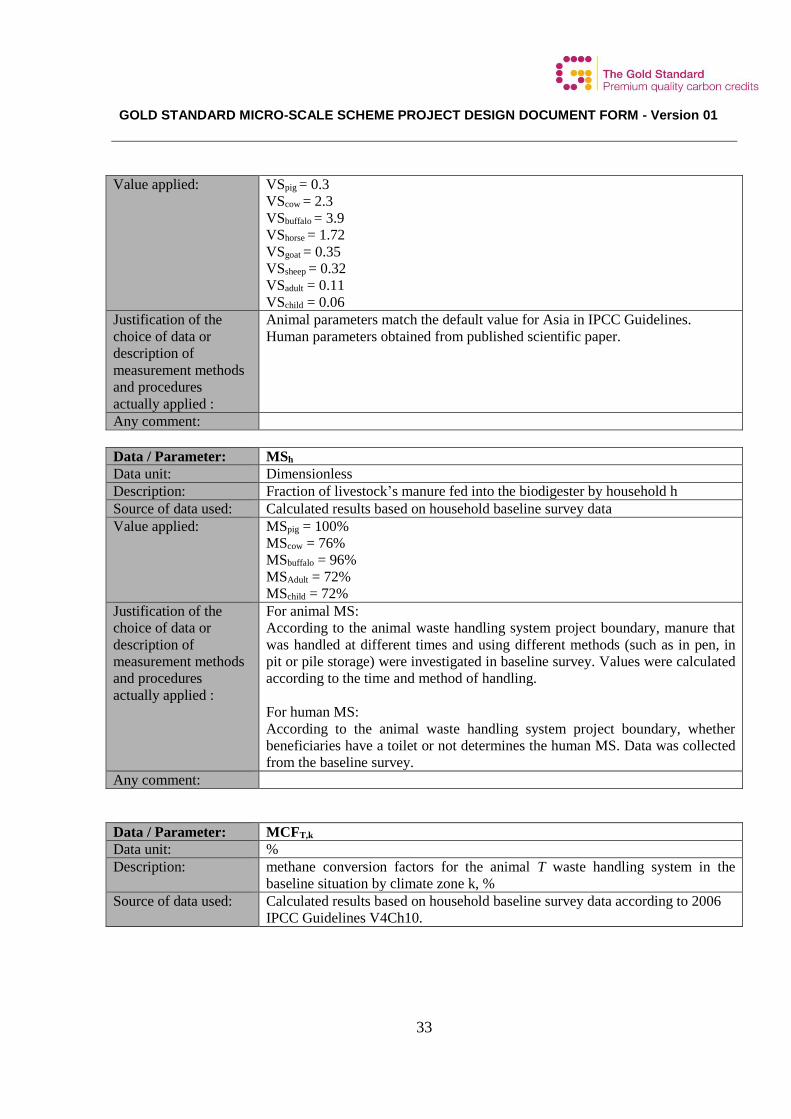
Value applied: VSpig = 0.3
VScow = 2.3
VSbuffalo = 3.9
VShorse = 1.72
VSgoat = 0.35
VSsheep = 0.32
VSadult = 0.11
VSchild = 0.06
Justification of the
choice of data or
description of
measurement methods
and procedures
actually applied :
Animal parameters match the default value for Asia in IPCC Guidelines.
Human parameters obtained from published scientific paper.
Any comment:
Data / Parameter: MSh
Data unit: Dimensionless
Description: Fraction of livestock’s manure fed into the biodigester by household h
Source of data used: Calculated results based on household baseline survey data
Value applied: MSpig = 100%
MScow = 76%
MSbuffalo = 96%
MSAdult = 72%
MSchild = 72%
Justification of the
choice of data or
description of
measurement methods
and procedures
actually applied :
For animal MS:
According to the animal waste handling system project boundary, manure that
was handled at different times and using different methods (such as in pen, in
pit or pile storage) were investigated in baseline survey. Values were calculated
according to the time and method of handling.
For human MS:
According to the animal waste handling system project boundary, whether
beneficiaries have a toilet or not determines the human MS. Data was collected
from the baseline survey.
Any comment:
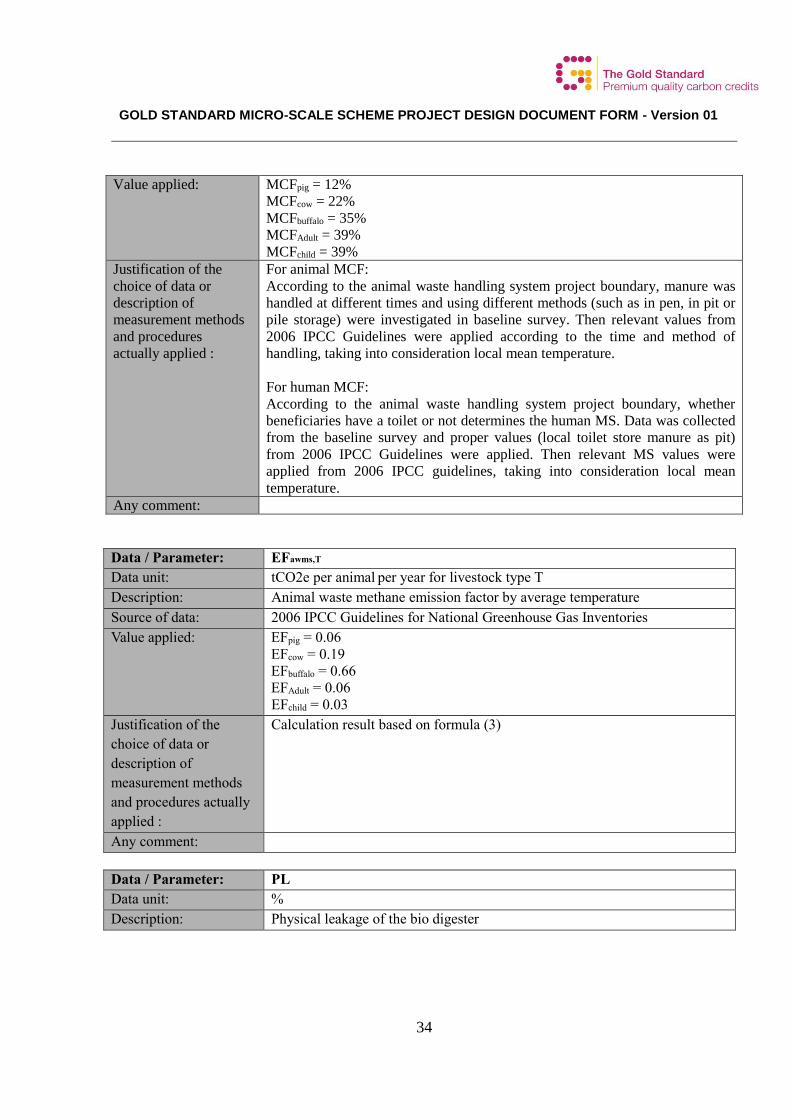
Data / Parameter: MCFT,k
Data unit: %
Description: methane conversion factors for the animal T waste handling system in the
baseline situation by climate zone k, %
Source of data used: Calculated results based on household baseline survey data according to 2006
IPCC Guidelines V4Ch10.
GOLD STANDARD MICRO-SCALE SCHEME PROJECT DESIGN DOCUMENT FORM - Version 01
34
Value applied: MCFpig = 12%
MCFcow = 22%
MCFbuffalo = 35%
MCFAdult = 39%
MCFchild = 39%
Justification of the
choice of data or
description of
measurement methods
and procedures
actually applied :
For animal MCF:
According to the animal waste handling system project boundary, manure was
handled at different times and using different methods (such as in pen, in pit or
pile storage) were investigated in baseline survey. Then relevant values from
2006 IPCC Guidelines were applied according to the time and method of
handling, taking into consideration local mean temperature.
For human MCF:
According to the animal waste handling system project boundary, whether
beneficiaries have a toilet or not determines the human MS. Data was collected
from the baseline survey and proper values (local toilet store manure as pit)
from 2006 IPCC Guidelines were applied. Then relevant MS values were
applied from 2006 IPCC guidelines, taking into consideration local mean
temperature.
Any comment:
Data / Parameter: EFawms,T
Data unit: tCO2e per animal per year for livestock type T
Description: Animal waste methane emission factor by average temperature
Source of data: 2006 IPCC Guidelines for National Greenhouse Gas Inventories
Value applied: EFpig = 0.06
EFcow = 0.19
EFbuffalo = 0.66
EFAdult = 0.06
EFchild = 0.03
Justification of the
choice of data or
description of
measurement methods
and procedures actually
applied :
Calculation result based on formula (3)
Any comment:
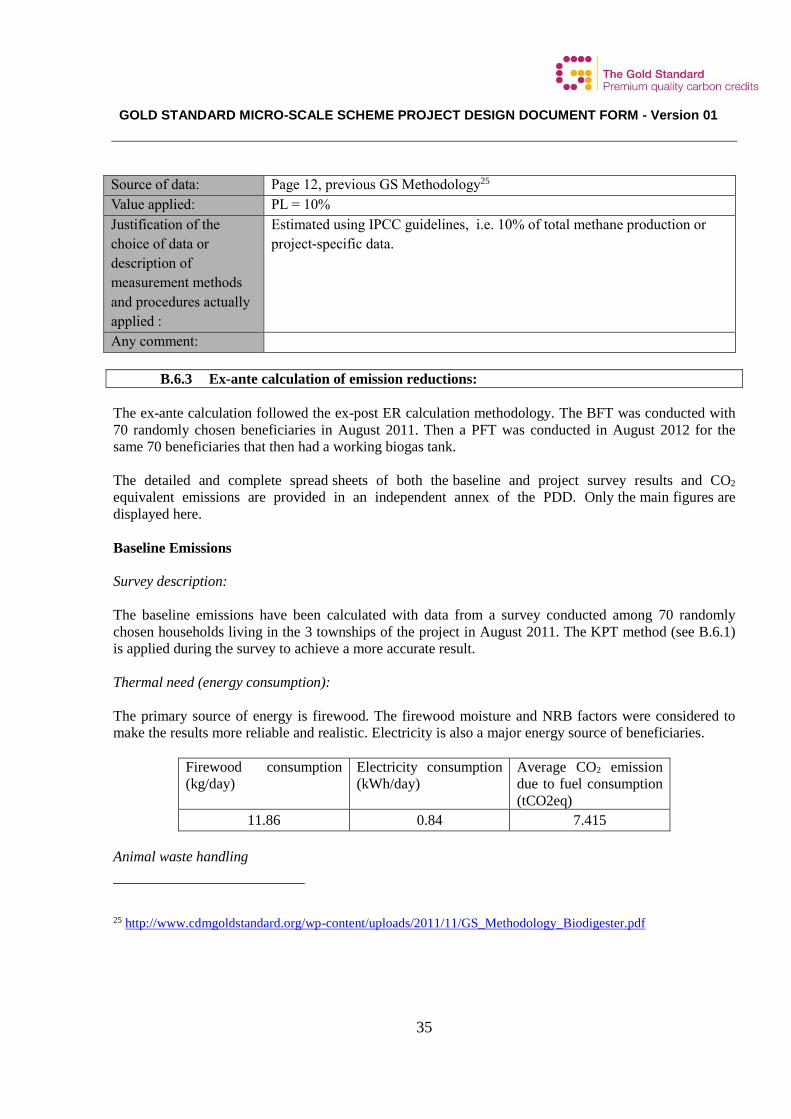
Data / Parameter: PL
Data unit: %
Description: Physical leakage of the bio digester
GOLD STANDARD MICRO-SCALE SCHEME PROJECT DESIGN DOCUMENT FORM - Version 01
35
Source of data: Page 12, previous GS Methodology25
Value applied: PL = 10%
Justification of the
choice of data or
description of
measurement methods
and procedures actually
applied :
Estimated using IPCC guidelines, i.e. 10% of total methane production or
project-specific data.
Any comment:
B.6.3 Ex-ante calculation of emission reductions:
The ex-ante calculation followed the ex-post ER calculation methodology. The BFT was conducted with
70 randomly chosen beneficiaries in August 2011. Then a PFT was conducted in August 2012 for the
same 70 beneficiaries that then had a working biogas tank.
The detailed and complete spread sheets of both the baseline and project survey results and CO2
equivalent emissions are provided in an independent annex of the PDD. Only the main figures are
displayed here.
Baseline Emissions
Survey description:
The baseline emissions have been calculated with data from a survey conducted among 70 randomly
chosen households living in the 3 townships of the project in August 2011. The KPT method (see B.6.1)
is applied during the survey to achieve a more accurate result.
Thermal need (energy consumption):
The primary source of energy is firewood. The firewood moisture and NRB factors were considered to
make the results more reliable and realistic. Electricity is also a major energy source of beneficiaries.
Firewood consumption
(kg/day)
Electricity consumption
(kWh/day)
Average CO2 emission
due to fuel consumption
(tCO2eq)
11.86 0.84 7.415
Animal waste handling
25 http://www.cdmgoldstandard.org/wp-content/uploads/2011/11/GS_Methodology_Biodigester.pdf
GOLD STANDARD MICRO-SCALE SCHEME PROJECT DESIGN DOCUMENT FORM - Version 01
36
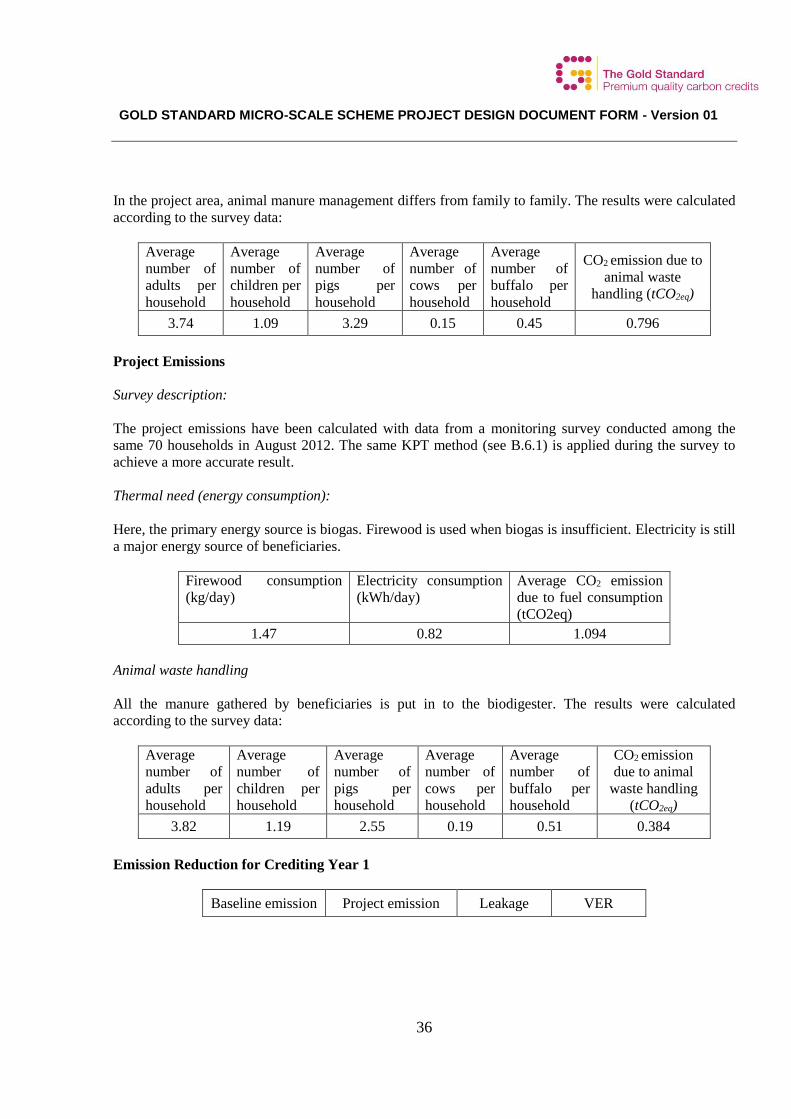
In the project area, animal manure management differs from family to family. The results were calculated
according to the survey data:
Average
number of
adults per
household
Average
number of
children per
household
Average
number of
pigs per
household
Average
number of
cows per
household
Average
number of
buffalo per
household
CO2 emission due to
animal waste
handling (tCO2eq)
3.74 1.09 3.29 0.15 0.45 0.796
Project Emissions
Survey description:
The project emissions have been calculated with data from a monitoring survey conducted among the
same 70 households in August 2012. The same KPT method (see B.6.1) is applied during the survey to
achieve a more accurate result.
Thermal need (energy consumption):
Here, the primary energy source is biogas. Firewood is used when biogas is insufficient. Electricity is still
a major energy source of beneficiaries.
Firewood consumption
(kg/day)
Electricity consumption
(kWh/day)
Average CO2 emission
due to fuel consumption
(tCO2eq)
1.47 0.82 1.094
Animal waste handling
All the manure gathered by beneficiaries is put in to the biodigester. The results were calculated
according to the survey data:
Average
number of
adults per
household
Average
number of
children per
household
Average
number of
pigs per
household
Average
number of
cows per
household
Average
number of
buffalo per
household
CO2 emission
due to animal
waste handling
(tCO2eq)
3.82 1.19 2.55 0.19 0.51 0.384
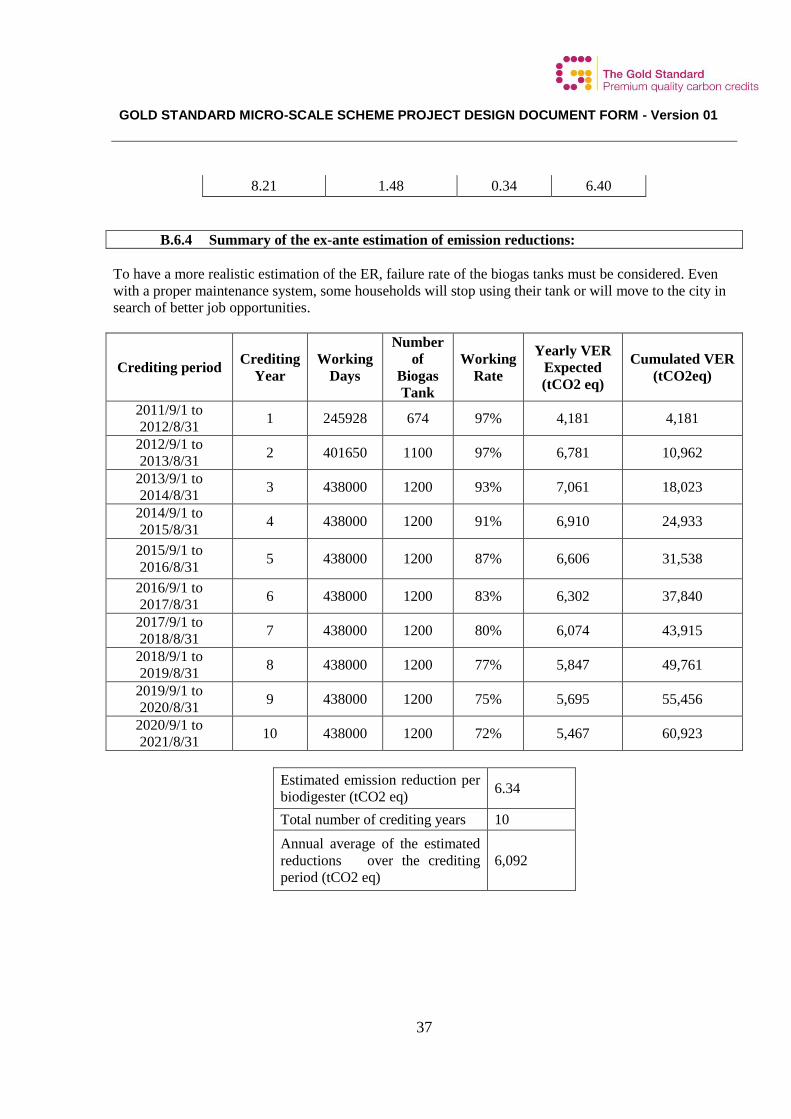
Emission Reduction for Crediting Year 1
Baseline emission Project emission Leakage VER
GOLD STANDARD MICRO-SCALE SCHEME PROJECT DESIGN DOCUMENT FORM - Version 01
37
8.21 1.48 0.34 6.40
B.6.4 Summary of the ex-ante estimation of emission reductions:
To have a more realistic estimation of the ER, failure rate of the biogas tanks must be considered. Even
with a proper maintenance system, some households will stop using their tank or will move to the city in
search of better job opportunities.
Crediting period Crediting
Year
Working
Days
Number
of
Biogas
Tank
Working
Rate
Yearly VER
Expected
(tCO2 eq)
Cumulated VER
(tCO2eq)
2011/9/1 to
2012/8/31 1 245928 674 97% 4,181 4,181
2012/9/1 to
2013/8/31 2 401650 1100 97% 6,781 10,962
2013/9/1 to
2014/8/31 3 438000 1200 93% 7,061 18,023
2014/9/1 to
2015/8/31 4 438000 1200 91% 6,910 24,933
2015/9/1 to
2016/8/31 5 438000 1200 87% 6,606 31,538
2016/9/1 to
2017/8/31 6 438000 1200 83% 6,302 37,840
2017/9/1 to
2018/8/31 7 438000 1200 80% 6,074 43,915
2018/9/1 to
2019/8/31 8 438000 1200 77% 5,847 49,761
2019/9/1 to
2020/8/31 9 438000 1200 75% 5,695 55,456
2020/9/1 to
2021/8/31 10 438000 1200 72% 5,467 60,923
Estimated emission reduction per
biodigester (tCO2 eq) 6.34
Total number of crediting years 10
Annual average of the estimated
reductions over the crediting
period (tCO2 eq)
6,092
GOLD STANDARD MICRO-SCALE SCHEME PROJECT DESIGN DOCUMENT FORM - Version 01
38
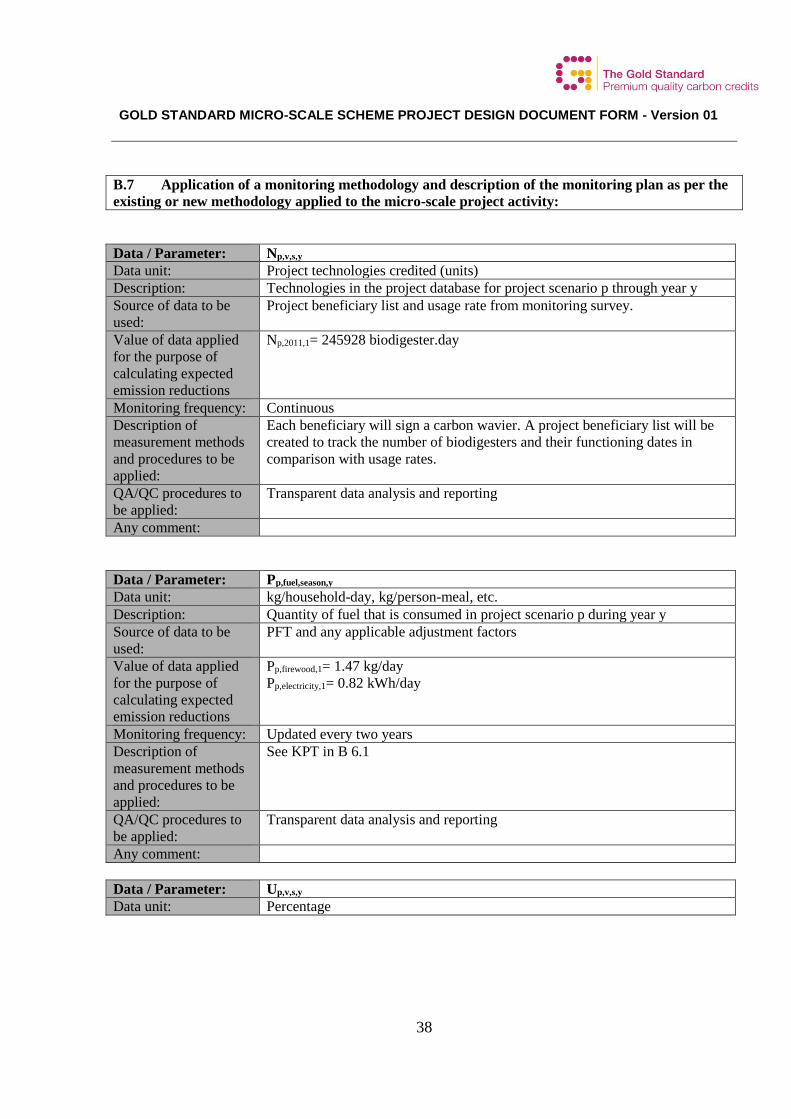
B.7 Application of a monitoring methodology and description of the monitoring plan as per the
existing or new methodology applied to the micro-scale project activity:
Data / Parameter: Np,v,s,y
Data unit: Project technologies credited (units)
Description: Technologies in the project database for project scenario p through year y
Source of data to be
used:
Project beneficiary list and usage rate from monitoring survey.
Value of data applied
for the purpose of
calculating expected
emission reductions
Np,2011,1= 245928 biodigester.day
Monitoring frequency: Continuous
Description of
measurement methods
and procedures to be
applied:
Each beneficiary will sign a carbon wavier. A project beneficiary list will be
created to track the number of biodigesters and their functioning dates in
comparison with usage rates.
QA/QC procedures to
be applied:
Transparent data analysis and reporting
Any comment:
Data / Parameter: Pp,fuel,season,y
Data unit: kg/household-day, kg/person-meal, etc.
Description: Quantity of fuel that is consumed in project scenario p during year y
Source of data to be
used:
PFT and any applicable adjustment factors
Value of data applied
for the purpose of
calculating expected
emission reductions
Pp,firewood,1= 1.47 kg/day
Pp,electricity,1= 0.82 kWh/day
Monitoring frequency: Updated every two years
Description of
measurement methods
and procedures to be
applied:
See KPT in B 6.1
QA/QC procedures to
be applied:
Transparent data analysis and reporting
Any comment:
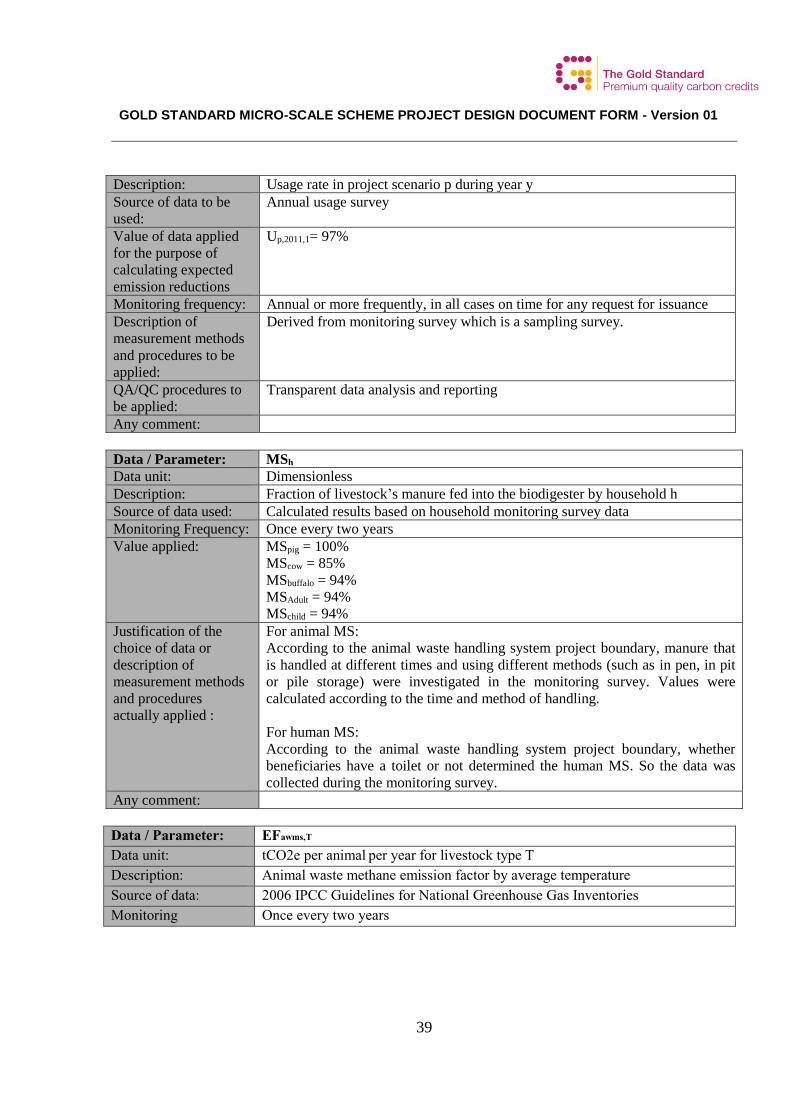
Data / Parameter: Up,v,s,y
Data unit: Percentage
GOLD STANDARD MICRO-SCALE SCHEME PROJECT DESIGN DOCUMENT FORM - Version 01
39
Description: Usage rate in project scenario p during year y
Source of data to be
used:
Annual usage survey
Value of data applied
for the purpose of
calculating expected
emission reductions
Up,2011,1= 97%
Monitoring frequency: Annual or more frequently, in all cases on time for any request for issuance
Description of
measurement methods
and procedures to be
applied:
Derived from monitoring survey which is a sampling survey.
QA/QC procedures to
be applied:
Transparent data analysis and reporting
Any comment:
Data / Parameter: MSh
Data unit: Dimensionless
Description: Fraction of livestock’s manure fed into the biodigester by household h
Source of data used: Calculated results based on household monitoring survey data
Monitoring Frequency: Once every two years
Value applied: MSpig = 100%
MScow = 85%
MSbuffalo = 94%
MSAdult = 94%
MSchild = 94%
Justification of the
choice of data or
description of
measurement methods
and procedures
actually applied :
For animal MS:
According to the animal waste handling system project boundary, manure that
is handled at different times and using different methods (such as in pen, in pit
or pile storage) were investigated in the monitoring survey. Values were
calculated according to the time and method of handling.
For human MS:
According to the animal waste handling system project boundary, whether
beneficiaries have a toilet or not determined the human MS. So the data was
collected during the monitoring survey.
Any comment:
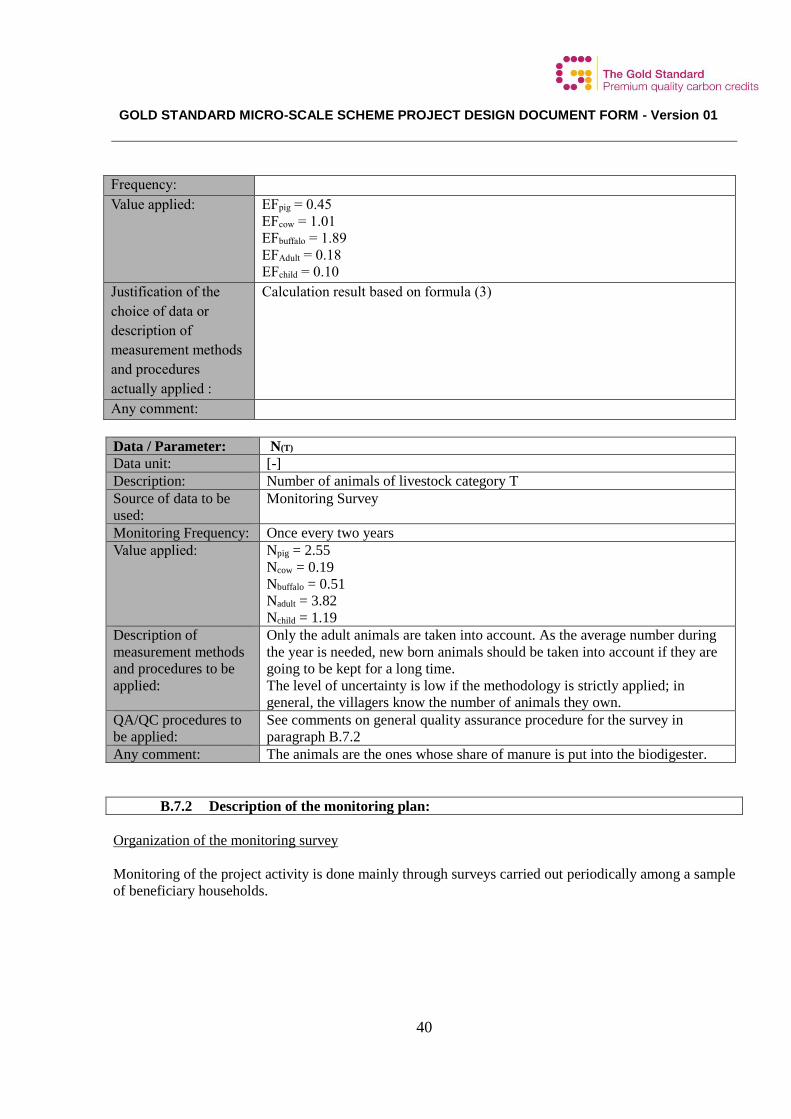
Data / Parameter: EFawms,T
Data unit: tCO2e per animal per year for livestock type T
Description: Animal waste methane emission factor by average temperature
Source of data: 2006 IPCC Guidelines for National Greenhouse Gas Inventories
Monitoring Once every two years
GOLD STANDARD MICRO-SCALE SCHEME PROJECT DESIGN DOCUMENT FORM - Version 01
40
Frequency:
Value applied: EFpig = 0.45
EFcow = 1.01
EFbuffalo = 1.89
EFAdult = 0.18
EFchild = 0.10
Justification of the
choice of data or
description of
measurement methods
and procedures
actually applied :
Calculation result based on formula (3)
Any comment:
Data / Parameter: N(T)
Data unit: [-]
Description: Number of animals of livestock category T
Source of data to be
used:
Monitoring Survey
Monitoring Frequency: Once every two years
Value applied: Npig = 2.55
Ncow = 0.19
Nbuffalo = 0.51
Nadult = 3.82
Nchild = 1.19
Description of
measurement methods
and procedures to be
applied:
Only the adult animals are taken into account. As the average number during
the year is needed, new born animals should be taken into account if they are
going to be kept for a long time.
The level of uncertainty is low if the methodology is strictly applied; in
general, the villagers know the number of animals they own.
QA/QC procedures to
be applied:
See comments on general quality assurance procedure for the survey in
paragraph B.7.2
Any comment: The animals are the ones whose share of manure is put into the biodigester.
B.7.2 Description of the monitoring plan:
Organization of the monitoring survey
Monitoring of the project activity is done mainly through surveys carried out periodically among a sample
of beneficiary households.

GOLD STANDARD MICRO-SCALE SCHEME PROJECT DESIGN DOCUMENT FORM - Version 01
41
The whole process will be carried out by project owner Mangshi Animal Husbandry and Veterinary
Bureau and supervised by the project developer Initiative Développement. Yearly monitoring will be
provided for verification within one month after the end of the considered crediting year.
Frequency of the survey
For the baseline scenario, the BFT is fixed and does not need to be updated. For the project scenario, the
PFT is updated every two years around August. However, the technology usage survey and Monitoring
Survey will be done annually.
Size and selection of the sample
For BFT and PFT, the sample size is 70 households. For technology usage survey, the sample size is 106,
with at least 30 samples for project technologies of each age being credited. The majority of interviews in
a usage survey will be conducted in person and include expert observation by the interviewer within the
kitchen in question, while the remainder may be conducted via telephone by the same interviewers on
condition that in-kitchen observational interviews are first concluded and analyzed such that typical
circumstances are well understood by the telephone interviewers.
The usage survey will establish a useful lifetime for technologies, after which they are removed from the
project database and no longer credited.
Project database
The project database is derived from the construction record (or dissemination record in case of non-
commercial distribution) with project technologies differentiated by different project scenarios. The
differentiation of the project database into sections is based on the results of the applicable monitoring
studies for each project scenario, with the goal of allowing ER calculations to be conducted appropriately
section by section. Technological equipment that cannot be repaired according to the usage survey, are
removed from the project database and no longer credited.
Ongoing monitoring studies
The following ongoing monitoring studies are conducted for each project scenario following verification
of the associated initial project studies. These monitoring studies investigate and define parameters that
could not be determined at the time of the initial project studies, or that change with time.
a) Monitoring Survey –Completed annually, beginning 1 year after project registration
The monitoring survey investigates changes over time in a project scenario, and in a baseline scenario in
case of industrial applications (or renewal of crediting period), by surveying end users with project
technologies (and baseline technologies in case on industrial applications) on an annual basis. It provides
critical information on year-to-year trends in end user characteristics such as technology use, fuel
consumption and seasonal variations.
GOLD STANDARD MICRO-SCALE SCHEME PROJECT DESIGN DOCUMENT FORM - Version 01
42
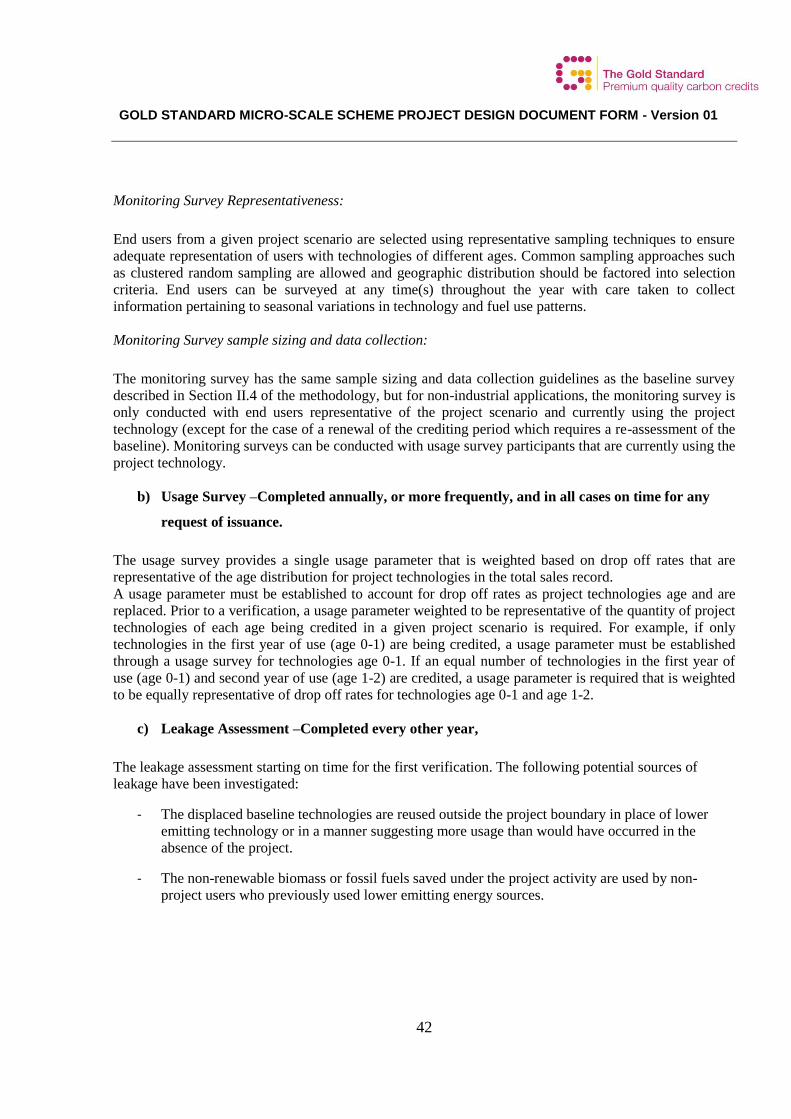
Monitoring Survey Representativeness:
End users from a given project scenario are selected using representative sampling techniques to ensure
adequate representation of users with technologies of different ages. Common sampling approaches such
as clustered random sampling are allowed and geographic distribution should be factored into selection
criteria. End users can be surveyed at any time(s) throughout the year with care taken to collect
information pertaining to seasonal variations in technology and fuel use patterns.
Monitoring Survey sample sizing and data collection:
The monitoring survey has the same sample sizing and data collection guidelines as the baseline survey
described in Section II.4 of the methodology, but for non-industrial applications, the monitoring survey is
only conducted with end users representative of the project scenario and currently using the project
technology (except for the case of a renewal of the crediting period which requires a re-assessment of the
baseline). Monitoring surveys can be conducted with usage survey participants that are currently using the
project technology.
b) Usage Survey –Completed annually, or more frequently, and in all cases on time for any
request of issuance.
The usage survey provides a single usage parameter that is weighted based on drop off rates that are
representative of the age distribution for project technologies in the total sales record.
A usage parameter must be established to account for drop off rates as project technologies age and are
replaced. Prior to a verification, a usage parameter weighted to be representative of the quantity of project
technologies of each age being credited in a given project scenario is required. For example, if only
technologies in the first year of use (age 0-1) are being credited, a usage parameter must be established
through a usage survey for technologies age 0-1. If an equal number of technologies in the first year of
use (age 0-1) and second year of use (age 1-2) are credited, a usage parameter is required that is weighted
to be equally representative of drop off rates for technologies age 0-1 and age 1-2.
c) Leakage Assessment –Completed every other year,
The leakage assessment starting on time for the first verification. The following potential sources of
leakage have been investigated:
- The displaced baseline technologies are reused outside the project boundary in place of lower
emitting technology or in a manner suggesting more usage than would have occurred in the
absence of the project.
- The non-renewable biomass or fossil fuels saved under the project activity are used by non-
project users who previously used lower emitting energy sources.
GOLD STANDARD MICRO-SCALE SCHEME PROJECT DESIGN DOCUMENT FORM - Version 01
43
- The project significantly impacts the NRB fraction within an area where other CDM or VER
project activities account for NRB fraction in their baseline scenario.
- The project population compensates for loss of the space heating effect of inefficient technology
by adopting some other form of heating or by retaining some use of inefficient technology
- By virtue of promotion and marketing of a new technology with high efficiency, the project
stimulates substitution within households who commonly used a technology with relatively lower
emissions, in cases where such a trend is not eligible as an evolving baseline.
Actually, the project will apply 5% of the ERs as the fixed leakage for simplicity in consideration of the
micro-scale.
d) Non-Renewable Biomass Assessment Update
The non-renewable biomass fraction is fixed based on the results of the NRB assessment. Over the course
of a project activity the project proponent may at any time choose to re-examine renewability by
conducting a new NRB assessment. In case of a renewal of the crediting period and as per Gold Standard
rules, the NRB fraction must be reassessed as any other baseline parameters and updated in line with most
recent data available.
e) Summary of the surveys to be done
The table below summarizes the different surveys and at times of completion
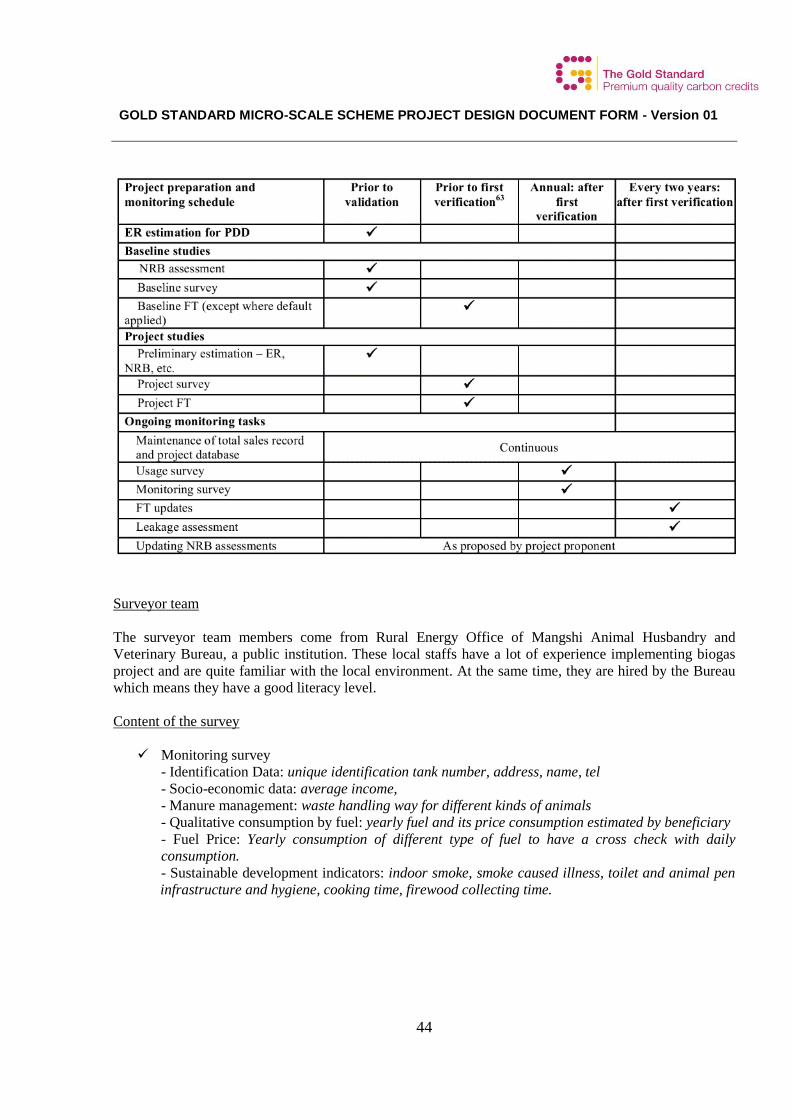
GOLD STANDARD MICRO-SCALE SCHEME PROJECT DESIGN DOCUMENT FORM - Version 01
44
Surveyor team
The surveyor team members come from Rural Energy Office of Mangshi Animal Husbandry and
Veterinary Bureau, a public institution. These local staffs have a lot of experience implementing biogas
project and are quite familiar with the local environment. At the same time, they are hired by the Bureau
which means they have a good literacy level.
Content of the survey
Monitoring survey
- Identification Data: unique identification tank number, address, name, tel
- Socio-economic data: average income,
- Manure management: waste handling way for different kinds of animals
- Qualitative consumption by fuel: yearly fuel and its price consumption estimated by beneficiary
- Fuel Price: Yearly consumption of different type of fuel to have a cross check with daily
consumption.
- Sustainable development indicators: indoor smoke, smoke caused illness, toilet and animal pen
infrastructure and hygiene, cooking time, firewood collecting time.
GOLD STANDARD MICRO-SCALE SCHEME PROJECT DESIGN DOCUMENT FORM - Version 01
45
Usage survey
- Biogas use status: tank failure, biogas use for cooking and lighting.
- Field cultivate & use of biogas product
The monitoring survey and usage survey are merged into one questionnaire.
Project Field Performance Test
- Quantitative consumption by fuel: three days’ consumption per type of fuel according to the =
KPT method.
The complete (English-Chinese) questionnaire is available in Annex 4 and can be updated if needed.
Quality Assurance procedures
A survey training was carried out on 25th Aug, 2011 in Mangshi for all the surveyors by ID’s experienced
carbon survey trainer. ID emphasized the importance of the coherence of the survey. Specific points are
subject to greater attention, such as the estimation of average adult animals per year and the fact that,
during the 3 days of fuel use, beneficiaries are limited to using wood that has been put aside to be
weighed, in order to facilitate the calculation of wood saved.
Quality control is done again after the data is collected. Unit conversion and overall coherence are
assessed.
Storage of the Data:
An Excel database has been developed by ID. It has been specifically designed to store data from the
monitoring surveys and from the baseline survey. The Emission Reduction assessment is also included in
this file.
All the data encoded will be kept until 2 years after the end of the crediting period. Formatted excel
spreadsheets will be available for verification purposes as well as direct access to the database if required.
B.8 Date of completion of the application of the existing or new baseline and monitoring
methodology and name of the responsible person(s)/entity(ies)
Methodology completed the 30th of March 2012.
The responsible entity is Initiative Développement (see contact in Annex).
SECTION C. Duration of the project activity / crediting period
C.1 Duration of the project activity:
C.1.1. Starting date of the project activity:
GOLD STANDARD MICRO-SCALE SCHEME PROJECT DESIGN DOCUMENT FORM - Version 01
46
The project activity begins on 1st Apr, 2011. And the activity period will last for 2 years. The 1064 tanks
from the first year begin functioning on 1st September 2011. So the crediting year is started from 1st
September 2011.
C.1.2. Expected operational lifetime of the project activity:
Usually a biodigester has a lifespan of 10 years, in the targeted area, an additional maintenance and
service system will be built to ensure a longer lifetime of the biodigesters. As a result, this project’s tank
expect to have a lifespan of 15 years.
C.2 Choice of the crediting period and related information:
The project is applied for fixed crediting period.
C.2.1. Renewable crediting period
C.2.1.1. Starting date of the first crediting period:
Not applicable.
C.2.1.2. Length of the first crediting period:
Not applicable.
C.2.2. Fixed crediting period:
C.2.2.1. Starting date:
01/09/2011.
C.2.2.2. Length:
Ten years.
SECTION D. Stakeholders’ comments
D.1. Brief description of the means used to invite local stakeholders for comments:
In order to gather stakeholders’ opinions and concerns related to the project, a Local Stakeholder
Consultation meeting was held on 13th Mar. 2011 in Xinguan group, Mangbie village. This followed the
Gold Standard guidelines for the LSC, a fully detailed report is available. Participants include mainly
local beneficiaries and their representatives, local authorities, Gold Standard NGO supporter, and project
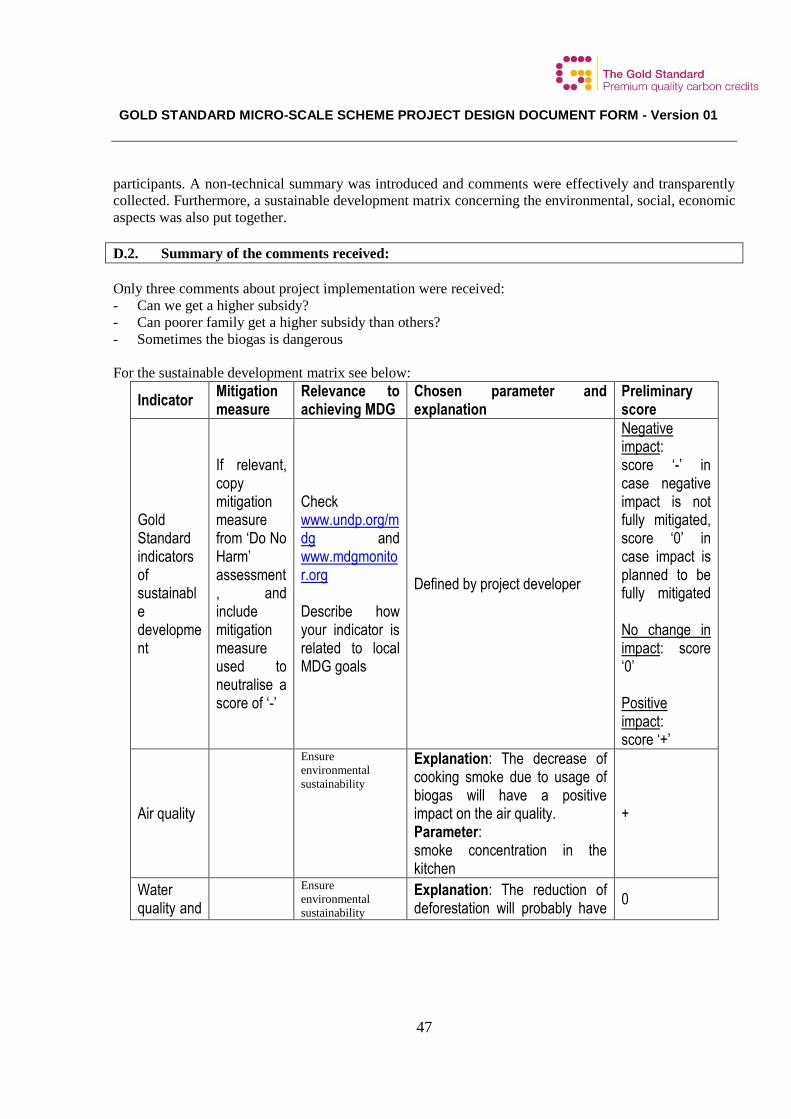
GOLD STANDARD MICRO-SCALE SCHEME PROJECT DESIGN DOCUMENT FORM - Version 01
47
participants. A non-technical summary was introduced and comments were effectively and transparently
collected. Furthermore, a sustainable development matrix concerning the environmental, social, economic
aspects was also put together.
D.2. Summary of the comments received:
Only three comments about project implementation were received:
- Can we get a higher subsidy?
- Can poorer family get a higher subsidy than others?
- Sometimes the biogas is dangerous
For the sustainable development matrix see below:
Indicator Mitigation measure
Relevance to achieving MDG
Chosen parameter and explanation
Preliminary score
Gold Standard indicators of sustainable development
If relevant, copy mitigation measure from ‘Do No Harm’ assessment, and include mitigation measure used to neutralise a score of ‘-’
Check www.undp.org/mdg and www.mdgmonitor.org Describe how your indicator is related to local MDG goals
Defined by project developer
Negative impact: score ‘-’ in case negative impact is not fully mitigated, score ‘0’ in case impact is planned to be fully mitigated No change in impact: score ‘0’ Positive impact: score ‘+’
Air quality
Ensure
environmental
sustainability
Explanation: The decrease of cooking smoke due to usage of biogas will have a positive impact on the air quality. Parameter: smoke concentration in the kitchen
+
Water quality and
Ensure
environmental
sustainability
Explanation: The reduction of deforestation will probably have
0
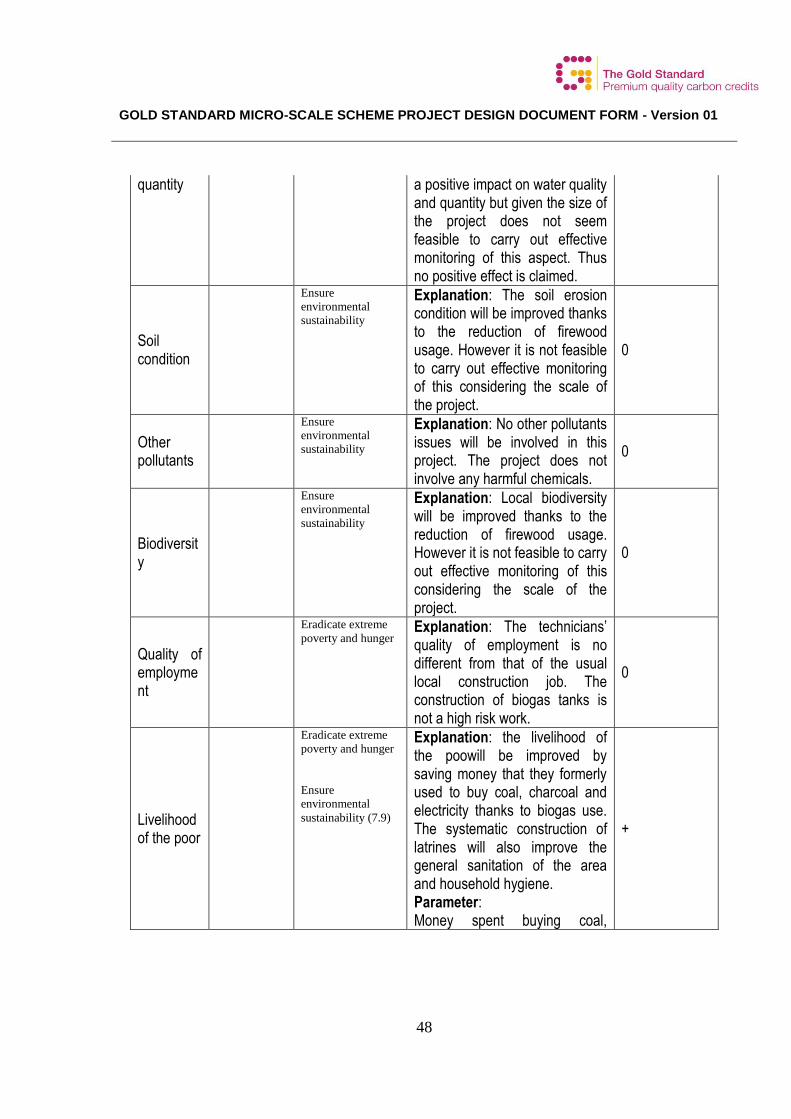
GOLD STANDARD MICRO-SCALE SCHEME PROJECT DESIGN DOCUMENT FORM - Version 01
48
quantity a positive impact on water quality and quantity but given the size of the project does not seem feasible to carry out effective monitoring of this aspect. Thus no positive effect is claimed.
Soil condition
Ensure
environmental
sustainability
Explanation: The soil erosion condition will be improved thanks to the reduction of firewood usage. However it is not feasible to carry out effective monitoring of this considering the scale of the project.
0
Other pollutants
Ensure
environmental
sustainability
Explanation: No other pollutants issues will be involved in this project. The project does not involve any harmful chemicals.
0
Biodiversity
Ensure
environmental
sustainability
Explanation: Local biodiversity will be improved thanks to the reduction of firewood usage. However it is not feasible to carry out effective monitoring of this considering the scale of the project.
0
Quality of employment
Eradicate extreme
poverty and hunger Explanation: The technicians’ quality of employment is no different from that of the usual local construction job. The construction of biogas tanks is not a high risk work.
0
Livelihood of the poor
Eradicate extreme
poverty and hunger
Ensure
environmental
sustainability (7.9)
Explanation: the livelihood of the poowill be improved by saving money that they formerly used to buy coal, charcoal and electricity thanks to biogas use. The systematic construction of latrines will also improve the general sanitation of the area and household hygiene. Parameter: Money spent buying coal,
+
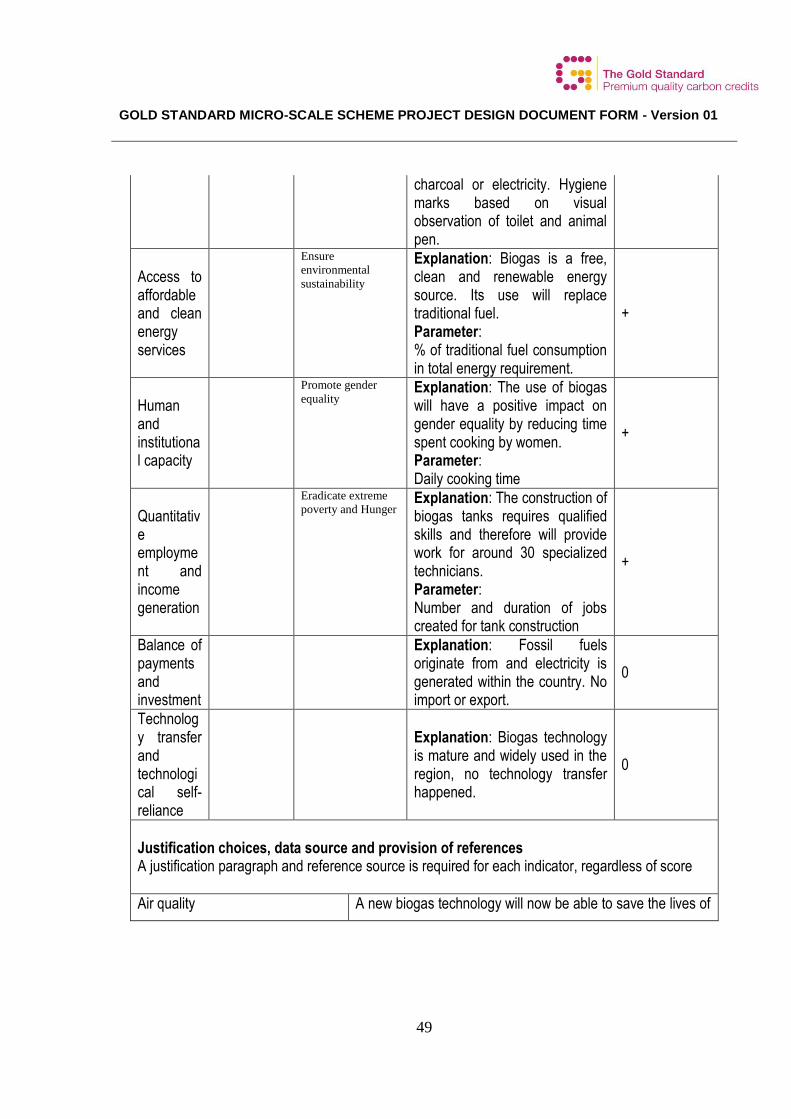
GOLD STANDARD MICRO-SCALE SCHEME PROJECT DESIGN DOCUMENT FORM - Version 01
49
charcoal or electricity. Hygiene marks based on visual observation of toilet and animal pen.
Access to affordable and clean energy services
Ensure
environmental
sustainability
Explanation: Biogas is a free, clean and renewable energy source. Its use will replace traditional fuel. Parameter: % of traditional fuel consumption in total energy requirement.
+
Human and institutional capacity
Promote gender
equality Explanation: The use of biogas will have a positive impact on gender equality by reducing time spent cooking by women. Parameter: Daily cooking time
+
Quantitative employment and income generation
Eradicate extreme
poverty and Hunger
Explanation: The construction of biogas tanks requires qualified skills and therefore will provide
work for around 30 specialized technicians. Parameter: Number and duration of jobs created for tank construction
+
Balance of payments and investment
Explanation: Fossil fuels originate from and electricity is generated within the country. No import or export.
0
Technology transfer and technological self-reliance
Explanation: Biogas technology is mature and widely used in the region, no technology transfer happened.
0
Justification choices, data source and provision of references A justification paragraph and reference source is required for each indicator, regardless of score
Air quality A new biogas technology will now be able to save the lives of
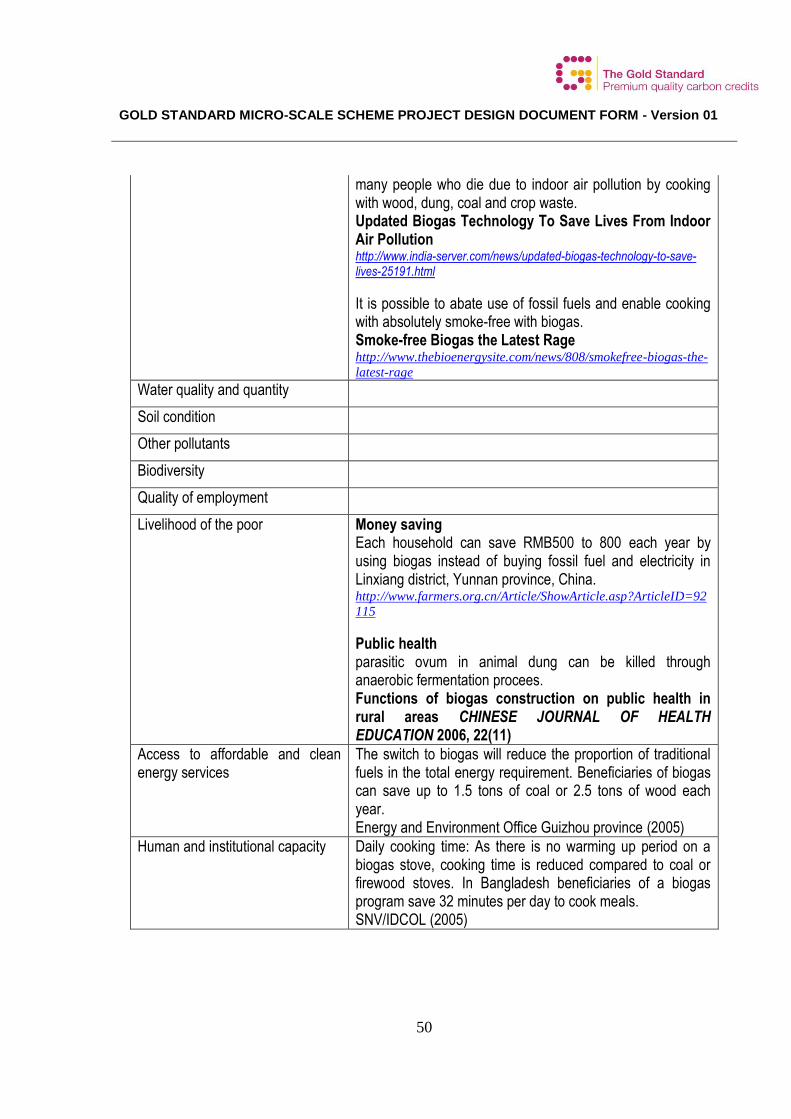
GOLD STANDARD MICRO-SCALE SCHEME PROJECT DESIGN DOCUMENT FORM - Version 01
50
many people who die due to indoor air pollution by cooking with wood, dung, coal and crop waste. Updated Biogas Technology To Save Lives From Indoor Air Pollution http://www.india-server.com/news/updated-biogas-technology-to-save-lives-25191.html
It is possible to abate use of fossil fuels and enable cooking with absolutely smoke-free with biogas. Smoke-free Biogas the Latest Rage http://www.thebioenergysite.com/news/808/smokefree-biogas-the-
latest-rage Water quality and quantity
Soil condition
Other pollutants
Biodiversity
Quality of employment
Livelihood of the poor Money saving Each household can save RMB500 to 800 each year by using biogas instead of buying fossil fuel and electricity in Linxiang district, Yunnan province, China. http://www.farmers.org.cn/Article/ShowArticle.asp?ArticleID=92
115
Public health parasitic ovum in animal dung can be killed through anaerobic fermentation procees. Functions of biogas construction on public health in rural areas CHINESE JOURNAL OF HEALTH EDUCATION 2006, 22(11)
Access to affordable and clean energy services
The switch to biogas will reduce the proportion of traditional fuels in the total energy requirement. Beneficiaries of biogas can save up to 1.5 tons of coal or 2.5 tons of wood each year. Energy and Environment Office Guizhou province (2005)
Human and institutional capacity Daily cooking time: As there is no warming up period on a biogas stove, cooking time is reduced compared to coal or firewood stoves. In Bangladesh beneficiaries of a biogas program save 32 minutes per day to cook meals. SNV/IDCOL (2005)
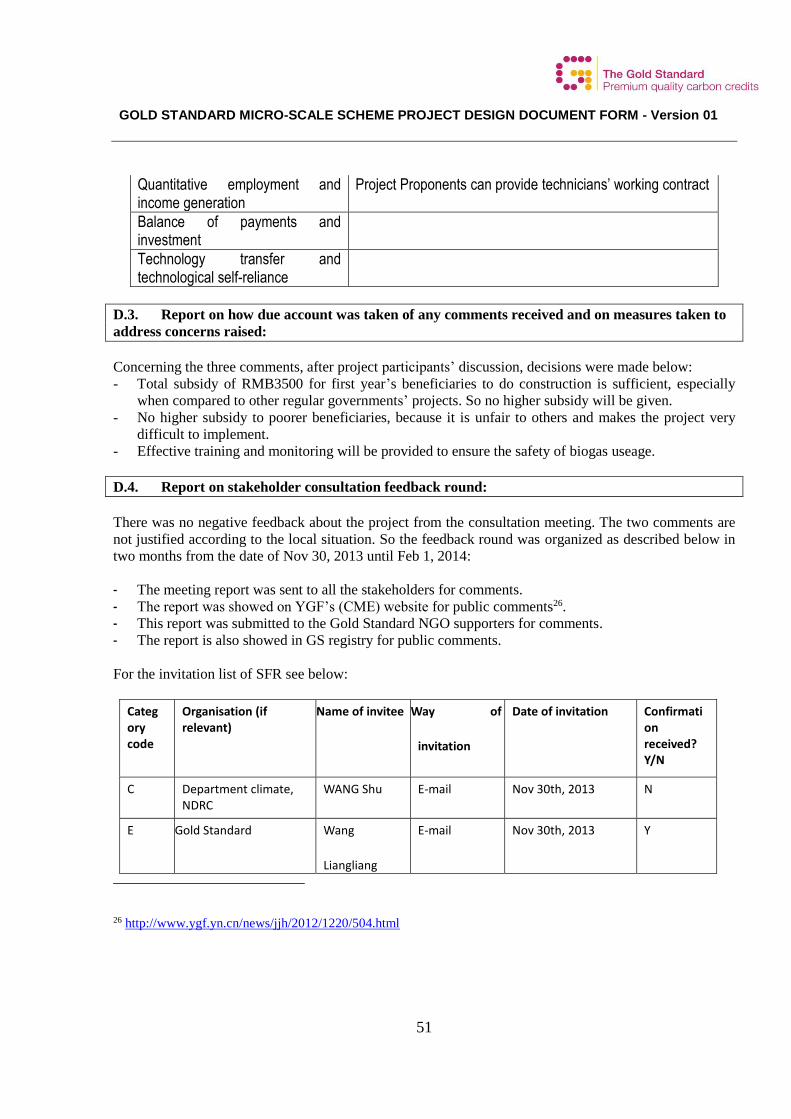
GOLD STANDARD MICRO-SCALE SCHEME PROJECT DESIGN DOCUMENT FORM - Version 01
51
Quantitative employment and income generation
Project Proponents can provide technicians’ working contract
Balance of payments and investment
Technology transfer and technological self-reliance
D.3. Report on how due account was taken of any comments received and on measures taken to
address concerns raised:
Concerning the three comments, after project participants’ discussion, decisions were made below:
- Total subsidy of RMB3500 for first year’s beneficiaries to do construction is sufficient, especially
when compared to other regular governments’ projects. So no higher subsidy will be given.
- No higher subsidy to poorer beneficiaries, because it is unfair to others and makes the project very
difficult to implement.
- Effective training and monitoring will be provided to ensure the safety of biogas useage.
D.4. Report on stakeholder consultation feedback round:
There was no negative feedback about the project from the consultation meeting. The two comments are
not justified according to the local situation. So the feedback round was organized as described below in
two months from the date of Nov 30, 2013 until Feb 1, 2014:
- The meeting report was sent to all the stakeholders for comments.
- The report was showed on YGF’s (CME) website for public comments26.
- This report was submitted to the Gold Standard NGO supporters for comments.
- The report is also showed in GS registry for public comments.
For the invitation list of SFR see below:
Categ ory code
Organisation (if relevant)
Name of invitee Way of
invitation
Date of invitation Confirmati on received? Y/N
C Department climate, NDRC
WANG Shu E-mail Nov 30th, 2013 N
E Gold Standard Wang
Liangliang
E-mail Nov 30th, 2013 Y
26 http://www.ygf.yn.cn/news/jjh/2012/1220/504.html
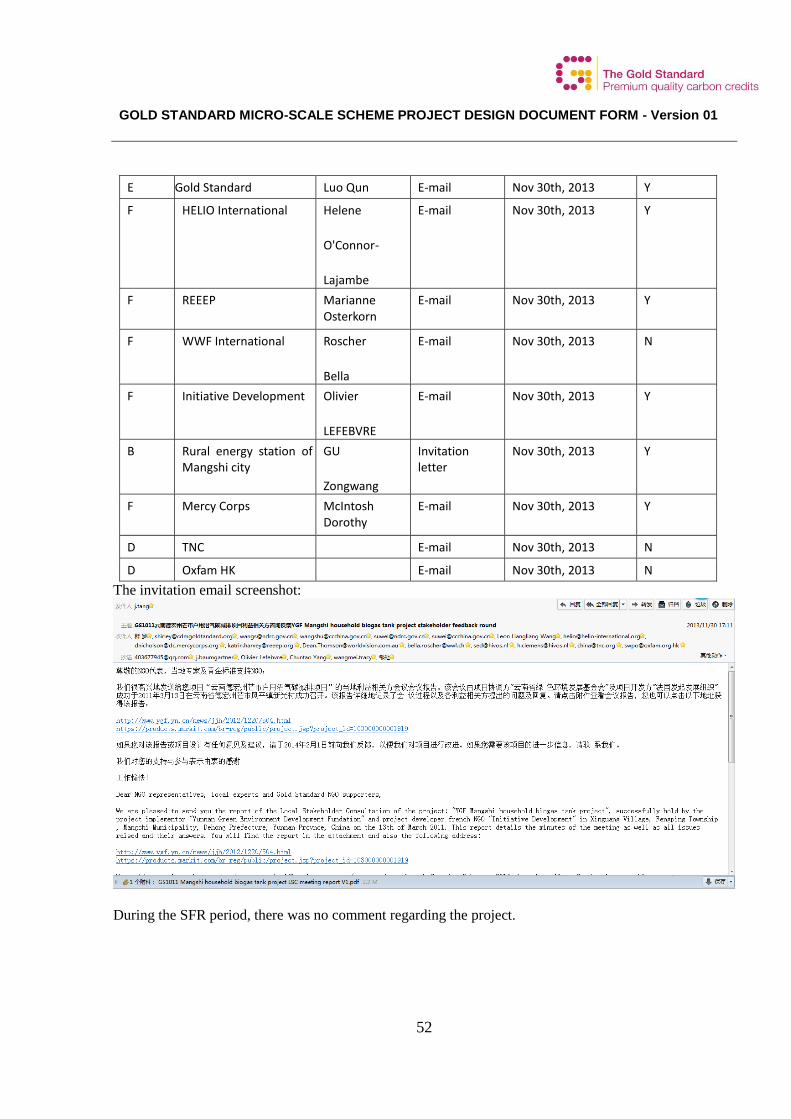
GOLD STANDARD MICRO-SCALE SCHEME PROJECT DESIGN DOCUMENT FORM - Version 01
52
E Gold Standard Luo Qun E-mail Nov 30th, 2013 Y
F HELIO International Helene
O'Connor-
Lajambe
E-mail Nov 30th, 2013 Y
F REEEP Marianne Osterkorn
E-mail Nov 30th, 2013 Y
F WWF International Roscher
Bella
E-mail Nov 30th, 2013 N
F Initiative Development Olivier
LEFEBVRE
E-mail Nov 30th, 2013 Y
B Rural energy station of Mangshi city
GU
Zongwang
Invitation letter
Nov 30th, 2013 Y
F Mercy Corps McIntosh Dorothy
E-mail Nov 30th, 2013 Y
D TNC E-mail Nov 30th, 2013 N
D Oxfam HK E-mail Nov 30th, 2013 N
The invitation email screenshot:
During the SFR period, there was no comment regarding the project.
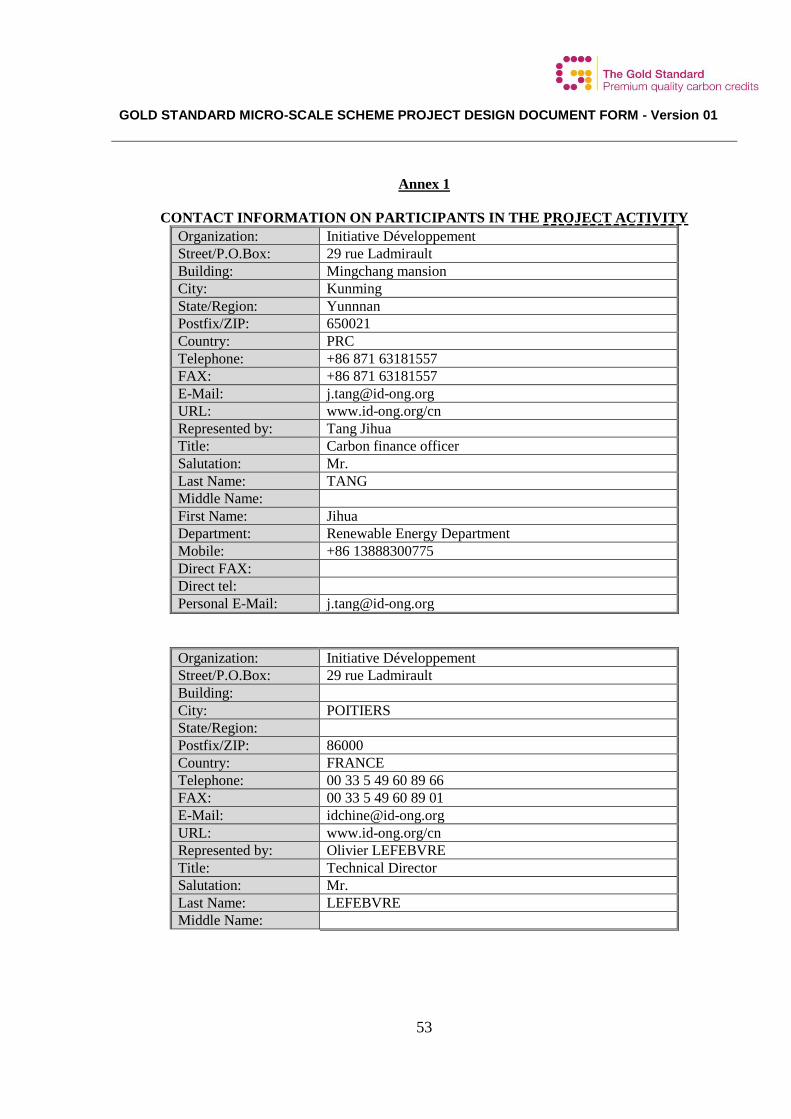
GOLD STANDARD MICRO-SCALE SCHEME PROJECT DESIGN DOCUMENT FORM - Version 01
53
Annex 1
CONTACT INFORMATION ON PARTICIPANTS IN THE PROJECT ACTIVITY
Organization: Initiative Développement
Street/P.O.Box: 29 rue Ladmirault
Building: Mingchang mansion
City: Kunming
State/Region: Yunnnan
Postfix/ZIP: 650021
Country: PRC
Telephone: +86 871 63181557
FAX: +86 871 63181557
E-Mail: [email protected]
URL: www.id-ong.org/cn
Represented by: Tang Jihua
Title: Carbon finance officer
Salutation: Mr.
Last Name: TANG
Middle Name:
First Name: Jihua
Department: Renewable Energy Department
Mobile: +86 13888300775
Direct FAX:
Direct tel:
Personal E-Mail: [email protected]
Organization: Initiative Développement
Street/P.O.Box: 29 rue Ladmirault
Building:
City: POITIERS
State/Region:
Postfix/ZIP: 86000
Country: FRANCE
Telephone: 00 33 5 49 60 89 66
FAX: 00 33 5 49 60 89 01
E-Mail: [email protected]
URL: www.id-ong.org/cn
Represented by: Olivier LEFEBVRE
Title: Technical Director
Salutation: Mr.
Last Name: LEFEBVRE
Middle Name:

GOLD STANDARD MICRO-SCALE SCHEME PROJECT DESIGN DOCUMENT FORM - Version 01
54
First Name: Olivier
Department: Renewable Energy Department
Mobile:
Direct FAX: 00 33 5 49 60 89 01
Direct tel: 00 33 5 49 60 89 66
Personal E-Mail: [email protected]
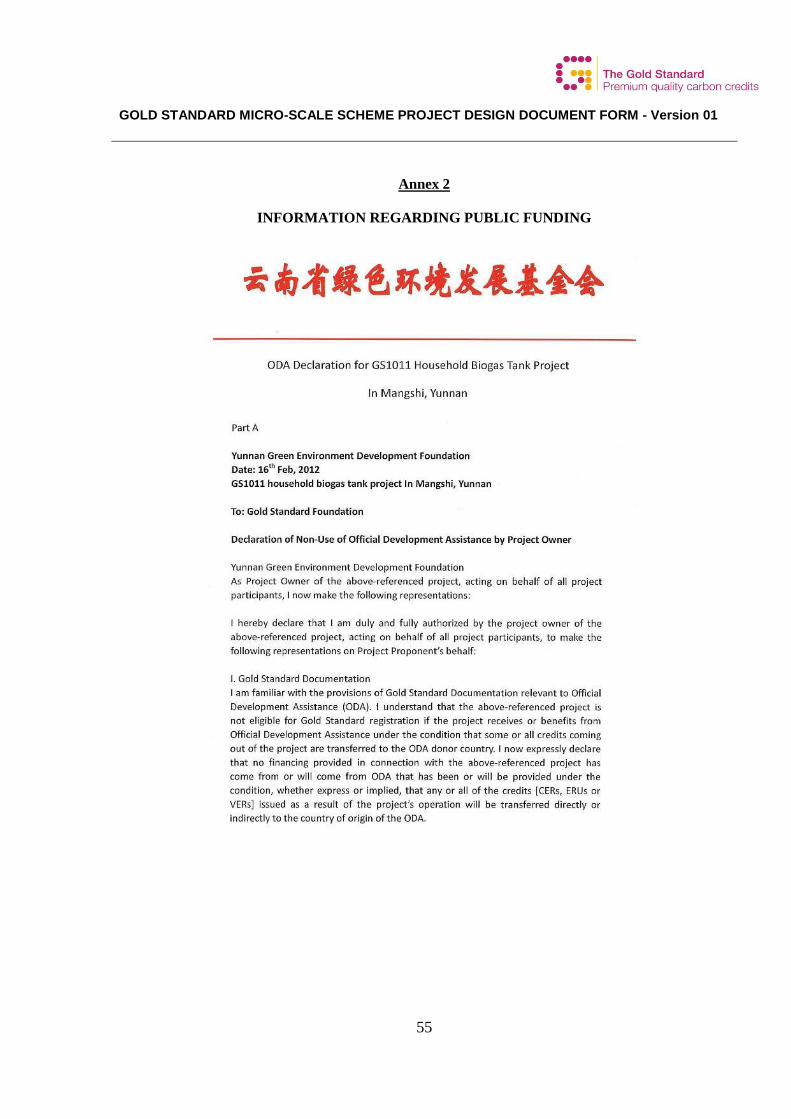
GOLD STANDARD MICRO-SCALE SCHEME PROJECT DESIGN DOCUMENT FORM - Version 01
55
Annex 2
INFORMATION REGARDING PUBLIC FUNDING
GOLD STANDARD MICRO-SCALE SCHEME PROJECT DESIGN DOCUMENT FORM - Version 01
56
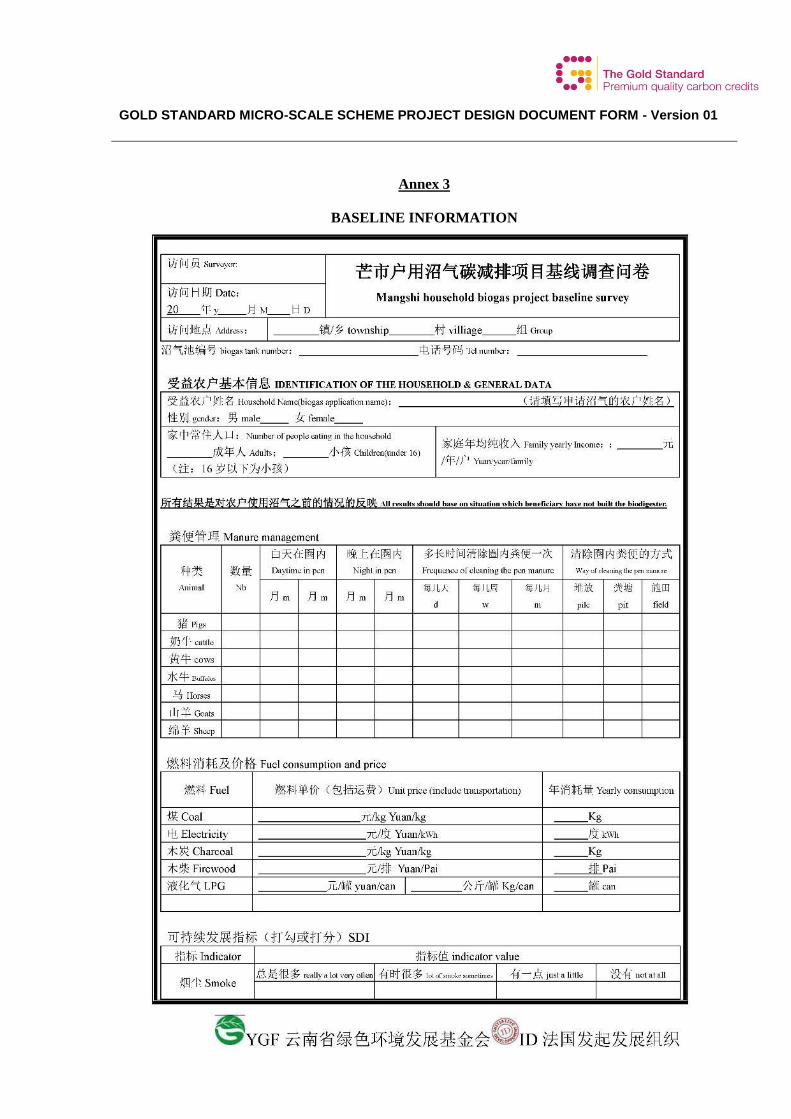
GOLD STANDARD MICRO-SCALE SCHEME PROJECT DESIGN DOCUMENT FORM - Version 01
57
Annex 3
BASELINE INFORMATION
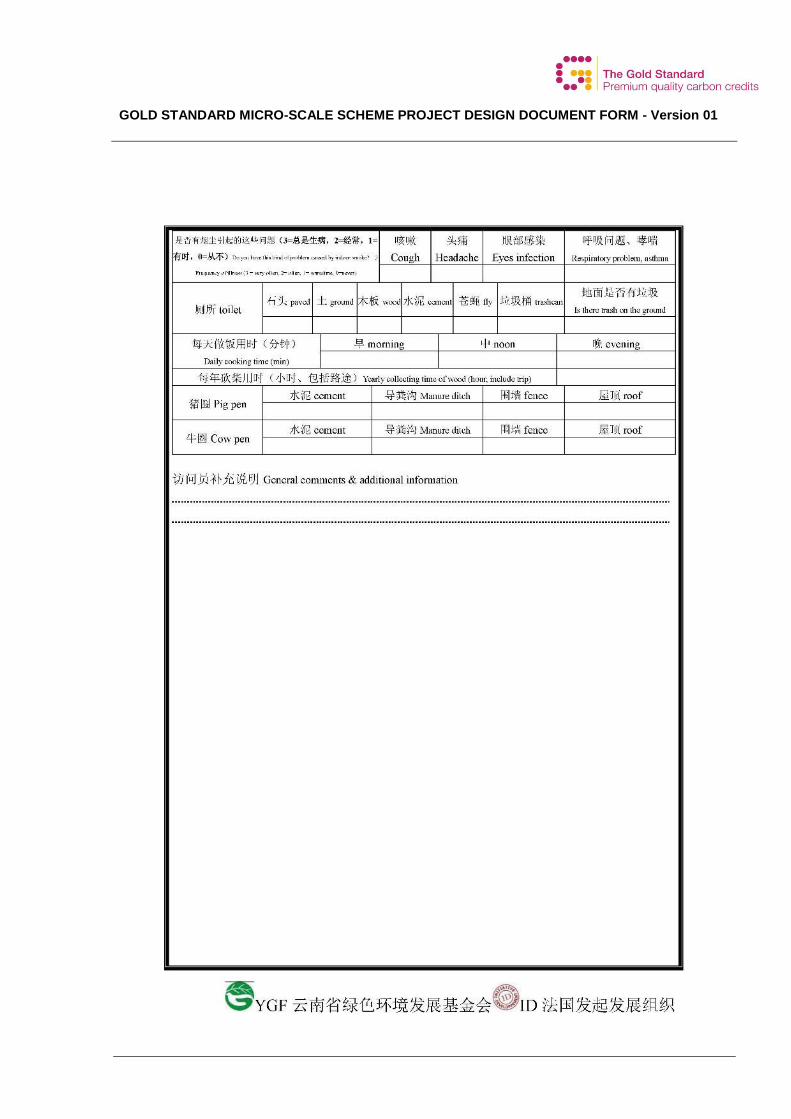
GOLD STANDARD MICRO-SCALE SCHEME PROJECT DESIGN DOCUMENT FORM - Version 01
58
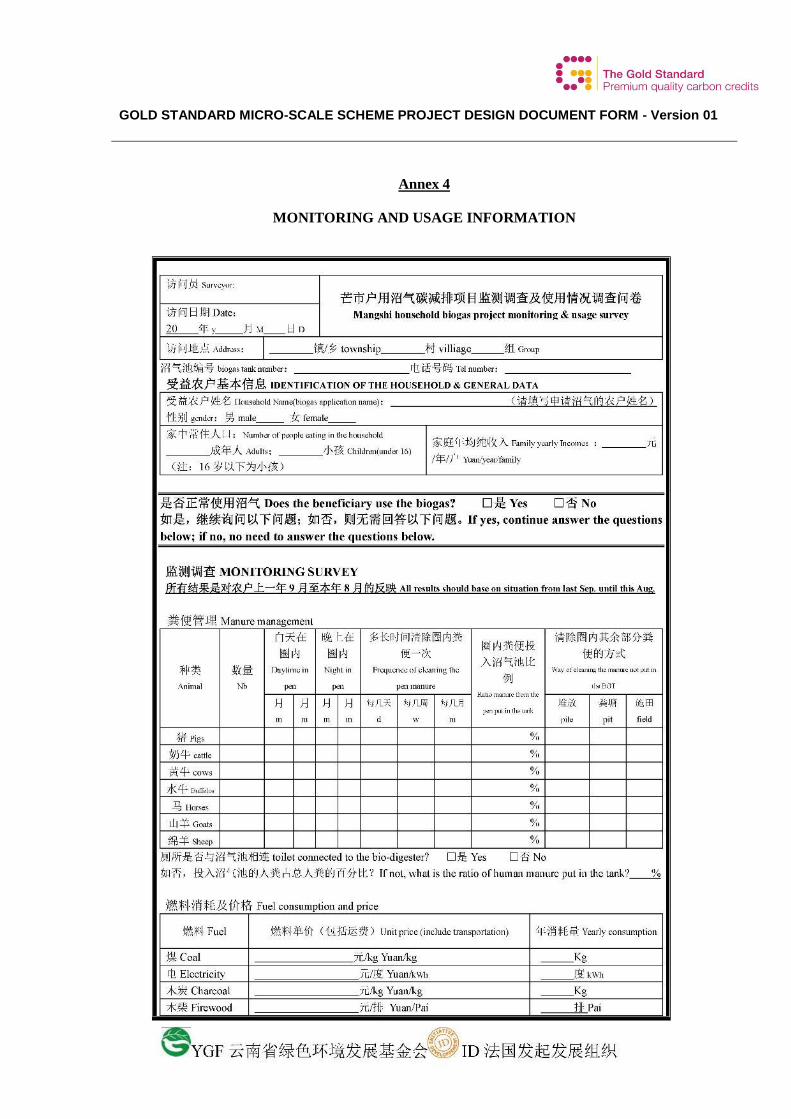
GOLD STANDARD MICRO-SCALE SCHEME PROJECT DESIGN DOCUMENT FORM - Version 01
59
Annex 4
MONITORING AND USAGE INFORMATION
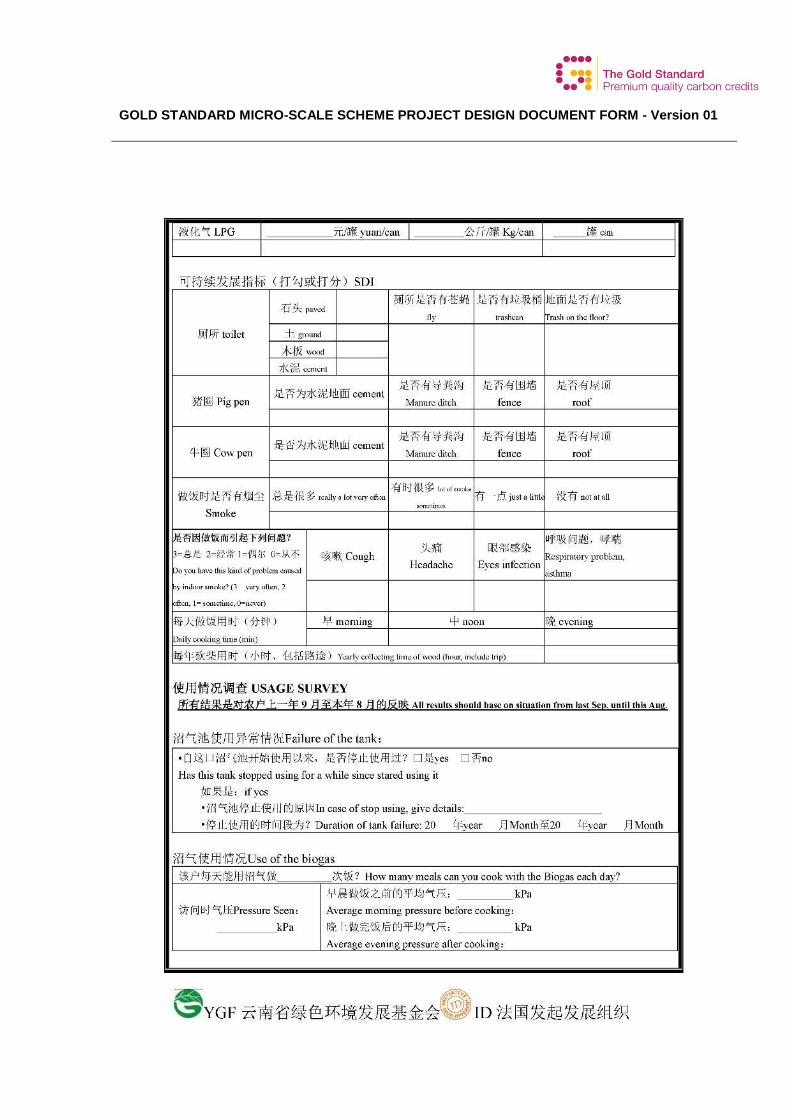
GOLD STANDARD MICRO-SCALE SCHEME PROJECT DESIGN DOCUMENT FORM - Version 01
60
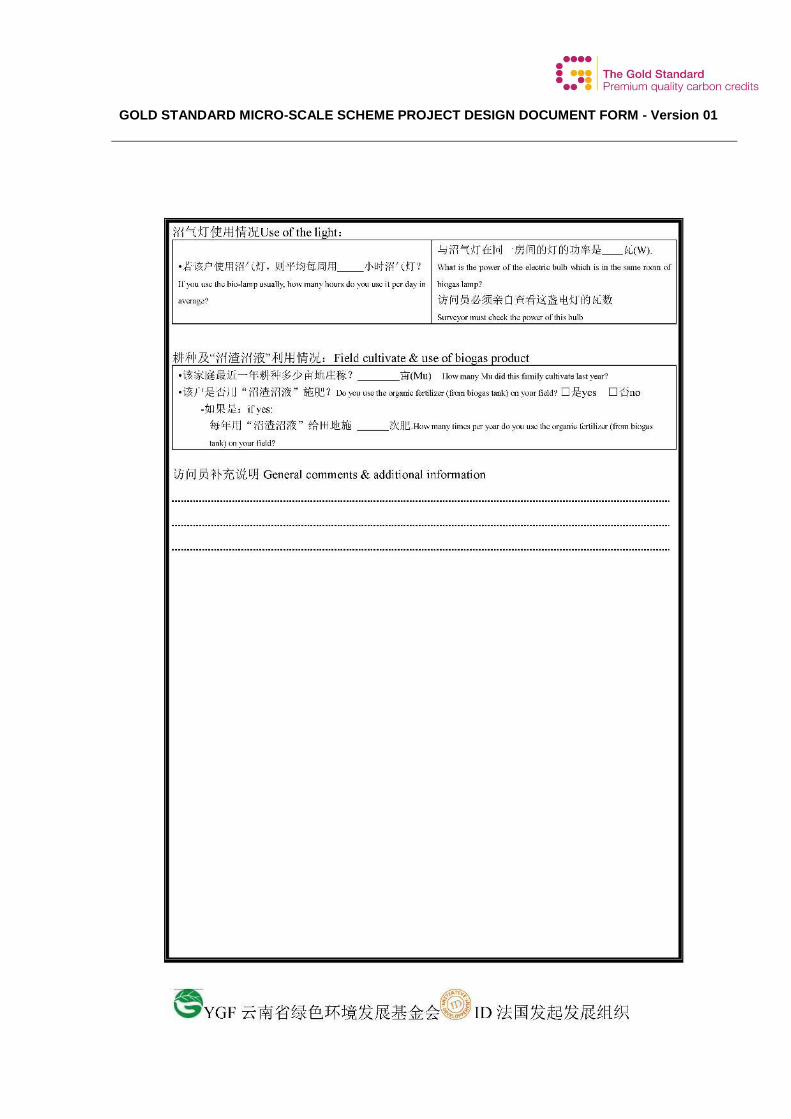
GOLD STANDARD MICRO-SCALE SCHEME PROJECT DESIGN DOCUMENT FORM - Version 01
61
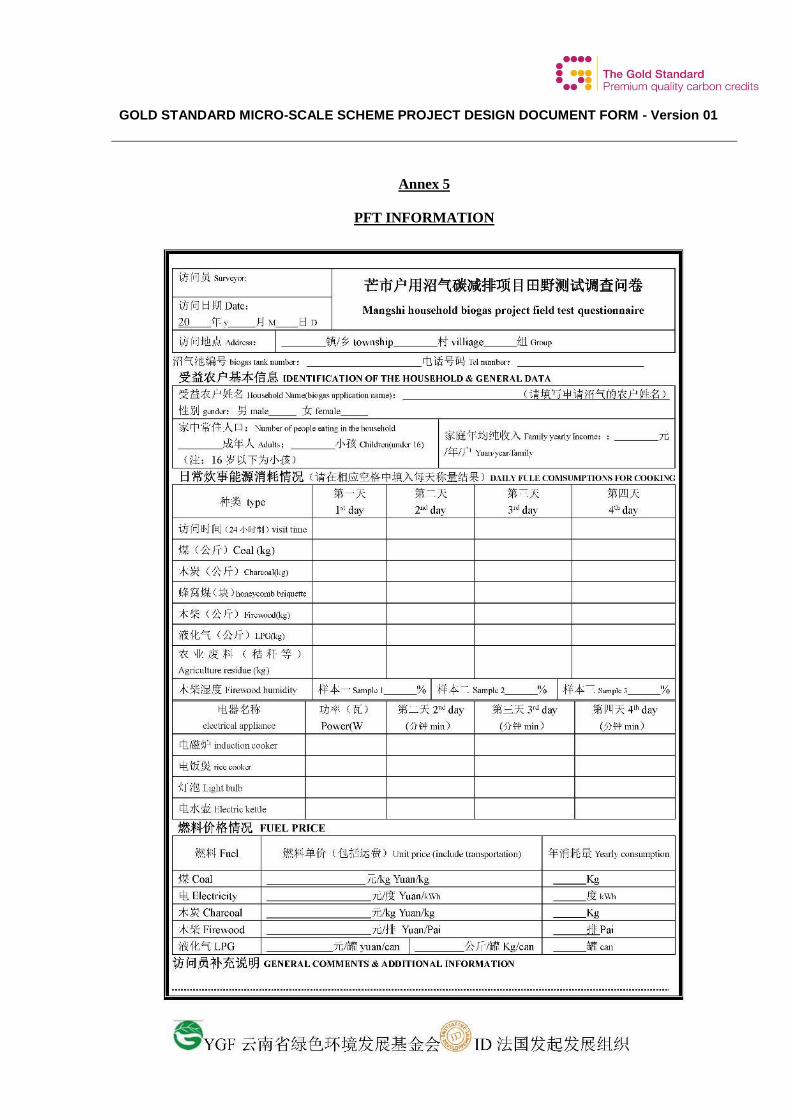
GOLD STANDARD MICRO-SCALE SCHEME PROJECT DESIGN DOCUMENT FORM - Version 01
62
Annex 5
PFT INFORMATION
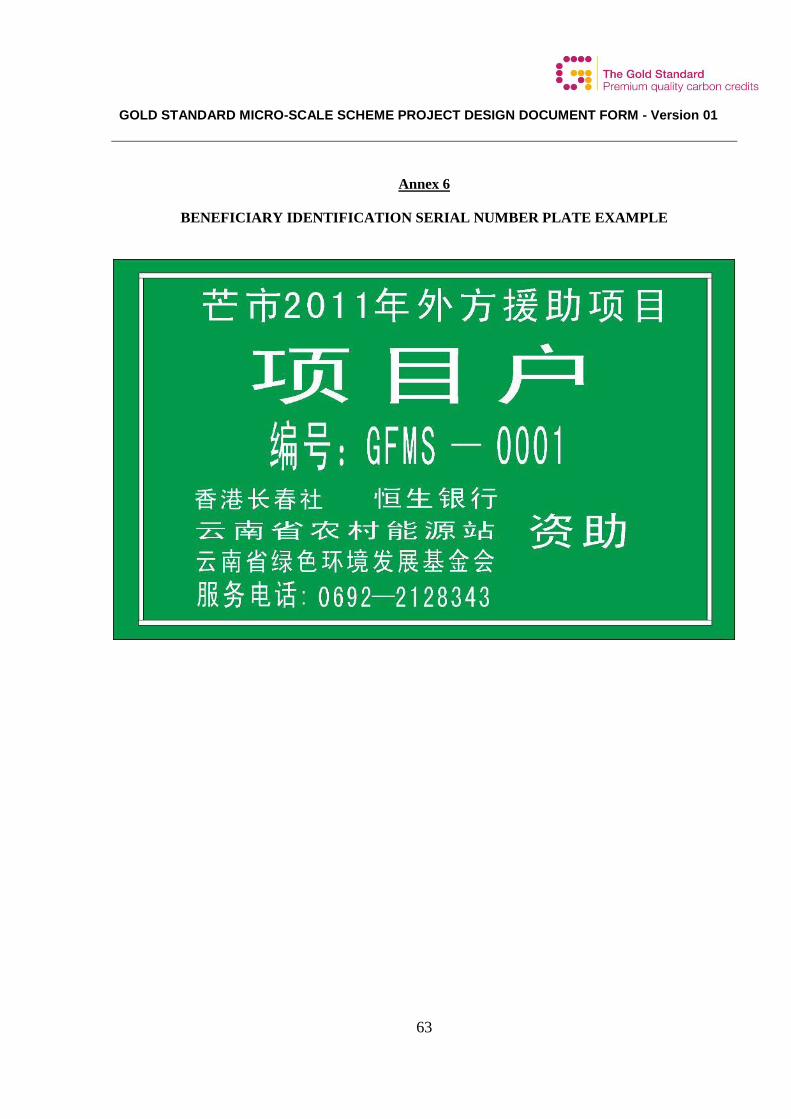
GOLD STANDARD MICRO-SCALE SCHEME PROJECT DESIGN DOCUMENT FORM - Version 01
63
Annex 6
BENEFICIARY IDENTIFICATION SERIAL NUMBER PLATE EXAMPLE