progress_report_2000_english.pdf - nestlé
TRANSCRIPT
Environment – Progress Report 2000
Table of contents
3 Message from the CEO4 Nestlé – The World Food Company5 The Nestlé Policy on the Environment6 Progress summary 2000
8 Nestlé’s environmental focus areas
11 Focus 1Integrated approach throughout the supply chain
12 The supply chain14 Raw materials18 Manufacturing processes28 Packaging32 Distribution34 Consumers and the community
39 Focus 2Water as a key priority
40 Water resources and Nestlé activities42 Water and raw materials43 Water use in manufacturing46 Bottled waters48 Water safety49 Education and sponsorship
51 Focus 3Systematic management of environmental performance
52 Environmental targets and plans55 Progress towards objectives57 Continuous improvement59 The future
60 Research and Development64 Modern biotechnology and environment66 Alcon
68 Annex69 Environmental performance indicators (EPIs)72 List of awards75 List of ISO 14001 and EMAS certified factories76 Glossary of terms and abbreviations
Case studies
14 Germany Pesticides and fertilisers: as little as possible… as much as necessary
16 PhilippinesReducing soil erosion on coffee plantations
22 PhilippinesUsing spent coffee grounds as a fuel
26 FranceAn innovative process to eliminate an ozone depleting refrigerant
31 Contributing to packaging source reductionPerrier Vittel and PET bottles
33 ArgentinaImproving distribution efficiency with dual-temperature vehicles
35 USANestlé and Disney: partners in environmental education
36 SwitzerlandRenovating the international head office building
40 ThailandPartnership for reforestation
42 Global water use reductionReducing water through post-harvest processing techniques for coffee
44 From Switzerland to ChinaPioneering efforts around the globe
46 FranceInnovative source protection at Vittel and Contrexéville
48 USASponsoring a programme for water education
56 USANEMS in action
58 GermanyFrom NEMS to ISO 14001 and EMAS
61 Research and DevelopmentHelping to reduce air emissions in coffee factories
63 South East AsiaA method for pest control in coffee plantations

Environment – Progress Report 2000
Message from the CEO
Nestlé was founded in 1867 by pharmacist Henri Nestlé on the shores of Lake Geneva in Vevey,Switzerland. One hundred and thirty-four years later,our headquarters are still in Vevey, surrounded bythe Swiss Alps in one of the world’s best-preservedenvironmental settings.
As we have grown from humble beginnings into theworld’s largest food company, we have attemptedto take the fundamental cultural values of environmental preservation and cleanliness intoevery country where we operate.
I spend a great deal of time travelling to thesecountries and have personally visited many of the 479 Nestlé factories currently in operation.One of the reasons for doing so is to see for myself that our facilities reflect the environmentalvalues basic to our Company.
Moreover, I follow the Company’s environmentalperformance, including the results of our environ-mental performance indicators. Our EnvironmentalOfficer reports directly to General Managementto ensure there is on-going awareness regardingenvironmental affairs. Also, the Nestlé Environ-mental Advisory Group (made up of corporateexperts from many functions) meets regularly toreview current environmental issues and to anticipate potential concerns. This allows us tomaximise control over our activities and contributeto sustainable development in the countries wherewe operate.
The Nestlé Environment – Progress Report 2000describes the results of continuous improvement inour environmental practices. I am pleased about the clear progress in a number of key areas,including a significant decline in the amounts ofwater and energy used to bring each kilo of Nestléproducts into your home, and a similar reduction infactors which potentially affect global warming.However, we are never completely satisfied with ourcurrent performance, and are committed to furtherenvironmental improvements.
We try to remain sensitive to the environmentalconcerns of our consumers and the public as a whole. As a charter member of the World
Business Council for Sustainable Development, we attempt to keep our policies at the forefront ofindustrial companies. For this reason, we havepledged our adherence to The Business Charter forSustainable Development of the InternationalChamber of Commerce, and we are committed tobeing a leader in environmental performance.
This leadership is only possible through thecollective commitment of the tens of thousands of individual Nestlé employees who, on a dailybasis, work to make this a better planet on which to live. This Report is dedicated to them.
3
Peter Brabeck-Letmathe Chief Executive Officer
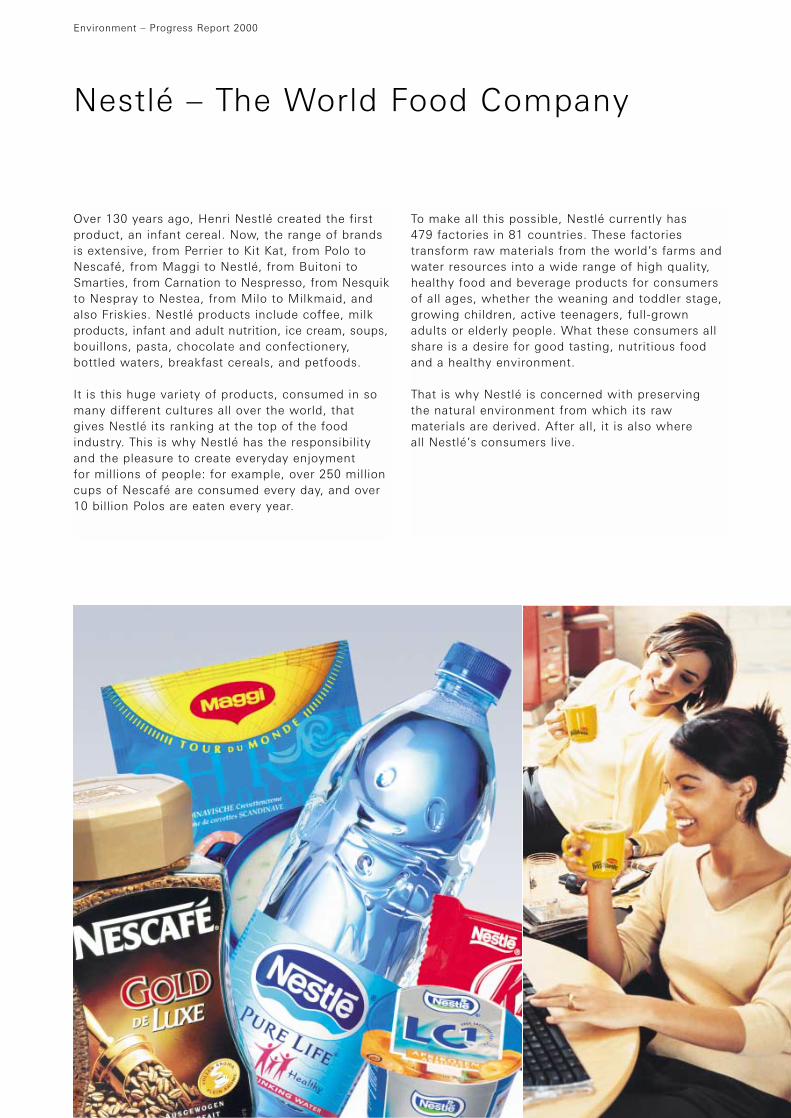
Over 130 years ago, Henri Nestlé created the firstproduct, an infant cereal. Now, the range of brandsis extensive, from Perrier to Kit Kat, from Polo toNescafé, from Maggi to Nestlé, from Buitoni toSmarties, from Carnation to Nespresso, from Nesquikto Nespray to Nestea, from Milo to Milkmaid, andalso Friskies. Nestlé products include coffee, milkproducts, infant and adult nutrition, ice cream, soups,bouillons, pasta, chocolate and confectionery,bottled waters, breakfast cereals, and petfoods.
It is this huge variety of products, consumed in somany different cultures all over the world, thatgives Nestlé its ranking at the top of the foodindustry. This is why Nestlé has the responsibilityand the pleasure to create everyday enjoyment for millions of people: for example, over 250 millioncups of Nescafé are consumed every day, and over10 billion Polos are eaten every year.
To make all this possible, Nestlé currently has 479 factories in 81 countries. These factoriestransform raw materials from the world’s farms andwater resources into a wide range of high quality,healthy food and beverage products for consumersof all ages, whether the weaning and toddler stage,growing children, active teenagers, full-grownadults or elderly people. What these consumers allshare is a desire for good tasting, nutritious foodand a healthy environment.
That is why Nestlé is concerned with preserving the natural environment from which its rawmaterials are derived. After all, it is also where all Nestlé’s consumers live.
Environment – Progress Report 2000
Nestlé – The World Food Company
The Nestlé Policy on the Environment
The United Nations World Commission on Environ-ment and Development, in its 1987 milestone report Our Common Future, stated that sustainabledevelopment means “meeting the needs of thepresent without compromising the ability of futuregenerations to meet their own needs”.
For Nestlé, respect and responsibility for the environment is part of its broader commitment tosustainable development. It requires an integratedapproach to policy and decision making in whichlong-term economic growth, environmental protec-tion and social achievements are not incompatible,but are complementary and mutually dependent.
Since the 1992 Earth Summit in Rio de Janeiro, allof society – be it governments, industry, NGOs or others – has worked to translate the sustainabledevelopment concept into reality. As part of thiseffort, Nestlé has participated in the work of severalorganisations dealing with this subject. For example,the Company is a founding member of the WorldBusiness Council for Sustainable Development(WBCSD) in Geneva, Switzerland. Nestlé hasadhered to The Business Charter for SustainableDevelopment of the International Chamber ofCommerce (ICC) since its publication in 1991.
Nestlé’s commitment to sustainable developmentand other fundamental principles of business areoutlined in the Nestlé Corporate Business Principles.This document defines the standards of behaviourfor all companies in the Nestlé Group. The CorporateBusiness Principles are designed to complementapplicable legislation and international recommen-dations. How Nestlé brings these principles to life,specifically the environmental aspects, is evidencedthrough the numerous examples in this Report.
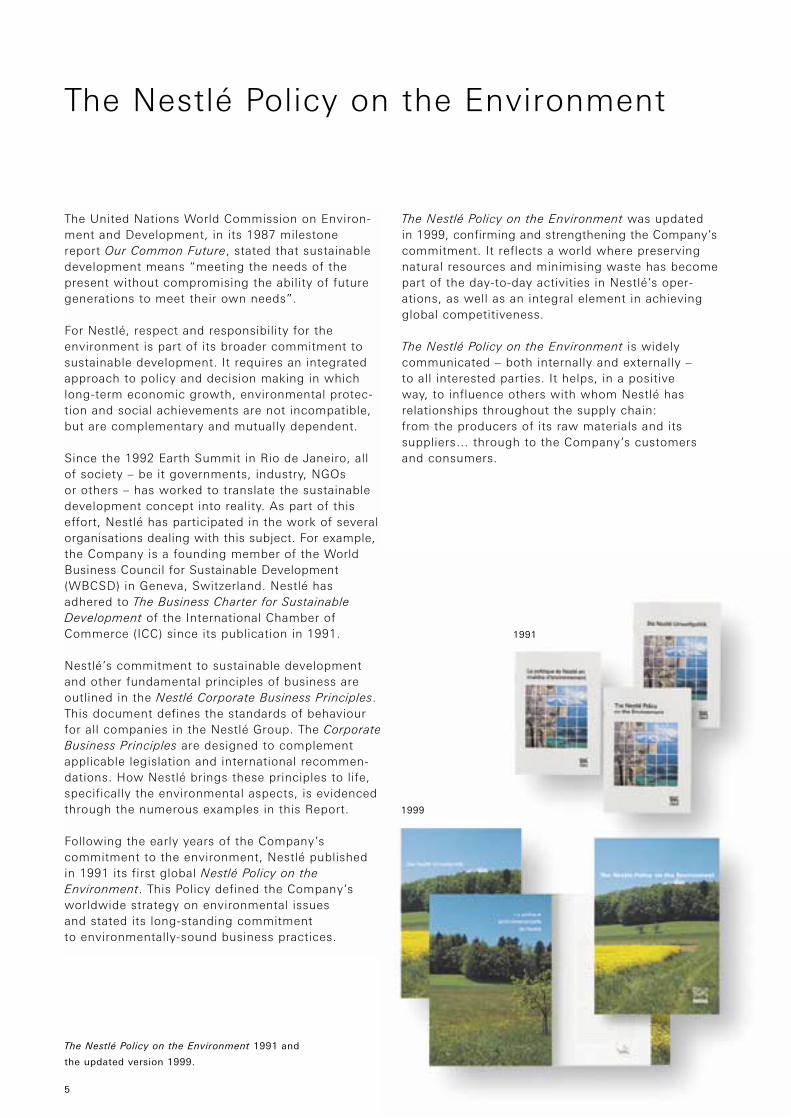
Following the early years of the Company’scommitment to the environment, Nestlé publishedin 1991 its first global Nestlé Policy on theEnvironment. This Policy defined the Company’sworldwide strategy on environmental issues and stated its long-standing commitment to environmentally-sound business practices.
The Nestlé Policy on the Environment was updatedin 1999, confirming and strengthening the Company’scommitment. It reflects a world where preservingnatural resources and minimising waste has becomepart of the day-to-day activities in Nestlé’s oper-ations, as well as an integral element in achievingglobal competitiveness.
The Nestlé Policy on the Environment is widelycommunicated – both internally and externally – to all interested parties. It helps, in a positive way, to influence others with whom Nestlé hasrelationships throughout the supply chain: from the producers of its raw materials and itssuppliers… through to the Company’s customersand consumers.
5
The Nestlé Policy on the Environment 1991 and
the updated version 1999.
1999
1991

Nestlé’s record of environmental activities can betraced back over several decades, with manyeffective measures put in place. In 1990, theCompany decided to deal with environmentalaspects in a more systematic way. Environmentalachievements have been reported in the annualManagement Report since 1991. A special report,Nestlé and the Environment, was published in 1995and presented results for the previous five years.This Report covers progress since 1995 and revealsfocus in three key areas:
Focus 1 Integrated approach throughout the supply chainNestlé minimises the impact on the environment at each step in its activities, from buying rawmaterials to manufacturing products and their useby consumers.
Environmental performance indicators (EPIs)covering manufacturing operations have beendefined. Their collection and consolidation
across the Company started in 1997. Resultspresented below show significant progress.
Packaging source reduction efforts were initiated in 1991. As a result, cumulative packaging materialsavings during the years 1991 to 1999 amounted to165 000 tonnes, equivalent to CHF 300 million,without affecting product safety and quality.
Internal and external communication, training andeducation efforts have been increased significantly. In 1996, Nestlé initiated its Internet site to enableconsumers, and the community at large, to better understand Nestlé and its commitment to the environment: www.nestle.com The site was significantly expanded in 1999, addressing theincreasing environmental interests of its users.
Focus 2 Water as a key priorityNestlé supports the sustainable use of water andtakes the necessary measures to ensure theresponsible management of this vital resource.
Environment – Progress Report 2000
Progress summary 2000
The results below cover the period 1997–1999, during which production volume increased by 24%
Unit 1997 1998 1999
Water consumption m3 per tonne product 11.0 9.37 8.59
Energy consumption 109 Joules (GJ) per tonne product 4.55 3.90 3.65
Waste water generation m3 per tonne product 8.86 7.11 6.62
Greenhouse gases kg CO2 per tonne product 241 212 197
Air acidification potential kg SOx equiv. per tonne product 1.74 1.34 1.21
Ozone depleting substances g R-11 equiv. per tonne product 36.0 * 2.76 2.41
By-products/waste generation kg per tonne product 103 84.5 78.5
By-products/waste recovery % recovery 75.7 74.2 74.9
* Data is for 1986 when measurement began.
6
From 1997 to 1999, the Company has achieved a 22% reduction in water consumption per tonne of product, while, at the same time, meeting itsbusiness growth objectives for bottled waters. Inaddition, strong emphasis has been placed on the protection of natural mineral water sources,effective management of waste water, participationin the development of programmes for water safety and community-based water improvementand educational activities.
Focus 3 Systematic management of environmental performanceNestlé has developed its own system to efficientlymanage the environmental aspects of its activities.
The Nestlé Environmental Management System(NEMS) was elaborated in 1996 and has beenimplemented throughout the Company. WhereasNEMS implementation is mandatory, certificationsunder other systems such as ISO 14001 and the eco-management and audit scheme (EMAS)
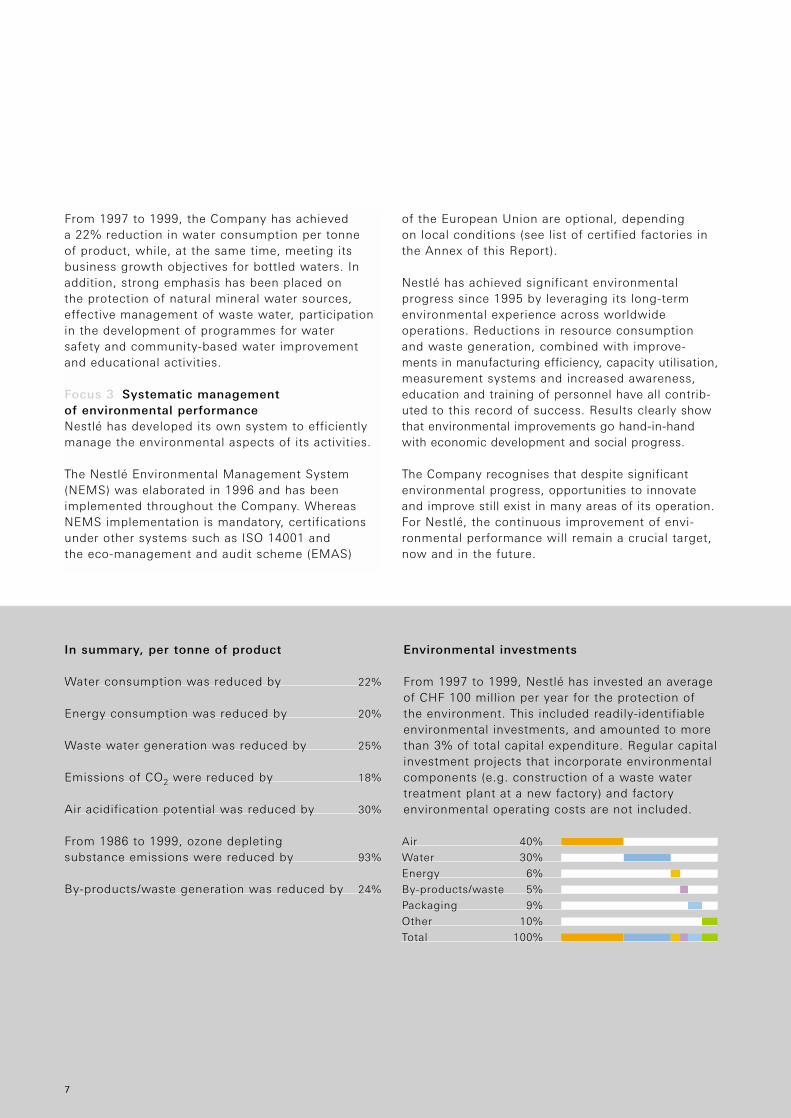
In summary, per tonne of product
Water consumption was reduced by 22%
Energy consumption was reduced by 20%
Waste water generation was reduced by 25%
Emissions of CO2 were reduced by 18%
Air acidification potential was reduced by 30%
From 1986 to 1999, ozone depleting substance emissions were reduced by 93%
By-products/waste generation was reduced by 24%
Environmental investments
From 1997 to 1999, Nestlé has invested an averageof CHF 100 million per year for the protection of the environment. This included readily-identifiableenvironmental investments, and amounted to morethan 3% of total capital expenditure. Regular capitalinvestment projects that incorporate environmentalcomponents (e.g. construction of a waste watertreatment plant at a new factory) and factoryenvironmental operating costs are not included.
Air 40%
Water 30%
Energy 6%
By-products/waste 5%
Packaging 9%
Other 10%
Total 100%
7
of the European Union are optional, depending on local conditions (see list of certified factories inthe Annex of this Report).
Nestlé has achieved significant environmentalprogress since 1995 by leveraging its long-termenvironmental experience across worldwideoperations. Reductions in resource consumptionand waste generation, combined with improve-ments in manufacturing efficiency, capacity utilisation,measurement systems and increased awareness,education and training of personnel have all contrib-uted to this record of success. Results clearly showthat environmental improvements go hand-in-handwith economic development and social progress.
The Company recognises that despite significantenvironmental progress, opportunities to innovateand improve still exist in many areas of its operation.For Nestlé, the continuous improvement of envi-ronmental performance will remain a crucial target,now and in the future.

Nestlé’senvironmentalfocus areas
Nestlé’s environmental progress is theresult of many years of “real worldexperience” and reveals focus in three key areas:
Integrated approach throughout the supply chain Nestlé minimises the impacton the environment at each step in itsactivities, from buying raw materials to manufacturing products and their useby consumers.
Water as a key priority Nestlé supports the sustainable use of water and takes the necessary measures to ensure the responsible management of this vital resource.
Systematic management of environmentalperformance Nestlé has developed its own system to efficiently manage the environmental aspects of its activities.
9
Environment – Progress Report 2000
This focused approach enables Nestlé to maintain a clear vision with respect to
its environmental objectives. The Company is careful to ensure that environmen-
tal progress is properly co-ordinated so that an improvement made in one area is
complementary to environmental aspects in other areas.
Nestlé’s environmental progress is theresult of many years of “real worldexperience” and reveals focus in three key areas:
Focus 1
Integrated approach throughout the supply chain Nestlé minimises the impacton the environment at each step in itsactivities, from buying raw materials to manufacturing products and their useby consumers.
Focus 2
Water as a key priority Nestlé supports the sustainable use of water and takes the necessary measures to ensure the responsible management of this vital resource.
Focus 3
Systematic management of environmentalperformance Nestlé has developed its own system to efficiently manage the environmental aspects of its activities.
11
Environnment – Progress Report 2000
Focus 1
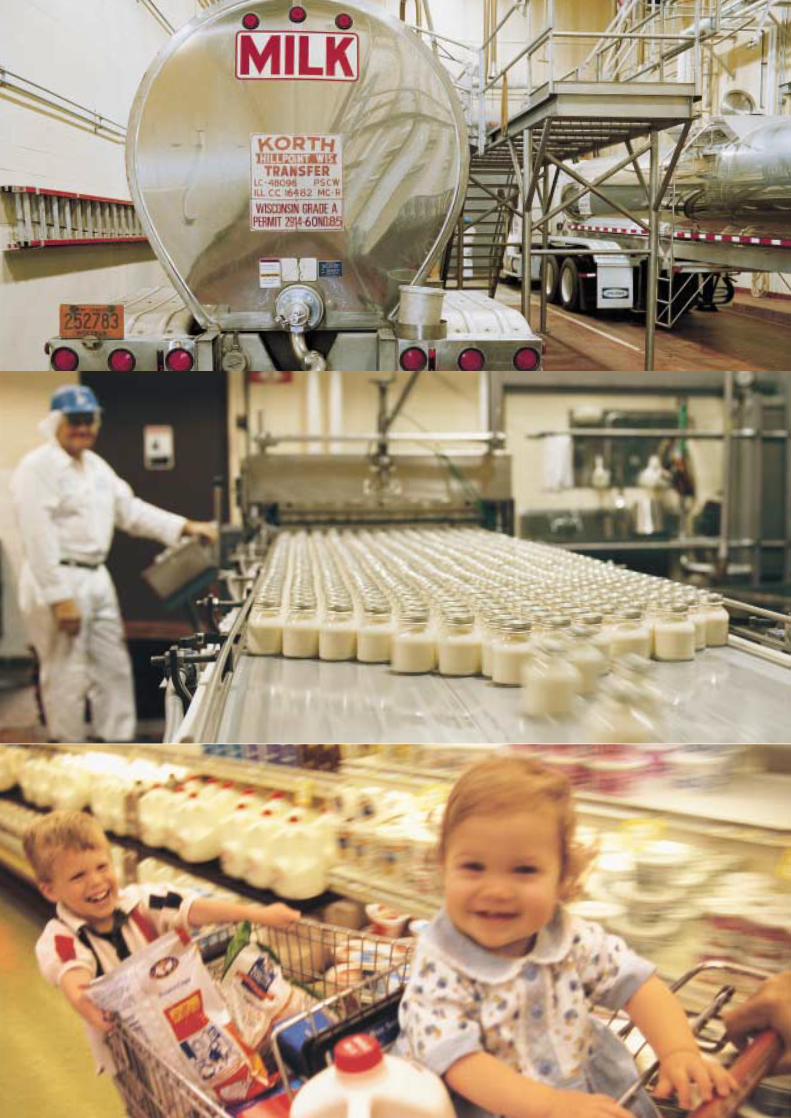
Integrated approach throughout the supplychain Nestlé’s primary business is thetransformation of perishable raw materialsinto high quality, safe and wholesome foodproducts that meet the needs of consumersthroughout their lives. To accomplish this,the Company interacts, both directly andindirectly, at different steps along the way – from producing and purchasing of itsraw materials, to manufacturing, packaging,distribution and finally to the consumer. Thischain is referred to as “the supply chain”.Taking care of environmental considerationsthroughout the supply chain is a vital part of Nestlé’s strategy.

Raw materials and ingredients Nestlé buys rawmaterials and ingredients either on the open marketor directly from producers. In all cases, strict qualitycriteria are applied, for example limiting potentialenvironmental contaminants.
Manufacturing processes In Nestlé’s factories,many different processing technologies are used to transform raw materials and ingredients intofinished products. Environmental objectives centre on minimising consumption of resources andreducing waste.
Packaging The main reason for a product package is to protect the finished goods. Nestlépromotes integrated waste management including packaging source reduction, reuse, recycling andenergy recovery.
Environment – Progress Report 2000 Integrated approach throughout the supply chain
The supply chainAt every step along the supply chain, Nestlé addresses environmental aspects
12
Distribution Once the finished product leaves thefactory, it has to be transported to sales outlets,some only a few miles away, but others across the world. Nestlé’s policy is to optimise shipmentsin order to limit effects on the environment and to reduce its use of energy resources.
Consumers and the community The all-importantconsumer is at the end of the supply chain. Nestléplaces special emphasis on clear, open communi-cation about its environmental activities. The Company also contributes to the good of commu-nities through programmes that foster broad-basedenvironmental awareness and improvements.
13
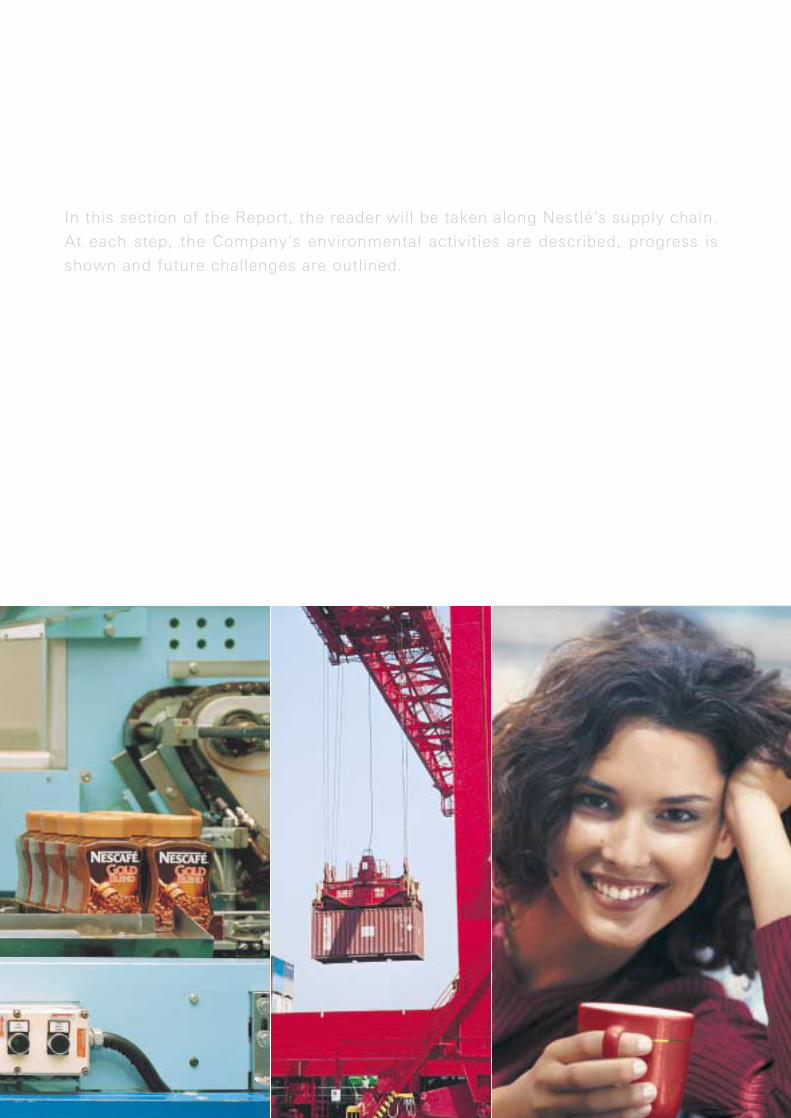
In this section of the Report, the reader will be taken along Nestlé’s supply chain.
At each step, the Company’s environmental activities are described, progress is
shown and future challenges are outlined.
Agricultural raw materials provide the basis forNestlé’s finished products and therefore are centralto its operations. They represent a significantinvestment.
For Nestlé it is important that the environment from which these raw materials come is safe andprotected in a sustainable manner.
Supporting sustainable agriculture The qualityof agricultural raw materials is dependent on farm-ing practices applied during their production. Nestlésupports sustainable agricultural practices, includ-ing environmental protection, as the best means toassure the high quality that is needed for its finishedproducts. Furthermore, such practices must beeconomically competitive and socially acceptable.
In general, Nestlé is not involved in raw materialproduction and does not own or operate farms. The Company purchases agricultural materials in
either raw or semi-processed form, directly from farmers or via traditional trade channels.Where possible, preference is given to raw materials that are produced by sustainable farmingpractices, while meeting Nestlé’s high qualityrequirements.
Supplier relationships based on sound businesspractices and mutual trust are important in this respect. As far as possible, suppliers areencouraged to apply sustainable agriculturepractices. Traceability systems across the supplychain have also been established to help ensure the efficient management of food safety issues.
A key contribution to sustainable agriculture is theapplication of integrated production methods.Integrated production is a comprehensive approach to farming that is based on consideration of themany different aspects of farm management as a“whole”. These range from animal husbandry and crop management to post-harvest treatment,
Environment – Progress Report 2000 Integrated approach throughout the supply chain
Raw materialsEnsure supply of quality raw materials, minimise environmental impacts
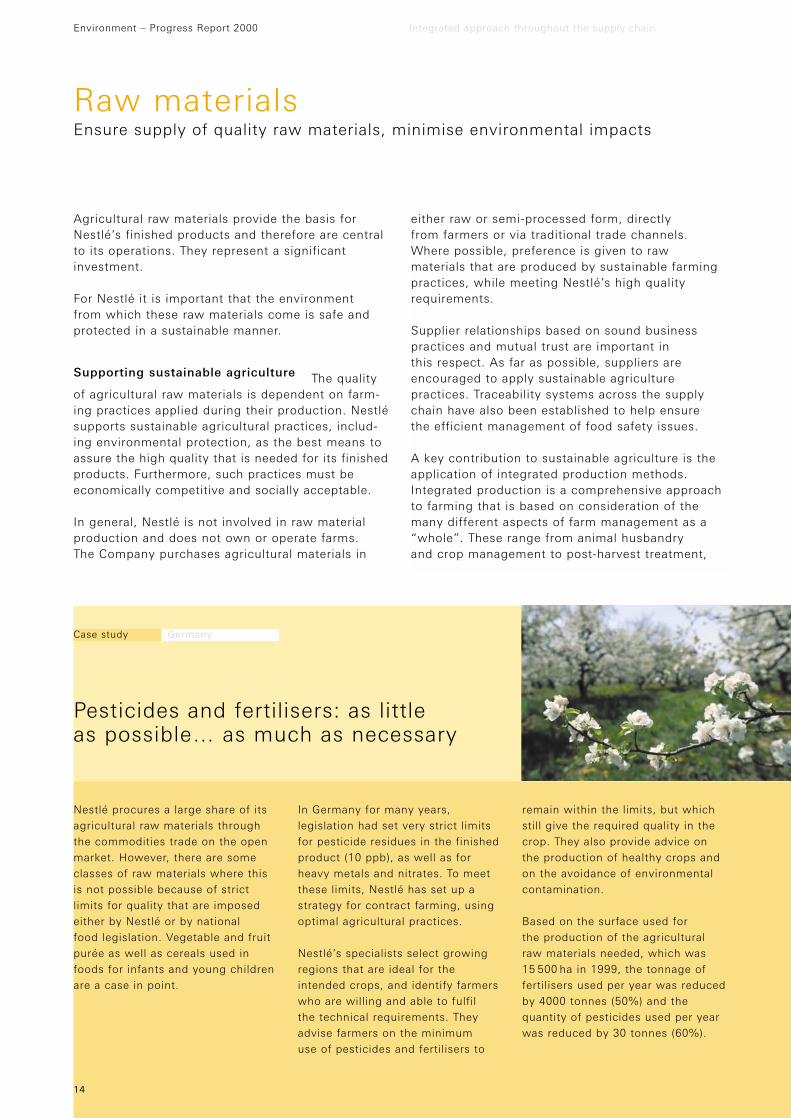
Nestlé procures a large share of itsagricultural raw materials throughthe commodities trade on the openmarket. However, there are someclasses of raw materials where thisis not possible because of strictlimits for quality that are imposedeither by Nestlé or by national food legislation. Vegetable and fruit purée as well as cereals used infoods for infants and young childrenare a case in point.
In Germany for many years, legislation had set very strict limitsfor pesticide residues in the finishedproduct (10 ppb), as well as forheavy metals and nitrates. To meetthese limits, Nestlé has set up astrategy for contract farming, usingoptimal agricultural practices.
Nestlé’s specialists select growingregions that are ideal for theintended crops, and identify farmerswho are willing and able to fulfil the technical requirements. Theyadvise farmers on the minimum use of pesticides and fertilisers to
remain within the limits, but whichstill give the required quality in thecrop. They also provide advice onthe production of healthy crops andon the avoidance of environmentalcontamination.
Based on the surface used for the production of the agriculturalraw materials needed, which was15 500 ha in 1999, the tonnage offertilisers used per year was reducedby 4000 tonnes (50%) and the quantity of pesticides used per yearwas reduced by 30 tonnes (60%).
Case study Germany
Pesticides and fertilisers: as little as possible… as much as necessary
14
storage and transport of raw materials. Integratedproduction also takes into account local soil,climatic and economic conditions.
An important environmental aspect of integratedproduction is integrated pest management. It uses environmentally compatible techniques forcontrolling pests at levels below those that causeeconomically unacceptable damage or loss.
Nestlé is involved with a variety of partners to foster sustainable agriculture. For many years, theCompany has supported farmers by providingtechnical assistance. Sustainable farming methodsare an important basis for this assistance.
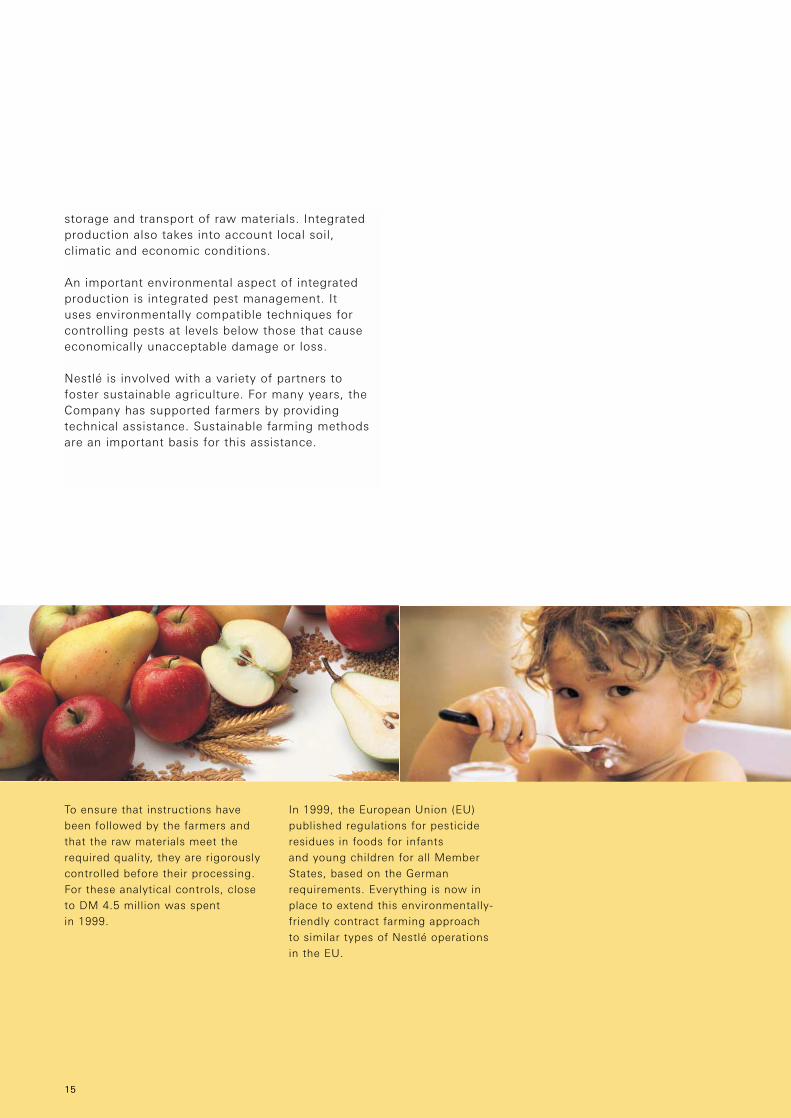
To ensure that instructions havebeen followed by the farmers andthat the raw materials meet therequired quality, they are rigorouslycontrolled before their processing. For these analytical controls, close to DM 4.5 million was spent in 1999.
In 1999, the European Union (EU)published regulations for pesticideresidues in foods for infants and young children for all MemberStates, based on the Germanrequirements. Everything is now inplace to extend this environmentally-friendly contract farming approachto similar types of Nestlé operationsin the EU.
15
Milk sourcing Nestlé buys and collects milk fromover 300 000 farmers in 40 countries, on five conti-nents. In recent years, important progress has beenmade to improve milk sourcing, benefitting bothNestlé and its milk suppliers.
Nestlé’s efforts to help farmers include the develop-ment of farm quality assurance schemes for milksourcing. The schemes are essentially guidelines for farmers on the application of sustainable milk production methods. They cover the entire milksupply chain, with special emphasis on the safetyand the consistent quality of milk.
The farm quality assurance scheme guidelinesinclude advice on:
– responsible farm management that is targeted at long-term, prosperous development of dairyfarms,
– appropriate use of pesticides and related record-keeping requirements,
– good animal husbandry, including animal health and welfare, animal nutrition and housing and the use of veterinary drugs, and
– handling of farm manure, including storage,application in fields to avoid contamination of soil and ground water with nitrates, and relatedrecord-keeping.
Through farm quality assurance schemes, Nestléworks to ensure the high quality that it needs in itsmilk supply, while at the same time minimising the environmental impact from milk production. A traceability system, which is part of theguidelines, allows Nestlé to guarantee the originand safety of its milk. Farm quality assuranceschemes are already in place in the Netherlands, the UK, France and Australia. They will beimplemented in the near future in all countrieswhere Nestlé sources its milk.
Environment – Progress Report 2000 Integrated approach throughout the supply chain
Raw materials
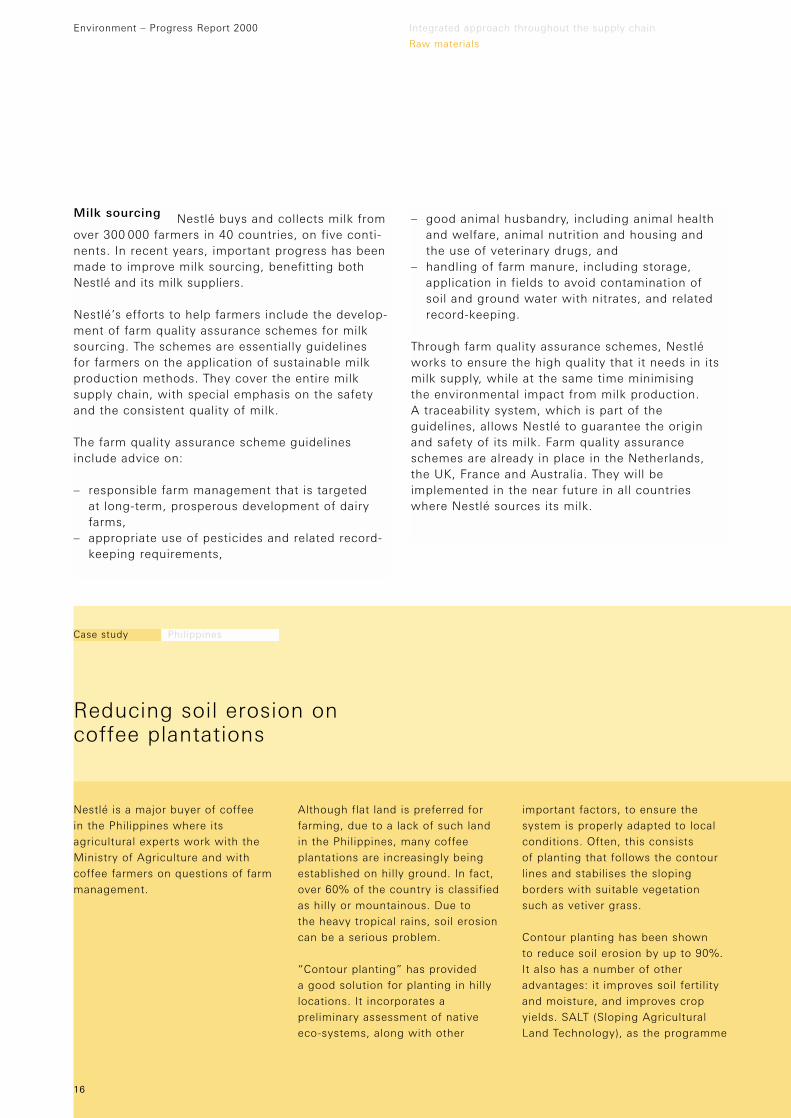
Nestlé is a major buyer of coffee in the Philippines where itsagricultural experts work with theMinistry of Agriculture and withcoffee farmers on questions of farmmanagement.
Although flat land is preferred forfarming, due to a lack of such land in the Philippines, many coffeeplantations are increasingly beingestablished on hilly ground. In fact,over 60% of the country is classified as hilly or mountainous. Due to the heavy tropical rains, soil erosioncan be a serious problem.
“Contour planting” has provided a good solution for planting in hillylocations. It incorporates apreliminary assessment of nativeeco-systems, along with other
important factors, to ensure thesystem is properly adapted to localconditions. Often, this consists of planting that follows the contourlines and stabilises the slopingborders with suitable vegetationsuch as vetiver grass.
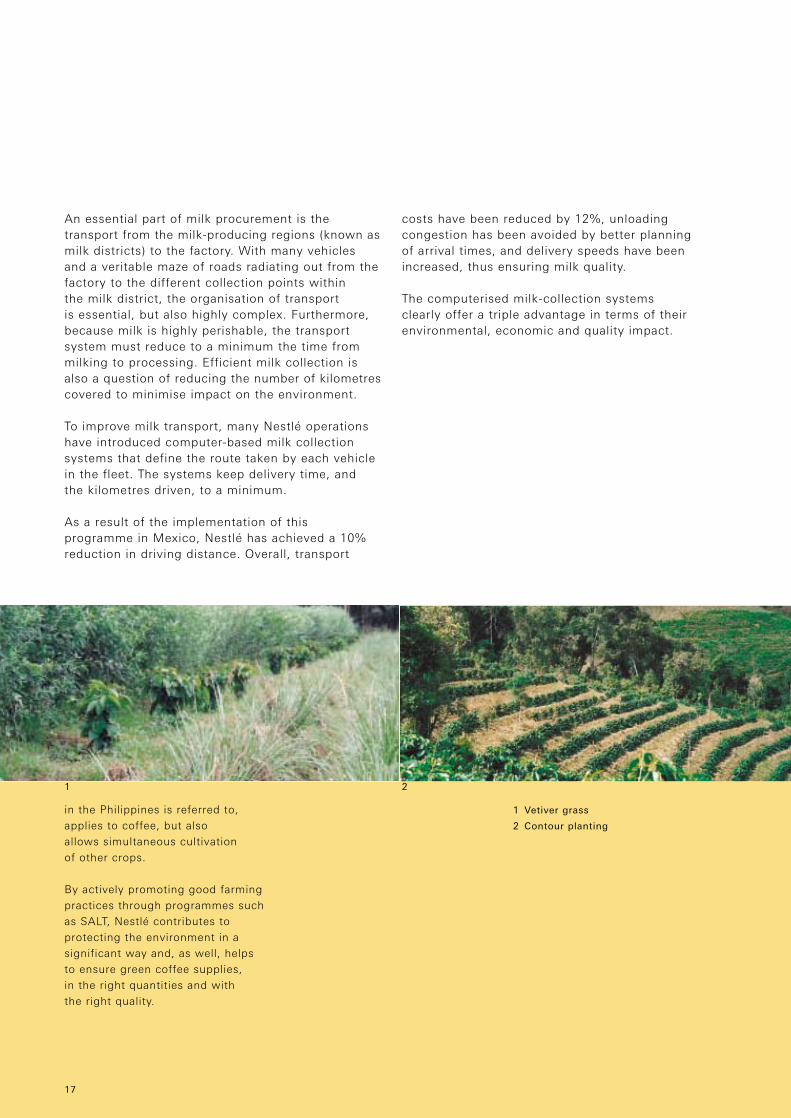
Contour planting has been shown to reduce soil erosion by up to 90%. It also has a number of otheradvantages: it improves soil fertilityand moisture, and improves cropyields. SALT (Sloping AgriculturalLand Technology), as the programme
Case study Philippines
Reducing soil erosion on coffee plantations
16
17
in the Philippines is referred to,applies to coffee, but also allows simultaneous cultivation of other crops.
By actively promoting good farmingpractices through programmes suchas SALT, Nestlé contributes toprotecting the environment in asignificant way and, as well, helpsto ensure green coffee supplies, in the right quantities and with the right quality.
An essential part of milk procurement is the transport from the milk-producing regions (known asmilk districts) to the factory. With many vehiclesand a veritable maze of roads radiating out from thefactory to the different collection points within the milk district, the organisation of transport is essential, but also highly complex. Furthermore,because milk is highly perishable, the transportsystem must reduce to a minimum the time frommilking to processing. Efficient milk collection isalso a question of reducing the number of kilometrescovered to minimise impact on the environment.
To improve milk transport, many Nestlé operationshave introduced computer-based milk collectionsystems that define the route taken by each vehiclein the fleet. The systems keep delivery time, and the kilometres driven, to a minimum.
As a result of the implementation of this programme in Mexico, Nestlé has achieved a 10%reduction in driving distance. Overall, transport
costs have been reduced by 12%, unloadingcongestion has been avoided by better planning of arrival times, and delivery speeds have beenincreased, thus ensuring milk quality.
The computerised milk-collection systems clearly offer a triple advantage in terms of theirenvironmental, economic and quality impact.
1 2
1 Vetiver grass
2 Contour planting
At Nestlé, manufacturing is a very important part of the supply chain. In nearly 500 factories aroundthe world, perishable raw materials are transformedinto safe, convenient, high quality food products. To accomplish this, a variety of processes arecarried out – from receiving and cleaning raw mate-rials, to extracting, roasting and cooking, drying,cooling and packing. In addition to raw materials,all of these activities also require resources such asenergy and water.
The manufacturing process not only yields finishedproducts, but also results in by-products and waste. By-products have a value and can be used asraw materials in other processes. What remains –the waste – can not be used.
Air emissions are also sometimes generated, forexample from cooking operations or energyproduction.
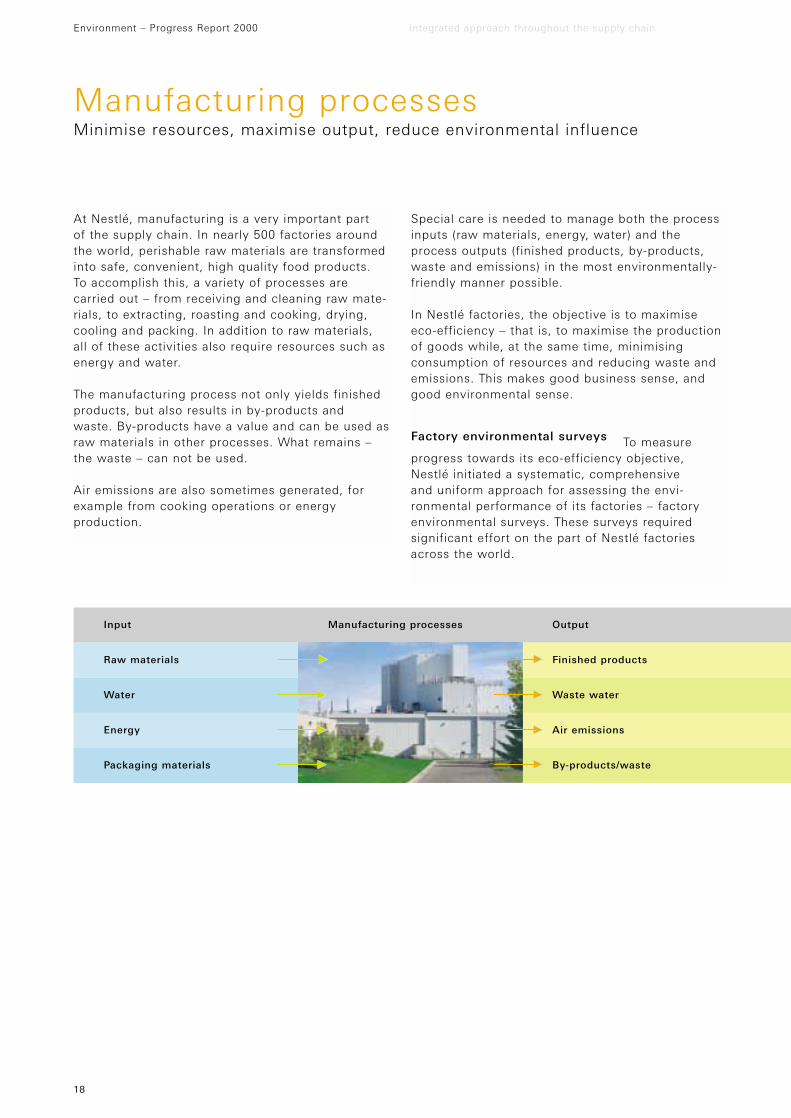
Special care is needed to manage both the processinputs (raw materials, energy, water) and theprocess outputs (finished products, by-products,waste and emissions) in the most environmentally-friendly manner possible.
In Nestlé factories, the objective is to maximise eco-efficiency – that is, to maximise the productionof goods while, at the same time, minimisingconsumption of resources and reducing waste andemissions. This makes good business sense, andgood environmental sense.
Factory environmental surveys To measureprogress towards its eco-efficiency objective, Nestlé initiated a systematic, comprehensive and uniform approach for assessing the envi-ronmental performance of its factories – factoryenvironmental surveys. These surveys requiredsignificant effort on the part of Nestlé factoriesacross the world.
Environment – Progress Report 2000 Integrated approach throughout the supply chain
Manufacturing processesMinimise resources, maximise output, reduce environmental influence
18
Input Manufacturing processes
Raw materials
Water
Energy
Packaging materials
Output
Finished products
Waste water
Air emissions
By-products/waste
The results of the first survey, completed in 1994,were reported in the 1995 Nestlé and theEnvironment publication. In summary, the resultsindicated that: – Nestlé had no major environmental problems, – Nestlé complied with relevant regulations, or in a
few exceptional cases, was taking action to do so,– Nestlé had been proactive in seeking environ-
mental solutions, and – data available from the factories was a valuable
source of information for prioritising futureenvironmental actions.
Building on what was learned in the first survey,environmental surveys were again conducted at allmanufacturing locations in 1997. The results were checked against 1994 action plans and newobjectives were established.
To achieve improvements in eco-efficiency requiresinvestment – investment of capital, time and humanresources. From a capital investment standpoint, thesurveys showed that Nestlé invested an average ofCHF 100 million per year for the protection of theenvironment. This included only readily-identifiableenvironmental investments, and amounted to morethan 3% of total capital expenditure.
In addition, substantial amounts were also spent onenvironmental aspects as part of regular capitalinvestment projects (e.g. the construction of awaste water treatment plant at a new factory) and in factory environmental operating costs (e.g. the operation of waste water treatment plants).Operating costs and investments in time and human resources are difficult to measure, primarilybecause environmental aspects are integrated into so many activities. Nonetheless, as illustratedthroughout this Report, these investments play abig role in achieving operational savings.
19
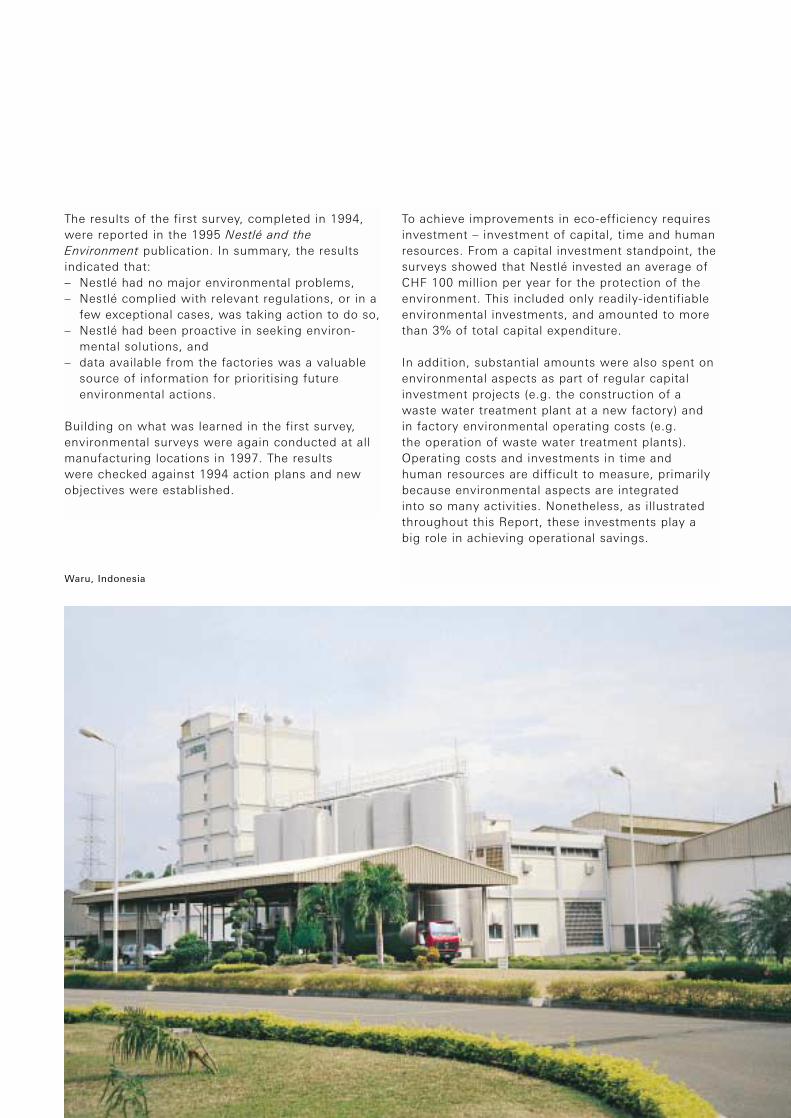
Waru, Indonesia
Environmental performance indicators In thepast, many individual Nestlé factories had useddifferent methods to track environmental perform-ance. To consolidate data, to benchmark bestpractices and to allow internal and externalreporting, a system was established that definedstandardised environmental performance indicators(EPIs) across the Company. In 1997, all manufac-turing sites were required to report their performanceresults annually and consolidation of EPIs began ona Group wide basis.
The consolidated Group EPIs cover manufacturingoperations. To determine environmentalperformance, both the process inputs and outputsare measured. This is based on the concept of eco-efficiency as defined in 1992 by the WBCSD intheir document Measuring eco-efficiency – a guideto reporting company performance. The methodologyused to identify, track and report the indicators isalso consistent with ISO 14031. The EPIs includewater and energy consumption, waste watergeneration, greenhouse gases, air acidificationpotential, and ozone depleting substance emissionsas well as by-products/waste generation.
Compiling data from nearly 500 factories is a challenging and demanding task. The accuracy ofthe data and the level of reporting have constantlyimproved. As can be seen in the table below, theoverall reporting level was 95%.
1997 1998 1999
Nestlé factories (excluding Alcon) 480 507 494
Factories that reported 464 476 471
The following sections show results from 1997 to 1999 and examples of how they have been achieved. During the same period production volume increased by 24%. Supporting data, methods of collection and detailed definitions forall EPIs are included in the Annex of this Report.
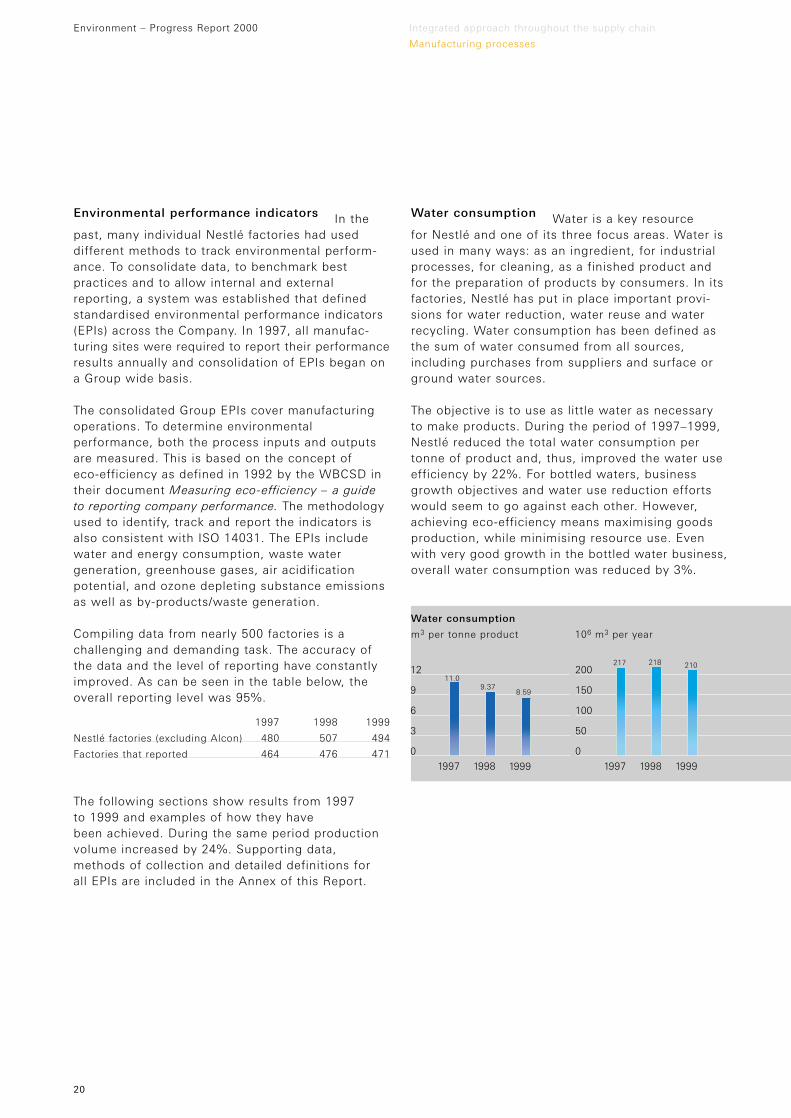
Water consumption Water is a key resource for Nestlé and one of its three focus areas. Water is used in many ways: as an ingredient, for industrialprocesses, for cleaning, as a finished product andfor the preparation of products by consumers. In itsfactories, Nestlé has put in place important provi-sions for water reduction, water reuse and waterrecycling. Water consumption has been defined asthe sum of water consumed from all sources,including purchases from suppliers and surface orground water sources.
The objective is to use as little water as necessaryto make products. During the period of 1997–1999,Nestlé reduced the total water consumption pertonne of product and, thus, improved the water useefficiency by 22%. For bottled waters, businessgrowth objectives and water use reduction effortswould seem to go against each other. However,achieving eco-efficiency means maximising goodsproduction, while minimising resource use. Evenwith very good growth in the bottled water business,overall water consumption was reduced by 3%.
Environment – Progress Report 2000 Integrated approach throughout the supply chain
Manufacturing processes
20
1997 1998 19991997 1998 1999
0
3
6
9
12
0
50
100
150
20011.0
9.378.59
217 218 210
m3 per tonne product 106 m3 per year
Water consumption
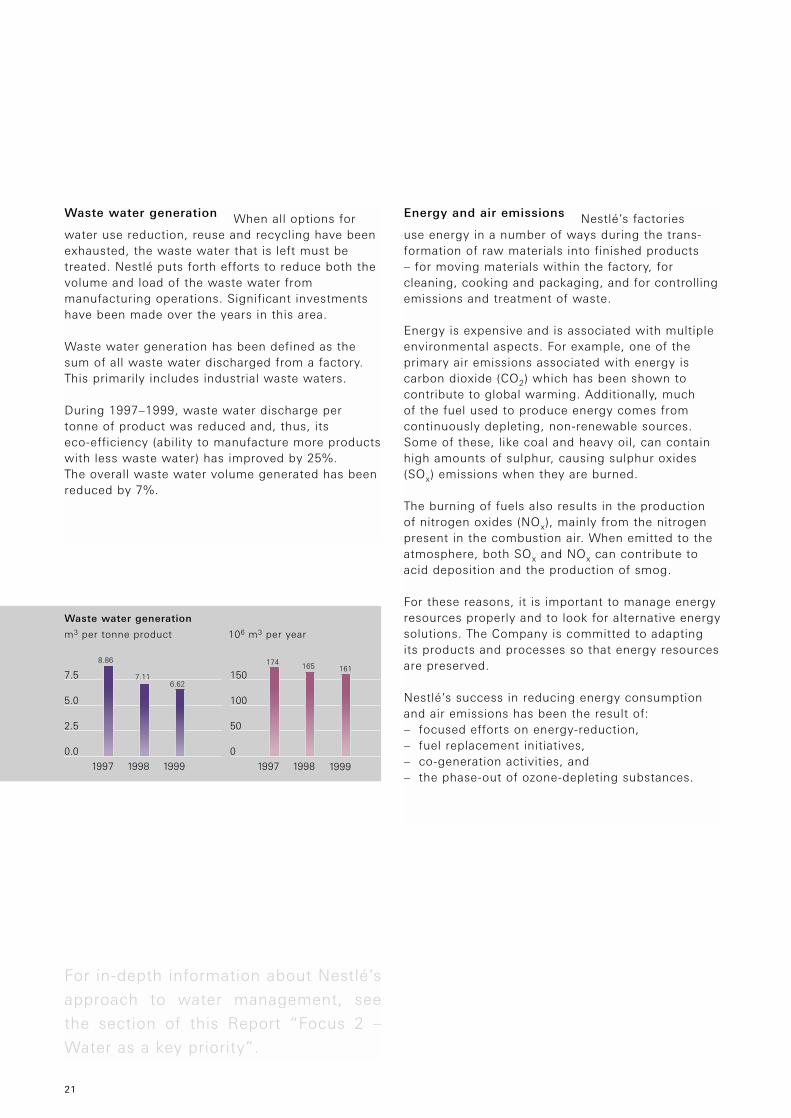
Waste water generation When all options forwater use reduction, reuse and recycling have beenexhausted, the waste water that is left must betreated. Nestlé puts forth efforts to reduce both thevolume and load of the waste water frommanufacturing operations. Significant investmentshave been made over the years in this area.
Waste water generation has been defined as thesum of all waste water discharged from a factory.This primarily includes industrial waste waters.
During 1997–1999, waste water discharge pertonne of product was reduced and, thus, its eco-efficiency (ability to manufacture more productswith less waste water) has improved by 25%. The overall waste water volume generated has beenreduced by 7%.
Energy and air emissions Nestlé’s factories use energy in a number of ways during the trans-formation of raw materials into finished products – for moving materials within the factory, forcleaning, cooking and packaging, and for controllingemissions and treatment of waste.
Energy is expensive and is associated with multipleenvironmental aspects. For example, one of theprimary air emissions associated with energy iscarbon dioxide (CO2) which has been shown tocontribute to global warming. Additionally, much of the fuel used to produce energy comes from continuously depleting, non-renewable sources.Some of these, like coal and heavy oil, can containhigh amounts of sulphur, causing sulphur oxides(SOx) emissions when they are burned.
The burning of fuels also results in the productionof nitrogen oxides (NOx), mainly from the nitrogenpresent in the combustion air. When emitted to theatmosphere, both SOx and NOx can contribute toacid deposition and the production of smog.
For these reasons, it is important to manage energyresources properly and to look for alternative energysolutions. The Company is committed to adaptingits products and processes so that energy resourcesare preserved.
Nestlé’s success in reducing energy consumptionand air emissions has been the result of: – focused efforts on energy-reduction, – fuel replacement initiatives, – co-generation activities, and – the phase-out of ozone-depleting substances.
21
0
50
100
150
0.0
2.5
5.0
7.5
1997 1998 19991997 1998 1999
161165174
6.627.11
8.86
m3 per tonne product 106 m3 per year
Waste water generation
For in-depth information about Nestlé’s
approach to water management, see
the section of this Report “Focus 2 –
Water as a key priority”.
Energy consumption Reducing the amount ofenergy needed and, therefore, the amount of energy consumed during manufacturing, is a critical element in the management of energyresources. Through various energy-conservationprogrammes and by employing a systematicapproach (the Nestlé Environmental ManagementSystem – NEMS – presented later in this Report),Nestlé has achieved good results in the area of energy reduction. This can be illustrated by thefollowing examples:
– In the Netherlands, at Nestlé’s Roermond factory, electricity consumption was reduced bymaking programming changes in an automatedproduction process. This resulted in savings of 550 000 kWh/year.
– In two factories in Portugal, Nestlé installedequipment to recover excess heat given off fromboilers and air heaters. The action resulted in acombined annual savings of about CHF 120 000.
– In India, an energy optimisation study wasconducted which identified opportunities for a12% improvement in energy use. Projects are currently being implemented to achieve these savings.
In many factories, Nestlé uses renewable fuelsinstead of, or in combination with, more traditionalnon-renewable fuels. Renewable fuels are fuels derived from materials that are readily and naturally reproducible, rather than non-renewable fuels like oil and natural gas that takemillions of years to be regenerated by natural processes.
An interesting example of a “renewable fuel” isspent coffee grounds. The manufacturing processfor soluble coffees requires extraction of the roastedand ground coffee beans (brewing). The material left after extraction is spent coffee grounds – one of Nestlé’s high-volume by-products. The Companyhas found ways to use this by-product as fuel to
Environment – Progress Report 2000 Integrated approach throughout the supply chain
Manufacturing processes
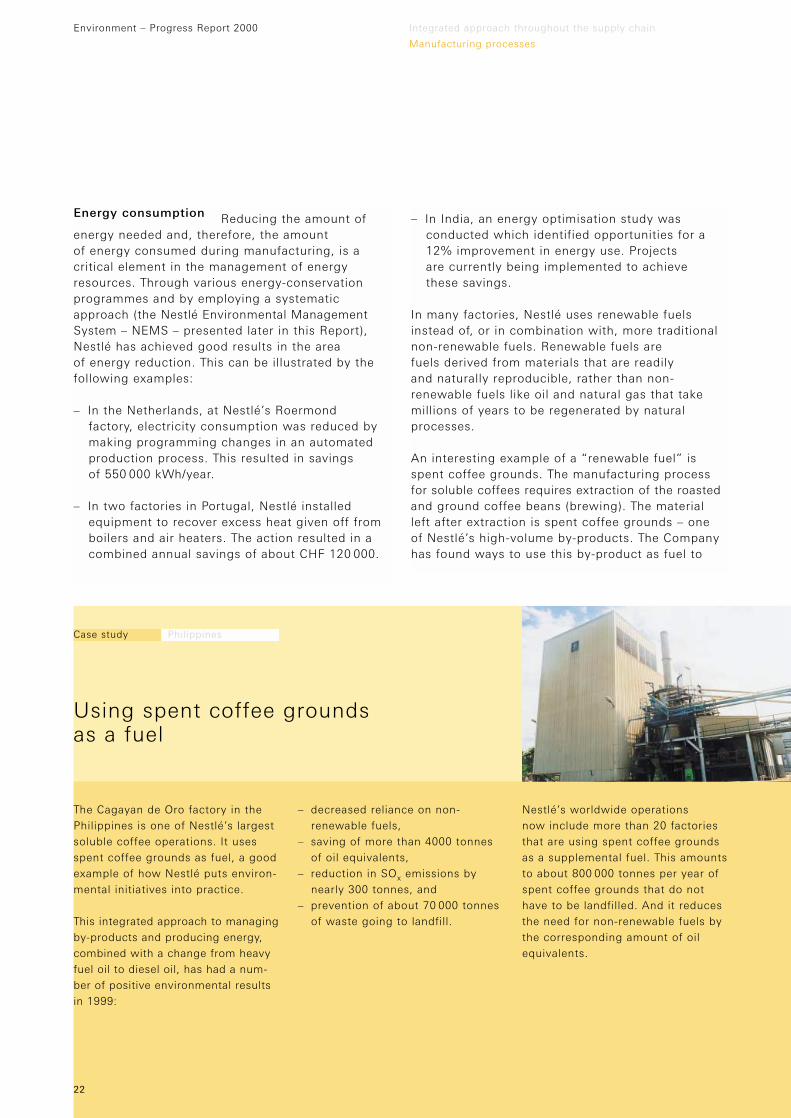
The Cagayan de Oro factory in thePhilippines is one of Nestlé’s largestsoluble coffee operations. It uses spent coffee grounds as fuel, a goodexample of how Nestlé puts environ-mental initiatives into practice.
This integrated approach to managingby-products and producing energy,combined with a change from heavyfuel oil to diesel oil, has had a num-ber of positive environmental resultsin 1999:
– decreased reliance on non-renewable fuels,
– saving of more than 4000 tonnesof oil equivalents,
– reduction in SOx emissions bynearly 300 tonnes, and
– prevention of about 70 000 tonnesof waste going to landfill.
Nestlé’s worldwide operations now include more than 20 factoriesthat are using spent coffee groundsas a supplemental fuel. This amounts to about 800 000 tonnes per year ofspent coffee grounds that do nothave to be landfilled. And it reducesthe need for non-renewable fuels bythe corresponding amount of oilequivalents.
Case study Philippines
Using spent coffee grounds as a fuel
22
produce energy for manufacturing processes. Using spent coffee grounds in this way reduces the burden on fossil fuel supplies, and can haveother environmental benefits, as presented in theaccompanying case study.
Energy consumption has been defined as the sumof all energy purchased or obtained – less anyenergy which, in rare cases, is sold. This includeselectricity, steam, fuels such as oil and natural gas,and by-products such as spent coffee grounds.
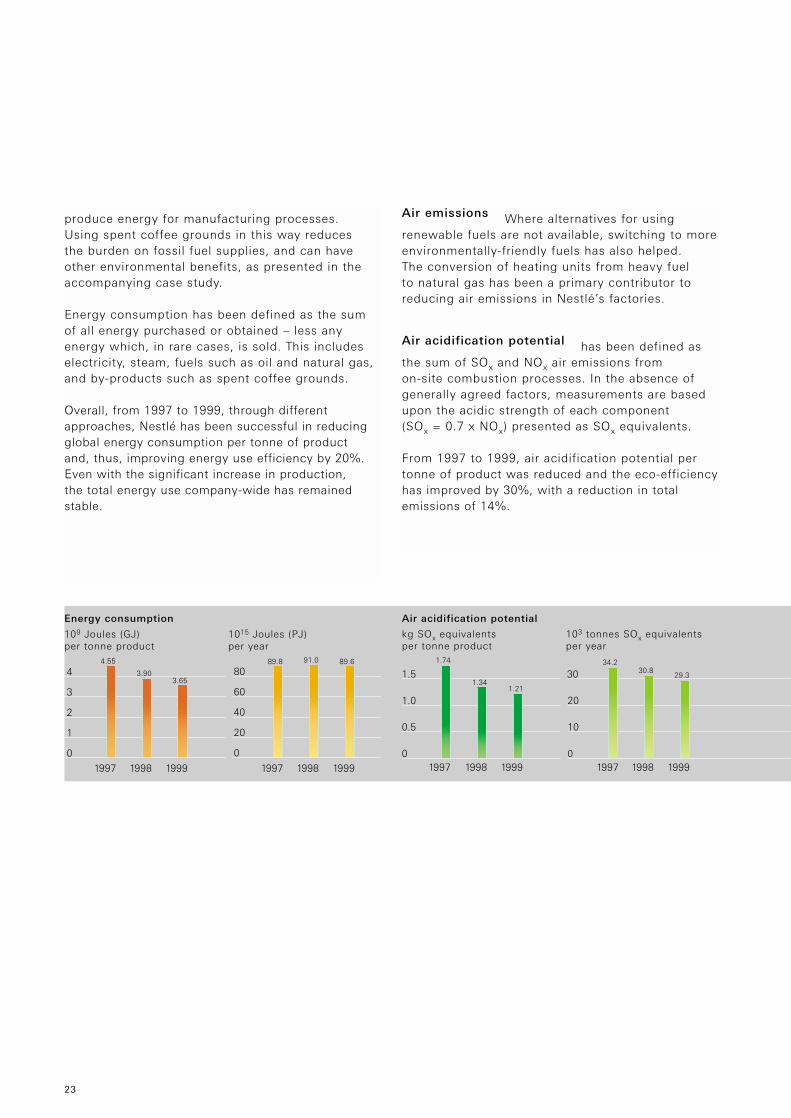
Overall, from 1997 to 1999, through differentapproaches, Nestlé has been successful in reducingglobal energy consumption per tonne of product and, thus, improving energy use efficiency by 20%.Even with the significant increase in production, the total energy use company-wide has remained stable.
Air emissions Where alternatives for usingrenewable fuels are not available, switching to moreenvironmentally-friendly fuels has also helped. The conversion of heating units from heavy fuel to natural gas has been a primary contributor toreducing air emissions in Nestlé’s factories.
Air acidification potential has been defined asthe sum of SOx and NOx air emissions from on-site combustion processes. In the absence ofgenerally agreed factors, measurements are basedupon the acidic strength of each component (SOx = 0.7 x NOx) presented as SOx equivalents.
From 1997 to 1999, air acidification potential pertonne of product was reduced and the eco-efficiencyhas improved by 30%, with a reduction in totalemissions of 14%.
23
1997 1998 19991997 1998 1999
0
20
40
60
80
0
1
2
3
489.691.089.8
3.653.90
4.55
109 Joules (GJ) 1015 Joules (PJ) per tonne product per year
Energy consumption
0
10
20
30
0
0.5
1.0
1.5
1997 1998 19991997 1998 1999
29.330.8
34.2
1.211.34
1.74
kg SOx equivalents 103 tonnes SOx equivalentsper tonne product per year
Air acidification potential

Greenhouse gases have been defined as the sumof all on-site CO2 emissions from combustionprocesses used to manufacture Nestlé products.
From 1997 to 1999, emissions of greenhouse gasesas CO2 per tonne of product were reduced and,thus, the eco-efficiency has improved by 18%, whiletotal emissions remained stable.
Co-generation plants also present an opportunity forimproved efficiency. By producing both electricityand steam at the same time, they are much moreefficient than conventional power plants. Co-generation reduces the amount of fuel consumedand therefore air emissions.
Co-generation plants are, however, expensive toinstall. The feasibility of installing such plants is very much dependent on local energy costs.Using combined steam and power generation hasresulted in impressive reductions of CO2 – the main “greenhouse” gas – as well as SOx and NOx.
The 1995 publication Nestlé and the Environmentpresented two successful co-generation projects inSpain and the UK with combined annual CO2
reductions amounting to 80 000 tonnes. Today, Nestlé has ten factories throughout the worldthat take advantage of this technology.
Environment – Progress Report 2000 Integrated approach throughout the supply chain
Manufacturing processes
24
1997 1998 19991997 1998 1999
0
1
2
3
4
0
50
100
150
200
4.754.904.71
197212
241
kg CO2 per tonne product 106 tonnes CO2 per year
Greenhouse gases
Co-generation
Gerona, Spain
25
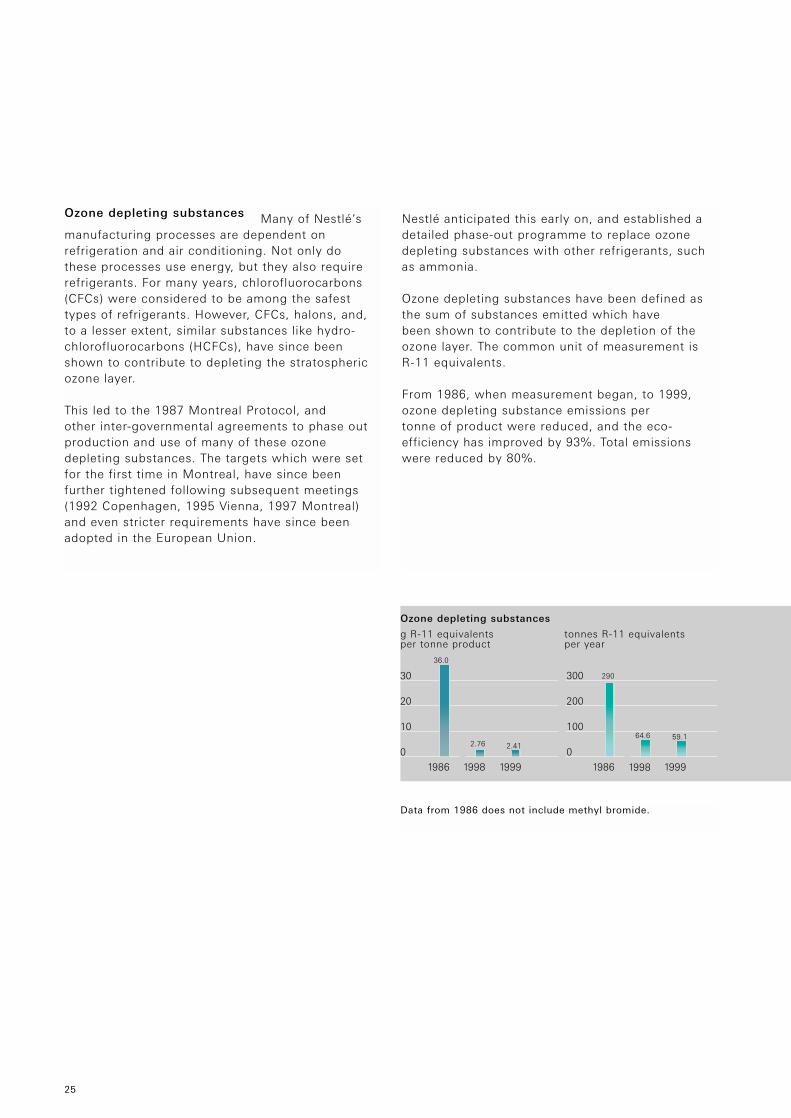
Ozone depleting substances Many of Nestlé’smanufacturing processes are dependent onrefrigeration and air conditioning. Not only do these processes use energy, but they also requirerefrigerants. For many years, chlorofluorocarbons(CFCs) were considered to be among the safesttypes of refrigerants. However, CFCs, halons, and, to a lesser extent, similar substances like hydro-chlorofluorocarbons (HCFCs), have since beenshown to contribute to depleting the stratosphericozone layer.
This led to the 1987 Montreal Protocol, and other inter-governmental agreements to phase outproduction and use of many of these ozonedepleting substances. The targets which were setfor the first time in Montreal, have since beenfurther tightened following subsequent meetings(1992 Copenhagen, 1995 Vienna, 1997 Montreal)and even stricter requirements have since beenadopted in the European Union.
Nestlé anticipated this early on, and established adetailed phase-out programme to replace ozonedepleting substances with other refrigerants, suchas ammonia.
Ozone depleting substances have been defined asthe sum of substances emitted which have been shown to contribute to the depletion of theozone layer. The common unit of measurement is R-11 equivalents.
From 1986, when measurement began, to 1999,ozone depleting substance emissions per tonne of product were reduced, and the eco-efficiency has improved by 93%. Total emissionswere reduced by 80%.
0
100
200
300
0
10
20
30
19981986 19991986 1998 1999
290
2.412.7659.164.6
36.0
g R-11 equivalents tonnes R-11 equivalents per tonne product per year
Data from 1986 does not include methyl bromide.
Ozone depleting substances
Environment – Progress Report 2000 Integrated approach throughout the supply chain
Manufacturing processes
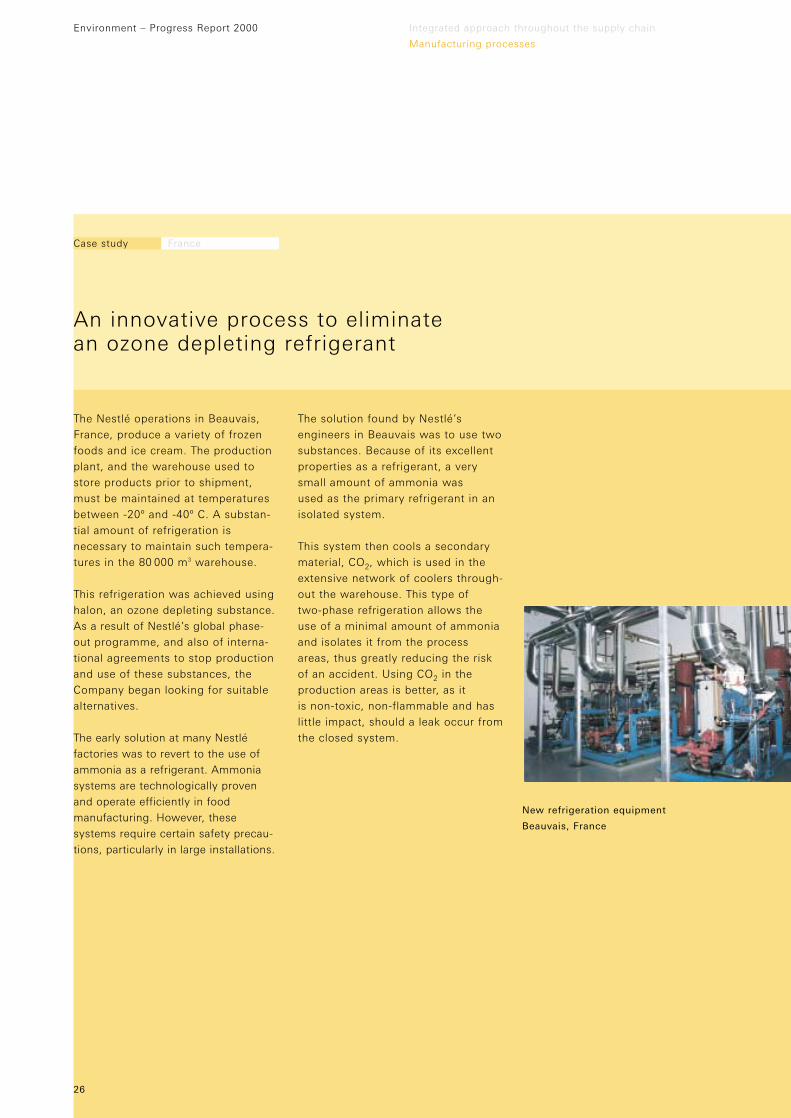
The Nestlé operations in Beauvais,France, produce a variety of frozenfoods and ice cream. The productionplant, and the warehouse used tostore products prior to shipment,must be maintained at temperaturesbetween -20º and -40º C. A substan-tial amount of refrigeration isnecessary to maintain such tempera-tures in the 80 000 m3 warehouse.
This refrigeration was achieved usinghalon, an ozone depleting substance.As a result of Nestlé’s global phase-out programme, and also of interna-tional agreements to stop productionand use of these substances, theCompany began looking for suitablealternatives.
The early solution at many Nestléfactories was to revert to the use ofammonia as a refrigerant. Ammoniasystems are technologically provenand operate efficiently in food manufacturing. However, thesesystems require certain safety precau-tions, particularly in large installations.
The solution found by Nestlé’sengineers in Beauvais was to use twosubstances. Because of its excellentproperties as a refrigerant, a verysmall amount of ammonia was used as the primary refrigerant in anisolated system.
This system then cools a secondarymaterial, CO2, which is used in theextensive network of coolers through-out the warehouse. This type of two-phase refrigeration allows theuse of a minimal amount of ammoniaand isolates it from the processareas, thus greatly reducing the riskof an accident. Using CO2 in theproduction areas is better, as it is non-toxic, non-flammable and haslittle impact, should a leak occur fromthe closed system.
Case study France
An innovative process to eliminate an ozone depleting refrigerant
New refrigeration equipment
Beauvais, France
26
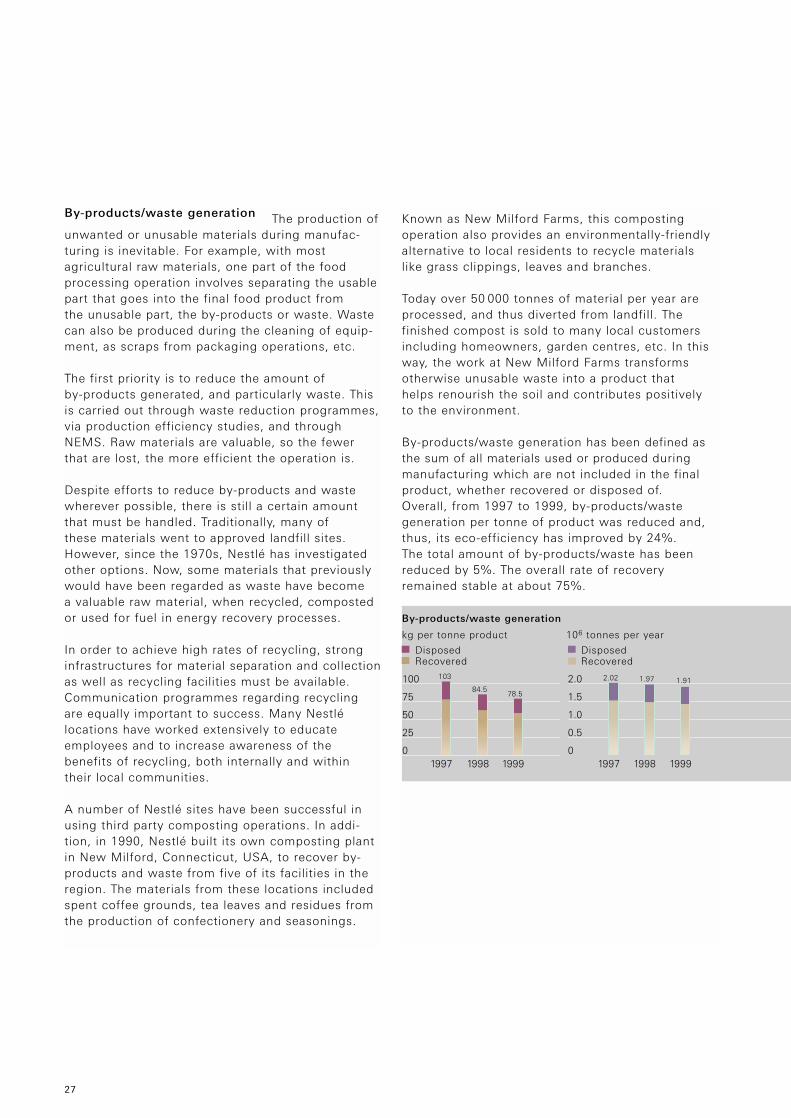
By-products/waste generation The production ofunwanted or unusable materials during manufac-turing is inevitable. For example, with mostagricultural raw materials, one part of the foodprocessing operation involves separating the usablepart that goes into the final food product from the unusable part, the by-products or waste. Wastecan also be produced during the cleaning of equip-ment, as scraps from packaging operations, etc.
The first priority is to reduce the amount of by-products generated, and particularly waste. Thisis carried out through waste reduction programmes,via production efficiency studies, and throughNEMS. Raw materials are valuable, so the fewerthat are lost, the more efficient the operation is.
Despite efforts to reduce by-products and wastewherever possible, there is still a certain amountthat must be handled. Traditionally, many of these materials went to approved landfill sites.However, since the 1970s, Nestlé has investigatedother options. Now, some materials that previouslywould have been regarded as waste have become a valuable raw material, when recycled, compostedor used for fuel in energy recovery processes.
In order to achieve high rates of recycling, stronginfrastructures for material separation and collectionas well as recycling facilities must be available.Communication programmes regarding recycling are equally important to success. Many Nestlé locations have worked extensively to educateemployees and to increase awareness of the benefits of recycling, both internally and within their local communities.
A number of Nestlé sites have been successful inusing third party composting operations. In addi-tion, in 1990, Nestlé built its own composting plantin New Milford, Connecticut, USA, to recover by-products and waste from five of its facilities in theregion. The materials from these locations includedspent coffee grounds, tea leaves and residues fromthe production of confectionery and seasonings.
Known as New Milford Farms, this compostingoperation also provides an environmentally-friendlyalternative to local residents to recycle materialslike grass clippings, leaves and branches.
Today over 50 000 tonnes of material per year areprocessed, and thus diverted from landfill. Thefinished compost is sold to many local customersincluding homeowners, garden centres, etc. In thisway, the work at New Milford Farms transforms otherwise unusable waste into a product that helps renourish the soil and contributes positively to the environment.
By-products/waste generation has been defined asthe sum of all materials used or produced duringmanufacturing which are not included in the finalproduct, whether recovered or disposed of.Overall, from 1997 to 1999, by-products/wastegeneration per tonne of product was reduced and,thus, its eco-efficiency has improved by 24%. The total amount of by-products/waste has beenreduced by 5%. The overall rate of recoveryremained stable at about 75%.
27
0
0.5
1.0
1.5
2.0
0
25
50
75
100
1997 1998 19991997 1998 1999
103 1.911.972.02
78.584.5
kg per tonne product 106 tonnes per year
Disposed DisposedRecovered Recovered
By-products/waste generation
Fulfilling a basic need Nestlé is firmly committedto continue progress in finding packaging solutionsthat will contribute to a better environment.Packaging is, of course, essential both for Nestléand for the consumer. It ensures the safety andquality of products – from manufacture through tostorage, distribution and consumption. In addition,packaging contributes to product appeal, providesconvenience and communicates information, e.g.,on nutrition and serving instructions. In many cases, packaging includes tamper-evidence features. Packaging also helps prevent or reduce product waste.
Progress in packaging source reduction Therehas been an increased focus on packaging and itsenvironmental impact over the past ten years. As stated in The Nestlé Policy on the Environment,Nestlé supports an integrated approach that favourssource reduction, reuse, recycling and energyrecovery to minimise the impact of packaging onthe environment.
Since 1991, environmental considerations havebecome an important criterion in Nestlé’s renovationand innovation of packages and packaging materials.Reducing the amount of packaging material neededfor a product, while safeguarding safety and quality, is a continuing key objective and priority.
To meet this objective, Nestlé initiated, in 1991, aprocess for the continuous review and assessment of its packaging source reduction opportunities.Comprehensive surveys were carried out on anannual basis to track the many individual reductionprojects. Their progress was due, in large part, tothe work of multi-disciplinary teams, the establish-ment of clear objectives and the implementation of a systematic approach.
The first consolidated packaging reduction resultswere published in the 1993 Management Report.Cumulative results, which have since been reported on an annual basis, show that packagingmaterial savings from 1991 to 1999 amounted
Environment – Progress Report 2000 Integrated approach throughout the supply chain
PackagingUse less material, encourage recovery
28
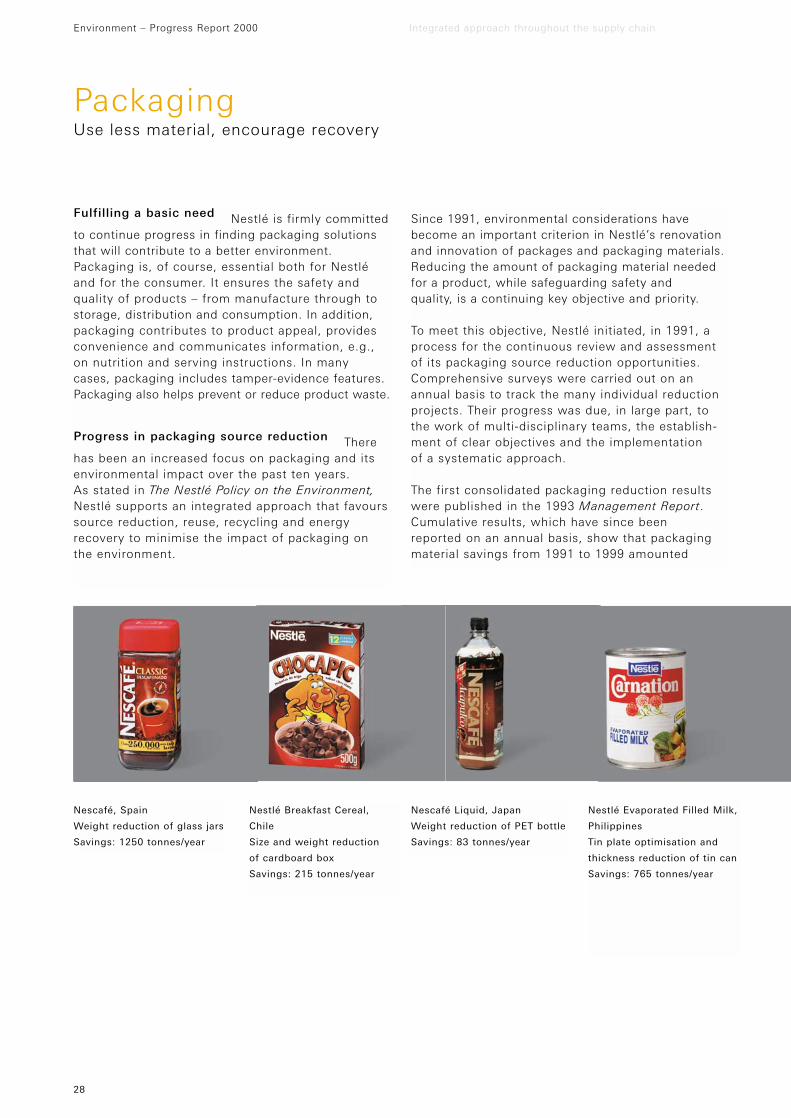
Nescafé, Spain
Weight reduction of glass jars
Savings: 1250 tonnes/year
Nestlé Breakfast Cereal,
Chile
Size and weight reduction
of cardboard box
Savings: 215 tonnes/year
Nescafé Liquid, Japan
Weight reduction of PET bottle
Savings: 83 tonnes/year
Nestlé Evaporated Filled Milk,
Philippines
Tin plate optimisation and
thickness reduction of tin can
Savings: 765 tonnes/year
29
corresponding shifts in food habits. Surveys haveshown an increased preference for single-servepackages and, in certain cases, a decline in thedesire for soft packs. Addressing these preferencesis part of meeting consumer expectations in ahighly competitive market. This may result in anincrease in the use of packaging materials forcertain new products.
Promoting packaging waste recovery It is notenough to achieve packaging source reduction andrecyclability. It is also necessary that systems are put in place for the collection, separation andrecovery of used packaging.
In some countries, in particular in the EuropeanUnion, ambitious recycling objectives have been set as part of the packaging waste regulations. To fulfil these regulations, several European coun-tries have established national packaging wasterecovery schemes. These include DSD in Germany,Eco-Emballages in France, and others in Belgium,Italy, Luxembourg, Portugal, Spain and the UK.Nestlé has participated actively in establishing theseschemes and in their management. Nestlé is keenlyaware of the need to contribute to the recovery of its packaging waste and will continue to investconsiderable time, energy and money.
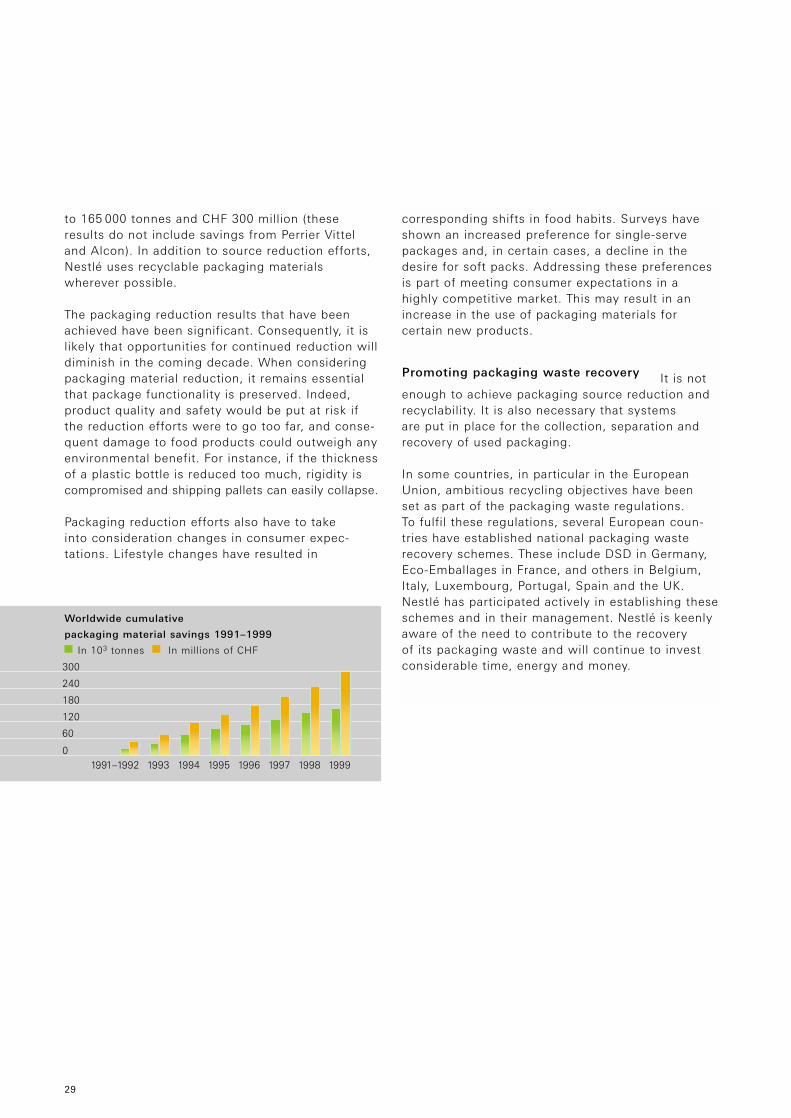
Worldwide cumulative
packaging material savings 1991–1999
1991–1992 1993 1994 1995 1996 1997 1998 19990
60
120
180
240
300
In 103 tonnes In millions of CHF
to 165 000 tonnes and CHF 300 million (theseresults do not include savings from Perrier Vitteland Alcon). In addition to source reduction efforts,Nestlé uses recyclable packaging materials wherever possible.
The packaging reduction results that have beenachieved have been significant. Consequently, it islikely that opportunities for continued reduction willdiminish in the coming decade. When consideringpackaging material reduction, it remains essentialthat package functionality is preserved. Indeed,product quality and safety would be put at risk ifthe reduction efforts were to go too far, and conse-quent damage to food products could outweigh anyenvironmental benefit. For instance, if the thicknessof a plastic bottle is reduced too much, rigidity iscompromised and shipping pallets can easily collapse.
Packaging reduction efforts also have to take into consideration changes in consumer expec-tations. Lifestyle changes have resulted in

Environment – Progress Report 2000 Integrated approach throughout the supply chain
Packaging
30
Progress data published by some packaging wasterecovery organisations show high overall packagingrecovery rates. For example, rates of 86% inGermany, 87% in Belgium and 72% in France havebeen reported. However, the total cost of thesesystems is high and needs to be optimised.Combined initiatives for source reduction, energyrecovery and recycling will be helpful in this effort.
When considering the overall impact of theseinitiatives, it should be kept in mind that packagingwaste represents just 2% of total waste.
Recent studies have suggested that there are nosimple universal solutions to the problem ofpackaging waste. Environmentally-friendly disposalmethods depend on local factors such as the type of waste stream, the availability of recovery facili-ties, the feasibility of using different recoverymeasures, and the willingness of local communitiesto support proposed schemes. Geography and
demographics are both important factors. Therefore,it is locally-based approaches that will lead to themost environmentally effective and economicallyefficient solutions.
Nestlé supports industrial and government efforts to promote integrated waste management (IWM).The objective of IWM is to prevent waste byoptimising resource conservation and limiting theamount of waste material that goes to landfills. It provides a practical and sustainable system thatintegrates waste streams, collection and treatmentmethods, environmental benefits and economicoptimisation. Reuse, recycling, composting, energyrecovery and landfilling are all part of IWM.
In addition, Nestlé encourages its packaging suppliersto adopt sound environmental practices. For example,Nestlé Perrier Vittel and their PET suppliers areinvolved in joint research for the optimal recyclingof PET bottles. An interesting and innovativeapplication of this kind is found in the textile sector where recycled PET from used bottles isreprocessed and transformed into textile fibre.
Bales of compacted PET bottles:
a raw material for textile fibre production
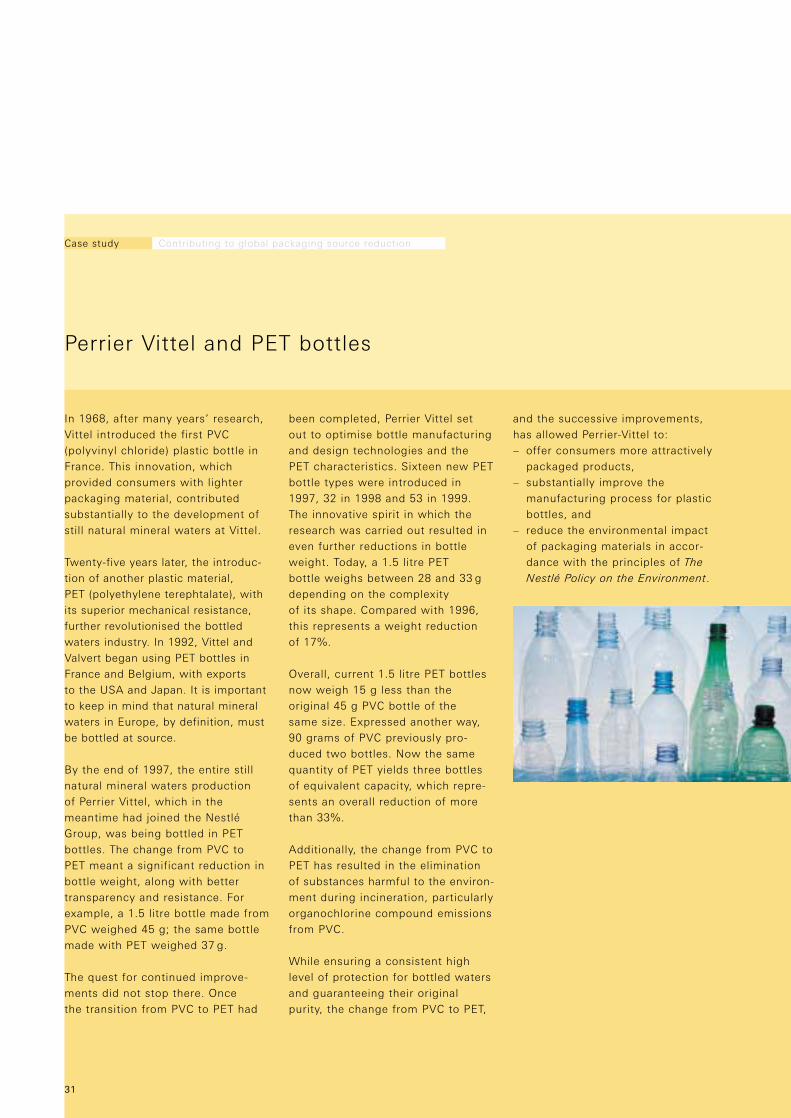
In 1968, after many years’ research,Vittel introduced the first PVC (polyvinyl chloride) plastic bottle inFrance. This innovation, whichprovided consumers with lighterpackaging material, contributedsubstantially to the development ofstill natural mineral waters at Vittel.
Twenty-five years later, the introduc-tion of another plastic material, PET (polyethylene terephtalate), withits superior mechanical resistance,further revolutionised the bottledwaters industry. In 1992, Vittel andValvert began using PET bottles inFrance and Belgium, with exports to the USA and Japan. It is importantto keep in mind that natural mineralwaters in Europe, by definition, mustbe bottled at source.
By the end of 1997, the entire stillnatural mineral waters production of Perrier Vittel, which in themeantime had joined the NestléGroup, was being bottled in PETbottles. The change from PVC to PET meant a significant reduction inbottle weight, along with bettertransparency and resistance. Forexample, a 1.5 litre bottle made fromPVC weighed 45 g; the same bottlemade with PET weighed 37 g.
The quest for continued improve-ments did not stop there. Once the transition from PVC to PET had
been completed, Perrier Vittel setout to optimise bottle manufacturingand design technologies and the PET characteristics. Sixteen new PETbottle types were introduced in1997, 32 in 1998 and 53 in 1999.The innovative spirit in which theresearch was carried out resulted ineven further reductions in bottleweight. Today, a 1.5 litre PET bottle weighs between 28 and 33 gdepending on the complexity of its shape. Compared with 1996,this represents a weight reduction of 17%.
Overall, current 1.5 litre PET bottlesnow weigh 15 g less than theoriginal 45 g PVC bottle of the same size. Expressed another way,90 grams of PVC previously pro-duced two bottles. Now the samequantity of PET yields three bottlesof equivalent capacity, which repre-sents an overall reduction of morethan 33%.
Additionally, the change from PVC toPET has resulted in the eliminationof substances harmful to the environ-ment during incineration, particularlyorganochlorine compound emissionsfrom PVC.
While ensuring a consistent highlevel of protection for bottled watersand guaranteeing their originalpurity, the change from PVC to PET,
and the successive improvements,has allowed Perrier-Vittel to:– offer consumers more attractively
packaged products,– substantially improve the
manufacturing process for plasticbottles, and
– reduce the environmental impactof packaging materials in accor-dance with the principles of The
Nestlé Policy on the Environment.
Case study Contributing to global packaging source reduction
Perrier Vittel and PET bottles
31
Environment – Progress Report 2000 Integrated approach throughout the supply chain
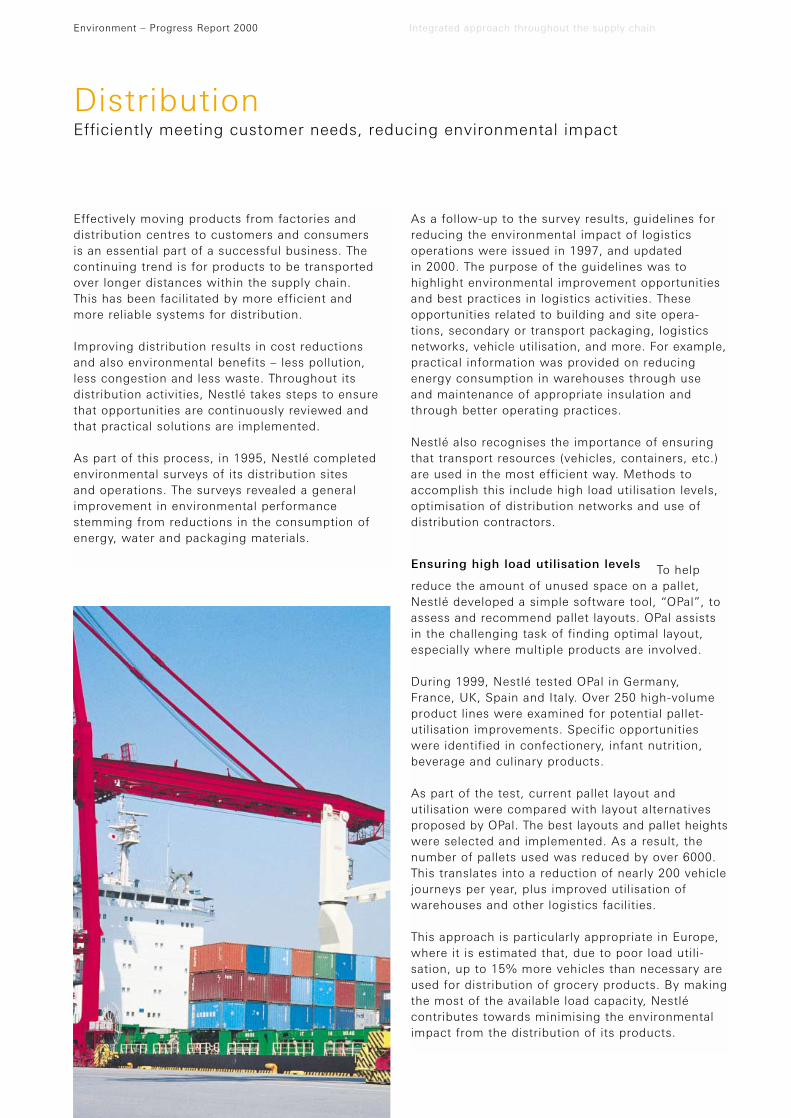
DistributionEfficiently meeting customer needs, reducing environmental impact
Effectively moving products from factories anddistribution centres to customers and consumers is an essential part of a successful business. Thecontinuing trend is for products to be transportedover longer distances within the supply chain. This has been facilitated by more efficient and more reliable systems for distribution.
Improving distribution results in cost reductions and also environmental benefits – less pollution,less congestion and less waste. Throughout itsdistribution activities, Nestlé takes steps to ensurethat opportunities are continuously reviewed andthat practical solutions are implemented.
As part of this process, in 1995, Nestlé completedenvironmental surveys of its distribution sites and operations. The surveys revealed a generalimprovement in environmental performancestemming from reductions in the consumption ofenergy, water and packaging materials.
As a follow-up to the survey results, guidelines forreducing the environmental impact of logisticsoperations were issued in 1997, and updated in 2000. The purpose of the guidelines was to highlight environmental improvement opportunitiesand best practices in logistics activities. Theseopportunities related to building and site opera-tions, secondary or transport packaging, logisticsnetworks, vehicle utilisation, and more. For example,practical information was provided on reducingenergy consumption in warehouses through use and maintenance of appropriate insulation andthrough better operating practices.
Nestlé also recognises the importance of ensuringthat transport resources (vehicles, containers, etc.)are used in the most efficient way. Methods toaccomplish this include high load utilisation levels,optimisation of distribution networks and use ofdistribution contractors.
Ensuring high load utilisation levels To helpreduce the amount of unused space on a pallet,Nestlé developed a simple software tool, “OPal”, toassess and recommend pallet layouts. OPal assistsin the challenging task of finding optimal layout,especially where multiple products are involved.
During 1999, Nestlé tested OPal in Germany,France, UK, Spain and Italy. Over 250 high-volumeproduct lines were examined for potential pallet-utilisation improvements. Specific opportunitieswere identified in confectionery, infant nutrition,beverage and culinary products.
As part of the test, current pallet layout andutilisation were compared with layout alternativesproposed by OPal. The best layouts and pallet heightswere selected and implemented. As a result, thenumber of pallets used was reduced by over 6000.This translates into a reduction of nearly 200 vehiclejourneys per year, plus improved utilisation ofwarehouses and other logistics facilities.
This approach is particularly appropriate in Europe,where it is estimated that, due to poor load utili-sation, up to 15% more vehicles than necessary areused for distribution of grocery products. By makingthe most of the available load capacity, Nestlécontributes towards minimising the environmentalimpact from the distribution of its products.
Using “slip sheets”, rather than traditional pallets, also improves load utilisation. Slip sheets are thin pieces of paper-board on which products arestacked. They require special handling systems, but save a considerable amount of wasted spacecompared with normal pallets.
Optimising networks Nestlé also works to opti-mise its distribution networks through the reductionof vehicle journeys and the use of appropriatemodes of transport. For example, co-operation withother producers allows the free vehicle capacity of one company to be matched with the availableloads of another. A further opportunity is the use of“shared-user” distribution facilities, an option that allows consolidation of customer deliveries.
Use of a combined system of road and rail transportprovides an additional method to optimisedistribution networks. This approach involves load-ing trailers or containers onto specially adapted
rail cars. After the longest part of the journey hasbeen accomplished by rail, local delivery can becarried out by road transport.
Working with contractors Increasingly, Nestléworks with contractors in order to make better useof transport and other distribution resources. Suchoperators should, in general, be able to avoid emptytransport journeys by contracting for return loadsand by consolidating under-utilised distributionfacilities.
Nestlé transportation guidelines have been devel-oped to ensure that contractors meet the standardsexpected by Nestlé. They outline the expectationsfor equipment, facilities and personnel. The guide-lines are used to build an open and proactivedialogue with contractors so that they understandNestlé’s environmental approach and the importantrole they have to play in reducing the environmentalimpact of distribution activities.
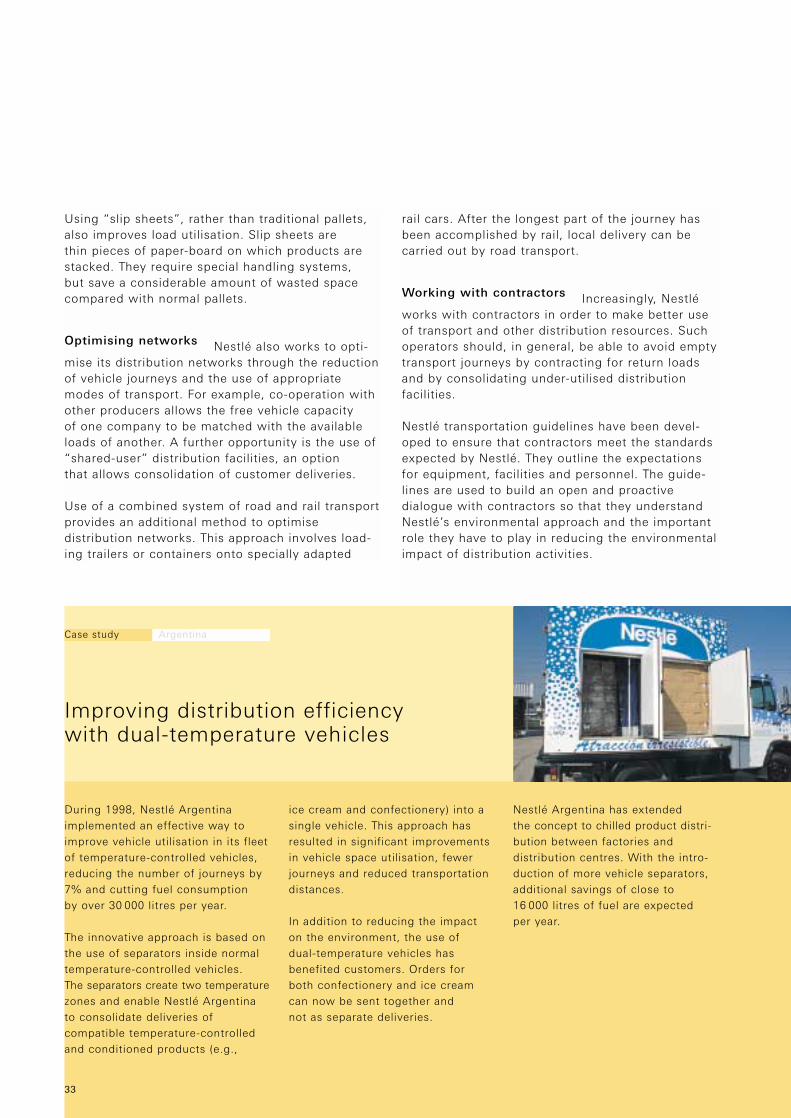
During 1998, Nestlé Argentinaimplemented an effective way toimprove vehicle utilisation in its fleetof temperature-controlled vehicles,reducing the number of journeys by7% and cutting fuel consumption by over 30 000 litres per year.
The innovative approach is based onthe use of separators inside normaltemperature-controlled vehicles. The separators create two temperaturezones and enable Nestlé Argentinato consolidate deliveries ofcompatible temperature-controlledand conditioned products (e.g.,
ice cream and confectionery) into asingle vehicle. This approach hasresulted in significant improvementsin vehicle space utilisation, fewerjourneys and reduced transportationdistances.
In addition to reducing the impact on the environment, the use of dual-temperature vehicles hasbenefited customers. Orders for both confectionery and ice cream can now be sent together and not as separate deliveries.
Nestlé Argentina has extended the concept to chilled product distri-bution between factories anddistribution centres. With the intro-duction of more vehicle separators,additional savings of close to 16 000 litres of fuel are expected per year.
Case study Argentina
Improving distribution efficiency with dual-temperature vehicles
33

Consumers are of the utmost importance to Nestlé.Without consumers there would be no business.Nestlé’s focus on the consumer extends from thosewho buy and consume its products, to “consumers” in the broadest sense – the whole community.
As such, consideration for consumers’ interests has ranged from providing on-pack recyclingmessages to conveying clear, open and transparentinformation to all interested parties about Nestlé’senvironmental efforts and achievements.
No “green marketing” Nestlé has a simple andstraight-forward philosophy on so-called “environ-mental advertising”. It is categorically opposed to short-sighted and opportunistic “green claims”.Attempting to compare the “greenness” of differentfood products is irrelevant, particularly since thepractical benefits of these types of ratings arequestionable, at best.
The Company follows the International Chamber of Commerce Code on Environmental Advertising.The Code is based on the principles of self-regulation, with the key premise that environmentaladvertisements should neither take advantage of consumers’ concerns about the environment, nor exploit any possible lack of environmentalknowledge.
Sharing information In 1996, Nestlé initiated its Internet site to enable consumers, and thecommunity at large, to understand Nestlé better,including its commitment to the environment:www.nestle.com
The site was significantly expanded in 1999,addressing the increasing environmental interests of its users. An Intranet site is also underdevelopment that will enable the rapid exchange of environmental information internally.
Community programmes The Company has alsoreached out to communities around the worldthrough participation in numerous education andcommunication programmes.
Nestlé’s Perrier Vittel Company is involved in abroad spectrum of innovative, water-relatededucational activities for children and adults. One of these activities is the Mineralix School Book,which was published in collaboration with Frenchschool authorities. The Mineralix Book uses themultiple aspects of water resource management toteach concepts in mathematics, physics, chemistry,geography and physiology to school children, aged11 and 12. The result is a unique and interestingapproach to the “basics” of education that instils inchildren an early respect for protecting water as avital world resource.
Environment – Progress Report 2000 Integrated approach throughout the supply chain
Consumers and the communityHelpful environmental information, communication and education
34
Nestlé’s Internet site www.nestle.com
In the Philippines, Nestlé supports the government’senvironmental campaigns by sponsoringprogrammes designed to create awareness amongthe public of the importance of environmentalprotection and preservation. Central to NestléPhilippines’ approach is the belief that environ-mental awareness begins at home. Nestlé hasprepared brochures and audio-visual presentationson proper waste management in the home and has produced print, radio and TV materials on airand water pollution. Public service billboards with environmental messages have also been used.
Regular training has been conducted for employees, focused on the importance of environmentalawareness and action, both at work and at home. Through these programmes, employees understandthe importance that Nestlé and the governmentplace on the environment, and the role that eachperson has to play in protecting and preserving itsmany facets.
Investors are increasingly interested in environmentalissues. Keeping them informed in an open and transparent manner is important. Since 1990, anenvironmental section has been included in Nestlé’sManagement Report. Each year, information and data in this section has been expanded to reflect theCompany’s continuing environmental progress. In 1995, the first detailed publication, Nestlé and theEnvironment, was issued. The current Environment –Progress Report 2000 is yet a further example ofNestlé’s communication efforts.
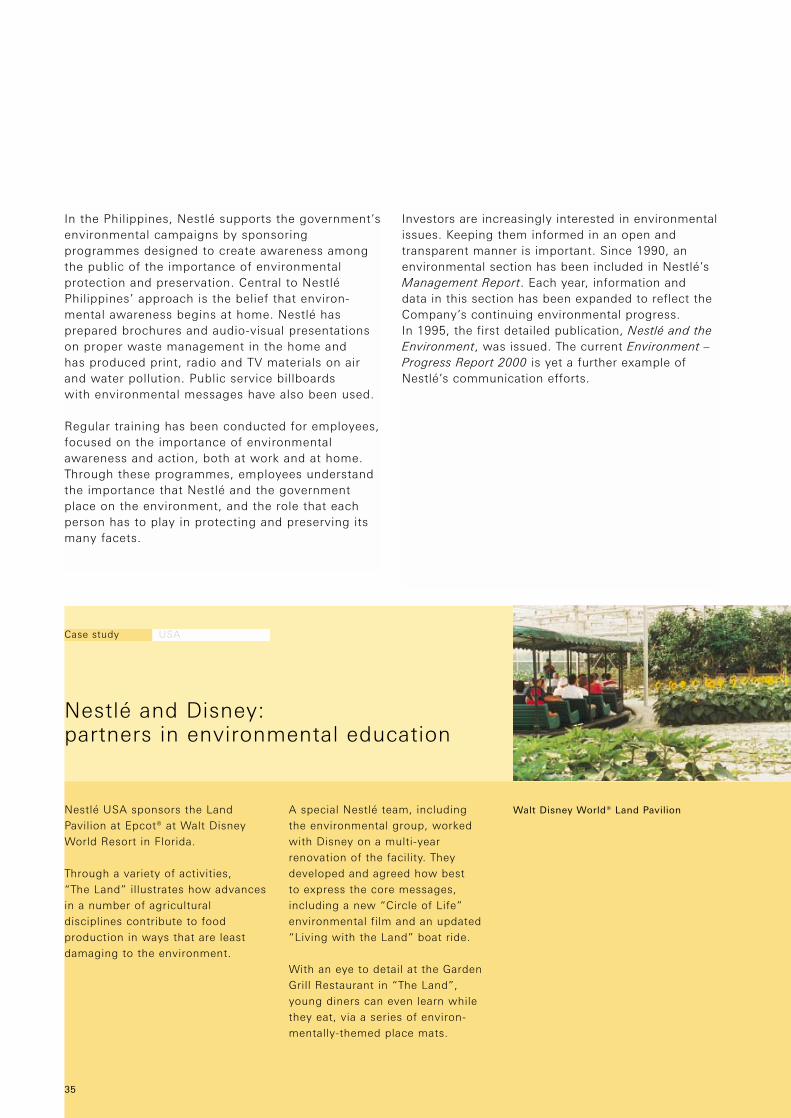
Nestlé USA sponsors the LandPavilion at Epcot® at Walt DisneyWorld Resort in Florida.
Through a variety of activities, “The Land” illustrates how advancesin a number of agriculturaldisciplines contribute to foodproduction in ways that are leastdamaging to the environment.
A special Nestlé team, including the environmental group, workedwith Disney on a multi-yearrenovation of the facility. Theydeveloped and agreed how best to express the core messages,including a new “Circle of Life”environmental film and an updated“Living with the Land” boat ride.
With an eye to detail at the GardenGrill Restaurant in “The Land”,young diners can even learn whilethey eat, via a series of environ-mentally-themed place mats.
Walt Disney World® Land Pavilion
Case study USA
Nestlé and Disney: partners in environmental education
35
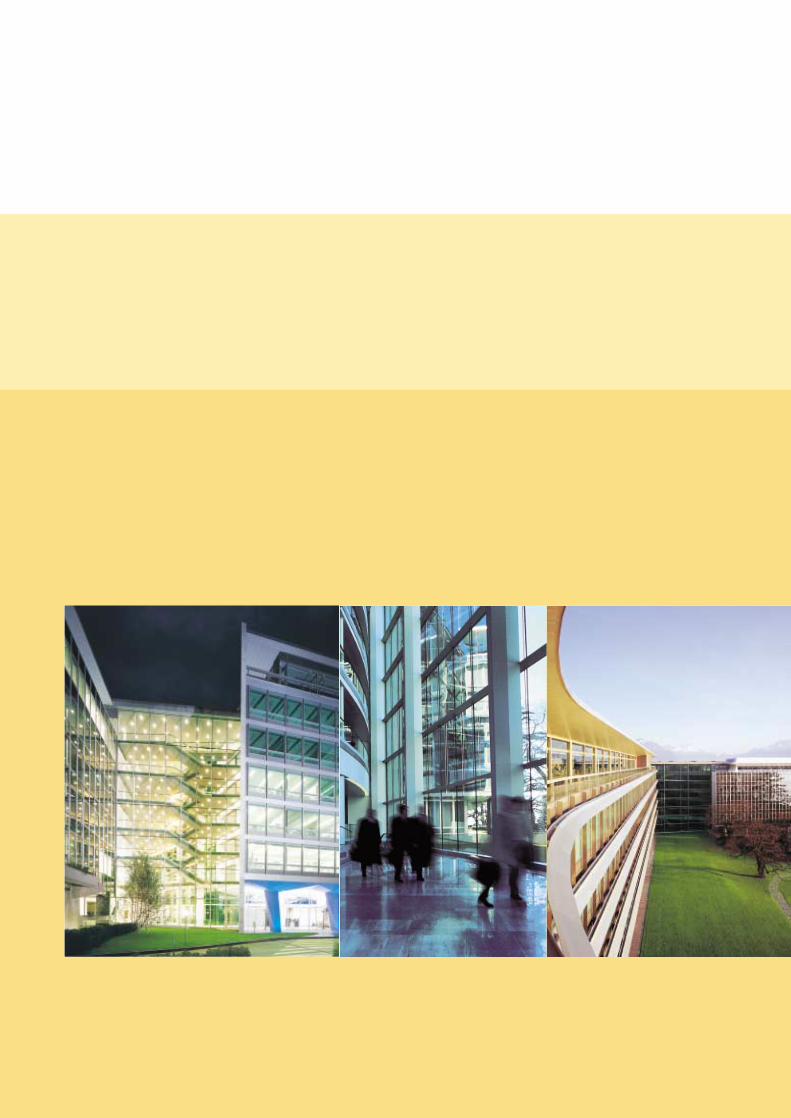
In November 1996, Nestléannounced the renovation of itsinternational headquarters buildingin Vevey, Switzerland. This modernistbuilding was designed at the end of the 50s by the renowned Swissarchitect Jean Tschumi. It wasacclaimed by critics the world overfrom the moment of its inaugu-ration in 1960. Despite meticulousmaintenance, the building had aged and had become technicallyobsolete.
Nestlé’s challenge was to find long-term solutions that wouldensure excellent working conditionsand a versatile, efficient and highlytechnical use of the building, as well as environmental protectionmeasures. All these aspects were tobe achieved without altering thearchitecture of a building that is oneof the official historical monumentsin the Canton of Vaud.
The renovation project was a stimulusfor the local economy. Companies in the region proved their com-petence and dynamism, and contri-buted competitive solutions inresponse to the Groups’ needs andexpectations.
The architects and techniciansinvolved in the renovation appliedconsiderable talent and imagination inexamining all the options and thenensuring the best implementation.
Regarding electricity consumption inthe building, innovative solutionswere found that are expected to leadto savings of 750 000 kWh per year,i.e. about 7.5% of total electricityconsumption, and include:
– selection of efficient long-lifelights that adjust the amount ofillumination depending on thenatural light available and whichnormally allow a 60-70% electri-city reduction versus traditionallighting systems, and
– implementation of good energymanagement practices, such asshutting off or putting certainmachines on stand-by status out-side working hours (e.g. printers,photocopy machines, etc.).
Further enhancements were madethat are expected to result in greatlyimproved efficiency of heating and airconditioning systems. These includea new ventilation system, which usesair/water heat exchangers to recuper-ate heat from the air which must beexpelled for fresh. An energy reduc-tion of about 40% is expected versusthe previous air/air exchange process.
The realisation of these efforts willbe verified in the coming months.
Even before the renovation began,steps were being taken to reduceenergy consumption. In 1995 a
new boiler system was installedwhich allowed heat recovery fromthe combustion gas of the mainboilers, improving their efficiency byabout 8%. Additionally, the Nestléheadquarters has always beencooled by extracting and returningwater from the bordering LakeGeneva. This has kept energy use for summer air conditioning aboutsix times lower than a traditionalrefrigeration system.
Moreover, the companies at work on the building site managed to sortwaste products and recycle mostmaterial in appropriate centres. The feasibility of recycling the newbuilding materials chosen for the renovation was also taken intoaccount.
Inaugurated in May 2000, the newlyrenovated headquarters enableemployees to enjoy a vastlyimproved work setting that offersboth beauty and comfort in itsarchitectural design, whilstcontributing to the preservation ofthe environment.
Case study Switzerland
Renovating the international head office building
Environment – Progress Report 2000 Integrated approach throughout the supply chain
Consumers and the community
36

39
Environment – Progress Report 2000
Focus 2
Water as a key priority Water is auniversal resource that is indispensablefor life. Nestlé recognises that theresponsible management of worldwidewater resources is an absolute necessity.For the Company, preserving both thequantity and the quality of water is notonly an environmental challenge, but alsoone that spans economic, political, social,cultural and emotional considerations.
Water, an indispensable world resource, is alsoessential for Nestlé. It is used in manufacturing theCompany’s food products, for their preparation by consumers, and for bottled waters. To helpensure a long-term, high quality, adequate watersupply, Nestlé supports the sustainable use of water and encourages environmentally-soundfarming methods.
Nestlé’s long-term commitment to the responsiblemanagement of water resources was confirmed inThe Nestlé Water Policy, published in early 2000.
Environment – Progress Report 2000 Water as a key priority
Water resources and Nestlé activities
While Nestlé fully supports the sustainable use ofwater, it is important to realise that the Company’suse of fresh water resources is relatively small. The accompanying illustration shows the estimatedamount of worldwide fresh water use.
More than 70% of all available water is used inagriculture – much of it wastefully, since nearly half of it is lost. Nestlé’s worldwide operationsutilise just 0.006% per year of the total estimatedfreshwater withdrawal. Perrier Vittel, Nestlé’s bottledwater division, uses only 10% of this amount, i.e. 0.0006%.
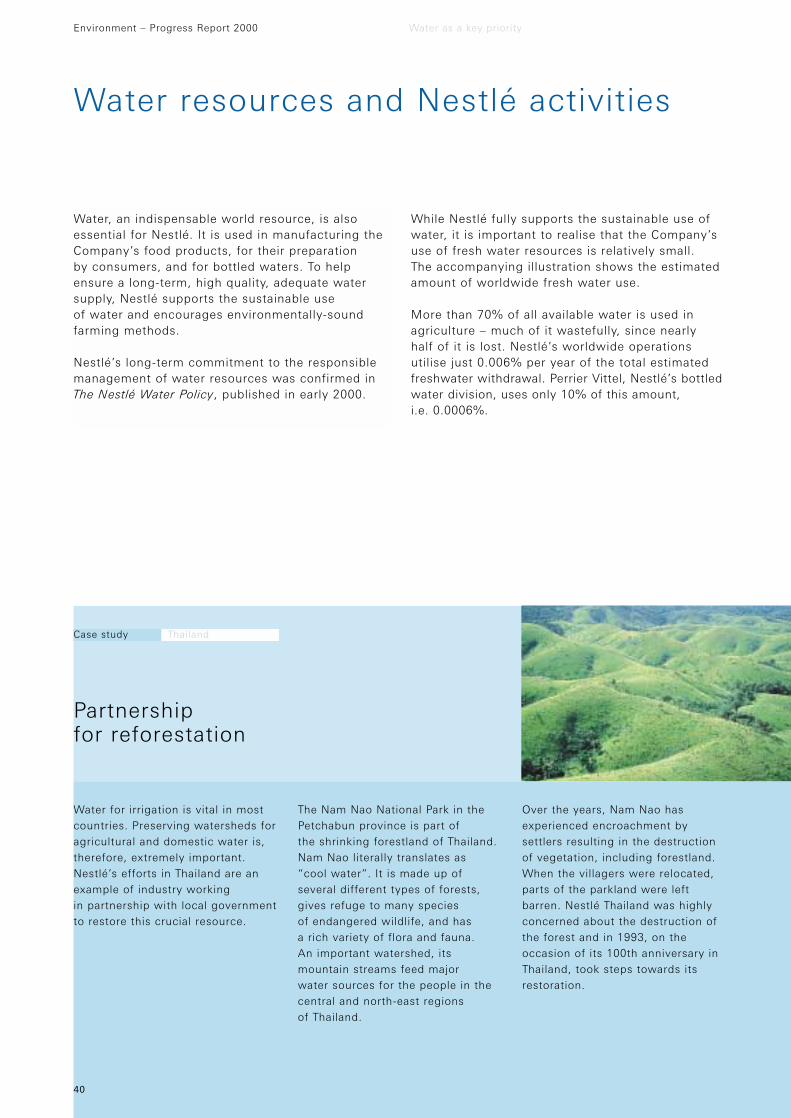
Water for irrigation is vital in mostcountries. Preserving watersheds foragricultural and domestic water is,therefore, extremely important.Nestlé’s efforts in Thailand are anexample of industry working in partnership with local governmentto restore this crucial resource.
The Nam Nao National Park in thePetchabun province is part of the shrinking forestland of Thailand.Nam Nao literally translates as “cool water”. It is made up ofseveral different types of forests,gives refuge to many species of endangered wildlife, and has a rich variety of flora and fauna. An important watershed, itsmountain streams feed major water sources for the people in thecentral and north-east regions of Thailand.
Over the years, Nam Nao hasexperienced encroachment bysettlers resulting in the destructionof vegetation, including forestland.When the villagers were relocated,parts of the parkland were leftbarren. Nestlé Thailand was highlyconcerned about the destruction ofthe forest and in 1993, on the occasion of its 100th anniversary inThailand, took steps towards itsrestoration.
Case study Thailand
Partnership for reforestation
40

Worldwide fresh water use
Working with the Royal ForestryDepartment, Nestlé initiated aproject to reforest parts of Nam NaoNational Park. Over 300 000 treeswere planted. Care is being provided for the trees until they canflourish on their own.
It is hoped that the Nam NaoNational Park will, before too manyyears, be restored to its originalbeauty and will once again serve asan important watershed for peopleand agriculture in the region.
41
Perrier Vittel 0.0006%Nestlé 0.006%Food and drinks industry 0.18%Domestic 9%Total industry 20%Agriculture and reservoirs 71%
Total fresh water used worldwide
3 800 000 billion litres/year = 100%
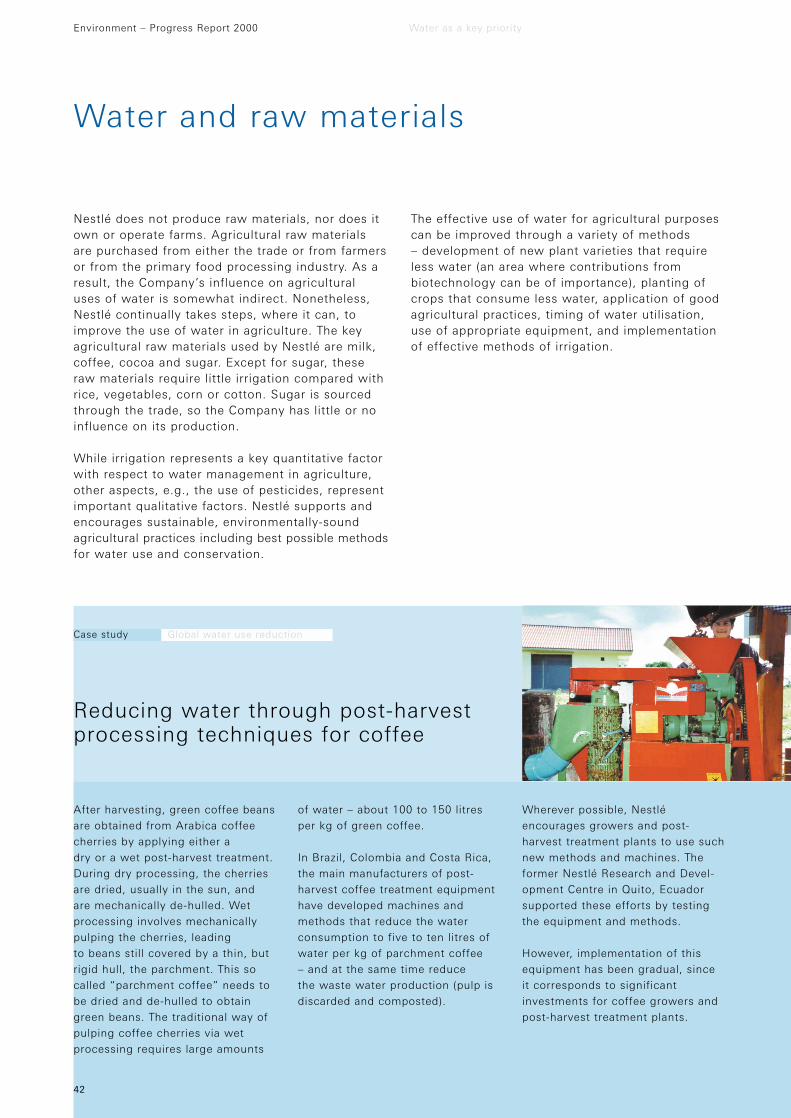
After harvesting, green coffee beansare obtained from Arabica coffeecherries by applying either a dry or a wet post-harvest treatment. During dry processing, the cherriesare dried, usually in the sun, and are mechanically de-hulled. Wetprocessing involves mechanicallypulping the cherries, leading to beans still covered by a thin, butrigid hull, the parchment. This socalled “parchment coffee” needs tobe dried and de-hulled to obtaingreen beans. The traditional way ofpulping coffee cherries via wetprocessing requires large amounts
Case study Global water use reduction
Reducing water through post-harvest processing techniques for coffee
of water – about 100 to 150 litres per kg of green coffee.
In Brazil, Colombia and Costa Rica, the main manufacturers of post-harvest coffee treatment equipmenthave developed machines andmethods that reduce the waterconsumption to five to ten litres ofwater per kg of parchment coffee – and at the same time reduce the waste water production (pulp isdiscarded and composted).
Wherever possible, Nestlé encourages growers and post-harvest treatment plants to use suchnew methods and machines. Theformer Nestlé Research and Devel-opment Centre in Quito, Ecuadorsupported these efforts by testingthe equipment and methods.
However, implementation of thisequipment has been gradual, since it corresponds to significantinvestments for coffee growers andpost-harvest treatment plants.
Nestlé does not produce raw materials, nor does itown or operate farms. Agricultural raw materials are purchased from either the trade or from farmersor from the primary food processing industry. As aresult, the Company’s influence on agricultural uses of water is somewhat indirect. Nonetheless,Nestlé continually takes steps, where it can, toimprove the use of water in agriculture. The keyagricultural raw materials used by Nestlé are milk,coffee, cocoa and sugar. Except for sugar, these raw materials require little irrigation compared withrice, vegetables, corn or cotton. Sugar is sourcedthrough the trade, so the Company has little or noinfluence on its production.
While irrigation represents a key quantitative factorwith respect to water management in agriculture, other aspects, e.g., the use of pesticides, representimportant qualitative factors. Nestlé supports andencourages sustainable, environmentally-sound agricultural practices including best possible methodsfor water use and conservation.
Environment – Progress Report 2000 Water as a key priority
Water and raw materials
42
The effective use of water for agricultural purposescan be improved through a variety of methods – development of new plant varieties that requireless water (an area where contributions frombiotechnology can be of importance), planting ofcrops that consume less water, application of goodagricultural practices, timing of water utilisation,use of appropriate equipment, and implementationof effective methods of irrigation.
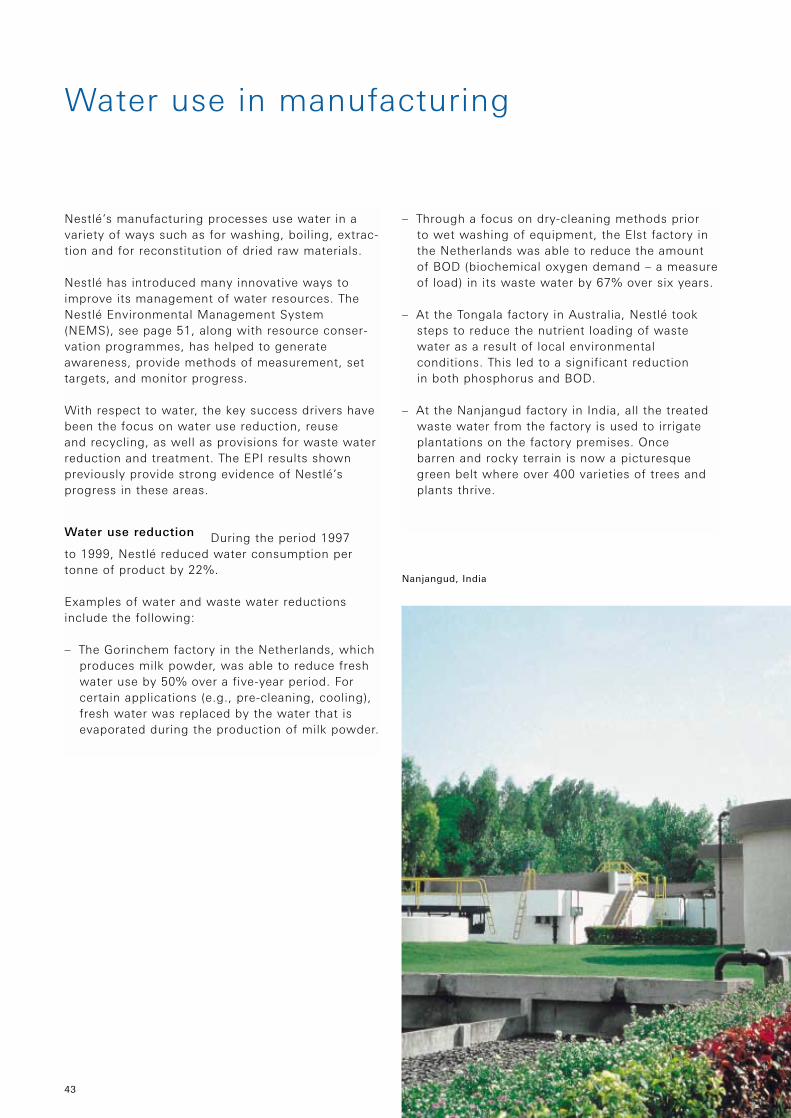
Nestlé’s manufacturing processes use water in avariety of ways such as for washing, boiling, extrac-tion and for reconstitution of dried raw materials.
Nestlé has introduced many innovative ways toimprove its management of water resources. TheNestlé Environmental Management System (NEMS), see page 51, along with resource conser-vation programmes, has helped to generateawareness, provide methods of measurement, settargets, and monitor progress.
With respect to water, the key success drivers havebeen the focus on water use reduction, reuse and recycling, as well as provisions for waste waterreduction and treatment. The EPI results shownpreviously provide strong evidence of Nestlé’sprogress in these areas.
Water use reduction During the period 1997 to 1999, Nestlé reduced water consumption pertonne of product by 22%.
Examples of water and waste water reductionsinclude the following:
– The Gorinchem factory in the Netherlands, whichproduces milk powder, was able to reduce freshwater use by 50% over a five-year period. Forcertain applications (e.g., pre-cleaning, cooling),fresh water was replaced by the water that isevaporated during the production of milk powder.
– Through a focus on dry-cleaning methods prior to wet washing of equipment, the Elst factory inthe Netherlands was able to reduce the amountof BOD (biochemical oxygen demand – a measureof load) in its waste water by 67% over six years.
– At the Tongala factory in Australia, Nestlé took steps to reduce the nutrient loading of wastewater as a result of local environmentalconditions. This led to a significant reduction in both phosphorus and BOD.
– At the Nanjangud factory in India, all the treatedwaste water from the factory is used to irrigateplantations on the factory premises. Once barren and rocky terrain is now a picturesquegreen belt where over 400 varieties of trees andplants thrive.
Water use in manufacturing
43
Nanjangud, India
Waste water treatment When water cannot bere-used, either in the manufacturing process or forexternal factory purposes, it is treated and returnedto the environment. Nestlé made a very early start in providing waste water treatment and theCompany is genuinely proud of its achievementsaround the world.
Providing waste water treatment is an ongoingprocess and Nestlé has continued to incorporatenew technology, upgrade existing waste water treat-ment plants and build new ones. Of the CHF 100million spent per year on its environmental invest-ments, an average of 30 million is devoted to waterand waste water improvement projects. From 1993to 1999, at least 38 new waste water treatmentplants were built and 120 upgrades to waste watertreatment systems were completed.
In many cases, Nestlé invested not only in its own infrastructure, but also in that of the localcommunity. The Company works with local
governments to assess the need for municipalwaste water treatment plants and often helpsfinance the cost of construction.
This was the case in Hungary where, in 1992, Nestlé bought a factory that was discharging wastewater into an open pond. To solve the problem,Nestlé was instrumental in helping local authoritiesreach a decision to build a waste water treatmentplant for the city. Due to the lack of availablegovernmental funds, Nestlé advanced money to thecity for construction. The new plant began operationin 1997, benefitting the entire community.
Progress in methods of waste water treatment will remain a significant part of the Company’sactivities.
Environment – Progress Report 2000 Water as a key priority
Water use in manufacturing
In 1932, Switzerland’s first biologicalwaste water treatment plant was builtat the Maggi factory in Kempttal,near Zurich. Today, Nestlé continuesto be a pioneer in waste water man-agement. The story of the Company’sfirst factory in China is an exampleof its on-going and innovative efforts.
In 1987, after much negotiation with the Chinese government, Nestlé began construction of theShuangcheng factory for theproduction of milk products, prima-rily powdered milk, infant formulaand weaning foods.
Meeting the many challengesencountered in developing theShuangcheng factory and itsinfrastructure required careful navi-gation through political, cultural andtechnical issues. Nestlé’s journey, andthat of the Shuangcheng community,are described in Nestlé: Starting
up Industrial Production in China.
Among the most significant chal-lenges, was the weather. The factory is located in one of the harshestregions of north-east China. Duringthe deep winter, which lasts fromthe end of November to early March,
Case study From Switzerland to China
Pioneering efforts around the globe
44
temperatures can reach as low as -40° C. In the summer, the heat isextreme, with temperaturesconsistently above 30º C. Weatherwas therefore a key factor that had to be addressed in ensuring thefactory’s milk supply and in treatingits waste water.
To ensure sufficient milk supplies,Nestlé worked in co-operation with the provincial government tostimulate milk production in the area. Initiatives includedprogrammes for improved breeding,better milk prices for farmers, better
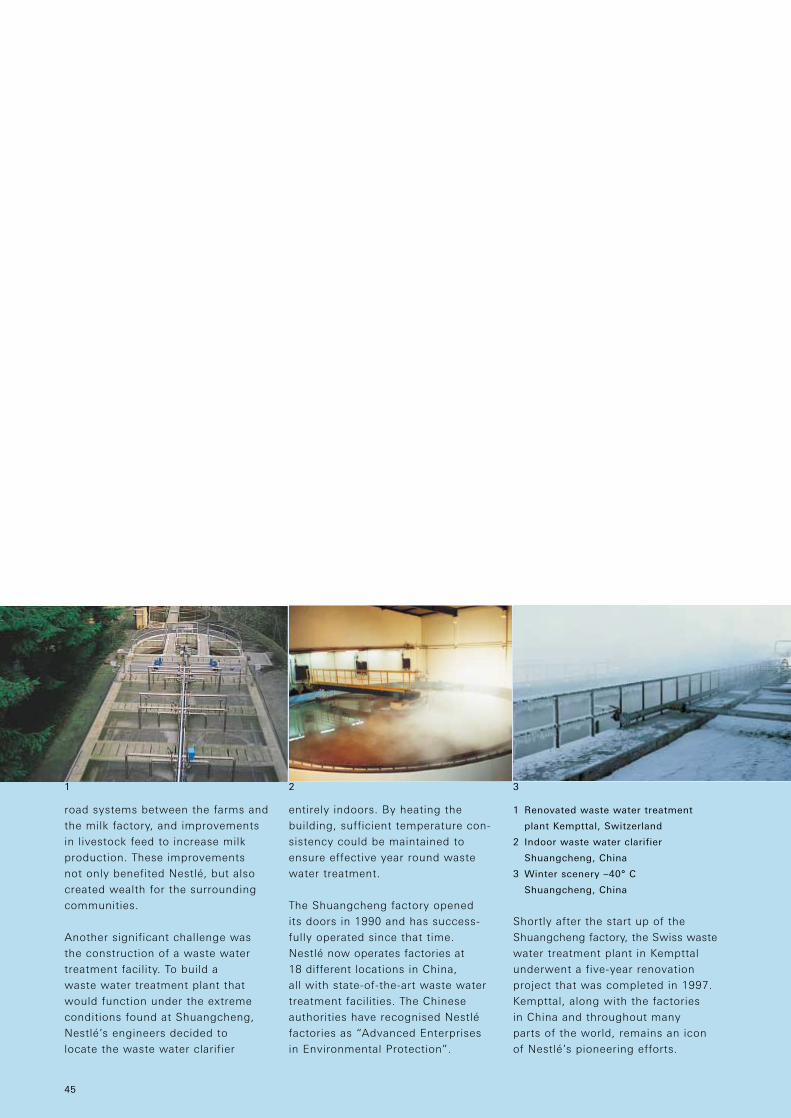
road systems between the farms andthe milk factory, and improvementsin livestock feed to increase milkproduction. These improvements not only benefited Nestlé, but alsocreated wealth for the surroundingcommunities.
Another significant challenge wasthe construction of a waste watertreatment facility. To build a waste water treatment plant thatwould function under the extremeconditions found at Shuangcheng,Nestlé’s engineers decided to locate the waste water clarifier
entirely indoors. By heating thebuilding, sufficient temperature con-sistency could be maintained toensure effective year round wastewater treatment.
The Shuangcheng factory opened its doors in 1990 and has success-fully operated since that time. Nestlé now operates factories at 18 different locations in China, all with state-of-the-art waste watertreatment facilities. The Chineseauthorities have recognised Nestléfactories as “Advanced Enterprisesin Environmental Protection”.
Shortly after the start up of theShuangcheng factory, the Swiss wastewater treatment plant in Kempttalunderwent a five-year renovationproject that was completed in 1997.Kempttal, along with the factories in China and throughout many parts of the world, remains an iconof Nestlé’s pioneering efforts.
45
1 Renovated waste water treatment
plant Kempttal, Switzerland
2 Indoor waste water clarifier
Shuangcheng, China
3 Winter scenery –40° C
Shuangcheng, China
1 2 3
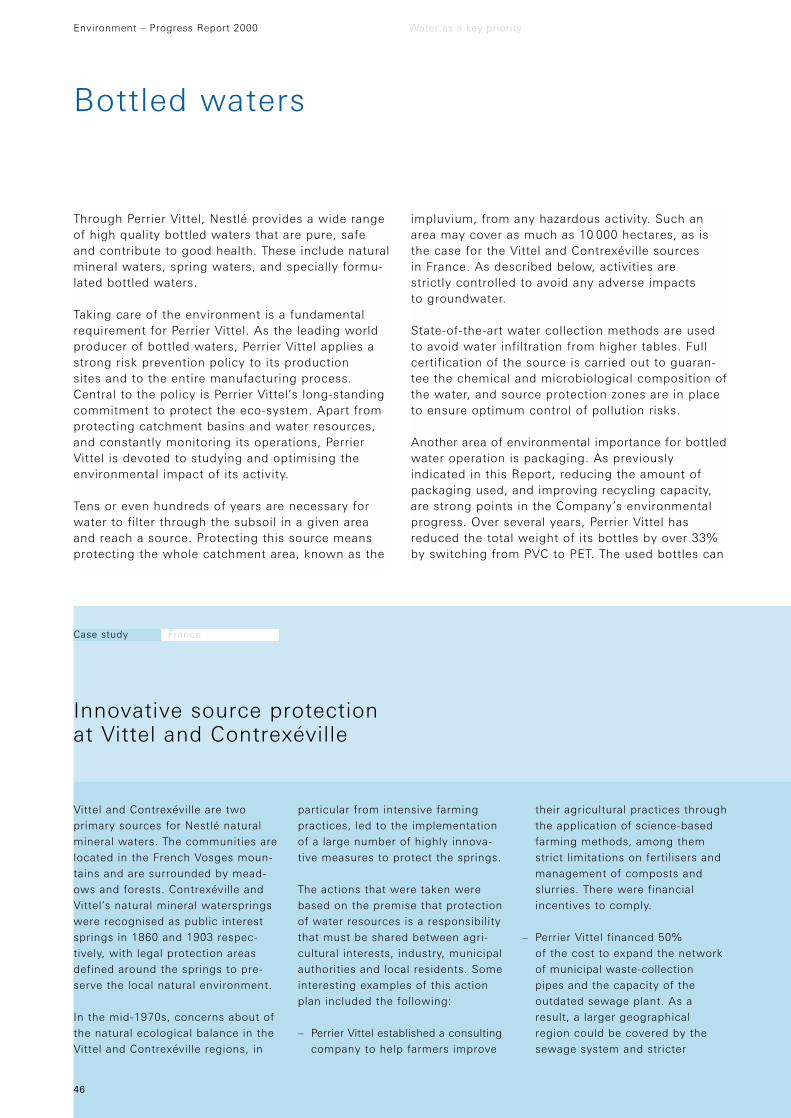
Through Perrier Vittel, Nestlé provides a wide rangeof high quality bottled waters that are pure, safeand contribute to good health. These include naturalmineral waters, spring waters, and specially formu-lated bottled waters.
Taking care of the environment is a fundamentalrequirement for Perrier Vittel. As the leading worldproducer of bottled waters, Perrier Vittel applies astrong risk prevention policy to its production sites and to the entire manufacturing process.Central to the policy is Perrier Vittel’s long-standingcommitment to protect the eco-system. Apart fromprotecting catchment basins and water resources,and constantly monitoring its operations, PerrierVittel is devoted to studying and optimising theenvironmental impact of its activity.
Tens or even hundreds of years are necessary forwater to filter through the subsoil in a given areaand reach a source. Protecting this source meansprotecting the whole catchment area, known as the
impluvium, from any hazardous activity. Such anarea may cover as much as 10 000 hectares, as isthe case for the Vittel and Contrexéville sources in France. As described below, activities are strictly controlled to avoid any adverse impacts to groundwater.
State-of-the-art water collection methods are usedto avoid water infiltration from higher tables. Fullcertification of the source is carried out to guaran-tee the chemical and microbiological composition ofthe water, and source protection zones are in placeto ensure optimum control of pollution risks.
Another area of environmental importance for bottledwater operation is packaging. As previously indicated in this Report, reducing the amount ofpackaging used, and improving recycling capacity,are strong points in the Company’s environmentalprogress. Over several years, Perrier Vittel hasreduced the total weight of its bottles by over 33%by switching from PVC to PET. The used bottles can
Environment – Progress Report 2000 Water as a key priority
Bottled waters
Vittel and Contrexéville are twoprimary sources for Nestlé naturalmineral waters. The communities arelocated in the French Vosges moun-tains and are surrounded by mead-ows and forests. Contrexéville andVittel’s natural mineral waterspringswere recognised as public interestsprings in 1860 and 1903 respec-tively, with legal protection areasdefined around the springs to pre-serve the local natural environment.
In the mid-1970s, concerns about ofthe natural ecological balance in theVittel and Contrexéville regions, in
particular from intensive farmingpractices, led to the implementationof a large number of highly innova-tive measures to protect the springs.
The actions that were taken werebased on the premise that protectionof water resources is a responsibilitythat must be shared between agri-cultural interests, industry, municipalauthorities and local residents. Someinteresting examples of this actionplan included the following:
– Perrier Vittel established a consultingcompany to help farmers improve
their agricultural practices throughthe application of science-basedfarming methods, among themstrict limitations on fertilisers andmanagement of composts andslurries. There were financialincentives to comply.
– Perrier Vittel financed 50% of the cost to expand the network of municipal waste-collection pipes and the capacity of theoutdated sewage plant. As aresult, a larger geographicalregion could be covered by thesewage system and stricter
Case study France
Innovative source protection at Vittel and Contrexéville
46
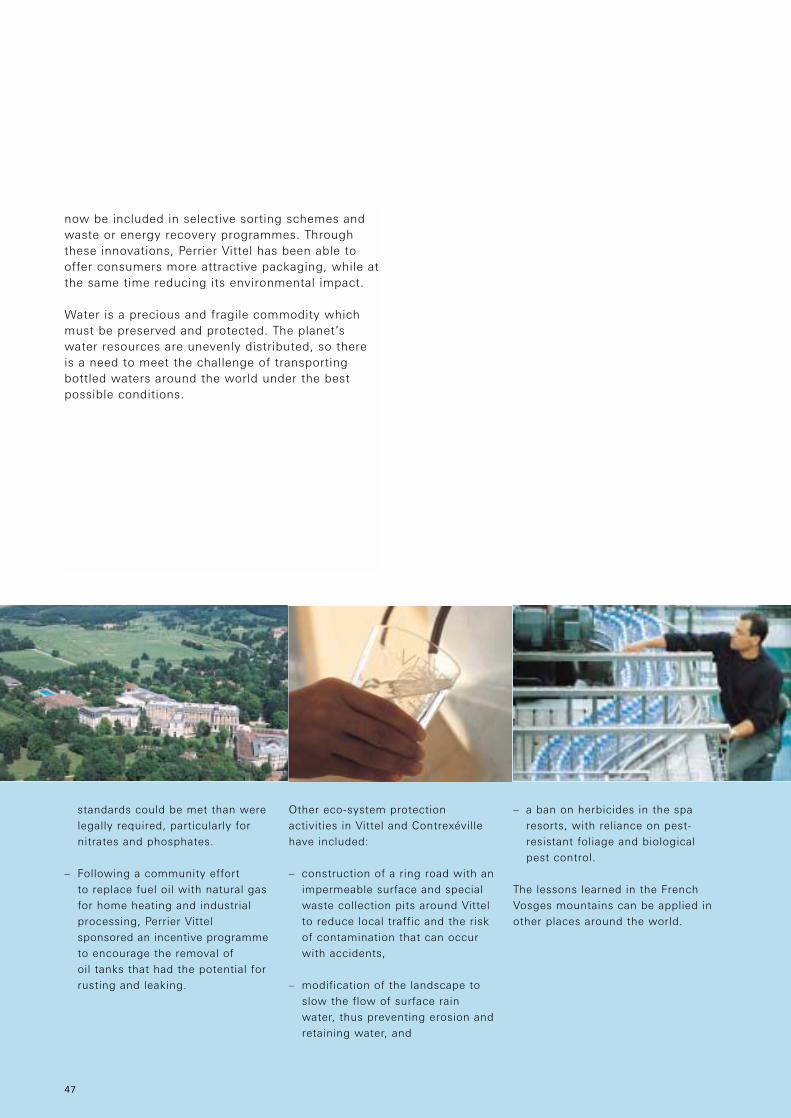
now be included in selective sorting schemes andwaste or energy recovery programmes. Throughthese innovations, Perrier Vittel has been able tooffer consumers more attractive packaging, while atthe same time reducing its environmental impact.
Water is a precious and fragile commodity whichmust be preserved and protected. The planet’swater resources are unevenly distributed, so there is a need to meet the challenge of transporting bottled waters around the world under the best possible conditions.
standards could be met than werelegally required, particularly fornitrates and phosphates.
– Following a community effort to replace fuel oil with natural gasfor home heating and industrialprocessing, Perrier Vittelsponsored an incentive programmeto encourage the removal of oil tanks that had the potential forrusting and leaking.
Other eco-system protectionactivities in Vittel and Contrexévillehave included:
– construction of a ring road with animpermeable surface and specialwaste collection pits around Vittel to reduce local traffic and the riskof contamination that can occurwith accidents,
– modification of the landscape toslow the flow of surface rainwater, thus preventing erosion andretaining water, and
– a ban on herbicides in the sparesorts, with reliance on pest-resistant foliage and biological pest control.
The lessons learned in the FrenchVosges mountains can be applied inother places around the world.
47
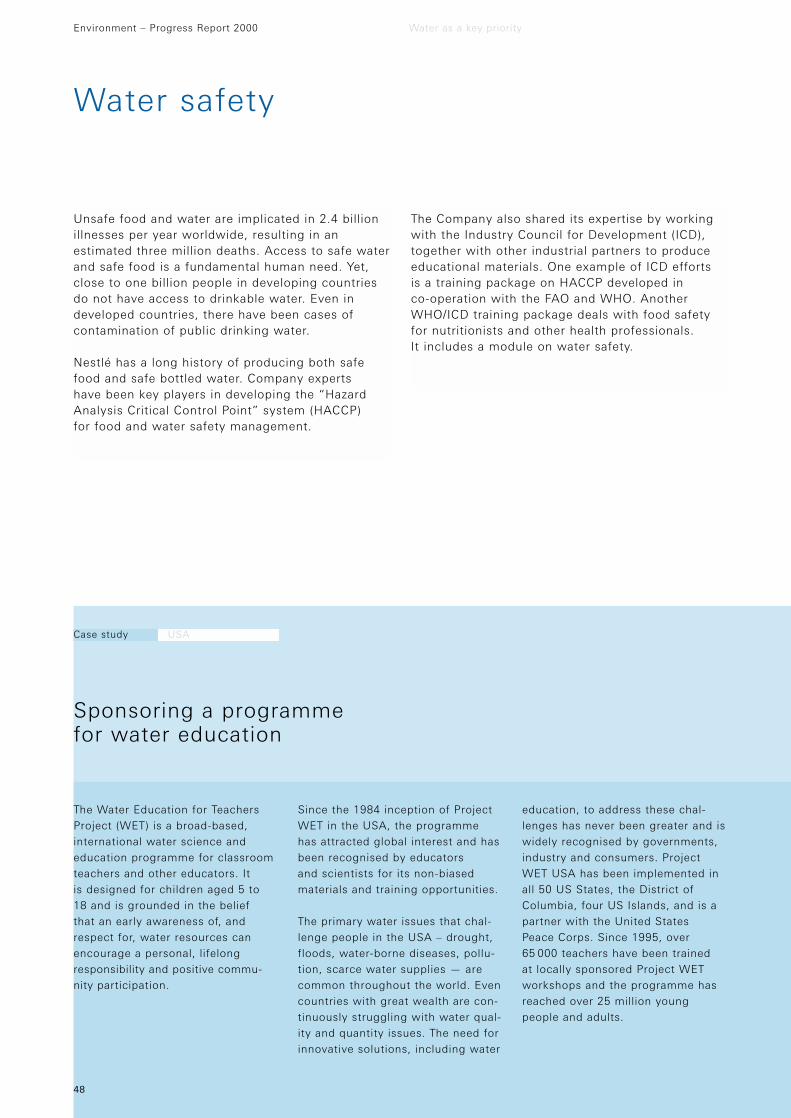
Unsafe food and water are implicated in 2.4 billionillnesses per year worldwide, resulting in anestimated three million deaths. Access to safe waterand safe food is a fundamental human need. Yet,close to one billion people in developing countriesdo not have access to drinkable water. Even indeveloped countries, there have been cases ofcontamination of public drinking water.
Nestlé has a long history of producing both safefood and safe bottled water. Company experts have been key players in developing the “HazardAnalysis Critical Control Point” system (HACCP) for food and water safety management.
The Company also shared its expertise by workingwith the Industry Council for Development (ICD),together with other industrial partners to produceeducational materials. One example of ICD efforts is a training package on HACCP developed in co-operation with the FAO and WHO. AnotherWHO/ICD training package deals with food safetyfor nutritionists and other health professionals. It includes a module on water safety.
Environment – Progress Report 2000 Water as a key priority
Water safety
The Water Education for TeachersProject (WET) is a broad-based, international water science andeducation programme for classroomteachers and other educators. It is designed for children aged 5 to 18 and is grounded in the belief that an early awareness of, andrespect for, water resources canencourage a personal, lifelongresponsibility and positive commu-nity participation.
Since the 1984 inception of ProjectWET in the USA, the programme has attracted global interest and hasbeen recognised by educators and scientists for its non-biasedmaterials and training opportunities.
The primary water issues that chal-lenge people in the USA – drought,floods, water-borne diseases, pollu-tion, scarce water supplies — arecommon throughout the world. Evencountries with great wealth are con-tinuously struggling with water qual-ity and quantity issues. The need forinnovative solutions, including water
education, to address these chal-lenges has never been greater and iswidely recognised by governments,industry and consumers. ProjectWET USA has been implemented inall 50 US States, the District ofColumbia, four US Islands, and is apartner with the United States Peace Corps. Since 1995, over 65 000 teachers have been trained at locally sponsored Project WETworkshops and the programme hasreached over 25 million youngpeople and adults.
Case study USA
Sponsoring a programme for water education
48
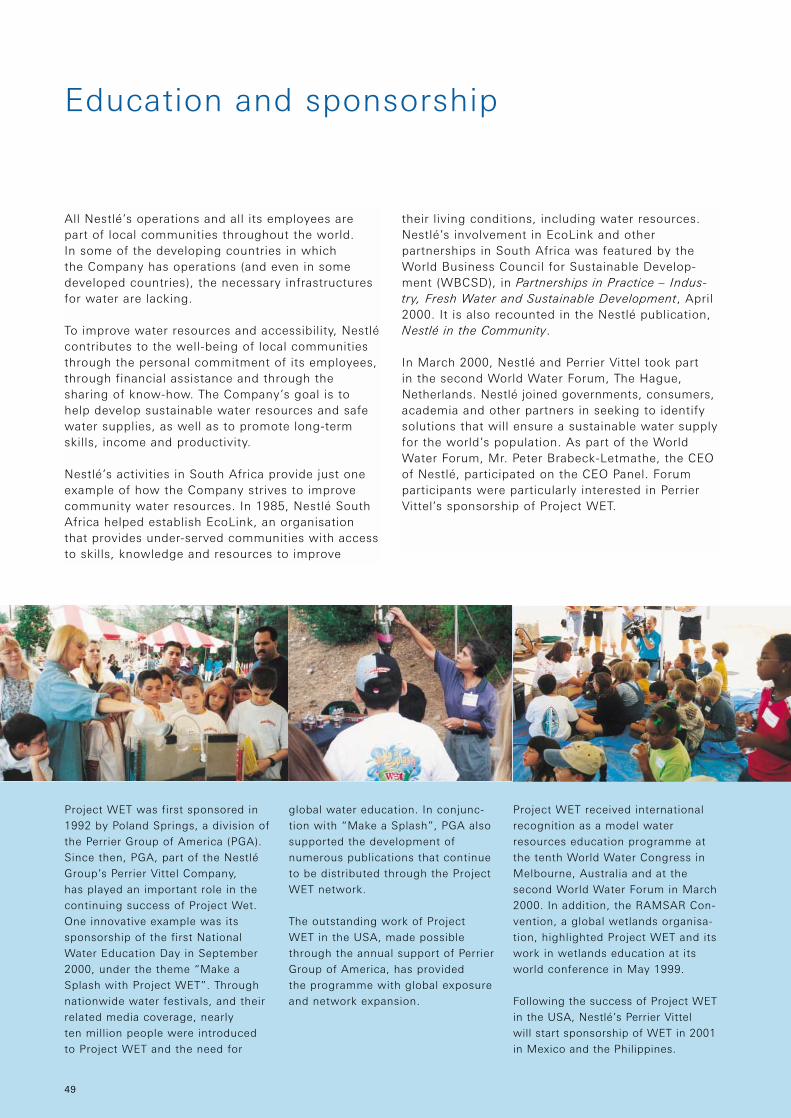
Education and sponsorship
All Nestlé’s operations and all its employees arepart of local communities throughout the world. In some of the developing countries in which the Company has operations (and even in somedeveloped countries), the necessary infrastructuresfor water are lacking.
To improve water resources and accessibility, Nestlécontributes to the well-being of local communitiesthrough the personal commitment of its employees,through financial assistance and through thesharing of know-how. The Company’s goal is to help develop sustainable water resources and safewater supplies, as well as to promote long-termskills, income and productivity.
Nestlé’s activities in South Africa provide just oneexample of how the Company strives to improvecommunity water resources. In 1985, Nestlé SouthAfrica helped establish EcoLink, an organisationthat provides under-served communities with accessto skills, knowledge and resources to improve
their living conditions, including water resources.Nestlé’s involvement in EcoLink and other partnerships in South Africa was featured by theWorld Business Council for Sustainable Develop-ment (WBCSD), in Partnerships in Practice – Indus-try, Fresh Water and Sustainable Development, April2000. It is also recounted in the Nestlé publication,Nestlé in the Community.
In March 2000, Nestlé and Perrier Vittel took part in the second World Water Forum, The Hague,Netherlands. Nestlé joined governments, consumers,academia and other partners in seeking to identifysolutions that will ensure a sustainable water supplyfor the world’s population. As part of the WorldWater Forum, Mr. Peter Brabeck-Letmathe, the CEOof Nestlé, participated on the CEO Panel. Forumparticipants were particularly interested in PerrierVittel’s sponsorship of Project WET.
Project WET was first sponsored in1992 by Poland Springs, a division ofthe Perrier Group of America (PGA).Since then, PGA, part of the NestléGroup’s Perrier Vittel Company, has played an important role in thecontinuing success of Project Wet.One innovative example was its sponsorship of the first NationalWater Education Day in September2000, under the theme “Make aSplash with Project WET”. Throughnationwide water festivals, and theirrelated media coverage, nearly ten million people were introduced to Project WET and the need for
global water education. In conjunc-tion with “Make a Splash”, PGA alsosupported the development ofnumerous publications that continueto be distributed through the ProjectWET network.
The outstanding work of ProjectWET in the USA, made possiblethrough the annual support of PerrierGroup of America, has provided the programme with global exposureand network expansion.
Project WET received internationalrecognition as a model waterresources education programme atthe tenth World Water Congress inMelbourne, Australia and at thesecond World Water Forum in March2000. In addition, the RAMSAR Con-vention, a global wetlands organisa-tion, highlighted Project WET and its work in wetlands education at itsworld conference in May 1999.
Following the success of Project WETin the USA, Nestlé’s Perrier Vittel will start sponsorship of WET in 2001in Mexico and the Philippines.
49

51
Environment – Progress Report 2000
Focus 3
Systematic management of environmental performance Nestlé’srecord of environmental activities can be traced back over several decades, with many effective measures put in place. However, in the early 1990s, it became apparent that a company the size of Nestlé would need to have aclear, global environmental management system that everyone could follow if itwas more effectively to translate policyinto action.

The need for a management system In 1996,the Nestlé Environmental Management System(NEMS) was created to pull together all of theCompany’s environmental activities and measures.The system, which provides a common, coherentframework for environmental management at alllevels of the organisation, has been implementedthroughout the Company.
NEMS has led to:
– a systematic approach that ensures respect for Company policy and legal requirements. This has been achieved via an environmentalorganisational structure, policies and guidelines,objectives and programmes, training andcommunication, operational control and surveysand audits,
– the continuous improvement of environmentalperformance as shown by the EPI results presented earlier in this Report,
– the achievement of compatibility with international standards for environmentalmanagement systems, such as ISO 14001 and the eco-management and audit scheme (EMAS) of the European Union. Whereas NEMSimplementation is mandatory, certifications under these other systems are optional,depending on local conditions (see list of certified factories in the Annex), and
– an expansion of mutual trust with consumers,government authorities and business partnersthrough open communication and an on-goingrecord of environmental improvements (see list of awards in the Annex).
But setting up a system doesn’t, in itself, guarenteeresults. What separates NEMS from other systemsis its focus on performance and improvements in allaspects of sustainability.
Environment – Progress Report 2000 Systematic management of environmental performance
Environmental targets and plans
52
The Nestlé Environmental Advisory Group, led by the
Corporate Environmental Officer, is made up of specialists
representing: Environmental Affairs, Agricultural Services,
Engineering, Research & Development, Purchasing,
geographical Zone Technical Management, Packaging,
Distribution, Quality Management, and Public Affairs.
NEMS is not a closed loop, but a spiral
for continuous improvement.
NEMS framework
A Establish environmental targets and plans
B Monitor environmental progress against plans
C Check results and define corrective and preventive actions
Environmental commitment
C2Audits
C1Documentation
B3Operational control
B2Training and communication
A1Policies
A2 Legislation
and regulations
A3 Programmes
B1Organisational
structure
The people who make it happen In one way or another, many employees share environmentalresponsibility and contribute to the success of NEMS.However, its success is dependent upon an efficientorganisational structure. For this reason, environ-mental officers are appointed at different levels ofthe organisation, from corporate to factory level.
At the corporate level in Vevey, Switzerland, theEnvironmental Affairs Department is headed by theCorporate Environmental Officer who reports directly to General Management. The EnvironmentalAffairs Department works with an internal networkof high-level senior managers, representing a varietyof functions covering the whole supply chain.Referred to as the Environmental Advisory Group(EAG), this group meets regularly to review currentand future environmental issues and to co-ordinateenvironmental strategy, planning and action.
In Nestlé’s local operations throughout the world,referred to as “markets”, market environmental
officers are designated who are responsible for theimplementation and performance of NEMS in theircountry. They set local objectives and co-ordinateactivities throughout the supply chain.
In addition, at Nestlé’s sites (e.g., R&D centres,distribution centres, factories), site environmentalofficers are appointed. They are responsible for localissues, including interaction with the community, siteresources, local government, etc. The commitment of top management, together with this cascade ofenvironmental responsibility at all levels of the organ-isation, remains the cornerstone of NEMS success.
Policies As stated earlier, The Nestlé Policy on theEnvironment provides worldwide environmentaldirection for the Company. It is complemented with a number of other policies and guidelines, both internal and external. In addition, markets and factories develop their own policies based onlocal conditions and requirements.
53
Environmental policies and guidelines
1990 Nestlé Policy on Environment and Packaging
1991 and 1999 Nestlé Policy on the Environment
1992 Nestlé Tuna Policy
1993, 1999 and 2000 Use and Phase-out of Ozone Depleting Substances
1995 and 1999 Nestlé’s Principles of Purchasing
1997 Nestlé Environmental Minimum Technical Requirements (EMTR)
1997 and 2000 Guidelines for Improving Environmental Impact of Logistics
1998 Guidelines on Sourcing of Agricultural Raw Materials
1998 Nestlé Corporate Business Principles
2000 Nestlé Water Policy
The table above shows the wide range of Nestlé’s policies and guidelines regarding environmental issues.
Some of them are for internal use, some others are publicly available.
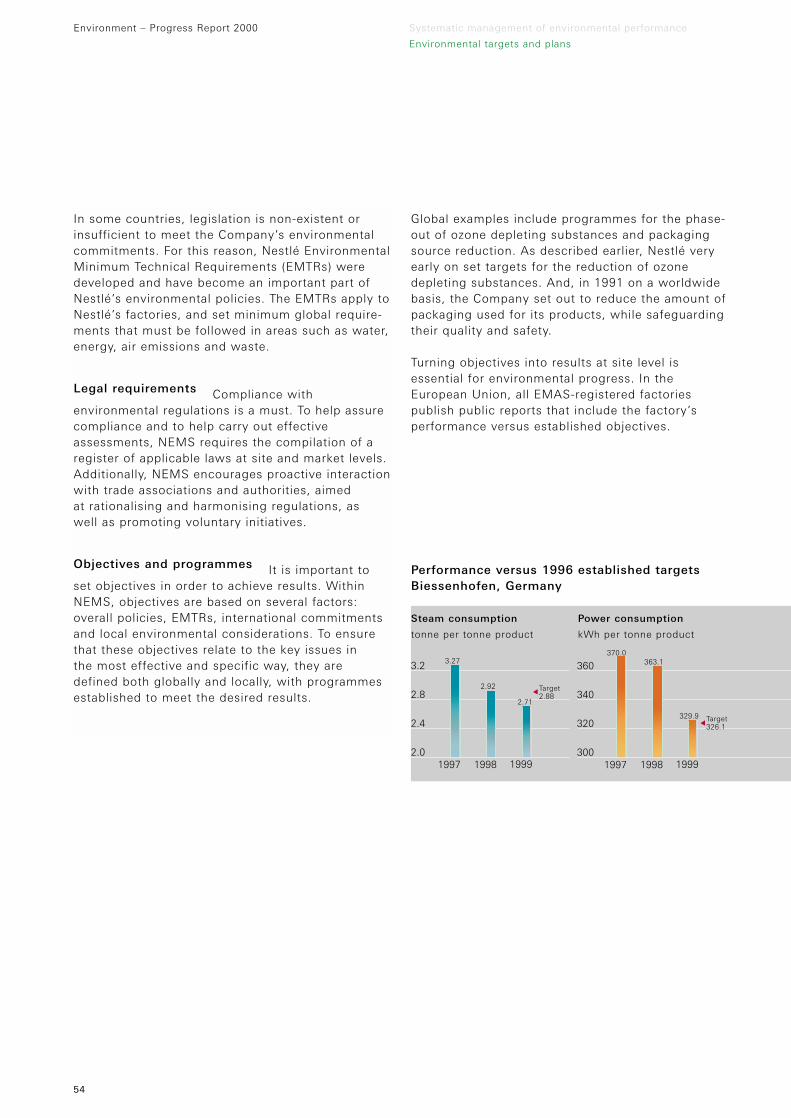
In some countries, legislation is non-existent orinsufficient to meet the Company’s environmentalcommitments. For this reason, Nestlé EnvironmentalMinimum Technical Requirements (EMTRs) weredeveloped and have become an important part ofNestlé’s environmental policies. The EMTRs apply toNestlé’s factories, and set minimum global require-ments that must be followed in areas such as water,energy, air emissions and waste.
Legal requirements Compliance with environmental regulations is a must. To help assure compliance and to help carry out effectiveassessments, NEMS requires the compilation of aregister of applicable laws at site and market levels.Additionally, NEMS encourages proactive interactionwith trade associations and authorities, aimed at rationalising and harmonising regulations, as well as promoting voluntary initiatives.
Objectives and programmes It is important toset objectives in order to achieve results. WithinNEMS, objectives are based on several factors:overall policies, EMTRs, international commitmentsand local environmental considerations. To ensurethat these objectives relate to the key issues in the most effective and specific way, they aredefined both globally and locally, with programmesestablished to meet the desired results.
Environment – Progress Report 2000 Systematic management of environmental performance
Environmental targets and plans
54
Global examples include programmes for the phase-out of ozone depleting substances and packagingsource reduction. As described earlier, Nestlé veryearly on set targets for the reduction of ozonedepleting substances. And, in 1991 on a worldwidebasis, the Company set out to reduce the amount ofpackaging used for its products, while safeguardingtheir quality and safety.
Turning objectives into results at site level isessential for environmental progress. In theEuropean Union, all EMAS-registered factoriespublish public reports that include the factory’sperformance versus established objectives.
2.0
2.4
2.8
3.2
199919981997
3.27
2.92 Target 2.88
2.71
300
320
340
360
199919981997
370.0363.1
Target 326.1
329.9
Steam consumption Power consumption
tonne per tonne product kWh per tonne product
Performance versus 1996 established targetsBiessenhofen, Germany

Progress towards objectives
Training and communication Training andcommunication is an important part of NEMS. Onetask of Nestlé’s global environmental team is tobuild ever-stronger environmental awareness andresponsibility among the Company’s employees.This is done in many ways. For example, the factoryenvironmental surveys involved thousands of peopleat all levels, from top management to the factoryfloor. This practical experience is reinforced throughin-house magazines, newsletters, videos andthrough the Intranet.
In 2000, an international environment conferencetook place in Vevey. It brought together environ-mental specialists from 50 Nestlé markets, as well as from Vevey headquarters. The participantsreviewed the overall NEMS objectives and workedtogether to identify ways to further improve NEMS,the EMTRs, EPIs and resource management.
At Rive-Reine, the Company’s international trainingcentre in Switzerland, environmental issues are aregular part of courses for Nestlé’s executives. Thecorporate efforts are multiplied by countless othertraining sessions organised in the markets aroundthe world.
NEMS encourages communication and dialogueabout environmental issues with external interestedparties. These interactions have led directly toregulatory and educational improvements beyondthe world of Nestlé, as well as to many beneficialcommunity initiatives.
55
Centre front row: Mr. Peter Brabeck-Letmathe, CEO, Mr. Rupert Gasser, Executive Vice President Technical, Production and
R & D and Mrs. Irina du Bois, Corporate Environmental Officer during the Nestlé Environmental Conference 2000. Participants
included the Nestlé Environmental Advisory Group and Market Environmental Officers from all over the world.
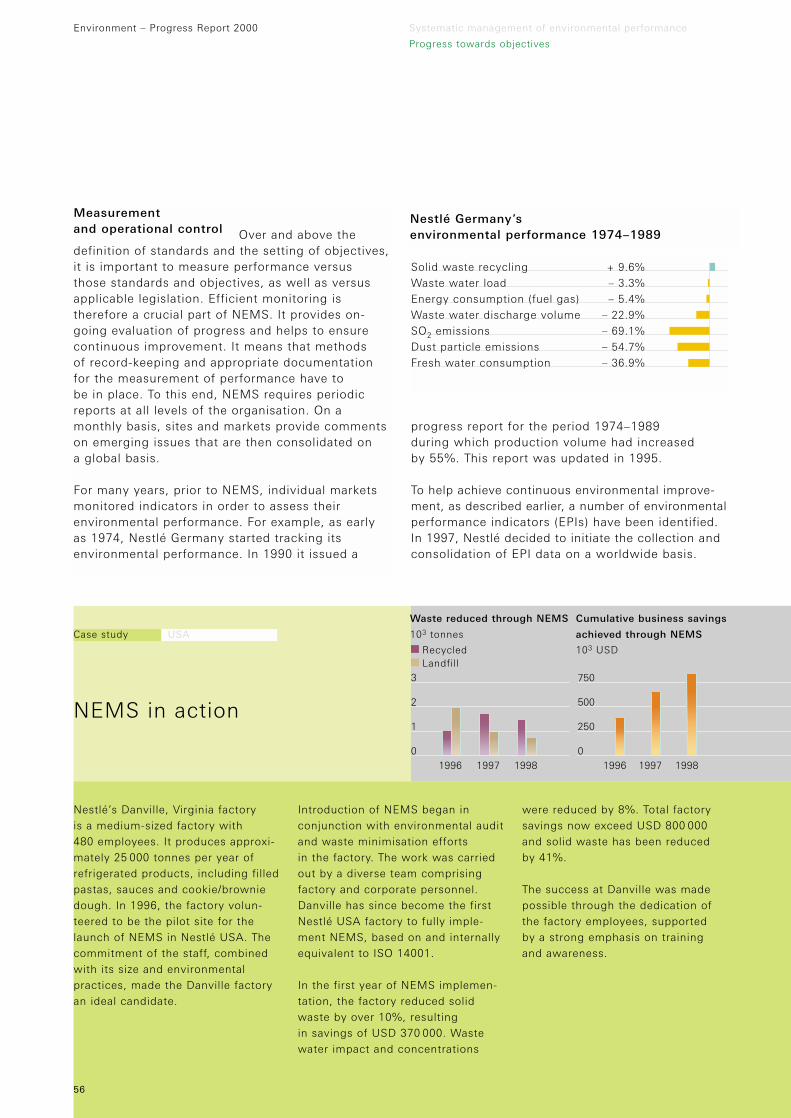
Measurement and operational control Over and above thedefinition of standards and the setting of objectives,it is important to measure performance versus those standards and objectives, as well as versusapplicable legislation. Efficient monitoring istherefore a crucial part of NEMS. It provides on-going evaluation of progress and helps to ensurecontinuous improvement. It means that methods of record-keeping and appropriate documentationfor the measurement of performance have to be in place. To this end, NEMS requires periodicreports at all levels of the organisation. On amonthly basis, sites and markets provide commentson emerging issues that are then consolidated on a global basis.
For many years, prior to NEMS, individual marketsmonitored indicators in order to assess theirenvironmental performance. For example, as earlyas 1974, Nestlé Germany started tracking itsenvironmental performance. In 1990 it issued a
Environment – Progress Report 2000 Systematic management of environmental performance
Progress towards objectives
Nestlé’s Danville, Virginia factory is a medium-sized factory with 480 employees. It produces approxi-mately 25 000 tonnes per year ofrefrigerated products, including filledpastas, sauces and cookie/browniedough. In 1996, the factory volun-teered to be the pilot site for thelaunch of NEMS in Nestlé USA. Thecommitment of the staff, combinedwith its size and environmentalpractices, made the Danville factoryan ideal candidate.
Introduction of NEMS began inconjunction with environmental auditand waste minimisation efforts in the factory. The work was carried out by a diverse team comprisingfactory and corporate personnel.Danville has since become the firstNestlé USA factory to fully imple-ment NEMS, based on and internallyequivalent to ISO 14001.
In the first year of NEMS implemen-tation, the factory reduced solidwaste by over 10%, resulting in savings of USD 370 000. Wastewater impact and concentrations
were reduced by 8%. Total factorysavings now exceed USD 800 000and solid waste has been reduced by 41%.
The success at Danville was madepossible through the dedication ofthe factory employees, supported by a strong emphasis on training and awareness.
Case study USA
NEMS in action
56
Solid waste recycling + 9.6%
Waste water load – 3.3%
Energy consumption (fuel gas) – 5.4%
Waste water discharge volume – 22.9%
SO2 emissions – 69.1%
Dust particle emissions – 54.7%
Fresh water consumption – 36.9%
Nestlé Germany’s environmental performance 1974–1989
progress report for the period 1974–1989 during which production volume had increased by 55%. This report was updated in 1995.
To help achieve continuous environmental improve-ment, as described earlier, a number of environmentalperformance indicators (EPIs) have been identified.In 1997, Nestlé decided to initiate the collection andconsolidation of EPI data on a worldwide basis.
1996 1997 1998 1996 1997 19980
1
2
3
0
250
500
750
Waste reduced through NEMS Cumulative business savings
103 tonnes achieved through NEMS
Recycled 103 USDLandfill
Continuous improvement
Surveys and audits Nestlé has a comprehensivesystem of surveys and audits encompassing alllevels of its operations. Some audits specificallyfocus on environmental issues – from compliance tomanagement systems – at factories, distributionsites, office buildings, etc. Other audits are multi-disciplinary in nature and include environmentalcomponents.
Both types of audit are carried out at corporate and market levels. They are conducted internallyand can also be conducted externally by thirdparties.
Nestlé’s suppliers are also encouraged to followenvironmentally-sound business practices. Toassess the way they meet their responsibility, Nestléhas incorporated environmental components into its supplier quality assurance audits. To date, morethan 1400 such audits have been carried out. Throughthese audits, Nestlé has been able to improvesupplier practices, for example, the replacement of
equipment using CFCs in Indonesia and Canada,and a special initiative in the Philippines, “Greeningthe Supply Chain”.
It is not enough simply to conduct audits. It is evenmore important that problems are identified and that appropriate action plans are then developedand implemented.
As just one example, the 1997 factory environ-mental survey showed that the Valsayn factory in Trinidad had inadequate waste water treatment.The factory manufactured close to 40 000 tonnes of products per year including UHT liquid milks,juices, Nescafé, Milo and Quik.
57
Surveys and audits
1987 to present Ammonia safety audits
1988 to present Ozone depleting substance emissions surveys
1991 to present Packaging source reduction surveys
1994 First factory environmental survey
1995 Environmental surveys of worldwide administrative buildings
1995 to present Environmental aspects included in annual corporate internal operational audits
1995 to present Environmental aspects included in supplier quality assurance audits
1996 Environmental surveys of distribution and logistics operations
1997 Second factory environmental survey
1997 to present Environmental performance indicators consolidated
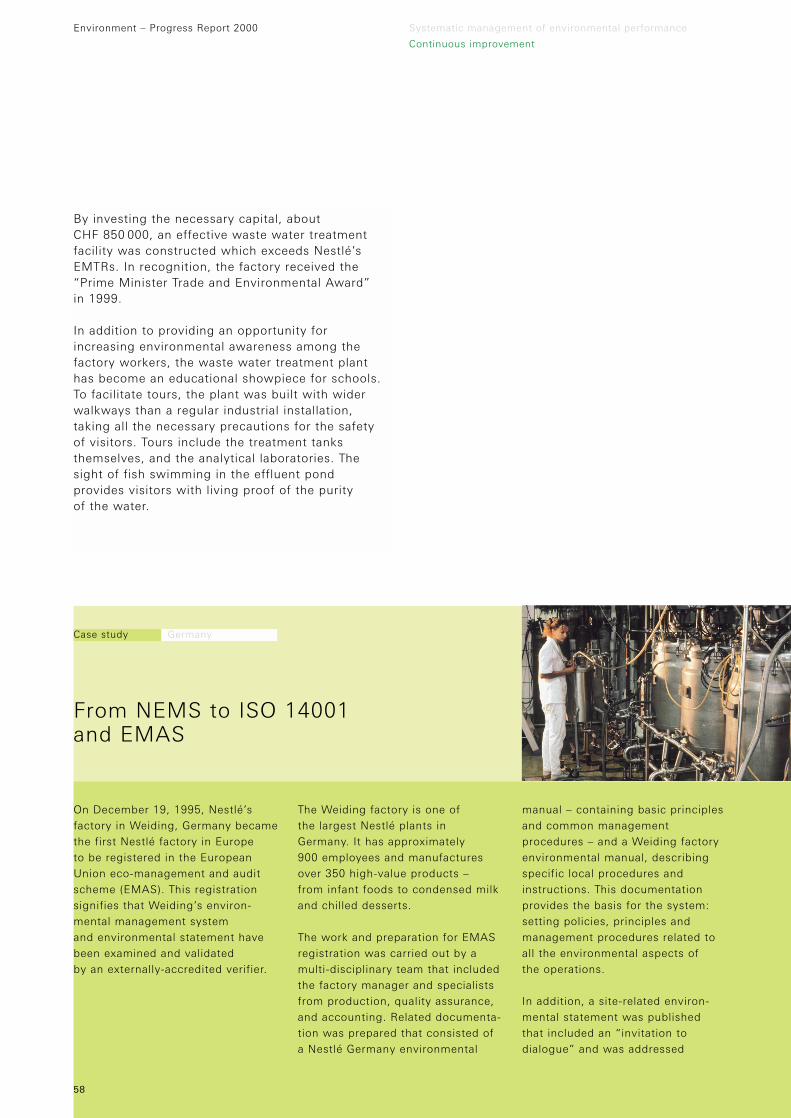
By investing the necessary capital, about CHF 850 000, an effective waste water treatmentfacility was constructed which exceeds Nestlé’sEMTRs. In recognition, the factory received the“Prime Minister Trade and Environmental Award” in 1999.
In addition to providing an opportunity forincreasing environmental awareness among thefactory workers, the waste water treatment planthas become an educational showpiece for schools.To facilitate tours, the plant was built with widerwalkways than a regular industrial installation,taking all the necessary precautions for the safetyof visitors. Tours include the treatment tanksthemselves, and the analytical laboratories. Thesight of fish swimming in the effluent pond provides visitors with living proof of the purity of the water.
Environment – Progress Report 2000 Systematic management of environmental performance
Continuous improvement
On December 19, 1995, Nestlé’sfactory in Weiding, Germany becamethe first Nestlé factory in Europe to be registered in the EuropeanUnion eco-management and auditscheme (EMAS). This registrationsignifies that Weiding’s environ-mental management system and environmental statement havebeen examined and validated by an externally-accredited verifier.
The Weiding factory is one of the largest Nestlé plants in Germany. It has approximately 900 employees and manufacturesover 350 high-value products – from infant foods to condensed milkand chilled desserts.
The work and preparation for EMASregistration was carried out by amulti-disciplinary team that includedthe factory manager and specialistsfrom production, quality assurance,and accounting. Related documenta-tion was prepared that consisted ofa Nestlé Germany environmental
manual – containing basic principlesand common managementprocedures – and a Weiding factoryenvironmental manual, describingspecific local procedures andinstructions. This documentationprovides the basis for the system:setting policies, principles andmanagement procedures related toall the environmental aspects of the operations.
In addition, a site-related environ-mental statement was published that included an “invitation to dialogue” and was addressed
Case study Germany
From NEMS to ISO 14001 and EMAS
58
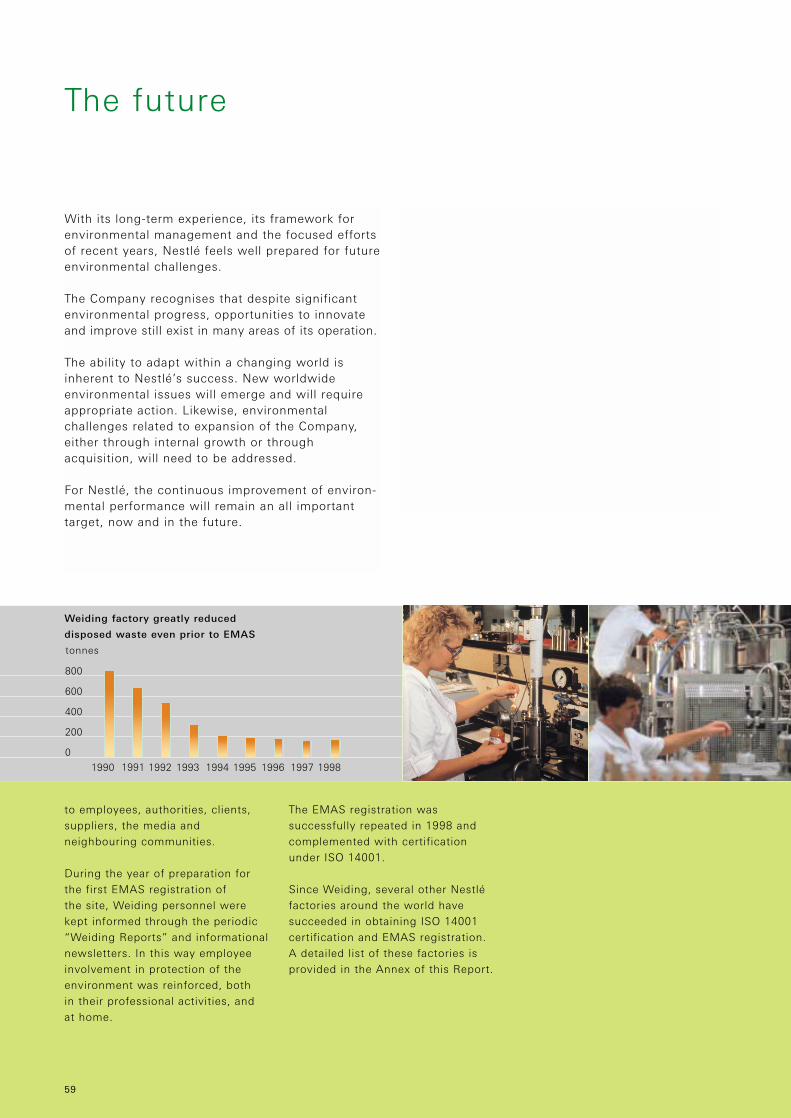
The future
With its long-term experience, its framework forenvironmental management and the focused effortsof recent years, Nestlé feels well prepared for futureenvironmental challenges.
The Company recognises that despite significantenvironmental progress, opportunities to innovateand improve still exist in many areas of its operation.
The ability to adapt within a changing world isinherent to Nestlé’s success. New worldwideenvironmental issues will emerge and will requireappropriate action. Likewise, environmentalchallenges related to expansion of the Company,either through internal growth or throughacquisition, will need to be addressed.
For Nestlé, the continuous improvement of environ-mental performance will remain an all importanttarget, now and in the future.
to employees, authorities, clients,suppliers, the media and neighbouring communities.
During the year of preparation forthe first EMAS registration of the site, Weiding personnel werekept informed through the periodic“Weiding Reports” and informationalnewsletters. In this way employeeinvolvement in protection of theenvironment was reinforced, both in their professional activities, and at home.
The EMAS registration wassuccessfully repeated in 1998 andcomplemented with certificationunder ISO 14001.
Since Weiding, several other Nestléfactories around the world havesucceeded in obtaining ISO 14001certification and EMAS registration.A detailed list of these factories isprovided in the Annex of this Report.
0
200
400
600
800
1991 1992 1993 1994 1995 1996 1997 19981990
tonnes
Weiding factory greatly reduced
disposed waste even prior to EMAS
59
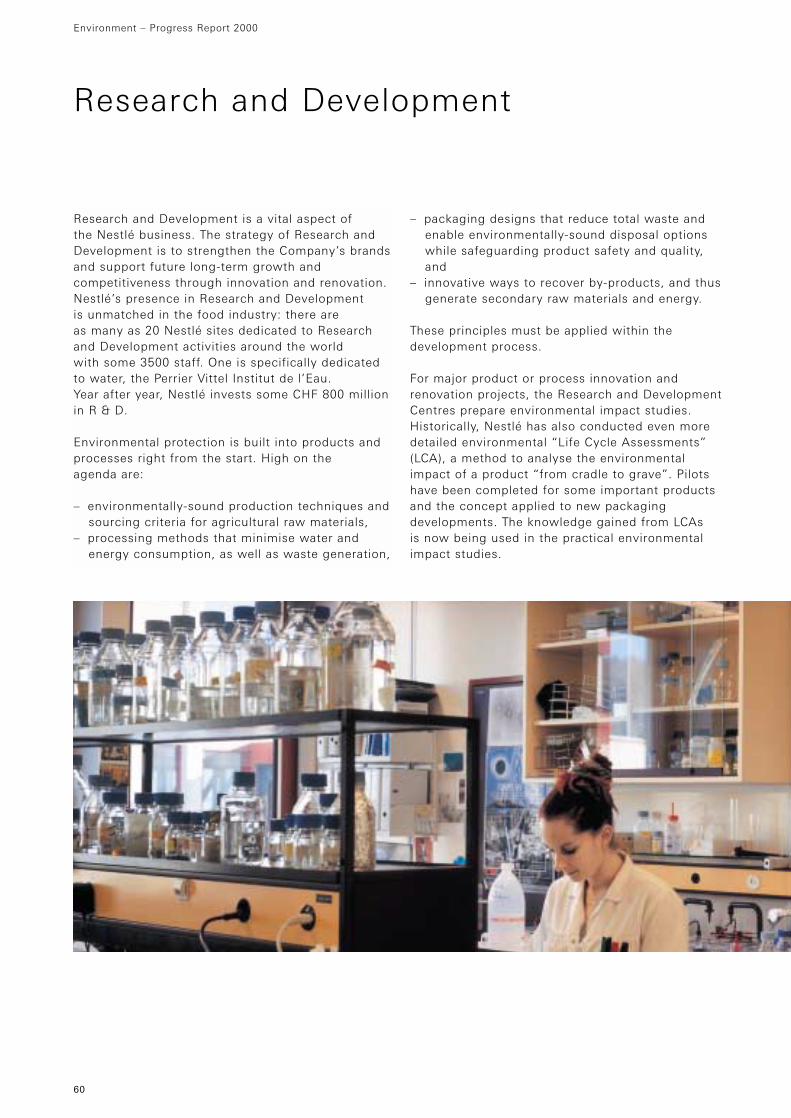
Research and Development is a vital aspect of the Nestlé business. The strategy of Research andDevelopment is to strengthen the Company’s brandsand support future long-term growth andcompetitiveness through innovation and renovation.Nestlé’s presence in Research and Development is unmatched in the food industry: there are as many as 20 Nestlé sites dedicated to Researchand Development activities around the world with some 3500 staff. One is specifically dedicatedto water, the Perrier Vittel Institut de l’Eau. Year after year, Nestlé invests some CHF 800 million in R & D.
Environmental protection is built into products andprocesses right from the start. High on the agenda are:
– environmentally-sound production techniques andsourcing criteria for agricultural raw materials,
– processing methods that minimise water andenergy consumption, as well as waste generation,
Environment – Progress Report 2000
Research and Development
60
– packaging designs that reduce total waste andenable environmentally-sound disposal optionswhile safeguarding product safety and quality,and
– innovative ways to recover by-products, and thusgenerate secondary raw materials and energy.
These principles must be applied within thedevelopment process.
For major product or process innovation andrenovation projects, the Research and DevelopmentCentres prepare environmental impact studies.Historically, Nestlé has also conducted even moredetailed environmental “Life Cycle Assessments”(LCA), a method to analyse the environmentalimpact of a product “from cradle to grave”. Pilotshave been completed for some important productsand the concept applied to new packagingdevelopments. The knowledge gained from LCAs is now being used in the practical environmentalimpact studies.
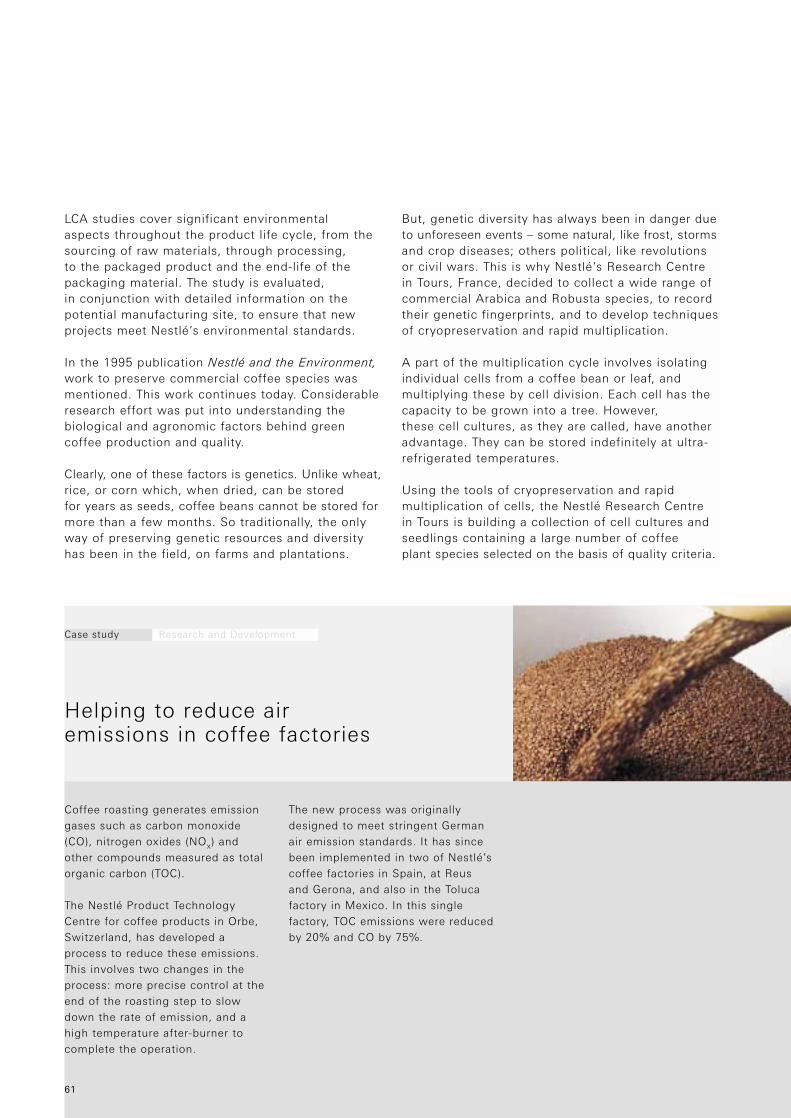
But, genetic diversity has always been in danger dueto unforeseen events – some natural, like frost, stormsand crop diseases; others political, like revolutionsor civil wars. This is why Nestlé’s Research Centrein Tours, France, decided to collect a wide range ofcommercial Arabica and Robusta species, to recordtheir genetic fingerprints, and to develop techniquesof cryopreservation and rapid multiplication.
A part of the multiplication cycle involves isolatingindividual cells from a coffee bean or leaf, andmultiplying these by cell division. Each cell has thecapacity to be grown into a tree. However, these cell cultures, as they are called, have anotheradvantage. They can be stored indefinitely at ultra-refrigerated temperatures.
Using the tools of cryopreservation and rapid multiplication of cells, the Nestlé Research Centrein Tours is building a collection of cell cultures andseedlings containing a large number of coffee plant species selected on the basis of quality criteria.
Coffee roasting generates emissiongases such as carbon monoxide(CO), nitrogen oxides (NOx) andother compounds measured as totalorganic carbon (TOC).
The Nestlé Product TechnologyCentre for coffee products in Orbe,Switzerland, has developed aprocess to reduce these emissions.This involves two changes in theprocess: more precise control at theend of the roasting step to slowdown the rate of emission, and ahigh temperature after-burner tocomplete the operation.
The new process was originallydesigned to meet stringent Germanair emission standards. It has sincebeen implemented in two of Nestlé’scoffee factories in Spain, at Reusand Gerona, and also in the Tolucafactory in Mexico. In this single factory, TOC emissions were reducedby 20% and CO by 75%.
Case study Research and Development
Helping to reduce air emissions in coffee factories
61
LCA studies cover significant environmental aspects throughout the product life cycle, from thesourcing of raw materials, through processing, to the packaged product and the end-life of thepackaging material. The study is evaluated, in conjunction with detailed information on thepotential manufacturing site, to ensure that newprojects meet Nestlé’s environmental standards.
In the 1995 publication Nestlé and the Environment,work to preserve commercial coffee species wasmentioned. This work continues today. Considerableresearch effort was put into understanding thebiological and agronomic factors behind greencoffee production and quality.
Clearly, one of these factors is genetics. Unlike wheat,rice, or corn which, when dried, can be stored for years as seeds, coffee beans cannot be stored formore than a few months. So traditionally, the onlyway of preserving genetic resources and diversityhas been in the field, on farms and plantations.
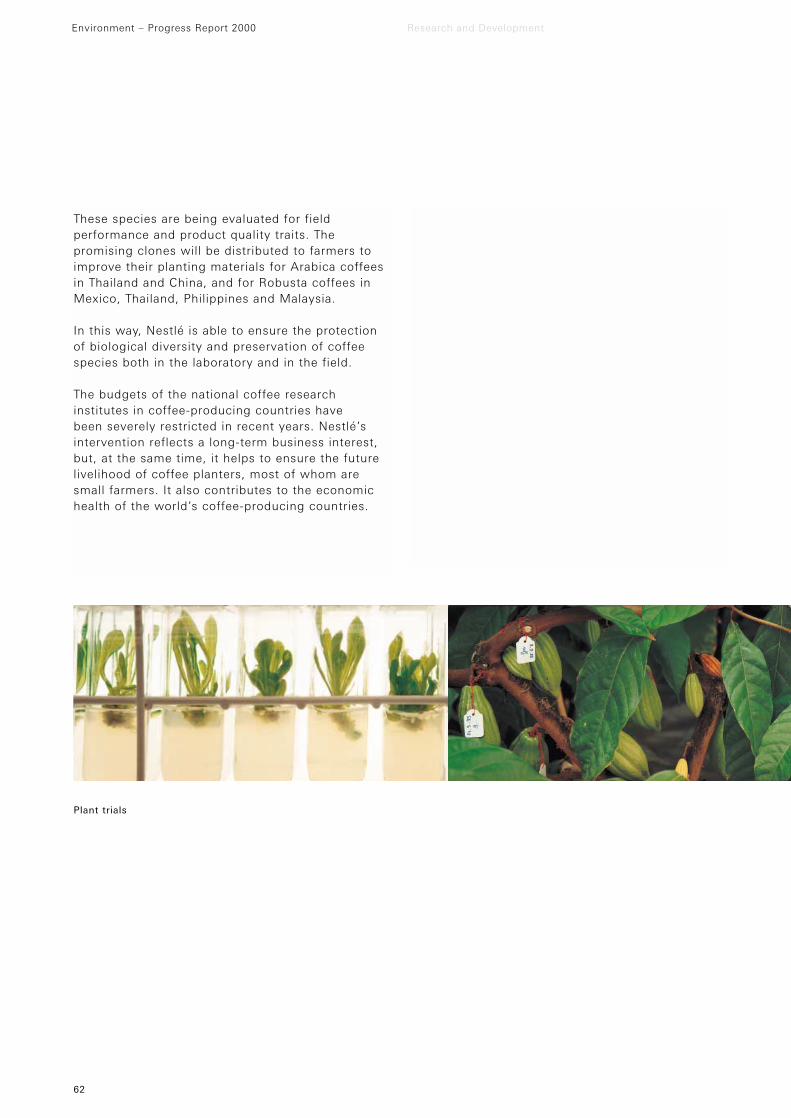
These species are being evaluated for fieldperformance and product quality traits. Thepromising clones will be distributed to farmers toimprove their planting materials for Arabica coffeesin Thailand and China, and for Robusta coffees inMexico, Thailand, Philippines and Malaysia.
In this way, Nestlé is able to ensure the protectionof biological diversity and preservation of coffeespecies both in the laboratory and in the field.
The budgets of the national coffee researchinstitutes in coffee-producing countries have been severely restricted in recent years. Nestlé’sintervention reflects a long-term business interest,but, at the same time, it helps to ensure the futurelivelihood of coffee planters, most of whom aresmall farmers. It also contributes to the economichealth of the world’s coffee-producing countries.
Environment – Progress Report 2000 Research and Development
62
Plant trials
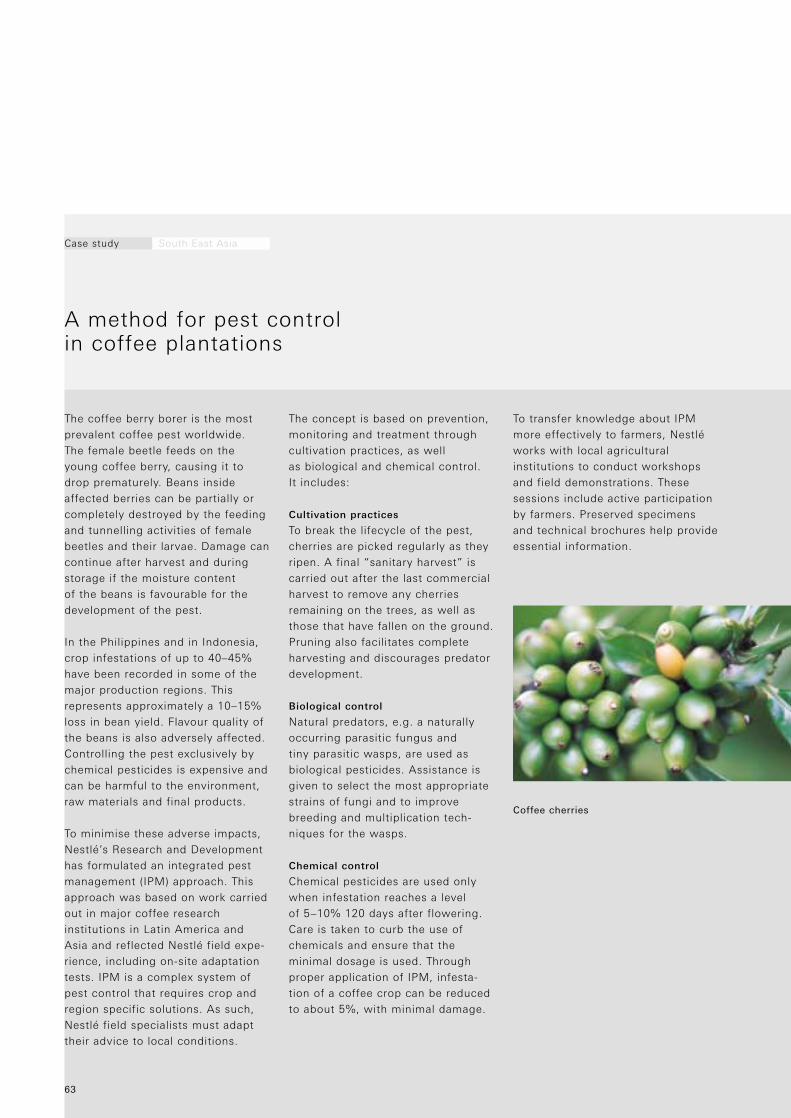
The coffee berry borer is the mostprevalent coffee pest worldwide. The female beetle feeds on theyoung coffee berry, causing it todrop prematurely. Beans insideaffected berries can be partially orcompletely destroyed by the feedingand tunnelling activities of femalebeetles and their larvae. Damage cancontinue after harvest and duringstorage if the moisture content of the beans is favourable for thedevelopment of the pest.
In the Philippines and in Indonesia,crop infestations of up to 40–45% have been recorded in some of themajor production regions. Thisrepresents approximately a 10–15%loss in bean yield. Flavour quality ofthe beans is also adversely affected.Controlling the pest exclusively bychemical pesticides is expensive andcan be harmful to the environment,raw materials and final products.
To minimise these adverse impacts,Nestlé’s Research and Developmenthas formulated an integrated pestmanagement (IPM) approach. Thisapproach was based on work carriedout in major coffee researchinstitutions in Latin America andAsia and reflected Nestlé field expe-rience, including on-site adaptationtests. IPM is a complex system ofpest control that requires crop andregion specific solutions. As such,Nestlé field specialists must adapttheir advice to local conditions.
The concept is based on prevention,monitoring and treatment throughcultivation practices, as well as biological and chemical control. It includes:
Cultivation practices
To break the lifecycle of the pest,cherries are picked regularly as theyripen. A final “sanitary harvest” iscarried out after the last commercialharvest to remove any cherriesremaining on the trees, as well asthose that have fallen on the ground.Pruning also facilitates completeharvesting and discourages predatordevelopment.
Biological control
Natural predators, e.g. a naturallyoccurring parasitic fungus and tiny parasitic wasps, are used asbiological pesticides. Assistance isgiven to select the most appropriatestrains of fungi and to improvebreeding and multiplication tech-niques for the wasps.
Chemical control
Chemical pesticides are used onlywhen infestation reaches a level of 5–10% 120 days after flowering. Care is taken to curb the use ofchemicals and ensure that theminimal dosage is used. Throughproper application of IPM, infesta-tion of a coffee crop can be reducedto about 5%, with minimal damage.
To transfer knowledge about IPMmore effectively to farmers, Nestléworks with local agriculturalinstitutions to conduct workshopsand field demonstrations. Thesesessions include active participationby farmers. Preserved specimensand technical brochures help provideessential information.
Case study South East Asia
A method for pest control in coffee plantations
63
Coffee cherries
Modern biotechnology or gene technology has thepotential to contribute to sustainable agriculturalpractices. However, there is increasing publicdebate about its potential impact on the environ-ment and human health. As a major purchaser andprocessor of agricultural raw materials, Nestlé has a responsibility to address these developments.
Farmers have used traditional biotechnology forcenturies, cross breeding plants and animals toimprove the quantity and quality of food. Today,modern biotechnology makes the processes moredirected and creates new opportunities in manyareas from medicine to food.
Agricultural biotechnology can assist in conservingnatural resources, natural habitats and nativespecies thus reducing the ecological impact ofcurrent intensive farming practices. The first com-mercialised genetically modified crops are providingresistance to pests and diseases or helping to controlweeds. The environmental benefits of these crops include reduced pesticide use and decreasedtillage. For instance, herbicide-resistant crops are, by their very nature, no-till crops thus assistingfarmers in their quest to prevent erosion andimprove soil quality. In addition, many geneticallymodified crops offer increased yields, thuspotentially reducing the need to expand existingagricultural land bases.
Environmental data from multi-year practicalexperience with genetically modified crops in theUSA has shown that insect-resistant and herbicide-tolerant crops can effectively reduce the use ofpesticides. Apart from direct advantages for theenvironment and farmers, a decrease in the netamount of agrochemicals used can help protect thequality of ground water.
In the near future, crops that are adjusted toadverse growth conditions, such as salineenvironments or drought, could help to reduce thepressure on the arable land that is available to feedan ever-increasing population. Additionally, otherdevelopments such as high Vitamin A rice maycontribute to fighting nutritional deficiencies andimproving human health.
Nestlé supports the need for continuing research to assess and minimise any potential environmentalimpact of modern biotechnology. Regarding thehealth aspects, Nestlé concurs with independentorganisations like FAO and WHO that have con-cluded that those crops that have passed the evalu-ation procedures are as safe as their conventionalcounterparts.
Nestlé developed its position on gene technology in1989. The position has been regularly updated sincethen to address new developments. The latest version is available on Nestlé’s Internet site, www.nestle.com
Environment – Progress Report 2000
Modern biotechnology and environment
64
Nestlé position on gene technology
Introduction Nestlé’s business for more than 130 years has been built on manufacturing and marketing products tailored to meet the diverseneeds and preferences of consumers all over theworld. Based on this experience, Nestlé recognisesthe potential contribution of gene technology to the improvement of the quality and nutritional valueof our food. Gene technology also can lead toincreased food production and can supportsustainable agricultural practices. In someinstances, positive effects on health have beenconfirmed. For those reasons, Nestlé supports aresponsible application of gene technology for food production based on sound scientific research.Nestlé will continue to use ingredients derived fromgenetically modified crops when it has completeconfidence in their safety.
Safety The safety of our products and the integrity of the ingredients from which they aremanufactured are paramount to Nestlé. Geneticallymodified crops and all raw materials used by Nestléare subject to strict safety evaluation. Nestlé isconfident that the safety of ingredients derived fromsuch crops is assured through this evaluationprocess and is confident that they do not constitutea health risk. Nestlé concurs with the opinionexpressed by WHO, FAO, OECD and numerousindependent scientific bodies that those crops that have passed the evaluation procedure are assafe as their conventional counterparts.
Compliance and labelling Legislation regulatingthe use of ingredients derived from geneticallymodified crops and their labelling is in place or under preparation in many countries. Nestlé isstrictly complying with all the relevant laws andregulations.
Consumer perceptions and the future needs of society As Nestlé ismarketing its products globally, it takes intoconsideration local needs, cultural differences andconsumer wishes as well as attitudes concerningthe use of ingredients derived from geneticallymodified crops. Nestlé also recognises that in someregions of the world, governments have expressed akeen interest in this technology as a potential tool toaddress their country’s future food requirements.
Consumer dialogue and communication Nestlé promotes an opendialogue on gene technology with consumers,government bodies, the trade and the scientificworld. We closely monitor public opinion as well asregulatory and scientific developments. NestléConsumer Services, established in 60 countries, areavailable to respond to consumer inquiries inrelation to genetic modification in food production.
65
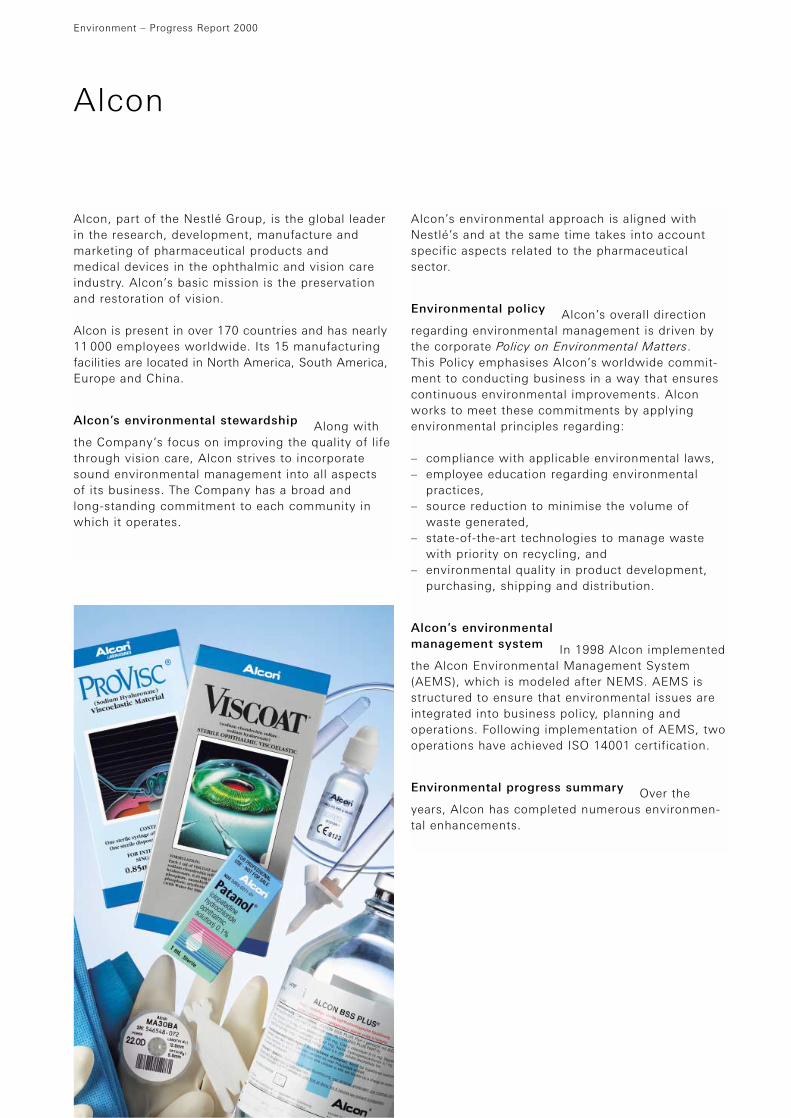
Alcon, part of the Nestlé Group, is the global leaderin the research, development, manufacture andmarketing of pharmaceutical products and medical devices in the ophthalmic and vision careindustry. Alcon’s basic mission is the preservationand restoration of vision.
Alcon is present in over 170 countries and has nearly11 000 employees worldwide. Its 15 manufacturingfacilities are located in North America, South America,Europe and China.
Alcon’s environmental stewardship Along withthe Company’s focus on improving the quality of lifethrough vision care, Alcon strives to incorporatesound environmental management into all aspectsof its business. The Company has a broad and long-standing commitment to each community inwhich it operates.
Alcon’s environmental approach is aligned withNestlé’s and at the same time takes into accountspecific aspects related to the pharmaceutical sector.
Environmental policy Alcon’s overall directionregarding environmental management is driven bythe corporate Policy on Environmental Matters. This Policy emphasises Alcon’s worldwide commit-ment to conducting business in a way that ensurescontinuous environmental improvements. Alconworks to meet these commitments by applyingenvironmental principles regarding:
– compliance with applicable environmental laws,– employee education regarding environmental
practices,– source reduction to minimise the volume of
waste generated,– state-of-the-art technologies to manage waste
with priority on recycling, and– environmental quality in product development,
purchasing, shipping and distribution.
Alcon’s environmental management system In 1998 Alcon implementedthe Alcon Environmental Management System(AEMS), which is modeled after NEMS. AEMS isstructured to ensure that environmental issues areintegrated into business policy, planning andoperations. Following implementation of AEMS, twooperations have achieved ISO 14001 certification.
Environmental progress summary Over theyears, Alcon has completed numerous environmen-tal enhancements.
Environment – Progress Report 2000
Alcon
66
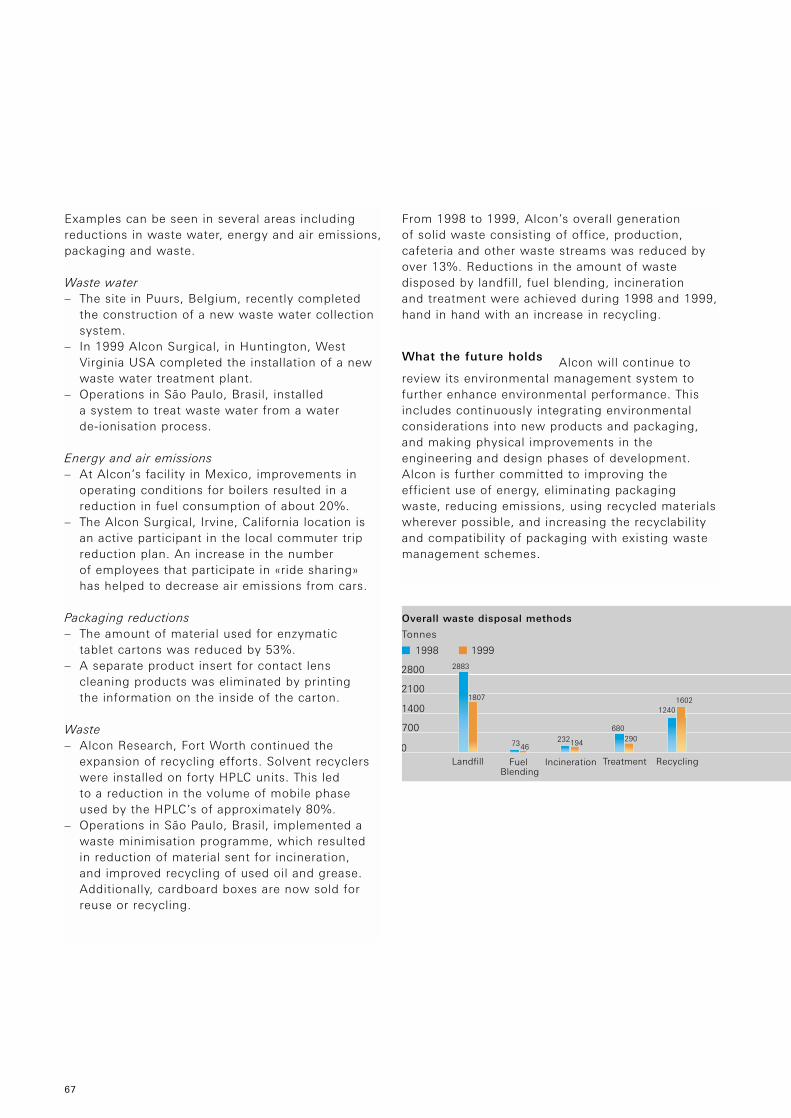
Examples can be seen in several areas includingreductions in waste water, energy and air emissions,packaging and waste.
Waste water– The site in Puurs, Belgium, recently completed
the construction of a new waste water collectionsystem.
– In 1999 Alcon Surgical, in Huntington, WestVirginia USA completed the installation of a newwaste water treatment plant.
– Operations in São Paulo, Brasil, installed a system to treat waste water from a water de-ionisation process.
Energy and air emissions– At Alcon’s facility in Mexico, improvements in
operating conditions for boilers resulted in areduction in fuel consumption of about 20%.
– The Alcon Surgical, Irvine, California location isan active participant in the local commuter tripreduction plan. An increase in the number of employees that participate in «ride sharing»has helped to decrease air emissions from cars.
Packaging reductions– The amount of material used for enzymatic
tablet cartons was reduced by 53%.– A separate product insert for contact lens
cleaning products was eliminated by printing the information on the inside of the carton.
Waste– Alcon Research, Fort Worth continued the
expansion of recycling efforts. Solvent recyclerswere installed on forty HPLC units. This led to a reduction in the volume of mobile phaseused by the HPLC’s of approximately 80%.
– Operations in São Paulo, Brasil, implemented awaste minimisation programme, which resulted in reduction of material sent for incineration, and improved recycling of used oil and grease.Additionally, cardboard boxes are now sold forreuse or recycling.
From 1998 to 1999, Alcon’s overall generation of solid waste consisting of office, production,cafeteria and other waste streams was reduced byover 13%. Reductions in the amount of wastedisposed by landfill, fuel blending, incineration and treatment were achieved during 1998 and 1999, hand in hand with an increase in recycling.
What the future holds Alcon will continue toreview its environmental management system tofurther enhance environmental performance. Thisincludes continuously integrating environmentalconsiderations into new products and packaging,and making physical improvements in theengineering and design phases of development.Alcon is further committed to improving theefficient use of energy, eliminating packagingwaste, reducing emissions, using recycled materialswherever possible, and increasing the recyclabilityand compatibility of packaging with existing wastemanagement schemes.
67
Landfill Fuel Blending
TreatmentIncineration Recycling0
700
1400
2100
2800 2883
1807
7346232194
680
12401602
290
19991998
Overall waste disposal methods
Tonnes

Annex
Methodology The consolidatedGroup EPIs cover manufacturingoperations. To determine the environ-mental performance, both the processinputs and outputs are measured.This is based on the concept of eco-efficiency – an increase in productor service value per unit of environ-mental influence – as defined in 1992by WBCSD in their documentMeasuring eco-efficiency – a guide to
reporting company performance. The methodology used to identify,track and report the indicators is alsoconsistent with ISO 14031.
The EPIs include water and energyconsumption, waste water genera-tion, greenhouse gases, air acidifica-tion potential and ozone depletingsubstance emissions as well as by-products/waste generation.
Across the world, there is differentlegislation, and different methods ofmeasurement. For this reason, manyorganisations, including WBCSD,have been working to definestandard environmental indicators.Although progress has been made,this remains a difficult task.Wherever possible, the widelyaccepted definitions have been used,such as the WBCSD’s “generallyapplicable indicators” and “businessspecific indicators”.
Compiling data from nearly 500 factories is a challenging anddemanding task. Through NEMS, theaccuracy of the data and the level of reporting have constantlyimproved. As can be seen in thetable below, the overall level ofreporting was 95%.
The consolidated indicators pre-sented in this Report are for thefood-related activities. Because ofthe significant difference in products,the pharmaceutical group, Alcon, is not included. In a very limitednumber of cases, some of thereporting sites did not provide datafor all indicators. In order not tooverstate performance, this has beentaken into account when calculatingthe consolidated eco-efficiency.
69
Environment – Progress Report 2000
Environmental performance indicators (EPIs)
1997 1998 1999
Nestlé factories 495 522 509
Nestlé factories (excluding Alcon) 480 507 494
Factories that reported 464 476 471
Air acidification potential Thesum of SOx and NOx air emissions from on-site combustion processes.There are currently no generallyagreed factors for measurement ofthis effect. Therefore, measurementsare based upon the acidic strengthof each component (SOx = 0.7 xNOx) presented as SOx equivalents. These components contribute to the acidification of water and soils. Burning of fuels in boilers,roasters, dryers and electricalgenerators produces NOx emissions.When these fuels contain sulphur,such as coal and heavy oil, SOx
emissions are produced.
Ozone depleting substances The sum of substances emitted which havebeen shown to contribute to the depletion of the ozone layer. Thecommon unit of measurement is R-11 equivalents. R-11 is one type ofrefrigerant which has been assignedan ozone depletion potential of one,with all other ozone depletingsubstances being assigned relatedvalues. The impact potential of eachsubstance is determined using con-version factors commonly agreed bymost authorities. For Nestlé, thesesubstances are primarily refrigerantsin equipment used to cool or freezeproducts, or methyl bromide – afumigant used to protect raw mate-rials or products from insects.
By-products/waste generation The sum of allmaterials used or produced duringmanufacturing which are notincluded in the final product. Thisincludes materials that are eitherrecovered or disposed of. Examplesinclude off-specification raw mate-rials, cleaning residues, trimmingsfrom raw and packaging materials,etc. (Although this indicator is
defined on a global basis, somedifferences in reporting may exist due to differences in nationallegislation defining waste).
By-products/waste recovery The sum of all by-products and excess materialsgenerated which are not destined for final disposal (e.g. landfill or incineration without energyrecovery). These are used togenerate energy, for recycling, or as feed stock for other processes.An example is the use of spentcoffee grounds to produce energy or compost.
Disposed waste The sum of allmaterials used or produced duringmanufacturing which are notincluded in the final product andwhich are disposed of. This does notinclude materials that are reused,recovered or recycled. An example iswaste that is sent to an approvedlandfill.
Environment – Progress Report 2000 Environmental performance indicators (EPIs)
70
EPI Definitions
Inputs
Water consumption The sum of water consumed from all sources,including purchases from suppliersand surface or ground water sources.It is used in a variety of ways: for bottled water, as an ingredient, for industrial processes (for example,steam for cooking), in coolingprocesses and for cleaning.
Energy consumption The sum of all energy purchased or obtained – less any energy which, in rarecases, is sold. This includes elec-tricity, steam, fuels such as oil andnatural gas, and by-products such as spent coffee grounds. The energyis used in many different ways totransform raw materials into finishedproducts, for example, conveying,cooking and packaging.
Outputs
Waste water generation The sumof all waste water discharged from afactory. This primarily includesindustrial waste waters. Waste wateris generated in manufacturing fromprocessing, cleaning, and somecooling processes. In certain casesrain water run-off may be included.
Greenhouse gases The sum of all on-site CO2 emissions fromcombustion processes used tomanufacture Nestlé products. CO2 iscommonly accepted as contributingto global warming, as outlined in theKyoto Protocol. These CO2 emissionscan result from burning of fuels inboilers, roasters, dryers and electricgenerators.
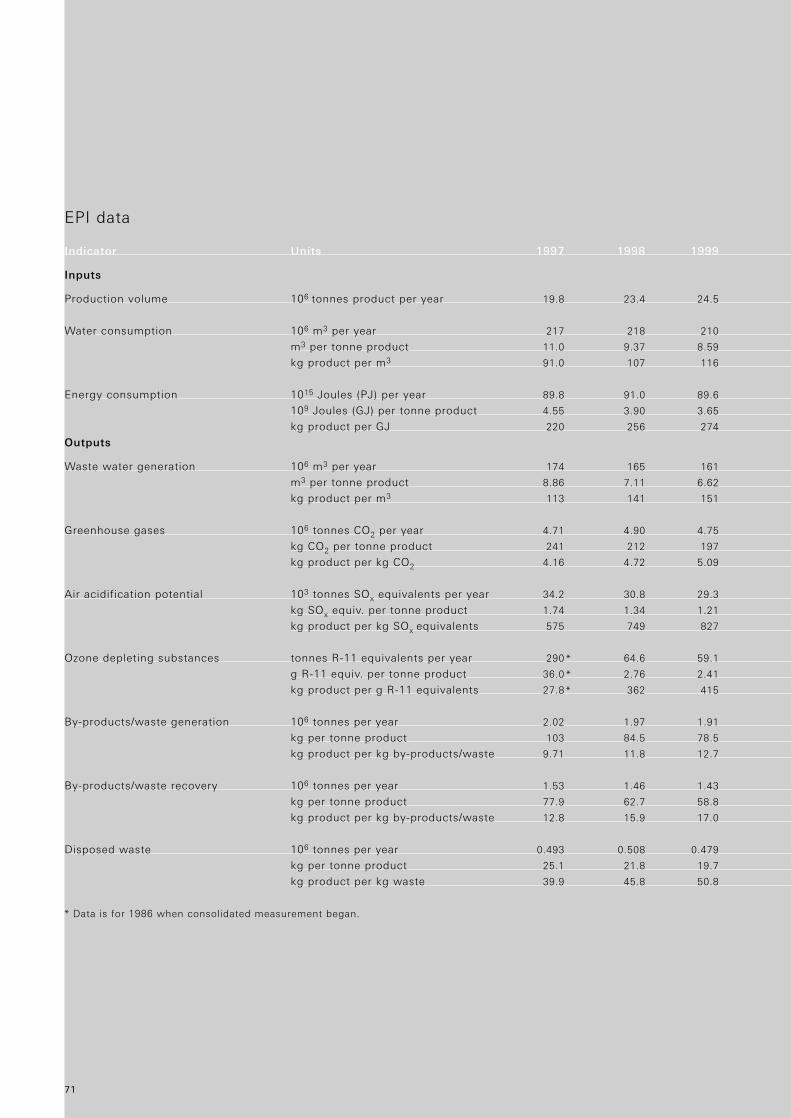
EPI data
Indicator Units 1997 1998 1999
Inputs
Production volume 106 tonnes product per year 19.8 23.4 24.5
Water consumption 106 m3 per year 217 218 210
m3 per tonne product 11.0 9.37 8.59
kg product per m3 91.0 107 116
Energy consumption 1015 Joules (PJ) per year 89.8 91.0 89.6
109 Joules (GJ) per tonne product 4.55 3.90 3.65
kg product per GJ 220 256 274
Outputs
Waste water generation 106 m3 per year 174 165 161
m3 per tonne product 8.86 7.11 6.62
kg product per m3 113 141 151
Greenhouse gases 106 tonnes CO2 per year 4.71 4.90 4.75
kg CO2 per tonne product 241 212 197
kg product per kg CO2 4.16 4.72 5.09
Air acidification potential 103 tonnes SOx equivalents per year 34.2 30.8 29.3
kg SOx equiv. per tonne product 1.74 1.34 1.21
kg product per kg SOx equivalents 575 749 827
Ozone depleting substances tonnes R-11 equivalents per year 290 * 64.6 59.1
g R-11 equiv. per tonne product 36.0 * 2.76 2.41
kg product per g R-11 equivalents 27.8 * 362 415
By-products/waste generation 106 tonnes per year 2.02 1.97 1.91
kg per tonne product 103 84.5 78.5
kg product per kg by-products/waste 9.71 11.8 12.7
By-products/waste recovery 106 tonnes per year 1.53 1.46 1.43
kg per tonne product 77.9 62.7 58.8
kg product per kg by-products/waste 12.8 15.9 17.0
Disposed waste 106 tonnes per year 0.493 0.508 0.479
kg per tonne product 25.1 21.8 19.7
kg product per kg waste 39.9 45.8 50.8
* Data is for 1986 when consolidated measurement began.
71
Environment – Progress Report 2000
List of awards
72
1995
Brazil Goiania factory received the Cenáqua Award from the Envi-ronment and Amazonian BrazilianInstitute (IBAMA) in recognition ofits environmental achievements.
Mexico Coatepec factory received the White Flag Award fromthe Veracruz State Government for environmental achievements.
Nigeria Nestlé Nigeria won anEnvironmental Performance Awardfrom the Federal EnvironmentalProtection Agency.
South Africa Nestlé South Africareceived the Custodians of TableMountain Award from the WorldWide Fund for Nature (WWF) forefforts to safeguard Table Mountainand the Cape Peninsula Mountains.
Nestlé South Africa received theEcoLink Earth Care Award in recognition for one decade (1985–1995) of motivation, sponsorshipand support in serving communitiesthrough environmental educationand development.
United Kingdom Tutbury factoryreceived a Technology Award fromthe East Midlands Electricity Board for the installation of state-of-the-artelectrical equipment to solve aneffluent disposal problem.
1996
Germany As part of the compe-tition on electrical supply andinnovation sponsored by the GermanElectrical Suppliers Association,Herten factory received an award for the environmentally-friendlyconversion of their CFC refrigerationplant. Hamburg factory received anaward for reducing fresh well waterconsumption through installation of a closed-loop cooling circuit.
Philippines Alabang, Aurora and Cabuyao factories received the Most Environmentally FriendlyEstablishment Award from theLaguna Lake Development Authority(LLDA) in recognition for environ-mental achievements.
Aurora factory received the Greenest Company Award from the Department of Environment and Natural Resources (DENR) inrecognition of its waste minimisationefforts in the factory.
Nestlé Philippines received the Anvil Award of Excellence fromthe Public Relations Society of the Philippines in recognition forcompany efforts in enhancing the environmental awareness of the public.
United Kingdom York factory wonthe President’s Award for Excellenceand the Best Scheme in All Industrial Sectors Awards from the UK Combined Heat and PowerAssociation for achieving savings in CO2 emissions.
USA Nestlé USA received theannual Earth Spirit Award fromFleming Company, Inc. in recogni-tion of outstanding achievement in protecting the environment.
1997
China Shuangcheng factoryreceived two Advanced EnvironmentalProtection Enterprise Awards fromthe Harbin Municipal Governmentand the Shuangcheng MunicipalGovernment in recognition of signifi-cant contributions to environmentalprotection.
Tianjin factory received theOutstanding Environmental Protec-tion Enterprise Award from TianjinEconomic and Technical Develop-ment Area (TEDA) ManagementCommittee in recognition of effortsin environmental protection.
Malaysia Shah Alam factoryreceived the Hibiscus Award fromthe Federation of MalaysianManufacturers, co-sponsored by the Department of Environment,recognising environmental achieve-ments and efforts by private sectorcompanies in Malaysia.
Shah Alam factory received theCleanliness and Landscaping Awardby Shah Alam City Council for itsgood achievements in the area ofindustrial hygiene and landscaping.
Mexico Coatepec factory receivedthe Certificate for Industrial Cleanliness from the Department of Environment, Natural Resourcesand Fishing for environmentalpreventive and protective actions.
Nigeria Nestlé Nigeria won an Environmental PerformanceAward from the Federal Environmen-tal Protection Agency.
Ivory Coast Abidjan factoryreceived the National ExcellenceAward for Least Polluting IndustrialSite from the Ministry of Housingand Environment as part of theNational Competition of Excellence(environment category).
Mexico Toluca and Tamuín factories each received the Certifi-cate for Industrial Cleanliness fromthe Department of Environment,Natural Resources and Fishing forenvironmental preventive andprotective actions.
Philippines Nestlé Philippinesreceived the Mother Nature Awardfrom the Pollution ControlAssociation of the Philippines for its outstanding achievements inenvironmental protection.
Cabuyao factory received theOutstanding Healthy WorkplaceAward – National Champion from the Office of the President for achievements in occupationalhealth and safety.
Cagayan de Oro, Lipa and Pulilanfactories each received a Top 25Healthy Workplace RegionalChampion Award from the Office of the President for achievements inoccupational health and safety.
South Africa Nestlé South Africareceived a Certificate from Trees for Africa acknowledging its supportfor work to improve the physical andaesthetic quality of life and preservethe environment in Southern Africathrough the planting of trees.
Nestlé South Africa received theAchievement Award from PeaceGardens for its exceptional per-formance in the field of corporatepublic concern.
73
Philippines Mandaluyong factoryreceived the Ecowatch ProgramAward (Blue Color Rating) from theDepartment of Environment andNatural Resources (DENR) – NationalCapital Region (NCR), the highestrating given for consistent environ-mental achievements.
Cabuyao factory received the Safetyand Health Institutional Award from the Department of Labor andEmployment in recognition of itsoutstanding programmes for safetyand health, including protection of the work environment.
United Kingdom Dalston factory,accountable for part of a tributary of the River Eden that is on its land,was honoured by designation of thetributary section as a Site of Special Scientific Interest (SSSI) by English Nature. This actionrecognised the factory’s responsiblemanagement of an industrialoperation alongside an importantarea of conservation.
1998
China Shuangcheng, Tianjin andQuindao factories received AdvancedEnvironmental Protection EnterpriseAwards from their respectivemunicipal governments for significantcontributions to environmentalprotection.
Tianjin factory received the Outstanding Environmental Protec-tion Enterprise Award from theTianjin Economic and TechnicalDevelopment Area (TEDA) Manage-ment Committee in recognition forits environmental protection efforts.
USA Alcon received the WasteWater Pre-treatment PartnershipAward from the city of Fort Worth,Texas, Water Department, in recogni-tion of its pollution prevention andwaste water achievements.
The Perrier Group of Americareceived the Friends of the Environ-ment Award from the EnvironmentalFederation of New England incelebration of its innovative achievements in conservation.
1999
China Shuangcheng factoryreceived two Advanced Environmen-tal Protection Enterprise Awardsfrom the Harbin Municipal Government and the ShuangchengMunicipal Government for itssignificant contributions to environmental protection.
Czech Republic Sfinx factoryreceived the Safe Enterprise Awardfrom the Czech Occupational SafetyOffice for its environmental andsafety achievements.
India Samalkha factory receivedthe Haryana State Safety andWelfare Award from the LabourDepartment, Government ofHaryana, an award intended toencourage industries to excel in safety and environmental efforts.
Ivory Coast Yopougon factoryreceived the National ExcellenceAward for Least Polluting IndustrialSite from the President of Ivory Coastas part of the National Competition ofExcellence (environment category).

Jordan Nestlé Jordan Trading Co.received a Certificate of Appreciationfrom the Minister of Water andIrrigation and the Head of theJordanian Environment Co-operationfor efforts in supporting the waterawareness project to conserve themarine environment in Aquaba.
Korea Cheong Ju factory receivedthe Governor of Chung Buk ProvinceCitation from Chung Buk Provincefor outstanding performance inenvironmental preservation.
Mexico Chiapa de Corzo, Lagos deMoreno, Ocotlan and Coatepec fac-tories each received the Certificatefor Industrial Cleanliness from the Department of Environment, Natural Resources and Fishing forpreventive and protective environ-mental actions.
Coatepec factory received theGalardón Antonio Chedaui CaramAward from the Confederation ofChambers, Associations and Council of Enterprises of the State of Veracruz in recognition of itsleadership and competitiveness as anecological company and its environ-mental protection achievements.
New Zealand Nestlé New Zealandreceived the Award for Excellence in Environmentally AcceptablePackaging Systems from the NewZealand Packaging Council forachievements in waste recycling.
Israel Osem-Givol, Osem-Yokneamand Osem-Sderot factories eachreceived Trustee of the EnvironmentAwards from the Ministry of theEnvironment and ManufacturersAssociation of Israel for environmen-tal and safety achievements, includinginvestments in environmentalprojects.
Mexico Tlaxcala, La Piedad, Tolucaand Lagos de Moreno factories eachreceived the Certificate for IndustrialCleanliness from the Department ofEnvironment, Natural Resources andFishing for preventive and protectiveenvironmental actions.
Coatepec factory received theGalardón Antonio Chedaui CaramAward from the Confederation ofChambers, Associations and Councilof Enterprises of the State ofVeracruz in recognition of environ-mental leadership and competitivenessas an ecological company and itsenvironmental protection achievements.
Santa María factory received theNational Programme for NaturallyProtected Areas, 1995–2000 Recognition from the Department ofEnvironment, Natural Resources andFishing in recognition of its collabo-ration with the National Programmefor Protected Natural Areas.
USA Perrier Group of Americareceived the EnvironmentalStewardship Award from the WaterResources Association of Pennsyl-vania in recognition of its achieve-ments in environmental stewardship,community relations and soundwater management.
Environment – Progress Report 2000 List of awards
74
Nigeria Nestlé Nigeria receivedthe National Roll of Honour forEnvironmental Achievement Awardfrom the Federal EnvironmentalProtection Agency for outstandingcontributions toward the promotionof environmental protection andnatural resource conservation.
Philippines Mandaluyong factoryreceived the Dangal ng Pasig Awardfrom Sagip Pasig Movement for itsexemplary environmental initiatives.
Trinidad Valsayn factory receivedthe Prime Minister Trade and Envi-ronmental Award for advancementsmade in waste water treatment.
USA Alcon received the Pre-treatment Partnership Award fromthe city of Fort Worth, Texas, WaterDepartment, in recognition of itsachievements in pollution preventionand waste water treatment.
2000
Canada Scarborough, Carberry,Chesterville, Edmonton, London,Rexdale, Sherbrooke, Toronto andTrenton factories each receivedIndustrial Energy Innovator Awards from the Office of EnergyEfficiency Natural Resources Canadain recognition of their energy-efficiency improvement targets andaction plans.
Czech Republic Marysa factoryreceived the Safe Enterprise Award from Czech OccupationalSafety Office for its environmentaland safety achievements.
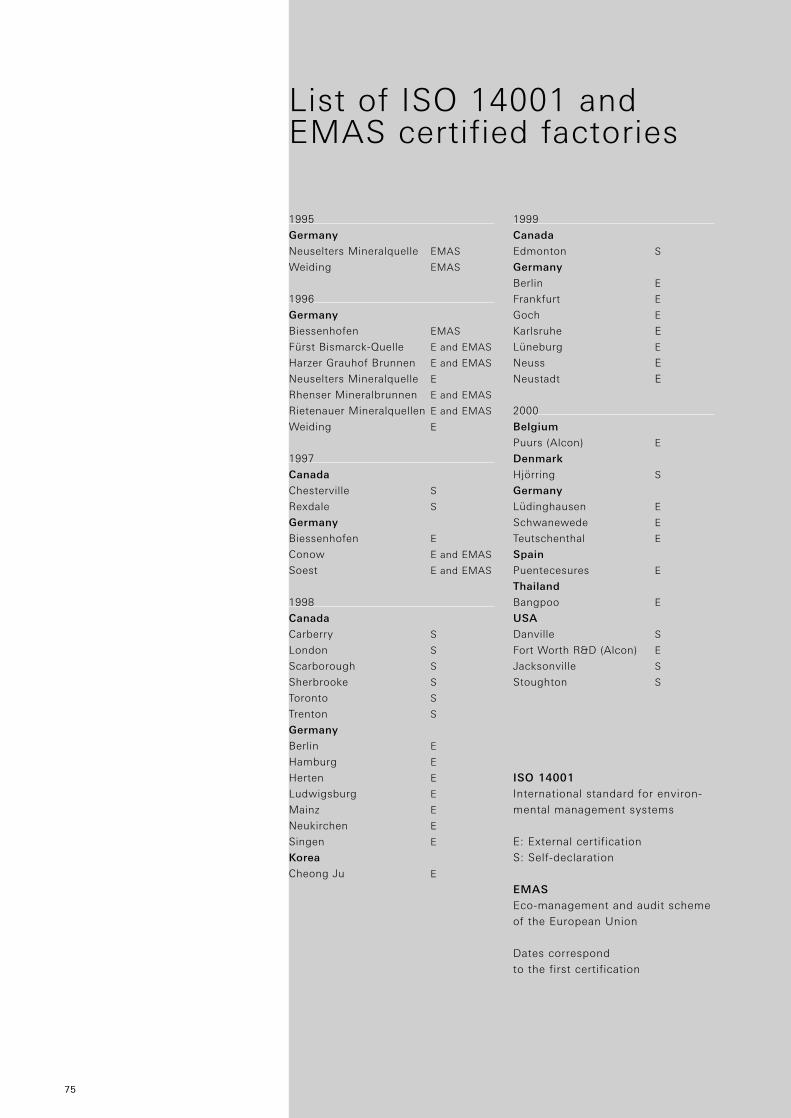
List of ISO 14001 and EMAS certified factories
1995
Germany
Neuselters Mineralquelle EMAS
Weiding EMAS
1996
Germany
Biessenhofen EMAS
Fürst Bismarck-Quelle E and EMAS
Harzer Grauhof Brunnen E and EMAS
Neuselters Mineralquelle E
Rhenser Mineralbrunnen E and EMAS
Rietenauer Mineralquellen E and EMAS
Weiding E
1997
Canada
Chesterville S
Rexdale S
Germany
Biessenhofen E
Conow E and EMAS
Soest E and EMAS
1998
Canada
Carberry S
London S
Scarborough S
Sherbrooke S
Toronto S
Trenton S
Germany
Berlin E
Hamburg E
Herten E
Ludwigsburg E
Mainz E
Neukirchen E
Singen E
Korea
Cheong Ju E
1999
Canada
Edmonton S
Germany
Berlin E
Frankfurt E
Goch E
Karlsruhe E
Lüneburg E
Neuss E
Neustadt E
2000
Belgium
Puurs (Alcon) E
Denmark
Hjörring S
Germany
Lüdinghausen E
Schwanewede E
Teutschenthal E
Spain
Puentecesures E
Thailand
Bangpoo E
USA
Danville S
Fort Worth R&D (Alcon) E
Jacksonville S
Stoughton S
ISO 14001International standard for environ-mental management systems
E: External certificationS: Self-declaration
EMASEco-management and audit scheme of the European Union
Dates correspond to the first certification
75
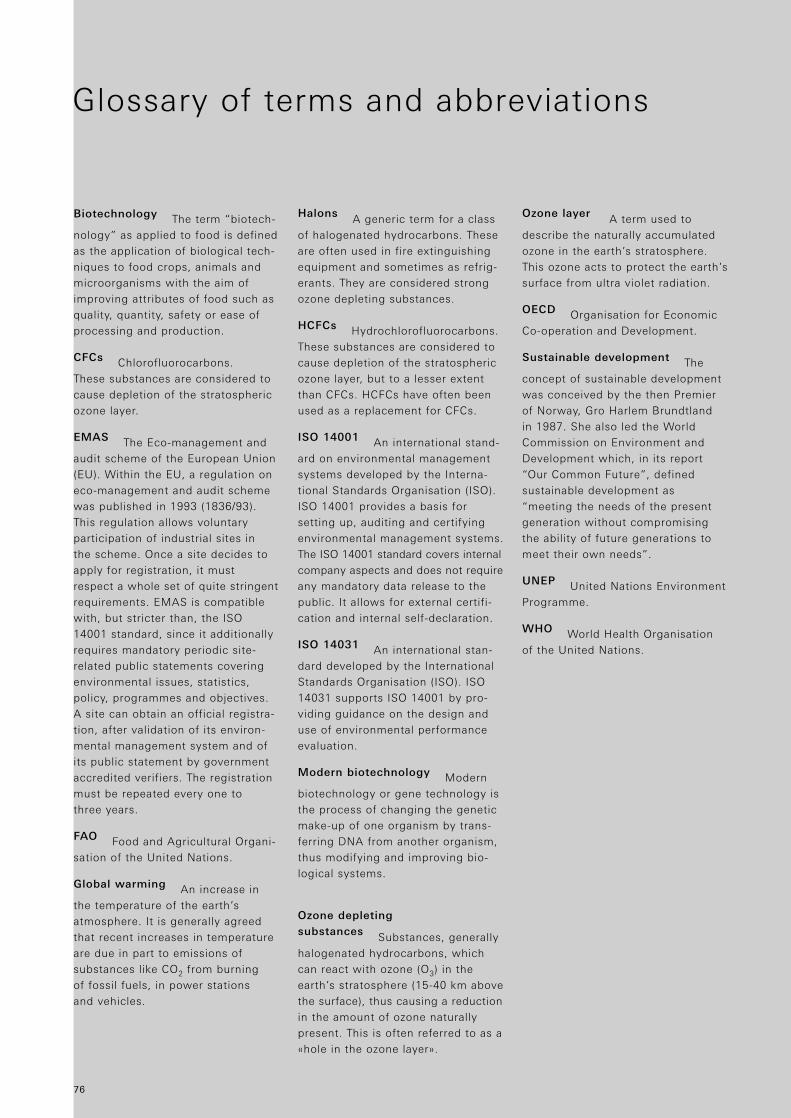
Glossary of terms and abbreviations
Biotechnology The term “biotech-nology” as applied to food is definedas the application of biological tech-niques to food crops, animals andmicroorganisms with the aim ofimproving attributes of food such asquality, quantity, safety or ease ofprocessing and production.
CFCs Chlorofluorocarbons.These substances are considered tocause depletion of the stratosphericozone layer.
EMAS The Eco-management andaudit scheme of the European Union(EU). Within the EU, a regulation oneco-management and audit schemewas published in 1993 (1836/93).This regulation allows voluntaryparticipation of industrial sites in the scheme. Once a site decides toapply for registration, it must respect a whole set of quite stringentrequirements. EMAS is compatiblewith, but stricter than, the ISO14001 standard, since it additionallyrequires mandatory periodic site-related public statements coveringenvironmental issues, statistics,policy, programmes and objectives.A site can obtain an official registra-tion, after validation of its environ-mental management system and ofits public statement by governmentaccredited verifiers. The registrationmust be repeated every one to three years.
FAO Food and Agricultural Organi-sation of the United Nations.
Global warming An increase inthe temperature of the earth’satmosphere. It is generally agreedthat recent increases in temperatureare due in part to emissions ofsubstances like CO2 from burning of fossil fuels, in power stations and vehicles.
Halons A generic term for a classof halogenated hydrocarbons. Theseare often used in fire extinguishingequipment and sometimes as refrig-erants. They are considered strongozone depleting substances.
HCFCs Hydrochlorofluorocarbons.These substances are considered tocause depletion of the stratosphericozone layer, but to a lesser extentthan CFCs. HCFCs have often beenused as a replacement for CFCs.
ISO 14001 An international stand-ard on environmental managementsystems developed by the Interna-tional Standards Organisation (ISO).ISO 14001 provides a basis forsetting up, auditing and certifyingenvironmental management systems.The ISO 14001 standard covers internalcompany aspects and does not requireany mandatory data release to thepublic. It allows for external certifi-cation and internal self-declaration.
ISO 14031 An international stan-dard developed by the InternationalStandards Organisation (ISO). ISO14031 supports ISO 14001 by pro-viding guidance on the design anduse of environmental performanceevaluation.
Modern biotechnology Modernbiotechnology or gene technology isthe process of changing the geneticmake-up of one organism by trans-ferring DNA from another organism,thus modifying and improving bio-logical systems.
Ozone depleting substances Substances, generallyhalogenated hydrocarbons, whichcan react with ozone (O3) in theearth’s stratosphere (15-40 km abovethe surface), thus causing a reductionin the amount of ozone naturallypresent. This is often referred to as a«hole in the ozone layer».
Ozone layer A term used todescribe the naturally accumulatedozone in the earth’s stratosphere.This ozone acts to protect the earth’ssurface from ultra violet radiation.
OECD Organisation for EconomicCo-operation and Development.
Sustainable development Theconcept of sustainable developmentwas conceived by the then Premierof Norway, Gro Harlem Brundtland in 1987. She also led the WorldCommission on Environment andDevelopment which, in its report“Our Common Future”, definedsustainable development as “meeting the needs of the presentgeneration without compromisingthe ability of future generations tomeet their own needs”.
UNEP United Nations EnvironmentProgramme.
WHO World Health Organisationof the United Nations.
76