programming projectile point typologies
TRANSCRIPT
1
Programming Projectile Point Typologies
by Tom Arnold
The purpose of this paper is to describe the development and transformation of a traditionalpaper based projectile point typology to a digital format and to document the pitfalls and insightsthat this exercise revealed. Since the early 1990s I have been interested in creating programsspecifically geared towards archaeology. 1 was influenced by articles written by Latta (1985),Reid (1985), and Keron (1986), to name but a few, and more recently by Mesoudi and O'Brien(2008a and 2008b) who have used computer simulation games to test cultural transmission ofprojectile point technology.
The accumulation of my early 1990s interest was a program that I gave the unimaginative nameof POINTY. It was a projectile point comparison program written in Atari Basic. Why AtariBasic? Well, yes 1admit it, I had an 8-bit Atari computer and then a 16-bit Atari computer.
The program included data taken from the Kewa Projectile Point sheets. You entered measuredvariables from a point and the program compared it to this dataset. The program drew crudeoutlines of your point and the point closest to it in the dataset. The problem I had is that theprojectile point sheets give a limited number of measured trait ranges (e.g., maximum andminimum lengths) along with some mean values, but very little else to statistically compare pointtypes (see discussion below for details on how the comparison is performed in the program).They seldom mention how many points were sampled to get the ranges. In addition, in order todraw an even crudely accurate representation, other variables had to be derived from the existingmeasurements. Further, non-metric variable ranges had to be coded (e.g., some points haveconcave, convex or straight lateral blade edges and some points can be classified as side-notchedor expanding stemmed). This required the creation of additional variables to enable even a crudeoutline drawing and the development of some way to compare points.
This interest in programming was shelved when I returned to school to start my doctorate.Fortunately, I had printed the code every time I corrected a bug in it. For some bizarre reason Jdragged this file to the West Coast and back with me. I still have the Pointy program and used itas the basis of my current program.
After completion of my doctorate, I took up programming again but had to start from thebeginning. A lot had changed in the years since I finished my studies. I switched to a Windowscomputer and programming had shifted to an object oriented approach. Luckily Microsoftprovided a free version of object oriented programming called Visual Basic Express (VB).Microsoft provides an updated version every two to three years. I am currently using VB 2010Express and the most recent version, VB 2012, is out for Windows 8.
Since returning to programming, I became aware that I was not the only researcher who isinterested in transforming traditional typologies for the computer to use as an analytical tool. Forexample, Prindle (2001) developed a MSDOS based program for points for New England(http://www.nativetech.orglstone/pointprogramlindex.php). Schlader et al. (2004) and Lohse et
2
al. (2005), both of the Idaho State University, Informatics Research Institute, have been r=>.
investigating artifact classification based on computerized agents (Artificial Intelligence). Otherregional typology programs may also exist that I am not aware of. This is not the place to go intodetail about these various approaches to programming typologies.
Once I had become acquainted with VB programming I was able to start the process ofreproducing my initial program in an object oriented environment. First, VB creates a separatedata file from information that you enter into a database and then attaches it to the VB program.Visual Basic will accept Microsoft Access but free versions of Microsoft SQL Server 2008 orMicrosoft SQL Server Express 3.5 also work. I first needed to create the basic database of theSouthern Ontario Projectile Points, thus was born the even less imaginatively named ProjectilePoint Database. This task involved taking all the information (both numerical and text) from theKEWA point sheets and transcribing them into a database. After this was complete I could thenbegin coding the VB program to display this data and compare projectile points.
THE PROGRAM
Introduction
This section provides a quickoverview of the program, its layoutand what it does. The various tabsshould be straightforward for mostpeople, even for those with arudimentary understanding ofprojectile point typologies.
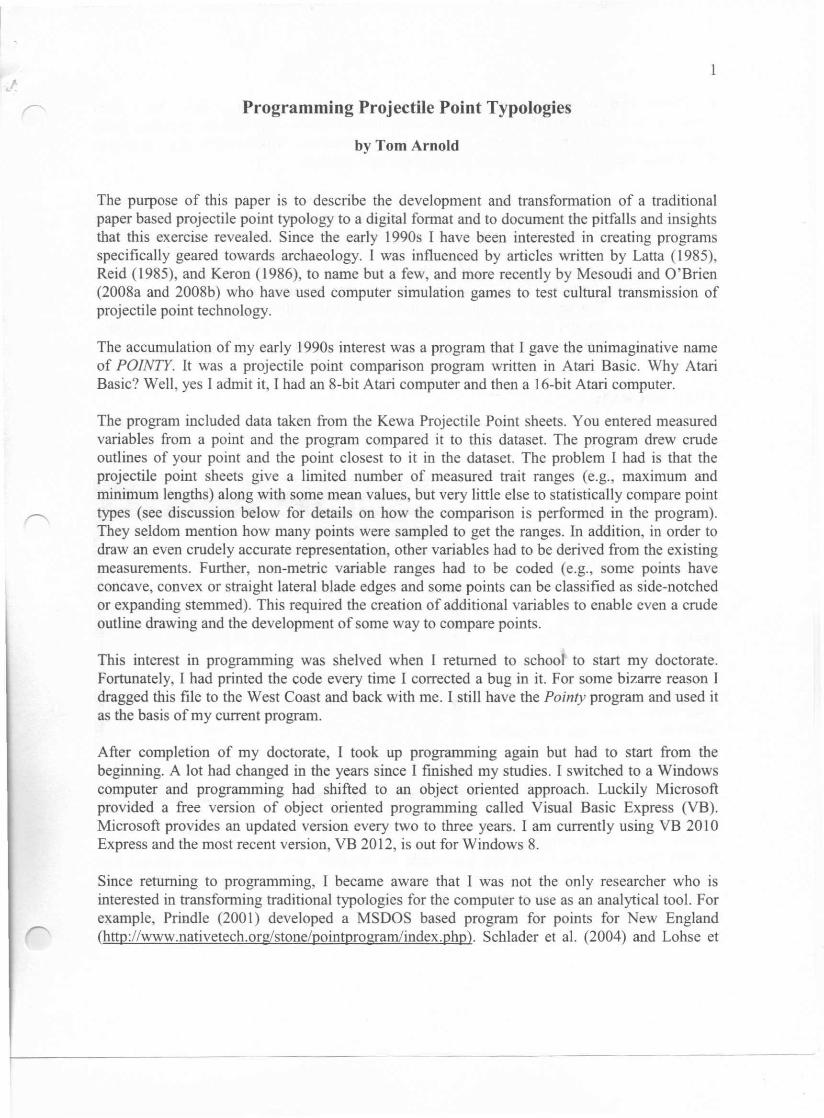
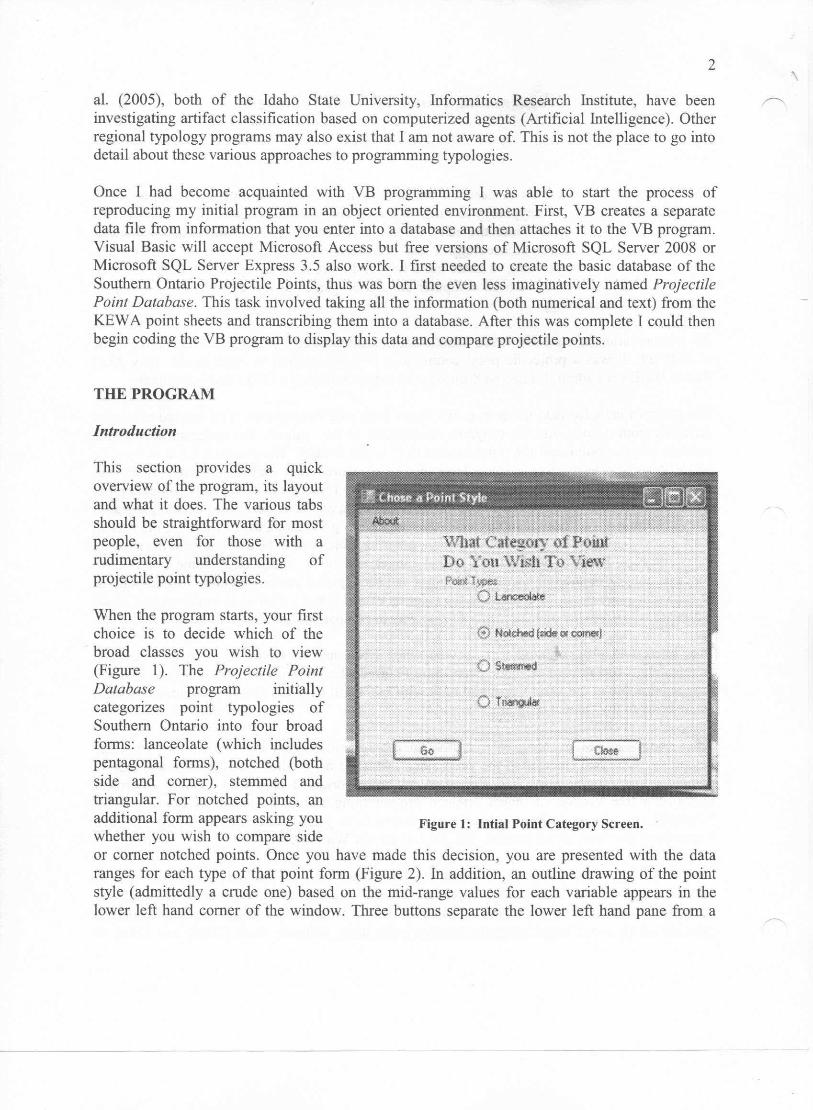
When the program starts, your firstchoice is to decide which of thebroad classes you wish to view(Figure 1). The Projectile PointDatabase program initiallycategorizes point typologies ofSouthern Ontario into four broadforms: lanceolate (which includespentagonal forms), notched (bothside and comer), stemmed andtriangular. For notched points, anadditional form appears asking you Figure 1: Intial Point Category Screen.whether you wish to compare sideor comer notched points. Once you have made this decision, you are presented with the dataranges for each type of that point form (Figure 2). In addition, an outline drawing of the pointstyle (admittedly a crude one) based on the mid-range values for each variable appears in thelower left hand corner of the window. Three buttons separate the lower left hand pane from a
3
blank pane to the right. The three buttons are Close, which closes the point form window;Random, which will be explained below; and Update, which will update the drawing to the leftif you change any of the range values for that point type .
.....WIla! Sljiil of Point"Do You Wisll on, ~'..w
_""'" WodIh Min: ,5 Bess W",,,, MifI.
S_w.dIIlM ee ~ IIo ... W,mh_ 19
TMl<jJ," Hoftlng l«1lI1h ",.,. 7
C'SV.'9h'Ic.Ccneew
!{;El<tloh<liOGSO' .... d
" carn.._
: eo... . I
·..•i~iElL~u~-;:]
C,_KI<!lUI"'"'!60Md On R4ndom~ Gell"_v .......__ ..__ ......•... _-_..... ....__ ..... _ .._ .....__ ....
~<-.' , ..;..,;...... '. >'::'§;.:- ,-; • ;·-:;·.<::L.. <"::;,,,"
Figure 2: Projectile Point Data Screen.
Each point form window should be self-explanatory. There are six tabs for each point type. Thefirst tab, Variables, is the default tab; it gives you the upper and lower limits of each measuredvariable as well as which discrete variables defme each point type. The second tab,Measurement Defrnitions, describes or defmes the measured variables. The remaining threetabs, Mid-Range and Random Values, Manipulate and Compare, require more detailedexplanation.
Mid-Range and Random Tab
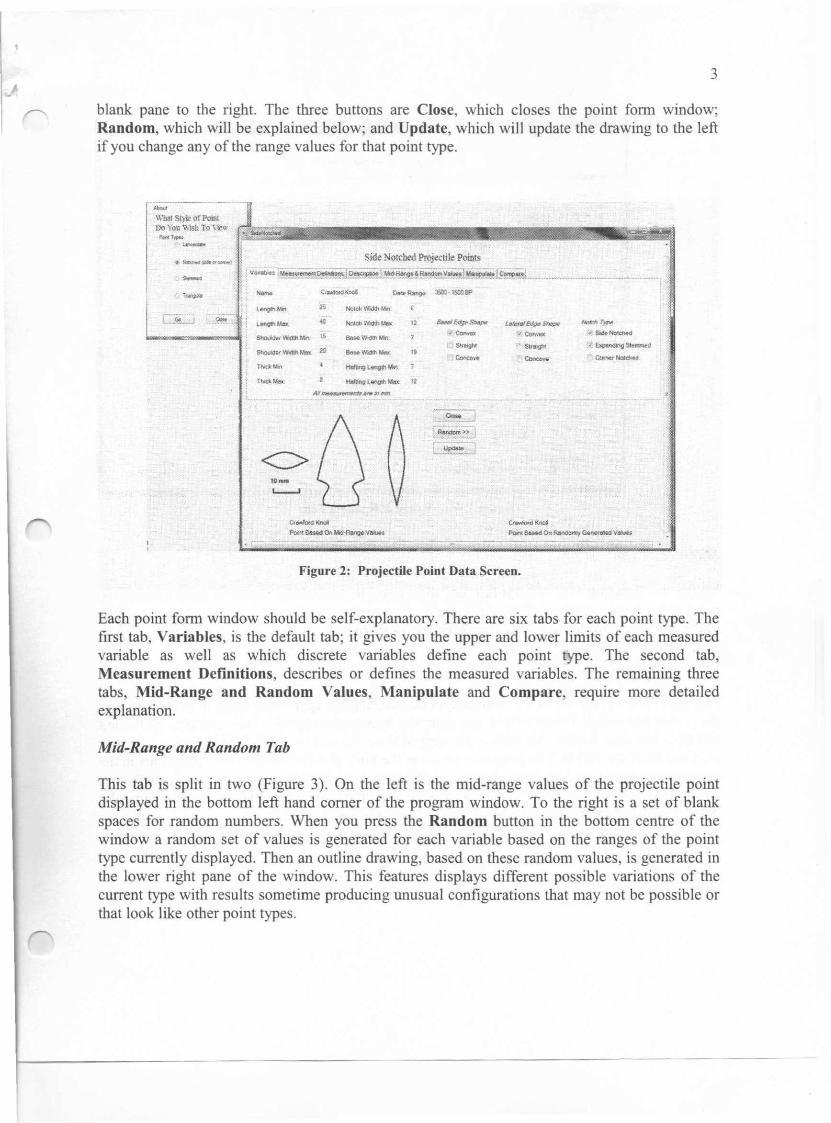
This tab is split in two (Figure 3). On the left is the mid-range values of the projectile pointdisplayed in the bottom left hand comer of the program window. To the right is a set of blankspaces for random numbers. When you press the Random button in the bottom centre of thewindow a random set of values is generated for each variable based on the ranges of the pointtype currently displayed. Then an outline drawing, based on these random values, is generated inthe lower right pane of the window. This features displays different possible variations of thecurrent type with results sometime producing unusual configurations that may not be possible orthat look like other point types.
4
-I-I
""" >
-I:1
.'J
Lanceol'ata ProjedUa f>QlntsJ~:1j'ii:_i3itl1tT~i1"~¥~·.&~~!~t~tL"o.",." ..·."..,.,~..".'m .·•.·...w•. , .••••... , ..•
_~V$"'"
f~"".It~1!<~~ t~",1"1n *"_ pw44P<'u--.m~.1b$ '.Vl.d!Ui~·m.·
T~"'_rn'!;I··__'..m_,.,..~*"" e,
lft·!M'tL-.J
.~ ..~t-.....J
G#IO¢f 1'14144P_~~'Mid~ __
"~i'tut~~~~#~!!W~o/~
Figure 3: Mid-Range & Random Tab.
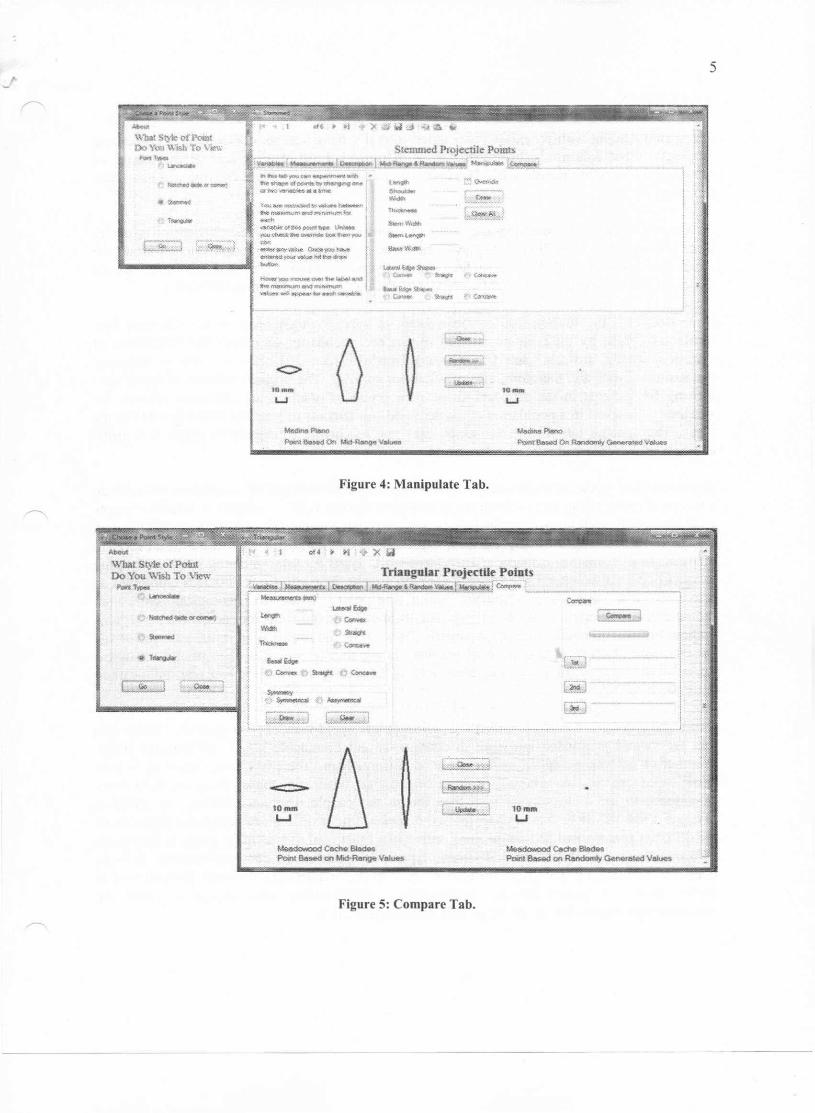
Manipulate Tab
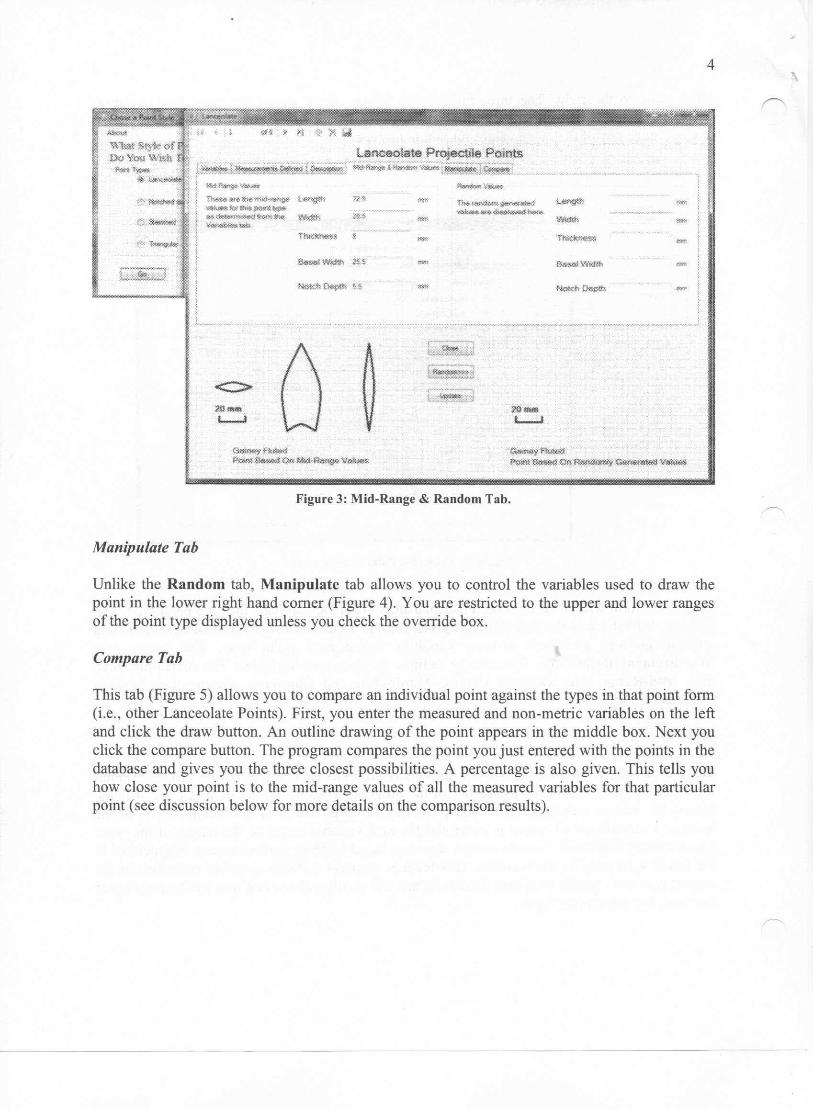
Unlike the Random tab, Manipulate tab allows you to control the variables used to draw thepoint in the lower right hand comer (Figure 4). You are restricted to the upper and lower rangesof the point type displayed unless you check the override box.
Compare Tab
This tab (Figure 5) allows you to compare an individual point against the types in that point form(i.e., other Lanceolate Points). First, you enter the measured and non-metric variables on the leftand click the draw button. An outline drawing of the point appears in the middle box. Next youclick the compare button. The program compares the point you just entered with the points in thedatabase and gives you the three closest possibilities. A percentage is also given. This tells youhow close your point is to the mid-range values of all the measured variables for that particularpoint (see discussion below for more details on the comparison results).
5
-\\ 'hat Sty~ Qf PooItDo Yon 'l\1m To view.....i_.~
1-""""":$.~J~-..............$-~~,,",
~~~t
1j"... W,1III>
'f~~m~~t6~;tNt.t~"i&~'tl~~~"*rwm,m~~tt :~~~t>!iro$~m~ \...~ !=~~~lXW:f'l#1\yoQ I~:~~~W~\It' ~fe¥:IV~,*,,'tI' :=»~~Z:~I'~Mtmodr-aw~QI;~.
111_
L..J
M»lf"'" PItln<>Poml~ 0<\ 'Ji<:HIa,,~.11_
MadIrm~_1low4o"~~ ..",,,,~
Figure 4: Manipulate Tab.
"_tWbat ~1e of PointDo You WISh To VJe\vP..... ,-... ~
&...I_f' ~ HSl'*l# . i c.,_""
Triangular Ptojectile P'Oints,t~,l~!~I~·~~.I~"":;;;;;·L _ _ _. -tMIl
lOmmU
MeedcMloacl C<>Che 6IedI>!lPoinl Bose<! an Mid>Range Villues
TOmmU
MflMowood~ SlsW>sPcinl. 8as4!d on Rarldamly Gene,aled Value1;
Figure 5: Compare Tab.
- ----- ---------------------------------
6
DISCUSSION
A program dealing with projectile point types naturally must lead to a discussion on types andtypology. What follows is by no means a thorough or detailed review or discussion oftypological theory but merely a few brief points that came to mind while creating and using thisprogram.
As we are all taught in undergraduate courses, archaeology borrowed the concept of typologyfrom geology. The type fossil along with the basic principals of stratigraphy (lower strata areolder than higher strata) were used for relative dating of stratigraphic columns, prior to theadvent of radiometric dating techniques (e.g., C 14 dating) (Bray and Trump 1975 :240).
In archaeology, the introduction of the concept of types brought order to the chaos of data(artifacts). Types by their nature attempt to enforce boundaries or reduce the continuum ofvariation among artifacts (see Charlin and Gonzalez-lose 2012:226-227, for a summarydiscussion). Types are, therefore, a form of cluster analysis. The original definers of types werelooking for patterns in the size and shape of a group of points. This clustering reduces thevariability observed in a population of artifacts and sets barriers of size and shape that define thetypes. The opening tab (Figure 1), which asks you to choose a category of point, is a primeexample of this enforced reduction in variation.
Archaeological types are traditionally based on forms and manufacturing techniques and providea means of categorizing and cataloguing. Although criticized as being subjective despite attemptsover the last 30 or 40 years to create objective classes using statistical techniques, it still remainsa basis for archaeological interpretations, explanations and dating, at least at an initial level inmany studies. In cultural resource management work, types are vital to dating sites and helpingto quickly decide whether a site requires additional work. Trigger (1989:382) sees typologies asproviding low level generalizations about the past. When archaeological types areradiometrically dated they may be used to date isolated finds and sites from neighbouring regionswithout the need to obtain further radiometric dates. Although useful as an initial estimate of siteage, the extended use of this form of regional dating transference can obscure archaeologicalexplanations such as diffusion, migration etc. by inhibiting the obtaining of new radiocarbondating assays.
Types and typology, therefore, reflect the philosophical world view of 'Essentialism,' or the ideathat the "world is divided into real, discontinuous and immutable kinds" (Wikepedia 2013).Whether or not you accept the world view of 'Essentialism,' there has been debate as to how'real' types are. It has generally been accepted that types may mean more or have moreimportance to the archaeologist than they did to the people who manufactured the artifacts(Trigger 1989:382-383). Yet, archaeologists, it seems, find it difficult to accept the idea that allthe different forms noted had no meaning, either in a functional or a stylistic sense, to the peoplewho made and used them, especially those types that appear to be contemporaneous. It is thequestions surrounding why these difference occur in the archaeological record that can lead tohigher levels of generalizations, explanations, interpretations and inferences about thearchaeological record that go far beyond the lowly artifact type.
7J
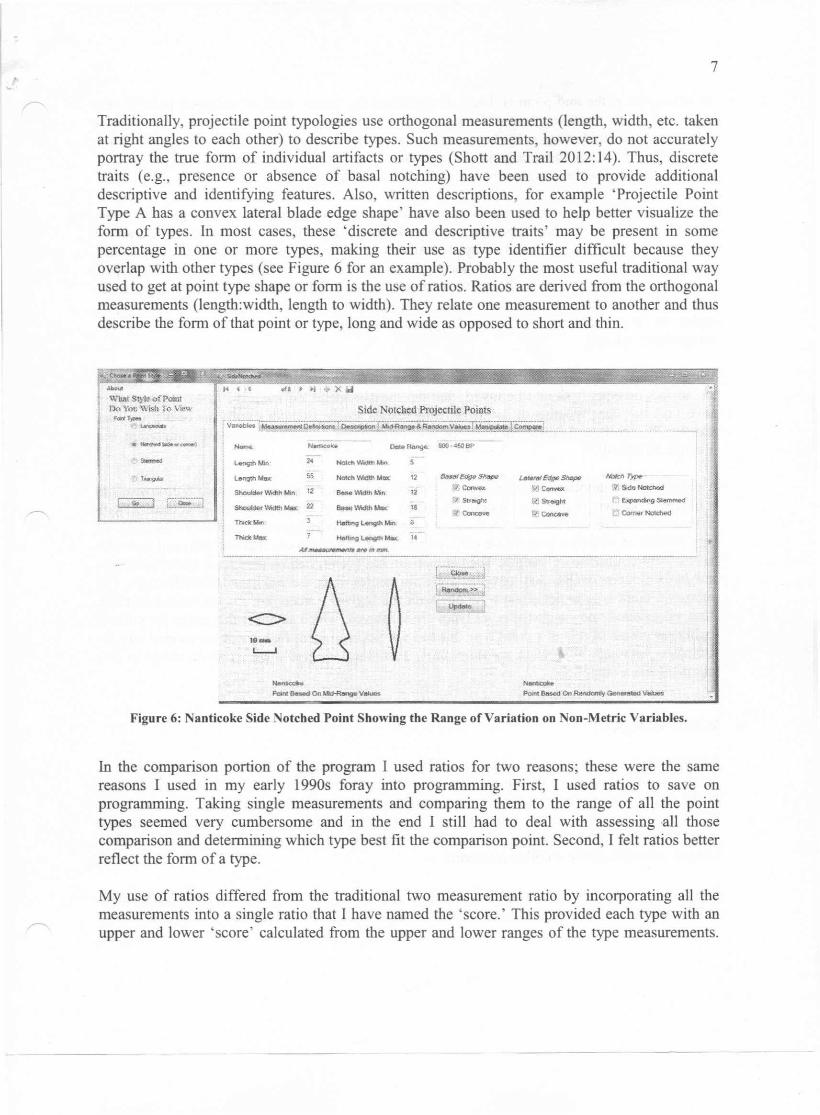
Traditionally, projectile point typologies use orthogonal measurements (length, width, etc. takenat right angles to each other) to describe types. Such measurements, however, do not accuratelyportray the true form of individual artifacts or types (Shott and Trail 2012: 14). Thus, discretetraits (e.g., presence or absence of basal notching) have been used to provide additionaldescriptive and identifying features. Also, written descriptions, for example 'Projectile PointType A has a convex lateral blade edge shape' have also been used to help better visualize theform of types. In most cases, these 'discrete and descriptive traits' may be present in somepercentage in one or more types, making their use as type identifier difficult because theyoverlap with other types (see Figure 6 for an example). Probably the most useful traditional wayused to get at point type shape or form is the use of ratios. Ratios are derived from the orthogonalmeasurements (length:width, length to width). They relate one measurement to another and thusdescribe the form of that point or type, long and wide as opposed to short and thin.
_ ..Wbal $tl:'k ofPclnt})o'Yoil Wi,<;jl To y-mwF...,T ....~~~
Side Notched PrQjectile Points!'V;;~;bi;,~';~~~'p.~~;;~:Ii~~~§~~Y~I~~J~ii;;:
f;'::~ ~nd:lng Slammed
;~; COme, NOrehed
2~ _Wodtt>M", S
55, NotchWodthMm< 12 _t:®~S!l!>/J<> Ltlt"''''£d!J''sr~
Shovi.tmrWJdtt'lMin. ii' ~WidthMin. 12 &.1C"""".fri' St'~igh'.,.':{.'Conmve
!qj 'ConVEX
L?; st'OlgM:
P'eooca eeThicicMrn Htstbog Length ""'" a
.... f1i.Q Laogt~ Male ,.
[;;:~~j,#jM~;Zi'JL~~,"",J
,,_.""""ea_ On,R~Go<I_ Volues
Figure 6: Nanticoke Side Notched Point Showing the Range of Vartatlon on Non-Metric Variables.
In the comparison portion of the program I used ratios for two reasons; these were the samereasons I used in my early 1990s foray into programming. First, I used ratios to save onprogramming. Taking single measurements and comparing them to the range of all the pointtypes seemed very cumbersome and in the end I still had to deal with assessing ·all thosecomparison and determining which type best fit the comparison point. Second, I felt ratios betterreflect the form of a type.
My use of ratios differed from the traditional two measurement ratio by incorporating all themeasurements into a single ratio that I have named the 'score.' This provided each type with anupper and lower 'score' calculated from the upper and lower ranges of the type measurements.
8
As noted above, the mid-point is then calculated and the 'score' from an unknown point is then ~compared to this mid-point 'score' for each type. A percentage difference from the mid-point isthen calculated (mid-point = 100% and upper and lower score = 0%). The point type with theleast difference from the mid-point is considered to be the most likely point type for theunknown point. The three highest percentage types are displayed.
My reasoning behind this approach is an extension of the ratio assumption that a pair of artifactmeasurements has a relationship to each other. By using all the measurements to create a ratio Iassume that all measurements of complete artifacts are in some way related, or else the artifactwould not exist. The score range for each type is also different from the range of other types.This should be no great revelation to anyone. These 'score' numbers are extremely smallfractions and are hard to interpret by the human brain (I know I tried), unlike the simplertraditional two measurement ratios. Computers, however, can make the calculations andcomparisons quickly.
Therefore, a ratio that incorporates all the measurements should best reflect the shape or form ofthe artifact or type. It should be noted, that the measurements do not have to be orthogonal tohave a relationship. Whether or not these relationships are statistically significant or that they arestatistically significantly different from those of other types is also not necessarily important, butit would be useful.
Although the assumptions surrounding the 'score' have not been proven, using the program tocompare unknown points has produced results that show three different possibilities withdifferent percentages. If the approach was not working, I would have expected more instances ofvery similar or identical percentage differences. So it would appear that the different types dohave different ratio 'score' ranges. The comparison has been tested on published identified pointsand has produced results that agree to a certain degree with the published identification. Thepublished point type is not always the one with the highest percent but maybe second or third.Also, occasionally no suggested point types are displayed, which suggests that either the point ishighly reworked, or it is of a point type that has not yet been identified or not yet entered into thedatabase. Although somewhat circumstantial, this does suggest there is some merit to thisapproach and assumption.
WHA T IS NEXT?
I think with the increase sophistication of 2D and 3D scanning it will become easier to scan inpoints and use their form to compare them to others (for example, see Buchanan and Collard2010; Drydan 2001). In some ways my program and those of Prindle (2001), Schlader et al.(2004) and Lohse et al. (2005) bridge the gap between the traditional use of typologies and whatmay come in the future. Finally, I am currently planning on re-creating the program in Java tomake it more accessible on other platforms.
I must admit that in the back of my mind, when I first conceived my first point typology programin the early 1990s, was this idea of a band held device, a fa Star Trek, that one could use to scan
9
in a point in the field and confirm immediately its type. With today's smartphone technology thehardware is here, or nearly so. All that is needed is the application to make this possible. Thesoftware for identifying form is also here (see Rolf 2008; Rolf and Slice 1990). What is needed isthe database of typology point forms and the programming to connect these three into a usefulfield application.
Acknowledgements: I would like to acknowledge the help of Barb Johnson and BethanyFindlay who have both used and provided feedback on the program, including pointing out someof the bugs.
REFERENCES CITED
Bray, Warrick and David Trump1975 The Penguin Dictionary of Archaeology. Penguin Books, Hammondsworth, England,
reprinted 1975.
Buchanan, Briggs and Mark Collard2010 A Geometric Morphometries-Based Assessment of Blade Shape Differences Among
Paleoindian Projectile Point Types from Western North America. Journal ofArchaeological Science 37: 350-359.
Charlin, J. and Gonzalez-Jose, R.2012 Size and shape variation in Late Holocene projectile points of southern Patagonia. A
geometric morphometric study. American Antiquity 77: 221-242.
Drydan, Ian L.2001 Statistical shape analysis in Archaeology. This article is a summary of a presentation at
the workshop 'Spatial Statistics in Archaeology' held at the University of Chieti, Italy,July, 2000.http://www.faculty. biol. ttu.edu/strauss/morphometrics/readings/dryden200 l.pdf accessedSept. 19,2013
Keron, James1986 CSPMAP: A Surface Distribution Plot Program or the Lazy Archaeologist: Why Draw up
a Map When a Machine Will do it for You? Kewa 86(1):3-10.
Kenyon, Ian1985 The Walls That Wouldn't Be Straight. Kewa 85(1):11-12.
Latta, M.A.1985 Two Easy Pieces for the Microcomputer. Kewa 85(1):2-5.
------
10
Lohse, E.S, C. Schou, R. Schlader and D. Sammons r>.2005 Detailed Automated Comparisons of Distinctive Projectile Point Type Sequences of
Northern Intermountain West. Paper presented at the 63rd Plains Conference, Edmonton,Alberta.http://iri. isu. edu/AIRC%2 OResearch%20Documents/Points%20Docs%20documents/IRI%20websitelPlains%2005rev.ppt, access July 2ih, 2010.
Mesoudi, Alex and Michael J. 0'Brien2008a Cultural Transmission of Great Basin Projectile-Point Technology I: An Agent-Based
Computer Simulation. American Antiquity 73:3-28.2008b Cultural Transmission of Great Basin Projectile-Point Technology II: An Agent-Based
Computer Simulation. American Antiquity 73:627-644.
Prindle, Tara2001 Point: Projectile Point Classification Program.
http://www.nativetech.org/stone/pointprogramlindex.php, accessed July 27th 2010.
Reid, Peter1985 You, Your Microcomputer, and Basic Decay. Kewa 85(1):5-10.
Rolf, James F and Dennis E. Slice1990 Extensions of Proscrustes Method for Optimal Superimposition of Landmarks.
Systematic Zoology 39:40-59. ~-c-,
Rolf, James F.2008 TPSDig version 2.12. Department of Ecology and Evolution. State University, Stoney
Brook, New York.
Schlader, R, E.S. Lohse, C. Schou and A. Strickland2004 SIGGI-AACS, a Prototype for Archaeological Artifact Classification using Computerized
Agents, access July 26,2010, http://iri.isu.edulAACSDocuments/SchladerCAA2004.doc
Shott, Michael J and Brian W. Trail2012 New Developments in Lithic Analysis: Laser Scanning and Digitial Modeling. The SAA
Archaeological Record 12(3): 12- 18.
Trigger, Bruce G.1989 A Hstory of Archaeological Thought. Cambridge University Press, Cambridge.
Wikepedia2013 Typology (archaeology), http://en.wikipedia.orglwikilTypology (archaeology), accessed
August 26, 2013.