processing mechanics of alternate twist ply (atp) yarn
TRANSCRIPT
Processing Mechanics of Alternate Twist Ply (ATP) Yarn Technology
A Thesis
Submitted to the Faculty
of
Drexel University
by
Donia Said Elkhamy
in partial fulfillment of the
requirements for the degree
of
Doctor of Philosophy
September 2007

© Copyright 2007
Donia S. Elkhamy. All Rights Reserved.

ii
DEDICATIONS
First and last of all, I dedicate this Ph.D. thesis to Almighty ALLAH SWT for
giving me the strength to finish this thesis and for all his blessings to me.
Secondly, I dedicate this work to my parents Prof. Said Elkhamy and Eng.Sannaa
Seif Eldin for their love, support, for encouraging me to go to my limits and to achieve my
goals. You’ve sacrificed a lot to see me get to where I am today and for that I’ll be forever
grateful.
I also dedicate this Ph.D. thesis to my husband, Maged Ghanem, MD, for his
support, motivation and encouragement throughout my doctorate graduate studies. I dedicate
it to my two beautiful daughters, Mariam and Noor, for their patience and consideration.
I’d also like to thank my brother Dr. Mostafa Elkhamy, my sisters, Eng.Rasha
Elkhamy and Acct. Rehab Elkhamy, and my mother in-law Hadia Emara for their continuous
support and assistance.
iii
ACKNOWLEDGEMENTS
The list of those that I would like to acknowledge seems to be endless; however
there are those who provided support, without which this PhD thesis would not have been
possible:
First and foremost, I would like to thank my advisor and mentor, Prof. Frank Ko for
his patience, support, and excellent guidance through my graduate studies, research, and
thesis work, and I’m grateful to him for providing me with the opportunity of joining his
research group. Without his support, not only as my advisor but also as a considerate parent,
I would not have been able to complete my studies.
Special thanks to my committee members Dr. Christopher Li, Dr. Frank Ko,
Dr.Martin Jacobs, Dr. Peter Popper and Dr. Wei Sun for their guidance, advice and support.
Their input has been enriching and has added great value to my thesis
I am greatly indebted to Dr. Peter Popper and Paul Yngve for introducing me to the
ATP yarn technology, for their great assistance in upgrading the Drexel ATP machine and
for the numerous advice and valuable suggestions and ideas given. It is their continuous
everyday support that has made this thesis a reality.
Many thanks to DuPont Inc., especially Michael Blaustein, for their support of the
research work and to Belmont Textile Machinery Inc. in their kind support of some of the
machine equipment used for this research work.
I would also like to thank all the professors that I have taken courses with them and shared
their professional knowledge with me. In addition, I thank all my graduate student colleagues
for their research input, support and assistance.
iv
TABLE OF CONTENTS
LIST OF TABLES ..................................................................................................... x
LIST OF FIGURES................................................................................................... xi
ABTSRACT............................................................................................................ xix
CHAPTER 1: INTRODUCTION .............................................................................. 1
CHAPTER 2: BACKGROUND AND LITERATURE REVIEW ............................ 5
2.1 Ply Yarn and Its Applications................................................................. 5
2.1.1 Ply Yarn Application in Carpets ................................................ 6
2.2 Development of Ply Twisting Processes................................................ 8
2.2.1 Conventional Two Stage Ply Twisting Process ...................... 10
2.2.2 Two for One Twister .............................................................. 11
2.2.3 Yarn Cabling Process .............................................................. 12
2.2.4 Alternate Twist Ply Process .................................................... 14
2.2.4.1 Basics of the ATP Process ....................................... 15
2.2.4.2 Modeling of the ATP Process .................................. 19
2.2.5 Sirospun Process ..................................................................... 25
2.3 Commercial Alternate Twist Ply Processes ........................................... 28
2.3.1 Repco ATP Process................................................................. 28
2.3.2 Gilbos Air Twist Process ......................................................... 29
2.3.3 Belmont Roto-Twist Process ................................................... 30
2.3.4 DuPont ATP Process................................................................ 33
v
CHAPTER 3: OBJECTIVES.................................................................................. 38
3.1 Production of ATP yarn on the Drexel ATP process............................... 39
3.2 Characterization of the ATP yarn ........................................................... 39
3.3 Process Optimization and Prediction of the Yarn Twist Profile ............. 39
3.4 Process Optimization and Prediction of the Yarn Twist Efficiency ....... 41
3.4.1 Effect of Process Variables on the Yarn Twist Efficiency ....... 41
3.4.2 Empirical Modeling of the Yarn Twist Efficiency................... 41
3.4.3 Equilibrium Analysis and Static Modeling of the ATP Process at the Convergence Point .................................................... 42
3.4.4 Mathematical Modeling of the ATP yarn Twist Efficiency..... 42
CHAPTER 4: MATERIAL AND METHODS........................................................ 43
4.1 Introduction ............................................................................................ 43
4.2 Upgrading of the Drexel ATP Process.................................................... 43
4.3 Production of ATP yarn .......................................................................... 50
4.4 Characterization Methods ...................................................................... 51
4.4.1 Twist Profile Measurement ..................................................... 51
4.4.2 Twist Efficiency Measurement................................................ 53
4.5 Process Optimization of the Yarn Twist Profile ..................................... 55
4.6 Process Optimization of the Yarn Twist Efficiency................................ 55
4.6.1 Effect of Process Variables on the Yarn Twist Efficiency ....... 55
4.6.2 Empirical Modeling of the Yarn Twist Efficiency................... 56
4.6.3 Design and Construction of the Static Tester to Model the ATP Process at the Point of Self Ply ................................................ 57
vi
CHAPTER 5: PROCESS OPTIMIZATION AND PREDICTION OF THE YARN TWIST PROFILE ........................................................................................ 63
5.1 Background and Significance................................................................. 63
5.2 Materials and Methods .......................................................................... 65
5.3 Mathematical Modeling and Simulation of the Yarn Twist Profile ...... 66
5.4 Experimental Verification and Results .................................................. 71
5.4.1 Effect of Velocity Profile on Twist Profile ............................. 71
5.4.2 Effect of Machine Zone Lengths on Twist Profile.................. 79
5.4.3 Coordination of the Velocity, Rotation and Bonding Profiles on the Drexel ATP Process................................................. 80
5.5 Discussion .............................................................................................. 82
CHAPTER 6: PROCESS OPTIMIZATION OF THE YARN TWIST EFFICIENCY........................................................................................................... 83
6.1 Background and Significance ................................................................ 83
6.2 Materials and Machine Setup................................................................. 85
6.3 Results .................................................................................................... 86
6.3.1 Effect of Main Jet Pressure on Twist Efficiency .................... 86
6.3.2 Effect of Yarn Tension on Twist Efficiency .......................... 88
6.3.3 Effect of Helper Jet Direction and Pressure on Twist Efficiency ......................................................................................... 90 6.3.4 Effect of Heat on Twist Efficiency ......................................... 95
6.4 Discussion .............................................................................................. 98
CHAPTER 7: EMPIRICAL MODELING OF THE YARN TWIST EFFICIENCY USING RESPONSE SURFACE METHODOLOGY.................... 100
7.1 Background and Significance .............................................................. 100
7.1.1 Response surface methodology (RSM) ................................ 101
vii
7.2 Materials and methods ........................................................................ 103
7.2.1 Materials and Machine Setup................................................ 103
7.2.2 Experimental design.............................................................. 104
7.3 Results .................................................................................................. 106
7.3.1 Response function ................................................................. 106
7.3.2 Response Surfaces of Yarn Twist Efficiency as a function of the Main Process Factors ........................................................... 109
7.3.2.1 Effect of Main Torque Jet and Singles Yarn Tension on Twist Efficiency ............................................. 109 7.3.2.2 Effect of Helper Jet on Twist Efficiency................ 110
7.3.2.3 Effect of Heat on Twist Efficiency ....................... 113
7.3.2.4 Optimum processing window for High Twist Efficiency ATP yarns ......................................................... 114
7.4 Discussion ............................................................................................ 114
CHAPETER 8: EQULIBRIUM ANALYSIS AND STATIC MODELING OF THE ATP PROCESS AT THE CONVERGENCE POINT .................................... 116
8.1 Background and Significance .............................................................. 116
8.2 Materials and Methods ......................................................................... 118
8.3 Equilibrium Analysis of the ATP Process at the Point of Self Ply ....... 119
8.3.1 Effect of Yarn Convergence Angle on Singles Yarn Torque . 127
8.4 Results of Static Modeling using Rubber Monofilament Yarn............ 128
8.4.1 Validation of Static Tester Results with Previous ATP Models.............................................................................................129 8.4.2 Effect of Ply Torque on Twist Efficiency ............................ 131
8.4.3 Effect of Yarn Convergence Angle on Twist Efficiency ...... 132
8.5 Results of Static Modeling using Nylon Multifilament Yarn .............. 136
viii
8.5.1 Validation of Static Tester Results with Drexel ATP Process Results............................................................................... 136 8.5.2 Effect of Yarn Tension on Twist Efficiency ......................... 138
8.5.3 Effect of Ply Torque on Twist Efficiency ........................... 139
8.5.4 Effect of Yarn Convergence Angle on Twist Efficiency ...... 140
8.6 Effect of Yarn Convergence Angle on Twist Efficiency on the Drexel ATP Process ................................................................................... 146
8.6.1 Redesign of the Singles Jets on the Drexel ATP Machine ... 146
8.6.2 Material and Machine Setup ................................................. 148
8.6.3 Experimental Results on the Drexel ATP Process ................ 149
8.7 Discussion ............................................................................................ 150
CHAPTER 9: MATHEMATICAL MODELING OF THE YARN TWIST EFFICIECNY......................................................................................................... 152
9.1 Background and Significance............................................................... 152
9.2 Materials and Methods ......................................................................... 153
9.3 Monofilament Rubber Model of the Yarn Twist Efficiency................. 153
9.3.1 Singles Yarn Torque .............................................................. 154
9.3.2 Equations of Equilibrium at the Self Ply Point ..................... 155
9.3.3 Strain Energy of the Singles Yarns........................................ 156
9.3.4 Strain Energy of the Ply Yarn................................................ 158
9.4 Experimental Verification and Results ................................................ 163
9.4.1 Model Verification with Previous ATP Model and Static Tester Data ..................................................................................... 163 9.4.2 Effect of Applying a Ply Yarn Torque on Ply Yarn Twist ... 166
9.4.3 Effect of Singles Yarn Twist on the Singles Yarn Strain Energy.................................................................................. 168
ix
9.4.4 Effect of Ply Helix Angle on the ATP Yarn Strain Energy .. 169
9.4.5 Effect of Singles Yarn Twist on Yarn Tension .................... 170
9.4.6 Effect of Singles Yarn Twist on Twist Efficiency ............... 171
9.4.7 Effect of Yarn Convergence Angle on Twist Efficiency ...... 172
9.5 Discussion ............................................................................................ 174
CHAPTER 10: CONCLUSIONS .......................................................................... 175
10.1 Future Work and Recommendations.................................................. 180
LIST OF REFERENCES ....................................................................................... 182
APPENDIX A: DUPONT ATP PROCESS PATENTS FILED 1989-1998 ........... 185 APPENDIX B: EQUIPMENT MANUAL AND OPERATIONAL PROCEDURE FOR THE DREXEL ALTERNATE TWIST PLY MACHINE...... 186 APPENDIX C: VISUAL BASIC PROGRAM FOR COMPUTER CONTROL OF THE DREXEL ALTERNATE TWIST PLY MACHINE ................................. 204 APPENDIX D: MEASUREMENT OF THE YARN TORSIONAL RIGIDITY AND THE HELPER JET TORQUE .................................................. 231 APPENDIX E: CALIBRATION OF THE ELASTIC YARN TORQUE TRANSDUCER ..................................................................................................... 232 APPENDIX F: MATHEMATICAL SIMULATION OF YARN TWIST PROFILE............................................................................................................... 234 APPENDIX G: OPTIMUM VELOCITY, ROTATION AND BONDING PROFILES FOR A SQUARE WAVE TWIST PROFILE ................................... 237 APPENDIX H: EFFECT OF ATP YARN TWIST EFFICIENCY ON BULK ...... 240
APPENDIX I: LIST OF SYMBOLS ..................................................................... 242
APPENDIX J: LIST OF DIMENSIONLESS VARIABLES ................................. 243
VITA ...................................................................................................................... 244
x
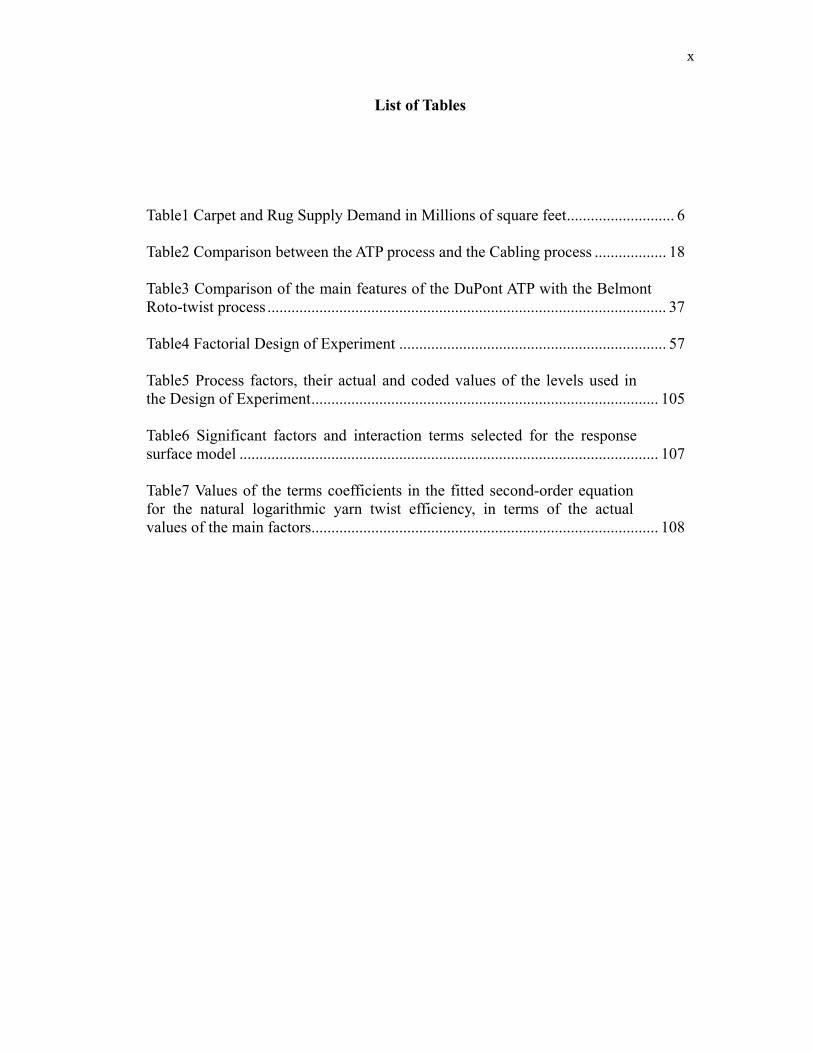
List of Tables
Table1 Carpet and Rug Supply Demand in Millions of square feet........................... 6
Table2 Comparison between the ATP process and the Cabling process .................. 18
Table3 Comparison of the main features of the DuPont ATP with the Belmont Roto-twist process .................................................................................................... 37 Table4 Factorial Design of Experiment ................................................................... 57
Table5 Process factors, their actual and coded values of the levels used in the Design of Experiment....................................................................................... 105 Table6 Significant factors and interaction terms selected for the response surface model ......................................................................................................... 107 Table7 Values of the terms coefficients in the fitted second-order equation for the natural logarithmic yarn twist efficiency, in terms of the actual values of the main factors....................................................................................... 108
xi
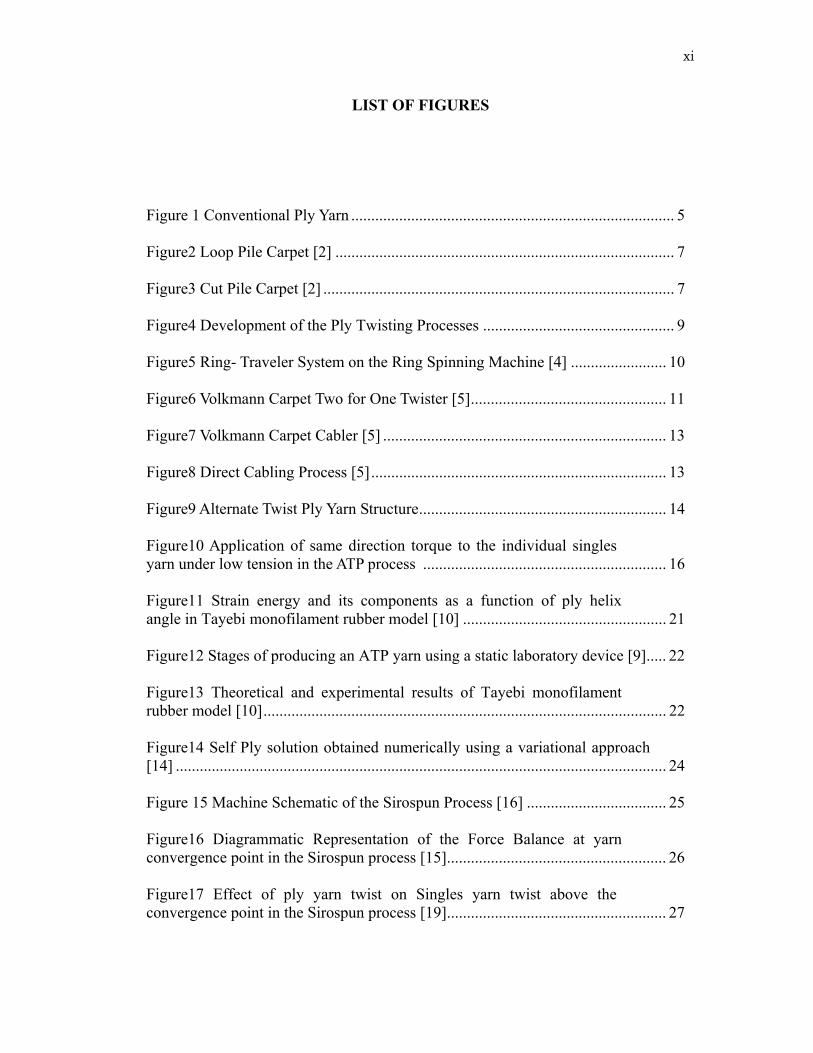
LIST OF FIGURES
Figure 1 Conventional Ply Yarn ................................................................................. 5
Figure2 Loop Pile Carpet [2] ..................................................................................... 7
Figure3 Cut Pile Carpet [2] ........................................................................................ 7
Figure4 Development of the Ply Twisting Processes ................................................ 9
Figure5 Ring- Traveler System on the Ring Spinning Machine [4] ........................ 10
Figure6 Volkmann Carpet Two for One Twister [5]................................................. 11
Figure7 Volkmann Carpet Cabler [5] ....................................................................... 13
Figure8 Direct Cabling Process [5].......................................................................... 13
Figure9 Alternate Twist Ply Yarn Structure.............................................................. 14
Figure10 Application of same direction torque to the individual singles yarn under low tension in the ATP process ............................................................. 16 Figure11 Strain energy and its components as a function of ply helix angle in Tayebi monofilament rubber model [10] ................................................... 21 Figure12 Stages of producing an ATP yarn using a static laboratory device [9]..... 22
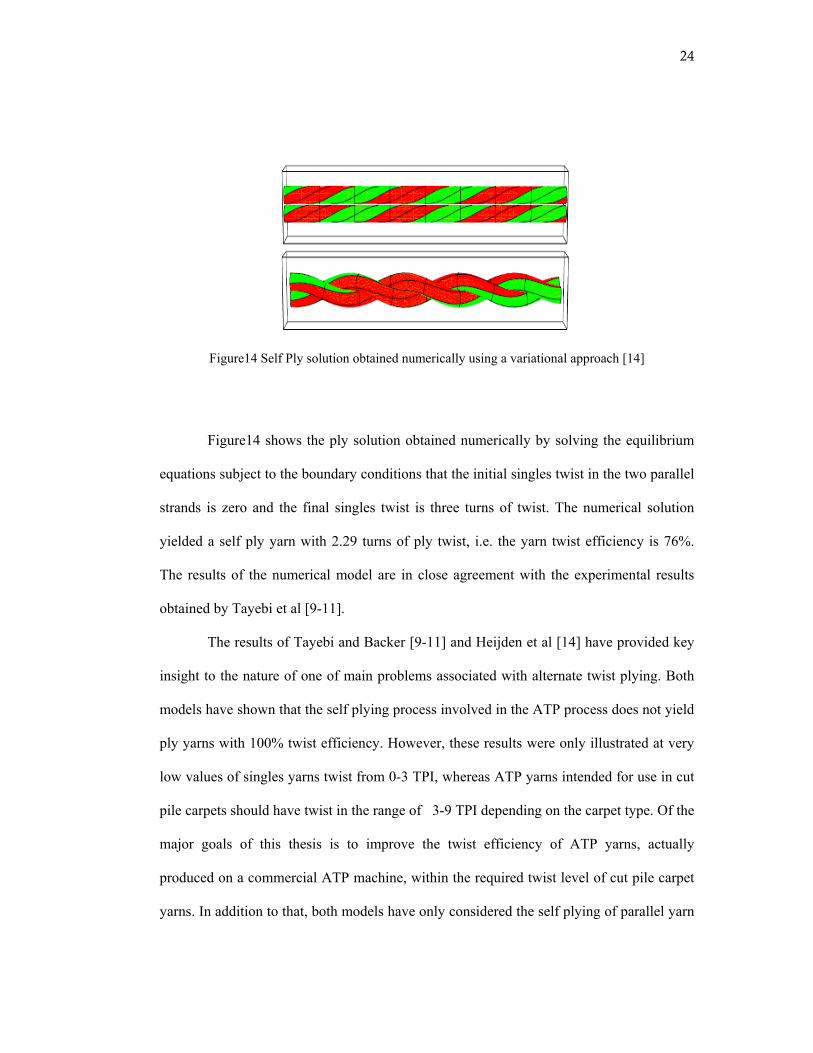
Figure13 Theoretical and experimental results of Tayebi monofilament rubber model [10]..................................................................................................... 22 Figure14 Self Ply solution obtained numerically using a variational approach [14] ........................................................................................................................... 24 Figure 15 Machine Schematic of the Sirospun Process [16] ................................... 25
Figure16 Diagrammatic Representation of the Force Balance at yarn convergence point in the Sirospun process [15]....................................................... 26 Figure17 Effect of ply yarn twist on Singles yarn twist above the convergence point in the Sirospun process [19]....................................................... 27
xii
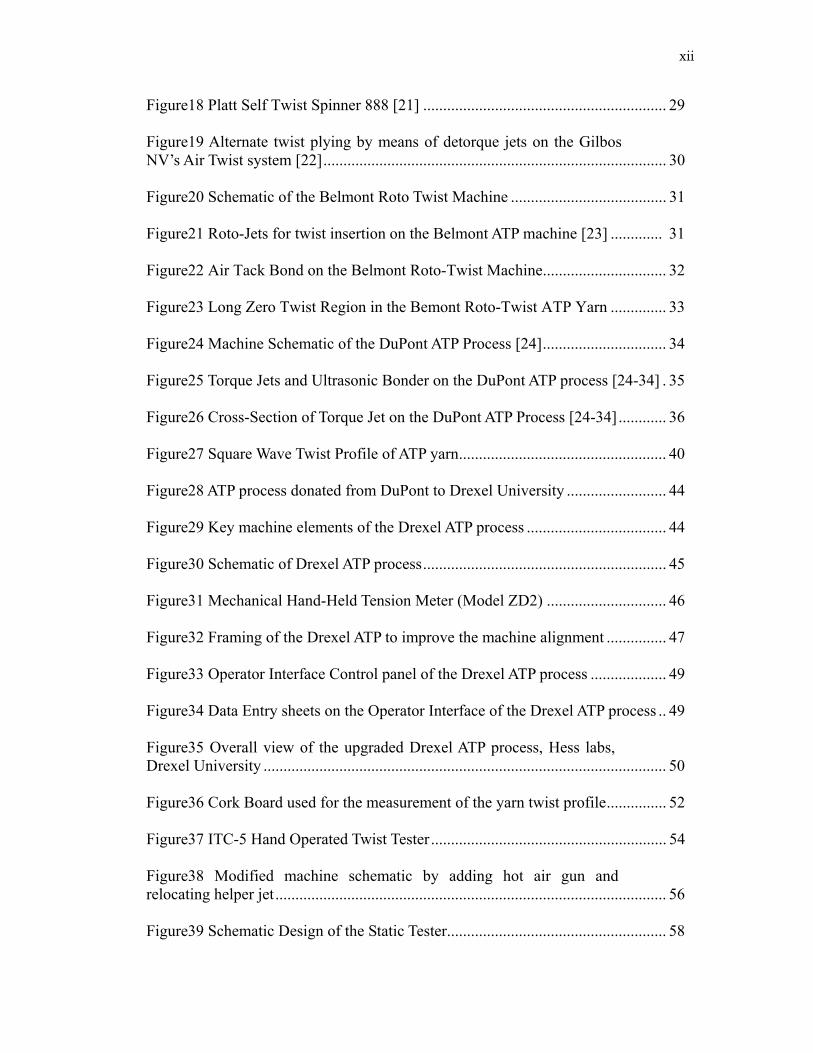
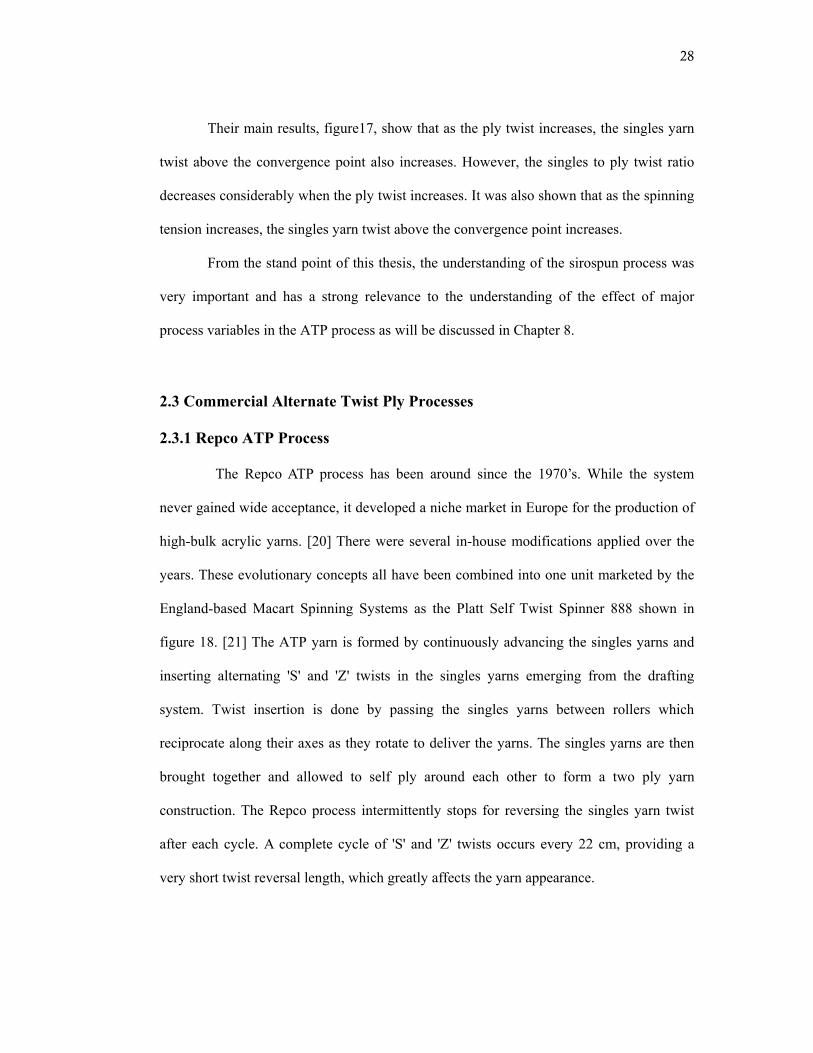
Figure18 Platt Self Twist Spinner 888 [21] ............................................................. 29
Figure19 Alternate twist plying by means of detorque jets on the Gilbos NV’s Air Twist system [22]...................................................................................... 30 Figure20 Schematic of the Belmont Roto Twist Machine ....................................... 31
Figure21 Roto-Jets for twist insertion on the Belmont ATP machine [23] ............. 31
Figure22 Air Tack Bond on the Belmont Roto-Twist Machine............................... 32
Figure23 Long Zero Twist Region in the Bemont Roto-Twist ATP Yarn .............. 33
Figure24 Machine Schematic of the DuPont ATP Process [24]............................... 34
Figure25 Torque Jets and Ultrasonic Bonder on the DuPont ATP process [24-34] . 35
Figure26 Cross-Section of Torque Jet on the DuPont ATP Process [24-34]............ 36
Figure27 Square Wave Twist Profile of ATP yarn.................................................... 40
Figure28 ATP process donated from DuPont to Drexel University ......................... 44 Figure29 Key machine elements of the Drexel ATP process ................................... 44
Figure30 Schematic of Drexel ATP process............................................................. 45
Figure31 Mechanical Hand-Held Tension Meter (Model ZD2) .............................. 46
Figure32 Framing of the Drexel ATP to improve the machine alignment ............... 47
Figure33 Operator Interface Control panel of the Drexel ATP process ................... 49
Figure34 Data Entry sheets on the Operator Interface of the Drexel ATP process .. 49
Figure35 Overall view of the upgraded Drexel ATP process, Hess labs, Drexel University ..................................................................................................... 50 Figure36 Cork Board used for the measurement of the yarn twist profile............... 52
Figure37 ITC-5 Hand Operated Twist Tester........................................................... 54
Figure38 Modified machine schematic by adding hot air gun and relocating helper jet.................................................................................................. 56 Figure39 Schematic Design of the Static Tester....................................................... 58
xiii
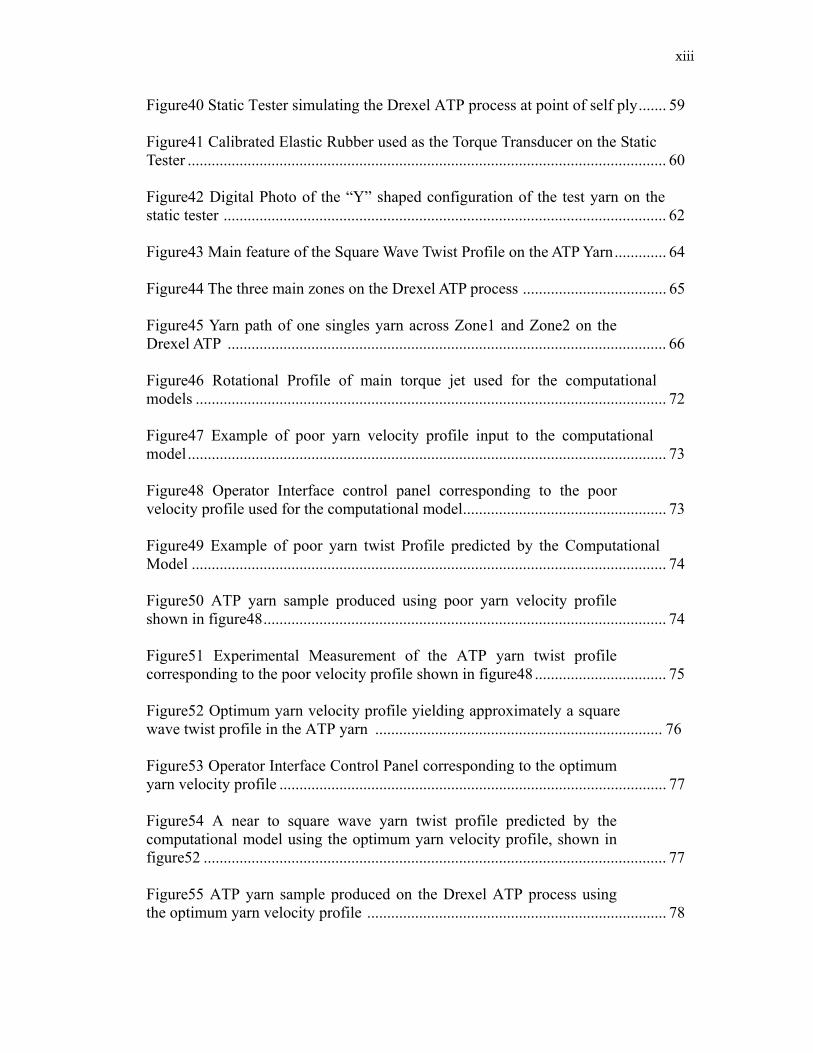
Figure40 Static Tester simulating the Drexel ATP process at point of self ply....... 59
Figure41 Calibrated Elastic Rubber used as the Torque Transducer on the Static Tester ........................................................................................................................ 60 Figure42 Digital Photo of the “Y” shaped configuration of the test yarn on the static tester ............................................................................................................... 62 Figure43 Main feature of the Square Wave Twist Profile on the ATP Yarn............. 64
Figure44 The three main zones on the Drexel ATP process .................................... 65
Figure45 Yarn path of one singles yarn across Zone1 and Zone2 on the Drexel ATP .............................................................................................................. 66 Figure46 Rotational Profile of main torque jet used for the computational models ...................................................................................................................... 72 Figure47 Example of poor yarn velocity profile input to the computational model........................................................................................................................ 73 Figure48 Operator Interface control panel corresponding to the poor velocity profile used for the computational model................................................... 73 Figure49 Example of poor yarn twist Profile predicted by the Computational Model ....................................................................................................................... 74 Figure50 ATP yarn sample produced using poor yarn velocity profile shown in figure48..................................................................................................... 74 Figure51 Experimental Measurement of the ATP yarn twist profile corresponding to the poor velocity profile shown in figure48 ................................. 75 Figure52 Optimum yarn velocity profile yielding approximately a square wave twist profile in the ATP yarn ........................................................................ 76 Figure53 Operator Interface Control Panel corresponding to the optimum yarn velocity profile ................................................................................................. 77 Figure54 A near to square wave yarn twist profile predicted by the computational model using the optimum yarn velocity profile, shown in figure52 .................................................................................................................... 77 Figure55 ATP yarn sample produced on the Drexel ATP process using the optimum yarn velocity profile ........................................................................... 78
xiv
Figure56 Experimental Measurement of the ATP yarn twist profile corresponding to the optimum velocity profile ....................................................... 78 Figure57 Perfect Square Wave Twist Profile predicted by the computational model ................................................................................................ 79 Figure58 The singles yarns are not in a Self Plied structure during Bonding .................................................................................................................... 81 Figure59 Long Zero Twist Region at the Twist Reversal........................................ 81 Figure60 The singles yarns are Self Plied during Bonding...................................... 81 Figure61 Very Short Zero Twist Region at the Twist Reversal .............................. 81 Figure62 Cut Tip Stability in Cut Pile Carpet ......................................................... 84 Figure63 Effect of Main Jet Pressure on the Singles Yarn Twist ........................... 87 Figure64 Effect of Main Jet Pressure on the ATP Yarn Twist Efficiency .............. 87 Figure65 Effect of singles yarn tension on singles and ply yarn twist..................... 88 Figure66 Effect of singles yarn tension on the ATP yarn twist efficiency ............... 89 Figure67 Effect of the operating direction of the ply torque applied by the helper jet on the singles yarn and ply yarn twist ...................................................... 91 Figure68 Effect of the operating direction of the ply torque applied by the helper jet on the ATP yarn twist efficiency .............................................................. 92 Figure69 Effect of Helper Jet Pressure on the Singles yarn and Ply yarn Twist ........................................................................................................................ 93 Figure70 Effect of helper torque jet pressure on the ATP yarn twist efficiency.................................................................................................................. 94 Figure71 Weldy Hot air gun positioned between the ultrasonic bonder and the helper torque jet .......................................................................................... 95 Figure72 Effect of the yarn temperature, due to hot air exposure, on the singles yarn and ply yarn twist................................................................................. 96 Figure73 Effect of the yarn temperature, due to hot air exposure, on the ATP yarn twist efficiency ......................................................................................... 97
xv
Figure74 RSM procedure to optimize the ATP process parameters for achieving maximum yarn twist efficiency ............................................................. 102 Figure75 Profiles used for the yarn velocity, main and helper torque jets and ultrasonic horn and anvil for experiments used in the Response Surface analysis ..................................................................................................... 103 Figure76 Central Composite Design ...................................................................... 104 Figure77 Response Surface of the yarn twist efficiency as a function of the main torque jet pressure and the singles yarn tension in the absence of the helper jet and heat (room temperature) ............................................................ 110 Figure78 Response Surface of the yarn twist efficiency as a function of the main torque jet pressure and the singles yarn tension, with the helper jet pressure of 42PSI in the absence of heat (room temperature)........................... 111 Figure79 Response Surface of the yarn twist efficiency as a function of the main torque jet pressure and the singles yarn tension, with the helper jet pressure of 75PSI in the absence of heat (room temperature)........................... 111 Figure80 Response Surface of the yarn twist efficiency as a function of the main torque jet pressure and the helper torque jet pressure, with the singles yarn tension 34g, in the absence of heat (RT).............................................112 Figure81 Effect of yarn temperature on yarn twist efficiency resulting from the RSM model ............................................................................................. 113 Figure82 Yarn Convergence Angle at the point of self ply on the Drexel ATP process ........................................................................................................... 117 Figure83 Analysis of the tensions and torques acting on an ATP rubber model at the point of self ply and the resulting singles and ply twist directions ................................................................................................................ 119 Figure84 Effect of the dimensionless ply yarn torque applied by the helper torque jet on the dimensionless singles yarn torque for different yarn half convergence angles ................................................................................ 122 Figure85 The singles and ply twist directions generated in a ply yarn at the convergence point due to the application of ply torque in the absence of an applied singles torque.................................................................................... 124 Figure86 Effect of ply yarn twist on the singles twist to ply twist ratio on a steady state Sirospun spinning process [19] ...................................................... 126
xvi
Figure87 Effect of yarn convergence angle on the dimensionless singles yarn torque for different applied ply yarn torques ................................................. 127 Figure88 Verification of the static tester results, in the case where no ply torque is applied, against the results previously obtained by “Tayebi” Rubber Monofilament theoretical model and experimental results [9- 11] ........... 130
Figure89 Effect of Singles yarns twist on Ply yarn twist with and without an applied ply yarn torque of 25μN.m and ply yarn tension of 34g ...................... 132 Figure90 Effect of half yarn convergence angle on yarn twist efficiency with and without an applied ply yarn torque of 25μN.m and ply yarn tension of 34g ........................................................................................................ 133 Figure91 Effect of the dimensionless ply yarn tension and the applied ply yarn torque on the half yarn convergence angle at equilibrium............................. 134 Figure92 Relation between the ply yarn helix angle and the half yarn convergence angle under ply yarn tension of 34g and without applied ply yarn torque.............................................................................................................. 135 Figure93 Effect of the singles yarn twist on the ply yarn twist with and without applying a ply yarn torque on the static tester and on the Drexel ATP process .......................................................................................................... 137 Figure94 Effect of ply yarn tension on yarn twist efficiency with an applied ply yarn torque of 25μN.m ........................................................................ 138 Figure95 Effect of applying ply yarn torque on the yarn twist efficiency on the static tester................................................................................................... 139 Figure96 Effect of the half yarn convergence angle on the yarn twist efficiency without any applied ply yarn torque for different ply yarn tensions................................................................................................................... 141 Figure97 Effect of the half yarn convergence angle on the singles yarns twist without any applied ply yarn torque for different ply yarn tensions ............. 141 Figure98 Effect of the half yarn convergence angle on the yarn twist efficiency with applied ply yarn torque 98μN.m for different ply yarn tensions .................................................................................................................. 143 Figure99 Effect of the half yarn convergence angle on the singles yarns twist with applied ply yarn torque 98μN.m for different ply yarn tensions........... 143
xvii
Figure100 Effect of the half yarn convergence angle on the yarn twist efficiency for different applied ply yarn torques.................................................... 145 Figure101 Effect of the half yarn convergence angle on the singles yarns twist for different applied ply yarn torques............................................................ 145 Figure102 Design of the main torque jets to enable a high convergence angle at the self ply point on the Drexel ATP process ........................................... 146 Figure 103 Design of a bar and low friction roller system so the singles yarns are passed around the roller then through the centerline of the main torque jest .............................................................................................................. 147 Figure 104 Insertion of a yarn guide between the main torque jets and the ultrasonic bonder to force the yarns to converge at the desired convergence angle .................................................................................................. 148 Figure 105 Effect of the half yarn convergence angle on the resulting yarn twist efficiency with and without an applied ply yarn torque........................ 149 Figure106 Geometry of the helical path of twisted singles yarn in the ply yarn structure ......................................................................................................... 156 Figure107 Geometry of the helical path followed by the singles yarns in the ply yarn ............................................................................................................ 160 Figure108 Model verification with Tayebi Model [10], static tester experimental results and nylon experimental results on the Drexel ATP process without applying ply yarn torque .............................................................. 164 Figure109 Effect of Singles yarn twist on the ply yarn twist values predicted by the model and experimentally on the static tester without applying a ply yarn torque...................................................................................... 165 Figure110 Effect of Singles yarn twist on the ply yarn twist values predicted by the model and experimentally on the static tester with applying a ply yarn torque ..................................................................................... 166 Figure 111 Effect of singles yarn twist on the ply yarn twist with and without applying a ply yarn torque as a predicted by the model............................ 167 Figure112 Effect of singles yarn twist on the singles strain energy and its components............................................................................................................. 168
xviii
Figure 113 Effect of the ply helix angle on the ply strain energy of the ATP yarn system and its components .................................................................... 169 Figure 114 Effect of singles yarn twist on the singles yarn tension with and without applying a ply yarn torque as a predicted by the model..................... 170 Figure115 Effect of the singles yarn twist on the resulting yarn twist efficiency with and without applying ply yarn torque ........................................... 171 Figure116 Effect of the combined effect of increasing the half yarn convergence angle and the ply yarn torque on the resulting yarn twist efficiency ............................................................................................................... 173 Figure 117 Modified Drexel ATP process schematic for core insertion................ 181
xix
ABSTRACT Processing Mechanics of Alternate Twist Ply (ATP) Yarn Technology
Donia Said Elkhamy Prof. Frank K. Ko
Ply yarns are important in many textile manufacturing processes and various
applications. The primary process used for producing ply yarns is cabling. The speed of
cabling is limited to about 35m/min. With the world’s increasing demands of ply yarn supply,
cabling is incompatible with today’s demand activated manufacturing strategies.
The Alternate Twist Ply (ATP) yarn technology is a relatively new process for
producing ply yarns with improved productivity and flexibility. This technology involves self
plying of twisted singles yarn to produce ply yarn. The ATP process can run more than ten
times faster than cabling. To implement the ATP process to produce ply yarns there are major
quality issues; uniform Twist Profile and yarn Twist Efficiency. The goal of this thesis is to
improve these issues through process modeling based on understanding the physics and
processing mechanics of the ATP yarn system.
In our study we determine the main parameters that control the yarn twist profile.
Process modeling of the yarn twist across different process zones was done. A computational
model was designed to predict the process parameters required to achieve a square wave
twist profile.
Twist efficiency, a measure of yarn torsional stability and bulk, is determined by the
ratio of ply yarn twist to singles yarn twist. Response Surface Methodology was used to
develop the processing window that can reproduce ATP yarns with high twist efficiency.
Equilibrium conditions of tensions and torques acting on the yarns at the self ply point were
analyzed and determined the pathway for achieving higher twist efficiency. Mechanistic
modeling relating equilibrium conditions to the twist efficiency was developed. A static

xx
tester was designed to zoom into the self ply zone of the ATP yarn. A computer controlled,
prototypic ATP machine was constructed and confirmed the mechanistic model results.
Optimum parameters achieving maximum twist efficiency were determined in this study.
The successful results of this work have led to the filing of a US patent disclosing the method
for producing ATP yarns with high yarn twist efficiency using a high convergence angle at
the self ply point together with applying ply torque.

1
CHAPTER 1: INTRODUCTION
Plied yarns are widely used in tire cords, cables and many textile products as well
as industrial applications. Of particular interest in this thesis is the use of plied yarns in the
carpet industry where the plied yarns are either looped or cut. Commercially available ATP
processes have been able to supply yarns to the loop pile carpet market, however none of
them has succeeded to supply yarns to the cut pile carpet market due to major quality
issues. Plied yarn structures intended for use in the cut pile carpet are currently prepared by
the cabling process. This cabling process is time consuming and is often the bottleneck in
the carpet industry. The speed of cabling process for ply yarn production is limited to about
35 m/min due to the aerodynamic drag as one yarn is whirled around the other by a flyer
guide.
The Alternate Twist Ply (ATP) yarn technology is a new process for producing ply
yarns. An ATP yarn is a self twisted plied yarn, where the twist direction alternates every
few feet. To ensure yarn stability at the twist reversal locations, the fibers must be
interconnected or bonded. The ATP process can run up to ten times faster than
conventional ply twisting. The speed advantage results from the fact that the paths taken
by the individual fibers are topologically equivalent to that of a simple parallel array. This
geometric feature permits the process to be run without capturing or rotating either the feed
or output yarn packages; thus eliminating completely the limiting factors to productivity.
Current commercial ATP processes (Repco, Gilbos, Belmont) have limited
applications in the carpet industry. They can only be used for loop pile carpet yarn
production and not for cut pile carpet yarns. This is mainly due to the quality of the ATP
yarn produced. Yarns produced by the current ATP technologies have a long zero twist
region at the twist reversal, lack a uniform square wave twist distribution along the yarn
2
length and adequate twist efficiency. Non-uniformity in the twist will create sections of
substandard twist and appear as defects in the carpet. The twist efficiency is defined as the
ratio of the ply yarn twist to the singles yarn twist. High twist efficiency is needed to
ensure that the yarns do not unravel after being cut.
There are still no disclosures which enable one skilled in the art to operate a
process at a speed greater than that of conventional cabling while making a satisfactory
product with good twist uniformity and twist stability suitable for use as cut pile carpet
yarns.
Alternate twist plying involving the self plying of a fibrous assembly is a
complex physical phenomenon. Little work in the literature has been done on the modeling
of the self plying process. The goal of this thesis was to understand the physics and the
processing mechanics of the Alternate Twist Ply yarn system. Through this understanding
and process modeling, achieving a square wave yarn twist profile and an improved twist
efficiency of the yarns produced on the Drexel ATP process was made possible.
Several parameters in the ATP process control the yarn twist profile. The ATP
process is a time dependant process where the coordination of the yarn velocity profile and
the twist insertion rate as a function of time is very crucial to produce a uniform ply twist
distribution. Thus process modeling of the yarn twist across the different process zones
was needed. This was done through establishing the equations of state for the different
zones using a set of differential equations. A solution for these differential equations was
obtained using a stiff integrator. This process modeling has also shown that the lengths of
the twist insertion zone and the self plying zone on the machine greatly affect the twist
propagation and distribution along the yarn length. Process Optimization using this process
model together with a computer simulation of the time dependant velocity and rotation
3
profiles was done. The optimum process profiles and machine zone lengths required to
achieve a square wave twist profile were determined.
A major goal of this thesis was to improve the twist efficiency of the ATP yarns.
Aside from the yarn twist profile, the yarn twist efficiency is considered the main limiting
factor to the use of ATP yarns in cut pile carpets. Conventional cabling produces ply yarns
with 100 % twist efficiency, while the maximum twist efficiency achieved in yarns
produced by current commercial ATP processes is 65 %. Twist efficiency is a measure of
the tip stability of the yarn structure after it is cut to be used in the cut pile carpet. The yarn
twist efficiency also affects the bulk properties of the yarn. Higher bulk yarns would
provide a greater coverage in square footage per yard of the carpet which in turn has a
huge impact on the economics of the carpet manufacturing industry.
This thesis has systematically studied the effect of the ATP process variables on
the yarn twist efficiency. This research has also included the upgrading and modifying the
Drexel ATP process to ensure that the experimental results are reliable and reproducible.
Response Surface Methodology (RSM) was applied for the first time to the ATP process,
to develop the processing window that can reproduce ATP yarns with the highest possible
Twist efficiency. Results from RSM have shown that a maximum twist efficiency of 73%
could be obtained with current machine setup. To further improve the yarn twist
efficiency, a detailed study focusing on the self plying zone of the ATP process was
conducted. The equilibrium conditions of the tensions and torques acting on the singles
and ply yarns at the self ply point were analyzed. This analysis determined that the
pathway for achieving higher twist efficiency is through the use of a wide yarn
convergence angle at the point of self ply together with the addition of torque to the self
ply yarn. A mechanistic model relating these equilibrium conditions to the yarn twist

4
efficiency was developed. This thesis has additionally designed and built a static tester to
simulate the self plying process. The static tester has allowed us to study the effect of a
large range of yarn convergence angles and ply torques on twist efficiency, which was not
possible on the Drexel ATP process due to the restricted machine design. The results of the
static tester were used to verify the mechanistic model results. This thesis has successfully
identified the optimum process parameters needed to achieve maximum twist efficiency.
The production of ATP yarns with a square wave twist profile and high twist
efficiency is of vital importance to the carpet industry. Successful modeling and
application of the ATP process to produce cut pile carpet yarns would revolutionize the
carpet yarn manufacture and the global carpet market will be transformed to a much higher
level performance.
5
CHAPTER 2: BACKGROUND AND LITERATURE REVIEW
2.1 Ply Yarn and Its Applications
Plied yarn structures, occur widely in science and engineering. Yarns are seldom
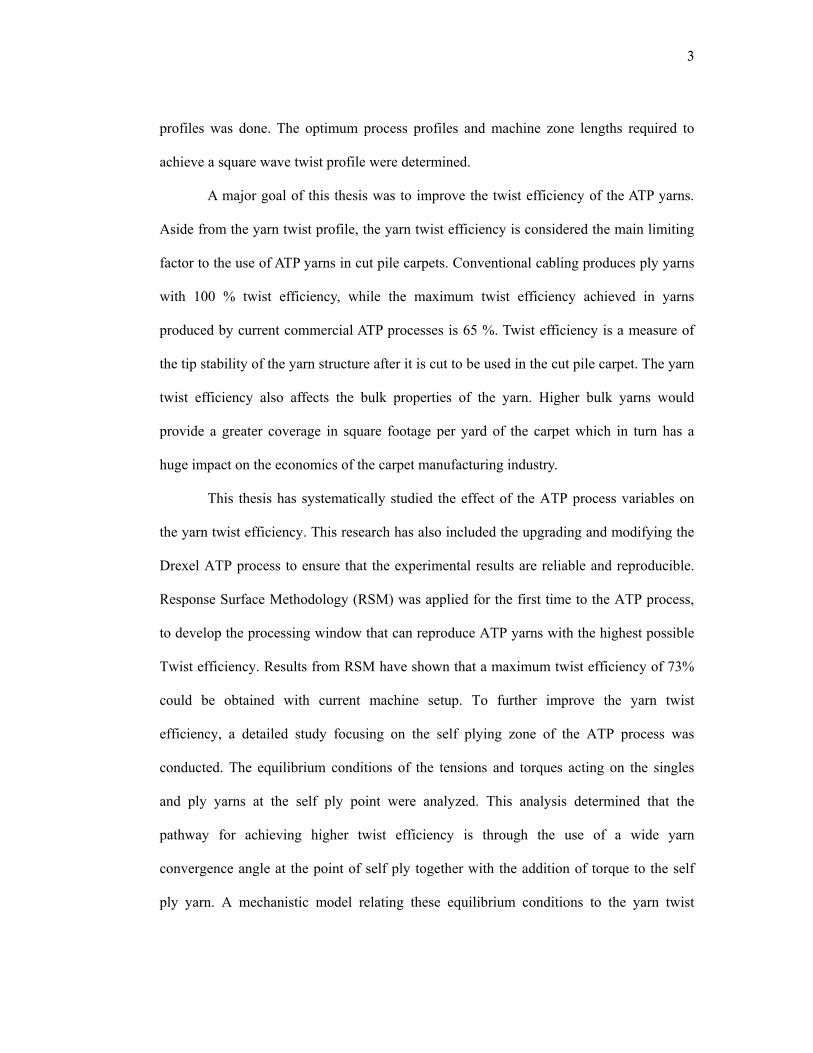
being used in the form of single twisted strands. A conventional plied yarn shown in
figure1 is made from two or more twisted single yarns which have been combined together
in a second twisting operation. The plying process generally improves the yarn strength
and abrasion resistance to be able to withstand the stresses they are subjected to during
subsequent processing operations.
Figure 1 Conventional Ply Yarn
Plied yarns have numerous applications. They are widely used in tire cords, cables,
sewing threads and many textile products. Knit wear is almost always made from plied
yarns in which the twist must be balanced as any residual torque in the yarn causes loop
distortion. Ply yarns are also used in many industrial applications including filtration and
geo-textiles. High performance technical yarns and hybrid yarns are also made from ply
yarn constructions. A novel interest also is the use of ply yarn structures in biomedical
applications.
6
2.1.1 Ply Yarn Application in Carpets
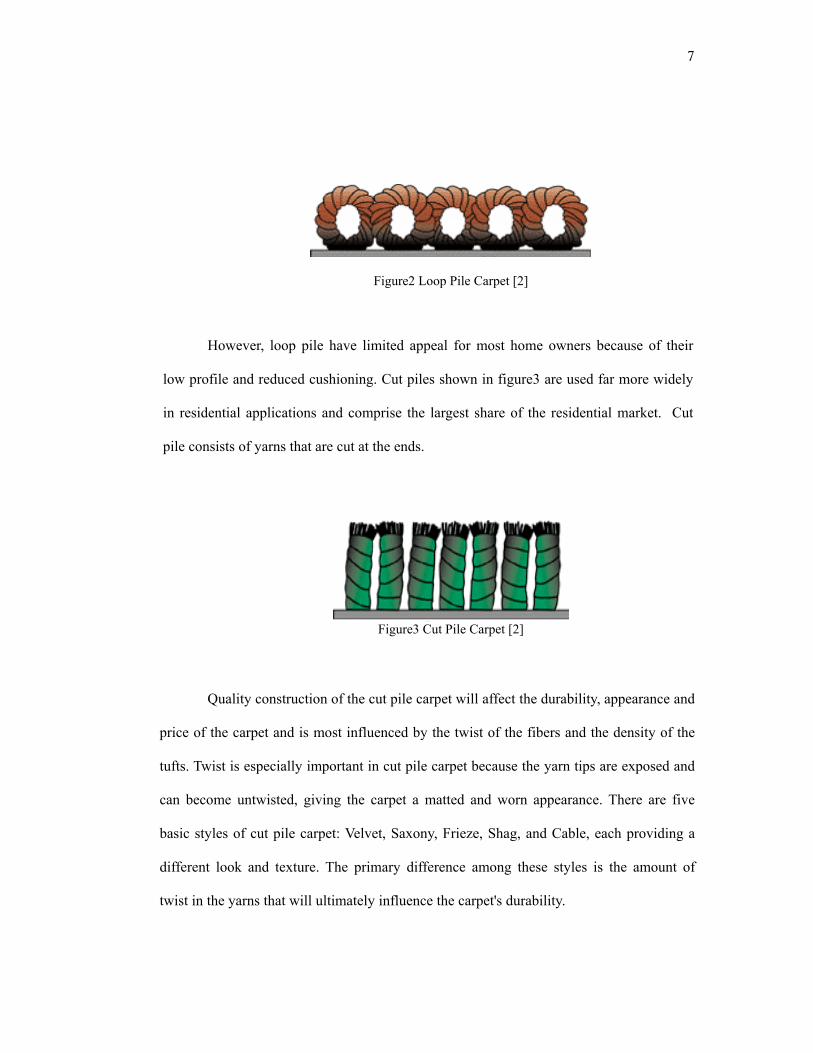
Of particular interest to this thesis is the use of plied yarns in the carpet industry.
Carpets account for 65%of the floor covering market. The US market for carpet and rugs is
a huge market with a good growing potential. As shown in Table1, the carpet and rug
supply demand is projected to rise 1.6% per year, through 2009, to more than 22 billion
square feet. The US carpet and rug industry consists of about 200 companies. The key
companies include Mohawk with 5.9 billion dollars in 2004 annual revenues with the
carpet accounting for 70%, Shaw Industries with 5.2 billion dollars in 2004 revenues,
Beaulieu and Interface. [1]
Table1 Carpet and Rug Supply Demand in Millions of square feet [1]
3.3.1
3.3.2
3.3.3
3.3.4
3.3.5
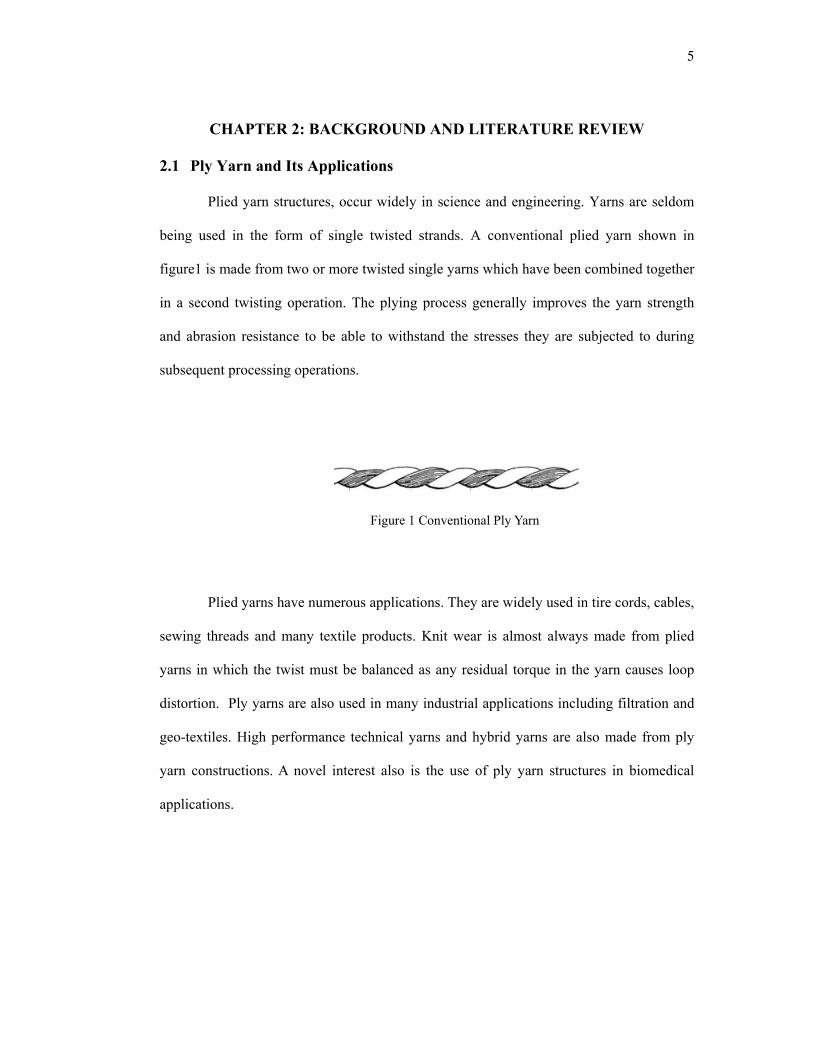
Carpet piles are usually made from two ply or three ply yarns. Over 90% of
residential carpet is manufactured as tufted carpet. The two main types of tufted carpets
are loop pile carpets and cut pile carpets. Loop pile carpets shown in figure2 have yarns
that are looped and uncut on the carpet surface. Loop pile carpet has excellent durability,
strength and soil hiding capabilities.
q )
0.82.1181001742015715Tufted
7.912.3850580325Woven
1.70.81450133012800ther
1.12.2204001933017320Carpet & Rug Shipments---1700-1040901.63.4221002037017230Carpet & Rug Demand
+ Net Exports
% Annual Growth04/99 09/04
200920041999Item
7
Figure2 Loop Pile Carpet [2]
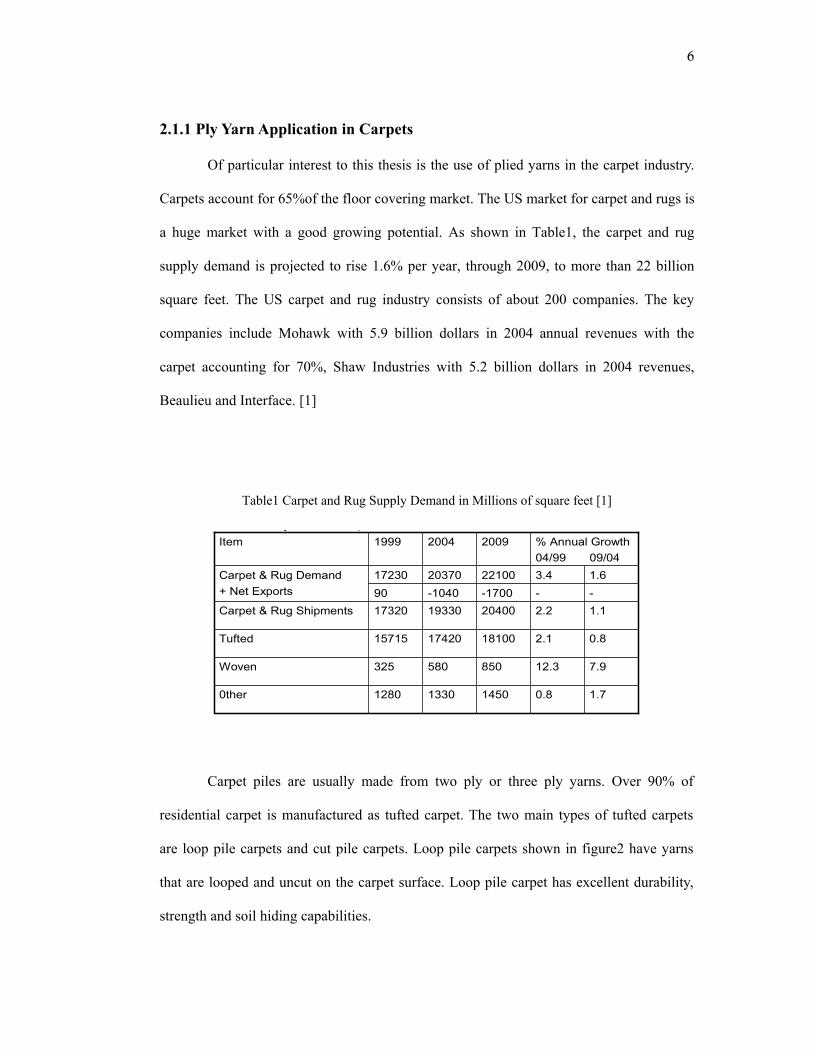
However, loop pile have limited appeal for most home owners because of their
low profile and reduced cushioning. Cut piles shown in figure3 are used far more widely
in residential applications and comprise the largest share of the residential market. Cut
pile consists of yarns that are cut at the ends.
Figure3 Cut Pile Carpet [2]
Quality construction of the cut pile carpet will affect the durability, appearance and
price of the carpet and is most influenced by the twist of the fibers and the density of the
tufts. Twist is especially important in cut pile carpet because the yarn tips are exposed and
can become untwisted, giving the carpet a matted and worn appearance. There are five
basic styles of cut pile carpet: Velvet, Saxony, Frieze, Shag, and Cable, each providing a
different look and texture. The primary difference among these styles is the amount of
twist in the yarns that will ultimately influence the carpet's durability.
8
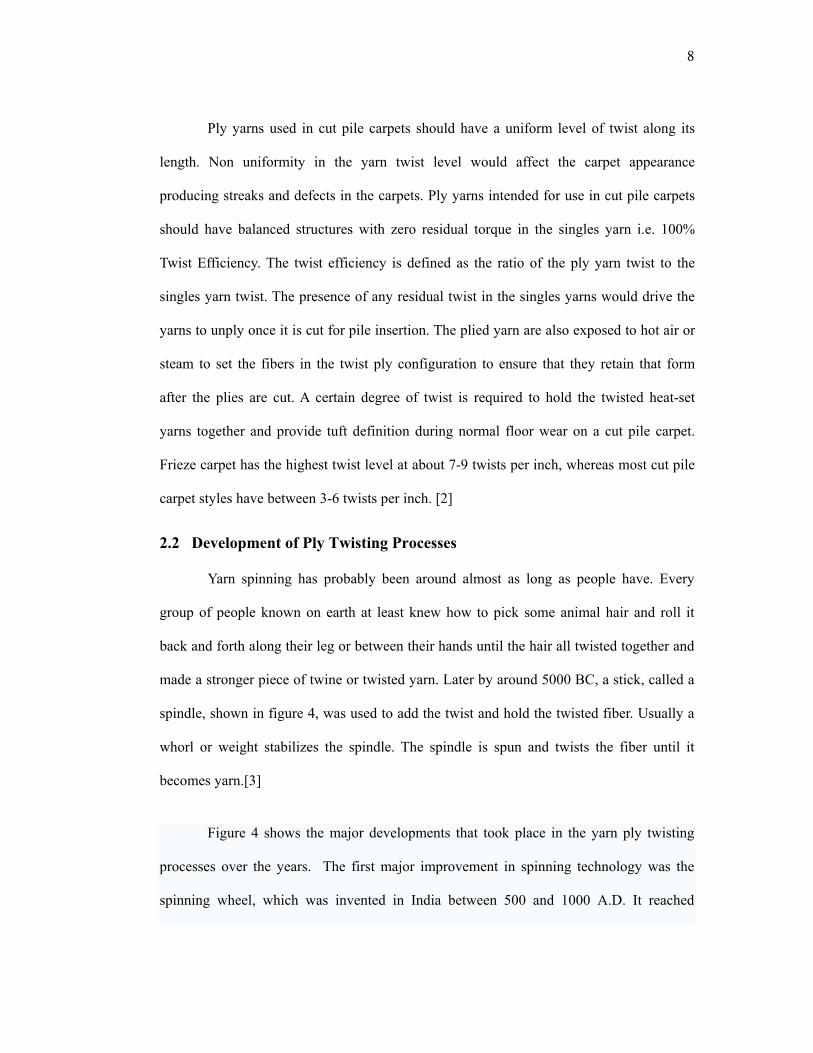
Ply yarns used in cut pile carpets should have a uniform level of twist along its
length. Non uniformity in the yarn twist level would affect the carpet appearance
producing streaks and defects in the carpets. Ply yarns intended for use in cut pile carpets
should have balanced structures with zero residual torque in the singles yarn i.e. 100%
Twist Efficiency. The twist efficiency is defined as the ratio of the ply yarn twist to the
singles yarn twist. The presence of any residual twist in the singles yarns would drive the
yarns to unply once it is cut for pile insertion. The plied yarn are also exposed to hot air or
steam to set the fibers in the twist ply configuration to ensure that they retain that form
after the plies are cut. A certain degree of twist is required to hold the twisted heat-set
yarns together and provide tuft definition during normal floor wear on a cut pile carpet.
Frieze carpet has the highest twist level at about 7-9 twists per inch, whereas most cut pile
carpet styles have between 3-6 twists per inch. [2]
2.2 Development of Ply Twisting Processes
Yarn spinning has probably been around almost as long as people have. Every
group of people known on earth at least knew how to pick some animal hair and roll it
back and forth along their leg or between their hands until the hair all twisted together and
made a stronger piece of twine or twisted yarn. Later by around 5000 BC, a stick, called a
spindle, shown in figure 4, was used to add the twist and hold the twisted fiber. Usually a
whorl or weight stabilizes the spindle. The spindle is spun and twists the fiber until it
becomes yarn.[3]
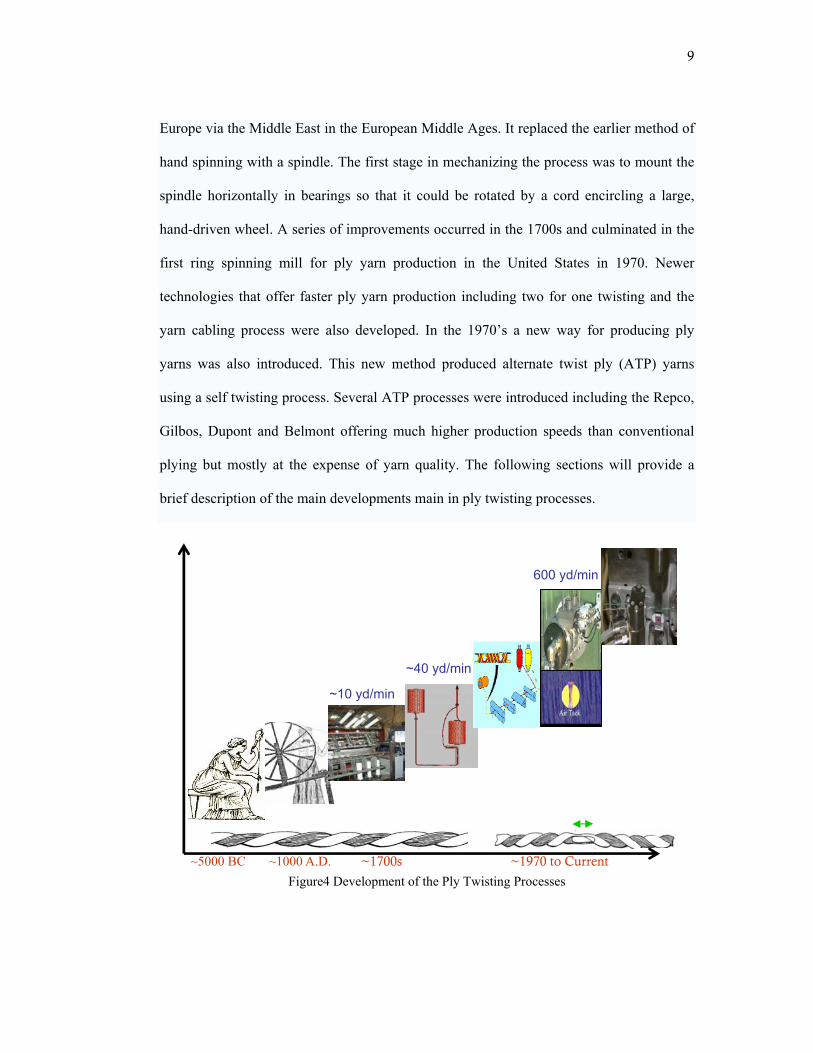
Figure 4 shows the major developments that took place in the yarn ply twisting
processes over the years. The first major improvement in spinning technology was the
spinning wheel, which was invented in India between 500 and 1000 A.D. It reached
9
Europe via the Middle East in the European Middle Ages. It replaced the earlier method of
hand spinning with a spindle. The first stage in mechanizing the process was to mount the
spindle horizontally in bearings so that it could be rotated by a cord encircling a large,
hand-driven wheel. A series of improvements occurred in the 1700s and culminated in the
first ring spinning mill for ply yarn production in the United States in 1970. Newer
technologies that offer faster ply yarn production including two for one twisting and the
yarn cabling process were also developed. In the 1970’s a new way for producing ply
yarns was also introduced. This new method produced alternate twist ply (ATP) yarns
using a self twisting process. Several ATP processes were introduced including the Repco,
Gilbos, Dupont and Belmont offering much higher production speeds than conventional
plying but mostly at the expense of yarn quality. The following sections will provide a
brief description of the main developments main in ply twisting processes.
Figure4 Development of the Ply Twisting Processes
~10 yd/min
~40 yd/min
600 yd/min
~5000 BC ~1000 A.D. ~1700s ~1970 to Current
10
2.2.1 Conventional Two Stage Ply Twisting Process
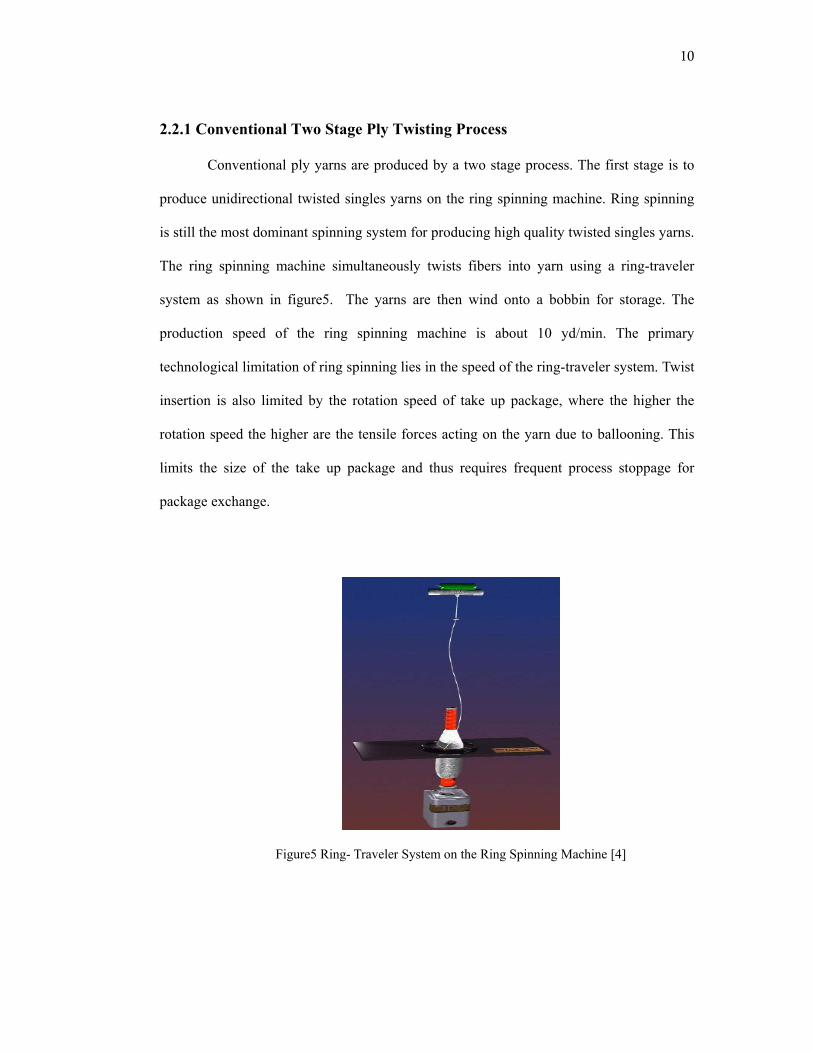
Conventional ply yarns are produced by a two stage process. The first stage is to
produce unidirectional twisted singles yarns on the ring spinning machine. Ring spinning
is still the most dominant spinning system for producing high quality twisted singles yarns.
The ring spinning machine simultaneously twists fibers into yarn using a ring-traveler
system as shown in figure5. The yarns are then wind onto a bobbin for storage. The
production speed of the ring spinning machine is about 10 yd/min. The primary
technological limitation of ring spinning lies in the speed of the ring-traveler system. Twist
insertion is also limited by the rotation speed of take up package, where the higher the
rotation speed the higher are the tensile forces acting on the yarn due to ballooning. This
limits the size of the take up package and thus requires frequent process stoppage for
package exchange.
Figure5 Ring- Traveler System on the Ring Spinning Machine [4]
11
The second stage is the plying of the twisted singles yarns together on the plying
machine. The plying machine also has the similar speed limitations as the ring spinning
machine due to ballooning and frequent process stoppage. With the speed limitations of
both the yarn spinning process and the plying process, the conventional two stage ply
twisting process is a very expensive one and represents a serious production bottleneck
problem.
2.2.2 Two for One Twister
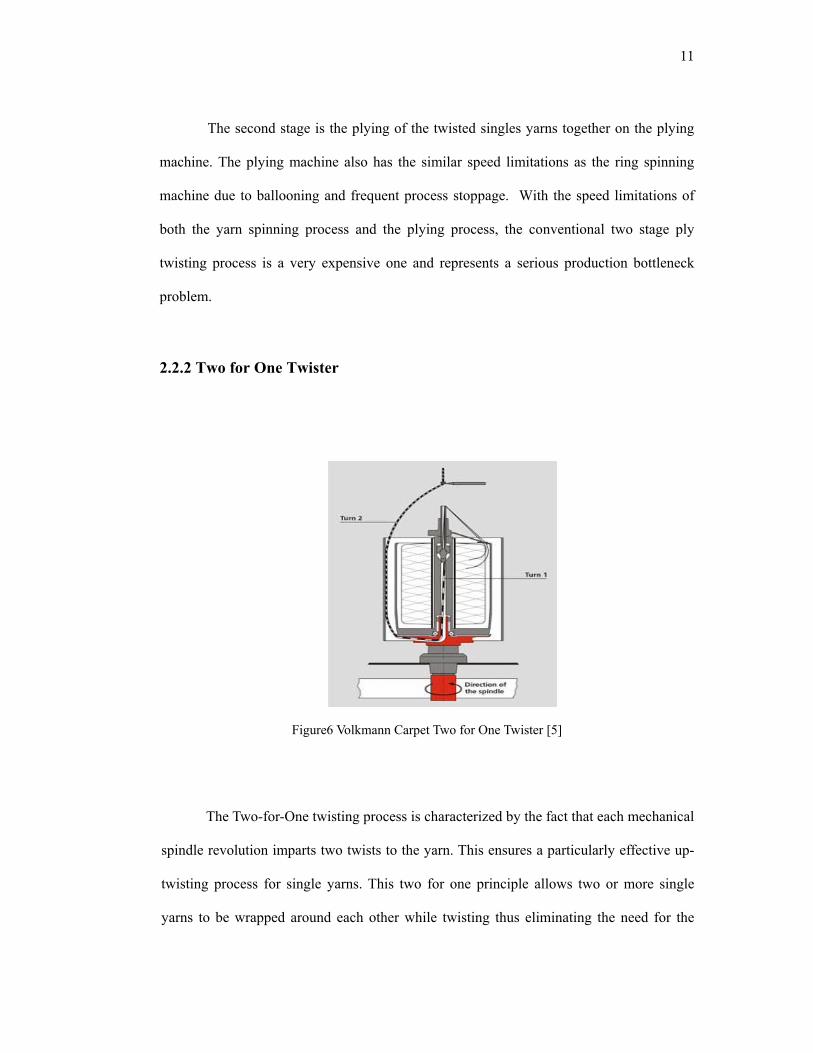
Figure6 Volkmann Carpet Two for One Twister [5]
The Two-for-One twisting process is characterized by the fact that each mechanical
spindle revolution imparts two twists to the yarn. This ensures a particularly effective up-
twisting process for single yarns. This two for one principle allows two or more single
yarns to be wrapped around each other while twisting thus eliminating the need for the
12
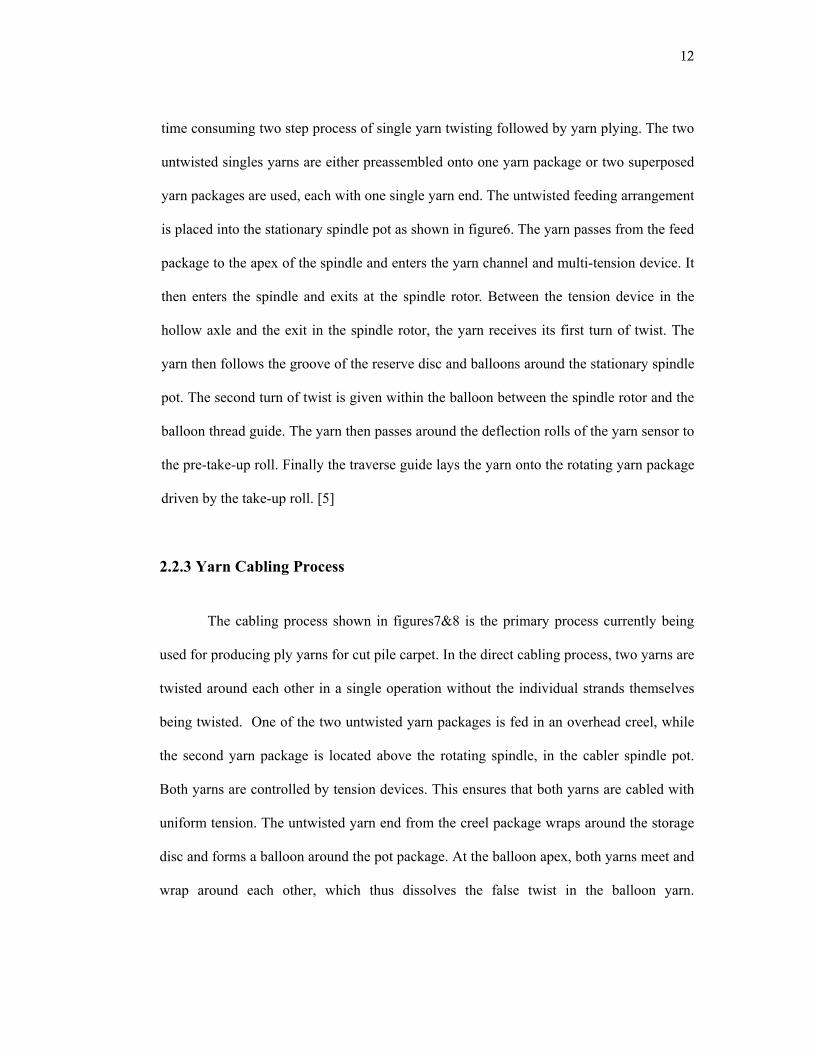
time consuming two step process of single yarn twisting followed by yarn plying. The two
untwisted singles yarns are either preassembled onto one yarn package or two superposed
yarn packages are used, each with one single yarn end. The untwisted feeding arrangement
is placed into the stationary spindle pot as shown in figure6. The yarn passes from the feed
package to the apex of the spindle and enters the yarn channel and multi-tension device. It
then enters the spindle and exits at the spindle rotor. Between the tension device in the
hollow axle and the exit in the spindle rotor, the yarn receives its first turn of twist. The
yarn then follows the groove of the reserve disc and balloons around the stationary spindle
pot. The second turn of twist is given within the balloon between the spindle rotor and the
balloon thread guide. The yarn then passes around the deflection rolls of the yarn sensor to
the pre-take-up roll. Finally the traverse guide lays the yarn onto the rotating yarn package
driven by the take-up roll. [5]
2.2.3 Yarn Cabling Process
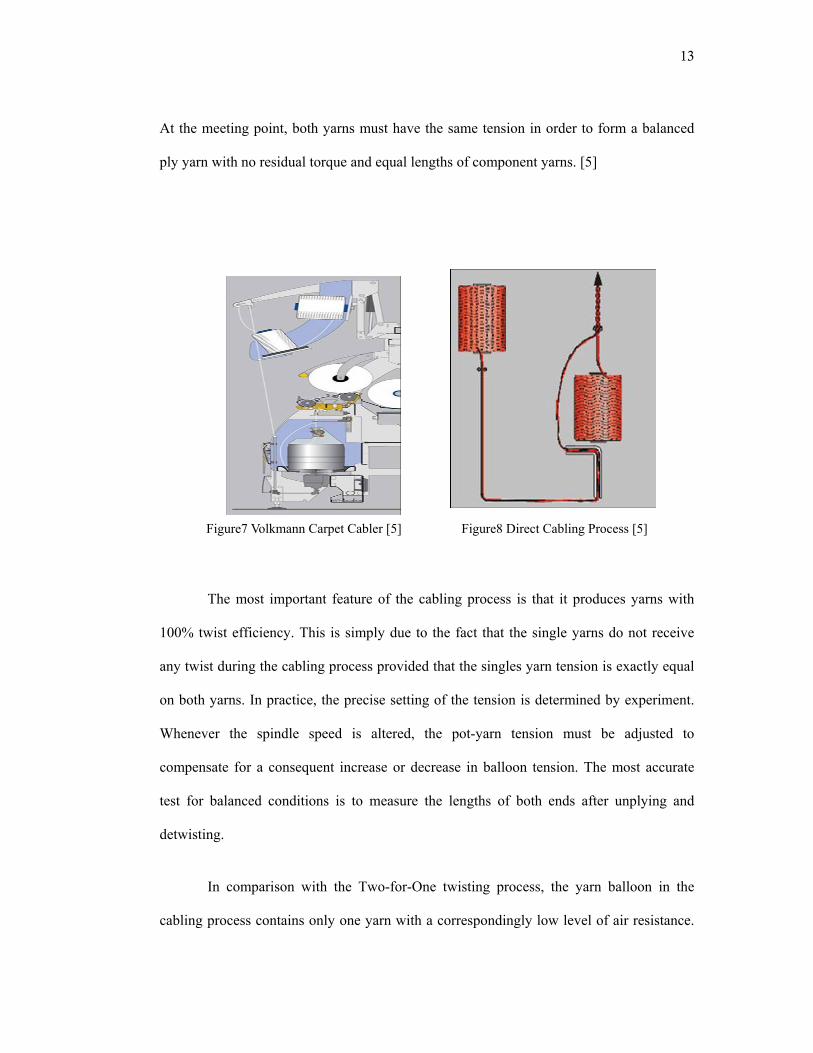
The cabling process shown in figures7&8 is the primary process currently being
used for producing ply yarns for cut pile carpet. In the direct cabling process, two yarns are
twisted around each other in a single operation without the individual strands themselves
being twisted. One of the two untwisted yarn packages is fed in an overhead creel, while
the second yarn package is located above the rotating spindle, in the cabler spindle pot.
Both yarns are controlled by tension devices. This ensures that both yarns are cabled with
uniform tension. The untwisted yarn end from the creel package wraps around the storage
disc and forms a balloon around the pot package. At the balloon apex, both yarns meet and
wrap around each other, which thus dissolves the false twist in the balloon yarn.
13
At the meeting point, both yarns must have the same tension in order to form a balanced
ply yarn with no residual torque and equal lengths of component yarns. [5]
Figure7 Volkmann Carpet Cabler [5] Figure8 Direct Cabling Process [5]
The most important feature of the cabling process is that it produces yarns with
100% twist efficiency. This is simply due to the fact that the single yarns do not receive
any twist during the cabling process provided that the singles yarn tension is exactly equal
on both yarns. In practice, the precise setting of the tension is determined by experiment.
Whenever the spindle speed is altered, the pot-yarn tension must be adjusted to
compensate for a consequent increase or decrease in balloon tension. The most accurate
test for balanced conditions is to measure the lengths of both ends after unplying and
detwisting.
In comparison with the Two-for-One twisting process, the yarn balloon in the
cabling process contains only one yarn with a correspondingly low level of air resistance.
14
Energy consumption levels are thus also considerably smaller for the cabling process.
Because only one yarn is drawn from the pot, double-length feed packages can be
processed in one loading. This ensures long operating times and the manufacture of
substantial knot-free lengths of cabled yarn.
The major disadvantage of the cabling process is its speed limitation. The speed of
cabling process for ply yarn production is limited to about 35 m/min due to the
aerodynamic drag as one yarn is whirled around the other by the flyer guide. The cabling
process is often the bottleneck in the carpet industry. The cabling process also has limited
product flexibility where only two ply yarn constructions could be produced.
2.2.4 Alternate Twist Ply Process
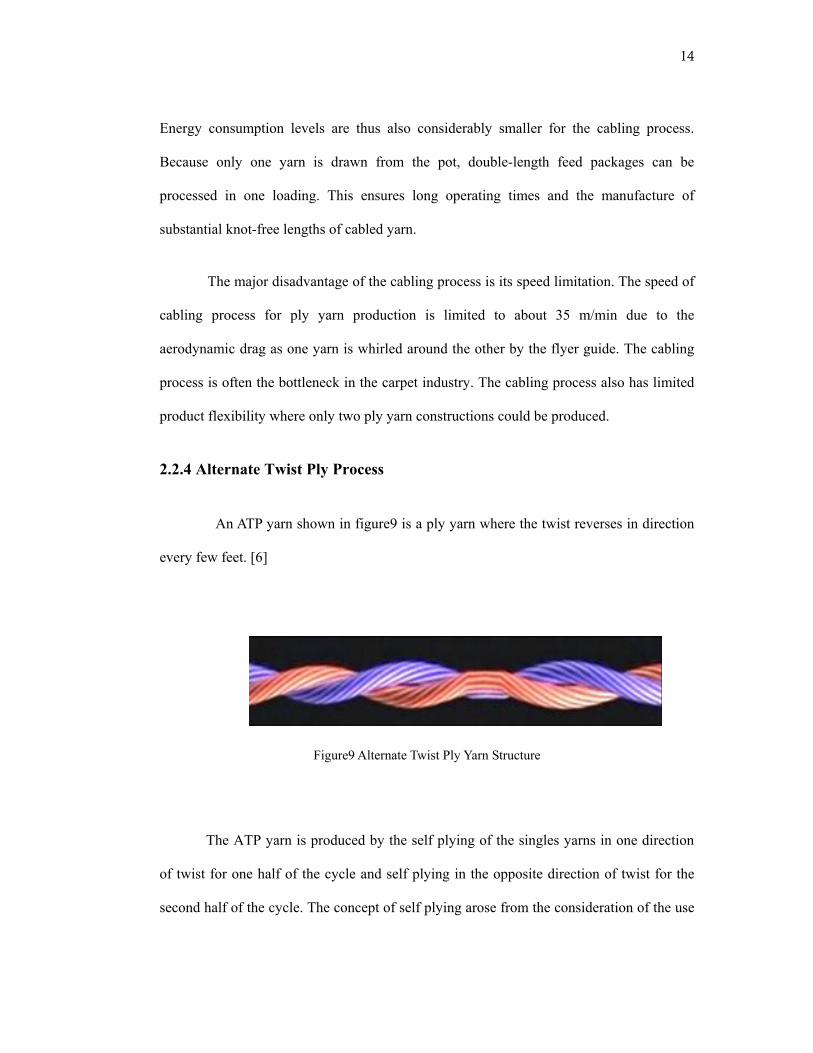
An ATP yarn shown in figure9 is a ply yarn where the twist reverses in direction
every few feet. [6]
Figure9 Alternate Twist Ply Yarn Structure
The ATP yarn is produced by the self plying of the singles yarns in one direction
of twist for one half of the cycle and self plying in the opposite direction of twist for the
second half of the cycle. The concept of self plying arose from the consideration of the use
15
of alternating twist. In the conventional two stage ply twisting process, mentioned in
section 2.2.1, in order to be able to insert unidirectional twist, it is necessary to rotate the
take-up packages. This is the short coming of the process. Thus, if it were possible to
accept twist alternating in S and Z directions; it would be necessary only to rotate the
singles yarn rather than the associated take up package. Since the singles yarn mass and
diameter are small, it thus should be possible to rotate it at high speeds with the
expenditure of very little energy.
2.2.4.1 Basics of the ATP Process
An ATP yarn [6] is produced by applying torque in the same direction to two
singles yarns under low tension as shown in figure10. This applied singles yarn torque is
the main driving force of the ATP yarn system. The singles torque generates twist in the
singles yarns which in turn leads to the build up of the tensile and torsional strain energies
in the singles yarns. Once these singles yarns are allowed to converge together, the yarns
immediately release the energies stored in the system through a spontaneous self plying
process. This is because the unwinding torques developed in the individual singles yarns,
before they are allowed to converge, do not counter balance one another but urge the
singles yarn to rotate in the same direction and thus self ply. The self ply yarn produced
has an opposite direction of twist to that inserted in the singles before self plying. As the
self plying process proceeds the strain energy in the singles yarns gradually decreases and
tensile, torsional and bending strain energies are developed in the ply yarn. The bending
strain energy increases due to the yarn curvature in the ply structure and the tensile strain
energy increases due to ply twist contraction. Ideally, the self plying process stops when all
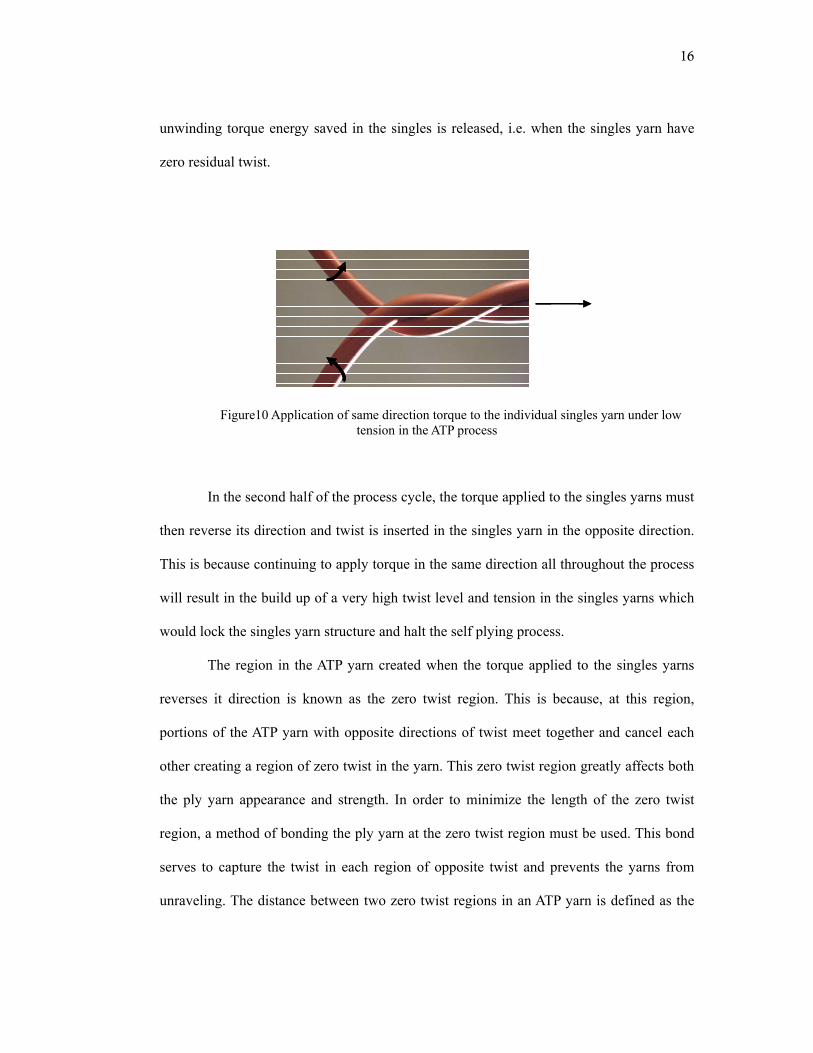
16
unwinding torque energy saved in the singles is released, i.e. when the singles yarn have
zero residual twist.
Figure10 Application of same direction torque to the individual singles yarn under low tension in the ATP process
In the second half of the process cycle, the torque applied to the singles yarns must
then reverse its direction and twist is inserted in the singles yarn in the opposite direction.
This is because continuing to apply torque in the same direction all throughout the process
will result in the build up of a very high twist level and tension in the singles yarns which
would lock the singles yarn structure and halt the self plying process.
The region in the ATP yarn created when the torque applied to the singles yarns
reverses it direction is known as the zero twist region. This is because, at this region,
portions of the ATP yarn with opposite directions of twist meet together and cancel each
other creating a region of zero twist in the yarn. This zero twist region greatly affects both
the ply yarn appearance and strength. In order to minimize the length of the zero twist
region, a method of bonding the ply yarn at the zero twist region must be used. This bond
serves to capture the twist in each region of opposite twist and prevents the yarns from
unraveling. The distance between two zero twist regions in an ATP yarn is defined as the
17
twist reversal length.
An optimum ATP yarn should have a uniform level of twist along the yarn length,
known as a square wave Twist Profile, a minimum bond length of about 0.1” and a twist
reversal length of a few feet.
The ATP yarn should also be a balanced ply yarn structure. A balanced ATP yarn is
one that will maintain its configuration without the application of external tension or
torque. This means that the torque applied to the singles yarns, before they are allowed to
self ply, must all be translated to the ply yarn structure leaving zero residual twist in the
singles yarn. The measure of this translation efficiency is called the Twist Efficiency. The
twist efficiency is defined as the ratio of the ply twist to the singles twist.
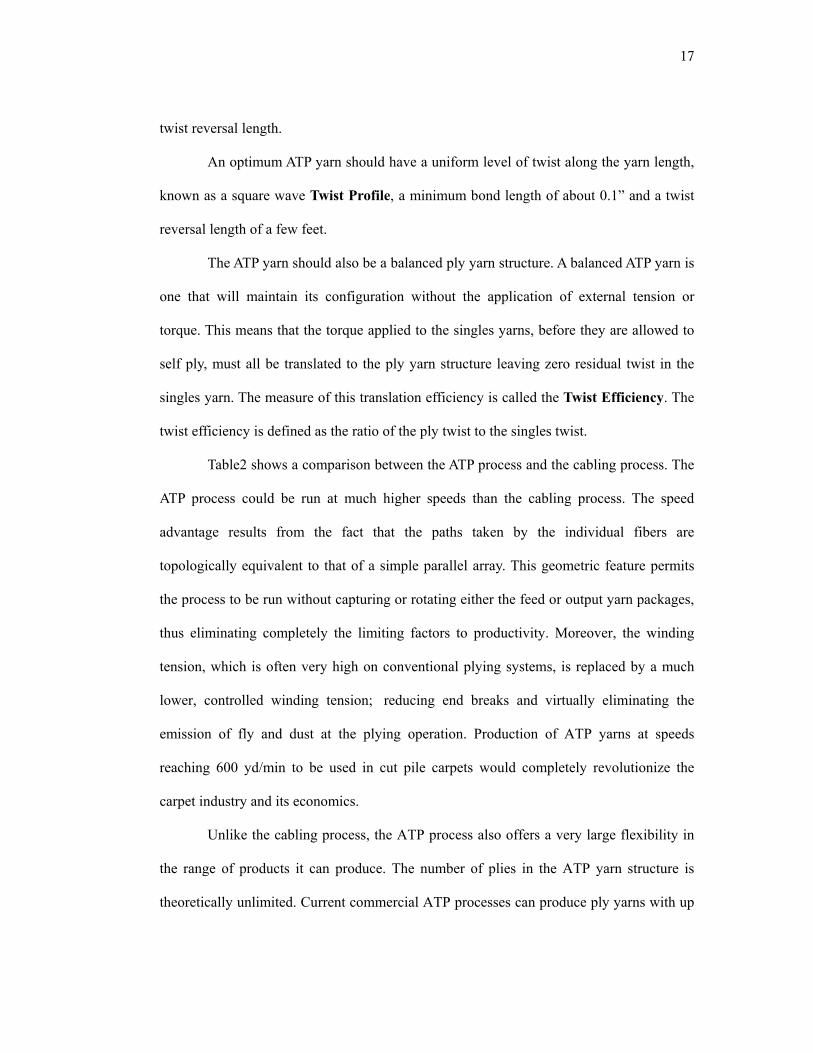
Table2 shows a comparison between the ATP process and the cabling process. The
ATP process could be run at much higher speeds than the cabling process. The speed
advantage results from the fact that the paths taken by the individual fibers are
topologically equivalent to that of a simple parallel array. This geometric feature permits
the process to be run without capturing or rotating either the feed or output yarn packages,
thus eliminating completely the limiting factors to productivity. Moreover, the winding
tension, which is often very high on conventional plying systems, is replaced by a much
lower, controlled winding tension; reducing end breaks and virtually eliminating the
emission of fly and dust at the plying operation. Production of ATP yarns at speeds
reaching 600 yd/min to be used in cut pile carpets would completely revolutionize the
carpet industry and its economics.
Unlike the cabling process, the ATP process also offers a very large flexibility in
the range of products it can produce. The number of plies in the ATP yarn structure is
theoretically unlimited. Current commercial ATP processes can produce ply yarns with up
18
to six plies. This feature offers a great advantage over the cabling process, where ATP
yarns constructed with various yarn colors, diameters and types could be made use of in
the producing of numerous fancy effects in carpets.
A major advantage of the cabling process over current commercial ATP processes
is the yarn twist efficiency. Compared to the 100% twist efficiency yarns produced by the
cabling process, the ATP yarns produced in the current commercial market have a
maximum twist efficiency of 65%. This means that the singles yarn still have about 35%
residual twist in their structure after self plying. Although this feature of twist liveliness of
the singles yarn could be made use of in various applications such as to provide different
surface looks and texture in loop pile carpets, but it is unacceptable for use in cut pile
carpet yarns.
Table 2 Comparison between the ATP process and the Cabling process
Cabling ATP
Speed Limited by Inertia
Aerodynamic drag Unlimited
Max. No. of plies 2 6
Twist efficiency 100% 65%
19
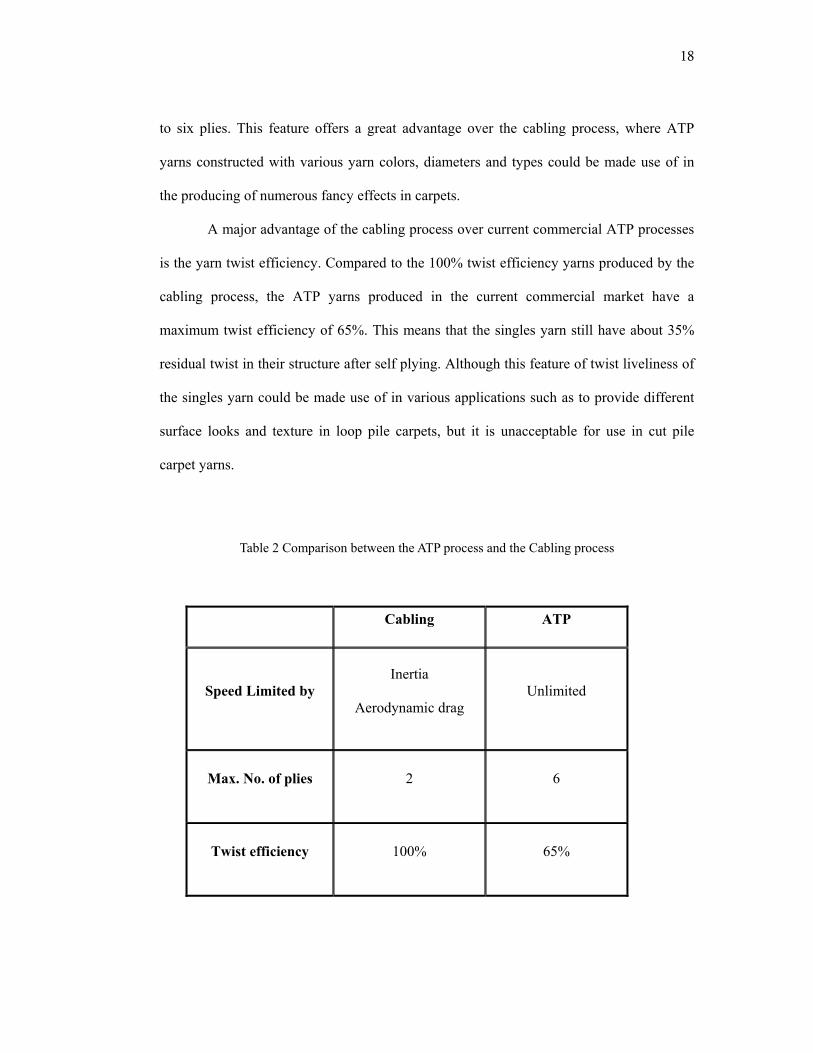
2.2.4.2 Modeling of the ATP Process
Very little work in the literature has been done on the modeling and understanding
of the Alternate twist plying process. This is in most possibly due to that the ATP process,
never really gained a world wide acceptance commercially when it was first introduced in
the 1970’s.
In 1971, Henshaw [7, 8] reviewed the basic concepts of ATP and the different
methods of inserting alternating twist with a description of the associating machine
components and the resulting ATP yarn properties, with an emphasis on the Repco ATP
process. The Repco ATP process is described in section 2.3.1. In this study, Henshaw, also
provided a simple model to derive the relationship between the singles yarn twist and the
ply twist in the ATP yarn. This model was based on the analysis of the internal forces set
up in the ATP yarn structure when it is subjected to stress. The theory behind the model
was that the ATP yarn is a stable structure on its own account without needing any setting
treatment. Thus, in order to obtain that stable structure, a balance must be maintained
between the untwisting forces, due to tension applied on the yarn, and the binding forces,
due to the compression forces generated between the two plies of the ATP yarn. This
model yielded the relationship between the ply and singles twist shown in equation 1.
)(6 21 SSD +−= (2.1)
Where D is the ply yarn twist, S1 and S2 are the twist in each of the singles yarn
respectively. Thus, if the two singles yarns have the same twist level, the ply twist would
be opposite and equal to one third of the singles yarn twist, i.e. yielding a yarn twist
efficiency of 33%. The results of the theoretical model where much lower than the
experimental results which showed that the ply twist is equal to or higher than two thirds
20
of the singles yarn twist. [8] This was attributed to the extremely crude approximations to
the actual yarn used in the theoretical model.
The work done by Tayebi and Backer, [9-11] on the analysis of the mechanics of
parallel self plying structures is one of the most significant reviews available in literature.
Their research was directed towards the theoretical prediction of the equilibrium ply twist
in the ATP yarn on the basis of singles yarn twist and properties. Both monofilament and
multi-filament singles yarn were considered in their research. The procedure adopted in
that study was to express the total strain energy of the ply yarn system as a function of the
initial singles twist, singles yarn diameter and physical properties, and the ply twist helix
angle. The prediction of the ply twist helix angle was based on the theory that a stable
equilibrium condition is reached when a minimum strain energy system is obtained and
that any further externally imposed change in ply twist will result in an increase in the total
strain energy and develop a restoring torque which tends to drive the system back to the
minimum strain energy configuration.
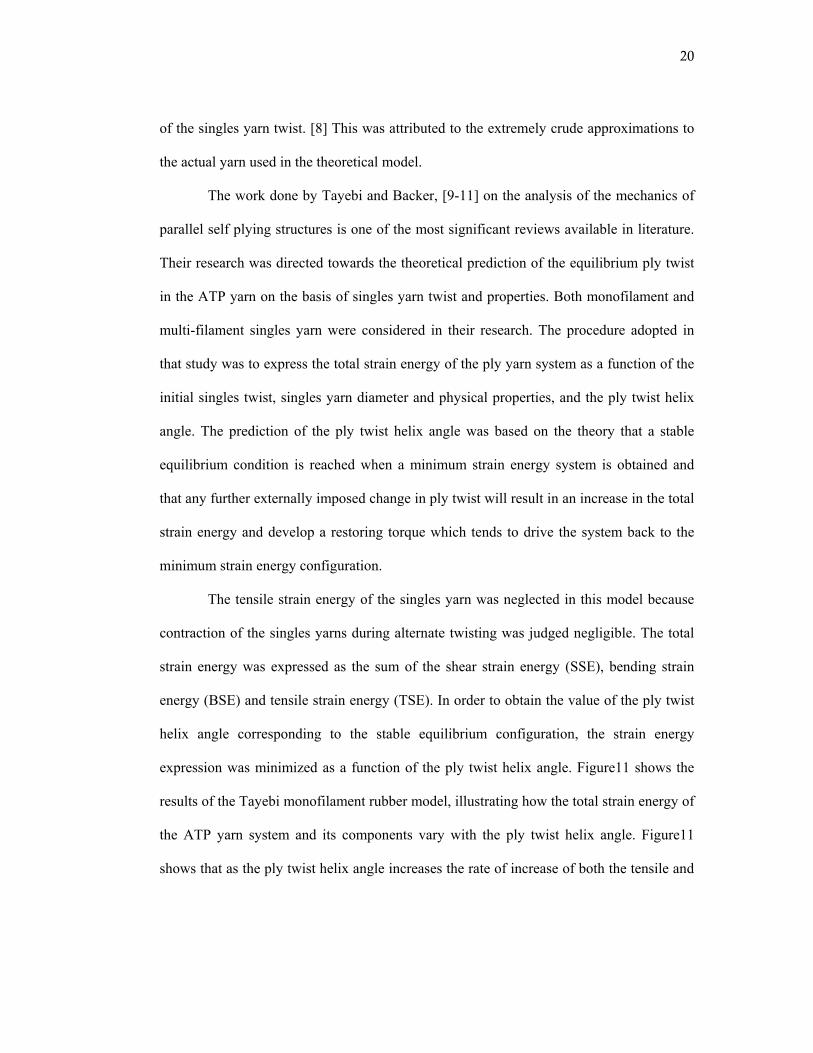
The tensile strain energy of the singles yarn was neglected in this model because
contraction of the singles yarns during alternate twisting was judged negligible. The total
strain energy was expressed as the sum of the shear strain energy (SSE), bending strain
energy (BSE) and tensile strain energy (TSE). In order to obtain the value of the ply twist
helix angle corresponding to the stable equilibrium configuration, the strain energy
expression was minimized as a function of the ply twist helix angle. Figure11 shows the
results of the Tayebi monofilament rubber model, illustrating how the total strain energy of
the ATP yarn system and its components vary with the ply twist helix angle. Figure11
shows that as the ply twist helix angle increases the rate of increase of both the tensile and
21
bending strain energies increases and that the total strain energy possesses a minimum at a
certain value of ply twist helix angle.
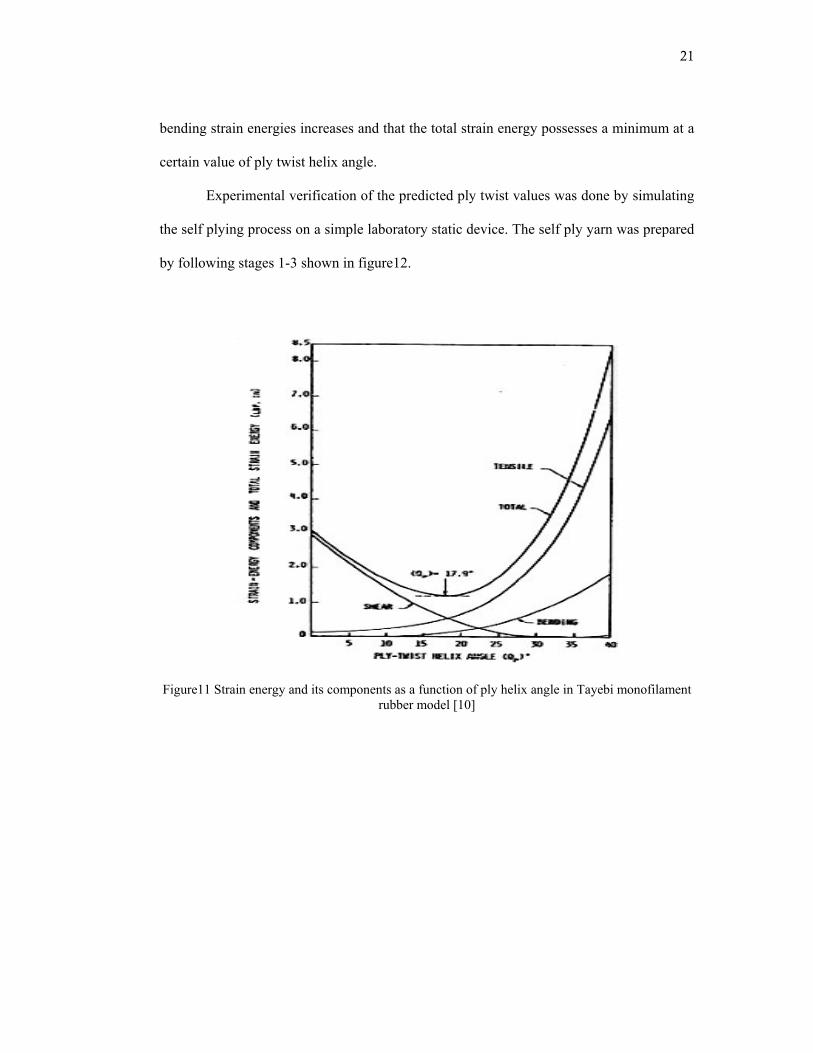
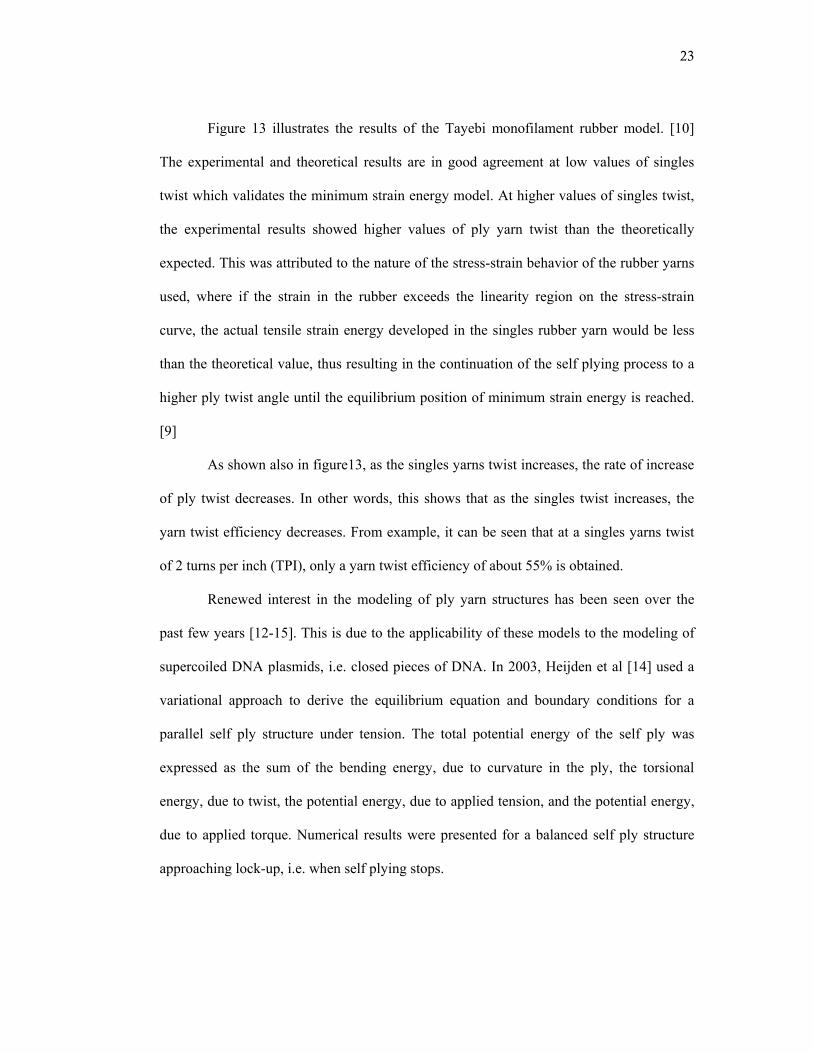
Experimental verification of the predicted ply twist values was done by simulating
the self plying process on a simple laboratory static device. The self ply yarn was prepared
by following stages 1-3 shown in figure12.
Figure11 Strain energy and its components as a function of ply helix angle in Tayebi monofilament rubber model [10]
22
Figure12 Stages of producing an ATP yarn using a static laboratory device [9]
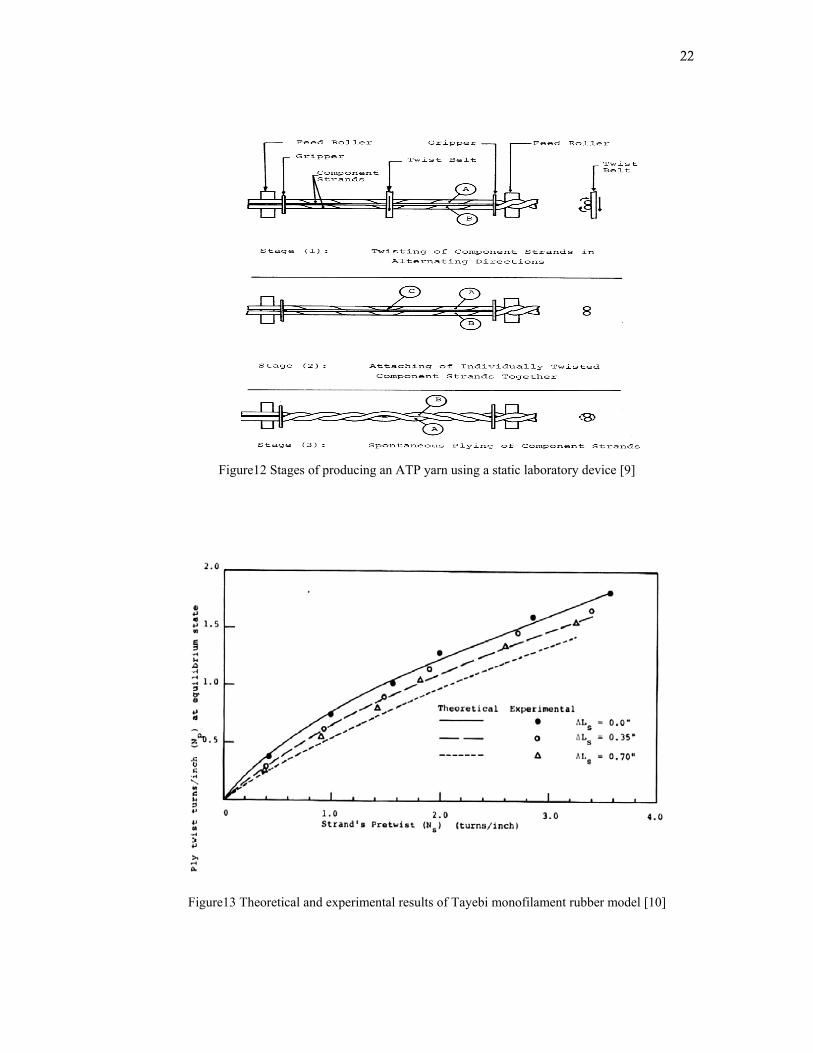
Figure13 Theoretical and experimental results of Tayebi monofilament rubber model [10]
23
Figure 13 illustrates the results of the Tayebi monofilament rubber model. [10]
The experimental and theoretical results are in good agreement at low values of singles
twist which validates the minimum strain energy model. At higher values of singles twist,
the experimental results showed higher values of ply yarn twist than the theoretically
expected. This was attributed to the nature of the stress-strain behavior of the rubber yarns
used, where if the strain in the rubber exceeds the linearity region on the stress-strain
curve, the actual tensile strain energy developed in the singles rubber yarn would be less
than the theoretical value, thus resulting in the continuation of the self plying process to a
higher ply twist angle until the equilibrium position of minimum strain energy is reached.
[9]
As shown also in figure13, as the singles yarns twist increases, the rate of increase
of ply twist decreases. In other words, this shows that as the singles twist increases, the
yarn twist efficiency decreases. From example, it can be seen that at a singles yarns twist
of 2 turns per inch (TPI), only a yarn twist efficiency of about 55% is obtained.
Renewed interest in the modeling of ply yarn structures has been seen over the
past few years [12-15]. This is due to the applicability of these models to the modeling of
supercoiled DNA plasmids, i.e. closed pieces of DNA. In 2003, Heijden et al [14] used a
variational approach to derive the equilibrium equation and boundary conditions for a
parallel self ply structure under tension. The total potential energy of the self ply was
expressed as the sum of the bending energy, due to curvature in the ply, the torsional
energy, due to twist, the potential energy, due to applied tension, and the potential energy,
due to applied torque. Numerical results were presented for a balanced self ply structure
approaching lock-up, i.e. when self plying stops.
24
Figure14 Self Ply solution obtained numerically using a variational approach [14]
Figure14 shows the ply solution obtained numerically by solving the equilibrium
equations subject to the boundary conditions that the initial singles twist in the two parallel
strands is zero and the final singles twist is three turns of twist. The numerical solution
yielded a self ply yarn with 2.29 turns of ply twist, i.e. the yarn twist efficiency is 76%.
The results of the numerical model are in close agreement with the experimental results
obtained by Tayebi et al [9-11].
The results of Tayebi and Backer [9-11] and Heijden et al [14] have provided key
insight to the nature of one of main problems associated with alternate twist plying. Both
models have shown that the self plying process involved in the ATP process does not yield
ply yarns with 100% twist efficiency. However, these results were only illustrated at very
low values of singles yarns twist from 0-3 TPI, whereas ATP yarns intended for use in cut
pile carpets should have twist in the range of 3-9 TPI depending on the carpet type. Of the
major goals of this thesis is to improve the twist efficiency of ATP yarns, actually
produced on a commercial ATP machine, within the required twist level of cut pile carpet
yarns. In addition to that, both models have only considered the self plying of parallel yarn
25
structures which is not the actual case in all commercial ATP processes where the yarns
converge together at an angle termed “Convergence Angle” at the point of self ply.
2.2.5 Sirospun Process
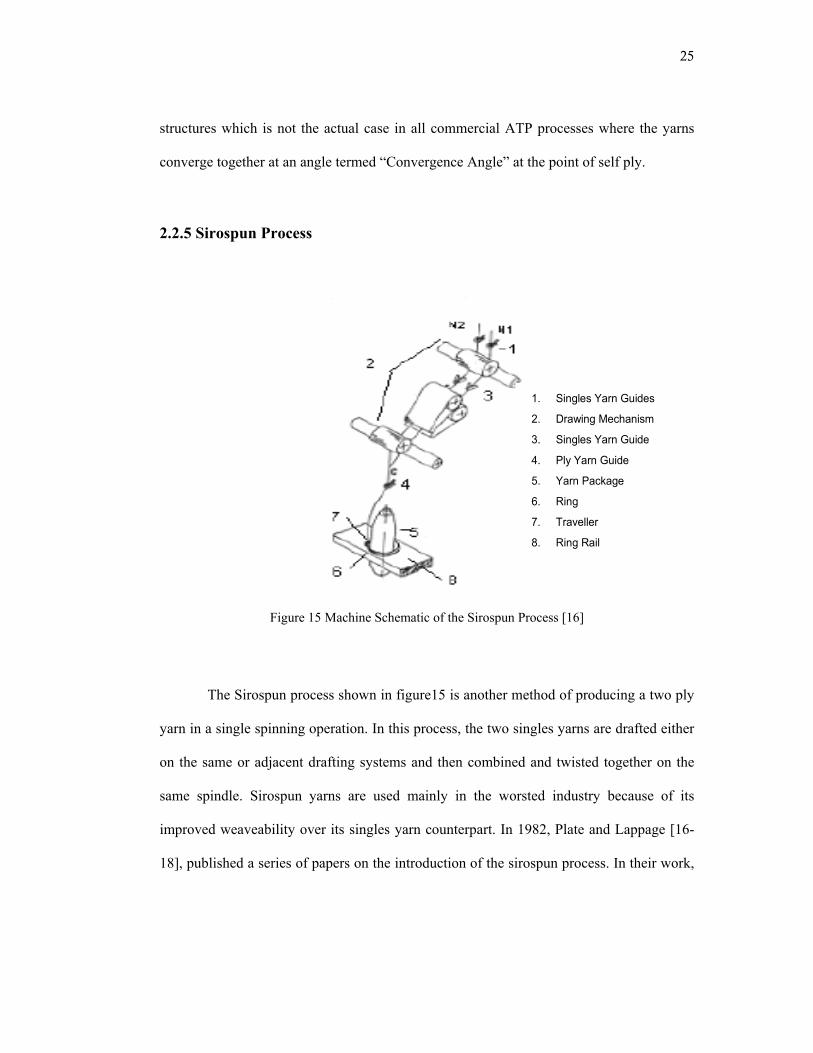
Figure 15 Machine Schematic of the Sirospun Process [16]
The Sirospun process shown in figure15 is another method of producing a two ply
yarn in a single spinning operation. In this process, the two singles yarns are drafted either
on the same or adjacent drafting systems and then combined and twisted together on the
same spindle. Sirospun yarns are used mainly in the worsted industry because of its
improved weaveability over its singles yarn counterpart. In 1982, Plate and Lappage [16-
18], published a series of papers on the introduction of the sirospun process. In their work,
1. Singles Yarn Guides
2. Drawing Mechanism
3. Singles Yarn Guide
4. Ply Yarn Guide
5. Yarn Package
6. Ring
7. Traveller
8. Ring Rail
26
the basis of the sirospun process was discussed and the theoretical model underlying the
process was presented.
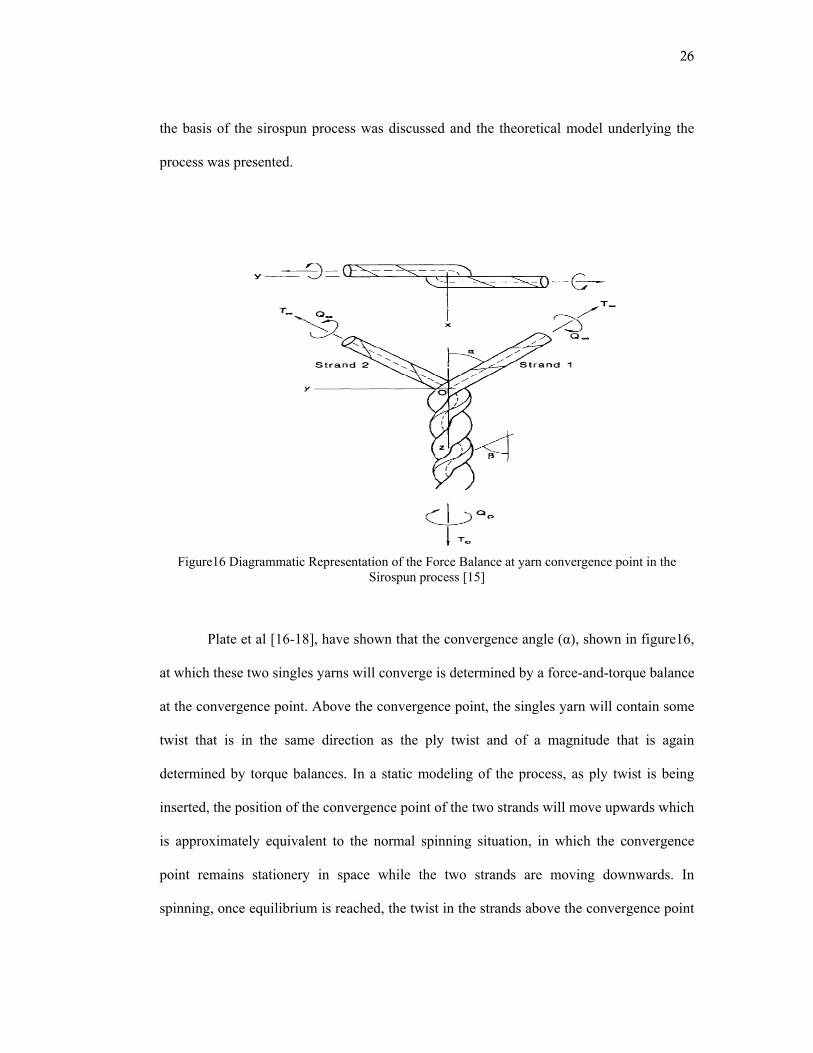
Figure16 Diagrammatic Representation of the Force Balance at yarn convergence point in the Sirospun process [15]
Plate et al [16-18], have shown that the convergence angle (α), shown in figure16,
at which these two singles yarns will converge is determined by a force-and-torque balance
at the convergence point. Above the convergence point, the singles yarn will contain some
twist that is in the same direction as the ply twist and of a magnitude that is again
determined by torque balances. In a static modeling of the process, as ply twist is being
inserted, the position of the convergence point of the two strands will move upwards which
is approximately equivalent to the normal spinning situation, in which the convergence
point remains stationery in space while the two strands are moving downwards. In
spinning, once equilibrium is reached, the twist in the strands above the convergence point
27
will remain constant. As the strands move downwards, the twist would run up the strands
so as to retain a constant position in space and the ply yarn below the convergence will
have no residual singles twist.
The sirospun model results [16, 17] showed that the level of twist generated in the
singles yarns above the convergence point at equilibrium relies solely on the ply twist and
the helix radius of the yarns inside the ply. This model was based on the idealizing
assumptions that the singles yarns are perfectly elastic and that the flexural rigidity of the
singles yarns are the same above and below the convergence point. Experimental
verification using rubber monofilaments showed good agreement with the theory. [18]
Miao et al, [19] also adopted an experimental procedure to investigate the steady-
state sirospun spinning geometry and the effect of some major machine variables on the
process. The experiments were conducted on a ring spinning frame and a high frequency
stroboscope in a single flash mode was used and synchronized with an automatic camera.
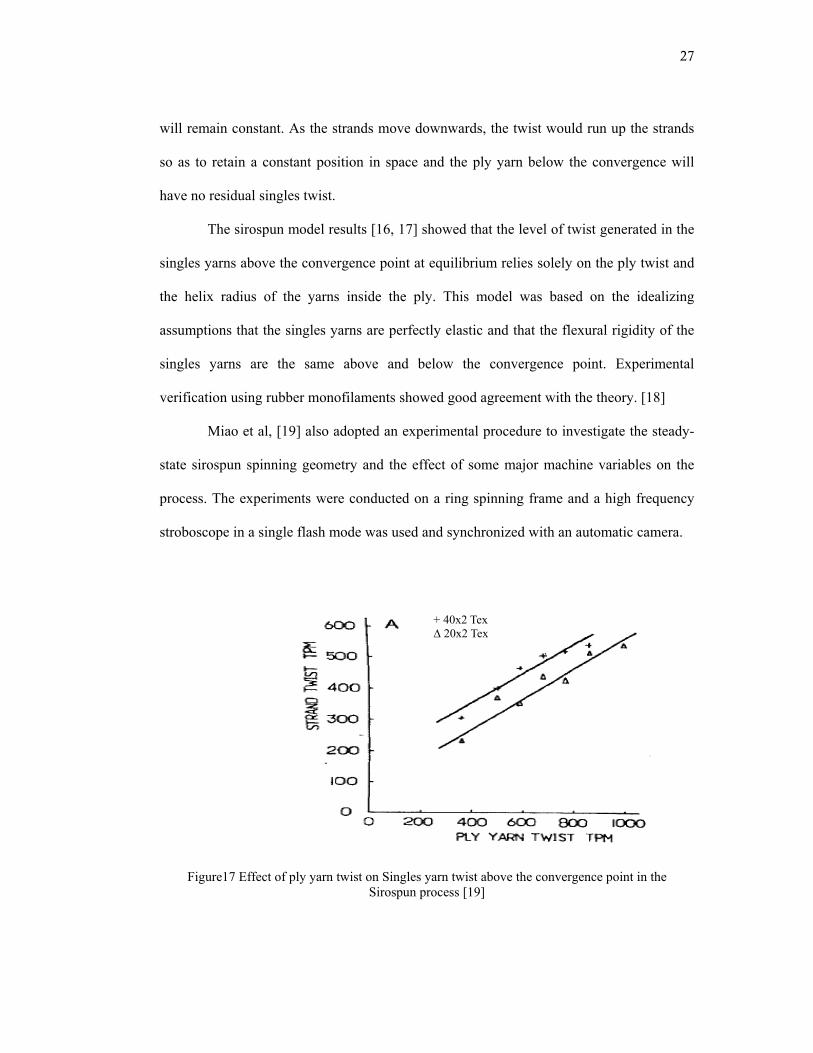
Figure17 Effect of ply yarn twist on Singles yarn twist above the convergence point in the Sirospun process [19]
+ 40x2 Tex ∆ 20x2 Tex
28
Their main results, figure17, show that as the ply twist increases, the singles yarn
twist above the convergence point also increases. However, the singles to ply twist ratio
decreases considerably when the ply twist increases. It was also shown that as the spinning
tension increases, the singles yarn twist above the convergence point increases.
From the stand point of this thesis, the understanding of the sirospun process was
very important and has a strong relevance to the understanding of the effect of major
process variables in the ATP process as will be discussed in Chapter 8.
2.3 Commercial Alternate Twist Ply Processes
2.3.1 Repco ATP Process
The Repco ATP process has been around since the 1970’s. While the system
never gained wide acceptance, it developed a niche market in Europe for the production of
high-bulk acrylic yarns. [20] There were several in-house modifications applied over the
years. These evolutionary concepts all have been combined into one unit marketed by the
England-based Macart Spinning Systems as the Platt Self Twist Spinner 888 shown in
figure 18. [21] The ATP yarn is formed by continuously advancing the singles yarns and
inserting alternating 'S' and 'Z' twists in the singles yarns emerging from the drafting
system. Twist insertion is done by passing the singles yarns between rollers which
reciprocate along their axes as they rotate to deliver the yarns. The singles yarns are then
brought together and allowed to self ply around each other to form a two ply yarn
construction. The Repco process intermittently stops for reversing the singles yarn twist
after each cycle. A complete cycle of 'S' and 'Z' twists occurs every 22 cm, providing a
very short twist reversal length, which greatly affects the yarn appearance.
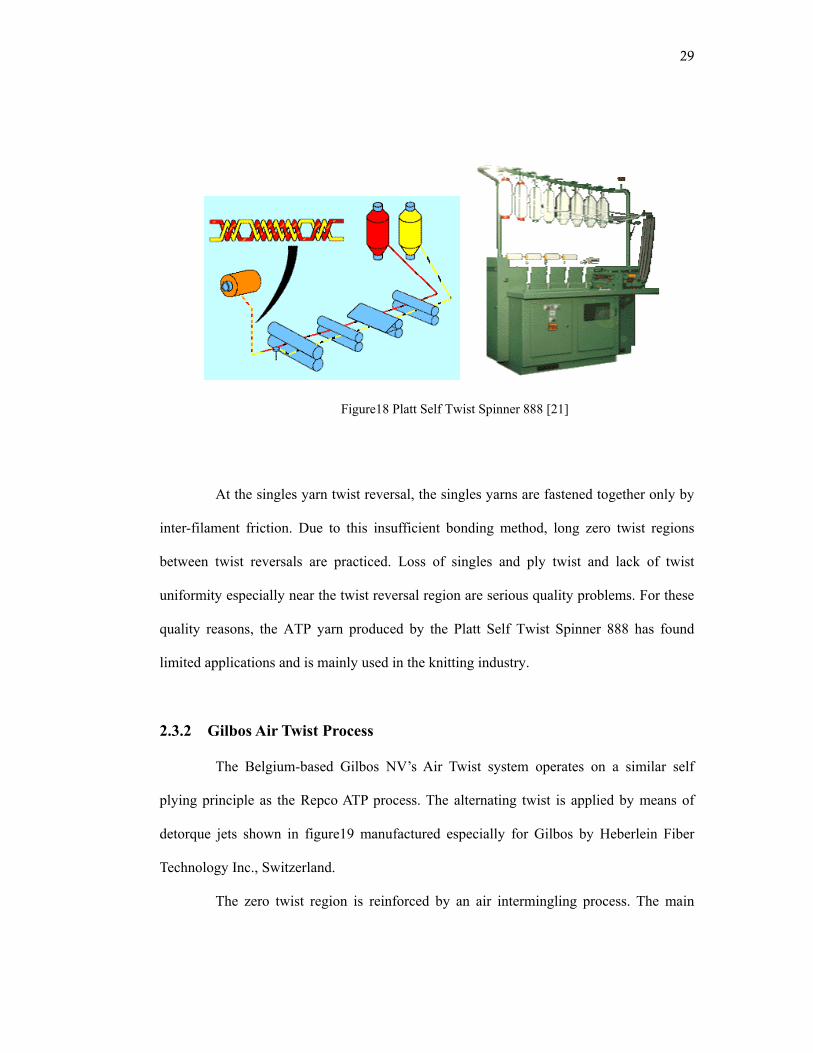
29
Figure18 Platt Self Twist Spinner 888 [21]
At the singles yarn twist reversal, the singles yarns are fastened together only by
inter-filament friction. Due to this insufficient bonding method, long zero twist regions
between twist reversals are practiced. Loss of singles and ply twist and lack of twist
uniformity especially near the twist reversal region are serious quality problems. For these
quality reasons, the ATP yarn produced by the Platt Self Twist Spinner 888 has found
limited applications and is mainly used in the knitting industry.
2.3.2 Gilbos Air Twist Process
The Belgium-based Gilbos NV’s Air Twist system operates on a similar self
plying principle as the Repco ATP process. The alternating twist is applied by means of
detorque jets shown in figure19 manufactured especially for Gilbos by Heberlein Fiber
Technology Inc., Switzerland.
The zero twist region is reinforced by an air intermingling process. The main
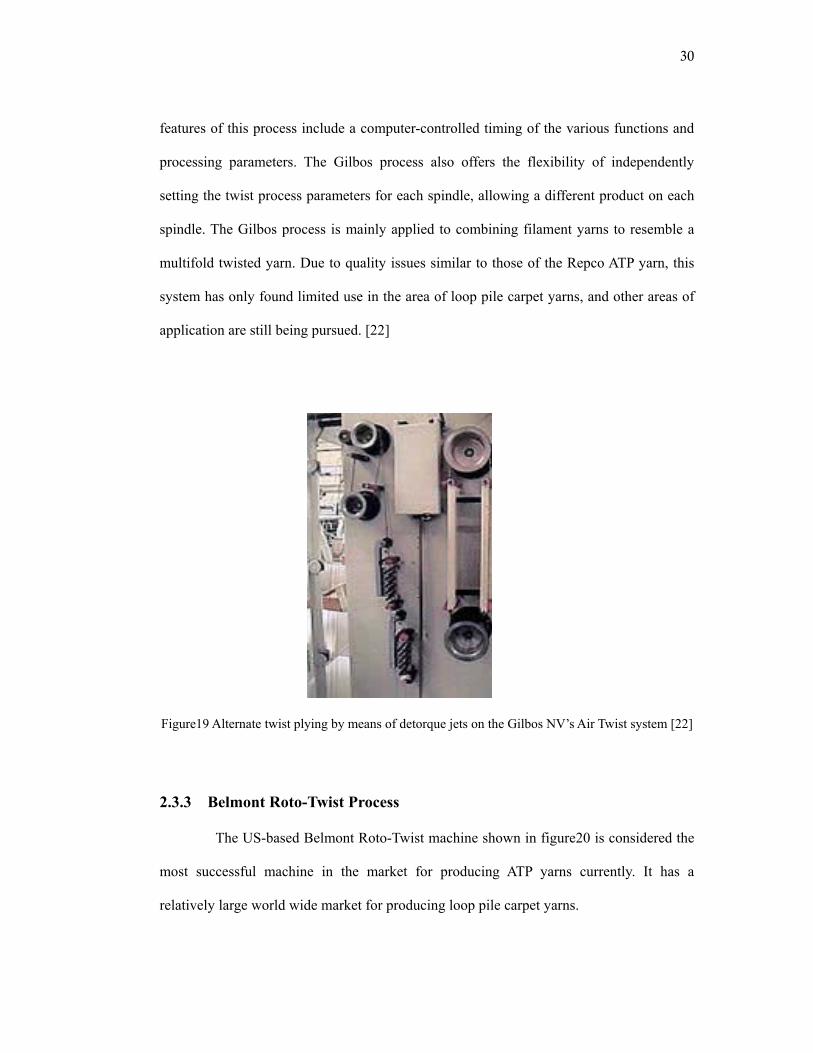
30
features of this process include a computer-controlled timing of the various functions and
processing parameters. The Gilbos process also offers the flexibility of independently
setting the twist process parameters for each spindle, allowing a different product on each
spindle. The Gilbos process is mainly applied to combining filament yarns to resemble a
multifold twisted yarn. Due to quality issues similar to those of the Repco ATP yarn, this
system has only found limited use in the area of loop pile carpet yarns, and other areas of
application are still being pursued. [22]
Figure19 Alternate twist plying by means of detorque jets on the Gilbos NV’s Air Twist system [22]
2.3.3 Belmont Roto-Twist Process
The US-based Belmont Roto-Twist machine shown in figure20 is considered the
most successful machine in the market for producing ATP yarns currently. It has a
relatively large world wide market for producing loop pile carpet yarns.
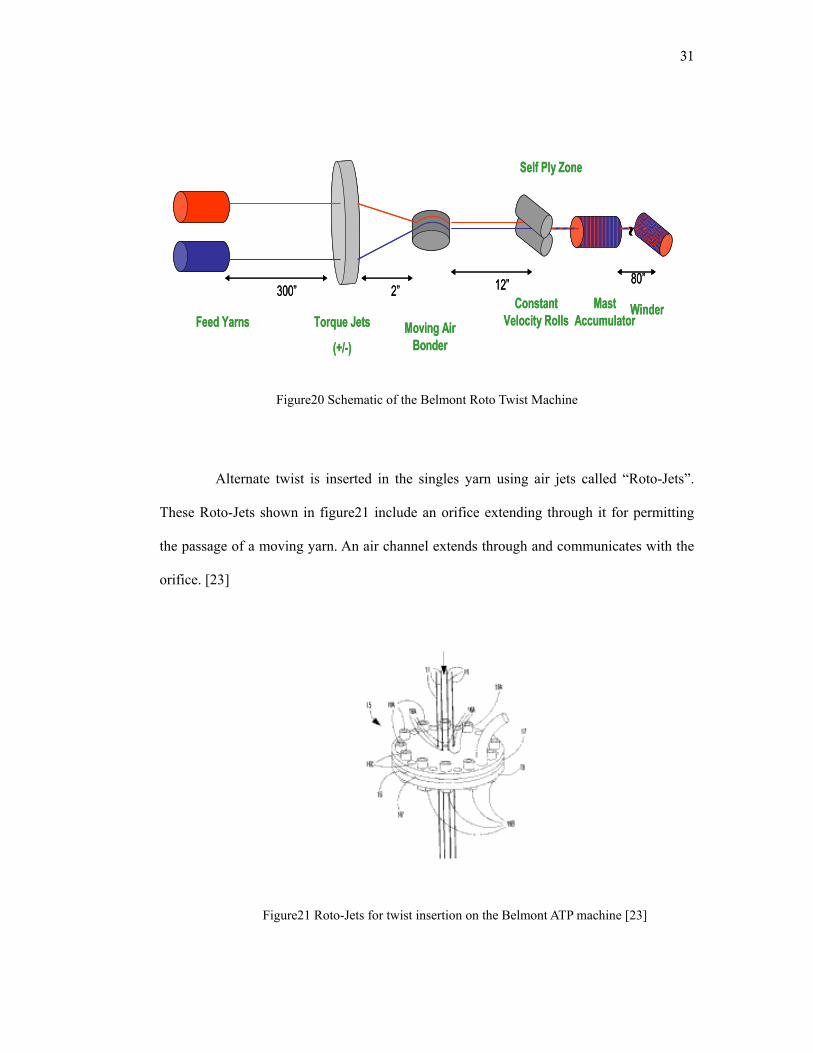
31
Figure20 Schematic of the Belmont Roto Twist Machine
Alternate twist is inserted in the singles yarn using air jets called “Roto-Jets”.
These Roto-Jets shown in figure21 include an orifice extending through it for permitting
the passage of a moving yarn. An air channel extends through and communicates with the
orifice. [23]
Figure21 Roto-Jets for twist insertion on the Belmont ATP machine [23]
Feed Yarns Torque Jets
(+/-)
Winder
Self Ply Zone
300” 2” 12”Constant
Velocity RollsMast
Accumulator
~
Moving Air Bonder
80”
Feed Yarns Torque Jets
(+/-)
Winder
Self Ply Zone
300” 2” 12”Constant
Velocity RollsMast
Accumulator
~
Moving Air Bonder
80”

32
This air channel communicates with the orifice at a tangentially-offset angle to
the path of the yarn through the orifice to create a cyclonic air circulation pattern in the
orifice to insert a predetermined direction of twist into the yarn as the yarn passes through
the orifice. [23] The twisted singles yarns are then bonded together by an air tack before
they are allowed to self ply, as shown in figure22.
Figure22 Air Tack Bond on the Belmont Roto-Twist Machine
This air tack is inserted using a moving air bonder that allows the Roto-Twist
machine to be a continuous non stop process that can run at very high speeds reaching 600
yd/min. One of the main features of this process is the delayed self plying zone, where the
bonded singles yarns are not allowed to self ply except after they are taken up by a
constant velocity roll. The ATP yarns are then wound on a mast accumulator which ensures
a continuous yarn supply to subsequent processes in the production line. The Belmont
Roto-twist process produces ATP yarns with long twist reversal lengths of about three feet.
The Roto-Twist machine also has the flexibility of producing up to six plies in the yarn
structure. Despite this very high productivity and the large flexibility that the Belmont
Roto-twist process offers, these ATP yarns can not be used as cut pile carpet yarns. This is
mainly attributed to the relatively long zero twist regions that exist between the twist
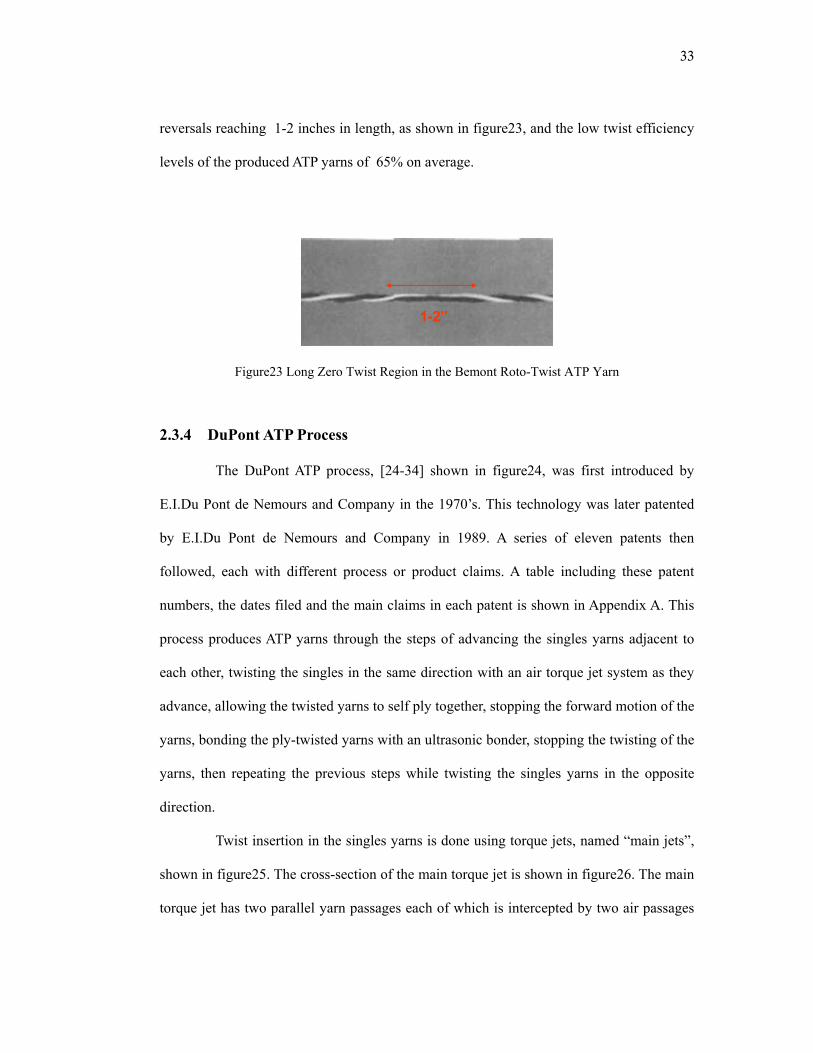
33
reversals reaching 1-2 inches in length, as shown in figure23, and the low twist efficiency
levels of the produced ATP yarns of 65% on average.
Figure23 Long Zero Twist Region in the Bemont Roto-Twist ATP Yarn
2.3.4 DuPont ATP Process
The DuPont ATP process, [24-34] shown in figure24, was first introduced by
E.I.Du Pont de Nemours and Company in the 1970’s. This technology was later patented
by E.I.Du Pont de Nemours and Company in 1989. A series of eleven patents then
followed, each with different process or product claims. A table including these patent
numbers, the dates filed and the main claims in each patent is shown in Appendix A. This
process produces ATP yarns through the steps of advancing the singles yarns adjacent to
each other, twisting the singles in the same direction with an air torque jet system as they
advance, allowing the twisted yarns to self ply together, stopping the forward motion of the
yarns, bonding the ply-twisted yarns with an ultrasonic bonder, stopping the twisting of the
yarns, then repeating the previous steps while twisting the singles yarns in the opposite
direction.
Twist insertion in the singles yarns is done using torque jets, named “main jets”,
shown in figure25. The cross-section of the main torque jet is shown in figure26. The main
torque jet has two parallel yarn passages each of which is intercepted by two air passages
1-2”1-2”
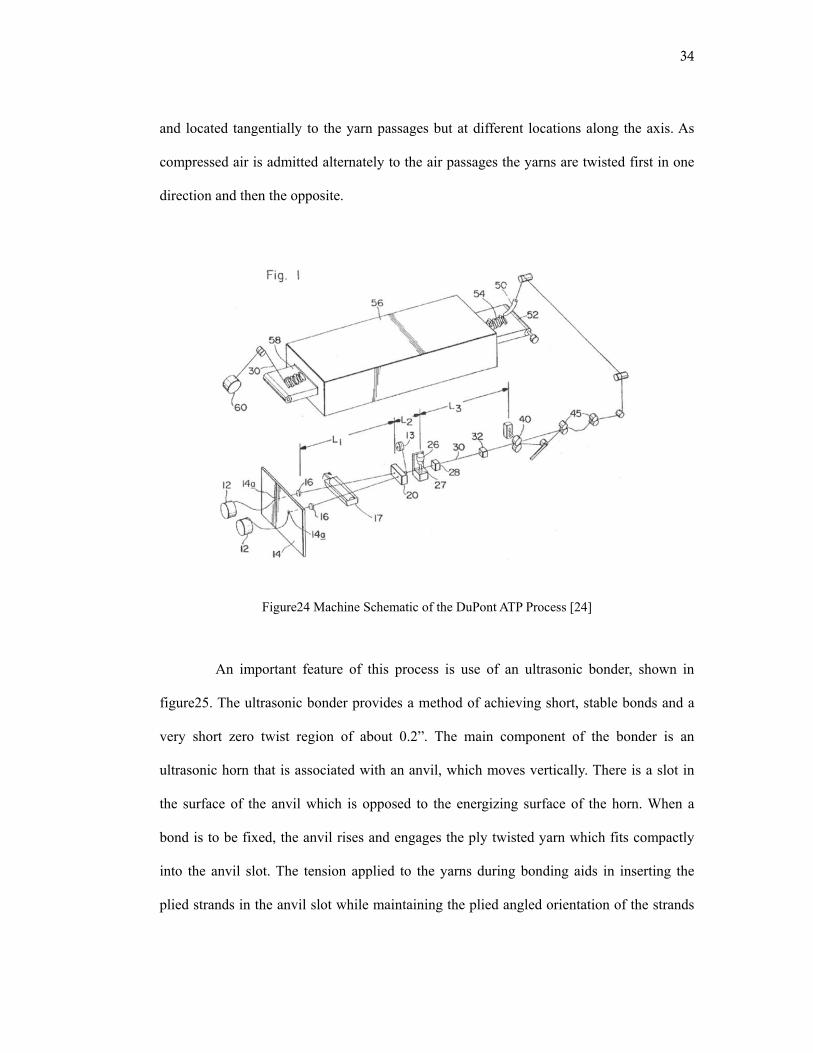
34
and located tangentially to the yarn passages but at different locations along the axis. As
compressed air is admitted alternately to the air passages the yarns are twisted first in one
direction and then the opposite.
Figure24 Machine Schematic of the DuPont ATP Process [24]
An important feature of this process is use of an ultrasonic bonder, shown in
figure25. The ultrasonic bonder provides a method of achieving short, stable bonds and a
very short zero twist region of about 0.2”. The main component of the bonder is an
ultrasonic horn that is associated with an anvil, which moves vertically. There is a slot in
the surface of the anvil which is opposed to the energizing surface of the horn. When a
bond is to be fixed, the anvil rises and engages the ply twisted yarn which fits compactly
into the anvil slot. The tension applied to the yarns during bonding aids in inserting the
plied strands in the anvil slot while maintaining the plied angled orientation of the strands
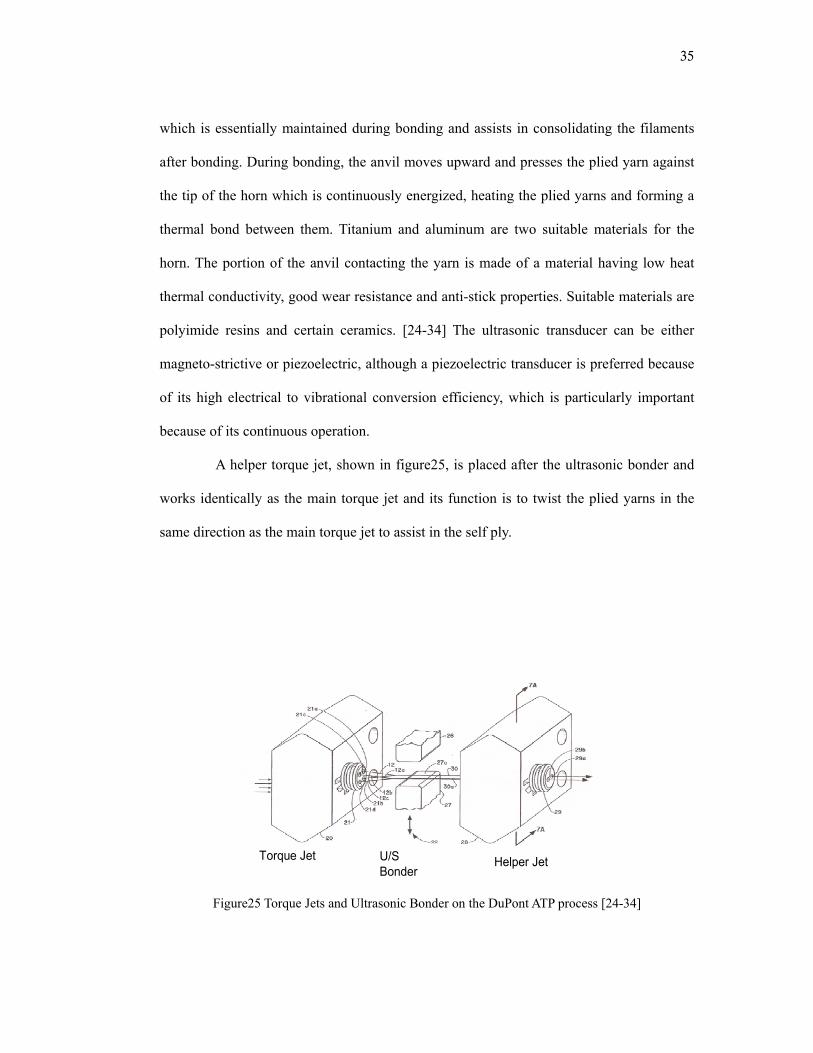
35
which is essentially maintained during bonding and assists in consolidating the filaments
after bonding. During bonding, the anvil moves upward and presses the plied yarn against
the tip of the horn which is continuously energized, heating the plied yarns and forming a
thermal bond between them. Titanium and aluminum are two suitable materials for the
horn. The portion of the anvil contacting the yarn is made of a material having low heat
thermal conductivity, good wear resistance and anti-stick properties. Suitable materials are
polyimide resins and certain ceramics. [24-34] The ultrasonic transducer can be either
magneto-strictive or piezoelectric, although a piezoelectric transducer is preferred because
of its high electrical to vibrational conversion efficiency, which is particularly important
because of its continuous operation.
A helper torque jet, shown in figure25, is placed after the ultrasonic bonder and
works identically as the main torque jet and its function is to twist the plied yarns in the
same direction as the main torque jet to assist in the self ply.
Figure25 Torque Jets and Ultrasonic Bonder on the DuPont ATP process [24-34]
Helper JetU/S Bonder
Torque Jet Helper JetU/S Bonder
Helper JetU/S Bonder
Torque Jet
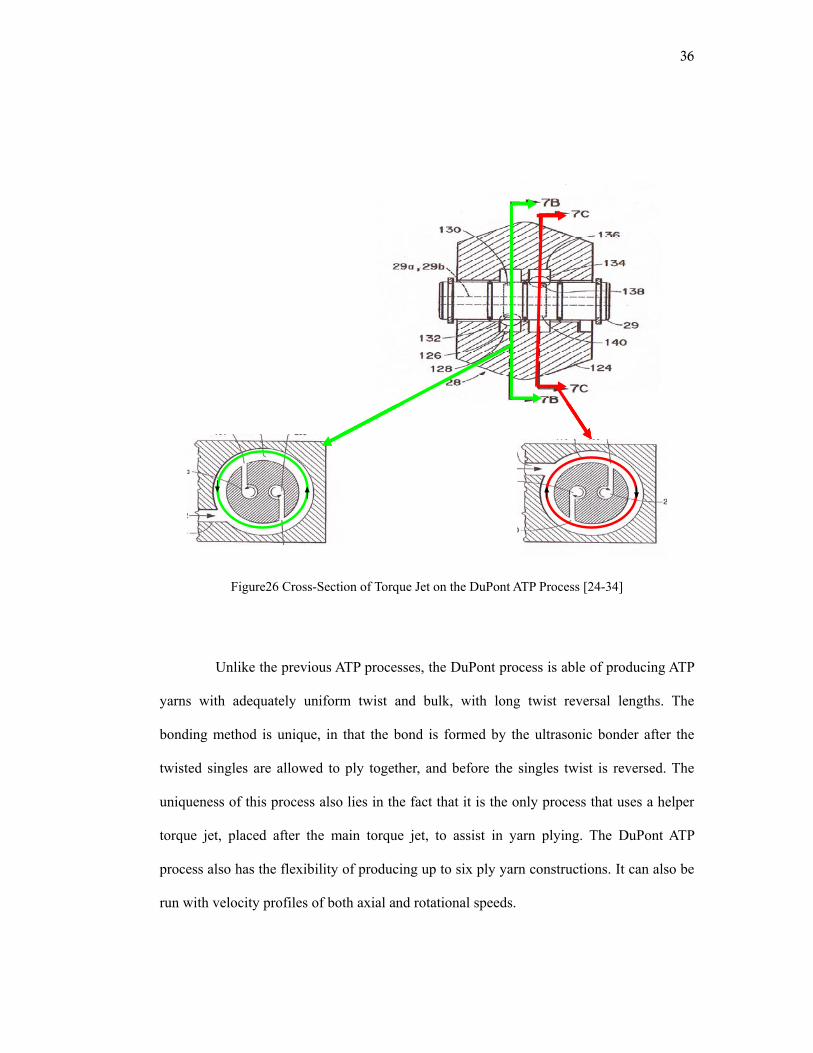
36
Figure26 Cross-Section of Torque Jet on the DuPont ATP Process [24-34]
Unlike the previous ATP processes, the DuPont process is able of producing ATP
yarns with adequately uniform twist and bulk, with long twist reversal lengths. The
bonding method is unique, in that the bond is formed by the ultrasonic bonder after the
twisted singles are allowed to ply together, and before the singles twist is reversed. The
uniqueness of this process also lies in the fact that it is the only process that uses a helper
torque jet, placed after the main torque jet, to assist in yarn plying. The DuPont ATP
process also has the flexibility of producing up to six ply yarn constructions. It can also be
run with velocity profiles of both axial and rotational speeds.
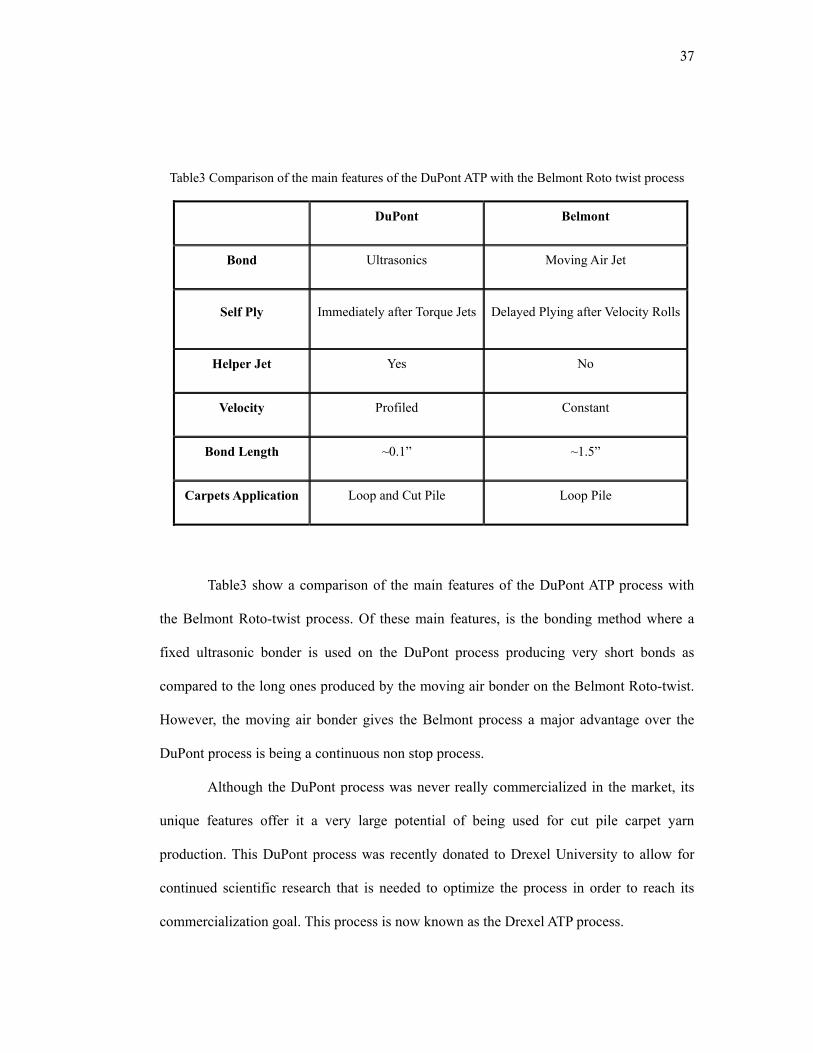
37
Table3 Comparison of the main features of the DuPont ATP with the Belmont Roto twist process
DuPont Belmont
Bond Ultrasonics Moving Air Jet
Self Ply Immediately after Torque Jets Delayed Plying after Velocity Rolls
Helper Jet Yes No
Velocity Profiled Constant
Bond Length ~0.1” ~1.5”
Carpets Application Loop and Cut Pile Loop Pile
Table3 show a comparison of the main features of the DuPont ATP process with
the Belmont Roto-twist process. Of these main features, is the bonding method where a
fixed ultrasonic bonder is used on the DuPont process producing very short bonds as
compared to the long ones produced by the moving air bonder on the Belmont Roto-twist.
However, the moving air bonder gives the Belmont process a major advantage over the
DuPont process is being a continuous non stop process.
Although the DuPont process was never really commercialized in the market, its
unique features offer it a very large potential of being used for cut pile carpet yarn
production. This DuPont process was recently donated to Drexel University to allow for
continued scientific research that is needed to optimize the process in order to reach its
commercialization goal. This process is now known as the Drexel ATP process.
38
CHAPTER 3: OBJECTIVES
One of the largest applications of ply yarn is in the carpet industry. The cabling
process is currently the primary process used to supply ply yarns to the carpet industry.
However its major drawbacks in speed limitation and product flexibility, urge the need for
the development of an alternate process for ply yarn production. Current researches in
conventional ply twisting processes have been aimed to increase their production speeds,
but to date, none of these developments have been successful to achieve significant
improvements compatible with today’s dynamic market strategies. The ATP yarn
technology has been recognized for its ability to produce ply yarns at ultimate production
speeds. Few currently available commercial ATP processes, reviewed in Chapter2, have
been able produce ATP yarns for use in loop pile carpets. However, efforts to produce
ATP yarns for use in cut pile carpets have not been yet fruitful. The yarn prerequisites for
such a use are the uniformity of the twist profile along the ATP yarn length and high yarn
twist efficiency. The Drexel ATP process, (based on the DuPont ATP), has been identified
as a promising process for production of ATP yarns with the required high quality levels at
very competitive production speeds.
Since alternate twist plying with ultrasonic bonding and profiled velocity offer
the possibility of high speed high quality yarn production, it is envisioned that optimizing
the ATP yarn twist profile and yarn twist efficiency on the Drexel ATP would enable its use
for cut pile carpet yarn production. Successful demonstration of this pilot-scale process
should lead to demonstration on a commercial machine.
39
The objectives of this thesis are:
3.1 Production of ATP yarn on the Drexel ATP process
This section presents an investigation into the feasibility of producing ATP yarns
with reproducible characteristics on the Drexel ATP process. Bulk Continuous filament
(BCF) nylon yarns were mostly used as being the most common material used in cut pile
carpet yarns.
3.2 Characterization of the ATP yarn
This section establishes the characterization procedures used for the quantitative
evaluation of the ATP yarn twist profile and twist efficiency.
3.3 Process Optimization and Prediction of the Yarn Twist Profile
The main objective of this section it to improve the yarn twist profile of the Drexel
ATP process to achieve a square wave twist profile shown in figure27. The main features
of a square wave twist profile is a constant twist level along the twist reversal length with a
sharp transition from “S” to “Z” twist at twist direction alternation. A square wave twist
profile should have a very short zero twist region including the bond of approximately
0.2inch. This objective is approached by providing an understanding of how the twist is
inserted in the yarn along its path through the different zones of the ATP process and thus
controlling the yarn twist profile.
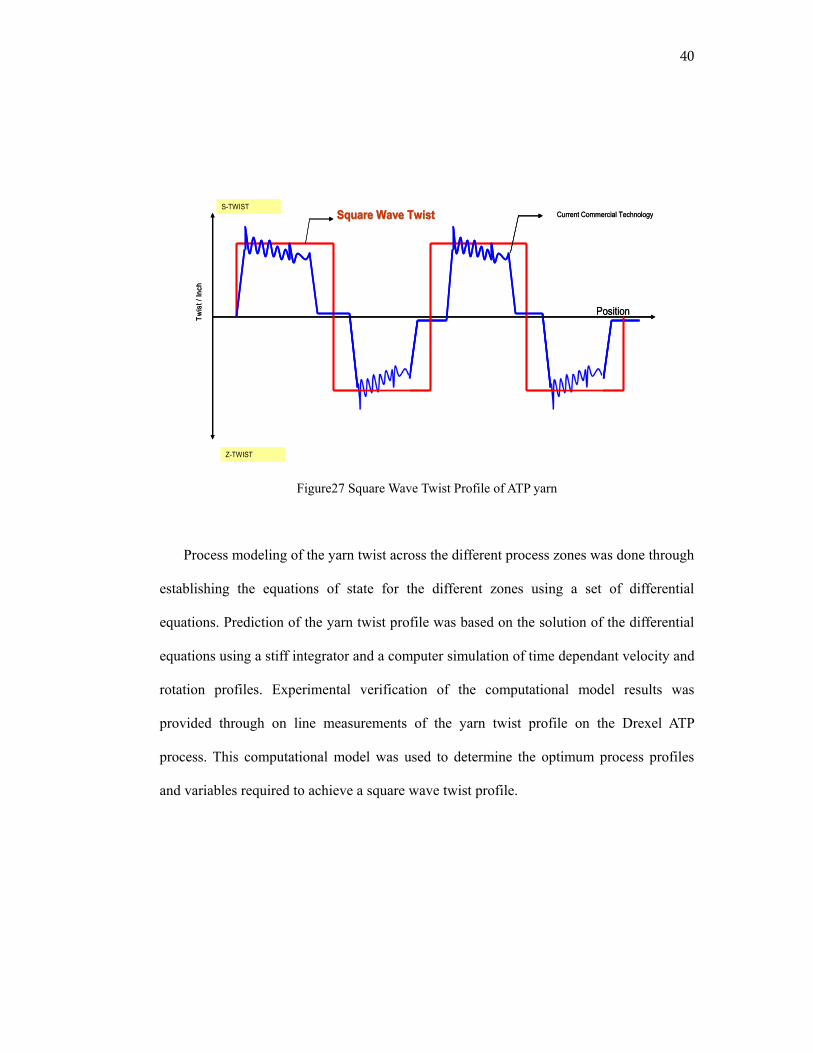
40
Figure27 Square Wave Twist Profile of ATP yarn
Process modeling of the yarn twist across the different process zones was done through
establishing the equations of state for the different zones using a set of differential
equations. Prediction of the yarn twist profile was based on the solution of the differential
equations using a stiff integrator and a computer simulation of time dependant velocity and
rotation profiles. Experimental verification of the computational model results was
provided through on line measurements of the yarn twist profile on the Drexel ATP
process. This computational model was used to determine the optimum process profiles
and variables required to achieve a square wave twist profile.
Position
Square Wave TwistSquare Wave TwistTw
ist /
Inch
Current Commercial TechnologyS-TWIST
Z-TWIST
Position
Square Wave TwistSquare Wave TwistTw
ist /
Inch
Current Commercial TechnologyS-TWIST
Z-TWIST
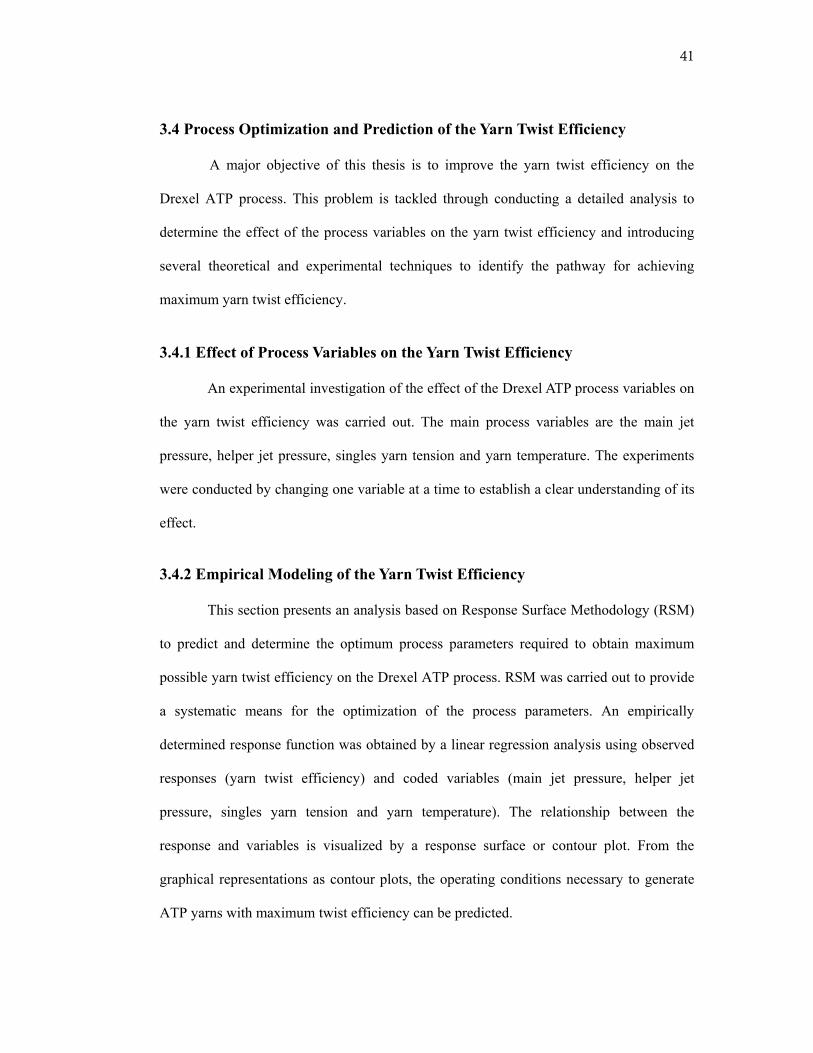
41
3.4 Process Optimization and Prediction of the Yarn Twist Efficiency
A major objective of this thesis is to improve the yarn twist efficiency on the
Drexel ATP process. This problem is tackled through conducting a detailed analysis to
determine the effect of the process variables on the yarn twist efficiency and introducing
several theoretical and experimental techniques to identify the pathway for achieving
maximum yarn twist efficiency.
3.4.1 Effect of Process Variables on the Yarn Twist Efficiency
An experimental investigation of the effect of the Drexel ATP process variables on
the yarn twist efficiency was carried out. The main process variables are the main jet
pressure, helper jet pressure, singles yarn tension and yarn temperature. The experiments
were conducted by changing one variable at a time to establish a clear understanding of its
effect.
3.4.2 Empirical Modeling of the Yarn Twist Efficiency
This section presents an analysis based on Response Surface Methodology (RSM)
to predict and determine the optimum process parameters required to obtain maximum
possible yarn twist efficiency on the Drexel ATP process. RSM was carried out to provide
a systematic means for the optimization of the process parameters. An empirically
determined response function was obtained by a linear regression analysis using observed
responses (yarn twist efficiency) and coded variables (main jet pressure, helper jet
pressure, singles yarn tension and yarn temperature). The relationship between the
response and variables is visualized by a response surface or contour plot. From the
graphical representations as contour plots, the operating conditions necessary to generate
ATP yarns with maximum twist efficiency can be predicted.
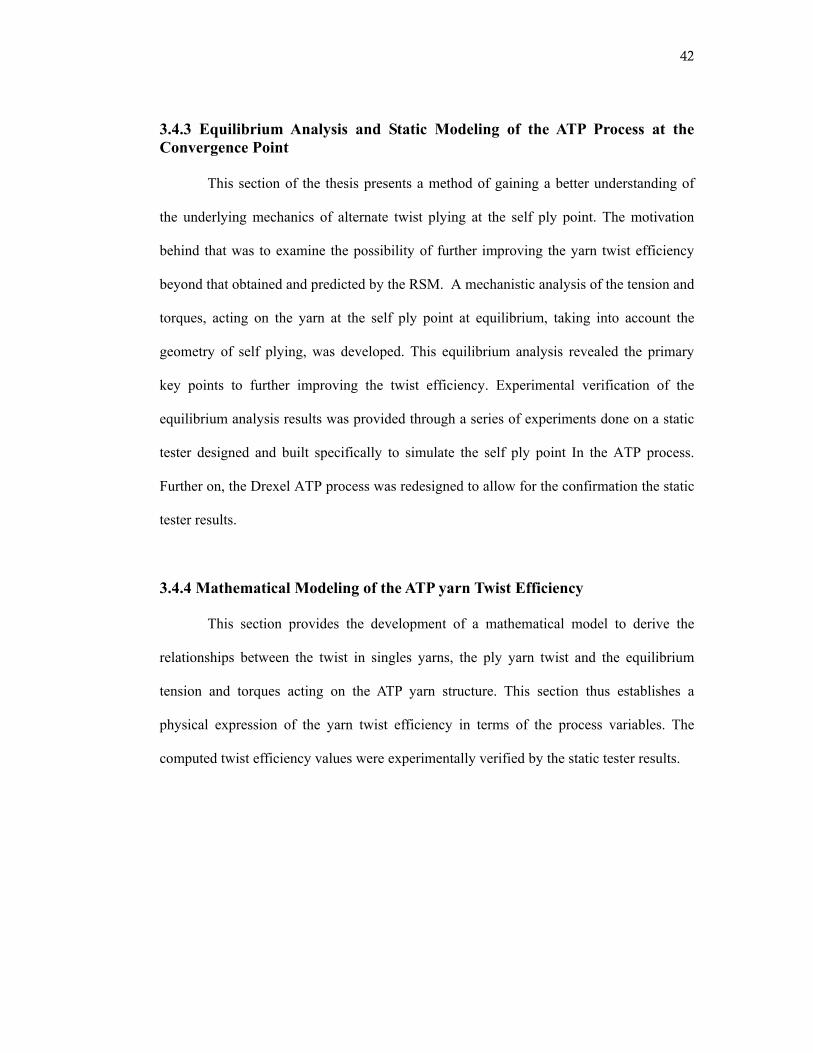
42
3.4.3 Equilibrium Analysis and Static Modeling of the ATP Process at the Convergence Point
This section of the thesis presents a method of gaining a better understanding of
the underlying mechanics of alternate twist plying at the self ply point. The motivation
behind that was to examine the possibility of further improving the yarn twist efficiency
beyond that obtained and predicted by the RSM. A mechanistic analysis of the tension and
torques, acting on the yarn at the self ply point at equilibrium, taking into account the
geometry of self plying, was developed. This equilibrium analysis revealed the primary
key points to further improving the twist efficiency. Experimental verification of the
equilibrium analysis results was provided through a series of experiments done on a static
tester designed and built specifically to simulate the self ply point In the ATP process.
Further on, the Drexel ATP process was redesigned to allow for the confirmation the static
tester results.
3.4.4 Mathematical Modeling of the ATP yarn Twist Efficiency
This section provides the development of a mathematical model to derive the
relationships between the twist in singles yarns, the ply yarn twist and the equilibrium
tension and torques acting on the ATP yarn structure. This section thus establishes a
physical expression of the yarn twist efficiency in terms of the process variables. The
computed twist efficiency values were experimentally verified by the static tester results.
43
CHAPTER 4: MATERIAL AND METHODS
4.1 Introduction
The objectives of this thesis were applied to the Drexel ATP Process which is
based on the DuPont ATP described in Section 2.3.4. This process was donated from
DuPont to Drexel University. In order to be able obtain reliable and reproducible data,
several upgrades were required. The following section describes the main machine
components of the Drexel ATP process and includes a description of the upgrading of
several features in it. The remaining sections, of this chapter, include descriptions of the
materials and methods employed in attaining the thesis objectives. The experimental parts
of this thesis can be subdivided according to the objectives into the following sections: 1)
Production of ATP yarn on the Drexel ATP process 2) Characterization of the ATP yarns
3) Process optimization of the yarn twist profile and yarn twist efficiency.
4.2 Upgrading of the Drexel ATP Process
The Drexel ATP process, donated from DuPont, is shown in figure28. The Drexel
ATP process in its initial status was composed of a two yarn holder wooden creel, a
stainless steel plate, with the main jets, the ultrasonic bonder and the helper jet mounted on
it, in a horizontal plane and a profiled velocity roll. The main jets, ultrasonic bonder and
helper jets, shown in figure29, represent the key elements characterizing the Drexel ATP
process. Several process and machinery upgrades including the addition of new machine
components were required in order to enable continuous production of ATP yarns on the
Drexel ATP process. This equipment upgrade was also crucial because of the need to
ensure that the ATP yarn features resulting from the different experimental trials,
conducted to achieve the thesis objectives, are reliable and reproducible.
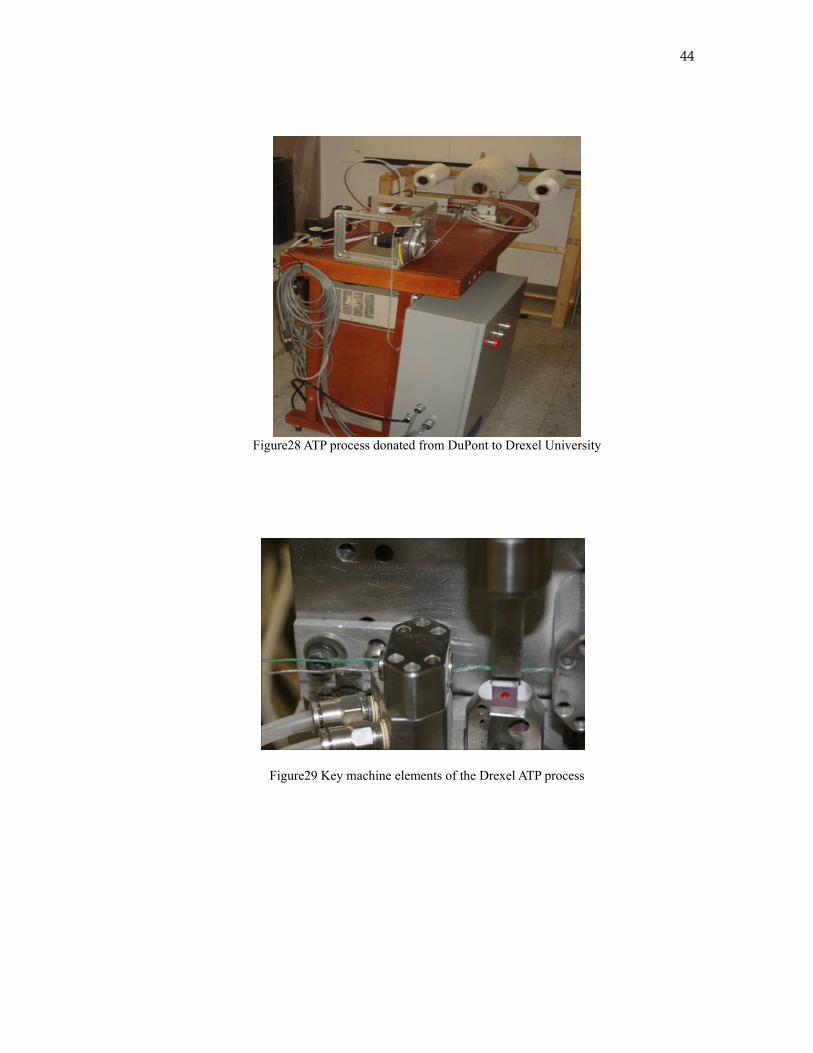
44
Figure28 ATP process donated from DuPont to Drexel University
Figure29 Key machine elements of the Drexel ATP process
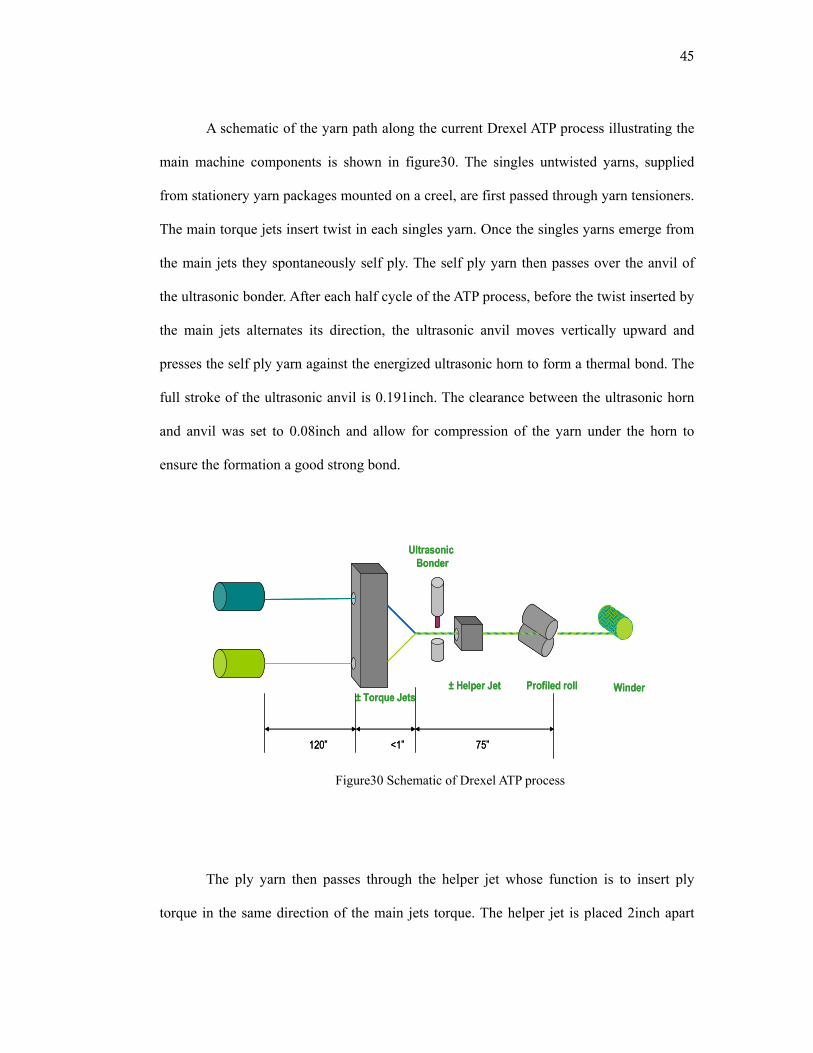
45
A schematic of the yarn path along the current Drexel ATP process illustrating the
main machine components is shown in figure30. The singles untwisted yarns, supplied
from stationery yarn packages mounted on a creel, are first passed through yarn tensioners.
The main torque jets insert twist in each singles yarn. Once the singles yarns emerge from
the main jets they spontaneously self ply. The self ply yarn then passes over the anvil of
the ultrasonic bonder. After each half cycle of the ATP process, before the twist inserted by
the main jets alternates its direction, the ultrasonic anvil moves vertically upward and
presses the self ply yarn against the energized ultrasonic horn to form a thermal bond. The
full stroke of the ultrasonic anvil is 0.191inch. The clearance between the ultrasonic horn
and anvil was set to 0.08inch and allow for compression of the yarn under the horn to
ensure the formation a good strong bond.
Figure30 Schematic of Drexel ATP process
The ply yarn then passes through the helper jet whose function is to insert ply
torque in the same direction of the main jets torque. The helper jet is placed 2inch apart
± Torque Jets± Helper Jet
UltrasonicBonder
Profiled roll Winder
120” <1” 75”
± Torque Jets± Helper Jet
UltrasonicBonder
Profiled roll Winder
120” <1” 75”
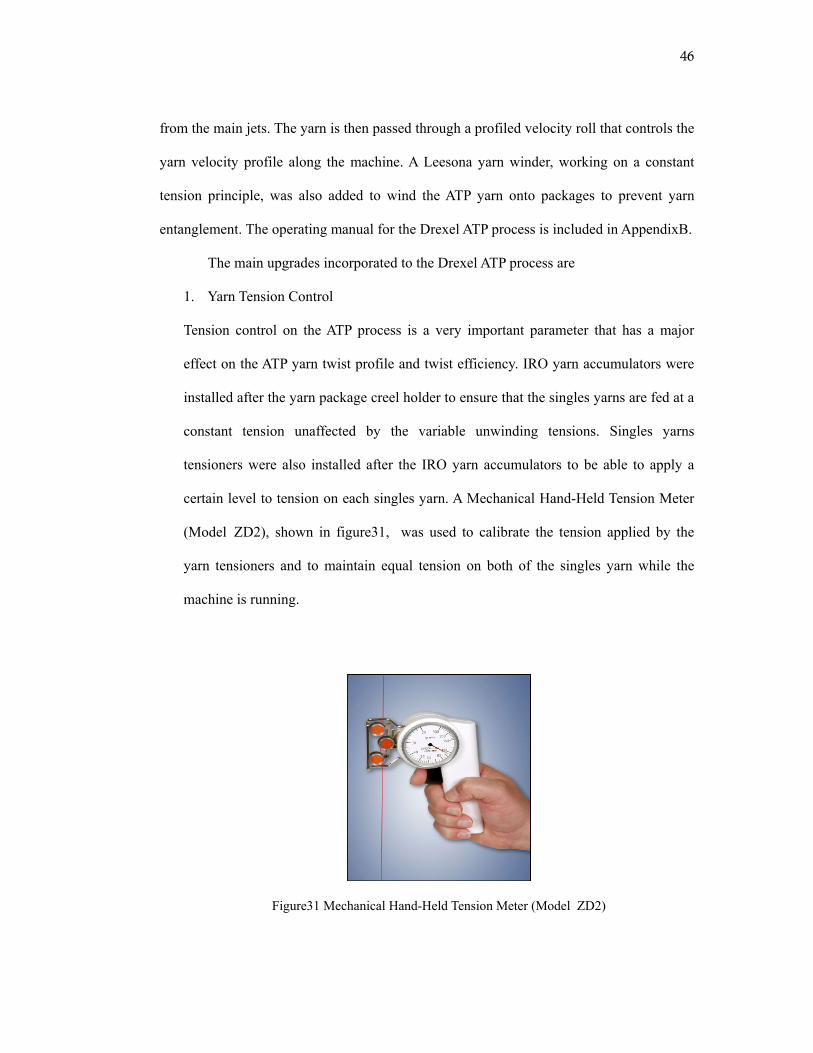
46
from the main jets. The yarn is then passed through a profiled velocity roll that controls the
yarn velocity profile along the machine. A Leesona yarn winder, working on a constant
tension principle, was also added to wind the ATP yarn onto packages to prevent yarn
entanglement. The operating manual for the Drexel ATP process is included in AppendixB.
The main upgrades incorporated to the Drexel ATP process are
1. Yarn Tension Control
Tension control on the ATP process is a very important parameter that has a major
effect on the ATP yarn twist profile and twist efficiency. IRO yarn accumulators were
installed after the yarn package creel holder to ensure that the singles yarns are fed at a
constant tension unaffected by the variable unwinding tensions. Singles yarns
tensioners were also installed after the IRO yarn accumulators to be able to apply a
certain level to tension on each singles yarn. A Mechanical Hand-Held Tension Meter
(Model ZD2), shown in figure31, was used to calibrate the tension applied by the
yarn tensioners and to maintain equal tension on both of the singles yarn while the
machine is running.
Figure31 Mechanical Hand-Held Tension Meter (Model ZD2)
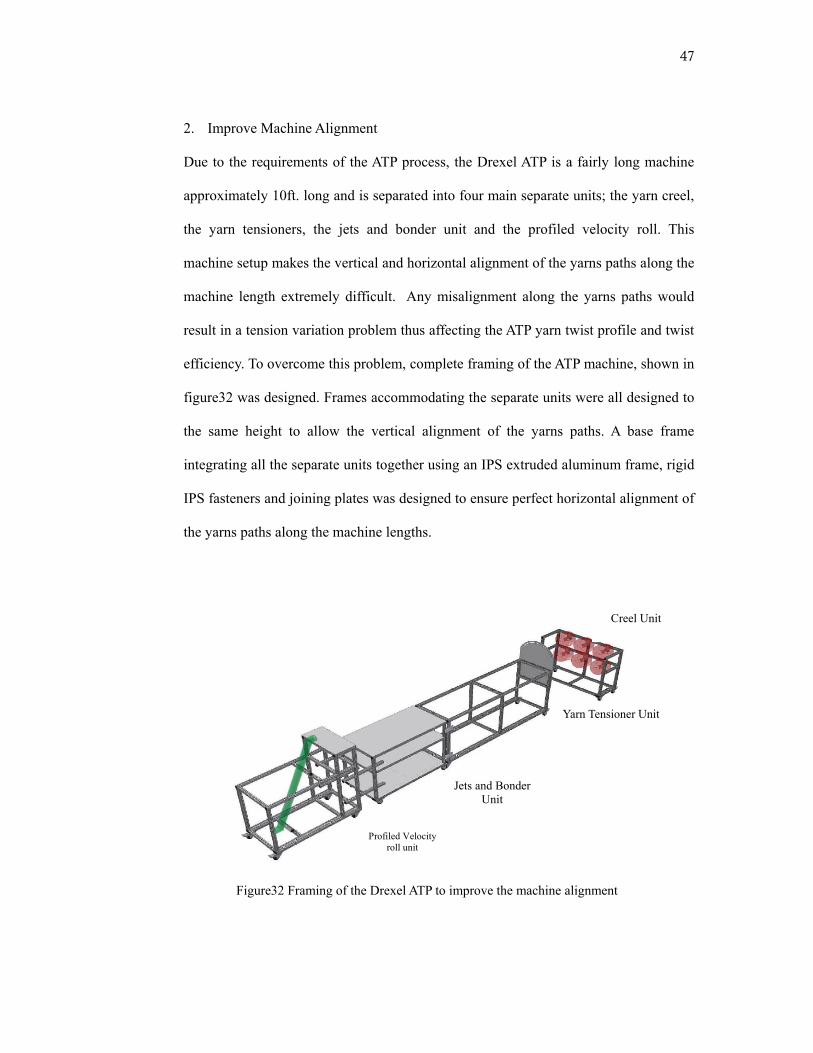
47
2. Improve Machine Alignment
Due to the requirements of the ATP process, the Drexel ATP is a fairly long machine
approximately 10ft. long and is separated into four main separate units; the yarn creel,
the yarn tensioners, the jets and bonder unit and the profiled velocity roll. This
machine setup makes the vertical and horizontal alignment of the yarns paths along the
machine length extremely difficult. Any misalignment along the yarns paths would
result in a tension variation problem thus affecting the ATP yarn twist profile and twist
efficiency. To overcome this problem, complete framing of the ATP machine, shown in
figure32 was designed. Frames accommodating the separate units were all designed to
the same height to allow the vertical alignment of the yarns paths. A base frame
integrating all the separate units together using an IPS extruded aluminum frame, rigid
IPS fasteners and joining plates was designed to ensure perfect horizontal alignment of
the yarns paths along the machine lengths.
Figure32 Framing of the Drexel ATP to improve the machine alignment
Profiled Velocity roll unit
Creel Unit
Yarn Tensioner Unit
Jets and Bonder Unit
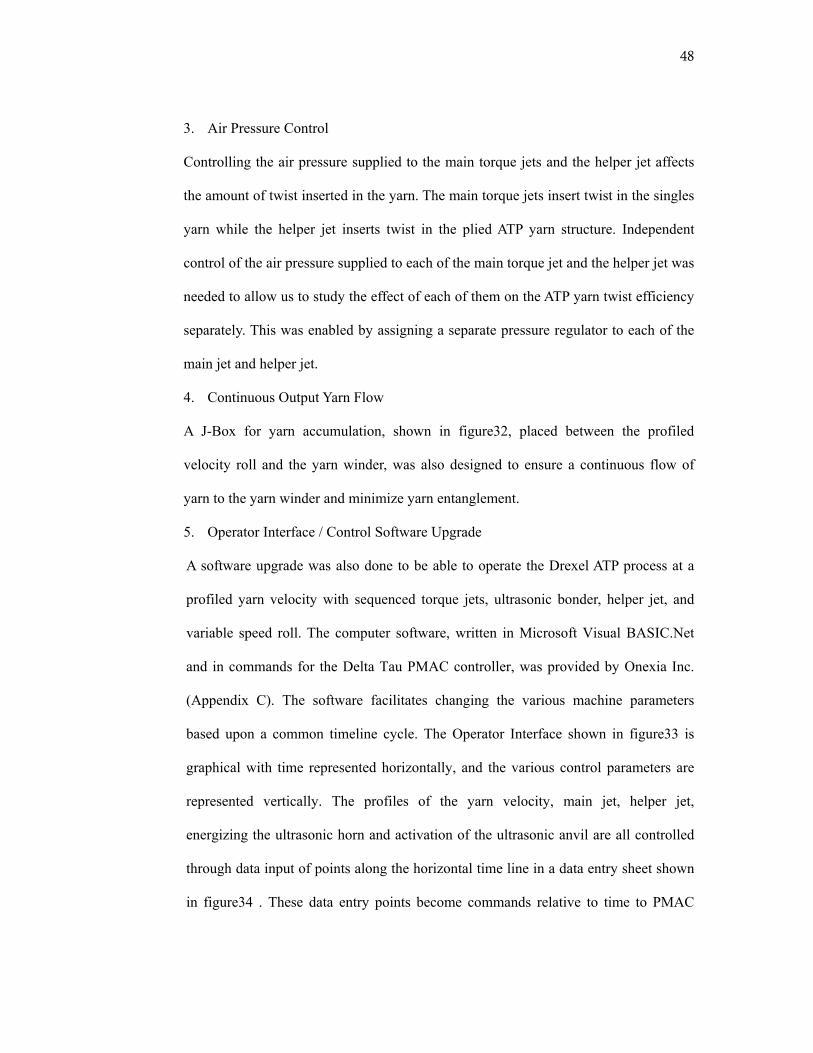
48
3. Air Pressure Control
Controlling the air pressure supplied to the main torque jets and the helper jet affects
the amount of twist inserted in the yarn. The main torque jets insert twist in the singles
yarn while the helper jet inserts twist in the plied ATP yarn structure. Independent
control of the air pressure supplied to each of the main torque jet and the helper jet was
needed to allow us to study the effect of each of them on the ATP yarn twist efficiency
separately. This was enabled by assigning a separate pressure regulator to each of the
main jet and helper jet.
4. Continuous Output Yarn Flow
A J-Box for yarn accumulation, shown in figure32, placed between the profiled
velocity roll and the yarn winder, was also designed to ensure a continuous flow of
yarn to the yarn winder and minimize yarn entanglement.
5. Operator Interface / Control Software Upgrade
A software upgrade was also done to be able to operate the Drexel ATP process at a
profiled yarn velocity with sequenced torque jets, ultrasonic bonder, helper jet, and
variable speed roll. The computer software, written in Microsoft Visual BASIC.Net
and in commands for the Delta Tau PMAC controller, was provided by Onexia Inc.
(Appendix C). The software facilitates changing the various machine parameters
based upon a common timeline cycle. The Operator Interface shown in figure33 is
graphical with time represented horizontally, and the various control parameters are
represented vertically. The profiles of the yarn velocity, main jet, helper jet,
energizing the ultrasonic horn and activation of the ultrasonic anvil are all controlled
through data input of points along the horizontal time line in a data entry sheet shown
in figure34 . These data entry points become commands relative to time to PMAC
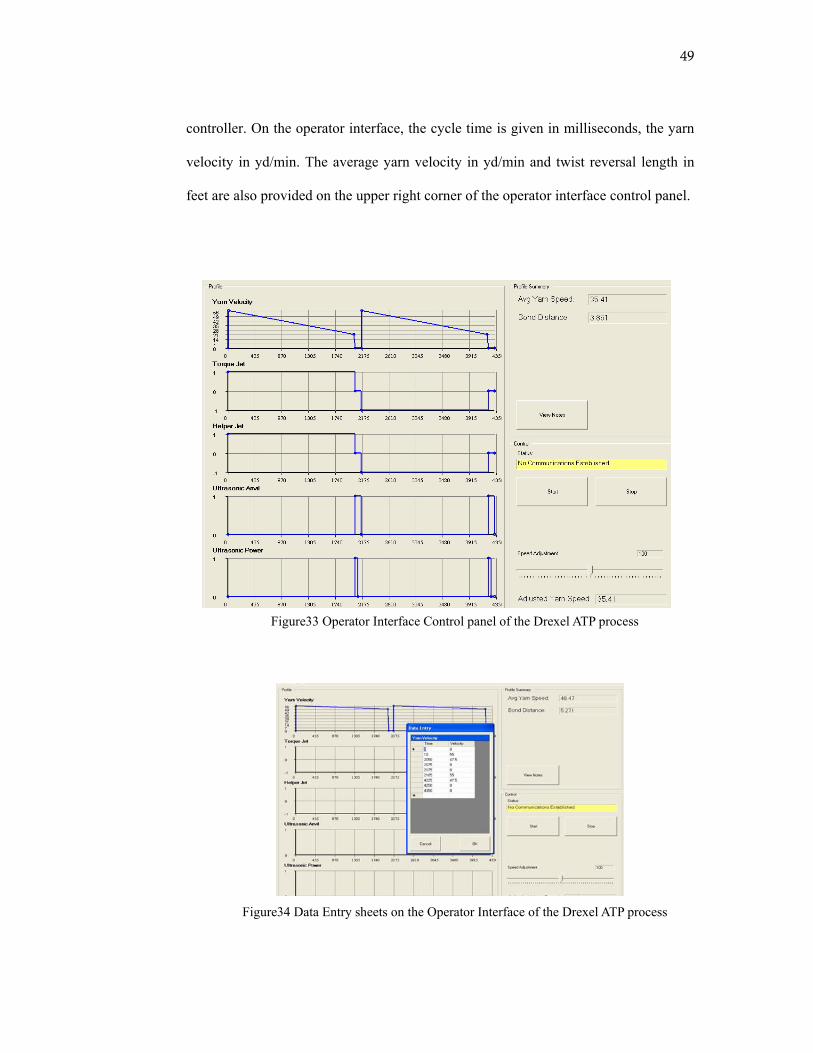
49
controller. On the operator interface, the cycle time is given in milliseconds, the yarn
velocity in yd/min. The average yarn velocity in yd/min and twist reversal length in
feet are also provided on the upper right corner of the operator interface control panel.
Figure33 Operator Interface Control panel of the Drexel ATP process
Figure34 Data Entry sheets on the Operator Interface of the Drexel ATP process
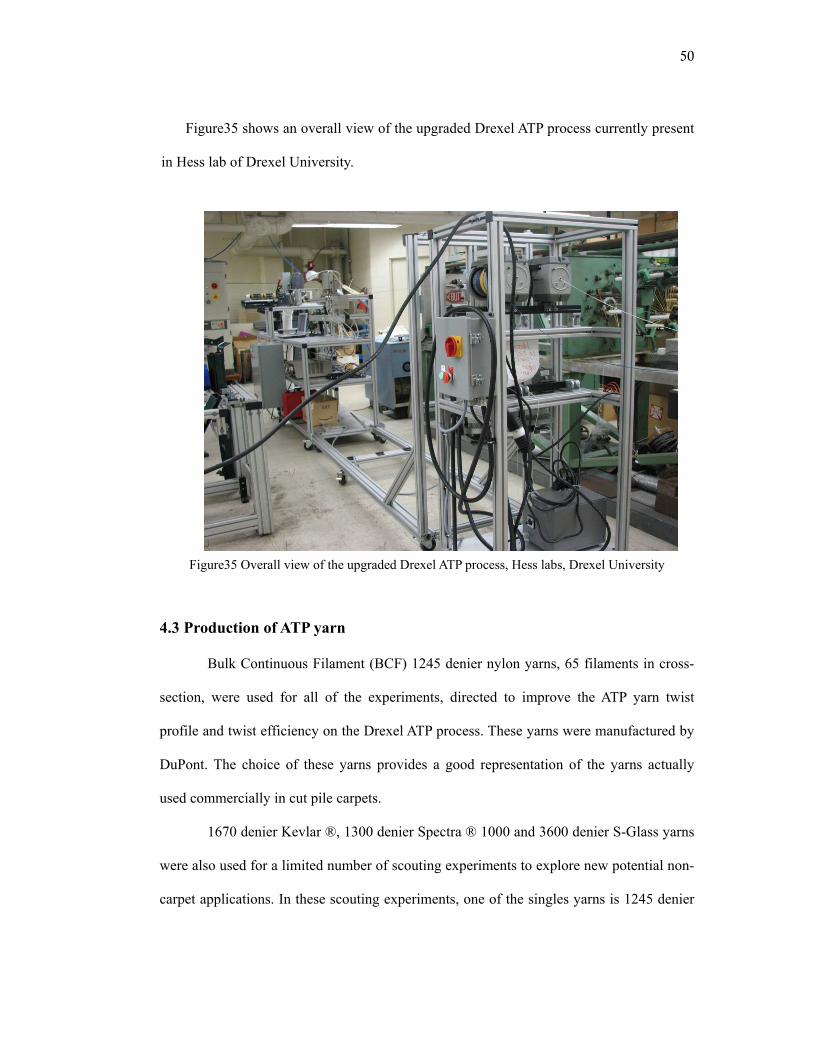
50
Figure35 shows an overall view of the upgraded Drexel ATP process currently present
in Hess lab of Drexel University.
Figure35 Overall view of the upgraded Drexel ATP process, Hess labs, Drexel University
4.3 Production of ATP yarn
Bulk Continuous Filament (BCF) 1245 denier nylon yarns, 65 filaments in cross-
section, were used for all of the experiments, directed to improve the ATP yarn twist
profile and twist efficiency on the Drexel ATP process. These yarns were manufactured by
DuPont. The choice of these yarns provides a good representation of the yarns actually
used commercially in cut pile carpets.
1670 denier Kevlar ®, 1300 denier Spectra ® 1000 and 3600 denier S-Glass yarns
were also used for a limited number of scouting experiments to explore new potential non-
carpet applications. In these scouting experiments, one of the singles yarns is 1245 denier
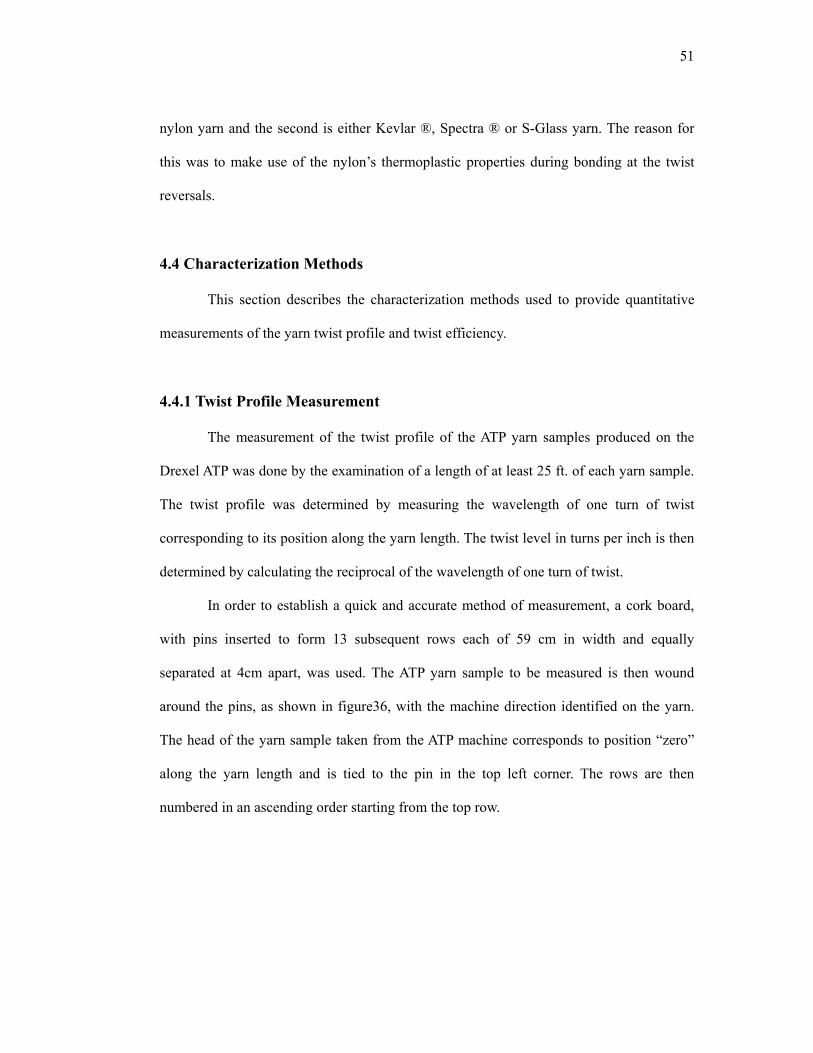
51
nylon yarn and the second is either Kevlar ®, Spectra ® or S-Glass yarn. The reason for
this was to make use of the nylon’s thermoplastic properties during bonding at the twist
reversals.
4.4 Characterization Methods
This section describes the characterization methods used to provide quantitative
measurements of the yarn twist profile and twist efficiency.
4.4.1 Twist Profile Measurement
The measurement of the twist profile of the ATP yarn samples produced on the
Drexel ATP was done by the examination of a length of at least 25 ft. of each yarn sample.
The twist profile was determined by measuring the wavelength of one turn of twist
corresponding to its position along the yarn length. The twist level in turns per inch is then
determined by calculating the reciprocal of the wavelength of one turn of twist.
In order to establish a quick and accurate method of measurement, a cork board,
with pins inserted to form 13 subsequent rows each of 59 cm in width and equally
separated at 4cm apart, was used. The ATP yarn sample to be measured is then wound
around the pins, as shown in figure36, with the machine direction identified on the yarn.
The head of the yarn sample taken from the ATP machine corresponds to position “zero”
along the yarn length and is tied to the pin in the top left corner. The rows are then
numbered in an ascending order starting from the top row.
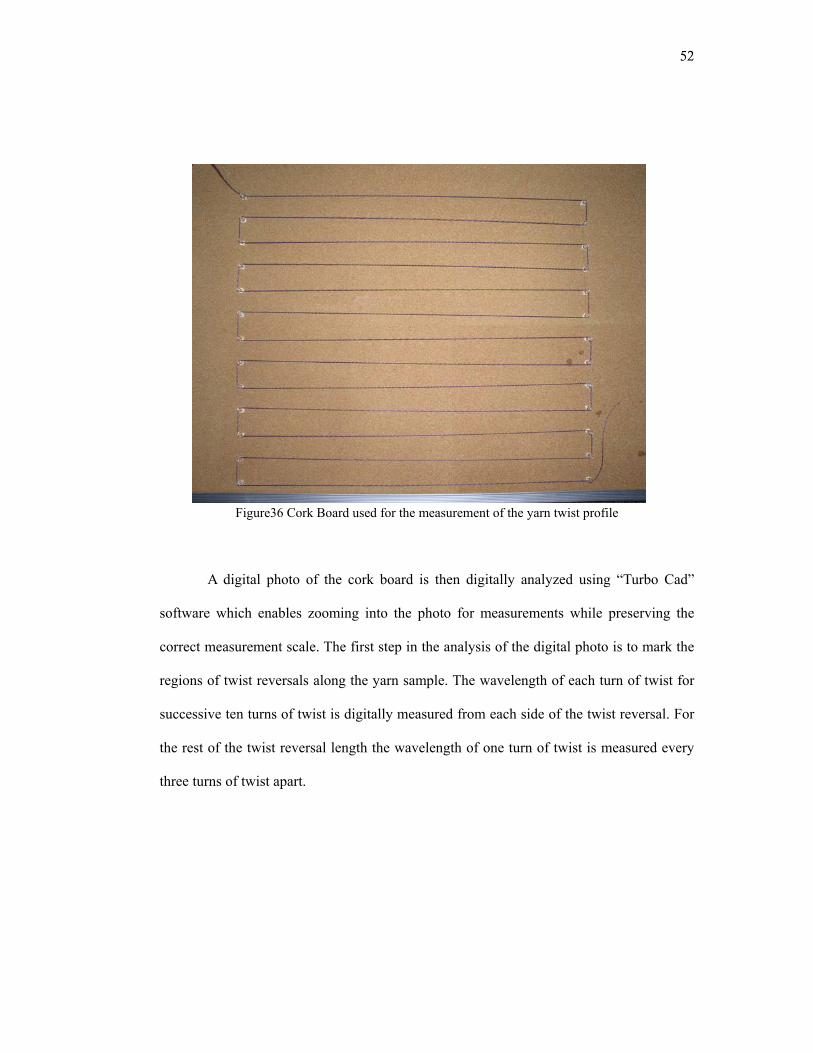
52
Figure36 Cork Board used for the measurement of the yarn twist profile
A digital photo of the cork board is then digitally analyzed using “Turbo Cad”
software which enables zooming into the photo for measurements while preserving the
correct measurement scale. The first step in the analysis of the digital photo is to mark the
regions of twist reversals along the yarn sample. The wavelength of each turn of twist for
successive ten turns of twist is digitally measured from each side of the twist reversal. For
the rest of the twist reversal length the wavelength of one turn of twist is measured every
three turns of twist apart.
53
The position along the yarn length, corresponding to each measured wavelength of
twist, was determined using the following equations
S = LP + LC (4.1)
LP = (R- 1)*(W+ ∆y) (4.2)
⎭⎬⎫
⎩⎨⎧
−=
integereven an is Rfor ,integer oddan is Rfor ,
XWX
LC (4.3)
Where S is the position along the yarn length in (inch), LP is the yarn length (inch)
in the previous rows to the one where twist measurement is done, Ls is the yarn length
(inch) in the current row to the point where twist measurement is done, R is the current
row number where twist measurement is done, W is the row width (inch), ∆y is the spacing
between the rows (inch) and X is the position of point where twist measurement is done in
the current row, i.e the distance from the left start point of the row to the point of
measurement (inch).
The twist profile along the yarn length is then obtained by plotting the twist
measurements in turns per inch versus the position along the yarn in inches.
4.4.2 Twist Efficiency Measurement
The twist efficiency of the ATP yarns produced on the Drexel ATP process is
determined by measuring the ply yarn twist and singles yarn twist in the produced yarns
using an ITC-5 hand operated Twist Tester, shown in figure37.
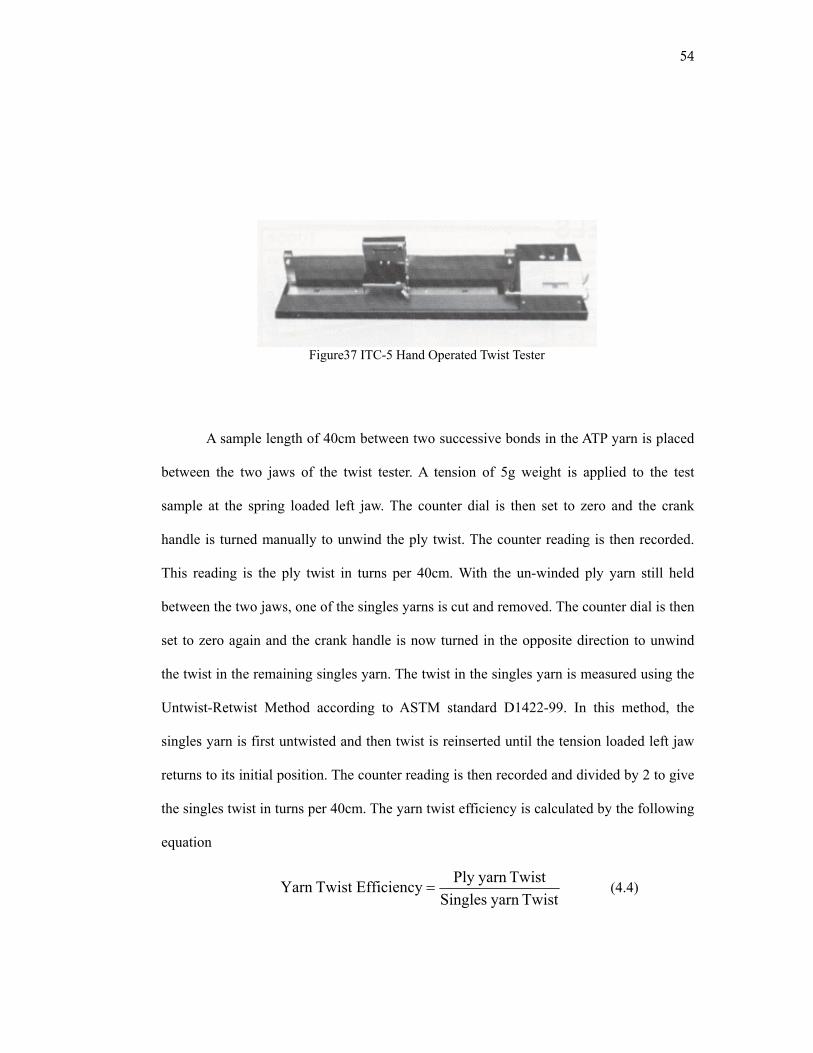
54
Figure37 ITC-5 Hand Operated Twist Tester
A sample length of 40cm between two successive bonds in the ATP yarn is placed
between the two jaws of the twist tester. A tension of 5g weight is applied to the test
sample at the spring loaded left jaw. The counter dial is then set to zero and the crank
handle is turned manually to unwind the ply twist. The counter reading is then recorded.
This reading is the ply twist in turns per 40cm. With the un-winded ply yarn still held
between the two jaws, one of the singles yarns is cut and removed. The counter dial is then
set to zero again and the crank handle is now turned in the opposite direction to unwind
the twist in the remaining singles yarn. The twist in the singles yarn is measured using the
Untwist-Retwist Method according to ASTM standard D1422-99. In this method, the
singles yarn is first untwisted and then twist is reinserted until the tension loaded left jaw
returns to its initial position. The counter reading is then recorded and divided by 2 to give
the singles twist in turns per 40cm. The yarn twist efficiency is calculated by the following
equation
Twistyarn SinglesTwistyarn Ply EfficiencyTwist Yarn = (4.4)
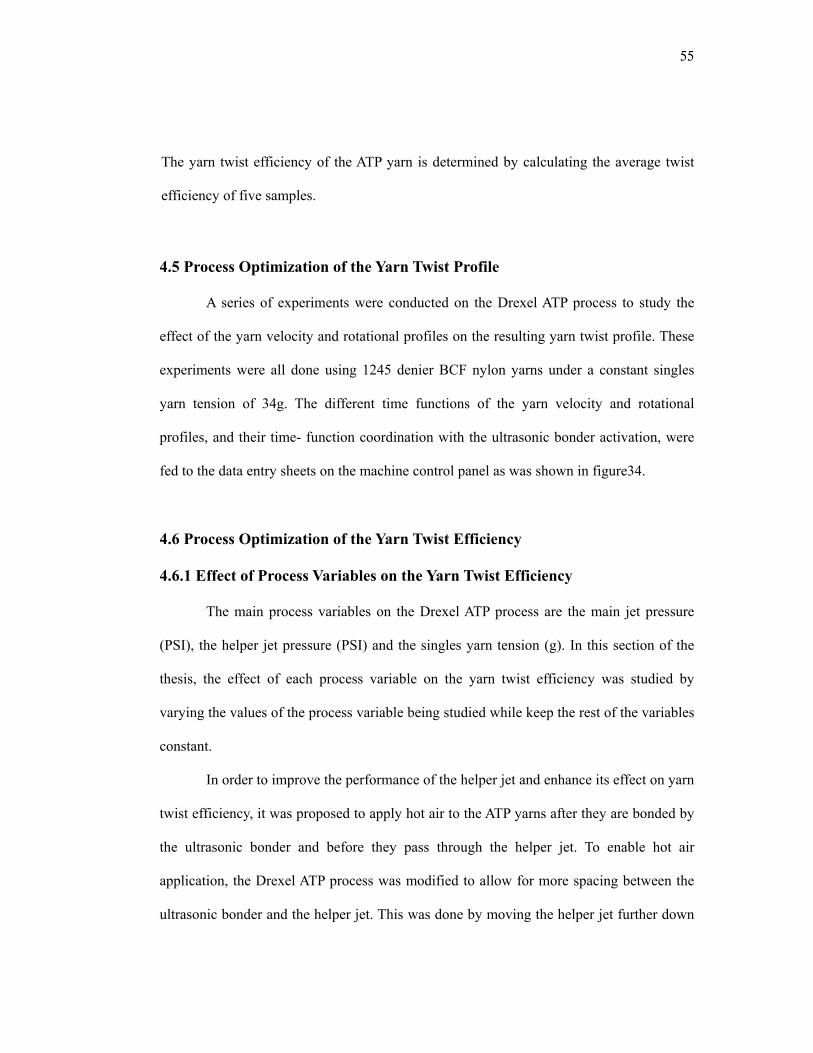
55
The yarn twist efficiency of the ATP yarn is determined by calculating the average twist
efficiency of five samples.
4.5 Process Optimization of the Yarn Twist Profile
A series of experiments were conducted on the Drexel ATP process to study the
effect of the yarn velocity and rotational profiles on the resulting yarn twist profile. These
experiments were all done using 1245 denier BCF nylon yarns under a constant singles
yarn tension of 34g. The different time functions of the yarn velocity and rotational
profiles, and their time- function coordination with the ultrasonic bonder activation, were
fed to the data entry sheets on the machine control panel as was shown in figure34.
4.6 Process Optimization of the Yarn Twist Efficiency
4.6.1 Effect of Process Variables on the Yarn Twist Efficiency
The main process variables on the Drexel ATP process are the main jet pressure
(PSI), the helper jet pressure (PSI) and the singles yarn tension (g). In this section of the
thesis, the effect of each process variable on the yarn twist efficiency was studied by
varying the values of the process variable being studied while keep the rest of the variables
constant.
In order to improve the performance of the helper jet and enhance its effect on yarn
twist efficiency, it was proposed to apply hot air to the ATP yarns after they are bonded by
the ultrasonic bonder and before they pass through the helper jet. To enable hot air
application, the Drexel ATP process was modified to allow for more spacing between the
ultrasonic bonder and the helper jet. This was done by moving the helper jet further down
56
along the yarn path and a hot air gun was placed before the helper jet as shown in figure38.
A Weldy Plus hot air gun, with a digital variable temperature control, an LCD display and
a digitally controlled air flow adjustment, was used.
Figure38 Modified machine schematic by adding hot air gun and relocating helper jet.
The effect of yarn temperature on the yarn twist efficiency was studied by
controlling the hot air temperature on the gun and the resulting yarn temperature was
determined using an Infrared thermometer.
4.6.2 Empirical Modeling of the Yarn Twist Efficiency
In order to obtain a more systematic understanding of the effect of the process
variables and to establish a quantitative basis for the relationship between the process
variables and the yarn twist efficiency, response surface methodology was employed. A
factorial experiment was designed to investigate and identify the relative significance of
the process variables on the yarn twist efficiency (Table 4).
Feed YarnsTorque Jets
(+/-)
Helper Jet
(+/-)
Ultrasonic
Bonder
Profiled velocity roll
Winder
Self Ply Zone
120” <1” 75”
4”
Hot Air Gun
Feed YarnsTorque Jets
(+/-)
Helper Jet
(+/-)
Ultrasonic
Bonder
Profiled velocity roll
Winder
Self Ply Zone
120” <1” 75”
4”
Hot Air Gun
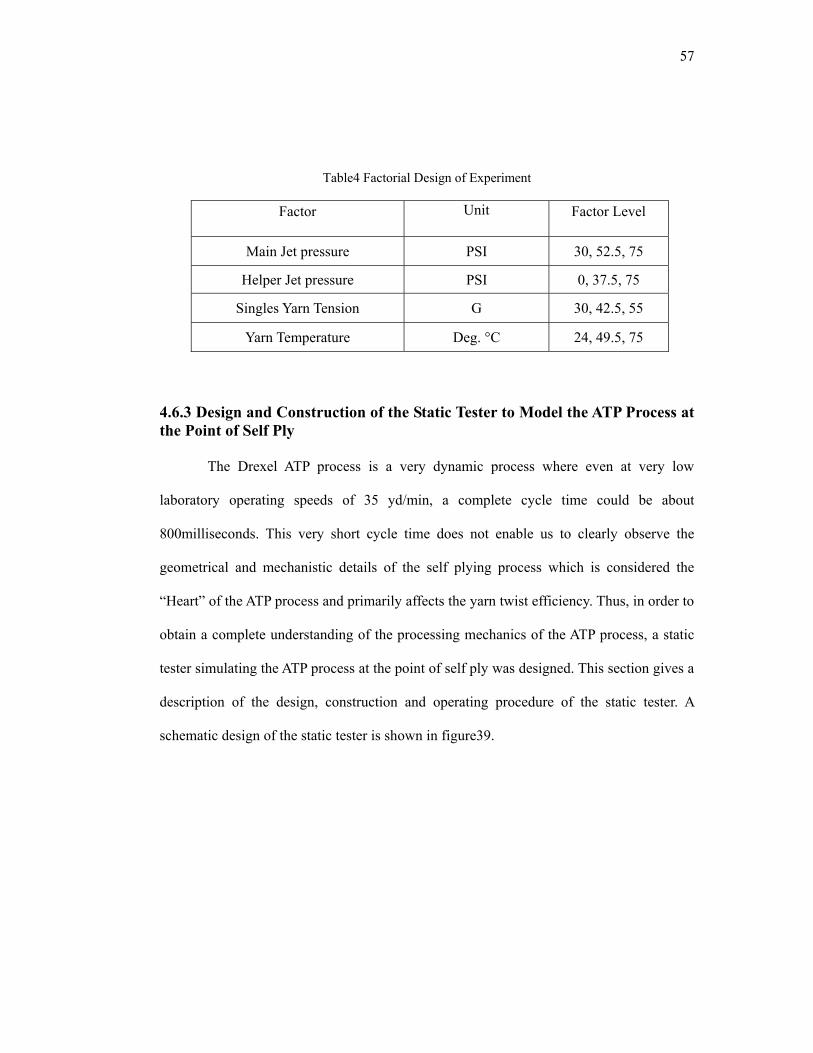
57
Table4 Factorial Design of Experiment
Factor Unit Factor Level
Main Jet pressure PSI 30, 52.5, 75
Helper Jet pressure PSI 0, 37.5, 75
Singles Yarn Tension G 30, 42.5, 55
Yarn Temperature Deg. °C 24, 49.5, 75
4.6.3 Design and Construction of the Static Tester to Model the ATP Process at the Point of Self Ply
The Drexel ATP process is a very dynamic process where even at very low
laboratory operating speeds of 35 yd/min, a complete cycle time could be about
800milliseconds. This very short cycle time does not enable us to clearly observe the
geometrical and mechanistic details of the self plying process which is considered the
“Heart” of the ATP process and primarily affects the yarn twist efficiency. Thus, in order to
obtain a complete understanding of the processing mechanics of the ATP process, a static
tester simulating the ATP process at the point of self ply was designed. This section gives a
description of the design, construction and operating procedure of the static tester. A
schematic design of the static tester is shown in figure39.
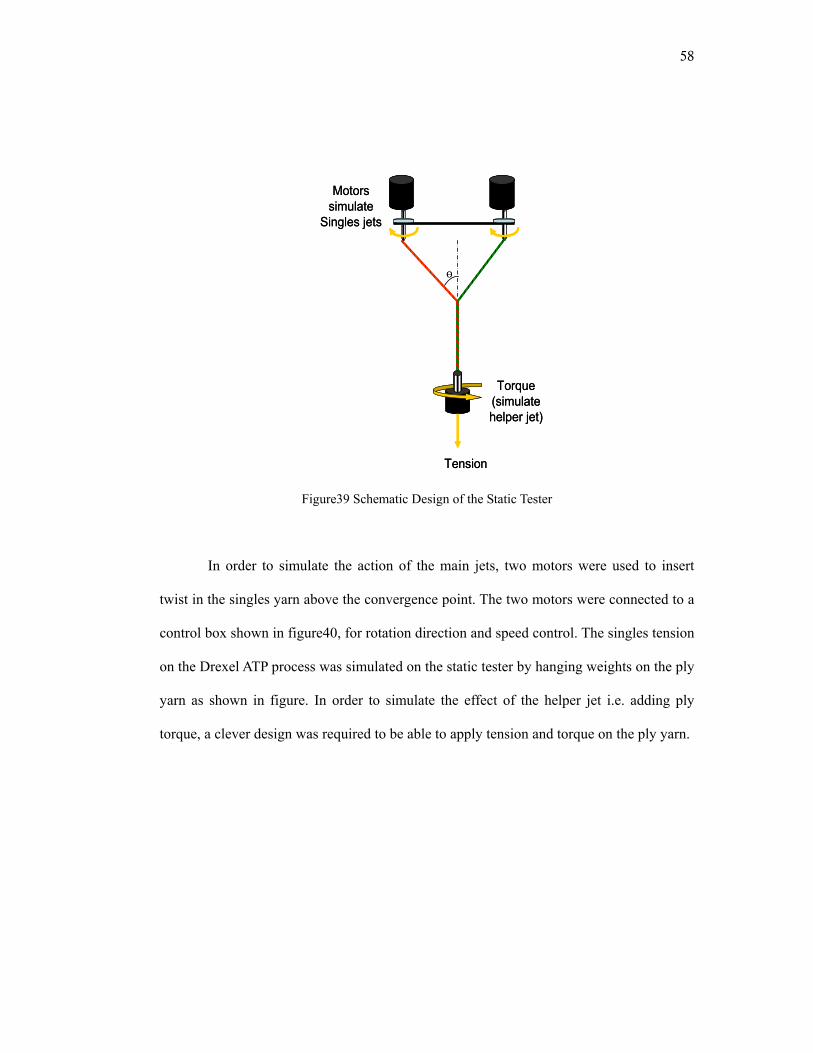
58
Figure39 Schematic Design of the Static Tester
In order to simulate the action of the main jets, two motors were used to insert
twist in the singles yarn above the convergence point. The two motors were connected to a
control box shown in figure40, for rotation direction and speed control. The singles tension
on the Drexel ATP process was simulated on the static tester by hanging weights on the ply
yarn as shown in figure. In order to simulate the effect of the helper jet i.e. adding ply
torque, a clever design was required to be able to apply tension and torque on the ply yarn.
Ө
Torque (simulate helper jet)
Motors simulate
Singles jets
Tension
Ө
Torque (simulate helper jet)
Motors simulate
Singles jets
Tension
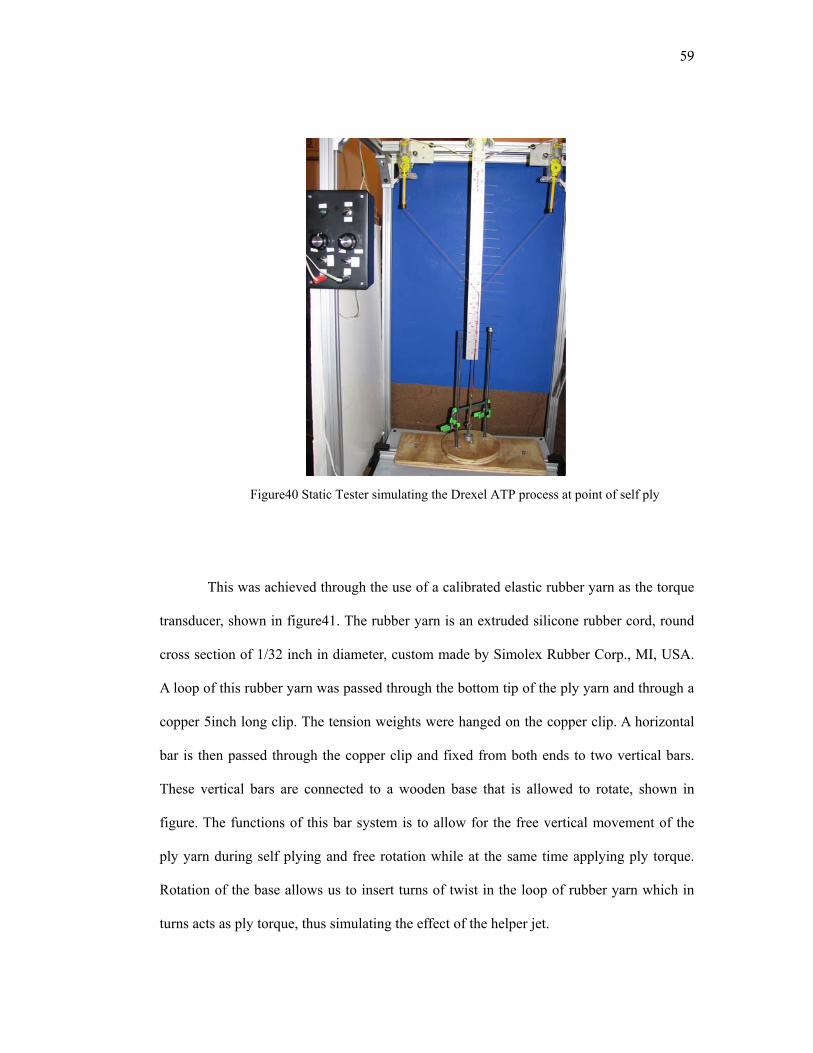
59
Figure40 Static Tester simulating the Drexel ATP process at point of self ply
This was achieved through the use of a calibrated elastic rubber yarn as the torque
transducer, shown in figure41. The rubber yarn is an extruded silicone rubber cord, round
cross section of 1/32 inch in diameter, custom made by Simolex Rubber Corp., MI, USA.
A loop of this rubber yarn was passed through the bottom tip of the ply yarn and through a
copper 5inch long clip. The tension weights were hanged on the copper clip. A horizontal
bar is then passed through the copper clip and fixed from both ends to two vertical bars.
These vertical bars are connected to a wooden base that is allowed to rotate, shown in
figure. The functions of this bar system is to allow for the free vertical movement of the
ply yarn during self plying and free rotation while at the same time applying ply torque.
Rotation of the base allows us to insert turns of twist in the loop of rubber yarn which in
turns acts as ply torque, thus simulating the effect of the helper jet.
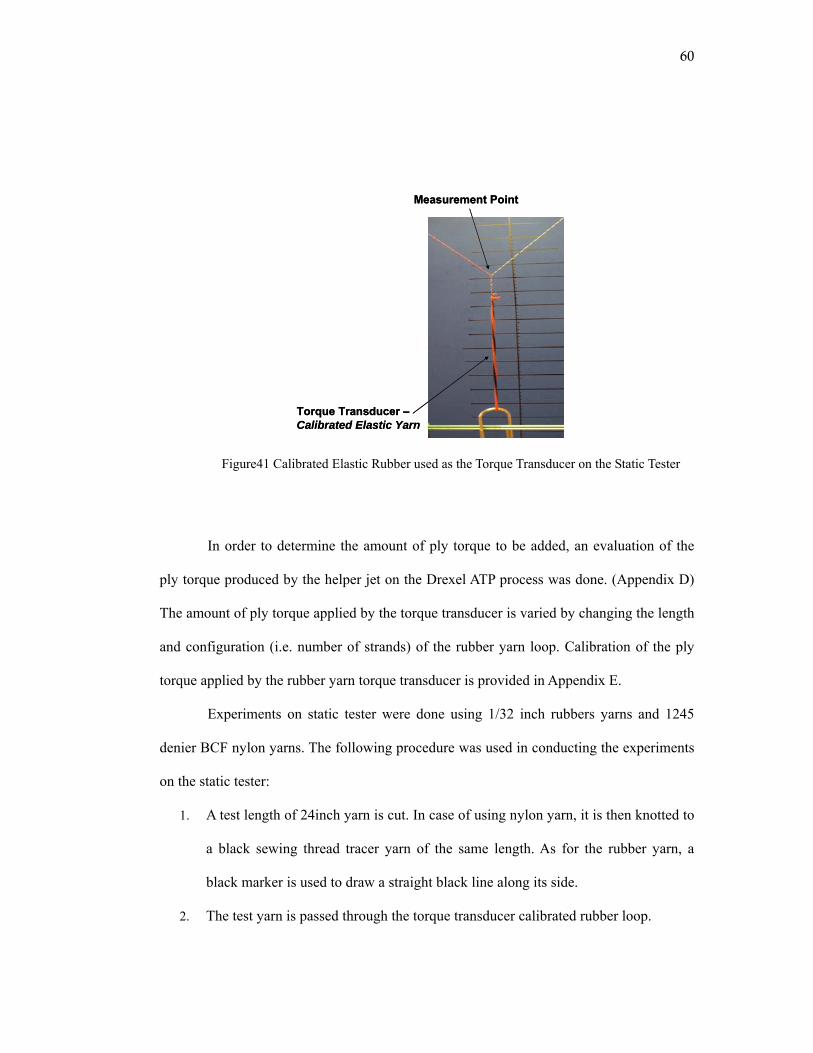
60
Figure41 Calibrated Elastic Rubber used as the Torque Transducer on the Static Tester
In order to determine the amount of ply torque to be added, an evaluation of the
ply torque produced by the helper jet on the Drexel ATP process was done. (Appendix D)
The amount of ply torque applied by the torque transducer is varied by changing the length
and configuration (i.e. number of strands) of the rubber yarn loop. Calibration of the ply
torque applied by the rubber yarn torque transducer is provided in Appendix E.
Experiments on static tester were done using 1/32 inch rubbers yarns and 1245
denier BCF nylon yarns. The following procedure was used in conducting the experiments
on the static tester:
1. A test length of 24inch yarn is cut. In case of using nylon yarn, it is then knotted to
a black sewing thread tracer yarn of the same length. As for the rubber yarn, a
black marker is used to draw a straight black line along its side.
2. The test yarn is passed through the torque transducer calibrated rubber loop.
Torque Transducer –Calibrated Elastic Yarn
Measurement Point
Torque Transducer –Calibrated Elastic Yarn
Measurement Point
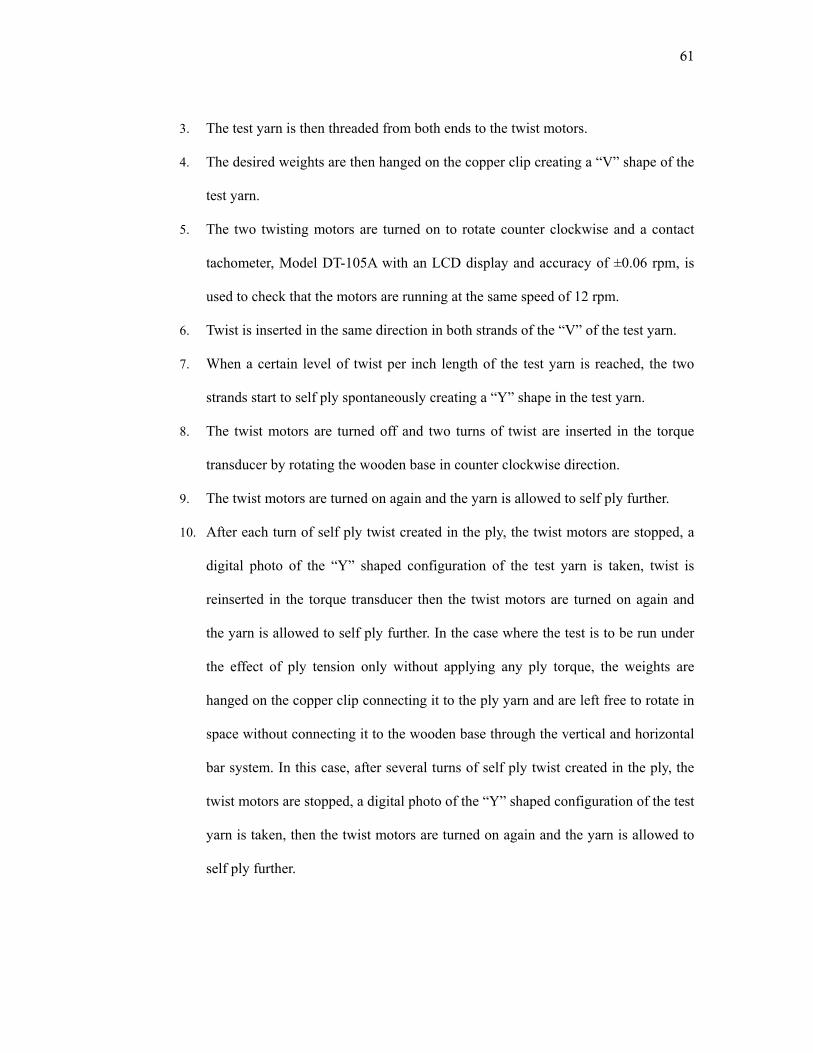
61
3. The test yarn is then threaded from both ends to the twist motors.
4. The desired weights are then hanged on the copper clip creating a “V” shape of the
test yarn.
5. The two twisting motors are turned on to rotate counter clockwise and a contact
tachometer, Model DT-105A with an LCD display and accuracy of ±0.06 rpm, is
used to check that the motors are running at the same speed of 12 rpm.
6. Twist is inserted in the same direction in both strands of the “V” of the test yarn.
7. When a certain level of twist per inch length of the test yarn is reached, the two
strands start to self ply spontaneously creating a “Y” shape in the test yarn.
8. The twist motors are turned off and two turns of twist are inserted in the torque
transducer by rotating the wooden base in counter clockwise direction.
9. The twist motors are turned on again and the yarn is allowed to self ply further.
10. After each turn of self ply twist created in the ply, the twist motors are stopped, a
digital photo of the “Y” shaped configuration of the test yarn is taken, twist is
reinserted in the torque transducer then the twist motors are turned on again and
the yarn is allowed to self ply further. In the case where the test is to be run under
the effect of ply tension only without applying any ply torque, the weights are
hanged on the copper clip connecting it to the ply yarn and are left free to rotate in
space without connecting it to the wooden base through the vertical and horizontal
bar system. In this case, after several turns of self ply twist created in the ply, the
twist motors are stopped, a digital photo of the “Y” shaped configuration of the test
yarn is taken, then the twist motors are turned on again and the yarn is allowed to
self ply further.
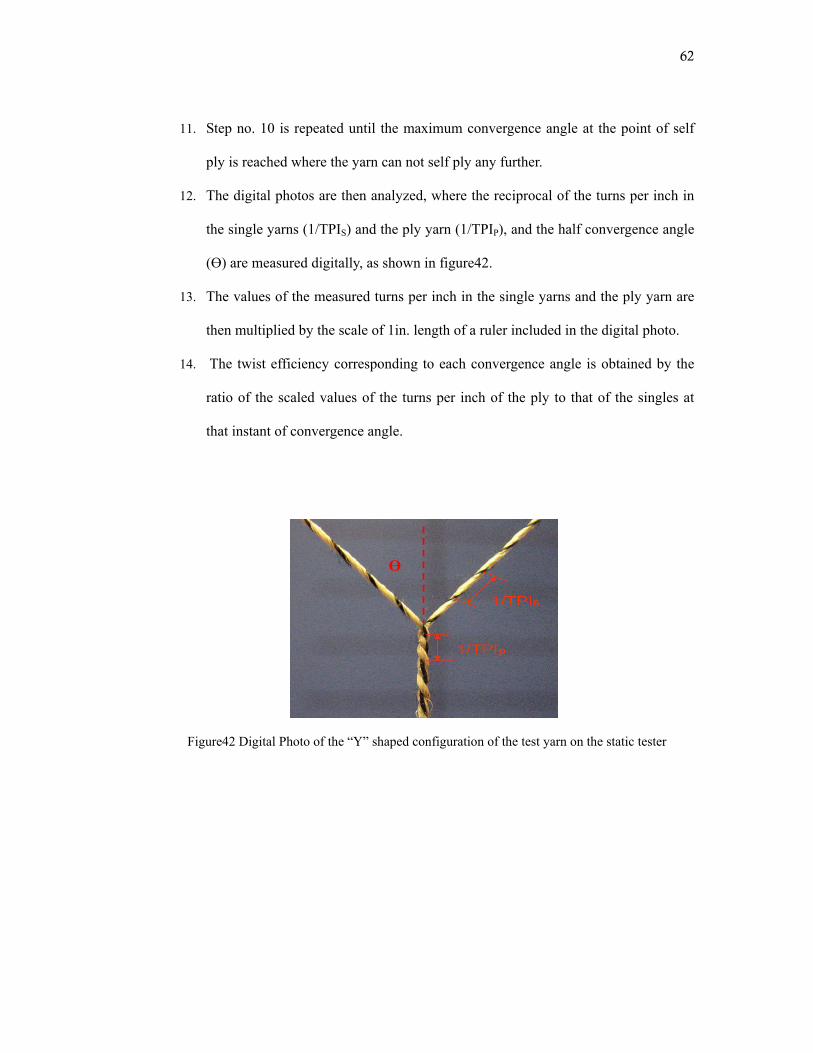
62
11. Step no. 10 is repeated until the maximum convergence angle at the point of self
ply is reached where the yarn can not self ply any further.
12. The digital photos are then analyzed, where the reciprocal of the turns per inch in
the single yarns (1/TPIS) and the ply yarn (1/TPIP), and the half convergence angle
(Ө) are measured digitally, as shown in figure42.
13. The values of the measured turns per inch in the single yarns and the ply yarn are
then multiplied by the scale of 1in. length of a ruler included in the digital photo.
14. The twist efficiency corresponding to each convergence angle is obtained by the
ratio of the scaled values of the turns per inch of the ply to that of the singles at
that instant of convergence angle.
Figure42 Digital Photo of the “Y” shaped configuration of the test yarn on the static tester
Ө
63
CHAPTER 5: PROCESS OPTIMIZATION AND PREDICTION OF THE YARN TWIST PROFILE
5.1 Background and Significance
ATP yarns produced by the current commercial ATP technologies (Repco, Gilbos
and Belmont) lack a uniform square wave twist profile along the yarn length and have a
long zero twist region at the twist reversal. As attempts are made to increase the processing
speeds, reaching 600yd/min in the Belmont ATP process, this requires twisting the yarns
more forcefully to be able to twist them more rapidly. However, this forceful twisting also
results in a higher yarn compact, so that they have inadequate bulk when tufted into a
carpet. Such compaction becomes more pronounced and can vary extremely along the yarn
length in the presence of non-uniformly twisted sections thus affecting the carpet
appearance to a great extent. Non-uniformity in the twist will create sections of
substandard twist. These sections tend to separate and mat together and appear as defects
in the carpet. Furthermore, the twist reversal length also affects the carpet appearance to a
great degree. In ATP yarns with a short twist reversal length, as in the case of the Repco
ATP process, the zero twist region at the reversals would occupy a substantial percentage
of the total yarn length and appear at the surface of a cut pile carpet more frequently. In
addition to that, tufts which are cut at a bond are more compact than those which are cut
between bonds, and the more frequently they occur, the less uniform is the carpet
appearance. Therefore, it is desirable to make the distances between bonds as great as
possible to minimize their visibility. Furthermore after the bonds are fixed, they must have
sufficient strength to resist separating under tension and abrasion encountered in the
subsequent handling and tufting into carpet. If just one bond fails to hold, the plies untwist
for a remarkable distance and form separated sections which mat together in the carpet and
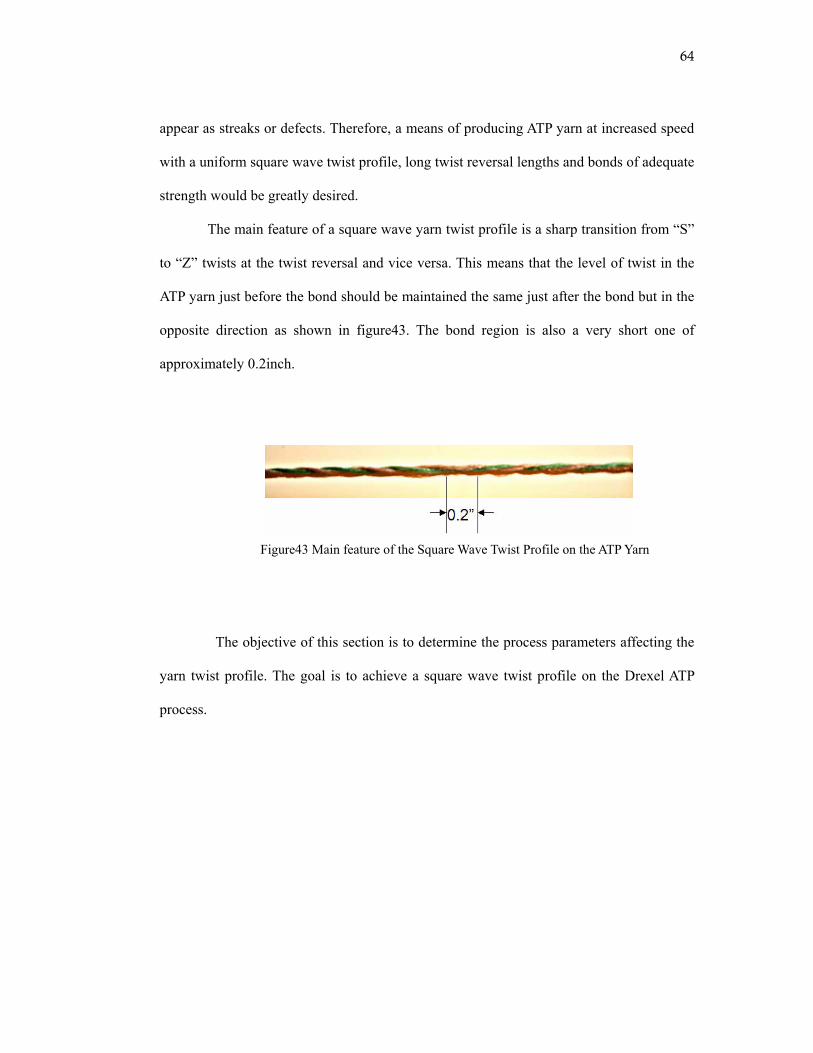
64
appear as streaks or defects. Therefore, a means of producing ATP yarn at increased speed
with a uniform square wave twist profile, long twist reversal lengths and bonds of adequate
strength would be greatly desired.
The main feature of a square wave yarn twist profile is a sharp transition from “S”
to “Z” twists at the twist reversal and vice versa. This means that the level of twist in the
ATP yarn just before the bond should be maintained the same just after the bond but in the
opposite direction as shown in figure43. The bond region is also a very short one of
approximately 0.2inch.
Figure43 Main feature of the Square Wave Twist Profile on the ATP Yarn
The objective of this section is to determine the process parameters affecting the
yarn twist profile. The goal is to achieve a square wave twist profile on the Drexel ATP
process.
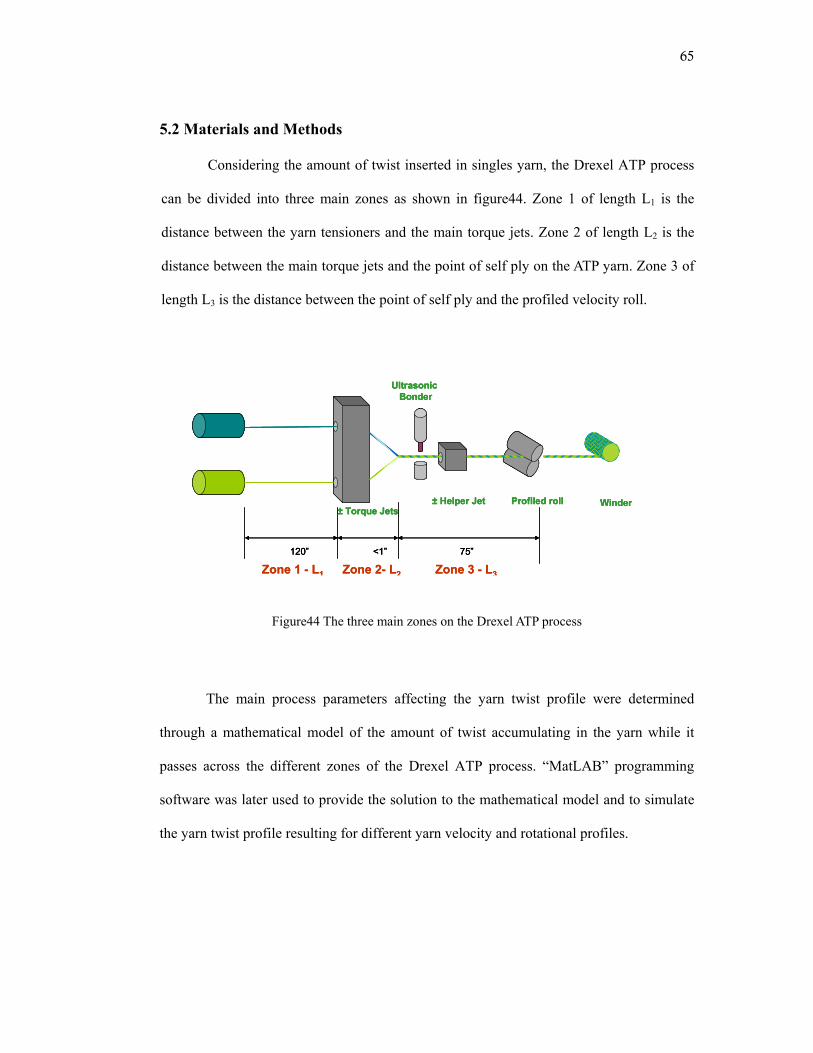
65
5.2 Materials and Methods
Considering the amount of twist inserted in singles yarn, the Drexel ATP process
can be divided into three main zones as shown in figure44. Zone 1 of length L1 is the
distance between the yarn tensioners and the main torque jets. Zone 2 of length L2 is the
distance between the main torque jets and the point of self ply on the ATP yarn. Zone 3 of
length L3 is the distance between the point of self ply and the profiled velocity roll.
Figure44 The three main zones on the Drexel ATP process
The main process parameters affecting the yarn twist profile were determined
through a mathematical model of the amount of twist accumulating in the yarn while it
passes across the different zones of the Drexel ATP process. “MatLAB” programming
software was later used to provide the solution to the mathematical model and to simulate
the yarn twist profile resulting for different yarn velocity and rotational profiles.
Zone 1 - L1 Zone 2- L2 Zone 3 - L3
L1/LR >>1 L2/LR<<1 L3/LR >>1
± Torque Jets± Helper Jet
UltrasonicBonder
Profiled roll Winder
120” <1” 75”
Zone 1 - L1 Zone 2- L2 Zone 3 - L3
L1/LR >>1 L2/LR<<1 L3/LR >>1
± Torque Jets± Helper Jet
UltrasonicBonder
Profiled roll Winder
120” <1” 75”
± Torque Jets± Helper Jet
UltrasonicBonder
Profiled roll Winder
120” <1” 75”
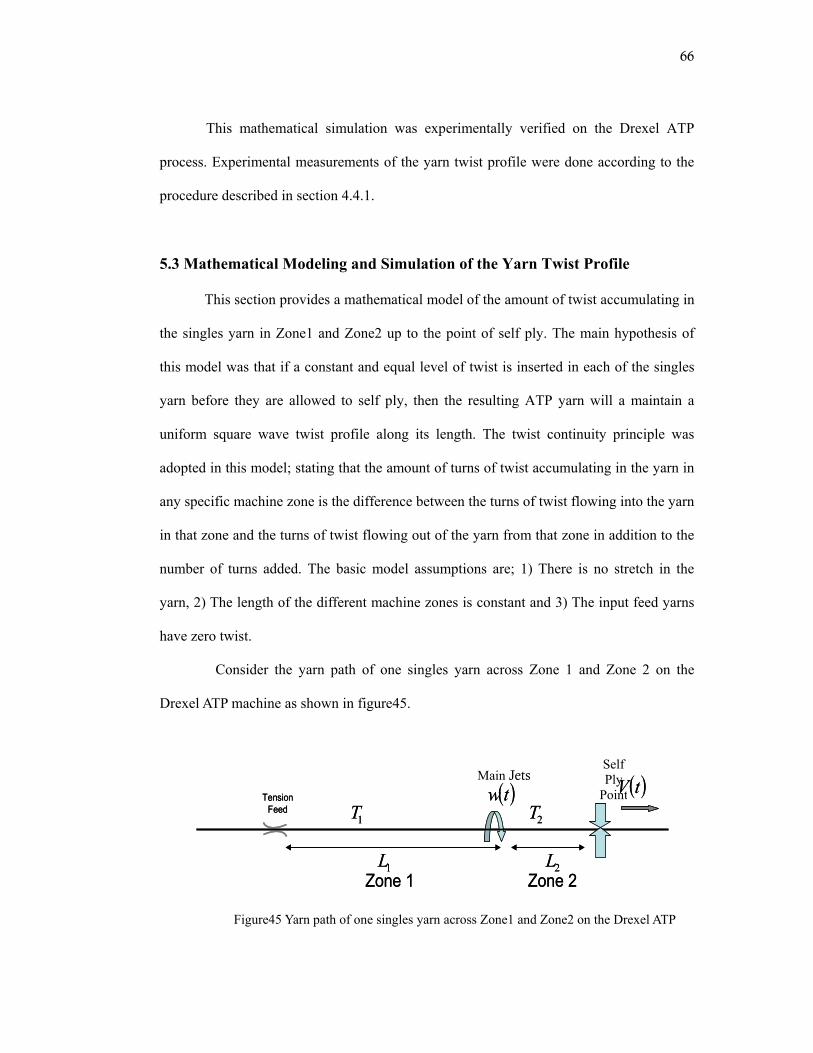
66
This mathematical simulation was experimentally verified on the Drexel ATP
process. Experimental measurements of the yarn twist profile were done according to the
procedure described in section 4.4.1.
5.3 Mathematical Modeling and Simulation of the Yarn Twist Profile
This section provides a mathematical model of the amount of twist accumulating in
the singles yarn in Zone1 and Zone2 up to the point of self ply. The main hypothesis of
this model was that if a constant and equal level of twist is inserted in each of the singles
yarn before they are allowed to self ply, then the resulting ATP yarn will a maintain a
uniform square wave twist profile along its length. The twist continuity principle was
adopted in this model; stating that the amount of turns of twist accumulating in the yarn in
any specific machine zone is the difference between the turns of twist flowing into the yarn
in that zone and the turns of twist flowing out of the yarn from that zone in addition to the
number of turns added. The basic model assumptions are; 1) There is no stretch in the
yarn, 2) The length of the different machine zones is constant and 3) The input feed yarns
have zero twist.
Consider the yarn path of one singles yarn across Zone 1 and Zone 2 on the
Drexel ATP machine as shown in figure45.
Figure45 Yarn path of one singles yarn across Zone1 and Zone2 on the Drexel ATP
( )tw
1L
( )tV
2L
1T 2TTension
Feed
Zone 1 Zone 2
( )tw
1L
( )tV
2L
1T 2TTension
Feed
Zone 1 Zone 2
Main Jets Self Ply
Point
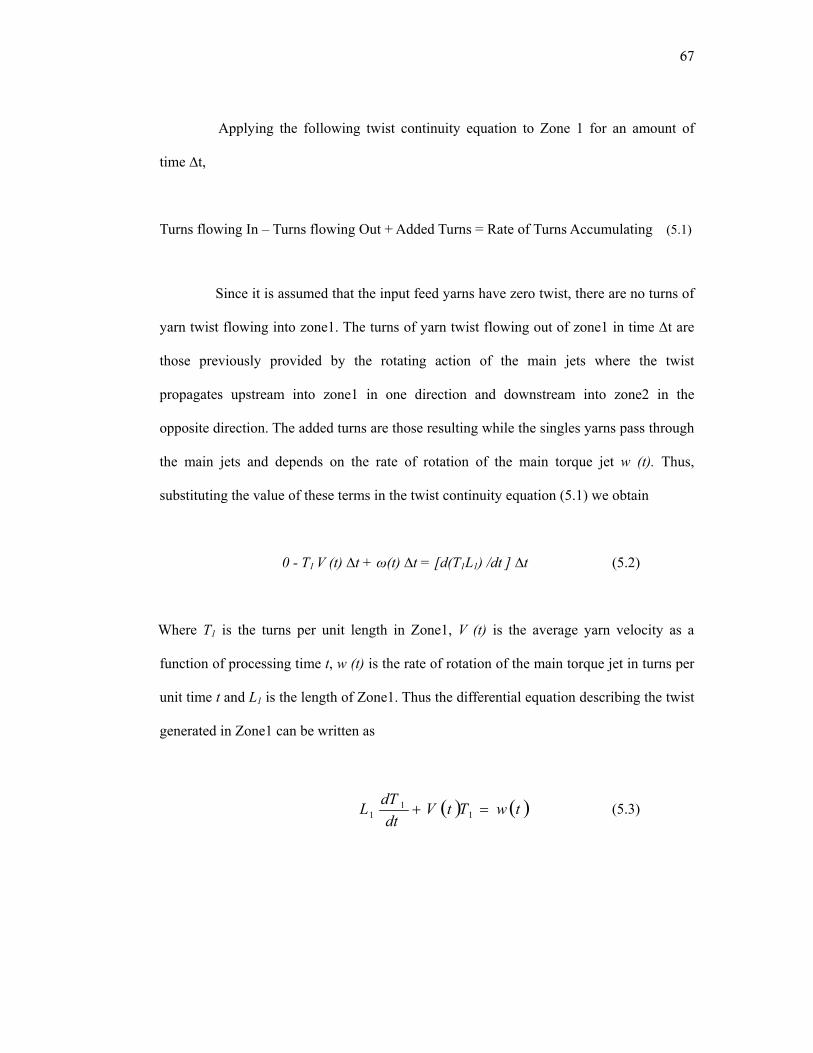
67
Applying the following twist continuity equation to Zone 1 for an amount of
time ∆t,
Turns flowing In – Turns flowing Out + Added Turns = Rate of Turns Accumulating (5.1)
Since it is assumed that the input feed yarns have zero twist, there are no turns of
yarn twist flowing into zone1. The turns of yarn twist flowing out of zone1 in time ∆t are
those previously provided by the rotating action of the main jets where the twist
propagates upstream into zone1 in one direction and downstream into zone2 in the
opposite direction. The added turns are those resulting while the singles yarns pass through
the main jets and depends on the rate of rotation of the main torque jet w (t). Thus,
substituting the value of these terms in the twist continuity equation (5.1) we obtain
0 - T1 V (t) ∆t + ω(t) ∆t = [d(T1L1) /dt ] ∆t (5.2)
Where T1 is the turns per unit length in Zone1, V (t) is the average yarn velocity as a
function of processing time t, w (t) is the rate of rotation of the main torque jet in turns per
unit time t and L1 is the length of Zone1. Thus the differential equation describing the twist
generated in Zone1 can be written as
( ) ( )twTtVdt
dTL =+ 11
1 (5.3)
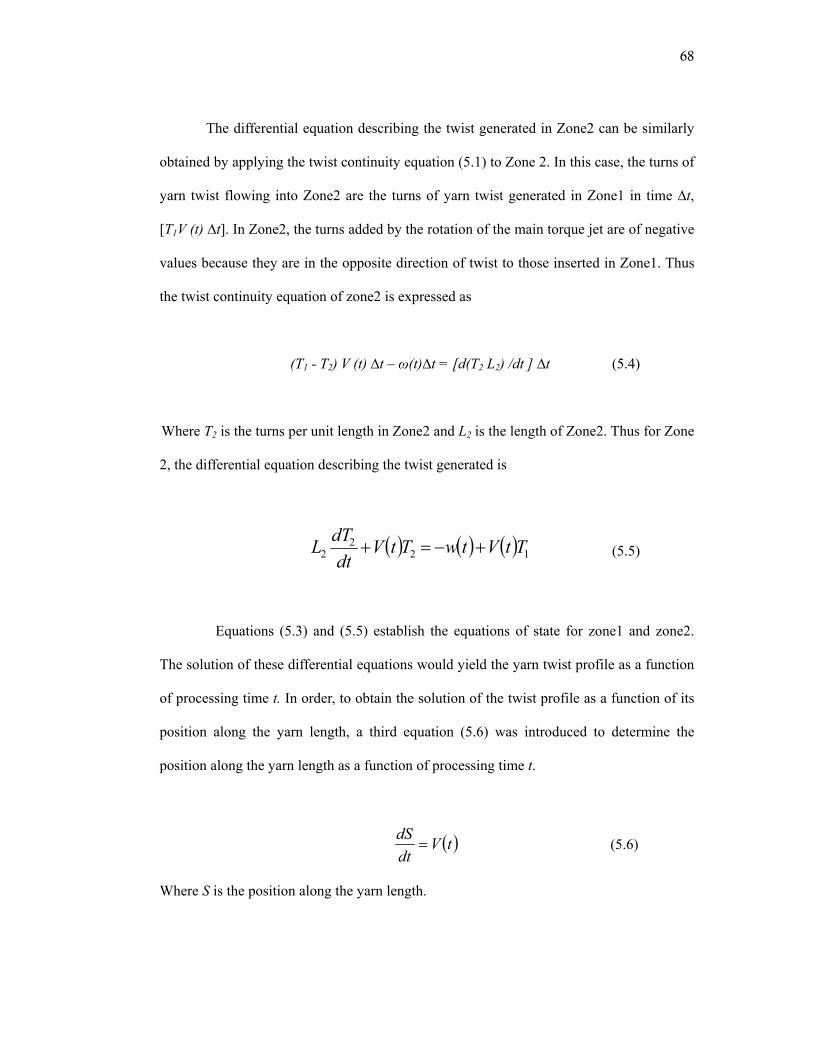
68
The differential equation describing the twist generated in Zone2 can be similarly
obtained by applying the twist continuity equation (5.1) to Zone 2. In this case, the turns of
yarn twist flowing into Zone2 are the turns of yarn twist generated in Zone1 in time ∆t,
[T1V (t) ∆t]. In Zone2, the turns added by the rotation of the main torque jet are of negative
values because they are in the opposite direction of twist to those inserted in Zone1. Thus
the twist continuity equation of zone2 is expressed as
(T1 - T2) V (t) ∆t – ω(t)∆t = [d(T2 L2) /dt ] ∆t (5.4)
Where T2 is the turns per unit length in Zone2 and L2 is the length of Zone2. Thus for Zone
2, the differential equation describing the twist generated is
( ) ( ) ( ) 122
2 TtVtwTtVdt
dTL +−=+ (5.5)
Equations (5.3) and (5.5) establish the equations of state for zone1 and zone2.
The solution of these differential equations would yield the yarn twist profile as a function
of processing time t. In order, to obtain the solution of the twist profile as a function of its
position along the yarn length, a third equation (5.6) was introduced to determine the
position along the yarn length as a function of processing time t.
( )tVdtdS
= (5.6)
Where S is the position along the yarn length.
69
For reasons of simplification, equations (5.3), (5.5) and (5.6) were reduced to a
dimensionless form by introducing the dimensionless variable τ shown in equations (5.7).
M
R
VL
=τ (5.7)
Where VM is the maximum yarn speed, LR is the twist reversal length. The physical
meaning of τ is the time taken for one half cycle to be completed or the time taken for one
twist reversal length (i.e. distance between two successive bonds) to pass through at
maximum yarn speed. Equations (5.8) through (5.11) illustrate the dimensionless form of
the different process parameters.
RLLL =ˆ (5.8)
RLTT =ˆ (5.9)
τtt =ˆ (5.10)
ωτω =ˆ (5.11)
70
Substituting into equations (5.3), (5.5) and (5.6), the reduced dimensionless
equations are shown below
( ) ( )1
1
1
1ˆ
ˆˆˆ
ˆˆˆ
LTV
LtdTd ττω
−= (5.12)
( ) ( ) ( )1
1
22
22
ˆˆˆ
ˆˆ
ˆˆˆ
ˆˆ
LTV
LLTV
tdTd ττωτ
+−−= (5.13)
( )τVtdSd ˆˆˆ= (5.14)
Equations (5.12), (5.13) and (5.14) represent the main differential equations
required to predict the yarn twist profile. These equations also determine the main process
parameters that affect the yarn twist profile. The yarn twist profile is greatly affected by
the yarn velocity profile and the rotational profile of the main torque jet. This
mathematical model also reveals a very surprising result that the yarn twist profile is also
affected by the zone lengths of the ATP process (L1 and L2).
A computational model was used to provide the solution to equations (5.12),
(5.13) and (5.14) through the use of a stiff integrator. “MatLab” programming software
was used to develop the computational model. The initial conditions were identified as
T1(0)=0 and T2(0)=0, where at time t=0, the turns per unit length in zone1 and zone2 are
equal to zero. A simulation of the yarn velocity profile and the rotational profile of the
main torque jet as functions of the cycle time were done and used as inputs to the
71
computational model. The dimensionless zone lengths 1L and 2L were also inputs to the
computational model. The command functions of the computational model are shown in
Appendix F.
Several runs of the computational model using different yarn velocity profiles
and zonal lengths were done in order to determine the optimum process conditions needed
to obtain a square wave twist profile in the ATP yarn.
5.4 Experimental Verification and Results
Experimental trials on the Drexel ATP process were conducted to substantiate the
mathematical model. The yarns used in these experiments were 1245 denier BCF nylon
singles yarn. A singles yarn tension of 34g was used for all these experiments. The same
yarn velocity profile and rotational profile of the torque jet used as the inputs to the
computational model were fed to the operator interface control panel of the Drexel ATP
process.
5.4.1 Effect of Velocity Profile on Twist Profile
In order to determine the optimum yarn velocity profile required to obtain a square
wave twist profile, several profiles were constructed and the computational model was
used to predict the yarn twist profile. The predicted yarn twist profiles were examined, and
the features of the yarn velocity profile required to achieve the square wave twist profile
were then determined. The dimensionless zone lengths values used in these model runs
were calculated from the actual lengths of zone1 and zone2 on the Drexel ATP process,
such that 55.3ˆ1 =L and 03.0ˆ
2 =L .
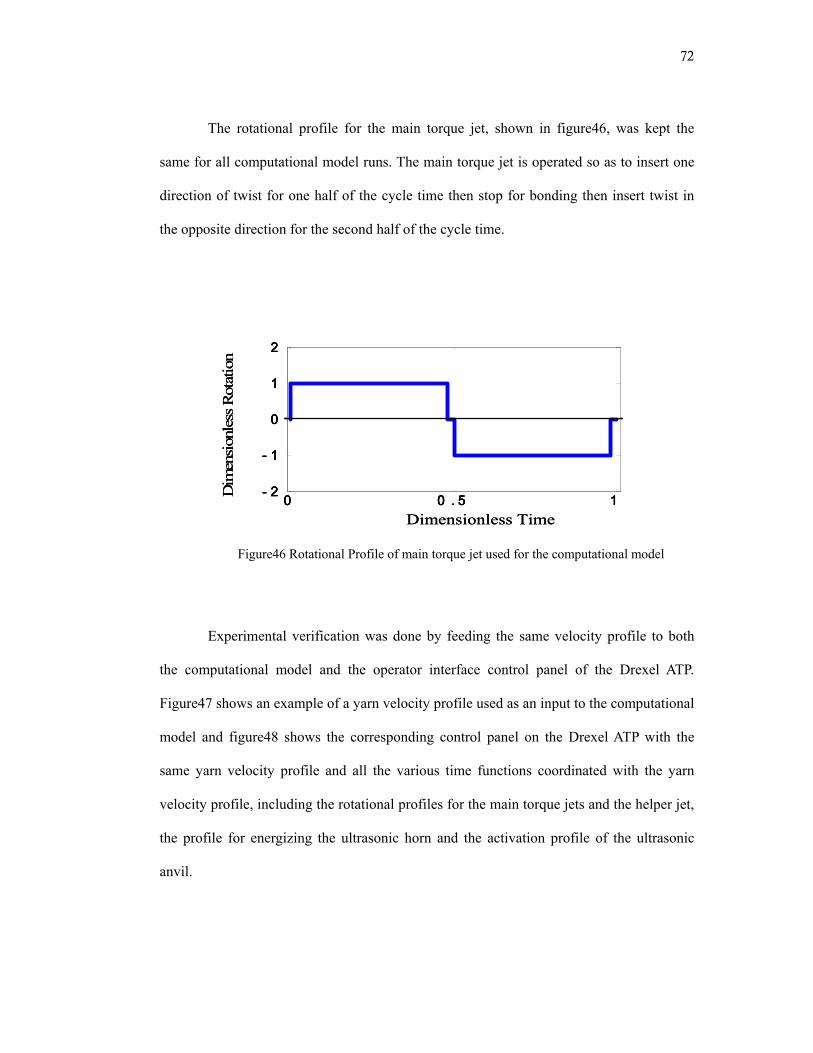
72
The rotational profile for the main torque jet, shown in figure46, was kept the
same for all computational model runs. The main torque jet is operated so as to insert one
direction of twist for one half of the cycle time then stop for bonding then insert twist in
the opposite direction for the second half of the cycle time.
Figure46 Rotational Profile of main torque jet used for the computational model
Experimental verification was done by feeding the same velocity profile to both
the computational model and the operator interface control panel of the Drexel ATP.
Figure47 shows an example of a yarn velocity profile used as an input to the computational
model and figure48 shows the corresponding control panel on the Drexel ATP with the
same yarn velocity profile and all the various time functions coordinated with the yarn
velocity profile, including the rotational profiles for the main torque jets and the helper jet,
the profile for energizing the ultrasonic horn and the activation profile of the ultrasonic
anvil.
Dimensionless Time
Dim
ensi
onle
ss R
otat
ion
0 0 . 5 1- 2
- 1
0
1
2
0 0 . 5 1- 2
- 1
0
1
2
Dimensionless Time
Dim
ensi
onle
ss R
otat
ion
0 0 . 5 1- 2
- 1
0
1
2
0 0 . 5 1- 2
- 1
0
1
2
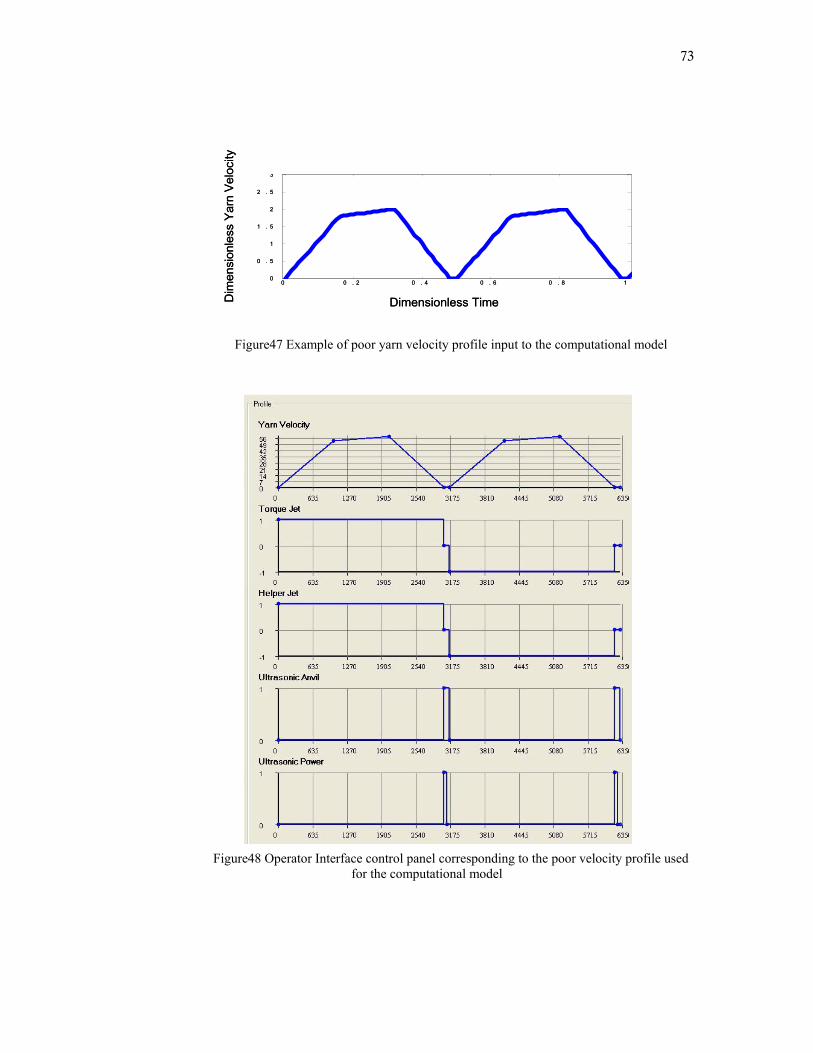
73
Figure47 Example of poor yarn velocity profile input to the computational model
Figure48 Operator Interface control panel corresponding to the poor velocity profile used for the computational model
0 0 . 2 0 . 4 0 . 6 0 . 8 10
0 . 5
1
1 . 5
2
2 . 5
3
Dimensionless TimeDim
ensi
onle
ss Y
arn
Vel
ocity
0 0 . 2 0 . 4 0 . 6 0 . 8 10
0 . 5
1
1 . 5
2
2 . 5
3
Dimensionless TimeDim
ensi
onle
ss Y
arn
Vel
ocity
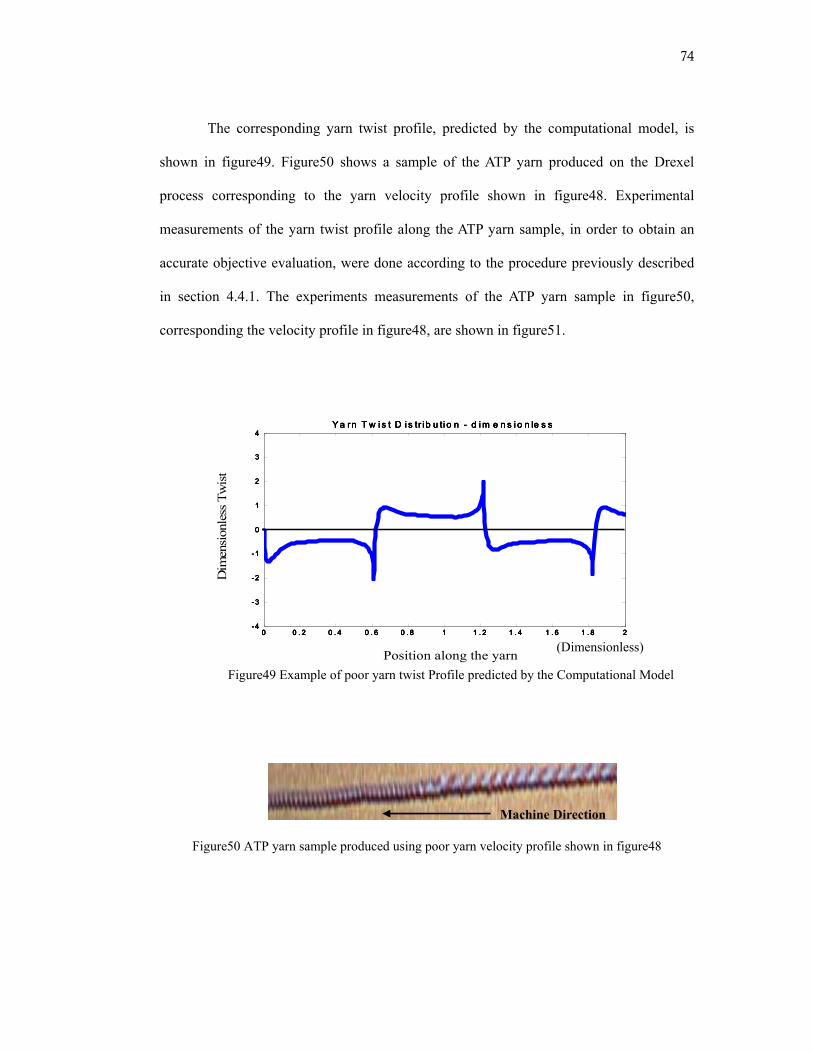
74
The corresponding yarn twist profile, predicted by the computational model, is
shown in figure49. Figure50 shows a sample of the ATP yarn produced on the Drexel
process corresponding to the yarn velocity profile shown in figure48. Experimental
measurements of the yarn twist profile along the ATP yarn sample, in order to obtain an
accurate objective evaluation, were done according to the procedure previously described
in section 4.4.1. The experiments measurements of the ATP yarn sample in figure50,
corresponding the velocity profile in figure48, are shown in figure51.
Figure49 Example of poor yarn twist Profile predicted by the Computational Model
Figure50 ATP yarn sample produced using poor yarn velocity profile shown in figure48
Machine Direction
Dim
ensi
onle
ss T
wis
t
0 0 . 2 0 . 4 0 . 6 0 . 8 1 1 . 2 1 . 4 1 . 6 1 . 8 2-4
-3
-2
-1
0
1
2
3
4Y a rn T w i s t D i s tr i b u ti o n - d i m e n s i o n le s s
0 0 . 2 0 . 4 0 . 6 0 . 8 1 1 . 2 1 . 4 1 . 6 1 . 8 2-4
-3
-2
-1
0
1
2
3
4Y a rn T w i s t D i s tr i b u ti o n - d i m e n s i o n le s s
Position along the yarn
Dim
ensi
onle
ss T
wis
t
0 0 . 2 0 . 4 0 . 6 0 . 8 1 1 . 2 1 . 4 1 . 6 1 . 8 2-4
-3
-2
-1
0
1
2
3
4Y a rn T w i s t D i s tr i b u ti o n - d i m e n s i o n le s s
0 0 . 2 0 . 4 0 . 6 0 . 8 1 1 . 2 1 . 4 1 . 6 1 . 8 2-4
-3
-2
-1
0
1
2
3
4Y a rn T w i s t D i s tr i b u ti o n - d i m e n s i o n le s s
Position along the yarn (Dimensionless)
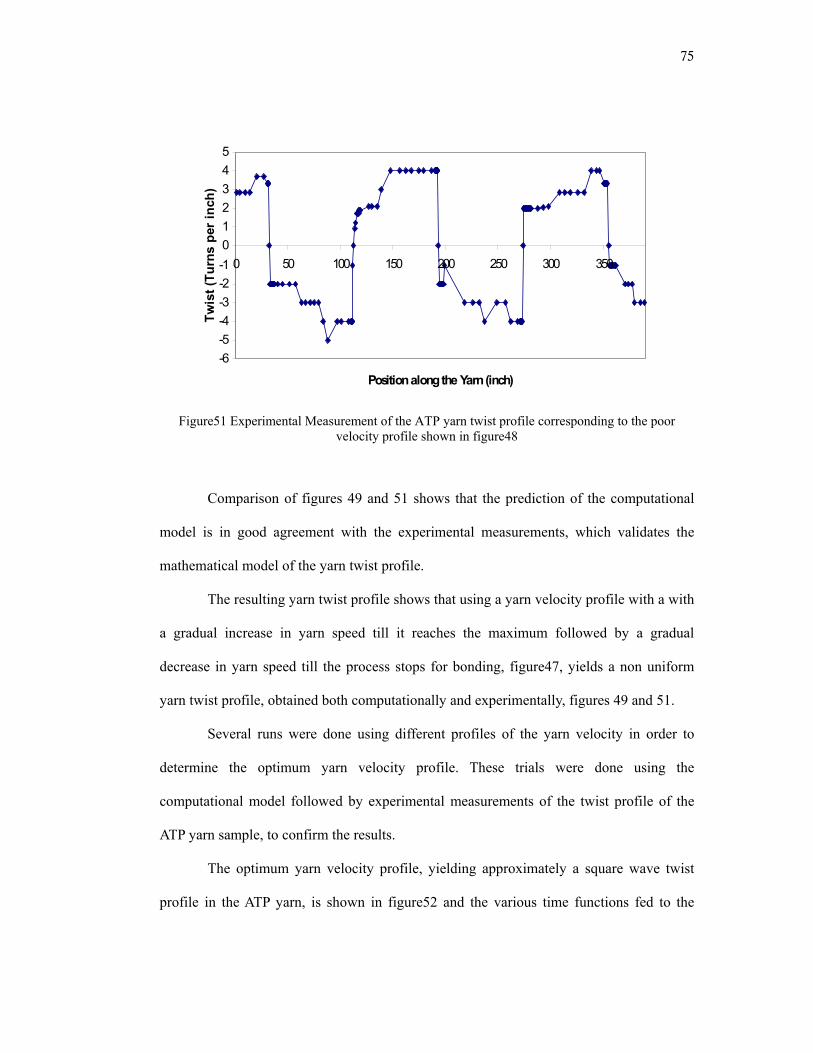
75
Figure51 Experimental Measurement of the ATP yarn twist profile corresponding to the poor velocity profile shown in figure48
Comparison of figures 49 and 51 shows that the prediction of the computational
model is in good agreement with the experimental measurements, which validates the
mathematical model of the yarn twist profile.
The resulting yarn twist profile shows that using a yarn velocity profile with a with
a gradual increase in yarn speed till it reaches the maximum followed by a gradual
decrease in yarn speed till the process stops for bonding, figure47, yields a non uniform
yarn twist profile, obtained both computationally and experimentally, figures 49 and 51.
Several runs were done using different profiles of the yarn velocity in order to
determine the optimum yarn velocity profile. These trials were done using the
computational model followed by experimental measurements of the twist profile of the
ATP yarn sample, to confirm the results.
The optimum yarn velocity profile, yielding approximately a square wave twist
profile in the ATP yarn, is shown in figure52 and the various time functions fed to the
-6-5-4-3-2-1012345
0 50 100 150 200 250 300 350
Position along the Yarn (inch)
Twis
t (Tu
rns
per i
nch)
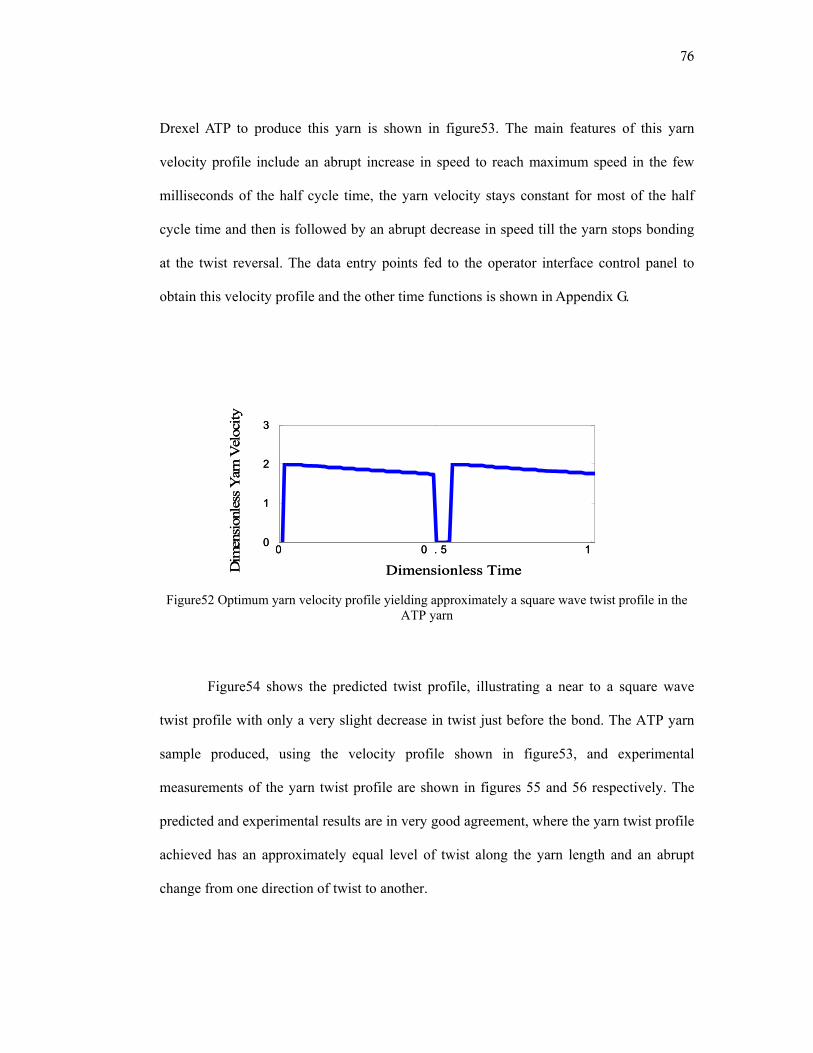
76
Drexel ATP to produce this yarn is shown in figure53. The main features of this yarn
velocity profile include an abrupt increase in speed to reach maximum speed in the few
milliseconds of the half cycle time, the yarn velocity stays constant for most of the half
cycle time and then is followed by an abrupt decrease in speed till the yarn stops bonding
at the twist reversal. The data entry points fed to the operator interface control panel to
obtain this velocity profile and the other time functions is shown in Appendix G.
Figure52 Optimum yarn velocity profile yielding approximately a square wave twist profile in the ATP yarn
Figure54 shows the predicted twist profile, illustrating a near to a square wave
twist profile with only a very slight decrease in twist just before the bond. The ATP yarn
sample produced, using the velocity profile shown in figure53, and experimental
measurements of the yarn twist profile are shown in figures 55 and 56 respectively. The
predicted and experimental results are in very good agreement, where the yarn twist profile
achieved has an approximately equal level of twist along the yarn length and an abrupt
change from one direction of twist to another.
0 0 . 5 10
1
2
3
Dim
ensi
onle
ss Y
arn
Vel
ocity
Dimensionless Time0 0 . 5 10
1
2
3
Dim
ensi
onle
ss Y
arn
Vel
ocity
Dimensionless Time
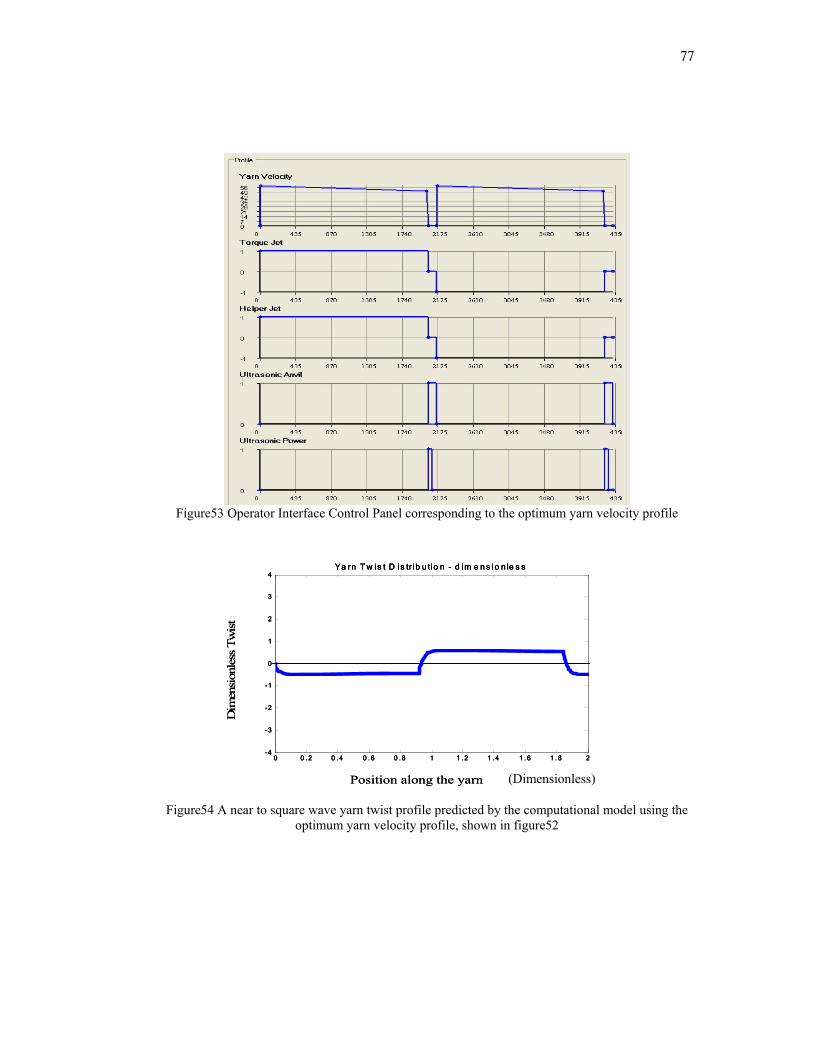
77
Figure53 Operator Interface Control Panel corresponding to the optimum yarn velocity profile
Figure54 A near to square wave yarn twist profile predicted by the computational model using the optimum yarn velocity profile, shown in figure52
0 0 . 2 0 . 4 0 . 6 0 . 8 1 1 . 2 1 . 4 1 . 6 1 . 8 2-4
-3
-2
-1
0
1
2
3
4Ya rn T w is t D is tr ib u tio n - d im e ns io n le s s
Position along the yarn
Dim
ensi
onle
ss T
wis
t
0 0 . 2 0 . 4 0 . 6 0 . 8 1 1 . 2 1 . 4 1 . 6 1 . 8 2-4
-3
-2
-1
0
1
2
3
4Ya rn T w is t D is tr ib u tio n - d im e ns io n le s s
0 0 . 2 0 . 4 0 . 6 0 . 8 1 1 . 2 1 . 4 1 . 6 1 . 8 2-4
-3
-2
-1
0
1
2
3
4Ya rn T w is t D is tr ib u tio n - d im e ns io n le s s
Position along the yarn
Dim
ensi
onle
ss T
wis
t
(Dimensionless)
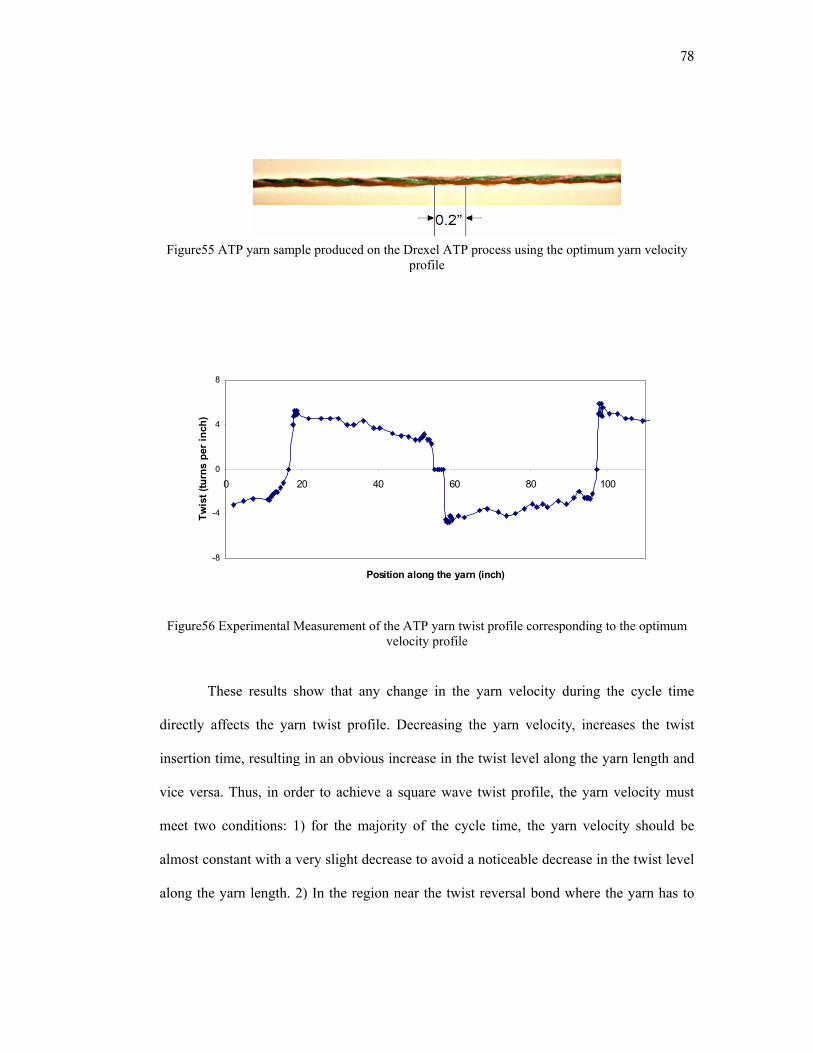
78
Figure55 ATP yarn sample produced on the Drexel ATP process using the optimum yarn velocity profile
Figure56 Experimental Measurement of the ATP yarn twist profile corresponding to the optimum
velocity profile
These results show that any change in the yarn velocity during the cycle time
directly affects the yarn twist profile. Decreasing the yarn velocity, increases the twist
insertion time, resulting in an obvious increase in the twist level along the yarn length and
vice versa. Thus, in order to achieve a square wave twist profile, the yarn velocity must
meet two conditions: 1) for the majority of the cycle time, the yarn velocity should be
almost constant with a very slight decrease to avoid a noticeable decrease in the twist level
along the yarn length. 2) In the region near the twist reversal bond where the yarn has to
-8
-4
0
4
8
0 20 40 60 80 100
Position along the yarn (inch)
Twis
t (tu
rns
per i
nch)
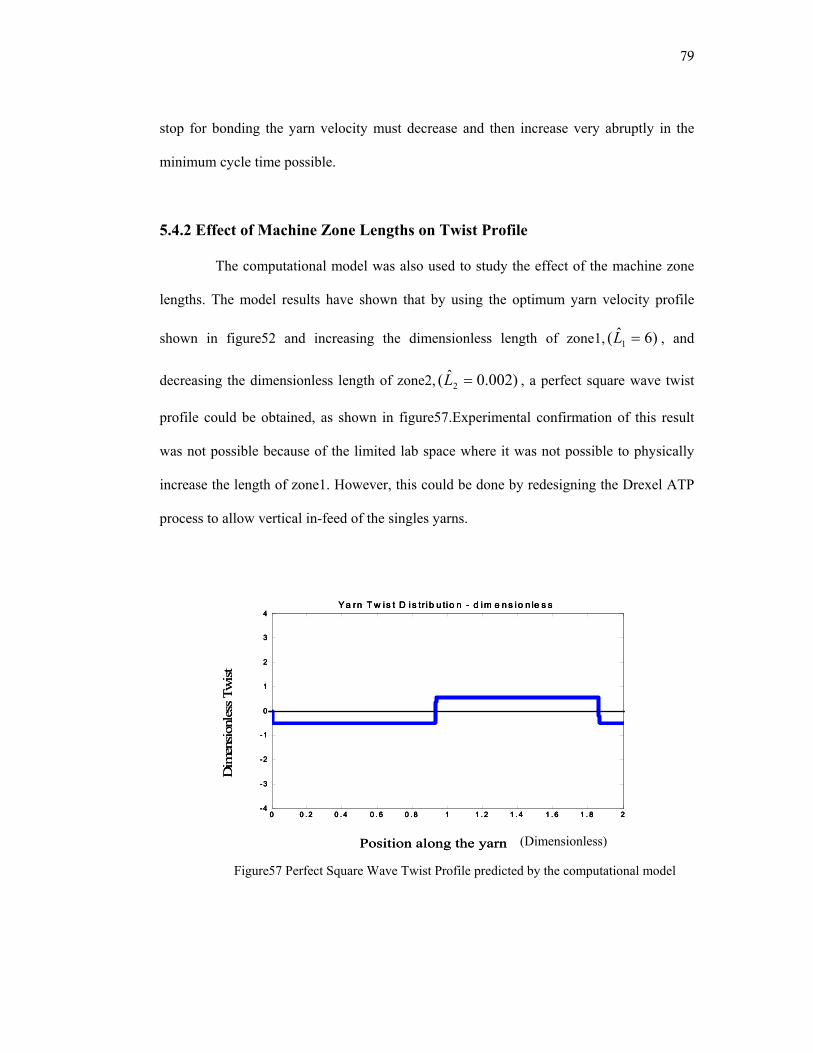
79
stop for bonding the yarn velocity must decrease and then increase very abruptly in the
minimum cycle time possible.
5.4.2 Effect of Machine Zone Lengths on Twist Profile
The computational model was also used to study the effect of the machine zone
lengths. The model results have shown that by using the optimum yarn velocity profile
shown in figure52 and increasing the dimensionless length of zone1, )6ˆ( 1 =L , and
decreasing the dimensionless length of zone2, )002.0ˆ( 2 =L , a perfect square wave twist
profile could be obtained, as shown in figure57.Experimental confirmation of this result
was not possible because of the limited lab space where it was not possible to physically
increase the length of zone1. However, this could be done by redesigning the Drexel ATP
process to allow vertical in-feed of the singles yarns.
Figure57 Perfect Square Wave Twist Profile predicted by the computational model
Position along the yarn
Dim
ensi
onle
ss T
wis
t
0 0 . 2 0 . 4 0 . 6 0 . 8 1 1 . 2 1 . 4 1 . 6 1 . 8 2-4
-3
-2
-1
0
1
2
3
4Y a rn T w is t D i s tr i b u tio n - d im e n s io n le s s
Position along the yarn
Dim
ensi
onle
ss T
wis
t
0 0 . 2 0 . 4 0 . 6 0 . 8 1 1 . 2 1 . 4 1 . 6 1 . 8 2-4
-3
-2
-1
0
1
2
3
4Y a rn T w is t D i s tr i b u tio n - d im e n s io n le s s
0 0 . 2 0 . 4 0 . 6 0 . 8 1 1 . 2 1 . 4 1 . 6 1 . 8 2-4
-3
-2
-1
0
1
2
3
4Y a rn T w is t D i s tr i b u tio n - d im e n s io n le s s
(Dimensionless)
80
These results could be attributed to that increasing the length of zone1 with respect
to the twist reversal length would allow a more uniform propagation of twist upstream
through the singles yarn before they are allowed to self ply. However, the length of zone2
with respect to the twist reversal length should be as short as possible to force the twist
inserted by the main jets to propagate downstream along the yarn and generate sufficient
detwisting torques in the singles yarn causing them to spontaneously self ply.
5.4.3 Coordination of the Velocity, Rotation and Bonding Profiles on the Drexel ATP Process
Coordination of the jets rotational profiles and the ultrasonic horn and anvil
profiles together with the yarn velocity profile also has a great effect on the yarn twist
profile. This coordination is very crucial especially during bonding at the twist reversal. To
obtain a good strong bond at the twist reversal, it is recommended that both the main
torque jets and the helper jet stop during bonding and the yarn too has to completely stop
during the bonding time. If that is not the case, then during bonding, the yarns pushed by
the ultrasonic anvil against the horn will not be in a self ply structure, as shown in
figure58. This will in turn result in the presence of a long zero twist region between the
twist reversals, as shown in figure59. The optimum case is shown in figure60, where the
yarns are in a self ply structure during bonding and thus resulting in a very short bond and
zero twist region, as shown in figure61. The bonding time on the Drexel ATP process is
about 40-100 milliseconds. During bonding the ultrasonic anvil ascends upward to press
the yarns against the ultrasonic horn, however, the ultrasonic horn is energized for only
half of the bonding time. This is done so as to allow the yarns to cool down in the
remaining half of the bonding time to ensure that the yarns do not unbond after that.
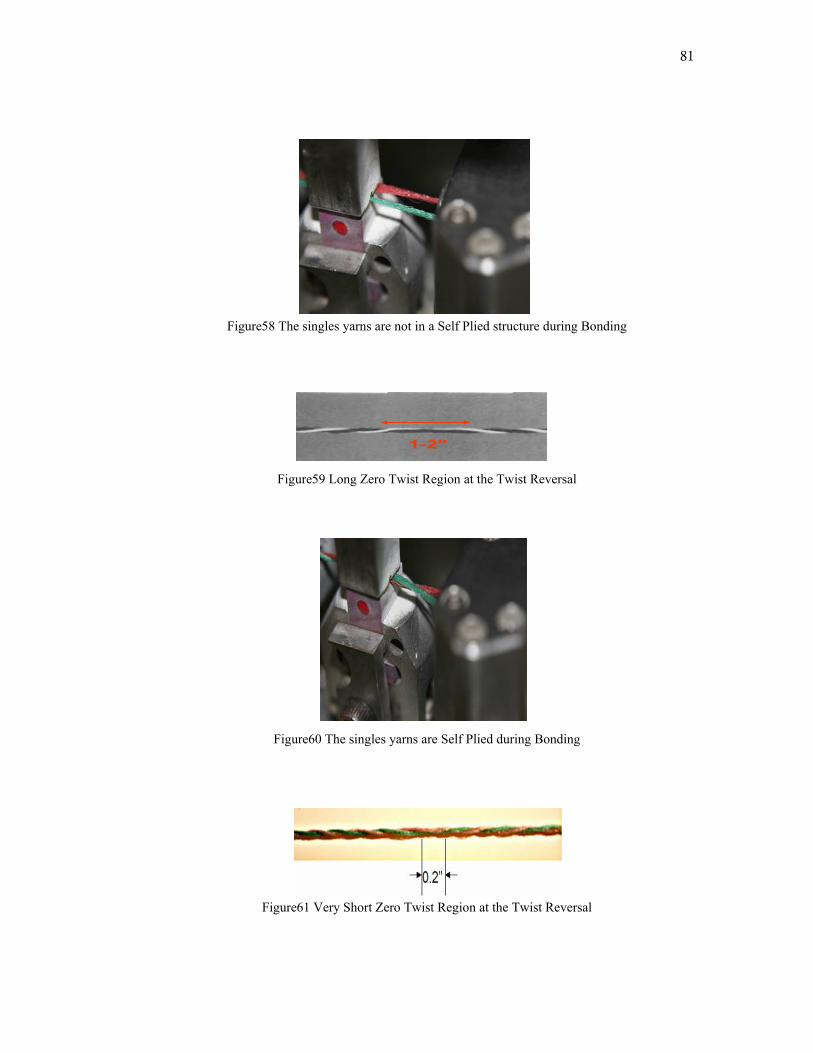
81
Figure58 The singles yarns are not in a Self Plied structure during Bonding
Figure59 Long Zero Twist Region at the Twist Reversal
Figure60 The singles yarns are Self Plied during Bonding
Figure61 Very Short Zero Twist Region at the Twist Reversal
1-2”1-2”
82
5.4 Discussion
A mathematical model to predict the ATP yarn twist profile was done. The model
was based on studying the rate of turns of twist accumulating in the singles yarns across
the different ATP process zones before they self ply. This mathematical model has defined
the yarn velocity profile and the process zone lengths as the key process parameters
affecting the yarn twist profile. A computational model used to solve the mathematical
model together with a computer simulation of the yarn velocity and main jet rotational
profiles. The results of the computational model were experimentally verified on the
Drexel ATP process and are in very good agreement. [35]
The computational model has determined the optimum yarn velocity profile and
the process zone lengths needed to obtain a square wave twist profile. This yarn velocity
profile must have a minimal change in velocity while twist is being inserted in the yarn by
the main torque jet. Before bonding at the twist reversal, there should be an abrupt
decrease in speed to stop for bonding, followed by an abrupt increase to the maximum
after bonding. This yarn velocity profile should also be coordinated with the jets rotational
profiles and the ultrasonic horn and anvil bonding profiles to ensure short zero twist
regions at the twist reversals and strong bonds. In order to assist in a uniform distribution
of twist in the singles yarn, before the twist is trapped in the self ply structure, the length of
zone1; distance between the yarn tensioners and the main torque jets, should be at least six
times the twist reversal length. The length of zone2; distance between the main torque jets,
with respect to the twist reversal length should be very small ~ 0.003, to force the
spontaneous self plying process.
83
CHAPTER 6: PROCESS OPTIMIZATION OF THE YARN TWIST EFFICIENCY
6.1 Background and Significance
The objective of the previous chapter was to achieve a square wave twist profile in
the ATP yarn produced on the Drexel ATP process. The second major objective of this
thesis is to improve the yarn twist efficiency of the ATP yarn. Twist efficiency is
determined by the ratio of the ply yarn twist to the singles yarn twist. The ATP yarn twist
efficiency is a very complex feature of the ATP yarn. The physical meaning of twist
efficiency is how much of the torque energy saved in the singles yarn structure is released
into the ply yarn structure through the self plying process. A 100% twist efficiency yarn is
one that has no residual torque in the singles yarn inside the ATP yarn structure. 100%
twist efficiency yarns can only be produced by the cabling process. This is basically
because no twist is actually being inserted in the singles yarns during cabling. The action,
of the yarns wrapping around each other, dissolves all the false twist in the balloon yarn.
The maximum twist efficiency of the ATP yarns produced on the current
commercial ATP processes is 65%. This presents the major limitation of the current ATP
processes that holds them from being used as cut pile carpet yarns. The reason for that is
that higher yarn twist efficiency is needed to be able to provide two important features: 1)
Cut Tip Stability and 2) Greater Yarn Coverage Area. Yarns with higher twist efficiency
will in turn have a lower residual singles torque; this is greatly desirable for cut pile carpet
yarns to decrease the tendency for the individual singles yarns to split at the tuft tips after
they are being cut. The tuft tips should be completely balanced and stable structures
capable of preserving their ply twisted structure after they are cut, as shown in figure62.
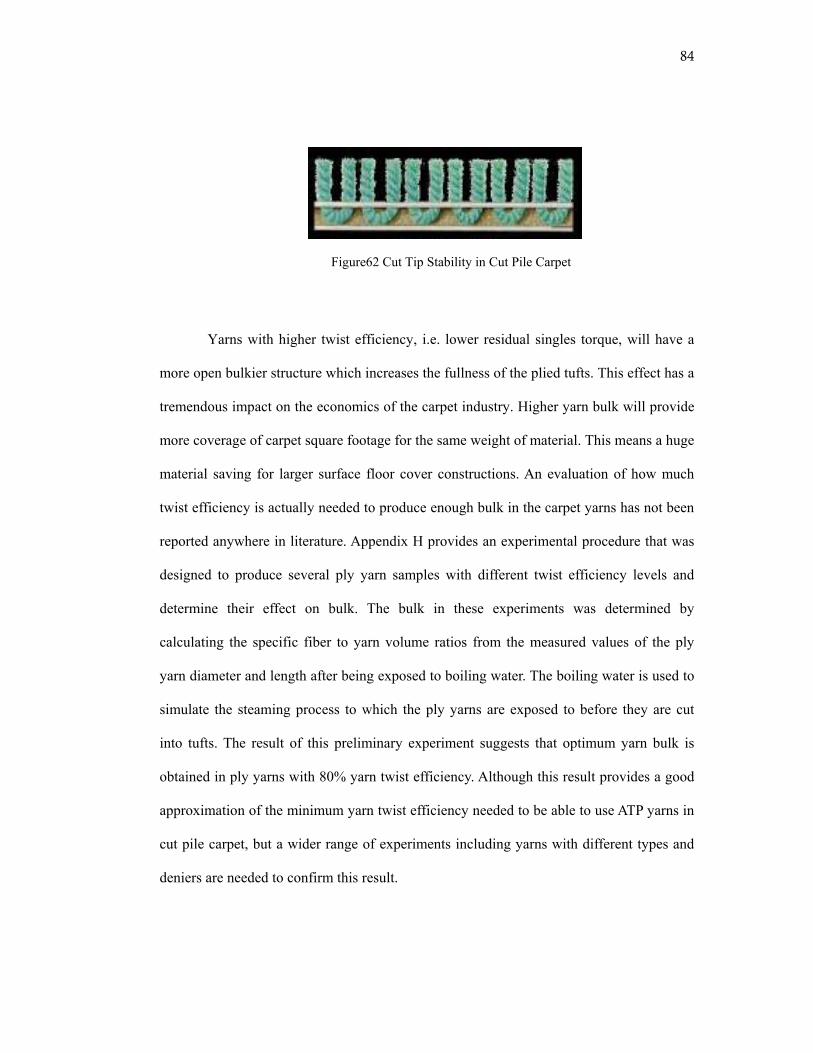
84
Figure62 Cut Tip Stability in Cut Pile Carpet
Yarns with higher twist efficiency, i.e. lower residual singles torque, will have a
more open bulkier structure which increases the fullness of the plied tufts. This effect has a
tremendous impact on the economics of the carpet industry. Higher yarn bulk will provide
more coverage of carpet square footage for the same weight of material. This means a huge
material saving for larger surface floor cover constructions. An evaluation of how much
twist efficiency is actually needed to produce enough bulk in the carpet yarns has not been
reported anywhere in literature. Appendix H provides an experimental procedure that was
designed to produce several ply yarn samples with different twist efficiency levels and
determine their effect on bulk. The bulk in these experiments was determined by
calculating the specific fiber to yarn volume ratios from the measured values of the ply
yarn diameter and length after being exposed to boiling water. The boiling water is used to
simulate the steaming process to which the ply yarns are exposed to before they are cut
into tufts. The result of this preliminary experiment suggests that optimum yarn bulk is
obtained in ply yarns with 80% yarn twist efficiency. Although this result provides a good
approximation of the minimum yarn twist efficiency needed to be able to use ATP yarns in
cut pile carpet, but a wider range of experiments including yarns with different types and
deniers are needed to confirm this result.
85
Improving the ATP yarn twist efficiency is thus a very challenging task and
accomplishing this task would indeed revolutionize the whole carpet industry. The rest of
this thesis focuses mainly on solving this problem. This chapter and the following chapters
provide different methods of tackling this problem and novel approaches to improve the
twist efficiency of the ATP yarn. None or very little work, available in literature, has
studied the effect of the different process parameters on the ATP yarn twist efficiency. In
this chapter, the main process parameters affecting the yarn twist efficiency are
determined, on the Drexel ATP process. This provides the starting point and the basis of
the detailed studies that will be conducted in the subsequent chapters to determine how is it
possible to improve the yarn twist efficiency.
6.2 Materials and Machine Setup
1245 denier BCF nylon yarns were used in the following experiments conducted
on the Drexel ATP process. The yarn velocity profile used in these experiments is the
optimum profile, determined in Chapter 5, to produce a square wave yarn twist profile.
This profile and the corresponding main jets and helper jet rotational profiles and the
ultrasonic horn and anvil bonding profiles are shown figure53. The yarn twist efficiency of
the produced ATP yarn samples was determined using the twist tester according to the
procedure described in section 4.4.2.
86
6.3 Results 6.3.1 Effect of Main Jet Pressure on Twist Efficiency
The function of the main torque jets on the Drexel ATP process is to apply equal
and same direction torque on each of the singles yarns. This applied singles torque is the
main driving force for the self plying process. The applied singles torque generates twist in
the singles yarns before they are allowed to converge for self ply. The magnitude of the
singles torque, applied by the main torque jets on the Drexel ATP, is controlled by the
pressure of the compressed air supplied to the main jets. This compressed air pressure is
controlled using a pressure gauge. The direction of the applied singles torque is also
controlled using an electronic pressure regulator.
In order to determine the effect of the applied singles torque on the yarn twist
efficiency, the main torque jets pressure was varied from 30 PSI to 80 PSI which is the
maximum capacity of the air pressure line supplied to the Drexel ATP process. In this
experiment, the helper jet was turned off so as to allow us to understand the effect of the
main torque jets clearly and independently. Figures 63 and 64 illustrate the effect of the
main jet pressure on the singles yarn twist and the twist efficiency respectively, for two
different singles yarn tension.
The results show that as the main jet pressure increases, the twist in the singles
yarn increases. This is attributed to the increase in the torque applied to the singles yarns as
the jet pressure increases. The increase in the singles torque generates a higher level of
twist in the singles yarn. Figure63 also shows that for different singles yarn tension, the
rate of increase in the singles yarn twist as the jet pressure increases is not the same. This
suggests that there is an interaction between the different process variables.
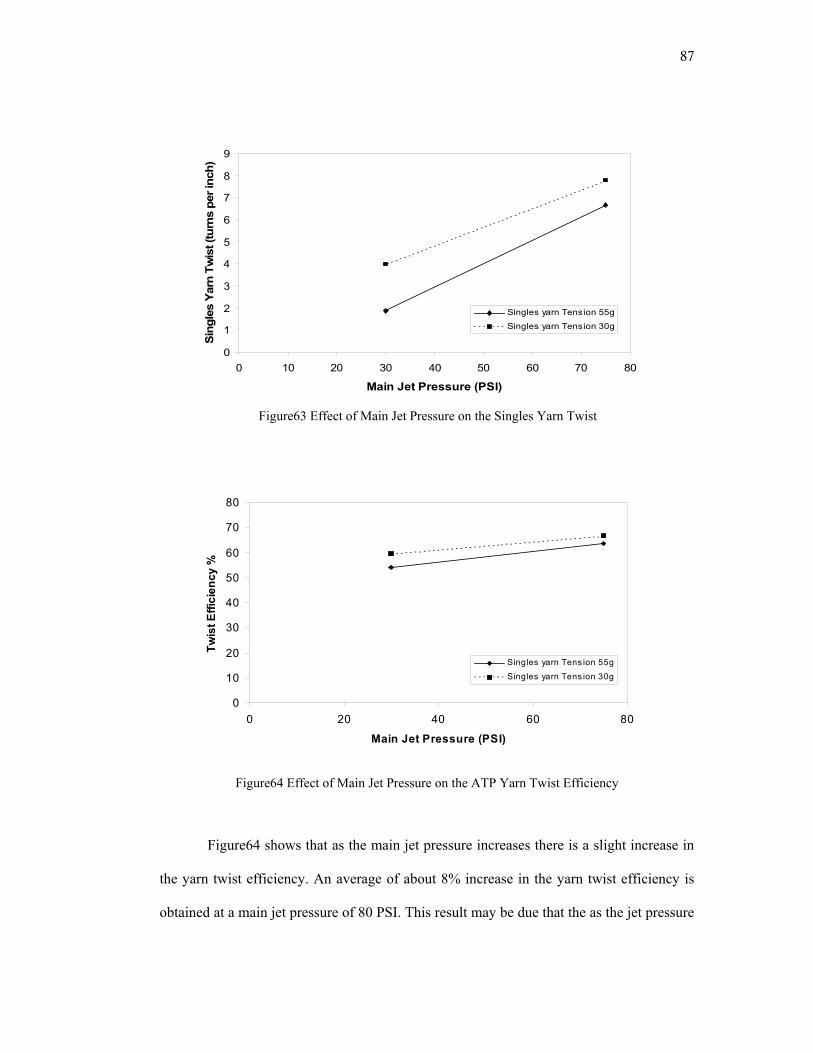
87
0
1
2
3
4
5
6
7
8
9
0 10 20 30 40 50 60 70 80
Main Jet Pressure (PSI)
Sing
les
Yarn
Tw
ist (
turn
s pe
r inc
h)
Singles yarn Tension 55g
Singles yarn Tension 30g
Figure63 Effect of Main Jet Pressure on the Singles Yarn Twist
Figure64 Effect of Main Jet Pressure on the ATP Yarn Twist Efficiency
Figure64 shows that as the main jet pressure increases there is a slight increase in
the yarn twist efficiency. An average of about 8% increase in the yarn twist efficiency is
obtained at a main jet pressure of 80 PSI. This result may be due that the as the jet pressure
0
10
20
30
40
50
60
70
80
0 20 40 60 80
Main Jet Pressure (PSI)
Twis
t Effi
cien
cy %
Singles yarn Tens ion 55g
Singles yarn Tens ion 30g
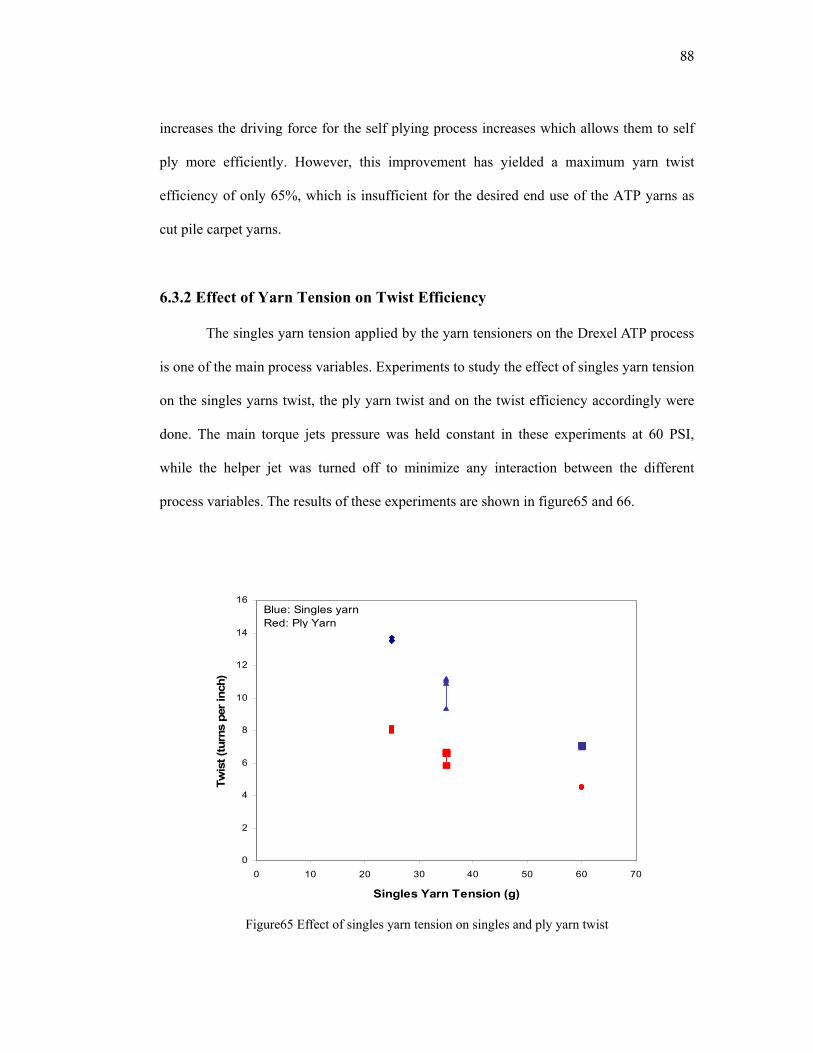
88
increases the driving force for the self plying process increases which allows them to self
ply more efficiently. However, this improvement has yielded a maximum yarn twist
efficiency of only 65%, which is insufficient for the desired end use of the ATP yarns as
cut pile carpet yarns.
6.3.2 Effect of Yarn Tension on Twist Efficiency The singles yarn tension applied by the yarn tensioners on the Drexel ATP process
is one of the main process variables. Experiments to study the effect of singles yarn tension
on the singles yarns twist, the ply yarn twist and on the twist efficiency accordingly were
done. The main torque jets pressure was held constant in these experiments at 60 PSI,
while the helper jet was turned off to minimize any interaction between the different
process variables. The results of these experiments are shown in figure65 and 66.
0
2
4
6
8
10
12
14
16
0 10 20 30 40 50 60 70
Singles Yarn Tension (g)
Twis
t (tu
rns
per i
nch)
Blue: Singles yarnRed: Ply Yarn
Figure65 Effect of singles yarn tension on singles and ply yarn twist
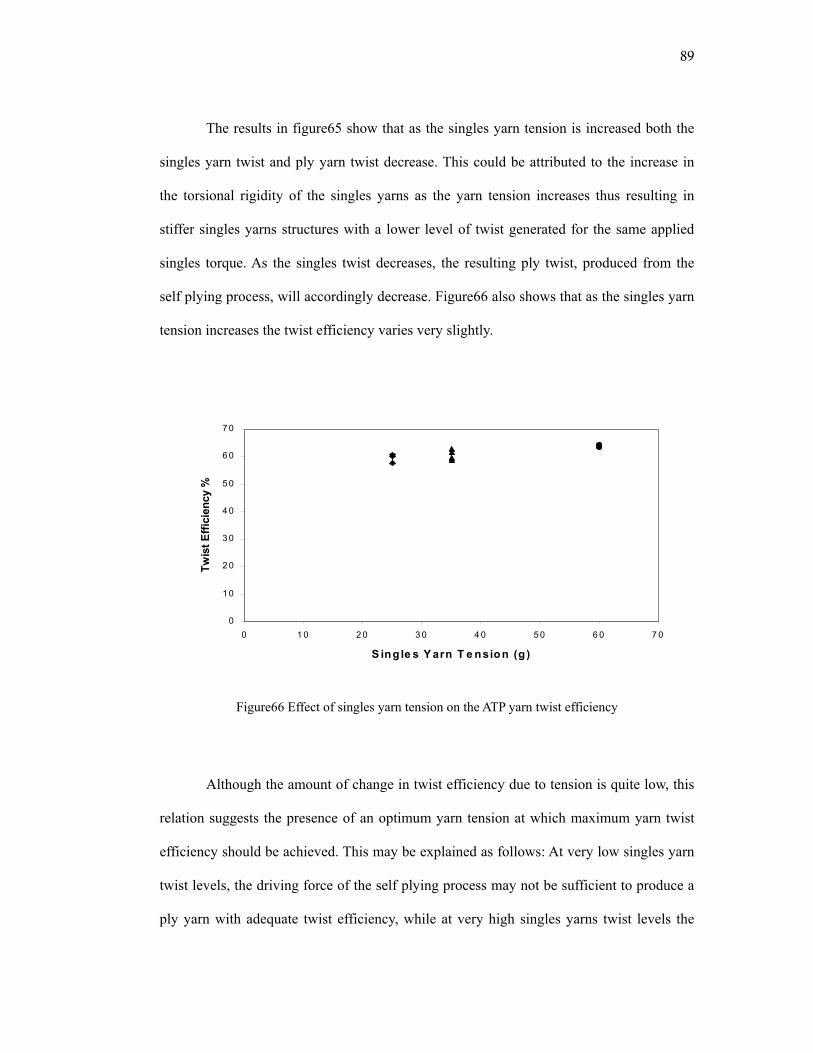
89
The results in figure65 show that as the singles yarn tension is increased both the
singles yarn twist and ply yarn twist decrease. This could be attributed to the increase in
the torsional rigidity of the singles yarns as the yarn tension increases thus resulting in
stiffer singles yarns structures with a lower level of twist generated for the same applied
singles torque. As the singles twist decreases, the resulting ply twist, produced from the
self plying process, will accordingly decrease. Figure66 also shows that as the singles yarn
tension increases the twist efficiency varies very slightly.
Figure66 Effect of singles yarn tension on the ATP yarn twist efficiency
Although the amount of change in twist efficiency due to tension is quite low, this
relation suggests the presence of an optimum yarn tension at which maximum yarn twist
efficiency should be achieved. This may be explained as follows: At very low singles yarn
twist levels, the driving force of the self plying process may not be sufficient to produce a
ply yarn with adequate twist efficiency, while at very high singles yarns twist levels the
0
1 0
2 0
3 0
4 0
5 0
6 0
7 0
0 1 0 2 0 3 0 4 0 5 0 6 0 7 0
S ing le s Y arn T e nsion (g )
Twis
t Effi
cien
cy %
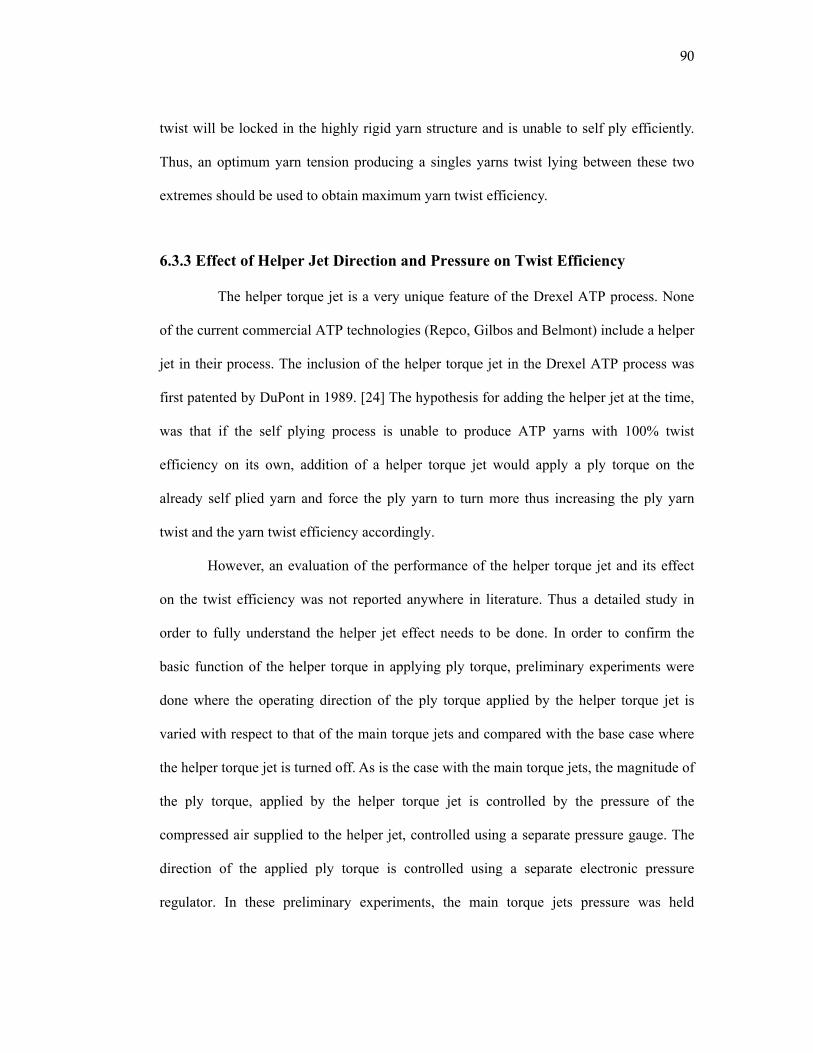
90
twist will be locked in the highly rigid yarn structure and is unable to self ply efficiently.
Thus, an optimum yarn tension producing a singles yarns twist lying between these two
extremes should be used to obtain maximum yarn twist efficiency.
6.3.3 Effect of Helper Jet Direction and Pressure on Twist Efficiency
The helper torque jet is a very unique feature of the Drexel ATP process. None
of the current commercial ATP technologies (Repco, Gilbos and Belmont) include a helper
jet in their process. The inclusion of the helper torque jet in the Drexel ATP process was
first patented by DuPont in 1989. [24] The hypothesis for adding the helper jet at the time,
was that if the self plying process is unable to produce ATP yarns with 100% twist
efficiency on its own, addition of a helper torque jet would apply a ply torque on the
already self plied yarn and force the ply yarn to turn more thus increasing the ply yarn
twist and the yarn twist efficiency accordingly.
However, an evaluation of the performance of the helper torque jet and its effect
on the twist efficiency was not reported anywhere in literature. Thus a detailed study in
order to fully understand the helper jet effect needs to be done. In order to confirm the
basic function of the helper torque in applying ply torque, preliminary experiments were
done where the operating direction of the ply torque applied by the helper torque jet is
varied with respect to that of the main torque jets and compared with the base case where
the helper torque jet is turned off. As is the case with the main torque jets, the magnitude of
the ply torque, applied by the helper torque jet is controlled by the pressure of the
compressed air supplied to the helper jet, controlled using a separate pressure gauge. The
direction of the applied ply torque is controlled using a separate electronic pressure
regulator. In these preliminary experiments, the main torque jets pressure was held
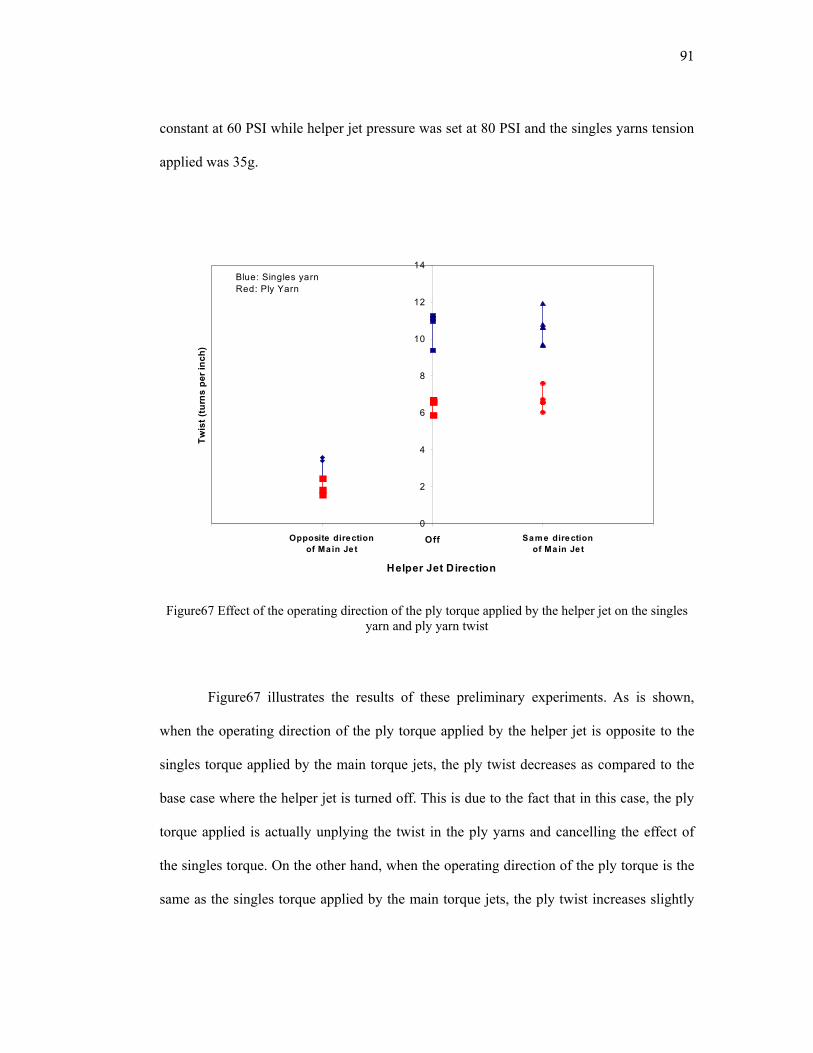
91
constant at 60 PSI while helper jet pressure was set at 80 PSI and the singles yarns tension
applied was 35g.
Figure67 Effect of the operating direction of the ply torque applied by the helper jet on the singles
yarn and ply yarn twist
Figure67 illustrates the results of these preliminary experiments. As is shown,
when the operating direction of the ply torque applied by the helper jet is opposite to the
singles torque applied by the main torque jets, the ply twist decreases as compared to the
base case where the helper jet is turned off. This is due to the fact that in this case, the ply
torque applied is actually unplying the twist in the ply yarns and cancelling the effect of
the singles torque. On the other hand, when the operating direction of the ply torque is the
same as the singles torque applied by the main torque jets, the ply twist increases slightly
0
2
4
6
8
10
12
14
Off
Twis
t (tu
rns
per i
nch)
Blue: Singles yarnRed: Ply Yarn
Helper Jet Direction
Opposite direction of Main Je t
Same direction of Ma in Je t
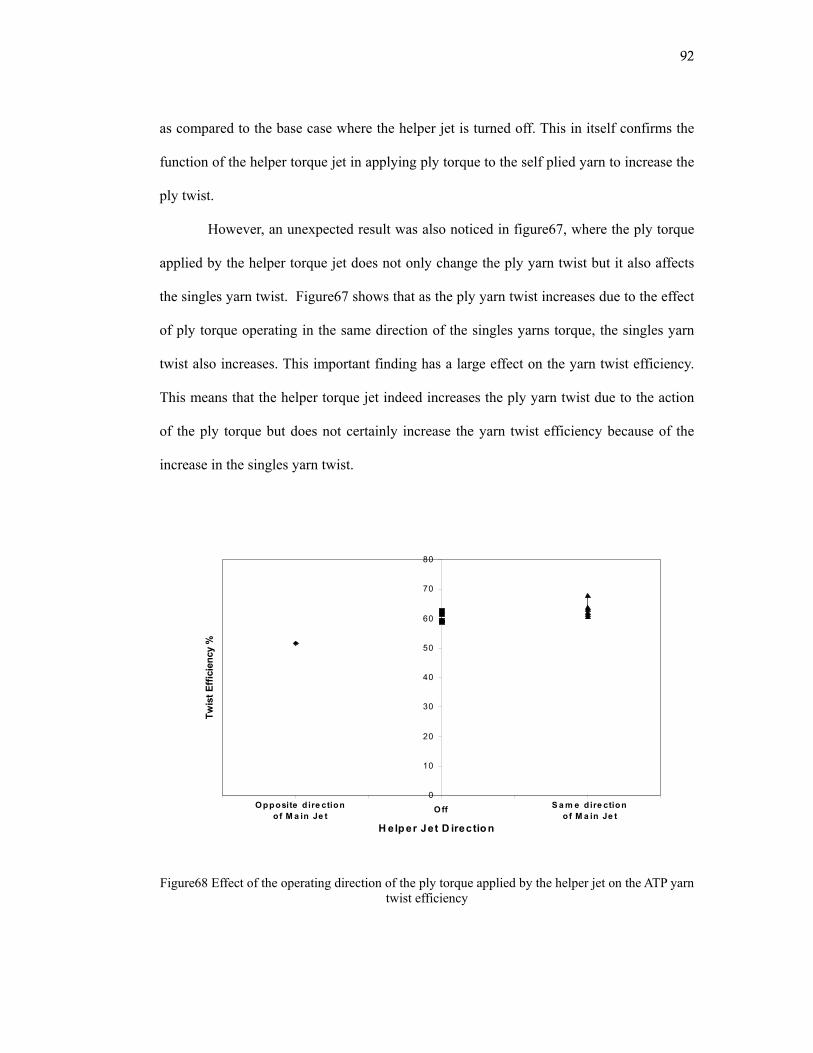
92
as compared to the base case where the helper jet is turned off. This in itself confirms the
function of the helper torque jet in applying ply torque to the self plied yarn to increase the
ply twist.
However, an unexpected result was also noticed in figure67, where the ply torque
applied by the helper torque jet does not only change the ply yarn twist but it also affects
the singles yarn twist. Figure67 shows that as the ply yarn twist increases due to the effect
of ply torque operating in the same direction of the singles yarns torque, the singles yarn
twist also increases. This important finding has a large effect on the yarn twist efficiency.
This means that the helper torque jet indeed increases the ply yarn twist due to the action
of the ply torque but does not certainly increase the yarn twist efficiency because of the
increase in the singles yarn twist.
Figure68 Effect of the operating direction of the ply torque applied by the helper jet on the ATP yarn
twist efficiency
0
10
20
30
40
50
60
70
80
O ff
Twis
t Effi
cien
cy %
H e lp er Jet D irectio n
S a m e d ire ction o f M a in Je t
Opposite d ire ction of M a in Je t
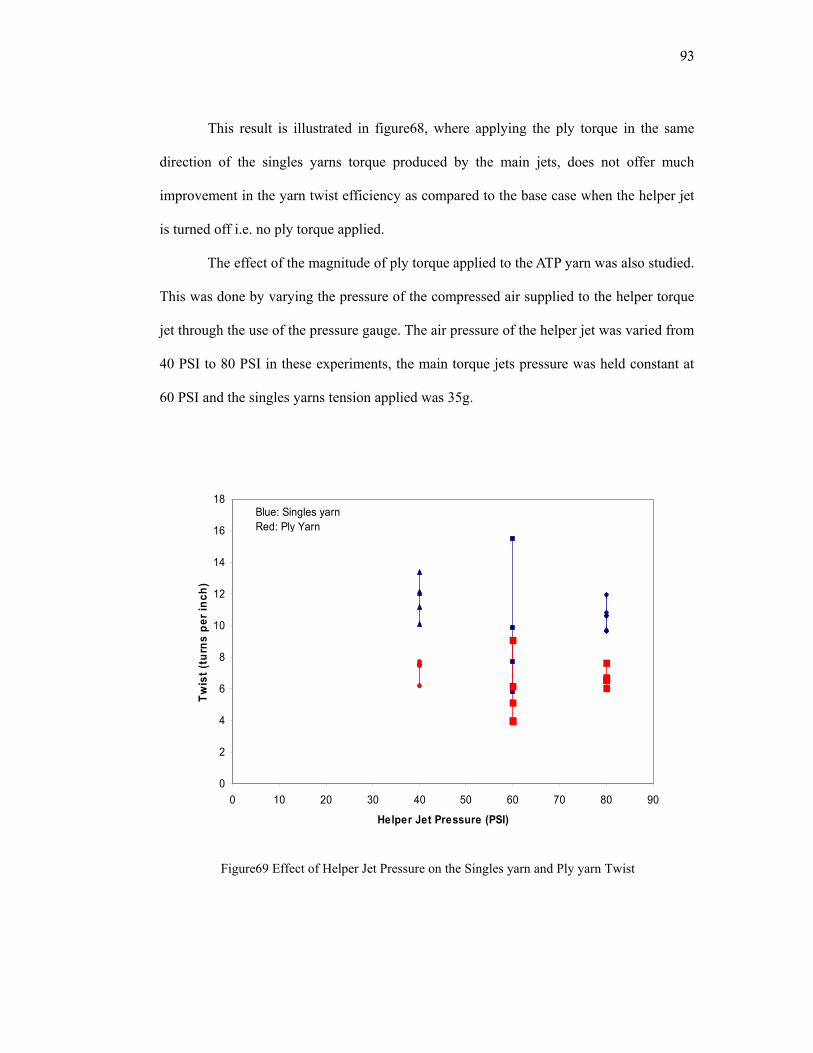
93
This result is illustrated in figure68, where applying the ply torque in the same
direction of the singles yarns torque produced by the main jets, does not offer much
improvement in the yarn twist efficiency as compared to the base case when the helper jet
is turned off i.e. no ply torque applied.
The effect of the magnitude of ply torque applied to the ATP yarn was also studied.
This was done by varying the pressure of the compressed air supplied to the helper torque
jet through the use of the pressure gauge. The air pressure of the helper jet was varied from
40 PSI to 80 PSI in these experiments, the main torque jets pressure was held constant at
60 PSI and the singles yarns tension applied was 35g.
0
2
4
6
8
10
12
14
16
18
0 10 20 30 40 50 60 70 80 90
Helper Jet Pressure (PSI)
Twis
t (tu
rns
per i
nch)
Blue: Singles yarnRed: Ply Yarn
Figure69 Effect of Helper Jet Pressure on the Singles yarn and Ply yarn Twist
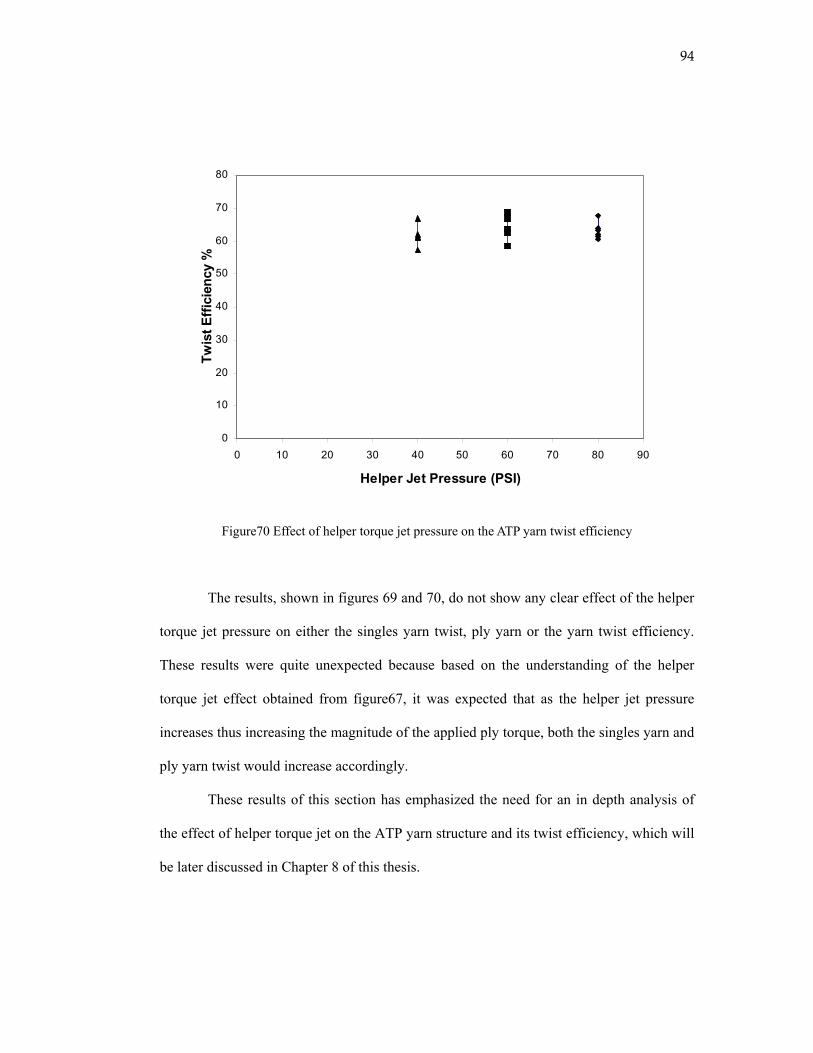
94
Figure70 Effect of helper torque jet pressure on the ATP yarn twist efficiency
The results, shown in figures 69 and 70, do not show any clear effect of the helper
torque jet pressure on either the singles yarn twist, ply yarn or the yarn twist efficiency.
These results were quite unexpected because based on the understanding of the helper
torque jet effect obtained from figure67, it was expected that as the helper jet pressure
increases thus increasing the magnitude of the applied ply torque, both the singles yarn and
ply yarn twist would increase accordingly.
These results of this section has emphasized the need for an in depth analysis of
the effect of helper torque jet on the ATP yarn structure and its twist efficiency, which will
be later discussed in Chapter 8 of this thesis.
0
10
20
30
40
50
60
70
80
0 10 20 30 40 50 60 70 80 90
Helper Jet Pressure (PSI)
Twis
t Effi
cien
cy %
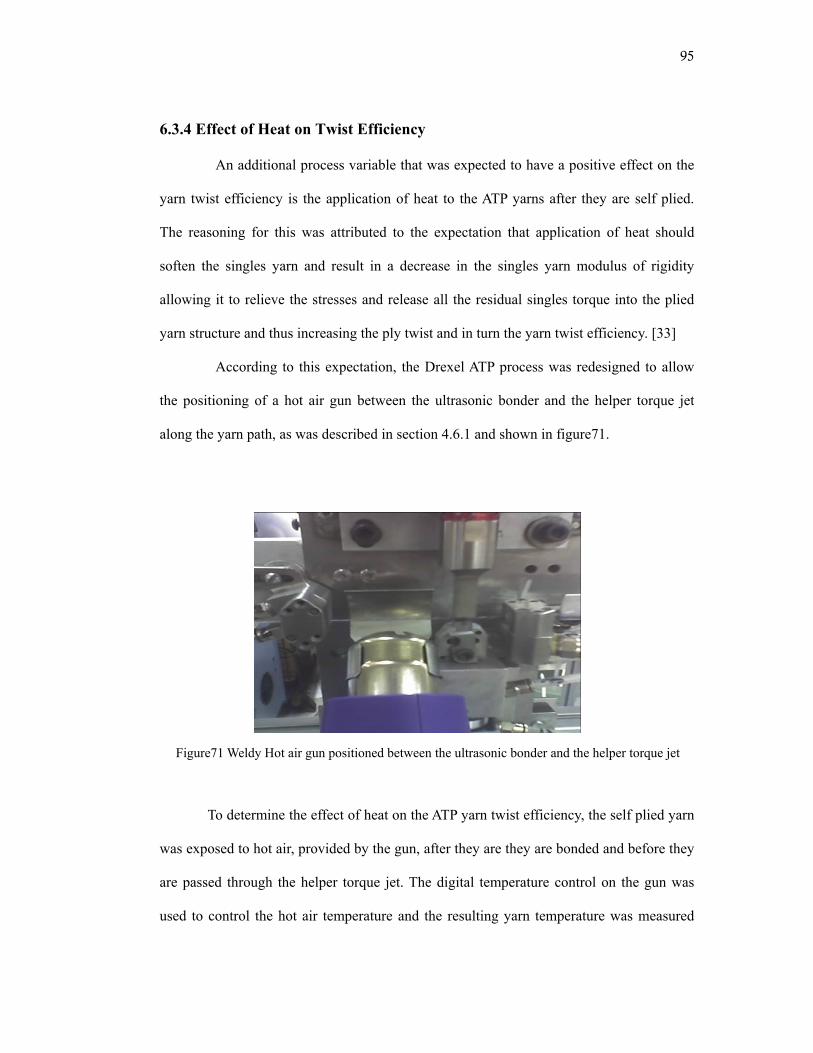
95
6.3.4 Effect of Heat on Twist Efficiency
An additional process variable that was expected to have a positive effect on the
yarn twist efficiency is the application of heat to the ATP yarns after they are self plied.
The reasoning for this was attributed to the expectation that application of heat should
soften the singles yarn and result in a decrease in the singles yarn modulus of rigidity
allowing it to relieve the stresses and release all the residual singles torque into the plied
yarn structure and thus increasing the ply twist and in turn the yarn twist efficiency. [33]
According to this expectation, the Drexel ATP process was redesigned to allow
the positioning of a hot air gun between the ultrasonic bonder and the helper torque jet
along the yarn path, as was described in section 4.6.1 and shown in figure71.
Figure71 Weldy Hot air gun positioned between the ultrasonic bonder and the helper torque jet
To determine the effect of heat on the ATP yarn twist efficiency, the self plied yarn
was exposed to hot air, provided by the gun, after they are they are bonded and before they
are passed through the helper torque jet. The digital temperature control on the gun was
used to control the hot air temperature and the resulting yarn temperature was measured
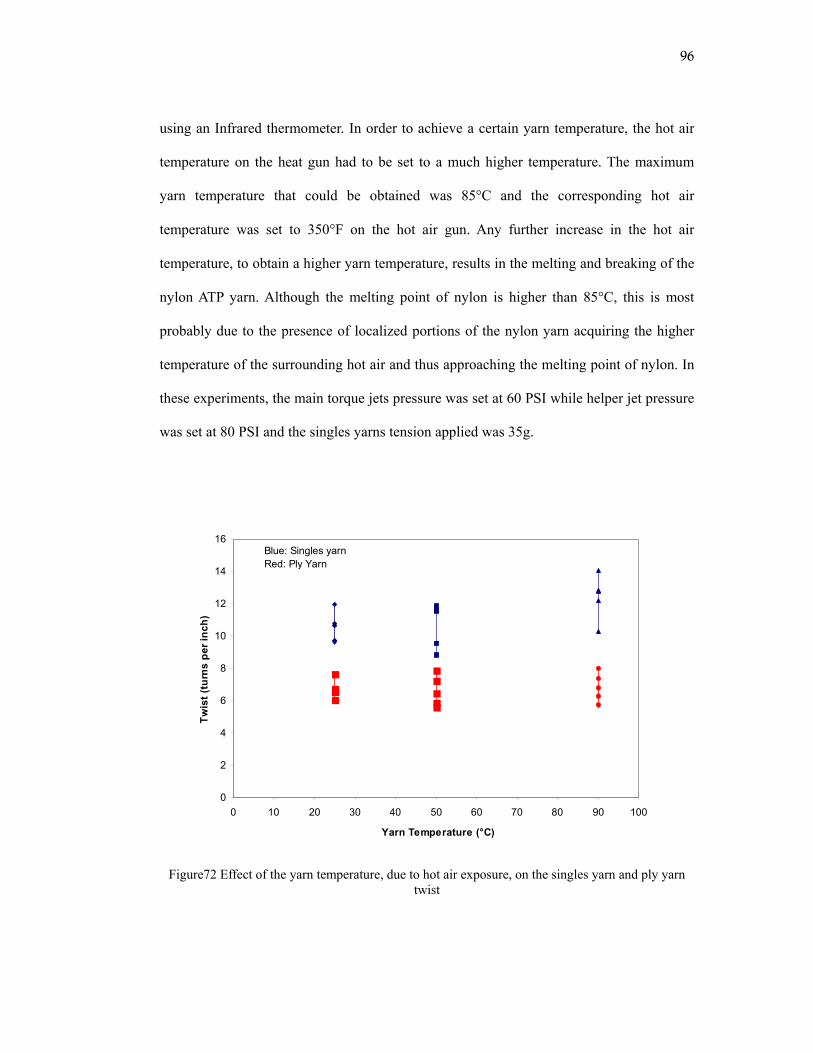
96
using an Infrared thermometer. In order to achieve a certain yarn temperature, the hot air
temperature on the heat gun had to be set to a much higher temperature. The maximum
yarn temperature that could be obtained was 85°C and the corresponding hot air
temperature was set to 350°F on the hot air gun. Any further increase in the hot air
temperature, to obtain a higher yarn temperature, results in the melting and breaking of the
nylon ATP yarn. Although the melting point of nylon is higher than 85°C, this is most
probably due to the presence of localized portions of the nylon yarn acquiring the higher
temperature of the surrounding hot air and thus approaching the melting point of nylon. In
these experiments, the main torque jets pressure was set at 60 PSI while helper jet pressure
was set at 80 PSI and the singles yarns tension applied was 35g.
Figure72 Effect of the yarn temperature, due to hot air exposure, on the singles yarn and ply yarn twist
0
2
4
6
8
10
12
14
16
0 10 20 30 40 50 60 70 80 90 100
Yarn Temperature (°C)
Twis
t (tu
rns
per i
nch)
Blue: Singles yarnRed: Ply Yarn
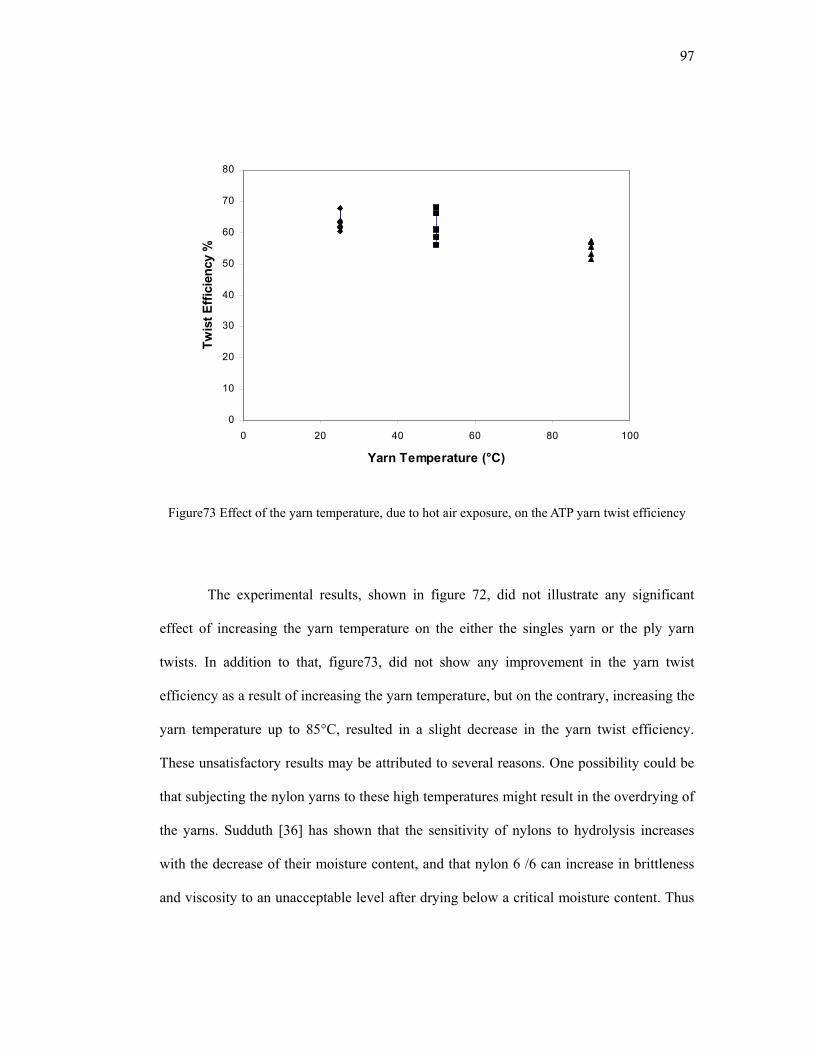
97
Figure73 Effect of the yarn temperature, due to hot air exposure, on the ATP yarn twist efficiency
The experimental results, shown in figure 72, did not illustrate any significant
effect of increasing the yarn temperature on the either the singles yarn or the ply yarn
twists. In addition to that, figure73, did not show any improvement in the yarn twist
efficiency as a result of increasing the yarn temperature, but on the contrary, increasing the
yarn temperature up to 85°C, resulted in a slight decrease in the yarn twist efficiency.
These unsatisfactory results may be attributed to several reasons. One possibility could be
that subjecting the nylon yarns to these high temperatures might result in the overdrying of
the yarns. Sudduth [36] has shown that the sensitivity of nylons to hydrolysis increases
with the decrease of their moisture content, and that nylon 6 /6 can increase in brittleness
and viscosity to an unacceptable level after drying below a critical moisture content. Thus
0
10
20
30
40
50
60
70
80
0 20 40 60 80 100
Yarn Temperature (°C)
Twis
t Effi
cien
cy %
98
the decrease in the yarn twist efficiency might be attributed to the increased brittleness of
the yarn structure due to overdrying. Another possibility could be that the method of
applying heat to the ATP yarns using the hot air gun was not very efficient especially with
the high yarn speeds of the process and that another method of heat application should be
designed.
6.4 Discussion
The main objective of this chapter was to determine and study the main process
variables on the Drexel ATP process that affect the ATP yarn twist efficiency. Each
process variable was studied independently keeping all other parameters constant in order
to gain a good understanding of its effect on the singles yarns twist, the ply yarn twist and
the twist efficiency.
The main torque jets control the twist in the singles yarns, where increasing the
main jet pressure increases the magnitude of the applied singles torque which in turn
generates a higher twist in the singles yarn. Increasing the main torque jet pressure was
also found to slightly increase the yarn twist efficiency to about 65%. However the main
jet pressure needed to produce maximum twist efficiency still needs to be determined.
The singles yarns tension has also been found to affect both the singles yarn and
ply yarn twist. In the range of singles yarn tensions used, an increase in the singles yarn
tension resulted in a decrease in the resulting singles yarn and ply yarn twists and a slight
increase in the yarn twist efficiency to about 64%.
The above results show that the maximum ATP yarn twist efficiency that can be
obtained from the self plying process on its own through the use of the main torque jets
and applied singles tension is 65%. This twist efficiency level is in agreement with
99
literature [30], which shows that for two 1050 denier plied strands of BCF nylon, only
about 60% to 70% of the twist in the singles yarn is converted to ply twist during
spontaneous self plying with no external assistance or restraint to the plying. This was
attributed to the presence of frictional forces resisting the plying forces and thus not all of
the twist applied to the singles yarns is converted to ply twist.
The use of a helper torque jet to improve the yarn twist efficiency was also
studied. The experimental results show that the ply torque applied by the helper jet on the
self plied yarn does not only affect the ply twist but also the singles yarn twist. Thus, the
helper torque jet does not have a direct effect on the yarn twist efficiency and more
research needs to be done to establish a clear understanding of the helper jet performance.
The experimental results have also shown the effect of increasing the yarn
temperature, through the use of a hot air gun, on the yarn twist efficiency. The results
were not successful in improving the twist efficiency, most possibly due to the overdrying
of the nylon yarns while being exposed to the hot air.
This chapter has provided an overview of the effect of the different process
variables on the yarn twist efficiency, however a more systematic approach is needed to
establish a good solid understanding of the effect of these variables, study the interaction
between these different process variables and determine the optimum process parameters
required to achieve the maximum possible twist efficiency in the yarns produced on the
Drexel ATP process.
100
CHAPTER 7: EMPIRICAL MODELING OF THE YARN TWIST EFFICIENCY USING RESPONSE SURFACE METHODOLOGY
7.1 Background and Significance
In the preceding chapter, the important processing parameters that affect the yarn
twist efficiency of ATP yarns were identified. It was also empirically determined that
approximately 8% increase in the yarn twist efficiency could be obtained by increasing
main torque jet pressure, without the application of ply torque through the helper jet.
The purpose of this chapter is to investigate the interaction of these variables and
to identify the optimum combination of main torque jet pressure, singles yarn tension,
helper torque jet pressure and yarn temperature in order to produce ATP yarns on the
Drexel process with the highest possible twist efficiency.
In order to obtain a more systematic understanding of these process conditions and
to establish a quantitative basis for the relationships between the ATP process parameters
and the yarn twist efficiency, Response Surface Methodology (RSM) [37] was employed
in this study. The objective is to develop an empirical model to guide the forthcoming
research on how to further improve the ATP yarn twist efficiency and to determine the
optimum values of these parameters to be used in the future commercial application of the
Drexel ATP process.
RSM has been used successfully for material and process optimization [38] in
numerous studies including various textile processing applications. This approach has the
advantage of taking into account the combined effects of several parameters and it uses
statistical methods to fit an empirical model to the experimental data.
The use of a model to describe the effects of the processing parameters permits the
representation of the influencing parameter in a simple and systematic way and prediction
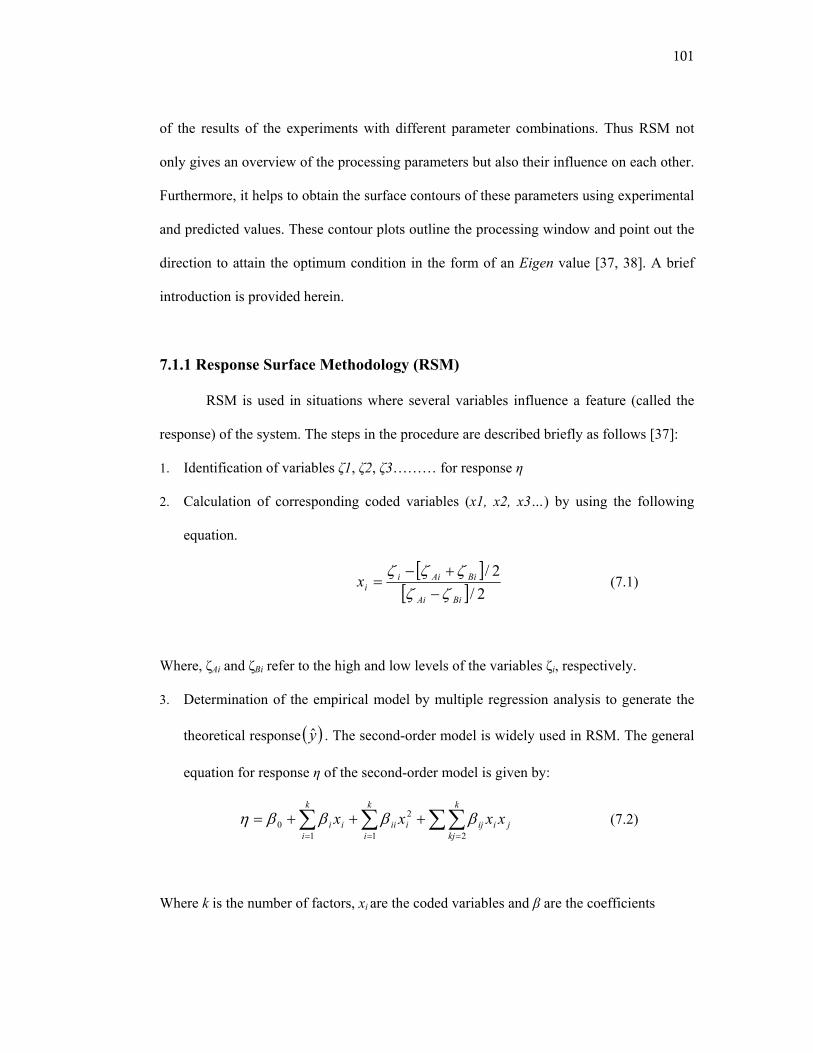
101
of the results of the experiments with different parameter combinations. Thus RSM not
only gives an overview of the processing parameters but also their influence on each other.
Furthermore, it helps to obtain the surface contours of these parameters using experimental
and predicted values. These contour plots outline the processing window and point out the
direction to attain the optimum condition in the form of an Eigen value [37, 38]. A brief
introduction is provided herein.
7.1.1 Response Surface Methodology (RSM)
RSM is used in situations where several variables influence a feature (called the
response) of the system. The steps in the procedure are described briefly as follows [37]:
1. Identification of variables ζ1, ζ2, ζ3……… for response η
2. Calculation of corresponding coded variables (x1, x2, x3…) by using the following
equation.
[ ][ ] 2/
2/
BiAi
BiAiiix
ζζζζζ
−+−
= (7.1)
Where, ζAi and ζBi refer to the high and low levels of the variables ζi, respectively.
3. Determination of the empirical model by multiple regression analysis to generate the
theoretical response ( )y . The second-order model is widely used in RSM. The general
equation for response η of the second-order model is given by:
∑∑∑∑===
+++=k
kjjiij
k
iiii
k
iii xxxx
21
2
10 ββββη (7.2)
Where k is the number of factors, xi are the coded variables and β are the coefficients
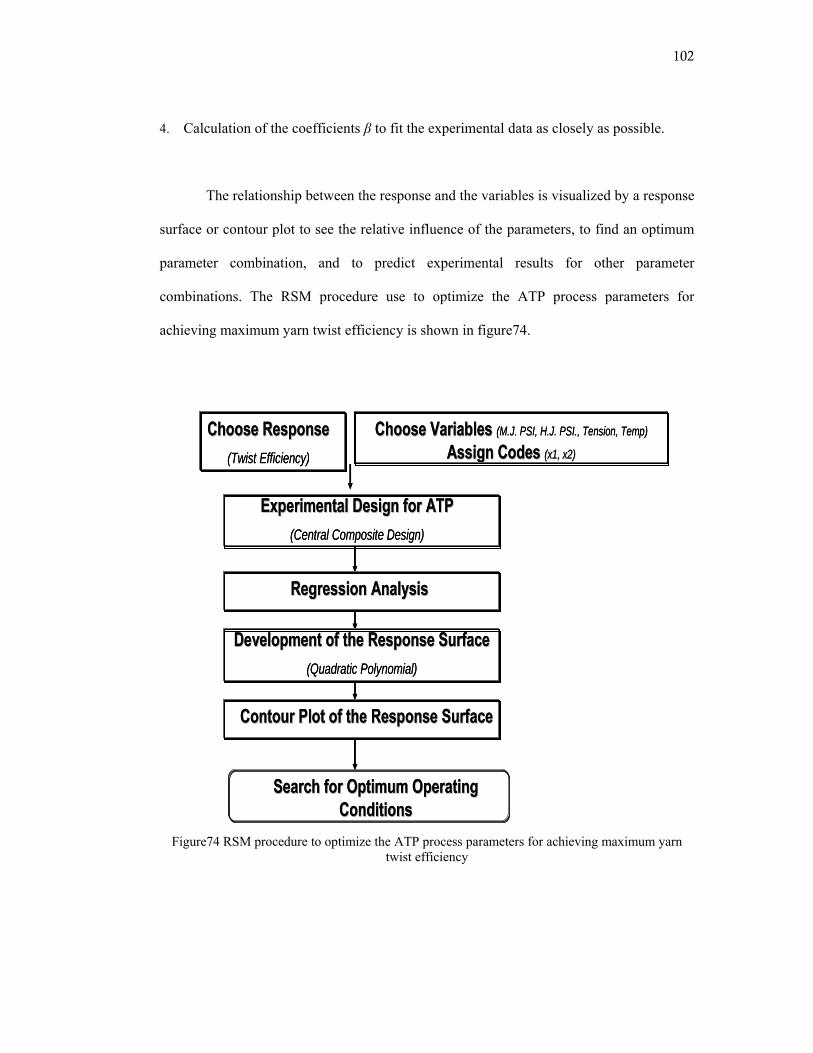
102
4. Calculation of the coefficients β to fit the experimental data as closely as possible.
The relationship between the response and the variables is visualized by a response
surface or contour plot to see the relative influence of the parameters, to find an optimum
parameter combination, and to predict experimental results for other parameter
combinations. The RSM procedure use to optimize the ATP process parameters for
achieving maximum yarn twist efficiency is shown in figure74.
Figure74 RSM procedure to optimize the ATP process parameters for achieving maximum yarn twist efficiency
Choose ResponseChoose Response(Twist Efficiency)
Choose VariablesChoose Variables (M.J. PSI, H.J. PSI., Tension, Temp)
Assign CodesAssign Codes (x1, x2)(x1, x2)
Experimental Design for ATPExperimental Design for ATP(Central Composite Design)
Regression AnalysisRegression Analysis
Development of the Response SurfaceDevelopment of the Response Surface(Quadratic Polynomial)
Contour Plot of the Response SurfaceContour Plot of the Response Surface
Search for Optimum Operating Search for Optimum Operating ConditionsConditions
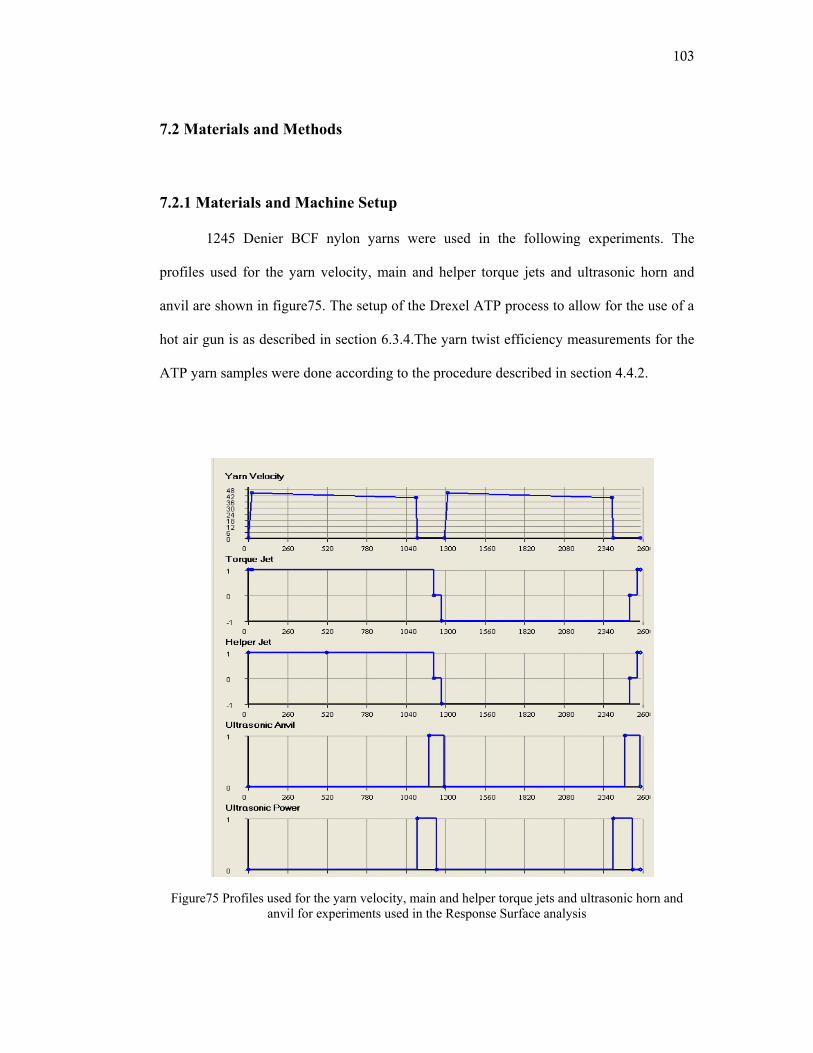
103
7.2 Materials and Methods
7.2.1 Materials and Machine Setup
1245 Denier BCF nylon yarns were used in the following experiments. The
profiles used for the yarn velocity, main and helper torque jets and ultrasonic horn and
anvil are shown in figure75. The setup of the Drexel ATP process to allow for the use of a
hot air gun is as described in section 6.3.4.The yarn twist efficiency measurements for the
ATP yarn samples were done according to the procedure described in section 4.4.2.
Figure75 Profiles used for the yarn velocity, main and helper torque jets and ultrasonic horn and anvil for experiments used in the Response Surface analysis

104
7.2.2 Experimental Design
The experimental design used in this study is the central composite design (CCD),
shown in figure76. It is the most popular RSM design used for most industrial
applications. CCD is designed to estimate the coefficients of a quadratic model. A CCD
has three groups of design points: (a) two-level factorial design points (b) axial points
("star" points) (c) center points.
Figure76 Central Composite Design
The two-level factorial design points consist of all possible combinations of the
high and low levels of the factors. The star points have all of the factors set to 0, the
midpoint, except one factor, which has the value (+/- α). The value for (α) is calculated in
each design for the rotatability of its blocks. The value of α determines the location of the
star points in a central composite design. ( α) is usually somewhat larger than 1.The center
points, as implied by the name, are points with all factors set to the coded level (0) i.e. the
midpoint of each factor range. The center points are usually repeated 4-6 times to get a
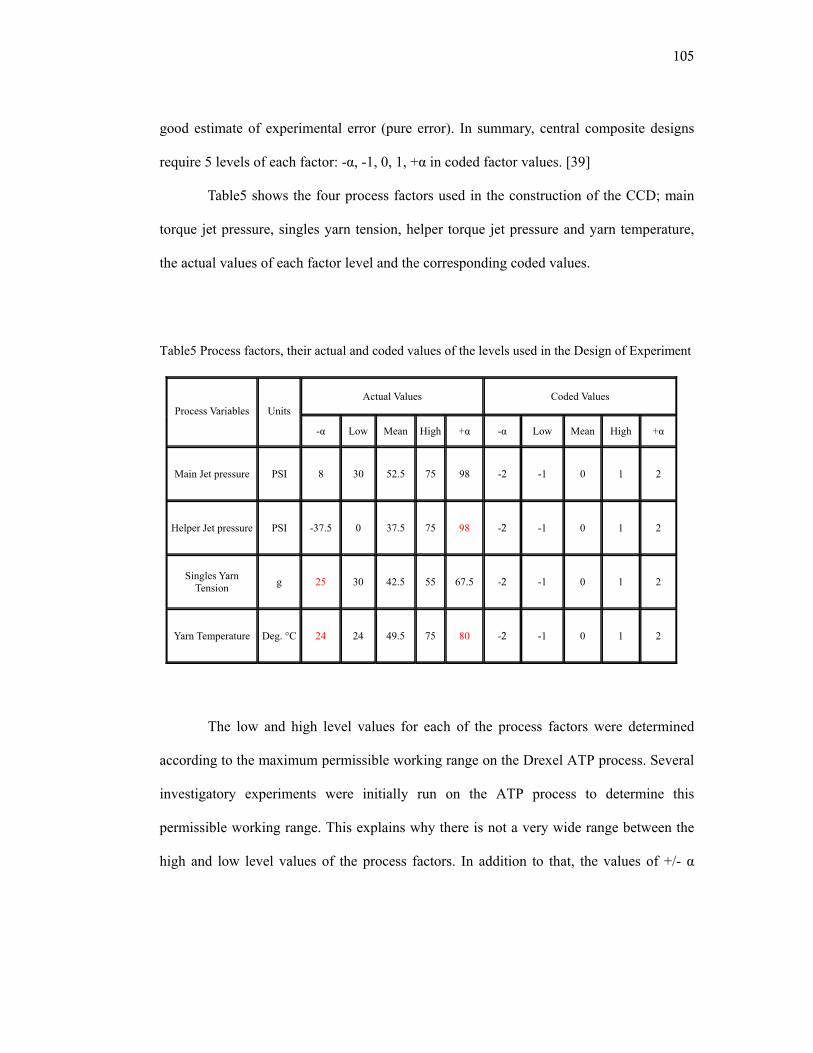
105
good estimate of experimental error (pure error). In summary, central composite designs
require 5 levels of each factor: -α, -1, 0, 1, +α in coded factor values. [39]
Table5 shows the four process factors used in the construction of the CCD; main
torque jet pressure, singles yarn tension, helper torque jet pressure and yarn temperature,
the actual values of each factor level and the corresponding coded values.
Table5 Process factors, their actual and coded values of the levels used in the Design of Experiment
Actual Values Coded Values Process Variables Units
-α Low Mean High +α -α Low Mean High +α
Main Jet pressure PSI 8 30 52.5 75 98 -2 -1 0 1 2
Helper Jet pressure PSI -37.5 0 37.5 75 98 -2 -1 0 1 2
Singles Yarn Tension g 25 30 42.5 55 67.5 -2 -1 0 1 2
Yarn Temperature Deg. °C 24 24 49.5 75 80 -2 -1 0 1 2
The low and high level values for each of the process factors were determined
according to the maximum permissible working range on the Drexel ATP process. Several
investigatory experiments were initially run on the ATP process to determine this
permissible working range. This explains why there is not a very wide range between the
high and low level values of the process factors. In addition to that, the values of +/- α
106
shown in red in Table5 are modified values, because the initially calculated values were
beyond the workability extremes of the ATP process.
7.3 Results 7.3.1 Response function
In this study, a quadratic polynomial function was used. The response function
was obtained using multiple regression analysis using “Design-Expert” software. An initial
model is first built using the method of least squares in a hierarchical fashion to compute
the coefficients, building from a base that contains the intercept. Initially, all the terms,
including all the main factors and the two-factor interactions are selected. The effect of
each term is then calculated in the following order: 1) main effects, adjusted for other main
effects 2) two-factor interactions, adjusted for main effects and other two-factor
interactions [39].
Secondly, the significant factors effects must be identified and separated from the
insignificant effects. Selection of terms having significant effect is done by the probability
value, (Prob > F), i.e. Probability of seeing the observed F value if the null hypothesis is
true (there is no factor effect). If the Prob>F value is very small (less than 0.05) then the
individual terms in the model have a significant effect on the response. However, if a two
factor interaction is a significant term, then the model should also include the main effects
of this interaction, even if the main effects do not appear to be statistically significant on
their own. A well-formulated model should include the factors and interactions that are
significant, plus any terms that are needed to maintain hierarchy.
After the significant terms have been selected for the model, The term effects are
recalculated in the following order: 1) all terms selected for the model, adjusted for other
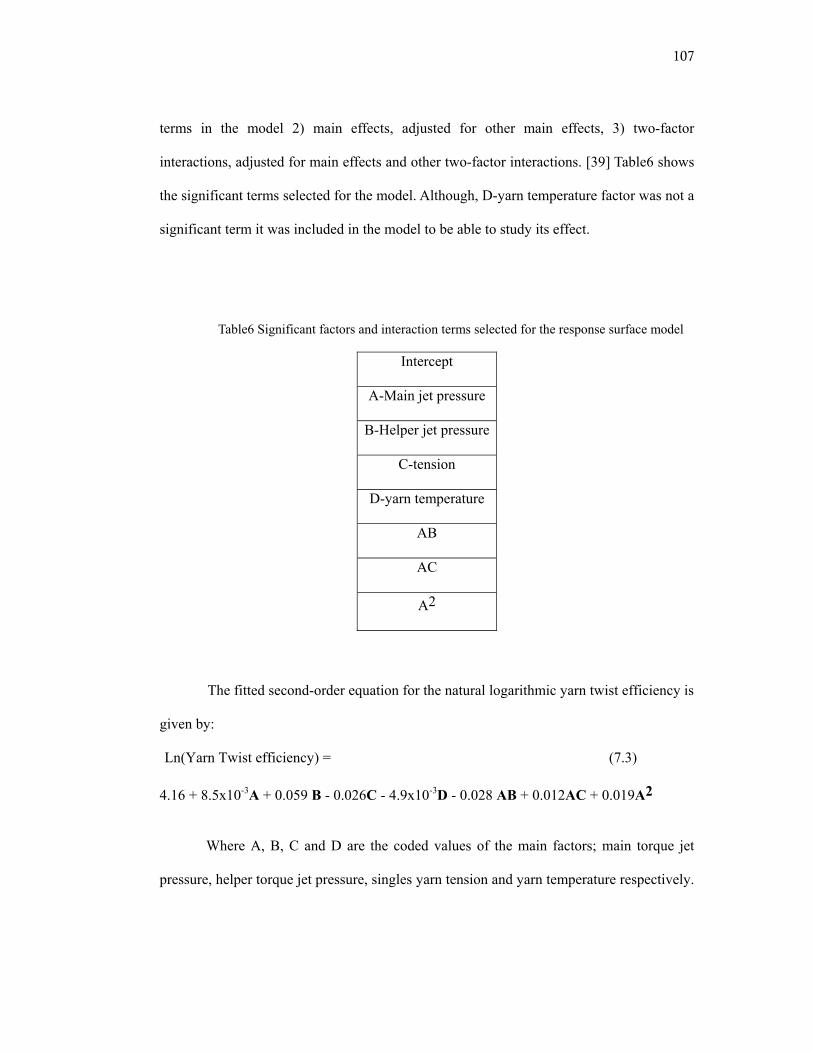
107
terms in the model 2) main effects, adjusted for other main effects, 3) two-factor
interactions, adjusted for main effects and other two-factor interactions. [39] Table6 shows
the significant terms selected for the model. Although, D-yarn temperature factor was not a
significant term it was included in the model to be able to study its effect.
Table6 Significant factors and interaction terms selected for the response surface model
Intercept
A-Main jet pressure
B-Helper jet pressure
C-tension
D-yarn temperature
AB
AC
A2
The fitted second-order equation for the natural logarithmic yarn twist efficiency is
given by:
Ln(Yarn Twist efficiency) = (7.3) 4.16 + 8.5x10⁻³A + 0.059 B - 0.026C - 4.9x10⁻³D - 0.028 AB + 0.012AC + 0.019A2
Where A, B, C and D are the coded values of the main factors; main torque jet
pressure, helper torque jet pressure, singles yarn tension and yarn temperature respectively.
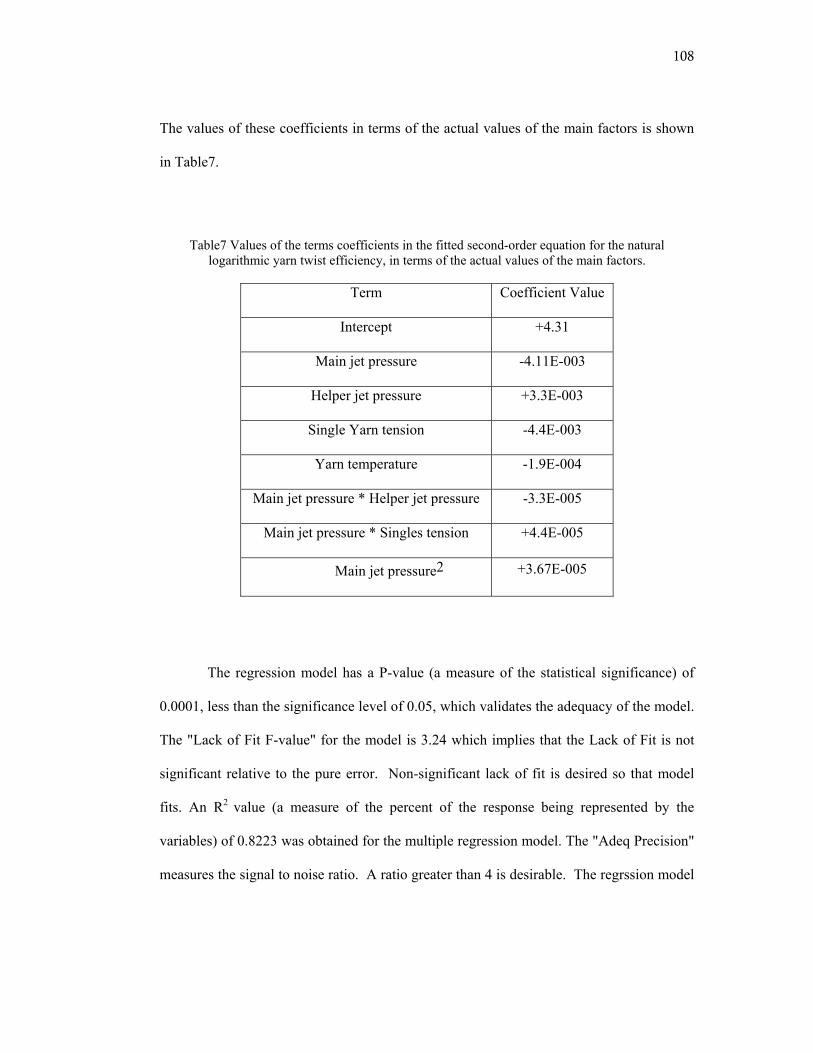
108
The values of these coefficients in terms of the actual values of the main factors is shown
in Table7.
Table7 Values of the terms coefficients in the fitted second-order equation for the natural logarithmic yarn twist efficiency, in terms of the actual values of the main factors.
Term Coefficient Value
Intercept +4.31
Main jet pressure -4.11E-003
Helper jet pressure +3.3E-003
Single Yarn tension -4.4E-003
Yarn temperature -1.9E-004
Main jet pressure * Helper jet pressure -3.3E-005
Main jet pressure * Singles tension +4.4E-005
Main jet pressure2 +3.67E-005
The regression model has a P-value (a measure of the statistical significance) of
0.0001, less than the significance level of 0.05, which validates the adequacy of the model.
The "Lack of Fit F-value" for the model is 3.24 which implies that the Lack of Fit is not
significant relative to the pure error. Non-significant lack of fit is desired so that model
fits. An R2 value (a measure of the percent of the response being represented by the
variables) of 0.8223 was obtained for the multiple regression model. The "Adeq Precision"
measures the signal to noise ratio. A ratio greater than 4 is desirable. The regrssion model
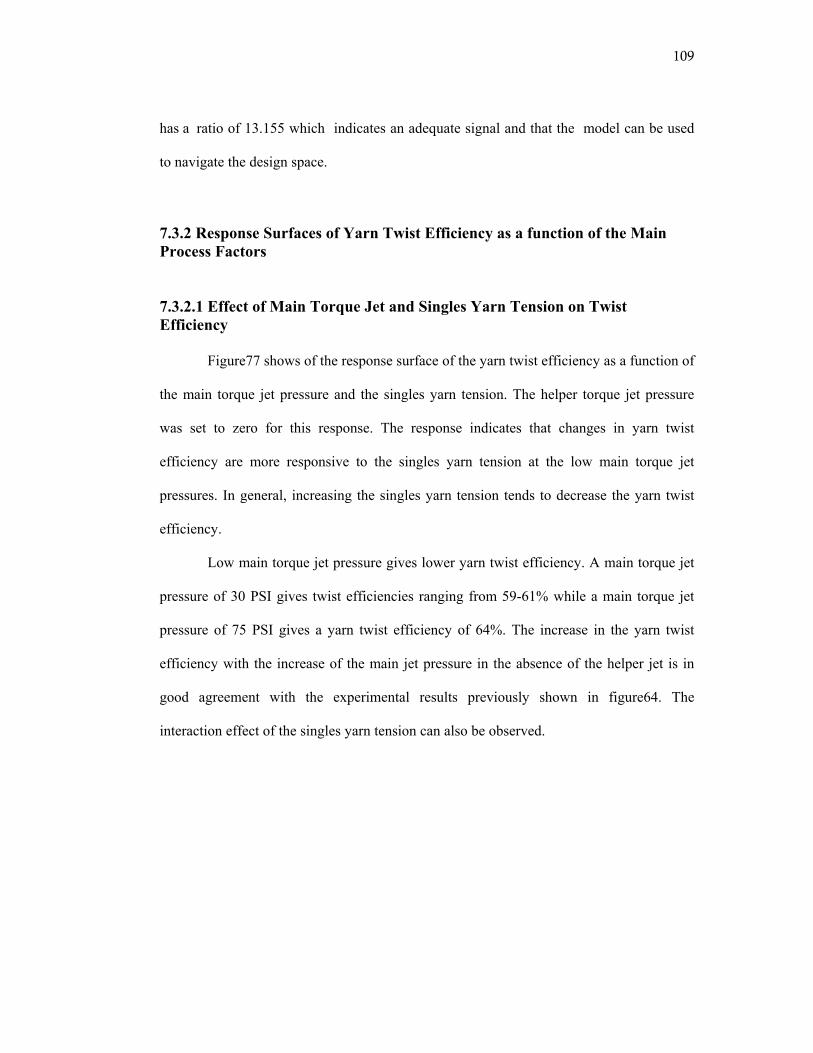
109
has a ratio of 13.155 which indicates an adequate signal and that the model can be used
to navigate the design space.
7.3.2 Response Surfaces of Yarn Twist Efficiency as a function of the Main Process Factors
7.3.2.1 Effect of Main Torque Jet and Singles Yarn Tension on Twist Efficiency
Figure77 shows of the response surface of the yarn twist efficiency as a function of
the main torque jet pressure and the singles yarn tension. The helper torque jet pressure
was set to zero for this response. The response indicates that changes in yarn twist
efficiency are more responsive to the singles yarn tension at the low main torque jet
pressures. In general, increasing the singles yarn tension tends to decrease the yarn twist
efficiency.
Low main torque jet pressure gives lower yarn twist efficiency. A main torque jet
pressure of 30 PSI gives twist efficiencies ranging from 59-61% while a main torque jet
pressure of 75 PSI gives a yarn twist efficiency of 64%. The increase in the yarn twist
efficiency with the increase of the main jet pressure in the absence of the helper jet is in
good agreement with the experimental results previously shown in figure64. The
interaction effect of the singles yarn tension can also be observed.
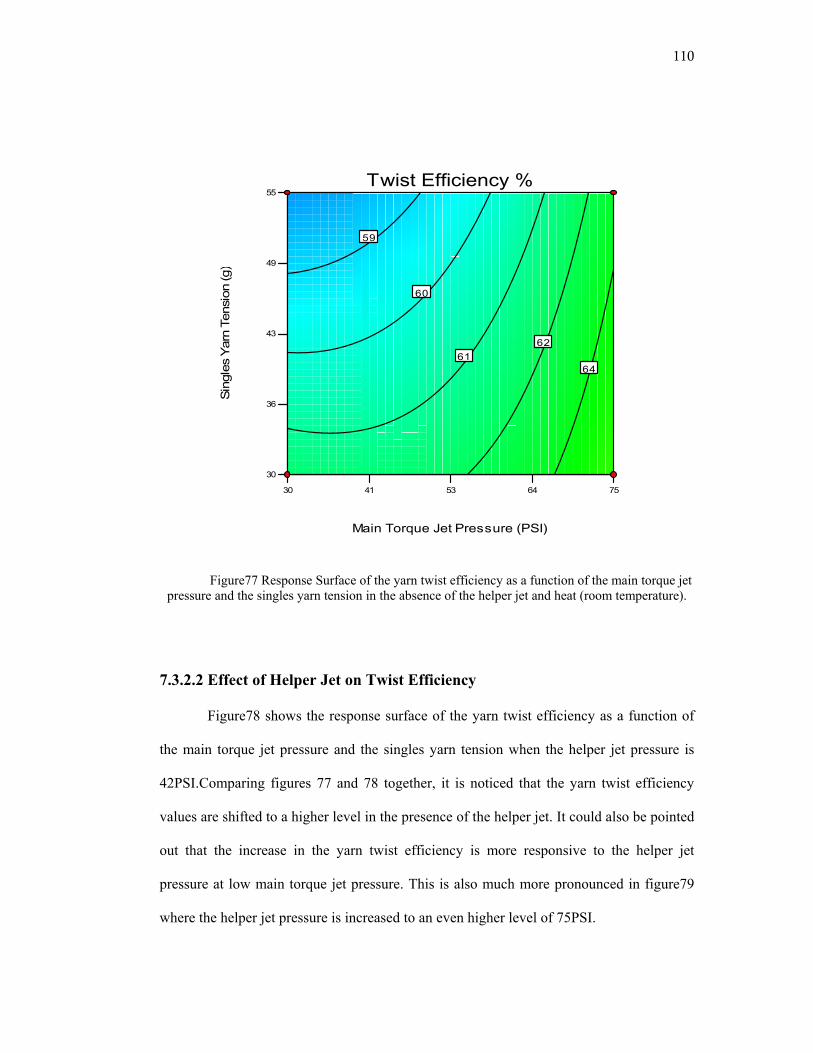
110
30 41 53 64 75
30
36
43
49
55Twist Efficiency %
Main Torque Jet Pressure (PSI)
Sing
les
Yarn
Ten
sion
(g)
59
60
6162
64
Figure77 Response Surface of the yarn twist efficiency as a function of the main torque jet pressure and the singles yarn tension in the absence of the helper jet and heat (room temperature).
7.3.2.2 Effect of Helper Jet on Twist Efficiency
Figure78 shows the response surface of the yarn twist efficiency as a function of
the main torque jet pressure and the singles yarn tension when the helper jet pressure is
42PSI.Comparing figures 77 and 78 together, it is noticed that the yarn twist efficiency
values are shifted to a higher level in the presence of the helper jet. It could also be pointed
out that the increase in the yarn twist efficiency is more responsive to the helper jet
pressure at low main torque jet pressure. This is also much more pronounced in figure79
where the helper jet pressure is increased to an even higher level of 75PSI.
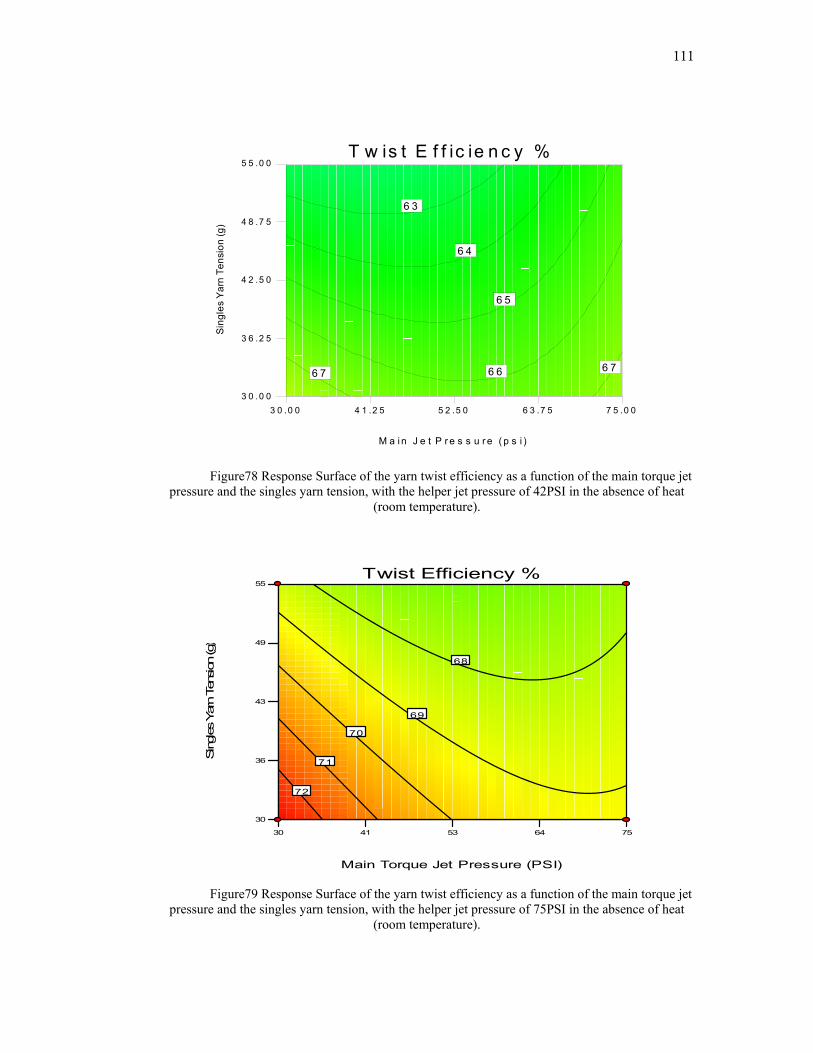
111
Figure78 Response Surface of the yarn twist efficiency as a function of the main torque jet pressure and the singles yarn tension, with the helper jet pressure of 42PSI in the absence of heat
(room temperature).
30 41 53 64 75
30
36
43
49
55Twist Efficiency %
Main Torque Jet Pressure (PSI)
Singles
Yar
n Te
nsion
(g)
68
69
70
71
72
Figure79 Response Surface of the yarn twist efficiency as a function of the main torque jet
pressure and the singles yarn tension, with the helper jet pressure of 75PSI in the absence of heat (room temperature).
3 0 .0 0 4 1 .2 5 5 2 .5 0 6 3 .7 5 7 5 .0 03 0 .0 0
3 6 .2 5
4 2 .5 0
4 8 .7 5
5 5 .0 0T w is t E f f ic ie n c y %
M a in J e t P r e s s u r e ( p s i )
Sin
gles
Yar
n Te
nsio
n (g
)6 3
6 4
6 5
6 66 7 6 7
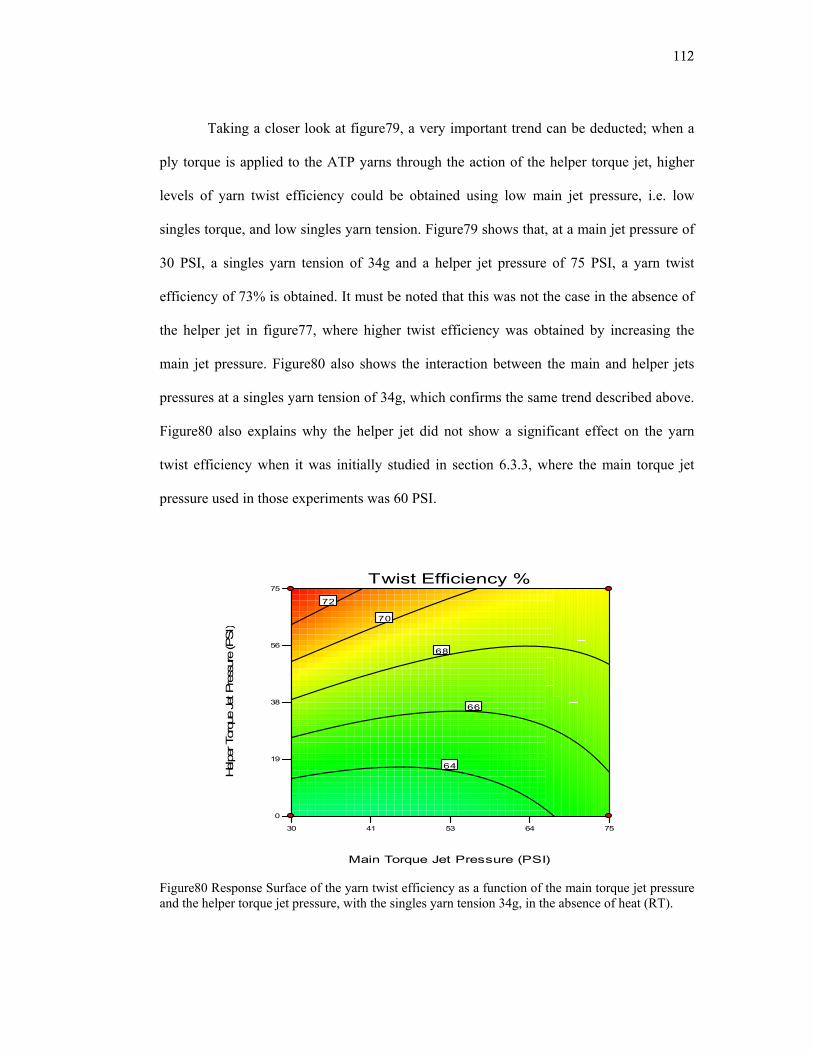
112
Taking a closer look at figure79, a very important trend can be deducted; when a
ply torque is applied to the ATP yarns through the action of the helper torque jet, higher
levels of yarn twist efficiency could be obtained using low main jet pressure, i.e. low
singles torque, and low singles yarn tension. Figure79 shows that, at a main jet pressure of
30 PSI, a singles yarn tension of 34g and a helper jet pressure of 75 PSI, a yarn twist
efficiency of 73% is obtained. It must be noted that this was not the case in the absence of
the helper jet in figure77, where higher twist efficiency was obtained by increasing the
main jet pressure. Figure80 also shows the interaction between the main and helper jets
pressures at a singles yarn tension of 34g, which confirms the same trend described above.
Figure80 also explains why the helper jet did not show a significant effect on the yarn
twist efficiency when it was initially studied in section 6.3.3, where the main torque jet
pressure used in those experiments was 60 PSI.
30 41 53 64 75
0
19
38
56
75Twist Efficiency %
Main Torque Jet Pressure (PSI)
Helpe
r Tor
que
Jet P
ress
ure
(PSI)
64
66
68
70
72
Figure80 Response Surface of the yarn twist efficiency as a function of the main torque jet pressure and the helper torque jet pressure, with the singles yarn tension 34g, in the absence of heat (RT).
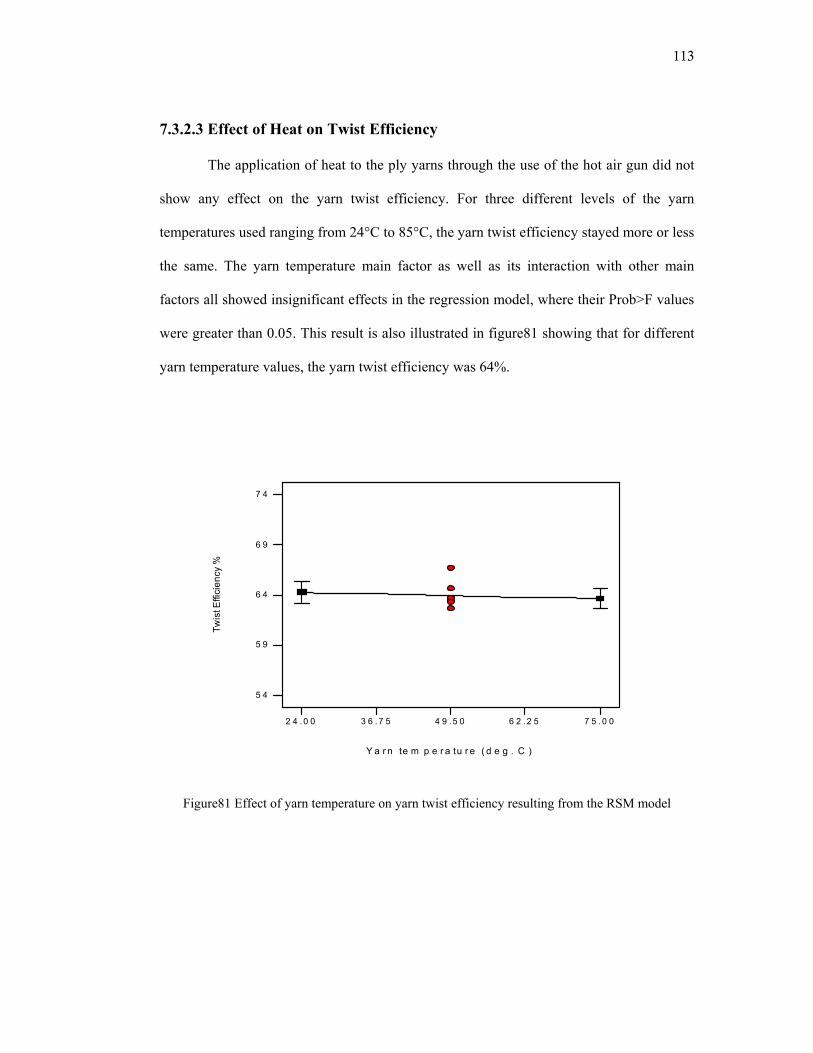
113
7.3.2.3 Effect of Heat on Twist Efficiency
The application of heat to the ply yarns through the use of the hot air gun did not
show any effect on the yarn twist efficiency. For three different levels of the yarn
temperatures used ranging from 24°C to 85°C, the yarn twist efficiency stayed more or less
the same. The yarn temperature main factor as well as its interaction with other main
factors all showed insignificant effects in the regression model, where their Prob>F values
were greater than 0.05. This result is also illustrated in figure81 showing that for different
yarn temperature values, the yarn twist efficiency was 64%.
Figure81 Effect of yarn temperature on yarn twist efficiency resulting from the RSM model
2 4 .0 0 3 6 .7 5 4 9 .5 0 6 2 .2 5 7 5 .0 0
5 4
5 9
6 4
6 9
7 4
Y a r n te m p e r a tu r e ( d e g . C )
Twis
t Effi
cien
cy %
114
7.3.2.4 Optimum Processing Window for High Twist Efficiency ATP yarns
The use of RSM has enabled us to study the effect of the main process factors and
their interactions over the whole range of possible processing conditions. This has allowed
us to point out the optimum processing window on the Drexel ATP process to produce
yarns with an improved twist efficiency level, higher than the previously obtained average
of 65%. As can be concluded from the results of the response surfaces demonstrated in the
previous section, the use of low main torque jet pressure of 30 PSI, low singles yarn
tension of 34g, high helper torque jet pressure of 75PSI and processing at room
temperature with no heat application constructs the main window frame that produces ATP
yarns with a 73% yarn twist efficiency. This result has also been confirmed experimentally
with a number of repeated trials.
7.4 Discussion
In this chapter, RSM was introduced to the Drexel ATP process for the first time.
RSM has proved to be a very useful tool providing us of a complete vision of the effect of
all the possible interactions between the different process factors across the complete
workability range of the Drexel ATP process. RSM has employed Multiple Regression
analysis to correlate the yarn twist efficiency to the main process factors by using a
quadratic polynomial function. Regression analysis has allowed us to determine the main
factors and interactions with a significant effect on the yarn twist efficiency and exclude
them from the insignificant ones. This has provided an extremely useful guide which will
greatly influence the further work of this thesis on how to further improve the yarn twist
efficiency as will be discussed in Chapter8.
Response surfaces for the yarn twist efficiency were generated based on the
multiple regression model. The response surfaces have shown that the use of minimum
115
singles yarn tension just enough to satisfy the requirements of the self plying process is
recommended to obtain higher values of yarn twist efficiency. The response surfacehas
also illustrated the presence of an interaction between the main torque jet pressure and the
singles yarn tension which influences the twist efficiency. It has also been shown that
increasing the yarn temperature insignificantly affects the yarn twist efficiency. This could
be due to the same reasons of over drying the nylon yarns previously discussed in
section6.3.4.
Response surfaces relating the yarn twist efficiency to the main torque jet pressure
and singles yarn tension for different levels of helper jet pressure have shed the light on a
very important result that was not possibly obtained in Chapter 6. The response surfaces
have shown that in the absence of a helper torque jet in the ATP process, the yarn twist
efficiency increases with the increase of the main torque jet pressure, and the maximum
possible yarn twist efficiency is about 65%, which is the base case for most current
commercial ATP processes. When a helper torque jet is used, the unique feature of the
Drexel ATP process, the interaction between the main torque jet and the helper torque jet
strongly influences the yarn twist efficiency. This interaction allows us to achieve yarns
with improved yarn twist efficiency of 73%. This is achieved through the use of low main
jet pressure and a high helper jet pressure. [40] This result has emphasized the need for a
scientific physical explanation for the interaction between the two torque jets which would
be the point of focus in Chapter8.
Thus RSM has identified the main torque jet pressure, singles yarn tension, helper
torque jet pressure as the main process variables affecting the ATP yarn twist efficiency.
The use of the optimum processing window determined by the response surface allows us
to achieve an 8% increase in the twist efficiency, than the initial base case, reaching 73%.
116
CHAPETER 8: EQULIBRIUM ANALYSIS AND STATIC MODELING OF THE ATP PROCESS AT THE CONVERGENCE POINT
8.1 Background and Significance
The results of the previous chapter have enabled us to achieve an improvement in
the twist efficiency of the ATP yarns produced on the Drexel ATP process. However, this
improvement is not still sufficient to fulfill the requirements of bulk and tuft stability
demanded for use as cut pile carpet yarns. Nevertheless, these results have paved the
pathway to further improve the twist efficiency. It has been empirically shown that the
means for increasing the yarn twist efficiency is through applying a small singles yarn
torque through the action of the main torque jet, a low singles yarn tension, and a high ply
torque through the action of the helper torque jet. Although this empirical solution has
been confirmed, reasoning for it remains yet unavailable. Thus in order to step up with the
yarn twist efficiency to a higher level, a physical understanding of the processing
mechanics involved in the ATP process including a role effect analysis of the singles yarn
torque and tension and the applied ply yarn torque must first be provided.
The self plying zone in the ATP process is considered the “heart” of this process,
basically because it is in this zone that twist is transferred from the singles yarns structure
to the ply yarn structure. It is thus the efficiency of this transfer that results in the yarn
twist efficiency value. Thus the key to understanding the underlying effects of the main
factors controlling the ATP process is through the establishing of a mechanistic analysis of
the self ply zone. A very few researchers in literature [7-11, 14], previously mentioned in
section 2.2.4.2, have actually already studied and modeled the self plying process.
However, all of these models were based on the analysis of the self plying process of two
parallel strands, which is not the actual case in any running ATP process. In all
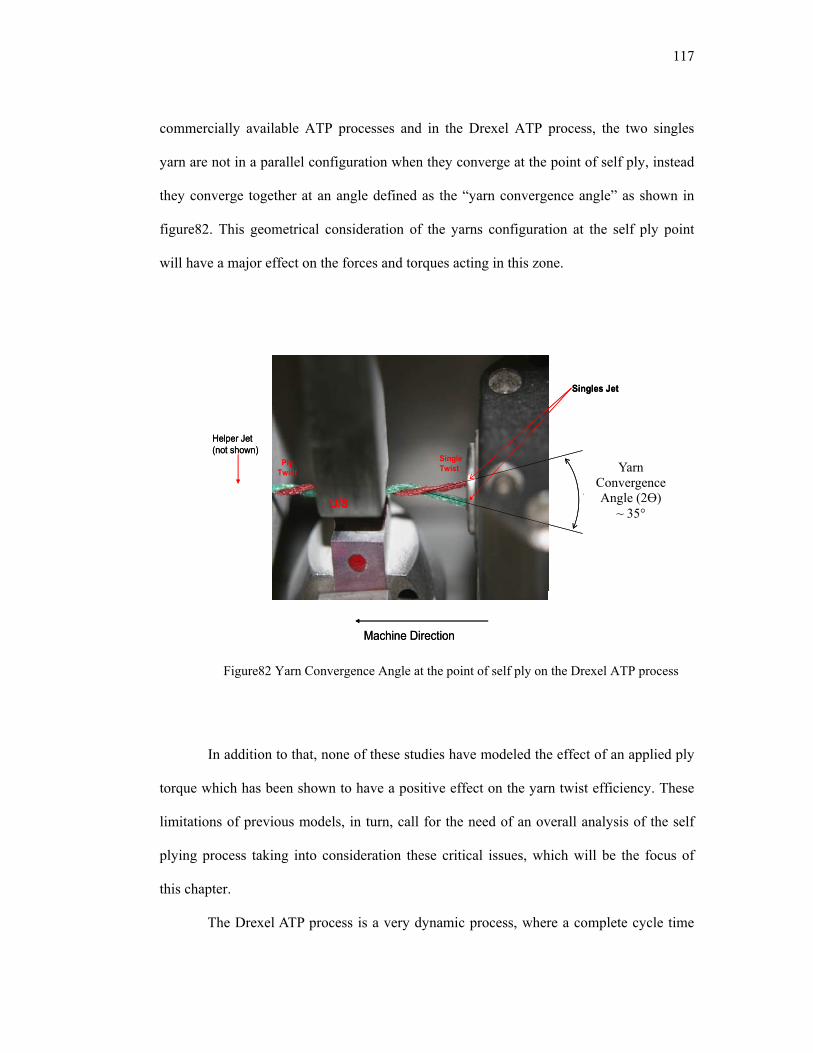
117
commercially available ATP processes and in the Drexel ATP process, the two singles
yarn are not in a parallel configuration when they converge at the point of self ply, instead
they converge together at an angle defined as the “yarn convergence angle” as shown in
figure82. This geometrical consideration of the yarns configuration at the self ply point
will have a major effect on the forces and torques acting in this zone.
Convergence Angle (2ө) ~ 35°
Machine Direction
Singles Jet
Single Twist
Ply Twist
U/S
Helper Jet (not shown)
Convergence Angle (2ө) ~ 35°
Machine Direction
Singles Jet
Single Twist
Ply Twist
U/S
Helper Jet (not shown)
Figure82 Yarn Convergence Angle at the point of self ply on the Drexel ATP process
In addition to that, none of these studies have modeled the effect of an applied ply
torque which has been shown to have a positive effect on the yarn twist efficiency. These
limitations of previous models, in turn, call for the need of an overall analysis of the self
plying process taking into consideration these critical issues, which will be the focus of
this chapter.
The Drexel ATP process is a very dynamic process, where a complete cycle time
Yarn Convergence Angle (2Ө)
~ 35°
118
including two twist reversal lengths could take only 1000milliseconds or even less. Thus
actually observing and investigating the yarns configuration and structure at the self plying
point is practically impossible. To allow the feasibility of investigating the self plying
zone, a static tester was designed to exactly simulate the self plying conditions on the
Drexel ATP process. The static tester has also allowed us to experimentally study the effect
of varying the yarn convergence angle (2Ө) at the point of self ply on the resulting yarn
twist efficiency. These experiments could not be possibly done on the Drexel ATP process,
because, as shown in figure82, the yarn convergence angle is restricted to a maximum
value of 35° due to the design of the singles main torque jets.
The objective of this chapter is to provide an understanding of the underlying
mechanics governing the self plying process through the development of an equilibrium
analysis of all the tensions and torques acting on the yarns at the point of self ply. This
analysis in conjunction with the static tester will be used to determine the method for
achieving a further improvement of the yarn twist efficiency.
8.2 Materials and Methods
Experiments were conducted on the static tester to study the effect of the yarn
convergence angle and the main process factors, namely; the singles yarn torque, the
singles yarn tension and the ply yarn torque on the resulting singles and ply yarns twists
and accordingly the yarn twist efficiency specifically at the point of self ply. The design of
the static tester, previously shown in figure40, and the experimental procedure were
previously described in section 4.6.3. Two sets of experiments were conducted on the
static tester. In the first set of experiments, extruded silicone rubber yarns of round cross
section and 1/32 inch in diameter, custom made by Simolex Rubber Corp., MI, USA, were
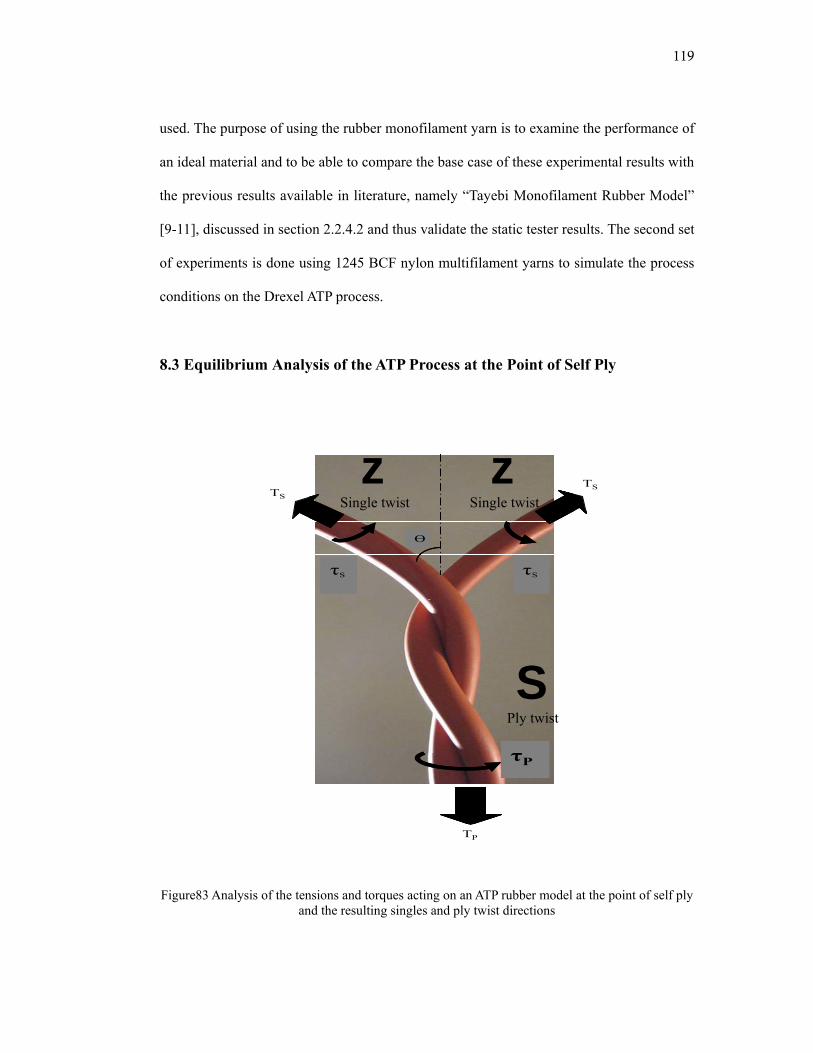
119
used. The purpose of using the rubber monofilament yarn is to examine the performance of
an ideal material and to be able to compare the base case of these experimental results with
the previous results available in literature, namely “Tayebi Monofilament Rubber Model”
[9-11], discussed in section 2.2.4.2 and thus validate the static tester results. The second set
of experiments is done using 1245 BCF nylon multifilament yarns to simulate the process
conditions on the Drexel ATP process.
8.3 Equilibrium Analysis of the ATP Process at the Point of Self Ply
Figure83 Analysis of the tensions and torques acting on an ATP rubber model at the point of self ply
and the resulting singles and ply twist directions
TS
TS
Ө
TP
τP
τSτS
TS
TS
Ө
TP
τP
τSτS
TS
TS
Ө
TP
τP
τSτS
S Ply twist
z Single twist
z Single twist
120
A stable balanced ATP yarn is one that will maintain its structure after the forces
and torques exerted on it are removed. In order to produce this stable ATP yarn structure,
an equilibrium condition must be maintained during the self plying process. This section
analyzes the tension and torques acting in the self ply zone at equilibrium, illustrated in
figure83 for a monofilament rubber yarn. During self plying, the tensions in the singles
yarns above the convergence point (TS), applied by the yarn tensioners, must be balanced
by the tension in the ply yarns (TP ) below the yarn convergence point. This results in the
following equation relating the tensions in the self ply zone to fulfill equilibrium
conditions:
θcos2 SP TT = (8.1)
Where TS and TP are the tensions in the singles and ply yarn respectively and Ө is the half
angle of convergence at the point of self ply.
At equilibrium, the torques produced in the singles yarns structure (τS), due to the
action of the main torque jets, and the torque produced in the ply yarn structure (τP), due to
the action of the helper torque jet, are counterbalanced by the unplying torque produced
due to the singles tension components acting on the singles yarns cross-section with a
moment arm equal to the singles yarns radius. This results in the following equation
relating the different torques at equilibrium. This equation neglects the bending moment
contribution to yarn torque for reasons of model simplicity.
0sin2cos2 =−+ θθττ SSSP DT (8.2)
121
Where τS and τP are the singles yarn and ply yarn torques respectively and Ds is the singles
yarn diameter.
Equations (8.1) and (8.2) present the two main equations that are needed to fulfill
the equilibrium conditions required for producing a stable ATP yarn structure. These two
equations in themselves also illustrate the importance of taking into account the existence
of the yarn convergence angle at the point of self ply which results in appearance of the
component terms effects of the tensions and torques in these equations. The effect of the
yarn convergence angle will further be emphasized section 8.3.1.
A special case for equation (8.2) is in the absence of the helper torque jet, which
is the case for most current commercial ATP processes. In this case, the ply torque term in
equation (8.2) diminishes and the unplying torque produced due to the singles tension
components would be balanced by the components of the singles yarn torque only, as
shown in equation (8.3).
0sin2cos2 =− θθτ SSS DT (8.3)
In order to establish a quantitative relationship describing the effect of the ply
torque in the Drexel ATP process, the equilibrium equations (8.1) and (8.2) were used.
Substituting equation (8.1) into equation (8.2) and solving for the singles yarn torque we
obtain the following equation
θ
τθτ
cos2
tan2 ⎥
⎦
⎤⎢⎣
⎡−⎟
⎠⎞
⎜⎝⎛
=PP
s
s
TD
(8.4)
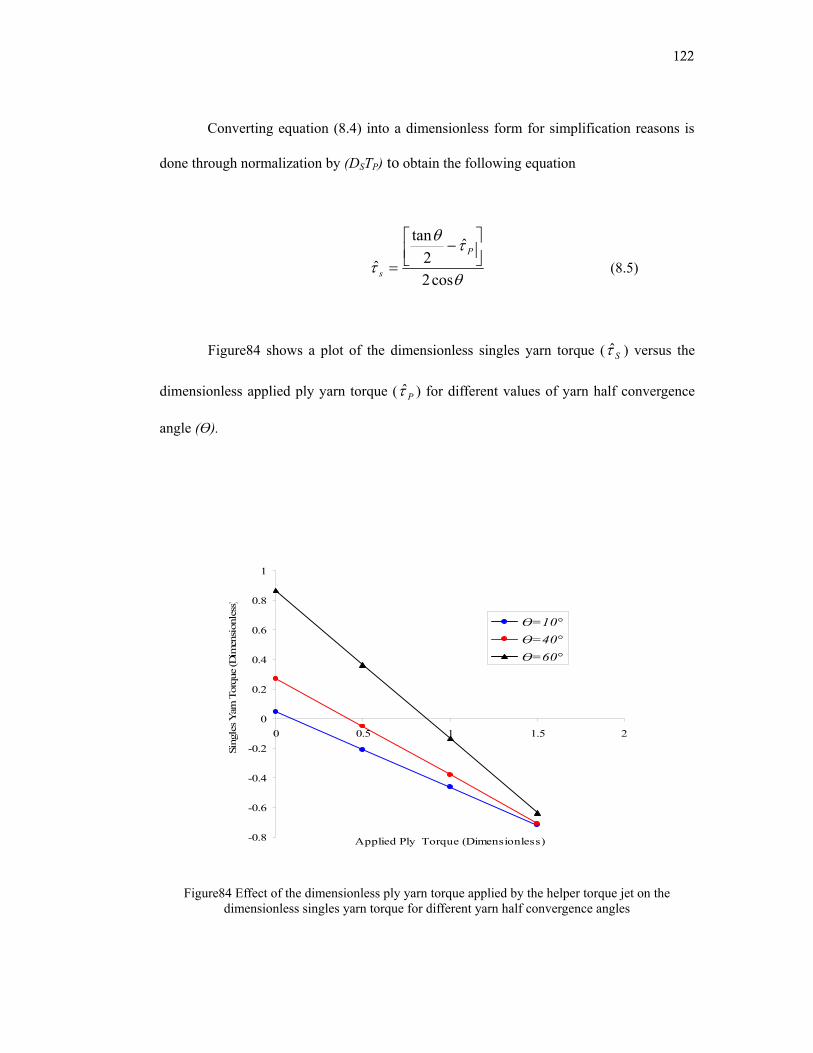
122
Converting equation (8.4) into a dimensionless form for simplification reasons is
done through normalization by (DSTP) to obtain the following equation
θ
τθ
τcos2
ˆ2
tan
ˆ⎥⎦⎤
⎢⎣⎡ −
=P
s (8.5)
Figure84 shows a plot of the dimensionless singles yarn torque ( Sτ ) versus the
dimensionless applied ply yarn torque ( Pτ ) for different values of yarn half convergence
angle (Ө).
-0.8
-0.6
-0.4
-0.2
0
0.2
0.4
0.6
0.8
1
0 0.5 1 1.5 2
Applied Ply Torque (Dimensionless)
Sing
les Y
arn
Torq
ue (D
imen
sion
less
)
Ө=10°Ө=40°Ө=60°
Figure84 Effect of the dimensionless ply yarn torque applied by the helper torque jet on the
dimensionless singles yarn torque for different yarn half convergence angles
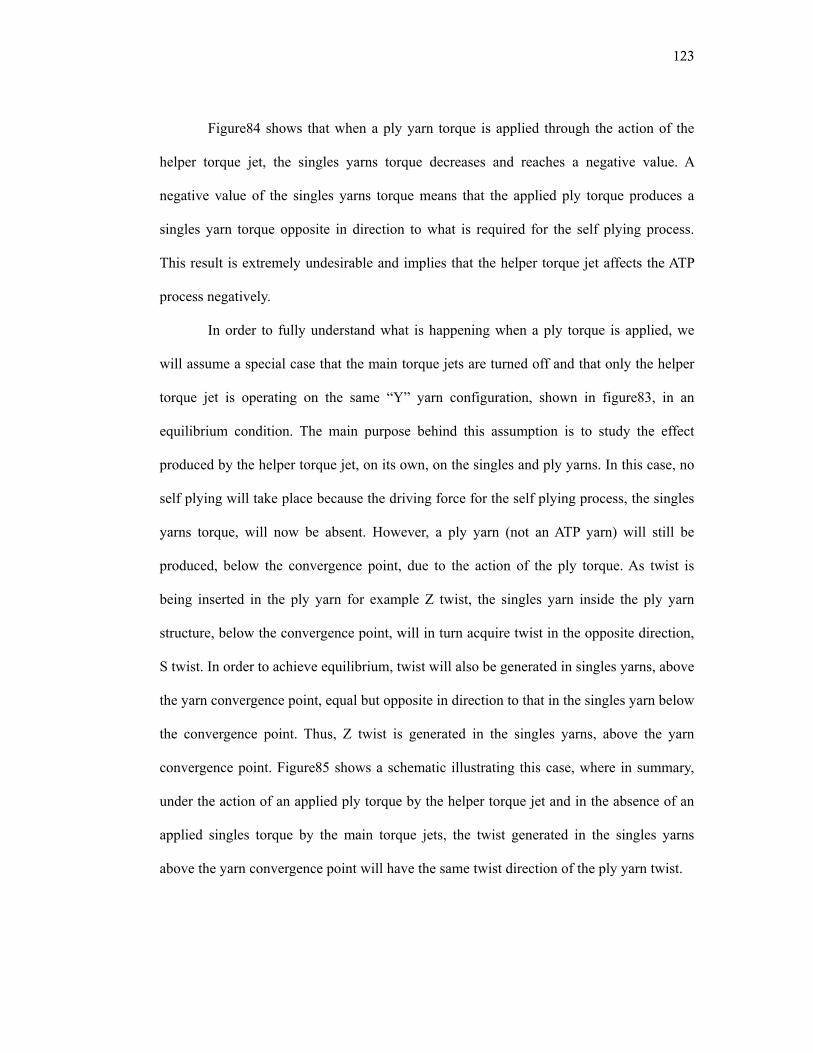
123
Figure84 shows that when a ply yarn torque is applied through the action of the
helper torque jet, the singles yarns torque decreases and reaches a negative value. A
negative value of the singles yarns torque means that the applied ply torque produces a
singles yarn torque opposite in direction to what is required for the self plying process.
This result is extremely undesirable and implies that the helper torque jet affects the ATP
process negatively.
In order to fully understand what is happening when a ply torque is applied, we
will assume a special case that the main torque jets are turned off and that only the helper
torque jet is operating on the same “Y” yarn configuration, shown in figure83, in an
equilibrium condition. The main purpose behind this assumption is to study the effect
produced by the helper torque jet, on its own, on the singles and ply yarns. In this case, no
self plying will take place because the driving force for the self plying process, the singles
yarns torque, will now be absent. However, a ply yarn (not an ATP yarn) will still be
produced, below the convergence point, due to the action of the ply torque. As twist is
being inserted in the ply yarn for example Z twist, the singles yarn inside the ply yarn
structure, below the convergence point, will in turn acquire twist in the opposite direction,
S twist. In order to achieve equilibrium, twist will also be generated in singles yarns, above
the yarn convergence point, equal but opposite in direction to that in the singles yarn below
the convergence point. Thus, Z twist is generated in the singles yarns, above the yarn
convergence point. Figure85 shows a schematic illustrating this case, where in summary,
under the action of an applied ply torque by the helper torque jet and in the absence of an
applied singles torque by the main torque jets, the twist generated in the singles yarns
above the yarn convergence point will have the same twist direction of the ply yarn twist.
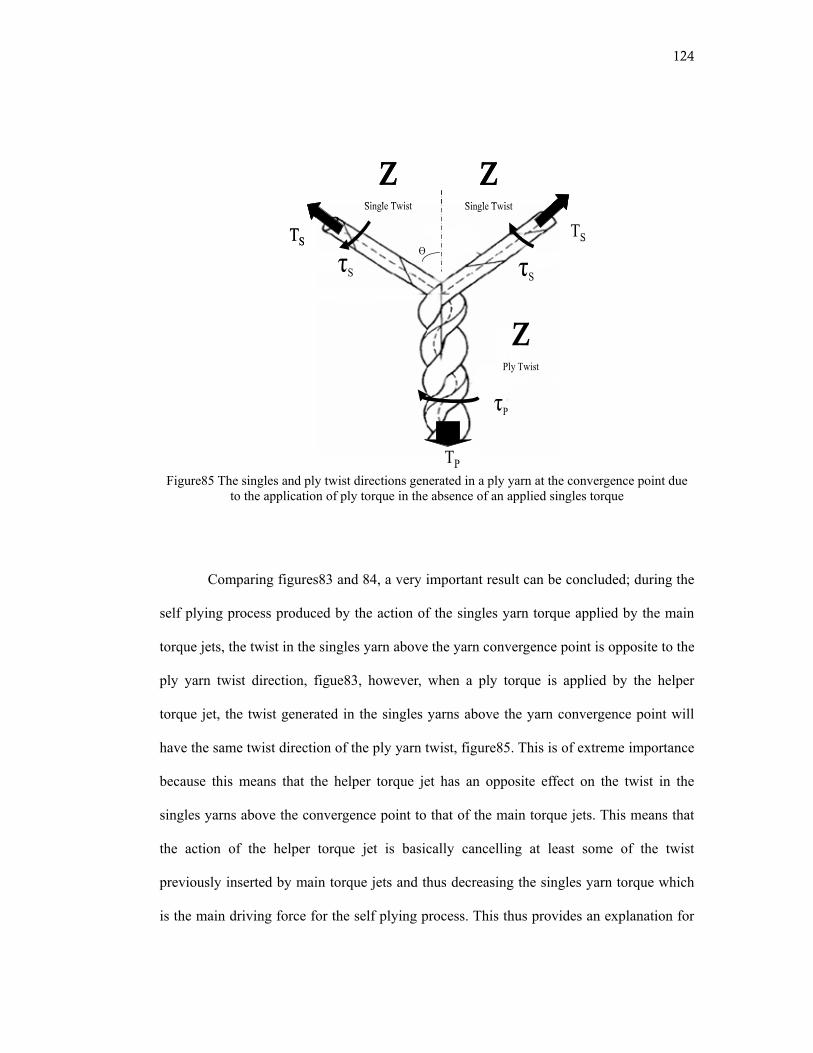
124
Figure85 The singles and ply twist directions generated in a ply yarn at the convergence point due to the application of ply torque in the absence of an applied singles torque
Comparing figures83 and 84, a very important result can be concluded; during the
self plying process produced by the action of the singles yarn torque applied by the main
torque jets, the twist in the singles yarn above the yarn convergence point is opposite to the
ply yarn twist direction, figue83, however, when a ply torque is applied by the helper
torque jet, the twist generated in the singles yarns above the yarn convergence point will
have the same twist direction of the ply yarn twist, figure85. This is of extreme importance
because this means that the helper torque jet has an opposite effect on the twist in the
singles yarns above the convergence point to that of the main torque jets. This means that
the action of the helper torque jet is basically cancelling at least some of the twist
previously inserted by main torque jets and thus decreasing the singles yarn torque which
is the main driving force for the self plying process. This thus provides an explanation for
TSӨ
TP
τP
τSτS
TS
ZSingle Twist
ZSingle Twist
ZPly Twist
TSӨ
TP
τP
τSτS
TS
ZSingle Twist
ZSingle Twist
ZPly Twist
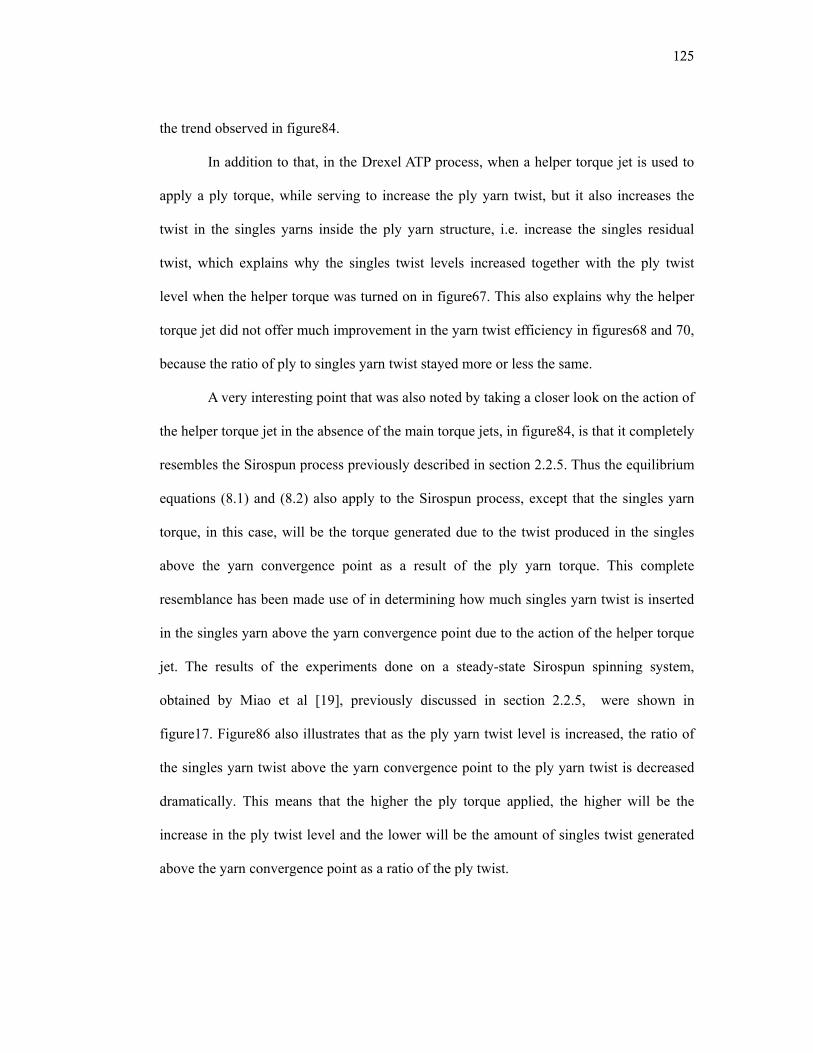
125
the trend observed in figure84.
In addition to that, in the Drexel ATP process, when a helper torque jet is used to
apply a ply torque, while serving to increase the ply yarn twist, but it also increases the
twist in the singles yarns inside the ply yarn structure, i.e. increase the singles residual
twist, which explains why the singles twist levels increased together with the ply twist
level when the helper torque was turned on in figure67. This also explains why the helper
torque jet did not offer much improvement in the yarn twist efficiency in figures68 and 70,
because the ratio of ply to singles yarn twist stayed more or less the same.
A very interesting point that was also noted by taking a closer look on the action of
the helper torque jet in the absence of the main torque jets, in figure84, is that it completely
resembles the Sirospun process previously described in section 2.2.5. Thus the equilibrium
equations (8.1) and (8.2) also apply to the Sirospun process, except that the singles yarn
torque, in this case, will be the torque generated due to the twist produced in the singles
above the yarn convergence point as a result of the ply yarn torque. This complete
resemblance has been made use of in determining how much singles yarn twist is inserted
in the singles yarn above the yarn convergence point due to the action of the helper torque
jet. The results of the experiments done on a steady-state Sirospun spinning system,
obtained by Miao et al [19], previously discussed in section 2.2.5, were shown in
figure17. Figure86 also illustrates that as the ply yarn twist level is increased, the ratio of
the singles yarn twist above the yarn convergence point to the ply yarn twist is decreased
dramatically. This means that the higher the ply torque applied, the higher will be the
increase in the ply twist level and the lower will be the amount of singles twist generated
above the yarn convergence point as a ratio of the ply twist.
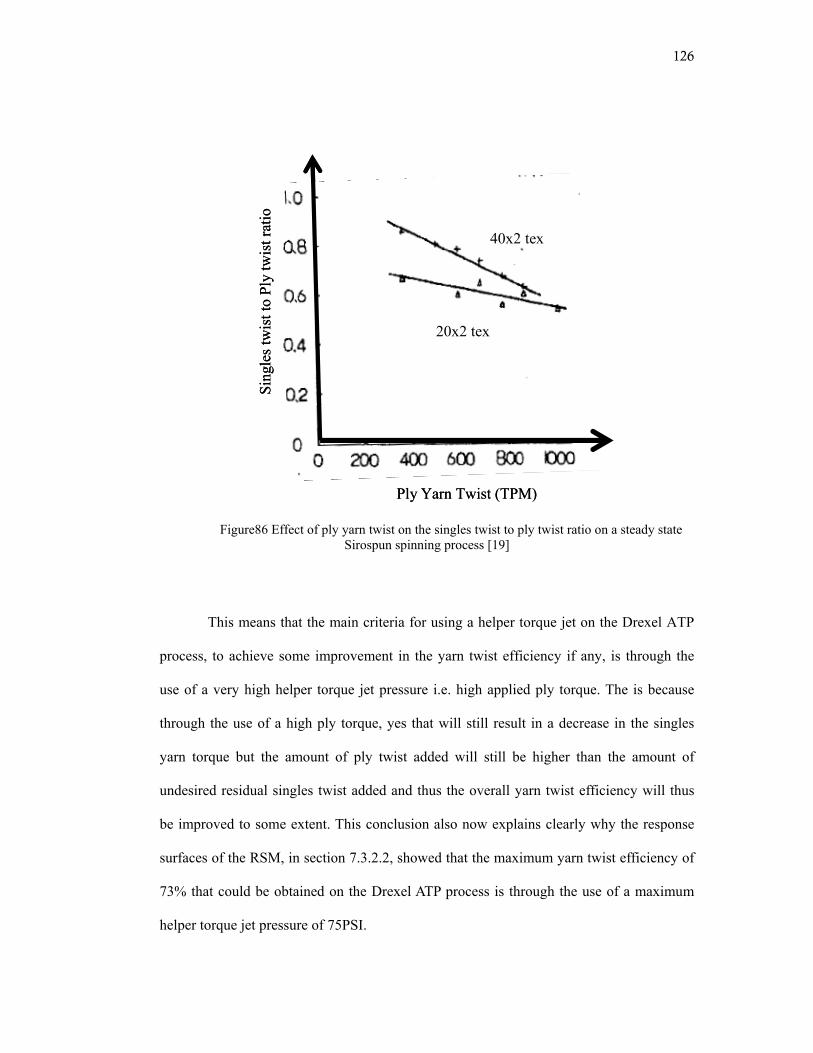
126
Figure86 Effect of ply yarn twist on the singles twist to ply twist ratio on a steady state Sirospun spinning process [19]
This means that the main criteria for using a helper torque jet on the Drexel ATP
process, to achieve some improvement in the yarn twist efficiency if any, is through the
use of a very high helper torque jet pressure i.e. high applied ply torque. The is because
through the use of a high ply torque, yes that will still result in a decrease in the singles
yarn torque but the amount of ply twist added will still be higher than the amount of
undesired residual singles twist added and thus the overall yarn twist efficiency will thus
be improved to some extent. This conclusion also now explains clearly why the response
surfaces of the RSM, in section 7.3.2.2, showed that the maximum yarn twist efficiency of
73% that could be obtained on the Drexel ATP process is through the use of a maximum
helper torque jet pressure of 75PSI.
Ply Yarn Twist (TPM)
Sing
les t
wis
t to
Ply
twis
t rat
io
40x2 tex
20x2 tex
Ply Yarn Twist (TPM)
Sing
les t
wis
t to
Ply
twis
t rat
io
40x2 tex
20x2 tex
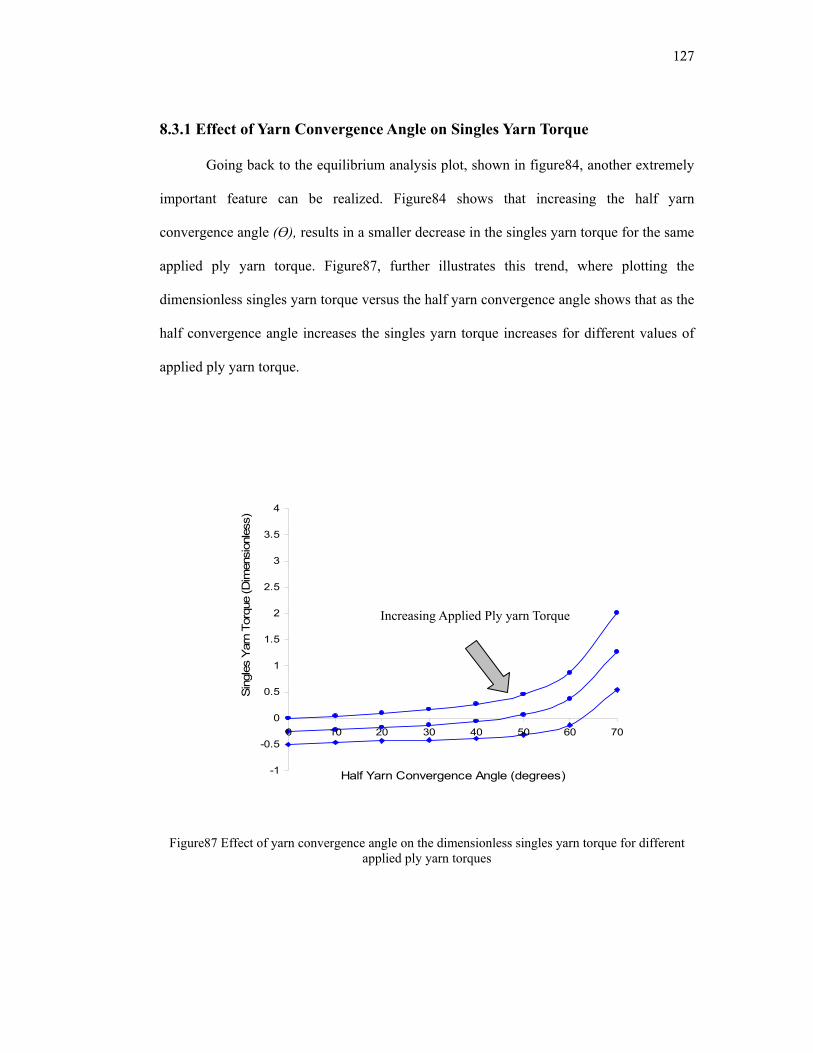
127
8.3.1 Effect of Yarn Convergence Angle on Singles Yarn Torque
Going back to the equilibrium analysis plot, shown in figure84, another extremely
important feature can be realized. Figure84 shows that increasing the half yarn
convergence angle (Ө), results in a smaller decrease in the singles yarn torque for the same
applied ply yarn torque. Figure87, further illustrates this trend, where plotting the
dimensionless singles yarn torque versus the half yarn convergence angle shows that as the
half convergence angle increases the singles yarn torque increases for different values of
applied ply yarn torque.
-1
-0.5
0
0.5
1
1.5
2
2.5
3
3.5
4
0 10 20 30 40 50 60 70
Half Yarn Convergence Angle (degrees)
Sing
les
Yarn
Tor
que
(Dim
ensi
onle
ss)
Figure87 Effect of yarn convergence angle on the dimensionless singles yarn torque for different applied ply yarn torques
Increasing Applied Ply yarn Torque
128
This means that if the singles yarns are forced to converge at a high convergence
angle, this would remarkably reduce the undesired effect of the applied ply yarn torque, in
reducing the singles yarn torque, and at the same time increase the ply yarn twist and thus
produce a tremendous increase in the yarn twist efficiency on the Drexel ATP process. In
order to confirm this proposed method for further improving the yarn twist efficiency,
through the use of the combined effect of applied high ply yarn torque and high yarn
convergence angle at the point of self ply on the Drexel ATP process, a series of
experiments demonstrating this effect were required.
Since the two main torque jets on the Drexel ATP process are confined in space
together inside a stainless steel box, as shown in figure82, varying the yarn convergence
angle on this process was not feasible at the time because it required redesigning the jets
configuration which is a time consuming and expensive process. For this reason and for
purposes of acquiring a detailed analysis of the change in the levels of the singles and ply
yarns twist with the change of the applied ply yarn torque and yarn convergence angle at
the self ply point, the static tester previously described in section4.6.3 and shown in
figure40 was used in the following experiments.
8.4 Results of Static Modeling using Rubber Monofilament Yarn
In this set of experiments, 1/32” rubber monofilament yarn was used to study the
effect of ply yarn torque and the yarn convergence angle on the resulting singles and ply
yarn twists at the self ply point. These rubber yarns were used in order to study these
effects with the use of a perfectly elastic ideal material as a base case thus eliminating any
friction or interfilament interaction effects in nylon multifilament yarns. The procedure
used in these experiments is as previously mentioned in section 4.6.3. The ply tension used
129
in this set of experiments was 34g. Experiments using higher ply tensions were also done
but the results were not reported because a great degree of stretching of the rubber yarn
occurred during the self plying process due to the higher applied tension. For this reason,
studying the effect of the ply yarn tension on the yarn twist efficiency was not possible in
this set of experiments using rubber yarns and will be studied in the second set of
experiments using BCF nylon yarns.
8.4.1 Validation of Static Tester Results with Previous ATP Models
In order to validate the results of the static tester, an initial experiment was done
with no ply torque applied to the ply yarns and the self plying process was examined under
the effect of applied ply tension only. These results are compared to the experimental and
theoretical results previously obtained by Tayebi et al [9-11] using a rubber monofilament
model to simulate the self plying process of two parallel yarns under the effect of tension
only.
Figure88 shows a plot of the ply twist helix angle versus the singles twist helix
angle. The helix angle (Φ) expressed in radians is a measure of the twist in the yarn
structure and is related to the twist (t) expressed in turns per inch through the following
equation derived by Treloar [41]
dsdt φ
π21
= (8.6)
Where dsdφ
is the angle of twist in radians per inch. Figure88 shows that that the
static tester results are in good agreement with results of the “Tayebi” monofilament
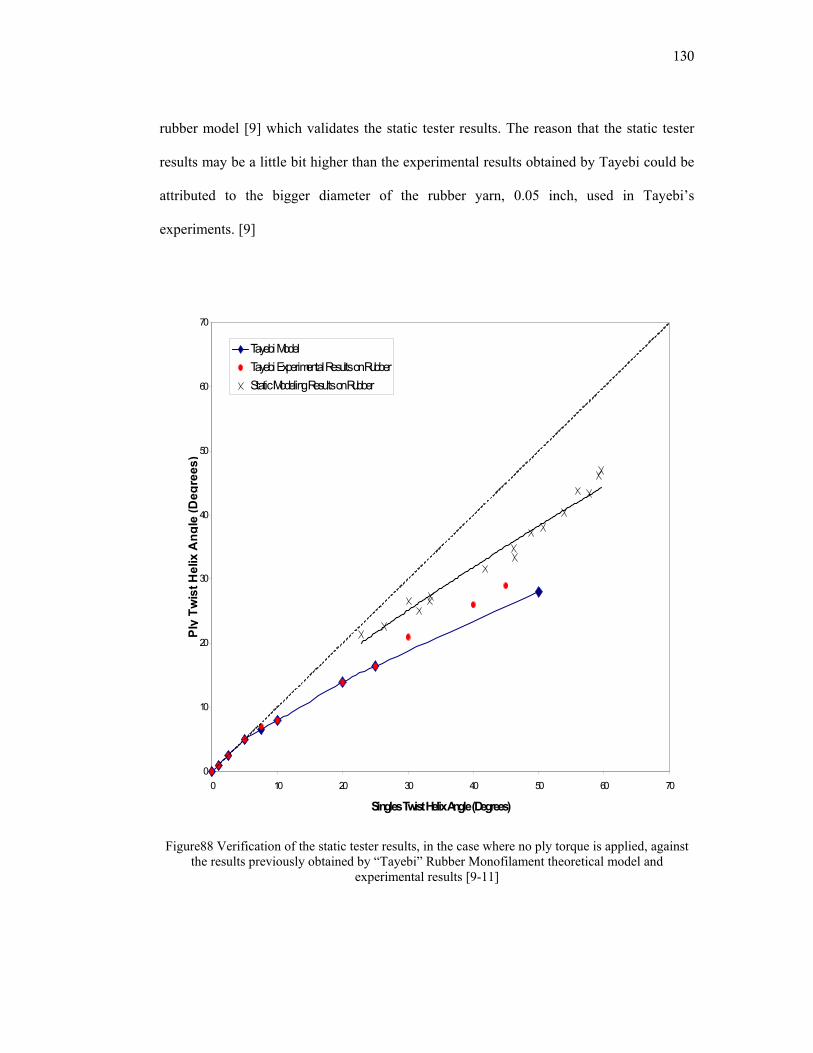
130
rubber model [9] which validates the static tester results. The reason that the static tester
results may be a little bit higher than the experimental results obtained by Tayebi could be
attributed to the bigger diameter of the rubber yarn, 0.05 inch, used in Tayebi’s
experiments. [9]
Figure88 Verification of the static tester results, in the case where no ply torque is applied, against
the results previously obtained by “Tayebi” Rubber Monofilament theoretical model and experimental results [9-11]
0
10
20
30
40
50
60
70
0 10 20 30 40 50 60 70
Singles Twist Helix Angle (Degrees)
Ply
Twis
t Hel
ix A
ngle
(Deg
rees
)
Tayebi ModelTayebi Experimental Results on RubberStatic Modeling Results on Rubber
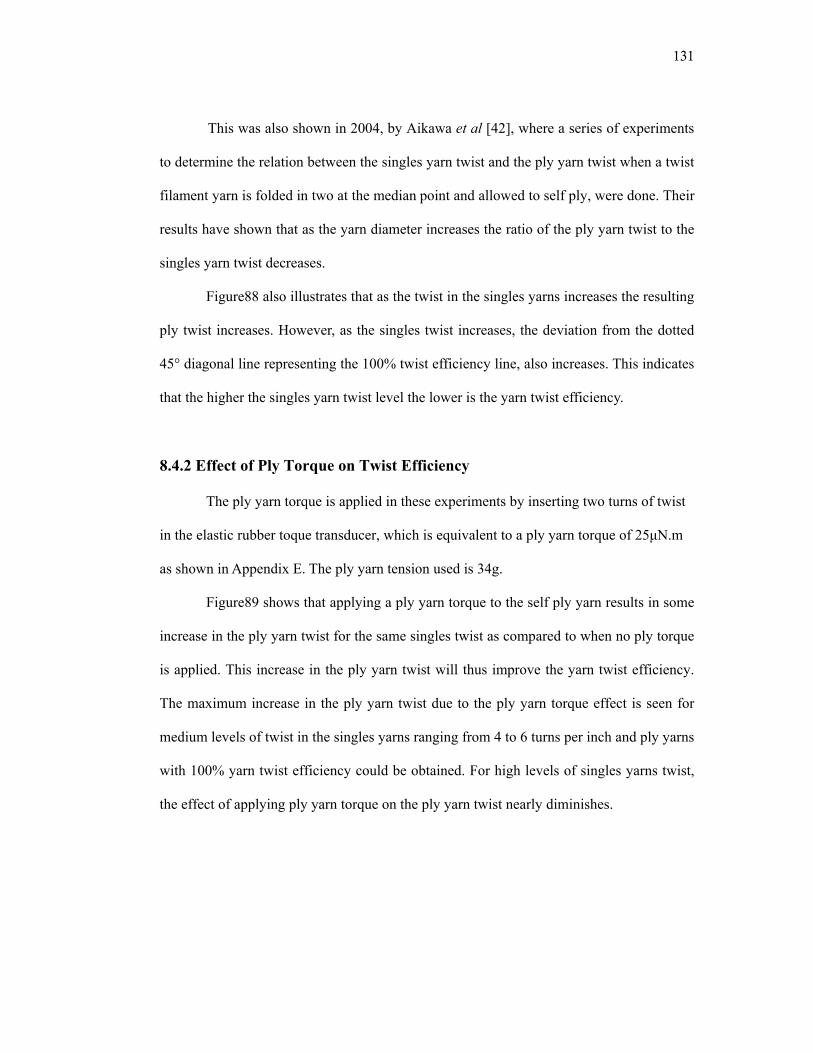
131
This was also shown in 2004, by Aikawa et al [42], where a series of experiments
to determine the relation between the singles yarn twist and the ply yarn twist when a twist
filament yarn is folded in two at the median point and allowed to self ply, were done. Their
results have shown that as the yarn diameter increases the ratio of the ply yarn twist to the
singles yarn twist decreases.
Figure88 also illustrates that as the twist in the singles yarns increases the resulting
ply twist increases. However, as the singles twist increases, the deviation from the dotted
45° diagonal line representing the 100% twist efficiency line, also increases. This indicates
that the higher the singles yarn twist level the lower is the yarn twist efficiency.
8.4.2 Effect of Ply Torque on Twist Efficiency
The ply yarn torque is applied in these experiments by inserting two turns of twist
in the elastic rubber toque transducer, which is equivalent to a ply yarn torque of 25μN.m
as shown in Appendix E. The ply yarn tension used is 34g.
Figure89 shows that applying a ply yarn torque to the self ply yarn results in some
increase in the ply yarn twist for the same singles twist as compared to when no ply torque
is applied. This increase in the ply yarn twist will thus improve the yarn twist efficiency.
The maximum increase in the ply yarn twist due to the ply yarn torque effect is seen for
medium levels of twist in the singles yarns ranging from 4 to 6 turns per inch and ply yarns
with 100% yarn twist efficiency could be obtained. For high levels of singles yarns twist,
the effect of applying ply yarn torque on the ply yarn twist nearly diminishes.
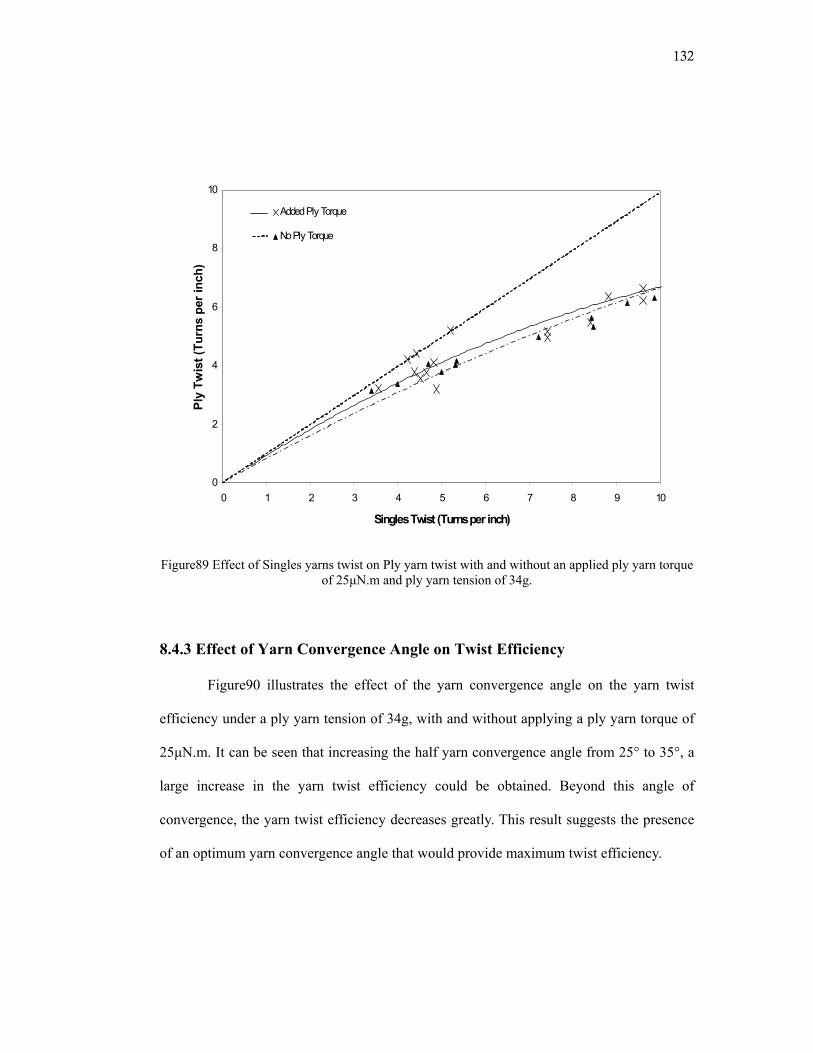
132
Figure89 Effect of Singles yarns twist on Ply yarn twist with and without an applied ply yarn torque
of 25μN.m and ply yarn tension of 34g.
8.4.3 Effect of Yarn Convergence Angle on Twist Efficiency
Figure90 illustrates the effect of the yarn convergence angle on the yarn twist
efficiency under a ply yarn tension of 34g, with and without applying a ply yarn torque of
25μN.m. It can be seen that increasing the half yarn convergence angle from 25° to 35°, a
large increase in the yarn twist efficiency could be obtained. Beyond this angle of
convergence, the yarn twist efficiency decreases greatly. This result suggests the presence
of an optimum yarn convergence angle that would provide maximum twist efficiency.
0
2
4
6
8
10
0 1 2 3 4 5 6 7 8 9 10
Singles Twist (Turns per inch)
Ply
Twis
t (Tu
rns
per i
nch)
Added Ply Torque
No Ply Torque
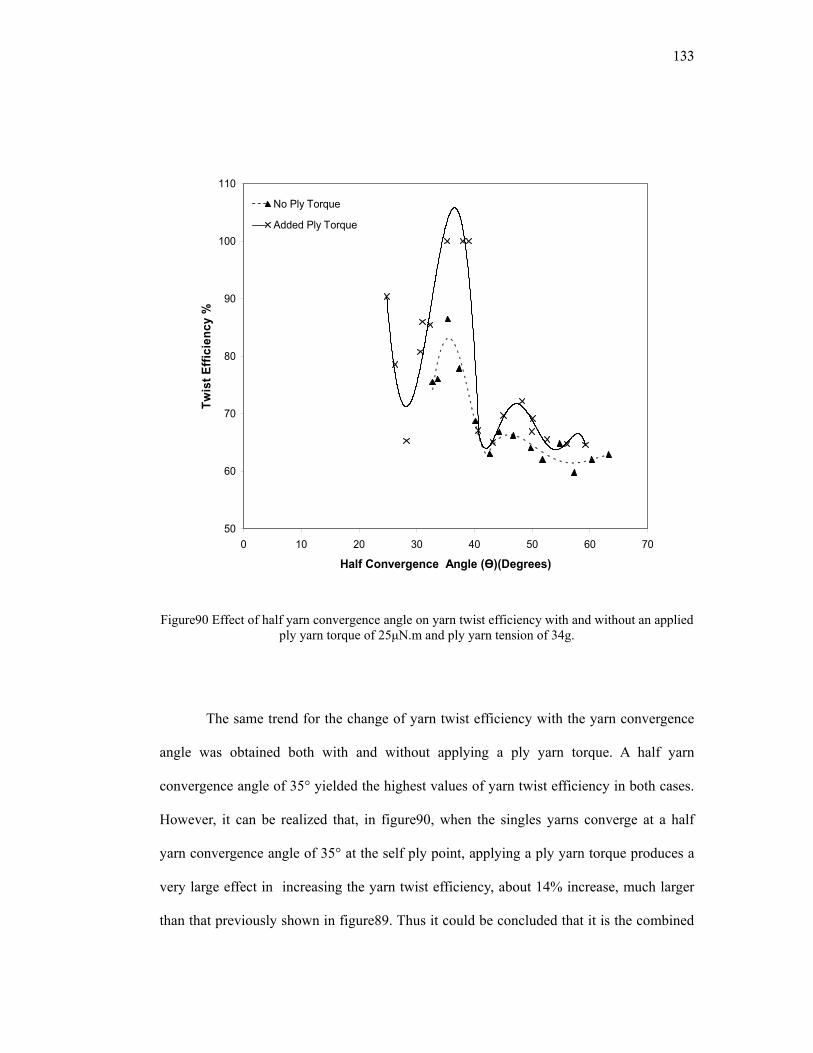
133
Figure90 Effect of half yarn convergence angle on yarn twist efficiency with and without an applied
ply yarn torque of 25μN.m and ply yarn tension of 34g.
The same trend for the change of yarn twist efficiency with the yarn convergence
angle was obtained both with and without applying a ply yarn torque. A half yarn
convergence angle of 35° yielded the highest values of yarn twist efficiency in both cases.
However, it can be realized that, in figure90, when the singles yarns converge at a half
yarn convergence angle of 35° at the self ply point, applying a ply yarn torque produces a
very large effect in increasing the yarn twist efficiency, about 14% increase, much larger
than that previously shown in figure89. Thus it could be concluded that it is the combined
50
60
70
80
90
100
110
0 10 20 30 40 50 60 70
Half Convergence Angle (Ө)(Degrees)
Twis
t Effi
cien
cy %
No Ply Torque
Added Ply Torque
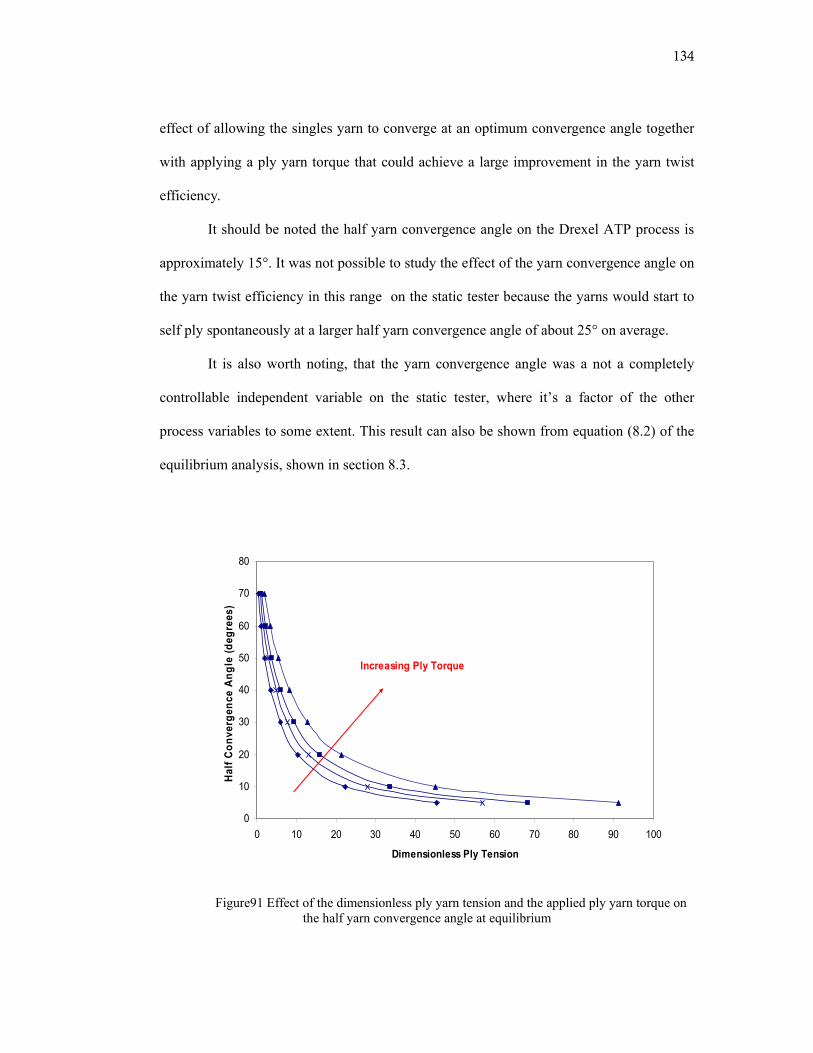
134
effect of allowing the singles yarn to converge at an optimum convergence angle together
with applying a ply yarn torque that could achieve a large improvement in the yarn twist
efficiency.
It should be noted the half yarn convergence angle on the Drexel ATP process is
approximately 15°. It was not possible to study the effect of the yarn convergence angle on
the yarn twist efficiency in this range on the static tester because the yarns would start to
self ply spontaneously at a larger half yarn convergence angle of about 25° on average.
It is also worth noting, that the yarn convergence angle was a not a completely
controllable independent variable on the static tester, where it’s a factor of the other
process variables to some extent. This result can also be shown from equation (8.2) of the
equilibrium analysis, shown in section 8.3.
0
10
20
30
40
50
60
70
80
0 10 20 30 40 50 60 70 80 90 100
Dimensionless Ply Tension
Hal
f Con
verg
ence
Ang
le (d
egre
es)
Increasing Ply Torque
Figure91 Effect of the dimensionless ply yarn tension and the applied ply yarn torque on the half yarn convergence angle at equilibrium
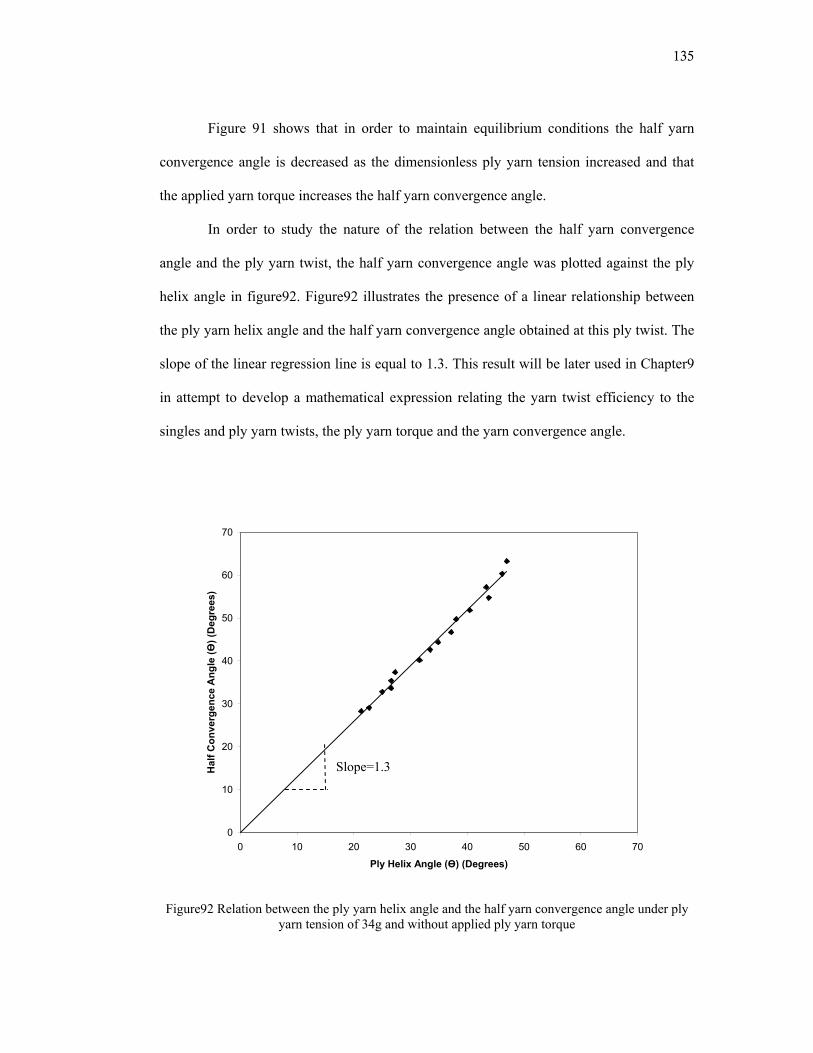
135
Figure 91 shows that in order to maintain equilibrium conditions the half yarn
convergence angle is decreased as the dimensionless ply yarn tension increased and that
the applied yarn torque increases the half yarn convergence angle.
In order to study the nature of the relation between the half yarn convergence
angle and the ply yarn twist, the half yarn convergence angle was plotted against the ply
helix angle in figure92. Figure92 illustrates the presence of a linear relationship between
the ply yarn helix angle and the half yarn convergence angle obtained at this ply twist. The
slope of the linear regression line is equal to 1.3. This result will be later used in Chapter9
in attempt to develop a mathematical expression relating the yarn twist efficiency to the
singles and ply yarn twists, the ply yarn torque and the yarn convergence angle.
Figure92 Relation between the ply yarn helix angle and the half yarn convergence angle under ply
yarn tension of 34g and without applied ply yarn torque
0
10
20
30
40
50
60
70
0 10 20 30 40 50 60 70
Ply Helix Angle (Ө) (Degrees)
Hal
f Con
verg
ence
Ang
le (Ө
) (D
egre
es)
Slope=1.3
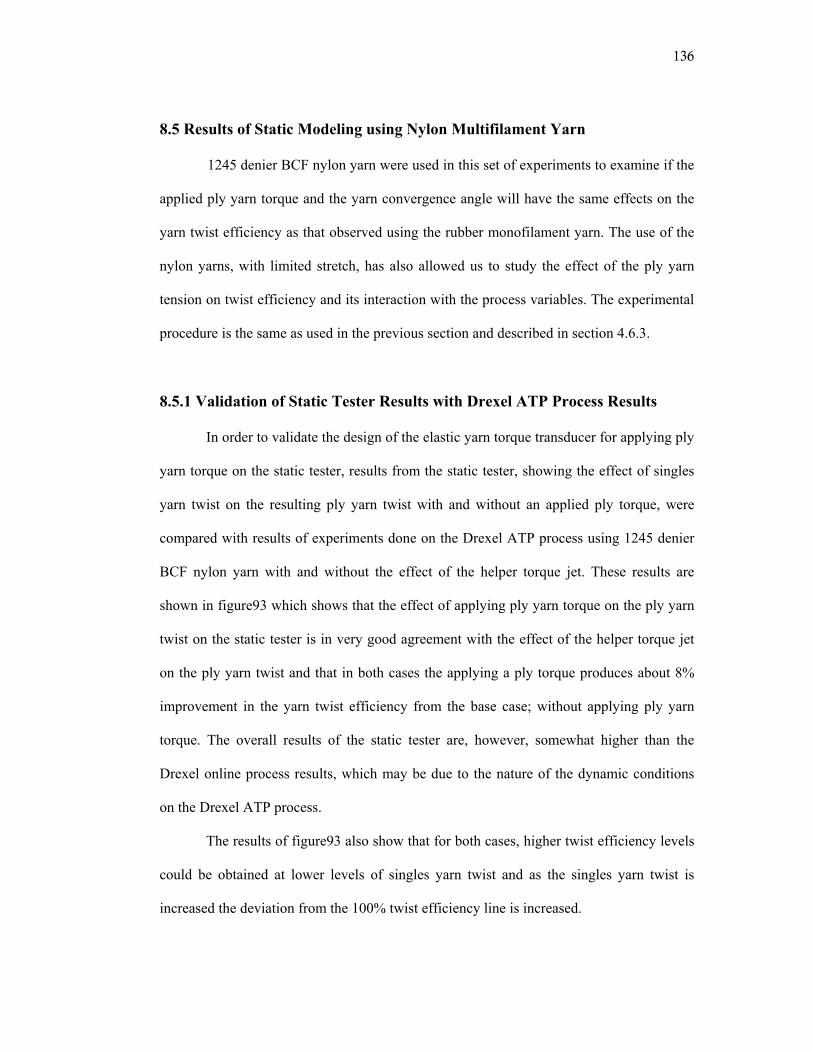
136
8.5 Results of Static Modeling using Nylon Multifilament Yarn
1245 denier BCF nylon yarn were used in this set of experiments to examine if the
applied ply yarn torque and the yarn convergence angle will have the same effects on the
yarn twist efficiency as that observed using the rubber monofilament yarn. The use of the
nylon yarns, with limited stretch, has also allowed us to study the effect of the ply yarn
tension on twist efficiency and its interaction with the process variables. The experimental
procedure is the same as used in the previous section and described in section 4.6.3.
8.5.1 Validation of Static Tester Results with Drexel ATP Process Results
In order to validate the design of the elastic yarn torque transducer for applying ply
yarn torque on the static tester, results from the static tester, showing the effect of singles
yarn twist on the resulting ply yarn twist with and without an applied ply torque, were
compared with results of experiments done on the Drexel ATP process using 1245 denier
BCF nylon yarn with and without the effect of the helper torque jet. These results are
shown in figure93 which shows that the effect of applying ply yarn torque on the ply yarn
twist on the static tester is in very good agreement with the effect of the helper torque jet
on the ply yarn twist and that in both cases the applying a ply torque produces about 8%
improvement in the yarn twist efficiency from the base case; without applying ply yarn
torque. The overall results of the static tester are, however, somewhat higher than the
Drexel online process results, which may be due to the nature of the dynamic conditions
on the Drexel ATP process.
The results of figure93 also show that for both cases, higher twist efficiency levels
could be obtained at lower levels of singles yarn twist and as the singles yarn twist is
increased the deviation from the 100% twist efficiency line is increased.
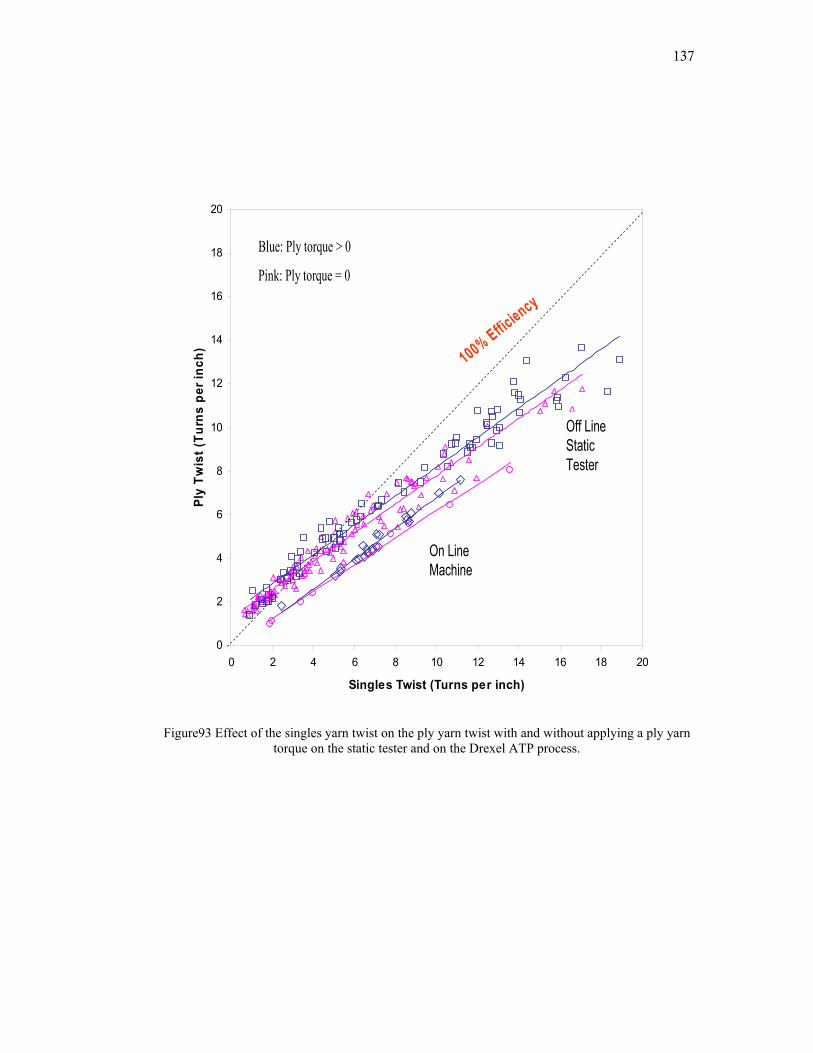
137
Figure93 Effect of the singles yarn twist on the ply yarn twist with and without applying a ply yarn torque on the static tester and on the Drexel ATP process.
0
2
4
6
8
10
12
14
16
18
20
0 2 4 6 8 10 12 14 16 18 20
Singles Twist (Turns per inch)
Ply
Twis
t (Tu
rns
per i
nch)
Off Line Static Tester
On Line Machine
100% Efficiency
Blue: Ply torque > 0
Pink: Ply torque = 0
0
2
4
6
8
10
12
14
16
18
20
0 2 4 6 8 10 12 14 16 18 20
Singles Twist (Turns per inch)
Ply
Twis
t (Tu
rns
per i
nch)
Off Line Static Tester
On Line Machine
100% Efficiency
Blue: Ply torque > 0
Pink: Ply torque = 0
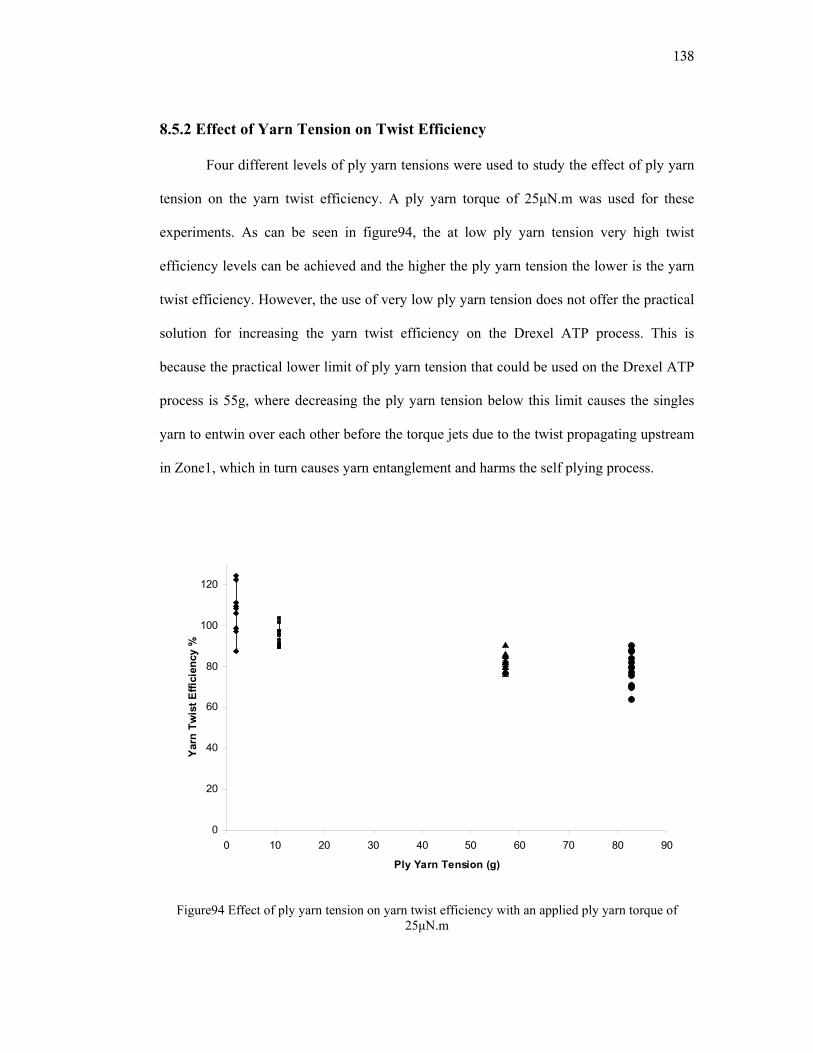
138
8.5.2 Effect of Yarn Tension on Twist Efficiency
Four different levels of ply yarn tensions were used to study the effect of ply yarn
tension on the yarn twist efficiency. A ply yarn torque of 25μN.m was used for these
experiments. As can be seen in figure94, the at low ply yarn tension very high twist
efficiency levels can be achieved and the higher the ply yarn tension the lower is the yarn
twist efficiency. However, the use of very low ply yarn tension does not offer the practical
solution for increasing the yarn twist efficiency on the Drexel ATP process. This is
because the practical lower limit of ply yarn tension that could be used on the Drexel ATP
process is 55g, where decreasing the ply yarn tension below this limit causes the singles
yarn to entwin over each other before the torque jets due to the twist propagating upstream
in Zone1, which in turn causes yarn entanglement and harms the self plying process.
0
20
40
60
80
100
120
0 10 20 30 40 50 60 70 80 90
Ply Yarn Tension (g)
Yar
n Tw
ist E
ffici
ency
%
Figure94 Effect of ply yarn tension on yarn twist efficiency with an applied ply yarn torque of 25μN.m
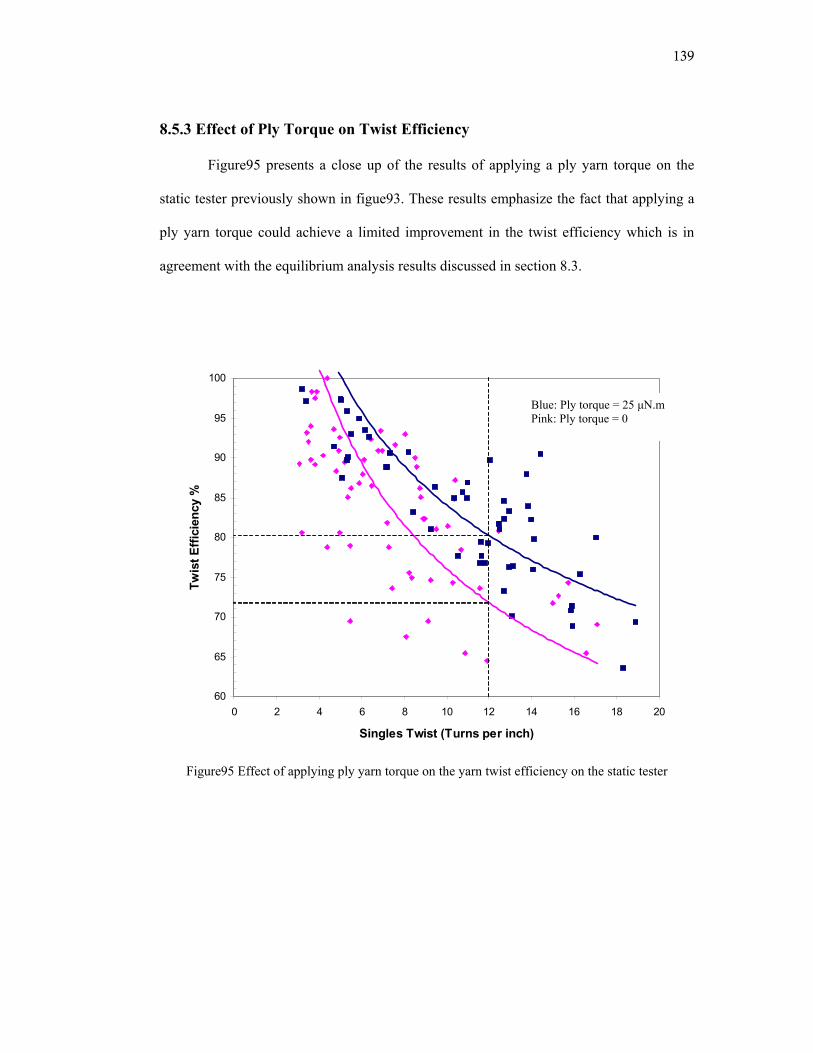
139
8.5.3 Effect of Ply Torque on Twist Efficiency
Figure95 presents a close up of the results of applying a ply yarn torque on the
static tester previously shown in figue93. These results emphasize the fact that applying a
ply yarn torque could achieve a limited improvement in the twist efficiency which is in
agreement with the equilibrium analysis results discussed in section 8.3.
Figure95 Effect of applying ply yarn torque on the yarn twist efficiency on the static tester
60
65
70
75
80
85
90
95
100
0 2 4 6 8 10 12 14 16 18 20
Singles Twist (Turns per inch)
Twis
t Effi
cien
cy %
Blue: Ply torque = 25 μN.m Pink: Ply torque = 0
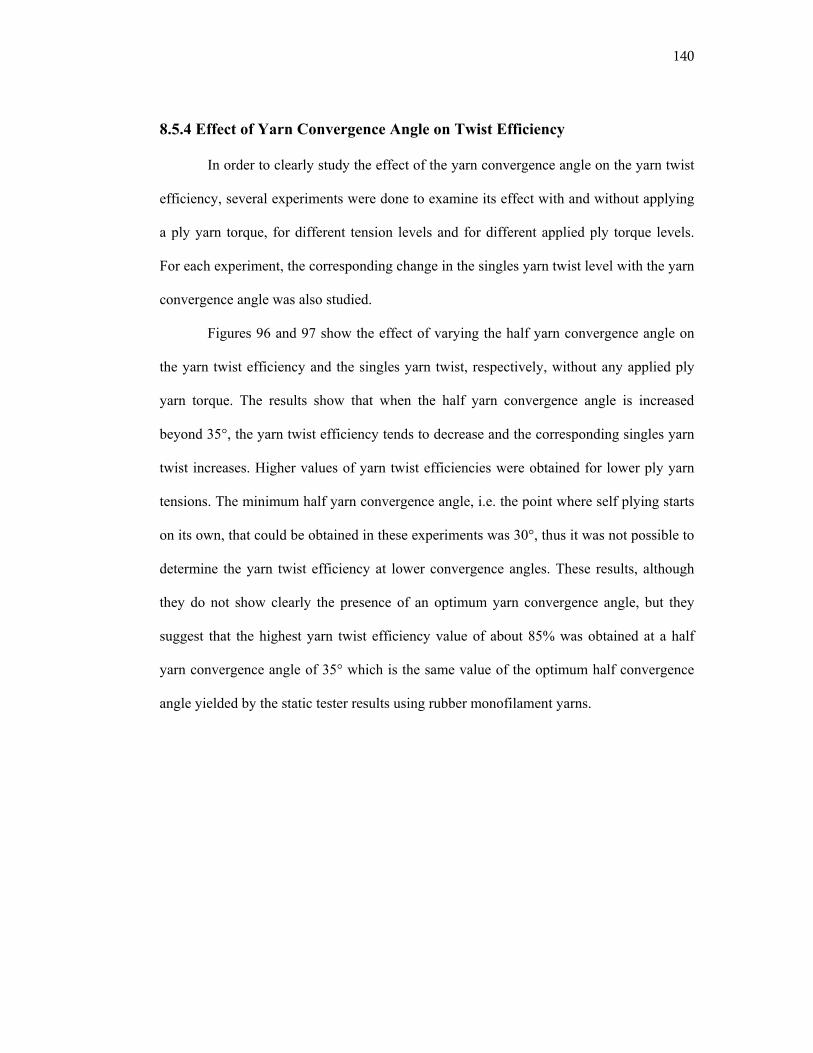
140
8.5.4 Effect of Yarn Convergence Angle on Twist Efficiency
In order to clearly study the effect of the yarn convergence angle on the yarn twist
efficiency, several experiments were done to examine its effect with and without applying
a ply yarn torque, for different tension levels and for different applied ply torque levels.
For each experiment, the corresponding change in the singles yarn twist level with the yarn
convergence angle was also studied.
Figures 96 and 97 show the effect of varying the half yarn convergence angle on
the yarn twist efficiency and the singles yarn twist, respectively, without any applied ply
yarn torque. The results show that when the half yarn convergence angle is increased
beyond 35°, the yarn twist efficiency tends to decrease and the corresponding singles yarn
twist increases. Higher values of yarn twist efficiencies were obtained for lower ply yarn
tensions. The minimum half yarn convergence angle, i.e. the point where self plying starts
on its own, that could be obtained in these experiments was 30°, thus it was not possible to
determine the yarn twist efficiency at lower convergence angles. These results, although
they do not show clearly the presence of an optimum yarn convergence angle, but they
suggest that the highest yarn twist efficiency value of about 85% was obtained at a half
yarn convergence angle of 35° which is the same value of the optimum half convergence
angle yielded by the static tester results using rubber monofilament yarns.
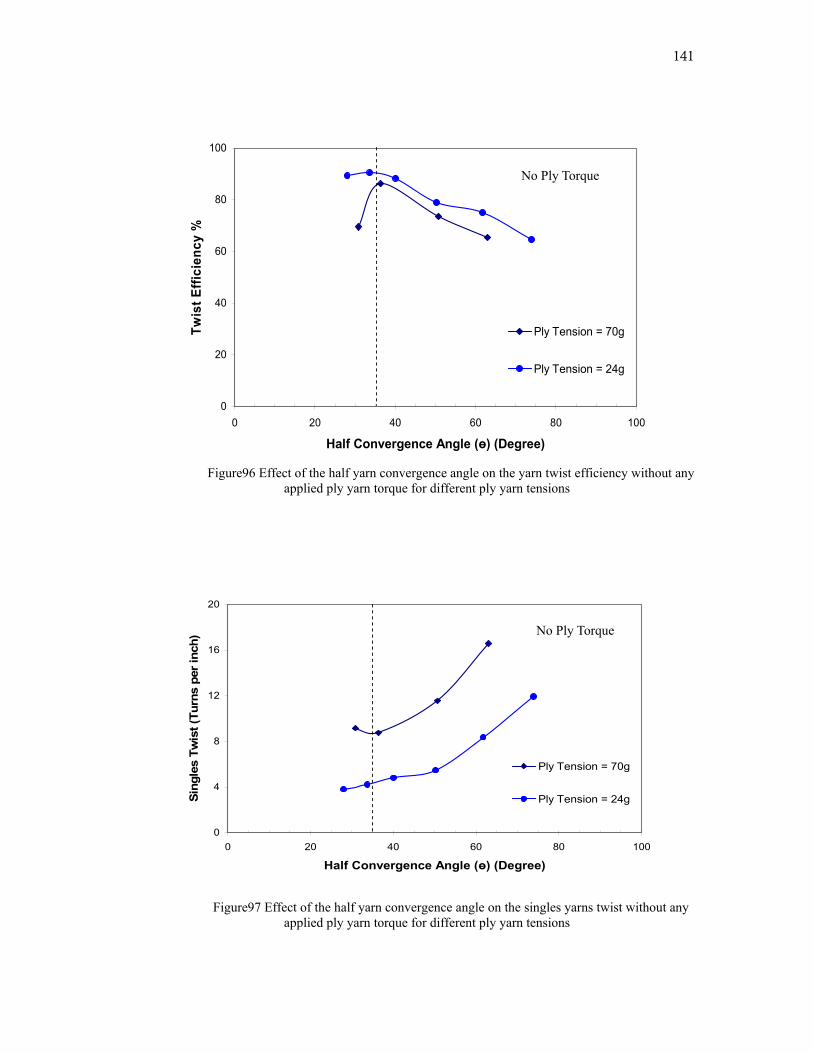
141
Figure96 Effect of the half yarn convergence angle on the yarn twist efficiency without any
applied ply yarn torque for different ply yarn tensions
Figure97 Effect of the half yarn convergence angle on the singles yarns twist without any applied ply yarn torque for different ply yarn tensions
0
4
8
12
16
20
0 20 40 60 80 100
Half Convergence Angle (ө) (Degree)
Sing
les
Twis
t (Tu
rns
per i
nch)
Ply Tension = 70g
Ply Tension = 24g
No Ply Torque
0
20
40
60
80
100
0 20 40 60 80 100
Half Convergence Angle (ө) (Degree)
Twis
t Effi
cien
cy %
Ply Tension = 70g
Ply Tension = 24g
No Ply Torque
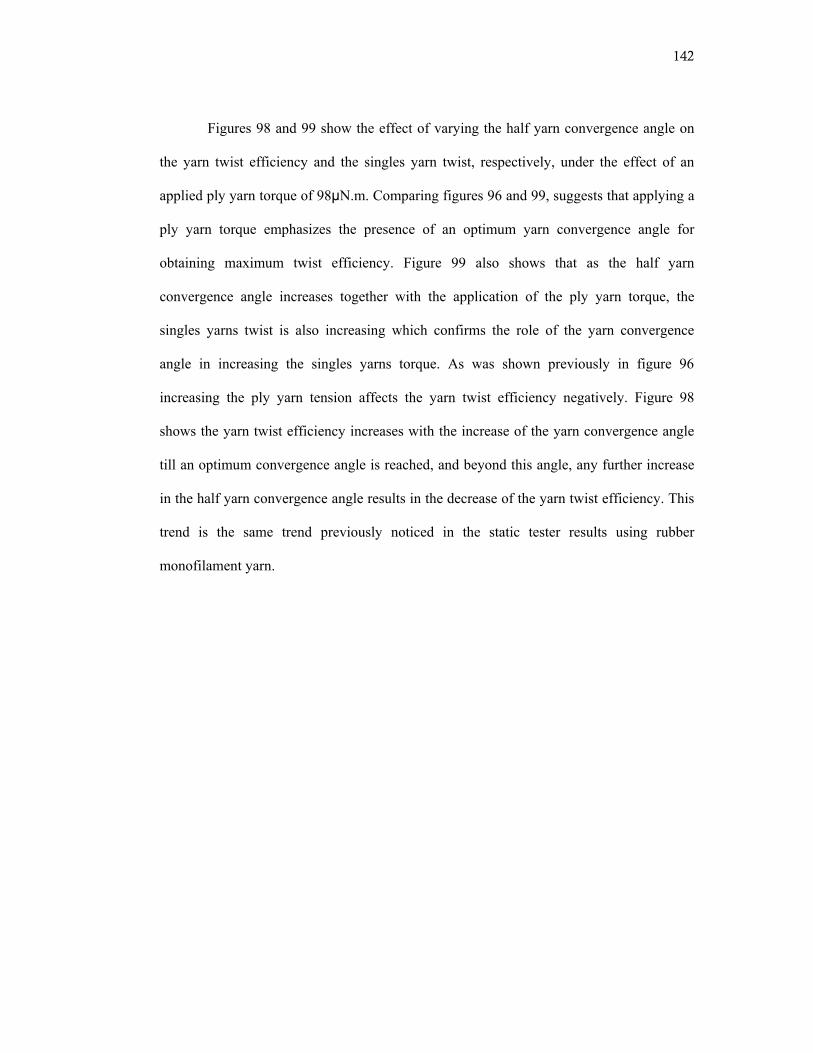
142
Figures 98 and 99 show the effect of varying the half yarn convergence angle on
the yarn twist efficiency and the singles yarn twist, respectively, under the effect of an
applied ply yarn torque of 98μN.m. Comparing figures 96 and 99, suggests that applying a
ply yarn torque emphasizes the presence of an optimum yarn convergence angle for
obtaining maximum twist efficiency. Figure 99 also shows that as the half yarn
convergence angle increases together with the application of the ply yarn torque, the
singles yarns twist is also increasing which confirms the role of the yarn convergence
angle in increasing the singles yarns torque. As was shown previously in figure 96
increasing the ply yarn tension affects the yarn twist efficiency negatively. Figure 98
shows the yarn twist efficiency increases with the increase of the yarn convergence angle
till an optimum convergence angle is reached, and beyond this angle, any further increase
in the half yarn convergence angle results in the decrease of the yarn twist efficiency. This
trend is the same trend previously noticed in the static tester results using rubber
monofilament yarn.
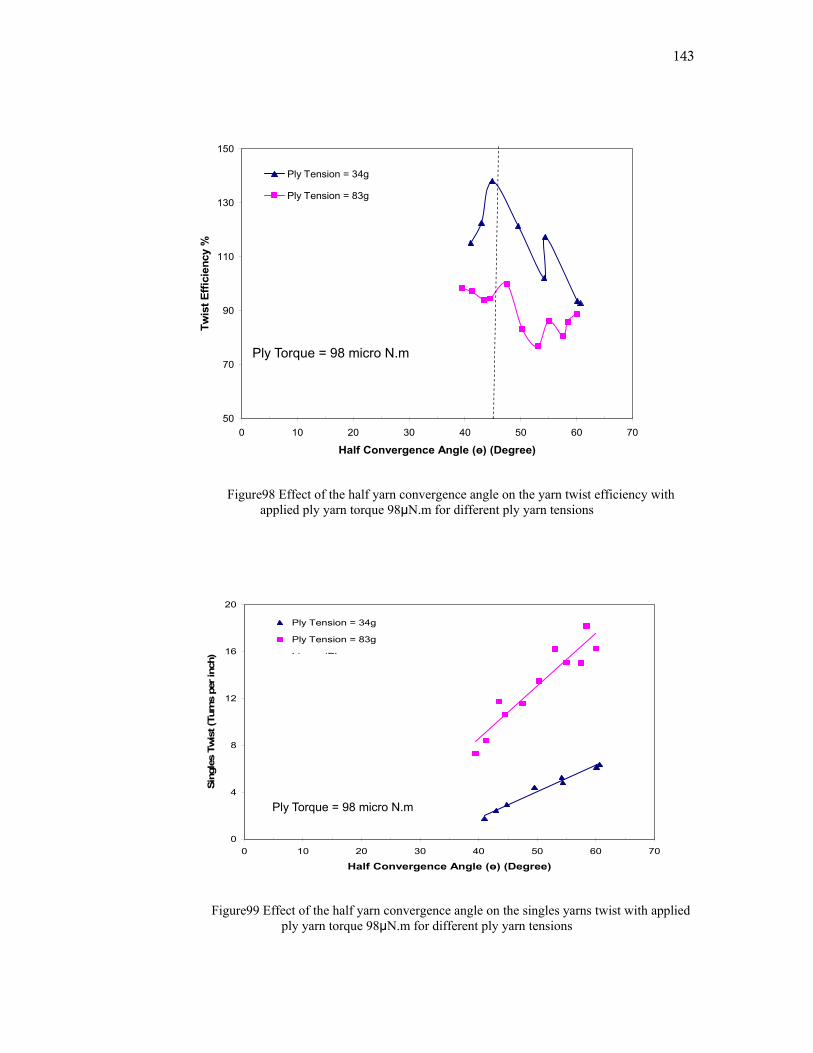
143
Figure98 Effect of the half yarn convergence angle on the yarn twist efficiency with applied ply yarn torque 98μN.m for different ply yarn tensions
Figure99 Effect of the half yarn convergence angle on the singles yarns twist with applied ply yarn torque 98μN.m for different ply yarn tensions
50
70
90
110
130
150
0 10 20 30 40 50 60 70
Half Convergence Angle (ө) (Degree)
Twis
t Effi
cien
cy %
Ply Tension = 34g
Ply Tension = 83g
Ply Torque = 98 micro N.m
0
4
8
12
16
20
0 10 20 30 40 50 60 70
Half Convergence Angle (ө) (Degree)
Sing
les
Twis
t (Tu
rns
per i
nch)
Ply Tension = 34g
Ply Tension = 83g
Li (Pl
Ply Torque = 98 micro N.m
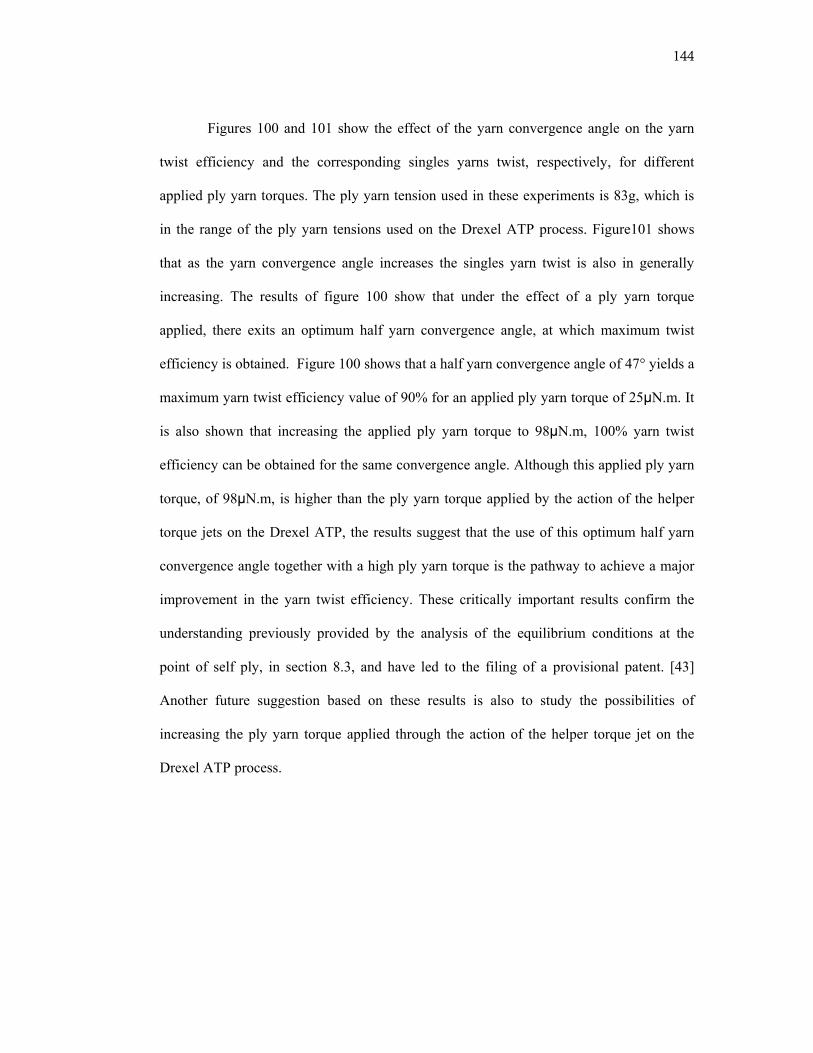
144
Figures 100 and 101 show the effect of the yarn convergence angle on the yarn
twist efficiency and the corresponding singles yarns twist, respectively, for different
applied ply yarn torques. The ply yarn tension used in these experiments is 83g, which is
in the range of the ply yarn tensions used on the Drexel ATP process. Figure101 shows
that as the yarn convergence angle increases the singles yarn twist is also in generally
increasing. The results of figure 100 show that under the effect of a ply yarn torque
applied, there exits an optimum half yarn convergence angle, at which maximum twist
efficiency is obtained. Figure 100 shows that a half yarn convergence angle of 47° yields a
maximum yarn twist efficiency value of 90% for an applied ply yarn torque of 25μN.m. It
is also shown that increasing the applied ply yarn torque to 98μN.m, 100% yarn twist
efficiency can be obtained for the same convergence angle. Although this applied ply yarn
torque, of 98μN.m, is higher than the ply yarn torque applied by the action of the helper
torque jets on the Drexel ATP, the results suggest that the use of this optimum half yarn
convergence angle together with a high ply yarn torque is the pathway to achieve a major
improvement in the yarn twist efficiency. These critically important results confirm the
understanding previously provided by the analysis of the equilibrium conditions at the
point of self ply, in section 8.3, and have led to the filing of a provisional patent. [43]
Another future suggestion based on these results is also to study the possibilities of
increasing the ply yarn torque applied through the action of the helper torque jet on the
Drexel ATP process.
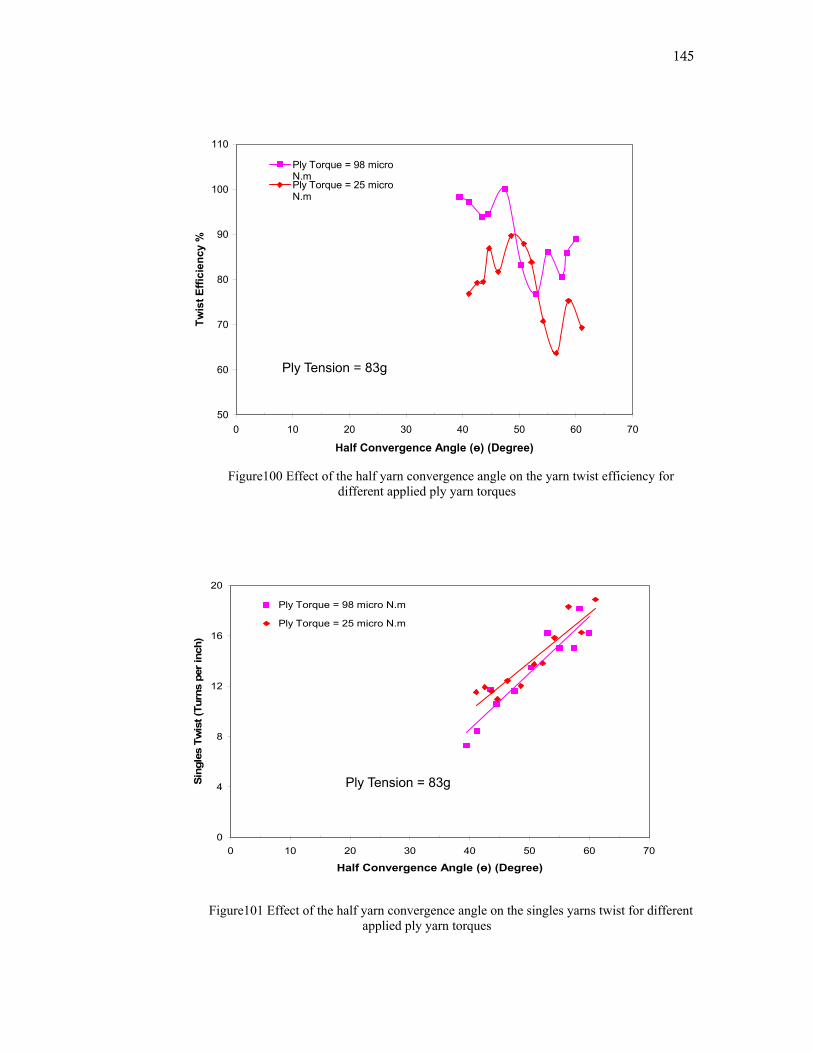
145
Figure100 Effect of the half yarn convergence angle on the yarn twist efficiency for different applied ply yarn torques
Figure101 Effect of the half yarn convergence angle on the singles yarns twist for different applied ply yarn torques
50
60
70
80
90
100
110
0 10 20 30 40 50 60 70
Half Convergence Angle (ө) (Degree)
Twis
t Effi
cien
cy %
Ply Torque = 98 microN.mPly Torque = 25 microN.m
Ply Tension = 83g
0
4
8
12
16
20
0 10 20 30 40 50 60 70
Half Convergence Angle (ө) (Degree)
Sing
les
Twis
t (Tu
rns
per i
nch)
Ply Torque = 98 micro N.m
Ply Torque = 25 micro N.m
Ply Tension = 83g
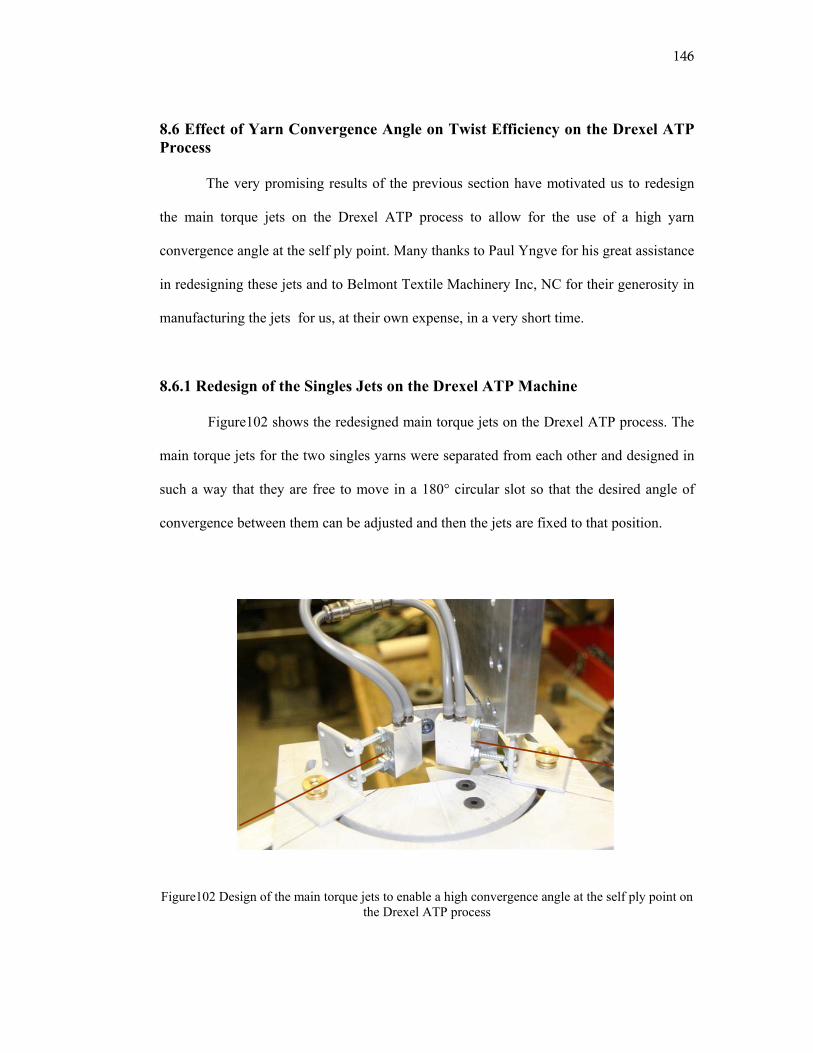
146
8.6 Effect of Yarn Convergence Angle on Twist Efficiency on the Drexel ATP Process
The very promising results of the previous section have motivated us to redesign
the main torque jets on the Drexel ATP process to allow for the use of a high yarn
convergence angle at the self ply point. Many thanks to Paul Yngve for his great assistance
in redesigning these jets and to Belmont Textile Machinery Inc, NC for their generosity in
manufacturing the jets for us, at their own expense, in a very short time.
8.6.1 Redesign of the Singles Jets on the Drexel ATP Machine
Figure102 shows the redesigned main torque jets on the Drexel ATP process. The
main torque jets for the two singles yarns were separated from each other and designed in
such a way that they are free to move in a 180° circular slot so that the desired angle of
convergence between them can be adjusted and then the jets are fixed to that position.
Figure102 Design of the main torque jets to enable a high convergence angle at the self ply point on
the Drexel ATP process
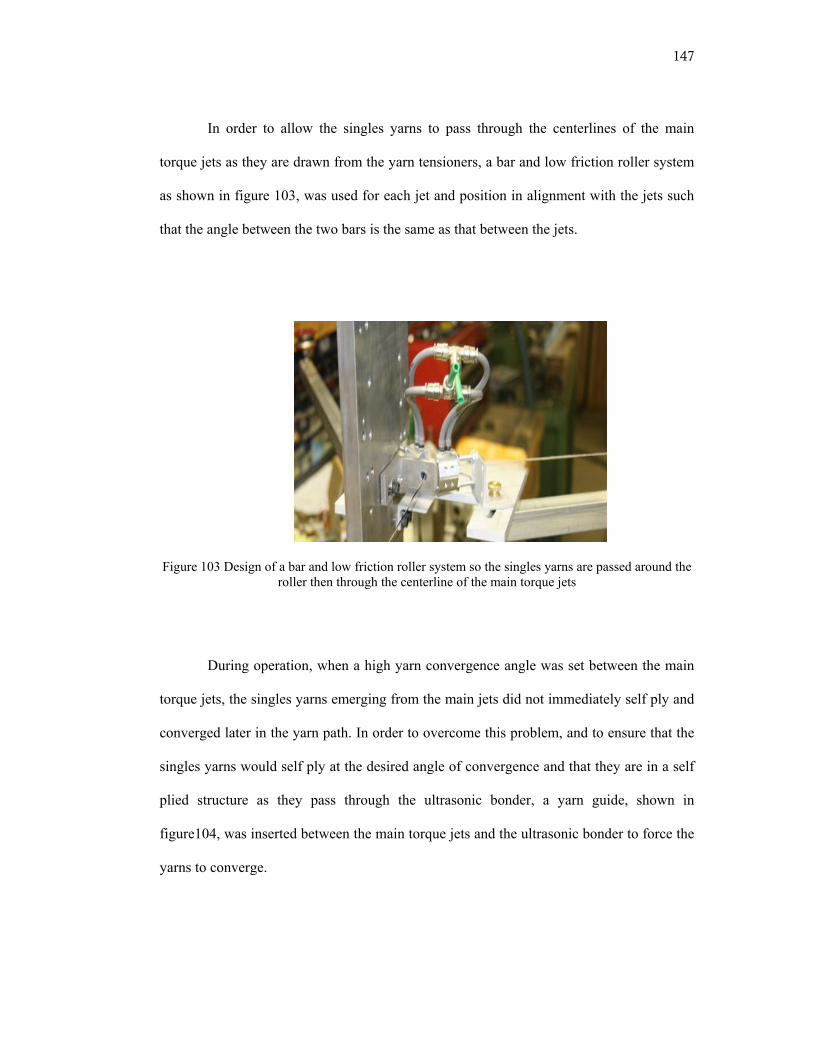
147
In order to allow the singles yarns to pass through the centerlines of the main
torque jets as they are drawn from the yarn tensioners, a bar and low friction roller system
as shown in figure 103, was used for each jet and position in alignment with the jets such
that the angle between the two bars is the same as that between the jets.
Figure 103 Design of a bar and low friction roller system so the singles yarns are passed around the roller then through the centerline of the main torque jets
During operation, when a high yarn convergence angle was set between the main
torque jets, the singles yarns emerging from the main jets did not immediately self ply and
converged later in the yarn path. In order to overcome this problem, and to ensure that the
singles yarns would self ply at the desired angle of convergence and that they are in a self
plied structure as they pass through the ultrasonic bonder, a yarn guide, shown in
figure104, was inserted between the main torque jets and the ultrasonic bonder to force the
yarns to converge.
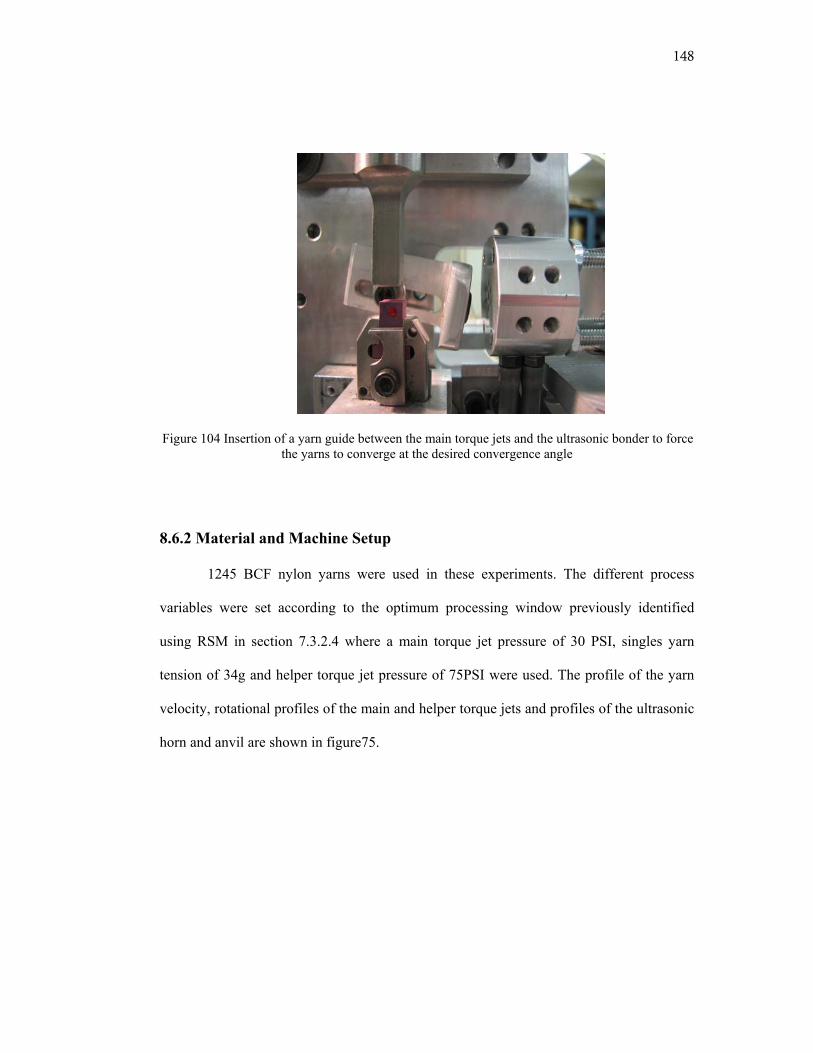
148
Figure 104 Insertion of a yarn guide between the main torque jets and the ultrasonic bonder to force the yarns to converge at the desired convergence angle
8.6.2 Material and Machine Setup
1245 BCF nylon yarns were used in these experiments. The different process
variables were set according to the optimum processing window previously identified
using RSM in section 7.3.2.4 where a main torque jet pressure of 30 PSI, singles yarn
tension of 34g and helper torque jet pressure of 75PSI were used. The profile of the yarn
velocity, rotational profiles of the main and helper torque jets and profiles of the ultrasonic
horn and anvil are shown in figure75.
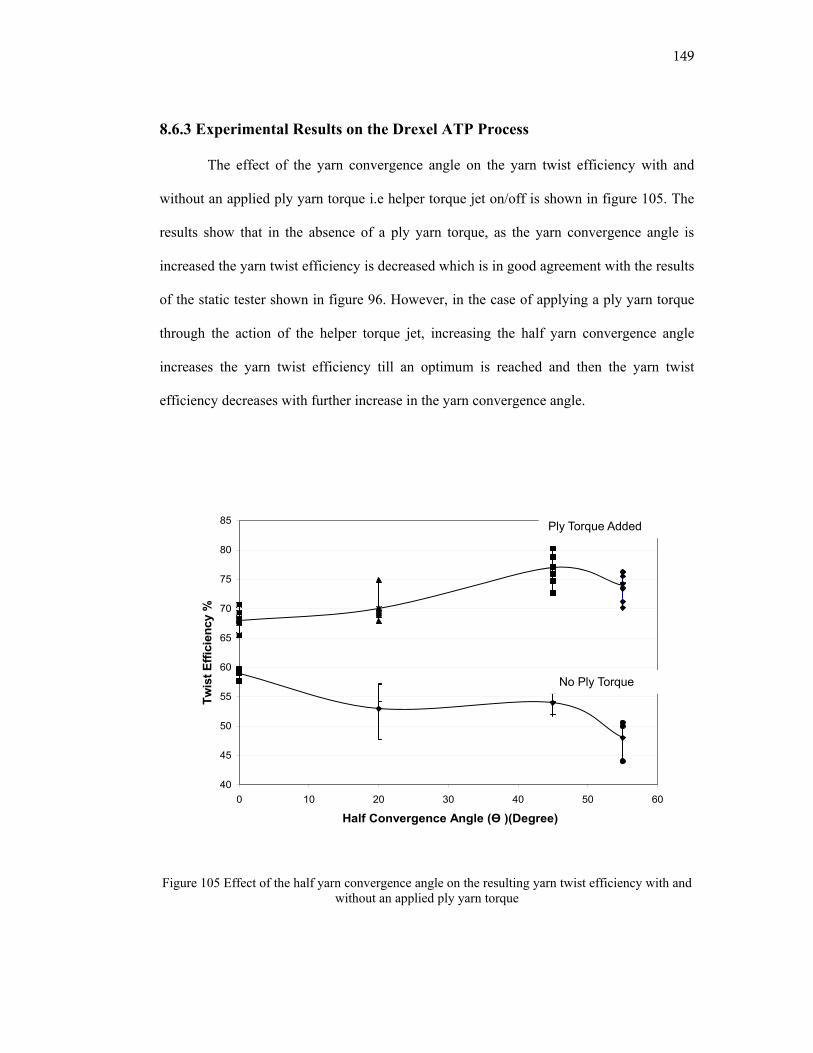
149
8.6.3 Experimental Results on the Drexel ATP Process
The effect of the yarn convergence angle on the yarn twist efficiency with and
without an applied ply yarn torque i.e helper torque jet on/off is shown in figure 105. The
results show that in the absence of a ply yarn torque, as the yarn convergence angle is
increased the yarn twist efficiency is decreased which is in good agreement with the results
of the static tester shown in figure 96. However, in the case of applying a ply yarn torque
through the action of the helper torque jet, increasing the half yarn convergence angle
increases the yarn twist efficiency till an optimum is reached and then the yarn twist
efficiency decreases with further increase in the yarn convergence angle.
Figure 105 Effect of the half yarn convergence angle on the resulting yarn twist efficiency with and
without an applied ply yarn torque
40
45
50
55
60
65
70
75
80
85
0 10 20 30 40 50 60
Half Convergence Angle (Ө )(Degree)
Twis
t Effi
cien
cy %
Ply Torque Added
No Ply Torque
150
The optimum half yarn convergence angle obtained in these results is 45° which is
in close agreement with the static tester results shown in figure 100. The maximum twist
efficiency obtained at this half convergence angle is an average 78%. This presents a 13%
increase in the yarn twist efficiency from the base case of 65%. The reason this twist
efficiency value is a little lower than the static tester results may be attributed to that a
higher ply yarn torque value was used on the static tester.
The results of this section provide an experimental confirmation and support the
hypothesis from the mathematics and basic static experiments that “TWIST EFFICIENCY
CAN BE IMPROVED BY USING BOTH A HELPER TORQUE JET AND A
RELATIVELY HIGH CONVERGENCE ANGLE”.
8.7 Discussion
In this chapter, an equilibrium analysis of the ATP process at the self ply was
presented. This analysis has taken into account the effect of applying a ply yarn torque and
using a high yarn convergence angle at the self ply point was has never been studied in any
previous work done on self plying. This equilibrium analysis has unveiled the unobserved
effects on the helper torque jet on the Drexel ATP process and provided us of a good
interpretation of the previous experimental results and RSM modeling results obtained in
chapters 6 and 7. The results have shown that the helper torque jet while serving to
increase the ply yarn twist also has a very critical hidden effect in decreasing the singles
yarns torque above the yarn convergence point. The second very important result that was
revealed by this equilibrium analysis is that the use of high yarn convergence angle at the
point of self ply would overcome the undesired effect of the helper torque jet in decreasing
the singles yarn torque and thus achieve an overall improvement in the yarn twist
151
efficiency.
The results of the equilibrium analysis were further confirmed in this chapter
through a series of experiments on the static tester. The static tester has enabled us to study
the effect of the yarn convergence angle on the yarn twist efficiency which not possible to
be done on the Drexel ATP process at the time. The static tester results were first validated
with the previous experimental and theoretical results in literature and showed close
agreement. The effect of applying a ply yarn torque using an elastic yarn torque transducer
were also validated through comparing them with the experimental results of the Drexel
ATP process. The results of the static tester have shown that the yarn convergence angle
does not show much effect on the yarn twist efficiency in the absence of a ply torque. In
the presence of an applied yarn torque, the yarn twist efficiency increases as the yarn
convergence angle is increased until an optimum angle is reached. The optimum half yarn
convergence angle obtained in case of using rubber monofilament yarns was 35° while that
in case of using BCF nylon yarns was 47°. The use of a ply yarn torque of 98μN.m at this
optimum half yarn convergence angle and a ply yarn tension of 83g has yielded a 100%
yarn twist efficiency using the BCF nylon yarns.
This chapter has also included redesigning the main torque jets on the Drexel ATP
process to allow for a high yarn convergence angle at the self ply point, based on the
previous results. Experiments done on the Drexel ATP process using the redesigned jets
have shown a 13% percent increase in the yarn twist efficiency using a half yarn
convergence angle of 45° which is very close to that determined by the static tester results.
152
CHAPTER 9: MATHEMATICAL MODELING OF THE YARN TWIST EFFICIECNY
9.1 Background and Significance
The results of the previous chapter have enabled us to improve the yarn twist
efficiency greatly on the Drexel ATP process and achieve 100% yarn twist efficiency on
the static tester. The reason for this improvement was attributed to the use of a high ply
yarn torque and an optimum yarn convergence angle at the point of self ply. The
hypothesis for the use of a high ply yarn torque and increasing the yarn convergence angle
was established from the analysis of the equilibrium forces, torques and singles yarns
geometry at the point of self ply. The value of the optimum yarn convergence angle
required for obtaining maximum twist efficiency was determined empirically from the
experimental results. Although the results of this approach were very promising, there still
remains the need of developing a mathematical expression relating the yarn twist
efficiency to the ply yarn torque, singles yarn torque and the yarn convergence angle.
The mathematical expression previously developed by RSM modeling, in
Chapter7, relating the yarn twist efficiency to the main process variables; main and helper
torque jets pressures, the singles yarn tension and yarn temperature serves as an excellent
guide to determine the optimum processing window for operation on the Drexel ATP
process. However, this empirical expression does not express the yarn twist efficiency in
terms of the applied singles and ply yarn torques to allow us to gain a better mechanistic
understanding and it does not take into account the effect of the yarn convergence angle
because the possibility of increasing the yarn convergence angle on the Drexel ATP
process was not feasible at the time.
153
The objective of this chapter is to develop a mathematical mechanistic model able
to predict the yarn twist efficiency from the main process input variables. This
mathematical model must satisfy the equilibrium conditions at the self ply point, which are
the essence of all the resulting improvement in the yarn twist efficiency. In order to further
relate the resulting yarn twist efficiency to the underlying mechanics of the ATP yarn
system, equations expressing the strain energy of the singles yarns and the strain energy of
the self ply yarn were also derived. The predicted yarn twist efficiency values of the
mathematical model are also compared against the experimental results.
9.2 Materials and Methods
Experiments were done on the static tester using rubber yarns to verify the results
of the mathematical model. The experimental procedure used is as previously described in
section 4.6.3.
9.3 Monofilament Rubber Model of the Yarn Twist Efficiency
This section provides the development of a mathematical model to predict the yarn
twist efficiency, the singles strain energy and the ply strain energy for two monofilament
rubber yarns at the self ply point.
A model for multifilament yarns was not developed due to its increased
complexity while its prediction of the yarn twist efficiency will not offer much difference
in the understanding and analysis of the results as compared to the rubber monofilament
model. The increased complexity of a multifilament model lies in the complex differential
geometry of the plied multifilament yarns due to their double helical structure, presence of
friction and filament to filament interaction during bending in the ply structure, local
154
filament torsion and curvature change with the yarn bending inside the ply in a complex
manner and change of the single yarn cross sectional shape in the ply yarn structure. [11,
41, 44, 45]
The main assumptions of this model are 1) there is no stretching in the rubber
yarns i.e. No change in the length of the rubber yarns occurs after twisting 2) The yarns
circular cross-section remains perpendicular to the yarn axis after twist is inserted 3) No
deformation of the yarn circular cross-section inside the ply yarn structure.
The list of symbols and their definition used in this section is provided in
Appendix I.
9.3.1 Singles Yarn Torque
The torque generated in the singles yarn above the yarn convergence point is in major due
to twist inserted in the yarns that is the main driving force of the self plying process. Since
the tensions accompanying the self plying process are small, the singles torque generated
due to tension is assumed negligible. Thus the singles yarns torque in the direction of the
yarns axis [46] is equal
SPs GI φτ = (9.1)
Where a good approximation of the shear modulus [45] is taken to be
3~ EG (9.2)
And relating singles yarn helix angle (ΦS ) to the singles yarn twist (tS ) through
the following equation derived by Treloar [41]
sS tπφ 2= (9.3)
155
And the polar moment of inertia (IP)
32
4s
Pd
Iπ
= (9.4)
Thus substituting equations (9.2), (9.3) and (9.4) into equation (9.1), the singles yarns
torque (τS) can be expressed in terms of the singles yarn twist (tS ) as
sss tEd 42
48πτ = (9.5)
For reasons of simplification, all the derived equations are converted into a dimensionless
form. A list of the dimensionless variables and their definitions is provided in Appendix J.
Equation (9.6) shows the expression for the dimensionless singles yarn torque.
( )ss tE ˆ48
ˆˆ
2πτ = (9.6)
9.3.2 Equations of Equilibrium at the Self Ply Point
The equilibrium equations at the point of self ply (8.1) and (8.2) are expressed in
terms of the singles yarn tension (TS) and singles yarns torque (τS), and converted into a
dimensionless form to yield
θcos21ˆ =sT (9.7)
θτθ
τcos2
ˆsinˆˆ ps
s
T −= (9.8)
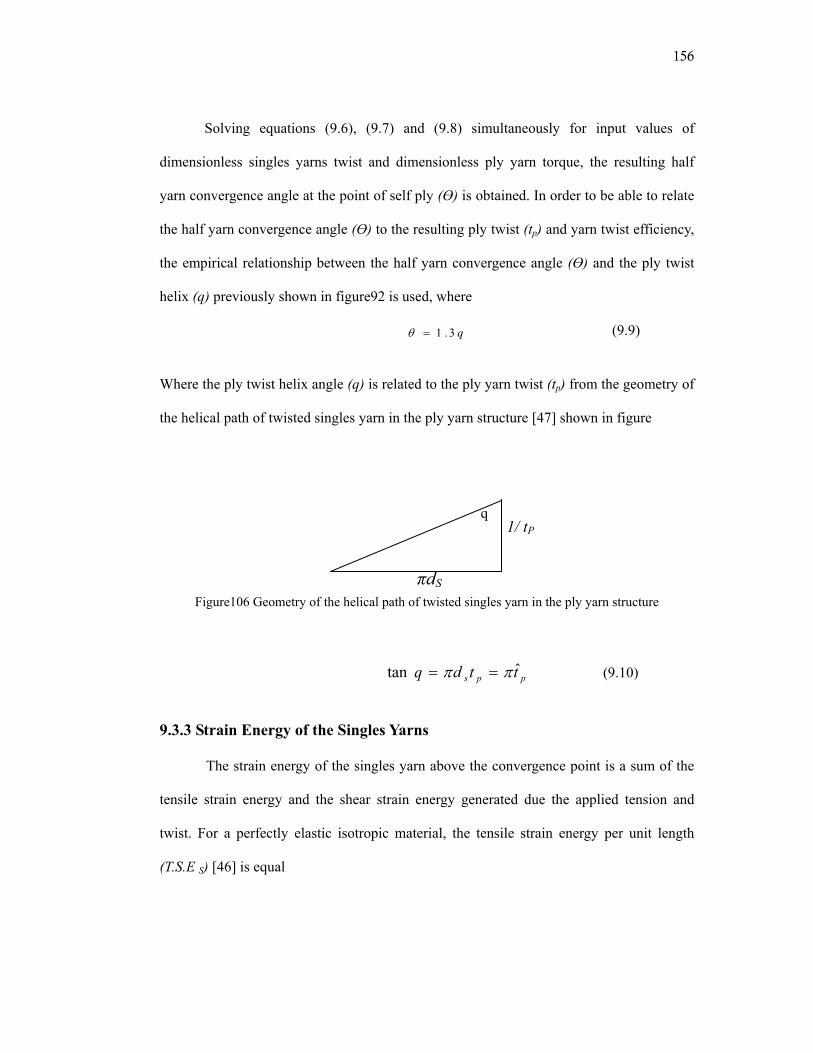
156
Solving equations (9.6), (9.7) and (9.8) simultaneously for input values of
dimensionless singles yarns twist and dimensionless ply yarn torque, the resulting half
yarn convergence angle at the point of self ply (Ө) is obtained. In order to be able to relate
the half yarn convergence angle (Ө) to the resulting ply twist (tp) and yarn twist efficiency,
the empirical relationship between the half yarn convergence angle (Ө) and the ply twist
helix (q) previously shown in figure92 is used, where
q3.1=θ (9.9)
Where the ply twist helix angle (q) is related to the ply yarn twist (tp) from the geometry of
the helical path of twisted singles yarn in the ply yarn structure [47] shown in figure
Figure106 Geometry of the helical path of twisted singles yarn in the ply yarn structure
pps ttdq ˆtan ππ == (9.10)
9.3.3 Strain Energy of the Singles Yarns
The strain energy of the singles yarn above the convergence point is a sum of the
tensile strain energy and the shear strain energy generated due the applied tension and
twist. For a perfectly elastic isotropic material, the tensile strain energy per unit length
(T.S.E S) [46] is equal
q 1/ tP
πdS
157
2
21.. εEAEST S = (9.11)
And expressing the values of the singles yarn tensile strain (є) and singles yarn cross
sectional area (A) in the following equations (9.12) and (9.13) respectively
EATs=ε (9.12)
2
4 sdA π= (9.13)
Substituting equations (9.12) and (9.13) into (9.11), the tensile strain energy per unit length
per single yarn (T.S.E S) is
EdTEST
s
SS 2
22..π
= (9.14)
Thus the expression of the tensile strain energy per unit length for two singles yarn
(T.S.E S) is
EdTEST
s
SS 2
24..π
= (9.15)
And in dimensionless form
( )2ˆˆ
4.ˆ. sS TE
ESTπ
= (9.16)
Similarly, the shear strain energy per unit length (S.S.E S) for a twisted rod [46] is
P
SS GI
ESS2
21..
τ= (9.17)

158
Substituting equations (9.2) and (9.4) for the shear modulus (G) and the polar moment of
inertia (IP) respectively in equation (9.17), we obtain the following expression for the shear
strain energy per unit length for two singles yarns
EdESS
s
SS 4
296..π
τ= (9.18)
Converting equation (9.18) into dimensionless form, we obtain
( )2ˆˆ96.ˆ. sS E
ESS τπ
= (9.19)
Thus the total singles strain energy per unit length for the two singles yarns (US) above the
yarn convergence point expressed as the sum of the tensile and shear strain energies in a
dimensionless form, shown in equations (9.16) and (9.19), is given as
( )22 ˆ24ˆˆ
4ˆssS T
EU τ
π+= (9.20)
Substituting for the values of the dimensionless singles tension and torque obtained from
solving equations (9.6), (9.7) and (9.8) simultaneously, the strain energy of the singles
yarns above the yarn convergence point is determined.
9.3.4 Strain Energy of the Ply Yarn
The strain energy in the self ply yarn below the convergence point is a sum of the
tensile strain energy due to the applied ply yarn tension, shear strain energy due to the ply

159
yarn twist and the bending strain energy due to the curvature of the singles yarns inside the
ply yarn structure upon twisting.
From equations (9.11) and (9.12), the tensile strain energy of a singles yarn per
unit length of the singles yarn as it lies inside the ply yarn can be expressed as
EATEST S
s
2
21.. = (9.21)
And since the self ply yarn consists of two singles yarn, then the tensile strain
energy of a self ply yarn per unit length of the singles yarn is
EATEST S
p
2
.. = (9.22)
Thus the tensile strain energy of a self ply yarn per unit length of the ply (T.S.E p) could be
expressed as
ξEATEST S
p
2
.. = (9.23)
Where (ξ) presents the decrease in the resulting ply yarn length with respect to the length
of the singles yarns used to produce the ply yarn and can be expressed as
s
p
SS
δδ
ξ = (9.24)
Since the length of the resulting ply yarn is smaller than length of the singles yarns
used to produce it, owing to the fact that the singles yarns follow a straight path above the
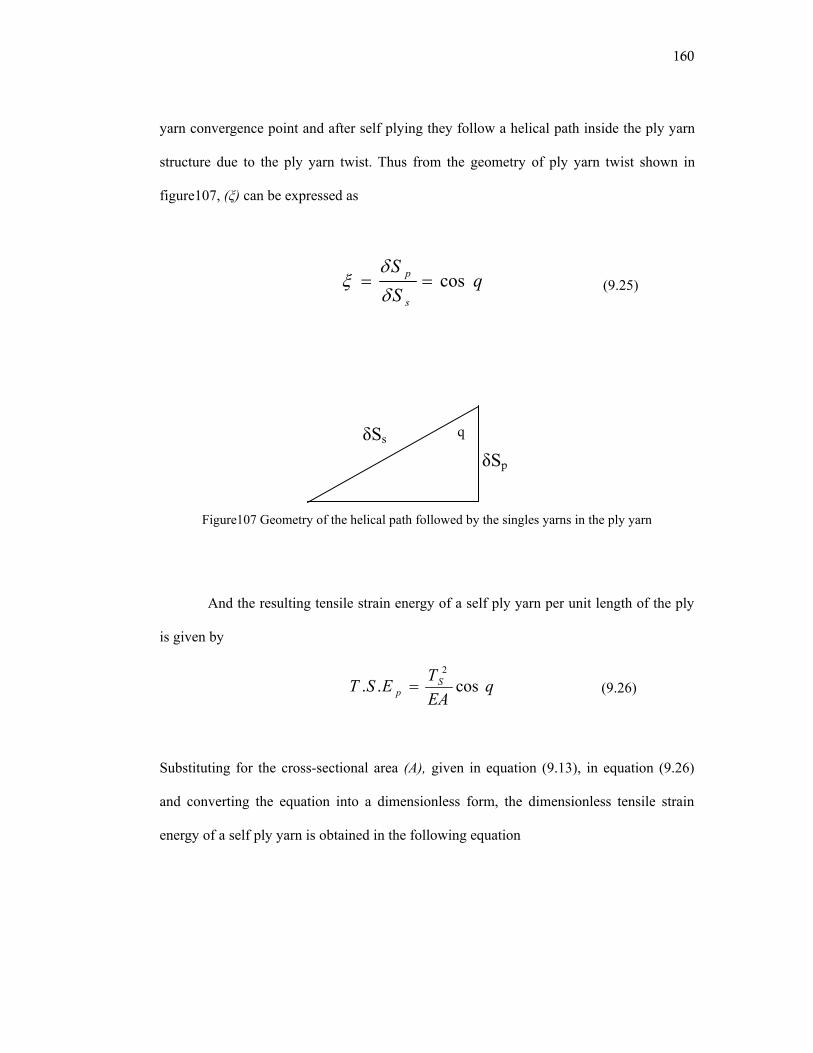
160
yarn convergence point and after self plying they follow a helical path inside the ply yarn
structure due to the ply yarn twist. Thus from the geometry of ply yarn twist shown in
figure107, (ξ) can be expressed as
qSS
s
p cos==δδ
ξ (9.25)
Figure107 Geometry of the helical path followed by the singles yarns in the ply yarn
And the resulting tensile strain energy of a self ply yarn per unit length of the ply
is given by
qEATEST S
p cos..2
= (9.26)
Substituting for the cross-sectional area (A), given in equation (9.13), in equation (9.26)
and converting the equation into a dimensionless form, the dimensionless tensile strain
energy of a self ply yarn is obtained in the following equation
q
δSp
δSs
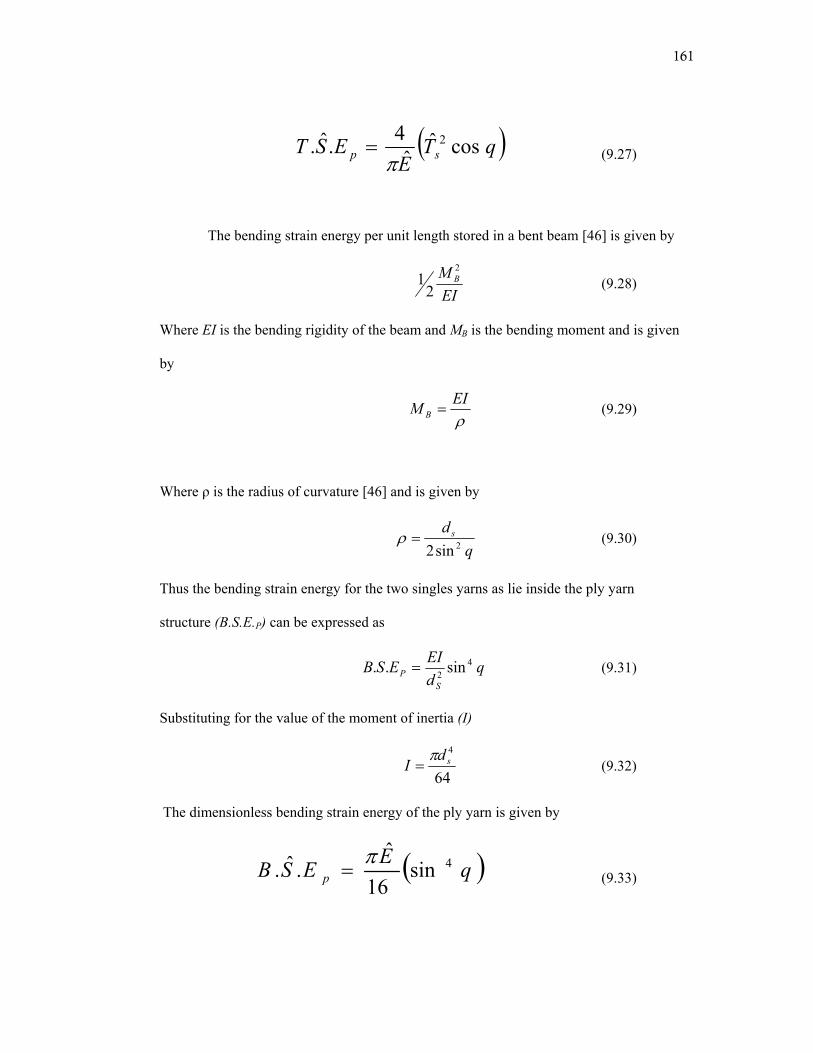
161
( )qTE
EST sp cosˆˆ
4.ˆ. 2
π= (9.27)
The bending strain energy per unit length stored in a bent beam [46] is given by
EIM B
2
21 (9.28)
Where EI is the bending rigidity of the beam and MB is the bending moment and is given
by
ρEIM B = (9.29)
Where ρ is the radius of curvature [46] and is given by
qd s
2sin2=ρ (9.30)
Thus the bending strain energy for the two singles yarns as lie inside the ply yarn
structure (B.S.E.P) can be expressed as
qdEIESB
SP
42 sin.. = (9.31)
Substituting for the value of the moment of inertia (I)
64
4sd
Iπ
= (9.32)
The dimensionless bending strain energy of the ply yarn is given by
( )qEESB p4sin
16
ˆ.ˆ. π
= (9.33)
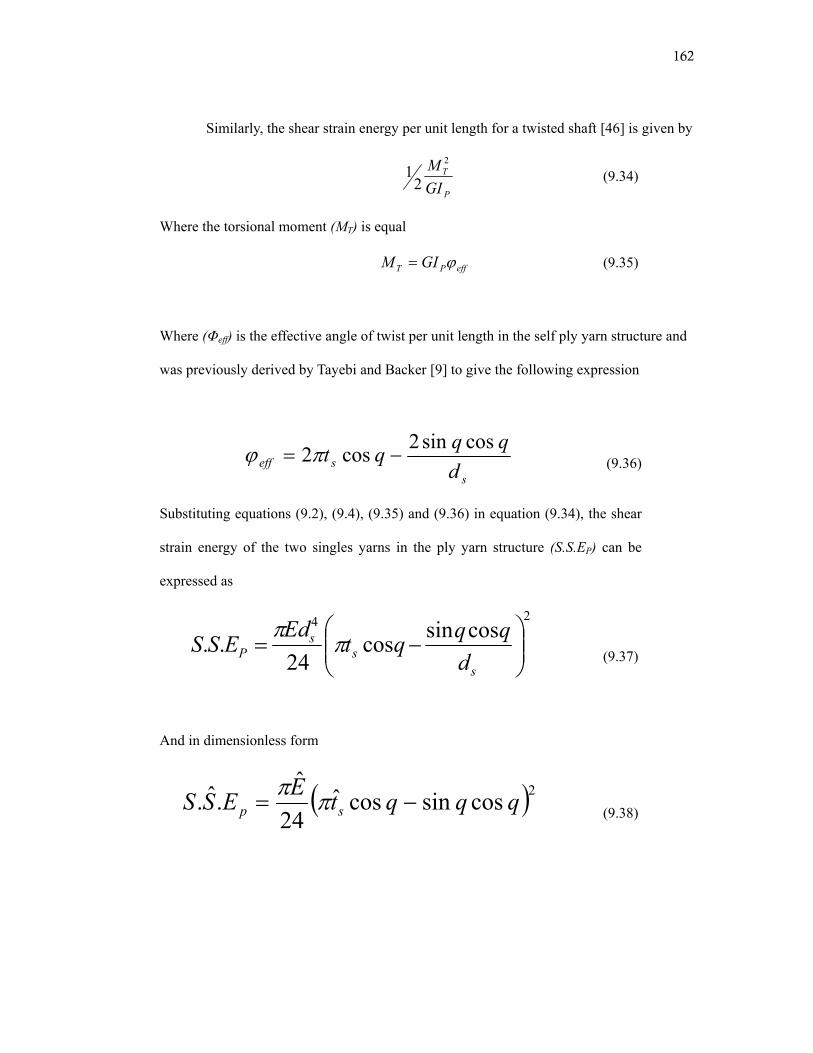
162
Similarly, the shear strain energy per unit length for a twisted shaft [46] is given by
P
T
GIM 2
21 (9.34)
Where the torsional moment (MT) is equal
effPT GIM ϕ= (9.35)
Where (Φeff) is the effective angle of twist per unit length in the self ply yarn structure and
was previously derived by Tayebi and Backer [9] to give the following expression
sseff d
qqqt cossin2cos2 −= πϕ (9.36)
Substituting equations (9.2), (9.4), (9.35) and (9.36) in equation (9.34), the shear
strain energy of the two singles yarns in the ply yarn structure (S.S.EP) can be
expressed as
24 cossincos24
.. ⎟⎟⎠
⎞⎜⎜⎝
⎛−=
ss
sP d
qqqtEd
ESS ππ
(9.37)
And in dimensionless form
( )2cossincosˆ24
ˆ.ˆ. qqqtEESS sp −= ππ
(9.38)
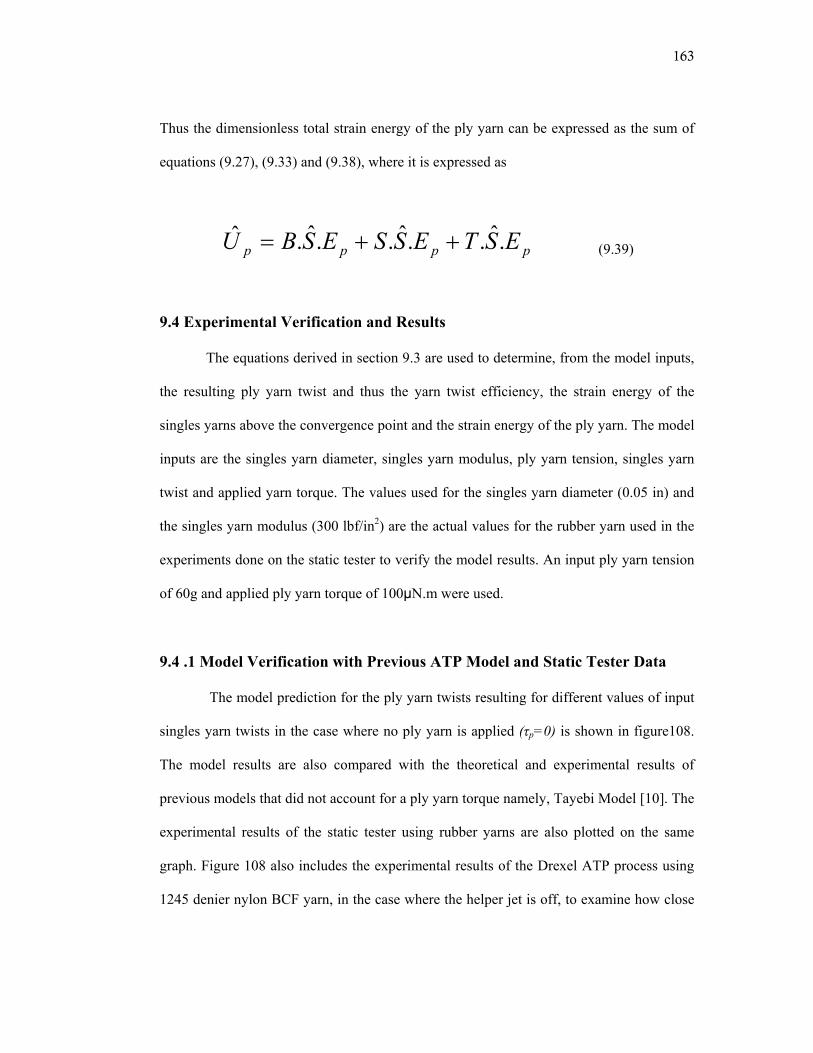
163
Thus the dimensionless total strain energy of the ply yarn can be expressed as the sum of
equations (9.27), (9.33) and (9.38), where it is expressed as
pppp ESTESSESBU .ˆ..ˆ..ˆ.ˆ ++= (9.39)
9.4 Experimental Verification and Results
The equations derived in section 9.3 are used to determine, from the model inputs,
the resulting ply yarn twist and thus the yarn twist efficiency, the strain energy of the
singles yarns above the convergence point and the strain energy of the ply yarn. The model
inputs are the singles yarn diameter, singles yarn modulus, ply yarn tension, singles yarn
twist and applied yarn torque. The values used for the singles yarn diameter (0.05 in) and
the singles yarn modulus (300 lbf/in2) are the actual values for the rubber yarn used in the
experiments done on the static tester to verify the model results. An input ply yarn tension
of 60g and applied ply yarn torque of 100μN.m were used.
9.4 .1 Model Verification with Previous ATP Model and Static Tester Data
The model prediction for the ply yarn twists resulting for different values of input
singles yarn twists in the case where no ply yarn is applied (τp=0) is shown in figure108.
The model results are also compared with the theoretical and experimental results of
previous models that did not account for a ply yarn torque namely, Tayebi Model [10]. The
experimental results of the static tester using rubber yarns are also plotted on the same
graph. Figure 108 also includes the experimental results of the Drexel ATP process using
1245 denier nylon BCF yarn, in the case where the helper jet is off, to examine how close
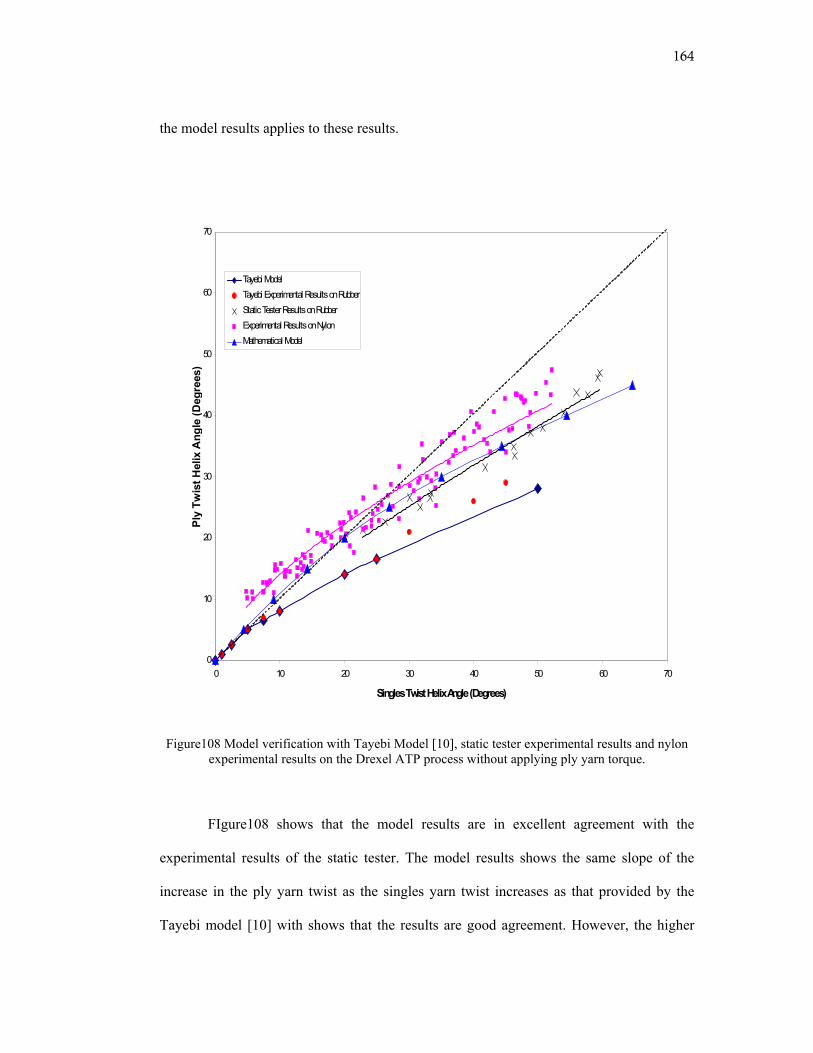
164
the model results applies to these results.
Figure108 Model verification with Tayebi Model [10], static tester experimental results and nylon
experimental results on the Drexel ATP process without applying ply yarn torque.
FIgure108 shows that the model results are in excellent agreement with the
experimental results of the static tester. The model results shows the same slope of the
increase in the ply yarn twist as the singles yarn twist increases as that provided by the
Tayebi model [10] with shows that the results are good agreement. However, the higher
0
10
20
30
40
50
60
70
0 10 20 30 40 50 60 70
Singles Twist Helix Angle (Degrees)
Ply
Twis
t Hel
ix A
ngle
(Deg
rees
)
Tayebi ModelTayebi Experimental Results on RubberStatic Tester Results on RubberExperimental Results on NylonMathematical Model
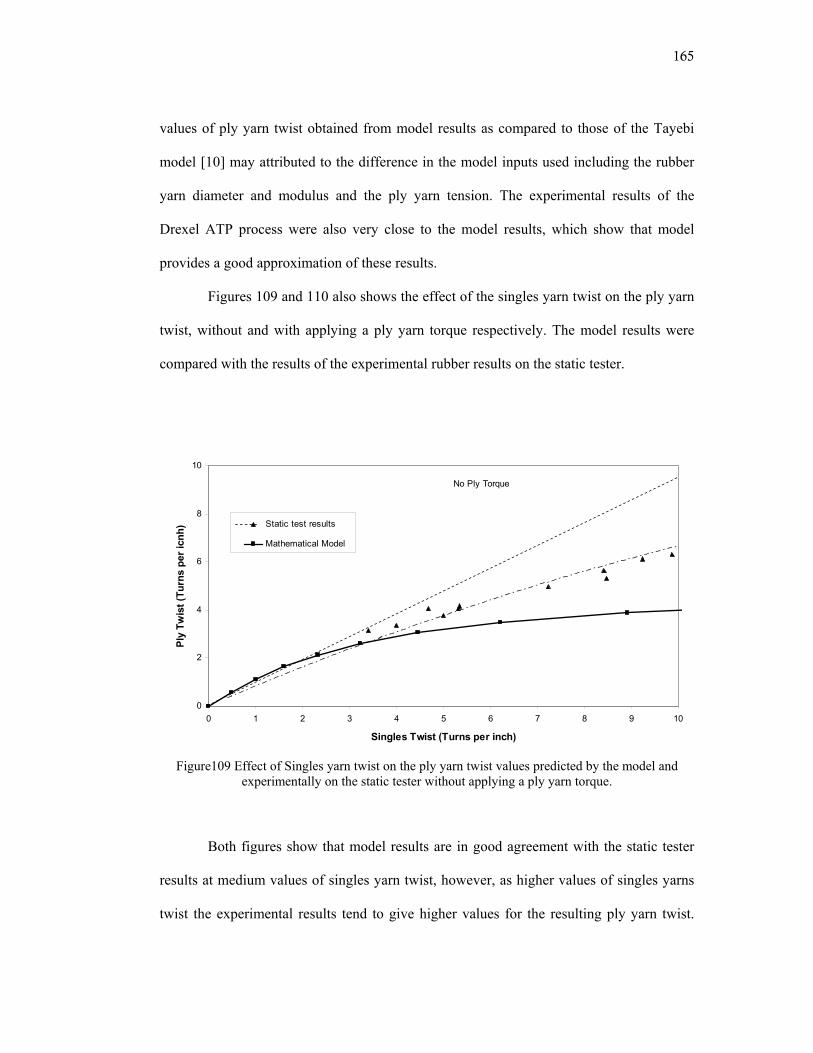
165
values of ply yarn twist obtained from model results as compared to those of the Tayebi
model [10] may attributed to the difference in the model inputs used including the rubber
yarn diameter and modulus and the ply yarn tension. The experimental results of the
Drexel ATP process were also very close to the model results, which show that model
provides a good approximation of these results.
Figures 109 and 110 also shows the effect of the singles yarn twist on the ply yarn
twist, without and with applying a ply yarn torque respectively. The model results were
compared with the results of the experimental rubber results on the static tester.
0
2
4
6
8
10
0 1 2 3 4 5 6 7 8 9 10
Singles Twist (Turns per inch)
Ply
Twis
t (Tu
rns
per i
cnh)
Static test results
Mathematical Model
No Ply Torque
Figure109 Effect of Singles yarn twist on the ply yarn twist values predicted by the model and
experimentally on the static tester without applying a ply yarn torque.
Both figures show that model results are in good agreement with the static tester
results at medium values of singles yarn twist, however, as higher values of singles yarns
twist the experimental results tend to give higher values for the resulting ply yarn twist.
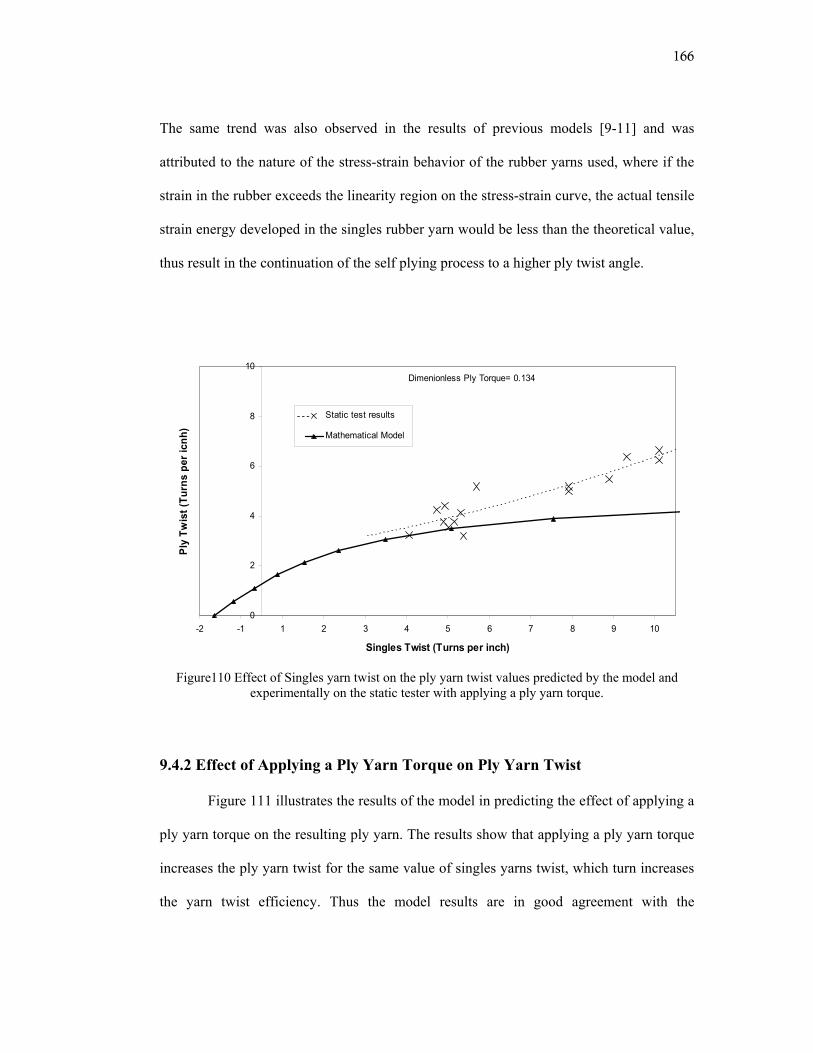
166
The same trend was also observed in the results of previous models [9-11] and was
attributed to the nature of the stress-strain behavior of the rubber yarns used, where if the
strain in the rubber exceeds the linearity region on the stress-strain curve, the actual tensile
strain energy developed in the singles rubber yarn would be less than the theoretical value,
thus result in the continuation of the self plying process to a higher ply twist angle.
0
2
4
6
8
10
-2 -1 1 2 3 4 5 6 7 8 9 10
Singles Twist (Turns per inch)
Ply
Twis
t (Tu
rns
per i
cnh)
Static test results
Mathematical Model
Dimenionless Ply Torque= 0.134
Figure110 Effect of Singles yarn twist on the ply yarn twist values predicted by the model and
experimentally on the static tester with applying a ply yarn torque.
9.4.2 Effect of Applying a Ply Yarn Torque on Ply Yarn Twist
Figure 111 illustrates the results of the model in predicting the effect of applying a
ply yarn torque on the resulting ply yarn. The results show that applying a ply yarn torque
increases the ply yarn twist for the same value of singles yarns twist, which turn increases
the yarn twist efficiency. Thus the model results are in good agreement with the
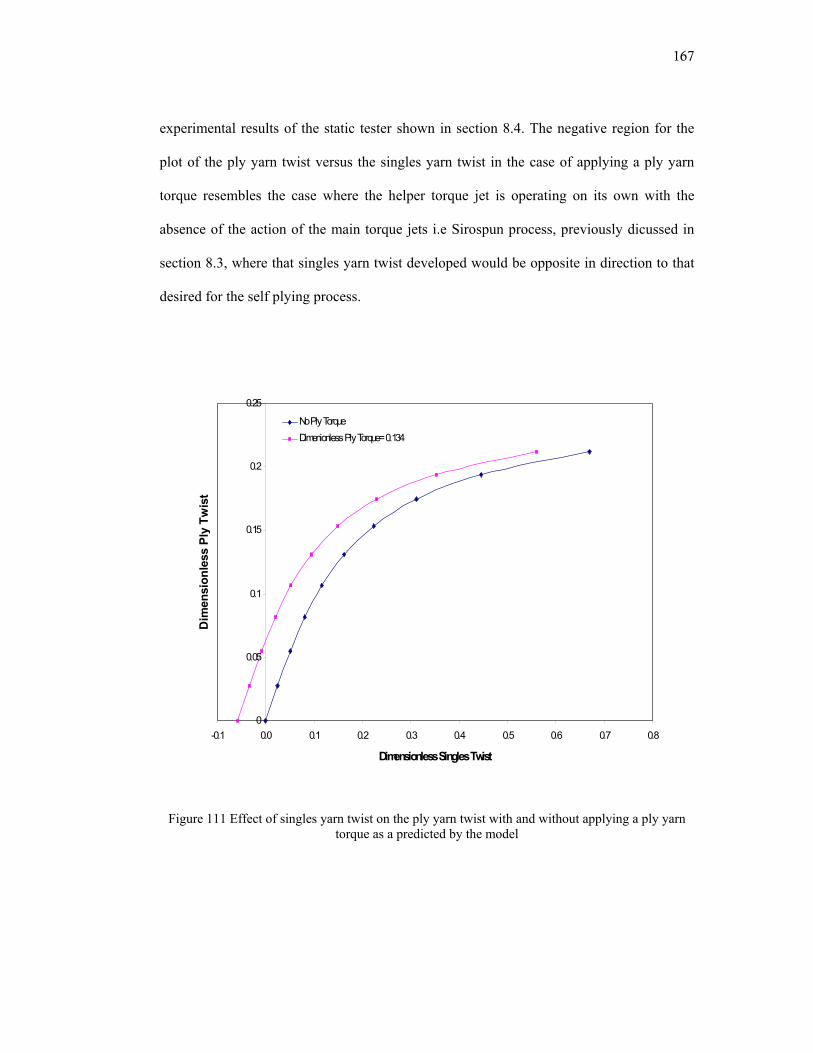
167
experimental results of the static tester shown in section 8.4. The negative region for the
plot of the ply yarn twist versus the singles yarn twist in the case of applying a ply yarn
torque resembles the case where the helper torque jet is operating on its own with the
absence of the action of the main torque jets i.e Sirospun process, previously dicussed in
section 8.3, where that singles yarn twist developed would be opposite in direction to that
desired for the self plying process.
Figure 111 Effect of singles yarn twist on the ply yarn twist with and without applying a ply yarn torque as a predicted by the model
0
0.05
0.1
0.15
0.2
0.25
-0.1 0.0 0.1 0.2 0.3 0.4 0.5 0.6 0.7 0.8
Dimensionless Singles Twist
Dim
ensi
onle
ss P
ly T
wis
t
No Ply TorqueDimenionless Ply Torque= 0.134
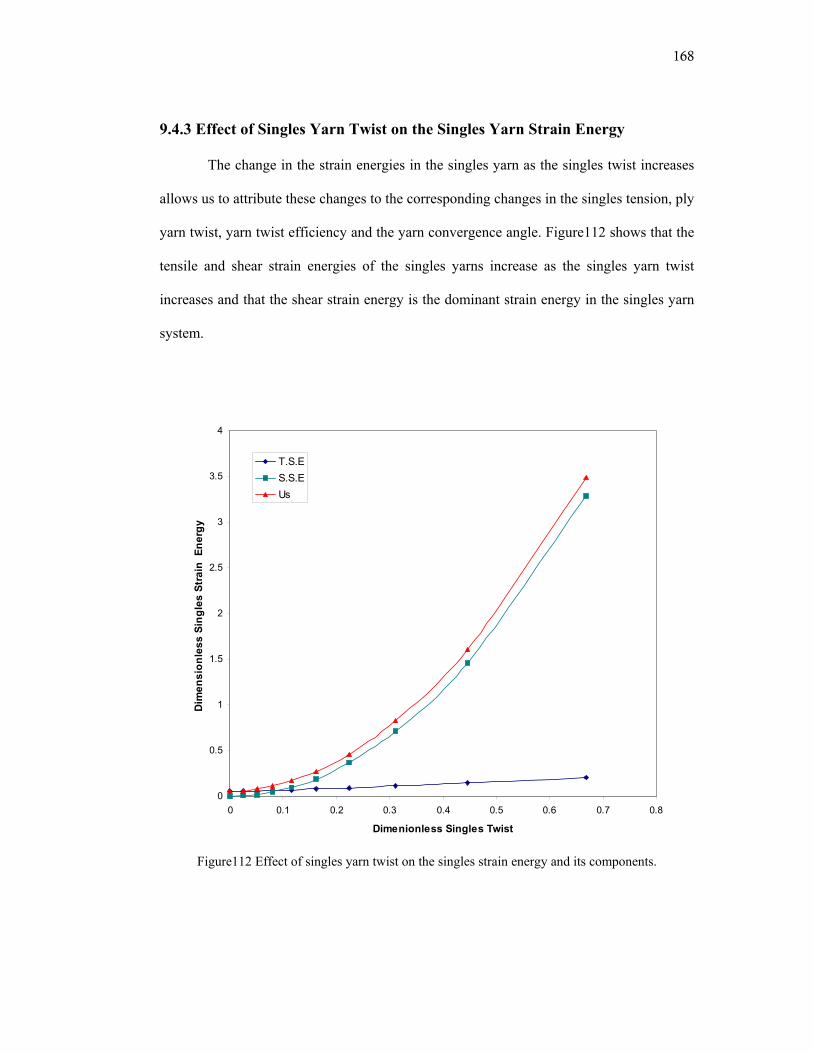
168
9.4.3 Effect of Singles Yarn Twist on the Singles Yarn Strain Energy
The change in the strain energies in the singles yarn as the singles twist increases
allows us to attribute these changes to the corresponding changes in the singles tension, ply
yarn twist, yarn twist efficiency and the yarn convergence angle. Figure112 shows that the
tensile and shear strain energies of the singles yarns increase as the singles yarn twist
increases and that the shear strain energy is the dominant strain energy in the singles yarn
system.
Figure112 Effect of singles yarn twist on the singles strain energy and its components.
0
0.5
1
1.5
2
2.5
3
3.5
4
0 0.1 0.2 0.3 0.4 0.5 0.6 0.7 0.8
Dimenionless Singles Twist
Dim
ensi
onle
ss S
ingl
es S
trai
n E
nerg
y
T.S.ES.S.EUs
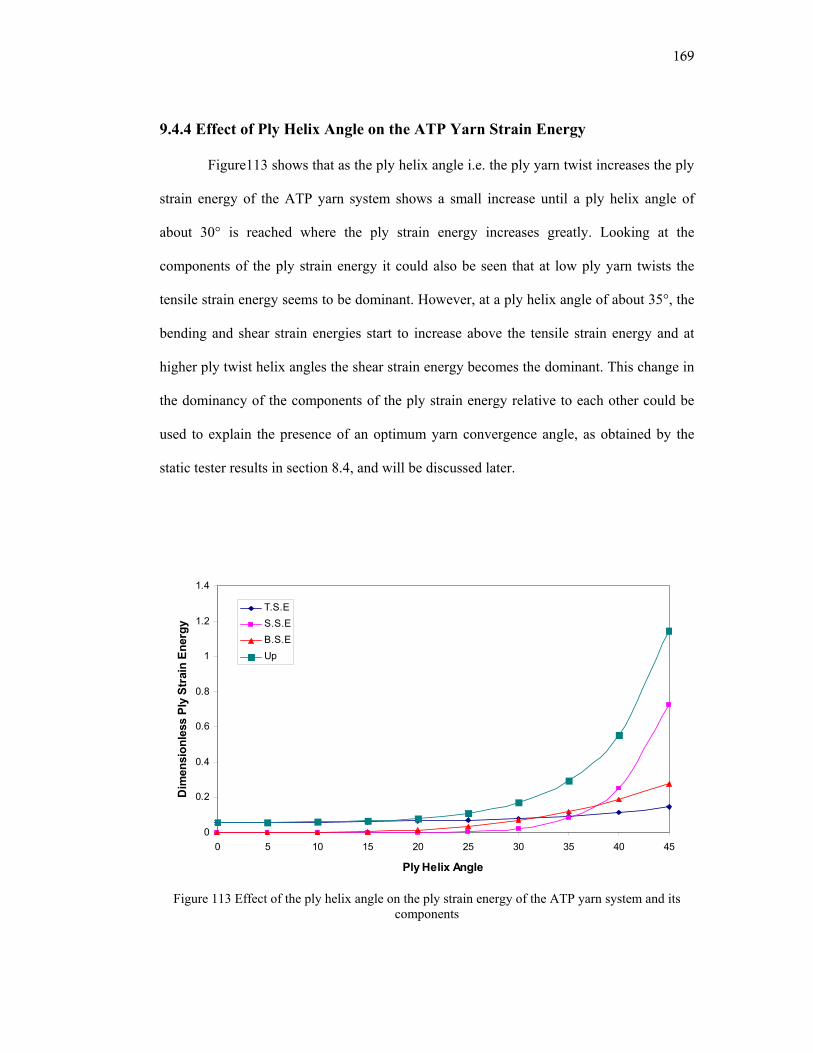
169
9.4.4 Effect of Ply Helix Angle on the ATP Yarn Strain Energy
Figure113 shows that as the ply helix angle i.e. the ply yarn twist increases the ply
strain energy of the ATP yarn system shows a small increase until a ply helix angle of
about 30° is reached where the ply strain energy increases greatly. Looking at the
components of the ply strain energy it could also be seen that at low ply yarn twists the
tensile strain energy seems to be dominant. However, at a ply helix angle of about 35°, the
bending and shear strain energies start to increase above the tensile strain energy and at
higher ply twist helix angles the shear strain energy becomes the dominant. This change in
the dominancy of the components of the ply strain energy relative to each other could be
used to explain the presence of an optimum yarn convergence angle, as obtained by the
static tester results in section 8.4, and will be discussed later.
0
0.2
0.4
0.6
0.8
1
1.2
1.4
0 5 10 15 20 25 30 35 40 45
Ply Helix Angle
Dim
ensi
onle
ss P
ly S
trai
n En
ergy
T.S.ES.S.EB.S.EUp
Figure 113 Effect of the ply helix angle on the ply strain energy of the ATP yarn system and its
components
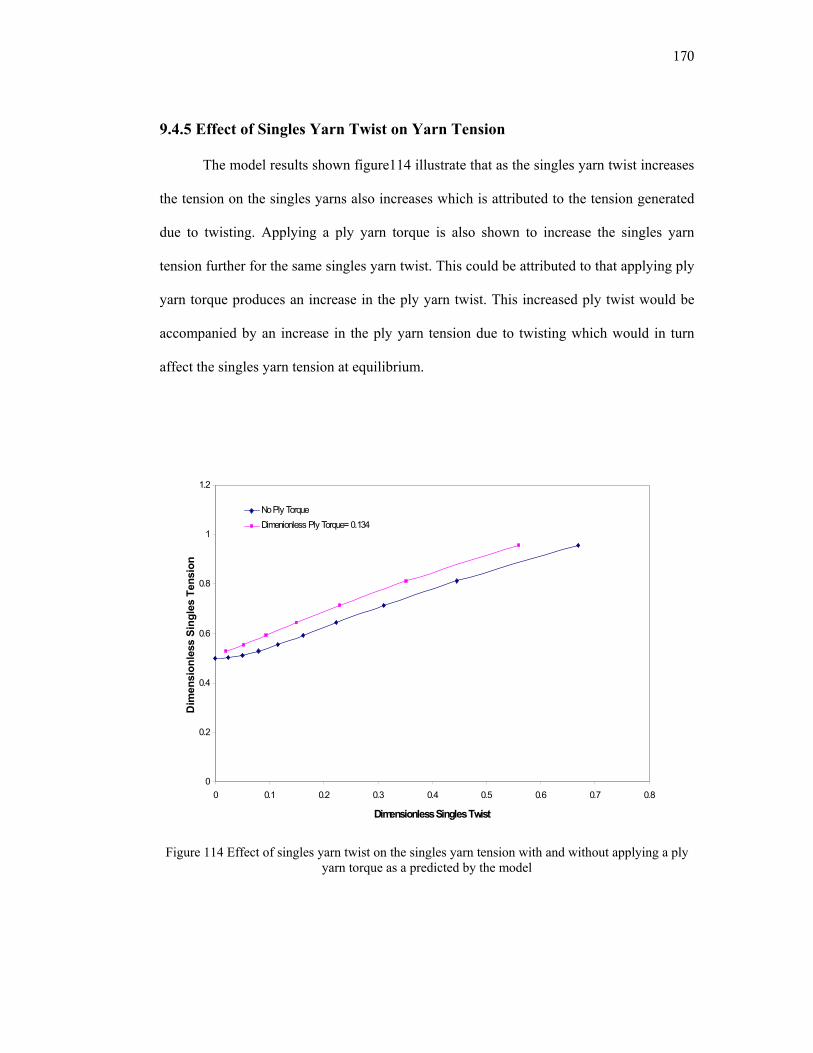
170
9.4.5 Effect of Singles Yarn Twist on Yarn Tension
The model results shown figure114 illustrate that as the singles yarn twist increases
the tension on the singles yarns also increases which is attributed to the tension generated
due to twisting. Applying a ply yarn torque is also shown to increase the singles yarn
tension further for the same singles yarn twist. This could be attributed to that applying ply
yarn torque produces an increase in the ply yarn twist. This increased ply twist would be
accompanied by an increase in the ply yarn tension due to twisting which would in turn
affect the singles yarn tension at equilibrium.
Figure 114 Effect of singles yarn twist on the singles yarn tension with and without applying a ply
yarn torque as a predicted by the model
0
0.2
0.4
0.6
0.8
1
1.2
0 0.1 0.2 0.3 0.4 0.5 0.6 0.7 0.8
Dimensionless Singles Twist
Dim
ensi
onle
ss S
ingl
es T
ensi
on
No Ply TorqueDimenionless Ply Torque= 0.134
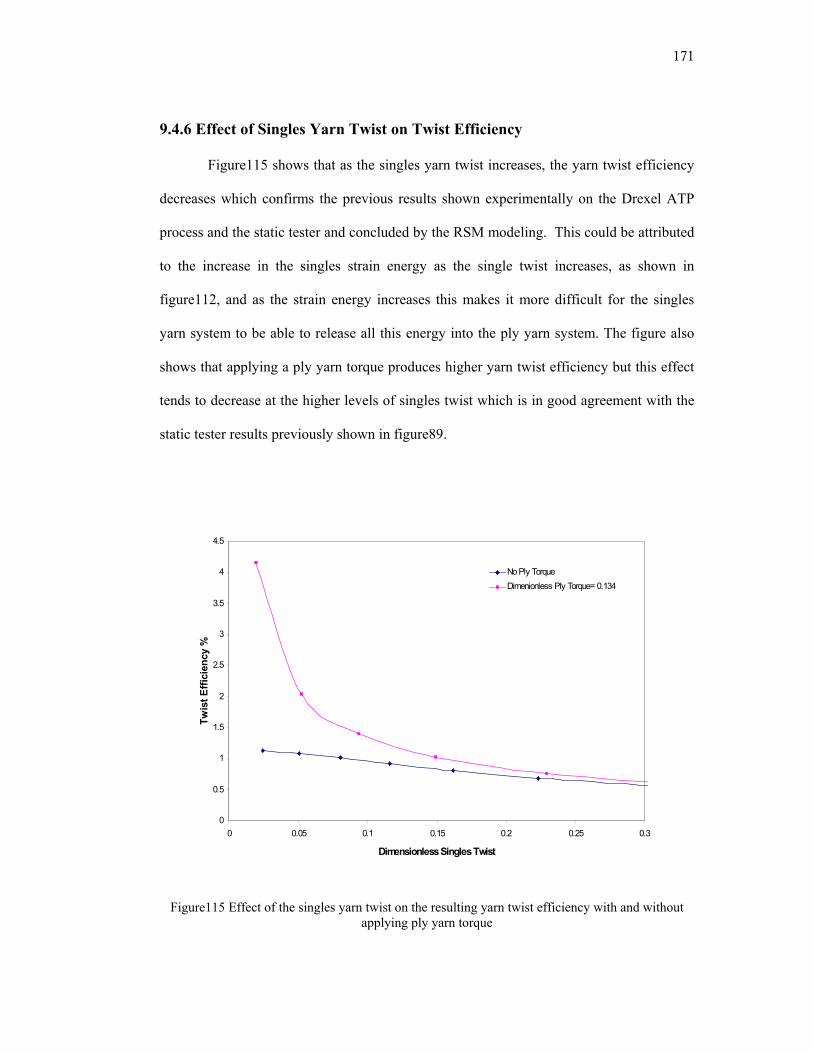
171
9.4.6 Effect of Singles Yarn Twist on Twist Efficiency
Figure115 shows that as the singles yarn twist increases, the yarn twist efficiency
decreases which confirms the previous results shown experimentally on the Drexel ATP
process and the static tester and concluded by the RSM modeling. This could be attributed
to the increase in the singles strain energy as the single twist increases, as shown in
figure112, and as the strain energy increases this makes it more difficult for the singles
yarn system to be able to release all this energy into the ply yarn system. The figure also
shows that applying a ply yarn torque produces higher yarn twist efficiency but this effect
tends to decrease at the higher levels of singles twist which is in good agreement with the
static tester results previously shown in figure89.
Figure115 Effect of the singles yarn twist on the resulting yarn twist efficiency with and without applying ply yarn torque
0
0.5
1
1.5
2
2.5
3
3.5
4
4.5
0 0.05 0.1 0.15 0.2 0.25 0.3
Dimensionless Singles Twist
Twis
t Effi
cien
cy %
No Ply TorqueDimenionless Ply Torque= 0.134
172
9.4.7 Effect of Yarn Convergence Angle on Twist Efficiency
Figure116 shows the effect of increasing the half yarn convergence angle together
with increasing the applied ply yarn torque on the resulting yarn twist efficiency. The
results confirms the previous experimental results of the static tester, shown in section 8.4,
that the combined effect of using a high yarn convergence together with increasing the
applied ply yarn torque produces a large improvement in the yarn twist efficiency.
However, the model results did not show an optimum half yarn convergence angle after
which the yarn twist efficiency decreases. This is probably because of the numerical limits
of the model, where the maximum ply yarn helix angle that can be reached is about 35°
after which the model fails numerically. According to equation (9.9), which relates the half
yarn convergence angle to the ply helix angle, a ply helix angle of 35° would yield a half
yarn convergence angle of 46° which is about the same optimum half convergence angle
obtained from the experimental results of both the static tester and the Drexel ATP process
in Chapter8. This could explain why, using the model, the twist efficiency continued to
increase with increasing the convergence angle till this half yarn convergence angle limit
was reached.
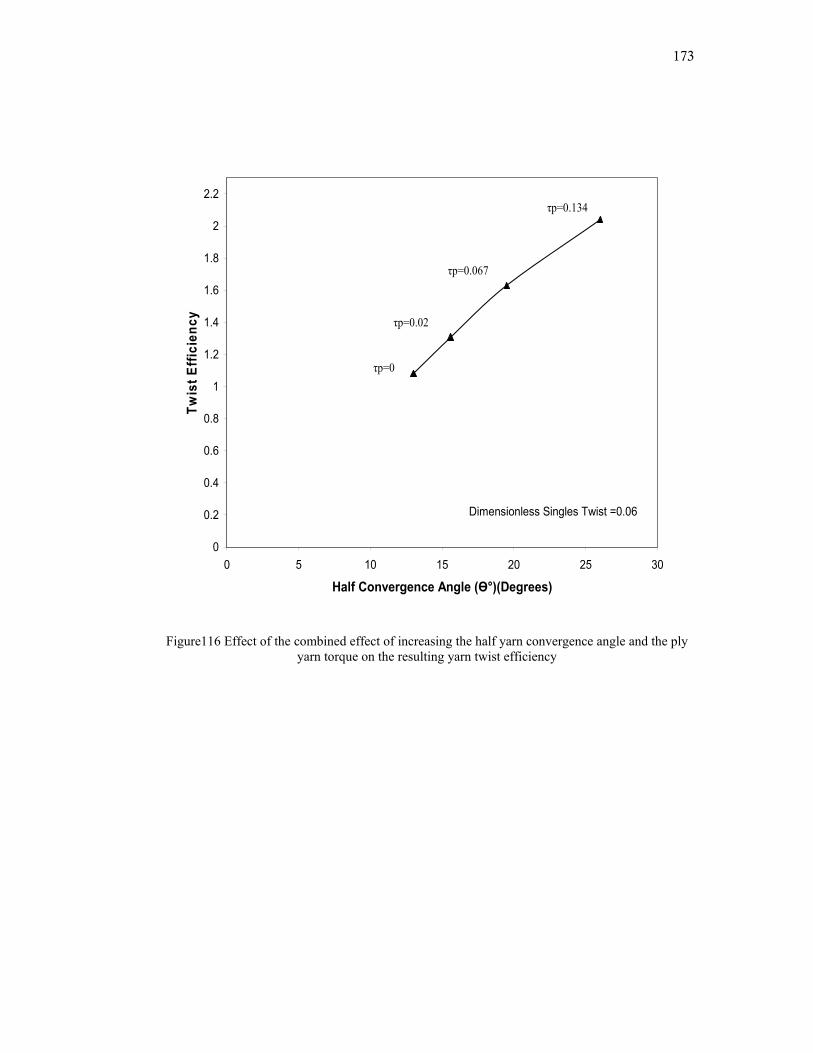
173
Figure116 Effect of the combined effect of increasing the half yarn convergence angle and the ply
yarn torque on the resulting yarn twist efficiency
0
0.2
0.4
0.6
0.8
1
1.2
1.4
1.6
1.8
2
2.2
0 5 10 15 20 25 30
Half Convergence Angle (Ө°)(Degrees)
Twis
t Effi
cien
cy
τp=0
τp=0.134
τp=0.067
τp=0.02
Dimensionless Singles Twist =0.06
174
9.5 Discussion
This chapter has developed a model able to predict the ATP ply yarn twist and
twist efficiency from given values of singles yarn diameter and modulus, singles yarn
twist, ply yarn tension and applied ply yarn torque. The results of this model have shown
excellent agreement with the experimental results of the static tester and in close
agreement in its base case; no ply yarn torque applied, with previous models in literature.
The model has shown also to provide a close approximation of the experimental results of
the Drexel ATP process.
The model has also established mathematical expressions for the singles and ply
strain energies and their components which have enabled us to study the change in the
energy of the singles and ply yarns as the singles yarn twist; the main driving force, is
increased.
The developed model has also been able to demonstrate the effect of the ply yarn
torque in increasing the yarn twist efficiency together with increasing the yarn
convergence angle which confirms the previous experimental results in chapter 8.
175
CHAPTER 10: CONCLUSIONS
• Alternate twist plying with ultrasonic bonding at the twist reversals and the use of a
profiled velocity profile offers the possibility of a high speed process for producing
high quality cut pile carpet yarns.
• A complete review of all the commercially available ATP processes, their aspects of
design, their applications and comparing them to the conventional ply twisting
processes and the cabling process has been provided.
• The Drexel ATP process has been upgraded to offer accurate and reproducible test
results. This upgrade has included the installation of IRO weft accumulators, yarn
tensioners, J-box and a yarn winder. Complete framing of the machine has been
designed and installed to achieve perfect two-dimensional alignment. Upgrading the
Drexel ATP process has resulted in a pilot-scale machine ready for transformation
into a commercial machine.
• Demonstration of the capability of the Drexel ATP process in processing a wide
variety of materials, including Nylon, Kevlar, Spectra 1000 and glass fibers has been
done.
• Measurement procedures to obtain an objective accurate evaluation of the ATP yarn
twist profile and yarn twist efficiency have been established.
• A static tester capable of simulating all the process variables of on the Drexel ATP
was designed and built for the first time. This innovative design has allowed us to
apply a ply yarn torque on the order of micro newton. meters while fulfilling the
process the process requirements of tension and freedom of movement.
176
• A square wave twist profile was achieved on the Drexel ATP Machine using process
and computational modeling and simulation.
o The key process parameters affecting the yarn twist profile were determined
through process modeling. The equations of state describing the amount of twist
accumulating in the singles yarns across zone1 and zone2 of the Drexel ATP
process where established using a set of differential equations. The yarn velocity
profile, the rotation profile of the main torque jets and the machine zone lengths
were identified as the key process parameters.
o The computational model was used to provide the solution for these differential
equations in the dimensionless form using a stiff integrator. Computer
simulation of the yarn velocity profile, the main torque jet rotation profile and
the resulting yarn twist profile was done.
o The effects of the yarn velocity and rotational profile and the machine zone
lengths were studied through the computational model predictions of the yarn
twist profile. Experimental verification of the computational model was done by
experimental measurements of the yarn twist profile of ATP yarn samples
produced on the Drexel ATP process. The experimental results showed very
good agreement with the model.
o The computational model and computer simulation were able to determine the
optimum process parameters required to achieve a square wave yarn twist
profile.
o The optimum yarn profile required to achieve a square wave twist profile is
characterized by an abrupt increase in speed to reach the maximum at the start
177
of the twist reversal cycle followed by a nearly constant yarn velocity across the
cycle to prevent the twist from decreasing along the yarn length. At the twist
reversal where the yarn must stop for bonding the yarn velocity must then
decrease abruptly to a stop.
o The optimum length of zone1; distance between the yarn tensioners and the
main torque jets, was found to be at least six times the twist reversal length to
assure a uniform distribution of twist in the singles yarn, before the twist is
trapped in the self ply structure. The optimum length of zone2; distance between
the main torque jets and the self ply point, with respect to the twist reversal
length was found to be very small ~ 0.003, to force the spontaneous self plying
process.
o Coordination between the different profiles of the different functions on the
Drexel ATP process which is also very crucial to produce a uniform twist profile
with a very short bond and a short zero twist region at the twist reversal has also
been done.
• The yarn twist efficiency has been significantly improved on the Drexel ATP process.
o The main process variables of the Drexel ATP process affecting the singles and
ply yarns twists and thus the yarn twist efficiency were determined.
The main torque jets control the twist in the singles yarns, where
increasing the main jet pressure increases the magnitude of the applied
singles torque.
The singles yarns tension has also been found to affect both the singles
yarn and ply yarn twist. Increasing in the singles yarn tension results in
a decrease in the resulting singles and ply yarn twists.
178
The helper torque jet was also found to affect both the singles and ply
yarns twists through applying a ply yarn torque.
The effect of increasing the yarn temperature, through the use of a hot
air gun, on the yarn twist efficiency was also studied.
The maximum ATP yarn twist efficiency that could be obtained on the
Drexel ATP through the use of the main torque jets and applied singles
tension, as the base case, is 65%.
o RSM analysis was applied to the experimental results to develop a processing
window which will produce ATP yarns with maximum yarn twist efficiency.
Response surfaces relating the yarn twist efficiency to the main torque
jets pressure and the singles yarns tensions were generated for different
helper torque jet pressures of 0 PSI (off), 42 PSI and 75 PSI.
The RSM model has shown that a low main torque jet pressure of 30
PSI, low singles yarn tension of 34g, high helper torque jet pressure of
75PSI and processing at room temperature with no heat application
were found to be the optimum conditions for achieving maximum yarn
twist efficiency of 73%.
This result has also been confirmed experimentally with a number of
repeated trials.
o The equilibrium analysis has provided the key findings of how to improve the
twist efficiency
An analysis of the forces and torques acting on the yarns at the self ply
point was done taking into account the effects of applying a ply yarn
torque and the geometry of the yarn convergence angle at the self ply
179
point.
The results have shown that applying a ply yarn torque decreases the
singles yarns torque above the yarn convergence point while increasing
the ply yarn twist.
The action of the helper torque jet has also been found to resemble the
sirospun process and from thus it was concluded that a limited
improvement in the twist efficiency could only be achieved through
applying a high ply yarn torque
The equilibrium analysis has also shown that increasing the yarn
convergence angle at the point of self ply increases the singles yarn
torque under the effect of ply yarn torque and thus achieves an overall
improvement in the yarn twist efficiency.
It was also found that increasing the ply torque for the same tension a
higher convergence angle can be obtained.
o The yarn twist Efficiency was largely improved on the Static Tester through the
use of high ply torque and an optimum yarn convergence angle.
The static tester has enabled us to study the effect of the yarn
convergence angle on the yarn twist efficiency.
The static tester results showed close agreement with the previous
experimental and theoretical results in literature.
The static tester also approximates the experimental results of the
Drexel ATP process with 1.8% increase in twist.
The results have shown that higher twist efficiency is obtained for lower
yarn tensions and at lower twist levels.
180
Applying a ply yarn torque without increasing the yarn convergence
angle showed little effect in improving the twist efficiency.
The use of a ply yarn torque of 98μN.m at the optimum half yarn
convergence of angle, 47°, and a ply yarn tension of 83g has yielded a
100% yarn twist efficiency using the BCF nylon yarns.
o Results of the experiments done on the Drexel ATP process using the redesigned
jets have shown a 13% percent increase in the yarn twist efficiency to reach
78%, on average, using a half yarn convergence angle of 45° and maximum
helper jet pressure.
o A mathematical model able to predict the yarn twist efficiency and the singles
and ply strain energies of the ATP yarn system has also been developed and has
been verified against the results of previous models and with the experimental
result of the static tester. The results of the model have confirmed the effect of
increasing the ply yarn torque and the half yarn convergence angle in increasing
the twist efficiency.
10.1 Future Work and Recommendations
Achieving a square wave twist profile and high twist efficiency together on the
wide convergence angle setup on the Drexel ATP process.
Methods of enhancing the helper jet performance through increasing its applied
ply yarn torque to better improve the twist efficiency on the Drexel ATP process.
Evaluation of the feasibility of a providing constant velocity process on the Drexel
ATP process.
Develop methods of combining the best features of both types of ATP processes:
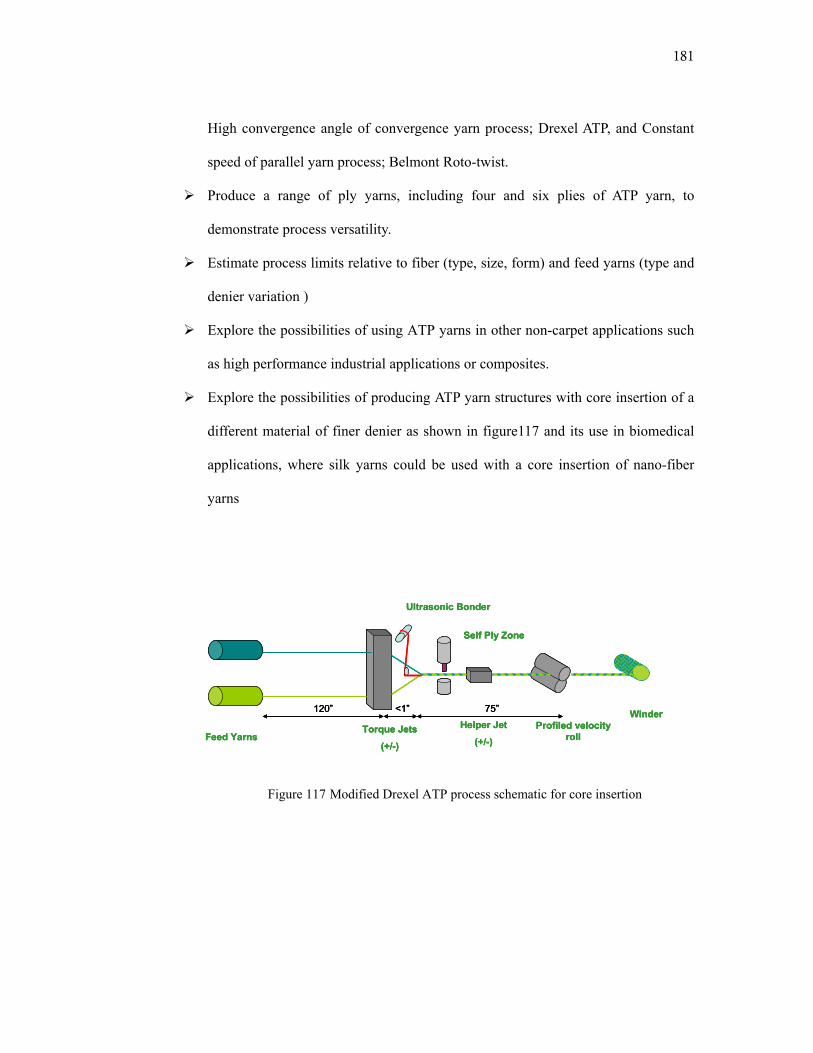
181
High convergence angle of convergence yarn process; Drexel ATP, and Constant
speed of parallel yarn process; Belmont Roto-twist.
Produce a range of ply yarns, including four and six plies of ATP yarn, to
demonstrate process versatility.
Estimate process limits relative to fiber (type, size, form) and feed yarns (type and
denier variation )
Explore the possibilities of using ATP yarns in other non-carpet applications such
as high performance industrial applications or composites.
Explore the possibilities of producing ATP yarn structures with core insertion of a
different material of finer denier as shown in figure117 and its use in biomedical
applications, where silk yarns could be used with a core insertion of nano-fiber
yarns
Figure 117 Modified Drexel ATP process schematic for core insertion
Feed YarnsTorque Jets
(+/-)
Helper Jet
(+/-)
Ultrasonic Bonder
Profiled velocity roll
Winder
Self Ply Zone
120” <1” 75”
Feed YarnsTorque Jets
(+/-)
Helper Jet
(+/-)
Ultrasonic Bonder
Profiled velocity roll
Winder
Self Ply Zone
120” <1” 75”
Feed YarnsTorque Jets
(+/-)
Helper Jet
(+/-)
Ultrasonic Bonder
Profiled velocity roll
Winder
Self Ply Zone
120” <1” 75”
182
LIST OF REFERENCES
1. Carpet, Rug Sales set top $20 Billion, Int. fiber journal , 21, 3, 2006 2. http://www.flooringamerica.com/
3. http://en.wikipedia.org/wiki/Spinning_wheel 4. http://www.ucl.ac.uk/ 5. http://www.allma-volkmann.oerlikontextile.com/
6. Backer, Popper, US Patent, 3, 434, 275, 1969
7. Henshaw, US Patent, 3,255,533, 1965
8. Henshaw, Self-Twist Yarn, Merrow Publishing Co. Ltd., 1971
9. Tayebi, Backer, M.S. Thesis, Massachusetts Institute of Technology, 1970
10. Tayebi, Backer, The mechanics of self plying structures Part I: Monofilament
Strands, J. Text. Inst., 64, 704, 1973
11. Tayebi, Backer, The mechanics of self plying structures Part II: Multifilament strands, J. Text. Inst., 64, 711, 1973
12. Coleman, Swigon, Theory of supercoiled elastic rings with self contact and its
application to DNA plasmids, J. Elasticity, 60, 173-221, 2000 13. Van Der Heijden, Thompson, Neukirc, Super-coiling of DNA plasmids: Mechanics
of generalized ply, Proc. R. Soc. Lond. (In Press)
14. Van Der Heijden, Thompson, Neukirc, A Variational Approach to Loaded Ply Structures, Journal of Vibration and Control, Vol. 9, No.1-2, 2003
15. Fraser, Stump, The equilibrium of the convergence point in a two strand yarn
plying, Int. J. Solids Struct. 35, 285-98, 1998
16. Platte, Lappage, An Alternative Approach to two fold yarn weaving, Part I: Control of surface fibers, J. Text. Inst, Vol.73, No.3, 1982
17. Platte, Lappage, An Alternative Approach to two fold yarn weaving, Part II: The
theoretical model, J. Text. Inst, Vol.73, No.3, 1982
18. Platte, Lappage, An Alternative Approach to two fold yarn weaving, Part III: Testing of the theoretical model, J. Text. Inst, Vol.73, No.3, 1982
183
19. Miao, Cai, Zhang, Influence of Machine Variables on Two Strand Yarn Spinning
Geometry, Text. Res. J., 63, 2, 1993
20. http://www.textileworld.com/News_Archives.htm
21. http://www.platt.co.uk/
22. http://www.gilbos.com/e_textieltotaalframe.htm 23. US Patent, 6, 345,491, 2002
24. US Patent, 4,873,821, 1989
25. US Patent, 5,003,763, 1991
26. US Patent, 5,012,636, 1991
27. US Patent, 5,179,827, 1993
28. US Patent, 5,228,282, 1993
29. US Patent, 5,465,566 ,1995
30. US Patent, 5,557,915, 1996
31. US Patent, 5,577,376, 1996
32. US Patent, 5,598,694, 1997
33. US Patent, 5,644,909, 1997
34. US Patent, 5,829,241, 1998
35. Elkhamy, Popper, Yngve, Ko, An Introduction to Alternate Twist Ply (ATP) Yarn
Technology, The 35th Textile Research Symposium, Hangzhou, China, Aug.2006
36. Sudduth, Hydrolysis Effects on the Molecular Weight Degradation of Condensation Polymers as Estimated From Their Prior Drying Condition, Polymer engineering and science, Vol. 36, No.16, 1996
37. Myers, Montgomery, D.C. In Response Surface Methodology: Process and
Product Optimization using Designed Experiments; Wiley Interscience, 1995
38. Davies, In The Design and Analysis of Industrial Experiments, Hafner Publishing Company: NY, 1956
184
39. Getting started with V7 of Design-Expert software, Copyright by Stat-Ease Inc, 2006
40. Elkhamy, Popper, Yngve, Ko, Alternate Twist Ply (ATP) Yarn Technology:
Process Modeling and Optimization, The Fiber Society 2007 Spring Conf., Greenville, SC, 2007
41. Treloar, The geometry of multi-ply yarns, J. Text. Inst, 47, T348-68, 1956
42. Ougizawa, Ikeda, Hasebe, Nakanishi, Ogawa, Aikawa, A Twisted Filament and Its
Helix Structure Formation, Textile Res. J., Vol.74, No.7, 629-633, 2004
43. Elkhamy, Popper, Yngve, Li, Ko, US Patent, Drexel Docket # 07-0792D: Alternate twist ply yarn with low residual twist and method of manufacture, 2007
44. Backer, Text. Res. J, 22, 668-81, 1952
45. Naar, The steady state mechanics of the false twist yarn texturing process, PhD
Thesis, MIT, 1975
46. Timoshenko, Young, Elements of strength of Materials, 5th Ed., D. Van Nostrand Co., Princeton, NJ, 1968
47. Hearle, Grosberg, Backer, Structural Mechanics of fibers, yarns and fabric, Vol.1,
Wiley Interscience, 1969.
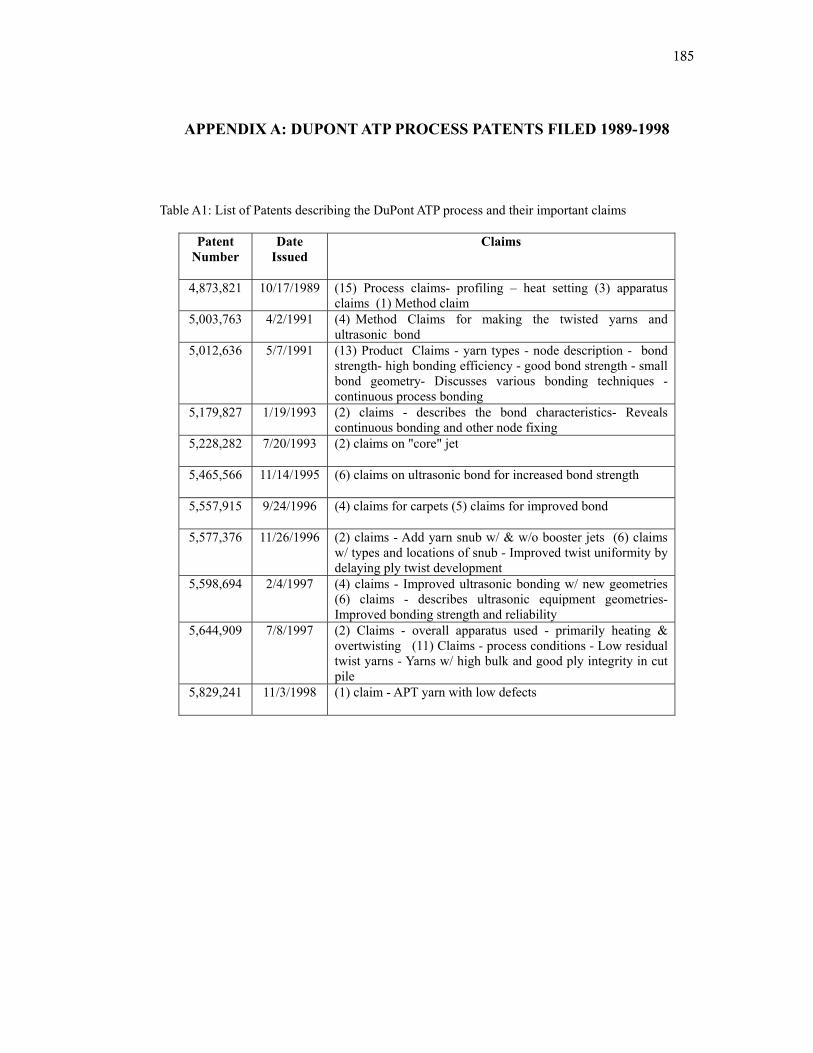
185
APPENDIX A: DUPONT ATP PROCESS PATENTS FILED 1989-1998
Table A1: List of Patents describing the DuPont ATP process and their important claims
Patent Number
Date Issued
Claims
4,873,821
10/17/1989 (15) Process claims- profiling – heat setting (3) apparatus claims (1) Method claim
5,003,763
4/2/1991 (4) Method Claims for making the twisted yarns and ultrasonic bond
5,012,636
5/7/1991 (13) Product Claims - yarn types - node description - bond strength- high bonding efficiency - good bond strength - small bond geometry- Discusses various bonding techniques - continuous process bonding
5,179,827
1/19/1993 (2) claims - describes the bond characteristics- Reveals continuous bonding and other node fixing
5,228,282
7/20/1993 (2) claims on "core" jet
5,465,566
11/14/1995 (6) claims on ultrasonic bond for increased bond strength
5,557,915
9/24/1996 (4) claims for carpets (5) claims for improved bond
5,577,376 11/26/1996 (2) claims - Add yarn snub w/ & w/o booster jets (6) claims w/ types and locations of snub - Improved twist uniformity by delaying ply twist development
5,598,694
2/4/1997 (4) claims - Improved ultrasonic bonding w/ new geometries (6) claims - describes ultrasonic equipment geometries- Improved bonding strength and reliability
5,644,909
7/8/1997 (2) Claims - overall apparatus used - primarily heating & overtwisting (11) Claims - process conditions - Low residual twist yarns - Yarns w/ high bulk and good ply integrity in cut pile
5,829,241
11/3/1998 (1) claim - APT yarn with low defects
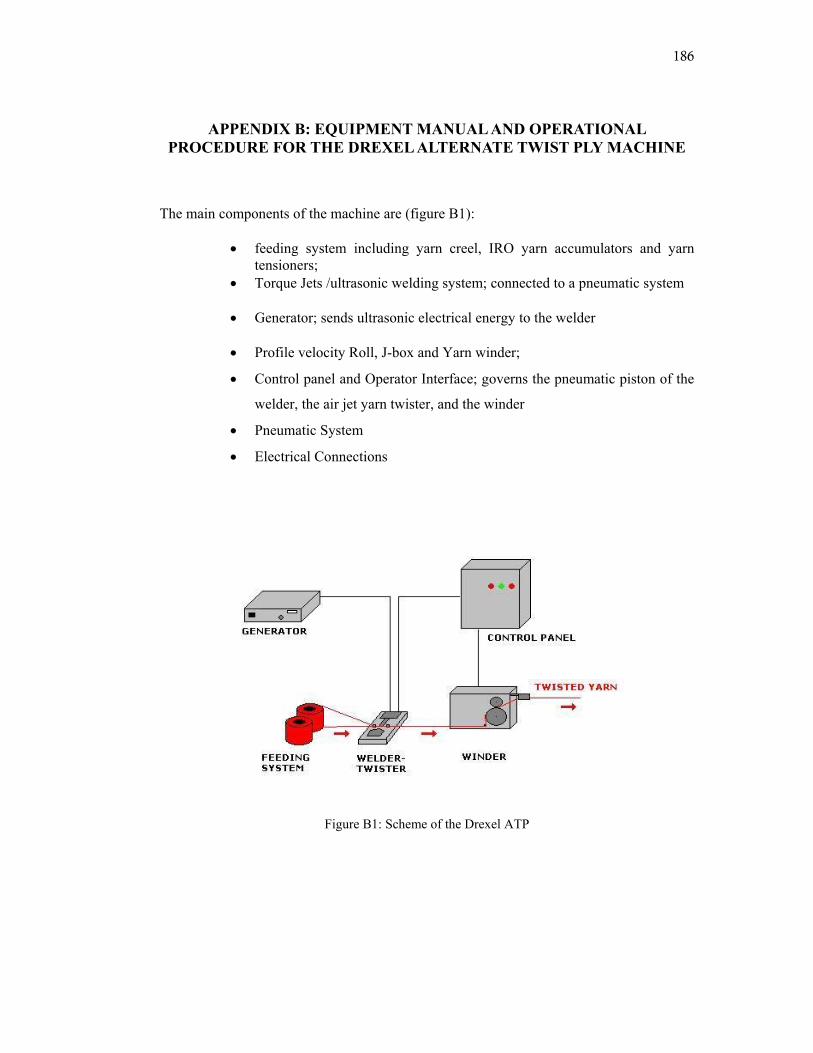
186
APPENDIX B: EQUIPMENT MANUAL AND OPERATIONAL PROCEDURE FOR THE DREXEL ALTERNATE TWIST PLY MACHINE
The main components of the machine are (figure B1):
• feeding system including yarn creel, IRO yarn accumulators and yarn tensioners;
• Torque Jets /ultrasonic welding system; connected to a pneumatic system
• Generator; sends ultrasonic electrical energy to the welder
• Profile velocity Roll, J-box and Yarn winder;
• Control panel and Operator Interface; governs the pneumatic piston of the
welder, the air jet yarn twister, and the winder
• Pneumatic System
• Electrical Connections
Figure B1: Scheme of the Drexel ATP
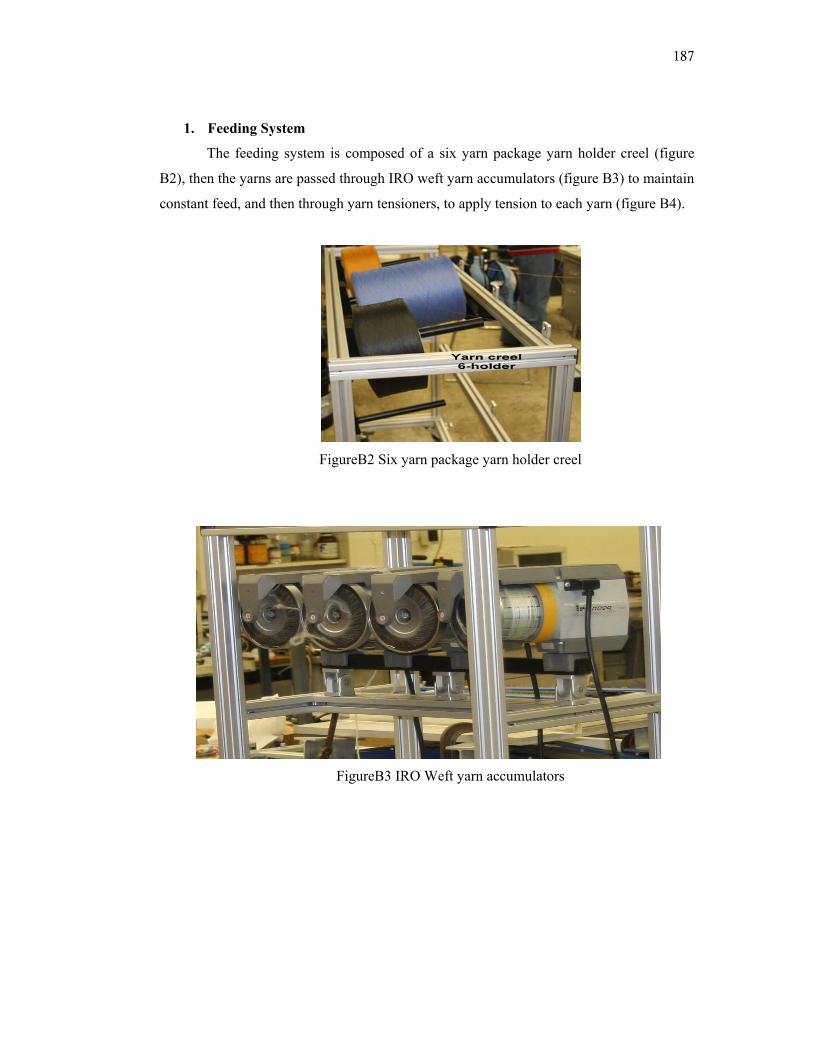
187
1. Feeding System
The feeding system is composed of a six yarn package yarn holder creel (figure
B2), then the yarns are passed through IRO weft yarn accumulators (figure B3) to maintain
constant feed, and then through yarn tensioners, to apply tension to each yarn (figure B4).
FigureB2 Six yarn package yarn holder creel
FigureB3 IRO Weft yarn accumulators
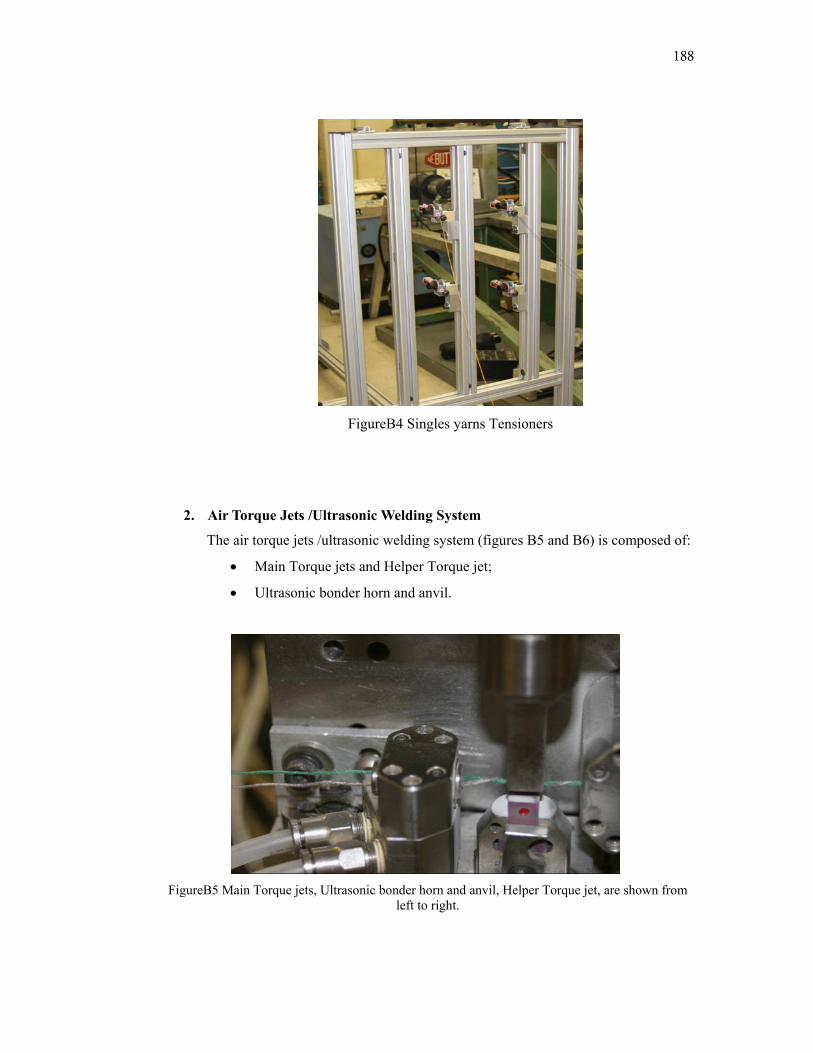
188
FigureB4 Singles yarns Tensioners
2. Air Torque Jets /Ultrasonic Welding System
The air torque jets /ultrasonic welding system (figures B5 and B6) is composed of:
• Main Torque jets and Helper Torque jet;
• Ultrasonic bonder horn and anvil.
FigureB5 Main Torque jets, Ultrasonic bonder horn and anvil, Helper Torque jet, are shown from
left to right.
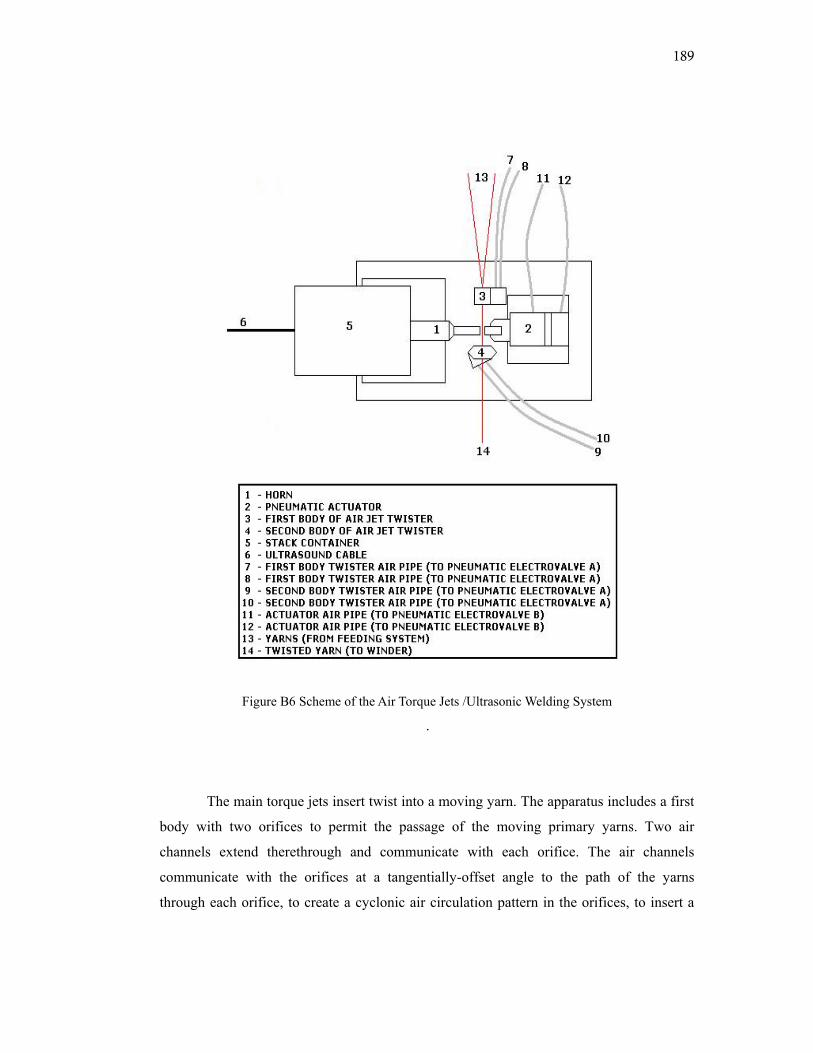
189
Figure B6 Scheme of the Air Torque Jets /Ultrasonic Welding System
.
The main torque jets insert twist into a moving yarn. The apparatus includes a first
body with two orifices to permit the passage of the moving primary yarns. Two air
channels extend therethrough and communicate with each orifice. The air channels
communicate with the orifices at a tangentially-offset angle to the path of the yarns
through each orifice, to create a cyclonic air circulation pattern in the orifices, to insert a
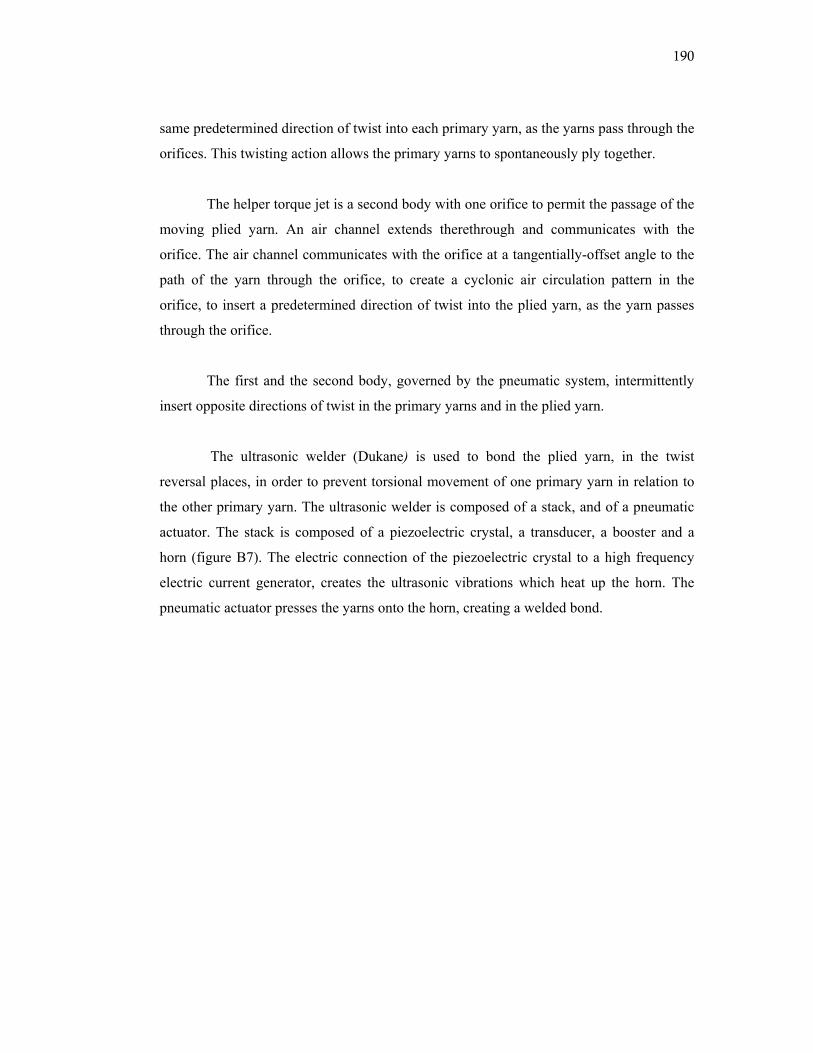
190
same predetermined direction of twist into each primary yarn, as the yarns pass through the
orifices. This twisting action allows the primary yarns to spontaneously ply together.
The helper torque jet is a second body with one orifice to permit the passage of the
moving plied yarn. An air channel extends therethrough and communicates with the
orifice. The air channel communicates with the orifice at a tangentially-offset angle to the
path of the yarn through the orifice, to create a cyclonic air circulation pattern in the
orifice, to insert a predetermined direction of twist into the plied yarn, as the yarn passes
through the orifice.
The first and the second body, governed by the pneumatic system, intermittently
insert opposite directions of twist in the primary yarns and in the plied yarn.
The ultrasonic welder (Dukane) is used to bond the plied yarn, in the twist
reversal places, in order to prevent torsional movement of one primary yarn in relation to
the other primary yarn. The ultrasonic welder is composed of a stack, and of a pneumatic
actuator. The stack is composed of a piezoelectric crystal, a transducer, a booster and a
horn (figure B7). The electric connection of the piezoelectric crystal to a high frequency
electric current generator, creates the ultrasonic vibrations which heat up the horn. The
pneumatic actuator presses the yarns onto the horn, creating a welded bond.
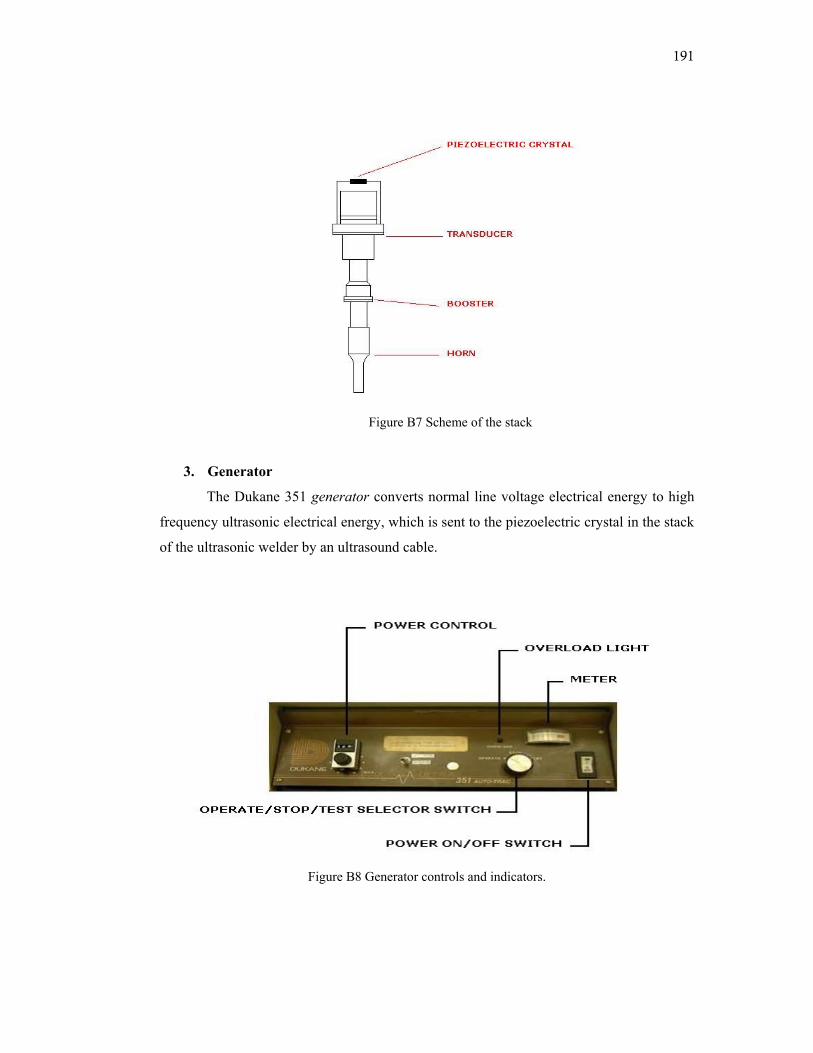
191
Figure B7 Scheme of the stack
3. Generator
The Dukane 351 generator converts normal line voltage electrical energy to high
frequency ultrasonic electrical energy, which is sent to the piezoelectric crystal in the stack
of the ultrasonic welder by an ultrasound cable.
Figure B8 Generator controls and indicators.
192
The generator controls and indicators (figure B8) are:
Power ON/OFF Switch
The power ON/OFF switch switches the electrical power to the generator. It is also
a circuit breaker for overload protection.
OPERATE/STOP/TEST Selector
This selector provides a means of turning on and off the generator’s ability to
produce ultrasounds.
OPERATE Position – This is an on position. With the selector in this position, the
generator will send ultrasounds.
STOP Position – This is a off position. The generator cannot generate ultrasounds
when this selector is in this position.
TEST Position – Use this position only to evaluate the vibrational characteristics
of the stack, using the appropriate procedure (machine’s manual, procedure V.E.).
Front Panel Meter
The front panel meter indicates the percentage of power drawn from the generator
when the ultrasound is on. The power draw varies with each application. The
meter scale is from 0 to 10, in increments of 1. If the meter reading is in the red
portion of the scale (beyond 100%), too much power is being drawn and the
system operation should be discontinued. During an overload condition the red
OVERLOAD light will be on.
Red OVERLOAD Light
The red OVERLOAD light illuminates to indicate a mismatch between the
ultrasound signal and the vibrational characteristics of the stack. It also lights
when too much power is drawn from the generator and the meter reading is in the
red portion. Either conditions may damage the generator. When the OVERLOAD
light glows or flickers, stop the operation.
Power
This control adjusts the amplitude of the vibration of the stack. To achieve
optimum efficiency from this generator, set this control to a setting, as high as
possible. Use this control only for fine adjustment.
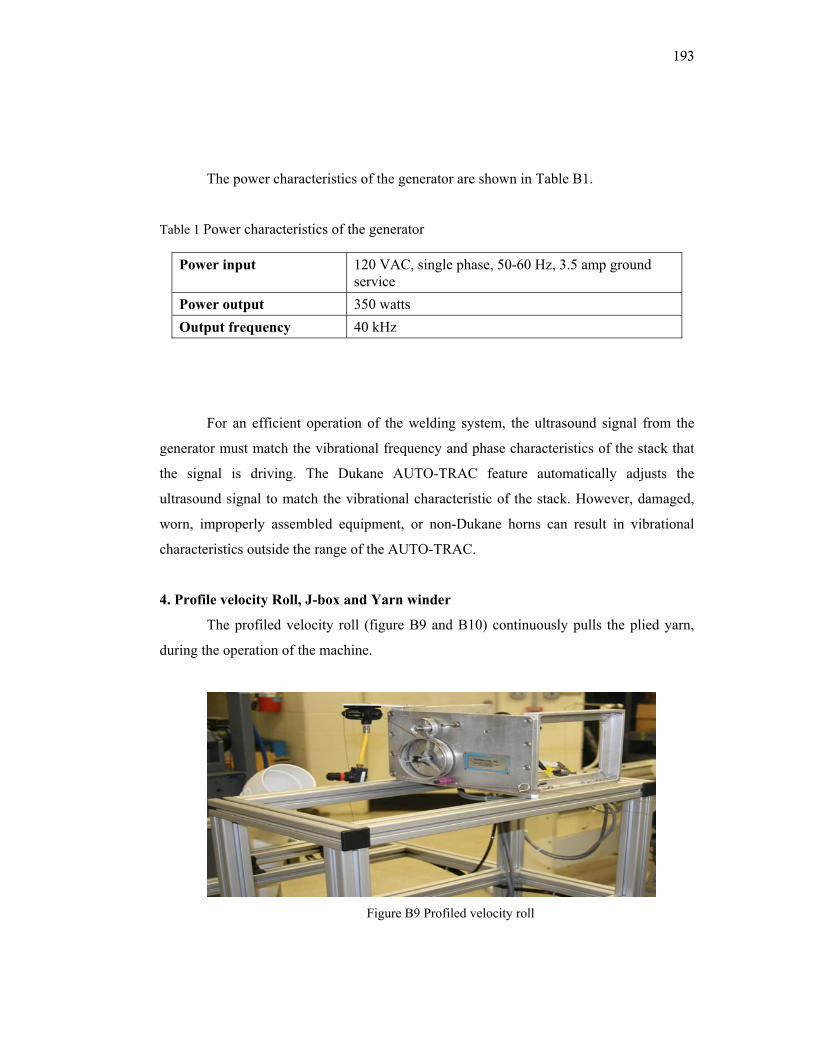
193
The power characteristics of the generator are shown in Table B1.
Table 1 Power characteristics of the generator
Power input 120 VAC, single phase, 50-60 Hz, 3.5 amp ground service
Power output 350 watts Output frequency 40 kHz
For an efficient operation of the welding system, the ultrasound signal from the
generator must match the vibrational frequency and phase characteristics of the stack that
the signal is driving. The Dukane AUTO-TRAC feature automatically adjusts the
ultrasound signal to match the vibrational characteristic of the stack. However, damaged,
worn, improperly assembled equipment, or non-Dukane horns can result in vibrational
characteristics outside the range of the AUTO-TRAC.
4. Profile velocity Roll, J-box and Yarn winder
The profiled velocity roll (figure B9 and B10) continuously pulls the plied yarn,
during the operation of the machine.
Figure B9 Profiled velocity roll
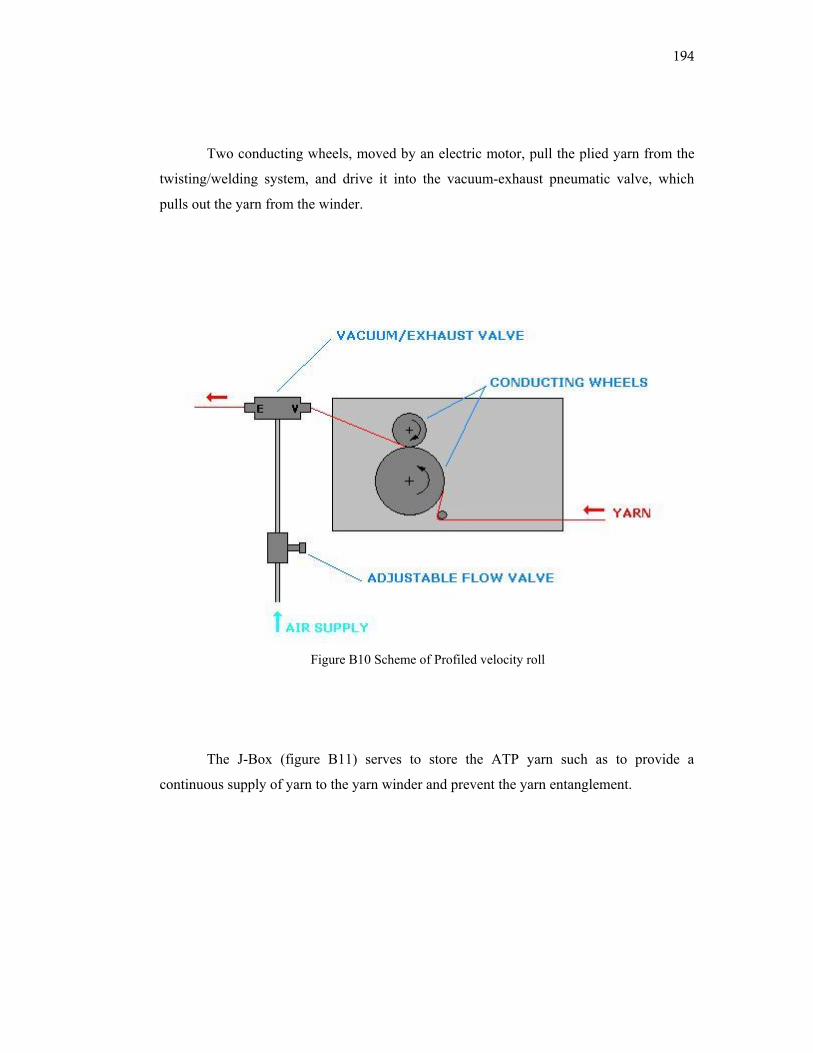
194
Two conducting wheels, moved by an electric motor, pull the plied yarn from the
twisting/welding system, and drive it into the vacuum-exhaust pneumatic valve, which
pulls out the yarn from the winder.
Figure B10 Scheme of Profiled velocity roll
The J-Box (figure B11) serves to store the ATP yarn such as to provide a
continuous supply of yarn to the yarn winder and prevent the yarn entanglement.
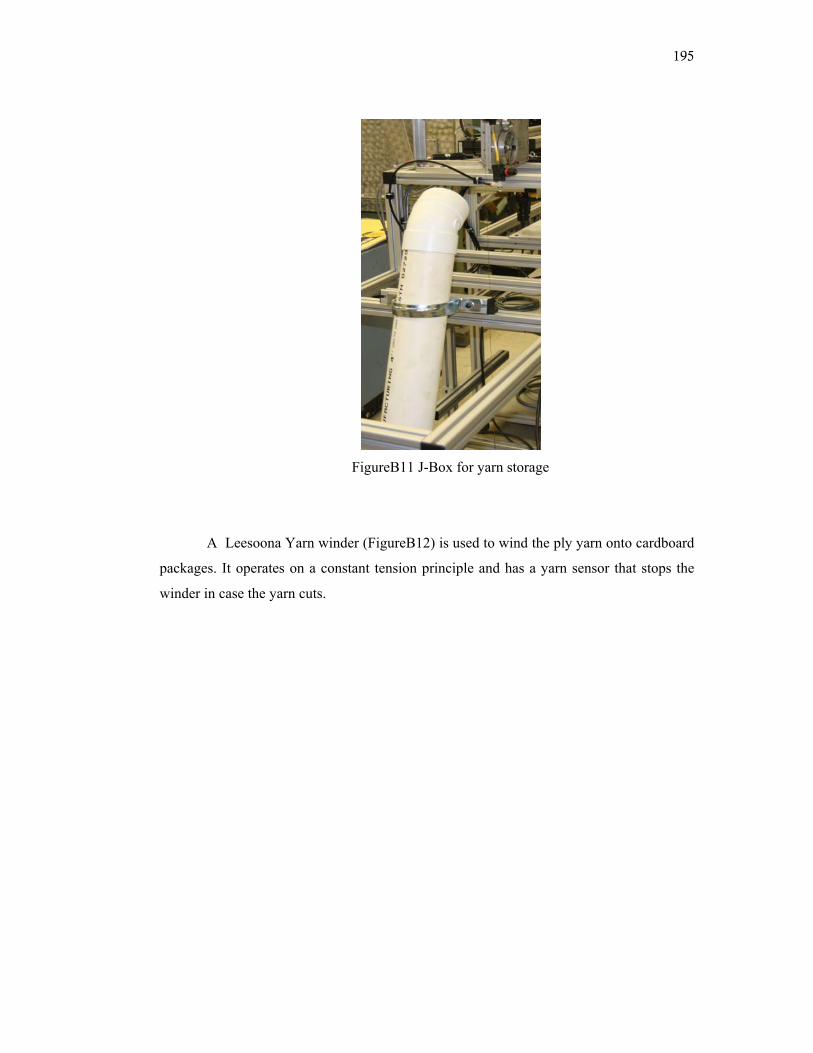
195
FigureB11 J-Box for yarn storage
A Leesoona Yarn winder (FigureB12) is used to wind the ply yarn onto cardboard
packages. It operates on a constant tension principle and has a yarn sensor that stops the
winder in case the yarn cuts.
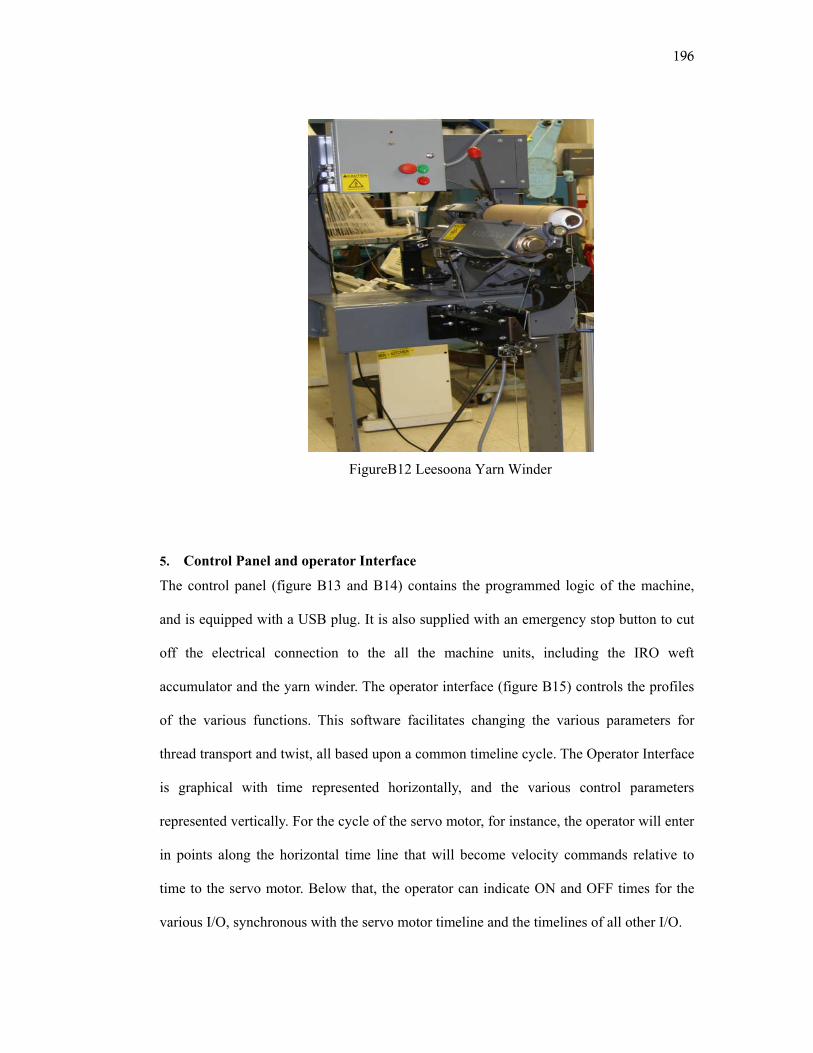
196
FigureB12 Leesoona Yarn Winder
5. Control Panel and operator Interface
The control panel (figure B13 and B14) contains the programmed logic of the machine,
and is equipped with a USB plug. It is also supplied with an emergency stop button to cut
off the electrical connection to the all the machine units, including the IRO weft
accumulator and the yarn winder. The operator interface (figure B15) controls the profiles
of the various functions. This software facilitates changing the various parameters for
thread transport and twist, all based upon a common timeline cycle. The Operator Interface
is graphical with time represented horizontally, and the various control parameters
represented vertically. For the cycle of the servo motor, for instance, the operator will enter
in points along the horizontal time line that will become velocity commands relative to
time to the servo motor. Below that, the operator can indicate ON and OFF times for the
various I/O, synchronous with the servo motor timeline and the timelines of all other I/O.

197
Once the timelines have been entered for each parameter, they will be able to be saved in a
file for later retrieval. Previous files will be able to be edited and saved as new files. The
software provides the operator with the means to start and stop the machine. The software
is written in Microsoft Visual BASIC.Net, and in commands for the Delta Tau PMAC
controller.
Figure B13 Control Panel.
Figure B14 START and STOP buttons on the control panel.
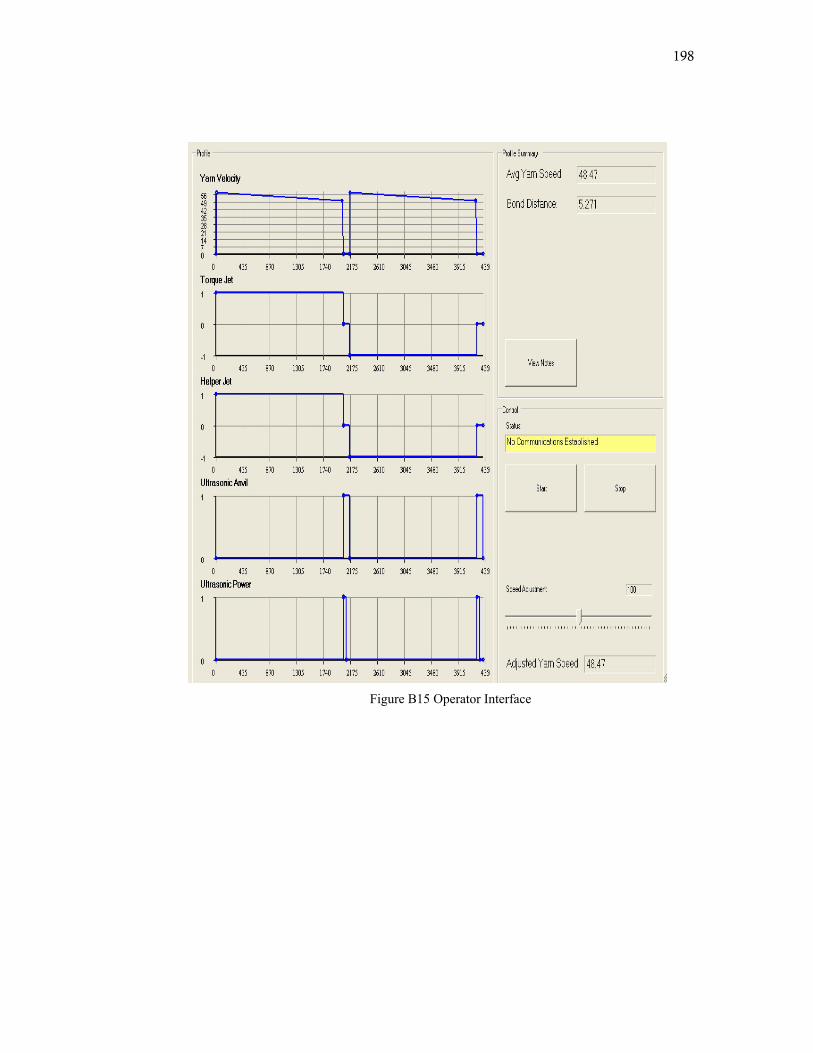
198
Figure B15 Operator Interface
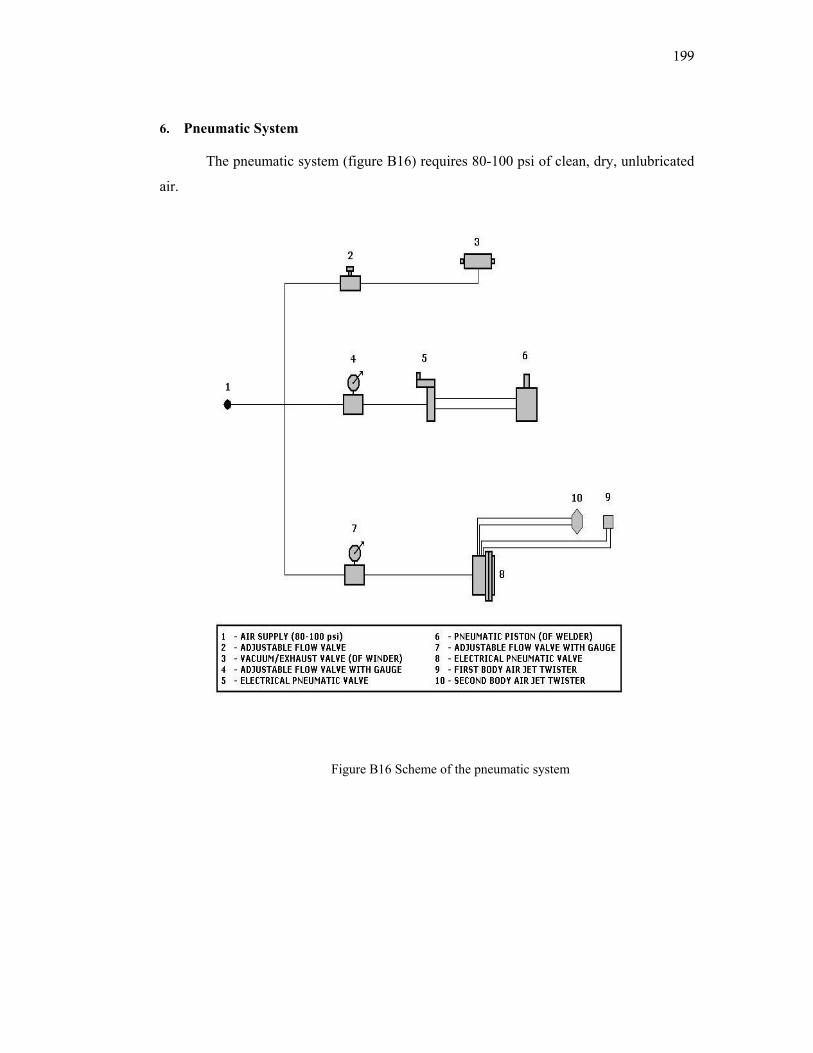
199
6. Pneumatic System
The pneumatic system (figure B16) requires 80-100 psi of clean, dry, unlubricated
air.
Figure B16 Scheme of the pneumatic system
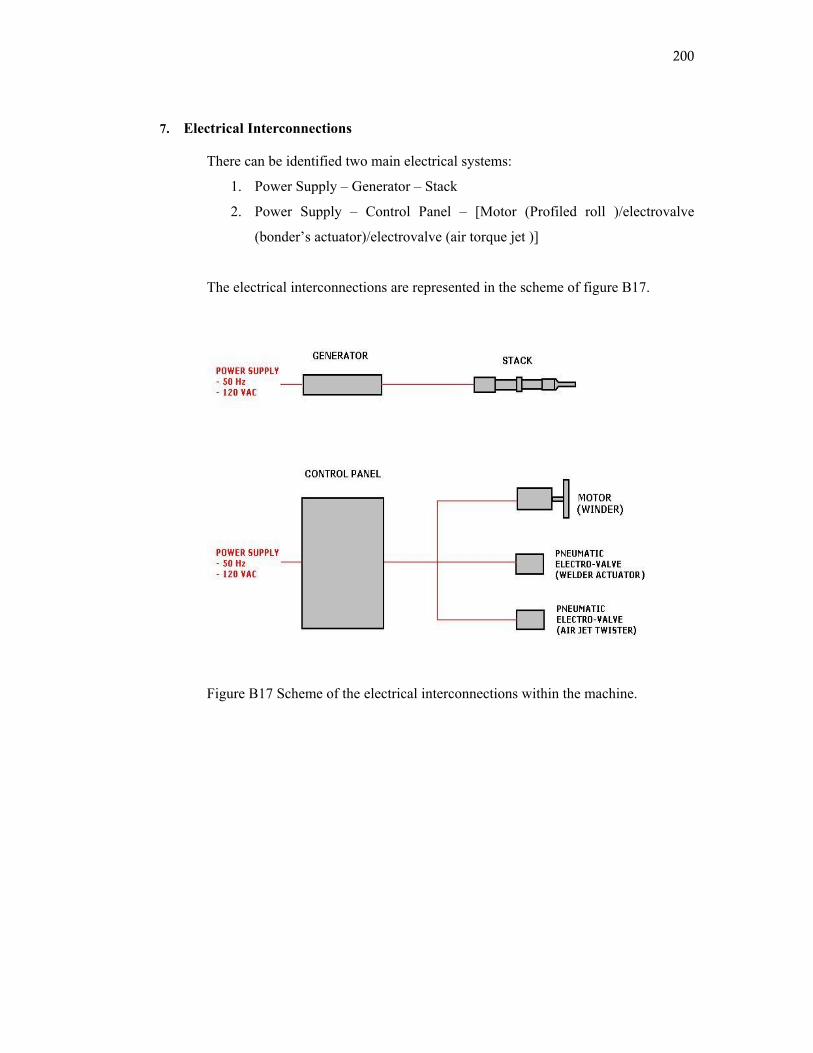
200
7. Electrical Interconnections
There can be identified two main electrical systems:
1. Power Supply – Generator – Stack
2. Power Supply – Control Panel – [Motor (Profiled roll )/electrovalve
(bonder’s actuator)/electrovalve (air torque jet )]
The electrical interconnections are represented in the scheme of figure B17.
Figure B17 Scheme of the electrical interconnections within the machine.
201
8. Operational Procedure
The following is a recommended procedure for starting the equipment at the
beginning of a day of operation. Following this procedure will result in a safer operation
for the operator and the equipment.
1. Check control cables - Are all cable plugs are properly connected to their
respective receptacles. Specifically check the ultrasound cable.
2. Check the ground strap – Verify that there is a good ground connection to the
generator and the control panel.
3. Check the stack – Is the stack properly assembled and installed with the cover
bolted and closed
4. Check horn – Visually check horn for cracks, misalignment, etc.
5. Load the creel with the yarn packages
6. Insert the yarns into the IRO, yarn tensioner, torque jets, and through the
winder
7. Turn generator ON/OFF switch to ON – The lamp in the switch should light.
8. Turn air power on.
9. If you have disassembled the stack or changed any stack component since you
last performed the Operational Test of Stack (procedure V.E.2. in the
Operation Manual of the Ultrasonic Welder), perform this test again.
10. Set the generator’s OPERATE/STOP/TEST selector on OPERATE.
202
11. Adjust the POWER control of the generator to the proper value for the
current application (carpet yarn: 500).
If this value is unknown, start with a relatively low value for the POWER, run the
machine, and check if the welded joints meet your quality standards. If the
welding is of a poor quality, raise this value, run the machine, and check again.
Repeat this until you reach the optimum value.
12. Begin Operation – Press the START button on the operator interface after
selecting the required profiles for the different machine functions.
13. Monitor the generator meter and the OVERLOAD light during operation.
If an overload condition occurs, immediately stop the operation, and reset the stack
(procedure V.E.2. in the Operation Manual of the Ultrasonic Welder).
14. End the Operation – Press the STOP button on the control panel.
15. Turn generator ON/OFF switch to OFF.
16. Turn air power off.
17. Inspect the machine for any visible damage or irregularities.
18. Wipe the mating surface with a clean cloth – ATTENTION: the horn is hot after
operation. Allow it to cool down before touching it.
203
9. Safety Recommendations
For Operator
- Certain plastic materials, when processed, may emit hazardous
fumes. Proper ventilation of the work station should be provided
when such materials are processed.
- Do not put head, hands, or body near the horn during operation.
- Do not operate the equipment unless it is properly grounded.
- The operator’s head should be kept at least 6 inches away from the
ultrasonic welder during operation, to reduce ear annoyance and
discomfort.
- The horn gets hot during operation. Allow the horn to cool down
before touching it.
- Safety Glasses should be put on before turning on the machine. - Ear protection devices should be put on in case the noise
increases with higher speeds.
No loose jewelry, rings, watches or lockers should be worn during operation.
For Equipment
- Never activate the ultrasound generator, unless the generator is
connected with the transducer.
- Do not continue the operation if the generator OVERLOAD light
glows or if the meter needle rises into the red zone.
- The main air pressure valve should be opened gradually before
turning on the machine and should be closed after turning it off.
204
APPENDIX C: VISUAL BASIC PROGRAM FOR COMPUTER CONTROL OF THE DREXEL ALTERNATE TWIST PLY MACHINE
Imports System.Runtime.InteropServices Imports System.Text Imports System.Threading Imports System.ComponentModel Imports System.IO #Region "RS232" Public Class Rs232 : Implements IDisposable '=================================================== ' ' Module : Rs232 ' Description : Class for handling RS232 comunication with VB.Net ' Created : 10/08/2001 - 8:45:25 ' Author : Corrado Cavalli ([email protected]) 'WebSite : www.codeworks.it/net/index.htm ' ' Notes : '----------------------------------------------------------------------------------------------- ' * Revisions * ' ' 02/12/2000 First internal alpha version built on framework beta1 ' ' 1st Public release Beta2 (10/08/2001) ' ' Rev.1 (28.02.2002) ' 1. Added ResetDev, SetBreak and ClearBreak to the EscapeCommFunction constants ' 2. Added the overloaded Open routine. ' 3. Added the modem status routines, properties and enum. ' 4. If a read times out, it now returns a EndOfStreamException (instead of a simple Exception). ' 5.Compiled with VS.Net final ' Rev.2 (01.03.2002) ' Added Async support ' ' Rev.3 (07.04.2002) ' Minor bugs fixed ' ' Rev.3 (05/05/2002) ' Fixed BuildCommmDCB problem
205
' ' Rev.4 (24/05/2002) ' Fixed problem with ASCII Encoding truncating 8th bit ' ' Rev.5 (27/05/2002) ' Added IDisposable / Finalize implementation ' ' Rev.6 (14/03/2003) ' Fixed problem on DCB fields Initialization ' ' Rev.7 (26/03/2003) ' Added XON/XOFF support ' ' Rev.8 (12/07/2003) ' Added support to COM port number greater than 4 ' ' Rev.9 (15/07/2003) ' Added CommEvent to detect incoming chars/events ' Updated both Tx/Rx method from Non-Ovelapped to Overlapped mode ' Removed unused Async methods and other stuff. ' ' Rev.10 (21/07/2003) ' Fixed incorrect character handling when using EnableEvents() ' ' Rev.11 (12/08/2003) ' Fixed some bugs signaled by users ' ' Rev.12 (01/09/2003) ' Removed AutoReset of internal buffers and added PurgeBuffer() method ' ' Rev.13 (02/09/2003) ' Removed GetLastErrorUse in favour of Win32Exception() ' ' Rev.14 (14/09/2003) ' Added IsPortAvailable() function ' Revised some API declaration ' Fixed problem with Win98/Me OS ' ' Rev.15 (24/09/2003) ' Fixed bug introduced on Rev.14 ' ' Rev.16 (12/10/2003) ' Added SetBreak/ClearBreak() methods ' ' Rev.17 (02/11/2003) ' Fixed field on COMMCONFIG ' ' Rev.18 (03/03/2004) ' Fixed bug: Testing mhRS for <>0 is not correct ' ' Rev.19 (08/04/2004)
206
' Fixed bug: Fixed bug on DTR property ' ' Rev.20 (12/07/2004) ' CommEvent is no more raised on a secondary thread ' pEventsWatcher now uses a background thread ' ' Rev.21 (24/10/2004) ' EscapeCommFunction declaration fixed ' Pariti enum fixed to Parity ' ' Rev. 22 (05/03/2005) ' Fixed memory leak problem causing program closing ' without any message on some systems. ' Thanks to Ralf Gedrat for testing this scenario ' ' Rev.23 (05/04/2005) ' Fixed bug DisableEvents not working bug ' ' Rev.24 (20/04/2005) ' Fixed memory leak on Read method ' Added InBufferCount property ' IsPortAvailable method is now shared ' Thanks to Jean-Pierre ZANIER for the feedback '=================================================== '// Class Members Private mhRS As IntPtr = New IntPtr(0) '// Handle to Com Port Private miPort As Integer = 1 '// Default is COM1 Private miTimeout As Int32 = 70 '// Timeout in ms Private miBaudRate As Int32 = 9600 Private meParity As DataParity = 0 Private meStopBit As DataStopBit = 0 Private miDataBit As Int32 = 8 Private miBufferSize As Int32 = 512 '// Buffers size default to 512 bytes Private mabtRxBuf As Byte() '// Receive buffer Private meMode As Mode '// Class working mode Private moThreadTx As Thread Private moThreadRx As Thread Private moEvents As Thread Private miTmpBytes2Read As Int32 Private meMask As EventMasks Private mbDisposed As Boolean Private mbUseXonXoff As Boolean Private mbEnableEvents As Boolean Private miBufThreshold As Int32 = 1 Private muOvlE As OVERLAPPED Private muOvlW As OVERLAPPED Private muOvlR As OVERLAPPED Private mHE As GCHandle Private mHR As GCHandle Private mHW As GCHandle '-----------------------------------------------------------

207
----------------------------- #Region "Enums" '// Parity Data Public Enum DataParity Parity_None = 0 Parity_Odd Parity_Even Parity_Mark End Enum '// StopBit Data Public Enum DataStopBit StopBit_1 = 1 StopBit_2 End Enum <Flags()> Public Enum PurgeBuffers RXAbort = &H2 RXClear = &H8 TxAbort = &H1 TxClear = &H4 End Enum Private Enum Lines SetRts = 3 ClearRts = 4 SetDtr = 5 ClearDtr = 6 ResetDev = 7 ' // Reset device if possible SetBreak = 8 ' // Set the device break line. ClearBreak = 9 ' // Clear the device break line. End Enum '// Modem Status <Flags()> Public Enum ModemStatusBits ClearToSendOn = &H10 DataSetReadyOn = &H20 RingIndicatorOn = &H40 CarrierDetect = &H80 End Enum '// Working mode Public Enum Mode NonOverlapped Overlapped End Enum '// Comm Masks <Flags()> Public Enum EventMasks RxChar = &H1 RXFlag = &H2 TxBufferEmpty = &H4 ClearToSend = &H8 DataSetReady = &H10 CarrierDetect = &H20 Break = &H40
208
StatusError = &H80 Ring = &H100 End Enum #End Region #Region "Structures" <StructLayout(LayoutKind.Sequential, Pack:=1)> Private Structure DCB Public DCBlength As Int32 Public BaudRate As Int32 Public Bits1 As Int32 Public wReserved As Int16 Public XonLim As Int16 Public XoffLim As Int16 Public ByteSize As Byte Public Parity As Byte Public StopBits As Byte Public XonChar As Char Public XoffChar As Char Public ErrorChar As Char Public EofChar As Char Public EvtChar As Char Public wReserved2 As Int16 End Structure <StructLayout(LayoutKind.Sequential, Pack:=1)> Private Structure COMMTIMEOUTS Public ReadIntervalTimeout As Int32 Public ReadTotalTimeoutMultiplier As Int32 Public ReadTotalTimeoutConstant As Int32 Public WriteTotalTimeoutMultiplier As Int32 Public WriteTotalTimeoutConstant As Int32 End Structure <StructLayout(LayoutKind.Sequential, Pack:=8)> Private Structure COMMCONFIG Public dwSize As Int32 Public wVersion As Int16 Public wReserved As Int16 Public dcbx As DCB Public dwProviderSubType As Int32 Public dwProviderOffset As Int32 Public dwProviderSize As Int32 Public wcProviderData As Int16 End Structure <StructLayout(LayoutKind.Sequential, Pack:=1)> Public Structure OVERLAPPED Public Internal As Int32 Public InternalHigh As Int32 Public Offset As Int32 Public OffsetHigh As Int32 Public hEvent As IntPtr End Structure <StructLayout(LayoutKind.Sequential, Pack:=1)> Private Structure COMSTAT Dim fBitFields As Int32
209
Dim cbInQue As Int32 Dim cbOutQue As Int32 End Structure #End Region #Region "Constants" Private Const PURGE_RXABORT As Integer = &H2 Private Const PURGE_RXCLEAR As Integer = &H8 Private Const PURGE_TXABORT As Integer = &H1 Private Const PURGE_TXCLEAR As Integer = &H4 Private Const GENERIC_READ As Integer = &H80000000 Private Const GENERIC_WRITE As Integer = &H40000000 Private Const OPEN_EXISTING As Integer = 3 Private Const INVALID_HANDLE_VALUE As Integer = -1 Private Const IO_BUFFER_SIZE As Integer = 1024 Private Const FILE_FLAG_OVERLAPPED As Int32 = &H40000000 Private Const ERROR_IO_PENDING As Int32 = 997 Private Const WAIT_OBJECT_0 As Int32 = 0 Private Const ERROR_IO_INCOMPLETE As Int32 = 996 Private Const WAIT_TIMEOUT As Int32 = &H102& Private Const INFINITE As Int32 = &HFFFFFFFF #End Region #Region "Win32API" '// Win32 API <DllImport("kernel32.dll", SetlastError:=True)> Private Shared Function SetCommState(ByVal hCommDev As IntPtr, ByRef lpDCB As DCB) As Int32 End Function <DllImport("kernel32.dll", SetlastError:=True)> Private Shared Function GetCommState(ByVal hCommDev As IntPtr, ByRef lpDCB As DCB) As Int32 End Function <DllImport("kernel32.dll", SetlastError:=True, CharSet:=CharSet.Auto)> Private Shared Function BuildCommDCB(ByVal lpDef As String, ByRef lpDCB As DCB) As Int32 End Function <DllImport("kernel32.dll", SetlastError:=True)> Private Shared Function SetupComm(ByVal hFile As IntPtr, ByVal dwInQueue As Int32, ByVal dwOutQueue As Int32) As Int32 End Function <DllImport("kernel32.dll", SetlastError:=True)> Private Shared Function SetCommTimeouts(ByVal hFile As IntPtr, ByRef lpCommTimeouts As COMMTIMEOUTS) As Int32 End Function <DllImport("kernel32.dll", SetlastError:=True)> Private Shared Function GetCommTimeouts(ByVal hFile As IntPtr, ByRef lpCommTimeouts As COMMTIMEOUTS) As Int32 End Function <DllImport("kernel32.dll", SetlastError:=True)> Private Shared Function ClearCommError(ByVal hFile As IntPtr, ByRef lpErrors As Int32, ByRef lpComStat As COMSTAT) As Int32 End Function
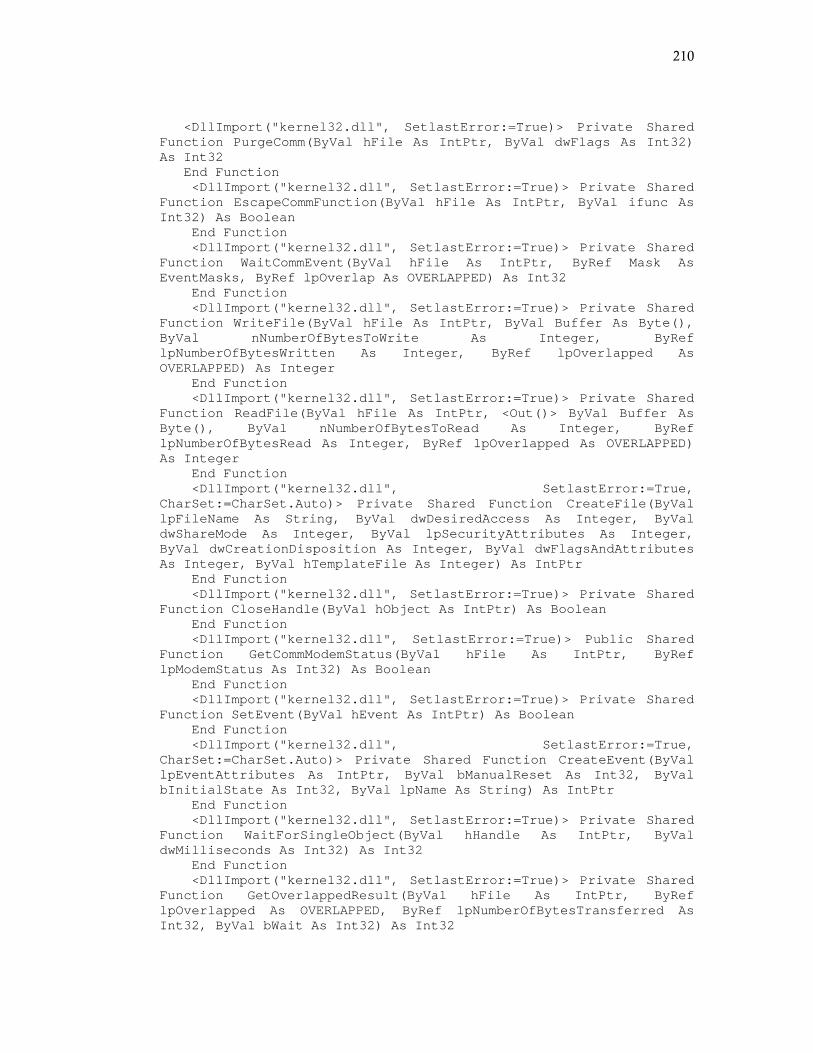
210
<DllImport("kernel32.dll", SetlastError:=True)> Private Shared Function PurgeComm(ByVal hFile As IntPtr, ByVal dwFlags As Int32) As Int32 End Function <DllImport("kernel32.dll", SetlastError:=True)> Private Shared Function EscapeCommFunction(ByVal hFile As IntPtr, ByVal ifunc As Int32) As Boolean End Function <DllImport("kernel32.dll", SetlastError:=True)> Private Shared Function WaitCommEvent(ByVal hFile As IntPtr, ByRef Mask As EventMasks, ByRef lpOverlap As OVERLAPPED) As Int32 End Function <DllImport("kernel32.dll", SetlastError:=True)> Private Shared Function WriteFile(ByVal hFile As IntPtr, ByVal Buffer As Byte(), ByVal nNumberOfBytesToWrite As Integer, ByRef lpNumberOfBytesWritten As Integer, ByRef lpOverlapped As OVERLAPPED) As Integer End Function <DllImport("kernel32.dll", SetlastError:=True)> Private Shared Function ReadFile(ByVal hFile As IntPtr, <Out()> ByVal Buffer As Byte(), ByVal nNumberOfBytesToRead As Integer, ByRef lpNumberOfBytesRead As Integer, ByRef lpOverlapped As OVERLAPPED) As Integer End Function <DllImport("kernel32.dll", SetlastError:=True, CharSet:=CharSet.Auto)> Private Shared Function CreateFile(ByVal lpFileName As String, ByVal dwDesiredAccess As Integer, ByVal dwShareMode As Integer, ByVal lpSecurityAttributes As Integer, ByVal dwCreationDisposition As Integer, ByVal dwFlagsAndAttributes As Integer, ByVal hTemplateFile As Integer) As IntPtr End Function <DllImport("kernel32.dll", SetlastError:=True)> Private Shared Function CloseHandle(ByVal hObject As IntPtr) As Boolean End Function <DllImport("kernel32.dll", SetlastError:=True)> Public Shared Function GetCommModemStatus(ByVal hFile As IntPtr, ByRef lpModemStatus As Int32) As Boolean End Function <DllImport("kernel32.dll", SetlastError:=True)> Private Shared Function SetEvent(ByVal hEvent As IntPtr) As Boolean End Function <DllImport("kernel32.dll", SetlastError:=True, CharSet:=CharSet.Auto)> Private Shared Function CreateEvent(ByVal lpEventAttributes As IntPtr, ByVal bManualReset As Int32, ByVal bInitialState As Int32, ByVal lpName As String) As IntPtr End Function <DllImport("kernel32.dll", SetlastError:=True)> Private Shared Function WaitForSingleObject(ByVal hHandle As IntPtr, ByVal dwMilliseconds As Int32) As Int32 End Function <DllImport("kernel32.dll", SetlastError:=True)> Private Shared Function GetOverlappedResult(ByVal hFile As IntPtr, ByRef lpOverlapped As OVERLAPPED, ByRef lpNumberOfBytesTransferred As Int32, ByVal bWait As Int32) As Int32

211
End Function <DllImport("kernel32.dll", SetlastError:=True)> Private Shared Function SetCommMask(ByVal hFile As IntPtr, ByVal lpEvtMask As Int32) As Int32 End Function <DllImport("kernel32.dll", SetlastError:=True, CharSet:=CharSet.Auto)> Private Shared Function GetDefaultCommConfig(ByVal lpszName As String, ByRef lpCC As COMMCONFIG, ByRef lpdwSize As Integer) As Boolean End Function <DllImport("kernel32.dll", SetlastError:=True)> Private Shared Function SetCommBreak(ByVal hFile As IntPtr) As Boolean End Function <DllImport("kernel32.dll", SetlastError:=True)> Private Shared Function ClearCommBreak(ByVal hFile As IntPtr) As Boolean End Function #End Region #Region "Events" Public Event CommEvent As CommEventHandler #End Region #Region "Delegates" Public Delegate Sub CommEventHandler(ByVal source As Rs232, ByVal Mask As EventMasks) #End Region Public Property Port() As Integer '=================================================== ' ' Description : Comunication Port ' Created : 21/09/2001 - 11:25:49 ' ' *Parameters Info* ' ' Notes : '=================================================== Get Return miPort End Get Set(ByVal Value As Integer) miPort = Value End Set End Property Public Sub PurgeBuffer(ByVal Mode As PurgeBuffers) '=================================================== ' ©2003 ALSTOM FIR S.p.A All rights reserved ' ' Description : Purge Communication Buffer ' Created : 01/09/03 - 10:37:39

212
' Author : Corrado Cavalli ' ' *Parameters Info* ' ' Notes : This method will clear any character into buffer, use TxAbort/RxAbort ' to terminate any pending overlapped Tx/Rx operation. '=================================================== If (mhRS.ToInt32 > 0) Then PurgeComm(mhRS, Mode) End Sub Public Overridable Property Timeout() As Integer '=================================================== ' ' Description: Comunication timeout in seconds ' Created : 21/09/2001 - 11:26:50 ' ' *Parameters Info* ' ' Notes : '=================================================== Get Return miTimeout End Get Set(ByVal Value As Integer) miTimeout = CInt(IIf(Value = 0, 500, Value)) '// If Port is open updates it on the fly pSetTimeout() End Set End Property Public Property Parity() As DataParity '=================================================== ' ' Description : Comunication parity ' Created : 21/09/2001 - 11:27:15 ' ' *Parameters Info* ' ' Notes : '=================================================== Get Return meParity End Get Set(ByVal Value As DataParity) meParity = Value End Set End Property Public Property StopBit() As DataStopBit

213
'=================================================== ' ' Description: Comunication StopBit ' Created : 21/09/2001 - 11:27:37 ' ' *Parameters Info* ' ' Notes : '=================================================== Get Return meStopBit End Get Set(ByVal Value As DataStopBit) meStopBit = Value End Set End Property Public Property BaudRate() As Integer '=================================================== ' ' Description: Comunication BaudRate ' Created : 21/09/2001 - 11:28:00 ' ' *Parameters Info* ' ' Notes : '=================================================== Get Return miBaudRate End Get Set(ByVal Value As Integer) miBaudRate = Value End Set End Property Public Property DataBit() As Integer '=================================================== ' ' Description : Comunication DataBit ' Created : 21/09/2001 - 11:28:20 ' ' *Parameters Info* ' ' Notes : '=================================================== Get Return miDataBit

214
End Get Set(ByVal Value As Integer) miDataBit = Value End Set End Property Public Property BufferSize() As Integer '=================================================== ' ' Description : Receive Buffer size ' Created : 21/09/2001 - 11:33:05 ' ' *Parameters Info* ' ' Notes : '=================================================== Get Return miBufferSize End Get Set(ByVal Value As Integer) miBufferSize = Value End Set End Property Public Overloads Sub Open() '=================================================== ' ' Description : Initializes and Opens comunication port ' Created : 21/09/2001 - 11:33:40 ' ' *Parameters Info* ' ' Notes : '=================================================== '// Get Dcb block,Update with current data Dim uDcb As DCB, iRc As Int32 '// Set working mode meMode = Mode.Overlapped Dim iMode As Int32 = Convert.ToInt32(IIf(meMode = Mode.Overlapped, FILE_FLAG_OVERLAPPED, 0)) '// Initializes Com Port If miPort > 0 Then Try '// Creates a COM Port stream handle mhRS = CreateFile("\\.\COM" & miPort.ToString, GENERIC_READ Or GENERIC_WRITE, 0, 0, OPEN_EXISTING, iMode, 0) If (mhRS.ToInt32 > 0) Then '// Clear all comunication errors Dim lpErrCode As Int32
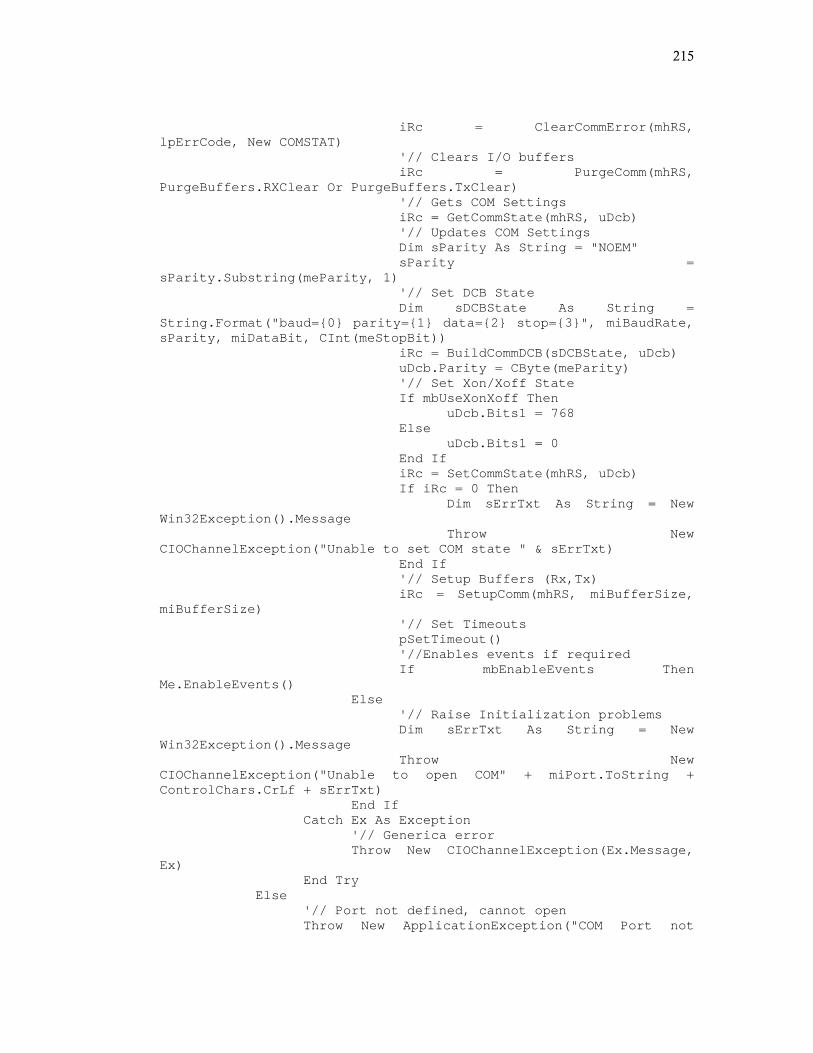
215
iRc = ClearCommError(mhRS, lpErrCode, New COMSTAT) '// Clears I/O buffers iRc = PurgeComm(mhRS, PurgeBuffers.RXClear Or PurgeBuffers.TxClear) '// Gets COM Settings iRc = GetCommState(mhRS, uDcb) '// Updates COM Settings Dim sParity As String = "NOEM" sParity = sParity.Substring(meParity, 1) '// Set DCB State Dim sDCBState As String = String.Format("baud={0} parity={1} data={2} stop={3}", miBaudRate, sParity, miDataBit, CInt(meStopBit)) iRc = BuildCommDCB(sDCBState, uDcb) uDcb.Parity = CByte(meParity) '// Set Xon/Xoff State If mbUseXonXoff Then uDcb.Bits1 = 768 Else uDcb.Bits1 = 0 End If iRc = SetCommState(mhRS, uDcb) If iRc = 0 Then Dim sErrTxt As String = New Win32Exception().Message Throw New CIOChannelException("Unable to set COM state " & sErrTxt) End If '// Setup Buffers (Rx,Tx) iRc = SetupComm(mhRS, miBufferSize, miBufferSize) '// Set Timeouts pSetTimeout() '//Enables events if required If mbEnableEvents Then Me.EnableEvents() Else '// Raise Initialization problems Dim sErrTxt As String = New Win32Exception().Message Throw New CIOChannelException("Unable to open COM" + miPort.ToString + ControlChars.CrLf + sErrTxt) End If Catch Ex As Exception '// Generica error Throw New CIOChannelException(Ex.Message, Ex) End Try Else '// Port not defined, cannot open Throw New ApplicationException("COM Port not
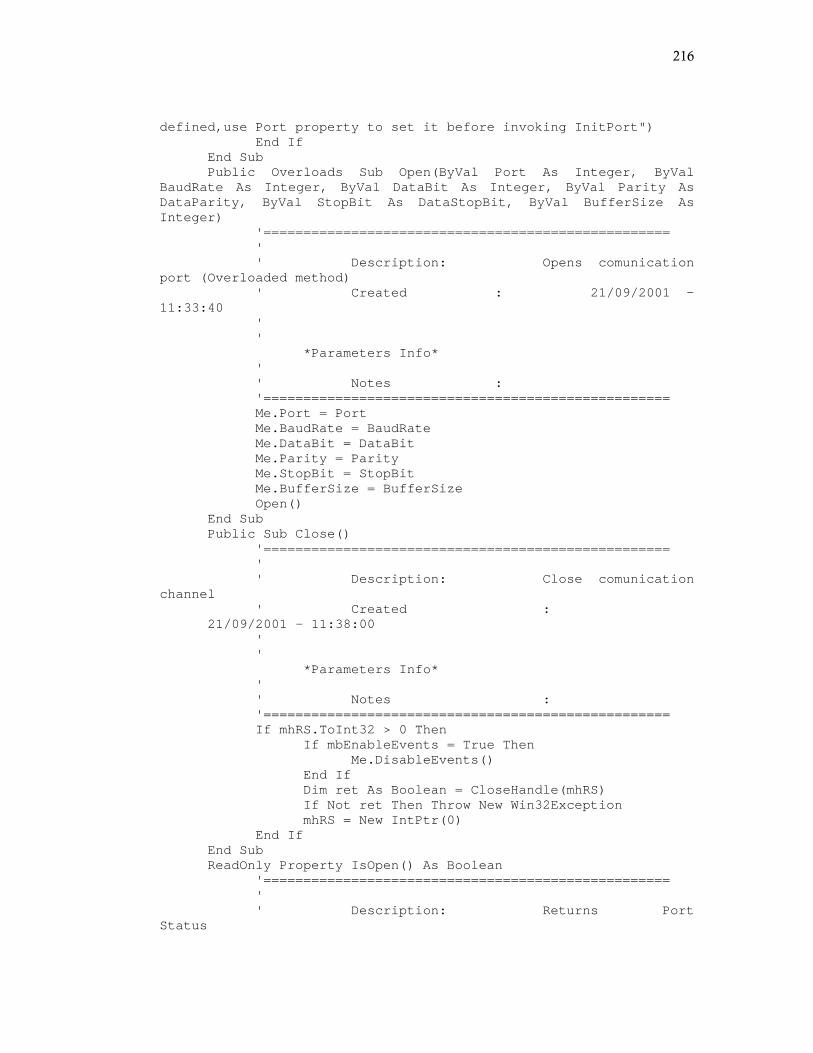
216
defined,use Port property to set it before invoking InitPort") End If End Sub Public Overloads Sub Open(ByVal Port As Integer, ByVal BaudRate As Integer, ByVal DataBit As Integer, ByVal Parity As DataParity, ByVal StopBit As DataStopBit, ByVal BufferSize As Integer) '=================================================== ' ' Description: Opens comunication port (Overloaded method) ' Created : 21/09/2001 - 11:33:40 ' ' *Parameters Info* ' ' Notes : '=================================================== Me.Port = Port Me.BaudRate = BaudRate Me.DataBit = DataBit Me.Parity = Parity Me.StopBit = StopBit Me.BufferSize = BufferSize Open() End Sub Public Sub Close() '=================================================== ' ' Description: Close comunication channel ' Created : 21/09/2001 - 11:38:00 ' ' *Parameters Info* ' ' Notes : '=================================================== If mhRS.ToInt32 > 0 Then If mbEnableEvents = True Then Me.DisableEvents() End If Dim ret As Boolean = CloseHandle(mhRS) If Not ret Then Throw New Win32Exception mhRS = New IntPtr(0) End If End Sub ReadOnly Property IsOpen() As Boolean '=================================================== ' ' Description: Returns Port Status
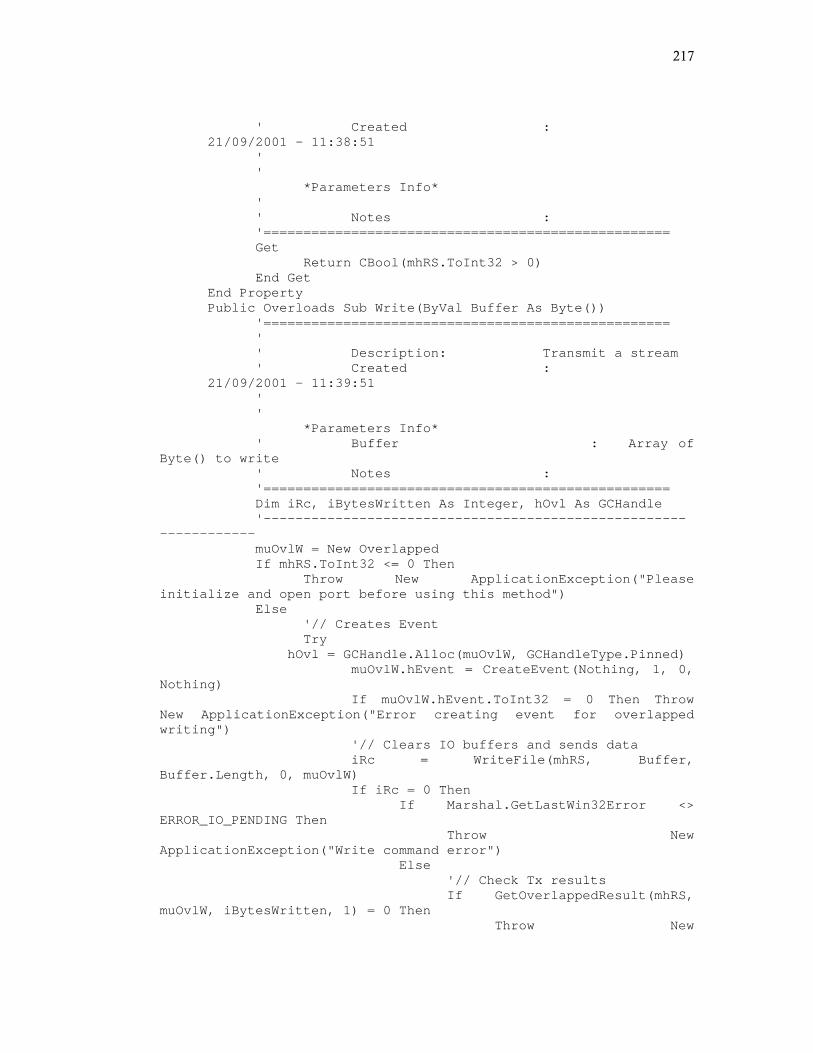
217
' Created : 21/09/2001 - 11:38:51 ' ' *Parameters Info* ' ' Notes : '=================================================== Get Return CBool(mhRS.ToInt32 > 0) End Get End Property Public Overloads Sub Write(ByVal Buffer As Byte()) '=================================================== ' ' Description: Transmit a stream ' Created : 21/09/2001 - 11:39:51 ' ' *Parameters Info* ' Buffer : Array of Byte() to write ' Notes : '=================================================== Dim iRc, iBytesWritten As Integer, hOvl As GCHandle '----------------------------------------------------------------- muOvlW = New Overlapped If mhRS.ToInt32 <= 0 Then Throw New ApplicationException("Please initialize and open port before using this method") Else '// Creates Event Try hOvl = GCHandle.Alloc(muOvlW, GCHandleType.Pinned) muOvlW.hEvent = CreateEvent(Nothing, 1, 0, Nothing) If muOvlW.hEvent.ToInt32 = 0 Then Throw New ApplicationException("Error creating event for overlapped writing") '// Clears IO buffers and sends data iRc = WriteFile(mhRS, Buffer, Buffer.Length, 0, muOvlW) If iRc = 0 Then If Marshal.GetLastWin32Error <> ERROR_IO_PENDING Then Throw New ApplicationException("Write command error") Else '// Check Tx results If GetOverlappedResult(mhRS, muOvlW, iBytesWritten, 1) = 0 Then Throw New
218
ApplicationException("Write pending error") Else '// All bytes sent? If iBytesWritten <> Buffer.Length Then Throw New ApplicationException("Write Error - Bytes Written " & iBytesWritten.ToString & " of " & Buffer.Length.ToString) End If End If End If Finally '//Closes handle CloseHandle(muOvlW.hEvent) If (hOvl.IsAllocated = True) Then hOvl.Free() End Try End If End Sub Public Overloads Sub Write(ByVal Buffer As String) '=================================================== ' ' Description : Writes a string to RS232 ' Created : 04/02/2002 - 8:46:42 ' ' *Parameters Info* ' ' Notes : 24/05/2002 Fixed problem with ASCII Encoding '=================================================== Dim oEncoder As New System.Text.ASCIIEncoding Dim oEnc As Encoding = oEncoder.GetEncoding(1252) '------------------------------------------------------------- Dim aByte() As Byte = oEnc.GetBytes(Buffer) Me.Write(aByte) End Sub Public Function Read(ByVal Bytes2Read As Integer) As Integer '=================================================== ' ' Description: Read Bytes from Port ' Created : 21/09/2001 - 11:41:17 ' ' *Parameters Info* ' Bytes2Read : Bytes to read from port ' Returns : Number of readed chars ' ' Notes : '=================================================== Dim iReadChars, iRc As Integer, bReading As Boolean,

219
hOvl As GCHandle '-------------------------------------------------------------- '// If Bytes2Read not specified uses Buffersize If Bytes2Read = 0 Then Bytes2Read = InBufferCount 'miBufferSize muOvlR = New Overlapped If mhRS.ToInt32 <= 0 Then Throw New ApplicationException("Please initialize and open port before using this method") Else '// Get bytes from port Try hOvl = GCHandle.Alloc(muOvlR, GCHandleType.Pinned) muOvlR.hEvent = CreateEvent(Nothing, 1, 0, Nothing) If muOvlR.hEvent.ToInt32 = 0 Then Throw New ApplicationException("Error creating event for overlapped reading") '// Clears IO buffers and reads data ReDim mabtRxBuf(Bytes2Read - 1) iRc = ReadFile(mhRS, mabtRxBuf, Bytes2Read, iReadChars, muOvlR) If iRc = 0 Then If Marshal.GetLastWin32Error() <> ERROR_IO_PENDING Then Throw New ApplicationException("Read pending error") Else '// Wait for characters iRc = WaitForSingleObject(muOvlR.hEvent, miTimeout) Select Case iRc Case WAIT_OBJECT_0 '// Some data received... If GetOverlappedResult(mhRS, muOvlR, iReadChars, 0) = 0 Then Throw New ApplicationException("Read pending error.") Else Return iReadChars End If Case WAIT_TIMEOUT Throw New IOTimeoutException("Read Timeout.") Case Else Throw New ApplicationException("General read error.") End Select End If Else Return (iReadChars) End If Finally
220
'//Closes handle CloseHandle(muOvlR.hEvent) If (hOvl.IsAllocated) Then hOvl.Free() End Try End If End Function Overridable ReadOnly Property InputStream() As Byte() '=================================================== ' ' Description: Returns received data as Byte() ' Created : 21/09/2001 - 11:45:06 ' ' *Parameters Info* ' ' Notes : '=================================================== Get Return mabtRxBuf End Get End Property Overridable ReadOnly Property InputStreamString() As String '=================================================== ' ' Description : Return a string containing received data ' Created : 04/02/2002 - 8:49:55 ' ' *Parameters Info* ' ' Notes : '=================================================== Get Dim oEncoder As New System.Text.ASCIIEncoding Dim oEnc As Encoding = oEncoder.GetEncoding(1252) '------------------------------------------------------------- If Not Me.InputStream Is Nothing Then Return oEnc.GetString(Me.InputStream) End Get End Property Public Sub ClearInputBuffer() '=================================================== ' ' Description: Clears Input buffer ' Created : 21/09/2001 - 11:45:34 ' ' *Parameters Info*
221
' ' Notes : Gets all character until end of buffer '=================================================== If mhRS.ToInt32 > 0 Then PurgeComm(mhRS, PURGE_RXCLEAR) End If End Sub Public WriteOnly Property Rts() As Boolean '=================================================== ' ' Description: Set/Resets RTS Line ' Created : 21/09/2001 - 11:45:34 ' ' *Parameters Info* ' ' Notes : '=================================================== Set(ByVal Value As Boolean) If mhRS.ToInt32 > 0 Then If Value Then EscapeCommFunction(mhRS, Lines.SetRts) Else EscapeCommFunction(mhRS, Lines.ClearRts) End If End If End Set End Property Public WriteOnly Property Dtr() As Boolean '=================================================== ' ' Description: Set/Resets DTR Line ' Created : 21/09/2001 - 11:45:34 ' ' *Parameters Info* ' ' Notes : '=================================================== Set(ByVal Value As Boolean) If mhRS.ToInt32 > 0 Then If Value Then EscapeCommFunction(mhRS, Lines.SetDtr) Else EscapeCommFunction(mhRS, Lines.ClearDtr)
222
End If End If End Set End Property Public ReadOnly Property ModemStatus() As ModemStatusBits '=================================================== ' ' Description : Gets Modem status ' Created : 28/02/2002 - 8:58:04 ' ' *Parameters Info* ' ' Notes : '=================================================== Get If mhRS.ToInt32 <= 0 Then Throw New ApplicationException("Please initialize and open port before using this method") Else '// Retrieve modem status Dim lpModemStatus As Int32 If Not GetCommModemStatus(mhRS, lpModemStatus) Then Throw New ApplicationException("Unable to get modem status") Else Return CType(lpModemStatus, ModemStatusBits) End If End If End Get End Property Public Function CheckLineStatus(ByVal Line As ModemStatusBits) As Boolean '=================================================== ' ' Description : Check status of a Modem Line ' Created : 28/02/2002 - 10:25:17 ' ' *Parameters Info* ' ' Notes : '=================================================== Return Convert.ToBoolean(ModemStatus And Line) End Function Public Property UseXonXoff() As Boolean '=================================================== ' ' Description : Set XON/XOFF mode ' Created : 26/05/2003 - 21:16:18 '
223
' *Parameters Info* ' ' Notes : '=================================================== Get Return mbUseXonXoff End Get Set(ByVal Value As Boolean) mbUseXonXoff = Value End Set End Property Public Sub EnableEvents() '=================================================== ' ' Description : Enables monitoring of incoming events ' Created : 15/07/2003 - 12:00:56 ' ' *Parameters Info* ' ' Notes : '=================================================== If mhRS.ToInt32 <= 0 Then Throw New ApplicationException("Please initialize and open port before using this method") Else If moEvents Is Nothing Then mbEnableEvents = True moEvents = New Thread(AddressOf pEventsWatcher) moEvents.IsBackground = True moEvents.Start() End If End If End Sub Public Sub DisableEvents() '=================================================== ' ' Description : Disables monitoring of incoming events ' Created : 15/07/2003 - 12:00:56 ' ' *Parameters Info* ' ' Notes : '=================================================== If mbEnableEvents = True Then SyncLock Me mbEnableEvents = False '// This should kill the thread End SyncLock '// Let WaitCommEvent exit...
224
If muOvlE.hEvent.ToInt32 <> 0 Then SetEvent(muOvlE.hEvent) moEvents = Nothing End If End Sub Public Property RxBufferThreshold() As Int32 '=================================================== ' ©2003 www.codeworks.it All rights reserved ' ' Description : Numer of characters into input buffer ' Created : 16/07/03 - 9:00:57 ' Author : Corrado Cavalli ' ' *Parameters Info* ' ' Notes : '=================================================== Get Return miBufThreshold End Get Set(ByVal Value As Int32) miBufThreshold = Value End Set End Property Public Shared Function IsPortAvailable(ByVal portNumber As Int32) As Boolean '=================================================== ' ©2003 www.codeworks.it All rights reserved ' ' Description : Returns true if a specific port number is supported by the system ' Created : 14/09/03 - 17:00:57 ' Author : Corrado Cavalli ' ' *Parameters Info* ' portNumber : port number to check ' ' Notes : '=================================================== If portNumber <= 0 Then Return False Else Dim cfg As COMMCONFIG Dim cfgsize As Int32 = Marshal.SizeOf(cfg) cfg.dwSize = cfgsize Dim ret As Boolean = GetDefaultCommConfig("COM" + portNumber.ToString, cfg, cfgsize) Return ret End If End Function Public Sub SetBreak()
225
'=================================================== ' ©2003 www.codeworks.it All rights reserved ' ' Description : Set COM in break modem ' Created : 12/10/03 - 10:00:57 ' Author : Corrado Cavalli ' ' *Parameters Info* ' ' ' Notes : '=================================================== If mhRS.ToInt32 > 0 Then If SetCommBreak(mhRS) = False Then Throw New Win32Exception End If End Sub Public Sub ClearBreak() '=================================================== ' ©2003 www.codeworks.it All rights reserved ' ' Description : Clear COM break mode ' Created : 12/10/03 - 10:02:57 ' Author : Corrado Cavalli ' ' *Parameters Info* ' ' ' Notes : '=================================================== If mhRS.ToInt32 > 0 Then If ClearCommBreak(mhRS) = False Then Throw New Win32Exception End If End Sub Public ReadOnly Property InBufferCount() As Int32 '=================================================== ' ©2003 www.codeworks.it All rights reserved ' ' Description : Returns the number of bytes inside Rx buffer ' Created : 20/04/05 - 10:02:57 ' Author : Corrado Cavalli/Jean-Pierre ZANIER ' ' '=================================================== Get Dim comStat As COMSTAT Dim lpErrCode As Int32
226
Dim iRc As Int32 comStat.cbInQue = 0 If mhRS.ToInt32 > 0 Then iRc = ClearCommError(mhRS, lpErrCode, comStat) Return comStat.cbInQue End If Return 0 End Get End Property #Region "Finalize" Protected Overrides Sub Finalize() '=================================================== ' ' Description : Closes COM port if object is garbage collected and still owns ' COM port reosurces ' ' Created : 27/05/2002 - 19:05:56 ' ' *Parameters Info* ' ' Notes : '=================================================== Try If Not mbDisposed Then If mbEnableEvents Then Me.DisableEvents() Close() End If Finally MyBase.Finalize() End Try End Sub #End Region #Region "Private Routines" Private Sub pSetTimeout() '=================================================== ' ' Description: Set comunication timeouts ' Created : 21/09/2001 - 11:46:40 ' ' *Parameters Info* ' ' Notes : '=================================================== Dim uCtm As COMMTIMEOUTS '// Set ComTimeout If mhRS.ToInt32 <= 0 Then Exit Sub
227
Else '// Changes setup on the fly With uCtm .ReadIntervalTimeout = 0 .ReadTotalTimeoutMultiplier = 0 .ReadTotalTimeoutConstant = miTimeout .WriteTotalTimeoutMultiplier = 10 .WriteTotalTimeoutConstant = 100 End With SetCommTimeouts(mhRS, uCtm) End If End Sub Private Sub pDispose() Implements IDisposable.Dispose '=================================================== ' ' Description : Handles correct class disposing Write ' Created : 27/05/2002 - 19:03:06 ' ' *Parameters Info* ' ' Notes : '=================================================== If (Not mbDisposed AndAlso (mhRS.ToInt32 > 0)) Then '// Closes Com Port releasing resources Try Me.Close() Finally mbDisposed = True '// Suppress unnecessary Finalize overhead GC.SuppressFinalize(Me) End Try End If End Sub Private Sub pEventsWatcher() '=================================================== ' ©2003 www.codeworks.it All rights reserved ' ' Description : Watches for all events raising events when they arrive to the port ' Created : 15/07/03 - 11:45:13 ' Author : Corrado Cavalli ' ' *Parameters Info* ' ' Notes : '=================================================== '// Events to watch Dim lMask As EventMasks = EventMasks.Break Or EventMasks.CarrierDetect Or EventMasks.ClearToSend Or _ EventMasks.DataSetReady Or EventMasks.Ring Or
228
EventMasks.RxChar Or EventMasks.RXFlag Or _ EventMasks.StatusError Dim lRetMask As EventMasks, iBytesRead, iTotBytes, iErrMask As Int32, iRc As Int32, aBuf As New ArrayList Dim uComStat As COMSTAT '----------------------------------- '// Creates Event muOvlE = New Overlapped Dim hOvlE As GCHandle = GCHandle.Alloc(muOvlE, GCHandleType.Pinned) muOvlE.hEvent = CreateEvent(Nothing, 1, 0, Nothing) If muOvlE.hEvent.ToInt32 = 0 Then Throw New ApplicationException("Error creating event for overlapped reading") '// Set mask SetCommMask(mhRS, lMask) '// Looks for RxChar While mbEnableEvents = True WaitCommEvent(mhRS, lMask, muOvlE) Select Case WaitForSingleObject(muOvlE.hEvent, INFINITE) Case WAIT_OBJECT_0 '// Event (or abort) detected If mbEnableEvents = False Then Exit While If (lMask And EventMasks.RxChar) > 0 Then '// Read incoming data ClearCommError(mhRS, iErrMask, uComStat) If iErrMask = 0 Then Dim ovl As New Overlapped Dim hOvl As GCHandle = GCHandle.Alloc(ovl, GCHandleType.Pinned) ReDim mabtRxBuf(uComStat.cbInQue - 1) If ReadFile(mhRS, mabtRxBuf, uComStat.cbInQue, iBytesRead, ovl) > 0 Then If iBytesRead > 0 Then '// Some bytes read, fills temporary buffer If iTotBytes < miBufThreshold Then aBuf.AddRange(mabtRxBuf) iTotBytes += iBytesRead End If '// Threshold reached?, raises event If iTotBytes >= miBufThreshold Then '//Copies temp buffer into Rx buffer ReDim mabtRxBuf(iTotBytes - 1) aBuf.CopyTo(mabtRxBuf) '// Raises event Try
229
Me.OnCommEventReceived(Me, lMask) Finally iTotBytes = 0 aBuf.Clear() End Try End If End If End If If (hOvl.IsAllocated) Then hOvl.Free() End If Else '// Simply raises OnCommEventHandler event Me.OnCommEventReceived(Me, lMask) End If Case Else Dim sErr As String = New Win32Exception().Message Throw New ApplicationException(sErr) End Select End While '// Release Event Handle CloseHandle(muOvlE.hEvent) muOvlE.hEvent = IntPtr.Zero If (hOvlE.IsAllocated) Then hOvlE.Free() muOvlE = Nothing End Sub #End Region #Region "Protected Routines" Protected Sub OnCommEventReceived(ByVal source As Rs232, ByVal mask As EventMasks) '=================================================== ' ©2003 www.codeworks.it All rights reserved ' ' Description : Raises CommEvent ' Created : 15/07/03 - 15:09:50 ' Author : Corrado Cavalli ' ' *Parameters Info* ' ' Notes : '=================================================== Dim del As CommEventHandler = Me.CommEventEvent If (Not del Is Nothing) Then Dim SafeInvoker As ISynchronizeInvoke Try SafeInvoker = DirectCast(del.Target, ISynchronizeInvoke) Catch End Try
230
If (Not SafeInvoker Is Nothing) Then SafeInvoker.Invoke(del, New Object() {source, mask}) Else del.Invoke(source, mask) End If End If End Sub #End Region End Class #End Region #Region "Exceptions" Public Class CIOChannelException : Inherits ApplicationException '=================================================== ' ' Module : CChannellException ' Description: Customized Channell Exception ' Created : 17/10/2001 - 10:32:37 ' ' Notes : This exception is raised when NACK error found '=================================================== Sub New(ByVal Message As String) MyBase.New(Message) End Sub Sub New(ByVal Message As String, ByVal InnerException As Exception) MyBase.New(Message, InnerException) End Sub End Class Public Class IOTimeoutException : Inherits CIOChannelException '=================================================== ' ' Description : Timeout customized exception ' Created : 28/02/2002 - 10:43:43 ' ' *Parameters Info* ' ' Notes : '=================================================== Sub New(ByVal Message As String) MyBase.New(Message) End Sub Sub New(ByVal Message As String, ByVal InnerException As Exception) MyBase.New(Message, InnerException) End Sub End Class #End Region
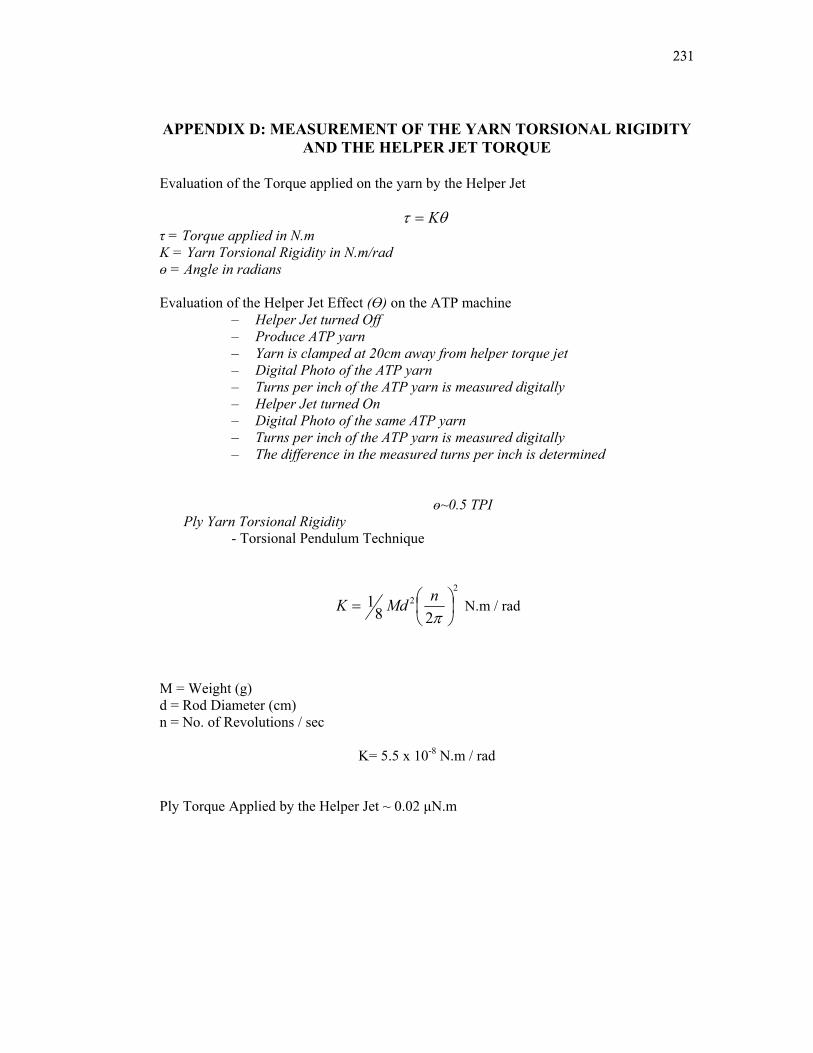
231
APPENDIX D: MEASUREMENT OF THE YARN TORSIONAL RIGIDITY AND THE HELPER JET TORQUE
Evaluation of the Torque applied on the yarn by the Helper Jet
θτ K= τ = Torque applied in N.m K = Yarn Torsional Rigidity in N.m/rad ө = Angle in radians Evaluation of the Helper Jet Effect (Ө) on the ATP machine
– Helper Jet turned Off – Produce ATP yarn – Yarn is clamped at 20cm away from helper torque jet – Digital Photo of the ATP yarn – Turns per inch of the ATP yarn is measured digitally – Helper Jet turned On – Digital Photo of the same ATP yarn – Turns per inch of the ATP yarn is measured digitally – The difference in the measured turns per inch is determined
ө~0.5 TPI Ply Yarn Torsional Rigidity
- Torsional Pendulum Technique
2
2
281 ⎟
⎠⎞
⎜⎝⎛=πnMdK N.m / rad
M = Weight (g) d = Rod Diameter (cm) n = No. of Revolutions / sec
K= 5.5 x 10⁻⁸ N.m / rad
Ply Torque Applied by the Helper Jet ~ 0.02 μN.m
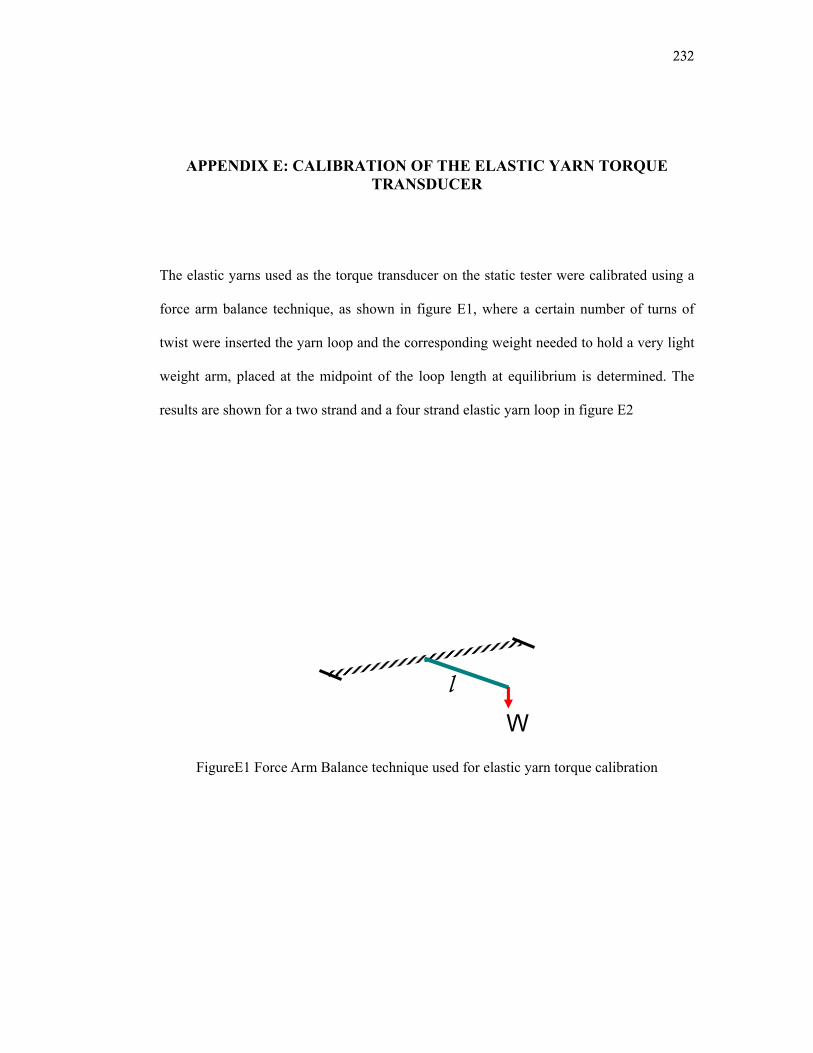
232
APPENDIX E: CALIBRATION OF THE ELASTIC YARN TORQUE TRANSDUCER
The elastic yarns used as the torque transducer on the static tester were calibrated using a
force arm balance technique, as shown in figure E1, where a certain number of turns of
twist were inserted the yarn loop and the corresponding weight needed to hold a very light
weight arm, placed at the midpoint of the loop length at equilibrium is determined. The
results are shown for a two strand and a four strand elastic yarn loop in figure E2
FigureE1 Force Arm Balance technique used for elastic yarn torque calibration
Wl
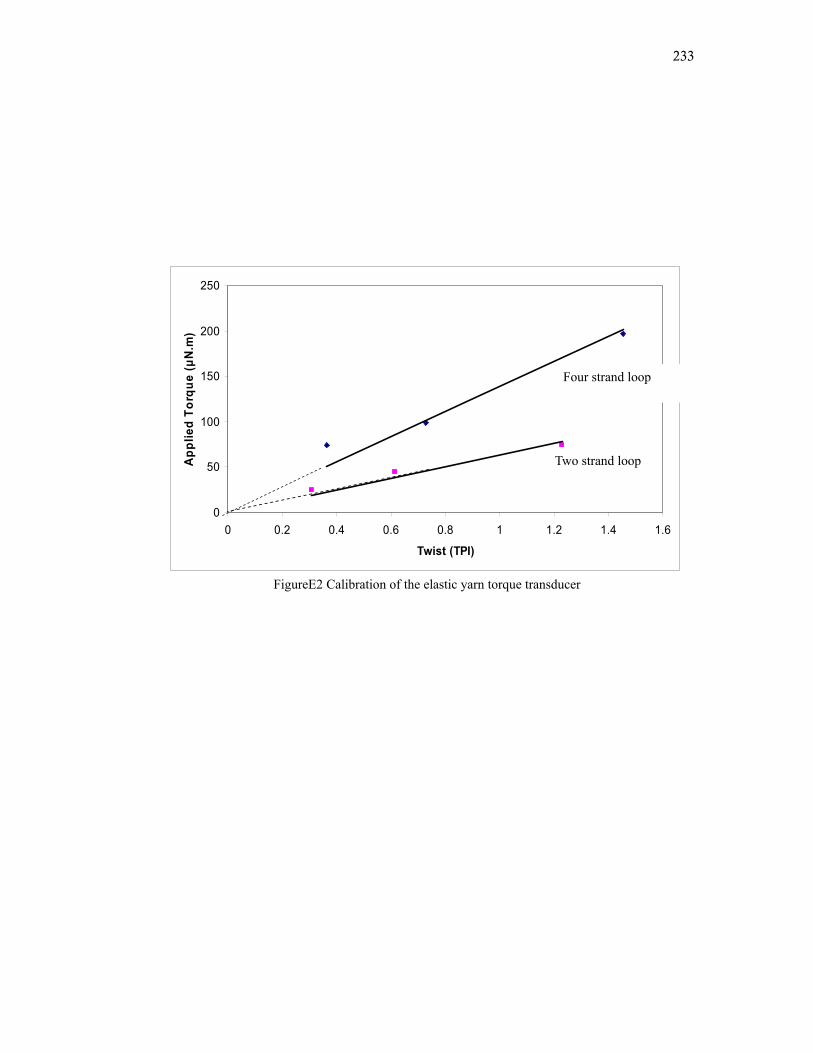
233
FigureE2 Calibration of the elastic yarn torque transducer
0
50
100
150
200
250
0 0.2 0.4 0.6 0.8 1 1.2 1.4 1.6
Twist (TPI)
App
lied
Torq
ue (μ
N.m
)
Four strand loop
Two strand loop
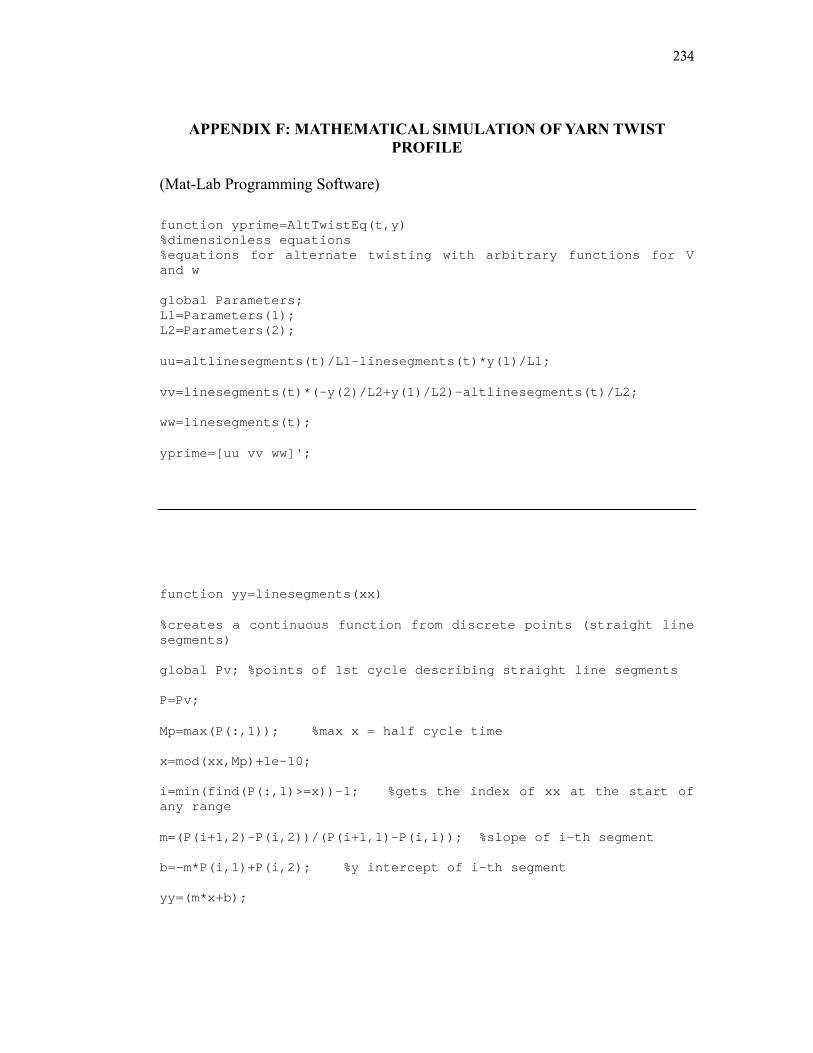
234
APPENDIX F: MATHEMATICAL SIMULATION OF YARN TWIST PROFILE
(Mat-Lab Programming Software)
function yprime=AltTwistEq(t,y) %dimensionless equations %equations for alternate twisting with arbitrary functions for V and w global Parameters; L1=Parameters(1); L2=Parameters(2); uu=altlinesegments(t)/L1-linesegments(t)*y(1)/L1; vv=linesegments(t)*(-y(2)/L2+y(1)/L2)-altlinesegments(t)/L2; ww=linesegments(t); yprime=[uu vv ww]'; function yy=linesegments(xx) %creates a continuous function from discrete points (straight line segments) global Pv; %points of 1st cycle describing straight line segments P=Pv; Mp=max(P(:,1)); %max x = half cycle time x=mod(xx,Mp)+1e-10; i=min(find(P(:,1)>=x))-1; %gets the index of xx at the start of any range m=(P(i+1,2)-P(i,2))/(P(i+1,1)-P(i,1)); %slope of i-th segment b=-m*P(i,1)+P(i,2); %y intercept of i-th segment yy=(m*x+b);
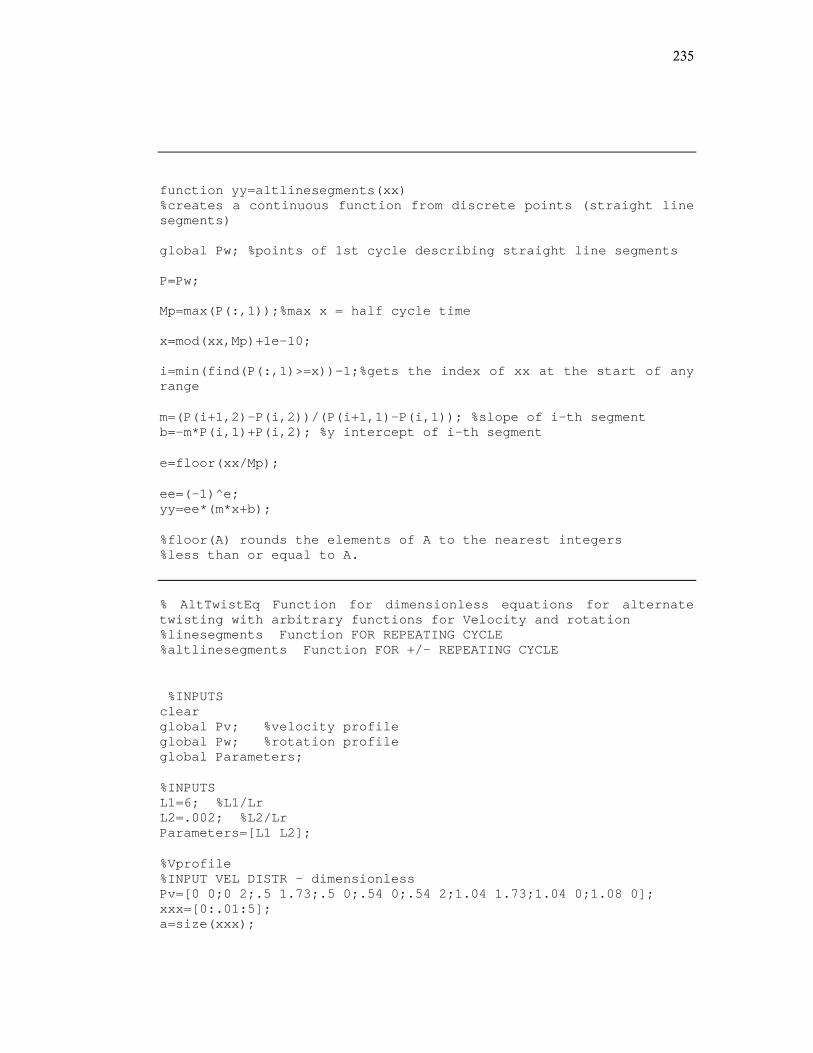
235
function yy=altlinesegments(xx) %creates a continuous function from discrete points (straight line segments) global Pw; %points of 1st cycle describing straight line segments P=Pw; Mp=max(P(:,1));%max x = half cycle time x=mod(xx,Mp)+1e-10; i=min(find(P(:,1)>=x))-1;%gets the index of xx at the start of any range m=(P(i+1,2)-P(i,2))/(P(i+1,1)-P(i,1)); %slope of i-th segment b=-m*P(i,1)+P(i,2); %y intercept of i-th segment e=floor(xx/Mp); ee=(-1)^e; yy=ee*(m*x+b); %floor(A) rounds the elements of A to the nearest integers %less than or equal to A. % AltTwistEq Function for dimensionless equations for alternate twisting with arbitrary functions for Velocity and rotation %linesegments Function FOR REPEATING CYCLE %altlinesegments Function FOR +/- REPEATING CYCLE %INPUTS clear global Pv; %velocity profile global Pw; %rotation profile global Parameters; %INPUTS L1=6; %L1/Lr L2=.002; %L2/Lr Parameters=[L1 L2]; %Vprofile %INPUT VEL DISTR - dimensionless Pv=[0 0;0 2;.5 1.73;.5 0;.54 0;.54 2;1.04 1.73;1.04 0;1.08 0]; xxx=[0:.01:5]; a=size(xxx);

236
nx=a(2); for i=1:nx; V(i)=linesegments(xxx(i)); end %RotationProfile %INPUT ROTATION DISTR - dimensionless Pw=[0 0;0 1;.5 1;.5 0;0.54 0]; xx=[0:.01:5]; a=size(xx); nx=a(2); for i=1:nx; w(i)=altlinesegments(xx(i)); %altlinesegments reverses the sign for each half cycle of inputs) end refresh %COMPUTATION PARAMETERS DeltaT=10; %total time (d'mless time) tspan=[0 DeltaT]; %range of calculation y0=[0;0;0]; %initial conditions for differential equation [t,y]=ode23s('AltTwistEq',tspan, y0); %Stiff INTEGRATOR - Solution of differential equation plot(y(:,3),y(:,2)) axis([0 10 -4 4]); title('Yarn Twist Distribution - dimensionless'); figure; plot(xx,w) axis([-.01 1.01 -2 2]); title('Rotation Profile - dimensionless'); figure; plot(xxx,V) axis([-.01 1.01 0 3]); title('Velocity Profile - dimensionless');
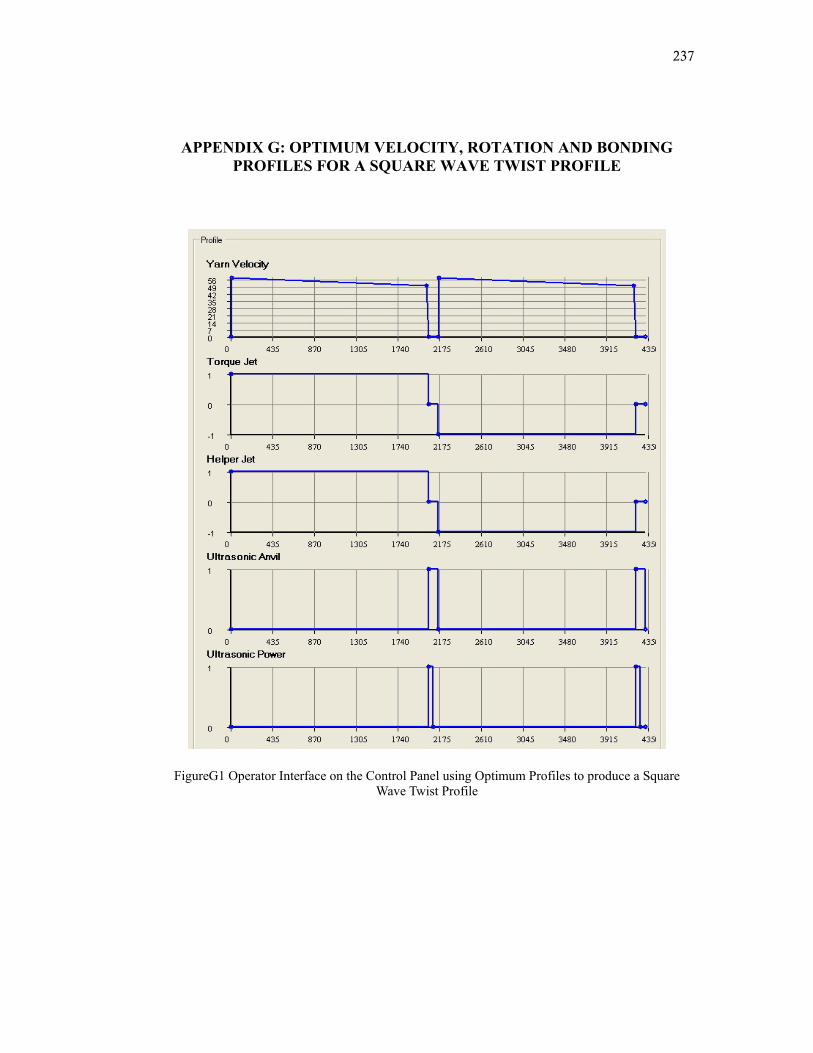
237
APPENDIX G: OPTIMUM VELOCITY, ROTATION AND BONDING
PROFILES FOR A SQUARE WAVE TWIST PROFILE
FigureG1 Operator Interface on the Control Panel using Optimum Profiles to produce a Square Wave Twist Profile

238
FigureG2 Data Entry points for the Optimum Yarn Velocity Profile
FigureG3 Data Entry points for the Optimum Main Jet Rotational Profile
FigureG4 Data Entry points for the Optimum Helper Jet Rotational Profile

239
FigureG5 Data Entry points for the Optimum Ultrasonic Anvil Profile
FigureG6 Data Entry points for the Optimum Ultrasonic Activation Profile
240
APPENDIX H: EFFECT OF ATP YARN TWIST EFFICIENCY ON BULK
Experimental Procedure:
1. BCF 1245 denier Single BCF Nylon yarns of different Twist levels were prepared.
2. Each Singles yarn is folded in two, without allowing to self ply and then plied to a
fixed ply twist level. This produces ply yarn samples with different twist efficiencies.
3. The ply yarn length and diameter of each sample is measured digitally by taking
photos along the yarn sample length. An average of reading is taken
4. The ply yarns are then soaked in boiling water for 15 min to simulate the steaming
process used for carpet yarns.
5. The ply yarns are allowed to dry at room temperature for 24 hrs.
6. The ply yarn length and diameter of each sample is measured again after boiling. An
average of reading is taken
7. The Specific Volume of each yarn is calculated from the average ply yarn length and
diameter after boiling. The ratio of the specific yarn volume to the specific fiber
volume is calculated.
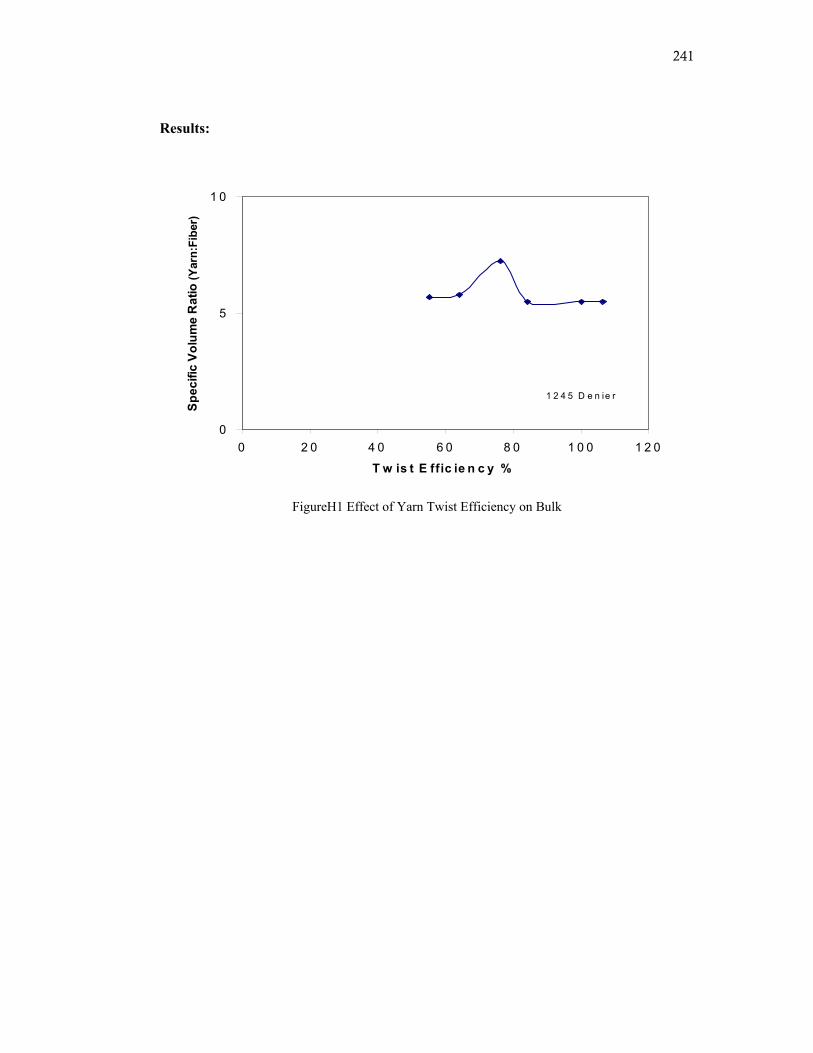
241
Results:
FigureH1 Effect of Yarn Twist Efficiency on Bulk
0
5
1 0
0 2 0 4 0 6 0 8 0 1 0 0 1 2 0
T w is t E ffic ie n c y %
Spec
ific
Volu
me
Rat
io (Y
arn:
Fibe
r)
1 2 4 5 D e n ie r

242
APPENDIX I: LIST OF SYMBOLS
ds = Singles Yarn Diameter(m) Ө=Half Yarn Convergence Angle (degrees) q= Ply helix angle (degrees) Φs= Singles Yarn twist (rad/inch) Φp= Ply Yarn twist (rad/inch) ts= Singles Yarn twist (turns/m) tp= Ply Yarn twist (turns/m) E = Singles Yarn Modulus of Elasticity (N/m2) G = Singles Yarn Shear Modulus (N/m2) Tp = Ply yarn Tension (Kgf) Ts = Singles yarn Tension (Kgf) τs = Singles Yarn torque (N.m) τp = Added Ply torque(N.m) US = Singles strain energy/ unit length of singles (N) Up = Ply strain energy / unit length of ply (N) δSs = Unit length of Singles Yarn (m) δSp = Unit length of Ply Yarn(m) I = Moment of Inertia (m4) Ip = Polar Moment of Inertia (m4) A = Singles Yarn cross sectional area (m2) є = Singles yarn tensile strain (%)
ρ= Radius of Curvature(m)

243
APPENDIX J: LIST OF DIMENSIONLESS VARIABLES
Dimensionless Ply Twist = spp dtt =ˆ
Dimensionless Singles Twist = sss dtt =ˆ
Dimensionless Modulus = P
s
TEdE
2ˆ =
Dimensionless Singles Tension = P
sS T
TT =ˆ
Dimensionless Singles Torque = sP
ss dT
ττ =ˆ
Dimensionless Ply Torque = sP
pp dT
ττ =ˆ
Dimensionless Singles strain energy = P
sS T
UU =ˆ
Dimensionless Ply strain energy = P
pp T
UU =ˆ
244
VITA
Name: Donia Said Elkhamy Place and Date of Birth: Alexandria, Egypt, 09/19/1979 Citizenship: USA, Egypt Education: • Ph.D. in Materials Science and Engineering, Drexel University, Philadelphia, PA, (2004-2007) • Ph.D. in Fiber and Polymer Science (Incomplete), North Carolina State University, Raleigh, NC,
(2003-2004) • M.S in Textile Engineering, Faculty of Engineering, Alexandria University, Egypt, (2000-2003) • B.S in Textile Engineering (Weaving Major), Faculty of Engineering, Alexandria University,
Egypt, (1996-2000) Professional and Teaching Experience: • Research Assistant, Electro-Spinning of Wool Nano-fibers for Biomedical Applications, Materials
Engineering, Drexel Univ. (2005) • Research Assistant, Very Light Weight High Tenacity Fabric for the High Altitude Airship
Program, MDA Phase I SBIR Program, Topic # MDA 04-160, Materials Eng, Drexel Univ,(2005) • Research Assistant, Fiber Orientation of Non-woven Fabrics using Electro-static Fields, North
Carolina State Univ., (2003-2004) • Teaching Assistant, College of Engineering, Alexandria University. (Sept 00-June 03) • Research in Application of Artificial Neural Networks to predict Knitted fabric Properties;
Alexandria University, Egypt, (2000-2003) • Training at SSM Company, Horgen, Switzerland, for manufacturing Yarn Winding Machines,
(07/99-09/99)
Publications: • Elkhamy, Popper, Yngve, Li & Ko, US Patent, Drexel Docket # 07-0792D: Alternate twist ply
yarn with low residual twist and method of manufacture, May, 4, 2007 • Elkhamy, Popper, Yngve & Ko, Alternate Twist Ply (ATP) Yarn Technology: Process Modeling
and Optimization, The Fiber Society 2007 Spring Conf., Greenville, SC, May 2007 • Elkhamy, Popper, Yngve & Ko, Introduction to Pneumatic Alternate Twist Ply (ATP) Yarn
Technology, The 35th Textile Research Symposium, Hangzhou, China, August 2006 • Elkhamy, Li, Ko, US Patent, Drexel Docket # 05-0625D, Regenerated Ultrafine wool fibers by
Electrospinning, August, 22, 2005 • Elkhamy, Atchison, Ko, Concentrically Electrospun Hollow PAN and PEO Nanofibers, Seventh
Annual Research Day, Drexel University, Philadelphia, PA, 2005 • Elkhamy, Seyam, Kim, Electro-Static Web Formation, 12th Annual NTC Forum , Hilton Head, SC,
2004 • Elkhamy, ElMeseiry, Int. Conf. of the Textile Institute, Cairo, Egypt, March 2003 • Elkhamy, ElGeheiny, Int. Conf. on Computers and Communications (ICCC’01), Omman, 2001 Professional Organizations: International Textile Institute, Manchester, England Honors and Awards: • Awarded the GAANN Fellowship for Academic year 2004/2005 • Honors of Excellence throughout my undergraduate years for being First in the Class
