proceedings - gov. bc. ca
TRANSCRIPT
27th Forum on the Geology of Industrial Minerals
Industrial Minerals of Alberta and British Columbia, Canada
Proceedings
Banff, Alberta, Canada
Sponsored by
Geological Survey Branch B.C. Ministry of Energy, Mines Alberta Geological Survey and Petroleum Resources Alberta Research Council
Open File 1991-23 Information Series 115
INDUSTRIAL MINERALS OF ALBERTA AND BRITISH COLUMBIA CANADA
Proceedings of the 27th Forum on the Geology of Industrial Minerals May 5 to May 10,1991, Banff, Alberta
Compiled and edited by: Z.D. Hora, W.N. Hamilton, B. Grant and P.D. Kelly
British Columbia Geological Survey Branch
Open File 1991-23
Alberta Geological Survey
Information Series 115
Conference Proceedings
Canadian Cataloguing in Publication Data Forum on the Geology of Industrial Metals (27th : 1991: Banff, Alta.)
Industrial minerals of Alberta and British Columbia Canada
(Open file, ISSN 0835-3530; 1991-23)
Joint publication of the British Columbia Geological Survey and the Alberta Geological Survey. - - Cf. p. ii.
Includes bibliographical references: p. ISBN 0-7718-9149-0
1. Industrial minerals - Geology - Alberta -Congresses. 2. Industrial minerals - Geology - British Columbia - Congresses. 3. Industrial minerals industry -Alberta - Congresses. 4. Industrial minerals industry -British Columbia Congresses. I. Hora, Z.D. II. British Columbia Geological Survey Branch. III. Alberta Geological Survey. IV. Title. V. Series: Open file (British Columbia. Geological Survey Branch) ; 1991-23.
TN799.5.F671991 553.6W712 C92-092040-3
VICTORIA BRITISH COLUMBIA
CANADA January 1992
Industrial Minerals Forum 1991
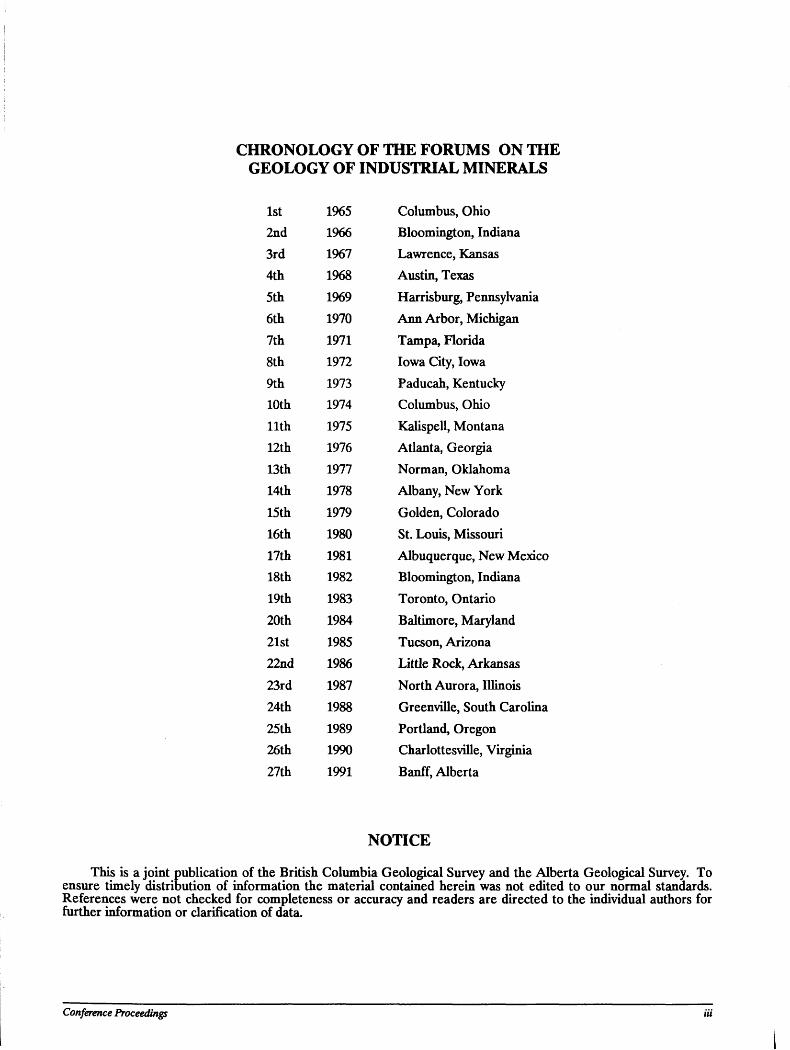
CHRONOLOGY OF THE FORUMS ON THE GEOLOGY OF INDUSTRIAL MINERALS
1st 1965 Columbus, Ohio 2nd 1966 Bloomington, Indiana
3rd 1967 Lawrence, Kansas 4th 1968 Austin, Texas 5th 1969 Harrisburg, Pennsylvania 6th 1970 Ann Arbor, Michigan 7th 1971 Tampa, Florida 8th 1972 Iowa City, Iowa 9th 1973 Paducah, Kentucky 10th 1974 Columbus, Ohio 11th 1975 Kalispell, Montana 12th 1976 Atlanta, Georgia 13th 1977 Norman, Oklahoma 14th 1978 Albany, New York
15th 1979 Golden, Colorado 16th 1980 St. Louis, Missouri 17th 1981 Albuquerque, New Mexico 18th 1982 Bloomington, Indiana 19th 1983 Toronto, Ontario 20th 1984 Baltimore, Maryland 21st 1985 Tucson, Arizona 22nd 1986 Little Rock, Arkansas 23rd 1987 North Aurora, Illinois 24th 1988 Greenville, South Carolina 25th 1989 Portland, Oregon 26th 1990 Charlottesville, Virginia 27th 1991 Banff, Alberta
NOTICE
This is a joint publication of the British Columbia Geological Survey and the Alberta Geological Survey. To ensure timely distribution of information the material contained herein was not edited to our normal standards. References were not checked for completeness or accuracy and readers are directed to the individual authors for further information or clarification of data.
Conference Proceedings Hi
I

Industrial Minerals Forum 1991
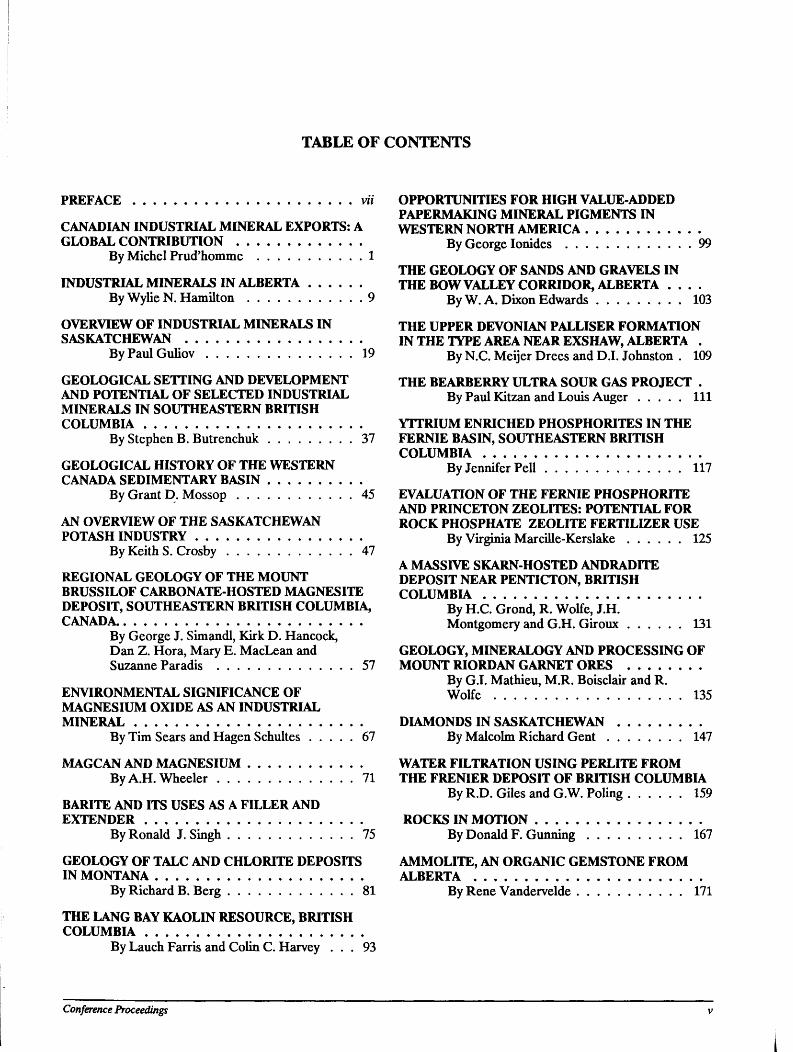
TABLE OF CONTENTS
PREFACE vii
CANADIAN INDUSTRIAL MINERAL EXPORTS: A GLOBAL CONTRIBUTION
By Michel Prud'homme 1
INDUSTRIAL MINERALS IN ALBERTA By Wylie N.Hamilton 9
OVERVIEW OF INDUSTRIAL MINERALS IN SASKATCHEWAN
ByPaulGuliov 19
GEOLOGICAL SETTING AND DEVELOPMENT AND POTENTIAL OF SELECTED INDUSTRIAL MINERALS IN SOUTHEASTERN BRITISH COLUMBIA
By Stephen B. Butrenchuk 37
GEOLOGICAL HISTORY OF THE WESTERN CANADA SEDIMENTARY BASIN
By Grant D. Mossop 45
AN OVERVIEW OF THE SASKATCHEWAN POTASH INDUSTRY
By Keith S.Crosby 47
REGIONAL GEOLOGY OF THE MOUNT BRUSSILOF CARBONATE-HOSTED MAGNESITE DEPOSIT, SOUTHEASTERN BRITISH COLUMBIA, CANADA.
By George J. Simandl, Kirk D. Hancock, Dan Z. Hora, Mary E. MacLean and Suzanne Paradis 57
ENVIRONMENTAL SIGNIFICANCE OF MAGNESIUM OXIDE AS AN INDUSTRIAL MINERAL
By Tim Sears and Hagen Schultes 67
MAGCAN AND MAGNESIUM By A.H. Wheeler 71
BARITE AND ITS USES AS A FILLER AND EXTENDER
By Ronald J. Singh 75
GEOLOGY OF TALC AND CHLORITE DEPOSITS IN MONTANA
By Richard B. Berg 81
THE LANG BAY KAOLIN RESOURCE, BRITISH COLUMBIA
By Lauch Farris and Colin C. Harvey . . . 93
OPPORTUNITIES FOR HIGH VALUE-ADDED PAPERMAKING MINERAL PIGMENTS IN WESTERN NORTH AMERICA
By George Ionides 99
THE GEOLOGY OF SANDS AND GRAVELS IN THE BOW VALLEY CORRIDOR, ALBERTA . . . .
By W. A. Dixon Edwards 103
THE UPPER DEVONIAN PALLISER FORMATION IN THE TYPE AREA NEAR EXSHAW, ALBERTA .
By N.C. Meijer Drees and D.I. Johnston . 109
THE BEARBERRY ULTRA SOUR GAS PROJECT . By Paul Kitzan and Louis Auger I l l
YTTRIUM ENRICHED PHOSPHORITES IN THE FERNIE BASIN, SOUTHEASTERN BRITISH COLUMBIA
By Jennifer Pell 117
EVALUATION OF THE FERNIE PHOSPHORITE AND PRINCETON ZEOLITES: POTENTIAL FOR ROCK PHOSPHATE ZEOLITE FERTILIZER USE
By Virginia Marcille-Kerslake 125
A MASSIVE SKARN-HOSTED ANDRADITE DEPOSIT NEAR PENTICTON, BRITISH COLUMBIA
By H.C. Grond, R. Wolfe, J.H. Montgomery and G.H. Giroux 131
GEOLOGY, MINERALOGY AND PROCESSING OF MOUNT RIORDAN GARNET ORES
By G.I. Mathieu, M.R. Boisclair and R. Wolfe 135
DIAMONDS IN SASKATCHEWAN By Malcolm Richard Gent 147
WATER FILTRATION USING PERLITE FROM THE FRENIER DEPOSIT OF BRITISH COLUMBIA
By R.D. Giles and G.W. Poling 159
ROCKS IN MOTION By Donald F. Gunning 167
AMMOLITE, AN ORGANIC GEMSTONE FROM ALBERTA
By Rene Vandervelde 171
Conference Proceedings
FOUR MARL DEPOSITS WITHIN THE SKEENA 1992 FORUM ON THE GEOLOGY OF INDUSTRIAL RIVER VALLEY, NORTHWESTERN BRITISH MINERALS, WEST VIRGINIA COLUMBIA (103I/16W, 103P/1W, 93M/5E) By Claudette M. Simard 179
ByM.L.Malott 173 APPENDIX 1: POSTER ABSTRACTS 181
APPENDIX 2: LIST OF REGISTRANTS 211
VI Industrial Minerals Forum 1991
PREFACE
The 27 th Forum on the Geology of Industrial Minerals was held in Banff, Alberta, from May 5 through May 10, 1991. For the first time in its 27 year history, the Forum had two sponsoring agencies - the Alberta Geological Survey and the British Columbia Geological Survey. The Banff location was chosen both for its attractive setting in the Canadian Rocky Mountains and because it
Erovided easy access to industrial minerals producers in oth provinces of Alberta and British Columbia. Visits
to operations were organized as three optional one-day field trips.
The Forum was attended by 150 industrial minerals specialists from Canada, the United States and Great Britain. About two thirds of the participants were from private industry and the rest were employees of various government agencies.
The Forum consisted of two full days of technical sessions with Alberta and British Columbia each sponsoring one day. The program focussed on the industrial mineral resources of the two provinces, but included contributions also from neighboring areas of Saskatchewan and Montana on some of their resources. Optional field trips covered such topics as the geology and industrial minerals of the Bow Valley between Banff and Jumping Pound in Alberta, and significant industrial minerals producers of the southern Rocky Mountain Trench in British Columbia. Over two thirds of the Forum attendees took at least one of the field trips.
The Alberta field trip visited the building stone operation of Thunderstone Quarries Ltd., and the Lafarge Canada Ltd. cement plant near Exshaw, the Continental Lime Ltd. plant and quarry, the Shell Resources Ltd. Jumping Pound gas and sulphur plant and the Burnco Rock Products Ltd. sand and gravel pit near Canmore. Field trips into British Columbia included visits to the Mount Moberly silica sand quarry and processing plant of Mountain Minerals Co. Ltd., the Nicholson lump silica quarry of Silicon Metaltech Inc., the Windermere gypsum quarries of Westroc Industries Ltd. and Mount Brussilof magnesite quarry of Baymag Mines Ltd. The gracious hospitality provided by the companies is gratefully acknowledged, most notably the explanations of individual operations provided by respective employees.
Conference Proceedings
The 27th Forum was exceptionally well supported financially. Contributions by a number of organizations helped considerably to underwrite the costs of special activities and publications. These organizations included:
Alberta Energy - Active Minerals Limited -BAYMAG - British Columbia Trade Development Corporation - Burnco Rocks Products Ltd. - Cardinal River Coal Ltd. - CN RAIL - Cominco Exploration - Continental Lime Ltd. - Inland Cement Limited - International Marble & Stone Company Ltd. - I-XL Industries Ltd. -Mountain Minerals Co. Ltd. - Canada-British Columbia Mineral Development Agreement - Society of Economic Geologists Foundation, Inc. - Tilbury Cement Limited -Trigg, Woollett, Olson Consulting Ltd. - Trimac Transportation Services Ltd. - Westroc Industries Ltd.
New-world Gemstone provided support by donating the rhodonite and jade samples for the registration package.
The support given by the Alberta Geological Survey and British Columbia Geological Survey toward the organization and hosting of the meeting is greatly appreciated. The members of the planning committee spent a considerable amount of personal time to ensure the smooth executions of the meeting's program. A special appreciation goes to Patricia D. Kelly, who performed the task of transforming the collection of manuscripts into a printable document.
And finally, a special thanks to all Forum speakers and authors, who had to find the time and resources to prepare the manuscripts and present their papers.
- Z.D. Hora, Industrial Mineral Specialist, Geological Survey Branch,
B.C. Ministry of Energy Mines and Petroleum Resources
- W.N. Hamilton, Economic Minerals Geologist Alberta Geological Survey, Alberta Research Council

Industrial Minerals Forum 1991
CANADIAN INDUSTRIAL MINERAL EXPORTS: A GLOBAL CONTRIBUTION
By Michel Prud'homme
INTRODUCTION The importance of industrial minerals to the Cana
dian economy is demonstrated in their daily, routine usage in virtually every economic activity in the country. To name just a few examples, sand and gravel, crushed stone and salt are widely used in road de-icing; acid-grade fluorspar and pharmaceutical-grade feldspar are utilized in dentistry, silica, nepheline syenite and limestone are basic materials for glass manufacture; and potash, sulphur, lime and peat moss are widely consumed by the agricultural sector. However, the extent of the contribution of industrial minerals is perhaps not as visible as that of the "glamour" metals sucn as gold, nickel and copper. Here are some figures that perhaps put the industrial minerals sector in the proper perspective.
First, production: over the last thirty years, the contribution of industrial minerals within the metal and minerals sector in Canada has ranged between 23 per cent and 36 per cent of total value of production from the Canadian mining industry; at an average of 30 per cent, industrial minerals have remained an important and stable component of the Canadian economy.
Second, employment: the industrial minerals industry operated more than 925 plants across Canada and provided some 24 700 jobs in 1990. The employment in this sector accounts for one-third of all jobs m the Canadian mining sector. The construction material segment of the industrial minerals industry employs close to 13 700 workers while the other non-metallic segment provides 11 000 jobs; the largest single employer in this latter category is the potash industry providing 3 700 jobs, followed by the asbestos industry with 2 600 jobs.
CONTRIBUTION OF INDUSTRIAL MINERALS TO CANADA
In 1989, total Canadian production of industrial minerals was valued at $5.4 billion and accounted for 0.85 per cent of the Gross Domestic Product. Exports of industrial minerals were estimated at $2.95 billion, a 2.1 per cent contribution to our total merchandise exports in 1989.
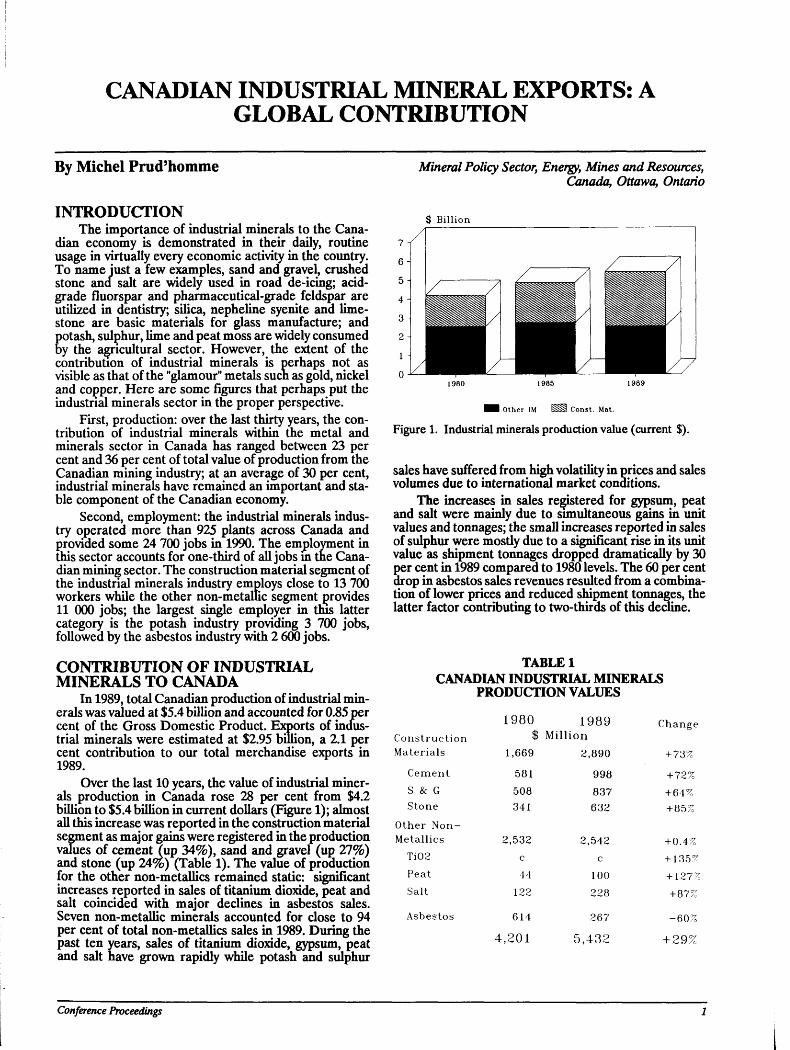
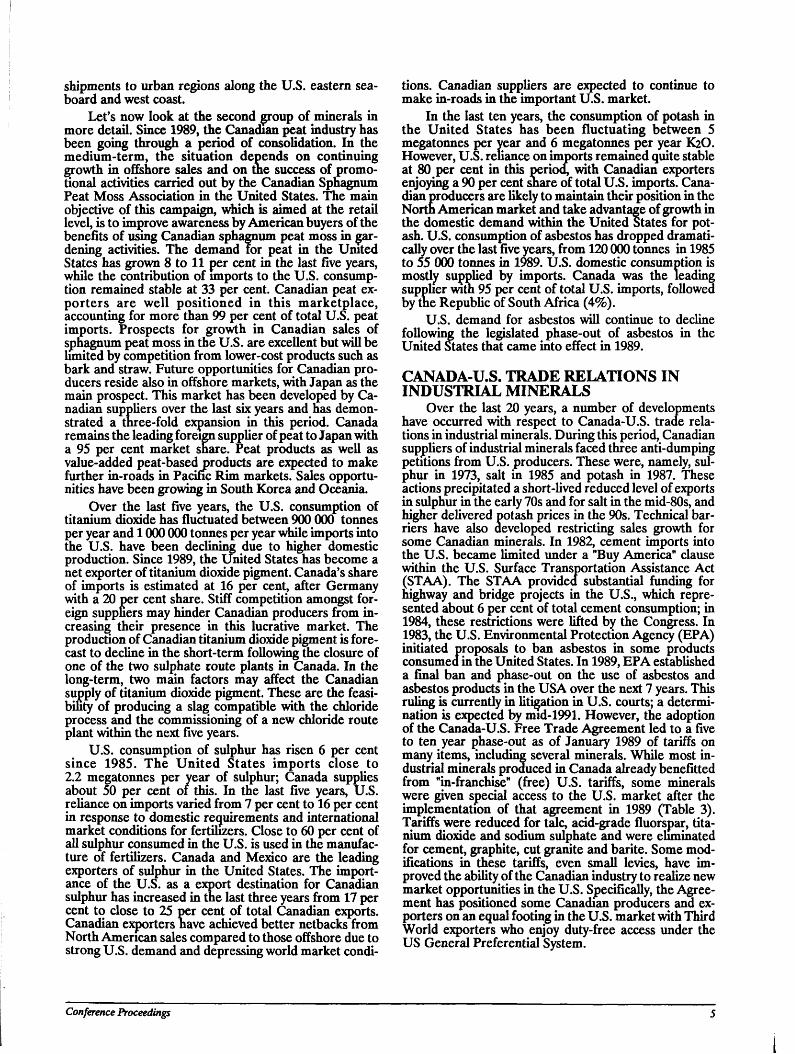
Over the last 10 years, the value of industrial minerals production in Canada rose 28 per cent from $4.2 billion to $5.4 billion in current dollars (Figure 1); almost all this increase was reported in the construction material segment as major gains were registered in the production values of cement Tup 34%), sand and gravel (up 27%) and stone (up 24%) (Table 1). The value of production for the other non-metallics remained static: significant increases reported in sales of titanium dioxide, peat and salt coincided with major declines in asbestos sales. Seven non-metallic minerals accounted for close to 94 per cent of total non-metallics sales in 1989. During the past ten years, sales of titanium dioxide, gypsum, peat and salt have grown rapidly while potash and sulphur
Mineral Policy Sector, Energy, Mines and Resources, Canada, Ottawa, Ontario
$ Billion
I H Other IM E^i Const. Mat.
Figure 1. Industrial minerals production value (current $).
sales have suffered from high volatility in prices and sales volumes due to international market conditions.
The increases in sales registered for gypsum, peat and salt were mainly due to simultaneous gains in unit values and tonnages; the small increases reported in sales of sulphur were mostly due to a significant rise in its unit value as shipment tonnages dropped dramatically by 30 per cent in 1989 compared to 1980 levels. The 60 per cent drop in asbestos sales revenues resulted from a combination of lower prices and reduced shipment tonnages, the latter factor contributing to two-thirds of this decline.
TABLE 1 CANADIAN INDUSTRIAL MINERALS
PRODUCTION VALUES
C o n s t r u c t i o n 1980
$ Mill 1989
ion Change
Mater ia ls 1,669 2,890 + 73%
C e m e n t 581 998 + 72% S & G 508 837 +64% S tone 341 632 + 85%
Other N o n -Metall ics 2,532 2,542 + 0.4%
Ti02 c c + 135% Pea t 44 100 + 127% Salt 122 228 + 87%
Asbestos 614 267 - 6 0 %
4,201 5,432 + 29%
Conference Proceedings
IMPORTANCE OF INDUSTRIAL MINERAL EXPORTS FOR CANADA
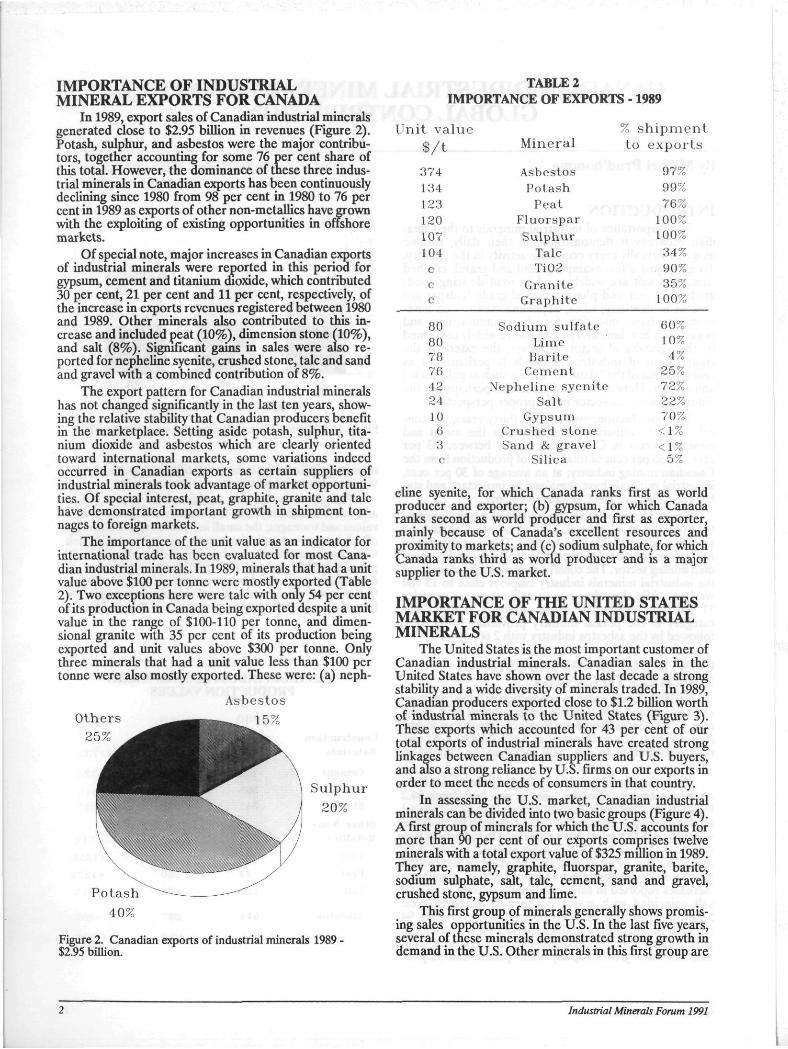
In 1989, export sales of Canadian industrial minerals generated close to $2.95 billion in revenues (Figure 2). Potash, sulphur, and asbestos were the major contributors, together accounting for some 76 per cent share of this total. However, the dominance of these three industrial minerals in Canadian exports has been continuously declining since 1980 from 98 per cent in 1980 to 76 per cent in 1989 as exports of other non-metallics have grown with the exploiting of existing opportunities in offshore markets.
Of special note, major increases in Canadian exports of industrial minerals were reported in this period for gypsum, cement and titanium dioxide, which contributed 30 per cent, 21 per cent and 11 per cent, respectively, of the increase in exports revenues registered between 1980 and 1989. Other minerals also contributed to this increase and included peat (10%), dimension stone (10%), and salt (8%). Significant gains in sales were also reported for nepheline syenite, crushed stone, talc and sand and gravel with a combined contribution of 8%.
The export pattern for Canadian industrial minerals has not changed significantly in the last ten years, showing the relative stability that Canadian producers benefit in the marketplace. Setting aside potash, sulphur, titanium dioxide and asbestos which are clearly oriented toward international markets, some variations indeed occurred in Canadian exports as certain suppliers of industrial minerals took advantage of market opportunities. Of special interest, peat, graphite, granite and talc have demonstrated important growth in shipment tonnages to foreign markets.
The importance of the unit value as an indicator for international trade has been evaluated for most Canadian industrial minerals. In 1989, minerals that had a unit value above $100 per tonne were mostly exported (Table 2). Two exceptions here were talc with only 54 per cent of its production in Canada being exported despite a unit value in the range of $100-110 per tonne, and dimensional granite with 35 per cent of its production being exported and unit values above $300 per tonne. Only three minerals that had a unit value less than $100 per tonne were also mostly exported. These were: (a) neph-
TABLE2 IMPORTANCE OF EXPORTS -1989
O t h e r s 25%
Asbes tos 15%
U n i t v a l u e % s h i p m e n t $ / t M i n e r a l t o e x p o r t s
374 Asbes to s 97% 134 P o t a s h 99% 123 P e a t 76% 120 F l u o r s p a r 100% 107 S u l p h u r 100% 104 Talc 34%
c Ti02 90% c G r a n i t e 35% c G r a p h i t e 100%
80 S o d i u m s u l f a t e 60% 80 Lime 10% 78 B a r i t e 4% 76 C e m e n t 25% 42 N e p h e l i n e s y e n i t e 72% 24 S a l t 22% 10 G y p s u m 70% 6 C r u s h e d s t o n e < 1 % 3 S a n d & g r a v e l < 1 % c Si l ica 5%
40%
Figure 2. Canadian exports of industrial minerals 1989 $2.95 billion.
eline syenite, for which Canada ranks first as world producer and exporter; (b) gypsum, for which Canada ranks second as world producer and first as exporter, mainly because of Canada's excellent resources and proximity to markets; and (ell sodium sulphate, for which Canada ranks third as world producer and is a major supplier to the U.S. market.
IMPORTANCE OF THE UNITED STATES MARKET FOR CANADIAN INDUSTRIAL MINERALS
The United States is the most important customer of Canadian industrial minerals. Canadian sales in the United States have shown over the last decade a strong stability and a wide diversity of minerals traded. In 1989, Canadian producers exported close to $1.2 billion worth of industrial minerals to the United States (Figure 3). These exports which accounted for 43 per cent of our total exports of industrial minerals have created strong linkages between Canadian suppliers and U.S. buyers, and also a strong reliance by U.S. firms on our exports in order to meet the needs of consumers in that country.
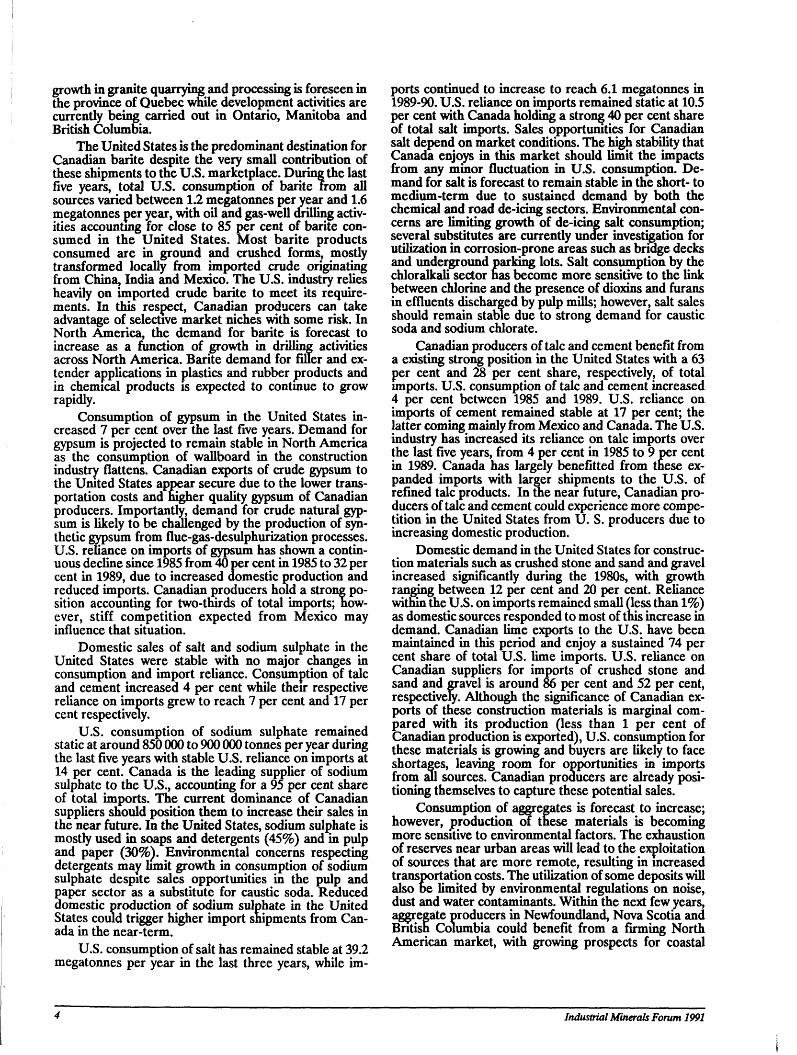
In assessing the U.S. market, Canadian industrial minerals can be divided into two basic groups (Figure 4). A first group of minerals for which the U.S. accounts for more than 90 per cent of our exports comprises twelve minerals with a total export value of $325 million in 1989. They are, namely, graphite, fluorspar, granite, barite, sodium sulphate, salt, talc, cement, sand and gravel, crushed stone, gypsum and lime.
This first group of minerals generally shows promising sales opportunities in the U.S. In the last five years, several of these minerals demonstrated strong growth in demand in the U.S. Other minerals in this first group are
2 Industrial Minerals Forum 1991
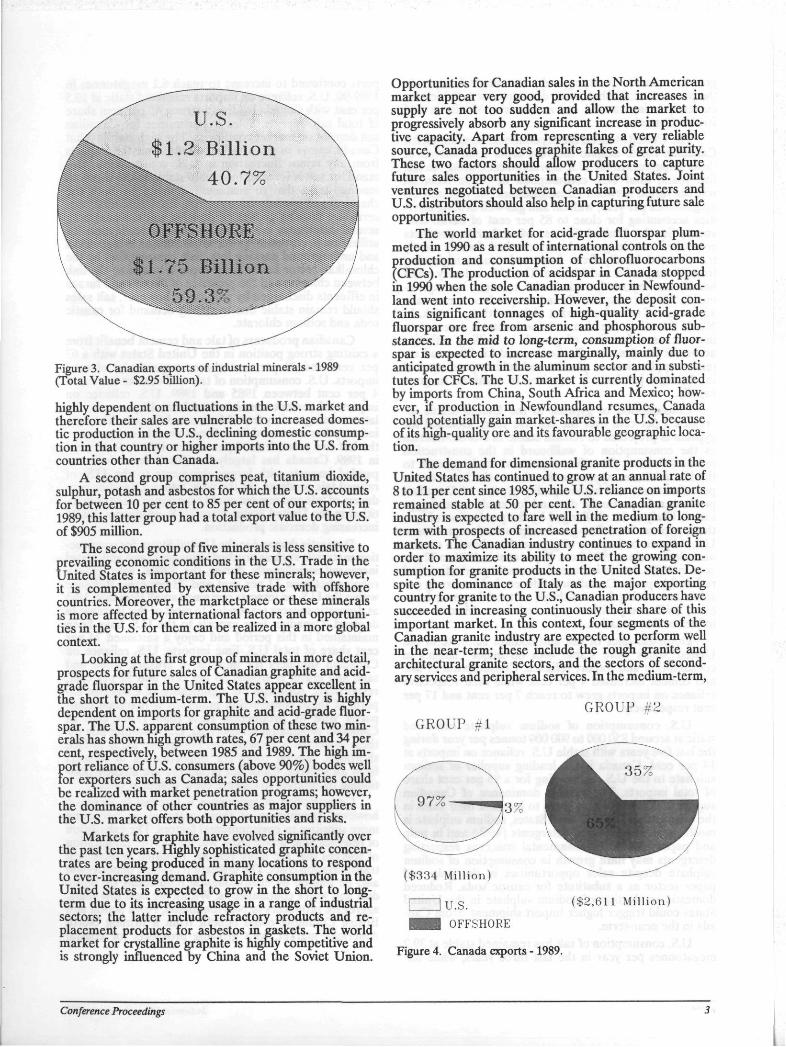
Figure 3. Canadian exports of industrial minerals - 1989 (TotalValue- $2.95billion).
highly dependent on fluctuations in the U.S. market and therefore their sales are vulnerable to increased domestic production in the U.S., declining domestic consumption in that country or higher imports into the U.S. from countries other than Canada.
A second group comprises peat, titanium dioxide, sulphur, potash and asbestos for which the U.S. accounts for between 10 per cent to 85 per cent of our exports; in 1989, this latter group had a total export value to the U.S. of $905 million.
The second group of five minerals is less sensitive to prevailing economic conditions in the U.S. Trade in the United States is important for these minerals; however, it is complemented by extensive trade with offshore countries. Moreover, the marketplace or these minerals is more affected by international factors and opportunities in the U.S. for them can be realized in a more global context.
Looking at the first group of minerals in more detail, prospects for future sales of Canadian graphite and acid-grade fluorspar in the United States appear excellent in the short to medium-term. The U.S. industry is highly dependent on imports for graphite and acid-grade fluorspar. The U.S. apparent consumption of these two minerals has shown high growth rates, 67 per cent and 34 per cent, respectively, between 1985 and 1989. The high import reliance of U.S. consumers (above 90%) bodes well for exporters such as Canada; sales opportunities could be realized with market penetration programs; however, the dominance of other countries as major suppliers in the U.S. market offers both opportunities and risks.
Markets for graphite have evolved significantly over the past ten years. Highly sophisticated graphite concentrates are being produced in many locations to respond to ever-increasing demand. Graphite consumption in the United States is expected to grow in the short to long-term due to its increasing usage in a range of industrial sectors; the latter include refractory products and replacement products for asbestos in gaskets. The world market for crystalline graphite is highly competitive and is strongly influenced by China and the Soviet Union.
Opportunities for Canadian sales in the North American market appear very good, provided that increases in supply are not too sudden and allow the market to progressively absorb any significant increase in productive capacity. Apart from representing a very reliable source, Canada produces graphite flakes of great purity. These two factors should allow producers to capture future sales opportunities in the United States. Joint ventures negotiated between Canadian producers and U.S. distributors should also help in capturing future sale opportunities.
The world market for acid-grade fluorspar plummeted in 1990 as a result of international controls on the production and consumption of chlorofluorocarbons (CFCs). The production of acidspar in Canada stopped in 1990 when the sole Canadian producer in Newfoundland went into receivership. However, the deposit contains significant tonnages of high-quality acid-grade fluorspar ore free from arsenic and phosphorous substances. In the mid to long-term, consumption of fluorspar is expected to increase marginally, mainly due to anticipated growth in the aluminum sector and in substitutes for CFCs. The U.S. market is currently dominated by imports from China, South Africa and Mexico; however, if production in Newfoundland resumes, Canada could potentially gain market-shares in the U.S. because of its high-quality ore and its favourable geographic location.
The demand for dimensional granite products in the United States has continued to grow at an annual rate of 8 to 11 per cent since 1985, while U.S. reliance on imports remained stable at 50 per cent. The Canadian granite industry is expected to fare well in the medium to long-term with prospects of increased penetration of foreign markets. The Canadian industry continues to expand in order to maximize its ability to meet the growing consumption for granite products in the United States. Despite the dominance of Italy as the major exporting country for granite to the U.S., Canadian producers have succeeded in increasing continuously their share of this important market. In this context, four segments of the Canadian granite industry are expected to perform well in the near-term; these include the rough granite and architectural granite sectors, and the sectors of secondary services and peripheral services. In the medium-term,
GROUP # 2 GROUP #1
| 1 Tj.s. (82,611 Million)
■ OFFSHORE
Figure 4. Canada exports -1989.
Conference Proceedings 3
growth in granite quarrying and processing is foreseen in the province of Quebec while development activities are currently being carried out in Ontario, Manitoba and British Columbia.
The United States is the predominant destination for Canadian barite despite the very small contribution of these shipments to the U.S. marketplace. During the last five years, total U.S. consumption of barite from all sources varied between 1.2 megatonnes per year and 1.6 megatonnes per year, with oil and gas-well drilling activities accounting for close to 85 per cent of barite consumed in the United States. Most barite products consumed are in ground and crushed forms, mostly transformed locally from imported crude originating from China, India and Mexico. The U.S. industry relies heavily on imported crude barite to meet its requirements. In this respect, Canadian producers can take advantage of selective market niches with some risk. In North America, the demand for barite is forecast to increase as a function of growth in drilling activities across North America. Barite demand for filler and extender applications in plastics and rubber products and in chemical products is expected to contmue to grow rapidly.
Consumption of gypsum in the United States increased 7 per cent over the last five years. Demand for gypsum is projected to remain stable in North America as the consumption of wallboard in the construction industry flattens. Canadian exports of crude gypsum to the Umted States appear secure due to the lower transportation costs and higher quality gypsum of Canadian producers. Importantly, demand for crude natural gypsum is likely to be challenged by the production of synthetic gypsum from flue-gas-desulphurization processes. U.S. reliance on imports of gypsum has shown a continuous decline since 1985 from 40 per cent in 1985 to 32 per cent in 1989, due to increased domestic production and reduced imports. Canadian producers hold a strong position accounting for two-thirds of total imports; however, stiff competition expected from Mexico may influence that situation.
Domestic sales of salt and sodium sulphate in the United States were stable with no major changes in consumption and import reliance. Consumption of talc and cement increased 4 per cent while then- respective reliance on imports grew to reach 7 per cent and 17 per cent respectively.
U.S. consumption of sodium sulphate remained static at around 850 000 to 900 000 tonnes per year during the last five years with stable U.S. reliance on imports at 14 per cent. Canada is the leading supplier of sodium sulphate to the U.S., accounting for a 95 per cent share of total imports. The current dominance of Canadian suppliers should position them to increase their sales in the near future. In the United States, sodium sulphate is mostly used in soaps and detergents (45%) and in pulp and paper (30%). Environmental concerns respecting detergents may limit growth in consumption of sodium sulphate despite sales opportunities in the pulp and paper sector as a substitute for caustic soda. Reduced domestic production of sodium sulphate in the United States could trigger higher import shipments from Canada in the near-term.
U.S. consumption of salt has remained stable at 39.2 megatonnes per year in the last three years, while im
ports continued to increase to reach 6.1 megatonnes in 1989-90. U.S. reliance on imports remained static at 10.5 per cent with Canada holding a strong 40 per cent share of total salt imports. Sales opportunities for Canadian salt depend on market conditions. The high stability that Canada enjoys in this market should limit the impacts from any minor fluctuation in U.S. consumption. Demand for salt is forecast to remain stable in the short- to medium-term due to sustained demand by both the chemical and road de-icing sectors. Environmental concerns are limiting growth of de-icing salt consumption; several substitutes are currently under investigation for utilization in corrosion-prone areas such as bridge decks and underground parking lots. Salt consumption by the chloralkali sector has become more sensitive to the link between chlorine and the presence of dioxins and furans in effluents discharged by pulp mills; however, salt sales should remain stable due to strong demand for caustic soda and sodium chlorate.
Canadian producers of talc and cement benefit from a existing strong position in the United States with a 63 per cent and 28 per cent share, respectively, of total imports. U.S. consumption of talc and cement increased 4 per cent between 1985 and 1989. U.S. reliance on imports of cement remained stable at 17 per cent; the latter coming mainly from Mexico and Canada. The U.S. industry has increased its reliance on talc imports over the last five years, from 4 per cent in 1985 to 9 per cent in 1989. Canada has largely benefitted from these expanded imports with larger shipments to the U.S. of refined talc products. In the near future, Canadian producers of talc and cement could experience more competition in the United States from U. S. producers due to increasing domestic production.
Domestic demand in the United States for construction materials such as crushed stone and sand and gravel increased significantly during the 1980s, with growth ranging between 12 per cent and 20 per cent. Reliance within the U.S. on imports remained small (less than 1%) as domestic sources responded to most of tnis increase in demand. Canadian lime exports to the U.S. have been maintained in this period and enjoy a sustained 74 per cent share of total U.S. lime imports. U.S. reliance on Canadian suppliers for imports of crushed stone and sand and gravel is around 86 per cent and 52 per cent, respectively. Although the significance of Canadian exports of these construction materials is marginal compared with its production (less than 1 per cent of Canadian production is exported), U.S. consumption for these materials is growing and buyers are likely to face shortages, leaving room for opportunities in imports from all sources. Canadian producers are already positioning themselves to capture these potential sales.
Consumption of aggregates is forecast to increase; however, production of these materials is becoming more sensitive to environmental factors. The exhaustion of reserves near urban areas will lead to the exploitation of sources that are more remote, resulting in increased transportation costs. The utilization of some deposits will also be limited by environmental regulations on noise, dust and water contaminants. Within the next few years, aggregate producers in Newfoundland, Nova Scotia and British Columbia could benefit from a firming North American market, with growing prospects for coastal
4 Industrial Minerals Forum 1991
shipments to urban regions along the U.S. eastern seaboard and west coast.
Let's now look at the second group of minerals in more detail. Since 1989, the Canadian peat industry has been going through a period of consolidation. In the medium-term, the situation depends on continuing growth in offshore sales and on the success of promotional activities carried out by the Canadian Sphagnum Peat Moss Association in the United States. The main objective of this campaign, which is aimed at the retail level, is to improve awareness by American buyers of the benefits of using Canadian sphagnum peat moss in gardening activities. The demand for peat in the Umted States has grown 8 to 11 per cent in the last five years, while the contribution of imports to the U.S. consumption remained stable at 33 per cent. Canadian peat exporters are well positioned in this marketplace, accounting for more than 99 per cent of total U.S. peat imports. Prospects for growth in Canadian sales of sphagnum peat moss in the U.S. are excellent but will be limited by competition from lower-cost products such as bark and straw. Future opportunities for Canadian producers reside also in offshore markets, with Japan as the main prospect. This market has been developed by Canadian suppliers over the last six years and has demonstrated a three-fold expansion in this period. Canada remains the leading foreign supplier of peat to Japan with a 95 per cent market share. Peat products as well as value-added peat-based products are expected to make further in-roads in Pacific Rim markets. Sales opportunities have been growing in South Korea and Oceania.
Over the last five years, the U.S. consumption of titanium dioxide has fluctuated between 900 000 tonnes per year and 1000 000 tonnes per year while imports into the U.S. have been declining due to higher domestic production. Since 1989, the United States has become a net exporter of titanium dioxide pigment. Canada's share of imports is estimated at 16 per cent, after Germany with a 20 per cent share. Stiff competition amongst foreign suppliers may hinder Canadian producers from increasing their presence in this lucrative market. The production of Canadian titanium dioxide pigment is forecast to decline in the short-term following the closure of one of the two sulphate route plants in Canada. In the long-term, two main factors may affect the Canadian supply of titanium dioxide pigment. These are the feasibility of producing a slag compatible with the chloride process and the commissioning of a new chloride route plant within the next five years.
U.S. consumption of sulphur has risen 6 per cent since 1985. The United States imports close to 2.2 megatonnes per year of sulphur; Canada supplies about 50 per cent of this. In the last five years, U.S. reliance on imports varied from 7 per cent to 16 per cent in response to domestic requirements and international market conditions for fertilizers. Close to 60 per cent of all sulphur consumed in the U.S. is used in the manufacture of fertilizers. Canada and Mexico are the leading exporters of sulphur in the United States. The importance of the U.S. as a export destination for Canadian sulphur has increased in the last three years from 17 per cent to close to 25 per cent of total Canadian exports. Canadian exporters have achieved better netbacks from North American sales compared to those offshore due to strong U.S. demand and depressing world market condi
tions. Canadian suppliers are expected to continue to make in-roads in the important U.S. market.
In the last ten years, the consumption of potash in the United States has been fluctuating between 5 megatonnes per year and 6 megatonnes per year K2O. However, U.S. reliance on imports remained quite stable at 80 per cent in this period, with Canadian exporters enjoying a 90 per cent snare of total U.S. imports. Canadian producers are likely to maintain their position in the North American market and take advantage of growth in the domestic demand within the United States for potash. U.S. consumption of asbestos has dropped dramatically over the last five years, from 120 000 tonnes in 1985 to 55 000 tonnes in 1989. U.S. domestic consumption is mostly supplied by imports. Canada was the leading supplier with 95 per cent of total U.S. imports, followed by the Republic of South Africa (4%).
U.S. demand for asbestos will continue to decline following the legislated phase-out of asbestos in the United States that came into effect in 1989.
CANADA-U.S. TRADE RELATIONS IN INDUSTRIAL MINERALS Over the last 20 years, a number of developments
have occurred with respect to Canada-U.S. trade relations in industrial minerals. During this period, Canadian suppliers of industrial minerals faced three anti-dumping petitions from U.S. producers. These were, namely, sulphur in 1973, salt in 1985 and potash in 1987. These actions precipitated a short-lived reduced level of exports in sulphur in the early 70s and for salt in the mid-80s, and higher delivered potash prices in the 90s. Technical barriers have also developed restricting sales growth for some Canadian minerals. In 1982, cement imports into the U.S. became limited under a "Buy America" clause within the U.S. Surface Transportation Assistance Act (STAA). The STAA provided substantial funding for highway and bridge projects in the U.S., which represented about 6 per cent of total cement consumption; in 1984, these restrictions were lifted by the Congress. In 1983, the U.S. Environmental Protection Agency (EPA) initiated proposals to ban asbestos in some products consumed in the United States. In 1989, EPA established a final ban and phase-out on the use of asbestos and asbestos products in the USA over the next 7 years. This ruling is currently in litigation in U.S. courts; a determination is expected by mid-1991. However, the adoption of the Canada-U.S. Free Trade Agreement led to a five to ten year phase-out as of January 1989 of tariffs on many items, including several minerals. While most industrial minerals produced in Canada already benefitted from Min-franchiseH (free) U.S. tariffs, some minerals were given special access to the U.S. market after the implementation of that agreement in 1989 (Table 3). Tariffs were reduced for talc, acid-grade fluorspar, titanium dioxide and sodium sulphate and were eliminated for cement, graphite, cut granite and barite. Some modifications in these tariffs, even small levies, have improved the ability of the Canadian industry to realize new market opportunities in the U.S. Specifically, the Agreement has positioned some Canadian producers and exporters on an equal footing in the U.S. market with Third World exporters who enjoy duty-free access under the US General Preferential System.
Conference Proceedings 5
CONTRIBUTION OF CANADIAN INDUSTRIAL MINERAL EXPORTS TO OFFSHORE MARKETS
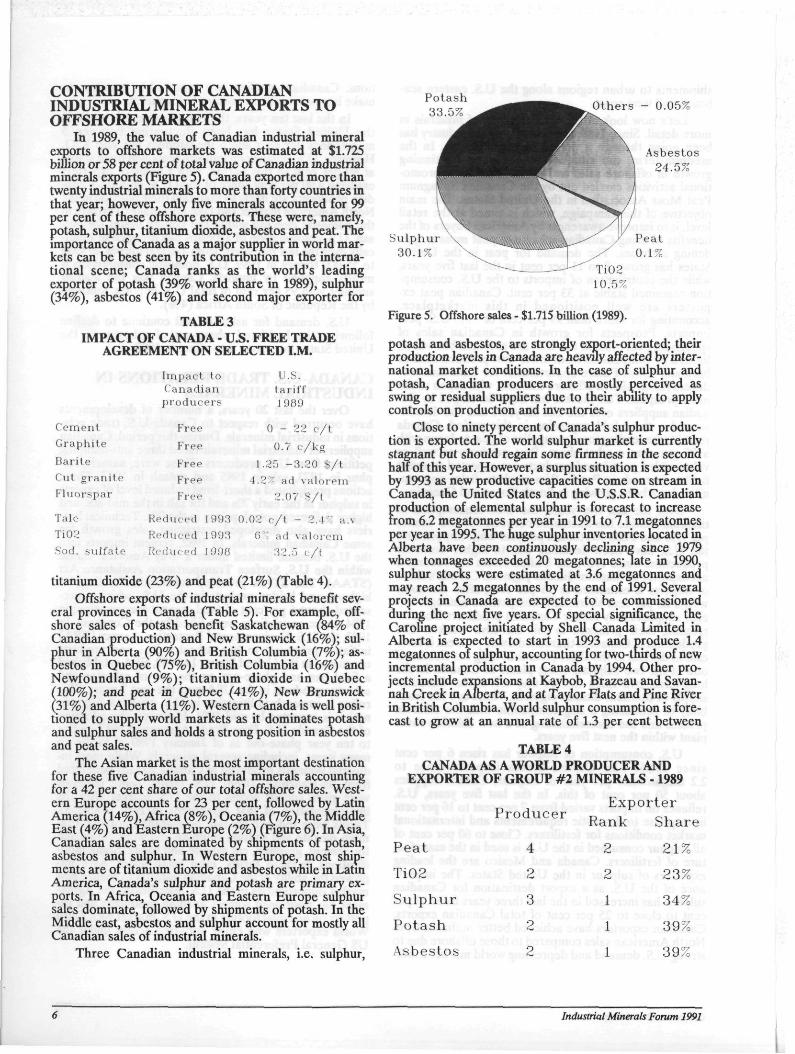
In 1989, the value of Canadian industrial mineral exports to offshore markets was estimated at $1,725 billion or 58 per cent of total value of Canadian industrial minerals exports (Figure 5). Canada exported more than twenty industrial minerals to more than forty countries in that year; however, only five minerals accounted for 99 per cent of these offshore exports. These were, namely, potash, sulphur, titanium dioxide, asbestos and peat. The importance of Canada as a major supplier in world markets can be best seen by its contribution in the international scene; Canada ranks as the world's leading exporter of potash (39% world share in 1989), sulphur (34%), asbestos (41%) and second major exporter for
TABLE3 IMPACT OF CANADA - U.S. FREE TRADE
AGREEMENT ON SELECTED I.M.
Cement Graphite Barite Cut gran i te Fluorspar
Talc Ti02 Sod, sulfate
Impact to Canadian p roducers
Free Free Free Free Free
U.S. t a r i f f 1989
0 - 22 c/ t 0.7 c / k g
1.25 -3 .20 S/t 1.'-' ad valorem
2.07 S/l
Reduced 1993 0.02 e / t - 2,4% a.v Reduced 1993 0 ' ad valorem Reduced 1998 32.5 c / t
titanium dioxide (23%) and peat (21%) (Table 4). Offshore exports of industrial minerals benefit sev
eral provinces in Canada (Table 5). For example, offshore sales of potash benefit Saskatchewan (84% of Canadian production) and New Brunswick (16%); sulphur in Alberta (90%) and British Columbia (7%); asbestos in Quebec (75%), British Columbia (16%) and Newfoundland (9%); titanium dioxide in Quebec (100%); and peat in Quebec (41%), New Brunswick (31%) and Alberta (11%). Western Canada is well positioned to supply world markets as it dominates potash and sulphur sales and holds a strong position in asbestos and peat sales.
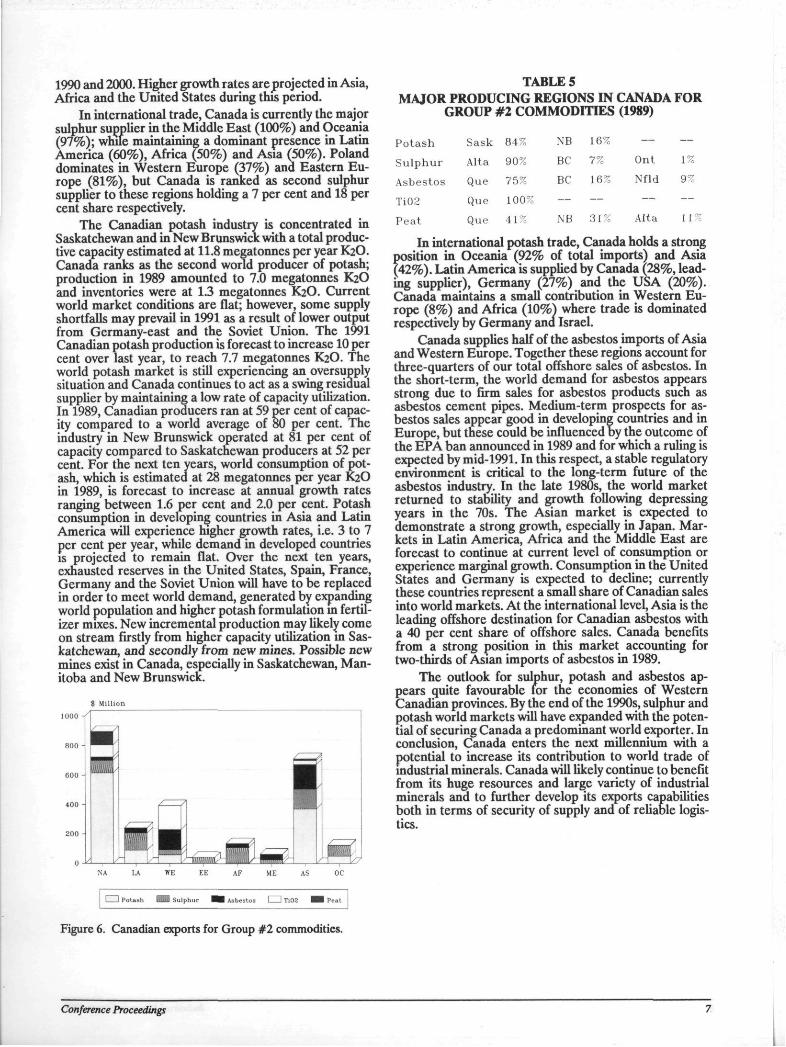
The Asian market is the most important destination for these five Canadian industrial minerals accounting for a 42 per cent share of our total offshore sales. Western Europe accounts for 23 per cent, followed by Latin America (14%), Africa (8%), Oceania (7%), the Middle East (4%) and Eastern Europe (2%) (Figure 6). In Asia, Canadian sales are dominated by shipments of potash, asbestos and sulphur. In Western Europe, most shipments are of titanium dioxide and asbestos while in Latm America, Canada's sulphur and potash are primary exports. In Africa, Oceania and Eastern Europe sulphur sales dominate, followed by shipments of potash. In the Middle east, asbestos and sulphur account for mostly all Canadian sales of industrial minerals.
Three Canadian industrial minerals, i.e. sulphur,
P o t a s h 3 3 . 5 % ^ ^ ^ Othe r s - 0.05%
Asbestos 24.5%
\ ^{/ S u l p h u r \ ^ ^ ^ / Pea t
30.1% " \ // 0.1% Ti02 10.5% Ti02 10.5%
Figure 5. Offshore sales - $1,715 billion (1989).
potash and asbestos, are strongly export-oriented; their production levels in Canada are heavily affected by international market conditions. In the case of sulphur and potash, Canadian producers are mostly perceived as swing or residual suppliers due to their ability to apply controls on production and inventories.
Close to ninety percent of Canada's sulphur production is exported. The world sulphur market is currently stagnant but should regain some firmness in the second half of this year. However, a surplus situation is expected by 1993 as new productive capacities come on stream in Canada, the United States and the U.S.S.R. Canadian production of elemental sulphur is forecast to increase from 6.2 megatonnes per year in 1991 to 7.1 megatonnes per year in 1995. The huge sulphur inventories located in Alberta have been continuously declining since 1979 when tonnages exceeded 20 megatonnes; late in 1990, sulphur stocks were estimated at 3.6 megatonnes and may reach 2.5 megatonnes by the end of 1991. Several projects in Canada are expected to be commissioned during the next five years. Of special significance, the Caroline project initiated by Shell Canada Limited in Alberta is expected to start in 1993 and produce 1.4 megatonnes of sulphur, accounting for two-thirds of new incremental production in Canada by 1994. Other projects include expansions at Kaybob, Brazeau and Savannah Creek in Alberta, and at Taylor Flats and Pine River in British Columbia. World sulphur consumption is forecast to grow at an annual rate of 1.3 per cent between
TABLE 4 CANADA AS A WORLD PRODUCER AND
EXPORTER OF GROUP #2 MINERALS -1989
P roducer Exp Rank
Drter Share
Peat 4 2 21%
Ti02 2 2 23%
Sulphur 3 1 34%
Potash 2 1 39%
Asbestos 2 1 39%
6 Industrial Minerals Forum 1991
1990 and 2000. Higher growth rates are projected in Asia, Africa and the United States during this period.
In international trade, Canada is currently the major sulphur supplier in the Middle East (100%) and Oceania (97%); while maintaining a dominant presence in Latin America (60%), Africa (50%) and Asia (50%). Poland dominates in Western Europe (37%) and Eastern Europe (81%), but Canada is ranked as second sulphur supplier to these regions holding a 7 per cent and 18 per cent share respectively.
The Canadian potash industry is concentrated in Saskatchewan and in New Brunswick with a total productive capacity estimated at 11.8 megatonnes per year K2O. Canada ranks as the second world producer of potash; production in 1989 amounted to 7.0 megatonnes K2O and inventories were at 1.3 megatonnes K2O. Current world market conditions are flat; however, some supply shortfalls may prevail in 1991 as a result of lower output from Germany-east and the Soviet Union. The 1991 Canadian potash production is forecast to increase 10 per cent over last year, to reach 7.7 megatonnes K2O. The world potash market is still experiencing an oversupply situation and Canada continues to act as a swing residual supplier by maintaining a low rate of capacity utilization. In 1989, Canadian producers ran at 59 per cent of capacity compared to a world average of 80 per cent. The industry in New Brunswick operated at 81 per cent of capacity compared to Saskatchewan producers at 52 per cent. For the next ten years, world consumption of potash, which is estimated at 28 megatonnes per year K2O in 1989, is forecast to increase at annual growth rates ranging between 1.6 per cent and 2.0 per cent. Potash consumption in developing countries in Asia and Latin America will experience higher growth rates, i.e. 3 to 7 per cent per year, while demand in developed countries is projected to remain flat. Over the next ten years, exhausted reserves in the United States, Spain, France, Germany and the Soviet Union will have to be replaced in order to meet world demand, generated by expanding world population and higher potash formulation m fertilizer mixes. New incremental production may likely come on stream firstly from higher capacity utilization m Saskatchewan, and secondly from new mines. Possible new mines exist in Canada, especially in Saskatchewan, Manitoba and New Brunswick.
TABLE 5 MAJOR PRODUCING REGIONS IN CANADA FOR
GROUP #2 COMMODITIES (1989)
P o t a s h Sask 84% NB 16% — — S u l p h u r Alta 90% ISC 7 ~ Ont V"
A s b e s t o s Que 75% BC 16% Nfld 9 '
Ti02 Que 100% — — — — P e a t Que 4 1 % NB 3 1 % Alta 1 1 "
In international potash trade, Canada holds a strong position in Oceania (92% of total imports) and Asia (42%). Latin America is supplied by Canada (28%, leading supplier), Germany (27%) and the USA (20%). Canada maintains a small contribution in Western Europe (8%) and Africa (10%j where trade is dominated respectively by Germany ana Israel.
Canada supplies half of the asbestos imports of Asia and Western Europe. Together these regions account for three-quarters of our total offshore sales of asbestos. In the short-term, the world demand for asbestos appears strong due to firm sales for asbestos products such as asbestos cement pipes. Medium-term prospects for asbestos sales appear good in developing countries and in Europe, but these could be influenced by the outcome of the EPA ban announced in 1989 and for which a ruling is expected by mid-1991. In this respect, a stable regulatory environment is critical to the long-term future of the asbestos industry. In the late 1980s, the world market returned to stability and growth following depressing years in the 70s. The Asian market is expected to demonstrate a strong growth, especially in Japan. Markets in Latin America, Africa and the Middle East are forecast to continue at current level of consumption or experience marginal growth. Consumption in the United States and Germany is expected to decline; currently these countries represent a small share of Canadian sales into world markets. At the international level, Asia is the leading offshore destination for Canadian asbestos with a 40 per cent share of offshore sales. Canada benefits from a strong position in this market accounting for two-thirds of Asian imports of asbestos in 1989.
The outlook for sulphur, potash and asbestos appears quite favourable for the economies of Western Canadian provinces. By the end of the 1990s, sulphur and potash world markets will have expanded with the potential of securing Canada a predominant world exporter. In conclusion, Canada enters the next millennium with a potential to increase its contribution to world trade of industrial minerals. Canada will likely continue to benefit from its huge resources and large variety of industrial minerals and to further develop its exports capabilities both in terms of security of supply and of reliable logistics.
$ Million
I I Potash H i Sulphur H i Asbestos I i Ti02 ^ B Peal
Figure 6. Canadian exports for Group #2 commodities.
Conference Proceedings 7

Industrial Minerals Forum 1991
INDUSTRIAL MINERALS IN ALBERTA
By Wylie N. Hamilton
INTRODUCTION A rich variety of industrial minerals is found in
Alberta, including 13 commodities that are currently
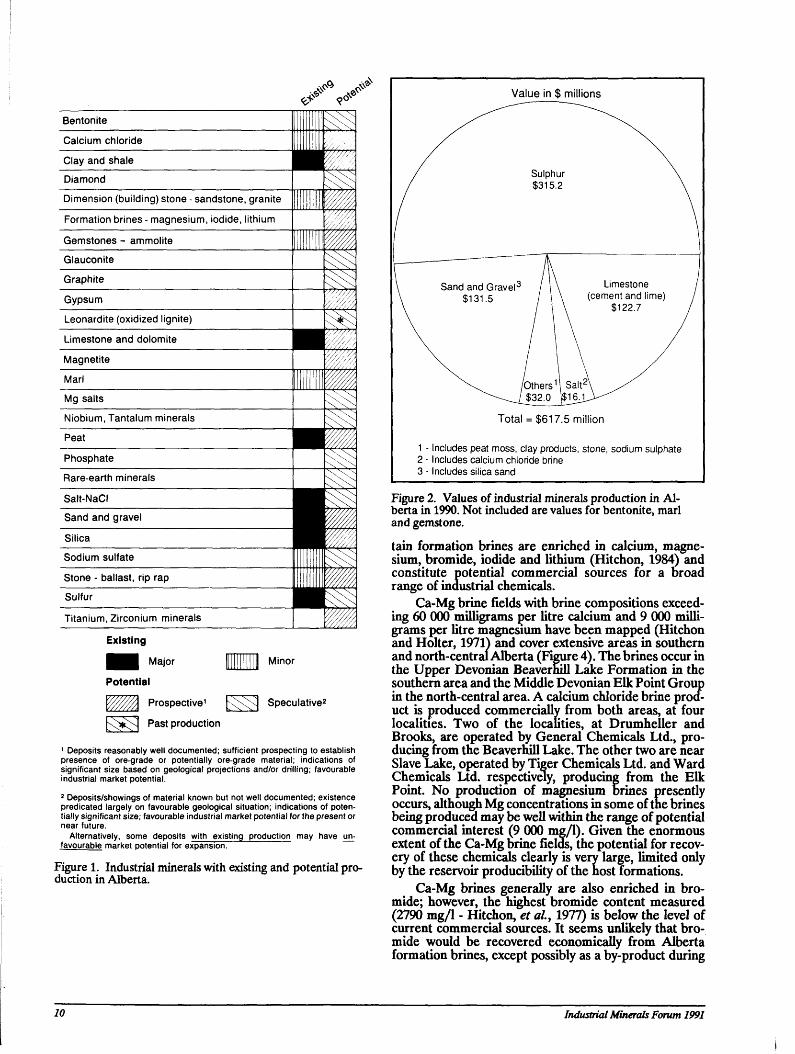
Eroduced and another dozen or so with potential for lture production (Figure 1). However, the bulk of the
current production value comes from four commodities - sulphur, limestone (in cement and lime), sand and gravel, and salt. These four accounted for 95 per cent of the province's total industrial minerals production value of $618 million in 1990 (Figure 2). Alberta ranks fourth among the Canadian provinces in industrial minerals production, with about 12 per cent of the total for Canada.
Alberta's industrial minerals are primarily of sedimentary origin, derived from Phanerozoic rocks of the Western Canada Sedimentary Basin. The rocks form a northeast-tapering wedge of strata that terminates against crystalline oasement rocks of the Precambrian Shield, exposed in the northeast corner of the province (Figure 3). The strata extend across the Plains region with a gentle southwestward dip, becoming upthrusted and deformed along the Rocky Mountains fold belt in the southwest. Basin sediments include Paleozoic carbonates and evaporates, and Mesozoic and Tertiary elastics, many of which are existing or potential sources of industrial minerals. Glacial sediments that mantle much of the Alberta landscape, and the exposed crystalline rocks in the northeast are also sources of some of the industrial minerals.
Information on known deposits of the industrial minerals is summarized in the following sections, presented in alphabetical order by commodity. Minerals that have been dealt with in previous published summaries (Hamilton, 1976,1984) are discussed only briefly. Those ior which new information has been obtained are described in greater length. Locations of producing operations and prospective deposits are shown in Figures 3 to 7.
BENTONITE Bentonite is common in Upper Cretaceous and
Paleocene sediments throughout the Plains region; however, economic deposits are rare (Scafe, 1975). Only one deposit currently is being quarried, by M-I Drilling Fluids Inc. along the Battle River southeast of Edmonton (Figure 3). Production is of both swelling and non-swelling types, and serves a variety of markets - drilling mud, binder in animal feed pellets, in foundry sand, as a sealant for lining of tailings ponds, etc. Total annual production is estimated to be in the range of 10 000 to 15 000 tonnes.
Other known bentonite deposits in Alberta have indicated little potential for development, due to low yields or high grit content. However, given the extensive distribution of bentonitic strata, discoveries of additional
Alberta Geological Survey, Alberta Research Council, Edmonton, Alberta
deposits in the shallow bedrock that have gone undetected to date are considered likely.
CLAY AND SHALE Clays and shales are the dominant rock types in
virtually all the Mesozoic formations and surficial deposits in Alberta. The clay rocks have been widely exploited at various times in the past for structural clay products, cement, and lightweight (expanded clay) aggregate manufacture. Although Alberta's clay resources are vast, as ceramic materials they are mostly the low-grade type, suitable only for low value ware such as brick (Scare, 1991). Intermediate-grade stoneware clay and fireclay are known to occur in a few deposits, but high-grade ball and china clays are unknown.
In general, the better grades of ceramic clay in Alberta are found in nonmarine bedrock formations, among which the Upper Cretaceous Whitemud Formation has been the principal source (Hamilton and Babet, 1975). The Whitemud is exposed in the Cypress Hills area of southeastern Alberta, where several quarry operations currently exist. The clays are used mainly for structural clay products manufacture in plants at Medicine Hat and Redcliff, operated by I-XL Industries Ltd. Although the Whitemua is host to large kaolin deposits in Saskatchewan (Guliov, this volume), its potential for kaolin in Alberta is lacking (Hamilton, et al., 1988).
Other Upper Cretaceous clays are quarried at several localities for use in cement making. Sources include the Paskapoo Formation - quarried at Wabamum (60 km west of Edmonton), and the Battle Formation - quarried in the Cypress Hills area. These clays are used along with local glacial clay in the cement plant at Edmonton operated by Inland Cement Ltd. Shales from the Wapiabi and Belly River Formations are quarried for use in the cement plant at Exshaw operated by Lafarge Canada Inc. Shale from the Paleocene Porcupine Hills Formation is used by Consolidated Concrete Ltd. for lightweight aggregate manufacture in Calgary, from pits at DeWinton just south of the city. Glacial lake clays are used by I-XL Industries Ltd. for a brick plant at Edmonton, from deposits quarried at the plant site and near the town of Athabasca (Figure 3). Other significant past uses of Alberta clay rocks included glacial clays for expanded aggregate at Edmonton and Namao (Figure 3), and dolomitic shale from the Mississippian Banff Formation for mineral wool production near Exshaw (Fox, 1981).
Production values for ceramic clay products and lightweight aggregate manufacture are not reported for Alberta. Neither are the quarried tonnages of raw clay and shale.
FORMATION BRINES Subsurface formation waters in Alberta range in
composition from almost fresh to brines with total dissolved solids content many times that of seawater. Cer-
Conference Proceedings 9
IF ^ A *
^
Bentonite
Calcium chloride
Clay and shale
Diamond
Dimension (building) stone - sandstone, granite
Formation brines - magnesium, iodide, lithium
Gemstones - ammolite
Glauconite
Graphite
Gypsum
Leonardite (oxidized lignite)
Limestone and dolomite
Magnetite
Marl
Mg salts
Niobium, Tantalum minerals
Peat
Phosphate
Rare-earth minerals
Salt-NaCI
Sand and gravel
Silica
Sodium sulfate
Stone - ballast, rip rap
Sulfur
Titanium, Zirconium minerals
Existing
^ ^ H Major
Potential
/ / ^ Prospective1
Minor
Speculative2
x ^ x Past production
1 Deposits reasonably well documented; sufficient prospecting to establish presence of ore-grade or potentially ore-grade material; indications of significant size based on geological projections and/or drilling; favourable industrial market potential. 2 Deposits/showings of material known but not well documented; existence predicated largely on favourable geological situation; indications of potentially significant size; favourable industrial market potential for the present or near future.
Alternatively, some deposits with existing production may have unfavourable market potential for expansion.
Figure 1. Industrial minerals with existing and potential production in Alberta.
Value in $ millions
Total = $617.5 million
1 - Includes peat moss, clay products, stone, sodium sulphate 2 - Includes calcium chloride brine 3 - Includes silica sand
Figure 2. Values of industrial minerals production in Alberta in 1990. Not included are values for bentonite, marl and gemstone.
tain formation brines are enriched in calcium, magnesium, bromide, iodide and lithium (Hitchon, 1984) and constitute potential commercial sources for a broad range of industrial chemicals.
Ca-Mg brine fields with brine compositions exceeding 60 000 milligrams per litre calcium and 9 000 milligrams per litre magnesium have been mapped (Hitchon and Holter, 1971) and cover extensive areas in southern and north-central Alberta (Figure 4). The brines occur in the Upper Devonian Beaverhill Lake Formation in the southern area and the Middle Devonian Elk Point Group in the north-central area. A calcium chloride brine product is produced commercially from both areas, at four localities. Two of the localities, at Drumheller and Brooks, are operated by General Chemicals Ltd., producing from the Beaverhill Lake. The other two are near Slave Lake, operated by Tiger Chemicals Ltd. and Ward Chemicals Ltd. respectively, producing from the Elk Point. No production of magnesium brines presently occurs, although Mg concentrations in some of the brines being produced may be well within the range of potential commercial interest (9 000 mg/1). Given the enormous extent of the Ca-Mg brine fields, the potential for recovery of these chemicals clearly is very large, limited only by the reservoir producibility of the host formations.
Ca-Mg brines generally are also enriched in bromide; however, the highest bromide content measured (2790 mg/1 - Hitchon, et aL, 1977) is below the level of current commercial sources. It seems unlikely that bromide would be recovered economically from Alberta formation brines, except possibly as a by-product during
10 Industrial Minerals Forum 1991
Wood Buffalo National Park
.21
n § S O CD 0) —
a. V
)20
30 0< 49
47 O/ 480/
381 beace River
]50 )31_
Fort McMurray
iine
rande
Jaspe / \ ^ . " iNatpnaK* 23 A VPark~\
2 8 # \ s _ ^ \ Red Deer
*^YV P29 \ <ty 'NattonaT] i
)56
H!*'24 \ D,Calgary
1 O55
• Producer O Prospect
„o: 53
Mec Hat\
iine
iLethbridge 19 9 # 1 0 #
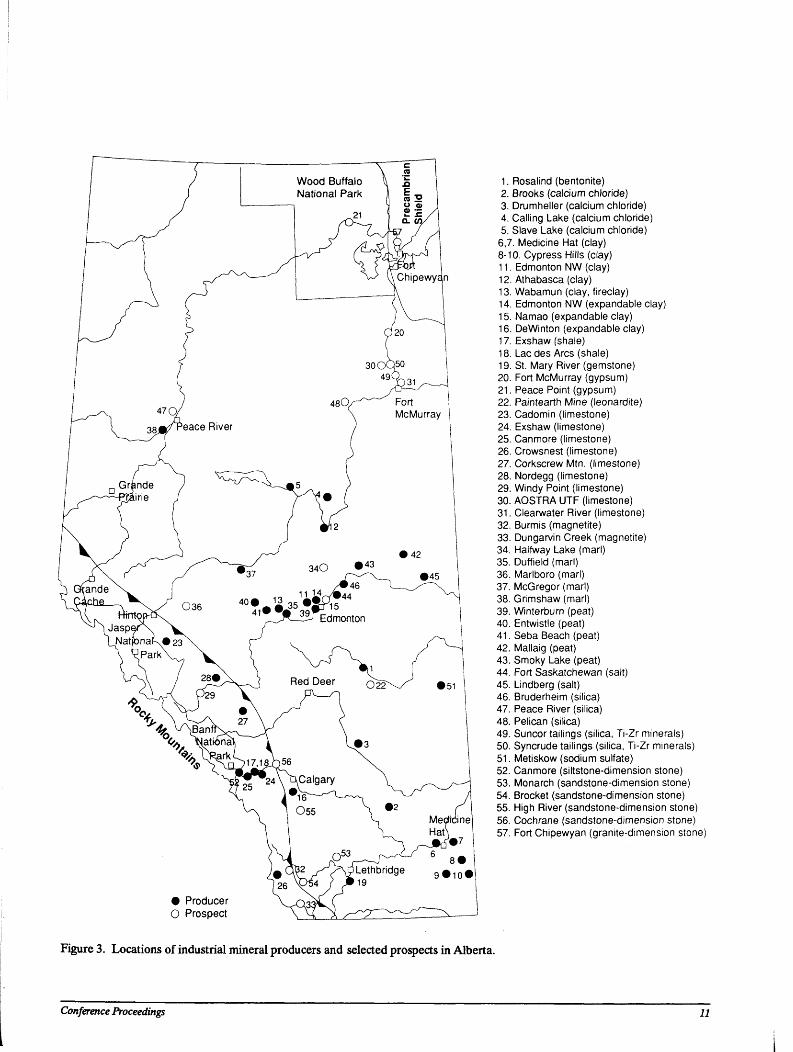
1. Rosalind (bentonite) 2. Brooks (calcium chloride) 3. Drumheller (calcium chloride) 4. Calling Lake (calcium chloride) 5. Slave Lake (calcium chloride) 6,7. Medicine Hat (clay) 8-10. Cypress Hills (clay) 11. Edmonton NW (clay) 12. Athabasca (clay) 13. Wabamun (clay, fireclay) 14. Edmonton NW (expandable clay) 15. Namao (expandable clay) 16. DeWinton (expandable clay) 17. Exshaw (shale) 18. Lac des Arcs (shale) 19. St. Mary River (gemstone) 20. Fort McMurray (gypsum) 21. Peace Point (gypsum) 22. Paintearth Mine (leonardite) 23. Cadomin (limestone) 24. Exshaw (limestone) 25. Canmore (limestone) 26. Crowsnest (limestone) 27. Corkscrew Mtn. (limestone) 28. Nordegg (limestone) 29. Windy Point (limestone) 30. AOSTRA UTF (limestone) 31. Clearwater River (limestone) 32. Burmis (magnetite) 33. Dungarvin Creek (magnetite) 34. Halfway Lake (marl) 35. Duffield (marl) 36. Marlboro (marl) 37. McGregor (marl) 38. Grimshaw (marl) 39. Winterburn (peat) 40. Entwistle (peat) 41. Seba Beach (peat) 42. Mallaig (peat) 43. Smoky Lake (peat) 44. Fort Saskatchewan (salt) 45. Lindberg (salt) 46. Bruderheim (silica) 47. Peace River (silica) 48. Pelican (silica) 49. Suncor tailings (silica, Ti-Zr minerals) 50. Syncrude tailings (silica, Ti-Zr minerals) 51. Metiskow (sodium sulfate) 52. Canmore (siltstone-dimension stone) 53. Monarch (sandstone-dimension stone) 54. Brocket (sandstone-dimension stone) 55. High River (sandstone-dimension stone) 56. Cochrane (sandstone-dimension stone) 57. Fort Chipewyan (granite-dimension stone)
Figure 3. Locations of industrial mineral producers and selected prospects in Alberta.
Conference Proceedings 11
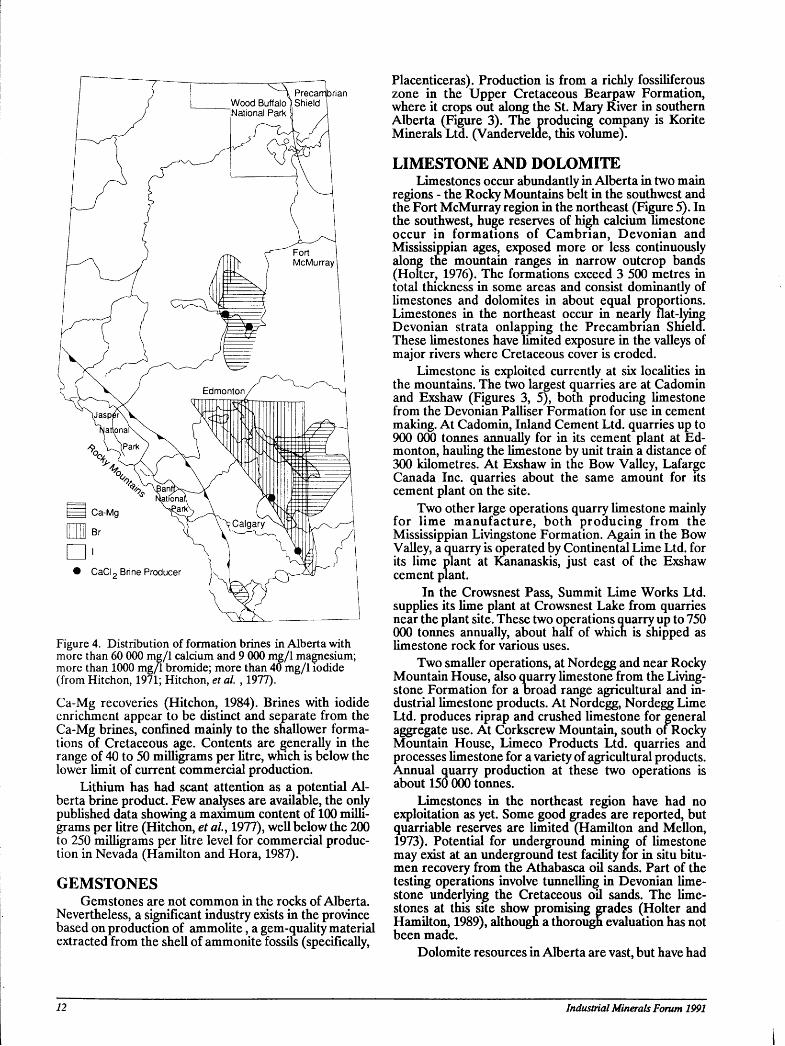
Figure 4. Distribution of formation brines in Alberta with more than 60 000 mg/1 calcium and 9 000 mg/1 magnesium; more than 1000 mg/1 bromide; more than 40 mg/1 iodide (from Hitchon, 1971; Hitchon, et al. , 1977).
Ca-Mg recoveries (Hitchon, 1984). Brines with iodide enrichment appear to be distinct and separate from the Ca-Mg brines, confined mainly to the shallower formations of Cretaceous age. Contents are generally in the range of 40 to 50 milligrams per litre, which is below the lower limit of current commercial production.
Lithium has had scant attention as a potential Alberta brine product. Few analyses are available, the only published data showing a maximum content of 100 milligrams per litre (Hitchon, et al., 1977), well below the 200 to 250 milligrams per litre level for commercial production in Nevada (Hamilton and Hora, 1987).
GEMSTONES Gemstones are not common in the rocks of Alberta.
Nevertheless, a significant industry exists in the province based on production of ammolite, a gem-quality material extracted from the shell of ammonite fossils (specifically,
Placenticeras). Production is from a richly fossiliferous zone in the Upper Cretaceous Bearpaw Formation, where it crops out along the St. Mary River in southern Alberta (Figure 3). The producing company is Korite Minerals Ltd. (Vandervelde, this volume).
LIMESTONE AND DOLOMITE Limestones occur abundantly in Alberta in two main
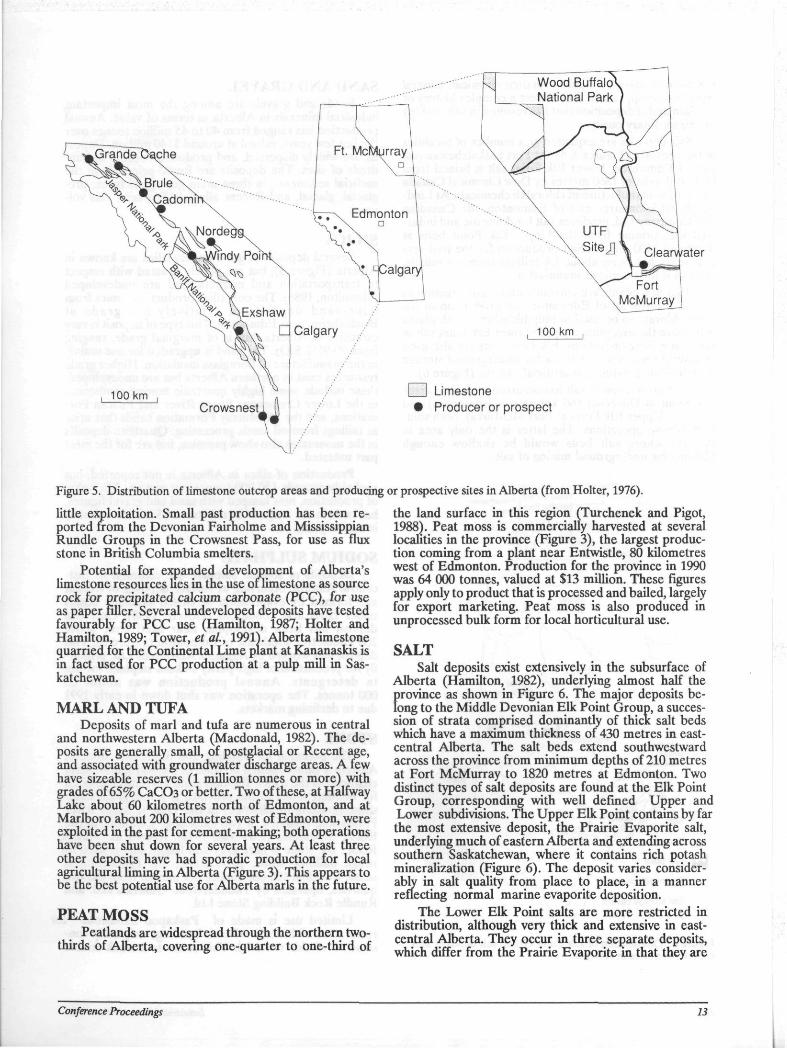
regions - the Rocky Mountains belt in the southwest and the Fort McMurray region in the northeast (Figure 5). In the southwest, huge reserves of high calcium limestone occur in formations of Cambrian, Devonian and Mississippian ages, exposed more or less continuously along the mountain ranges in narrow outcrop bands (Holter, 1976). The formations exceed 3 500 metres in total thickness in some areas and consist dominantly of limestones and dolomites in about equal proportions. Limestones in the northeast occur in nearly flat-tying Devonian strata onlapping the Precambrian Shield. These limestones have limited exposure in the valleys of major rivers where Cretaceous cover is eroded.
Limestone is exploited currently at six localities in the mountains. The two largest quarries are at Cadomin and Exshaw (Figures 3, 5), both producing limestone from the Devonian Palliser Formation for use in cement making. At Cadomin, Inland Cement Ltd. quarries up to 900 000 tonnes annually for in its cement plant at Edmonton, hauling the limestone by unit train a distance of 300 kilometres. At Exshaw in the Bow Valley, Lafarge Canada Inc. quarries about the same amount for its cement plant on the site.
Two other large operations quarry limestone mainly for lime manufacture, both producing from the Mississippian Livingstone Formation. Again in the Bow Valley, a quarry is operated by Continental Lime Ltd. for its lime plant at Kananaskis, just east of the Exshaw cement plant.
In the Crowsnest Pass, Summit Lime Works Ltd. supplies its lime plant at Crowsnest Lake from quarries near the plant site. These two operations quarry up to 750 000 tonnes annually, about half of which is shipped as limestone rock for various uses.
Two smaller operations, at Nordegg and near Rocky Mountain House, also quarry limestone from the Livingstone Formation for a broad range agricultural and industrial limestone products. At Nordegg, Nordegg Lime Ltd. produces riprap and crushed limestone for general aggregate use. At Corkscrew Mountain, south of Rocky Mountain House, Limeco Products Ltd. quarries and processes limestone for a variety of agricultural products. Annual quarry production at these two operations is about 150 000 tonnes.
Limestones in the northeast region have had no exploitation as yet. Some good grades are reported, but quarriable reserves are limited (Hamilton and Mellon, 1973). Potential for underground mining of limestone may exist at an underground test facility for in situ bitumen recovery from the Athabasca oil sands. Part of the testing operations involve tunnelling in Devonian limestone underlying the Cretaceous oil sands. The limestones at this site show promising grades (Holter and Hamilton, 1989), although a thorough evaluation has not been made.
Dolomite resources in Alberta are vast, but have had
12 Industrial Minerals Forum 1991
UTF Si teJ Y ciearvl/ater
100 km
F~1 Limestone • Producer or prospect
Figure 5. Distribution of limestone outcrop areas and producing or prospective sites in Alberta (from Holter, 1976).
little exploitation. Small past production has been reported from the Devonian Fairholme and Mississippian Rundle Groups in the Crowsnest Pass, for use as flux stone in British Columbia smelters.
Potential for expanded development of Alberta's limestone resources hes in the use of limestone as source rock for precipitated calcium carbonate (PCC), for use as paper filler. Several undeveloped deposits have tested favourably for PCC use (Hamilton, 1987; Holter and Hamilton, 1989; Tower, et a/., 1991). Alberta limestone quarried for the Continental Lime plant at Kananaskis is in fact used for PCC production at a pulp mill in Saskatchewan.
MARL AND TUFA Deposits of marl and tufa are numerous in central
and northwestern Alberta (Macdonald, 1982). The deposits are generally small, of postglacial or Recent age, and associated with groundwater discharge areas. A few have sizeable reserves (1 million tonnes or more) with grades of 65% CaC03 or better. Two of these, at Halfway Lake about 60 kilometres north of Edmonton, and at Marlboro about 200 kilometres west of Edmonton, were exploited in the past for cement-making; both operations have been shut down for several years. At least three other deposits have had sporadic production for local agricultural liming in Alberta (Figure 3). This appears to be the best potential use for Alberta marls in the future.
PEAT MOSS Peatlands are widespread through the northern two-
thirds of Alberta, covermg one-quarter to one-third of
the land surface in this region (Turchenek and Pigot, 1988). Peat moss is commercially harvested at several localities in the province (Figure 3), the largest production coming from a plant near Entwistle, 80 kilometres west of Edmonton. Production for the province in 1990 was 64 000 tonnes, valued at $13 million. These figures apply only to product that is processed and bailed, largely for export marketing. Peat moss is also produced in unprocessed bulk form for local horticultural use.
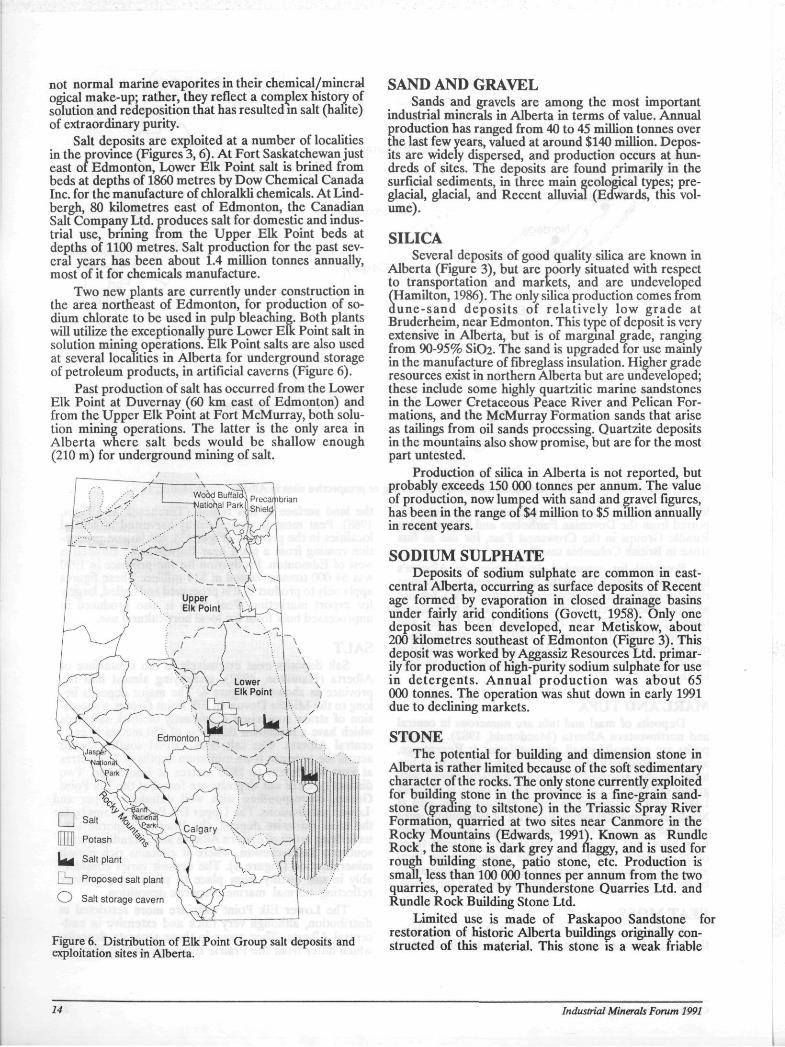
SALT Salt deposits exist extensively in the subsurface of
Alberta (Hamilton, 1982), underlying almost half the province as shown in Figure 6. The major deposits belong to the Middle Devonian Elk Point Group, a succession of strata comprised dominantly of thick salt beds which have a maximum thickness of 430 metres in east-central Alberta. The salt beds extend southwestward across the province from minimum depths of 210 metres at Fort McMurray to 1820 metres at Edmonton. Two distinct types of salt deposits are found at the Elk Point Group, corresponding with well defined Upper and Lower subdivisions. The Upper Elk Point contains by far the most extensive deposit, the Prairie Evaporite salt, underlying much of eastern Alberta and extending across southern Saskatchewan, where it contains rich potash mineralization (Figure 6). The deposit varies considerably in salt quality from place to place, in a manner reflecting normal marine evaporite deposition.
The Lower Elk Point salts are more restricted in distribution, although very thick and extensive in east-central Alberta. They occur in three separate deposits, which differ from the Prairie Evaporite m that they are
Conference Proceedings 13
not normal marine evaporites in their chemical/mineral ogical make-up; rather, they reflect a complex history of solution and redeposition that has resulted in salt (halite) of extraordinary purity.
Salt deposits are exploited at a number of localities in the province (Figures 3,6). At Fort Saskatchewan just east of Edmonton, Lower Elk Point salt is brined from beds at depths of 1860 metres by Dow Chemical Canada Inc. for the manufacture of chloralkli chemicals. At Lindbergh, 80 kilometres east of Edmonton, the Canadian Salt Company Ltd. produces salt for domestic and industrial use, brining from the Upper Elk Point beds at depths of 1100 metres. Salt production for the past several years has been about 1.4 million tonnes annually, most of it for chemicals manufacture.
Two new plants are currently under construction in the area northeast of Edmonton, for production of sodium chlorate to be used in pulp bleaching. Both plants will utilize the exceptionally pure Lower Elk Point salt in solution mining operations. Elk Point salts are also used at several localities in Alberta for underground storage of petroleum products, in artificial caverns (Figure 6).
Past production of salt has occurred from the Lower Elk Point at Duvernay (60 km east of Edmonton) and from the Upper Elk Point at Fort McMurray, both solution mining operations. The latter is the only area in Alberta where salt beds would be shallow enough (210 m) for underground mining of salt.
Figure 6. Distribution of Elk Point Group salt deposits and exploitation sites in Alberta.
SAND AND GRAVEL Sands and gravels are among the most important
industrial minerals in Alberta in terms of value. Annual production has ranged from 40 to 45 million tonnes over the last few years, valued at around $140 million. Deposits are widely dispersed, and production occurs at hundreds of sites. The deposits are found primarily in the surfjcial sediments, in three main geological types; pre-glacial, glacial, and Recent alluvial (Edwards, this volume).
SILICA Several deposits of good quality silica are known in
Alberta (Figure 3), but are poorly situated with respect to transportation and markets, and are undeveloped (Hamilton, 1986). The only silica production comes from dune-sand deposits of relatively low grade at Bruderheim, near Edmonton. This type of deposit is very extensive in Alberta, but is of marginal grade, ranging from 90-95% Si02. The sand is upgraded for use mainly in the manufacture of fibreglass insulation. Higher grade resources exist in northern Alberta but are undeveloped; these include some highly quartzitic marine sandstones in the Lower Cretaceous Peace River and Pelican Formations, and the McMurray Formation sands that arise as tailings from oil sands processing. Quartzite deposits in the mountains also show promise, but are for the most part untested.
Production of silica in Alberta is not reported, but probably exceeds 150 000 tonnes per annum. The value of production, now lumped with sand and gravel figures, has been in the range of $4 million to $5 million annually in recent years.
SODIUM SULPHATE Deposits of sodium sulphate are common in east-
central Alberta, occurring as surface deposits of Recent age formed by evaporation in closed drainage basins under fairly arid conditions (Govett, 1958). Only one deposit has been developed, near Metiskow, about 200 kilometres southeast of Edmonton (Figure 3). This deposit was worked by Aggassiz Resources Ltd. primarily for production of high-purity sodium sulphate for use in detergents. Annual production was about 65 000 tonnes. The operation was shut down in early 1991 due to declining markets.
STONE The potential for building and dimension stone in
Alberta is rather limited because of the soft sedimentary character of the rocks. The only stone currently exploited for building stone in the province is a fine-grain sandstone (grading to siltstone) in the Triassic Spray River Formation, quarried at two sites near Canmore in the Rocky Mountains (Edwards, 1991). Known as Rundle Rock , the stone is dark grey and flaggy, and is used for rough building stone, patio stone, etc. Production is small, less than 100 000 tonnes per annum from the two quarries, operated by Thunderstone Quarries Ltd. and Rundle Rock Building Stone Ltd.
Limited use is made of Paskapoo Sandstone for restoration of historic Alberta buildings originally constructed of this material. This stone is a weak triable
14 Industrial Minerals Forum 1991
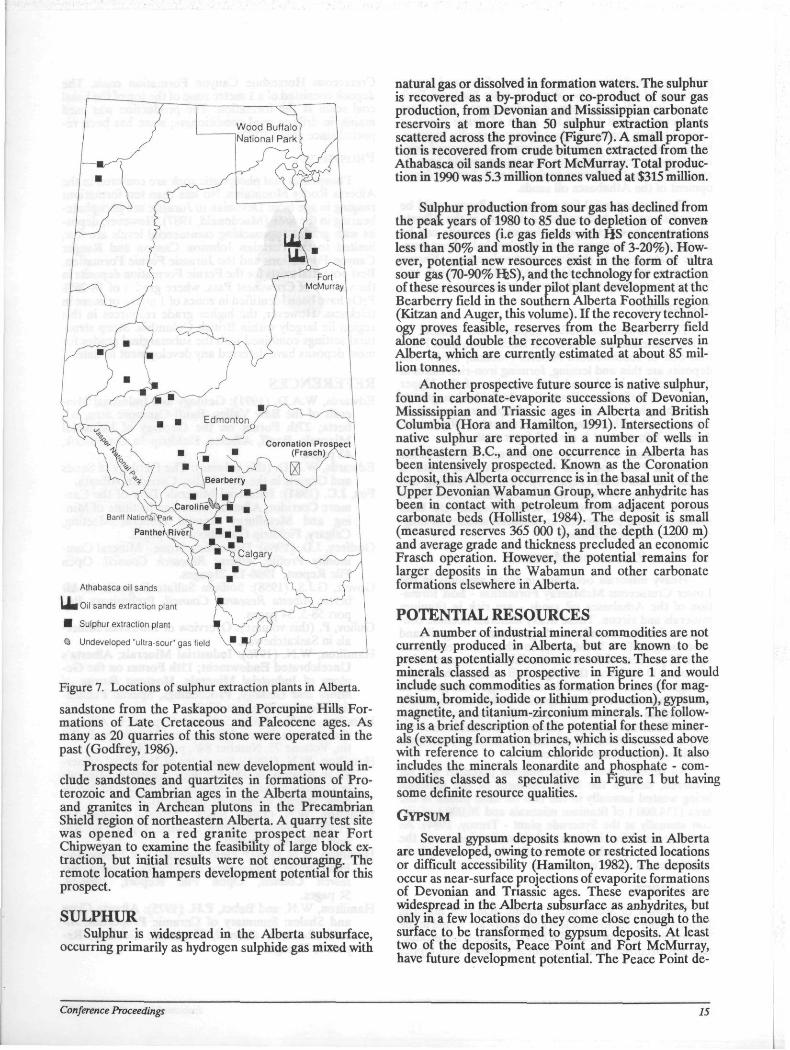
Figure 7. Locations of sulphur extraction plants in Alberta.
sandstone from the Paskapoo and Porcupine Hills Formations of Late Cretaceous and Paleocene ages. As many as 20 quarries of this stone were operated in the past (Godfrey, 1986).
Prospects for potential new development would include sandstones and quartzites in formations of Pro-terozoic and Cambrian ages in the Alberta mountains, and granites in Archean plutons in the Precambrian Shield region of northeastern Alberta. A quarry test site was opened on a red granite prospect near Fort Chipweyan to examine the feasibility oi large block extraction, but initial results were not encouraging. The remote location hampers development potential tor this prospect.
SULPHUR Sulphur is widespread in the Alberta subsurface,
occurring primarily as hydrogen sulphide gas mixed with
natural gas or dissolved in formation waters. The sulphur is recovered as a by-product or co-product of sour gas production, from Devonian and Mississippian carbonate reservoirs at more than 50 sulphur extraction plants scattered across the province (Figure?). A small proportion is recovered from crude bitumen extracted from the Athabasca oil sands near Fort McMurray. Total production in 1990 was 5.3 million tonnes valued at $315 million.
Sulphur production from sour gas has declined from the peak years of 1980 to 85 due to depletion of conven tional resources (i.e gas fields with HS concentrations less than 50% and mostly in the range of 3-20%). However, potential new resources exist m the form of ultra sour gas (70-90% HzS), and the technology for extraction of these resources is under pilot plant development at the Bearberry field in the southern Alberta Foothills region (Kitzan and Auger, this volume). If the recovery technology proves feasible, reserves from the Bearberry field alone could double the recoverable sulphur reserves in Alberta, which are currently estimated at about 85 million tonnes.
Another prospective future source is native sulphur, found in carbonate-evaporite successions of Devonian, Mississippian and Triassic ages in Alberta and British Columbia (Hora and Hamilton, 1991). Intersections of native sulphur are reported in a number of wells in northeastern B.C., and one occurrence in Alberta has been intensively prospected. Known as the Coronation deposit, this Alberta occurrence is in the basal unit of the Upper Devonian Wabamun Group, where anhydrite has been in contact with petroleum from adjacent porous carbonate beds (Holhster, 1984). The deposit is small (measured reserves 365 000 t), and the depth (1200 m) and average grade and thickness precluded an economic Frasch operation. However, the potential remains for larger deposits in the Wabamun and other carbonate formations elsewhere in Alberta.
POTENTIAL RESOURCES A number of industrial mineral commodities are not
currently produced in Alberta, but are known to be present as potentially economic resources. These are the minerals classed as prospective in Figure 1 and would include such commodities as formation brines (for magnesium, bromide, iodide or lithium production), gypsum, magnetite, and titanium-zirconium minerals. The following is a brief description of the potential for these minerals (excepting formation brines, which is discussed above with reference to calcium chloride production). It also includes the minerals leonardite and phosphate - commodities classed as speculative in Figure 1 but having some definite resource qualities.
GYPSUM Several gypsum deposits known to exist in Alberta
are undeveloped, owing to remote or restricted locations or difficult accessibility (Hamilton, 1982). The deposits occur as near-surface projections of evaporite formations of Devonian and Triassic ages. These evaporites are widespread in the Alberta subsurface as anhydrites, but only in a few locations do they come close enough to the surface to be transformed to gypsum deposits. At least two of the deposits, Peace Pomt and Fort McMurray, have future development potential. The Peace Point de-
Conference Proceedings 15
osit has a world class rating in terms of size and purity, ut much of it lies within Wood Buffalo National Park
and is interdicted from development. The Fort McMurray deposit (-200 km south of Peace Point) is huge, 2 billion tonnes grading 90 per cent plus gypsum, but is a subsurface deposit requiring underground mining. Gypsum exploitation in this region would have to await the industrialization projected with further development of the Athabasca oil sands.
The best potential for gypsum in Alberta could be for undiscovered, shallow buried deposits in the Alberta mountains. Prospective areas for such deposits can be postulated for locations in the disturbed belt where evap-oritic strata occur in shallow structural settings. Known evaporite units in the Devonian, Mississippian and Triassic formations would provide prospective targets.
MAGNETITE
Titaniferous magnetite deposits are present at widely scattered localities in the Rocky Mountain Foothills belt of southwestern Alberta (Mellon, 1961). The deposits are thin and lensing, forming iron-rich zones at the top of the basal sandstone member of the Upper Cretaceous Belly River Formation. Individual magnetite beds, thought to originate as paleoplacers, are up to 1 metre thick with average Fe203 content of 29 per cent. Average Ti02 content is about 3.5 per cent.
The richest deposits are located near Burmis in the Crowsnest Pass, and near Dungarvan Creek, south of Pincher Creek town (Figure 3). Complex faulting and folding at the two sites limit recoverable reserves to about 2 million and 6 million tonnes respectively. Both sites have been prospected as potential sources of magnetite for coal beneficiation.
TITANIUM-ZIRCONIUM MINERALS
Heavy minerals occurring in trace amounts in the Lower Cretaceous McMurray Formation - host formation of the Athabasca oil sands - are rich in titanium minerals and zircon. These heavy minerals become concentrated in the secondary tailings stream during oil sand processing at Fort McMurray, to where they constitute up to 25 per cent of the mineral solids. The concentration is about 100-fold from the original oil sands, such that the tailings become comparable in tonnage and grade to world-scale mineral sands deposits worked commercially for titanium and zirconium minerals recovery (Trevoy, 1984). Titanium minerals (ilmenite, leucoxene and ru-tile) constitute about 30 per cent of the heavy minerals fraction, zircon about 10 per cent.
No development of this mineral potential has yet occurred, despite the large tonnages of the minerals being wasted annually in the two oil sand plants in the area (114,000 t of titanium minerals and 26,000 t of zircon annually at the Syncrude plant - Trevoy, 1984). As world demand for titanium and zirconium increases, the potential for development of the heavy minerals in Athabasca oil sands is enhanced.
LEONARDITE
Deposits of leonardite - humic acid-rich material formed from oxidation of low rank coal - are found in the Battle River area of central Alberta. Small-scale production has occurred from a deposit associated with Upper
Cretaceous Horseshoe Canyon Formation coals. The deposit consisted of a 1 metre zone of the top of the basal coal seam in the formation. The production was used mainly in drilling mud conditioners; none has been reported since about 1980. PHOSPHATE
Phosphates and phosphatic rock are common in the Alberta Rocky Mountains. No less than ten formations ranging in age from Devonian to Jurassic are phosphate-bearing in the area (Macdonald, 1987). However, deposits with grades approaching commercial levels are few, limited to the Permian Johnson Canyon and Ranger Canyon Formations and the Jurassic Fernie Formation. Best potential exists for the Fernie Formation deposits in the vicinity of Crowsnest Pass, where grades of 18-26% P2O5 have been identified in zones of 1 metre or more in thickness. However, the higher grade resources in this region lie largely within British Columbia. Steep structural settings combined with the submarginal grades for most deposits have deterred any development to date.
REFERENCES Edwards, WA.D. (1991): Geology and Industrial Min
erals of the Bow Valley, Banff-Canmore area, Alberta; 27th Forum on the Geology of Industrial Minerals, Banff, Alberta, Fieldtrip la Guidebook, 45 pages.
Edwards, WA.D. (this volume): The Geology of Sands and Gravels in the Bow Valley Corridor, Alberta.
Fox, J.C. (1981): Industrial Minerals Tour of the Can-more Corridor, Alberta; Canadian Institute of Mining and Metallurgy Annual General Meeting, Calgary, Fieldtrip Guidebook, 30 pages.
Godfrey, J.D. (1986): Dimension Stone - Mineral Commodity Profile; Alberta Research Council, Open File Report, 1986-13, 21pages.
Govett, G J.S. (1958): Sodium Sulfate Deposits in Alberta; Alberta Research Council, Preliminary Report 58-5,34 pages.
Guliov, P. (this volume): Overview of Industrial Minerals in Saskatchewan.
Hamilton, W.N. (1976): Industrial Minerals; Alberta's Uncelebrated Endowment; 11th Forum on the Geology of Industrial Minerals, Montana Bureau of Mines and Geology, Proceedings, Special Publication Number 74, pages 17-35.
Hamilton, W.N. (1982): Salt and Gypsum in Alberta; Canadian Institute of Mining and Metallurgy, Bulletin, Volume 75, Number 846, pages 74-89.
Hamilton, W.N. (1984): Summary of Industrial Minerals in Alberta; in The Geology Industrial Minerals in Canada, Canadian Institute of Mining and Metallurgy, Special Volume 29, pages 250-253.
Hamilton, W.N. (1986): Silica - Mineral Commodity Profile; Alberta Research Council, Open File Report, 1986-13, 31 pages.
Hamilton, W.N. (1987): Field Evaluation of Prospective Filler-grade Limestones in Alberta; Alberta Research Council, Open File Report, 1989-14, 51 pages.
Hamilton, W.N. and Babet, P.H. (1975): Alberta Clays and Shales: Summary of Ceramic Properties; Alberta Research Council, Economic Geology, Report 3,73 pages.
16 Industrial Minerals Forum 1991
Hamilton, W.N. and Hora, Z.D. (1987): Industrial Mineral Opportunities in British Columbia and Alberta, Canada; Society of Mining Engineers, Annual Meeting, Denver, Colorado, Preprint, Number 87-111,13 pages.
Hamilton, W.N. and Mellon, G.B. (1973): Industrial Mineral Resources of the Fort McMurray Area; in. Guidebook to Athabasca Oil Sands Area, Alberta Research Council, Information Series, Number 65, pages 123-162.
Hamilton, W.N., Scafe, D.W. and Laidler, J.K. (1988): Evaluation of Kaolin in the Whitemud Formation of Alberta for Use as Paper Filler; Alberta Research Council, Open File Report, 1989-5,79 pages.
Hitchon, B. (1984): Formation Waters as a Source of Industrial Minerals in Alberta; in The Geology of Industrial Minerals in Canada, Canadian Institute of Mining and Metallurgy, Special Volume Number 29, pages 247-249.
Hitchon, B. and Holter, M.E. (1971): Calcium and Magnesium in Alberta Brines; Alberta Research Council, Economic Geology Report, Number 1, 39 pages.
Hitchon, B., Levinson, A A . and Horn, M.K. (1977): Bromide, Iodide, and Boron in Alberta Formation Waters; Alberta Research Council, Economic Geology Report Number 5, 25 pages.
Hollister, V.F. (1984): Sulphur Potential of the Wabamun Group, Alberta; in The Geology of Industrial Minerals in Canada, Canadian Institute of Mining and Metallurgy, Special Volume 29, pages 238-243.
Holter, M.E. (1976): Limestone Resources of Alberta; Alberta Research Council, Economic Geology Report Number 4, 91 pages.
Holter, M.E. and Hamilton, W.N. (1989): An Evaluation of Alberta Limestones for use as Paper Filler Materials; Alberta Research Council, Open File Report, 1990-11, 89 pages.
Hora, Z.D. and Hamilton, W.N. (in press): Native Sulphur Resource Potential in Western Canada; Society of Mining Engineers, Annual Meeting, Proceedings, Phoenix, Arizona, 1992.
Kitzan, P. and Auger, L. (this volume): The Bearberry Ultra-sour Gas Project.
Macdonald, D.E. (1982): Marl Resources of Alberta; Alberta Research Council, Earth Sciences Report, 82-1,94 pages.
Macdonald, D.E. (1987): Geology and Resource Potential of Phosphates in Alberta; Alberta Research Council, Earth Sciences Report, 87-2,65 pages.
Mellon, G.B. (1961): Sedimentary Magnetite Deposits of the Crowsnest Pass Region, Southwestern Alberta; Alberta Research Council, Bulletin, Number 9, 93 pages.
Scafe, D.W. (1975): Alberta Bentonites; Alberta Research Council, Economic Geology Report, Number 2,19 pages.
Scafe, D.W. (1991): The Ceramic Potential of Alberta Clays and Shales; Alberta Research Council, Economic Geology Report, Number 7,138 pages.
Tower, R.W., Bertram, E.F. and Melnichuk, JA. (1991): Evaluation of Alberta Limestone for Precipitated Calcium Carbonate Production Suitability; Alberta Research Council, Manufacturing Technologies Department, internal unpublished report, 11 pages, appendix.
Trevoy, L.W. (1984): Heavy Mineral By-products from Athabasca Tar Sands; in The Geology of Industrial Minerals in Canada, Canadian Institute of Mining and Metallurgy, Special Volume, Number 29, p. 244-246.
Turchenek, L.W. and Pigot, M.E. (1988): Peatland Distribution in Alberta; Alberta Research Council, map, scale 1:2,000,000.
Vandervelde, R. (this volume): Ammolite, an Organic Gemstone from Alberta.
Conference Proceedings 17

18 Industrial Minerals Forum 1991
OVERVIEW OF INDUSTRIAL MINERALS IN SASKATCHEWAN
By Paul Guliov
ABSTRACT The diversity and quality of Saskatchewan's indus
trial mineral resources offer many significant opportunities for development. Recent contributions to the total mineral sales value by industrial minerals in the province range from about 20 to 35 per cent. Industrial minerals production and sales value are dominated by potash, followed distantly by lignite, sodium sulphate, aggregate and salt. While lignite is not normally considered an industrial mineral it is included for practical reasons.
The principal industrial minerals of Saskatchewan are presented under five major groups including salts and brines, clays, construction materials, organics and gem materials. A sixth group, other industrial minerals, represents minor, less well known and poorly documented occurrences. Of the twenty-one principal minerals discussed four are considered to have significant medium term developmental potential. These are subsurface brines, kaolin, dimension stone and silica sand.
While no economic diamond deposits have been reported to date the discovery of at least four macrodiamonds and widespread favorable indicators of kimberlite occurrences are sufficient reasons for optimism and aggressive exploration programs.
Current silica sand development is on a modest scale. Sand quality, resource size and accessibility are factors favoring the development of the sand deposits and diversification of the industry.
A rapid growth in dimension stone markets in North America might favor the development of at least three stone deposits in east-central Saskatchewan. Of particular interest are veined amphibolites similar to verde antique, red and grey dolomite marbles and red and green varieties of granite.
Large kaolin resources in southern Saskatchewan are upgradable at least to paper filler quality. The kaolin with associated ball clays ana a variety of Cretaceous and Tertiary stoneware clays could become the basis for growth in the province's clay industry.
Subsurface brines with very high levels of calcium and magnesium chloride have been identified in several areas of the province and are being investigated. In addition, high levels of bromine and significant boron and iodine values improve the economic prospects. If sufficiently large resources are present the orines could be the basis for a very significant chemical industry.
INTRODUCTION Saskatchewan is host to a diverse group of industrial
minerals and rocks that contribute about 20 to 35 per cent of the value of all mineral substances produced in the province (Table 1).
Although the level of contribution by industrial min-
Saskatchewan Energy and Mines, Regina, Saskatchewan
erals is substantial it will likely grow significantly during the next decade based on the diversity of resources and their qualitative and quantitative aspects.
Nearly all industrial minerals production takes place in the Phanerozoic region of the province (Figure 1). Mineral production ranges from potash, sodium sulphate and salt used for their chemical properties to granular aggregate, silica sand and clays used principally for their physical properties. The level of development ranges from very high, as in the case of the world-class potash and sodium sulphate deposits, to low where small-scale single producers serve a limited market (eg. silica flux and bloating clay).
TABLE 1 COMPARISON OF SALES VALUE OF
INDUSTRIAL MINERALS AND OTHER MINERAL GROUPS
Fuel Industrial Metallic Year Minerals Minerals Minerals
1984 2 073.9 905.1 372.8 1985 2 477.6 698.3 476.5 1986 1442.8 631.5 467.4 1987 1 788.7 752.3 663.3 1988 1 375.8 1 055.7 493.7
The industrial minerals of the Precambrian Shield of Saskatchewan are less well known than those of the Phanerozoic basin. Numerous occurrences are known but require investigation and better documentation.
INDUSTRIAL MINERAL DEPOSITS SALTS AND BRINES
POTASH Of the several Devonian evaporite deposits in Sas
katchewan the Middle Devonian Prairie Formation is the only one known to contain potash. The potash mineralization is largely confined to Saskatchewan, (Figure 2), but also extends southward into North Dakota and northeastern Montana and eastward into Manitoba, (Fuzesy 1984). Potash occurs within four members separated by halite in the upper 60 metres of the Prairie Formation (Holter, 1969) (Figure 3). The principal minerals are hal i te (NaCl ) , sylvite (KC1) and carnal l i te (KCl.MgCl2.6H2O). Insoluble content consists largely of anhydrite with minor clay, dolomite, quartz and iron oxide. Sylvite grades of about 30 per cent are common in all members.
The Prairie Formation has a regional gradient ranging from 1:450 to 1:160 due south m western areas and southwest in eastern areas. The evaporite beds are inter-
Conference Proceedings 19
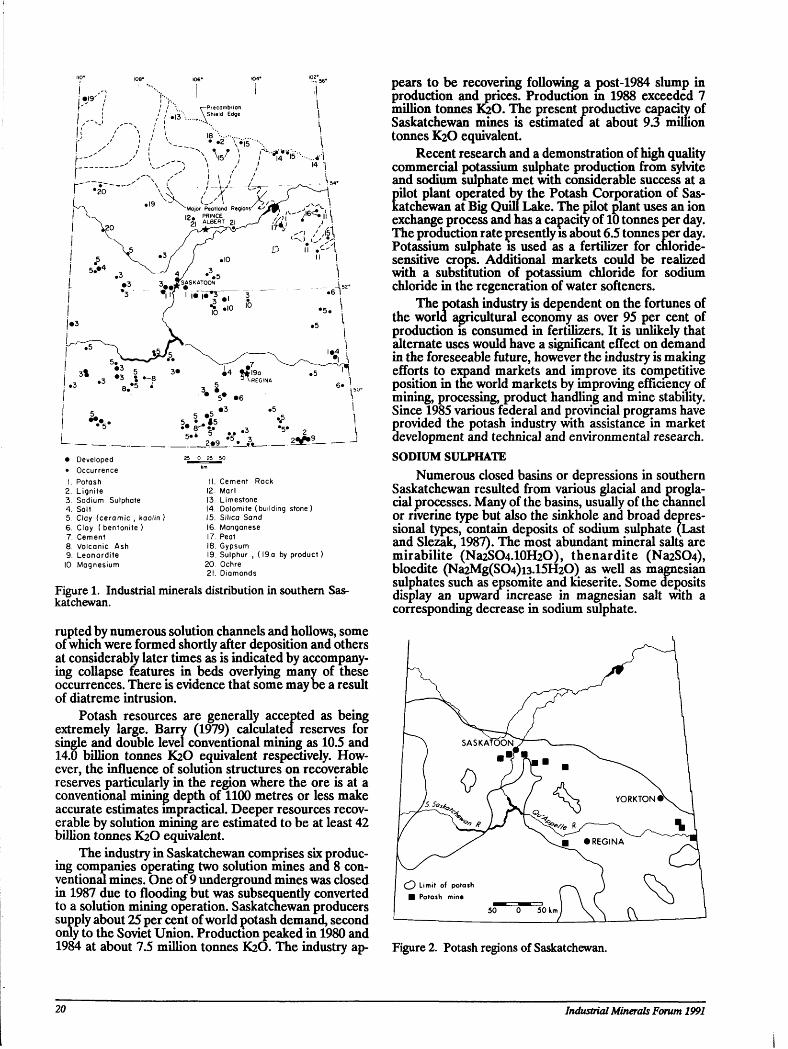
j *J9" I
L-j ,—
\-"'' , r r *2o~
i \?0
V5
.3
i • 3 •3
r—Precombrion \ Shield Edge
I __2t9 • A 2 5 P ^ 1
• Developed • Occurrence I. Potash
2. Lignite 3. Sodium Sulphate 4 Salt 5 Clay (ceramic , kaolin ) 6. Clay ( bentonite ) 7. Cement 8 Volcanic Ash 9. Leonardite 10 Magnesium
25 0 25 50
II. Cement Rock 12. Marl 13 Limestone 14. Dolomite (building stone) 15. Silica Sand 16 Manganese 17. Peat 18. Gypsum 19. Sulphur , (19a by product)
20 Ochre 21. Diamonds
Figure 1. Industrial minerals distribution in southern Saskatchewan.
rupted by numerous solution channels and hollows, some of which were formed shortly after deposition and others at considerably later times as is indicated by accompanying collapse features in beds overlying many of these occurrences. There is evidence that some maybe a result of diatreme intrusion.
Potash resources are generally accepted as being extremely large. Barry (1979) calculated reserves for single and double level conventional mining as 10.5 and 14.0 billion tonnes K2O equivalent respectively. However, the influence of solution structures on recoverable reserves particularly in the region where the ore is at a conventional mining depth of 1100 metres or less make accurate estimates unpractical. Deeper resources recoverable by solution mining are estimated to be at least 42 billion tonnes K2O equivalent.
The industry in Saskatchewan comprises six producing companies operating two solution mines and 8 conventional mines. One of 9 underground mines was closed in 1987 due to flooding but was subsequently converted to a solution mining operation. Saskatchewan producers supply about 25 per cent of world potash demand, second only to the Soviet Union. Production peaked in 1980 and 1984 at about 7.5 million tonnes K2O. The industry ap
pears to be recovering following a post-1984 slump in production and prices. Production m 1988 exceeded 7 million tonnes K2O. The present productive capacity of Saskatchewan mines is estimated at about 9.3 million tonnes K2O equivalent.
Recent research and a demonstration of high quality commercial potassium sulphate production from sylvite and sodium sulphate met with considerable success at a pilot plant operated by the Potash Corporation of Saskatchewan at Big Quill Lake. The pilot plant uses an ion exchange process and has a capacity of 10 tonnes per day. The production rate presently is about 6.5 tonnes per day. Potassium sulphate is used as a fertilizer for chloride-sensitive crops. Additional markets could be realized with a substitution of potassium chloride for sodium chloride in the regeneration of water softeners.
The potash industry is dependent on the fortunes of the world agricultural economy as over 95 per cent of production is consumed in fertilizers. It is unlikely that alternate uses would have a significant effect on demand in the foreseeable future, however the industry is making efforts to expand markets and improve its competitive position in the world markets by improving efficiency of mining, processing, product handling and mine stability. Since 1985 various federal and provincial programs have provided the potash industry with assistance in market development and technical and environmental research. SODIUM SULPHATE
Numerous closed basins or depressions in southern Saskatchewan resulted from various glacial and progla-cial processes. Many of the basins, usually of the channel or riverine type but also the sinkhole and broad depression^ types, contain deposits of sodium sulphate (Last and Slezak, 1987). The most abundant mineral salts are mirabilite (Na2SO4.10H2O), thenardite (Na2S04), bloedite (Na2Mg(S04)i3.15H20) as well as magnesian sulphates such as epsomite and kieserite. Some deposits display an upward increase in magnesian salt with a corresponding decrease in sodium sulphate.
Figure 2. Potash regions of Saskatchewan.
20 Industrial Minerals Forum 1991
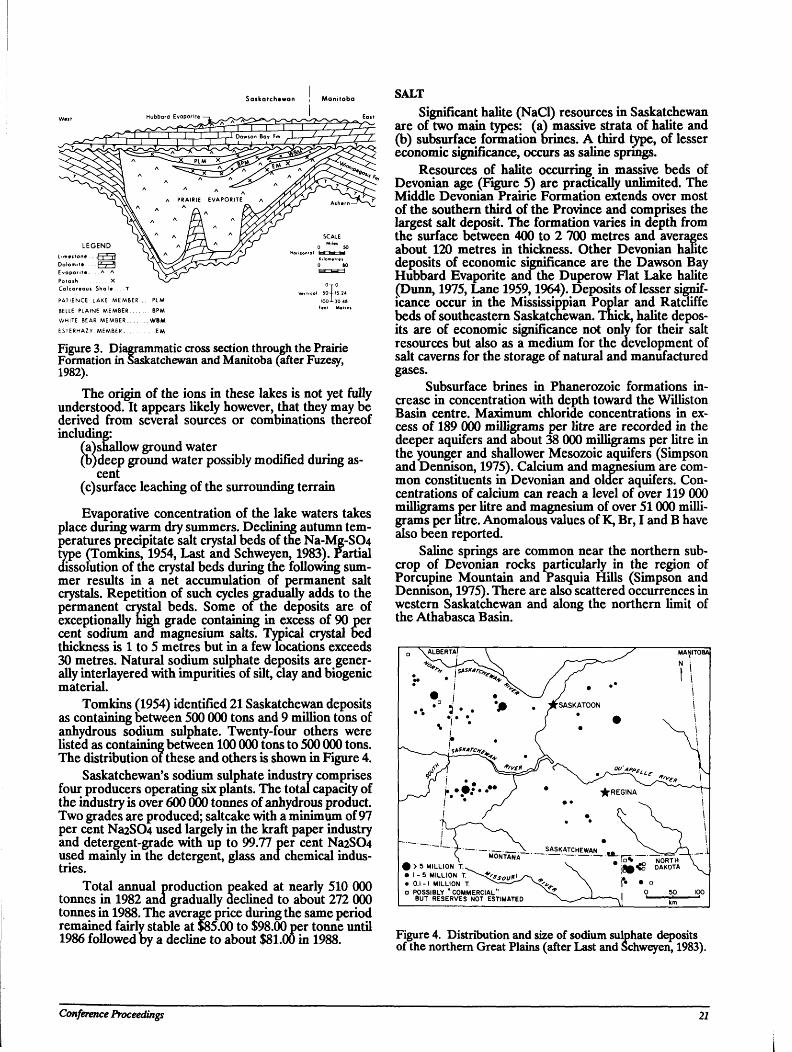
PATIENCE LAKE MEMBER . . PLM IOO-1-304»
BELLE PIAINE MEMBER BPM ' * * ' " " " *
WHITE BEAR MEMBER W B M
ESTERHAZV MEMBER E M
Figure 3. Diagrammatic cross section through the Prairie Formation in Saskatchewan and Manitoba (after Fuzesy, 1982).
The origin of the ions in these lakes is not yet fully understood. It appears likely however, that they may be derived from several sources or combinations thereof including:
(a}shallow ground water (b)deep ground water possibly modified during as
cent (c)surface leaching of the surrounding terrain
Evaporative concentration of the lake waters takes place during warm dry summers. Declining autumn temperatures precipitate salt crystal beds of the Na-Mg-SCto type (Tomkins, 1954, Last and Schweyen, 1983). Partial dissolution of the crystal beds during the following summer results in a net accumulation of permanent salt crystals. Repetition of such cycles gradually adds to the permanent crystal beds. Some of the deposits are of exceptionally nigh grade containing in excess of 90 per cent sodium and magnesium salts. Typical crystal bed thickness is 1 to 5 metres but in a few locations exceeds 30 metres. Natural sodium sulphate deposits are generally interlayered with impurities of silt, clay and biogenic material.
Tomkins (1954) identified 21 Saskatchewan deposits as containing between 500 000 tons and 9 million tons of anhydrous sodium sulphate. Twenty-four others were listed as containing between 100 000 tons to 500 000 tons. The distribution of these and others is shown in Figure 4.
Saskatchewan's sodium sulphate industry comprises four producers operating six plants. The total capacity of the industry is over 600 000 tonnes of anhydrous product. Two grades are produced; saltcake with a minimum of 97 per cent Na2S04 used largely in the kraft paper industry and detergent-grade with up to 99.77 per cent Na2S04 used mainly in the detergent, glass and chemical industries.
Total annual production peaked at nearly 510 000 tonnes in 1982 and gradually declined to about 272 000 tonnes in 1988. The average price during the same period remained fairly stable at $85.00 to $98.00 per tonne until 1986 followed by a decline to about $81.00 in 1988.
SALT Significant halite (NaCl) resources in Saskatchewan
are of two main types: (a) massive strata of halite and (b) subsurface formation orines. A third type, of lesser economic significance, occurs as saline springs.
Resources of halite occurring in massive beds of Devonian age (Figure 5) are practically unlimited. The Middle Devonian Prairie Formation extends over most of the southern third of the Province and comprises the largest salt deposit. The formation varies in depth from the surface between 400 to 2 700 metres and averages about 120 metres in thickness. Other Devonian haute deposits of economic significance are the Dawson Bay Hubbard Evaporite ana the Duperow Flat Lake halite (Dunn, 1975, Lane 1959,1964). Deposits of lesser significance occur in the Mississippian Poplar and Ratcliffe beds of southeastern Saskatchewan. Thick, halite deposits are of economic significance not only for their salt resources but also as a medium for the development of salt caverns for the storage of natural and manufactured gases.
Subsurface brines in Phanerozoic formations increase in concentration with depth toward the Williston Basin centre. Maximum chloride concentrations in excess of 189 000 milligrams per litre are recorded in the deeper aquifers and about 38 000 milligrams per litre in the younger and shallower Mesozoic aquifers (Simpson and Dennison, 1975). Calcium and magnesium are common constituents in Devonian and older aquifers. Concentrations of calcium can reach a level of over 119 000 milligrams per litre and magnesium of over 51000 milligrams per litre. Anomalous values of K, Br, I and B have also been reported.
Saline springs are common near the northern sub-crop of Devonian rocks particularly in the region of Porcupine Mountain and Pasquia Hills (Simpson and Dennison, 1975). There are also scattered occurrences in western Saskatchewan and along the northern limit of the Athabasca Basin.
Figure 4. Distribution and size of sodium sulphate deposits of the northern Great Plains (after Last and Schweyen, 1983).
Conference Proceedings 21
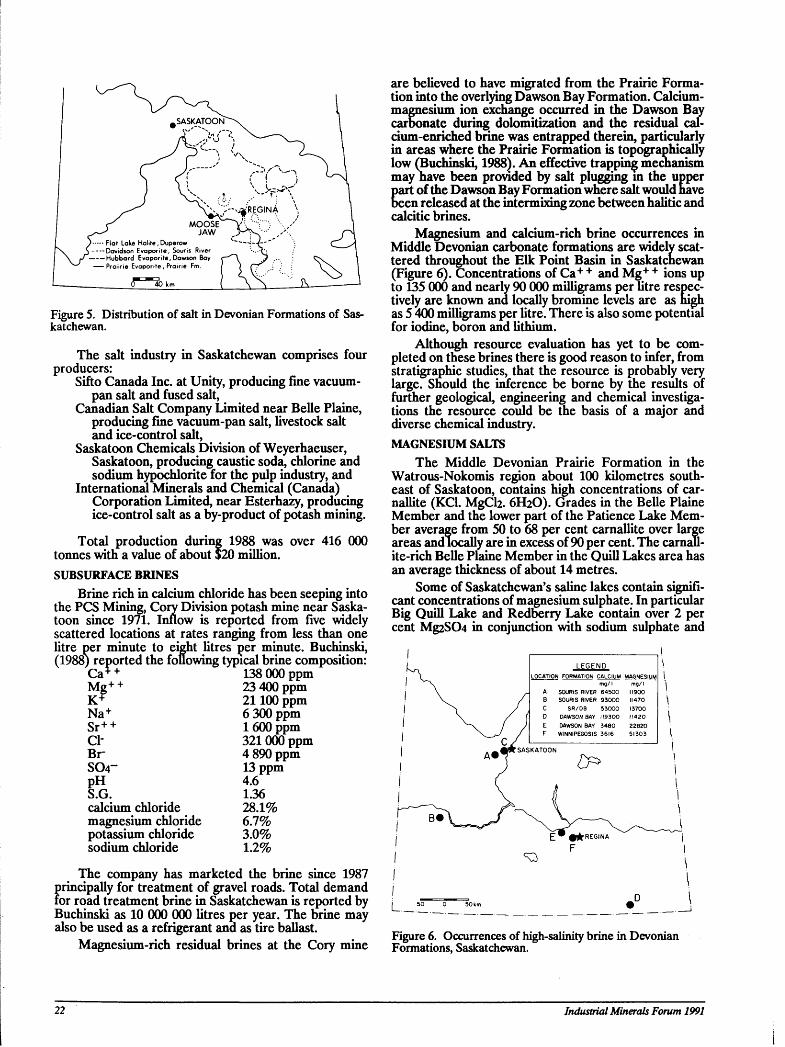
Figure 5. Distribution of salt in Devonian Formations of Saskatchewan.
The salt industry in Saskatchewan comprises four producers:
Sifto Canada Inc. at Unity, producing fine vacuum-pan salt and fused salt,
Canadian Salt Company Limited near Belle Plaine, producing fine vacuum-pan salt, livestock salt and ice-control salt,
Saskatoon Chemicals Division of Weyerhaeuser, Saskatoon, producing caustic soda, chlorine and sodium hypochlorite for the pulp industry, and
International Minerals and Chemical (Canada) Corporation Limited, near Esterhazy, producing ice-control salt as a by-product of potash mining.
Total production during 1988 was over 416 000 tonnes with a value of about $20 million. SUBSURFACE BRINES
Brine rich in calcium chloride has been seeping into the PCS Mining, Cory Division potash mine near Saskatoon since 1971. Inflow is reported from five widely scattered locations at rates ranging from less than one litre per minute to eight litres per minute. Buchinski, (1988) reported the following typical brine composition:
Ca* + 138 000 ppm Mg+ + 23 400 ppm Mg+ +
21100 ppm Na+ 6 300 ppm Sr+ + 1600 ppm ci- 321 000 ppm Br 4 890 ppm SO4- 13 ppm pH 4.6 S.G. 1.36 calcium chloride 28.1% magnesium chloride 6.7% potassium chloride 3.0% sodium chloride 1.2%
The company has marketed the brine since 1987 principally for treatment of gravel roads. Total demand for road treatment brine in Saskatchewan is reported by Buchinski as 10 000 000 litres per year. The brine may also be used as a refrigerant and as tire ballast.
Magnesium-rich residual brines at the Cory mine
are believed to have migrated from the Prairie Formation into the overlying Dawson Bay Formation. Calcium-magnesium ion exchange occurred in the Dawson Bay carbonate during dolomitization and the residual calcium-enriched brine was entrapped therein, particularly in areas where the Prairie Formation is topographically low (Buchinski, 1988). An effective trapping mechanism may have been provided by salt plugging m the upper
Eart of the Dawson Bay Formation where salt would have een released at the intermixing zone between halitic and
calcitic brines. Magnesium and calcium-rich brine occurrences in
Middle Devonian carbonate formations are widely scattered throughout the Elk Point Basin in Saskatchewan (Figure 6). Concentrations of Ca+ + and Mg+ + ions up to 135 000 and nearly 90 000 milligrams per litre respectively are known and locally bromine levels are as high as 5 400 milligrams per litre. There is also some potential for iodine, boron and lithium.
Although resource evaluation has yet to be completed on these brines there is good reason to infer, from stratigraphic studies, that the resource is probably very large. Should the inference be borne by the results of further geological, engineering and chemical investigations the resource could be the basis of a major and diverse chemical industry. MAGNESIUM SALTS
The Middle Devonian Prairie Formation in the Watrous-Nokomis region about 100 kilometres southeast of Saskatoon, contains high concentrations of car-nallite (KC1. MgCb. 6H2O). Grades in the Belle Plaine Member and the lower part of the Patience Lake Member average from 50 to 68 per cent carnallite over large areas and locally are in excess of 90 per cent. The carnaU-ite-rich Belle Plaine Member in the Quill Lakes area has an average thickness of about 14 metres.
Some of Saskatchewan's saline lakes contain significant concentrations of magnesium sulphate. In particular Big Quill Lake and Redberry Lake contain over 2 per cent Mg2S04 in conjunction with sodium sulphate and
LEGEND LOCATION FORMATION CALCIUM MAGNESIUM
mg/l mg/l A SOURIS RIVER 64500 11900 B SOURIS RIVER 9 3 0 0 0 11470 C SR/DB 53000 13700 D DAWSON BAY 119300 I I 4 Z 0 E DAWSON BAY 3 4 8 0 22820 F WINNIPEGOSIS 36161 51303
SASKATOON
£p>
Figure 6. Occurrences of high-salinity brine in Devonian Formations, Saskatchewan.
22 Industrial Minerals Forum 1991
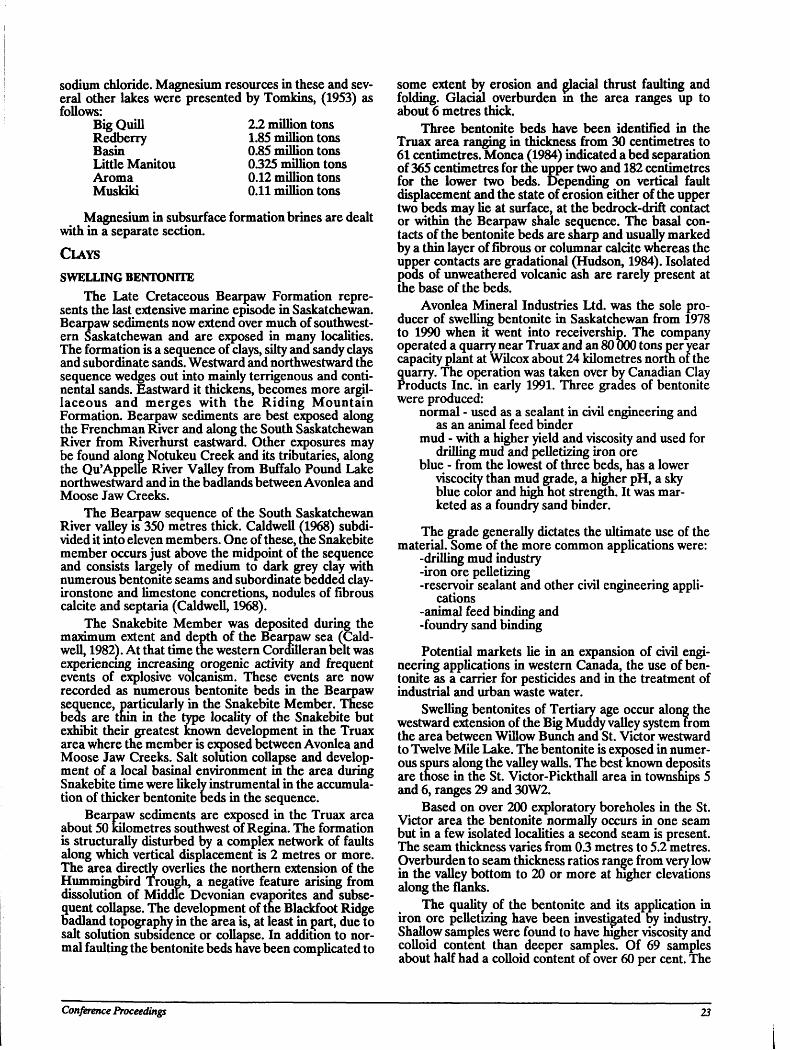
sodium chloride. Magnesium resources in these and several other lakes were presented by Tomkins, (1953) as follows:
Big Quill 2.2 million tons Redberry 1.85 million tons Basin 0.85 million tons Little Manitou 0.325 million tons Aroma 0.12 million tons Muskiki 0.11 million tons
Magnesium in subsurface formation brines are dealt with in a separate section. CLAYS
SWELLING BENTONITE
The Late Cretaceous Bearpaw Formation represents the last extensive marine episode in Saskatchewan. Bearpaw sediments now extend over much of southwestern Saskatchewan and are exposed in many localities. The formation is a sequence of clays, silty and sandy clays and subordinate sands. Westward and northwestward the sequence wedges out into mainly terrigenous and continental sands. Eastward it thickens, becomes more argillaceous and merges with the Riding Mountain Formation. Bearpaw sediments are best exposed along the Frenchman River and along the South Saskatchewan River from Riverhurst eastward. Other exposures may be found along Notukeu Creek and its tributaries, along the Qu'AppelJe River Valley from Buffalo Pound Lake northwestward and in the badlands between Avonlea and Moose Jaw Creeks.
The Bearpaw sequence of the South Saskatchewan River valley is 350 metres thick. Caldwell (1968) subdivided it into eleven members. One of these, the Snakebite member occurs just above the midpoint of the sequence and consists largely of medium to dark grey clay with numerous bentonite seams and subordinate bedded clay-ironstone and limestone concretions, nodules of fibrous calcite and septaria (Caldwell, 1968).
The Snakebite Member was deposited during the maximum extent and depth of the Bearpaw sea (Caldwell, 1982). At that time the western Cordilleran belt was experiencing increasing orogenic activity and frequent events of explosive volcanism. These events are now recorded as numerous bentonite beds in the Bearpaw sequence, particularly in the Snakebite Member. These beds are thin in the type locality of the Snakebite but exhibit their greatest known development in the Truax area where the member is exposed between Avonlea and Moose Jaw Creeks. Salt solution collapse and development of a local basinal environment in the area during Snakebite time were likely instrumental in the accumulation of thicker bentonite beds in the sequence.
Bearpaw sediments are exposed in the Truax area about 50 kilometres southwest of Regina. The formation is structurally disturbed by a complex network of faults along which vertical displacement is 2 metres or more. The area directly overlies the northern extension of the Hummingbird Trough, a negative feature arising from dissolution of Middle Devonian evaporites and subsequent collapse. The development of the Blackfoot Ridge badland topography in the area is, at least in part, due to salt solution subsidence or collapse. In addition to normal faulting the bentonite beds have been complicated to
some extent by erosion and glacial thrust faulting and folding. Glacial overburden m the area ranges up to about 6 metres thick.
Three bentonite beds have been identified in the Truax area ranging in thickness from 30 centimetres to 61 centimetres. Monea (1984) indicated a bed separation of 365 centimetres for the upper two and 182 centimetres for the lower two beds. Depending on vertical fault displacement and the state of erosion either of the upper two beds may lie at surface, at the bedrock-drift contact or within the Bearpaw shale sequence. The basal contacts of the bentonite beds are sharp and usually marked by a thin layer of fibrous or columnar calcite whereas the upper contacts are gradational (Hudson, 1984). Isolated pods of unweathered volcanic ash are rarely present at the base of the beds.
Avonlea Mineral Industries Ltd. was the sole producer of swelling bentonite in Saskatchewan from 1978 to 1990 when it went into receivership. The company operated a quarry near Truax and an 80 000 tons per year capacity plant at Wilcox about 24 kilometres north of the quarry. The operation was taken over by Canadian Clay Products Inc. in early 1991. Three grades of bentonite were produced:
normal - used as a sealant in civil engineering and as an animal feed binder
mud - with a higher yield and viscosity and used for drilling mud and pelletizing iron ore
blue - from the lowest of three beds, has a lower viscocity than mud grade, a higher pH, a sky blue color and high hot strength. It was marketed as a foundry sand binder.
The grade generally dictates the ultimate use of the material. Some of the more common applications were:
-drilling mud industry -iron ore pelletizing -reservoir sealant and other civil engineering appli
cations -animal feed binding and -foundry sand binding
Potential markets lie in an expansion of civil engineering applications in western Canada, the use of bentonite as a carrier for pesticides and in the treatment of industrial and urban waste water.
Swelling bentonites of Tertiary age occur along the westward extension of the Big Muddy valley system from the area between Willow Bunch and St. Victor westward to Twelve Mile Lake. The bentonite is exposed in numerous spurs along the valley walls. The best known deposits are those in the St. Victor-Pickthall area in townships 5 and 6, ranges 29 and 30W2.
Based on over 200 exploratory boreholes in the St. Victor area the bentonite normally occurs in one seam but in a few isolated localities a second seam is present. The seam thickness varies from 0.3 metres to 5.2 metres. Overburden to seam thickness ratios range from very low in the valley bottom to 20 or more at higher elevations along the flanks.
The quality of the bentonite and its application in iron ore pelletizing have been investigated by industry. Shallow samples were found to have higher viscosity and colloid content than deeper samples. Of 69 samples about half had a colloid content of over 60 per cent. The
Conference Proceeding? 23
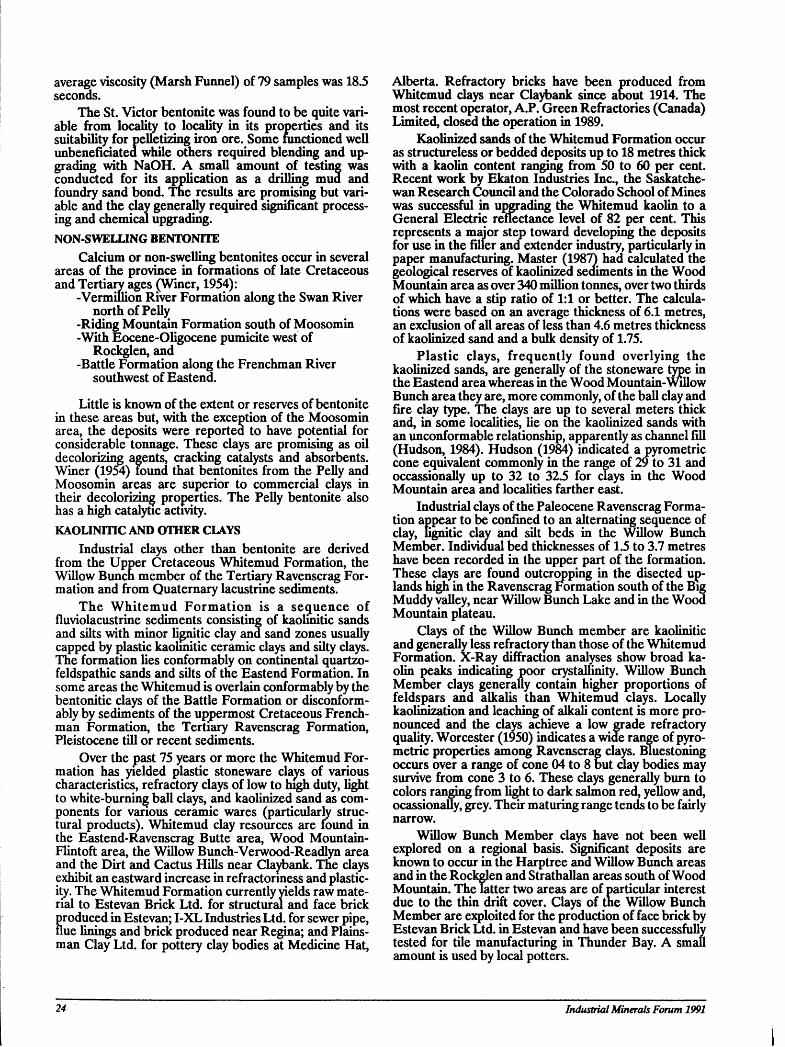
average viscosity (Marsh Funnel) of 79 samples was 18.5 seconds.
The St. Victor bentonite was found to be quite variable from locality to locality in its properties and its suitability for pelletizing iron ore. Some functioned well unbeneficiated while others required blending and upgrading with NaOH. A small amount of testing was conducted for its application as a drilling mud and foundry sand bond. The results are promising but variable and the clay generally required significant processing and chemical upgrading. NON-SWELLING BENTONITE
Calcium or non-swelling bentonites occur in several areas of the province in formations of late Cretaceous and Tertiary ages (Winer, 1954):
-Vermillion River Formation along the Swan River north of Pelly
-Riding Mountain Formation south of Moosomin -With Eocene-Oligocene pumicite west of
Rockglen, and -Battle Formation along the Frenchman River
southwest of Eastend.
Little is known of the extent or reserves of bentonite in these areas but, with the exception of the Moosomin area, the deposits were reported to have potential for considerable tonnage. These clays are promising as oil decolorizing agents, cracking catalysts and absorbents. Winer (1954) found that bentonites from the Pelly and Moosomin areas are superior to commercial clays in their decolorizing properties. The Pelly bentonite also has a high catalytic activity. KAOLINinC AND OTHER CLAYS
Industrial clays other than bentonite are derived from the Upper Cretaceous Whitemud Formation, the Willow Bunch member of the Tertiary Ravenscrag Formation and from Quaternary lacustrine sediments.
The Whitemud Formation is a sequence of fluviolacustrine sediments consisting of kaohnitic sands and silts with minor lignitic clay and sand zones usually capped by plastic kaohnitic ceramic clays and silty clays. The formation lies conformably on continental quartzo-feldspathic sands and silts of the Eastend Formation. In some areas the Whitemud is overlain conformably by the bentonitic clays of the Battle Formation or disconform-ably by sediments of the uppermost Cretaceous Frenchman Formation, the Tertiary Ravenscrag Formation, Pleistocene till or recent sediments.
Over the past 75 years or more the Whitemud Formation has yielded plastic stoneware clays of various characteristics, refractory clays of low to high duty, light to white-burning ball clays, and kaolinized sand as components for various ceramic wares (particularly structural products). Whitemud clay resources are round in the Eastend-Ravenscrag Butte area, Wood Mountain-Flintoft area, the Willow Bunch-Verwood-Readlyn area and the Dirt and Cactus Hills near Claybank. The clays exhibit an eastward increase in refractoriness and plasticity. The Whitemud Formation currently yields raw material to Estevan Brick Ltd. for structural and face brick produced in Estevan; I-XL Industries Ltd. for sewer pipe, flue linings and brick produced near Regina; and Plainsman Clay Ltd. for pottery clay bodies at Medicine Hat,
Alberta. Refractory bricks have been produced from Whitemud clays near Claybank since about 1914. The most recent operator, A.P. Green Refractories (Canada) Limited, closed the operation in 1989.
Kaolinized sands of the Whitemud Formation occur as structureless or bedded deposits up to 18 metres thick with a kaolin content ranging from 50 to 60 per cent. Recent work by Ekaton Industries Inc., the Saskatchewan Research Council and the Colorado School of Mines was successful in upgrading the Whitemud kaolin to a General Electric reflectance level of 82 per cent. This represents a major step toward developing the deposits for use in the filler and extender industry, particularly in paper manufacturing. Master (1987) had calculated the geological reserves of kaolinized sediments in the Wood Mountain area as over 340 million tonnes, over two thirds of which have a stip ratio of 1:1 or better. The calculations were based on an average thickness of 6.1 metres, an exclusion of all areas of less than 4.6 metres thickness of kaolinized sand and a bulk density of 1.75.
Plastic clays, frequently found overlying the kaolinized sands, are generally of the stoneware type in the Eastend area whereas in the Wood Mountain-Willow Bunch area they are, more commonly, of the ball clay and fire clay type. The clays are up to several meters thick and, in some localities, lie on the kaolinized sands with an unconformable relationship, apparently as channel fill (Hudson, 1984). Hudson (1984) indicated a pyrometric cone equivalent commonly in tne range of 29 to 31 and occassionally up to 32 to 32.5 for clays in the Wood Mountain area and localities farther east.
Industrial clays of the Paleocene Ravenscrag Formation appear to be confined to an alternating sequence of clay, lignitic clay and silt beds in the Willow Bunch Member. Individual bed thicknesses of 1.5 to 3.7 metres have been recorded in the upper part of the formation. These clays are found outcropping in the disected uplands high in the Ravenscrag Formation south of the Big Muddy valley, near Willow Bunch Lake and in the Wood Mountain plateau.
Clays of the Willow Bunch member are kaohnitic and generally less refractory than those of the Whitemud Formation. X-Ray diffraction analyses show broad kaolin peaks indicating poor crystallinity. Willow Bunch Member clays generally contain higher proportions of feldspars and alkalis than Whitemud clays. Locally kaolinization and leaching of alkali content is more pronounced and the clays achieve a low grade refractory quality. Worcester (1950) indicates a wide range of pyrometric properties among Ravenscrag clays. Bluestoning occurs over a range of cone 04 to 8 but clay bodies may survive from cone 3 to 6. These clays generally burn to colors ranging from light to dark salmon red, yellow and, ocassionaUy, grey. Their maturing range tends to be fairly narrow.
Willow Bunch Member clays have not been well explored on a regional basis. Significant deposits are known to occur in the Harptree and Willow Bunch areas and in the Rockglen and Strathallan areas south of Wood Mountain. The latter two areas are of particular interest due to the thin drift cover. Clays of tne Willow Bunch Member are exploited for the production of face brick by Estevan Brick Ltd. in Estevan and have been successfully tested for tile manufacturing in Thunder Bay. A small amount is used by local potters.
24 Industrial Minerals Forum 1991
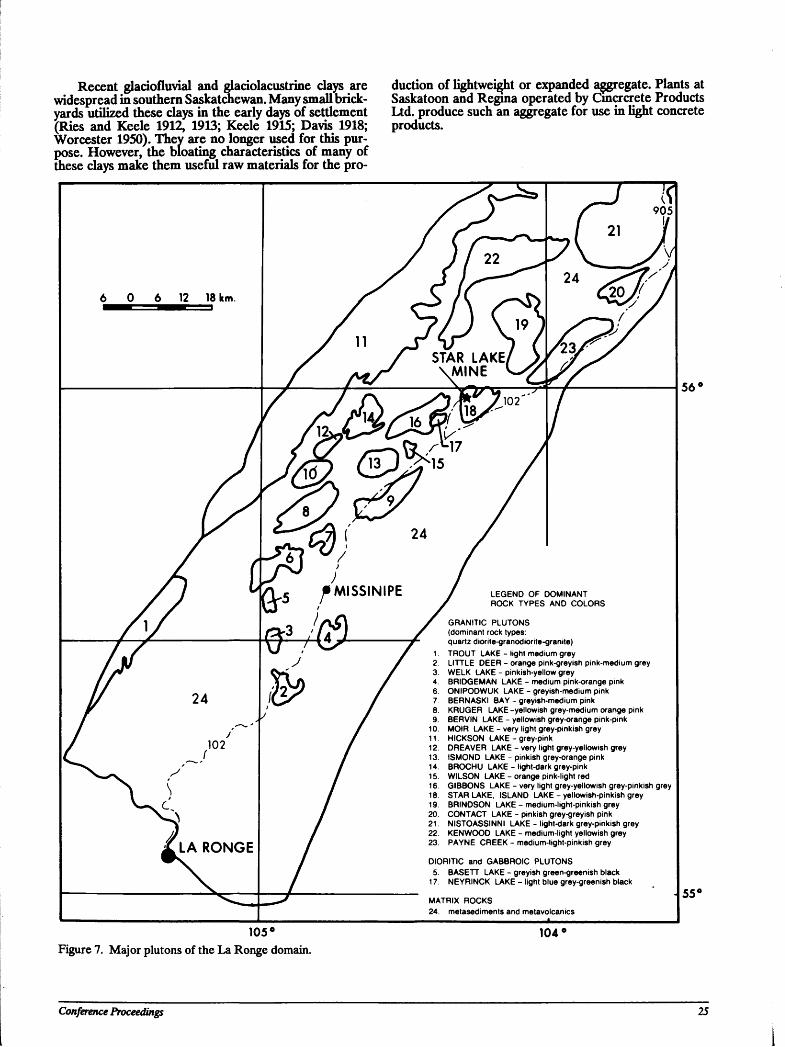
Recent gladofluvial and gladolacustrine days are widespread in southern Saskatchewan. Many small brickyards utilized these days in the early days of settlement (Ries and Keele 1912, 1913; Keele 1915; Davis 1918; Worcester 1950). They are no longer used for this purpose. However, the bloating characteristics of many of these clays make them useful raw materials for the pro
duction of lightweight or expanded aggregate. Plants at Saskatoon and Regina operated by Cmcrcrete Products Ltd. produce such an aggregate for use in light concrete products.
(0®Jf"
24
102
y
LA RONGE
LEGEND OF DOMINANT ROCK TYPES AND COLORS
GRANITIC PLUTONS (dominant rock types: quartz diorite-granodiorite-granite)
1 TROUT LAKE - light medium grey 2. LITTLE DEER - orange pink-greyish pink-medium grey 3. WELK LAKE - pinkish-yellow grey 4. BRIDGEMAN LAKE - medium pink-orange pink 6 ONIPODWUK LAKE - greyish-medium pink 7 BERNASKI BAY - greyish-medium pink 8. KRUGER LAKE-yellowish grey-medium orange pink 9. BERVIN LAKE - yellowish grey-orange pink-pink
10. MOIR LAKE - very light grey-pinkish grey 11 HICKSON LAKE - grey-pink 12 DREAVER LAKE - very light grey-yellowish grey 13. ISMOND LAKE - pinkish grey-orange pink 14. BROCHU LAKE - light-dark grey-pink 15. WILSON LAKE - orange pink-light red 16. GIBBONS LAKE - very light grey-yellowish grey-pinkish grey 18 STAR LAKE, ISLAND LAKE - yellowish-pinkish grey 19. BRINDSON LAKE - medium-light-pinkish grey 20 CONTACT LAKE - pinkish grey-greyish pink 21. NISTOASSINNI LAKE - light-dark grey-pinkish grey 22. KENWOOD LAKE - medium-light yellowish grey 23. PAYNE CREEK - medium-light-pinkish grey
DIORITIC and GABBROIC PLUTONS 5. BASETT LAKE - greyish green-greenish black
17. NEYRINCK LAKE - light blue grey-greenish black
MATRIX ROCKS 24. metasediments and metavolcanics
56'
55«
105° Figure 7. Major plutons of the La Ronge domain.
104
Conference Proceedings 25
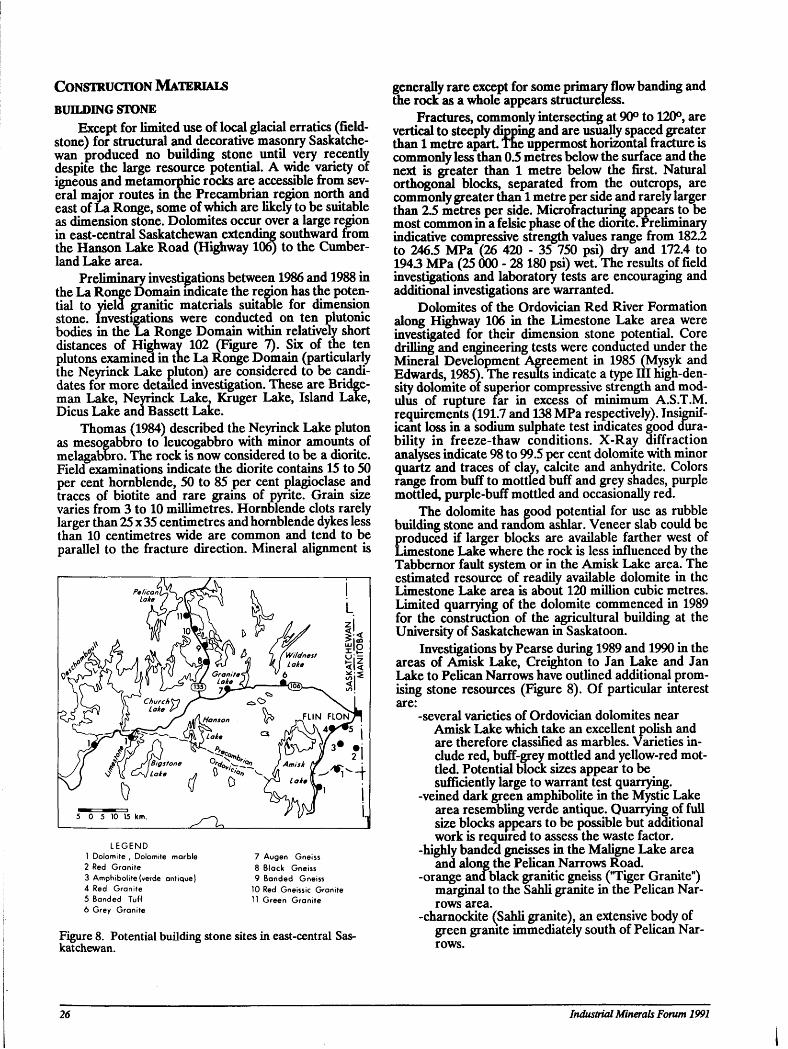
CONSTRUCTION MATERIALS
BUILDING STONE Except for limited use of local glacial erratics (field-
stone) for structural and decorative masonry Saskatchewan produced no building stone until very recently despite the large resource potential. A wide variety of igneous and metamorphic rocks are accessible from several major routes in the Precambrian region north and east of La Ronge, some of which are likely to be suitable as dimension stone. Dolomites occur over a large region in east-central Saskatchewan extending southward from the Hanson Lake Road (Highway 106) to the Cumberland Lake area.
Preliminary investigations between 1986 and 1988 in the La Ronge Domain indicate the region has the potential to yield granitic materials suitable for dimension stone. Investigations were conducted on ten plutonic bodies in the La Ronge Domain within relatively short distances of Highway 102 (Figure 7). Six of the ten plutons examined in the La Ronge Domain (particularly the Neyrinck Lake pluton) are considered to be candidates for more detailed investigation. These are Bridge-man Lake, Neyrinck Lake, Kruger Lake, Island Lake, Dicus Lake and Bassett Lake.
Thomas (1984) described the Neyrinck Lake pluton as mesogabbro to leucogabbro with minor amounts of melagabbro. The rock is now considered to be a diorite. Field examinations indicate the diorite contains 15 to 50 per cent hornblende, 50 to 85 per cent plagioclase and traces of biotite and rare grains of pyrite. Grain size varies from 3 to 10 millimetres. Hornblende clots rarely larger than 25 x 35 centimetres and hornblende dykes less than 10 centimetres wide are common and tend to be parallel to the fracture direction. Mineral alignment is
1 Dolomite , Dolomite marble 7 Augen Gneiss 2 Red Granite 8 Black Gneiss 3 Amphibolite (verde antique) 9 Banded Gneiss 4 Red Granite 10 Red Gneissic Granite 5 Banded Tuff 11 Green Granite 6 Grey Granite
Figure 8. Potential building stone sites in east-central Saskatchewan.
26
generally rare except for some primary flow banding and the rock as a whole appears structureless.
Fractures, commonly intersecting at 90° to 120°, are vertical to steeply dipping and are usually spaced greater than 1 metre apart. The uppermost horizontal fracture is commonly less than 0.5 metres below the surface and the next is greater than 1 metre below the first. Natural orthogonal blocks, separated from the outcrops, are commonly greater than 1 metre per side and rarely larger than 2.5 metres per side. Microfracturing appears to be most common in a felsic phase of the diorite. Preliminary indicative compressive strength values range from 182.2 to 246.5 MPa (26 420 - 35 750 psi) dry and 172.4 to 194.3 MPa (25 000 - 28 180 psi) wet. The results of field investigations and laboratory tests are encouraging and additional investigations are warranted.
Dolomites of the Ordovician Red River Formation along Highway 106 in the Limestone Lake area were investigated for their dimension stone potential. Core drilling and engineering tests were conducted under the Mineral Development Agreement in 1985 (Mysyk and Edwards, 1985). The results indicate a type III high-density dolomite of superior compressive strength and modulus of rupture far in excess of minimum A.S.T.M. requirements (191.7 and 138 MPa respectively). Insignificant loss in a sodium sulphate test indicates good durability in freeze-thaw conditions. X-Ray diffraction analyses indicate 98 to 99.5 per cent dolomite with minor quartz and traces of clay, calcite and anhydrite. Colors range from buff to mottled buff and grey shades, purple mottled, purple-buff mottled and occasionally red.
The dolomite has good potential for use as rubble building stone and random ashlar. Veneer slab could be produced if larger blocks are available farther west of Limestone Lake where the rock is less influenced by the Tabbernor fault system or in the Amisk Lake area. The estimated resource of readily available dolomite in the Limestone Lake area is about 120 million cubic metres. Limited quarrying of the dolomite commenced in 1989 for the construction of the agricultural building at the University of Saskatchewan in Saskatoon.
Investigations by Pearse during 1989 and 1990 in the areas of Amisk Lake, Creighton to Jan Lake and Jan Lake to Pelican Narrows have outlined additional promising stone resources (Figure 8). Of particular interest are:
-several varieties of Ordovician dolomites near Amisk Lake which take an excellent polish and are therefore classified as marbles. Varieties include red, buff-grey mottled and yellow-red mottled. Potential block sizes appear to be sufficiently large to warrant test quarrying.
-veined dark green amphibolite in the Mystic Lake area resembling verde antique. Quarrying of full size blocks appears to be possible but additional work is required to assess the waste factor.
-highly banded gneisses in the Maligne Lake area and along the Pelican Narrows Road.
-orange and black granitic gneiss ("Tiger Granite") marginal to the Sahli granite in the Pelican Narrows area.
-charnockite (Sahli granite), an extensive body of green granite immediately south of Pelican Narrows.
Industrial Minerals Forum 1991
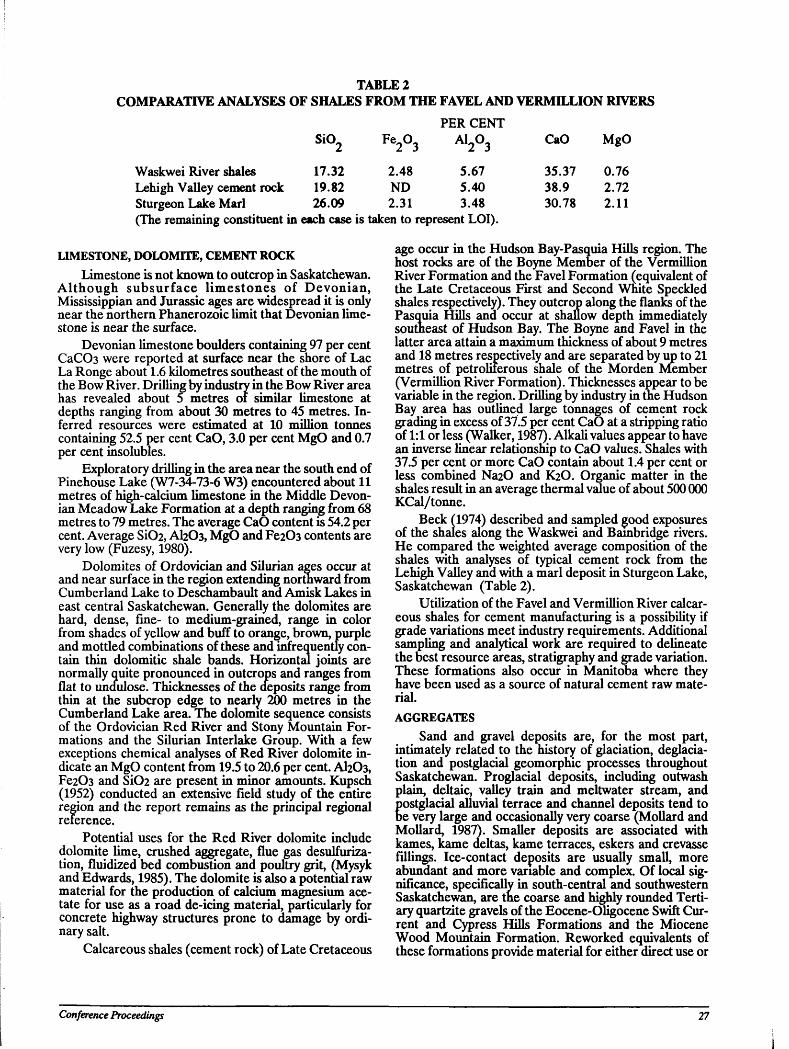
TABLE 2 COMPARATIVE ANALYSES OF SHALES FROM THE FAVEL AND VERMILLION RIVERS
PER CENT Si0 2 F e 2 0 3 A1203 CaO MgO
Waskwei River shales 17.32 2.48 5.67 35.37 0.76 Lehigh Valley cement rock 19.82 ND 5.40 38.9 2.72 Sturgeon Lake Marl 26.09 2.31 3.48 30.78 2.11 (The remaining constituent in each case is taken to represent LOI).
LIMESTONE, DOLOMITE, CEMENT ROCK Limestone is not known to outcrop in Saskatchewan.
Al though subsurface l imestones of Devonian, Mississippian and Jurassic ages are widespread it is only near the northern Phanerozoic limit that Devonian limestone is near the surface.
Devonian limestone boulders containing 97 per cent CaC03 were reported at surface near the shore of Lac La Ronge about 1.6 kilometres southeast of the mouth of the Bow River. Drilling by industry in the Bow River area has revealed about 5 metres of similar limestone at depths ranging from about 30 metres to 45 metres. Inferred resources were estimated at 10 million tonnes containing 52.5 per cent CaO, 3.0 per cent MgO and 0.7 per cent insolubles.
Exploratory drilling in the area near the south end of Pinehouse Lake (W7-34-73-6 W3) encountered about 11 metres of high-calcium limestone in the Middle Devonian Meadow Lake Formation at a depth ranging from 68 metres to 79 metres. The average CaO content is 54.2 per cent. Average Si02, AI2O3, MgO and Fe203 contents are very low (Fuzesy, 1980).
Dolomites of Ordovician and Silurian ages occur at and near surface in the region extending northward from Cumberland Lake to Deschambault and Amisk Lakes in east central Saskatchewan. Generally the dolomites are hard, dense, fine- to medium-grained, range in color from shades of yellow and buff to orange, brown, purple and mottled combinations of these and infrequently contain thin dolomitic shale bands. Horizontal joints are normally quite pronounced in outcrops and ranges from flat to undulose. Thicknesses of the deposits range from thin at the subcrop edge to nearly 200 metres in the Cumberland Lake area. The dolomite sequence consists of the Ordovician Red River and Stony Mountain Formations and the Silurian Interlake Group. With a few exceptions chemical analyses of Red River dolomite indicate an MgO content from 19.5 to 20.6 per cent. AI2O3, Fe203 and S1O2 are present in minor amounts. Kupsch (1952) conducted an extensive field study of the entire region and the report remains as the principal regional reference.
Potential uses for the Red River dolomite include dolomite lime, crushed aggregate, flue gas desulfuriza-tion, fluidized bed combustion and poultry grit, (Mysyk and Edwards, 1985). The dolomite is also a potential raw material for the production of calcium magnesium acetate for use as a road de-icing material, particularly for concrete highway structures prone to damage by ordinary salt.
Calcareous shales (cement rock) of Late Cretaceous
age occur in the Hudson Bay-Pasquia Hills region. The host rocks are of the Boyne Member of the Vermillion River Formation and the Favel Formation (equivalent of the Late Cretaceous First and Second White Speckled shales respectively). They outcrop along the flanks of the Pasquia Hills and occur at shallow depth immediately southeast of Hudson Bay. The Boyne and Favel in the latter area attain a maximum thickness of about 9 metres and 18 metres respectively and are separated by up to 21 metres of petroliferous shale of the Morden Member (Vermillion River Formation). Thicknesses appear to be variable in the region. Drilling by industry in the Hudson Bay area has outlined large tonnages of cement rock grading in excess of 37.5 per cent CaO at a stripping ratio of 1:1 or less (Walker, 1987). Alkali values appear to have an inverse linear relationship to CaO values. Shales with 37.5 per cent or more CaO contain about 1.4 per cent or less combined Na20 and K2O. Organic matter in the shales result in an average thermal value of about 500 000 KCal/tonne.
Beck (1974) described and sampled good exposures of the shales along the Waskwei and Bainbridge rivers. He compared the weighted average composition of the shales with analyses of typical cement rock from the Lehigh Valley and with a marl deposit in Sturgeon Lake, Saskatchewan (Table 2).
Utilization of the Favel and Vermillion River calcareous shales for cement manufacturing is a possibility if grade variations meet industry requirements. Additional sampling and analytical work are required to delineate the best resource areas, stratigraphy and grade variation. These formations also occur in Manitoba where they have been used as a source of natural cement raw material. AGGREGATES
Sand and gravel deposits are, for the most part, intimately related to the history of glaciation, deglacia-tion and postglacial geomorphic processes throughout Saskatchewan. Proglacial deposits, including outwash plain, deltaic, valley train and meltwater stream, and
Eostglacial alluvial terrace and channel deposits tend to e very large and occasionally very coarse (Mollard and
Mollard, 198A Smaller deposits are associated with kames, kame aeltas, kame terraces, eskers and crevasse fillings. Ice-contact deposits are usually small, more abundant and more variable and complex. Of local significance, specifically in south-central and southwestern Saskatchewan, are the coarse and highly rounded Tertiary quartzite gravels of the Eocene-Oligocene Swift Current and Cypress Hills Formations and the Miocene Wood Mountain Formation. Reworked equivalents of these formations provide material for either direct use or
Conference Proceedings 27
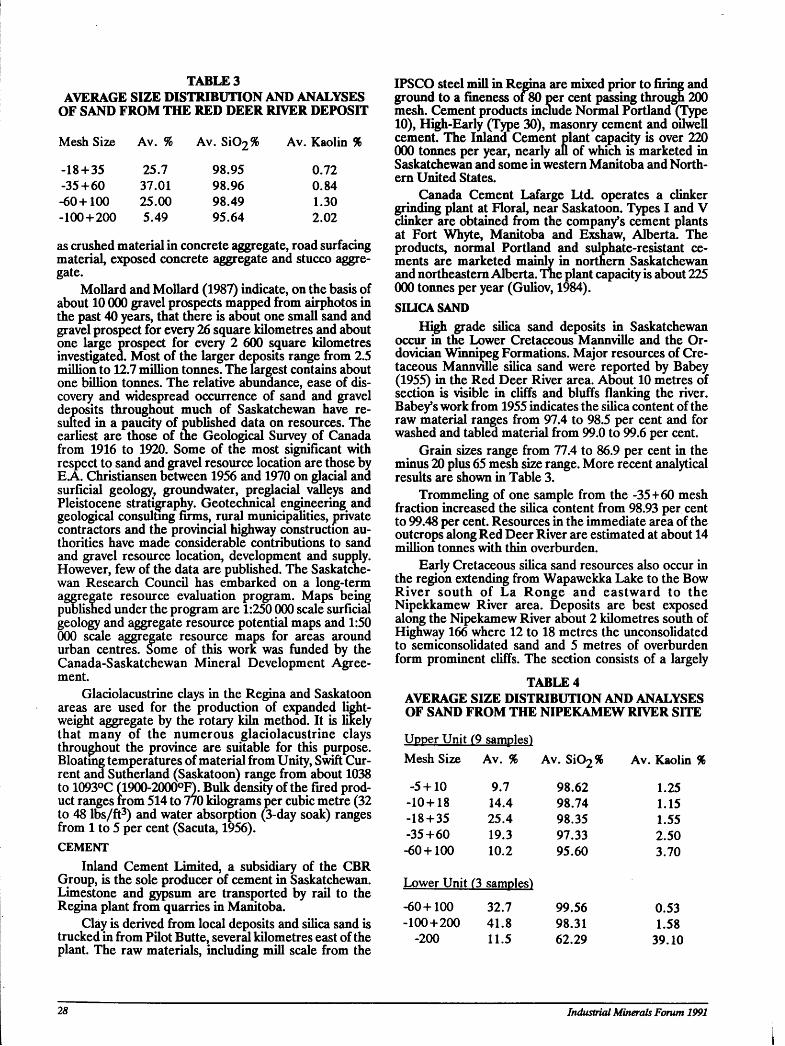
TABLE3 AVERAGE SIZE DISTRIBUTION AND ANALYSES
OF SAND FROM THE RED DEER RIVER DEPOSIT
Mesh Size Av. % Av. Si02% Av. Kaoli
-18 + 35 25.7 98.95 0.72 -35+60 37.01 98.96 0.84 -60+100 25.00 98.49 1.30 -100+200 5.49 95.64 2.02
as crushed material in concrete aggregate, road surfacing material, exposed concrete aggregate and stucco aggregate.
Mollard and Mollard (1987) indicate, on the basis of about 10 000 gravel prospects mapped from airphotos in the past 40 years, that there is about one small sand and gravel prospect for every 26 square kilometres and about one large prospect for every 2 600 square kilometres investigated. Most of the larger deposits range from 2.5 million to 12.7 million tonnes. The largest contains about one billion tonnes. The relative abundance, ease of discovery and widespread occurrence of sand and gravel deposits throughout much of Saskatchewan have resulted in a paucity of published data on resources. The earliest are those of the Geological Survey of Canada from 1916 to 1920. Some of the most significant with respect to sand and gravel resource location are those by E A. Christiansen between 1956 and 1970 on glacial and surficial geology, groundwater, preglacial valleys and Pleistocene stratigraphy. Geotechnical engineering and geological consulting firms, rural municipalities, private contractors and the provincial highway construction authorities have made considerable contributions to sand and gravel resource location, development and supply. However, few of the data are published. The Saskatchewan Research Council has embarked on a long-term aggregate resource evaluation program. Maps being published under the program are 1:250 000 scale surficial geology and aggregate resource potential maps and 1:50 000 scale aggregate resource maps for areas around urban centres. Some of this work was funded by the Canada-Saskatchewan Mineral Development Agreement.
Glaciolacustrine clays in the Regina and Saskatoon areas are used for the production of expanded lightweight aggregate by the rotary kiln method. It is likely that many of the numerous glaciolacustrine clays throughout the province are suitable for this purpose. Bloating temperatures of material from Unity, Swift Current and Sutherland (Saskatoon) range from about 1038 to 1093°C (1900-2000°F). Bulk density of the fired product ranges from 514 to 7/0 kilograms per cubic metre (32 to 48 lbs/ft3) and water absorption (3-day soak) ranges from 1 to 5 per cent (Sacuta, 1956). CEMENT
Inland Cement Limited, a subsidiary of the CBR Group, is the sole producer of cement in Saskatchewan. Limestone and gypsum are transported by rail to the Regina plant from quarries in Manitoba.
Clay is derived from local deposits and silica sand is trucked in from Pilot Butte, several kilometres east of the plant. The raw materials, including mill scale from the
IPSCO steel mill in Regina are mixed prior to firing and ground to a fineness of 80 per cent passing through 200 mesh. Cement products include Normal Portland (Type 10), High-Early (Type 30), masonry cement and oilwell cement. The Inland Cement plant capacity is over 220 000 tonnes per year, nearly all of which is marketed in Saskatchewan and some in western Manitoba and Northern United States.
Canada Cement Lafarge Ltd. operates a clinker grinding plant at Floral, near Saskatoon. Types I and V clinker are obtained from the company's cement plants at Fort Whyte, Manitoba and Exshaw, Alberta. The products, normal Portland and sulphate-resistant cements are marketed mainly in northern Saskatchewan and northeastern Alberta. The plant capacity is about 225 000 tonnes per year (Guliov, 1984). SILICA SAND
High grade silica sand deposits in Saskatchewan occur in the Lower Cretaceous Mannville and the Or-dovician Winnipeg Formations. Major resources of Cretaceous Mannville silica sand were reported by Babey (1955) in the Red Deer River area. About 10 metres of section is visible in cliffs and bluffs flanking the river. Babey's work from 1955 indicates the silica content of the raw material ranges from 97.4 to 98.5 per cent and for washed and tabled material from 99.0 to 99.6 per cent.
Grain sizes range from 77.4 to 86.9 per cent in the minus 20 plus 65 mesh size range. More recent analytical results are shown in Table 3.
Trommeling of one sample from the -35+60 mesh fraction increased the silica content from 98.93 per cent to 99.48 per cent. Resources in the immediate area of the outcrops along Red Deer River are estimated at about 14 million tonnes with thin overburden.
Early Cretaceous sihca sand resources also occur in the region extending from Wapawekka Lake to the Bow River south of La Ronge and eastward to the Nipekkamew River area. Deposits are best exposed along the Nipekamew River about 2 kilometres south of Highway 166 where 12 to 18 metres the unconsolidated to semiconsolidated sand and 5 metres of overburden form prominent cliffs. The section consists of a largely
TABLE 4 AVERAGE SIZE DISTRIBUTION AND ANALYSES OF SAND FROM THE NIPEKAMEW RIVER SITE
Upper Unit (9 samples^ Mesh Size Av. % Av. Si02% Av. Kaolin %
-5 + 10 9.7 98.62 1.25 -10+18 14.4 98.74 1.15 -18+35 25.4 98.35 1.55 -35+60 19.3 97.33 2.50 -60 + 100 10.2 95.60 3.70
Lower Unit (3 samples')
-60+100 32.7 99.56 0.53 -100+200 41.8 98.31 1.58
-200 11.5 62.29 39.10
28 Industrial Minerals Forum 1991
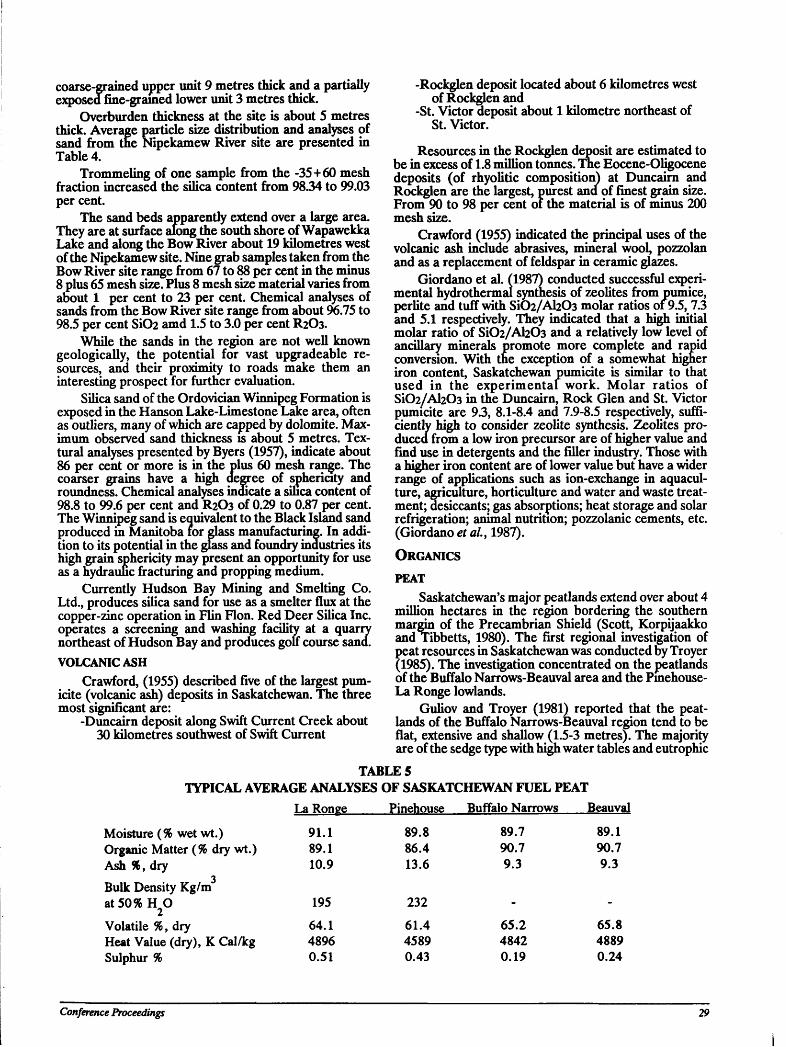
coarse-grained upper unit 9 metres thick and a partially exposedfine-grained lower unit 3 metres thick.
Overburden thickness at the site is about 5 metres thick. Average particle size distribution and analyses of sand from the Nipekamew River site are presented in Table 4.
Trommeling of one sample from the -35+60 mesh fraction increased the silica content from 98.34 to 99.03 per cent.
The sand beds apparently extend over a large area. They are at surface along the south shore of Wapawekka Lake and along the Bow River about 19 kilometres west of the Nipekamew site. Nine grab samples taken from the Bow River site range from 67 to 88 per cent in the minus 8 plus 65 mesh size. Plus 8 mesh size material varies from about 1 per cent to 23 per cent. Chemical analyses of sands from the Bow River site range from about 96.75 to 98.5 per cent Si02 amd 1.5 to 3.0 per cent R2O3.
While the sands in the region are not well known geologically, the potential for vast upgradeable resources, and their proximity to roads make them an interesting prospect for further evaluation.
Silica sand of the Ordovician Winnipeg Formation is exposed in the Hanson Lake-Limestone Lake area, often as outliers, many of which are capped by dolomite. Maximum observed sand thickness is about 5 metres. Tex-tural analyses presented by Byers (1957), indicate about 86 per cent or more is in the plus 60 mesh range. The coarser grains have a high degree of sphericity and roundness. Chemical analyses indicate a silica content of 98.8 to 99.6 per cent and R2O3 of 0.29 to 0.87 per cent. The Winnipeg sand is equivalent to the Black Island sand produced in Manitoba for glass manufacturing. In addition to its potential in the glass and foundry industries its high grain sphericity may present an opportunity for use as a hydraulic fracturing and propping medium.
Currently Hudson Bay Mining and Smelting Co. Ltd., produces silica sand for use as a smelter flux at the copper-zinc operation in Flin Flon. Red Deer Silica Inc. operates a screening and washing facility at a quarry northeast of Hudson Bay and produces golf course sand. VOLCANIC ASH
Crawford, (1955) described five of the largest pum-icite (volcanic ash) deposits in Saskatchewan. The three most significant are:
-Duncairn deposit along Swift Current Creek about 30 kilometres southwest of Swift Current
-Rockglen deposit located about 6 kilometres west of Rockglen and
-St. Victor deposit about 1 kilometre northeast of St. Victor.
Resources in the Rockglen deposit are estimated to be in excess of 1.8 million tonnes. The Eocene-Oligocene deposits (of rhyolitic composition) at Duncairn and Rockglen are the largest, purest ana of finest grain size. From 90 to 98 per cent of the material is of minus 200 mesh size.
Crawford (1955) indicated the principal uses of the volcanic ash include abrasives, mineral wool, pozzolan and as a replacement of feldspar in ceramic glazes.
Giordano et al. (1987) conducted successful experimental hydrothermal synthesis of zeolites from pumice, perlite and tuff with Si02/Ah03 molar ratios of 9.5, 7.3 and 5.1 respectively. They indicated that a high initial molar ratio of Si02/Al203 and a relatively low level of ancillary minerals promote more complete and rapid conversion. With the exception of a somewhat higher iron content, Saskatchewan pumicite is similar to that used in the experimental work. Molar ratios of Si02/Al203 in the Duncairn, Rock Glen and St. Victor pumicite are 93, 8.1-8.4 and 7.9-8.5 respectively, sufficiently high to consider zeolite synthesis. Zeolites produced from a low iron precursor are of higher value and find use in detergents and the filler industry. Those with a higher iron content are of lower value but have a wider range of applications such as ion-exchange in aquacul-ture, agriculture, horticulture and water and waste treatment; desiccants; gas absorptions; heat storage and solar refrigeration; animal nutrition; pozzolanic cements, etc. (Giordano etal, 1987).
ORGANICS
PEAT Saskatchewan's major peatlands extend over about 4
million hectares in the region bordering the southern margin of the Precambrian Shield (Scott, Korpijaakko and Tibbetts, 1980). The first regional investigation of peat resources in Saskatchewan was conducted by Troyer (1985). The investigation concentrated on the peatlands of the Buffalo Narrows-Beauval area and the Pinehouse-La Ronge lowlands.
Guliov and Troyer (1981) reported that the peatlands of the Buffalo Narrows-Beauval region tend to be flat, extensive and shallow (1.5-3 metres). The majority are of the sedge type with high water tables and eutrophic
TABLE 5 TYPICAL AVERAGE ANALYSES OF SASKATCHEWAN FUEL PEAT
La Ronge Pinehouse Buffalo Narrows Beauval
Moisture (% wet wt.) 91.1 89.8 89.7 89.1 Organic Matter (% dry wt.) 89.1 86.4 90.7 90.7 Ash %, dry 10.9 13.6 9.3 9.3
Bulk Density Kg/m3
at 50% H O 2
195 232 - -
Volatile %, dry 64.1 61.4 65.2 65.8 Heat Value (dry), K Cal/kg 4896 4589 4842 4889 Sulphur % 0.51 0.43 0.19 0.24
Conference Proceedings 29
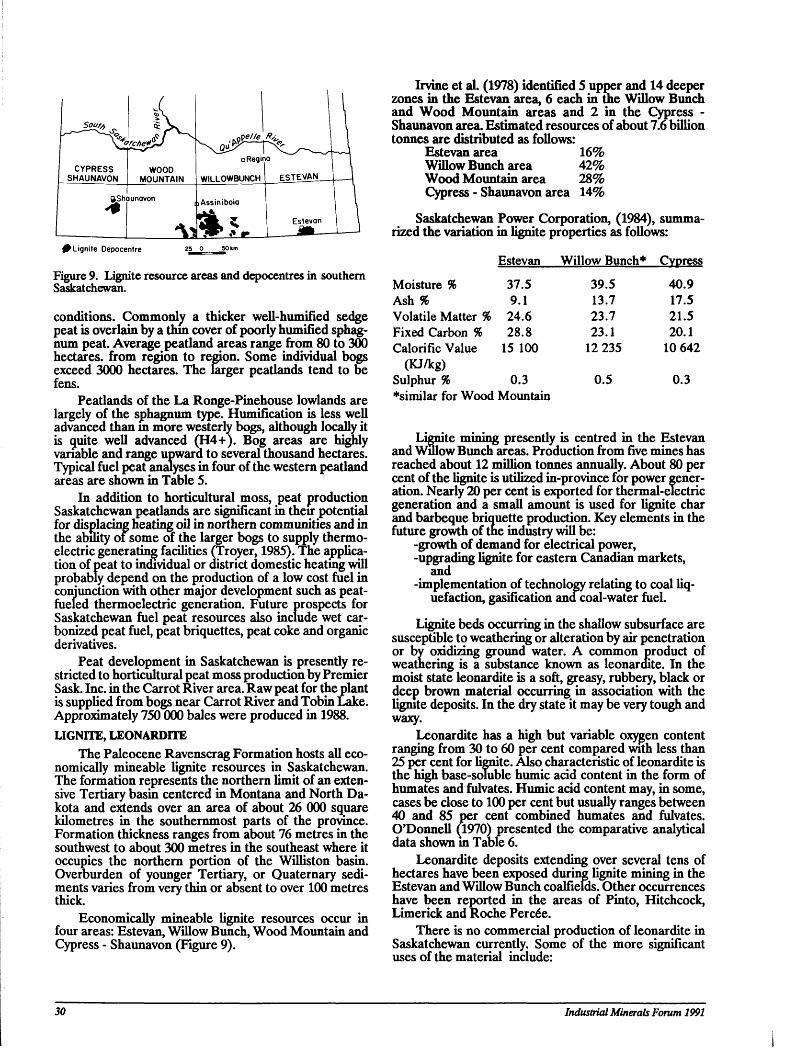
0Lignite Depocentre 25 0 50*™
Figure 9. Lignite resource areas and depocentres in southern Saskatchewan.
conditions. Commonly a thicker well-humified sedge peat is overlain by a thin cover of poorly humified sphagnum peat. Average peatland areas range from 80 to 300 hectares, from region to region. Some individual bogs exceed 3000 hectares. The larger peatlands tend to be fens.
Peatlands of the La Ronge-Pinehouse lowlands are largely of the sphagnum type. Humification is less well advanced than m more westerly bogs, although locally it is quite well advanced (H4+). Bog areas are highly variable and range upward to several thousand hectares. Typical fuel peat analyses in four of the western peatland areas are shown in Table 5.
In addition to horticultural moss, peat production Saskatchewan peatlands are significant in their potential for displacing heating oil in northern communities and in the ability of some of the larger bogs to supply thermoelectric generating facilities (Troyer, 1985). The application of peat to individual or district domestic heatmg will probably depend on the production of a low cost fuel in conjunction with other major development such as peat-fueled thermoelectric generation. Future prospects for Saskatchewan fuel peat resources also include wet carbonized peat fuel, peat briquettes, peat coke and organic derivatives.
Peat development in Saskatchewan is presently restricted to horticultural peat moss production by Premier Sask. Inc. in the Carrot River area. Raw peat for the plant is supplied from bogs near Carrot River and Tobin Lake. Approximately 750 000 bales were produced in 1988. LIGNITE, LEONARDITE
The Paleocene Ravenscrag Formation hosts all economically mineable lignite resources in Saskatchewan. The formation represents the northern limit of an extensive Tertiary basin centered in Montana and North Dakota and extends over an area of about 26 000 square kilometres in the southernmost parts of the province. Formation thickness ranges from about 76 metres in the southwest to about 300 metres in the southeast where it occupies the northern portion of the Williston basin. Overburden of younger Tertiary, or Quaternary sediments varies from very thin or absent to over 100 metres thick.
Economically mineable lignite resources occur in four areas: Estevan, Willow Bunch, Wood Mountain and Cypress - Shaunavon (Figure 9).
Irvine et al. (1978) identified 5 upper and 14 deeper zones in the Estevan area, 6 each in the Willow Bunch and Wood Mountain areas and 2 in the Cypress -Shaunavon area. Estimated resources of about 7.6 billion tonnes are distributed as follows:
Estevan area 16% Willow Bunch area 42% Wood Mountain area 28% Cypress - Shaunavon area 14%
Saskatchewan Power Corporation, (1984), summarized the variation in lignite properties as follows:
Estevan Willow Bunch* Cypress
Moisture % 37.5 39.5 40.9 Ash % 9.1 13.7 17.5 Volatile Matter % 24.6 23.7 21.5 Fixed Carbon % 28.8 23.1 20.1 Calorific Value 15 100 12 235 10 642
(KJ/kg) Sulphur % 0.3 0.5 0.3 ♦similar for Wood Mountain
Lignite mining presently is centred in the Estevan and Willow Bunch areas. Production from five mines has reached about 12 million tonnes annually. About 80 per cent of the lignite is utilized in-province for power generation. Nearly 20 per cent is exported for thermal-electric generation and a small amount is used for lignite char and barbeque briquette production. Key elements in the future growth of the industry will be:
-growth of demand for electrical power, -upgrading lignite for eastern Canadian markets,
and -implementation of technology relating to coal liq
uefaction, gasification and coal-water fuel.
Lignite beds occurring in the shallow subsurface are susceptible to weathering or alteration by air penetration or by oxidizing ground water. A common product of weathering is a substance known as leonardite. In the moist state leonardite is a soft, greasy, rubbery, black or deep brown material occurring in association with the lignite deposits. In the dry state it may be very tough and waxy.
Leonardite has a high but variable oxygen content ranging from 30 to 60 per cent compared with less than 25 per cent for lignite. Also characteristic of leonardite is the high base-soluble humic acid content in the form of humates and fulvates. Humic acid content may, in some, cases be close to 100 per cent but usually ranges between 40 and 85 per cent combined humates and fulvates. O'Donnell (1970) presented the comparative analytical data shown m Table 6.
Leonardite deposits extending over several tens of hectares have been exposed during lignite mining in the Estevan and Willow Bunch coalfields. Other occurrences have been reported in the areas of Pinto, Hitchcock, Limerick and Roche Percee.
There is no commercial production of leonardite in Saskatchewan currently. Some of the more significant uses of the material include:
30 Industrial Minerals Forum 1991
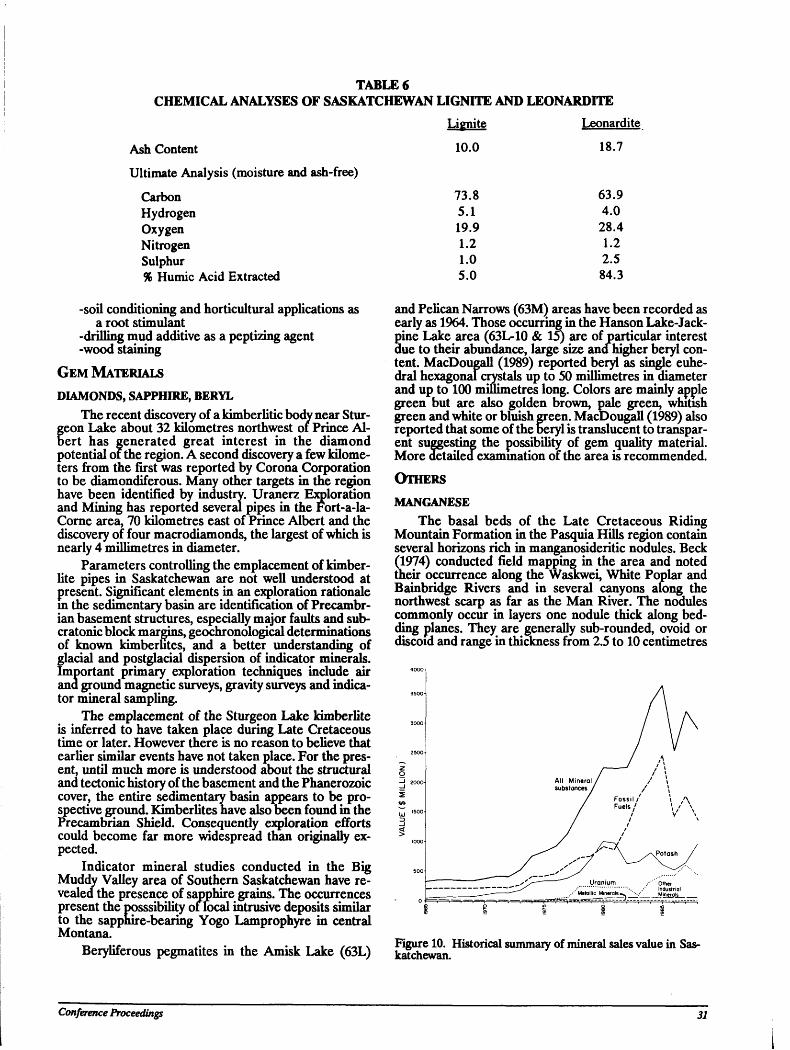
TABLE 6 CHEMICAL ANALYSES OF SASKATCHEWAN LIGNITE AND LEONARDITE
Lignite Leonardite 10.0 18.7 Ash Content
Ultimate Analysis (moisture and ash-free)
Carbon Hydrogen Oxygen Nitrogen Sulphur % Humic Acid Extracted
73.8 5.1 19.9 1.2 1.0 5.0
63.9 4.0 28.4 1.2 2.5 84.3
-soil conditioning and horticultural applications as a root stimulant
-drilling mud additive as a peptizing agent -wood staining
GEM MATERIALS
DIAMONDS, SAPPHIRE, BERYL The recent discovery of a kimberlitic body near Stur
geon Lake about 32 kilometres northwest of Prince Albert has generated great interest in the diamond potential of the region. A second discovery a few kilometers from the first was reported by Corona Corporation to be diamondiferous. Many other targets in the region have been identified by industry. Uranerz Exploration and Mining has reported several pipes in the Fort-a-la-Corne area, 70 kilometres east of Prince Albert and the discovery of four macrodiamonds, the largest of which is nearly 4 millimetres in diameter.
Parameters controlling the emplacement of kimber-lite pipes in Saskatchewan are not well understood at present. Significant elements in an exploration rationale in the sedimentary basin are identification of Precambr-ian basement structures, especially major faults and sub-cratonic block margins, geochronological determinations of known kimberUtes, and a better understanding of glacial and postglacial dispersion of indicator minerals. Important primary exploration techniques include air and ground magnetic surveys, gravity surveys and indicator mineral sampling.
The emplacement of the Sturgeon Lake kimberlite is inferred to have taken place during Late Cretaceous time or later. However there is no reason to believe that earlier similar events have not taken place. For the present, until much more is understood about the structural and tectonic history of the basement and the Phanerozoic cover, the entire sedimentary basin appears to be prospective ground. KimberUtes have also been found in the Precambrian Shield. Consequently exploration efforts could become far more widespread than originally expected.
Indicator mineral studies conducted in the Big Muddy Valley area of Southern Saskatchewan have revealed the presence of sapphire grains. The occurrences present the posssibility of local intrusive deposits similar to the sapphire-bearing Yogo Lamprophyre in central Montana.
Beryliferous pegmatites in the Amisk Lake (63L)
and Pelican Narrows (63M) areas have been recorded as early as 1964. Those occurring in the Hanson Lake-Jack-pine Lake area (63L-10 & 15) are of particular interest due to their abundance, large size ana higher beryl content. MacDougall (1989) reported beryl as single euhe-dral hexagonal crystals up to 50 millimetres in diameter and up to 100 millimetres long. Colors are mainly apple green but are also golden brown, pale green, whitish green and white or bluish green. MacDougall (1989) also reported that some of the beryl is translucent to transparent suggesting the possibility of gem quahty material. More detailed examination of the area is recommended.
OTHERS
MANGANESE The basal beds of the Late Cretaceous Riding
Mountain Formation in the Pasquia Hills region contain several horizons rich in manganosideritic nodules. Beck (1974) conducted field mapping in the area and noted their occurrence along the Waskwei, White Poplar and Bainbridge Rivers and in several canyons along the northwest scarp as far as the Man River. The nodules commonly occur in layers one nodule thick along bedding planes. They are generally sub-rounded, ovoid or discoid and range in thickness from 2.5 to 10 centimetres
Figure 10. Historical summary of mineral sales value in Saskatchewan.
Conference Proceeding? 31
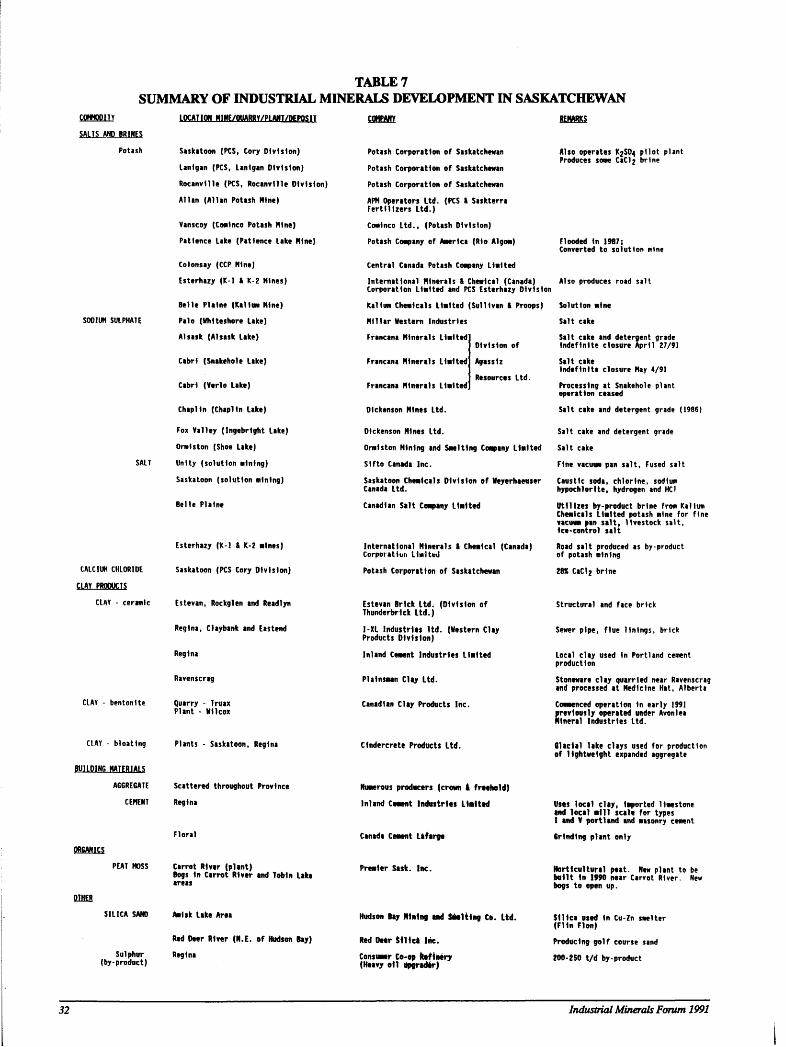
TABLE 7 SUMMARY OF INDUSTRIAL MINERALS DEVELOPMENT IN SASKATCHEWAN
C0HH00ITV SALTS AND BRINES
Potash
SODIUM SULPHATE
CALCIUM CHLORIDE CLAY PRODUCTS
CLAY - ceramic
CLAY - bentonlte
LOCATION HIHE/OUARRY/PLAWT/DFPOSIT
Saskatoon (PCS, Cory Division) Lanlgan (PCS, Lanlgan Division) Rocanvllle (PCS, Rocanvllle Division) Allan (Allan Potash Mine)
Vanscoy (Comlnco Potash Mine) Patience Lake (Patience Lake Nine)
Colonsay (CCP nine) Esterhazy (K-l & K-2 Nines)
Belle Plalne (Kallum Nine) Palo (Vhlteshore Lake) Alsask (Alsask Lake)
Cabrl (Snakehole Lake)
Cabrl (Vtrlo Lake)
Chaplin (Chaplin Lake)
Fox Valley (Ingebrlght Lake) Ormlston (Shoe Lake) Unity (solution mining) Saskatoon (solution mining)
Belle Plalne
Esterhazy (K-l & K-2 mines)
Saskatoon (PCS Cory Division)
Estevan, Rockglen and Readlyn
Reglna, Claybank and Eastern)
Reglna
Ravenscrag
Quarry - Truax Plant - Wllcox
COMPANY
Potash Corporation of Saskatchewan Potash Corporation of Saskatchewan Potash Corporation of Saskatchewan APN Operators Ltd. (PCS & Saskterra Fertilizers Ltd.) Comlnco Ltd., (Potash Division) Potash Company of America (Rio Algom)
Central Canada Potash Company Limited International Minerals * Chemical (Canada) Corporation Limited and PCS Esterhazy Division Kallum Chemicals Limited (Sullivan I Proops) Millar Western Industries Francana Minerals Limited]
] Division of Francana Minerals Limited] Agassiz
j Resources Ltd. Francana Minerals Limited]
Dlckenson Nines Ltd.
REMARKS
Also operates K2SO4 pilot plant Produces some CaCl; brine
Dlckenson Nines Ltd. Ormlston Mining and Smelting Company Limited Slfto Canada Inc. Saskatoon Chemicals Division of Neyerhaeuser Canada Ltd.
Canadian Salt Company Limited
International Minerals S Chemical (Canada) Corporation Limited
Potash Corporation of Saskatchewan
Estevan Brick Ltd. (Division of Thunderbrlck Ltd.)
I-XL Industries ltd. (Western Clay Products Division)
Inland Cement Industries limited
Plainsman Clay Ltd.
Canadian Clay Products Inc.
Flooded In 1987; Converted to solution mine
Also produces road salt
Solution mine Salt cake Salt cake and detergent grade Indefinite closure April 27/91 Salt cake Indefinite closure Nay 4/91 Processing at Snakehole plant operation ceased Salt cake and detergent grade (1986)
Salt cake and detergent grade Salt cake Fine vacuum pan salt. Fused salt Caustic soda, chlorine, sodium hypochlorlte, hydrogen and HC1
Utilizes by-product brine from Kallum Chemicals Limited potash mine for fine vacuum pan salt, livestock salt, ice-control salt Road salt produced as by-product of potash mining 28X CaClj brine
Structural and face brick
Sewer pipe, flue linings, brick
Local clay used In Portland cement production
Stoneware clay quarried near Ravenscrag and processed at Medicine Hat, Alberta Commenced operation in early 1991 Rrevlously operated under Avonlea Ineral Industries Ltd.
CLAY - bloating
BUILDING MATERIALS
AGGRE6ATE CEMENT
OR6AN1CS
PEAT MOSS
OTHER SILICA SAND
Sulphur (by-product)
Plants - Saskatoon, Reglna
Scattered throughout Province Reglna
Carrot River (plant) Bogs In Carrot River and Tobln Lake areas
Amlsk Lake Area
Red Deer River (N.E. of Hudson Bay) Reglna
Clndercrete Products Ltd.
Numerous producers (crown i freehold) Inland Cement Industries Limited
Canada Cement Lafarge
Premier Sask. Inc.
Hudson Bay Mining and Smelting Co. Ltd.
Red De*r Silica Inc. Consumer Co-op Refinery (Heavy oil ttpgrader)
Glacial lake clays used for production of lightweight expanded aggregate
Uses local day, Imported limestone and local mill scale for types I and V portland and masonry cement Grinding plant only
Horticultural peat. New plant to be built In 1990 near Carrot River. New bogs to open up.
Silica used In Cu-Zn smelter (Flln Flon) Producing golf course sand 200-250 t/d by-product
32 Industrial Minerals Forum 1991
and occassionally up to 15 centimetres. Diameters as reported by Beck (1974) are from 5 centimetres to 15 centimetres and occasionally in excess of 50 centimetres.
Six analyses indicate the nodules contain iron ranging from 17.54 to 21.95 per cent and manganese ranging from 12.54 to 22.45 per cent. The iron and manganese are present as carbonates with quartz, calcite and various trace elements.
Beck (1974) calculated a potential maximum tonnage of 5 to 6 million tons of nodules assuming a stripping ratio of 0.5 waste to 1.0 ore, an average bed thickness of 30 feet (9 metres), a grade of one ton nodules per 400 cubic ieet of shale and continuity of the nodule horizons around the scarp edge of the hills between Waskwei and Man Rivers.
Recent analyses of some manganese nodules from the Pasquia Hills reveal anomalously high values of some rare elements:
cesium 92 ppm neodymium 40 ppm samarium 7.5 ppm germanium 10 ppm tin 54 ppm lanthanum 47 ppm platinum 10 ppm uranium 7.5 ppm silver 6 ppm
OTHER INDUSTRIAL MINERALS
A wide variety of other industrial minerals occur in the province. As markets expand and traditional sources become depleted many of them will likely be targets for further investigation and possible development. While some of the minerals listed below fall within major categories previously discussed they are grouped separately in a poorly documented catagory requiring further investigations. The most significant are presented in the following summary: PRECAMBRIAN
Soapstone Lac la Ronge, Wapawekka
Marble Stanley Mission area K-Feldspar La Ronge, McLennan Lake
areas Quartzite Sandfly Lake area Graphite Deep Bay (Reindeer Lake) Rare Earths Uranium City area,
Nisikkatch-Hoidas Lakes area
Magnesite Mosher Lake Phosphate Athabasca Lake (south
4EROZOIC shore)
Elemental Sulphur Devonian, west-central Saskatchewan
Gypsum Devonian, Egg Lake area south Saskatchewan lignite Leonardite (humic Devonian, Egg Lake area south Saskatchewan lignite
acid-rich oxidized fields lignite)
Ochre MakwaLake Marl Sturgeon Lake
SUMMARY OF DEVELOPMENT
Industrial mineral development in Saskatchewan has experienced a slow growth rate from the late 1800s to about 1969. Accelerated growth and periods of fluctuations in industrial mineral sales value smce 1969 has been due largely to the development of the potash industry (Figure 10). Presently the dominant industrial minerals in terms of value of sales are potash, sodium sulphate, granular aggregate and salt. Potash is by far the dominant of this group, contributing about 93 per cent of all industrial mineral sales value over the past two decades.
In addition to potash the industry produces sodium sulphate, salt, calcium chloride brine, clay products, aggregate, cement, peat moss, silica sand and by-product sulphur. These are summarized in Table 7. The potential for new development appears to be high for subsurface calcium and magnesium brines, clay products (particularly kaolin ana bentonite), building stone and silica sand. Although it is too early to speculate on the developmental potential for a diamond industry exploration results are very encouraging and the prospect for discovering an economic pipe is increasing.
REFERENCES Babey, WJ. (1955): The Red Deer River Silica Sand
Deposits of East Central Saskatchewan; Saskatchewan Department of Mineral Resources, Report of Investigations, Number 7,29 pages.
Barry, G. (1988): Sodium Sulphate; in Canadian Minerals Yearbook 1987, Review and Outlook, Energy, Mines and Resources Canada, Mineral Report 36, pages 59.1-59.6.
Barry, G.S. (1981): Potash; in Canadian Minerals Yearbook 19*79, Mineral Report 29, Energy, Mines and Resources Canada, pages 349-363.
Beck, L.S. (1974): Geological Investigations in the Pasquia Hills Area; Saskatchewan Department of Mineral Resources, Report Number 158,16 pages.
Brock, G. (1990): Larger Diamonds Turn up near Melfort; The Leader Post, Nov. 9,1990, page Bll.
Buchinski, K.W. (1988): Recovery and Commercial Application of Calcium Chloride Brine; CIMM 90th Annual General Meeting, Edmonton, Paper Number 22.
Byers, A.R. (1957): The Geology and Mineral Deposits of the Hanson Lake Area, Saskatchewan; Saskatchewan Department of Mineral Resources, Report Number 30,47 pages.
Caldwell, W.G.E. (1982): The Cretaceous System in the Wilhston Basin - a Modern Appraisal; in Fourth International Williston Basin Symposium, pages 295-312.
Crawford, G.S. (1955): Pumicite in Saskatchewan; Saskatchewan Department of Mineral Resources, Report Number 16,35 pages.
Davis, N.B. (1918): Report on the Clay Resources of Southern Saskatchewan; Canada Department of Mines, Mines Branch, Report Number 468, 93 pages.
Dunn, C.E. (1975): The Upper Devonian Duperow Formation in Southeastern Saskatchewan; Saskatchewan Department of Mineral Resources, Report Number 179,151 pages.
Dyck, J.H., McKenzie, C.T., Tibbetts, T.E. and Whita-ker, S.H. (1979): Quality and Occurrence of Coal in
Conference Proceedings 33
Southern Saskatchewan, Canada, Volume 1, Introduction to Data Acquisition and to Associated Computer Processable Files; Saskatchewan Research Council, project under Canada DSS file No. 19SQ.23440-8-9015.
Fuzesy, Anne (1984): Potash in Western Canada; in The Geology of Industrial Minerals in Canada, Canadian Institute of Mining and Metallurgy, Special Volume 29 pages 188-194.
Fuzesy, L.M. (1980): Geology of the Deadwood (Cambrian), Meadow Lake and Winnipegosis (Devonian) Formations in West-central Saskatchewan; Saskatchewan Mineral Resources, Report Number 210,64 pages.
Giordano, N., Recupero, V., Pino, L. and Bart, J.CJ. (1987): Zeolitisation of Perlite, A Prospective Route; Industrial Minerals, September, pages 83-95.
Guliov, P. and Troyer, D.R. (1981): Potential for Fuel Peat Heating in Northern Communities of Saskatchewan; in Summary of Investigations 1981, Saskatchewan Geological Survey, Saskatchewan Mineral Resources, Miscellaneous Report 81-4, pages 167-176.
Guliov, P. (1984): Summary of Industrial Minerals in Saskatchewan; in The Geology of Industrial Minerals in Canada, Special Volume 29, Canadian Institute of Mining and Metallurgy, pages 201-208.
Guliov, P. (1987): Industrial Minerals of Southern Saskatchewan; GAC-MAC Joint Annual Meeting, Guidebook, Field Trip 5,50 pages.
Holter, M.E. (1969): The Middle Devonian Prairie Evaporite Formation of Saskatchewan; Saskatchewan Department of Mineral Resources Report Number 123,133 pages.
Hudson, J.H. (1984): Ceramic Clays and Bentonites of the Prairie Provinces; in The Geology of Industrial Minerals in Canada, Special Vol. 29, CIMM, pages 184-187.
Irvine, JA., Whittaker, S.H. and Broughton, P.L. (1978): Coal Resources of Southern Saskatchewan: A Model for Evaluation Methodology, Saskatchewan Department of Mineral Resources, Report 209, pt I 156 pages, pt II (atlas) 56 plates.
Keele, J. (1915): Clay and Shale Deposits of the Western Provinces (Part V); Geologic Survey of Canada, Memoir 66,74 pages.
Kupsch, W.O. (1952): Ordovician and Silurian Stratigraphy of East Central Saskatchewan; Saskatchewan Department of Mineral Resources, Report Number 10,62 pages.
Lane, D.M. (1959): Dawson Bay Formation in the Quill Lakes - Qu'Appelle Area Saskatchewan; Saskatchewan Department of Mineral Resources, Report Number 38, 49 pages.
Lane, D.M. (1964): Souris River Formation in Southern Saskatchewan; Saskatchewan Department of Mineral Resources, Report Number 92, 72 pages.
Last, W.M. and Schweyen, T.H. (1983): Sedimentology and Geochemistry of Saline Lakes of the Great Plains; Hydrobiologia, Volume 105, pages 245-263.
Last, W.M. and Slezak, LA. (1987): Sodium Sulphate Deposits of Western Canada: Geology, Minero-logy, and Origin; in Economic Minerals of Saskatchewan, Saskatchewan Geologic Society of Specialists, Publication Number 8, pages 197-205.
MacDougall, D.G. (1989): Beryl Pegmatites in the Jan
Lake Area, NTS 63L and 63M; in Summary of Investigations 1989, Saskatchewan Energy and Mines, Saskatchewan Geological Survey, Miscellaneous Report 89-4, pages 71-81.
Master, P.P. (1987): Evaluation and Geology of Kaolinized Sediments, Wood Mountain, Saskatchewan; in Economic Minerals of Saskatchewan, Saskatchewan Geologic Society of Specialists, Publication Number 8, pages 166-181.
Mollard, J.D. and Mollard, D.G. (1987): Location, Exploration and Production of Gravel Resources in Saskatchewan; in Economic Minerals of Saskatchewan, Saskatchewan Geologic Society of Specialists, Publication 8, pages 210-215.
Monea, MJ. (1984): High-Swelling Bentonite Deposits in Southwest Saskatchewan; in The Geology of Industrial Minerals in Canada, Canadian Institute of Mining and Metallurgy, Special Volume 29, 183 pages.
Mysyk, W.K. (1985): Ordovician Dolomites in the Deschambault-Limestone Lakes Area of Saskatchewan (63L 11 & 12); unpublished report of investigation conducted for Energy, Mines and Resources, Canada under DSS Contract No. OISF, 23230-5-0110.
O'Donnel, R.W. (1970): The Effects of Coal Derived Humic Compounds on Plant Root Initiation; Report C70-5 Chem Div., Saskatchewan Research Council, page 20.
Ries, H. and Keele, J. (1912): Preliminary Report on the Clay and Shale Deposits of the Western Provinces; Geological Survey of Canada, Memoir 24-E, 231 pages.
Ries, H. and Keele, J. (1913): Report on the Clay and Shale Deposits of the Western Provinces (Part II); Geological Survey of Canada, Memoir 25, 105 pages.
Sacuta, Alec (1956): Light-weight Concrete Aggregate From Saskatchewan Clays; Saskatchewan Department of Mineral Resources, Report of Investigation, Number 9,35 pages.
Saskatchewan Power Corporation (1984): Saskatchewan Lignite Resource; prepared for Saskatchewan Energy and Mines under the Canada-Saskatchewan Heavy Oil/Fossil Fuels Research Program, 49 pages.
Scott, J.B., Korpijaakko, E.O. and Tibbetts, T.E. (1980): Development of Conversion Factors for Expressing Peat Resource Estimates; in Peat as an Energy Alternative, Symposium Papers, Institute of Gas Technology, Arlington, Virginia, pages 37-49.
Simpson, F. and Dennison, E.G. (1975): Subsurface Waste-Disposal Potential of Saskatchewan; Saskatchewan Deparment of Mineral Resources, Report Number 177, 76 pages.
Thomas, DJ. (1984): Geological Mapping, Star Lake Area (part of NTS 73P-16 and 74A-1); in Summary of Investigations 1984, Saskatchewan Geological Survey, Saskatchewan Energy and Mines, Miscellaneous Report 84-4.
Tompkins, R.V. (1953): Magnesium in Saskatchewan; Saskatchewan Department of Mineral Resources, Report Number 11,23 pages.
Tompkins, R.V. (1954): Natural Sodium Sulphate in Saskatchewan; Saskatchewan Department of Mineral Resources, Report Number 6, 71 pages.
34 Industrial Minerals Forum 1991
Troyer, D.R. (1985): Peat Resources in Saskatchewan; Saskatchewan Energy and Mines, Report 218, 74 pages.
Walker, T. (1987): Hudson Bay Industrial Minerals Project Summary of 1987, Geological Investigations; Saskatchewan Energy and Mines, Mineral Assessment file Number 63D 16-SE-0002, submitted byS.M.D.C.
Winer, A.A. (1954): Acid Activation of Saskatchewan Bentonites; Saskatchewan Department of Mineral Resources, Report of Investigations, Number 4, 29 pages.
Worcester, W.G. (1950): Clay Resources of Saskatchewan; Saskatchewan Department of Mineral Resources, Report Number 7,198 pages.
Conference Proceedings

36 Industrial Minerals Forum 1991
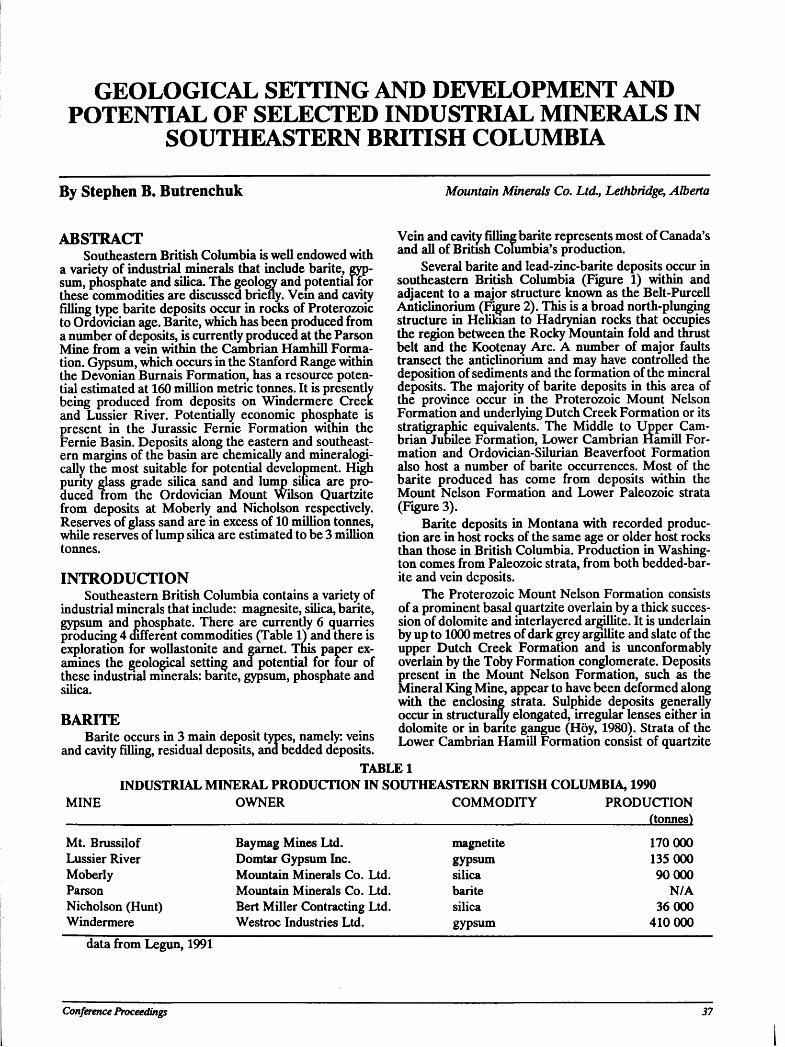
GEOLOGICAL SETTING AND DEVELOPMENT AND POTENTIAL OF SELECTED INDUSTRIAL MINERALS IN
SOUTHEASTERN BRITISH COLUMBIA
By Stephen B. Butrenchuk Mountain Minerals Co. Ltd., Lethbridge, Alberta
ABSTRACT Southeastern British Columbia is well endowed with
a variety of industrial minerals that include barite, gypsum, phosphate and silica. The geology and potential for these commodities are discussed briefly. Vem and cavity filling type barite deposits occur in rocks of Proterozoic to Ordovician age. Barite, which has been produced from a number of deposits, is currently produced at the Parson Mine from a vein within the Cambrian Hamhill Formation. Gypsum, which occurs in the Stanford Range within the Devonian Burnais Formation, has a resource potential estimated at 160 million metric tonnes. It is presently being produced from deposits on Windermere Creek and Lussier River. Potentially economic phosphate is present in the Jurassic Fernie Formation within the Fernie Basin. Deposits along the eastern and southeastern margins of the basin are chemically and mineralogi-cally the most suitable for potential development. High purity glass grade silica sand and lump silica are produced rrom the Ordovician Mount Wilson Quartzite from deposits at Moberly and Nicholson respectively. Reserves of glass sand are in excess of 10 million tonnes, while reserves of lump silica are estimated to be 3 million tonnes.
INTRODUCTION Southeastern British Columbia contains a variety of
industrial minerals that include: magnesite, sihca, barite, gypsum and phosphate. There are currently 6 quarries producing 4 different commodities (Table 1) and there is exploration for wollastonite and garnet. Tnis paper examines the geological setting and potential for four of these industrial minerals: barite, gypsum, phosphate and sihca.
BARITE Barite occurs in 3 main deposit types, namely: veins
and cavity filling, residual deposits, and bedded deposits.
Vein and cavity filling barite represents most of Canada's and all of British Columbia's production.
Several barite and lead-zinc-barite deposits occur in southeastern British Columbia (Figure 1) within and adjacent to a major structure known as the Belt-Purcell Anticlinorium (Figure 2). This is a broad north-plunging structure in Helikian to Hadrynian rocks that occupies the region between the Rocky Mountain fold and thrust belt and the Kootenay Arc. A number of major faults transect the anticlinorium and may have controlled the deposition of sediments and the formation of the mineral deposits. The majority of barite deposits in this area of the province occur in the Proterozoic Mount Nelson Formation and underlying Dutch Creek Formation or its stratigraphic equivalents. The Middle to Upper Cambrian Jubilee Formation, Lower Cambrian Hamill Formation and Ordovician-Silurian Beaverfoot Formation also host a number of barite occurrences. Most of the barite produced has come from deposits within the Mount Nelson Formation and Lower Paleozoic strata (Figure 3).
Barite deposits in Montana with recorded production are in host rocks of the same age or older host rocks than those in British Columbia. Production in Washington comes from Paleozoic strata, from both bedded-bar-ite and vein deposits.
The Proterozoic Mount Nelson Formation consists of a prominent basal quartzite overlain by a thick succession of dolomite and interlayered argillite. It is underlain by up to 1000 metres of dark grey argillite and slate of the upper Dutch Creek Formation and is unconformably overlain by the Toby Formation conglomerate. Deposits present in the Mount Nelson Formation, such as the Mineral King Mine, appear to have been deformed along with the enclosing strata. Sulphide deposits generally occur in structurally elongated, irregular lenses either in dolomite or in barite gangue (Hoy, 1980). Strata of the Lower Cambrian Hamill Formation consist of quartzite
TABLE 1 INDUSTRIAL MINERAL PRODUCTION IN SOUTHEASTERN BRITISH COLUMBIA, 1990
MINE OWNER COMMODITY PRODUCTION (tonnes)
Mt. Brussilof Lussier River Moberly Parson Nicholson (Hunt) Windermere
Baymag Mines Ltd. Domtar Gypsum Inc. Mountain Minerals Co. Ltd. Mountain Minerals Co. Ltd. Bert Miller Contracting Ltd. Westroc Industries Ltd.
magnetite gypsum silica barite silica gypsum
170 000 135 000 90 000
N/A 36 000
410 000
data from Legun, 1991
Conference Proceedings 37
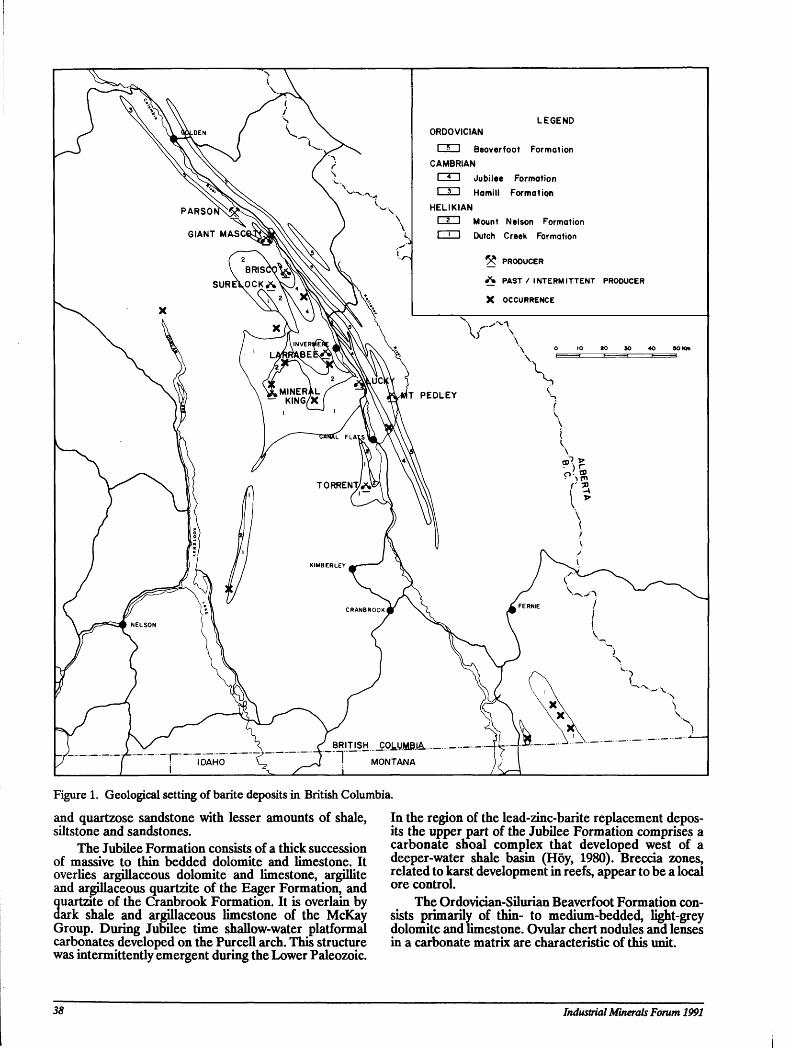
PARSOr _
GIANT MASCC
^
BRISCQ^ SURE\OCK/»
LEGEND ORDOVICIAN
I "■ I Beaverfoot Formation CAMBRIAN
I 4 I Jubilee Formation 1 3 I Hamill Formation
HELIKIAN I 2 I Mount Nelson Formation
Dutch Creek Formation
5Z PRODUCER
•*» PAST / INTERMITTENT PRODUCER
X OCCURRENCE
\S INVERMEfl VBEBV^'
.MINERAL — KING/X
10 20 SO 40 90 Km
\ . k.uck
n PEDLEY
\
r •*
{ ( \y \ C_BRITISH _COLUMB.|A_ ]
r IDAHO T MONTANA LL Figure 1. Geological setting of barite deposits in British Columbia. and quartzose sandstone with lesser amounts of shale, siltstone and sandstones.
The Jubilee Formation consists of a thick succession of massive to thin bedded dolomite and limestone. It overlies argillaceous dolomite and limestone, argillite and argillaceous quartzite of the Eager Formation, and
3uartzite of the Cranbrook Formation. It is overlain by ark shale and argillaceous limestone of the McKay
Group. During Jubilee time shallow-water platformal carbonates developed on the Purcell arch. This structure was intermittently emergent during the Lower Paleozoic.
In the region of the lead-zinc-barite replacement deposits the upper part of the Jubilee Formation comprises a carbonate shoal complex that developed west of a deeper-water shale basin (Hoy, 1980). Breccia zones, related to karst development in reefs, appear to be a local ore control.
The Ordovician-Silurian Beaverfoot Formation consists primarily of thin- to medium-bedded, light-grey dolomite and limestone. Ovular chert nodules and lenses in a carbonate matrix are characteristic of this unit.
38 Industrial Minerals Forum 1991
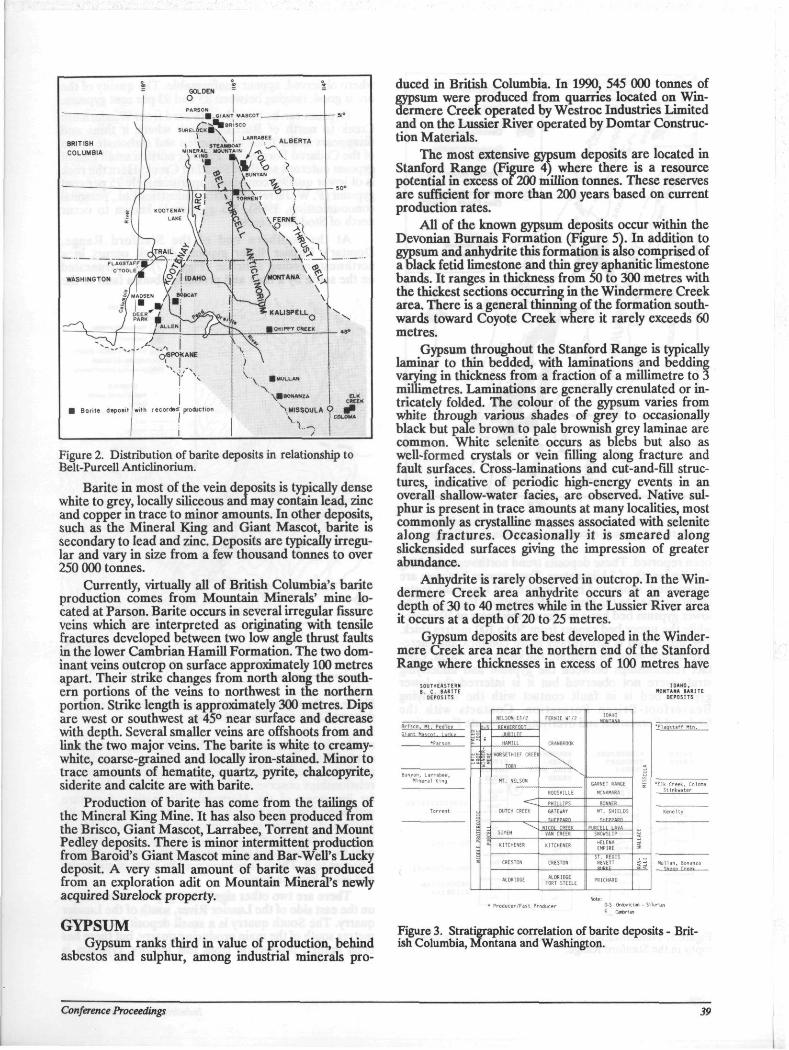
V B R I T I S H
C O L U M B I A
GOLDEN O
.OIANT MASCOT .
Q4 \ SUREU \ I LARR
1 V STEAMBOAT MINERAL MOUNTA"
K I N O m. t n
A L B E R T A
\
B o n t e depos i t
Figure 2. Distribution of barite deposits in relationship to Belt-Purcell Anticlinorium.
Barite in most of the vein deposits is typically dense white to grey, locally siliceous and may contain lead, zinc and copper m trace to minor amounts. In other deposits, such as the Mineral King and Giant Mascot, barite is secondary to lead and zinc. Deposits are typically irregular and vary in size from a few thousand tonnes to over 250 000 tonnes.
Currently, virtually all of British Columbia's barite production comes from Mountain Minerals' mine located at Parson. Barite occurs in several irregular fissure veins which are interpreted as originating with tensile fractures developed between two low angle thrust faults in the lower Cambrian Hamill Formation. The two dominant veins outcrop on surface approximately 100 metres apart. Their strike changes from north along the southern portions of the veins to northwest in the northern portion. Strike length is approximately 300 metres. Dips are west or southwest at 45° near surface and decrease with depth. Several smaller veins are offshoots from and link the two major veins. The barite is white to creamy-white, coarse-grained and locally iron-stained. Minor to trace amounts of hematite, quartz, pyrite, chalcopyrite, siderite and calcite are with barite.
Production of barite has come from the tailings of the Mineral King Mine. It has also been produced from the Brisco, Giant Mascot, Larrabee, Torrent and Mount Pedley deposits. There is minor intermittent production from Baroid's Giant Mascot mine and Bar-Well's Lucky deposit. A very small amount of barite was produced from an exploration adit on Mountain Mineral's newly acquired Surelock property.
GYPSUM Gypsum ranks third in value of production, behind
asbestos and sulphur, among industrial minerals pro
duced in British Columbia. In 1990, 545 000 tonnes of gypsum were produced from quarries located on Win-dermere Creek operated by Westroc Industries Limited and on the Lussier River operated by Domtar Construction Materials.
The most extensive gypsum deposits are located in Stanford Range (Figure 4) where there is a resource potential in excess of 200 million tonnes. These reserves are sufficient for more than 200 years based on current production rates.
All of the known gypsum deposits occur within the Devonian Burnais Formation (Figure 5}. In addition to gypsum and anhydrite this formation is also comprised of a black fetid limestone and thin grey aphanitic limestone bands. It ranges in thickness from 50 to 300 metres with the thickest sections occurring in the Windermere Creek area. There is a general thinning of the formation southwards toward Coyote Creek where it rarely exceeds 60 metres.
Gypsum throughout the Stanford Range is typically laminar to thin bedded, with laminations and bedding varying in thickness from a fraction of a millimetre to 3 millimetres. Laminations are generally crenulated or intricately folded. The colour of the gypsum varies from white through various shades of grey to occasionally black but pale brown to pale brownish grey laminae are common. White selenite occurs as blebs but also as well-formed crystals or vein filling along fracture and fault surfaces. Cross-laminations and cut-and-fill structures, indicative of periodic high-energy events in an overall shallow-water fades, are observed. Native sulphur is present in trace amounts at many localities, most commonly as crystalline masses associated with selenite along fractures. Occasionally it is smeared along slickensided surfaces giving the impression of greater abundance.
Anhydrite is rarely observed in outcrop. In the Windermere Creek area anhydrite occurs at an average depth of 30 to 40 metres while in the Lussier River area it occurs at a depth of 20 to 25 metres.
Gypsum deposits are best developed in the Winder-mere Creek area near the northern end of the Stanford Range where thicknesses in excess of 100 metres have
SOUTHEASTERN 3. C. BARITE
0EP0SITS
IDAHO. MONTANA BARITE
DEPOSITS
Bun/an, Larrabee. Mineral King
Torrent
NELSON E l / 2 'ERNIE H I / ? I0AH0
P ■■;•. ' , • ;■■ 1 1
5
P C ■■;•. ' , • ;■■ 1 1
5
P C HAM!11 ■■;•. ' , • ;■■ 1 1
5
H HORSETHIEF CREE
\J
5 i MT. NELSON
5 i MT. NELSON GARNET RANGE
5
•E lk Creek, Colona
i R00S»ILIE
GARNET RANGE
5
Stink.ater
i R00S»ILIE
GARNET RANGE
5 i DUTCH CREEK
5 i DUTCH CREEK GATEMAY ■-■. F " : I 11
5
Kenelty
i SIYEH
5 i SIYEH VAN CREEK SNOWSI IP
5 i KITCHENER KITCHENER H i f r . ; EMPIRE 5 i CREST0N CREST0N
ST. REGIS REVETT IS Mullan, Bonanza i
ALDRIDGE ALDRIDGE FORT STEELS PRICHARO
Figure 3. Stratigraphic correlation of barite deposits - British Columbia, Montana and Washington.
Conference Proceedings 39
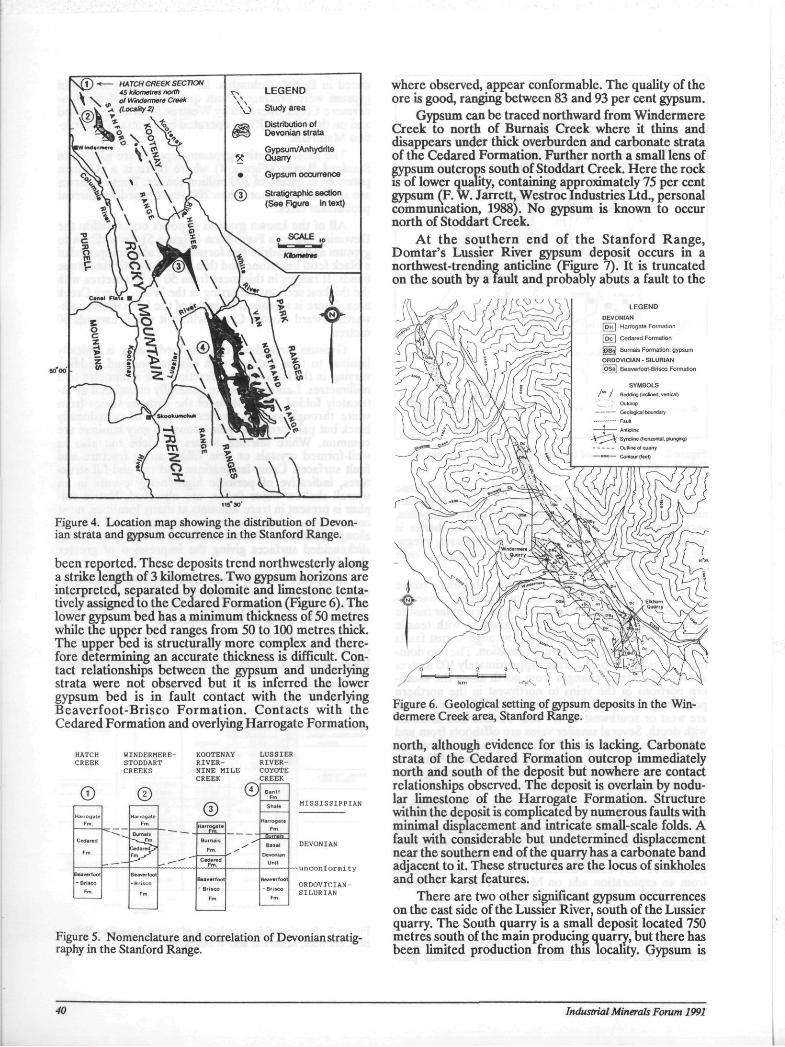
Figure 4. Location map showing the distribution of Devonian strata and gypsum occurrence in the Stanford Range.
been reported. These deposits trend northwesterly along a strike length of 3 kilometres. Two gypsum horizons are interpreted, separated by dolomite and limestone tentatively assigned to the Cedared Formation (Figure 6). The lower gypsum bed has a minimum thickness of 50 metres while the upper bed ranges from 50 to 100 metres thick. The upper oed is structurally more complex and therefore determining an accurate thickness is difficult. Contact relationships between the gypsum and underlying strata were not observed but it is inferred the lower gypsum bed is in fault contact with the underlying Beaverfoot-Brisco Formation. Contacts with the Cedared Formation and overlying Harrogate Formation,
HATCH CREEK
WINDERMERE-STODDART CREEKS
KOOTENAY RIVER-NINE M I L E CREEK
(3)
LUSSIER R I V E R -COYOTE CREEK
O
WINDERMERE-STODDART CREEKS
KOOTENAY RIVER-NINE M I L E CREEK
(3) Banff
Fm
KOOTENAY RIVER-NINE M I L E CREEK
(3) Shale
,*£*. Harrogate Fm.
KOOTENAY RIVER-NINE M I L E CREEK
(3) Shale
,*£*. Harrogate Fm. Harrogate
Fm. ,*£*. Harrogate
Fm. Harrogate Harrogate
Fm.
Cedared
Fm
-x__Fnv CedareO" F m r - " J
Harrogate Harrogate
Fm.
Cedared
Fm
-x__Fnv CedareO" F m r - " J
Burnats Fm.
Cedared
Fm
-x__Fnv CedareO" F m r - " J
Burnats Fm.
Basal
Devonian Unit
DEVONIAN Cedared
Fm
-x__Fnv CedareO" F m r - " J Cedared
Fm.
Basal
Devonian Unit
Jeaverfoot
Fm.
Beaver foot
Fm
Beaverlool
- Brisco
Fm
Beaverfool
-Brisco Fm
ORDOVICIAN-S ILURIAN
Beaver foot
Fm
Beaverlool
- Brisco
Fm
Beaverfool
-Brisco Fm
Beaver foot
Fm
Beaverlool
- Brisco
Fm
where observed, appear conformable. The quality of the ore is good, ranging between 83 and 93 per cent gypsum.
Gypsum can be traced northward from Windermere Creek to north of Burnais Creek where it thins and disappears under thick overburden and carbonate strata of the Cedared Formation. Further north a small lens of gypsum outcrops south of Stoddart Creek. Here the rock is of lower quality, containing approximately 75 per cent gypsum (F. W. Jarrett, Westroc Industries Ltd., personal communication, 1988). No gypsum is known to occur north of Stoddart Creek.
At the southern end of the Stanford Range, Domtar's Lussier River gypsum deposit occurs in a northwest-trending anticline (Figure 7). It is truncated on the south by a fault and probably abuts a fault to the
LEGEND DEVONIAN |DH I Harrogate Formation | Dc) Cedared Formation [D8a| Burnais Formation: gypsum ORDOVICIAN - SILURIAN |OSB| Beavertoot-Brisco Formation
Figure 5. Nomenclature and correlation of Devonian stratigraphy in the Stanford Range.
Figure 6. Geological setting of gypsum deposits in the Windermere Creek area, Stanford Range.
north, although evidence for this is lacking. Carbonate strata of the Cedared Formation outcrop immediately north and south of the deposit but nowhere are contact relationships observed. The deposit is overlain by nodular limestone of the Harrogate Formation. Structure within the deposit is complicated by numerous faults with minimal displacement and intricate small-scale folds. A fault with considerable but undetermined displacement near the southern end of the quarry has a carbonate band adjacent to it. These structures are the locus of sinkholes and other karst features.
There are two other significant gypsum occurrences on the east side of the Lussier River, south of the Lussier quarry. The South quarry is a small deposit located 750 metres south of the main producing quarry, but there has been limited production from this locality. Gypsum is
40 Industrial Minerals Forum 1991
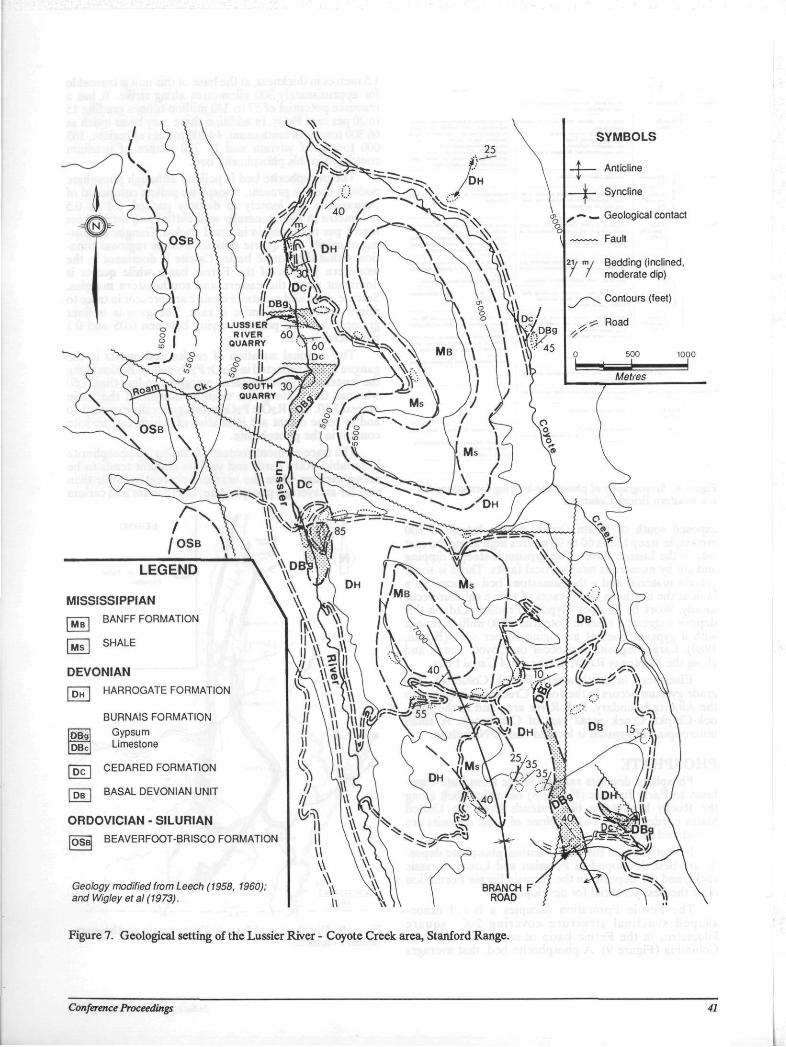
SYMBOLS
- t - Anticline
-+ Syncline
y » — «— Geological contact
a Fault
77 Bedding (inclined, moderate dip)
Contours (feet)
^ Road
0 500 1000
Metres
DEVONIAN fp^\ HARROGATE FORMATION
BURNAIS FORMATION Gypsum Limestone
HE IS
CEDARED FORMATION
BASAL DEVONIAN UNIT
ORDOVICIAN - SILURIAN
[osS BEAVERFOOT-BRISCO FORMATION
Geology modified from Leech (1958, 1960); and Wigleyetal (1973).
Figure 7. Geological setting of the Lussier River - Coyote Creek area, Stanford Range.
Conference Proceedings 41
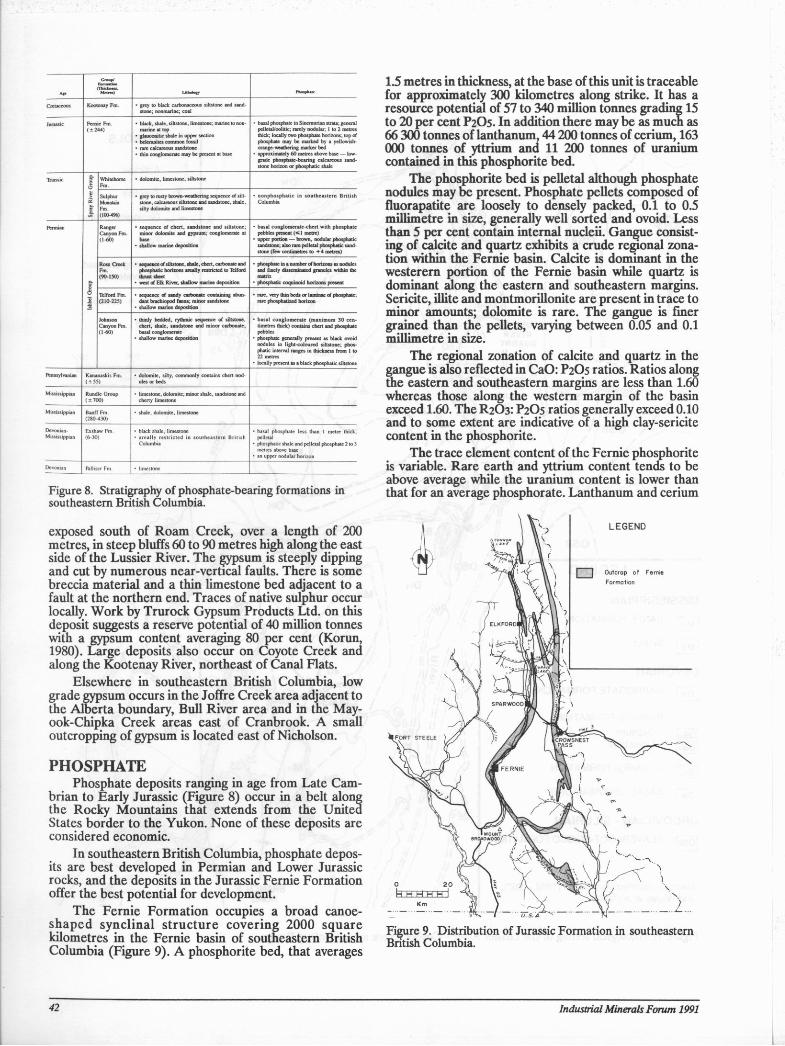
A f
<•—t*
U M a a y nmt*m
Kootenay F m . Kootenay F m . Sone; nonnurine; c o d
Jurassic Fernie F m ( = 2 4 4 )
• black, shale, Siltstone. limestone. manne to non marine i t lop
• glauconitic shale in upper section • belemniies common fossil • rare calcareous sandstone • thin conglomerate may be present at base
• basal phosphate in Sinemurian strata; general p e l l e u l o o h t K , rarely nodular. 1 to 2 metres truck. locally t w o phosphate horizons; lop of phosphate may be marked by a yel lowish-orange- weathering marker bed
■ approumately 6 0 metres above base — low-grade phosphate-bearing calcareous sandstone horizon or phosphatic shale
Triassk
a
Whitehorse Fm
• dolomite, limestone, siltstone
a Sulphur Momxam F m . (100-496)
• g i r y to rusty brown-wearhering sequence of silt-stone. calcareous siltstone and sandstone, shale, sil ly dolomite and limestone
• n o n p h o s p h a t i c in southeastern B r i t i s h Columbia
ftnni*n
i
Ranger Canyon F m . ( 1 - 6 0 )
• sequence of c h e r t , sandstone and si l tstone; minor dolomite and gypsum; conglomerate at base
• shallow marine deposition
* basal conglomerate cher t w i t h phosphate pebbles present ( * . 1 metre)
■ upper portion — brown, nodular phosphatic sandstone; also rare pellcta! phosphatic sandstone (few centimetres to + 4 metres)
i Rocs Creek K m . (90 -150 )
* sequeaceof siltstone. shale, chert, carbonate and phosphatic horizons areally restricted to Telford thrust sheet
• west of Elk River. shallow marine deposition
• phosphate in a number of horizons as nodulo and finely disseminated granules within the
* phosphatic coquinoid horizons present i Telford F m . ( 2 1 0 - 2 2 5 )
• sequence of sandy carbonate containing abundant brachiopod fauna; minor sandstone
• shallow marine deposition
■ rare, very thin beds or laminae of phosphate, rare pnosphatized horizon i
Johnson Canyon F m ( 1 - 6 0 )
■ thinly bedded, rytnrnic sequence of siltstone, chert, shale, sandstone and minor carbonate; basal conglomerate
• shallow marine deposition
• basal c o n g l o m e r a t e ( m a x i m u m 3 0 c e n timetres thick) contains chert and phosphate pebbles
■ phosphate generally present as black ovoid nodules in l ight-coloured siltstone; phosphatic interval ranges in thickness f rom 1 to 22 metres
• locally present as a black phosphatic siltstone
Hcnnsylvanian Kananaskis F m . ( ± 5 5 )
* dolomite , sihy. commonly conuins chert nodules or beds
Mississippian Rundle Group ( • 7001
* limestone, dolomite , minor shale, sandstone and cherty lunestone
Mississippian Banf f F m 1280-430)
• shale, dolomite , limestone
Devonian Mississippian
Ex shaw F m ( 6 - 3 0 )
• black shale, limestone • a r e a l l y res t r i c ted in s o u t h e a s t e r n B r i t i s h
Columbia
• basal phosphate less than 1 metre thick. pe l leu l
• phosphatic shale and pelletal phosphate 2 to 3 metres above base
• an upper nodular horizon
Devonian fclliser F m • limestone
Figure 8. Stratigraphy of phosphate-bearing formations in southeastern British Columbia.
exposed south of Roam Creek, over a length of 200 metres, in steep bluffs 60 to 90 metres high along the east side of the Lussier River. The gypsum is steeply dipping and cut by numerous near-vertical faults. There is some breccia material and a thin limestone bed adjacent to a fault at the northern end. Traces of native sulphur occur locally. Work by Trurock Gypsum Products Ltd. on this deposit suggests a reserve potential of 40 million tonnes with a gypsum content averaging 80 per cent (Korun, 1980). Large deposits also occur on Coyote Creek and along the Kootenay River, northeast of Canal Flats.
Elsewhere in southeastern British Columbia, low grade gypsum occurs in the Joffre Creek area adjacent to the Alberta boundary, Bull River area and in the May-ook-Chipka Creek areas east of Cranbrook. A small outcropping of gypsum is located east of Nicholson.
PHOSPHATE Phosphate deposits ranging in age from Late Cam
brian to Early Jurassic (Figure 8) occur in a belt along the Rocky Mountains that extends from the United States border to the Yukon. None of these deposits are considered economic.
In southeastern British Columbia, phosphate deposits are best developed in Permian and Lower Jurassic rocks, and the deposits in the Jurassic Fernie Formation offer the best potential for development.
The Fernie Formation occupies a broad canoe-shaped synclinal structure covering 2000 square kilometres in the Fernie basin of southeastern British Columbia (Figure 9). A phosphorite bed, that averages
42
1.5 metres in thickness, at the base of this unit is traceable for approximately 300 kilometres along strike. It has a resource potential of 57 to 340 million tonnes grading 15 to 20 per cent P2O5. In addition there may be as much as 66 300 tonnes of lanthanum, 44 200 tonnes of cerium, 163 000 tonnes of yttrium and 11 200 tonnes of uranium contained in this phosphorite bed.
The phosphorite bed is pelletal although phosphate nodules may be present. Phosphate pellets composed of fluorapatite are loosely to densely packed, 0.1 to 0.5 millimetre in size, generally well sorted and ovoid. Less than 5 per cent contain internal nuclcii. Gangue consisting of calcitc and quartz exhibits a crude regional zona-tion within the Fernie basin. Calcitc is dominant in the westerern portion of the Fernie basin while quartz is dominant along the eastern and southeastern margins. Sericite, illite and montmorillonite are present in trace to minor amounts; dolomite is rare. The gangue is finer grained than the pellets, varying between 0.05 and 0.1 millimetre in size.
The regional zonation of calcite and quartz in the gangue is also reflected in CaO: P2O5 ratios. Ratios along the eastern and southeastern margins are less than 1.60 whereas those along the western margin of the basin exceed 1.60. The R2O3: P2O5 ratios generally exceed 0.10 and to some extent are indicative of a high clay-sericite content in the phosphorite.
The trace element content of the Fernie phosphorite is variable. Rare earth and yttrium content tends to be above average while the uranium content is lower than that for an average phosphorate. Lanthanum and cerium
Figure 9. Distribution of Jurassic Formation in southeastern British Columbia.
Industrial Minerals Forum 1991
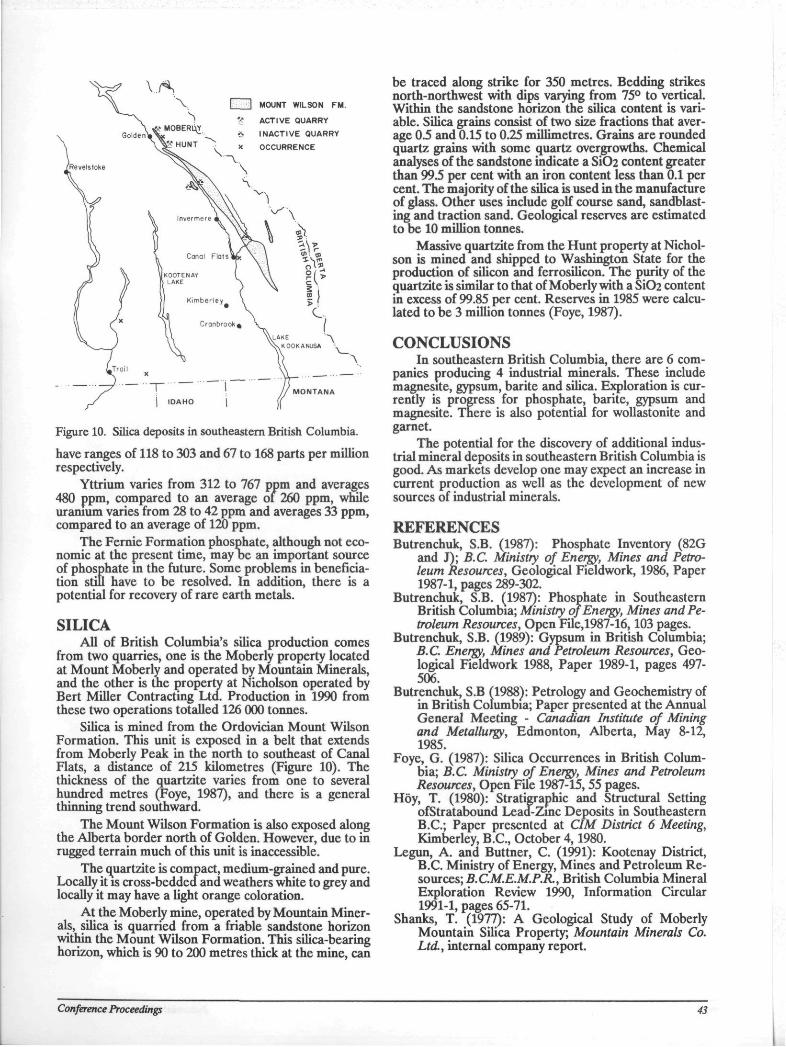
I 1 MOUNT WILSON FM.
ACTIVE QUARRY
INACTIVE QUARRY
OCCURRENCE
LAKE ' - \ KOOKANUSA
Figure 10. Silica deposits in southeastern British Columbia.
have ranges of 118 to 303 and 67 to 168 parts per million respectively.
Yttrium varies from 312 to 767 ppm and averages 480 ppm, compared to an average of 260 ppm, while uranium varies from 28 to 42 ppm and averages 33 ppm, compared to an average of 120 ppm.
The Fernie Formation phosphate, although not economic at the present time, may oe an important source of phosphate m the future. Some problems in beneficia-tion still have to be resolved. In addition, there is a potential for recovery of rare earth metals.
SILICA All of British Columbia's silica production comes
from two quarries, one is the Moberly property located at Mount Moberly and operated by Mountain Minerals, and the other is the property at Nicholson operated by Bert Miller Contractmg Ltd. Production in 1990 from these two operations totalled 126 000 tonnes.
Silica is mined from the Ordovician Mount Wilson Formation. This unit is exposed in a belt that extends from Moberly Peak in the north to southeast of Canal Flats, a distance of 215 kilometres (Figure 10). The thickness of the quartzite varies from one to several hundred metres (Foye, 1987), and there is a general thinning trend southward.
The Mount Wilson Formation is also exposed along the Alberta border north of Golden. However, due to in rugged terrain much of this unit is inaccessible.
The quartzite is compact, medium-grained and pure. Locally it is cross-bedded and weathers white to grey and locally it may have a light orange coloration.
At the Moberly mine, operated by Mountain Minerals, silica is quarried from a friable sandstone horizon within the Mount Wilson Formation. This silica-bearing horizon, which is 90 to 200 metres thick at the mine, can
be traced along strike for 350 metres. Bedding strikes north-northwest with dips varying from 75° to vertical. Within the sandstone horizon the silica content is variable. Silica grains consist of two size fractions that average 0.5 and 0.15 to 0.25 millimetres. Grains are rounded quartz grains with some quartz overgrowths. Chemical analyses of the sandstone indicate a SiOz content greater than 99.5 per cent with an iron content less than 0.1 per cent. The majority of the silica is used in the manufacture of glass. Other uses include golf course sand, sandblasting and traction sand. Geological reserves are estimated to be 10 million tonnes.
Massive quartzite from the Hunt property at Nicholson is mined and shipped to Washington State for the production of silicon and ferrosilicon. The purity of the quartzite is similar to that of Moberly with a Si02 content in excess of 99.85 per cent. Reserves in 1985 were calculated to be 3 million tonnes (Foye, 1987).
CONCLUSIONS In southeastern British Columbia, there are 6 com
panies producing 4 industrial minerals. These include magnesite, gypsum, barite and silica. Exploration is currently is progress for phosphate, barite, gypsum and magnesite. There is also potential for wollastonite and garnet.
The potential for the discovery of additional industrial mineral deposits in southeastern British Columbia is good. As markets develop one may expect an increase in current production as well as the development of new sources of industrial minerals.
REFERENCES Butrenchuk, S.B. (1987): Phosphate Inventory (82G
and J); B.C. Ministry of Energy, Mines and Petroleum Resources, Geological Fieldwork, 1986, Paper 1987-1, pages 289-302.
Butrenchuk, S.B. (1987): Phosphate in Southeastern British Columbia; Ministry of Energy, Mines and Petroleum Resources, Open File,1987-16,103 pages.
Butrenchuk, S.B. (1989): Gypsum in British Columbia; B.C. Energy, Mines and Petroleum Resources, Geological Fieldwork 1988, Paper 1989-1, pages 497-506.
Butrenchuk, S.B (1988): Petrology and Geochemistry of in British Columbia; Paper presented at the Annual General Meeting - Canadian Institute of Mining and Metallurgy, Edmonton, Alberta, May 8-12, 1985.
Foye, G. (1987): Silica Occurrences in British Columbia; B.C. Ministry of Energy, Mines and Petroleum Resources, Open File 1987-15, 55 pages.
Hoy, T. (1980): Stratigraphic and Structural Setting ofStratabound Lead-Zinc Deposits in Southeastern B.C.; Paper presented at CIM District 6 Meeting, Kimberley, B.C., October 4,1980.
Legun, A. and Buttner, C. (1991): Kootenay District, B.C. Ministry of Energy, Mines and Petroleum Resources; B. C.M.E.M.P.R., British Columbia Mineral Exploration Review 1990, Information Circular 1991-1, pages 65-71.
Shanks, T. (1977): A Geological Study of Moberly Mountain SUica Property, Mountain Minerals Co. Ltd., internal company report.
Conference Proceedings 43

44 Industrial Minerals Forum 1991
GEOLOGICAL HISTORY OF THE WESTERN CANADA SEDIMENTARY BASIN
By Grant D. Mossop Alberta Geological Survey, Alberta Research Council, Edmonton, Alberta.
ABSTRACT The Western Canada Sedimentary Basin comprises a wedge of dominantly Phanerozoic strata above Precambr-
ian crystalline basement. The wedge tapers from a maximum thickness of about 6000 metres in the axis of the Alberta Svncline (just east of the Foothills front) to a zero edge in the northeast along the Canadian Shield. The succession reflects sedimentation in two profoundly different tectonic settings - Late Proterozic to Jurassic platfor-mal succession dominated by carbonate rocks, deposited on the stable craton adjacent to the passive margin of ancient North America; overlain by a elastics-dominated foreland basin wedge deposited in mid-Jurassic to Paleocene times during active margin orogenic evolution of the Canadian Cordillera.
The platformal succession consists of four major sequences, each representing more or less continuous internal deposition but separated from adjacent sequences by profound regional unconformities. Patterns of marine inundation, sedimentation and erosion were influenced by epeirogenic movement on various intracratonic arches, that episodically differentiated the region into a complex of sub-basins and uplifts.
Beginning in the mid-Jurassic, as North America began to drift westward with the opening of the Atlantic, the western margin of the continent was subjected to at least two major episodes of compressive tectonism, as a result of collision with large oceanic terranes that accreted onto the continent in the west. Strata originally deposited outboard of the ancient passive margin of the continent were compressed and displaced eastward over the continental margin. In turn, platformal cover rocks were thrusted and folded to form the Canadian Rocky Mountains and Foothills. Emplacement of the imbricate thrust slices, progressively from west to east, produced tectonic thickening of the crust and isostatic downward of the foreland, formmg an eastward-migrating trough that trapped clastic detritus shed from the developing mountains. Net erosion and sediment bypass have prevailed in the region since the Paleocene culmination of the Laramide Orogeny.
Conference Proceedings 45

46 Industrial Minerals Forum 1991
AN OVERVIEW OF THE SASKATCHEWAN POTASH INDUSTRY
By Keith S. Crosby International Minerals & Chemical Corporation (Canada) Ltd., Esterhazy, Saskatchewan
ABSTRACT Nearly 30 years have past since International Miner
als & Chemical Corporation (Canada) Limited produced the first Canadian potash near Esterhazy, Saskatchewan. Today potash is a billion dollar industry in Saskatchewan where the annual design capacity of 10 mines is 10.6 million tonnes K2O equivalent. In 1989, planned production of 6.5 million tonnes of product accounted for approximately 21 per cent of world production.
In Saskatchewan, sylvite (KC1) is mined from two members within the Middle Devonian Prairie Formation, with production concentrated near Saskatoon and Esterhazy - Rocanville. Compared to most salt deposits, the Prairie Evaporites have witnessed only limited kinematic disturbance. Locally, due to metasomatism, each mine experiences mineralogical and consequential grade changes. Anomalous stratigraphic and structural disturbances are coincident with underlying reefal mounds and syn- to post-depositional leaching and erosional phenomena.
At present production rates, potash resources in Saskatchewan represent nearly 600 years of reserves. Producers are, however, bound by a volatile world market. Five year forecasts suggest the potash industry will continue to be plagued by long and short-term implications on consumption and production. The Saskatchewan potash industry infrastructure is well established. Its ability to maintain or increase its share in the marketplace will depend on improved mining and milling technology, maintaining an efficient transportation system and exporting strategies.
World demand for potash is expected to grow in the 1990s. Saskatchewan producers are positioned to, not only remain as competitive and reliable suppliers, but to increase production once world supply and demand become better balanced.
INTRODUCTION As a leading commodity in the industrial minerals
sector, the discovery, development and future outlook of the Saskatchewan potash industry deserves special interest within the Canadian mining industry. This billion dollar industry accounts for nearly one-third of Saskatchewan's mineral production, directly accounting for over 3 000 jobs. Although the Canadian potash industry witnessed only 64 per cent utilization of production capacity in 1989/90, growth in world demand is expected to increase production capacity utilization to nearly 81 per cent by 1995. In fact, whether the potash market is for fertilizer or chemical and associated industries, some market analysts forecast potash demand will be greater than supply before the turn of the century. This translates to Canadian producers supplying 25 per cent of the world's market today, which is expected to increase to over 28 per cent by 1995.
If vertical or lateral stratigraphic, structural and mineralogical changes in Canadian potash mines was not challenging enough, complex global marketing conditions are also having a significant impact on potash producers' sales and profit margins. Pohtical changes and consequential moves to a free market economy in eastern Europe, climatic changes and mine closures have lead to significant fluctuations in potash production or consumption in countries as the Soviet Union, China, the eastern European community and the United States. Consequently, the market values of potash has fluctuated accordingly.
At the global level, potash consuming crops such as corn and soybean are expected to grow in direct ratio with the growth in worldpopulation, particularly in underdeveloped countries. This will lead to a better balance in the world potash supply and demand by the late 1990s. Saskatchewan's core of modern, high tech and low-cost producers are positioned to remain as competitive and reliable potash suppliers in an ever-increasing competitive world market.
HISTORICAL BACKGROUND OF THE SASKATCHEWAN POTASH MINING INDUSTRY
Potash - indeed its very name describes the historical and yet natural evolution of this product. Tot ash" an alkaline substance or crude potassium carbonate leached in iron pots from wood ashes for centuries served in cleansing, medicinal and food seasoning applications. Later its use in the early glass, soap and cloth mdustries evolved.
In the mid- 1800s, a German chemist, Justus von Liebig, chemically detected phosphate and potassium in ashes of burned plants and ammonia in the vapours. The age of agricultural chemistry began.
Today, "potash" is a term applied to the common salts of potassium. Soluble potassium salts occur in crystalline form within evaporite deposits and were first discovered in rock salt deposits m Germany in 1839. Germany supplied the world with potash from 1861 until the first world war. Shortages of potash resulted in exploration and discovery of potash m New Mexico in 1927. Today potash is produced commercially in the Soviet Union, Germany, the United States, Israel, France, Jordan, Spain, United Kingdom, Italy, Brazil, China, Chile, and of course Canada.
During the search for oil in Saskatchewan in 1942, the most common potassium-bearing salt minerals, sylvite and carnallite were first recognized in salt cores taken from a depth of 2 330 metres (7 644 ft). The world's largest deposit of potash was incidentally discovered. Potash was discovered in a second well in 1943. However, due to the discovery location and consequential depth and low grade of these first discoveries of potash, little
Conference Proceedings 47
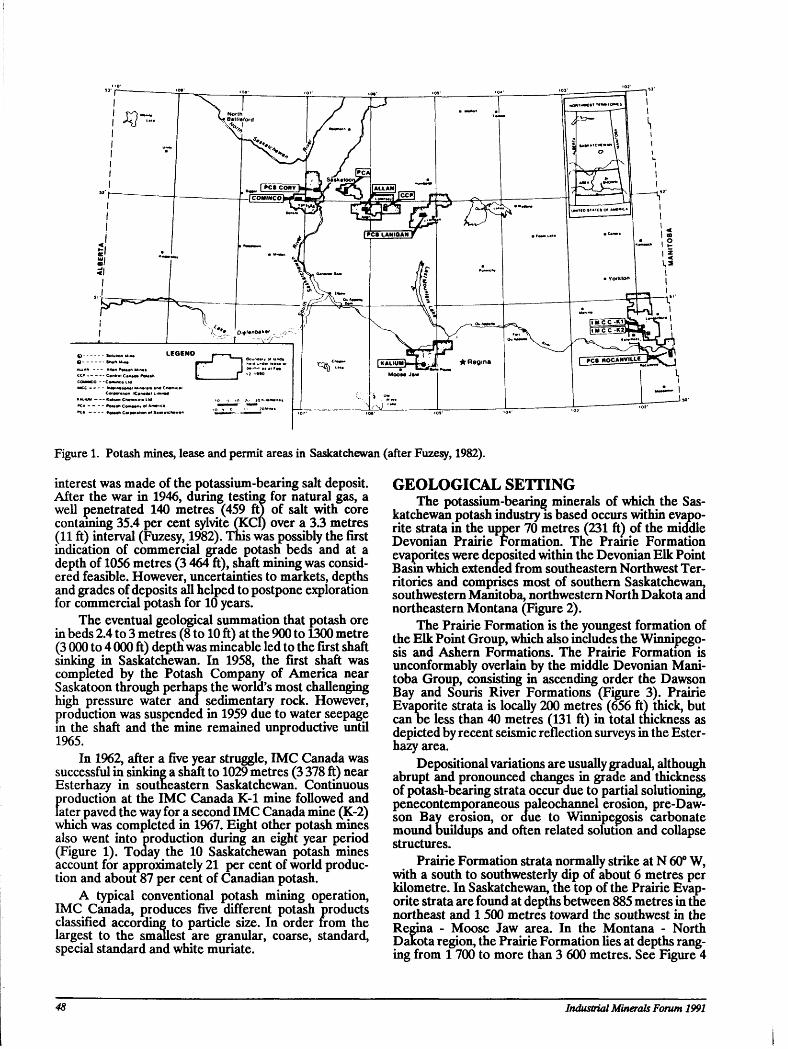
Figure 1. Potash mines, lease and permit areas in Saskatchewan (after Fuzesy, 1982).
interest was made of the potassium-bearing salt deposit. After the war in 1946, during testing for natural gas, a well penetrated 140 metres (459 ft) of salt with core containing 35.4 per cent sylvite (KCl) over a 3.3 metres (11 ft) interval (Fuzesy, 1982). This was possibly the first indication of commercial grade potash beds and at a depth of 1056 metres (3 464 ft), shaft mining was considered feasible. However, uncertainties to markets, depths and grades of deposits all helped to postpone exploration for commercial potash for 10 years.
The eventual geological summation that potash ore in beds 2.4 to 3 metres (8 to 10 ft) at the 900 to 1300 metre (3 000 to 4 000 ft) depth was mineable led to the first shaft sinking in Saskatchewan. In 1958, the first shaft was completed by the Potash Company of America near Saskatoon through perhaps the world's most challenging high pressure water and sedimentary rock. However, production was suspended in 1959 due to water seepage in the shaft and the mine remained unproductive until 1965.
In 1962, after a five year struggle, IMC Canada was successful in sinking a shaft to 1029 metres (3 378 ft) near Esterhazy in southeastern Saskatchewan. Continuous production at the IMC Canada K-l mine followed and later paved the way for a second IMC Canada mine (K-2) which was completed in 1967. Eight other potash mines also went into production during an eight year period (Figure 1). Today the 10 Saskatchewan potash mines account for approximately 21 per cent of world production and about 87 per cent of Canadian potash.
A typical conventional potash mining operation, IMC Canada, produces five different potash products classified according to particle size. In order from the largest to the smallest are granular, coarse, standard, special standard and white muriate.
GEOLOGICAL SETTING The potassium-bearing minerals of which the Sas
katchewan potash industry is based occurs within evapo-rite strata in the upper 70 metres (231 ft) of the middle Devonian Prairie Formation. The Prairie Formation evaporites were deposited within the Devonian Elk Point Basm which extended from southeastern Northwest Territories and comprises most of southern Saskatchewan, southwestern Manitoba, northwestern North Dakota and northeastern Montana (Figure 2).
The Prairie Formation is the youngest formation of the Elk Point Group, which also includes the Winnipego-sis and Ashern Formations. The Prairie Formation is unconformably overlain by the middle Devonian Manitoba Group, consisting in ascending order the Dawson Bay and Souris River Formations (Figure 3). Prairie Evaporite strata is locally 200 metres (656 ft) thick, but can be less than 40 metres (131 ft) in total thickness as depicted by recent seismic reflection surveys in the Ester-hazy area.
Depositional variations are usually gradual, although abrupt and pronounced changes in grade and thickness of potash-bearing strata occur due to partial solutioning, penecontemporaneous paleochannel erosion, pre-Daw-son Bay erosion, or due to Winnipegosis carbonate mound buildups and often related solution and collapse structures.
Prairie Formation strata normally strike at N 60° W, with a south to southwesterly dip of about 6 metres per kilometre. In Saskatchewan, the top of the Prairie Evaporite strata are found at depths between 885 metres in the northeast and 1 500 metres toward the southwest in the Regina - Moose Jaw area. In the Montana - North Dakota region, the Prairie Formation lies at depths ranging from 1 700 to more than 3 600 metres. See Figure 4
48 Industrial Minerals Forum 1991
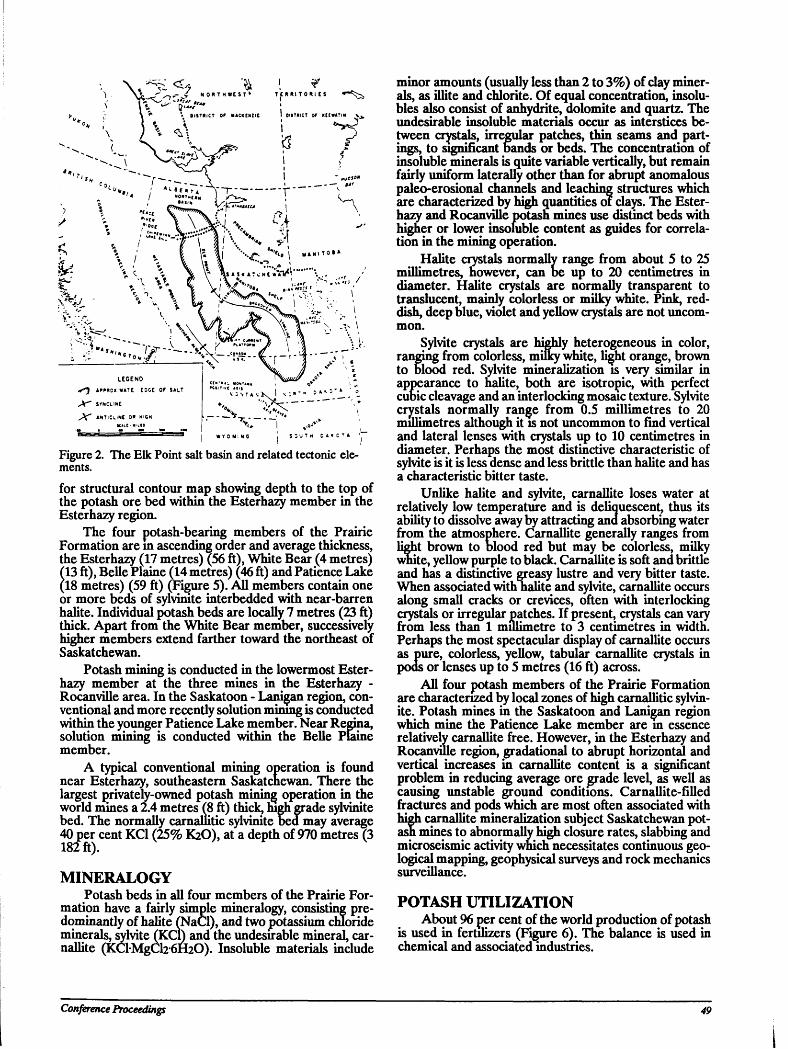
Figure 2. The Elk Point salt basin and related tectonic elements. for structural contour map showing depth to the top of the potash ore bed within the Esterhazy member in the Esterhazy region.
The four potash-bearing members of the Prairie Formation are m ascending order and average thickness, the Esterhazy (17 metres) (56 ft), White Bear (4 metres) (13 ft), Belle Plaine fl4 metres) (46 ft) and Patience Lake (18 metres) (59 ft) (Figure 5). All members contain one or more beds of sylvinite interbedded with near-barren halite. Individual potash beds are locally 7 metres (23 ft) thick. Apart from the White Bear member, successively higher members extend farther toward the northeast of Saskatchewan.
Potash mining is conducted in the lowermost Esterhazy member at the three mines in the Esterhazy -Rocanville area. In the Saskatoon - Lanigan region, conventional and more recently solution mining is conducted within the younger Patience Lake member. Near Regina, solution mining is conducted within the Belle Plaine member.
A typical conventional mining operation is found near Esterhazy, southeastern Saskatchewan. There the largest privately-owned potash mining operation in the world mines a 2.4 metres (8 ft) thick, high grade sylvinite bed. The normally carnaliitic sylvinite bed may average 40 per cent KC1 (25% K2O), at a depth of 970 metres (3 182 ft).
MINERALOGY Potash beds in all four members of the Prairie For
mation have a fairly simple mineralogy, consisting predominantly of halite (NaCl), and two potassium chloride minerals, sylvite (KCn and the undesirable mineral, car-nallite (KClMgCh^tbO). Insoluble materials include
Conference Proceedings
minor amounts (usually less than 2 to 3%) of clay minerals, as illite and chlorite. Of equal concentration, insolu-bles also consist of anhydrite, dolomite and quartz. The undesirable insoluble materials occur as interstices between crystals, irregular patches, thin seams and partings, to significant bands or beds. The concentration of insoluble minerals is quite variable vertically, but remain fairly uniform laterally other than for abrupt anomalous paleo-erosional channels and leaching structures which are characterized by high quantities of clays. The Esterhazy and Rocanville potash mines use distinct beds with higher or lower insoluble content as guides for correlation in the mining operation.
Halite crystals normally range from about 5 to 25 millimetres, however, can be up to 20 centimetres in diameter. Halite crystals are normally transparent to translucent, mainly colorless or milky white. Pink, reddish, deep blue, violet and yellow crystals are not uncommon.
Sylvite crystals are highly heterogeneous in color, ranging from colorless, milky white, light orange, brown to blood red. Sylvite mineralization is very similar in appearance to halite, both are isotropic, with perfect cubic cleavage and an interlocking mosaic texture. Sylvite crystals normally range from 0.5 millimetres to 20 millimetres although it is not uncommon to find vertical and lateral lenses with crystals up to 10 centimetres in diameter. Perhaps the most distinctive characteristic of sylvite is it is less dense and less brittle than halite and has a characteristic bitter taste.
Unlike halite and sylvite, carnallite loses water at relatively low temperature and is deliquescent, thus its ability to dissolve away by attracting and absorbing water from the atmosphere. Carnallite generally ranges from light brown to blood red but may be colorless, milky white, yellow purple to black. Carnallite is soft and brittle and has a distinctive greasy lustre and very bitter taste. When associated with halite and sylvite, carnallite occurs along small cracks or crevices, often with interlocking crystals or irregular patches. If present, crystals can vary from less than 1 millimetre to 3 centimetres in width. Perhaps the most spectacular display of carnallite occurs as pure, colorless, yellow, tabular carnallite crystals in pods or lenses up to 5 metres (16 ft) across.
All four potash members of the Prairie Formation are characterized by local zones of high carnaliitic sylvinite. Potash mines in the Saskatoon and Lanigan region which mine the Patience Lake member are m essence relatively carnallite free. However, in the Esterhazy and Rocanville region, gradational to abrupt horizontal and vertical increases in carnallite content is a significant problem in reducing average ore grade level, as well as causing unstable ground conditions. Carnallite-filled fractures and pods which are most often associated with high carnallite mineralization subject Saskatchewan potash mines to abnormally high closure rates, slabbing and microseismic activity which necessitates continuous geological mapping, geophysical surveys and rock mechanics surveillance.
POTASH UTILIZATION About 96 per cent of the world production of potash
is used in fertilizers (Figure 6). The balance is used in chemical and associated industries.
49
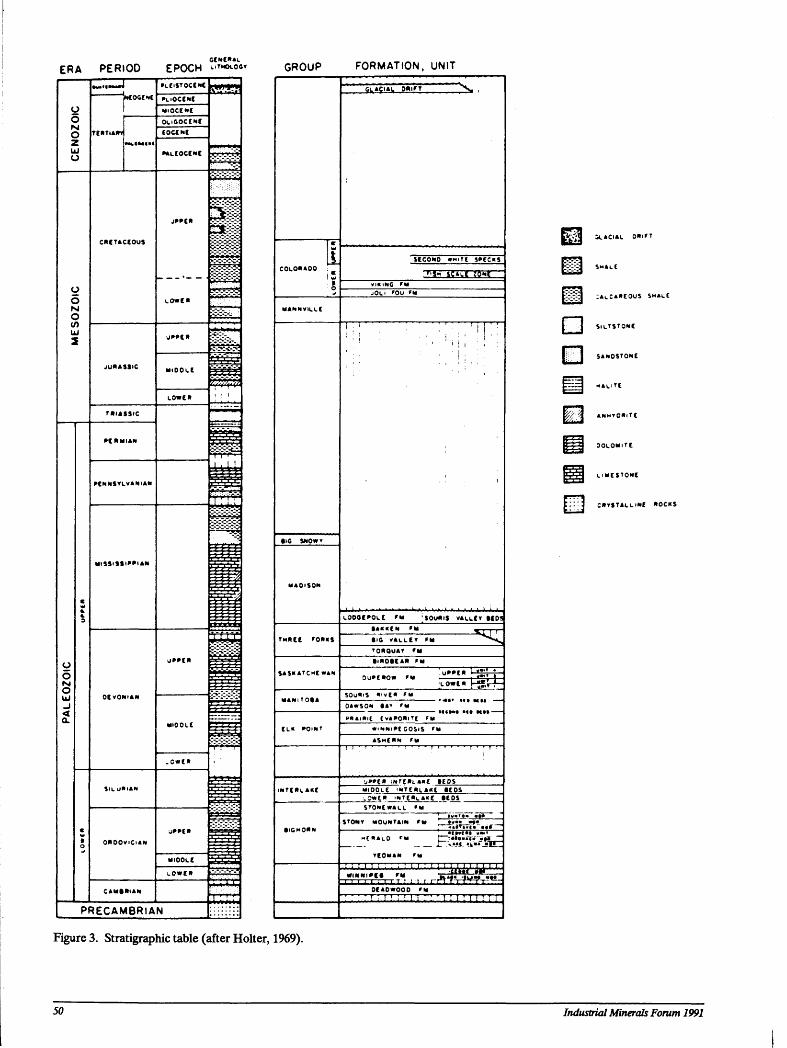
ERA PERIOO EPOCH L.TNOLOOY
o o M O z UJ o
o 5 N O </) UJ
2
CMTACCOUS
PENNSYLVANIA"
MlSSl»»l»»IAN
0R00V<O«N
m
p j g V V
22^2
PRECAMBRIAN
\*HmV
S8f5
X
* = »
ew
i'i..jvJL
sxx
GROUP FORMATION, UNIT
a
TMftCt ' 0 * « J
SASKATCHEWAN
G L A C I A L Q*>rr " " ^
S I C O N O O N I T C SPECKS
23E3SS053: ■>0L' ' ou **
I i
> i i i i > > i i i 1, > >,i. L O O O E P O L E rw 'SOuftis VALLCY »EDS
■ A K K E N ' M
• IG VALLEY FM fs TQMQUAY m
0 u » t » O » »»• !^"HSH
^ SOU«lS « iv£« » " OAwSON i * ' '*»
* • • I I I M M
PSAlPlE CvAPONlYC '* «MN«|PIG0$IS ' M A S H E K N rw
. j g p f i N r c » L > m » E O S MIQDLC u t t n n m BEDS . Q W C 'WTC«L««e >EDS STONEWALL »M
• !•»<•• .»» Y E O M A N r M
: i i i i : : : ! i i : i i i WINN1PC* ' M JgiF
I I I I I i I T T 1 l . l r rrtTrftgft OEAOwOOO ^ M
!; i i i! i i ; : ' ii i: n i: i,
Figure 3. Stratigraphic table (after Holter, 1969).
r£ll U.»CI»L o*irT
: A L C A « E O U S S M » L E
D
?/ 3 ANMYO*lTl
CRYSTALLINE »OCKS
50 Industrial Minerals Forum 1991
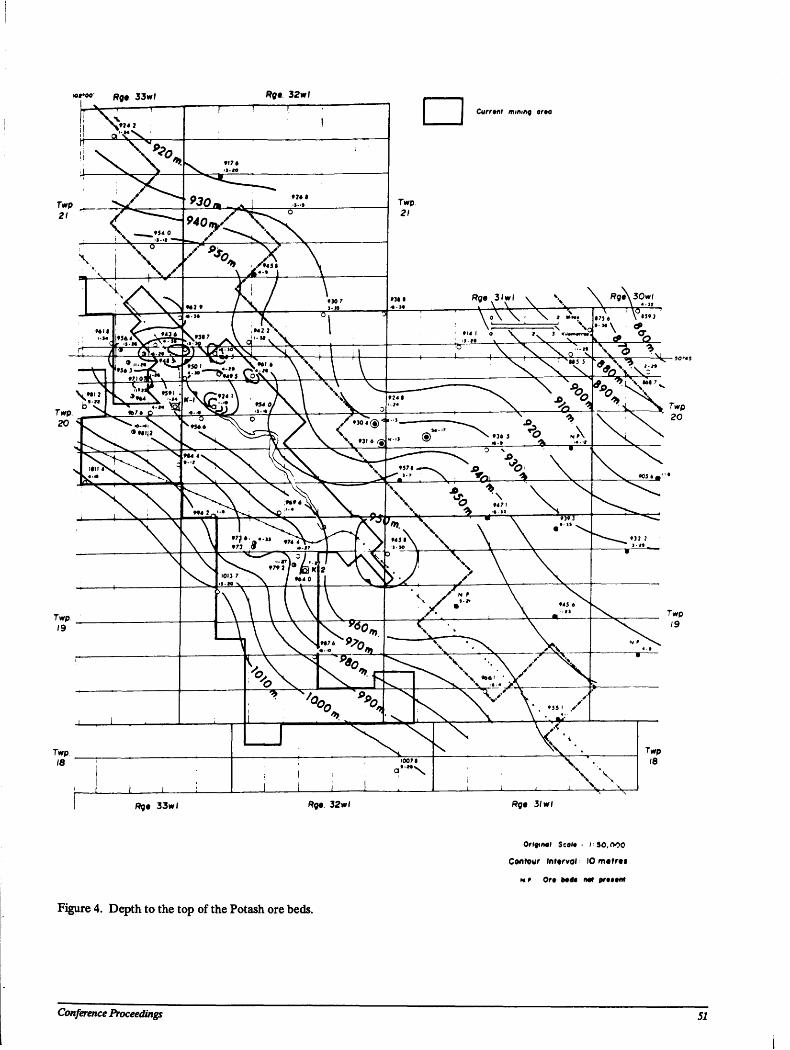
•ofoe Rg9 33„j P0t 32w/
Currtftf min/nfl area
ffgt 33wf Rq* 32 w I Rg« 3/wl
Figure 4. Depth to the top of the Potash ore beds.
Original Seal*- l-30,000
Contour Inrtrvol 10 mctrts
N P Ort b««« iMf prtttfM
Conference Proceeding 51
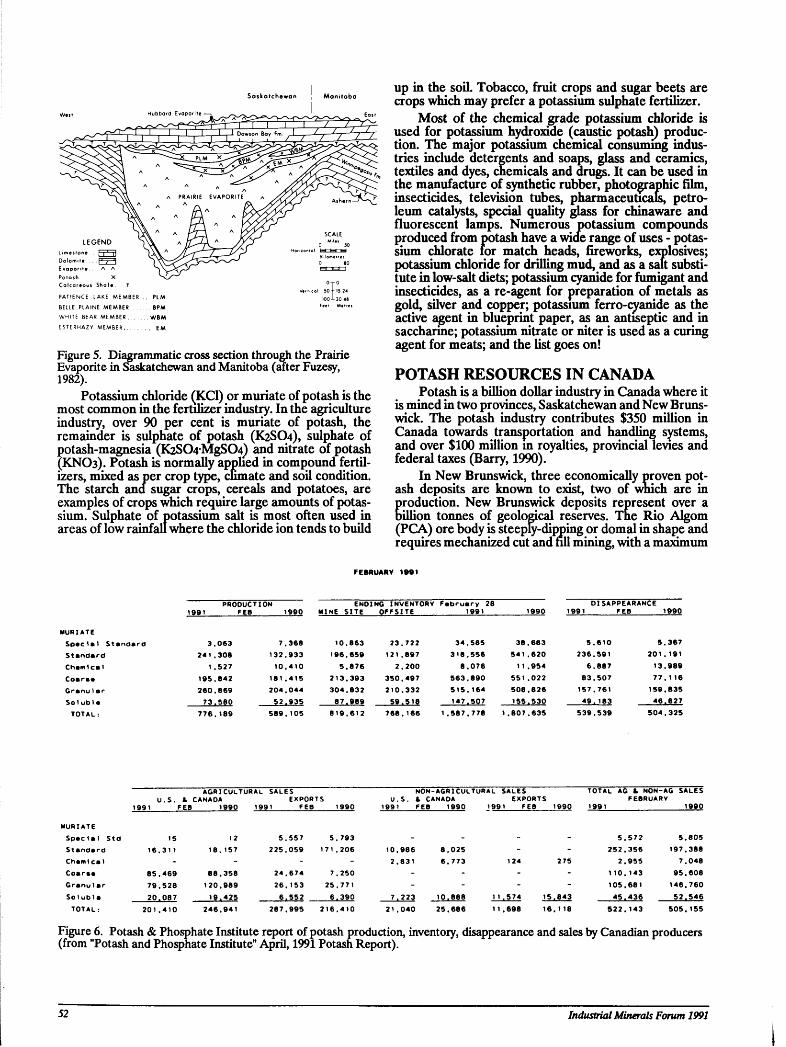
Calcareous Sha le T
PATIENCE LAKE MEMBER . . PLM
BELLE PLAINE MEMBER 8PM WHITE BEAR MEMBER W B M
ESTERHAZY MEMBER E M
Figure 5. Diagrammatic cross section through the Prairie Evaporite in Saskatchewan and Manitoba (after Fuzesy, 1982).
Potassium chloride (KC1) or muriate of potash is the most common in the fertilizer industry. In the agriculture industry, over 90 per cent is muriate of potash, the remainder is sulphate of potash (K2SO4), sulphate of potash-magnesia (K2S04*MgS04) and nitrate of potash (KNO3). Potash is normally applied in compound fertilizers, mixed as per crop type, climate and soil condition. The starch and sugar crops, cereals and potatoes, are examples of crops which require large amounts of potassium. Sulphate of potassium salt is most often used in areas of low rainfall where the chloride ion tends to build
up in the soil. Tobacco, fruit crops and sugar beets are crops which may prefer a potassium sulphate fertilizer.
Most of the chemical grade potassium chloride is used for potassium hydroxide (caustic potash) production. The major potassium chemical consuming industries include detergents and soaps, glass and ceramics, textiles and dyes, chemicals and drugs. It can be used in the manufacture of synthetic rubber, photographic film, insecticides, television tubes, pharmaceuticals, petroleum catalysts, special quality glass for chinaware and fluorescent lamps. Numerous potassium compounds produced from potash have a wide range of uses - potassium chlorate for match heads, fireworks, explosives; potassium chloride for drilling mud, and as a salt substitute in low-salt diets; potassium cyanide for fumigant and insecticides, as a re-agent for preparation of metals as gold, silver and copper; potassium ferro-cvanide as the active agent in blueprint paper, as an antiseptic and in saccharine; potassium nitrate or niter is used as a curing agent for meats; and the list goes on!
POTASH RESOURCES IN CANADA Potash is a billion dollar industry in Canada where it
is mined in two provinces, Saskatchewan and New Brunswick. The potash industry contributes $350 million in Canada towards transportation and handling systems, and over $100 million m royalties, provincial levies and federal taxes (Barry, 1990).
In New Brunswick, three economically proven potash deposits are known to exist, two of which are in Production. New Brunswick deposits represent over a
illion tonnes of geological reserves. The Rio Algom (PCA) ore body is steepry-dipping or domal in shape and requires mechanized cut and nil mining, with a maximum
FEBRUARY 19*1
1991 PRODUCTION
FEB 1990 ENOING INVENTORV
MINE SITE OFFSITE February 28
1991 1990 DISAPPEARANCE
1991 FEB 1990
MURIATE Special Standard 3 063 7.366 10.863 23.722 34.585 38.683 5.610 5.367 Standard 241 306 132.933 196.659 121.697 316.556 54 1.620 236.591 201.191 Chemical 1 527 10.410 5.876 2.200 8.076 11.954 6.887 13.989 Coara* 195 642 181.415 213.393 350.497 563.890 551.022 83.507 77.1 16 Cranu1ar 260 869 204.044 304.832 210.332 515.164 508.626 157.761 159.835 Soluble 73 580 52.935 87.989 59.518 147.507 155.530 49.183 46.827 TOTAL: 776 189 589.105 819.612 768.166 1.587.778 1.807.635 539.539 504.325
U.S. a 1991 FEB
AGRICULTURAL SALES CANADA EXPORTS
1990 1991 FEB 1990 NON-AGRICULTURAL SALES
U.S. 1 CANADA EXPORTS 1991 FEB 1990 1991 FEB 1990
TOTAL AG fc NON-AG SALES FEBRUARY
1991 1990
MURIATE Special Std 15 12 5.557 5.793 - - - - 5.572 5.805 Standard 16.311 18.157 225.059 171.206 10.986 8.025 - - 252.356 197.388 Chemlca1 - - - - 2.831 6.773 124 275 2.955 7.048 Coar»e 85.469 88.358 24.674 7.250 - - - - 110.143 95.608 Granular 79.528 120.989 26.153 25.771 - - - - 105.681 146.760 Solubla 20.087 19.425 6.552 6.390 7.223 10.888 1 1 .574 15.843 45.436 52.546 TOTAL: 201.410 246.941 287.995 216.410 21 .040 25.686 11.698 16.118 522.143 505.155
Figure 6. Potash & Phosphate Institute report of potash production, inventory, disappearance and sales by Canadian producers (from "Potash and Phosphate Institute" April, 1991 Potash Report).
52 Industrial Minerals Forum 1991
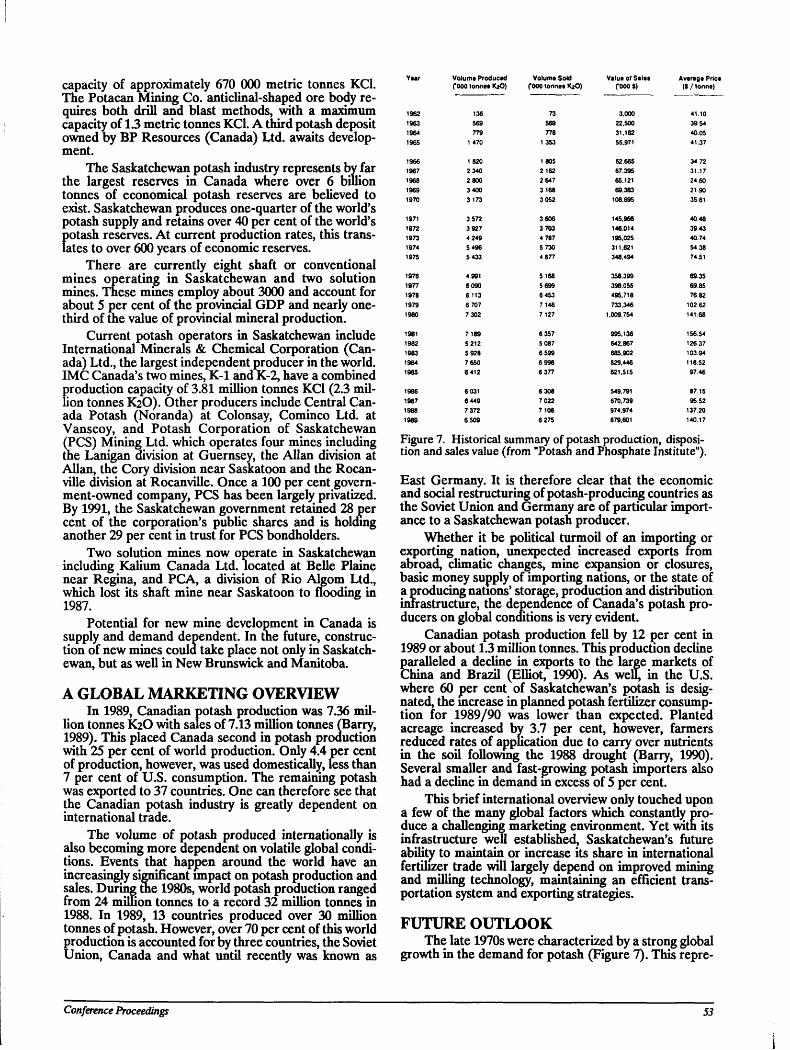
capacity of approximately 670 000 metric tonnes KC1. The Potacan Mining Co. anticlinal-shaped ore body requires both drill and blast methods, with a maximum capacity of 1.3 metric tonnes KC1. A third potash deposit owned by BP Resources (Canada) Ltd. awaits development.
The Saskatchewan potash industry represents by far the largest reserves in Canada where over 6 billion tonnes of economical potash reserves are believed to exist. Saskatchewan produces one-quarter of the world's potash supply and retains over 40 per cent of the world's {>otash reserves. At current production rates, this trans-ates to over 600 years of economic reserves.
There are currently eight shaft or conventional mines operating in Saskatchewan and two solution mines. These mines employ about 3000 and account for about 5 per cent of the provincial GDP and nearly one-third of the value of provincial mineral production.
Current potash operators in Saskatchewan include International Minerals & Chemical Corporation (Canada) Ltd., the largest independent producer in the world. IMC Canada's two mines, K-l and K-2, have a combined production capacity of 3.81 million tonnes KC1 (2.3 million tonnes K2O). Other producers include Central Canada Potash (Noranda) at Colonsay, Cominco Ltd. at Vanscoy, and Potash Corporation of Saskatchewan (PCS) Mining Ltd. which operates four mines including the Lanigan division at Guernsey, the Allan division at Allan, the Cory division near Saskatoon and the Rocan-ville division at Rocanville. Once a 100 per cent government-owned company, PCS has been largely privatized. By 1991, the Saskatchewan government retained 28 per cent of the corporation's public shares and is holdmg another 29 per cent in trust for PCS bondholders.
Two solution mines now operate in Saskatchewan including Kalium Canada Ltd. located at Belle Plaine near Regina, and PCA, a division of Rio Algom Ltd., which lost its shaft mine near Saskatoon to flooding in 1987.
Potential for new mine development in Canada is supply and demand dependent. In the future, construction of new mines could take place not only in Saskatchewan, but as well in New Brunswick and Manitoba.
A GLOBAL MARKETING OVERVIEW In 1989, Canadian potash production was 7.36 mil
lion tonnes K2O with sales of 7.13 million tonnes (Barry, 1989). This placed Canada second in potash production with 25 per cent of world production. Only 4.4 per cent of production, however, was used domestically, less than 7 per cent of U.S. consumption. The remaining potash was exported to 37 countries. One can therefore see that the Canadian potash industry is greatly dependent on international trade.
The volume of potash produced internationally is also becoming more dependent on volatile global conditions. Events that happen around the world have an increasingly significant impact on potash production and sales. During the 1980s, world potash production ranged from 24 million tonnes to a record 32 million tonnes in 1988. In 1989, 13 countries produced over 30 million tonnes of potash. However, over 70 per cent of this world production is accounted for by three countries, the Soviet Union, Canada and what until recently was known as
YMf Volume Productd Volume Sold Value of Sale* Average Price f 000 tonne* KjO) f 000 tonne* KjO) (•000$) (S / tonne)
1962 136 73 3.000 41.10 1963 569 569 22.500 39 54 1964 779 778 31.162 40.05 1965 1 470 1 353 55.971 41.37
1966 1 820 1 805 62.665 34.72 1967 2340 2 162 67.395 31.17 1968 2800 2 647 65.121 24.60 1969 3400 3168 69.383 21.90 1970 3173 30S2 108.695 35.61
1971 3 572 3606 145.966 40.48 1972 3 927 3703 146.014 39.43 1973 4 249 4 787 195.025 40.74 1974 5 496 5730 311.621 54.38 1975 5433 4 677 348.494 74.51
1976 4 991 5 168 358.399 69.35 1977 6090 5699 398.055 69.85 1978 6 113 6 453 495.718 76.82 1979 6 707 7 146 733,346 102 62 1980 7 302 7 127 1.009.754 141.68
1961 7 189 6 357 995.136 156.54 1982 5 212 5 087 642.867 126.37 1983 5 928 6 599 685.902 103.94 1984 7650 6998 829.446 118.52 1985 6 412 6 377 621.515 97.46
1986 6 031 6308 549,791 87.15 1987 6 449 7 022 670,739 95 52 1988 7 372 7106 974.974 137.20 1989 6509 6 275 879,601 140.17
Figure 7. Historical summary of potash production, disposition and sales value (from "Potash and Phosphate Institute").
East Germany. It is therefore clear that the economic and social restructuring of potash-producing countries as the Soviet Union and Germany are of particular importance to a Saskatchewan potash producer.
Whether it be political turmoil of an importing or exporting nation, unexpected increased exports from abroad, climatic changes, mine expansion or closures, basic money supply of importing nations, or the state of a producing nations' storage, production and distribution infrastructure, the dependence of Canada's potash producers on global conditions is very evident.
Canadian potash production fell by 12 per cent in 1989 or about 1.3 million tonnes. This production decline paralleled a decline in exports to the large markets of China and Brazil (Elliot, 1990). As well, in the U.S. where 60 per cent of Saskatchewan's potash is designated, the increase in planned potash fertilizer consumption for 1989/90 was lower than expected. Planted acreage increased by 3.7 per cent, however, farmers reduced rates of application due to carry over nutrients in the soil following the 1988 drought (Barry, 1990). Several smaller and fast-growing potash importers also had a decline in demand m excess of 5 per cent.
This brief international overview only touched upon a few of the many global factors which constantly produce a challenging marketing environment. Yet with its infrastructure well established, Saskatchewan's future ability to maintain or increase its share in international fertilizer trade will largely depend on improved mining and milling technology, maintaining an efficient transportation system and exporting strategies.
FUTURE OUTLOOK The late 1970s were characterized by a strong global
growth in the demand for potash (Figure 7). This repre-
Conference Proceedings 53
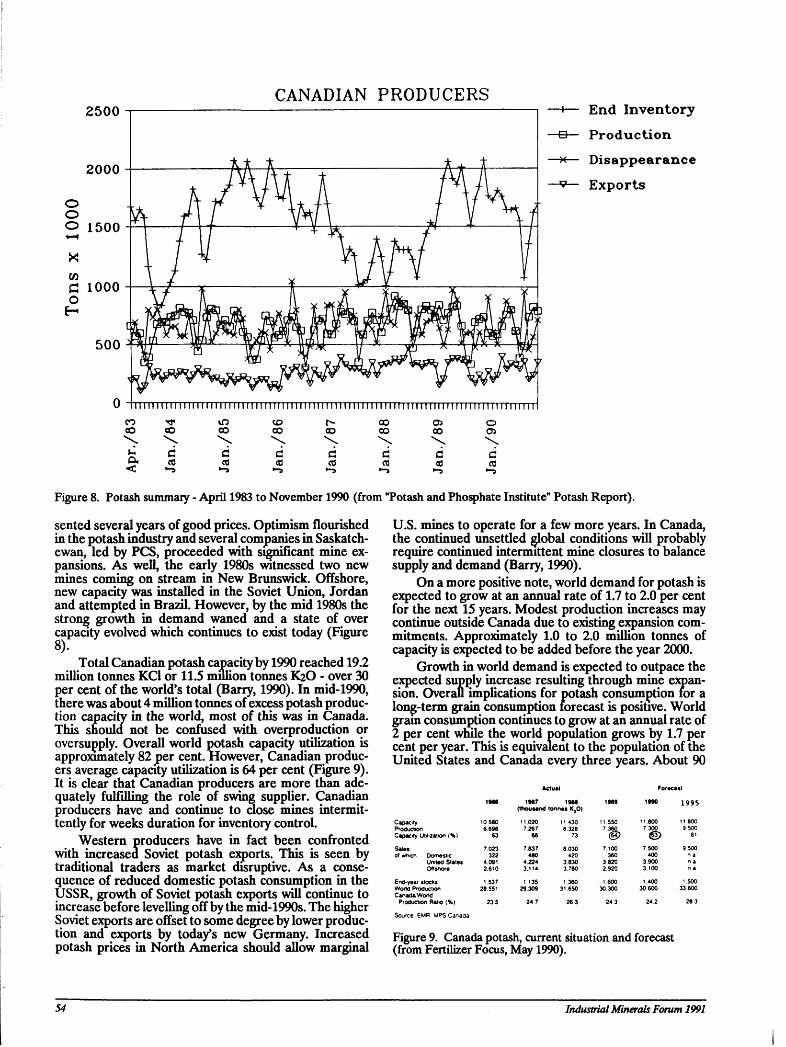
CANADIAN PRODUCERS cOOO -
O
o *—' 100U "
C 1UUU ~ o ^&?^%|S8i-i5fe tjiwyJi w l P S i h 3 J ^ I \ ^ ^ ¥ L r f i § i \ ^ ? I I S
DUU
o- I I I I I I I I I I I I I I I I I I I I I I I I I I I I I I I I I I I I I I I I I I I I I I I I I I I I I I I I I I I I I I I I I I I I I I I I M I I I I I I M I I I I I M I
H— End Inventory
B— Production
*— Disappearance
**— Exports
CO co CO
^ C
co
d co
co
c •-9
GO
c CO
»-3
co co
OJ CO
o Oi
c co
•-9
Figure 8. Potash summary - April 1983 to November 1990 (from "Potash and Phosphate Institute" Potash Report).
sented several years of good prices. Optimism flourished in the potash industry and several companies in Saskatchewan, led by PCS, proceeded with significant mine expansions. As well, the early 1980s witnessed two new mines coming on stream in New Brunswick. Offshore, new capacity was installed in the Soviet Union, Jordan and attempted in Brazil. However, by the mid 1980s the strong growth in demand waned and a state of over capacity evolved which continues to exist today (Figure 8).
Total Canadian potash capacity by 1990 reached 19.2 million tonnes KC1 or 11.5 million tonnes K2O - over 30 per cent of the world's total (Barry, 1990). In mid-1990, there was about 4 million tonnes of excess potash production capacity in the world, most of this was in Canada. This should not be confused with overproduction or oversupply. Overall world potash capacity utilization is approximately 82 per cent. However, Canadian producers average capacity utilization is 64 per cent (Figure 9). It is clear that Canadian producers are more than adequately fulfilling the role of swing supplier. Canadian producers have and continue to close mines intermittently for weeks duration for inventory control.
Western producers have in fact been confronted with increased Soviet potash exports. This is seen by traditional traders as market disruptive. As a consequence of reduced domestic potash consumption in the USSR, growth of Soviet potash exports will continue to increase before levelling off by the mid-1990s. The higher Soviet exports are offset to some degree by lower production and exports by today's new Germany. Increased potash prices in North America should allow marginal
U.S. mines to operate for a few more years. In Canada, the continued unsettled global conditions will probably require continued intermittent mine closures to balance supply and demand (Barry, 1990).
On a more positive note, world demand for potash is expected to grow at an annual rate of 1.7 to 2.0 per cent for the next 15 years. Modest production increases may continue outside Canada due to existing expansion commitments. Approximately 1.0 to 2.0 million tonnes of capacity is expected to be added before the year 2000.
Growth in world demand is expected to outpace the expected supply increase resulting through mine expansion. Overall implications for potash consumption for a long-term grain consumption forecast is positive. World gram consumption continues to grow at an annual rate of 2 per cent while the world population grows by 1.7 per cent per year. This is equivalent to the population of the United States and Canada every three years. About 90
Actual Forecast
1 M 6 1987 1988 (thousand tonnes K,0)
1989 1990 1995
Capacity Production Capacity Utilization (%)
10 580 6.698
63
11.020 7.267
66
11 430 8.328
73
11.550 11.800 7300
11 800 9500
81
Sales of which Domestic
United States Offshore
7.023 322
4.091 2.610
7837 480
4224 3.114
8 0 3 0 420
3830 3780
7.100 360
3.820 2.920
7.5O0 400
3.900 3.100
9500 n a n a
End-year stocks World Production Canada/World
Production Ratio (%)
1.537 28.551
2 3 5
1.135 29.309
24 7
1.360 31 650
2 6 3
1 600 30 300
24 3
1 400 30.600
2 4 2
1.500 33 600
28 3
Source EMR MPS Canaoa
Figure 9. Canada potash, current situation and forecast (from Fertilizer Focus, May 1990).
54 Industrial Minerals Forum 1991
per cent of this increase in population will be in underdeveloped countries. Higher population combined with growing world income and near constant per capital grain consumption bodes well for the two largest potash-consuming crops, corn and soybean.
It is predicted that world potash supply and demand will become balanced by the late 1990s. Saskatchewan mines could be the first to increase their production capacity. This could be achieved by small expansions of existing mines. However, new mine construction cannot be ruled out, whether it be in New Brunswick or Manitoba.
Potash is a very significant part of the Saskatchewan as well as the Canadian mining industry. We should consider ourselves fortunate of having the largest and highest grade potash reserves in the world. It should be ofparticular pride and credit to the Saskatchewan potash producers that operating costs of Canadian mines are the most efficient in the world. In fact, operating costs in Canada are only half as high as those mines in the U.S. and Europe and many times lower than in the USSR.
One is therefore able to state that Saskatchewan producers are well positioned to remain not only as competitive and reliable suppliers in a volatile global industry, but to increase production once world supply and demand for potash become better balanced.
ACKNOWLEDGMENTS I am grateful for permission from International Min
erals & Chemical Corporation (Canada) Limited to use data from the corporation and allowing me to present this paper at the 27th Forum on the Geology of Industrial Minerals.
REFERENCES Barry, G.S. (1989): Potash; Chapter in Canadian Miner
als Yearbook, Mineral Policy Sector, Energy Mines and Resources Canada.
Barry, G.S. (1990): Opinion, Potash in Canada; Fertilizer Focus, Mineral Policy Sector, Energy Mines and Resources Canada.
Elliot, A. (1990): The Potash Situation in Canada; Presented in Washington D.C. for the Economics and Information Committee of the Fertilizer Institute.
Fuzesy, A. (1982): Potash in Saskatchewan; Saskatchewan Geological Survey, Report 181.
Holter, M.E. (1969): The Middle Devonian Prairie Evaporite of Saskatchewan; Saskatchewan Department of Mineral Resources, Report 123.
Conference Proceeding? 55

56 Industrial Minerals Forum 1991
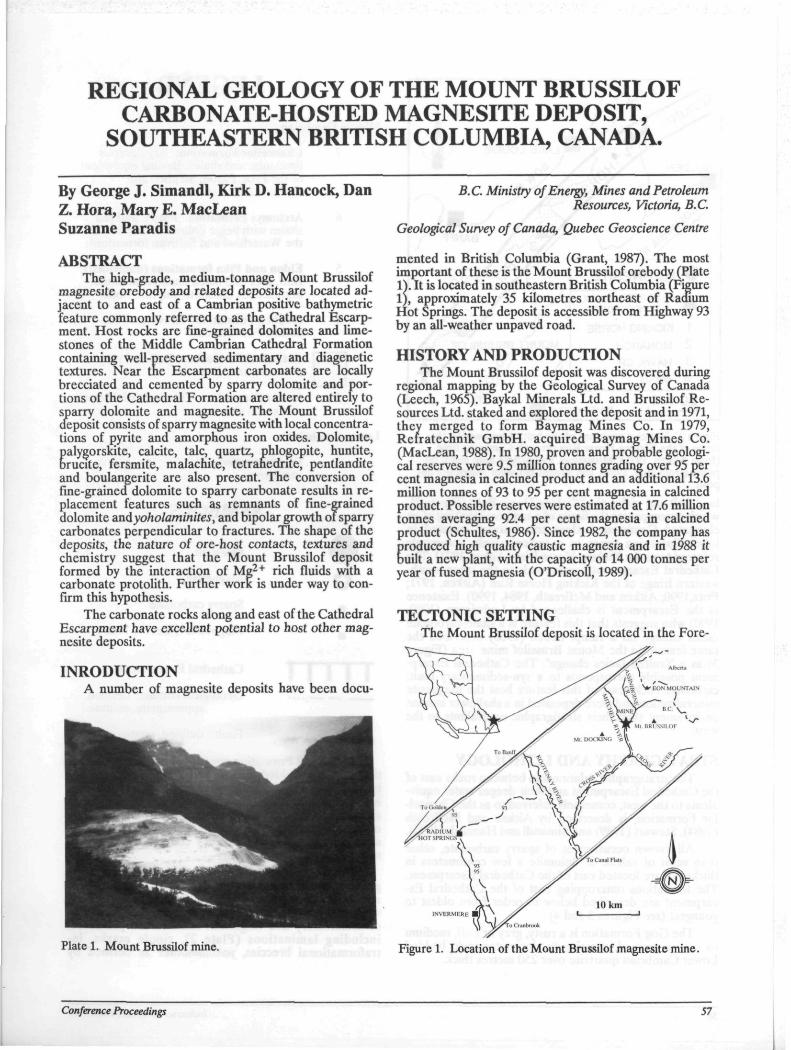
REGIONAL GEOLOGY OF THE MOUNT BRUSSILOF CARBONATE-HOSTED MAGNESITE DEPOSIT,
SOUTHEASTERN BRITISH COLUMBIA, CANADA.
By George J. Simandl, Kirk D. Hancock, Dan Z. Hora, Mary E. MacLean Suzanne Paradis
ABSTRACT The high-grade, medium-tonnage Mount Brussilof
magnesite orebody and related deposits are located adjacent to and east of a Cambrian positive bathymetric feature commonly referred to as the Cathedral Escarpment. Host rocks are fine-grained dolomites and limestones of the Middle Cambrian Cathedral Formation containing well-preserved sedimentary and diagenetic textures. Near the Escarpment carbonates are locally brecciated and cemented by sparry dolomite and portions of the Cathedral Formation are altered entirely to sparry dolomite and magnesite. The Mount Brussilof deposit consists of sparry magnesite with local concentrations of pyrite and amorphous iron oxides. Dolomite, palygorskite, calcite, talc, quartz, phlogopite, huntite, brucite, fersmite, malachite, tetrahedrite, pentlandite and boulangerite are also present. The conversion of fine-grained dolomite to sparry carbonate results in replacement features such as remnants of fine-grained dolomite andyoholaminites, and bipolar growth of sparry carbonates perpendicular to fractures. The shape of the deposits, the nature of ore-host contacts, textures and chemistry suggest that the Mount Brussilof deposit formed by the interaction of Mg2+ rich fluids with a carbonate protolith. Further worlc is under way to confirm this hypothesis.
The carbonate rocks along and east of the Cathedral Escarpment have excellent potential to host other magnesite deposits.
INRODUCTION A number of magnesite deposits have been docu-
B.C. Ministry of Energy, Mines and Petroleum Resources, Victoria, B.C.
Geological Survey of Canada, Quebec Geoscience Centre
mented in British Columbia (Grant, 1987). The most important of these is the Mount Brussilof orebody (Plate 1). It is located in southeastern British Columbia (Figure 1), approximately 35 kilometres northeast of Radium Hot Springs. The deposit is accessible from Highway 93 by an all-weather unpaved road.
HISTORY AND PRODUCTION The Mount Brussilof deposit was discovered during
regional mapping by the Geological Survey of Canada (Leech, 1965). Baykal Minerals Ltd. and Brussilof Resources Ltd. staked and explored the deposit and in 1971, they merged to form Baymag Mines Co. In 1979, Reiratechnik GmbH. acquired Baymag Mines Co. (MacLean, 1988). In 1980, proven and probable geological reserves were 9.5 million tonnes grading over 95 per cent magnesia in calcined product and an additional 13.6 million tonnes of 93 to 95 per cent magnesia in calcined product. Possible reserves were estimated at 17.6 million tonnes averaging 92.4 per cent magnesia in calcined product (Schultes, 1986). Since 1982, the company has
Eroduced high quality caustic magnesia and in 1988 it uilt a new plant, witn the capacity of 14 000 tonnes per
year of fused magnesia (O'Driscoll, 1989).
TECTONIC SETTING The Mount Brussilof deposit is located in the Fore-
Plate 1. Mount Brussilof mine. Figure 1. Location of the Mount Brussilof magnesite mine.
Conference Proceedings 57
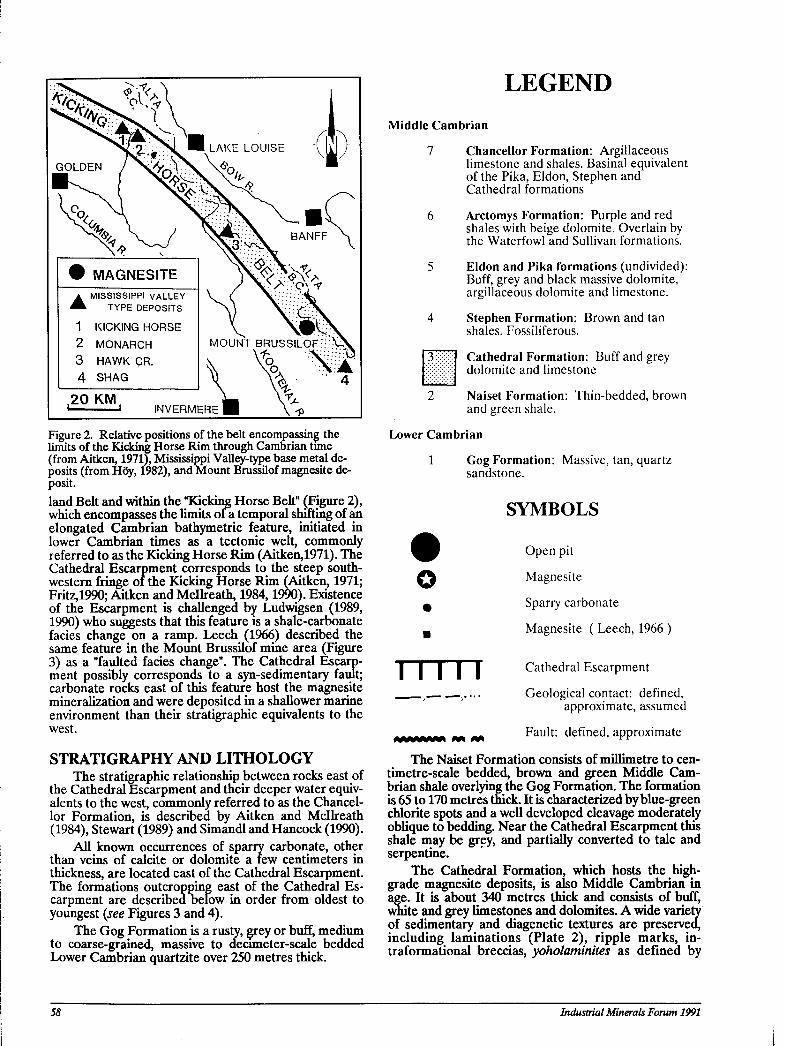
1 KICKING HORSE 2 MONARCH 3 HAWK CR. 4 SHAG
, 20 KM, INVERMERE
MOUNT BRUSSILOF1
V A 4
•£
LEGEND
Figure 2. Relative positions of the belt encompassing the limits of the Kicking Horse Rim through Cambrian tune (from Aitken, 1971), Mississippi Valley-type base metal deposits (from H6y, 1982), and Mount Brussilof magnesite deposit. land Belt and within the "Kicking Horse Belt" (Figure 2), which encompasses the limits ofa temporal shifting of an elongated Cambrian bathymetric feature, initiated in lower Cambrian times as a tectonic welt, commonly referred to as the Kicking Horse Rim (Aitken,1971). The Cathedral Escarpment corresponds to the steep southwestern fringe of the Kicking Horse Rim (Aitken, 1971; Fritz,1990; Aitken and Mcllreath, 1984,1990). Existence of the Escarpment is challenged by Ludwigsen (1989, 1990) who suggests that this feature is a shale-carbonate facies change on a ramp. Leech (1966) described the same feature in the Mount Brussilof mine area (Figure 3) as a "faulted facies change". The Cathedral Escarpment possibly corresponds to a syn-sedimentary fault; carbonate rocks east of this feature host the magnesite mineralization and were deposited in a shallower marine environment than their stratigraphic equivalents to the west.
STRATIGRAPHY AND LITHOLOGY The stratigraphic relationship between rocks east of
the Cathedral Escarpment and their deeper water equivalents to the west, commonly referred to as the Chancellor Formation, is described by Aitken and Mcllreath (1984), Stewart (1989) and Simandl and Hancock (1990).
All known occurrences of sparry carbonate, other than veins of calcite or dolomite a tew centimeters in thickness, are located east of the Cathedral Escarpment. The formations outcropping east of the Cathedral Escarpment are described below in order from oldest to youngest (see Figures 3 and 4).
The Gog Formation is a rusty, grey or buff, medium to coarse-grained, massive to decimeter-scale bedded Lower Cambrian quartzite over 250 metres thick.
Middle Cambrian
7 Chancellor Formation: Argillaceous limestone and shales. Basinal equivalent of the Pika, Eldon, Stephen and Cathedral formations
6 Arctomys Formation: Purple and red shales with beige dolomite. Overlain by the Waterfowl and Sullivan formations.
5 Eldon and Pika formations (undivided): Buff, grey and black massive dolomite, argillaceous dolomite and limestone.
4 Stephen Formation: Brown and tan shales. Fossiliferous.
3:i:ig:j Cathedral Formation: Buff and grey dolomite and limestone
Naiset Formation: Thin-bedded, brown and green shale.
Lower Cambrian
O
Gog Formation: Massive, tan, quartz sandstone.
SYMBOLS
Open pit
Magnesite
Sparry carbonate
Magnesite ( Leech, 1966 )
11111 Cathedral Escarpment
Geological contact: defined, approximate, assumed
Fault: defined, approximate
The Naiset Formation consists of millimetre to centimetre-scale bedded, brown and green Middle Cambrian shale overlying the Gog Formation. The formation is 65 to 170 metres thick. It is characterized by blue-green chlorite spots and a well developed cleavage moderately oblique to bedding. Near the Cathedral Escarpment this shale may be grey, and partially converted to talc and serpentine.
The Cathedral Formation, which hosts the high-grade magnesite deposits, is also Middle Cambrian in age. It is about 340 metres thick and consists of buff, white and grey limestones and dolomites. A wide variety of sedimentary and diagenetic textures are preserved, including laminations (Plate 2), ripple marks, in-traformational breccias, yoholaminites as defined by
58 Industrial Minerals Forum 1991
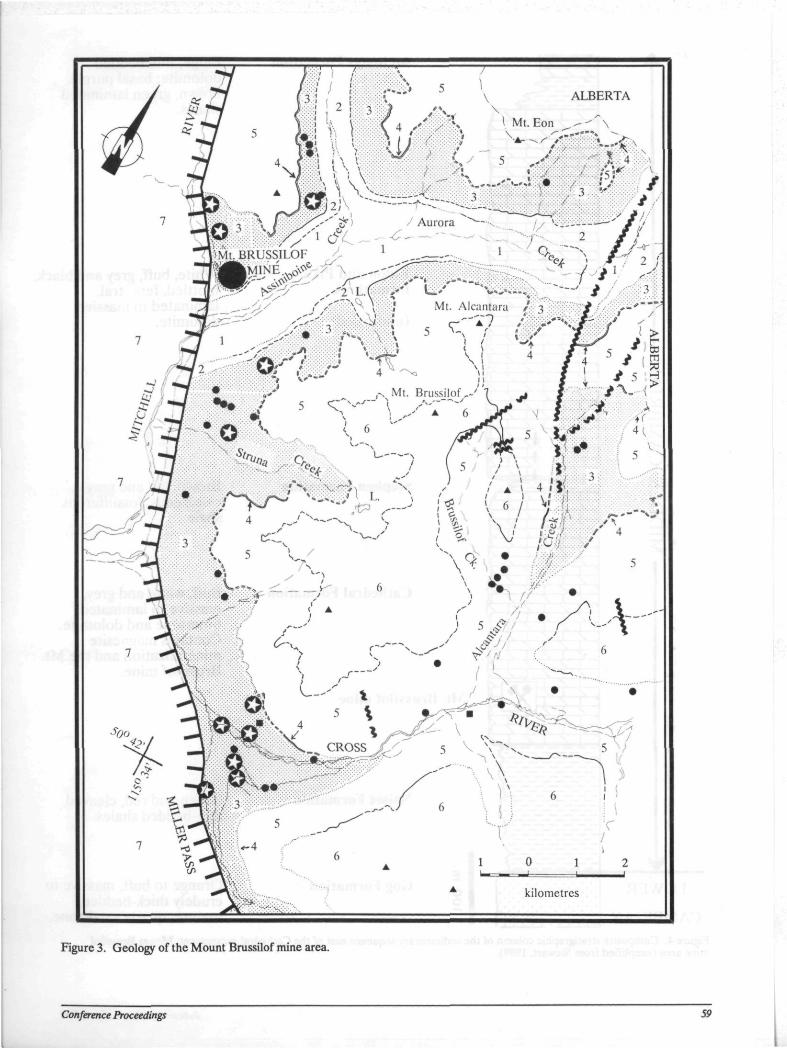
ALBERTA
kilometres
Figure 3. Geology of the Mount Bnissilof mine area.
Conference Proceedings 59
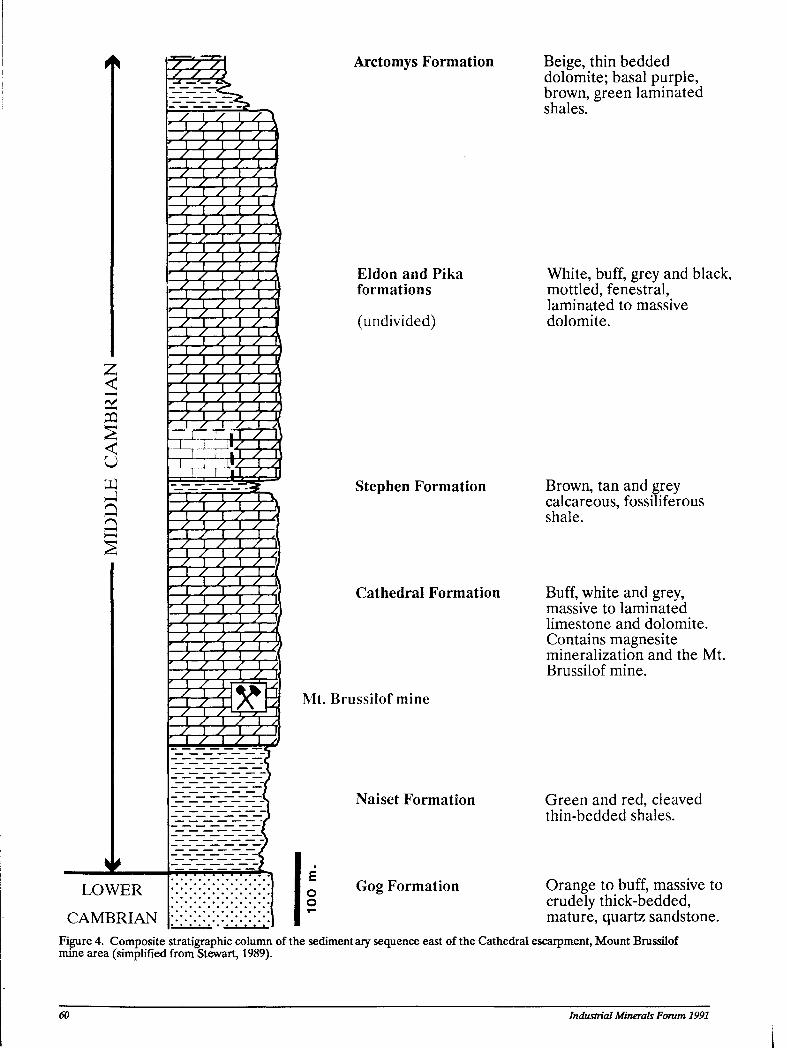
PC
PQ
<
3 Q Q
r ; <) <) [XX \ \ >< >< > )< x<)
\xx> t&m [><>'*> r ; <) <) B \ x x)
LOWER
CAMBRIAN
TT? 7T7rT,
s \ / \ /
J < J < j
> ■? > ' ' I X
J o o
) < ) i J 7 1 7 L X I ±
XX) X.X). J X I X I
^ -1"Z i 5 JfcfcS
nno fc* ; o o ■ ^ i. ^ i ^ I >• I < 3 z H^1
[ M ^ ^ 7TTT; [ j O f J ^m m X na ^ s -r-r.
1 ^ 1 ^ tB
p ^ /
Arctomys Formation
Eldon and Pika formations
(undivided)
Stephen Formation
Cathedral Formation
Mt. Brussilof mine
Naiset Formation
o o Gog Formation
Beige, thin bedded dolomite; basal purple, brown, green laminated shales.
White, buff, grey and black, mottled, fenestral, laminated to massive dolomite.
Brown, tan and grey calcareous, fossiliferous shale.
Buff, white and grey, massive to laminated limestone and dolomite. Contains magnesite mineralization and the Mt. Brussilof mine.
Green and red, cleaved thin-bedded shales.
Orange to buff, massive to crudely thick-bedded, mature, quartz sandstone.
Figure 4. Composite stratigraphic column of the sedimentary sequence east of the Cathedral escarpment, Mount Brussilof mine area (simplified from Stewart, 1989).
60 Industrial Minerals Forum 1991
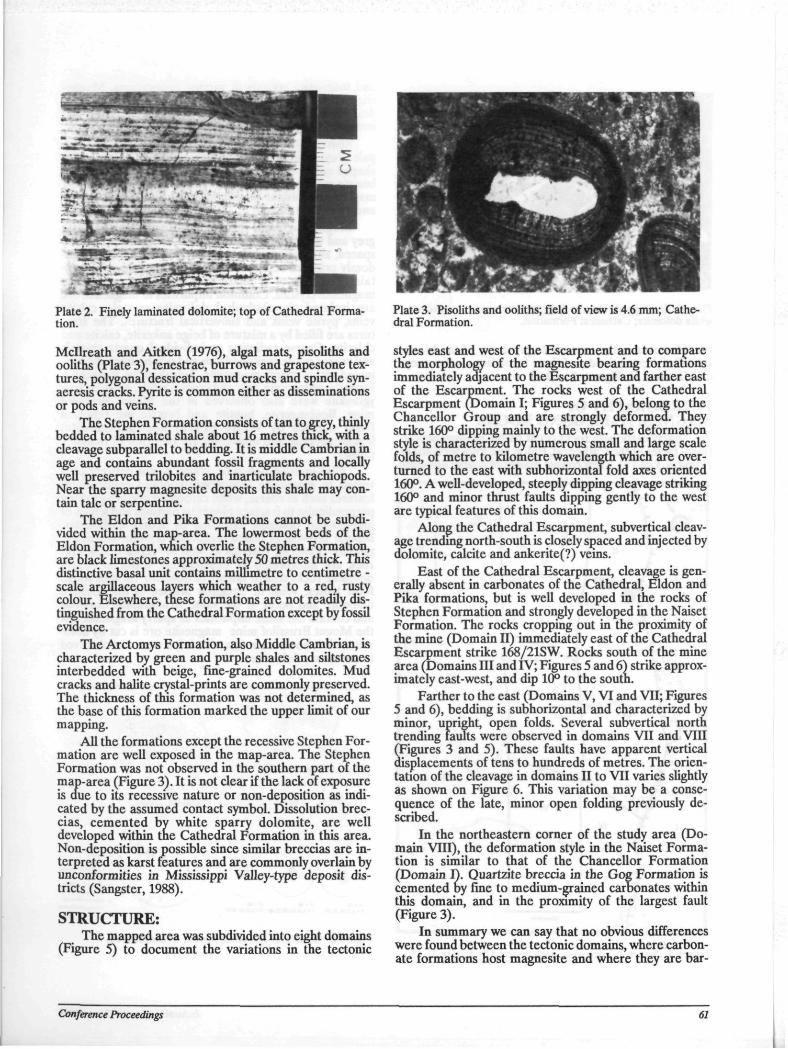
Plate 2. Finely laminated dolomite; top of Cathedral Formation.
Mcllreath and Aitken (1976), algal mats, pisoliths and ooliths (Plate 3), fenestrae, burrows and grapestone textures, polygonal dessication mud cracks and spindle syn-aeresis cracks. Pyrite is common either as disseminations or pods and veins.
The Stephen Formation consists of tan to grey, thinly bedded to laminated shale about 16 metres thick, with a cleavage subparallel to bedding. It is middle Cambrian in age and contains abundant fossil fragments and locally well preserved trilobites and inarticulate brachiopods. Near the sparry magnesite deposits this shale may contain talc or serpentine.
The Eldon and Pika Formations cannot be subdivided within the map-area. The lowermost beds of the Eldon Formation, which overlie the Stephen Formation, are black limestones approximately 50 metres thick. This distinctive basal unit contains millimetre to centimetre -scale argillaceous layers which weather to a red, rusty colour. Elsewhere, tnese formations are not readily distinguished from the Cathedral Formation except by fossil evidence.
The Arctomys Formation, also Middle Cambrian, is characterized by green and purple shales and siltstones interbedded with beige, fine-grained dolomites. Mud cracks and halite crystal-prints are commonly preserved. The thickness of this formation was not determined, as the base of this formation marked the upper limit of our mapping.
All the formations except the recessive Stephen Formation are well exposed in the map-area. The Stephen Formation was not observed in the southern part of the map-area (Figure 3). It is not clear if the lack of exposure is due to its recessive nature or non-deposition as indicated by the assumed contact symbol. Dissolution breccias, cemented by white sparry dolomite, are well developed within trie Cathedral Formation in this area. Non-deposition is possible since similar breccias are interpreted as karst features and are commonly overlain by unconformities in Mississippi Valley-type deposit districts (Sangster, 1988).
STRUCTURE: The mapped area was subdivided into eight domains
(Figure 5) to document the variations in the tectonic
Plate 3. Pisoliths and ooliths; field of view is 4.6 mm; Cathedral Formation.
styles east and west of the Escarpment and to compare the morphology of the magnesite bearing formations immediately adjacent to the Escarpment and farther east of the Escarpment. The rocks west of the Cathedral Escarpment (Domain I; Figures 5 and 6), belong to the Chancellor Group and are strongly deformed. They strike 160° dipping mainly to the west. The deformation style is characterized by numerous small and large scale folds, of metre to kilometre wavelength which are overturned to the east with subhorizontal fold axes oriented 160°. A well-developed, steeply dipping cleavage striking 160° and minor thrust faults dipping gently to the west are typical features of this domain.
Along the Cathedral Escarpment, subvertical cleavage trending north-south is closely spaced and injected by dolomite, calcite and ankerite(?) veins.
East of the Cathedral Escarpment, cleavage is generally absent in carbonates of the Cathedral, Eldon and Pika formations, but is well developed in the rocks of Stephen Formation and strongly developed in the Naiset Formation. The rocks cropping out in the proximity of the mine (Domain II) immediately east of the Cathedral Escarpment strike 168/21SW. Rocks south of the mine area (Domains III and IV; Figures 5 and 6) strike approximately east-west, and dip 10° to the south.
Farther to the east (Domains V, VI and VII; Figures 5 and 6), bedding is subhorizontal and characterized by minor, upright, open folds. Several subvertical north trending faults were observed in domains VII and VIII (Figures 3 and 5). These faults have apparent vertical displacements of tens to hundreds of metres. The orientation of the cleavage in domains II to VII varies slightly as shown on Figure 6. This variation may be a consequence of the late, minor open folding previously described.
In the northeastern corner of the study area (Domain VIII), the deformation style in the Naiset Formation is similar to that of the Chancellor Formation (Domain I). Quartzite breccia in the Gog Formation is cemented oy fine to medium-grained carbonates within this domain, and in the proximity of the largest fault (Figure 3).
In summary we can say that no obvious differences were found between the tectonic domains, where carbonate formations host magnesite and where they are bar-
Conference Proceedings 61
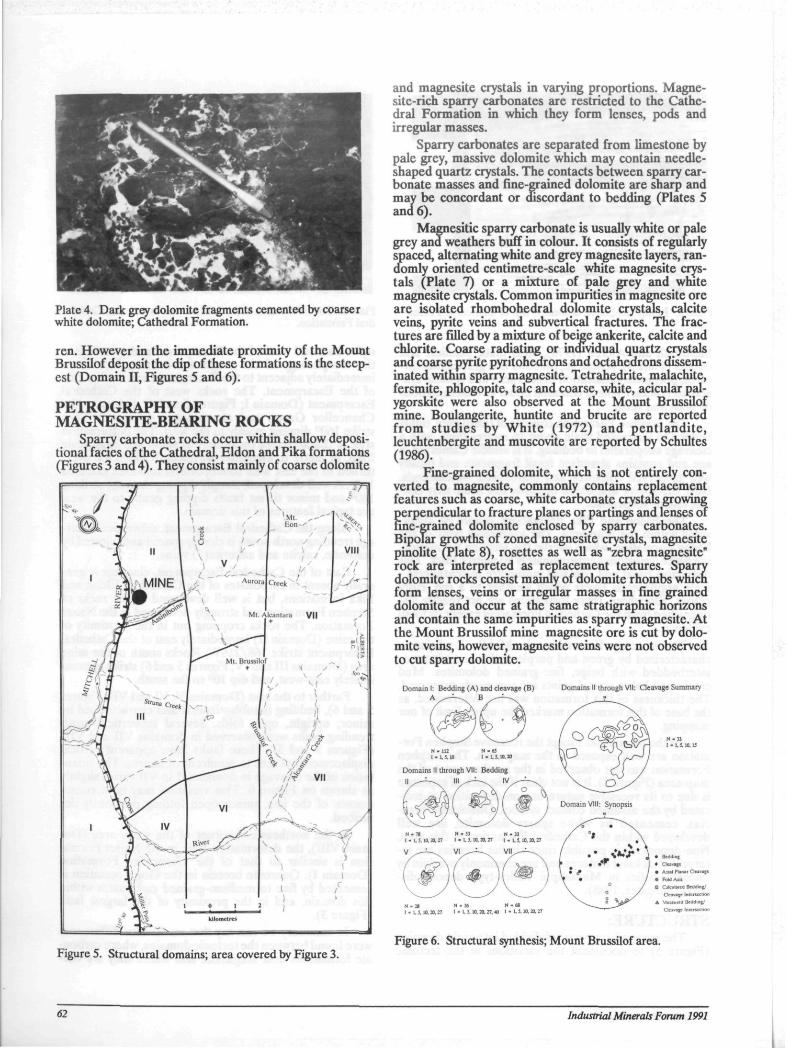
Plate 4. Dark grey dolomite fragments cemented by coarser white dolomite; Cathedral Formation.
ren. However in the immediate proximity of the Mount Brussilof deposit the dip of these formations is the steepest (Domain II, Figures 5 and 6).
PETROGRAPHY OF MAGNESITE-BEARING ROCKS
Sparry carbonate rocks occur within shallow deposi-tional facies of the Cathedral, Eldon and Pika formations (Figures 3 and 4). They consist mainly of coarse dolomite
Figure 5. Structural domains; area covered by Figure 3.
62
and magnesite crystals in varying proportions. Magne-site-rich sparry carbonates are restricted to the Cathedral Formation in which they form lenses, pods and irregular masses.
Sparry carbonates are separated from limestone by pale grey, massive dolomite which may contain needle-shaped quartz crystals. The contacts between sparry carbonate masses and fine-grained dolomite are sharp and may be concordant or discordant to bedding (Plates 5 and 6).
Magnesitic sparry carbonate is usually white or pale grey and weathers buff in colour. It consists of regularly spaced, alternating white and grey magnesite layers, randomly oriented centimetre-scale white magnesite crystals (Plate 7) or a mixture of pale grey and white magnesite crystals. Common impurities m magnesite ore are isolated rhombohedral dolomite crystals, calcite veins, pyrite veins and subvertical fractures. The fractures are filled by a mixture of beige ankerite, calcite and chlorite. Coarse radiating or individual quartz crystals and coarse pyrite pyritohedrons and octahedrons disseminated within sparry magnesite. Tetrahedrite, malachite, fersmite, phlogopite, talc and coarse, white, acicular pal-ygorskite were also observed at the Mount Brussilof mine. Boulangerite, huntite and brucite are reported from studies by White (1972) and pentlandite, leuchtenbergite and muscovite are reported by Schultes (1986).
Fine-grained dolomite, which is not entirely converted to magnesite, commonly contains replacement features such as coarse, white carbonate crystals growing perpendicular to fracture planes or partings and lenses of fine-grained dolomite enclosed by sparry carbonates. Bipolar growths of zoned magnesite crystals, magnesite pinolite (Plate 8), rosettes as well as "zebra magnesite" rock are interpreted as replacement textures. Sparry dolomite rocks consist mainly of dolomite rhombs which form lenses, veins or irregular masses in fine grained dolomite and occur at the same stratigraphic horizons and contain the same impurities as sparry magnesite. At the Mount Brussilof mine magnesite ore is cut by dolomite veins, however, magnesite veins were not observed to cut sparry dolomite.
Domain I: Bedding (A) and cleavage (B) Domains II through VII: Cleavage Summary
Figure 6. Structural synthesis; Mount Brussilof area.
Industrial Minerals Forum 1991
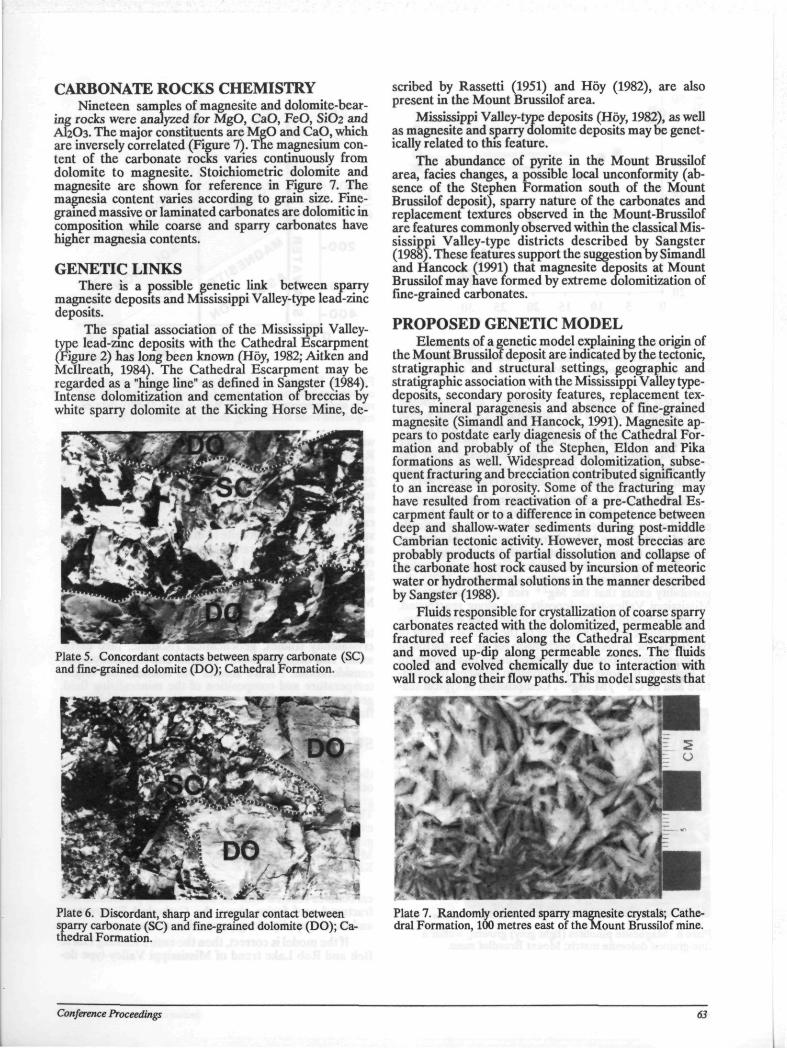
CARBONATE ROCKS CHEMISTRY Nineteen samples of magnesite and dolomite-bear
ing rocks were analyzed for MgO, CaO, FeO, Si02 and AI2O3. The major constituents are MgO and Cap, which are inversely correlated (Figure 7). The magnesium content of the carbonate rocks varies continuously from dolomite to magnesite. Stoichiometric dolomite and magnesite are shown for reference in Figure 7. The magnesia content varies according to grain size. Finegrained massive or laminated carbonates are dolomitic in composition while coarse and sparry carbonates have higher magnesia contents.
GENETIC LINKS There is a possible genetic link between sparry
magnesite deposits and Mississippi Valley-type lead-zinc deposits.
The spatial association of the Mississippi Valley-type lead-zinc deposits with the Cathedral Escarpment (Figure 2) has long been known (Hoy, 1982; Aitken and Mcllreath, 1984). The Cathedral Escarpment may be regarded as a "lunge line" as defined in Sangster (1984). Intense dolomitization and cementation or breccias by white sparry dolomite at the Kicking Horse Mine, de-
Plate 5. Concordant contacts between sparry carbonate (SC) and fine-grained dolomite (DO); Cathedral Formation.
Plate 6. Discordant, sharp and irregular contact between sparry carbonate (SC) and fine-grained dolomite (DO); Cathedral Formation.
Conference Proceedings
scribed by Rassetti (1951) and Hoy (1982), are also present in the Mount Brussilof area.
Mississippi Valley-type deposits (Hoy, 1982), as well as magnesite and sparry dolomite deposits may be genetically related to this feature.
The abundance of pyrite in the Mount Brussilof area, facies changes, a possible local unconformity (absence of the Stephen Formation south of the Mount Brussilof deposit), sparry nature of the carbonates and replacement textures observed in the Mount-Brussilof are features commonly observed within the classical Mississippi Valley-type districts described by Sangster (1988). These features support the suggestion by Simandl and Hancock (1991) that magnesite deposits at Mount Brussilof may have formed by extreme dolomitization of fine-grained carbonates.
PROPOSED GENETIC MODEL Elements of a genetic model explaining the origin of
the Mount Brussilof deposit are indicated by the tectonic, stratigraphic and structural settings, geographic and stratigraphic association with the Mississippi Valley type-deposits, secondary porosity features, replacement textures, mineral paragenesis and absence of fine-grained magnesite (Simandl and Hancock, 1991). Magnesite appears to postdate early diagenesis of the Cathedral Formation and probably of the Stephen, Eldon and Pika formations as well. Widespread dolomitization, subsequent fracturing and brecciation contributed significantly to an increase m porosity. Some of the fracturing may have resulted from reactivation of a pre-Cathedral Escarpment fault or to a difference in competence between deep and shallow-water sediments during post-middle Cambrian tectonic activity. However, most breccias are probably products of partial dissolution and collapse of the carbonate host rock caused by incursion of meteoric water or hydrothermal solutions in the manner described by Sangster (1988).
Fluids responsible for crystallization of coarse sparry carbonates reacted with the dolomitized, permeable and fractured reef facies along the Cathedral Escarpment and moved up-dip along permeable zones. The fluids cooled and evolved chemically due to interaction with wall rock along their flow paths. This model suggests that
Plate 7. Randomly oriented sparry magnesite crystals; Cathedral Formation, 100 metres east of the Mount Brussilof mine.
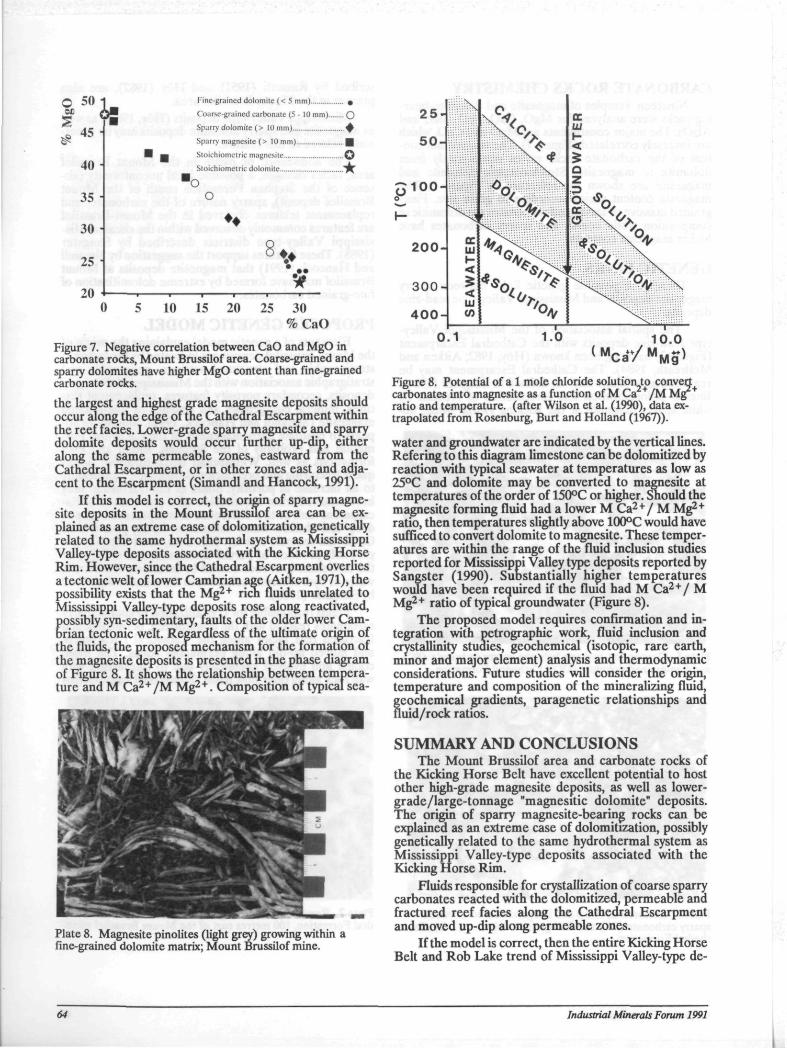
O 50 OB
£ 45
40-1
35 •
30
25 •
20
i inc-grained dolomite (< 5 mm) »
Coarse -grained carbonate (5 - 10 mm) O
Sparry dolomite (> 10 mm) ♦
Sparry magnesite (> 10 mm) B
Stoichiometric magnesite ©
Stoichiometric dolomite .y^ lo
o ♦♦
*
*
0 5 10 15 20 25 30 % C a O
Figure 7. Negative correlation between CaO and MgO in carbonate rocks, Mount Brussilof area. Coarse-grained and sparry dolomites have higher MgO content than fine-grained carbonate rocks. the largest and highest grade magnesite deposits should occur along the edge of the Cathedral Escarpment within the reef fades. Lower-grade sparry magnesite and sparry dolomite deposits would occur further up-dip, either along the same permeable zones, eastward from the Cathedral Escarpment, or in other zones east and adjacent to the Escarpment (Simandl and Hancock, 1991).
If this model is correct, the origin of sparry magnesite deposits in the Mount Brussilof area can be explained as an extreme case of dolomitization, genetically related to the same hydrothermal system as Mississippi Valley-type deposits associated with the Kicking Horse Rim. However, since the Cathedral Escarpment overlies a tectonic welt of lower Cambrian age (Aitken, 1971), the possibility exists that the Mg2+ rich fluids unrelated to Mississippi Valley-type deposits rose along reactivated, possibly syn-sedimentary, faults of the older lower Cambrian tectonic welt. Regardless of the ultimate origin of the fluids, the proposedmechanism for the formation of the magnesite deposits is presented in the phase diagram of Figure 8. It shows the relationship between temperature and M Ca 2 + /M Mg 2 + . Composition of typical sea-
2 5 -
IBS UJ 5 0 - IBS 1-<
'.: \ *
o
h-
200-
300-
400-< IU
^ \ 0.1 1 0 10.0
( M C a / MM g >
Plate 8. Magnesite pinolites (light grey) growing within a fine-grained dolomite matrix; Mount Brussilof mine.
Figure 8. Potential of a 1 mole chloride solution to convert carbonates into magnesite as a function of M Ca + / M Mgr +
ratio and temperature, (after Wilson et al. (1990), data extrapolated from Rosenburg, Burt and Holland (1967)).
water and groundwater are indicated by the vertical lines. Refering to this diagram limestone can be dolomitized by reaction with typical seawater at temperatures as low as 25°C and dolomite may be converted to magnesite at temperatures of the order of 150°C or higher. Should the magnesite forming fluid had a lower M C a 2 + / M Mg2+
ratio, then temperatures slightly above 100°C would have sufficed to convert dolomite to magnesite. These temperatures are within the range of the fluid inclusion studies reported for Mississippi Valley type deposits reported by Sangster (1990). Substantially higher temperatures would have been required if the fluid had M Ca 2 + / M Mg2+ ratio of typical groundwater (Figure 8).
The proposed model requires confirmation and integration with petrographic work, fluid inclusion and crystallinity studies, geochemical (isotopic, rare earth, mmor and major element) analysis and thermodynamic considerations. Future studies will consider the origin, temperature and composition of the mineralizing fluid, geochemical gradients, paragenetic relationships and fluid/rock ratios.
SUMMARY AND CONCLUSIONS The Mount Brussilof area and carbonate rocks of
the Kicking Horse Belt have excellent potential to host other high-grade magnesite deposits, as well as lower-grade/large-tonnage "magnesitic dolomite" deposits. The origin of sparry magnesite-bearing rocks can be explained as an extreme case of dolomitization, possibly genetically related to the same hydrothermal system as Mississippi Valley-type deposits associated with the Kicking Horse Rim.
Fluids responsible for crystallization of coarse sparry carbonates reacted with the dolomitized, permeable and fractured reef facies along the Cathedral Escarpment and moved up-dip along permeable zones.
If the model is correct, then the entire Kicking Horse Belt and Rob Lake trend of Mississippi Valley-type de-
64 Industrial Minerals Forum 1991
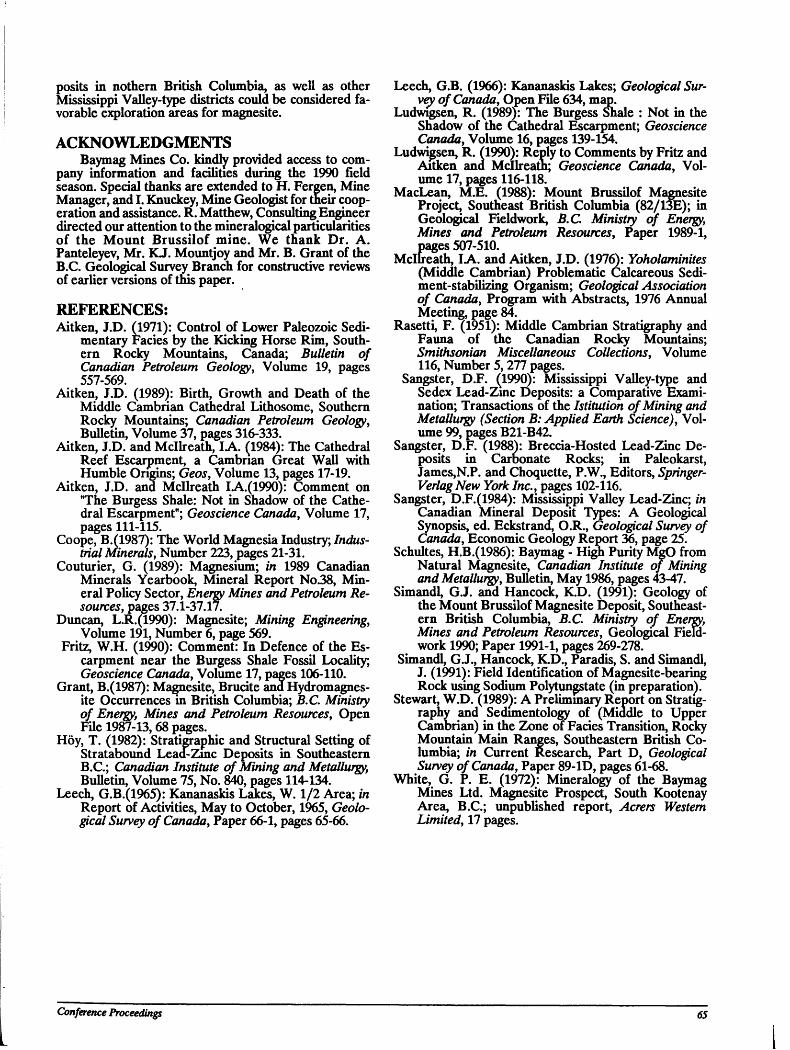
posits in nothern British Columbia, as well as other Mississippi Valley-type districts could be considered favorable exploration areas for magnesite.
ACKNOWLEDGMENTS Baymag Mines Co. kindly provided access to com
pany information and facilities during the 1990 field season. Special thanks are extended to H. Fergen, Mine Manager, and I. Knuckey, Mine Geologist for their cooperation and assistance. R. Matthew, Consulting Engineer directed our attention to the mineralogical particularities of the Mount Brussilof mine. We thank Dr. A. Panteleyev, Mr. KJ. Mountjoy and Mr. B. Grant of the B.C. Geological Survey Branch for constructive reviews of earlier versions of this paper.
REFERENCES: Aitken, J.D. (1971): Control of Lower Paleozoic Sedi
mentary Fades by the Kicking Horse Rim, Southern Rocky Mountains, Canada; Bulletin of Canadian Petroleum Geology, Volume 19, pages 557-569.
Aitken, J.D. (1989): Birth, Growth and Death of the Middle Cambrian Cathedral Lithosome, Southern Rocky Mountains; Canadian Petroleum Geology, Bulletin, Volume 37, pages 316-333.
Aitken, J.D. and Mcllreath, IA. (1984): The Cathedral Reef Escarpment, a Cambrian Great Wall with Humble Origins; Geos, Volume 13, pages 17-19.
Aitken, J.D. and Mcllreath IA.(1990): Comment on "The Burgess Shale: Not in Shadow of the Cathedral Escarpment"; Geoscience Canada, Volume 17, pages 111-115.
Coope, B.(1987): The World Magnesia Industry; Industrial Minerals, Number 223, pages 21-31.
Couturier, G. (1989): Magnesium; in 1989 Canadian Minerals Yearbook, Mineral Report No.38, Mineral Policy Sector, Energy Mines and Petroleum Resources, pages 37.1-37.17.
Duncan, L.R.(1990): Magnesite; Mining Engineering, Volume 191, Number 6, page 569.
Fritz, W.H. (1990): Comment: In Defence of the Escarpment near the Burgess Shale Fossil Locality; Geoscience Canada, Volume 17, pages 106-110.
Grant, B.(1987): Magnesite, Brucite and Hydromagnes-ite Occurrences in British Columbia; B.C. Ministry of Energy, Mines and Petroleum Resources, Open File 1987-13,68 pages.
Hoy, T. (1982): Stratieraphic and Structural Setting of Stratabound Lead-Zinc Deposits in Southeastern B.C.; Canadian Institute of Mining and Metallurgy, Bulletin, Volume 75, No. 840, pages 114-134.
Leech, G.B.(1965): Kananaskis Lakes, W. 1/2 Area; in Report of Activities, May to October, 1965, Geological Survey of Canada, Paper 66-1, pages 65-66.
Leech, G.B. (1966): Kananaskis Lakes; Geological Survey of Canada, Open File 634, map.
Ludwigsen, R. (1989): The Burgess Shale : Not in the Shadow of the Cathedral Escarpment; Geoscience Canada, Volume 16, pages 139-154.
Ludwigsen, R. {1990): Reply to Comments by Fritz and Aitken ana Mcllreath; Geoscience Canada, Volume 17, pages 116-118.
MacLean, M.E. (1988): Mount Brussilof Magnesite Project, Southeast British Columbia (82/13E); in Geological Fieldwork, B.C. Ministry of Energy, Mines and Petroleum Resources, Paper 1989-1, pages 507-510.
Mcllreath, IA. and Aitken, J.D. (1976): Yoholaminites (Middle Cambrian) Problematic Calcareous Sediment-stabilizing Organism; Geological Association of Canada, Program with Abstracts, 1976 Annual Meeting, page 84.
Rasetti, F. (1951): Middle Cambrian Stratigraphy and Fauna of the Canadian Rocky Mountains; Smithsonian Miscellaneous Collections, Volume 116, Number 5, 277 pages.
Sangster, D.F. (1990): Mississippi Valley-type and Sedex Lead-Zinc Deposits: a Comparative Examination; Transactions of the Istitution of Mining and Metallurgy (Section B: Applied Earth Science), Volume 99, pages B21-B42.
Sangster, D.F. (1988): Breccia-Hosted Lead-Zinc Deposits in Carbonate Rocks; in Paleokarst, James,N.P. and Choquette, P.W., Editors, Springer-VerlagNew York Inc., pages 102-116.
Sangster, D.F.(1984): Mississippi Valley Lead-Zinc; in Canadian Mineral Deposit Types: A Geological Synopsis, ed. Eckstrand, O.R., Geological Survey of Canada, Economic Geology Report 36, page 25.
Schultes, H.B.(1986): Baymag - High Purity MgO from Natural Magnesite, Canadian Institute of Mining and Metallurgy, Bulletin, May 1986, pages 43-47.
Simandl, G.J. and Hancock, K.D. (1991): Geology of the Mount Brussilof Magnesite Deposit, Southeastern British Columbia, B.C. Ministry of Energy, Mines and Petroleum Resources, Geological Field-work 1990; Paper 1991-1, pages 269-278.
Simandl, G.J., Hancock, K.D., Paradis, S. and Simandl, J. (1991): Field Identification of Magnesite-bearing Rock using Sodium Polytungstate (in preparation).
Stewart, W.D. (1989): A Preliminary Report on Stratigraphy and Sedimentology of (Middle to Upper Cambrian) in the Zone of Fades Transition, Rocky Mountain Main Ranges, Southeastern British Columbia; in Current Research, Part D, Geological Survey of Canada, Paper 89-ID, pages 61-68.
White, G. P. E. (1972): Mineralogy of the Baymag Mines Ltd. Magnesite Prospect, South Kootenay Area, B.C.; unpublished report, Acrers Western Limited, 17 pages.
Conference Proceedings 6S

66 Industrial Minerals Forum 1991
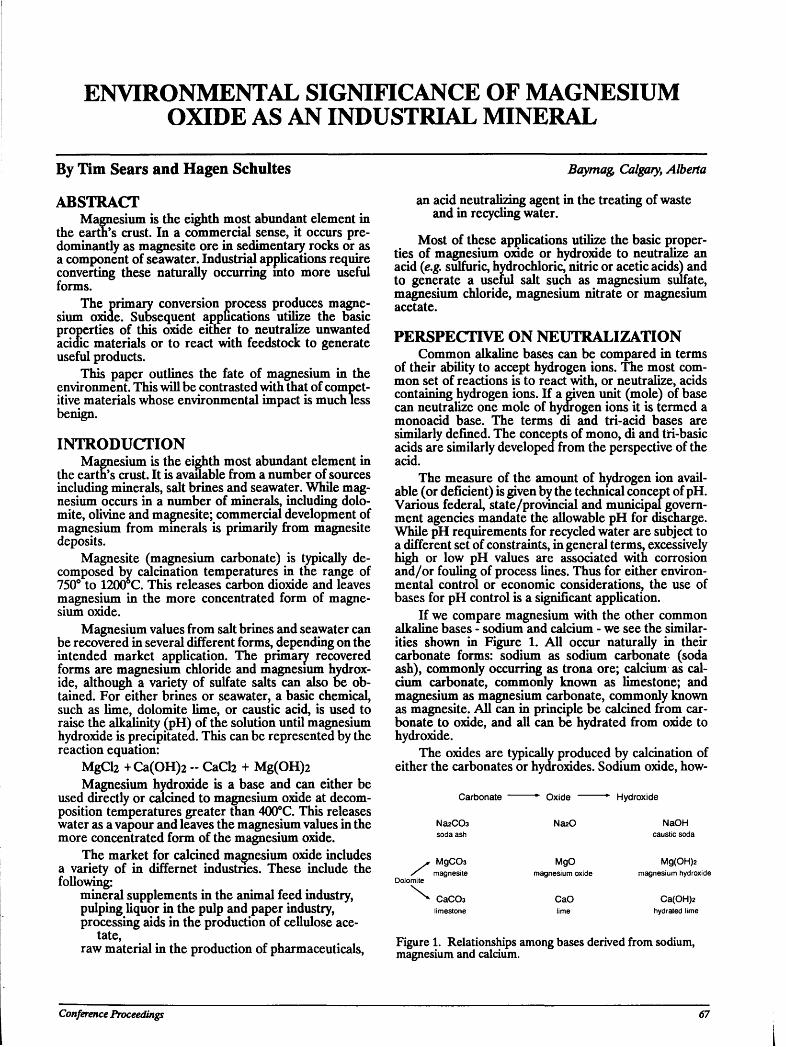
ENVIRONMENTAL SIGNIFICANCE OF MAGNESIUM OXIDE AS AN INDUSTRIAL MINERAL
By Tim Sears and Hagen Schultes
ABSTRACT Magnesium is the eighth most abundant element in
the earth's crust. In a commercial sense, it occurs predominantly as magnesite ore in sedimentary rocks or as a component of seawater. Industrial applications require converting these naturally occurring mto more useful forms.
The primary conversion process produces magnesium oxide. Subsequent applications utilize the basic properties of this oxide either to neutralize unwanted acidic materials or to react with feedstock to generate useful products.
This paper outlines the fate of magnesium in the environment. This will be contrasted with that of competitive materials whose environmental impact is much less benign.
INTRODUCTION Magnesium is the eighth most abundant element in
the earth's crust. It is available from a number of sources including minerals, salt brines and seawater. While magnesium occurs in a number of minerals, including dolomite, olivine and magnesite; commercial development of magnesium from minerals is primarily from magnesite deposits.
Magnesite (magnesium carbonate) is typically decomposed by calcination temperatures in the range of 750° to 1200 C. This releases carbon dioxide and leaves magnesium in the more concentrated form of magnesium oxide.
Magnesium values from salt brines and seawater can be recovered in several different forms, depending on the intended market application. The primary recovered forms are magnesium chloride and magnesium hydroxide, although a variety of sulfate salts can also be obtained. For either brines or seawater, a basic chemical, such as lime, dolomite lime, or caustic acid, is used to raise the alkalinity (pH) of the solution until magnesium hydroxide is precipitated. This can be represented by the reaction equation:
MgCh +Ca(OH)2 ~ CaCfc + Mg(OH)2 Magnesium hydroxide is a base and can either be
used directly or calcined to magnesium oxide at decomposition temperatures greater than 400°C. This releases water as a vapour and leaves the magnesium values in the more concentrated form of the magnesium oxide.
The market for calcined magnesium oxide includes a variety of in differnet industries. These include the following:
mineral supplements in the animal feed industry, pulping liquor in the pulp and paper industry, processing aids in the production of cellulose ace
tate, raw material in the production of pharmaceuticals,
Baymag, Calgary, Alberta
an acid neutralizing agent in the treating of waste and in recycling water.
Most of these applications utilize the basic properties of magnesium oxide or hydroxide to neutralize an acid {e.g. sulfuric, hydrochloric, nitric or acetic acids) and to generate a useful salt such as magnesium sulfate, magnesium chloride, magnesium nitrate or magnesium acetate.
PERSPECTIVE ON NEUTRALIZATION Common alkaline bases can be compared in terms
of their ability to accept hydrogen ions. The most common set of reactions is to react with, or neutralize, acids containing hydrogen ions. If a given unit (mole) of base can neutralize one mole of hydrogen ions it is termed a monoacid base. The terms di and tri-acid bases are similarly defined. The concepts of mono, di and tri-basic acids are similarly developed from the perspective of the acid.
The measure of the amount of hydrogen ion available (or deficient) is given by the technical concept of pH. Various federal, state/provincial and municipal government agencies mandate the allowable pH for discharge. While pH requirements for recycled water are subject to a different set of constraints, in general terms, excessively high or low pH values are associated with corrosion and/or fouling of process lines. Thus for either environmental control or economic considerations, the use of bases for pH control is a significant application.
If we compare magnesium with the other common alkaline bases - sodium and calcium - we see the similarities shown in Figure 1. All occur naturally in their carbonate forms: sodium as sodium carbonate (soda ash), commonly occurring as trona ore; calcium as calcium carbonate, commonly known as limestone; and magnesium as magnesium carbonate, commonly known as magnesite. All can in principle be calcined from carbonate to oxide, and all can be hydrated from oxide to hydroxide.
The oxides are typically produced by calcination of either the carbonates or hydroxides. Sodium oxide, how-
Carbonate • Oxide * Hydroxide
NaaCOa soda ash
NazO NaOH caustic soda
y , MgCC-3 / magnesite
Dolomite
MgO magnesium oxide
Mg(OH)2 magnesium hydroxide
^ CaCOa limestone
CaO lime
Ca(OH)2
hydrated lime
Figure 1. Relationships among bases derived from sodium, magnesium and calcium.
Conference Proceedings 61
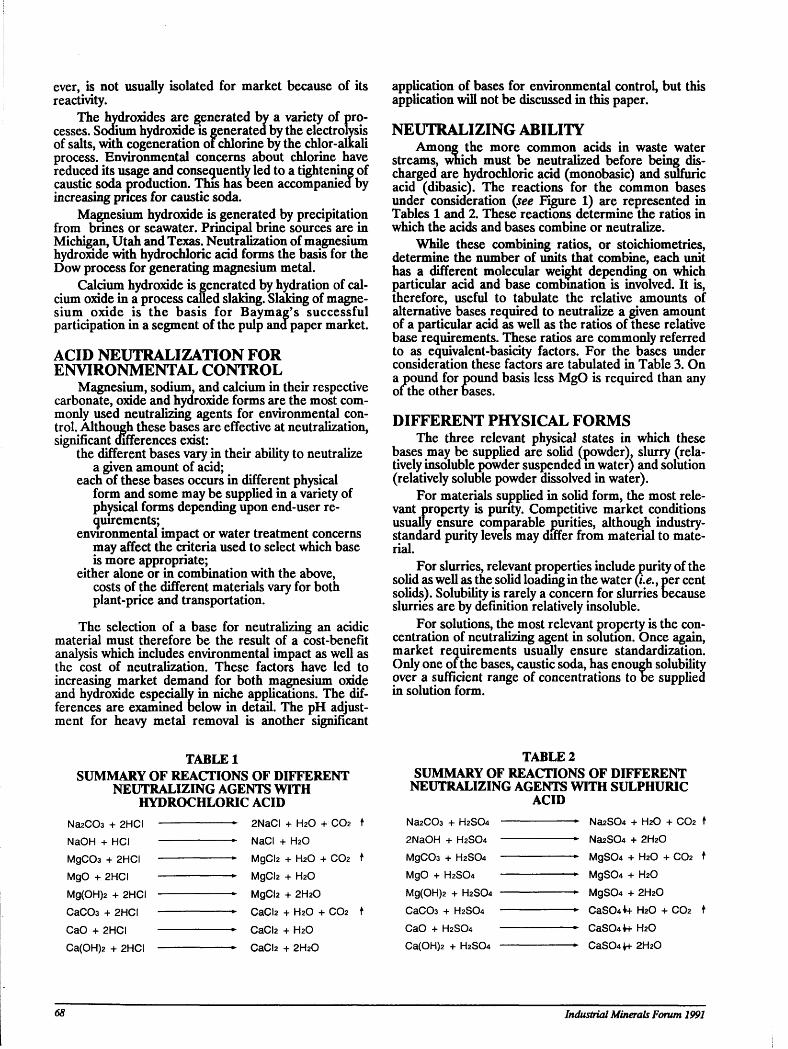
ever, is not usually isolated for market because of its reactivity.
The hydroxides are generated by a variety of processes. Sodium hydroxide is generated by the electrolysis of salts, with cogeneration of chlorine by the chlor-alkali process. Environmental concerns about chlorine have reduced its usage and consequently led to a tightening of caustic soda production. This has been accompanied by increasing prices for caustic soda.
Magnesium hydroxide is generated by precipitation from brines or seawater. Principal brine sources are in Michigan, Utah and Texas. Neutralization of magnesium hydroxide with hydrochloric acid forms the basis for the Dow process for generating magnesium metal.
Calcium hydroxide is generated by hydration of calcium oxide in a process called slaking. Slaking of magnesium oxide is the basis for Bay mag's successful participation in a segment of the pulp and paper market.
ACID NEUTRALIZATION FOR ENVIRONMENTAL CONTROL
Magnesium, sodium, and calcium in their respective carbonate, oxide and hydroxide forms are the most commonly used neutralizing agents for environmental control. Although these bases are effective at neutralization, significant differences exist:
the different bases vary in their ability to neutralize a given amount of acid;
each of these bases occurs in different physical form and some may be supplied in a variety of physical forms depending upon end-user requirements;
environmental impact or water treatment concerns may affect the criteria used to select which base is more appropriate;
either alone or in combination with the above, costs of the different materials vary for both plant-price and transportation.
The selection of a base for neutralizing an acidic material must therefore be the result of a cost-benefit analysis which includes environmental impact as well as the cost of neutralization. These factors have led to increasing market demand for both magnesium oxide and hydroxide especially in niche applications. The differences are examined below in detail. The pH adjustment for heavy metal removal is another significant
TABLE 1 SUMMARY OF REACTIONS OF DIFFERENT
NEUTRALIZING AGENTS WITH HYDROCHLORIC ACID
NazCOa + 2HCI 2NaCI + H2O + CO2 t
NaOH + HCI * NaCI + H2O
MgCOa + 2HCI ► MgCIa + H2O + CO2 f
MgO + 2HCI - MgCl2 + H2O
Mg(OH)2 + 2HCI ► MgCl2 + 2H2O
CaCOa + 2HCI ► CaCl2 + H2O + CO2 t
CaO + 2HCI CaCl2 + H2O
Ca(OH)2 + 2HCI ► CaCl2 + 2H2O
application of bases for environmental control, but this application will not be discussed in this paper.
NEUTRALIZING ABILITY Among the more common acids in waste water
streams, which must be neutralized before being discharged are hydrochloric acid (monobasic) and sulfuric acid (dibasic). The reactions for the common bases under consideration (see Figure 1) are represented in Tables 1 and 2. These reactions determine the ratios in which the acids and bases combine or neutralize.
While these combining ratios, or stoichiometries, determine the number of units that combine, each unit has a different molecular weight depending on which particular acid and base combmation is involved. It is, therefore, useful to tabulate the relative amounts of alternative bases required to neutralize a given amount of a particular acid as well as the ratios of these relative base requirements. These ratios are commonly referred to as equivalent-basicity factors. For the bases under consideration these factors are tabulated in Table 3. On a pound for pound basis less MgO is required than any of the other bases.
DIFFERENT PHYSICAL FORMS The three relevant physical states in which these
bases may be supplied are solid (powder), slurry (relatively insoluble powder suspended m water) and solution (relatively soluble powder dissolved in water).
For materials supplied in solid form, the most relevant property is purity. Competitive market conditions usually ensure comparable purities, although industry-standard purity levels may differ from material to material.
For slurries, relevant properties include purity of the solid as well as the solid loading in the water (i.e., per cent solids). Solubility is rarely a concern for slurries because slurries are by definition relatively insoluble.
For solutions, the most relevant property is the concentration of neutralizing agent in solution. Once again, market requirements usually ensure standardization. Only one of the bases, caustic soda, has enough solubility over a sufficient range of concentrations to be supplied in solution form.
TABLE 2 SUMMARY OF REACTIONS OF DIFFERENT
NEUTRALIZING AGENTS WITH SULPHURIC ACID
Na2C03 + H2SO4 Na2S04 + H2O + CO2 t
2NaOH + H2SO4 * Na2S04 + 2H2O
MgCOa + H2SO4 ► MgS04 + H2O + CO2 t
MgO + H2SO4 ► MgS04 + H2O
Mg(OH)2 + H2SO4 MgS04 + 2H2O
CaCOa + H2SO4 ► CaS04*+ H2O + CO2 t
CaO + H2SO4 ► CaS04*+ H2O
Ca(OH)2 + H2SO4 ► CaS04t+ 2H2O
68 Industrial Minerals Forum 1991
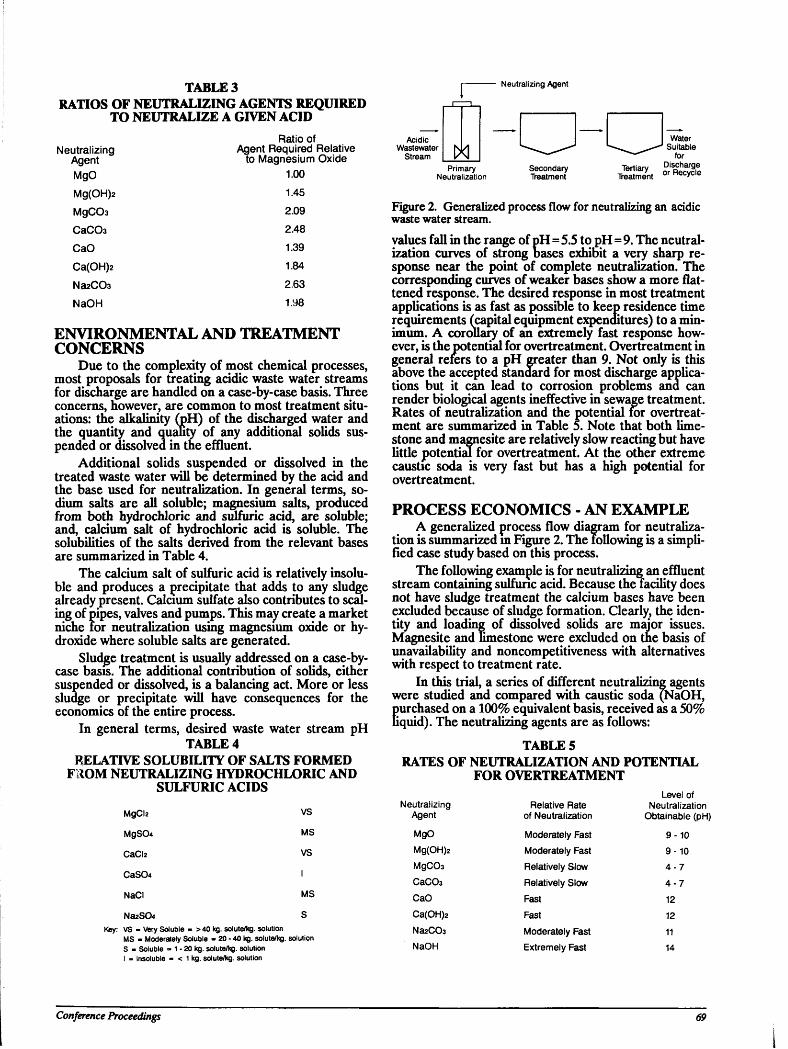
TABLE3 RATIOS OF NEUTRALIZING AGENTS REQUIRED
TO NEUTRALIZE A GIVEN ACID
Neutralizing Agent
Neutralizing Agent
MgO
Mg(OH)2
MgC03
CaC03 CaO Ca(OH)2
NaaCCh
NaOH
Ratio of Agent Required Relative
to Magnesium Oxide
1.00 1.45 2.09 2.48 1.39 1.84 2.63 1.98
ENVIRONMENTAL AND TREATMENT CONCERNS
Due to the complexity of most chemical processes, most proposals for treating acidic waste water streams for discharge are handled on a case-by-case basis. Three concerns, however, are common to most treatment situations: the alkalinity (pH) of the discharged water and the quantity and quality of any additional solids suspended or dissolved in the effluent.
Additional solids suspended or dissolved in the treated waste water will be determined by the acid and the base used for neutralization. In general terms, sodium salts are all soluble; magnesium salts, produced from both hydrochloric and sulfuric acid, are soluble; and, calcium salt of hydrochloric acid is soluble. The solubilities of the salts derived from the relevant bases are summarized in Table 4.
The calcium salt of sulfuric acid is relatively insoluble and produces a precipitate that adds to any sludge already present. Calcium sulfate also contributes to scaling of pipes, valves and pumps. This may create a market niche for neutralization using magnesium oxide or hydroxide where soluble salts are generated.
Sludge treatment is usually addressed on a case-by-case basis. The additional contribution of solids, either suspended or dissolved, is a balancing act. More or less sludge or precipitate will have consequences for the economics of the entire process.
In general terms, desired waste water stream pH TABLE 4
RELATIVE SOLUBILITY OF SALTS FORMED FROM NEUTRALIZING HYDROCHLORIC AND
SULFURIC ACIDS MgCb VS
MgS04 MS
CaCl2 VS
CaS04 I
NaCI MS
NaaS04 S Key: VS - Very Soluble - > 40 kg. solute/kg. solution
MS - Moderately Soluble - 20 - 40 kg. solute/kg. solution S - Soluble » 1 - 20 kg. solute/kg. solution I =» Insoluble - < 1 kg. solute/kg. solution
Acidic Wastewater
Stream W Primary
Neutralization Secondary Treatment
Tertiary
Water Suitable
for Discharge
Treatment o r R e cV c l e
Figure 2. Generalized process flow for neutralizing an acidic waste water stream. values fall in the range of pH=5.5 to pH=9. The neutralization curves of strong bases exhibit a very sharp response near the point of complete neutralization. The corresponding curves of weaker bases show a more flattened response. The desired response in most treatment applications is as fast as possible to keep residence time requirements (capital equipment expenditures) to a minimum. A corollary of an extremely fast response however, is the potential for overtreatment. Overtreatment in general refers to a pH greater than 9. Not only is this above the accepted standard for most discharge applications but it can lead to corrosion problems and can render biological agents ineffective in sewage treatment. Rates of neutralization and the potential tor overtreatment are summarized in Table 5. Note that both limestone and magnesite are relatively slow reacting but have little potential for overtreatment. At the other extreme caustic soda is very fast but has a high potential for overtreatment.
PROCESS ECONOMICS - AN EXAMPLE A generalized process flow diagram for neutraliza
tion is summarized m Figure 2. The following is a simplified case study based on this process.
The following example is for neutralizing an effluent stream containing sulfuric acid. Because the facility does not have sludge treatment the calcium bases have been excluded because of sludge formation. Clearly, the identity and loading of dissolved solids are major issues. Magnesite and limestone were excluded on the basis of unavailability and noncompetitiveness with alternatives with respect to treatment rate.
In this trial, a series of different neutralizing agents were studied and compared with caustic soda (NaOH,
Eurchased on a 100% equivalent basis, received as a 50% quid). The neutralizing agents are as follows:
TABLES RATES OF NEUTRALIZATION AND POTENTIAL
FOR OVERTREATMENT Neutralizing
Agent Relative Rate
of Neutralization
Level of Neutralization
Obtainable (pH)
MgO Moderately Fast 9-10 Mg(OH)2 Moderately Fast 9-10 MgCOa Relatively Slow 4 - 7 CaC03 Relatively Slow 4 - 7 CaO Fast 12 Ca(OH)z Fast 12 NaaCOa Moderately Fast 11 NaOH Extremely Fast 14
Conference Proceedings 69
TABLE 6 ANNUAL CHEMICAL COST OF
NEUTRALIZATION
Neutralizing Agent
Annual Product Requirement Price
(Metric (F.O.a Plant; F.O.& Tons) CDN$/Metric Ton) Point
Estimated Freight Cost
(CDN$/Metric Ton)
Annual Cost of Neutralization (CDNJ x 1000)
Neutralizing Agent
MgO 1210 360 Alberta 10 435 MgO
Mg(OH)2 1750 250 Michigan 50 -r 58 = 90 590 Mg(OH)2
N6UC03
NaOH
3180
2400 390
Wyoming
Ontario
60
50 - 50 = 100
560
1180
l)magnesium oxide (MgO) powder, purchased as 97 per cent pure, received, as 50 per cent liquid,
2)magnesium hydroxide [(Mg(OH)2] slurry, purchased on a 100 per cent equivalent basis, received as a 58 per cent slurry in water,
3)soda ash (Na2C03) powder, purchased on a 100 per cent equivalent basis, received as a 58 per cent slurry in water,
4)current product, caustic soda (NaOH).
Neutralization consists of reacting one of these agents with the effluent containing sulfuric acid. The reactions are included in Table 2.
An annual requirement of 2 400 tonnes per year of caustic soda is the current consumption. Based upon the equivalent basicity factors from Table 3, the equivalent requirements for alternative neutralizing agents can be calculated.
The following ratios are presented as the amount of alternative neutralizing agent relative to the amount of caustic soda currently used:
Neutralizing Amount Required to Agent Neutralize Relative
to Caustic Soda MgO 0.504 Mg(OH)2 0.729 Na2C03 1.325 NaOH 1
Based upon the client's current annual usage of caustic soda, the annual requirement for each alternative is presented below:
Neutralizing Annual Volume, Agent 100% Basis (tonnes) MgO 1210 Mg(OH)2 1750 Na2C03 3180 NaOH 2400
A summary of the alternative annual chemical costs of neutralization are presented in Table 6. Material costs are derived from published sources and industry estimates. The physical form of the various agents will also affect transportation costs.
It should be noted that a storage and handling system is required for alternate neutralizing agents to allow the end-user the flexibility of using powders or slurries instead of a liquid handling system. A summary of process economics including these capital costs, as well as environmental considerations, is presented in Table 7. Note
Na2(X>3
NaOH
TABLE 7 SUMMARY OF PROCESS ECONOMICS
Form 9 of
Material
Annual Chemical Cost
of Neutralization (CDN$ x 1000)
Estimated Relative Capital
Cost for Conversion of Handling and Storage Facilities
Environmental Impact Contribution to Total
Dissolved Solids (Pounds per Ton
of Acid Neutralized)
Powder 435 1 2460 as MgS04
12 Slurry 590 1 2460 as MgS04
3 Powder 560 1 2900 as Na2S04
Solution 1180 0 2900 as Na2S04
that the solids loading is lower with either of the magnesium bases.
SUMMARY Although magnesium oxide and hydroxide account
for less than 1 per cent of the neutralization market, they provide a growing alternative as more stringent environmental and economic conditions prevail. Their advantages in neutralization applications define a sizable market niche. Among these advantages are:
higher neutralizing ability per unit of neutralizing agent,
less potential for overtreatment, less contribution to neutralization solids, less corrosive than most competitive materials.
High purity magnesite (Schultes, 1986) can provide a neutralizing capability in either oxide or hydroxide form. Properly selected with due consideration for overall process consequences, magnesium oxide can prove an economical as well as an environmentally safe choice of neutralizing agent.
REFERENCES CRC Handbook of Chemistry and Physics; 63rd Edi
tion, Robert C. Weast, ed., CRC Press, Inc., Boca Raton, 1982.
Magnesium oxide and hydroxide derived from: Mag Hydroxide Growth Seen in Caustic Soda Replacement; Chemical Marketing Reporter, April 22,1991, page 5.
Schultes, H.B. (1986): Baymag - high-purity magnesium oxide from natural magnesite; Canadian Institute Mining and Metallurgy; Bulletin, May, 1986.
70 Industrial Minerals Forum 1991
MAGCAN AND MAGNESIUM
By A.H. Wheeler The Magnesium Company of Canada plant site is
located 5 kilometres north of High River, Alberta and 50 kilometres south of Calgary. The existing 12 500 tonne per year facility of magnesium metal production is the first module of five modules planned for the site. The plant produces high-grade (99.8%) primary magnesium metal and magnesium alloys. Most of the primary metal goes to the aluminum industry for alloymg, while the magnesium alloys go to the die-casting industry.
MAGCAN purchases magnesite rock from the BAYMAG Mine near Radium B.C. The rock (150 -12 millimetres, 6" - 1/2") is hauled under contract by truck to the plant site, a distance of 392 kilometres. The semitrailer, plus a trailer, carried about 35 tonnes. The plant requires about 150 tonnes per day of rock (this is normally 6 trucks per day, 5 days a week). The plant maintains a two month stockpile of rock to cover the spring thaw and any emergency which might arise. The BAYMAG Mine will be covered by another paper so I will not describe it, except to say the rock is an excellent feed for a magnesium plant.
The plant has a 100 tonnes per hour semi-portable crushing/screening unit where the rock is crushed to 50 - 6 millimetres (2" -1/4") size. The crushed rock is stored in a covered shed from which it is fed into bucket elevators then to a surge bin. From the surge bin, the rock is fed into a weigh hopper where a specified weight is measured. This "charge" is fed via tripper belts into one of eight reactors. The entire charging system is automatic and is programmed from the control room.
One of the properties of rock, in our cold climate, is that while it is coarse (150 - 12 millimetres), it does not freeze into a solid mass when rain or snow falls on a pile and freezing occurs inside the pile. When the rock is crushed to 50 - 6 millimetres, the pile would freeze solid under the same conditions. The two month stockpile is left uncovered, while the crushed product is stored in a covered shed.
The semi-portable crushing/screening unit was purchased with over capacity for the future expansion. When expansion is complete, we expect the rock will come by rail and the crushing plant will be located at the railhead in British Columbia.
The magnesite rock contains approximately 28 per cent magnesium ion. The plant recovers about 78 per cent of the magnesium as saleable metal. About 11 per cent is crushing losses and the other 11 per cent is process losses.
The operating processes at the MAGCAN plant consists of three major parts:
l.The reactors which convert MgC03 to MgCb. 2.The electrolytic cells which convert the MgCb to
Cb gas and magnesium metal. 3.The gas cleaning and waste disposal systems.
The reactor conversion process is based on a patent
Magnesium Company of Canada, Ltd., Calgary, Alberta
developed by the MPLC Laboratory Ltd. in the United Kingdom.
Magnesite rock is fed into the top of the reactor through a double bell system. Hot gas coming up from the "reaction zone" calcines the MgC03 to MgO + CO2. This removes heat from the gas stream. The MgO particles work down in the reactor. Cb and CO gas are put in below the MgO and the following reaction takes place:
Cb + CO + MgO MgCb (liquid) + CO2 + Heat This is a very exothermic reaction and the tempera
ture is maintained at 1000 to 1200°C by controlling the feed rate of the Cb and CO gases. Too high a temperature can cause the MgCb to vaporize and cause dust losses through the offgas system. The molten MgCb runs down to the bottom of the reactor.
The bottom of the reactor is filled with loose-packed carbon chunks. AC current is run through the carbon chunks to keep them hot (800°C). MgCb freezes at 718°C. The molten MgCb builds in the voids in the carbon zone and is tapped out at regular intervals into a ladle car. The ladle car transfers the molten salt to the surge furnace.
The molten MgCb is stored in an electrically heated surge "furnace". The molten MgCb is then transferred via vacuum ladle to one of the twenty D.C. electrolytic cells. The electrolytic cells are connected in series. The bus bar can carry up to 188 000 amps. In addition to MgCb, the cells are fed CaCb, NaCl and KC1. These salts improve the performance of the cell and lower the melting temperature of the salt mixture. The MgCb is decomposed into magnesium metal (liquid) on the steel cathode and chlorine gas at graphite anode by the D.C. current. The cell operates at 700°C and since magnesium metal freezes at 651°C, the magnesium stays molten and, because it is less dense than the salt mixture, it floats on the molten salt surface. The chlorine gas is taken off the back of the cell and recycled to the reactors. The magnesium is vacuumed (like oil skimming) off the top of the molten salt and taken to the refinery.
At the refinery, the metal is put into gas-heated steel pots (2 700 kilogram capacity), wnere the solid and liquid impurities settle out. It is then cast into ingots under a CO2 plus 0.5 per cent SF6 atmosphere (to prevent oxidation of the molten magnesium).
If a magnesium alloy is desired, the alloying materials are added to the molten magnesium in the refinery and the alloy is then cast into ingots.
The plant has a carbon monoxide generator where oxygen is blown into a coke bed at a controlled rate and CO2 is added as a modulator. The temperature is maintained at about 1200°C so the second reaction can go to completion.
2C + O2 ~ 2CO exothermic C + CO2 -- 2CO endothermic Make-up Cb is purchased in RR tank cars and the
liquid Cb is vapourized in a Cb vapourization plant.
Conference Proceeding! 71
Waste gases containing Ch and HCl are scrubbed with NaOH solution in various packed towers. The hypo-chlorite generated is decomposed in a hypochlorite destruction system.
2 NaOH + Cb - NaOCl + NaCl 2 NaOCl + Catalyst - 2 NaCl + O2
Various fumes and dusts are collected and scrubbed in a water scrubber system.
The scrubbed gases are manifolded to a single stack (50 metres high) which is monitored for Ch and CO.
The electrolytic cells produce "waste" salts which are frozen before handling. Also, any waste material containing soluble salts is collected. The treated solutions from the various scrubbers are used to dissolve the soluble portion of the waste material, the inerts are filtered out and washed clean, then sent to landfill. All salt contaminated solutions are combined and put down a 2300 metres deep injection well.
All runoff water from the plant site is collected in a storm water runoff pond and it is pumped back to the plant as scrubber makeup water. Our environmental permit allows no water to leave the site. The Highwood River, a major trout stream, flows through the plant site and its protection is of prime concern.
This is a very brief simplified description of the plant processes. There are a great many details which are not covered in this paper.
SITE SELECTION A few comments on the site selection process. We
looked at sites from Squamish, B.C. on the Pacific Ocean to Quebec City on the Atlantic. While economics are critical to the final selection, the following items were a necessity for the site:
1.Railroad Service: We must get delivery of Cb in RR tank cars. All other items could be trucked in or out. 2.A Source of Process Water: We need 30 cubic metres per hour of water for the first module and 150 cubic metres per hour for the final plant size. At High River we use tertiary treated sewage from the Town. We built a tertiary water treatment plant for this purpose and gave it to the Town. Also, we built a 3 mile pipeline from the treatment plant to our site. We do not use water from the Highwood River, which flows through the plant site. 3.Electric Power: We use 18 000 kilowatts per hour of electricity for the first module. The site needed to be near an existing power line. Environmental problems usually cause a delay of 5 years or more m building new long distance lines. Our power requirements will grow to about 100 000 kilowatts per hour, but we could not afford the time to build new lines as we add to the plant.
4.Waste Water Disposal: Since we produce various chloride salts (about 25 tonne per day) as part of our waste material, we need to dispose of them. The accepted method is to put the salts into a solution which can be put into the ocean or injected into an underground formation. At the plant we inject into the Elkton Formation (Mississippian) 2
300 metres deep. High River is as close to Calgary as you can set and still have a good injection formation available. The total cost of the injection well was about $1500 000 Canadian. 5.Plant Personnel: The first phase employes 140 people, mainly on shiftwork. There has to be a fairly large labour pool available to get qualified personnel. The Calgary area is our major labour source. 6.Local Acceptance: The community and local governments need to accept a heavy industrial plant handling various chemicals, etc. In looking at the various sites I would estimate about half said they would object to our locating in their area. 7.Freight Costs: This has an impact on the location. The cost of shipping the rock to the plant site, plus shipping chlorine, coke, and caustic to the site, and cost of snipping the metal to the market had to be considered.
RAW MATERIALS FOR MAGNESIUM METAL
Magnesium is the sixth commonest element in the earth's crust. Of it is is not present as the free metal.
Sea water which contains 0.13 per cent Mg ion in the form of MgCb. Lime (CaO) or Dolomitic Lime (CaO.MgO) is used to precipitate Mg(OH)2. This process is rather common. Dow uses it at their Freeport, Texas plant; Norsk Hydro uses it in Norway for one of their processes; and a large number of refractory companies use it as a step in making MgO for refractory purposes.
Brines containing MgCb are evaporated to make a concentrated MgCb solution. American Magnesium Co. in Snyder, Texas used a 11 per cent MgCb brme from the Yates formation as a source of material and concentrated it to 25 per cent in their solar ponds. The Magnesium Corporation of America at the Great Salt Lake uses solar ponds to concentrate the lake water (1.6% MgCb) to 30 per cent MgCb. They also used bitterns from Leslie Salt sea water solar ponds in San Francisco Bay when the MAGCORP solar ponds were flooded in the early 1980's. Norsk Hydro in Norway in a second process also uses brine (35% MgCb) which is a by-product of the German potash industry. Dow's original magnesium plant in Michigan used an underground brine as its source. Now that brine is used to make CaCb and MgO.
Dolomite is used as a source of magnesium by the direct reduction of the MgO content by silicon (ferrosil-icon).
Magnesite (MgC03) is used by MAGCAN as noted above. Norsk Hydro in Quebec uses magnesite from China and dissolves it in HCl solution to make a MgCb brine. The Basic Magnesium Plant at Henderson, Nevada, which operated during the Second World War, used magnesite and brucite from Gabbs, Nevada.
The Noranda Company is presently developing a process to make magnesium from MgCb which will be made from the tailings from the Quebec asbestos mines.
The TVA before the Second World War tried to
72 Industrial Minerals Forum 1991
develop processes to make magnesium from olivine (Mg, Fe)2Si04.
The Soviets mine carnallite KMgCb.6HO and use the MgCh portion to make magnesium with potash (KC1) as a by-product.
As you see, there are a variety of sources for magnesium metal. They all suffer from the same problem - they contain impurities which adversely affect the quality of the produced metal.
Prime magnesium - ASTM 9980A quality has the following limits on impurities:
Copper 0.02% Lead 0.01% Manganese 0.10% Nickel 0.001% Tin 0.01% Other impurities maximum 0.05%
each Magnesium by dif- minimum 99.80%
ference (The total of all impurities cannot exceed 0.20%.) The major reason for keeping the impurities low in
the primary metal is that they accelerate the corrosion of magnesium. Any H2O present on a magnesium metal surface will start a corrosion reaction at an impurity grain. Coated magnesium does not corrode if H2O does not get to the metal surface. The processing of the raw material is how most of the impurities are removed. In addition, boron compounds and sulfate ions have a very adverse affect on the electrolytic process so they need to be removed also.
At the present time magnesium is made by one of two processes:
fnReduction of MgO by silicon (in ferrosilicon). (2)Fused salt electrolysis of MgCh.
There are a number of other processes which have been tried and have not succeeded, primarily for economic reasons.
(l)Reduction of MgO by carbon - the Hansgirg process. MgO + C = Mg + CO (very reversible)
(2)Reduction of MgO by another metal. Aluminum and sodium have been tried. The Intal process used aluminum. 3MgO + 2A1 - 3Mg + AI2O3
(3)Reduction of MgO by CaC2 - the Murex process. 3MgO + CaC2 - 3Mg + CaO + CO
(4)Electrolytic "reduction" of MgO in a flouride salt bath. This reaction appears similar to the Hall aluminum cell but MgO is not soluble in MgF2 - the American Magnesium Corp process (1920s). MgO(S) + C + F2(g) - MgF2(l) + CO MgF2(l)-Mg(l) + F2(g)
Depending on economics and process equipment improvements, some of these processes may be revived. REDUCTION OF M G O BY SILICON
The cheapest source of silicon is ferrosilicon made in electric arc furnaces.
The reaction is:
2 CaO,2MgO (from calcined dolomite) + FeSi - 2 CaO.Si02 + 2Mg + Fe
Heat is applied to make the reaction go and a vacuum is pulled on the system to vaporize the magnesium. The magnesium vapor is condensed to a solid in a vessel outside the reaction vessel. The iron does not enter into the reaction. The 2CaO.Si02 is a "slag".
The Pidgeon version uses a small retort and it is a batch process using pellets and the "slag" never becomes molten. The Timminco Plant in Ontario uses this process. There are a number of small plants around the world which use variations of this process.
The Magnetherm (Pechinay) version uses large retorts and is semi-continuous, the slag is molten due to the addition of AI2O3 as a flux agent, and the slag is tapped from the retort. Northwest Alloys (ALCOA) in Wasning-ton State uses this process in addition to the original plant in France and a third plant in Yugoslavia. FUSED SALT ELECTROLYSIS OF MGCI*
About 90 per cent of the magnesium produced today is made by fused salt electrolysis; there are two variations of the process.
(l)The Dow process which uses a dry feed of MgCh.H20. Graphite anodes are consumed to remove the oxygen.
C + MgCl2.H20 - Mg (metal) + 2HC1 + CO2 The HC1 is used to dissolve the Mg(OH)2 precipi
tated from sea water. The resultant MgCh brme is purified before being dried in spray driers.
(2)Anhydrous MgCh feed. The feed can be dry or molten. The new Norsk Hydro process concentrates 35 per cent MgCh brine to 80 per cent MgCh. The hot 80 per cent solution is prilled to a solid in a tower then an HC1 fluid bed drier removes the last H2O from the MgCh prills.
The anhydrous prills are fed directed into electrolytic cells.
Most plants use molten MgCh as the feed. There are a number of ways of obtaining the molten feed.
a.From a Faben chlorinator: MgO and coke are pelletized and hot CI2 blown through the pellets.
MgO + C + CI2 - MgCh(l) + CO b.From the MAGCAN reactor:
MgC03 + CO + CI2 - MgCh(l) + 2CO2 cFrom melting spray dried powder:
MgCh (dry) + 4% H2O + 4% MgO -MgCh(l) + MgO(s) + HCl(g)
The MgO sludge is settled out in the melt furnace. d.From melting carnallite:
KMgCb.6H20(s) - KMgCb(l) + H2O + 5% MgO(s) +5%HC1
The MgO sludge is also settled out. e.From molten MgCh from a Kroll titanium reactor.
2Mg + TiCU - MgCh(l) + Ti(s) This has been a brief overview of magnesium metal
raw materials sources and production methods. There are a great many details and problems which have been omitted. The magnesium industry consists of a number of small plants (compared to other metals), each with its
Conference Proceedings 73
own proprietary process. No one process has developed as a standard method as has occurred in the aluminum industry.
REFERENCES Emley, E.F. (1966): Principles of Magnesium Technol
ogy, Pergamon, London. Gross, W.H. (1949): The Story of Magnesium; Ameri
can Society for Metals, pages 1-258. Magnesium Production Facility, Socio-economic and
Environmental Impact Assessment, 1986; Magnesium Company of Canada Ltd., Lavalin, Calgary, Alberta.
Mamantou, G. (1987): Advances in Molten Salt Chemistry; in The Chemistry and Electro-chemistry of Magnesium Production, Kipouros, GJ. and Sadoway, D.R., Editors, Elsevier, Amsterdam, Volume 6, pages 127-209.
Pidgeon, L.M. (1946): Magnesium; American Society for Metals, Cleveland, Ohio, pages 1-22.
Shackleton, C.E.E. et al (1981): U.S. Patent No. 4,269,816.
Strelets, Kh.L. (1972): Electrolytic Production of Magnesium; Metallurgy a, Moscow, translated by J. Schmorak, Keter, Jerusalem, 1977, also available as TT 76-50003, U.S. Department of Commerce, NTIS, Springfield, VA.
74 Industrial Minerals Forum 1991
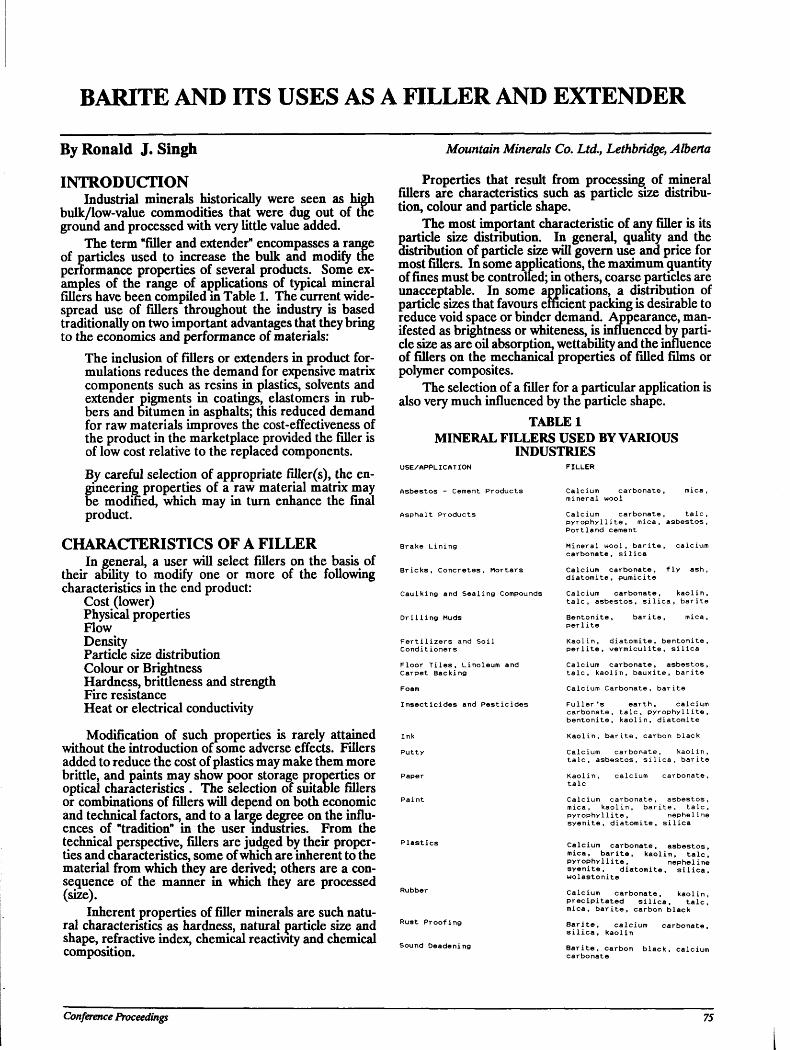
BARITE AND ITS USES AS A FILLER AND EXTENDER
By Ronald J. Singh Mountain Minerals Co. Ltd., Lethbridge, Alberta
INTRODUCTION Industrial minerals historically were seen as high
bulk/low-value commodities that were dug out of the ground and processed with very little value added.
The term "filler and extender" encompasses a ranee of particles used to increase the bulk and modify the performance properties of several products. Some examples of the range of applications of typical mineral fillers have been compiled in Table 1. The current widespread use of fillers throughout the industry is based traditionally on two important advantages that they bring to the economics and performance of materials:
The inclusion of fillers or extenders in product formulations reduces the demand for expensive matrix components such as resins in plastics, solvents and extender pigments in coatings, elastomers in rubbers and bitumen in asphalts; this reduced demand for raw materials improves the cost-effectiveness of the product in the marketplace provided the filler is of low cost relative to the replaced components. By careful selection of appropriate filler(s), the engineering properties of a raw material matrix may be modified, which may in turn enhance the final product.
CHARACTERISTICS OF A FILLER In general, a user will select fillers on the basis of
their ability to modify one or more of the following characteristics in the end product:
Cost (lower) Physical properties Flow Density Particle size distribution Colour or Brightness Hardness, brittleness and strength Fire resistance Heat or electrical conductivity
Modification of such properties is rarely attained without the introduction of some adverse effects. Fillers added to reduce the cost of plastics may make them more brittle, and paints may show poor storage properties or optical characteristics . The selection of suitable fillers or combinations of fillers will depend on both economic and technical factors, and to a large degree on the influences of "tradition" in the user industries. From the technical perspective, fillers are judged by their properties and characteristics, some of which are inherent to the material from which they are derived; others are a consequence of the manner in which they are processed (size).
Inherent properties of filler minerals are such natural characteristics as hardness, natural particle size and shape, refractive index, chemical reactivity and chemical composition.
Properties that result from processing of mineral fillers are characteristics such as particle size distribution, colour and particle shape.
The most important characteristic of any filler is its particle size distribution. In general, quality and the distribution of particle size will govern use and price for most fillers. In some applications, the maximum quantity of fines must be controlled; in others, coarse particles are unacceptable. In some applications, a distribution of particle sizes that favours efficient packing is desirable to reduce void space or binder demand. Appearance, manifested as brightness or whiteness, is influenced by particle size as are oil absorption, wettability and the influence of fillers on the mechanical properties of filled films or polymer composites.
The selection of a filler for a particular application is also very much influenced by the particle shape.
TABLE 1 MINERAL FILLERS USED BY VARIOUS
INDUSTRIES USE/APPLICATION
Asbestos - Cement Products
Asphalt Products
Brake Lining
Bricks, Concretes, Mortars
Caulking and Sealing Compounds
Drilling Muds
Fertilizers and Soil Conditioners Floor Tiles, Linoleum and Carpet Backing
Foam Insecticides and Pesticides
Ink Putty
Rubber
Rust Proofing
Sound Deadening
Calcium carbonate, mica, mineral wool Calcium carbonate, talc, pyrophyllite, mica, asbestos, Portland cement Mineral wool, barite, calcium carbonate, silica Calcium carbonate, fly ash, diatomite, pumicite Calcium carbonate, kaolin, talc, asbestos, silica, barite Bentonite, barite, mica, per lite Kaolin, diatomite, bentonite, perlite, vermiculite, silica Calcium carbonate, asbestos, talc, kaolin, bauxite, barite Calcium Carbonate, barite Fuller's earth, calcium carbonate, talc, pyrophyllite, bentonite, kaolin, diatomite Kaolin, barite, carbon black Calcium carbonate, kaolin, talc, asbestos, silica, barite Kaolin, calcium carbonate, talc Calcium carbonate, asbestos, mica, kaolin, barite, talc, pyrophyllite, nepheline syenite, diatomite, silica
Calcium carbonate, asbestos, mica, barite, kaolin, talc, pyrophyllite, nepheline syenite, diatomite, silica, wolastonite
Calcium carbonate, kaolin, precipitated silica, talc, mica, barite, carbon black Barite, calcium carbonate, silica, kaolin Barite, carbon black, calcium carbonate
Conference Proceeding? 75
Because most fillers are produced by crushing, grinding and classifying minerals, they are usually of an irregular particle shape. Synthetic fillers are likely to be more regular in shape, and are either fibrous or generally spherical in form.
Where colour is important in the end product, the colour of the filler is a critical factor in its acceptability. Paper, foam and paint applications are particularly influenced by filler colour. The colour of a filler may sometimes be modified by removal of a coloured component (for example, an iron compound) during processing.
Refractive index is closely related to colour in that it strongly influences the appearance of the final product. The difference between the refractive index of the filler and the binder determines the extent of light scattering and hence, opacity and "whiteness" that the filler imparts to the filled product.
Chemical composition is important for some applications where the filler might be susceptible to attack when the end product is in service, or where chemical reactivity of the filler may influence the processing or integrity of the matrix material. As with colour, some modification of chemical composition may be possible during processing. Deliberate modification of chemical properties may be induced by acid washing, calcining or treatment with surface-active molecules or coupling agents.
With such a range of parameters, filler selection inevitably involves some compromises which the chemist must balance against the performance and cost-effectiveness of the product.
BARITE AS A FILLER Barite is a common mineral found extensively
around the world. It is frequently found as a replacement orebody in limestones or dolomites and is typically found in veins or as residual deposits in highly weathered rocks.
Mineral Name: Barite Chemical Names: Barium Sulphate, Barium
Sulfate Chemical Formula: BaS04 Barite Properties: Pure BaSCU (100%)
Specific Gravity: 4.48 MOHS Hardness: 3.5 - 4 Refractive Index: 1.64 (Average) Insoluble in concentrated 3C1QS
Fuses at 800°C to 1100°C to form Sulphide or Carbonate of Barium.
Pure barite is white, but crystalline varieties may have a translucent blue, pink, grey or green hue. All are white when ground into powders. The colours of industrial grade barite are typically:
Buff Tan Pink Brown Yellow Brown Grey White
These colours are typical of the impurities associated with barite deposits, for example:
Colour Typical Impurity Buff Tan Iron Hydroxides (Limonite) Pink Iron Oxide (Hematite) Brown Iron Oxides and Clays Yellow Brown Iron Oxides and Hydroxides Grey Shales and Clays White Typically low impurities ex
cept for Quartz and Calcite
Many types of barite ore are used to produce industrial grade barite in North America.
Virtually all barite ores have some impurities resulting in varying properties such as:
Colour Specific Gravity Chemical Composition
The most important impurities are: Silica and Silicates Iron Oxides and Hydroxides Lead and Heavy Metals
IMPORTANT PROPERTIES OF BARITE AS A FILLER SPECIFIC GRAVITY
Pure barite (100% BaS04) has a specific gravity of 4.48. Most industrial grade barite has a specific gravity ranging from 4.2 to 4.3 with some very pure products falling m the range of 4.3 to 4.4 or greater.
Essentially, specific gravity is related to chemical purity. Since most impurities such as silica, calcite, iron hydroxides and clays have lower specific gravity than barite, the combined effect lowers the specific gravity of the final product.
F R E E SILICA C O N T E N T
With the recent awareness of silica hazards and the resulting governmental and industrial awareness programs, silica content can be an important impurity.
Silica can occur in combination with many elements, most form minerals of the silicate class. The most common type of silica is silicon dioxide (Si02). In natural form this is quartz.
Many other minerals share the same chemical formula but have different properties and crystal structures. Most forms of Si02 are nazardous in terms of respirable silica.
Barite ores are normally analyzed for silica content. Most analysis is to determine total silica content.
Free silica content is defined as unbound grains of silica which can be separated from other grains by selective gravity separation. By this method only free unbound grains with a specific gravity lower than 2.9 (quartz) are separated; most other forms of silica have specific gravities at about 2.65.
In most cases free silica content is one or two orders of magnitude lower than total silica content, since in many barite ores the silicates are bound to or locked within individual grains of barite. Furthermore, free silica in the ground-barite products usually occurs as
76 Industrial Minerals Forum 1991
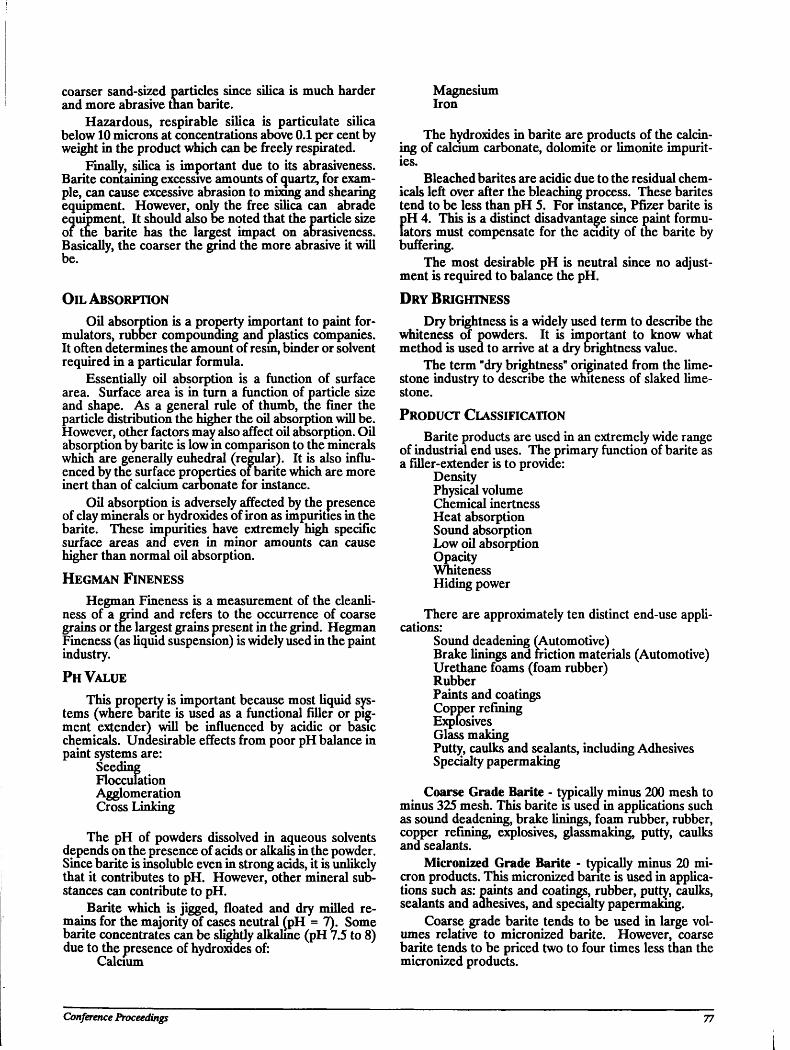
coarser sand-sized particles since silica is much harder and more abrasive than barite.
Hazardous, respirable silica is particulate silica below 10 microns at concentrations above 0.1 per cent by weight in the product which can be freely respirated.
Finally, silica is important due to its abrasiveness. Barite containing excessive amounts of quartz, for example, can cause excessive abrasion to mixing and shearing equipment. However, only the free silica can abrade equipment. It should also be noted that the particle size of the barite has the largest impact on abrasiveness. Basically, the coarser the grind the more abrasive it will be.
OIL ABSORPTION
Oil absorption is a property important to paint for-mulators, rubber compounding and plastics companies. It often determines the amount of resin, binder or solvent required in a particular formula.
Essentially oil absorption is a function of surface area. Surface area is in turn a function of particle size and shape. As a general rule of thumb, the finer the particle distribution the higher the oil absorption will be. However, other factors may also affect oil absorption. Oil absorption by barite is low in comparison to the minerals which are generally euhedral (regular). It is also influenced by the surface properties of barite which are more inert than of calcium carbonate for instance.
Oil absorption is adversely affected by the presence of clay minerals or hydroxides of iron as impurities in the barite. These impurities have extremely high specific surface areas and even in minor amounts can cause higher than normal oil absorption. HEGMAN FINENESS
Hegman Fineness is a measurement of the cleanliness of a grind and refers to the occurrence of coarse grains or the largest grains present in the grind. Hegman Fineness (as liquid suspension) is widely used in the paint industry.
PH VALUE
This property is important because most liquid systems (where barite is used as a functional filler or pigment extender) will be influenced by acidic or basic chemicals. Undesirable effects from poor pH balance in paint systems are:
Seeding Flocculation Agglomeration Cross Linking
The pH of powders dissolved in aqueous solvents depends on the presence of acids or alkalis in the powder. Since barite is insoluble even in strong acids, it is unlikely that it contributes to pH. However, other mineral substances can contribute to pH.
Barite which is jigged, floated and dry milled remains for the majority of cases neutral (pH = 7). Some barite concentrates can be slightly alkalme (pH 7.5 to 8) due to the presence of hydroxides of:
Calcium
Magnesium Iron
The hydroxides in barite are products of the calcining of calcium carbonate, dolomite or limonite impurities.
Bleached barites are acidic due to the residual chemicals left over after the bleaching process. These barites tend to be less than pH 5. For mstance, Pfizer barite is {)H 4. This is a distinct disadvantage since paint formu-ators must compensate for the acidity of the barite by
buffering. The most desirable pH is neutral since no adjust
ment is required to balance the pH. DRY BRIGHTNESS
Dry brightness is a widely used term to describe the whiteness of powders. It is important to know what method is used to arrive at a dry brightness value.
The term "dry brightness" originated from the limestone industry to describe the whiteness of slaked limestone. PRODUCT CLASSIFICATION
Barite products are used in an extremely wide range of industrial end uses. The primary function of barite as a filler-extender is to provide:
Density Physical volume Chemical inertness Heat absorption Sound absorption Low oil absorption Opacity Whiteness Hiding power
There are approximately ten distinct end-use applications:
Sound deadening (Automotive) Brake linings and friction materials (Automotive) Urethane foams (foam rubber) Rubber Paints and coatings Copper refining Explosives Glass making Putty, caulks and sealants, including Adhesives Specialty papermaking
Coarse Grade Barite - typically minus 200 mesh to minus 325 mesh. This barite is used in applications such as sound deadening, brake linings, foam rubber, rubber, copper refining, explosives, glassmaking, putty, caulks and sealants.
Micronized Grade Barite - typically minus 20 micron products. This micronized barite is used in applications such as: paints and coatings, rubber, putty, caulks, sealants and adhesives, and specialty papermaking.
Coarse grade barite tends to be used in large volumes relative to micronized barite. However, coarse barite tends to be priced two to four times less than the micronized products.
Conference Proceeding? 77
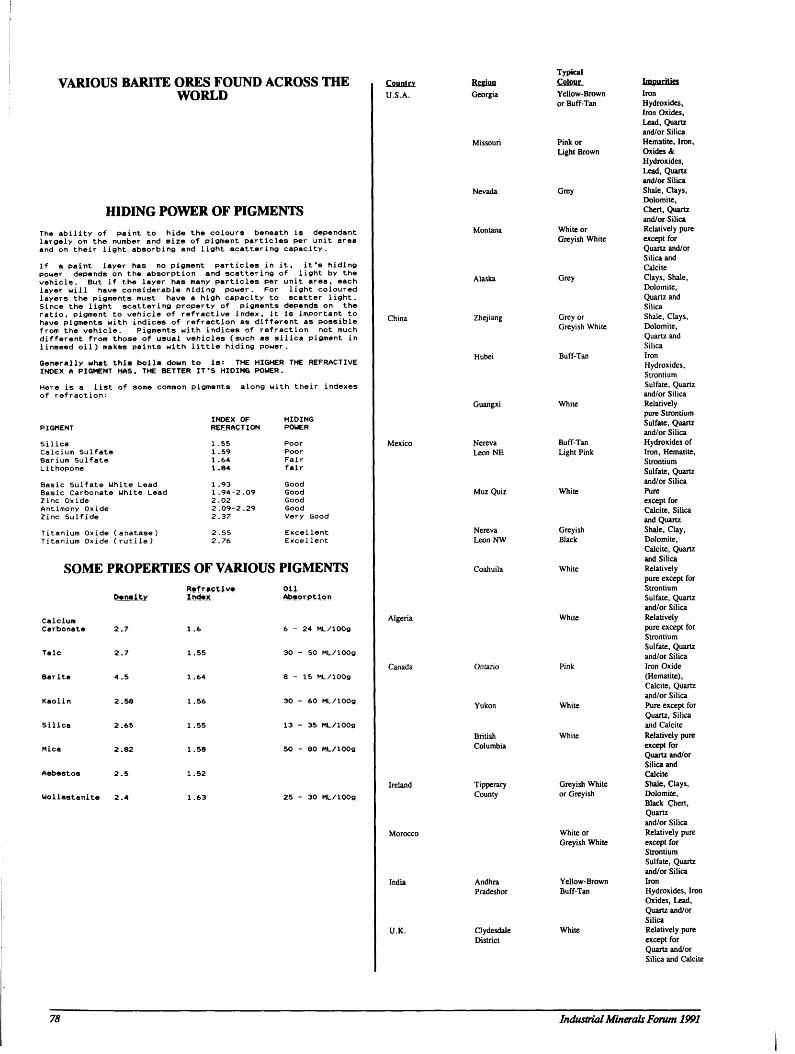
VARIOUS BARITE ORES FOUND ACROSS THE WORLD
HIDING POWER OF PIGMENTS The ability of paint to hide the colours beneath is dependant largely on the number and size of pigment particles per unit area and on their light absorbing and light scattering capacity. If a paint layer has no pigment particles in it, it's hiding power depends on the absorption and scattering of light by the vehicle. But if the layer has many particles per unit area, each layer will have considerable hiding power. For light coloured layers the pigments must have a high capacity to scatter light. Since the light scattering property of pigments depends on the ratio, pigment to vehicle of refractive index, it is important to have pigments with indices of refraction as different as possible from the vehicle. Pigments with indices of refraction not much different from those of usual vehicles (such as silica pigment in linseed oil) makes paints with little hiding power. Generally what this boils down to is: THE HIGHER THE REFRACTIVE INDEX A PIGMENT HAS, THE BETTER IT'S HIDING POWER.
Here is a list of some common pigments of refraction:
PIGMENT
along with their indexes
Silica Calcium Sulfate Barium Sulfate Lithopone Basic Sulfate White Lead Basic Carbonate White Lead Zinc Oxide Antimony Oxide Zinc Sulfide
Titanium Oxide (anatase) Titanium Oxide (rutile)
INDEX OF HIDING REFRACTION POUER 1 .55 Poor 1 .59 Poor 1.64 Fair 1 .84 fair 1 .93 Good 1.94-2 .09 Good 2.02 Good 2.09-2 .29 Good 2.37 Very Good 2.55 Excellent 2.76 Excel lent
SOME PROPERTIES OF VARIOUS PIGMENTS
Density RefTACtiVl. Index.
Oil Absorption
Calcium Carbonate 2.7 1.6 6 - 2 4 ML/lOOg
Talc 2.7 1.55 30 - 50 ML/lOOg
Barite 4.5 1 .64 8 - 1 5 ML/lOOg
Kaolin 2.58 1.56 30 - 60 ML/lOOg
Silica 2.65 1 .55 13 - 35 ML/lOOg
Mica 2.82 1 .58 50 - 80 ML/lOOg
Asbestos 2.5 1.52
Uollastanite 2.4 1.63 25 - 30 ML/lOOg
Country U.S.A.
Region Georgia
Missouri
Zhejiang
Guangxi
Nereva Leon NE
Muz Quiz
Nereva LeonNW
Coahuila
Algeria
Canada
Ireland
British Columbia
Tipperary County
India Andhra Pradeshor
Clydesdale District
Typical Colour Yellow-Brown or Buff-Tan
Pink or Light Brown
Grey
White or Greyish White
Grey
Grey or Greyish White
Buff-Tan
Buff-Tan Light Pink
Greyish Black
White
White
Greyish White or Greyish
White or Greyish White
Yellow-Brown Buff-Tan
Impurities Iron Hydroxides, Iron Oxides, Lead, Quartz and/or Silica Hematite, Iron, Oxides & Hydroxides, Lead, Quartz and/or Silica Shale, Clays, Dolomite, Chert, Quartz and/or Silica Relatively pure except for Quartz and/or Silica and Calcite Clays, Shale, Dolomite, Quartz and Silica Shale, Clays, Dolomite, Quartz and Silica Iron Hydroxides, Strontium Sulfate, Quartz and/or Silica Relatively pure Strontium Sulfate, Quartz and/or Silica Hydroxides of Iron, Hematite, Strontium Sulfate, Quartz and/or Silica Pure except for Calcite, Silica and Quartz Shale, Clay, Dolomite, Calcite, Quartz and Silica Relatively pure except for Strontium Sulfate, Quartz and/or Silica Relatively pure except for Strontium Sulfate, Quartz and/or Silica Iron Oxide (Hematite), Calcite, Quartz and/or Silica Pure except for Quartz, Silica and Calcite Relatively pure except for Quartz and/or Silica and Calcite Shale, Clays, Dolomite, Black Chert, Quartz and/or Silica Relatively pure except for Strontium Sulfate, Quartz and/or Silica Iron
Hydroxides, Iron Oxides, Lead, Quartz and/or Silica Relatively pure except for Quartz and/or Silica and Calcite
78 Industrial Minerals Forum 1991
THE NORTH AMERICAN MARKET FOR BARITE
This market can be divided into two distinct market segments:
(a) Coarse grind markets (b) Micronized grind markets It is estimated that approximately 150 000 short tons
of barite are sold per year as a filler and extender in the North American market. This market is made up of 65 per cent coarse grade and 35 per cent micronized grade products.
There are approximately 18 companies in North America producing barite from either domestic sources or imported barite ore. Most of the imported ore comes from China, Algeria, Mexico and Morocco. In addition, there are three known imported barite products which are used in North America. These are mainly high quality micronized products which are not usually readily available in North America.
Most producers of barite for the filler market usually restrict the range of products they produce to some specified segments and only a very few sell a complete range of products.
This barite filler and extender market is extremely competitive and freight rates play an important part as to whether or not a supplier can sell its product in a specific market segment.
BIBLIOGRAPHY Adhesive Handbook; Editor, Shields, J., Third Edition. Collings, R.K., Mineral Waste as Potential Mineral Fill
ers, Proceedings ORF/CANMET Symposium on Mineral Fillers, Toronto, October 20-21,1981.
Eckert, C.H., The Increasing Impact of Canadian Industrial Minerals on the North American Filler and Extender Market; Paper presented at the Sixth Industrial Minerals International Congress, Toronto, May 21-24,1984.
Eckert, C.H., Extender and Filler Pigments Versus Other Industrial Minerals - What it Takes to Succeed; Paper presented at the Metal Bulletin Pigments and Extender Forum, Atlanta, November 30, 1984.
Ferrigno, T.H. (1978): Principles of Filler Selection and Use; Editors, Katz, H.S. and Milewski, J.V., Handbook of Fillers and Reinforcements for Plastics, Van Nostrand and Reinhold, New York,
Katz, H.S. and Ehrenreich, L., (1978): Glass Fillers; in Additives for Plastics, Editor, Seymour, R.B., Academic Press, Vol. 2.
Lefond SJ., Industrial Minerals and Rocks, Vol. I, Barium Minerals.
Milewski, J.V. (1978): Packing Concepts in the Utilization of Filler and Reinforcement Combinations; Handbook of Fillers and Reinforcements for Plastics, Editors, Katz, H.S. and Milewski, J.V., Van Nostrand and Reinhold, New York,.
Muck, D.L. and Ritter, J., Glass Microspheres: Bubbles and Beads as Plastics Additives; Plastics Compounding, Jan/Feb, 1979, pages 12-28.
Oleesky, S.S. and Mohr, J.G. (1964): SPI Handbook of Reinforced Plastics; Reinhold.
Ritter, J. (1970): Sphere-filled Plastic Composites Theory, Testing, Applications; Paper at the 25th Anniversary Technical Conference RP/CI, SPI, Section 8-A
Ryan B. and Tardy, B. (1978): Solid Spherical Fillers and Hollow Spherical Fillers, Handbook of Fillers and Reinforcements for Plastics, Editors, Katz, H.S. and Milewski, J.V., Van Nostrand and Reinhold, New York.
Saveringhaus, N. (1975): Fillers, Filters and Absorbents; in Industrial Minerals and Rocks, Ed. in Chief, S. J. Lefond, American Institute of Mining, Metallurgy & Petroleum Engineers Inc., New York.
Surface Coatmg Vol. 1 and 2, Raw Material and Their Usage, Prepared by the Oil and Colour Chemist's Assoc., Australia.
Conference Proceeding? 79

80 Industrial Minerals Forum 1991
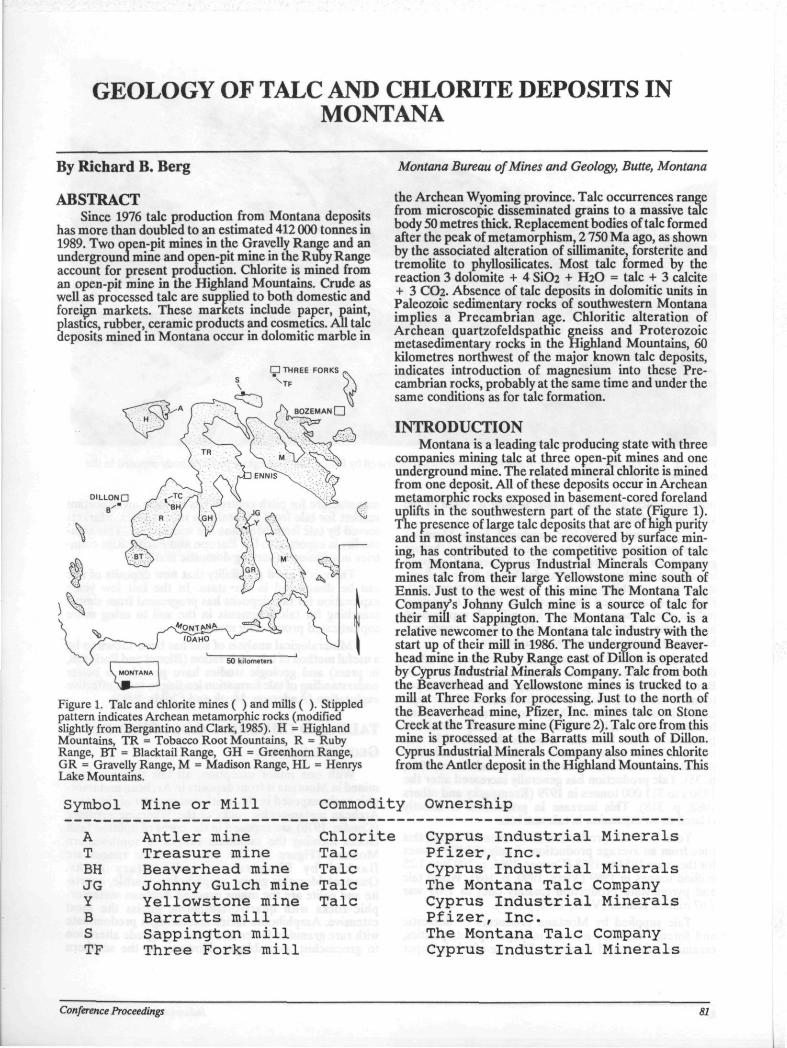
GEOLOGY OF TALC AND CHLORITE DEPOSITS IN MONTANA
By Richard B. Berg
ABSTRACT Since 1976 talc production from Montana deposits
has more than doubled to an estimated 412 000 tonnes in 1989. Two open-pit mines in the Gravelly Ranee and an underground mine and open-pit mine in the Ruby Range account for present production. Chlorite is mined from an open-pit mine in the Highland Mountains. Crude as well as processed talc are supplied to both domestic and foreign markets. These markets include paper, paint, plastics, rubber, ceramic products and cosmetics. All talc deposits mined in Montana occur in dolomitic marble in
□ THREE FORKS
Figure 1. Talc and chlorite mines ( ) and mills ( ). Stippled pattern indicates Archean metamorphic rocks (modified slightly from Bergantino and Clark, 1985). H = Highland Mountains, TR = Tobacco Root Mountains, R = Ruby Range, BT = Blacktail Range, GH = Greenhorn Range, GR = Gravelly Range, M = Madison Range, HL = Henrys Lake Mountains.
Montana Bureau of Mines and Geology, Butte, Montana
the Archean Wyoming province. Talc occurrences range from microscopic disseminated grains to a massive talc body 50 metres thick. Replacement bodies of talc formed after the peak of metamorphism, 2 750 Ma ago, as shown by the associated alteration of sillimanite, forsterite and tremolite to phyllosilicatcs. Most talc formed by the reaction 3 dolomite + 4 SiC»2 + H2O = talc + 3 calcite + 3 CO2. Absence of talc deposits in dolomitic units in Paleozoic sedimentary rocks of southwestern Montana implies a Precambrian age. Chloritic alteration of Archean quartzofeldspathic gneiss and Proterozoic metasedimentary rocks in the Highland Mountains, 60 kilometres northwest of the major known talc deposits, indicates introduction of magnesium into these Precambrian rocks, probably at the same time and under the same conditions as for talc formation.
INTRODUCTION Montana is a leading talc producing state with three
companies mining talc at three open-pit mines and one underground mine. The related mineral chlorite is mined from one deposit. All of these deposits occur in Archean metamorphic rocks exposed in basement-cored foreland uplifts in the southwestern part of the state (Figure 1). The presence of large talc deposits that are of high purity and m most instances can be recovered by surface mining, has contributed to the competitive position of talc from Montana. Cyprus Industrial Minerals Company mines talc from their large Yellowstone mine south of Ennis. Just to the west of this mine The Montana Talc Company's Johnny Gulch mine is a source of talc for their mill at Sappington. The Montana Talc Co. is a relative newcomer to the Montana talc industry with the start up of their mill in 1986. The underground Beaver-head mine in the Ruby Range east of Dillon is operated by Cyprus Industrial Minerals Company. Talc from both the Beaverhead and Yellowstone mines is trucked to a mill at Three Forks for processing. Just to the north of the Beaverhead mine, Pfizer, Inc. mines talc on Stone Creek at the Treasure mine (Figure 2). Talc ore from this mine is processed at the Barratts mill south of Dillon. Cyprus Industrial Minerals Company also mines chlorite from the Antler deposit in the Highland Mountains. This
Symbol Mine or Mill Commodity Ownership A Antler mine Chlorite T Treasure mine Talc BH Beaverhead mine Talc JG Johnny Gulch mine Talc Y Yellowstone mine Talc B Barratts mill S Sappington mill TF Three Forks mill
Cyprus Industrial Minerals Pfizer, Inc. Cyprus Industrial Minerals The Montana Talc Company Cyprus Industrial Minerals Pfizer, Inc. The Montana Talc Company Cyprus Industrial Minerals
Conference Proceedings 81
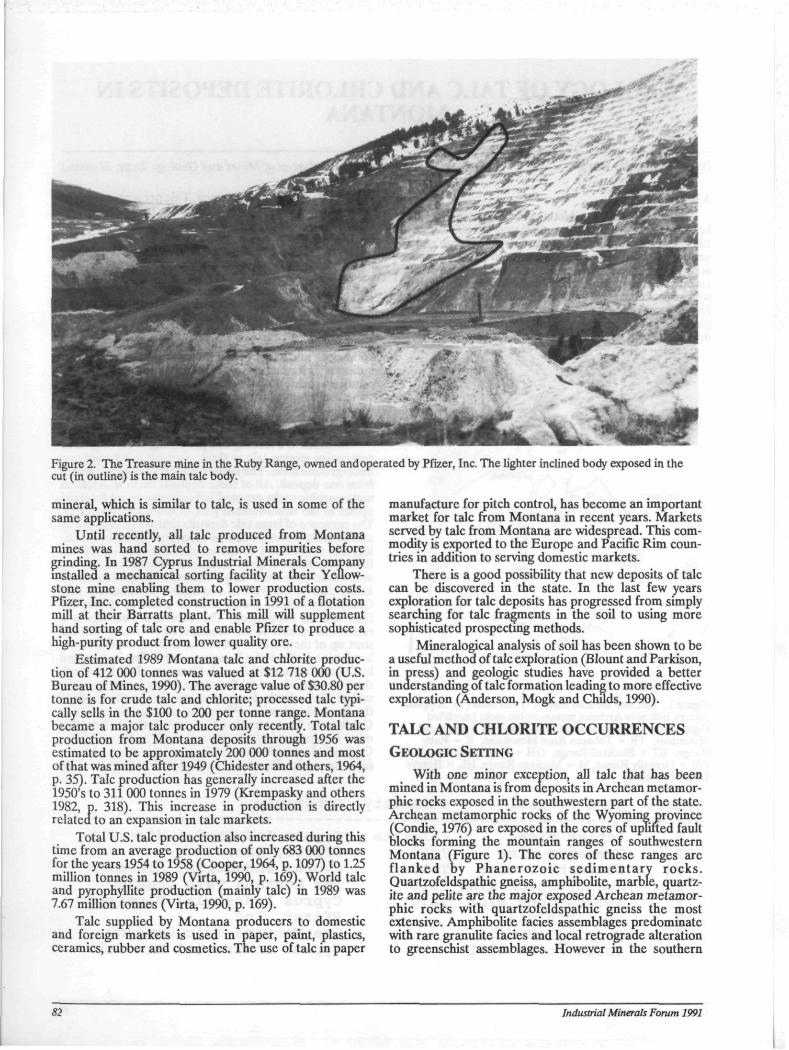
Figure 2. The Treasure mine in the Ruby Range, owned and operated by Pfizer, Inc. The lighter inclined body exposed in the cut (in outline) is the main talc body.
mineral, which is similar to talc, is used in some of the same applications.
Until recently, all talc produced from Montana mines was hand sorted to remove impurities before grinding. In 1987 Cyprus Industrial Minerals Company installed a mechanical sorting facility at their Yellowstone mine enabling them to lower production costs. Pfizer, Inc. completed construction in 1991 of a flotation mill at their Barratts plant. This mill will supplement hand sorting of talc ore and enable Pfizer to produce a high-purity product from lower quality ore.
Estimated 1989 Montana talc and chlorite production of 412 000 tonnes was valued at $12 718 000 (U.S. Bureau of Mines, 1990). The average value of $30.80 per tonne is for crude talc and chlorite; processed talc typically sells in the $100 to 200 per tonne range. Montana became a major talc producer only recently. Total talc production from Montana deposits through 1956 was estimated to be approximately 200 000 tonnes and most of that was mined after 1949 (Chidester and others, 1964, p. 35). Talc production has generally increased after the 1950's to 311 000 tonnes in 1979 (Krempasky and others 1982, p. 318). This increase in production is directly related to an expansion in talc markets.
Total U.S. talc production also increased during this time from an average production of only 683 000 tonnes for the years 1954 to 1958 (Cooper, 1964, p. 1097) to 1.25 million tonnes in 1989 (Virta, 1990, p. 169). World talc and pyrophyllite production (mainly talc) in 1989 was 7.67 million tonnes (Virta, 1990, p. 169).
Talc supplied by Montana producers to domestic and foreign markets is used in paper, paint, plastics, ceramics, rubber and cosmetics. The use of talc in paper
manufacture for pitch control, has become an important market for talc from Montana in recent years. Markets served by talc from Montana are widespread. This commodity is exported to the Europe and Pacific Rim countries in addition to serving domestic markets.
There is a good possibility that new deposits of talc can be discovered in the state. In the last few years exploration for talc deposits has progressed from simply searching for talc fragments in the soil to using more sophisticated prospectmg methods.
Mineralogical analysis of soil has been shown to be a useful method of talc exploration (Blount and Parkison, in press) and geologic studies have provided a better understanding of talc formation leading to more effective exploration (Anderson, Mogk and ChHds, 1990).
TALC AND CHLORITE OCCURRENCES GEOLOGIC SETTING
With one minor exception, all talc that has been mined in Montana is from deposits in Archean metamor-phic rocks exposed in the southwestern part of the state. Archean metamorphic rocks of the Wyoming province (Condie, 1976) are exposed in the cores of uplifted fault blocks forming the mountain ranges of southwestern Montana (Figure 1). The cores of these ranges are flanked oy Phane rozo i c sed imentary rocks. Quartzofeldspathic gneiss, amphibolite, marble, quartz-ite and pelite are the major exposed Archean metamorphic rocks with quartzofeldspathic gneiss the most extensive. Amphibolite facies assemblages predominate with rare granulite facies and local retrograde alteration to greenschist assemblages. However in the southern
82 Industrial Minerals Forum 1991
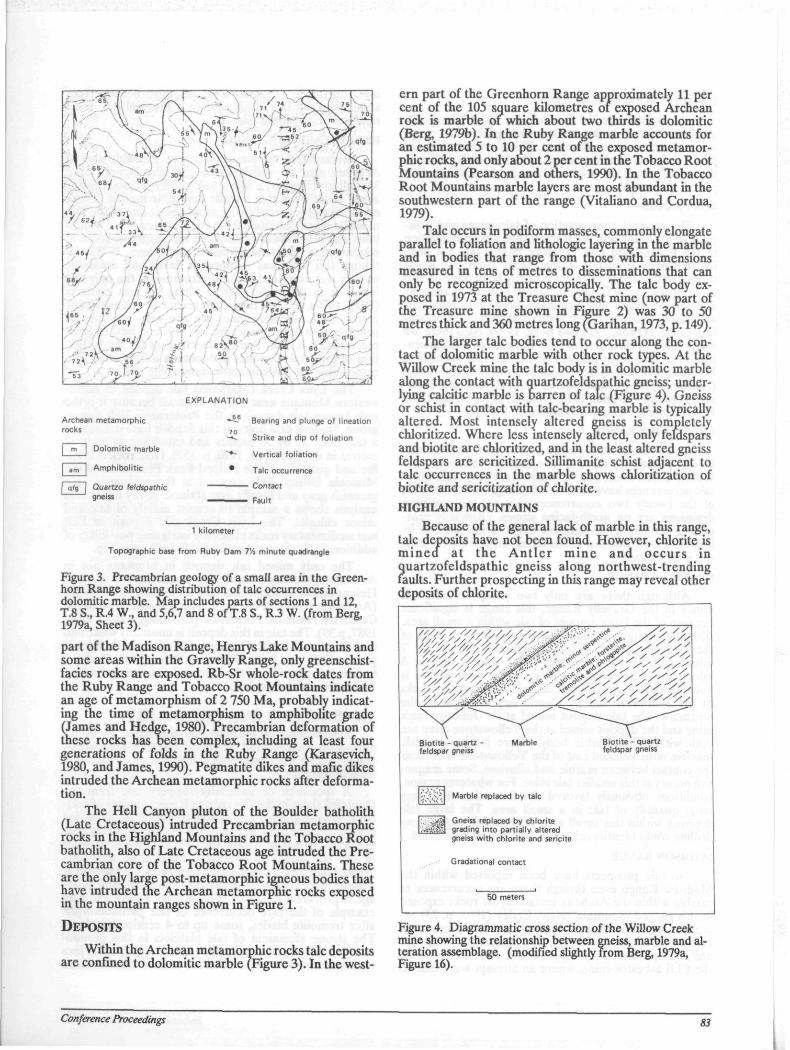
EXPLANATION
Archean metamorphic rocks
m I Dolomitic rnarble
am I Amphibolitic
qfg I Quartzo feldspathic gneiss
Bearing and plunge of lineation
Strike and dip of foliation
Vertical foliation
Talc occurrence
Contact
Fault
1 kilometer
Topographic base from Ruby Dam 7'A minute quadrangle
Figure 3. Precambrian geology of a small area in the Greenhorn Range showing distribution of talc occurrences in dolomitic marble. Map includes parts of sections 1 and 12, T.8 S., R.4 W., and 5,6,7 and 8 of T.8 S., R.3 W. (from Berg, 1979a, Sheet 3).
part of the Madison Range, Henrys Lake Mountains and some areas within the Gravelly Range, only greenschist-facies rocks are exposed. Rb-Sr whole-rock dates from the Ruby Range and Tobacco Root Mountains indicate an age of metamorphism of 2 750 Ma, probably indicating the time of metamorphism to amphibohte grade (James and Hedge, 1980). Precambrian deformation of these rocks has been complex, including at least four generations of folds in the Ruby Range (Karasevich, 1980, and James, 1990). Pegmatite dikes and mafic dikes intruded the Archean metamorphic rocks after deformation.
The Hell Canyon pluton of the Boulder batholith (Late Cretaceous) intruded Precambrian metamorphic rocks in the Highland Mountains and the Tobacco Root batholith, also of Late Cretaceous age intruded the Precambrian core of the Tobacco Root Mountains. These are the only large post-metamorphic igneous bodies that have intruded the Archean metamorphic rocks exposed in the mountain ranges shown in Figure 1.
DEPOSITS
Within the Archean metamorphic rocks talc deposits are confined to dolomitic marble (Figure 3). In the west
ern part of the Greenhorn Range approximately 11 per cent of the 105 square kilometres of exposed Archean rock is marble of which about two thirds is dolomitic (Berg, 1979b). In the Ruby Range marble accounts for an estimated 5 to 10 per cent of the exposed metamorphic rocks, and only about 2 per cent in the Tobacco Root Mountains (Pearson and others, 1990). In the Tobacco Root Mountains marble layers are most abundant in the southwestern part of the range (Vitaliano and Cordua, 1979).
Talc occurs in podiform masses, commonly elongate parallel to foliation and lithologic layering in the marble and in bodies that range from those with dimensions measured in tens of metres to disseminations that can only be recognized microscopically. The talc body exposed in 1973 at the Treasure Chest mine (now part of the Treasure mine shown in Figure 2) was 30 to 50 metres thick and 360 metres long (Garihan, 1973, p. 149).
The larger talc bodies tend to occur along the contact of dolomitic marble with other rock types. At the Willow Creek mine the talc body is in dolomitic marble along the contact with quartzofeldspathic gneiss; underlying calcitic marble is barren of talc (Figure 4). Gneiss or schist in contact with talc-bearing marble is typically altered. Most intensely altered gneiss is completely chloritized. Where less intensely altered, only feldspars and biotite are chloritized, and in the least altered gneiss feldspars are sericitized. Sillimanite schist adjacent to talc occurrences in the marble shows chloritization of biotite and sericitization of chlorite.
HIGHLAND MOUNTAINS Because of the general lack of marble in this range,
talc deposits have not been found. However, chlorite is mined at the Ant le r mine and occurs in quartzofeldspathic gneiss along northwest-trending faults. Further prospecting in this range may reveal other deposits of chlorite.
Biotite - quartz feldspar gneiss
Marble Biotite - quartz feldspar gneiss
'■/~\~-?, Marble replaced by talc
r~~*3 Gneiss replaced by chlorite ■■•cM fe grading into partially altered
gneiss with chlorite and sericite
Gradational contact
50 meters
Figure 4. Diagrammatic cross section of the Willow Creek mine showing the relationship between gneiss, marble and alteration assemblage, (modified slightly from Berg, 1979a, Figure 16).
Conference Proceedings 83
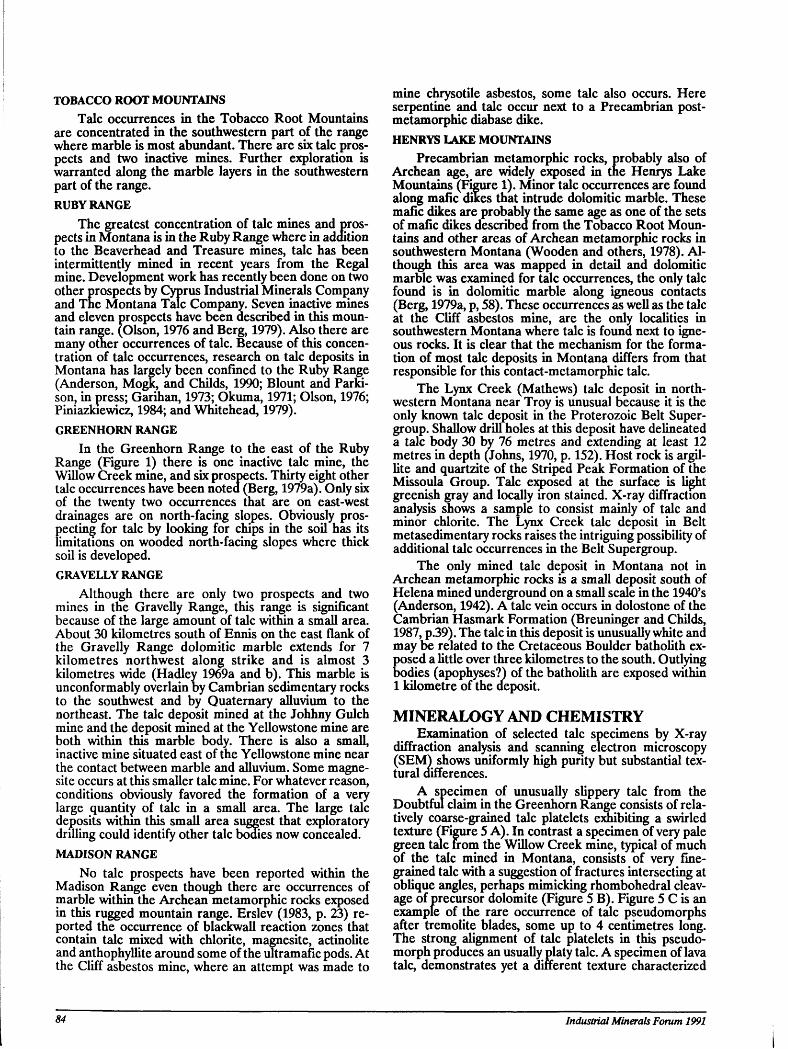
TOBACCO ROOT MOUNTAINS Talc occurrences in the Tobacco Root Mountains
are concentrated in the southwestern part of the range where marble is most abundant. There are six talc prospects and two inactive mines. Further exploration is warranted along the marble layers in the southwestern part of the range. RUBY RANGE
The greatest concentration of talc mines and prospects in Montana is in the Ruby Range where in addition to the Beaverhead and Treasure mines, talc has been intermittently mined in recent years from the Regal mine. Development work has recently been done on two other prospects by Cyprus Industrial Minerals Company and The Montana Talc Company. Seven inactive mines and eleven prospects have been described in this mountain range. (Olson, 1976 and Berg, 1979). Also there are many other occurrences of talc. Because of this concentration of talc occurrences, research on talc deposits in Montana has largely been confined to the Ruby Range (Anderson, Mogk, and Childs, 1990; Blount and Parki-son, in press; Garman, 1973; Okuma, 1971; Olson, 1976; Piniazkiewicz, 1984; and Whitehead, 1979). GREENHORN RANGE
In the Greenhorn Range to the east of the Ruby Range (Figure 1) there is one inactive talc mine, the Willow Creek mine, and six prospects. Thirty eight other talc occurrences have been noted (Berg, 1979a). Only six of the twenty two occurrences that are on east-west drainages are on north-facing slopes. Obviously prospecting for talc by looking for chips in the soil has its limitations on wooded north-facing slopes where thick soil is developed. GRAVELLY RANGE
Although there are only two prospects and two mines in the Gravelly Range, this range is significant because of the large amount of talc within a small area. About 30 kilometres south of Ennis on the east flank of the Gravelly Range dolomitic marble extends for 7 kilometres northwest along strike and is almost 3 kilometres wide (Hadley 1969a and b). This marble is unconformably overlain by Cambrian sedimentary rocks to the southwest and by Quaternary alluvium to the northeast. The talc deposit mined at the Johhny Gulch mine and the deposit mined at the Yellowstone mine are both within this marble body. There is also a small, inactive mine situated east of the Yellowstone mine near the contact between marble and alluvium. Some magne-site occurs at this smaller talc mine. For whatever reason, conditions obviously favored the formation of a very large quantity of talc in a small area. The large talc deposits within this small area suggest that exploratory drilling could identify other talc bodies now concealed.
MADISON RANGE No talc prospects have been reported within the
Madison Range even though there are occurrences of marble within the Archean metamorphic rocks exposed in this rugged mountain range. Erslev (1983, p. 23) reported the occurrence of blackwall reaction zones that contain talc mixed with chlorite, magnesite, actinolite and anthophyllite around some of the ultramafic pods. At the Cliff asbestos mine, where an attempt was made to
mine chrysotile asbestos, some talc also occurs. Here serpentine and talc occur next to a Precambrian post-metamorphic diabase dike. HENRYS LAKE MOUNTAINS
Precambrian metamorphic rocks, probably also of Archean age, are widely exposed in the Henrys Lake Mountains (Figure 1). Minor talc occurrences are found along mafic dikes that intrude dolomitic marble. These mafic dikes are probably the same age as one of the sets of mafic dikes described from the Tobacco Root Mountains and other areas of Archean metamorphic rocks in southwestern Montana (Wooden and others, 1978). Although this area was mapped in detail and dolomitic marble was examined for talc occurrences, the only talc found is in dolomitic marble along igneous contacts (Berg, 1979a, p, 58). These occurrences as well as the talc at the Cliff asbestos mine, are the only localities in southwestern Montana where talc is found next to igneous rocks. It is clear that the mechanism for the formation of most talc deposits in Montana differs from that responsible for this contact-metamorphic talc.
The Lynx Creek (Mathews) talc deposit in northwestern Montana near Troy is unusual because it is the only known talc deposit in the Proterozoic Belt Supergroup. Shallow drill holes at this deposit have delineated a talc body 30 by 76 metres and extending at least 12 metres in depth (Johns, 1970, p. 152). Host rock is argil-lite and quartzite of the Striped Peak Formation of the Missoula Group. Talc exposed at the surface is light greenish gray and locally iron stained. X-ray diffraction analysis shows a sample to consist mainly of talc and minor chlorite. The Lynx Creek talc deposit in Belt metasedimentary rocks raises the intriguing possibility of additional talc occurrences in the Belt Supergroup.
The only mined talc deposit in Montana not in Archean metamorphic rocks is a small deposit south of Helena mined underground on a small scale in the 1940's (Anderson, 1942). A talc vein occurs in dolostone of the Cambrian Hasmark Formation (Breuninger and Childs, 1987, p.39). The talc in this deposit is unusually white and may be related to the Cretaceous Boulder batholith ex-
Eosed a little over three kilometres to the south. Outlying odies (apophyses?^ of the batholith are exposed within
1 kilometre of the deposit.
MINERALOGY AND CHEMISTRY Examination of selected talc specimens by X-ray
diffraction analysis and scanning electron microscopy (SEM^ shows uniformly high purity but substantial tex-tural differences.
A specimen of unusually slippery talc from the Doubtful claim in the Greenhorn Range consists of relatively coarse-grained talc platelets exhibiting a swirled texture (Figure 5 A). In contrast a specimen of very pale green talc from the Willow Creek mine, typical of much of the talc mined in Montana, consists of very finegrained talc with a suggestion of fractures intersecting at oblique angles, perhaps mimicking rhombohedral cleavage of precursor dolomite (Figure 5 B). Figure 5 C is an example of the rare occurrence of talc pseudomorphs after tremolite blades, some up to 4 centimetres long. The strong alignment of talc platelets in this pseudo-morph produces an usually platy talc. A specimen of lava talc, demonstrates yet a different texture characterized
84 Industrial Minerals Forum 1991
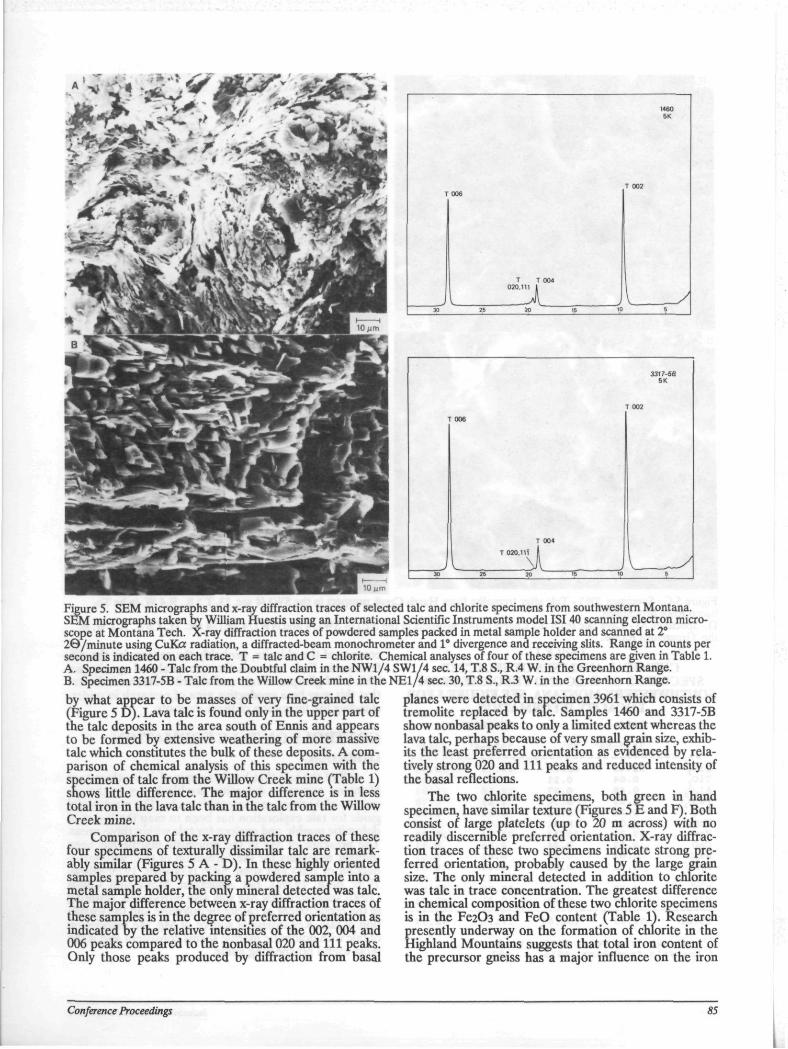
1460 5K
T006 T 002
1 L
T T 004 020.111 1
, I 5 30 2' 30 15 10 5
3317-58 5K
T002
r 006
T 004
J T 020.111 1
. \ 5 X 26 20 IS 10 5
Figure 5. SEM micrographs and x-ray diffraction traces of selected talc and chlorite specimens from southwestern Montana. SEM micrographs taken by William Huestis using an International Scientific Instruments model ISI 40 scanning electron microscope at Montana Tech. X-ray diffraction traces of powdered samples packed in metal sample holder and scanned at 2° 2©/minute using CuKa radiation, a diffracted-beam monochrometer and 1° divergence and receiving slits. Range in counts per second is indicated on each trace. T = talc and C = chlorite. Chemical analyses of four of these specimens are given in Table 1. A. Specimen 1460 - Talc from the Doubtful claim in the NW1/4 SW1/4 sec. 14, T.8 S., R.4 W. in the Greenhorn Range. B. Specimen 3317-5B - Talc from the Willow Creek mine in the NE1/4 sec. 30, T.8 S., R3 W. in the Greenhorn Range.
planes were detected in specimen 3961 which consists of by what appear to be masses of very fine-grained talc (Figure 5 D). Lava talc is found only in the upper part of the talc deposits in the area south of Ennis and appears to be formed by extensive weathering of more massive talc which constitutes the bulk of these deposits. A comparison of chemical analysis of this specimen with the specimen of talc from the Willow Creek mine (Table 1) snows little difference. The major difference is in less total iron in the lava talc than in the talc from the Willow Creek mine.
Comparison of the x-ray diffraction traces of these four specimens of texturally dissimilar talc are remarkably similar (Figures 5 A - D). In these highly oriented samples prepared by packing a powdered sample into a metal sample holder, the only mineral detected was talc. The major difference between x-ray diffraction traces of these samples is in the degree of preferred orientation as indicated by the relative mtensities of the 002, 004 and 006 peaks compared to the nonbasal 020 and 111 peaks. Only those peaks produced by diffraction from basal
tremolite replaced by talc. Samples 1460 and 3317-5B show nonbasal peaks to only a limited extent whereas the lava talc, perhaps because of very small grain size, exhibits the least preferred orientation as evidenced by relatively strong 020 and 111 peaks and reduced intensity of the basal reflections.
The two chlorite specimens, both green in hand specimen, have similar texture (Figures 5 E and F). Both consist of large platelets (up to 20 m across) with no readily discernible preferred orientation. X-ray diffraction traces of these two specimens indicate strong preferred orientation, probably caused by the large grain size. The only mineral detected in addition to chlorite was talc in trace concentration. The greatest difference in chemical composition of these two chlorite specimens is in the Fe203 and FeO content (Table IV Research presently underway on the formation of chlorite in the Highland Mountains suggests that total iron content of the precursor gneiss has a major influence on the iron
Conference Proceedings 85
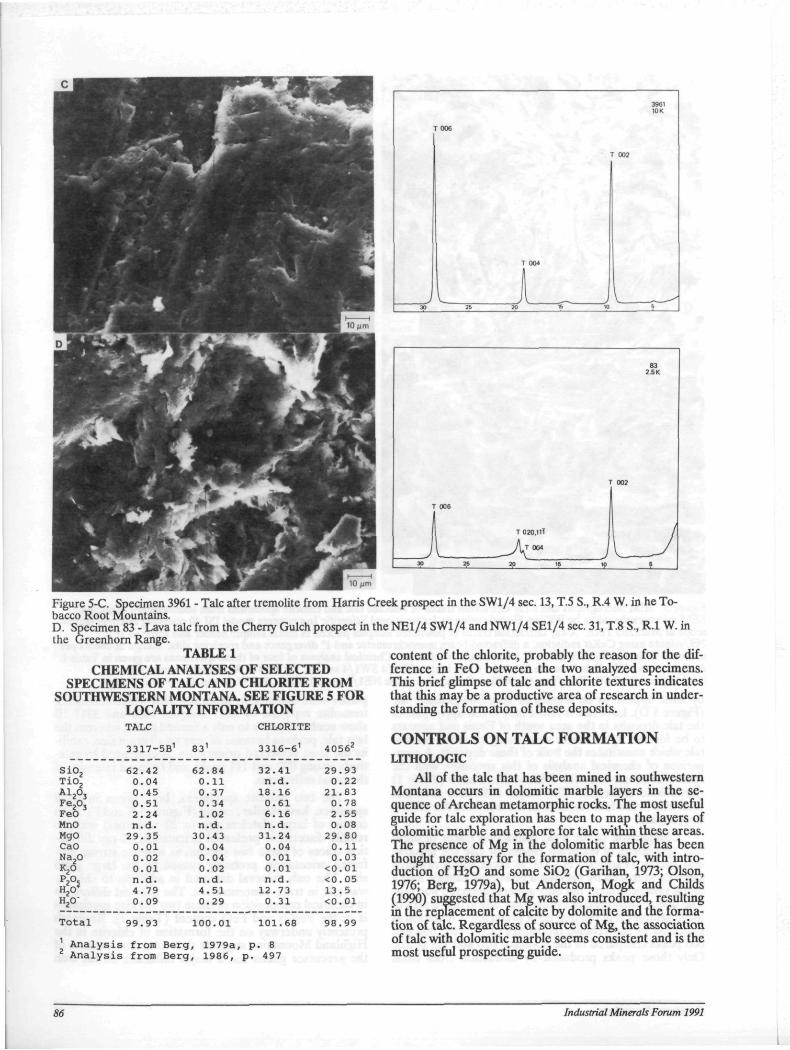
3961 10 K
T 006
r 002
T 004
1 1 I 1 \ \ 5 30 2S 20 15 i l l 5
Figure 5-C. Specimen 3961 - Talc after tremolite from Harris Creek prospect in the SWl/4 sec. 13, T.5 S., R.4 W. in he Tobacco Root Mountains. D. Specimen 83 - Lava talc from the Cherry Gulch prospect in the NEl/4 SWl/4 and NWl/4 SEl/4 sec. 31, T.8 S., R.l W. in the Greenhorn Range.
TABLE 1 CHEMICAL ANALYSES OF SELECTED
SPECIMENS OF TALC AND CHLORITE FROM SOUTHWESTERN MONTANA. SEE FIGURE 5 FOR
LOCALITY INFORMATION TALC
3317-5E »1
CHLORITE
3 3 1 6 - 6 1 4056 2
S i 0 2 6 2 . 4 2 6 2 . 8 4 3 2 . 4 1 2 9 . 9 3 T i 0 2 0 . 0 4 0 . 1 1 n . d . 0 . 2 2 A1 2 0 3 0 . 4 5 0 . 3 7 1 8 . 1 6 2 1 . 8 3 F e 2 0 3 0 . 5 1 0 . 3 4 0 . 6 1 0 . 7 8 FeO 2 . 2 4 1 . 0 2 6 . 1 6 2 . 5 5 MnO n . d . n . d . n . d . 0 . 0 8 MgO 2 9 . 3 5 3 0 . 4 3 3 1 . 2 4 2 9 . 8 0 CaO 0 . 0 1 0 . 0 4 0 . 0 4 0 . 1 1 N a 2 0 K20
0 . 0 2 0 . 0 4 0 . 0 1 0 . 0 3 N a 2 0 K20 0 . 0 1 0 . 0 2 0 . 0 1 < 0 . 0 1 P 2 0 H 2 0 J
n . d . n . d . n . d . < 0 . 0 5 P 2 0 H 2 0 J 4 . 7 9 4 . 5 1 1 2 . 7 3 1 3 . 5 H20- 0 . 0 9 0 . 2 9 0 . 3 1 < 0 . 0 1
T o t a l 9 9 . 9 3 1 0 0 . 0 1 1 0 1 . 6 8 9 8 . 9 9
A n a l y s i s from B e r g , 1979a , p . 8 A n a l y s i s from B e r g , 1986 , p . 497
content of the chlorite, probably the reason for the difference in FeO between the two analyzed specimens. This brief glimpse of talc and chlorite textures indicates that this may be a productive area of research in understanding the formation of these deposits.
CONTROLS ON TALC FORMATION LITHOLOGIC
All of the talc that has been mined in southwestern Montana occurs in dolomitic marble layers in the sequence of Archean metamorphic rocks. The most useful guide for talc exploration has been to map the layers of dolomitic marble and explore for talc within these areas. The presence of Mg in the dolomitic marble has been thought necessary for the formation of talc, with introduction of H2O and some SiC»2 (Garihan, 1973; Olson, 1976; Berg, 1979a), but Anderson, Mogk and Childs (1990) suggested that Me was also introduced, resulting in the replacement of calcite by dolomite and the formation of talc. Regardless of source of Mg, the association of talc with dolomitic marble seems consistent and is the most useful prospecting guide.
86 Industrial Minerals Forum 1991
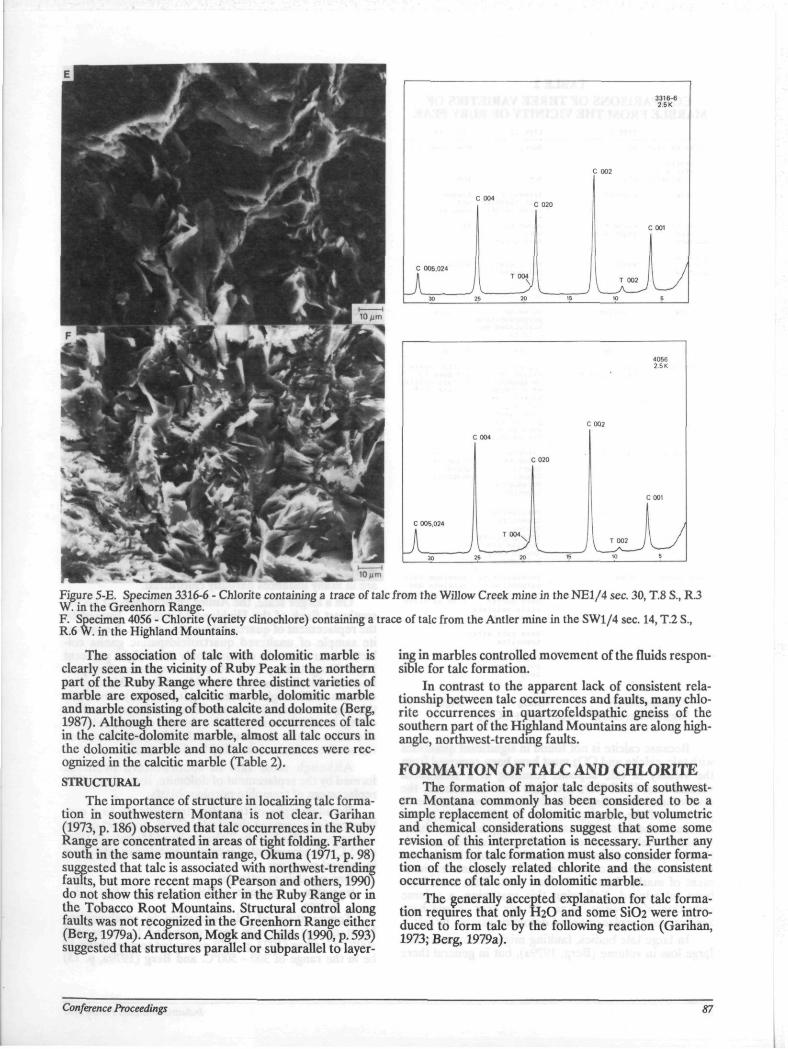
3316-6 2.5K
: oo2
C 004 C 020
C 001
C 005,024
i A SO 25
TCXMJ
20 1 15 J T 002 |
10 5
Figure 5-E. Specimen 3316-6 - Chlorite containing a trace of talc from the Willow Creek mine in the NE1/4 sec. 30, T.8 S., R.3 W. in the Greenhorn Range. F. Specimen 4056 - Chlorite (variety clinochlore) containing a trace of talc from the Antler mine in the SWl/4 sec. 14, T.2 S., R.6 W. in the Highland Mountains.
The association of talc with dolomitic marble is clearly seen in the vicinity of Ruby Peak in the northern part of the Ruby Range where three distinct varieties of marble are exposed, calcitic marble, dolomitic marble and marble consisting of both calcite and dolomite (Berg, 1987). Although there are scattered occurrences of talc in the calcite-dolomite marble, almost all talc occurs in the dolomitic marble and no talc occurrences were recognized in the calcitic marble (Table 2). STRUCTURAL
The importance of structure in localizing talc formation in southwestern Montana is not clear. Garihan (1973, p. 186) observed that talc occurrences in the Ruby Range are concentrated in areas of tight folding. Farther south in the same mountain range, Okuma (1971, p. 98) suggested that talc is associated with northwest-trending faults, but more recent maps (Pearson and others, 1990) do not show this relation either in the Ruby Range or in the Tobacco Root Mountains. Structural control along faults was not recognized in the Greenhorn Range either (Berg, 1979a). Anderson, Mogk and Childs (1990, p. 593) suggested that structures parallel or subparallel to layer
ing in marbles controlled movement of the fluids responsible for talc formation.
In contrast to the apparent lack of consistent relationship between talc occurrences and faults, many chlorite occurrences in auartzofeldspathic gneiss of the southern part of the Highland Mountains are along high-angle, northwest-trending faults.
FORMATION OF TALC AND CHLORITE The formation of major talc deposits of southwest
ern Montana commonly has been considered to be a simple replacement of dolomitic marble, but volumetric and chemical considerations suggest that some some revision of this interpretation is necessary. Further any mechanism for talc formation must also consider formation of the closely related chlorite and the consistent occurrence of talc only in dolomitic marble.
The generally accepted explanation for talc formation requires that only H2O and some Si02 were introduced to form talc by the following reaction (Garihan, 1973; Berg, 1979a).
Conference Proceedings 87

TABLE 2 COMPARISONS OF THREE VARIETIES OF
MARBLE FROM THE VICINITY OF RUBY PEAK TYPE I TYPE II TYPE III
Contains talc No Rarely Most commonly Estimated abundance of this variety 20% 50% 30% Outcrop Rounded Irregular
with solution along joints
Slabby and angular
Color of weathered surface
white to light gray
Brown to very dark brown
Tan
Color of fresh surface
White Tan overall Dolomite-honey Calcite-white
white
Texture Granular Dolomite porphyroblasts surrounded by calcite
Granular
Grain Size 2-10 mm 2-5 mm 2-7 mm Layering Rarely
recognizable Caused by variation in abundance of dolomite Layers 1 cm to l m thick Some quartz layers and boudins a few cm thick
Quartz layers and boudins Overall quartz content <10%
Mineralogy Calcite Calcite Dolomite Quartz Graphite Phlogopite Diopside
Mineralogy Calcite Calcite Dolomite Quartz Graphite Phlogopite Diopside
Dolomite Quartz Graphite
Forsterite Tremolite Spinel Anthophyllite Biotite (in quartz only) K-feldspar
Alteration None Forsterite to Numerous talc serpentine veinlets and
pods typically Rare chrys- < 30 cm thick otile veinlets a few mm thick Rare talc after tremolite Very rare talc pods a few cm long
3CaMg(C03)2 + 4Si02 + Mg3SUOio(OH)2 + 3CaC03 + 3C02
H2O
Because calcite is not found in significant quantities with talc, calcite and CO2 must have been removed from the vicinity of talc deposits resulting in a substantial volume loss. If all Si02 and H2O were introduced, the final volume according to the above reaction would be 71 per cent of the starting volume. If sufficient Si02 was present in the dolomitic marble initially, the final volume would be only 48 per cent of the starting volume. Although quartz occurs in dolomitic marble, it does not occur in sufficient concentration for complete replacement of marble by talc. At least some Si02 must have been introduced. Following this reasoning, a volume reduction of between 39 and 52 per cent should have accompanied replacement of dolomitic marble by talc.
In large talc bodies, faulting might account for this large loss m volume (Berg, 1979a), but in general there
is no evidence of such volume change. Anderson, Mogk and Childs (1990) presented convincing textural evidence that no significant volume change accompanied the replacement of dolomite by talc. Also, rare, talc pseudo-morphs after a rhombohedral carbonate, some up to 2 centimetre in maximum dimension, require essentially volume for volume replacement. The only mechanism for replacement of dolomite by talc accompanied by removal of calcite and CO2 without volume loss is the introduction of Mg. Piniazkiewicz (1984) recognized this problem and suggested that pore fluid in dolomitic marble was a source of Mg. Anderson, Mogk and Childs (1990) presented evidence not only for the volume for volume replacement of dolomite by talc, but also evidence of replacement of calcite in the marble by dolomite. In the deposits that they studied in the Ruby Range, calcite grains were in some instances rimmed by dolomite and replacement of calcite by dolomite occurred along calcite cleavage.
They suggested that introduction of additional Mg as well as Si02 and H2O finally resulted in replacement of dolomite by talc.
Field evidence clearly indicates introduction of Mg into the metamorphic rocks of southwestern Montana. Two quartz veins surrounded by a selvage of chloride alteration cut quartzofeldspathic gneiss and a post-meta-morphic pegmatite dike exposed in a roadcut east of Norris (Figure 6). Not only was Si02 introduced to form the vein, but also Mg and H2O. This caused the replacement of feldspars m the gneiss by chlorite and even partial replacement of quartz by chlorite. If these same solutions had migrated along a fracture cutting marble and this had occurred within the talc stability field, replacement by talc rather than chlorite would have taken place. The major controlling factor in the formation of chlorite rather than talc is the availability of Al. Metamorphic rocks adjacent to talc deposits that contain Al are in many instances partially chloritized.
On a larger scale, the Antler chlorite deposit on the southeast flank of the Highland Mountains, formed by the replacement of quartzofeldspathic gneiss. A composite sample of unaltered quartzofeldspathic gneiss collected near the vein contains only 0.6 weight per cent MgO (Berg, 1983, p. 350) whereas a representative specimen of chlorite (variety clinochlore) from this deposit contains 29.80 weight per cent MgO (Table 1). Obviously this deposit required the introduction of large quantities of Mg. In addition to the Antler chlorite deposit, chloritic alteration occurs along some of the high-angle faults on the southern flank of the Highland Mountains.
Although most talc in southwestern Montana formed by the replacement of dolomite, some formed by replacement of tremolite porphyroblasts.
Pseudomorphs of talc after tremolite up to 4 centimetres long occur at the Harris Creek prospect on the southwestern flank of the Tobacco Root Mountains (Figure 5 C). Replacement of tremolite by talc can take place by several reactions.
One possible reaction is: tremolite + dolomite + H2O + CO2 = 2 talc + 3
calcite Temperature of talc formation in southwestern
Montana has generally been estimated to be around 400°C. Garihan (1973, p. 189) estimated temperatures to be in the range of 300 - 500°C. and Berg (1979a, p. 13)
88 Industrial Minerals Forum 1991
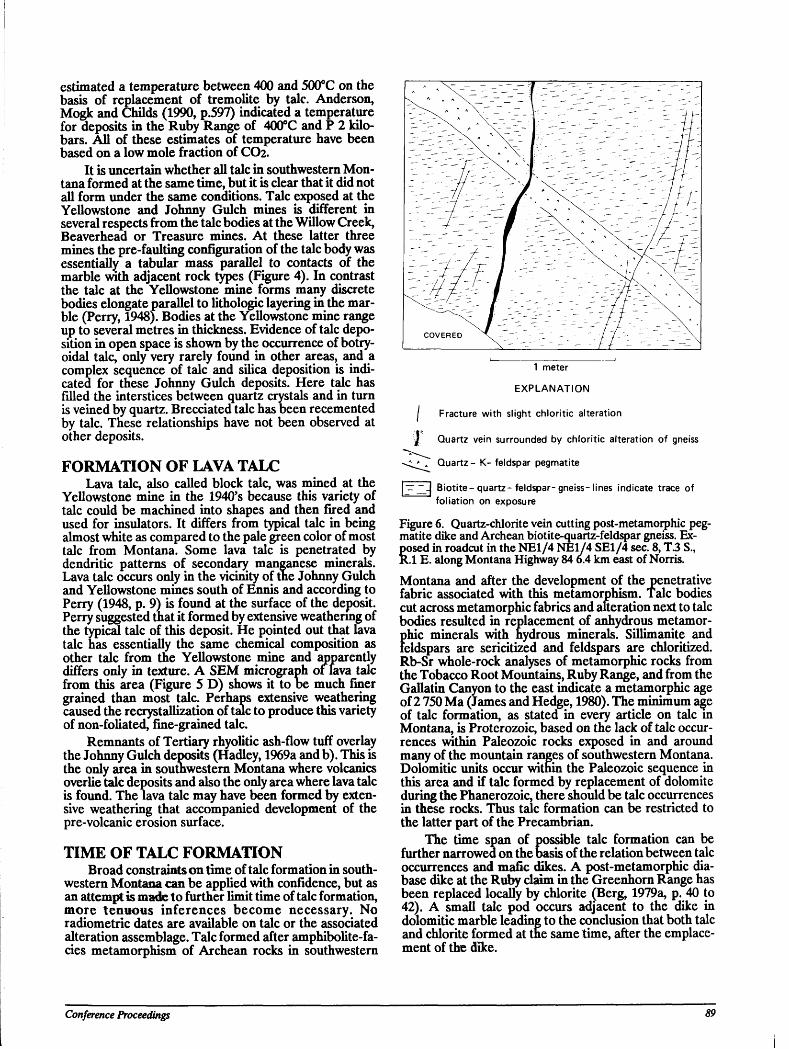
estimated a temperature between 400 and 500°C on the basis of replacement of tremolite by talc. Anderson, Mogk and Childs (1990, p.597) indicated a temperature for deposits in the Ruby Range of 400°C and P 2 kilo-bars. All of these estimates of temperature have been based on a low mole fraction of CO2.
It is uncertain whether all talc in southwestern Montana formed at the same time, but it is clear that it did not all form under the same conditions. Talc exposed at the Yellowstone and Johnny Gulch mines is different in several respects from the talc bodies at the Willow Creek, Beaverhead or Treasure mines. At these latter three mines the pre-faulting configuration of the talc body was essentially a tabular mass parallel to contacts of the marble with adjacent rock types (Figure 4). In contrast the talc at the Yellowstone mine forms many discrete bodies elongate parallel to lithologic layering in the marble (Perry, 1948). Bodies at the Yellowstone mine range up to several metres in thickness. Evidence of talc deposition in open space is shown by the occurrence of botry-oidal talc, only very rarely found in other areas, and a complex sequence of talc and silica deposition is indicated for these Johnny Gulch deposits. Here talc has filled the interstices between quartz crystals and in turn is veined by quartz. Brecciated talc has been recemented by talc. These relationships have not been observed at other deposits.
FORMATION OF LAVA TALC Lava talc, also called block talc, was mined at the
Yellowstone mine in the 1940's because this variety of talc could be machined into shapes and then fired and used for insulators. It differs from typical talc in being almost white as compared to the pale green color of most talc from Montana. Some lava talc is penetrated by dendritic patterns of secondary manganese minerals. Lava talc occurs only in the vicinity of the Johnny Gulch and Yellowstone mines south of Ennis and according to Perry (1948, p. 9) is found at the surface of the deposit. Perry suggested that it formed by extensive weathering of the typical talc of this deposit. He pointed out that lava talc has essentially the same chemical composition as other talc from the Yellowstone mine and apparently differs only in texture. A SEM micrograph of lava talc from this area (Figure 5 D) shows it to be much finer grained than most talc. Perhaps extensive weathering caused the recrystallization of talc to produce this variety of non-foliated, fine-grained talc.
Remnants of Tertiary rhyolitic ash-flow tuff overlay the Johnny Gulch deposits (Hadley, 1969a and b). This is the only area in southwestern Montana where volcanics overlie talc deposits and also the only area where lava talc is found. The lava talc may have been formed by extensive weathering that accompanied development of the pre-volcanic erosion surface.
TIME OF TALC FORMATION Broad constraints on time of talc formation in south
western Montana can be applied with confidence, but as an attempt is made to further limit time of talc formation, more tenuous inferences become necessary. No radiometric dates are available on talc or the associated alteration assemblage. Talc formed after amphibolite-fa-cies metamorphism of Archean rocks in southwestern
1 meter
EXPLANATION
/ Fracture with slight chloritic alteration
j Quartz vein surrounded by chloritic alteration of gneiss
Lf . Quartz - K- feldspar pegmatite
|_- 2_- Biot i te-quartz-feldspar-gneiss- l ines indicate trace of foliation on exposure
Figure 6. Quartz-chlorite vein cutting post-metamorphic pegmatite dike and Archean biotite-quartz-feldspar gneiss. Exposed in roadcut in the NE1/4 NE1/4 SE1/4 sec. 8, T3 S., R.1 E. along Montana Highway 84 6.4 km east of Norris. Montana and after the development of the penetrative fabric associated with this metamorphism. Talc bodies cut across metamorphic fabrics and alteration next to talc bodies resulted in replacement of anhydrous metamorphic minerals with hydrous minerals. Sillimanite and feldspars are sericitized and feldspars are chloritized. Rb-Sr whole-rock analyses of metamorphic rocks from the Tobacco Root Mountains, Ruby Range, and from the Gallatin Canyon to the east indicate a metamorphic age of 2 750 Ma (James and Hedge, 1980). The minimum age of talc formation, as stated in every article on talc in Montana, is Proterozoic, based on the lack of talc occurrences within Paleozoic rocks exposed in and around many of the mountain ranges of southwestern Montana. Dolomitic units occur within the Paleozoic sequence in this area and if talc formed by replacement of dolomite during the Phanerozoic, there should be talc occurrences in these rocks. Thus talc formation can be restricted to the latter part of the Precambrian.
The time span of possible talc formation can be further narrowed on the basis of the relation between talc occurrences and mafic dikes. A post-metamorphic diabase dike at die Ruby claim in the Greenhorn Range has been replaced locally by chlorite (Berg, 1979a, p. 40 to 42). A small talc pod occurs adjacent to the dike in dolomitic marble leading to the conclusion that both talc and chlorite formed at the same time, after the emplacement of the dike.
Conference Proceeding 89
Wooden and others (1978) were able to recognize three sets of mafic dikes in the southern Tobacco Root Mountains based on whole-rock Rb-Sr determinations and chemical composition. The oldest dikes are approximately 1455 Ma old and the two younger sets were intruded between 1120 and 1130 Ma ago. If the altered dike at the Ruby claim belongs to one of these sets of dikes, chlorite and talc exposed there must have formed since 1455 Ma. Mafic dikes that intruded quartzofeldspathic gneiss on the southern flank of the Highland Mountains are cut by chlorite veins.
In the western part of the Highland Mountains metasedimentary rocks of the LaHood Formation of the Middle Proterozoic Belt Supergroup are separated from Archean metamorphic rocks by a north-dipping fault along which O'Neill, Duncan and Zartman (1988) indicated only small displacement. On the north side of Soap Gulch in Sec. 1, T. 2 S., R. 9 W. about 5 kilometres north of areas of chloritic alteration in the Archean metamorphic rocks to the south, chloritic alteration occurs along NW-trending quartz veins. In hand specimen the altered rock has a decided green color and in thin section chloritization of feldspars is evident. If this chloritization in the LaHood Formation is related to that in the Archean metamorphlc rocks in this area, this process occurred after lithification of this section of the LaHood Formation, the oldest formation in the Belt Supergroup in this part of southwestern Montana. The Middle Cambrian Flathead Formation unconformably overlies both Proterozoic sedimentary and Archean metamorphic rocks. Quartz veins and associated chloritic alteration extend up to this unconformity, but have not been recognized in the Flathead Formation or overlying Paleozoic formations.
Lithology of clasts in the coarse-grained facies of the LaHood Formation of the Belt Supergroup exposed north of the Tobacco Root Mountains provides an inference concerning time of dolomitization of Archean marbles. This formation has been interpreted to be syntectonic, deposited next to an E-W trending fault zone that forms the southern margin of the Belt basin (Win-ston, 1986). It contains rounded clasts of hornblende gneiss and quartzofeldspathic gneiss like that commonly exposed in the mountain ranges to the south. Almost an of the marble clasts are fine-grained calcitic marble generally containing tremolite layers a few millimetres thick. The lithology of these clasts contrasts strongly with the coarse-grained dolomitic marble generally devoid of calcsilicate minerals which is the dominant marble in the Archean rocks exposed in the mountain ranges in southwestern Montana.
Either the source of marble clasts in the LaHood Formation must have differed from that now exposed in southwestern Montana where dolomitic marble is much more abundant than calcitic marble, or dolomitization of the marble occurred after erosion of these clasts. The latter possibility seems more likely as there is no reason to expect that the calcitic marble was somehow preferentially eroded over the presently more abundant dolomitic marble. If so dolomitization of Archean marble, and by inference, the time of talc formation was after erosion of detritus that is now incorporated in the LaHood Formation.
The source of Mg locally concentrated in Archean rocks in southwestern Montana to form talc and chlorite
90
is problematical. Either Mg was locally derived from surrounding Archean or Proterozoic rocks or it was introduced from an external source. Mafic dikes, amphibolite layers, hornblende gneiss and rare ultramafic bodies with the Archean metamorphic rocks are potential sources of Mg. If Mg had been derived by leaching of these rocks, alteration of Mg-bearing minerals and other silicates would be expected. Such alteration has not been observed. Chlorite veins at the Antler mine in the Highland Mountains cut both an amphibolite layer and a metabasite dike within the quartzofeldspathic gneiss surrounding this deposit. Except for replacement where this chlorite vein cuts these rocks, they appear unaltered indicating that these magnesian rocks could not have been a source of Mg for the development of this vein.
Anderson, Mogk and Childs (1990) suggested that the Proterozoic Belt Sea was the source of Mg for dolomitization of Archean carbonates and formation of talc deposits. The major objection to this source is that the Belt Sea did not cover the area of talc deposits in southwestern Montana. The southern boundary of this sea was the Willow Creek fault zone which extends east-west just north of the area of exposed Archean metamorphic rocks in the Highland Mountains and Tobacco Root Mountains (Figure 1). If the Belt Sea was the source of Mg, sea water must have migrated laterally to the southwest along more permeable zones in the metamorphic rocks. Formation of chlorite deposits in the Highland Mountains would not have required movement of sea water for such distances as these deposits are close to the margin of the Belt Sea. At this stage of our understanding the Belt Sea seems to offer the best possibility as a source of Mg for the formation of both talc and chlorite deposits.
SUMMARY Economically important talc deposits are confined
to dolomitic marble within the Archean rocks of southwestern Montana. Only one occurrence is known in the Proterozoic Belt Supergroup in Montana. Field relationships indicate that Mg was mtroduced into the Archean metamorphic rocks and at least the lowest part of the metasedimentary rocks of the Belt Supergroup. However there is no indication that Paleozoic sedimentary rocks were altered to talc or chlorite during this event. A control on the formation of talc and chlorite was the availability of Al in the host rock; where Al was present in the rock, formation of chlorite was favored, but in carbonate rocks lacking Al talc formed. It is suggested that Al-bearing rocks in the Archean Wyoming province of southwestern Montana and the lower part of the Belt Supergroup, are possible host rocks for cnlorite deposits and carbonate rocks in the same sequence of Archean and Proterozoic rocks are potential host rocks for talc deposits.
ACKNOWLEDGMENTS This continuing investigation of talc and chlorite
deposits in Montana benefitted from the suggestions and observations of other geologists. Hugh Dresser showed me quartz veins in the LaHood Formation which subsequently led to the recognition of associated chloritic alteration in this formation. John Childs suggested that it might be worthwhile to examine clasts in the LaHood Formation for the presence of talc. Reviews of this paper by Robert L. Virta, John F. Childs, Robert C. Pearson
Industrial Minerals Forum 1991
I
and Edward T. Ruppel contributed to its improvement and are appreciated.
REFERENCES Anderson, D.L., Mogk, D.W. and Childs, J.F. (1990):
Petrogenesis and Timing of Talc Formation in the Ruby Range, Southwestern Montana; Economic Geology, Volume 85, pages 585 to 600.
Anderson, H.N. (1942): Helena and Ennis Talc Deposits; B.S. thesis, Montana School of Mines (Montana Tech), 30 pages.
Berg, R.B. (1979a): Talc and Chlorite Deposits in Montana; Montana Bureau of Mines and Geology, Memoir 45,66 pages.
Berg, R.B. (1979b): Precambrian Geology of the West Part of the Greenhorn Range, Madison County, Montana; Montana Bureau of Mines and Geolo&, Geologic Map 6, Scale 1:28,570.
Berg, R.B. (1983): New Chlorite Mine in an Old Montana Gold District; Mining Engineering, Volume 35, pages 347 to 350.
Berg, R.B. (1986): Clinochlore from the Silver Star District, Madison County, Montana; Clays and Clay Minerals, Volume 34, Number 4, pages 496-498.
Berg, R.B. (1987): Potential for Talc Deposits within the BLM Wilderness Study Area of the Northern Part of the Ruby Range, Madison County, Montana; U.S. Geological Survey, Open-File Report 87-001, Map with text, Scale 1:24,000.
Bergantino, R.N. and Clark, M. (1985): Structure Contour Map on Top of Precamorian Crystalline Rocks; Montana Bureau of Mines and Geology, Open-File Report MBMG 158, Scale 1:1,000,000.
Blount, A.H. and Parkison, GA. (in press) Hydrother-mal Alteration Haloes and Enlarged Soil Anomalies over Concealed Talc Bodies, Southwestern Montana; Ore Geology Reviews, Volume 6.
Breuninger, R.H. and Childs, J.F. (1987): Road Log No. 4, Helena and the North Border Zone of the Boulder Batholith, Montana; in Berg, Richard B. and Breuninger, Ray H., eds., Guidebook of the Helena Area, West-central Montana, Montana Bureau of Mines and Geology, Special Publication 95, pages 27 to 43.
Chidester, A.H., Engel, A.E.J. and Wright, LA. (1964): Talc Resources of the United States; 17.5. Geological Survey, Bulletin 1167,61 pages.
Condie, K.C. (1976): The Wyoming Archean Province in the Western United States; in Windley, Brian F., Editor, The Early History of the Earth, John Wiley & Sons, New York, pages 499 to 510.
Cooper, J.D. (1964): Talc, Soapstone, and Pyrophyllite; in Minerals Yearbook, 1963, U.S. Bureau of Mines, Volume 1, pages 1097 to 1104.
Erslev, EA. (1983): Pre-Beltian Geology of the Southern Madison Range, Southwestern Montana; Montana Bureau of Mines and Geology, Memoir 55, 26 pages.
Ganhan, J.M. (1973): Geology and Talc Deposits of the Central Ruby Range, Madison County, Montana; Ph.D. dissertation, Pennsylvania State University, 209 pages.
Hadley, J.B. (1969a): Geologic Map of the Cameron Quadrangle, Madison County, Montana; U.S. Geological Survey, Map GQ-813, Scale 1:62,500.
Hadley, J.B. (1969b): Geologic Map of the Varney
Quadrangle, Madison County, Montana; U.S. Geological Survey, Map GQ-814, Scale 1:62,500.
James, H.L. (1990): Precambrian Geology and Bedded Iron Deposits of the Southwestern Ruby Range, Montana; U.S. Geological Survey, Professional Paper 1495,39 pages.
James, H.L. and Hedge, C.E. (1980): Age of Basement Rocks of Southwest Montana; Geological Society of America, Bulletin, Volume 91, pages 11 to 15.
Johns, W.M. (1970): Geology and Mineral Deposits of Lincoln and Flathead Counties, Montana; Montana Bureau of Mines and Geology, Bulletin 79, 182 pages.
Karasevich, L.P. (1980): Structure of the Pre-Beltian Metamorphic Rocks of the Northern Ruby Range, Southwestern Montana; M.S. thesis, Pennsylvania State University, 172 pages.
Krempasky, G.T., Binder, E.C. and Lawson, D.C. (1982): The Mineral Industry of Montana; in Minerals Yearbook, 1980, U.S. Bureau of Mines, Volume 2, pages 317 to 327.
Okuma, A.F. (1971): Structure of the Southwestern Ruby Range near Dillon, Montana; Ph.D. dissertation, Pennsylvania State University, 122 pages.
Olson, R.H. (1976): The Geology of Montana Talc Deposits; in Rooney, Lawrence F., and Berg, Richard B., eds., Eleventh Industrial Minerals Forum, Proceedings, Montana Bureau of Mines and Geology, SpecialPublication 74, pages 99 to 143.
O'Neill, J.M., Duncan, M.S. and Zartman, R.E. (1988): An Early Proterozoic Gneiss Dome in the Highland Mountains, Southwestern Montana; in Precambrian and Mesozoic Plate Margins, Lewis, Sharon E. and Berg, Richard B., eds., Montana Bureau of Mines and Geology, Special Publication 96, pages 81 to 88.
Pearson, R.C., Hanna, W.F., James, H.L., Loen, J.S., Moll, S.H., Ruppel, E.T. and Trautwein, CM. (1990): Map Showing Mineral Resource Assessment for Silver, Cobalt, and Base Metals in Proterozoic Sedimentary Rocks and for Iron, Chromium, Nickel, Talc, Chlorite, Gold, and Qraphite in Archean Crystalline Rocks, Dillon 1° x 2 Quadrangle, Idaho and Montana; U.S. Geological Survey, Map 1-1803-D, Scale 1:250,000.
Perrv, E.S. (1948): Talc, Graphite, Vermiculite and Asbestos in Montana; Montana Bureau of Mines and Geology, Memoir 27,44 pages.
Piniazkiewicz, R J. (1984): Geology of and Exploration Techniques for Pre-Beltian Talc Deposits of the Malesicn Ranch, Ruby Range, Madison County, Montana; M.S. thesis, University of Arizona, 101 pages.
U.S. Bureau of Mines (1990): The Mineral Industry of Montana, 3 pages.
Virta, R.L. (1990): Talc and Pyrophyllite; in Mineral Commoaity Summaries, 1990, U.S. Bureau of Mines, pages 168 to 169.
Vitaliano, C J., and Cordua, W.S. (1979): Geologic Map of Southern Tobacco Root Mountains, Madison County, Montana; Geological Society of America, Map MC-31.
Whitehead, M.L. (1979): Geology and Talc Occurrences of the Benson Ranch, Beaverhead County, Montana; M.S. thesis, Montana Tech., 53 pages.
Winston, D. (1986): Sedimentation and Tectonics of the
Conference Proceedings 91
Middle Proterozoic Belt Basin and their Influence on Phanerozoic Compression and Extension in Western Montana and Northern Idaho; in Pale-otectonics and Sedimentation in the Rocky Mountain Region, United States, Peterson, James. A. Editor, American Association of Petroleum Geologists, Memoir 41, pages 87 to 118.
Wooden, J.L., Vitaliano, CJ., Koehler, S.W. and Rag-land, P.C. (1978): The late Precambrian Mafic Dikes of the Southern Tobacco Root Mountains, Montana: Geochemistry, Rb-Sr Geochronology and Relationship to Belt Tectonics; Canadian Journal of Earth Sciences, Volume 15, pages 467 to 479.
92 Industrial Minerals Forum 1991
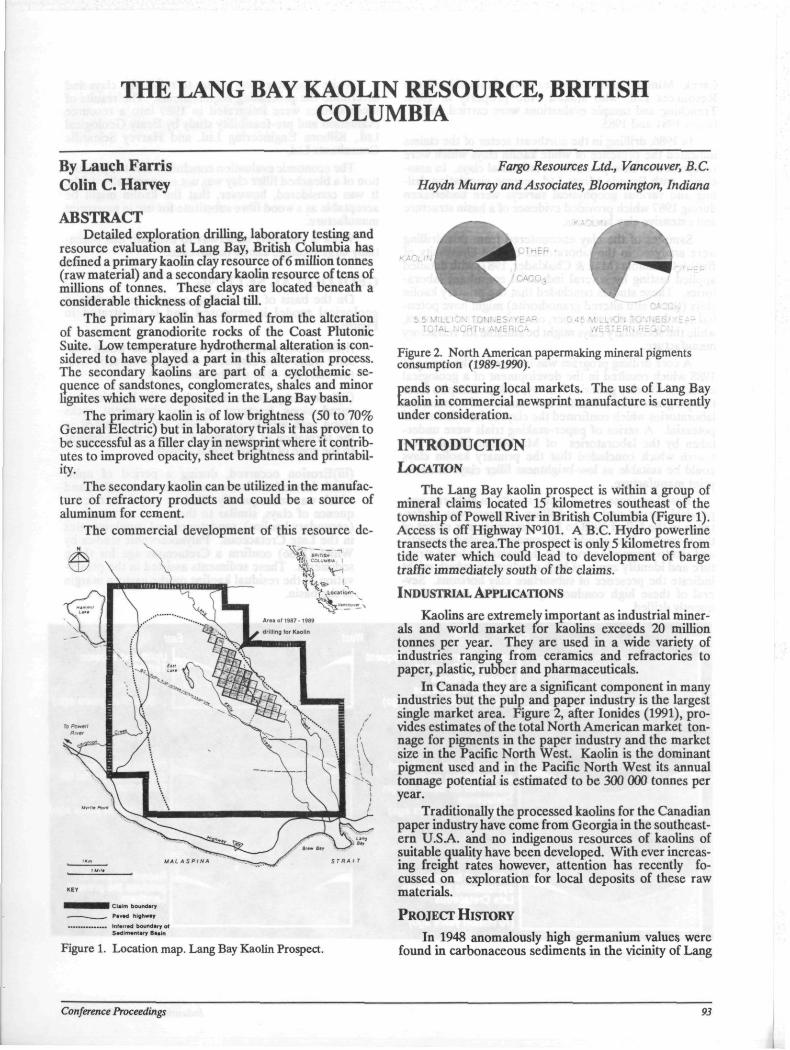
THE LANG BAY KAOLIN RESOURCE, BRITISH COLUMBIA
By Lauch Farris Colin C. Harvey
Forgo Resources Ltd., Vancouver, B.C. Haydn Murray and Associates, Bloomington, Indiana
ABSTRACT Detailed exploration drilling, laboratory testing and
resource evaluation at Lang Bay, British Columbia has defined a primary kaolin clay resource of 6 million tonnes (raw material) and a secondary kaolin resource of tens of millions of tonnes. These clays are located beneath a considerable thickness of glacial till.
The primary kaolin has formed from the alteration of basement granodiorite rocks of the Coast Plutonic Suite. Low temperature hydrothermal alteration is considered to have played a part in this alteration process. The secondary kaolins are part of a cyclothemic sequence of sandstones, conglomerates, shales and minor lignites which were deposited in the Lang Bay basin.
The primary kaolin is of low brightness (50 to 70% General Electric) but in laboratory trials it has proven to be successful as a filler clay in newsprint where it contributes to improved opacity, sheet brightness and printabil-ity.
The secondary kaolin can be utilized in the manufacture of refractory products and could be a source of aluminum for cement.
The commercial development of this resource de-
I Claim boundary
Pavad highway
Infarrad boundary ot Sadlmantary Baain
•'• • ■
. . . •
Figure 1. Location map. Lang Bay Kaolin Prospect.
Figure 2. North American papermaking mineral pigments consumption (1989-1990).
pends on securing local markets. The use of Lang Bay kaolin in commercial newsprint manufacture is currently under consideration.
INTRODUCTION LOCATION
The Lang Bay kaolin prospect is within a group of mineral claims located 15 kilometres southeast of the township of Powell River in British Columbia (Figure 1). Access is off Highway N°101. A B.C. Hydro powerline transects the area.The prospect is only 5 kilometres from tide water which could lead to development of barge traffic immediately south of the claims.
INDUSTRIAL APPLICATIONS
Kaolins are extremely important as industrial minerals and world market for kaolins exceeds 20 million tonnes per year. They are used in a wide variety of industries ranging from ceramics and refractories to paper, plastic, rubber and pharmaceuticals.
In Canada they are a significant component in many industries but the pulp and paper industry is the largest single market area. Figure 2, after Ionides (1991), provides estimates of the total North American market tonnage for pigments in the paper industry and the market size in the Pacific North West. Kaolin is the dominant pigment used and in the Pacific North West its annual tonnage potential is estimated to be 300 000 tonnes per year.
Traditionally the processed kaolins for the Canadian paper industry have come from Georgia in the southeastern U.SA. and no indigenous resources of kaolins of suitable quality have been developed. With ever increasing freight rates however, attention has recently fo-cussed on exploration for local deposits of these raw materials.
PROJECT HISTORY In 1948 anomalously high germanium values were
found in carbonaceous sediments in the vicinity of Lang
Conference Proceedings 93
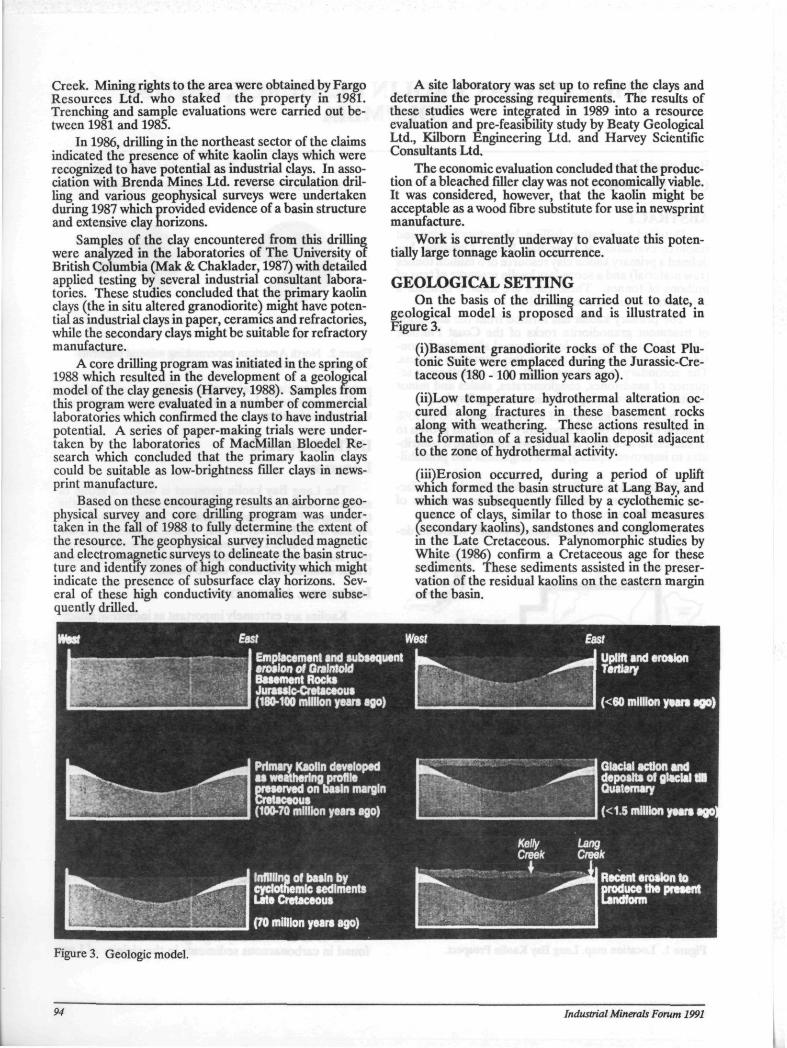
Creek. Mining rights to the area were obtained by Fargo Resources Ltd. who staked the property in 1981. Trenching and sample evaluations were carried out between 1981 and 1985.
In 1986, drilling in the northeast sector of the claims indicated the presence of white kaolin clays which were recognized to have potential as industrial clays. In association with Brcnda Mines Ltd. reverse circulation drilling and various geophysical surveys were undertaken during 1987 which provided evidence of a basin structure and extensive clay norizons.
Samples of the clay encountered from this drilling were analyzed in the laboratories of The University of British Columbia (Mak & Chaklader, 1987) with detailed applied testing by several industrial consultant laboratories. These studies concluded that the primary kaolin clays (the in situ altered granodiorite) might have potential as industrial clays in paper, ceramics and refractories, while the secondary clays might be suitable for refractory manufacture.
A core drilling program was initiated in the spring of 1988 which resulted in the development of a geological model of the clay genesis (Harvey, 1988). Samples from this program were evaluated in a number of commercial laboratories which confirmed the clays to have industrial potential. A series of paper-making trials were undertaken by the laboratories of MacMillan Bloedel Research which concluded that the primary kaolin clays could be suitable as low-brightness filler clays in newsprint manufacture.
Based on these encouraging results an airborne geophysical survey and core drilling program was undertaken in the fall of 1988 to fully determine the extent of the resource. The geophysical survey included magnetic and electromagnetic surveys to delineate the basin structure and identify zones of high conductivity which might indicate the presence of subsurface clay horizons. Several of these high conductivity anomalies were subsequently drilled.
A site laboratory was set up to refine the clays and determine the processing requirements. The results of these studies were integrated in 1989 into a resource evaluation and pre-feasibility study by Beaty Geological Ltd., Kilborn Engineering Ltd. and Harvey Scientific Consultants Ltd.
The economic evaluation concluded that the production of a bleached filler clay was not economically viable. It was considered, however, that the kaolin might be acceptable as a wood fibre substitute for use in newsprint manufacture.
Work is currently underway to evaluate this potentially large tonnage kaolin occurrence.
GEOLOGICAL SETTING On the basis of the drilling carried out to date, a
geological model is proposed and is illustrated in Figure 3.
(i)Basement granodiorite rocks of the Coast Plutonic Suite were emplaced during the Jurassic-Cretaceous (180 -100 million years ago).
(ii)Low temperature hydrothermal alteration oc-cured along fractures in these basement rocks along with weathering. These actions resulted in the formation of a residual kaolin deposit adjacent to the zone of hydrothermal activity.
(iii)Erosion occurred, during a period of uplift which formed the basin structure at Lang Bay, and which was subsequently filled by a cyclothemic sequence of clays, similar to those in coal measures (secondary kaolins), sandstones and conglomerates in the Late Cretaceous. Palynomorphic studies by White (1986) confirm a Cretaceous age for these sediments. These sediments assisted in the preservation of the residual kaolins on the eastern margin of the basin.
Emplacement and subsequent erosion of Graintoid Basement Rocks
(180-100 million years ago)
Uplift and erosion Tertiary
(< 60 million years ago)
Primary Kaolin developed a i weathering profile ring profile
on basin margin
(100-70 million years ago)
«*.". ■ 1 " ^m B J P ^ a
e ke™ H 1 e ke™ H 1
Glacial action and
Quaternary (< 1.5 million years ago
Figure 3. Geologic model.
Infilling of basin by cyclothemic sediments Late Cretaceous
(70 million years ago)
Recent erosion to
Kiduce the present ndform
94 Industrial Minerals Forum 1991
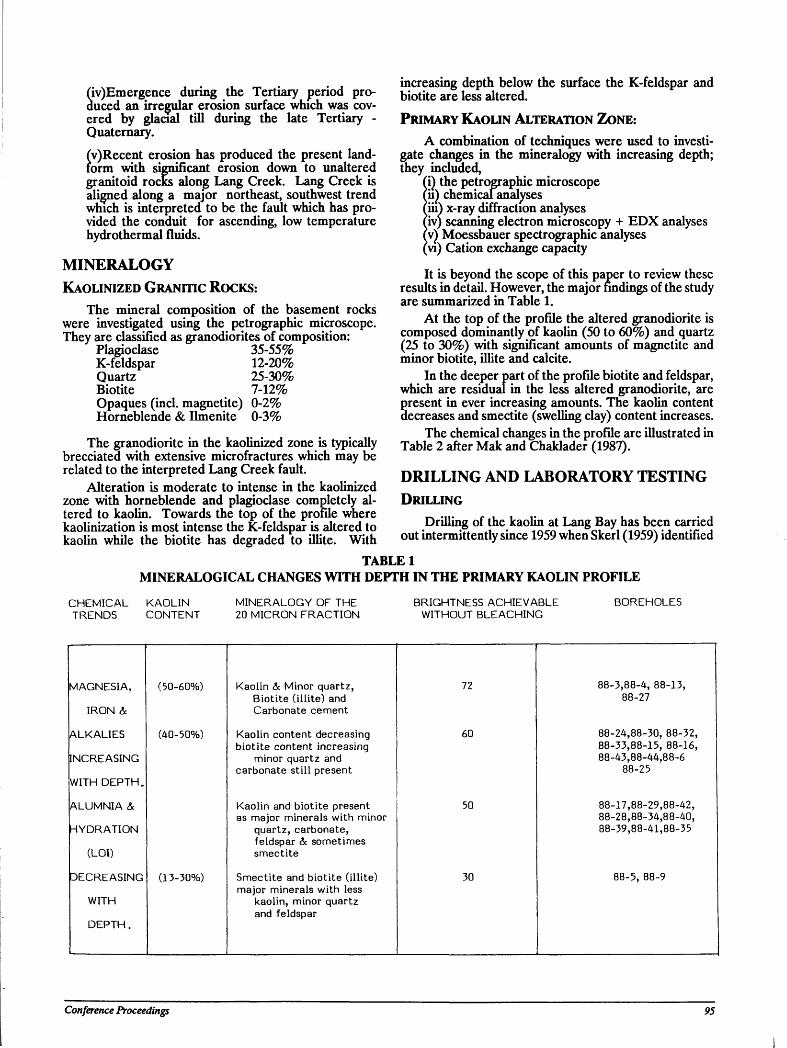
(iv)Emergence during the Tertiary period produced an irregular erosion surface which was covered by glacial till during the late Tertiary -Quaternary. (v)Recent erosion has produced the present land-iorm with significant erosion down to unaltered granitoid rocks along Lang Creek. Lang Creek is aligned along a major northeast, southwest trend which is interpreted to be the fault which has provided the conduit for ascending, low temperature hydrothermal fluids.
MINERALOGY KAOLINIZED GRANITIC ROCKS:
The mineral composition of the basement rocks were investigated using the petrographic microscope. They are classified as granodiorites of composition:
Plagioclase 35-55% K-feldspar 12-20% Quartz 25-30% Biotite 7-12% Opaques (incl. magnetite) 0-2% Horneblende & Ilmenite 0-3%
The granodiorite in the kaolinized zone is typically brecciated with extensive microfractures which may be related to the interpreted Lang Creek fault.
Alteration is moderate to intense in the kaolinized zone with horneblende and plagioclase completely altered to kaolin. Towards the top of the profile where kaolinization is most intense the K-feldspar is altered to kaolin while the biotite has degraded to illite. With
increasing depth below the surface the K-feldspar and biotite are less altered. PRIMARY KAOLIN ALTERATION ZONE:
A combination of techniques were used to investigate changes in the mineralogy with increasing depth; they included,
(I) the petrographic microscope (ii) chemical analyses (iii) x-ray diffraction analyses (iv) scanning electron microscopy + EDX analyses m Moessbauer spectrographic analyses (vi) Cation exchange capacity
It is beyond the scope of this paper to review these results in detail. However, the major findings of the study are summarized in Table 1.
At the top of the profile the altered granodiorite is composed dominantly of kaolin (50 to 60%) and quartz (25 to 30%) with significant amounts of magnetite and minor biotite, illite and calcite.
In the deeper part of the profile biotite and feldspar, which are residual in the less altered granodiorite, are present in ever increasing amounts. The kaolin content decreases and smectite (swelling clay) content increases.
The chemical changes in the profile are illustrated in Table 2 after Mak and Chaklader (1987).
DRILLING AND LABORATORY TESTING DRILLING
Drilling of the kaolin at Lang Bay has been carried out intermittently since 1959 when Skerl (1959) identified
TABLE 1 MINERALOGICAL CHANGES WITH DEPTH IN THE PRIMARY KAOLIN PROFILE
CHEMICAL TRENDS
KAOLIN CONTENT
MINERALOGY OF THE 20 MICRON FRACTION
BRIGHTNESS ACHIEVABLE WITHOUT BLEACHING
BOREHOLES
MAGNESIA,
IRON &
(50-60%) Kaolin & Minor quartz, Biotite (il l ite) and Carbonate cement
72 88-3,88-4, 88-13, 88-27
ALKALIES
INCREASING
WITH DEPTH.
(40-50%) Kaolin content decreasing biotite content increasing
minor quartz and carbonate sti l l present
60 88-24,88-30, 88-32, 88-33,88-15, 88-16, 88-43,88-44,88-6
88-25
ALUMNIA &
HYDRATION
(LOI)
Kaolin and biotite present as major minerals with minor
quartz, carbonate, feldspar & sometimes smectite
50 88-17,88-29,88-42, 88-28,88-34,88-40, 88-39,88-41,88-35
DECREASING
WITH
DEPTH.
(13-30%) Smectite and biotite (ill ite) major minerals with less
kaolin, minor quartz and feldspar
30 88-5, 88-9
Conference Proceedings 95
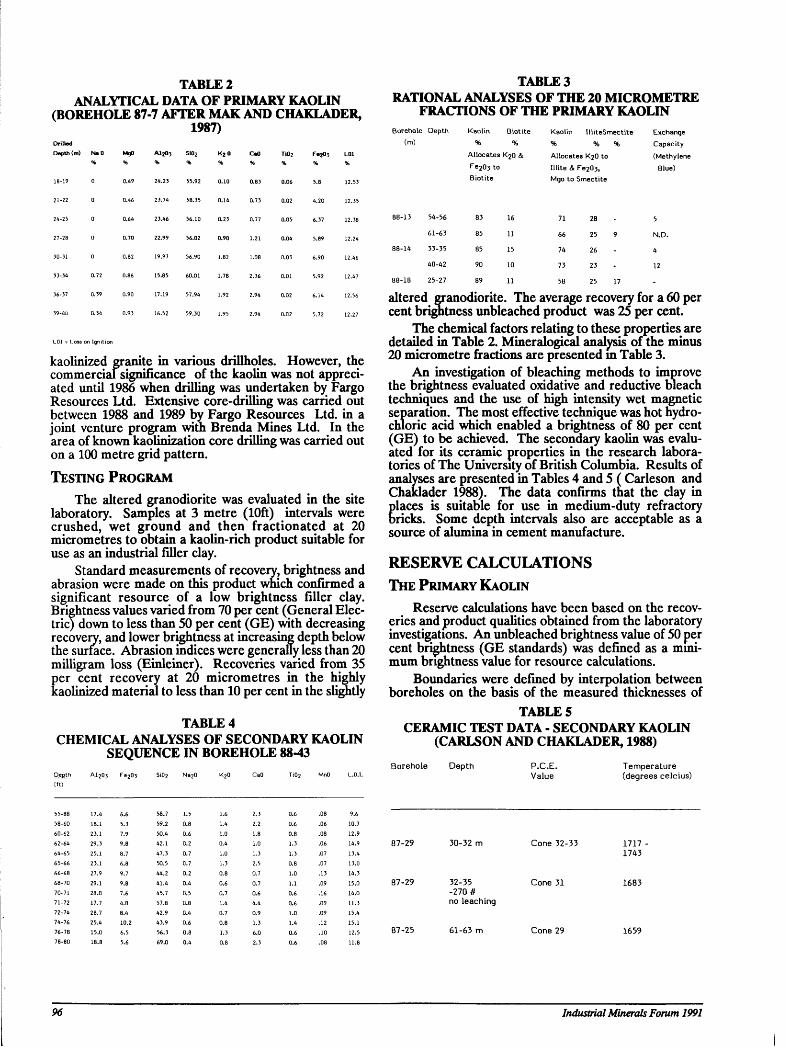
TABLE2 TABLE 3 ANALYTICAL DATA OF PRIMARY KAOLIN
(BOREHOLE 87-7 AFTER MAK AND CHAKLADER, 1987)
RATIONAL ANALYSES OF THE 20 MICROMETRE FRACTIONS OF THE PRIMARY KAOLIN
Drilled Depth (m) Na 0 MgO
18-19
21-22
24-25
27-28
50-31
33-34
36-37
0.49
0.46
0.64
0.70
0.82
0.86
0.90
AI2O3 S102
% % 24.23 55.92
23.74 58.35
23.46 56.10
22.99 56.02
19.97 56.90
15.85 60.01
17.19 57.94
16.52 59.30
0.14
0.23
0.90
1.82
1.78
1.92
1.95
0.83
0.73
0.77
1.21
Ti0 2 FojOs L01
% % % 0.06 5.8 12.53
12.35
12.38
12.24
0.03
0.01
0.02
4.20
6.37
5.89
6.90
5.92
12.46
kaolinized granite in various drillholes. However, the commercial significance of the kaolin was not appreciated until 1986 when drilling was undertaken by Fargo Resources Ltd. Extensive core-drilling was carried out between 1988 and 1989 by Fargo Resources Ltd. in a joint venture program with Brenda Mines Ltd. In the area of known kaolinization core drilling was carried out on a 100 metre grid pattern.
TESTING PROGRAM
The altered granodiorite was evaluated in the site laboratory. Samples at 3 metre (10ft) intervals were crushed, wet ground and then fractionated at 20 micrometres to obtain a kaolin-rich product suitable for use as an industrial filler clay.
Standard measurements of recovery, brightness and abrasion were made on this product which confirmed a significant resource of a low brightness filler clay. Brightness values varied from 70 per cent (General Electric) down to less than 50 per cent (GE) with decreasing recovery, and lower brightness at increasing depth below the surface. Abrasion indices were generally less than 20 milligram loss (Einleiner). Recoveries varied from 35 per cent recovery at 20 micrometres in the highly kaolinized material to less than 10 per cent in the slightly
TABLE 4 CHEMICAL ANALYSES OF SECONDARY KAOLIN
SEQUENCE IN BOREHOLE 88-43 Depth A1203 Fe203 Si02 (ft)
55-88 17.4 6.6 58.7 58-60 18.1 5.3 59.2 60-62 23.1 7.9 50.4 62-64 29.3 9.8 42.1 64-65 25.1 8.7 47.3 65-66 23.1 6.8 50.5 66-68 27.9 9.7 44.2 68-70 29.1 9.8 41.4 70-71 28.0 7.6 45.7 71-72 17.7 4.B 57.8 72-74 28.7 8.4 42.9 74-76 25.4 10.2 43.9 76-78 15.0 6.5 56.3 78-80 1B.8 5.6 69.0
Borehole Depth
(m)
54-56
Kaolin Biotite
% % Allocates K2O &
Fe203 to
Biotite
83
Kaolin IlliteSmectite
% % % Allocates K2O to
Illite & Fe2n3,
Mgo to Smectite
Exchange
Capacity
(Methylene
Blue)
61-63 85
33-35 85
40-42 90
25-27 89
66 25
74 26
73 23
altered granodiorite. The average recovery for a 60 per cent brightness unbleached product was 25 per cent.
The chemical factors relating to these properties are detailed in Table 2. Mineralogical analysis of the minus 20 micrometre fractions are presented in Table 3.
An investigation of bleaching methods to improve the brightness evaluated oxidative and reductive bleach techniques and the use of high intensity wet magnetic separation. The most effective technique was hot hydrochloric acid which enabled a brightness of 80 per cent (GE) to be achieved. The secondary kaolin was evaluated for its ceramic properties in the research laboratories of The University of British Columbia. Results of analyses are presented in Tables 4 and 5 ( Carleson and Chaklader 1988). The data confirms that the clay in
Elaces is suitable for use in medium-duty refractory ricks. Some depth intervals also are acceptable as a
source of alumina in cement manufacture.
RESERVE CALCULATIONS THE PRIMARY KAOLIN
Reserve calculations have been based on the recoveries and product qualities obtained from the laboratory investigations. An unbleached brightness value of 50 per cent brightness (GE standards) was defined as a minimum brightness value for resource calculations.
Boundaries were defined by interpolation between boreholes on the basis of the measured thicknesses of
TABLE 5 CERAMIC TEST DATA - SECONDARY KAOLIN
(CARLSON AND CHAKLADER, 1988) Borehole Depth P.C.E.
Value Temperature (degrees celcius)
10.3 12.9 14.9 13.4
87-29 30-32 m Cone 32-33 1717 -1743
13.0 14.3 15.0 14.0 11.3
87-29 32-35 -270 # no leaching
Cone 31 1683
15.4 15.1 12.5 87-25 61-63 m Cone 29 1659
11.8
96 Industrial Minerals Forum 1991
primary kaolin. In locations where borehole data was not available, extrapolation has been constrained to 10 metre horizontally per 3 metre thickness contour.
Geologic reserves were calculated by Kilborn Engineering (B.C.) Ltd. using vertical sections with a section {>rojection distance of 140 metre prepared by Beaty Geo-ogicalLtd. Because of environmental constraints intro
duced by the proximity of the resource to Lang Creek, calculations were made of Mineable Reserves on the basis of an open-pit operation.
Geologic Reserves =6.0 million metric tonnes. Mineable Reserves=4.8 million metric tonnes. If underground mining was used this mineable re
serve tonnage would increase to close to the geologic reserve figure.
THE SECONDARY KAOLIN
No attempt was made to evaluate the extent or reserves of the secondary kaolin. In some exploration drillholes the cyclothemic sequence is over 60 metres (200 ft) thick in boreholes 200 metres (200 yds) apart. In the absence of confirmed high price markets for this material, no further delineation of this material has been carried out. With such little drill hole test data it is categorized to be an inferred resource of tens of millions of tonnes.
OVERBURDEN
Glacial till covers the whole Lang Bay basin. It varies from 4 metres (13 ft ) thick in a borehole close to Lang Creek to over 45 metres (150 ft ) towards the centre of the basin. Much of the primary kaolin also is overlain by variable thicknesses of the cyclothemic (secondary kaolin) sequence of basin sediments.
In the calculation of overburden ratios for mine planning, both the glacial till and secondary kaolin sequence were classified as overburden. A slope stability factor of 30 per cent was used to determine an overall overburden ratio of 7.65 tonnes of overburden per tonne of primary kaolin ore.
If underground mining were to be used, the overburden ceases to be a major factor although it will stilll be necessary to access the primary kaolin by way of declines.
CURRENT STATUS OF THE PROJECT Discussions are currently being held with various
paper companies to investigate the possible use of the primary kaolin as a wood fibre substitute in newsprint manufacture.
Underground mining of the primary kaolin is also under consideration because of the very large amount of overburden which would have to be removed in any opencast operation.
The economics of mining the secondary kaolin as a refractory raw material or a source of alumina in cement manufacture are not attractive at this time because of the high overburden ratios. However, if the primary kaolin were to be mined by underground mining methods then these economics might become favourable.
REFERENCES Carlson, R. and Chaklader, A.C.D. (1988): Investiga
tions of the Brown Bed Clay of the Lang Bay Deposit; Department of Metals & Material Engineering, The University of British Columbia, unpublished report.
Harvey, C.C. (1988): Geology of the Lang Bay Kaolin Prospect, British Columbia,Canada; KRTA Ltd., Report to Fargo Resources Ltd. and Brenda Mines Ltd.
Ionides, G.N. (1991^):Opportunities for high value-added paper malting pigments in Western North America; Proceedings, 27th Forum on the Geology of Industrial Minerals, this volume.
Mak, S. and Chaklader, A.D.C. (1987): Investigation on the kaolin at the Lang Bay prospect; Department of Metals and Material Engineering The University of British Columbia, unpublished report.
Skerl, A.C. (1959): Report on the germanium property of Taiga Mines Ltd., Lang Creek Powell River area, British Columbia; Private report to Taiga Mines Ltd.
White, G.V. (1986): Lang Bay Germanium Prospect (92F/1610); Ministry of Energy, Mines and Petroleum Resources of British Columbia, Geological Field Work 1985, Paper 1986-1, Preliminary Report.
Conference Proceedings 97

98 Industrial Minerals Forum 1991
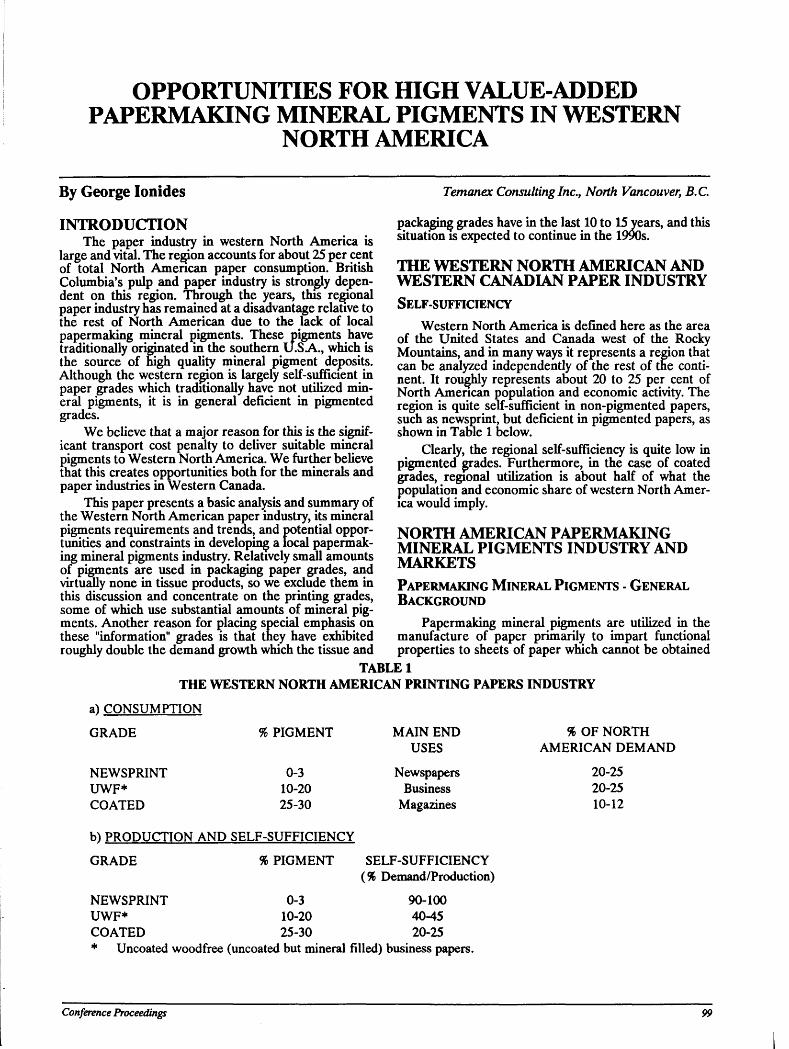
OPPORTUNITIES FOR HIGH VALUE-ADDED PAPERMAKING MINERAL PIGMENTS IN WESTERN
NORTH AMERICA
By George Ionides
INTRODUCTION The paper industry in western North America is
large and vital. The region accounts for about 25 per cent of total North American paper consumption. British Columbia's pulp and paper industry is strongly dependent on this region. Through the years, this regional paper industry has remained at a disadvantage relative to the rest of North American due to the lack of local papermaking mineral pigments. These pigments have traditionally originated in the southern U.SA., which is the source of nigh quality mineral pigment deposits. Although the western region is largely self-sufficient in paper grades which traditionally have not utilized mineral pigments, it is in general deficient in pigmented grades.
We believe that a major reason for this is the significant transport cost penalty to deliver suitable mineral pigments to Western North America. We further believe that this creates opportunities both for the minerals and paper industries in Western Canada.
This paper presents a basic analysis and summary of the Western North American paper industry, its mineral pigments requirements and trends, and potential opportunities and constraints in developing a local papermaking mineral pigments industry. Relatively small amounts of pigments are used in packaging paper grades, and virtually none in tissue products, so we exclude them in this discussion and concentrate on the printing grades, some of which use substantial amounts of mineral pigments. Another reason for placing special emphasis on these "information" grades is that they have exhibited roughly double the demand growth which the tissue and
Temanex Consulting Inc., North Vancouver, B.C.
packaging grades have in the last 10 to 15 years, and this situation is expected to continue in the 1990s.
THE WESTERN NORTH AMERICAN AND WESTERN CANADIAN PAPER INDUSTRY SELF-SUFFICIENCY
Western North America is defined here as the area of the United States and Canada west of the Rocky Mountains, and in many ways it represents a region that can be analyzed independently of the rest of the continent. It roughly represents about 20 to 25 per cent of North American population and economic activity. The region is quite self-sufficient in non-pigmented papers, such as newsprint, but deficient in pigmented papers, as shown in Table 1 below.
Clearly, the regional self-sufficiency is quite low in pigmented grades. Furthermore, in the case of coated grades, regional utilization is about half of what the population and economic share of western North America would imply.
NORTH AMERICAN PAPERMAKING MINERAL PIGMENTS INDUSTRY AND MARKETS PAPERMAKING MINERAL PIGMENTS - GENERAL BACKGROUND
Papermaking mineral pigments are utilized in the manufacture of paper primarily to impart functional properties to sheets of paper which cannot be obtained
TABLE 1 THE WESTERN NORTH AMERICAN PRINTING PAPERS INDUSTRY
SL) CONSUMPTION
GRADE % PIGMENT MAIN END % OF NORTH USES AMERICAN DEMAND
NEWSPRINT 0-3 Newspapers 20-25 UWF* 10-20 Business 20-25 COATED 25-30 Magazines 10-12
b) PRODUCTION AND SELF-SUFFICIENCY
GRADE % PIGMENT SELF-SUFFICIENCY (% Demand/Production)
NEWSPRINT 0-3 90-100 UWF* 10-20 40-45 COATED 25-30 20-25 * Uncoated woodfree (uncoated but mineral filled) business papers.
Conference Proceedings 99
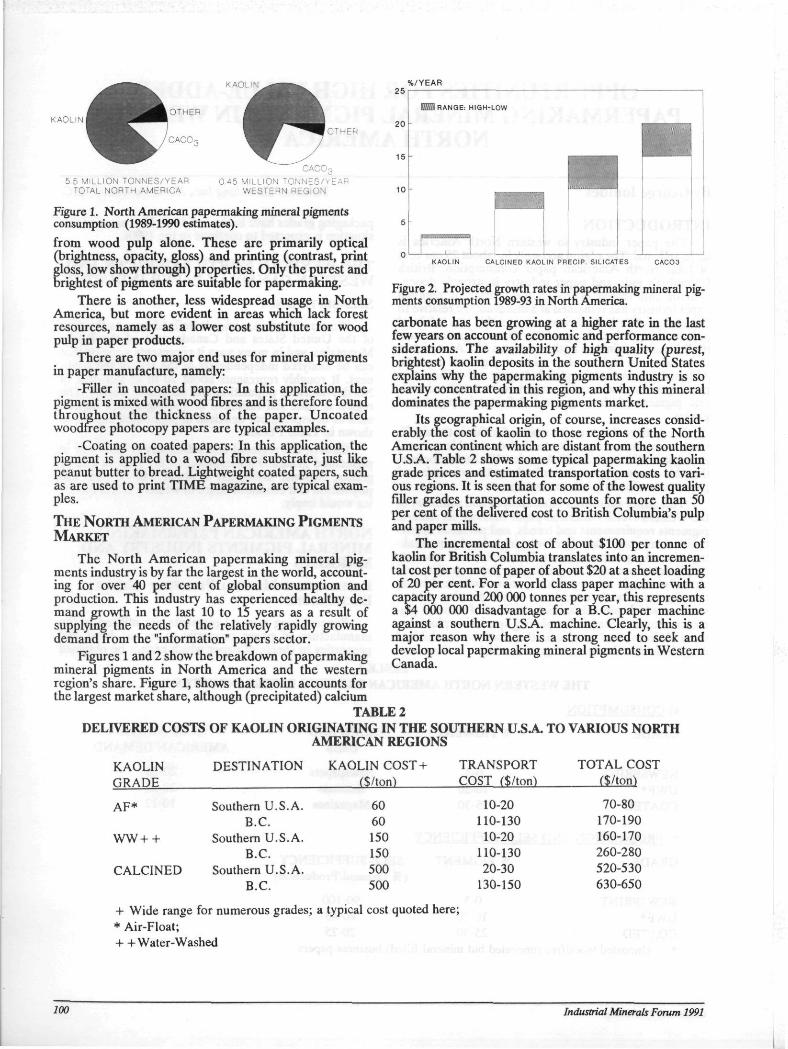
KAOLIN
KAOL IK %/YEAR
5 5 MILLION TONNES/YEAR TOTAL NORTH AMERICA
OTHER
CACOg 0.45 MILLION TONNES/YEA!
WESTERN REGION
Figure 1. North American papermaking mineral pigments consumption (1989-1990 estimates). from wood pulp alone. These are primarily optical (brightness, opacity, gloss) and printing (contrast, print gloss, low show through) properties. Only the purest and brightest of pigments are suitable for papermaking.
There is another, less widespread usage in North America, but more evident in areas which lack forest resources, namely as a lower cost substitute for wood pulp in paper products.
There are two major end uses for mineral pigments in paper manufacture, namely:
-Filler in uncoated papers: In this application, the pigment is mixed with wood fibres and is therefore found throughout the thickness of the paper. Uncoated woodfree photocopy papers are typical examples.
-Coating on coated papers: In this application, the pigment is applied to a wood fibre substrate, just like peanut butter to bread. Lightweight coated papers, such as are used to print TIME magazine, are typical examples.
THE NORTH AMERICAN PAPERMAKING PIGMENTS MARKET
The North American papermaking mineral pigments industry is by far the largest in the world, accounting for over 40 per cent of global consumption and production. This industry has experienced healthy demand growth in the last 10 to 15 years as a result of supplymg the needs of the relatively rapidly growing demand from the "information" papers sector.
Figures 1 and 2 show the breakdown of papermaking mineral pigments in North America and the western region's share. Figure 1, shows that kaolin accounts for the largest market share, although (precipitated) calcium
2 5
20 -
15
10
I RANGE: HIGH-LOW
CALCINED KAOLIN PRECIP. SILICATES
Figure 2. Projected growth rates in papermaking mineral pigments consumption 1989-93 in North America.
carbonate has been growing at a higher rate in the last few years on account of economic and performance considerations. The availability of high quality ("purest, brightest) kaolin deposits in the southern Unitea States explains why the papermaking pigments industry is so heavily concentrated in this region, and why this mineral dominates the papermaking pigments market.
Its geographical origin, of course, increases considerably the cost of kaolin to those regions of the North American continent which are distant from the southern U.SA. Table 2 shows some typical papermaking kaolin grade prices and estimated transportation costs to various regions. It is seen that for some of the lowest quality filler grades transportation accounts for more than 50 per cent of the delivered cost to British Columbia's pulp and paper mills.
The incremental cost of about $100 per tonne of kaolin for British Columbia translates into an incremental cost per tonne of paper of about $20 at a sheet loading of 20 per cent. For a world class paper machine with a capacity around 200 000 tonnes per year, this represents a $4 000 000 disadvantage for a B.C. paper machine against a southern U.SA. machine. Clearly, this is a major reason why there is a strong need to seek and develop local papermaking mineral pigments in Western Canada.
TABLE 2 [VERED COSTS OF KAOLIN ORIGINATING IN THE SOUTHERN U.S A TO VARIOUS NOR
AMERICAN REGIONS
KAOLIN DESTINATION KAOLIN COST + TRANSPORT TOTAL COST GRADE ($/toh) COST f$/ton) r$/ton<)
AF* Southern U.S.A. 60 10-20 70-80 B.C. 60 110-130 170-190
WW+ + Southern U.S.A. 150 10-20 160-170 B.C. 150 110-130 260-280
CALCINED Southern U.S.A. 500 20-30 520-530 B.C. 500 130-150 630-650
+ Wide range for numerous grades; a typical cost quoted here; * Air-Float; + + Water- Washed
100 Industrial Minerals Forum 1991
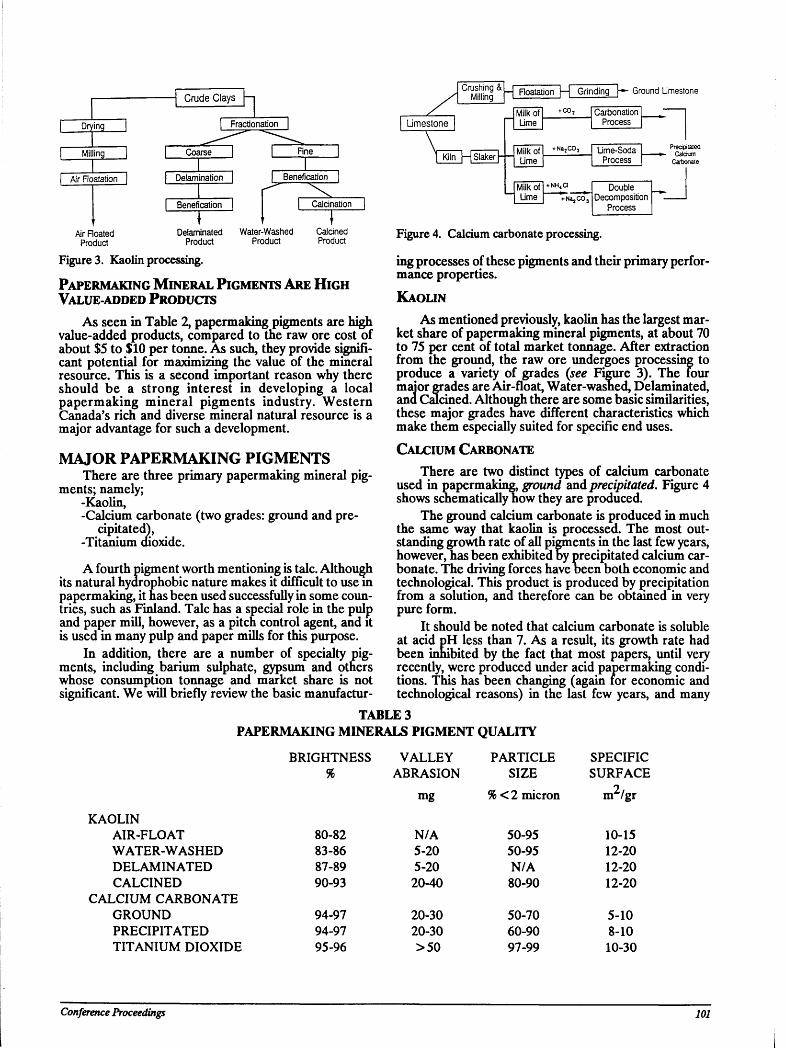
h . | Fra h . 1 Drying | | Fra donation | | Fra
I Milling | [ Coarse | | Rne |
1 1 1 | Air Floatation | | Delamination | | Benefication |
/ater Pre
r " \ ^ c Benefication |
/ater Pre
| Calcination |
AirF Pro
oated duct
1 Delaminated V
Product
/ater Pre
\ 1 Washed Calcined )duct Product
Crushing & Milling Floatation |—| Grinding"}*" Ground Limestone
Figure 3. Kaolin processing.
PAPERMAKING MINERAL PIGMENTS ARE HIGH VALUE-ADDED PRODUCTS
As seen in Table 2, papermaking pigments are high value-added products, compared to the raw ore cost of about $5 to $10 per tonne. As such, they provide significant potential for maximizing the value of the mineral resource. This is a second important reason why there should be a strong interest in developing a local papermaking mineral pigments industry. Western Canada's rich and diverse mineral natural resource is a major advantage for such a development.
MAJOR PAPERMAKING PIGMENTS There are three primary papermaking mineral pig
ments; namely; -Kaolin, -Calcium carbonate (two grades: ground and pre
cipitated), -Titanium dioxide.
A fourth pigment worth mentioning is talc. Although its natural hydrophobic nature makes it difficult to use in papermaking, it has been used successfully in some countries, such as Finland. Talc has a special role in the pulp and paper mill, however, as a pitch control agent, and it is used in many pulp and paper mills for this purpose.
In addition, there are a number of specialty pigments, including barium sulphate, gypsum and others whose consumption tonnage and market share is not significant. We will briefly review the basic manufactur-
Limestone
Kiln H S I a k e r " } - -
Milk of Lime
Carbonation Process
Milk of Lime
+ Na2C03 Lime-Soda Process
Precipitated Calcium
Carbonate
Milk of Lime
+NH4a Double Decomposition
Process
Milk of Lime + NajC03
Double Decomposition
Process
Double Decomposition
Process
Figure 4. Calcium carbonate processing.
ing processes of these pigments and their primary performance properties. KAOLIN
As mentioned previously, kaolin has the largest market share of papermaking mineral pigments, at about 70 to 75 per cent of total market tonnage. After extraction from the ground, the raw ore undergoes processing to produce a variety of grades (see Figure 3). The four major grades are Air-float, Water-washed, Delaminated, and Calcined. Although there are some basic similarities, these major grades have different characteristics which make them especially suited for specific end uses.
CALCIUM CARBONATE
There are two distinct types of calcium carbonate used in papermaking, ground and precipitated. Figure 4 shows schematically now they are produced.
The ground calcium carbonate is produced in much the same way that kaolin is processed. The most outstanding growth rate of all pigments in the last few years, however, has been exhibited by precipitated calcium carbonate. The driving forces have oeen both economic and technological. This product is produced by precipitation from a solution, and therefore can be obtained in very pure form.
It should be noted that calcium carbonate is soluble at acid pH less than 7. As a result, its growth rate had been inhibited by the fact that most papers, until very recently, were produced under acid papermaking conditions. This has been changing (again tor economic and technological reasons) in the last few years, and many
TABLE 3 PAPERMAKING MINERALS PIGMENT QUALITY
BRIGHTNESS VALLEY PARTICLE SPECIFIC % ABRASION SIZE SURFACE
mg % < 2 micron m2/gr
KAOLIN AIR-FLOAT 80-82 N/A 50-95 10-15 WATER-WASHED 83-86 5-20 50-95 12-20 DELAMINATED 87-89 5-20 N/A 12-20 CALCINED 90-93 20-40 80-90 12-20
CALCIUM CARBONATE GROUND 94-97 20-30 50-70 5-10 PRECIPITATED 94-97 20-30 60-90 8-10 TITANIUM DIOXIDE 95-96 >50 97-99 10-30
Conference Proceedings 101
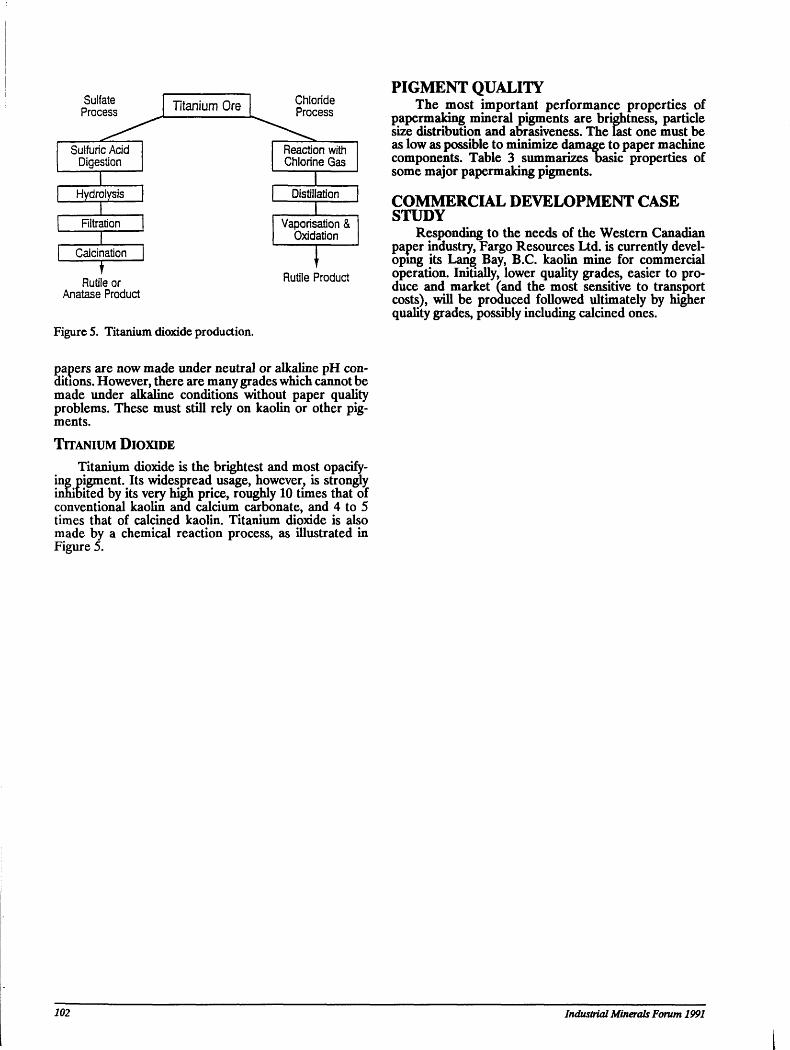
Sulfate Process Titanium Ore Chloride
Process
Sulfuric Acid Digestion
Reaction with Chlorine Gas
Hydrolysis Distillation 1 1
nitration Vaporisation & Oxidation 1
Vaporisation & Oxidation
Calcination i t Rutile or
Anatase Product Rutile Product
PIGMENT QUALITY The most important performance properties of
papermaking mineral pigments are brightness, particle size distribution and abrasiyeness. The last one must be as low as possible to minimize damage to paper machine components. Table 3 summarizes basic properties of some major papermaking pigments.
COMMERCIAL DEVELOPMENT CASE STUDY
Responding to the needs of the Western Canadian paper industry, Fargo Resources Ltd. is currently developing its Lang Bay, B.C. kaolin mine for commercial operation. Initially, lower quality grades, easier to produce and market (and the most sensitive to transport costs), will be produced followed ultimately by higher quality grades, possibly including calcined ones.
Figure 5. Titanium dioxide production.
papers are now made under neutral or alkaline pH conditions. However, there are many grades which cannot be made under alkaline conditions without paper quality problems. These must still rely on kaolin or other pigments.
TITANIUM DIOXIDE
Titanium dioxide is the brightest and most opacify-ing pigment. Its widespread usage, however, is strongly inhibited by its very high price, roughly 10 times that of conventional kaolin and calcium carbonate, and 4 to 5 times that of calcined kaolin. Titanium dioxide is also made by a chemical reaction process, as illustrated in Figure 5.
102 Industrial Minerals Forum 1991
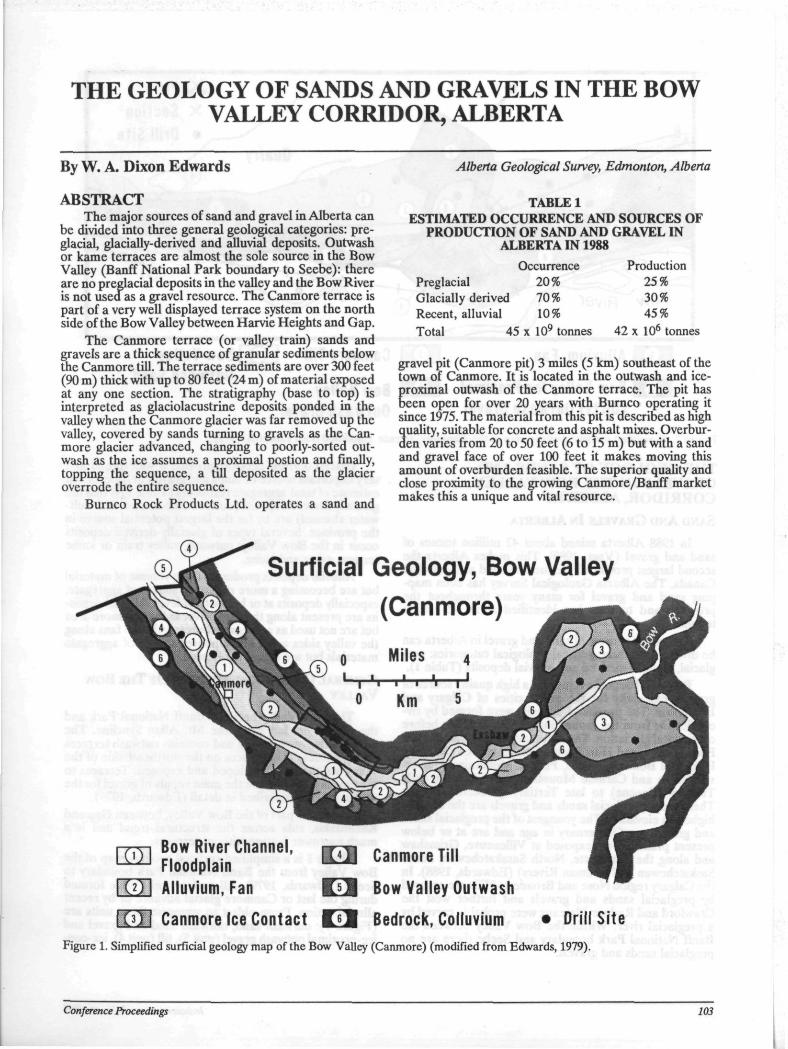
THE GEOLOGY OF SANDS AND GRAVELS IN THE BOW VALLEY CORRIDOR, ALBERTA
By W. A. Dixon Edwards
ABSTRACT The major sources of sand and gravel in Alberta can
be divided into three general geological categories: pre-glacial, glacially-derived and alluvial deposits. Outwash or kame terraces are almost the sole source in the Bow Valley (Banff National Park boundary to Seebe): there are no preglacial deposits in the valley and the Bow River is not used as a gravel resource. The Canmore terrace is part of a very well displayed terrace system on the north side of the Bow Valley between Harvie Heights and Gap.
The Canmore terrace (or valley train) sands and gravels are a thick sequence of granular sediments below the Canmore till. The terrace sediments are over 300 feet (90 m) thick with up to 80 feet (24 m) of material exposed at any one section. The stratigraphy (base to top) is interpreted as glaciolacustrine deposits ponded in the valley when the Canmore glacier was far removed up the valley, covered by sands turning to gravels as the Can-more glacier advanced, changing to poorly-sorted out-wash as the ice assumes a proximal postion and finally, topping the sequence, a till deposited as the glacier overrode the entire sequence.
Burnco Rock Products Ltd. operates a sand and
Alberta Geological Survey, Edmonton, Alberta
TABLE 1 ESTIMATED OCCURRENCE AND SOURCES OF
PRODUCTION OF SAND AND GRAVEL IN ALBERTA IN 1988
Occurrence Preglacial 20% Glacially derived 70% Recent, alluvial 10% Total 45 x 109 tonnes
Production 25% 30% 45%
42 x 106 tonnes
gravel pit (Canmore pit) 3 miles (5 km) southeast of the town of Canmore. It is located in the outwash and ice-proximal outwash of the Canmore terrace. The pit has been open for over 20 years with Burnco operating it since 1975. The material from this pit is described as high quality, suitable for concrete and asphalt mixes. Overburden varies from 20 to 50 feet (6 to 15 m) but with a sand and gravel face of over 100 feet it makes moving this amount of overburden feasible. The superior quality and close proximity to the growing Canmore/Banff market makes this a unique and vital resource.
Surficial Geology, Bow Valley
-T^yi Bow River Channel, - L ^ J Floodplain
ICOl Alluvium, Fan
E l Canmore Ice Contact I I Bedrock. Colluvium Figure 1. Simplified surficial geology map of the Bow Valley (Canmore) (modified from Edwards, 1979).
Canmore Till
Bow Valley Outwash
Bedrock, Colluvium
Conference Proceedings 70?
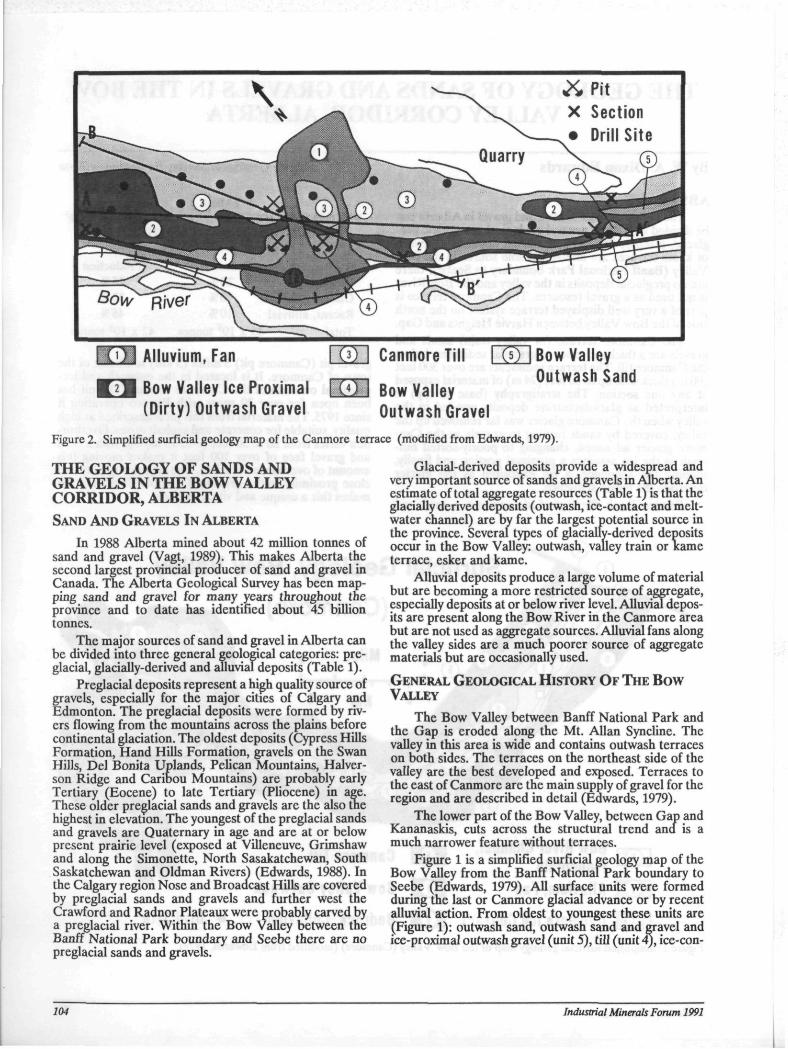
Bow Valley Ice Proximal (Dirty) Outwash Gravel
Bow Valley Outwash Gravel
C^TI Bow Valley Outwash Sand
Figure 2. Simplified surficial geology map of the Canmore terrace (modified from Edwards, 1979).
THE GEOLOGY OF SANDS AND GRAVELS IN THE BOW VALLEY CORRIDOR, ALBERTA SAND AND GRAVELS IN ALBERTA
In 1988 Alberta mined about 42 million tonnes of sand and gravel (Vagt, 1989). This makes Alberta the second largest provincial producer of sand and gravel in Canada. The Alberta Geological Survey has been mapping sand and gravel for many years throughout the province and to date has identified about 45 billion tonnes.
The major sources of sand and gravel in Alberta can be divided into three general geological categories: preglacial, glacially-derived and alluvial deposits (Table 1).
Preglacial deposits represent a high quality source of gravels, especially for the major cities of Calgary and Edmonton. The preglacial deposits were formed by rivers flowing from the mountains across the plains before continental glaciation. The oldest deposits (Cypress Hills Formation, Hand Hills Formation, gravels on the Swan Hills, Del Bonita Uplands, Pelican Mountains, Halver-son Ridge and Caribou Mountains) are probably early Tertiary (Eocene) to late Tertiary (Pliocene) in age. These older preglacial sands and gravels are the also the highest in elevation. The youngest of the preglacial sands and gravels are Quaternary in age and are at or below present prairie level (exposed at Villeneuve, Grimshaw and along the Simonette, North Saskatchewan, South Saskatchewan and Oldman Rivers') (Edwards, 1988). In the Calgary region Nose and Broadcast Hills are covered by preglacial sands and gravels and further west the Crawford and Radnor Plateaux were probably carved by a preglacial river. Within the Bow Valley between the Banff National Park boundary and Seebe there are no preglacial sands and gravels.
Glacial-derived deposits provide a widespread and very important source of sands and gravels in Alberta. An estimate of total aggregate resources (Table 1) is that the glacially derived deposits (outwash, ice-contact and melt-water channel) are by far the largest potential source in the province. Several types of glacially-derived deposits occur in the Bow Valley, outwash, valley train or W n e terrace, esker and kame.
Alluvial deposits produce a large volume of material but are becoming a more restricted source of aggregate, especially deposits at or below river level. Alluvial deposits are present along the Bow River in the Canmore area but are not used as aggregate sources. Alluvial fans along the valley sides are a much poorer source of aggregate materials but are occasionally used.
GENERAL GEOLOGICAL HISTORY OF THE BOW VALLEY
The Bow Valley between Banff National Park and the Gap is eroded along the Mt. Allan Syncline. The valley in this area is wide and contains outwash terraces on both sides. The terraces on the northeast side of the valley are the best developed and exposed. Terraces to the east of Canmore are the main supply of gravel for the region and are described in detail (Edwards, 1979).
The lower part of the Bow Valley, between Gap and Kananaskis, cuts across the structural trend and is a much narrower feature without terraces.
Figure 1 is a simplified surficial geology map of the Bow Valley from the Banff NationalPark boundary to Seebe (Edwards, 1979). All surface units were formed during the last or Canmore glacial advance or by recent alluvial action. From oldest to youngest these units are (Figure 1): outwash sand, outwash sand and gravel and ice-proximal outwash gravel (unit 5), till (unit 4), ice-con-
104 Industrial Minerals Forum 1991
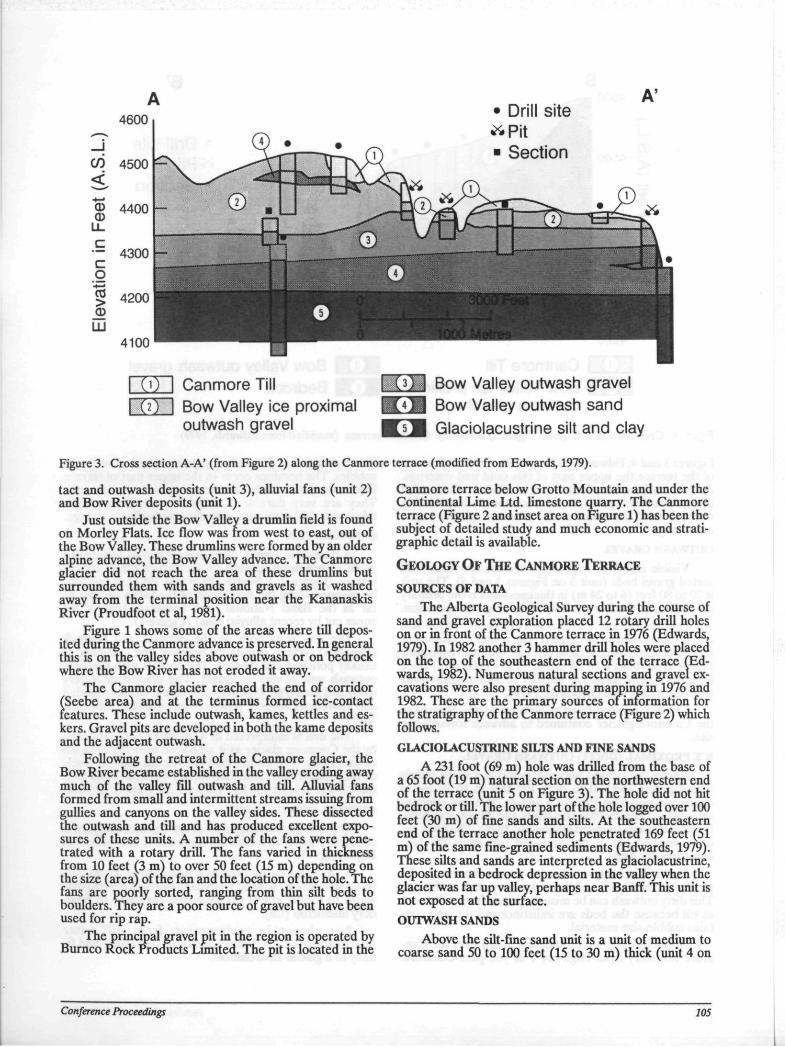
4600 • Drill site * P i t ■ Section
A'
§ 4200
LU 4100
(0 | Canmore Till 0 ) | Bow Valley ice proximal
outwash gravel
Bow Valley outwash gravel Bow Valley outwash sand Glaciolacustrine silt and clay
Figure 3. Cross section A-A' (from Figure 2) along the Canmore terrace (modified from Edwards, 1979).
tact and outwash deposits (unit 3), alluvial fans (unit 2) and Bow River deposits (unit 1).
Just outside the Bow Valley a drumlin field is found on Morley Flats. Ice flow was from west to east, out of the Bow Valley. These drumlins were formed by an older alpine advance, the Bow Valley advance. The Canmore glacier did not reach the area of these drumlins but surrounded them with sands and gravels as it washed away from the terminal position near the Kananaskis River (Proudfoot et al, 1981).
Figure 1 shows some of the areas where till deposited during the Canmore advance is preserved. In general this is on the valley sides above outwash or on bedrock where the Bow River has not eroded it away.
The Canmore glacier reached the end of corridor (Seebe area) and at the terminus formed ice-contact features. These include outwash, kames, kettles and es-kers. Gravel pits are developed in both the kame deposits and the adjacent outwash.
Following the retreat of the Canmore glacier, the Bow River became established in the valley eroding away much of the valley fill outwash and till. Alluvial fans formed from small and intermittent streams issuing from gullies and canyons on the valley sides. These dissected the outwash and till and has produced excellent exposures of these units. A number of the fans were penetrated with a rotary drill. The fans varied in thickness from 10 feet (3 m) to over 50 feet (15 m) depending on the size (area) of the fan and the location of the hole. The fans are poorly sorted, ranging from thin silt beds to boulders. They are a poor source of gravel but have been used for rip rap.
The principal gravel pit in the region is operated by Burnco Rock Products Limited. The pit is located in the
Canmore terrace below Grotto Mountain and under the Continental Lime Ltd. limestone quarry. The Canmore terrace (Figure 2 and inset area on Figure 1) has been the subject of detailed study and much economic and strati-graphic detail is available.
GEOLOGY O F THE CANMORE TERRACE
SOURCES OF DATA The Alberta Geological Survey during the course of
sand and gravel exploration placed 12 rotary drill holes on or in front of the Canmore terrace in 1976 (Edwards, 1979). In 1982 another 3 hammer drill holes were placed on tne top of the southeastern end of the terrace (Edwards, 1982). Numerous natural sections and gravel excavations were also present during mapping in 1976 and 1982. These are the primary sources of information for the stratigraphy of the Canmore terrace (Figure 2) which follows.
GLACIOLACUSTRINE SILTS AND FINE SANDS A 231 foot (69 m) hole was drilled from the base of
a 65 foot (19 m) natural section on the northwestern end of the terrace (unit 5 on Figure 3). The hole did not hit bedrock or till. The lower part of the hole logged over 100 feet (30 m) of fine sands and silts. At the southeastern end of the terrace another hole penetrated 169 feet (51 m) of the same fine-grained sediments (Edwards, 1979). Tnese silts and sands are interpreted as glaciolacustrine, deposited in a bedrock depression in the valley when the glacier was far up valley, perhaps near Banff. This unit is not exposed at the surface.
OUTWASH SANDS Above the silt-fine sand unit is a unit of medium to
coarse sand 50 to 100 feet (15 to 30 m) thick (unit 4 on
Conference Proceedings 105
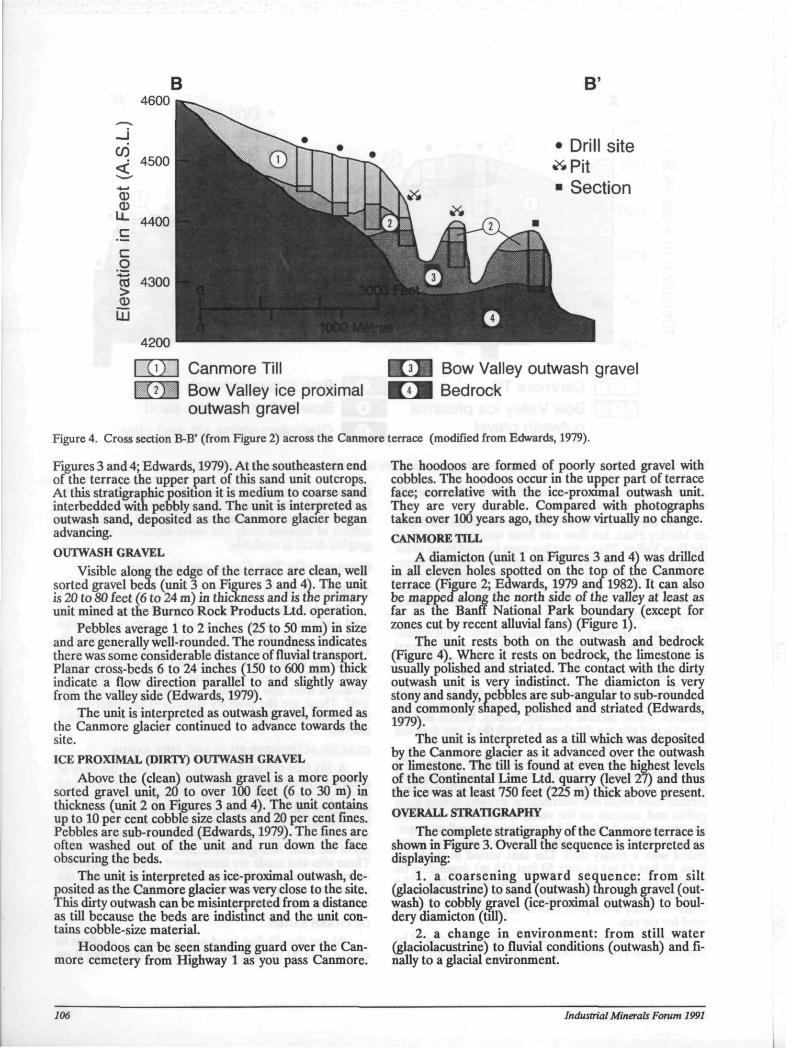
B 4600
B!
• Drill site * P i t ■ Section
Canmore Till Bow Valley ice proximal outwash gravel
Bow Valley outwash gravel Bedrock
Figure 4. Cross section B-B' (from Figure 2) across the Canmore terrace (modified from Edwards, 1979).
Figures 3 and 4; Edwards, 1979). At the southeastern end of the terrace the upper part of this sand unit outcrops. At this stratigraphic position it is medium to coarse sand interbedded with peobly sand. The unit is interpreted as outwash sand, deposited as the Canmore glacier began advancing. OUTWASH GRAVEL
Visible along the edge of the terrace are clean, well sorted gravel beds (unit 3 on Figures 3 and 4). The unit is 20 to 80 feet (6 to 24 m) in thickness and is tne primary unit mined at the Burnco Rock Products Ltd. operation.
Pebbles average 1 to 2 inches (25 to 50 mm) in size and are generally well-rounded. The roundness indicates there was some considerable distance of fluvial transport. Planar cross-beds 6 to 24 inches (150 to 600 mm) thick indicate a flow direction parallel to and slightly away from the valley side (Edwards, 1979).
The unit is interpreted as outwash gravel, formed as the Canmore glacier continued to advance towards the site. ICE PROXIMAL (DIRTY) OUTWASH GRAVEL
Above the (clean) outwash gravel is a more poorly sorted gravel unit, 20 to over 100 feet (6 to 30 m) in thickness (unit 2 on Figures 3 and 4). The unit contains up to 10 per cent cobble size clasts and 20 per cent fines. Pebbles are sub-rounded (Edwards, 1979). The fines are often washed out of the unit and run down the face obscuring the beds.
The unit is interpreted as ice-proximal outwash, deposited as the Canmore glacier was very close to the site. This dirty outwash can be misinterpreted from a distance as till because the beds are indistinct and the unit contains cobble-size material.
Hoodoos can be seen standing guard over the Can-more cemetery from Highway 1 as you pass Canmore.
The hoodoos are formed of poorly sorted gravel with cobbles. The hoodoos occur in the upper part of terrace face; correlative with the ice-proximal outwash unit. They are very durable. Compared with photographs taken over 100 years ago, they show virtually no change. CANMORE TILL
A diamicton (unit 1 on Figures 3 and 4) was drilled in all eleven holes spotted on the top of tne Canmore terrace (Figure 2; Edwards, 1979 and 1982). It can also be mapped along the north side of the valley at least as far as the Banff National Park boundary (except for zones cut by recent alluvial fans) (Figure l ) .
The unit rests both on the outwash and bedrock (Figure 4). Where it rests on bedrock, the limestone is usually polished and striated. The contact with the dirty outwash unit is very indistinct. The diamicton is very stony and sandy, pebbles are sub-angular to sub-rounded and commonly shaped, polished and striated (Edwards, 1979).
The unit is interpreted as a till which was deposited by the Canmore glacier as it advanced over the outwash or limestone. The till is found at even the highest levels of the Continental Lime Ltd. quarry (level 27) and thus the ice was at least 750 feet (225 m) thick above present. OVERALL STRATIGRAPHY
The complete stratigraphy of the Canmore terrace is shown in Figure 3. Overall the sequence is interpreted as displaying:
1. a coarsening upward sequence: from silt (glaciolacustrine) to sand (outwash) through gravel (out-wash) to cobbly gravel (ice-proximal outwash) to boul-dery diamicton (till).
2. a change in environment: from still water (glaciolacustrine) to fluvial conditions (outwash) and finally to a glacial environment.
106 Industrial Minerals Forum 1991
3. a decrease in distance of fluvial transport as inter-
Ereted from the decrease in pebble roundness upwards: om well-rounded pebbles in the outwash gravel to sub-
rounded pebbles in the ice-proximal outwash and finally to sub-angular clasts in the till.
4. a record of the advance of the Canmore glacier: based on the evidence from statements 1 to 3 above plus the decrease in sorting upwards from well-sorted sand and gravel in lower sequence to poorly sorted outwash and then into till (unsorted). SAND AND GRAVEL EXTRACTION
The major sand and gravel pit in the Canmore terrace is located at about the mid point of the terrace (longitudinally) and along the edge. The pit has been operating for over 20 years. Burnco Rock Products Ltd. has operated the pit since 1975.
The material is high quality, suitable for concrete and asphalt mixes. Overburden varies from 20 to 50 feet (6 to 15 m) but with a sand and gravel face of over 100 ieet (30 m) it makes moving this amount of overburden feasible. The superior quality and close proximity to the growing Canmore-Banff market makes the Canmore pit a unique and vital resource.
The land for the pit is leased from the Crown for long-term sand and gravel extraction. In 1985 Burnco Rock Products Ltd. in conjunction with the town Can-more looked into the feasibility of using the mined-out pit as a clean-waste disposal site. The proposal was approved by the provincial government and will allow Burnco Rock Products Ltd. to continue mining while creating an unobtrusive excavation for the expanding clean waste demands of the region (personnel communication, Scott Burns).
REFERENCES Edwards, W. A. D. (1979): Sand and gravel deposits in
the Canmore Corridor area, Alberta; Alberta Re-search Council Earth Science, Report 79-2, 30 pages.
Edwards, W. A. D. (1982): Evaluation of granular deposits in the Canmore Corridor terraces; Alberta Geological Survey, internal report.
Edwards, Dixon (1988): Tertiary gravel deposits of Alberta; Alberta Geological Survey Research Forum Program Presentation and Poster, Calgary, November 8,1988.
personnel communication: Scott Burns of Burnco Rock Products Ltd.
Proudfoot, D. N., Moran, S. R. and Rutter, N. W. (1981): The Quaternary stratigraphy and geomor-phology of southwest/central Alberta; in Field Guides to Geology ana Mineral Deposits, Thompson, R. I. and Cook, D. G., 1981 Geological Assoc. of Canada Annual General Meeting Calgary, 1981, pages 225-260.
Vagt, O. (1989): Mineral aggregates ; in Canadian Minerals Yearoook, Energy, Mines and Resources, Mineral Report No. 38.
Conference Proceedings 107

108 Industrial Minerals Forum 1991
THE UPPER DEVONIAN PALLISER FORMATION IN THE TYPE AREA NEAR EXSHAW, ALBERTA
By N.C. Meijer Drees Institute of Sedimentary and Petroleum Geology, Calgary, Alberta
D.I. Johnston University of Alberta, Edmonton, Alberta
ABSTRACT A 298.5 metre thick, composite section of the Palliser Formation near Exshaw includes 5 units. It was sampled
for conodonts and correlated with incomplete sections near Canmore and Lake Minnewanka. The basal, dark grey dolostone of unit 1 did not yield conodonts, but the dolomitic limestone of unit 2 includes conodonts of the Famenn-ian, Lower to Upper crepida zones. The peloidal limestones of unit 3 contain conodonts of the Lower rhomboidea to Lower marginifera zones. Unit 4 did not yield diagnostic conodonts. The fossiliferous limestones of unit 5 include conodonts of the praesulcata zones.
It appears that the interbedded dolostones, carbonate breccia, laminated and silty limestones and stromotolitic limestones of unit 4 represent the lower part of the Costigan member and correlate with the anhydritic deposits of the upper part of the Wabamun Formation in the Gap Lake 6-4-24-7W5 well. The fossiliferous beds of unit 5 represent the upper part of the Costigan member and correlate with the Big Valley member of the Wabamun Formation. Because umt 4 and the Big Valley include conodonts of the same zone as found in the overlying dark shales of the subsurface Exshaw Formation, it is assumed that the sharp contact between the Palliser and the Exshaw Formations does not represent a major unconformity.
Conference Proceedings 109

110 Industrial Minerals Forum 1991
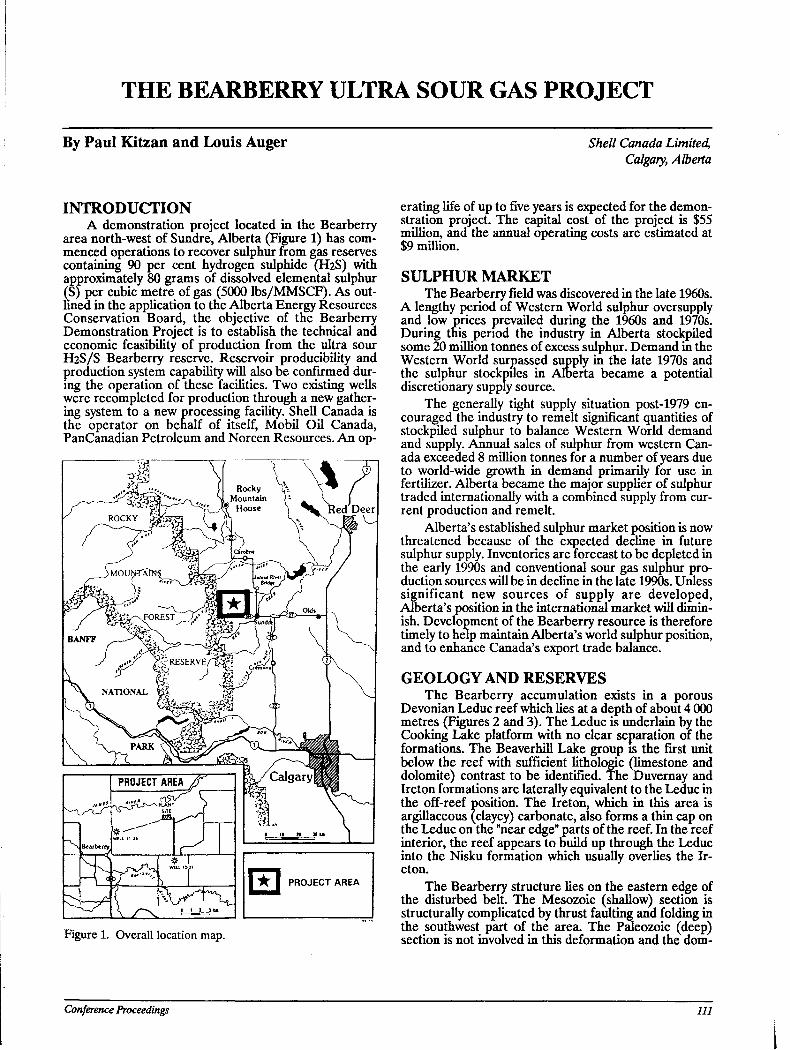
THE BEARBERRY ULTRA SOUR GAS PROJECT
By Paul Kitzan and Louis Auger Shell Canada Limited, Calgary, Alberta
INTRODUCTION A demonstration project located in the Bearberry
area north-west of Sundre, Alberta (Figure 1) has commenced operations to recover sulphur from gas reserves containing 90 per cent hydrogen sulphide (H2S) with approximately 80 grams of dissolved elemental sulphur (S) per cubic metre of gas (5000 lbs/MMSCF). As outlined in the application to the Alberta Energy Resources Conservation Board, the objective of the Bearberry Demonstration Project is to establish the technical and economic feasibility of production from the ultra sour H2S/S Bearberry reserve. Reservoir producibility and production system capability will also be confirmed during the operation of these facilities. Two existing wells were recompleted for production through a new gathering system to a new processing facility. Shell Canada is the operator on behalf of itself, Mobil Oil Canada, PanCanadian Petroleum and Norcen Resources. An op-
Figure 1. Overall location map.
erating life of up to five years is expected for the demonstration project. The capital cost of the project is $55 million, and the annual operating costs are estimated at $9 million.
SULPHUR MARKET The Bearberry field was discovered in the late 1960s.
A lengthy period of Western World sulphur oversupply and low prices prevailed during the 1960s and 1970s. During this period the industry in Alberta stockpiled some 20 million tonnes of excess sulphur. Demand in the Western World surpassed supply in the late 1970s and the sulphur stockpiles in Alberta became a potential discretionary supply source.
The generally tight supply situation post-1979 encouraged the industry to remelt significant quantities of stockpiled sulphur to balance Western World demand and supply. Annual sales of sulphur from western Canada exceeded 8 million tonnes for a number of years due to world-wide growth in demand primarily for use in fertilizer. Alberta became the major supplier of sulphur traded internationally with a combined supply from current production and remelt.
Alberta's established sulphur market position is now threatened because of the expected decline in future sulphur supply. Inventories are forecast to be depleted in the early 1990s and conventional sour gas sulphur production sources will be in decline in the late 1990s. Unless significant new sources of supply are developed, Alberta's position in the international market will diminish. Development of the Bearberry resource is therefore timely to help maintain Alberta's world sulphur position, and to enhance Canada's export trade balance.
GEOLOGY AND RESERVES The Bearberry accumulation exists in a porous
Devonian Leduc reef which lies at a depth of about 4 000 metres (Figures 2 and 3). The Leduc is underlain by the Cooking Lake platform with no clear separation of the formations. The Beaverhill Lake group is the first unit below the reef with sufficient lithologic (limestone and dolomite) contrast to be identified. The Duvernay and Ireton formations are laterally equivalent to the Leduc in the off-reef position. The Ireton, which in this area is argillaceous (clayey) carbonate, also forms a thin cap on the Leduc on the "near edge" parts of the reef. In the reef interior, the reef appears to build up through the Leduc into the Nisku formation which usually overlies the Ireton.
The Bearberry structure lies on the eastern edge of the disturbed belt. The Mesozoic (shallow) section is structurally complicated by thrust faulting and folding in the southwest part of the area. The Paleozoic (deep) section is not involved in this deformation and the dom-
Conference Proceedings 111
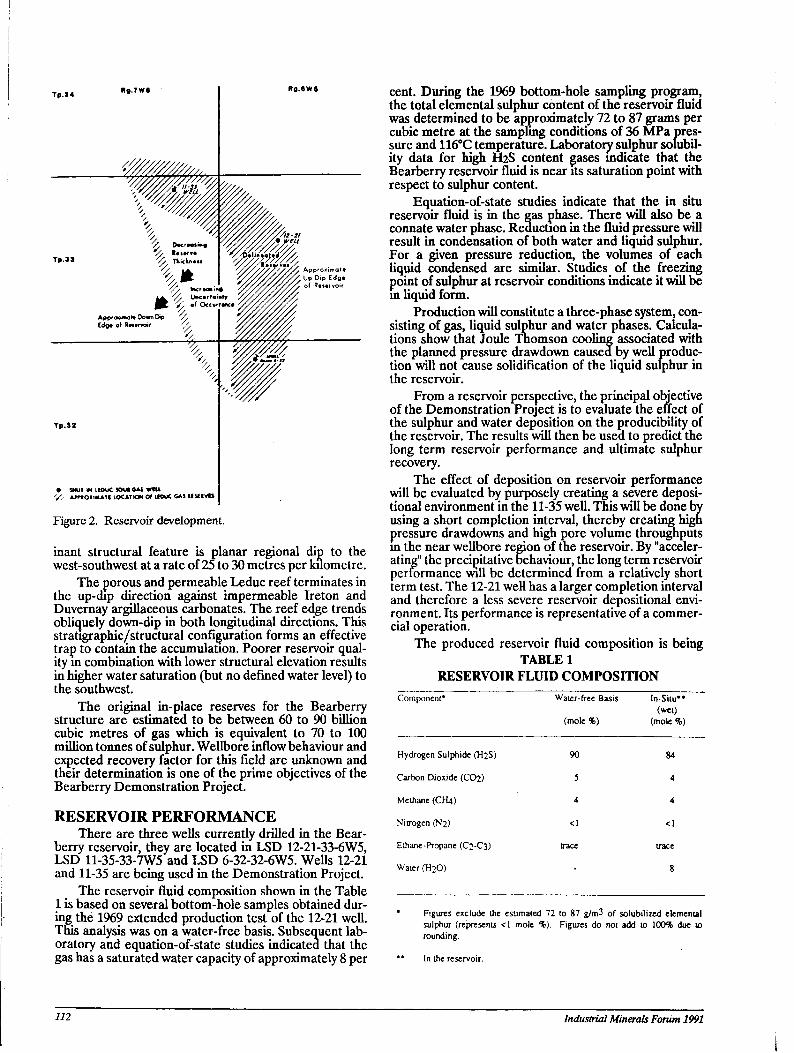
Rg.TWft Rg.OWS
• SMUT IN IIOUC SOUt CAS Wti l V- APftOXIMATI IOCATKJN Of UOUC GAS tf Sf IVtS |
Figure 2. Reservoir development.
inant structural feature is planar regional dip to the west-southwest at a rate of 25 to 30 metres per kilometre.
The porous and permeable Leduc reef terminates in the up-dip direction against impermeable Ireton and Duvernay argillaceous carbonates. The reef edge trends obliquely down-dip in both longitudinal directions. This stratigraphies/structural configuration forms an effective trap to contain the accumulation. Poorer reservoir quality in combination with lower structural elevation results in higher water saturation (but no defined water level) to the southwest.
The original in-place reserves for the Bearberry structure are estimated to be between 60 to 90 billion cubic metres of gas which is equivalent to 70 to 100 million tonnes of sulphur. Wellbore inflow behaviour and expected recovery factor for this field are unknown and their determination is one of the prime objectives of the Bearberry Demonstration Project.
RESERVOIR PERFORMANCE There are three wells currently drilled in the Bear
berry reservoir, they are located in LSD 12-21-33-6W5, LSD 11-35-33-7W5 and LSD 6-32-32-6W5. Wells 12-21 and 11-35 are being used in the Demonstration Project.
The reservoir fluid composition shown in the Table 1 is based on several bottom-hole samples obtained during the 1969 extended production test of the 12-21 well. This analysis was on a water-free basis. Subsequent laboratory and equation-of-state studies indicated that the gas has a saturated water capacity of approximately 8 per
cent. During the 1969 bottom-hole sampling program, the total elemental sulphur content of the reservoir fluid was determined to be approximately 72 to 87 grams per cubic metre at the sampling conditions of 36 MPa pressure and 116°C temperature. Laboratory sulphur solubility data for high H2S content gases indicate that the Bearberry reservoir fluid is near its saturation point with respect to sulphur content.
Equation-of-state studies indicate that the in situ reservoir fluid is in the gas phase. There will also be a connate water phase. Reduction in the fluid pressure will result in condensation of both water and liquid sulphur. For a given pressure reduction, the volumes of each liquid condensed are similar. Studies of the freezing point of sulphur at reservoir conditions indicate it will be m liquid form.
Production will constitute a three-phase system, consisting of gas, liquid sulphur and water phases. Calculations show that Joule Thomson cooling associated with the planned pressure drawdown caused by well production will not cause solidification of the liquid sulphur in the reservoir.
From a reservoir perspective, the principal objective of the Demonstration Project is to evaluate the effect of the sulphur and water deposition on the producibility of the reservoir. The results will then be used to predict the long term reservoir performance and ultimate sulphur recovery.
The effect of deposition on reservoir performance will be evaluated by purposely creating a severe deposi-tional environment in the 11-35 well. This will be done by using a short completion interval, thereby creating high pressure drawdowns and high pore volume throughputs in the near wellbore region of the reservoir. By "accelerating" the precipitative behaviour, the long term reservoir performance will be determined from a relatively short term test. The 12-21 well has a larger completion interval and therefore a less severe reservoir depositional environment. Its performance is representative of a commercial operation.
The produced reservoir fluid composition is being TABLE 1
RESERVOIR FLUID COMPOSITION Component* Water-free Basis
(mole %) w l Hydrogen Sulphide (H2S) 90 84
Carbon Dioxide (CO2) 5 4
Methane (CH4) 4 4
Nitrogen (N2) <1 <1
Ethane-Propane (C2-C3) trace trace
Water (H2O) - 8
Figures exclude the estimated 72 to 87 g/m3 of solubilized elemental sulphur (represents <1 mole %). Figures do not add to 100% due to rounding.
In the reservoir.
112 Industrial Minerals Forum 1991
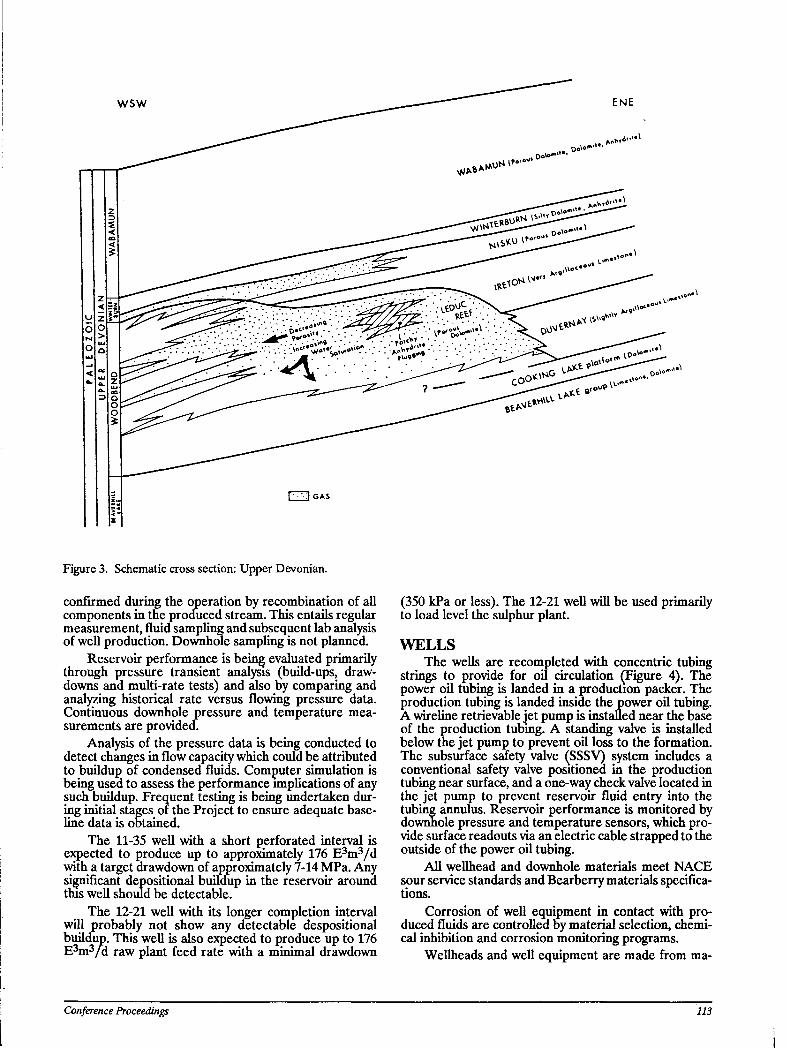
wsw
( \o"»" 1
( 1 3 GAS
Figure 3. Schematic cross section: Upper Devonian.
confirmed during the operation by recombination of all components in the produced stream. This entails regular measurement, fluid sampling and subsequent lab analysis of well production. Downhole sampling is not planned.
Reservoir performance is being evaluated primarily through pressure transient analysis (build-ups, drawdowns and multi-rate tests) and also by comparing and analyzing historical rate versus flowing pressure data. Continuous downhole pressure and temperature measurements are provided.
Analysis of the pressure data is being conducted to detect changes in flow capacity which could be attributed to buildup of condensed fluids. Computer simulation is being used to assess the performance implications of any such buildup. Frequent testing is being undertaken during initial stages 01 the Project to ensure adequate baseline data is obtained.
The 11-35 well with a short perforated interval is expected to produce up to approximately 176 E3m3/d with a target drawdown of approximately 7-14 MPa. Any significant depositional buildup in the reservoir around this well should be detectable.
The 12-21 well with its longer completion interval will probably not show any detectable despositional buildup. This well is also expected to produce up to 176 E3m3/d raw plant feed rate with a minimal drawdown
(350 kPa or less). The 12-21 well will be used primarily to load level the sulphur plant.
WELLS The wells are recompleted with concentric tubing
strings to provide for oil circulation (Figure 4). The power oil tubing is landed in a production packer. The production tubing is landed inside the power oil tubing. A wireline retrievable Jet pump is installed near the base of the production tubmg. A standing valve is installed below the jet pump to prevent oil loss to the formation. The subsurface safety valve (SSSV) system includes a conventional safety valve positioned in the production tubing near surface, and a one-way check valve located in the jet pump to prevent reservoir fluid entry into the tubing annulus. Reservoir performance is monitored by downhole pressure and temperature sensors, which provide surface readouts via an electric cable strapped to the outside of the power oil tubing.
All wellhead and downhole materials meet NACE sour service standards and Bearberry materials specifications.
Corrosion of well equipment in contact with produced fluids are controlled by material selection, chemical inhibition and corrosion monitoring programs.
Wellheads and well equipment are made from ma-
Conference Proceedings 113
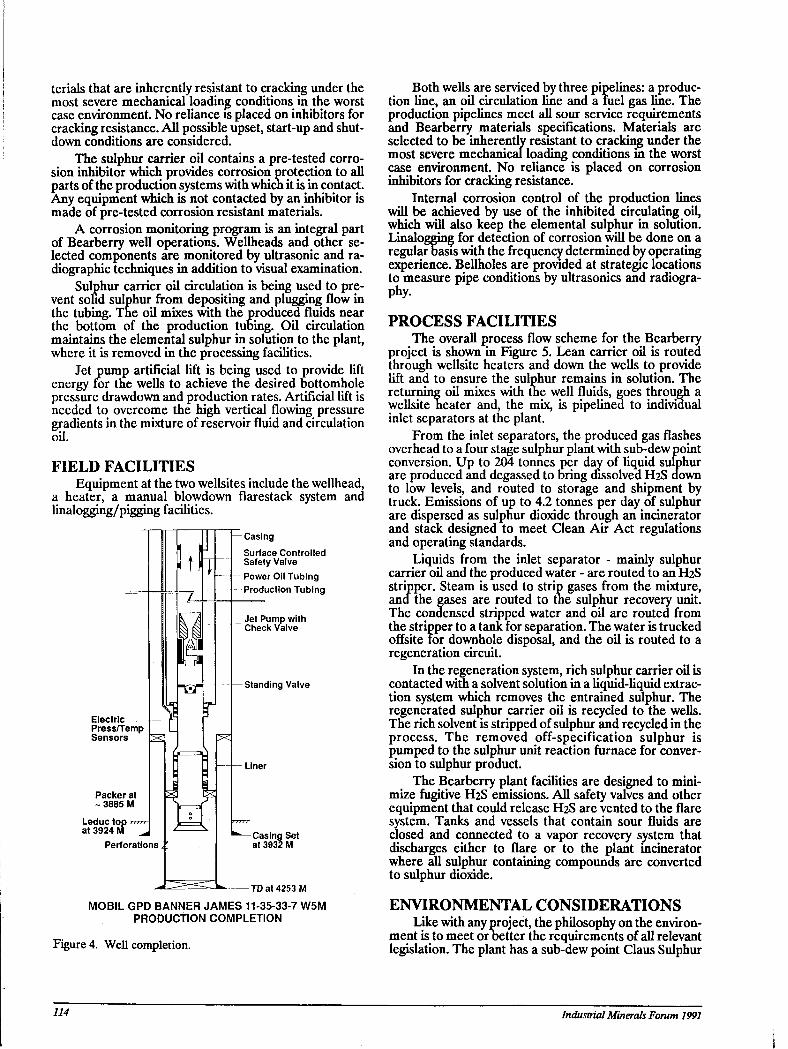
terials that are inherently resistant to cracking under the most severe mechanical loading conditions in the worst case environment. No reliance is placed on inhibitors for cracking resistance. All possible upset, start-up and shutdown conditions are considered.
The sulphur carrier oil contains a pre-tested corrosion inhibitor which provides corrosion protection to all parts of the production systems with which it is in contact. Any equipment which is not contacted by an inhibitor is made of pre-tested corrosion resistant materials.
A corrosion monitoring program is an integral part of Bearberry well operations. Wellheads and other selected components are monitored by ultrasonic and ra-diographic techniques in addition to visual examination.
Sulphur carrier oil circulation is being used to prevent solid sulphur from depositing and plugging flow in the tubing. The oil mixes with the produced fluids near the bottom of the production tubing. Oil circulation maintains the elemental sulphur in solution to the plant, where it is removed in the processing facilities.
Jet pump artificial lift is being used to provide lift energy for the wells to achieve the desired bottomhole pressure drawdown and production rates. Artificial lift is needed to overcome the high vertical flowing pressure gradients in the mixture of reservoir fluid and circulation oil.
FIELD FACILITIES Equipment at the two wellsites include the wellhead,
a heater, a manual blowdown flarestack system and linalogging/pigging facilities.
Casing
Surface Controlled Safety Valve Power Oil Tubing Production Tubing
Electric — Press/Temp Sensors
Packer at ~ 3885 M
Leduc top at 3924 M ^J
Perforations
Jet Pump with Check Valve
Standing Valve
Liner
Casing Set at 3932 M
TD at 4253 M
MOBIL GPD BANNER JAMES 11-35-33-7 W5M PRODUCTION COMPLETION
Figure 4. Well completion.
Both wells are serviced by three pipelines: a production line, an oil circulation line and a fuel gas line. The production pipelines meet all sour service requirements and Bearberry materials specifications. Materials are selected to be inherently resistant to cracking under the most severe mechanical loading conditions in the worst case environment. No reliance is placed on corrosion inhibitors for cracking resistance.
Internal corrosion control of the production lines will be achieved by use of the inhibited circulating oil, which will also keep the elemental sulphur in solution. Linalogging for detection of corrosion will be done on a regularbasis with the frequency determined by operating experience. Bellholes are provided at strategic locations to measure pipe conditions by ultrasonics and radiography.
PROCESS FACILITIES The overall process flow scheme for the Bearberry
project is shown in Figure 5. Lean carrier oil is routed through wellsite heaters and down the wells to provide lift and to ensure the sulphur remains in solution. The returning oil mixes with the well fluids, goes through a wellsite heater and, the mix, is pipelined to individual inlet separators at the plant.
From the inlet separators, the produced gas flashes overhead to a four stage sulphur plant with sub-dew point conversion. Up to 204 tonnes per day of liquid sulphur are produced and degassed to bring dissolved H2S down to low levels, and routed to storage and shipment by truck. Emissions of up to 4.2 tonnes per day of sulphur are dispersed as sulphur dioxide through an incinerator and stack designed to meet Clean Air Act regulations and operating standards.
Liquids from the inlet separator - mainly sulphur carrier oil and the produced water - are routed to an H2S stripper. Steam is used to strip gases from the mixture, ana the gases are routed to the sulphur recovery unit. The condensed stripped water and oil are routed from the stripper to a tank for separation. The water is trucked offsite for downhole disposal, and the oil is routed to a regeneration circuit.
In the regeneration system, rich sulphur carrier oil is contacted with a solvent solution in a liquid-liquid extraction system which removes the entrained sulphur. The regenerated sulphur carrier oil is recycled to the wells. The rich solvent is stripped of sulphur and recycled in the process. The removed off-specification sulphur is pumped to the sulphur unit reaction furnace for conversion to sulphur product.
The Bearberry plant facilities are designed to minimize fugitive H2S emissions. All safety valves and other equipment that could release H2S are vented to the flare system. Tanks and vessels that contain sour fluids are closed and connected to a vapor recovery system that discharges either to flare or to the plant incinerator where aid sulphur containing compounds are converted to sulphur dioxide.
ENVIRONMENTAL CONSIDERATIONS Like with any project, the philosophy on the environ
ment is to meet or better the requirements of all relevant legislation. The plant has a sub-dew point Claus Sulphur
114 Industrial Minerals Forum 1991
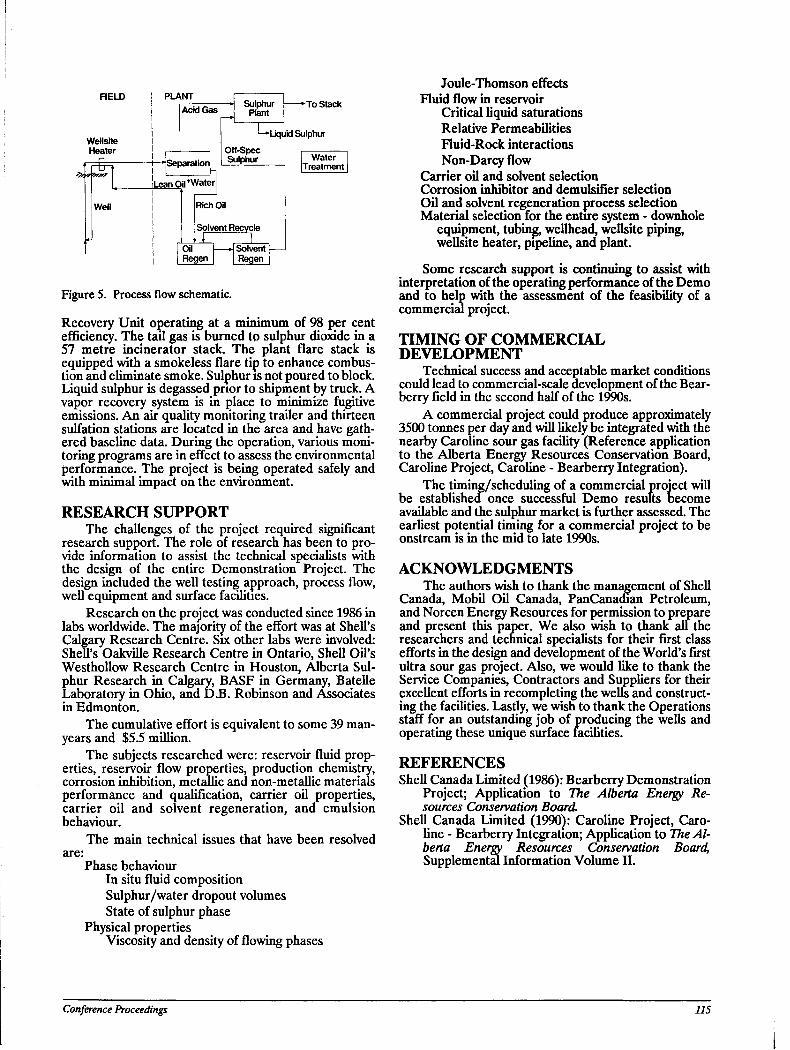
FIELD *To Stack
Liquid Sulphur
Tbctrftw?
Water iTreatment
Figure 5. Process flow schematic.
Recovery Unit operating at a minimum of 98 per cent efficiency. The tail gas is burned tp sulphur dioxide in a 57 metre incinerator stack. The plant flare stack is equipped with a smokeless flare tip to enhance combustion and eliminate smoke. Sulphur is not poured to block. Liquid sulphur is degassed prior to shipment by truck. A vapor recovery system is in place to minimize fugitive emissions. An air quality monitoring trailer and thirteen sulfation stations are located in the area and have gathered baseline data. During the operation, various monitoring programs are in effect to assess the environmental performance. The project is being operated safely and with minimal impact on the environment.
RESEARCH SUPPORT The challenges of the project required significant
research support. The role of research has been to provide information to assist the technical specialists with the design of the entire Demonstration Project. The design included the well testing approach, process flow, well equipment and surface facilities.
Research on the project was conducted since 1986 in labs worldwide. The majority of the effort was at Shell's Calgary Research Centre. Six other labs were involved: Shell's Oakville Research Centre in Ontario, Shell Oil's Westhollow Research Centre in Houston, Alberta Sulphur Research in Calgary, BASF in Germany, Batelle Laboratory in Ohio, and D.B. Robinson and Associates in Edmonton.
The cumulative effort is equivalent to some 39 man-years and $5.5 million.
The subjects researched were: reservoir fluid properties, reservoir flow properties, production chemistry, corrosion inhibition, metallic and non-metallic materials performance and qualification, carrier oil properties, carrier oil and solvent regeneration, and emulsion behaviour.
The main technical issues that have been resolved are:
Phase behaviour In situ fluid composition Sulphur/water dropout volumes State of sulphur phase
Physical properties Viscosity and density of flowing phases
Joule-Thomson effects Fluid flow in reservoir
Critical liquid saturations Relative Permeabilities Fluid-Rock interactions Non-Darcy flow
Carrier oil and solvent selection Corrosion inhibitor and demulsifier selection Oil and solvent regeneration process selection Material selection for the entire system - downhole
equipment, tubing, wellhead, wellsite piping, wellsite heater, pipeline, and plant.
Some research support is continuing to assist with interpretation of the operating performance of the Demo and to help with the assessment of the feasibility of a commercial project.
TIMING OF COMMERCIAL DEVELOPMENT
Technical success and acceptable market conditions could lead to commercial-scale development of the Bear-berry field in the second half of the 1990s.
A commercial project could produce approximately 3500 tonnes per day and will likely be integrated with the nearby Caroline sour gas facility (Reference application to the Alberta Energy Resources Conservation Board, Caroline Project, Caroline - Bearberry Integration).
The timing/scheduling of a commercial project will be established once successful Demo results become available and the sulphur market is further assessed. The earliest potential timing for a commercial project to be onstream is in the mid to late 1990s.
ACKNOWLEDGMENTS The authors wish to thank the management of Shell
Canada, Mobil Oil Canada, PanCanadian Petroleum, and Norcen Energy Resources for permission to prepare and present this paper. We also wish to thank all the researchers and technical speciaUsts for their first class efforts in the design and development of the World's first ultra sour gas project. Also, we would like to thank the Service Companies, Contractors and Suppliers for then-excellent efforts in recomputing the welk and constructing the facilities. Lastly, we wish to thank the Operations staff for an outstanding job of producing the wells and operating these unique surface facilities.
REFERENCES Shell Canada Limited (1986): Bearberry Demonstration
Project; Application to The Alberta Energy Re-sources Conservation Board.
Shell Canada Limited (1990): Caroline Project, Caroline - Bearberry Integration; Application to The Alberta Energy Resources Conservation Board, Supplemental Information Volume II.
Conference Proceedings 115

116 Industrial Minerals Forum 1991
YTTRIUM ENRICHED PHOSPHORITES IN THE FERNIE BASIN, SOUTHEASTERN BRITISH COLUMBIA
By Jennifer Pell Consultant to Formosa Resources Corporation, Vancouver, B.C.
ABSTRACT A series of predominantly marine strata, which
range in age from Devonian to Jurassic, and nonmarine fluvio-deltaic sediments of the Late Jurassic and Cretaceous are exposed in a broad, doubly plunging synclinor-ium, commonly referred to as the Fernie basin. Phosphatic horizons are known to occur at a number of intervals within the section; however, phosphatic strata at the base of the Jurassic Fernie Group are considered to have the best economic potential and have been the focus of most exploration activity.
The basal Fernie phosphate horizon is generally 1 to 3.5 metres thick and consists of interbedded phosphorites, shaley phosphorites and phosphatic shales with average grades of 21 to 22 per cent P2O5 and local concentrations in excess of 30 per cent P2O5. Preliminary beneficiation tests suggest that simple grinding and washing may be all that is required to upgrade the raw material to industry standard specifications for fertilizer plant feed, with acceptable P2O5 contents (27-42%), P20s/CaO ratios and concentrations of deleterious elements such as MgO, Fe203 and AI2O3. The Fernie phosphorites also contain anomalous concentrations of yttrium, averaging around 650 to 700 ppm versus the world phosphorite average of 275 ppm; byproduct recovery of yttrium could elevate these deposits to economic status.
Current exploration work has focussed on evaluating the grade and continuity of the basal Fernie phosphorite horizon in the southern and southeastern part of the Fernie Basin and locating areas with favorable conditions for mining (dip slope settings, etc.). Additional beneficiation and yttrium recovery studies are required.
INTRODUCTION Canada imported 2.39 million tonnes of phosphate
rock in 1986, approximately 80 per cent of which was used in the fertilizer industry. Other products which require the use of phosphorus include organic and inorganic chemicals, soaps and detergents, pesticides, insecticides, alloys, animal-food supplements, ceramics, beverages, catalysts, motor lubricants, photographic materials and dental and silicate cements. To date, there are no mines producing phosphate rock in Canada; however, approximately 55 million tonnes per annum are produced in the United States. Approximately 50 per cent of the phosphate rock imported mto western Canada comes from Florida, the remainder being supplied from the western U.S.. The majority of phosphate rock imported into eastern Canada is also from Florida; minor amounts have also been imported from Togo, Tunisia and Morocco (Barry, 1987; Stowasser, 1988). Resources in Florida are rapidly being depleted; some experts feel that the western U.S. sources will not be able to meet the demand when Florida becomes exhausted, which suggests a pos
sible niche for a new producer. Yttrium (atomic number 39) is an element that is closely associated with the rare earths flanthanides) in occurrence, chemical properties and ena use applications. The principal uses for vttrium are in producing red phosphors for colour television picture tubes, and other cathode ray tubes and in the production of commercial garnets for microwave controls and the fabrication of lasers used in cutting, drilling and welding. It is also used in the production of some advanced ceramics, in magnesium alloys, in stainless steel to impart high-temperature corrosion resistance characteristics and m cobalt and nickel based superalloys used in jet engines and turbine blades (Hendrick, 1985). Yttrium is commercially recovered from heavy mineral
!>lacers (monazite and xenotime placers) predominantly rom Australia, Thailand, Malaysia, India, Brazil and
China. Since 1986, yttrium concentrates have also been extracted as a byproduct of uranium processing at Elliot Lake, Ontario. Currently, there is no reported byproduct recovery of yttrium from any phosphate operations.
Phosphatic strata in the western Canadian Cordillera were discovered in 1925 and have been the subject of periodic exploration activity since that time, much of which has been focussed on beds at the base of the Jurassic Fernie Group (Christie, 1979; Kenny, 1977; Tel-fer, 1933). Recent government studies have indicated that Fernie phosphorites located near the southern and eastern limits of their exposure have the best economic potential (Butrenchuk, 1987 & in press; Macdonald, 1985; 1987). The phosphorite beds in the Fernie Group are thin relative to most phosphorites mined in the United States and, as with most of the U.S. phosphate ores, would require beneficiation to produce a product suitable for use in fertilizer plants. They contain anomalous concentrations of yttrium with respect to most other sedimentary phosphate deposits; averaging 650 to 700 ppm yttrium versus the world phosphorite average of 275 ppm yttrium (Altschuler, 1980; Butrenchuk, 1987). If it proves feasible to recover yttrium during the production of phosphoric acid, as has been suggested by some researchers (Altschuler, et al., 1967), the economics of exploiting the Fernie Group basal phosphorite horizon will become significantly more attractive.
The most recent exploration in the area was conducted by Formosa Resources Corporation of Vancouver; seven properties southeast of the town of Fernie, B.C., near the southern and eastern limits of the area underlain by Fernie Group strata, were examined (Figure 1). The primary objective of this work was to evaluate the grade and continuity of the basal Fernie phosphate horizon in terms of establishing its potential as a large tonnage P2O5-Y resource and to identify areas with optimum mining conditions.
Conference Proceedings 117
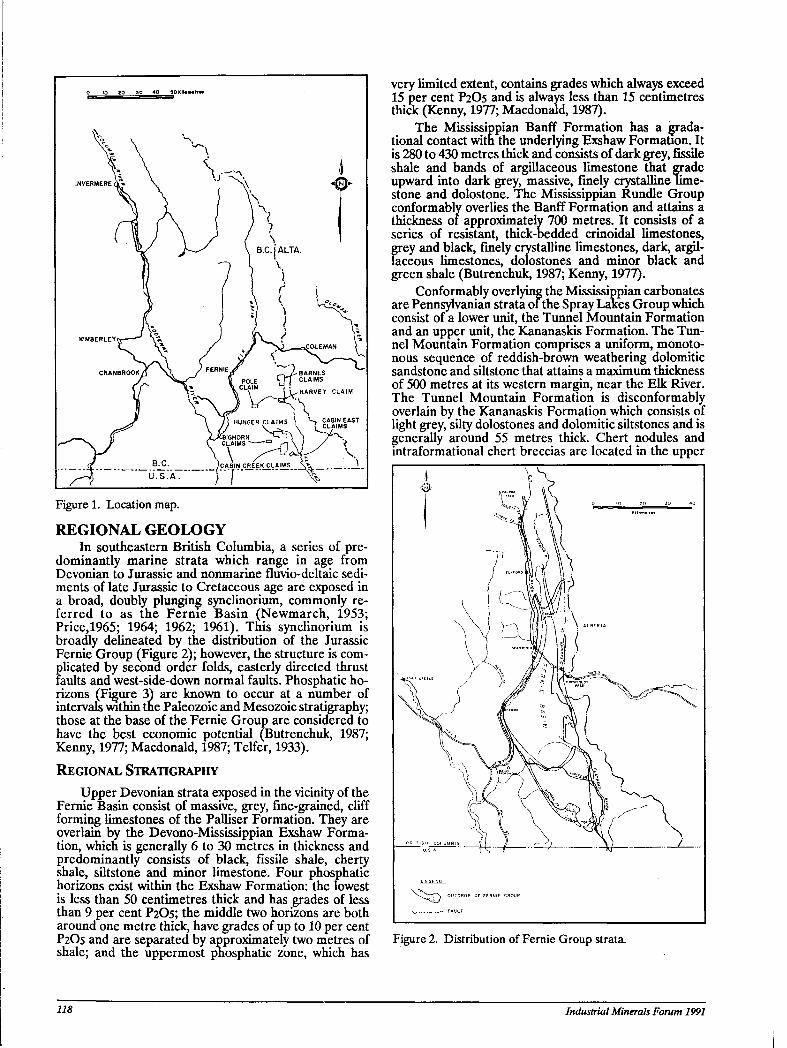
Figure 1. Location map.
REGIONAL GEOLOGY In southeastern British Columbia, a series of pre
dominantly marine strata which range in age from Devonian to Jurassic and nonmarine fluvio-deltaic sediments of late Jurassic to Cretaceous age are exposed in a broad, doubly plunging synclinorium, commonly referred to as the Fernie Basin (Newmarch, 1953; Price,1965; 1964; 1962; 1961). This synclinorium is broadly delineated by the distribution of the Jurassic Fernie Group (Figure 2); however, the structure is complicated by second order folds, easterly directed thrust faults and west-side-down normal faults. Phosphatic horizons (Figure 3) are known to occur at a number of intervals within tne Paleozoic and Mesozoic stratigraphy; those at the base of the Fernie Group are considered to have the best economic potential (Butrenchuk, 1987; Kenny, 1977; Macdonald, 1987; Telfer, 1933).
REGIONAL STRATIGRAPHY
Upper Devonian strata exposed in the vicinity of the Fernie Basin consist of massive, grey, fine-grained, cliff forming limestones of the Palliser Formation. They are overlain by the Devono-Mississippian Exshaw Formation, which is generally 6 to 30 metres in thickness and predominantly consists of black, fissile shale, cherty shale, siltstone and minor limestone. Four phosphatic horizons exist within the Exshaw Formation: the lowest is less than 50 centimetres thick and has grades of less than 9 per cent P2O5; the middle two horizons are both around one metre thick, have grades of up to 10 per cent P2O5 and are separated by approximately two metres of shale; and the uppermost pnosphatic zone, which has
118
very limited extent, contains grades which always exceed 15 per cent P2O5 and is always less than 15 centimetres thick (Kenny, 1977; Macdonald, 1987).
The Mississippian Banff Formation has a grada-tional contact with the underlying Exshaw Formation. It is 280 to 430 metres thick and consists of dark grey, fissile shale and bands of argillaceous limestone that grade upward into dark grey, massive, finely crystalline limestone and dolostone. The Mississippian Rundle Group conformably overlies the Banff Formation and attains a thickness ot approximately 700 metres. It consists of a series of resistant, thick-bedded crinoidal limestones, grey and black, finely crystalline limestones, dark, argillaceous limestones, dolostones and minor black and green shale (Butrenchuk, 1987; Kenny, 1977).
Conformably overlying the Mississippian carbonates are Pennsylvanian strata 01the Spray Lakes Group which consist of a lower unit, the Tunnel Mountain Formation and an upper unit, the Kananaskis Formation. The Tunnel Mountain Formation comprises a uniform, monotonous sequence of reddish-brown weathering dolomitic sandstone and siltstone that attains a maximum thickness of 500 metres at its western margin, near the Elk River. The Tunnel Mountain Formation is disconformably overlain by the Kananaskis Formation which consists of light grey, silty dolostones and dolomitic siltstones and is generally around 55 metres thick. Chert nodules and intraformational chert breccias are located in the upper
Figure 2. Distribution of Fernie Group strata.
Industrial Minerals Forum 1991
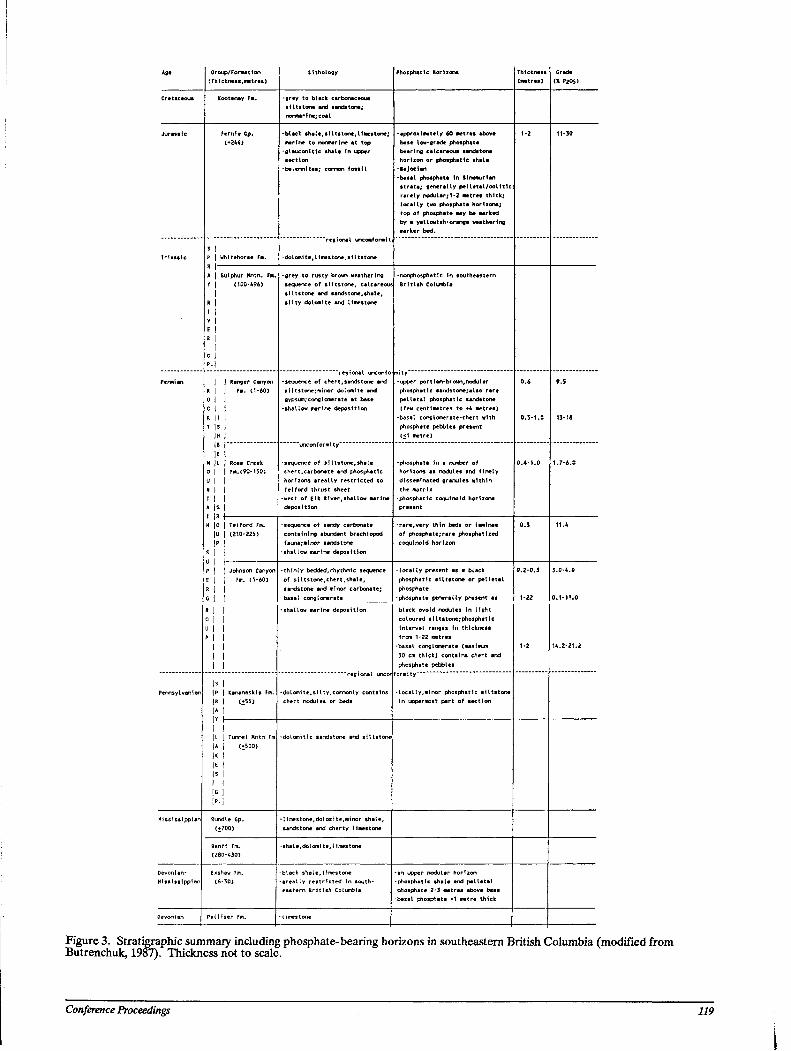
Group/Format i on (Thickness,metres)
Fernle Cp. (♦244)
Devon!an-Misslssipplanl
Uhitehorse Fm.
Sulphur Nntn. Fm. (100-496)
Ranger Canyon Fm. (1-60)
Ross Creek Fm.(90-150)
Tel ford Fm. (210-225)
Johnson Canyon Fm. (1-60)
Kananaskis Fm. (±55)
Tunnel Mntn (±500)
Rundle Gp. (±700)
Banff Fm. (280-430)
Exshaw Fm. (6-30)
Palllser Fm.
■grey to black carbonaceous siltstone and sandstone; nonmarine;coal
-black shale.slltstone,limestone; marine to nonmarine at top -glauconitic shale In upper section -belemnltes; common fossil
"regional uncomforaitJ
-dolomi te,Iimestone.siItstone
■grey to rusty brown weathering sequence of siltstone, calcareous] siltstone and sandstone,shale, silty dolomite and limestone
regional unconfi -sequence of chert,sandstone and siltstone;minor dolomite and gypsum;conglomerate at base -shallow marine deposition
unconformity
■sequence of siltstone,shale chert,carbonate and phosphatic horizons areally restricted to Tel ford thrust sheet -west of Elk River,shallow marir> depos111 on
-sequence of sandy carbonate containing abundant brachiopod fauna;minor sandstone shallow marine deposition
thinly bedded,rhythmic sequence of siltstone,chert,shale, sandstone and minor carbonate; basal conglomerate
shallow marine deposition
■dolomite,silty,commonly contains chert nodules or beds
dolomi tic sandstone and slltstonej
limestone,dolomite,minor shale, sandstone and cherty limestone
shale,dolomite,11mestone
black shale,limestone areally restricted in southeastern British Columbia
Phosphatic Horizons
-approximately 60 metres above base low-grade phosphate bearing calcareous sandstone horizon or phosphatic shale -Bajoclan ■basal phosphate In Slnemurian strata; generally pelletal/oolitic; rarely nodular;1-2 metres thick; locally two phosphate horizons; top of phosphate may be marked by a yellowish-orange weathering marker bed.
-nonphosphatic in southeastern British Columbia
-upper portion-brown,nodular phosphatic sandstone;also rare pelletal phosphatic sandstone (few centimetres to *4 metres) -basal conglomerate-chert with phosphate pebbles present (<1 metre)
-phosphate in a number of horizons as nodules and finely disseminated granules within the matrix phosphatic coqulnoid horizons present
■rare,very thin beds or laminae of phosphate;rare phosphatlzed coqulnoid horizon
-locally present as a black phosphatic siltstone or pelletal phosphate phosphate generally present as black ovoid nodules in light coloured siltstone;phosphatic interval ranges In thickness front 1-22 metres basal conglomerate (maximum 30 cm thick) contains chert and phosphate pebbles
formity
-locally,minor phosphatic siltstone in uppermost part of section
an upper nodular horizon phosphatic shale and pelletal phosphate 2-3 metres above bass basal phosphate <1 metre thick
Thickness (metres)
Grade (X P2O5)
Figure 3. Stratigraphic summary including phosphate-bearing horizons in southeastern British Columbia (modified from Butrenchuk, 1987). Thickness not to scale.
Conference Proceedings 119

part of the section. Slightly phosphatic horizons, containing up to 9 per cent P2O5, are reported as rare occurrences within the Kananaskis Formation (Macdonald, 1987).
The Spray Lakes Group is unconformably overlain by Permian strata of the Ishbel Group and together, they comprise the Rocky Mountain Supergroup (Figure 3). The Ishbel Group, which has been correlated with the Phosphoria Formation in the western United States, consists of the Johnston Canyon, Telford, Ross Creek and Ranger Canyon formations, from oldest to youngest, respectively.
The Johnston Canyon Formation comprises a series of recessive weathering, thin to medium-bedded silt-stones, silty carbonate rocks and sandstones, with minor shale and chert. It varies from 1 to 60 metres in thickness and commonly contains phosphatic rocks. Thin, in-traformational, phosphate-pebble conglomerate beds are common throughout the formation and, locally, mark its base. Phosphate is present as black nodules in distinct horizons within the siltstones, locally cements siltstone beds and, locally occurs in pelletal siltstone or pelletal silty phosphorite beds which are slightly greater than 1 metre in thickness (Butrenchuk, 1987; Macdonald, 1987). The pelletal phosphorites can contain up to 21 per cent P2O5, but are of limited distribution; the basal conglomerate is less than 50 centimetres thick and generally contains 3 to 4 per cent P2O5, only; the nodular and phosphate pebble-conglomerate beds can have cumulate thicknesses of up to 22 metres, but grades rarely exceed 10 per cent P2O5 over a few tens of centimetres.
The Telford and Ross Creek Formations are of limited distribution, exposed only in the Sparwood region. Slightly phosphatic rocks are reportedly present in both these formations (Butrenchuk, 1987; Macdonald, 1987).
The Ranger Canyon Formation, which can be up to 60 metres thick, paraconformably to disconformably overlies the Ross Creek Formation. It predominantly consists of resistant, cliff-forming, thick-bedded, blue-grey cherts, cherty sandstones, siltstones, fine sandstones and conglomerates. Minor gypsum and dolomite are also present. The base of the formation is marked by thin, phosphate-cemented, chert-pebble conglomerates that locally contain massive, phosphatic intraclasts. Phosphate also occurs as nodules in brownish weathering sandstone beds in the upper part of the formation. With the exception of phosphatic strata near the Fernie ski hill, most of the horizons are reportedly low grade; the highest values reported are 13.3 per cent P2O5 across 0.5 metres (Butrenchuk, 1987; Macdonald, 1987).
Permian strata are unconformably overlain by the Triassic Sulphur Mountain Formation of the Spray River Group. The Sulphur Mountain Formation is between 100 and 496 metres thick and typically consists of rusty brown weathering, medium-bedded siltstones, calcareous and dolomitic siltstones, silty dolostones and limestones and minor shale. Locally, the Sulphur Mountain Formation is overlain by pale weathering, variegated dolostones, limestones, sandstones and intraformational breccias of the Whitehorse Formation, which the upper member of the Spray River Group, but is not present in most parts of the Fernie Basin (Butrenchuk, 1987).
The Jurassic Fernie Group unconformably overlies
the Triassic strata. It consists of a lower zone of dark grey to black shales, dark brown shales, phosphates and mmor limestones, siltstones and sandstones (the basal phosphate zone and equivalent Nordegg Member, Poker Chip Shales and the Rock Creek Member), a middle unit of light grey shale, calcareous sandstone and sandy limestone (tne Grey Beds) and an upper unit of yellowish-grey to pale brown or dark grey weathering glauconitic sandstone and shale grading upwards into interbedded fine-grained sandstone, siltstone and black shales (the Green and Passage beds). In southeastern British Columbia, the Fernie Group is 70 to 376 metres in thickness and generally thickens to the west (Freehold, 1957; Kenny, 1977; Macdonald, 1987; Price, 1965).
The base of the Fernie Group is marked by a persistent pelletal phosphorite horizon that either rests directly on Triassic strata or is separated from the underlying rocks by a thin phosphatic conglomerate. Phosphatic shales of variable thickness overlie the phosphorite. The top of this sequence is locally marked by a yellow-oranee bentonite bed. This part 01 the formation is generally considered to be a lateral facies of the Sinemurian Nordegg Member and Nordegg equivalent beds. A second phosphatic horizon is present m the Bajocian Rock Creek Member, approximately 60 metres above the base of the Fernie Group. This zone is extremely low grade, generally containing less than 1 per cent P2O5 and is often associated with belemnite-bearing calcareous sandstone beds (Butrenchuk, 1987; Freehold, 1957; Macdonald, 1987).
The Kootenay Formation, of upper Jurassic to Cretaceous age, overlies rocks of the Fernie Group. It consists of dark grey carbonaceous sandstone, gritty to conglomeratic sandstone, siltstone, shale and coal and can be from 150 to 520 metres thick (Price, 1965).
THE BASAL FERNIE GROUP PHOSPHORITE HORIZON IN THE SOUTHERN AND EASTERN PARTS OF THE FERNIE BASIN
The main phosphatic horizon in the Fernie Group occurs at its base and was deposited during Lower Jurassic (Sinemurian) time at high paleolatitudes, approximately 40° north. This is a somewhat unusual spatial and temporal setting for phosphorite occurrences; the Lower Jurassic is not a time period commonly associated with phosphate deposition and most deposits on a worldwide basis were formed at paleolatitudes of 10 to 20° north or south of the equator (Cook and McElhinny, 1979; Christie, 1980).
The basal phosphorite horizon is 1 to 2 metres in thickness, and generally contains greater than 20 per cent P2O5. Its distribution, on the property scale, is defined by upright to overturned folds and northwesterly directed thrust faults that are characteristic of the Foreland Belt. Locallv, thrust faults complicate the stratigraphy of the phosphorite itself, through repetition and omission of units; in the Harvey Creek^Flathead River area the phosphate horizon, or parts of it, have been fault repeated as many as five times.
STRATIGRAPHY OF THE BASAL FERNIE GROUP PHOSPHORITES
In the southern part of the Fernie Basin, near Cabin
120 Industrial Minerals Forum 1991
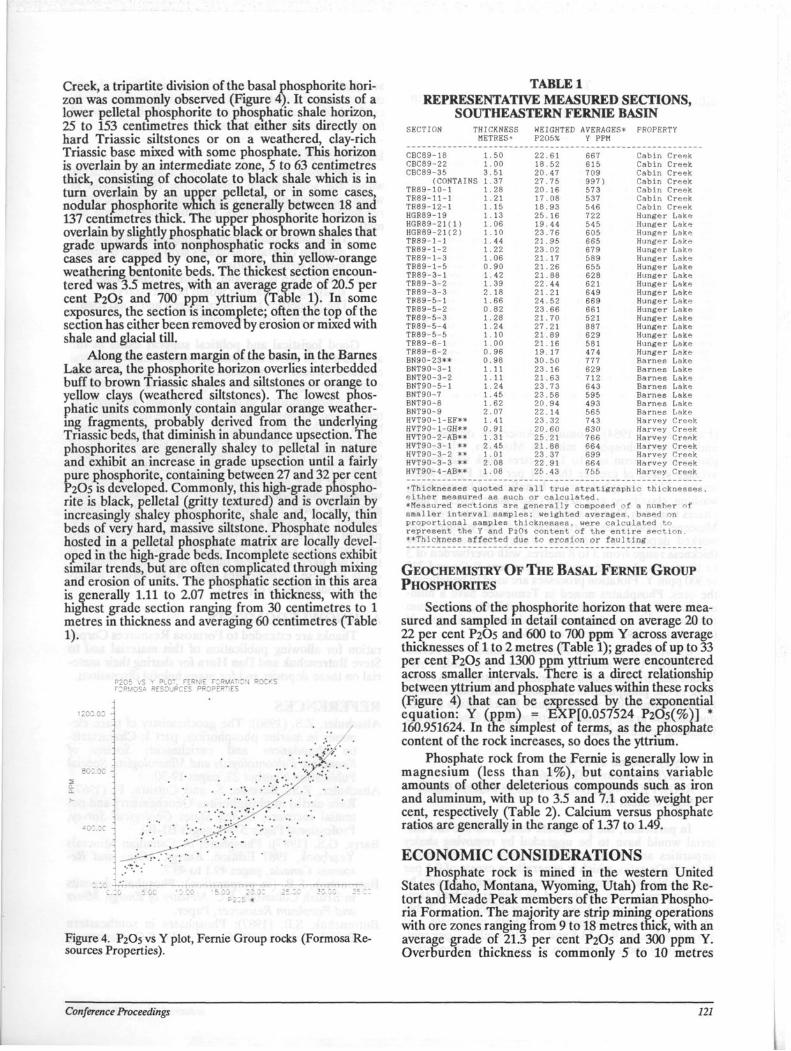
Creek, a tripartite division of the basal phosphorite horizon was commonly observed (Figure 4). It consists of a lower pelletal phosphorite to phosphatic shale horizon, 25 to 153 centimetres thick that either sits directly on hard Triassic siltstones or on a weathered, clay-rich Triassic base mixed with some phosphate. This horizon is overlain by an intermediate zone, 5 to 63 centimetres thick, consisting of chocolate to black shale which is in turn overlain by an upper pelletal, or in some cases, nodular phosphorite wmch is generally between 18 and 137 centimetres thick. The upper phosphorite horizon is overlain by slightly phosphatic black or brown shales that grade upwards into nonphosphatic rocks and in some cases are capped by one, or more, thin yellow-orange weathering bentonite beds. The thickest section encountered was 3.5 metres, with an average grade of 20.5 per cent P2O5 and 700 ppm yttrium (Table 1). In some exposures, the section is incomplete; often the top of the section has either been removed by erosion or mixed with shale and glacial till.
Along the eastern margin of the basin, in the Barnes Lake area, the phosphorite horizon overlies interbedded buff to brown Triassic shales and siltstones or orange to yellow clays (weathered siltstones). The lowest phosphatic units commonly contain angular orange weathering fragments, probably derived from the underlying Triassic beds, that diminish in abundance upsection. The phosphorites are generally shaley to pelletal in nature and exhibit an increase in grade upsection until a fairly pure phosphorite, containing between 27 and 32 per cent P2O5 is developed. Commonly, this high-grade phosphorite is black, pelletal (gritty textured) and is overlain by increasingly shaley phosphorite, shale and, locally, thin beds of very hard, massive siltstone. Phosphate nodules hosted in a pelletal phosphate matrix are locally developed in the high-grade beds. Incomplete sections exhibit sunilar trends, but are often complicated through mixing and erosion of units. The phosphatic section in this area is generally 1.11 to 2.07 metres in thickness, with the highest grade section ranging from 30 centimetres to 1 metres in thickness and averaging 60 centimetres (Table 1).
TABLE 1 REPRESENTATIVE MEASURED SECTIONS,
SOUTHEASTERN FERNIE BASIN
P205 VS Y PLOT, FERNIE FORMATION ROCKS FORMOSA RESOURCES PR0PERT!ES
SECTION THICKNESS WEIGHTED AVERAGES* PROPERTY METRES* P205% Y PPM
CBC89-18 1.50 22.61 667 Cabin Creek CBC89-22 1.00 18.52 615 Cabin Creek CBC89-35 3.51 20.47 7 09 Cabin Creek
(CONTAINS 1.37 27.75 997) Cabin Creek TB89-10-1 1.28 20. 16 573 Cabin Creek TR89-11-1 1.21 17.08 537 Cabin Creek TR89-12-1 1.15 18.93 546 Cabin Creek HGR89-19 1.13 25.16 722 Hunger Lake HGR89-2K1) 1.06 19.44 545 Hunger Lake HGP89-2K2) 1.10 23.76 605 Hunger Lake TR89-1-1 1.44 21.95 665 Hunger Lake TR89-1-2 1.22 23.02 679 Hunger Lake TR89-1-3 1.06 21 . 17 589 Hunger Lake TR89-1-5 0.90 21.26 655 Hunger Lake TR89-3-1 1.42 21.88 628 Hunger Lake TR89-3-2 1 .39 22.44 621 Hunger Lake TR89-3-3 2. 18 21 .21 649 Hunger Lake TR89-5-1 1.66 24.52 669 Hunger Lake TR89-5-2 0.82 23.66 661 Hunger Lake TR89-5-3 1.28 21 .70 521 Hunger Lake TR89-5-4 1 .24 27.21 887 Hunger Lake TR89-5-5 1.10 21.89 629 Hunger Lake TF89-6-1 1.00 21. 16 581 Hunger Lake TR89-6-2 0.96 19. 17 474 Hunger Lake BN90-23** 0.98 30.50 777 Barnes Lake BNT90-3-1 1. 11 23. 16 629 Barnes Lake BNT90-3-2 1. 11 21 .63 712 Barnes Lake BNT90-5-1 1.24 23.73 643 Barnes Lake BNT90-7 1.45 23 . 58 595 Barnes Lake BNT90-8 1.62 20.94 493 Barnes Lake BNT90-9 2.07 22.14 565 Barnes Lake HVT90-1-EF** 1.41 23.32 743 Harvey Creek HVT90-1-GH** 0.91 20.60 630 Harvey Creek HVT90-2-AB** 1.31 25.21 766 Harvey Creek HVT90-3-1 ** 2.45 21.88 664 Harvey Creek HVT90-3-2 ** 1.01 23.37 699 Harvey Creek HVT90-3-3 ** 2.08 22.91 664 Harvey Creek HVT90-4-AB** 1.08 25.43 755 Harvey Creek
Figure 4. P2O5 vs Y plot, Fernie Group rocks (Formosa Resources Properties).
♦Thicknesses quoted are all true stratigraphic thicknesses, either measured as such or calculated. ♦Measured sections are generally composed of a number of smaller interval samples; weighted averages, based on proportional samples thicknesses, were calculated to represent the Y and P2O5 content of the entire section. **Thickness affected due to erosion or faulting
GEOCHEMISTRY OF THE BASAL FERNIE GROUP PHOSPHORITES
Sections of the phosphorite horizon that were measured and sampled m detail contained on average 20 to 22 per cent P2O5 and 600 to 700 ppm Y across average thicknesses of 1 to 2 metres (Table 1); grades of up to 33 per cent P2O5 and 1300 ppm yttrium were encountered across smaller intervals. There is a direct relationship between yttrium and phosphate values within these rocks (Figure 4) that can be expressed by the exponential equation: Y (ppm) = EXP[0.057524 P20s(%)] * 160.951624. In the simplest of terms, as the phosphate content of the rock increases, so does the yttrium.
Phosphate rock from the Fernie is generally low in magnesium (less than 1%), but contains variable amounts of other deleterious compounds such as iron and aluminum, with up to 3.5 and 7.1 oxide weight per cent, respectively (Table 2). Calcium versus phosphate ratios are generally in the range of 1.37 to 1.49.
ECONOMIC CONSIDERATIONS Phosphate rock is mined in the western United
States (Idaho, Montana, Wyoming, Utah) from the Retort and Meade Peak members of the Permian Phospho-ria Formation. The majority are strip mining operations with ore zones ranging from 9 to 18 metres thick, with an average grade of 21.3 per cent P2O5 and 300 ppm Y. Overburden thickness is commonly 5 to 10 metres
Conference Proceedings 121
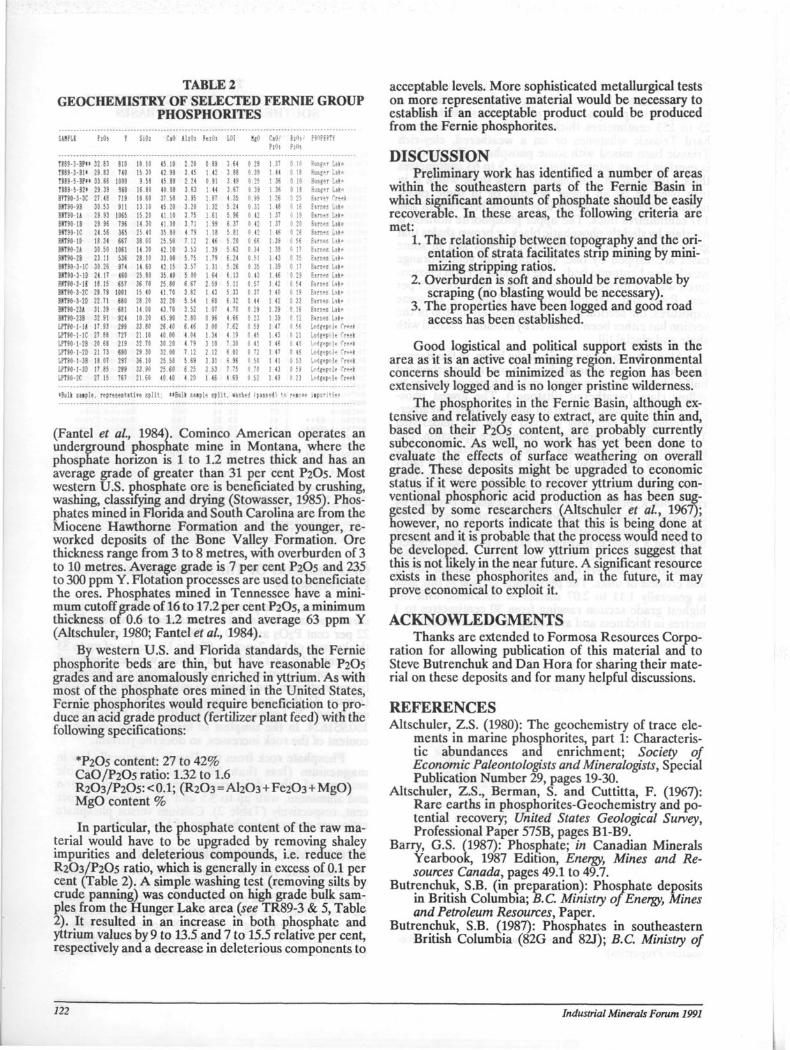
TABLE 2 GEOCHEMISTRY OF SELECTED FERNIE GROUP
PHOSPHORITES SAMPLE PlOl y Si02 CaO I l lOi Fe!0i LOI »|0 CaO'
PjOi
Iifii* PiOi
PR1FEPTY
TF89-3-BP** 32.83 810 10.10 45 10 2.20 0 89 3 64 0 29 1.11 Hung'-r Lak» 7189-3-BH 29.83 740 15 30 42.90 3.45 1 t l 3 88 o 33 1 44 1 ':? Hunger Lak»
TB89-5-BP»< 33.66 1000 9 58 45.80 2 24 1 ?! 3 49 1 3' 1 38 0 10 Hunger l i l t TR89-5-B2> 29.39 960 16.80 40.00 3 63 1 44 3 67 0.39 1 SI 0 18 Hunger lak* HVT90-3-3C 27.48 719 18 60 37 50 3.95 1.87 4 35 I IS 1 36 3 25 Sarvev Cree*
BHI90-9B 30.53 911 13.10 45.20 3.20 1.32 S 24 1 33 1 48 0 16 Fames Lake BHT90-1A 29.93 1065 15.20 41.10 3 75 1.61 5.96 12 ! ':• B. 19 Barnes Lak»
BHT90-1B 29 96 796 14 30 41 00 3.71 1.99 6 37 0 42 ! Jl 1 3^ Barnes Lake BM90-1C 24.56 365 25.40 35.80 4.79 ! !? i t l 1 43 ! 46 3 21 Barn"; In' BHT90- ID 18.34 667 38.00 25.50 7 12 I 4-' 5.20 I St ! 3S 0 56 Barnes lak* B&T90-2J 30.50 1061 14 30 42.10 3.53 1.39 i t l 1 )4 1 38 f, ]7 f a m e ; Lite BNT90-2B 23 11 536 28.10 33.00 5.75 ! 7« 6.24 0.51 ; 41 0 15 Earnes Lak" BHT90-3-1C 30.26 974 14.60 42 15 3.57 ! ''I 5 26 o JS i U 0 17 Barnes lak» BIT90-3-1D 24.17 460 25.80 35.40 5 00 1 64 6.13 0.43 ! 4S 0 29 Barnes tak» BHT90-3-1B 18.15 657 36 70 25 80 6.67 ! M 5.11 0 5? ! 4, 0 54 Barnes !,ak» BHT90-3-2C 29.79 1001 15.40 41.70 3.82 1 u 3 H 0 3? ! It f) 19 Barnes Lak» BHT90-3-2D 22.71 680 28.20 32.20 5.54 1 s i f 32 0 4 4 ! 43 3 33 Barnes lake BM90-23J 31.39 681 14.00 43.70 3.52 ; 07 4.70 0 29 1 39 0.16 Barnes lak» BH790-23B 32 91 924 10.20 45.90 2.80 0 96 1 M ': 33 ! 33 0 13 Barnes lake LPT90-1-U 17.93 299 33.80 26.40 6.46 3 N 7.62 1 51 ; i : 0 55 L^gepM" Cr"k LPT90-1-1C 27.88 727 21.10 40 00 4 M ! 34 4.19 0 45 1.43 1 21 LodgepMe Creek LPT90-1-2B 20.68 219 32.70 30 20 4 79 " H 7 30 0.41 1 46 0.40 l e d i e p o l e cr»»k LPT90-1-2D 21 73 690 29 30 32 00 7.12 2 12 I 0! " T2 1 47 0 II Lodgepoie Cr»ek LPT90-1-3B 18 07 297 36.10 25.50 5.69 • 3! 6 N SI ! 4! 0 53 M g f p M e Creek LPT90-1-3D 17 85 299 33.90 25.60 6.25 3.53 7 75 0.70 1 43 0 59 Lodfepole !reel LPT90-2C 27 15 767 21.60 40.40 4.20 1 M 4 69 J Y> : 4.) 0 23 L^gepMe Creek
•Bulk saiple, representative split; »»Bulk saiple split, washed ipannedi to rei^ve iipuritie?
(Fantel et ah, 1984). Cominco American operates an underground phosphate mine in Montana, where the phosphate horizon is 1 to 1.2 metres thick and has an average grade of greater than 31 per cent P2O5. Most western U.S. phosphate ore is beneficiated by crushing, washing, classifying and drying (Stowasser, 1985). Phosphates mined in Florida and South Carolina are from the Miocene Hawthorne Formation and the younger, reworked deposits of the Bone Valley Formation. Ore thickness range from 3 to 8 metres, with overburden of 3 to 10 metres. Average grade is 7 per cent P2O5 and 235 to 300 ppm Y. Flotation processes are used to beneficiate the ores. Phosphates mmed in Tennessee have a minimum cutoff grade of 16 to 17.2 per cent P2O5, a minimum thickness 01 0.6 to 1.2 metres and average 63 ppm Y (Altschuler, 1980; Fantel et al, 1984).
By western U.S. and Florida standards, the Fernie phosphorite beds are thin, but have reasonable P2O5 grades and are anomalously enriched in yttrium. As with most of the phosphate ores mined in the United States, Fernie phosphorites would require beneficiation to produce an acid grade product (fertilizer plant feed) with the following specifications:
*P20s content: 27 to 42% CaO/P20s ratio: 1.32 to 1.6 R2O3/P2O5: < 0.1; (R2O3=AI2O3 + Fe203 + MgO) MgO content %
In particular, the phosphate content of the raw material would have to be upgraded by removing shaley impurities and deleterious compounds, i.e. reduce the R2O3/P2O5 ratio, which is generally in excess of 0.1 per cent (Table 2). A simple washing test (removing silts by crude panning) was conducted on high grade bulk samples from the Hunger Lake area {see TR89-3 & 5, Table 2). It resulted in an increase in both phosphate and yttrium values by 9 to 13.5 and 7 to 15.5 relative per cent, respectively and a decrease in deleterious components to
122
acceptable levels. More sophisticated metallurgical tests on more representative material would be necessary to establish if an acceptable product could be produced from the Fernie phosphorites.
DISCUSSION Preliminary work has identified a number of areas
within the southeastern parts of the Fernie Basin in which significant amounts of phosphate should be easily recoverable. In these areas, the following criteria are met:
1. The relationship between topography and the orientation of strata facilitates strip mining by minimizing stripping ratios.
2. Overburden is soft and should be removable by scraping (no blasting would be necessary).
3. The properties have been logged and good road access has been established.
Good logistical and political support exists in the area as it is an active coal mining region. Environmental concerns should be minimized as the region has been extensively logged and is no longer pristine wilderness.
The phosphorites in the Fernie Basin, although extensive and relatively easy to extract, are quite thin and, based on their P2O5 content, are probably currently subeconomic. As well, no work has vet been done to evaluate the effects of surface weathering on overall grade. These deposits might be upgraded to economic status if it were possible to recover yttrium during conventional phosphoric acid production as has been suggested by some researchers (Altschuler et al, 1967); however, no reports indicate that this is being done at
Eresent and it is probable that the process woula need to e developed. Current low yttrium prices suggest that
this is not likely in the near future. A significant resource exists in these phosphorites and, in the future, it may prove economical to exploit it.
ACKNOWLEDGMENTS Thanks are extended to Formosa Resources Corpo
ration for allowing publication of this material and to Steve Butrenchuk and Dan Hora for sharing their material on these deposits and for many helpful discussions.
REFERENCES Altschuler, Z.S. (1980): The geochemistry of trace ele
ments in marine phosphorites, part 1: Characteristic abundances and enrichment; Society of Economic Paleontologists and Mineralogists, Special Publication Number 29, pages 19-30.
Altschuler, Z.S., Berman, S. and Cuttitta, F. (1967): Rare earths in phosphorites-Geochemistry and potential recovery; United States Geological Survey, Professional Paper 575B, pages B1-B9.
Barry, G.S. (1987): Phosphate; in Canadian Minerals Yearbook, 1987 Edition, Energy, Mines and Resources Canada, pages 49.1 to 49.7.
Butrenchuk, S.B. (in preparation): Phosphate deposits in British Columbia; B.C. Ministry of Energy, Mines and Petroleum Resources, Paper.
Butrenchuk, S.B. (1987): Phosphates in southeastern British Columbia (82G and 82J); B.C. Ministry of
Industrial Minerals Forum 1991
Energy, Mines and Petroleum Resources, Open File 1987-16,103 pages.
Christie, R.L. (1980): Paleolatitudes and potential for phosphorite deposition in Canada; in Current Research, Part B, Geological Survey of Canada, Paper 80-1B, pages 241-248.
Christie, R. L. (1979): Phosphorites in sedimentary basins of western Canada; in Current Research, Part B, Geological Survey of Canada, Paper 79-1B, pages 253-258.
Cook, P J. and McElhinny, M.W. (1979): A re-evaluation of the spatial and temporal distribution of sedimentary phosphate deposits in the light of plate tectonics; Economic Geology, Volume 74, pages 315-330.
Fantel, R.J., Anstett, T.F., Peterson, G.R., Porter, K.E. and Sullivan, D.E. (1984): Phosphate rock availability-World; United States Department of the Interior, Bureau of Mines Information Circular 8989, 65 pages.
Freebold, H. (1957): The Jurassic Fernie Group in the Canadian Rocky Mountains and Foothills; Geological Survey of Canada, Memoir 287,197 pages.
Hendrick, J.B. (1985): Rare-earth elements and yttrium; in Mineral Facts and Problems, United States Department of the Interior, Bureau of Mines Bulletin 675, pages 1-18.
Kenny, R.L. (1977): Exploration for phosphate in southeastern British Columbia by Cominco Ltd.; Paper presented at Canadian Institute of Mining and Metallurgy, Annual Meeting, Ottawa, Ontario.
Macdonald, D.E. (1987): Geology and resource poten
tial of phosphates in Alberta; Alberta Research Council, Earth Sciences Report 87-2,65 pages.
Macdonald, D.E. (1985): Geology and resource potential of phosphates in Alberta and portions of southeastern British Columbia; unpublished M.Sc. Thesis, University of Alberta, 238 pages.
Newmarch, C.B. (1953): Geology of the Crowsnest Coal Basin with special reference to the Fernie area; B.C. Ministry of Energy, Mines, and Petroleum Resources, Bulletin No. 33,107 pages.
Price, RA. (1965): Flathead map area, British Columbia and Alberta; Geological Survey of Canada, Memoir 336.
Price, R. A. (1964): Flathead (Upper Flathead, east half), British Columbia-Alberta; Geological Survey of Canada, Map 1154A (1:50,000).
Price, R. A. (1962): Fernie map area, east half, Alberta and British Columbia, 82G/E1/2; Geological Survey of Canada, Paper 61-24.
Price, R. A. (1961): Fernie (East half); Geological Survey of Canada, Map 35-1961 (1:126,720).
Stowasser, W.E. (1988): Phosphate rock; United States Department of the Interior, Bureau of Mines Phosphate Rock Minerals Yearbook, 15 pages.
Stowasser, W.E. (1985): Phosphate rock; in Mineral Facts and Problems, 1985 Edition, United States Department of the Interior, Bureau of Mines Bulletin 675, pages 579-594.
Telfer, L. (1933): Phosphate in the Canadian Rockies; The Canadian Mining and Metallurgical Bulletin-1933, Number 260, pages 566-605.
Conference Proceedings 123

124 Industrial Minerals Forum 1991
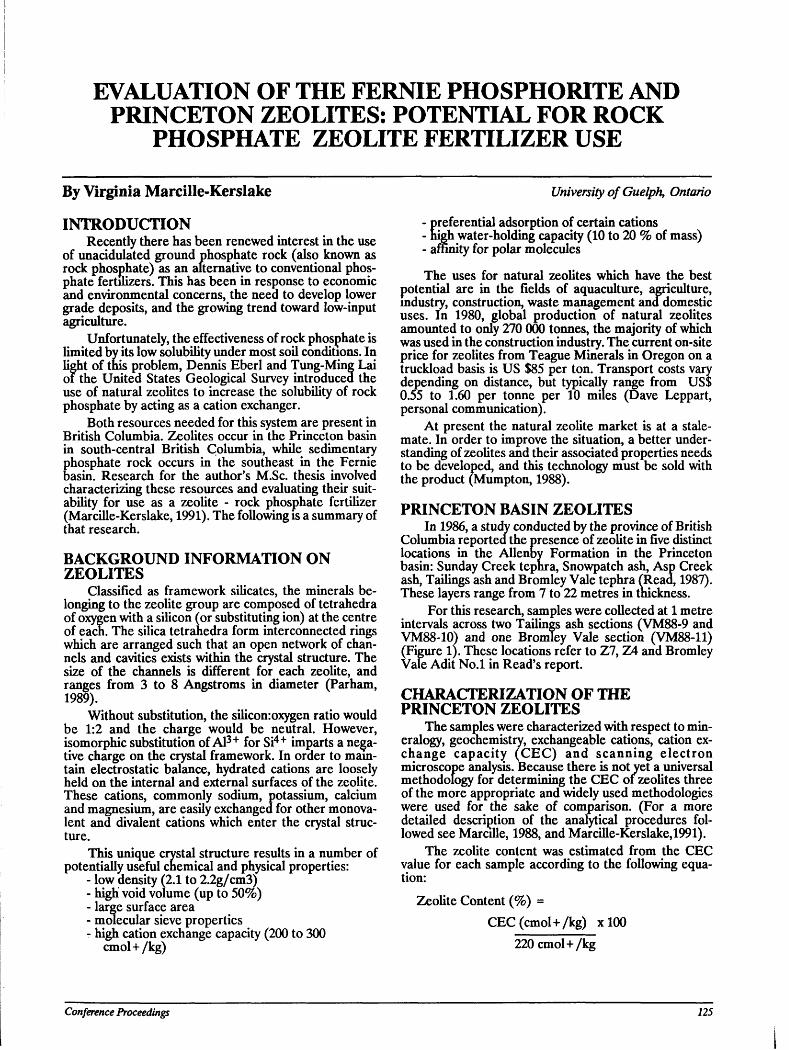
EVALUATION OF THE FERNIE PHOSPHORITE AND PRINCETON ZEOLITES: POTENTIAL FOR ROCK
PHOSPHATE ZEOLITE FERTILIZER USE
By Virginia Marcille-Kerslake
INTRODUCTION Recently there has been renewed interest in the use
of unacidulated ground phosphate rock (also known as rock phosphate) as an alternative to conventional phosphate fertilizers. This has been in response to economic and environmental concerns, the need to develop lower grade deposits, and the growing trend toward low-input agriculture.
Unfortunately, the effectiveness of rock phosphate is limited by its low solubility under most soil conditions. In light of this problem, Dennis Eberl and Tung-Ming Lai of the United States Geological Survey introduced the use of natural zeolites to increase the solubility of rock phosphate by acting as a cation exchanger.
Both resources needed for this system are present in British Columbia. Zeolites occur in the Princeton basin in south-central British Columbia, while sedimentary phosphate rock occurs in the southeast in the Fernie basin. Research for the author's M.Sc. thesis involved characterizing these resources and evaluating their suitability for use as a zeolite - rock phosphate fertilizer (Marcille-Kerslake, 1991). The following is a summary of that research.
BACKGROUND INFORMATION ON ZEOLITES
Classified as framework silicates, the minerals belonging to the zeolite group are composed of tetrahedra of oxygen with a silicon (or substituting ion) at the centre of each. The silica tetrahedra form interconnected rings which are arranged such that an open network of channels and cavities exists within the crystal structure. The size of the channels is different for each zeolite, and ranges from 3 to 8 Angstroms in diameter (Parham, 1989).
Without substitution, the silicon:oxygen ratio would be 1:2 and the charge would be neutral. However, isomorphic substitution of Al3 + for Si4+ imparts a negative charge on the crystal framework. In order to mam-tain electrostatic balance, hydrated cations are loosely held on the internal and external surfaces of the zeolite. These cations, commonly sodium, potassium, calcium and magnesium, are easily exchanged for other monova-lent and divalent cations which enter the crystal structure.
This unique crystal structure results in a number of potentially useful chemical and physical properties:
- low density (2.1 to 2.2g/cm3) - high void volume (up to 50%) - large surface area - molecular sieve properties - high cation exchange capacity (200 to 300
cmol+/kg)
University of Guelph, Ontario
- preferential adsorption of certain cations - high water-holding capacity (10 to 20 % of mass) - affinity for polar molecules
The uses for natural zeolites which have the best potential are in the fields of aquaculture, agriculture, industry, construction, waste management and domestic uses. In 1980, global production of natural zeolites amounted to only 270 000 tonnes, the majority of which was used in the construction industry. The current on-site price for zeolites from Teague Minerals in Oregon on a truckload basis is US $85 per ton. Transport costs vary depending on distance, but typically range from US$ 0.55 to 1.60 per tonne per 10 miles (Dave Leppart, personal communication).
At present the natural zeolite market is at a stalemate. In order to improve the situation, a better understanding of zeolites and their associated properties needs to be developed, and this technology must be sold with the product (Mumpton, 1988).
PRINCETON BASIN ZEOLITES In 1986, a study conducted by the province of British
Columbia reported the presence of zeolite in five distinct locations in the Allenby Formation in the Princeton basin: Sunday Creek tephra, Snowpatch ash, Asp Creek ash, Tailings ash and Bromley Vale tephra fReaa, 1987). These layers range from 7 to 22 metres in tnickness.
For this research, samples were collected at 1 metre intervals across two Tailings ash sections (VM88-9 and VM88-10) and one Bromley Vale section (VM88-11) (Figure 1). These locations refer to Z7, Z4 and Bromley Vale Adit No.l in Read's report.
CHARACTERIZATION OF THE PRINCETON ZEOLITES
The samples were characterized with respect to mineralogy, geochemistry, exchangeable cations, cation exchange capacity (CEC) and scanning electron microscope analysis. Because there is not yet a universal methodology for determining the CEC of zeolites three of the more appropriate and widely used methodologies were used for the sake of comparison. (For a more detailed description of the analytical procedures followed see Marcille, 1988, and Marcille-Kerslake,1991).
The zeolite content was estimated from the CEC value for each sample according to the following equation:
Zeolite Content (%) = CEC(cmol+/kg) xlOO
220cmol+/kg
Conference Proceedings 125
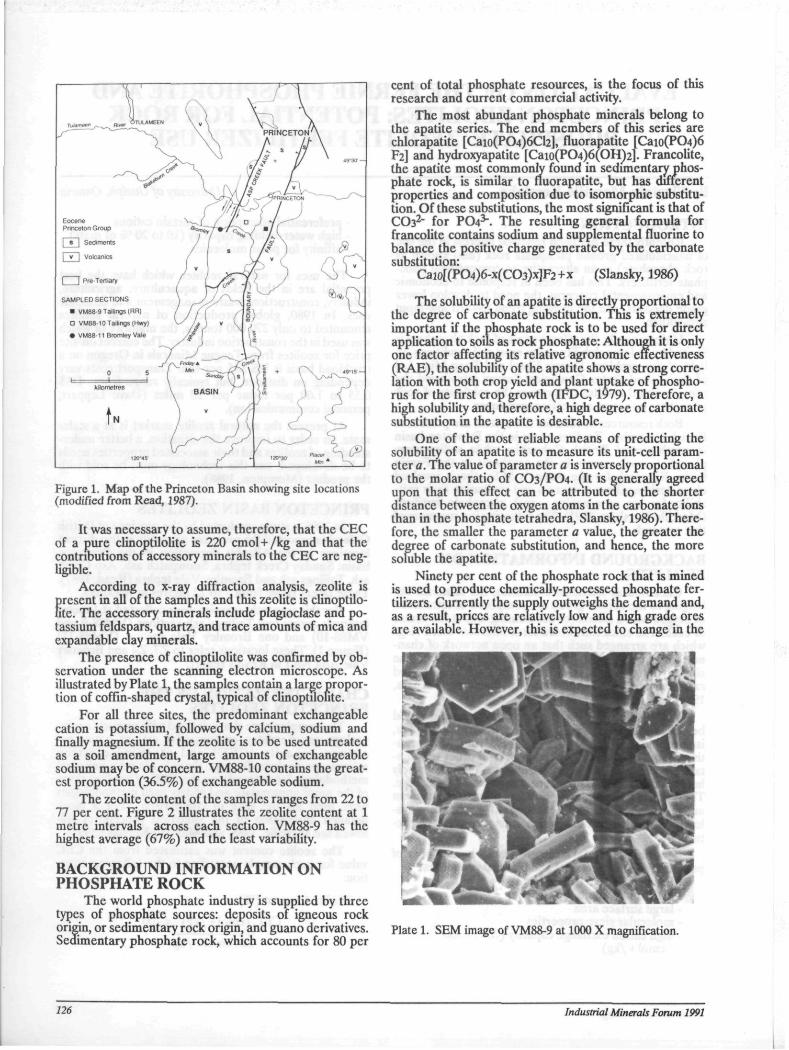
Figure 1. Map of the Princeton Basin showing site locations (modified from Read, 1987).
It was necessary to assume, therefore, that the CEC of a pure clinoptilolite is 220 cmol + /kg and that the contributions of accessory minerals to the CEC are negligible.
According to x-ray diffraction analysis, zeolite is present in all of the samples and this zeolite is clinoptilolite. The accessory minerals include plagioclase and potassium feldspars, quartz, and trace amounts of mica and expandable clay minerals.
The presence of clinoptilolite was confirmed by observation under the scanning electron microscope. As illustrated by Plate 1, the samples contain a large proportion of coffin-shaped crystal, typical of clinoptilolite.
For all three sites, the predominant exchangeable cation is potassium, followed by calcium, sodium and finally magnesium. If the zeolite is to be used untreated as a soil amendment, large amounts of exchangeable sodium may be of concern. VM88-10 contains the greatest proportion (36.5%) of exchangeable sodium.
The zeolite content of the samples ranges from 22 to 77 per cent. Figure 2 illustrates the zeolite content at 1 metre intervals across each section. VM88-9 has the highest average (67%) and the least variability.
BACKGROUND INFORMATION ON PHOSPHATE ROCK
The world phosphate industry is supplied by three types of phosphate sources: deposits of igneous rock origin, or sedimentary rock origin, and guano derivatives. Sedimentary phosphate rock, which accounts for 80 per
cent of total phosphate resources, is the focus of this research and current commercial activity.
The most abundant phosphate minerals belong to the apatite series. The end members of this series are chlorapatite [Caio(P04)6Ch], fluorapatite [Caio(P04)6 F2] and hydroxyapatite [Caio(P04)6(OH)2]. Francolite, the apatite most commonly found in sedimentary phosphate rock, is similar to fluorapatite, but has different properties and composition due to isomorphic substitution. Of these substitutions, the most significant is that of CO32" for PO43". The resulting general formula for francolite contains sodium and supplemental fluorine to balance the positive charge generated by the carbonate substitution:
Caio[(P04)6-x(C03)x]F2+x (Slansky, 1986)
The solubility of an apatite is directly proportional to the degree of carbonate substitution. This is extremely important if the phosphate rock is to be used for direct application to soils as rock phosphate: Although it is only one factor affecting its relative agronomic effectiveness (RAE), the solubility of the apatite shows a strong correlation with both crop yield and plant uptake of phosphorus for the first crop growth (IFDC, 1979). Therefore, a high solubility and, therefore, a high degree of carbonate substitution in the apatite is desirable.
One of the most reliable means of predicting the solubility of an apatite is to measure its unit-cell parameter a. The value of parameter a is inversely proportional to the molar ratio of CO3/PO4. (It is generally agreed upon that this effect can be attributed to the shorter distance between the oxygen atoms in the carbonate ions than in the phosphate tetrahedra, Slansky, 1986). Therefore, the smaller the parameter a value, the greater the degree of carbonate substitution, and hence, the more soluble the apatite.
Ninety per cent of the phosphate rock that is mined is used to produce chemically-processed phosphate fertilizers. Currently the supply outweighs the demand and, as a result, prices are relatively low and high grade ores are available. However, this is expected to change in the
Plate 1. SEM image of VM88-9 at 1000 X magnification.
126 Industrial Minerals Forum 1991

Figure 2. Zeolite content across sampled sections as estimated from CEC.
near future as global demand increases and the major Florida deposit nears depletion.
Canada currently produces no phosphate rock, and imports 100 per cent or its supply from the United States. This supply is secure until the year 2000 at which time Canada will need to secure a new supplier or develop our own resources.
FERNIE BASIN PHOSPHORITE In 1987, a province-wide inventory of phosphate rock
resources reported that the best potential for development lies at the base of the Fernie Formation in the Fernie basin of southeastern British Columbia (Butrenchuk, 1987).
This pelletal phosphorite bed is 1 to 2 metres thick and averages 20 per cent P2O5. Pellets of apatite and organic matter comprise 50 to 85 per cent of the rock. There is an estimated 57 to 340 million tonnes of phosphate rock of which 60 per cent and the highest grades lie m British Columbia, the rest in Alberta.
Seven exposures of the basal Fernie phosphorite were selected for this research. They are VM89-1,2,3,4, 5, 7 and 8 (Figure 3) and correspond to the following in the Butrenchuk study: Highway 3, Alexander, Crow, Abby, Bingay, Bighorn and Cabin.
CHARACTERIZATION OF THE FERNIE PHOSPHORITE
The samples were characterized with respect to mineralogy, geochemistry and solubility. The solubility was predicted using the unit a-cell value, fluorine content, and by chemical extraction using neutral ammonium citrate. The unit a-cell and c-cell values were calculated from the x-ray diffraction data. (For a more detailed description of the analytical procedures refer to Marcille-Kerslake, 1989 and 1991).
According to x-ray diffraction analysis, apatite is present in all of the samples, as are quartz and minor amounts of feldspar. Calcite is a minor constituent of VM89-1 to VM89-4 (i.e. Highway 3, Alexander, Crow and Abby), and dolomite occurs in trace amounts in VM89-1 and VM89-2.
The parameter a and c values for the samples fell
Conference Proceedings
within the range defined for francolite (i.e. 9.322 to 9.376 Angstroms and 6.877 to 6.900 Angstroms, respectively, McClennan and Gremillion, 1980), with the exception of VM89-1 which is a fluorohydroxyapatite (Table 1) .
To be accepted by fertilizer processing plants in Canada, the geochemical composition of a phosphate rock must meet the following standards (Butrenchuk, 1987):
P2O5: 27 to 42 per cent CaO/P205:1.32 to 1.60 R2O3/P2O5: less than 0.1 MgO: less than 1.0 per cent
Based on the results of geochemical analysis performed using two different techniques (x-ray fluorescence and wet chemistry), the Fernie basin phosphorite would meet these standards. However, Highway 3, Bingay, Bighorn and Cabin would require beneficiation, particularly Highway 3.
Using an electron microprobe, it was possible to obtain a geochemical analysis of individual points within a sample, most significantly, of points within the apatite-rich pellets. The results of this analysis are typical of francolite. Furthermore, the F/P2O5 ratio indicates an intermediate degree of carbonate substitution.
The degree of carbonate substitution was also estimated from the a-cell value using the following formula:
x/x-6 = 4.90 (9.374-a) such that, a is the parameter a value (in angstroms)
Figure 3. Map of the Fernie Basin showing site locations (modified from Butrenchuk, 1987).
127
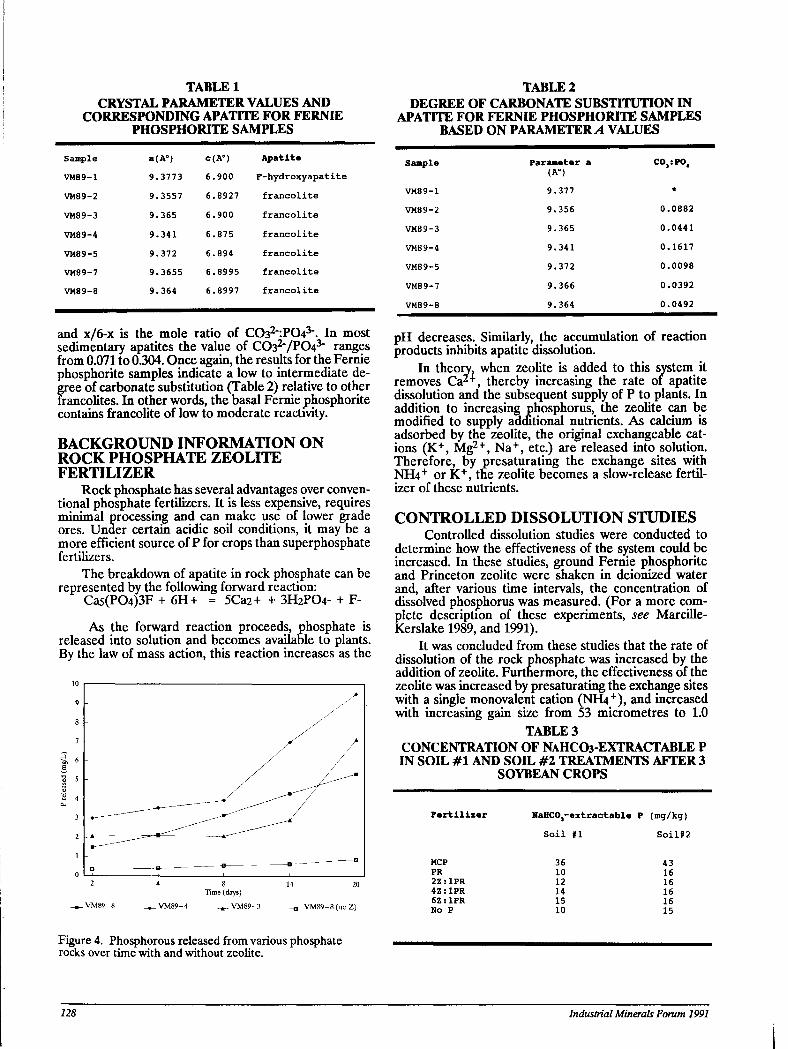
TABLE 1 TABLE 2 CRYSTAL PARAMETER VALUES AND
CORRESPONDING APATITE FOR FERNIE PHOSPHORITE SAMPLES
DEGREE OF CARBONATE SUBSTITUTION IN APATITE FOR FERNIE PHOSPHORITE SAMPLES
BASED ON PARAMETERS VALUES
Sample a(A°) C(A°) Apatite Sample Parameter a C03:P04 VM89-1 9.3773 6.900 F-hydroxyapatite (A°)
VM89-2 9.3557 6.8927 francolite VM89-1 9.377 * VM89-3 9.365 6.900 francolite VM89-2 9.356 0.0882
VM89-4 9.341 6.875 francolite VM89-3 9.365 0.0441
VM89-5 9.372 6.894 francolite VM89-4 9.341 0.1617
VM89-7 9.3655 6.8995 francolite VM89-5 9.372 0.0098
VM89-8 9.364 6.8997 francolite VM89-7 VM89-8
9.366 9.364
0.0392 0.0492
and x/6-x is the mole ratio of COs^ .PO^ . In most sedimentary apatites the value of C032"/P043" ranges from 0.071 to 0.304. Once again, the results for the Fernie phosphorite samples indicate a low to intermediate degree of carbonate substitution (Table 2) relative to other francolites. In other words, the basal Fernie phosphorite contains francolite of low to moderate reactivity.
BACKGROUND INFORMATION ON ROCK PHOSPHATE ZEOLITE FERTILIZER
Rock phosphate has several advantages over conventional phosphate fertilizers. It is less expensive, requires minimal processing and can make use of lower grade ores. Under certain acidic soil conditions, it may be a more efficient source of P for crops than superphosphate fertilizers.
The breakdown of apatite in rock phosphate can be represented by the following forward reaction:
Ca5(P04)3F + 6H+ = 5Ca2+ + 3H2P04- + F-
As the forward reaction proceeds, phosphate is released into solution and becomes available to plants. By the law of mass action, this reaction increases as the
E -
y
-B .
Q ~& , | .
Time (days)
_ VM89-4 _*_ VM89-3 _ VM89-8 (no Z)
pH decreases. Similarly, the accumulation of reaction products inhibits apatite dissolution.
In theory, when zeolite is added to this system it removes Ca^+, thereby increasing the rate oi apatite dissolution and the subsequent supply of P to plants. In addition to increasing phosphorus, the zeolite can be modified to supply aaaitional nutrients. As calcium is adsorbed by the zeolite, the original exchangeable cations (K+, Mg2 + , Na+ , etc.) are released into solution. Therefore, by presaturating the exchange sites with NH4+ or K+ , the zeolite becomes a slow-release fertilizer of these nutrients.
CONTROLLED DISSOLUTION STUDIES Controlled dissolution studies were conducted to
determine how the effectiveness of the system could be increased. In these studies, ground Fernie phosphorite and Princeton zeolite were shaken in deionized water and, after various time intervals, the concentration of dissolved phosphorus was measured. (For a more complete description of these experiments, see Marcille-Kerslake 1989, and 1991).
It was concluded from these studies that the rate of dissolution of the rock phosphate was increased by the addition of zeolite. Furthermore, the effectiveness of the zeolite was increased by presaturating the exchange sites with a single monovalent cation (NH4+), and increased with increasing gain size from 53 micrometres to 1.0
TABLE 3 CONCENTRATION OF NAHCO3-EXTRACTABLE P IN SOIL # 1 AND SOIL #2 TREATMENTS AFTER 3
SOYBEAN CROPS
Figure 4. Phosphorous released from various phosphate rocks over time with and without zeolite.
Fertilizer NaHC03-extractable P (mg/kg) Soil #1 Soil#2
MCP 36 43 PR 10 16 2Z:1PR 12 16 4Z:1PR 14 16 6Z:1PR 15 16 No P 10 15
128 Industrial Minerals Forum 1991
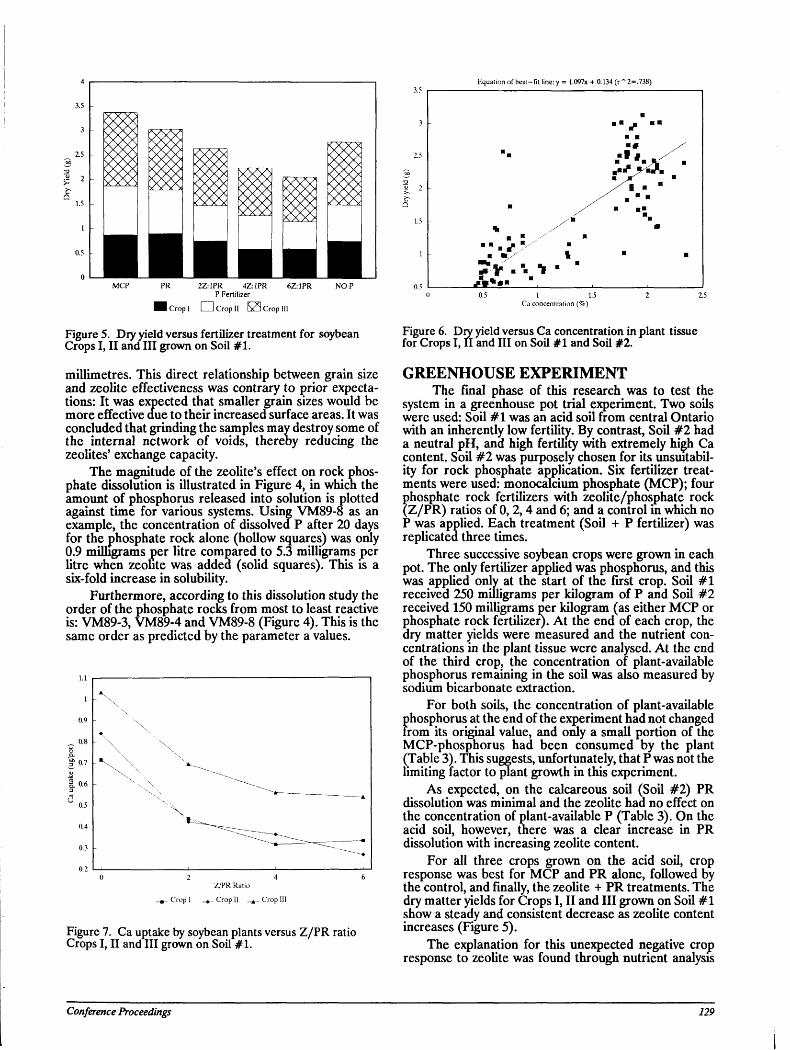
P Fertilizer
Crop I □ Crop II S 3 Crop III
Figure 5. Dry yield versus fertilizer treatment for soybean Crops I, II and III grown on Soil #1.
millimetres. This direct relationship between grain size and zeolite effectiveness was contrary to prior expectations: It was expected that smaller grain sizes would be more effective due to their increased surface areas. It was concluded that grinding the samples may destroy some of the internal network of voids, thereby reducing the zeolites' exchange capacity.
The magnitude of the zeolite's effect on rock phosphate dissolution is illustrated in Figure 4, in which the amount of phosphorus released into solution is plotted against time for various systems. Using VM89-8 as an example, the concentration of dissolved P after 20 days for the phosphate rock alone (hollow squares) was only 0.9 milligrams per litre compared to 5.3 milligrams per litre when zeohte was added (solid squares). This is a six-fold increase in solubility.
Furthermore, according to this dissolution study the order of the phosphate rocks from most to least reactive is: VM89-3, VM89-4 and VM89-8 (Figure 4). This is the same order as predicted by the parameter a values.
i.i
0 2 4 6 Z/PR Ratio
_»_ Crop I _^_ Crop II _, _ Crop III
Figure 7. Ca uptake by soybean plants versus Z/PR ratio Crops I, II and III grown on Soil #1.
Conference Proceedings
Equation of best-fit line: y = 1.097x + 0.134 (r~ 2=.738)
0 0.5 1 1.5 2 2.5 Ca concentration (%)
Figure 6. Dry yield versus Ca concentration in plant tissue for Crops I, II and III on Soil #1 and Soil #2.
GREENHOUSE EXPERIMENT The final phase of this research was to test the
system in a greenhouse pot trial experiment. Two soils were used: Soil # 1 was an acid soil from central Ontario with an inherently low fertility. By contrast, Soil #2 had a neutral pH, and high fertility with extremely high Ca content. Soil #2 was purposely chosen for its unsuitabil-ity for rock phosphate application. Six fertilizer treatments were used: monocalcium phosphate (MCP); four phosphate rock fertilizers with zeolite/phosphate rock (Z/PR) ratios of 0, 2,4 and 6; and a control in which no P was applied. Each treatment (Soil + P fertilizer) was replicated three times.
Three successive soybean crops were grown in each pot. The only fertilizer applied was phosphorus, and this was applied only at the start of the first crop. Soil # 1 received 250 milligrams per kilogram of P and Soil #2 received 150 milligrams per kilogram (as either MCP or phosphate rock fertilizer). At the end of each crop, the dry matter yields were measured and the nutrient concentrations in the plant tissue were analysed. At the end of the third crop, the concentration of plant-available phosphorus remaining in the soil was also measured by sodium bicarbonate extraction.
For both soils, the concentration of plant-available
f>hosphorus at the end of the experiment had not changed rom its original value, and only a small portion of the
MCP-phosphorus had been consumed by the plant (Table 3). This suggests, unfortunately, that P was not the limiting factor to plant growth in this experiment.
As expected, on the calcareous soil (Soil #2) PR dissolution was minimal and the zeolite had no effect on the concentration of plant-available P (Table 3). On the acid soil, however, there was a clear increase in PR dissolution with increasing zeohte content.
For all three crops grown on the acid soil, crop response was best for MCP and PR alone, followed by the control, and finally, the zeohte + PR treatments. The dry matter yields for Crops I, II and III grown on Soil # 1 show a steady and consistent decrease as zeohte content increases (Figure 5).
The explanation for this unexpected negative crop response to zeohte was found through nutrient analysis
129
of the plant tissue. In Figure 6, the dry matter yield has been plotted against the calcium concentration in the plant tissue for every replicate of each treatment (Fertilizer + Soil) over Crops I, II and III. There is a strong correlation between the two variables.
For all three crops grown on the acid soil (Soil #1), the MCP and PR treatments supplied adequate amounts of calcium to the plants, the control (No P) had marginal to adequate amounts, and there was calcium deficiency in the Z+PR treatments. Furthermore, Ca uptake decreased with increasing zeolite content, as illustrated in Figure 7.
Therefore, in addition to adsorbing calcium from the phosphate rock, the zeolite adsorbed calcium from the soil which was inherently low in calcium, and thereby lead to an induced calcium deficiency in the plants.
GENERAL CONCLUSIONS In conclusion, while the zeolite - phosphate rock
fertilizer is not a blanket solution, it may provide an alternative to conventional phosphate fertilizers under conditions favourable to its use. That is, the soil should be acidic and have a relatively low calcium content, and crops with low calcium requirements are desirable. In addition to soil and crop considerations, the use of this system should be preceded by a complete characterization of the zeolite and phosphate rock to ensure their appropriate use. Further studies to test the zeolite -phosphate rock fertilizer on a wide range of soil types, and long-term field trials are needed.
REFERENCES Butrenchuk S.B. (1987): Phosphate in South Eastern
British Columbia; B.C. Ministry of Energy, Mines and Petroleum Resources, Open File 1987-16, 103 pages.
International Fertilizer Development Centre (IFDC) (1979): Fertilizer Manual. Reference Manual IFDC-R-1. International Fertilizer Development Corporation. Muscle Shoals, Alabama. Pages 149-154.
Marcille V. (1989): Industrial Zeolites in the Princeton Basin; B.C. Ministry of Energy, Mines and Petroleum Resources, Geological Fieldwork 1988.
Marcille-Kerslake V. (1990): Sedimentary Phosphates in the Fernie Basin: Development of New Technology for Direct Application to Soils; B.C. Ministry of Energy, Mines and Petroleum Resources, Geological Fieldwork 1989.
Marcille,Kerslake, V. (1991): Evaluation of the Fernie Phosphorite and Princeton Zeolites: Potential for Rock Phosphate-Zeolite fertilizer use; M.Sc. thesis, University of Guelph.
McClennan, G.H. and L.R. Gremillion (1980): Evaluatin of Phosphatic Raw Materials; in The Role of Phosphorus in Agriculture, Agronomics Society of America - Crop Science Society of America -Soil Science Society of America, Madison, Wisconsin, pages 43 to 80.
Mumpton, FA. (1988): Development of uses for natural zeolites: A Critical Commentary; in D. Kallo and H.S. Sherry, eds., Occurrences, properties and, utilization of natural zeolites, Akademia Kiado, Budapest.
Parham W. (1989): Natural Zeolites: Some Potential Agricultural Applications for Developing Countries; Natural Resources Forum, May 1989, page 107-115.
Read P.B. (1987): Industrial minerals in some Tertiary basins, southern British Columbia (92H, 921); B.C. Ministry of Energy, Mines and Petroleum Resources, Geological Fieldwork 1986, Paper 1987-1, pages 247-254.
Slansky M. (1986): Geology of Sedimentary Phosphates; Elsevier Science Publishing Co. Inc., New York, 210 pages.
130 Industrial Minerals Forum 1991
A MASSIVE SKARN-HOSTED ANDRADITE DEPOSIT NEAR PENTICTON, BRITISH COLUMBIA
By H.C. Grond, R. Wolfe, J.H. Montgomery G.H. Giroux
INTRODUCTION Garnet is an important industrial mineral. Its high
density, angularity, hardness and non-toxicity make it an excellent product for many abrasive applications and other uses. However, currently available garnet products are relatively expensive: Idaho garnet sells for about US $160-260 per ton FOB minesite. Because of the favourable location, deposit size and high quality garnet content of the Crystal Peak deposit, it is expected that production costs will be low enough to capture a significant share of existing markets as well as allow development of markets previously inaccessible because of garnet's historically nigh cost.
Crystal Peak Garnet Corporation, a wholly-owned subsidiary of Vancouver-based Polestar Exploration Inc., is in the permitting stage of developing a large, high-grade deposit of skarn-hosted andradite garnet near Pen-ticton, British Columbia. Drilling conducted in 1989 and 1990 indicated 40 million tonnes of about 80 per cent garnet in three zones, with additional geological reserves of 60 million tonnes. Detailed drilling m the proposed pit area has defined 3.35 million tonnes of 81.3 per cent garnet.
The deposit has excellent potential for development. Elevations are moderate, ranging from 1900 to 2100 metres above sea level. Road access and power lines are already in place because of nearby mining and recreational developments. All supplies, facilities and manpower requirements are available in the nearby communities of Penticton and Keremeos.
Capital pre-production costs are estimated at approximately 3 million dollars. The construction phase of the project, scheduled for June 1991 (depending on permitting), is estimated to require six months to complete.
The Crystal Peak deposit is larger and of higher grade than any garnet deposit currently mined anywhere in the world. At the proposed operatmg rate of 60 000 tonnes per year, it is expected the Crystal Peak deposit will be the world's largest producer.
GEOLOGICAL SETTING The Crystal Peak deposit includes much of Mt.
Riordan and is within the Intermontane Belt of the Canadian Cordillera. The major rock units in the area are part of the Late Triassic Nicola Group. The Nicola Group rocks are intruded by the Early Jurassic Bromley batholith and Cahill Creek pluton.
The Crystal Peak skarn deposit is the most easterly of a series of skarns which includes those at the presently operating Nickel Plate Mine and the old French and Goodhope mines. The composition of the skarns varies from low garnet with high arsenic and gold in the west to high garnet with low gold and no arsenic in the east at Crystal Peak (Ray and Dawson, 1988; Ray et al., 1988).
Polestar Exploration Inc., Vancouver, B.C. Montgomery Consultants Ltd., Vancouver, B.C.
The Crystal Peak garnet deposit is unusual because of its large size and high grade (most commercial garnet deposits average 20% garnet or less). The surface extent of the garnet body is 300 by 800 metres, including three major zones of particularly high grade (78% garnet) - the North, South, and West Zones. Cliff exposure and drilling results indicate high grade garnet at considerable depths: one drill hole intersected high grade garnet to a depth of 200 metres. Replacement of limestone by garnet is almost complete: only one small limestone lens was observed in drill core (Grond and Wolfe, 1991). Diopside (clinopyroxene) is the most common accessory mineral. In most cases, the diopside has been partially altered to actinolite, sericite and epidote. Quartz, epidote and occasionally sphene occur m relatively low quantities. Cal-cite content is also relatively low; it occurs in small veins near the top of Mt. Riordan and as interstitial blebs up to 3 centimetres across. Magnetite, hematite and various sulphides including pyrite, pyrrhotite and chalcopyrite (rare) occur in very minor amounts throughout the deposit. Average values for accessory minerals in the North Zone deposit are as follows:
Diopside 10.94% Quartz 2.46% Calcite 1.83% Actinolite, epidote, sericite 4.67% Feldspar .03% Sphene .064% Apatite .06% Opaque .44% (magnetite and
minor sulphides)
Garnet occurs as massive garnetite or coarsely crystalline aggregates, locally showing growth zonation. Red-brown, green, and pink-orange are the most common colours although buff and black varieties have been noted.
Microprobe analyses show the garnet to be about 90 per cent andradite (Ca3Fe2Si30i2) and 10 per cent gros-sularite (Ca3Al2Si30i2). Andradite ana grossularite form a solid solution series with iron and aluminum being interchangeable. To a lesser extent manganese or magnesium can substitute for calcium. A granodiorite contact at the eastern edge of the skarn is well exposed. In addition, small diorite remnants are scattered m a broad zone through the centre of the skarn. The diorite remnants had some influence on skarn formation: samples of adjacent massive garnetite rock have distinct relict intrusive textures.
GRADE DETERMINATION Since garnet content cannot be determined by con
ventional assay techniques, different methods were employed. Both visual estimates and thin section analyses were used to estimate garnet content in the drill core and
Conference Proceedings 131
532 representative samples were selected for thin section analyses during core logging. In general, thin section analyses corresponded remarkably well with visual estimates.
Two additional methods of grade determination were employed to check results - thin section analyses of crushed mixed core, and heavy liquid separation. All methods correlated well and final results were judged to be accurate within 1 or 2 per cent.
RESERVE CALCULATIONS Reserve values for the entire deposit have been
generated based on average garnet content in drill holes. Surface dimensions were derived by results of detailed surface sampling and mapping to outline exposed areas of high grade garnet-bearing rock. An average specific gravity of 3.5 was used to determine tonnage.
A reserve total of approximately 40 million tonnes of about 80 per cent garnet was calculated based on depths of less than 10 metres. An additional 60 million tonnes of possible geological reserves are indicated. This is based principally on extending the deposit to depth, as drill hole data and cliff exposures indicate that the deposit is much deeper than the cut-off depths used in the calculations.
Detailed reserve calculations have been made for the proposed quarry in the North Zone (Giroux, 1991). Semi-variogram analysis indicates an isotropic structure for garnet, with a horizontal range of 120 metres. The nugget effect is less than 10 per cent of the sill value so estimation errors are relatively low.
Blocks 20 by 20 by 5 metres were estimated by ordinary kriging and indicate reserves in the North Zone of 3.35 million tonnes averaging 81.3 per cent garnet at a 64 per cent garnet cutoff between the 2 025 and 2 085 metre levels. The current pit outline in this zone contains 1.93 million tonnes of 80 per cent garnet or 25 years production at 75 000 tonnes per year (60 000 tonnes finished product).
MARKETING Current world production of garnet is estimated at
100 000 tonnes annually, with North American production being about 50 000 tonnes produced from two mines - one in New York and the other in Idaho. Other important producers are Australia and India, and recent reports indicate that pilot plant testing is being conducted in Montana and California. North American consumption is estimated at about 46 000 tonnes annually.
Garnet's main applications are: Abrasive blast cleaning Abrasive waterjet cutting Water filtration Bonded and coated abrasive products High density aggregate Wear resistant surfaces
The first four uses listed above probably account for about 90 per cent of North American garnet consumption.
The most promising market for garnet is in abrasive blast cleaning. In North America alone, 5 million tonnes of blasting abrasives are used each year, with west coast consumption estimated to be at least 500 000 tonnes. The
market is currently dominated by silica sand and smelter and coal slags, with garnet consumption being on the order of only 20 000 to 30 000 tonnes. There is a good chance of increasing the market share for garnet at the expense of the silica and slag because of health and environmental considerations. Use of silica sand has been linked to cancer and silicosis, and slags commonly contain toxic heavy metals.
The success in winning a market share for garnet in the abrasive blast cleaning industry has been limited by two factors: relatively high price (averaging about US$230 per tonne compared to sands and slags costing US$50-US$100 per tonne) and limited availability. Despite this, from 1983 to 1988 garnet consumption in all markets increased by 50 per cent in the United States and in the last five years has tripled in the rest of the world.
Strong markets are developing in Japan and Europe for garnet m the blast cleaning industry. This is as a result of health and environmental risks associated with silica sand and slags linked to cancer and silicosis. The use of silica is banned in most European countries and current demand is filled primarily with slags. Extremely high disposal costs are causing consumers to look for alternatives. Garnet is receiving considerable attention for several reasons including its ability to be reused several times in blast cleaning thus reducing disposal costs by reducing the amount of waste produced. An increasingly important market for garnet is in abrasive waterjet cutting. The market for garnet in this sector is increasing at a rate of 30 per cent per year and annual consumption is estimated at 20 000 tonnes. Customers are currently paying between US$300 and US$600 per tonne for garnet product. This market is very price sensitive as garnet represents 70 per cent of the hourly operating cost of the process.
Extensive testing of the Crystal Peak garnet products has been done under both laboratory and field conditions. The quality of the product is excellent and it performs very well in both sandblasting and waterjet cutting applications. Continued testing will be carried out for numerous other industrial applications.
Both demand and price forecasts for garnet products are very positive. Given recent growth rates in garnet consumption, it is reasonable to predict the world market could require another 200 000 tonnes annually within five years at tne current high prices. If garnet could be sold in the US$100/tonne range (Crystal Peak Garnet's projected price for sandblasting grit), it is estimated the blast cleaning industry in the western United States alone could consume more than 200 000 tonnes annually.
CONCLUSIONS Crystal Peak Garnet Corporation is in the permitting
stage of developing the largest known, highest grade garnet deposit in the world. The deposit is located near Penticton, British Columbia, and consists of mainly an-dradite garnet in a skarn zone. Drill indicated reserves total 40 million tonnes of about 80 per cent garnet in three zones, with additional geological reserves of 60 million tonnes. Detailed drilling in the proposed pit area defined 3.35 million tonnes of 81.3 per cent garnet. At the proposed operating rate of 60 000 tonnes per year, it is expected that Crystal Peak could be the world's largest garnet producer.
132 Industrial Minerals Forum 1991
Garnet is an important industrial mineral with rapidly expanding markets in spite of its currently higji price relative to available alternatives. Because of the size and purity of the Crystal Peak deposit, it is expected that production costs will be low enough to capture a significant share of existing markets in the abrasives field as well as allow development of markets previously inaccessible because of garnet's historically high cost.
REFERENCES Giroux, G.H. (1991): Geostatistical study of the Crystal
Peak Garnet Deposit; Polestar Exploration Inc. Report.
Grond, H.C. and Wolfe, R. (1991): Geological and Diamond Drilling Report on the Crystal Peak Garnet Property, Polestar Exploration Inc. Report.
Ray, G.E. and Dawson, G.L. (1988): Geology and mineral occurrences in the Hedley Gold Camp; B.C. Ministry of Energy, Mines and Petroleum Resources, Open File Map 1988-6.
Ray, G.E., Dawson, G.L. and Simpson, R. (1988): Geology, Geochemistry and Metallogenic zoning in the Hedley Gold-skarn camp; B.C. Ministry of Energy, Mines, and Petroleum Resources, Fieldwork Paper 1988-1, pages 59 to 80.
Conference Proceedings 133

134 Industrial Minerals Forum 1991
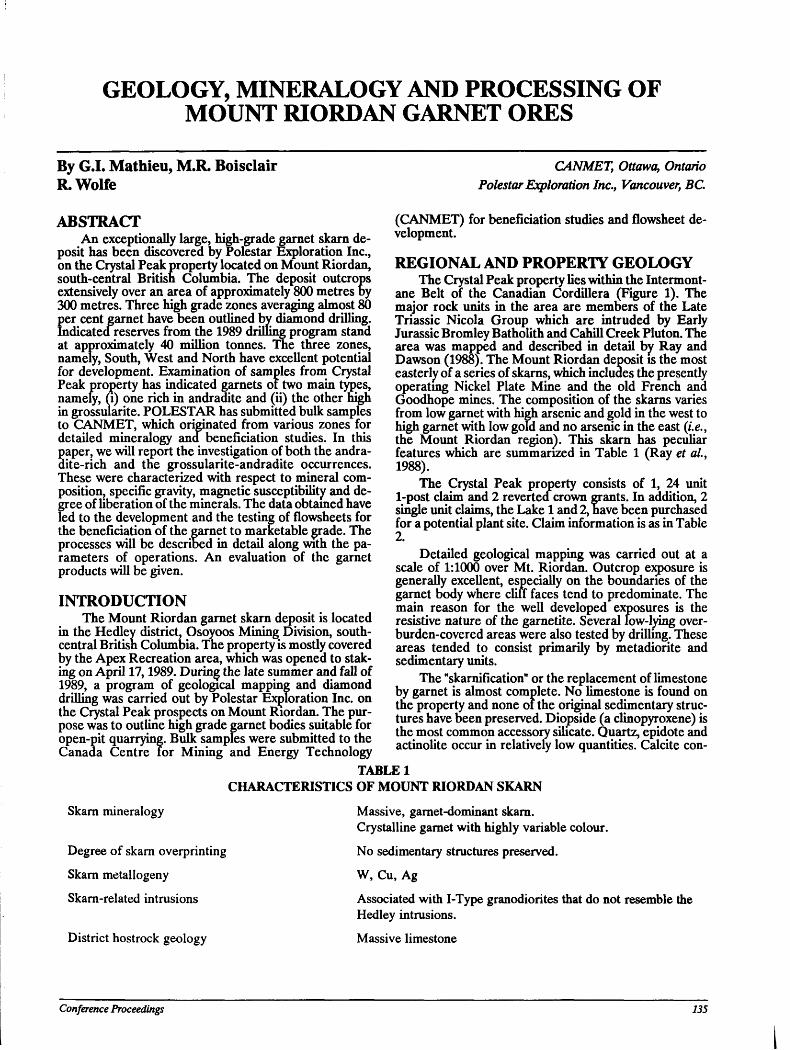
GEOLOGY, MINERALOGY AND PROCESSING OF MOUNT RIORDAN GARNET ORES
By G.I. Mathieu, M.R. Boisclair R. Wolfe
CANMET, Ottawa, Ontario Polestar Exploration Inc., Vancouver, BC.
ABSTRACT An exceptionally large, high-grade garnet skarn de
posit has been discovered by Polestar Exploration Inc., on the Crystal Peak property located on Mount Riordan, south-central British Columbia. The deposit outcrops extensively over an area of approximately 800 metres by 300 metres. Three high grade zones averaging almost 80 per cent garnet have been outlined by diamond drilling. Indicated reserves from the 1989 drilling program stand at approximately 40 million tonnes. The three zones, namely, South, West and North have excellent potential for development. Examination of samples from Crystal Peak property has indicated garnets of two main types, namely, (i) one rich in andradite and (ii) the other high in grossularite. POLESTAR has submitted bulk samples to CANMET, which originated from various zones for detailed mineralogy and beneficiation studies. In this paper, we will report the investigation of both the andra-dite-rich and the grossularite-andradite occurrences. These were characterized with respect to mineral composition, specific gravity, magnetic susceptibility and degree of liberation of the minerals. The data obtained have led to the development and the testing of flowsheets for the beneficiation of the garnet to marketable grade. The processes will be described in detail along with the parameters of operations. An evaluation of the garnet products will be given.
INTRODUCTION The Mount Riordan garnet skarn deposit is located
in the Hedley district, Osoyoos Mining Division, south-central British Columbia. The property is mostly covered by the Apex Recreation area, which was opened to staking on April 17,1989. During the late summer and fall of 1989, a program of geological mapping and diamond drilling was carried out by Polestar Exploration Inc. on the Crystal Peak prospects on Mount Riordan. The purpose was to outline high grade garnet bodies suitable for open-pit quarrying. Bulk samples were submitted to the Canada Centre for Mining and Energy Technology
(CANMET) for beneficiation studies and flowsheet development.
REGIONAL AND PROPERTY GEOLOGY The Crystal Peak property lies within the Intermont-
ane Belt of the Canadian Cordillera (Figure 1). The major rock units in the area are members of the Late Triassic Nicola Group which are intruded by Early Jurassic Bromley Batholith and Cahill Creek Pluton. The area was mapped and described in detail by Ray and Dawson (1988). The Mount Riordan deposit is the most easterly of a series of skarns, which includes the presently operatmg Nickel Plate Mine and the old French and Goodhope mines. The composition of the skarns varies from low garnet with high arsenic and gold in the west to high garnet with low gold and no arsenic in the east (i.e., the Mount Riordan region). This skarn has peculiar features which are summarized in Table 1 (Ray et al, 1988).
The Crystal Peak property consists of 1, 24 unit 1-post claim and 2 reverted crown grants. In addition, 2 single unit claims, the Lake 1 and 2, have been purchased for a potential plant site. Claim information is as in Table 2.
Detailed geological mapping was carried out at a scale of 1:1000 over Mt. Riordan. Outcrop exposure is generally excellent, especially on the boundaries of the garnet body where cliff faces tend to predominate. The main reason for the well developed exposures is the resistive nature of the garnetite. Several low-lying over-burden-covered areas were also tested by drilling. These areas tended to consist primarily by metadiorite and sedimentary units.
The "skarniiication" or the replacement of limestone by garnet is almost complete. No limestone is found on the property and none of the original sedimentary structures have been preserved. Diopside (a clinopyroxene) is the most common accessory silicate. Quartz, epidote and actinolite occur in relatively low quantities. Calcite con-
Skarn mineralogy
Degree of skarn overprinting
Skarn metallogeny
Skarn-related intrusions
District hostrock geology
TABLE 1 CHARACTERISTICS OF MOUNT RIORDAN SKARN
Massive, garnet-dominant skarn. Crystalline garnet with highly variable colour.
No sedimentary structures preserved.
W, Cu, Ag
Associated with I-Type granodiorites that do not resemble the Hedley intrusions.
Massive limestone
Conference Proceedings 135
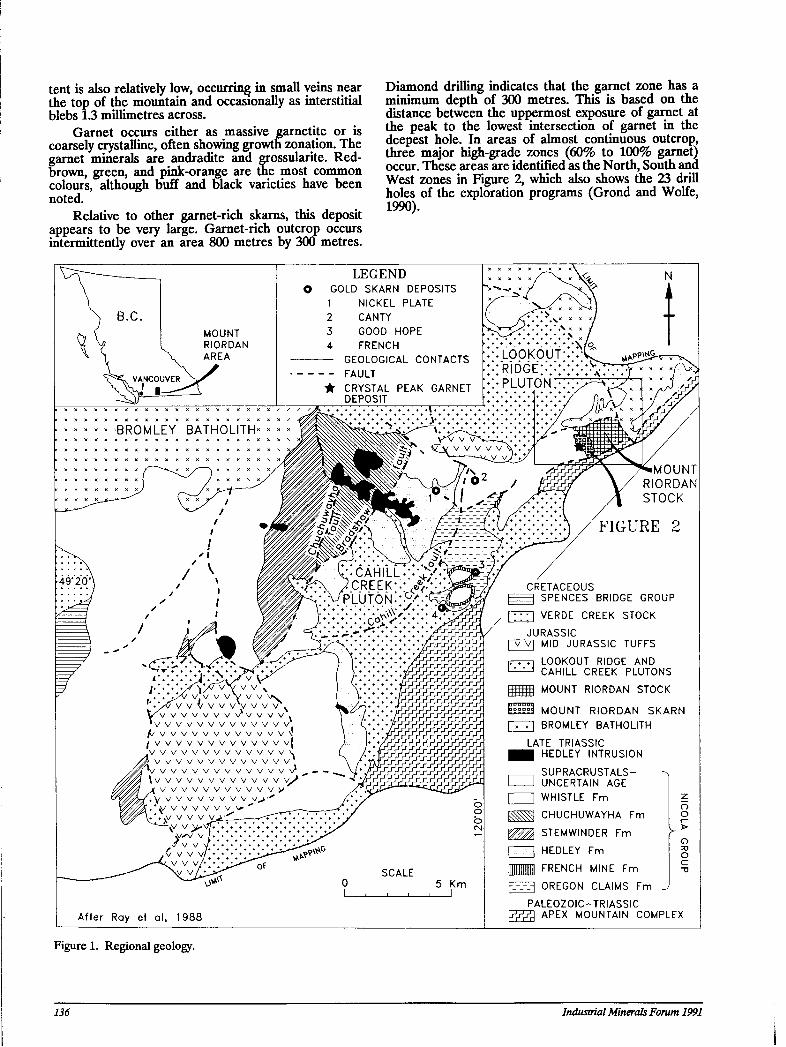
tent is also relatively low, occurring in small veins near the top of the mountain and occasionally as interstitial blebs 1.3 millimetres across.
Garnet occurs either as massive garnetite or is coarsely crystalline, often showing growth zonation. The garnet minerals are andradite and erossularite. Red-brown, green, and pink-orange are the most common colours, although buff and black varieties have been noted.
Relative to other garnet-rich skarns, this deposit appears to be very large. Garnet-rich outcrop occurs intermittently over an area 800 metres by 300 metres.
Diamond drilling indicates that the garnet zone has a minimum depth of 300 metres. This is based on the distance between the uppermost exposure of garnet at the peak to the lowest intersection of garnet in the deepest hole. In areas of almost continuous outcrop, three major high-grade zones (60% to 100% garnet) occur. These areas are identified as the North, South and West zones in Figure 2, which also shows the 23 drill holes of the exploration programs (Grond and Wolfe, 1990).
CRETACEOUS F = l SPENCES BRIDGE GROUP
3 VERDE CREEK STOCK
After Ray et al, 1988
[v] MID JURASSIC TUFFS LOOKOUT RIDGE AND CAHILL CREEK PLUTONS MOUNT RIORDAN STOCK
MOUNT RIORDAN SKARN BROMLEY BATHOLITH
LATE TRIASSIC ■ HEDLEY INTRUSION
SUPRACRUSTALS-UNCERTAIN AGE WHISTLE Fm
o o CHUCHUWAYHA Fm STEMWINDER Fm HEDLEY Fm FRENCH MINE Fm
F ? ^ OREGON CLAIMS Fr PALEOZOIC-TRIASSIC
\?tt\ APEX MOUNTAIN COMPLEX
o O c
Figure 1. Regional geology.
136 Industrial Minerals Forum 1991
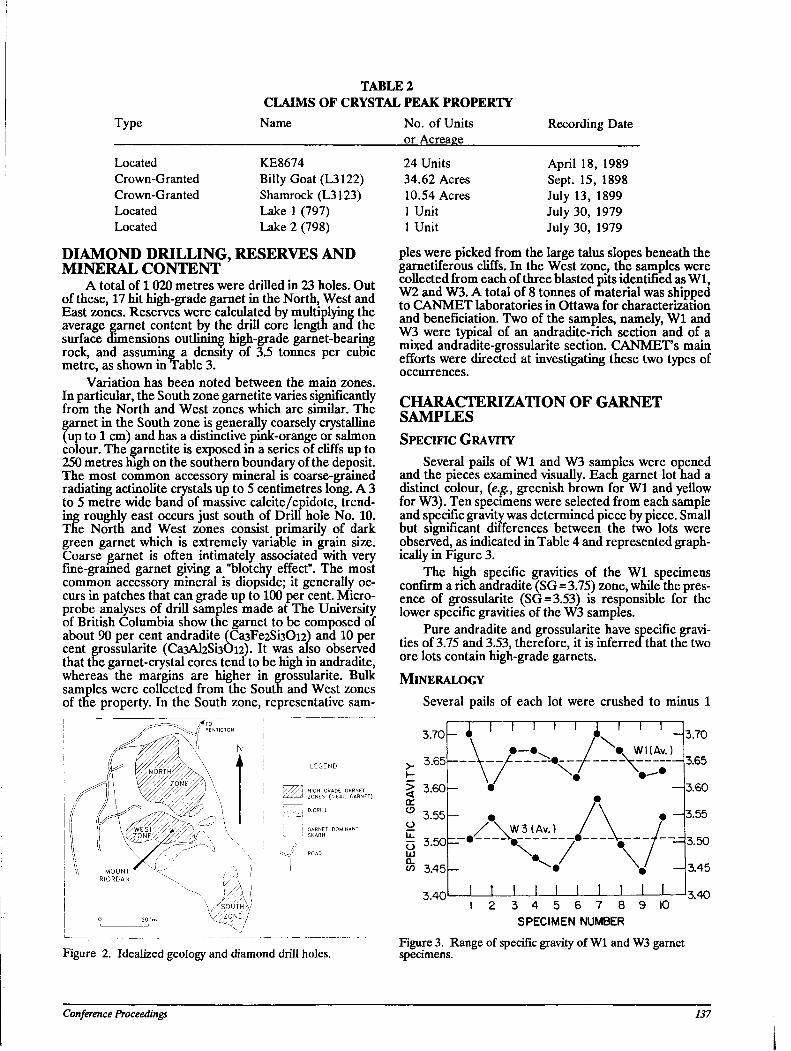
Type
TABLE 2 CLAIMS OF CRYSTAL PEAK PROPERTY
Name No. of Units or Acreage
Recording Date
KE8674 24 Units Billy Goat (L3122) 34.62 Acres Shamrock (L3123) 10.54 Acres Lake 1 (797) 1 Unit Lake 2 (798) lUnit
Located Crown-Granted Crown-Granted Located Located
DIAMOND DRILLING, RESERVES AND MINERAL CONTENT
A total of 1020 metres were drilled in 23 holes. Out of these, 17 hit high-grade garnet in the North, West and East zones. Reserves were calculated by multiplying the average garnet content by the drill core length and the surface dimensions outlining high-grade garnet-bearing rock, and assuming a density of 3.5 tonnes per cubic metre, as shown in Table 3.
Variation has been noted between the main zones. In particular, the South zone garnetite varies significantly from the North and West zones which are similar. The garnet in the South zone is generally coarsely crystalline (up to 1 cm) and has a distinctive pink-orange or salmon colour. The garnetite is exposed in a series of cliffs up to 250 metres high on the southern boundary of the deposit. The most common accessory mineral is coarse-grained radiating actinolite crystals up to 5 centimetres long. A 3 to 5 metre wide band of massive calcite/epidote, trending roughly east occurs just south of Drill hole No. 10. The Nortn and West zones consist primarily of dark green garnet which is extremely variable in grain size. Coarse garnet is often intimately associated with very fine-grained garnet giving a "blotchy effect". The most common accessory mineral is diopside; it generally occurs in patches that can grade up to 100 per cent. Micro-probe analyses of drill samples made at The University of British Columbia show the garnet to be composed of about 90 per cent andradite (Ca3Fe2Si30i2) and 10 per cent grossularite (Ca3AhSi30i2). It was also observed that the garnet-crystal cores tend to be high in andradite, whereas the margins are higher in grossularite. Bulk samples were collected from the South and West zones of the property. In the South zone, representative sam-
V//7A H I G H GRADE GARNET I y ///>1 ZONES (>64% GARNET)
April 18, 1989 Sept. 15, 1898 July 13, 1899 July 30, 1979 July 30, 1979
pies were picked from the large talus slopes beneath the garnetiferous cliffs. In the West zone, the samples were collected from each of three blasted pits identified as Wl, W2 and W3. A total of 8 tonnes of material was shipped to CANMET laboratories in Ottawa for characterization and beneficiation. Two of the samples, namely, Wl and W3 were typical of an andradite-rich section and of a mixed andradite-grossularite section. CANMETs main efforts were directed at investigating these two types of occurrences.
CHARACTERIZATION OF GARNET SAMPLES SPECIFIC GRAVITY
Several pails of Wl and W3 samples were opened and the pieces examined visually. Each garnet lot had a distinct colour, (e.g., greenish brown for Wl and yellow for W3). Ten specimens were selected from each sample and specific gravity was determined piece by piece. Small but significant differences between the two lots were observed, as indicated in Table 4 and represented graphically in Figure 3.
The high specific gravities of the Wl specimens confirm a rich andradite (SG=3.75) zone, while the presence of grossularite (SG=3.53) is responsible for the lower specific gravities of the W3 samples.
Pure andradite and grossularite have specific gravities of 3.75 and 3.53, therefore, it is inferred that the two ore lots contain high-grade garnets.
MINERALOGY
Several pails of each lot were crushed to minus 1
3.70 Ui ' '
3.40
I \ "i i r •v WKAv.) -x/--\~H
J L 1 1 1 1 2 3 4 5 6 7 8 9 10
SPECIMEN NUMBER
3.70
3.65
3.60
|3.55
3.50
3.45
3.40
Figure 2. Idealized geology and diamond drill holes. Figure 3. Range of specific gravity of Wl and W3 garnet specimens.
Conference Proceedings 137
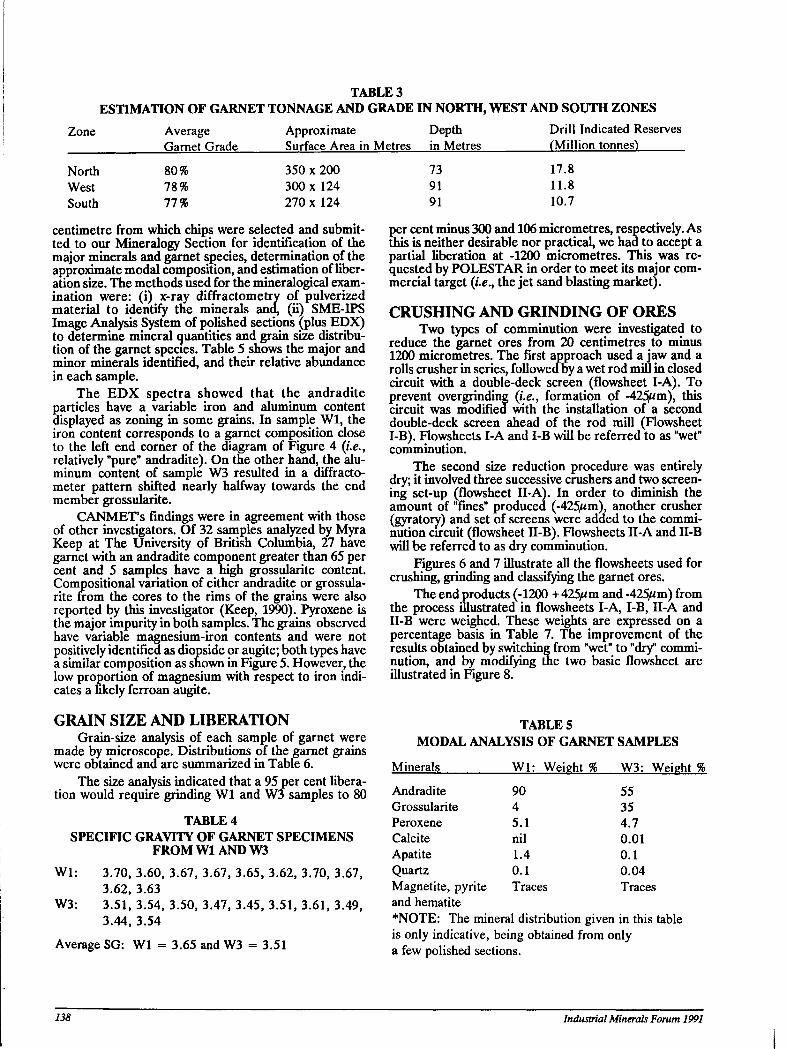
TABLE 3 ESTIMATION OF GARNET TONNAGE AND GRADE IN NORTH, WEST AND SOUTH ZONES
Zone Average Approximate Depth Drill Indicated Reserves Garnet Grade Surface Area in Metres in Metres (Million tonnes)
North West South
80% 78% 77%
350 x 200 300 x 124 270 x 124
centimetre from which chips were selected and submitted to our Mineralogy Section for identification of the major minerals and garnet species, determination of the approximate modal composition, and estimation of liberation size. The methods used for the mineralogical examination were: (i) x-ray diffractometry of pulverized material to identify the minerals and, (ii) SME-IPS Image Analysis System of polished sections (plus EDX) to determine mineral quantities and grain size distribution of the garnet species. Table 5 shows the major and minor minerals identified, and their relative abundance in each sample.
The EDX spectra showed that the andradite particles have a variable iron and aluminum content displayed as zoning in some grains. In sample Wl, the iron content corresponds to a garnet composition close to the left end corner of the diagram of Figure 4 (i.e.f relatively "pure" andradite). On the other hand, the aluminum content of sample W3 resulted in a diffracto-meter pattern shifted nearly halfway towards the end member grossularite.
CANMET's findings were in agreement with those of other investigators. Of 32 samples analyzed by Myra Keep at The University of British Columbia, 27 have garnet with an andradite component greater than 65 per cent and 5 samples have a high grossularite content. Compositional variation of either andradite or grossularite uom the cores to the rims of the grains were also reported by this investigator (Keep, 1990). Pyroxene is the major impurity in both samples. The grains observed have variable magnesium-iron contents and were not positively identified as diopside or augite; both types have a similar composition as shown in Figure 5. However, the low proportion of magnesium with respect to iron indicates a likely ferroan augite.
GRAIN SIZE AND LIBERATION Grain-size analysis of each sample of garnet were
made by microscope. Distributions of the garnet grains were obtained and are summarized in Table 6.
The size analysis indicated that a 95 per cent liberation would require grinding Wl and W3 samples to 80
TABLE 4 SPECIFIC GRAVITY OF GARNET SPECIMENS
FROM Wl AND W3 Wl: 3.70, 3.60, 3.67, 3.67, 3.65, 3.62, 3.70, 3.67,
3.62, 3.63 W3: 3.51, 3.54, 3.50, 3.47, 3.45, 3.51, 3.61, 3.49,
3.44, 3.54
Average SG: Wl = 3.65 and W3 = 3.51
73 91 91
17.8 11.8 10.7
per cent minus 300 and 106 micrometres, respectively. As this is neither desirable nor practical, we had to accept a partial liberation at -1200 micrometres. This was requested by POLESTAR in order to meet its major commercial target (i.e., the jet sand blasting market).
CRUSHING AND GRINDING OF ORES Two types of comminution were investigated to
reduce the garnet ores from 20 centimetres to minus 1200 micrometres. The first approach used a jaw and a rolls crusher in series, followed by a wet rod mifi in closed circuit with a double-deck screen (flowsheet I-A). To prevent overgrinding (i.e., formation of -425jwm), this circuit was modified with the installation of a second double-deck screen ahead of the rod mill (Flowsheet I-B). Flowsheets I-A and I-B will be referred to as HwetM
comminution. The second size reduction procedure was entirely
dry; it involved three successive crushers and two screening set-up (flowsheet II-A). In order to diminish the amount of "fines" produced (-425/*m), another crusher (gyratory) and set of screens were added to the comminution circuit (flowsheet II-B). Flowsheets II-A and II-B will be referred to as dry comminution.
Figures 6 and 7 illustrate all the flowsheets used for crushing, grinding and classifying the garnet ores.
The end products (-1200 +425/*m and -425/*m) from the process illustrated in flowsheets I-A, I-B, II-A and II-B were weighed. These weights are expressed on a percentage basis in Table 7. The improvement of the results obtained by switching from "wet" to "dry" comminution, and by modifying the two basic flowsheet are illustrated in Figure 8.
TABLES MODAL ANALYSIS OF GARNET SAMPLES
Minerals Wl: Weieht % W3: Weisht %
Andradite 90 55 Grossularite 4 35 Peroxene 5.1 4.7 Calcite nil 0.01 Apatite 1.4 0.1 Quartz 0.1 0.04 Magnetite, pyrite Traces Traces and hematite *NOTE: The mineral distribution given in this table is only indicative, being obtained from only a few polished sections.
138 Industrial Minerals Forum 1991
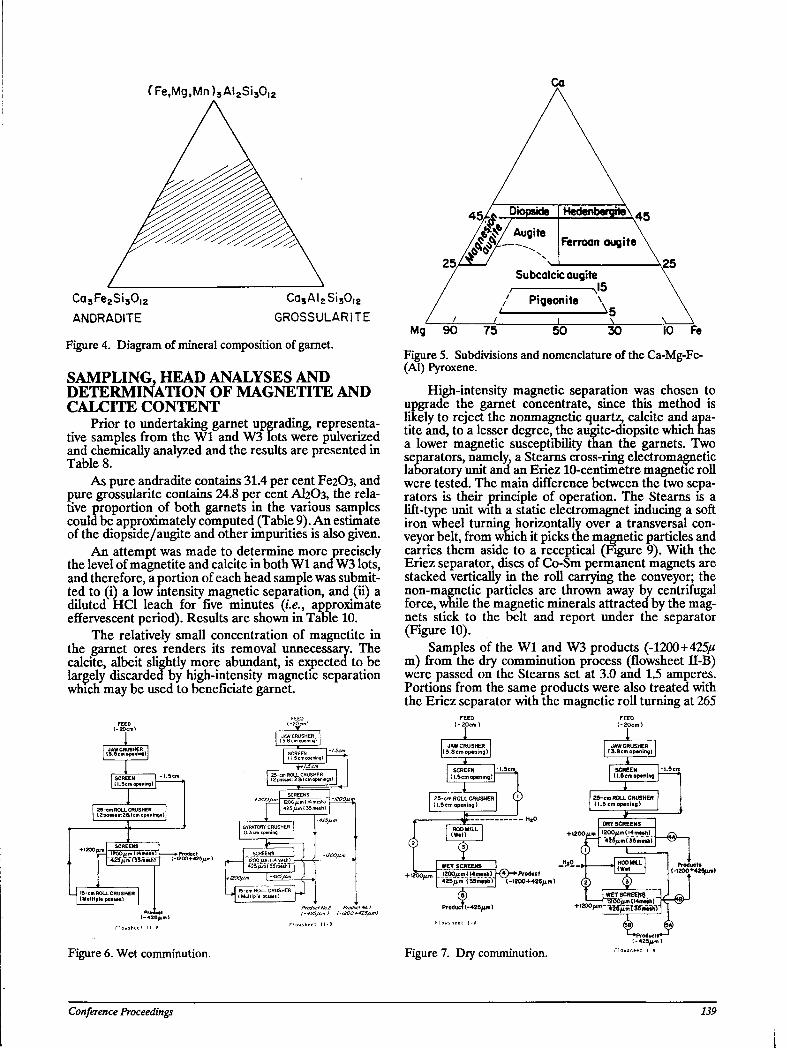
(Fe,Mg,Mn)3Al2Si30l2
Ca5Fe2Si30,2 ANDRADITE
Ca3AI2Si50 l2
GROSSULARITE
Figure 4. Diagram of mineral composition of garnet.
SAMPLING, HEAD ANALYSES AND DETERMINATION OF MAGNETITE AND CALCITE CONTENT
Prior to undertaking garnet upgrading, representative samples from the Wl and W3 lots were pulverized and chemically analyzed and the results are presented in Table 8.
As pure andradite contains 31.4 per cent Fe203, and pure grossularite contains 24.8 per cent AI2O3, the relative proportion of both garnets in the various samples could be approximately computed (Table 9). An estimate of the diopside/augite and other impurities is also given.
An attempt was made to determine more precisely the level of magnetite and calcite in both Wl ana W3 lots, and therefore, a portion of each head sample was submitted to (i) a low intensity magnetic separation, and (ii) a diluted HC1 leach for five minutes (Le., approximate effervescent period). Results are shown in Table 10.
The relatively small concentration of magnetite in the garnet ores renders its removal unnecessary. The calcite, albeit slightly more abundant, is expected to be largely discardea by high-intensity magnetic separation which may be used to beneficiate garnet.
_L (3.8cm opening)
+1200 ftm |_l200g.m(l4mMh)J-h 425/1 m(35mf
( -425 / tm)
ncocnpcrgiTQ \ 4 g
Ferroan augite
J.
Subcalcic augite 7 J5
/ Pigeonite \ *5
Mg 90 75 50 30 10 Fe
Figure 5. Subdivisions and nomenclature of the Ca-Mg-Fe-(Al) Pyroxene.
High-intensity magnetic separation was chosen to upgrade the garnet concentrate, since this method is likely to reject the nonmagnetic quartz, calcite and apatite and, to a lesser degree, the augite-diopsite which has a lower magnetic susceptibility than the garnets. Two separators, namely, a Stearns cross-ring electromagnetic laboratory unit and an Eriez 10-centimetre magnetic roll were tested. The main difference between the two separators is their principle of operation. The Stearns is a lift-type unit with a static electromagnet inducing a soft iron wheel turning horizontally over a transversal conveyor belt, from which it picks the magnetic particles and carries them aside to a receptical (Figure 9). With the Eriez separator, discs of Co-Sm permanent magnets are stacked vertically in the roll carrying the conveyor; the non-magnetic particles are thrown away by centrifugal force, while the magnetic minerals attracted by the magnets stick to the belt and report under the separator (Figure 10).
Samples of the Wl and W3 products (-1200+425// m) from the dry comminution process (flowsheet II-B) were passed on the Stearns set at 3.0 and 1.5 amperes. Portions from the same products were also treated with the Eriez separator with the magnetic roll turning at 265
JAW CRUSHER (3 .8 cm opening)
SCREEN (1.5cm opening)
25-cm ROLL CRUSHER (1.5 cm opening)
I + !20Cyim
H WET SCREENS l200/ im( l4me«h) 425 / t"ml35meinT
iuct(-
H © - * Product (-1200+425/tm)
Product ( -425 /un)
Figure 6. Wet comminution. Figure 7. Dry comminution. (-425/tm)
Conference Proceedings 139
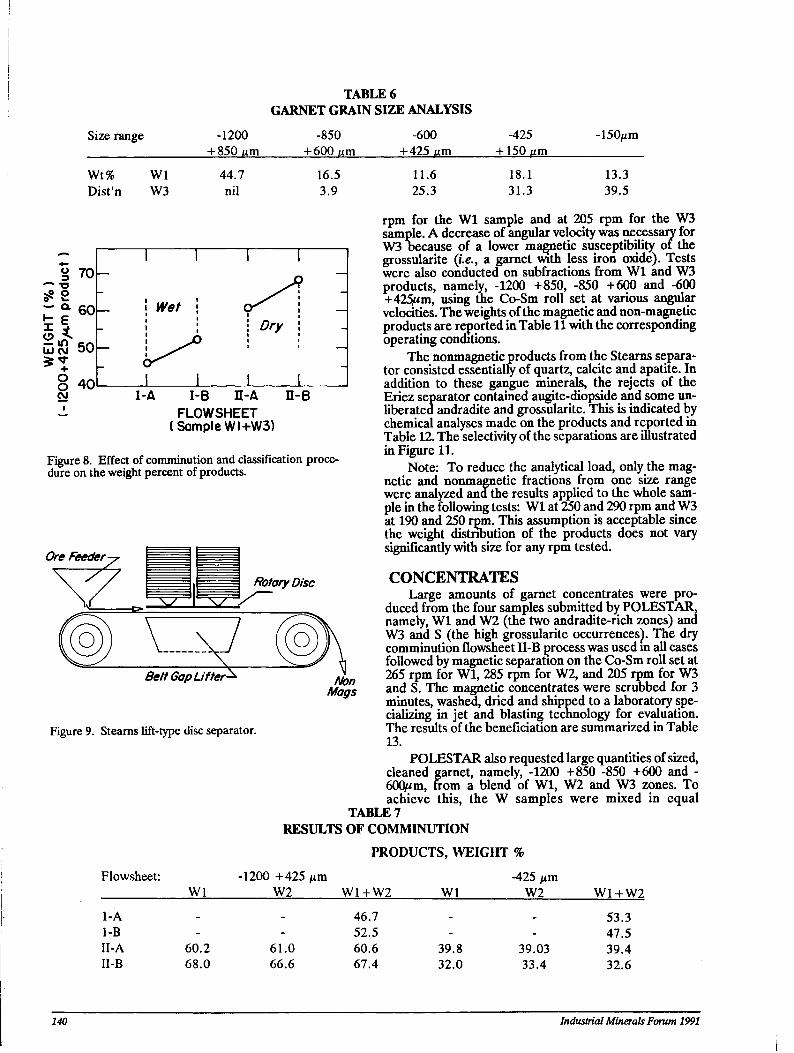
Size range -1200 + 850 um
TABLE 6 GARNET GRAIN SIZE ANALYSIS
-850 -600 + 600 um +425 um
-425 +150 um
-150/xm
Wt% Wl Disfn W3
44.7 nil
16.5 3.9
11.6 25.3
18.1 31.3
13.3 39.5
i 70 | -
i! i 8 40 CM
1 1 1
U- Wet j \ Dry
r J
1 1 1 -|
1-A I-B I -A FLOWSHEET
(Sample WI+W3)
E-B
Figure 8. Effect of comminution and classification procedure on the weight percent of products.
Ore Feeder
Rotary Disc
Belt Gap Lifter
Figure 9. Steams lift-type disc separator.
rpm for the Wl sample and at 205 rpm for the W3 sample. A decrease of angular velocity was necessary for W3 because of a lower magnetic susceptibility of the grossularite (Le.9 a garnet with less iron oxide). Tests were also conducted on subfractions from W l and W3 products, namely, -1200 +850, -850 +600 and -600 +425/*m, using the Co-Sm roll set at various angular velocities. The weights of the magnetic and non-magnetic products are reported in Table 11 with the corresponding operating conditions.
The nonmagnetic products from the Steams separator consisted essentially of quartz, calcite and apatite. In addition to these gangue minerals, the rejects of the Eriez separator contained augite-diopside and some un-liberated andradite and grossularite. This is indicated by chemical analyses made on the products and reported in Table 12. The selectivity of the separations are illustrated in Figure 11.
Note: To reduce the analytical load, only the magnetic and nonmagnetic fractions from one size range were analyzed ana the results applied to the whole sample in the following tests: W l at 250 and 290 rpm and W3 at 190 and 250 rpm. This assumption is acceptable since the weight distribution of the products does not vary significantly with size for any rpm tested.
CONCENTRATES Large amounts of garnet concentrates were pro
duced from the four samples submitted by POLESTAR, namely, Wl and W2 (the two andradite-rich zones) and W3 and S (the high grossularite occurrences). The dry comminution flowsheet II-B process was used m all cases followed by magnetic separation on the Co-Sm roll set at 265 rpm for Wl, 285 rpm for W2, and 205 rpm for W3 and S. The magnetic concentrates were scrubbed for 3 minutes, washed, dried and shipped to a laboratory specializing in jet and blasting technology for evaluation. The results of the beneficiation are summarized in Table 13.
POLESTAR also requested large quantities of sized, cleaned garnet, namely, -1200 +850 -850 +600 and -60Qum, from a blend of Wl, W2 and W3 zones. To achieve this, the W samples were mixed in equal
TABLE 7 RESULTS OF COMMINUTION
PRODUCTS, WEIGHT %
Non Mags
Flowsheet: -1200 +425 /xm -425 /im Wl W2 W1+W2 Wl W2 W1+W2
1-A _ . 46.7 . _ 53.3 1-B - - 52.5 - - 47.5 II-A 60.2 61.0 60.6 39.8 39.03 39.4 II-B 68.0 66.6 67.4 32.0 33.4 32.6
140 Industrial Minerals Forum 1991
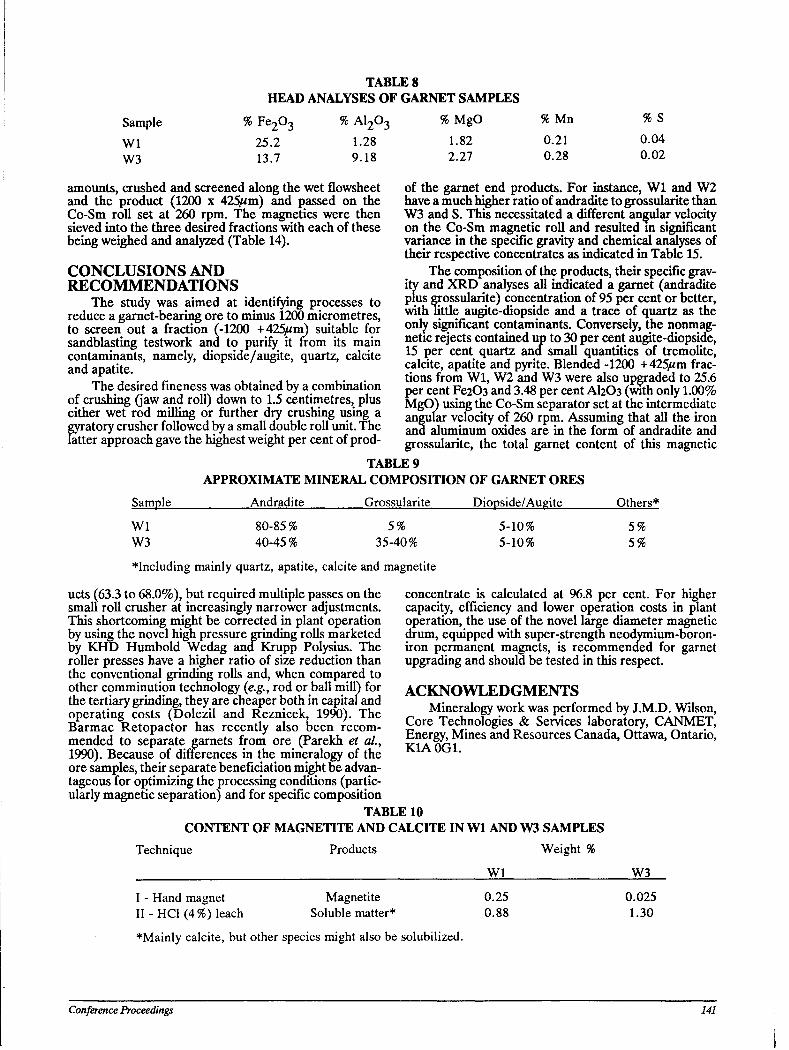
TABLE 8 HEAD ANALYSES OF GARNET SAMPLES
Sample % F e 2 0 3 % A1203 % MgO % Mn % S
Wl 25.2 1.28 1.82 0.21 0.04 W3 13.7 9.18 2.27 0.28 0.02
amounts, crushed and screened along the wet flowsheet and the product (1200 x 425/zm) and passed on the Co-Sm roll set at 260 rpm. The magnetics were then sieved into the three desired fractions with each of these being weighed and analyzed (Table 14).
CONCLUSIONS AND RECOMMENDATIONS
The study was aimed at identifying processes to reduce a garnet-bearing ore to minus 1200 micrometres, to screen out a fraction (-1200 +425//m) suitable for sandblasting testwork ana to purify it from its main contaminants, namely, diopside/augite, quartz, calcite and apatite.
The desired fineness was obtained by a combination of crushing (jaw and roll) down to 1.5 centimetres, plus either wet rod milling or further dry crushing using a gyratory crusher followed by a small double roll unit. The latter approach gave the highest weight per cent of prod-
of the garnet end products. For instance, Wl and W2 have a much higher ratio of andradite to grossularite than W3 and S. This necessitated a different angular velocity on the Co-Sm magnetic roll and resulted m significant variance in the specific gravity and chemical analyses of their respective concentrates as indicated in Table 15.
The composition of the products, their specific gravity and XRD analyses all indicated a garnet (andradite plus grossularite) concentration of 95 per cent or better, with little augite-diopside and a trace of quartz as the only significant contaminants. Conversely, the nonmagnetic rejects contained up to 30 per cent augite-diopside, 15 per cent quartz and small quantities of tremolite, calcite, apatite and pyrite. Blended -1200 +425/*m fractions from Wl, W2 and W3 were also upgraded to 25.6 per cent Fe203 and 3.48 per cent AI2O3 (with only 1.00% MgO) using the Co-Sm separator set at the intermediate angular velocity of 260 rpm. Assuming that all the iron and aluminum oxides are in the form of andradite and grossularite, the total garnet content of this magnetic
TABLE 9 APPROXIMATE MINERAL COMPOSITION OF GARNET ORES
Sample Andradite Grossularite Diopside/Augite Others*
Wl W3
80-85% 40-45%
5% 35-40%
5-10% 5-10%
5% 5%
including mainly quartz, apatite, calcite and magnetite
ucts (63.3 to 68.0%), but required multiple passes on the small roll crusher at increasingly narrower adjustments. This shortcoming might be corrected in plant operation by using the novel high pressure grinding rolls marketed by KHD Humbold Wedag and Krupp Polysius. The roller presses have a higher ratio of size reduction than the conventional grinding rolls and, when compared to other comminution technology (e.g., rod or ball mill) for the tertiary grinding, they are cheaper both in capital and operating costs (Dolezil and Reznicek, 1990). The Barmac Retopactor has recently also been recommended to separate garnets from ore (Parekh et al., 1990). Because of differences in the mineralogy of the ore samples, their separate beneficiation might be advantageous for optimizing the processing conditions (particularly magnetic separation) and for specific composition
concentrate is calculated at 96.8 per cent. For higher capacity, efficiency and lower operation costs in plant operation, the use of the novel large diameter magnetic drum, equipped with super-strength neodymium-boron-iron permanent magnets, is recommended for garnet upgrading and should be tested in this respect.
ACKNOWLEDGMENTS Mineralogy work was performed by J.M.D. Wilson,
Core Technologies & Services laboratory, CANMET, Energy, Mines and Resources Canada, Ottawa, Ontario, K1A0G1.
TABLE 10 CONTENT OF MAGNETITE AND CALCITE IN Wl AND W3 SAMPLES
Technique Products Weight %
Wl W3
I - Hand magnet II-HCl(4%)leach
Magnetite Soluble matter*
0.25 0.88
0.025 1.30
*Mainly calcite, but other species might also be solubilized.
Conference Proceedings 141
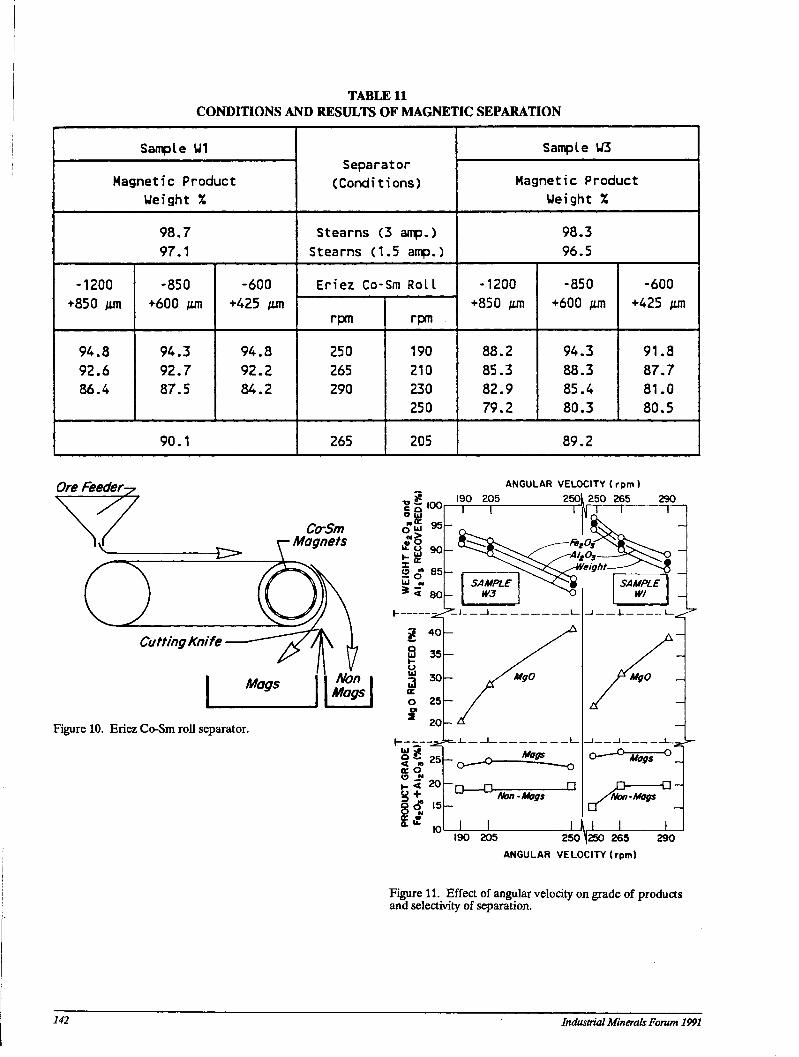
TABLE 11 CONDITIONS AND RESULTS OF MAGNETIC SEPARATION
Sample U1 Sample U3
Magnetic Product I Weight X
Separator (Conditions) Magnetic Product
Ueight X
98.7 97.1
Steams (3 amp.) Steams (1.5 amp.)
98.3 96.5
-1200 +850 jim
-850 +600 iim
-600 +425 /un
Eriez Co-Sm Roll -1200 +850 urn
-850 +600 nm
-600 +425 m
-1200 +850 jim
-850 +600 iim
-600 +425 /un
rpm rpm -1200
+850 urn -850
+600 nm -600
+425 m
94.8 92.6 86.4
94.3 92.7 87.5
94.8 92.2 84.2
250 265 290
190 210 230 250
88.2 85.3 82.9 79.2
94.3 88.3 85.4 80.3
91.8 87.7 81.0 80.5
90/1 265 205 89^2
Ore Feeder ^ l l O O r o p
ANGULAR VELOCITY ( rpm ) I90 205 250k 250 265 290
Figure 10. Eriez Co-Sm roll separator.
190 205 250^250 265 290 ANGULAR VELOCITY (rpm)
Figure 11. Effect of angular velocity on grade of products and selectivity of separation.
142 Industrial Minerals Forum 1991
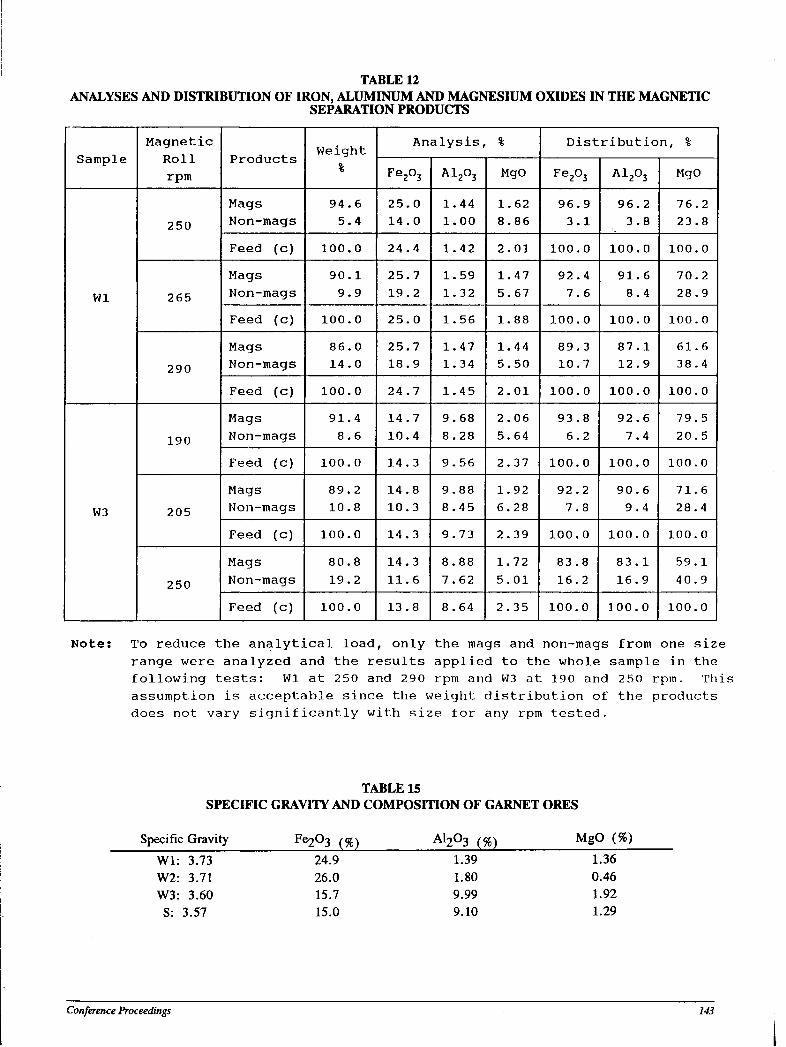
TABLE 12 ANALYSES AND DISTRIBUTION OF IRON, ALUMINUM AND MAGNESIUM OXIDES IN THE MAGNETIC
SEPARATION PRODUCTS
Sample Magnetic
Roll rpm
Products Weight %
Analysis, % Distribution, % Sample
Magnetic Roll rpm
Products Weight % Fe203 A1203 MgO Fe203 A1203 MgO
Wl
250 Mags Non-mags
94.6 5.4
25.0 14.0
1.44 1.00
1.62 8.86
96.9 3.1
96.2 3.8
76.2 23.8
Wl
250 Feed (c) 100.0 24.4 1.42 2.01 100.0 100.0 100.0
Wl 265 Mags Non-mags
90.1 9.9
25.7 19.2
1.59 1.32
1.47 5.67
92.4 7.6
91.6 8.4
70.2 28.9 Wl 265
Feed (c) 100.0 25.0 1.56 1.88 100.0 100.0 100.0 Wl
290 Mags Non-mags
86.0 14.0
25.7 18.9
1.47 1.34
1.44 5.50
89.3 10.7
87.1 12.9
61.6 38.4
Wl
290 Feed (c) 100.0 24.7 1.45 2.01 100.0 100.0 100.0
W3
190 Mags Non-mags
91.4 8.6
14.7 10.4
9.68 8.28
2.06 5.64
93.8 6.2
92.6 7.4
79.5 20.5
W3
190 Feed (c) 100.0 14.3 9.56 2.37 100.0 100.0 100.0
W3 205 Mags Non-mags
89.2 10.8
14.8 10.3
9.88 8.45
1.92 6.28
92.2 7.8
90.6 9.4
71.6 28.4 W3 205
Feed (c) 100.0 14.3 9.73 2.39 100.0 100.0 100.0 W3
250 Mags Non-mags
80.8 19.2
14.3 11.6
8.88 7.62
1.72 5.01
83.8 16.2
83.1 16.9
59.1 40.9
W3
250 Feed (c) 100.0 13.8 8.64 2.35 100.0 100.0 100.0
Note: To reduce the analytical load, only the mags and non-mags from one size range were analyzed and the results applied to the whole sample in the following tests: Wl at 250 and 290 rpm and W3 at 190 and 250 rpm. This assumption is acceptable since the weight distribution of the products does not vary significantly with size for any rpm tested.
TABLE 15 SPECIFIC GRAVITY AND COMPOSITION OF GARNET ORES
Specific Gravity ^ ^ ^ 3 (%) AI2O3 (%) MgO (%) Wl: 3.73 24.9 1.39 1.36 W2: 3.71 26.0 1.80 0.46 W3: 3.60 15.7 9.99 1.92
S: 3.57 15.0 9.10 1.29
Conference Proceedings 143
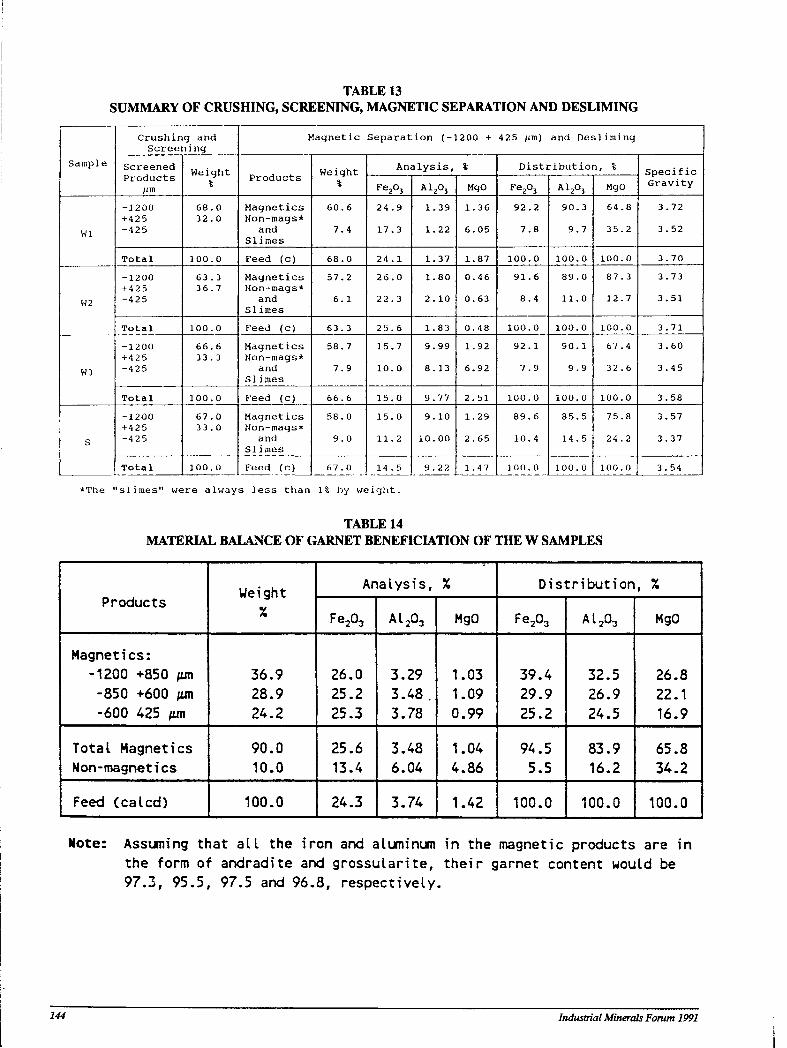
TABLE 13 SUMMARY OF CRUSHING, SCREENING, MAGNETIC SEPARATION AND DESLIMING
S a m p l e
C r u s h i n g a n d S c r e e n i n g
M a g n e t i c S e p a r a t i o n ( -1200 + 425 ^m) and D e s l i m i n g
S a m p l e S c r e e n e d P r o d u c t s
urn
W e i g h t % P r o d u c t s Weight
% A n a l y s i s , % D i s t r i b u t i o n , % S p e c i f i c
G r a v i t y
S a m p l e S c r e e n e d P r o d u c t s
urn
W e i g h t % P r o d u c t s Weight
% F e 2 0 3 A1 2 0 3 MgO F e 2 0 3 A1 2 0 3 MgO S p e c i f i c G r a v i t y
Wl
- 1 2 0 0 + 4 2 5 - 4 2 5
6 8 . 0 3 2 . 0
M a g n e t i c s Non-mags*
and S l i m e s
6 0 . 6
7 . 4
2 4 . 9
1 7 . 3
1 . 3 9
1 . 2 2
1 . 3 6
6 . 0 5
9 2 . 2
7 . 8
9 0 . 3
9 . 7
6 4 . 8
3 5 . 2
3 . 7 2
3 . 5 2 Wl
T o t a l 1 0 0 . 0 Feed (c) 6 8 . 0 2 4 . 1 1 . 3 7 1 . 8 7 1 0 0 . 0 1 0 0 . 0 1 0 0 . 0 3 . 7 0
W2
- 1 2 0 0 + 4 2 5 - 4 2 5
6 3 . 3 3 6 . 7
M a g n e t i c s Non-mags*
and S l i m e s
5 7 . 2
6 . 1
2 6 . 0
2 2 . 3
1 . 8 0
2 . 1 0
0 . 4 6
0 . 6 3
9 1 . 6
8 . 4
8 9 . 0
1 1 . 0
8 7 . 3
1 2 . 7
3 . 7 3
3 . 5 1 W2
T o t a l 100 . 0 Feed (c) 6 3 . 3 2 5 . 6 1 . 8 3 0 . 4 8 1 0 0 . 0 1 0 0 . 0 1 0 0 . 0 3 . 7 1
W3
- 1 2 0 0 + 4 2 5 - 4 2 5
6 6 . 6 3 3 . 3
M a g n e t i c s Non-mags*
and S l i m e s
5 8 . 7
7 . 9
1 5 . 7
1 0 . 0
9 . 9 9
8 . 1 3
1 . 9 2
6 . 9 2
9 2 . 1
7 . 9
9 0 . 1
9 . 9
6 7 . 4
3 2 . 6
3 . 6 0
3 . 4 5 W3
T o t a l 1 0 0 . 0 Feed (c) 6 6 . 6 1 5 . 0 9 . 7 7 2 . 5 1 1 0 0 . 0 1 0 0 . 0 1 0 0 . 0 3 . 5 8
S
- 1 2 00 + 4 2 5 - 4 2 5
6 7 . 0 3 3 . 0
M a g n e t i c s Non-mags*
and S l i m e s
5 8 . 0
9 . 0
1 5 . 0
1 1 . 2
9 . 1 0
1 0 . 0 0
1 . 2 9
2 . 6 5
8 9 . 6
1 0 . 4
8 5 . 5
1 4 . 5
7 5 . 8
2 4 . 2
3 . 5 7
3 . 3 7 S
T o t a l 1 0 0 . 0 Feed (c) 6 7 . 0 14 . 5 9 . 2 2 1 . 4 7 1 0 0 . 0 1 0 0 . 0 1 0 0 . 0 3 . 5 4 1
*The "slimes" were always less than 1% by weight.
TABLE 14 MATERIAL BALANCE OF GARNET BENEFICIATION OF THE W SAMPLES
Products Weight %
Analysis, % Distribution, % Products Weight
% Fe203 Al203 MgO Fe203 Al203 MgO
Magnetics: -1200 +850 /un
-850 +600 /un I -600 425 /un
36.9 28.9 24.2
26.0 25.2 25.3
3.29 3.48 . 3.78
1.03 1.09 0.99
39.4 29.9 25.2
32.5 26.9 24.5
26.8 22.1 16.9 |
Total Magnetics Non-magnetics
90.0 10.0
25.6 13.4
3.48 6.04
1.04 4.86
94.5 5.5
83.9 16.2
65.8 34.2 I
Feed (catcd) 100.0 | 24.3 3.74 1.42 100.0 100.0 100.0
Note: Assuming that all the iron and aluminum in the magnetic products are in the form of andradite and grossularite, their garnet content would be 97.3, 95,5, 97.5 and 96.8, respectively.
144 Industrial Minerals Forum 1991
REFERENCES Dolezil, M. and Reznicek, J. (1990): Mineral Processing
1989 - Trends and Development; International Mining.
Grond, H.C. and Wolfe, R. (1990): Geological and Diamond Drilling Report on the Crystal Peak Garnet Property, Osoyoos Mining Division, Southern, B.C., unpublished report for Polestar Resources Ltd.
Keep, M. (1990): Garnet Electron Microprobe Analyses from the Mt. Riordan Property, Apex Alpine, British Columbia; Appendix I in Crystal Peak Garnet Corporation Information Package.
Parekh, B.K. et al. (1990): Industry Newwatch - Concentration; Mining Engineering; Volume 42, Number 6, pages 542 to 543.
Ray, G.E. and Dawson, G.L. (1988): Geology and Mineral Occurrences in the Hedley Gold Camp; B.C. Ministry of Energy, Mines and Petroleum Resources, Open File Map 1988-6.
Ray, G.E., Dawson, G.L. and Simpson, R. (1988): Geology, Geochemistry and Metallogenic Zoning in the Hedley Gold-skarn Camp; B.C. Ministry of Energy, Mines and Petroleum Resources, Fieldwork Paper 1988-1, pages 59 to 80.
Conference Proceedings 145

246 Industrial Minerals Forum 1991
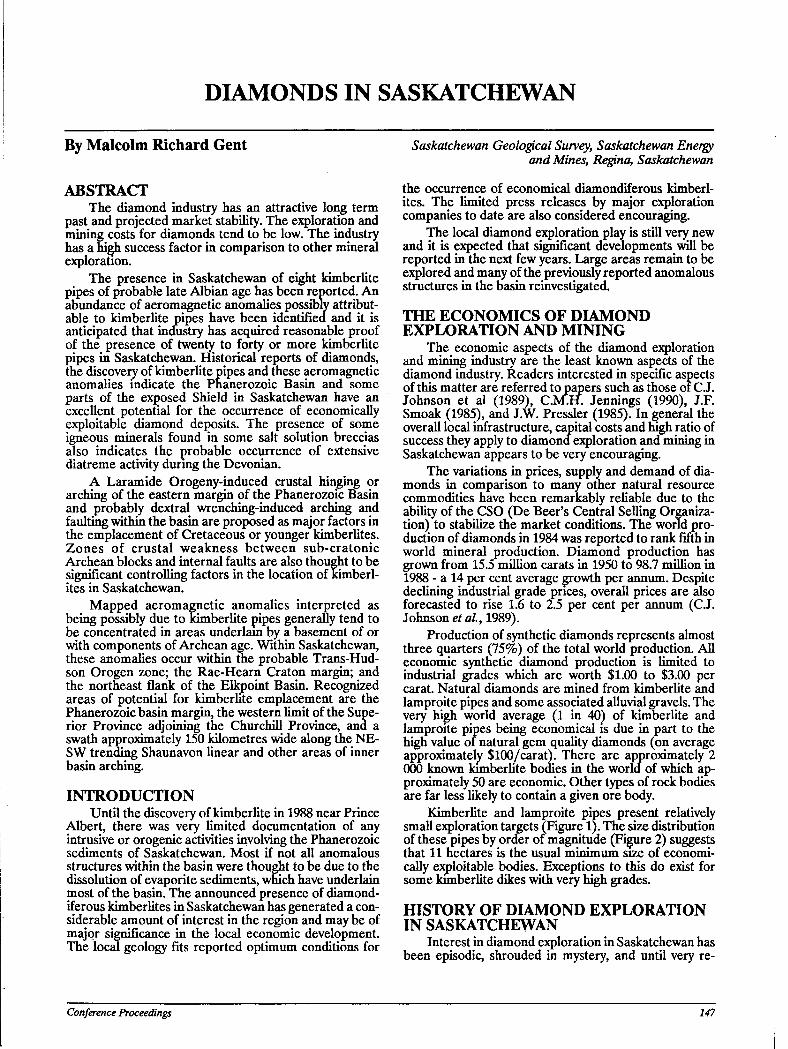
DIAMONDS IN SASKATCHEWAN
By Malcolm Richard Gent
ABSTRACT The diamond industry has an attractive long term
past and projected market stability. The exploration and mining costs for diamonds tend to be low. The industry has a high success factor in comparison to other mineral exploration.
The presence in Saskatchewan of eight kimberlite pipes of probable late Albian age has been reported. An abundance of aeromagnetic anomalies possibly attributable to kimberlite pipes have been identified and it is anticipated that industry has acquired reasonable proof of the presence of twenty to forty or more kimberlite pipes in Saskatchewan. Historical reports of diamonds, the discovery of kimberlite pipes and these aeromagnetic anomalies indicate the Phanerozoic Basin and some parts of the exposed Shield in Saskatchewan have an excellent potential for the occurrence of economically exploitable diamond deposits. The presence of some igneous minerals found in some salt solution breccias also indicates the probable occurrence of extensive diatreme activity durmg the Devonian.
A Laramide Orogeny-induced crustal hinging or arching of the eastern margin of the Phanerozoic Basin and probably dextral wrenching-induced arching and faulting within the basin are proposed as major factors in the emplacement of Cretaceous or younger kimberhtes. Zones of crustal weakness between sub-cratonic Archean blocks and internal faults are also thought to be significant controlling factors in the location of Jkimberl-ites in Saskatchewan.
Mapped aeromagnetic anomalies interpreted as being possibly due to kimberlite pipes generally tend to be concentrated in areas underlain by a basement of or with components of Archean age. Within Saskatchewan, these anomalies occur within the probable Trans-Hudson Orogen zone; the Rae-Hearn Craton margin; and the northeast flank of the Elkpoint Basin. Recognized areas of potential for kimberlite emplacement are the Phanerozoic basin margin, the western limit of the Superior Province adjoining the Churchill Province, and a swath approximately 150 kilometres wide along the NE-SW trending Shaunavon linear and other areas of inner basin arching.
INTRODUCTION Until the discovery of kimberlite in 1988 near Prince
Albert, there was very limited documentation of any intrusive or orogenic activities involving the Phanerozoic sediments of Saskatchewan. Most if not all anomalous structures within the basin were thought to be due to the dissolution of evaporite sediments, which have underlain most of the basin. The announced presence of diamond-iferous kimberhtes in Saskatchewan has generated a considerable amount of interest in the region and maybe of major significance in the local economic development. The local geology fits reported optimum conditions for
Saskatchewan Geological Survey, Saskatchewan Energy and Mines, Regina, Saskatchewan
the occurrence of economical diamondiferous kimberl-ites. The limited press releases by major exploration companies to date are also considered encouraging.
The local diamond exploration play is still very new and it is expected that significant developments will be reported in the next few years. Large areas remain to be explored and many of the previously reported anomalous structures in the basin reinvestigated.
THE ECONOMICS OF DIAMOND EXPLORATION AND MINING
The economic aspects of the diamond exploration and mining industry are the least known aspects of the diamond industry. Readers interested in specific aspects of this matter are referred to papers such as those of C J. Johnson et al (1989), C.M.H. Jennings (1990), J.F. Smoak (1985), and J.W. Pressler (1985). In general the overall local infrastructure, capital costs and high ratio of success they apply to diamond exploration and mining in Saskatchewan appears to be very encouraging.
The variations in prices, supply and demand of diamonds in comparison to many other natural resource commodities have been remarkably reliable due to the ability of the CSO (De Beer's Central Selling Organization) to stabilize the market conditions. The world production of diamonds in 1984 was reported to rank fifth in world mineral production. Diamond production has grown from 15.5 million carats in 1950 to 98.7 million in 1988 - a 14 per cent average growth per annum. Despite declining industrial grade prices, overall prices are also forecasted to rise 1.6 to 2.5 per cent per annum (C.J. Johnson etal, 1989).
Production of synthetic diamonds represents almost three quarters (75%) of the total world production. All economic synthetic diamond production is limited to industrial grades which are worth $1.00 to $3.00 per carat. Natural diamonds are mined from kimberlite and lamproite pipes and some associated alluvial gravels. The very high world average (1 in 40) of kimberlite and lamproite pipes being economical is due in part to the high value of natural gem quality diamonds (on average approximately $100/carat). There are approximately 2 000 known kimberlite bodies in the world of which approximately 50 are economic. Other types of rock bodies are far less likely to contain a given ore body.
Kimberlite and lamproite pipes present relatively small exploration targets (Figure 1). The size distribution of these pipes by order of magnitude (Figure 2) suggests that 11 hectares is the usual minimum size of economically exploitable bodies. Exceptions to this do exist for some kimberlite dikes with very high grades.
HISTORY OF DIAMOND EXPLORATION IN SASKATCHEWAN
Interest in diamond exploration in Saskatchewan has been episodic, shrouded in mystery, and until very re-
Conference Proceedings 147
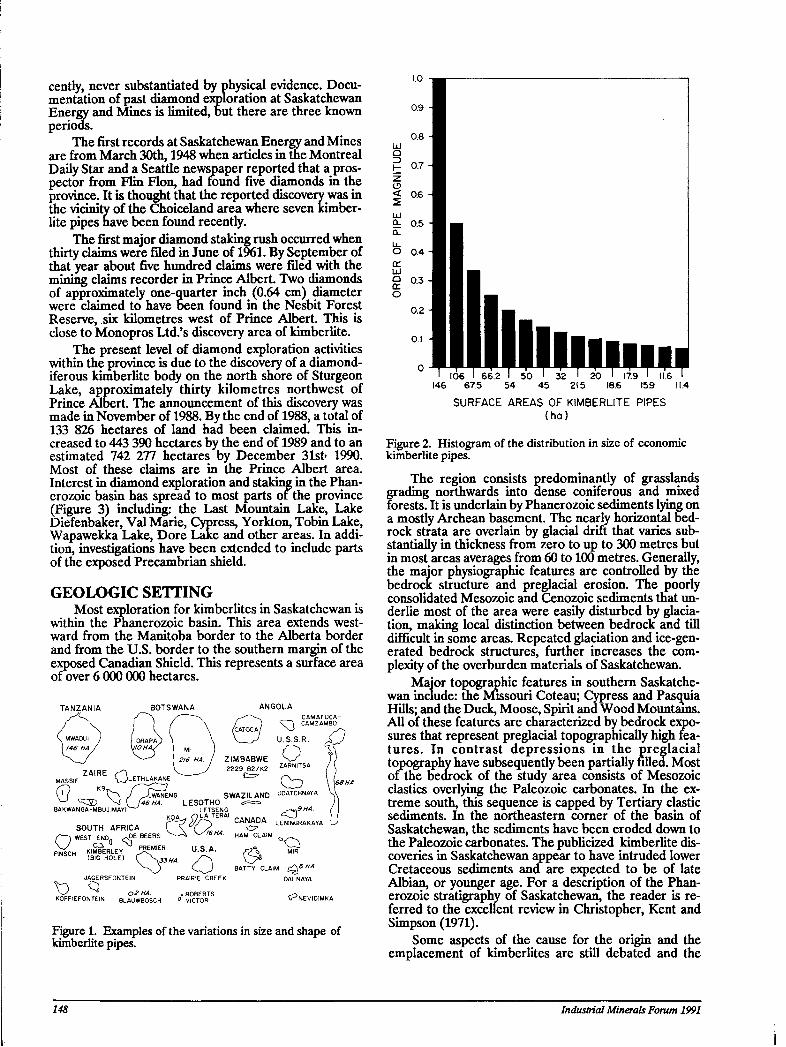
cently, never substantiated by physical evidence. Documentation of past diamond exploration at Saskatchewan Energy and Mines is limited, but there are three known periods.
The first records at Saskatchewan Energy and Mines are from March 30th, 1948 when articles in the Montreal Daily Star and a Seattle newspaper reported that a prospector from Flin Flon, had found five diamonds in the province. It is thought that the reported discovery was in the vicinity of the Choiceland area where seven kimberlite pipes have been found recently.
The first major diamond staking rush occurred when thirty claims were filed in June of 1961. By September of that year about five hundred claims were filed with the mining claims recorder in Prince Albert. Two diamonds of approximately one-quarter inch (0.64 cm) diameter were claimed to have been found in the Nesbit Forest Reserve, six kilometres west of Prince Albert. This is close to Monopros Ltd.'s discovery area of kimberlite.
The present level of diamond exploration activities within the province is due to the discovery of a diamond-iferous kimberlite body on the north shore of Sturgeon Lake, approximately thirty kilometres northwest of Prince Albert. The announcement of this discovery was made in November of 1988. By the end of 1988, a total of 133 826 hectares of land had been claimed. This increased to 443 390 hectares by the end of 1989 and to an estimated 742 277 hectares by December 31st» 1990. Most of these claims are in the Prince Albert area. Interest in diamond exploration and staking in the Phan-erozoic basin has spread to most parts of the province (Figure 3) including: the Last Mountain Lake, Lake Diefenbaker, Val Marie, Cypress, Yorkton, Tobin Lake, Wapawekka Lake, Dore Lake and other areas. In addition, investigations have been extended to include parts of the exposed Precambrian shield.
GEOLOGIC SETTING Most exploration for kimberlites in Saskatchewan is
within the Phanerozoic basin. This area extends westward from the Manitoba border to the Alberta border and from the U.S. border to the southern margin of the exposed Canadian Shield. This represents a surface area of over 6 000 000 hectares.
TANZANIA BOTSWANA
^ 3 D BAKWANGA-MBUJIMAYI
'^/3rN
ANGOLA
/CATOCA/ V fJ U.S.S.R.
ZIMBABWE o
2229 B2/K2 ZARNITSA
SWAZILAND UOATCHNAYA
CAMAFUCA-CAMZAMBO
'JWANENG ( [46 HA. LESOTHO ' ^ LETSENG s ^
KQ. OLATERA. C A N A D A ^J
SOUTH AFRICA C \a(y>UJt O p ) WEST ENO0 <NOE BEERS ^ ^ ^ \Sf6HA. HAM CLAIM Q
RNSCH K S E R L E Y ^ M ' E R U.S.A. #% W R N S C H (BIG HOLE) ( X ^ . / ^ \5>8
^ ^ J ) C ^ J BATTY CLAIM (Q6 HA-DALNAYA
<>H
Figure 1. Examples of the variations in size and shape of kimberlite pipes.
JAGERSFONTEIN PRAIRIE CRE
t) S o2HA . ROBERTS KOFFIEFONTEIN BLAUWBOSCH 0 VICTOR
18.6 159 11.4 146 6 7 5 54 4 5 21.5
SURFACE AREAS OF KIMBERLITE PIPES (ha)
Figure 2. Histogram of the distribution in size of economic kimberlite pipes.
The region consists predominantly of grasslands grading northwards into dense coniferous and mixed forests. It is underlain by Phanerozoic sediments lying on a mostly Archean basement. The nearly horizontal bedrock strata are overlain by glacial drift that varies substantially in thickness from zero to up to 300 metres but in most areas averages from 60 to 100 metres. Generally, the major physiographic features are controlled by the bedrock structure and preglacial erosion. The poorly consolidated Mesozoic and Cenozoic sediments that underlie most of the area were easily disturbed by glaciation, making local distinction between bedrock and till difficult in some areas. Repeated glaciation and ice-generated bedrock structures, further increases the complexity of the overburden materials of Saskatchewan.
Major topographic features in southern Saskatchewan include: the Missouri Coteau; Cypress and Pasquia Hills; and the Duck, Moose, Spirit and Wood Mountains. All of these features are characterized by bedrock exposures that represent preglacial topographically high features. In contrast depressions in the preglacial topography have subsequently been partially filled. Most or the bedrock of the study area consists of Mesozoic elastics overlying the Paleozoic carbonates. In the extreme south, this sequence is capped by Tertiary clastic sediments. In the northeastern corner of the basin of Saskatchewan, the sediments have been eroded down to the Paleozoic carbonates. The publicized kimberlite discoveries in Saskatchewan appear to have intruded lower Cretaceous sediments and are expected to be of late Albian, or younger age. For a description of the Phanerozoic stratigraphy of Saskatchewan, the reader is referred to the excellent review in Christopher, Kent and Simpson (1971).
Some aspects of the cause for the origin and the emplacement of kimberlites are still debated and the
148 Industrial Minerals Forum 1991
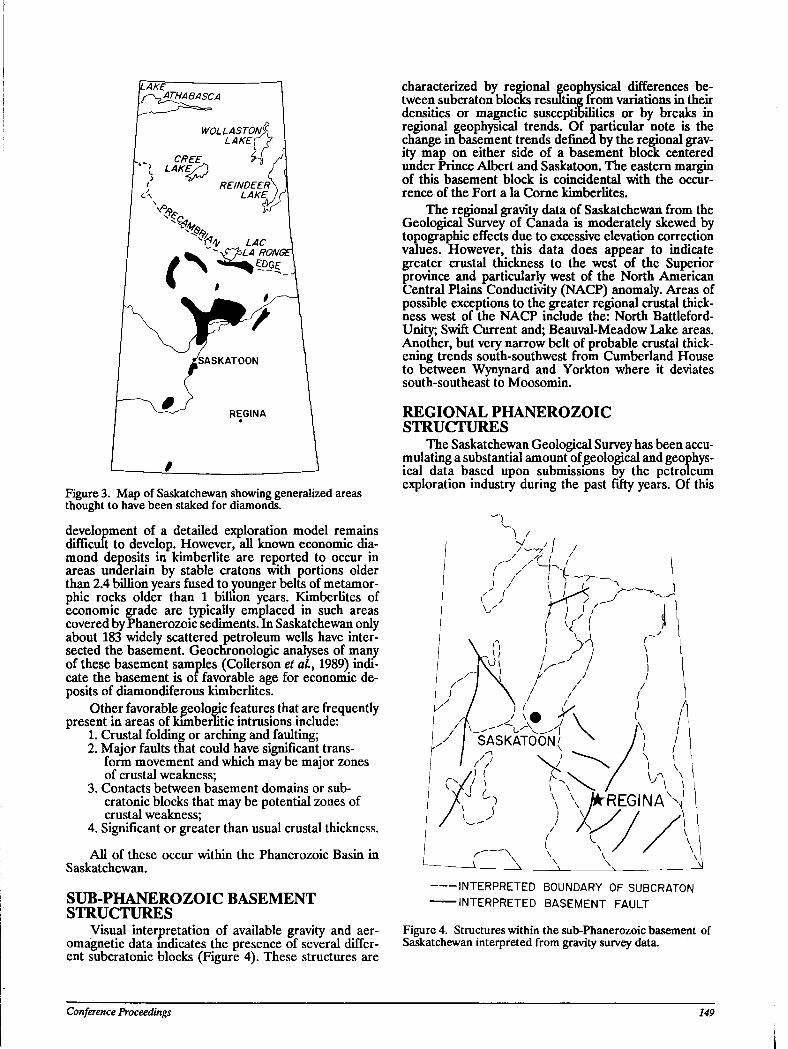
Figure 3. Map of Saskatchewan showing generalized areas thought to have been staked for diamonds.
development of a detailed exploration model remains difficult to develop. However, all known economic diamond deposits in kimberlite are reported to occur in areas underlain by stable cratons with portions older than 2.4 billion years fused to younger belts of metamor-phic rocks older than 1 billion years. Kimberlites of economic grade are typically emplaced in such areas covered by Phanerozoic sediments. In Saskatchewan only about 183 widely scattered petroleum wells have intersected the basement. Geochronologic analyses of many of these basement samples (Collerson et al, 1989) indicate the basement is of favorable age for economic deposits of diamondiferous kimberlites.
Other favorable geologic features that are frequently present in areas of kimberfitic intrusions include:
1. Crustal folding or arching and faulting; 2. Major faults that could have significant trans
form movement and which may be major zones of crustal weakness;
3. Contacts between basement domains or sub-cratonic blocks that may be potential zones of crustal weakness;
4. Significant or greater than usual crustal thickness.
All of these occur within the Phanerozoic Basin in Saskatchewan.
SUB-PHANEROZOIC BASEMENT STRUCTURES
Visual interpretation of available gravity and aer-omagnetic data indicates the presence of several different subcratonic blocks (Figure 4). These structures are
characterized by regional geophysical differences between subcraton blocks resulting from variations in their densities or magnetic susceptibilities or by breaks in regional geophysical trends. Of particular note is the change in basement trends defined by the regional gravity map on either side of a basement block centered under Prince Albert and Saskatoon. The eastern margin of this basement block is coincidental with the occurrence of the Fort a la Corne kimberlites.
The regional gravity data of Saskatchewan from the Geological Survey of Canada is moderately skewed by topographic effects due to excessive elevation correction values. However, this data does appear to indicate greater crustal thickness to the west of the Superior province and particularly west of the North American Central Plains Conductivity (NACP) anomaly. Areas of possible exceptions to the greater regional crustal thickness west of the NACP include the: North Battleford-Unity; Swift Current and; Beauval-Meadow Lake areas. Another, but very narrow belt of probable crustal thickening trends south-southwest from Cumberland House to between Wynynard and Yorkton where it deviates south-southeast to Moosomin.
REGIONAL PHANEROZOIC STRUCTURES
The Saskatchewan Geological Survey has been accumulating a substantial amount of geological and geophysical data based upon submissions by the petroleum exploration industry during the past fifty years. Of this
INTERPRETED BOUNDARY OF SUBCRATON INTERPRETED BASEMENT FAULT
Figure 4. Structures within the sub-Phanerozoic basement of Saskatchewan interpreted from gravity survey data.
Conference Proceedings 149
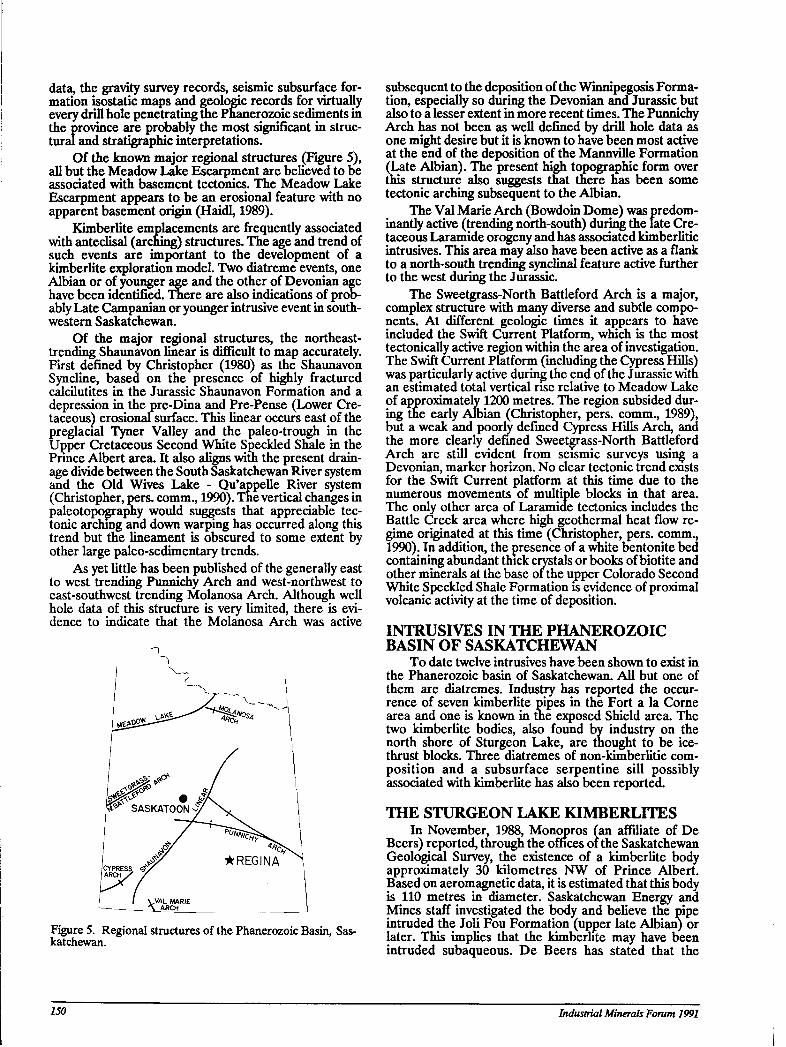
data, the gravity survey records, seismic subsurface formation isostatic maps and geologic records for virtually every drill hole penetrating the Phanerozoic sediments in the province are probably the most significant in structural and stratigraphic interpretations.
Of the known major regional structures ([Figure 5), all but the Meadow Lake Escarpment are believed to be associated with basement tectonics. The Meadow Lake Escarpment appears to be an erosional feature with no apparent basement origin (Haidl, 1989).
Kimberlite emplacements are frequently associated with anteclisal (arching) structures. The age and trend of such events are important to the development of a kimberlite exploration model. Two diatreme events, one Albian or of younger age and the other of Devonian age have been identified. Tnere are also indications of probably Late Campanian or younger intrusive event in southwestern Saskatchewan.
Of the major regional structures, the northeast-trending Shaunavon linear is difficult to map accurately. First defined by Christopher (1980) as the Shaunavon Syncline, based on the presence of highly fractured calcilutites in the Jurassic Shaunavon Formation and a depression in the pre-Dina and Pre-Pense (Lower Cretaceous) erosionafsurface. This linear occurs east of the preglacial Tyner Valley and the paleo-trough in the Upper Cretaceous Second White Speckled Shale in the Prmce Albert area. It also aligns with the present drainage divide between the South Saskatchewan River system and the Old Wives Lake - Qu'appelle River system (Christopher, pers. comm., 1990). The vertical changes in paleotopography would suggests that appreciable tectonic arching and down warping has occurred along this trend but the lineament is obscured to some extent by other large paleo-sedimentary trends.
As yet little has been published of the generally east to west trending Punnichy Arch and west-northwest to east-southwest trending Molanosa Arch. Although well hole data of this structure is very limited, there is evidence to indicate that the Molanosa Arch was active
Figure 5. Regional structures of the Phanerozoic Basin, Saskatchewan.
subsequent to the deposition of the Winnipegosis Formation, especially so during the Devonian and Jurassic but also to a lesser extent in more recent times. The Punnichy Arch has not been as well defined by drill hole data as one might desire but it is known to have been most active at the end of the deposition of the Mannville Formation (Late Albian). The present high topographic form over this structure also suggests that there has been some tectonic arching subsequent to the Albian.
The Val Marie Arch (Bowdoin Dome) was predominantly active (trending north-south) during the late Cretaceous Laramide orogeny and has associated kimberlitic intrusives. This area may also have been active as a flank to a north-south trending synclinal feature active further to the west during the Jurassic.
The Sweetgrass-North Battleford Arch is a major, complex structure with many diverse and subtle components. At different geologic times it appears to have included the Swift Current Platform, which is the most technically active region within the area of investigation. The Swift Current Platform (including the Cypress Hills) was particularly active during the end of the Jurassic witn an estimated total vertical rise relative to Meadow Lake of approximately 1200 metres. The region subsided during the early Albian (Christopher, pers. comm., 1989), but a weak and poorly defined Cypress Hills Arch, and the more clearly defined Sweetgrass-North Battleford Arch are still evident from seismic surveys using a Devonian, marker horizon. No clear tectonic trend exists for the Swift Current platform at this time due to the numerous movements of multiple blocks in that area. The only other area of Laramide tectonics includes the Battle Creek area where high geothermal heat flow regime originated at this time (Christopher, pers. comm., 1990). In addition, the presence of a white bentonite bed containing abundant thick crystals or books of biotite and other minerals at the base or the upper Colorado Second White Speckled Shale Formation is evidence of proximal volcanic activity at the time of deposition.
INTRUSIVES IN THE PHANEROZOIC BASIN OF SASKATCHEWAN
To date twelve intrusives have been shown to exist in the Phanerozoic basin of Saskatchewan. All but one of them are diatremes. Industry has reported the occurrence of seven kimberlite pipes in the Fort a la Corne area and one is known in the exposed Shield area. The two kimberlite bodies, also found by industry on the north shore of Sturgeon Lake, are thought to be ice-thrust blocks. Three diatremes of non-kimberlitic composition and a subsurface serpentine sill possibly associated with kimberlite has also been reported.
THE STURGEON LAKE KIMBERLITES In November, 1988, Monopros (an affiliate of De
Beers) reported, through the offices oi the Saskatchewan Geological Survey, the existence of a kimberlite body approximately 30 kilometres NW of Prince Albert. Based on aeromagnetic data, it is estimated that this body is 110 metres in diameter. Saskatchewan Energy and Mines staff investigated the body and believe the pipe intruded the Joli Fou Formation (upper late Albian) or later. This implies that the kimberlite may have been intruded subaqueous. De Beers has stated that the
150 Industrial Minerals Forum 1991
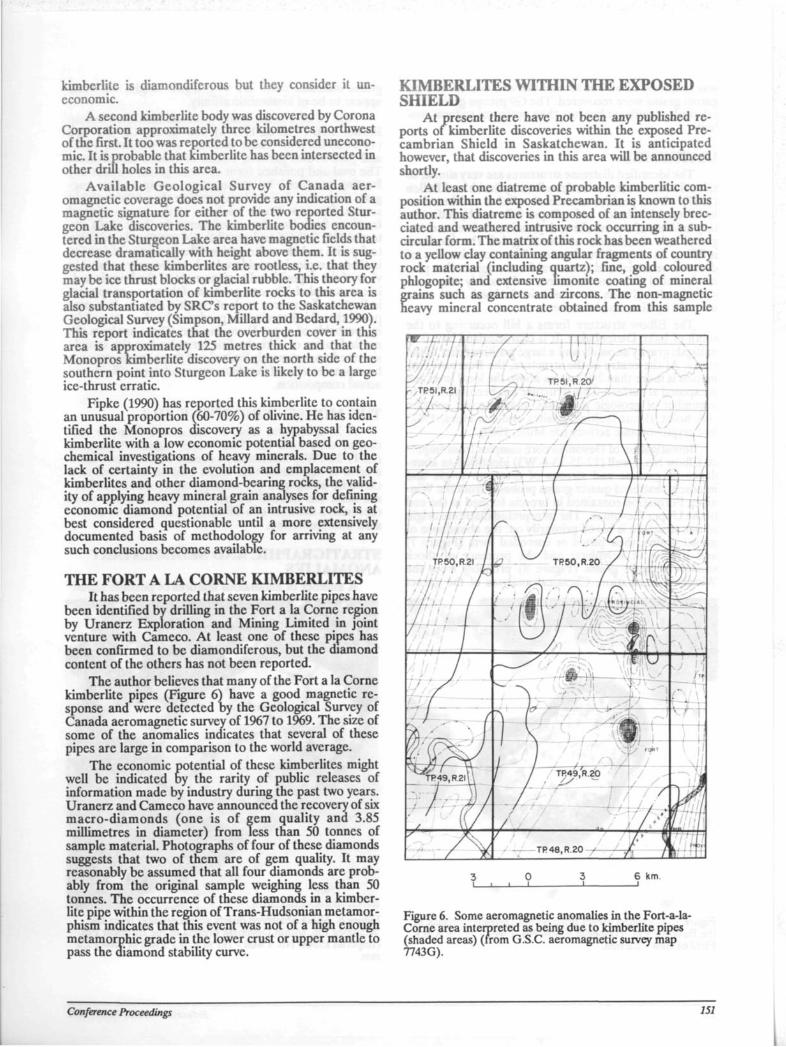
kimberlite is diamondiferous but they consider it uneconomic.
A second kimberlite body was discovered by Corona Corporation approximately three kilometres northwest of the first. It too was reported to be considered uneconomic. It is probable that kimberlite has been intersected in other drill holes in this area.
Available Geological Survey of Canada aer-omagnetic coverage does not provide any indication of a magnetic signature for either of the two reported Sturgeon Lake discoveries. The kimberlite bodies encountered in the Sturgeon Lake area have magnetic fields that decrease dramatically with height above them. It is suggested that these kimberlites are rootless, i.e. that they may be ice thrust blocks or glacial rubble. This theory for glacial transportation of kimberlite rocks to this area is also substantiated by SRC's report to the Saskatchewan Geological Survey (Simpson, Millard and Bedard, 1990). This report indicates that the overburden cover in this area is approximately 125 metres thick and that the Monopros Kimberlite discovery on the north side of the southern point into Sturgeon Lake is likely to be a large ice-thrust erratic.
Fipke (1990) has reported this kimberlite to contain an unusual proportion (60-70%) of olivine. He has identified the Monopros discovery as a hypabyssal facies kimberlite with a low economic potential based on geo-chcmical investigations of heavy minerals. Due to the lack of certainty in the evolution and emplacement of kimberlites and other diamond-bearing rocks, the validity of applying heavy mineral grain analyses for defining economic diamond potential of an intrusive rock, is at best considered questionable until a more extensively documented basis of methodology for arriving at any such conclusions becomes available.
THE FORT A LA CORNE KIMBERLITES It has been reported that seven kimberlite pipes have
been identified by drilling in the Fort a la Come region by Uranerz Exploration and Mining Limited in joint venture with Cameco. At least one of these pipes has been confirmed to be diamondiferous, but the diamond content of the others has not been reported.
The author believes that many of the Fort a la Corne kimberlite pipes (Figure 6) have a good magnetic response and were detected by the Geological Survey of Canada aeromagnetic survey of 1967 to 1969. The size of some of the anomalies indicates that several of these pipes are large in comparison to the world average.
The economic potential of these kimberlites might well be indicated by the rarity of public releases of information made by industry during the past two years. Uranerz and Cameco have announced the recovery of six macro-diamonds (one is of gem quality and 3.85 millimetres in diameter) from less than 50 tonnes of sample material. Photographs of four of these diamonds suggests that two of them are of gem quality. It may reasonably be assumed that all four diamonds are probably from the original sample weighing less than 50 tonnes. The occurrence of these diamonds in a kimberlite pipe within the region of Trans-Hudsonian metamor-phism indicates that this event was not of a high enough metamorphic grade in the lower crust or upper mantle to pass the diamond stability curve.
KIMBERLITES WITHIN THE EXPOSED SHIELD
At present there have not been any published reports of kimberlite discoveries within the exposed Precambrian Shield in Saskatchewan. It is anticipated however, that discoveries in this area will be announced shortly.
At least one diatreme of probable kimberlitic composition within the exposed Precambrian is known to this author. This diatreme is composed of an intensely brec-ciated and weathered intrusive rock occurring in a sub-circular form. The matrix of this rock has been weathered to a yellow clay containing angular fragments of country rock material (including quartz); fine, gold coloured phlogopite; and extensive limonite coating of mineral grains such as garnets and zircons. The non-magnetic heavy mineral concentrate obtained from this sample
Figure 6. Some aeromagnetic anomalies in the Fort-a-la-Corne area interpreted as being due to kimberlite pipes (shaded areas) (from G.S.C. aeromagnetic survey map 7743G).
Conference Proceedings 151
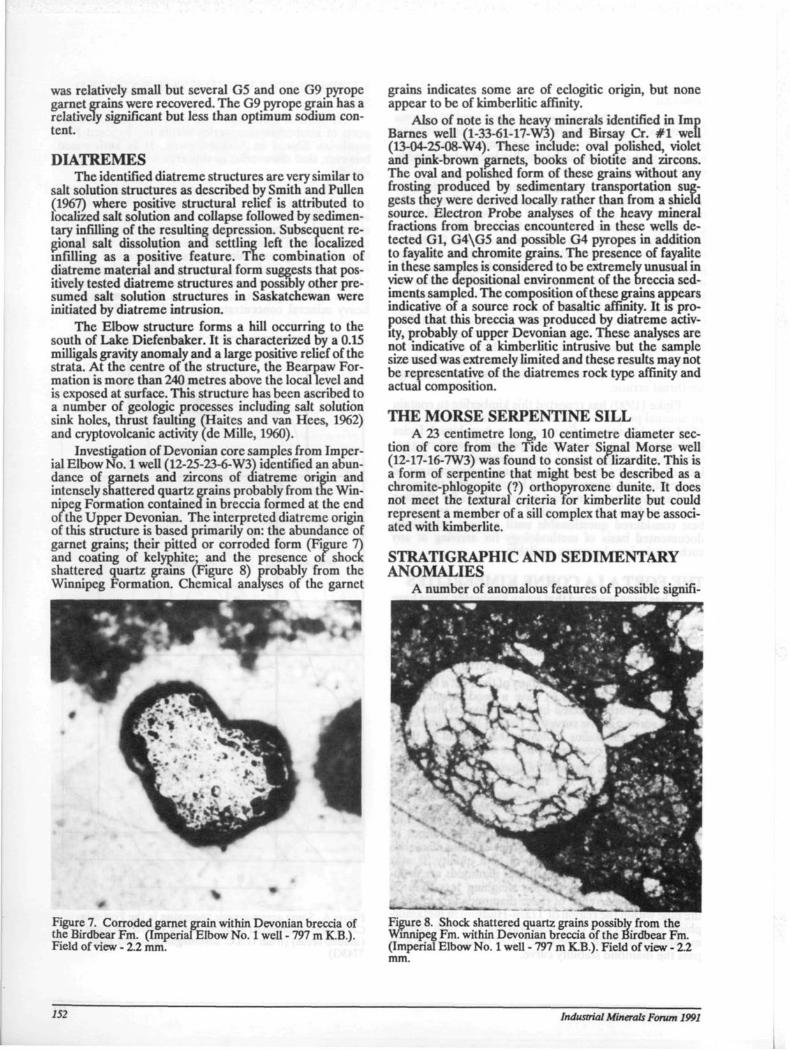
was relatively small but several G5 and one G9 pyrope garnet grains were recovered. The G9 pyrope grain has a relatively significant but less than optimum sodium content.
DIATREMES The identified diatreme structures are very similar to
salt solution structures as described by Smith and Pullen (1967) where positive structural relief is attributed to localized salt solution and collapse followed by sedimentary infilling of the resulting depression. Subsequent regional salt dissolution and settling left the localized infilling as a positive feature. The combination of diatreme material and structural form suggests that positively tested diatreme structures and possibly other presumed salt solution structures in Saskatchewan were initiated by diatreme intrusion.
The Elbow structure forms a hill occurring to the south of Lake Diefenbaker. It is characterized by a 0.15 milligals gravity anomaly and a large positive relief of the strata. At the centre of the structure, the Bearpaw Formation is more than 240 metres above the local level and is exposed at surface. This structure has been ascribed to a number of geologic processes including salt solution sink holes, thrust faulting (Haites and van Hees, 1962) and cryptovolcanic activity (de Mille, 1960).
Investigation of Devonian core samples from Imperial Elbow No. 1 well (12-25-23-6-W3) identified an abundance of garnets and zircons of diatreme origin and intensely shattered quartz grains probably from the Winnipeg Formation contained in breccia formed at the end of the Upper Devonian. The interpreted diatreme origin of this structure is based primarily on: the abundance of garnet grains; their pitted or corroded form (Figure 7) and coating of kelyphite; and the presence of shocic shattered quartz grams (Figure 8) probably from the Winnipeg Formation. Chemical analyses of the garnet
Figure 7. Corroded garnet grain within Devonian breccia of the Birdbear Fm. (Imperial Elbow No. 1 well - 797 m K.B.). Field of view - 2.2 mm.
grains indicates some are of eclogitic origin, but none appear to be of kimberlitic affinity.
Also of note is the heavy minerals identified in Imp Barnes weU (1-33-61-17-W3) and Birsay Cr. # 1 well (13-04-25-08-W4). These include: oval polished, violet and pink-brown garnets, books of biotite and zircons. The oval and polished form of these grains without any frosting produced by sedimentary transportation suggests they were derived locally rather than from a shield source. Electron Probe analyses of the heavy mineral fractions from breccias encountered in these wells detected Gl, G4\G5 and possible G4 pyropes in addition to fayalitc and chromite grains. The presence of fayalite in these samples is considered to be extremely unusual in view of the depositional environment of the breccia sediments sampled. The composition of these grains appears indicative of a source rock of basaltic affinity. It is proposed that this breccia was produced by diatreme activity, probably of upper Devonian age. These analyses are not indicative of a kimberlitic intrusive but the sample size used was extremely limited and these results may not be representative of the diatremes rock type affinity and actual composition.
THE MORSE SERPENTINE SILL A 23 centimetre long, 10 centimetre diameter sec
tion of core from the Tide Water Signal Morse well (12-17-16-7W3) was found to consist of lizardite. This is a form of serpentine that might best be described as a chromite-phlogopite (?) orthopyroxene dunite. It does not meet the textural criteria for kimberlite but could represent a member of a sill complex that may be associated with kimberlite.
STRATIGRAPHIC AND SEDIMENTARY ANOMALIES
A number of anomalous features of possible signifi-
mm.
152 Industrial Minerals Forum 1991
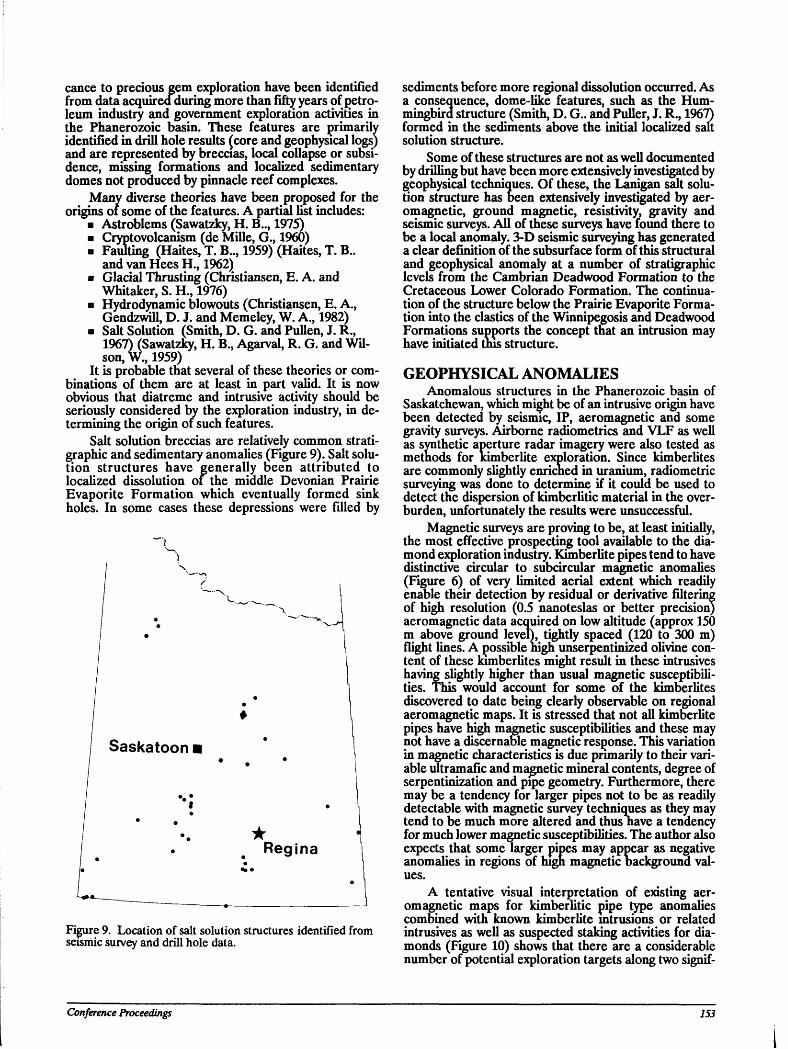
cance to precious gem exploration have been identified from data acquired during more than fifty years of oetro-leum industry and government exploration activities in the Phanerozoic basin. These features are primarily identified in drill hole results (core and geophysical logs) and are represented by breccias, local collapse or subsidence, missing formations and localized sedimentary domes not produced by pinnacle reef complexes.
Many diverse theories have been proposed for the origins of some of the features. A partial list includes:
■ Astroblems (Sawatzky, H. B.., 1975) ■ Cryptovolcanism (de Mille, G., 1960) ■ Faulting (Haites, T. B.., 1959) (Hakes, T. B..
and van Hees H., 1962) ■ Glacial Thrusting (Christiansen, E. A. and
Whitaker, S. H., 1976) ■ Hydrodynamic blowouts (Christiansen, E. A.,
Gendzwill, D. J. and Memeley, W. A., 1982) ■ Salt Solution (Smith, D. G. and Pullen, J. R.,
1967) (Sawatzky, H. B., Agarval, R. G. and Wilson, W., 1959)
It is probable that several of these theories or combinations of them are at least in part valid. It is now obvious that diatreme and intrusive activity should be seriously considered by the exploration industry, in determining the origin of such features.
Salt solution breccias are relatively common strati-graphic and sedimentary anomalies (Figure 9). Salt solution structures have generally been attributed to localized dissolution of the middle Devonian Prairie Evaporite Formation which eventually formed sink holes. In some cases these depressions were filled by
* Regina
Figure 9. Location of salt solution structures identified from seismic survey and drill hole data.
sediments before more regional dissolution occurred. As a consequence, dome-like features, such as the Hummingbird structure (Smith, D. G.. and Puller, J. R., 1967) formed in the sediments above the initial localized salt solution structure.
Some of these structures are not as well documented by drilling but have been more extensively investigated by geophysical techniques. Of these, the Lanigan salt solution structure has been extensively investigated by aeromagnetic, ground magnetic, resistivity, gravity and seismic surveys. All of these surveys have found there to be a local anomaly. 3-D seismic surveying has generated a clear definition of the subsurface form of this structural and geophysical anomaly at a number of stratigraphic levels from the Cambrian Deadwood Formation to the Cretaceous Lower Colorado Formation. The continuation of the structure below the Prairie Evaporite Formation into the elastics of the Winnipegosis and Deadwood Formations supports the concept that an intrusion may have initiated this structure.
GEOPHYSICAL ANOMALIES Anomalous structures in the Phanerozoic basin of
Saskatchewan, which might be of an intrusive origin have been detected by seismic, IP, aeromagnetic and some gravity surveys. Airborne radiometrics and VLF as well as synthetic aperture radar imagery were also tested as methods for kimberlite exploration. Since kimberlites are commonly slightly enriched in uranium, radiometric surveying was done to determine if it could be used to detect the dispersion of kimberlitic material in the overburden, unfortunately the results were unsuccessful.
Magnetic surveys are proving to be, at least initially, the most effective prospecting tool available to the diamond exploration industry. Kimberlite pipes tend to have distinctive circular to subcircular magnetic anomalies (Figure 6) of very limited aerial extent which readily enable their detection by residual or derivative filtering of high resolution (0.5 nanoteslas or better precision) aeromagnetic data acquired on low altitude (approx 150 m above ground level), tightly spaced (120 to 300 m) flight lines. A possible high unserpentinized olivine content of these kimberlites might result in these intrusives having slightly higher than usual magnetic susceptibilities. This would account for some of the kimberlites discovered to date being clearly observable on regional aeromagnetic maps. It is stressed that not all kimberlite pipes have high magnetic susceptibilities and these may not have a discernable magnetic response. This variation in magnetic characteristics is due primarily to their variable ultramafic and magnetic mineral contents, degree of serpentinization and pipe geometry. Furthermore, there may be a tendency for larger pipes not to be as readily detectable with magnetic survey techniques as they may tend to be much more altered and thus nave a tendency for much lower magnetic susceptibilities. The author also expects that some larger pipes may appear as negative anomalies in regions of high magnetic background values.
A tentative visual interpretation of existing aeromagnetic maps for kimberlitic pipe type anomalies combined with known kimberlite intrusions or related intrusives as well as suspected staking activities for diamonds (Figure 10) shows that there are a considerable number of potential exploration targets along two signif-
Conference Proceedings 153
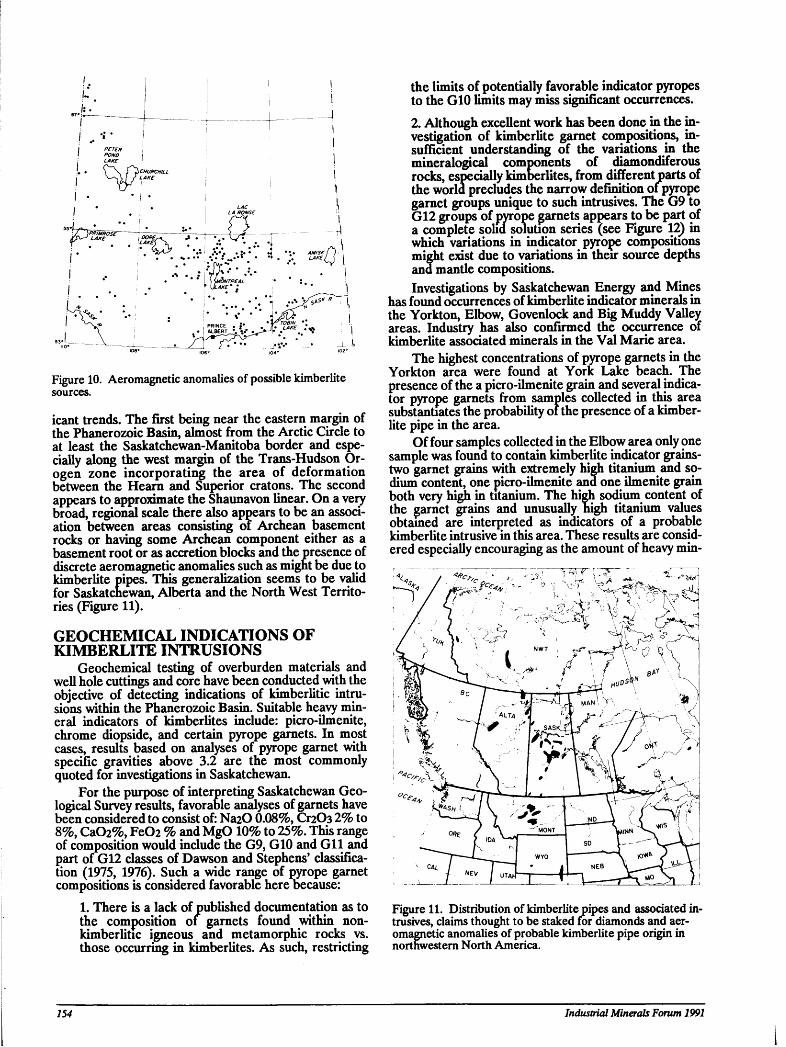
Figure 10. Aeromagnetic anomalies of possible kimberlite sources.
icant trends. The first being near the eastern margin of the Phanerozoic Basin, almost from the Arctic Circle to at least the Saskatchewan-Manitoba border and especially along the west margin of the Trans-Hudson Or-ogen zone incorporating the area of deformation between the Hearn and Superior cratons. The second appears to approximate the Shaunavon linear. On a very broad, regional scale there also appears to be an association between areas consisting of Archean basement rocks or having some Archean component either as a basement root or as accretion blocks and the presence of discrete aeromagnetic anomalies such as might be due to kimberlite pipes. This generalization seems to be valid for Saskatchewan, Alberta and the North West Territories (Figure 11).
GEOCHEMICAL INDICATIONS OF KIMBERLITE INTRUSIONS
Geochemical testing of overburden materials and well hole cuttings and core have been conducted with the objective of detecting indications of kimberlitic intrusions within the Phanerozoic Basin. Suitable heavy mineral indicators of kimberlites include: picro-ilmenite, chrome diopside, and certain pyrope garnets. In most cases, results based on analyses of pyrope garnet with specific gravities above 3.2 are the most commonly quoted for investigations in Saskatchewan.
For the purpose of interpreting Saskatchewan Geological Survey results, favorable analyses of garnets have been considered to consist of: Na20 0.08%, O2O3 2% to 8%, Ca02%, Fe02 % and MgO 10% to 25%. This range of composition would include the G9, G10 and Gil and part of G12 classes of Dawson and Stephens' classification (1975, 1976). Such a wide range of pyrope garnet compositions is considered favorable here because:
1. There is a lack of published documentation as to the composition 01 garnets found within non-kimberlitic igneous and metamorphic rocks vs. those occurring in kimberlites. As such, restricting
154
the limits of potentially favorable indicator pyropes to the G10 limits may miss significant occurrences. 2. Although excellent work has been done in the investigation of kimberlite garnet compositions, insufficient understanding of the variations in the mineralogical components of diamondiferous rocks, especially kimberlites, from different parts of the world precludes the narrow definition of pyrope garnet groups unique to such intrusives. The G9 to G12 groups of pyrope garnets appears to be part of a complete solid solution series (see Figure 12) in which variations in indicator pyrope compositions might exist due to variations in then* source depths ana mantle compositions. Investigations by Saskatchewan Energy and Mines
has found occurrences of kimberlite indicator minerals in the Yorkton, Elbow, Govenlock and Big Muddy Valley areas. Industry has also confirmed the occurrence of kimberlite associated minerals in the Val Marie area.
The highest concentrations of pyrope garnets in the Yorkton area were found at York Lake beach. The presence of the a picro-ilmenite grain and several indicator pyrope garnets from samples collected in this area substantiates the probability of the presence of a kimberlite pipe in the area.
Of four samples collected in the Elbow area only one sample was found to contain kimberlite indicator grains-two garnet grains with extremely high titanium and sodium content, one picro-ilmenite and one ihnenite grain both very high in titanium. The high sodium content of the garnet grains and unusually high titanium values obtained are interpreted as indicators of a probable kimberlite intrusive in this area. These results are considered especially encouraging as the amount of heavy min-
Figure 11. Distribution of kimberlite pipes and associated intrusives, claims thought to be staked for diamonds and aeromagnetic anomalies of probable kimberlite pipe origin in northwestern North America.
Industrial Minerals Forum 1991
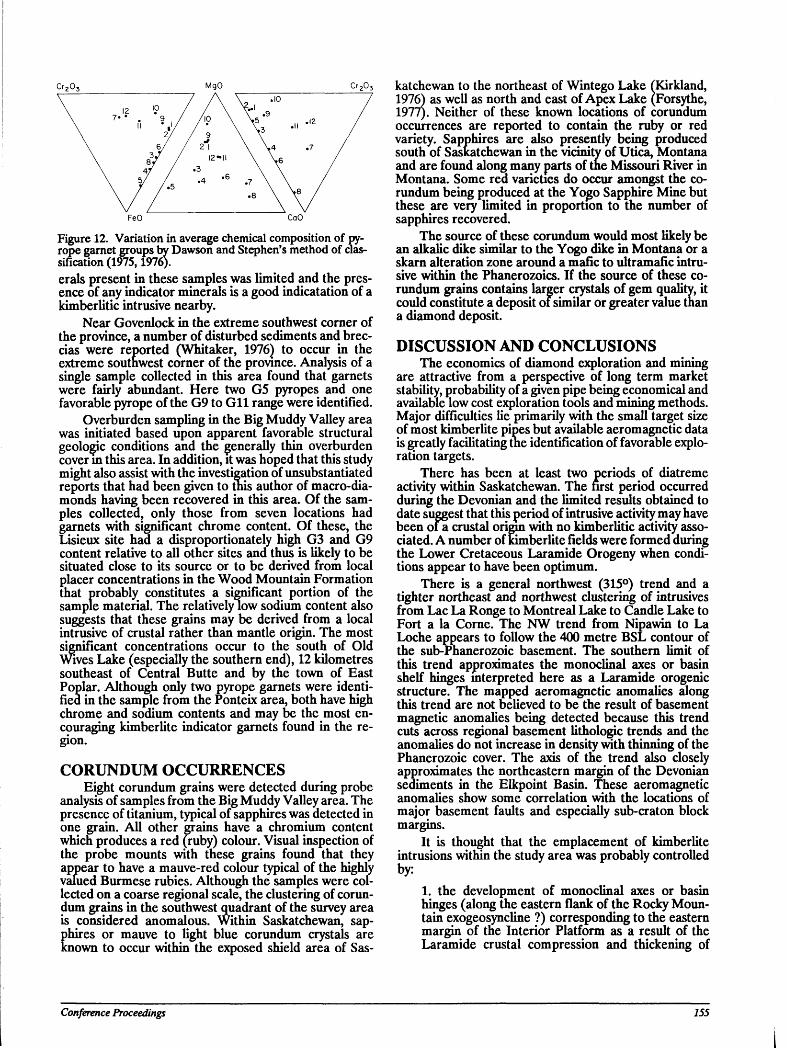
Cr203 MgO Cr2Q3
FeO CaO
Figure 12. Variation in average chemical composition of py-rope garnet groups by Dawson and Stephen's method of classification (1975,1976). erals present in these samples was limited and the presence of any indicator minerals is a good indicatation of a kimberlitic intrusive nearby.
Near Govenlock in the extreme southwest corner of the province, a number of disturbed sediments and breccias were reported (Whitaker, 1976) to occur in the extreme southwest corner of the province. Analysis of a single sample collected in this area found that garnets were fairly abundant. Here two G5 pyropes and one favorable pyrope of the G9 to G i l range were identified.
Overburden sampling in the Big Muddy Valley area was initiated based upon apparent favorable structural geologic conditions and the generally thin overburden cover m this area. In addition, it was hoped that this study might also assist with the investigation of unsubstantiated reports that had been given to this author of macro-diamonds having been recovered in this area. Of the samples collected, only those from seven locations had garnets with significant chrome content. Of these, the Lisieux site had a disproportionately high G3 and G9 content relative to all other sites and thus is likely to be situated close to its source or to be derived from local placer concentrations in the Wood Mountain Formation that probably constitutes a significant portion of the sample material. The relatively low sodium content also suggests that these grains may be derived from a local intrusive of crustal rather than mantle origin. The most significant concentrations occur to the south of Old Wives Lake (especially the southern end), 12 kilometres southeast of Central Butte and by the town of East Poplar. Although only two pyrope garnets were identified in the sample from the Ponteix area, both have high chrome and sodium contents and may be the most encouraging kimberlite indicator garnets found in the region.
CORUNDUM OCCURRENCES Eight corundum grains were detected during probe
analysis of samples from the Big Muddy Valley area. The presence of titanium, typical of sapphires was detected in one grain. All other grains have a chromium content which produces a red (ruby) colour. Visual inspection of the probe mounts with these grains found that they appear to have a mauve-red colour typical of the highly valued Burmese rubies. Although the samples were collected on a coarse regional scale, the clustering of corundum grains in the southwest quadrant of the survey area is considered anomalous. Within Saskatchewan, sap-
hires or mauve to light blue corundum crystals are nown to occur within the exposed shield area of Sas-
Conference Proceedings
katchewan to the northeast of Wintego Lake fKirkland, 1976) as well as north and east of Apex Lake (Forsythe, 1977). Neither of these known locations of corundum occurrences are reported to contain the ruby or red variety. Sapphires are also presently being produced south of Saskatchewan in the vicinity of Utica, Montana and are found along many parts of the Missouri River in Montana. Some red varieties do occur amongst the corundum being produced at the Yogo Sapphire Mine but these are very limited in proportion to the number of sapphires recovered.
The source of these corundum would most likely be an alkalic dike similar to the Yogo dike in Montana or a skarn alteration zone around a mafic to ultramafic intrusive within the Phanerozoics. If the source of these corundum grains contains larger crystals of gem quality, it could constitute a deposit of similar or greater value than a diamond deposit.
DISCUSSION AND CONCLUSIONS The economics of diamond exploration and mining
are attractive from a perspective of long term market stability, probability of a given pipe being economical and available low cost exploration tools and mining methods. Major difficulties lie primarily with the small target size of most kimberlite pipes but available aeromagnetic data is greatly facilitating the identification of favorable exploration targets.
There has been at least two periods of diatreme activity within Saskatchewan. The first period occurred during the Devonian and the limited results obtained to date suggest that this period of intrusive activity may have been ofa crustal origin with no kimberlitic activity associated. A number of kimberlite fields were formed during the Lower Cretaceous Laramide Orogeny when conditions appear to have been optimum.
There is a general northwest (315°) trend and a tighter northeast and northwest clustering of intrusives from Lac La Ronge to Montreal Lake to Candle Lake to Fort a la Corne. The NW trend from Nipawin to La Loche appears to follow the 400 metre BSL contour of the sub-Phanerozoic basement. The southern limit of this trend approximates the monoclinal axes or basin shelf hinges mterpreted here as a Laramide orogenic structure. The mapped aeromagnetic anomalies along this trend are not believed to be the result of basement magnetic anomalies being detected because this trend cuts across regional basement lithologic trends and the anomalies do not increase in density with thinning of the Phanerozoic cover. The axis of the trend also closely approximates the northeastern margin of the Devonian sediments in the Elkpoint Basin. These aeromagnetic anomalies show some correlation with the locations of major basement faults and especially sub-craton block margins.
It is thought that the emplacement of kimberlite intrusions within the study area was probably controlled by:
1. the development of monoclinal axes or basin hinges (along the eastern flank of the Rocky Mountain exogeosyncline ?) corresponding to the eastern margin of the Interior Platform as a result of the Laramide crustal compression and thickening of
155
the western margin of the basin as part of the Eastern Cordilleran Orogen, 2. the development of the proposed northeasterly-trending weak, broad anticlines or anteclises by probably dextral crustal wrenching and faulting to compensate for different crustal stresses along the length of the orogenic zone, 3. the intersection of northeasterly- and northwesterly-trending major weakness in the basement crust at sub-craton block margins. The data available to date suggests that the most
significant trends would include: those areas along the eastern Interior Platform margin; the Churchill-Superior Province boundary; areas of Laramide orogenic crustal arching (the Val Marie arch, the Shaunavon Linear, possibly the Sweetgrass-North Battleford arch as well as other similar small structures; and areas of significant intersections of basement sub-craton blocks and faults structures (including the Kindersley to North Battleford; Muskiki Lake; Last Mountain to Regina to Weyburn and Assiniboia; and Val Marie to Eastend areas).
Of the inner basin structures, very little is known of the occurrence of kimberlites within them. Industry has not publicized any of its results outside of the Sturgeon Lake and Choiceland areas and as such much must be left to speculation. Kimberlites are not known to this author as occurring along the Sweetgrass-North Battleford arch or any of the other anticlines/anteclises mapped with the exception of the Val Marie and those structures bordering the Shaunavon Linear. These latter areas have significant indications of alkalic and kimberlitic intrusive activity. Kimberlite intrusions are known to occur within the U.SA. portion of the Val Marie arch and this author believes that significant investigations of several claims are underway on the Saskatchewan section. The location of proven kimberlites in the Choiceland area and the presence of: the Lanigan anomaly, the lizardite serpentine sill near Morse, the occurrences of inert gases, folding to the south of the Cypress Hills and the kimberlites in Montana appears to support the potential significance of the Shaunavon Linear and its interpreted extension northwards to the Reindeer Lake area. The presence of structures along this trend appears promising but detailed data and especially the discovery of other kimberlites along it are essential to proving its potential.
The possibility of middle to upper Devonian kimberlitic activity is demonstrated by tne presence of diatreme material in the Elbow, Birsay Cr #1 and Imp Barnes structures. Limited heavy mineral chemical data for these diatremes suggests that they are not likely to have a kimberlitic affinity. Could they be associated with Devonian Elkpoint Basin margin tectonics? Spatially their occurrences might suggest so but information is far too limited at this point to derive any effective conclusions or even speculations.
The Phanerozoic Basin of Saskatchewan is a vast region suitable for precious gem exploration. Favorable indicators are wide spread and numerous. Aeromagnetic data coupled with excellent positive indicators demonstrates the potential for an economic diamond deposit. However, considerable efforts and skill will be needed to prove this potential and even more to find a
deposit. Careful evaluation of the regional tectonics, aeromagnetic and gravity data, the glacial sediments, and preglacial topography will be necessary.
ACKNOWLEDGMENTS The assistance of all those who provided informa
tion, advice and help in completing this report are gratefully acknowledged. To list all those who have assisted would try the readers' patience but special mention is due to:
Terry Danyluk of the Potash Corporation of Saskatchewan; and the staff of Saskatchewan Energy and Mines, including Paul Guliov, J. Christopher, C. Harper, C. Gilboy, K. Kreis, B. Troyer, F. Haidl, and D. Paterson.
REFERENCES Christiansen, EA., Gendzwill, D J. and Meneley. WA.
(1982): Howe Lake: a Hydrodynamic Blowout Structure; Canadian Journal of Earth Sciences, Volume 19, pages 1122-1139.
Christiansen, EA. and Whitaker, S.H. (1976): Glacial Thrusting of Drift and Bedrock: in Legget, R.F. (ed.), Glacial Till, Royal Society Canadian Specialists, Publication Number 12, pages 121-130.
Christopher, J.E., Kent, D.M. and Simpson, F. (1971): Hydrocarbon Potential of Saskatchewan; Saskatchewan Department of Mineral Resources, Report 157, 47 pages.
Collerson, K.D. and Lewry, J.F. (1989): Sm-Nd Isotope Systematics of the Buried Basement in Southern Saskatchewan: Implications for Diamond Exploration; Saskatchewan Energy and Mines, Open File.
Collerson, K.D., Lewry, J.F., Van Schmus, R.W. and Bickford, M.E. (1989): Sm-Nd Isotopic Constraints on the Age of the Buried Basement in Central and Southern Saskatchewan: Implications for Diamond Exploration; in Summary of Investigations 1989, Saskatchewan Geological Survey, Miscellaneous Report 89-4, pages 168-171.
Dawson, J.B. (1975): Statistical Classification of Garnets from Kimberlite and Associated Xenoliths; Journal of Geology, Volume 83, pages 589-607.
Dawson, J.B. (1976): Statistical Classification of Garnets from Kimberlite and Associated Xenothys; Journal of Geology, Volume 84, pages 495-496.
De Mille, G. (1960): The Elbow Structure of South-central Saskatchewan; Journal of Alberta Society of Petroleum Geology, Volume 8, Number 5, pages 154-162.
Fipke, C.F. (1990): The Development of Advanced Technology to Distinguish Between Diamondifer-ous and Barren Diatremes; Geological Survey of Canada, Open File 2124,1175 pages.
Forsythe, L.H. (1977): The Geology of the Pylypow Lake Area (west Half), Saskatchewan; Saskatchewan Department of Mineral Resources, Report 173, 35 pages.
Haidl, F.M. (1989): Distribution of Lower Paleozoic Strata in the Vicinity of the Meadow Lake Escarpment, West-central Saskatchewan; in Summary of Investigations 1989, Saskatchewan Geological Survey, Misc. Report 89-4, pages 125-132.
Haites, T.B. (1959): Avonlea and its Significance; Jour-
156 Industrial Minerals Forum 1991
nal of Alberta Society of Petroleum Geology, Volume 7, Number 8, pages 167-176.
Haites, T.B. and van Hees, H. (1962): The Origm of Some Anomalies in the Plains of Western Canada; Journal of Alberta Society of Petroleum Geology, Volume 10, Number 9, pages 511-533.
Jennings, C.M.H. (1990): Exploration for Diamondifer-ous Kimberlites and Lamproites; Modern Exploration Techniques, Saskatchewan Geological Society of Specialists, Publication Number 10, pages 139-148.
Johnson, CJ., Marriott, M. and von Saldern, M. (1989): World Diamond Industry 1970-2000; Natural Resources Forum, Natural Resources Forum, Volume 13, Number 5, pages 90-106.
Kirkland, S J.T. (1976): The Geology of the Marchel -Wintego - Sandy Bay Area, Saskatchewan; Saskatchewan Department of Mineral Resources, Report 172,12 pages.
Pressler, J.W. (1985): Gem Stones; in Mineral Facts and Problems, U.S. Bureau of Mines, Bulletin 675, pages 305-315.
Sawatzky, H.B. (1975): Astroblems in Williston Basin, American Association of Petroleum Geology, Volume 59, Number 4, pages 694-710.
Simpson, MA.., Millard, MJ. and Bedard, D. (1990): Geological and Remote Sensing Investigations of the Prince Albert-Shellbrook Area, Saskatchewan; Saskatchewan Geological Survey, internal report, 30 pages.
Smith, D.G. and Pullen, J.R. (1967): Hummingbird Structure of Southeast Saskatchewan; Bulletin of Canadian Petroleum Geologists, Volume 15, Number 4, pages 468-482.
Smoak, J.F. (1985): Diamond-Industrial; in Mineral Facts and Problems, U.S. Bureau of Mines Bulletin 675, pages 233-247.
Whitaker, S.H. (1976): Geology and Groundwater Resources of the Cypress Area; Saskatchewan Research Council, Map NTS Area 72F.
Conference Proceedings 157

158 Industrial Minerals Forum 1991
WATER FILTRATION USING PERLITE FROM THE FRENIER DEPOSIT OF BRITISH COLUMBIA
By R.D. Giles and G.W. Poling The University of British Columbia, Vancouver, B.C.
ABSTRACT Perlite filter aid materials produced from the Fren-
ier deposit are characterized according to size, shape, cell wall structure and specific surface area. These characteristics are correlated with precoat and body feed filter aid performance on water suspensions in a bomb-filter test apparatus. Attempts were made to assist an operating perlite producer in satisfying more sophisticated niter aid markets with finer and more closely sized filter aid materials.
INTRODUCTION Canada's only operating perlite mine (1983 - 1986)
probably owed its existence largely to a Federal government report written by H.S. Wilson (1981) of Energy Mines and Resources Canada in 1981. This report concerning "lightweight aggregates" documented several then unproven perlite deposits in British Columbia. Aurun Mines Ltd. mined approximately 3 000 tonnes per year of high quality perlite ore from one of these deposits now known as the Frenier Deposit. This mine was located approximately 60 kilometres northwest of the town of Clinton and 240 kilometres north-northeast of Vancouver, B.C. PerUte occurs at surface in two parallel zones 30 metres wide and several hundred metres long at the crest of a gently rolling hill. Elevation at the minesite is 1200 metres. Road access from Vancouver where Aurun's expansion plant was located, totalled 500 kilometres. Proven reserves of 450 000 tonnes of high grade perlite have been established.
The Frenier deposit was discovered in 1949 by Lawrence Frenier but commercial exploitation awaited Aurun's acquistion of the property in 1983. The mine was officially opened in July 1984. A pilot scale expansion plant using a 150 kilograms per hour vertical expander furnace was constructed at Aldergrove, B.C. in February, 1984. Over 3 000 tonnes of Frenier perlite ore were tested in this facility by April 1986. The plant was targetted to produce relatively coarse expanded perlite for horticultural, aggregate and insulating (cryogenic) uses to satisfy local markets. The Frenier ore proved to expand readily, produced a high yield, and a lightweight and clean finished product. Demands soon exceeded plant capacity. In the early spring of 1986 Aurun commissioned a new expansion plant in Surrey, B.C. (15 kilometres SE of Vancouver) capable of processing 4 500 tonnes per year of perlite ore.
Aurun's three initial expanded-perlite products were tailored to suit horticultural, insulation and lightweight aggregate needs. Horticultural grade perUte was coarse (up to 6 mm), had good resistance to degradation by crushing or aorasion and contained minimal fines. This product found ready users in bedding plant producers for creating easUy aerated, non-compacting sou's. Aurun's insulating or "cryogenic" grade perUte was usuaUy less
dense than horticultural grades and was produced by expanding a -20 mesh {850 fim ) size fraction. To be a good insulator this product had to retain as much of the expanded bubble envelope structure as possible and be thinwaUed. Fines were scalped off to produce an expanded product that was generally between 16 mesh (1000 fim) and 100 mesh (150 //m). A third major product line for Ughtweight aggregate and plasters was of similar size to cryogenic grade. This material was tougher with thicker "walls" to withstand mixing and handling.
Production of the above three grades of perUte involved removal of significant amounts of "fines" (mostly finer than 100 mesh or 150 ftm). Even very recent technical descriptions of perUte flowsheets indicate that these fines, which might comprise 25 per cent of the feed, are normaUy discarded (Chamberlain, 1985). Aurun soon realized that their fines might be marketable as filter aids. The Vancouver PubUc Aquarium uses vacuum precoat filters to provide sufficient clarity for viewing marine mammals through 11 metres of water. Aurun's expanded perUte fines (designated UF 100) proved to be an excellent filter aid for this appUcation. Total pool volume for these mammals, including killer whales, beluga whales, seals and sea otters, is replaced every 72 hours. Filter aid consumption as precoat and bulk feed amounts to several hundred pounds each day. This filter aid appUcation is particularly difficult since much of the purpose is to remove colloidal fecal material. Chemical coagulation and flocculation are required prior to filtration. In addition, the perUte filter aid material must be highly inert to ensure that no potential toxins are leached from it.
Precoat filter clarification of swimming pools soon found Aurun's UF 100 product an exceUent filter aid. Aurun Mines Ltd. found themselves in an enviable position of having a market (for their previous discard product) exceeding production capacity.
Early-on, during the advent of Aurun into the filter aid market they contacted the Department of Mining and Mineral Process Engineering at the University of British Columbia for technical assistance in developing a wide range of filter aid products. A research proposal supported jointly by Aurun Mines Ltd. and the Vancouver PubUc Aquarium was then submitted by UBC to the Science Council of British Columbia. This provincial agency provided support in order "to establish process parameters and operating procedures required to manufacture consistently high quaUty perUte filter aid materials from the "fines" which unttf recently had been rejected as waste at Aurun Mines Ltd. expansion plant". Since diatomaceous earth and competing perUte products had to be imported from distances of over 1600 kilometres, the economic benefits of local production were obvious.
Conference Proceedings 159
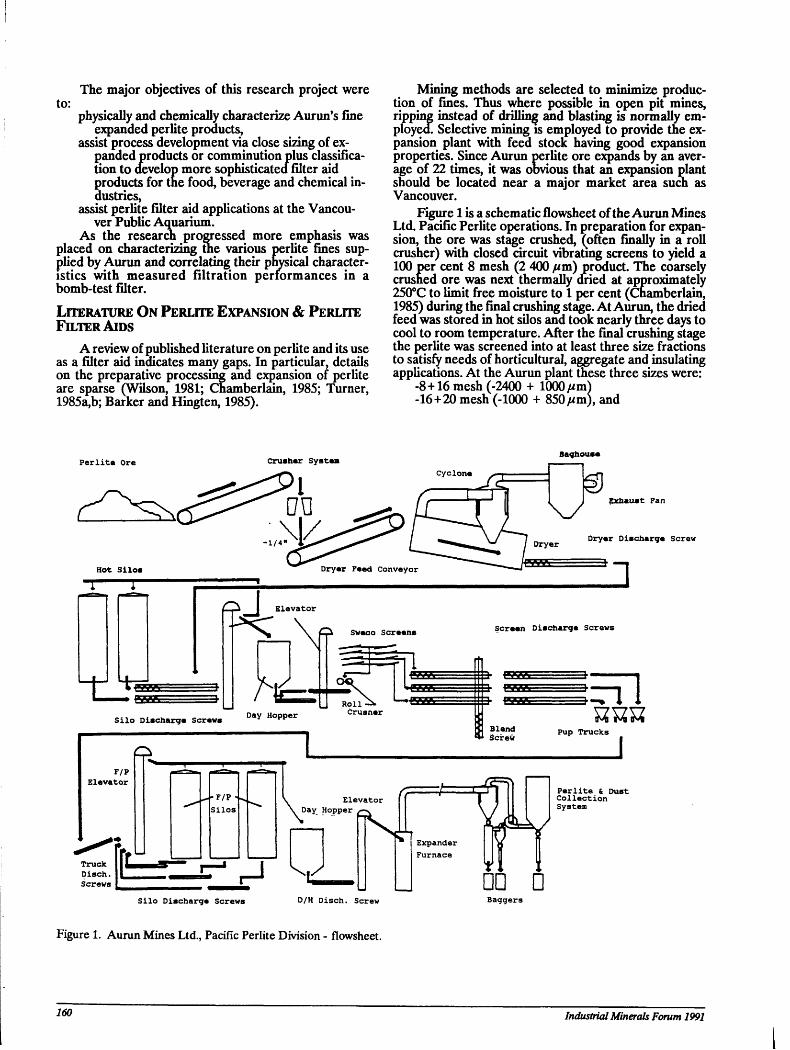
to: The major objectives of this research project were
physically and chemically characterize Aurun's fine expanded perlite products,
assist process development via close sizing of expanded products or comminution plus classification to develop more sophisticated filter aid products for the food, beverage and chemical industries,
assist perlite filter aid applications at the Vancouver Public Aquarium.
As the research progressed more emphasis was placed on characterizing the various perhte fines supplied by Aurun and correlating their physical characteristics with measured filtration performances in a bomb-test filter.
LITERATURE ON PERLITE EXPANSION & PERLITE FILTER AIDS
A review of published literature on perhte and its use as a filter aid indicates many gaps. In particular, details on the preparative processing and expansion of perhte are sparse (Wilson, 1981; Chamberlain, 1985; Turner, 1985a,b; Barker and Hingten, 1985).
Mining methods are selected to minimize production of fines. Thus where possible in open pit mines, ripping instead of drilling and blasting is normally employed. Selective mining is employed to provide the expansion plant with feed stock having good expansion properties. Since Aurun perhte ore expands by an average of 22 times, it was obvious that an expansion plant should be located near a major market area such as Vancouver.
Figure 1 is a schematic flowsheet of the Aurun Mines Ltd. Pacific Perhte operations. In preparation for expansion, the ore was stage crushed, (often finally in a roll crusher) with closed circuit vibrating screens to yield a 100 per cent 8 mesh (2 400 fim) product. The coarsely crushed ore was next thermally dried at approximately 250°C to limit free moisture to 1 per cent (Chamberlain, 1985) during the final crushing stage. At Aurun, the dried feed was stored in hot silos and took nearly three days to cool to room temperature. After the final crushing stage the perhte was screened into at least three size fractions to satisfy needs of horticultural, aggregate and insulating applications. At the Aurun plant these three sizes were:
-8+16 mesh (-2400 + 1000//m) -16+20 mesh (-1000 + 850 /*m), and
Perlite Ore Crusher Systea Baghouse
Exhaust Fan
Dryer Discharge Screw
— ^ | Elevator
Sweoo Screens Screen Discharge Screws
Truck Disch. Screws
Silo Discharge Screws
Figure 1. Aurun Mines Ltd., Pacific Perlite Division - flowsheet.
Baggers
160 Industrial Minerals Forum 1991
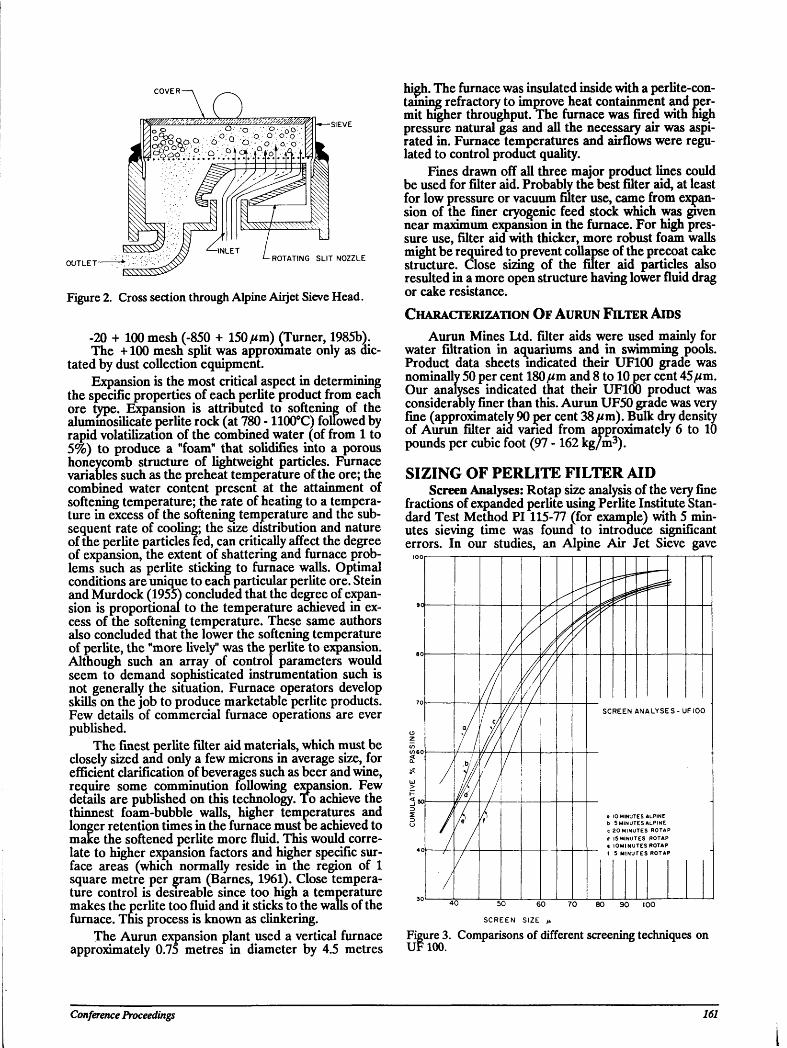
4
:K's;:?."tf>l'>;<JwzM}>?,x?ysy/f&w&z%'4P. ^ SIEVE O-. 'o" . ' '.'■o-":'o'o-.
•:■ O>. -O O. o. o : °*8fto.a
OUTLET r-* ROTATING SLIT NOZZLE
KWW^
Figure 2. Cross section through Alpine Airjet Sieve Head.
-20 + 100 mesh (-850 + 150 ^m) (Turner, 1985b). The +100 mesh split was approximate only as dic
tated by dust collection equipment. Expansion is the most critical aspect in determining
the specific properties of each perlite product from each ore type. Expansion is attributed to softening of the aluminosilicate perlite rock (at 780 - 1100°C) followed by rapid volatilization of the combined water (of from 1 to 5%) to produce a "foam" that solidifies into a porous honeycomb structure of lightweight particles. Furnace variables such as the preheat temperature of the ore; the combined water content present at the attainment of softening temperature; the rate of heating to a temperature in excess of the softening temperature and the subsequent rate of cooling; the size distribution and nature of the perlite particles fed, can critically affect the degree of expansion, the extent of shattering and furnace problems such as perlite sticking to furnace walls. Optimal conditions are unique to each particular perlite ore. Stein and Murdock (1955^ concluded that the degree of expansion is proportional to the temperature achieved in excess of the softening temperature. These same authors also concluded that the lower the softening temperature of perlite, the "more lively" was the perlite to expansion. Although such an array of control parameters would seem to demand sophisticated instrumentation such is not generally the situation. Furnace operators develop skills on the job to produce marketable perlite products. Few details of commercial furnace operations are ever published.
The finest perlite filter aid materials, which must be closely sized and only a few microns in average size, for efficient clarification of beverages such as beer and wine, require some comminution following expansion. Few details are published on this technology. To achieve the thinnest foam-bubble walls, higher temperatures and longer retention times in the furnace must be achieved to make the softened perlite more fluid. This would correlate to higher expansion factors and higher specific surface areas (which normally reside in the region of 1 square metre per gram (Barnes, 1961). Close temperature control is desireable since too high a temperature makes the perlite too fluid and it sticks to the walls of the furnace. This process is known as clinkering.
The Aurun expansion plant used a vertical furnace approximately 0.75 metres in diameter by 4.5 metres
high. The furnace was insulated inside with a perlite-con-taining refractory to improve heat containment and permit higher throughput. The furnace was fired with high pressure natural gas and all the necessary air was aspirated in. Furnace temperatures and airflows were regulated to control product quality.
Fines drawn off all three major product lines could be used for filter aid. Probably the best filter aid, at least for low pressure or vacuum filter use, came from expansion of the finer cryogenic feed stock which was given near maximum expansion in the furnace. For high pressure use, filter aid with thicker, more robust foam walls might be required to prevent collapse of the precoat cake structure. Close sizing of the filter aid particles also resulted in a more open structure having lower fluid drag or cake resistance.
CHARACTERIZATION OF AURUN FILTER AIDS Aurun Mines Ltd. filter aids were used mainly for
water filtration in aquariums and in swimming pools. Product data sheets indicated their UF100 grade was nominally 50 per cent 180//m and 8 to 10 per cent 45/m. Our analyses indicated that their UF100 product was considerably finer than this. Aurun UF50 grade was very fine (approximately 90 per cent 38 fim). Bulk dry density of Aurun filter aid varied from approximately 6 to 10 pounds per cubic foot (97 -162 kg/m3).
SIZING OF PERLITE FILTER AID Screen Analyses: Rotap size analysis of the very fine
fractions of expanded perlite using Perlite Institute Standard Test Method PI 115-77 (for example) with 5 minutes sieving time was found to introduce significant errors. In our studies, an Alpine Air Jet Sieve gave
8 0 t 8 0
// v/ >
/ / / / // /' / / / / SCREEN ANALYSES - UFIOO
/ c/ 0 / v/ 13 ' / i Z i / / / /
c/160 / / \U-c/160
/ ' 7 / Q. / ,t/// 1 ** / it/ 1 / ' ! ! b j
> / fa / ! < so // / / ' _ l x
* / / 3 / ' i / i / A 0 o 10 MINUTES ALPINE
<_) ' , /
b 5 MINUTES ALPINE c 20MINUTES ROTAP d 15 MINUTES ROTAP
4 0 / / t IOMINUTES ROTAP 4 0
/ 7
1 S M NU TES ROTA P
80 90
SCREEN SIZE M
Figure 3. Comparisons of different screening techniques on UF100.
Conference Proceedings 161
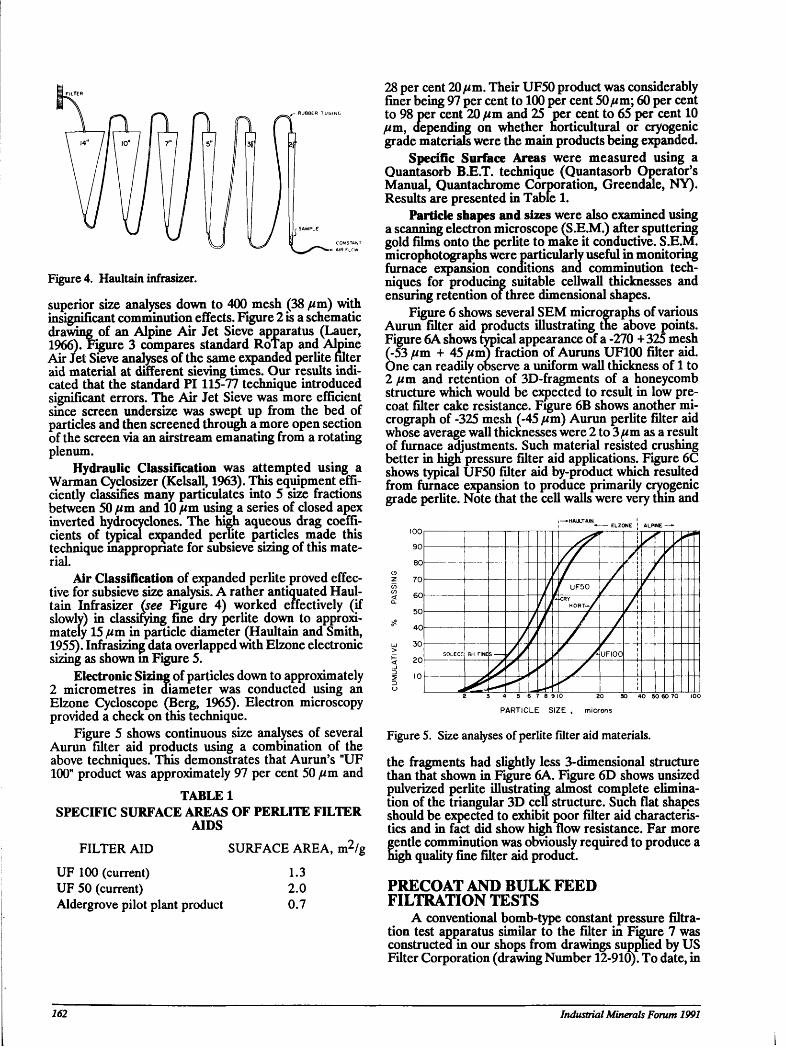
f RUB8ER TUbiNC
Figure 4. Haultain infrasizer.
superior size analyses down to 400 mesh (38 pm) with insignificant comminution effects. Figure 2 is a schematic drawing of an Alpine Air Jet Sieve apparatus (Lauer, 1966)7Figure 3 compares standard RoTap and Alpine Air Jet Sieve analyses of the same expanded perlite filter aid material at different sieving times. Our results indicated that the standard PI 115-77 technique introduced significant errors. The Air Jet Sieve was more efficient since screen undersize was swept up from the bed of particles and then screened through a more open section of the screen via an airstream emanating from a rotating plenum.
Hydraulic Classification was attempted using a Warman Cyclosizer (Kelsall, 1963). This equipment efficiently classifies many particulates into 5 size fractions between 50 yum and 10 /tm using a series of closed apex inverted hydrocyclones. The liigh aqueous drag coefficients of typical expanded perlite particles made this technique inappropriate for subsieve sizing of this material.
Air Classification of expanded perlite proved effective for subsieve size analysis. A rather antiquated Haul-tain Infrasizer (see Figure 4) worked effectively (if slowly) in classifying fine dry perlite down to approximately 15 fim in particle diameter (Haultain and Smith, 1955). Infrasizing data overlapped with Elzone electronic sizing as shown m Figure 5.
Electronic Sizing of particles down to approximately 2 micrometres in diameter was conducted using an Elzone Cycloscope (Berg, 1965). Electron microscopy provided a check on this technique.
Figure 5 shows continuous size analyses of several Aurun filter aid products using a combination of the above techniques. This demonstrates that Aurun's HUF 100" product was approximately 97 per cent 50 jum and
TABLE 1 SPECIFIC SURFACE AREAS OF PERLITE FILTER
AIDS FILTER AID
UF 100 (current) UF 50 (current) Aldergrove pilot plant product
SURFACE AREA, m2/g
1.3 2.0 0.7
28 per cent 20pm. Their UF50 product was considerably finer being 97 per cent to 100 per cent 50//m; 60 per cent to 98 per cent 20 pm and 25 per cent to 65 per cent 10 fim, depending on whether horticultural or cryogenic grade materials were the main products being expanded.
Specific Surface Areas were measured using a Quantasorb B.E.T. technique (Quantasorb Operator's Manual, Quantachrome Corporation, Greendale, NY). Results are presented in Table 1.
Particle shapes and sizes were also examined using a scanning electron microscope (S.E.M.) after sputtering gold films onto the perlite to make it conductive. S.E.M microphotographs were particularly useful in monitoring furnace expansion conditions and comminution techniques for producing suitable cellwall thicknesses and ensuring retention of three dimensional shapes.
Figure 6 shows several SEM micrographs of various Aurun filter aid products illustrating the above points. Figure 6A shows typical appearance of a -270 + 325 mesh (-53 fim + 45 ftm) fraction of Auruns UF100 filter aid. One can readily ooserve a uniform wall thickness of 1 to 2 pm and retention of 3D-fragments of a honeycomb structure which would be expected to result in low pre-coat filter cake resistance. Figure 6B shows another micrograph of -325 mesh (-45 fim) Aurun perlite filter aid whose average wall thicknesses were 2 to 3/urn as a result of furnace adjustments. Such material resisted crushing better in high pressure filter aid applications. Figure 6C shows typical UF50 filter aid by-product which resulted from furnace expansion to produce primarily cryogenic grade perlite. Note that the cell walls were very tnin and
100
90
80
70
60
50
40
30
—.HAULTAIN — ELZONE \ ALPNE
100
90
80
70
60
50
40
30
s * 100
90
80
70
60
50
40
30
/? 100
90
80
70
60
50
40
30
100
90
80
70
60
50
40
30
f UF50
100
90
80
70
60
50
40
30
CRY / H 0 R T - V
100
90
80
70
60
50
40
30
100
90
80
70
60
50
40
30
100
90
80
70
60
50
40
30 S0LECO BH FINE / ■ UFI00
20
10
S0LECO BH FINE / ■ UFI00 20
10
20
10
4 5 6 7 8 9 10 20
PARTICLE SIZE , microns
30 40 SO 60 70
Figure 5. Size analyses of perlite filter aid materials.
the fragments had slightly less 3-dimensional structure than that shown in Figure 6A. Figure 6D shows unsized pulverized perlite illustrating almost complete elimination of the triangular 3D cell structure. Such flat shapes should be expected to exhibit poor filter aid characteristics and in fact did show high flow resistance. Far more gentle comminution was obviously required to produce a high quality fine filter aid product.
PRECOAT AND BULK FEED FILTRATION TESTS
A conventional bomb-type constant pressure filtration test apparatus similar to the filter in Figure 7 was constructed in our shops from drawings supplied by US Filter Corporation (drawing Number 12-910). To date, in
162 Industrial Minerals Forum 1991
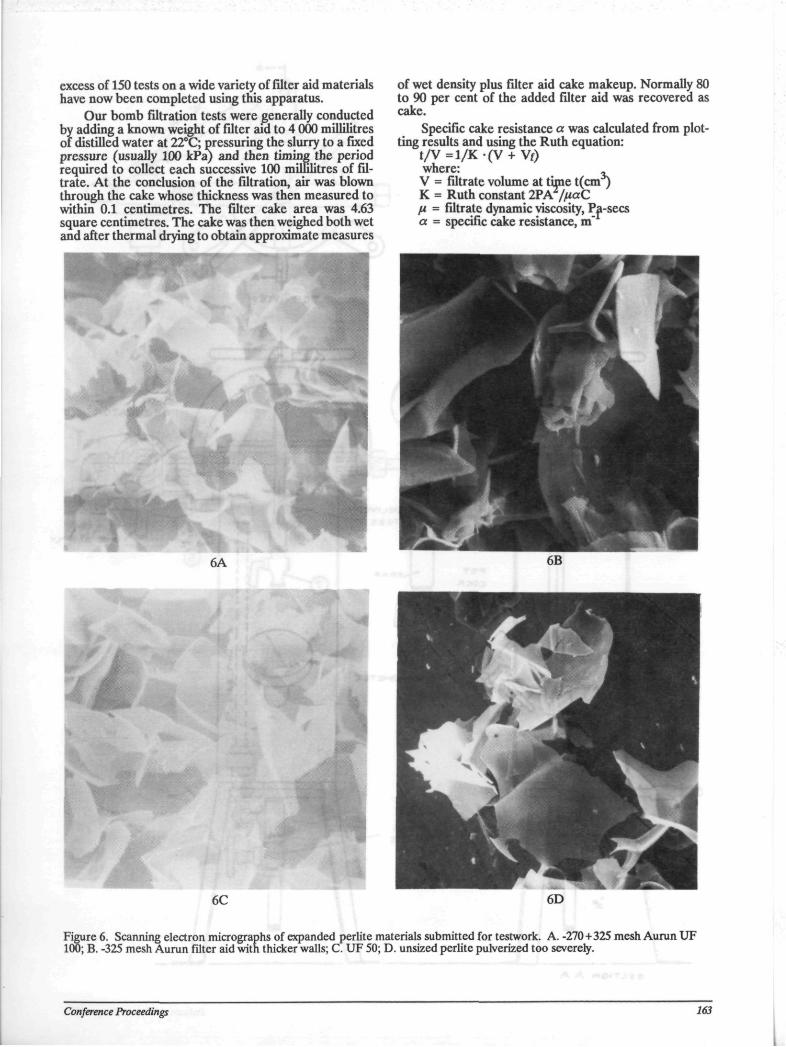
excess of 150 tests on a wide variety of filter aid materials have now been completed using this apparatus.
Our bomb filtration tests were generally conducted by adding a known weight of filter aid to 4 000 millilitres of distilled water at 22°C; pressuring the slurry to a fixed pressure (usually 100 kPa) and then timing the period required to collect each successive 100 millilitres of filtrate. At the conclusion of the filtration, air was blown through the cake whose thickness was then measured to within 0.1 centimetres. The filter cake area was 4.63 square centimetres. The cake was then weighed both wet and after thermal drying to obtain approximate measures
of wet density plus filter aid cake makeup. Normally 80 to 90 per cent of the added filter aid was recovered as cake.
Specific cake resistance a was calculated from plotting results and using the Ruth equation:
t /V=l /K- (V +Vf) where: . V = filtrate volume at time t(cnr) K = Ruth constant 2PA /uaC H = filtrate dynamic viscosity, Pa-secs a = specific cake resistance, m"
Figure 6. Scanning electron micrographs of expanded perlite materials submitted for testwork. A. -270+325 mesh Aurun UF 100; B. -325 mesh Aurun filter aid with thicker walls; C. UF 50; D. unsized perlite pulverized too severely.
Conference Proceedings 163
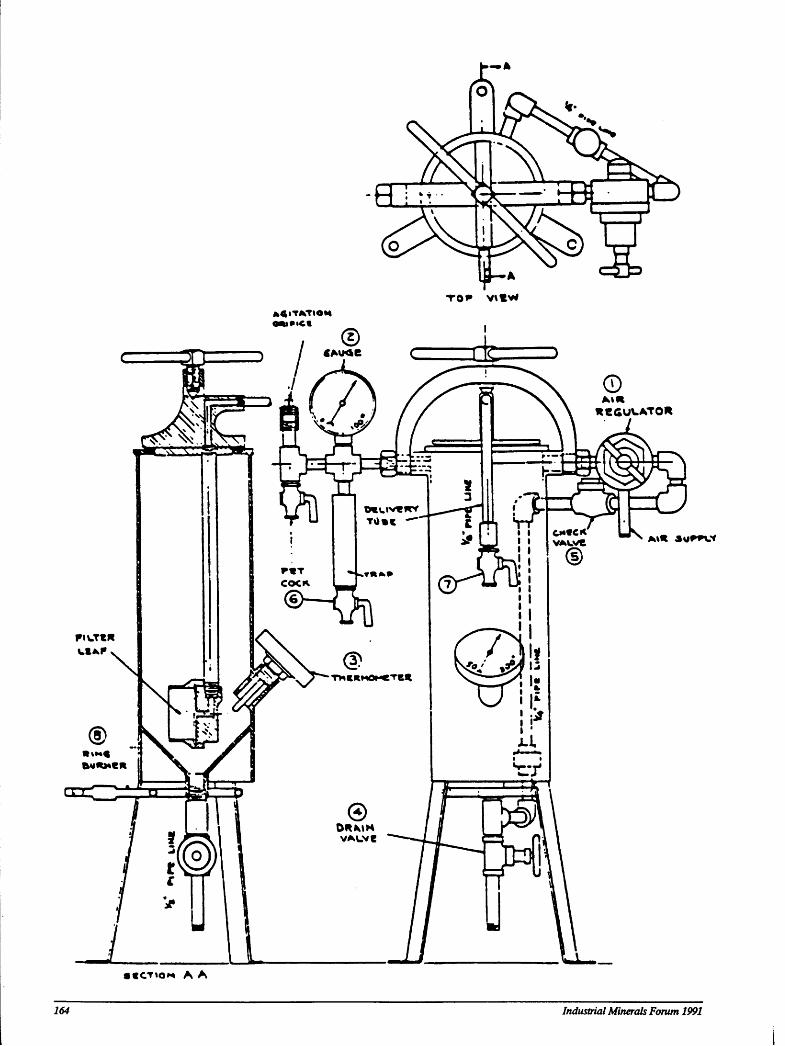
Altt *U*1»Vf
• «CT»on A A
164 Industrial Minerals Forum 1991
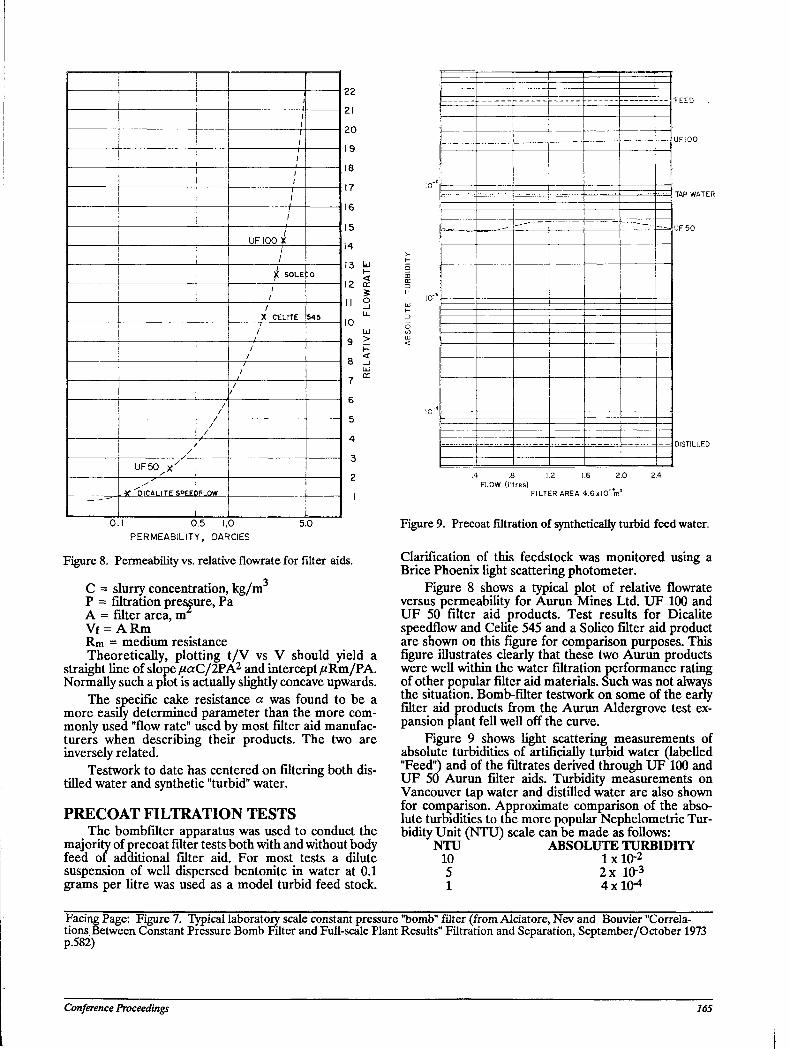
1 1
/ ; /
/ / UF 100 X
1 1
^ SOLE :o
/ /
/ X CELITE 5 4 5
/ / / / / /
1 1
/ / / / /
/ ■
UFSO^x'
. V ^ D I C A L I T E S P E E I )FLOW L "' 0.1 0.5 1,0
PERMEABILITY, DARCIES 5.0
Figure 8. Permeability vs. relative flowrate for filter aids.
C = slurry concentration, kg/m P = filtration pressure, Pa A = filter area, m Vf = A R m Rm = medium resistance Theoretically, plotting t /V vs V should yield a
straight line of slope /*aC/2PA2 and intercept //Rm/PA. Normally such a plot is actually slightly concave upwards.
The specific cake resistance a was found to be a more easily determined parameter than the more commonly used "flow rate" used by most filter aid manufacturers when describing their products. The two are inversely related.
Testwork to date has centered on filtering both distilled water and synthetic "turbid" water.
PRECOAT FILTRATION TESTS The bombfilter apparatus was used to conduct the
majority of precoat filter tests both with and without body feed of additional filter aid. For most tests a dilute suspension of well dispersed bentonite in water at 0.1 grams per litre was used as a model turbid feed stock.
'"'I '"'I I0~* I0~*
__.. 1 _ . — -J
io-3 io-3
I0"4 I0"4
-£HHJ TAP WATER
DISTILLED
FLOW (litres) FILTER AREA 4.6x10 m
Figure 9. Precoat filtration of synthetically turbid feed water.
Clarification of this feedstock was monitored using a Brice Phoenix light scattering photometer.
Figure 8 shows a typical plot of relative flowrate versus permeability for Aurun Mines Ltd. UF 100 and UF 50 filter aid products. Test results for Dicalite speedflow and Celite 545 and a Solico filter aid product are shown on this figure for comparison purposes. This figure illustrates clearly that these two Aurun products were well within the water filtration performance rating of other popular filter aid materials. Such was not always the situation. Bomb-filter testwork on some of the early filter aid products from the Aurun Aldergrove test expansion plant fell well off the curve.
Figure 9 shows light scattering measurements of absolute turbidities of artificially turbid water (labelled "Feed") and of the filtrates derived through UF 100 and UF 50 Aurun filter aids. Turbidity measurements on Vancouver tap water and distilled water are also shown for comparison. Approximate comparison of the absolute turbidities to the more popular Nephelometric Turbidity Unit (NTU) scale can be made as follows:
NTU ABSOLUTE TURBIDITY 10 lx lO- 2
5 2x IO"3
1 4 x l ( H
Facing Page: Figure 7. Typical laboratory scale constant pressure "bomb" filter (from Alciatore, Nev and Bouvier "Correlations Between Constant Pressure Bomb Filter and Full-scale Plant Results" Filtration and Separation, September/October 1973 p.582)
Conference Proceedings 165
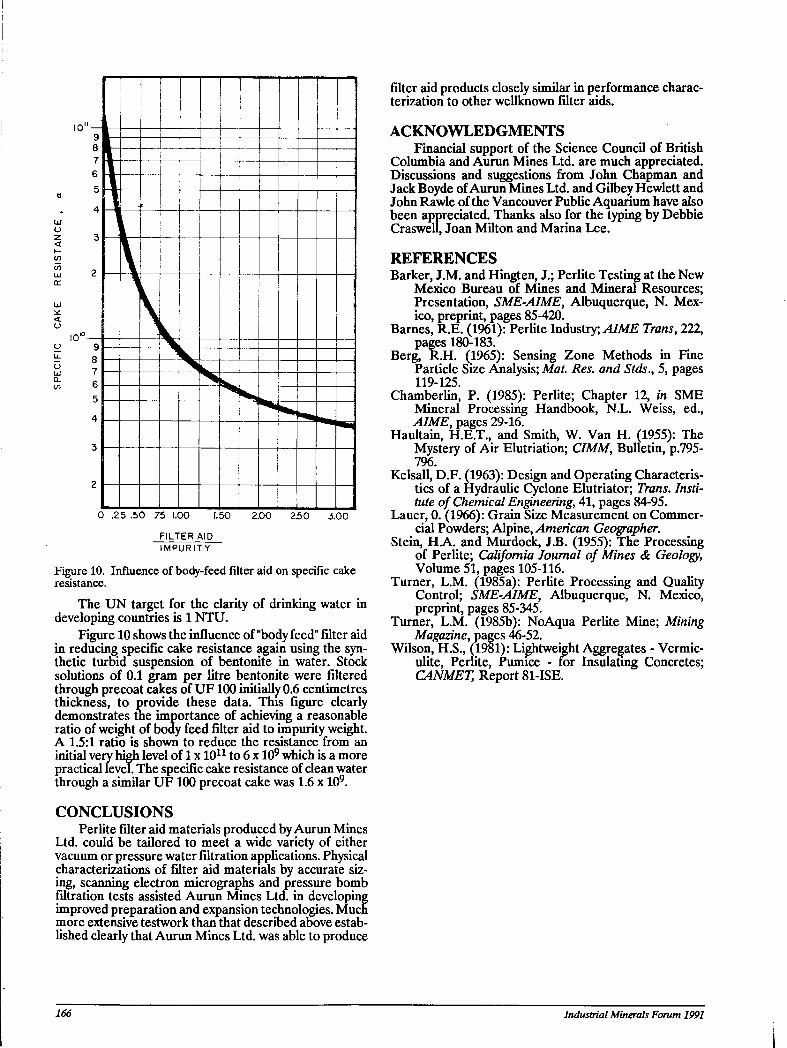
9 8 7
6
LU I H i I ! ! I I ! I I I
2 3 I =1—F h ~ 1 H i 1L I | I w o I \ I 1 ! _]_ I j w 2 I——v—r—i———'——————i oc I m l l ' l LJ i i r%! ! I I ! j I i I I <i * 1 i 1 % I < I i m i
i o ' ° — B — — — I V J — H — I — — I — — — — \ - 9 I — — — T L — — — I — — — — — j - s H — — iVI——I—————hH
5
4
3
2
0 .25 .50 .75 1.00 [.50 2.00 250 3.00
FILTER AID IMPURITY
Figure 10. Influence of body-feed filter aid on specific cake resistance.
The UN target for the clarity of drinking water in developing countries is 1NTU.
Figure 10 shows the influence of "body feed" filter aid in reducing specific cake resistance again using the synthetic turbid suspension of bentonite in water. Stock solutions of 0.1 gram per litre bentonite were filtered through precoat cakes of UF100 initially 0.6 centimetres thickness, to provide these data. This figure clearly demonstrates the importance of achieving a reasonable ratio of weight of body feed filter aid to impurity weight. A 1.5:1 ratio is shown to reduce the resistance from an initial very high level of 1 x 10¹¹ to 6 x 10⁹ which is a more practical level. The specific cake resistance of clean water through a similar UF 100 precoat cake was 1.6 x 10⁹.
CONCLUSIONS Perlite filter aid materials produced by Aurun Mines
Ltd. could be tailored to meet a wide variety of either vacuum or pressure water filtration applications. Physical characterizations of filter aid materials by accurate sizing, scanning electron micrographs and pressure bomb filtration tests assisted Aurun Mines Ltd. in developing improved preparation and expansion technologies. Much more extensive testwork than that described above established clearly that Aurun Mines Ltd. was able to produce
filter aid products closely similar in performance characterization to other wellknown filter aids.
ACKNOWLEDGMENTS Financial support of the Science Council of British
Columbia and Aurun Mines Ltd. are much appreciated. Discussions and suggestions from John Chapman and Jack Boyde of Aurun Mines Ltd. and Gilbey Hewlett and John Rawle of the Vancouver Public Aquarium have also been appreciated. Thanks also for the typing by Debbie Craswell, Joan Milton and Marina Lee.
REFERENCES Barker, J.M. and Hingten, J.; Perlite Testing at the New
Mexico Bureau of Mines and Mineral Resources; Presentation, SME-AIME, Albuquerque, N. Mexico, preprint, pages 85-420.
Barnes, R.E. (1961): Perlite Industry; AIME Trans, 222, pages 180-183.
Berg, R.H. (1965): Sensing Zone Methods in Fine Particle Size Analysis; Mat. Res. and Stds., 5, pages 119-125.
Chamberlin, P. (1985): Perlite; Chapter 12, in SME Mineral Processing Handbook, N.L. Weiss, ed., AIME, pages 29-16.
Haultain, H.E.T., and Smith, W. Van H. (1955): The Mystery of Air Elutriation; CIMM, Bulletin, p.795-796.
Kelsall, D.F. (1963): Design and Operating Characteristics of a Hydraulic Cyclone Elutriator; Trans. Institute of Chemical Engineering, 41, pages 84-95.
Lauer, 0. (1966): Grain Size Measurement on Commercial Powders; Alpine, American Geographer.
Stein, HA. and Murdock, J.B. (1955): The Processing of Perlite; California Journal of Mines & Geology, Volume 51, pages 105-116.
Turner, L.M. (1985a): Perlite Processing and Quality Control; SME-AJME, Albuquerque, N. Mexico, preprint, pages 85-345.
Turner, L.M. (1985b): NoAqua Perlite Mine; Mining Magazine,Jiages 46-52.
Wilson, H.S., (1981): Lightweight Aggregates - Vermic-ulite, Perlite, Pumice - for Insulating Concretes; CANMET, Report 81-ISE.
166 Industrial Minerals Forum 1991
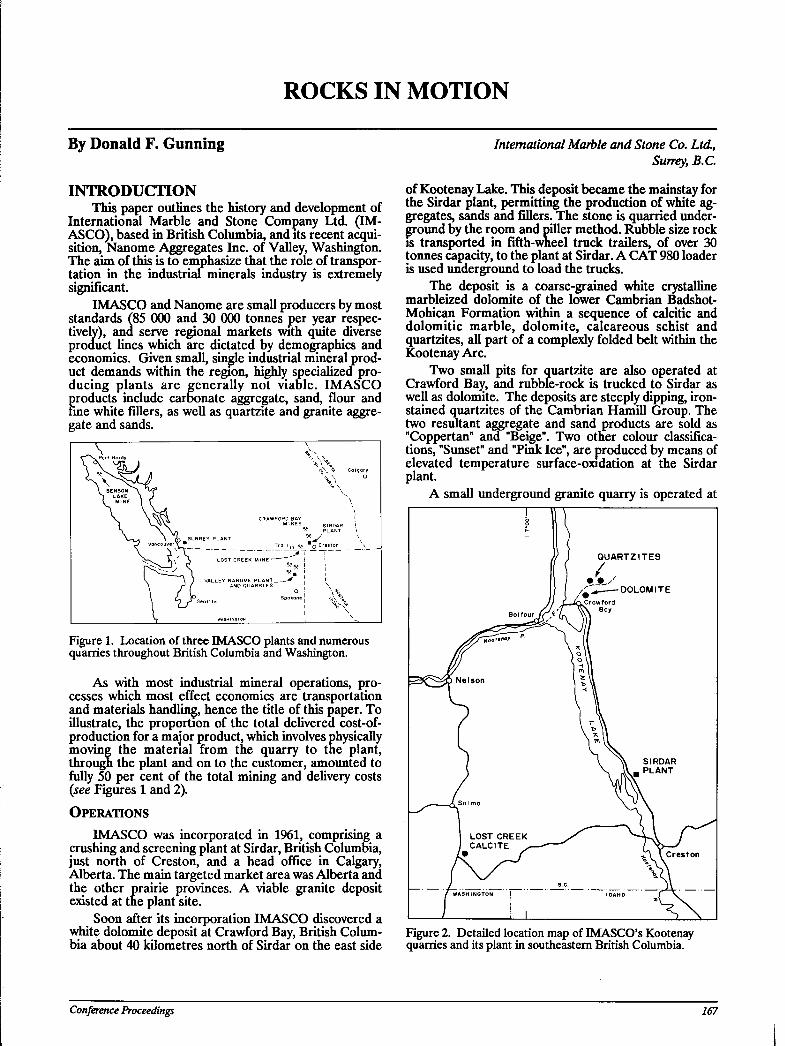
ROCKS IN MOTION
By Donald F. Gunning
INTRODUCTION This paper outlines the history and development of
International Marble and Stone Company Ltd. (IM-ASCO), based in British Columbia, and its recent acquisition, Nanome Aggregates Inc. of Valley, Washington. The aim of this is to emphasize that the role of transportation in the industrial minerals industry is extremely significant.
IMASCO and Nanome are small producers by most standards (85 000 and 30 000 tonnes per year respectively), ana serve regional markets with quite diverse product lines which are dictated by demographics and economics. Given small, single industrial mineral product demands within the region, highly specialized producing plants are generally not viable. IMASCO products include carbonate aggregate, sand, flour and fine white fillers, as well as quartzite and granite aggregate and sands.
Figure 1. Location of three IMASCO plants and numerous quarries throughout British Columbia and Washington.
As with most industrial mineral operations, processes which most effect economics are transportation and materials handling, hence the title of this paper. To illustrate, the proportion of the total delivered cost-of-production for a major product, which involves physically moving the material from the quarry to the plant, through the plant and on to the customer, amounted to fully 50 per cent of the total mining and delivery costs (see Figures 1 and 2).
OPERATIONS
IMASCO was incorporated in 1961, comprising a crushing and screening plant at Sirdar, British Columbia, just north of Creston, and a head office in Calgary, Alberta. The main targeted market area was Alberta and the other prairie provinces. A viable granite deposit existed at the plant site.
Soon after its incorporation IMASCO discovered a white dolomite deposit at Crawford Bay, British Columbia about 40 kilometres north of Sirdar on the east side
International Marble and Stone Co. Ltd., Surrey, B.C.
of Kootenay Lake. This deposit became the mainstay for the Sirdar plant, permitting the production of white aggregates, sands and fillers. The stone is quarried underground by the room and piller method. Rubble size rock is transported in fifth-wheel truck trailers, of over 30 tonnes capacity, to the plant at Sirdar. A CAT 980 loader is used underground to load the trucks.
The deposit is a coarse-grained white crystalline marbleized dolomite of the lower Cambrian Badshot-Mohican Formation within a sequence of calcitic and dolomitic marble, dolomite, calcareous schist and quartzites, all part of a complexly folded belt within the Kootenay Arc.
Two small pits for quartzite are also operated at Crawford Bay, and rubble-rock is trucked to Sirdar as well as dolomite. The deposits are steeply dipping, iron-stained quartzites of the Cambrian Hamill Group. The two resultant aggregate and sand products are sold as MCoppertanM ana "Beige". Two other colour classifications, "Sunset" and "Pink Ice", are produced by means of elevated temperature surface-oxidation at the Sirdar plant.
A small underground granite quarry is operated at
Figure 2. Detailed location map of IMASCO's Kootenay quarries and its plant in southeastern British Columbia.
Conference Proceedings 167
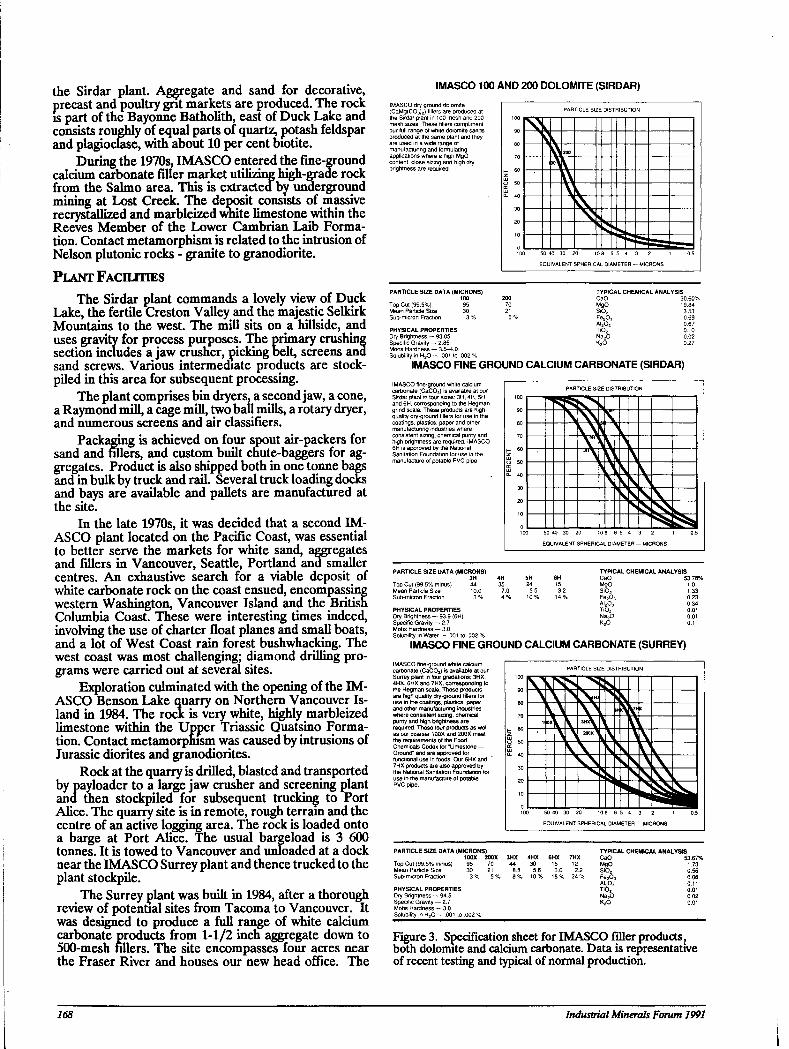
the Sirdar plant. Aggregate and sand for decorative, precast and poultry grit markets are produced. The rock is part of the Bayonne Batholith, east of Duck Lake and consists roughly of equal parts of quartz, potash feldspar and plagioclase, with about 10 per cent biotite.
During the 1970s, IMASCO entered the fine-ground calcium carbonate filler market utilizing high-grade rock from the Salmo area. This is extracted by underground mining at Lost Creek. The deposit consists of massive recrystallized and marbleized white limestone within the Reeves Member of the Lower Cambrian Laib Formation. Contact metamorphism is related to the intrusion of Nelson plutonic rocks - granite to granodiorite.
PLANT FACILITIES
The Sirdar plant commands a lovely view of Duck Lake, the fertile Creston Valley and the majestic Selkirk Mountains to the west. The mill sits on a hillside, and uses gravity for process purposes. The primary crushing section includes a jaw crusher, picking belt, screens and sand screws. Various intermediate products are stockpiled in this area for subsequent processing.
The plant comprises bin dryers, a second jaw, a cone, a Raymond mill, a cage mill, two ball mills, a rotary dryer, and numerous screens and air classifiers.
Packaging is achieved on four spout air-packers for sand and fillers, and custom built chute-baggers for aggregates. Product is also shipped both in one tonne bags and in bulk by truck and rail. Several truck loading docks and bays are available and pallets are manufactured at the site.
In the late 1970s, it was decided that a second IMASCO plant located on the Pacific Coast, was essential to better serve the markets for white sand, aggregates and fillers in Vancouver, Seattle, Portland and smaller centres. An exhaustive search for a viable deposit of white carbonate rock on the coast ensued, encompassing western Washington, Vancouver Island and the British Columbia Coast. These were interesting times indeed, involving the use of charter float planes and small boats, and a lot of West Coast rain forest bushwhacking. The west coast was most challenging; diamond drilling programs were carried out at several sites.
Exploration culminated with the opening of the IMASCO Benson Lake quarry on Northern Vancouver Island in 1984. The rock is very white, highly marbleized limestone within the Upper Triassic Quatsino Formation. Contact metamorphism was caused by intrusions of Jurassic diorites and granodiorites.
Rock at the quarry is drilled, blasted and transported by payloader to a large jaw crusher and screening plant and then stockpiled for subsequent trucking to Port Alice. The quarry site is in remote, rough terrain and the centre of an active logging area. The rock is loaded onto a barge at Port Alice. The usual bargeload is 3 600 tonnes. It is towed to Vancouver and unloaded at a dock near the IMASCO Surrey plant and thence trucked to the plant stockpile.
The Surrey plant was built in 1984, after a thorough review of potential sites from Tacoma to Vancouver. It was designed to produce a full range of white calcium carbonate products from 1-1/2 inch aggregate down to 500-mesh tillers. The site encompasses four acres near the Fraser River and houses our new head office. The
IMASC0100 AND 200 DOLOMITE (SIRDAR) IMASCO dry ground dolomite (CaMg(C03)2) fillers are produced at the Sirdar plant in 100 mesh and 200 mesh sizes. These fillers compliment our full range of white dolomite sands produced at the same plant and they are used in a wide range of manufacturing and formulating applications where a high MgO content, close sizing and high dry brightness are required.
100
90
80
70
K 60 Z O 50 DC
Q- 40
30
20
10
PARTICLE SIZE DISTRIBUTION 100
90
80
70
K 60 Z O 50 DC
Q- 40
30
20
10
100
90
80
70
K 60 Z O 50 DC
Q- 40
30
20
10
100
90
80
70
K 60 Z O 50 DC
Q- 40
30
20
10
200
100
90
80
70
K 60 Z O 50 DC
Q- 40
30
20
10
ipo\
100
90
80
70
K 60 Z O 50 DC
Q- 40
30
20
10
100
90
80
70
K 60 Z O 50 DC
Q- 40
30
20
10
100
90
80
70
K 60 Z O 50 DC
Q- 40
30
20
10
100
90
80
70
K 60 Z O 50 DC
Q- 40
30
20
10
100
90
80
70
K 60 Z O 50 DC
Q- 40
30
20
10
100
90
80
70
K 60 Z O 50 DC
Q- 40
30
20
10
100 50 40 30 20 108 6 5 4 3 2
EQUIVALENT SPHERICAL DIAMETER — MICRONS
0.5
PARTICLE SIZE DATA (MICRONS) 100
Top Cut (99.5%) 95 Mean Particle Size 30 Sub-micron Fraction 3 %
TYPICAL CHEMICAL ANALYSIS CaO 30.60% MgO 19.84 S i0 2 3.53 Fe 20 3 0.69 A l 2 0 3 0.67 T i0 2 0.10 Na20 0.02 K 20 0.27
PHYSICAL PROPERTIES Dry Brightness — 93.05 Specific Gravity — 2.85 Mohs Hardness — 3.5-4.0 Solubility in H 2 0 — .001 to .002 %
IMASCO FINE GROUND CALCIUM CARBONATE (SIRDAR) IMASCO fine-ground white calcium carbonate (CaC03) is available at our Sirdar plant in four sizes: 3H, 4H, 5H and 6H, corresponding to the Hegman grind scale. These products are high-quality dry-ground fillers for use in the coatings, plastics, paper and other manufacturing industries where consistent sizing, chemical purity and high brightness are required. IMASCO 6H is approved by the National Sanitation Foundation for use in the manufacture of potable PVC pipe.
100
90
80
70
^ 60
O 50 GC
O- 40
30
20
10
PARTICLE SIZE DISTRIBUTION 100
90
80
70
^ 60
O 50 GC
O- 40
30
20
10
100
90
80
70
^ 60
O 50 GC
O- 40
30
20
10
100
90
80
70
^ 60
O 50 GC
O- 40
30
20
10
100
90
80
70
^ 60
O 50 GC
O- 40
30
20
10
100
90
80
70
^ 60
O 50 GC
O- 40
30
20
10
100
90
80
70
^ 60
O 50 GC
O- 40
30
20
10
100
90
80
70
^ 60
O 50 GC
O- 40
30
20
10
100
90
80
70
^ 60
O 50 GC
O- 40
30
20
10
100
90
80
70
^ 60
O 50 GC
O- 40
30
20
10
100
90
80
70
^ 60
O 50 GC
O- 40
30
20
10
10C 50 40 30 20 108 6 5 4 3 2
EQUIVALENT SPHERICAL DIAMETER — MICRONS
1 0.5
PARTICLE SIZE DATA (MICRONS) 3H
Top Cut (99.5% minus) 44 Mean Particle Size 10.0 Sub-micron Fraction 3 %
PHYSICAL PROPERTIES Dry Brightness — 93.9 (6H) Specific Gravity — 2.7 Mohs Hardness — 3.0 Solubility in Water— .001 to .002 %
TYPICAL CHEMICAL ANALYSIS CaO 53.78% MgO 1.0 S i0 2 1.33 Fe 2 0 3 0.23 A l 2 0 3 0.34 T i0 2 0.01 Na 2 0 0.01 K 2 0 0.1
IMASCO FINE GROUND CALCIUM CARBONATE (SURREY) IMASCO fine-ground white calcium carbonate (CaC03) is available at our Surrey plant in four gradations; 3HX, 4HX, 6HX and 7HX, corresponding to the Hegman scale. These products are high quality dry-ground fillers for use in the coatings, plastics, paper and other manufacturing industries where consistent sizing, chemical purity and high brightness are required. These four products as well as our coarser 100X and 200X meet the requirements of the Food Chemicals Codex for "Limestone — Ground" and are approved for functional use in foods. Our 6HX and 7HX products are also approved by the National Sanitation Foundation for use in the manufacture of potable PVC pipe.
PARTICLE SIZE DISTRIBUTION
90
80
70
t_ 60 Z O 50 cc
Q- 40
30
20
10
90
80
70
t_ 60 Z O 50 cc
Q- 40
30
20
10
. ^ ^ H ) 90
80
70
t_ 60 Z O 50 cc
Q- 40
30
20
10
* (\ 90
80
70
t_ 60 Z O 50 cc
Q- 40
30
20
10
1I OX 3HxY
90
80
70
t_ 60 Z O 50 cc
Q- 40
30
20
10
200X1
90
80
70
t_ 60 Z O 50 cc
Q- 40
30
20
10
90
80
70
t_ 60 Z O 50 cc
Q- 40
30
20
10
90
80
70
t_ 60 Z O 50 cc
Q- 40
30
20
10
90
80
70
t_ 60 Z O 50 cc
Q- 40
30
20
10
90
80
70
t_ 60 Z O 50 cc
Q- 40
30
20
10
10C 50 40 30 20 108 6 5 4 3 2 1 0.S
EQUIVALENT SPHERICAL DIAMETER — MICRONS
PARTICLE SIZE DATA (MICRONS) 100X 200 X
Top Cut (99.5% minus) 95 70 Mean Particle Size 30 21 Sub-micron Fraction 3 % 5 %
PHYSICAL PROPERTIES Dry Brightness — 94.5 Specific Gravity — 2.7 Mohs Hardness — 3.0 Solubility in H2Q — .001 to .002 %
3HX 4HX 6HX 7HX
8% 10% 18% 24%
TYPICAL CHEMICAL ANALYSIS CaO 53.67% MgO 1.73 SiOz 0.56 Fe 2 0 3 0.06 A l 2 0 3 0.11 TiOa 0.01 Na20 0.02 K 2 0 0.01
Figure 3. Specification sheet for IMASCO filler products, both dolomite and calcium carbonate. Data is representative of recent testing and typical of normal production.
168 Industrial Minerals Forum 1991
rock is retrieved from the stockpile, crushed in a hammer mill and conveyed up and into surge tanks, then later withdrawn, dried, and ball-mill ground after the screen-ing-off of aggregates. Several sand and flour sizes are produced, as well as four fine-ground grades down to a 2-micron mean particle size. Products can be shipped bulk or bagged, and include aggregate, sand fillers, and a proprietary premix stucco witn custom colours. MASCO products are sold throughout Western Canada and the Northwest United States of America (see Figure 3).
Just over 2 years ago, Nanome Aggregates Inc. was acquired by IMASCO, this is a well established producer of coloured dolomite terrazzo chips, sand and fillers, located at Valley, Washington, just north of Spokane. Nanome has been in business for over 30 years and ships natural coloured dolomite terrazzo chips all over North America and serves regional markets for marble chips, dolomite line, white sand and fillers. Customers include precasters, manufacturers, agricultural distributors, contractors and numerous other industries. Nanome operates 9 or 10 different quarries and trucks rock to the plant at Valley, as required. Their MSuperwhiteH dolomite quarry is at Kelly Hill, north of Kettle Falls, on the west side of Roosevelt Lake. The rock is of high purity and brightness. "Sunlit White" rock from a quarry near Chewelah is used for lower brightness applications. The Cream/Botte quarry is just west of Chewelah, and the Watermary quarry is just west of Valley. The Nanome plant at Valley consists of a jaw crusher, screens, an
impact crusher, and a Raymond mill. Rock from each quarry is stored in a separate bunker prior to processing. Nanomes' colourful terrazzo chips can be found in airports and buildings all across North America. Product is shipped bulk by truck or rail, or in a variety of bags.
Most of the Nanome quarries are located in Cambrian, Lower Cambrian or Precambrian rocks and are 1)rincipally dolomite. Several comprise the Stensgar do-omite formation. There are no underground operations.
SUMMARY
IMASCO has maintained a strong growth rate over the past decade and continues to develop new products to sustain this trend. Nanome is doing the same. Only in this way can we stay profitable in the face of volatile business cycles and increased competition. The challenges are many, but we believe we can continue to serve western industrial mineral markets effectively for may years to come.
ACKNOWLEDGEMENT
I want to thank Dave Holmes of Denver for some of the geological information I have used.
Conference Proceedings 169

170 Industrial Minerals Forum 1991
AMMOLITE, AN ORGANIC GEMSTONE FROM ALBERTA
By Rene Vandervelde
INTRODUCTION It is a privilege to be able to address this Forum and
to thank the organizers for extending the invitation. Although I was asked to talk about ammolite, I will touch very briefly on other gemstones in Canada as well. Gem-stones are produced in Canada but among industrial minerals they do not rank very high. There are two rhodonite mines, one in the Yukon and one on Saltspring Island, British Columbia. Jade is found in British Columbia and the Yukon. Amethyst is reported from various locations: Nova Scotia, New Brunswick, Ontario and British Columbia. Apatite is found in Ontario and Quebec. Hessonite garnet has been mined at Asbestos, Quebec for years. The newest gemstone to be produced in Canada is the subject of this paper: ammolite from southern Alberta.
The subject can be approached from several points of view: historical, geological, gemological and commercial. I will attempt to review all of them, but I must tell you that my qualifications in each are limited.
HISTORICAL Ammolite was first described in 1917 by Dr. D.B.
Dowling of the Geological Survey of Canada. Further studies by GSC geologists, including Dr. Loris Russell, Drs. Link and Childerhose, and Dr. Archibald Stalker continued up to the mid 1960s, when the Nanton rock club started to assemble stones from surface collected ammonite shell. Some of these stones reached Calgary where they attracted the attention of several people. Ammolite Minerals Co. was formed in 1969 and lasted 2 years. Calcentine Ltd. was formed in 1974 and lasted till 1981. Cavecrafts Co. in Drumheller and several individuals worked with surface collected ammonite shell. However, only Calcentine provided a decent quality stone, which was researched and developed by Santo Carbone who at the time worked for the GSC.
Korite Minerals Ltd. was formed in 1977. It was the only company which from the start owned the mineral rights. In 1988 the Alberta Government opened up all of the Bearpaw Formation outcrop on Crown lands for bids and a flurry of activity resulted in over 200 parcels being leased to corporations and individuals. We estimate that over two dozen test pits have been dug, most of these on the St. Mary River, but after 25 years of exploration and all these test pits, only one active mine exists.
GEOLOGICAL Ammolite has been formed by the compression and
alteration of ammonite shell. Ammonite fossils are found in abundance and variety in the Late Cretaceous Bearpaw Formation of Alberta, but only two species produce gem material; Placenticeras meeki and Placenticeras intercalare. The ammonite collapsed under a heavy sedimentary overburden and we now find it as a crushed sheet of ammonite shell in ironstone concretions, which we dig with backhoes in shale beds to a depth
Korite Minerals Ltd., Calgary, Alberta
of 50 feet. There are mineral-rich bentonite layers in the shale, and some of this mineralization must nave been transferred to the ammonite shell because we find that some of our stones contain twice as much iron or copper as others. As Dr. Pough in his article in Lapidary Journal says:" A more reasonable premise is that the spectrum spreading spacing responsible for nacre's iridescence has been altered by burial, compression and alteration".
Although the Bearpaw Formation is very extensive, only in the area between the Red Deer River and the Mine River in Alberta does one find gem quality material. Even here, conditions vary widely from location to location. We have taken ammolite to every continent over the past 12 years. It appears to be a unique phenomenon of Alberta.
STRATIGRAPHY OF THE BEARPAW FORMATION
The Bearpaw Formation is recognized throughout central and southern Alberta, and extends into southwestern Saskatchewan, North and South Dakota and Montana. It is correlated with the type locality in the Bearpaw Mountains of Montana (Hatcher and Stanton, 1903). Its age is considered to be late Campanian to early Maestrichtian. The formation consists of grey, thin bedded to fissile marine shales, interbedded (in part) with several distinguishable coarse-grained sandstones that weather reddish brown. Thickness of the Bearpaw Formation in southern Alberta varies from 600 feet (180 metres) to 1100 feet (350 metres). Bentonite and ironstone concretionary beds are numerous. Portions are highly fossiliferous.
On the St. Mary River, the Bearpaw was measured at 720 feet (220 metres') in thickness (Link and Childerhose, 1931V Its basal boundary is with the uppermost member of tne Oldman Formation, the "Lethbridge coal measures". The transition is marked by grey sandy shales interbedded with two major coal seams. The lower seam is a commercial coal deposit 6 feet (2 metres) thick. An Ostrea coquina overlies the highest coal seam. A brown weathermg ferruginous sanastone bed is recognized here as the top of the Oldman Formation.
The Bearpaw Formation can be divided into two parts. The lower one-third contains well bedded dark shales devoid of sands. The upper two-thirds contains three distinct sandstone units separated by shales. Twenty-two bentonite beds are present in the formation, as well as several ironstone and calcareous concretionary zones (Link and Childerhose, 1931).
The lower shale member is distinguishable by its less sandy and fossiliferous nature. It is described as 210 feet (65 metres) of dark grey, well bedded shales. Six thin bentonite beds are present including one 6-inch (0.15 metre) bed approximately 40 feet (12 metres) above the base.
The upper member in the Bearpaw includes three sandstone units termed the Magrath, Kipp and Rye Grass sandstones. The lowest is Magrath sandstone, a
Conference Proceedings 171
sand/shale aggregate 62 feet (19 metres) thick characterized by an abundance of well preserved Arctica ovata. A 100-foot (30 metres) fossiliferous shale separates the Magrath from the second sand unit, the Kipjp Sandstone, a sand/shale aggregate 40 feet (12 metres) m thickness. It is characterized by an abundance of Placenticeras. The uppermost sand unit, the Rye Grass sandstone, is separated from tie Kipp sandstone by 140 feet (43 metres) of dark grey, often sandy shales. The Rye Grass is a 90-foot (27 metres) predominantly bluish-grey sandstone, which differentiates it from the other sandstone members. The upper beds in the Bearpaw are sandy shales with an abrupt transition to the massive, coarse grey sandstone of the Blood Reserve Formation.
GEMOLOGICAL Gemologically, the composition of ammolite is as
follows: aragonite 96% strontium .48% iron 1.00% silica 1.00% titanium .6% aluminum barium chromium copper magnesium vanadium
Aragonite alters to calcite in most rocks older than Pleistocene age. Although the Bearpaw Formation is of Late Cretaceous age, the aragonite appears to be entirely unaltered. The tigntly packed shale beds and the benton-ite layers seem to have protected the ammolite well.
The colour effect of ammolite is caused by the diffraction of white light into its constituent colours on the subsequent layers of ammonite shell. Red, green and orange colours are common, while blue colours are extremely rare.
The gemstone which has a mineralogical makeup similar to ammolite is the pearl. Both are organic in nature, formed by the secretion of nacre by molluses. In appearance ammolite is most often compared to black opal, because of the play of colour and the iridescence of the polished stones.
COMMERCIAL Sales of ammolite over the past 15 years have in
creased by about 25 per cent per year. Korite Minerals started from a very small base and sales are highly concentrated in a few markets. We are still developing new markets very slowly, but in a few years the availability of good quality rough may limit the growth of our markets.
Prices for ammolite have kept pace with inflation, but not with gemstone prices (except for diamonds). The price of diamonds was highly inflated compared to the availability of supplies in the late 1970s. Prices for a carat top colour stone tumbled from $55 000 U.S. to $15 000 U.S. in 1981. Since then prices have recovered, but sap-
!)hires, opals, rubies and emeralds have moved much aster than diamonds. Considering the rarity of ammolite
it is grossly undervalued, but this will probably adjust
itself as demand increases and as more responsible players enter the industry.
There are very large quantities of ammolite buried under the southern Alberta plains. Some estimates are in excess of 1 billion ammonites. The problem is that ammonites are very widely dispersed. Only one commercial concentration has been found to date, but it should be remembered that the ammolite industry is only 15 years old. If we compare its production value to that of the opal industry the ratio is close to 100 to 1, but 200 years ago the opal industry was also in its infancy. Experience, better techniques, financially stronger participants, a larger market and a better price will all help to make ammolite a significant industry for Alberta.
REFERENCES Arem, J.E. (1987): Colour encyclopedia of gemstones;
Van Nostrand Reinhold, New York. Arkell, WJ., Kummel, B and Wright, C.W. (1957):
Mesozoic Ammonoidea; in Moore, R.C., Treatise on Invertebrate Paleontology, University of Kansas Press, pages 180-1464.
Crowningsnield, R. (1977): Gems and gemology; XV (10), pages 312.
Fox, D.L. (1966): Pigmentation of molluses; in Wilbur, KM. and Youge, CM. (ed.), Physiology of Mlussa II, Academic Press, New York, pages 249-250.
Gubelin, E. (1980): Ammolith Eine never fossiler schmuckstein; Lapis, Vol. 4, No. 4, April 1980; Munich, pages 19-24.
Kennedy, WJ. and Cobban, WA. (1976): Aspects of ammonite biology biogeography and biostratigra-phy, in Special papers m Paleontology, No. 17, The Paleontological Association, London, pages 94.
Kraus, P.D. (1981): Korite from Alberta; Lapidary Jour-nal, January 1981, pages 1994-1996.
Link, TA. and Childerhose, A.V. (1931): Bearpaw shale and contiguous formations in the Lethbndge area, Alberta; American Association of Petroleum Geology, Bulletin, Vol. 15, No. 10, pages 1227-1242.
Pough, F.H. (1986): Ammolite; Lapidary Journal, January 1986, pages 35-41.
Sinkankas, J. (1976): Gemstones of North America; Vol. 2, Van Nostrand Reinhold, New York, page 494.
Stalker, A. Mac S. (1953): Surficial geology of southwestern Alberta; Alberta Society of Petroleum Geologists, pages 15-22.
Ward, F.H. (1986): Macro - Paleo Bearpaw Formation, southern Alberta; Canadian Society of Petroleum Geologists, pages 31.
Webster, R. (1975): Gems; 3rd edition, Newnes Butterworths, London, page 931.
Wight, W. (1981): Korite - Fossil ammonite shell from Alberta, 1981; The Journal of Gemology, Vol. XVII, No. 6, London, pages 406-415.
Zeitner, J.C. (1978): Callentine is ammolite is nacre; Lapidary Journal, Vol. 3, pages 622-628.
172 Industrial Minerals Forum 1991
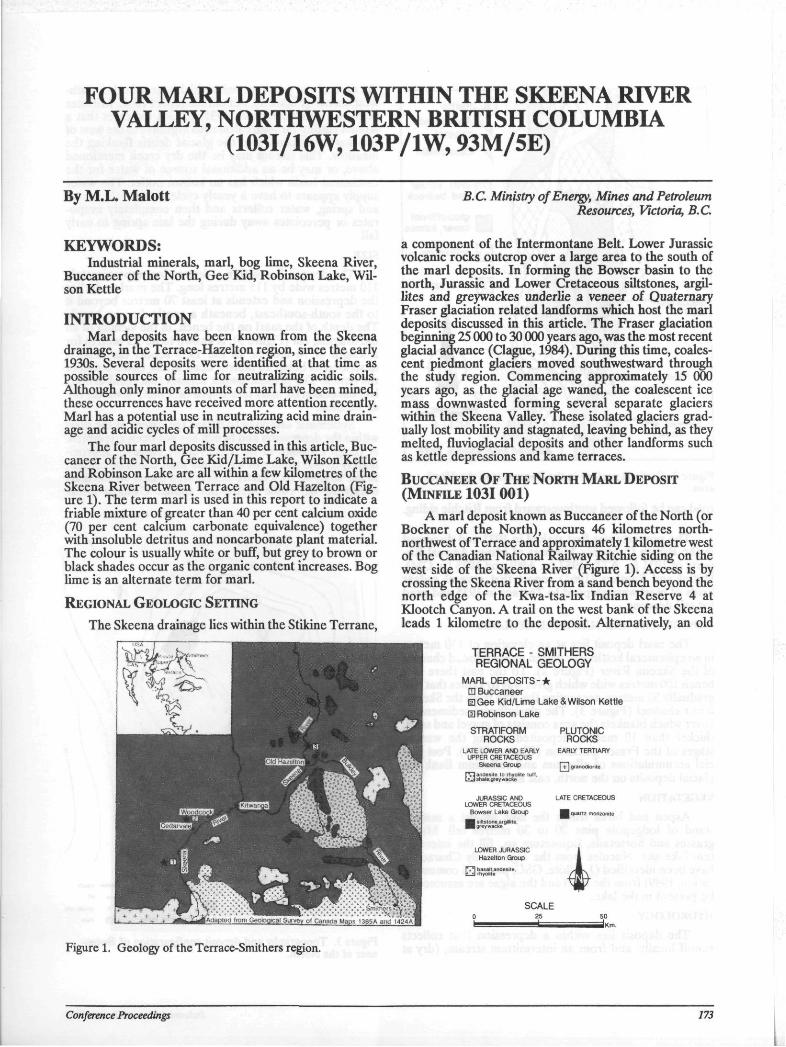
FOUR MARL DEPOSITS WITHIN THE SKEENA RIVER VALLEY, NORTHWESTERN BRITISH COLUMBIA
(103I/16W, 103P/1W, 93M/5E)
By MX. Malott
KEYWORDS: Industrial minerals, marl, bog lime, Skeena River,
Buccaneer of the North, Gee Kid, Robinson Lake, Wilson Kettle
INTRODUCTION Marl deposits have been known from the Skeena
drainage, in the Terrace-Hazelton region, since the early 1930s. Several deposits were identified at that time as possible sources of lime for neutralizing acidic soils. Although only minor amounts of marl have been mined, these occurrences have received more attention recently. Marl has a potential use in neutralizing acid mine drainage and acidic cycles of mill processes.
The four marl deposits discussed in this article, Buccaneer of the North, Gee Kid/Lime Lake, Wilson Kettle and Robinson Lake are all within a few kilometres of the Skeena River between Terrace and Old Hazelton (Figure 1). The term marl is used in this report to indicate a friable mixture of greater than 40 per cent calcium oxide (70 per cent calcium carbonate equivalence) together with insoluble detritus and noncarbonate plant material. The colour is usually white or buff, but grey to brown or black shades occur as the organic content increases. Bog lime is an alternate term for marl.
R E G I O N A L G E O L O G I C SETTING
The Skeena drainage lies within the Stikine Terrane,
B.C. Ministry of Energy, Mines and Petroleum Resources, Victoria, B.C.
a component of the Intermontane Belt. Lower Jurassic volcanic rocks outcrop over a large area to the south of the marl deposits. In forming the Bowser basin to the north, Jurassic and Lower Cretaceous siltstones, argil-lites and greywackes underlie a veneer of Quaternary Fraser glaciation related landforms which host the marl deposits discussed in this article. The Fraser glaciation beginning 25 000 to 30 000 years ago, was the most recent glacial advance (Clague, 1984). During this time, coalesced piedmont glaciers moved southwestward through the study region. Commencing approximately 15 000 years ago, as the glacial age wanea, the coalescent ice mass downwasted forming several separate glaciers within the Skeena Valley. These isolated glaciers gradually lost mobility and stagnated, leaving behind, as they melted, fluvioglacial deposits and other landforms such as kettle depressions and kame terraces.
BUCCANEER O F THE NORTH MARL DEPOSIT (MINFILE 1031001)
A marl deposit known as Buccaneer of the North (or Bockner of the North), occurs 46 kilometres north-northwest of Terrace and approximately 1 kilometre west of the Canadian National Railway Ritchie siding on the west side of the Skeena River (Figure 1). Access is by crossing the Skeena River from a sand bench beyond the north edge of the Kwa-tsa-lix Indian Reserve 4 at Klootch Canyon. A trail on the west bank of the Skeena leads 1 kilometre to the deposit. Alternatively, an old
TERRACE - SMITHERS REGIONAL GEOLOGY
MARL DEPOSITS-* LH Buccaneer EGee Kid/Lime Lake & Wilson Kettle CD Robinson Lake STRATIFORM
ROCKS LATE LOWER AND EARLY
UPPER CRETACEOUS Skeena Group
JURASSIC AND LOWER CRETACEOUS
Bowser Lake Group
LOWER JURASSIC Hazelton Group
PLUTONIC ROCKS
EARLY TERTIARY
f+J granodiorile
LATE CRETACEOUS
jHquanz monzonile
SCALE
Figure 1. Geology of the Terrace-Smithers region.
Conference Proceedings 173
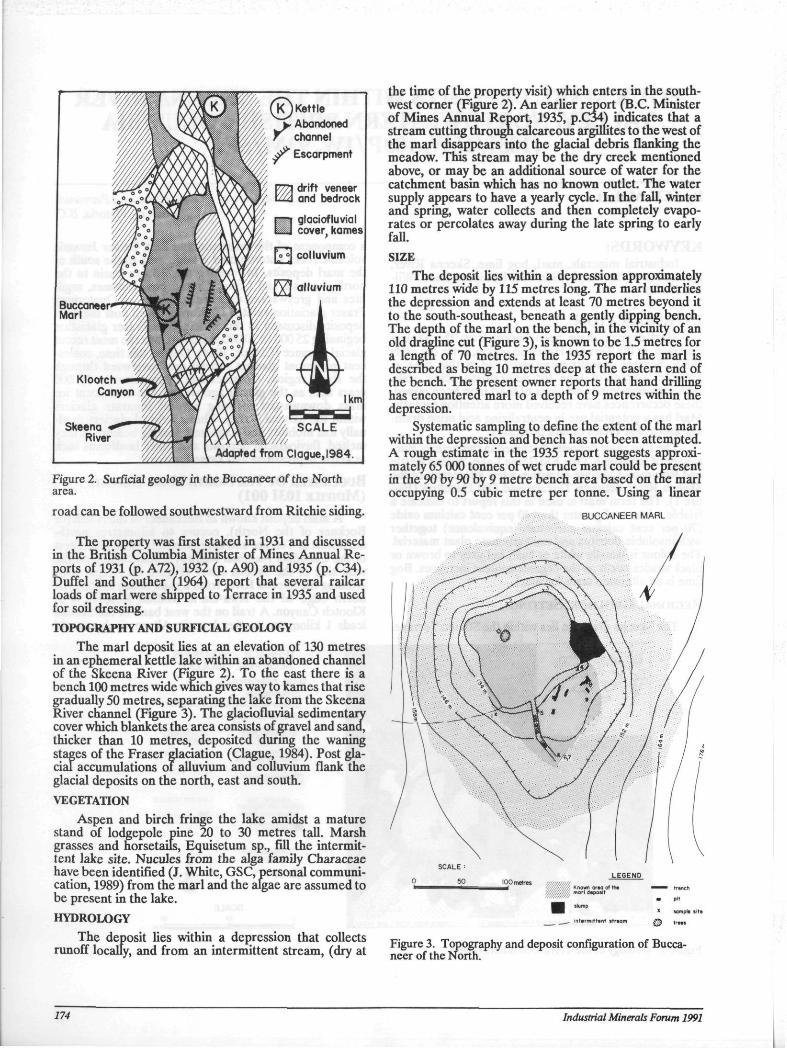
Figure 2. Surficial geology in the Buccaneer of the North area.
road can be followed southwestward from Ritchie siding.
The property was first staked in 1931 and discussed in the British Columbia Minister of Mines Annual Reports of 1931 (p. A72), 1932 (p. A90) and 1935 (p. C34). Duffel and Souther (1964) report that several railcar loads of marl were shippedto Terrace in 1935 and used for soil dressing. TOPOGRAPHY AND SURFICIAL GEOLOGY
The marl deposit lies at an elevation of 130 metres in an ephemeral kettle lake within an abandoned channel of the Skeena River (Figure 2). To the east there is a bench 100 metres wide which gives way to kames that rise gradually 50 metres, separating the lake from the Skeena River channel (Figure 3). The glaciofluvial sedimentary cover which blankets the area consists of gravel and sand, thicker than 10 metres, deposited during the waning stages of the Fraser glaciation (Clague, 1984). Post glacial accumulations of alluvium and colluvium flank the glacial deposits on the north, east and south.
VEGETATION Aspen and birch fringe the lake amidst a mature
stand of lodgepole pine 20 to 30 metres tall. Marsh grasses and horsetails, Equisetum sp., fill the intermittent lake site. Nucules from the alga family Characeae have been identified (J. White, GSC, personal communication, 1989) from the marl and the algae are assumed to be present in the lake. HYDROLOGY
The deposit lies within a depression that collects runoff locally, and from an intermittent stream, (dry at
the time of the property visit) which enters in the southwest corner (Figure 2). An earlier report (B.C. Minister of Mines Annual Report, 1935, p.C34J indicates that a stream cutting through calcareous argillites to the west of the marl disappears into the glacial debris flanking the meadow. This stream may be the dry creek mentioned above, or may be an additional source of water for the catchment basin which has no known outlet. The water supply appears to have a yearly cycle. In the fall, winter ana spring, water collects ana then completely evaporates or percolates away during the late spring to early fall.
SIZE The deposit lies within a depression approximately
110 metres wide by 115 metres long. The marl underlies the depression and extends at least 70 metres beyond it to the south-southeast, beneath a gently dipping bench. The depth of the marl on the bench, in the vicinity of an old dragline cut (Figure 3), is known to be 1.5 metres for a length of 70 metres. In the 1935 report the marl is described as being 10 metres deep at the eastern end of the bench. The present owner reports that hand drilling has encountered marl to a depth of 9 metres within the depression.
Systematic sampling to define the extent of the marl within the depression and bench has not been attempted. A rough estimate in the 1935 report suggests approximately 65 000 tonnes of wet crude marl could be present in the 90 by 90 by 9 metre bench area based on the marl occupying 0.5 cubic metre per tonne. Using a linear
BUCCANEER MARL
skimp * somptt * i t»
.. intermittent st r tam £ £ ( r M t
Figure 3. Topography and deposit configuration of Buccaneer of the North.
174 Industrial Minerals Forum 1991
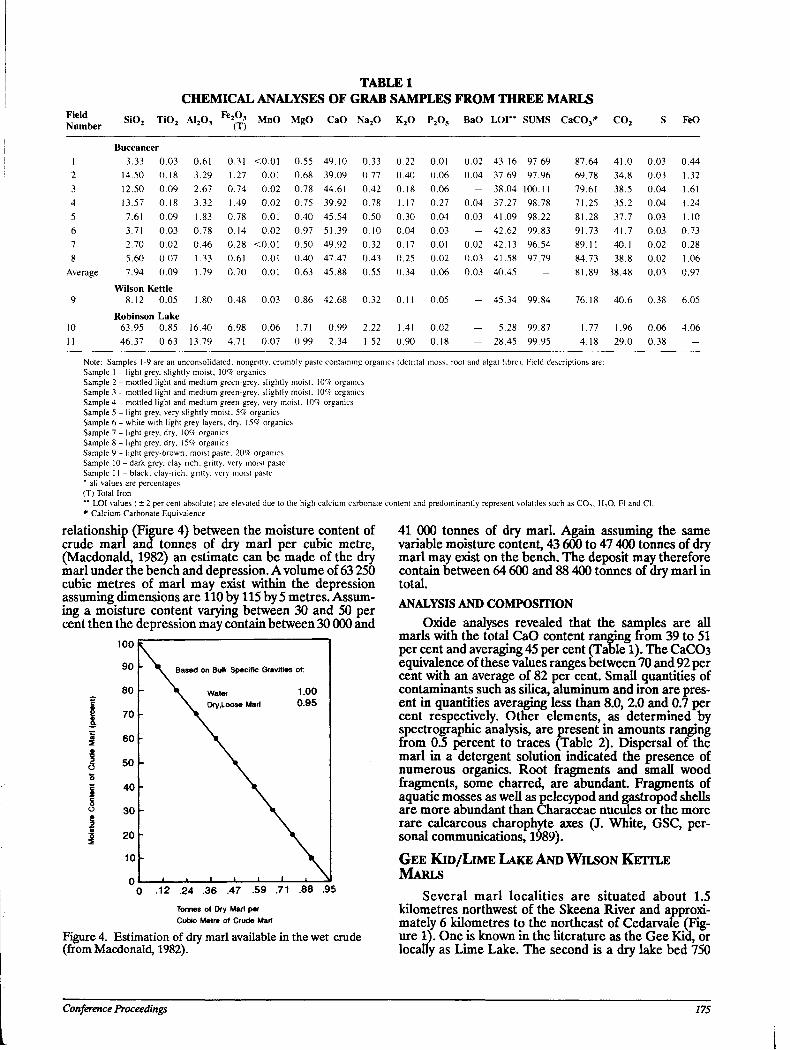
TABLE 1 CHEMICAL ANALYSES OF GRAB SAMPLES FROM THREE MARLS
Field Number SiO, TiO, A120, Fe.O 2^3
(T) MnO MgO CaO Na20 K20 P2Os BaO LOP* SUMS CaCQ3
# C02 FeO
Buccaneer 1 3.33 0.03 0.61 0.31 <0.01 0.55 49.10 0.33 0.22 0.01 0.02 43.16 97.69 87.64 41.0 0.03 0.44 2 14.50 0.18 3.29 1.27 0.01 0.68 39.09 0.77 0.40 0.06 0.04 37.69 97.96 69.78 34.8 0.03 1.32 3 12.50 0.09 2.67 0.74 0.02 0.78 44.61 0.42 0.18 0.06 - 38.04 100.11 79.61 38.5 0.04 1.61 4 13.57 0.18 3.32 1.49 0.02 0.75 39.92 0.78 1.17 0.27 0.04 37.27 98.78 71.25 35.2 0.04 1.24 5 7.61 0.09 1.83 0.78 0.01 0.40 45.54 0.50 0.30 0.04 0.03 41.09 98.22 81.28 37.7 0.03 1.10 6 3.71 0.03 0.78 0.14 0.02 0.97 51.39 0.10 0.04 0.03 — 42.62 99.83 91.73 41.7 0.03 0.73 7 2.70 0.02 0.46 0.28 <0.01 0.50 49.92 0.32 0.17 0.01 0.02 42.13 96.54 89.11 40.1 0.02 0.28 8 5.60 0.07 1.33 0.61 0.01 0.40 47.47 0.43 0.25 0.02 0.03 41.58 97.79 84.73 38.8 0.02 1.06
Average 7.94 0.09 1.79 0.70 0.01 0.63 45.88 0.55 0.34 0.06 0.03 40.45 - 81.89 38.48 0.03 0.97
Wilson Kettle 9 8.12 0.05 1.80 0.48 0.03 0.86 42.68 0.32 0.11 0.05 - 45.34 99.84 76.18 40.6 0.38 6.05
Robinson Lake 10 63.95 0.85 16.40 6.98 0.06 1.71 0.99 2.22 1.41 0.02 - 5.28 99.87 1.77 1.96 0.06 4.06 11 46.37 0.63 13.79 4.71 0.07 0.99 2.34 1.52 0.90 0.18 - 28.45 99.95 4.18 29.0 0.38 -
Note: Samples 1-9 are an unconsolidated. nongritty, crumbly paste containing organics (detrital moss, root and algal fibre). Field descriptions are: Sample 1 - light grey, slightly moist, 10% organics Sample 2 - mottled light and medium green-grey, slightly moist, \0c/c organics Sample 3 - mottled light and medium green-grey, slightly moist, \0c/c organics Sample 4 - mottled light and medium green-grey, very moist, 10% organics Sample 5 - light grey, very slightly moist, 5% organics Sample 6 - white with light grey layers, dry, 15% organics Sample 7 - light grey. dry. 10% organics Sample 8 - light grey. dry. 15% organics Sample 9 - light grey-brown, moist paste, 20% organics Sample 10 - dark grey, clay rich, gritty, very moist paste Sample 11 - black, clay-rich, gritty, very moist paste * all values are percentages (T) Total Iron ** LOI values ( ± 2 per cent absolute) are elevated due to the high calcium carbonate c # Calcium Carbonate Equivalence
e content and predominantly represent volatiles such as C02. H20, Fl and Cl.
relationship (Figure 4) between the moisture content of crude marl and tonnes of dry marl per cubic metre, (Macdonald, 1982) an estimate can be made of the dry marl under the bench and depression. A volume of 63 250 cubic metres of marl may exist within the depression assuming dimensions are 110 by 115 by 5 metres. Assuming a moisture content varying between 30 and 50 per cent then the depression may contain between 30 000 and
i
I J 1 M
I
100
90 v Based on Bulk Specific Gravities of:
80
70
Water 1.00 Dry,Loose Marl 0.95
60
50
40 -
30 -
20 -
10
n ! — 4 _ i 1 1 1 1—^1 12 .24 .36 .47 .59 .71 .88 .95
Tonnes of Dry Marl per Cubic Metre of Crude Marl
Figure 4. Estimation of dry marl available in the wet crude (from Macdonald, 1982).
41 000 tonnes of dry marl. Again assuming the same variable moisture content, 43 600 to 47 400 tonnes of dry marl may exist on the bench. The deposit may therefore contain between 64 600 and 88 400 tonnes of dry marl in total. ANALYSIS AND COMPOSITION
Oxide analyses revealed that the samples are all marls with the total CaO content ranging from 39 to 51 per cent and averaging 45 per cent (Table 1). The CaC03 equivalence of these values ranges between 70 and 92 per cent with an average of 82 per cent. Small quantities of contaminants such as silica, aluminum and iron are present in quantities averaging less than 8.0, 2.0 and 0.7 per cent respectively. Other elements, as determined by spectrographic analysis, are present in amounts ranging from 0.5 percent to traces (Table 2). Dispersal of the marl in a detergent solution indicated the presence of numerous organics. Root fragments and small wood fragments, some charred, are abundant. Fragments of aquatic mosses as well as pelecypod and gastropod shells are more abundant than Characeae nucules or the more rare calcareous charophyte axes (J. White, GSC, personal communications, 1989).
GEE KID/LIME LAKE AND WILSON KETTLE MARLS
Several marl localities are situated about 1.5 kilometres northwest of the Skeena River and approximately 6 kilometres to the northeast of Cedarvale (Figure 1). One is known in the literature as the Gee Kid, or locally as Lime Lake. The second is a dry lake bed 750
Conference Proceedings 175
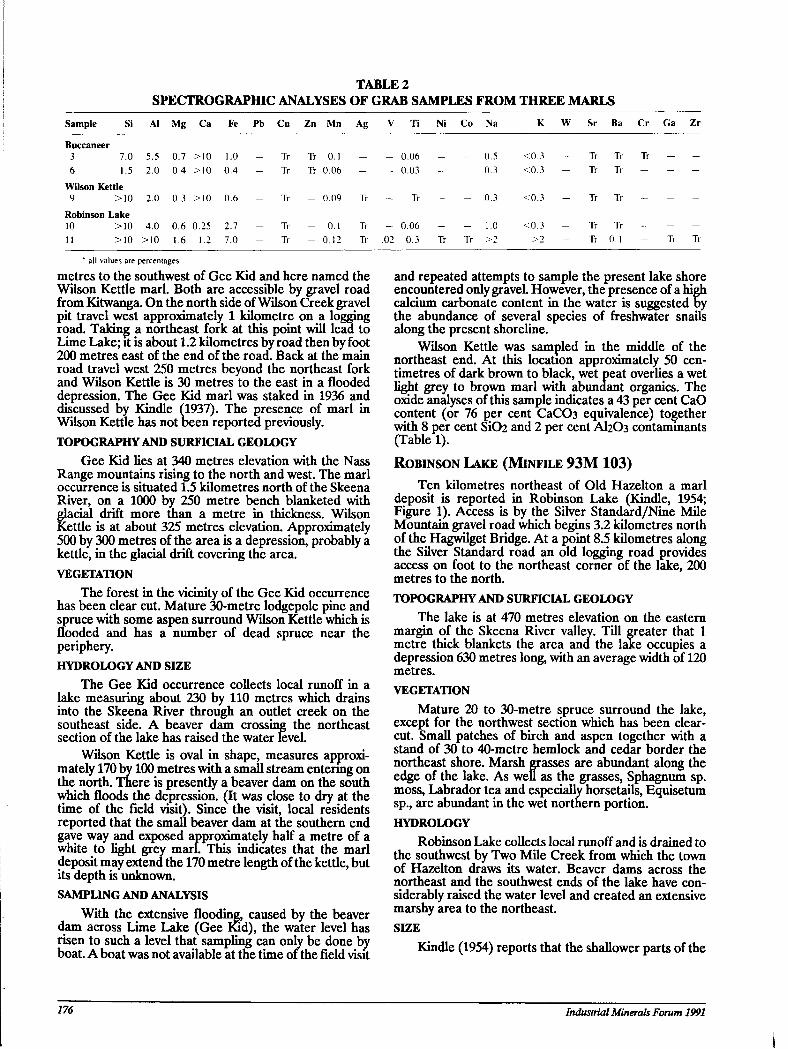
TABLE2 SPECTROGRAPHIC ANALYSES OF GRAB SAMPLES FROM THREE MARLS
Sample Si Al Mg Ca Fe Pb Cu Zn Mn Ag V Ti Ni Co Na K W Sr Ba Cr Ga Zr
Buccaneer 3 7.0 5.5 0.7 >10 1.0 Tr Tr 0.1 - 0.06 0.5 <0.3 Tr Tr Tr 6 1.5 2.0 0.4 >10 0.4 - Tr Tr 0.06 - - 0.03 - - 0.3 <0.3 - Tr Tr - - -
Wilson Kettle 9 >10 2.0 0.3 >10 0.6 Tr - 0.09 Tr - Tr 0.3 <0.3 _ Tr Tr _ _ _
Robinson Lake 10 >10 4.0 0.6 0.25 2.7 Tr - 0.1 Tr - 0.06 1.0 <0.3 _ Tr Tr _ _ 11 >10 >10 1.6 1.2 7.0 - Tr - 0.12 Tr .02 0.3 Tr Tr >2 >2 - Tr 0.1 - Tr Tr
* all values are percentages
metres to the southwest of Gee Kid and here named the Wilson Kettle marl. Both are accessible by gravel road from Kitwanga. On the north side of Wilson Creek gravel pit travel west approximately 1 kilometre on a logging road. Taking a northeast fork at this point will lead to Lime Lake; it is about 1.2 kilometres by road then by foot 200 metres east of the end of the road. Back at the main road travel west 250 metres beyond the northeast fork and Wilson Kettle is 30 metres to the east in a flooded depression. The Gee Kid marl was staked in 1936 and discussed by Kindle (1937). The presence of marl in Wilson Kettle has not oeen reported previously. TOPOGRAPHY AND SURFICIAL GEOLOGY
Gee Kid lies at 340 metres elevation with the Nass Range mountains rising to the north and west. The marl occurrence is situated 1.5 kilometres north of the Skeena River, on a 1000 by 250 metre bench blanketed with glacial drift more than a metre in thickness. Wilson Kettle is at about 325 metres elevation. Approximately 500 by 300 metres of the area is a depression, probably a kettle, in the glacial drift covering the area. VEGETATION
The forest in the vicinity of the Gee Kid occurrence has been clear cut. Mature 30-metre lodgepole pine and spruce with some aspen surround Wilson Kettle which is flooded and has a number of dead spruce near the periphery. HYDROLOGY AND SIZE
The Gee Kid occurrence collects local runoff in a lake measuring about 230 by 110 metres which drains into the Skeena River through an outlet creek on the southeast side. A beaver dam crossing the northeast section of the lake has raised the water level.
Wilson Kettle is oval in shape, measures approximately 170 by 100 metres with a small stream entering on the north. There is presently a beaver dam on the south which floods the depression. (It was close to dry at the time of the field visit). Since the visit, local residents reported that the small beaver dam at the southern end gave way and exposed approximately half a metre of a white to light grey marl. This indicates that the marl deposit may extend the 170 metre length of the kettle, but its depth is unknown. SAMPLING AND ANALYSIS
With the extensive flooding, caused by the beaver dam across Lime Lake (Gee Kid), the water level has risen to such a level that sampling can only be done by boat. A boat was not available at the time of the field visit
and repeated attempts to sample the present lake shore encountered only gravel. However, the presence of a high calcium carbonate content in the water is suggested By the abundance of several species of freshwater snails along the present shoreline.
Wilson Kettle was sampled in the middle of the northeast end. At this location approximately 50 centimetres of dark brown to black, wet peat overlies a wet light grey to brown marl with abundant organics. The oxide analyses of this sample indicates a 43 per cent CaO content (or 76 per cent CaC03 equivalence) together with 8 per cent Si02 and 2 per cent AI2O3 contaminants (Table 1).
ROBINSON LAKE (MINFILE 93M 103) Ten kilometres northeast of Old Hazelton a marl
deposit is reported in Robinson Lake (Kindle, 1954; Figure 1). Access is by the Silver Standard/Nine Mile Mountain gravel road which begins 3.2 kilometres north of the Hagwilget Bridge. At a point 8.5 kilometres along the Silver Standard road an old logging road provides access on foot to the northeast corner of the lake, 200 metres to the north. TOPOGRAPHY AND SURFICIAL GEOLOGY
The lake is at 470 metres elevation on the eastern margin of the Skeena River valley. Till greater that 1 metre thick blankets the area and the laxe occupies a depression 630 metres long, with an average width of 120 metres. VEGETATION
Mature 20 to 30-metre spruce surround the lake, except for the northwest section which has been clear-cut. Small patches of birch and aspen together with a stand of 30 to 40-metre hemlock and cedar border the northeast shore. Marsh grasses are abundant along the edge of the lake. As well as the grasses, Sphagnum sp. moss, Labrador tea and especially horsetails, Equisetum sp., are abundant in the wet northern portion. HYDROLOGY
Robinson Lake collects local runoff and is drained to the southwest by Two Mile Creek from which the town of Hazelton draws its water. Beaver dams across the northeast and the southwest ends of the lake have considerably raised the water level and created an extensive marshy area to the northeast. SIZE
Kindle (1954) reports that the shallower parts of the
176 Industrial Minerals Forum 1991
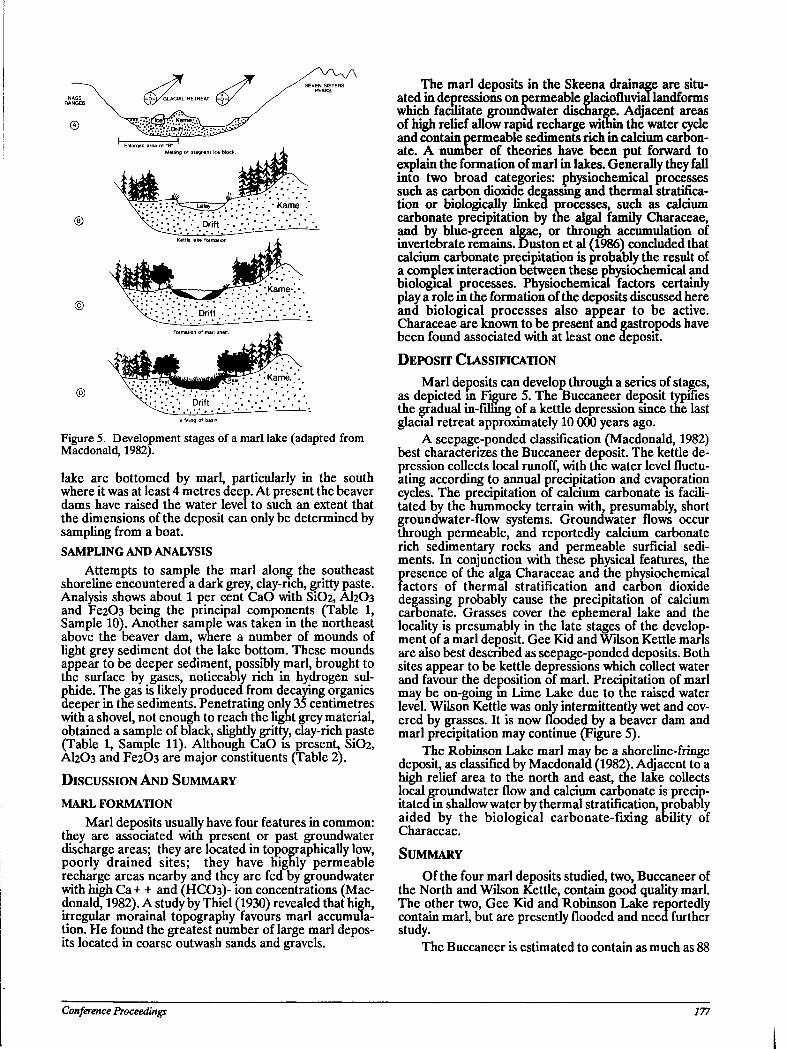
Figure 5. Development stages of a marl lake (adapted from Macdonald, 1982).
lake are bottomed by marl, particularly in the south where it was at least 4 metres deep. At present the beaver dams have raised the water level to such an extent that the dimensions of the deposit can only be determined by sampling from a boat. SAMPLING AND ANALYSIS
Attempts to sample the marl along the southeast shoreline encountered a dark grey, clay-rich, gritty paste. Analysis shows about 1 per cent CaO with Si02, AI2O3 and Fe203 being the principal components (Table 1, Sample 10). Another sample was taken in the northeast above the beaver dam, where a number of mounds of light grey sediment dot the lake bottom. These mounds appear to be deeper sediment, possibly marl, brought to the surface by gases, noticeably rich in hydrogen sulphide. The gas is likely produced from decaying organics deeper in the sediments. Penetrating only 35 centimetres with a shovel, not enough to reach the light grey material, obtained a sample of black, slightly gritty, clay-rich paste (Table 1, Sample 11). Although CaO is present, Si02, AI2O3 and Fe203 are major constituents (Table 2).
DISCUSSION A N D SUMMARY
MARL FORMATION
Marl deposits usually have four features in common: they are associated with present or past groundwater discharge areas; they are located in topographically low, poorly drained sites; they have highly permeable recharge areas nearby and they are fed by groundwater with high Ca+ + and (HCO3)- ion concentrations (Macdonald, 1982). A study by Thiel (1930) revealed that hieh, irregular morainal topography favours marl accumulation. He found the greatest number of large marl deposits located in coarse outwash sands and gravels.
The marl deposits in the Skeena drainage are situated in depressions on permeable elaciofluvial landforms which facilitate groundwater discharge. Adjacent areas of high relief allow rapid recharge within the water cycle and contain permeable sediments rich in calcium carbonate. A number of theories have been put forward to explain the formation of marl in lakes. Generally they fall into two broad categories: physiochemical processes such as carbon dioxide degassing and thermal stratification or biologically linked processes, such as calcium carbonate precipitation by the algal family Characeae, and by blue-green algae, or through accumulation of invertebrate remains. Duston et al (1986) concluded that calcium carbonate precipitation is probably the result of a complex interaction between these physiochemical and biological processes. Physiochemical factors certainly play a role in the formation of the deposits discussed here and biological processes also appear to be active. Characeae are known to be present and gastropods have been found associated with at least one deposit.
DEPOSIT CLASSIFICATION
Marl deposits can develop through a series of stages, as depicted m Figure 5. The Buccaneer deposit typifies the gradual in-filling of a kettle depression since the last glacial retreat approximately 10 000 years ago.
A seepage-ponded classification (Macdonald, 1982) best characterizes the Buccaneer deposit. The kettle depression collects local runoff, with the water level fluctuating according to annual precipitation and evaporation cycles. The precipitation of calcium carbonate is facilitated by the hummocky terrain with, presumably, short groundwater-flow systems. Groundwater flows occur through permeable, and reportedly calcium carbonate rich sedimentary rocks and permeable surficial sediments. In conjunction with these physical features, the {presence of the alga Characeae and the physiochemical actors of thermal stratification and carbon dioxide
degassing probably cause the precipitation of calcium carbonate. Grasses cover the ephemeral lake and the locality is presumably in the late stages of the development of a marl deposit. Gee Kid and Wilson Kettle marls are also best described as seepage-ponded deposits. Both sites appear to be kettle depressions which collect water and favour the deposition of marl. Precipitation of marl may be on-going m Lime Lake due to the raised water level. Wilson Kettle was only intermittently wet and covered by grasses. It is now flooded by a beaver dam and marl precipitation may continue (Figure 5).
The Robinson Lake marl may be a shoreline-fringe deposit, as classified by Macdonaia (1982). Adjacent to a high relief area to the north and east, tne lake collects local groundwater flow and calcium carbonate is precip-itateain shallow water by thermal stratification, probably aided by the biological carbonate-fixing ability of Characeae.
SUMMARY
Of the four marl deposits studied, two, Buccaneer of the North and Wilson Kettle, contain good quality marl. The other two, Gee Kid and Robinson Lake reportedly contain marl, but are presently flooded and need further study.
The Buccaneer is estimated to contain as much as 88
Conference Proceedings 177
400 tonnes of dry marl averaging 82 per cent calcium carbonate with a low percentage of contaminants. After removal of the thin vegetative cover, the marl could readily be scooped out and trucked to the railway only a kilometre away. The Wilson Kettle deposit contains marl of good quality with only a small percentage of contaminants, but further sampling is needed to determine its dimensions and overall quality. An all-weather road passes within a kilometre of the deposit. The extent and quality of the Gee Kid and Robinson Lake deposits was not ascertained because of extensive flooding, but exploitation of the Robinson Lake marl would be difficult as the town of Hazelton draws its water from the lake. In summary the marl in the Terrace-Hazelton area is of good quality, adjacent to transportation, readily remove-able, and at least one site has significant estimated reserves.
ACKNOWLEDGEMENTS
Dave Lefebure and Bob MacKillop are thanked for their assistance in the field. Dave Lefebure is especially acknowledged for his enthusiastic and constructive support throughout the project and his critical review of the manuscript. John Newefi's critical comments of the original manuscript are greatly appreciated.
REFERENCES Clague, J J. (1984): Quaternary Geology and Geomor-
phology, Smithers-Terrace-Prince Rupert Area, British Columbia; Geological Survey of Canada, Memoir 413, 71 pages.
Duffell, S. and Souther, J.G. (1964): Geology of Terrace Map-Area, British Columbia; Geological Survey of Canada, Memoir 329,117 pages.
Duston, N.M., Owen, R.M., and Wilkinson, B.H. (1986): Water Chemistry and Sedimentological Observations in Littlefield Lake, Michigan: Implications for Lacustrine Marl Deposition; Environmental Geology and Water Sciences, 8:4, pages 229-236.
Kindle, E.D. (1937): Mineral Resources, Usk to Cedarvale, Terrace Area Coast District, B.C.; Geological Survey of Canada, Memoir 212,63 pages.
Kindle, E.D. (1954): Mineral Resources, Hazelton and Smithers Areas, Cassiar and Coast Districts, British Columbia; Geological Survey of Canada,Memoir 223,148 pages.
Macdonald, D.E. (1982): Marl Resources of Alberta; Alberta Research Council, Earth Sciences Report 82-1, 94 pages.
Thiel, G.A. (1930): A Correlation of Marl Beds with Types of Glacial Deposits; Journal of Geology, Vol. 38, pages 717-728.
178 Industrial Minerals Forum 1991
1992 FORUM ON THE GEOLOGY OF INDUSTRIAL MINERALS, WEST VIRGINIA
By Claudette M. S imard West Virginia Geological & Economic Survey, Morgantown, WV
ABSTRACT The 28 th Forum on the Geology of Industrial Minerals, sponsored by West Virginia Geological and Economic
Survey, will be held in Martinsburg, West Virginia in early May 1992. Martinsburg is located in the State's eastern panhandle, an area of the most diverse industrial mineral production in West Virginia.
The four-day meeting will be comprised of two days of technical sessions and two days of field trips. The field trips will include tours offour nearby mineral operations, unique in the State. Capitol Cement, rated at 900 000 ton capacity, quarries the folded and faulted Ordovician Chambersburg and new Market Limestones and Martinsburg Shale to produce portland and masonry cement. Nearby Continental Brick Company quarries the Martinsburg Shale to produce face brick for buildings of all types. Millville Quarry, Inc., the largest aggregate producer in West Virginia, produces over 2.5 million tons of aggregate from the high-purity Cambrian Tomstown Dolomite. The last field trip will be a tour of the U.S. Silica Company quarry and processing plant. U.S. Silica quarries, crushes and grinds the 98 per cent pure Devonian Oriskany Sandstone into silica sand, ground silica, and micron-sized silica mainly for use by the glass industry.
Conference Proceedings 179

180 Industrial Minerals Forum 1991
APPENDIX 1
Conference Proceedings 181

182 Industrial Minerals Forum 1991
ALBERTA MINERAL DEPOSITS AND OCCURRENCES / GSIS Wylie Hamilton, Monica Price, Dennis Chao,
Barry Fildes, Jennie Lutz Alberta Geological Survey Alberta Research Council
Edmonton, Alberta
More than 30 different kinds of economic minerals are found in Alberta, mostly industrial (nonmetallic) minerals but with some notable metallics, in at least 1500 known occurrences. Data on geologic setting and resource attributes of these mineral occurrences have been captured systematically by the Alberta Geological Survey in a computer-based file termed the Alberta Mineral Deposits and Occurrences (AMDO) file. The ffle provides ready access to the data using automated file searching methods. Access currently is developed in two modes, each catering to software and system capabilities of particular user segments. The first of these is HyperCard, a software package for Macintosh computers. The second is IBM-PC, standard operating tool of the minerals industry. "User friendly" elements of HyperCard have been developed on the DOS platform by use of a package called ToolBook, a software construction set for Windows.
Another means of access to Alberta minerals data is through a Geoscience Information System (GSIS) currently in development. Based on Arclnfo software, the system has online query and display capabilities that allow integration of the minerals data with other resource information, for graphic output on maps. A GSIS pilot study was completed for the Bow Valley Corridor region of Alberta, a featured site of the 1991FGIM field trips.
The Bow Valley Corridor is a region richly developed in industrial minerals, for which an abundance of resource data exists. The pilot study has two principal products: (1) a hard-copy mineral deposits map on 1:50 000 scale, presenting the deposits in combination with various layers of geologic and geographic information; and (2) an online query and display package that displays the map on a screen with capabilities to (a) zoom in an area, (D) retrieve and display all data related to any selected deposit, and (c) allow selection by various criteria (e.g. geologic age, formation, township-range, etc). The procedures developed from this pilot are being applied on a province-wide basis to produce an operational GSIS package and Minerals Map for Alberta.
Conference Proceedings 183
MINFILE - A MINERAL DEPOSIT INFORMATION SYSTEM Larry Jones
B.C. Ministry of Energy, Mines and Petroleum Resources Geological Survey Branch Victoria, British Columbia
Information on mineral deposits in a country or province is valuable to the mining industry and essential for government planning, particularly when it is easily stored, searched and distributed. The British Columbia Geological Survey Branch maintains a comprehensive mineral inventory database of over 10 500 metallic, industrial mineral and coal occurrences, known as MINFILE. This database has evolved over the past 20 years from a simple card-based file to a powerful mainframe and microcomputer-based geoscience information system. Each occurrence record contains 43 data elements which describe mineral deposits in terms of geography, geology and economics. The data elements are organized within a relational database management system and application development software, and operate micro-computer environments. The strength of the MINFILE system is its ability to efficiently and easily search, sort and manipulate data in various information fields, which include location, tectonic belt, commodity, mineralogy, host-rock name and age, deposit type, lithology, production, and reserves. An expanded geological description in text form is in the capsule geology and information sources are included in the bibliography.
The MINFILE database is available to a diverse and vast user-community through MINFTLE/pc, a menu-driven data-entry, search and report program for the IBM/PC-compatible computer. This program is used to provide answers to specific queries, such as the relationship between mineralization and geologic features of an area, thus forming a basis for prospecting, ground acquisition and other geoscience and environmental research. MINF-ILE/pc helps provide solutions in mineral exploration, land-use planning and mineral resource management. Industry geologists may use MINFILE to better predict the location of new mineral deposits; land-use experts query MINFILE and channel extracted data into external support systems to make informed land-use decisions. A comprehensive mineral inventory database is an invaluable tool for academic research in metallogeny and related disciplines. MINFILE information may be used in other programs such as word processors, plotted using computer-aided mapping systems, and integrated with conventional Geographic Information Systems. MINFILE data are sold in both nard-copy and digital formats and the MINFILE system is licensed for sale worldwide for use by other geological surveys.
184 Industrial Minerals Forum 1991
ALKALIC DIATREMES, CARBONATITES AND ALKALINE SYENITES IN BRITISH COLUMBIA
Jennifer Pell ** B.C. Ministry of Energy, Mines
and Petroleum Resources Geological Survey Branch Victoria, British Columbia
A previously poorly documented alkaline igneous province is present in the eastern Canadian Cordillera. It comprises carbonatites, nepheline and sodalite syenites, some ijolite series rocks, one kimberlite locality and numerous ultramafic and lamprophyric diatreme breccias, all of which intruded the CordUleran miogeoclinal succession prior to the deformation and metamorphism associated with the Jura-Cretaceous Columbian orogeny.
CARBONATITES AND SYENITE GNEISSES
Carbonatites and syenite gneisses crop out in three belts parallel to the Rocky Mountain trench. The intrusions m the Eastern Roclcy and Cassiar Mountain Belt, are Middle Paleozoic, predominantly Devono-Mississippian in age, hosted in Lower to Middle Paleozoic strata and therefore are relatively high-level intrusions. They can be large and elliptical m shape and have significant alteration halos (for example, Aley car-bonatite), simply consist of metasomatic alteration zones (for example, Rock Canyon Creek showing), or be extensive linear belts comprising numerous, ana lithologically varied, sill, dykes and plugs (for example the Wicneeda Lake and Kechika River showings). The carbonatites in the Eastern Belt can be significantly enriched in niobium, fluorine, yttrium and rare earth elements.
The Central Belt lies within the Omineca Belt, immediately west of the Rocky Mountain Trench. The intrusions in this belt are also Devono-Mississippian in age, but are hosted in Precambrian strata; they were not emplaced as high in the stratigraphic succession as those in the Eastern Belt. The carbonatites in the Omineca Mountains are thin, discontinuous, sill-like intrusions generally with fenite alteration halos. With one example, they do not tend to be as enriched in niobium, fluorine or rare earth elements as their eastern counterparts.
The Western Belt, also within the Omineca Mountains, comprises intrusive and extrusive carbonatites and nepheline syenite gneisses hosted in the autochthonous cover sequence of the Frenchman Cap gneiss dome. The extrusive carbonatites are located relatively high in the mantling gneiss stratigraphy, and are probably Eocambr-ian in age.
The carbonatite intrusions are sill-like bodies with extensive fenitic aureoles. Work done to date indicates moderate enrichment in rare earth elements with or without niobium.
Commercial grade nepheline syenite could potentially be produced from the Trident Mountain syenite. Other compositionally similar syenites are present in British Columbia, but are also in remote locations and remain untested.
From an economic standpoint, the Aley carbonatite has within its core extensive zones containing between two-thirds and three-quarters of a per cent niobium contents and local concentrations of over two per cent Nb205. Wicheeda Lake carbonatite complex hosts rare earth minerals and pyrochlor. Rock Canyon Creek showing contains wide-spread fluorspar with rare earth carbonates and phosphates. The complex of alkaline rocks in Kechika River area has been explored for its yttrium and rare earth potential.
KIMBERLITES, LAMPROPHYRES AND OTHER ULTRABASIC DIATREMES
Ultrabasic diatremes have been recognized in five areas of British Columbia; the Kechika River and the Ospika River areas of northern British Columbia, the Golden are of south-central British Columbia and the Bull River-Elk River and Elkford areas of southern British Columbia. In the Ospika River area, north of Mackenzie and in the Columbia Icefields area north of Golden, the diatremes are characterized by macrocryst-rich breccias and dykes.
Microdiamonds have reportedly been recovered from heavy mineral separates taken from two of the pipes in the Golden - Columbia Icefields area. Preliminary investigations suggest that these rocks are neither kimberfites nor lamproites, the two lithologies currently known to contain economic concentrations of diamonds.
**Now Geological Consultant 1356 Kingsview Road RR5 Duncan, British Columbia V9L 4T6
Conference Proceedings 185
LIMESTONE AND DOLOMITE RESOURCES IN BRITISH COLUMBIA
P. Fischl B.C. Ministry of Energy, Mines
and Petroleum Resources Geological Survey Branch Victoria, British Columbia
Limestone and dolomite are found in abundance throughout most of British Columbia. Carbonate deposits ranging in age from Proterozoic to Jurassic can be found in all five of the tectonic belts that make up the Canadian Cordillera (Insular, Coast, Intermontane, Omineca and Foreland). The more dolomitic deposits are largely restricted to the Omineca and Foreland belts.
Purer limestone units, with generally minor contamination by chert and dolomite, are confined to extensive platformal and shelf deposits in the Upper Triassic of the insular Belt, the Permo-Carboniferous of the Intermontane Belt and the Mississippian and Upper Devonian of the Foreland Belt. Limestones associated with island arc sequences such as the Buttle Lake Group of the Insular Belt and the Nicola and Takla groups of the Intermontane Belt are commonly siliceous, argillaceous and limited in size. The Coast and Omineca belts contain limestones commonly contaminated with dolomite and various metamorphic silicates.
Extensive bedded dolomite deposits are confined to northeastern and southeastern British Columbia within Proterozoic and Paleozoic miogeosynclinal rocks of the Omineca and Foreland belts. Silt is a frequent contaminant in such deposits and chert is prevalent in some units. Smaller deposits of secondary origin occur sporadically in roof pendants of the Coast Belt, and adjacent to intrusions and faults in the Insular and Intermontane belts. Some of these deposits are contained within magnesian limestone units with sporadic dolomitization.
Limestone production in British Columbia is dominated by three major quarries on northern Texada Island, where some 4.2 million tonnes of limestone are currently mined each year. Approximately 400 000 tonnes of limestone are produced annually from six operations in the mterior of the province and from one quarry on northern Vancouver island. Two Texada Island quarries produce limestone for commercial suppliers of cement and lime, while one quarry east of Kamloops supplies limestone for cement manufacturing. A second interior quarry, at Marble Canyon (Pavilion Lake), produces limestone for lime manufacturing. The two Texada Island quarries and two quarries in the interior supply chemical-grade limestone to pulp mills. White limestone is currently quarried at three sites on the coast and at one location in the interior for fillers, extenders and pigments.
White dolomite is currently produced at a rate of 40 000 tones annually from two operations in southeastern British Columbia for agricultural, decorative and pigment applications. Several other dolomite deposits have been assessed in the past as a source of magnesium metal, but there has been no production for this use.
186 Industrial Minerals Forum 1991
DIMENSION STONE IN BRITISH COLUMBIA G. White **
B.C. Ministry of Energy, Mines and Petroleum Resources Geological Survey Branch Victoria, British Columbia
At the turn of the century, British Columbia produced a wide variety of quality dimension stone for both domestic and foreign markets. The industry flourished until the 1930's when many of the producing quarries closed. Our project examined formerly producing quarries to evaluate their development potential and document the stone's physical characteristics. At the same time were also documented the historical buildings where the original stone was used. White Nelson granite and Marblehead marble can be observed at the Revelstoke courthouse. Okanagan granite provided stone for the Vernon courthouse and the courtyard of the Royal British Columbia Museum in Victoria.
Granite from several coastal quarries on Nelson, Kelly, Fox and Hardy Islands has been used for construction of numerous buildings and structures in Vancouver and Victoria. Haddington Island andesite has been the most preferred stone for large buildings. Parliament Buildings, Royal British Columbia Museum and the Bank of Montreal building in Victoria are the typical examples. The maps of individual quarry sites and corresponding fracture density diagrams indicate that there is a potential for renewed granite and marble production in British Columbia.
** Now at the Science Institute of the Northwest Territories Inuvik Research Centre P.O. Box 1430 Inuvik, Northwest Territories XOE 0T0
Conference Proceedings 187
MOUNT BRUSSILOF MAGNESITE DEPOSIT, SOUTHEASTERN BRITISH COLUMBIA
G. Simandl and K Hancock B.C. Ministry of Energy, Mines
and Petroleum Resources Geological Survey Branch Victoria, British Columbia
For abstract see the paper in this volume.
188 Industrial Minerals Forum 1991
GYPSUM OCCURRENCES IN BRITISH COLUMBIA S.B. Butrenchuk **
B.C. Ministry of Energy, Mines and Petroleum Resources Geological Survey Branch Victoria, British Columbia
Gypsum is a low cost, high bulk commodity that finds major usage in the manufacture of wallboard and cement and therefore is closely related to the construction and housing industry. Presently, there are two producers in British Columbia, producing in excess of 500 000 tonnes annually. Markets for this gypsum are located in Alberta and Vancouver with very minor amounts of anhydrite shipped to the United States.
At present there are sufficient reserves for 200 years based on current production rates. Westroc Industries and Domtar Industries control both the source and market for gypsum. Another source of gypsum is located at the O'Connor River deposit located in the northwestern corner of the province. This deposit could conceivably replace the imports providing lower costs and suitable contracts can be achieved. Deposits at Falkland are now nearly depleted and a deposit at Forgetmenot Creek is not likely to be developed because of its location with respect to the Willmore Wilderness Area in Alberta.
The best potential for gypsum in British Columbia is in the Stanford Range where extensive gypsum deposits of Devonian Burnais Formation can be traced from Stoddart Creek to the north end of the Top of the World Park. The resource potential for the Stanford Range between Stoddart Creek and Top of the World Park is now estimated to have a potential for 210 million tonnes. It is known that much of the area previously thought to be underlain by the Burnais Formation and therefore gypsum is underlain by carbonate strata of the CedareaFormation.
Elsewhere in the province there is a potential for 10 million tonnes at the O'Connor River deposit and 3 to 20 million tonnes at Forgetmenot Creek. Because of their locations it may be some time before these deposits are developed.
** Now with Mountain Minerals Co. Ltd. P.O. Box 700 Lethbridge, Alberta T1J3Z6
Conference Proceedings 189
FELDSPATHIC MINERALS IN BRITISH COLUMBIA G. White ** andM. MacLean B.C. Ministry of Energy, Mines
and Petroleum Resources Geological Survey Branch Victoria, British Columbia
There is currently no production of feldspathic minerals in Western Canada; British Columbia imports feldspathic sand from Idaho and nepheline syenite from Ontario.
A field study was carried out by the British Columbia Geological Survey Branch of potential and known deposits of feldspathic minerals. The sites chosen for evaluation are all in southern British Columbia and close to transportation finks. Mineral processing studies were conducted by CANMET laboratories of Energy, Mines and Resources in Ottawa, Ontario.
Of the eleven prospects studied, four sites (Lumby, Hellroaring Creek, Scuzzy Creek and Trident Mountain) can produce a feldspathic product comparable to material currently being imported.
A market study of feldspathic minerals to be produced in B.C. indicates that local producers would enjoy a marked freight advantage over present suppliers.
It is estimated that about 29 700 tonnes per year of feldspar or 23 400 tonnes per year of nepheline syenite could be marketed in northwestern North America with an additional 23 400 tonnes nepheline syenite per year for Pacific Rim countries. The possibility also exists for penetration of nepheline syenite into the aplite market in Japan.
** Now at the Science Institute of the Northwest Territories Inuvik Research Centre P.O. Box 1430 Inuvik, Northwest Territories X0E 0T0
190 Industrial Minerals Forum 1991
PHOSPHATE POTENTIAL IN BRITISH COLUMBIA S.B. Butrenchuk **
B.C. Ministry of Energy, Mines and Petroleum Resources Geological Survey Branch Victoria, British Columbia
British Columbia is well endowed with phosphate deposits, both sedimentary and igneous. These deposits are all located in the Rocky Mountains east of the Rocky Moimtain Trench. Some isolated occurrences occur west of the trench but none are of economic significance. Sedimentary phosphate occurs in a variety of forms but only pelletal varieties offer potential for future development. Grades greater than 15 per cent P2O5, the threshold of economic interest, occur only in the Triassic Whistler member of the Sulphur Mountain Formation, in the Jurassic Fernie Formation and locally in Permian strata. In the future, as production in Florida decreases and mining of lower grade phosphate from the Phospho-ria Formation becomes necessary, phosphate deposits in British Columbia may become economically viable.
PERMIAN Phosphate deposits are present in several strati-
graphic units of Permian age. These deposits are best developed in southeastern British Columbia, in strata of the Johnston Canyon and Ranger Canyon formations.
Two areas of pelletal phosphorite, Weigert and Nordstrum Creek appear to have limited areal extent although phosphate grades are in excess of 12 and 24 per cent respectively.
In northeastern British Columbia the best potential for Permian phosphate is in the Mowitch Formation where there is an estimated potential for 113 million tonnes with a phosphate grade averaging approximately 12 per cent P2O5.
TRIASSIC Phosphate deposits of Triassic age include predom
inantly nodular varieties in the Toad Formation and pelletal phosphorite in the Whistler member of the Sulphur Mountain Formation. The Toad Formation may have a resource potential in excess of 2 billion tonnes with grades of 3 to 5 per cent P2O5. The Whistler member is estimated to have a resource potential of 113 million tonnes with grades of 15 to 20 per cent P2O5, assuming the best possible parameters. Included in this resource is the potential for grades of approximately 64 ppm of lanthanum and 42 ppm of cerium. These deposits, because of their high carbonate content, present benefi-ciation problems in addition to difficult mining conditions. Although most of these deposits would have to be mined underground there appears to be some open-pit potential in the Wapiti Lake area.
JURASSIC The best potential for an economic sedimentary
phosphate deposit occurs at the base of the Jurassic Ferme Formation. This phosphorite bed is estimated to have a maximum resource potential of 340 million tonnes grading 15 to 20 per cent P2O5 with approximately 195 ppm of lanthanum, 130 ppm of cerium, 480 ppm of yttrium and represents a significant source of these metals.
Beneficiation of the Fernie phosphate will require grinding to either 65- or 100-mesh depending on grain size, desliming to remove the clay fraction and flotation. Calcining will be required in areas where the carbonate or organic content is high. Exploration of these deposits should concentrate on the eastern and southeastern margin of the Fernie Basin. Phosphate grades and, to some extent, trace element contents are generally higher in these areas while the carbonate content tends to be much lower.
Carbonatites also represent a significant source of phosphate in the province. At present only the Aley carbonatite has significant phosphate potential. Other phosphate-bearing carbonatites do occur and the potential for locating more of these deposits is excellent.
** Now with Mountain Minerals Co. Ltd. P.O. Box 700 Lethbridge, Alberta T1J3Z6
Conference Proceedings 191
GARNET AND KYANITE IN BRITISH COLUMBIA Jennifer Pell **
B.C. Ministry of Energy, Mines and Petroleum Resources Geological Survey Branch Victoria, British Columbia
Garnet and kyanite group minerals occur mainly in two belts in the Cordillera, the Omineca crystalline belt and the Coast Mountain belt. Within these belts, pelitic metasedimentary rocks containing small percentages (less than 5
Eer cent) of these minerals are extremely abundant. Rocks containing significant concentrations of these minerals, owever, are considerably less frequently found.
This study deals with potential hardrock sources of garnet and aluminosilicate minerals. Virtually no information exists in the literature regarding secondary placer concentrations of these minerals. Common sense, however, dictates that the general areas in which hardrock enrichment occurs should also have good potential for placer accumulations. Secondary deposits could be economic with considerably lower concentrations of desired mineral species; as little as a few per cent may be all that is necessary, as opposed to 10 to 15 per cent kyanite and 25 to 40 per cent garnet in hardrock sources. Such garnet-rich placers were recently reported oy a prospector from the Revelstoke area.
Gneisses with up to 40 per cent garnet have been described from Passmore dome area (NTS 82F), schists from the Kinbasket Mountain - SulUvan River area (NTS 82N) and from Douglas Channel (NTS 103H) contain locally up to 50 per cent garnet. Garnet contents in the range from 20 to 30 per cent are common in many places of both belts of metamorphic rocks as well as concentrations oi kyanite and locally sillimanite.
High concentrations of andalusite have been described from the Leech River area on Vancouver Island (NTS 92B), Prince Rupert area (NTS 103G), Nahatlatch River (NTS 92H) and Frenchman Cap dome (NTS 82M).
**Now Geological Consultant 1356 Kingsview Road RR5 Duncan, British Columbia V9L 4T6
192 Industrial Minerals Forum 1991
MAGNETITE IN BRITISH COLUMBIA K Hancock
B.C. Ministry of Energy, Mines and Petroleum Resources Geological Survey Branch Victoria, British Columbia
Magnetite is found in several types of mineral deposits in British Columbia. The most common is skarns in which magnetite varies from the mam component to a trace mineral. Other types of magnetite occurrences are usually smaller; they include differentiated magmatic, stratabound, ultramafic and placer deposits. From a production standpoint, only the skarn bodies have been mined in the past.
Historically, magnetite was produced as an iron ore with the greatest production period in the 1950's and 1960's. At present, magnetite is currently produced from a stockpile at tne now closed Craigmont mine near Merritt. All of this magnetite is used in the coal processing plants of British Columbia and as the supply is limited, a new source of magnetite will be required.
Magnetite has been long overlooked as a secondary economic mineral. It is readily separated from other ores by simple methods and is easy to process. The best example is the Craigmont mine where the primary ore was chal-copyrite but now the magnetite tailings are providing contmued income for the operators.
Skarn deposits provide the greatest potential source of magnetite in B.C. The west coast of Vancouver Island and the Queen Charlotte Islands, the Greenwood - Deadwood and Rossland mining camps have the largest number of recorded magnetite occurrences. As well, several iron mines closed before their ore reserves were exhausted and many copper and base metal mines discarded magnetite with the mill tailings. These are potential magnetite sources as the infrastructure is still present or readily available.
Magnetite is a subsidiary component in many mines, for example asbestos, copper and base metal mines. The tailings of these mines could be an important source of magnetite. Many mines had magnetite concentrations on the order of 10 per cent, such as the Cassiar, Granduc or Phoenix mines.
There is potential for Banded Iron Formations in B.C. One such prospect north of MacKenzie is the Falcon property.
Conference Proceedings 193
INDUSTRIAL MINERALS POTENTIAL OF BRITISH COLUMBIA TERTIARY BASINS
P. Read Geotec Consultants Limited
1200 -100 West Fender Street Vancouver, British Columbia
V6B 1R8
Z.D. Hora B.C. Ministry of Energy, Mines
and Petroleum Resources Geological Survey Branch Victoria, British Columbia
This geological investigation concentrated on areas of sediment-dominated successions of Eocene age with occurrences of industrial minerals. Most of the areas lie close to major transportation routes and to nearby markets.
The Princeton and Tulameen basins share a common Eocene stratigraphy. The most extensive clinoptilo-lite-rich zeolite occurrences (eight showings) and the only bentonite past producer m the province (one past producer and seven showings) are in tne Princeton basin.
The Merritt basin contains four widely separated, sediment-dominated sequences of the Eocene Coldwater Formation. Bentonite (two showings) is the only industrial mineral known in the basin.
Along the southern edge of the Cache Creek and Arrowstone Hills, from the village of Cache Creek to Battle Creek, tuffaceous sediments and rhyolite tephra form several sedimentary lenses up to 100 metres thick. The basal sedimentary lenses contain four heulandite-clinoptilolite showings, and where the intermediate tephra is waterlain near the base, it is bentonite-rich (two showings). In the Arrowstone Hills, the Chilcotin Group consists of up to 500 metres of olivine basalt flows of the Chasm Formation overlying up to 400 metres of rhyolite tuff and ash, and tuffaceous, fluviatile and locally lacustrine sediments composing the Deadman River Formation. The sediments and rhyolite tephra fill mainly northwestward-flowing Miocene drainage channels up to 450 metres deep and 5 kilometres wide, which were mapped for over 45 kilometres from southeast of Dead-man River to northwest of Bonaparte River, but probably extend much farther. Diatomite-bearing sediments are restricted to the channel fillings and intercalations among the immediately superjacent basalt flows (one producer and 23 showings).
At Hat Creek, over 1600 metres of Eocene and (?) Oligocene sediments overlie up to a few hundred metres of Eocene volcanics and as many as 400 metres of mid-Cretaceous sediments. The Eocene rocks form two northerly trending synclines and contain bentonitic horizons (one bentonite showing).
Along the Fraser River from north of Lillooet to Gang Ranch, the Fraser fault slices through Eocene and older rocks. A 200-metre-thick panel of easterly dipping
Eocene volcanic rocks and waterlain ash lies between Slok Creek and Fraser faults for at least 12 kilometres between the mouths of Fountain and Slok Creeks (one bentonite showing). A few kilometres to the north, a thin westerly dipping panel of Eocene volcanic rocks and ash underlies a 10-kilometre-long wedge east of the fault (two bentonite showings).
Most of the industrial mineral occurrences are in waterlain rhyolite (nine heulandite-clinoptilolite showings') and intermediate tephra (eight bentonite showings) in tne upper part of the eocene volcanic succession. Volcanic glass (three showings) and perlite (two showings and one past producer) form in rhyolite flows and hypabyssal intrusions.
The geological setting of the previously known occurrences, combined with the known or inferred chemical and physical conditions of the 63 occurrences discovered during this study, lead to the following conclusions:
Of the areas investigated, industrial zeolite occurrences are restricted to the Princeton and Tulameen basins, basal sedimentary lenses near McAbee, and waterlain rhyolite tephra along the Fraser River. In the Princeton basin, zeolitized tephra horizons are up to 3.5 kilometres long and 30 metres thick. Some samples have cation exchange capacities (CEC) similar to those of the products from operating deposits in the western United States. Along the Fraser River, a few intermediate CEC values suggest an industrial zeolite potential.
Bentonite is widespread in sedimentary and adjacent volcanic rocks of Eocene age. Although few of the areas have been explored, drilling at Hat Creek has outlined significant thicknesses. From a few exchangeable cation analyses, divalent cations dominate except for showings in the south end of the Princeton basin and a showing in the Deadman River valley.
Known kaolinite occurrences in British Columbia are the result of subtropical weathering of gra-
194 Industrial Minerals Forum 1991
nitic or compositionally equivalent volcanic rocks on unconformities ranging in age from Early Cretaceous to Late Eocene. Kaolinite occurrences are in sediments overlying such an unconformity developed on granitic rocks, but sediments are absent within the area investigated. They occur to the southwest in the Georgia Basin and may have developed to the northwest in the Chilcotin-Nechako region.
Perlite develops in glassy rhyolite which is part of the little-altered Eocene volcanic sequence along the Fraser River. Similar rocks may occur farther north along and west of the river.
Diatomaceous earth occurs in Miocene and younger rocks in the sedimentary fill of the deep drainage channels buried beneath the wide-spread basalt flows of the Chilcotin Group. All of the showings in Arrowstone Hills are in the sediments of this northwestward-flowing drainage system, and those north of Gang Ranch are in sediments in a north-draining channel. This Miocene drainage system subparallels the Fraser and undoubtedly has tributaries to the west, in the Chilcotin-Nechako area.
Although not a subject of this investigation, the discovery of a major northwesterly to northerly flowing Miocene drainage system opens the possibility of Miocene placer gold and provides a framework to guide the prospecting for such occurrences.
Conference Proceedings 195
OLIVINE POTENTIAL IN BRITISH COLUMBIA G. White ** Z.D. Hora
B.C. Ministry of Energy, Mines and Petroleum Resources Geological Survey Branch Victoria, British Columbia
The dunite core of the Tulameen ultramafic complex is composed of variably serpentinized olivine. Detailed sampling has identified three zones of fresh unaltered olivine located on Grasshopper Mountain near the confluence of Britton Creek and Tulameen River. The zones exhibit loss of ignition less than 2 per cent.
Olivine samples from the fresh rock were tested for suitability in foundry sand applications. After positive results on a laboratory scale, a full series of tests with five separate metal castings were made. In each trial the Grasshopper Mountain olivine sand performed equally as well as the standard product available on the market. The olivme from the Tulameen complex compares favourably with other deposits worldwide and represents a development opportunity.
** Now with the Science Institute of the Northwest Territories Inuvik Research Centre P.O. Box 1430 Inuvik, Northwest Territories XOE 0T0
196 Industrial Minerals Forum 1991
THE PEAT RESOURCE IN BRITISH COLUMBIA D.E. Maynard, Consultant
13-251 West 14th Street North Vancouver, British Columbia
V7M1P4
It is estimated that approximately 1 per cent of the total land area of British Columbia is covered by peatland, much of which occurs in remote areas.
The dominant peatlands of British Columbia are mainly classed as bogs or fens. Bogs are ombrotrophic peat-lands with high water tables. The surface of bogs is virtually unaffected by nutrient-rich groundwater from surrounding mineral soils and thus is usually acidic and low in nutrients. Dominant materials are poorly to moderately decomposed sphagnum moss and woody peat, underlain at times by sedge peat. Fens are meadow-like, minerotrophic peatlands with high water tables. They are richer in nutrients and less acidic than bogs. Dominant materials are moderately to well-decomposed sedge or brown moss-peat of variable thickness.
Three general regions of the province are identified by the peatland inventory as being the principal locations of the resource: central and north coast area, central Interior Plateau and northeastern Great Plains. The largest deposits occur in the northeast. Large peat deposits also occur on certain coastal lowlands. Interior peatlands are usually smaller, but occur in clusters.
Peatlands are a common landform north of 50 latitude along a coastal strip 30 to 100 kilometres wide. The large peat deposits consist mainly of flat and slope bogs located on the Queen Charlotte Lowland, on the flat, mid-coast islands, in the Nootka Sound area and near Prince Rupert. They usually have a thin surficial cover of sphagnum moss overlying well-humified, sedge-dominated peat. On Vancouver Island and the adjacent mainland coast, peatlands are mainly undifferentiated organics and fens which are usually small in area and isolated from one another. Sedge-dominated peats are common in these areas.
Peatlands of the Interior Plateau are mainly fens, other sedge or brown moss-dominated organics and undifferentiated organics. Sphagnum bogs are uncommon. The north-trending core of the plateau, west of the Fraser River between Williams Lake and Prince George, has the highest concentration of organics.
Peat deposits occupy extensive tracts of level or depressional ground in the Peace River and Fort Nelson lowlands. Fairly deep sphagnum bogs predominate in these regions but fens are also common south of the Peace River. Bogs in the Fort Nelson area consist of an upper layer of partially decomposed fibric mosses overlying moss, sedge and woody peat of more advanced decomposition. Permafrost within 1 metre of the ground surface is a common feature of these extensive bogs. The Fort St. John - Dawson Creek area features clusters of contiguous and isolated bogs and fens in the south. Further north, vast level areas are nearly continuous bogs and bog-fen complexes. The bogs are similar to those in the Fort Nelson area but are unlikely to contain perennially frozen layers.
Conference Proceedings 197
WOLLASTONITE IN BRITISH COLUMBIA P. Fischl
B.C. Ministry of Energy, Mines and Petroleum Resources Geological Survey Branch Victoria, British Columbia
Wollastonite, a calcium silicate pyroxenoid used in ceramics, paints, plastics and in asbestos replacements, is known to occur at several sites in British Columbia as a major component of skarn bodies of contact metamorphic and metasomatic origin. There is potential for wollastonite to occur in significant quantities in carbonatite deposits, although it has yet to be identified in the numerous carbonatites that are known within the province.
Tremolite, an amphibole of similar origin and with the potential for similar uses as wollastonite, is found in similar geologic environments throughout the province.
Mapping, sampling and a review of the MINF1LE database has identified seven skarn occurrences containing significant wollastonite and two with significant tremolite. Of these occurrences, only Snake Bay is in the advanced exploration stage with drill-indicated reserves.
Testing by CANMET of bulk samples from four of the wollastonite occurrences and one tremolite occurrence revealed that wollastonite and tremolite with only low to moderate aspect ratios could be produced using conventional grinding and beneficiation techniques. Of the five deposits tested, marketable wollastonite-tremolite concentrates (less than 1 per cent Fe203 and ignition loss) could be produced from three of the occurrences with wet, high-intensity magnetic separation and reverse anionic flotation.
198 Industrial Minerals Forum 1991
PERLITE AND VERMICULITE IN BRITISH COLUMBIA G. White **
B.C. Ministry of Energy, Mines and Petroleum Resources Geological Survey Branch Victoria, British Columbia
Perlite deposits in British Columbia selected on the basis of their accessibility to established transportation networks were assessed for their development potential. As a benchmark was used the Frenier deposit near Empire Valley in central British Columbia, which saw production from 1985 through 1985 and has a proven record of high quality expanded product. The deposits were mapped and sampled to correlate their expansion properties. The results indicate, that perlites from Frenier deposit, Uncha Lake, Francois Lake and Ootsa Lake in B.C. interior and Blackwater Creek on Queen Charlotte Islands have similar expansion rates between 258 and 450 kilograms per cubic metre. The Gold Creek sample from Queen Charlotte Islands, however, expanded significantly more reaching a bulk density of 166 kilograms per cubic metre. The Gold Creek site location is particularly attractive because of its location near tidewater in the Port Clements area.
Jurassic intrusives in the Fort St. James - Fraser Lake area contain mica flakes which swell when heated with a propane torch. While the laboratory testing did not produce vermiculite with bulk densities meeting ASTM specifications for loose insulation, there is still a potential in filler or aggregate uses for this resource.
** Now with the Science Institute of the Northwest Territories Inuvik Research Centre P.O. Box 1430 Inuvik, Northwest Territories XOE 0T0
Conference Proceedings 199
TALC INVENTORY OF BRITISH COLUMBIA M. MacLean
B.C. Ministry of Energy, Mines and Petroleum Resources Geological Survey Branch Victoria, British Columbia
The geology of British Columbia offers potential for the discovery of a quality talc deposit. Generally, the highest purity talc is derived from deposits associated with magnesium carbonate rocks, and the talcs of lesser purity come from altered ultrabasic igneous rocks. Two properties studied by the industry in recent years have identified talc meeting the pulp and paper industry standards.
At the present time there are no operating talc mines in British Columbia; all of the province's talc is imported. In British Columbia the greatest demand for talc comes from the pulp and paper industry where it is used for
pitch control, and as a filler for paper coating. The twenty-five pulp mills in the province and five mills in Alberta use as much as 2.3 tonnes of talc per day. Tens of thousands of tonnes of talc are required by the industry each year.
There are many ultramafic belts in British Columbia which are ideal settings for a higher purity talc deposit. Other favourable host rocks which warrant exploration are also documented.
The number of known talc occurrences, together with favourable geology and laboratory research, indicates that talc meeting the industry's standards can be produced in British Columbia.
Of the four British Columbia pyrophyllite showings, the largest, at Kyoqout Sound, is hosted in dacitic to andes-itic volcanics, with abundant associated alunite.
200 Industrial Minerals Forum 1991
CHROMITE IN BRITISH COLUMBIA K Hancock
B.C. Ministry of Energy, Mines and Petroleum Resources Geological Survey Branch Victoria, British Columbia
This poster records the most significant mafic-ultramafic-associated chromite occurrences in British Columbia. Exploration for chromite in British Columbia has not been extensive. It was primarily done in the early 1930's
through to the late 1940's. The primary targets in exploration for chromite mineralization are the mantle portions of ophiolite bodies and ultramafic intrusions. Regionally, the most significant settings for ultramafic rocks are the Cache Creek terrane, the Anarchist Group rocks and their equivalents, the Shulaps ultramafic complex and the Hozameen Groups as well as the Alaskan-type mafic-ultramafic mtrusions.
Ophiolite complexes comprise a sequence of metamorphic to plutonic though hypabyssal volcanic and extrusive to sedimentary rocks. In British Columbia there are several ultramafic complexes which are the ultramafic, plutonic or upper mantle sections of a typical ophiolite sequence. These include the Shulaps ultramafic complex, ultramafic sections of the eastern facies in the Cache Creek terrane, and the Blue River ultramafite. Many of these bodies host minor chromite mineralization.
Alaskan-type ultramafic-mafic complexes occur in orogenic belts and are believed to have formed in subvolca-nic magma chambers in volcanic arcs over subduction zones. These complexes are intrusive and may be crudely zoned from ultramafic lithologies in the 'core' to gabbroic rocks near their margin.
Each complex may not contain a full suite of rock types which may make recognition of an Alaskan-type body difficult. In B.C. the Polaris and Tulameen complexes contain all of the typical rock types but others, such as the intrusions at Johanson Lake and Menard Creek, only have some of the characteristic lithologies.
Alaskan-type complexes in British Columbia fall into two discrete groups based on age and tectonic setting. Several complexes in Alaska have been dated at 100 Ma by potassium-argon methods, some complexes in British Columbia have been dated between 175 Ma and 156 Ma by potassium-argon methods.
Alaskan-type complexes may show prominent contact aureoles, usually of amphibolite grade, but they are commonly fault-bonded. The intrusions are usually small in size, a few kilometres across but may reach 20 kilometres in length (e.g. Tulameen). Faulting of the complexes can significantly distort their original shape and orientation.
Conference Proceedings 201
FLUORSPAR AND FLUORINE IN BRITISH COLUMBIA Jennifer Pell **
B.C. Ministry of Energy, Mines and Petroleum Resources Geological Survey Branch Victoria, British Columbia
Fluorspar mineralization in British Columbia occurs in a wide range of geologic environments and tectonic settings. Fluids (volatUes) are always important in the mineralizing process. Where fluorspar is associated with igneous systems, the late-stage differentiated fluids that were fractionated during crystallization are often enriched in incompatible elements (be it in granitic or alkaline systems) and play an important role.
Five significant fluorspar prospects are known in British Columbia. The Rock Candy mine, a vein deposit of probable late Tertiary age associated with the Coryell intrusions, occurs in the southern Omineca Belt and has a history of past production. The Eaglet fluorspar property consists of veins and replacements, of possible Cretaceous age, in the Quesnel Lake gneiss at the western margin of the Omineca Belt in central British Columbia. The Rexspar deposit, which is located along the western margin of the Omineca Belt in south-central British Columbia, comprises separate zones of fluorspar and uranium mineralization of volcanogenic origin, related to alkaline tuffs. Mineralization at Rexspar is considered to be syngenetic and Devono-Mississippian in age. The Deep Purple prospect on Rock Canyon Creek, in the Foreland Belt of southern British Columbia, is a metasomatic replacement deposit interpreted to be related to carbonatite-alkaline rock system. Mineralization at Deep Purple is probably Devono-Mississippian to Early Mississippian in age. The Foreland Belt of northern British Columbia contains the carbonate-hosted Liard fluorspar showings which are apparently related to carbonate-hosted lead-zinc deposits further to the south and formed by dewatering of the sedimentary basin in the Late Devonian.
A number of showings containing abundant fluorspar are also known. The Redbird property, located in the eastern Intermontane Belt, contains veins of epithermal fluorite and chalcedonic quartz hosted by Triassic Nicola Group volcanics. The Gypo (Oliver Silica) quarry near Oliver, the Whiteman Creek property near Vernon and the Galena Farm property near Silverton are all examples of quartz-fluorite and quartz-fluorite-lead-zinc-silver veins associated with Jurassic or Cretaceous granites and quartz monzonites in the Omineca Belt.
Numerous other showings occur throughout the province, but the major deposits and significant showings are confined to the Foreland and Omineca belts and eastern portions of the Intermontane Belt, which suggests that these areas are most favourable for future exploration. Some deposits with abundant fluorspar are reported from the Atlin area in the northern Intermontane Belt; this area also warrants exploration attention. The majority of fluorite deposits in British Columbia are underlain by crust with Mesozoic or Cenozoic Sr87 / ^Sr initial ratios of greater than 0.704. Areas with ratios of 0.707 or greater are underlain by Precambrian crust that has been incorporated into younger magmas; initial ratios of between 0.704 and 0.707 are indicative of areas underlain by rewor ked Precambrian basement of Proterozoic, continent-derived sediments. Initial ratios of less then 0.704 are indicative of areas underlain by ensimatic Phanerozoic crust (Armstrong, 1985). The fluorite deposits are formed, preferentially in areas underlain by continental (sialic) basement or continent-derived basement rocks. Areas with Sr87 / Sr86 initial ratios of less than 0.704 are unlikely to host fluorspar deposits and, as such, are not favourable exploration targets.
* *Now Geological Consultant 1356 Kingsview Road RR5 Duncan, British Columbia V9L 4T6
Industrial Minerals Forum 1991
INDUSTRIAL MINERAL DEVELOPMENTS IN NEWFOUNDLAND AND LABRADOR
Jamie Meyer and Ambrose Howse Geological Survey Branch
Newfoundland Department of Mines and Energy 95 Bonaventure Avenue
P.O. Box 8700 St. John's, Newfoundland A1B 4J6
The 1990's hold great promise for the ongoing production of industrial minerals in Newfoundland and Labrador, and the developmental new and exciting deposits. Several of the more promising developments are now briefly discussed.
The lower Paleozoic carbonate sequences of western Newfoundland host important deposits of limestone, marble and dolomite. The newly developed high-volume limestone aggregate quarry at Lower Cove on the Port au Port peninsula (Newfoundland Resources and Mining), is the largest current producer. Smaller tonnages are quarried for agricultural limestone and cement manufacturing. There is increased interest in the extremely pure limestone reserves within this belt, particularly for use in pollution control systems.
In western Labrador there are a number of large, extremely pure quartzite ridges near Labrador City, representing immense reserves of high quality silica. One of these ridges was drilled in 1986. In the same area, there is a unique deposit of very high purity, friable quartzite. This deposit was drilled, and is estimated to contain a minimum of 4 million tonnes silica sand. Initial benefi-ciation studies have reduced impurity levels to 0.01% AI2O3 and 0.01% Fe203.
Exploration for graphite in western Labrador by the Department of Mines and Energy, located a significant graphite prospect in 1989. A 25 kilogram sample, obtained from a 15 metre long trench, contains 41.9% carbon, although all flakes are finer than 300 micrometres. The deposit was staked by local prospectors in Labrador City, and carried out a small exploration program in 1990.
An investigation of the heavy-mineral placer potential of the Lake Melville area in Labrador, was begun in 1989 by the Department of Mines and Energy, and continued in 1990 with help from the placer section of the Centre for Coal Ocean Resources and Engineering (C-CORE). The numerous rivers entering Lake Melville and the coastal zone between Groswater Bay and Sandwich Bay, drain hinterlands underlain by gabbro-anor-thosite massifs containing disseminated llmenite. A 20 kilometre long coastal beach system had the highest concentration of heavy minerals seen during the sampling program, up to 50% over 1 metre in thickness.
The dimension stone potential of Newfoundland and Labrador has been highlighted in recent years through demonstration projects, and exploration by government and industry. The most advanced project was carried out in 1990 by the Mt. Peyton Granite Company. They
Siarried 3 to 7 tonne rough blocks of "black granite" from e Mt. Peyton gabbro in Central Newfoundland, and 6
to 15 tonne blocks of pink granite from the Pass Island granite on the South Coast. Many other granite prospects are being investigated. A large marble prospect in the Deer Lake area contains many different colours and textures of stone and could potentially host several quarries. In 1986 the Department of Mines and Energy carried out sampling 01 three dimension stone prospects in the Nain anorthosite, on the northern Labrador coast. A productive visit to the area by an Italian quarrying company in 1990 may lead to the formation of a joint venture company with the Labrador Inuit Development Corporation. Test blocks were quarried in the rail of 1990, and shipped to Italy.
Eastern Newfoundland possesses several deposits of excellent quality slate located at tidewater, some of these were worked in the late 1800's. An old slate quarry at Nut Cove, Trinity Bay, was reactivated in 1986 but large scale production has yet to be achieved. Welsh and American slate experts who have visited slate prospects in the province have agreed that the green and purple slate is of top quality, and that there is potential for red and grey slate as well.
Conference Proceedings 203
BARITE IN BRITISH COLUMBIA S.B. Butrenchuk **
B.C. Ministry of Energy, Mines and Petroleum Resources Geological Survey Branch Victoria, British Columbia
Commercial production of barite in British Columbia dates back to 1940 with shipments having been recorded from 10 deposits. Presently, barite in significant amounts is only produced from a single underground mine at Parson by Mountain Minerals Company, Ltd. There is some intermittent production from three other deposits.
Barite (BaS04) is a chemically inert mineral with an ideal specific gravity of 4.5 whose major usage is as a weighting agent for drill muds. Therefore, major markets are closely associated to the oil and gas industry. Potential market areas are oil and gas exploration wells in the Arctic Islands, Western Canada Sedimentary Basin and British Columbia offshore with the first being the largest potential market.
Potential new large sources of barite are located in shale and carbonate hosted bedded deposits in northeastern British Columbia. Stratigraphically these deposits occur in rocks of Devonian to Lower Mississippian age. Deposits like Cirque when developed for silver/lead/zinc production will have abundant barite as a by-product. In southeastern British Columbia vem and replacement type deposits present in rocks of Proterozoic and Lower Paleozoic age represent another potential source of barite. By-product barite may also be recovered from the mining and milling of volcanogenic massive sulphide deposits. The vein and replacement barite has usually higher purity and brightness and may be therefore more suitable for higher value barite products in filler/extender applications.
** Now with Mountain Minerals Co. Ltd. P.O. Box 700 Lethbridge, Alberta T1J3Z6
204 Industrial Minerals Forum 1991
MANITOBA INDUSTRIAL MINERALS Jim Bamburak
Manitoba Energy and Mines 555 - 330 Graham Avenue
Winnipeg, Manitoba R3C4E3
The poster consists of seven elements: a 1:1 000 000 location map of Industrial Mineral Producers and six selected commodity descriptions (text, map and photo). Total value of production in 1989 of silica sand, dimension stone, peat, high-calcium limestone and gypsum accounted for $24 million.
Traction sand, foundry sand, sandblast sand and construction products are produced from Ordovician silica sand; silicon metal may be a future product.
Dimension stone from three Precambrian quarries and one Ordovician quarry have been utilized in buildings in Canada and United States.
Almost 90 per cent of horticultural sphagnum from southeastern Manitoba bogs is shipped to the United States. Cement and chemical grade lime is produced from high-calcium limestone quarries in Devonian-age forma
tions. Wallboard is produced from Jurassic-age sediments located on the west side of Lake Manitoba. High-magnesium dolomite, with more than 19 per cent MgO, is not in production, but has a wide areal extent in
the Interlake area.
Conference Proceedings 205
WESTERN INDUSTRIAL CLAY PRODUCTS LTD. PeterAylen
714 East Sarcee Street Kamloops, British Columbia
V2H1E7
Western Industrial Clay Products Ltd., in Kamloops, B.C., was chosen as the recipient for the 1990 Federal Business Development Bank's award in the Product Enhancement category.
Western Industrial Clay Products Ltd. is the only Canadian company who is locally mining, milling, and packaging diatomaceous earth for industrial absorbent applications. Their Can-Dry industrial absorbent is one of the highest quality products available on the market today.
Recently, Western Industrial Clay Products Ltd. introduced a new product, W.C. Cat, a new Canadian cat Utter. Although a relatively recent arrival on the market, W.C. Cat is already enjoying a positive consumer response and is rapidly winning customer acceptance throughout Western Canada. Because of its inherent composition of diatoms and clay, W.C. Cat is able to effectively absorb odours without any chemical or deodorant additives, unlike other brands of cat litter. And because of this naturally occurring combination of elements, W.C. Cat is also able to absorb its own weight in water which means less litter is wasted.
Western Industrial Clay Products Ltd. has good reason to be proud of their achievements, not only because they have created a product literally from the earth, but because their products are also completely natural, and best of all, always environmentally friendly.
206 Industrial Minerals Forum 1991
DIMENSION STONE AERIAL PHOTOGRAPH STUDY Jay Page
Westex Exploration Ltd. Vancouver, British Columbia
An aerial photograph study was proposed as a cost effective means of providing a public database to promote the exploration for and development of new dimension stone quarries. Many essential features of successful quarries are visible on aerial photographs, and these areas can be located for a fraction of the cost of ground searches. In October, 1990 Westex Exploration Ltd. was contracted by the Ministry of Energy, Mines and Petroleum Resources to carry out an aerial photograph study of selected intrusions in southwestern British Columbia.
The aerial photograph study focused on granite intrusions of the types identified as having market potential in the 1989 Geological Survey Branch publication British Columbia Dimension Stone Market Study. The initial area considered for the study was the Southern Coast Range, and within this area all granodiorite and gabbro intrusions were examined. Quartz diorite intrusions in the Squamish and Duffy Lake road areas were also included in the study.
The technique of using aerial photograph to locate potential quarry sites integrates information from a variety of sources, of which the photographs are primarily used to locate areas of solid rock. Other information such as geology, access, elevation, etc. is obtained from geological, topographic and land-use maps. The basic assumption when using this technique is that areas of solid rock with moderate topography and reasonable access are potential quarry sites. The study was carried out in two phases; the first phase was a regional study using intermediate scale (1:31 680 to 1:40 000) photographs to locate areas of solid rock. This was then followed by a detailed study of each area using larger scale (1:15 000) photographs.
The aerial photograph study successfully identified a number of potential granite dimension stone quarry sites. A total of 725 stereo pairs of photographs were examined in the regional photograph study, and 165 sites were chosen for detailed study. The detailed study identified 30 sites as economically interesting, which were then rated according to a set of evaluation criteria.
Conference Proceedings 207
THE AGGREGATE MARKET OF THE EASTERN UNITED STATES
Richard Poulin University of British Columbia
Dept. of Mining and Mineral Process Engineering Vancouver, British Columbia
The aggregate market of the Eastern United States is quantitatively modelled and the interaction of its components measured. Concrete and paving aggregate were the selected tjrpes for the purposes of this study. Using 1987 as base year, production is segmented mto geographic units by using information obtained from the Mine Safety and Health Administration. The quarry price is given by an empirical relation, accounting for urbanization, and based on an extensive telephone survey. The global demand is determined by econometric procedures. The break-down by geographic unit is performed using construction data in an input/output manner. Transport, which is multi-modal, is simulated by linear programming. These concepts are consolidated by the optimisation of aggregate distribution. The model developed is used to simulate different situations, demonstrating the reliability of the obtained solutions.
208 Industrial Minerals Forum 1991
IMASCO INDUSTRIAL MINERALS D. Gunning, President
International Marble & Stone Co. Ltd. Surrey, British Columbia
For abstract see the paper in this volume.
Conference Proceedings 209
THE ORTHOSHOP John Kende
The Orthoshop - Calgary A Division ofMcMurchy Warne Surveys (Alberta) Ltd.
Calgary, Alberta
The Orthoshop provides surveying, mapping and consulting services to the mining, petroleum, resource, development industries and environmental studies worldwide.
The Orthoshop employs Survey and Photogrammetric Engineers, Professional Photogrammetrists, Cartographers, Computer Programmers and Photographic Technicians.
The Orthoshop is at the forefront of automated photogrammetric companies. Utilizing 3 million dollars worth of photogrammetnc equipment and a large library 01 software, the Company produces both digital and orthophoto maps.
The company uses the Digital Elevation Modelling (D.E.M.) method exclusively for digital map production. This necessitates obtaining 3 dimensional coordinates for gridding and break lines. For most of the projects the client is given the raw data tape for their in-house use. Digital mapping is cost effective, accurate and useful in future digital manipulation. The raw data can be used for volumetric computation, cross-section plots and for various engineering studies.
The Orthoshop has the most up to date software and hardware to produce orthophotos. Orthophoto is a most informative product, it is used in exploration, planning, environmental studies, or for presentation. It is produced quickly and economically.
The Orthoshop operates a CADD system to ensure the final product meets the highest possible standard.
210 Industrial Minerals Forum 1991
APPENDIX 2
Conference Proceedings 211

212 Industrial Minerals Forum 1991
Registrants 27th Forum On The Geology Of Industrial Minerals
Banff, Alberta, May 5 to May 10,1991
Abel, John C , Kerford Limestone Co.,P.O. Box 81201, Lincoln, NE 68501, USA. (402)-476-0129. Fax: (402)-476-3310.
Arenberg, Eric, Dupont, Rt 2 Box 2688, Melrose, FL 32666, USA. (904)-475-5057
Austin, George S., New Mexico Bureau of Mines & Min. Res., Campus Station, Socorro, NM 87801, USA. (505)-835-5230. Fax: (505)-835-6333
Bamburak, James D., Manitoba Energy and Mines, 555 - 330 Graham Avenue, Winnipeg, Manitoba R2Y 1A9, Canada. (204)-945-6534. Fax: (204)-945-0586.
Barker, James M., New Mexico Bureau of Mines & Min. Res., Campus Station, Socorro, NM 87801, USA. (505)-835-5114. Fax: (505)-835-6333
Barsotti,Aldo, U.S. Bureau of Mines Minerals Availability Field Office, Building 20, Denver Federal Center, Denver, CO 80225, USA. (303)-236-5210. Fax: (303)-236-4208.
Bartlett, Stanley C , Canada Tungsten Mining Corp. Ltd., 1600 - 1066 W. Hastings St., Vancouver, B.C. V6E 3X1, Canada. (604)-689-0046. Fax: (604)-688-8370
Bates, Robert L., 180 Canyon Drive, Columbus, OH 43214, USA. (614)-268-4989
Bebensee, Lloyd, Skaha Petroleum Ltd., 317 Weldwood Dr. SW, Calgary, Alberta T3C 3E4, Canada. (403)-264-6836. Fax: (403)-264-6838.
Benkis, Ronald A., Monenco Consultants Limited, 400 Monenco Consultants Limited, 801 - 6th Ave. SW, Calgary, Alberta T2P 3W3, Canada. (403)-298-4195. Fax: (403)-298-4125
Bentzen, Edwin H., Hazen Research Inc., 4601 Indiana Street, Golden, CO 80403, USA. (303)-279-4501. Fax: (303)-278-1528.
Berg, Dick, Montana Bureau of Mines and Geology, Butte, MT 59701, USA. (406)-496-4172. Fax: (406)-496-4133.
Bergeron, Michel, Energy, Mines & Resources, 460 O'Connor Street, Ottawa, Ontario K1A 0E4, Canada. (613)-992-5474. Fax: (613)-992-5893.
Blender, Doug, Domtar Gypsum, 12509 -116 Ave., Surrey, B.C. V3V3S6, Canada. (604)-580-0638. Fax: (604)-580-1073.
Boisvert, Doug, Alberta Geological Survey, Box 8330 Station F, Edmonton T6H 5X2, Canada. (403)-438-7638. Fax: (403)-438-3364.
Conference Proceedings
Bond, James E., Lafarge Canada Inc.,6150 Royalmount Ave., Montreal, Quebec H4P 2R3, Canada. (514)-738-1202. Fax: (514)-738-1124.
Bond, Martha, Consulting Geologist, 2715 Keller Boulevard, Saint-Laurent, Quebec H4K 1L8, Canada. (514)-956-0677.
Bourne, H.L., Consulting Geologist, P.O. Box 293, Northville, MI 48167, USA. (313)-462-0005. Fax: (same)
Burgh, Ernest E., EEB Inc., 55 Terry Ct., Chicago Heights, IL 60411, USA. (708)-754-8466.
Butrenchuk, Stephen B., Mountain Minerals Co. Ltd., P.O. Box 700, Lethbridge, Alberta T1J 3Z6, Canada. (403)-329-0443. Fax: (403)-328-9110.
Campbell, Dr. John D., Jaycon Reconnaissance, 10908 -65A Street, Edmonton, Alberta T6A 2P7, Canada. (403)-466-0109. Fax: (403)-469-0930.
Cardinal, Dan, Highland Talc Minerals Ltd., P.O. Box 594, Hope, B.C. VOX 1L0, Canada. (604)-869-9825. Fax: 9604)-869-9408.
Century, Jack, Industrial Minerals Recovery Inc., 1170, 340 12th Ave SW, Calgary, Alberta T2R 1L5, Canada. (403)-262-2835. Fax: (403)-262-2835.
Chao, Dennis, Alberta Geological Survey, P.O. Box 8330 Station F, Edmonton, Alberta T6H 5X2, Canada. (403)-438- 7637. Fax: (403)-438-3364.
Chapman, John A., J A . Chapman Mining Services,#30 1725 Southmere Cr., Surrey, B.C. V4A 7A7, Canada. (604)-682-4700. Fax: (604)-682-0606.
Clardy, Benjamin F., Arkansas Geological Commission, 3815 West Roosevelt Road, Little Rock, AR 72204, USA. (501)-324-9165.
Clement, Stephen C , Dept. of Geology, College of William and Mary, Williamsburg, VA 23185, USA. (804)-221-2442. Fax: (804)-221-3540.
Coats, Ken, American Aggregates Corp., 6450 Sand Lake Road, Dayton, OH 45414, USA. (513V454-1128. Fax: (513)-454-2900.
Cochrane, Kathryn J., Alberta Energy (Research and Technology Branch), 11 th Floor, 9945 - 108 St., Edmonton, alberta T5K 2G6, Canada. (403)-427-8042. Fax: (403)-422-0975.
Coffin, Eric and David, Vanguard Consulting Ltd., 710 - 1185 W Georgia St., Vancouver, B.C. V6E 4E6, Canada. (604)-681-3234. Fax: (604)-688-4218.
213
Crosby, Keith S., International Minerals Corp. (Canada) Limited, Esterhazy, Saskatoon, Saskatchewan SOA 0X0, Canada. (306)-745-5252. Fax: (306)-745-5255.
Cross, Don, Cross & Associates Ltd, 472 Berkley Crescent N.W., Calgary, Alberta T3K 1A8, Canada. (403)-295-8872.
Currie, Philip, The Royal Tyrrell Museum of Paleontology, Drumheller, Alberta TOJ 0Y0. (403)-823-7707
Dalheim, Peggy, The Mineral Lab, Inc., 2700 Youngfield Street, Suite 105, Lakewood, CO 80215, USA. (303)-232-8708
Das, B. (Manas), Western Economic Diversification, P.O. Box 2025, Saskatoon, Saskatchewan S7K 3S7, Canada. (306)-975-4816. Fax: (306)-975-5484.
Dean, Lyndon, Material Service Corporation,4226 Lawndale Ave., Lyons, IL 60534, USA. (708)-442-4624. Fax: (708)-442-0294
Dolhun, Wes, Inland Cement Limited, 12640 - 156 St, Edmonton, Alberta T5V 1K2, Canada. (403)-447-1450. Fax: (403)-447-1923
Edwards, Dixon, Alberta Geological Survey, Box 8330 Station F, Edmonton, Alberta T6H 5X2, Canada. (403)-438-7636. Fax: (403)-438-3364
Farris, Lauch F., Fargo Resources Limited,10th Floor 900 W.Hastings Street, Vancouver, B.C. V6C 1E5, Canada. (604)-684-4246. Fax: (604)-684-9959
Fowler, John H., Nova Scotia Department of Mines and Energy, P.O. Box 1087, Halifax, Nova Scotia B3J 2X1, Canada. (902)-424-4161. Fax: (902)-424-0528.
Fox, Campbell, Industrial Mineral Consultant, R.R. #4, Huntsville, Ontario P0A 1K0, Canada. (705)-635-1538. Fax: (705)-635-1538
Fuenning, Paul, Paul Fuenning and Associates Ltd, 7027 Kenosee Place SW, Calgary, Alberta T2V 2L6, Canada. (403)-255-6232
Fuller, J. Osborne, Ohio State, 3928 Fairlingron Dr., Columbus, OH 43220, USA. (614)-451-0070
Ganis, G. Robert, Tethys Consultants Inc., 2001 N. Front St., Suite 234, Bldg #3 , Harrisburg, PA 17102, USA. (717)-233-7625. Fax: (717)-233-5054
Gent, Malcolm, Saskatchewan Energy and Mines, Sed. Geodata Branch, 1914 Hamilton St., Regina, Saskatchewan S4P 4V4, Canada. (306)-787-2646. Fax: (306)-787-2488.
Goldsmith, M. Clare, 3M Company, 900 Bush Ave., St. Paul, MN 55133, USA. (612V778-4962. Fax: (612)-778-6054
Grisafe, David A., Kansas Geological Survey, 1930 Constant Avenue, University of Kansas, Lawrence, KS 66047, USA. (913)-864-3965. Fax: (913)-864-5317
Grond, H.C., Polestar Exploration Inc., 701 - 675 Hastings St., Vancouver, B.C. V5K 1C4, Canada. (604)-684-6287. Fax: (604)-684-6270.
Gulick, Charles, Department of Natural Resources/Geology, MS:P4-12, Olympia, WA 98504, USA. (206)-459-6372. Fax: (206)-459-6380.
Guliov, Paul, Saskatchewan Energy & Mines, 1914 Hamilton St., Regina, Saskatchewan S4P 4V4, Canada. (306)-787-2583. Fax: (306)-787-7338
Gunning, Donald F., International Marble & Stone Co. Ltd., 19287 98A Avenue, Surrey, B.C. V3T 4W2, Canada. (604)-888-3848. Fax: (604)-888-5671
Halabura, Steve P., North Rim Exploration Ltd., suite 106, 1001 3rd Avenue N, Saskatoon, Saskatchewan S7K 2K5, Canada. (306)-244-4878. Fax: (306)-653-1619.
Hamilton, Wylie N., Alberta Geological Survey, Box 8330 Station F, Edmonton, Alberta T6H 5X2, Canada. (403)-438-7634. Fax: (403)-438- 3364.
Hancock, Kirk, B.C. Geological Survey, 300 - 756 Fort St., Victoria, B.C. V8W 3A3, Canada. (604)-387-3243. Fax: (604)-356-8153
Harper, Glen, Golden Rule Resources Ltd., #410,1122 - 4th St. S.W., Calgary, Alberta T2R 1M1, Canada. (403)-233-7898. Fax: (403)-266-2606.
Harrison, Rand, Alberta Geological Survey, Box 8330 Station F, Edmonton, Alberta T6H 5X2, Canada. (403)-438-7615. Fax: (403)-438-3364.
Hart, Mitchell J., Monsanto Co., P.O. Box 816, Soda Springs, ID 83276, USA. (208)-547-3391. Fax: (208)-547-3312.
Harvey, Dr Colin, Haydn Murray and Associates, Bloo-mington, Indiana, USA.
Heter, John C , P.W. Gillibrand Co., 5131 Tapo Cyn. Rd., Simi Valley, CA 93063, USA. (805)-526-2195. Fax: (805)-522-4031.
Hill, Robert L., California Division of Mines & Geology* 107 South Broadway, Suite 1065, Los Angeles, CA 90012, USA. (213)-620-3560.
Hinton, John L., Georgia Minerals Company, 24 Nathan Circle, Alpharetta, GA 30201, USA. (404)-442-8962. Fax: (404)-664-8285.
Hodgins, John A., Morgan Hydrocarbons Inc., Suite 2200, 205 5 Ave. S.W., Calgary, Alberta T2P 2V7, Canada. (403)-298-8300. Fax: (403)-298-8390
214 Industrial Minerals Forum 1991
Hogg, Verne, Ranchmans Stable Products Ltd., #2112, 13045 - 6 St SW, Calgary, Alberta, Canada. (403)-238-4964.
Holmes, David A., Dunn-Behre Dolbear & Co., Inc., 1601 Blake street, Suite 510, Denver, CO 80202, USA. (303)-620-0020. Fax: (303)-620-0024.
Hotter, Milton E., Minprobe Consultants Ltd., 1052 Lake Christina Way S.E., Calgary, Alberta T2J 2R3, Canada. (403)-278-0546. Fax: (403)-278-9370.
Holtz, Willard I., Energy, Mines and Resources, Mineral Policy Sector, 520 - 1809 Barrington St., Halifax, Nova Scotia B3J 3K8, Canada. (902)-426-3790. Fax: (902)-426-7332.
Hopkins, David A., J.E. Baker Co., 320 North Baker Rd., York, PA 17404, USA. (71^-792-3683. Fax: (717)-792- 2309.
Hora, Z.Danny, B.C. Geological Survey, 3657 Doncas-ter Drive, Victoria, B.C. V8P 3W8, Canada. (604)-356-2846
Home, Emmet, Terracon Geotechnique Ltd., Suite 800, 633 - 6th Ave. SW, Calgary, Alberta T2P 2Y5, Canada. (403)-266-1150. Fax: (403)-233-0841
Howard, J. Michael (Mike), Arkansas Geological Commission, 3815 W. Roosevelt Road, Little Rock, AR 72204, USA. (501)-324-9165.
Hudson, Brian, Alberta Department of Energy, 9915 -108 Street, Edmonton, Alberta T5K 2C9, Canada. (403)-427-7749. Fax: (403)-422-1123
Hunt, C. Warren, Industrial Coal & Minerals Ltd, 1119 Sydenham Rd. SW, Calgary, Alberta T2T 0T5, Canada. (403)-244-3004. Fax: (403)-229-1661
Huss, Fred, Mountain Minerals Co. Ltd, P.O. Box 700, Lethbridge, Alberta T1J 3Z6, Canada. (403)-329-0443. Fax: (403)-328-9110
Inverarity, C.W., Hunter Resources Ltd., 3916 - 17 St. SW, Calgary, Alberta T2T 4P2, Canada. (403)-243-5605
Ionides, George N., Temanex Consulting Inc.,Presi-dent, 1403 Bewicke Avenue, N. Vancouver, B.C. V7M 3C7, Canada. (604V986-7523. Fax: (604)-986-7152.
Jarrett, F.W. (Rick), Westroc Industries Limited, P.O. Bpox 217, Invermere, B.C. V0A 1K0, Canada. (604)-342-9410. Fax: (604)-342-6311.
Jenkins, David, Grefco Inc., P.O. Box 939. Lompoc, CA 93438, USA. (805)-736-4581. Fax: (805)-736-5994.
Johnson, Gordon E., Great Lakes Mineral Corp., 3339 Clyde Drive, Port Huron, MI 48060, USA. (313)-385-4859
Kane, Malcolm, Mountain Minerals Co. Ltd, P.O. Box 700, Lethbridge, Alberta T1J 3Z6, Canada. (403)-329-0443. Fax: (403)-328-9110
Kende, John, The Orthoshop, 1723 - 27 Avenue NE, Calgary, AB T2E 7E1, Canada. (403)-250-7830. Fax: (403)-291-9327.
Kitzan, Paul, Shell Canada Limited, 1043 Edgemont Rd. NW, Calgary, Alberta T3A 2J5, Canada. (403)-691-3229. Fax: (403)-269-6768
Klosterman, Gregory E., American Aggregates Corp., 6450 Sand Lake Rd., Dayton, OH 45414, USA. (513)-454-1128. Fax: (513)-237-4791
Krueger, Al, Dravo Basic Materials, Box 2068, Mobile, AL 36652, USA. (205)-432-2651.
Lacombe, Randall, Highland Talc, 165 Hardin St., Ft. McMurray, Alberta T9H 2G1, Canada. (403V790-2036
Lefebure, David, B.C. Geological Survey Branch M.E.M.P.R., Rm 200 - 756 Fort Street, Victoria, B.C. V8W 3A3, Canada. (604)-356-2834. Fax: (604)-356-8153
Linkous, Mike, U.S. Borax, 6516 Falls of Neuse Rd. #100, Raleigh, NC 27615, USA. (919)-954-0147. Fax: (919)-954-0143
Lizak, John, The Millington Group, P.O. Box 407, Mil-lington, NJ 07946, USA. (201)-580-3910. Fax: (201)-580-3909
Loyd, Ralph, California Division of Mines & Geology, 650-B Bercut Drive, Sacramento, CA 95814, USA. (916)-323-8562
Lutz, Jennie, Alberta Research Council, Box 8330 Station F, Edmonton, Alberta T6H 5X2, Canada. (403)-438-7571. Fax: (403)-430-0839
Madunicky, Mika, Alberta Research Council, Box 8330 Station F, Edmonton, Alberta T6H 5X2, Canada. (403)-438-7609. Fax: (403)-438-3364
Manz , Ronald L., Wicked River Resources Ltd., P.O. Box 5668 Station A., Calgary, Alberta T2H 1Y1, Canada. (403)-264-8262
Marcille-Kerslake, Virginia, University of Guelph, Land Resource Science, Guelph, Ontario NIG 2W1, Canada. (519)-824-4120. Fax: (519)-824-5730.
Mathieu, Gilles, Dept. of Energy, Mines & Resources, 552 Booth St., Ottawa, Ontario KiA 0G1, Canada. (613)-995-3693. Fax: (613)-992-9389.
Meijer Drees, N.C., ISPG, 3303 - 33 St. NW, Calgary, Alberta T2L 2A7, Canada.
Meyer, Jamie, Newfoundland Department of Mines and Energy, 98 Bonaventure Ave., P.O. Box 8700, St.
Conference Proceedings 215
John's, Newfoundland A1B 4J6, Canada. (709)-576-5968. Fax: (704)-576-3443.
Mills, Doral S., Dry Branch Kaolin Co., Rt. 1 Box 468 D, Dry Branch, GA 31021, USA. (912)-750-3650. Fax: (912)-750-3643
Montgomery, Joe, Polestar Exploration Inc., 701 - 675 W. Hastings St., Vancouver, B.C. V6B 1N2, Canada. (604)-684-6287.
Morel-a-FHuissier, Patrick, Mineral Policy Sector, EMR, Room 622, 460 O'Connor Street, Ottawa, Ontario K1A 0E4, Canada. (613)-992-3258. Fax: (613)-992-5893
Morton, Paul, P.K. Morton & Associates, P.O. Box 11448, Costa Mesa, CA 92627, USA. (714)-642-9805
Mossop, Grant, Alberta Geological Survey, Box 8330 Station F, Edmonton, AlbertaT6H 5X2, Canada. (403)-438-7657. Fax: (403)-438-3364
Macgregor, D.H.G., BC Trade Development Corp., 999 Canada Place, Suite 130, Vancouver, B.C., Canada. Fax: (604)-660-2457.
MacLean, Mary, B.C. Ministry of Energy, Mines and Petroleum Resources, 756 Fort Street, Rm 300, Victoria, B.C. V8V1X4, Canada. (604)-356-2845. Fax: (604)-356-8153.
McArthur, Gilbert, B.C.Geological Survey, 200 - 756 Fort St., Victoria, B.C. V8V 1X4, Canaada. (604)-356-2839. Fax: (604)-356-8153
McClave, Michael A., ASARCO, Inc., E.920 Wolverton Ct., Spokane, WA 99207-2784, USA. (509)-489-7870. Fax: (509)-483-0131
McCosh, Rick, F.D. McCosh Resource Consultants Ltd., 15 Templemont Drive N.E., Calgary, Alberta T1Y 4Z5, Canada. (403)-280-2053
Newman, Tom, J.M. Huber Corp, Box 4005, Quincy, IL 62305, USA. (217)-224-1100. Fax: (217)-224-7957
Nikols, Dennis, Alberta Geological Survey, P.O. Box 8330 Station F. Edmonton, Alberta T6H 5X2, Canada. (403)-438-7622. Fax: (403)-438-3364
0'Connor,Bruce J., Georgia Geologic Survey, 19 M.L. King Jr. Dr. SW, Atlanta, GA 30087, USA. (404)-656-3214
O'Neil, Patrick R., Unified Chemistry, 658 loco Rd., Port Moody, B.C., Canada. (604)-469-1751.
Olmsted, Bill, School District #03, 604 Moyie St., Kim-berley,B.C. VIA 2N9, Canada. (604)-427-3627
Olson, Richard H., Industrial Minerals Evaluations, Inc., 1536 Cole Blvd. Suite 320, Golden, CO 80401, USA. (303)-239-9250. Fax: (303)-232-0501
Ouellette, Dennis, Geological Services, NAP, 200 Range Road, Whitehorse, Yukon Y1A 3V1, Canada. (403)-667-3205. Fax: (403)-668-4070.
Page, Jay W., Westex Exploration Ltd, 515 - 510 West Hastings Street, Vancouver, BC V6B 1L8, Canada. (604)-687-5064
Papke, Keith G., Consultant, 2180 Schroeder Way, Sparks, NV 89431, USA. (702)-358-3095
Peach, Allister R., 812 Coach Bluff Cres. S.W., Calgary, Alberta T3H 1A8, Canada. (403)-246-6534
Peel, Don, Alberta Forestry, Lands and Wildlife, 802 , 10531 - 90 Street, Edmonton, Alberta T5H 4E7, Canada. (403)-427-6597. Fax: (403)-422-4244
Pell, Jennifer, Formosa Resources, 3011 Quadra, Victoria, B.C. V8T4G2, Canada. (604)-385-6463.
Pickering Jr., Sam M., 1414 Twin Pines Dr., Macon, GA 31211, USA. (912)-743-9323. Fax: (912)-743-9323
Poling, George W., B.C. Mining Association, #860 -1066 West Hastings St., Vancouver, B.C. V6E 3X1, Canada. (604)-684-9918. Fax: (604)-681-5305.
Poulin, Richard, University of British Columbia, Dept. of Mining and Min. Proc. Eng., 6350 Stores Road, Vancouver, B.C. V6T 1Z4, Canada. (604)-822-4725. Fax: (604)-822-5599
Power, W.R. (Bob), P.O. Box 704, Frisco, CO 80443, USA. (303)-668-3616
Prentice, Mike, Alberta Geological Survey, Boc 8330 Station F, Edmonton, Alberta T6H 5X2, Canada. (403)-438-7619. Fax: (403)-438-3364
Prentice, John E., Eastwood, Gt. Comberton, Pershore, Worcestershire WR10 3DT, England. 038-674-244
Price, Monica, Alberta Geological Survey, Box 8330 Station F, Edmonton, Alberta T6H 5X2, Canada. (403)-438-7631
Rafuse, Ivan N., Indian and Northern Affairs, Les Ter-rasses de la Chaudiere, Ottawa, Ontario K1A 0H4, Canada. (819)-997-8363. Fax: (819)-953-3323.
Richardson, Rick, Alberta Geological Survey, P.O. Box 8330 Station F, Edmonton, Alberta T6H 5X2, Canada. (403)-438-7623. Fax: (403)-438-3364.
Riordan, Richard F., Geomapping Assoc. Ltd., 2674 Robidoux Rd., Sandy, Utah 84093, USA. (801)-943-3062. Fax: (801)-943-4110
Rogan, Mervyn, Ram Industrial Minerals Ltd, Box 300, Morinville, Alberta TOG 1P0, Canada. (403V939-3033. Fax: (403)-939-3044
216 Industrial Minerals Forum 1991
Root, Robert L., Consultant, P.O. Box 16156, Las Cruces, NM 88004, USA. (505)-524-1649
Santini, Ken, Santini and Associates, 1917 Sage Circle, Golden, Colorado 80401, USA. (303)-277-1807. Fax: (303)-278-0092.
Scafe, Don, Alberta Geological Survey, Box 8330 Station F, Edmonton, Alberta T6H 5X2, Canada. (403)-438-7633. Fax: (403)-438-3364
Schultes, Dr. Hagen, Baymag, 800 10655 southport Road SW, Calgary, Alberta T2W 4Y1, Canada. (403)-271-9400. Fax: (403)-271-0010
Scott, Dale, Ontario Ministry of Natural Resources, 10 Irongate Place, Brantford, Ontario N3R 5V5, Canada. (416)-965-6712. Fax: (416)-324-6714
Sears, Dr. Tim, Baymag, 800 Southport Road, Calgary, Alberta T2W 4Y1, Canada. (403)-271-9400. Fax: (403)-271-0010
Shayna, Michael, I-XL Industries Ltd., P.O. Box 70, Medicine Hat, Alberta T1A 7E7, Canada. (403)-526-5901. Fax: (403)-526-7680.
Shelden, Jim, U.S. Forest Service, Region 1 Box 7669, Missoula, MT 59807, USA. (406)-329-3577. Fax: (406)-329-3347
Simandl, George J., Geological Survey Branch, Ministry of Energy, Mines and Petroleum Resources, Parliament Buildings, Victoria, B.C. V8V 1X4, Canada. (604) 387-3242. Fax: (604)-356-8153
Simard, Claudette, West Virginia Geological Survey, P.O. Box 879, Morgantown, WV 265070879, USA. (304)-594-2331. Fax: (304)-594-2575
Singh, Ronald, Mountain Minerals Co. Ltd, P.O. Box 700, Lethbridge, Alberta T1J 3Z6, Canada. (403)-329-0443. Fax: (403)-328-9110
Smyth, Walter (Ron), B.C. Geological Survey, B.C. Ministry of Mines, Parliament Bldgs., Victoria, B.C. V8V 5W9, Canada. (604)-387-0687. Fax: (604)-356-8153.
Spilsbury, Wayne, Teck Exploration Ltd., 1199 West Hastings St.,Vancouver, B.C. V6E 2K5, Canada. (604)-687-1117. Fax: (604)-687-6100.
Steuart, Charles, Malvern Minerals Co., P.O. Box 1238, Hot Springs, AR 71902-1238, USA. (501)-623-8893. Fax: (501)-623-5113
Sweet, Palmer C , Virginia Division of Mineral Resources, P.O. Box 3667, Charlottesville, VA 22903, USA. (804)-293-5121. Fax: (804)-293-2239
Termuende, Robert, RWT Project Management, P.O. Box 7, Ft. Steele, B.C. V0B 1N0, Canada. (604)-426-6000.
Termuende, Tim, Toklat Resources, Inc., 1701 Mt. Nelson Cres., Cranbrook, B.C. VIC 5V6, Canada. (604)-426-3112. Fax: (604)-426-6899.
Timmons, Bobby J., Timmons Associates, P.O. Box 50606, Jacksonville Beach, FL 32240, USA. (904)-246-4533,241-4907. Fax: (904)-249-0459
Vandenbussche, Brad, Norwest Mine Services, 400 205 - 9 Ave. SE, Calgary, Alberta T2G 0R3. (403)-237-7763. Fax: (403)-263-4086
Vandervelde, Rene, Korite Minerals Ltd., 532 38A Ave. SE, Calgary, Alberta T2G 1X4, Canada.
Watson, Barry N., U.S. Borax, 6516 Falls of Neuse Rd. #100, Raleigh, NC 27615, USA. (919V954-0149. Fax: (919)-954-0143
Webb, Tim, New Brunswick Dept. of Natural Resources and Energy, P.O. Box 6000, Fredericton, New Brunswick E3B 5H1. (506)-453-2206. Fax: (506)-453-3671.
Westcott, James F., A.P. Green Industries (retired), 7 Branchwood Rd., Mexico , MO 65265, USA. (314)-581-3732.
Wheeler, Alfred H., Magnesium Company of Canada, Ste 1120 10201 Southport Rd. SW, Calgary, Alberta T2W 4X9, Canada. (403)-652-3997 Fax: (403)-652-3998
White, Melvyn G., Public Lands Div., Forestry, Lands and Wildlife Alberta, 11226 - 52 St., Edmonton, Alberta T5W 3H9, Canada. (403)-427-3570 Fax: (403)-422-4251.
Williams, Barrett J., Norfolk Southern Corporation, 185 Spring St. S.W., Atlanta, GA 30303, USA. (404)-529-1853 Fax: (404)-529-1057
Wise, Sandy, Western Industrial Clay Products Ltd., 714 East Sarcee Street, Kamloops, B.C. V2H 1E7, Canada. (604)-372-1600. Fax: (604)-372-3777.
Wood, Brad, Unit 6 1112 Russell St., Thunder Bay, Ontario P7B 5N2, Canada. (807)-623-9377 Fax: (807)-623-7202.
Zdunczyk, Mark J., Dunn Geoscience Corporation, 12 Metro Park Road, Albany, NY 12205, USA. (518)-458-1313. Fax: (518)-458-2472.
Conference Proceedings 217