principle-based mathematics: an exploratory study
TRANSCRIPT

1
Principle-Based Mathematics: An Exploratory Study
by
Rebecca Chung-Yan Poon
A dissertation submitted in partial satisfaction of the
requirements for the degree of
Doctor of Philosophy
in
Education
in the
Graduate Division
of the
University of California, Berkeley
Committee in charge:
Professor Xiaoxia Newton, Chair Professor Maryl Gearhart
Professor Sophia Rabe-Hesketh Professor Hung-Hsi Wu
Spring 2014

2
Principle-Based Mathematics: An Exploratory Study
© 2014
by
Rebecca Chung-Yan Poon

1
1
Abstract
Principle-Based Mathematics: An Exploratory Study
By
Rebecca Chung-Yan Poon
Doctor in Philosophy in Education
University of California, Berkeley
Professor Xiaoxia Newton, Chair Although educators and policymakers are becoming increasingly aware of the need for professional development that is content specific (Kennedy, 1999) and focuses on deepening and broadening teachers’ knowledge of content for teaching (American Federation of Teachers, 2002; National Academy of Education, 2009), little attention has been given to supporting teachers’ development of content knowledge as defined by Shulman (1986). Principle-Based Mathematics (PBM), a presentation of K-12 mathematics that adheres to the “fundamental principles of mathematics” (Wu, 2011a), has the potential to fill this void. This dissertation is an instrumental case study (Stake, 1995) that explores how teachers of 2 different grades (fourth and sixth) attempted to implement PBM in their classrooms and what the impact was on student learning. Results from analysis of teacher interviews, classroom artifacts, and student state test scores suggest: (1) The different approaches that the teachers used to teach the division interpretation of a fraction demonstrate the flexibility of PBM instruction to accommodate different curricular demands and teaching contexts; (2) The estimated average effect of PBM training on student achievement ranged between 0.25 and 0.34 standard deviations, but only 1 of the 4 teachers exhibited an increase in effect after PBM training. Estimated standardized effects on student achievement either decreased or remained nil for the other teachers after PBM training. The study’s findings provide exploratory evidence to inform future evaluations of PBM training and instruction.

i
i
Table of Contents
Chapter 1. Overview of the Study ................................................................................................... 1 1.1. Introduction .......................................................................................................................... 1 1.2. Purpose of the Study ............................................................................................................ 2 1.3. Study Design ........................................................................................................................ 3 1.4. Significance of the Study ..................................................................................................... 5 1.5. Limitations of the Study....................................................................................................... 6 1.6. Structure of the Dissertation ................................................................................................ 6
Chapter 2. Literature Review .......................................................................................................... 7 2.1. Mathematics Content of Teacher Professional Development .............................................. 7
2.1.1. PD studies based on program content ........................................................................... 7 2.1.2. PD programs for future study ..................................................................................... 10
2.2. Methodology for Evaluation of Professional Development Programs .............................. 11 2.2.1. Studying PD impact on classroom instruction ............................................................ 11 2.3.2. Studying PD impact on student achievement ............................................................. 12
2.3. Conclusion ......................................................................................................................... 15 Chapter 3. Principle-Based Mathematics ...................................................................................... 17
3.1. Division Interpretation of a Fraction .................................................................................. 18 3.2. PBM Approach to the Division Interpretation of a Fraction ............................................. 19 3.3. Implications for Present Study ........................................................................................... 22
Chapter 4. Methods ....................................................................................................................... 23 4.1. PD Program: Principle-Based Mathematics ...................................................................... 23 4.2. Study Design and Participants ........................................................................................... 24
4.2.1. Fourth grade case ........................................................................................................ 24 4.2.2. Sixth grade case .......................................................................................................... 25
4.3. Data Collection .................................................................................................................. 25 4.3.1. Classroom instruction ................................................................................................. 25 4.3.2. Student achievement ................................................................................................... 26
4.4. Analysis.............................................................................................................................. 28 4.4.1. Classroom instruction ................................................................................................. 28 4.4.2. Student achievement ................................................................................................... 28
Chapter 5. Results – Classroom Instruction .................................................................................. 31 5.1. Participating Teachers’ Approaches to the Division Interpretation of a Fraction ............. 31
5.1.1. Fourth Grade Case ...................................................................................................... 32 5.1.2. Sixth Grade Case. ........................................................................................................ 33 5.1.3. Summary ..................................................................................................................... 37
5.2. Alignment with Principles ................................................................................................. 38 5.2.1. Similarities Between PBM Institute and Teacher Approaches ................................... 38 5.2.2. Flexibility of PBM Instruction .................................................................................... 40
5.3. Inadequate Adherence to Principles ................................................................................... 43 5.4. Summary ............................................................................................................................ 43

ii
ii
Chapter 6. Results – Student Performance ................................................................................... 45 6.1. Data .................................................................................................................................... 45
6.1.1. Fourth grade case ........................................................................................................ 45 6.1.2. Sixth grade case .......................................................................................................... 46
6.2. Descriptive Statistics .......................................................................................................... 47 6.2.1. Fourth grade case ........................................................................................................ 47 6.2.2. Sixth grade case .......................................................................................................... 52
6.3. Propensity Score Matching ................................................................................................ 55 6.4. Estimated Effects ............................................................................................................... 62
6.4.1. Rival hypothesis #1: Pre-existing instructional qualities ............................................ 63 6.4.2. Rival hypothesis #2: School-wide resources .............................................................. 65
6.5. Summary ............................................................................................................................ 66 Chapter 7. Discussion ................................................................................................................... 67
7.1. Study Design ...................................................................................................................... 67 7.2. Summary and Discussion of Study Findings ..................................................................... 68
7.2.1. Classroom instruction ................................................................................................. 68 7.2.2. Student achievement ................................................................................................... 71
7.3. Limitations and Future Research ....................................................................................... 72 References ..................................................................................................................................... 75 Appendix A ................................................................................................................................... 81 Appendix B ................................................................................................................................... 82 Appendix C ................................................................................................................................... 88 Appendix D ................................................................................................................................... 92 Appendix E ................................................................................................................................... 94

iii
iii
Acknowledgments
I would have never reached this point without the support and guidance of the following people. I am deeply indebted to them all.
I thank Xiaoxia Newton for mentoring me over the course of my doctoral studies and giving me the freedom to pursue my interests. I thank Sophia Rabe-Hesketh for supporting my work and helping me make the most of what has been accessible to me. I thank Maryl Gearhart for reading my work carefully and pushing me to be a better writer. I thank Hung-Hsi Wu for opening my eyes to the world of school mathematics and inspiring the work in this dissertation.
I thank the teachers of this study – Ms. Iris, Ms. Violet, Ms. Carrie, and Ms. Laura – for making this dissertation possible. Your tireless commitment to providing students the mathematics instruction they need is without equal. I dedicate this dissertation to you.
I thank the school districts of this study for allowing me to tell these teachers’ stories. I thank the faculty and students of QME, POME, and RCME for supporting me through
my doctoral studies and enriching my contribution to the field. I thank my colleagues at Cal Teach and Math for America for giving me the opportunity to work with teachers and supporting my development as a teacher educator and researcher.
I thank UC Berkeley and IES for funding my doctoral studies. I thank my parents for sacrificing so much for me and encouraging me to pursue my
dreams. I share this accomplishment with you. I thank my family, friends, and pastor for carrying me to the finish line with their faithful
prayers. I thank Jesus Christ – the author and finisher of my faith – for bringing me through all my
years of study and holding my life in His hands.

1
1
Chapter 1. Overview of the Study
1.1. Introduction
Teacher professional development (PD) is often regarded as a critical vehicle for improving classroom instruction and student achievement (American Federation of Teachers, 2002; Chapin, 1994; Correnti, 2008). In particular, educators and policymakers are becoming increasingly aware of the need for PD that is content specific (Kennedy, 1999) and focuses on deepening and broadening teachers’ knowledge of content for teaching (American Federation of Teachers, 2002; National Academy of Education, 2009). Although extensive work on teachers’ content knowledge in mathematics has been carried out by education scholars such as Ball (e.g., Ball & Hill, 2009; Ball, Hoover, & Phelps, 2008; Thames & Ball, 2010), Carpenter (e.g., Carpenter T. P., Fennema, Peterson, & Carey, 1988; Carpenter & Fennema, 1992), and their colleagues, the focus has primarily been on “pedagogical content knowledge” (Shulman, 1986; 1987), which includes understanding “ways of representing and formulating the subject that make it comprehensible to others” and “the conceptions and preconceptions that students of different ages and background bring with them” to the learning of topics (Shulman, 1986, p. 9). Less attention has been given to content or subject matter knowledge that focuses on “understanding the structures of the subject in the manner defined by such scholars as Joseph Schwab” (Shulman, 1986, p. 9).
Schwab (1978) – an accomplished educational theorist, philosopher of science and education, and curriculum developer whose writings have shaped “the teaching of biology, the philosophy of curriculum, and the field of education as a whole” (Shulman, 1991, p. 454) – identified two approaches to the structures of disciplines: syntactical and substantive. The syntactical approach examines the ways in which truth or falsehood, validity or invalidity, are established in the discipline. How are assertions, that appear to be true, verified? Why are certain topics central to a discipline whereas others may be peripheral? Why are they worth knowing? As Shulman summarized, “it is the set of rules for determining what is legitimate to say in a disciplinary domain and what ‘breaks’ the rules” (Shulman, 1986, p. 9). The substantive approach refers to the ways in which the fundamental concepts and topics of the discipline are organized. How are accepted truths in a domain related to one another? How are they sequenced?
When teachers do not understand the structure of a discipline or curriculum, “scientific conclusions (are) treated as collections of separable statements of literal truths,” as the common practice has been in many K-12 classrooms (Schwab, 1978, p. 242). This observation is not unlike the concerns that many mathematics educators have raised over the last few decades regarding teachers’ mathematical knowledge (e.g., Ball, 1990; Ma, 1999) and K-12 mathematics curriculum (e.g., Burns, 1994; National Council of Teachers of Mathematics (NCTM), 1989; Schoenfeld, 2002). Yet, few educational scholars have attempted to delineate the structure of K-12 mathematics in sufficient detail to inform curriculum development and teacher training.
Contributions from the mathematics community, however, have the potential to illuminate the structure of K-12 mathematics for use in the K-12 classroom. In particular, Wu (2009, 2010, 2011a, 2011b) offers a comprehensive presentation of K-12 mathematics that illuminates “the structure of the subject matter” and addresses “why a particular proposition is deemed warranted, why it is worth knowing, and how it relates to other propositions” in the domain (Shulman, 1986, p. 9). Principle-Based Mathematics (PBM) has been termed by the

2
2
author to refer to K-12 mathematics that adheres to the fundamental principles of mathematics, which have been stated and defined by Wu (2011a) as the following:
1. Definitions: Every concept is precisely defined, and definitions furnish the basis for logical deductions.
2. Precision: Mathematical statements are precise. At any moment, it is clear what is known and what is not known.
3. Reasoning: Every assertion can be backed by logical reasoning. 4. Coherence: Mathematics is coherent; it is a tapestry in which all the concepts and
skills are logically interwoven to form a single piece. 5. Purposefulness: Mathematics is goal-oriented, and every concept or skill in the
standard curriculum is there for a purpose. (pp. 379-380) For over 10 years, training in PBM has been offered to mathematics teachers through an
intensive three-week summer institute. Although PBM rests on well-designed theory, there is a need for empirical evidence of how teachers bring PBM from the institute to their own classrooms and what the impact is on student learning. This dissertation intends to provide exploratory evidence of how teachers attempt to implement PBM in their classrooms and how their students, after receiving this instruction, perform on state mathematics tests compared to their peers.
1.2. Purpose of the Study The purpose of this study is to explore how teachers of two different grade levels (fourth
and sixth) attempted to implement PBM in their classrooms and what the impact was on student learning. The study seeks to address the following research questions:
1. What does it look like when teachers attempt to implement PBM in their K-12 classrooms, particularly in the teaching of the division interpretation of a fraction (i.e., !
!= 𝑚 ÷ 𝑛 for whole numbers 𝑚 and nonzero 𝑛)?
2. When teachers attempt to implement PBM in their classrooms, what effect does this instruction have on students’ mathematics achievement?
This study focuses on the topic of the division interpretation of a fraction because it is one of the more challenging interpretations of a fraction for students to learn. As Niemi (1996) notes, many middle and even high school students “do not conceive fractions as numbers, and particularly not as numbers that can represent a quotient relation between two other numbers” (p. 70). Behr, Lesh, Post, and Silver (1983) propose that the multiple interpretations of a fraction may be one reason why understanding fractions is a “formidable learning task,” as consistently evidenced by students’ performance on the National Assessment of Educational Progress (NAEP; Carpenter, Lindquist, Brown, Kouba, Silver, & Swofford, 1988; Kloosterman, 2010).
As shown in Figure 1, the research questions listed above are linked to the stages of the study’s conceptual model, which was informed by existing models of effective PD (e.g., Desimone, 2009; Fishman, Marx, Best, & Tal, 2003; Ingvarson, Meiers, & Beavis, 2005) to be further discussed in Chapter 2. It is hypothesized that the core theory of action for PBM would follow these steps: (1) teachers participate in PBM training and then (2) adapt the training content to implement PBM instruction in their classrooms, which then (3) fosters increased student achievement in mathematics.

3
3
Figure 1. Conceptual model and overview of research questions, data sources, and analyses.
Other conceptual models usually include additional mediating or moderating variables and occasionally more sophisticated relationships between variables. For example, most PD models include “teachers’ knowledge, beliefs, and attitudes” between the first two stages (i.e., between the PD and classroom instruction; e.g., Desimone, 2009). This intermediary outcome (or mediating variable) has been omitted because of the retrospective nature of this study, which will be further discussed in the following sections. Other models include contextual variables such as teaching environment or policy context (e.g., Newton, Poon, Nunes, & Stone, 2013) or propose that there are “multidirectional influences” between teachers’ participation in a PD and their classroom settings (Kazemi & Hubbard, 2008). Investigating these relationships, however, is beyond the scope of this study.
1.3. Study Design In this study, PBM training takes two forms: (1) a three-week summer institute, and (2)
teacher-led collaboration during the school year. The summer institute (herein called PBM Institute) is the primary focus of this study because it is the key PD that introduces teachers to PBM and equips them to share PBM with their teacher colleagues. Some attention, however, is devoted to the latter because of its relevance to the fourth grade case study, which will be discussed in more detail later.
This study uses instrumental case study to examine the classroom practices and outcomes of teachers who participate in PBM training and attempt to implement PBM in their teaching. Stake (1995) defines instrumental case study as research on a particular case to gain understanding of a broader phenomenon. In this study, two sets of teachers are examined to gain understanding of what implementation of PBM in the K-12 classroom looks like and what
4
4
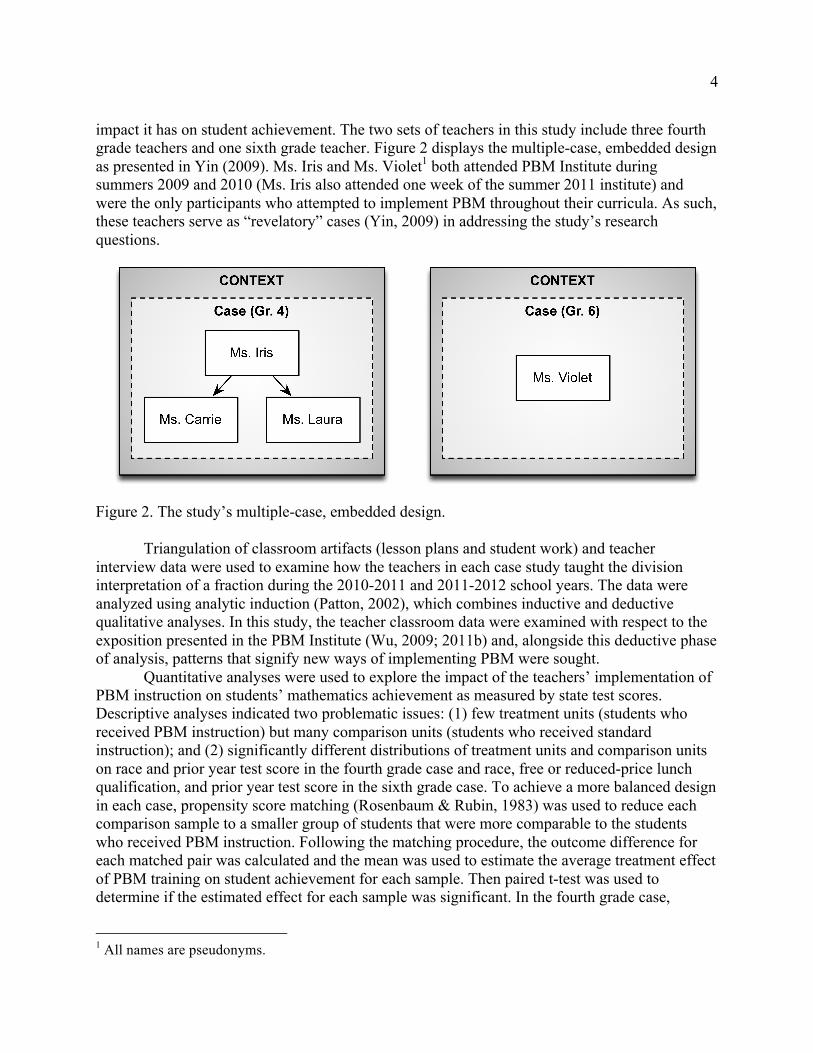
impact it has on student achievement. The two sets of teachers in this study include three fourth grade teachers and one sixth grade teacher. Figure 2 displays the multiple-case, embedded design as presented in Yin (2009). Ms. Iris and Ms. Violet1 both attended PBM Institute during summers 2009 and 2010 (Ms. Iris also attended one week of the summer 2011 institute) and were the only participants who attempted to implement PBM throughout their curricula. As such, these teachers serve as “revelatory” cases (Yin, 2009) in addressing the study’s research questions.
Figure 2. The study’s multiple-case, embedded design.
Triangulation of classroom artifacts (lesson plans and student work) and teacher interview data were used to examine how the teachers in each case study taught the division interpretation of a fraction during the 2010-2011 and 2011-2012 school years. The data were analyzed using analytic induction (Patton, 2002), which combines inductive and deductive qualitative analyses. In this study, the teacher classroom data were examined with respect to the exposition presented in the PBM Institute (Wu, 2009; 2011b) and, alongside this deductive phase of analysis, patterns that signify new ways of implementing PBM were sought.
Quantitative analyses were used to explore the impact of the teachers’ implementation of PBM instruction on students’ mathematics achievement as measured by state test scores. Descriptive analyses indicated two problematic issues: (1) few treatment units (students who received PBM instruction) but many comparison units (students who received standard instruction); and (2) significantly different distributions of treatment units and comparison units on race and prior year test score in the fourth grade case and race, free or reduced-price lunch qualification, and prior year test score in the sixth grade case. To achieve a more balanced design in each case, propensity score matching (Rosenbaum & Rubin, 1983) was used to reduce each comparison sample to a smaller group of students that were more comparable to the students who received PBM instruction. Following the matching procedure, the outcome difference for each matched pair was calculated and the mean was used to estimate the average treatment effect of PBM training on student achievement for each sample. Then paired t-test was used to determine if the estimated effect for each sample was significant. In the fourth grade case,
1 All names are pseudonyms.

5
5
multiple regression was also used to estimate a separate treatment effect for each of the three PBM classrooms.
1.4. Significance of the Study Garet (Sztajn, Marrongelle, & Smith, 2012) has recently pointed out, “providing PD that
places more direct emphasis on CK (content knowledge) is (a) potential avenue for future study” (p. 60). PBM training is precisely that type of PD: it is devoted specifically to the content knowledge needed for teaching K-12 mathematics; and this study focuses exclusively on the mathematics content of one topic – the division interpretation of a fraction – that participating teachers received and transfered to their classrooms. Moreover, PBM’s close alignment with the Common Core State Standards for Mathematics (CCSSM; Common Core State Standards (CCSS); Wu, 2011c) suggests the exposition of PBM’s approach to the division interpretation of a fraction can serve as an instructive model of how the CCSSM Standards of Mathematical Practice and the Standards of Mathematical Content can be effectively integrated (Sztajn, Marrongelle, & Smith, 2012) as well as inform the efforts of other PD that seek to address teachers’ mathematics content knowledge.
With regards to methodology, student test scores and teacher classroom practice are generally accepted as “valid and measurable outcome(s) of professional development” (American Federation of Teachers, 2002, p. 6), yet many PD programs like PBM training are “home-grown” – they arise from district or local developers’ needs and interests, have “relatively short shelf-life,” and continue with little or no formal evaluation (Hill, Beisiegel, & Jacob, 2013, p. 476). This study seeks to demonstrate how a portfolio of methods, including propensity score matching and examination of plausible rival hypotheses, can be used to provide exploratory evidence of program effectiveness under suboptimal research conditions (e.g., small sample, non-randomized assignment). Such methodological applications can be instrumental for grant applications such as the Institute of Education Sciences (IES, 2006) that expect applicants to provide “prior empirical evidence” of an intervention’s impact on intended outcomes.
These two strands – mathematics content and methodological applications for mathematics PD evaluation studies – represent two areas of research to which this study intends to make unique contributions. At the same time, these two parallel strands are brought together in this study to provide preliminary empirical evidence for future evaluations of PBM training and instruction (Figure 3). Specifically, the study’s examination of classroom instruction has the potential to inform future development of mathematics-focused lesson observation protocols, and the study’s exploration of PBM instruction’s effect on student state test scores has the potential to inform future analyses of the relationship between PBM instruction and student achievement.
Figure 3. The study’s two focal strands.

6
6
1.5. Limitations of the Study There are two types of selection bias occurring in two stages that may present limitations
to the findings of this study. First, there may be selection bias with regards to participation in PBM training. Teachers who participated in the PBM Institute voluntarily applied to the program and then were screened and selected based on their potential to benefit from the program. Teachers who participated in PBM collaboration did so voluntarily and often during non-contract hours, meaning they received no compensation for their participation in PBM training. Therefore, participants of PBM training may not have been representative of the population of elementary and middle school mathematics teachers.
Second, there may be selection bias with regards to attempted implementation of PBM in participants’ classrooms. The task of taking PBM as presented in the PD sessions and materials and integrating it into one’s classroom teaching lies with each individual teacher participant. Although the PBM Institute’s five Saturday follow-up sessions are intended to support this process, few participants have attempted to implement PBM beyond one lesson or topic (e.g., addition of whole numbers on the number line). Because PBM differs considerably from the content of the “de facto mathematics curriculum Textbook School Mathematics” (Wu, 2011c) and no PBM curriculum written for K-12 students exists to date, implementing PBM instruction requires a tremendous amount of teacher planning time and effort. Hence, the population of teachers who have participated in PBM training and attempted to implement PBM consistently across their curricula is very small and unique. As a result, the four teachers selected for this study may not be representative of the population of PBM training participants, let alone the population of elementary and middle school mathematics teachers. Exploring the contextual and personal factors that may explain the study participants’ membership in this special subgroup of teachers was beyond the scope of this study. Nevertheless, examination of these teachers’ attempted implementation of PBM in their classrooms and exploration of its effect on student achievement may provide useful theoretical and empirical findings to inform future efforts to scale up and design more rigorous evaluations of PBM training.
1.6. Structure of the Dissertation
Research reported in this dissertation focuses on the mathematics content of a teacher professional development program and applies a portfolio of methodological tools to explore the effects of the program. Chapter 2 reviews the empirical findings and theoretical understandings relevant to these two strands found in the literature on professional development programs for elementary and middle school mathematics teachers. Chapter 3 takes a closer look at PBM and outlines its approach to the division interpretation of a fraction. Chapter 4 describes the methods used in this study, and Chapters 5 and 6 report the findings from analyses of classroom instruction and student achievement, respectively. Chapter 7 discusses the implications of the findings for research and evaluation of professional development programs for mathematics teachers.

7
7
Chapter 2. Literature Review
The purpose of this chapter is to situate the present study in the existing literature on PD for elementary and middle school mathematics teachers. The chapter begins by reviewing the program designs and research findings of studies that have examined the impact of teacher PD programs on classroom instruction and/or student achievement in mathematics (Section 2.1). A major focus of Section 2.1 is the mathematics content (or lack thereof) addressed in these PD programs. The second half of this chapter (Section 2.2) reviews the research designs and methods commonly used in PD studies and other program evaluations, and examines their effectiveness in investigating PD impact on classroom instruction and student achievement, particularly under suboptimal research conditions. The chapter concludes with a preview of how this study will build upon the existing literature and advance the present understanding of effective PD for mathematics teachers.
2.1. Mathematics Content of Teacher Professional Development Studies that have examined the impact of teacher PD programs on classroom instruction
and/or student achievement in elementary or middle school mathematics have covered a broad range of programs that vary widely in content and foci. The studies examined in this literature review have been selected from recent reports (National Mathematics Advisory Panel, 2008; Yoon, Duncan, Lee, Scarloss, & Shapley, 2007), which have identified mathematics PD studies with “rigorous design” or “high-quality evidence.” This review focuses exclusively on the empirical studies that have been published and have studied the effects of PD programs that explicitly address skills or knowledge relevant to K-12 mathematics instruction. Two recent quasi-experimental studies (Garet, et al., 2011; Saxe, Diakow, & Gearhart, 2013) have also been included in this review. The following subsection provides an overview of these studies and examines them based on “program content” (Kennedy, 1999) – the topics or issues addressed in a program.
2.1.1. PD studies based on program content. Table 1 groups the studies according to program content. The three categories include, respectively:
• 1, Programs that focus on pedagogical techniques for teaching mathematics, but do not address teachers’ knowledge of mathematics or how students learn mathematics.
• 2, Programs that focus on pedagogical content knowledge in mathematics. In particular, these programs focus on developing teachers’ knowledge about students’ mathematical thinking, but they do not address teachers’ content knowledge of mathematics.
• 3, Programs that focus on pedagogical content knowledge and content knowledge in mathematics, but more emphasis is usually given to the former than the latter.

8 Table 1 Studies Included in This Review
Study Grade(s) Sample Size Effect(s) on Student
Achievement
Category 1: Focus on Pedagogical Techniques for Teaching Mathematics
Angrist & Lavy (2001) 6 Treatment group: 9 schools (7 secular, 2 religious); comparison group: 11 schools (6 secular, 5 religious)
Positive
Category 2: Focus on Pedagogical Content Knowledge in Mathematics
Carpenter et al. (1989) 1 Treatment group: 20 teachers; control group: 20 teachers Positive, significant; no difference
Category 3: Focus on Pedagogical Content Knowledge and Content Knowledge in Mathematics
Campbell (1996) K-1 Treatment group: 3 schools; comparison group: 3 schools Positive; no difference
Chapin (1994) 3, 6-7 42 teachers; 723 students (269 grade 3, 255 grade 6, 210 grade 7) Positive, significant
Garet et al. (2010, 2011)
7 Year 1 treatment group: 100 teachers; 5,858 students; control group: 95 teachers; 5,621 students: Year 2 treatment group: 45 teachers; 1,083 students; control group: 47 teachers; 1,049 students
No difference
Karges-Bone, Collins, & Maness (2002)
3-4 1 school Positive
Saxe, Diakow, & Gearhart (2013)
4-5 Treatment group: 11 classrooms; control group: 10 classrooms; 571 students Positive, significant
Saxe, Gearhart, & Nasir (2001)
4-5 23 classrooms; treatment groups: 17 teachers (9 in Integrated Mathematics Assessment, 8 in collegial support); comparison group: 6 teachers
Positive, significant; no difference
Van Haneghan, Pruet, & Bamberger (2004)
1-5 Treatment group: 4 schools; comparison group: 2 schools Positive, significant; no difference

9
9
The one study in Category 1 took place in Jerusalem elementary schools and focused on a PD program that “emphasized pedagogy rather than subject content” (Angrist & Lavy, 2001, p. 345). Outside instructors provided training in nine schools on a weekly basis for two years and focused on “improving instruction techniques” that were based on “a modern ‘humanistic mathematics’ philosophy of teaching” and “the ‘individualized instruction’ approach to schooling” (pp. 346-347). Programs of this type tend to focus on providing teachers with prescribed instructional techniques rather than equipping teachers with the knowledge to transform their instructional practices (Kennedy, 1999).
In contrast, programs in Categories 2 and 3 are interested in improving classroom instruction by developing teachers’ knowledge, particularly pedagogical content knowledge (Shulman, 1986; 1987). Shulman has defined pedagogical content knowledge to include “the ways of representing and formulating the subject that make it comprehensible to others” and “an understanding of what makes the learning of specific topics easy or difficult: the conceptions and preconceptions that students of different ages and backgrounds bring with them to the learning” of a subject (p. 9). Moreover, when preconceptions are misconceptions, pedagogical content knowledge equips teachers with “strategies most likely to be fruitful in reorganizing the understanding of learners” (pp. 9-10).
The one study in Category 2 examines a PD program that focused exclusively on developing teachers’ pedagogical content knowledge, particularly of student learning in mathematics. The Cognitively Guided Instruction program (CGI; Carpenter, Fennema, Peterson, Chiang, & Loef, 1989) included a four-week summer workshop where participants “learned to classify problems, to identify the processes that children use to solve different problems, and to relate processes to the levels and problems in which they are commonly used” (Carpenter, Fennema, Peterson, Chiang, & Loef, 1989, p. 503). On the one hand, CGI did not prescribe particular instructional techniques like the PD program in Category 1. On the other hand, CGI did not address teachers’ content knowledge of mathematics such as “understanding the structures of the subject matter” or “why a particular proposition is deemed warranted (and) why it is worth knowing” (Shulman, 1986, p. 9).
The studies in Category 3 focus on PD programs that have sought to address teachers pedagogical content knowledge and content knowledge in mathematics. For example, the Project IMPACT (Increasing the Mathematical Power of All Children and Teachers; Campbell, 1996) summer in-service program addressed “(a) adult-level mathematics content, (b) teaching mathematics for understanding … (c) research on children’s learning of those mathematics topics that were deemed critical to the grade-level focus…and (d) teaching mathematics in culturally diverse classrooms” (p. 460). The Maysville Mathematics Initiative (Van Haneghan, Pruet, & Bamberger, 2004), which modeled its PD component after Project IMPACT, also “emphasized several overarching pedagogical concepts in support of instruction that enables students to make sense of mathematics” and “taught mathematics content knowledge that would be useful for applying what they (teachers) learned in the classroom” (pp. 192-193). Similarly, the Berkeley-Dorchester Mathematics and Science HUB (Karges-Bone, Collins, & Maness, 2002) offered mathematics (and science) teachers three-week sessions that began with “renewing and enhancing teachers’ content knowledge and pedagogy” and progressed to supporting teachers with lesson development, research projects, and visits to business and industry sites to observe how mathematics and science standards might apply in private sector settings (p. 25).

10
10
Three of the studies in Category 3 examine PD programs that focused on specific mathematics topics, namely fractions and rational numbers. The Integrating Mathematics Assessment program (IMA; Saxe, Gearhart, & Nasir, 2001) “supported teachers’ construction of sophisticated understandings of fractions, measurement, and scale,” and “teachers’ knowledge of children’s mathematical thinking,” including “the general pattern of children’s developing understandings of fractions” (pp. 60-61). More recently, the Learning Mathematics through Representations (LMR) program (Saxe, Diakow, & Gearhart, 2013) has built “teachers’ knowledge of the mathematics content of the (LMR) curriculum, the ‘partial understandings’ that students typically reveal as they work with the curriculum, and the pedgaogical strategies that are core to leasson implementation” (p. 351). The Middle School Mathematics Professional Development Impact Study (Garet, et al., 2010; Garet, et al., 2011) examined the impact of providing a PD program focused on developing teachers’ “common knowledge of mathematics (CK) … the knowledge of topics in rational numbers that students should ideally have after completing seventh grade” and “specialized knowledge of mathematics for teaching (SK) … (the) additional knowledge of rational numbers that may be useful for teaching rational number topics,” including “identifying errors that occur in student work, and choosing useful representations and explanations when teaching rational numbers” (Garet, et al., 2010, p. ix).
Across the categories of programs, the studies generally point to a positive effect of mathematics PD programs on student achievement, though the estimated effects are not always significant. The one study in Category 1 (Angrist & Lavy, 2001) estimated a conservative though not significant effect of 0.25 standard deviation of a pedagogy-focused PD on student achievement. The one study in Category 2 (Carpenter T. P., Fennema, Peterson, Chiang, & Loef, 1989) found a significant positive effect of CGI on student performance as measured by a problem solving interview and a computation number facts scale but estimated effects were not significant on other measures. Three of the seven studies in Category 3 (Campbell, 1996; Saxe, Gearhart, & Nasir, 2001; Van Haneghan, Pruet, & Bamberger, 2004) also found some positive effects that were significant and some that were not significant, depending on the outcome measure.
In summary, the mathematics PD programs included in this review fall into one of three categories: (1) programs that focus on pedagogical techniques for teaching mathematics; (2) programs that focus on pedagogical content knowledge in mathematics; and (3) programs that focus on pedagogical content knowledge and content knowledge in mathematics. Across the categories, the PD programs have focused more on pedagogical content knowledge or techniques than on content knowledge in mathematics. Although the studies, in general, signal a positive effect of mathematics PD programs on student achievement, the estimated effects are not always significant, meaning the evidence is not always sufficient to indicate the PD program has had an effect on the indicator(s) used to measure student achievement. The inconclusive evidence suggests more research is still needed to determine when and how PD programs improve student achievement in mathematics.
2.1.2. PD programs for future study. As the review in the last subsection has indicated, PD programs that have sought to develop teachers’ pedagogical content knowledge and content knowledge in mathematics have generally placed more emphasis on the former than the latter. In some cases, the training that teachers received did not provide them with new or deeper knowledge of the mathematics that they teach. As researchers of the Middle School Mathematics Professional Development Impact Study conceded, “instruction in common knowledge of

11
11
mathematics (CK) content was mainly implicit. That is, the PD was not presented to teachers as an opportunity for teachers to improve their understanding of rational number content…” (Garet, et al., 2011, p. 21). Moreover, lead author Garet has since recommended: “providing PD that places more direct emphasis on CK is another potential avenue for future study” (Sztajn, Marrongelle, & Smith, 2012, p. 60).
PBM training is precisely that type of PD – it is devoted specifically to the content knowledge needed for teaching K-12 mathematics. PBM has been developed for the K-12 mathematics curriculum2, from whole numbers to integrals (Wu, 2011b; forthcoming). In the next chapter, PBM will be explained in more detail, specifically in the context of teaching and learning fractions.
2.2. Methodology for Evaluation of Professional Development Programs Another important element to consider in the existing mathematics PD literature is the
methodology used to evaluate PD programs. Although student test scores and teacher classroom practice are generally accepted as “valid and measurable outcome(s) of professional development” (American Federation of Teachers, 2002, p. 6), many PD programs are “home-grown” – they arise from district or local developers’ needs and interests, have “relatively short shelf-life,” and continue with little or no formal evaluation (Hill, Beisiegel, & Jacob, 2013, p. 476). In addition, most PD research is “relatively short term, lacking the follow-up data on teacher knowledge, classroom instruction, and student learning that would determine whether effects are robust and enduring” (National Academy of Education, 2009, p. 7).
The Institute of Education Sciences (IES) and other federal agencies have made the use of randomized controlled trials “a research priority” (Schneider, Carnoy, Kilpatrick, Schmidt, & Shavelson, 2007, p. 4) and, yet, to receive funding to carry out such research, applicants must often provide “prior empirical evidence” such as “prior evidence suggest(ing) that the intervention is likely to substantially improve student learning and achievement” (IES, 2006, pp. 7-8). How can researchers produce such pilot evidence, especially under limited conditions (e.g., small sample, no control over selection or assignment of program participants, restricted access to district data or school classrooms)? The following subsections revisit the PD studies discussed earlier in the chapter and highlight the studies’ methods for investigating PD impact on classroom instruction and student achievement. Special attention is given to examining the extent to which the methods presented support analyses of mathematics content in classroom instruction or provide evidence of program impact on student achievement when “use of randomized controlled trials” is not feasible.
2.2.1. Studying PD impact on classroom instruction. Studies that have investigated the impact of PD on classroom instruction have generally focused more on teacher behavior than mathematics content. For example, Campbell (1996) focused on teachers’ questioning techniques by looking for the presence of “ask(ing) (students) to share alternative approaches for solving problems (and) … why they solved a problem in a particular way…” (p. 467). Similarly, Garet et al. (2010) collected data on the following instructional practices: engagement in activities that elicited student thinking, use of representations, and focus on mathematical reasoning. Across these studies, classroom instruction was measured by frequency or proportion of instructional
2 Excluding probability and statistics.

12
12
time (Carpenter, Fennema, Peterson, Chiang, & Loef, 1989) – and not the quality – of coded behaviors or activities.
In contrast, Gearhart et al. (1999) developed “opportunity-to-learn” rating scales that measure the extent to which a dimension of instruction has been implemented (e.g., eliciting and building upon students’ thinking). Although the rating scales provide richer information about classroom instruction than frequency analyses, Gearhart et al. (1999) acknowledged that the scales were designed to reflect the goals of the NCTM Standards (1989), the research questions specific to their study, and “the ways classroom practices emerged over the year” of their study (p. 292). As such, the rating scales developed by Gearhart et al. (1999) serve a particular purpose that is not directly applicable to the present study. Nevertheless, the use of guiding documents, research questions, and classroom data in the development of rating scales provides a promising model for developing measures of classroom instruction in future evaluations of PBM training and instruction. Moreover, the present study can illuminate “the ways classroom practices emerge” specifically for the topic of the division interpretation of a fraction, which can then inform the development of a rating scale in a future follow-up study.
In summary, the existing methods used to study PD impact on classroom instruction have (1) focused more on instructional behavior and activities than mathematics content, and (2) simplified the complexity of mathematics instruction to frequency analyses and rating scales that are more useful for comparing instructional practices at the large-scale, quantitative level than for describing the instructional content of a mathematics topic such as the division interpretation of a fraction. Case study research (Stake, 1995; Yin, 2009), however, provides a viable method for examining mathematics instruction in its complexity and depth. As Yin (2009) explains, case study is preferred when: (1) “how” or “why” questions are being posed; (2) the investigator has minimal control over the events; (3) focus is on a “contemporary phenomenon with a real-life context”; and (4) the research questions require an “extensive and ‘in-depth’ description of a social phenomenon” (p. 4). Although case study research has been used to describe instructional practice and the process of changing one’s practice (e.g., Wood, Cobb, & Yackel, 1991), there remains a scarcity of literature examining the mathematics content of classroom instruction, specifically how a particular mathematics topic like the division interpretation of a fraction is introduced and developed in a classroom setting, using case study research.
2.3.2. Studying PD impact on student achievement. Funded research programs in institutions such as the IES and National Science Foundation (NSF) have called for more intervention studies that provide “clear evidence of student learning” (Schneider, Carnoy, Kilpatrick, Schmidt, & Shavelson, 2007, p. 2). To provide such evidence, the use of randomized controlled trials, or experimental designs, has been made “a research priority” (Schneider, Carnoy, Kilpatrick, Schmidt, & Shavelson, 2007, p. 4). Randomized controlled trial (i.e., random assignment of units to treatment and control conditions) is often regarded as the “gold standard” in program evaluation because “all systematic sources of bias (are) made random” (Rubin, 1974, p. 692). Therefore, when the study sample is large, the units in the control group are on average comparable to the units in the treatment group so that the observed mean outcome of the control group can serve as an unbiased estimate of the potential mean outcome of the treatment group under the counterfactual (control) condition, and vice versa. The difference in observed group means can then be confidently attributed to the intervention rather than a confounding variable.
Although a number of “quasi-experimental” PD studies have applied random assignment at the teacher (Saxe, Diakow, & Gearhart, 2013; Saxe, Gearhart, & Nasir, 2001) or school level

13
13
(Campbell, 1996; Carpenter T. P., Fennema, Peterson, Chiang, & Loef, 1989; Garet, et al., 2010), randomized controlled trials are generally difficult and impractical to conduct in social settings. Winship and Morgan (1999) identify at least four problems with social experiments: (1) they are often too expensive to implement; (2) they may require unethical coercion of subjects; (3) subjects may be unwilling to remain in the condition to which they are randomly assigned; and (4) the treatment may not be directly manipulable. When randomized controlled trials are infeasible, researchers must resort to the use of observational data from sources such as surveys, censuses, and administrative records. Because assignment to treatment is usually nonrandom in observational data, there may be systematic differences between treatment and comparison3 units that make it challenging to draw casual inference from observational data. Statistical methods, however, can be used to control for observed pre-intervention differences between units in treatment and comparison groups so that causal effects can be estimated in the absence of, or in combination with, a randomized controlled trial.
Regression is a common approach to controlling for observed pre-intervention differences between units in treatment and comparison groups. Nevertheless, few PD studies, particularly non-experimental (i.e., non-randomized controlled) studies, have taken full advantage of this method in their investigation of PD impact on student achievement. Angrist and Lavy (2001) used multiple linear regression to control for lagged (prior) test scores and a full set of covariates for the secular schools in their study. Saxe, Gearhart, and Nasir (2001) used analysis-of-covariance (ANCOVA), which is equivalent to multiple linear regression, to control for classroom mean pretest score and English Fluency Language scores. Saxe, Diakow, and Gearhart (2013) used a sequence of three-level hierarchical linear models to take into account commonalities between students within a classroom and between assessments within a student.
There are a number of drawbacks, however, to linear regression. First, there is the assumption about the functional form (linearity) of the dependence between the outcome and the covariates in the model. Nonlinear terms can be added to relax the linearity constraint but it is often difficult to know how the nonlinearity should be approximated. Polynomial and related expressions may inadequately model nonlinearity and lead to biased estimates (Morgan & Winship, 2007). Second, regression puts most weight on covariate x cells where there are equal numbers of treatment and comparison observations (Angrist & Pischke, 2009). This may be problematic if the distributions of treatment units and comparison units on a covariate x are very different so that greater weight is placed on non-representative units of the treatment group (and/or comparison group). When there is little or no overlap in the distributions (i.e., lack of common support), adjustments are applied to the mean where neither group has any observation (i.e., extrapolation). Thus, “regression analysis cannot reliably adjust for differences in observed covariates when there are substantial differences in the distribution of these covariates in the two groups” (Rubin, 2001, p. 173).
Propensity score methods provide an alternative approach to adjusting for pre-intervention differences by using only the covariates in the data. Because regression requires the outcome data, there is a risk of selecting the analysis that yields the most favorable treatment effect estimate when multiple attempts are made to control for covariates. In contrast, propensity
3 Herein “comparison” group will be used to identify the non-treatment group in any type of study, and “control” group will only be used to identify the non-treatment group in an experimental study (randomized controlled trial).

14
14
score methods do not require or use the outcome data. Therefore, “repeated analyses attempting to balance covariate distributions across treatment groups do not bias estimates of the treatment effect on outcome variables” (Rubin, 2001, p. 169).
The propensity score is the conditional probability that an individual is assigned to the treatment instead of the comparison condition given a vector of observed pretreatment covariates, Xi. In a randomized controlled trial, treatment and control units have equal probability of being assigned to a condition, but in non-experimental studies, the probability of being assigned to one condition over another is usually unknown, let alone equal for treatment and comparison units. Propensity score methods, however, provide a way to (1) model or predict this probability (the propensity score) for each unit based on observed pretreatment covariates and then, (2) adjust the design (e.g., how units are grouped or weighted) based on the propensity scores. Rubin (2001) has identified three main applications of propensity scores for initial design of an observational study:
• Matching: Propensity score matching refers to the pairing of treatment and control units with similar values of the propensity score, and possibly other covariates, and the discarding of unmatched units.
• Subclassification: Subclassification on the propensity score ranks all units by their propensity score and then uses boundaries to create subclasses with treated and control units with similar values of the propensity score – typically five or six subclasses are used, with approximately the same total number of units within each subclass.
• Weighting: Weighting methods use the inverse of the propensity score as a weight to apply to each treated unit and the inverse of one minus the propensity score as the weight to apply to each control unit. (Rubin, 2001, p. 173)
Rosenbaum and Rubin (1983) have shown that nothing is gained by matching or stratifying in more refined ways on Xi than on just the propensity score. In other words, the propensity score contains all the information needed to achieve a balanced design (i.e., balanced distribution of observed covariates between the treatment and comparison groups) and reduces matching to a single dimension, a “scalar summary of Xi” (Rubin, 2001, p. 171). By matching on the propensity score, the potential outcomes then become independent of treatment assignment (i.e., the assumption of unconfoundedness) conditional on , and the assignment mechanism is assumed to be random conditional on Xi. The resulting design then simulates a randomized controlled trial conditional on observed pretreatment covariates Xi.
Given a distance measure (e.g., the absolute value of the difference between the propensity scores of a treatment unit and a comparison unit), there are two basic approaches to building a matched sample: greedy matching and optimal matching. Greedy matching follows a greedy algorithm, which “divides a large decision problem into a series of simpler decisions each of which is handled optimally, and makes those decisions one at a time without reconsidering early decisions as later ones are made” (Rosenbaum, 2002, p. 311). For example, one type of greedy matching is nearest available or neighbor (Rubin, 1973): each treatment unit is matched with a comparison unit (from the yet unmatched comparison pool) that minimizes the distance measure. In contrast, optimal matching is based on an algorithm that minimizes the total distance within matched pairs (Gu & Rosenbaum, 1993). Although optimal matching is “by definition” better than greedy matching at producing close matches, Gu and Rosenbaum (1993) found that
Xi

15
15
optimal matching was only slightly better than greedy at minimizing the propensity distance and neither method was better than the other at producing balanced matched samples.
For each method of matching, additional specifications can be made to the matching process. For example, the default matching ratio is typically 1 (pair matching), but it is also possible to specify matching with a fixed or variable number of comparison units (Rosenbaum, 2002). Additionally for nearest neighbor matching, the matching order may be random or begin with the treatment unit with the highest propensity score or the treatment unit with the lowest propensity score. For all matching orders, the resulting observed difference (i.e., the “standard estimator” (Winship & Morgan, 1999)) attempts to estimate the average treatment effect on the treated because matching the comparison units to the treatment units yields the potential outcome, or counterfactual, for the treatment sample.
Since the introduction of propensity score methods (Rosenbaum & Rubin, 1983), the number of published studies using propensity scores has increased exponentially (Bai, 2011). In particular, propensity score methods have been widely used in the fields of education and other social and behavioral sciences (Bai, 2011). Examples of recent use of propensity score matching in education research include exploring the effect of Catholic schooling on educational outcomes (Nguyen, Taylor, & Bradley, 2006), the effect of kindergarten retention on children’s social-emotional development (Hong & Yu, 2008), the effects of small school size on mathematics achievement (Wyse, Keesler, & Schneider, 2008), the effect of teenage alcohol use on educational attainment (Staff, Patrick, Loken, & Maggs, 2008), and the effect of teacher performance incentive on student achievement and teacher retention (Glazerman & Seifullah, 2012). Studies of PD for mathematics teachers, however, have yet to use propensity score matching to investigate the effect of PD on student achievement, particularly in observational studies when randomized controlled trials are not feasible.
2.3. Conclusion This chapter has reviewed mathematics PD studies with respect to two strands: program
content and research methodology. The review has shown that mathematics PD programs tend to focus more on pedagogical content knowledge or techniques than on content knowledge in mathematics. Similarly, studies that have investigated the impact of mathematics PD on classroom instruction have generally focused more on teacher behavior and pedagogical skills than mathematics content. With regards to PD impact on student achievement, many studies in this review have managed to apply random assignment at the teacher or school level, but few studies have used statistical methods to control for possible confounding factors in estimating effects on student achievement with observational data. In particular, none of the studies has used propensity score matching to achieve a more balanced design in the absence of a randomized control trial.
Although there has been a wide range of studies examining the impact of teacher PD programs on classroom instruction and/or student achievement in elementary or middle school mathematics, a review of the literature points to further research needed in: (1) examining PD programs that place “direct emphasis” on the content knowledge needed for teaching K-12 mathematics (Sztajn, Marrongelle, & Smith, 2012, p. 60); and (2) applying research methods that can afford “extensive and in-depth description” (Yin, 2009, p. 4) of the mathematics content of classroom instruction and estimate the effect of PD on student achievement when use of randomized controlled trials is not feasible. This dissertation intends to contribute to these areas

16
16
of research by using a portfolio of methods to explore how teachers attempt to implement PBM in their own classrooms, specifically for the topic of the division interpretation of a fraction, and how their students, after receiving this instruction, perform on state mathematics tests compared to their peers. The following chapter takes a closer look at PBM and presents a benchmark for how the topic of the division interpretation of a fraction will be examined in Chapter 5.
17
17
Chapter 3. Principle-Based Mathematics
Principle-Based Mathematics (PBM) has been termed by the author to refer to K-12 mathematics that adheres to the fundamental principles of mathematics, which have been stated and defined by Wu (2011a) as the following:
1. Definitions: Every concept is precisely defined, and definitions furnish the basis for logical deductions.
2. Precision: Mathematical statements are precise. At any moment, it is clear what is known and what is not known.
3. Reasoning: Every assertion can be backed by logical reasoning. 4. Coherence: Mathematics is coherent; it is a tapestry in which all the concepts and
skills are logically interwoven to form a single piece. 5. Purposefulness: Mathematics is goal-oriented, and every concept or skill in the
standard curriculum is there for a purpose. (pp. 379-380) Wu’s awareness and knowledge of these principles were born of his experience as a
mathematician. When asked whose work he had built upon to develop this set of principles, he replied, “I had nothing to build on, because professional mathematicians tend not to discuss what they regard as common sense with the outside world” (H. Wu, personal communication, January 8, 2012). Although other mathematicians who have been involved in mathematics education have occasionally referenced elements of these principles (e.g., Klein (2003) briefly noted the deficiency of mathematical definitions and proofs in reform-based curricula), Wu is the first to compile this set of interrelated principles and demonstrate in explicit detail how the K-12 mathematics curriculum can be presented in a way that adheres to these principles (cf. Wu, 2008, 2011a).
With PBM, Wu offers a perspective from the mathematics community on how “to engineer the abstract mathematics for use by students and teachers in K-12” (Wu, 2007, p. 5). His contribution to this work primarily began in the form of “lecture notes” that were written for PD summer institutes for mathematics teachers and a three-semester mathematics course sequence for undergraduate students who major in mathematics with a teaching concentration. These “lecture notes” became the early drafts of his book Understanding numbers in elementary school mathematics and forthcoming Pre-algebra and algebra and Mathematics of the secondary school curriculum. Put together, these books present PBM for the K-12 mathematics curriculum (excluding probability and statistics), from whole numbers to integrals.
This dissertation focuses on a central topic covered during the PBM Institute: fractions. It is widely known that learning fractions is important yet challenging for students to learn (Kieren, 1992; National Mathematics Advisory Panel, 2008). Of all the elementary school mathematics topics, learning fractions and other rational number concepts remains “a serious obstacle in the mathematical development of children” (Behr, Harel, Post, & Lesh, 1992, p. 296). For example, on the fourth mathematics assessment of the National Assessment of Educational Progress (NAEP), many seventh grade students demonstrated little knowledge of the most fundamental concepts of fractions, decimals, or percents (Carpenter, Lindquist, Brown, Kouba, Silver, & Swofford, 1988). Behr, Lesh, Post, and Silver (1983) propose that the multiple interpretations of

18
18
a fraction (and rational number4) may be one reason why understanding fractions, and rational numbers in general, is a “formidable learning task.” They identify at least six ways that fractions can be interpreted: “a part-to-whole comparison, a decimal, a ratio, an indicated division (quotient), an operator, and a measure of continuous or discrete quantities” (pp. 92-93). One of the more challenging interpretations for students to learn is the division, or quotient, interpretation of a fraction. As Niemi (1996) notes, many middle and even high school students “do not conceive fractions as numbers, and particularly not as numbers that can represent a quotient relation between two other numbers” (p. 70). In other words, students often struggle to understand that the fraction !
! can represent, or be interpreted as, the quotient 𝑚 ÷ 𝑛. The
remainder of this chapter examines the challenges of learning the division interpretation of a fraction and how PBM’s approach to the concept addresses these challenges.
3.1. Division Interpretation of a Fraction In the Secondary Mathematics Project (Kerslake, 1986), an investigation conducted in
England of problems children experience with fractions, 12- and 13-year-old students were asked the following “equal sharing” question: “Three bars of chocolate are to be shared equally between five children. How much should each child get?” Researchers found that only 65.9% of 12-year-olds and 63.4% of 13-year-olds were able to identify !
! as the answer. Moreover, when
presented with 3÷ 5 on its own without any context, even fewer students were able to identify the quotient as the number !
!. Nearly 27% of the 12-year-olds and 35.6 % of the 13-year-olds
appeared to have inverted the expression and divided 5 by 3 instead of 3 by 5 (Kerslake, 1986, p. 2).
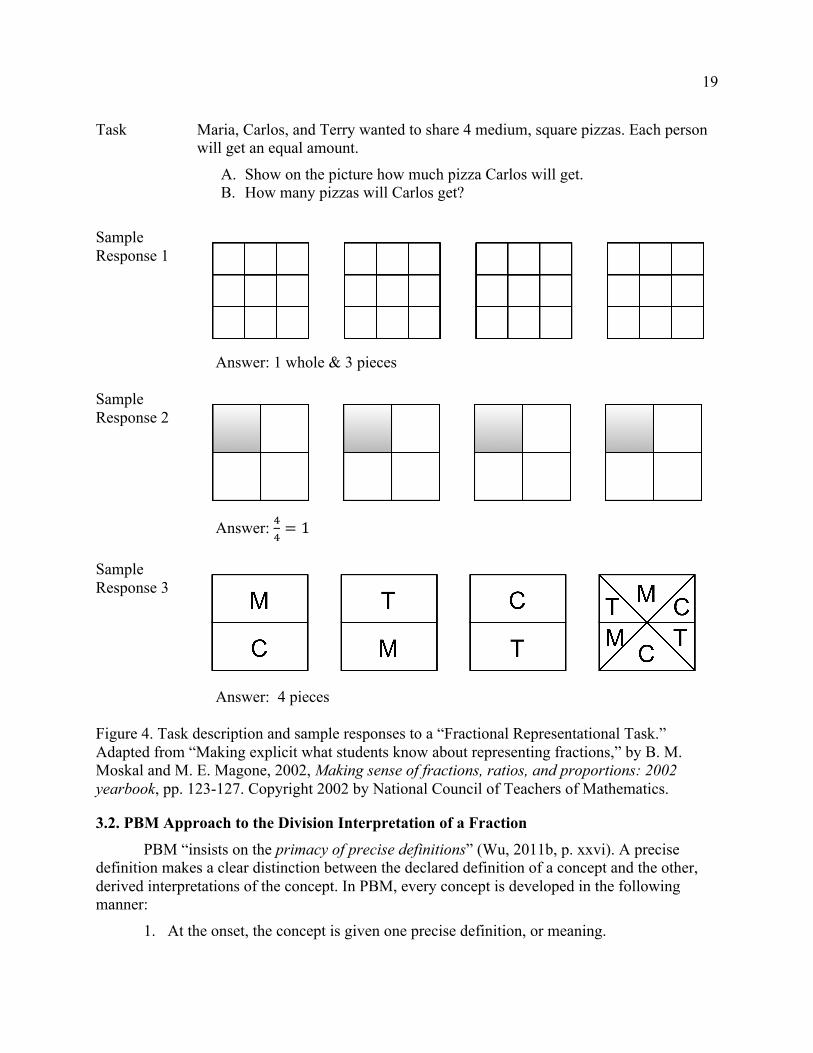
Studies that have taken a closer look at student thinking on fractions reveal a wide range of confusion associated with solving “equal sharing” problems. In their chapter “Making explicit what students know about representing fractions,” Moskal and Magone (2002) present three sample student responses (Figure 4) to the following task: “Maria, Carlos, and Terry wanted to share 4 medium, square pizzas. Each person will get an equal amount. (A) Show on the picture how much pizza Carlos will get. (B) How many pizzas will Carlos get?” The responses indicate a lack of precision in the students’ conceptions of fractions and division of whole numbers (when the quotient is not a whole number). In the first and third sample responses, the students overlook the need for more precision when referring to “pieces” (i.e., “3 pieces” of what? “4 pieces” of what?). Specifically, the size of the “pieces” needs to be specified and consistent, which is fundamental to a precise definition of a fraction. The second sample response points out the ambiguity inherent in many “equal sharing” problems – the assumption that the four pizzas should be completely shared among the three students – and points to the need for a precise definition of division of whole numbers. The following section of this chapter presents precise definitions for both concepts – fractions and division of whole numbers – and demonstrates how these definitions furnish the basis for justifying the division interpretation of a fraction.
4 As in mathematics, we use rational number to mean the number !
! where 𝑎 is an integer and 𝑏 is a
nonzero integer whereas a fraction represents a number !!
where 𝑚 is a non-negative integer (i.e., a whole number) and 𝑛 is a positive integer.
19
19
Task Maria, Carlos, and Terry wanted to share 4 medium, square pizzas. Each person will get an equal amount.
A. Show on the picture how much pizza Carlos will get. B. How many pizzas will Carlos get?
Sample Response 1
Answer: 1 whole & 3 pieces
Sample Response 2
Answer: !
!= 1
Sample Response 3
Answer: 4 pieces
Figure 4. Task description and sample responses to a “Fractional Representational Task.” Adapted from “Making explicit what students know about representing fractions,” by B. M. Moskal and M. E. Magone, 2002, Making sense of fractions, ratios, and proportions: 2002 yearbook, pp. 123-127. Copyright 2002 by National Council of Teachers of Mathematics.
3.2. PBM Approach to the Division Interpretation of a Fraction
PBM “insists on the primacy of precise definitions” (Wu, 2011b, p. xxvi). A precise definition makes a clear distinction between the declared definition of a concept and the other, derived interpretations of the concept. In PBM, every concept is developed in the following manner:
1. At the onset, the concept is given one precise definition, or meaning.

20
20
2. All other interpretations of the concept are then explained by reasoning to be equivalent to that definition.
School texts and education literature, however, usually list multiple interpretations of a concept upfront without identifying which interpretation is true by definition and which interpretation(s) is (are) true by reasoning. For example, one widely used fourth grade textbook says: “A fraction is a symbol, such as !
! or !
!, used to name a part of a whole, a part of a set, a
location on a number line, or a division of whole numbers.” When the concept of a fraction is presented in this manner, we are left with two unanswered questions: (1) which of these interpretations is the definition, or meaning, of a fraction – the statement that students can point to every time and say, without ambiguity, “that is what a fraction is” – and (2) what is the meaning of each of the other interpretations, in particular “division of whole numbers,” and why are they also true?
In contrast, PBM presents a single, precise definition of a fraction at the onset:
Definition. The collection of all the sequences of 𝑛ths5, as 𝑛 runs through the nonzero whole numbers 1, 2, 3,… , is called the fractions. The 𝑚th point to the right of 0 in the sequence of 𝑛ths is denoted by !
!. (Wu, 2009, p. 15)
After this definition is introduced, all other interpretations are then systematically explained to be true. In particular, before the division interpretation of a fraction is introduced, the following observations (informal theorems) from the definition of a fraction and subsequent definition of equal fractions are established because they are essential to the reasoning behind the division interpretation of a fraction:
!"!= 𝑘 for all whole numbers 𝑘,𝑛 where 𝑛 > 0. In particular, !
!= 𝑚 and !
!= 1 for any
whole number 𝑚 (Wu, 2009, p. 16)
… two fractions (which are two points on the number line) are said to be equal if they are the same point. (Wu, 2009, p. 18)
With these observations and definition in place, PBM now gives the definition, or meaning, of the division of two whole numbers:
… the division 𝑚 ÷ 𝑛 of two whole numbers 𝑚 and 𝑛: 𝑚 ÷ 𝑛 is the length of one part when a segment of length 𝑚 is partitioned into 𝑛 equal parts. (Wu, 2009, p. 39)
This definition is an expansion of the partitive interpretation of the division 𝑚 ÷ 𝑛 when 𝑚 ÷ 𝑛 is a whole number:
𝑚 ÷ 𝑛 is the number of objects in each group when 𝑚 objects are partitioned into 𝑛 equal groups. (Wu, 2008, p. 91)
The critical difference between the definition of division in the context of whole numbers and the expanded definition of division in the context of fractions is the latter does not restrict 𝑚 ÷ 𝑛 to a
5 “Divide each of the line segments 0,1 , 1,2 , 2,3 , 3,4 ,… into 𝑛 equal parts, then these division points (which include the whole numbers) form an infinite sequence of equi-spaced points on the number line, to be called the sequence of 𝒏ths. “ (Wu, 2009, p. 15)

21
21
whole number. With fractions defined, the “length of one part when a segment of length 𝑚 is partitioned into 𝑛 equal parts” may be a fraction whereas “the number of objects in each group” is necessarily a whole number. The expanded definition of division of two whole numbers leads to the to-be-proven theorem of the division interpretation of a fraction:
Theorem 5 For any two whole numbers 𝑚 and 𝑛, 𝑛 ≠ 0, !!= 𝑚 ÷ 𝑛. (Wu, 2009, p.
39)
To simplify our discussion, a proof of the special case !!= 5÷ 3 is presented here, and
the general proof is provided in Appendix A. Consistent in both proofs though is the exclusive use of the pre-established definitions and observations. First, the definitions of a fraction, equal, and the definition of division of whole numbers are directly and literally applied so that the goal now becomes to prove the division interpretation of a fraction re-stated as the following equivalent statement: The 5th point to the right of 0 in the sequence of thirds is the same point as the length of one part when a segment of length 5 is partitioned into 3 equal parts. This re-statement of the division interpretation of a fraction is true because of the following: By the preceding observations, 5 = !
!= !×!
!. That means the segment 0,5 , which has length , is 3×5
copies of !!. Then when the 3×5 copies of !
! are partitioned into 3 equal parts, each part is 5
copies of !! (see Figure 5), which coincides with the 5th point to the right of 0 in the sequence of
thirds. Therefore, !!= 5÷ 3, which concludes the proof of the special case.
Figure 5. The segment 0,5 consisting of 3×5 copies of !
! and partitioned into 3 equal parts.
From Lecture notes for the 2009 pre-algebra institute, by H. Wu, 2009, p. 38. Copyright 2009 by Hung-Hsi Wu. Reprinted with permission.
In addition to explaining the division interpretation of a fraction based on the two basic building blocks of mathematics – precise definitions and proven theorems – the above exposition demonstrates how PBM consistently grounds the discussion of fractions in the number line. Many school texts, like the one referenced earlier, treat the number line as merely one interpretation that is unrelated to other interpretations of a fraction and continue to place more emphasis on other representations such as pizzas, pies, and brownies. In most cases, the number line is used for nothing more than locating fractions as points on the number line. On the one hand, there is growing support in the literature for using the number line to support students’ understanding of fractions beyond the basic interpretation. For example, LMR (Saxe, Diakow, & Gearhart, 2013) and the Middle School Mathematics Professional Development Impact Study (Garet, et al., 2010; Garet, et al., 2011) both used number lines as a central representational tool in teaching rational numbers. On the other hand, there remains a dearth of literature that explores how the number line can be used to define and prove all fraction concepts such as the division interpretation of a fraction, multiplication of fractions, the product rule of fraction multiplication (i.e., !
!× !!= !"
!"), or the invert-and-multiply rule of fraction division (i.e., !
!÷ !
!= !
!× !
!). As the
5

22
22
above exposition illustrates, PBM fills this void by demonstrating how: (1) fraction concepts (e.g., equal fractions, division of two whole numbers) beyond the basic definition can be defined on the number line, and (2) theorems (e.g., the division interpretation of a fraction) can be proven with the number line.
3.3. Implications for Present Study Despite the evidence that suggests many students have difficulty understanding the
division interpretation of a fraction, research on how teachers can help students better understand this fundamental concept is lacking, especially when compared to other more popular fractions topics such as equivalent fractions and division of fractions. One of the goals of the present study is to provide evidence to fill this gap in the literature by using a portfolio of methods to investigate how PBM-trained teachers teach the division interpretation of a fraction (using the above exposition as a benchmark) and how their students perform on state tests after receiving a year of PBM instruction. The following chapter explains these methods and the background of the study in greater detail.

23
23
Chapter 4. Methods
This chapter presents the background of the present study’s research design and methods. It begins with a more detailed description of PBM training and the teacher participants of this study. The following section outlines the procedures and discusses the limitations of the data collected in the study. The final sections of the chapter summarize the plans of analysis developed to address the study’s research questions, and Chapters 5 and 6 report the results of these analyses.
4.1. PD Program: Principle-Based Mathematics
As introduced in Chapter 1, PBM training takes two forms: (1) a three-week summer institute (referred to as PBM Institute in this study), and (2) teacher-led collaboration during the school year. PBM Institute is the main focus of this study because it is the primary PD that presents teachers to PBM and prepares them to share PBM with their colleagues. Some attention, however, is devoted to the latter because of its relevance to the fourth grade case study, which will be further discussed in the following section.
PBM Institute, which began in 2000, cycles through one of three sets of grades 3-8 mathematics topics each summer: (1) whole numbers, fractions, and rational numbers; (2) pre-algebra; (3) algebra. The target population of the institute is upper elementary school teachers and middle school teachers. A mathematics professor, who is an expert in PBM, leads the institute with the support of three assistants: a mathematics college instructor, a high school mathematics teacher, and a middle school mathematics teacher. Approximately 20 teachers participate in the institute each summer. Participants are screened and admitted based on an application that includes a statement of interest, and preference is given to teams of teachers from the same school or district. Participating teachers receive a $100 stipend for each day of attendance, although the funder has restricted stipends to California teachers as of 2011.
The institute demands a substantial commitment of time and effort from participants. Each of the 15 weekdays of the institute begins at 8:30 AM and officially ends at 4:30 PM, although many participants often stay longer to work on the daily homework assignments with other participants. Each day includes five hours of lecture and seatwork and ends with one-and-a-half-hours of small group discussions to discuss the prior day’s homework assignment or that day’s lecture. The homework assignments consist of rigorous mathematics problems, often involving mathematical proofs. In addition, participants are expected to read relevant sections of the textbook6 in preparation for each day’s lecture. Study participants reported spending one to six hours each day on the assigned homework and reading.
In addition to the 15 weekdays in the summer, PBM Institute includes five Saturday follow-up sessions during the school year. The purpose of the follow-up sessions is for participants to share how they are implementing, as well as get input on how to incorporate, PBM in their teaching. As time permits, the lead facilitator also reviews requested mathematics
6 The textbook for the 2009 pre-algebra institute was Lecture notes for the 2009 pre-algebra institute (Wu, 2009); the textbook for the 2010 algebra institute was Introduction to school algebra (Wu, 2010); the textbook for the 2011 whole numbers, fractions, and rational numbers institute was Understanding numbers in elementary school mathematics (Wu, 2011b).

24
24
topics from the past summer. Attendance of the follow-up sessions is usually 40-60% lower than that of the summer sessions.
Because the institute lectures and textbooks present PBM for an adult audience (i.e., K-12 teachers and not students), the task of taking this form of PBM and integrating it into one’s classroom teaching lies with each individual teacher participant. Implementing PBM instruction requires a tremendous amount of teacher planning time and effort, however, because PBM differs considerably from the content of the “de facto mathematics curriculum Textbook School Mathematics” (Wu, 2011c) and no PBM curriculum written for K-12 students exists to date. Although the institute follow-up sessions are intended to support teachers in the process of transferring their knowledge from the PD to the classroom, few participants have attempted to implement PBM beyond one lesson or topic (e.g., addition of whole numbers on the number line).
4.2. Study Design and Participants Because this study seeks to examine the classroom practices and outcomes of teachers
who participate in PBM training and attempt to implement PBM in their teaching, case study is the optimal approach to addressing the research questions. Robert Stake (1995) calls this type of inquiry “instrumental case study.” He states, “we will have a research question, a puzzlement, a need for general understanding, and feel that we may get insight into the question by studying a particular case. … Case study here is instrumental to accomplishing something other than understanding this particular teacher…” (p. 3). Instrumental case study is, therefore, particularly fitting for this study because the purpose is not to understand a particular teacher but to understand PBM instruction. Moreover, the population of interest (i.e., teachers who have participated in PBM training and attempted to implement PBM in their teaching) only consists of a few teachers in the study’s time frame, making case study the optimal design.
With the assistance of PBM Institute’s lead facilitator, two institute participants were identified and recruited for the present study. These two teachers – Ms. Iris and Ms. Violet – both traveled out-of-state to attend PBM Institute during summers 2009 and 2010 (Ms. Iris also attended one week of the summer 2011 institute) and were the only participants who attempted to implement PBM throughout their curricula. They serve as the main focal participants of this study’s multiple-case, embedded design (see Figure 2 in Chapter 1).
4.2.1. Fourth grade case. The fourth grade case takes place in a northwestern state of the U.S. and involves Ms. Iris and two of her teacher colleagues, Ms. Carrie and Ms. Laura. Each teacher had at least 20 years of experience teaching elementary grades prior to this study. Of the three teachers, Ms. Iris was the only one who attended PBM Institute and the others were introduced to PBM through her. In other words, the other two teachers’ training in PBM was through teacher-led collaboration during the school year, not the three-week summer institute. Moreover, Ms. Iris is the only teacher in her district to have attended PBM Institute to date; therefore, Ms. Carrie and Ms. Laura’s exposure to PBM was exclusively through Ms. Iris and no other teachers in the district were exposed to PBM during the time frame of this study.
As Ms. Iris attempted to implement PBM while using the district-mandated curriculum in 2010-2011, she would share the content of her instruction with Ms. Carrie, the one other fourth grade teacher at her school (Lakeview), and Ms. Laura, a fourth grade teacher who taught at a different elementary school in the same district (Riverside). Being at a different school, however,

25
25
limited Ms. Laura’s opportunities to collaborate with Ms. Iris. Most of their collaboration was over email and mainly involved Ms. Iris sending documents and responding to questions about instructional materials (e.g., handouts, worksheets) that she created in her attempted implementation of PBM. The two teachers corresponded, on average, twice a week, and met once in spring 2011 using the district’s contract time to discuss the topics of fractions and decimals. In contrast, most of the collaboration between Ms. Iris and Ms. Carrie was in person. The teachers checked-in with each other on a daily basis (about 10 minutes per meeting) and twice each week for more extended collaboration (about 45 minutes per meeting). Therefore, Ms. Carrie was able to follow Ms. Iris’ attempted implementation of PBM more closely than Ms. Laura was, but neither teacher engaged with the mathematics content as deeply or extensively as Ms. Iris had during and following PBM Institute.
4.2.2. Sixth grade case. The sixth grade case takes place in a northeastern state of the U.S. and involves one focal teacher, Ms. Violet. Ms. Violet received her teacher training as a New York City Teaching Fellow and, as of spring 2013, has taught 4th through 6th grade mathematics for nine years. Since 2008 Ms. Violet has been teaching 6th grade mathematics at Park School; prior to that, she taught mathematics and other subjects at City School.
As mentioned above, Ms. Violet attended PBM Institute during the same two summers as Ms. Iris: 2009 and 2010. Because her school has not been required to follow any district-mandated curriculum, Ms. Violet has more latitude in her instructional practices than the teachers in the fourth grade case. Ms. Violet is also the only sixth grade mathematics teacher at Park School, meaning all sixth grade students at Park School receive mathematics instruction from her. Moreover, like Ms. Iris, Ms. Violet is the only teacher in her district who has participated in PBM Institute to date. Unlike Ms. Iris, however, Ms. Violet did not collaborate or share her professional development experiences with other teachers in her school or district during the time frame of this study; therefore, Ms. Violet was the only teacher in her district who attempted to implement PBM during this study.
4.3. Data Collection 4.3.1. Classroom instruction. Access to data on classroom instruction was limited due to
the school district’s restrictions in the fourth grade case and lack of funding to support extended data collection in both cases, which were both out-of-state. The school district in the fourth grade case restricted data collection to the school years that included or preceded 2010-2011, consequently limiting this dissertation to a retrospective study. Although the school district in the sixth grade case did not set such restrictions, limited funding only made it possible to observe and video tape Ms. Violet’s first three lessons of the fraction unit (which did not include the topic of the division interpretation of a fraction) during the 2012-2013 school year. As a result, in both cases, teacher interviews and classroom artifacts (e.g., lesson plans, student work) were the main data sources used to explore the attempted implementation of PBM for the topic of the division interpretation of a fraction.
4.3.1.1. Teacher interviews. All four teacher participants of the study were interviewed in person between August and October of 2012. They were asked to describe past and present professional development opportunities, especially their participation in PBM training, and to explain the ways in which they attempted to implement PBM in their classrooms, particularly in the teaching of fractions. Interviews in the fourth grade case included one-on-one interviews with

26
26
each teacher as well as a group interview with all three teachers together. Follow-up interviews with Ms. Iris and Ms. Violet were conducted over the phone in September and October 2013 to clarify information collected from the initial round of interviews and to obtain more details about how they taught the division interpretation of a fraction.
4.3.1.2. Classroom artifacts. Teacher lesson plans and sample student work (e.g., class notes, worksheet exercises, homework assignments, chapter tests) from the 2010-2011 and, in the sixth grade case, 2011-2012 school years were collected and examined. Data collection focused on the teaching and learning of fractions. The fourth grade case only covered the following introductory topics: definition of fraction, equivalent fractions, addition and subtraction of fractions, and division interpretation of fraction. The sixth grade case covered these as well as more advanced topics such as multiplication and division of fractions.
4.3.2. Student achievement. Student demographics and state test scores were obtained from the study participants’ school districts to address the research question regarding student achievement. Specifically, in the fourth grade case, the district provided access to fourth grade student data from the 2008-2009, 2009-2010, and 2010-2011 school years and fifth grade student data from the 2010-2011 school year. In the sixth grade case, the district provided access to sixth grade student data from the 2006-2007, 2010-2011, and 2011-2012 school years and ninth grade student data from the 2010-2011 school year, though the latter was excluded from the present study’s analyses. Reasons for obtaining additional years and grades of data will be explained in the following section of this chapter. Table 2 summarizes the data sets by grade, teacher or school, and year; Table 3 lists the variables used in the study; Table 4 presents the summary statistics for each state mathematics test. Table 2 Summary of Data Sets
Grade Teacher or School 2006-07 2008-09 2009-10 2010-11 2011-12
4 Ms. Irisa X X
Ms. Carriea X X X
Ms. Laurab X X X
5 Lakeview X
Riverside X
6 Ms. Violet X X X aTaught at Lakeview School during the 2010-2011 school year. b Taught at Riverside School during the 2010-2011 school year.

27
27
Table 3 List of Variables
Variable Description
mscaleN Nth grade state mathematics scale score
male Coded as 1 if student was male
asian Coded as 1 if student was Asian or Hawaiian-Pacific Islander
black Coded as 1 if student was Black or African American
hispanic Coded as 1 if student was Hispanic or Latino
amindian Coded as 1 if student was American Indian or Alaskan Native
multi Coded as 1 if student was multi-racial
ell Coded as 1 if student was classified English Language Learner
frl Coded as 1 if student qualified for free or reduced-price lunch (proxy for socioeconomic status)
sped Coded as 1 if student was in Special Education

28
28
Table 4 Population Summary Statistics for State Mathematics Tests
Case Year Grade Mean SD Minimum Maximum
Grade 4 2007-08 3 412.6 35.9 175 550
2008-09 3 410.5 43.3 175 550
4 400.7 42.4 200 550
2009-10 3 404.5 35.0 200 575
4 402.9 51.9 200 575
2010-11 4 408.8 56.7 200 575
5 409.2 45.6 200 575
Grade 6 2005-06 5 665.59 39.85 495 780
2006-07 6 667.96 40.34 500 780
2009-10 5 684.79 32.48 495 780
2010-11 5 686.12 30.49 495 780
6 682.16 31.60 500 780
2011-12 6 683.05 34.99 500 780
4.4. Analysis
4.4.1. Classroom instruction. Teacher interviews and classroom artifacts (lesson plans and student work) were triangulated to examine how the teachers in each case study taught the division interpretation of a fraction during the 2010-2011 and 2011-2012 school years. The data were analyzed using analytic induction (Patton, 2002), which combines inductive and deductive qualitative analyses. Analytic induction begins with “examining the data in terms of theory-derived sensitizing concepts or applying a theoretical framework developed by someone else,” and then “after or alongside this deductive phase of analysis, the researcher strives to look at the data afresh for undiscovered patterns and emergent understandings (inductive analysis)” (Patton, 2002, p. 454). In this study, the classroom instruction data were examined with respect to PBM Institute’s approach (Wu, 2009; 2011b) to the division interpretation of a fraction, which was summarized in Chapter 3 (Section 3.2). Alongside this deductive phase of analysis, “undiscovered patterns and emergent understandings” that signify new ways of implementing PBM were sought. Chapter 5 summarizes the results of these analyses.
4.4.2. Student achievement. Fourth grade student data from the 2010-2011 school year in the fourth grade case and sixth grade student data from the 2010-2011 and 2011-2012 school years in the sixth grade case were used to explore the effect of PBM training on student achievement. Prior to analyses, the sixth grade student data set was reduced to the “peer group”
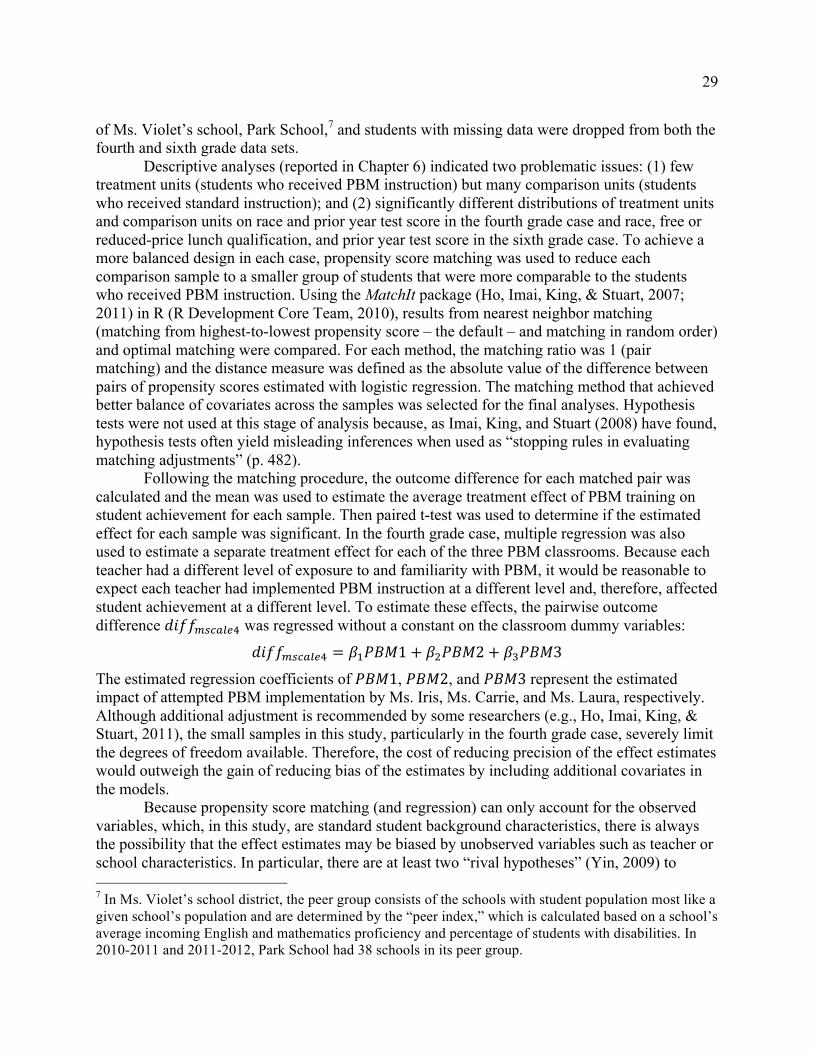
29
29
of Ms. Violet’s school, Park School,7 and students with missing data were dropped from both the fourth and sixth grade data sets.
Descriptive analyses (reported in Chapter 6) indicated two problematic issues: (1) few treatment units (students who received PBM instruction) but many comparison units (students who received standard instruction); and (2) significantly different distributions of treatment units and comparison units on race and prior year test score in the fourth grade case and race, free or reduced-price lunch qualification, and prior year test score in the sixth grade case. To achieve a more balanced design in each case, propensity score matching was used to reduce each comparison sample to a smaller group of students that were more comparable to the students who received PBM instruction. Using the MatchIt package (Ho, Imai, King, & Stuart, 2007; 2011) in R (R Development Core Team, 2010), results from nearest neighbor matching (matching from highest-to-lowest propensity score – the default – and matching in random order) and optimal matching were compared. For each method, the matching ratio was 1 (pair matching) and the distance measure was defined as the absolute value of the difference between pairs of propensity scores estimated with logistic regression. The matching method that achieved better balance of covariates across the samples was selected for the final analyses. Hypothesis tests were not used at this stage of analysis because, as Imai, King, and Stuart (2008) have found, hypothesis tests often yield misleading inferences when used as “stopping rules in evaluating matching adjustments” (p. 482).
Following the matching procedure, the outcome difference for each matched pair was calculated and the mean was used to estimate the average treatment effect of PBM training on student achievement for each sample. Then paired t-test was used to determine if the estimated effect for each sample was significant. In the fourth grade case, multiple regression was also used to estimate a separate treatment effect for each of the three PBM classrooms. Because each teacher had a different level of exposure to and familiarity with PBM, it would be reasonable to expect each teacher had implemented PBM instruction at a different level and, therefore, affected student achievement at a different level. To estimate these effects, the pairwise outcome difference 𝑑𝑖𝑓𝑓!"#$%&! was regressed without a constant on the classroom dummy variables:
𝑑𝑖𝑓𝑓!"#$%&! = 𝛽!𝑃𝐵𝑀1+ 𝛽!𝑃𝐵𝑀2+ 𝛽!𝑃𝐵𝑀3
The estimated regression coefficients of 𝑃𝐵𝑀1, 𝑃𝐵𝑀2, and 𝑃𝐵𝑀3 represent the estimated impact of attempted PBM implementation by Ms. Iris, Ms. Carrie, and Ms. Laura, respectively. Although additional adjustment is recommended by some researchers (e.g., Ho, Imai, King, & Stuart, 2011), the small samples in this study, particularly in the fourth grade case, severely limit the degrees of freedom available. Therefore, the cost of reducing precision of the effect estimates would outweigh the gain of reducing bias of the estimates by including additional covariates in the models.
Because propensity score matching (and regression) can only account for the observed variables, which, in this study, are standard student background characteristics, there is always the possibility that the effect estimates may be biased by unobserved variables such as teacher or school characteristics. In particular, there are at least two “rival hypotheses” (Yin, 2009) to 7 In Ms. Violet’s school district, the peer group consists of the schools with student population most like a given school’s population and are determined by the “peer index,” which is calculated based on a school’s average incoming English and mathematics proficiency and percentage of students with disabilities. In 2010-2011 and 2011-2012, Park School had 38 schools in its peer group.

30
30
consider: (1) there were other pre-existing qualities of the participating teachers’ instruction, unrelated to the content of their instruction, that caused the difference in test scores, and (2) there were school-wide resources unique to the participating teachers’ schools that caused the difference in test scores. If the first rival hypothesis were true, participating teachers’ students would also be expected to have outperformed comparable district or peer students in school years prior to implementation of PBM instruction. If the second rival hypothesis were true, students at other grades in the participating teachers’ schools would also be expected to have outperformed comparable district or peer students during the 2010-2011 school year. To test these rival hypotheses, the following research questions were identified:
1. In school years prior to their attempted implementation of PBM instruction (i.e., before 2010-2011), did the participating teachers’ students outperform comparable district or peer students on state mathematics tests?
2. During the 2010-2011 school year, did students at other grades in the participating teachers’ schools outperform comparable district or peer students on state mathematics tests?
To address the first rival hypothesis question, fourth grade student data from the 2008-2009 and 2009-2010 school years in the fourth grade case and sixth grade student data from the 2006-2007 school year in the sixth grade case were examined. Because Ms. Iris (from the fourth grade case) was a “Teacher on Special Assignment” during 2008-2009, only effects for Ms. Carrie and Ms. Laura could be estimated for that school year, but effects for all three teachers were estimated for the 2009-2010 school year. In the sixth grade case, data from the 2006-2007 school year were examined because that was the last year Ms. Violet taught sixth grade mathematics without any knowledge of PBM.
To address the second rival hypothesis question, fifth grade student data from the 2010-2011 school year were examined in the fourth grade case. Other grades were not accessible because testing in that state begins in third grade. The second rival hypothesis question could not be investigated in the sixth grade case because Ms. Violet had taught the 2010-2011 Park seventh and eighth grade students in prior years (when they were in sixth grade) when she had started to incorporate PBM into instruction. Although students in higher grades had not been taught by Ms. Violet (she had joined Park School in 2007-2008), a variety of state mathematics tests are given in grades nine through twelve (i.e., there is no “ninth grade state mathematics test” given to all ninth grade students), making it difficult to define a common outcome, or dependent, variable for all students in the sample.
The rival hypothesis questions were investigated in the same manner as the main research question: students with missing data were dropped from the data sets; descriptive analyses were examined; propensity score matching was used to assign each student of PBM affiliation (i.e., had a teacher who implemented PBM in a subsequent school year or attended a school where PBM had been implemented at another grade level) with a matching comparison student; balance diagnostics were checked; and the mean of pairwise differences was used to estimate the difference in achievement between students with PBM affiliation and students without PBM affiliation. Chapter 6 summarizes the results of these analyses.

31
31
Chapter 5. Results – Classroom Instruction
This chapter reports on the results of investigating PBM-trained teachers’ attempted implementation of PBM during the 2010-2011 school year (and 2011-2012 school year in the sixth grade case). The purpose of the investigation was to explore an intermediary variable, namely classroom instruction, which mediates the effect of PBM training on student achievement (cf. Figure 1 in Chapter 1). The analyses of classroom instruction focused on one mathematics topic – the division interpretation of a fraction (i.e., !
!= 𝑚 ÷ 𝑛 for whole numbers
𝑚 and nonzero 𝑛) – in order to closely examine the ways in which PBM-trained teachers’ classroom instruction align with or deviate from the fundamental principles of mathematics (Wu, 2011a).
To examine the classroom and student outcomes of PBM training, the study needed teachers who had participated in PBM training and attempted to teach PBM in the classroom. As discussed in Chapter 4, few participants of PBM Institute have attempted to implement PBM beyond one lesson or topic. With the assistance of PBM Institute’s lead facilitator, two institute participants – Ms. Iris and Ms. Violet – were identified and recruited for the present study. Although Ms. Iris and Ms. Violet teach different grades (fourth and sixth, respectively) in different states, both teachers taught the topic of the division interpretation of a fraction during the 2010-2011 school year (and 2011-2012 school year in the sixth grade case) in accordance with district-mandated curriculum or state content standards.
In this chapter, the two teachers’ approaches to the division interpretation of a fraction are described and then analyzed with respect to the fundamental principles of mathematics. The chapter begins with a description of how the division interpretation of a fraction was presented in each case (Section 5.1). The next section (5.2) analyzes the alignment of these approaches with the fundamental principles of mathematics, including similarities and differences from PBM Institute’s approach to the division interpretation of a fraction, as summarized in Chapter 3 (Section 3.2). Departures of the teachers’ approaches from the fundamental principles are studied in Section 5.3. The final section (5.4) closes the chapter with a summary of the investigation’s findings.
5.1. Participating Teachers’ Approaches to the Division Interpretation of a Fraction
This section describes how the division interpretation of a fraction was taught during the year(s) that the participating teachers attempted to implement PBM in their classrooms. For each case, a narrative description of the lesson has been constructed from teacher interviews and classroom artifacts that include a teacher hand-written example in the fourth grade case and student hand-written notes in the sixth grade case. Because initial analyses identified differences between the two teachers’ approaches, the cases are presented separately in this section, and unique features are highlighted in the analyses (Sections 5.2 and 5.3).
A note about the fourth grade case: Although the fourth grade case involves three teachers (Ms. Iris and two colleagues, Ms. Carrie and Ms. Laura, who were introduced to PBM through Ms. Iris), the exposition described in this section is primarily based on interview and artifact data collected from Ms. Iris. The other two teachers did not retain records of their lesson plan or student work on the topic of the division interpretation of a fraction, although they reported to have used Ms. Iris’ instructional materials and followed the same instructional plans during the 2010-2011 school year. Therefore, the fourth grade case description below represents

32
32
Ms. Iris’ approach to the division interpretation of a fraction and, at most, serves as a proxy of how Ms. Carrie and Ms. Laura attempted to implement PBM in the teaching of the division interpretation of a fraction.
5.1.1. Fourth Grade Case. After a fraction on the number line is defined (Appendix B) and the relationship between counting “multiples” of the fraction 𝟏
𝒏 (e.g., 𝟏
𝟓, 𝟐𝟓, 𝟑𝟓, etc.) and adding
fractions with the same denominator (e.g., 𝟏𝟓+ 𝟏
𝟓+ 𝟏
𝟓= 𝟑
𝟓) on the number line is observed, the
teacher introduces a “sharing” problem adapted from the district-adopted textbook: Five people share three sheets of drawing paper. Tell what fraction each person gets when they share equally.
The teacher begins by representing the problem pictorially with three sheets of drawing paper (Figure 6). Next, she partitions each sheet into five congruent sections and labels each section 𝟏
𝟓.
She then assigns each person a section (𝟏𝟓) of each sheet. For example, one person gets the top 𝟏
𝟓
of each sheet, as indicated by the shaded sections of the three sheets in Figure 6. To determine the number represented by the composite of these sections, the teacher “transfers” the identified sections into a separate sheet (this is indicated in Figure 7 by the arrows and the top three shaded sections of the sheet drawn on the far left). Then, using the definition of fraction addition with common denominator, the teacher represents the three “stacked” sections as 𝟏
𝟓+ 𝟏
𝟓+ 𝟏
𝟓, which
equals 𝟑𝟓. The process is the same for the other four persons. Therefore, the teacher concludes that
each person gets 𝟑𝟓 of a sheet of drawing paper.
Figure 6. Pictorial representation of five people sharing three sheets of drawing paper.
Figure 7. Solution to five people sharing three sheets of drawing paper.

33
33
The teacher also presents the solution using the number line. She first represents the three sheets of drawing paper with the segment 0,3 and partitions each unit segment 0,1 , 1,2 , and 2,3 into five congruent segments, forming a sequence of fifths (i.e., 𝟏
𝟓, 𝟐𝟓, 𝟑𝟓, etc.). The teacher
then assigns each of the five people a 𝟏𝟓 segment from each unit segment. For example, as shown
in Figure 8, one person gets the first 𝟏𝟓 segment from each unit segment: 0, !
!, 1, 𝟔
𝟓, and 2, 𝟏𝟏
𝟓.
The teacher then concatenates these segments (i.e., connect end-to-end on the same line) to show that 𝟏
𝟓+ 𝟏
𝟓+ 𝟏
𝟓= 𝟑
𝟓 by the definition of fraction addition. As with the pictorial model, the process
is the same for the other four persons, so the teacher concludes: each person gets !! of a sheet
when five people share three sheets of drawing paper equally.
Figure 8. Number line representation of five people sharing three sheets of drawing paper.
5.1.2. Sixth Grade Case. Figure 9 summarizes the fraction concepts that have been developed in lessons prior to introducing the division interpretation of a fraction, though not in order of chronology or significance. The list includes the following representations of a fraction: a point on the number line (items 3 and 4), an equivalent fraction (items 9 and 10), a decimal (item 5), a sum of fractions (item 7), and a product of fractions (item 8).
With this background knowledge, the teacher introduces a “sharing” problem adapted from Field trips and fund-raisers: Introducing fractions (Fosnot, 2007):
On a trip five kids brought nothing to eat. Ms. Violet only had three subway sandwiches. If the five kids shared the three sandwiches equally, how much did each kid get?
The teacher first approaches the problem pictorially, as shown in Figure 10. She represents the three subway sandwiches with three rectangles and partitions each rectangle into five congruent sections. The teacher then assigns each kid one of the five sections from each sandwich (e.g., one kid gets the first section, labeled “K1,” from each sandwich). Because one of the five sections in each sandwich represents the number !
!, the teacher adds the !
!’s from each of the three
sandwiches and concludes the answer is !!.

34
34
Figure 9. The fraction concepts that have been developed in lessons prior to introducing the division interpretation of a fraction.

35
35
Figure 10. Pictorial representation and solution to five kids sharing three subway sandwiches.
Next, the teacher represents the problem as the division statement 3÷ 5 = !!, as shown in
Figure 11. Specifically, the 3 in the division 3÷ 5 corresponds to the “3 sandwiches,” and the 5 in the division 3÷ 5 corresponds to the “5 people sharing.” The division 3÷ 5 introduces a new conception or interpretation of the fraction !
! to the students. As the list in Figure 9 shows, up to
this point the students have not interpreted the fraction !! as a division statement. Therefore, the
new interpretation of a fraction warrants an explanation (as indicated by the exclamation “WHAT?!?!?!”).
Figure 11. Division statement of five kids sharing three subway sandwiches.
To explain why the fraction !! can be interpreted as the division statement 3÷ 5, the
teacher revisits the definitions of a fraction and the division of two whole numbers. As shown in Figure 12, she defines the fraction !
! on the number line as the third point to the right of 0 when
the unit segment 0,1 is partitioned into 5 segments of equal length. She shows the division 3÷ 5 on a separate number line as the segment 0,3 partitioned into five segments or parts of equal length. To determine the length of each segment, the teacher represents the number 3 as the equivalent fraction !"
!, which forms the sequence of fifths on the number line (i.e., 𝟏
𝟓, 𝟐𝟓, 𝟑𝟓, etc.).
She then marks off every set of three contiguous partitions in the sequence of fifths (i.e., 0, !!
,

36
36
!!, !!
, !!, !!
, !!, !"!, !"
!, 3 ) to form five equal parts, each of length !
!. Thus, when the teacher
partitions the segment 0,3 into five parts of equal length, the length of one part coincides with the point !
!.
Figure 12. Number line representations of the fraction !
! and the division 3÷ 5.
Lastly, the teacher uses the division statement 3÷ 5 = !
! to build upon the division of
whole numbers (from the context of whole numbers) in two ways. First, she extends the following definition of division of whole numbers initially presented in the context of whole numbers:
What is division (with whole numbers)? Statement 1: Division with whole numbers is another way of expressing multiplication.
Statement 2: Every true division statement leads to one true multiplication statement. When the teacher extends the above definition to the division of whole numbers in the context of fractions, she interprets 3÷ 5 = !
! to mean !
!×5 must equal 3 (Figure 13). Then, using fraction
multiplication, she deduces that !!×5 = !"
!, which simplifies to 3. The teacher concludes that the
multiplication statement!!×5 = 3 is true and, therefore, its corresponding division statement
3÷ 5 = !! is also true.
Figure 13. The corresponding multiplication statement for the division statement 3÷ 5 = !
!.

37
37
Second, in the context of whole numbers, the teacher has only defined division when the quotient is a whole number. For example, the teacher has been able to define 10÷ 2 because 10÷ 2 is equal to 5, a whole number. In contrast, she has not been able to define 3÷ 5 in the context of whole numbers because there is no whole number 𝑛 such that 𝑛×5 = 3. Therefore, as noted in Figure 12, 3÷ 5 is not a whole number. Yet, in the context of fractions, the teacher is now able to define 3÷ 5 and find the number that it equals, namely !
!. Thus, in the context of
fractions, the teacher can now define division of whole numbers for all whole numbers (not just when the dividend is a multiple of the divisor). The teacher summarizes these key ideas in Figure 14.
Figure 14. The “big ideas” emphasized in the sixth grade case.
5.1.3. Summary. This section has described the participating teachers’ approaches to the division interpretation of a fraction based on data gathered from teacher interviews and classroom artifacts. The next two sections of this chapter analyze how the teachers’ approaches align with or depart from the fundamental principles of mathematics. The following questions are considered: What are the ways in which the teachers’ approaches are similar to PBM Institute’s approach to the division interpretation of a fraction? What are the ways in which the teachers’ approaches are different from the institute’s approach yet still exemplify PBM? What are the ways in which the teachers’ approaches do not exemplify PBM (i.e., do not adhere to the fundamental principles of mathematics)?

38
38
5.2. Alignment with Principles This section examines two ways in which the PBM-trained teachers’ approaches to the
division interpretation of a fraction exemplify PBM. The first subsection (5.2.1) looks at elements of PBM that are similar between the teacher and institute approaches. The second subsection (5.2.2) looks at elements of PBM that are unique to the teachers’ approaches and demonstrate the flexibility of PBM instruction (i.e., that PBM is not confined to the institute’s approach to topics of the K-12 curriculum).
5.2.1. Similarities Between PBM Institute and Teacher Approaches. The PBM Institute and PBM-trained teachers share the following features in their approaches to teaching the division interpretation of a fraction:
One interpretation as the definition of a fraction: Both the PBM Institute and PBM-trained teachers define a fraction precisely with one interpretation: a point on the number line. As Figures 15 and 16 show, both sets of teachers emphasize the following two ideas when introducing the concept of a fraction: (1) a fraction is “a number” and, therefore, “a point on the number line;” and (2) this interpretation constitutes as the only definition of a fraction.
Figure 15. Excerpt from the fourth grade case’s definition of a fraction.
Figure 16. Excerpt from the sixth grade case’s definition of a fraction.
Pre-requisite definitions and theorems: Each approach has established, in prior lessons, the definitions and observations or theorems on fractions that are necessary for the explanation(s) presented. No explanation draws upon a concept that has not yet been defined or proven. The pre-requisite definitions and observations or theorems used in each approach are summarized in Table 5.
Justification for additional interpretation: Both the PBM Institute and PBM-trained teachers precisely define a fraction as a point on the number line and then use reasoning to prove the definition’s equivalence to an additional interpretation of a fraction. For example, the fourth
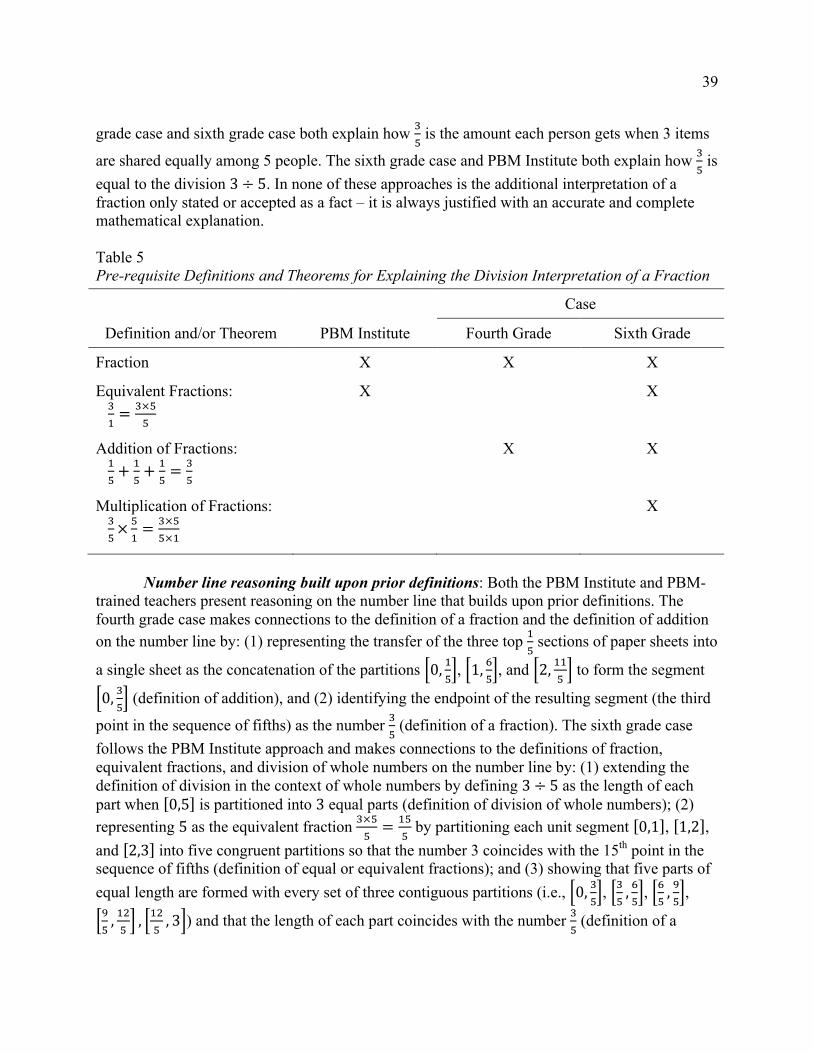
39
39
grade case and sixth grade case both explain how !! is the amount each person gets when 3 items
are shared equally among 5 people. The sixth grade case and PBM Institute both explain how !! is
equal to the division 3÷ 5. In none of these approaches is the additional interpretation of a fraction only stated or accepted as a fact – it is always justified with an accurate and complete mathematical explanation. Table 5 Pre-requisite Definitions and Theorems for Explaining the Division Interpretation of a Fraction
Case
Definition and/or Theorem PBM Institute Fourth Grade Sixth Grade
Fraction X X X
Equivalent Fractions: !!= !×!
!
X X
Addition of Fractions: !!+ !
!+ !
!= !
!
X X
Multiplication of Fractions: !!× !!= !×!
!×!
X
Number line reasoning built upon prior definitions: Both the PBM Institute and PBM-
trained teachers present reasoning on the number line that builds upon prior definitions. The fourth grade case makes connections to the definition of a fraction and the definition of addition on the number line by: (1) representing the transfer of the three top !
! sections of paper sheets into
a single sheet as the concatenation of the partitions 0, !!
, 1, !!
, and 2, !!!
to form the segment
0, !!
(definition of addition), and (2) identifying the endpoint of the resulting segment (the third
point in the sequence of fifths) as the number !! (definition of a fraction). The sixth grade case
follows the PBM Institute approach and makes connections to the definitions of fraction, equivalent fractions, and division of whole numbers on the number line by: (1) extending the definition of division in the context of whole numbers by defining 3÷ 5 as the length of each part when 0,5 is partitioned into 3 equal parts (definition of division of whole numbers); (2) representing 5 as the equivalent fraction !×!
!= !"
! by partitioning each unit segment 0,1 , 1,2 ,
and 2,3 into five congruent partitions so that the number 3 coincides with the 15th point in the sequence of fifths (definition of equal or equivalent fractions); and (3) showing that five parts of equal length are formed with every set of three contiguous partitions (i.e., 0, !
!, !!, !!
, !!, !!
, !!, !"!, !"
!, 3 ) and that the length of each part coincides with the number !
! (definition of a

40
40
fraction). In all of these approaches, reasoning on the number line makes direct application or extension of definitions that have been formulated on the number line in earlier lessons.
Generalizable explanations: Although the PBM-trained teachers never provide proof of the general case !
!= 𝑚 ÷ 𝑛 for whole numbers 𝑚 and nonzero 𝑛, their explanations for the
special case !!= 3÷ 5 are fully generalizable, just like the exposition given in Chapter 3. For
example, the teachers’ explanations from the pictorial representation of a “sharing” problem can be generalized as follows: to find out how much each person gets when 𝑛 people share 𝑚 items equally, partition each of the 𝑚 items into 𝑛 congruent parts. Each person gets one of the partitions from each of the 𝑚 items. Because one partition represents the number !
!, the
composite of the 𝑚 partitions that each person gets is represented by the sum 1n+1n+!+
1n
m" #$$ %$$
(i.e.,
the sum of 𝑚 copies of !!), which by fraction addition equals !
!. Therefore, each person gets !
!
when 𝑛 people share 𝑚 items equally. In summary, the common features of the PBM Institute and PBM-trained teachers’
approaches to the division interpretation of a fraction emphasize the fundamental principles of definitions, reasoning, coherence, and, to a lesser extent, precision and purposefulness. Both sets of approaches highlight definitions in two ways: (1) to provide a precise meaning of a fraction, distinct from its other interpretations; and (2) to furnish the basis for deducing the additional interpretation of a fraction. The institute and teachers both put reasoning at the center of teaching the division interpretation of a fraction and present explanations that are fully generalizable. Finally, both sets of approaches exemplify coherence by: (1) building upon previously established definitions and theorems or observations; and (2) continuing the development of fraction concepts on the number line. These are not the only ways, however, that the teachers’ approaches to the division interpretation of a fraction adhere to the fundamental principles of mathematics. The following subsection examines how the teachers’ approaches to the topic differ from the institute’s approach yet still exemplify the fundamental principles of mathematics.
5.2.2. Flexibility of PBM Instruction. Some elements of the PBM-trained teachers’ approaches to teaching the division interpretation of a fraction deviate from PBM Institute’s approach yet remain consistent with the fundamental principles of mathematics. These novel applications of the principles include the following:
Introduction through a story problem: The fourth grade case and sixth grade case both introduce the division interpretation of a fraction by presenting a story “sharing” problem whereas the institute introduces the concept by going straight to the definition. By using a classic story problem, the teachers provide a context to motivate a new interpretation of a fraction. Their approach exemplifies the purposefulness of mathematics, particularly the utility of the division interpretation of a fraction for solving contextualized as well as abstract problems.
Precision and coherence using fraction addition: Both cases relate the process of combining a !
! section from each of the three objects (sheets of paper or sandwiches) to the
arithmetic operation of fraction addition before producing the answer !!. Defining the action
(combining equal parts) as an arithmetic operation (addition) and then using the properties of the

41
41
arithmetic operation to generate the answer demonstrate the precision of mathematics. Furthermore, by only drawing upon concepts that have been developed in prior lessons, the teachers attend to the coherence of mathematics. Specifically, the teachers are able to draw upon the definition and properties of fraction addition in their discussion of the division interpretation of a fraction because they develop the concept of fraction addition before the division interpretation of a fraction (whereas PBM Institute sequences the topic of fraction addition after the division interpretation of a fraction and, therefore, does not have fraction addition at its disposal for the division interpretation of a fraction). Thus, the teachers’ use of fraction addition in teaching the division interpretation of a fraction, though different from the institute’s approach, adheres to the fundamental principles of precision and coherence.
Sequencing division after multiplication: In the sixth grade case, the teacher Ms. Violet also adheres to the principle of coherence by drawing upon the properties of fraction multiplication after having thoroughly developed the concept of fraction multiplication in prior lessons. This groundwork lays the foundation for presenting the division interpretation of a fraction as an extension of the following definition of division among whole numbers 𝑚 and nonzero 𝑛: the division 𝑚 ÷ 𝑛 is the number 𝑘 that satisfies the multiplication 𝑘𝑛 = 𝑚. In the context of whole numbers, 𝑘 needs to be a whole number, which restricts 𝑚 to the multiples of 𝑛. In the context of fractions, however, 𝑘 can be a fraction, which allows 𝑚 to be any arbitrary whole number. Consequently, the multiplication 𝑘𝑛 becomes fraction multiplication (a fraction multiplied by a whole number) and its calculation requires the product formula (!
!× !!= !"
!" for
fractions !! and !
!). PBM Institute does not cover the topic of fraction multiplication until after the
division interpretation of a fraction and, therefore, does not present the division 𝑚 ÷ 𝑛 as “an alternate, but equivalent, way of expressing multiplication” (Wu, 2008, p. 88). Ms. Violet, however, does cover the definition and properties of fraction multiplication before the division interpretation of a fraction and, therefore, emphasizes the division statement 𝑚 ÷ 𝑛 = !
! as the
multiplication statement !!×𝑛 = 𝑚 in accordance with the fundamental principle of coherence.
Number line reasoning that parallels pictorial representation: In the fourth grade case, the teachers present reasoning on the number line that parallels the reasoning formulated with the pictorial representation. As with the sixth grade case approach, the process of partitioning each of the three objects into five congruent parts is analogous to partitioning each unit segment 0,1 , 1,2 , and 2,3 into five congruent segments. The next step in the reasoning is where the fourth
grade case deviates from the approaches of the institute and the sixth grade case yet remains consistent with the fundamental principle of reasoning: First, the process of giving the first or top !! part of each object to the first person is represented on the number line as selecting the first !
!
partition of each unit segment (i.e., 0, !!
, 1, !!
, and 2, !!!
). Second, the process of collecting
the three !! parts into one object is represented on the number line as concatenating the three !
!
segments into one unit segment (see Figure 17). When the process is repeated for the second through fifth !
! partition of each unit segment (Figure 18), the final number line representation is
the same as the one presented in the institute and sixth grade case: the segment 0,3 is partitioned into five equal parts, each of length !
!. Though less direct than the institute or sixth
grade approach on the number line, the fourth grade teachers’ reasoning on the number line

42
42
parallels the pictorial representation while still adhering to the fundamental principle of reasoning.
Figure 17. Concatenation of the first !
! partition of each unit segment.
Figure 18. Repeated concatenation results in the segment 0,3 partitioned into five equal parts.
In summary, the PBM-trained teachers’ approaches to the division interpretation of a fraction demonstrate the flexibility of PBM instruction. For example, the topic of the division interpretation of a fraction can be introduced with a story “sharing” problem instead of a direct definition and support the fundamental principle of purposefulness. Alternative reasoning on the number line can be used to translate the processes represented in pictorial form and still adhere to the fundamental principle of reasoning. Finally, topics such as fraction addition and multiplication can be sequenced earlier and then used to provide alternative explanations for the division interpretation of a fraction, thereby exemplifying the fundamental principle of coherence. These examples demonstrate how the division interpretation of a fraction can be presented in ways that deviate from PBM Institute’s approach yet remain consistent with the fundamental principles of mathematics.

43
43
5.3. Inadequate Adherence to Principles Although the PBM-trained teachers’ approaches to the division interpretation of a
fraction exemplify the fundamental principles of mathematics in various ways, the omission of the division 𝑚 ÷ 𝑛 in the fourth grade case reveals an inadequate adherence to three principles: definitions, precision, and purposefulness. First, the division 𝑚 ÷ 𝑛 as a general or special case (e.g., 3÷ 5) is not introduced in the fourth grade case. As a result, the definition of division of whole numbers (in the context of fractions) is not presented. In addition, two key ideas are overlooked: (1) the relationship between the division 𝑚 ÷ 𝑛 and the “sharing” problem; and (2) the relationship between the division 𝑚 ÷ 𝑛 and the fraction !
! (i.e., the division interpretation of
a fraction). Although the division 𝑚 ÷ 𝑛 for whole numbers 𝑚 and nonzero 𝑛 can be interpreted and
represented in multiple ways (e.g., the second side length of a rectangle with area 𝑚 and first side length 𝑛), the story problem of finding the amount for one person when 𝑚 objects are shared equally among 𝑛 people has only one precise mathematical representation: 𝑚 ÷ 𝑛. The fourth grade case, however, does not make this connection – it only addresses the relationship between the “sharing” problem and the fraction
!!
. The latter appears to be the result of jumping straight into finding the answer to the “sharing” problem instead of first giving a precise mathematical meaning to the contextualized problem. By missing the relationship between the “sharing” problem and the division 𝑚 ÷ 𝑛, the fourth grade case overlooks the fundamental principle of precision.
The fourth grade case also omits the relationship between the division 𝑚 ÷ 𝑛 and the fraction !
! (i.e., the division interpretation of a fraction), thereby overlooking the fundamental
principle of purposefulness. Although there is purposefulness in relating the fraction !!
to the contextualized problem of sharing 𝑚 objects equally among 𝑛 people, the larger goal or purpose is to interpret the fraction !
! as the division 𝑚 ÷ 𝑛. For example, in the sixth grade case, the
following “big ideas” are emphasized (Figure 14 in Section 5.1.2): (1) Every fraction is also a division statement (e.g., !
!= 3÷ 5); and (2) Quotient can be a fraction, not just a whole number
(e.g., 3÷ 5 = !!). These “big ideas” highlight two unique purposes of the division interpretation
of a fraction: (1) it expands the notion of a quotient from whole numbers to fractions; and (2) it makes computation of the division 𝑚 ÷ 𝑛 possible, independent of context. Therefore, by missing the relationship between the division 𝑚 ÷ 𝑛 and the fraction !
! the fourth grade case
overlooks the key idea of interpreting a fraction as division and the purpose that the concept serves in the K-12 mathematics curriculum.
5.4. Summary
This chapter has reported on the results of investigating PBM-trained teachers’ attempted implementation of PBM in teaching the division interpretation of a fraction. The study found the teachers’ approaches exemplify PBM in ways that are similar as well as different from the institute’s approach. Similarities between the PBM Institute and PBM-trained teachers’ approaches to the division interpretation of a fraction include the following: emphasis on definitions to provide a precise meaning of a fraction and furnish the basis for deducing an
44
44
additional interpretation of a fraction; evidence of reasoning by presenting generalizable explanations and justifying the additional interpretation of a fraction; attention to coherence by building upon previously established definitions and theorems or observations and continuing the development of fraction concepts on the number line. Deviations from the institute approach that adhere to the fundamental principles of mathematics include: introduction of the topic through a contextualized problem (purposefulness); use of fraction addition to give mathematical meaning to a pictorial action (precision); sequencing addition and multiplication earlier in the progression of fraction topics and using the concepts to supply reasoning for the division interpretation of a fraction (coherence and reasoning); number line reasoning that parallels the pictorial representation (reasoning). On the one hand, the teachers’ novel applications of the fundamental principles demonstrate how PBM instruction is flexible and not prescriptive. On the other hand, alternative approaches to teaching the division interpretation of a fraction must be considered in the context of grade level curriculum (e.g., state-adopted content standards). This issue will be discussed in Chapter 7.
In addition to finding deviations that adhered to the fundamental principles, the study found a difference – the omission of the division 𝑚 ÷ 𝑛 in the fourth grade case – that indicates an oversight of definitions, precision, and purposefulness. Specifically, with the absence of the division 𝑚 ÷ 𝑛 as a general or special case (e.g., 3÷ 5), the definition of division of whole numbers (in the context of fractions) is not presented and two key ideas are overlooked: (1) the relationship between the division 𝑚 ÷ 𝑛 and the “sharing” problem; and (2) the relationship between the division 𝑚 ÷ 𝑛 and the fraction !
! (i.e., the division interpretation of a fraction). The
omission of the division 𝑚 ÷ 𝑛 in the fourth grade case is evidence that a teacher’s attempt at implementing PBM instruction may not fully adhere to the fundamental principles of mathematics. In other words, a PBM-trained teacher may only partially implement PBM instruction, despite her best attempts to fully implement PBM instruction. The teachers’ reasons for and the possible ramifications of omitting the division 𝑚 ÷ 𝑛 are discussed in Chapter 7.

45
45
Chapter 6. Results – Student Performance
This chapter reports on the results of exploring the effect of PBM training on student achievement. In the first two sections, the student sample sizes and characteristics of each data set are presented. The following section describes the propensity score matching models and compares the balance of covariates from two methods of propensity score matching (nearest neighbor and optimal). The final section summarizes the results of estimating the program effect and investigating the rival hypotheses previously identified in Chapter 4.
6.1. Data
6.1.1. Fourth grade case. Table 6 displays the fourth grade sample sizes by teacher type (PBM-trained teachers versus non-PBM-trained teachers), and Table 7 displays the fourth grade class sizes by PBM teacher. Ms. Laura’s class sizes were, on average, twice as large Ms. Iris and Ms. Carrie’s individual classes because Ms. Laura taught mathematics to two classes of fourth grade students: her own assigned class and her teaching partner’s class. Table 8 displays the 2010-2011 fifth grade sample sizes by school.
Missing data were only found in the 2010-2011 fourth grade data set; all other data sets had complete data for all students. In the 2010-2011 fourth grade data set, 68 students (10% of the sample) had a missing 2010 third grade state mathematics test score. As Table 9 shows, the sample of missing cases has a lower mean fourth grade state mathematics test score and higher percentages of black and Hispanic students, English Language Learners, and students who qualify for free or reduced-price lunch. The patterns suggest that the missing cases are not missing at random; nevertheless, students missing the 2010 third grade test score were dropped from the study sample because prior achievement (third grade test score) is a critical variable to include in the propensity score model. Table 6 Fourth Grade Student Sample Sizes
Year PBM Non-PBM
2008-09 63 475
2009-10 106 483
2010-11 109 543
Table 7 PBM-trained Teachers’ Fourth Grade Class Sizes
Year Ms. Iris Ms. Carrie Ms. Laura
2008-09 21 42
2009-10 27 26 53
2010-11 27 27 55
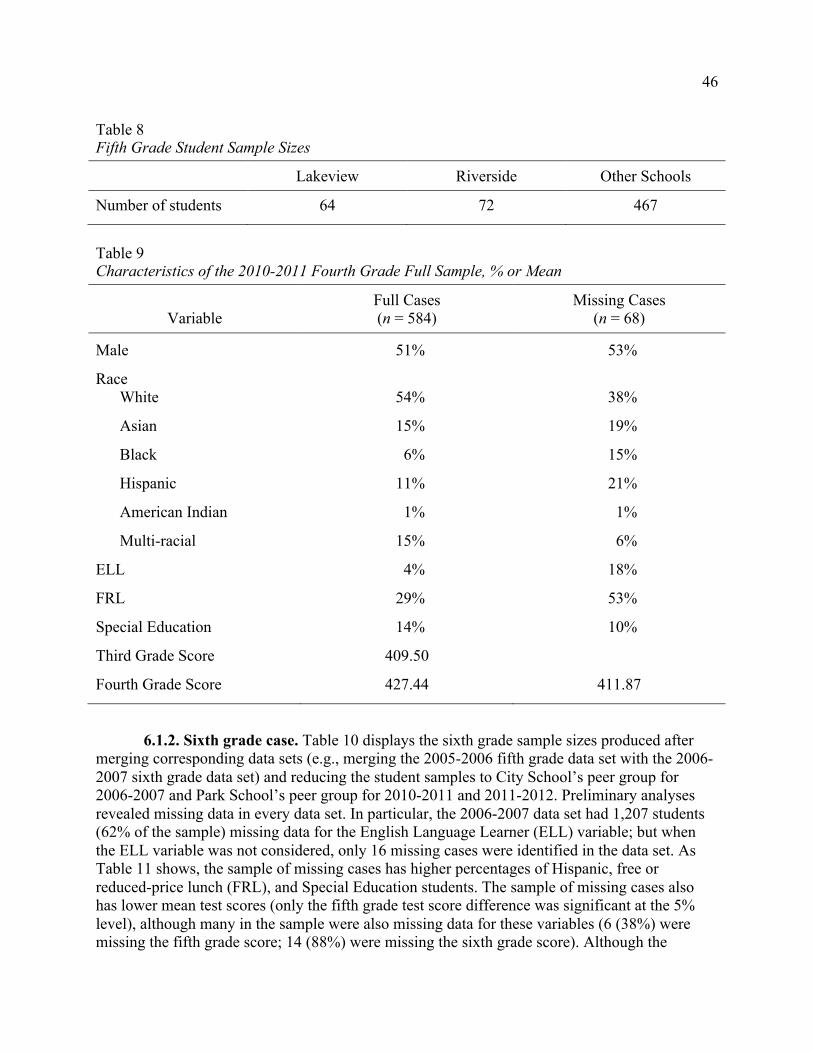
46
46
Table 8 Fifth Grade Student Sample Sizes
Lakeview Riverside Other Schools
Number of students 64 72 467
Table 9 Characteristics of the 2010-2011 Fourth Grade Full Sample, % or Mean
Variable
Full Cases (n = 584)
Missing Cases (n = 68)
Male 51% 53%
Race White 54% 38%
Asian 15% 19%
Black 6% 15%
Hispanic 11% 21%
American Indian 1% 1%
Multi-racial 15% 6%
ELL 4% 18%
FRL 29% 53%
Special Education 14% 10%
Third Grade Score 409.50
Fourth Grade Score 427.44 411.87
6.1.2. Sixth grade case. Table 10 displays the sixth grade sample sizes produced after merging corresponding data sets (e.g., merging the 2005-2006 fifth grade data set with the 2006-2007 sixth grade data set) and reducing the student samples to City School’s peer group for 2006-2007 and Park School’s peer group for 2010-2011 and 2011-2012. Preliminary analyses revealed missing data in every data set. In particular, the 2006-2007 data set had 1,207 students (62% of the sample) missing data for the English Language Learner (ELL) variable; but when the ELL variable was not considered, only 16 missing cases were identified in the data set. As Table 11 shows, the sample of missing cases has higher percentages of Hispanic, free or reduced-price lunch (FRL), and Special Education students. The sample of missing cases also has lower mean test scores (only the fifth grade test score difference was significant at the 5% level), although many in the sample were also missing data for these variables (6 (38%) were missing the fifth grade score; 14 (88%) were missing the sixth grade score). Although the

47
47
patterns suggest data are not missing at random, students missing either test score were dropped from the study sample because achievement scores were essential to include in subsequent analyses. Cases that were only missing data for the ELL variable, however, were kept in the final 2006-2007 sample. In the 2010-2011 and 2011-2012 data sets, missing cases composed less than 0.1% of each sample and were dropped from the final study samples. Table 10 Sixth Grade Student Sample Sizes
Year City or Park School Peer Schools
2006-07 63 1,872
2010-11 92 8,549
2011-12 87 9,789
Table 11 Characteristics of the 2006-2007 Sixth Grade Full Sample, % or Mean
Variable
Full Cases (n = 1,919)
Missing Cases (n = 16)
Male 50% 50%
Race White 40% 27%
Asian 17% 7%
Black 19% 20%
Hispanic 23% 47%
American Indian 0% 0%
FRL 53% 63%
Special Education 4% 50%
Fifth Grade Score 678.81 652.10
Sixth Grade Score 684.70 637.00
6.2. Descriptive Statistics
6.2.1. Fourth grade case. Student characteristics of the fourth grade case samples are shown in Tables 12 through 15. Across the samples, the gender composition was similar between the classes taught by PBM-trained teachers (or the schools with PBM-trained teachers) and the classes taught by non-PBM-trained teachers (or the schools with non-PBM-trained teachers only). Racial composition was also fairly similar, except in the 2010-2011 fourth grade sample

48
48
(𝜒! 5 = 13.24,𝑝 = .021), which had a higher percentage of White (56% v. 44%) and Asian students (16% v. 10%) and lower percentage of Hispanic students (10% v. 17%) in the non-PBM group than in the PBM group. Across the samples, there was a low percentage of ELL’s; in 2008-2009 and 2009-2010, the PBM teachers had no ELL in their fourth grade classes. The classes taught by PBM-trained teachers (or the schools with PBM-trained teachers) consistently had higher percentages of FRL and Special Education students than the classes taught by non-PBM-trained teachers (or the schools with non-PBM-trained teachers only); the differences, however, were not statistically significant.
With respect to test scores, the students taught by PBM-trained teachers on average performed lower or no different than the students taught by non-PBM-trained teachers. The mean third grade scores of the classes taught by PBM-trained teachers were significantly lower (at the 5% significance level or lower) than the mean third grade scores of the classes taught by non-PBM-trained teachers, particularly in 2010-2011 when PBM was implemented (2008-2009: standardized difference = −0.28, 𝑡 536 = −2.30, 𝑝 = .022; 2009-2010: standardized difference = −0.27, 𝑡 587 = −2.74, 𝑝 = .006; 2010-2011: standardized difference = −0.59, 𝑡 582 = −5.52, 𝑝 < .001). The mean fourth grade score of the schools with PBM-trained teachers was also lower than the mean fourth grade score of the schools with non-PBM-trained teachers only, but the difference was not significant. In summary, the classes taught by PBM-trained teachers (or the schools with PBM-trained teachers only), on average, had higher percentages of students with disadvantaged backgrounds (special learning needs, lower socio-economic status, and lower prior achievement) than the classes taught by non-PBM-trained teachers (or the schools with non-PBM-trained teachers only).
Descriptive analyses of each PBM-trained teachers’ class (Appendix C) indicate student characteristics varied across the classes. In general, Ms. Laura’s classes were more racially diverse in 2008-2009 and 2009-2010, but in 2010-2011, Ms. Iris and Ms. Laura’s classes were equally diverse whereas Ms. Carrie’s class was predominantly White and Hispanic. The teachers had no ELL student in 2008-2009 or 2009-2010, but even in 2010-2011, the percentages of ELL were low in each class (2-8%). Ms. Laura’s classes tended to have higher percentages of FRL and Special Education students and their mean achievement scores were consistently lower than that of the other two classes. These differences in background characteristics and mathematics performance among the PBM-trained teachers’ classes suggest the importance of considering the classes separately as well as collectively.
Likewise, descriptive analyses of Lakeview and Riverside’s 2010-2011 fifth grade students (Table C4) indicate differences in student characteristics between the two schools with PBM-trained teachers. Although their racial compositions, percentages of FRL and Special Education students, and mean fourth grade test scores (prior achievement) were fairly similar, Riverside had a significantly higher mean fifth grade test score than Lakeview (standardized difference = 0.54, 𝑡 134 = 3.19, 𝑝 = .002). The inconsistency between the fifth grade descriptive patterns and the fourth grade descriptive patterns provides preliminary evidence against the second rival hypothesis (an effect of school-level resources).

49
49
Table 12 Characteristics of the 2008-2009 Fourth Grade Sample, % or Mean (Standard Deviation)
Variable
PBM (n = 63)
Non-PBM (n = 475)
Male 54% 54%
Race White 73% 67%
Asian 5% 17%
Black 6% 6%
Hispanic 10% 6%
American Indian 3% 1%
Multi-racial 3% 2%
ELL 0% 3%
FRL 25% 23%
Special Education 14% 12%
Third Grade Score 418.54 (28.35)
428.43 (32.46)
Fourth Grade Score 409.14 (37.86)
426.10 (42.86)

50
50
Table 13 Characteristics of the 2009-2010 Fourth Grade Sample, % or Mean (Standard Deviation)
Variable
PBM (n = 106)
Non-PBM (n = 483)
Male 58% 53%
Race White 61% 59%
Asian 15% 19%
Black 5% 6%
Hispanic 6% 4%
American Indian 1% 1%
Multi-racial 12% 10%
ELL 0% 5%
FRL 25% 25%
Special Education 18% 13%
Third Grade Score 413.79 (36.64)
425.29 (39.64)
Fourth Grade Score 412.11 (48.29)
425.45 (58.61)
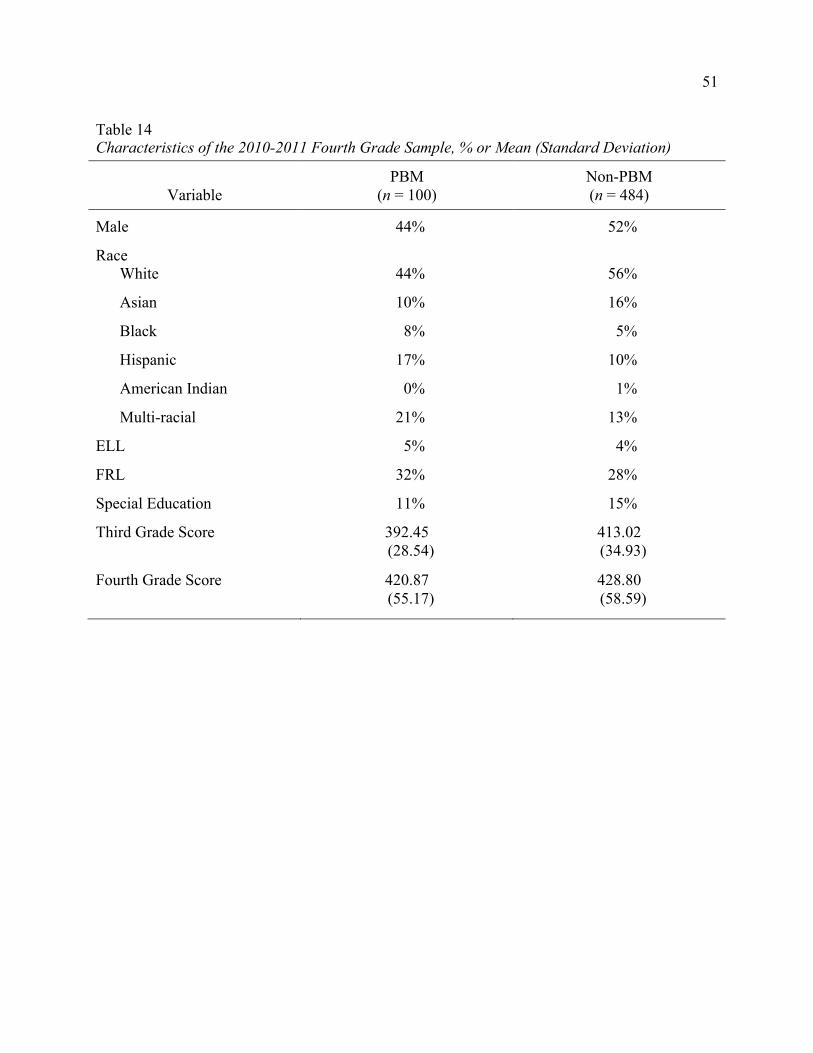
51
51
Table 14 Characteristics of the 2010-2011 Fourth Grade Sample, % or Mean (Standard Deviation)
Variable
PBM (n = 100)
Non-PBM (n = 484)
Male 44% 52%
Race White 44% 56%
Asian 10% 16%
Black 8% 5%
Hispanic 17% 10%
American Indian 0% 1%
Multi-racial 21% 13%
ELL 5% 4%
FRL 32% 28%
Special Education 11% 15%
Third Grade Score 392.45 (28.54)
413.02 (34.93)
Fourth Grade Score 420.87 (55.17)
428.80 (58.59)

52
52
Table 15 Characteristics of the 2010-2011 Fifth Grade Sample, % or Mean (Standard Deviation)
Variable
PBM (n = 136)
Non-PBM (n = 467)
Male 53% 55%
Race White 60% 56%
Asian 15% 16%
Black 4% 6%
Hispanic 7% 10%
American Indian 1% 1%
Multi-racial 13% 12%
ELL 4% 4%
FRL 27% 25%
Special Education 16% 11%
Fourth Grade Score 414.50 (50.92)
425.39 (58.72)
Fifth Grade Score 430.51 (46.70)
422.97 (48.27)
6.2.2. Sixth grade case. Student characteristics of the sixth grade case samples are shown
in Tables 16 through 18. Across the samples, gender, ELL, and Special Education percentages were fairly similar between the sixth grade samples in Ms. Violet’s schools and peer schools, except in 2006-2007 Ms. Violet’s school (City) had a lower percentage of male students (𝜒! 1 = 6.90,𝑝 = .009) than peer schools. In each sample, racial composition was significantly different (at the 5% significance level or lower) between Ms. Violet’s schools and peer schools (2006-2007: 𝜒! 4 = 44.70,𝑝 < .001; 2010-2011: 𝜒! 5 = 17.02,𝑝 = .004; 2011-2012: 𝜒! 3 = 8.22,𝑝 = .042). For example, City School had a higher percentage of Black (35% v. 18%) and Hispanic students (48% v. 22%) than its peer schools, but Park School had a higher percentage of White (2010-2011: 46% v. 35%; 2011-2012: 46% v. 32%) and lower percentage of Asian students (2010-2011: 11% v. 27%; 2011-2012: 24% v. 34%) than its peer schools. The percentage of FRL was also significantly lower in Ms. Violet’s schools, except in 2006-2007 (2006-2007: 𝜒! 1 = 3.69,𝑝 = .055; 2010-2011: 𝜒! 1 = 32.59,𝑝 < .001; 2011-2012: 𝜒! 1 = 27.88,𝑝 < .001).
With respect to test scores, Ms. Violet’s pre-PBM students (City School) on average performed lower than Ms. Violet’s PBM students (Park School) relative to students from peer

53
53
schools. In 2006-2007 the mean fifth grade score of Ms. Violet’s sixth grade students was significantly lower than the mean fifth grade score of peer schools’ sixth grade students (standardized difference = −0.38, 𝑡 1917 = −2.90, 𝑝 = .004), but in 2010-2011 and 2011-2012 the mean fifth grade score of Ms. Violet’s sixth grade students was only slightly lower (and not significantly lower) than the mean fifth grade score of peer schools’ sixth grade students. Across the samples, the mean sixth grade score of Ms. Violet’s sixth grade students was higher than the mean sixth grade score of peer schools’ sixth grade students but the differences were only significant after Ms. Violet began to implement PBM into her instruction (2010-2011: standardized difference = 0.27, 𝑡 8637 = 2.77, 𝑝 = .006; 2011-2012: standardized difference = 0.39, 𝑡 9869 = 3.91, 𝑝 < .001). Table 16 Characteristics of the 2006-2007 Sixth Grade Sample, % or Mean (Standard Deviation)8
Variable
City School (n = 63)
Peer Schools (n = 1,856)
Male 33% 50%
Race White 16% 41%
Asian 2% 18%
Black 35% 18%
Hispanic 48% 22%
American Indian 0% 0%
Multi-racial 0% 0%
FRL 41% 54%
Special Education 0% 4%
Fifth Grade Score 664.19 (30.92)
679.30 (40.97)
Sixth Grade Score
689.19 (37.29)
684.55 (42.11)
8 Percentage of ELL is not reported in this table because of the high number of missing ELL data in the 2006-2007 sixth grade data set (see Section 5.1.2).

54
54
Table 17 Characteristics of the 2010-2011 Sixth Grade Sample, % or Mean (Standard Deviation)
Variable
Park School (n = 92)
Peer Schools (n = 8,547)
Male 50% 51%
Race White 46% 35%
Asian 11% 27%
Black 10% 13%
Hispanic 33% 24%
American Indian 1% 0%
Multi-racial 0% 0%
ELL 3% 5%
FRL 43% 71%
Special Education 17% 14%
Fifth Grade Score 700.25 (26.37)
701.08 (31.18)
Sixth Grade Score 705.54 (18.82)
696.95 (29.72)
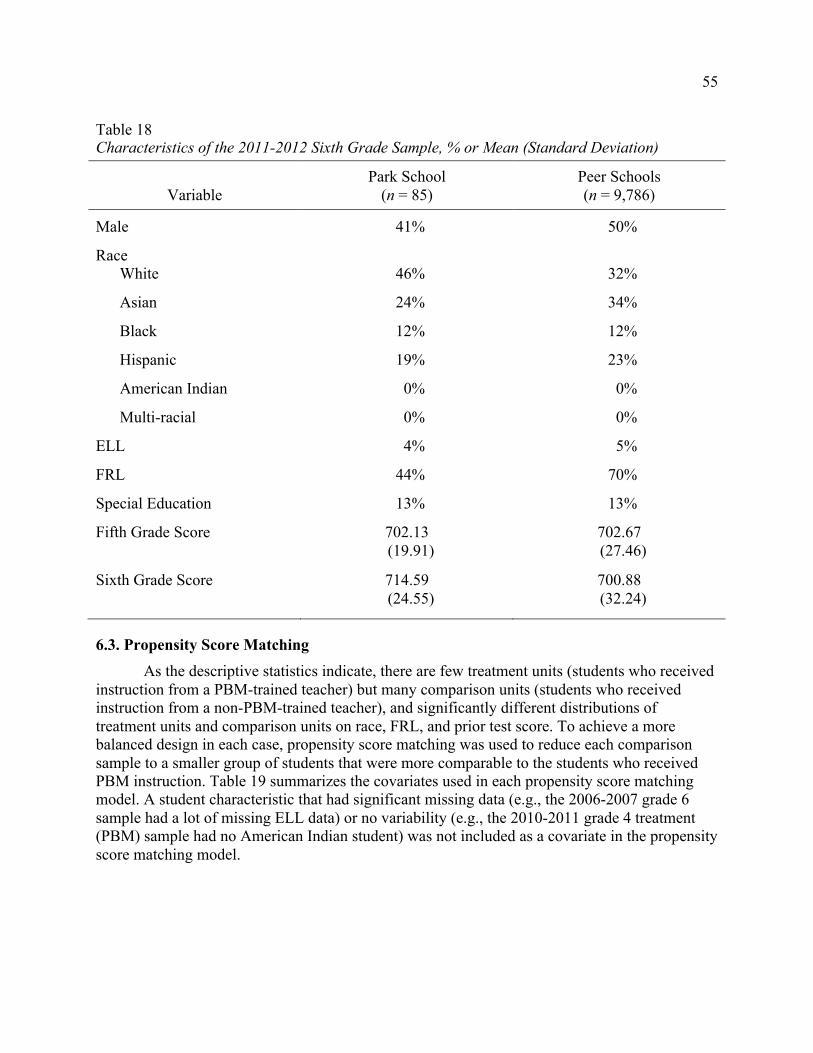
55
55
Table 18 Characteristics of the 2011-2012 Sixth Grade Sample, % or Mean (Standard Deviation)
Variable
Park School (n = 85)
Peer Schools (n = 9,786)
Male 41% 50%
Race White 46% 32%
Asian 24% 34%
Black 12% 12%
Hispanic 19% 23%
American Indian 0% 0%
Multi-racial 0% 0%
ELL 4% 5%
FRL 44% 70%
Special Education 13% 13%
Fifth Grade Score 702.13 (19.91)
702.67 (27.46)
Sixth Grade Score 714.59 (24.55)
700.88 (32.24)
6.3. Propensity Score Matching As the descriptive statistics indicate, there are few treatment units (students who received
instruction from a PBM-trained teacher) but many comparison units (students who received instruction from a non-PBM-trained teacher), and significantly different distributions of treatment units and comparison units on race, FRL, and prior test score. To achieve a more balanced design in each case, propensity score matching was used to reduce each comparison sample to a smaller group of students that were more comparable to the students who received PBM instruction. Table 19 summarizes the covariates used in each propensity score matching model. A student characteristic that had significant missing data (e.g., the 2006-2007 grade 6 sample had a lot of missing ELL data) or no variability (e.g., the 2010-2011 grade 4 treatment (PBM) sample had no American Indian student) was not included as a covariate in the propensity score matching model.
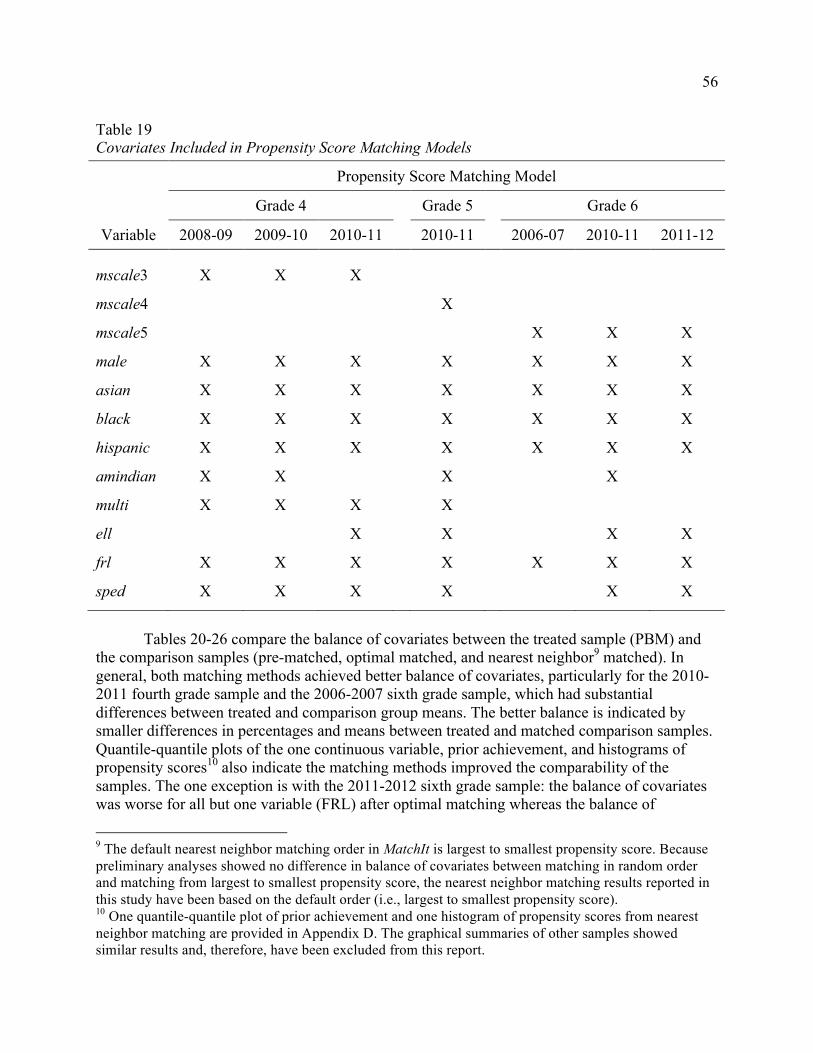
56
56
Table 19 Covariates Included in Propensity Score Matching Models
Propensity Score Matching Model
Grade 4
Grade 5
Grade 6
Variable 2008-09 2009-10 2010-11
2010-11
2006-07 2010-11 2011-12
mscale3 X X X
mscale4
X
mscale5
X X X
male X X X
X
X X X
asian X X X
X
X X X
black X X X
X
X X X
hispanic X X X
X
X X X
amindian X X
X
X
multi X X X
X
ell X
X
X X
frl X X X
X
X X X
sped X X X
X
X X
Tables 20-26 compare the balance of covariates between the treated sample (PBM) and
the comparison samples (pre-matched, optimal matched, and nearest neighbor9 matched). In general, both matching methods achieved better balance of covariates, particularly for the 2010-2011 fourth grade sample and the 2006-2007 sixth grade sample, which had substantial differences between treated and comparison group means. The better balance is indicated by smaller differences in percentages and means between treated and matched comparison samples. Quantile-quantile plots of the one continuous variable, prior achievement, and histograms of propensity scores10 also indicate the matching methods improved the comparability of the samples. The one exception is with the 2011-2012 sixth grade sample: the balance of covariates was worse for all but one variable (FRL) after optimal matching whereas the balance of
9 The default nearest neighbor matching order in MatchIt is largest to smallest propensity score. Because preliminary analyses showed no difference in balance of covariates between matching in random order and matching from largest to smallest propensity score, the nearest neighbor matching results reported in this study have been based on the default order (i.e., largest to smallest propensity score). 10 One quantile-quantile plot of prior achievement and one histogram of propensity scores from nearest neighbor matching are provided in Appendix D. The graphical summaries of other samples showed similar results and, therefore, have been excluded from this report.

57
57
covariates was better for all but one variable (Special Education) after nearest neighbor matching. Because nearest neighbor matching achieved better balance of covariates consistently across the samples, it was the matching method selected for the final analyses, which are reported in the following section. Table 20 Balance of Covariates for the 2008-2009 Fourth Grade Sample, % or Mean
Non-PBM
Variable
PBM (n = 63)
All (n = 475)
Optimal (n = 63)
Nearest (n = 63)
Male 54% 54% 52% 51%
Race White 73% 67% 76% 78%
Asian 5% 17% 5% 5%
Black 6% 6% 11% 10%
Hispanic 10% 6% 5% 5%
American Indian 3% 1% 0% 0%
Multi-racial 3% 2% 3% 3%
FRL 25% 23% 19% 24%
Special Education 14% 12% 14% 14%
Third Grade Score 418.54 428.43 415.29 415.49

58
58
Table 21 Balance of Covariates for the 2009-2010 Fourth Grade Sample, % or Mean
Non-PBM
Variable
PBM (n = 106)
All (n = 483)
Optimal (n = 106)
Nearest (n = 106)
Male 58% 53% 58% 60%
Race White 61% 59% 57% 61%
Asian 15% 19% 20% 20%
Black 5% 6% 2% 2%
Hispanic 6% 4% 8% 7%
American Indian 1% 1% 0% 1%
Multi-racial 12% 10% 13% 9%
FRL 25% 25% 25% 23%
Special Education 18% 13% 15% 13%
Third Grade Score 413.79 425.29 414.92 414.90
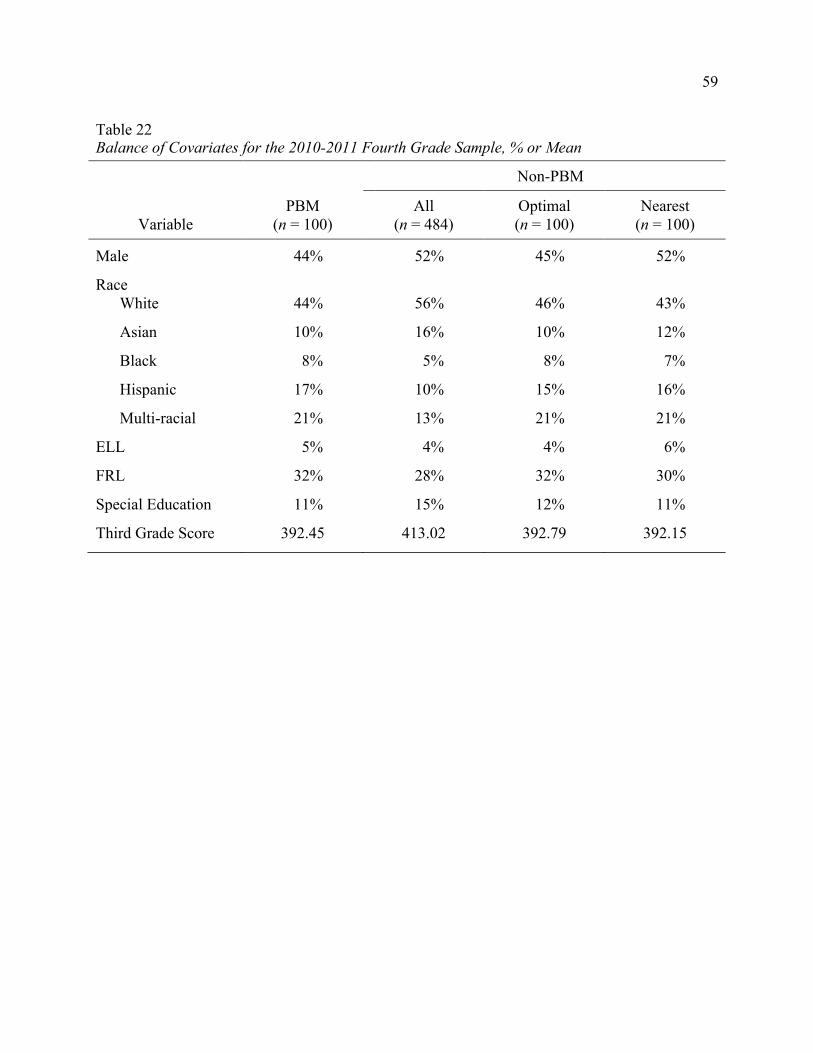
59
59
Table 22 Balance of Covariates for the 2010-2011 Fourth Grade Sample, % or Mean
Non-PBM
Variable
PBM (n = 100)
All (n = 484)
Optimal (n = 100)
Nearest (n = 100)
Male 44% 52% 45% 52%
Race White 44% 56% 46% 43%
Asian 10% 16% 10% 12%
Black 8% 5% 8% 7%
Hispanic 17% 10% 15% 16%
Multi-racial 21% 13% 21% 21%
ELL 5% 4% 4% 6%
FRL 32% 28% 32% 30%
Special Education 11% 15% 12% 11%
Third Grade Score 392.45 413.02 392.79 392.15

60
60
Table 23 Balance of Covariates for the 2010-2011 Fifth Grade Sample, % or Mean
Non-PBM
Variable
PBM (n = 136)
All (n = 467)
Optimal (n = 136)
Nearest (n = 136)
Male 53% 55% 54% 52%
Race White 60% 56% 62% 63%
Asian 15% 16% 14% 17%
Black 4% 6% 4% 3%
Hispanic 7% 10% 6% 6%
American Indian 1% 1% 1% 0%
Multi-racial 13% 12% 13% 11%
ELL 4% 4% 3% 3%
FRL 27% 25% 22% 24%
Special Education 16% 11% 15% 15%
Fourth Grade Score 414.50 425.39 414.46 416.49

61
61
Table 24 Balance of Covariates for the 2006-2007 Sixth Grade Sample, % or Mean
Non-PBM
Variable
PBM (n = 63)
All (n = 1,856)
Optimal (n = 63)
Nearest (n = 63)
Male 33% 50% 35% 35%
Race White 16% 41% 15% 17%
Asian 2% 18% 2% 0%
Black 35% 18% 40% 33%
Hispanic 48% 22% 43% 49%
FRL 41% 54% 41% 43%
Fifth Grade Score 664.19 679.30 663.24 664.05
Table 25 Balance of Covariates for the 2010-2011 Sixth Grade Sample, % or Mean
Non-PBM
Variable
PBM (n = 92)
All (n = 8,547)
Optimal (n = 92)
Nearest (n = 92)
Male 50% 51% 55% 51%
Race White 46% 35% 43% 46%
Asian 11% 27% 11% 11%
Black 10% 13% 12% 10%
Hispanic 33% 24% 34% 34%
American Indian 1% 0% 0% 0%
ELL 3% 5% 4% 3%
FRL 43% 71% 42% 42%
Special Education 17% 14% 17% 16%
Fifth Grade Score 700.25 701.08 698.88 701.12

62
62
Table 26 Balance of Covariates for the 2011-2012 Sixth Grade Sample, % or Mean
Non-PBM
Variable
PBM (n = 85)
All (n = 9,786)
Optimal (n = 85)
Nearest (n = 85)
Male 41% 50% 67% 44%
Race White 46% 32% 80% 47%
Asian 24% 34% 8% 21%
Black 12% 12% 0% 12%
Hispanic 19% 23% 12% 20%
ELL 4% 5% 1% 0%
FRL 44% 70% 42% 44%
Special Education 13% 13% 21% 11%
Fifth Grade Score 702.13 702.67 699.34 702.74
6.4. Estimated Effects Table 27 displays the estimated average effect of PBM training on student achievement
for the fourth grade case and two years of the sixth grade case. Each estimated standardized effect was calculated by dividing the estimated effect by the respective sample standard deviation, which were reported earlier in Table 4. The results suggest that PBM training had a significantly positive average effect on student achievement for both cases. Specifically, in the fourth grade case, the estimated standardized average effect was 0.34 (95% confidence interval from 0.14 to 0.53). In the sixth grade case, the estimated standardized average effect was 0.25 (95% confidence interval from 0.07 to 0.43) in 2010-2011 and 0.29 (95% confidence interval from 0.15 to 0.44) in 2011-2012. According to Cohen (1992), these estimated standardized average effects reflect small to medium effect sizes.
Table 28 reports the results of estimating the effect for each fourth grade PBM teacher by regressing the pairwise differences on the classroom dummy variables, without a constant. The results indicate that only Ms. Iris – the teacher who attended PBM Institute and introduced the other two teachers to PBM – had a significant and substantial positive effect. Specifically, the estimated standardized effect for Ms. Iris was 0.85 (95% confidence interval from 0.46 to 1.22), which Cohen (1992) considers a large effect size. In contrast, the estimated standardized effects for Ms. Carrie and Ms. Laura were 0.33 (95% confidence interval from -0.04 to 0.70) and 0.10 (95% confidence interval from -0.17 to 0.36), respectively. Nevertheless, the F-test (𝐹 2,97 =5.24,𝑝 = .007) attained by regressing the pairwise differences on two of the three classroom dummy variables showed the effect of teacher on mean difference scores was significant.
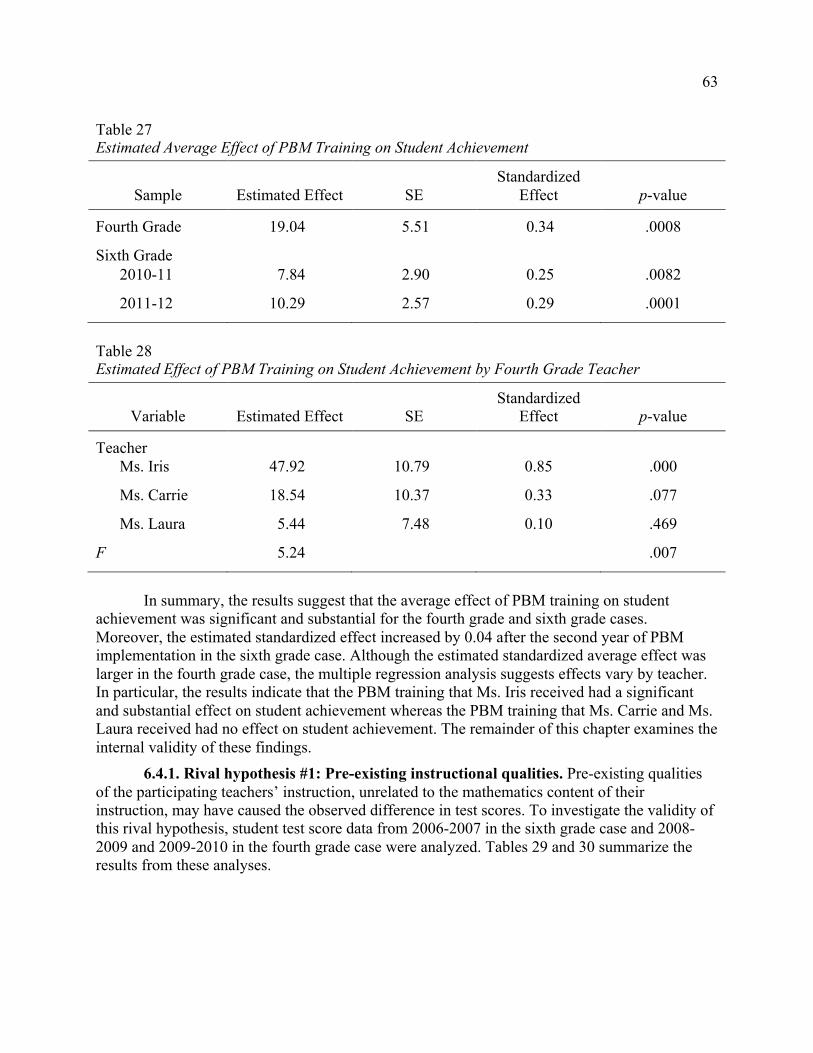
63
63
Table 27 Estimated Average Effect of PBM Training on Student Achievement
Sample
Estimated Effect
SE
Standardized Effect
p-value
Fourth Grade 19.04 5.51 0.34 .0008
Sixth Grade 2010-11 7.84 2.90 0.25 .0082
2011-12 10.29 2.57 0.29 .0001
Table 28 Estimated Effect of PBM Training on Student Achievement by Fourth Grade Teacher
Variable
Estimated Effect
SE
Standardized Effect
p-value
Teacher Ms. Iris 47.92 10.79 0.85 .000
Ms. Carrie 18.54 10.37 0.33 .077
Ms. Laura 5.44 7.48 0.10 .469
F 5.24 .007
In summary, the results suggest that the average effect of PBM training on student
achievement was significant and substantial for the fourth grade and sixth grade cases. Moreover, the estimated standardized effect increased by 0.04 after the second year of PBM implementation in the sixth grade case. Although the estimated standardized average effect was larger in the fourth grade case, the multiple regression analysis suggests effects vary by teacher. In particular, the results indicate that the PBM training that Ms. Iris received had a significant and substantial effect on student achievement whereas the PBM training that Ms. Carrie and Ms. Laura received had no effect on student achievement. The remainder of this chapter examines the internal validity of these findings.
6.4.1. Rival hypothesis #1: Pre-existing instructional qualities. Pre-existing qualities of the participating teachers’ instruction, unrelated to the mathematics content of their instruction, may have caused the observed difference in test scores. To investigate the validity of this rival hypothesis, student test score data from 2006-2007 in the sixth grade case and 2008-2009 and 2009-2010 in the fourth grade case were analyzed. Tables 29 and 30 summarize the results from these analyses.

64
64
Table 29 Estimated Average Effect of Pre-PBM Instruction on Student Achievement
Sample
Estimated Effect
SE
Standardized Effect
p-value
Fourth Grade 2008-09 -6.14 4.61 -0.14 .1876
2009-10 -0.90 4.40 -0.02 .8391
Sixth Grade 15.51 4.92 0.38 .0025
Table 30 Estimated Effect of Pre-PBM Instruction on Student Achievement by Fourth Grade Teacher
Teacher
Estimated Effect
SE
Standardized Effect
p-value
Ms. Iris 2008-09
2009-10 -4.56 8.45 -0.09 .591
Ms. Carrie 2008-09 2.05 7.95 0.05 .798
2009-10 21.12 8.61 0.41 .016
Ms. Laura 2008-09 -10.24 5.62 -0.24 .073
2009-10 -9.83 6.03 -0.19 .106
Table 29 displays the estimated average effect of participating teachers’ instruction on
student achievement prior to PBM implementation. On the one hand, no (significant) effect was found in the fourth grade case. On the other hand, a significant effect was found in the sixth grade case, and its effect size was larger than the estimated effects found during the two years of Ms. Violet’s attempted implementation of PBM. Neither of these results supports the rival hypothesis that pre-existing qualities of instruction caused the significant average treatment effects reported in the last section. In the fourth grade case, there was no average effect to “carry over” from pre-PBM years, and in the sixth grade case, the effect of the pre-PBM year failed to carry over to the years of PBM implementation.
Table 30 reports the estimated effect of pre-PBM instruction on student achievement for each participating fourth grade teacher. The results indicate two of the teachers – Ms. Iris and Ms. Laura – had no effect on student achievement prior to implementing PBM in their instruction. Ms. Carrie had no effect in 2008-2009 but a significant and substantial effect in 2009-2010 (standardized effect = 0.41, 95% confidence interval from 0.08 to 0.74). Neither

65
65
pattern supports the rival hypothesis that pre-existing qualities of instruction caused the individual effects reported in the last section. For Ms. Iris and Ms. Laura, there was no effect to carry over from pre-PBM years, and for Ms. Carrie, the effect of the preceding year failed to carry over to the year that she attempted to implement PBM.
In summary, the results provide little evidence to support the rival hypothesis that pre-existing qualities of instruction caused the average and individual effects reported in the last section. The results vary by teacher: for two of the fourth grade teachers (Ms. Iris and Ms. Laura), no effect was found in the year(s) prior to PBM implementation, which implies there was no effect to carry over from pre-PBM years; and for the other two teachers (Ms. Carrie and Ms. Violet), larger effects were found in the year prior to PBM implementation, which implies the effect of the pre-PBM year failed to carry over to the year(s) of PBM implementation. Therefore, it is unlikely that pre-existing instructional qualities pose a threat to the findings of this study.
6.4.2. Rival hypothesis #2: School-wide resources. Another possibility is that school-wide resources unique to the participating teachers’ schools caused the observed difference in test scores. To investigate the validity of this rival hypothesis in the fourth grade case, fifth grade student data from 2010-2011 were analyzed. Tables 31 and 32 summarize the results from these analyses. Table 31 Estimated Average Effect of Instruction on Student Achievement in PBM Teachers’ Schools
Sample
Estimated Effect
SE
Standardized Effect
p-value
Fifth Grade 9.45 4.44 0.21 .0350
Table 32 Estimated Effect of Instruction on Fifth Grade Student Achievement by PBM Teachers’ School
School
Estimated Effect
SE
Standardized Effect
p-value
Lakeview -3.55 6.30 0.08 .575
Riverside 21.00 5.94 0.46 .001
Although the results displayed in Table 31 indicate a significant yet small average effect
of instruction on fifth grade student achievement at the schools where the fourth grade PBM teachers taught, the results shown in Table 32 indicate that effects vary considerably by school. For Lakeview, the school where Ms. Iris and Ms. Carrie taught in 2010-2011, no effect was found (standardized effect = -3.55, 95% confidence interval from -0.35 to 0.20). Therefore, the evidence does not suggest that the significant and substantial PBM training effect found for Ms. Iris is likely attributable to school-wide resources. As reported earlier, no effect was found for Ms. Laura before or during PBM implementation; yet, a significant medium-size effect was found for the 2010-2011 fifth grade sample at her school Riverside (standardized effect = 0.46,

66
66
95% confidence interval from 0.20 to 0.72). The evidence from both schools suggests that grade and/or classroom-specific resources, rather than school-wide resources, have likely caused the student achievement differences observed in this study. Therefore, the results do not support the rival hypothesis that school-wide resources unique to the participating teachers’ schools are what caused the observed difference in fourth grade test scores.
6.5. Summary
This chapter has reported the results of exploring the effect of PBM training on student achievement. Descriptive analyses indicated: (1) few treatment units (students who received PBM instruction) but many comparison units (students who received standard instruction); and (2) significantly different distributions of treatment units and comparison units on race, FRL, and prior test score. Nearest neighbor propensity score matching was used to achieve a more balanced design for each sample.
In both cases, the study found a positive average effect of PBM training on student achievement. When the fourth grade case was analyzed by teacher, however, a significant effect was only found for one teacher (Ms. Iris). Although the evidence does not suggest that pre-existing instructional qualities or school-wide resources were confounding variables in either case, the results of this study show PBM training only improved the estimated classroom instruction effect on student achievement for one teacher (Ms. Iris). For the other three teachers, estimated standardized effects on student achievement either decreased or remained nil. The next chapter interprets these findings and discusses their implications for future evaluations of PBM training and instruction.

67
67
Chapter 7. Discussion
Although professional development (PD) for mathematics teachers has become more content specific in the last 30 years, emphasis has generally been placed on developing teachers’ pedagogical content knowledge more than their content knowledge in mathematics. As Garet has noted, “PD that places more direct emphasis on CK (content knowledge) is another potential avenue for future study” (Sztajn, Marrongelle, & Smith, 2012, p. 60). This dissertation was an exploratory study of a PD that places direct emphasis on content knowledge: Principle-Based Mathematics (PBM) training. The purpose of this dissertation was to explore how PBM-trained teachers of two different grade levels (fourth and sixth) attempted to implement PBM in their classrooms and what the impact was on student learning, as measured by state test scores. The study sought to address the following two research questions:
1. What does it look like when teachers attempt to implement PBM in their K-12 classrooms, particularly in the teaching of the division interpretation of a fraction (i.e., !
!= 𝑚 ÷ 𝑛 for whole numbers 𝑚 and nonzero 𝑛)?
2. When teachers attempt to implement PBM in their classrooms, what effect does this instruction have on students’ mathematics achievement?
These questions were investigated through an instrumental case study that employed a portfolio of qualitative and quantitative methods. Although additional program evaluations are needed, the study’s findings have revealed the flexibility of PBM instruction and a range of potential effect on student achievement. The findings also provide exploratory evidence to inform future efforts to design larger scale and more rigorous evaluations of PBM training.
In this closing chapter, the dissertation study design and findings are reexamined to identify lessons learned for the development and study of future mathematics PD. The first section recaps the study purpose and design. The following section summarizes the study’s findings and examines their implications for mathematics teaching and learning. The chapter concludes with a discussion of limitations of the present study and suggestions for future research.
7.1. Study Design In order to investigate how teachers bring PBM from the institute to their own classrooms
and what the impact is on student learning, there was a need to recruit teachers who had participated in PBM training and attempted to implement PBM in their teaching. The task of taking the adult form of PBM presented at PBM Institute and translating it to a student form of PBM for the classroom is a tremendous undertaking, especially because no PBM curriculum has been written for K-12 students thus far. Therefore, few participants of PBM Institute have attempted to implement PBM beyond one lesson or topic. With the assistance of PBM Institute’s lead facilitator, two institute participants were identified and recruited for the present study.
The two sets of teachers in this study consisted of three fourth grade teachers – Ms. Iris, Ms. Carrie, and Ms. Laura – and one sixth grade teacher, Ms. Violet. The two institute participants, Ms. Iris and Ms. Violet, both attended PBM Institute during summers 2009 and 2010 and attempted to implement PBM across their curricula beginning in fall 2010. As Ms. Iris attempted to implement PBM in conjunction with the district-mandated curriculum, she shared the content of her instruction and introduced PBM to her colleagues, Ms. Carrie and Ms. Laura.

68
68
PBM training, therefore, took two forms in this study: (1) the three-week PBM Institute during the summer (for Ms. Iris and Ms. Violet), and (2) teacher-led collaboration during the school year (for Ms. Carrie and Ms. Laura).
Access to classroom and student data was limited due to the school district’s restrictions in the fourth grade case and lack of travel funding to support extended data collection in the sixth grade case. As a result, this dissertation was largely restricted to retrospective data up to the 2010-2011 school year (and up to 2012 in the sixth grade case). Descriptions of classroom instruction were based on classroom artifacts (teacher notes and student work) and teacher interviews. Analyses of student achievement were based on state test scores and other student background characteristics provided by the districts. Despite the limitations of data access and study design, the findings provide exploratory evidence of how PBM-trained teachers attempt to implement PBM in the classroom and how their students, after receiving this instruction, perform on state mathematics tests compared to their peers. A summary and discussion of these findings follow.
7.2. Summary and Discussion of Study Findings 7.2.1. Classroom instruction. This section will highlight two major findings from the
analyses of the teachers’ approaches to the division interpretation of a fraction: (1) the flexibility of PBM instruction, as demonstrated by the teachers’ novel applications of the fundamental principles of mathematics; and (2) the possible ramifications of inadequate adherence to the fundamental principles.
Flexibility of PBM instruction: In their attempts to implement PBM instruction, the teachers taught the division interpretation of a fraction in ways that deviated from the institute’s approach yet still adhered to the fundamental principles. These deviations include: introduction of the topic through a contextualized problem (purposefulness); use of fraction addition to give mathematical meaning to a pictorial action (precision); sequencing addition and multiplication earlier in the progression of fraction topics and using the concepts to supply reasoning for the division interpretation of a fraction (coherence and reasoning); and number line reasoning that parallels the pictorial representation (reasoning).
These principle-adhering deviations provide evidence of how teachers can extend what they have learned in PBM training to formulate their own valid approaches to fit their teaching contexts. For example, in the fourth grade case, the teacher introduced the topic of the division interpretation of a fraction through a contextualized problem because her district-mandated textbook presents the topic through “sharing” problems (e.g., “Tom, Joe, and Sam made clay pots using two rolls of clay. If they shared the clay equally, what fraction of the clay did each friend use?”). Such word problems are common in the school curriculum and included in the Common Core State Standards for Mathematics (5.NF.3 “Solve word problems involving division of whole numbers leading to answers in the form of fractions or mixed numbers.”). Although PBM Institute’s approach to the topic made no direct reference to “sharing” problems, both institute participants recognized the relevance of such problems and used them to add purposefulness to their teaching of the division interpretation of a fraction.
The different approaches taken by the fourth grade teacher and the sixth grade teacher also reveal PBM’s flexibility to accommodate different curricular constraints and standards. In the fourth grade case, the teachers were required to follow a district-mandated textbook in which the lesson on the division interpretation of a fraction followed immediately after the introductory

69
69
lesson on fractions. Hence, the fourth grade teachers only had the definition of a fraction (and the addition of fractions with common denominator, which the teachers taught as an extension of counting “multiples” of a fraction) at their disposal to explain the division interpretation of a fraction. In contrast, the sixth grade teacher had much more flexibility in teaching the topic and, in general, extensive autonomy with her curriculum. Although the state standards in the sixth grade case only included the more advanced fraction topics (e.g., multiple and divide fractions with unlike denominators), the sixth grade teacher began her fractions unit with the definition of a fraction (“What is a fraction?”) and then progressed through all the major fraction topics, including equivalent fractions, comparing fractions, and the four arithmetic operations with fractions (see items 22-56 in Appendix E). As a result, the sixth grade teacher had the flexibility to teach the division interpretation of a fraction much later in her curriculum. In particular, by sequencing the division interpretation of a fraction after fraction multiplication, she was able to emphasize the division statement’s corresponding multiplication statement (i.e., for any fraction !!
, 𝑚 ÷ 𝑛 = !!
implies !!×𝑛 = 𝑚), which reflects the approach outlined in the Common Core
State Standards (5.NF.3 “For example, interpret ¾ as the result of dividing 3 by 4, noting that ¾ multiplied by 4 equals 3…”). Therefore, the teachers’ different yet valid approaches to the division interpretation of fraction show the flexibility of PBM to meet the demands of different curricula and standards, including the soon-to-be-implemented Common Core State Standards for Mathematics.
The teachers’ unique approaches to the division interpretation of a fraction also demonstrate PBM Institute’s “lack of prescriptiveness,” a quality that is consistent with effective mathematics PD programs (Kennedy, 1999). Programs that have greater effects on student learning provide teachers with “the least amount of specific information about what they should do in their classrooms and with the most specific information about the mathematics content they would be teaching…” (Kennedy, 1999, pp. 4-5). In addition, these programs “expect teaching practice to change, but instead of prescribing the details of the new practices, they assume that changes in teacher knowledge will stimulate teachers to devise their own new teaching practices that will, in turn, lead to student learning” (Kennedy, 1999, p. 3). The PBM-trained teachers’ principle-adhering deviations from the institute approach to the division interpretation of a fraction suggest that PBM Institute provides the specificity of content and flexibility of practice that are characteristic of an effective mathematics PD program.
Possible ramifications of inadequate adherence to principles: The omission of the division 𝑚 ÷ 𝑛 in the fourth grade case revealed an instance of inadequate adherence to the fundamental principles of mathematics. In the fourth grade case, the division 𝑚 ÷ 𝑛 as a general or special case (e.g., 3÷ 5) was not introduced or defined and, as a result, two key ideas were overlooked: (1) the relationship between the division 𝑚 ÷ 𝑛 and the “sharing” problem; and (2) the relationship between the division 𝑚 ÷ 𝑛 and the fraction !
! (i.e., the division interpretation of
a fraction). When asked why the division 𝑚 ÷ 𝑛 was absent in her lesson, Ms. Iris said she thought it was unnecessary, for two reasons. First, based on her understanding of the fourth grade state standards, her students only needed to be able to interpret a fraction as division in the context of a word problem, not a computation problem. In other words, fourth grade students only needed to be able to identify !
! as the answer to a word problem such as “How much paper
does each person get when three sheets of paper are shared equally among five people?” but not to a computational problem such as “What fraction is equal to 3÷ 5?” Second, Ms. Iris focused

70
70
her efforts on finding solutions to the “sharing” problems rather than on understanding the “sharing” problems as special, contextualized cases of the division interpretation of a fraction. Hence, her instruction focused on helping students “get the answer” rather than understand the broader mathematics, as indicated by the following comment: “If students could get the answer, it didn’t matter if I defined it as three divided by five.”
Although it is true that students can “get the answer” to sharing problems without learning about division with whole numbers (in the context of fractions), the lack of precision in this approach may leave students – and teachers – vulnerable to misconceptions. For example, in the interview, Ms. Iris recounted the confusion that she and her students had the year before (2009-2010) over two different “solutions” – resulting in two different answers – to sharing problems. The first solution reflected the approach outlined in Chapter 5 (Section 5.1.1). The second “solution” is shown in Figure 19. Ms. Iris formulated the second “solution” by defining the unit as the set of three sheets instead of as a single sheet. Confusion over the unit is not uncommon when fractions are represented as shapes or objects (e.g., Barnett, Goldstein, & Jackson, 1994; Mack, 1995; Moskal & Magone, 2002) and often signals a need for more precision. In this case, Ms. Iris’ confusion over a second “solution” appears to be due to lack of attention to the mathematical meaning of the story problem. If Ms. Iris had defined the statement “how much each person gets when three sheets are shared equally among five people” as the division “3÷ 5” and then defined “3÷ 5” on the number line as “the length of each part when 0,3 is divided into five parts of equal length,”11 the unit would have been clearly defined and
the second “solution,” !!, would likely have been avoided (at least one can easily verify that five
copies of !! do not form the segment 0,3 ). Therefore, closer adherence to the principle of
precision may have helped Ms. Iris discern and avoid misconceived “solutions.”
Figure 19. Ms. Iris’ second “solution” to five people sharing three sheets of drawing paper.
Evidence from other studies of students’ difficulty with the division interpretation of a fraction also suggests the importance of explicitly teaching the division 𝑚 ÷ 𝑛, especially as it relates to the contextualized problem. As mentioned in Chapter 3, the Secondary Mathematics Project (Kerslake, 1986) found about a third of their student sample had trouble solving a “sharing” problem but even more had difficulty computing the quotient 3÷ 5. The evidence suggests that equal, if not more, instructional attention needs to be given to the symbolic, 11 More generally, the statement “how much each person gets when 𝑚 items are shared equally among 𝑛 people” can be defined as the division “𝑚 ÷ 𝑛,” which can be defined on the number line as “the length of each part when 0,𝑚 is divided into 𝑛 parts of equal length.”

71
71
computation form as the contextualized, word-problem form of the division interpretation of a fraction.
In summary, the study findings show that PBM-trained teachers’ attempted implementation of PBM in teaching the division interpretation of a fraction deviated from the institute’s approach in unique ways. Most deviations still adhered to the fundamental principles of mathematics and demonstrated the flexibility of PBM to accommodate different curricular demands and teaching contexts. The one instance of inadequate adherence to the principles in the fourth grade case revealed an emphasis on “getting the answer” at the expense of learning the broader mathematics. Closer adherence to the principle of precision may have helped the teacher discern and avoid misconceived “solutions” and helped students understand the computation form of the division interpretation of a fraction, a concept that has historically been challenging for students.
7.2.2. Student achievement. Descriptive analyses indicated two problematic issues: (1) few treatment units (students who received PBM instruction) but many comparison units (students who received standard instruction); and (2) significantly different distributions of treatment units and comparison units on pretreatment covariates such as race, free or reduced-price lunch qualification, and prior year test score. To achieve a more balanced design for each sample, nearest neighbor propensity score matching was used to reduce each comparison sample to a smaller group of students that were more comparable to the students who received PBM instruction. Following the matching procedure, a positive average effect was found for each case during the year(s) that the teachers attempted to implement PBM instruction (fourth grade standardized effect: 0.34; sixth grade standardized effects: 0.25 and 0.29). When the fourth grade case was examined by individual teacher, however, a significant and substantial positive effect was only found for Ms. Iris (standardized effect = 0.85), and no effect was found for either of the other two teachers, Ms. Carrie or Ms. Laura. Analyses of prior years also indicated that Ms. Iris was the only teacher to show “improvement” in effect on student achievement after implementing PBM. For the other three teachers, including the sixth grade teacher Ms. Violet, estimated standardized effects on student achievement either decreased or remained nil. How are these results to be interpreted?
There are two hypotheses to consider for the two fourth grade teachers, Ms. Carrie and Ms. Laura, who exhibited no effect during the year that they attempted to implement PBM instruction. First, their attempted implementation of PBM might have differed from Ms. Iris’ attempted implementation of PBM. Although Ms. Carrie and Ms. Laura both claimed to have used Ms. Iris’ instructional materials that year, limited data access and records have made it difficult to verify the teachers’ claims. Moreover, the teachers might have used the same materials but implemented them differently. For example, Ms. Carrie and Ms. Laura might not have emphasized certain principles such as definitions and reasoning as much as Ms. Iris had; yet, without direct observation of these teachers’ classroom instruction, this conjecture cannot be explored.
Another hypothesis is that one school year of PBM training and implementation is insufficient to make a difference in a teacher’s instructional effect on student achievement. Ms. Carrie and Ms. Laura had significantly less PBM training than Ms. Iris had, both in terms of time and depth. Perhaps given more time, the teachers’ ease and proficiency with PBM instruction would have reached a level that would have impacted student achievement. As Tyler (1991) points out, successful implementation of a new program requires “providing adequate

72
72
opportunity for those involved to develop new skills, new understanding, and new attitudes when the new program differs in these respects from the older programs” (p. 9). Tyler also notes that “it usually takes about six or seven years for a complex program to become fully operational as planned” (p. 9). Therefore, it is important for future evaluations of PBM to provide participating teachers sufficient time to learn PBM and also learn to teach PBM in the classroom to ensure PBM instruction has sufficient opportunity to be fully implemented.
In the sixth grade case with Ms. Violet, the observed decrease in effect on student achievement may be indication of a limitation in the student assessments rather than the teacher’s instruction. Given Ms. Iris’ observed increase in effect on student achievement despite inadequate adherence to the fundamental principles, one might expect that Ms. Violet would have the same, if not greater, change in effect, because of the multiple ways that her approach to the division interpretation of a fraction consistently adhered to the principles. Instead, the effects estimated from two years of PBM instruction were both smaller than the effect estimated from the year that preceded PBM implementation (standardized effects 0.25 and 0.29 versus 0.38). One possible explanation is that Ms. Violet’s pre-PBM instruction focused on the procedural skills that helped students perform well on standardized tests. When asked about her earlier years of teaching, she explained: “I was teaching procedures without reasoning. I was teaching the procedures well but they didn’t have reasons behind them.” Therefore, prior to PBM instruction, Ms. Violet’s students were likely learning the procedures well and, consequently, performing well on the state tests, but had her students been assessed on the reasoning behind the procedures, they probably would not have performed well. A high score on a basic skills test “runs the risk of being a false positive, certifying a student as competent when the student is unable to meet some very important mathematical standards” (Schoenfeld, 2002, p. 21). In other words, the higher effect observed during Ms. Violet’s pre-PBM instruction year might be a “false positive” and only indicate that students had excelled in a narrow set of mathematics skills, namely procedures.
Although the student achievement results were not as favorable as expected for three of the four teachers, the significant and substantial increase in effect on student achievement for Ms. Iris shows promise. As discussed in the last section, the omission of the division 𝑚 ÷ 𝑛 revealed an instance of inadequate adherence to the fundamental principles in Ms. Iris’ classroom instruction. With additional years of implementation, however, Ms. Iris’ instruction may exhibit closer alignment with PBM. As she shared in the interview:
You oftentimes learn from a year of going through things. You refine it. You make it better. … I am progressing in a way that I know that I am going to be able to accomplish my goal, which is to have full implementation of PBM down the road.
Given the increased effect that the sixth grade teacher Ms. Violet demonstrated in her second year of implementing PBM, Ms. Iris’ effect on student achievement may continue to increase as she works towards “full implementation of PBM down the road.”
7.3. Limitations and Future Research The following features of the study design present limitations to the findings of this
dissertation research: two stages of selection bias, lack of direct classroom observation, analysis of only one curricular topic, and limited measures of student achievement.
73
73
Selection bias: The sample selected for this study may exhibit two types of selection bias occurring in two stages. First, there may be selection bias with regards to participation in PBM training. Teachers who participated in PBM Institute applied to the program and were admitted based on their potential to benefit from the program, and teachers who participated in PBM collaboration engaged in the work voluntarily and often with no compensation. Therefore, participants of PBM training may not be representative of the population of elementary and middle school mathematics teachers. Second, there may be selection bias with regards to attempted implementation of PBM in participants’ classrooms. As mentioned earlier in the chapter, implementing PBM instruction requires a tremendous amount of teacher planning time and effort, especially in the absence of PBM curriculum that can be directly used in the classroom. Therefore, the four teachers selected for this study may not be representative of the population of PBM training participants. Thus, the classroom instruction and student achievement results reported in this dissertation study may not be generalizable (i.e., may be limited in external validity) to the population of elementary and middle school mathematics teachers.
There are two potential avenues of research to address the issue of selection bias. One possibility is to explore the factors that may explain why the teachers of this study participated in PBM training and why they attempted to implement PBM across their respective curricula. Interview data collected in this study suggest a variety of possible factors, including trust in the trainer’s expertise (e.g., Ms. Laura perceived Ms. Iris as “the smartest elementary math teacher in the district”) and personal experiences that prompt critical reflection of one’s teaching practice (e.g., when Ms. Iris saw that her seventh grade daughter had “a lot of holes” in her mathematics understanding, Ms. Iris began to ask herself, “Oh, no, what am I doing in my classroom teaching that is causing kids to develop holes in their mathematical thinking and reasoning?”). A larger study sample, including (1) teachers who hear of PBM training but choose not to participate in it and (2) teachers who participate in PBM training but do not implement PBM across their curricula, may also help identify additional factors that may influence training participation and classroom implementation. These factors need to be further investigated in order to understand the conditions and the extent to which the findings of the present study can be generalized to the population of elementary and middle school mathematics teachers.
Another way to address the threat of selection bias is to study the effects of PBM training through an experimental or quasi-experimental design in which the selection process is known and/or controlled by the researchers. As explained in Chapter 2, an experimental design with randomized assignment to treatment and control conditions is ideal. If, however, the PBM Institute facilitators have a selection criterion that can be quantified and program participants are admitted on the basis of a cutoff score, then a basic regression discontinuity design (Shadish, Cook, & Campbell, 2002) may be a viable alternative. In a regression discontinuity design, the outcomes for the study participants near the cutoff score are compared, and if a sudden discontinuity is observed at the cutoff, selection is not considered a plausible cause because “we can model selection successfully given that it is fully known and perfectly measured” (Shadish, Cook, & Campbell, 2002, p. 237). Whether through an experimental or quasi-experimental design, the effect of PBM training needs to be further investigated using a study design in which the selection can be modeled to minimize the threat of selection bias.
Direct observation: Another limitation of this dissertation study is the absence of direct observation of teaching and learning. As summarized earlier in the chapter, classroom instruction

74
74
data were limited to classroom artifacts and retrospective interviews, which may have provided incomplete and/or inaccurate accounts of how the division interpretation of a fraction was taught during the 2010-2011 or 2011-2012 school year. Future evaluations of PBM instruction should include direct observations of classroom instruction, in addition to classroom artifacts and teacher interviews.
Curriculum analysis: This dissertation analyzed classroom teaching of one mathematics topic: the division interpretation of a fraction. On the one hand, close examination of one topic provided the opportunity to conduct an in-depth analysis of the teachers’ approaches to the topic, including the unique ways in which their approaches exemplified PBM. On the other hand, many topics of the fourth grade and sixth grade curricula were omitted in the analysis of classroom instruction. As a result, conclusions about the teachers’ attempted implementation of PBM instruction are limited to the topic of the division interpretation of a fraction. No conclusion can be drawn about their attempts to implement PBM across their respective curricula. Moreover, it is unknown whether the degree of alignment with PBM observed in the teachers’ approaches to the division interpretation of a fraction is representative or indicative of how well the teachers aligned the rest of their respective curricula and instruction to PBM. Future evaluations of PBM instruction need to consider more topics of the curriculum and develop analytic instruments (e.g., rating scales or rubrics) to measure the alignment of multiple lessons and topics with PBM.
Achievement measures: The state tests used to measure student mathematics achievement also present a limitation to the results of this dissertation study. Although the two state testing programs in this study have undergone extensive analyses to ensure their psychometric quality, they generally fail to distinguish superficial, procedural knowledge from deeper, conceptual understanding of mathematics. Both norm-referenced and criterion-referenced tests developed by state testing programs “tend to be poor measures of curriculum attainment and of students’ abilities to undertake independent tasks” (Darling-Hammond, 1991, p. 220). Furthermore, the tests’ broad content strands (e.g., “number sense and operations”) do not provide specific information about students’ understanding of key fraction topics such as the division interpretation of a fraction. Therefore, student performance on the state tests cannot directly validate the study’s analyses of classroom instruction, which were restricted to the topic of the division interpretation of a fraction. Future evaluations of PBM instruction would benefit from additional measures of student achievement that assess the learning of specific mathematics topics and the quality of students’ understanding of such topics.
Despite the limitations of the study, this dissertation research provides the first empirical evidence of PBM training’s impact on classroom instruction and student achievement. In particular, it is the first study to investigate how teachers bring PBM from the institute to their own classrooms and how students perform on state tests compared to their peers after a year of receiving PBM instruction. The study also demonstrates how a portfolio of methods can be used to conduct an exploratory study under suboptimal research conditions. The findings of this research will hopefully enrich the implementation and evaluation of future forms of PBM training as well as inform the development and study of other mathematics PD programs.

75
75
References
American Federation of Teachers. (2002). Principles for professional development: AFT's guidelines for creating professional development programs that make a difference. Washington, DC: Author.
Angrist, J. D., & Lavy, V. (2001). Does teacher training affect pupil learning? Evidence from matched comparisons in Jerusalem public schools. Journal of Labor Economics , 19 (2), 343-369.
Angrist, J., & Pischke, J. (2009). Mostly harmless econometrics: An empiricist's companion. Princeton: Princeton University Press.
Bai, H. (2011). Using propensity score analysis for making causal claims in research articles. Educational Psychology Review , 23 (2), 273-278.
Ball, D. L. (1990). The mathematical understanding that prospective teachers bring to teacher education. Elementary School Journal , 90, 449-466.
Ball, D. L., & Hill, H. C. (2009). The curious - and crucial - case of mathematical knowledge for teaching. Phi Delta Kappan , 91 (2), 68-71.
Ball, D. L., Hoover, M. H., & Phelps, G. (2008). Content knowledge for teaching: What makes it special. Journal of Teacher Education , 59 (5), 389-407.
Barnett, C., Goldstein, D., & Jackson, B. (1994). Fractions, decimals, ratios, and percents: Hard to teach and hard to learn? Portsmouth, NH: Heinemann.
Behr, M. J., Harel, G., Post, T., & Lesh, R. (1992). Rational number, ratio, and proportion. In D. A. Grouws, Handbook of research on mathematics teaching and learning (pp. 296-333). New York: Macmillan.
Behr, M. J., Lesh, R., Post, T., & Silver, E. A. (1983). Rational number concepts. In R. Lesh, & M. Landau, Acquisition of mathematics concepts and processes (pp. 91-126). New York: Academic Press.
Burns, M. (1994). Arithmetic: The last holdout. The Phi Delta Kappan , 75 (6), 471-476.
Campbell, P. F. (1996). Empowering children and teachers in the elementary mathematics classrooms of urban schools. Urban Education , 30 (4), 449-475.
Carpenter, T. P., & Fennema, E. (1992). Cognitively guided instruction: Building on the knowledge of students and teachers. International Journal of Educational Research , 457-470.
Carpenter, T. P., Fennema, E., Peterson, P. L., & Carey, D. A. (1988). Teachers' pedagogical content knowledge of students' problem solving in elementary arithmetic. Journal for Research in Mathematics Education , 19 (5), 385-401.
Carpenter, T. P., Fennema, E., Peterson, P., Chiang, C., & Loef, M. (1989). Using knowledge of children's mathematics thinking in classroom teaching: An experimental study. American Educational Research Journal , 26 (4), 499-531.

76
76
Carpenter, T. P., Lindquist, M. M., Brown, C. A., Kouba, V. L., Silver, E. A., & Swofford, J. O. (1988). Results of the fourth NAEP assessment of mathematics: Trends and conclusions. Arithmetic Teacher , 36, 38-41.
Chapin, S. (1994). Implementing reform in school mathematics. Journal of Education , 176 (1), 67-76.
Cohen, J. (1992). A power primer. Psychological Bulletin , 112 (1), 155-159.
Common Core State Standards (CCSS). (2010). Retrieved from Common Core State Standards Initiative: http://www.corestandards.org/
Correnti, R. (2008). Professional development as a lever for changing teacher practice. University of Pittsburgh. Pittsburgh: The Learning Policy Center.
Darling-Hammond, L. (1991). The implications of testing policy for quality and equality. The Phi Delta Kappan , 73 (3), 220-225.
Desimone, L. M. (2009). Improving impact studies of teachers' professional development: Toward better conceptualizations and measures. Educational Researcher , 38 (3), 181-199.
Fishman, J. J., Marx, R. W., Best, S., & Tal, R. T. (2003). Linking teacher and student learning to improve professional development in systemic reform. Teaching and Teacher Education , 19, 643-658.
Fosnot, C. T. (2007). Field trips and fund-raisers: Introducing fractions. Portsmouth, NH: Heinemann.
Garet, M., Wayne, A., Stancavage, F., Taylor, J., Eaton, M., Walters, K., et al. (2011). Middle School Mathematics Professional Development Impact Study: Findings after the second year of implementation (NCEE 2011-4024). Washington, DC: National Center for Education Evaluation and Regional Assistance, Institute of Education Sciences, U.S. Department of Education.
Garet, M., Wayne, A., Stancavage, F., Taylor, J., Walters, K., Song, M., et al. (2010). Middle School Mathematics Professional Development Impact Study: Findings after the first year of implementation (NCEE 2010-4009). Washington, DC: National Center for Education Evaluation and Regional Assistance, Institute of Education Sciences, U.S. Department of Education.
Gearhart, M., Saxe, G. B., Seltzer, M., Schlackman, J., Ching, C. C., Nasir, N., et al. (1999). Opportunities to learn fractions in elementary mathematics classrooms. Journal for Research in Mathematics Education , 30 (3), 286-315.
Glazerman, S., & Seifullah, A. (2012). An evaluation of the Chicago Teacher Advancement Program (Chicago TAP) after four years. Washington, DC: Mathematica Policy Research.
Gu, X. S., & Rosenbaum, P. R. (1993). Comparison of multivariate matching methods: Structures, distances, and algorithms. Journal of Computational and Graphical Statistics , 2 (4), 405-420.
77
77
Hill, H. C., Beisiegel, M., & Jacob, R. (2013). Professional development research: Consensus, crossroads, and challenges. Educational Researcher , 42 (9), 476-487.
Ho, D., Imai, K., King, G., & Stuart, E. (2007). Matching as nonparametric preprocessing for reducing model dependence in parametric causal inference. Political Analysis , 15 (3), 199-236.
Ho, D., Imai, K., King, G., & Stuart, E. A. (2011). MatchIt: Nonparametric preprocessing for parametric causal inference. Journal of Statistical Software , 42 (8), 1-28.
Hong, G., & Yu, B. (2008). Effects of kindergarten retention on children's social-emotional development: An application of propensity score method to multivariate, multilevel data. Developmental Psychology , 44 (2), 407-421.
Imai, K., King, G., & Stuart, E. A. (2008). Misunderstandings between experimentalists and observationalists about causal inference. Journal of the Royal Statistical Society. Series A (Statistics in Society) , 171 (2), 481-502.
Ingvarson, L., Meiers, M., & Beavis, A. (2005). Factors affecting the impact of professional development programs on teachers' knowledge, practice, student outcomes & efficacy. Education Policy Analysis Archives , 13 (10).
Institute of Education Sciences (IES). (2006). Procedures for peer review of grant applications. Washington, DC: Author.
Karges-Bone, L., Collins, F. J., & Maness, E. (2002). Last place is a fine place to begin. Journal of Staff Development , 23 (2), 24-48.
Kazemi, E., & Hubbard, A. (2008). New directions for the design and study of professional development: Attending to the coevolution of teachers' participation across contexts. Journal of Teacher Education , 59 (5), 428-441.
Kennedy, M. M. (1999). Form and substance in mathematics and science professional development. National Institute for Science Education Brief , 3 (2), 1-8.
Kerslake, D. (1986). Fractions: Children's strategies and errors, a report of the strategies and errors in secondary mathematics project. Windsor, England: NFER-Nelson.
Kieren, T. E. (1992). Rational and fractional numbers as mathematical and personal knowledge: Implications for curriculum and instruction. In G. Leinhardt, R. Putnam, & R. A. Hattrup, Analysis of arithmetic for mathematics teaching (pp. 323-371). Hillsdale, NJ: Erlbaum.
Klein, D. (2003). A brief history of American K-12 mathematics education in the 20th century. In J. Royer (Ed.), Mathematical cognition.
Kloosterman, P. (2010). Mathematics skills of 17-year-olds in the United States: 1978 to 2004. Journal for Research in Mathematics Education , 41 (1), 20-51.
Ma, L. (1999). Knowing and teaching elementary mathematics: Teachers' understanding of fundamental mathematics in China and the United States. Mahwah, NJ: Lawrence Erlbaum Association.
Mack, N. K. (1995). Confounding whole-number and fraction concepts when building on informal knowledge. Journal for Research in Mathematics Education , 26 (5), 422-441.
78
78
Morgan, S. L., & Winship, C. (2007). Counterfactuals and causal inference: Methods and principles for social research. Cambridge, MA: Cambridge University Press.
Moskal, B. M., & Magone, M. E. (2002). Making explicit what students know about representing fractions. In B. H. Litwiller, & G. W. Bright, Making sense of fractions, ratios, and proportions: 2002 yearbook (pp. 121-129). Reston, VA: National Council of Teachers of Mathematics.
National Academy of Education. (2009). Education policy white paper on teacher quality. Washington, DC: Author.
National Council of Teachers of Mathematics (NCTM). (1989). Curriculum and evaluation standards for school mathematics. Reston: Author.
National Mathematics Advisory Panel. (2008). Reports of the task groups and subcommittees. Washington, D.C.: U.S. Department of Education.
Newton, X. A., Poon, R. C., Nunes, N. L., & Stone, E. M. (2013). Research on teacher education programs: Logic model approach. Evaluation and Program Planning , 36, 88-96.
Nguyen, A. N., Taylor, J., & Bradley, S. (2006). The estimated effect of Catholic schooling on educational outcomes using propensity score matching. Bulletin of Economics Research , 58 (4), 285-307.
Niemi, D. (1996). A fraction Is not a piece of pie: Assessing exceptional performance and deep understanding in elementary school mathematics. Gifted Child Quarterly , 40, 70-80.
Patton, M. Q. (2002). Qualitative evaluation and research methods (Third ed.). Thousand Oaks: Sage Publications.
R Development Core Team. (2010). R: A language and environment for statistical computing. Vienna, Austria: R Foundation for Statistical Computing.
Rosenbaum, P. R. (2002). Observational studies. New York: Springer.
Rosenbaum, P. R., & Rubin, D. B. (1983). The central role of the propensity score in observational studies for causal effects. Biometrika , 70 (1), 41-55.
Rubin, D. B. (1973). Matching to remove bias in observational studies. Biometrics , 29 (1), 159-183.
Rubin, D. B. (1974). Estimating causal effects of treatments in randomized and nonrandomized studies. Journal of Educational Psychology , 66 (5), 688-701.
Rubin, D. B. (2001). Using propensity scores to help design observational studies: Application to the tobacco litigation. Health Services & Outcomes Research Methodology , 2 (3), 169-188.
Saxe, G. B., Diakow, R., & Gearhart, M. (2013). Towards curricular coherence in integers and fractions: A study of the efficacy of a lesson sequence that uses the number line as the principal representational context. ZDM Mathematics Education , 45, 343-364.

79
79
Saxe, G. B., Gearhart, M., & Nasir, N. S. (2001). Enhancing students' understanding of mathematics: A study of three contrasting approaches to professional support. Journal of Mathematics Teacher Education , 4, 55-79.
Schneider, B., Carnoy, M., Kilpatrick, J., Schmidt, W. H., & Shavelson, R. J. (2007). Estimating causal e"ects using experimental and observational designs (report from the Governing Board of the American Educational Research Association Grants Program). Washington, DC: American Educational Research Association.
Schoenfeld, A. H. (2002). Making mathematics work for all children: Issues of standards, testing, and equity. Educational Researcher , 31 (1), 13-25.
Schwab, J. J. (1978). Science, curriculum, and liberal education: Selected essays. Chicago: The University of Chicago Press.
Shadish, W. R., Cook, T. D., & Campbell, D. T. (2002). Experimental and quasi-experimental designs for generalized causal inference. Boston: Houghton Mifflin Company.
Shulman, L. S. (1986). Those who understand: Knowledge growth in teaching. Educational Researcher , 15 (2), 4-14.
Shulman, L. S. (1987). Knowledge and teaching: Foundations of the new reform. Harvard Educational Review , 57 (1), 1-22.
Shulman, L. S. (1991). Joseph Jackson Schwab. In E. Shils (Ed.), Remembering the University of Chicago (pp. 452-468). Chicago: The University of Chicago Press.
Staff, J., Patrick, M. E., Loken, E., & Maggs, J. L. (2008). Teenage alcohol use and educational attainment. Journal of Studies on Alcohol and Drugs , 69 (6), 848-858.
Stake, R. E. (1995). The art of case study research. Thousand Oaks: Sage Publications.
StataCorp. (2011). Stata 12.0. College Station, TX: Stata Press Publication. Sztajn, P., Marrongelle, K., & Smith, P. (2012). Supporting implementation of the Common Core
State Standards for Mathematics. North Carolina State University, College of Education. North Carolina State University.
Thames, M. H., & Ball, D. L. (2010). What mathematical knowledge does teaching require? Knowing mathematics in and for teaching. Teaching Children Mathematics , 17 (4), 220-225.
Tyler, R. W. (1991). General statement on program evaluation. In M. W. McLaughlin, & D. C. Phillips, Evaluation and education at quarter century: Ninetieth yearbook of the national society for the study of education (pp. 3-17). Chicago: The University of Chicago Press.
Van Haneghan, J. P., Pruet, S. A., & Bamberger, H. J. (2004). Mathematics reform in a minority community: Student outcomes. Journal of Education for Students Placed at Risk , 9 (2), 189-211.
Winship, C., & Morgan, S. L. (1999). The estimation of causal effects from observational data. Annual Review of Sociology , 25, 659-707.

80
80
Wood, T., Cobb, P., & Yackel, E. (1991). Change in teaching mathematics: A case study. American Educational Research Journal , 28 (3), 587-616.
Wu, H. (2007, March). What is mathematics education? Atlanta, GA. Wu, H. (2008). Whole numbers, fractions, and rational numbers. Berkeley.
Wu, H. (2009). Lecture notes for the 2009 pre-algebra institute. Berkeley. Wu, H. (2010). Introduction to school algebra. Berkeley.
Wu, H. (2011a). The mis-education of mathematics teachers. Notices of the American Mathematical Society , 58 (3), 372-384.
Wu, H. (2011b). Understanding numbers in elementary school mathematics. Providence, RI: American Mathematical Society.
Wu, H. (2011c). Phoenix rising: Bringing the Common Core Mathematics Standards to life. American Educator , 3-13.
Wu, H. (forthcoming). Mathematics of the secondary school curriculum. Wyse, A. E., Keesler, V., & Schneider, B. (2008). Assessing the effects of small school size on
mathematics achievement: A propensity score-matching approach. Teachers College Record , 110 (9), 1879-1900.
Yin, R. K. (2009). Case study research: Design and methods. Thousand Oaks: Sage. Yoon, K. S., Duncan, T., Lee, S. W.-Y., Scarloss, B., & Shapley, K. (2007). Reviewing the
evidence on how teacher professional development affects student achievement (Issues & Answers Report, REL 2007-No. 033). Washington, DC: Department of Education, Institute of Education Sciences, National Center for Education Evaluation and Regional Assistance, Regional Educational Laboratory Southwest.

81
81
Appendix A
General Proof of Theorem 5
When the definitions of a fraction, equal, and the definition of division of whole numbers are directly and literally applied, the goal becomes to prove the division interpretation of a fraction re-stated as the following equivalent statement: The 𝑚th point to the right of 0 in the sequence of 𝑛ths is the same point as the length of one part when a segment of length 𝑚 is partitioned into 𝑛 equal parts. This re-statement of the division interpretation of a fraction is true because of the following: By the preceding observations, 𝑚 = !
!= !"
!. That means the segment 0,𝑚 , which
has length 𝑚, is 𝑛𝑚 copies of !!. Then when the 𝑛𝑚 copies of !
! are partitioned into 𝑛 equal parts,
each part is 𝑚 copies of !!, which coincides with the 𝑚th point to the right of 0 in the sequence of
𝑛ths. Thus, the re-statement of the division interpretation of a fraction is proved, and, in turn, the division interpretation of a fraction, !
!= 𝑚 ÷ 𝑛, is proved.

82
82
Appendix B
Figure B1. Introduction to fractions in the fourth grade case.

83
83
Figure B2. Introduction to fractions in the fourth grade case (continued).

84
84
Figure B3. Introduction to fractions in the fourth grade case (continued).

85
85
Figure B4. Introduction to fractions in the sixth grade case.

86
86
Figure B5. Introduction to fractions in the sixth grade case (continued).
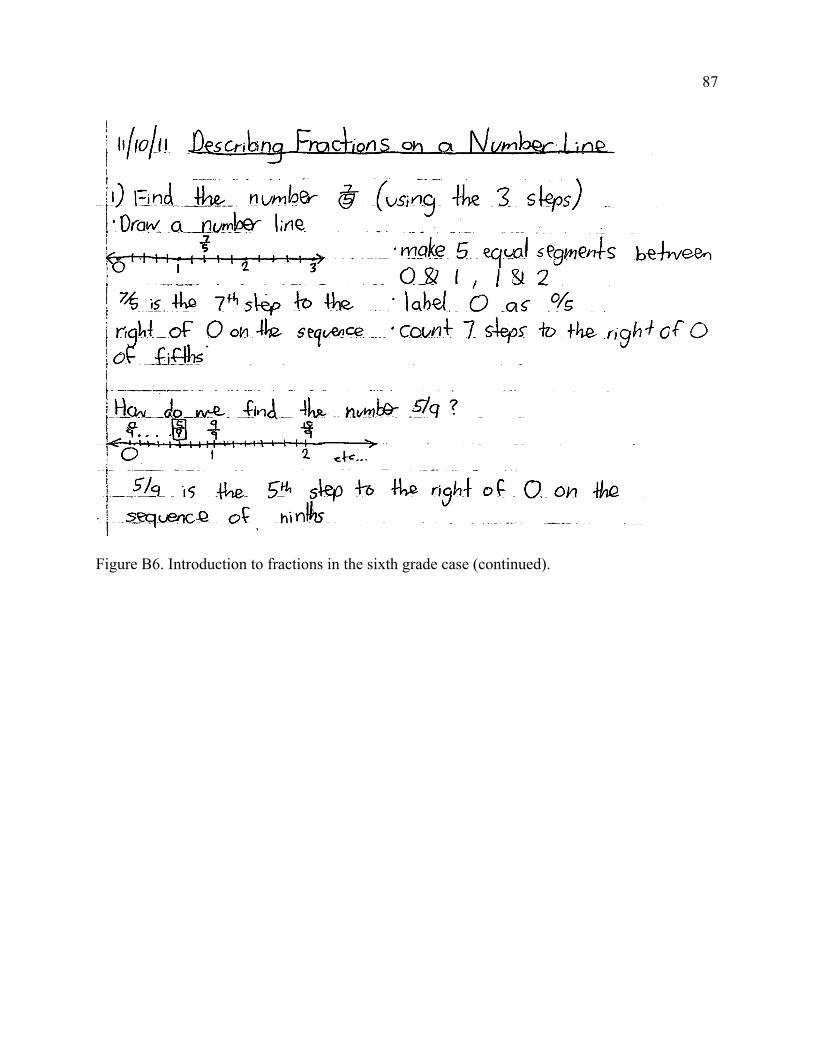
87
87
Figure B6. Introduction to fractions in the sixth grade case (continued).

88
88
Appendix C
Table C1 Characteristics of the 2008-2009 Fourth Grade PBM Sample, % or Mean (Standard Deviation)
Variable
Ms. Carrie (n = 21)
Ms. Laura (n = 42)
Male 48% 57%
Race White 90% 64%
Asian 0% 7%
Black 0% 10%
Hispanic 10% 10%
American Indian 0% 5%
Multi-racial 0% 5%
ELL 0% 0%
FRL 14% 31%
Special Education 19% 12%
Third Grade Score 427.19 (27.10)
414.21 (28.28)
Fourth Grade Score 433.67 (35.32)
396.88 (33.12)
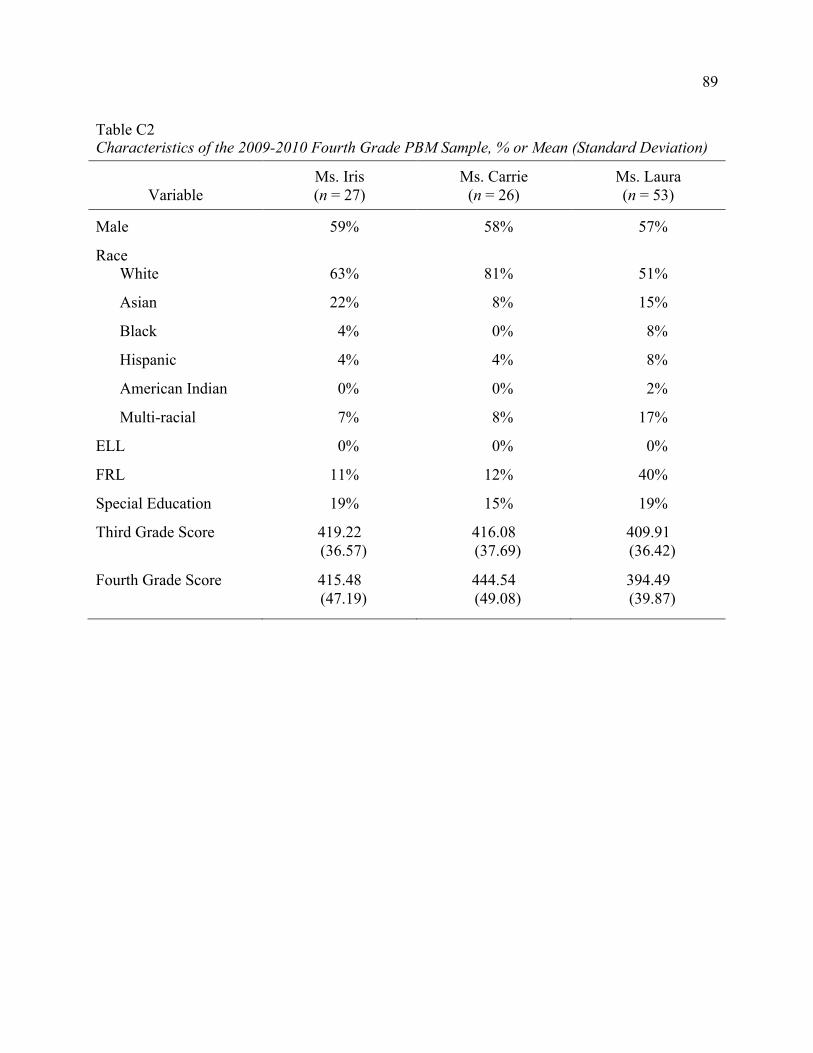
89
89
Table C2 Characteristics of the 2009-2010 Fourth Grade PBM Sample, % or Mean (Standard Deviation)
Variable
Ms. Iris (n = 27)
Ms. Carrie (n = 26)
Ms. Laura (n = 53)
Male 59% 58% 57%
Race White 63% 81% 51%
Asian 22% 8% 15%
Black 4% 0% 8%
Hispanic 4% 4% 8%
American Indian 0% 0% 2%
Multi-racial 7% 8% 17%
ELL 0% 0% 0%
FRL 11% 12% 40%
Special Education 19% 15% 19%
Third Grade Score 419.22 (36.57)
416.08 (37.69)
409.91 (36.42)
Fourth Grade Score 415.48 (47.19)
444.54 (49.08)
394.49 (39.87)

90
90
Table C3 Characteristics of the 2010-2011 Fourth Grade PBM Sample, % or Mean (Standard Deviation)
Variable
Ms. Iris (n = 27)
Ms. Carrie (n = 27)
Ms. Laura (n = 55)
Male 46% 54% 38%
Race White 50% 46% 40%
Asian 13% 0% 14%
Black 13% 0% 10%
Hispanic 8% 35% 12%
American Indian 0% 0% 0%
Multi-racial 17% 19% 24%
ELL 8% 8% 2%
FRL 38% 23% 34%
Special Education 4% 8% 16%
Third Grade Score 392.75 (30.30)
395.42 (27.37)
390.76 (28.73)
Fourth Grade Score 433.67 (57.10)
439.35 (48.91)
405.12 (53.71)

91
91
Table C4 Characteristics of the 2010-2011 Fifth Grade PBM Sample, % or Mean (Standard Deviation)
Variable
Lakeview (n = 64)
Riverside (n = 72)
Male 45% 60%
Race White 69% 51%
Asian 14% 17%
Black 5% 3%
Hispanic 5% 10%
American Indian 2% 0%
Multi-racial 6% 19%
ELL 8% 0%
FRL 28% 26%
Special Education 17% 15%
Fourth Grade Score 414.02 (45.66)
414.93 (55.49)
Fifth Grade Score 417.39 (33.81)
442.18 (53.28)
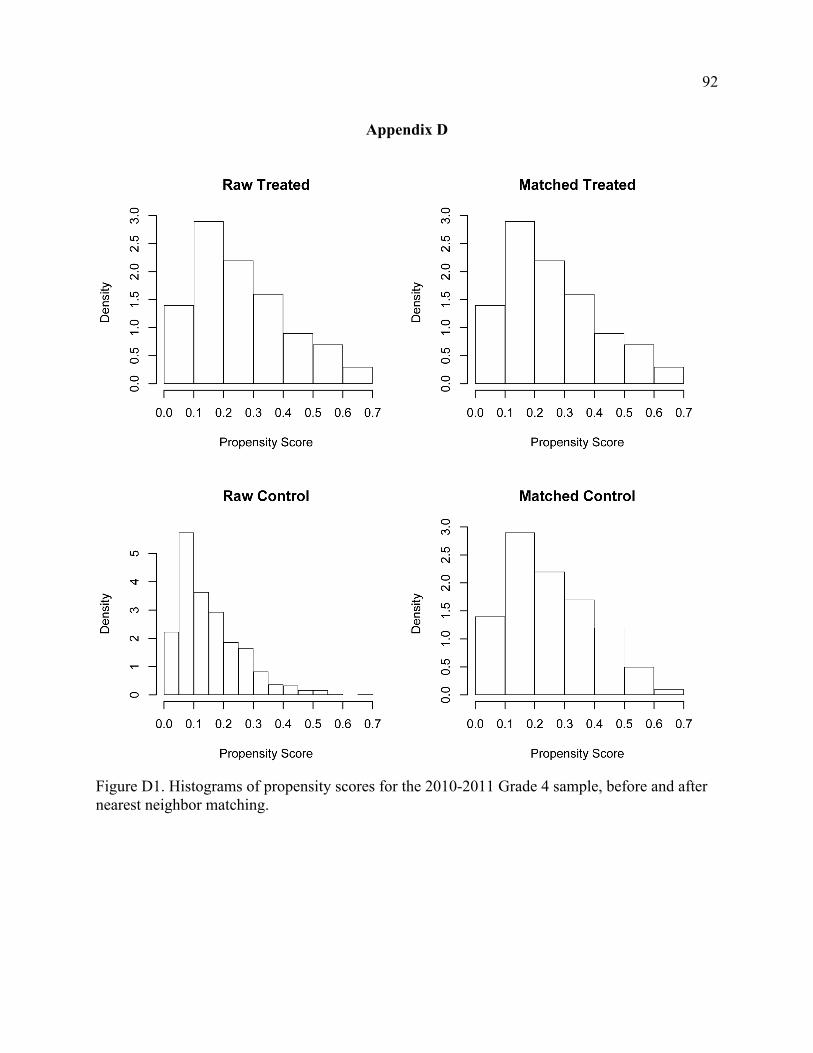
92
92
Appendix D
Figure D1. Histograms of propensity scores for the 2010-2011 Grade 4 sample, before and after nearest neighbor matching.

93
93
Figure D2. Quantile-quantile plots of the prior achievement variable included in the 2010-2011 Grade 4 nearest neighbor matching model.

94
94
Appendix E
Partial list of the sixth grade case’s curriculum topics (September – March)
1. The Equal Sign 2. Hindu-Arabic Number System 3. Sums and Differences
• What is Addition? • Understanding the Subtraction Algorithm
4. Laws of Addition 5. Multiplication with Whole Numbers: Definition 6. Distributive Property 7. Multiplication Algorithm 8. Relationship between Distributive Property and Multiplication Algorithm 9. Properties of Multiplication 10. Strategies of Multiplication (including mental math) 11. Exponents 12. Simplifying Expressions with Exponents and One Operation (+, ×, −) 13. Comparing Expressions with Exponents 14. Writing about Math (What strategies can we use to write about math clearly and
precisely?) 15. Multiplying by Powers of 10 16. Estimation with Operations 17. What is Division? (with whole numbers) 18. Relationship between Division and Multiplication 19. Order of Operation Convention 20. Long Division Algorithm 21. Division-with-Remainder 22. What is a Fraction? 23. Locating Fractions on a Number Line (lots of practice with number lines!) 24. Equivalent Fractions 25. Reducing/Simplifying Fractions using Cancellation Law 26. Comparing Fractions PRECISELY! (unlike denominators) 27. Cross-Multiplication Algorithm (CMA) 28. Adding Fractions (same denominators) 29. Writing Fractions as Mixed Numbers 30. Adding Fractions and Mixed Numbers (same denominators) 31. Adding Fractions (with unlike denominators/different sequences) (adding and
subtracting) 32. Word Problems with Adding and Subtracting Fractions 33. What are Decimals? Definition of Decimals 34. Comparing Decimals 35. Ordering Decimals 36. Adding and Subtracting Decimals 37. Fractions in Decimal Form (when denominator of fraction is a factor of a power of 10)

95
95
38. A Fraction “of” a Whole Number: MEANING • The meaning of “I ate 1/3 of a pie.” “3/8 of the 40 MnMs are red.” • Number line model • LOTS OF PRACTICE USING NUMBER LINES!
39. A Fraction “of” a Fraction (that is not in the set of whole numbers) • Example: There was 6/7 of a pie left. Hungry Husband Harry came home and ate 2/3
of what was left. What fractional part of the pie did her eat? • Meaning of 2/3 of 6/7 • Finding 2/3 of 6/7 using Number Line
40. A Fraction of Number (using Equivalent Fractions) • How do we find 2/3 of 7/9? (equivalent fractions and number line)
41. Given any two nonzero fractions, a/b of m/n = a times m/b times n 42. Multiplication of Fractions
• Definition of Multiplication of Fractions • a/b × m/n is by definition “a” parts when m/n is partitioned into “b” equal parts. (And
by now, the kids should be like OMG! I know this!) 43. Product Formula Practice 44. Multiplication of Decimals, including WHY behind the algorithm 45. Multiplication with Mixed Numbers (distributive property/changing mixed number into
improper fractions) 46. The Subway Sandwich Problem: entry point into showing why 3 divided by 5 is the same
as 3/5, i.e. m÷n = m/n 47. Lots of Practice showing how/why m÷n = m/n (using number lines too) 48. Changing Fractions and Mixed Numbers into Decimal Form 49. Reflection: List all that you know about the number 3/5… 50. Whole Number divided by a Fraction 51. Division with Fractions
• Division statement: Example: 8 ÷ 2/3 = k (let k be a number) • Multiplication statement: if 8 ÷ 2/3 = k, then k × 2/3 = 8 (and by commutative
property of multiplication: 2/3 k = 8) • Finding k using the number line • Putting it together (invert and multiply)
52. Interpreting word problems involving division of fractions 53. Percent: Definition (bring in complex fractions here) 54. Finding the Percent of a Number 55. Finding the Missing Percent 56. Ratios • And then we continue with rates, integers, rational numbers, geometry, statistics,
probability