prevalence of undernutrition and overweight or obesity
TRANSCRIPT
ANTHROPOLOGYPUBLISHERS
ISSN 2473-4772
Open Journal
Pushpa Lata Tigga, MSc, RGNF1; Sampriti Debnath, MSc, UGC-NET, SRF1; Mousumi Das, MSc1; Nitish Mondal, PhD2; Jaydip Sen, PhD1*
1Department of Anthropology, University of North Bengal, Raja Rammohunpur, Darjeeling 734013, West Bengal, India2Department of Anthropology, Assam University (Diphu Campus), Diphu, Karbi Anglong 782462, Assam, India
*Corresponding authorJaydip Sen, PhD Professor, Department of Anthropology, University of North Bengal, Raja Rammohanpur, Darjeeling 734013, West Bengal, India; E-mail: [email protected]
Article informationReceived: February 5th, 2018; Revised: April 6th, 2018; Accepted: April 9th, 2018; Published: April 9th, 2018
Cite this articleTigga PL, Debnath S, Das M, Mondal N, Sen J. Prevalence of undernutrition and overweight or obesity among the Bengali Muslim population of West Bengal, India. Anthropol Open J. 2018; 3(1): 1-10. doi: 10.17140/ANTPOJ-3-115
Prevalence of Undernutrition and Overweight or Obesity Among the Bengali Muslim Population of West Bengal, India
Original Research
Original Research | Volume 3 | Number 1| 1
ABSTRACT
Copyright 2018 by Sen J. This is an open-access article distributed under Creative Commons Attribution 4.0 International License (CC BY 4.0), which allows to copy, redistribute, remix, transform, and reproduce in any medium or format, even commercially, provided the original work is properly cited.cc
BackgroundPoor nutritional conditions, as well as excess adiposity levels, are the major public health problems of developing countries like India.ObjectivesThe aim of the present investigation were to assess the prevalence of undernutrition and overweight or obesity and their associa-tions with certain socio-economic and demographic variables.Subjects and MethodsThe present community-based cross-sectional investigation was undertaken among 420 adult Bengali Muslim individuals (males: 182; females: 238) aged 18-59 years and residing in rural areas of Uttar Dinajpur district, West Bengal, India. Anthropometric measurements of height and weight were recorded using standard procedures and Body mass index (BMI= Weight/Height kg/m2) was calculated. Prevalence of undernutrition (BMI<18.50 kg/m2) and overweight or obesity (BMI≥25.00 kg/m2) were determined using World Health Organization (WHO) cut-offs. The statistical analyses of descriptive statistics, ANOVA, chi-square analysis and binary logistic regression (BLR) analysis was performed using SPSS, Inc., Chicago, IL USA; version 17.0. ResultsThe overall mean height (164.22 cm vs. 152.65 cm), weight (57.03 kg vs. 48.70 kg) and BMI (21.18 kg/m2 vs. 20.89 kg/m2) were observed to be significantly higher among men than women (p<0.05). The overall prevalence of undernutrition and overweight or obesity were observed to be 22.86% and 12.86%, respectively. The BLR analysis showed associations of lower age group (i.e., 20-29 years) (odds ratio: 1.65) (p<0.05) and occupation (odds ratio: 5.61) (p<0.01) with undernutrition. Overweight or obesity was also observed to be statistically significantly associated with smaller family size (odds ratio: 2.09) (p<0.05).ConclusionThe present investigation indicates the simultaneous existence of double burden of malnutrition (i.e., both under- and overnutri-tion) among the Bengali Muslim adults of West Bengal, India. Appropriate intervention programmes are necessary to improve the overall nutritional situation. KeywordsAnthropometry; Bengali Muslim; Body mass index (BMI); Overweight or Obesity; Undernutrition; Public health; India.
AbbreviationsBLR: Binary Logistic Regression; BMP: Bengali Muslim Population; DBM: Double Burden of Malnutrition; BMI: Body Mass Index; ORs: Odds Ratios; SES: Socio-economic Status; CIs: Confidence Intervals; WB: West Bengal.
Anthropol Open J. 2018; 3(1): 1-10. doi: 10.17140/ANTPOJ-3-115
Sen J, et al2
INTRODUCTION
The co-existence of undernutrition and overweight or obesi-ty among populations is, known as the “double burden of
malnutrition (DBM). The DBM is a major public health problem contributing to high mortality and morbidities among populations worldwide. India has achieved positive economic growth, but there persists substantial economic nutritional inequalities and insuffi-ciencies (e.g., malnutrition).1-8 On one hand, a large proportion of the population of the country is suffering from severe to moderate undernutrition and on the other, there is the major problem of overweight or obesity. Recent studies have documented prevalence of a DBM which in turn, increases the burden of non-commu-nicable diseases (NCDs) mainly in the developing countries.3,5,9-13 The simultaneous occurrence of both under- and overnutrition (e.g., overweight or obesity) within a population is likely to reflect the differential distribution of resources at the individual or house-hold level, i.e., some people do not have sufficient resources to meet their caloric requirements, while others have the resources to purchase their calorie requirements and more.1,2,6-8 Several inves-tigations demonstrated that a vast proportion of the population belongs to the underprivileged and undernourished segments in India.12,14-16 Recent studies have now observed that a considera-ble amount of overweight or obesity exist among Indian popula-tions.2,5,13,17-22 Recent trends have indicated that the prevalence of overweight or obesity are also increasing among women belonging to lower socio-economic status in India.2,4,5,12,23,24 Studies also have documented the associations of several socio-economic, demo-graphic and lifestyle variables on the prevalence of overweight or obesity.2,5,13,21,25 Therefore, it becomes necessary to understand the actual magnitude of malnutrition among the rural and marginalised populations of India. Several research studies have been conduct-ed on various aspects of undernutrition among its populations.26-30
Overweight or obesity is a physical condition that con-tribute to the prevalence of numerous non-communicable dis-eases within populations. A steady increase in the prevalence of overweight or obesity has been reported from different Indian populations.3,17-21,25,31-33 Recent studies have also suggested that this ‘double burden’ is becoming increasingly apparent in addition to the burden of non-communicable diseases affecting developing countries such as India.2,10,22,34,35 However, undernutrition still re-mains a consistent public health problem among populations in the country.36
Anthropometry is a universally applicable, widely used, highly valid, inexpensive, and non-invasive technique available to researchers in the assessment of nutritional status.37-40 Body mass index (BMI) is widely used, non-invasive, inexpensive anthropo-metric indicator to determine the nutritional status (both under and overnutrition) across populations for large-scale epidemiolog-ical and clinical investigations.1,4,5,18,19,21,25,32,40-44 Extensive studies have been done using BMI as an indicator for assessing undernu-trition5,42,45-47 and overweight or obesity.1,2,31,48,49
There is a scarcity of studies on nutritional status among the Bengali Muslim Population (BMP) of India. The objectives of the present investigation was to determine and compare the
prevalence of under-and overnutrition and their associations with certain socio-economic and demographic determinants among the BMP in a rural area of West Bengal, India.
MATERIALS AND METHODS
The present community-based cross-sectional investigation was carried out among 420 adult BMP individuals (males: 182; females: 238) aged 18-59 years residing in rural areas of Islampur subdivi-sion of Uttar Dinajpur district, West Bengal, India. The Islampur subdivision (Latitude 26.27°N, Longitude 88.20°E) covers an area of 3142 km2. According to 2011 National Census, India, Islampur had a population of 308,518 (males: 51.54%; females: 48.48%). The region is predominantly inhabited by the BMP and Hindus. The BMP is the largest religious minority population in West Ben-gal and comprises a considerable percentage of the state’s popu-lation.50 According to the census of 2011, the Muslim population constituted 27.10% of West Bengal’s total population. Hindus and Muslims share more than 97% of the total population of the state.50 Ethnically, the BMP is a Bengali-speaking ethnic commu-nity and by religion faithful to the Islam.51 They contribute a large share to the social and economic well-being of the state and of the country as a whole. Therefore, it becomes important to assess the nutritional conditions of this population.
The individuals in the present investigation were selected using a stratified sampling method. Initially, the BMP individuals were identified in the present investigation based on their surnames and the data was verified from the block office records. Individuals belonging to the age group 18-59 years were then identified. Age of the subjects was recorded from their birth certificates and relevant official records issued by the local government officials. The min-imum number of individuals required for reliably estimating the prevalence of overweight and obesity in the present investigation was calculated following a standard method of estimating sample size.52 In this method, the anticipated population proportion of 50%, absolute precision of 5% and confidence interval of 95% were taken into consideration. The investigation was conducted in accordance with the ethical guidelines for human experiments, as laid down in the Helsinki Declaration of 2000.53 Research permis-sion to conduct the present investigation was obtained from the Department of Anthropology, University of North Bengal. Local leaders and authorities at community levels were informed prior to initiating the present investigation. The individuals were free from any physical deformities, previous histories of medical and surgical episodes and not suffering from any disease at the time of data col-lection. The data for this present investigation was recorded from January 2016 to April 2016.
Anthropometric Measurements
Anthropometric measurements were recorded using standard an-thropometric procedures.54 The height of the individuals was re-corded to the nearest 0.1 cm with help of an anthropometer rod with the head held in the Frankfort horizontal plane. The weight of the individuals wearing minimum clothing and was taken with bare feet using a portable weighing scale to the nearest 100 gm. The individuals were measured with ample precision for avoiding
Original Research | Volume 3 | Number 1|
Anthropol Open J. 2018; 3(1): 1-10. doi: 10.17140/ANTPOJ-3-115
Sen J, et al 3
any possible systematic errors of anthropometric data collection (e.g., instrumental or landmarks).55
Intra-observer and inter-observer technical errors of the measurements (TEM) were calculated to determine the accura-cy of the anthropometric measurement using the standard pro-cedure.56 For calculating TEM, height and weight were recorded from different data set of 50 adults other than those selected for the investigation by Pushpalata Tigga (PT), Sampriti Debnath (SD) and Mousumi Das (MD). The coefficient of reliability (R) of the measurements were calculated for testing the reliability of the measurements. Very high values of R (>0.975) were obtained for height and weight and these values were observed to be within the recommended a cut-off limit of 0.95.56 Hence, the measurements recorded by PT, SD, and MD were considered to be reliable and re-producible. All the measurements in the present investigation were subsequently recorded by MD.
Socio-economic, Socio-demographic and Lifestyle Data
Data on age, sex, family size, toilet facility, house type, occupation and household income were collected using a structured schedule by visiting the households. A modified version of Kuppuswamy’s socio-economic scale was used to evaluate the socio-economic sta-tus (SES).57,58 The SES determination showed that all the individu-als belonged to a lower-middle SES.
Assessment of Nutritional Status
Nutritional status has been assessed in terms of BMI. The BMI was calculated using the standard equation of the World Health Organization (WHO) (WHO 1995): BMI=Weight/Height² (kg/m²)
The BMI cut-off points utilized for the assessment of undernourished and overweight or obesity were <18.50 kg/m2 and ≥25.00 kg/m2 respectively.37
Statistical Analysis
The data were statistically analyzed using the Statistical Package for Social Sciences (SPSS, Inc., Chicago, IL, USA; version 17.0). The descriptive statistical analysis of the data obtained was depicted in terms of mean and standard deviation (±SD). One way ANOVA has been performed to test the age-specific mean differences in an-thropometric variables of the groups. Chi-square (χ2) analysis was used to assess sex-specific differences in the prevalence of under-nutrition and overweight. Chi-square analysis was also applied to assess differences in nutritional status between different socio-eco-nomic and demographic variables. Binary logistic regression (BLR) analysis was undertaken to estimate the odds ratios (ORs), min-imum of 95% confidence intervals (CIs) and to assess possible differences in risk factors associated with those individuals being undernourished (BMI<18.50 kg/m2) and combined-overweight and obesity (BMI≥25.00 kg/m2), separately. In the BLR analysis, the different socio-economic, demographic and lifestyle predictor variables were used as univariate independent regression model analyses. To create the dichotomous dependent variables, individ-
uals who were undernourished (BMI<18.50 kg/m2) were coded as ‘1’ in the respective BLR model. Similarly, individuals who happen to be combined overweight and obese (BMI≥25.00 kg/m2) were also coded as ‘1’ in the respective BLR model. Individuals who exhibited normal BMI were coded as ‘0’ in the BLR models. These different regression models were utilized to identify possible risk factor(s) associated with undernutrition and excess adiposity levels (overweight or obesity). The BLR analysis allows the creation of categorical depended variables and odds ratios were obtained by comparing with the reference categories. The predictor variables of sex, age, family size, toilet facility, house type, occupation and income were entered in the regression equation and the results were obtained by comparing them with the reference categories. The p values of <0.01 and <0.05 were considered to be statistically significant.
RESULTS
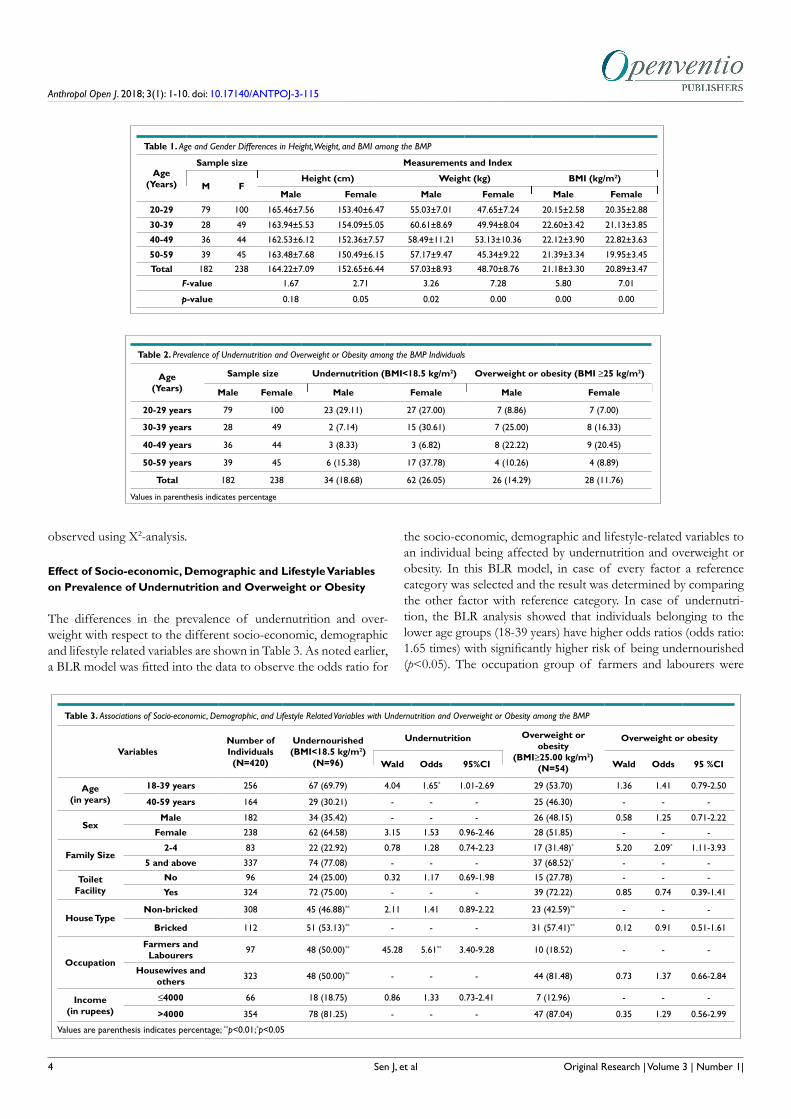
The sex-specific distribution of subjects, age groups, means, and standard deviations of height, weight, and BMI are shown in Table 1. The overall mean height and weight were observed to be higher among males than that of females. Age group-specific means of height of males ranged from 162.53 cm (in 40-49 years) to 165.46 cm (in 20-29 years). In females, the age group-specific means of height ranged from 150.49 cm (in 50-59 years) to 154.09 cm (in 39-39 years). Age group specific weight among males ranged from 55.03 kg (in 20-29 years) to 60.61 kg (in 30-39 years). Among fe-males, the age group-specific means of weight ranged from 45.34 kg (in 50-59 years) to 53.13 kg (40-49 years). Age group-specific mean values of BMI among males ranged from 20.15 kg/m2 (in 20-29 years) to 22.60 kg/m2 (30-39 years). Among females, the age group specific mean values ranged from 19.95 kg/m2 (50-59 years) to 22.82 kg/m2 (40-49 years). Using ANOVA, the age-spe-cific mean differences were observed to be statistically significant for males and females (in height, weight, and BMI). Age-sex spe-cific mean differences in height, weight, and BMI were observed to be statistically insignificant (p>0.05). The age-specific differences were observed to be statistically significant in case of weight and BMI among males and females and only in case of mean height of females (Table 1).
Prevalence of Undernutrition and Overweight or Obesity
The overall prevalence of undernutrition and overweight or obe-sity is shown in Table 2. The overall prevalence of undernutrition was observed to be 22.86% (males: 18.68%; females: 26.05%). Age-specific prevalence of undernutrition was higher in the age groups of 20-29 years (29.11%) and 50-59 years (15.38%) among males. Among females, the prevalence of undernutrition was higher in the age groups of 50-59 years (37.78%) and 30-39 years (30.61%). The overall prevalence of overweight and obesity was observed to be 12.86% (males: 14.29%; females: 11.76%). Age-spe-cific prevalence of overweight or obesity was higher among the age groups of 30-39 years (males: 25.00% and females: 16.33%) and 40-49 years (males: 22.22% and females: 20.45%) among males as well as among females. No age and sex-specific differences in the prevalence of undernutrition and overweight or obesity have been
Original Research | Volume 3 | Number 1|
Anthropol Open J. 2018; 3(1): 1-10. doi: 10.17140/ANTPOJ-3-115
Sen J, et al4
observed using Χ2-analysis.
Effect of Socio-economic, Demographic and Lifestyle Variables on Prevalence of Undernutrition and Overweight or Obesity
The differences in the prevalence of undernutrition and over-weight with respect to the different socio-economic, demographic and lifestyle related variables are shown in Table 3. As noted earlier, a BLR model was fitted into the data to observe the odds ratio for
the socio-economic, demographic and lifestyle-related variables to an individual being affected by undernutrition and overweight or obesity. In this BLR model, in case of every factor a reference category was selected and the result was determined by comparing the other factor with reference category. In case of undernutri-tion, the BLR analysis showed that individuals belonging to the lower age groups (18-39 years) have higher odds ratios (odds ratio: 1.65 times) with significantly higher risk of being undernourished (p<0.05). The occupation group of farmers and labourers were
Original Research | Volume 3 | Number 1|
Table 2. Prevalence of Undernutrition and Overweight or Obesity among the BMP Individuals
Age(Years)
Sample size Undernutrition (BMI<18.5 kg/m2) Overweight or obesity (BMI ≥25 kg/m2)
Male Female Male Female Male Female
20-29 years 79 100 23 (29.11) 27 (27.00) 7 (8.86) 7 (7.00)
30-39 years 28 49 2 (7.14) 15 (30.61) 7 (25.00) 8 (16.33)
40-49 years 36 44 3 (8.33) 3 (6.82) 8 (22.22) 9 (20.45)
50-59 years 39 45 6 (15.38) 17 (37.78) 4 (10.26) 4 (8.89)
Total 182 238 34 (18.68) 62 (26.05) 26 (14.29) 28 (11.76)
Values in parenthesis indicates percentage
Table 1. Age and Gender Differences in Height, Weight, and BMI among the BMP
Age(Years)
Sample size Measurements and Index
M FHeight (cm) Weight (kg) BMI (kg/m2)
Male Female Male Female Male Female
20-29 79 100 165.46±7.56 153.40±6.47 55.03±7.01 47.65±7.24 20.15±2.58 20.35±2.88
30-39 28 49 163.94±5.53 154.09±5.05 60.61±8.69 49.94±8.04 22.60±3.42 21.13±3.85
40-49 36 44 162.53±6.12 152.36±7.57 58.49±11.21 53.13±10.36 22.12±3.90 22.82±3.63
50-59 39 45 163.48±7.68 150.49±6.15 57.17±9.47 45.34±9.22 21.39±3.34 19.95±3.45
Total 182 238 164.22±7.09 152.65±6.44 57.03±8.93 48.70±8.76 21.18±3.30 20.89±3.47
F-value 1.67 2.71 3.26 7.28 5.80 7.01
p-value 0.18 0.05 0.02 0.00 0.00 0.00
Table 3. Associations of Socio-economic, Demographic, and Lifestyle Related Variables with Undernutrition and Overweight or Obesity among the BMP
VariablesNumber of Individuals(N=420)
Undernourished(BMI<18.5 kg/m2)
(N=96)
Undernutrition Overweight or obesity
(BMI≥25.00 kg/m2)(N=54)
Overweight or obesity
Wald Odds 95%CI Wald Odds 95 %CI
Age(in years)
18-39 years 256 67 (69.79) 4.04 1.65* 1.01-2.69 29 (53.70) 1.36 1.41 0.79-2.50
40-59 years 164 29 (30.21) - - - 25 (46.30) - - -
SexMale 182 34 (35.42) - - - 26 (48.15) 0.58 1.25 0.71-2.22
Female 238 62 (64.58) 3.15 1.53 0.96-2.46 28 (51.85) - - -
Family Size2-4 83 22 (22.92) 0.78 1.28 0.74-2.23 17 (31.48)* 5.20 2.09* 1.11-3.93
5 and above 337 74 (77.08) - - - 37 (68.52)* - - -
Toilet Facility
No 96 24 (25.00) 0.32 1.17 0.69-1.98 15 (27.78) - - -
Yes 324 72 (75.00) - - - 39 (72.22) 0.85 0.74 0.39-1.41
House TypeNon-bricked 308 45 (46.88)** 2.11 1.41 0.89-2.22 23 (42.59)** - - -
Bricked 112 51 (53.13)** - - - 31 (57.41)** 0.12 0.91 0.51-1.61
Occupation
Farmers and Labourers 97 48 (50.00)** 45.28 5.61** 3.40-9.28 10 (18.52) - - -
Housewives and others 323 48 (50.00)** - - - 44 (81.48) 0.73 1.37 0.66-2.84
Income (in rupees)
≤4000 66 18 (18.75) 0.86 1.33 0.73-2.41 7 (12.96) - - -
>4000 354 78 (81.25) - - - 47 (87.04) 0.35 1.29 0.56-2.99
Values are parenthesis indicates percentage; **p<0.01;*p<0.05
Anthropol Open J. 2018; 3(1): 1-10. doi: 10.17140/ANTPOJ-3-115
Sen J, et al 5
observed to be at a statistically significant (p<0.01) higher risk of undernutrition (odds ratio: 5.61) than the group of housewives and others. Other variables did not show any significant associations with the prevalence of undernutrition. The χ2 analysis showed sta-tistically highly significant group differences in house type (non-bricked vs. bricked) (Χ2-value=25.31) (p<0.01) and occupation (farmers and labours vs. housewives and others) (Χ2-value=28.00) (p<0.01). In case of overweight or obesity, the BLR results showed that the individuals with less number of family members were at a significantly higher risk of overweight or obesity (odds ratio: 2.09 times) (p<0.05) and significant associations have been documented between family size and prevalence of overweight or obesity. Oth-er variables did show statistically significant association with preva-lence of overweight or obesity. The Χ2-analysis showed statistically significant group differences in family size (2-4 family members vs. 5 and above family members) (Χ2 -value= 3.95)(p<0.05) and house type (non-bricked vs. bricked) (Χ2-value= 21.46) (p<0.01).
DISCUSSION
Prevalence of overweight or obesity has reached epidemic propor-tions globally. The rising prevalence of overnutrition in developing countries is largely due to rapid urbanization and changes in energy expenditure. Recent nutritional trend has shown that individuals/populations belonging to the developing countries were observed to be particularly vulnerable to obesity-related diseases in addition to comorbidities.13,21,59,60,61 In India, there is an increasing trend of dual burden of malnutrition (both undernutrition and over-nutri-tion) which needs proper management to control the epidemic within populations. It also requires assessments and establishment of the socio-economic, educational, environmental and cultural factors involved in determining overweight or obesity within pop-ulations.5,13,21,62,63,64 Majority of the Indian states have shown the prevalence of undernutrition among adults to varying between 20% and 29%.65 Several studies have also reported high under-nourishment among various Indian populations.1,2,4,36,40,44 Recent
studies have documented populations of the country to exhibit a high prevalence of overweight or obesity.4,21,25,32 The prevalence of undernutrition is also a serious problem among the adult popula-tions of East and Northeast India.5,25,38,66,67-69 Therefore, the co-ex-istence of the DBM (both under and overnutrition) is presenting a unique difficulty for public health policymakers. Nutrition tran-sition have taken place in developing countries which led to the transition from undernutrition to overweight or obesity in popula-tions.33 Although, this type of transition may lead to the reduction of infectious diseases and mortality-morbidity associated with it but it may increase the burden to several preventable non-commu-nicable and lifestyle diseases and incurred economic expenditures.
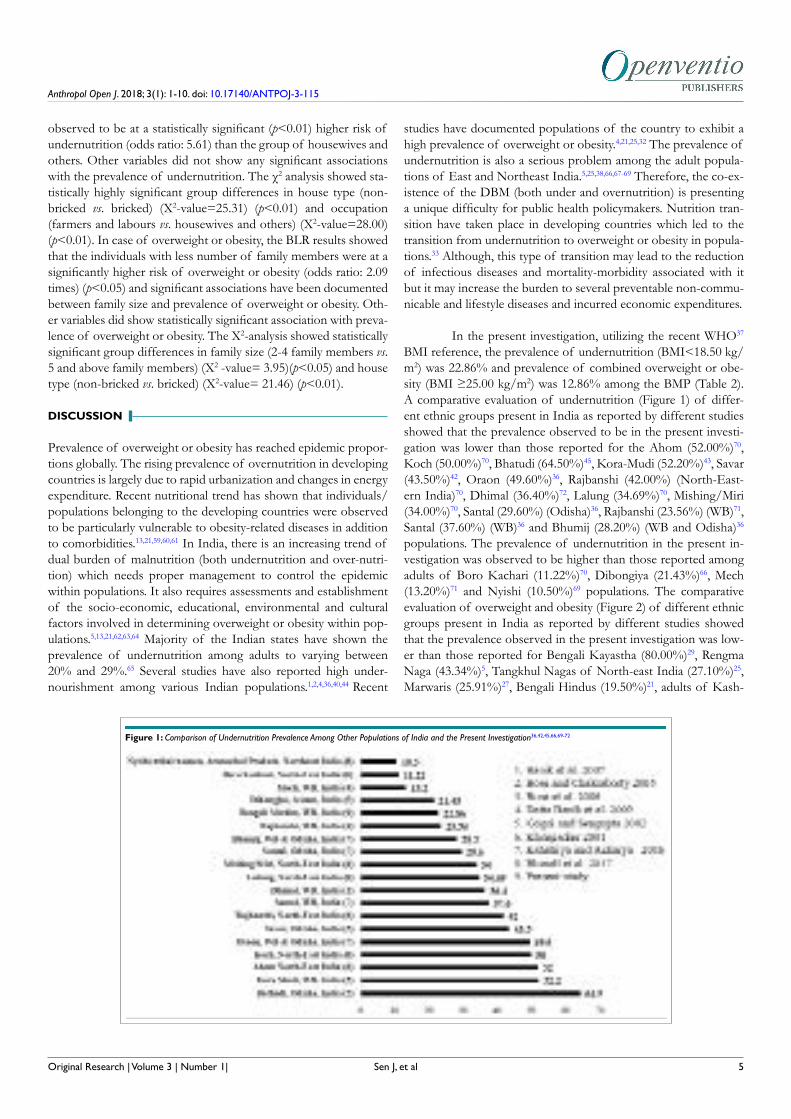
In the present investigation, utilizing the recent WHO37
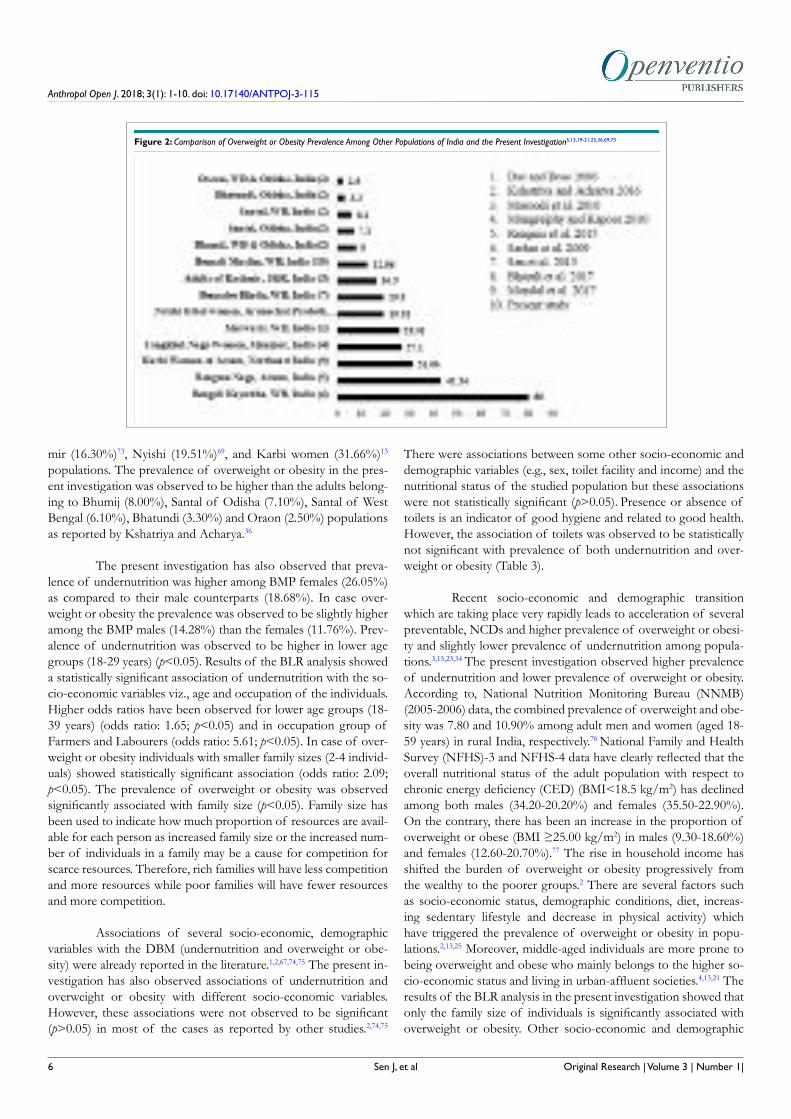
BMI reference, the prevalence of undernutrition (BMI<18.50 kg/m2) was 22.86% and prevalence of combined overweight or obe-sity (BMI ≥25.00 kg/m2) was 12.86% among the BMP (Table 2). A comparative evaluation of undernutrition (Figure 1) of differ-ent ethnic groups present in India as reported by different studies showed that the prevalence observed to be in the present investi-gation was lower than those reported for the Ahom (52.00%)70, Koch (50.00%)70, Bhatudi (64.50%)45, Kora-Mudi (52.20%)43, Savar (43.50%)42, Oraon (49.60%)36, Rajbanshi (42.00%) (North-East-ern India)70, Dhimal (36.40%)72, Lalung (34.69%)70, Mishing/Miri (34.00%)70, Santal (29.60%) (Odisha)36, Rajbanshi (23.56%) (WB)71, Santal (37.60%) (WB)36 and Bhumij (28.20%) (WB and Odisha)36 populations. The prevalence of undernutrition in the present in-vestigation was observed to be higher than those reported among adults of Boro Kachari (11.22%)70, Dibongiya (21.43%)66, Mech (13.20%)71 and Nyishi (10.50%)69 populations. The comparative evaluation of overweight and obesity (Figure 2) of different ethnic groups present in India as reported by different studies showed that the prevalence observed in the present investigation was low-er than those reported for Bengali Kayastha (80.00%)29, Rengma Naga (43.34%)5, Tangkhul Nagas of North-east India (27.10%)25, Marwaris (25.91%)27, Bengali Hindus (19.50%)21, adults of Kash-
Original Research | Volume 3 | Number 1|
Figure 1: Comparison of Undernutrition Prevalence Among Other Populations of India and the Present Investigation36,42,45,66,69-72
Anthropol Open J. 2018; 3(1): 1-10. doi: 10.17140/ANTPOJ-3-115
Sen J, et al6
mir (16.30%)73, Nyishi (19.51%)69, and Karbi women (31.66%)13 populations. The prevalence of overweight or obesity in the pres-ent investigation was observed to be higher than the adults belong-ing to Bhumij (8.00%), Santal of Odisha (7.10%), Santal of West Bengal (6.10%), Bhatundi (3.30%) and Oraon (2.50%) populations as reported by Kshatriya and Acharya.36
The present investigation has also observed that preva-lence of undernutrition was higher among BMP females (26.05%) as compared to their male counterparts (18.68%). In case over-weight or obesity the prevalence was observed to be slightly higher among the BMP males (14.28%) than the females (11.76%). Prev-alence of undernutrition was observed to be higher in lower age groups (18-29 years) (p<0.05). Results of the BLR analysis showed a statistically significant association of undernutrition with the so-cio-economic variables viz., age and occupation of the individuals. Higher odds ratios have been observed for lower age groups (18-39 years) (odds ratio: 1.65; p<0.05) and in occupation group of Farmers and Labourers (odds ratio: 5.61; p<0.05). In case of over-weight or obesity individuals with smaller family sizes (2-4 individ-uals) showed statistically significant association (odds ratio: 2.09; p<0.05). The prevalence of overweight or obesity was observed significantly associated with family size (p<0.05). Family size has been used to indicate how much proportion of resources are avail-able for each person as increased family size or the increased num-ber of individuals in a family may be a cause for competition for scarce resources. Therefore, rich families will have less competition and more resources while poor families will have fewer resources and more competition.
Associations of several socio-economic, demographic variables with the DBM (undernutrition and overweight or obe-sity) were already reported in the literature.1,2,67,74,75 The present in-vestigation has also observed associations of undernutrition and overweight or obesity with different socio-economic variables. However, these associations were not observed to be significant (p>0.05) in most of the cases as reported by other studies.2,74,75
There were associations between some other socio-economic and demographic variables (e.g., sex, toilet facility and income) and the nutritional status of the studied population but these associations were not statistically significant (p>0.05). Presence or absence of toilets is an indicator of good hygiene and related to good health. However, the association of toilets was observed to be statistically not significant with prevalence of both undernutrition and over-weight or obesity (Table 3).
Recent socio-economic and demographic transition which are taking place very rapidly leads to acceleration of several preventable, NCDs and higher prevalence of overweight or obesi-ty and slightly lower prevalence of undernutrition among popula-tions.3,15,23,34 The present investigation observed higher prevalence of undernutrition and lower prevalence of overweight or obesity. According to, National Nutrition Monitoring Bureau (NNMB) (2005-2006) data, the combined prevalence of overweight and obe-sity was 7.80 and 10.90% among adult men and women (aged 18-59 years) in rural India, respectively.76 National Family and Health Survey (NFHS)-3 and NFHS-4 data have clearly reflected that the overall nutritional status of the adult population with respect to chronic energy deficiency (CED) (BMI<18.5 kg/m2) has declined among both males (34.20-20.20%) and females (35.50-22.90%). On the contrary, there has been an increase in the proportion of overweight or obese (BMI ≥25.00 kg/m2) in males (9.30-18.60%) and females (12.60-20.70%).77 The rise in household income has shifted the burden of overweight or obesity progressively from the wealthy to the poorer groups.2 There are several factors such as socio-economic status, demographic conditions, diet, increas-ing sedentary lifestyle and decrease in physical activity) which have triggered the prevalence of overweight or obesity in popu-lations.2,13,25 Moreover, middle-aged individuals are more prone to being overweight and obese who mainly belongs to the higher so-cio-economic status and living in urban-affluent societies.4,13,21 The results of the BLR analysis in the present investigation showed that only the family size of individuals is significantly associated with overweight or obesity. Other socio-economic and demographic
Original Research | Volume 3 | Number 1|
Figure 2: Comparison of Overweight or Obesity Prevalence Among Other Populations of India and the Present Investigation5,13,19-21,25,36,69,73
Anthropol Open J. 2018; 3(1): 1-10. doi: 10.17140/ANTPOJ-3-115
Sen J, et al 7
variables did not show any significant association with overweight obesity. On the other hand, age and occupation of individuals have shown significant association with undernutrition as observed in other studies.2,21,25
CONCLUSION
The findings of the present investigation suggest that even though undernutrition is still a cause for concern among the BMP there is also an existence of overweight and obesity. This establishes the existence of the DBM and the greater magnitude of undernutri-tion and overweight or obesity among the BMP. This observation was also similar to the findings of recent studies of Indian adult population. This suggests necessary nutritional interventions in the population concerned. The limitation of the present investi-gation is that the present investigation did not observe significant associations of many socio-economic factors as observed in other similar studies. The results in the present investigation might be helpful to the Government agencies and policy makers to formu-late appropriate strategies such as organising regular health check-up camps to identify the health problems among the individuals due to undernutrition and overweight or obesity and also to carry out proper dissemination of knowledge about healthy diet, healthy lifestyle, and food supplementation for the overall improvement of the health status of the BMP.
CONFLICTS OF INTEREST
The authors report no conflicts of interest. The authors alone are responsible for the content and writing of the paper.
REFERENCES
1. Subramanian SV, Smith GD. Patterns, distribution, and deter-minants of under- and overnutrition: A population-based study of women in India. Am J Clin Nutr. 2006; 84: 633-640. doi: 10.1093/ajcn/84.3.633
2. Subramanian SV, Kawachi I, Smith GD. Income inequality and the double burden of under- and overnutrition in India. J Epidemiol Comm Health. 2007; 61: 802-809. doi: 10.1136/jech.2006.053801
3. Wang Y, Chen HJ, Shaikh S, Mathur P. Is obesity becoming a public health problem in India. Examine the shift from under- to overnutrition problems over time. Obes Rev. 2009; 10: 456-474. doi: 10.1111/j.1467-789X.2009.00568.x
4. Sengupta A, Angeli F, Syamala TS, Van Schayck CP, Dagnelie P. State-wise dynamics of the double burden of malnutrition among 15-49 year-old women in India: How much does the scenario change considering Asian population-specific BMI cut-off values. Ecol Food Nutr. 2014; 53: 618-638. doi: 10.1080/03670244.2014.891994
5. Rengma MS, Sen J, Mondal N. Socio-economic, demographic and lifestyle determinants of overweight and obesity among adults of Northeast India. Ethiop J Health Sci. 2015; 25: 199-208.
6. Bhutia DT. Protein energy malnutrition in India: The plight of our under five children. J Fam Med Pri Care. 2014; 3: 63-67. doi: 10.4103/2249-4863.130279
7. Jain S. Food security in India: Problems and prospects. OIDA International Journal of Sustainable Development. 2016; 9: 11-20.
8. Mishra CP. Malnutrition-free India: Dream or reality. Indian J Pub Health. 2017; 61: 155. doi: 10.4103/ijph.IJPH_217_17
9. Popkin BM. Nutrition in transition: The changing global nutri-tion challenge. Asia Pac J Clin Nutr. 2001; 10: S13-S18.
10. Popkin BM. The shift in stages of the nutrition transition in the developing world differs from past experiences!. Pub Health Nutr. 2002; 5: 205-214. doi: 10.1079/PHN2001295
11. Kapoor SK, Anand K. Nutritional transition: A public health challenge in developing countries; 2002.
12. Kapil U, Sachdev HP. Urgent need to orient public health re-sponse to rapid nutrition transition. Ind J Comm Med: Off Pub Ind Ass Prev Soc Med. 2012; 37: 207. doi: 10.4103/0970-0218.103465
13. Mondal N, Timungpi R, Sen J, Bose K. Socio-economic and demographic correlates of overweight and obesity: A study on the Karbi women of Assam, Northeast India. Anthropol Open J. 2017; 2: 31-39. doi: 10.17140/ANTPOJ-2-111
14. Som S, Pal M, Bharati P. Role of individual and household level factors on stunting: A comparative study in three Indian states. Ann Hum Biol. 2007; 34: 632-646. doi: 10.1080/03014460701671772
15. Varadharajan KS, Thomas T, Kurpad AV. Poverty and the state of nutrition in India. Asia Pac J Clin Nutr. 2013; 22: 326-339. doi: 10.6133/apjcn.2013.22.3.19
16. Debnath S, Mondal N, Sen J. Use of upper arm anthropometry, upper arm muscle area-by-height (UAMAH) and midupper-arm-circumference (MUAC)-for-height as indicators of body composi-tion and nutritional status among children. Anthropol Rev. 2017; 80: 85-102. doi: 10.1515/anre-2017-0004
17. Dudeja V, Misra A, Pandey RM, Devina G, Kumar G, Vikram NK. BMI does not accurately predict overweight in Asian Indi-ans in northern India. Br J Nutr. 2001; 86: 105-112. doi: 10.1079/BJN2001382
18. Bhadra MA, Mukhopadhyay A, Bose K. Overweight and obe-sity among adult Bengalee Hindu Women of Kolkata India. Hum Ecol. 2005; 13: 77-83.
19. Das M, Bose K. Presence of high rates of overweight and obe-sity among adult Marwaris of Howrah, West Bengal, India. Coll Antropol. 2006; 30: 81-86.
Original Research | Volume 3 | Number 1|
Anthropol Open J. 2018; 3(1): 1-10. doi: 10.17140/ANTPOJ-3-115
Sen J, et al
20. Sarkar D, Mondal N, Sen J. Obesity and blood pressure varia-tions among the Bengali Kayastha Population of North Bengal, In-dia. J Life Sci. 2009; 1: 35-43. doi: 10.1080/09751270.2009.11885132
21. Sen J, Mondal N, Dutta S. Factors affecting overweight and obesity among urban adults: A cross-sectional study. Epidemiol Bio-stat Pub Health. 2013; 10: e8741–1-8. doi: 10.2427/8741
22. Kulkarni VS, Kulkarni VS, Gaiha R. Double burden of malnu-trition: Re-examining the coexistence of undernutrition and over-weight among Women in India. Int J Health Serv. 2017; 47: 108-133. doi: 10.1177/0020731416664666
23. Subramanian SV, Corsi DJ, Subramanyam MA, Smith GD. Jumping the gun: The problematic discourse on socioeconomic status and cardiovascular health in India. Int J Epidemiol. 2013; 42: 1410-1426. doi: 10.1093/ije/dyt017
24. De R, Kundu JK. Nutritional status of adult female tribes in different villages of Jhargram, West Bengal. World J Pharma Pharmac Sci. 2016; 5: 1213-1220.
25. Mungreiphy NK, Kapoor S. Socioeconomic changes as covari-ates of overweight and obesity among Tangkhul Naga tribal wom-en of Manipur, north-east India. J Biosoc Sci. 2010; 42: 289-305. doi: 10.1017/S0021932009990587
26. Sen J, Mondal N, Dey S. Assessment of the nutritional status of children aged 5-12 years using upper arm composition. Ann Hum Biol.2011; 38: 752-759. doi: 10.3109/03014460.2011.610358
27. Das S, Bose K. Nutritional assessment by mid-upper arm cir-cumference of Santal adults of Purulia, West Bengal, India. Coll Antropol. 2012; 36: 581-584.
28. Patil YP, Shinde RL. Undernutrition among Indian men: A study based on NFHS-3. Am J Mens Health. 2014; 8: 492-502. doi: 10.1177/1557988314525193
29. Kalaiselvi S, Arjumand Y, Jayalakshmy R, Gomathi R, Pruthu T, Palanivel C. Prevalence of under-nutrition, associated factors and perceived nutritional status among elderly in a rural area of Puducherry, South India. Arch Gerontol Geriatr. 2016; 65: 156-160. doi: 10.1016/j.archger.2016.03.003
30. Faizi N, Khan Z, Khan IM, Amir A, Azmi SA, Khalique N. A study on nutritional status of school-going adolescents in Aligarh, India. Trop Doct. 2017; 47: 212-216. doi: 10.1177/0049475516668985
31. Shukla HC, Gupta PC, Mehta HC, Hébert JR. Descriptive epidemiology of body mass index of an urban adult population in western India. J Epidemiol Comm Health. 2002; 56: 876-880. doi: 10.1136/jech.56.11.876
32. Girdhar S, Sharma S, Chaudhary A, Bansal P, Satija M. An epidemiological study of overweight and obesity among women in an Urban Area of North India. Ind J Comm Med. 2016; 41: 154-157.
doi: 10.4103/0970-0218.173492
33. Jaiswal M, Bansal R, Agarwal A. Role of mid-upper arm circum-ference for determining overweight and obesity in children and adolescents. J Clin Diagn Res. 2017; 11: SC05-SC08. doi: 10.7860/JCDR/2017/27442.10422
34. Popkin BM, Adair LS, Ng SW. Global nutrition transition and the pandemic of obesity in developing countries. Nutr Rev. 2012; 70: 3-21. doi: 10.1111/j.1753-4887.2011.00456.x
35. Ghosh P, Mondal N, Sen J. Evidence of a double burden of malnutrition among Rajbanshi adolescent boys. South Asian An-thropol. 2014; 14: 81-88.
36. Kshatriya GK, Acharya SK. Gender disparities in the preva-lence of undernutrition and the higher risk among the young wom-en of Indian tribes. PLoS One. 2016; 11: e0158308. doi: 10.1371/journal.pone.0158308
37. World Health Organization (WHO). Physical Status: The use and interpretation of anthropometry. Technical Report Series No. 854. Geneva: World Health Organization; 1995.
38. Khongsdier R. Body mass index and morbidity in adult males of the War Khasi in Northeast India. Eur J Clin Nutr. 2002; 56: 484. doi: 10.1038/sj.ejcn.1601281
39. Rao KM, Kumar RH, Venkaiah K, Brahmam GNV. Nutri-tional status of saharia – A primitive tribe of Rajasthan. J Hum Ecol. 2006; 19: 117-123.
40. Bharati S, Pal M, Bhattacharya BM, Bharati P. Prevalence and causes of chronic energy deficiency and obesity in Indian women. Hum Biol. 2007; 79: 395-412. doi: 10.1353/hub.2007.0048
41. Griffiths PL, Bentley ME. The nutrition transition is underway in India. Nutr. 2001; 131: 2692-2700. doi: 10.1093/jn/131.10.2692
42. Bose K, Chakraborty F, Bisai S, Khatun A, Bauri H. Body mass index and nutritional status of adult Savartribals of Keonjhar District, Orissa, India. Asia Pac J Pub Health. 2006; 18: 3-7. doi: 10.1177/10105395060180030201
43. Bose K, Ganguli S, Mamtaz H, Mukhopadhyay A, Bhadra M. High prevalence of undernutrition among adult Kora Mudi tribals of Bankura District, West Bengal, India. Anthro Sci. 2006; 114: 65-68. doi: 10.1537/ase.050306
44. Datta Banik S. Nutritional status adiposity and body com-position of Oraon and Sarak females in Ranchi District, India--a comparison. Ecol Food Nutr. 2011; 50: 43-62. doi: 10.1080/03670244.2011.539160
45. Bose K, Chakraborty F. Anthropometric characteristics and nutritional status based on body mass index of adult Bathudis: A tribal population of Keonjhar District, Orissa, India. Asia Pac J Clin Nutr. 2005; 14: 80-82.
8 Original Research | Volume 3 | Number 1|
Anthropol Open J. 2018; 3(1): 1-10. doi: 10.17140/ANTPOJ-3-115
Sen J, et al
46. Gouda J, Prusty RK. Overweight and obesity among women by economic stratum in urban India. J Health Pop Nutr. 2014; 32: 79-88.
47. Banik SD, Ghosh M, Bose K. Anthropometric and body frame size characteristics in relation to body mass index and percentage body fat among adult Bengalee male brick-kiln workers from Mur-shidabad, West Bengal, India. Anthropol Anz. 2016; 73: 313-321. doi: 10.1127/anthranz/2016/0644
48. Sudar A. Body fatness and its social and lifestyle determinants in young working males from Cracow, Poland. J Biosoc Sci. 2009; 41: 139-154. doi: 10.1017/S0021932008002873
49. Garg C, Khan SA, Ansari SH, Garg M. Prevalence of obesity in Indian women. Obesity Rev.2010; 11: 105-108. doi: 10.1111/j.1467-789X.2009.00666.x
50. Kar NB, Ghosh BN. Education and Socio-economic Margin-alization of Muslim Women: A case study of North 24-Parganas District in West Bengal. Bangladesh e-J Soc. 2017; 14.
51. Das Chaudhuri AB, Basu S, Chakraborty S. Twinning rate in the Muslim population of West Bengal. Acta Genet Med Gemellol (Roma).1993; 42: 35-39. doi: 10.1017/S0515283600042268
52. Lwanga SK, Lemeshow S. Sample size determination in health studies: A Practical Manual. Geneva: World Health Organization; 1991.
53. Touitou Y, Portaluppi F, Smolensky MH, Rensing L. Ethical principles and standards for the conduct of human and animal biological rhythm research. Chronobiol Int. 2004; 21: 161-170. doi: 10.1081/CBI-120030045
54. Hall J, Allanson J, Gripp K, Slavotinek A. Handbook of Physical Measurements. New York, USA: Oxford University Press; 2007.
55. Harris EF, Smith RN. Accounting for measurement error: A critical but often overlooked process. Arch Oral Biol. 2009; 54: S107-S117. doi: 10.1016/j.archoralbio.2008.04.010
56. Ulijaszek SJ, Kerr DA. Anthropometric measurement error and the assessment of nutritional status. Brit J Nutr. 1999; 82: 165-177. doi: 10.1017/S0007114599001348
57. Mishra D, Singh HP. Kuppuswami’s socio-economic status scale – A revision. Ind J Pediatr. 2003; 70: 273-274. doi: 10.1007/s12098-016-2223-y
58. Kumar N, Shekhar C, Kumar P, Kundu AS. Kuppuswamy’s socioeconomic status scale-updating for 2007. Ind J Pediatr. 2007; 74: 1131-1132.
59. Bhurosy T, Jeewon R. Overweight and obesity epidemic in de-veloping countries: A problem with diet, physical activity, or so-cioeconomic status?. Sci World J. 2014. doi: 10.1155/2014/964236
60. Jésus P, Maëlenn G, Sophie P, et al. Undernutrition and obesity among elderly people living in two cities of developing countries: Prevalence and associated factors in the EDAC study. Clin Nutr ESPEN. 2017; 21: 40-50. doi: 10.1016/j.clnesp.2017.05.007
61. Tremmel M, Gerdtham UG, Nilsson PM, Saha S. Economic burden of obesity: A systematic literature review. Int J Environ Res Pub Health. 2017; 14: 435. doi: 10.3390/ijerph14040435
62. Biernat E, Tomaszewski P. Association of socio-econom-ic and demographic factors with physical activity of males and females aged 20-69 years. Ann Agri Env Med. 2015; 22. doi: 10.5604/12321966.1141380
63. Bagordo F, De Donno A, Grassi T, et al. Lifestyles and socio-cultural factors among children aged 6-8 years from five Italian towns: The MAPEC_LIFE study cohort. BMC Pub Health. 2017; 17: 233. doi: 10.1186/s12889-017-4142-x
64. Nienaber-Rousseau C, Sotunde OF, Ukegbu PO, et al. So-cio-demographic and lifestyle factors predict 5-year changes in adi-posity among a group of black South African adults. Int J Env Res Pub Health. 2017; 14: 1089. doi: 10.3390/ijerph14091089
65. Ramachandran N. Persisting Under-nutrition in India. India: Sprin-ger; 2014.
66. Gogoi G, Sengupta S. Body Mass Index among the Dibongi-ya Deoris of Assam, India. J Hum Ecol. 2002; 13: 271-273. doi: 10.1080/09709274.2002.11905544
67. Tigga PL, Sen J, Mondal N. Association of some socio-eco-nomic and socio-demographic variables with wasting among pre-school children of North Bengal, India. Ethiop J Health Sci. 2015; 25: 63-72.
68. Singh KD, Alagarajan M, Ladusingh L. What explains child malnutrition of indigenous people of northeast india? PLoS One. 2015; 10: e0130567. doi: 10.1371/journal.pone.0130567
69. Bharali N, Mondal N, Singh KN. Prevalence of undernutrition. overweight and obesity among. Hum Biol Rev. 2017; 6: 63-78.
70. Khongsdier R. Body mass index of adult males in 12 populations of Northeast India. Ann Hum Biol. 2001; 28: 374-383. doi: 10.1080/03014460010004610
71. Datta Banik S, Bhattacharjee P, Das S, et al. Sexual dimorphism in health and nutritional status of three communities of Darjeeling District in West Bengal and comparison with some other populations of eastern India: An anthropometric appraisal. J Life Sci. 2009; 1: 27-34. doi: 10.1080/09751270.2009.11885131
72. Datta Banik S, Bose K, Bisai S, Bhattacharya M, Das S, Jana A, Purkait P. Undernutrition among adult Dhimals of Naxalbari, West Bengal: Comparison with other tribes of eastern India. Food Nutr Bull. 2007; 28: 348-352. doi: 10.1177/156482650702800311
9Original Research | Volume 3 | Number 1|
Anthropol Open J. 2018; 3(1): 1-10. doi: 10.17140/ANTPOJ-3-115
Sen J, et al
73. Masoodi SR, Wani AA, Wani AI, Bashir MI, Laway BA, Zargar AH. Prevalence of overweight and obesity in young adults aged 20-40 years in North India (Kashmir Valley). Diabetes Res Clin Pract. 2010; 87: e4-e6. doi: 10.1016/j.diabres.2009.11.004
74. Sen J, Roy A, Mondal N. Association of maternal nutritional status, body composition and socio-economic variables with low birth weight in India. J Trop Paediatr. 2009; 56: 254-259. doi: 10.1093/tropej/fmp102
75. Venkatramanan S, Marquis GS, Haas JD. Ethnicity and
socioeconomic factors are associated with poor nutritional status in female tea plantation workers from rural India. FASEB J. 2017; 31: 637-639. doi: 10.1096/fasebj.31.1_supplement.639.37
76. National Nutrition Monitoring Bureau (NNMB). Diet and nutritional status of population and prevalence of hypertension amongst adults in rural areas. Nat Nutr Monitor Bureau Tech Report No: 24. 2007.
77. Mishra CP. Malnutrition-free India: Dream or reality. Indian J Pub Health. 2017; 61: 155. doi: 10.4103/ijph.IJPH_217_17
Submit your article to this journal | https://openventio.org/submit-manuscript/
10 Original Research | Volume 3 | Number 1|