prevalence of overweight and obesity and body image
TRANSCRIPT
PREVALENCE OF OVERWEIGHT AND OBESITY AND BODY IMAGE
PERCEPTION AMONGST BLACK SOUTH AFRICAN FEMALE NURSES
PRACTICING IN DURBAN, KWAZULU-NATAL, SOUTH AFRICA
By
Yovenita Ramgolam
BSc Diet, PGDip Diet (UKZN)
Dissertation submitted in fulfilment of the academic requirements for the
degree of
MASTER OF SCIENCE IN DIETETICS
DIETETICS AND HUMAN NUTRITION
School of Agricultural, Earth and Environmental Sciences
College of Agriculture, Engineering and Science
University of Kwazulu-Natal, Pietermaritzburg
South Africa
March 2018
I
ABSTRACT
Background: In South Africa, there is a high prevalence of overweight and obesity
mostly amongst black women, placing them at increased risk for non-communicable
diseases, (NCDs) which is the leading group cause of mortality. Powerful and unique
influences predisposing to overweight and obesity amongst black South Africans
include body image perception and cultural beliefs. Traditionally, being overweight is
associated with being healthy, happy, strong and wealthy with the ability to bear
children, while an underweight woman is considered to be unhappy, weak, poor and
infected with the human immunodeficiency virus (HIV) or acquired immune deficiency
syndrome (AIDS). As media and its messages promoting thinness became more
available in the country, there has been a shift towards black South Africans desiring
thinner bodies than what is preferred traditionally.
Objectives: To determine the prevalence of overweight and obesity. To determine
body fat percentage and fat-free mass (FFM) as well as body image perception. To
determine how they perceived their body image. To determine whether body image
perception was influenced by cultural beliefs and whether factors such as media and
family beliefs were overpowering cultural beliefs and influencing them to lose weight.
To determine which factors were barriers to their body weight control.
Design: A descriptive, cross-sectional study involving 152 black female nurses from
Netcare St Augustine’s Hospital, Durban, South Africa.
Methods: Overweight and obesity was determined by body mass index (BMI) while
body fat percentage and fat-free mass (FFM) were determined by bioelectrical
impedance. A self-administered questionnaire, using the Stunkard figure rating scale
was used to determine body image perception and the beliefs and factors influencing
this.
Results: Mean age was 34 years (SD ± 8.4) and mean nursing years of experience
was 6 years (SD ± 5.6). Half grew up in rural areas (56.0%) and most were of Zulu
culture (82.0%). Very few (8.7%) reported being diagnosed with or having NCDs, while
21.3% were taking medications or had conditions that could cause weight gain. The
II
prevalence of overweight and obesity was 88.7% with 11.3% being normal weight,
34.4% overweight, 23.8% obese class I, 16.6% obese class II and 13.9% obese class
III. The mean BMI was 32.1 kg/m² (SD ± 7.0) (obese class I) and the mean body fat
percentage was 43.8% (SD ± 7.2). Many (69.6%) underestimated their body size by at
least one body shape (41.1%), believing that they were thinner than they were. Their
perceived mean BMI was 28.2 kg/m² (SD ± 5.6) which was overweight. Half (53.6%)
wanted to reduce weight mostly by one (29.9%) or two shapes (44.8%).
Weakness (84.9%), HIV/AIDS (84.2%) and poverty (77.6%) were associated with
underweight (BMI 18.3 kg/m²), while wealth (75.0%) was associated with obesity (BMI
34.3-45.4 kg/m²). Culturally, being overweight (BMI 26.2-29.9 kg/m²) (65.8%) was more
desirable, however, health (90.1%) was associated with normal weight (BMI 19.3-23.1
kg/m²).
Amongst media, television was the most influential with respect to body image although
older nurses were more influenced by radio (r=0.262, p=0.001) and newspapers
(r=0.176, p=0.033) while younger nurses were more influenced by Facebook (r= -0.198,
p=0.024) and Instagram (r= -0.205, p=0.030) to lose weight. Half agreed that media
(57.4%) and family (51.4%) had a bigger influence on their body image than culture,
indicating a shift in attitude. Over half (59.3%) had tried to reduce weight by mostly
exercising (74.2%) and cutting out junk food (66.3%). The main factors that made it
difficult for nurses to control their weight included working different shifts or long hours
(M= 3.74, SD ± 1.0), being too tired to exercise (M=3.66, SD ± 1.2) or prepare balanced
meals (M=3.41, SD ± 1.3), which resulted in fast food being an easier option (M=3.37,
SD ± 1.3).
Conclusion: Black female nurses had a high prevalence of overweight and obesity
placing them at increased risk for developing NCDs. Being educated health
professionals did not encourage them to adopt healthy eating and lifestyle behaviours.
Additionally, they underestimated their body image perception, masking their ability to
self-diagnose overweight and obesity and were still influenced by cultural beliefs. It
appears that media and family beliefs have caused a shift in attitude regarding large
body sizes as many nurses wanted to reduce weight, although not enough to attain a
III
normal body weight. This shift in attitude could help reduce the prevalence of
overweight and obesity amongst black SA females since they could be influenced to
adopt healthy eating and lifestyle behaviours.
Keywords: obesity, body image perception, body fat, cultural beliefs, nurses in South
Africa, black, female, media
IV
PREFACE
This dissertation was written between February 2017 and December 2017 under the
supervision of Dr Chara Biggs using data collected from Black female nurses practicing
at Netcare St Augustine’s Hospital, Durban, KwaZulu-Natal, South Africa between July
2017 – August 2017.
Signed: …………………………………….. Date: ……………………………….
Yovenita Ramgolam (candidate)
As the supervisor of the candidate, I agree to the submission of this dissertation.
Signed: …………………………………….. Date: ………13 April 2018.
Dr Chara Biggs (Supervisor)

V
DECLARATION OF ORIGINAL WORK
I, Yovenita Ramgolam, declare that:
1. The entirety of the work contained in this dissertation is my own original work,
except where otherwise stated.
2. This dissertation, or any part of it, has not been submitted for any degree or
examination at any other university.
3. Where other sources have been used, they have not been copied and have been
properly acknowledged.
Signed: …………………………………….. Date: ……………………………….
Yovenita Ramgolam (candidate)
VI
ACKNOWLEDGEMENTS
I would like to express my deepest gratitude to the following individuals who have
supported me and contributed to the completion of this study:
Dr Chara Biggs, for providing expert knowledge and funding throughout this
study. Thank you for the support, excellent supervision and for the research
experience gained – I am forever grateful.
Dr Gill Hendry for the statistical analysis of data.
Dietician Mandy Read for all the help throughout this study.
Netcare St Augustine’s Hospital for approval of this study.
All the unit managers from Netcare St Augustine’s Hospital who were supportive
of this study.
Zimeleni Nursing College, Hillcrest AIDS centre and La Domaine for allowing
nurses to participate in the pilot studies.
All the nurses, without whose participation this study would not have been
possible.
Lastly my parents Dhunraj and Chundrani as well as my sister Jivenita for the
consistent support, encouragement and understanding throughout the study.
VII
TABLE OF CONTENTS PAGE
ABSTRACT I
PREFACE IV
DECLARATION OF ORIGINAL WORK V
ACKNOWLEDGEMENTS VI
TABLE OF CONTENTS VII
LIST OF FIGURES XIII
LIST OF TABLES XVI
LIST OF APPENDICES XVII
LIST OF ABBREVIATIONS XVIII
CHAPTER 1: INTRODUCTION, THE PROBLEM AND ITS SETTING 1-8
1.1 Importance of the study 1
1.2 Statement of the problem 3
1.3 Research objectives 3
1.4 Hypotheses 4
1.5 Study parameters 4
1.6 Assumptions 4
1.7 Definition of terms 4
1.8 Summary 8
1.9 Dissertation outline 8
1.10 Referencing style 9
VIII
CHAPTER 2: REVIEW OF RELATED LITERATURE 10-37
2.1 Introduction 10
2.2 Prevalence of overweight and obesity and non-communicable 11
diseases
2.2.1 Worldwide 11
2.2.2 South Africa 11
2.3 Factors influencing overweight and obesity 14
2.3.1 Body Image 15
2.3.2 The influence of media 19
2.3.3 Education 21
2.4 Healthcare workers 23
2.4.1 Prevalence of overweight and obesity amongst healthcare 23
workers worldwide
2.4.2 Prevalence of overweight and obesity amongst nurses worldwide. 23
2.4.3 Prevalence of overweight and obesity amongst healthcare 24
workers in South Africa.
2.4.4 Prevalence of overweight and obesity amongst nurses in South 25
Africa
2.5 Risk factors for overweight and obesity amongst nurses 27
2.5.1 Time constraints 27
2.5.2 Working hours and shift times 27
2.5.3 Place of work 28
2.5.4 Accessibility of healthy food 28
IX
2.5.5 Body image perception of healthcare workers 29
2.6 Assessment of body image 29
2.6.1 Figural scales 30
2.7 Conclusion 37
CHAPTER 3: METHODOLOGY 38-59
3.1 Type of study 38
3.2 Background information on the study site 38
3.3 Study design 39
3.4 Study population and sample selection 40
3.4.1 Study population 40
3.4.2 Sample selection 40
3.5 Study methods and materials 41
3.5.1 Anthropometry 41
3.5.2 Bioelectrical impedance analysis 44
3.5.3 Questionnaire 47
3.5.4 Data collection form 50
3.6 Pilot studies 50
3.7 Main study 52
3.8 Statistical analysis 54
3.9 Variables included in the study, data capturing and statistical 55
analysis
3.10 Reduction of bias 57
X
3.10.1 Anthropometry 57
3.10.2 Bioelectrical impedance analysis 58
3.10.3 Questionnaire 58
3.11 Reliability and validity 58
3.12 Ethical considerations 59
CHAPTER 4: RESULTS 60-96
4.1 Introduction 60
4.2 Sample size 60
4.3 Socio-demographic status 60
4.4 Career choice satisfaction 61
4.5 Nurses as role models 62
4.6 Medical conditions 62
4.7 Medications 64
4.8 Prevalence of overweight and obesity 65
4.9 Body composition 66
4.10 Body image perception 68
4.11 Body image satisfaction 70
4.12 Cultural beliefs and body shape 71
4.12.1 The most healthy 72
4.12.2 The most unhealthy 73
4.2.13 Overweight 73
4.12.4 Obese 74
XI
4.12.5 Thin 75
4.12.6 The most desirable in your culture 76
4.12.7 Most preferred by men in my culture 76
4.12.8 Associated with human immunodeficiency virus/acquired 77
Immunodeficiency syndrome and tuberculosis
4.12.9 Associated with being weak 78
4.12.10 Associated with being strong 79
4.12.11 Associated with being able to bear children 80
4.12.12 Associated with hard times or being poor 81
4.12.13 Associated with wealth 82
4.12.14 Most desirable in your family 83
4.13 Influence of media on body image perception 86
4.14 Media versus culture 88
4.15 Family beliefs 89
4.16 Family beliefs versus culture 93
4.17 Attempts to reduce weight 94
4.18 Barriers to body weight control amongst nurses 95
4.19 Summary 96
CHAPTER 5: DISCUSSION 98-112
5.1 Introduction 98
5.2 Response rate 98
5.3 Study population 98
XII
5.4 Satisfaction with career choice 99
5.5 Role models 99
5.6 Medical conditions and medications 100
5.7 Prevalence of overweight and obesity 101
5.8 Body composition 102
5.9 Body image perception 103
5.10 Body image satisfaction 105
5.11 Cultural beliefs and body image 106
5.12 Influences overpowering culture 108
5.12.1 Media 109
5.12.2 Family beliefs 110
5.13 Barriers to body weight control amongst nurses 111
5.14 Conclusion 112
CHAPTER 6: CONCLUSION AND RECOMMENDATIONS 115-119
6.1 Introduction 115
6.2 Conclusions of the study 115
6.3 Study constraints/limitations 118
6.4 Recommendations for improvement of the study 118
6.5 Recommendations for nutrition practice 119
6.6 Implications for further research 119
REFERENCES 119-133
XIII
LIST OF FIGURES
FIGURE PAGE
Figure 2.1: Female body size scale used in Cameroon 31
Figure 2.2: Silhouettes used in Malawi validated by Mciza et al (2005) 32
Figure 2.3: Photographic silhouettes used in Senegal 33
Figure 2.4: The body image assessment for obesity (BIA-O) 34
Figure 2.5: Stunkard figure rating scale 35
Figure 2.6: Set of photographs used in Mangaung 36
Figure 3.1: St Augustine’s Hospital 38
Figure 3.2: Depiction of how a skewer was inserted through the hair of nurses 43
with high hairstyles and the reading was taken where the skewer
touched the stadiometer
Figure 3.3: The Frankort plane 43
Figure 3.4: Placement of electrodes on dorsal surfaces of right ankle and foot 46
(Bodystat 2014)
Figure 3.5: Placement of electrodes on dorsal surfaces of right wrist and hand 46
(Bodystat 2014)
Figure 3.6: A flow diagram depicting the main study 54
Figure 4.1: Culture of the nurses 61
Figure 4.2: Nurses’ satisfaction level regarding their current career choice 61
Figure 4.3: Nurses’ perception of themselves as a role model in the 62
community
Figure 4.4: Prevalence of overweight and obesity amongst the nurses 66
XIV
Figure 4.5: Actual body fat percentage of the nurses versus the normal 67
body fat reference range
Figure 4.6: Actual fat free mass (kg) of the nurses versus the normal reference 68
range
Figure 4.7: Actual body image versus perceived body image 69
Figure 4.8: The discrepancy between actual and perceived body image 70
shapes
Figure 4.9: Desired weight loss or weight gain 71
Figure 4.10: The Stunkard FRS with associated BMI with each shape 72
Figure 4.11: The nurses’ perceptions of the most healthy body shapes 72
Figure 4.12: The nurses’ perceptions of the most unhealthy body shapes 73
Figure 4.13: The nurses’ perceptions of overweight body shapes 74
Figure 4.14: The nurses’ perceptions of obese body shapes 75
Figure 4.15: The nurses’ perceptions of thin body shapes 75
Figure 4.16: The nurses’ perceptions of most culturally desirable body shapes 76
Figure 4.17: The nurses’ perceptions of most preferred body shapes by men in 77
their culture
Figure 4.18: The nurses’ perceptions of HIV/AIDS and TB infected body shapes 78
Figure 4.19: The nurses’ perceptions of weak body shapes 79
Figure 4.20: The nurses’ perceptions of strong body shapes 80
Figure 4.21: The nurses’ perceptions of body shapes associated with the ability 81
to bear children
Figure 4.22: The nurses’ perceptions of body shapes associated with poverty 82
XV
Figure 4.23: The nurses’ perceptions of body shapes associated with wealth 83
Figure 4.24: The nurses’ perceptions of most desirable body shapes in their 84
family
Figure 4.25: The most to the least influential source of media 87
Figure 4.26: The influence of media versus cultural beliefs on the nurses’ 88
body shape
Figure 4.27: The influence of family beliefs on the nurses’ body shape 90
Figure 4.28: The influence of family beliefs versus cultural beliefs on the 94
nurses’ body shape
Figure 4.29: Methods of weight loss 95
Figure 4.30: Barriers to body weight control amongst nurses 96
XVI
LIST OF TABLES
TABLE PAGE
Table 2.1: Comparison between the prevalence of overweight 12
and obesity in South Africa by gender (Global Health Observatory
2016; Shisana et al 2013)
Table 2.2: Comparison of the prevalence of overweight/obesity 14
amongst black women in South Africa
Table 2.3: The prevalence of overweight and obesity between 25
gender and job category amongst healthcare workers (Skaal &
Pengpid 2011).
Table 2.4: Prevalence of overweight and obesity amongst nurses in 26
South Africa (Goon et al 2013)
Table 3.1: Measurements from QuadScan 4000 (Bodystat 2014) 47
Table 3.2: Variables included in the study, data capturing and statistical 55
analysis
Table 4.1: Medical conditions as listed by the nurses 63
Table 4.2: Medications mostly commonly taken by the nurses 64
Table 4.3: Classification of BMI amongst the nurses 65
Table 4.4: Summary of results regarding the association of body shapes 85
from the Stunkard FRS with cultural beliefs
Table 4.5: Influence of media on the nurses’ desired body shape 86
XVII
LIST OF APPENDICES
APPENDIX PAGE
Appendix A: Data collection form 134
Appendix B: Questionnaire 136
Appendix C: Information Informed consent form 142
Appendix D: Permission from Zimeleni Nursing School 145
Appendix E: Permission from Netcare St Augustine’s Hospital 146
Appendix F: Ethical approval from Biomedical Research Ethics 147
Committee, UKZN
Appendix G: Ethical approval from Netcare Research Operations 148
Committee
XVIII
LIST OF ABBREVIATIONS
AIDS Acquired Immune Deficiency Syndrome
BIA Bioelectrical Impedance Analysis
BIA-O Body Image Assessment for Obesity
BID Body Image Dissatisfaction/ Body Image Disturbance
BIRF Body Image Rating Figures
BMI Body Mass Index
BREC Biomedical Research Ethics Committee
BSS Body Size Scale
CHW Community Health Worker
DOH Department of Health
FFM Fat Free Mass
FRS Figure Rating Scale
HCW Healthcare Worker
HIV Human Immunodeficiency Virus
ISAK International Society for the Advancement of Kinanthropometry
KZN KwaZulu-Natal
NCDs Non-Communicable Diseases
NHS National Health Service
OECD Organization for Economic Co-operation and Development
PCOS Polycystic Ovarian Syndrome
RMR Resting Metabolic Rate
XIX
SA South Africa/South African
SADHS South African Demographic and Health Survey
SANHANES South African National Health and Nutrition Examination Survey
SD Standard Deviation
SPSS Statistical Package for the Social Sciences
TB Tuberculosis
TV Television
UK United Kingdom
UKZN University of KwaZulu-Natal
UNICEF United Nations Children's Fund
USA United States of America
WHO World Health Organization
1
CHAPTER 1: INTRODUCTION, THE PROBLEM AND ITS SETTING
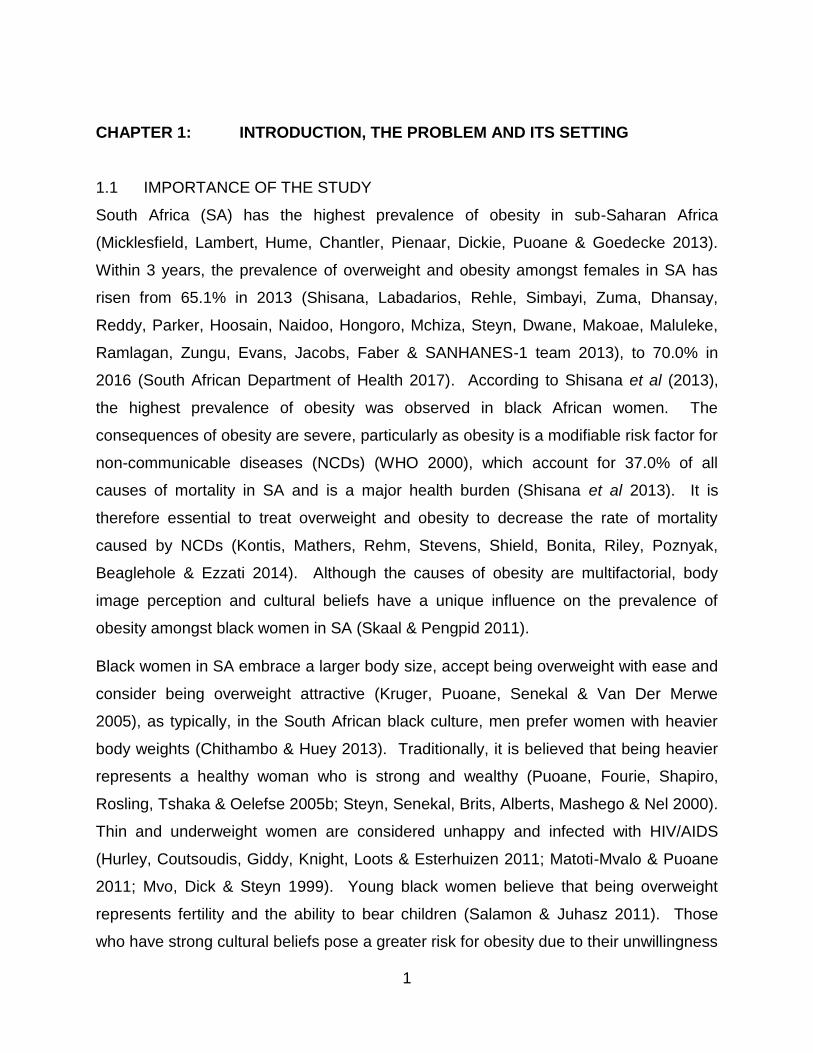
1.1 IMPORTANCE OF THE STUDY
South Africa (SA) has the highest prevalence of obesity in sub-Saharan Africa
(Micklesfield, Lambert, Hume, Chantler, Pienaar, Dickie, Puoane & Goedecke 2013).
Within 3 years, the prevalence of overweight and obesity amongst females in SA has
risen from 65.1% in 2013 (Shisana, Labadarios, Rehle, Simbayi, Zuma, Dhansay,
Reddy, Parker, Hoosain, Naidoo, Hongoro, Mchiza, Steyn, Dwane, Makoae, Maluleke,
Ramlagan, Zungu, Evans, Jacobs, Faber & SANHANES-1 team 2013), to 70.0% in
2016 (South African Department of Health 2017). According to Shisana et al (2013),
the highest prevalence of obesity was observed in black African women. The
consequences of obesity are severe, particularly as obesity is a modifiable risk factor for
non-communicable diseases (NCDs) (WHO 2000), which account for 37.0% of all
causes of mortality in SA and is a major health burden (Shisana et al 2013). It is
therefore essential to treat overweight and obesity to decrease the rate of mortality
caused by NCDs (Kontis, Mathers, Rehm, Stevens, Shield, Bonita, Riley, Poznyak,
Beaglehole & Ezzati 2014). Although the causes of obesity are multifactorial, body
image perception and cultural beliefs have a unique influence on the prevalence of
obesity amongst black women in SA (Skaal & Pengpid 2011).
Black women in SA embrace a larger body size, accept being overweight with ease and
consider being overweight attractive (Kruger, Puoane, Senekal & Van Der Merwe
2005), as typically, in the South African black culture, men prefer women with heavier
body weights (Chithambo & Huey 2013). Traditionally, it is believed that being heavier
represents a healthy woman who is strong and wealthy (Puoane, Fourie, Shapiro,
Rosling, Tshaka & Oelefse 2005b; Steyn, Senekal, Brits, Alberts, Mashego & Nel 2000).
Thin and underweight women are considered unhappy and infected with HIV/AIDS
(Hurley, Coutsoudis, Giddy, Knight, Loots & Esterhuizen 2011; Matoti-Mvalo & Puoane
2011; Mvo, Dick & Steyn 1999). Young black women believe that being overweight
represents fertility and the ability to bear children (Salamon & Juhasz 2011). Those
who have strong cultural beliefs pose a greater risk for obesity due to their unwillingness
2
to choose facts over culture and understanding these cultural beliefs and the extent of
their influence on body image perception is essential to develop strategies to prevent
and treat overweight and obesity in black women in SA (Hendley, Zhao, Coverson, Din-
Dzietham, Morris, Quyyumi, Gibbons & Vaccarino 2011). Puoane et al (2005b) stated
that although black SA women respected a moderately overweight woman, they would
like to lose weight and this shift in attitude could be due to the media. According to Mvo
et al (1999), black overweight and obese women reported being content with the way
they look when their significant partner complimented their body size. This indicates
that the opinion of family can be influential on black SA women and therefore, it is
essential to investigate the influence of family beliefs as well as factors which could
influence cultural beliefs such as education and the media need to be investigated.
If education is effective in counteracting the influence of culture, then individuals in
health care professions who maintain people’s health through evidence-based medicine
and advices regarding optimal health, should adopt healthy behaviours and be effective
role models themselves. Since nurses make up a large proportion of South Africa’s
Health Care System (DOH 2013), this study was conducted on them and a lower
prevalence of overweight and obesity would therefore be expected amongst this
population (Pistikou, Zyga, Sachlas, Katsa, Daratsianou & Gil 2014). In general, the
risk of obesity amongst nursing staff is similar to that of the general population and they
have a higher prevalence of obesity than other healthcare professionals (Kyle, Neall &
Atherton 2016). Since in SA, the high prevalence of overweight and obesity has been
linked to cultural beliefs amongst black women, an understanding about these and
perceptions regarding body image, as well as risk factors that are barriers to body
weight control may help develop culturally targeted interventions in SA to address the
obesity epidemic (Baleta & Mitchell 2016).
This research was important as there are very few studies investigating the influence of
education and media on cultural beliefs and body image perception amongst black SA
nurses. It was important to determine the impact of culture, media and family beliefs on
body image perception as well as risk factors that are barriers to body weight control
3
amongst nurses, in order to be able to develop culturally sensitive strategies to prevent
and treat the obesity epidemic in SA.
1.2 STATEMENT OF THE PROBLEM
The purpose of this descriptive cross-sectional study conducted on black SA female
nurses practicing in a private hospital in Durban, KwaZulu-Natal (KZN), SA was to
investigate the prevalence of overweight and obesity, body fat percentage, FFM as well
as body image perception and the influence of culture, media and family on those
perceptions. Factors that are barriers to weight control amongst them were also
investigated.
1.3 RESEARCH OBJECTIVES
The following objectives were investigated amongst black female nurses practising in a
private hospital in Durban, KZN, SA.
1.3.1 To determine the prevalence of overweight and obesity.
1.3.2 To determine their body fat percentage and FFM.
1.3.3 To determine how they perceived their body image.
1.3.4 To determine whether they were satisfied with their body shape.
1.3.5 To determine whether their cultural beliefs influenced their body image
perception.
1.3.6 To determine whether they were influenced by media to lose weight and whether
the influence of media overpowered their cultural beliefs.
1.3.7 To determine whether family beliefs influenced the way they felt about their body
image.
1.3.8 To determine which factors were barriers to their body weight control.
4
1.4 HYPOTHESES
Black female nurses practising in a private hospital in Durban KZN, SA would:
1.4.1 Have a low prevalence of overweight and obesity.
1.4.2 Have a low body fat percentage and normal FFM.
1.4.3 Perceive themselves to be smaller than what they actually were.
1.4.4 Be satisfied with their body shape.
1.4.5 Be strongly influenced by cultural beliefs to be overweight or obese.
1.4.6 Be influenced by media to lose weight.
1.4.7 Think that media is overpowering culture.
1.4.8 Be influenced by family beliefs to lose weight.
1.5 STUDY PARAMETERS
The parameters included female nurses who were SA citizens of black ethnicity
practicing in Durban, KZN at Netcare St. Augustine’s hospital during July – August
2017.
1.6 ASSUMPTIONS
It was assumed that:
1.6.1 The study population would be honest when answering the questionnaire.
1.6.2 The study population would not be influenced by the responses of other nurses
who were participating.
1.6.3 The study population would return the questionnaire.
1.7 DEFINITIONS OF TERMS
Affluence – having a copious amount of material goods, i.e. wealth (Bate 2009).
Attitude – a person’s attitude refers to their personal appraisal of an entity and
influence the person’s responses to this entity (Ajzen & Fishbein 1977).
Attractiveness – a quality pleasing to the senses that creates a desire in a person or
object (Talamas, Mavor & Perrett 2016).
5
Beliefs – incessant, unopposed representations of the world that include key principles
about events, causes, and objects which people use and accept as reality (Connors &
Halligan 2015).
Body image – an all-surrounding concept regarding self-perception and attitudes
related to their physical appearance (Cash, Morrow, Hrabosky & Perry 2004).
Body image dissatisfaction– a personal unhappiness with some features regarding
one’s appearance (Gardner & Brown 2010).
Body mass index – a person’s weight in kilograms (kg) divided by height in metres
squared (m²) (World Health Organization 2017).
Community health worker – a trusted member of the community who enters the
homes in the community to assist people to improve their health status. This is an
extension of the Primary Health Care which reaches out to people at household level
(KZN DOH 2001).
Compartment model – a method for body composition measurement which involves
independent assessment of body density, body water and bone (Fields & Goran 2000).
While a two-compartment body composition model requires one measurement besides
body weight, a four-compartment model is based upon three or more measurements
(Heymsfield & Lichtman 1990).
Culture - consists of a system of common behaviours and learnt patterns of thought
that are communicated within groups, communities or populations through forms of
social learning tools. These behaviours consist of practical information about life as well
as values, attitudes and beliefs (Figueroa, Saltzman, Jarick, Metcalfe & Wiley 2017).
Desirable – the tendency to see something or someone in a favourable light and is
worth seeking (Dodaj 2012).
Ethnicity – is a set of individual points of reference that involve differences between
people. These people belong to different social groups based on common cultural
traditions (Hale 2004).
6
Fast food – an easily prepared processed meal which is served at snack bars or
restaurants as a quick meal or to be taken away (New Oxford American Dictionary
2017).
Health care professional – personnel who maintain the health of individuals and
communities through evidence-based medicine and caring, advising or providing
preventative and curative measures and promote optimal health (World Health
Organization 2010).
Health care worker – an individual whose job entails protecting and improving the
health of their communities (World Health Organization 2006).
Health education – any experience relating to knowledge that is considered to help
communities and individuals improve their health. This can be done by increasing their
knowledge or influencing their attitudes (World Health Organization 2013).
Higher education – education beyond the secondary level, that is provided by a
college or university (EP-Nuffic 2015).
Junk food – foods that contribute substantial amount of calories but little nutritional
value (WebMD 2017b).
Non-communicable diseases – chronic diseases which are not spread from one
person to another. The four main types include cardiovascular diseases, cancers,
chronic respiratory diseases and diabetes (World Health Organization 2017).
Nurse - one whose job entails the treatment and care of, and the administration of
medicine to a patient, as well as monitoring of the patient's vital signs and their reaction
to disease conditions, trauma, stress, anxiety, medication and treatment (South African
Nursing Council 2016).
Obesity – for adults, a body mass index (BMI) of 30.0 kg/m² or higher is used to identify
individuals with obesity (World Health Organization 2017).
Overweight – for adults, a body mass index greater than or equal to 25.0 kg/m² – 29.9
kg/m² (World Health Organization 2017).
7
Perception – a complex thought process that portrays a unique picture of the world
which may contrast with reality (Shisana et al 2013).
Peri-urban – an area between consolidated urban and rural regions (UNICEF 2012).
Prevalence –the total number of individuals in a population who have a disease or
health condition at a specific period that is expressed as a percentage (Harvard TH
Chan School of Public Health 2017).
Prosperity – combination of the measurement of economic wealth and well-being (Bate
2009).
Private hospital – is one which provides specialised healthcare services which cannot
be acquired from public hospitals (Basu, Andrews, Kishore, Panjabi & Stuckler 2012).
Rural – is a large and isolated area with a low population density (UNICEF 2012).
Secondary education – in SA, secondary education comprises of two phases: the
senior phase (grades 7 up to and including 9); and the further education and training
phase (grades 10 up to and including 12) (EP-Nuffic 2015).
Severe obesity – for adults, a body mass index greater than 35.0 kg/m² (South African
Demographic and Health Survey 2016).
Suburban – an area of residence situated on the outskirts of a city or town (UNICEF
2012).
Tetrapolar impedance – is a valid and reliable field method for assessing body
composition at different frequencies, in the supine position by placing four electrodes in
the middle of the dorsal surfaces of the hands and feet, proximal to the metacarpal-
phalangeal and metatarsal-phalangeal joints (Lukaski, Bolonchuk, Hall & Siders 1986).
Urban – an area within the power of a municipality, which has a threshold population,
population density and economic function or an area with certain characteristics such as
paved streets, electric lighting and sewerage (UNICEF 2012).
Wealth – an abundance of material goods and money (Tan 1994).
8
1.8 SUMMARY
It is evident that the prevalence of overweight and obesity is increasing in SA especially
amongst women. Black SA women, including those in the health profession such as
nurses who make up a large proportion of South Africa’s Health Care System, are
especially at risk due to cultural beliefs and body image perception. Factors that may
influence cultural beliefs and the association of overweight and obese body shapes with
wealth, beauty, health, ability to bear children and thin body shapes with sickness and
poverty should be investigated. Therefore, it was essential that the attitude and beliefs
influencing body image perception in addition to the influence of media, education and
family beliefs amongst black female nurses be investigated. Moreover, it is important to
investigate and understand factors that are barriers to body weight control amongst
them. Since there is a scarcity of published studies that have been conducted on black
SA nurses investigating prevalence of overweight and obesity, body image perception,
cultural beliefs, the influence of media, education and family beliefs regarding body
image and factors that prevent nurses from being able to control their weight, this study
would contribute important knowledge to SA literature regarding black female nurses.
1.9 DISSERTATION OUTLINE
This dissertation is laid out as follows:
Chapter 1: Introduction, the problem and its setting
Chapter 2: Review of related literature
Chapter 3: Methodology
Chapter 4: Results
Chapter 5: Discussion
Chapter 6: Conclusion and recommendations

9
1.10 REFERENCING STYLE
The referencing style used in this dissertation is in accordance with the referencing
guidelines used in the Department of Dietetics and Human Nutrition at the University of
KwaZulu-Natal, Pietermaritzburg, South Africa.
10
CHAPTER 2: REVIEW OF RELATED LITERATURE
2.1 INTRODUCTION
Overweight and obesity are a growing epidemic around the world, mostly amongst
women (Organization for Economic Co-operation and Development 2012). In 2016,
more than 1.9 billion adults were overweight of which 650 million were obese (WHO
2018). In SA, the prevalence of overweight and obesity amongst women is 25.0% and
40.1%, respectively with the prevalence of obesity being highest amongst black women
(58.5%) (Shisana et al 2013). Obesity predisposes to NCDs (Puoane, Bradley &
Hugles 2005a). The epidemic of NCDs in SA presents a leading threat to health and
development (Shisana et al 2013). This obesity epidemic therefore needs to be
addressed to decrease the prevalence of NCDs (Kontis et al 2014).
The high prevalence of obesity amongst black SA women is a consequence of a
multitude of factors, including socio-cultural and behavioural attitudes towards fatness
and body image perception (Micklesfield et al 2013; Skaal & Pengpid 2011). Being
overweight is desirable to most black SA women because this signifies health and
happiness, in contrast to thinness which represents personal problems and infections
such as HIV/AIDS (Kruger et al 2005; Puoane et al 2005b; Mvo et al 1999). Despite
black SA women in general favouring an overweight figure, some desire to lose weight
which, could be the influence of media causing a shift in attitudes (Puoane et al 2005b).
An understanding of these cultural beliefs, and whether they are changing because of
media exposure is essential to be able to combat the obesity epidemic (Puoane et al
2005b). In addition to cultural beliefs and the influence of media, it is essential to
investigate whether conventional health education, that health professionals are
exposed to as part of their training, is effective in encouraging them to adopt healthy
eating and lifestyle behaviours, as they are considered to be important role models in
the community (Rush, Kee & Rice 2005) and could therefore play an important role in
the strategies to overcome obesity in SA.
11
This literature review discusses the prevalence of overweight and obesity in general and
then amongst educated healthcare workers such as nurses. Factors such as body
image perception, culture and media influencing overweight and obesity in black SA
women and tools used to assess body image perception are also reviewed.
2.2 PREVALENCE OF OVERWEIGHT AND OBESITY AND, NON-
COMMUNICABLE DISEASES
2.2.1 Worldwide
The prevalence of obesity worldwide has nearly tripled between 1975 and 2016 (WHO
2017). In 2016, 39.0% of the world’s adult population were overweight, of which 39.0%
were men and 40.0% were women. The prevalence of obesity was 13.0% of which
11.0% were men and 15.0% were women (WHO 2017). Obesity predisposes to NCDs
such as cardiovascular diseases, respiratory diseases, diabetes and cancer (Puoane et
al 2005a). According to the WHO (2017), 40 million people die each year due to NCDs,
a figure that is equivalent to 70.0% of deaths globally. Most annual deaths from NCDs
are attributed to cardiovascular diseases (44.3%, 17.7 million), followed by cancer
(22.0%, 8.8 million), respiratory diseases (9.8%, 3.9 million) and diabetes mellitus
(4.0%, 1.6 million). Reducing the prevalence of obesity may consequently diminish the
prevalence of NCDs (Kontis et al 2014).
2.2.2 South Africa
Following the global trend, there has been a progressive increase in the prevalence of
overweight and obesity in SA (Van Der Merwe & Pepper 2006), as shown in Table 2.1.
According to Shisana et al (2013), obesity is a risk factor for NCDs which accounts for
37.0% of all causes of mortality in SA and is therefore a major public health concern
(Kruger et al 2005). By 2010, 44.0% of NCD deaths in SA were due to cardiovascular
disease, 18.0% due to cancers, 9.3% due to chronic respiratory diseases and 8.0% due
12
to diabetes mellitus (Nojilana, Bradshaw, Pillay-van Wyk, Msemburi, Laubscher,
Somdyala, Joubert, Groenewald & Dorrington 2016). It is therefore imperative to
address the obesity epidemic in SA to decrease the prevalence of NCDs and hence the
mortality rates (Kontis et al 2014).
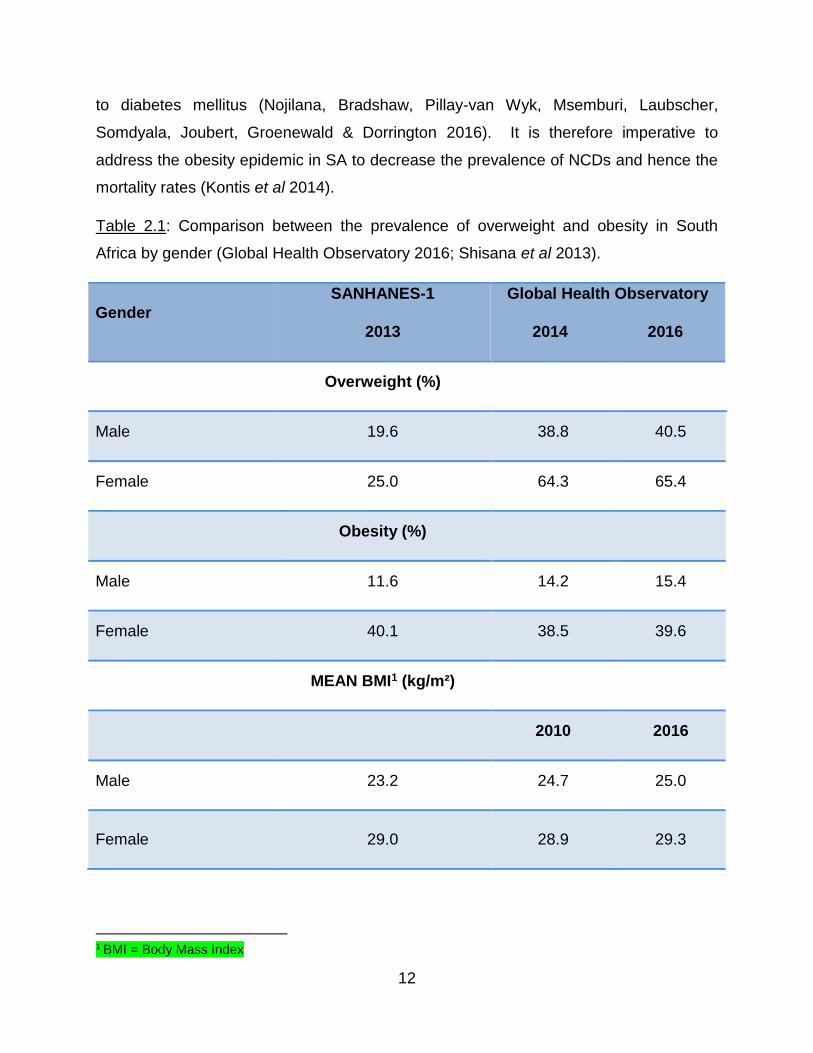
Table 2.1: Comparison between the prevalence of overweight and obesity in South
Africa by gender (Global Health Observatory 2016; Shisana et al 2013).
1 BMI = Body Mass Index
Gender
SANHANES-1
2013
Global Health Observatory
2014 2016
Overweight (%)
Male 19.6 38.8 40.5
Female 25.0 64.3 65.4
Obesity (%)
Male 11.6 14.2 15.4
Female 40.1 38.5 39.6
MEAN BMI1 (kg/m²)
2010 2016
Male 23.2 24.7 25.0
Female 29.0 28.9 29.3
13
The prevalence of overweight and obesity amongst SA black women is particularly high.
The results from a cross-sectional analytical study carried out on 304 women (303 black
and one coloured) in Bloemfontein by Prinsloo, Joubert, Mohale, Nyindi, Matu,
Ntechane & Struwig (2011), found that 32.2% of women were overweight, 44.1% were
obese women and the mean BMI was 30.1 kg/m², which is obese class I. They were
both from formal and informal settlements and 195 were unemployed, while 64 were
employed and the rest were students. Twenty were uneducated while 261 had primary
school, secondary school and higher education. In an exploratory study conducted by
Matoti-Mvalo & Puoane (2011) in an urban township in Cape Town on 513 black
women, 40.3% were overweight while 42.3% were obese. A health survey conducted
by Malaza, Mossong, Bärnighausen & Newell (2012) in a rural area in KZN SA with a
high HIV prevalence in 2010 on 14,198 black adults found that 58.7% of women were
overweight and 31.3% were obese. A cross-sectional exploratory study carried out on
328 black women in Durban by Devanathan, Esterhuizen & Govender (2013)
demonstrated a mean BMI of 37.0 kg/m² which is obese class II, with 16.0% overweight
and 76.0% obese participants. In the SANHANES-1 study, the prevalence of
overweight was 24.9% and obesity was 39.9% amongst black women with a mean BMI
of 29.0 kg/m², which is overweight (Shisana et al 2013). In the National Department of
Health SADHS (2016) report, the prevalence of overweight and obesity was 26.5% and
40.9% respectively, amongst black women with a mean BMI of 29.2 kg/m², which is
overweight. These studies have demonstrated a high prevalence of overweight and
obesity amongst black women across SA (Table 2.2).
14
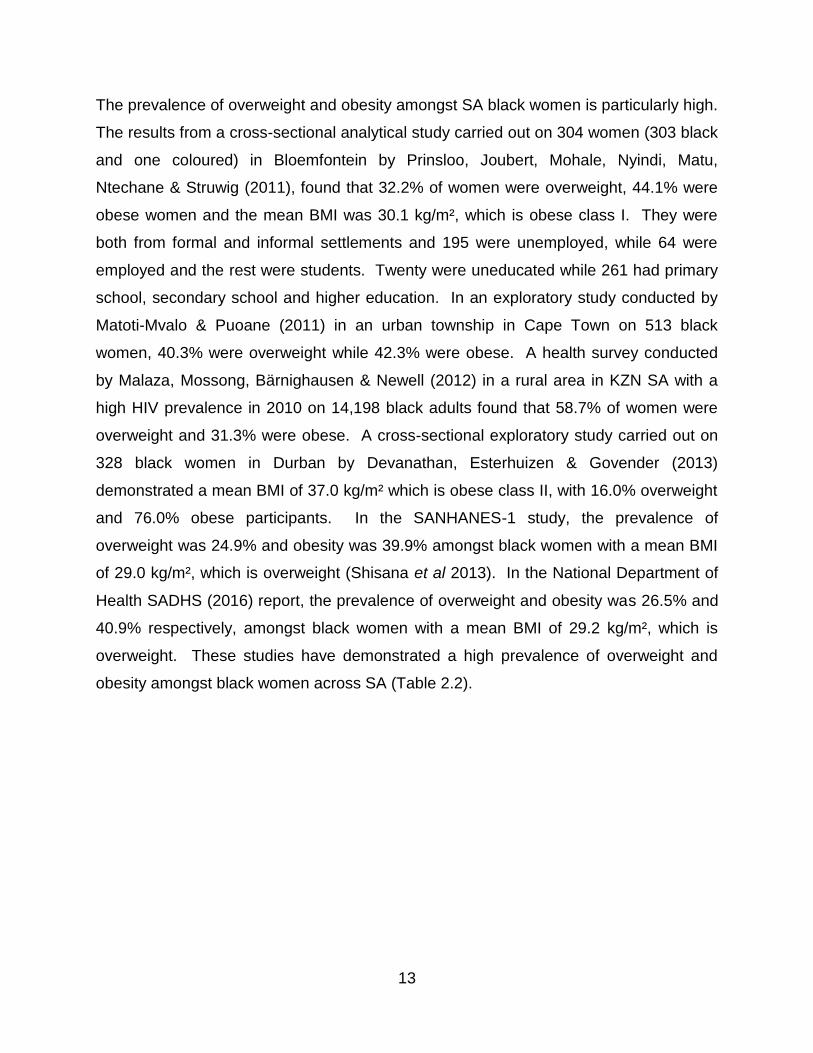
Table 2.2: Comparison of the prevalence of overweight and obesity amongst black
women in South Africa.
Prevalence (%)
Studies Overweight Obesity Total
Prinsloo et al (2011) 32.2 44.1 76.3
Matoti-Mvalo & Puoane (2011) 40.3 42.3 82.6
Malaza et al (2012) 58.7 31.3 90.0
Devanathan et al (2013) 16.0 76.0 92.0
Shisana et al (2013) 24.9 39.9 64.8
SADHS (2016) 26.5 40.9 67.4
The prevalence of overweight and obesity in black SA women appears to be rising at an
alarming rate, and it is therefore essential to identify the causes of this situation.
Identifying the factors influencing overweight and obesity amongst black SA women will
enable the implementation of strategies to combat this epidemic.
2.3 FACTORS INFLUENCING OVERWEIGHT AND OBESITY
Although obesity is the result of an excess energy intake in comparison to requirements,
the etiology of obesity is highly complicated involving genetic, physiologic,
environmental, psychological, socio-cultural, economic and even political factors that
interact in a variety of ways (Wright & Aronne 2012). To correspond with the objectives
of this study, this literature review focusses on body image perception amongst
educated health professionals (nurses), cultural beliefs and the possible influence of
media on body image.
15
2.3.1 Body image
2.3.1.1 Definition
Body image is defined as the multidimensional concept people have about their bodies
including body size self-perception, attitudes and dissatisfaction regarding body size
and body size concerns (Cash et al 2004). These beliefs determine a person’s
preference for thinness or fatness (Shisana et al 2013).
2.3.1.2 Determination of body image
Body image is measured by using body shape drawings (pictograms) or figure rating
scales (FRS) which are usually eight to nine drawings showing increasing adiposity
along the scale. Several studies have taken place in Africa, addressing body image
perception, using different FRS.2
2.3.1.3 Body image perception
Several studies investigating body image perception on black SA women have been
conducted and some are as follows. In the study conducted in Bloemfontein by Prinsloo
et al (2011), 28.6% (86/301) of the black women perceived themselves as obese, of
whom 72.1% (62/86) were actually obese. This indicated that some could properly
identify their body image. Out of 215 who did not perceive themselves as obese, 33.0%
(71/215) were actually obese. Therefore, more than half of the obese women (53.4%)
underestimated their body image and were not able to perceive themselves as being
obese, despite the fact that 84.0% (236/281) had secondary and higher education
(Prinsloo et al 2011).
In the study in Cape Town, 40.3% (207/513) of the black women were overweight, of
which only 33.5% (172/513) perceived themselves as overweight while 42.3% (217/513)
were obese, of which only 8.0% (41/513) perceived themselves as obese (Matoti-Mvalo
& Puoane 2011). Although more than half (52.1%) had high school education they still
underestimated their body image (Matoti-Mvalo & Puoane 2011).
2 An in-depth discussion of these scales, and which was the most appropriate for this study, follows at the end of the literature
review.
16
In the study in Durban, when comparing the actual body image as determined by BMI
with the perceived body image of black women, it was observed that the participants
tended to underestimate their body image across all weight categories (Devanathan et
al 2013). Over half (52.0%, 171/328) perceived themselves as overweight when only
16.0% (51/328) were truly overweight. Only 27.0% (89/328) perceived themselves as
obese when 76.0% (250/328) were actually obese. The literacy level of participants
was not recorded in this study (Devanathan et al 2013).
Misconceptions regarding perceived weight status should be addressed (Prinsloo et al
2011) because it is very common for black women to underestimate their body image.
This is a very important factor that is contributing to the high prevalence of overweight
and obesity in this ethnic group since they are comfortable with being overweight
(Kruger et al 2005). It is therefore essential to investigate their perceptions regarding
their own body weight within the culture.
2.3.1.4 Preferred body image amongst black South African women
Generally, in SA, black women have shown a preference for a larger (overweight) body
size as compared to their white counterparts (Mchiza, Goedecke & Lambert 2011;
Mciza, Goedecke, Steyn, Charlton, Puoane, Meltzer, Levitt & Lambert 2005; Puoane et
al 2005a; Puoane, Steyn, Bradshaw, Laubscher, Fourie, Lambert & Mbananga 2002).
In the descriptive cross-sectional study “Big is Beautiful”, conducted in a township in
Cape Town, the beliefs and attitudes about body size was investigated using the
Stunkard FRS3 in 44 black, female community health workers (CHW). A moderately
overweight woman (BMI=27.0 kg/m²) was the most preferred size (Puoane et al 2005b).
In a follow up cross-sectional exploratory study carried out in the same township five
years later, 513 black women aged 18 to 65 years were asked to choose their preferred
figure from the Stunkard FRS (Matoti-Mvalo & Puoane 2011). Fifty percent preferred to
be normal weight while approximately a third (33.5%) preferred to be overweight and
7.8% preferred to be obese (Matoti-Mvalo & Puoane 2011).
3 The figure rating scale consists of nine silhouettes with a BMI assigned to each, ranging from underweight (BMI: <18.5 kg/m2) to obese class III (BMI: >40.0 kg/m2).
17
South African studies have shown that black women display less body size
dissatisfaction when compared to other ethnic groups (Micklesfield et al 2013; Mchiza et
al 2011; Mciza et al 2005). This is because the western culture promotes thinness,
denigrates excess weight and stigmatizes obese people (Schwartz & Brownell 2003).
This preference for a higher body weight is the result of culture-bound beliefs which
encourage fuller bodies and promote lifestyle behaviours commonly associated with
obesity (Micklesfield et al 2013; Shisana et al 2013). Although aware of the negative
consequences of being overweight, many overweight and obese black SA women did
not want to lose weight (Kruger et al 2005) as body image is associated with valued
attributes such as strength, respect, beauty, wealth, health but also sickness.
Strength
In the study “Big is Beautiful”, an overweight woman was regarded as someone who is
round and who should be able to do any work required of her, such as being able to
cook a big pot of food without getting easily blown away by the wind (Puoane et al
2005b).
Respect and beauty
A body image with a BMI of 27.0 kg/m² was associated with dignity, respect, confidence
and beauty (Puoane et al 2005b). According to Okop, Mukumbang, Mathole, Levitt &
Puoane (2016), who conducted a descriptive qualitative survey on 78 black men and
women near the Cape Town metropolis, weight gain was desirable as an overweight
woman was more attractive to men. In a secondary analysis conducted by Mchiza et al
(2011) on 204 mothers and 372 pre-adolescent girls in Cape Town, black mothers and
daughters associated a bigger body size with beauty. Qualitative in-depth interviews
conducted in a metropolitan area in Cape Town on 10 uneducated, overweight black
women found that their significant partners complimented their body size. This made
them happy and therefore content with their body shape (Mvo et al 1999). As being
overweight is considered beautiful and attractive, black SA women viewed themselves
as being of a normal weight and healthy, when they were actually overweight and obese
(Mchiza et al 2011; Skaal & Pengpid 2011; Puoane et al 2005b).
18
Wealth
In many sectors of the African population, obesity is perceived to reflect affluence.
Being an overweight or obese woman shows society the ability of a husband to care for
his wife and family (Puoane et al 2002). An overweight woman is regarded as someone
who is being well treated by her husband (Puoane et al 2005a). It also indicates the
availability of a sufficient food supply and intake, as food is associated with pleasure
and comfort in areas where there is a high prevalence of food insecurity (Okop et al
2016; Mvo et al 1999). In urban areas, a common practice among the black culture is to
consume large portion sizes to gain respect from neighbours, because food security
indicates self-sufficiency (Puoane & Tsolekile 2008). Being overweight is associated
with happiness as it shows that the person does not lack anything (Okop et al 2016;
Mchiza et al 2011). Those who migrated to urban areas were often envied or
complimented if they were overweight or obese when they visited rural areas as this
indicated that they could afford to eat (Puoane & Tsolekile 2008). Although obesity,
which used to mainly affect people of higher socio-economic classes, now equally
affects the poor, it is difficult to change the perception that obese people are wealthy,
while thin people are poor or sick (Matoti-Mvalo & Puoane 2011).
Health and Sickness
Many SA black women preferred to be big rather than thin as being overweight
indicates good health (Puoane et al 2005b; Mvo et al 1999). Thinness indicates
sickness such as tuberculosis (TB) and cancer, physical stress, unhappiness, emotional
stress and depression (Okop et al 2016; Mvo et al 1999). In SA, weight loss is
associated with HIV/AIDS amongst the black population (Matoti-Mvalo & Puoane 2011;
Puoane et al 2005b; Mvo et al 1999). Puoane et al (2005b) reported that SA black
women were not motivated to do any sort of physical activity for fear of losing weight
and thus being stigmatized as being infected with HIV/AIDS.
Out of 513 black SA women, 69.3% (356/513) associated the thin figures from the
Stunkard FRS with a person infected with HIV/AIDS (Matoti-Mvalo & Puoane 2011).
None associated overweight/obese figures with the disease. Nearly a third (31.0%,
159/513) associated being overweight with health, while almost a quarter (24.0%,
19
123/513) thought that being obese indicated health. Only 34.2% (175/513) thought that
a normal weight represented a healthy person. Despite being aware of the risks
associated with excess body weight, some (41.3%) still preferred to be overweight or
obese because they were afraid of losing weight due to the stigma attached to a small
body size (Matoti-Mvalo & Puoane 2011).
It is crucial to understand the beliefs associated with body image perception to be able
to address the prevalence of overweight and obesity in SA. It is impossible to address
overweight and obesity, if the person does not perceive themselves as being overweight
or obese or desire to reduce weight, because of cultural beliefs. This cross-sectional
descriptive study was therefore very important as it further investigated body image
perception amongst educated black women in the nursing profession who should
understand the concept and consequences of overweight and obesity and should
therefore have adopted healthy eating and lifestyle behaviours.
To address these cultural misconceptions, it is essential to identify factors such as the
influence of the media and education on the cultural beliefs impacting body image
perception amongst black SA women.
2.3.2 The influence of media
Throughout history, body image has been influenced by various factors including media
(Derenne & Beresin 2006). Exposure to mass media such as television (TV), movies,
magazines and the internet is positively correlated with obesity and can influence
people to lose weight (Derenne & Beresin 2006). Media promotion of the ideal body as
thinness for women has caused an increasing number of young adults to report
dissatisfaction with their bodies, as well as an increase in the use of weight control
products (Luevorasirikul 2007). In general, both locally and internationally, there has
been an increase in body image dissatisfaction (BID) and eating disturbances due to
society largely publicizing a thin body as ideal for women, thus causing them to objectify
their bodies (Morry & Staska 2001).
20
Radio and TV are the most common source of nutrition information for urban black SA
women (Van Der Merwe & Pepper 2006). As the economy improves, media influences
extended further into disadvantaged areas causing black SA women to be increasingly
exposed to conflicting body size ideals (Micklesfield et al 2013). In SA, the emphasis on
thinness by the media is very evident by the ever-increasing number of advertisements,
promoting dieting and encouraging thinness, as well as by the availability of a wide
range of low-energy diets on the market and the many business organizations which
specifically promote weight loss (Edwards, d’Agrela, Geach & Welman 2003).
A survey carried out by Edwards et al (2003) on 39 black and 41 white females at high
schools and universities in SA, showed that intentionally or unintentionally, all women
regardless of race competed with the media and each other to increase their sense of
self-worth and social acceptability. Several studies reported disordered eating attitudes
and high levels of body dissatisfaction with the desire to be thinner amongst middle-
aged black women (Mchiza et al 2011; Puoane et al 2005a; Mciza et al 2005). The ‘Big
is Beautiful’ study in Cape Town by Puoane et al (2005b) demonstrated that although
black women usually preferred a woman to be moderately obese, they themselves
desired to lose weight, thus showing the possible effects of media influences on body
dissatisfaction. In the older generation of the SA black culture, a curvy woman is still
admired. The younger ones who are more exposed to media images which portray thin
women as attractive, get confused as they want to have a body shape according to their
cultural beliefs, but they also want to follow the media (Puoane et al 2005b).
The cross-sectional analytical study at Mangaung University Community Partnership
Project Healthcare Centre, Bloemfontein reported that out of the 28.6% (86/301) black
women who perceived themselves as obese, 22.0% (19/86) were attempting to reduce
weight through exercise and diet. They were asked if they read magazines and if they
did, whether images of female bodies influenced or motivated them to lose or gain
weight. Of the many (72.0%, 219/304) who read magazines, 58.0% (127/219) said that
the body images portrayed in the magazines influenced them either positively or
negatively (Prinsloo et al 2011).
21
The results from the first International Body Project, which measured 7434 individual
preferred body sizes in twenty-six countries were reported by Swami, Frederick, Aavik,
Alcalay, Allik, Anderson, Andrianto, Arora, Brännstrőm, Cunningham, Danel,
Doroszewicz, Forbes, Furnham, Greven, Halberstadt, Hao, Haubner, Hwang, Inman,
Jaafar, Johansson, Jung, Keser, Kretzschmar, Lachenicht, Li, Locke, Lőnnqvist, Lopez,
Loutzenhiser, Maisel, McCabe, McCreary, McKibbin, Mussap, Neto, Nowell, Alampay,
Pillai, Pokrajac-Bulian, Proyer, Quintelier, Ricciardelli, Rozmus-Wrzesinska, Ruch,
Russo, Schűtz, Shackelford, Shasidharan, Simonetti, Sinniah, Swami M,
Vandermassen, van Duynslaeger, Verkasalo, Voracek, Yee, Zhang E, Zhang X &
Zivcic-Becirevic (2010). Participants self-reported their exposure to both western and
local media. Results demonstrated that in SA, 105 rural participants residing in KZN
who were less exposed to western media selected significantly larger ideal body sizes
when compared to 100 urban participants in Cape Town, who were exposed to western
media and preferred a thinner figure (Swami et al 2010).
A potential shift in attitudes and perceptions regarding body weight has been
demonstrated amongst black SA women due to media influences, which portray thin
images as being attractive (Mchiza et al 2011; Puoane et al 2005b; Mciza et al 2005).
The media therefore does play a large role in the development of body image ideals and
could be used to implement weight loss strategies to decrease the prevalence of
overweight and obesity amongst black SA women. This study is very relevant as it
investigated the current impact of media on cultural beliefs and whether there has been
a further shift in attitudes.
2.3.3 Education
Education may enable an individual to correctly perceive their body image (Prinsloo et
al 2011) as it improves health knowledge, which in turn could translate into a better
choice of health behaviours. The health knowledge of South Africans could be targeted
to help reduce the prevalence of both obesity and NCDs (Shisana et al 2013).
22
Low education was one of the most commonly reported causative factors regarding the
increasing prevalence of global obesity (Senekal, Steyn & Nel 2003), although this
remains controversial. People with an education of less than Grade 7 were more at risk
of having a BMI greater than 25.0 kg/m² due to their lack of knowledge regarding
healthy lifestyle choices (Senekal et al 2003)4. Under the Apartheid laws, black South
Africans had very limited exposure to education (Micklesfield et al 2013) which could be
one causative factor regarding the high prevalence of overweight and obesity amongst
them.
Ziraba, Fotso & Ochako (2009) used the Demographic and Health Survey’s data from
1992 to 2005 from seven African countries, to demonstrate that there was an increase
in the prevalence of overweight and obesity by 45-50% among non-educated and
primary-educated African women, while there was a decrease by 10.0% amongst
African women with secondary education or higher. This suggests that the education
level may be influential in weight loss since women with higher education would most
likely make healthy eating and lifestyle choices.
Conversely, Bourne, Lambert & Steyn (2002) who reviewed and analysed secondary
data from the existing literature, mentioned that black SA women with no education
were found to have a lower mean BMI as they were involved in more manual labour
than their better-educated counterparts. These findings were similar to the study
conducted in Bloemfontein by Prinsloo et al (2011) which reported that 83.9% (99/118)
of obese women were educated to a secondary level or higher. Matoti-Mvalo & Puoane
(2011), concluded that cultural beliefs had a significant influence on black SA women
despite more than half having a Grade 7-12 education.
If education supposedly decreases the prevalence of overweight and obesity, health
professionals such as nurses, who have been educated regarding the consequences of
obesity, should demonstrate a lower prevalence as a consequence of the adoption of
healthy behaviours.
4 Grade 7-12 education: In SA, secondary education consists of two phases; the senior phase (grades 7-9) and training phase
(grades 10-12) (EP-Nuffic 2015).
23
2.4 HEALTHCARE WORKERS
Healthcare workers (HCW) are considered to be health professionals who are supposed
to have a good knowledge about health promotion, as well as act as role models for
their patients (Skaal & Pengpid 2011). With health promotion being one of the main
priorities of health care, the teaching role of HCWs such as nurses is more significant
than ever and the trustworthiness of nurses as health educators is linked to the
expectation that they portray healthy behaviours (Rush et al 2005). The prevalence of
overweight and obesity should therefore be lower amongst HCW, including nurses.
2.4.1 Prevalence of overweight and obesity amongst healthcare workers worldwide
A cross-sectional study carried out on 76 HCWs in Mexico showed that the prevalence
of overweight and obesity amongst female HCWs was 26.0% and 52.0%, respectively
compared to male HCWs who had a prevalence of 63.0% overweight and 23.0%
obesity (González-Velázquez & Mendez 2007).
A cross-sectional study which included 13483 adults in Scotland aimed to investigate
the prevalence of overweight and obesity amongst 411 nurses, 320 other HCWs, 685
unqualified health care staff and 12067 in non-health related occupations. The
prevalence of overweight (39.7%) and obesity (29.4%) was significantly higher amongst
nurses (69.1%), than other healthcare professionals; seven out of ten nurses in
Scotland were either overweight or obese with a mean BMI of 27.9 kg/m², which is
overweight (Kyle et al 2016).
2.4.2 Prevalence of overweight and obesity amongst nurses worldwide
A survey was mailed to 4890 randomly selected registered nurses from one state in six
geographic regions in United States of America (USA). The response rate was 15.5%
(n=760) of which 749 had provided their weight and height measurements. The mean
BMI was 27.2 kg/m², while the prevalence of overweight was 30.6% and obesity was
23.6% (Miller, Alpert & Cross 2008) which was high (54.2%). In 2011, Zitkus conducted
24
a cross sectional descriptive study on 721 registered nurses who were recruited from
the American Academy of Nurse Practitioners in the USA (Zitkus 2011). The
prevalence of overweight was 30.0% and obesity was 27.0% amongst the nurses,
indicating an increase of 2.8% over three years.
A cross-sectional study of self-reported survey data was carried out by Bogossian,
Hepworth, Leong, Flaws, Gibbons, Benefer & Turner (2012) on 4996 nurses from
Australia (n=3144), New Zealand (n=778) and United Kingdom (UK) (n=1074). The
prevalence of overweight and obesity combined was 59.1% for UK, 61.3% for Australia
and 61.8% for New Zealand which was higher than the USA.
Internationally, the prevalence of overweight and obesity amongst nurses have been
observed to be lowest in USA (54.2% - 57.0%) (Zitkus 2011; Miller et al 2008), followed
by UK (59.1%), Australia (61.3%), New Zealand (61.8%) (Bogossian et al 2012) and
Scotland (69.1%) (Kyle et al 2016), showing that the prevalence of overweight and
obesity is high amongst nurses despite being educated HCWs.
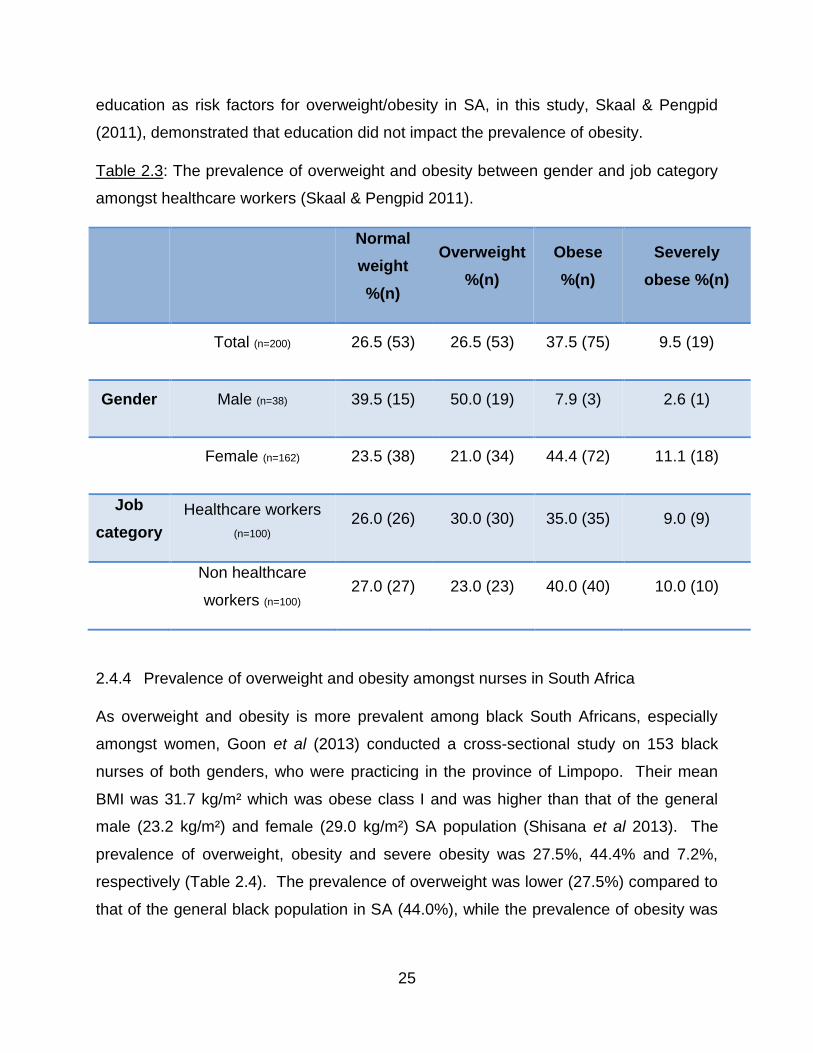
2.4.3 Prevalence of overweight and obesity amongst healthcare workers in South
Africa
South African studies have shown that overweight and obesity may be as prevalent in
the nursing profession as it is for the general public (Goon, Maputle, Olukoga, Lebese,
Khoza & Ayanwu 2013; Skaal & Pengpid 2011; Van Den Berg, Okeyo, Dannhauser &
Nel 2012). A quantitative, cross-sectional study consisting of 100 HCWs including
nurses and 100 non-HCWs was carried out in Pretoria to determine the prevalence of
overweight and obesity, obesity-related health problems as well as their perceptions
regarding their own body weight using the Stunkard FRS (Skaal & Pengpid 2011). The
results showed a high prevalence of overweight and obesity, particularly in females
(Table 2.3). Regardless of the various levels of education and profession, there was no
major difference in the prevalence of obesity between HCWs and non-HCWs (Skaal &
Pengpid 2011). Although Senekal et al (2003) acknowledged poverty and low levels of
25
education as risk factors for overweight/obesity in SA, in this study, Skaal & Pengpid
(2011), demonstrated that education did not impact the prevalence of obesity.
Table 2.3: The prevalence of overweight and obesity between gender and job category
amongst healthcare workers (Skaal & Pengpid 2011).
Normal
weight
%(n)
Overweight
%(n)
Obese
%(n)
Severely
obese %(n)
Total (n=200) 26.5 (53) 26.5 (53) 37.5 (75) 9.5 (19)
Gender Male (n=38) 39.5 (15) 50.0 (19) 7.9 (3) 2.6 (1)
Female (n=162) 23.5 (38) 21.0 (34) 44.4 (72) 11.1 (18)
Job
category
Healthcare workers
(n=100) 26.0 (26) 30.0 (30) 35.0 (35) 9.0 (9)
Non healthcare
workers (n=100) 27.0 (27) 23.0 (23) 40.0 (40) 10.0 (10)
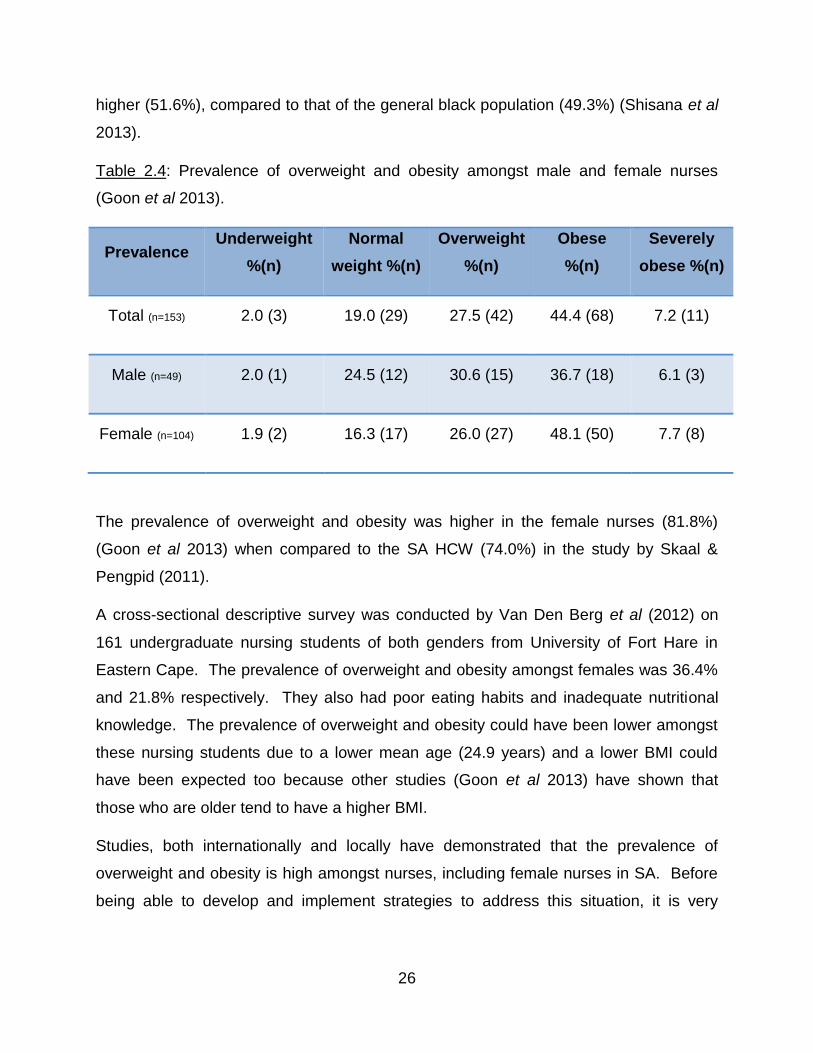
2.4.4 Prevalence of overweight and obesity amongst nurses in South Africa
As overweight and obesity is more prevalent among black South Africans, especially
amongst women, Goon et al (2013) conducted a cross-sectional study on 153 black
nurses of both genders, who were practicing in the province of Limpopo. Their mean
BMI was 31.7 kg/m² which was obese class I and was higher than that of the general
male (23.2 kg/m²) and female (29.0 kg/m²) SA population (Shisana et al 2013). The
prevalence of overweight, obesity and severe obesity was 27.5%, 44.4% and 7.2%,
respectively (Table 2.4). The prevalence of overweight was lower (27.5%) compared to
that of the general black population in SA (44.0%), while the prevalence of obesity was
26
higher (51.6%), compared to that of the general black population (49.3%) (Shisana et al
2013).
Table 2.4: Prevalence of overweight and obesity amongst male and female nurses
(Goon et al 2013).
Prevalence Underweight
%(n)
Normal
weight %(n)
Overweight
%(n)
Obese
%(n)
Severely
obese %(n)
Total (n=153) 2.0 (3) 19.0 (29) 27.5 (42) 44.4 (68) 7.2 (11)
Male (n=49) 2.0 (1) 24.5 (12) 30.6 (15) 36.7 (18) 6.1 (3)
Female (n=104) 1.9 (2) 16.3 (17) 26.0 (27) 48.1 (50) 7.7 (8)
The prevalence of overweight and obesity was higher in the female nurses (81.8%)
(Goon et al 2013) when compared to the SA HCW (74.0%) in the study by Skaal &
Pengpid (2011).
A cross-sectional descriptive survey was conducted by Van Den Berg et al (2012) on
161 undergraduate nursing students of both genders from University of Fort Hare in
Eastern Cape. The prevalence of overweight and obesity amongst females was 36.4%
and 21.8% respectively. They also had poor eating habits and inadequate nutritional
knowledge. The prevalence of overweight and obesity could have been lower amongst
these nursing students due to a lower mean age (24.9 years) and a lower BMI could
have been expected too because other studies (Goon et al 2013) have shown that
those who are older tend to have a higher BMI.
Studies, both internationally and locally have demonstrated that the prevalence of
overweight and obesity is high amongst nurses, including female nurses in SA. Before
being able to develop and implement strategies to address this situation, it is very
27
important to investigate the risk factors which could make it difficult for nurses as a
profession to maintain a normal body weight.
2.5 RISK FACTORS FOR OVERWEIGHT AND OBESITY AMONGST NURSES
Several studies, locally and internationally, have identified time constraints, working
hours, place of work, shift times and inability to access healthy food as the potential risk
factors for weight gain amongst nurses. This section discusses the risk factors further.
2.5.1 Time constraints
A review of lifestyle patterns, eating practices and obesity amongst nurses in general
was conducted by Shipra Gupta (2016) who acknowledged that work-related stressors,
particularly a lack of time, influenced the ability of nurses to engage in regular exercise,
despite being aware of the need for regular physical activity. Naidoo & Coopoo (2007)
conducted a quantitative survey on 107 nurses in KZN, SA to determine their health and
fitness profiles and reported poor physical activity levels. Phiri, Draper, Lambert &
Kolbe-Alexander (2014) conducted 12 focus group discussions (FDGs), consisting of
103 participants which included 57 night-shift nurses and 36 day-shift nurses in public
hospitals of the Western Cape Metropole, SA. The aim of this study was to determine
the health concerns, health priorities and barriers to living a healthy lifestyle amongst
the nurses. The nurses frequently mentioned lack of time to prepare healthy meals as
being an obstacle to weight loss or weight control (Phiri et al 2014).
2.5.2 Working hours and shift times
According to Han, Trinkoff, Storr & Geiger-Brown (2011) who conducted a secondary
data analysis on 2103 female nurses in USA, long working hours were reported to
adversely affect their energy levels and frequency of exercise. Adverse work schedules
could lead to obesity as shift work or long working hours may disrupt normal eating
hours and reduce access to healthy food options (Han et al 2011). A baseline survey
28
conducted on 194 nurses in the USA by Zapka, Lemon, Magner & Hale (2009)
investigating lifestyle behaviours of hospital-based nurses, reported that working hours
resulted in nurses not being released at adequate times for breaks and meals. Phiri et
al (2014) found that long working hours and shift work resulted in being overtired.
2.5.3 Place of work
The physical demands were reported to be highest for staff nurses and nurses working
in critical care and emergency or operating room/post anaesthesia units. These units
were highly stressful for many nurses who did not get adequate time for a proper meal
(Trinkoff, Storr & Lipscomb 2001).
2.5.4 Accessibility of healthy food
The hospital environment itself was perceived to have a harmful influence on the
nurses’ lifestyle behaviours, including the food service that offered mostly unhealthy
foods in the USA (Han et al 2011). In SA, day shift nurses agreed that the hospital
cafeterias sold mostly unhealthy foods such as fried chicken, French fries and pastries.
Healthier foods such as fruits and salads were costly, therefore they chose the
unhealthier options which were cheaper. Night shift nurses reported that the cafeteria
was closed at night (Phiri et al 2014) and therefore resorted to eating unhealthy food
(high in salt and sugar) from vending machines or prepacked food (Trinkoff et al 2001).
It is therefore essential to provide healthy vending machine choices and food services to
the work unit to increase food quality and access to healthy food choices for the nurses
particularly those on night shift (Han et al 2011).
An understanding of all these risk factors is important to plan suitable diet and lifestyle-
related interventions for nurses to promote optimum health and prevent overweight and
obesity (Shipra Gupta 2016). In addition, it is also important to investigate body image
perception as underestimating body image could be an important cause of the high
prevalence of overweight and obesity amongst nurses.
29
2.5.5 Body image perception of healthcare workers
It has been observed that HCWs in general tend to underestimate their body image by
thinking they are thinner than they actually are (Skaal & Pengpid 2011; Puoane et al
2005b).
In the study on HCWs versus non-HCWs conducted in Pretoria by Skaal & Pengpid
(2011), despite 73.5% of the total sample being either overweight/obese/severely
obese, when asked about their body weight satisfaction, 56.0% of the HCWs indicated
satisfaction with their current weight versus 61.0% of the non HCWs. Overweight staff
(73.6%; 39/53) perceived themselves as being normal weight while more than half
(57.3%; 54/94) of obese staff also perceived themselves as being of normal weight. Of
these obese staff, 40.0% (38/94) perceived themselves as being overweight.
Additionally, 66.8% (13/19) of severely obese participants perceived themselves as
overweight, 10.0% (2/19) of which also perceived their weight as normal (Skaal &
Pengpid 2011).
In a similar manner to the general population, HCWs tended to underestimate their body
image. Body image perception has been investigated by many studies internationally
and locally and different tools have been used throughout. As this study investigated
body image perception, it was critical to choose an appropriate tool which had been
validated in SA and was comparable to those used in other local studies. A detailed
description follows for the different tools used to assess body image perception in the
African continent.
2.6 ASSESSMENT OF BODY IMAGE
Various techniques have been developed to assess different aspects of body image,
especially BID. To date, body image perception has been assessed through both
qualitative and quantitative methods, including interviews, focus groups, figural scales,
photographs, questionnaires and examination of cognitive, affective and behavioral
functioning (Gardner & Brown 2010). The most commonly used methods are the figural
scales because of their ability to depict various human body sizes (Cohen, Bernard,
30
Ponty, Ndao, Amougou, Saïd-Mohamed & Pasquet 2015). Figural scales will be
discussed in more details.
2.6.1 Figural scales
Figural scales or FRS are also referred to as silhouettes or contour line drawings and
consist of a series of frontal drawings or images, usually nine, ranging from underweight
to obese class III. Participants are asked to select the image that mostly represents
their current and ideal body size. Even though researchers have developed dozens of
these scales, numerous problems continue to be identified with their use and it has
been observed that reliability and validity measures are absent for the majority (Gardner
& Brown 2010). Although there is a wide range of validated scales that have been used
both internationally and locally, it was extremely important to choose a scale for this
study that was culturally appropriate, and which had been validated and adapted for use
in SA.
2.6.1.1 Figural scale used in Cameroon
The study by Cohen et al (2015) aimed to develop and validate the Body Size Scale
(BSS) to estimate African body weight perception, as they felt that the existing scales
were usually not accurate enough to assess body weight perception in different African
populations, since existing African scales were usually based on White Caucasian
populations. Eighty Cameroonians and 81 Senegalese participated to develop the BSS.
Children, adolescents, elderly and pregnant women were excluded and only individuals
of reproductive age were recruited. They were photographed in full face and profile
positions. Anthropometric measurements were taken to evaluate their BMI, body fat
percentage, body fat distribution and body type. Nine participants per gender group
were selected as models for the BSS, after carefully ensuring representative
anthropometric variability and progressive adiposity gain along the scale. The BMI
frequency distribution led to the following number of models per BMI category: one in
underweight (< 18.5 kg/m²), three in normal weight (18.5-24.9 kg/m²), two in overweight
31
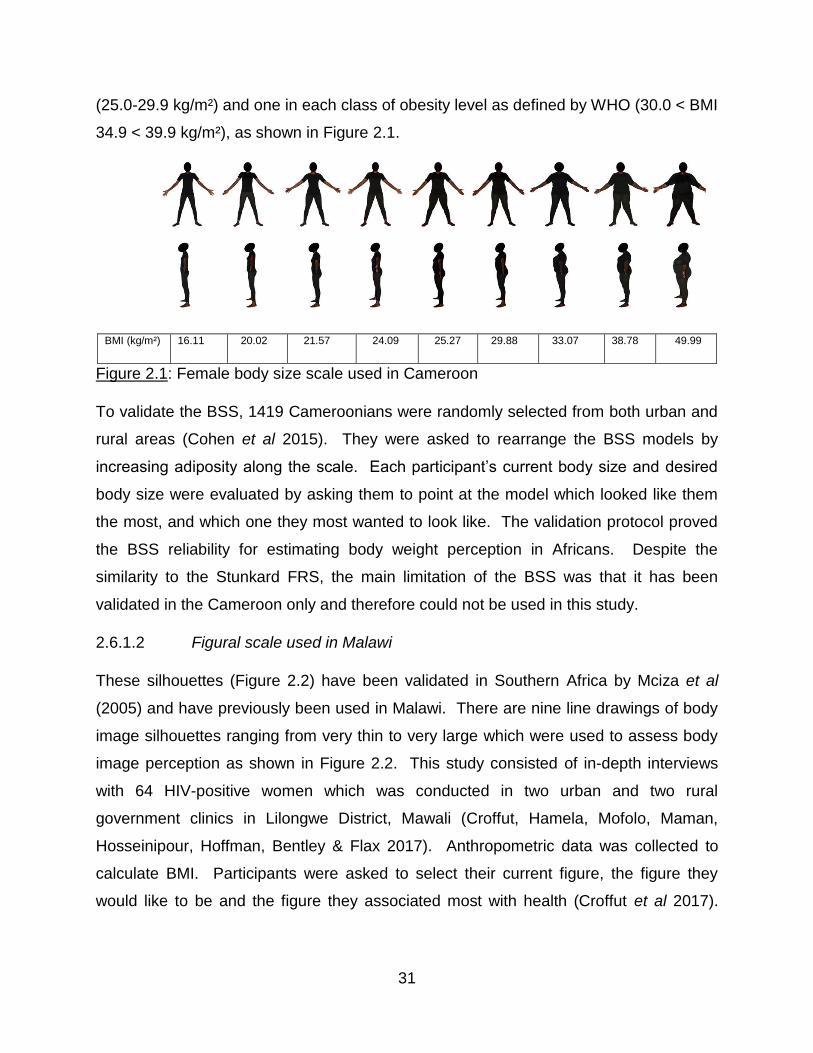
(25.0-29.9 kg/m²) and one in each class of obesity level as defined by WHO (30.0 < BMI
34.9 < 39.9 kg/m²), as shown in Figure 2.1.
BMI (kg/m²) 16.11 20.02 21.57 24.09 25.27 29.88 33.07 38.78 49.99
Figure 2.1: Female body size scale used in Cameroon
To validate the BSS, 1419 Cameroonians were randomly selected from both urban and
rural areas (Cohen et al 2015). They were asked to rearrange the BSS models by
increasing adiposity along the scale. Each participant’s current body size and desired
body size were evaluated by asking them to point at the model which looked like them
the most, and which one they most wanted to look like. The validation protocol proved
the BSS reliability for estimating body weight perception in Africans. Despite the
similarity to the Stunkard FRS, the main limitation of the BSS was that it has been
validated in the Cameroon only and therefore could not be used in this study.
2.6.1.2 Figural scale used in Malawi
These silhouettes (Figure 2.2) have been validated in Southern Africa by Mciza et al
(2005) and have previously been used in Malawi. There are nine line drawings of body
image silhouettes ranging from very thin to very large which were used to assess body
image perception as shown in Figure 2.2. This study consisted of in-depth interviews
with 64 HIV-positive women which was conducted in two urban and two rural
government clinics in Lilongwe District, Mawali (Croffut, Hamela, Mofolo, Maman,
Hosseinipour, Hoffman, Bentley & Flax 2017). Anthropometric data was collected to
calculate BMI. Participants were asked to select their current figure, the figure they
would like to be and the figure they associated most with health (Croffut et al 2017).
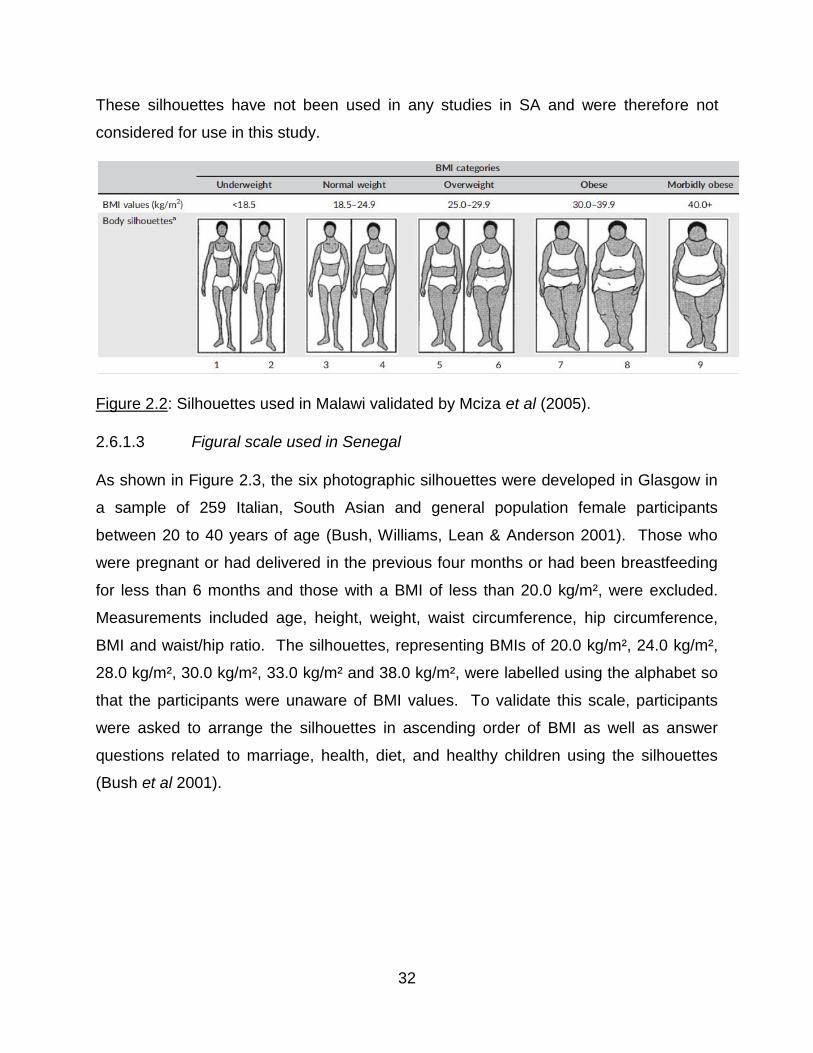
32
These silhouettes have not been used in any studies in SA and were therefore not
considered for use in this study.
Figure 2.2: Silhouettes used in Malawi validated by Mciza et al (2005).
2.6.1.3 Figural scale used in Senegal
As shown in Figure 2.3, the six photographic silhouettes were developed in Glasgow in
a sample of 259 Italian, South Asian and general population female participants
between 20 to 40 years of age (Bush, Williams, Lean & Anderson 2001). Those who
were pregnant or had delivered in the previous four months or had been breastfeeding
for less than 6 months and those with a BMI of less than 20.0 kg/m², were excluded.
Measurements included age, height, weight, waist circumference, hip circumference,
BMI and waist/hip ratio. The silhouettes, representing BMIs of 20.0 kg/m², 24.0 kg/m²,
28.0 kg/m², 30.0 kg/m², 33.0 kg/m² and 38.0 kg/m², were labelled using the alphabet so
that the participants were unaware of BMI values. To validate this scale, participants
were asked to arrange the silhouettes in ascending order of BMI as well as answer
questions related to marriage, health, diet, and healthy children using the silhouettes
(Bush et al 2001).
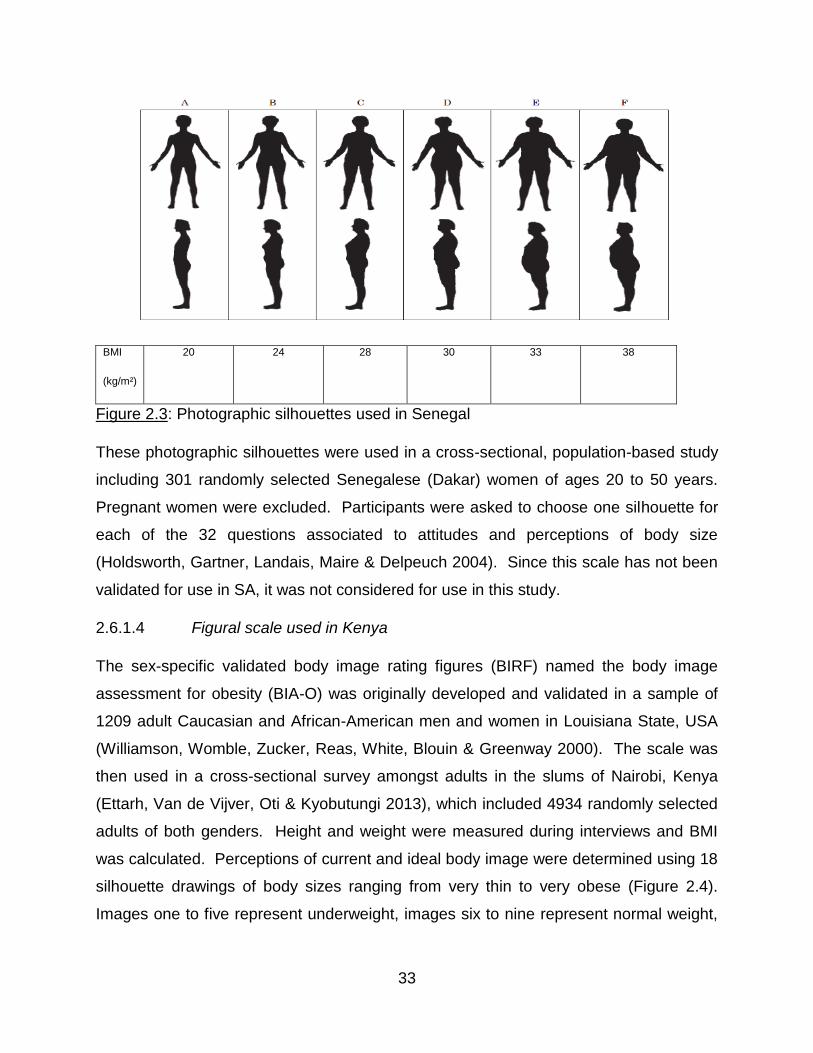
33
BMI
(kg/m²)
20 24 28 30 33 38
Figure 2.3: Photographic silhouettes used in Senegal
These photographic silhouettes were used in a cross-sectional, population-based study
including 301 randomly selected Senegalese (Dakar) women of ages 20 to 50 years.
Pregnant women were excluded. Participants were asked to choose one silhouette for
each of the 32 questions associated to attitudes and perceptions of body size
(Holdsworth, Gartner, Landais, Maire & Delpeuch 2004). Since this scale has not been
validated for use in SA, it was not considered for use in this study.
2.6.1.4 Figural scale used in Kenya
The sex-specific validated body image rating figures (BIRF) named the body image
assessment for obesity (BIA-O) was originally developed and validated in a sample of
1209 adult Caucasian and African-American men and women in Louisiana State, USA
(Williamson, Womble, Zucker, Reas, White, Blouin & Greenway 2000). The scale was
then used in a cross-sectional survey amongst adults in the slums of Nairobi, Kenya
(Ettarh, Van de Vijver, Oti & Kyobutungi 2013), which included 4934 randomly selected
adults of both genders. Height and weight were measured during interviews and BMI
was calculated. Perceptions of current and ideal body image were determined using 18
silhouette drawings of body sizes ranging from very thin to very obese (Figure 2.4).
Images one to five represent underweight, images six to nine represent normal weight,
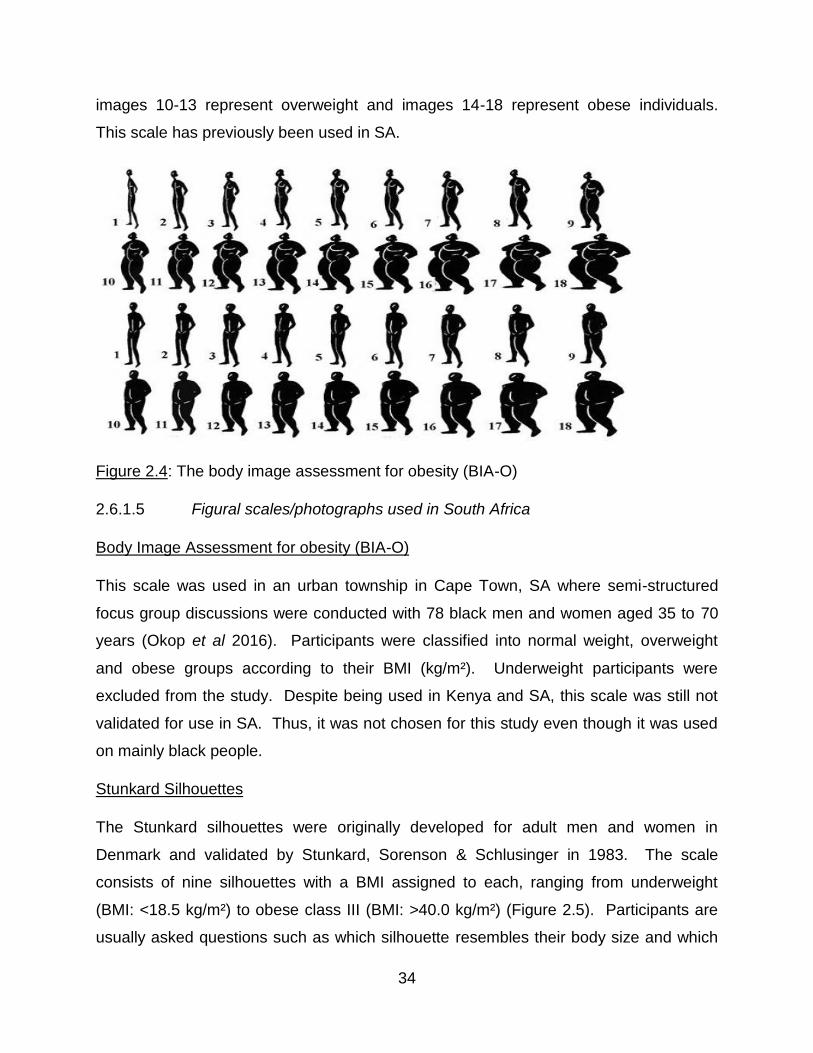
34
images 10-13 represent overweight and images 14-18 represent obese individuals.
This scale has previously been used in SA.
Figure 2.4: The body image assessment for obesity (BIA-O)
2.6.1.5 Figural scales/photographs used in South Africa
Body Image Assessment for obesity (BIA-O)
This scale was used in an urban township in Cape Town, SA where semi-structured
focus group discussions were conducted with 78 black men and women aged 35 to 70
years (Okop et al 2016). Participants were classified into normal weight, overweight
and obese groups according to their BMI (kg/m²). Underweight participants were
excluded from the study. Despite being used in Kenya and SA, this scale was still not
validated for use in SA. Thus, it was not chosen for this study even though it was used
on mainly black people.
Stunkard Silhouettes
The Stunkard silhouettes were originally developed for adult men and women in
Denmark and validated by Stunkard, Sorenson & Schlusinger in 1983. The scale
consists of nine silhouettes with a BMI assigned to each, ranging from underweight
(BMI: <18.5 kg/m²) to obese class III (BMI: >40.0 kg/m²) (Figure 2.5). Participants are
usually asked questions such as which silhouette resembles their body size and which
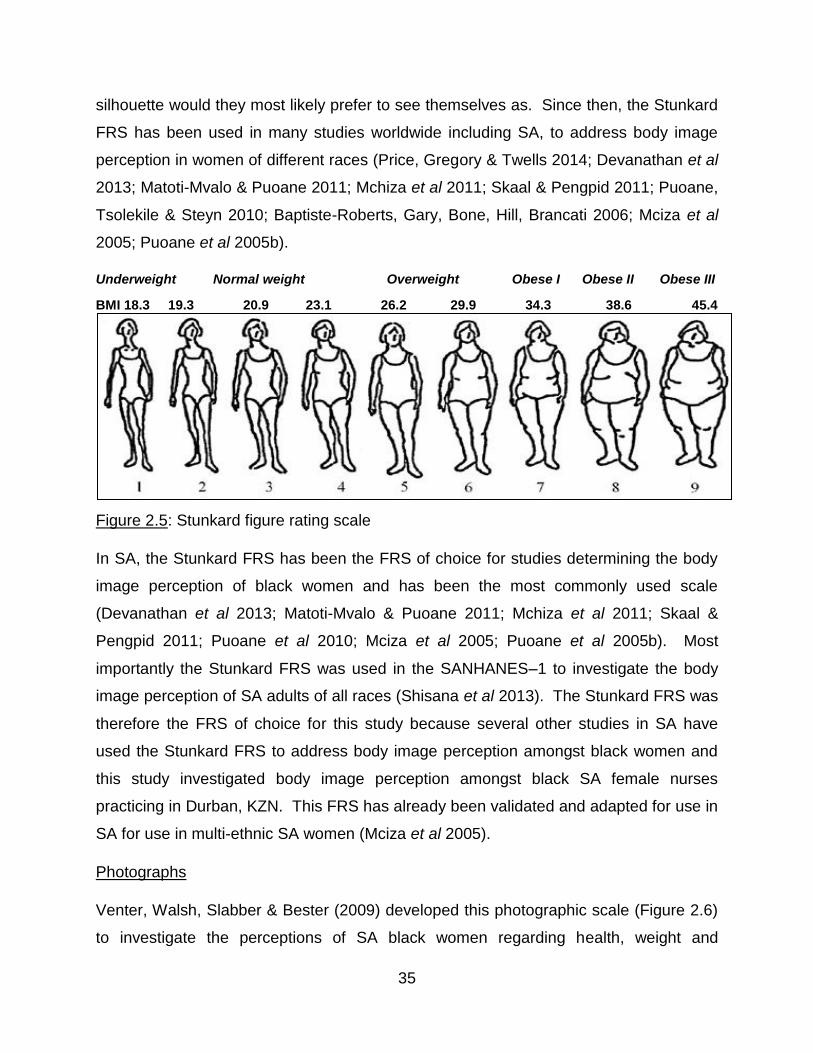
35
silhouette would they most likely prefer to see themselves as. Since then, the Stunkard
FRS has been used in many studies worldwide including SA, to address body image
perception in women of different races (Price, Gregory & Twells 2014; Devanathan et al
2013; Matoti-Mvalo & Puoane 2011; Mchiza et al 2011; Skaal & Pengpid 2011; Puoane,
Tsolekile & Steyn 2010; Baptiste-Roberts, Gary, Bone, Hill, Brancati 2006; Mciza et al
2005; Puoane et al 2005b).
Underweight Normal weight Overweight Obese I Obese II Obese III
BMI 18.3 19.3 20.9 23.1 26.2 29.9 34.3 38.6 45.4
Figure 2.5: Stunkard figure rating scale
In SA, the Stunkard FRS has been the FRS of choice for studies determining the body
image perception of black women and has been the most commonly used scale
(Devanathan et al 2013; Matoti-Mvalo & Puoane 2011; Mchiza et al 2011; Skaal &
Pengpid 2011; Puoane et al 2010; Mciza et al 2005; Puoane et al 2005b). Most
importantly the Stunkard FRS was used in the SANHANES–1 to investigate the body
image perception of SA adults of all races (Shisana et al 2013). The Stunkard FRS was
therefore the FRS of choice for this study because several other studies in SA have
used the Stunkard FRS to address body image perception amongst black women and
this study investigated body image perception amongst black SA female nurses
practicing in Durban, KZN. This FRS has already been validated and adapted for use in
SA for use in multi-ethnic SA women (Mciza et al 2005).
Photographs
Venter, Walsh, Slabber & Bester (2009) developed this photographic scale (Figure 2.6)
to investigate the perceptions of SA black women regarding health, weight and
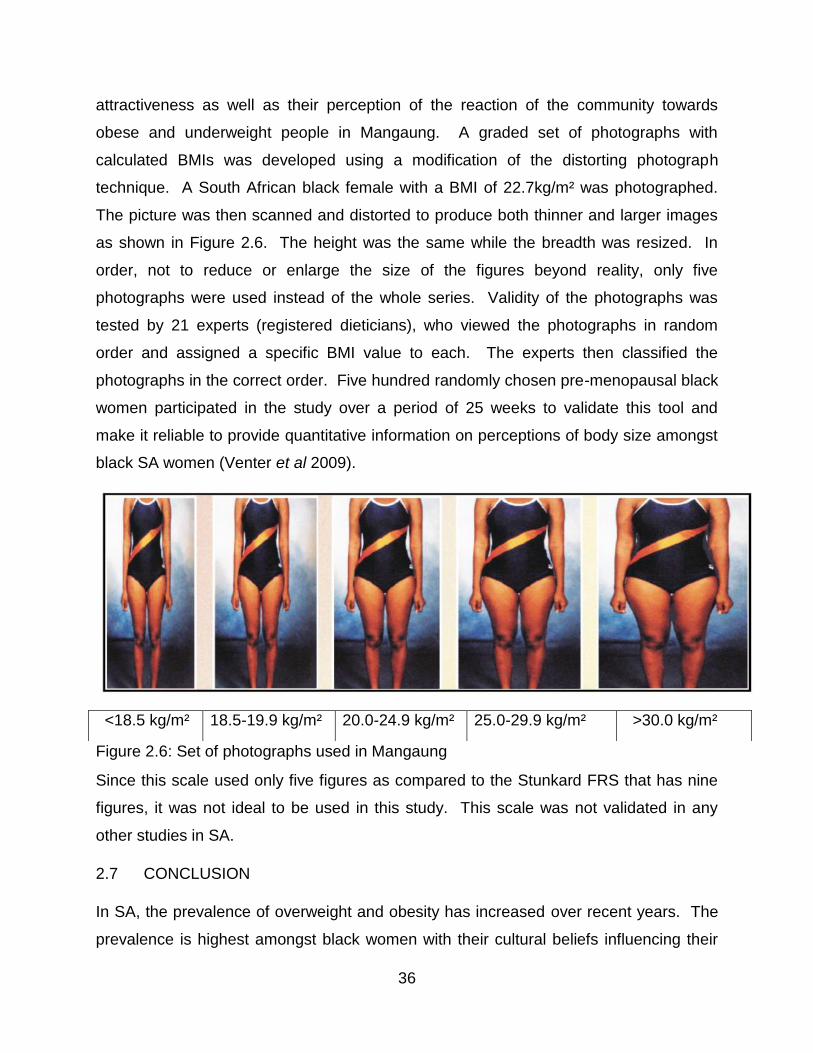
36
attractiveness as well as their perception of the reaction of the community towards
obese and underweight people in Mangaung. A graded set of photographs with
calculated BMIs was developed using a modification of the distorting photograph
technique. A South African black female with a BMI of 22.7kg/m² was photographed.
The picture was then scanned and distorted to produce both thinner and larger images
as shown in Figure 2.6. The height was the same while the breadth was resized. In
order, not to reduce or enlarge the size of the figures beyond reality, only five
photographs were used instead of the whole series. Validity of the photographs was
tested by 21 experts (registered dieticians), who viewed the photographs in random
order and assigned a specific BMI value to each. The experts then classified the
photographs in the correct order. Five hundred randomly chosen pre-menopausal black
women participated in the study over a period of 25 weeks to validate this tool and
make it reliable to provide quantitative information on perceptions of body size amongst
black SA women (Venter et al 2009).
Figure 2.6: Set of photographs used in Mangaung
Since this scale used only five figures as compared to the Stunkard FRS that has nine
figures, it was not ideal to be used in this study. This scale was not validated in any
other studies in SA.
2.7 CONCLUSION
In SA, the prevalence of overweight and obesity has increased over recent years. The
prevalence is highest amongst black women with their cultural beliefs influencing their
<18.5 kg/m² 18.5-19.9 kg/m² 20.0-24.9 kg/m² 25.0-29.9 kg/m² >30.0 kg/m²
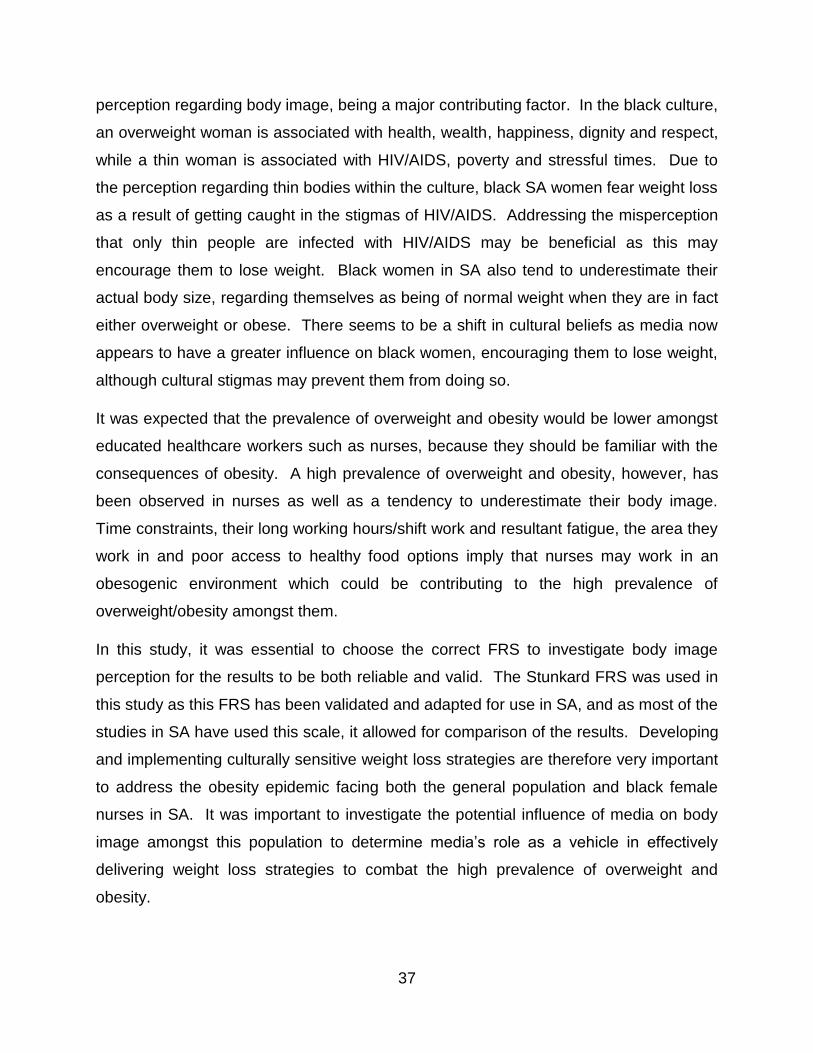
37
perception regarding body image, being a major contributing factor. In the black culture,
an overweight woman is associated with health, wealth, happiness, dignity and respect,
while a thin woman is associated with HIV/AIDS, poverty and stressful times. Due to
the perception regarding thin bodies within the culture, black SA women fear weight loss
as a result of getting caught in the stigmas of HIV/AIDS. Addressing the misperception
that only thin people are infected with HIV/AIDS may be beneficial as this may
encourage them to lose weight. Black women in SA also tend to underestimate their
actual body size, regarding themselves as being of normal weight when they are in fact
either overweight or obese. There seems to be a shift in cultural beliefs as media now
appears to have a greater influence on black women, encouraging them to lose weight,
although cultural stigmas may prevent them from doing so.
It was expected that the prevalence of overweight and obesity would be lower amongst
educated healthcare workers such as nurses, because they should be familiar with the
consequences of obesity. A high prevalence of overweight and obesity, however, has
been observed in nurses as well as a tendency to underestimate their body image.
Time constraints, their long working hours/shift work and resultant fatigue, the area they
work in and poor access to healthy food options imply that nurses may work in an
obesogenic environment which could be contributing to the high prevalence of
overweight/obesity amongst them.
In this study, it was essential to choose the correct FRS to investigate body image
perception for the results to be both reliable and valid. The Stunkard FRS was used in
this study as this FRS has been validated and adapted for use in SA, and as most of the
studies in SA have used this scale, it allowed for comparison of the results. Developing
and implementing culturally sensitive weight loss strategies are therefore very important
to address the obesity epidemic facing both the general population and black female
nurses in SA. It was important to investigate the potential influence of media on body
image amongst this population to determine media’s role as a vehicle in effectively
delivering weight loss strategies to combat the high prevalence of overweight and
obesity.
38
CHAPTER 3: METHODOLOGY
This chapter discusses the study design, study population, sample selection, study
methods and materials. It also discusses the measuring instruments, data collection,
pilot study, variables included in the study, data capturing and statistical analysis as well
as data quality control and ethical considerations.
3.1 TYPE OF STUDY
This was a cross-sectional descriptive study conducted on black South African female
nurses practicing at Netcare St Augustine’s Hospital, Durban, KZN, SA in July-August
2017.
3.2 BACKGROUND INFORMATION ON THE STUDY SITE
St Augustine’s hospital is a private 470-bed facility situated in Durban, KZN and is part
of the Netcare group (Figure 3.1). It is the largest private hospital in the area and
therefore employs the highest number of nurses which made it a good choice as the
sample was likely to be representative of the black nursing population in Durban.
Figure 3.1: St Augustine’s Hospital
39
3.3 STUDY DESIGN
This study was a descriptive cross-sectional study and according to Levin (2006), cross-
sectional studies are usually carried over a short period of time or at one given time to
estimate the prevalence of the outcome of interest for a given population. A cross-
sectional study design is used when the purpose of the study is descriptive, usually in
the form of a survey. The aim is to describe a population or subgroup within a
population regarding an outcome and a set of risk factors for the population or
subgroups at a given time (Levin 2006). Many cross-sectional studies are done using
questionnaires (Levin 2006).
The advantages of a cross-sectional descriptive study design include that it is quick and
cost effective as well as the best way to determine prevalence. Multiple outcomes can
be studied and since there is no follow up, fewer resources are required to run the study
(Mann 2003). The disadvantages of a cross-sectional descriptive study design include
differentiating cause and effect from simple association as there are frequently a
number of reasonable explanations (Mann 2003). Therefore, using a cross sectional
approach for this study was appropriate because this study investigated the prevalence
of overweight and obesity over a short period of time.
Descriptive research can either be qualitative or quantitative which involves collecting
data that describes events which outline data such as mean, median, mode, deviance
from the mean, variation, percentage and correlation between the variables (Knupfer &
McLellon 1996, p1197).
The advantages of using descriptive studies include data that is already available which
can be used efficiently at a low cost (Grimes & Schulz 2002). The disadvantages of
using descriptive studies are that casual conclusions can be drawn by researchers
when none is possible. This may overstep the data and result in unclear associations
between supposedly causes and effects over time (Grimes & Schulz 2002). Therefore,
a descriptive approach for this study was appropriate because both quantitative and
qualitative data was collected to investigate prevalence of overweight and obesity and
factors influencing body image perception amongst black female nurses practicing in
KZN, SA.
40
3.4 STUDY POPULATION AND SAMPLE SELECTION
3.4.1 Study population
The study population consisted of 152 black African female nurses between 21 to 66
years of age practicing at Netcare St Augustine’s Hospital during the period of 24th July
2017 to 31st August 2017.
3.4.2 Sample selection
The total population sampling technique was used as all the black African female
nurses (n=225) employed by St Augustine’s hospital who complied with the inclusion
and exclusion criteria were invited to participate.
According to Lund Research (2012), total population sampling is a type of purposive
sampling technique whereby the entire population is chosen to participate in a study.
The advantages of total population sampling include the possibility of getting deep
understanding by reducing the risk of missing information and the ability to make
analytical generalization (Lund Research 2012). The disadvantages of total population
sampling are that it is time consuming and challenging. If a large proportion of
members choose not to participate, analytical generalization can be severely
compromised (Lund Research 2012).
3.4.2.1 The inclusion criteria include:
Black ethnicity
Female
Nurses employed at St Augustine’s Hospital
3.4.2.2 The exclusion criteria include:
Ethnicity other than black SA
Male
41
Nurses not employed as St Augustine’s Hospital
Pregnancy
Renal impairment
Oedema
Pacemakers
Artificial limbs
Any black African nurse who grew up following a different culture such as the
White or Indian culture.
Pregnancy, renal impairment, oedema, pacemakers and artificial limbs were listed as
exclusion criteria as they would interfere with the bioelectrical impedance analysis and
produce inaccurate results.
3.4.2.3 Outcome variables
These included demographics (age, culture, area they grew up in), years of nursing
experience, career choice satisfaction, being a role model, body composition (weight,
height, BMI, body fat percentage and mass, FFM). Cultural beliefs and factors
influencing the nurses’ perceptions about body image such as media, family beliefs,
their perceived current and desired body shapes related to the Stunkard FRS as well as
factors that are barriers to body weight control were also outcome variables.
3.4.2.4 Confounding variables
These included medical conditions and medications that affect body weight.
3.5 STUDY METHODS AND MATERIALS
3.5.1 Anthropometry
Anthropometric measurements included weight and height. These measurements were
recorded on the data collection form (Appendix A).
42
3.5.1.1 Weight
Weight was measured using a precision scale (AND UC-321, A&D Medical) with a
capacity of 150 kg. The scale was calibrated with a known weight (5 kg Avery) every
day before any measurements were taken. The scale was placed on a large ceramic
tile where the floor was carpeted, to ensure that the scale was on a stable surface.
Nurses were asked to remove shoes, socks, any heavy clothing and heavy objects such
as mobile phones, wallets, loose change and heavy jewellery. The nurses stood on the
centre of the scale with their weight evenly distributed on both legs with their arms
hanging loose by their sides and looking straight ahead. They were asked to stand still
while the measurement was being taken (WHO STEPS surveillance 2017). The weight
was measured to two decimal places and recorded on the data collection sheet
(Appendix A). The nurses were asked to step off the scale and the measurement was
repeated, and the mean value was used. If the measurements differed by more than
0.01 kg, the weight was taken a third time and the two closest values were used to
calculate the mean weight.
3.5.1.2 Inhaled height
Height was measured using a portable stadiometer (SECA model 217) for adults with a
measuring range of 20-220 cm. Height was taken without shoes and socks on and for
nurses with high hairstyles, a skewer was inserted through their hair with their
permission and then the reading was taken where the skewer touched the stadiometer
as shown in Figure 3.2.
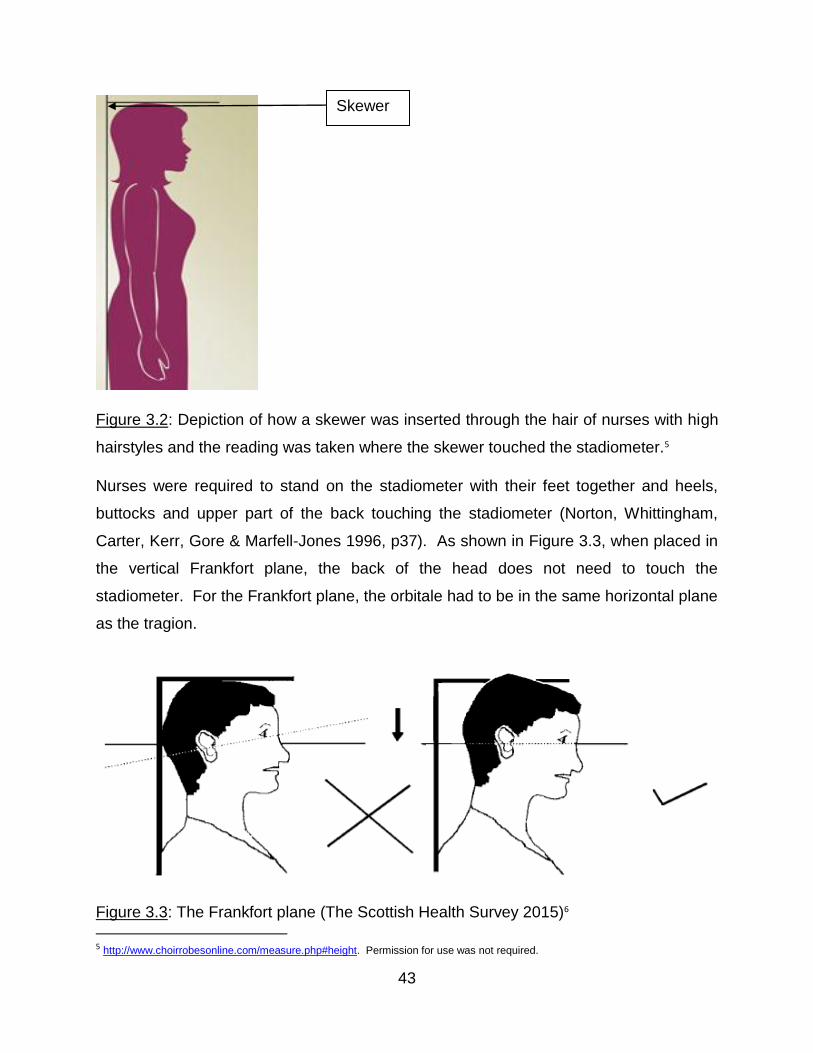
43
Figure 3.2: Depiction of how a skewer was inserted through the hair of nurses with high
hairstyles and the reading was taken where the skewer touched the stadiometer.5
Nurses were required to stand on the stadiometer with their feet together and heels,
buttocks and upper part of the back touching the stadiometer (Norton, Whittingham,
Carter, Kerr, Gore & Marfell-Jones 1996, p37). As shown in Figure 3.3, when placed in
the vertical Frankfort plane, the back of the head does not need to touch the
stadiometer. For the Frankfort plane, the orbitale had to be in the same horizontal plane
as the tragion.
Figure 3.3: The Frankfort plane (The Scottish Health Survey 2015)6
5 http://www.choirrobesonline.com/measure.php#height. Permission for use was not required.
Skewer
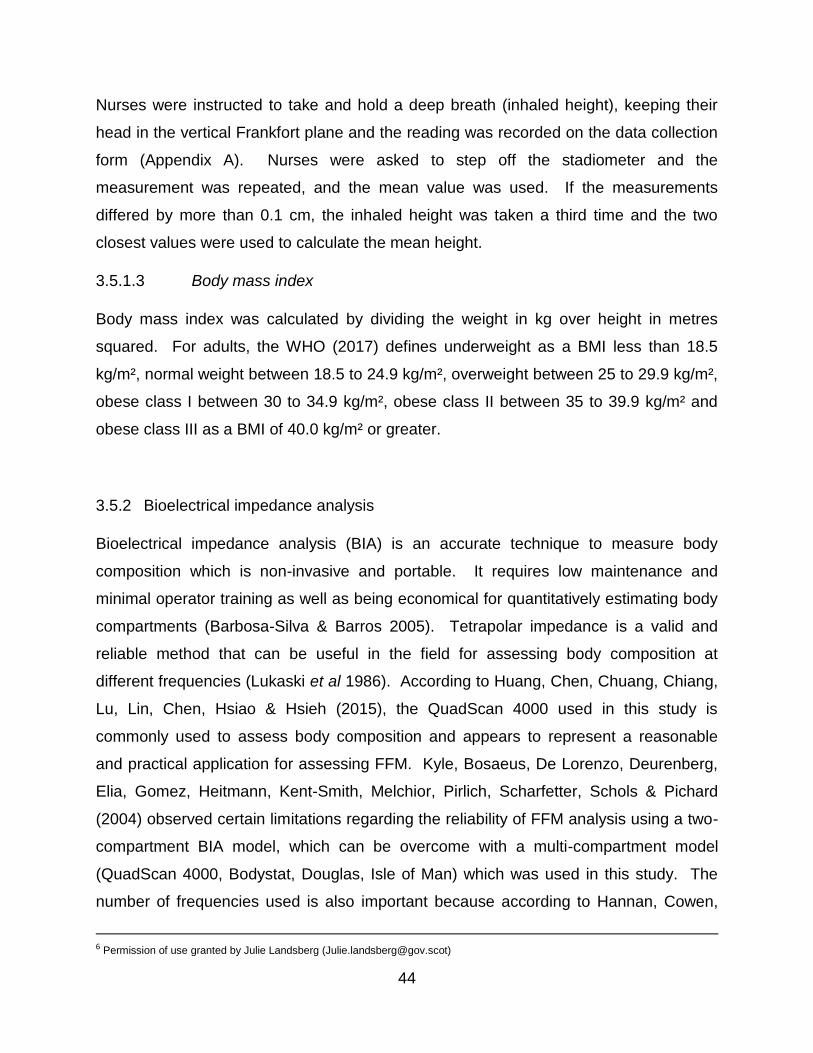
44
Nurses were instructed to take and hold a deep breath (inhaled height), keeping their
head in the vertical Frankfort plane and the reading was recorded on the data collection
form (Appendix A). Nurses were asked to step off the stadiometer and the
measurement was repeated, and the mean value was used. If the measurements
differed by more than 0.1 cm, the inhaled height was taken a third time and the two
closest values were used to calculate the mean height.
3.5.1.3 Body mass index
Body mass index was calculated by dividing the weight in kg over height in metres
squared. For adults, the WHO (2017) defines underweight as a BMI less than 18.5
kg/m², normal weight between 18.5 to 24.9 kg/m², overweight between 25 to 29.9 kg/m²,
obese class I between 30 to 34.9 kg/m², obese class II between 35 to 39.9 kg/m² and
obese class III as a BMI of 40.0 kg/m² or greater.
3.5.2 Bioelectrical impedance analysis
Bioelectrical impedance analysis (BIA) is an accurate technique to measure body
composition which is non-invasive and portable. It requires low maintenance and
minimal operator training as well as being economical for quantitatively estimating body
compartments (Barbosa-Silva & Barros 2005). Tetrapolar impedance is a valid and
reliable method that can be useful in the field for assessing body composition at
different frequencies (Lukaski et al 1986). According to Huang, Chen, Chuang, Chiang,
Lu, Lin, Chen, Hsiao & Hsieh (2015), the QuadScan 4000 used in this study is
commonly used to assess body composition and appears to represent a reasonable
and practical application for assessing FFM. Kyle, Bosaeus, De Lorenzo, Deurenberg,
Elia, Gomez, Heitmann, Kent-Smith, Melchior, Pirlich, Scharfetter, Schols & Pichard
(2004) observed certain limitations regarding the reliability of FFM analysis using a two-
compartment BIA model, which can be overcome with a multi-compartment model
(QuadScan 4000, Bodystat, Douglas, Isle of Man) which was used in this study. The
number of frequencies used is also important because according to Hannan, Cowen,
6 Permission of use granted by Julie Landsberg ([email protected])
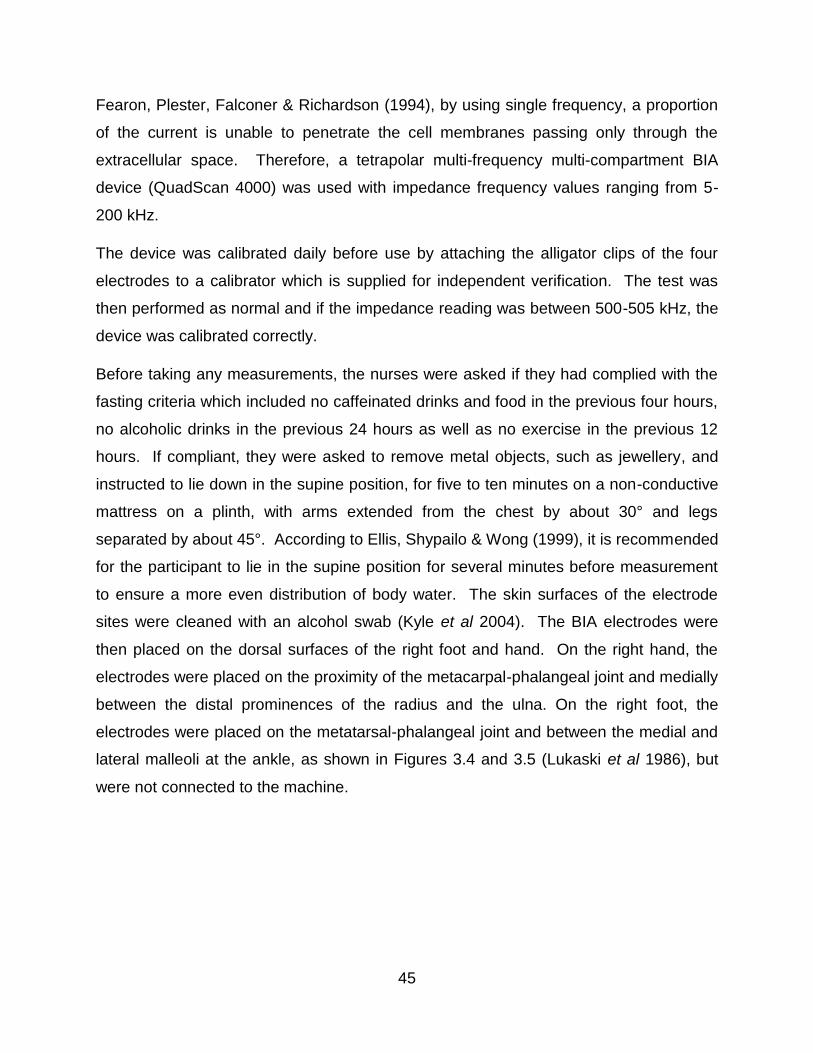
45
Fearon, Plester, Falconer & Richardson (1994), by using single frequency, a proportion
of the current is unable to penetrate the cell membranes passing only through the
extracellular space. Therefore, a tetrapolar multi-frequency multi-compartment BIA
device (QuadScan 4000) was used with impedance frequency values ranging from 5-
200 kHz.
The device was calibrated daily before use by attaching the alligator clips of the four
electrodes to a calibrator which is supplied for independent verification. The test was
then performed as normal and if the impedance reading was between 500-505 kHz, the
device was calibrated correctly.
Before taking any measurements, the nurses were asked if they had complied with the
fasting criteria which included no caffeinated drinks and food in the previous four hours,
no alcoholic drinks in the previous 24 hours as well as no exercise in the previous 12
hours. If compliant, they were asked to remove metal objects, such as jewellery, and
instructed to lie down in the supine position, for five to ten minutes on a non-conductive
mattress on a plinth, with arms extended from the chest by about 30° and legs
separated by about 45°. According to Ellis, Shypailo & Wong (1999), it is recommended
for the participant to lie in the supine position for several minutes before measurement
to ensure a more even distribution of body water. The skin surfaces of the electrode
sites were cleaned with an alcohol swab (Kyle et al 2004). The BIA electrodes were
then placed on the dorsal surfaces of the right foot and hand. On the right hand, the
electrodes were placed on the proximity of the metacarpal-phalangeal joint and medially
between the distal prominences of the radius and the ulna. On the right foot, the
electrodes were placed on the metatarsal-phalangeal joint and between the medial and
lateral malleoli at the ankle, as shown in Figures 3.4 and 3.5 (Lukaski et al 1986), but
were not connected to the machine.
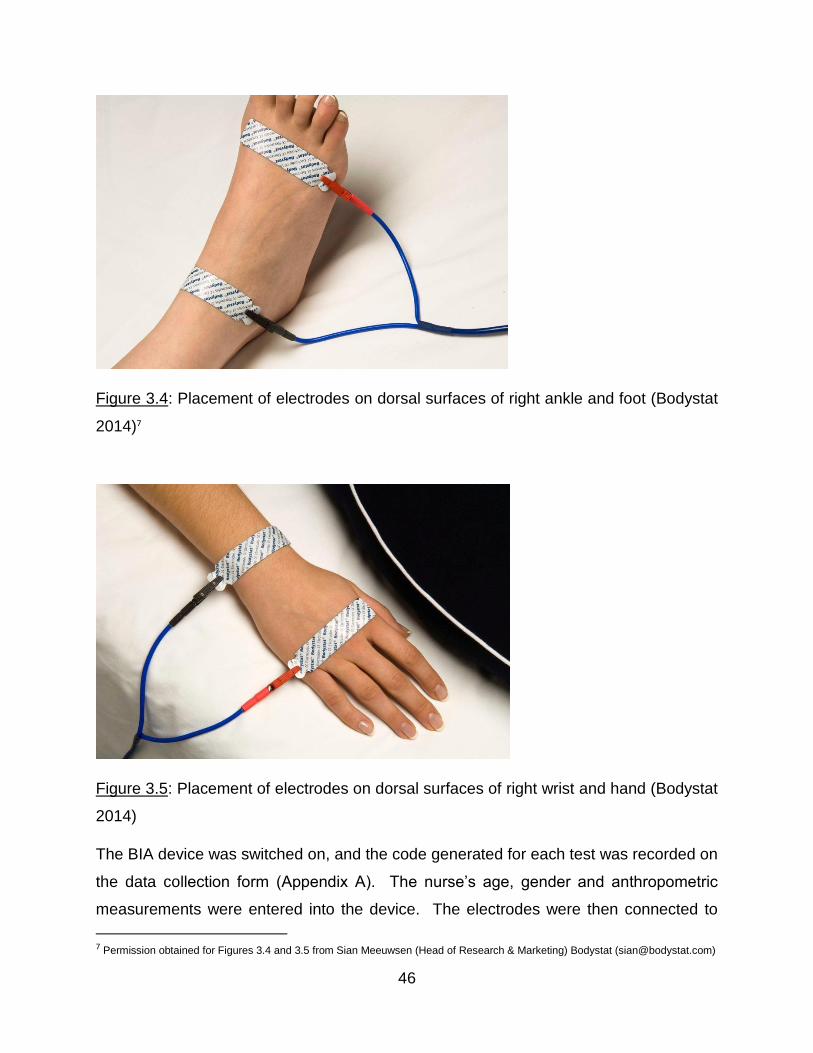
46
Figure 3.4: Placement of electrodes on dorsal surfaces of right ankle and foot (Bodystat
2014)7
Figure 3.5: Placement of electrodes on dorsal surfaces of right wrist and hand (Bodystat
2014)
The BIA device was switched on, and the code generated for each test was recorded on
the data collection form (Appendix A). The nurse’s age, gender and anthropometric
measurements were entered into the device. The electrodes were then connected to
7 Permission obtained for Figures 3.4 and 3.5 from Sian Meeuwsen (Head of Research & Marketing) Bodystat ([email protected])
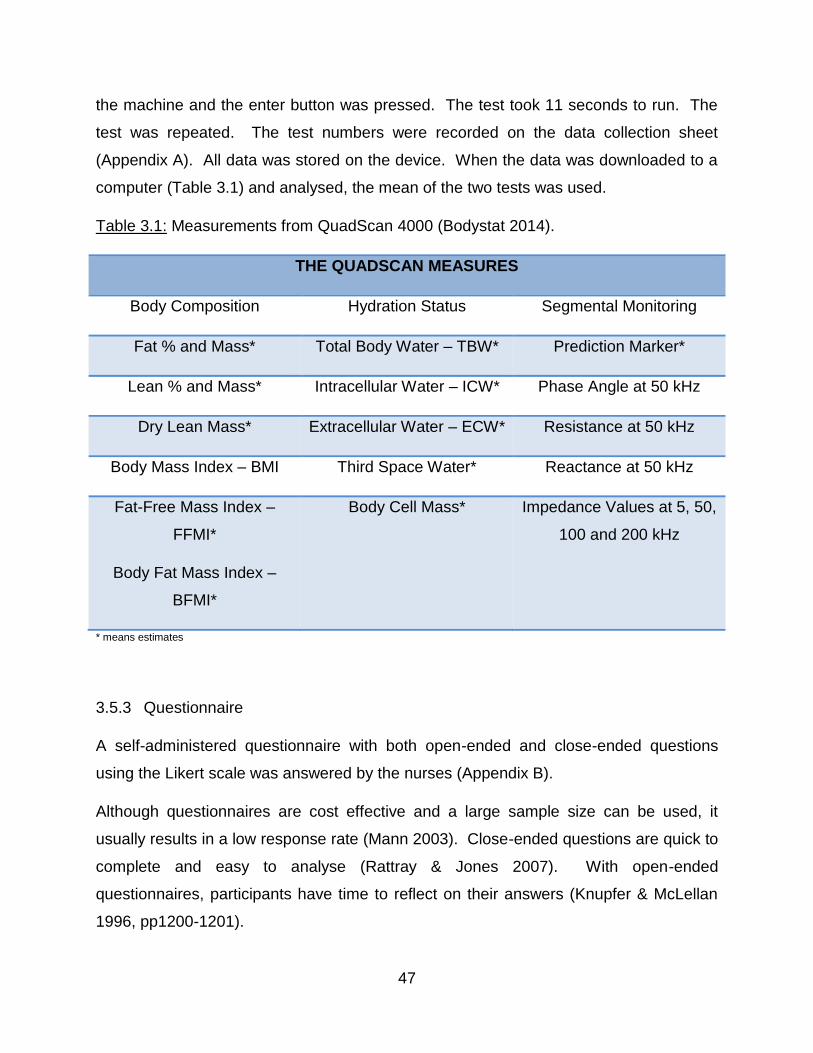
47
the machine and the enter button was pressed. The test took 11 seconds to run. The
test was repeated. The test numbers were recorded on the data collection sheet
(Appendix A). All data was stored on the device. When the data was downloaded to a
computer (Table 3.1) and analysed, the mean of the two tests was used.
Table 3.1: Measurements from QuadScan 4000 (Bodystat 2014).
THE QUADSCAN MEASURES
Body Composition Hydration Status Segmental Monitoring
Fat % and Mass* Total Body Water – TBW* Prediction Marker*
Lean % and Mass* Intracellular Water – ICW* Phase Angle at 50 kHz
Dry Lean Mass* Extracellular Water – ECW* Resistance at 50 kHz
Body Mass Index – BMI Third Space Water* Reactance at 50 kHz
Fat-Free Mass Index –
FFMI*
Body Fat Mass Index –
BFMI*
Body Cell Mass* Impedance Values at 5, 50,
100 and 200 kHz
* means estimates
3.5.3 Questionnaire
A self-administered questionnaire with both open-ended and close-ended questions
using the Likert scale was answered by the nurses (Appendix B).
Although questionnaires are cost effective and a large sample size can be used, it
usually results in a low response rate (Mann 2003). Close-ended questions are quick to
complete and easy to analyse (Rattray & Jones 2007). With open-ended
questionnaires, participants have time to reflect on their answers (Knupfer & McLellan
1996, pp1200-1201).
48
The disadvantages of using questionnaires include lower response rates and the
special care that is required to design questions that will be self-administered. Although
all questionnaires should contain some open-ended questions to allow for participants’
ideas to emerge, a considerable number of participants will not take the time to answer
the open-ended questions thoroughly (Knupfer & McLellan 1996, pp1200-1201). Close-
ended questions may limit the depth of participants’ responses which can result in data
with inadequate quality (Rattray & Jones 2007).
The advantages of using the Likert scale include that it is easy to construct and likely to
produce a very reliable scale. It is also simple to understand and complete (Hartley
2013). The disadvantages of using the Likert scale are that participants can present a
false impression of their attitudes by not being honest. It is difficult to show validity and
there is a lack of reproducibility (Hartley 2013).
Validity refers to whether the questionnaire is measuring what it claims to. Content
validity refers to expert opinion regarding whether the scale items used in the
questionnaire address the areas being investigated (Rattray & Jones 2007). This
questionnaire was validated for content by a statistician Dr Gill Hendry
([email protected]). The questions in this questionnaire were valid as they
were mainly based on those used in other studies, or were based on findings from
studies that investigated cultural beliefs that influence SA black women’s perceptions
about body image.
3.5.3.1 Section A
This included basic demographics such as name and culture. Culture was asked
because differences in beliefs were expected. The type of area they grew up in was
included to determine if being raised in an urban or semi-urban environment altered
their attitude towards body image perception as well as prevalence of overweight and
obesity. Years of nursing experience were asked to determine whether overweight and
obesity would be less prevalent in the more experienced nurses as they had longer to
“practice what they preach”. Job satisfaction and whether they saw themselves as role
models were included because during the Apartheid era, very few job options were
available to the black people and as a result, many black women took up nursing as a
49
career (Nursing Act 1957). This may have influenced their behaviour as a role model if
they did not choose the career out of passion and hence did not adopt any healthy
lifestyle behaviours.
3.5.3.2 Section B
These questions were formulated to obtain information regarding confounding factors
including medical conditions and medications that impact body weight (Wright & Aronne
2012; Naidoo & Coopoo 2007).
3.5.3.3 Section C
This section dealt with the perceived influence of media on nurses’ perception of body
image. Questions 10 and 11 were based on a study by Grabe, Ward & Hyde (2008),
who investigated the role of media in body image concerns amongst women.
3.5.3.4 Section D
Question 12 dealt with the black women’s perception of body image and which body
shape/s they felt represented health, wealth, overweight, obesity, thinness, HIV,
poverty, strength, weakness, ability to bear children and which body shapes were
desired by their family, and by men in their culture. These questions were based on
previous studies which have reported that black SA women consider being overweight
as beautiful (Skaal & Pengpid 2011; Mvo et al 1999) and representative of strength,
health, wealth and happiness (Puoane et al 2005b). Thinness, however, has been
associated with hard times, poverty and HIV infection (Mvo et al 1999). The choice of
the Stunkard FRS has been discussed and justified in Chapter 2.
3.5.3.5 Section E
In this section, questions 13,14 and 17 were designed to determine whether family
beliefs influenced the way the nurses felt about their body image. According to Puoane,
Matwa, Bradley & Hughes (2006), society, families and communities played a large role
in the determinants of weight. Questions 15 and 16 were designed to determine
whether media is overpowering cultural beliefs. These questions were also essential to
50
investigate the possible factors causing the shift in attitudes amongst black SA females
since it was observed that many of them were being influenced by media to lose weight.
3.5.3.6 Section F
Questions 18 to 21 were designed to determine whether nurses had tried to reduce
weight, the options they had used to do so and whether they were successful or not
(Matoti-Mvalo & Puoane 2011; Prinsloo et al 2011). Question 22 was included to
investigate factors that prevented nurses from being able to control their body weight,
because it has been observed that adverse work schedules could lead to obesity
amongst nurses (Shipra Gupta 2016; Phiri et al 2014; Han et al 2011).
3.5.4 Data collection form
In this form, a code was assigned to each nurse and their name, age, ID and ward were
recorded (Appendix A). The ward was included so that the researcher would know
where to fetch the questionnaire from. The fasting criteria were asked to ensure that
they met the requirements for the BIA. Their perceived current and desired body
shapes were recorded on this form prior to the anthropometric measurements being
taken. Anthropometric measurements, as well as the QuadScan code, were recorded
on this form.
3.6 PILOT STUDIES
The first pilot study was conducted in Pietermaritzburg. A group of four black females
and three black males (18 to 22 years old) who were waiting to catch the bus, were
approached by the researcher and asked if they were willing to answer a few questions
regarding obesity and cultural beliefs amongst black African women. The students were
interviewed separately and were asked about their cultural beliefs regarding obesity,
and about other factors that could possibly influence obesity amongst black women.
The females were asked to choose their perceived actual body image and ideal body
image on the Stunkard FRS. Black male students were interviewed since previous
51
studies have shown that in the black culture men prefer women who are overweight
(Okop et al 2016; Mvo et al 1999). The males were therefore asked which body image
they would prefer in their respective partners. Anthropometric measurements and BIA
were not done on these students. This pilot study resulted in the modification of the
questionnaire by including questions such as culture, job satisfaction and media.
For the second pilot study, For the second pilot study, one of the African staff at the
Discipline of Dietetics and Human Nutrition was asked to take part in an additional pilot
study and to recruit her friends. The aims and objectives were explained to them and
eight women aged 25 to 60 years signed the informed consent form (Appendix C).
Height and weight were taken using the described methodology. Bioelectrical
impedance analysis was not done as the equipment was not available at the time. The
data collection form (Appendix A) and the self-administered questionnaire (Appendix B)
were piloted. This pilot study resulted in the modification of the questionnaire by
including questions regarding family beliefs.
For the third pilot study, the head of Zimeleni Nursing School Mrs Thobile Shelmbe
([email protected]) was contacted by the researcher via a phone call and the aims
and objectives of the study were explained to her. Thereafter, permission was granted
to carry out this pilot study at the Zimeleni Nursing School (Appendix D). All the black
female nurses, both students and staff, who were present, were invited to participate in
the study. A group talk was given by the researcher who explained the aims, objectives
and procedures and what was expected of them. Overall, 18 signed informed consent
forms were collected. The nurses were instructed to not eat anything or drink any
caffeinated drinks four hours prior to the tests, not to consume any alcoholic drinks 24
hours prior to the tests and not to do any exercise 12 hours prior to the tests. The next
day, if compliant, they were weighed in minimal clothing and their height was taken
using the mobile SECA stadiometer. Their BIA was measured using the QuadScan
4000 (Bodystat). Each nurse was given the questionnaire to fill and this was collected
the following day by the researcher. Only nine questionnaires were received from
Zimeleni Nursing School since many were absent the following day or forgot to bring
their questionnaires. This pilot study resulted in the rewording of several questions from
52
the questionnaire due to feedback from the pilot study participants. No changes were
necessary to the procedure to be followed.
Since very few questionnaires were returned, it was essential to re-pilot them. Hillcrest
Aids Centre Trust and Le Domaine retirement village were contacted, and copies of the
questionnaires were emailed to them after explaining the aims and objectives of this
study. Mrs Jennifer Phumele Dlamini ([email protected]), a nursing
manager, as well as her personal friends who were nurses also filled in the
questionnaires. A total of 17 re-piloted questionnaires were collected. This final pilot
study resulted in making the final changes to the questionnaire by restructuring and
regrouping the questions.
3.7 MAIN STUDY
Permission to conduct the main study was obtained from the hospital manager, Mr
Heinrich Venter ([email protected]) of St Augustine’s Hospital
(Appendix E). Ethics approval was obtained from the Biomedical Research Ethics
Committee of UKZN (BREC) (Appendix F) and the Netcare Research Operations
Committee (Appendix G). Thereafter, the main study was carried out at the hospital
and data was collected over a period of six weeks (24th July 2017- 31st August 2017).
The Human Resources department of the hospital supplied a list of all black female
nurses employed.
A management meeting was held between the Nursing Manager, Jenny Pieterse
([email protected]), the unit managers, the resident hospital dietician,
Mandy Read ([email protected]) and the MSc supervisor, Dr Chara Biggs
([email protected]) to explain the aims and objectives as well as to discuss the
logistics and feasibility of the study. All the unit managers agreed to allow the nurses
from their respective units time off to participate in the study.
The researcher went to each ward and asked the unit manager for permission to speak
with the black female nurses on duty. The researcher spoke with each black female
nurse individually inviting them to participate and explained the inclusion criteria, aims
53
and objectives of the study. On the day of data collection, each nurse was greeted by
the researcher in an available treatment room within the hospital. The nurse was asked
if she had complied with the fasting and exercise criteria. If yes, she could participate
on the same day and if no, she was asked to comply with the criteria for participation
the following day.
The informed consent form (Appendix C) was explained thoroughly and once the
researcher was satisfied that the nurse understood the purpose of the study and what
was expected, they were then asked to sign the informed consent form. Their names
and details were recorded by the researcher on the data collection form (Appendix A)
and the nurse was asked to choose their perceived actual and desired body shape on
the Stunkard FRS (Appendix A). All measurements were conducted in a private
examination room. Nurses were then weighed in minimal clothing by removing their
uniform and wearing a cotton gown over their undergarments and their inhaled height
was taken using the mobile SECA stadiometer. They were then asked to take off any
jewellery and lie down on the plinth with their arms extended from the chest by about
30° and legs separated by about 45°. For obese nurses, a non-conductive material
(cotton bedsheet) was folded and placed between their legs. Their BIA was measured
using the QuadScan 4000. Once all measurements were completed, the nurse was
thanked for her participation and given the questionnaire (Appendix B) to fill in. The
researcher collected the questionnaire later on the same day or on the following day.
Once the questionnaires were collected, they were checked thoroughly by the
researcher to ensure that they were correctly completed, and the nurses were given a
lucky draw form to fill in. The lucky draw prize was R1000 per every 50 nurses. Figure
3.6 depicts the flow diagram of the main study.
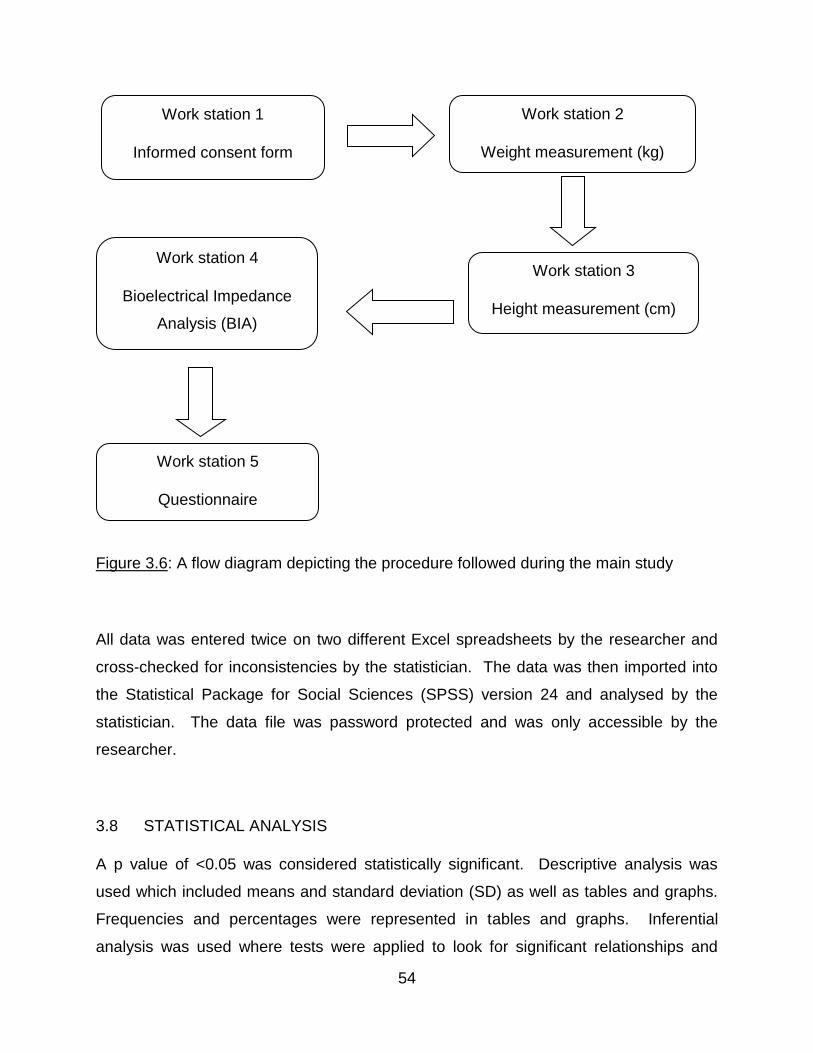
54
Figure 3.6: A flow diagram depicting the procedure followed during the main study
All data was entered twice on two different Excel spreadsheets by the researcher and
cross-checked for inconsistencies by the statistician. The data was then imported into
the Statistical Package for Social Sciences (SPSS) version 24 and analysed by the
statistician. The data file was password protected and was only accessible by the
researcher.
3.8 STATISTICAL ANALYSIS
A p value of <0.05 was considered statistically significant. Descriptive analysis was
used which included means and standard deviation (SD) as well as tables and graphs.
Frequencies and percentages were represented in tables and graphs. Inferential
analysis was used where tests were applied to look for significant relationships and
Work station 2
Weight measurement (kg)
Work station 3
Height measurement (cm)
Work station 4
Bioelectrical Impedance
Analysis (BIA)
Work station 5
Questionnaire
Work station 1
Informed consent form
55
trends in the data. This included the Pearson’s correlation, Chi-square tests, ANOVA,
paired sample t-test, one sample t-test, independent sample t-test and Binomial test.
Pearson’s correlation coefficient was used to measure the linear relationship between
the two interval variables. The Chi-square test of independence was used on cross-
tabulations to determine whether there was a significant relationship between two
nominal variables. Where conditions were not met, the Fisher’s exact test was used.
ANOVA was used to test if a significant difference existed in mean values for a specific
variable across another variable that had more than two categories. The one sample t-
test was used to test whether a mean score was significantly different from a scalar
value while, the paired samples t-test compared the means of two variables for a single
group. The independent sample t-test was used to compare two independent groups of
cases. The Binomial test was used to test whether a significant proportion of
respondents selected one of a possible two responses, which could be extended when
data with more than two response options is split into two distinct groups.
3.9 VARIABLES INCLUDED IN THE STUDY, DATA CAPTURING AND
STATISTICAL ANALYSIS
Table 3.2 covers all the objectives and variables and statistical analysis used to achieve
them.
Table 3.2: Variables included in the study, data capturing and statistical analysis.
Objective Variable (s) Statistical analysis
1. To determine the
prevalence of overweight
and obesity.
Weight (kg), height (m) Descriptive statistics in the form
of means and standard
deviations
Chi-square goodness-of-fit test
was used to test if any category
(ies) of BMI occurred
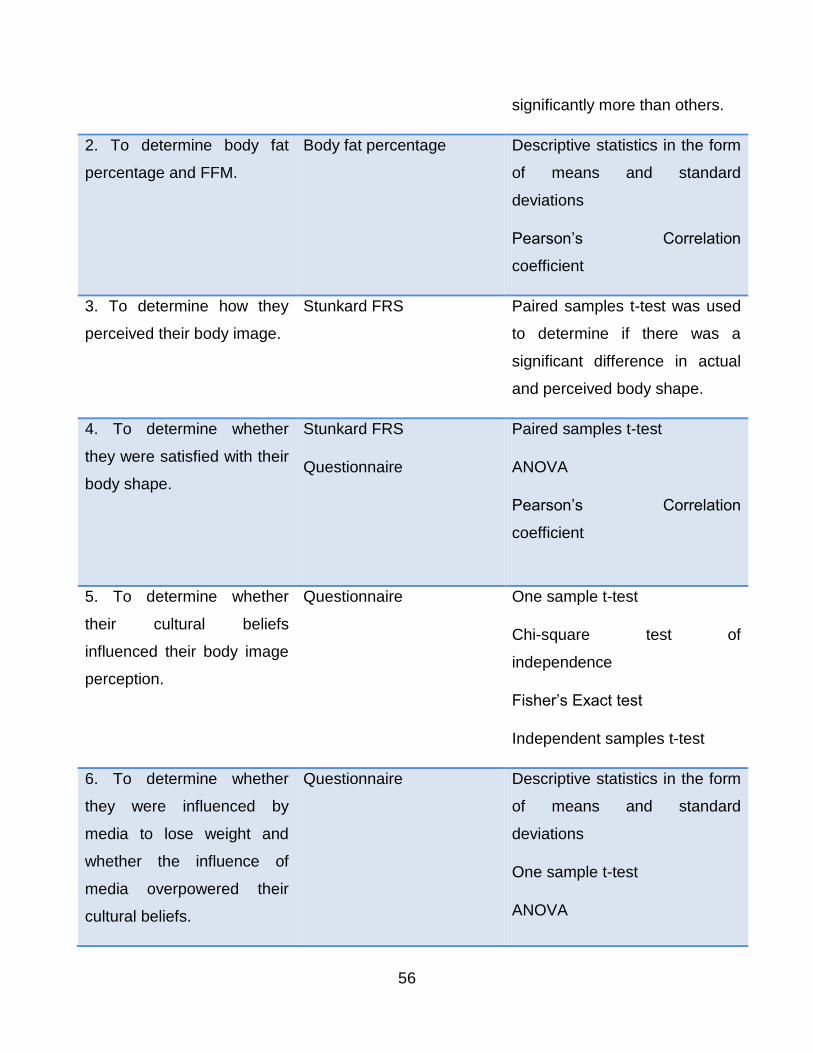
56
significantly more than others.
2. To determine body fat
percentage and FFM.
Body fat percentage Descriptive statistics in the form
of means and standard
deviations
Pearson’s Correlation
coefficient
3. To determine how they
perceived their body image.
Stunkard FRS Paired samples t-test was used
to determine if there was a
significant difference in actual
and perceived body shape.
4. To determine whether
they were satisfied with their
body shape.
Stunkard FRS
Questionnaire
Paired samples t-test
ANOVA
Pearson’s Correlation
coefficient
5. To determine whether
their cultural beliefs
influenced their body image
perception.
Questionnaire One sample t-test
Chi-square test of
independence
Fisher’s Exact test
Independent samples t-test
6. To determine whether
they were influenced by
media to lose weight and
whether the influence of
media overpowered their
cultural beliefs.
Questionnaire Descriptive statistics in the form
of means and standard
deviations
One sample t-test
ANOVA
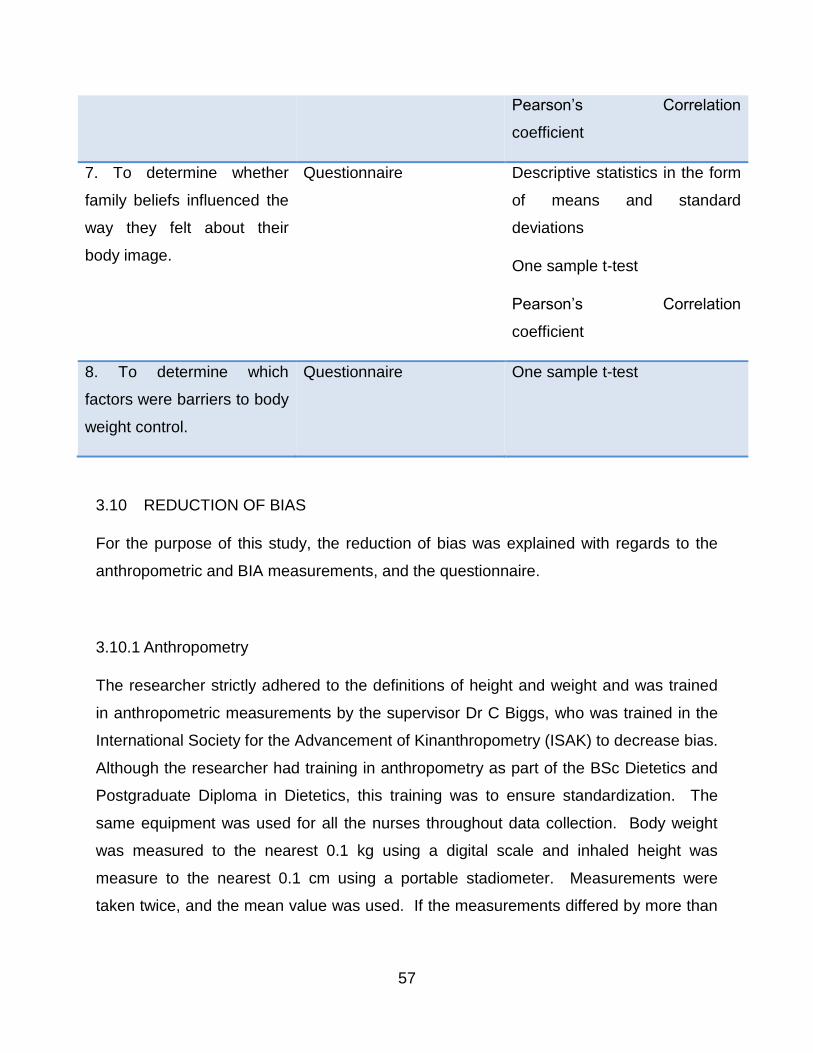
57
Pearson’s Correlation
coefficient
7. To determine whether
family beliefs influenced the
way they felt about their
body image.
Questionnaire Descriptive statistics in the form
of means and standard
deviations
One sample t-test
Pearson’s Correlation
coefficient
8. To determine which
factors were barriers to body
weight control.
Questionnaire One sample t-test
3.10 REDUCTION OF BIAS
For the purpose of this study, the reduction of bias was explained with regards to the
anthropometric and BIA measurements, and the questionnaire.
3.10.1 Anthropometry
The researcher strictly adhered to the definitions of height and weight and was trained
in anthropometric measurements by the supervisor Dr C Biggs, who was trained in the
International Society for the Advancement of Kinanthropometry (ISAK) to decrease bias.
Although the researcher had training in anthropometry as part of the BSc Dietetics and
Postgraduate Diploma in Dietetics, this training was to ensure standardization. The
same equipment was used for all the nurses throughout data collection. Body weight
was measured to the nearest 0.1 kg using a digital scale and inhaled height was
measure to the nearest 0.1 cm using a portable stadiometer. Measurements were
taken twice, and the mean value was used. If the measurements differed by more than
58
0.01 kg or 0.1 cm, the measurements were done for a third time and the two closest
values were used.
3.10.2 Bioelectrical impedance analysis
The researcher was trained to use the QuadScan 4000 (Bodystat) by the supervisor, Dr
Chara Biggs. All standard operating procedures were adhered to. Measurements were
taken twice, and the mean was used.
3.10.3 Questionnaire
Each nurse was advised to fill in their questionnaire on their own since it contained very
confidential information. Some nurses chose to fill in their questionnaires in the
presence of the researcher.
3.11 RELIABILITY AND VALIDITY
Reliability is defined as the extent to which results are accurate and consistent over a
period of time (Nahid 2003). Validity is measured by determining whether the
researcher is truly measuring that which was intended to be measured in the study,
and/or how constant the results are (Nahid 2003).
The precision scale (AND UC-321, A&D Medical) with a capacity of 150 kg was
calibrated with a known weight daily (5 kg Avery). The QuadScan 4000 was calibrated
daily using a calibrator according to standard operating procedures. Calibration
ensured reliability of the results collected. Each measurement was taken twice to
ensure reliability and validity. The questionnaire used in this study was based on
previous studies that investigated body image perception amongst black women in SA
as well as prevalence of obesity amongst nurses in SA. The Stunkard FRS was
validated and adapted for use in SA by Mciza et al (2005).
59
3.12 ETHICAL CONSIDERATIONS
Ethical approval was obtained from BREC UKZN (BE 286/97) and the Netcare
Research Operations Committee (UNIV-2017-0026). Permission was obtained from St
Augustine’s Hospital manager and Zimeleni Nursing School manager. Prior to data
collection, each nurse signed an informed consent form after being thoroughly informed
of the procedures and what was expected of them. Data collected from each nurse was
kept confidential as none of the other nurses had any access to the data. Each nurse
was allocated an anonymous code and the data was entered into SPSS version 24
using those codes. Only the researcher had access to the data collected which was
password protected. All questionnaires and data collection forms were kept in a locked
cupboard and will be kept for a period of five years before being destroyed.
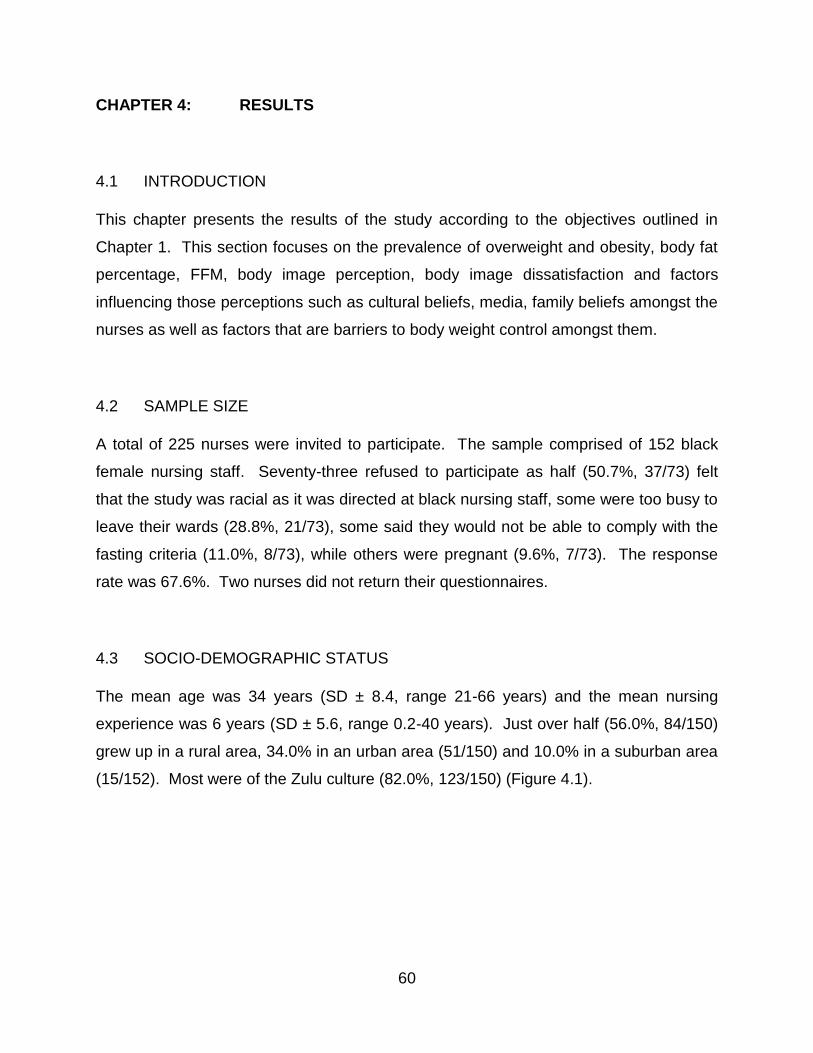
60
CHAPTER 4: RESULTS
4.1 INTRODUCTION
This chapter presents the results of the study according to the objectives outlined in
Chapter 1. This section focuses on the prevalence of overweight and obesity, body fat
percentage, FFM, body image perception, body image dissatisfaction and factors
influencing those perceptions such as cultural beliefs, media, family beliefs amongst the
nurses as well as factors that are barriers to body weight control amongst them.
4.2 SAMPLE SIZE
A total of 225 nurses were invited to participate. The sample comprised of 152 black
female nursing staff. Seventy-three refused to participate as half (50.7%, 37/73) felt
that the study was racial as it was directed at black nursing staff, some were too busy to
leave their wards (28.8%, 21/73), some said they would not be able to comply with the
fasting criteria (11.0%, 8/73), while others were pregnant (9.6%, 7/73). The response
rate was 67.6%. Two nurses did not return their questionnaires.
4.3 SOCIO-DEMOGRAPHIC STATUS
The mean age was 34 years (SD ± 8.4, range 21-66 years) and the mean nursing
experience was 6 years (SD ± 5.6, range 0.2-40 years). Just over half (56.0%, 84/150)
grew up in a rural area, 34.0% in an urban area (51/150) and 10.0% in a suburban area
(15/152). Most were of the Zulu culture (82.0%, 123/150) (Figure 4.1).
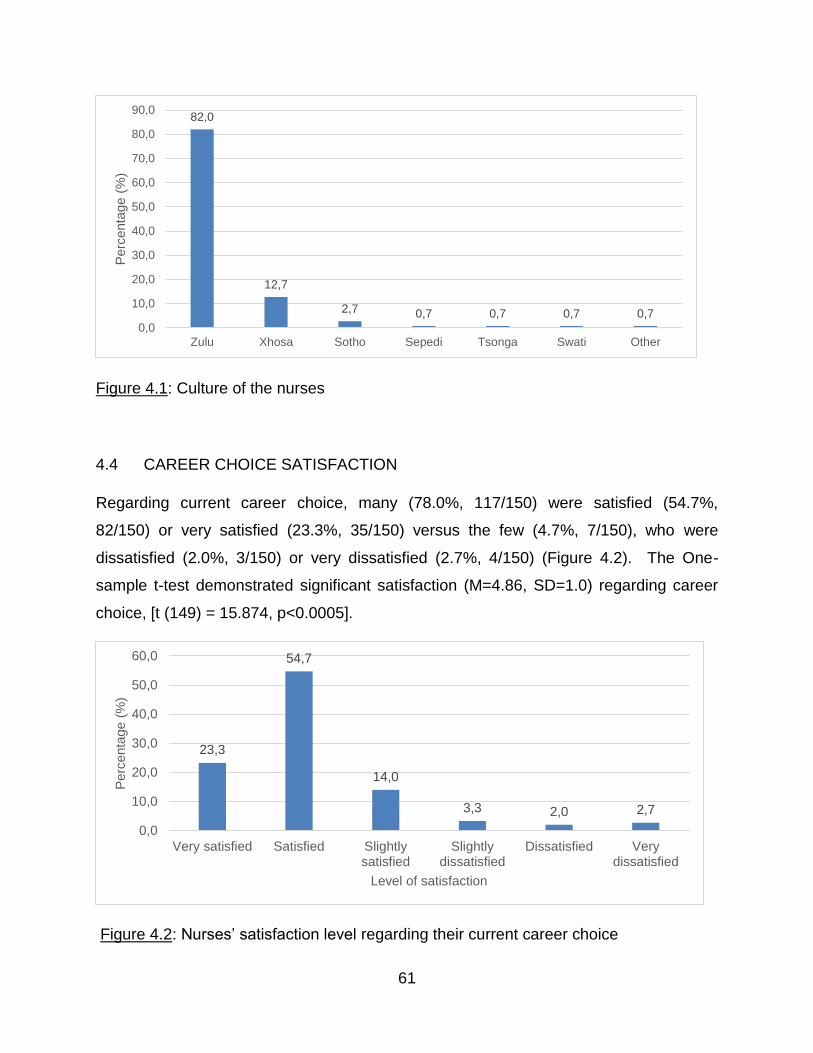
61
Figure 4.1: Culture of the nurses
4.4 CAREER CHOICE SATISFACTION
Regarding current career choice, many (78.0%, 117/150) were satisfied (54.7%,
82/150) or very satisfied (23.3%, 35/150) versus the few (4.7%, 7/150), who were
dissatisfied (2.0%, 3/150) or very dissatisfied (2.7%, 4/150) (Figure 4.2). The One-
sample t-test demonstrated significant satisfaction (M=4.86, SD=1.0) regarding career
choice, [t (149) = 15.874, p<0.0005].
Figure 4.2: Nurses’ satisfaction level regarding their current career choice
82,0
12,7
2,7 0,7 0,7 0,7 0,7
0,0
10,0
20,0
30,0
40,0
50,0
60,0
70,0
80,0
90,0
Zulu Xhosa Sotho Sepedi Tsonga Swati Other
Perc
enta
ge (
%)
23,3
54,7
14,0
3,3 2,0 2,7
0,0
10,0
20,0
30,0
40,0
50,0
60,0
Very satisfied Satisfied Slightlysatisfied
Slightlydissatisfied
Dissatisfied Verydissatisfied
Perc
enta
ge (
%)
Level of satisfaction
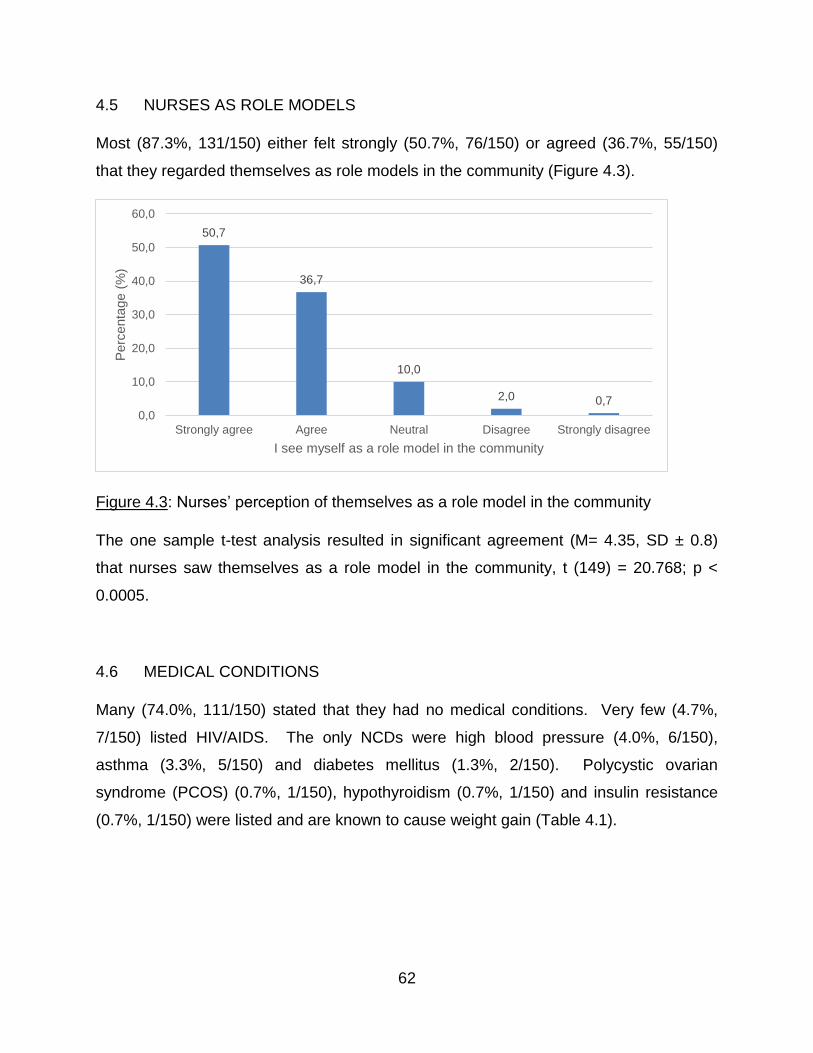
62
4.5 NURSES AS ROLE MODELS
Most (87.3%, 131/150) either felt strongly (50.7%, 76/150) or agreed (36.7%, 55/150)
that they regarded themselves as role models in the community (Figure 4.3).
Figure 4.3: Nurses’ perception of themselves as a role model in the community
The one sample t-test analysis resulted in significant agreement (M= 4.35, SD ± 0.8)
that nurses saw themselves as a role model in the community, t (149) = 20.768; p <
0.0005.
4.6 MEDICAL CONDITIONS
Many (74.0%, 111/150) stated that they had no medical conditions. Very few (4.7%,
7/150) listed HIV/AIDS. The only NCDs were high blood pressure (4.0%, 6/150),
asthma (3.3%, 5/150) and diabetes mellitus (1.3%, 2/150). Polycystic ovarian
syndrome (PCOS) (0.7%, 1/150), hypothyroidism (0.7%, 1/150) and insulin resistance
(0.7%, 1/150) were listed and are known to cause weight gain (Table 4.1).
50,7
36,7
10,0
2,0 0,7
0,0
10,0
20,0
30,0
40,0
50,0
60,0
Strongly agree Agree Neutral Disagree Strongly disagree
Perc
enta
ge (
%)
I see myself as a role model in the community
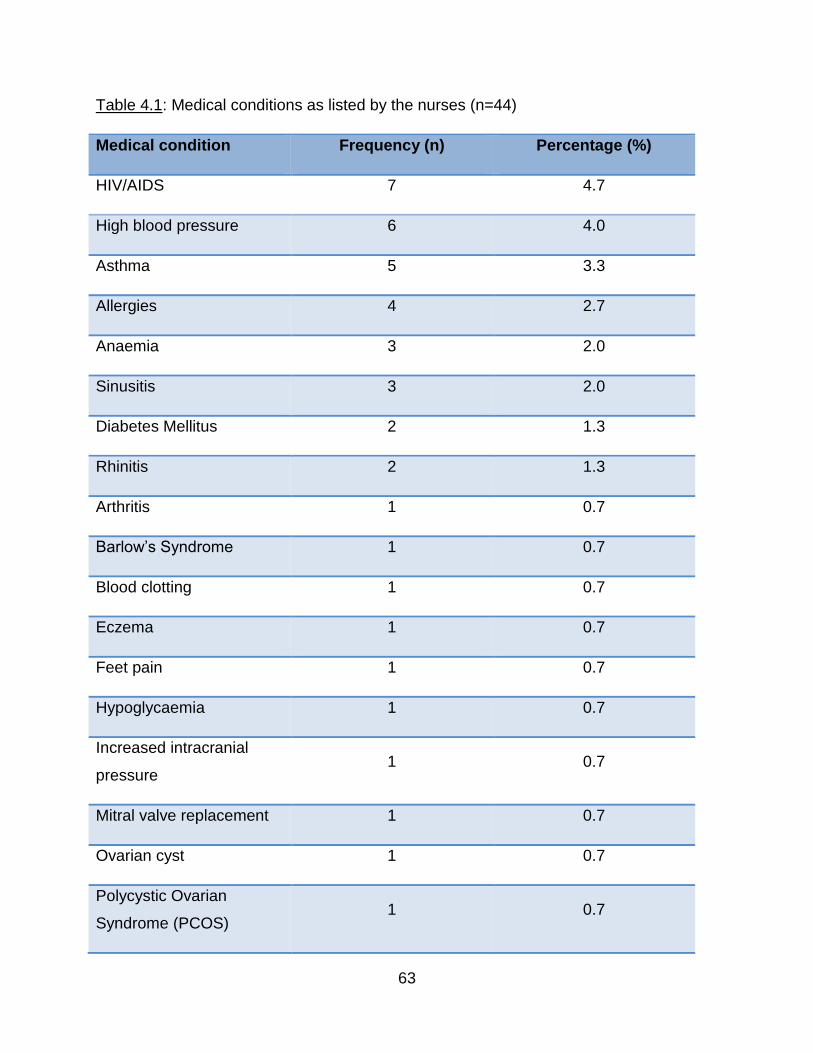
63
Table 4.1: Medical conditions as listed by the nurses (n=44)
Medical condition Frequency (n) Percentage (%)
HIV/AIDS 7 4.7
High blood pressure 6 4.0
Asthma 5 3.3
Allergies 4 2.7
Anaemia 3 2.0
Sinusitis 3 2.0
Diabetes Mellitus 2 1.3
Rhinitis 2 1.3
Arthritis 1 0.7
Barlow’s Syndrome 1 0.7
Blood clotting 1 0.7
Eczema 1 0.7
Feet pain 1 0.7
Hypoglycaemia 1 0.7
Increased intracranial
pressure 1 0.7
Mitral valve replacement 1 0.7
Ovarian cyst 1 0.7
Polycystic Ovarian
Syndrome (PCOS) 1 0.7
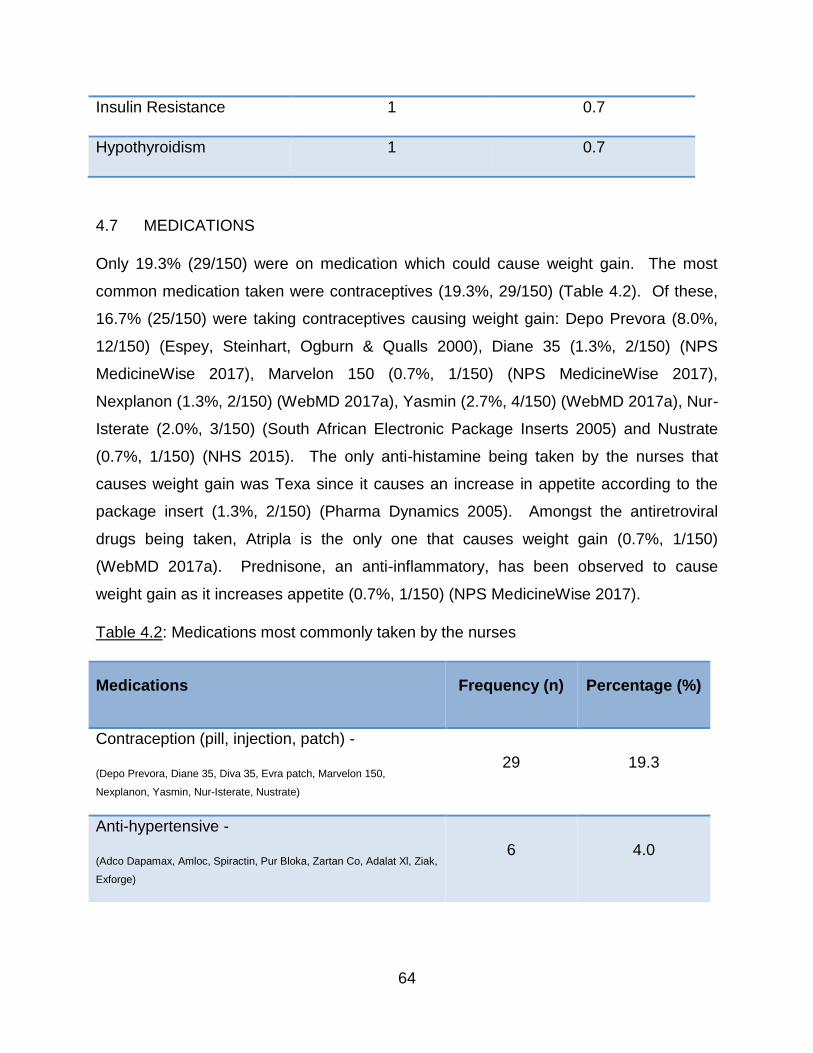
64
Insulin Resistance 1 0.7
Hypothyroidism 1 0.7
4.7 MEDICATIONS
Only 19.3% (29/150) were on medication which could cause weight gain. The most
common medication taken were contraceptives (19.3%, 29/150) (Table 4.2). Of these,
16.7% (25/150) were taking contraceptives causing weight gain: Depo Prevora (8.0%,
12/150) (Espey, Steinhart, Ogburn & Qualls 2000), Diane 35 (1.3%, 2/150) (NPS
MedicineWise 2017), Marvelon 150 (0.7%, 1/150) (NPS MedicineWise 2017),
Nexplanon (1.3%, 2/150) (WebMD 2017a), Yasmin (2.7%, 4/150) (WebMD 2017a), Nur-
Isterate (2.0%, 3/150) (South African Electronic Package Inserts 2005) and Nustrate
(0.7%, 1/150) (NHS 2015). The only anti-histamine being taken by the nurses that
causes weight gain was Texa since it causes an increase in appetite according to the
package insert (1.3%, 2/150) (Pharma Dynamics 2005). Amongst the antiretroviral
drugs being taken, Atripla is the only one that causes weight gain (0.7%, 1/150)
(WebMD 2017a). Prednisone, an anti-inflammatory, has been observed to cause
weight gain as it increases appetite (0.7%, 1/150) (NPS MedicineWise 2017).
Table 4.2: Medications most commonly taken by the nurses
Medications Frequency (n) Percentage (%)
Contraception (pill, injection, patch) -
(Depo Prevora, Diane 35, Diva 35, Evra patch, Marvelon 150,
Nexplanon, Yasmin, Nur-Isterate, Nustrate)
29 19.3
Anti-hypertensive -
(Adco Dapamax, Amloc, Spiractin, Pur Bloka, Zartan Co, Adalat Xl, Ziak,
Exforge)
6 4.0
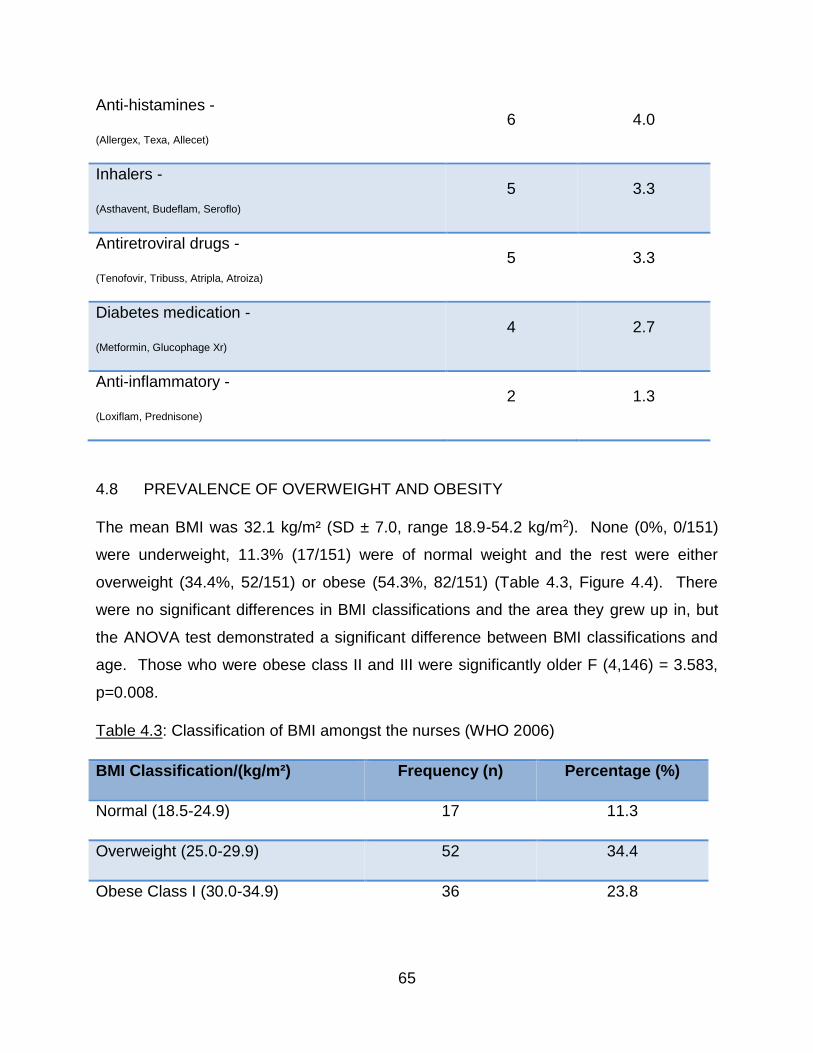
65
Anti-histamines -
(Allergex, Texa, Allecet)
6 4.0
Inhalers -
(Asthavent, Budeflam, Seroflo)
5 3.3
Antiretroviral drugs -
(Tenofovir, Tribuss, Atripla, Atroiza)
5 3.3
Diabetes medication -
(Metformin, Glucophage Xr)
4 2.7
Anti-inflammatory -
(Loxiflam, Prednisone)
2 1.3
4.8 PREVALENCE OF OVERWEIGHT AND OBESITY
The mean BMI was 32.1 kg/m² (SD ± 7.0, range 18.9-54.2 kg/m2). None (0%, 0/151)
were underweight, 11.3% (17/151) were of normal weight and the rest were either
overweight (34.4%, 52/151) or obese (54.3%, 82/151) (Table 4.3, Figure 4.4). There
were no significant differences in BMI classifications and the area they grew up in, but
the ANOVA test demonstrated a significant difference between BMI classifications and
age. Those who were obese class II and III were significantly older F (4,146) = 3.583,
p=0.008.
Table 4.3: Classification of BMI amongst the nurses (WHO 2006)
BMI Classification/(kg/m²) Frequency (n) Percentage (%)
Normal (18.5-24.9) 17 11.3
Overweight (25.0-29.9) 52 34.4
Obese Class I (30.0-34.9) 36 23.8
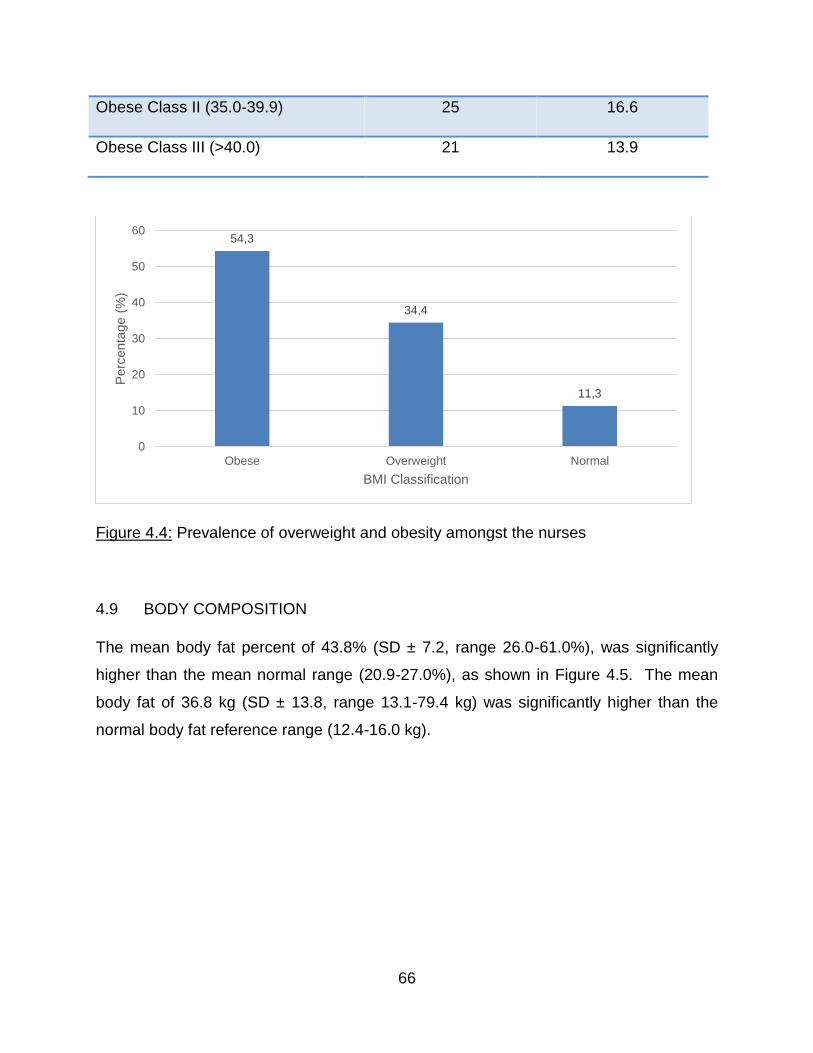
66
Obese Class II (35.0-39.9) 25 16.6
Obese Class III (>40.0) 21 13.9
Figure 4.4: Prevalence of overweight and obesity amongst the nurses
4.9 BODY COMPOSITION
The mean body fat percent of 43.8% (SD ± 7.2, range 26.0-61.0%), was significantly
higher than the mean normal range (20.9-27.0%), as shown in Figure 4.5. The mean
body fat of 36.8 kg (SD ± 13.8, range 13.1-79.4 kg) was significantly higher than the
normal body fat reference range (12.4-16.0 kg).
54,3
34,4
11,3
0
10
20
30
40
50
60
Obese Overweight Normal
Perc
enta
ge (
%)
BMI Classification
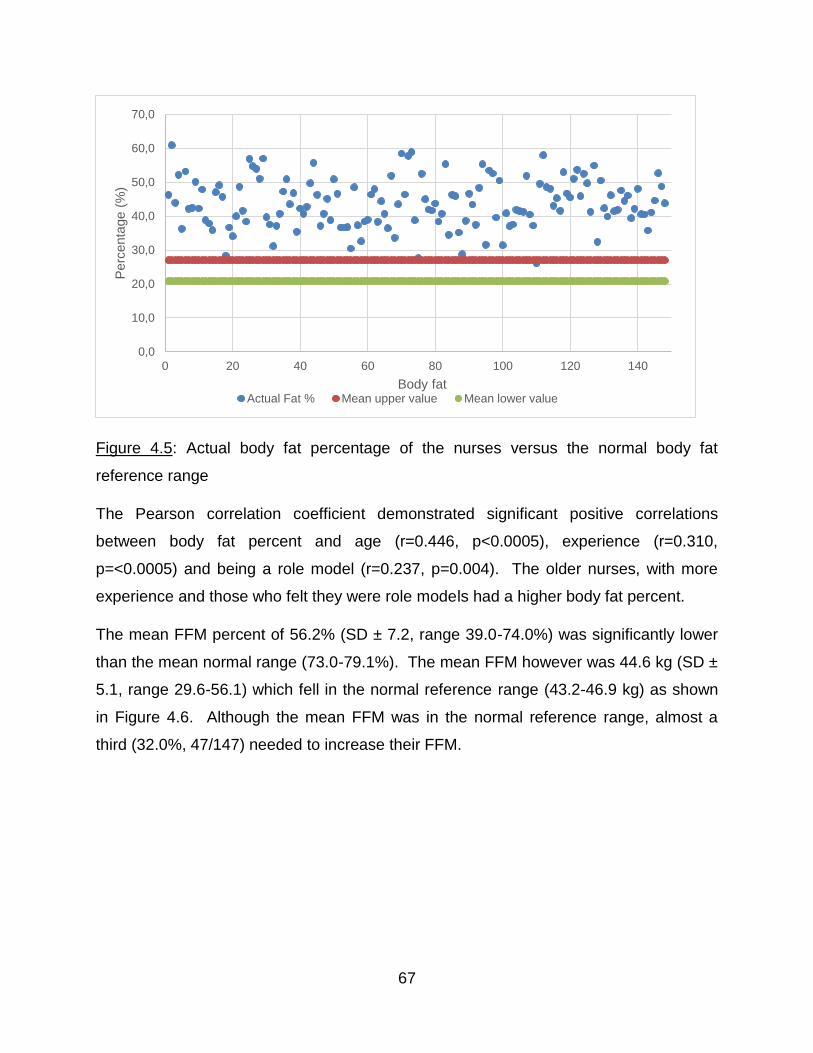
67
Figure 4.5: Actual body fat percentage of the nurses versus the normal body fat
reference range
The Pearson correlation coefficient demonstrated significant positive correlations
between body fat percent and age (r=0.446, p<0.0005), experience (r=0.310,
p=<0.0005) and being a role model (r=0.237, p=0.004). The older nurses, with more
experience and those who felt they were role models had a higher body fat percent.
The mean FFM percent of 56.2% (SD ± 7.2, range 39.0-74.0%) was significantly lower
than the mean normal range (73.0-79.1%). The mean FFM however was 44.6 kg (SD ±
5.1, range 29.6-56.1) which fell in the normal reference range (43.2-46.9 kg) as shown
in Figure 4.6. Although the mean FFM was in the normal reference range, almost a
third (32.0%, 47/147) needed to increase their FFM.
0,0
10,0
20,0
30,0
40,0
50,0
60,0
70,0
0 20 40 60 80 100 120 140
Perc
enta
ge (
%)
Body fatActual Fat % Mean upper value Mean lower value
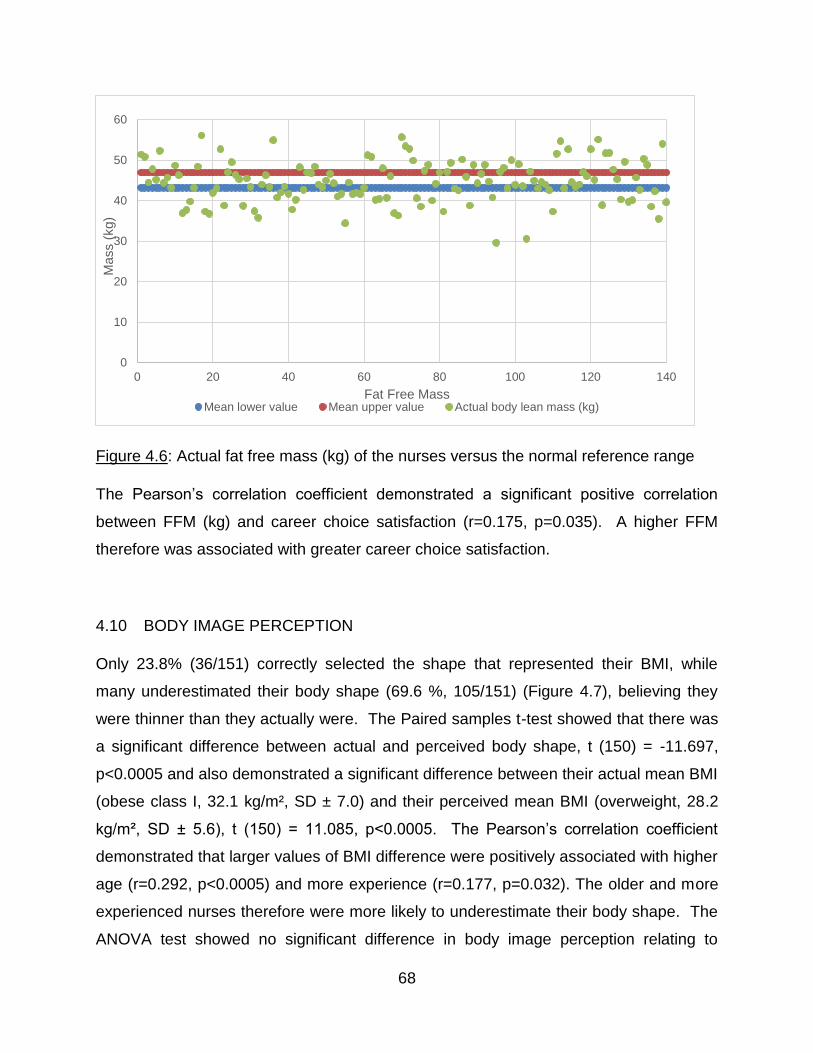
68
Figure 4.6: Actual fat free mass (kg) of the nurses versus the normal reference range
The Pearson’s correlation coefficient demonstrated a significant positive correlation
between FFM (kg) and career choice satisfaction (r=0.175, p=0.035). A higher FFM
therefore was associated with greater career choice satisfaction.
4.10 BODY IMAGE PERCEPTION
Only 23.8% (36/151) correctly selected the shape that represented their BMI, while
many underestimated their body shape (69.6 %, 105/151) (Figure 4.7), believing they
were thinner than they actually were. The Paired samples t-test showed that there was
a significant difference between actual and perceived body shape, t (150) = -11.697,
p<0.0005 and also demonstrated a significant difference between their actual mean BMI
(obese class I, 32.1 kg/m², SD ± 7.0) and their perceived mean BMI (overweight, 28.2
kg/m², SD ± 5.6), t (150) = 11.085, p<0.0005. The Pearson’s correlation coefficient
demonstrated that larger values of BMI difference were positively associated with higher
age (r=0.292, p<0.0005) and more experience (r=0.177, p=0.032). The older and more
experienced nurses therefore were more likely to underestimate their body shape. The
ANOVA test showed no significant difference in body image perception relating to
0
10
20
30
40
50
60
0 20 40 60 80 100 120 140
Mass (
kg)
Fat Free MassMean lower value Mean upper value Actual body lean mass (kg)
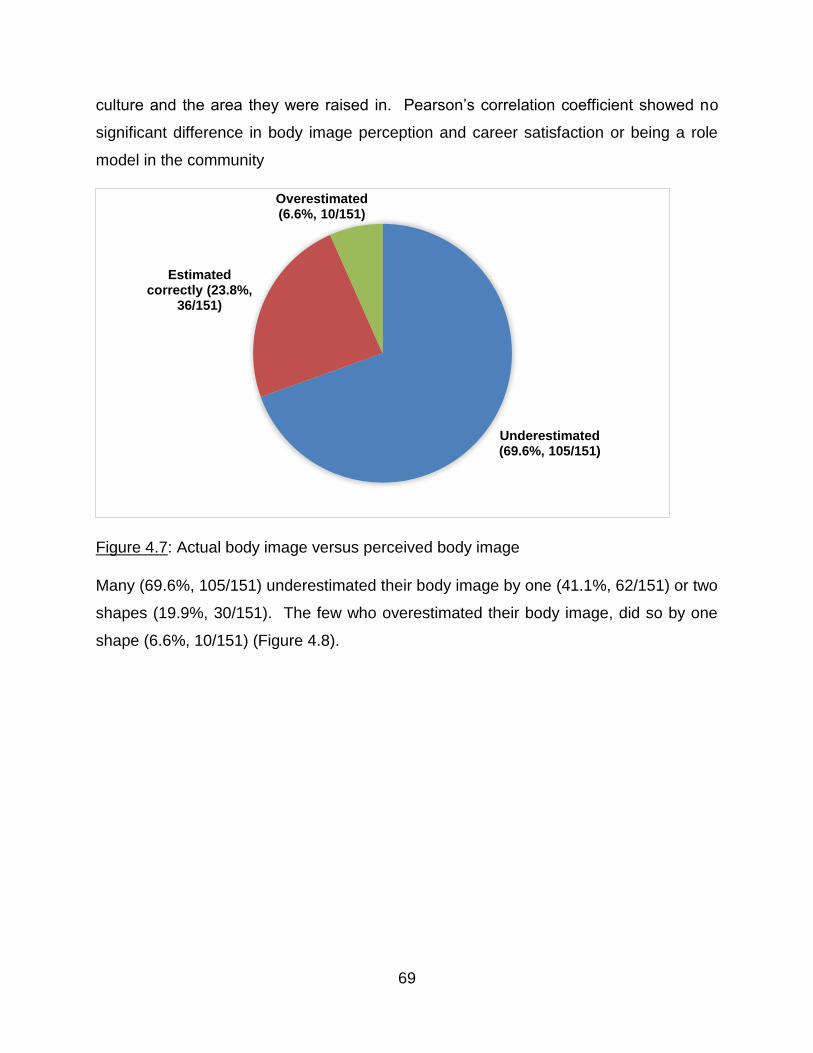
69
culture and the area they were raised in. Pearson’s correlation coefficient showed no
significant difference in body image perception and career satisfaction or being a role
model in the community
Figure 4.7: Actual body image versus perceived body image
Many (69.6%, 105/151) underestimated their body image by one (41.1%, 62/151) or two
shapes (19.9%, 30/151). The few who overestimated their body image, did so by one
shape (6.6%, 10/151) (Figure 4.8).
Underestimated(69.6%, 105/151)
Estimated correctly (23.8%,
36/151)
Overestimated(6.6%, 10/151)
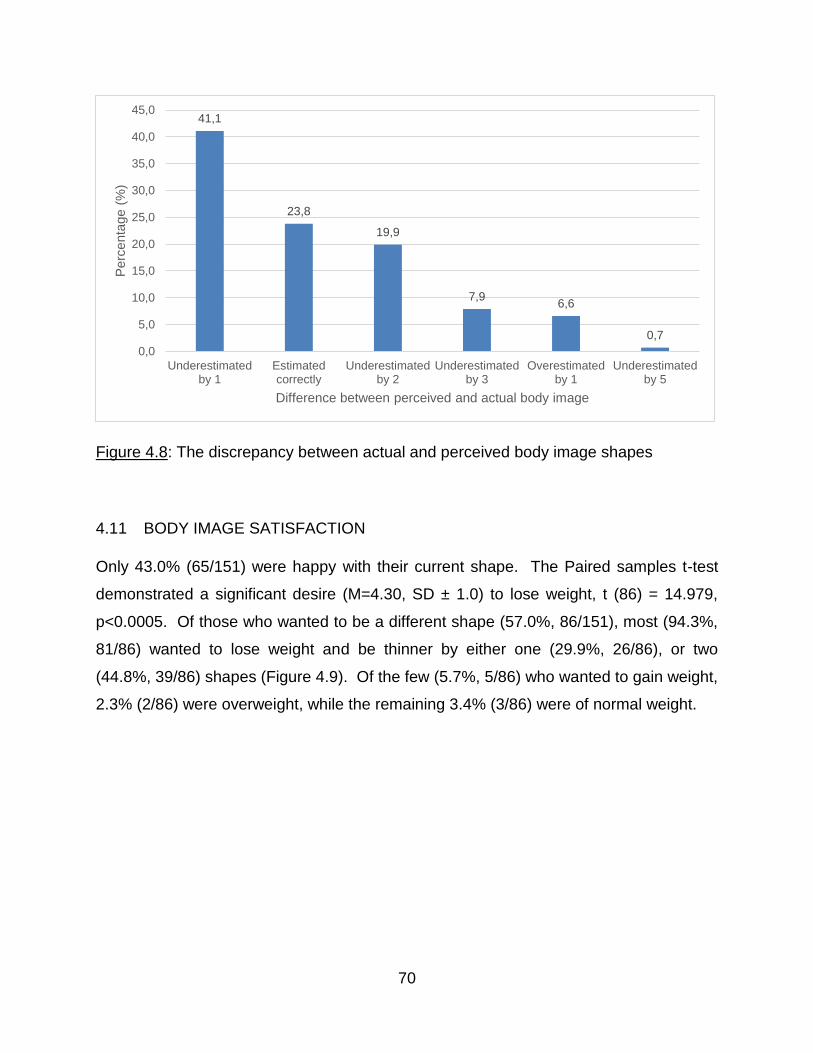
70
Figure 4.8: The discrepancy between actual and perceived body image shapes
4.11 BODY IMAGE SATISFACTION
Only 43.0% (65/151) were happy with their current shape. The Paired samples t-test
demonstrated a significant desire (M=4.30, SD ± 1.0) to lose weight, t (86) = 14.979,
p<0.0005. Of those who wanted to be a different shape (57.0%, 86/151), most (94.3%,
81/86) wanted to lose weight and be thinner by either one (29.9%, 26/86), or two
(44.8%, 39/86) shapes (Figure 4.9). Of the few (5.7%, 5/86) who wanted to gain weight,
2.3% (2/86) were overweight, while the remaining 3.4% (3/86) were of normal weight.
41,1
23,8
19,9
7,96,6
0,7
0,0
5,0
10,0
15,0
20,0
25,0
30,0
35,0
40,0
45,0
Underestimatedby 1
Estimatedcorrectly
Underestimatedby 2
Underestimatedby 3
Overestimatedby 1
Underestimatedby 5
Perc
enta
ge (
%)
Difference between perceived and actual body image
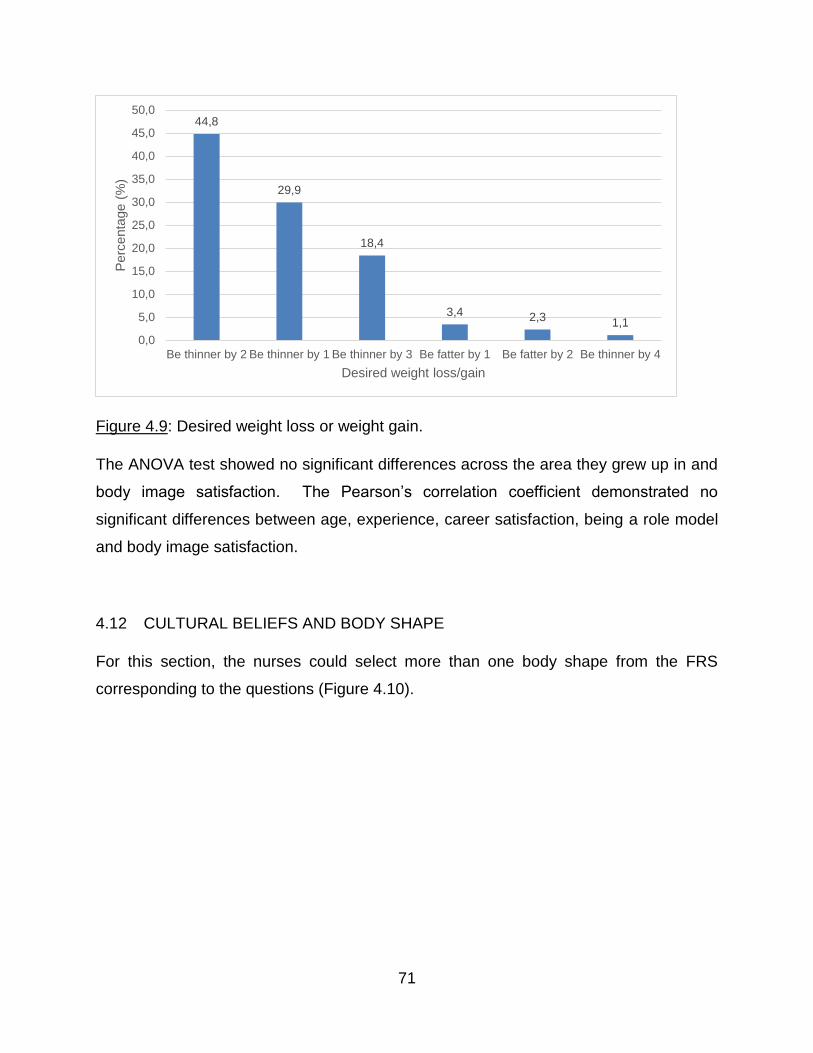
71
Figure 4.9: Desired weight loss or weight gain.
The ANOVA test showed no significant differences across the area they grew up in and
body image satisfaction. The Pearson’s correlation coefficient demonstrated no
significant differences between age, experience, career satisfaction, being a role model
and body image satisfaction.
4.12 CULTURAL BELIEFS AND BODY SHAPE
For this section, the nurses could select more than one body shape from the FRS
corresponding to the questions (Figure 4.10).
44,8
29,9
18,4
3,4 2,3 1,1
0,0
5,0
10,0
15,0
20,0
25,0
30,0
35,0
40,0
45,0
50,0
Be thinner by 2 Be thinner by 1 Be thinner by 3 Be fatter by 1 Be fatter by 2 Be thinner by 4
Perc
enta
ge (
%)
Desired weight loss/gain
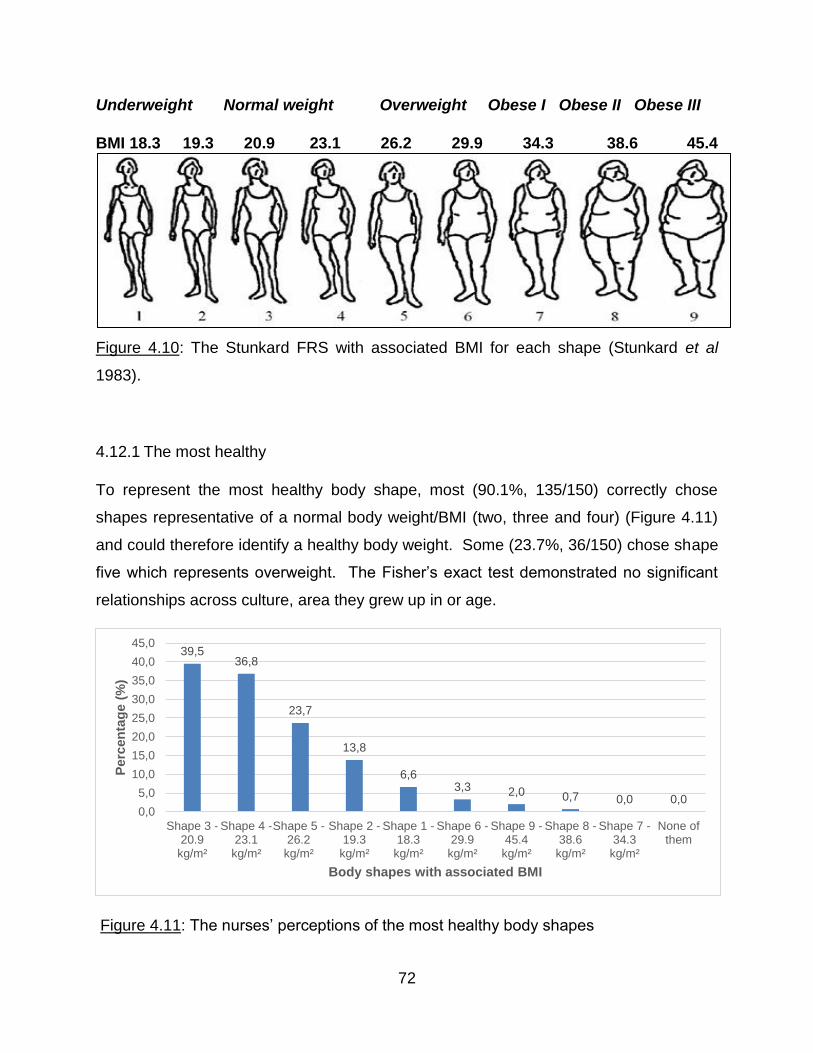
72
Underweight Normal weight Overweight Obese I Obese II Obese III
BMI 18.3 19.3 20.9 23.1 26.2 29.9 34.3 38.6 45.4
Figure 4.10: The Stunkard FRS with associated BMI for each shape (Stunkard et al
1983).
4.12.1 The most healthy
To represent the most healthy body shape, most (90.1%, 135/150) correctly chose
shapes representative of a normal body weight/BMI (two, three and four) (Figure 4.11)
and could therefore identify a healthy body weight. Some (23.7%, 36/150) chose shape
five which represents overweight. The Fisher’s exact test demonstrated no significant
relationships across culture, area they grew up in or age.
Figure 4.11: The nurses’ perceptions of the most healthy body shapes
39,536,8
23,7
13,8
6,63,3 2,0 0,7 0,0 0,0
0,0
5,0
10,0
15,0
20,0
25,0
30,0
35,0
40,0
45,0
Shape 3 -20.9kg/m²
Shape 4 -23.1kg/m²
Shape 5 -26.2kg/m²
Shape 2 -19.3kg/m²
Shape 1 -18.3kg/m²
Shape 6 -29.9kg/m²
Shape 9 -45.4kg/m²
Shape 8 -38.6kg/m²
Shape 7 -34.3kg/m²
None ofthem
Perc
en
tag
e (
%)
Body shapes with associated BMI
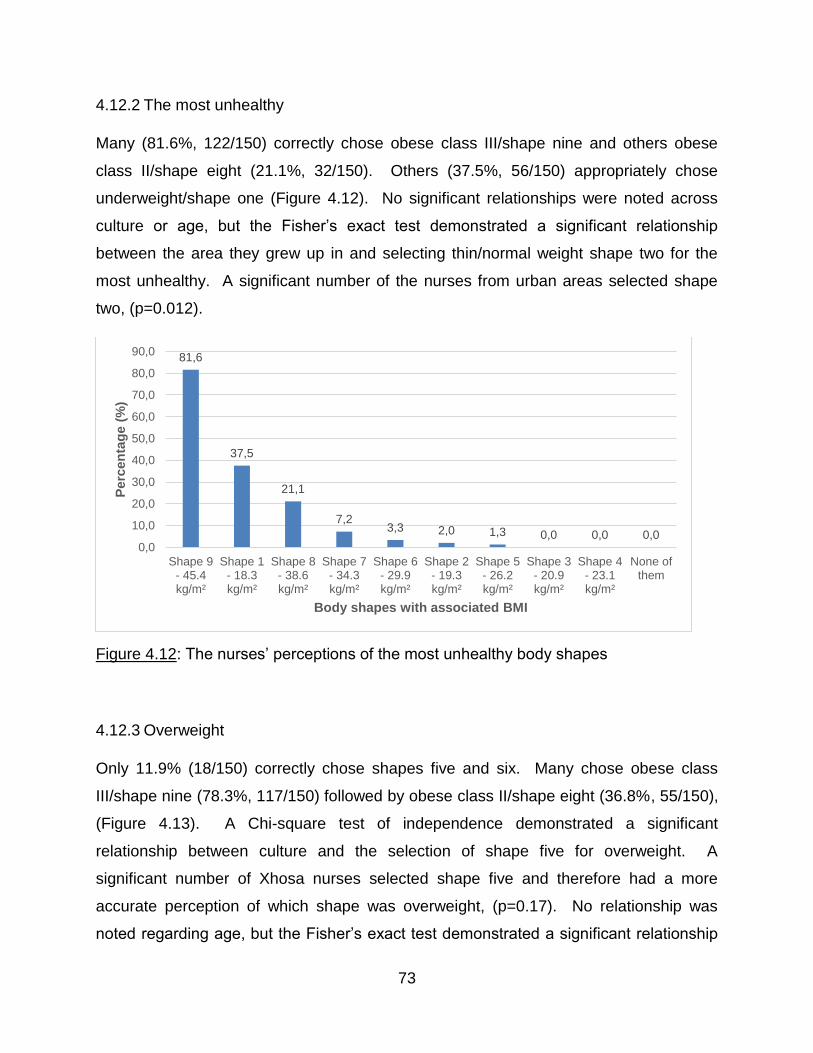
73
4.12.2 The most unhealthy
Many (81.6%, 122/150) correctly chose obese class III/shape nine and others obese
class II/shape eight (21.1%, 32/150). Others (37.5%, 56/150) appropriately chose
underweight/shape one (Figure 4.12). No significant relationships were noted across
culture or age, but the Fisher’s exact test demonstrated a significant relationship
between the area they grew up in and selecting thin/normal weight shape two for the
most unhealthy. A significant number of the nurses from urban areas selected shape
two, (p=0.012).
Figure 4.12: The nurses’ perceptions of the most unhealthy body shapes
4.12.3 Overweight
Only 11.9% (18/150) correctly chose shapes five and six. Many chose obese class
III/shape nine (78.3%, 117/150) followed by obese class II/shape eight (36.8%, 55/150),
(Figure 4.13). A Chi-square test of independence demonstrated a significant
relationship between culture and the selection of shape five for overweight. A
significant number of Xhosa nurses selected shape five and therefore had a more
accurate perception of which shape was overweight, (p=0.17). No relationship was
noted regarding age, but the Fisher’s exact test demonstrated a significant relationship
81,6
37,5
21,1
7,23,3 2,0 1,3 0,0 0,0 0,0
0,0
10,0
20,0
30,0
40,0
50,0
60,0
70,0
80,0
90,0
Shape 9- 45.4kg/m²
Shape 1- 18.3kg/m²
Shape 8- 38.6kg/m²
Shape 7- 34.3kg/m²
Shape 6- 29.9kg/m²
Shape 2- 19.3kg/m²
Shape 5- 26.2kg/m²
Shape 3- 20.9kg/m²
Shape 4- 23.1kg/m²
None ofthem
Perc
en
tag
e (
%)
Body shapes with associated BMI
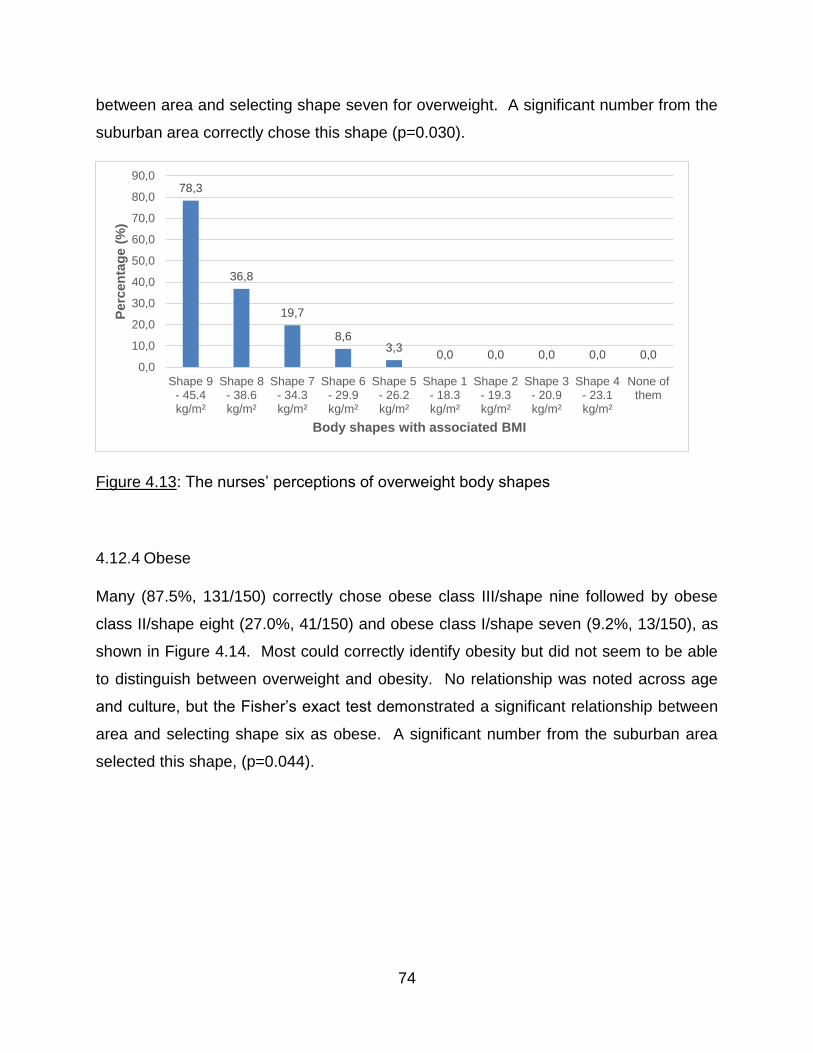
74
between area and selecting shape seven for overweight. A significant number from the
suburban area correctly chose this shape (p=0.030).
Figure 4.13: The nurses’ perceptions of overweight body shapes
4.12.4 Obese
Many (87.5%, 131/150) correctly chose obese class III/shape nine followed by obese
class II/shape eight (27.0%, 41/150) and obese class I/shape seven (9.2%, 13/150), as
shown in Figure 4.14. Most could correctly identify obesity but did not seem to be able
to distinguish between overweight and obesity. No relationship was noted across age
and culture, but the Fisher’s exact test demonstrated a significant relationship between
area and selecting shape six as obese. A significant number from the suburban area
selected this shape, (p=0.044).
78,3
36,8
19,7
8,63,3
0,0 0,0 0,0 0,0 0,00,0
10,0
20,0
30,0
40,0
50,0
60,0
70,0
80,0
90,0
Shape 9- 45.4kg/m²
Shape 8- 38.6kg/m²
Shape 7- 34.3kg/m²
Shape 6- 29.9kg/m²
Shape 5- 26.2kg/m²
Shape 1- 18.3kg/m²
Shape 2- 19.3kg/m²
Shape 3- 20.9kg/m²
Shape 4- 23.1kg/m²
None ofthem
Perc
en
tag
e (
%)
Body shapes with associated BMI
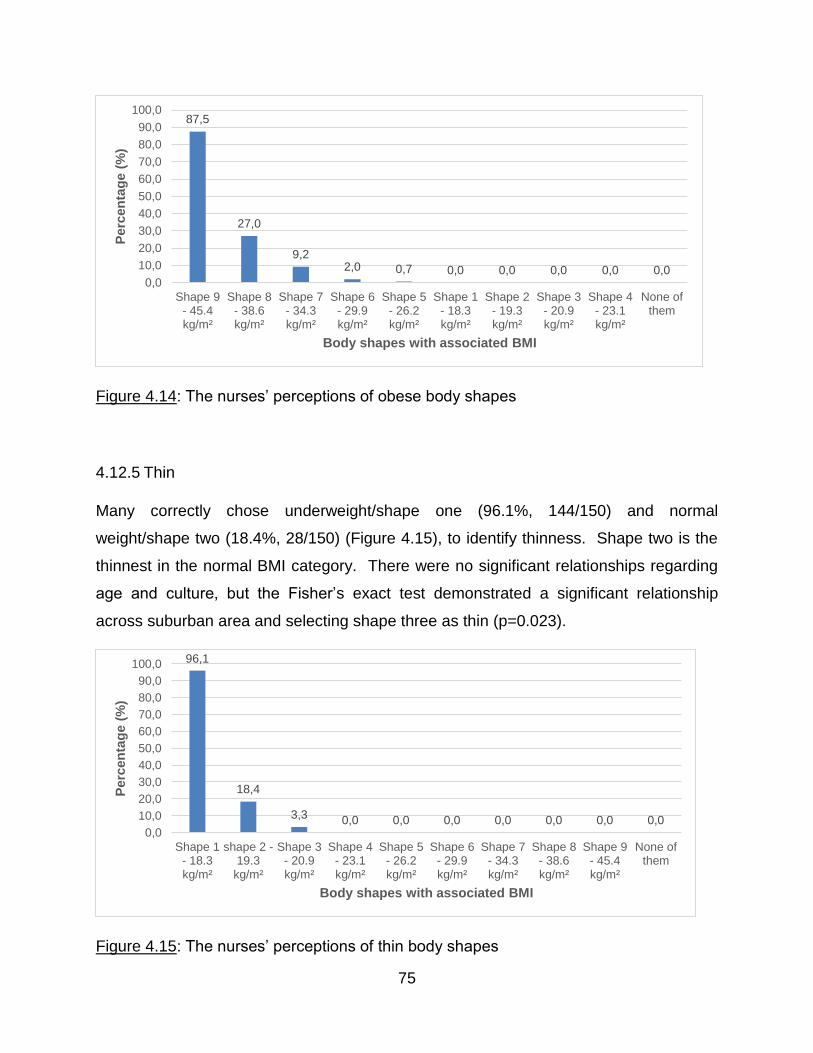
75
Figure 4.14: The nurses’ perceptions of obese body shapes
4.12.5 Thin
Many correctly chose underweight/shape one (96.1%, 144/150) and normal
weight/shape two (18.4%, 28/150) (Figure 4.15), to identify thinness. Shape two is the
thinnest in the normal BMI category. There were no significant relationships regarding
age and culture, but the Fisher’s exact test demonstrated a significant relationship
across suburban area and selecting shape three as thin (p=0.023).
Figure 4.15: The nurses’ perceptions of thin body shapes
87,5
27,0
9,22,0 0,7 0,0 0,0 0,0 0,0 0,0
0,0
10,0
20,0
30,0
40,0
50,0
60,0
70,0
80,0
90,0
100,0
Shape 9- 45.4kg/m²
Shape 8- 38.6kg/m²
Shape 7- 34.3kg/m²
Shape 6- 29.9kg/m²
Shape 5- 26.2kg/m²
Shape 1- 18.3kg/m²
Shape 2- 19.3kg/m²
Shape 3- 20.9kg/m²
Shape 4- 23.1kg/m²
None ofthem
Perc
en
tag
e (
%)
Body shapes with associated BMI
96,1
18,4
3,3 0,0 0,0 0,0 0,0 0,0 0,0 0,00,0
10,0
20,0
30,0
40,0
50,0
60,0
70,0
80,0
90,0
100,0
Shape 1- 18.3kg/m²
shape 2 -19.3kg/m²
Shape 3- 20.9kg/m²
Shape 4- 23.1kg/m²
Shape 5- 26.2kg/m²
Shape 6- 29.9kg/m²
Shape 7- 34.3kg/m²
Shape 8- 38.6kg/m²
Shape 9- 45.4kg/m²
None ofthem
Perc
en
tag
e (
%)
Body shapes with associated BMI
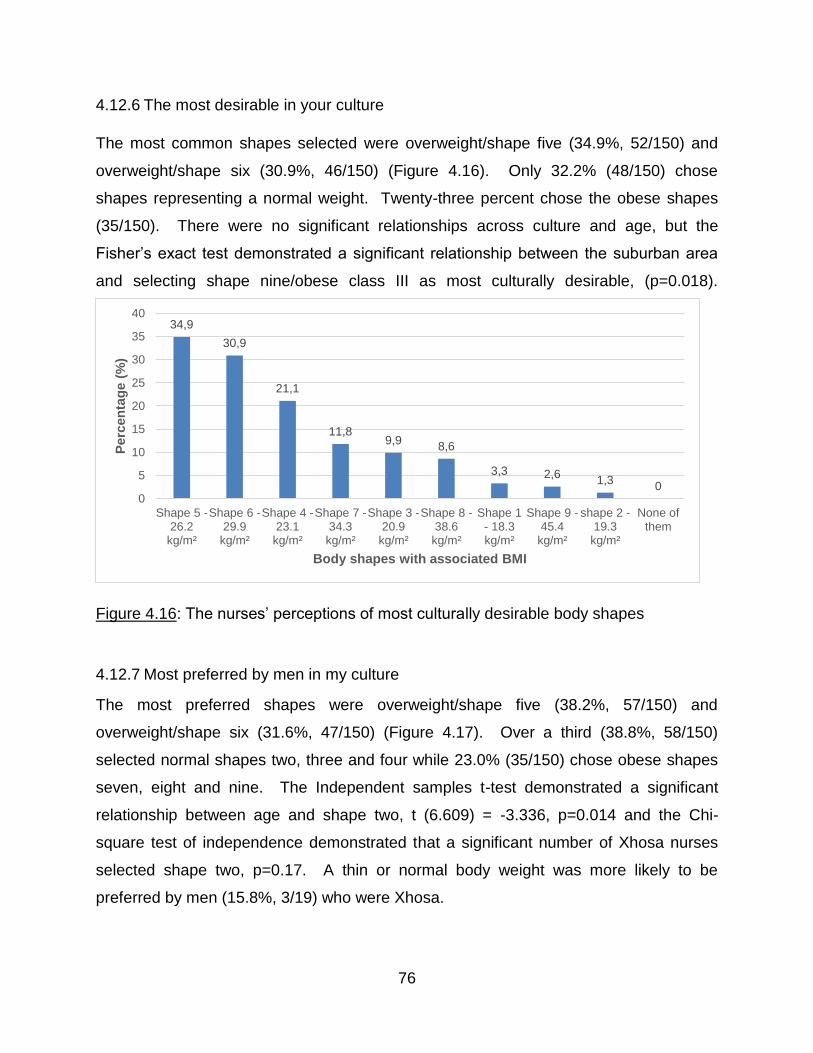
76
4.12.6 The most desirable in your culture
The most common shapes selected were overweight/shape five (34.9%, 52/150) and
overweight/shape six (30.9%, 46/150) (Figure 4.16). Only 32.2% (48/150) chose
shapes representing a normal weight. Twenty-three percent chose the obese shapes
(35/150). There were no significant relationships across culture and age, but the
Fisher’s exact test demonstrated a significant relationship between the suburban area
and selecting shape nine/obese class III as most culturally desirable, (p=0.018).
Figure 4.16: The nurses’ perceptions of most culturally desirable body shapes
4.12.7 Most preferred by men in my culture
The most preferred shapes were overweight/shape five (38.2%, 57/150) and
overweight/shape six (31.6%, 47/150) (Figure 4.17). Over a third (38.8%, 58/150)
selected normal shapes two, three and four while 23.0% (35/150) chose obese shapes
seven, eight and nine. The Independent samples t-test demonstrated a significant
relationship between age and shape two, t (6.609) = -3.336, p=0.014 and the Chi-
square test of independence demonstrated that a significant number of Xhosa nurses
selected shape two, p=0.17. A thin or normal body weight was more likely to be
preferred by men (15.8%, 3/19) who were Xhosa.
34,9
30,9
21,1
11,89,9
8,6
3,3 2,61,3
00
5
10
15
20
25
30
35
40
Shape 5 -26.2kg/m²
Shape 6 -29.9kg/m²
Shape 4 -23.1kg/m²
Shape 7 -34.3kg/m²
Shape 3 -20.9kg/m²
Shape 8 -38.6kg/m²
Shape 1- 18.3kg/m²
Shape 9 -45.4kg/m²
shape 2 -19.3kg/m²
None ofthem
Perc
en
tag
e (
%)
Body shapes with associated BMI
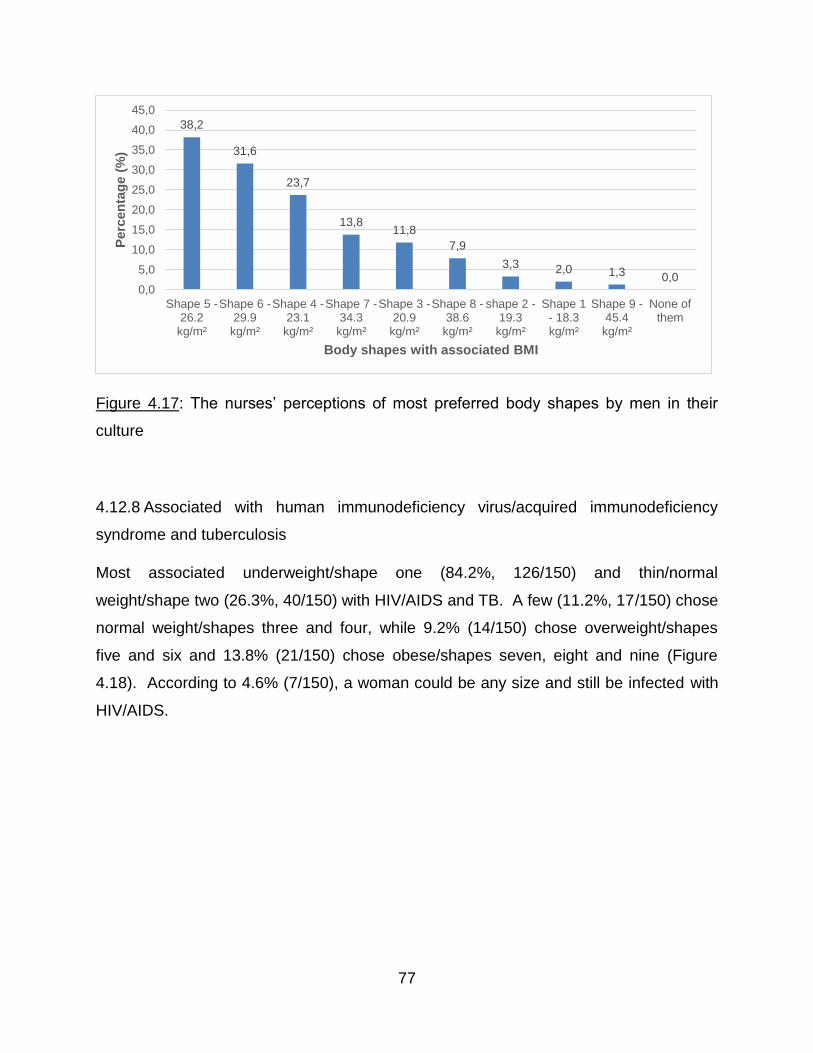
77
Figure 4.17: The nurses’ perceptions of most preferred body shapes by men in their
culture
4.12.8 Associated with human immunodeficiency virus/acquired immunodeficiency
syndrome and tuberculosis
Most associated underweight/shape one (84.2%, 126/150) and thin/normal
weight/shape two (26.3%, 40/150) with HIV/AIDS and TB. A few (11.2%, 17/150) chose
normal weight/shapes three and four, while 9.2% (14/150) chose overweight/shapes
five and six and 13.8% (21/150) chose obese/shapes seven, eight and nine (Figure
4.18). According to 4.6% (7/150), a woman could be any size and still be infected with
HIV/AIDS.
38,2
31,6
23,7
13,811,8
7,9
3,3 2,0 1,3 0,00,0
5,0
10,0
15,0
20,0
25,0
30,0
35,0
40,0
45,0
Shape 5 -26.2kg/m²
Shape 6 -29.9kg/m²
Shape 4 -23.1kg/m²
Shape 7 -34.3kg/m²
Shape 3 -20.9kg/m²
Shape 8 -38.6kg/m²
shape 2 -19.3kg/m²
Shape 1- 18.3kg/m²
Shape 9 -45.4kg/m²
None ofthem
Perc
en
tag
e (
%)
Body shapes with associated BMI
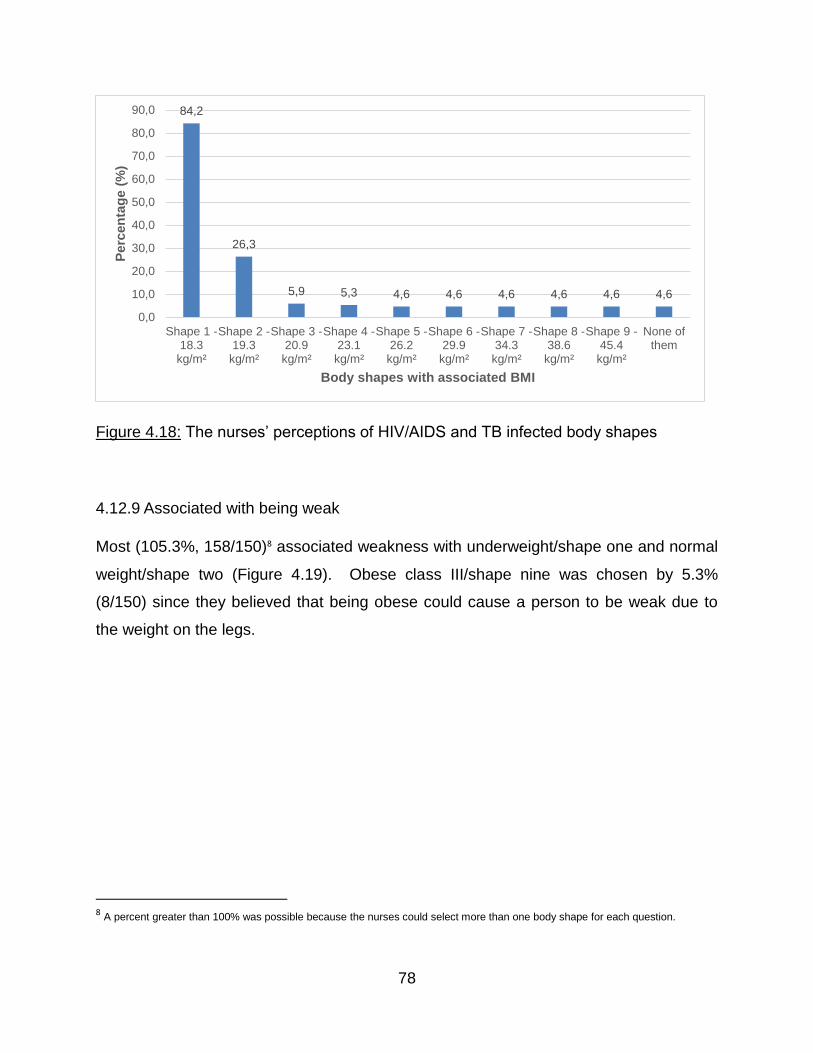
78
Figure 4.18: The nurses’ perceptions of HIV/AIDS and TB infected body shapes
4.12.9 Associated with being weak
Most (105.3%, 158/150)8 associated weakness with underweight/shape one and normal
weight/shape two (Figure 4.19). Obese class III/shape nine was chosen by 5.3%
(8/150) since they believed that being obese could cause a person to be weak due to
the weight on the legs.
8 A percent greater than 100% was possible because the nurses could select more than one body shape for each question.
84,2
26,3
5,9 5,3 4,6 4,6 4,6 4,6 4,6 4,6
0,0
10,0
20,0
30,0
40,0
50,0
60,0
70,0
80,0
90,0
Shape 1 -18.3kg/m²
Shape 2 -19.3kg/m²
Shape 3 -20.9kg/m²
Shape 4 -23.1kg/m²
Shape 5 -26.2kg/m²
Shape 6 -29.9kg/m²
Shape 7 -34.3kg/m²
Shape 8 -38.6kg/m²
Shape 9 -45.4kg/m²
None ofthem
Perc
en
tag
e (
%)
Body shapes with associated BMI
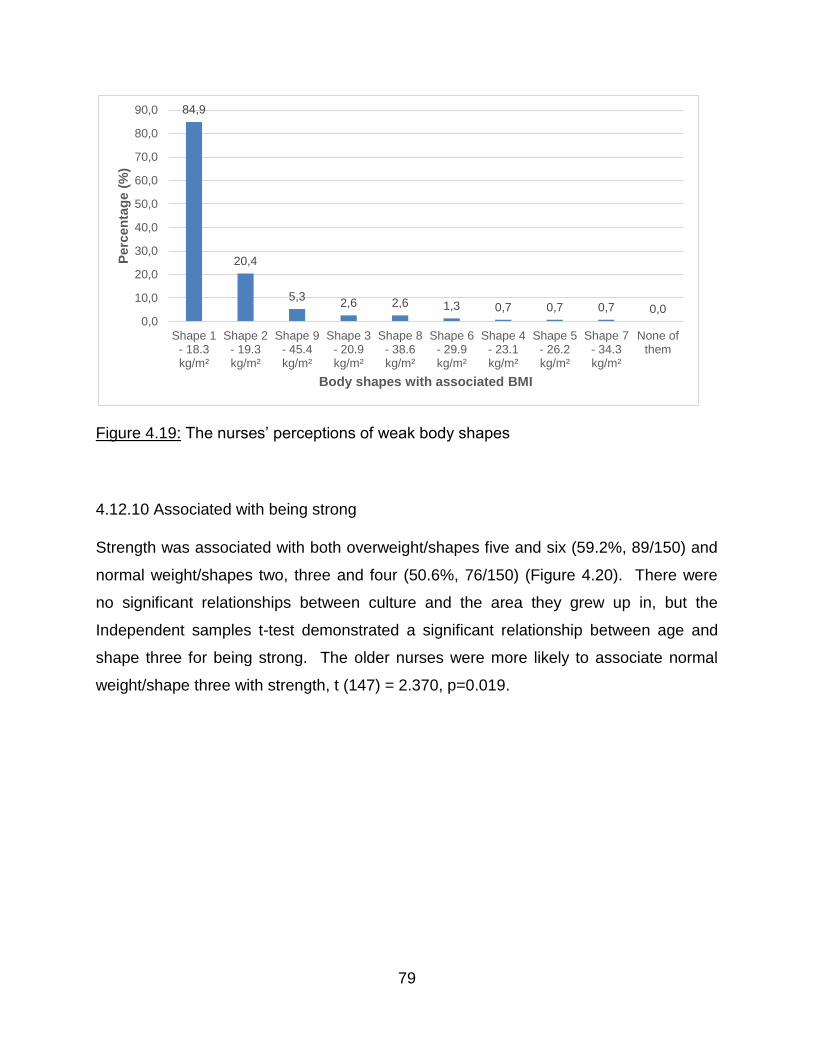
79
Figure 4.19: The nurses’ perceptions of weak body shapes
4.12.10 Associated with being strong
Strength was associated with both overweight/shapes five and six (59.2%, 89/150) and
normal weight/shapes two, three and four (50.6%, 76/150) (Figure 4.20). There were
no significant relationships between culture and the area they grew up in, but the
Independent samples t-test demonstrated a significant relationship between age and
shape three for being strong. The older nurses were more likely to associate normal
weight/shape three with strength, t (147) = 2.370, p=0.019.
84,9
20,4
5,32,6 2,6 1,3 0,7 0,7 0,7 0,0
0,0
10,0
20,0
30,0
40,0
50,0
60,0
70,0
80,0
90,0
Shape 1- 18.3kg/m²
Shape 2- 19.3kg/m²
Shape 9- 45.4kg/m²
Shape 3- 20.9kg/m²
Shape 8- 38.6kg/m²
Shape 6- 29.9kg/m²
Shape 4- 23.1kg/m²
Shape 5- 26.2kg/m²
Shape 7- 34.3kg/m²
None ofthem
Perc
en
tag
e (
%)
Body shapes with associated BMI
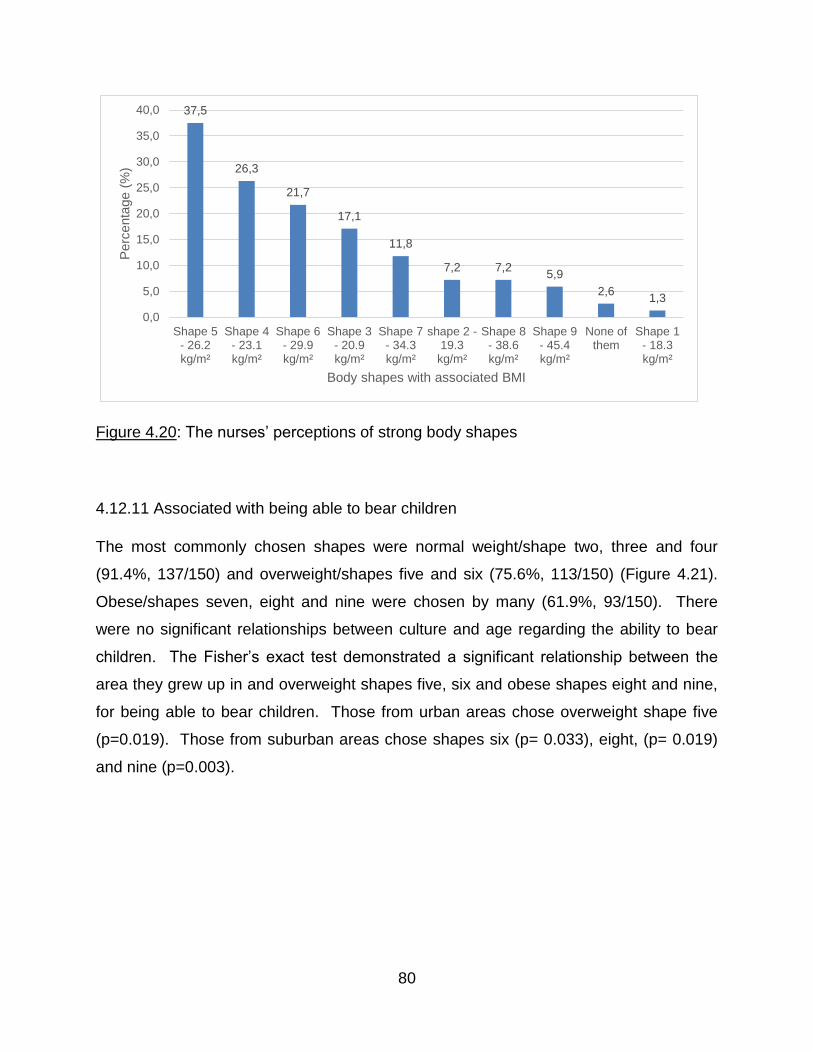
80
Figure 4.20: The nurses’ perceptions of strong body shapes
4.12.11 Associated with being able to bear children
The most commonly chosen shapes were normal weight/shape two, three and four
(91.4%, 137/150) and overweight/shapes five and six (75.6%, 113/150) (Figure 4.21).
Obese/shapes seven, eight and nine were chosen by many (61.9%, 93/150). There
were no significant relationships between culture and age regarding the ability to bear
children. The Fisher’s exact test demonstrated a significant relationship between the
area they grew up in and overweight shapes five, six and obese shapes eight and nine,
for being able to bear children. Those from urban areas chose overweight shape five
(p=0.019). Those from suburban areas chose shapes six (p= 0.033), eight, (p= 0.019)
and nine (p=0.003).
37,5
26,3
21,7
17,1
11,8
7,2 7,25,9
2,61,3
0,0
5,0
10,0
15,0
20,0
25,0
30,0
35,0
40,0
Shape 5- 26.2kg/m²
Shape 4- 23.1kg/m²
Shape 6- 29.9kg/m²
Shape 3- 20.9kg/m²
Shape 7- 34.3kg/m²
shape 2 -19.3kg/m²
Shape 8- 38.6kg/m²
Shape 9- 45.4kg/m²
None ofthem
Shape 1- 18.3kg/m²
Perc
enta
ge (
%)
Body shapes with associated BMI
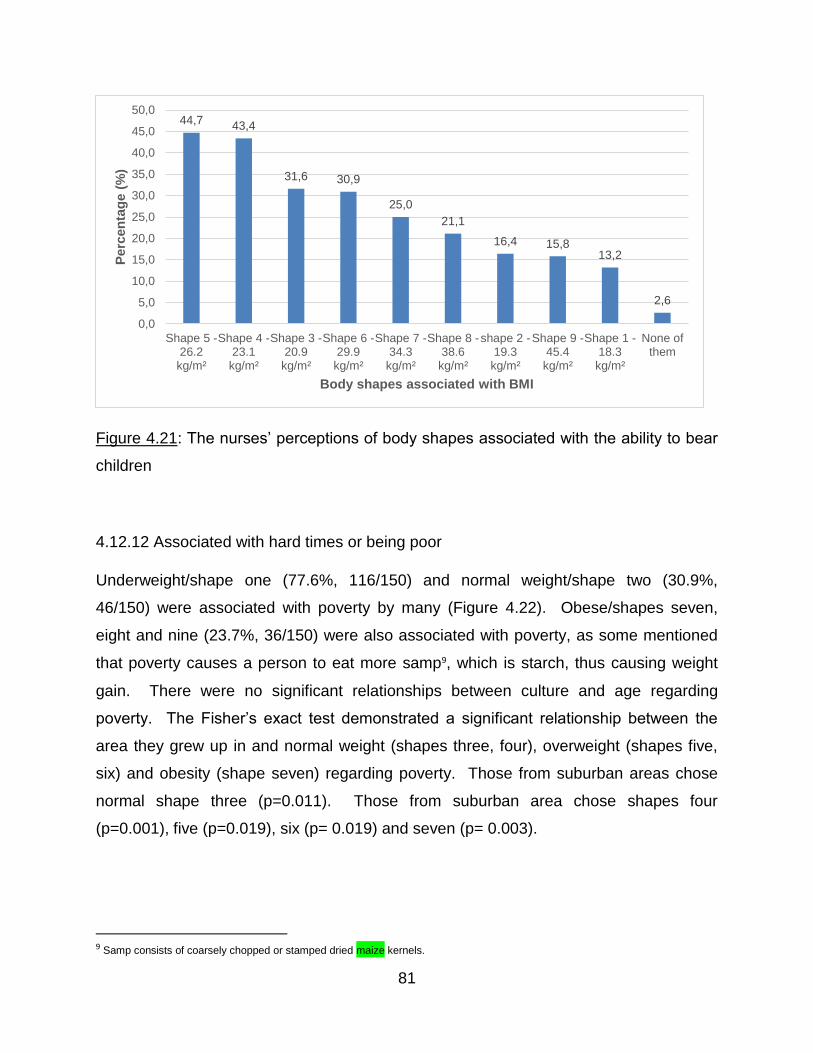
81
Figure 4.21: The nurses’ perceptions of body shapes associated with the ability to bear
children
4.12.12 Associated with hard times or being poor
Underweight/shape one (77.6%, 116/150) and normal weight/shape two (30.9%,
46/150) were associated with poverty by many (Figure 4.22). Obese/shapes seven,
eight and nine (23.7%, 36/150) were also associated with poverty, as some mentioned
that poverty causes a person to eat more samp9, which is starch, thus causing weight
gain. There were no significant relationships between culture and age regarding
poverty. The Fisher’s exact test demonstrated a significant relationship between the
area they grew up in and normal weight (shapes three, four), overweight (shapes five,
six) and obesity (shape seven) regarding poverty. Those from suburban areas chose
normal shape three (p=0.011). Those from suburban area chose shapes four
(p=0.001), five (p=0.019), six (p= 0.019) and seven (p= 0.003).
9 Samp consists of coarsely chopped or stamped dried maize kernels.
44,7 43,4
31,6 30,9
25,0
21,1
16,4 15,813,2
2,6
0,0
5,0
10,0
15,0
20,0
25,0
30,0
35,0
40,0
45,0
50,0
Shape 5 -26.2kg/m²
Shape 4 -23.1kg/m²
Shape 3 -20.9kg/m²
Shape 6 -29.9kg/m²
Shape 7 -34.3kg/m²
Shape 8 -38.6kg/m²
shape 2 -19.3kg/m²
Shape 9 -45.4kg/m²
Shape 1 -18.3kg/m²
None ofthem
Perc
en
tag
e (
%)
Body shapes associated with BMI
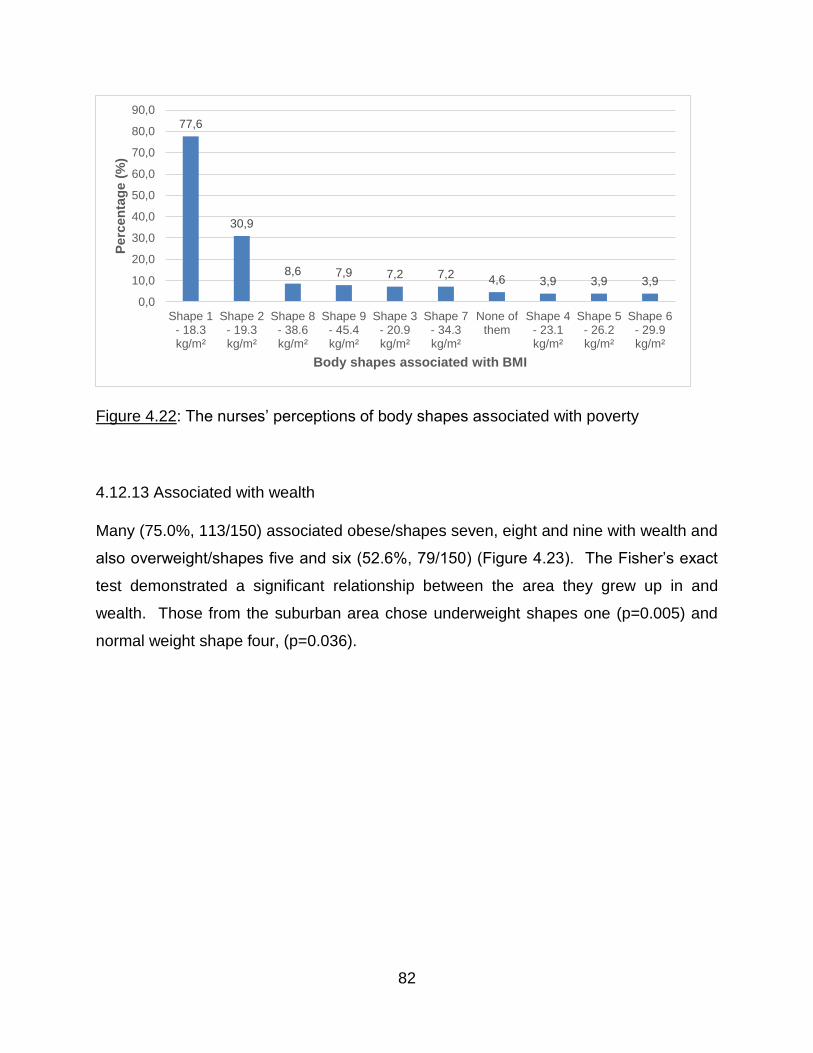
82
Figure 4.22: The nurses’ perceptions of body shapes associated with poverty
4.12.13 Associated with wealth
Many (75.0%, 113/150) associated obese/shapes seven, eight and nine with wealth and
also overweight/shapes five and six (52.6%, 79/150) (Figure 4.23). The Fisher’s exact
test demonstrated a significant relationship between the area they grew up in and
wealth. Those from the suburban area chose underweight shapes one (p=0.005) and
normal weight shape four, (p=0.036).
77,6
30,9
8,6 7,9 7,2 7,2 4,6 3,9 3,9 3,9
0,0
10,0
20,0
30,0
40,0
50,0
60,0
70,0
80,0
90,0
Shape 1- 18.3kg/m²
Shape 2- 19.3kg/m²
Shape 8- 38.6kg/m²
Shape 9- 45.4kg/m²
Shape 3- 20.9kg/m²
Shape 7- 34.3kg/m²
None ofthem
Shape 4- 23.1kg/m²
Shape 5- 26.2kg/m²
Shape 6- 29.9kg/m²
Perc
en
tag
e (
%)
Body shapes associated with BMI
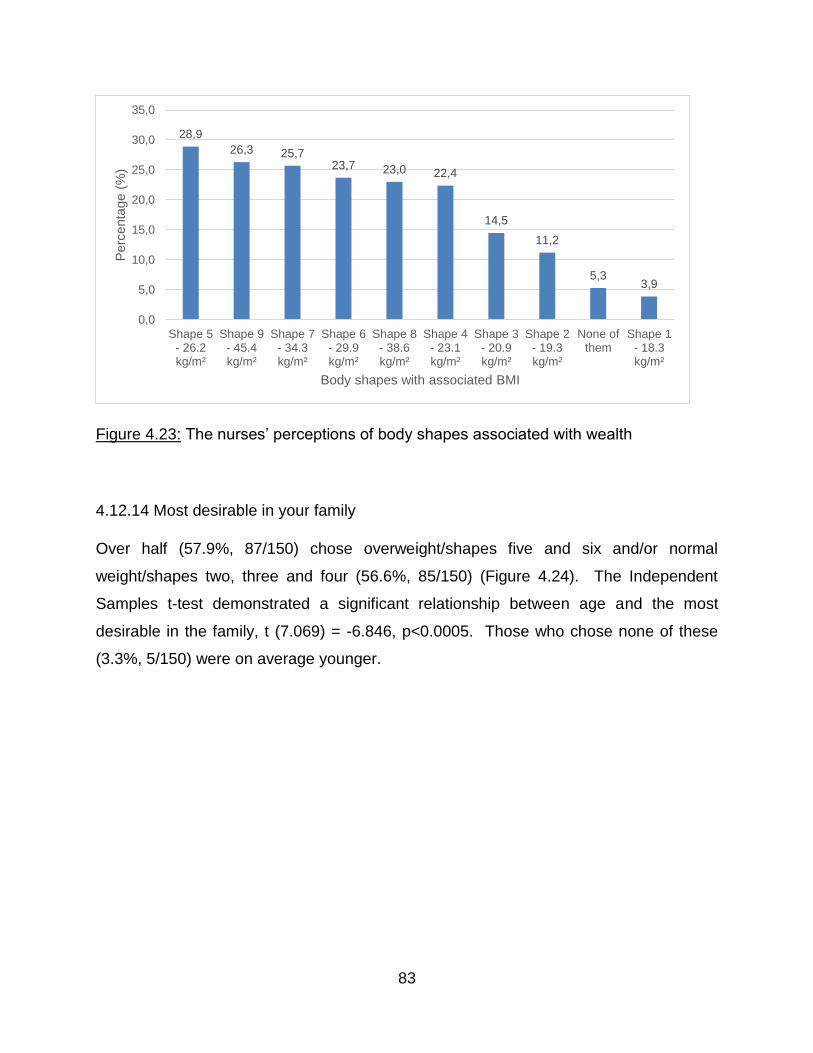
83
Figure 4.23: The nurses’ perceptions of body shapes associated with wealth
4.12.14 Most desirable in your family
Over half (57.9%, 87/150) chose overweight/shapes five and six and/or normal
weight/shapes two, three and four (56.6%, 85/150) (Figure 4.24). The Independent
Samples t-test demonstrated a significant relationship between age and the most
desirable in the family, t (7.069) = -6.846, p<0.0005. Those who chose none of these
(3.3%, 5/150) were on average younger.
28,9
26,3 25,723,7 23,0 22,4
14,5
11,2
5,33,9
0,0
5,0
10,0
15,0
20,0
25,0
30,0
35,0
Shape 5- 26.2kg/m²
Shape 9- 45.4kg/m²
Shape 7- 34.3kg/m²
Shape 6- 29.9kg/m²
Shape 8- 38.6kg/m²
Shape 4- 23.1kg/m²
Shape 3- 20.9kg/m²
Shape 2- 19.3kg/m²
None ofthem
Shape 1- 18.3kg/m²
Perc
enta
ge (
%)
Body shapes with associated BMI
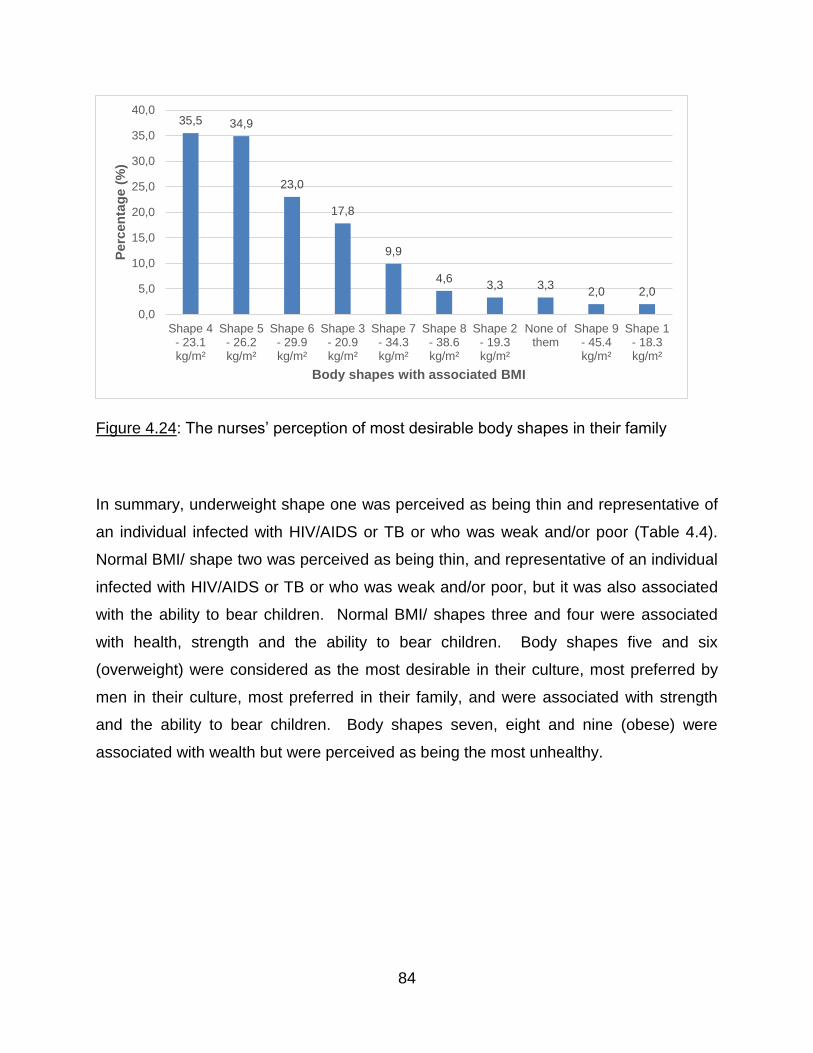
84
Figure 4.24: The nurses’ perception of most desirable body shapes in their family
In summary, underweight shape one was perceived as being thin and representative of
an individual infected with HIV/AIDS or TB or who was weak and/or poor (Table 4.4).
Normal BMI/ shape two was perceived as being thin, and representative of an individual
infected with HIV/AIDS or TB or who was weak and/or poor, but it was also associated
with the ability to bear children. Normal BMI/ shapes three and four were associated
with health, strength and the ability to bear children. Body shapes five and six
(overweight) were considered as the most desirable in their culture, most preferred by
men in their culture, most preferred in their family, and were associated with strength
and the ability to bear children. Body shapes seven, eight and nine (obese) were
associated with wealth but were perceived as being the most unhealthy.
35,5 34,9
23,0
17,8
9,9
4,63,3 3,3
2,0 2,0
0,0
5,0
10,0
15,0
20,0
25,0
30,0
35,0
40,0
Shape 4- 23.1kg/m²
Shape 5- 26.2kg/m²
Shape 6- 29.9kg/m²
Shape 3- 20.9kg/m²
Shape 7- 34.3kg/m²
Shape 8- 38.6kg/m²
Shape 2- 19.3kg/m²
None ofthem
Shape 9- 45.4kg/m²
Shape 1- 18.3kg/m²
Perc
en
tag
e (
%)
Body shapes with associated BMI
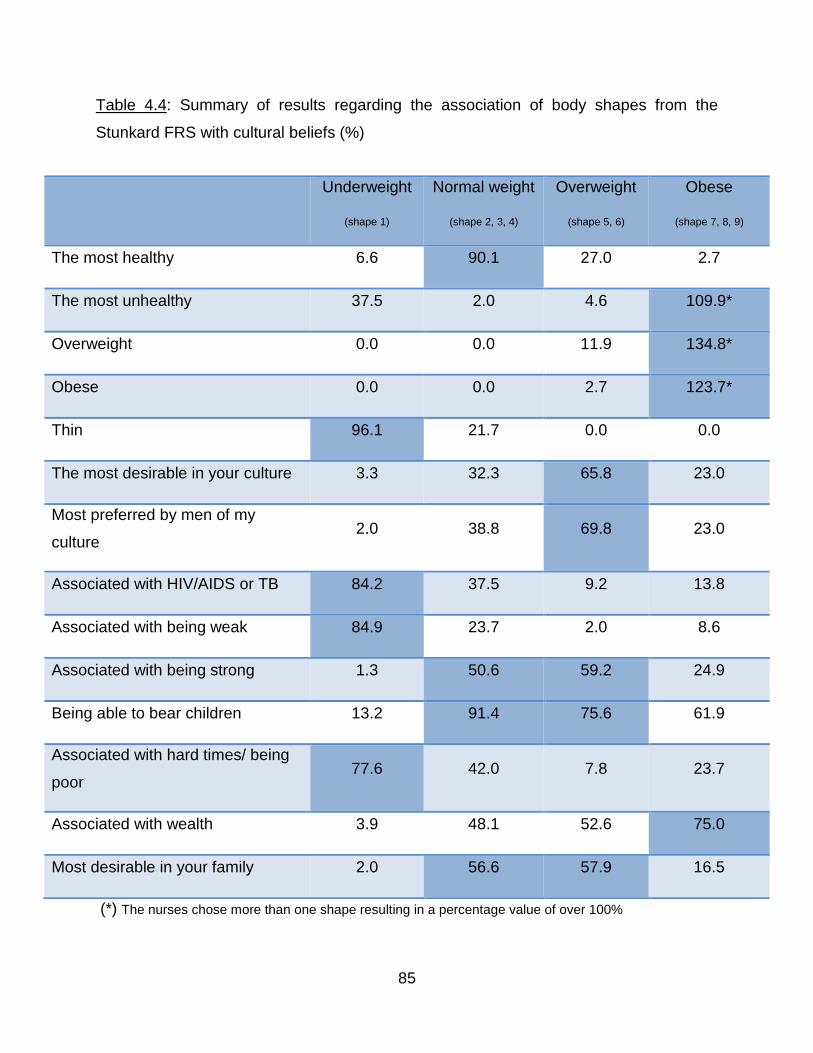
85
Table 4.4: Summary of results regarding the association of body shapes from the
Stunkard FRS with cultural beliefs (%)
(*) The nurses chose more than one shape resulting in a percentage value of over 100%
Underweight
(shape 1)
Normal weight
(shape 2, 3, 4)
Overweight
(shape 5, 6)
Obese
(shape 7, 8, 9)
The most healthy 6.6 90.1 27.0 2.7
The most unhealthy 37.5 2.0 4.6 109.9*
Overweight 0.0 0.0 11.9 134.8*
Obese 0.0 0.0 2.7 123.7*
Thin 96.1 21.7 0.0 0.0
The most desirable in your culture 3.3 32.3 65.8 23.0
Most preferred by men of my
culture 2.0 38.8 69.8 23.0
Associated with HIV/AIDS or TB 84.2 37.5 9.2 13.8
Associated with being weak 84.9 23.7 2.0 8.6
Associated with being strong 1.3 50.6 59.2 24.9
Being able to bear children 13.2 91.4 75.6 61.9
Associated with hard times/ being
poor 77.6 42.0 7.8 23.7
Associated with wealth 3.9 48.1 52.6 75.0
Most desirable in your family 2.0 56.6 57.9 16.5
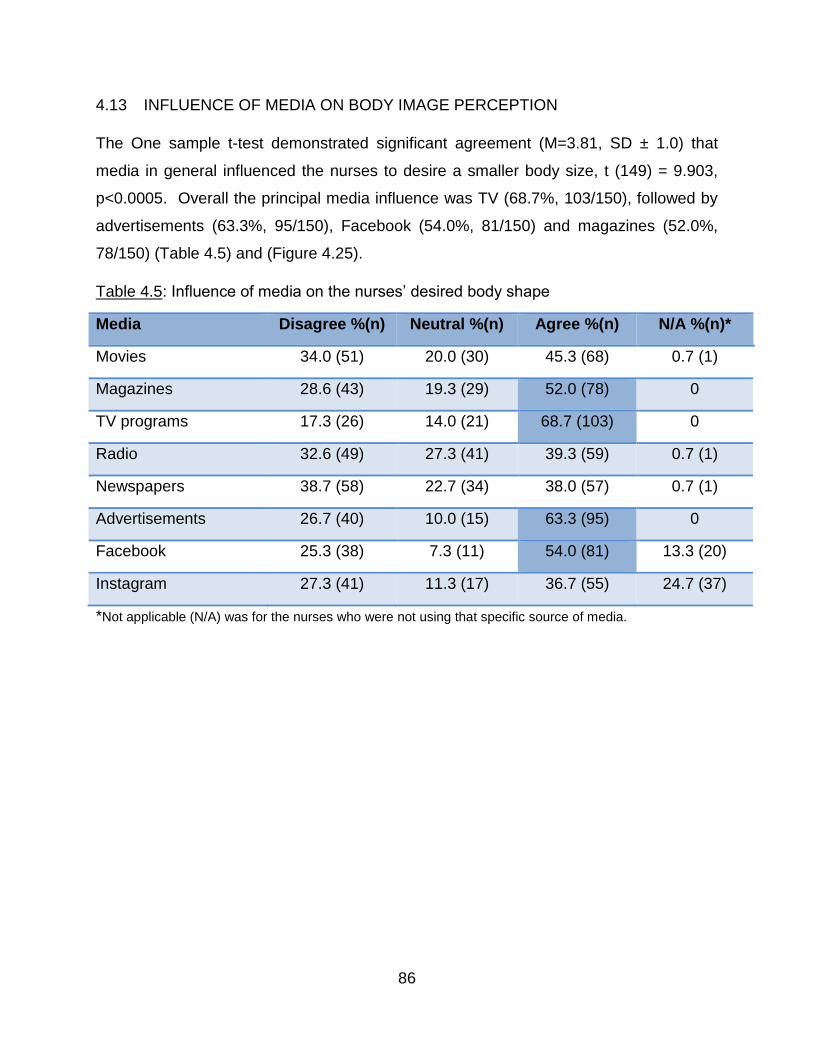
86
4.13 INFLUENCE OF MEDIA ON BODY IMAGE PERCEPTION
The One sample t-test demonstrated significant agreement (M=3.81, SD ± 1.0) that
media in general influenced the nurses to desire a smaller body size, t (149) = 9.903,
p<0.0005. Overall the principal media influence was TV (68.7%, 103/150), followed by
advertisements (63.3%, 95/150), Facebook (54.0%, 81/150) and magazines (52.0%,
78/150) (Table 4.5) and (Figure 4.25).
Table 4.5: Influence of media on the nurses’ desired body shape
Media Disagree %(n) Neutral %(n) Agree %(n) N/A %(n)*
Movies 34.0 (51) 20.0 (30) 45.3 (68) 0.7 (1)
Magazines 28.6 (43) 19.3 (29) 52.0 (78) 0
TV programs 17.3 (26) 14.0 (21) 68.7 (103) 0
Radio 32.6 (49) 27.3 (41) 39.3 (59) 0.7 (1)
Newspapers 38.7 (58) 22.7 (34) 38.0 (57) 0.7 (1)
Advertisements 26.7 (40) 10.0 (15) 63.3 (95) 0
Facebook 25.3 (38) 7.3 (11) 54.0 (81) 13.3 (20)
Instagram 27.3 (41) 11.3 (17) 36.7 (55) 24.7 (37)
*Not applicable (N/A) was for the nurses who were not using that specific source of media.
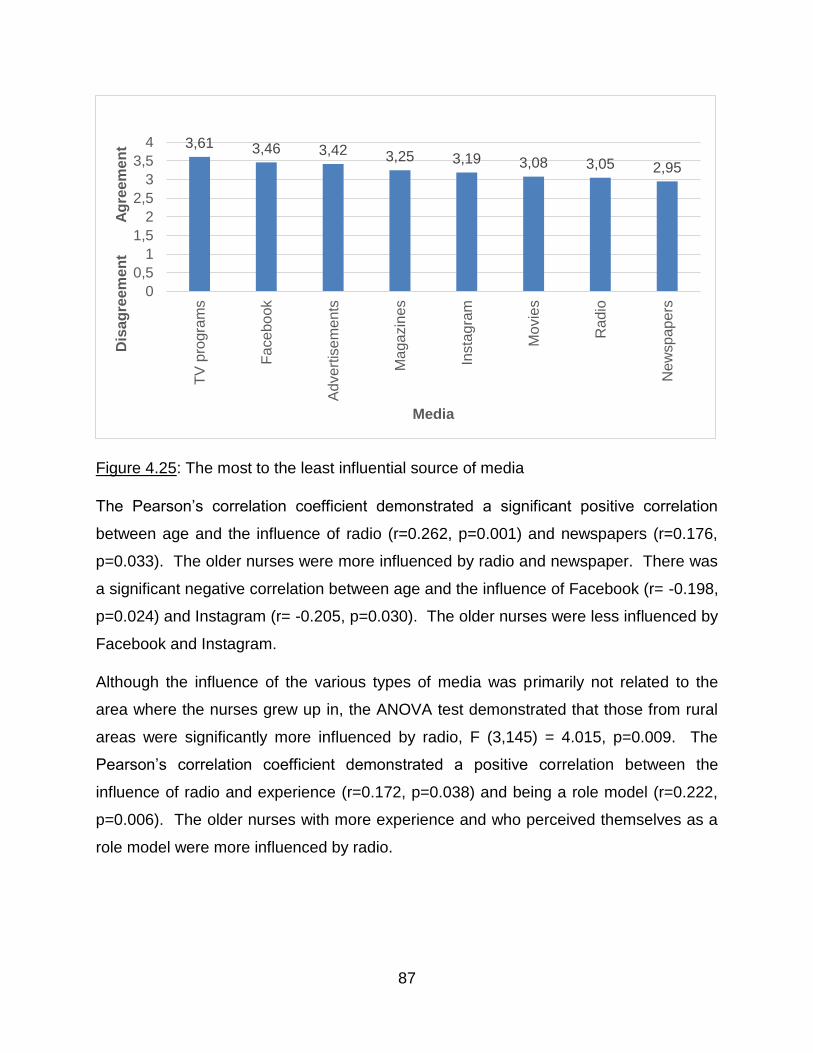
87
Figure 4.25: The most to the least influential source of media
The Pearson’s correlation coefficient demonstrated a significant positive correlation
between age and the influence of radio (r=0.262, p=0.001) and newspapers (r=0.176,
p=0.033). The older nurses were more influenced by radio and newspaper. There was
a significant negative correlation between age and the influence of Facebook (r= -0.198,
p=0.024) and Instagram (r= -0.205, p=0.030). The older nurses were less influenced by
Facebook and Instagram.
Although the influence of the various types of media was primarily not related to the
area where the nurses grew up in, the ANOVA test demonstrated that those from rural
areas were significantly more influenced by radio, F (3,145) = 4.015, p=0.009. The
Pearson’s correlation coefficient demonstrated a positive correlation between the
influence of radio and experience (r=0.172, p=0.038) and being a role model (r=0.222,
p=0.006). The older nurses with more experience and who perceived themselves as a
role model were more influenced by radio.
3,61 3,46 3,42 3,25 3,19 3,08 3,05 2,95
0
0,5
1
1,5
2
2,5
3
3,5
4
TV
pro
gra
ms
Ad
vert
ise
me
nts
Ma
ga
zin
es
Insta
gra
m
Mo
vie
s
Ra
dio
Ne
wsp
ap
ers
Dis
ag
reem
en
t A
gre
em
en
t
Media
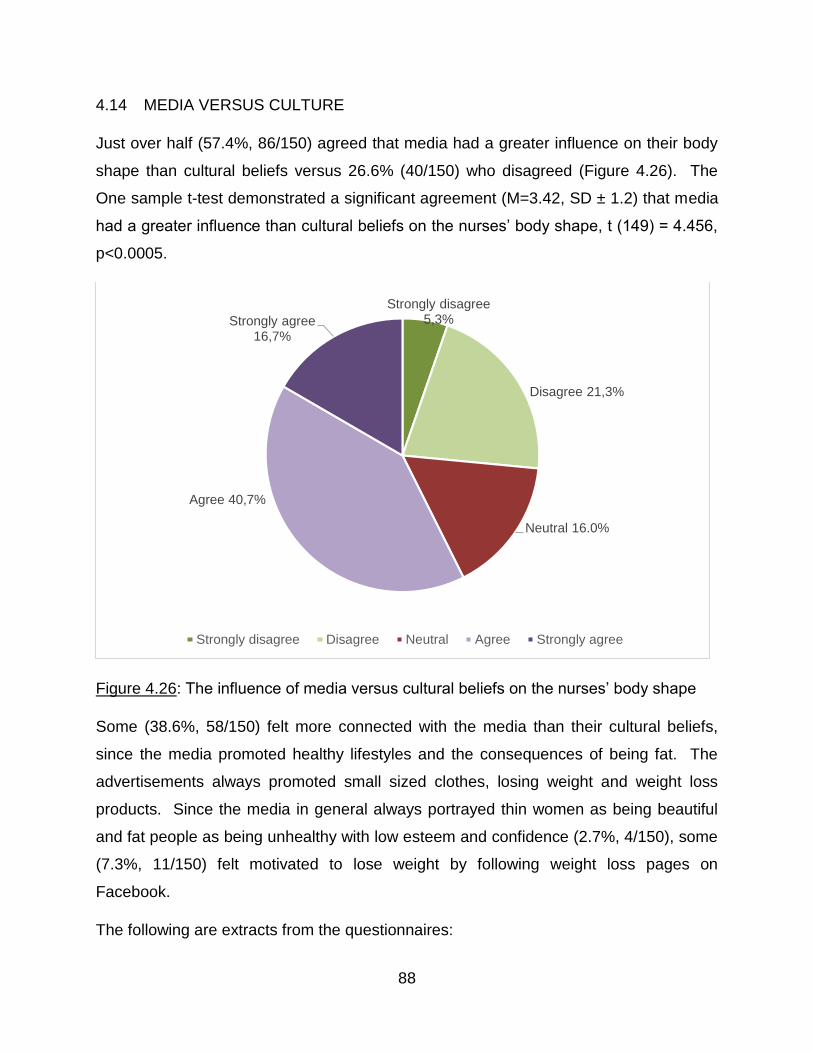
88
4.14 MEDIA VERSUS CULTURE
Just over half (57.4%, 86/150) agreed that media had a greater influence on their body
shape than cultural beliefs versus 26.6% (40/150) who disagreed (Figure 4.26). The
One sample t-test demonstrated a significant agreement (M=3.42, SD ± 1.2) that media
had a greater influence than cultural beliefs on the nurses’ body shape, t (149) = 4.456,
p<0.0005.
Figure 4.26: The influence of media versus cultural beliefs on the nurses’ body shape
Some (38.6%, 58/150) felt more connected with the media than their cultural beliefs,
since the media promoted healthy lifestyles and the consequences of being fat. The
advertisements always promoted small sized clothes, losing weight and weight loss
products. Since the media in general always portrayed thin women as being beautiful
and fat people as being unhealthy with low esteem and confidence (2.7%, 4/150), some
(7.3%, 11/150) felt motivated to lose weight by following weight loss pages on
Facebook.
The following are extracts from the questionnaires:
Strongly disagree 5,3%
Disagree 21,3%
Neutral 16.0%
Agree 40,7%
Strongly agree 16,7%
Strongly disagree Disagree Neutral Agree Strongly agree
89
“Everybody watches TV so it influences me and I want to look like someone who looks
nice on TV”, (40 years old, BMI: 37.1 kg/m²).
“On Facebook, I follow a lot of pages regarding weight loss. I don’t care about my
culture”, (42 years old, BMI: 42.7 kg/m²).
A few (8.7%;13/150) felt that watching TV programs about health educated them about
many things that they could practice, such as exercise, healthy eating tips or preparing
a proper balanced meal. In particular, watching fashion, food, health and gardening
channels influenced them to lose weight, prepare healthier meals and keep fit.
Those (14.7%; 22/150) who held cultural values in high esteem did not support losing
weight. Some (15.3%; 23/150) were neutral since they felt that neither media nor
cultural beliefs influenced the way they felt about their body shape and they did not
really follow media
4.15 FAMILY BELIEFS
The nurses were asked what influenced their feelings about their body as opposed to
more general beliefs regarding culture. The One sample t-test demonstrated that the
opinion of their partner was the most influential factor (t (145) = 1.633, p=0.105)
followed closely by the opinions of the women in the family (t (149) = 1.502, p=0.135)
and family beliefs (t (149) = 0.271, p=0.787) (Figure 4.27). The One sample t-test
demonstrated that there was significant disagreement (M=2.72, SD ± 1.1) that the men
in the family (27.6%, 40/145) had any influence on the way they felt about their body
shapes, t (144) = -2.980, p=0.003.
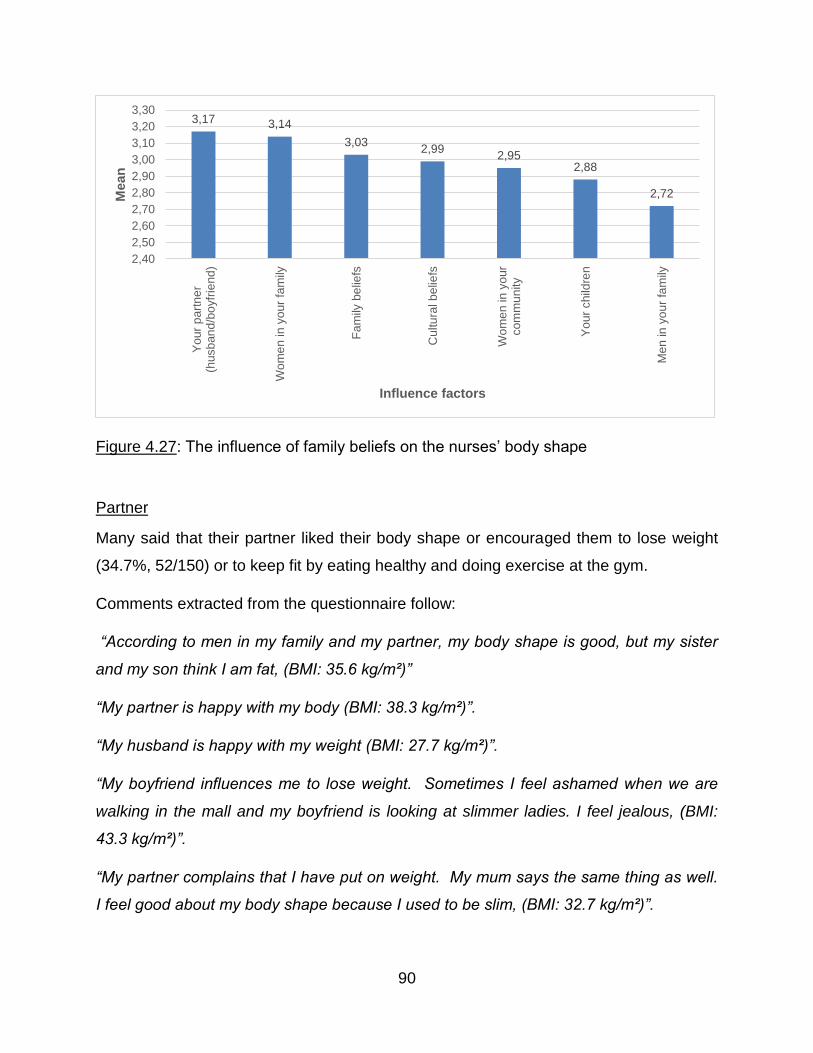
90
Figure 4.27: The influence of family beliefs on the nurses’ body shape
Partner
Many said that their partner liked their body shape or encouraged them to lose weight
(34.7%, 52/150) or to keep fit by eating healthy and doing exercise at the gym.
Comments extracted from the questionnaire follow:
“According to men in my family and my partner, my body shape is good, but my sister
and my son think I am fat, (BMI: 35.6 kg/m²)”
“My partner is happy with my body (BMI: 38.3 kg/m²)”.
“My husband is happy with my weight (BMI: 27.7 kg/m²)”.
“My boyfriend influences me to lose weight. Sometimes I feel ashamed when we are
walking in the mall and my boyfriend is looking at slimmer ladies. I feel jealous, (BMI:
43.3 kg/m²)”.
“My partner complains that I have put on weight. My mum says the same thing as well.
I feel good about my body shape because I used to be slim, (BMI: 32.7 kg/m²)”.
3,17 3,14
3,032,99
2,952,88
2,72
2,40
2,50
2,60
2,70
2,80
2,90
3,00
3,10
3,20
3,30
Yo
ur
pa
rtn
er
(husb
an
d/b
oyfr
iend
)
Wo
me
n in
yo
ur
fam
ily
Fa
mily
be
liefs
Cu
ltu
ral b
elie
fs
Wo
me
n in
yo
ur
com
mu
nity
Yo
ur
child
ren
Me
n in
yo
ur
fam
ily
Mean
Influence factors
91
Family beliefs
Some (23.3%, 35/150) stated that both men and women in their family encouraged
them to lose weight. Their children would encourage them to lose weight by pointing
out that they were putting on weight (10.7%, 16/150). Some (11.3%, 17/150) felt
encouraged by their children to do exercise and cut down on junk food10 to lose weight,
while others (8.7%, 13/150) had women in their family to always encourage each other
to lose weight and keep fit.
Comments extracted from the questionnaire follow:
“Men in my family criticize my body shape. They say I need to lose weight, (BMI: 36.6
kg/m²)”.
“My children want me to lose weight to be able to participate in activities with them,
(BMI: 38.7 kg/m²)”.
“My children feel very ashamed of my body and as a result, I feel very embarrassed,
(BMI: 33.2 kg/m²)”.
“My daughter encourages me to exercise and stop eating junk food, (BMI: 39.6 kg/m²)”.
“Women in my family compliments me on my body shape but my daughter tells me I
need to lose some weight, (BMI: 39.5 kg/m²)”.
“Nobody in my family says anything about my body shape, (BMI: 28.7 kg/m²)”.
“Men in my family and women in my family encourage me to put on weight but my
husband and children are happy with my weight, (BMI: 27.7 kg/m²)”.
Culture
Regarding the impact of cultural beliefs on body shape, a few (8.0%,12/150) said that in
the Zulu culture, men preferred a full woman with curves. Cultural beliefs were
important because they believed that the bigger the body, the healthier the person is
and being thin was considered unhealthy and was associated with sickness. Others
10 Junk food: Food that contributes increased calories above requirements but little nutritional value (WebMD 2017b).
92
(5.3%, 8/150) felt that according to their culture, their weight and body shape were
good.
Comments extracted from the questionnaire follow:
“In the Zulu culture, it is believed that you are not supposed to be thin or obese. You
must have curves. Therefore, I try to keep my body in shape avoiding being too thin or
overweight, (BMI: 27.3 kg/m²)”.
“According to my culture, my weight and size is good, (BMI: 28.7 kg/m²)”.
“In our culture, if you are big, it seems you are happy and well-off, (BMI: 38.3 kg/m²)”.
“My culture likes an average body weight as being thin is associated with sickness,
(BMI: 33.3 kg/m²)”.
“In Zulu culture, bigger women are appreciated but I am happy with my body, (BMI: 27.7
kg/m²)”.
“As a Zulu female, sometimes people see me as not attractive since I am not fat, but I
am happy about my weight. I am trying to eat healthy food and exercise sometimes,
(BMI: 24.9 kg/m²)”.
“I am a cultural person but also very open minded to change. I am happy with my body
shape although I can do with a little healthier diet, (BMI: 30.4 kg/m²)”.
For some (6.0%, 9/150), none of the factors influenced the way they felt about their
body shape but instead they wanted to lose weight for themselves to be more confident,
to look good and to be able to wear what they felt like.
“I feel good about my body shape. I don’t care about how others feel. I am from a rural
area where they believe culturally I should be bigger, but I like the way I am, (BMI: 22.2
kg/m²)”.
“I am happy with my weight and body shape. I cannot change my body for someone,
(BMI: 33.6 kg/m²)”.
“I don’t feel comfortable about my body shape. It influences me to lose weight so that I
can wear whatever I like, (BMI: 31.6 kg/m²)”.
93
Some (10.7%, 16/150) were comfortable and content with their body shape and their
family and friends had no complaints, but instead complimented them on their body
shapes.
“I feel confident about my body shape. There is nothing I want to change about my
body, (BMI: 24.4 kg/m²)”.
“I feel good about my body because I never have someone to tell me that I should lose
some weight. I am the one who always decides, not because someone is putting me
under pressure, (BMI: 30.4 kg/m²)”.
Some (6.7%, 10/150) felt good about their body shape but would like to work harder to
keep their bodies in shape even if they were from a rural area, where they believed
culturally they should have been bigger.
In summary, the nurses were more influenced by their family members than cultural
beliefs. This showed a shift in attitude even though the prevalence of overweight and
obesity was very high. Many were willing to lose while some were still influenced by
cultural beliefs and believed being plump and curvier was more accepted within the
culture than being thin.
4.16 FAMILY BELIEFS VERSUS CULTURE
Half (51.4%, 77/150) agreed that their family had a stronger influence on their shape
than cultural beliefs, versus 32.7% (49/150) who disagreed (Figure 4.28). There was
significant agreement (M=3.27, SD ± 1.2) that family had a bigger influence than cultural
beliefs on the nurses’ body shape, t (149) = 2.742, p=0.007. The Pearson’s correlation
coefficient was used to test for significance across age and family beliefs over cultural
beliefs and no correlation with age was observed.
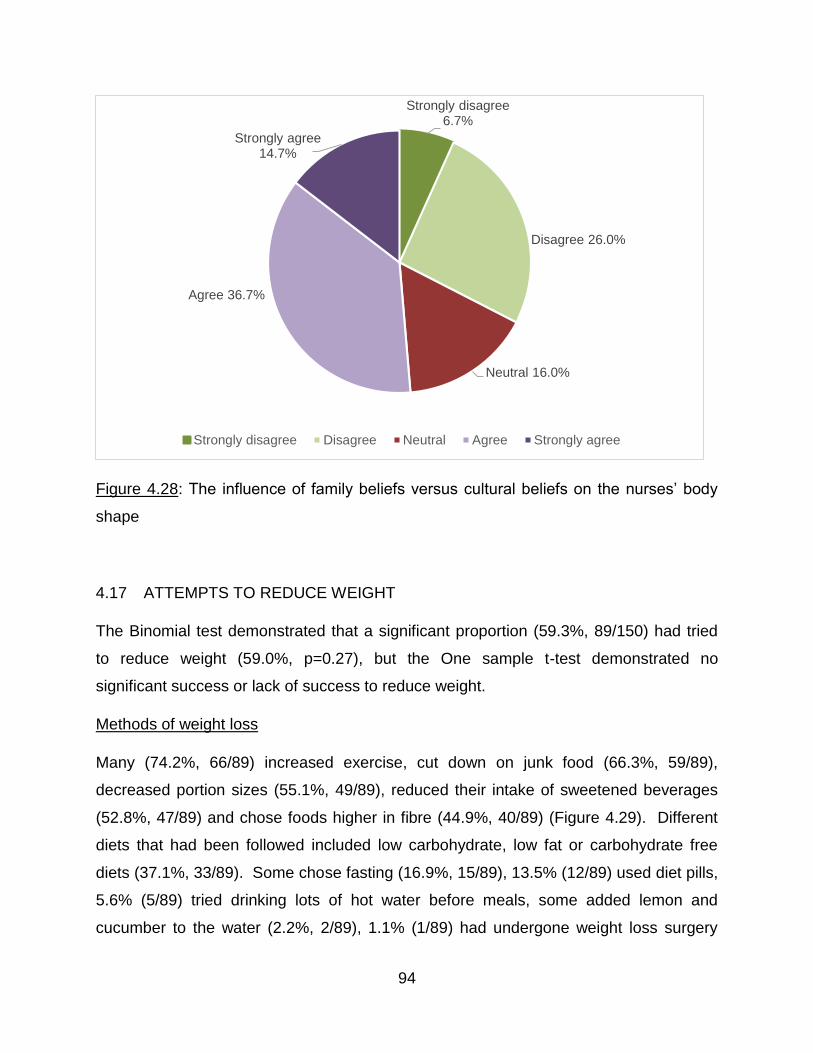
94
Figure 4.28: The influence of family beliefs versus cultural beliefs on the nurses’ body
shape
4.17 ATTEMPTS TO REDUCE WEIGHT
The Binomial test demonstrated that a significant proportion (59.3%, 89/150) had tried
to reduce weight (59.0%, p=0.27), but the One sample t-test demonstrated no
significant success or lack of success to reduce weight.
Methods of weight loss
Many (74.2%, 66/89) increased exercise, cut down on junk food (66.3%, 59/89),
decreased portion sizes (55.1%, 49/89), reduced their intake of sweetened beverages
(52.8%, 47/89) and chose foods higher in fibre (44.9%, 40/89) (Figure 4.29). Different
diets that had been followed included low carbohydrate, low fat or carbohydrate free
diets (37.1%, 33/89). Some chose fasting (16.9%, 15/89), 13.5% (12/89) used diet pills,
5.6% (5/89) tried drinking lots of hot water before meals, some added lemon and
cucumber to the water (2.2%, 2/89), 1.1% (1/89) had undergone weight loss surgery
Strongly disagree 6.7%
Disagree 26.0%
Neutral 16.0%
Agree 36.7%
Strongly agree 14.7%
Strongly disagree Disagree Neutral Agree Strongly agree
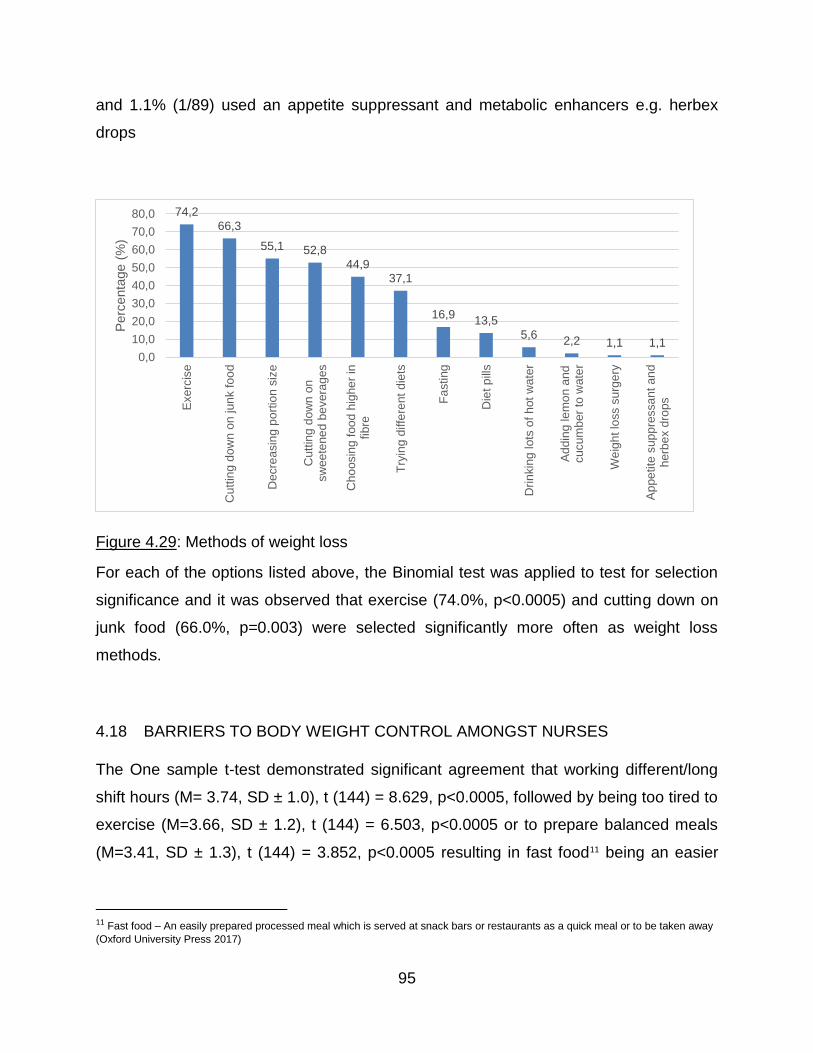
95
and 1.1% (1/89) used an appetite suppressant and metabolic enhancers e.g. herbex
drops
Figure 4.29: Methods of weight loss
For each of the options listed above, the Binomial test was applied to test for selection
significance and it was observed that exercise (74.0%, p<0.0005) and cutting down on
junk food (66.0%, p=0.003) were selected significantly more often as weight loss
methods.
4.18 BARRIERS TO BODY WEIGHT CONTROL AMONGST NURSES
The One sample t-test demonstrated significant agreement that working different/long
shift hours (M= 3.74, SD ± 1.0), t (144) = 8.629, p<0.0005, followed by being too tired to
exercise (M=3.66, SD ± 1.2), t (144) = 6.503, p<0.0005 or to prepare balanced meals
(M=3.41, SD ± 1.3), t (144) = 3.852, p<0.0005 resulting in fast food11 being an easier
11 Fast food – An easily prepared processed meal which is served at snack bars or restaurants as a quick meal or to be taken away
(Oxford University Press 2017)
74,2
66,3
55,1 52,8
44,937,1
16,913,5
5,62,2 1,1 1,1
0,0
10,0
20,0
30,0
40,0
50,0
60,0
70,0
80,0
Exerc
ise
Cu
ttin
g d
ow
n o
n jun
k f
oo
d
Decre
asin
g p
ort
ion s
ize
Cutt
ing
do
wn o
nsw
ee
tene
d b
evera
ges
Cho
osin
g f
oo
d h
ighe
r in
fibre
Try
ing d
iffe
rent
die
ts
Fa
sting
Die
t p
ills
Dri
nkin
g lots
of
hot
wate
r
Ad
din
g le
mo
n a
nd
cucum
ber
to w
ate
r
We
igh
t lo
ss s
urg
ery
Ap
pe
tite
sup
pre
ssa
nt a
nd
herb
ex d
rops
Perc
enta
ge (
%)
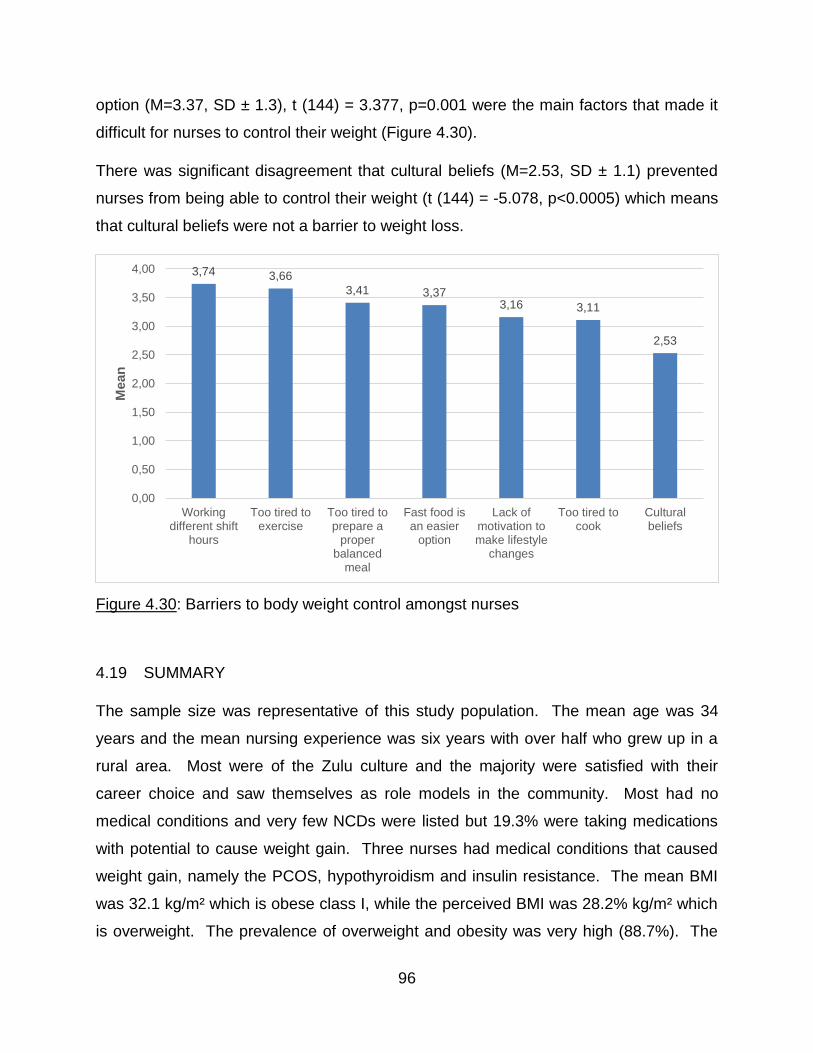
96
option (M=3.37, SD ± 1.3), t (144) = 3.377, p=0.001 were the main factors that made it
difficult for nurses to control their weight (Figure 4.30).
There was significant disagreement that cultural beliefs (M=2.53, SD ± 1.1) prevented
nurses from being able to control their weight (t (144) = -5.078, p<0.0005) which means
that cultural beliefs were not a barrier to weight loss.
Figure 4.30: Barriers to body weight control amongst nurses
4.19 SUMMARY
The sample size was representative of this study population. The mean age was 34
years and the mean nursing experience was six years with over half who grew up in a
rural area. Most were of the Zulu culture and the majority were satisfied with their
career choice and saw themselves as role models in the community. Most had no
medical conditions and very few NCDs were listed but 19.3% were taking medications
with potential to cause weight gain. Three nurses had medical conditions that caused
weight gain, namely the PCOS, hypothyroidism and insulin resistance. The mean BMI
was 32.1 kg/m² which is obese class I, while the perceived BMI was 28.2% kg/m² which
is overweight. The prevalence of overweight and obesity was very high (88.7%). The
3,74 3,66
3,41 3,373,16 3,11
2,53
0,00
0,50
1,00
1,50
2,00
2,50
3,00
3,50
4,00
Workingdifferent shift
hours
Too tired toexercise
Too tired toprepare a
properbalanced
meal
Fast food isan easier
option
Lack ofmotivation tomake lifestyle
changes
Too tired tocook
Culturalbeliefs
Mean
97
nurses had a high body fat percentage and a normal mean FFM. The nurses wrongly
perceived their body image by thinking they were of normal weight/overweight when
they were in fact either overweight or obese. Just over half wanted to lose weight by
one or two shapes. Culturally, an overweight body shape was still preferred, and
HIV/AIDS, weakness and poverty was still associated with thinness. Strength and the
ability to bear children were associated with overweight body shapes while wealth was
associated with obese body shapes. The nurses also do not seem to know the
difference between overweight and obese body shapes. There seemed to be a shift in
attitude as the nurses were more influenced by media and family beliefs than culture
and were willing to lose weight although they still favoured an overweight body shape.
The nurses did not want to be obese or thin as they still preferred a curvy body. This
was probably due to the fact that being thin was associated with sickness within their
culture. Older nurses were more influenced by radio and newspapers while younger
nurses were more influenced by Facebook and Instagram. This shift in attitude was
probably due to all the media sources and easy internet access now available to the
population. The nurses were mostly influenced by their partner to lose/gain or maintain
body weight. For some nurses, culture was more important as a curvy woman is
admired and respected by people within their culture. They did not believe as much in
media for they believed cultural values were more important. Over half had tried to lose
weight with most trying exercise and cutting down on junk food followed by decreasing
portion size and reducing their intake of sweetened beverages. Working long/different
shift hours, being too tired to exercise or to prepare a balanced meal resulted in fast
food being an easier option for the nurses. These factors were identified as barriers to
body weight control amongst nurses.
98
CHAPTER 5: DISCUSSION
5.1 INTRODUCTION
The following objectives were investigated amongst black female nurses practising in a
private hospital in Durban, KZN, SA.
1.3.9 To determine the prevalence of overweight and obesity.
1.3.10 To determine their body fat percentage and FFM.
1.3.11 To determine how they perceived their body image.
1.3.12 To determine whether they were satisfied with their body shape.
1.3.13 To determine whether their cultural beliefs influenced their body image
perception.
1.3.14 To determine whether they were influenced by media to lose weight and whether
the influence of media overpowered their cultural beliefs.
1.3.15 To determine whether family beliefs influenced the way they felt about their body
image.
1.3.16 To determine which factors were barriers to their body weight control.
This chapter discussed the results presented in chapter 4.
5.2 RESPONSE RATE
The response rate was 67.6% (152/225). According to the statistician, the sample size
should have been a minimum of 63.1% (142/225) to be representative and therefore,
the sample was representative of this study population.
5.3 STUDY POPULATION
The sample comprised of 152 black female nurses whose mean age was 34 years with
a mean nursing experience of 6 years, of whom just over half (56.0%) grew up in a rural
area and most were of the Zulu culture (82.0%).
99
5.4 SATISFACTION WITH CAREER CHOICE
Many (78.0%) were satisfied/very satisfied with their career choice. In SA, during the
Apartheid era, the black population had a very limited earning capacity (Micklesfield et
al 2013). Very few jobs were available to the black population, one of which was the
nursing profession which was open to young African women. Since studying nursing
did not require university fees and because a student nurse could earn while studying, it
was possible for many young African women to become nurses (Nursing Act 1957).
Many chose this career therefore, not out of a passion for the job but instead to be able
to earn and feed their families. It was therefore essential to determine whether the
nurses, particularly the older ones were satisfied with their career choice. If the nurse
was in the profession simply out of necessity to earn a living, it was assumed that they
would not feel an obligation or passion to be role models in the community and
therefore would not adopt healthy behaviours.
5.5 ROLE MODELS
Being HCWs, who assumedly have more knowledge than the general population
regarding the consequences of obesity, it was expected that the prevalence of
overweight and obesity would be lower amongst the nurses, if they strongly considered
themselves as role models.
Although being overweight or obese meant that they were not role models of a healthy
lifestyle, most (87.3%) strongly agreed/agreed that they saw themselves as role models
in the community. Nurses who were most likely to see themselves as role models also
had a higher body fat percentage, which was surprising because it was expected that
the nurses within the normal BMI range would be more likely to see themselves as role
models. Since a bigger body shape is embraced amongst black women, perhaps the
nurses felt themselves to be role models because they did not perceive that they were
overweight/obese.
100
According to Pervez & Ramonaledi (2017), overweight nurses were poor role models as
their weight undermined their credibility to give advice on weight control and therefore it
was essential to improve nursing education regarding obesity.
5.6 MEDICAL CONDITIONS AND MEDICATIONS
Despite the high prevalence of overweight/obesity, most were apparently healthy as
many (74.0%) did not list any medical conditions. Non-communicable diseases, of
which overweight and obesity is a risk factor, account for 37.0% of all group causes of
deaths in SA (Shisana et al 2013). According to Skaal & Pengpid (2011), the
prevalence of hypertension was 20.0%, diabetes was 12.0%, heart disease was 3.0%
and respiratory disease was 6.0% (total 41.0%), amongst 100 HCWs practicing in
Pretoria. The prevalence of NCDs (high blood pressure, asthma, diabetes) in this study
was surprisingly low (8.7%), considering the high prevalence in SA. This could be due
to underreporting because no tests were conducted on the nurses to check their blood
pressure or sugar levels. It is possible that they were also unaware of existing
conditions.
Very few reported having HIV/AIDS (4.7%) which was unexpected since Statistics
South Africa (2016) estimated the prevalence to be 18.9% amongst SA adults aged 15-
49 years. The prevalence of HIV was found to be 15.7% in a sample of 595 SA HCWs
from both public and private health facilities in the Free State, KZN, Mpumalanga and
North West in 2002 (Shisana, Hall, Maluleke, Chauveau & Schwabe 2004). The HIV
status of the nurses in this study was not tested. The low prevalence could be due to
under reporting, which is common due to the stigma associated with the disease in SA
(Campbell, Foulis, Maimane & Sibiya 2005).
Conditions which could have exacerbated weight gain, included insulin resistance
(0.7%), PCOS (0.7%) and hypothyroidism (0.7%). The occurrence was not high
enough to influence the prevalence of overweight and obesity in this sample as only
three nurses suffered from these conditions. Medications potentially causing weight
gain were being taken by 19.3%, which may have contributed to the prevalence of
101
overweight and obesity. The most commonly taken contraceptive Depo Prevora (8.0%)
is known to cause weight gain (Espey et al 2000). Qualitative, in-depth interviews were
conducted in Cape Town on ten overweight black women who blamed their large body
size on the contraceptive injection, Depo Provera (Mvo et al 1999). In summary, 21.3%
either had medical conditions or were taking medications that could cause weight gain.
5.7 PREVALENCE OF OVERWEIGHT AND OBESITY
The hypothesis that the prevalence of overweight and obesity would be low amongst
black SA nurses was rejected because their mean BMI of 32.1 kg/m² classified them as
obese class I.
Their mean BMI was higher than that of the black nurses practicing in Limpopo (31.7
kg/m²) (Goon et al 2013). This possibly indicates a trend of an increase in the
prevalence of overweight and obesity amongst black nurses in SA. As the mean BMI
was higher in nurses in this study than the general black female population in SA (29.2
kg/m²) (SADHS 2016), being a nurse did not encourage the adoption of healthy lifestyle
behaviours.
Most nurses in this study (88.7%) were either overweight (34.4%) or obese (54.3%). In
general, this was higher than that found amongst the black female nurses from Limpopo
(81.8%), where the prevalence of overweight (26.0%) was lower although the
prevalence of obesity (55.8%) was similar (Goon et al 2013). In the Eastern Cape
study, the prevalence of overweight (36.4%) was higher and the prevalence of obesity
(21.8%) was much lower amongst female nursing students (Van Den Berg et al 2012),
when compared to this study and that of Goon et al (2013). This difference in
prevalence could be due to the nursing students having a lower mean age. The
Limpopo study and the current study amongst nurses demonstrated that the prevalence
of overweight fluctuated, while the high prevalence of obesity remained similar. The
HCWs in Pretoria demonstrated a lower prevalence (74.0%) of overweight (30.0%) and
obesity (44.0%), confirming that the prevalence was higher in the nurses (Skaal &
Pengpid 2011).
102
In SA, the prevalence of obesity amongst black African females is 58.5% (Shisana et al
2013) which is slightly higher than the prevalence (±55.0%) amongst the nurses in the
current study and the other study by Goon et al (2013). This study confirmed the
opinion of Goon et al (2013), who suggested that obesity is as prevalent amongst SA
nurses as it is in the general population. Even though nurses are educated HCWs, they
have not appeared to have changed their behaviour and adopted a healthy lifestyle
therefore education has not equated to changes in behaviour and lifestyle.
The prevalence of overweight and obesity (88.7%) was higher than that found amongst
nurses internationally which was 69.1% in Scotland (Kyle et al 2016), 61.8% in New
Zealand, 61.3% in Australia, 59.1% in the UK (Bogossian et al 2012) and 54.2-57.0% in
the USA (Zitkus 2011; Miller et al 2008). These results suggest that SA is facing a more
serious epidemic of obesity amongst nurses than that experienced internationally.
5.8 BODY COMPOSITION
The hypothesis that the nurses would have a low body fat percentage was rejected as
the mean body fat percentage (43.8%) was significantly higher than the normal range
(20.9-27.0%). According to our knowledge, this was the first study in SA that used
multi-frequency BIA to determine the body fat percentage of nurses.
The only other study to our knowledge that investigated body fat percentage of nurses
was conducted by Naidoo & Coopoo (2007). Skinfold readings at three sites (triceps,
subscapular, suprailiac) were measured and body fat percentage was calculated using
an undisclosed equation. However, since only overweight and obese nurses
participated in the study by Naidoo & Coopoo (2007), the results therefore do not reflect
the body fat percentage or BMI of the nursing population in general, therefore the
results have not been included.
Three hundred and twenty-two Bodystat 1500 bio-impedance analyzers that had data
from 23,626 UK adults (male – 11,582, female – 12,044) aged 18 to 99 years were
returned to the company for servicing from 2000-2006. Using the data from these
machines, Meeuwsen, Horgan & Elia (2010) determined that the body fat percentage
103
increased in women with age. This could explain the finding in this study which
demonstrated that the more experienced nursing staff, who were older, tended to have
a higher body fat percent.
The hypothesis that the nurses would have a normal FFM was accepted because their
mean FFM (44.6 kg) was within the mean normal FFM range (43.2-46.9 kg)
demonstrating that the nurses on average carried a high fat mass and normal muscle
mass. This could be due to the nurses increased physical activity as part of their daily
work routine. Although the mean FFM was in the mean normal range, almost a third
(32.0%) needed to improve their FFM.
According to Byrne, Weinsier, Hunter, Desmond, Patterson, Darnell & Zuckerman
(2003), the metabolic rate of FFM is higher than that of fat tissue, therefore FFM uses
more energy than fat mass and hence could help control body weight. Since some
needed to improve their FFM, resistance exercise could increase the FFM, increasing
the resting metabolic rate (RMR) thereby contributing to weight loss (Willis, Slentz,
Bateman, Shields, Piner, Bales, Houmard & Kraus 1985). The loss of fat mass while
maintaining FFM and RMR seems desirable for long term effective weight loss
programmes, due to alterations in respiring tissues that use up considerable amount of
energy (Stiegler & Cunliffe 2006).
5.9 BODY IMAGE PERCEPTION
The hypothesis that the nurses would incorrectly perceive their body image was
accepted as many underestimated their body size, therefore believing they were thinner
than they actually were. According to our knowledge, this is the first study that
investigated body image perception amongst black female nurses in SA.
Although in general, the nurses were obese class I (BMI-32.1 kg/m²), they perceived
themselves to be overweight (BMI-28.2 kg/m²). Out of the 88.7% overweight/obese
nurses, 69.6% underestimated their body image mostly by one shape. This was similar
to the findings of Puoane et al (2005b), who found that two thirds of SA overweight
104
black CHWs did not perceive themselves as being overweight, when 95.0% were
actually overweight/obese.
Skaal & Pengpid’s (2011) study on black SA HCW versus non-HCW demonstrated that
73.6% of those overweight and 57.3% of those obese perceived themselves as being of
normal weight. Despite education, both CHWs and HCWs were unable to perceive their
body image correctly. This study demonstrated that being educated HCW did not
prevent the nurses from incorrectly perceiving their body image.
Body image misconception has been reported amongst the general SA population.
Devanathan et al (2013) conducted a cross-sectional exploratory study on 328 urban
black women in Durban, where the prevalence of overweight was 16.0% and obesity
was 76.0%. Fifty-two percent perceived themselves as overweight when only 16.0%
had a BMI within the overweight category. Only 27.0% perceived themselves as obese
when 76.0% were truly obese. Fourteen percent perceived themselves as normal
weight when in fact only eight percent were in the normal weight category.
The results of this study agreed with those of Monteagudo, Dijkstra & Visser (2015),
Boo (2014) and Lawlor, Taylor, Bedford & Ebrahim (2002), who found that older women
with a higher BMI were more likely to underestimate their body weight. Nurses who
grew up in a rural area as well those who grew up in an urban area incorrectly
perceived their body image. It was expected that nurses who grew up in urban areas
would be more likely to correctly perceive their body image since results from the first
International Body Project demonstrated that in SA, 105 rural participants residing in
KZN selected significantly larger ideal body sizes compared to 100 urban participants in
Cape Town (Swami et al 2010).
These results demonstrated that the nurses incorrectly perceived their body image
which could be one of the underlying factors causing the high prevalence of overweight
and obesity within the profession. According to Skaal & Pengpid (2011), black SA
women considered being overweight as beautiful and attractive, which resulted in
overweight women viewing themselves as being normal weight and healthy. Being
educated did not overcome this misconception. According to Boo (2014),
105
misconception of body weight poses a barrier to the prevention and treatment of
obesity.
Health promotion strategies in SA need to find effective means to address
misconceptions regarding perceived weight status as well as to emphasize the health
risks of being overweight/obese (Prinsloo et al 2011), as traditional education has been
ineffective.
5.10 BODY IMAGE SATISFACTION
The hypothesis that the nurses would be happy with their current body shape was
rejected because just over half were dissatisfied. Body image dissatisfaction was not
expected since the nurses strongly saw themselves as role models in the community
and yet were unhappy with their shape. As their definition of being a role model was not
investigated, perhaps the nurses’ perceived issues other than body weight to be more
important where role modeling was concerned.
Of those who wanted to be a different shape (57.0%), the majority (94.3%) wanted to
lose weight. Over half (59.3%) had tried to lose weight mostly by exercising (74.2%)
and cutting down on junk food (66.3%). Of these, 44.9% stated that they were
successful/extremely successful at weight loss, but the study did not determine their
definition of successful, the extent of weight loss and for what period of time the weight
loss had been maintained. As the majority wanted to reduce weight by two body
shapes on the Stunkard FRS, they would still be overweight or may be normal weight by
the WHO standards. This would, however, improve their health profile as according to
Blackburn & Read (1984), a ten percent reduction in excess body weight can result in
lower prevalence of hypertension and may result in type II diabetes mellitus patients
reducing their need for oral hypoglycaemic agents. It was observed that modest weight
losses can reduce the risk of developing diabetes and produce improvements in sleep
apnea, kidney disease, urinary incontinence, depression, number of hospitalizations
and use of medications (Olson, Bond & Wing 2017).
106
The desire to reduce weight and the attempts to do so were reported in earlier studies
(Prinsloo et al 2011; Puoane et al 2005b). In the current study, 53.6% wanted to reduce
weight while 59.3% had attempted to do so. This was higher than that reported by
Puoane et al (2005b) where 54.8% attempted to reduce weight by reducing their food
intake, taking slimming tablets or doing exercise and 22.1% attempted to reduce weight
through diet and exercise (Prinsloo et al 2011). This indicates a positive change in
attitude.
Although the CHWs in Cape Town respected a moderately obese woman, they also
desired to lose weight (although they definitely did not want to be thin), because an
obese body was heavy to carry, causing continuous fatigue (Puoane et al 2005b).
5.11 CULTURAL BELIEFS AND BODY IMAGE
The hypothesis that the nurses would be strongly influenced by cultural beliefs was
partly accepted because a possible shift in attitude was observed where a healthy body
shape was now identified with that of a normal BMI.
The majority (90.1%) associated a normal weight with health and associated obesity
with being the unhealthiest. It was expected that nurses would associate overweight
with health since earlier research had shown that within the black culture, a moderately
overweight woman (27.0 kg/m²) indicated good health (Puoane et al 2005b; Mvo et al
1999). This shift in attitude was positive as an acceptance that overweight and obesity
was unhealthy could motivate the nurses to reduce weight.
Both overweight (134.8%)12 and obesity (123.7%) were solely associated with obese
body shapes, which demonstrated that the nurses could not discern between
overweight and obesity. This raises concerns about whether the nurses were able to
identify overweight patients and advise them accordingly before they became obese.
Thinness was appropriately associated with weakness (84.9%), hard times/poverty
(77.6%) and sickness. This was similar to the findings of Okop et al (2016); Matoti-
12 Nurses could choose more than one body shape from the Stunkard FRS which resulted in percent that totaled over 100%.
107
Mvalo & Puoane (2011); Puoane et al (2005b) and Mvo et al (1999), where SA black
women correlated thinness with sickness, poverty, unhappiness and stress. Thinness,
however, was inappropriately associated with HIV/AIDS (84.2%). These findings were
similar to the study by Matoti-Mvalo & Puoane (2011) conducted in Cape Town, where
69.3% of black women associated thinness with HIV/AIDS. Despite the increasing
awareness of the negative health consequences of being overweight, many black
women preferred to be big as being thin was associated with HIV/AIDS (Matoti-Mvalo &
Puoane 2011; Puoane et al 2005b; Mvo et al 1999). Historically, weight loss has been
recognized as a significant prognostic factor in HIV infection (Koethe & Heimburger
2010) to the extent that it has shaped cultural beliefs in SA. Studies both internationally
(Delpierre, Bonnet, Marion-Latard, Aquilina, Obadia, Marchou, Massip, Perret &
Bernard 2007; Lazanas, Lambrinoudaki, Douskas, Tsekes, Chini & Georgiou 2003) and
in SA (Biggs & Spooner 2017; Devanathan et al 2013; Malaza et al 2012), have clearly
demonstrated that the prevalence of overweight/obesity in asymptomatic HIV infected
individuals mirrors that of the general population of the country in which they reside.
Wasting is no longer an inevitable consequence of HIV, particularly with the accessibility
of antiretrovirals to all in SA who test positive for HIV (Hurley et al 2011). This
misconception should therefore be addressed as priority using media such as TV as this
tool is already being used in SA to educate the population about HIV/AIDS testing and
the prevention and precautions (Kaiser Family Foundation & South African
Broadcasting Corporation 2007). Education regarding body image should also target
black men as well, as some overweight black women mentioned that their significant
partners complimented their body size and the positive feedback regarding their
attractiveness made them happy and therefore content with their body shape (Mvo et al
1999).
Despite health being associated with a normal body weight, interestingly the most
desirable body shapes in their culture (65.8%) and the most preferred by men in their
culture (69.8%) was overweight. This concurred with Puoane et al (2005b) who stated
that an overweight black woman (BMI 27.0 kg/m²) in SA was culturally preferred, since
this was associated with dignity, respect, confidence, beauty and wealth. Since being
overweight was the most desirable, it was surprising that the prevalence of obesity was
108
so high and perhaps explained the desire to lose weight from an obese shape to an
overweight shape amongst the nurses in this study.
The high prevalence of obesity, however, could be explained by the association of
wealth (75.0%) with obesity in the current study. Puoane et al (2002) reported that
being an obese black woman shows society the ability of a husband to care for his wife
and his family. The current study, however found a poor association with wealth and
being overweight, which was in contrast to the findings of Okop et al (2016), where an
overweight woman was considered wealthy as she was able to “eat nicely” and
therefore could afford to “eat a lot”. Being overweight or obese also indicated the
availability of a sufficient food supply and intake, as food was associated with pleasure
and comfort in areas where there was a high prevalence of food insecurity (Mvo et al
1999).
Both normal weight and overweight was associated with strength (50.6%, 59.2%) and
the ability to bear children (91.4%, 75.6%). No previous studies have shown any
association of normal weight with strength and the ability to bear children; again,
demonstrating a shift in attitude amongst black SA women. According to the ‘Big is
Beautiful’ study conducted in Cape Town, an overweight woman was regarded as
someone who is round, and should be able to do any work required of her such as
cooking a big pot of food without getting easily blown away by the wind (Puoane et al
2005b). Young black women believed that being overweight represented fertility and
the ability to bear children (Salamon & Juhasz 2011).
Cultural beliefs may therefore lead to conflicting desires regarding optimum body shape.
To be healthy one needs to be a normal weight, but to be desirable one needs to be
overweight and to demonstrate success and affluence one needs need to be obese.
5.12 INFLUENCES OVERPOWERING CULTURE
Even though cultural beliefs had a strong influence on the nurses in the current study,
there seemed to be a shift in attitude possibly due to the influences of media (Puoane et
al 2005b) or the family.
109
5.12.1 Media
The hypotheses that the nurses would be influenced by the media to lose weight, and
that media would overpower culture, were accepted.
Only 16.0% were undecided regarding the impact of media while just over half (57.4%)
believed that media had a bigger influence on their body shape than cultural beliefs in
contrast to the one fifth (26.6%), who disagreed. These findings were similar to that
found in the Bloemfontein study where 58.0% were influenced either negatively or
positively by the images in magazines, while the remaining 42.0% were either self-
confident or were not influenced by magazines (Prinsloo et al 2011).
In the current study, the overall biggest media influence was TV, although the older
nurses were more influenced by the radio and the newspaper, while the younger nurses
were more influenced by social media such as Facebook and Instagram. This was
expected as the younger generation are more accustomed to these forms of social
media and have better access to internet (Lenhart, Purcell, Smith & Zickuhr 2010;
Quan-Haase & Young 2010). Although the influence of the various types of media was
primarily not related to the area where the nurses were raised, those from rural areas
were significantly more influenced by radio. Radio and TV are the most common
source of nutrition information for the urban black SA women (Van Der Merwe & Pepper
2006). Although overall TV was the most influential, the government could take
advantage of these preferences and strategise the use of different forms of media to
impact different target audiences. This could include the use of radio to focus
campaigns on weight loss in rural areas.
In the current study, some (38.1%) felt more connected with the media than their
cultural beliefs, since the media promoted healthy lifestyles and the consequences of
being fat. The media in general always portrayed thin women as being beautiful and
overweight or obese people as being unhealthy with low esteem and confidence.
The first International Body Project reported that in SA, women from rural areas who
were less exposed to western media, preferred heavier bodies, whereas those from
urban areas who were more exposed to western media, preferred a thinner figure
110
(Swami et al 2010). Over the years, as the economy has improved, media influences
have extended further into disadvantaged areas causing black SA women to become
increasingly exposed to conflicting body size ideals of other cultures (Micklesfield et al
2013). Media promotion of the Western body ideals as thinness for women has caused
an increasing number of young SA females to report dissatisfaction with their bodies
(Szabo & Allwood 2006).
According to Edwards et al (2003), in SA all women, intentionally or unintentionally
competed with the media and each other to increase their sense of self-worth and social
acceptability.
5.12.2 Family Beliefs
The hypothesis that the nurses would be influenced by family beliefs to lose weight was
partly accepted since only half agreed that their family had a stronger influence on their
shape than cultural beliefs, which indicated conflicting ideals.
According to Puoane et al (2006), society, families and communities influence beliefs
concerning body weight. Some (32.7%) disagreed that family beliefs had any influence,
while 16.0% were neutral and felt that family beliefs did not influence their body image
at all.
Of those who agreed (51.4%) that family beliefs have a greater influence than culture,
the opinion of their partner was the most influential factor, followed closely by the
opinions of the women (mother/sister/grandmother) in the family. Other men in their
family (brother/father/grandfather) did not have any influence. According to Mvo et al
(1999), some overweight black women mentioned that when their significant partners
complimented their body size, they would be happy and feel content with their body.
Even though this study has shown that culturally men preferred an overweight woman, it
also demonstrated that some men encouraged their significant partners to lose weight,
thus showing that even though family members had an influence on how a black woman
feels about her body image, some of them did not conform to the ideals of culture.
Besides their partner, some (39.7%) agreed that their children influenced the way they
111
felt about their body shape by encouraging them to eat healthily and lose weight. This
could be due to the impact of health education at school promoting obesity preventative
strategies and hence influencing children.
This new shift in attitude away from cultural beliefs could be due to the influence of
media. According to our knowledge, family beliefs had not been investigated in any
previous studies regarding body image perception and these findings could add
essential information to literature. In addition to factors such as body image perception,
the influence of media and family beliefs, it was also essential to investigate factors that
were barriers to body weight control amongst nurses.
5.13 BARRIERS TO BODY WEIGHT CONTROL AMONGST NURSES
Working different/long shift hours, being too tired to exercise or to prepare balanced
meals and fast food being an easier option, were the main factors that made it difficult
for the nurses to control their weight. Similar findings were observed by Han et al
(2011) who stated that adverse work schedules could lead to obesity amongst nurses
as shift work or long working hours may disrupt normal eating hours and reduce access
to healthy food options. Nurses working night shifts tend to eat unhealthy foods high in
salt and sugar, and have reported that their working hours affect their energy levels and
frequency of exercise (Han et al 2011; Trinkoff et al 2001). Twelve focus group
discussions were conducted in the Western Cape, SA, including 103 nurses mentioned
that there was a lack of time to prepare healthy meals due to long working hours and
shift work and being overtired from work (Phiri et al 2014). An understanding of all
these concerns is important to plan suitable diet and lifestyle-related interventions for
nurses to promote optimum health and prevent overweight and obesity (Shipra Gupta
2016).
112
5.14 CONCLUSION
Many were satisfied with their career choice and most were apparently healthy. Despite
the high prevalence in SA, there was a very low prevalence of both NCDs and
HIV/AIDS amongst the nurses, which could have been due to underreporting or
unawareness of existing conditions. Very few either had conditions or were taking
medications that could cause weight gain. According to their mean BMI, they were
classified as obese class I with a higher BMI than that reported previously in nurses and
in the general black female population in SA. Conventional health education and
training in nursing therefore had not encouraged the adoption of healthy lifestyle
behaviours.
There was a high prevalence of overweight and obesity amongst the nurses, which was
higher than previous studies involving SA nurses and substantially higher than that
found internationally. The prevalence was higher than that of the general black SA
female population, indicating that overweight and obesity is as prevalent within the
nursing profession as in the general population. The nurses also had high body fat
levels. Although not all the nurses were under lean yet, some needed to do exercise to
help them to further increase their FFM.
Despite being educated HCWs, the nurses still incorrectly perceived their body image
by assuming they were of normal weight or overweight, when they were in fact
overweight or obese. They also could not differentiate between overweight and obese
shapes which could be a contributing factor for incorrectly perceiving their own body
shape. This was similar to other HCWs and CHWs and the general population in SA.
This could be one of the underlying factors causing the high prevalence of overweight
and obesity within the profession since they could not identify that they were overfat.
The nurses strongly considered themselves as role models in the community but since
overweight and obesity were as prevalent within the profession as it is in the general
black SA female population, they were not actually role models. Despite considering
themselves as role models, more than half were not satisfied with their body image and
wanted to lose weight by one or two shapes on the Stunkard FRS. Although this would
not be a normal BMI, losing weight would still be beneficial to the health. Over half had
113
tried to reduce weight by exercising and cutting down on junk food. This shift in attitude
could be due to the media and it is important to be addressed by the Government via
targeted media campaigns as this could be helpful to reduce the prevalence of
overweight and obesity.
There has been a change in cultural beliefs as health was associated with normal BMI
body shapes, unlike in previous studies that associated health with overweight shapes.
An underweight woman was correctly perceived as being weak, poor or sick, however,
being underweight was incorrectly associated with HIV/AIDS. A high prevalence of
overweight and obesity similar to that of the general population in SA has been
observed amongst HIV infected people. It is essential to educate the nurses as well as
the general population as changing this perception could influence overweight/obese
women to consider losing weight and no longer fear the stigma associated with
HIV/AIDS, thus reducing the obesity epidemic. An overweight woman was perceived to
be most desirable by their culture which was similar to the findings of other studies on
the black culture in SA. Obesity (not overweight) was associated with affluence
because culturally this shows society the ability of a husband to care for his wife and
family, as well as the availability of sufficient food supply and intake. While the ability to
bear children and strength were previously associated with being overweight, in the
current study, they were associated with normal weight and overweight, as well which
also indicates a shift in perception regarding body image.
Cultural beliefs therefore led to conflicting desires regarding the nurse’s ideal body
shape since to be healthy they needed to be a normal weight, but to be culturally
desirable they needed to be overweight and obesity seemed to demonstrate affluence
and success.
Media, primarily TV was observed to be highly influential in the way the nurses felt
about their body image. The media could therefore be used as mediums for
intervention programs for different age groups as the older nurses were more influenced
by radio and newspapers, while the younger ones were more influenced by Facebook
and Instagram as they reported that media did influence them to lose weight. Since
media has been observed to be influential, it could be used as a medium for health
114
education and to address the misconceptions regarding body image which could
influence them to lose weight. The nurses were also influenced by family members who
made them feel differently about their body image by influencing them to lose weight.
The most influential was their partner followed by women in their families, but it was
also observed that their children encouraged them to eat healthier and to lose weight.
The nurses also stated that working different/long shift hours, being too tired to exercise
or to prepare a proper balanced meal and fast food being an easier option, were
barriers for them to being able to control their weight. It is therefore essential to
carefully consider all the factors that are promoting a high prevalence of overweight and
obesity amongst the black SA female nurses, to be able to implement culturally
sensitive weight loss strategies.
115
CHAPTER 6: CONCLUSION AND RECOMMENDATIONS
6.1 INTRODUCTION
The following objectives were investigated amongst black female nurses practising in a
private hospital in Durban, KZN, SA.
6.1.1 To determine the prevalence of overweight and obesity.
6.1.2 To determine their body fat percentage and FFM.
6.1.3 To determine how they perceived their body image.
6.1.4 To determine whether they were satisfied with their body shape.
6.1.5 To determine whether their cultural beliefs influenced their body image
perception.
6.1.6 To determine whether they were influenced by media to lose weight and whether
the influence of media overpowered their cultural beliefs.
6.1.7 To determine whether family beliefs influenced the way they felt about their body
image.
6.1.8 To determine which factors were barriers to their body weight control.
This chapter concludes and critiques the study and gives recommendations followed by
implications for further research.
6.1 CONCLUSIONS OF THE STUDY
The rising obesity epidemic in SA is a major public health problem as obesity is a
significant risk factor for NCDs, which in turn are the leading group causes of death in
SA. Understanding the factors which contribute to obesity in SA is important to develop
appropriate intervention strategies. Unique socio-cultural factors amongst the black
culture play a critical role regarding body image in SA, an understanding of which would
help manage this epidemic. In general, it has been shown that black SA women favour
being overweight as this represents respect, strength, beauty, wealth and health and
disdain thinness which is associated with HIV/AIDS, sickness, poverty and depression.
116
Black SA women also tend to underestimate their body weight by assuming they are
thinner than they actually are, which could mask their ability to self-diagnose
overweight/obesity and thus impact the obesity epidemic. As much of the research has
been done on the general black population, it was important to investigate if nurses,
who as part of their qualifications were educated on the consequences of
overweight/obesity, had adopted healthy behaviours and therefore demonstrated a
lower prevalence of overweight/obesity and whether they would be able to correctly
identify their body shape.
The prevalence of overweight and obesity amongst the nurses followed that of the
general SA black female population indicating that traditional methods of education as
part of their training, had not encouraged them to adopt healthy behaviours. When the
results of this study were compared to nurses internationally, SA is facing an even
bigger problem because the prevalence of overweight and obesity amongst nurses was
far higher in SA. The nurses were overfat with a high body fat percentage and many
had a normal FFM. Although they did not need to improve their FFM, exercising would
further increase their lean mass that would in turn increase their RMR, therefore aiding
weight loss/maintenance by burning additional energy. Despite the FFM being in the
normal range, almost a third were underlean and needed to exercise to increase their
FFM.
Many, particularly the older nurses, perceived their body image incorrectly and believed
that they were thinner than they actually were, a misconception which could be a barrier
to weight loss management. Despite being educated, they were unable to discern
between overweight and obese shapes which raised the question as to whether the
nurses would therefore be able to identify and therefore help overweight patients. An
intervention strategy would be to educate the nurses on how to identify overweight and
obesity in themselves and in their patients. The nurses would, however, still need to
desire to correct their body weight.
Many were dissatisfied with their body shape, as approximately half wanted to be
thinner by at least one/two body shapes. This shift in attitude is particularly important
for weight loss campaigns and strategies to be successful. Although they would remain
117
in the overweight category, decreasing their weight by one/two body shapes would
positively impact their health profile and conceivably reduce the prevalence of NCDs
and other related health issues.
Although culture still played an important role, some cultural beliefs appeared to have
shifted as this study identified that black SA nurses associated normal BMI body shapes
with health, whereas previous studies had associated health with overweight. In
contrast to previous research, normal body shapes were also associated with the ability
to bear children and strength. Obesity remained a demonstration of wealth however
and thinness a representation of HIV/AIDS. Despite recent studies demonstrating that
the prevalence of overweight/obesity amongst those with asymptomatic HIV mirrors that
of the general black female population in SA, the majority still associated thinness with
HIV/AIDS. A few however did associate normal/overweight/obese shapes with
HIV/AIDS which may indicate that the belief is beginning to shift. This particular
misconception needs to be urgently addressed to eliminate the commonly used excuse
for weight loss being unacceptable in black South Africans.
The apparent shifting in cultural beliefs towards desiring to be less overweight/obese
could be due to the influence of either or both media and family beliefs, as
approximately half felt these were overpowering their cultural beliefs and motivated
them to lose weight. While TV was the main influential source of media, the older
nurses were more influenced by the radio and newspaper and the younger ones by
Facebook and Instagram. This implies that different sources of media should be
considered for different age groups when designing weight loss intervention strategies.
Regarding family beliefs, the most influential factor was their significant partners
followed by women in their families. It was also observed that children played a role in
the way nurses felt about their body image and this could be the impact of health
education at school which promotes obesity-preventative strategies. Health education
directed at children could highly influence their parents and therefore the weight of the
nation.
Nurses work in an obesogenic environment and profession and barriers to body weight
control amongst them included being too tired to prepare a proper meal and to exercise
118
due to long working hours/shift work which caused them to choose fast food as an
easier option. Over half had attempted to reduce weight by exercising and cutting out
junk food.
Despite being health ambassadors to the public, these nurses were instead contributing
towards the obesity epidemic. It is therefore imperative to understand the cultural
influences on body image perception and the impact of various types of media and
family beliefs. This will enable the implementation of effective culturally sensitive
obesity-preventative strategies to combat the obesity epidemic in SA.
6.3 STUDY CONSTRAINTS/LIMITATIONS
6.3.1 Medical conditions were self-reported and may have been under reported or
there may have been underlying conditions unknown to the nurses.
6.3.2 Since this study was conducted in one private hospital in KZN, the sample may
not be representative of all the black female nurses in SA.
6.3.3 Seventy-three nurses refused to participate as half felt that the study was racial
as it was directed at black nursing staff, some were too busy to leave their wards,
some said they would not be able to comply with the fasting criteria, while others
were pregnant.
6.4 RECOMMENDATIONS FOR IMPROVEMENT OF THE STUDY
6.4.1 As the nurses claimed to have been successful losing weight and yet remained
overweight and obese, the understanding of successful weight loss needs to be
investigated as well as for how long the weight loss was maintained.
6.4.2 The sample size could have been expanded to different provinces to represent
cultures other than the Zulu and Xhosa cultures.
6.4.3 Underestimation of body size can be analyzed respective to BMI category to
demonstrate how many obese nurses perceived themselves as
119
overweight/normal or how many overweight nurses perceived themselves as
normal.
6.5 RECOMMENDATIONS FOR NUTRITION PRACTICE
6.5.1 The Government can use the media (TV, radio and social media such as
Facebook) as a direct channel to provide nutrition education for different age
groups as they are preferred and reliable sources of information which are
accessible. For example, the misconception that only thin people are infected
with HIV/AIDS needs to be addressed at a national level.
6.6 IMPLICATIONS FOR FURTHER RESEARCH
6.6.1 This study could be repeated in both state and private hospitals from different
provinces for a larger sample size to be more representative of the prevalence of
overweight/obesity amongst black female nurses.
6.6.2 Different media platforms should be used to address body image misconceptions
and hence the prevalence of overweight and obesity amongst different age
groups could be monitored.
6.6.3 Future studies should conduct focus group discussions with nurses regarding the
factors that are barriers to them being unable to control their weight, intervene in
the environment to address these and monitor the impact on weight loss and the
prevalence of overweight/obesity.
120
REFERENCES
Ajzen I, Fishbein M (1977). Attitude-behavior relations: A theoretical analysis and
review of empirical research. Psychol Bull 84(5):888-918.
Baleta A, Mitchell F (2016). Country in Focus: Diabetes and Obesity in South Africa.
Lancet Diabetes Endocrinol 2: 687-88.
Baptiste-Roberts K, Gary TL, Bone LR, Hill MN, Brancati FL (2006). Perceived body
image among African Americans with type 2 diabetes. Patient Educ Couns 60
(2):194-200.
Barbosa-Silva MC, Barros AJ (2005). Bioelectrical impedance analysis in clinical
practice: a new perspective on its use beyond body composition equations. Curr
Opin Clin Nutr Metab Care 8(3): 311-7.
Basu S, Andrews J, Kishore S, Panjabi R, Stuckler D (2012). Comparative performance
of private and public healthcare systems in low- and middle-income countries: A
Systematic Review. PLoS Med 9(6): 1-14.
Bate R (2009). What Is Prosperity and How Do We Measure It? Am Enterp 3:1-7.
Biggs C, Spooner E (2017). Obesity and HIV: a compounding problem. S Afr J Clin
Nutr 658: 1-6.
Blackburn GL, Read JL (1984). Benefits of reducing –revisited. Postgrad Med J 60(3):
13-18.
Bogossian FE, Hepworth J, Leong GM, Flaws DF, Gibbons KS, Benefer CA, Turner CT
(2012). A cross-sectional analysis of patterns of obesity in a cohort of working
nurses and midwives in Australia, New Zealand, and the United Kingdom. Int J
Nurs Stud 49(6): 727-738.
Boo S (2014). Misperception of body weight and associated factors. Nurs Health Sci
16(4): 468-475.
Bourne L, Lambert EV, Steyn K (2002). Where does the black population of South
Africa stand on the nutrition transition. Public Health Nutr 5:157-162.
121
Bush HM, Williams RG, Lean ME, Anderson AS (2001). Body image and weight
consciousness among South Asian, Italian and general population women in
Britain. Appetite 37: 207-215.
Byrne NM, Weinsier RL, Hunter GR, Desmond R, Patterson MA, Darnell BE,
Zuckerman PA (2003). Influence of distribution of lean body mass on resting
metabolic rate after weight loss and weight regain: comparison of responses in
white and black women. Am J Clin Nutr 77(6): 1368-73.
Campbell C, Foulis CA, Maimane S, Sibiya Z (2005). “I Have an Evil Child at My
House”: Stigma and HIV/AIDS Management in a South African Community. Am
J Public Health 95(5): 805-815.
Cash TF, Morrow JA, Hrabosky JI, Perry AA (2004). How has body image changed? A
cross sectional investigation of college women and men from 1983 to 2001. J
Consult Clin Psychol 72: 1081-1089.
Chithambo TP, Huey SJ (2013). Black/White differences in perceived weight and
attractiveness among overweight women. J Obes 2013: 1-4.
Cohen E, Bernard JY, Ponty A, Ndao A, Amougou N, Saïd-Mohamed R, Pasquet P
(2015). Development and validation of the body size scale for assessing body
weight perception in African populations. PLoS ONE 10(11): 1-14.
Connors MH, Halligan PW (2015). A cognitive account of belief: A tentative road map.
Front Psychol 6:1–14.
Croffut SE, Hamela G, Mofolo I, Maman S, Hosseinipour MC, Hoffman IF, Bentley ME,
Flax VL (2017). HIV-positive Malawian women with young children prefer
overweight body sizes and link underweight body size with inability to exclusively
breastfeed. Matern Child Nutr January: e12446.
Delpierre C, Bonnet E, Marion-Latard F, Aquilina C, Obadia M, Marchou B, Massip P,
Perret B, Bernard J (2007). Impact of HIV infection on total body composition in
treatment-naïve men evaluated by dual-energy X-ray absorptiometry comparison
of 90 untreated HIV-infected men to 241 Controls. J Clin Densitom 10(4): 376-
80.
122
Department of Health (2013). THE NATIONAL STRATEGIC PLAN FOR NURSE
EDUCATION, TRAINING AND PRACTICE 2012/13 – 2016/17.
[http://www.sanc.co.za/archive/archive2013/linked_files/Strategic_Plan_for_Nurs
e_Education_Training_and_Practice.pd] (Accessed on 28 January 2017).
Department of Health (2017). World Obesity Day 2016.
[http://www.health.gov.za/index.php/gf-tb-program/323-world-obesity-day-2016]
(Accessed on 9 February 2017).
Derenne JL, Beresin EV (2006). Body image, media, and eating disorders. Acad
Psychiatry 30(3): 257-61.
Devanathan R, Esterhuizen TM, Govender RD (2013). Overweight and obesity
amongst Black women in Durban, KwaZulu-Natal: A “disease” of perception in an
area of high HIV prevalence. Afr J Prm Health Care Fam Med 5(1):1–7.
Dodaj A (2012). Social desirability and self-reports: Testing a content and response-
style model of socially desirable responding. Eur J Psychol 8(4):651–666.
Edwards D, d’Agrela A, Geach M, Welman M (2003). Disturbances of attitudes and
behaviours related to eating in Black and White females at high school and
university in South Africa. J Psychol Africa; South Sahara, Caribbean, Afro-
Latin Am 13(1): 16-33.
Ellis KJ, Shypailo RJ, Wong WW (1999). Measurement of body water by
multifrequency bioelectrical impedance spectroscopy in a multi-ethnic pediatric
population. Am J Clin Nutr 70(5): 847-853.
EP-Nuffic (2015). South African education system described and compared with
the Dutch. [https://www.nuffic.nl/en/publications/find-a-publication/education-
system-south-africa] (Accessed on 18 June 2017).
Espey E, Steinhart J, Ogburn T, Qualls C (2000). Depo-provera associated with weight
gain in Navajo women. Contraception 62(2): 55-58.
123
Ettarh R, Van de Vijver S, Oti S, Kyobutungi C (2013). Overweight, obesity and
Perception of Body Image Among Slum Residents in Nairobi, Kenya, 2008-2009.
Prev Chronic Dis 10(4): 130198.
Fields DA, Goran MI (2000). Body composition techniques and the four-compartment
model in children. J Appl Physiol 89(2): 613-20.
Figueroa R, Saltzman J, Jarick Metcalfe J, Wiley A (2017). “Culture Is So Interspersed”:
Child-Minders’ and Health Workers’ Perceptions of Childhood Obesity in South
Africa. J Obes 2017:1–14.
Gardner RM, Brown DL (2010). Body image assessment: A review of figural drawing
scales. Pers Indiv Differ 48(2): 107-111.
Global Health Observatory (2016). Overweight and obesity.
[http://www.who.int/gho/ncd/risk_factors/overweight/en/]. (Accessed on 15
November 2017).
González-Velázquez F, Mendez GF (2007). Cardiovascular risk stratification by means
of the SCORE system in health care workers in Veracruz, Mexico. Int J Cardiol
121: 81-83.
Goon DT, Maputle MS, Olukoga A, Lebese R, Khoza LB, Ayanwu FC (2013).
Overweight, obesity and underweight in nurses in Vhembe and Capricorn
districts, Limpopo. S Afr J Clin Nutr (26)3: 147-149.
Grabe S, Ward LM, Hyde JS (2008). The role of the media in body image concerns
among women: A meta-analysis of experimental and correlational studies.
Psychol Bull 134(3): 460-476.
Grimes DA, Schulz KF (2002). Descriptive studies: What they can and cannot do.
LANCET 359(9301): 145-149.
Hale HE (2004). Explaining Ethnicity. Comp Polit Stud 37(4):458–485.
Han K, Trinkoff AM, Storr CL, Geiger-Brown J (2011). Job stress and work Schedules
in Relation to Nurse Obesity. J Nurs Adm 41(11): 488-495.
124
Hannan WJ, Cowen SJ, Fearon KC, Plester CE, Falconer JS, Richardson RA (1994).
Evaluation of multi-frequency bio-impedance analysis for the assessment of
extracellular and total body water in surgical patients. Clin Sci 86(4): 479-485.
Hartley J (2013). Some thoughts on Likert-type scales. Int J Clin Heal Psychol 14(1):
83-86.
Harvard TH Chan School of Public Health (2017). Obesity Prevention Source.
[https://www.hsph.harvard.edu/obesity-prevention-source/prevalence-incidence]
(Accessed on 18 June 2017).
Hendley Y, Zhao L, Coverson DL, Din-Dzietham R, Morris A, Quyyumi AA, Gibbons
GH, Vaccarino V (2011). Differences in Weight Perception Among Blacks and
Whites. J Women’s Health 20(12): 1805-1811.
Heymsfield SB, Lichtman S (1990). New approaches to body composition research: a
reexamination of two-compartment model assumptions. Infusionstherapie
17(3): 4-8.
Holdsworth M, Gartner A, Landais E, Maire B, Delpeuch F (2004). Perceptions of
healthy and desirable body size in urban Senegalese women. Int J Obes
28(12): 1561-1568.
Huang AC, Chen YY, Chuang CL, Chiang LM, Lu HK, Lin HC, Chen KT, Hsiao AC,
Hsieh KC (2015). Cross-mode bioelectrical impedance analysis in a standing
position for estimating fat-free mass validated against dual-energy x-ray
absorptiometry. Nutr Res 35(11): 982-989.
Hurley E, Coutsoudis A, Giddy J, Knight SE, Loots E, Esterhuizen TM (2011). Weight
evolution and perceptions of adults living with HIV following initiation of
antiretroviral therapy in a South African urban setting. S Afr Med J 101(9): 645-
650.
Kaiser Family Foundation, South African Broadcasting Corporation (2007). Young
South Africans, Broadcast Media, And Hiv/Aids Awareness: Results of A
National Survey.
125
[https://kaiserfamilyfoundation.files.wordpress.com/2013/01/7614.pdf] (Accessed
on 30 November 2017).
Knupfer NN, McLellan H (1996). Descriptive research methodologies. In: Jonassen DH,
ed. Handbook of research for educational communications and
technology. New York: MacMillan.
Koethe JR, Heimburger DC (2010). Nutritional aspects of HIV-associated wasting in
sub-Saharan Africa. Am J Clin Nutr 91(4): 1138-42.
Kontis V, Mathers CD, Rehm J, Stevens GA, Shield KD, Bonita R, Riley LM, Poznyak V,
Beaglehole R, Ezzati M (2014). Contribution of six risk factors to achieving the
25 x 25 non-communicable disease mortality reduction target: A modelling study.
The Lancet 384(9941): 427-37.
Kruger HS, Puoane T, Senekal M, van der Merwe MT (2005). Obesity in South Africa:
challenges for government and health professionals. Public Health Nutr 8(5):
491–500.
KwaZulu-Natal Department of Health (2001). Community Health Workers.
[http://www.kznhealth.gov.za/chw.htm] (Accessed on 18 November 2017).
Kyle RG, Neall RA, Atherton IM (2016). Prevalence of overweight and obesity among
nurses in Scotland: A cross-sectional study using the Scottish Health Survey. Int
J Nurs Stud 53: 126–133.
Kyle UG, Bosaeus I, De Lorenzo AD, Deurenberg P, Elia M, Gómez JM, Heitmann BL,
Kent-Smith L, Melchior JC, Pirlich M, Scharfetter H, Schols A, Pichard C (2004).
Bioelectrical impedance analysis – part II: Utilization in clinical practice. Clin
Nutr 23(6): 1430-1453.
Lawlor D, Taylor M, Bedford C, Ebrahim S (2002). Is housework good for health?
Levels of physical activity and factors associated with activity in elderly women.
J Epidemiol Commun H 56(6): 473-478.
Lazanas MC, Lambrinoudaki IV, Douskas GA, Tsekes GA, Chini MN, Georgiou EK
(2003). Body composition in asymptomatic HIV-infected men: cross-sectional
and prospective assessment. Hormones (Athens) 2(1): 43-48.
Lenhart A, Purcell K, Smith A, Zickuhr (2010). Social Media & Mobile Internet Use
Among Teens and Young Adults.
126
[https://files.eric.ed.gov/fulltext/ED525056.pdf] (Accessed on 3 December 2017).
Levin KA (2006). Study design III: Cross-sectional studies. Evid Based Dent 7(1): 24-
25.
Luevorasirikul K (2007). ‘Body Image and Weight Management: Young People, Internet
Advertisements and Pharmacists’. Unpublished Doctoral thesis: University of
Nottingham.
Lukaski HC, Bolonchuk WW, Hall CB, Siders WA (1986). Validation of tetrapolar
bioelectrical impedance method to assess human body composition. J Appl
Physiol 60(4): 1327-1332.
Lund Research (2012). Total population sampling|Lærd Dissertation.
[http://dissertation.laerd.com/total-population-sampling.php] (Accessed on 29
June 2017).
Malaza A, Mossong J, Bärnighausen T, Newell ML (2012). Hypertension and Obesity in
Adults Living in a High HIV Prevalence Rural Area in South Africa. PLoS ONE
7(10): e47761.
Mann C (2003). Observational research methods. Research design II: cohort, cross
sectional, and case-control studies. Emerg Med J 20: 54-60.
Matoti-Mvalo T, Puoane T (2011). Perceptions of body size and its association with
HIV/AIDS. S Afr J Clin Nutr 24(1): 40-45.
Mchiza ZJ, Goedecke JH, Lambert EV (2011). Intra-familial and ethnic effects on
attitudinal and perceptual body image: a cohort of South African mother-daughter
dyads. BMC Public Health 11(1):433.
Mciza Z, Goedecke J, Steyn NP, Charlton K, Puoane T, Meltzer S, Levitt NS, Lambert
EV (2005). Development and validation of instruments measuring body image
and body weight dissatisfaction in South African mothers and their daughters.
Public Health Nutr 8(5): 509-519.
127
Meeuwsen S, Horgan GW, Elia M (2010). The relationship between BMI and percent
body fat, measured by bioelectrical impedance, in a large adult sample is
curvilinear and influenced by age and sex. Clin Nutr 29(5): 560-566.
Micklesfield LK, Lambert EV, Hume DJ, Chantler S, Pienaar PR, Dickie K, Puoane T,
Goedecke JH (2013). Socio-cultural, environmental and behavioural
determinants of obesity in black South African women. Cardiovasc J Afr 24(9):
369-375.
Miller SK, Alpert PT, Cross CL (2008). Overweight and obesity in nurses, advanced
practice nurses and nurse educators. J Am Acad Nurse Pract 20(5): 259-265.
Monteagudo C, Dijkstra SC, Visser M (2015). Self-Perception of Body Weight Status in
Older Dutch Adults. J Nutr Heal Aging 19(6): 612-618.
Morry MM, Staska SL (2001). Magazine Exposure: Internalization, Self-Objectification,
Eating Attitudes, and Body Satisfaction in Male and Female University Students.
Can J Behav Sci 33(4): 269-279.
Mvo Z, Dick J, Steyn K (1999). Perceptions of overweight African women about
acceptable body size of women and children. Curationis 22(2): 27-31.
Nahid G (2003). Understanding Reliability and Validity in Qualitative Research. Qual
Rep 8(4): 597-607.
Naidoo R, Coopoo Y (2007). The health and fitness profiles of nurses in KwaZulu-
Natal. Curationis: 66-73.
National Department of Health, South African Medical Research Council, Program TD
(2017). South African Demographic and Health Survey 2016: Key
Indicators. Statistics South Africa.
New Oxford American Dictionary (2017). English Oxford Living Dictionaries.
[https://en.oxforddictionaries.com/definition/fast_food] (Accessed on 16
December 2017).
128
NHS (2015). Your contraception guide.
[https://www.nhs.uk/conditions/contraception/contraceptive-injection/?]
(Accessed on 20 September 2017).
Nojilana B, Bradshaw D, Pillay-van Wyk V, Msemburi W, Laubscher R, Somdyala NIM,
Joubert JD, Groenewald P, Dorrington RE (2016). Emerging trends in non-
communicable disease mortality in South Africa, 1997-2010. S Afr Med J
106(5): 477-484.
Norton K, Whittingham N, Carter L, Kerr D, Gore C, Marfell-Jones M (1996).
Measurement techniques in anthropometry. Anthropometrica: 25-75.
NPS MedicineWise (2017). Medicine Finder. [https://www.nps.org.au/medical-
info/medicine-finder] (Accessed on 20 September 2017).
Nursing Act (1957). Nurses Face Apartheid. Another Profession Under Fire From
The Government: 21-24. [http://www.sahistory.org.za/archive/nurses-face-
apartheid-another-profession-under-fire-from-the-government] (Accessed on 17
November 2017).
Okop KJ, Mukumbang FC, Mathole T, Levitt N, Puoane T (2016). Perceptions of body
size, obesity threat and the willingness to lose weight among black South African
adults: a qualitative study. BMC Public Health 16(235): 1-13.
Olson K, Bond D, Wing RR (2017). Behavioral Approaches to the Treatment of
Obesity. R I Med J: 21-24.
Organization for Economic Co-operation and Development (2012). Health at a glance:
Europe 2012. [http://www.oecd.org/health/ healthataglanceeurope.htm]
Pervez H, Ramonaledi (2017). Nurses’ attitudes towards obese patients: a review of
the literature. Nurs Times 113(2): 42-45.
Pharma Dynamics (2015). Skin Allergies.
[http://pharmadynamics.co.za/treat/allergies/skin-allergies/second-
generation/texa-allergy/] (Accessed 17 March 2018).
129
Phiri LP, Draper CE, Lambert EV, Kolbe-Alexander TL (2014). Nurses’ lifestyle
behaviours, health priorities and barriers to living a healthy lifestyle: a qualitative
descriptive study. BMC Nurs 13(1).
Pistikou AM, Zyga S, Sachlas A, Katsa ME, Daratsianou M and Gil APR (2014).
Determinative Factors of being an Effective Health-care Role Model. Int J
Occup Heal Public Heal Nurs 1(3): 3-14.
Price HI, Gregory DM, Twells LK (2014). Body shape expectations and self-ideal body
shape discrepancy in women seeking bariatric surgery: a cross-sectional study.
BMC Obes 1(1): 28.
Prinsloo EAM, Joubert G, Mohale M, Nyindi N, Matu N, Ntechane L, Struwig MC (2011).
The prevalence and perception of obesity and its association with the lifestyle of
women at the Mangaung University Community Partnership Project healthcare
centre, Bloemfontein. S Afr Fam Pract 53(4): 366-372.
Puoane T, Bradley H, Hugles GD (2005a). Obesity Among Black South African
Women. J Hum Ecol Spec 13: 91-95.
Puoane T, Fourie JM, Shapiro M, Rosling L, Tshaka NC, Oelefse A (2005b). “Big is
beautiful” – an exploration with urban black community health workers in a South
African township. S Afr J Clin Nutr 18(1): 6-15.
Puoane T, Matwa P, Bradley H, Hughes G (2006). Socio-cultural factors influencing
food consumption patterns in the black african population in an urban township in
South Africa. J Hum Ecol 14: 89-93.
Puoane T, Steyn K, Bradshaw D, Laubscher R, Fourie J, Lambert V, Mbananga N
(2002). Obesity in South Africa: The South African demographic and health
survey. Obes Res 10(10): 1038-1048.
Puoane T, Tsolekile L (2008). Challenges faced by the urban Black South Africans in
the prevention of non-communicable diseases. Tribes and Tribals 2: 9-14.
Puoane T, Tsolekile L, Steyn N (2010). Perceptions about body image and sizes
among black African girls living in Cape Town. Ethnic Dis 20: 29-34.
130
Quan-Haase A, Young AL (2010). Uses and Gratifications of Social Media: A
Comparison of Facebook and Instant Messaging. Bull Sci Technol Soc 30(5):
350-361.
Rattray J, Jones MC (2007). Essential elements of questionnaire design and
development. J Clin Nurs 16(2): 234-243.
Rush KL, Kee CC, Rice M (2005). Nurses as Imperfect Role Models for Health
Promotion. West J Nurs Res 27(2): 166-183.
Salamon H, Juhasz E (2011). Goddesses of Flesh and Metal: Gazes on the Tradition of
Fattening Jewish Brides in Tunisia. J Middle E Women’s St 7(1): 1-38.
Schwartz MB, Brownell KD (2004). Obesity and body image. Body Image 1(1): 43-56.
Senekal M, Steyn NP, Nel JH (2003). Factors associated with overweight/obesity in
economically active South African populations. Ethnic Dis 13(1): 109-116.
Shipra Gupta SG (2016). Lifestyle Patterns, Eating Practices and Obesity among
Nurses: A Review. Int J Heal Sci Res 6(11): 258-266.
Shisana O, Hall EJ, Malukele R, Chauveau J, Schwabe C (2004). HIV/AIDS prevalence
among South African health workers. S Afr Med J 94(10): 846-850.
Shisana O, Labadarios D, Rehle T, Simbayi L, Zuma K, Dhansay A, Reddy P, Parker
W, Hoosain E, Naidoo P, Hongoro C, Mchiza Z, Steyn NP, Dwane N, Makoae M,
Maluleke T, Ramlagan S, Zungu N, Evans MG, Jacobs L, Faber M, SANHANES-
1 Team (2013). South African National Health and Nutrition Examination
Survey (SANHANES-1). Cape Town: HSRC Press.
Skaal L, Pengpid S (2011). Obesity and health problems among South African
healthcare workers: do healthcare workers take care of themselves? S Afr Fam
Pract 53(6): 563-567.
South African Electronic Package Inserts (2005). NUR-ISTERATE.
[http://home.intekom.com/pharm/schering/nur-ist.html] (Accessed on 20
September 2017).
South African Nursing Council (2016). Education and Training of Nursing and
Midwifery Students. [http://www.sanc.co.za/education_and_training.htm]
131
(Accessed on 18 June 2017).
Steyn NP, Senekal M, Brits S, Alberts M, Mashego T, Nel JH (2000). Weight and health
status of black female students. S Afr Med J 90(2): 146-152.
Stiegler P, Cunliffe A (2006). The role of diet and exercise for the maintenance of fat-
free mass and resting metabolic rate during weight loss. Sports Med 36(3): 239-
262.
Stunkard AJ, Sorensen T, Schulsinger F (1983). Use of the Danish Adoption Register
for the Study of Obesity and Thinness. Research Publications – Association
for Research in nervous & Mental Disease 60: 115-120.
Swami V, Frederick DA, Aavik T, Alcalay L, Allik J, Anderson D, Andrianto S, Arora A,
Brännstrőm A, Cunningham J, Danel D, Doroszewicz K, Forbes GB, Furnham A,
Greven CU, Halberstadt J, Hao S, Haubner T, Hwang CS, Inman M, Jaafar JL,
Johansson J, Jung J, Keser A, Kretzschmar U, Lachenicht L, Li NP, Locke K,
Lőnnqvist JE, Lopez C, Loutzenhiser L, Maisel NC, McCabe MP, McCreary DR,
McKibbin WF, Mussap A, Neto F, Nowell C, Alampay LP, Pillai SK, Pokrajac-
Bulian A, Proyer RT, Quintelier K, Ricciardelli LA, Rozmus-Wrzesinska M, Ruch
W, Russo T, Schűtz A, Shackelford TK, Shasidharan S, Simonetti F, Sinniah D,
Swami M, Vandermassen G, van Duynslaeger M, Verkasalo M, Voracek M, Yee
CK, Zhang EX, Zhang X, Zivcic-Becirevic I (2010). The Attractive Female Body
Weight and Female Body Dissatisfaction in 26 Countries Across 10 World
Regions: Results of the International Body Project I. Pers Soc Psychol Bull
36(3):309–325.
Szabo CP, Allwood CW (2006). Body figure preference in South African adolescent
females: a cross cultural study. Afr Health Sci 6(4): 201-206.
Talamas S, Mavor K, Perrett D (2016). Blinded by Beauty: Attractiveness Bias and
Accurate Perceptions of Academic Performance. PLoS ONE 11(2):1–18.
Tan WL (1994). The Creation of Wealth and Value – Yet Another Definition of
Entrepreneurship. J Enterpr Cult 1(3 & 4): i–iv.
132
Trinkoff AM, Storr CL, Lipscomb JA (2001). Physically demanding work and inadequate
sleep, pain medication use, and absenteeism in registered nurses. J Occup
Environ Med 43(4): 355-363.
UNICEF (2012). Children in an Urban World.
[https://www.unicef.org/sowc/files/SOWC_2012-
Main_Report_EN_21Dec2011.pdf] (Accessed on 14 June 2017).
Van Den Berg VL, Okeyo AP, Dannhauser A, Nel M (2012). Body weight, eating
practices and nutritional knowledge amongst university nursing students, Eastern
Cape, South Africa. African J Prim Heal Care Fam Med 4(1): 1-9.
Van Der Merwe MT, Pepper MS (2006). Obesity in South Africa. Obes Rev 7(4): 315-
322.
Venter FC, Walsh CM, Slabber M, Bester CJ (2009). Body size perception of African
women (25-44 years) in Mangaung. J Fam Ecol Cons Sci 37(1): 12-23.
WebMD (2017a). Drugs & Medications. [https://www.webmd.com/drugs/2/drug-
144753/atripla-oral/details] (Accessed on 20 September 2017).
WebMD (2017b). Junk-Food Facts. [https://www.webmd.com/diet/features/junk-food-
facts#1] (Accessed on 28 December 2017).
Williamson DA, Womble LG, Zucker NL, Reas DL, White MA, Blouin DC, Greenway F
(2000). Body image assessment for obesity (BIA-O): development of a new
procedure. Int J Obes Relat Metab Disord 24(10): 1326-1332.
Willis LH, Slentz CA, Bateman LA, Shields AT, Piner LW, Bales CW, Houmard JA,
Kraus WE (1985). Effects of aerobic and/or resistance training on body mass
and fat mass in overweight or obese adults. J Appl Physiol 113(12): 1831-
1837.
World Health Organization (2010). Definition and list of health professionals.
[http://whoeducationguidelines.org/content/1-definition-and-list-health-
133
professionals] (Accessed on 18 June 2017).
World Health Organization (2000). Obesity: preventing and managing the global
epidemic – Report of a WHO consultation. Geneva: WHO.
World Health Organization (2017). Noncommunicable diseases.
[http://www.who.int/mediacentre/factsheets/fs355/en/] (Accessed on 24 January
2017).
World Health Organization (2017). Obesity and overweight.
[http://www.who.int/mediacentre/factsheets/fs311/en/] (Accessed on 24 January
2017).
World Health Organization (2006). Global Database on Body Mass Index.
[http://apps.who.int/bmi/index.jsp?introPage=intro_3.html] (Accessed on 24
January 2017).
World Health Organization (2006). Health Workers. Geneva, Switzerland.
World Health Organization (2013). Health education.
[http://www.who.int/topics/health_education/en/] (Accessed on 13 June 2017).
Wright SM, Aronne LJ (2012). Causes of obesity. Abdom Imaging 37(5):730–732.
Zapka JM, Lemon SC, Magner RP, Hale J (2009). Lifestyle behaviours and weight
among hospital-based nurses. J Nurs Manag 17(7): 853-860.
Ziraba A, Fotso J, Ochako R (2009). Overweight and obesity in urban Africa: A problem
of the rich or the poor? BMC Public Health 9(465):1–9.
Zitkus BS (2011). The relationship among registered nurses’ weight status, weight loss
regimens, and successful or unsuccessful weight loss. J Am Acad Nurse Prac
23(2): 110-116.
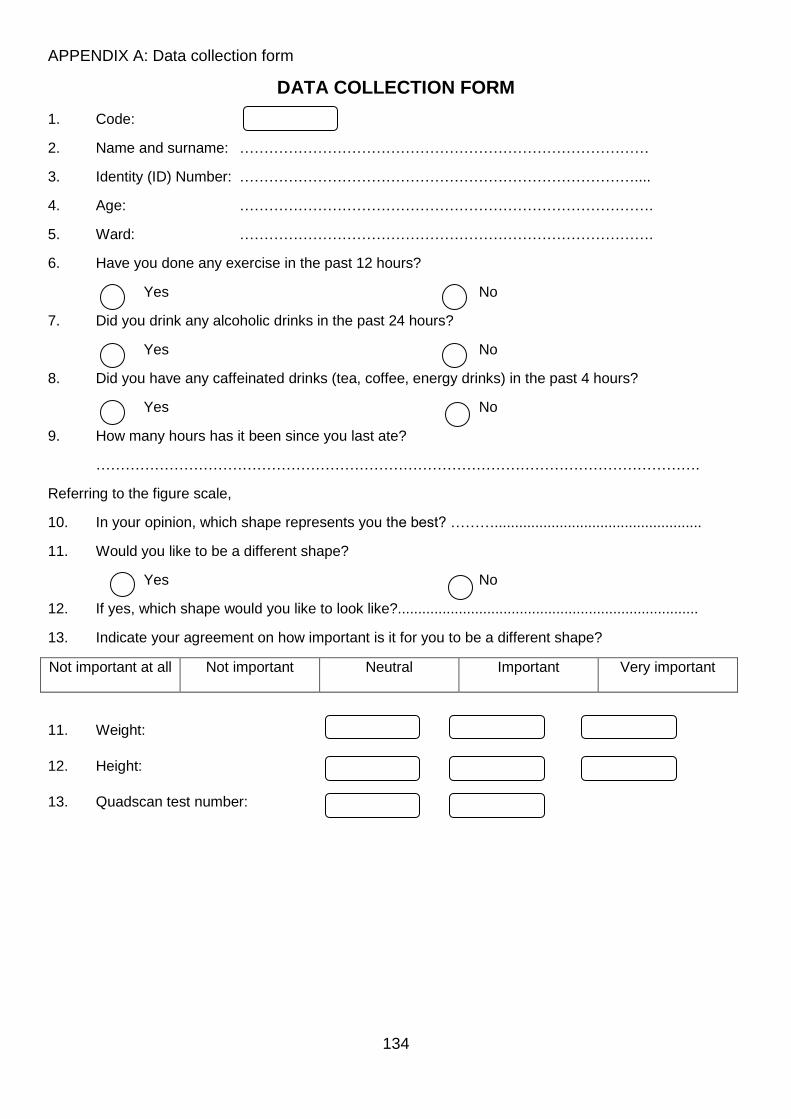
134
APPENDIX A: Data collection form
DATA COLLECTION FORM
1. Code:
2. Name and surname: …………………………………………………………………………
3. Identity (ID) Number: ………………………………………………………………………....
4. Age: ………………………………………………………………………….
5. Ward: ………………………………………………………………………….
6. Have you done any exercise in the past 12 hours?
Yes No
7. Did you drink any alcoholic drinks in the past 24 hours?
Yes No
8. Did you have any caffeinated drinks (tea, coffee, energy drinks) in the past 4 hours?
Yes No
9. How many hours has it been since you last ate?
…………………………………………………………………………………………………………….
Referring to the figure scale,
10. In your opinion, which shape represents you the best? ………...................................................
11. Would you like to be a different shape?
Yes No
12. If yes, which shape would you like to look like?..........................................................................
13. Indicate your agreement on how important is it for you to be a different shape?
Not important at all Not important Neutral Important Very important
11. Weight:
12. Height:
13. Quadscan test number:
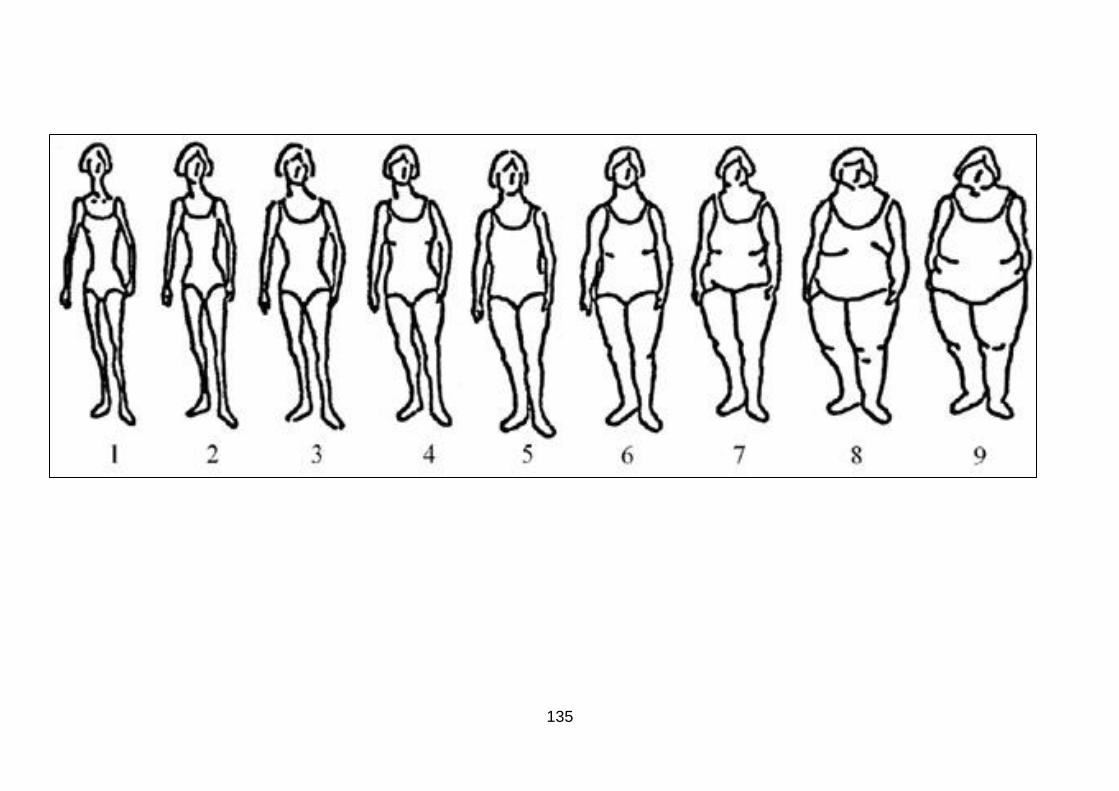
135
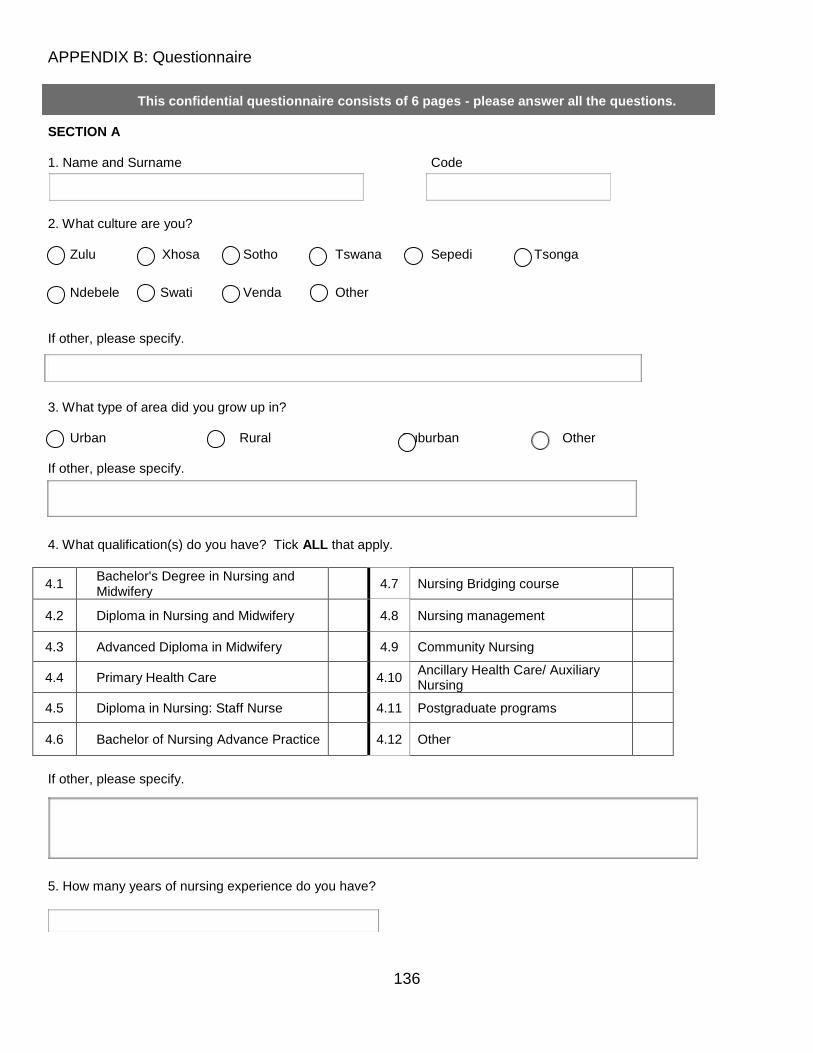
136
APPENDIX B: Questionnaire
This confidential questionnaire consists of 6 pages - please answer all the questions.
SECTION A 1. Name and Surname Code
2. What culture are you? Zulu Xhosa Sotho Tswana Sepedi Tsonga
Ndebele Swati Venda Other
If other, please specify.
3. What type of area did you grow up in? Urban Rural Suburban Other If other, please specify. 4. What qualification(s) do you have? Tick ALL that apply.
4.1 Bachelor's Degree in Nursing and Midwifery
4.7 Nursing Bridging course
4.2 Diploma in Nursing and Midwifery
4.8 Nursing management
4.3 Advanced Diploma in Midwifery
4.9 Community Nursing
4.4 Primary Health Care
4.10 Ancillary Health Care/ Auxiliary Nursing
4.5 Diploma in Nursing: Staff Nurse
4.11 Postgraduate programs
4.6 Bachelor of Nursing Advance Practice
4.12 Other
If other, please specify.
5. How many years of nursing experience do you have?
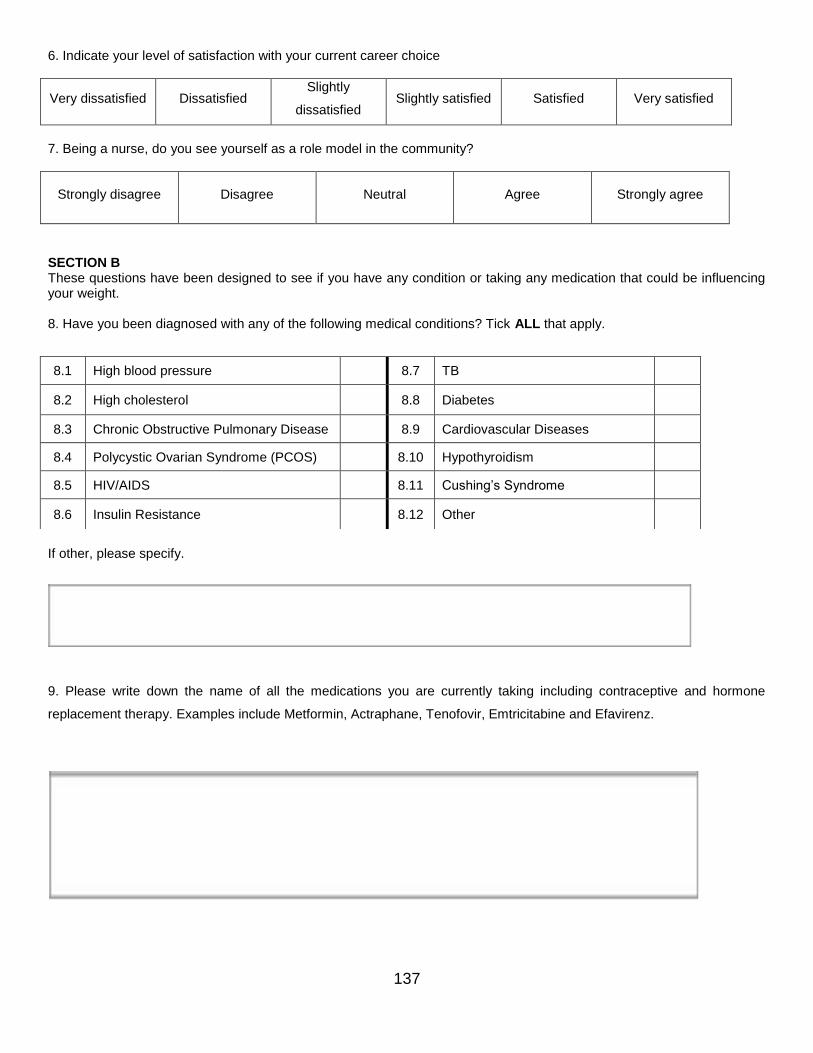
137
6. Indicate your level of satisfaction with your current career choice
Very dissatisfied Dissatisfied Slightly
dissatisfied Slightly satisfied Satisfied Very satisfied
7. Being a nurse, do you see yourself as a role model in the community?
Strongly disagree Disagree Neutral Agree Strongly agree
SECTION B These questions have been designed to see if you have any condition or taking any medication that could be influencing your weight. 8. Have you been diagnosed with any of the following medical conditions? Tick ALL that apply.
If other, please specify.
9. Please write down the name of all the medications you are currently taking including contraceptive and hormone
replacement therapy. Examples include Metformin, Actraphane, Tenofovir, Emtricitabine and Efavirenz.
8.1 High blood pressure 8.7 TB
8.2 High cholesterol
8.8 Diabetes
8.3 Chronic Obstructive Pulmonary Disease 8.9 Cardiovascular Diseases
8.4 Polycystic Ovarian Syndrome (PCOS) 8.10 Hypothyroidism
8.5 HIV/AIDS 8.11 Cushing’s Syndrome
8.6 Insulin Resistance
8.12 Other
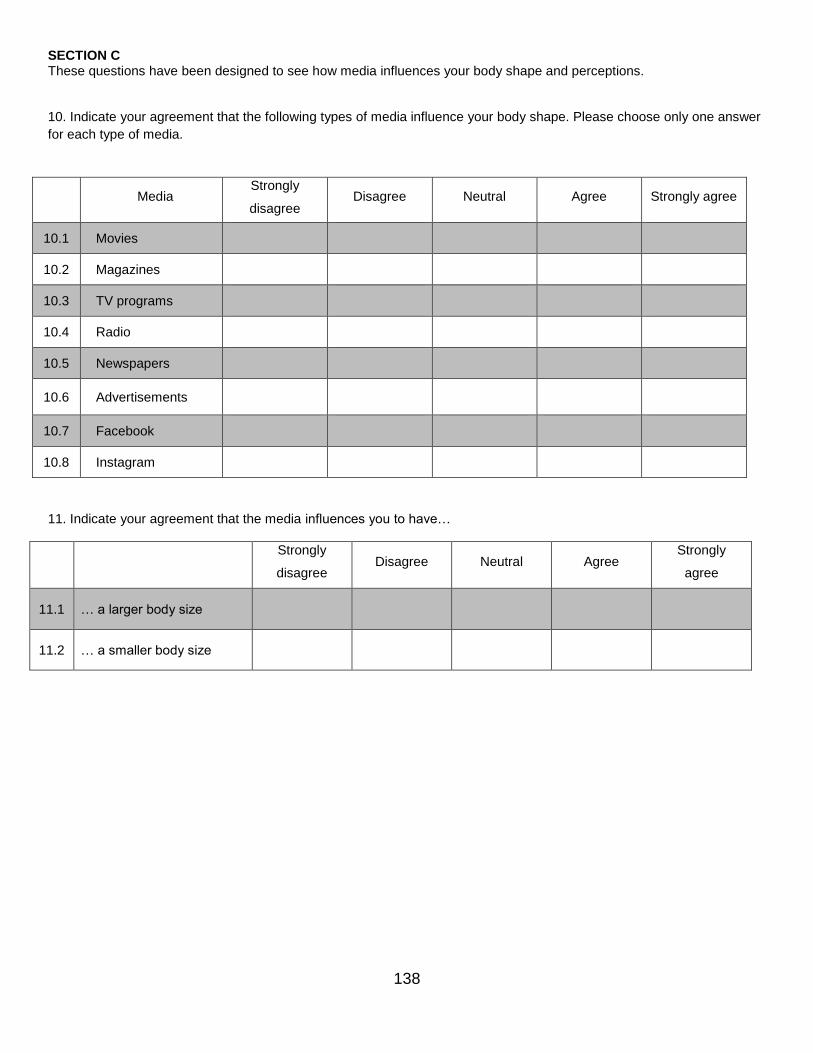
138
SECTION C These questions have been designed to see how media influences your body shape and perceptions. 10. Indicate your agreement that the following types of media influence your body shape. Please choose only one answer
for each type of media.
Media Strongly
disagree Disagree Neutral Agree Strongly agree
10.1 Movies
10.2 Magazines
10.3 TV programs
10.4 Radio
10.5 Newspapers
10.6 Advertisements
10.7 Facebook
10.8 Instagram
11. Indicate your agreement that the media influences you to have…
Strongly
disagree Disagree Neutral Agree
Strongly
agree
11.1 … a larger body size
11.2 … a smaller body size
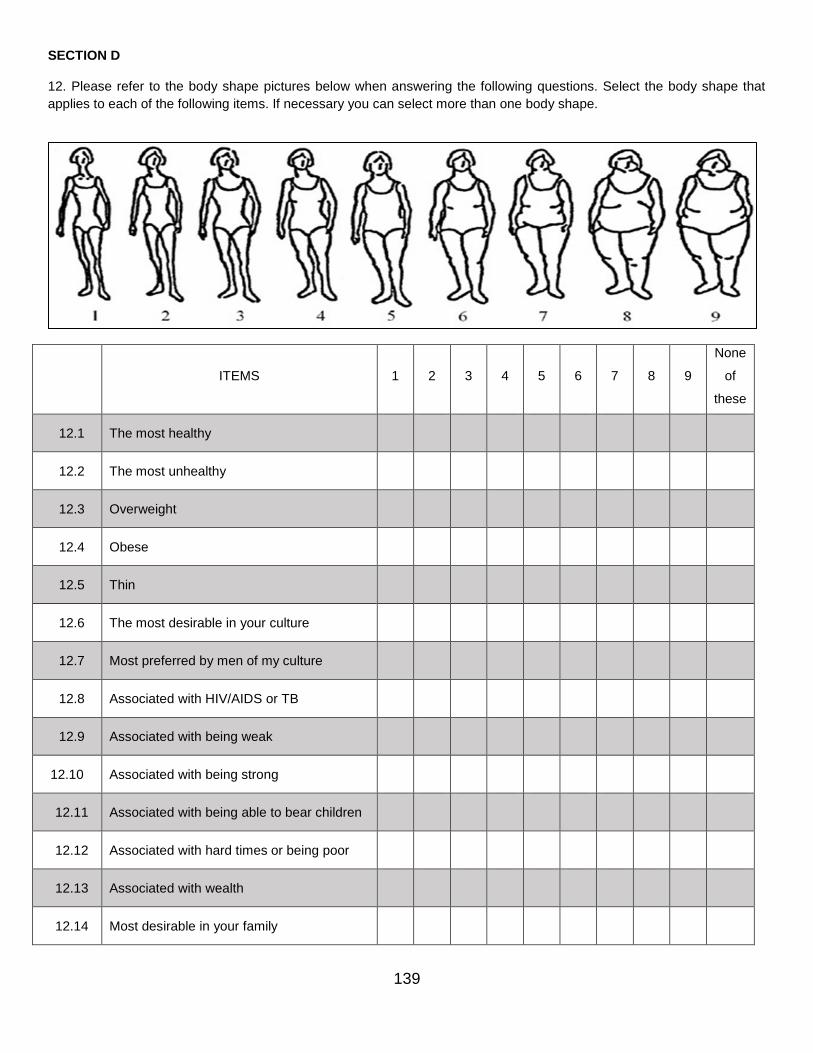
139
SECTION D 12. Please refer to the body shape pictures below when answering the following questions. Select the body shape that
applies to each of the following items. If necessary you can select more than one body shape.
ITEMS 1 2 3 4 5 6 7 8 9
None
of
these
12.1 The most healthy
12.2 The most unhealthy
12.3 Overweight
12.4 Obese
12.5 Thin
12.6 The most desirable in your culture
12.7 Most preferred by men of my culture
12.8 Associated with HIV/AIDS or TB
12.9 Associated with being weak
12.10 Associated with being strong
12.11 Associated with being able to bear children
12.12 Associated with hard times or being poor
12.13 Associated with wealth
12.14 Most desirable in your family
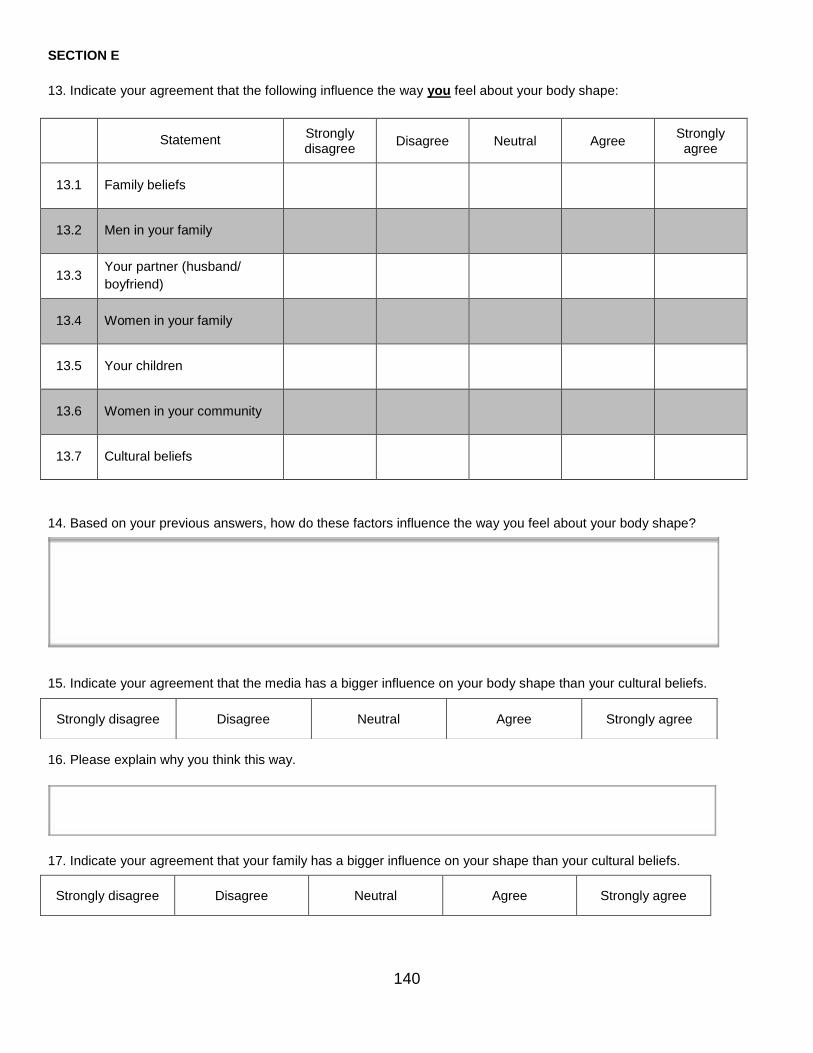
140
SECTION E
13. Indicate your agreement that the following influence the way you feel about your body shape:
Statement
Strongly disagree
Disagree Neutral Agree Strongly
agree
13.1 Family beliefs
13.2 Men in your family
13.3 Your partner (husband/
boyfriend)
13.4 Women in your family
13.5 Your children
13.6 Women in your community
13.7 Cultural beliefs
14. Based on your previous answers, how do these factors influence the way you feel about your body shape?
15. Indicate your agreement that the media has a bigger influence on your body shape than your cultural beliefs.
16. Please explain why you think this way.
17. Indicate your agreement that your family has a bigger influence on your shape than your cultural beliefs.
Strongly disagree Disagree Neutral Agree Strongly agree
Strongly disagree Disagree Neutral Agree Strongly agree
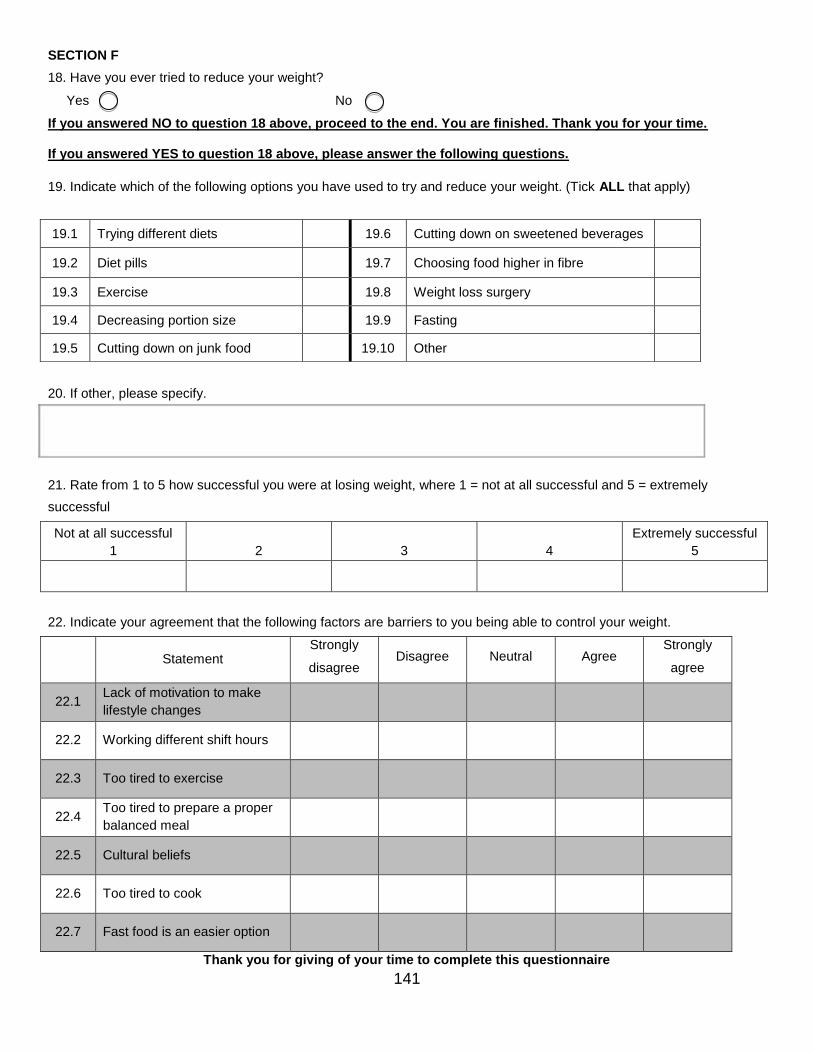
141
SECTION F
18. Have you ever tried to reduce your weight?
Yes No
If you answered NO to question 18 above, proceed to the end. You are finished. Thank you for your time. If you answered YES to question 18 above, please answer the following questions.
19. Indicate which of the following options you have used to try and reduce your weight. (Tick ALL that apply)
20. If other, please specify.
21. Rate from 1 to 5 how successful you were at losing weight, where 1 = not at all successful and 5 = extremely
successful
Not at all successful
1 2
3
4
Extremely successful 5
22. Indicate your agreement that the following factors are barriers to you being able to control your weight.
Statement
Strongly
disagree Disagree Neutral Agree
Strongly
agree
22.1 Lack of motivation to make
lifestyle changes
22.2 Working different shift hours
22.3 Too tired to exercise
22.4 Too tired to prepare a proper
balanced meal
22.5 Cultural beliefs
22.6 Too tired to cook
22.7 Fast food is an easier option
Thank you for giving of your time to complete this questionnaire
19.1 Trying different diets 19.6 Cutting down on sweetened beverages
19.2 Diet pills
19.7 Choosing food higher in fibre
19.3 Exercise 19.8 Weight loss surgery
19.4 Decreasing portion size 19.9 Fasting
19.5 Cutting down on junk food 19.10 Other
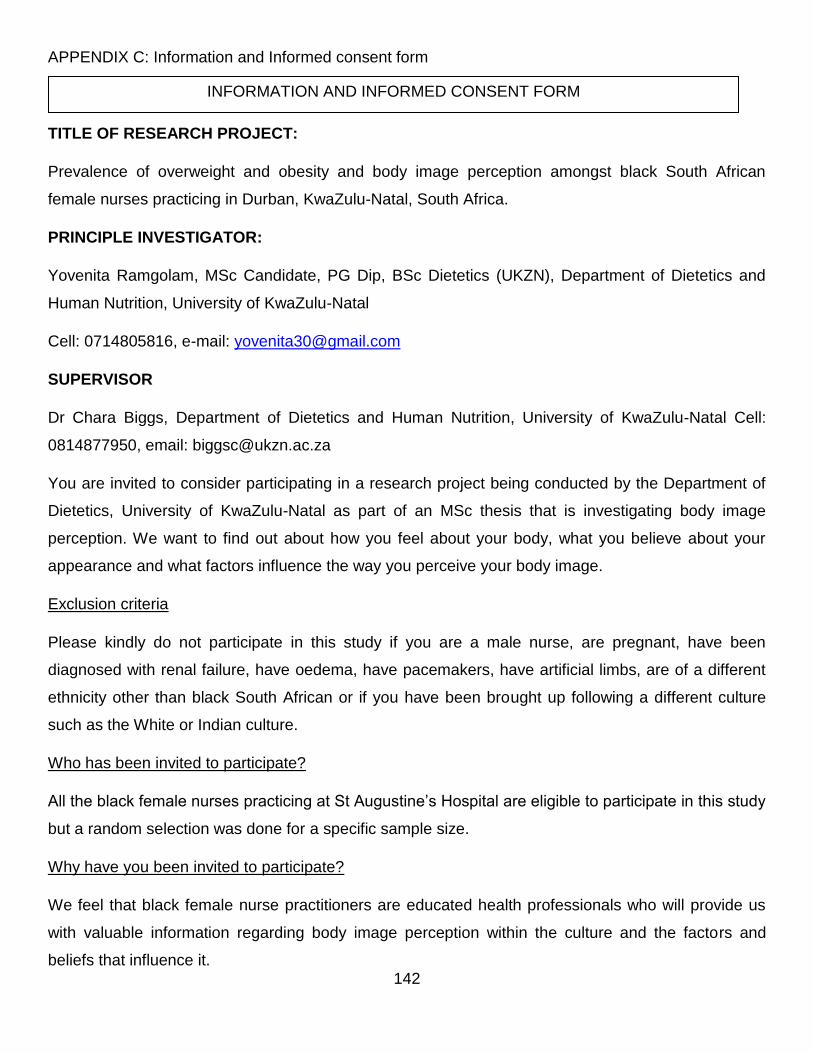
142
APPENDIX C: Information and Informed consent form
TITLE OF RESEARCH PROJECT:
Prevalence of overweight and obesity and body image perception amongst black South African
female nurses practicing in Durban, KwaZulu-Natal, South Africa.
PRINCIPLE INVESTIGATOR:
Yovenita Ramgolam, MSc Candidate, PG Dip, BSc Dietetics (UKZN), Department of Dietetics and
Human Nutrition, University of KwaZulu-Natal
Cell: 0714805816, e-mail: [email protected]
SUPERVISOR
Dr Chara Biggs, Department of Dietetics and Human Nutrition, University of KwaZulu-Natal Cell:
0814877950, email: [email protected]
You are invited to consider participating in a research project being conducted by the Department of
Dietetics, University of KwaZulu-Natal as part of an MSc thesis that is investigating body image
perception. We want to find out about how you feel about your body, what you believe about your
appearance and what factors influence the way you perceive your body image.
Exclusion criteria
Please kindly do not participate in this study if you are a male nurse, are pregnant, have been
diagnosed with renal failure, have oedema, have pacemakers, have artificial limbs, are of a different
ethnicity other than black South African or if you have been brought up following a different culture
such as the White or Indian culture.
Who has been invited to participate?
All the black female nurses practicing at St Augustine’s Hospital are eligible to participate in this study
but a random selection was done for a specific sample size.
Why have you been invited to participate?
We feel that black female nurse practitioners are educated health professionals who will provide us
with valuable information regarding body image perception within the culture and the factors and
beliefs that influence it.
INFORMATION AND INFORMED CONSENT FORM
143
What procedures will be involved in this research?
The procedures involved are simple, do not hurt and are not harmful in any way. Since we want the
measurements to be as accurate as possible, we cannot take them directly after you have eaten, e.g.
after lunch or after tea/snack. To be eligible to participate in this study, participants must refrain from:
Exercising 12 hours prior the tests
Consuming alcoholic drinks 24 hours prior the tests
Consuming caffeinated drinks (tea, coffee, energy drinks) 4 hours prior the tests
Eating (breakfast, snacks, full meals) 4 hours prior the tests
Weight will be taken in minimal clothing. Thereafter, height will be taken, followed by a quick, non-
invasive full body composition analysis involving the latest and most accurate technology which will
provide accurate measurements. It should take us a total of 15 minutes to do all the measurements.
We will then give you a questionnaire to complete in your own time (where there are no right or wrong
answers) and arrange a time to fetch it. Participation in this research is voluntary and you have the
right to withdraw from the study at any given time without any negative or undesirable consequences
to yourself.
Will you receive any money or gifts for taking part in the study?
There will be a lucky draw for the amount of R1000 for every 50 successful participants at the end of
the data collection. Incomplete questionnaires will be discarded and will not be considered for the
lucky draw. You will also receive a full body composition analysis which will give you a very accurate
breakdown of your fat and muscle mass as well as an explanation from a qualified dietician on the
implications.
ETHICS:
The research project has been approved by the Biomedical Research Ethics Committee (BREC)
(BREC ref number: BE286/17) of UKZN and Netcare Research Operations Committee (UNIV-2017-
0026). If you have any questions about the research that you feel that the researchers have not
satisfactory dealt with, the contact details for BREC are as follows:
BIOMEDICAL RESEARCH ETHICS ADMINISTRATION
Research Office, Westville Campus, Govan Mbeki Building, University of KwaZulu-Natal, Private Bag
X 54001, Durban, 4000, KwaZulu-Natal, South Africa.
144
Tel: +27 31 2602486, Fax: +27 31 2604609, e-mail: [email protected]
To protect your confidentiality, the results of the measurements and answers to the questionnaires
will be entered into a database using a code and not your name. Once the data is entered, the
questionnaires and forms will be destroyed and the data will remain confidential to the supervisor and
principle investigator. Every effort will be made to keep personal information confidential. However,
absolute confidentiality cannot be guaranteed. Personal information may be disclosed if required by
law.
Organizations that may inspect and/or copy your research records for quality assurance and data
analysis include groups such as the Research Ethics Committee, Data Safety Monitoring Committee
and the Medicines Control Council (where appropriate). Data collected will be used to obtain a MSc
Dietetics qualification and will be published in a scientific journal.
By signing below, I ………………………………………………………………….. agree to participate in
this study entitled: Prevalence of overweight and obesity and body image perception amongst
qualified black South African female nurses practicing in Durban, KwaZulu-Natal, South Africa.
I declare that:
- I have read or had read to me this information and consent form and it is written in a language with
which I am comfortable. I have had a chance to ask questions and all my questions have been
adequately answered.
- I understand that taking part in this study is voluntary and I have the right to withdraw from this study
at any given time without any negative or undesirable consequences to myself.
Signed …………………………………………………………………………. at (place)
……………………………………………....…… on (date) …………………………..2017

145
APPENDIX D: Permission letter from Zimeleni Nursing School
Ms Yovenita Ramgolam
Email: [email protected]
Dear Yovenita,
RE: PREVALENCE OF OVERWEIGHT AND OBESITY AND BODY IMAGE PERCEPTION
AMONGST QUALIFIED BLACK SOUTH AFRICAN FEMALE NURSES PRACTISING IN DURBAN,
KWAZULU-NATAL, SOUTH AFRICA
The above-mentioned research proposal was reviewed and it is with pleasure that I inform you that your request
to conduct a pilot study at Zimeleni Nursing School has been approved, subject to the following:
i. All information regarding Zimeleni Nursing School will be treated as legally privileged and
confidential.
ii. All legal requirements with regards to participants’ rights and confidentiality will be complied with.
iii. Zimeleni Nursing School reserves the right to withdraw the approval for the pilot study at any time
during the process, should the research prove to be detrimental to the subjects/Zimeleni Nursing School
or should the researcher not comply with the conditions of approval.
May I wish you all the best for your pilot study.
Yours faithfully,
Mrs Thobile Shelmbe
(Head of Zimeleni Nursing School)
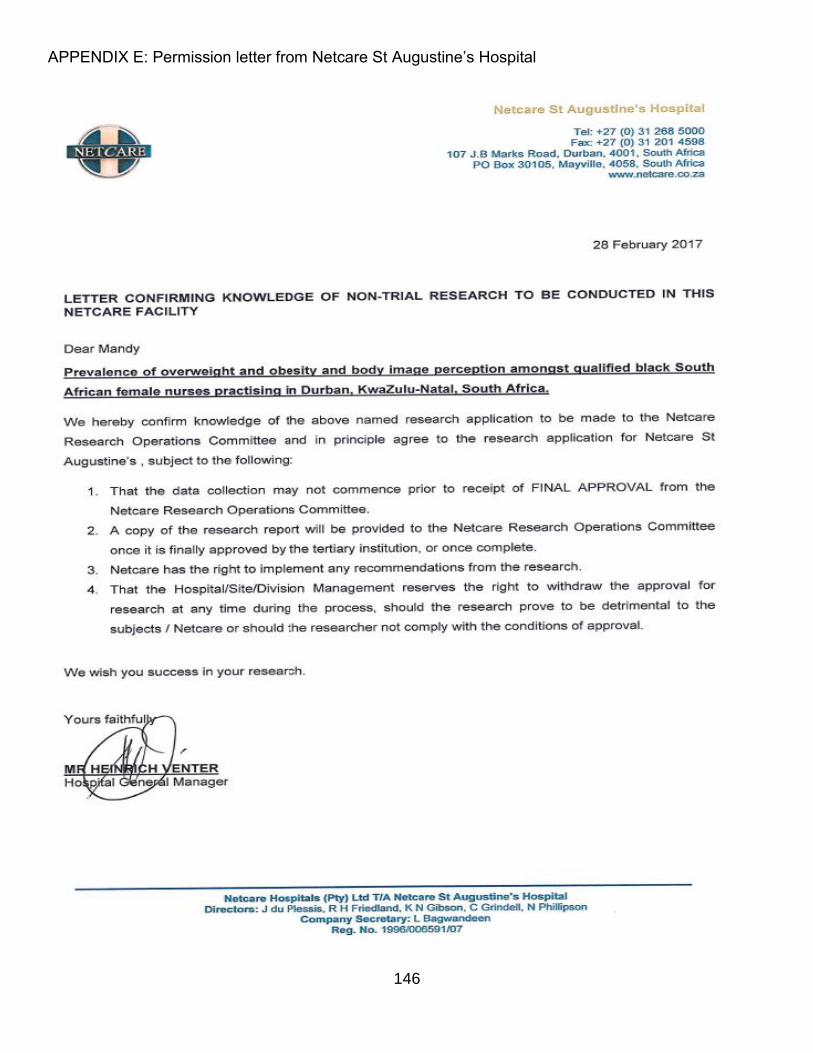
146
APPENDIX E: Permission letter from Netcare St Augustine’s Hospital
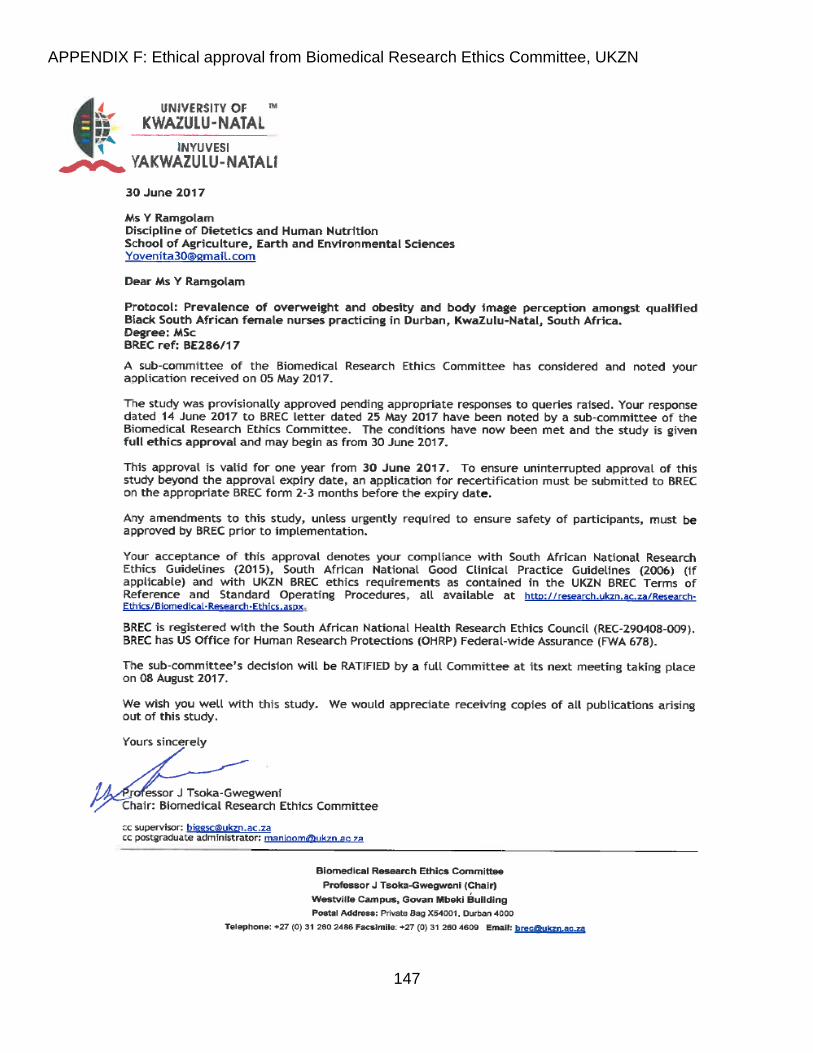
147
APPENDIX F: Ethical approval from Biomedical Research Ethics Committee, UKZN
148
APPENDIX G: Ethical approval from Netcare Research Operations Committee
149