presidential popularity and the politics of distributing federal funds in argentina
TRANSCRIPT
Presidential Popularity and the Politics ofDistributing Federal Funds in Argentina
Lucas Gonza¤ lez*
*CONICET/UCA-UNSAM; [email protected]
This article studies the main factors that affect the allocation of non-earmarked federal funds to
subnational units in Argentina between 1999 and 2009. The main contribution is that it brings
presidential popularity together with presidential structural and partisan preferences for distribu-
tion into the analysis. It argues that electorally strong and popular presidents tend to increase
transfers to developing districts and reduce allocations to richer districts. Investing in developing
provinces is more efficient, and governors from these districts tend to support redistributive
presidents and be weaker political challengers than governors from richer units. In contrast,
weaker presidents are less capable of resisting pressures from governors from larger and richer
districts.There is also more distribution to developing regions when presidents have a larger share
of partisan allies there and fewer in richer states. The article discusses these results, compares
them with competitive claims, and explores implications for the comparative debate.
Distributive politics depends on powerful actors. However, there is still much
discussion about who these relevant actors are and particularly how they influence
distribution. Empirical studies on the topic fail to show conclusive evidence in this
regard.
Existing scholarship, particularly in the United States, has long studied the
federal resource allocation across regions by focusing fundamentally on the role of
Congress and its internal operations, such as committee composition, partisan
configuration, or the role of majority party leaders (Atlas et al. 1995; Balla et al.
2002; Grossman 1994, 299; Holcombe and Zardkoohi 1981, 397; Lauderdale 2008;
Lee 2000; Lee 2003). Although most researchers recognize a crucial role of members
of Congress, we have only mixed empirical evidence on how they shape
distribution (Berry et al. 2010, 784; Kriner and Reeves 2012, 349).
Some recent studies have explored the influence presidents have over the
allocation of federal outlays (Berry et al. 2010; Kriner and Reeves 2015; Larcinese
Publius:TheJournal of Federalism, pp.1^25doi:10.1093/publius/pjw001� TheAuthor 2016. Published by Oxford University Press on behalf of CSFAssociates: Publius, Inc.All rights reserved. For permissions, please email: [email protected]
by guest on February 20, 2016http://publius.oxfordjournals.org/
Dow
nloaded from

et al. 2006, 2013). Scholars present several theoretical reasons why presidents target
funds to their reelection constituency. It may be to enhance cooperation between
the president and members of Congress (Cox and McCubbins 1986), to further the
president’s legislative agenda by directing spending to specific legislators (McCarty
2000), or to support district leaders with the same policy preferences (Larcinese
et al. 2006, 448).
This work provides new evidence on how presidents shape distributive politics
in developing federal democracies by bringing presidential popularity together with
presidential structural and partisan preferences for distribution into the analysis.
The main argument is that politically powerful and popular presidents tend to
distribute more funds to poorer districts and fewer to richer ones. More
specifically, it claims that electorally strong and highly popular presidents, that is,
presidents who have some leverage in the distribution of infrastructure funds,
increase transfers to less developed districts and reduce allocations to richer
districts. This is because governors from less developed districts prefer and need
redistribution (that is, they need a central government taking resources from richer
districts and transferring them to poorer states), investing in them is more efficient
(in terms of the political return for each invested dollar), and they tend to be
weaker political challengers to the president than governors from more developed
districts (who usually control more votes and resources). Electorally weak and less
popular presidents, on the contrary, have less leverage in the distribution of
infrastructure funds and are less capable of resisting pressures from more developed
districts. Strong governors from these districts struggle against presidents and
governors from poorer districts to increase transfers to their provinces.
These factors are particularly relevant in developing countries, where inequality
among regions is sharper and, hence, cleavages among provinces are sometimes
fierce and most of the time enduring. Moreover, in some of these countries most
rules that regulate the distribution of federal funds tend to be more flexible (and
changing), partisan structures and ties are weaker and territorialized (or weakening,
such as in Argentina), and clashes among contending national and regional elites
tend to be more direct or personalistic than in consolidated democracies.
I study the politics of the allocation of highly redistributive and non-earmarked
discretionary federal grants. Discretionary funds are those that are not allocated
following particular legal frameworks. Hence, I exclude from the analysis legally
mandated and earmarked funds. Redistributive grants are those that can generate
potentially large economic and social externalities in the localities or regions in
which they are invested. Based on this decision, I concentrate the analysis on public
infrastructure, a policy tool in hands of governments that most scholars in the
literature consider crucial to stimulate growth and promote territorial redistribu-
tion (it is labor intensive and tends to generate large positive economic externalities
where allocated). The regional distribution of infrastructure funds is a mechanism
2 Presidential Popularity and the Politics of Distributing Federal Funds
by guest on February 20, 2016http://publius.oxfordjournals.org/
Dow
nloaded from

through which to redistribute money from the regions that pay taxes that finance
these funds to others in which the investment is actually made (Sole Olle 2010).
I analyze distributive politics in Argentina, an unequal Latin American case in a
region that is, in fact, the most unequal region in the world. I calculated the
average income of each province and estimated the interregional Gini index to
measure income inequality across provinces in five of the largest Latin American
countries: Argentina stands out as the most unequal country, with a Gini of 33,
closely followed by Brazil with 30 and Colombia with 28. Mexico and Chile are less
unequal, with about 24 each. The average income per capita in rich districts in
Argentina is up to six times higher than that of poorer ones. Even more starkly,
Santiago del Estero, one of the poorest Northern Argentine provinces, has a Gross
Geographic Product (GGP) per capita 17 times lower than Santa Cruz’s, one the
richest oil-producing Patagonian districts.
The relevance of studying the allocation of infrastructure funds in this case is
threefold. First, these are crucial funds central governments have to correct
territorial inequality.1 Second, these territorially redistributive funds have increased
429 percent in real terms (after controlling for inflation) during the last decade in
Argentina, becoming one of the most important redistributive tools in the hands of
the central government.2
Third, the president in Argentina has enormous discretionary power over its
allocation. To begin with, the president has large ex-ante institutional powers to
decide the allocation of infrastructure grants through the budget bill. The federal
executive is in charge of drafting this bill. The territorial distribution of most
infrastructure grants is outlined in this moment.3 On top of that, presidents Nestor
Kirchner (2003–2007) and Cristina Fernandez (2007–2015) counted on large
parliamentary majorities (and large partisan discipline) in both chambers for most
of the time during their presidential mandates, granting them large partisan powers
to influence the decision making process. Finally, the federal executive in Argentina
has enormous ex-post institutional powers to reassign budget allocations already
approved by Congress making use of so-called ‘‘super-powers.’’4
Due to this discretion, loyal districts are advantaged in the distribution of federal
outlays. Several newspaper articles repeatedly reported how presidents used these
ex-ante and ex-post institutional as well as partisan powers to discretionarily
allocate infrastructure funds in the provinces, particularly in allied ones (see, for
instance, La Nacion, 2007–2014; and Cların 2014). In Argentina, districts loyal to
the president receive on average almost 60 percent more infrastructure funds than
the opposition. Interestingly, these figures are much larger than the share of
equivalent grants in Brazil (20.4 percent), Colombia (17 percent) (Gonzalez and
Mamone 2015), Portugal (19 percent; Migueis 2013), India (16 percent;
Arulampalam et al. 2009), and the United States (about 4–5 percent; Berry et al.
2010, 783). Larcinese et al. claim that while this gap between loyal and opposition
Lucas Gonzalez 3
by guest on February 20, 2016http://publius.oxfordjournals.org/
Dow
nloaded from

districts can be entirely due to the needs and characteristics of the states’ respective
populations, ‘‘it is legitimate to ask how much of this difference can be due to
purely political factors’’ (2006, 450).
I organize the article as follows. First, I discuss the literature on the topic and,
based on it, present the main theoretical claim. Second, I operationalize the
variables and provide the data sources for the main and competing hypotheses.
Third, I introduce the methodological approach selected to analyze the data. In the
fourth and fifth sections, I put forth the empirical findings and discuss them.
State of Research
A large part of the literature analyzes whether programmatic factors influence the
distribution of federal funds. A central government distributes funds program-
matically when it follows certain ideas of equality and efficiency. Programmatic
policies distribute public resources to all members of a socioeconomic group, such
as the elderly, the sick, and the unemployed (Persson and Tabellini 2000, 115).
Some authors have grouped the programmatic criteria into efficiency and equity
categories. According to the first, the favored regions should be those in which
infrastructure projects have a greater economic impact, such as areas with the
largest number of users or those with higher development levels. Under equity
criteria, a government committed to maximizing a nationwide social welfare
function allocates grants among states to compensate the effects that an uneven
distribution of wealth across a territory of a given country or to provide for those
that are especially in need. Hence, investments should target districts with low
levels of development to offset the effects of an uneven geographical distribution of
public services (Grossman 1994, 295; Sole Olle 2010, 297). I explore whether
political factors influence the distribution of federal grants, controlling for the role
programmatic factors may play.
Early studies on the topic have also claimed that the distribution of federal
grants depends on relatively time-invariant institutional rules. Among those rules,
overrepresentation is believed to affect the amount of federal grants states receive.
Bennett and Mayberry (1979) and Holcombe and Zardkoohi (1981) developed
early studies claiming that overrepresented states tend to receive more federal
grants per capita. The claim, supported by several other works (see Atlas et al.
1995; Hoover and Pecorino 2005; Lee 1998), is that the political benefits from a
marginal dollar of increased grants to a small and overrepresented state are greater
than a marginal dollar of increased grants to a large state in which the per capita
impact is smaller. Although part of the comparative literature on the topic reached
similar conclusions (see Gibson et al. 2004; Gibson and Calvo 2000; Gordin 2006;
Rodden 2010; Samuels and Snyder 2001), other studies did not find
overrepresentation to be a relevant factor in explaining changes in the allocation
4 Presidential Popularity and the Politics of Distributing Federal Funds
by guest on February 20, 2016http://publius.oxfordjournals.org/
Dow
nloaded from
of federal funds (Gonzalez and Mamone 2012; Lodola 2005). I analyze the role of
overrepresentation and especially explore its interactions with the provinces’
structural characteristics, and other dynamic variables, such as partisan links
between presidents and governors.
Specialists on the US Congress have long debated whether legislative delegations,
the composition of committees, or individual deputies and senators as well as
majority leaders have a significant effect over the distribution of federal grants. In
an early work, Ferejohn (1974) demonstrated that members of the Appropriation
and Public Works committees allocated more funds to their districts. But since
then, scholars found mixed empirical evidence on the relevance of committees
(Berry et al. 2010, 784; Kriner and Reeves 2012, 349). Some studies found that
larger delegations and committee membership affect federal distribution (Grossman
1994, 299; Holcombe and Zardkoohi 1981, 397), but several other works found
mixed results for this claim (Alvarez and Saving 1997; Anzia and Berry 2011; Atlas
et al. 1995; Balla et al. 2002; Bickers and Stein 2000; Knight 2005; Lee 2000; Lee
2003; Levitt and Poterba 1999; Stein and Bickers 1994). In this article, I study
whether the distribution of electoral and partisan power in Congress has an
influence over the allocation of funds and if so, whether national and state
executives have more sway over the final outcome.
Recent studies show that presidents influence the geographic distribution of
non-earmarked funds (Berry et al. 2010; Dynes and Huber 2015; Kriner and Reeves
2015; Larcinese et al. 2006). However, there is still discussion on how and why
presidents affect the allocation of federal outlays. Some argue presidents influence
the budgetary process following electoral expectations: they allocate more funds in
districts where they expect larger electoral benefits and returns. Those districts that
are not expected to generate electoral or political returns will be excluded from
federal non-earmarked investment. Lindbeck and Weibull (1987, 289) argue that
presidents spend funds in swing districts (those with a high proportion of relatively
unattached voters or in which the incumbent won or lost by a narrow margin)
because these regions have larger electoral power than secure ones.5 For Cox and
McCubbins (1986, 379), in contrast, the optimal strategy for risk-averse candidates
is to distribute to their reelection constituency and over-invest in their closest
supporters to maintain existing political coalitions.6
There are several theoretical reasons why presidents may target funds to their
reelection constituency. For Cox and McCubbins, cooperation between the
president and members of Congress is enhanced when one is the party leader and
the others are her copartisan. But for other scholars, the president could also target
core supporters to prioritize the needs of politically important constituents (Kriner
and Reeves 2015) or to further her legislative agenda by directing spending to
specific legislators (McCarty 2000). It may also be that the federal administration
prefers to allocate funds to governors with the same policy preferences (Larcinese
Lucas Gonzalez 5
by guest on February 20, 2016http://publius.oxfordjournals.org/
Dow
nloaded from
et al. 2006, 448; 2013) or to districts in which interest groups are powerful
(Larcinese et al. 2013, 874).
I put forward an argument to explain why and how presidents influence the
distribution of federal grants by including presidential popularity together with
presidential structural and partisan preferences for distribution into the analysis.
Structural cleavages and partisan alliances influence presidential preferences for
distribution. Popularity affects the leverage presidents have to materialize their
preferences.
Presidential Popularity and the Distribution of Federal Funds
Presidents distribute revenue to secure regional votes, build up congressional
majorities, and form territorial governing coalitions. To do that, they allocate
federal funds across the territory.7 To influence the territorial allocation of
infrastructure funds, presidents need institutional powers. The institutional powers
of presidents are established by the constitution, which determines whether they
have authority to introduce legislation (and exclusive authority to introduce certain
types of legislative proposals, such as in budgetary matters), decree power (either to
legislate in some policy areas, where the decree is law unless it is overturned by
Congress; or to legislate by delegation of Congress), veto power (partial or pocket
veto), and emergency powers (Shugart and Carey 1992, 134–43).
According to Mainwaring and Shugart (1997, 49), presidents in Argentina are
‘‘potentially dominant,’’ as they have strong veto powers, decree authority, and
exclusive introduction.8 As Mustapic (2000, 573) claims, the fact that these authors
use this expression (‘‘potentially’’) to classify the dominant executive reveals that
institutional resources are not decisive by themselves but rather that they interact
with several other contextual factors that are critical to determine the executive
capacity to influence Congress and affect policies. In a similar vein, Calvo (2007,
263) argues that there is little comparative research integrating different
institutional and contextual factors to explain the sources of presidential strength
or weakness. Based on this discussion, I claim that we need to combine relatively
stable institutional variables together with more dynamic, contextual factors.
Among contextual factors, I argue that presidential popularity (or presidential
support in public opinion) influences the capacity of the president to decide the
allocation of infrastructure funds. As Neustadt (1989, 4, 11) claims, presidential
popularity or public support is ‘‘the power to persuade’’ and is also related to the
president’s ‘‘capacity to influence the conduct of men who make up government.’’
By that he is mainly referring to members of the executive cabinet, bureaucrats,
and, to some extent, federal legislators, whose support is crucial to make decisions.
For Calvo (2007, 266–268), public opinion is relevant because legislators might fear
the electoral consequences of supporting executive initiatives opposed by the
6 Presidential Popularity and the Politics of Distributing Federal Funds
by guest on February 20, 2016http://publius.oxfordjournals.org/
Dow
nloaded from
public. A president having strong institutional powers but weak public support is
less powerful to influence the territorial allocation of infrastructure grants than one
having strong support in terms of both institutional power and public opinion.
When presidents allocate federal funds across the territory, they do not
distribute federal funds to all districts uniformly: they take into account structural
and partisan differences among districts. To begin with, in structural terms, they
prefer to distribute to less developed districts. There are three main reasons for
them to do this. First, governors from poorer districts prefer a strong central
government capable of extracting funds from richer districts and distributing these
funds to them. Unlike their counterparts from richer districts, they support a
redistributive president.9 Through the distribution of infrastructure funds, the
central government redistributes money from the regions that pay taxes to finance
them (and usually richer regions pay proportionately more taxes than poorer
regions) to others in which the investment is actually made (Sole Olle 2010).
Second, political leaders from less developed districts tend to be weaker political
challengers to the president than those from more developed and populated
districts (who tend to control more money and votes).
And third, the political return for each invested dollar is larger in these units
than in more developed ones. A peso spent in Formosa (one of the poorest and
sparsely populated provinces in Argentina) has a much larger socioeconomic (and
possibly electoral) impact than in Buenos Aires province (the most populated
province in the country).10 This is Gibson’s (1997) and Gibson and Calvo’s (2000)
claim. But in their argument, provincial authorities from poorer districts (called
‘‘peripheral’’) appear to be passive and federal authorities prefer them because they
are politically ‘‘cheap’’ to buy. In this article, the claim is somewhat different.
Provincial authorities from poorer provinces support a politically strong central
government because this is what they prefer: they need a strong federal government
capable of redistributing transfers to them and limiting the power of richer
districts.
Ceteris paribus then, I expect that strong presidents, that is, presidents who have
some leverage in the distribution of infrastructure grants, will distribute more funds
to poorer districts and fewer to richer ones. Weaker presidents, on the contrary,
would be less capable of resisting distributive pressures from richer districts
(Model 1).
Data and Method
I test the main and competitive hypotheses using original data on federal
government infrastructure spending in Argentina between 1999 and 2009 collected
from the National Budget Office.11 Total infrastructure funds include transfers
from the central government to the provinces from eighteen budget programs of
Lucas Gonzalez 7
by guest on February 20, 2016http://publius.oxfordjournals.org/
Dow
nloaded from

the Ministry of Federal Planning, Public Works, and Services. All values are
reported in thousand Argentine pesos (AR$), per capita, in constant values.12
The main independent variable is presidential electoral support. This variable
seeks to capture whether presidents are electorally powerful, have support in
Congress, are popular in public opinion, and, as a consequence, have some leverage
over the distribution of infrastructure funds. To operationalize this variable, I use a
proxy that measures the support presidents get in public opinion polls.13 This
proxy allows me to have more variation over time than their share of votes and
seats in Congress. The share of votes that the presidents’ party and electoral
coalition got in national elections is a relative time invariant variable in the time
series I have: there were only four presidential elections between 1999 and 2011
(1999, 2003, 2007, and 2011). Something similar can be said about the share of
seats the president got in Congress, as there were seven legislative elections during
this period (1999, 2001, 2003, 2005, 2007, 2009, and 2011).
In structural terms, we can classify districts according to their demography,
development level, and factor endowments. Here, I use a series of control variables
for each subnational unit: population (as Larcinese et al. 2013 advise),14 per capita
income (Gross Geographic Product, GGP, per capita), regional poverty (number
of people or families below poverty line or with unsatisfied basic needs), and
industrialization (state industrial gross domestic product). Table 1 provides
descriptive statistics for the dependent and the main independent variables.
I also construct a simplified classification of provinces according to their
structural characteristics. I divide the federation into two main regions, as
Gibson (1997) and Gibson and Calvo (2000) do. I labeled them developed15 and
Table 1 Descriptive statistics for the main variables
Variable Number of
observation
Mean Standard
deviation
Minimum Maximum
Infrastructure grants (in thousand
constant AR$ per capita)
241 0.1094 0.1773 0.0014 1.5930
Presidential positive image (per-
centage of the population)
648 38.7404 17.7931 6.43 72
Share of allied governors 624 0.5307 0.1850 0.1364 0.8333
Index of overrepresentation 590 1.9695 2.1984 0.6442 19.1255
Poverty (share of the total
population)
593 26.9191 11.4646 7.8 54.4
Per capita Gross Geographic
Product
409 11855.78 10781.32 2140.08 82384.09
8 Presidential Popularity and the Politics of Distributing Federal Funds
by guest on February 20, 2016http://publius.oxfordjournals.org/
Dow
nloaded from
less developed interior provinces.16 I include dummy variables for each of these two
categories.
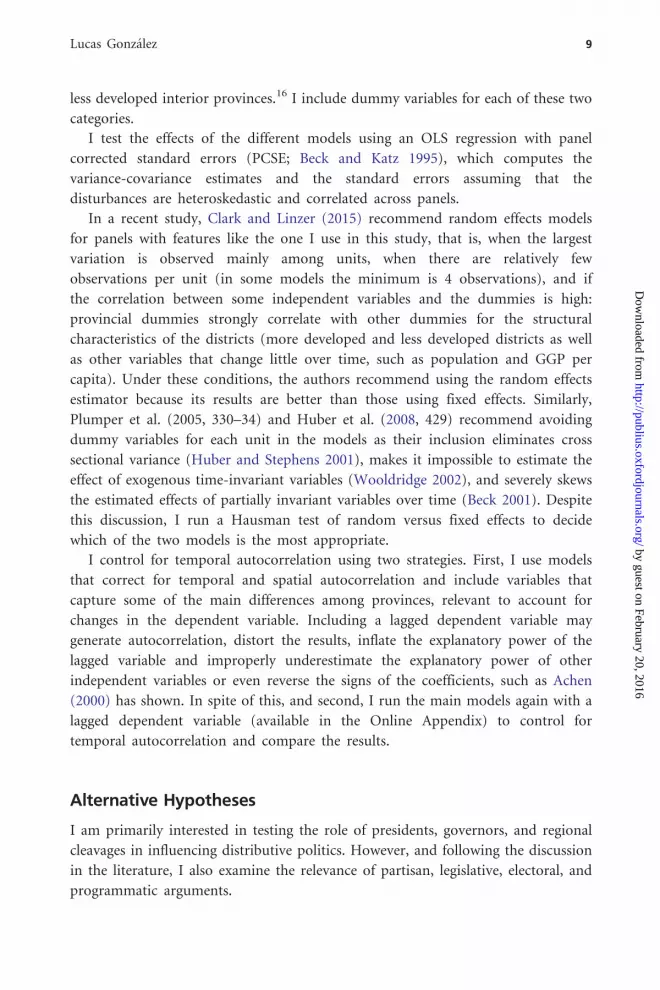
I test the effects of the different models using an OLS regression with panel
corrected standard errors (PCSE; Beck and Katz 1995), which computes the
variance-covariance estimates and the standard errors assuming that the
disturbances are heteroskedastic and correlated across panels.
In a recent study, Clark and Linzer (2015) recommend random effects models
for panels with features like the one I use in this study, that is, when the largest
variation is observed mainly among units, when there are relatively few
observations per unit (in some models the minimum is 4 observations), and if
the correlation between some independent variables and the dummies is high:
provincial dummies strongly correlate with other dummies for the structural
characteristics of the districts (more developed and less developed districts as well
as other variables that change little over time, such as population and GGP per
capita). Under these conditions, the authors recommend using the random effects
estimator because its results are better than those using fixed effects. Similarly,
Plumper et al. (2005, 330–34) and Huber et al. (2008, 429) recommend avoiding
dummy variables for each unit in the models as their inclusion eliminates cross
sectional variance (Huber and Stephens 2001), makes it impossible to estimate the
effect of exogenous time-invariant variables (Wooldridge 2002), and severely skews
the estimated effects of partially invariant variables over time (Beck 2001). Despite
this discussion, I run a Hausman test of random versus fixed effects to decide
which of the two models is the most appropriate.
I control for temporal autocorrelation using two strategies. First, I use models
that correct for temporal and spatial autocorrelation and include variables that
capture some of the main differences among provinces, relevant to account for
changes in the dependent variable. Including a lagged dependent variable may
generate autocorrelation, distort the results, inflate the explanatory power of the
lagged variable and improperly underestimate the explanatory power of other
independent variables or even reverse the signs of the coefficients, such as Achen
(2000) has shown. In spite of this, and second, I run the main models again with a
lagged dependent variable (available in the Online Appendix) to control for
temporal autocorrelation and compare the results.
Alternative Hypotheses
I am primarily interested in testing the role of presidents, governors, and regional
cleavages in influencing distributive politics. However, and following the discussion
in the literature, I also examine the relevance of partisan, legislative, electoral, and
programmatic arguments.
Lucas Gonzalez 9
by guest on February 20, 2016http://publius.oxfordjournals.org/
Dow
nloaded from

Partisan Determinants
So far, I have discussed whether presidents prefer to distribute to governors from
poorer or richer districts. The coalitions presidents build with governors have not
only a structural but also a partisan component. As an important part of the
literature claims (e.g., Cox and McCubbins 1986; Kriner and Reeves 2015; Larcinese
et al. 2006; McCarty 2000), we could expect president to distribute more funds to
politically allied districts (Model 2). Governors from allied provinces can offer
presidents political support, both in terms of votes and seats, to govern.
To test this partisan model, I include a dummy variable to determine
how politically linked governors are to the president. This variable, labeled core
ally, is coded as 1 if presidents and governors are in the same governing coalition
in a given year; 0 otherwise. I coded them during fieldwork, based on
official electoral data, information from newspapers, and interviews with
provincial experts. I classified districts into those belonging to the opposition
(which are expected to receive few funds, if any), swing districts17 (which are
expected to receive somewhat more money), and support districts (core ally), or
those aligned in partisan terms (which are expected to receive the largest share of
funds).
Furthermore, I also expect that the geographical allocation of federal grants will
depend on how partisan coalitions between presidents and governors are
territorially distributed: the developing regions of the country will receive more
grants when presidents have a larger number (or share) of their partisan allies there
and fewer in richer states. On the contrary, I anticipate less distribution to poorer
provinces when presidents have a smaller number of their partisan allies in these
districts or more allies in developed states (Model 3). The number of allied
governors of the president is the number of allies in both developed and developing
states. The share of allies is the number of allied governors in each region, divided
by the total number of governorships in the region.
Legislative and Electoral Determinants
I also test whether provinces with more representatives in core committees
(committee) and with larger delegations from the president’s party (delegation) in
Congress are more likely to receive more funds (Model 4). The variable
‘‘committee’’ reports the number of deputies a given province has in the Budget
and Appropriations (Presupuesto y Hacienda) and in the Public Works (Obras
Publicas) Committees in the Argentine Chamber of Deputies. The variable
‘‘delegation’’ is the percentage of congressmen in the Chamber of Deputies who are
members of the majority party.
Several scholars expect overrepresentation to influence the distribution of federal
grants (Atlas et al. 1995; Gibson and Calvo 2000; Gibson et al. 2004; Holcombe and
10 Presidential Popularity and the Politics of Distributing Federal Funds
by guest on February 20, 2016http://publius.oxfordjournals.org/
Dow
nloaded from

Tab
le2
PC
SEre
sult
s,m
ain
mo
del
s Mo
del
1aM
od
el1b
Mo
del
2M
od
el3a
Mo
del
3bM
od
el4
Mo
del
5M
od
el6
Pre
sid
enti
alp
op
ula
rity
0.00
2**
0.00
00.
002*
**
(0.0
01)
(0.0
00)
(0.0
01)
Pre
sid
enti
alp
op
ula
rity
*–
0.00
2***
rich
pro
vin
ce(0
.001
)
Pre
sid
enti
alp
op
ula
rity
*0.
002*
*
po
or
pro
vin
ce(0
.001
)
Co
re0.
183*
**0.
074*
*
(0.0
40)
(0.0
37)
Swin
g0.
265*
**0.
080*
(0.0
32)
(0.0
44)
Shar
eo
fal
lied
gove
rno
rs0.
295*
*0.
061
(0.1
21)
(0.0
79)
Shar
eo
fal
lied
gove
rno
rs*
rich
pro
vin
ce
–0.
244*
**
(0.0
75)
Shar
eo
fal
lied
gove
rno
rs*
po
or
pro
vin
ce
0.20
7***
(0.0
76)
Pre
sid
enti
alel
ecti
on
year
0.01
6–
0.04
3**
(0.0
41)
(0.0
20)
Co
mm
itte
e–
0.03
4*–
0.00
4
(0.0
18)
(0.0
06)
Del
egat
ion
–0.
434
(co
nti
nu
ed)
Lucas Gonzalez 11
by guest on February 20, 2016http://publius.oxfordjournals.org/
Dow
nloaded from
Table
2C
on
tin
ued
Mo
del
1aM
od
el1b
Mo
del
2M
od
el3a
Mo
del
3bM
od
el4
Mo
del
5M
od
el6
(0.4
87)
Ind
ust
rial
G.
pro
du
ct(l
og)
0.00
0–
0.03
5*
(0.0
00)
(0.0
21)
Car
s–
0.00
0**
0.00
0*
(0.0
00)
(0.0
00)
Po
pu
lati
on
den
sity
–0.
000*
**–
0.00
0*
(0.0
00)
(0.0
00)
Urb
aniz
atio
nra
te0.
269*
*0.
212
(0.1
18)
(0.1
83)
Ove
r-re
pre
sen
tati
on
0.02
8***
0.02
6***
0.03
0***
0.03
2***
0.03
0***
0.04
20.
015*
**0.
017*
*
(0.0
08)
(0.0
08)
(0.0
09)
(0.0
09)
(0.0
09)
(0.0
33)
(0.0
06)
(0.0
07)
Po
vert
y–
0.00
1–
0.00
20.
001
–0.
002
–0.
002
0.00
30.
001
–0.
001
(0.0
02)
(0.0
02)
(0.0
01)
(0.0
02)
(0.0
02)
(0.0
03)
(0.0
01)
(0.0
01)
GG
Pp
erca
pit
a(n
atlo
g)0.
034
0.03
70.
061*
**0.
016
0.02
30.
141*
*0.
036*
0.01
8
(0.0
28)
(0.0
27)
(0.0
22)
(0.0
29)
(0.0
29)
(0.0
58)
(0.0
20)
(0.0
18)
Ric
her
pro
vin
ces
0.00
10.
069
(0.0
32)
(0.0
46)
Po
ore
rp
rovi
nce
s0.
032
–0.
031
(0.0
30)
(0.0
47)
Co
nst
ant
–0.
300
–0.
340
–0.
597*
**–
0.22
8–
0.22
5–
1.23
6**
–0.
508*
*–
0.15
3
(0.2
72)
(0.2
60)
(0.2
22)
(0.2
73)
(0.2
58)
(0.5
70)
(0.2
17)
(0.1
56)
Ob
serv
atio
ns
168
168
165
168
168
7514
913
0
R2
0.24
0.24
0.31
0.24
0.25
0.29
0.22
0.45
Cro
ss-s
ecti
on
alu
nit
s24
2424
2424
2223
23
Not
e:D
epen
den
tva
riab
le:
Fed
eral
Go
vern
men
tIn
vest
men
tin
Pu
bli
cW
ork
sp
erca
pit
a,in
tho
usa
nd
Arg
enti
ne
pes
os,
def
late
du
sin
gIN
DE
C’s
con
stru
ctio
nin
dex
pri
ces.
Un
stan
dar
diz
edre
gres
sio
nco
effi
cien
ts.
Stan
dar
dE
rro
rsre
po
rted
inp
aren
thes
is.
*p5
0.10
0;**
p5
0.05
0;**
*p5
0.01
0.
12 Presidential Popularity and the Politics of Distributing Federal Funds
by guest on February 20, 2016http://publius.oxfordjournals.org/
Dow
nloaded from

Zardkoohi 1981; Lee 2000; Rodden 2010; Samuels and Snyder 2001; Hoover and
Pecorino 2005).18 This article furnishes further evidence to the discussion including
this variable as a control in the different models.
In addition, and following electoral considerations, I analyze whether provinces
will be more likely to receive more investment during election times, both
legislative, and executive—presidential and gubernatorial—elections (Model 4).
Programmatic Determinants
I control for programmatic variables. According to equity-oriented arguments,
relatively deprived districts, those with lower GGP per capita and higher poverty
rates, will be more likely to receive more federal grants. For efficiency-oriented
claims, provinces with higher urbanization rate, population density, larger number
of cars, and GGP, should be more likely to receive more funds. In the same way, I
expect more infrastructure investment in areas in which industrial production is
larger, as this activity requires it for its expansion (Model 5). Finally, I include the
main variables in a single, full-specified model (Model 6).
Empirical Analysis
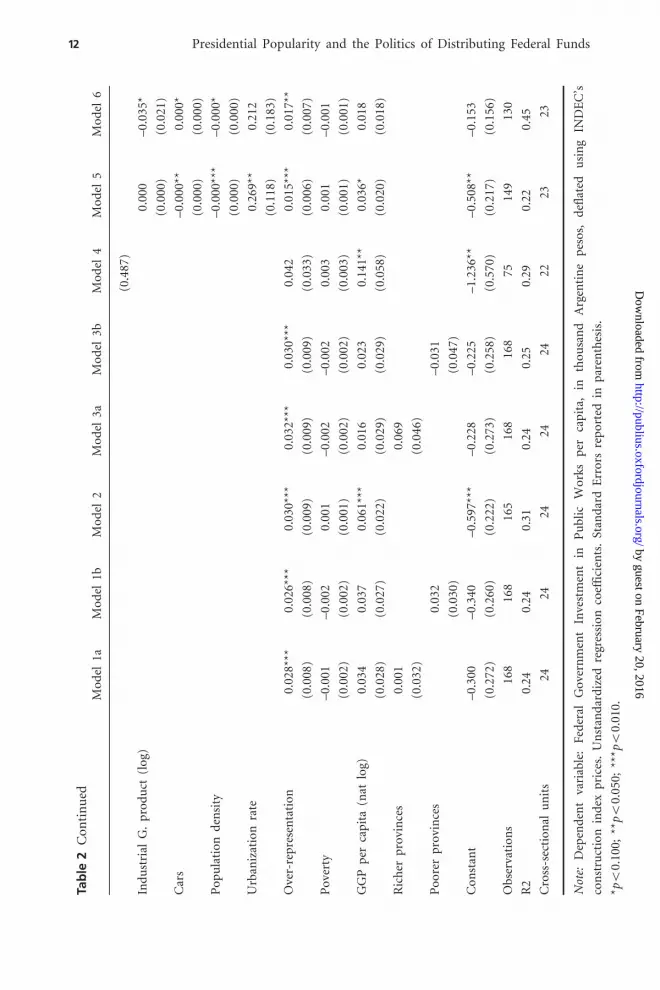
Results from the main PCSE regression models displayed in table 2 suggest that,
controlling for third variables, powerful presidents distribute more funds to poorer
districts and fewer to richer ones (Models 1a and 1b). The interaction terms
between presidential popularity and type of district move in the theoretically
expected direction and are relatively robust as well as statistically significant. It is
negative for developed districts and positive for less developed, indicating that
popular presidents tend to distribute fewer funds to developed units and more to
developing provinces. More specifically, and maintaining third variables constant, a
1 percent increase in presidential popularity augments federal infrastructure grants
to poorer districts in about 2$ per capita and to richer provinces in 0.2$.19 Or, put
in another way, a 10 percent rise in presidential approval rates represents an
increase in about 20$ per capita to poorer districts (or about 16 percent of the
mean value of 126$) and only 2$ for richer provinces (8 percent of their mean, of
25$). Although powerful presidents do not appear to reduce grants to richer
districts, results clearly show that they tend to transfer ten times more funds per
capita to poorer ones.
I run these two and the other main models again with a lagged dependent
variable (available in the Online Appendix) to control for temporal autocorrelation.
Substantive results remain identical. I also run a Hausman test of random versus
fixed effects. The p-value for Model 1a using random and fixed effects is 0.54 and
0.45 for Model 1b (much larger than 0.05). Therefore, it is safe to use random
effects models.20
Lucas Gonzalez 13
by guest on February 20, 2016http://publius.oxfordjournals.org/
Dow
nloaded from
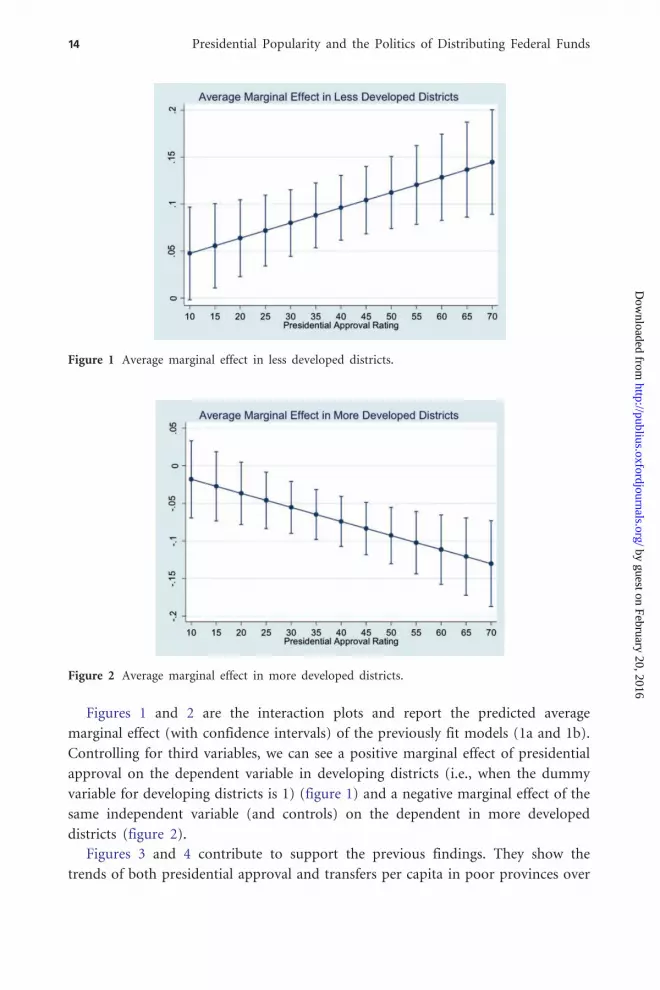
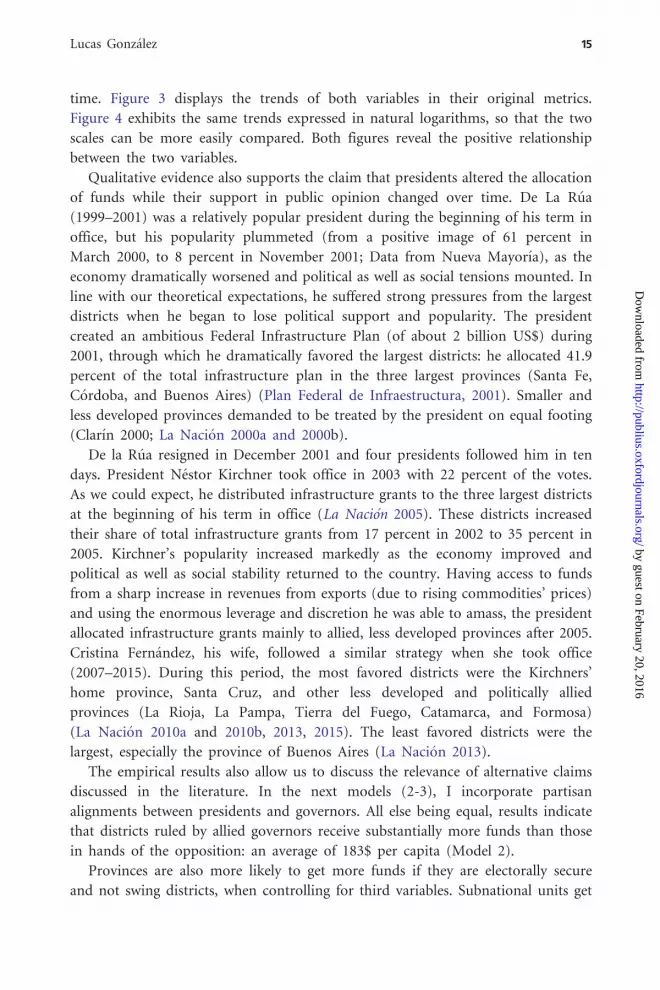
Figures 1 and 2 are the interaction plots and report the predicted average
marginal effect (with confidence intervals) of the previously fit models (1a and 1b).
Controlling for third variables, we can see a positive marginal effect of presidential
approval on the dependent variable in developing districts (i.e., when the dummy
variable for developing districts is 1) (figure 1) and a negative marginal effect of the
same independent variable (and controls) on the dependent in more developed
districts (figure 2).
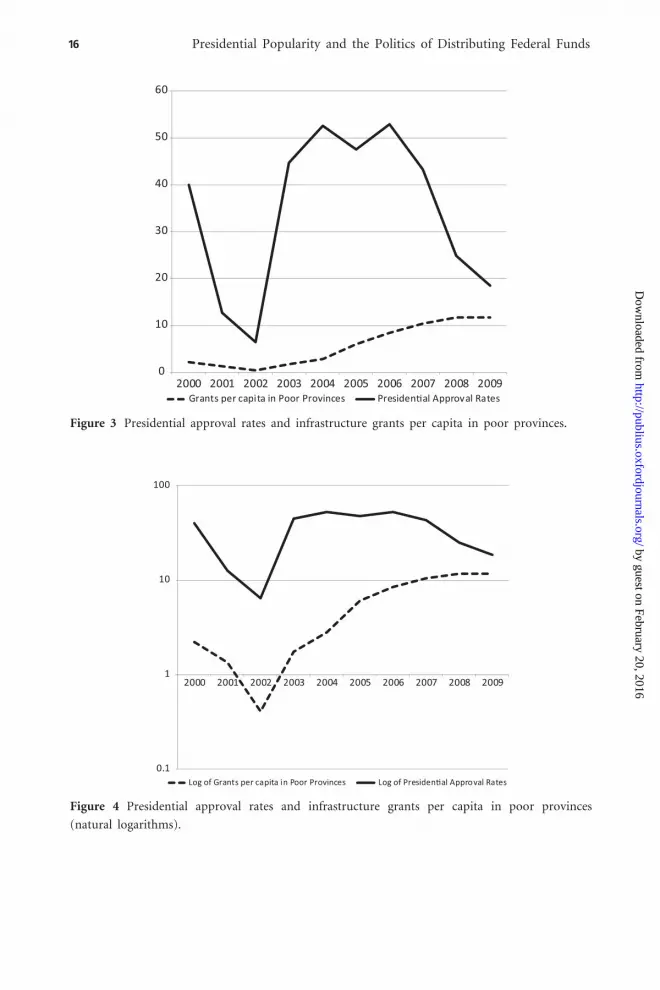
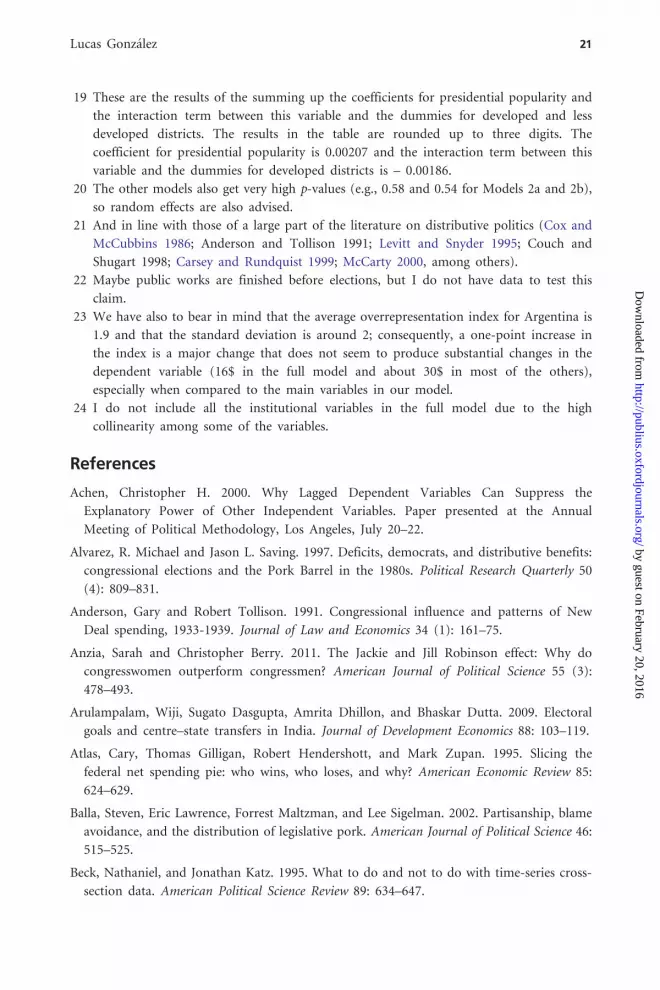
Figures 3 and 4 contribute to support the previous findings. They show the
trends of both presidential approval and transfers per capita in poor provinces over
Figure 1 Average marginal effect in less developed districts.
Figure 2 Average marginal effect in more developed districts.
14 Presidential Popularity and the Politics of Distributing Federal Funds
by guest on February 20, 2016http://publius.oxfordjournals.org/
Dow
nloaded from
time. Figure 3 displays the trends of both variables in their original metrics.
Figure 4 exhibits the same trends expressed in natural logarithms, so that the two
scales can be more easily compared. Both figures reveal the positive relationship
between the two variables.
Qualitative evidence also supports the claim that presidents altered the allocation
of funds while their support in public opinion changed over time. De La Rua
(1999–2001) was a relatively popular president during the beginning of his term in
office, but his popularity plummeted (from a positive image of 61 percent in
March 2000, to 8 percent in November 2001; Data from Nueva Mayorıa), as the
economy dramatically worsened and political as well as social tensions mounted. In
line with our theoretical expectations, he suffered strong pressures from the largest
districts when he began to lose political support and popularity. The president
created an ambitious Federal Infrastructure Plan (of about 2 billion US$) during
2001, through which he dramatically favored the largest districts: he allocated 41.9
percent of the total infrastructure plan in the three largest provinces (Santa Fe,
Cordoba, and Buenos Aires) (Plan Federal de Infraestructura, 2001). Smaller and
less developed provinces demanded to be treated by the president on equal footing
(Cların 2000; La Nacion 2000a and 2000b).
De la Rua resigned in December 2001 and four presidents followed him in ten
days. President Nestor Kirchner took office in 2003 with 22 percent of the votes.
As we could expect, he distributed infrastructure grants to the three largest districts
at the beginning of his term in office (La Nacion 2005). These districts increased
their share of total infrastructure grants from 17 percent in 2002 to 35 percent in
2005. Kirchner’s popularity increased markedly as the economy improved and
political as well as social stability returned to the country. Having access to funds
from a sharp increase in revenues from exports (due to rising commodities’ prices)
and using the enormous leverage and discretion he was able to amass, the president
allocated infrastructure grants mainly to allied, less developed provinces after 2005.
Cristina Fernandez, his wife, followed a similar strategy when she took office
(2007–2015). During this period, the most favored districts were the Kirchners’
home province, Santa Cruz, and other less developed and politically allied
provinces (La Rioja, La Pampa, Tierra del Fuego, Catamarca, and Formosa)
(La Nacion 2010a and 2010b, 2013, 2015). The least favored districts were the
largest, especially the province of Buenos Aires (La Nacion 2013).
The empirical results also allow us to discuss the relevance of alternative claims
discussed in the literature. In the next models (2-3), I incorporate partisan
alignments between presidents and governors. All else being equal, results indicate
that districts ruled by allied governors receive substantially more funds than those
in hands of the opposition: an average of 183$ per capita (Model 2).
Provinces are also more likely to get more funds if they are electorally secure
and not swing districts, when controlling for third variables. Subnational units get
Lucas Gonzalez 15
by guest on February 20, 2016http://publius.oxfordjournals.org/
Dow
nloaded from
0
10
20
30
40
50
60
2000 2001 2002 2003 2004 2005 2006 2007 2008 2009Grants per capita in Poor Provinces Presiden�al Approval Rates
Figure 3 Presidential approval rates and infrastructure grants per capita in poor provinces.
0.1
1
10
100
2000 2001 2002 2003 2004 2005 2006 2007 2008 2009
Log of Grants per capita in Poor Provinces Log of Presiden�al Approval Rates
Figure 4 Presidential approval rates and infrastructure grants per capita in poor provinces
(natural logarithms).
16 Presidential Popularity and the Politics of Distributing Federal Funds
by guest on February 20, 2016http://publius.oxfordjournals.org/
Dow
nloaded from

more funds when the difference between the share of votes of the governor and the
main party in the opposition is larger (that is, when the value of the variable swing
increases). The mean value of the variable swing is .16 (it ranges from 0 to 1).
Hence, a one percent increase in the difference between the governor share of votes
and the main opposition party produces an increase in 2.6$ per capita (Model 2).
All coefficients are robust, positive, and statistically significant. These findings are
similar to what Larcinese et al. (2006, 452) and Berry et al. (2010, 791) found in
the United States, Dıaz Cayeros (2006, 139) found in Mexico, and Arulamparam
et al. (2009) found in India.21
I also explored whether the geographical allocation of federal grants depend on
how coalitions between presidents and governors are territorially distributed.
Ceteris paribus, presidents distribute fewer funds to richer states when they have a
larger share of their partisan allies in these districts (Model 3a) and more funds to
the developing provinces of the country when they have a larger share of their
partisan allies there (Model 3b) (the average share of allies in a given year is 0.53,
or 53 percent). A one percent increase in the share of allies in poorer provinces
increases grants in about 268$ per capita, but only in 50$ per capita in the allies are
in richer districts.
Results also indicate that infrastructure distribution in Argentina is mainly
decided by the national and provincial executives and not the federal legislative:
neither congressional committees nor congressional delegations seem to affect the
outcome as theoretically expected. Both coefficients are negative, and the one for
congressional committees is within the limit of statistical significance (Model 4).
These findings are consistent with those of Berry et al. (2010, 795) for the United
States.
Presidential election years do not seem to contribute to explaining the allocation
of infrastructure investment either. More funds are not transferred to governors
during (federal or state) election times (Model 4). I also lagged presidential election
one year and results remain the same. These results are intuitive, since most
infrastructure projects need a more or less large period of time to be finished
(sometimes even more than four years, which is the period between presidential
elections in Argentina).22
The coefficient for overrepresentation is statistically significant in most models.
These findings are consistent to what several authors reported in their studies on
the United States and the European Union (see Atlas et al. 1995; Hoover and
Pecorino 2005; Lee 2000; Rodden 2002). Despite being statistically significant, the
coefficient is always smaller than the ones for the variables in the main models
presented in this article.23
The main controls to test programmatic arguments get mixed empirical support.
The efficiency criteria are feeble to explain the allocation of infrastructure funds.
More industrialized provinces do not receive more federal infrastructure funds and
Lucas Gonzalez 17
by guest on February 20, 2016http://publius.oxfordjournals.org/
Dow
nloaded from

districts more densely populated and with more cars receive fewer funds. Only
urbanization rate moves as expected (Model 5). There is also weak empirical
support for equity criteria: poverty is not statistically significant and moves in the
opposite direction than theoretically expected in many models. Richer districts
seem to receive more funds, although the coefficient for GGP per capita is not
statistically significant in five out of eight models (Models 1-6).
Including the main variables in a single, full-specified model24 does not change
substantive results, as most of the key variables remain unchanged (Model 6).
The R-Squares oscillate between 22 and 45 percent. Although differences across
models are not large, the main model has more robust and statistically significant
coefficients that move in the expected direction, something which is not always the
case in most competing models. These R-Squares also indicate that between three-
quarters and half of the variation in the dependent variable is left unexplained and
that we need better theories, data, and models to account for the factors that affect
the allocation of federal grants beyond the ones included in this study. Case studies
may contribute to a better understanding of idiosyncratic factors involved in the
distribution.
Final Comments
This article makes two important contributions. First, it provides further evidence
on the key role presidents play in distributive politics in developing federal
democracies, as a part of the literature in the United States and elsewhere has
stressed. Instead of focusing solely on presidential preferences or partisan coalitions,
this work shows that presidential popularity is relevant to explain the allocation of
discretionary federal grants.
Second, it provides a theoretical argument and supports it with empirical
evidence to account for why and how presidents influence the distribution of
grants. It shows that popular presidents tend to increase transfers to developing
provinces and reduce allocations to richer districts. Investing in poorer provinces is
more efficient, and governors from these districts tend to support redistributive
presidents and be weaker political challengers. Weaker presidents, on the contrary,
are less capable of resisting pressures from governors from larger and richer
districts.
All in all, the article stresses the relevance of regional cleavages, partisan
alliances, and the role of presidential popularity on the allocation of discretionary
federal funds. Regional cleavages and political alliances between presidents and
governors from more or less developed regions of the country may be important
not only in developing federal democracies such as Argentina, where inequality and
cleavages among regions are sharp and enduring, partisan structures and partisan
ties are weak and territorialized, and clashes among contending national and
18 Presidential Popularity and the Politics of Distributing Federal Funds
by guest on February 20, 2016http://publius.oxfordjournals.org/
Dow
nloaded from

regional elites tend to be more personalistic than in consolidated democracies. The
influence of these factors on distributive politics should also be further explored in
other nations, developing or developed, in which regional cleavages are essential to
understanding federal politics.
Supplementary Data
Supplementary data can be found at www.publius.oxfordjournals.org.
Notes
This research was supported by the National Council for Scientific and Technical
Research of Argentina (CONICET). Ana Bovino, Noelia Carmona, Ignacio
Mamone, Maria Laura Sluga, and Dominica Zabala Zubizarreta provided research
assistance at different stages. The author would like to thank Marcelo Escolar,
Marcelo Leiras, German Lodola, Carlos Pereira, Fabiano Santos, Craig Volden, and
the three anonymous reviewers as well as the Editor of Publius: The Journal of
Federalism, for their insightful comments and suggestions. Many thanks also to
Dawn Carsey, the Editorial Assistant for Publius: The Journal of Federalism. Any
errors are the sole responsibility of the author.
1 Central governments have other redistributive tools to correct functional inequality,
ranging from subsidies, credits, or tariffs to redistributive social programs, such as
conditional income transfers. I concentrate on a policy tool crucial to correct territorial
inequality.
2 These funds represented almost 8 percent of the total budget in Argentina in 2006.
3 The bill is then submitted to Congress and discussed in both chambers. Once the bill is
approved in Congress, the president has ten working days to sign or veto the law. This
guarantees the president large institutional powers to propose the bill and reject the
legislation she opposes (and the changes Congress made to the bill that the president
does not want to approve).
4 These powers were initially created as an extraordinary measure during the economic
crisis of 2001. But president Kirchner got Congress sanctioned the reform of article 37 of
the Financial Administration Law (24,156) in August 2006, giving stability to the
contested decision.
5 Some authors (see Wallis 1987; Wright 1974) found empirical evidence in the United
States and some comparative analyses support this claim (see Magaloni et al. 2007, 202;
Brollo and Nannicini 2012, 742; Dahlberg and Johansson 2002).
6 Several authors supported this claim with empirical evidence from the United States (see
Carsey and Rundquist 1999; Levitt and Snyder 1995; Anderson and Tollison 1991;
Couch and Shugart 1998, contrary to the findings of Wallis 1989, and Wright 1974) and
the comparative experience (see Arulampalam et al. 2009).
Lucas Gonzalez 19
by guest on February 20, 2016http://publius.oxfordjournals.org/
Dow
nloaded from

7 Some of these funds are legally mandated and earmarked, so presidents cannot influence
their allocation. I exclude them from the analysis and concentrate on discretionary
grants, which are those that are not allocated following particular legal frameworks. See
footnote 3 for the Argentine case.
8 Out of four categories: potentially dominant, proactive, reactive, and potentially
marginal executives.
9 In interviews, provincial authorities from Catamarca (a relatively poor district in the
Northwest) defended a strong central government to deliver public services in the
provinces, such as health and education. With a strong central government, these
officials argued, they could get teachers trained according to national standards, and get
more competitive salaries. The Catamarcan provincial government could not guarantee
either of these two things after the decentralization of primary health and education in
1992.
10 Both provinces have three senators. Buenos Aires has seventy deputies and Formosa five.
But Buenos Aires has almost 14 million inhabitants, while Formosa has less than
500,000. Every deputy in Buenos Aires represents about 200,000 inhabitants; in Formosa
this rate is half: less than 100,000.
11 Oficina Nacional de Presupuesto (ONP). It is the first time that data on the territorial
distribution of public infrastructure is systematically gathered for Argentina. With the
help of research assistants, I collected these data by reviewing ONP’s official documents,
for eighteen budget programs, for each of the provinces in each year of the series for
which we have available data. I received important help of several research assistants
(including a geographer who helped us geo-referencing each of the budget items).
12 The original data in current pesos were deflated using the index of construction costs
(ICC) reported by INDEC (base year is 1993 ¼ 100). The models were also calculated
using the dependent variable in U.S. dollars and substantive results remain very similar
to those reported.
13 The data on presidential popularity is from the Centro de Estudios Nueva Mayorıa, for
the years 1984–2001. Poliarquıa Consultores and Universidad Torcuato Di Tella
provided the data on presidential popularity between the years 2002–2010 (data from the
index of government confidence, or ICG). The observations are monthly measured, so
the data have been averaged yearly.
14 Larcinese et al. (2013) show that properly controlling for population dynamics provides
more reasonable estimates of small-state advantage in their empirical research on the
geographic distribution of U.S. federal spending.
15 In Argentina, this region includes the provinces of Buenos Aires, Cordoba, Santa Fe, and
the Federal Capital.
16 This region includes all the other provinces.
17 The variable swing measures the difference between the incumbent’s share of votes and
the share of votes of the main opposition party.
18 Samuels and Snyder (2001) calculate legislative overrepresentation using the Loosemore–
Hanby index of electoral disproportionality: Overrepresentation ¼ (1/2) � jsi–vij, where
si is the percentage of all seats allocated to district i, and vi is the percentage of the
overall population residing in district I.
20 Presidential Popularity and the Politics of Distributing Federal Funds
by guest on February 20, 2016http://publius.oxfordjournals.org/
Dow
nloaded from
19 These are the results of the summing up the coefficients for presidential popularity and
the interaction term between this variable and the dummies for developed and less
developed districts. The results in the table are rounded up to three digits. The
coefficient for presidential popularity is 0.00207 and the interaction term between this
variable and the dummies for developed districts is – 0.00186.
20 The other models also get very high p-values (e.g., 0.58 and 0.54 for Models 2a and 2b),
so random effects are also advised.
21 And in line with those of a large part of the literature on distributive politics (Cox and
McCubbins 1986; Anderson and Tollison 1991; Levitt and Snyder 1995; Couch and
Shugart 1998; Carsey and Rundquist 1999; McCarty 2000, among others).
22 Maybe public works are finished before elections, but I do not have data to test this
claim.
23 We have also to bear in mind that the average overrepresentation index for Argentina is
1.9 and that the standard deviation is around 2; consequently, a one-point increase in
the index is a major change that does not seem to produce substantial changes in the
dependent variable (16$ in the full model and about 30$ in most of the others),
especially when compared to the main variables in our model.
24 I do not include all the institutional variables in the full model due to the high
collinearity among some of the variables.
References
Achen, Christopher H. 2000. Why Lagged Dependent Variables Can Suppress the
Explanatory Power of Other Independent Variables. Paper presented at the Annual
Meeting of Political Methodology, Los Angeles, July 20–22.
Alvarez, R. Michael and Jason L. Saving. 1997. Deficits, democrats, and distributive benefits:
congressional elections and the Pork Barrel in the 1980s. Political Research Quarterly 50
(4): 809–831.
Anderson, Gary and Robert Tollison. 1991. Congressional influence and patterns of New
Deal spending, 1933-1939. Journal of Law and Economics 34 (1): 161–75.
Anzia, Sarah and Christopher Berry. 2011. The Jackie and Jill Robinson effect: Why do
congresswomen outperform congressmen? American Journal of Political Science 55 (3):
478–493.
Arulampalam, Wiji, Sugato Dasgupta, Amrita Dhillon, and Bhaskar Dutta. 2009. Electoral
goals and centre–state transfers in India. Journal of Development Economics 88: 103–119.
Atlas, Cary, Thomas Gilligan, Robert Hendershott, and Mark Zupan. 1995. Slicing the
federal net spending pie: who wins, who loses, and why? American Economic Review 85:
624–629.
Balla, Steven, Eric Lawrence, Forrest Maltzman, and Lee Sigelman. 2002. Partisanship, blame
avoidance, and the distribution of legislative pork. American Journal of Political Science 46:
515–525.
Beck, Nathaniel, and Jonathan Katz. 1995. What to do and not to do with time-series cross-
section data. American Political Science Review 89: 634–647.
Lucas Gonzalez 21
by guest on February 20, 2016http://publius.oxfordjournals.org/
Dow
nloaded from
Beck, Nathaniel. 2001. Time-series-cross-section data: what have we learned in the past few
years? Annual Review of Political Science 4 (1): 271–293.
Berry, Christopher, Barry Burden, and William Howell. 2010. The president and the
distribution of federal spending. American Political Science Review 104: 783–799.
Bickers, Kenneth, and Robert Stein. 2000. The congressional pork barrel in a republican era.
The Journal of Politics 62: 1070–1086.
Brollo, Fernanda, and Tommaso Nannicini. 2012. Tying your enemy’s hands in close races:
the politics of federal transfers in Brazil. American Political Science Review 106: 742–761.
Calvo, Ernesto. 2007. The responsive legislature: public opinion and law making in a highly
disciplined legislature. British Journal of Political Science 37: 263–280.
Carsey, Thomas, and Barry Rundquist. 1999. Party and Committee in Distributive Politics:
Evidence from Defense Spending. The Journal of Politics 61: 1156–1169.
Cların, El Gobierno volvio a hacer una millonaria modificacion del Presupuesto, August 1,
2014.
Clark, Tom S., and Drew A. Linzer. 2015. Should i use fixed or random effects? Political
Science Research and Methods 3 (2): 399–408.
Couch, Jim, and William Shugart. 1998. The political economy of the New Deal.
Cheltenham, UK: Edward Elgar.
Cox, Gary, and Mathew McCubbins. 1986. Electoral politics as a redistributive game. The
Journal of Politics 48: 379–389.
Dahlberg, Matz, and Eva Johansson. 2002. On the vote-purchasing behavior of incumbent
governments. American Political Science Review 96: 27–40.
Dıaz Cayeros, Alberto. 2006. Federalism, fiscal authority, and centralization in Latin America.
Cambridge: Cambridge University Press.
Dynes, Adam, and Gregory A. Huber. 2015. Partisanship and the allocation of federal
spending: do same-party legislators or voters benefit from shared party affiliation with the
president and house majority? American Political Science Review 109: 172–186.
Ferejohn, John. 1974. Pork barrel politics: Rivers and harbors legislation, 1947–1968. Stanford,
CA: Stanford University Press.
Gibson, Edward. 1997. The populist road to market reform: policy and electoral coalitions in
Mexico and Argentina. World Politics 49 (3): 339–370.
Gibson, Edward, and Ernesto Calvo. 2000. Federalism and low-maintenance constituencies:
territorial dimensions of economic reform in Argentina. Studies in Comparative
International Development 35: 32–55.
Gibson, Edward, Ernesto Calvo, and Tullia Falleti. 2004. Reallocative federalism: over-
representation and public spending in the Western Hemisphere. In Federalism and
Democracy in Latin America, ed. E. Gibson. Baltimore, MD: Johns Hopkins University Press.
Gonzalez, Lucas, and Ignacio Mamone 2012. La economıa polıtica de la distribucion federal
de obra publica en Argentina. Desarrollo Economico - Revista de Ciencias Sociales 50 (201):
59–80.
22 Presidential Popularity and the Politics of Distributing Federal Funds
by guest on February 20, 2016http://publius.oxfordjournals.org/
Dow
nloaded from
——— 2015. Distributive Politics in Developing Federal Democracies: Compensating
Governors for their Territorial Support. Latin American Politics and Society 57 (3): 50–76.
Gordin, Jorge P. 2006. The Politics of Intergovernmental Fiscal Relations in Argentina. IBEI
Working Paper No. 2006/2: 1–15.
Grossman, Phillip. 1994. A political theory of intergovernmental grants. Public Choice 78:
295–303.
Holcombe, Randall, and Ashgar Zardkoohi. 1981. The determinants of federal grants.
Southern Economic Journal 48: 393–399.
Hoover, Gary, and Pecorino Paul. 2005. The political determinants of federal expenditure at
the state level. Public Choice 123 (1): 95–113.
Huber, Evelyne, and John D. Stephens. 2001. Development and crisis of the welfare state:
parties and policies in global markets. Chicago: University of Chicago Press.
Huber, Evelyne, Thomas Mustillo, and John D. Stephens. 2008. Politics and Social Spending
in Latin America. The Journal of Politics 70 (2): 420–436.
Jones, Mark. 2002. Explaining the high level of party discipline in the Argentine Congress. In
Legislative Politics in Latin America, S. Morgenstern and B. Nacif (eds), 147–184.
Cambridge: Cambridge University Press.
Jones, Mark, and Wonjae Hwang. 2005. Provincial Party Bosses: Keystone of the Argentine
Congress. In Argentine Democracy: The Politics of Institutional Weakness. Eds., S. Levitsky
and M. V. Murillo, 115–38. University Park, PA: The Pennsylvania State University Press.
Knight, Brian. 2005. Estimating the value of proposal power. The American Economic Review
95 (5): 1639–1652.
Kriner, Douglas, and Andrew Reeves. 2015. Presidential particularism and divide-the-dollar
politics. American Political Science Review 109: 155–171.
———. 2012. The influence of federal spending on presidential elections. American Political
Science Review 106: 348–366.
La Nacion, El plan de infraestructura, al Congreso, August 5, 2000a.
———, Como sera el Plan de Infraestructura, December 30, 2000b.
———, Redoblan el reparto de fondos en plena campana. Buenos Aires, Santa Fe y Cordoba
son las mas beneficiadas, July 4, 2005.
———, El Gobierno reasigno $928 millones para incrementar las obras en rutas, June 20,
2007.
———, Santa Cruz, otra vez beneficiada con fondos discrecionales, September 27, 2010a.
———, Favorece a Santa Cruz el presupuesto, October 28, 2010b.
———, Advierten fuertes inequidades en el reparto de fondos para obras, April 29, 2013.
———, El Gobierno preve un fuerte aumento del gasto en obra publica en 2015, September
22, 2014.
———, Santa Cruz, la mas beneficiada de la decada con fondos para rutas y obras, April 25,
2015.
Lucas Gonzalez 23
by guest on February 20, 2016http://publius.oxfordjournals.org/
Dow
nloaded from

Larcinese, Valentino, Leonzio Rizzo, and Cecilia Testa. 2006. Allocating the U.S. federal
budget to the states: the impact of the president. The Journal of Politics 68: 447–456.
Larcinese, Valentino, James M. Snyder Jr., and Cecilia Testa. 2013. Testing models of
distributive politics using exit polls to measure voters’ preferences and partisanship. British
Journal of Political Science 43 (04): 845–875.
Lauderdale, Benjamin E. 2008. Pass the pork: measuring shares in bicameral legislatures.
Political Analysis 16 (3): 235–249.
Lee, Frances. 1998. Representation and public policy: the consequences of senate
apportionment for the geographic distribution of federal funds. The Journal of Politics
60 (1): 34–62.
———. 2000. Senate representation and coalition building in distributive politics. American
Political Science Review 94: 59–72.
———. 2003. Geographic politics in the U.S. house of representatives: coalition building
and distribution of benefits. American Journal of Political Science 47 (4): 714–728.
Levitt, Steven, and James Poterba. 1999. Congressional distributive politics and state
economic performance. Public Choice 99 (1): 185–216.
Levitt, Steven, and James Snyder. 1995. Political parties and the distribution of federal
outlays. American Journal of Political Science 39: 958–980.
Lindbeck, Assar, and Jorgen Weibull. 1987. Balanced-budget redistribution as the outcome
of political competition. Public Choice 52: 273–297.
Lodola, German. 2005. Protesta Popular y Redes Clientelares en la Argentina: El Reparto
Federal del Plan Trabajar (1996–2001). Desarrollo Economico 44 (176): 515–536.
Mainwaring, Scott, and Matthew Shugart. 1997. Presidentialism and democracy in Latin
America. Cambridge: Cambridge University Press.
Magaloni, Beatriz, Alberto Dıaz Cayeros, and Federico Estevez. 2007. Clientelism and
Portfolio Diversification: A Model of Electoral Investment with Application to Mexico. In
Patrons or Policies? Patterns of Democratic Accountability and Political Competition, eds.
H. Kitschelt and S. Wilkinson. Cambridge: Cambridge University Press.
McCarty, Nolan. 2000. Presidential Pork: Executive Veto Power and Distributive Politics.
American Political Science Review 94: 117–29.
Migueis, Marco. 2013. The effect of political alignment on transfers to Portuguese
municipalities. Economics & Politics 25 (1): 110–133.
Mustapic, Ana Marıa. 2000. Oficialistas y Diputados: Las Relaciones Ejecutivo-Legislativo en
la Argentina. Desarrollo Economico 39 (156): 571–595.
Neustadt, Richard. 1989. Presidential Power. Free Press.
Persson, Torsten, and Guido Tabellini. 2000. Political economics. Explaining economic policy.
Cambridge: MIT Press.
Plan Federal de Infraestructura, Decree 1377/2001, November 1, 2001.
24 Presidential Popularity and the Politics of Distributing Federal Funds
by guest on February 20, 2016http://publius.oxfordjournals.org/
Dow
nloaded from
Plumper, Thomas, Vera Troeger, and Philip Manow. 2005. Panel data analysis in
comparative politics: linking method to theory. European Journal of Political Research 44
(2): 327–354.
Rodden, Jonathan. 2002. Strength in numbers? Representation and redistribution in the
European Union. European Union Politics 3: 151–175.
———. 2010. The geographic distribution of political preferences. Annual Review of Political
Science 13: 297–340.
Samuels, David, and Richard Snyder. 2001. The value of a vote: Malapportionment in
comparative perspective. British Journal of Political Science 31: 651–671.
Shugart, Matthew, and John Carey. 1992. Presidents and assemblies. Constitutional design
and electoral dynamics. Cambridge: Cambridge University Press.
Sole Olle, Albert. 2010. The determinants of regional allocation of infrastructure investment
in Spain. In N. Bosch, M. Espasa, and A. Sole Olle, eds. The political economy of inter-
regional fiscal flows: measurement determinants and effects on country stability.
Cheltenham: Elgar Publishing.
Stein, Robert M., and Kenneth N. Bickers. 1994. Congressional elections and the pork barrel.
The Journal of Politics 56 (2): 377–399.
Wallis, John. 1987. Employment, politics, and economic recovery during the Great
Depression. The Review of Economics and Statistics 69 (3): 516–520.
Wright, Gavin. 1974. The political economy of New Deal spending: An econometric analysis.
Review of Economics and Statistics 56 (1): 30–38.
Wooldridge, Jeffrey. 2002. Econometric analysis of cross section and panel data. Cambridge:
MIT Press.
Lucas Gonzalez 25
by guest on February 20, 2016http://publius.oxfordjournals.org/
Dow
nloaded from