preparation and characterisation of spinel ferrites - dyuthi
TRANSCRIPT

\.~ I jil'7~
PREPARATION AND CHARACTERISATION OFSPINEL FERRITES - THEIR INCORPORATION
IN RUBBER MATRIX AND EVALUATION OFPROPERTIES
Thesis submitted to
COCHIN UNIVERSITY OF SCIENCE AND TECHNOLOGY
in partial fulfilment of the requirements for the award of the degree of
DOCTOR OF PHILOSOPHY
By
SINDHU S.
DEPARTMENT OF PHYSICSCOCHIN UNIVERSITY OF SCIENCE AND TECHNOLOGY
COCHIN - 682 022, INDIA
APRIL 2001
Department of Physics
Cochin University of Science and Technology
Cochin - 682 022
India
- ......;:-;::==================================:::::-=:::"--. .- .
Certified that the work presented in this thesis entitled 11 Preparation
and characterisation of spinel ferrites - Their incorporation in
rubber matrix and evaluation of properties " is based on the
bonafide research work carried out by Miss. Sindhu S under my
guidance, at the Magnetics laboratory of the Physics Department,
Cochin University of Science & Technology, Cochin - 682 022, and
has not been included in any other thesis submitted previously for
the award of any degree.
Cochin - 22
09.04.2001
t~L,~zc,=-oOr.M.R.Anantharaman
(Supervising Guide)

CONTENTS
Page No.
Preface
Chapter I Introduction
1.1. History of magnetism 11.2. Science behind magnetism 31.3. Kinds of magnetic materials 61.4. Applications of magnetic materials 91.5. Ferrimagnetism and ferrites 101.6. Crystal chemistry of spinel ferrites 111.7. Magnetic properties of ferrites 131.8. Electrical properties of ferrites 151.9. Magnetostriction 161.10. About Butyl rubber 171.11. Rubber Ferrite Composites (RFCs) 19
Chapter 11 Experimental Methods
2.1. Preparation of ceramic Nh-xZnxFe204 222.2. Structural Evaluation of Nh-xZnxFe204 232.3. Incorporation of Nh-xZnxFe204 in butyl rubber matrix 242.4. Cure characteristics 252.5. Magnetic characterisation 25
2.5.1. Principle & Theory involved in VSM 262.6. Surface studies on ZnFe204 27
2.6.1. Low Energy Ion Scattering (LEIS) 272.7. Mossbauer studies 292.8. Electrical characterisation 32
2.8.1. Dielectric properties 322.8.2. Ac electrical conductivity 35
Chapter III Cure characteristics and magnetic properties ofRubber Ferrite Composites (RFCs)
3.1. Introduction 363.2. Structural studies on Nh-xZnxFe204 373.3. Magnetic properties of ceramic Nh-xZnxFe204 41
3.4. Cure characteristics of RFCs 493.5. Magnetic properties of RFCs 513.6. Tailoring magnetic properties of RFCs 563.7. Low temperature VSM results of x = 0.2, 120phr 593.8. Conclusion 61
Chapter IV On the magnetic properties of ultrafine zinc ferrites
4.1. Introduction 62·4.2. Preparation of zinc ferrite at low temperature 644.3. Preparation of zinc ferrite at high temperature 644.4. Structural evaluation of ZnFe204 644.5. Magnetic measurements 664.6. BET surface area measurements 664.7. Results and Discussion 664.8. Conclusion 72
Chapter V Dielectric properties of RFCs containing mixed ferrites
5.1. Introduction 735.2. Dielectricproperties of ceramic Nh-xZnxFe204 74
5.2.1. Frequency dependence 755.2.2. Compositional dependence 765.2.3. Temperature dependence 78
5.3. Dielectric properties of blank butyl rubber 805.4. Dielectric studies on RFCs 81
5.4.1. Frequency dependence 815.4.2. Compositional dependence 835.4.3. Loading dependence 845.4.4. Temperature dependence 88
5.5. Conclusion 88
Chapter VI Evaluation of AC conductivity of RFCs fromdielectric measurements
6.1. Introduction 906.2. AC electrical conductivity - principle & theory 916.3. Frequency dependence 936.4. Compositional dependence 966.5. Loading dependence 996.6. Temperature dependence 1016.7. Conclusion 104
Chapter VII Evaluation of hysteresis loss for RFCs & Theestimation of magnetostrictive constant As
7.1. Introduction 1057.2. Estimation of As from magnetic measurements 1067.3. Results and discussion 1097.4. Conclusion 114
Chapter VIII Summary and Conclusion 116
References
Appendix 1: List of publications/communicated articles/ papers
Man's quest for exploring the unknown is as old as Adam and Eve. Almost all the
foundations of modern discoveries/inventions are an outcome of this canonical
attribute of human kind. This has resulted in major advancements in science and
technology and has benefited the mankind to a large extent. The developments
made in science and technology from time to time during the past three, four
centuries have been a catalyst for social development. The industrial revolution of
ts" century and later the world wars witnessed many upheavals in the society and
this lead to the polarisation of the civilized world in to two blocks, the East and the
West. Though this polarisation has vertically split the Western society, the efforts
of scientists and engineers under the banner of these blocks have been to make life
more humane.
In the broader realm of science and technology magnetism and magnetic materials
have played a dominant role. This has provided to the world a whole new products
in the form of passive energy storage devices. The vast ocean of knowledge and
experience available in this field provided a major impetus to the development of
this science called magnetism. The discovery of ferrimagnetism and ferrites by
Louie Neel is one of the major milestones in this area. Today the magnetism
industry is big as the semiconductor industry or rather it has started outgrowing
the latter. The modern world has benefited a lot from the I wonder material '
(called ferrite) and it will continue to benefit.
Name any device and there is a piece of magnet or an element of magnetism
embedded into it. Such is the spectrum of applications of these materials.
The dawn of 21st century has already started witnessing the fruits of past labour in
the form of new gadgets called GMR / CMR devices, MRAMs, high density
PY'~ 1I
storages and ferrofluids. Man's desire to improve upon the existing, removal of
obsolescence, value addition and bringing cost effectiveness has produced many
devices which have superior performance characteristics and at the same time
inexpensive.
This piece of work which is undertaken here may be viewed from this angle to
improve upon the existing and adding value to the existing without comprom,ising
on the quality. The underlying principle of physics will also be dealt with from a
fundamental viewpoint.
Of the different kinds of magnetism ferrirnagnetism is the term proposed by Neel
to describe the magnetism of ferrites. In these substances magnetic ions occupy
two different kinds of lattice sites called tetrahedral (A) and octahedral (B). The
number of magnetic ions and also the magnitude of spins of individual ions arc
different on A and B sites and this gives rise to a net magnetisation. These
materials are important because of their high frequency applications due to their
high resistivity and low eddy current losses. They are employed in various
devices like television sets, transformer cores, loud speakers, telephone receivers
and memory devices. They are employed in the form of ceramic materials in
devices. An inherent drawback of ceramic materials used in devices is their poor
machinability to obtain complex shapes. Plastic magnets or elastomer magnets
can fill these voids by reduction of cost and can be moulded in to any shape.
Hence plastic magnets or rubber ferrite composites have the potential in replacing
the ceramic type of magnetic materials for applications.
Rubber ferrite composites can be prepared by the incorporation of poly crystalline
ferrite powders in various elastomer matrixes. The addition of magnetic fillers in
an elastomer matrix modifies the physical properties of the matrix considerably.
They modifiy the dielectric properties and impart magnetic properties to the
matrix. In applications involving ferrites at high frequencies especially for
microwave absorbing devices it is essential that the material posses an appropriate
dielectric constant and suitable magnetic permeability. This can be achieved in a
single shot by preparing rubber ferrite composites.
III
In this work nickel zinc ferrite having the general formula Ni l _xZnxFe204, where x
varies from 0 to 1 in steps of 0.2 have been prepared by the conventional ceramic
techniques. The system of Nil_xZnxFe204 is chosen because of their excellent high
frequency characteristics. Their structural, magnetic and dielectric properties were
evaluated by employing appropriate analytical techniques. These polycrystalline
Nil_xZnxFe204 were then incorporated in a synthetic rubber matrix namely Butyl
rubber. The incorporation was done according to a specific recipe and for various
loadings of magnetic fillers and also for all compositions. The cure characteristics,
magnetic properties and dielectric properties of these elastomer blends were
carried out. The ac electrical conductivity of both ceramic nickel zinc ferrites and
rubber ferrite composites were also calculated using a simple relation from the
dielectric data. Attempts are made to estimate the magnetostrictive constant (As)
of these samples using the magnetic parameters. The results are correlated.
Chapter 1 gives a brief introduction about the history of magnetism followed by a
brief discussion on the physics of magnetism. Different magnetic materials and
their uses and applications are also dealt with in this chapter. SpineI ferrites and
their crystal chemistry are also discussed with emphasis on Neel's two sub lattice
model.
An outline about the experimental techniques including the preparative techniques
employed for the preparation and characterisation of samples at various stages are
cited in Chapter 2. A detailed description of the preparation of Rubber Ferrite
Composites are also provided. A brief description about the various analytical
tools employed for characterisation at different levels are also given. This includes
ideas about Low Energy Ion Scattering (LEIS) and Mossbauer spectroscopy.
Chapter 3 deals with the Structural and magnetic properties of ceramic fillers. The
cure characteristics of RFCs and the magnetic properties of RFCs are also dealt with
in this Chapter. The correlation of the properties are carried out with a view to
tailor making materials with specific magnetic properties. The variation of
coercivity with composition and the variation of magnetisation for different filler
loadings are compared and correlated.
IV
During the evaluation of magnetic properties of Ni l -xZnxFe204 an interesting
observation of anomalous magnetisation for fine particle ZnFe204 was observed.
Chapter 4 deals with the studies carried out on the magnetic properties of ultrafine
zinc ferrites.
The dielectric properties of ceramic Nil_xZnxFe204 and rubber ferrite composites
containing Nil-xZnxFe204 were evaluated and the results are discussed in Chapter
5. They are studied as a function of frequency, composition, loading and
temperature.
The ac electrical conductivity (aae) calculation were carried out using the data
available from the dielectric measurements by employing a simple relationship for
both ceramic Nil_xZnxFe204 and also for rubber ferrite composites. The results are
discussed in detail in Chapter 6. The effect of temperature on the conductivity of
the ceramic sample as well as RFCs are carried out and discussed in this chapter.
Chapter 7 deals with the estimation of magnetostriction constant A.s which was
carried out by utilising the hysteresis loop parameters and employing simple
relationships.
Chapter 8 is the concluding chapter of the thesis and in this chapter the salient
observations and results are discussed and compared. Commercial importance and
possibility for applications of rubber ferrite composites are also discussed in this
chapter.

Chapter I
Introduction
1.1. History of magnetism
Magnetism is very common to everything you see. The term magnetism comes
from a rock called lodestone. The ancient Greeks, and the Chinese knew about this
strange and rare stone with the power to attract iron. This natural form of magnet
was then named as lodestone. The name magnet was used by the Greeks for this
lodestone, because of itts property of attracting other pieces of the same material
and iron as well. It was proved later that this naturally occurring lodestone is the
magnetic iron oxide or the naturally occurring mineral called magnetite. The
Chinese found that whenra steel needle stroked with such a lodestone became
magnetic and the needle pointed north -south when it is suspended freely. They
applied this characteristic feature of the lodestone for navigation, fortune tellingCV> .
and.a guide for building. Some of the properties of magnets were discovered earlier
than 600 RC, although it is only in the twentieth century that physicists have
begun to understand why substances behave magnetically. Thus magnetism is one
of the earliest known physical phenomena of solid materials.
In 1263 Pierre de Maricourt a French soldier mapped the magnetic field of a
lodestone with a compass. He discovered that a magnet had two magnetic poles
north and south poles. The magnetic compass was first used for navigation in the
west sometime after AD 1200. In the 13th century important investigations on
magnets were made by the French scholar Petrus Peregrinus. His discoveries
stood for nearly 300 years until the English physicist and physician to Queen
Elizabeth I of England, William Gilbert published his book on Magnets, Magnetic
bodies and the Great Magnet of the Earth, in 1600. William Gilbert was the first to
apply scientific methods to a systematic exploration of magnetic phenomena. His
greatest contribution was the discovery that the earth itself behaves like a giant
Chapter 1 2
magnet. He distinguished clearly between electricity and magnetism. Quantitative
studies of magnetism began in the early eighteenth century. In 1750 the English
geologist John Michel(1724 - 1793) invented a balance that he used in the study of
magnetic forces. He showed that attraction and repulsion of magnets decreases as
the square of the distance from the poles increases. The French physicists Charles
Augustine de Coulomb (1736- 1806) had measured the forces between electric
charges and established the inverse square law of force between magnetic poles
and also between electric charges. Thus he verified John Michel's observation with
high precision.
In the late 18th and early 19th centuries the theories of electricity and magnetism
were investigated simultaneously. In 1819 an important discovery was made by the
Danish physicist Hans Christian Oersted, who found that a magnetic needle could
be deflected by an electric current flowing through a wire. This discovery, which
showed a connection between electricity and magnetism, was followed up by the
French scientist Andre Marie Ampere, who studied the forces between wires
carrying electric currents and worked out the mathematical relationship between
the current of electricity and the strength of the magnetic field. He also had a
theory that the electric current in atoms had a magnetic field. In 1831 the English
scientist Michel Faraday discovered that moving a magnet near a wire would
induce an electric current in that wire and the inverse effect of that was found by
Oersted. Eventually simple devices based on magnetic materials started rolling out.
They slowly percolated in to every sphere of human life. They came into being as
passive energy devices such as transformers and electric motors.
Subsequent studies of magnetism were increasingly concerned with an
understanding of the atomic and molecular origins of the magnetic properties of
matter. Pierre Curie discovered that magnets lose their magnetism above a certain
temperature which became known as the curie point. In the 1900's Edward
M.Purcell and Flix Bloch both American physicists developed a way to measure
the magnetic field of the nuclei. This discovery led to Magnetic Resonance
Imaging (MRI). In 1905 the French physicists Paul Langevin (1872- 1946)
produced a theory regarding the temperature dependence of the magnetic
properties of paramagnets, which was based on the atomic structure of matter.
Chapter I 3
This theory is an early example of the description of large scale properties in terms
of the properties of electrons and atoms. Langevin's theory was subsequently
expanded by the French physicist Pierre Ernst Weiss (1865 - 1940), who
postulated the existence of an internal, molecular magnetic field in materials such
as iron. This concept, when combined with Langevin's theory, served to explain
the properties of magnetic system such as lodestone.
After Weiss theory, magnetic properties were explored in greater detail by Danish
physicist Niel's Bohr. His theory of atomic structure, for example, provided an
understanding of the periodic table and showed quantitatively why magnetism
occurs in the so called transition elements, such as iron and the rare earths or in
compounds containing these elements. The American physicists Samuel Abraham
Ooudsmit (1902 - 1978) and George E, Uhlenbeek (1900 ... 1988) showed that the
electron itself has a spin and behaves like a small bar magnet. At the atomic level,
magnetism is measured in terms of magnetic moments. A moment being analogous
to a unit of angular momentum in mechanics, except that electric charge is
substituted for mass. The German physicist Wener Heisenberg gave a detailed
explanation for Weiss's molecular field in 1927, on the basis of the newly
developed quantum mechanics. In the 1960's and 1970's scientists developed
superconducting magnets. Only when the magnet is cooled to absolute zero these
magnets can~eneratemagnetic fields up to 200,000 gauss [1-2].
1.2. Science behind magnetism
Only one kind of magnetism was known until 1821, which was produced by iron
magnets. But later it was proved that the flow of an electric current in a wire
moves a compass needle near by it. This new phenomenon was again studied by
Ampere and concluded that the nature of magnetism was quite different from what
everyone had believed. It was basically a force between electric currents. Two
parallel currents in the same direction attract and in opposite direction repel.
Magnetism comprises those physical phenomena involving magnetic fields and
their effects upon materials. Magnetic fields may be set up on a macroscopic scale
by electric currents or by magnets. On an atomic scale, individual atoms cause
Chapter I 4
magnetic fields when their electrons have a net magnetic moment as a result of
their angular momentum. A magnetic moment arises when a charged particle has
an angular momentum. It is the cooperative effect of the atomic magnetic moments
which causes the macroscopic magnetic field of a permanent magnet.
Magnetic field is defined as the region around a magnet where the magnetic force
is exerted. There are two essential ingredients for generating a magnetic field.
These two ingredients are magnetic material and current. A magnetic field is said
to occupy a region when the magnetic effect of an electric current or of a magnet
upon a small test magnet which is brought to the vicinity is detectable. Because of
the magnetic effect, a torque will be exerted on the test magnet until it becomes
oriented in a particular direction. The magnitude of this torque is a measure of the
strength of the magnetic field, and the preferred direction of orientation is the
direction of the field. In eleetro magnetic units, the magnitude of the torque is
given by
L = -!,uI·IH!. Sine (1.1)
Where ~ is the magnetic moment of the test magnet. H is the magnetic field
strength and e is the angle between the direction of ~ and H. When a magnetic
material is placed in a magnetic field H, it becomes magnetized, that is it becomes
itself a magnet. The intensity of the induced magnetism is called the magnetization
'M'. More precisely, M is the magnetic moment per unit volume of the material.
In a vector field the magnetic induction B is often defined to describe the magnetic
forces anywhere in space. In electromagnetic units the definition of B is given by
B = H + 4 7t M (1.2)
The motion of an electric charge also produces a magnetic field. The atoms whose
electrons in a bar magnet are in constant motion about atomic nuclei. This moving
charge creates a tiny current and produces a magnetic field, so every spinning
electron is a tiny magnet. Two electrons spinning in the same direction creates a
stronger magnetic field, if a pair of electrons are spinning in opposite direction then
they cancel each other out and there is no magnetic field. This occurs in substances
such as wood and plastics too. Hence it can be said that materials turn magnetic
when they acquire a non zero magnetisation in the presence of an applied magnetic
filed. Based on this magnetic property upon the application of an external field,

Chapter I 5
magnetic materials can be divided into temporary and permanent magnets.
Temporary magnets will lose all or most of their magnetic properties after the
removal of the applied field, but a permanent magnet will retain or keep their
magnetic properties for a very long time. Temporary magnets are made of such
materials as iron nickel and cobalt. These materials are known as soft magnetic
materials because they usually do not retain their magnetism outside a strong
magnetic field.
Ferromagnets are characterised by spontaneous magnetisation, that is they attain
saturation magnetisation in each of the domains even though no field is applied.
But the magnetisation curve on the other hand asserts that an unmagnetised
ferromagnetic sample displays no overall magnetisation in zero field. Moreover it
takes an appreciable field to produce magnetisation close to the saturation value.
This discrepancy between the theory and the observation was explained by Weiss
based on domain hypothesis. According to Weiss domain hypothesis a ferromagnet
of macroscopic size contains numerous regions called magnetic domains in the
demagnetized state. Within each domain all the atomic moments are aligned in one
of the easy directions. The direction of the spontaneous magnetisation varies from
domain to domain, so as to minimize the magnetosatic energy. If the ferromagnetic+-
grains are subdivided i~t\10 many domains with walls between them hen they are
called multi domains. When the grain size is of the order of the wall thickness, it
would not support a wall and will be a single domain grain. One clear distinction
between multi domain and single domain grain is that the multi domain grains have
a net zero magnetic moment due to different directions of the individual domain
magnetisation, but the single domain grains will always show the saturation
intensity until heated to beyond it's curie temperature. The single domain size
range could be from less than 1OOOA° down to a diameter equal to a few times the
lattice constant of the material and these grains are also referred to as fine particles.
The magnetic energy of a single domain particle of volume V with uniaxial
anisotropy, coercive force He and spontaneous magnetisation Js is VJs He / 2 and
depending on V this could become comparable to the thermal energy kT at ambient
temperature. In such a case and when there is no external field , the particle
moment VJs will orient along one of the two opposite direction (0° or 180°). These
Chapter 1 6
two minimum energy position would be switched between them due to thermal
agitation. Particles undergoing such fluctuations are called superparamagnetic
particles. The temperature at which the magnetic energy equal to the thermal
energy is called blocking temperature (TB)' The hysterisis behaviour of these
particles show reversible magnetisation curves with zero remanence and zero
coercive force. Another important point is that multi domain particles require a
much larger field than single domain and super paramagnetic particles' to get
saturated. The hysterisis loop of single domain and super paramagnetic particles
are inter changeable through an appropriate temperature change, where as multi
domain particles are independent of temperature. A simple experiment based on X
vs T can bring out these features very clearly [3-6].
1.3. Kinds of magnetic materials
The magnetic properties of the materials can be classified i4}0 di~agnetic,
paramagnetic and ferromagnetic. This was based on how the material reacted to a
magnetic field. Diamagnetic materials, when placed in a magnetic field, have a
magnetic moment induced in them, that opposes the direction of the applied
magnetic field. This property is a result of electric currents that are induced in
individual atoms and molecules. These currents according to Amperes law produce
the magnetic moments in opposition to the applied field. Many materials are
diamagnetic, the strongest ones are metallic bismuth and organic molecules, such
as benzene, that have a cyclic structure, enabling the easy establishment of electric
current.
Paramagnetic materials result when the applied magnetic field lines up all the
existing magnetic moments of the individual atoms or molecules making up the
material. This results in an over all magnetic moment that adds to the magnetic
field. Paramagnetic structures usually contain transition metals or rare earth
materials that posses unpaired electrons. Paramagnetism in nonmetallic substances
is usually characterized by temperature dependence, that is, the size of an induced
magnetic moment varies inversely to the temperature. Langeven's theory of
paramagnetism is based on this assumption. According to this theory the magnetic
atoms or ions whose spins are isolated from their magnetic environment and can
Chapter I 7
more or less freely change their directions. At finite temperatures the spins are
thermally agitated and take random orientations. By applying a magnetic field the
average orientation of the spins are slightly changed so as to produce a weak
induced magnetisation parallel to the applied magnetic field. The orientation of
magnetic moment (u) with respect to the applied field (H) can be arbitrary and
therefore, the angle between ~ and H can be continuously varied. If there are N.number of atoms then the total magnetic moment is given by M = Nil. Langevin
function L(a) is used to represent the average effective component of the angle ebetween different magnetic dipoles with the applied filed, which is represented by
L(a) = ,LL.H . Saturation will occur if L(a) is large enough, that is, large field or3k B·T
low temperature is necessary to make the spins allign in the field direction by
overcoming the disordering effect of thermal agitation. The susceptibility in this
case is inversely proportional to the absolute temperature.
Paramagnetism of the conduction electrons are called Pauli paramagnetism or
weak spin paramagnetism. The conduction electrons, present to the extent of one or
more per atom, depending on the valence state will have a spin magnetic moment
of one Bohr magneton. One would therefore expect them to make a sizable
paramagnetic contribution. This does not happen, however, because the conduction
electrons of a metal occupy energy levels in such a way that an applied field can
reorient the spins of only a very small fraction of the total number of electrons. The
resulting paramagnetism is very weak and does not vary much with temperature
and the susceptibility is independent of temperature.
A ferromagnetic substance is one that, like iron, retains a magnetic moment even
when the external magnetic field is reduced to zero. This effect is due to the strong
interaction between the magnetic moments of the individual atoms or electrons in
the magnetic substance that causes them to line up parallel to one another. In
ordinary circumstances these ferromagnetic materials are divided in to regions
called domains, in each of which the atomic moments are aligned parallel to one
another. Separate domains have total moments that do not necessarily point in the
same direction. Thus although an ordinary piece of iron may not have a magnetic
Chapter 1 8
moment, magnetization can be induced in it by placing the iron in a magnetic field,
there by aligning the moments of all the individual domains. The energy expended
in reorienting the domains from the magnetized back to the demagnetized state
manifests itself in a lag in response, which is known as hysteresis. Ferro magnetic
materials when heated eventually lose their magnetic properties. This loss becomes
complete above the so called Curie temperature, named after Pierre Curie who
discovered it in 1895.
In recent years a greater understanding of the atomic origins of magnetic properties
has resulted in the discovery of other types of magnetic ordering. The substances in
which the magnetic moments interact in a way, such that it is energetically
favorable for them to line up antiparallel are called antiferromagnets. There is a
temperature analogous to Curie temperature called the Neel temperature, above
which antiferromagnetic order disappears.
Other more complex atomic arrangements of magnetic moments have also been
found. They are ferrimagnetic substances, they have atleast two different kinds of
atomic magnetic moments, which are oriented antiparallel to one another. Because
the moments are of different size a net magnetic moment remains, unlike the
situation in an antiferromagnet where all the magnetic moments cancel out.
Interestingly lodestone is a ferrimagnet rather than a ferromagnet. There are two
. types of iron ions, ferrous and ferric in the material. More complex arrangements
have been found in which the magnetic moments are arranged in spirals. Studies of
these arrangements have provided much information on the interactions between
magnetic moments in solids. The details are dealt with in the other sections[7].
1.4. Applications of magnetic materials
Numerous applications of magnetism and of magnetic materials have arisen in the
past 100 years. The most important use of magnets is in the electric motors, which
is based on the principle of an electromagnet. Hence all electric motors use
elctromagnets. These motors run refrigerators, vacuum cleaners, washing machines
etc. Audio tape and video tape players have electromagnets called heads that
record and read information on tapes covered with tiny magnetic particles.
Chapter I 9
Magnets in speakers transform the signal in to a sound by making the speakers
vibrate. An electromagnet called a deflection yoke in TV picture tubes helps to
form images on a screen. Magnetic materials are also used as isolators and
circulators in microwave devices.
The development of new magnetic materials has also been important in the
computer revolution. One of the most important applications of magnetic materials
is in memory devices. Apart from audio/video applications, most of the present day
storage devices used in computer and related devices are based on magnetic
materials. The high density diskettes, the hard disk are a few examples. Recently
the area of spintronics is being employed to device Magnetic RAMs and efforts
are afoot to utilise this concept in making Giga bit memory devices. This will be
used as primary memories in computers. These advancement made in magnetics
will completely revolutionize the working of modern day computers. The
invention of Magneto Optical devices is another breakthrough in the realm of
magnetism and is being used extensively as LASER disks in secondary storages.
The magnets used in the industry and business are mostly electromagnetic powered
devices, such as cranes, cutters, fax machines magnetic tapes and disks. In
transportation, magnetism is applied to trains, subways, trolleys, monorails,
escalators and elevators. Scientists and engineers have combined super
conductivity and magnetism to levitate trains based on the principle of levitation.
This eliminates friction and so it has an advantage of higher speed over ordinary
trains. Bending magnets are very powerful magnets which help control beam lines
of atomic particles in synchrotron facilities. Magnetic bottles are created to hold
plasmas. Another important application of magnetism in medicine is Magnetic
Resonance Imaging (MRI). The patient lies in between two magnets and the
magnetic fields which cause some of the domains in the human body to align such
as the heart, brain, spine and other internal organs. In general we can say that
applications of magnetism and magnetic materials is found everywhere including
home, industry, business, transportation, science and medicine. The recent
discovery of magnetic fluids has opened up a plethora of engineering applications
and is being exploited for making many high tech devices. Ideal and typical
applications for ferrofluids are still in the area of high technology, such as space
Chapter 1 10
and vacuum technology, aeronautical, robotics, numerically controlled machines
siliconwater handling systems, lens grinding, magnetic disk read/write head
actuators, film projectors, other computer peripherals and medical equipments.
Since ferrimagnetism has dominated the magnetic industry scenario it would be
appropriate to discuss ferrimagnetism and ferrites in particular.
1.5. Ferrimagnetism and ferrites
Ferrites are Ferrimagnetic substances and are mixed metal oxides with iron oxides
(Fe3+) as their main component. Ferrimagnetic substances are industrially
important because they exhibit a substantial spontaneous magnetization at room
temperature. Like ferromagnets) ferrimagnets also consists of self saturated
domains and they exhibit the phenomena of magnetic saturation and hysteresis.
Ferrimagnetic materials developed in')o a distinct class of magnetic materials and
emerged as basic components in various energy storing devices in the late 1950s.
Since then research. in this frontier area is an ongoing proces~not only because of
it's commercial importanct) but also from the point of understanding the
fundamental properties exhibited by them.
Ferrites are classified mainly in to three groups with different crystal types. They
are spinel, Garnets and Magneto-plumbite. Spine I ferrites have a cubic structure
with general formula MO .Fe203, where M is a divalent metal ion like Mn, Ni, Fe,
Co, Mg etc. Garnets have a complex cubic structure having a general formula
Ln3~~1~~~O12 . The third typ,,"magneto-plumbite is having a hexagonal structure
with general formula MO. Fe120I8. The most important in the group of magneto
plumbite is barium ferrite BaO Fe12018, which is a hard ferrite. Since the proposed
work will be based on spinel ferrites having cubic symmetry the crystal chemistry
of spinel ferrites will be dealt with in the next section.
1.6. Crystal chemistry of spinel ferrites
The structure of spinel ferrites is derived from that of the mineral spinel MgO
Ab03. The structure is complex, in that there are 8 molecules per unit cell (8x A
Fe204) where A is the divalent metal ion. The 32 large Oxygen ions form a face
centered cubic lattice in which two kinds of interstitial sites are present. The

Chapter 1 11
smaller metal ions occupy these interstitial spaces. These spaces are of two kinds.
One is called tetrahedral 'A'sites because it is located at the center of a tetrahedron
whose corners are occupied by oxygen ions. There are 64 tetrahedral sites
surrounded by 4 oxygen ions. The other is called an octahedral or B site, because
the oxygen ions around it occupy the corners of an octahedron. There are 32
octahedral sites surrounded by 6 oxygen ions. The crystallographic environments
of A and B sites are therefore distinctly different. Figure 1.1 explains the
tetrahedral A site, octahedral B site and the crystal structure of a cubic ferrite.
Only one eighth of the A sites and one half of the B sites are occupied by the metal
ions. In the chemical formula of MO. Fe203 if M2+ are in A sites and Fe3+ in B
sites then this structure is normally referred to as the normal spinel structure. When
the divalent metallic ion M2+ occupies the B site and the Fe3
+ ions equally divided
between A and B sites then this configuration is called inverse spinel. ZnFe204 is a
normal spinel, while NiFe204 is an inverse spinel. The normal and inverse
structure are to be regarded as extreme cases, because X-ray and neutron
diffraction have shown that intermediate structures can exist. The distribution of
the divalent ions on A and B sites in some ferrites can be altered by heat treatment,
it depends on whether the material is quenched from a high temperature or
annealed.
The various factors determining the cation distribution includes the size of the
cation, valency of the cation and the oxygen parameter of the anions. Large
divalent ions tend to occupy tetrahedral sites as this is favoured by polarization
effects.

Chapter I
(a) Tetrahedral A site
• Metal Ion In tetrahedral slle
• Metal Ion In Octahedral slle
• Oxygen Ion
I--a_~(d)
+~ -
I I
"
(b) Octahedral B site
(c)
Figure 1.1 Crystal structure of a splnel ferrite
Chapter I 13
If the A site ions have a lower valency and the B site ions a higher valency then the
intermediate 0 2- ion will become polarized towards B sites. Thus polarization
favours normal spinel configuration. It has been proved that the inverse structure
has the lowest lattice energy for u parameter ( u <0.379), where as the normal
structure has the lowest energy when u>0.379. These factors alone can not give
consistent picture of the observed cation distribution in spineI ferrites. For instance
CoFe20 4 is an inverse spinel while ZnFe20 4 crystallizes in normal spinel structure
although Zn2+ and C02
+ have almost the same ionic radii. These discrepancies can
be explained by an individual site preference of the various ions as a result of their
electronic configuration. In order to explain the site preference of transition metal
ions, in oxides, two theories have been proposed, which differ in the concept of
chemical bonding in oxides. One is based on crystal field theory, which is purely
ionic type of bonding. Second one is a simplified molecular orbital theory, based
on the covalent bonding between oxygen and transition metal atoms.
1.7. Magnetic properties of ferrites
It is known that in ferrimagnetic materials the magnitude of the magnetic moments
oriented in either way differ, so that there always exists a resultant uncompensated
magnetic moment. The various factors that determine the magnetic properties of
these ferrites are the nature of cations, heat treatment, preparative methods, site
preference energy of cations and madelung energy. According to Neel, ferrites
exhibit a magnetic structure distinctly different from any previously recognized
structure. Neel explained the spontaneous magnetisation of these ferrites on the
basis of Heisenberg's exchange forces. According to this theory the exchange
energy between two adjacent atoms having spin angular momentum is given by
Eex = -2 lex Si. Sj (1.3)
Where Eex is the exchange energy, Si and Sj are the total spins of adjacent atoms
and lex is the exchange integral which represents the probability of exchange of
electron. In ferrites three kinds of magnetic interactions are possible, between the
magnetic ions, which are occupied in the two crystallographically distinct lattice
sites. These interactions are possible through the intermediate 0 2- ions by
Chapter I 14
superexchange mechanism. The three possible interactions are A-A interaction, B
B interaction and A-B interaction. The exchange force acting between an ion on A
site and an ion on B site is governed by the above equation 1.1. The interaction is
ferri, ferro or antiferro and is determined by the value of lex. It has been established
experimentally that these interaction energies are negative for ferrites and hence
induce an anti parallel orientation. However the magnitudes of the A and B
sublattice magnetisations are not equal and this will produce a resultant net
magnetisation in ferrites. In general the magnitude of the interaction energy
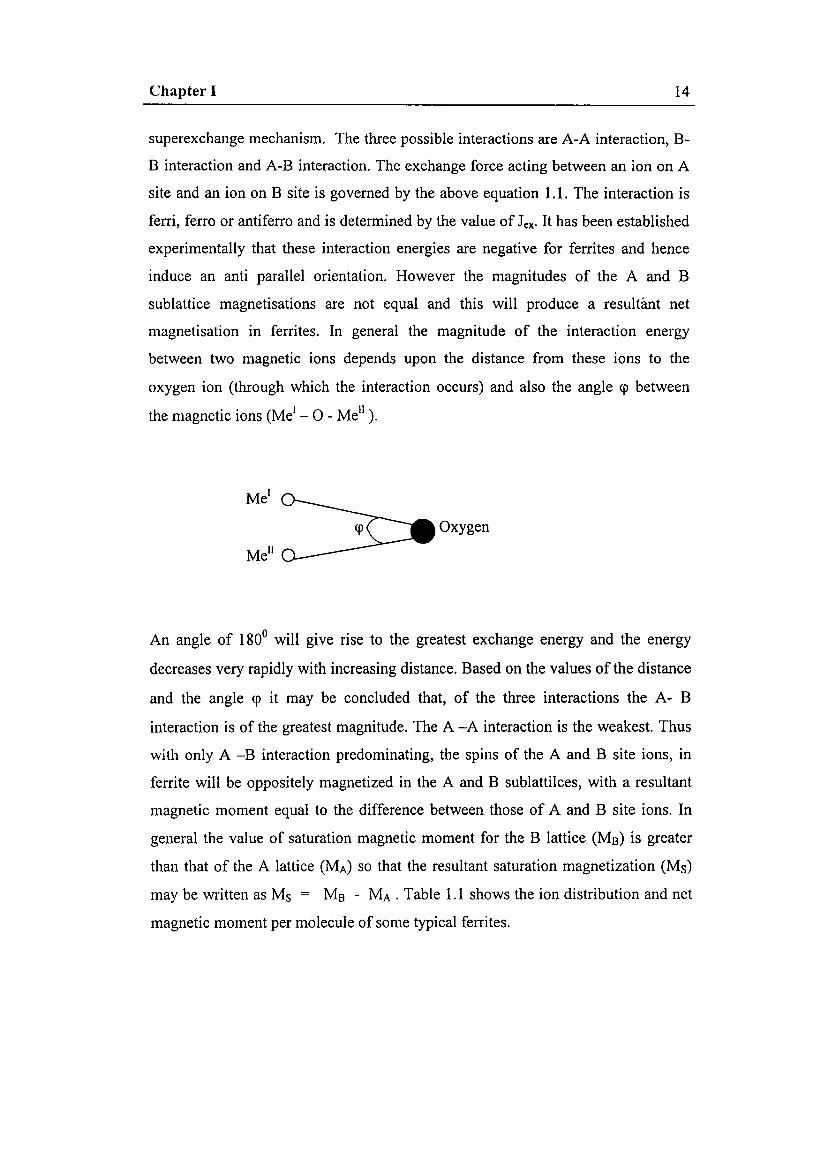
between two magnetic ions depends upon the distance from these ions to the
oxygen ion (through which the interaction occurs) and also the angle <p between
the magnetic ions (Me' - 0 - Me ll).
Me'
Me ll
Oxygen
An angle of 1800 will give rise to the greatest exchange energy and the energy
decreases very rapidly with increasing distance. Based on the values of the distance
and the angle <p it may be concluded that, of the three interactions the A- B
interaction is of the greatest magnitude. The A -A interaction is the weakest. Thus
with only A -B interaction predominating, the spins of the A and B site ions, in
ferrite will be oppositely magnetized in the A and B sublattilces, with a resultant
magnetic moment equal to the difference between those of A and B site ions. In
general the value of saturation magnetic moment for the B lattice (Mn) is greater
than that of the A lattice (MA) so that the resultant saturation magnetization (Ms)
may be written as M, = Ms - MA. Table 1.1 shows the ion distribution and net
magnetic moment per molecule of some typical ferrites.
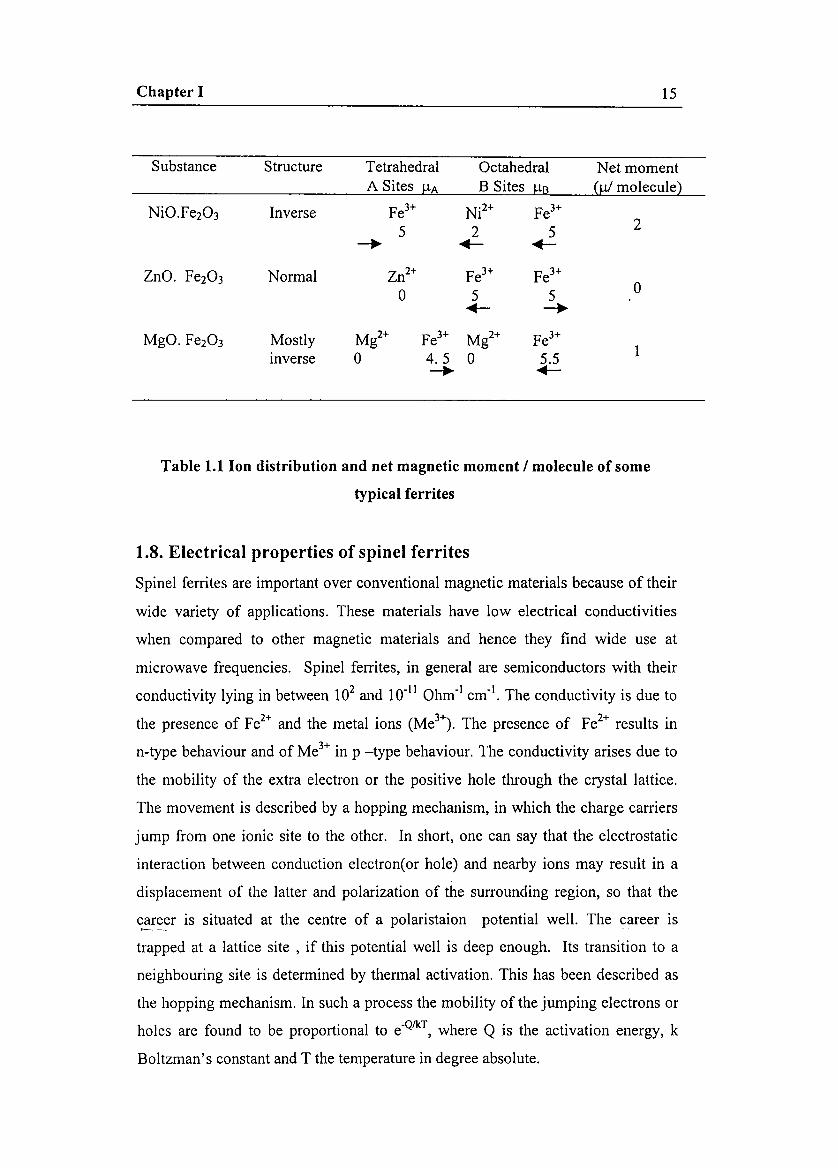
Chapter I 15
Substance Structure Tetrahedral Octahedral Net momentA Sites JlA B Sites JlB (g/ molecule)
NiO. Fe203 Inverse Fe3+ Ni2+ Fe3+
5 2 5 2-. .- .-
ZnO. Fe203 Normal Zn2+ Fe3+ Fe3+
0 5 5 0.- -.MgO. Fe203 Mostly Mg2+ Fe3+ Mg2+ Fe3+
Inverse 0 4. 5 0 5.5 1-. .-
Table 1.1 Ion distribution and net magnetic moment / molecule of some
typical ferrites
1.8. Electrical properties of spinel ferrites
Spinel ferrites are important over conventional magnetic materials because of their
wide variety of applications. These materials have low electrical conductivities
when compared to other magnetic materials and hence they find wide use at
microwave frequencies. Spinel ferrites, in general are semiconductors with their
conductivity lying in between 102 and 10-11 Ohm-I cm-I. The conductivity is due to
the presence of Fe2+ and the metal ions (Me3
+) . The presence of Fe2+ results in
n-type behaviour and of Me3+ in p -type behaviour. The conductivity arises due to
the mobility of the extra electron or the positive hole through the crystal lattice.
The movement is described by a hopping mechanism, in which the charge carriers
jump from one ionic site to the other. In short, one can say that the electrostatic
interaction between conduction electron(or hole) and nearby ions may result in a
displacement of the latter and polarization of the surrounding region, so that the
career is situated at the centre of a polaristaion potential well. The career ist"------ __ -- .
trapped at a lattice site , if this potential well is deep enough. Its transition to a
neighbouring site is determined by thermal activation. This has been described as
the hopping mechanism. In such a process the mobility of the jumping electrons or
holes are found to be proportional to e-Q/kT, where Q is the activation energy, k
Boltzman's constant and T the temperature in degree absolute.
Cnapter 1 16
1.9. Magnetostriction
Magnetostriction is the phenomena exhibited by both ferro and ferromagnetic
materials. When these materials are magnetized they undergo small changes in
dimensions. This effect is called magnetostriction. The fractional change in length
to the original length (,11/1) is simply a strain and is represented as A. The value of
the strain A measured at magnetic saturation is called the saturation
magnetostriction (As) .-
Magnetostriction occurs in all pure substances. However even in strong magnetic
substances the effect is small and As is typically of the order of 10-5. In weak
magnetic substances the effect is even smaller, by about two orders of magnitude
and can be observed only in very strong fields. The strain due to magnetostriction
changes with increase of magnetic field intensity and reaches the saturation value.
The process of magnetisation occurs by two mechanisms, domain wall motion and
domain rotation. Most of the magnetostrictive change in length usually occurs
during domain rotation. This is because each domain is spontaneously deformed in
the direction of domain magnetisation and its strain axis rotates with a rotation of
the domain magnetisation, thus resulting in a deformation of the specimen.
Magnetostriction is mainly due to spin-orbit coupling. There are two basic kinds of
magnetostriction, one is the spontaneous magnetostriction and the other is forced
magnetostriction. Spontaneous magnetostriction occurs in each domain when a
specimen is cooled below the curie point. Forced magnetostriction occurs when a
saturated specimen is exposed to fields large enough to increase the magnetisation
of the domain of the spin order. The magnetostrictive strain produced in a domain
or a crystal when its direction of magnetisation is changed, is usually very small.
This means that the reorientation of the electron clouds take place only to a very
small extent. This conclusion supports the assumption that the orbital magnetic
moments are not susceptible to rotation by an applied field. The amount of
magnetostrictive strain exhibited by a crystal in a particular direction depends on
the direction of the magnetisation. The direction of magnetisation is controlled by
anisotropy constant K and the stress c present. The measurement of
magneto striction is not accompanied by the determination of the kind and degree
Chapter I 17
of preferred orientation. The sign of A as well as its value depends on the
crystallographic direction of magnetisation. For isotropic magnetostriction the
spontaneous strain is independent of the crystallographic direction of
magnetisation.
The saturation magnetostriction of a polycrystalline specimen parallel to the
magnetisation is characterised by a single constant Ap• Its value depends 'on the
magnetostrictive properties of the individual crystals and the way in which they are
arranged, that is the presence or absence of preferred domain or grain orientation.
If the grain orientations are completely random, the saturation magnetostriction of
polycrystals should be given by some sort of average over these orientations. When
a polycrystal is saturated by an applied field, each grain tries to strain
magnetostrictively, in the direction of the field, by a different amount than its
neighbours.
1.10. About butyl rubber
Since Butyl rubber is chosen as the base matrix for the preparation of rubber ferrite
composites, a brief description about the origin, nature, structure and the
advantages of butyl rubber is provided below for the sake of clarity and
completeness.
The development of Butyl rubber owed its origin to the pioneering research work
carried out by Gorianov and Butlerov (1870) and Otto (1927). They found that
oily homopolymers of isobutylene could be produced in the presence of boron
trifluoride. Subsequent research in the 1930's led W.J.Sparks and R.M.Thomas of
Exxon research and engineering company to advance the state of the art of
isobutylene polymerization and in 1937, the first vulcanizable isobutylene based
elastomer was produced by incorporating small amounts of a diolefin and
particularly isoprene, into the polymer molecule. This introduced the first concept
of limited olefinic functionality for vulcanization in an otherwise saturated
copolymer. Corresponding vulcanizates of these new copolymers (now known as
butyl rubber) were found to posses a set of unique and desirable properties, like

Chapter I 18
low gas permeability, high hysteresis, outstanding resistance to heat, ozone,,-------.
chemical attack and tearing.
The most widely used commercially available butyl rubbers are copolymers of
isobutylene and isoprene. The grades are distinguished by molecular weight
(Mooney viscosity) and mole % unsaturation. The mole % unsaturation is the
number of moles of isoprene per 100 moles of isobutylene. Figure 1.2 illustrates
the physical nature of butyl rubber, where n represents the mole of isobutylene that
are combined with m moles of isoprene.
CH3 H H CH 3 H
I I I I IC ===c + C === C-C === C •I I I I ICH 3
H H H Hn m
CH 3 H
I I-C-C-
I ICH3 H n
H CH3 H
I I I-C-C===C-C-
I I IH H H m
x
Figure 1.2: Physical nature of butyl rubber
The discovery and development of butyl rubber not only furnished rubber
technology with a new elastomer , but , as mentioned earlier, it also provided a
new principle, the concept of low functionality. A low functionality elastomer has
sufficient chemical unsaturation so that flexible low modulus vulcanized networks
can be produced, but the larger inert portions of the chain contribute towards
oxidation and ozone resistance. The molecular characteristics of low levels of
Chapter I 19
unsaturation between long segments of polyisobutylene produce unique
elastomeric qualities that find wide variety of applications. The special properties
include low rates of gas permeability, thermal stability, ozone and weathering
resistance vibration damping and higher coefficients of friction and chemical and
moisture resistance. These butyl rubbers were used as the base matrix for the
preparation of rubber ferrite composites. The incorporation of magnetic fillers
gives rise to rubber ferrite composites.
1.11.Rubber ferrite composites (RFCs)
Nickel zinc ferrites have been found to be one of the most versatile ferrites for
general use, because they exhibit a wide range of permeability, coercive force and
magnetic and electric loss. Cations like Ni and Zn gives rise to mixed ferrites
which exhibits interesting magnetic and electric properties depending on the
composition[8-11]. They are important mixed ferrites because of their relatively
high resistivity at carrier frequencies and sufficiently low loss for microwave
applications. Non-stoichiometric NiZn ferrites are used in many types of electronic
devices, such as transformers and inductors in high frequency circuits, because of
the low eddy current loss attributable to it's high resistivity. In this work it is
proposed to synthesize mixed ferrites belonging to the series Nil-xZnxFe204. Here
x varies from 0 to 1 in steps of 0.2. The incorporation of these cations in the spinel
lattice is expected to effect changes in cation distribution on A and B sites and thus
it is possible to alter its various properties. So it is also envisaged to study the
variations in magnetic, dielectric and conducting properties with respect to the
change in composition. The structural properties of these ceramic materials will
also be evaluated.
Composite magnetic materials or rubber ferrite composites are possible with
commercially important polymer matrixes along with different magnetic fillers.
Synthesis of these rubber ferrite composites (RFCs) will be carried out by the
incorporation of ferrite powders in synthetic rubber like butyl rubber. This could
lead to making devices meant for flexible elastomeric magnetic devices [12].
While preparing these composites with tailored properties care should be taken to
choose the suitable magnetic filler with optimal size and shape of the particles. A
judicious choice of the magnetic filler with the appropriate recipe can give a
Chapter 1 20
combination of dielectric and magnetic properties suited for various applications.
Also factors like percolation limit or nature of the matrix, like saturated/
unsaturated / polar rubber all influences the final properties of the composites. In
principle the macroscopic parameters of the composites would be influenced by the
interaction between the filler and the matrix. The effect of fillers in modifying the
properties is to be understood properly in explaining the dielectric and magnetic
properties of the composites. For plastic magnets it is easy to see that the
properties of the polymer matrices, especially viscoelasticity may affect the
processability as well as magnetic property. Further more; because identical poles
in magnetic particles are oriented repulsively in the anisotropic plastic magnets, it
will be interesting to study the effect of polymer matrix as well as the shape and
concentration of the magnetic powder on the magnetic properties and also change
in the magnetic properties during thermal treatment. It has also been reported that
incorporation of nano crystals of these types in polymer bases have potential
applications in color imaging, magnetic memories for computers, magnetic fluids,
microwave and radar technology and magnetic refrigeration [13-16]. These
composite materials are useful as microwave absorber materials due to their
advantages in respect to lightweight, low cost, design flexibility and microwave
properties. The addition of reinforcing fillers like carbon black increases the
bandwidth of absorption there by suppressing the reflected waves. The absorption'./
properties vary with the amount of added ferrites to the matrix. A number of
investigations has been reported for studying the effect of composition on their
microwave properties. Also there are reports wherein the effect of ferrite materials
and their volume percentage in the composites for absorption have been studied
[17-38 ].
The proposed work includes the preparation of nickel zinc ferrites belonging to the
series Ni l_xZnxFe204 with x varying from 0 to 1 in steps of 0.2 by using ceramic
methods. Structural evaluation of these Ni l _xZnxFe204 by using X-ray diffraction
will be carried out to confirm the single phasic nature of these magnetic powders.
The magnetic powders will then be incorporated in to a butyl rubber matrix for the
preparation of rubber ferrite composites. The impregnation is to be carried out for
various volume fractions (loading) of the filler. The cure characteristics will be
evaluated by employing Gottfert elastograph. Then the evaluation of magnetic
Chapter I 21
properties for both ceramic Ni'_xZnxFe204 and rubber ferrite composites will be
carried out by using vibrating sample magnetometer. The structural and magnetic
properties with respect to composition and loading will be correlated. The
evaluation of dielectric properties for ceramic nickel zinc ferrites and rubber ferrite
composites in the frequency range 5Hz to 13MHz at different temperature, from
30°C to 200°C will also be carried out by using an impedance analyzer and a
dielectric cell. The dependence of dielectric constant on various factors like
frequency, composition, loading and temperature will be studied for both ceramic
and rubber ferrite composites. The evaluation of ac electrical conductivity and its
dependence on various factors will also be investigated by using the data available
from dielectric measurements. The magnetostriction constant for RFCs will be
estimated using the hysteresis loop parameters. Thus the objectives of the
proposed work could be summarised as follows
+,1) Preparation of ceramic nickel ZInC ferrite belonging to the senes
Nil-xZnxFe204 with x varying from 0 to 1 in steps of 0.2.
+,il Structural, Magnetic and Electrical characterization of Nil-xZnxFe204.
+,1) Preparation of Rubber Ferrite Composites (RFCs).
+'~ Evaluation of Cure characteristics of RFCs.
~u Magnetic characterization of RFCs using vibrating sample magnetometer
(VSM).
+,1) Electrical characterization of RFCs (Dielectric and ac electrical
conductivity studies).
+'~ Estimation of magnetostriction constant from HL parameters.
Chapter 11
Experimental Methods
In this chapter the techniques employed for the synthesis of spinel like ferrites
belonging to the series Nil-xZnxFe204 , where x varies from 0 to 1 in steps of 0.2 is
presented. The incorporation of mixed nickel zinc ferrites in butyl rubber to obtain
rubber ferrite composites is explained. Various analytical tools employed for the
characterization of these samples at different stages are also discussed in the
ensuing sections.
2.1. Preparation of Nil_xZnxFe204
Nickel zinc ferrites having the general formula Nil-xZnxFe204 for various x values
(where x varies from 0 to 1 in steps of 0.2) were synthesized by the ceramic
technique[39-41]. Appropriate amount of precursors, necessary for the synthesis of
the mixed ferrites were weighed according to molecular weight considerations. AR
grade precursors namely iron oxide, nickel oxide and zinc oxide were employed for
the preparation of nickel zinc ferrites. It is to be noted that ferric oxide in turn was
prepared by decomposing freshly precipitated ferrous oxalate dyhidrate (FOD).
FOD inturn was prepared by the eo-precipitation technique. Nickel oxide, zinc
oxide together with the required amount of ferric oxide were mixed thoroughly in
an agate mortar to produce a homogeneous mixture of fine particles. The process of
mixing was carried out in slurry of acetone to ensure uniformity. This
homogeneous mixture was pre-fired at around 5000e for five hours in a furnace in
an ambient atmosphere. The pre sintering was repeated twice for ensuring
homogeneity. The pre-sintered samples were then crushed into powder form. The
pre-sintered powders were pressed in the form of cylindrical pellets having a
diameter of 10mm and then they were finally sintered at around 10000e by keeping
the pellets inside the furnace for several hours. They were then allowed to cool
naturally under ambient conditions and now these pellets are ready for

Cnapter II 23
characterization. Nil.xZnxFe204 for various x values (x varies from 0 to 1 in steps
of 0.2) were synthesized using this technique.
2.2. Structural Evaluation of Nil_xZnxFe204
The method of X ray powder diffraction was used to evaluate the various structural
parameters namely inter atomic spacing (d), relative intensity (1/10) and lattice
parameter. The identification of the phase was carried out by comparing the
observed structural parameters with that of the standard values reported in the
literature. The powder diffractograms of the samples were recorded on a Philips
PW 1710 model X ray diffractometer using cex, radiation (A = 1.5414 A 0). From
the XRD pattern obtained the 'd' values are calculated using the relation 2d sine =
n A. Then the lattice parameter (a) was calculated assuming cubic symmetry by
using the relation
ad= .Jh2+k2+12 (2.1)
The particle size was also calculated from the XRD data using Scherer formula,
which is given by
D = 0.9 A (2.2)fJ cosB
This method is used to estimate the particle size from the measured width of their
diffraction curves. D is the particle size, Pis the angular width which is equal to
the full width at half maximum and A is the wavelength of X-ray radiation which
is equal to 1.5414 AO. Porosity of the samples were also calculated using the X-ray
density and apparent density. The X-ray density was calculated using the equation
~.M . Where 'a' is the lattice parameter, Na is the avagadro number, M thea .No
molecular weight of the compound, and n is the number of molecules per unit cell.
Apparent densities of these samples were also calculated by taking the pellet
samples. Porosity is given by (X-ray density - Apparent density)/ X-ray density.
Chapter II
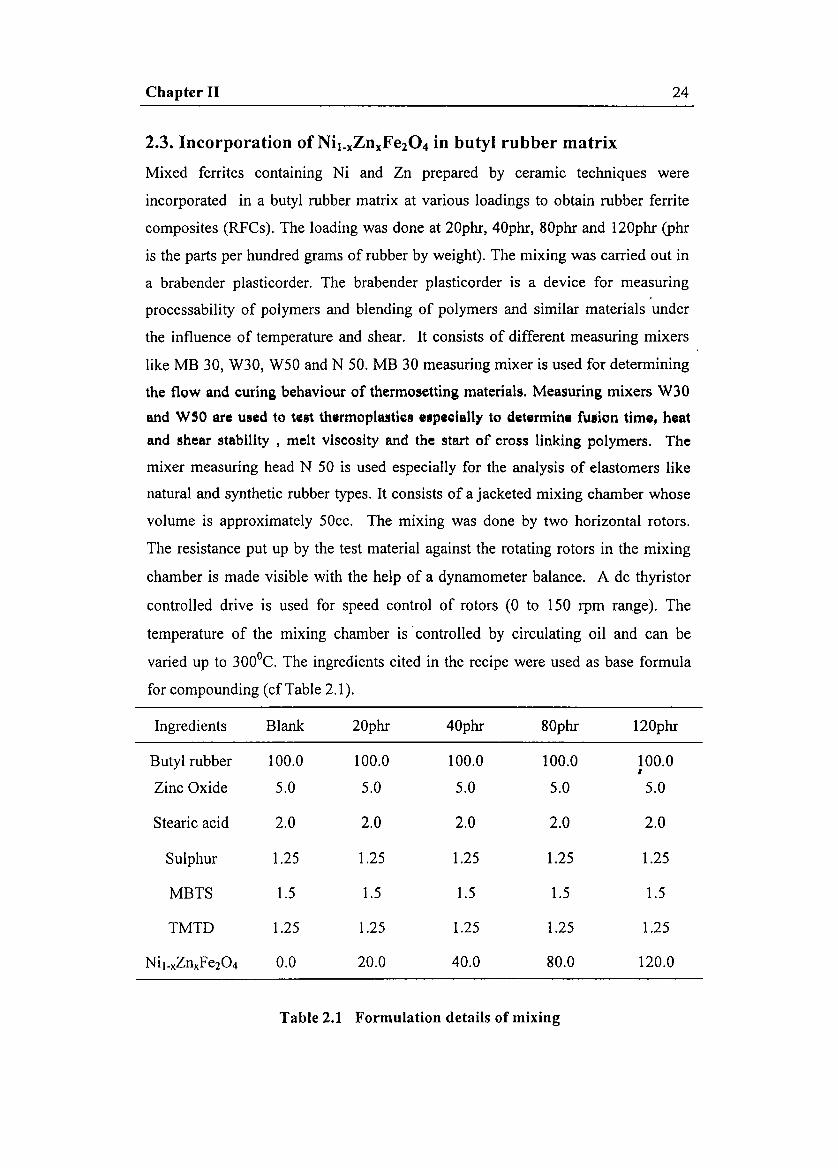
2.3. Incorporation of Nil_xZnxFe204 in butyl rubber matrix
24
Mixed ferrites containing Ni and Zn prepared by ceramic techniques were
incorporated in a butyl rubber matrix at various loadings to obtain rubber ferrite
composites (RFCs). The loading was done at 20phr, 40phr, 80phr and 120phr (phr
is the parts per hundred grams of rubber by weight). The mixing was carried out in
a brabender plasticorder. The brabender plasticorder is a device for measuring
processability of polymers and blending of polymers and similar materials under
the influence of temperature and shear. It consists of different measuring mixers
like MB 30, W30, W50 and N 50. MB 30 measuring mixer is used for determining
the flow and curing behaviour of thermosetting materials. Measuring mixers W30
and WSO are used to test thermoplsstlcs l.pIQiall,. to dQterminl fusion time, heat
and shear stability , melt viscosity and the start of cross linking polymers. The
mixer measuring head N 50 is used especially for the analysis of elastomers like
natural and synthetic rubber types. It consists of a jacketed mixing chamber whose
volume is approximately 50cc. The mixing was done by two horizontal rotors.
The resistance put up by the test material against the rotating rotors in the mixing
chamber is made visible with the help of a dynamometer balance. A de thyristor
controlled drive is used for speed control of rotors (0 to 150 rpm range). The
temperature of the mixing chamber is controlled by circulating oil and can be
varied up to 300°C. The ingredients cited in the recipe were used as base formula
for compounding (cf Table 2.1).
Ingredients Blank 20phr 40phr 80phr 120phr
Butyl rubber 100.0 100.0 100.0 100.0 100.0,Zinc Oxide 5.0 5.0 5.0 5.0 5.0
Stearic acid 2.0 2.0 2.0 2.0 2.0
Sulphur 1.25 1.25 1.25 1.25 1.25
MBTS 1.5 1.5 1.5 1.5 1.5
TMTD 1.25 1.25 1.25 1.25 1.25
Ni l-xZnxFe20 4 0.0 20.0 40.0 80.0 120.0
Table 2.1 Formulation details of mixing
Chapter II 25
Here sulphur plays the role of a cross linking agent, while zinc oxide is added for
activation. Stearic acid, MBTS and TMTD act as accelerators. The mixing was
performed at around 50°C and the mixing operation went on for around 7 minutes.
A constant torque of 450Nm and a frequency of rotation of 50rpm was maintained
through out the course of mixing.
2.4. Cure characteristics
After the physical blending of the elastomer with the magnetic filler according to
the recipe, the resulting blend has to be cured. For this the knowledge of cure
characteristics is very much essential. Cure characteristics also throws light on the
processability of these polymers. Parameters like maximum and minimum torque,
cure time, cure temperature were evaluated by determining the cure characteristics
of compounds on a Gottfert Elastograph (model: 67.85). Gottfert Elastograph is a
rotor less curometer. This instrument gives the time of cure which would be
expected to produce 90%, 95% or 100% optimum cross links in a sheet of rubber
of 2.5mm in thickness. The accuracy of this measuring system depends on certain
design factors, like the temperature of the specimen, the amount ofwork done on
the rubber during the course of measurements and the nature of the cured product.
Vulcanized rubber with relatively large amounts of filler at high frequency must
result in a substantial rise in the interior temperature of the material. Hence
measurements at low frequency are preferred. Also care must be taken to ensure
that the frequency is sufficient enough to give an adequate curve for quick curing
compounds at high temperatures. After curing, the compounds were then
vulcanized at 170°C on an electrically heated laboratory hydraulic press up to their
respective cure times to make sheets of the sample.
2.5. Magnetic characterisation
The magnetic characterization of both ceramic Nil-xZnxFe204 and rubber ferrite
composites were carried out by using Vibrating Sample Magnetometer (VSM)
(model: EG & G PARC 4500). Parameters like Saturation magnetization (Mg),
Retentivity (M}, Coercivity (He) and energy loss were obtained from the hysteresis
loop obtained from VSM measurements.
Chapter 11 26
2.5.1. Principle & Theory involved in VSM:
When a sample material is placed in a uniform magnetic field, a dipole moment
proportional to the product of the sample susceptibility times the applied field is
induced in the sample. If the sample is made to undergo sinusoidal motion, an
electrical signal can as well be induced in suitably located stationary pick up coils.
This signal which is at the vibration frequency is proportional to the magnetic
moment, vibration amplitude and vibration frequency. This means of producing an
electrical signal related to the magnetic properties of a sample material is used in
the model 4500 VSM. The material under study is contained in a sample holder,
which iscentered in the region between the pole pieces of an electromagnet. A
slender vertical sample rod connects the sample holder with a transducer assembly
located above the magnet, which in turn supports the transducer assembly by
means of sturdy adjustable support rods.
The transducer converts a sinusoidal ac drive signal provided by a circuit located in
the console in to a sinusoidal vertical vibration of the sample rod and the sample is
thus made to undergo a sinusoidal motion in a uniform magnetic field. Coils
mounted on the pole pieces of the magnet pick up the signal resulting from the
sample motion. This ac signal at the vibrating frequency is proportional to the
magnitude of the moment induced in the sample. However, it is also proportional to
the vibration amplitude and frequency. A servo system maintains constancy in the
drive amplitude and frequency so that the output accurately tracks the moment
level without degradation due to variation in the amplitude and frequency of
vibration.
This technique depends on the ability of a vibrating capacitor located beneath the
transducer to generate an ac control signal, which varies solely with the vibration
amplitude and frequency. This signal, which is at the vibration frequency, is fed
back to the oscillator where it is compared with the drive signal so as to maintain a
constant drive output. It is also phase adjusted and routed to the signal demodulator
where it function as the reference drive signal. The signal originating from the
sample in the pick up coils is then buffered, amplified and applied to the
demodulator. Then it is synchronously demodulated with respect to the reference
signal derived from the moving capacitor assembly. The resulting de output is an
Chapter 11 27
analog of the moment magnitude alone, uninfluenced by vibration amplitude
changes and frequency drifts [42-44].
2.6. Surface studies on ZnFe204
Low energy ion scattering spectroscopy (LEIS) is a powerful tool to probe the
outermost layer of atoms on a material, it gives information about the surface
composition of samples. The experiment was performed with LEIS instrument
NODUS on two samples of zinc ferrite at the Technical University of Eindhoven,
The Netherlands. The basic design of the instrument NODUS is illustrated
elsewhere [45]. In this apparatus it is possible to compensate for surface charging
by impinging thermal electron over the surface from all sides. The base pressure in
the UHV system was about 10-9 mbar and during operation it increases to 10-smbar.
The polycrystalline powders used for the LEIS experiments were pressed into
pellets in lead holders. A 3keV 4He+ ion beam was used for the measurements.
The scattering conditions were kept constant during the measurements in order to
facilitate comparison of data on an absolute level on different powder samples
having different surface areas.
2.6.1 Low Energy Ion Scattering (LEIS) - Principle & Theory:
The technique of Low Energy Ion Scattering (LEIS) is increasingly being used for
the identification of surface stains and corrosion products, compositional depth
profiling, surface study of oxides etc. It enables to probe clean surfaces. Its extreme
surface sensitivity enables the selective analysis of the outermost atomic layer. It is
this layer that is largely responsible for many chemical and physical properties of
oxides. In contrast to other commonly used surface analytical methods such as
Auger Electron Spectroscopy (AES), X-ray Photoelectron Spectroscopy (XPS) or
Electron Spectroscopy for Chemical Analysis (ESCA) and Secondary Ion Mass
Spectroscopy (SIMS) that probe several atomic layers, it was shown by
Brongersma and Mul [46-47] that LEIS can be used to selectively study the
outermost atomic layer of a surface. The extreme surface sensitivity of LEIS is
because of using inert gas ions. They have high neutralization probability and
scattering cross sections at energies of few keV. Because of its high neutralization
probability all most all ions, which penetrate beyond the first atomic layer, get
Chapter 11 28
neutralized. With energy analyzers it is possible to detect only ionized particles by
eliminating scattered particles from the deeper layers. The data thus gathered yields
information on atomic and electronic structures, surface composition of alloys and
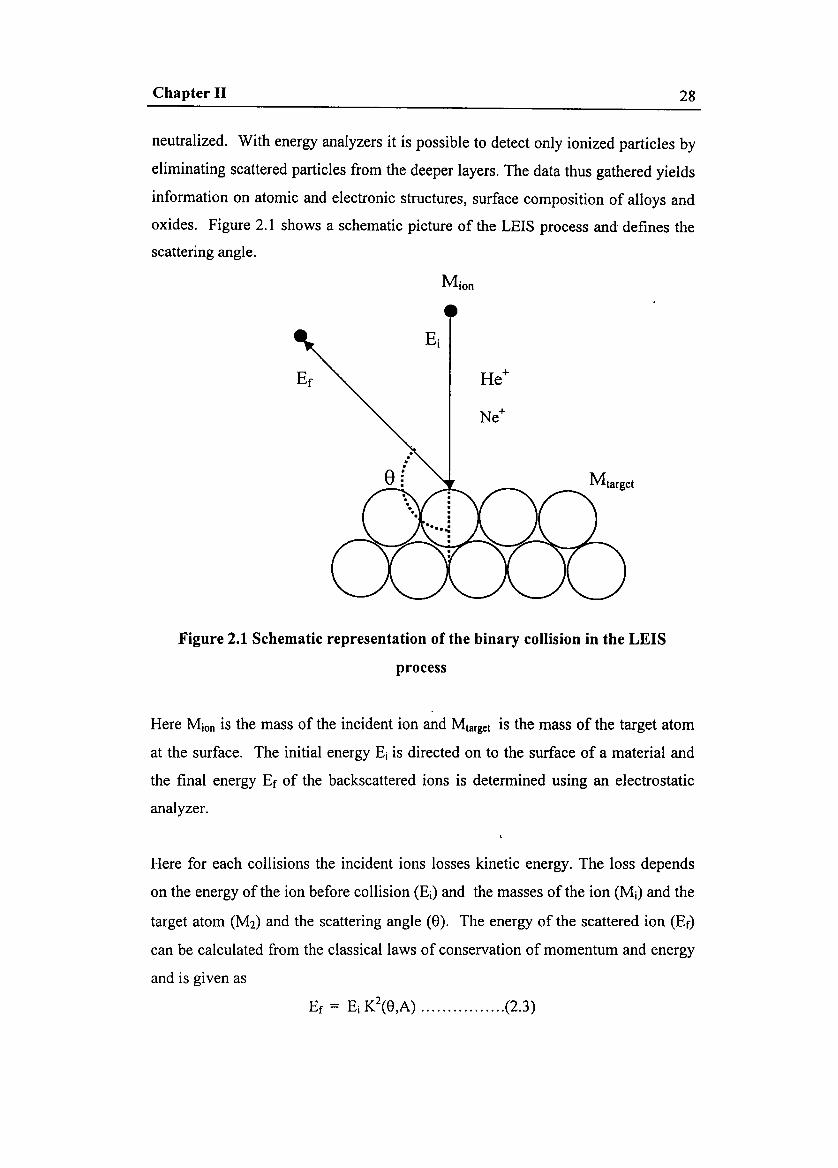
oxides. Figure 2.1 shows a schematic picture of the LEIS process and defines the
scattering angle.
•
Figure 2.1 Schematic representation of the binary collision in the LEIS
process
Here Mion is the mass of the incident ion and Mtarget is the mass of the target atom
at the surface. The initial energy E, is directed on to the surface of a material and
the final energy Er of the backscattered ions is determined using an electrostatic
analyzer.
Here for each collisions the incident ions losses kinetic energy. The loss depends
on the energy of the ion before collision (Ei) and the masses of the ion (Mi) and the
target atom (M2) and the scattering angle (8). The energy of the scattered ion (Er)
can be calculated from the classical laws of conservation of momentum and energy
and is given as
Er = E, K\e,A) (2.3)
Chapter 11 29
Kinematic factor K depends on the scattering angle 8 and the mass ratio A = M2/
M1 , and is found out from the relation
Cose+.JA2 -SineK = (2.4)
l+A
provided the mass of the projectile ion is lower than the mass of the surface atom.
Segregation of impurities or dopants may dominate surface properties, especially
with single crystals and sintered ceramics, which have a low specific surface area.
Since thermodynamics often restricts the enrichment to the outermost atomic layer,
LEIS is the ideal technique to detect and quantify segregation. In most applications
the main reason for using LEIS is it's monolayer sensitivity. In general, the ability
of LEIS to perform compositional analysis is related to the following features, like
selectivity for first atomic layer, straightforward quantification, very rough surfaces
can be studied, detection of isotopes, samples can be conductors as well as
insulators and in - situ studies are also possible at high temperatures.
2.7. Mdssbauer studies
The phenomenon of the emission or absorption of a y-ray photon without loss of
energy due to recoil of the nucleus and without thermal broadening is known as the
Mossbauer effect. In other words one can say that the Mossbauer effect is the
recoil free emission of gamma radiation from a solid radioactive material. Since the
gamma emission is recoil free it can be resonantly absorbed by stationary atoms. It
enables the study of minute energy changes and hyperfine interactions which are
otherwise undetectable. The nuclear transitions are very sensitive to the local
environment of the atom and Mossbauer spectroscopy is a sensitive probe of the
different environments an atom occupies in a solid material [48-51].
To observe this effect a source and an absorber of gamma rays are required. Both
should have a recoilless fraction at the operating temperature. A gamma ray
detection system can monitor the process. Usually the transmission mode is
followed where the intensity of the gamma rays after passing through the absorber
decreases during resonance. In the off resonance regions, the intensity does not
change sufficiently. To create resonance and off resonance conditions, the energy
Chapter 11 30
of gamma rays is modulated by imparting Doppler velocity between the source and
the absorber. They are in the range of 0-16mm/sec for 57Fe. In a typical Mossbauer
experiment the material under study contains 57Fe or any Mossbauer nucleus. The
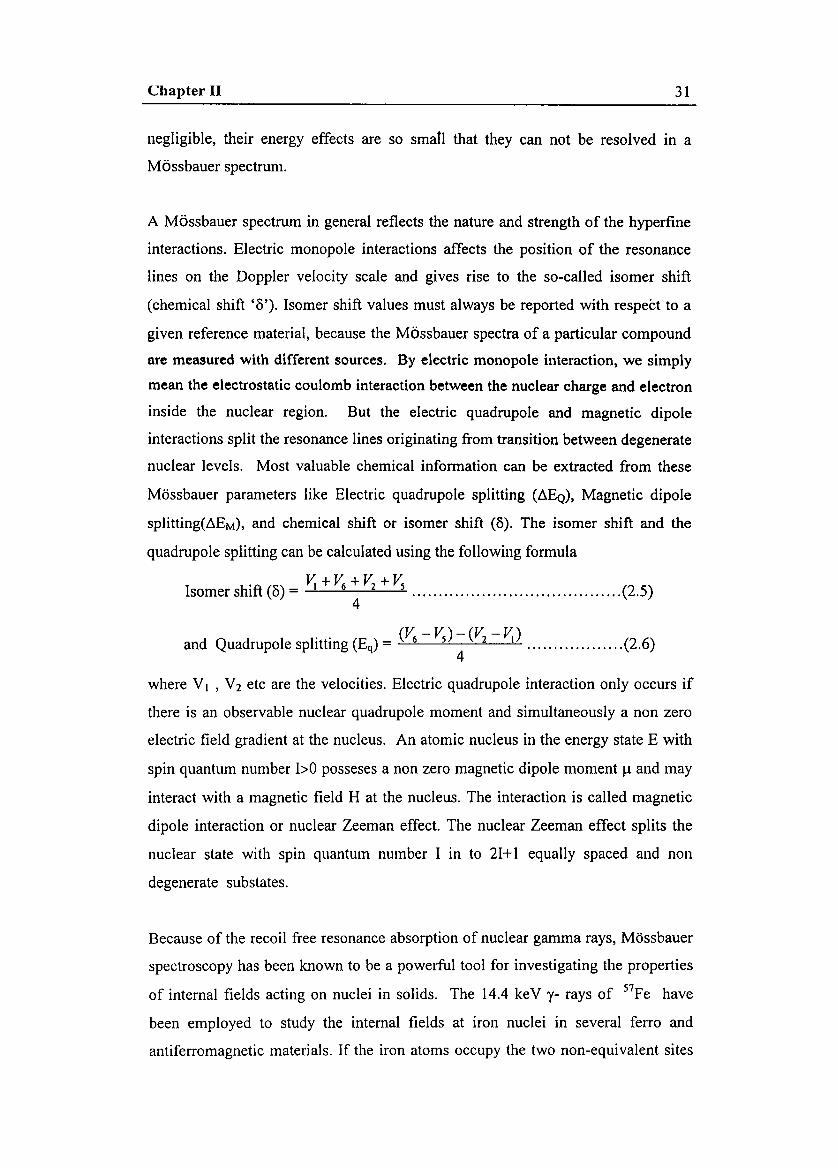
emitted gamma rays of energy 14.4 KeV were used in the present Mossbauer
studies. A block diagram of the instrumental setup is shown in Figure 2.2
Nuclei are positively charged and may posses various kinds of nuclear moments.
They generally interact with the electric and magnetic field in the nuclear region
and perturb the nuclear energy levels. The perturbation is called nuclear hyperfine
interactions. These interaction. shift. th., nu~lelf 4U11tiY level•• 11 ili the caie in
electric monopole interaction. It splits degenerate nuclear levels into sublevels
without shifting the centroid of the multiplet, as is observed in electric quadrupole
interaction and magnetic dipole interaction.
High voltagesupply
Absorber
Proportionalcounter Head Amplifier Linear amplifier
Furnace
Source
Thermocouple
Printer Multichannelanalyser
Function Generator &MS drive unit
Figure 2.2 Schematic diagram of the Mdssbauer spectrometer
The hyperfine field Heff at the nucleus was calculated using the formula Heff = total
split in mm/ sec.3l.25KOe. The total split here corresponds to the split between the
extreme lines. The factor 3l.25KOe was deduced from the total split (in channels)
of the iron foil spectrum for calibration. The three kinds of interactions considered
in Mossbauer spectroscopy are electric monopole interaction, electric quadrupole
interaction and magnetic dipole interaction. Interactions of higher order are
Chapter II 31
negligible, their energy effects are so small that they can not be resolved in a
Mossbauer spectrum.
A Mossbauer spectrum in general reflects the nature and strength of the hyperfine
interactions. Electric monopole interactions affects the position of the resonance
lines on the Doppler velocity scale and gives rise to the so-called isomer shift
(chemical shift '0'). Isomer shift values must always be reported with respect to a
given reference material, because the Mossbauer spectra of a particular compound
are measured with different sources. By electric monopole interaction, we simply
mean the electrostatic coulomb interaction between the nuclear charge and electron
inside the nuclear region. But the electric quadrupole and magnetic dipole
interactions split the resonance lines originating from transition between degenerate
nuclear levels. Most valuable chemical information can be extracted from these
Mossbauer parameters like Electric quadrupole splitting (~EQ), Magnetic dipole
splitting(6EM), and chemical shift or isomer shift (0). The isomer shift and the
quadrupole splitting can be calculated using the following formula
. _~+V6+V2+VsIsomer shift (0) - (2.5)
4
. . _ (V6-VS)-(V2-~)and Quadrupole splitting (Eq) - •••••••••••••••••• (2.6)
4
where V I , V2 etc are the velocities. Electric quadrupole interaction only occurs if
there is an observable nuclear quadrupole moment and simultaneously a non zero
electric field gradient at the nucleus. An atomic nucleus in the energy state E with
spin quantum number 1>0 posseses a non zero magnetic dipole moment Il and may
interact with a magnetic field H at the nucleus. The interaction is called magnetic
dipole interaction or nuclear Zeeman effect. The nuclear Zeeman effect splits the
nuclear state with spin quantum number I in to 21+1 equally spaced and non
degenerate substates.
Because of the recoil free resonance absorption of nuclear gamma rays, Mossbauer
spectroscopy has been known to be a powerful tool for investigating the properties
of internal fields acting on nuclei in solids. The 14.4 keY y- rays of 57Fe have
been employed to study the internal fields at iron nuclei in several ferro and
antiferromagnetic materials. If the iron atoms occupy the two non-equivalent sites

Chapter 11 32
of position as in the case of ferrites, one would expect to obtain a superposition of
two patterns. Mossbauer studies on ferrites provides valuable information on the
ratio of the Fe3+ ion in tetrahedral and octahedral sites, the type of ordering ( Neel
type or Yafet Kittel type) and any deviation from stoichiometry leading to mixed
valence states such as Fe2+ and Fe3+.
In the present study the 57Fe Mossbauer spectrum of ZnFe204 was recorded at
room temperature and also at 16 K using constant acceleration Mossbauer
Spectrometer. A closed cycle He -refrigerator (eTI cryogenics model 226) was
used to cool the absorber at 16 K.
2.8. Electrical characterization
2.8.1: Dielectric properties:
Every material has a unique set of electrical characteristics that are dependent on its
dielectric properties. Accurate measurements of these properties will provide
scientists and engineers with valuable information. This information when properly
incorporated and correlated can pave way for intended applications or monitor a
manufacturing process for improved quality control.
A measurement of dielectric parameters can provide initial design parameters for
many electronic applications. With this, one can relate the loss of a cable insulator,
the impedance of a substrate or the frequency of a dielectric resonator with the
dielectric properties. Dielectric information is also useful for improving ferrite
absorbers. Recent applications in the area of industrial microwave processing of
food, rubber, plastic and ceramics have also been found to benefit from knowledge
of dielectric properties.
The utmost dielectric property of importance to physicists and engineers is the
permitivity. These properties are not constant; they can change with frequency,
temperature, orientation, mixture, pressure and molecule structure of the material.
A material is said to be dielectric if it has the ability to store energy when an
external electric field is applied. If a de voltage source is placed across a parallel
plate capacitor, more charge is stored when the separation between the plates is
v.naprer 11 33
occupied by a dielectric material. The dielectric material increases the storage
capacity of the capacitor by neutralizing charges at the electrodes, which ordinarily
would contribute to the external field.
If an ac sinusoidal voltage source is placed across the same capacitor, the resulting
current will be made up of a charging current and a loss current that is related to the
dielectric constant. Here we are interested only in the permitivity (Er) of the
material and the loss (tan5). Permittivity describes the interaction of a material
with an electric field. The relative permitivity Er = El EO . The complex relative
permitivity is given by
• s· S _jsllsr =- = (2.7)
So So
Where EO is the permitivity of free space, which is equal to 8.854 x 10⁻¹² F/m. The
real part of permitivity (Er) is a measure of how much energy from an external
electric field is stored in a material. The imaginary part of the permitivity (Erl1) is
called the loss factor. The loss factor includes the effects of both dielectric loss and
conductivity. The dielectric properties of Nil_xZnxFe204 was studied using a
dielectric cell and an impedance analyzer ( Model: HP 4192A) in the frequency
range 5Hz to 13 MHz. Schematic of the dielectric cell is shown in Figure. 2.3.
Ni l-xZnxFe204 samples which was prepared by ceramic techniques were then made
in the form of pellets of l Omm diameter and is loaded in to the dielectric cell. The
capacitance values at different frequencies ranging from 5Hz to 13MHz was noted.
The dielectric constant was calculated using the formula
sO's r .A ,C = d (2.8)
Where A is the area of the sample piece used and d its thickness. EO and Er are the
dielectric constant of the air and medium respectively and C is the capacitance
value. The measurement was carried out at different temperature in the temperature
range 303K to 473K. The sample temperature is controlled by a temperature
controller and the temperature on the surface of the sample is sensed by a Fe-K
thermocouple kept on the sample.
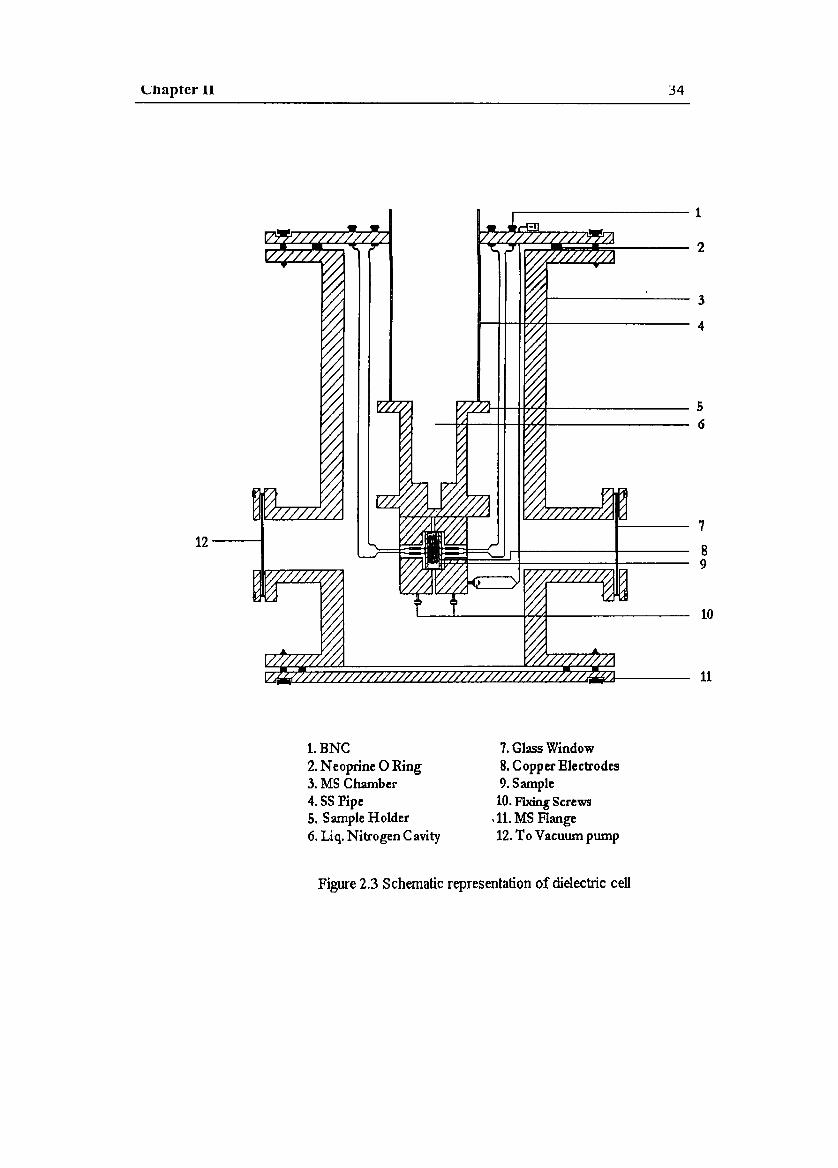
Cnapter II
12----4
34
....----------- 1
2
//...If--------- 3
4
'//~I+_~;,£,I_--------56
7
89
10
11
1.BNC2.N eoprine0 Ring3. MSChamber4.SS Pipe5. SampleHolder6. Liq. Nitrogen Cavity
7. GlassWindow8.Copper Electrodes9.Sample10. FixingScrews
,11. MS Flange12.To Vacuum pump
Figure 2.3 Schematic representation of dielectric cell
Chapter 11 35
2.8.2 Ac conductivity.
The ac electrical conductivity of both the ceramic and rubber ferrite composites
were evaluated by calculating the ac conductivity values using dielectric
parameters. The dielectric studies of both ceramic and rubber ferrite composites
were carried out by using a dielectric cell and an impedance analyzer (Model: HP
4192A). Disc shaped samples were used to find out the dielectric constant. The
capacitance and dielectric loss in the frequency range 100KHz - 5MHz were found
out. Dielectric constant or relative permittivity was calculated using the formula..C.d
Er =- (2.9)EQ.A
where d is the thickness of the sample, C the capacitance and A the area of cross
section of the sample. Er is the relative permittivity of the material which is a
dimensionless quantity. The ac conductivity of these samples were then evaluated
using the relation
O'ae = 27tf tanf EO Er (2.10)
f is the frequency of the applied filed and tanf is the loss factor. The principle and
the theory underlying the evaluation of Oae from dielectric measurements are based
on a treatment dealt by Goswamy [52]. It may be noted that Er and tand for both
ceramic and RFCs were made available from the dielectric measurements of these
samples. The theory and principle involved in the determination of ac conductivity
from the dielectric measurements is dealt in detail in chapter 6.
Chapter III
Cure characteristics and magneticproperties of rubber ferrite composites
3.1. Introduction
It is known that magnetic polycrystalline ceramic powders can be incorporated in
various elastomer matrixes to produce flexible magnets or rubber ferrite composites
(RFC). These plastic magnets can in turn be useful for various applications in
different devices. The addition of magnetic fillers in an elastomer matrix modifies
the physical properties of the matrix considerably in that they modify the dielectric
properties and impart magnetic properties to the matrix [53-54]. In applications
involving ferrites at high frequencies it is essential that the material posses an
appropriate dielectric constant and suitable magnetic permeability. This can be
achieved by synthesizing rubber ferrite composites (RFC) [55-57].
It has also been reported that the chemical incorporation of ferrite particles in
polymer matrix can lead to the development of magnetic nanocomposites with
excellent performance characteristics [13-15]. The preparation of RFCs and
evaluation of various properties such as magnetic) dielectric and mechanical
assumes significance not only in tailor making compounds but also in
understanding the fundamental aspects that govern these properties. The results of
investigations conducted on ceramic nickel zinc mixed ferrites and their
incorporatlon in a butyl rubber matrix are discussed in this chapter.
Mixed ferrites belonging to the series Nit-x ZnxFe204 have been prepared with x
varying from 0 to I in steps of 0.2 using ceramic processing techniques. The
details are described in chapter 2. The structural and magnetic properties were
evaluated. These NiZn ferrites were then incorporated in a butyl rubber matrix at
different loadings according to a specific recipe cited in chapter 2. Their cure
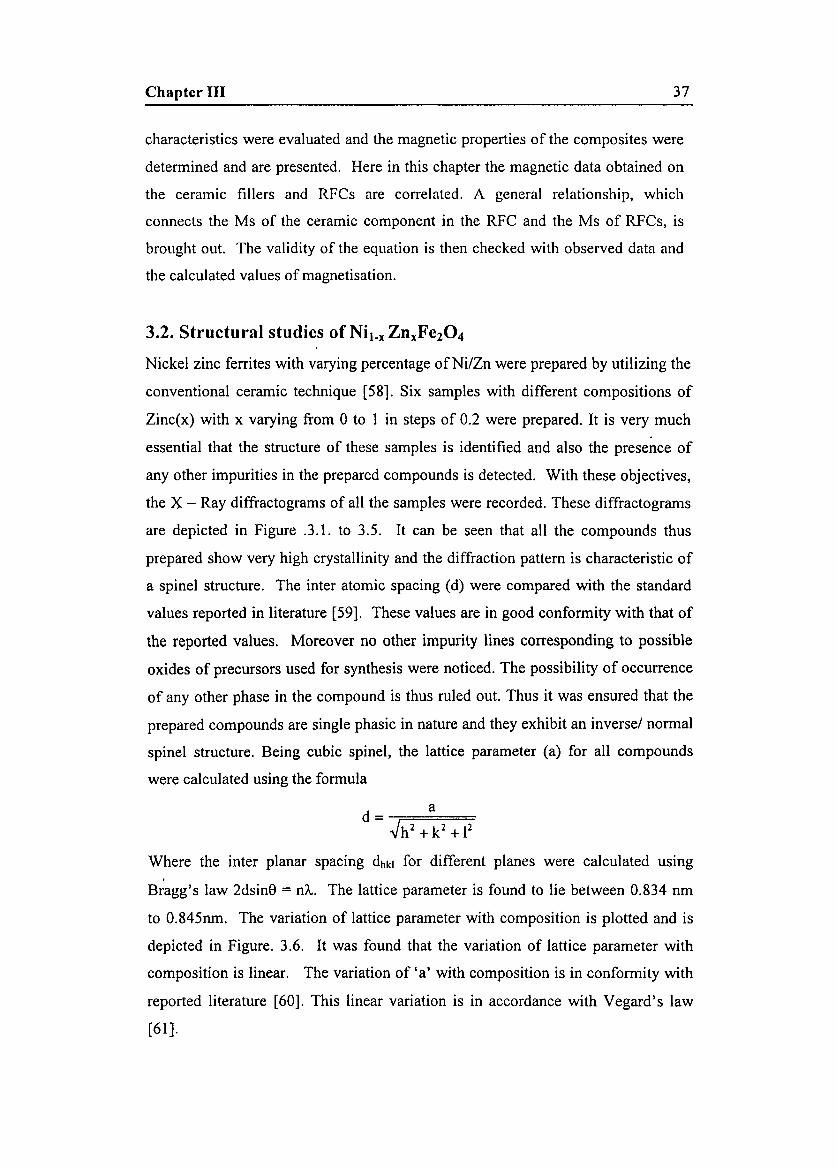
Chapter III 37
characteristics were evaluated and the magnetic properties of the composites were
determined and are presented. Here in this chapter the magnetic data obtained on
the ceramic fillers and RFCs are correlated. A general relationship, which
connects the Ms of the ceramic component in the RFC and the Ms of RFCs, is
brought out. The validity of the equation is then checked with observed data and
the calculated values of magnetisation.
3.2. Structural studies of Ni.., ZnxFeZ04
Nickel zinc ferrites with varying percentage of Ni/Zn were prepared by utilizing the
conventional ceramic technique [58]. Six samples with different compositions of
Zinc(x) with x varying from 0 to 1 in steps of 0.2 were prepared. It is very much
essential that the structure of these samples is identified and also the presence of
any other impurities in the prepared compounds is detected. With these objectives,
the X - Ray diffractograms of all the samples were recorded. These diffractograms
are depicted in Figure .3.1. to 3.5. It can be seen that all the compounds thus
prepared show very high crystallinity and the diffraction pattern is characteristic of
a spinel structure. The inter atomic spacing (d) were compared with the standard
values reported in literature [59]. These values are in good conformity with that of
the reported values. Moreover no other impurity lines corresponding to possible
oxides of precursors used for synthesis were noticed. The possibility of occurrence
of any other phase in the compound is thus ruled out. Thus it was ensured that the
prepared compounds are single phasic in nature and they exhibit an inverse/ normal
spinel structure. Being cubic spinel, the lattice parameter (a) for all compounds
were calculated using the formula
Where the inter planar spacing dhkl for different planes were calculated usmg
Bragg's law 2dsin8 = nA. The lattice parameter is found to lie between 0.834 nm
to 0.845nm. The variation of lattice parameter with composition is plotted and is
depicted in Figure. 3.6. It was found that the variation of lattice parameter with
composition is linear. The variation of 'a' with composition is in conformity with
reported literature [60]. This linear variation is in accordance with Vegard's law
[61].
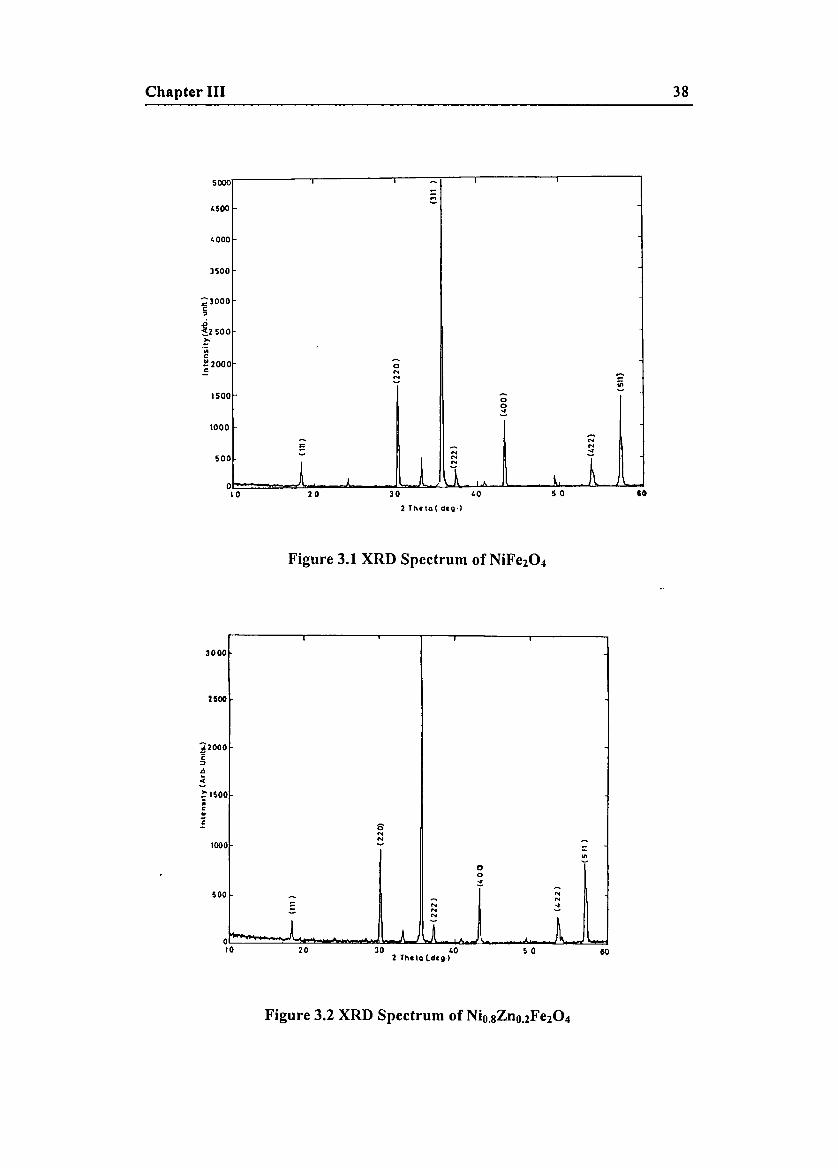
Chapter III 38
~ I
...
0
0~
0....~
~ in~
~
0 00~
;:;!': ;::; .......
0
!....
1!....
0j 1 l
50
1000
150
3500
4500
5000
4000
;3000c
"~250?:'iiic.!!200c
10 20 30 40 50 80
2 Theta( dell')
Figure 3.1 XRD Spectrum of NiFe204
605030 402 Theta ldell')
20to
0
8...~ ~
0 =~
00
:!~
~...
;::; N
~N .:!....
k"'- J A A0 ........
2500
100
500
3000
~ISOiie..C
Figure 3.2 XRD Spectrum of Nio.sZno.2Fe204
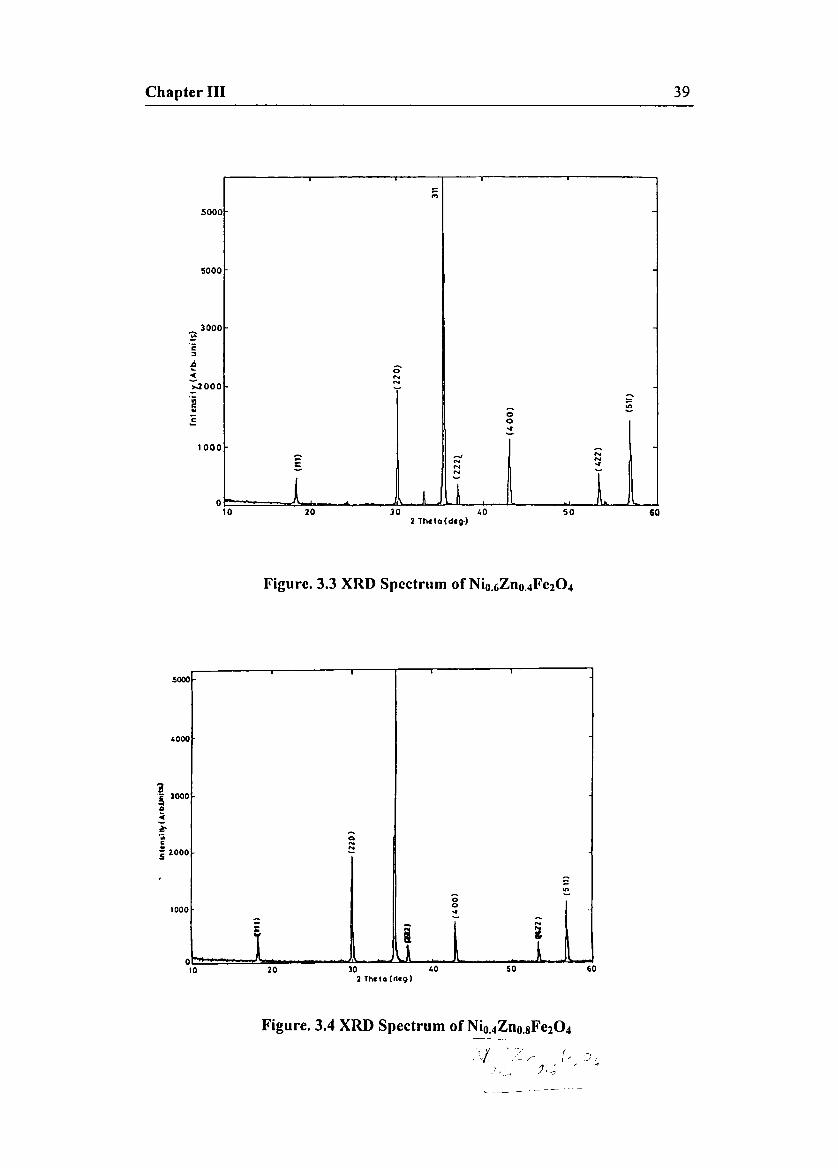
Chapter III
5000
5000
3000~'c"e 0-< ....~OOO
.....~
'iii ;;-e
~ e..0
~ 0
~
1000 ;;;'" .....
~ N~N
~
N
I0t ~ 1
10 20 30 '0 50 602 Thcla(dcg,)
Figure. 3.3 XRD Spectrum of Nio.6Zno.4Fc204
5000
4000
13000
•~';;c
i 1000
39
1000
0i
10 20 30 '02 Thola (l1og,)
oo..
50 60
Figure. 3.4 XRD Spectrum of Nio.4Zno.sFe204
,11,.i 4.,
, ,/.
/- r,,:] ..i.;
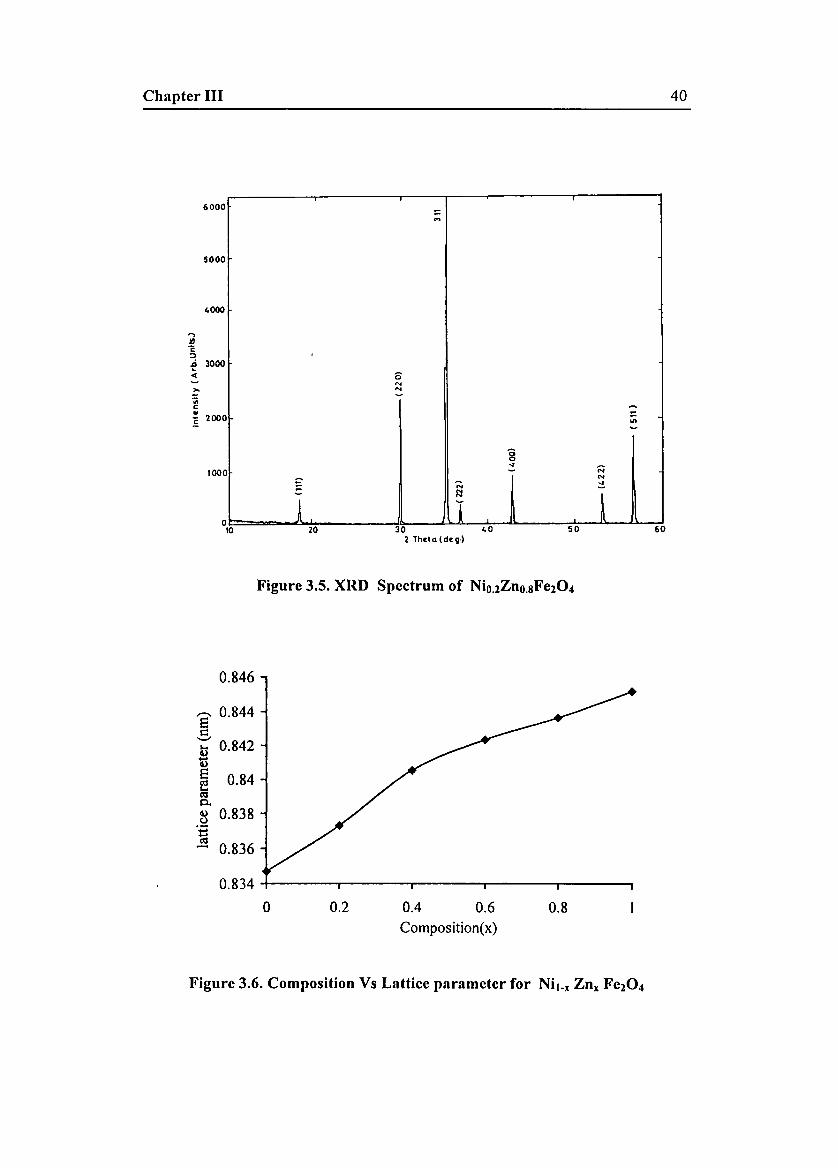
Chapter III 40
605030 402 Theta (deg,)
20
...
,
0'"'"-
~
'"-'00
0 :: NN
N ~- f:j
~~ 1o10
100
5000
...'iijc..£ 2000
6000
4000
Figure 3.5. XRD Spectrum of Nio.2Zno.sFe204
0.846
,-... 0.8448t:-- 0.842Loo
~
~ 0.84
0..Q) 0.838o
~ 0.836
0.834
0 0.2 0.4 0.6 0.8Composition(x)
Figure 3.6. Composition Vs Lattice parameter for Ni l _x Zn, Fe204
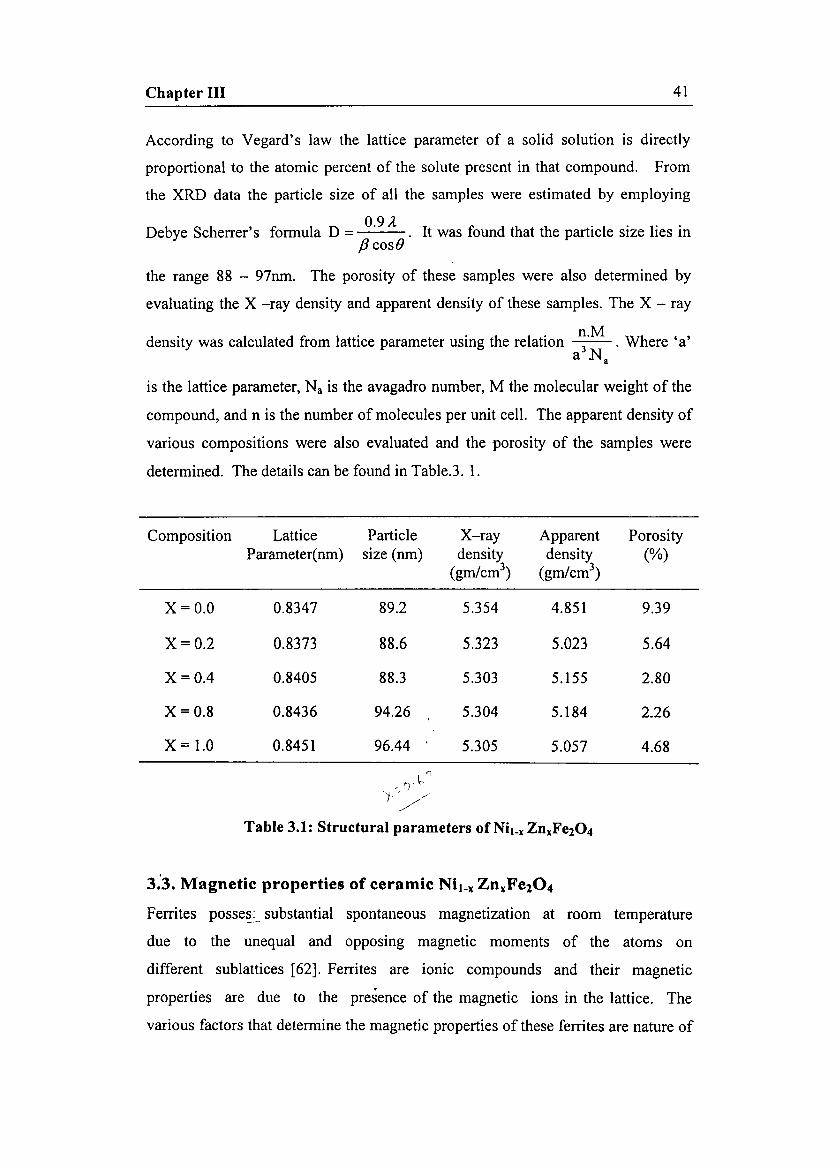
Chapter III 41
According to Vegard's law the lattice parameter of a solid solution is directly
proportional to the atomic percent of the solute present in that compound. From
the XRD data the particle size of all the samples were estimated by employing
Debye Scherrer's formula D = 0.9 A . It was found that the particle size lies inf3 cose
the range 88 - 97nm. The porosity of these samples were also determined by
evaluating the X -ray density and apparent density of these samples. The X - ray
density was calculated from lattice parameter using the relation ~.M . Where 'a'a .N,
is the lattice parameter, Na is the avagadro number, M the molecular weight of the
compound, and n is the number of molecules per unit cell. The apparent density of
various compositions were also evaluated and the porosity of the samples were
determined. The details can be found in Table.3. 1.
Composition Lattice Particle X-ray Apparent PorosityParameter(nm) size (nm) density density (%)
(gm/crrr') (gm/cnr')
X=O.O 0.8347 89.2 5.354 4.851 9.39
X=0.2 0.8373 88.6 5.323 5.023 5.64
X=O.4 0.8405 88.3 5.303 5.155 2.80
X=0.8 0.8436 94.26 5.304 5.184 2.26
X = 1.0 0.8451 96.44 5.305 5.057 4.68
'1
, ')' \:.'t/
Table 3.1: Structural parameters of Ni l _xZnxFe204
3~3. Magnetic properties of ceramic Ni l _xZnxFe204
Ferrites posse~~ substantial spontaneous magnetization at room temperature
due to the unequal and opposmg magnetic moments of the atoms on
different sublattices [62]. Ferrites are ionic compounds and their magnetic
properties are due to the presence of the magnetic ions in the lattice. The
various factors that determine the magnetic properties of these ferrites are nature of
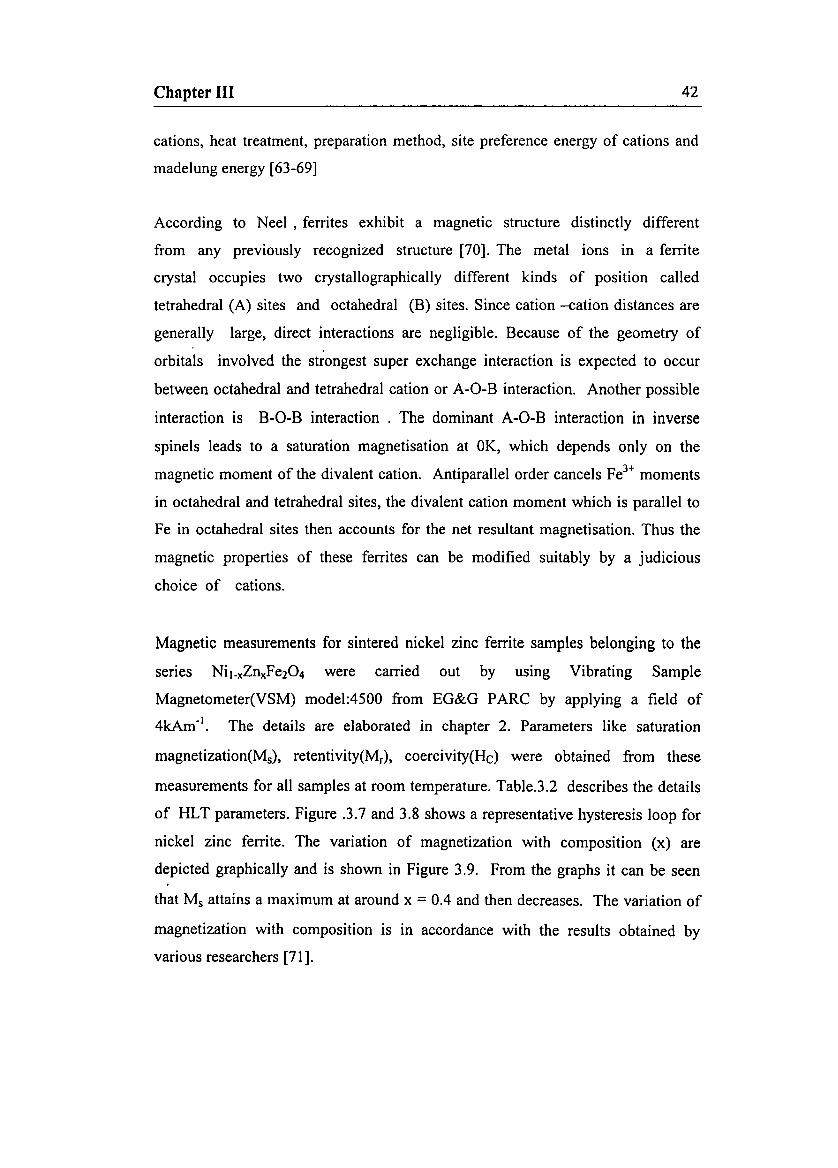
Chapter III 42
cations, heat treatment, preparation method, site preference energy of cations and
madelung energy [63-69]
According to Neel, ferrites exhibit a magnetic structure distinctly different
from any previously recognized structure [70]. The metal ions in a ferrite
crystal occupies two crystallographically different kinds of position called
tetrahedral (A) sites and octahedral (B) sites. Since cation -cation distances are
generally large, direct interactions are negligible. Because of the geometry of
orbitals involved the strongest super exchange interaction is expected to occur
between octahedral and tetrahedral cation or A-O-B interaction. Another possible
interaction is B-O-B interaction . The dominant A-O-B interaction in inverse
spinels leads to a saturation magnetisation at OK, which depends only on the
magnetic moment of the divalent cation. Antiparallel order cancels Fe3+ moments
in octahedral and tetrahedral sites, the divalent cation moment which is parallel to
Fe in octahedral sites then accounts for the net resultant magnetisation. Thus the
magnetic properties of these ferrites can be modified suitably by a judicious
choice of cations.
Magnetic measurements for sintered nickel zinc ferrite samples belonging to the
senes Nil-xZnxFe204 were carried out by usmg Vibrating Sample
Magnetometer(VSM) model:4500 from EG&G PARC by applying a field of
4kAmol• The details are elaborated in chapter 2. Parameters like saturation
magnetizationflvl.), retentivitytMj), coercivity(Hc) were obtained from these
measurements for all samples at room temperature. Table.3.2 describes the details
of HLT parameters. Figure .3.7 and 3.8 shows a representative hysteresis loop for
nickel zinc ferrite. The variation of magnetization with composition (x) are
depicted graphically and is shown in Figure 3.9. From the graphs it can be seen
that M, attains a maximum at around x = 0.4 and then decreases. The variation of
magnetization with composition is in accordance with the results obtained by
various researchers [71].

Chapter III 43
Composition Magnetizationtlvl-) Retentivity CoercivitytlL) M/MsAm2/Kg (Mr) Am2/Kg Aim
X=O 44.12 7.83 8159 0.177
X=O.2 67.53 3.767 5970 0.056
X=O.4 69.94 7.044 4593 0.100
X=0.6 46.82 4.77 3767 0.102
X=0.8 7.589 0.3759 4975 0.049
X=1 3.118 0.2419 4975 0.077
Table3. 2. Hysterisis loop Parameters for Ni l _x z», Fe204
The variation pattern of saturation magnetization (Ms) as a function of Zn content
shows an increase for small substitutions, goes through a maximum value of
69.94Am2/Kg at x = 0.4 and then decreases. Similarly the magnetic moment IlB
for various compositions were calculated by assuming Neel's two sub lattice
model and compared with that of observed values. For this a probable cation
distribution based on site preference energy, radius ratio rules is necessary. The
cation distribution can be written as Zn.Fe.., [Nii., Fel+x] 0 4, where Zn2+ is
diamagnetic and its main effect is to break linkages between magnetic cations.
Another effect is to increase interaction distance by expanding the unit cell, since it
has an ionic radius larger than the Ni and Fe radii. From Table: 3.3 it can be seen
that Nickel has a strong preference for B site while Zinc occupies only tetrahedral
sites. Based on octahedral site preference energies and radius ratio rules, a
probable cation distribution was arrived at, and the magnetic moment (Ilo) was
calculated for all composition. They are cited in Table.3.4. Also, from the
measured data IlB for all compositions were calculated using the formula
Ms·Mol.wl h M' h d .. '1Ps = were s IS t e measure magnetisation per atom. Detai s are5585
shown in Table. 3.5.
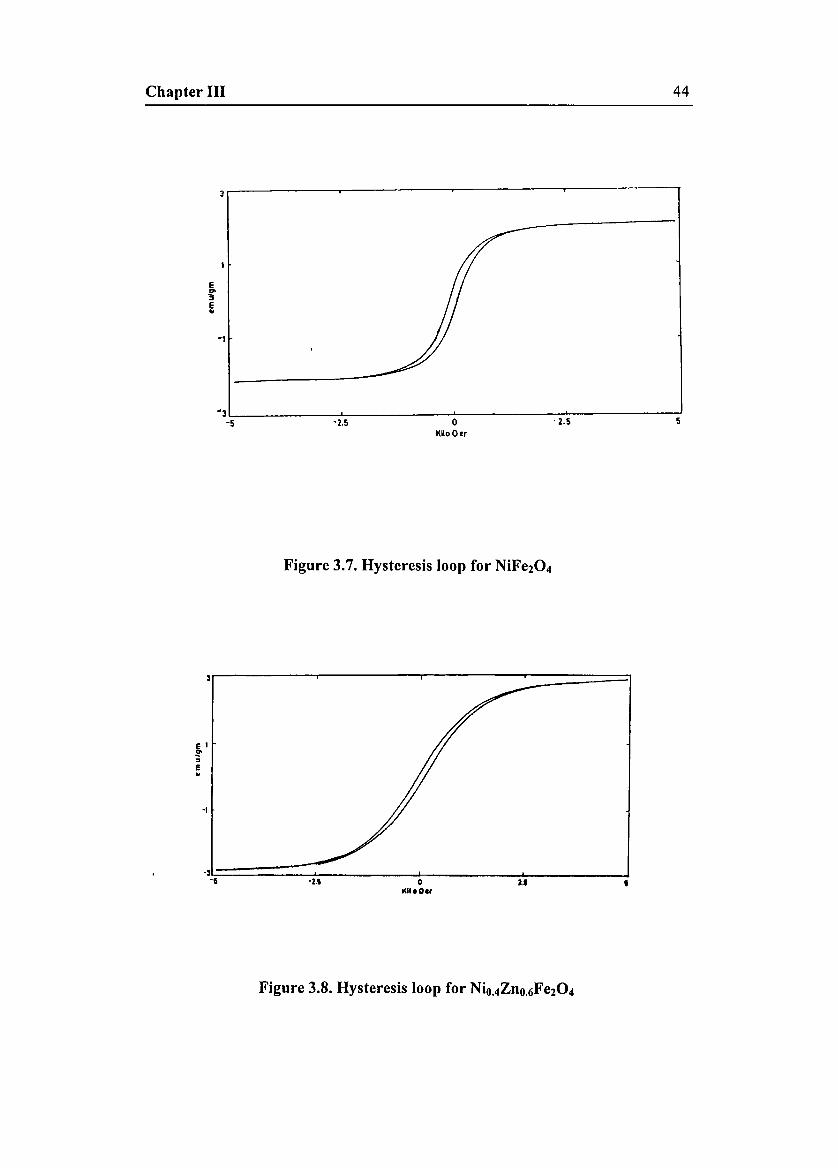
Chapter III 44
E
~E..
52.5oKilo Orr
-2.5"3L ----:~-----_:_----__:_:;:_;_-----_:
-5
Figure 3.7. Hysteresis loop for NiFe204
e 1~::l
E..
-I
•uoKU.Olr
'2.1.3
1!.===========- --' ---"' -.J.,
Figure 3.8. Hysteresis loop for Nio.4Zno.6Fe204
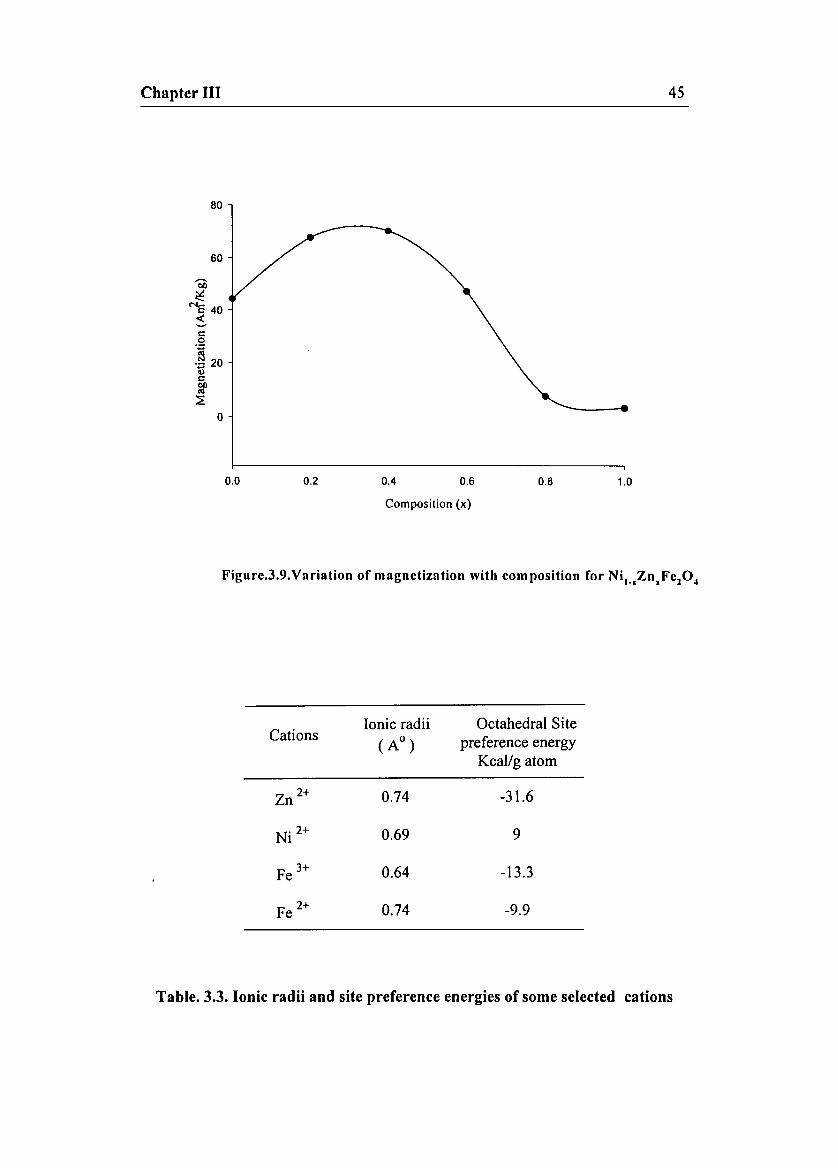
Chapter III
80
60
co~
Ne: 40sco.~
.~ 20c~:2
o
45
0.0 0.2 0.4 0.6 0.8 1.0
Composition (x)
Figurc.3.9.Variation of magnctization with composition for Ni.oxZnxFcl04
CationsIonic radii Octahedral Site
(Ao
) preference energyKcal/g atom
Zn2+ 0.74 -31.6
Ni 2+ 0.69 9
Fe 3+ 0.64 -13.3
F 2+ 0.74 -9.9<e
Table. 3.3. Ionic radii and site preference energies of some selected cations
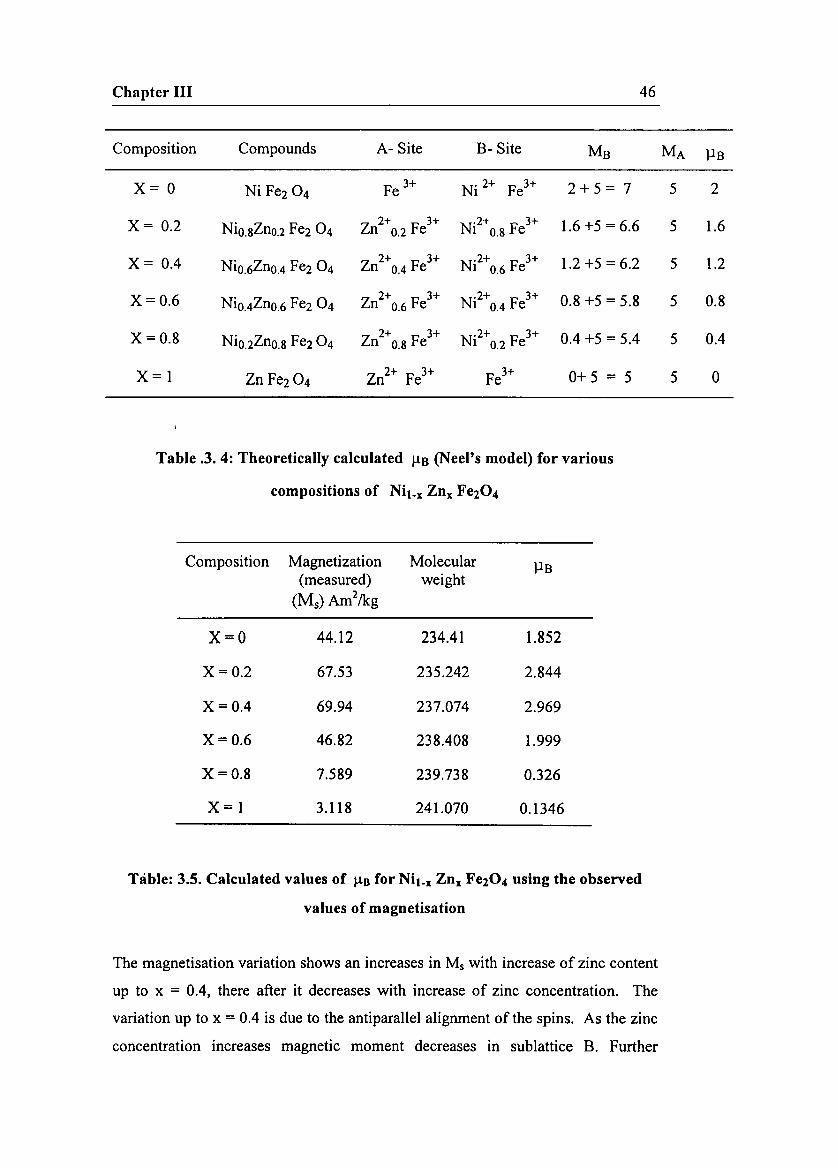
Chapter III 46
Composition Compounds A- Site B- Site MB MA PB
X= 0 Ni Fe2 0 4 Fe3+ Ni 2+ Fe3+ 2 + 5 = 7 5 2
X= 0.2 Nio.8Zno.2 Fe2 04 Z 2+ F 3+ N· 2+ F 3+ 1.6 +5 = 6.6 5 1.6n 0.2 e 1 0.8 e
X= 0.4 Nio.6Zn0.4 Fe2 04 Z 2+ F 3+ N· 2+ F 3+ 1.2 +5 = 6.2 5 1.2n 0.4 e 1 0.6 e
X=0.6 Ni0.4ZnO.6 Fe2 04 Z 2+ F 3+ N· 2+ F 3+ 0.8 +5 = 5.8 5 0.8n 0.6 e 1 0.4 e
X=0.8 Nio.2ZnO.8 Fe2 0 4 Z 2+ F 3+ N· 2+ F 3+ 0.4 +5 = 5.4 5 0.4n 0.8 e 1 0.2 e
X= 1 Zn Fe2 04 Zn2+ Fe3+ Fe3+ 0+ 5 = 5 5 0
Table .3. 4: Theoretically calculated JlB (Neel's model) for various
Composition Magnetization Molecular PB(measured) weight
(Ms) Am2/kg
X=O 44.12 234.41 1.852
X=0.2 67.53 235.242 2.844
X=O.4 69.94 237.074 2.969
X=0.6 46.82 238.408 1.999
X=0.8 7.589 239.738 0.326
X= 1 3.118 241.070 0.1346
Table: 3.5. Calculated values of Jln for Nil_x Zn, Fe204 using the observed
values of magnetisation
The magnetisation variation shows an increases in M, with increase of zinc content
up to x = 0.4, there after it decreases with increase of zinc concentration. The
variation up to x = 0.4 is due to the antiparallel alignment of the spins. As the zinc
concentration increases magnetic moment decreases in sublattice B. Further
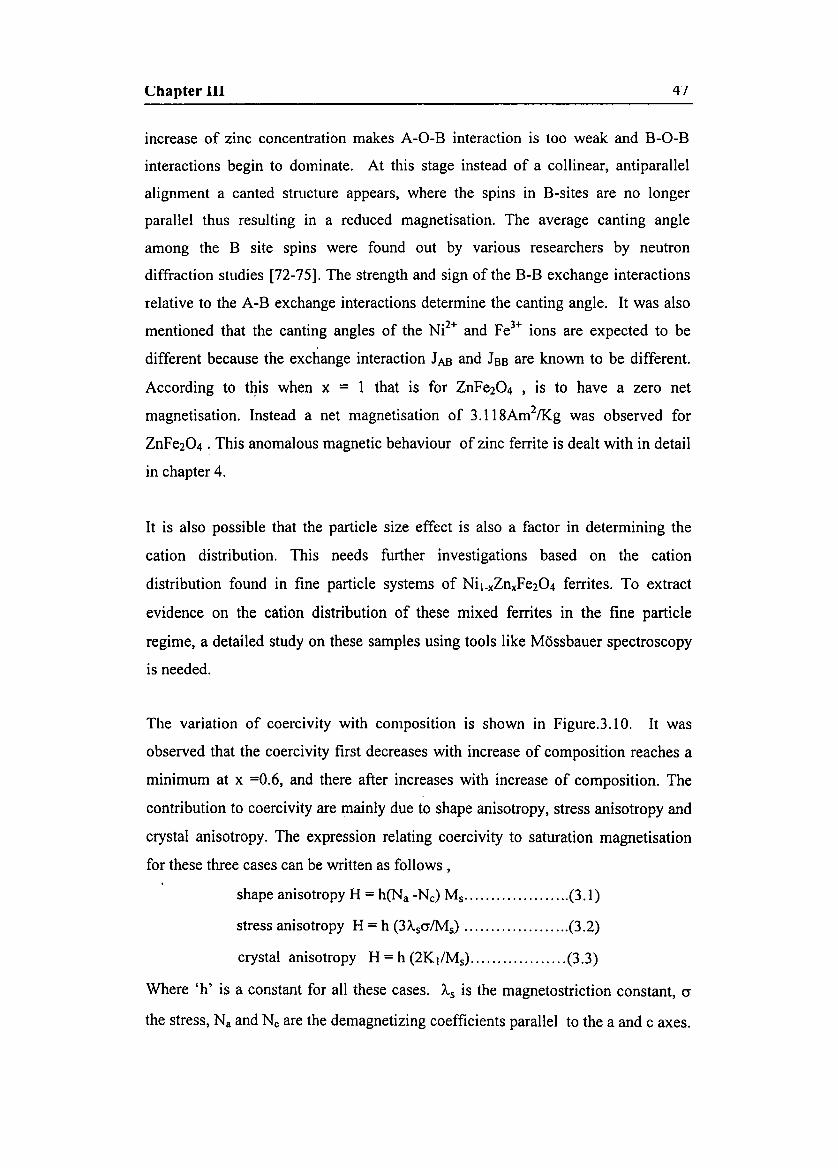
Chapter 111 4/
increase of zinc concentration makes A-O-B interaction is too weak and B-O-B
interactions begin to dominate. At this stage instead of a collinear, antiparallel
alignment a canted structure appears, where the spins in B-sites are no longer
parallel thus resulting in a reduced magnetisation. The average canting angle
among the B site spins were found out by various researchers by neutron
diffraction studies [72-75]. The strength and sign of the B-B exchange interactions
relative to the A-B exchange interactions determine the canting angle. It was also
mentioned that the canting angles of the Ni2+ and Fe3+ ions are expected to be
different because the exchange interaction ha and Jaa are known to be different.
According to this when x = 1 that is for ZnFe204 , is to have a zero net
magnetisation. Instead a net magnetisation of 3.118Am2/Kg was observed for
ZnFe204 . This anomalous magnetic behaviour of zinc ferrite is dealt with in detail
in chapter 4.
It is also possible that the particle size effect is also a factor in determining the
cation distribution. This needs further investigations based on the cation
distribution found in fine particle systems of Nil-xZnxFe204 ferrites. To extract
evidence on the cation distribution of these mixed ferrites in the fine particle
regime, a detailed study on these samples using tools like Mossbauer spectroscopy
is needed.
The variation of coercivity with composition is shown in Figure.3.1 O. It was
observed that the coercivity first decreases with increase of composition reaches a
minimum at x =0.6, and there after increases with increase of composition. The
contribution to coercivity are mainly due to shape anisotropy, stress anisotropy and
crystal anisotropy. The expression relating coercivity to saturation magnetisation
for these three cases can be written as follows,
shape anisotropy H = h(Na -Ne) M, (3.1)
stress anisotropy H = h (3A.scr/Ms) (3.2)
crystal anisotropy H = h (2KI/Ms) (3.3)
Where 'h' is a constant for all these cases. As is the magnetostriction constant, o
the stress, N, and Ne are the demagnetizing coefficients parallel to the a and c axes.
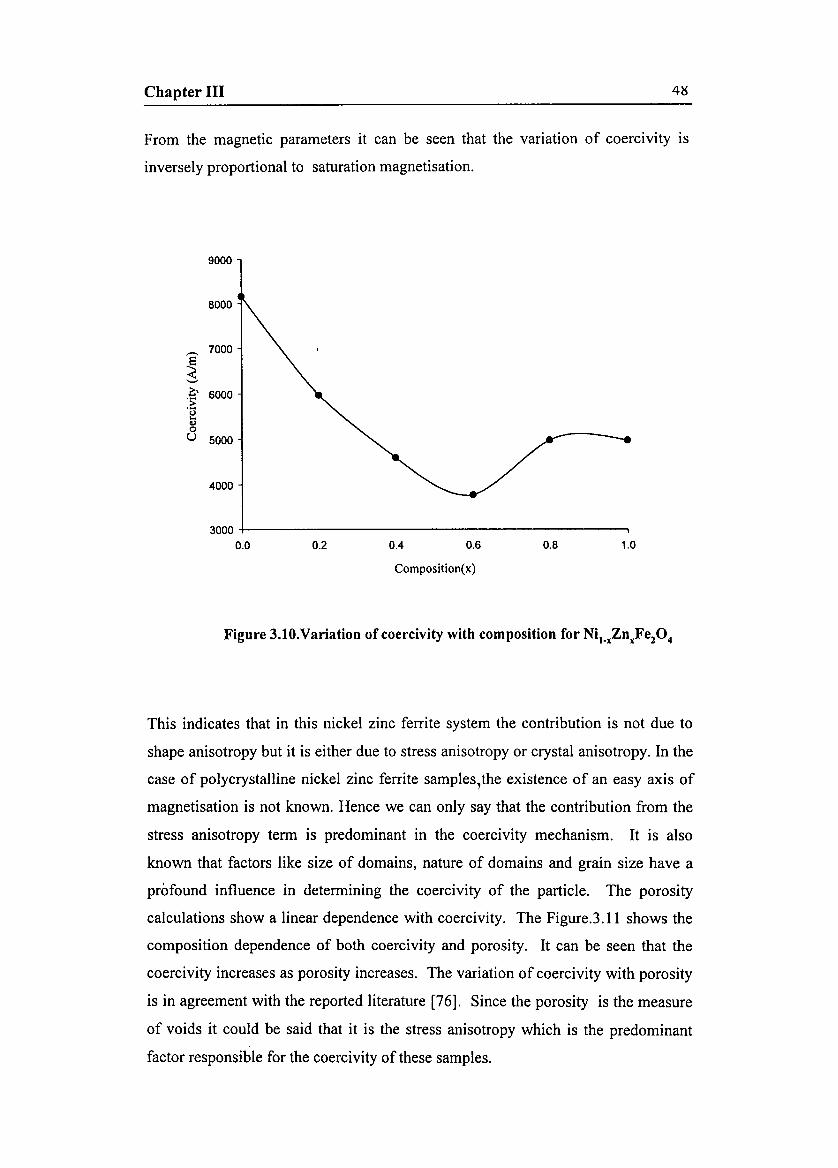
Chapter III 4~
From the magnetic parameters it can be seen that the variation of coercivity is
inversely proportional to saturation magnetisation.
9000
8000
--- 7000e.......<'-'0 6000':;'0...
Cl)
0U 5000
4000
30000.0 0.2 0.4 0.6 0.8 1.0
Composition(x)
Figure 3.10.Variation of coercivity with composition for Nit_xZnxFe204
This indicates that in this nickel zinc ferrite system the contribution is not due to
shape anisotropy but it is either due to stress anisotropy or crystal anisotropy. In the
case of polycrystalline nickel zinc ferrite samples.the existence of an easy axis of
magnetisation is not known. Hence we can only say that the contribution from the
stress anisotropy term is predominant in the coercivity mechanism. It is also
known that factors like size of domains, nature of domains and grain size have a
profound influence in determining the coercivity of the particle. The porosity
calculations show a linear dependence with coercivity. The Figure.Ll l shows the
composition dependence of both coercivity and porosity. It can be seen that the
coercivity increases as porosity increases. The variation of coercivity with porosity
is in agreement with the reported literature [76]. Since the porosity is the measure
of voids it could be said that it is the stress anisotropy which is the predominant
factor responsible for the coercivity of these samples.
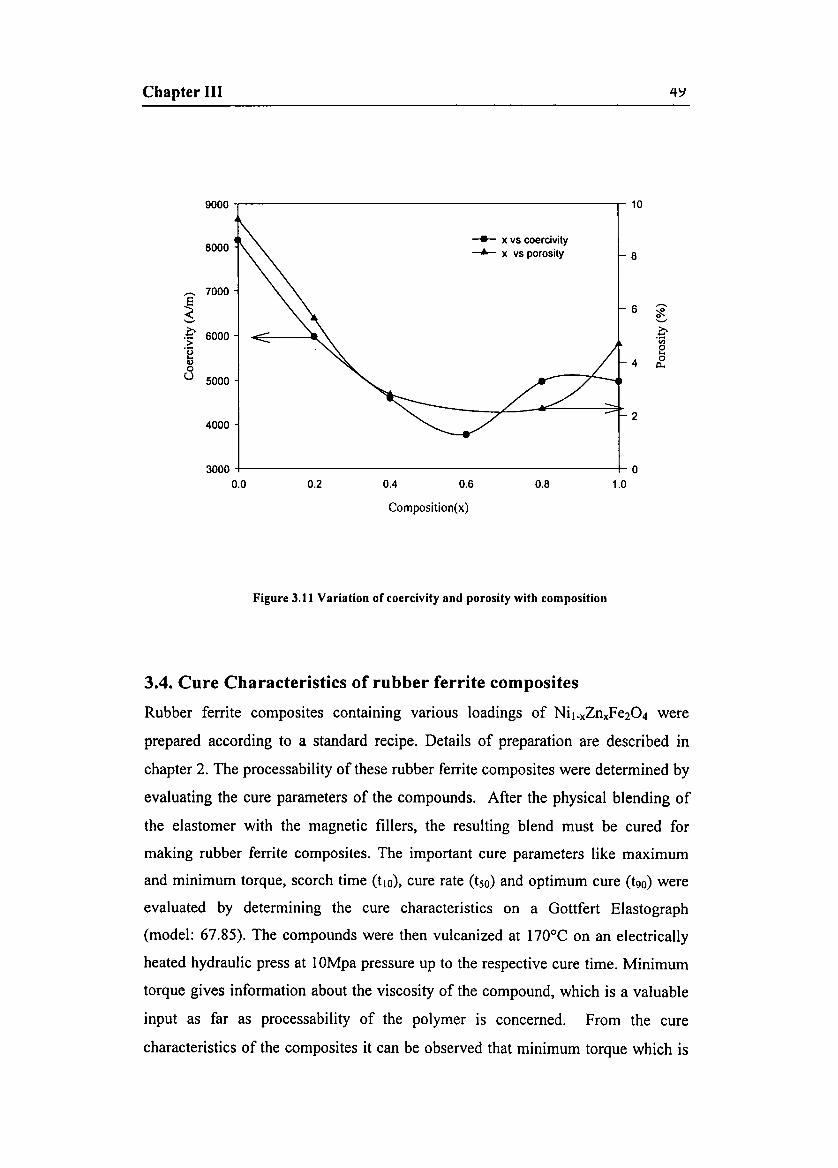
Chapter III
9000 10
8000-e-- x vs coercivity---*- x vs porosity 8
--- 7000E
6 ---< "$........, .......,
.£ 6000 .0';;;> e'0...
4 011) t:l..0U 5000
24000
3000 00.0 0.2 0.4 0.6 0.8 1.0
Composition(x)
Figure 3.11 Variation ofcoercivity and porosity with composition
3.4. Cure Characteristics of rubber ferrite composites
Rubber ferrite composites containing various loadings of Nit-xZnxFe204 were
prepared according to a standard recipe. Details of preparation are described in
chapter 2. The processability of these rubber ferrite composites were determined by
evaluating the cure parameters of the compounds. After the physical blending of
the elastomer with the magnetic fillers, the resulting blend must be cured for
making rubber ferrite composites. The important cure parameters like maximum
and minimum torque, scorch time (tlO), cure rate (t50) and optimum cure (t90) were
evaluated by determining the cure characteristics on a Gottfert Elastograph
(model: 67.85). The compounds were then vulcanized at 170°C on an electrically
heated hydraulic press at 10Mpa pressure up to the respective cure time. Minimum
torque gives information about the viscosity of the compound, which is a valuable
input as far as processability of the polymer is concerned. From the cure
characteristics of the composites it can be observed that minimum torque which is
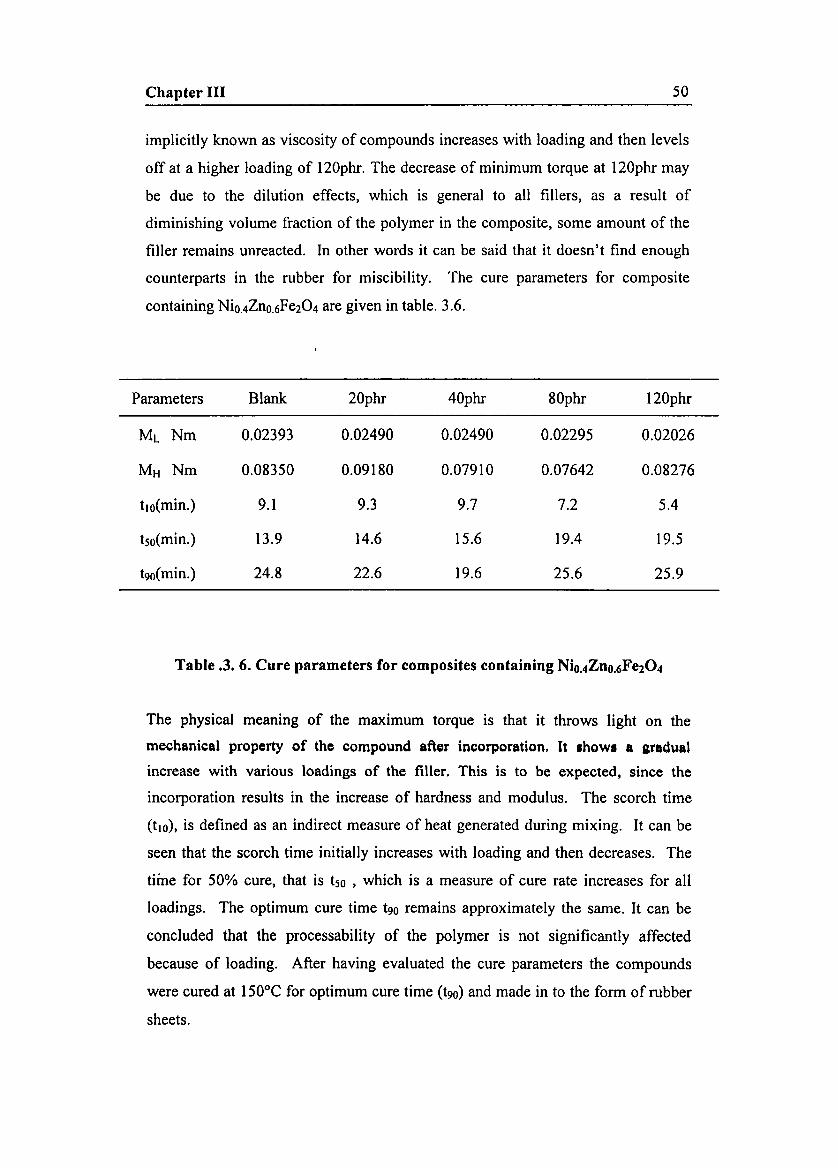
Chapter III 50
implicitly known as viscosity of compounds increases with loading and then levels
off at a higher loading of 120phr. The decrease of minimum torque at 120phr may
be due to the dilution effects, which is general to all fillers, as a result of
diminishing volume fraction of the polymer in the composite, some amount of the
filler remains unreacted. In other words it can be said that it doesn't find enough
counterparts in the rubber for miscibility. The cure parameters for composite
containing Nio.4Zno.6Fe204 are given in table. 3.6.
Parameters Blank 20phr 40phr 80phr 120phr
ML Nm 0.02393 0.02490 0.02490 0.02295 0.02026
M H Nm 0.08350 0.09180 0.07910 0.07642 0.08276
tlO(min.) 9.1 9.3 9.7 7.2 5.4
tso(min.) 13.9 14.6 15.6 19.4 19.5
t90(min.) 24.8 22.6 19.6 25.6 25.9
Table .3. 6. Cure parameters for composites containing Nio.4Zno.6Fe204
The physical meaning of the maximum torque is that it throws light on the
mechanical property of the compound after incorporation. It show. a aradual
increase with various loadings of the filler. This is to be expected, since the
incorporation results in the increase of hardness and modulus. The scorch time
(tlO), is defined as an indirect measure of heat generated during mixing. It can be
seen that the scorch time initially increases with loading and then decreases. The
time for 50% cure, that is tse , which is a measure of cure rate increases for all
loadings. The optimum cure time t90 remains approximately the same. It can be
concluded that the processability of the polymer is not significantly affected
because of loading. After having evaluated the cure parameters the compounds
were cured at 150°C for optimum cure time (t90) and made in to the form of rubber
sheets.

Chapter III 51
3.5. Magnetic properties of rubber ferrite composites
Further, the magnetic parameters of these Rubber ferrite composites were evaluated
by using vibrating sample magnetometer (VSM) and they are shown in Table.3.7.
Representative hysteresis loops for rubber ferrite composites are shown in
Figure.3.12 to 3.15. The measured values of Ms of the ceramic sample was
utilized for the calculation of the Ms of the composite. While calculating the Ms of
the rubber ferrite composites it was assumed that only single magnetic component
is contributing to the magnetic properties of the matrix. The details of the results
are shown in TableJ.7. It was also observed that the magnetization increases with
loading for each composition. The variations of magnetization with loading for
different compositions are shown in Figure.3.16. But it may be noted that the
coercivity remains more or less the same for different loadings of each
composition, this value of coercivity tallies well with the value of coercivity
obtained for the corresponding ceramic magnetic component in the matrix. From
this observation it can be concluded that loading has no effect on coercivity or there
is no interaction between the filler and the matrix. Like ceramic samples, for
rubber ferrite composites too, the variation of magnetization and coercivity with
composition is the same. In the case of composites also the magnetization first
increases with increase of composition and reaches a maximum value at x=OA and
thereafter the magnetization decreases with increase of composition. The variation
of magnetization with composition for different loadings is shown in Figure.3 .17.
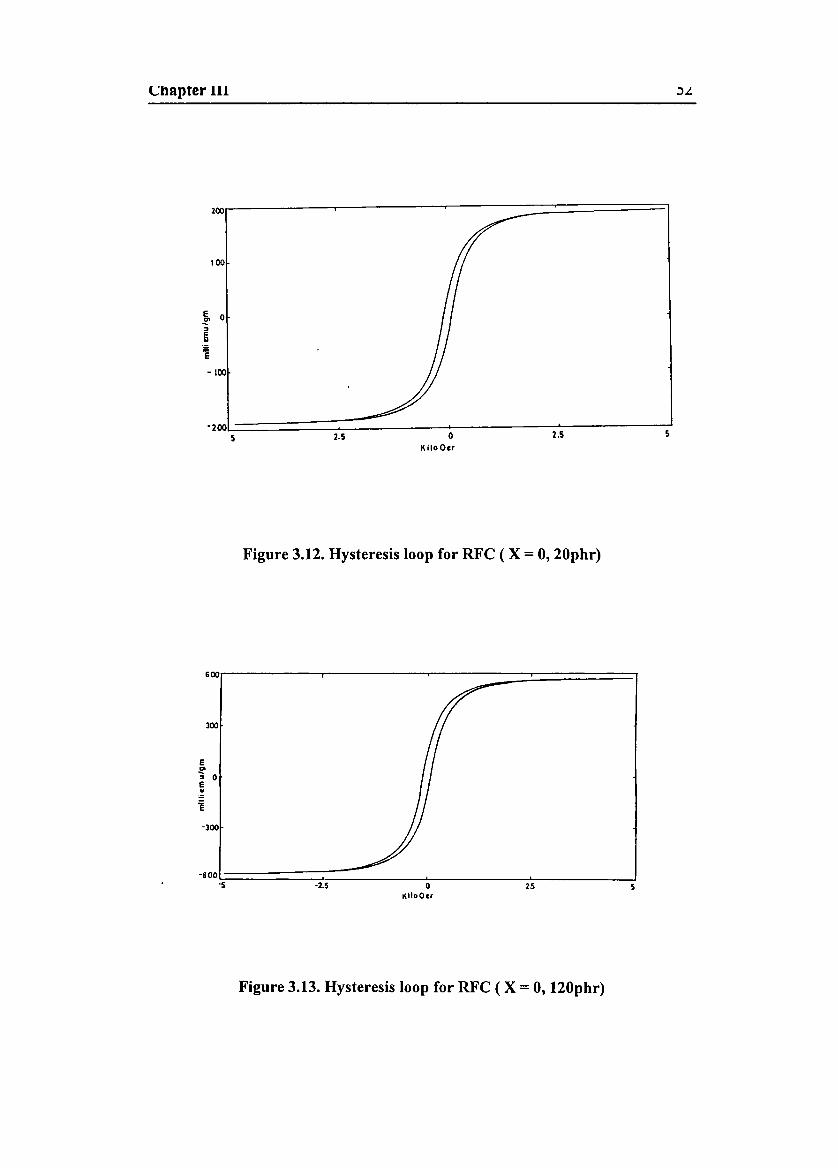
Chapter III
200r-------,r--------.-------:============~
100
52.5oKiloOcr
2.5-200L=:=======::;:::::=---~:__--------;~-----:
5
Figure 3.12. Hysteresis loop for RFC ( X = 0, 20phr)
600,-------,-------.----===::2::==========1
300
eDO
:; 0e..
-300
52.5oKlloOcr
-2.5.6001:=========;;:===- ~-----"------.-J
'5
Figure 3.13. Hysteresis loop for RFC ( X = 0, 120phr)
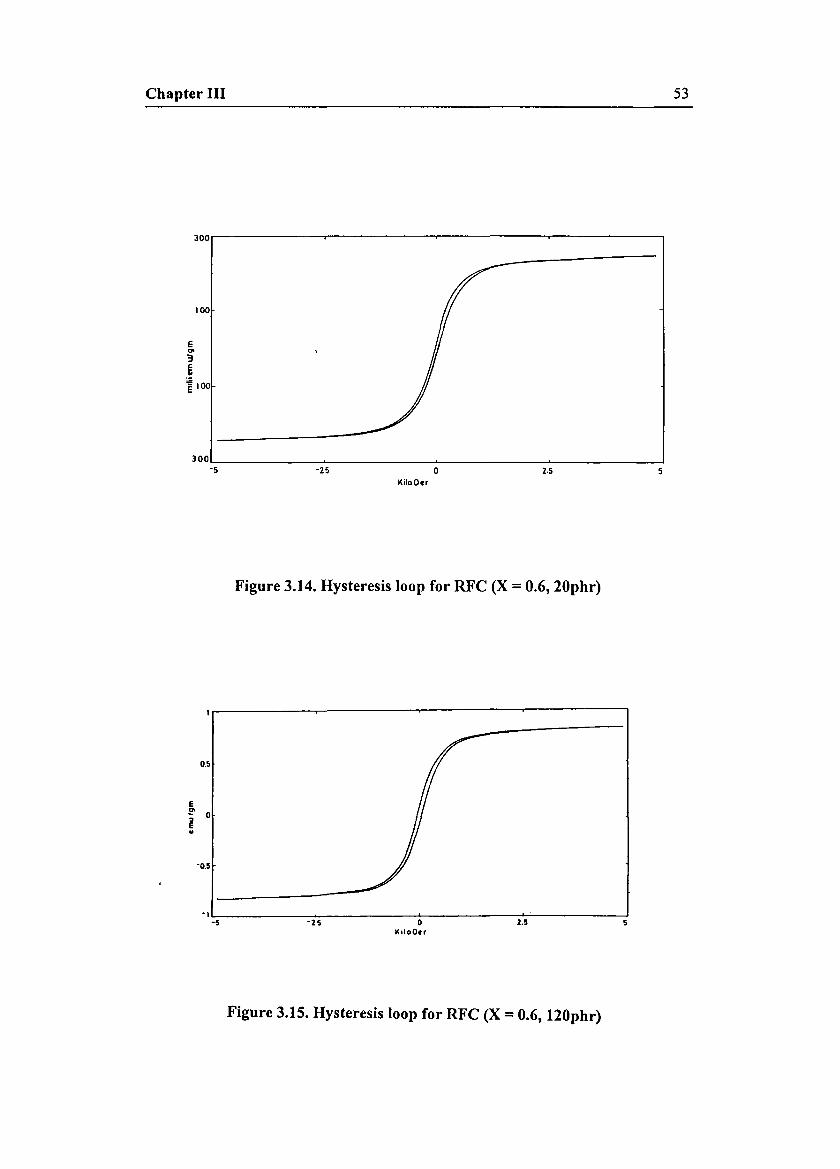
Chapter III 53
300,....-------.-------..---------r-------,
100
E.,.'3~~ 100
52·5o-Z5
300L-- --'- ~ --'- ---'
°5
KiloOcr
Figure 3.14. Hysteresis loop for RFC (X = 0.6, 20phr)
0.5
E.,.- 0~..
·0.5
2.5oK.loOcr
-25-Il- ~ ~----___::':_'_----__:
-5
Figure 3.15. Hysteresis loop for RFC (X = 0.6, 120phr)
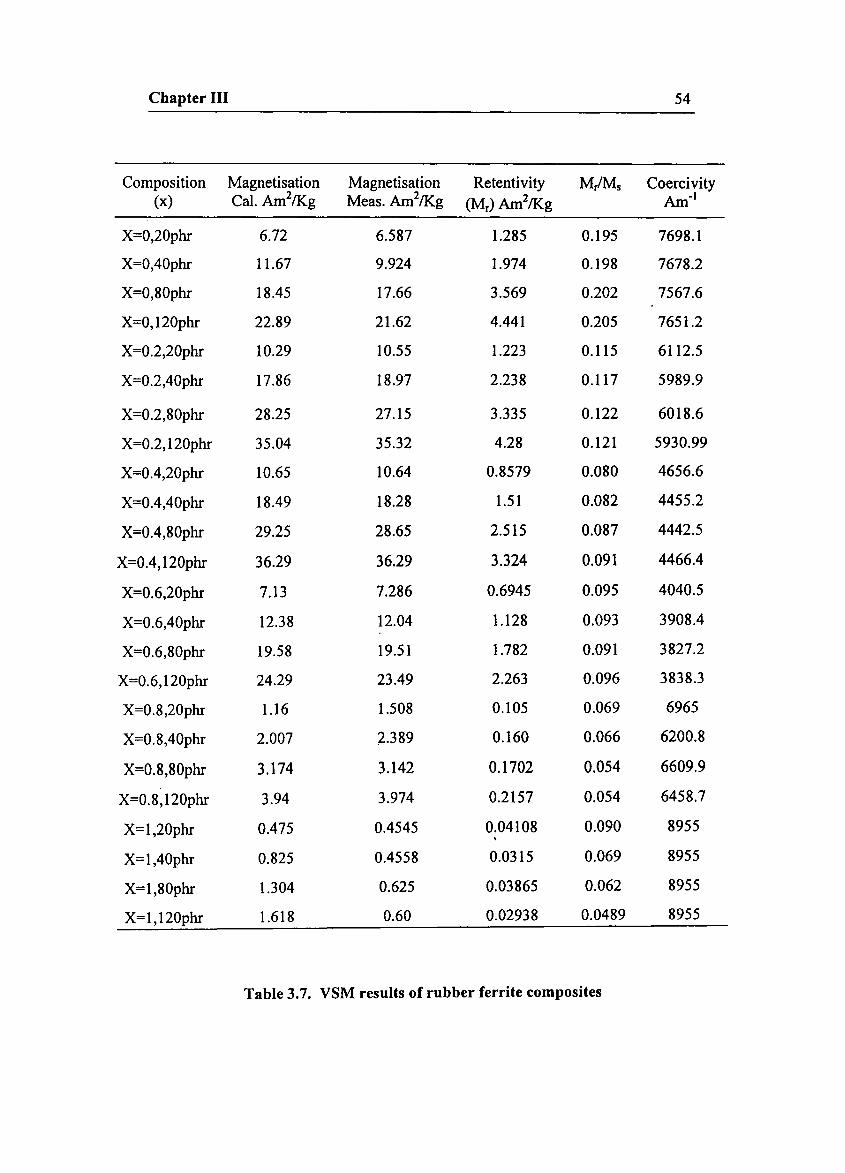
Chapter III 54
Composition Magnetisation Magnetisation Retentivity M/Ms Coercivity(x) Ca!. Am2/Kg Meas. Am2/Kg
(Mr) Am2/Kg Am-I
X=0,20phr 6.72 6.587 1.285 0.195 7698.1
X=0,40phr 11.67 9.924 1.974 0.198 7678.2
X=0,80phr 18.45 17.66 3.569 0.202 7567.6
X=0,120phr 22.89 21.62 4.441 0.205 7651.2
X=0.2,20phr 10.29 10.55 1.223 0.115 6112.5
X=0.2,40phr 17.86 18.97 2.238 0.117 5989.9
X=0.2,80phr 28.25 27.15 3.335 0.122 6018.6
X=0.2,120phr 35.04 35.32 4.28 0.121 5930.99
X=0.4,20phr 10.65 10.64 0.8579 0.080 4656.6
X=0.4,40phr 18.49 18.28 1.51 0.082 4455.2
X=0.4,80phr 29.25 28.65 2.515 0.087 4442.5
X=0.4,120phr 36.29 36.29 3.324 0.091 4466.4
X=0.6,20phr 7.13 7.286 0.6945 0.095 4040.5
X=0.6,40phr 12.38 12.04 1.128 0.093 3908.4
X=0.6,80phr 19.58 19.51 1.782 0.091 3827.2
X=0.6,120phr 24.29 23.49 2.263 0.096 3838.3
X=0.8,20phr 1.16 1.508 0.105 0.069 6965
X=0.8,40phr 2.007 2.389 0.160 0.066 6200.8
X=0.8,80phr 3.174 3.142 0.1702 0.054 6609.9
X=0.8,120phr 3.94 3.974 0.2157 0.054 6458.7
X=I,20phr 0.475 0.4545 0.04108 0.090 8955,
X=I,40phr 0.825 0.4558 0.0315 0.069 8955
X=I,80phr 1.304 0.625 0.03865 0.062 8955
X=I,120phr 1.618 0.60 0.02938 0.0489 8955
Table 3.7. VSM results of rubber ferrite composites
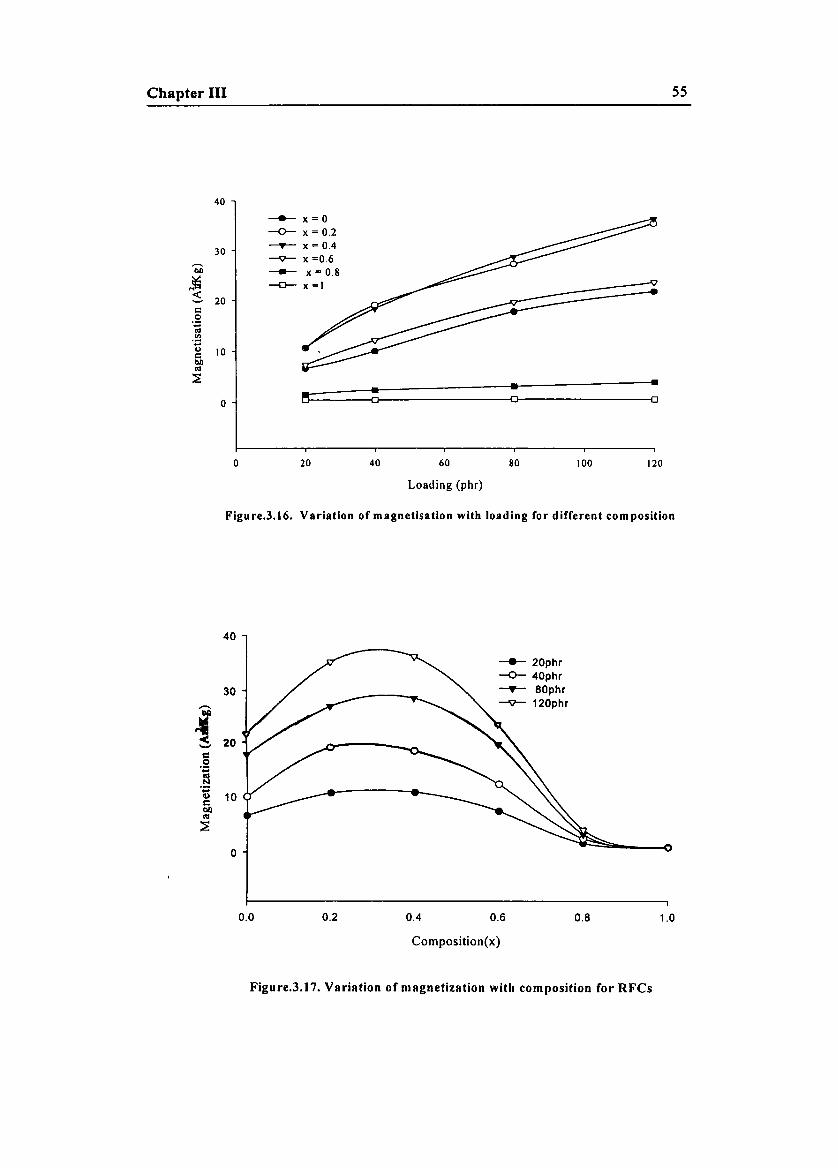
Chapter III 55
40
----x=o-0-- x = 0.2
30 --T- x = 0.4---"\l- x =0.6
~ ---- x = 0.8
~-0- x =1
20s::0.;::t'l
'".;::0 10s::ll/lt'l
::E :~ ~ ~0
o 20 40 60 80 100 120
Loading (phr)
Figure.3.16. Variation of magnetisation with loading for different composition
40
---- 20phr-0- 40phr
30 -...- 80phr
..... ----9- 120phr
~ 20-c0.;::s';::0 10s::bI)t'l
~
0
0.0 0.2 0.4 0.6 0.8 1.0
Composition(x)
Figure.3.17. Variation of magnetization with composition for RFCs
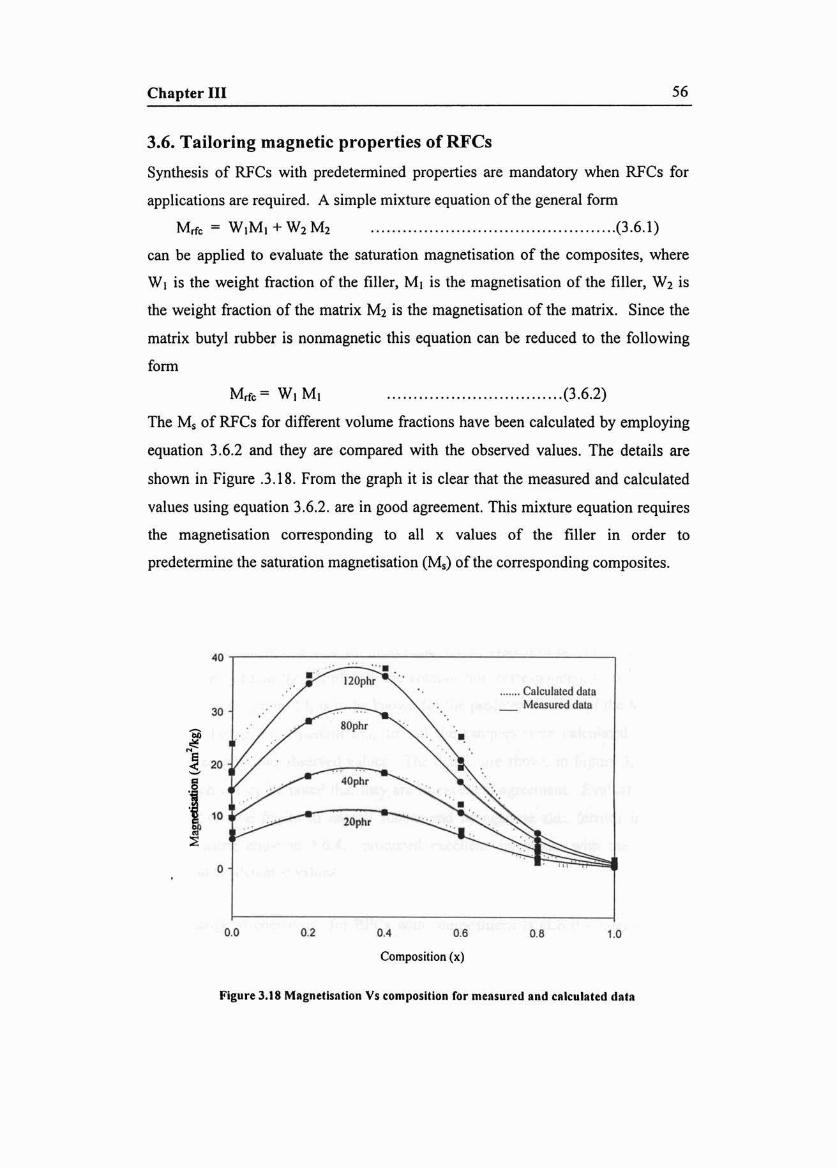
Chapter III 56
3.6. Tailoring magn etic properties of RFCs
Synthesis of RFCs with predetermined properties are mandatory when RFCs for
applications are required. A simple mixture equation of the general form
M", ~ W,M , + W, M, (3.6.1)
can be applied to evaluate the saturation magnetisat ion of the composites, where
W1 is the weight fraction of the filler, M1 is the magnetisat ion of the filler, W2 is
the weight fraction of the matrix M2 is the magnetisation of the matrix. Since the
matrix butyl rubber is nonmagnetic this equation can be reduced to the following
form
.. . . . . . . . . . . . . . . . . . . . . .. . . . . . . . . .(3.6.2)
The M, of RFCs for different volume fractions have been calculated by employing
equation 3.6.2 and they are compared with the observed values. The details are
shown in Figure .3.18. From the graph it is clear that the measured and calculated
values using equation 3.6.2. are in good agreement. This mixture equation req uires
the magnetisation corresponding to all x values of the filler in order to
predetermine the saturation magnetisation (Ms) of the corresponding composites.
0.0 0.' 0.4 0.6 o. 1.0
Composition (x)
Figur e 3.18 Magnetisation Vs ecmpcs rn cn for measured an d calculated data
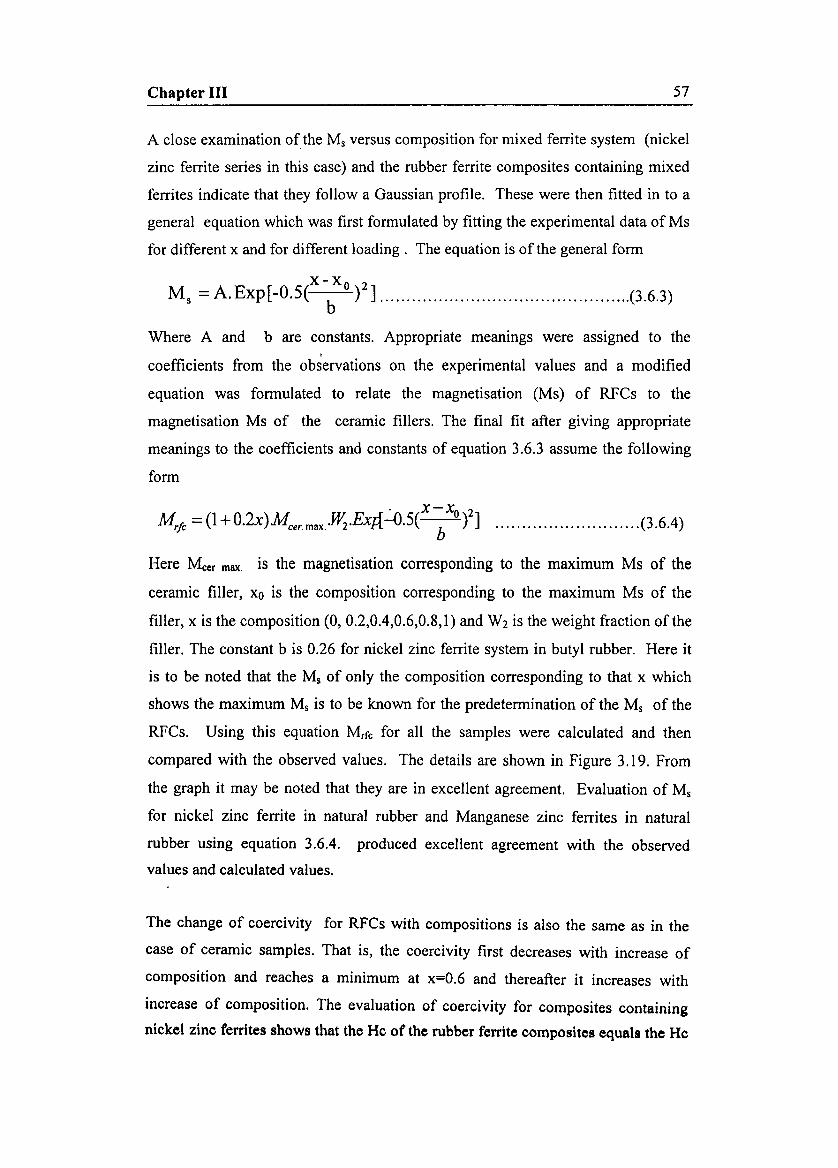
Chapter III 57
A close examination of the M, versus composition for mixed ferrite system (nickel
zinc ferrite series in this case) and the rubber ferrite composites containing mixed
ferrites indicate that they follow a Gaussian profile. These were then fitted in to a
general equation which was first formulated by fitting the experimental data of Ms
for different x and for different loading. The equation is of the general form
x-xo 2
M, =A.Exp[-O.5( b )] (3.6.3)
Where A and b are constants. Appropriate meanings were assigned to the
coefficients from the ob~ervations on the experimental values and a modified
equation was formulated to relate the magnetisation (Ms) of RFCs to the
magnetisation Ms of the ceramic fillers. The final fit after giving appropriate
meanings to the coefficients and constants of equation 3.6.3 assume the following
form
. x-xo 2Mr/c=(1 +O.2x)Mcer.max.·J1i·Exlf-D·5( b )] (3.6.4)
Here Mcer max. is the magnetisation corresponding to the maximum Ms of the
ceramic filler, xo is the composition corresponding to the maximum Ms of the
filler, x is the composition (0, 0.2,0.4,0.6,0.8,1) and W2 is the weight fraction of the
filler. The constant b is 0.26 for nickel zinc ferrite system in butyl rubber. Here it
is to be noted that the M, of only the composition corresponding to that x which
shows the maximum M, is to be known for the predetermination of the M, of the
RFCs. Using this equation Mrfc for all the samples were calculated and then
compared with the observed values. The details are shown in Figure 3.19. From
the graph it may be noted that they are in excellent agreement. Evaluation of M,
for nickel zinc ferrite in natural rubber and Manganese zinc ferrites in natural
rubber using equation 3.6.4. produced excellent agreement with the observed
values and calculated values.
The change of coercivity for RFCs with compositions is also the same as in the
case of ceramic samples. That is, the coercivity first decreases with increase of
composition and reaches a minimum at x=0.6 and thereafter it increases with
increase of composition. The evaluation of coercivity for composites containing
nickel zinc ferrites shows that the He of the rubber ferrite composites equals the He
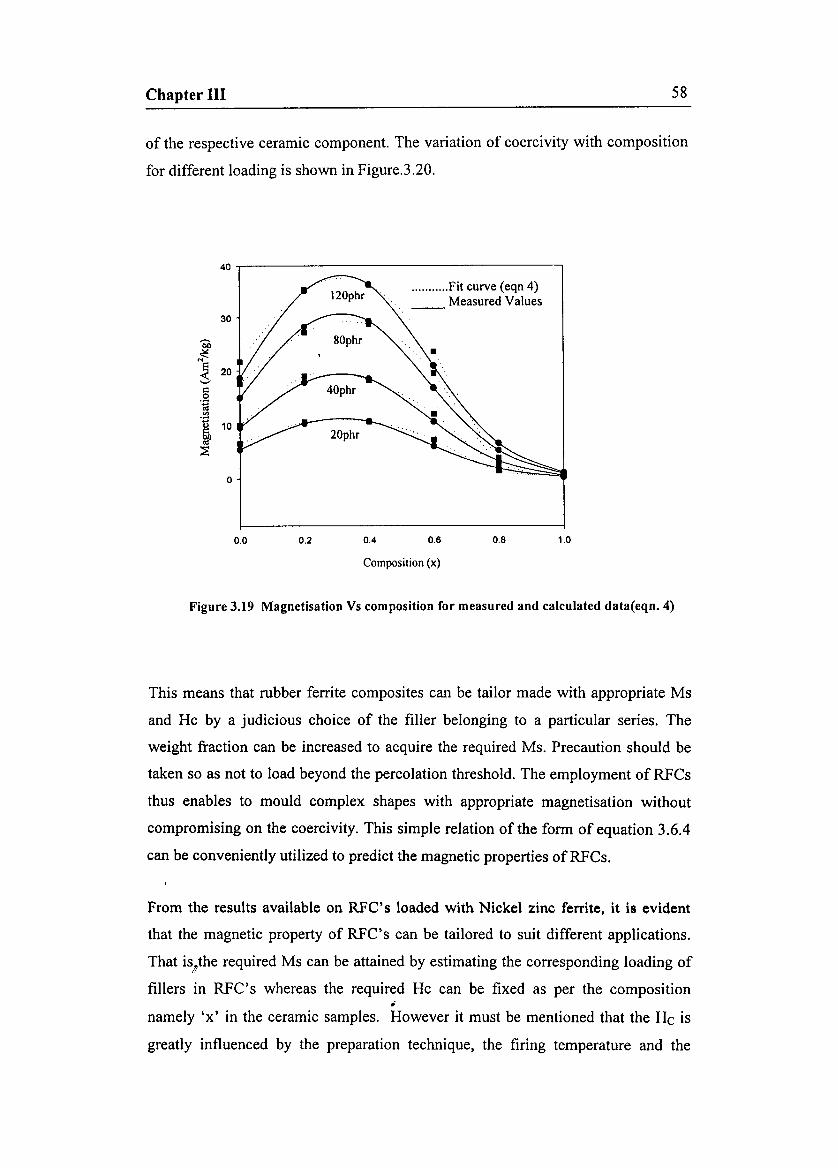
Chapter III 58
of the respective ceramic component. The variation of coercivity with composition
for different loading is shown in Figure.3.20.
40 -r----------------------,
30
o
...........Fit curve (eqn 4)Measured Values
0.0 0.2 0.4 0.6 0.8 1.0
Composition (x)
Figure 3.19 Magnetisation Vs composition for measured and calculated data(eqn. 4)
This means that rubber ferrite composites can be tailor made with appropriate Ms
and He by a judicious choice of the filler belonging to a particular series. The
weight fraction can be increased to acquire the required Ms. Precaution should be
taken so as not to load beyond the percolation threshold. The employment of RFCs
thus enables to mould complex shapes with appropriate magnetisation without
compromising on the coercivity. This simple relation of the form of equation 3.6.4
can be conveniently utilized to predict the magnetic properties of RFCs.
From the results available on RFC's loaded with Nickel zinc ferrite, it is evident
that the magnetic property of RFC's can be tailored to suit different applications.
That iSJ'the required Ms can be attained by estimating the corresponding loading of
fillers in RFC's whereas the required He can be fixed as per the composition•
namely 'x' in the ceramic samples. However it must be mentioned that the He is
greatly influenced by the preparation technique, the firing temperature and the
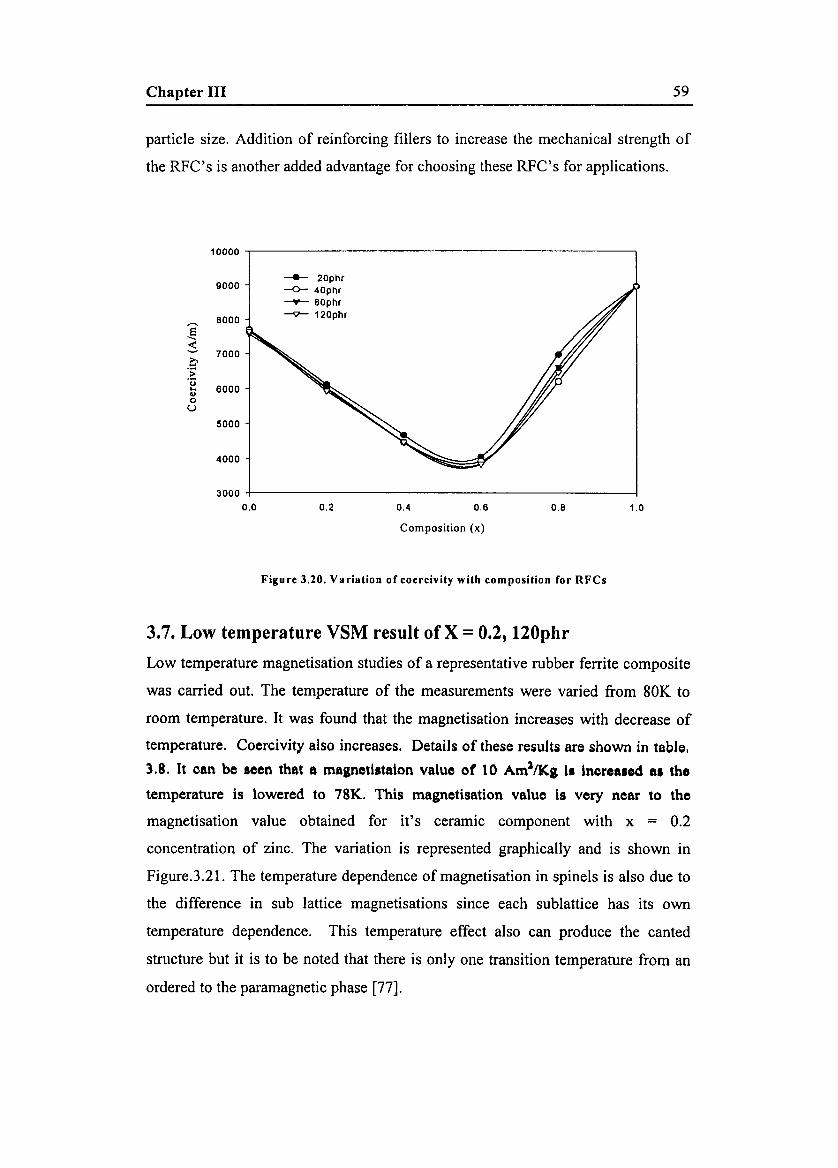
Chapter III 59
particle size. Addition of reinforcing fillers to increase the mechanical strength of
the RFC's is another added advantage for choosing these RFC's for applications.
10000
- 20phr9000 -0- 40phr
--...- 60phr
6000 -?- 120phr,.-,
.§$ 7000.q>'0
6000...v0
U
5000
4000
30000.0 0.2 0.4 0.6 0.6 1.0
Composition (x)
Figu re 3.20. Va riation of coercivity with corn position for RFCs
3.7. Low temperature VSM result of X = 0.2, 120phr
Low temperature magnetisation studies of a representative rubber ferrite composite
was carried out. The temperature of the measurements were varied from 80K to
room temperature. It was found that the magnetisation increases with decrease of
temperature. Coercivity also increases. Details of these results are shown in table,
3.8. It can be seen that a maanollltalon value of 10 Am2/Ka 11 lncrealod al tho
temperature is lowered to 78K. This magnetisation value is very near to the
magnetisation value obtained for it's ceramic component with x = 0.2
concentration of zinc. The variation is represented graphically and is shown in
Figure.3.21. The temperature dependence of magnetisation in spinels is also due to
the difference in sub lattice magnetisations since each sublattice has its own
temperature dependence. This temperature effect also can produce the canted
structure but it is to be noted that there is only one transition temperature from an
ordered to the paramagnetic phase [77].
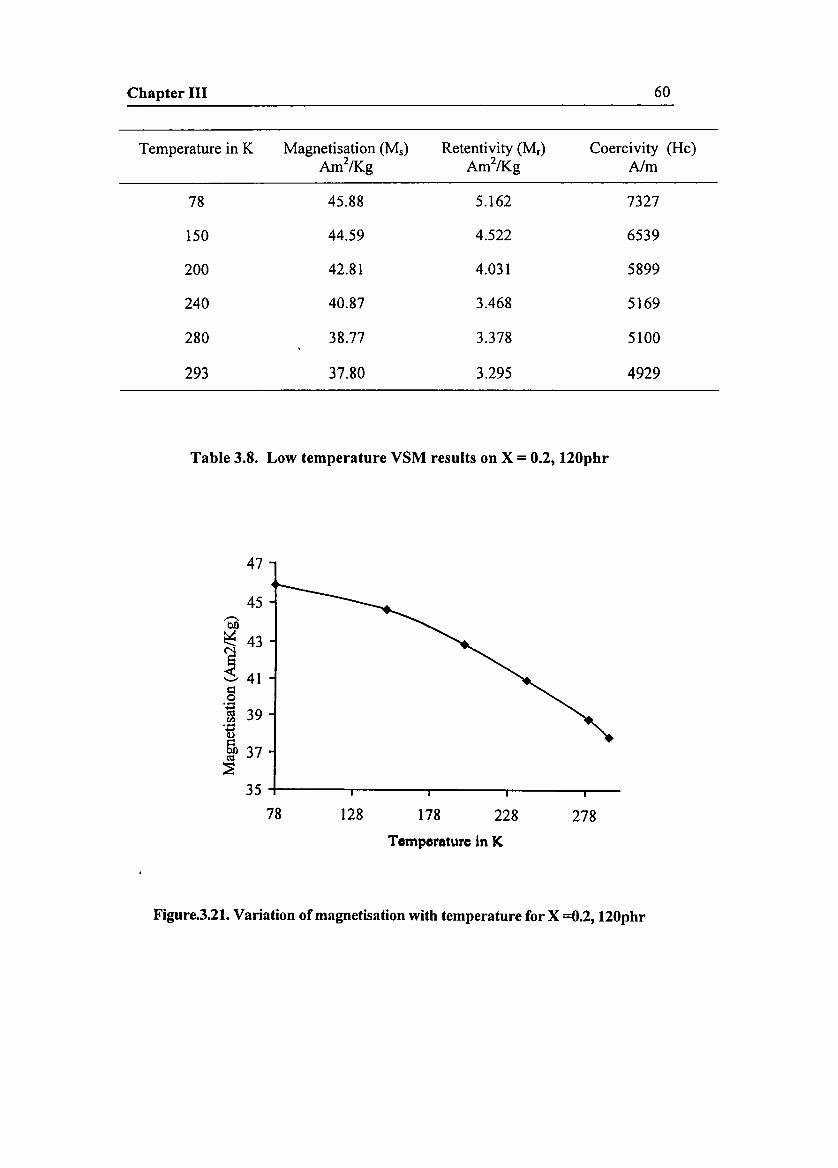
Chapter III 60
Temperature in K Magnetisation (Ms) Retentivity (M r) Coereivity (He)Am2/Kg Am2/Kg Aim
78 45.88 5.162 7327
150 44.59 4.522 6539
200 42.81 4.031 5899
240 40.87 3.468 5169
280 38.77 3.378 5100
293 37.80 3.295 4929
Table 3.8. Low temperature VSM results on X = 0.2, 120phr
278228178128
45
47
35 ;---~---.....-----,r------,-
78
Temperature in K
Figure.3.21. Variation of magnetisation with temperature for X =0.2, 120phr
Chapter III 61
3.8 Conclusion
Polycrystalline nickel zinc ferrite samples were synthesized and characterised by XRD
and vibrating sample magnetometry. The X-ray diffraction studies show that these
polycrystalline have crystallized in the spinel phase without any detectable impurity
phases. These compounds exhibit an increase in lattice parameter with increase in Zn
content. The magnetic measurements indicate that the saturation magnetisation increases
with increase in x, reaches a maximum at x = 0.4, and then decreases. Coercivity
decreases with x attains a minimum at x = 0.6 and then increases with x. Nickel zinc
ferrites were then incorporated in a butyl rubber matrix to produce rubber ferrite
composites (RFCs). Before making thin sheets, the processability of these polymers was
studied by evaluating the cure characteristics. The results show that the processability is
not affected by loading. It was also found that the cure characteristics, particularly the
minimum and maximum torque do not vary with increase ofcomposition.
Magnetisation measurements on RFCs suggests that their saturation magnetisation can
be modified by a judicious selection of composition, that is x and its loadings. Based on
the present study it can be concluded that the magnetic field strength remains as that of
the original magnetic component in the matrix. Fundamentally these results indicate that
there is no possible interaction between the between the matrix and the filler because , if
there were an interaction it would have affected the nature of the domain and hence
would have disturbed the coercivity.
A general equation ofthe form M,./c = (1 +O.2x).Mc,,..mlllC.,W2.exp{-D.5(X ~xo )2]
was also formulated to predict the saturation magnetisation of RFCs. It is to be noted
that the calculation requires only the maximum magnetisation value corresponding to the
composition xo. Calculations and comparisons have shown that this fits well for the
present system as well as for other systems and it is to be assumed that a general
equation of the above form can be employed to predetermine the saturation
magnetisation of RFCs containing any mixed ferrites series.
Chapter IV
On the magnetic properties ofUltra fine zinc ferrites
4.1 Introduction
Investigations carried out in evaluating the magnetic properties of Nil_xZnxFe204
samples for various compositions have revealed that for the composition
corresponding to x =1, that is ZnFe204 , the magnetisation values obtained are not
in conformity with that of the reported literature [78]. These results were difficult
to explain by applying conventional understanding of magnetism of micron-sized
particles. Hence a detailed study was undertaken to explain the anomalous
behaviour exhibited by zinc ferrite samples. The details are discussed in this
chapter.
Spinel ferrites are commercially important materials because of their excellent
electrical and magnetic properties [79]. These class of materials have been the
subject of extensive studies by physicists and chemists alike. A whole range of
distribution of cations is possible in spinels which can be represented generally by
the formula (Me" )O(Felll)I_O[(Me" )1-0 (Felll)I+O]04 where the ions inside the square
brackets are said to be occupying octahedral sites (B) and the ions outside the
bracket occupy the tetrahedral sites (A) [80]. In the above formula when 0 =1, then
it is called a normal spinel. When 0 = 0 it is called an inverse spinel. When 0=1/3
it is called a random spinel. The structure can be described as a close packed
assemblage of oxygen atoms with metal atoms occupying positions in some of the
interstices. The metal position are of two types, those in which the oxygen atoms
are tetrahedrally coordinated to the metal atoms, and those in which the
surrounding oxygen atoms have octahedral symmetry of the twenty four positions
available to the metal atoms in the unit cell, eight are of the tetrahedral type and
sixteen belong to the octahedral category. From the fundamental point of view,
Chapter IV 63
these materials serve as ideal candidates for studying ferrimagnetism and
ferrimagnetic properties.
The crystal structure of ferrites has been the subject of several investigations in the
past [81]. Ferrites are technologically important because of their interesting
magnetic properties, which is explained by Neel [82]. The saturation moment
according to the theory of Neel is related in a simple and elegant manner to the
distribution of magnetic ions among the available lattice sites. According to the
Neel model of ferrimagnetism, the exchange integrals between an arbitrary pair of
metal ions is such as to produce an antiparallel alignment of the two. The A-B
coupling however is taken to be considerably stronger than that between ions
located on the same type of crystallographic site. Thus the spin of ions in the
octahedral positions are antiparallel to those of the tetrahedral ions. In an inverted
spinel the saturation moment is then determined solely by the atomic moment of
the divalent cation.
Zinc ferrite belongs to the category of normal spinels [78]. The structural and
magnetic properties of zinc ferrites have been the subject of study by various
researchers over the last two decades [83-98]. It has been established that
structurally Zn Fe2 0 4 is a normal spinel where it can be written as (Zn2+)A
((Fe3+h)B04 and its net magnetisation is zero. Investigations on zinc ferrite
indicated that zinc ferrite is antiferromagnetic because of B-B interactions with a
Neel temperature of about IOK. Above Neel temperature, it behaves as a
paramagnet [99]. There have been reports indicating anomalies in the magnetic
properties of zinc ferrites saying that zinc ferrite samples are not completely the
normal spinel [100-102]. The Occupancy of Fe3+ ions at the A site is larger in
smaller crystallite samples and the cation substitution increases with decreasing
particle size. This is explained on the basis that a Fe3+ ion located at the A-site
forms a cluster with its twelve nearest Fe3+ neighbours at B-sites through coupling
by the A-B interaction, which is much stronger than the B-B interaction. The
number of these clusters would increase with decreasing particle size because
cation substitution is more pronounced in smaller particles. Thus the magnetisation
increases with decreasing particle size. This A-B interaction is short range in
Chapter IV 64
nature. For instance, Lotgering et.al[IOO] detected anomalous behaviour in the
paramagnetic susceptibility in the zinc ferrite. Brock-house and others [103] found
the presence of short-range order of parallel spins separated by 0.29nm in their
neutron diffraction studies at 89K.
Investigations on the structural and magnetic properties on zinc ferrite samples
prepared by two techniques were under taken. Zinc ferrite samples were prepared
by two different routes and have been analyzed by using Low Energy Ion
Scattering, Mossbauer Spectroscopy and vibratiing sample magnetometry. Low
Energy Ion Scattering (LEIS) was used to find out the surface composition of the
samples prepared by these two different techniques. Mossbauer spectroscopy was
employed as an analytical tool to discern more information on the nature of
ordering on these samples.
4.2. Preparation of zinc ferrite at Low temperature
Zinc Ferrite was prepared by low temperature preparative techniques as described
by T.Sato et.al.[104] 0.1 m aqueous solution of zinc nitrate and 0.2m aqueous
solution of ferric nitrate were prepared separately. 100 ml. of each solution was
mixed together, while stirring this mixture, 25% ammonia was added until the pH
was between 9 - 11 at 320K. The precipitate was dried at 373K and calcined in air
at 773K which yielded zinc ferrite.
4.3. Preparation of Zinc ferrite at high temperature
Zinc ferrite was also prepared by conventional ceramic technique [105].
Appropriate amounts of Zinc oxide were mixed with freshly prepared alpha iron
oxide, which in turn was prepared by using oxalate precursors. All the reagents
used were AR grade. They were pre-fired at 773K. The pre sintering was repeated
twice for ensuring homogeneity. They were finally sintered at around 1223 K for
several hours. They were then allowed to cool naturally under ambient conditions.
4.4. Structural evaluation of ZnFel04"
The crystal structure of ZnFe204 prepared by two different routes was determined
by using X-Ray powder Diffraction techniques. The powder diffractograms were
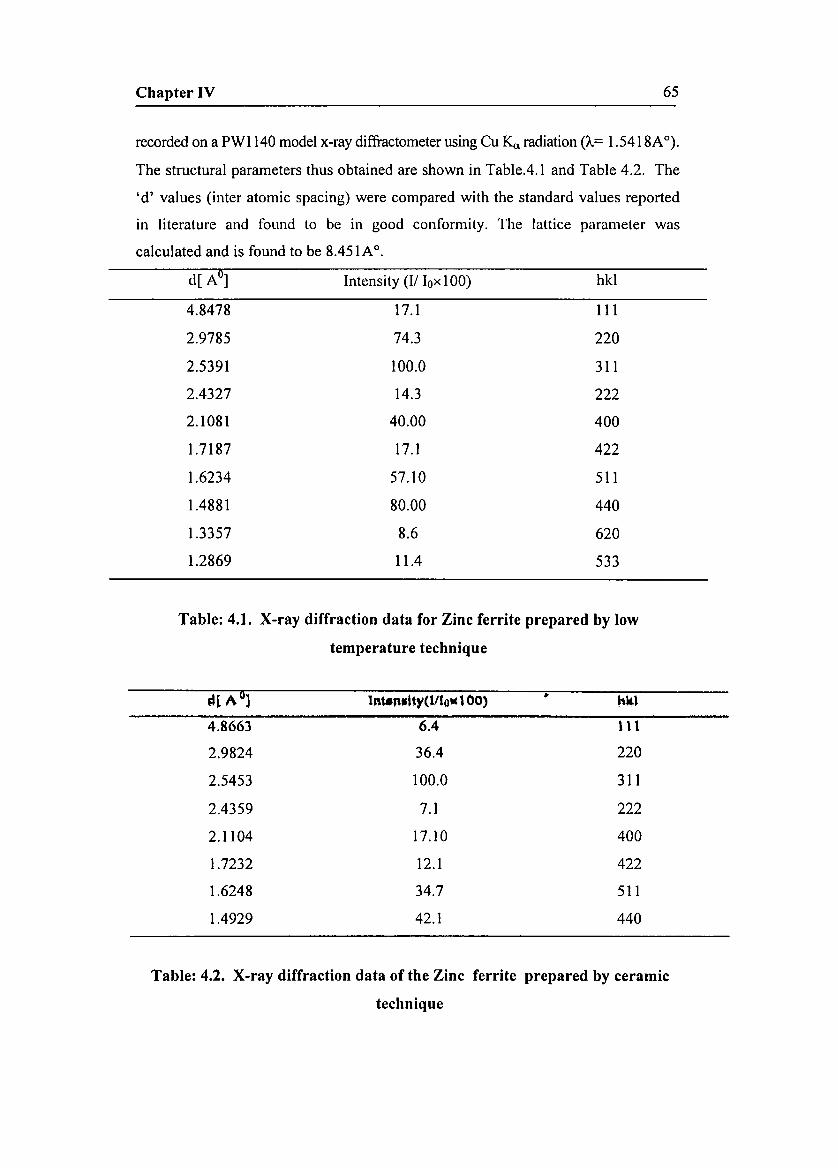
Chapter IV 65
recorded on a PW1140 model x-ray diffractometer using Cu K, radiation (/...= 1.5418A0).
The structural parameters thus obtained are shown in Table.4.1 and Table 4.2. The
'd' values (inter atomic spacing) were compared with the standard values reported
in literature and found to be in good conformity. The lattice parameter was
calculated and is found to be 8.451A0.
d[ AD] Intensity (1/ lox100) hkl
4.8478 17.1 III
2.9785 74.3 220
2.5391 100.0 311
2.4327 14.3 222
2.1081 40.00 400
1.7187 17.1 422
1.6234 57.10 511
1.4881 80.00 440
1.3357 8.6 620
1.2869 11.4 533
Table: 4.1. X-ray diffraction data for Zinc ferrite prepared by low
temperature technique
d[ It.0) la\~".t\y(l/lo. tOO) kkl
4.8663 6.4 111
2.9824 36.4 220
2.5453 100.0 311
2.4359 7.1 222
2.1104 17.10 400
1.7232 12.1 422
1.6248 34.7 511
1.4929 42.1 440
Table: 4.2. X-ray diffraction data of the Zinc ferrite prepared by ceramic
technique
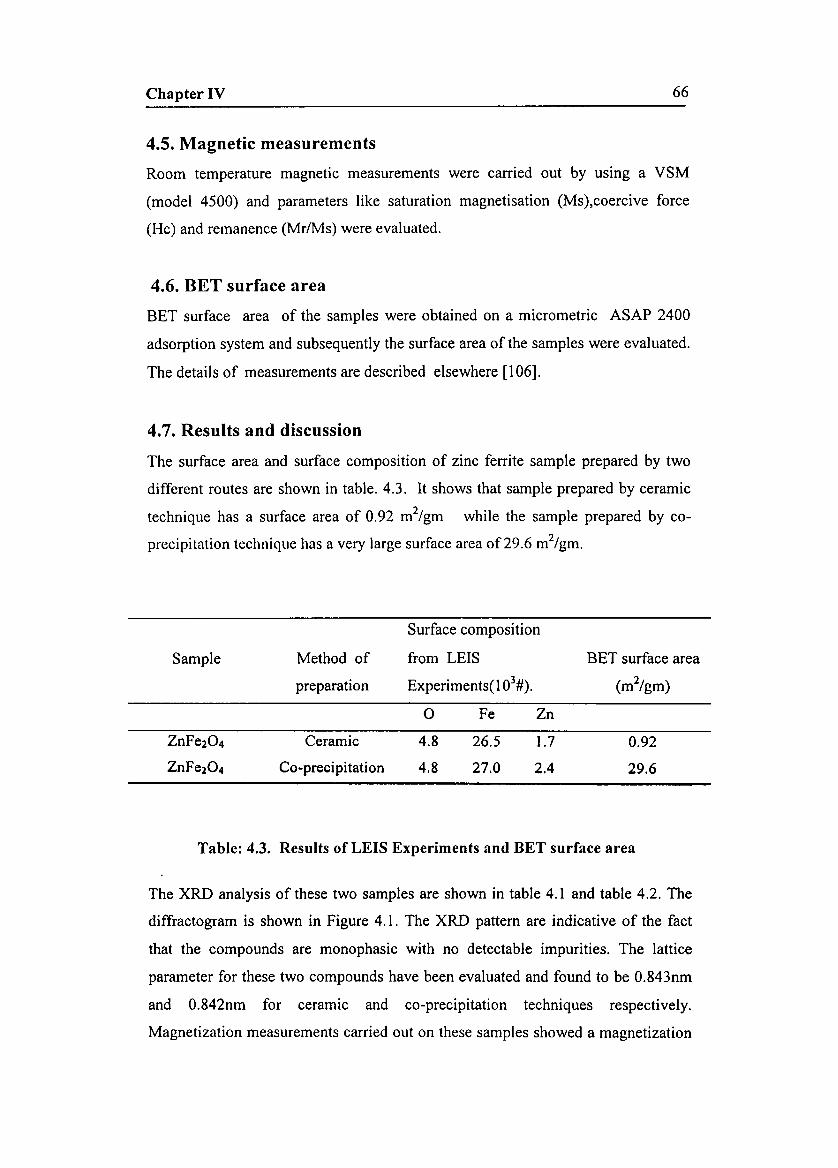
Chapter IV 66
4.5. Magnetic measurements
Room temperature magnetic measurements were carried out by using a VSM
(model 4500) and parameters like saturation magnetisation (Ms),coercive force
(He) and remanence (Mr/Ms) were evaluated.
4.6. BET surface area
BET surface area of the samples were obtained on a micrometric ASAP 2400
adsorption system and subsequently the surface area of the samples were evaluated.
The details of measurements are described elsewhere [106].
4.7. Results and discussion
The surface area and surface composition of zinc ferrite sample prepared by two
different routes are shown in table. 4.3. It shows that sample prepared by ceramic
technique has a surface area of 0.92 m2/gm while the sample prepared by co
precipitation technique has a very large surface area of29.6 m2/gm.
Surface composition
Sample Method of from LEIS BET surface area
preparation Experiments( I03#). (m2/gm)
0 Fe Zn
ZnFe204 Ceramic 4.8 26.5 1.7 0.92
ZnFe204 Cc-precipitation 4.8 27.0 2.4 29.6
Table: 4.3. Results of LEIS Experiments and BET surface area
The XRD analysis of these two samples are shown in table 4.1 and table 4.2. The
diffractogram is shown in Figure 4.1. The XRD pattern are indicative of the fact
that the compounds are monophasic with no detectable impurities. The lattice
parameter for these two compounds have been evaluated and found to be 0.843nm
and 0.842nm for ceramic and eo-precipitation techniques respectively.
Magnetization measurements carried out on these samples showed a magnetization

Chapter IV 67
of 3.12 Am2/kg and coercivity of 4976A/m. Figure 4.2 shows the hysteresis loop
obtained for the ZnFe204 from VSM measurements. This is an anomalous result
in the sense that ZnFe204 crystallises in the normal spinel structure, where Zn2+ is
found exclusively on the tetrahedral sites(A). Since Zinc ferrite exhibits a net
magnetisation of 3.12 Am2/kg it is to be assumed that some amount of Zn is
occupying B site. From LEIS measurements (cf table 4.3) it can be seen that some
amount of Zn is detected at the surface. The amount of Zn detected on the ceramic
sample is less than that of the zinc ferrite sample prepared by eo-precipitation
method (cf table 4.3). It must be mentioned in this context that low concentration
of Zn on the surface cannot be attributed to a low sensitivity of LEIS for Zn
because this is not the case for pure Zn where no matrix effects are expected [I 07].
Usually, only low index planes are taken in to consideration when discussing the
surface of spinels. Following the suggestion by Knozinger and Ratnasamy [108]
and using their notation, one can distinguish 6 different low index surface planes,
which are shown in Figure 4.3. In the figure the open spheres represents oxygen
anions, the solid spheres are octahedrally coordinated cations and cross -hatched
spheres are the tetrahedrally coordinated cations. From the figure, it follows that
the A(1II), C(IIO) ,E(100) and F(lOO) planes have both tetrahedral and octahedral
sites on the surface while B(1II) and D(110) only expose octahedral coordinated
cations. Thus it is possible to construct a spinel surface where tetrahedral sites are
not exposed. Ziolkowski and Barbaux [109] have predicted through semi
empirical calculations that in the case of spinels like C0304 it is the A(1II) and
D(110) planes which are energetically preferred on the surface, but these
predictions do not form a final conclusion. Where as Shelef et.al [110] with the aid
of LEIS concluded that tetrahedral sites are not on the surface. These findings were
again supported by Beaufils and Barbaux by using differential neutron diffraction
[1'11]. Jacob's et.al [112] and Anantharaman et.al [113] through independent
experiments conducted on spinel aluminates and spinel ferrites respectively have
established that it is the octahedral sites which are preferentially getting exposed on
the surface of spinel compounds. They have predicted that D(1lO) or B(111) are
the preferentially exposed piano. on .plnol ferrltes surfaces which alve, ICOpO for
selecting catalytically active cations in spinel type compounds.
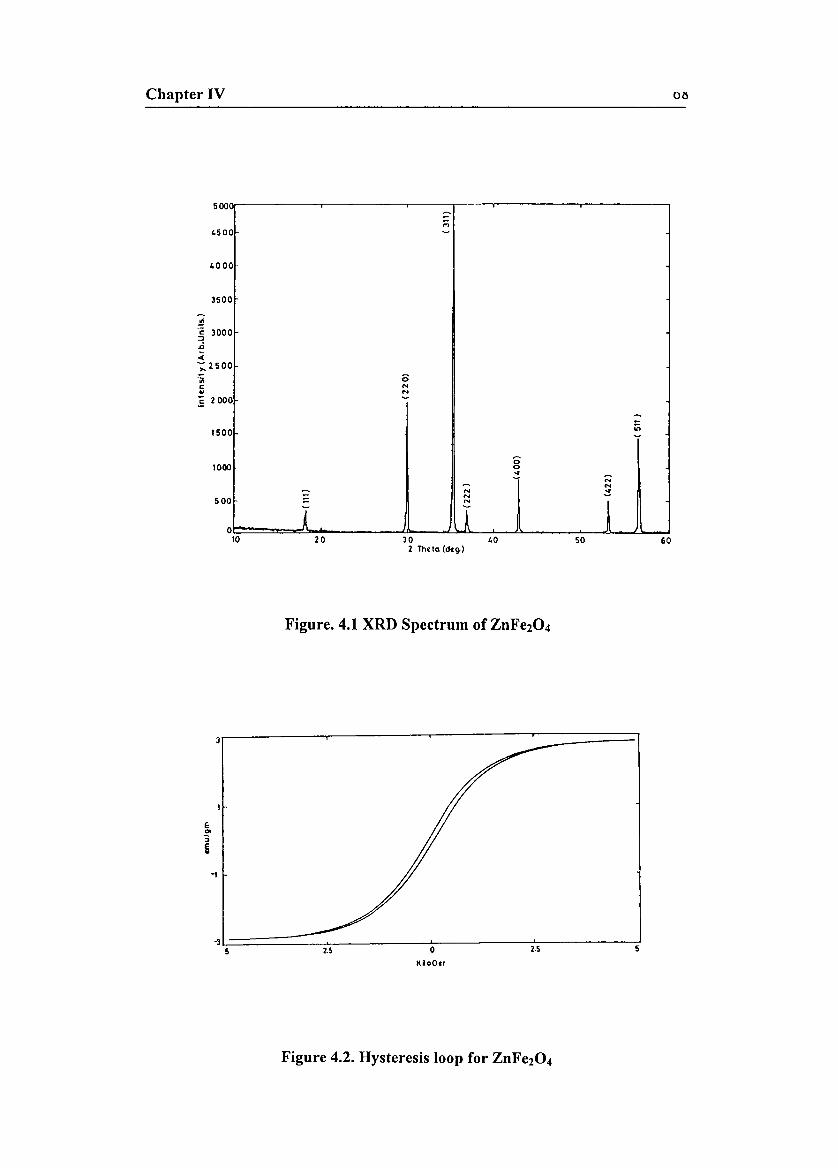
Chapter IV Ol)
605040302 Thola (dog.)
20
0
;;;~
0NN~
~
in~
a0..
~- N~ NN ;:!N- N
~I Io10
500
4500
1500
1000
500
3500
4000
.l!!
.~ 3000
.a-e;. 2500
'iIIc..:E 2000
Figure. 4.1 XRD Spectrum of ZnFe204
52.5oKloOcr
2.5"3L.=====:::::::=-:';----~;___---_::_,.______---_;!
5
E
'"';~
3.---------,--------.--------r-----==:==l
Figure 4.2. Hysteresis loop for ZnFe204
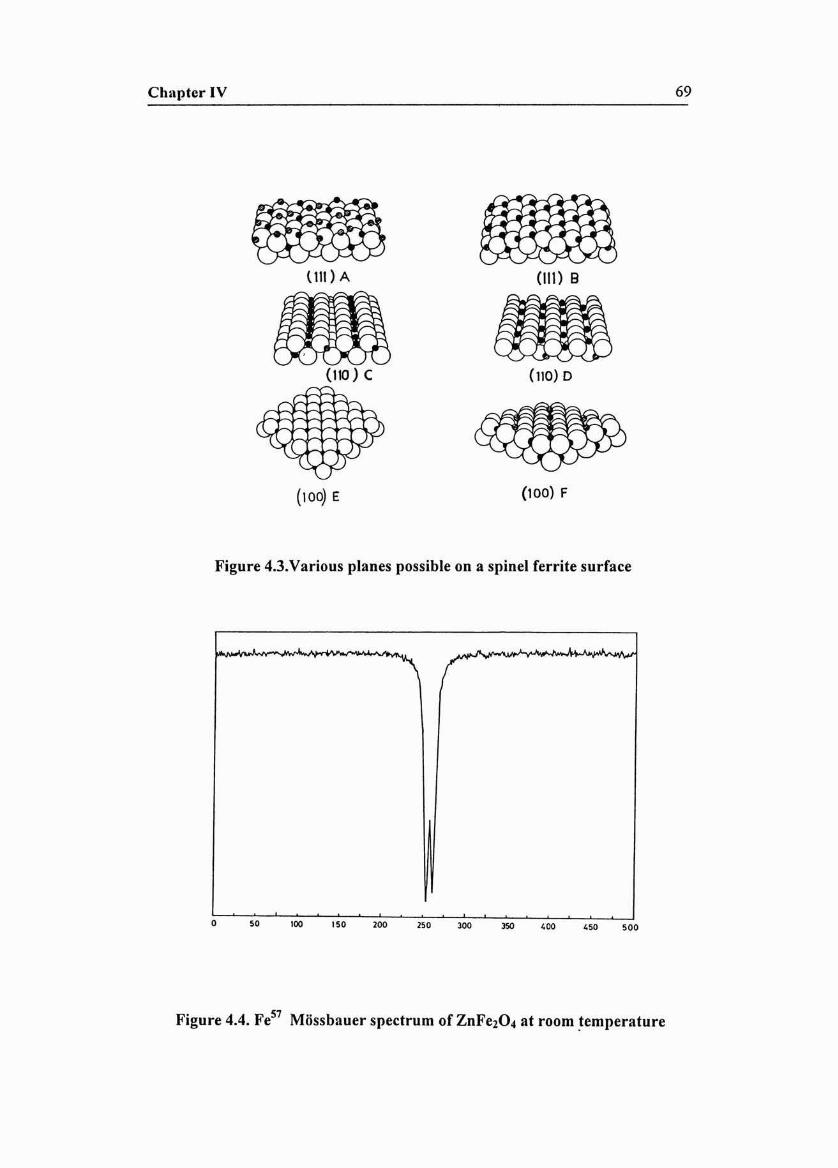
Chapter IV
~,..~ 'X ~~
UII) A
(110) C
(100) E
n
~
(Ht) 8
( 110) 0
(100) F
69
Figu re 4.3.Various planes possible on a spine) ferrite surface
c .. '00 ,.. >0. ". '00 '00 450 SOO
Figure 4.4. Fe57 Mbssbauer spectrum of ZnFe204 at room temperature

Chapter IV 'IU
LEIS results indicate that the amount of Zinc detected on the high surface area
sample prepared by coprecipitation method is much more than that detected on the
sample prepared by ceramic technique (table 4.3). It has been proven by various
researchers that it is the octahedral sites which are preferentially exposed on the
spineI surfaces. Thus the detection of Zn on the surface of Zinc ferrite leads to the
conclusion that some amount of Zn is occupying the Octahedral sites, and the
amount of Zinc occupation is dependent on particle size. The finer the particles, the
more is the zinc on the B site. This observation using LEIS receives further
evidence in the magnetic measurements conducted by Kamiyame et al.[102].
Kamiyame et al in their experiments have found that finer the particle, the more is
the saturation magnetisation. They assumed a cation distribution of
Znl_xFex[ZnxFe2_x]04,where x = 0.04 or more.
The Mossbauer spectrum at room temperature is shown in figure 4.4. The spectrum
was satisfactorily fitted with a single doublet having a quadrupole splitting of 0.37
mm/s and center shift of 0.33mm/s. Since the fitted line width was only 0.30mm/s
the presence of another doublet is ruled out. The Fe57 Mossbauer spectrum of
ZnFe204 recorded at 16K is shown in figure 4.5. The spectrum shows clearly that
ZnFe204 is magnetically ordered at 16 K . The data was analysed by means of a
procedure developed by Window [114]. In this method it is assumed that the
observed line shapes arise from the probability distribution P(H) of hyperfine
fields. In figure.4.5 the dots represent the experimental data and the solid line is a
result of the fitting of the data using the Window approach. The resultant
probability distributions are shown in figure.4.6. The most probable field is found
to be 63 kOe and the mean field of the distribution is 80 kOe. The magnetic
ordering in ZnFe204 is possible only if there is an inversion that is, some of the
Zn2+ ions occupy the octahedral sites and some of the Fe3+ ions occupy the
tetrahedral sites which give rise to a strong coupling between Fe3+ ions at A- and
B- sites due to the A-B interaction. This experimental observations receives further
support from the studies conducted on ultrafine zinc ferrite particles by Sato et al.
[104]. In their experiments, they found that the saturation magnetization of ultra
fine zinc ferrite particles increases with a decrease in particle size at room
temperature. They observed the same trend at low temperature also.
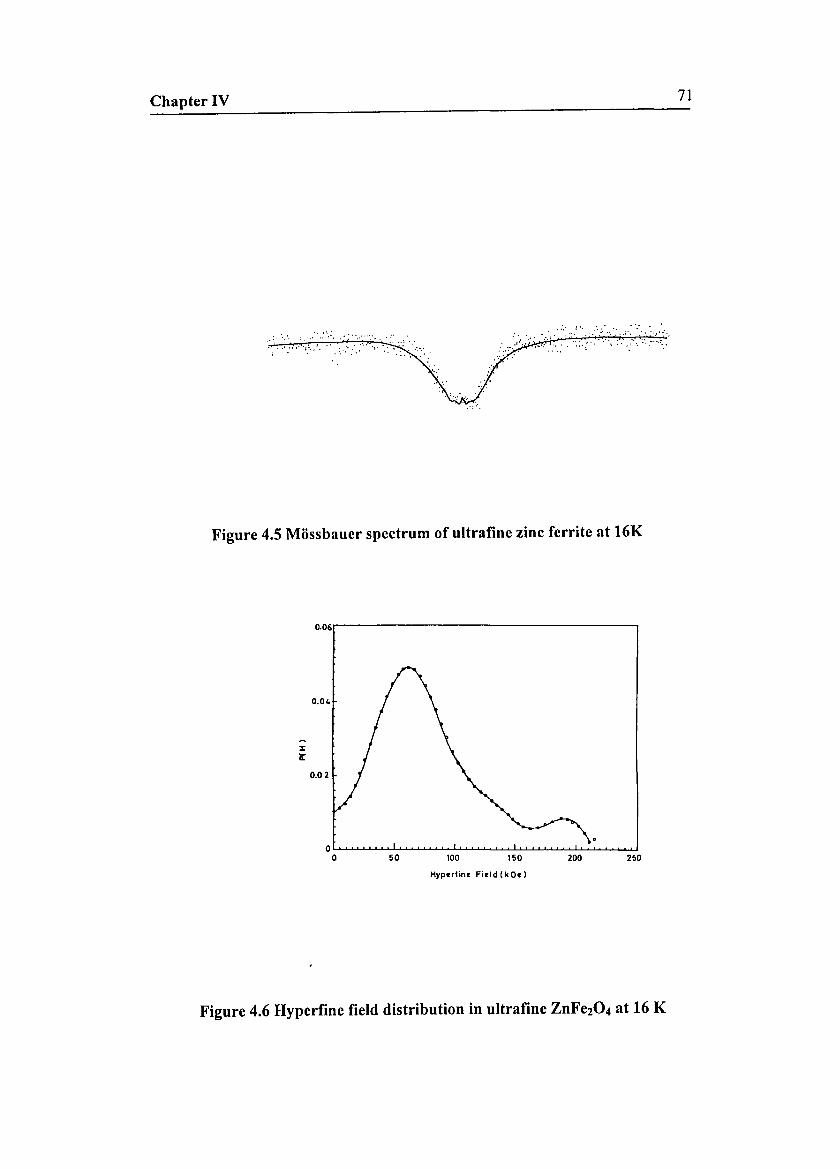
. ..' .....: ~..'. ".;.: :'.'.,
Chapter IV
:: . . ....... ''; .". :.' :".' ••••;. ',." ••1', .. ':":":"
. '"". : .. :'", ':",~' ":..
71
Figure 4.5 Mdssbauer spectrum of ultrafine zinc ferrite at 16K
0.06r------------------~
0.02
100 150 200 2~0
Hypcrlinc Field(kOc)
Figure 4.6 Hyperfine field distribution in ultrafine ZnFe20 4at 16 K

Chapter IV 72
Further more, EXAFS studies conducted on zinc ferrites by Jayadevan et al. [115]
also support the presence of Zn 2+ on the B site. Thus it is reasonable to conclude
that the Fe3+ situated on A sites, according to cation distribution Znl_xFex [Zn,
Fe 2-x]04 forms a cluster with its 12 nearest Fe 3+neighbours at B sites through
coupling. Probably the number of clusters increases with decreasing particle size.
So anomalous magnetisation may be due to the short range ordering of the samples
as reported by Schiessel et al [116] and Kamiyame et al [102]. However it must be
mentioned that the surface spins may also contribute to the observed magnetization
as they are expected to be considerably high in number due to small size of
particles.
4.8. Conclusion
ZnFe204 samples prepared by both low temperature and ceramic method were
found to be single phasic in nature from XRD analysis. Magnetisation
measurements carried out on these samples shows a magnetisation value contrary
to the classical case of normal spineI ferrites, according to which the zinc ferrite is
purported to be exhibiting a zero net magnetisation. A detailed analysis of these
samples were carried out by using low energy ion scattering, BET surface area
measurements and Mossbauer spectroscopy. Initial analysis on the results of zinc
ferrite samples using LEIS , BET surface area and Mossbauer spectroscopy suggest
that zinc occupies the B-site contrary to the earlier belief that it occupies only A
site. The amount of zinc detected on the surface of high surface area zinc ferrite is
higher than that of the low surface area zinc ferrite prepared by ceramic technique.
This establishes that zinc substitution increases with decreasing particle size.
Mossbauer results shows that the A-B interactions are not long range but only short
range.
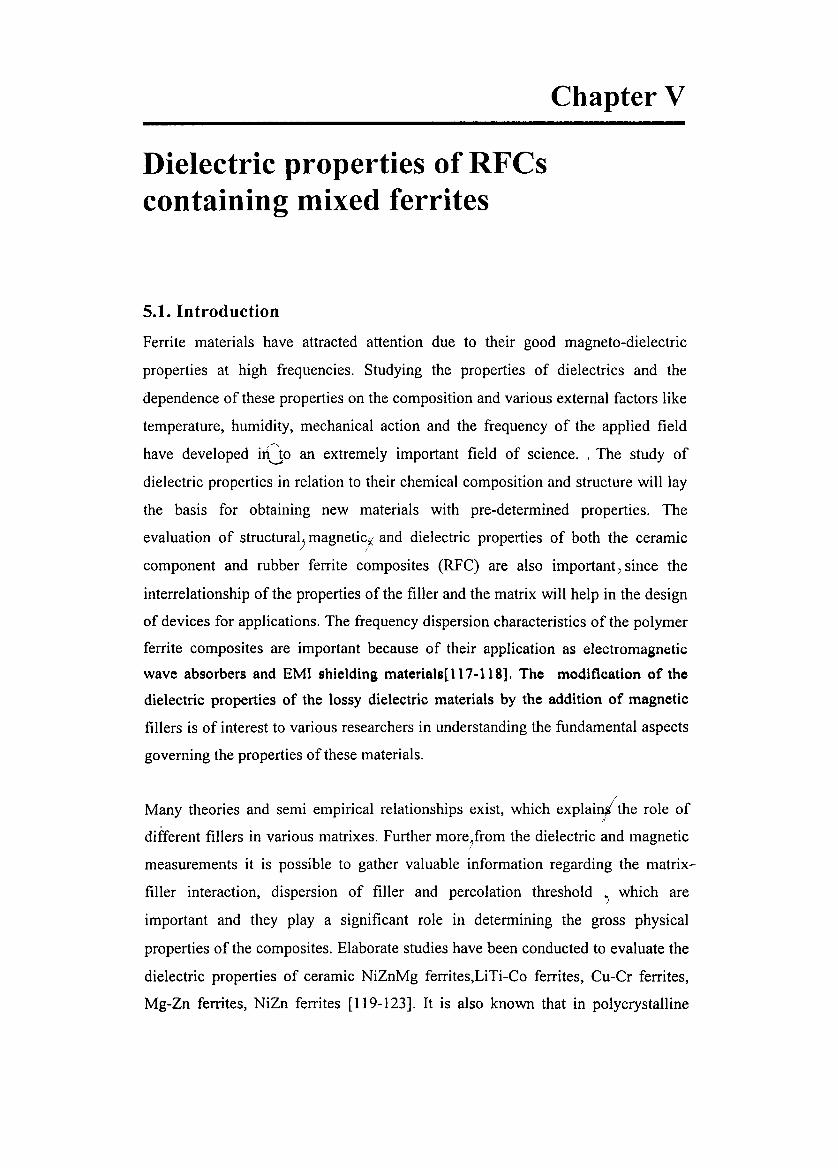
Chapter V
Dielectric properties of RFCscontaining mixed ferrites
5.1. Introduction
Ferrite materials have attracted attention due to their good magneto-dielectric
properties at high frequencies. Studying the properties of dielectrics and the
dependence of these properties on the composition and various external factors like
temperature, humidity, mechanical action and the frequency of the applied field
have developed iri"to an extremely important field of science. , The study of~
dielectric properties in relation to their chemical composition and structure will lay
the basis for obtaining new materials with pre-determined properties. The
evaluation of structural) magneticj and dielectric properties of both the ceramic
component and rubber ferrite composites (RFC) are also important i since the
interrelationship of the properties of the filler and the matrix will help in the design
of devices for applications. The frequency dispersion characteristics of the polymer
ferrite composites are important because of their application as electromagnetic
wave absorbers and EMI shielding materials]117-118]. The modification of the
dielectric properties of the lossy dielectric materials by the addition of magnetic
fillers is of interest to various researchers in understanding the fundamental aspects
governing the properties of these materials.
Many theories and semi empirical relationships exist, which explain/the role ofi
different fillers in various matrixes. Further more.from the dielectric and magnetic
measurements it is possible to gather valuable information regarding the matrix
filler interaction, dispersion of filler and percolation threshold ') which are
important and they play a significant role in determining the gross physical
properties of the composites. Elaborate studies have been conducted to evaluate the
dielectric properties of ceramic NiZnMg ferrites,LiTi-Co ferrites, Cu-Cr ferrites,
Mg-Zn ferrites, NiZn ferrites [119-123]. It is also known that in polycrystalline
Chapter V 74
materials the dielectric properties are generally dictated by a combination of
various factors like method of preparation, cation distribution, grain size, the ratio
of Fe3+/Fe2+ ions, ac conductivity and sintering temperature [124]. So the
incorporation of pre-characterised ceramic powders into various matrixes assumes'-'
significance. The dependence of these parameters on the dielectric properties of
ceramic fillers will also have a profound influence on the overall physical
properties of the composites incorporated with the filler. Such a systematic study
on the incorporation of pre-characterised powders irtto various matrixes is rarely'V
found in the literature.
The evaluation of dielectric properties is important in understanding the physical
properties of these composites. Pre -characterised Nickel Zinc ferrites
(Nir..Zn.Fe-O, where 0:::;; x s 1 in steps of 0.2) prepared by ceramic techniques
were incorporated ivo a butyl rubber matrix according to a specific recipe to yield
RFC. The details are cited in chapter 2. The dielectric constant of ceramic Nij,
xZnxFe204 and the butyl rubber composites incorporated with Nil-xZnxFe204 have
been studied as a function of frequency, composition, loading and temperature.
From the experimentally observed dielectric constant of the filler, the matrix
(blank) and the composite, the validity of an appropriate mixture equation, which
will govern the dielectric properties of RFC, is established. This is done by using
the independently observed value of the respective dielectric constant of filler,
matrix and the composite and is fitted theoretically as well as experimentally with
the observed value of the dielectric constant of RFCs. The effect of temperature onr":::t./> ~..,
the dielectric properties of the composite i~ also he- studied. These results are
discussed in this chapter.
5.2. Dielectric properties of ceramic Nil_xZnxFe204
The dielectric constant and dielectric loss of nickel zinc ferrite samples were
determined using an experimental setup, described in chapter 2. Impedance
Analyzer model: HP 4192 A was employed for the evaluation of the dielectric
constant in the frequency range lOKHz to 13MHz. The samples were made
in the form of pellets using a hydraulic press by exerting a pressure of 9 ton
These circular disc pellets having a diameter of 1Omm C~~~) loaded iPJo the
dielectric cell. The lead and fringe capacitance was eliminated by a method
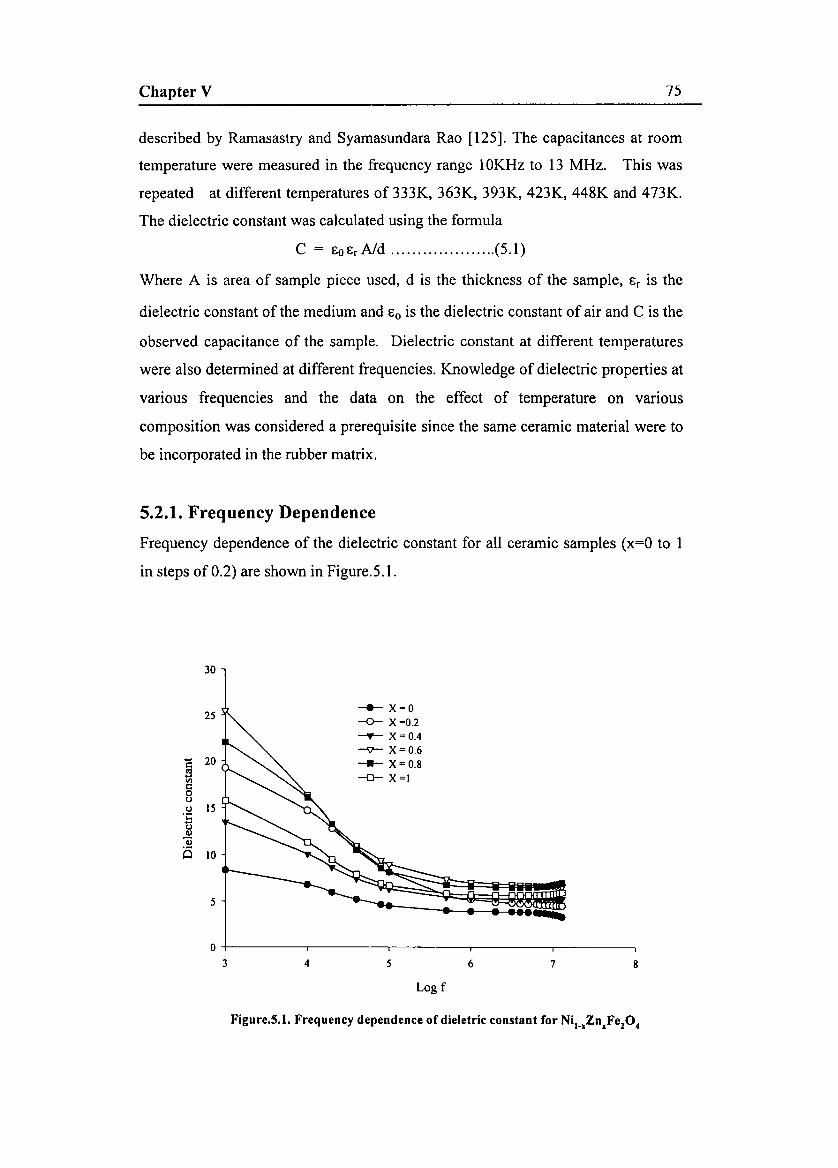
Chapter V 75
described by Ramasastry and Syamasundara Rao [125]. The capacitances at room
temperature were measured in the frequency range 10KHz to 13 MHz. This was
repeated at different temperatures of 333K, 363K, 393K, 423K, 448K and 473K.
The dielectric constant was calculated using the formula
C = Eo Er AId (5.1)
Where A is area of sample piece used, d is the thickness of the sample, Er is the
dielectric constant of the medium and Eo is the dielectric constant of air and C is the
observed capacitance of the sample. Dielectric constant at different temperatures
were also determined at different frequencies. Knowledge of dielectric properties at
various frequencies and the data on the effect of temperature on various
composition was considered a prerequisite since the same ceramic material were to
be incorporated in the rubber matrix.
5.2.1. Frequency Dependence
Frequency dependence of the dielectric constant for all ceramic samples (x=O to 1
in steps of 0.2) are shown in Figure.5.1.
30
25-+- x=o~ X=0.2-......- X=O.4-v- X=0.6- 20 --- X=0.8c
5 ~X=IVlc0uu 15'i:'0uv
CS 10
5
0
3 4 5 6 7 8
Log f
Figure.5.1. Frequency dependence of dieletric constant for Ni1_.Zn.Fe104
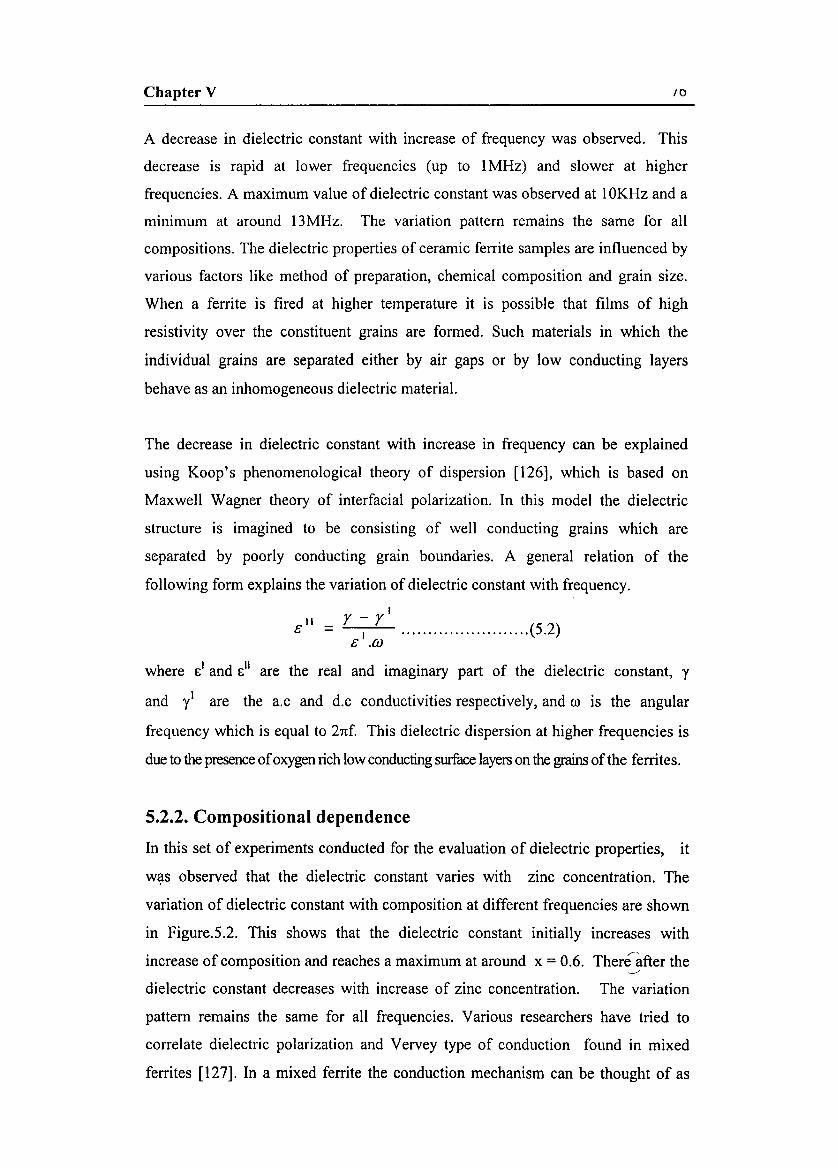
Chapter V 10
A decrease in dielectric constant with increase of frequency was observed. This
decrease is rapid at lower frequencies (up to IMHz) and slower at higher
frequencies. A maximum value of dielectric constant was observed at 10KHz and a
minimum at around 13MHz. The variation pattern remains the same for all
compositions. The dielectric properties of ceramic ferrite samples are influenced by
various factors like method of preparation, chemical composition and grain size.
When a ferrite is fired at higher temperature it is possible that films of high
resistivity over the constituent grains are formed. Such materials in which the
individual grains are separated either by air gaps or by low conducting layers
behave as an inhomogeneous dielectric material.
The decrease in dielectric constant with increase in frequency can be explained
using Koop's phenomenological theory of dispersion [126], which is based on
Maxwell Wagner theory of interfacial polarization. In this model the dielectric
structure is imagined to be consisting of well conducting grains which are
separated by poorly conducting grain boundaries. A general relation of the
following form explains the variation of dielectric constant with frequency.
I11 r - rs = I (5.2)
c .UJ
where El and E" are the real and imaginary part of the dielectric constant, y
and yl are the a.c and d.c conductivities respectively, and ro is the angular
frequency which is equal to 2nf. This dielectric dispersion at higher frequencies is
dueto thepresence ofoxygen richlowconducting surface layers on thegrains of the ferrites.
5.2.2. CompositionaI dependence
In this set of experiments conducted for the evaluation of dielectric properties, it
WI;lS observed that the dielectric constant varies with zinc concentration. The
variation of dielectric constant with composition at different frequencies are shown
in Figure.5.2. This shows that the dielectric constant initially increases with
increase of composition and reaches a maximum at around x = 0.6. Thereafter the.:>
dielectric constant decreases with increase of zinc concentration. The variation
pattern remains the same for all frequencies. Various researchers have tried to
correlate dielectric polarization and Vervey type of conduction found in mixed
ferrites [127]. In a mixed ferrite the conduction mechanism can be thought of as
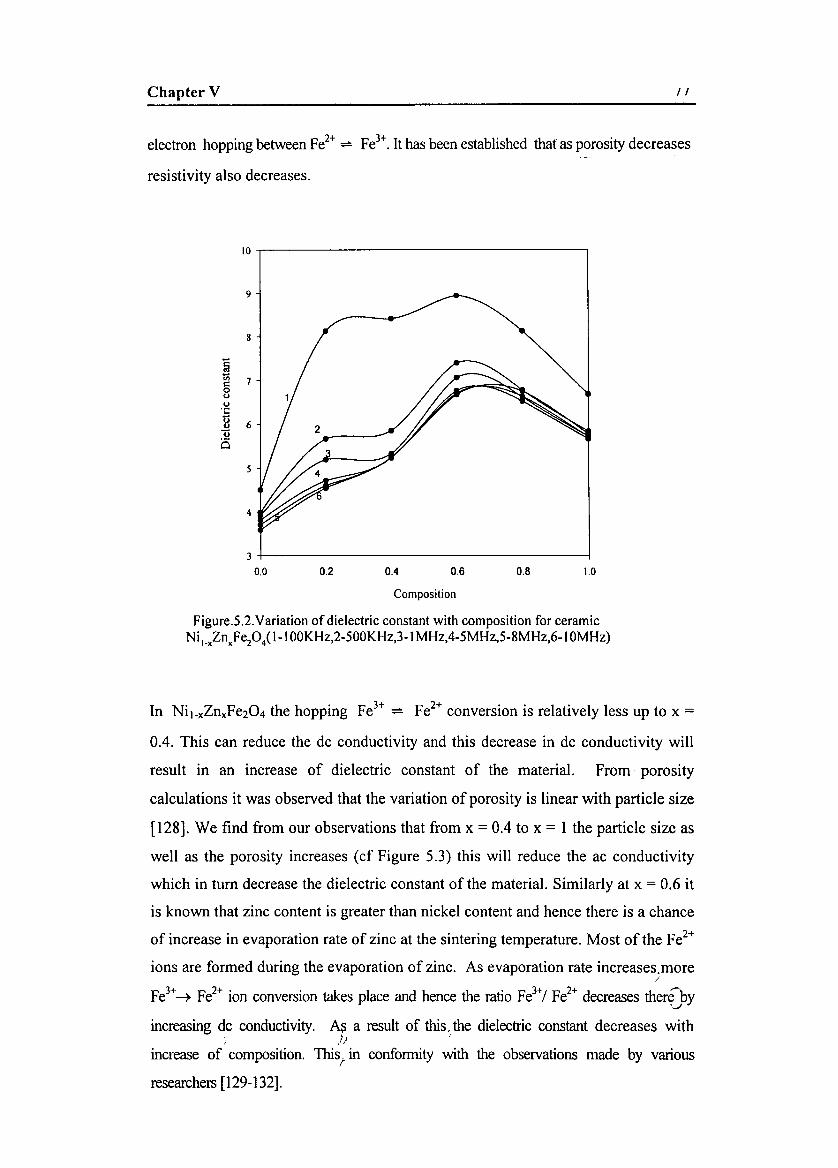
Chapter V 11
electron hopping between Fe2+ ~ Fe3
+. It has been established that as porositydecreases
resistivity also decreases.
10,--------------------,
9
8
~~ 7ouu
'C
E 6vQ
5
4
1.00.80.60.40.2
3+-----------------------l0.0
Composition
Figure.5.2.Variation of dielectric constantwith composition for ceramicNi I'KZnlep4(I-I OOKHz,2-500KHz,3-1 MHz,4-5MHz,5-8MHz,6-1 OMHz)
In Nil-xZnxFe204 the hopping Fe3+ ~ Fe2
+ conversion is relatively less up to x =
0.4. This can reduce the de conductivity and this decrease in de conductivity will
result in an increase of dielectric constant of the material. From porosity
calculations it was observed that the variation of porosity is linear with particle size
[128]. We find from our observations that from x = 0.4 to x = 1 the particle size as
well as the porosity increases (cf Figure 5.3) this will reduce the ac conductivity
which in turn decrease the dielectric constant of the material. Similarly at x = 0.6 it
is known that zinc content is greater than nickel content and hence there is a chance
of increase in evaporation rate of zinc at the sintering temperature. Most of the Fe2+
ions are formed during the evaporation of zinc. As evaporation rate increases.more/
Fe3+~ Fe2
+ ion conversion takes place and hence the ratio Fe3+/ Fe2
+ decreases thenCby
increasing de conductivity. A$ a result of this. the dielectric constant decreases with;. /J I
increase of composition. ThisI in conformity with the observations made by various
researchers [129-132].
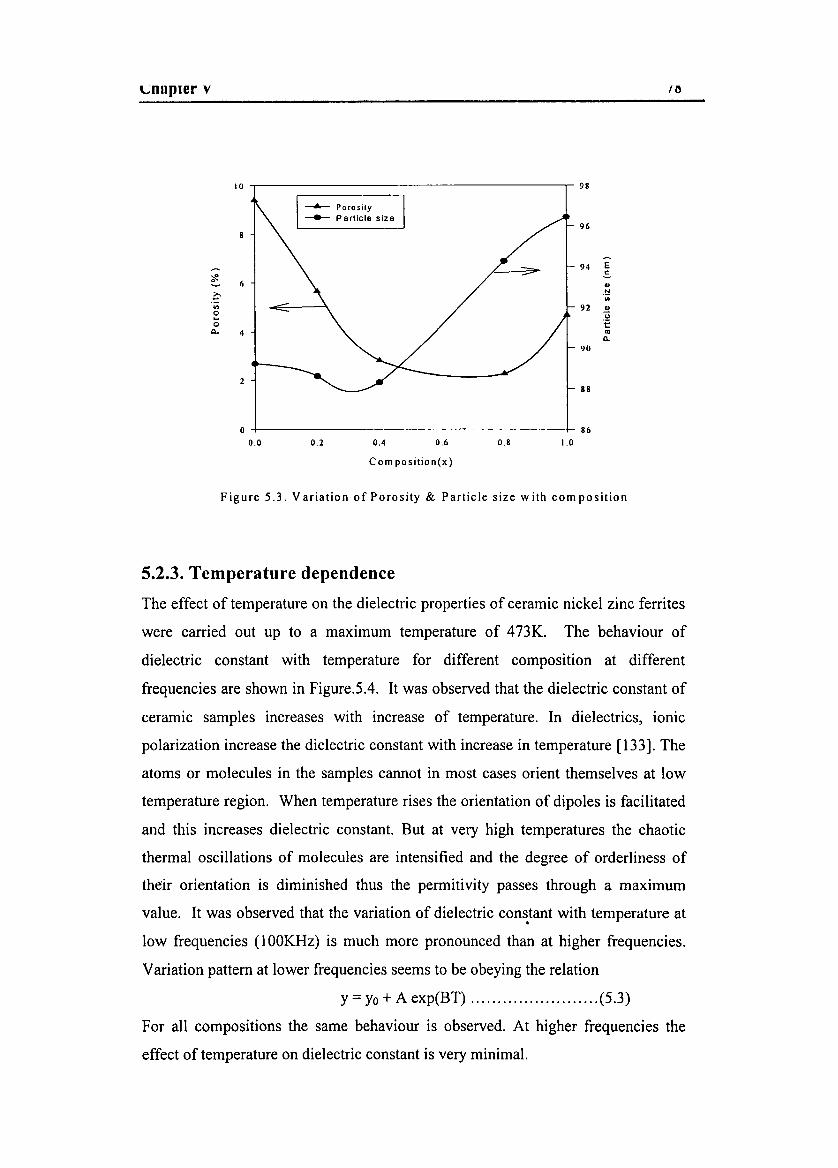
Lnnpler v 1l'J
Figure 5.3. Variation of Porosity & Particle size with composition
5.2.3. Temperature dependence
The effect of temperature on the dielectric properties of ceramic nickel zinc ferrites
were carried out up to a maximum temperature of 473K. The behaviour of
dielectric constant with temperature for different composition at different
frequencies are shown in Figure.5A. It was observed that the dielectric constant of
ceramic samples increases with increase of temperature. In dielectrics, ionic
polarization increase the dielectric constant with increase in temperature [133]. The
atoms or molecules in the samples cannot in most cases orient themselves at low
temperature region. When temperature rises the orientation of dipoles is facilitated
and this increases dielectric constant. But at very high temperatures the chaotic
thermal oscillations of molecules are intensified and the degree of orderliness of
their orientation is diminished thus the permitivity passes through a maximum
value. It was observed that the variation of dielectric cons.tant with temperature at
low frequencies (100KHz) is much more pronounced than at higher frequencies.
Variation pattern at lower frequencies seems to be obeying the relation
y = Yo + A exp(BT) (5.3)
For all compositions the same behaviour is observed. At higher frequencies the
effect of temperature on dielectric constant is very minimal.
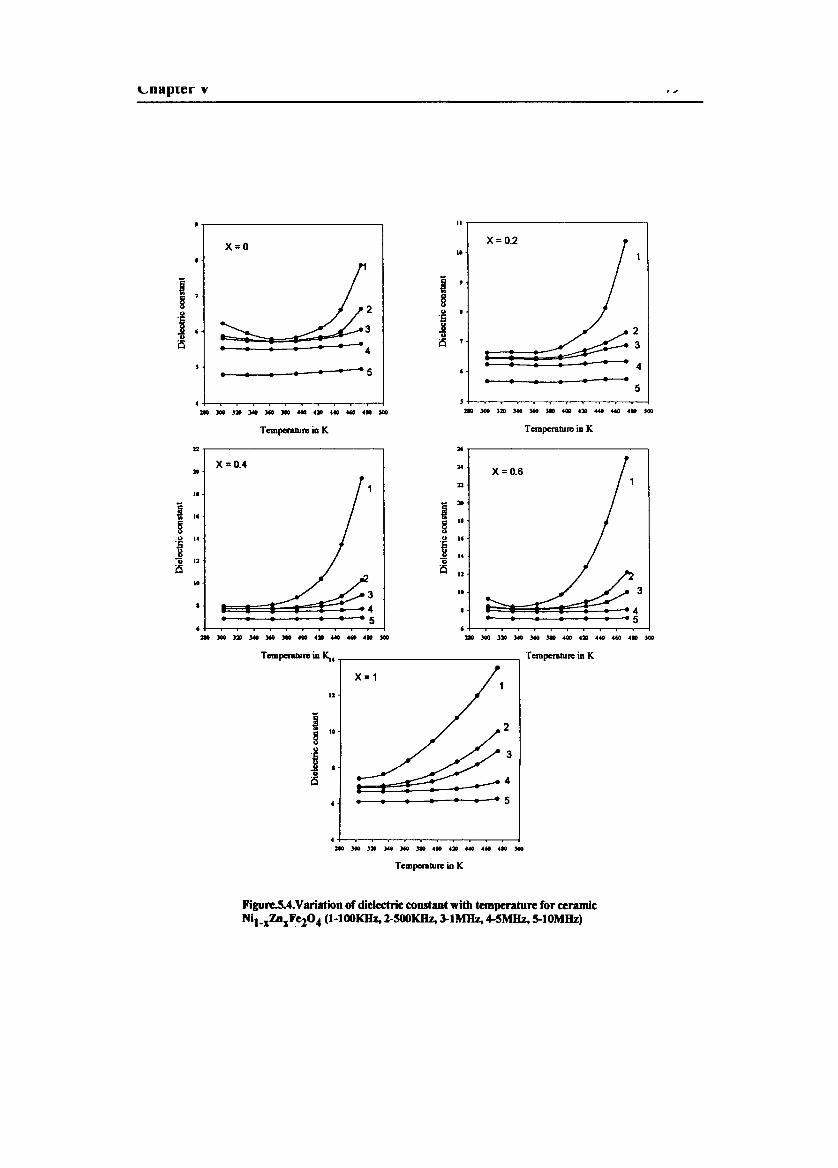
11
X=O.2••
j§"·5ilQis
: :• •• • •
5)
210 lOO )20 :wo l60 )10 400 420 .... ... ... ,..Tempcrature iD K
26
..n
~»
§,.
u ...«I.
Qis .2
I. 3
• • • ••
210 :J<IO ,,. :wo l60 JIG ... .,. ... 440 ... ,..Temperature iD K
i ,. 2§
I~:"j0
isI
• • .... 5
•210 :J<IO ),. )oM :MO )10 400 OD 440 4" 4" *
TC1Dpcrablle in K
x=O
j§"·5j •"is • •
• •
•210 )00 ),. :wo :wo JIG ... .,. ... 440 ... ,..
Temperature iD K
22
X=O.4)0
11
~ ..§o I.·5il
Q ..is ,.
• • ••210 )00 ),. :wo :wo JIG ... .,. -... ... "'"
Temperature iD K,.
X= 1
..
Figu~4.Variation of dielectric constant with temperature for ceramicNil_xZDxF.e204 (I-100KHz, 2-SOOKHz,3-1MHz, 4-5MHz, 5-IOMBz)
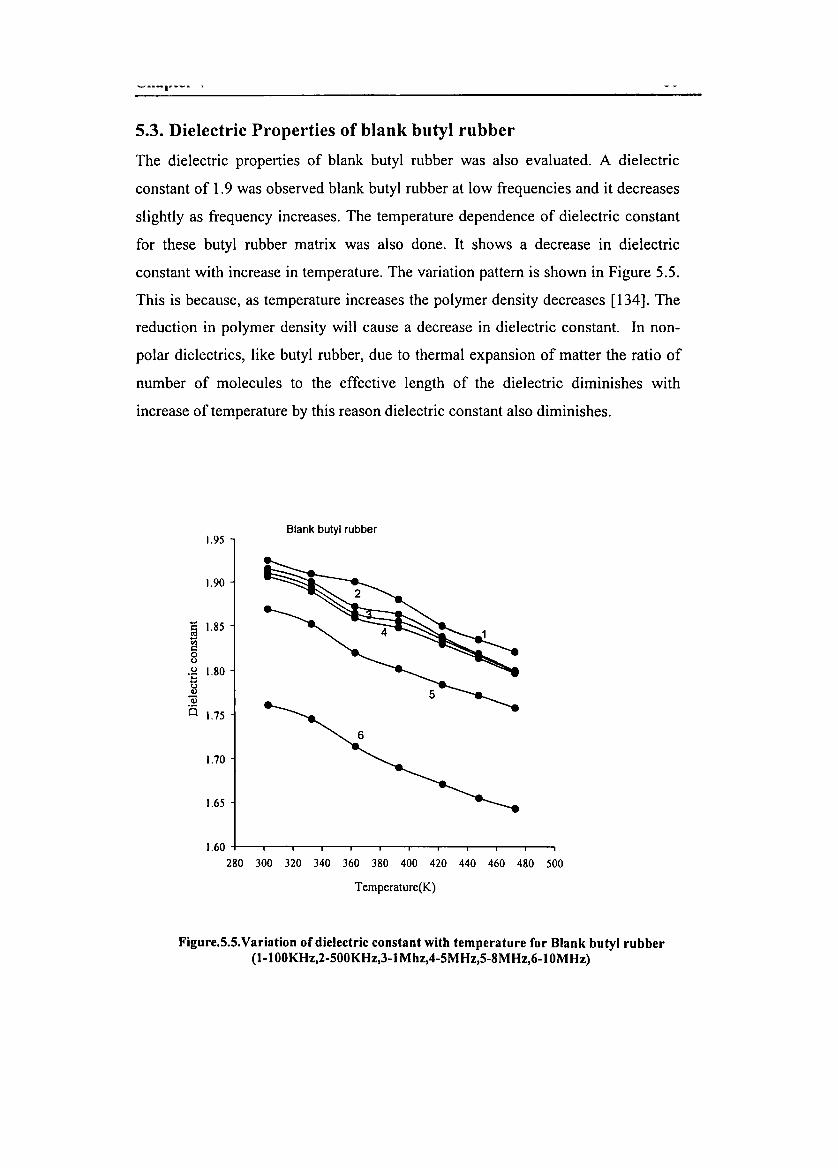
~..-..._. .
5.3. Dielectric Properties of blank butyl rubber
The dielectric properties of blank butyl rubber was also evaluated. A dielectric
constant of 1.9 was observed blank butyl rubber at low frequencies and it decreases
slightly as frequency increases. The temperature dependence of dielectric constant
for these butyl rubber matrix was also done. It shows a decrease in dielectric
constant with increase in temperature. The variation pattern is shown in Figure 5.5.
This is because, as temperature increases the polymer density decreases [134]. The
reduction in polymer density will cause a decrease in dielectric constant. In non
polar dielectrics, like butyl rubber, due to thermal expansion of matter the ratio of
number of molecules to the effective length of the dielectric diminishes with
increase of temperature by this reason dielectric constant also diminishes.
Blank butyl rubber1.95
1.90
~ 1.85Cl>l::ou
.~ 1.80ou"0o 1.75
1.70
1.65
1.60 -I----,;----,-,..--,....----.--.---,-----.----r--r----,
280 300 320 340 360 380 400 420 440 460 480 500
Temperature(K)
Figure.S.S.Variation of dielectric constant with temperature for Blank butyl rubber(1-lOOKHz,2-S00KHz,3-1Mhz,4-SMHz,S-8MHz,6-10MHz)

LIIaIHC.- V 01
5.4. Dielectric studies on rubber ferrite composites
The dielectric properties of RFCs were also carried out at different frequencies and
at different temperatures. The dependence of dielectric constant on various factors
like frequency, composition, loading and temperature are discussed in the
following paragraphs. From the experimentally observed dielectric constant of the
filler, matrix (blank) and the composite, the validity of an appropriate mixture
equation, which will govern the dielectric properties of the RFCs, will be
established. This will be done using the independently observed value of the
respective dielectric constant of the filler, matrix and the composites and will be
fitted theoretically as well as experimentally with the observed value of the
dielectric constants of the RFCs.
5.4.1. Frequency dependence
Like ceramic nickel zinc ferrite rubber ferrite,composites also shows a decrease in
dielectric constant with increase of frequency. The variation pattern for
representative samples is shown in Figure.5.6. However, here in the case of rubber
ferrite composites the variation is not so rapid as in the case of ceramic samples at
lower frequencies. The value of dielectric constant is small as compared to that of
the corresponding ceramic nickel zinc samples in the composites, but it is larger
than that of blank butyl rubber. For blank butyl rubber a maximum value of 1.9 was
observed at low frequencies. This shows that the dielectric property of the matrix
was improved by the addition of the magnetic filler. Ma{,well Wagner interfacial
polarization is applicable in the case of RFCs for the dependence of dielectric
constant with frequency. A maximum value of dielectric constant was obtained for
samples with maximum loading of 120phr.
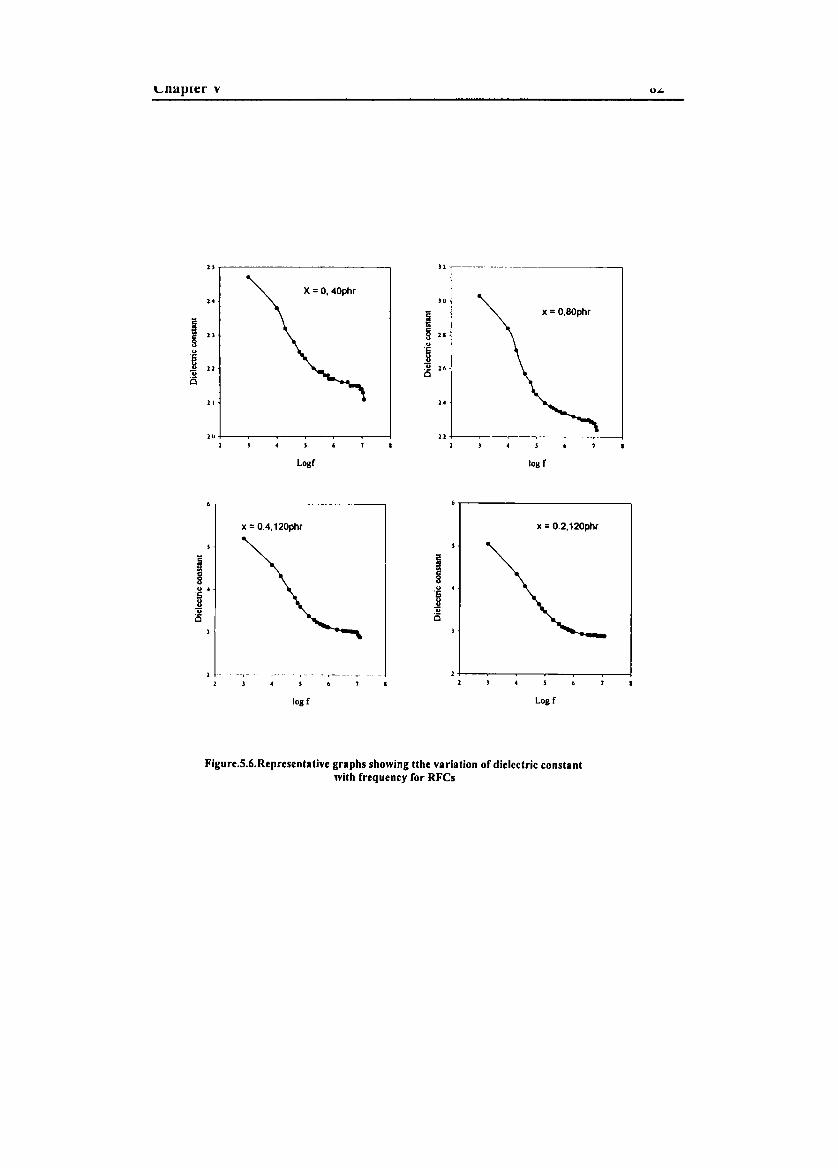
Lllapler v
2S 11
X =0, 40phrI .• ID
~X =O,80phr
I 11 § ]I
S uu .§§
11 U 16U isis
1.1 I .•
ID 11I I
Logf 1011 f
X = 0.4,120phr X =0.2,120phr
Iu •S
~is
Iu •·SIIuis
2 ._- ----,- -~ - ,--- - -r-~
I
log f
I +--~-~--~-~-~----lI
Logf
Figure.5.6.Representative graphs showing tthe variation of dielectric constantwith frequency for RFCs
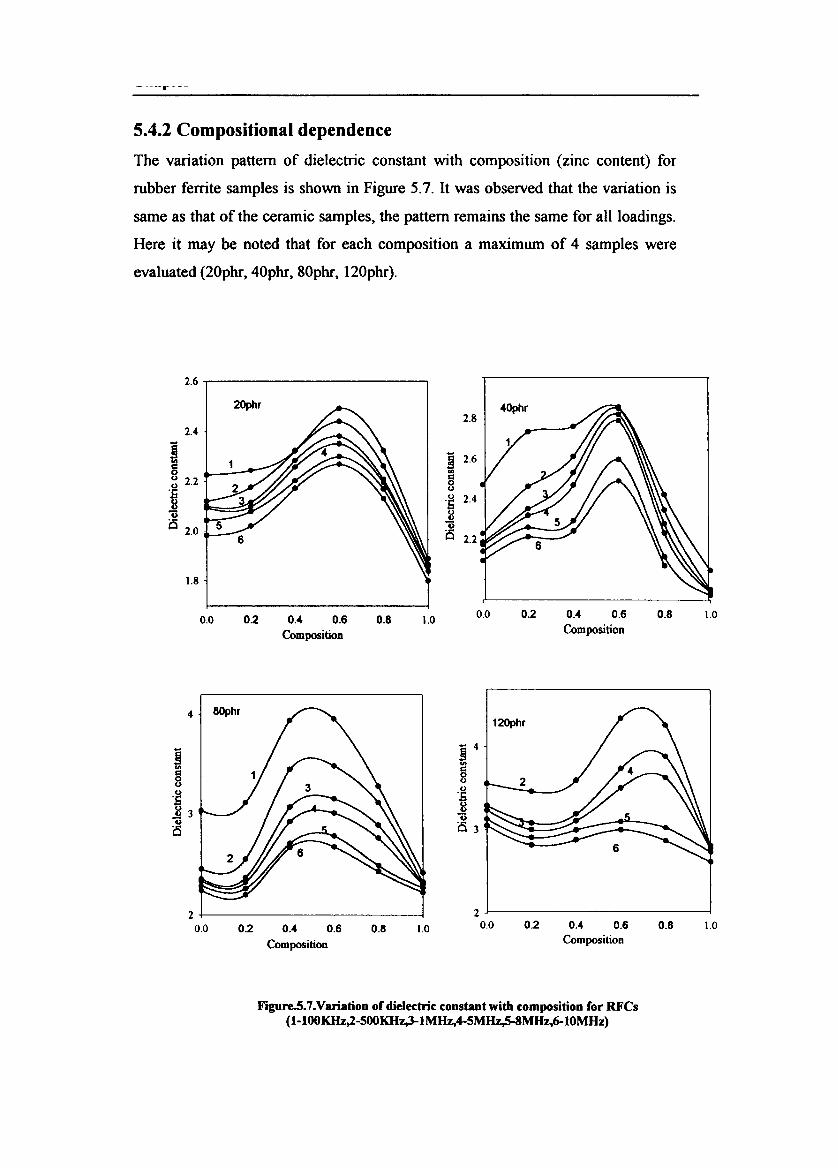
-----.- --~
5.4.2 Compositional dependence
The variation pattern of dielectric constant with composition (zinc content) for
rubber ferrite samples is shown in Figure 5.7. It was observed that the variation is
same as that of the ceramic samples, the pattern remains the same for all loadings.
Here it may be noted that for each composition a maximum of 4 samples were
evaluated (20phr, 40phr, 80phr, 120phr).
1.00.80.4 0.6Composition
0.20.01.00.802 0.4 0.6
Composition0.0
1.8
2.6
2.82.4
I ~ 2.60 '"~ 2.2 =0
·B 00 2.4g ·B
'0 0vj5 2.0 '0
is 2.2
1.00.80.2 0.4 0.6Composition
2J-------------~
0.0
- 4B'"8·Sg'0j5 3
1.00.80.2 0.4 0.6
Composition
4
2+----------------10.0
Figure.5.7.VariatioD of dlelectrie censtant with c:ompositioD for RFCs(1-IOOKHz,2-S00KHz,3-1Mllz,4-SMHz,5-8MHz,6-10MHz)
'-' 11..__ 't'
In rubber ferrite composites also a maximum value of dielectric constant was
observed at around x = 0.6. The variation pattern is by and large the same for all
loadings of the filler. These results suggest that the dielectric properties of the
rubber matrix can be suitably modified by an appropriate choice of the composition
and with the required loading of the filler.
5.4.3. Loading dependence
Studies on the variation of dielectric constant with the addition of magnetic filler
(loading) were also carried out. It was observed that for all compositions the
dielectric constant increases with increase of volume fraction of the ferrite material.
A maximum value of dielectric constant was observed for a loading of 120phr.
The variation is same for all composition(x) at different frequencies. The details of
the dependence of dielectric constant on loading are shown in Figure 5.8.
Composite dielectrics can be treated as chaotic or as static mixtures of several
components. Researchers [135-136] have suggested many formulae and semi
emperical relationships for the evaluation of permitivity of the composites. This is
based on various theoretical presumptions.
For example, for a mixture of m componentsthe dielectric constant E* is connected
by a relation,
m
Log G * = L Y i log G; (5.4);=1
Where E* is the dielectric constant of the mixture and y is the volume fraction of the
component. For a two component system the relationship can be written as
*log E = yjlog El + Y2 log E2 (5.5)
where E* is the dielectric constant of the composite, El ,Yl and E2 ,Y2 are the
dielectric constant and volume fractions of the matrix and the filler component
respectively.
Another mixture equation, which is used to calculate the dielectric constant of the
mixture, is given by
*e (5.6)
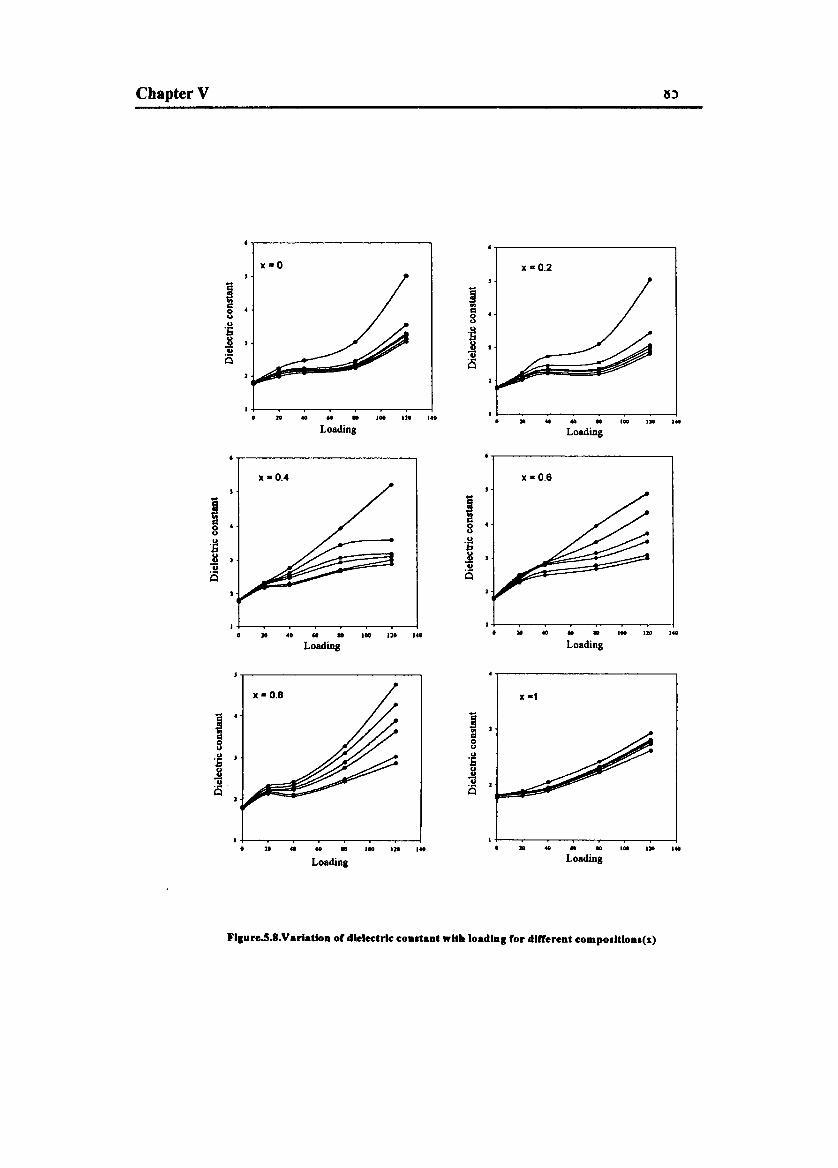
Chapter V
Loading...'20'00....
Loading..
x·0.2
>ll100 UI I'"•....,.
x -004 x -0.6
• •• '" • 100 n. ,.. >ll .. .. .. '00 '20 ,..Loading Loading
x -1
I ~'"... ...
8 0u
u u·S os~
u.!!u
is is
•2. •• .. .. •00 •• ••• • >ll .. .. .. '00 •• ...Loading Loading
Fllure.S.8.VarlatIoD of dielectric eOD.taDtwith 10adlDI for dlffereDt eompo.ltloD'(X)
Chapter V 86
Here El is the permitivity of the matrix and y the volume fraction of the inclusion or
filler. Employing equation.5.6 the dielectric constant of the composites were
calculated using the experimentally measured permitivity of the matrix. It was
found that the calculated value of E' and experimentally observed E' do not tally
each other. These formulae have their own limitations. Equation 5.6 seems to be
satisfying a composite containing conducting fillers and can not be applied to a
composite containing an insulating filler. For a two component system consisting
of a non-polar matrix and insulating filler of the ferrite type the relationship can be
written with the help of an equation of the form
8' =8\.{[28\ +82 +2Y(82 -8\)]}[28\ +8
2- Y(8
2-8\) (5.7)
Where El is the dielectric constant of the blank matrix, E2 is the dielectric constant
of the uniformly distributed (by volume) spherical inclusions(Nh.xZnxFe204) and
let y be the volume fraction of the inclusion and E' is the dielectric constant of the
matrix mixture or the composite.
A characteristic feature of this equation is that the formula does not require any
symmetry with respect to the components of the mixture or composites. The
experimentally observed value of El and E2 were employed to calculate the E' of
the composite. Since the experimentally observed value of e' were also available
the validity of the above equation (5.7) was checked. The details are shown in
Figure.9. Equation 5.7 generally satisfies the experimentally observed value of
dielectric constantrs") of the composite. Calculations carried out using equations
5.7 up to a loading of 120phr is generally found to be in conformity with
experimentally observed values of E' . So the most probable relationship, which
determines the permitivity of the composite consisting of a two component system
consisting of an insulating filler could
This observation implies that the magnetic filler is uniformly distributed in the
matrix and the percolation threshold is probably not reached even up to a loading of
120phr.
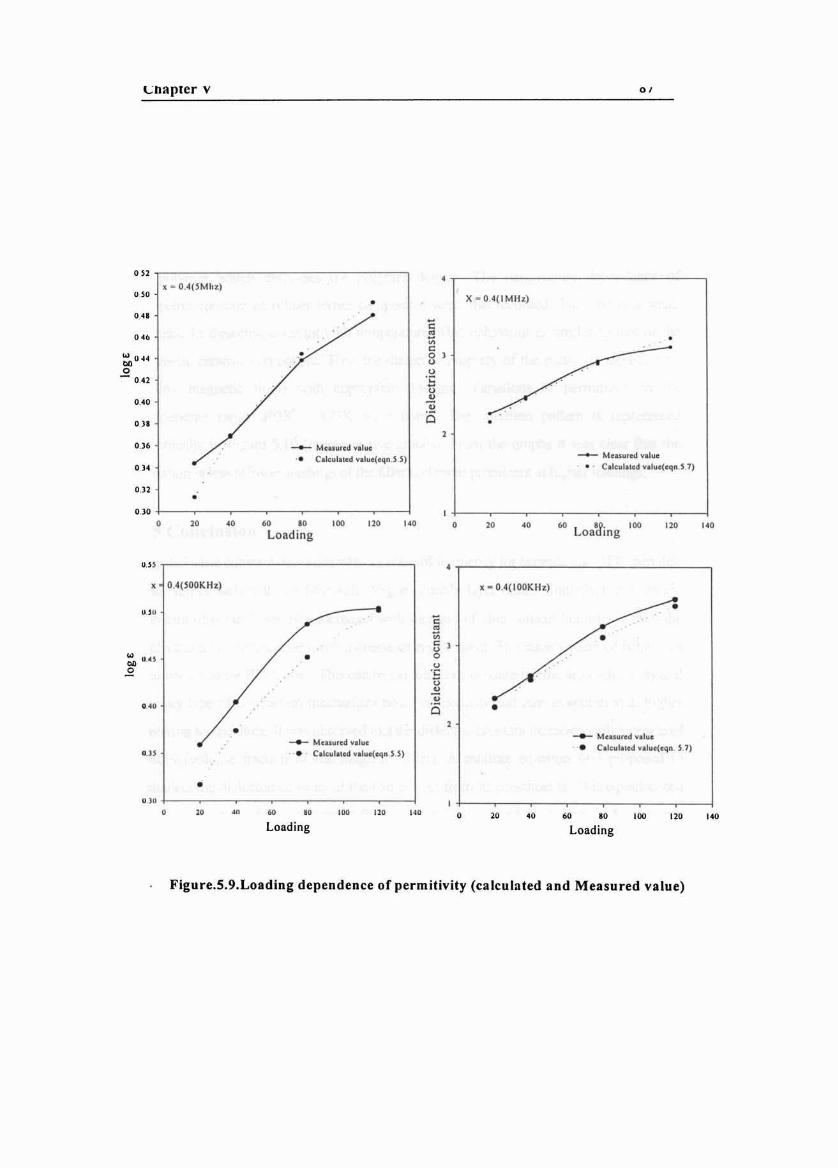
Cnaprer v
'" r - -------- - - - - - - -,
0 '
".."."
~U ~4o .""'.• n
on
0"
x ~ 0 4( SMh )
•
•
__ M... ~,.d yol...
• Cole~lol<d ysl~",.q. S S)
Es•c8u'5~
11
" ,
X -O.4( IMIIl)
•
•
- M.u~,ed ... Iue. ' C.I.~I . ..d y. lue(.... S 1 )
DU•
D.l D0 " " ec " ' 00 '" '" 0 " " " Loa~in g ' 00 '" '"Loading
'"• °4(SDOKHI) x ~ O,4( IOOKlh)
•"" E•, •cu
~ U ~ l • 0u
0 su..
"'" £5 •• ........ M. u Uf<d ...Iu.__ M. u . rod vol... • C.kul. ....... I.«oql\ '"'" .. Colculo..d YOluc('q. S Sl
•" "• " .. " .. ' 00 n . '" 0 ac " eo " '00 '" '"Loading Loading
Figure.S.9.Loading dependence of permitivity (calcu lated and Measured value)

- ----&- --- .
5.4.4 Temperature dependence
The effect oftemperature on the dielectric constant for the ceramic samples were discussed
and found that the dielectric constant increases with increase of temperature. The dielectric
constant at different temperature for blank butyl rubber (without the filler) was also
evaluated. It shows a decrease in dielectric constant with temperature due to the expansion
of polymer which decreases the polymer density. The temperature dependence of
dielectric constant of rubber ferrite composites were also recorded. This shows a small
increase in dielectric constant with temperature. This behaviour is similar to that of the
magnetic ceramic component. Thus the dielectric property of the matrix is modified by
adding magnetic fillers with appropriate loading. Variations of perrnitivity in the
temperature range 303K - 473K were noted. The variation pattern is represented
graphically in Figure 5.10 (representative graphs). From the graphs it was clear that the
variation is less at lower loadings of the filler and more prominent at higher loadings.
5.5 Conclusion
The dielectric constant decreases with increase offrequency for ceramic and RFC samples.
This agrees well with the Maxwell Wagner double layer model. Initially the dielectric
constant of ceramic samples increases with increase of zinc content but after x =0.6 the
dielectric constant decreases with increase of zinc content. The SaI11e pattern of behaviour
was observed for RFCs also. This can be explained by considering the ac conductivity and
verwey type of conduction mechanism based on porosity and zinc evaporation at higher
sintering temperature. It was observed that the dielectric constant increases with increase of
loading(volume fraction of the magnetic filler). A mixture equation was proposed to
calculate the dielectric constant of the composites from its constituents. This equation can
be employed to fabricate composites with predetermined dielectric and magnetic
properties. The experimentally observed values of dielectric constant of the composite
suggest that the magnetic filler is uniformly distributed and the percolation threshold is not
reached up to a loading of 120phr. The dielectric constant of the composite as well as that
of filler increases with increase of temperature. For blank butyl rubber the. dielectric
constant decreases with increase of temperature, because in non-polar dielectrics due to
thermal expansion of matter the ratio of number of molecules to the effective length of the
dielectrics diminishes with increase of temperature, Thus the dielectric and magnetic
properties of RFCs can be appropriately modified by a judicious choice of matrix and
filler. This is important in designing microwave absorbers.
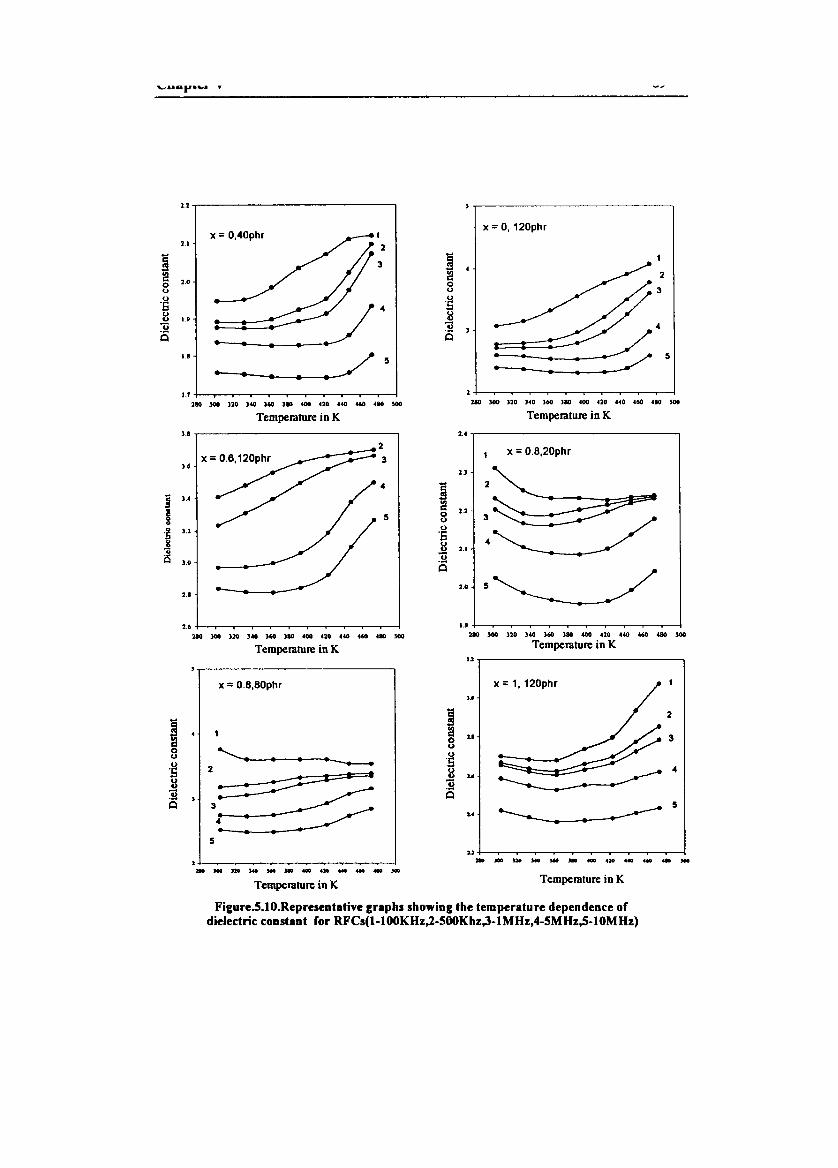
2.1.,---------------..,
x = O.40phrx = 0, 120phr
•••••
r.9
1.1
2.1
~~ 2.0oo
·5~Jio
1.7 -l--.-___,...--.--.--..--....__--.-..---.---.--1110 )00 320 340 360 310 40G 420 440 460 ~IO SOO
Temperature in K
2 +-_.____,.----~_.____,.----~_._-..__~_.______1
:110 lOO 320 3~0 )60 no ~.. 420 ~~o ~6O ~.. ~..
Temperature in K
).1,------------------, 2.~ ,---------------~
2.0 5
2
x = O.8.20phr
2.3
Io uoo·E~ 2.1
.so
5
2
3
j u
I.5 32
j
is 30
2.6+-_r___,.-----.--.--..--....__~-....__r___..---l
110 lOO )20 340 )60 110 400 0110 440 460 410 soo
Temperature in K
u+-_._-..__~~-....__r-..__~~-~_l
uo lOO 310 )40 )60 )80 400 420 440 460 480 '00
Temperature in K'.l,---------------~
x = O.8.80phr
2 "-----------~,.
'~5
x = 1, 120phr
2
3
1 +-_r__.._~_r__..-~_r__..-~_r___1281 _ ne Me ,.. )10 .... 42_ .... 4tO .eo HO
Temperature in K
u+-_._-..--~~-....__._-..__....__~-...._~,. lOO 120 ue 160 .Ill 400 420 440 .-0 <lID JOt
Temperature in K
Figure.S.IO.Representative graphs sbowing the temperature dependence ofdielectric constant for RFCs(I-IOOKHz,2-S00Khz,3-IMHz,4-SMHz,5-10MHz)
Chapter VI
Evaluation of ac conductivity of RFCsfrom dielectric measurements
6.1.Introduction
The electrical properties are most important for ferrites and composites containing
mixed ferrites, not only from the application point of view but also from the
fundamental view point [137-143]. Evaluation of ac electrical conductivity reveals
a wealth of information as regards the usefulness of these materials for various
applications. Moreover. the study of ac electrical conductivity shed>, light on the
behaviour of charge carriers under an ac field, their mobility and the mechanism of
conduction [144-145]. It was reported that the electron hopping between Fe2+ and
Fe3+ ions and the hole hopping between Ni2+ and Ni3
+ on B sites are responsible for
conduction in ferrites. The conductivity studies on nickel zinc ferrites were carried
out by various researchers on the basis of hole and electron hopping, the site
occupation of Ni2+ ions and Zn ions were also reported [146-169]. El Hiti et.al
carried out the conductivity studies for different mixed ferrite system like Mn-Zn,
Ni-Mg, Sb-CoNi, Cu-Cr and also for Mg substituted nickel zinc ferrites [170-178].
The conductivity studies on ferrites carried out by various researchers proved its
semiconducting behaviour and also proved the dependence of electrical
conductivity on preparation condition, sintering time, temperature and the types of
impurities [179-184]. However a survey of literature reveals that the conductivity
studies on ferrite incorporated rubber composites are rather scarce or seldom
reported. RFCs are essentially dielectric materials and ac conductivity plays an
important role. So study of these materials, particularly, in an ac field assumes
significance.
The present study includes evaluation of ac electrical conductivity for both ceramic
Nil-xZnxFe204 as well as the filler incorporated composites. It is also to be noted
that the evaluation of ac conductivity for both ceramic and RFCs have been carried
\.., IliIIJlC.... Y I 71
(6.1)
out using the data made available from the dielectric measurements conducted on
these samples, in the frequency range 100KHz to 13MHz[185] by employing a
simple relationship. The effect of frequency, composition, loading and temperature
on the ac electrical conductivity were studied for the ceramic Nil_xZnxFe204 as well
as the filler (Nil-xZnxFe204) incorporated rubber ferrite composites (RFCs). The
dependence of ac conductivity on the volume fraction of the magnetic filler was
also investigated.
6.2. AC electrical conductivity - Principle & Theory
A capacitor when charged under an ac voltage will have some loss current due to
ohmic resistance or impedance by heat absorption. If Qbe the charge in coulombs
due to a potential difference of V volts between two plates of a condenser of area A
and interplate distance d then ac conductivity (O'ac)due to ac voltage v(vo e jCJlt) is
given by the relation
J(Tuc = E
J is the current density and E is the electric field strength vector.
But we know that the electric field vector E = D. D is the displacement vector ofe
the dipole charges and E is the complex permittivity of the material. It is also
known that for a parallel plate capacitor the electric field intensity (E) is the ratio
of potential difference between the plates of the capacitor to the inter plate
distance.
That isV
E=-d
(6.2)
dq Q __ VeSince the current density J =- but q is given by
dt A d
J = dq =-!(Ve) =~ dVdt dt d d dt
:. J = ~Vj{()d
substituting for E and J in equation (6.1)
J . . b . 1 .(TQC =- = EJ (() smce E emg a comp ex quantity
E
(6.3)
(6.4)
(6.5)
'-'lInpU;;1 ....
in order that ac conductivity may be a real quantity the term containing j has to be
neglected hence
I1O"ac = ro E (6.6)
In any dielectric material there will be some power loss because of the work done
to overcome the frictional damping forces encountered by the dipoles during their
rotation. If an ac field is considered, then in an ideal case the charging current le
will be 900 out of phase with the voltage. But in most of the capacitors due to the
absorption of electrical energy some loss current IL will also be produced, which
will be in phase with the voltage. Charging current le and loss current Ii. will make
angles cS and e respectively with the total current I passing through the capacitor.
The loss current is represented by sind of the total current I. Generally, sind is
called the loss factor but when 0 is small then sinf = 0 = tano, The two components
El and Ell of the complex dielectric constant E will be frequency dependent and is
given by
EI(ro) = DoCosOl Eo (6.7)
EI1(ro) = DoSino/ Eo (6.8)
since the displacement vector in atime varying field will not be in phase with E
and hence there will be a phase difference 0 between them.
From equation (6.7) and equation(6.8) we have
&11(m)tanzi = I (6.9)
e (m)
Substituting the value of EII(ro) from equation (6.9) in equation (6.6) then we
have
O"ac = eo tand E1(ro) (6.10)
Where ro = 27tf and El = EO Er , here Er is the relative permitivity of the material and
Eo the permittivity of free space.
So O"ac = Znf tano Eo Er (6.11)
This equation is used to calculatethe ac conductivity using dielectric constant and tand at a
given frequency. It is to be noted that both tand and Er were available from dielectric
measurements. The details of dielectric studies of both ceramic and rubber ferrite
composites were discussed in chapter 5. The details of these measurements are
given in chapter 2.
v.napter v I 93
6.3. Frequency dependence
The ac electrical conductivity of ceramic nickel zinc ferrites and rubber ferrite
composites have been computed for different frequencies (lOOKHz to lOMHz) and
also at different temperatures (varying from 303K to 473K). It was observed that
the ac electrical conductivity increases with increase of frequency initially and it
shows a small dip at higher frequencies that is above 5MI-Iz. This variation is same
for samples with different concentration of zinc ions. Frequency dependence of
conductivity for blank butyl rubber was also noted. It also shows a small decrease
after 5MHz. Figure 6.1. shows the dependence of conductivity with frequency for
both ceramic and blank butyl rubber. The hopping of electron between Fe2+ and
Fe3+ ions on the octahedral sites is responsible for conduction mechanism in
ferrites. Also various reports show that the hole hopping between Ni2+ and Ni3+ on
B site also contribute to the electric conduction in ferrites. In this Nil_xZnxFe204
system the hole conduction depends on the concentration of Zn ions on the A site
to the Ni ion concentration on B site. In general the increase in conductivity with
increase of frequency can be explained on the basis of Maxwell-Wagner theory
[126]. According to this theory dielectric structure was formed by two layers. First
layer consists of ferrite grains of fairly well conducting (ferrous ions), which is
separated by a thin layer of poorly conducting substances, which forms the grain
boundary. The non conducting layer or grain boundary is formed by oxygen ions.
Thus each grain possek~n oxygen rich layer on the surface as boundary. These
grain boundaries are more active at lower frequencies, hence the hopping
frequency of Fe2+ and Fe3
+ ion is less at lower frequencies. As the frequency of the
applied filed increases the conductive grains became more active by promoting the
hopping between Fe2+ and Fe3+ ions, there by increasing the hopping frequency.
Thus we observe a gradual increase in conductivity with frequency. Also the
theoretical equation which we used here to calculate the ac electrical conductivity
shows a direct proportionality with frequency. But at higher frequencies the
frequency of the hopping ions could not follow the applied field frequency and it
lags behind it. This causes a dip in conductivity at higher frequencies. We also
observed an increase in conductivity with frequency from 100KHz to 5MHz. But
after 5MHz we observed a decrease in conductivity this may be due to the lagging
of hopping ions with the applied ~!~~ frequency. The same variation is observed/\ \ ,
') \ ,-I. ~... I

Lnapler v I 7"t
for ferrite incorporated rubber samples also. Figure.6.2. shows the dependence of
ac electrical conductivity with frequency for representative rubber ferrite
composites. It was also noted that this remains the same for samples with different
volume fractions of the magnetic filler. The frequency dependence is same at
different temperatures for both ceramic as well as for rubber ferrite composites.
-2
-3
~e -4
.E
-5--- x=O-0- x = 0.2-or- x= 0.4-v- x = 0.6
-- x=1
8765
-6 +----~----,...------r---____,4
Log f
-s
Blank butyl rubber
·6
-7
b~ -8.E
-9
-10
-11 +----~----,...------r---____,
4 6 7 8
log f
Figure.6.I.Frequency dependence of conductivity for Ni._.Zn.Fe z0 4 blank butyl rubber
(room temperature)
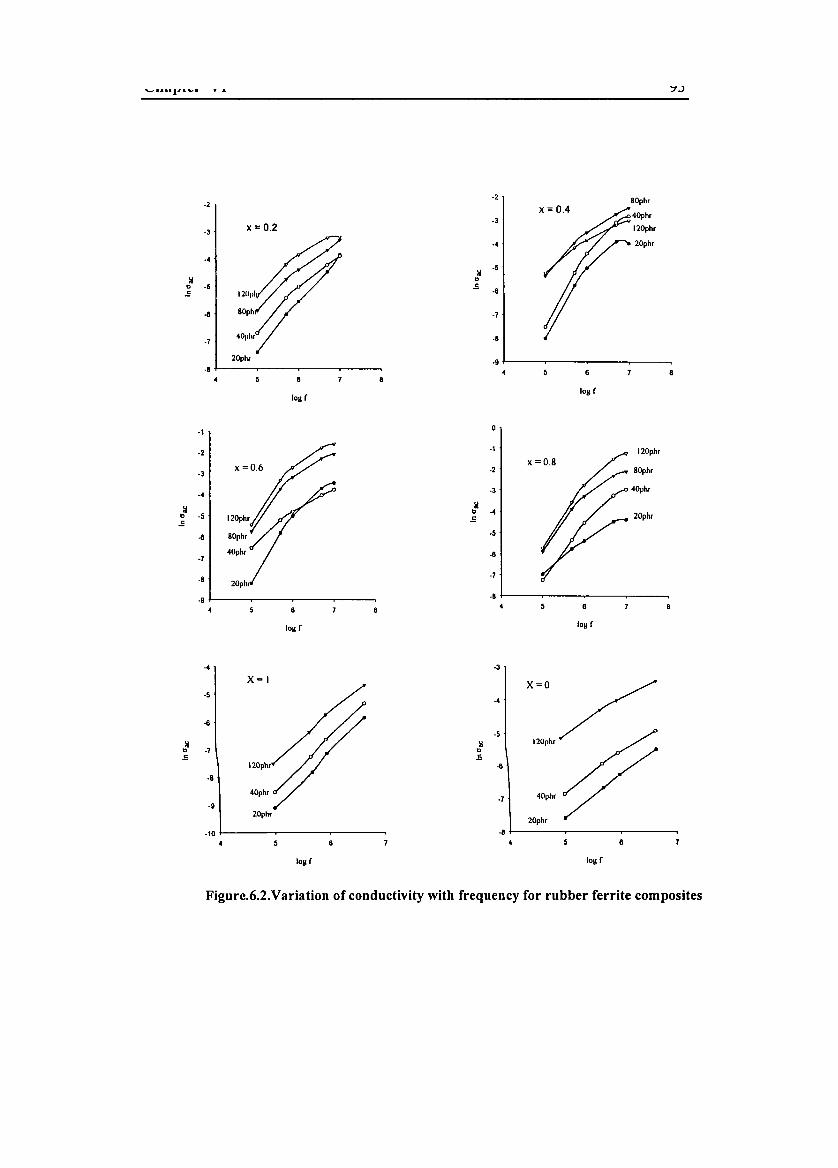
'-'&&"&11 " "' . ':IJ
-2 80phr
-340phr
120phr
-4 20phr
~-5
".5-8
-7
-8
-94 6
leg f
-I 120phr
-2 80phr
-3 40phr
Mb ...
20phr.5
-5
-8
-7
-84 8
leg t
-2
-3 X =0.2
-4
~
" -5.5
-8
-7
20phr
-84
101lf
-1
-2
-3
-4
M" -5.5
-8 80phr
-740phr
-8
-94 8
lOllf
-4
-5
-8
~e -7.E
-8
-9
-104
X= I
120plu
40phr
20phr
6
lOllf
-3
...
-51I".E
-8
-7 40phr
20phr
-84 6
lOllt
Figure.6.2.Variation of conductivity with frequency for rubber ferrite composites

~""l"-' ••
6.4. Compositional dependence
Compositional dependence of ac electrical conductivity for both ceramic and
rubber ferrite composites were studied at different frequencies and also for
different temperatures. The variation of conductivity with composition (zinc
content) for ceramic nickel zinc ferrites at room temperature was shown in
figure.6.3. It is found that the ac electrical conductivity for NiFe204 (i.e x =0) is
greater than that for Nio.sZno.2Fe204 and Nio.6Zno4Fe204. As we know the
conductivity in ferrites is mainly due to the hole hopping in metallic ions (Ni ions)
and electron hopping in ferrous ions on the octahedral sites.
·2
.)
11e -4.s
-5-- 100Khz-0- 500Khz-T- IMhz--'Q- 5Mhz
1.00.80.60.40.2
-6 +--------------------,0.0
Composition (x)
Figure.6.J.Variation of conductivity with composition for ceramic Ni._.Zn.Fe204
In the Nil-xZnxFe204 system when x = 0 maximum number of Ni 2+ and Ni 3+ ions
are available for hopping. Hence the main contribution of conductivity may be due
to the hole hopping. As the zinc concentration (x) increases the number of Ni2+
and Ni 3+ ions on B sites decreases. In the present work the small decrease in
conductivity for composition x = 0.2 and x = 0.4 was observed, this may be due to
the electron hole compensation at the B site. Further increase of zinc concentration
diminishes the hole hopping by decreasing the no of Ni2+ and Ni 3+ ions on the B

~ •••••••_. • &
site. Thus electron hopping become predominant and it increases the conductivity.
Thus we observe a maximum conductivity for Nio.4Zno.6Fe204. Again it was
observed that for x = 1, that is for ZnFe204 the conductivity decreases. This
decrease can be explained by considering the grain size. It is well known that the
growth of grain size and the formation of grain boundaries also influences the
conductivity. In the present NiZn ferrite system we observed that the grain size
first decreases with increase of Zn concentration and attain a minimum for x = 0.6,
thereafter it increases with x. Thus a maximum grain size of 96.44nm was./
observed for Znre204(x = 1). As the grain size increases the formation of oxygen
rich layers on the surface of the grains are possible. These non conducting layers
increases the resistivity there by decreasing the conductivity. This explains the
decrease in conductivity at x = 1. Porosity variation of ceramic nickel zinc ferrite
also support this result. It was found that the porosity initially decreases with»:>
increase of zinc content and shows a minimum value for x=O.6. There after the
porosity increases with increase of zinc content. It was known that when porosity
decreases the resistivity also decreases therfyy increasing the conductivity.
Likewise when the porosity increases the resistivity also increases by decreasing
the conductivity [186]. This also explains the compositional dependence of ac
electrical conductivity in ceramic nickel zinc ferrite system. For rubber ferrite
composites also the same variation is observed for allloadings. Variation pattern is
shown in figure.6.4. The effect of matrix is minimal in this case.
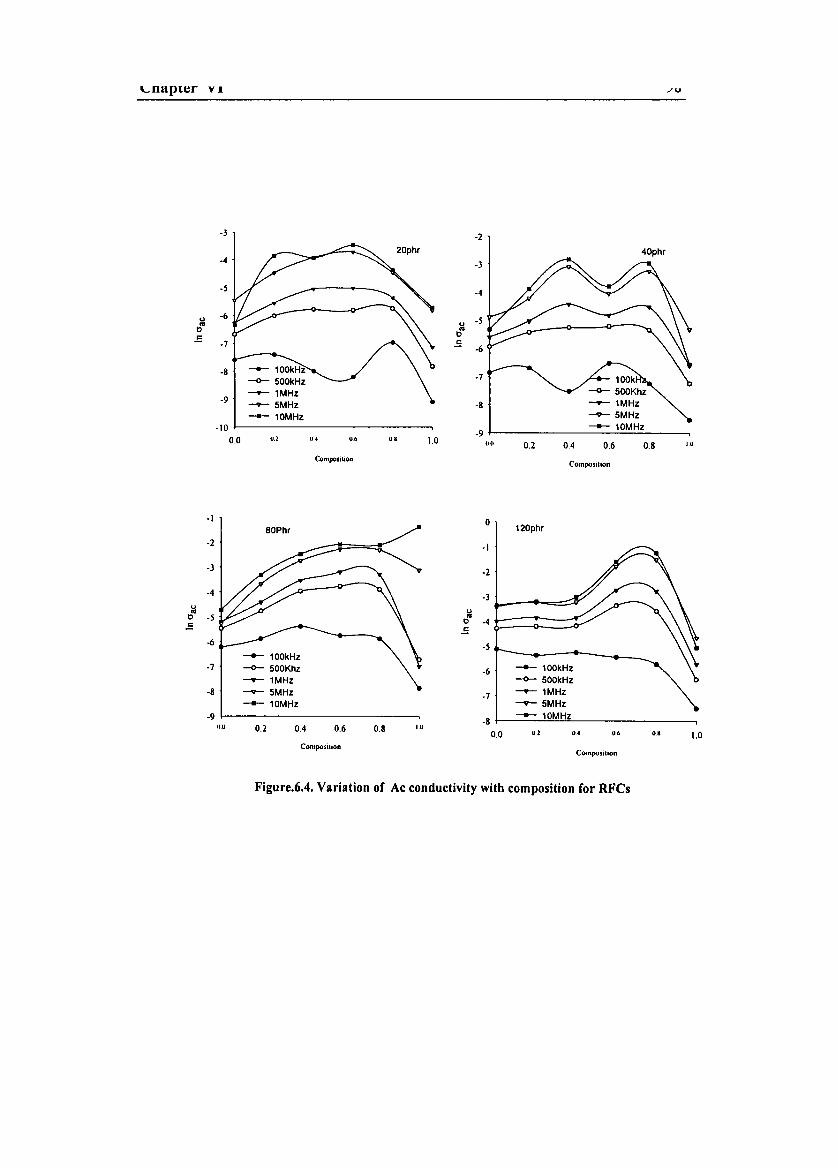
Composition
\..-naplcr v.
-3
-4
-s
u -6..tl.5 -7
-8
-9
-10
0.0 0.1 0'- 0.1.
Composition
o.
-2
-3
-4
u -s..tl.5
-6
-7
-8
-91.0 on 0.2 0.4 0.6 0.8
JU
1.0
-I 0BOPhr 120phr
-2 -I
-3 -2
-4 -3u.. l;le -s
.5tl -4.5
-6 -s--+- 100kHz
-7 -0- 500Khz -6 --+- 100kHz
-- 1MHz -0- 500kHz-8 --- 5MHz -7 -- 1MHz
--+- 10MHz --- 5MHz-9 -8
--+- 10MHz11.0 0.2 0.4 0.6 0.8 10
0.0 01 0.' UCI 0.' 1.0Composition
Composition
Figure.6.4. Variation of Ac conductivity with composition for RFCs
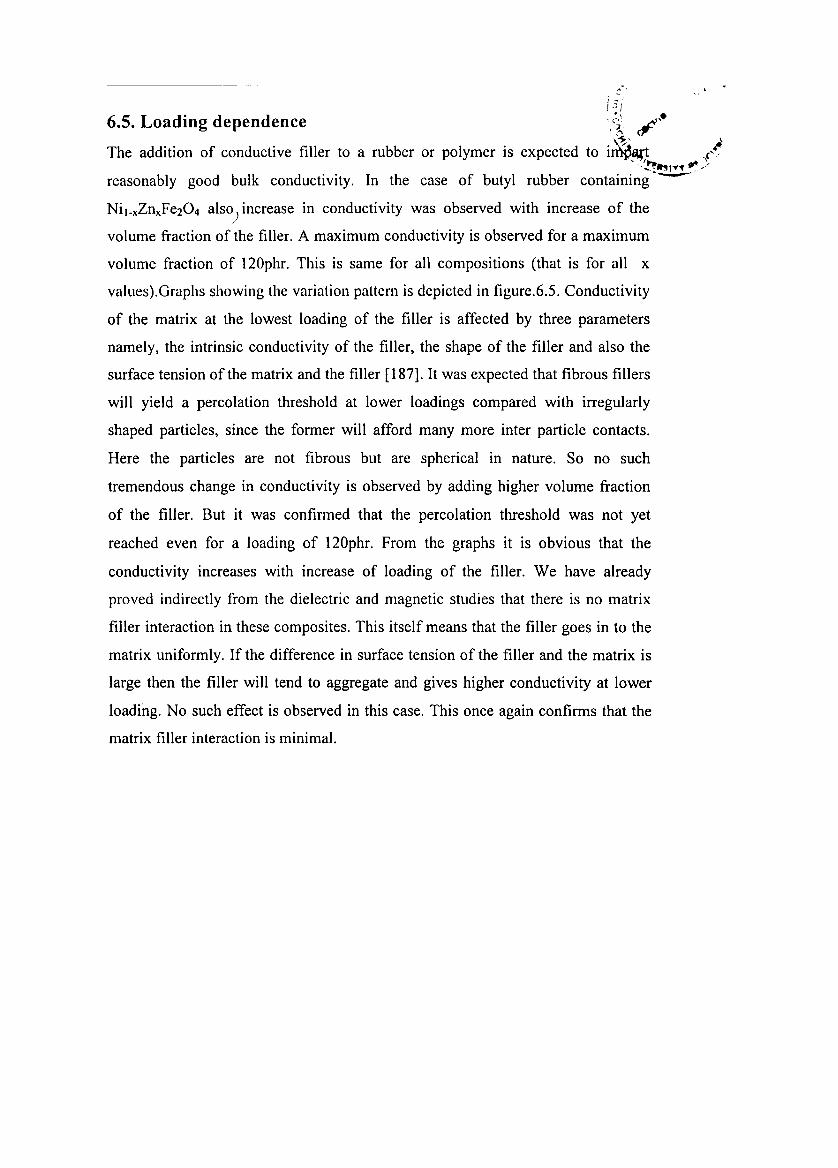
,:: ..
! ..1 i
6.5. Loading dependence '/~ /,.
The addition of conductive filler to a rubber or polymer is expected to i~ .cl-<~"1""" "* ,>
reasonably good bulk conductivity. In the case of butyl rubber containing----
Nil-xZnxFe204 also) increase in conductivity was observed with increase of the
volume fraction of the filler. A maximum conductivity is observed for a maximum
volume fraction of 120phr. This is same for all compositions (that is for all x
values).Graphs showing the variation pattern is depicted in figure.6.S. Conductivity
of the matrix at the lowest loading of the filler is affected by three parameters
namely, the intrinsic conductivity of the filler, the shape of the filler and also the
surface tension of the matrix and the filler [187]. It was expected that fibrous fillers
will yield a percolation threshold at lower loadings compared with irregularly
shaped particles, since the former will afford many more inter particle contacts.
Here the particles are not fibrous but are spherical in nature. So no such
tremendous change in conductivity is observed by adding higher volume fraction
of the filler. But it was confirmed that the percolation threshold was not yet
reached even for a loading of 120phr. From the graphs it is obvious that the
conductivity increases with increase of loading of the filler. We have already
proved indirectly from the dielectric and magnetic studies that there is no matrix
filler interaction in these composites. This itself means that the filler goes in to the
matrix uniformly. If the difference in surface tension of the filler and the matrix is
large then the filler will tend to aggregate and gives higher conductivity at lower
loading, No such effect is observed in this case. This once again confirms that the
matrix filler interaction is minimal.
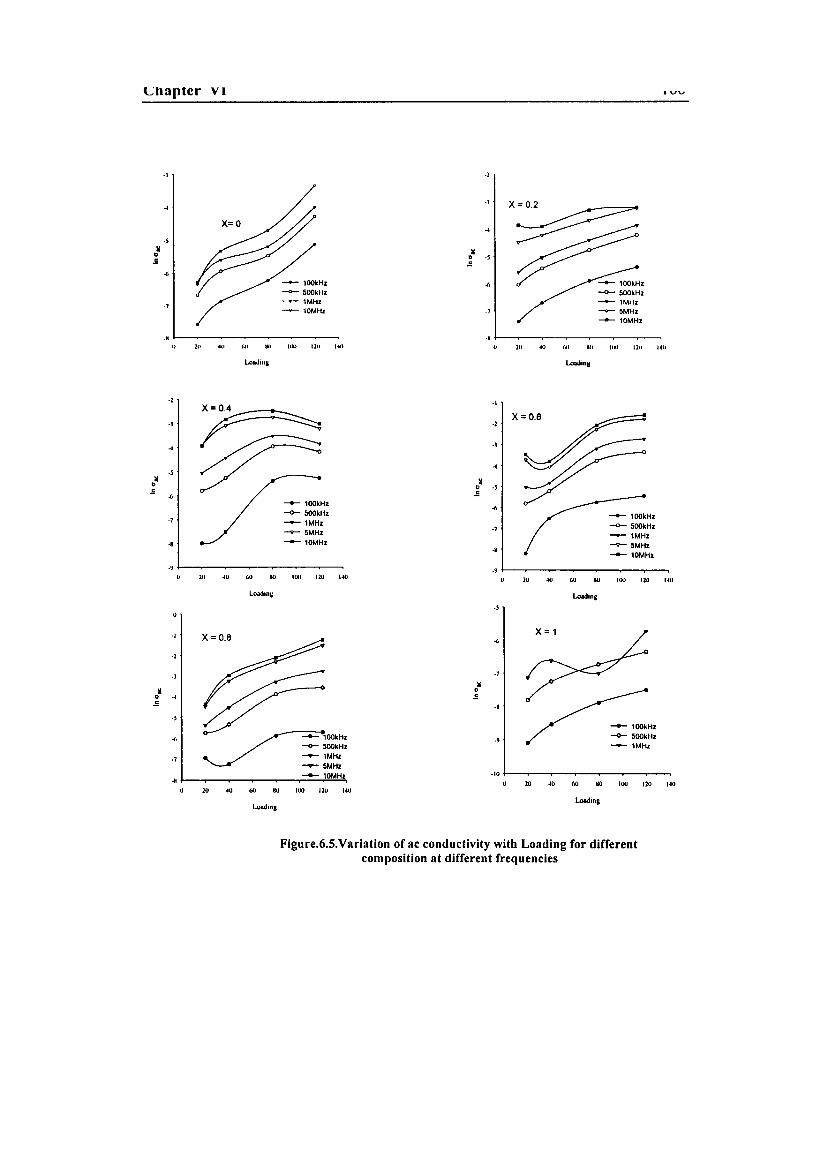
Chapter VI
-J -2
-J
x~...
X= 0 ...-s
~~ ~0 0 -sc c
.(,
--+- 100kHz .(,
......0- 500kHz -0- 500kHz
., --- lMHz ~1MHz
--- 10MHz -, --9- 5MHz
-- 10MHz
-K .,I> 21> '1> '" ,.. IIIU 1211 un 21> '" '<J Ko IlKI 120 140
Lolll.lillll LolMliny
-2 ·1
-J~ -2
x~...
~.)
....s
~ ~0 0 -sc .s.(,
-- 100kHz .(,-0- 500kHz
-- 100kHz-7 -.- lMHz ., -0- 500kHz~5MHz --1MHz
-& -- 10MHz ~5MHz-,-- 10MHz
-. -.u 20 ." GO KO llNl 120 1<0 0 20 '" GO KO 100 120 1<0
LoadinG Loading
-s
·1 X = 0.8 .(,
-I
'"·7
~::::~
~ 00 ... .sc
-8
-s--- 100kHz
.(, .. -0- 500kHz-.- lMHz
·7 -- 1MHz-- 5104Hz--- 10MHz -10
-K 0 20 .0 (00 80 100 120 1<00 20 ." GO KO 100 120 1<0
loAdingLoading
Figure.6.S.Variation of ac conductivity with Loading for differentcomposition at different frequencies
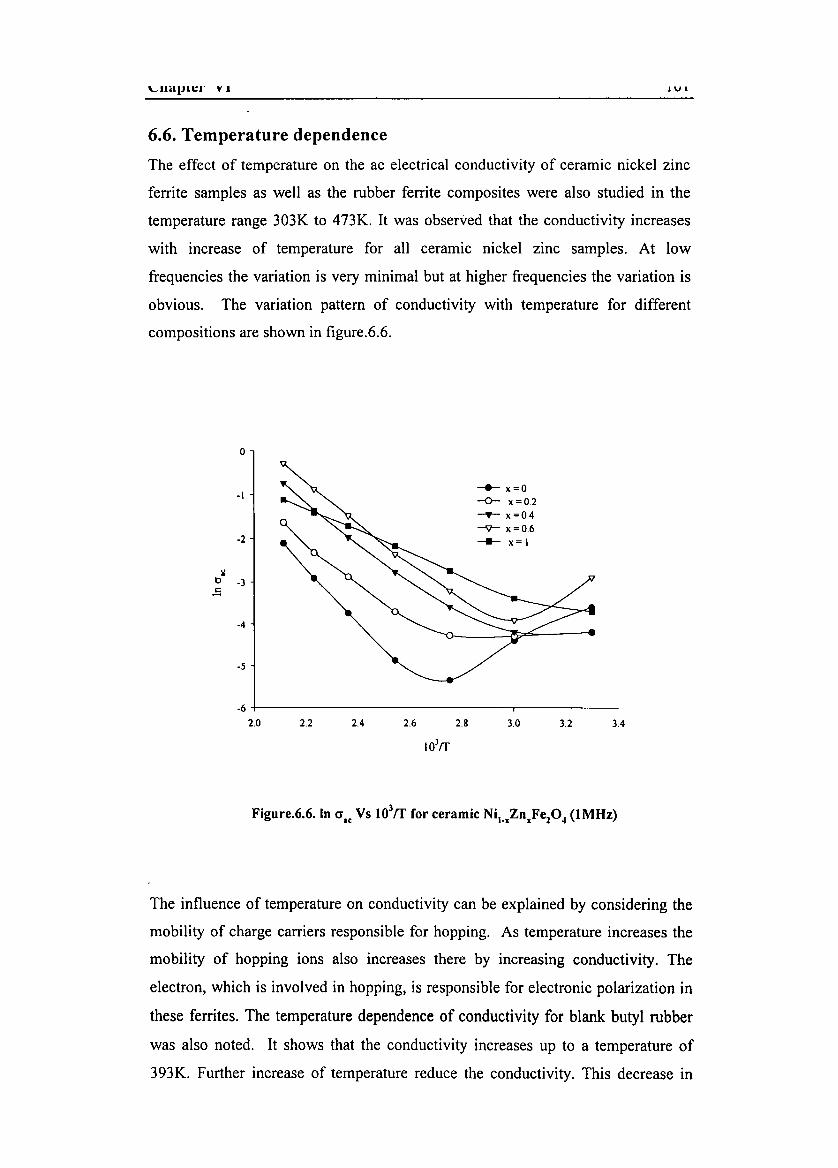
\...uapu:r Y 1 JVJ
6.6. Temperature dependence
The effect of temperature on the ac electrical conductivity of ceramic nickel zinc
ferrite samples as well as the rubber ferrite composites were also studied in the
temperature range 303K to 473K. It was observed that the conductivity increases
with increase of temperature for all ceramic nickel zinc samples. At low
frequencies the variation is very minimal but at higher frequencies the variation is
obvious. The variation pattern of conductivity with temperature for different
compositions are shown in figure.6.6.
o
-\
-2
b~ _3
.5
-4
-5
-.- x=O-0- x=0.2-y- x =0.4--'il"- x =0.6
-.- x=\
3.43.23.02.42.2
-6 +---------------.-------2.0
The influence of temperature on conductivity can be explained by considering the
mobility of charge carriers responsible for hopping. As temperature increases the
mobility of hopping ions also increases there by increasing conductivity. The
electron, which is involved in hopping, is responsible for electronic polarization in
these ferrites. The temperature dependence of conductivity for blank. butyl rubber
was also noted. It shows that the conductivity increases up to a temperature of
393K. Further increase of temperature reduce the conductivity. This decrease in
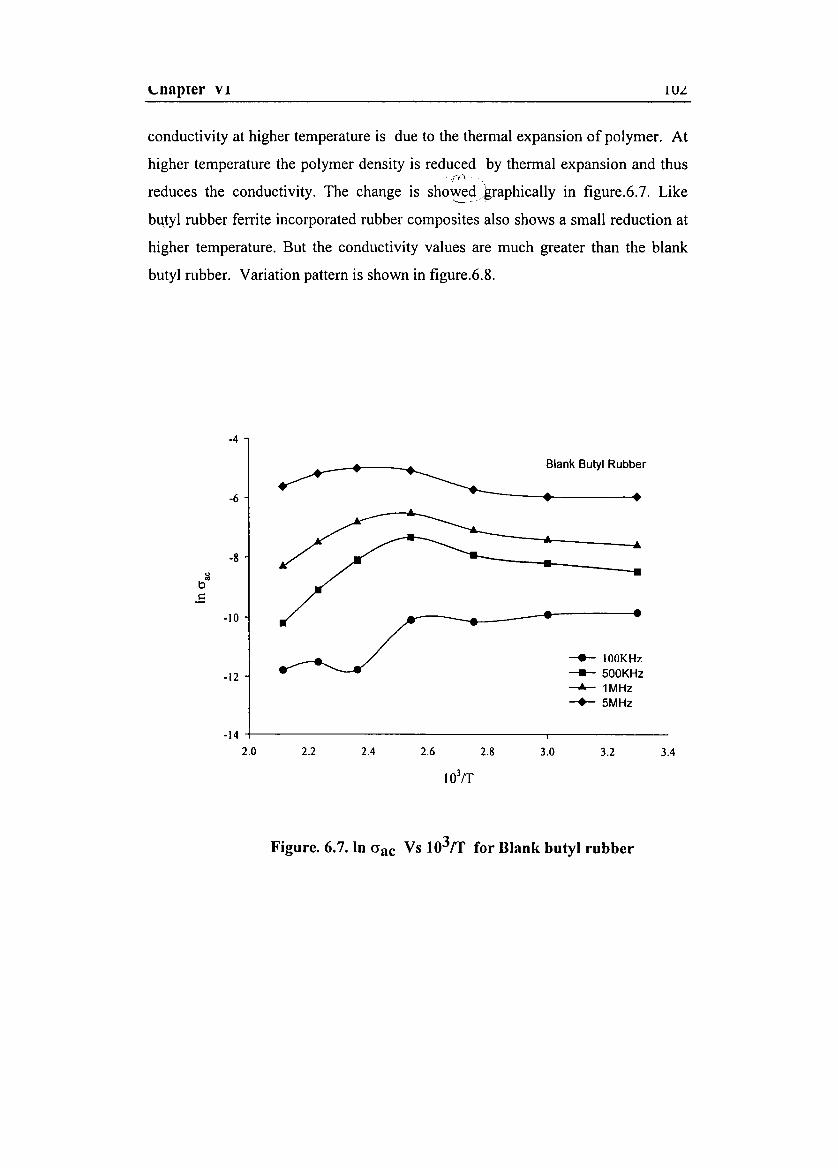
Lnaplcr VI IUL
conductivity at higher temperature is due to the thermal expansion of polymer. At
higher temperature the polymer density is reduced by thermal expansion and thus.' ·rl\
reduces the conductivity. The change is showedgraphically in figure.6.7. Like
butyl rubber ferrite incorporated rubber composites also shows a small reduction at
higher temperature. But the conductivity values are much greater than the blank
butyl rubber. Variation pattern is shown in figure.6.8.
-4
Blank Butyl Rubber
-6
~ : '"-8
~b.E
-10
---.- 100KHz
-12 --- 500KHz---A-- 1MHz--+- 5MHz
-14
2,0 2,2 2.4 2.6 2.8 3.0 3.2 3.4
103fT
Figure. 6.7. In Gac Vs 103fT for Blank butyl rubber
Chapter VI IU.)
X=0.2
.. e... ..
-- 20phr-<>- 40phr-- BOphr
120 hr,. u ,. "
}, u ,. ,. u U l.'
Io'tr IOIIT
-,X= 0.4
X=0.6
/-l
~: : :-}
~ .... : e.
~-s.. .5
..-+- 20phr--0- 40phr
-0- 40phr-1 --- 80phr-- 80phr
--- 120phr --- 120phr., -I
l.1 " II " ," " ,. ,. a III II H
IlI JtrIOIIf-,
-J
X=0.8X= I
.J
~: : ....
-se,
.5 e,
.5.s ..-+- 20phr -+- 20phr.. --0- 40phr
-1 --0- 40phr--- 80phr --- 80phr--- 120phr --- 120phr-1
2,11 " " '" a JlI II 14 -,211 " " 16 a l.lI II 14
IUJfT
IOlrr
Figure .6.8. Temperature dependence of conductivity for RFCs (1MHz)
Chapter VI
6.7. Conclusion
The ac electrical conductivity of ceramic as well as composite samples can be
calculated by using a simple relationship of the form O"ac = 27tf tano EOEr ,with the
data available from dielectric measurements. The results suggest that the ac
electrical conductivity is directly proportional to the frequency. It shows an
increase in conductivity with increase in frequency for both ceramic and rubber
ferrite composites. The compositional dependence shows an initial increase of ac
electrical conductivity with zinc content and reaches a maximum for x= 0.6
thereafter it decreases. This variation can be successfully explained with the help
of porosity of the ceramic samples. The variation of conductivity with volume
fraction of the magnetic filler shows a continuous increase up to a loading of
120phr. This variation remains the same for all compositions.

Chapter VII
Evaluation of hysteresis loss for RFCs &The estimation of magnetostrictiveconstant As
7.1. Introduction
Magnetostriction is the phenomena exhibited by ferro and ferrimagnetic materials
[188-189]. The state of strain of the magnetic sample is dependent on the direction
and the extent of magnetization. The strain caused by magnetization from the
demagnetized state to the magnetic saturation is denoted by the magnetostriction
constant A. Magnetostriction appears because a crystal is always deformed
spontaneously in the direction of magnetization in each domain[ 190-195]. As the
direction of spontaneous magnetization is changed by technical magnetization, the
direction of spontaneous strain of the crystal also changes, resulting in a change in
the shape of the crystal as a whole. Normally A is represented by the change in
length to the original length and can be written as ~l/l.
This particular phenomena has important applications in making magnetostrictive
transducers, which are used extensively in sonar devices. Currently the phenomena
of magnetostriction is used in analog positioning problems. They are also used in
acoustic delay lines, sonar devices and oscillators[196].
The theory of magnetostriction is complex and models are generally related to
those of magneto crystalline anisotropy since both these phenomena are due to spin
orbit coupling[197-198]. The microscopic origin of magnetostriction in spinel
ferrites are considered to be due to the strain potential and spin-orbit, intra spin
spin intercations, anisotropy exchange and the strain modulation of the dipolar
interaction. The magnetostrictive strains are usually so small that they can only be
measured if adequately magnified by mechanical .electrical or optical devices[ 199].

"""lIfll'·"· , ••
The precise determination of A or As the saturation magnetostriction constant is
important. This is significant not only from the applications point of view but this
also provides information as regard the nature of the domain or the domain
dynamics under the application of an external magnetic field. There are several
experimental methods available for the determination of As. Of them As. evaluation
by strain gauge methods, optical dilatometry, capacitance method and X-ray
analysis need special mention[200-205]. In most of the cases these experiments are
able to predict the magnitude and not the sign.
RFCs are composites containing elastomer matrixes and they are elastic in nature.
Under normal circumstances, they cannot be made transparent and hence optical
methods can not be employed to determine As. Since they are elastic in nature,
employment of strain gauge techniques for the evaluation of As also doesn't give
accurate values. This is because the adhesion of strain gauges to the composites,
requires a small force and this might already cause a strain to the sample under test
even before the application of a magnetic filed. So results obtained from these
techniques could be erroneous unless appropriate corrections are incorporated. This
is often time consuming and not fail proof. This lead us to search for simpler and
quicker methods to estimate As.
7.2. Estimation of As from Magnetic measurements
The saturation magnetostriction of a polycrystalline specimen depends on the
properties of its individual crystals and the way in which they are arranged. The
energy loss is attributed to the creation and anhilation of the domain wall surface
during it's displacement. This means that the value of saturation magnetostriction
depends on the energy loss. In polYJrystalline materials the grains are oriented
randomly. The saturation magnetostriction obtained here is an average over the
orientations.
It is known from first principles that simple relationships exist between As and the
total energy loss (Wh) when considering the hysteresis loop of a ferro or
ferrimagnetic material. Normally Wh is related to M, and He and they are in turn
determined by loop constants. Here the shape of the hysteresis loop play~ a very
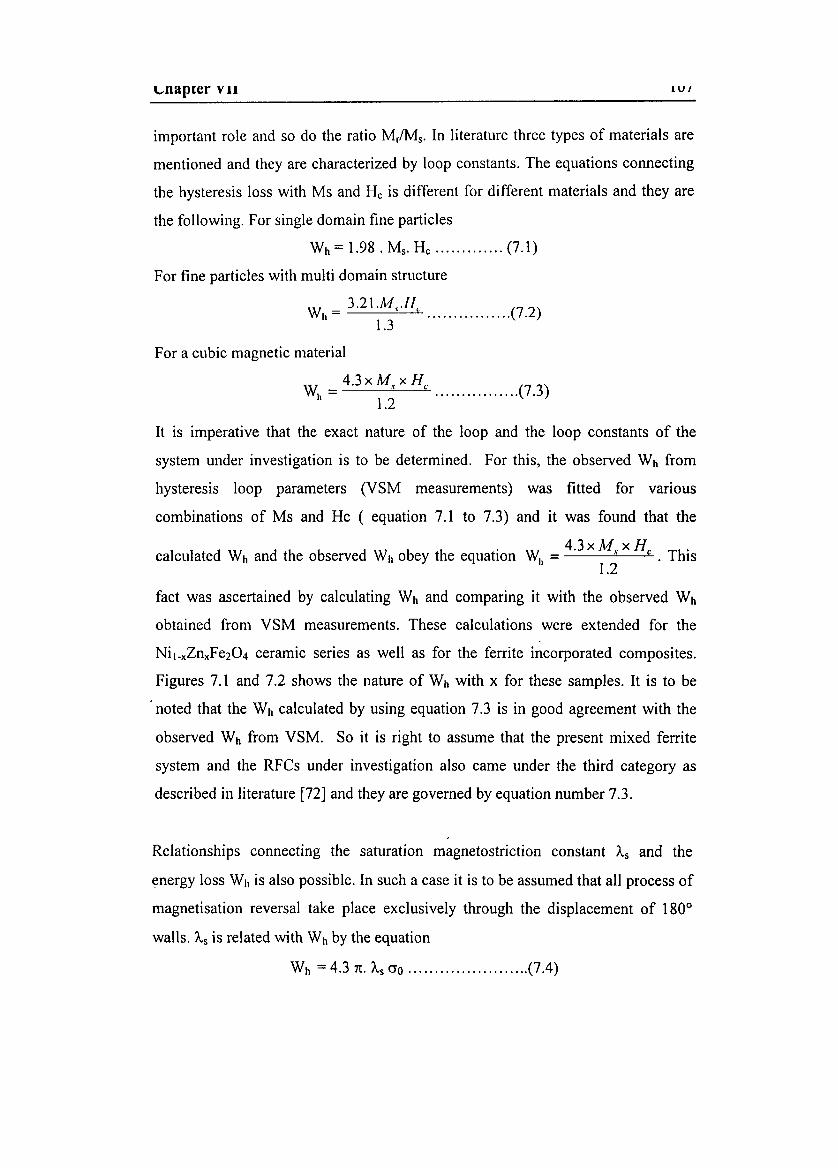
\...napter v 1J IVI
important role and so do the ratio M/Ms. In literature three types of materials are
mentioned and they are characterized by loop constants. The equations connecting
the hysteresis loss with Ms and He is different for different materials and they are
the following. For single domain fine particles
Wh = 1.98 . M; He (7.1)
For fine particles with multi domain structure
Wit = 3.21.M,./( (7.2)1.3
For a cubic magnetic material
Wh
=4.3 x M" x He (7.3)1.2
It is imperative that the exact nature of the loop and the loop constants of the
system under investigation is to be determined. For this, the observed Wh from
hysteresis loop parameters (VSM measurements) was fitted for various
combinations of Ms and He ( equation 7.1 to 7.3) and it was found that the
calculated Wh and the observed Wh obey the equation Wh = 4.3 x M., x He . This1.2
fact was ascertained by calculating Wh and comparing it with the observed Wh
obtained from VSM measurements. These calculations were extended for the
Nil_xZnxFe204 ceramic series as well as for the ferrite incorporated composites.
Figures 7.1 and 7.2 shows the nature of Wh with x for these samples. It is to be
noted that the Wh calculated by using equation 7.3 is in good agreement with the
observed Wh from VSM. So it is right to assume that the present mixed ferrite
system and the RFCs under investigation also came under the third category as
described in literature [72] and they are governed by equation number 7.3.
Relationships connecting the saturation magnetostriction constant As and the
energy loss Wh is also possible. In such a case it is to be assumed that all process of
magnetisation reversal take place exclusively through the displacement of 1800
walls. As is related with Wh by the equation
Wh =4.3 7t. As ao (7.4)
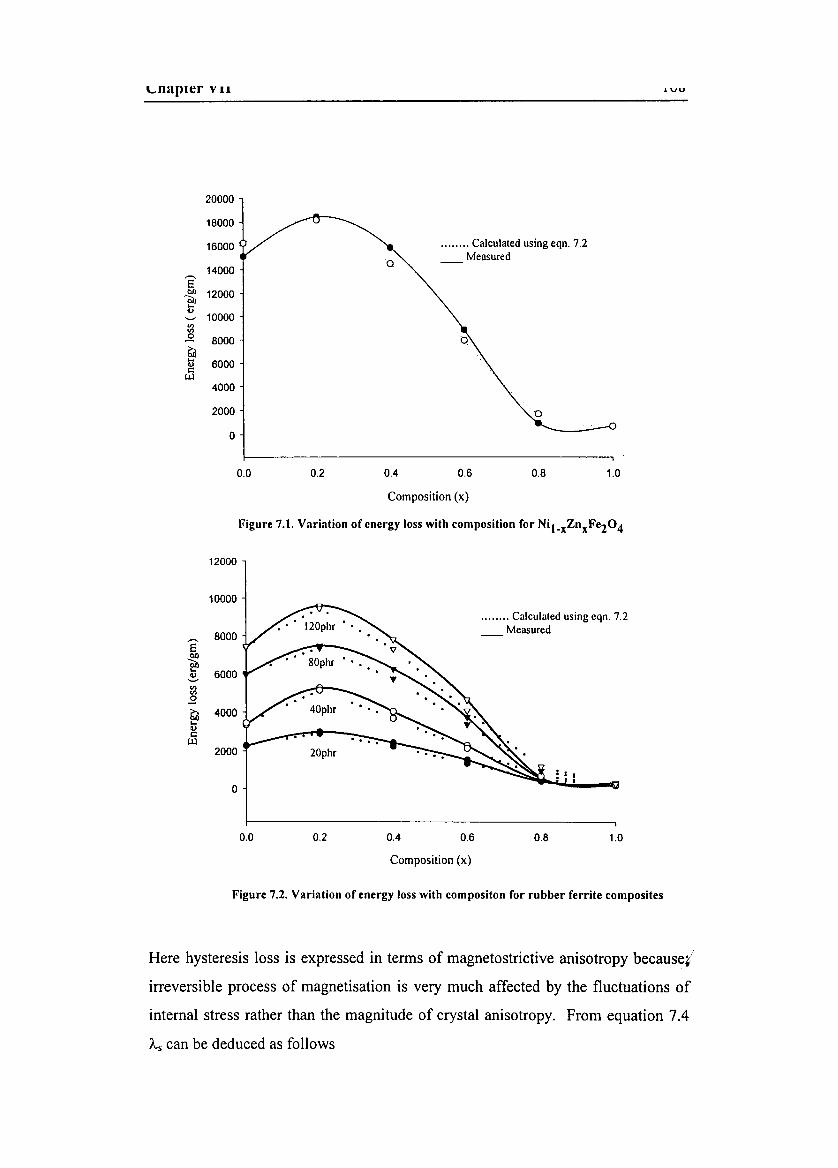
........ Calculated using eqn. 7.2Measured
Lm'plt~r VII
20000
18000
16000
14000E.~ 12000...
Q)
10000<Il<Il
.2 8000~... 6000Q)c::
u.l4000
2000
0
0.0 0.2
o
0.4 0.6 0.8 1.0
lVU
Composition (x)
Figure 7.1. Variation of energy loss with composition for Nil_xZnxFeZ04
........ Calculated using cqn. 7.2Measured
12000
10000
,....., 8000E
~ 6000~<Il<Il
.2~ 4000...11)
c::u.l
2000
0
0.0
20phr
0.2 0.4 0.6 0.8
:: I: I.
1.0
Composition (x)
Figure 7.Z. Variation of energy loss with composlton for rubber ferrite composites
Here hysteresis loss is expressed in terms of magnetostrictive anisotropy because/
irreversible process of magnetisation is very much affected by the fluctuations of
internal stress rather than the magnitude of crystal anisotropy. From equation 7.4
As can be deduced as follows
'-" •••••' __ • 9 __
A = Wh•.•.•..••••.•••.•..•• (7.5)
s 4.3 x 1l" x 0"0
where As is the magnetostrictive constant Wh is the hysteresis loss factor and 0'0 IS
the internal stress. However this relationship requires a knowledge of 0'0 . One of
the two extreme assumptions are possible like stress is uniform throughout but
strain varies from grain to grain or strain is uniform and stress varies. It has been
reported in the literature that 0'0 is universal in nature, especially, for polycrystals
and it is of the order of 109 N/m2. The origin of 0'0 , is assumed to be a constant
which is not clear and dealt very scarcely in literature. This value of 0'0 was
employed for the estimation of As.
7.3. Results and discussions
For the purpose of comparison and checking the validity of this simple
relationship, data available from literature on similar systems namely,
Nil-xZnxFe204 were made use of. As was calculated for Nil-xZnxFe204 with
various x for two series of samples fired at different temperatures and they are
shown in Figure 7.3. This was done by employing the reported values of M, and He
and substituting these values in equation 7.5. As for nickel zinc ferrite series was
experimentally found out by J.Smit and H.P.J Wijn [79] and they are compared
with the calculated values. Table 7.1 shows a gist of the As values reported by
various scientists for various ferrites. As reported for Nil-xZnxFe204 by using
experimental techniques was also plotted for different x and is shown in figure 7.3.
These were also compared with the calculated As (using the reported M, and He
values of Nil-xZnxFe204 ferrite samples by employing equation 7.5). An increase
in As was observed with increase in zinc concentration. Etienne du Tremolet de
Lacheisserie have found out the magnetostriction coefficients for Nh-xZnxFe204 at
77K and it is found to be lie between 105 x 10-6 and 63 x 10-6 [206]. He also
analyzed the x dependence of As for Nil-xZnxFe204. The As for NiFe204 at room
temperature was first reported by Smit and Wijn, and it is found to be -26 x 10-6
(cf Table 7.1). But Murthy and Rao reports that for NiFe204 the value of As is -24
X 10-6
[207]. These discrepancies could be because of the influence on the
preparative conditions on the value of As . That is as sintering temperature

increases the absolute value of As decreases. This decrease was correlated with the
appearance of Fe2+ in the nickel ferrite. Since Fe304 exhibit a positive As value,
hence any appearance of Fe2+ in the nickel ferrite markedly reduces the absolute
value of its As coefficient.[206].
This estimation only provides the magnitude of the magnetostriction and not the
sign. This is one of the drawbacks of this method of estimation. However a survey
of the literature reveals that except magnetite most of the ferrites exhibit a negative
magnetostrictive constant. So intuitively one can indirectly gain an idea about the
sign of As. More over a knowledge of anisotropy constants can also give
indications about the sign. So going by the vast experimental data available on
similar systems sign can be attributed to the As.
Sample ID As x 106 By Smit & Wijn
Nio.36Zno.64Fe204 -5
Nio.sZno.sFe204 -11
Nio.64Zno.36Fe204 -16
Nio.sZno.2Fe204 -21
NiFe204 -26
Fe304,
40
CoFe204 -110
MnFe204 -5
MgFe204 -6
Lio.sFe2.s04 -8
Table: 7.1 Linear magnetostriction coefficient for some mixed
ferrites(reported by Smit & Wijn)
The graph depicting the variation of As with x for samples fired at higher
temperature indicates that As is higher for particles with lower He. The variation
pattern of As with x is the same for Nil-xZnxFe204 for both calculated and
measured values (from literature). However barring compositions at x = 0 and x =

Cnapter VII 11 1
I (cf.Fig.7.3)the variation pattern for As vs x is almost the same. This could be
because no As values were reported earlier for ZnFe204 and it was assumed to be
an antiferromagnetic material. In the present study we observed a net
magnetization of 3.118emu/gm for fine particle zinc ferrite and this behaviour has
been discussed in detail in chapter 4. It is also possible that at x = 0 the Ni2+ too
will be occupying the tetrahedral sites instead of octahedral sites. This observation
is supported by complimentary evidences and is reported by Chinnasamy et al
[208]. The estimated As for the samples under investigation is less than that of the
reported.
LandoltBornsteinFiringat 1250·C LandoltBornsteinFiring at 1450·C
.,
...'"~ ....~ .,
-..·11
.,... ., ., •• .,Composition (x)
,. u
.,
"b
'" ·1
~
.)
.,+---~~-~-~-~---luu U.2 U,4 U.6 0.. I U 11
Composilion(x)
·5
·10
'"~'"
·15
£·20
·25
·30
Smit & Wijn Experimentaldata
0.0 0.1 0.2 0.3 0.4 0.5 e.e 0.7
Composition (x)
Our estimateddata
·1
...
·IU
·11
·14
.11, +-- ~----l
uu 0.2 0.4 o.e 0.8 ,. 1.2Composition(x)
Figure 7.3 A, Vs Composition for Nil-aZn.Fe104
From the graphs it is clear that the As calculated by using equation 7.5 have
resulted in values comparable to the experimentally observed values. As is
essentially determined by M, and He and hence He influences the As value. Here it
Chapter VII 112
is to be noted that the value of He was relatively high (for the sample under present
study) almost an order difference and this has resulted a As value which is almost
an order less than that of the calculated values (from literature).
The same principle was applied to estimate As for RFCs. The As values of rubber
ferrite composites are larger compared to that of it's ceramic component. The
compositional dependence of As for RFCs shows same pattern as that observed for
ceramic fillers. Figure 7.4 shows the variation of magnetostriction constant with
zinc concentration for RFCs. It is also to be noted that the saturation
magnetostriction decreases with increase of weight fraction of the magnetic filler.
The details are shown in Figure 7.5 . The As of RFCs exhibit a cumulative property
of the matrix and the filler. The As of RFCs is characteristics of a dilute system.
The values range from 6.98 x 10⁻⁵ to 0.1356 x10⁻⁵. This is because the matrix is
nonmagnetic and are assumed that there is no filler matrix interaction. Moreover
magnetization measurements carried out on RFCs (chapter 3) show that the He of
the composites and He of the filler are the same. So naturally the As is determined
by the amount of the filler or rather the M, of the filler.
It is to be noted that the employment of equation 7.5 provides only approximate
values for As. If As for ceramic as well as the composites can be determined
experimentally a comparative study can be carried out. This together with some
modeling and simulation can throw light in the origin of 0'0 and thus could even tell
us whether there is a large change in 0'0 or this could be assumed as a constant.
This estimation does not provide the sign for the estimated As. This is one of the
drawbacks of this method of estimation of As.
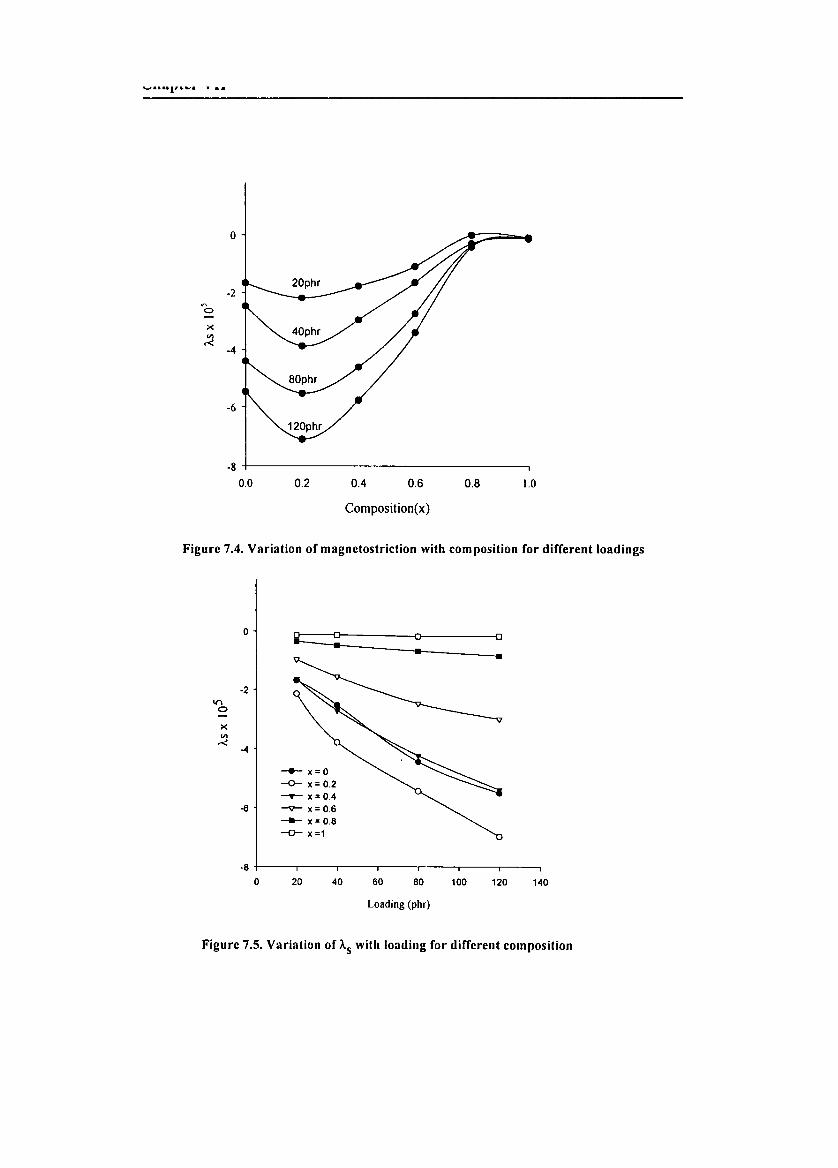
o
-2
'0:><Vl
.<-4
-6
1.00.80.60.40.2
-8 +----------------------,0.0
Composition(x)
Figure 7.4. Variation of magnetostriction with composition for different loadings
0 o-----a 0 0... • • •
-2V'I
0
:><Vl
.<-4
-- x=O-0- x= 0.2-T- x= 0.4
-6 ~ x=0.6
-- x=0.8-0- x=1
-8
0 20 40 60 BO 100 120 140
Loading (phr)
Figure 7.5. Variation of AS with loading for different composition
Chapter VII 114
7.4 Conclusion
Estimation of magnetostriction constant As was carried out by utilizing the
hysteresis loop parameters and employing a simple relationship. The magnetic
parameters obtained from the vibrating sample magnetometer is used to estimate
the magnetostricti on constant (As). One of the main drawbacks of this estimation is
that the sign of As can not be predicted directly. From the literature it can be seen
that except magnetite most of the ferrites exhibit a negative magnetostrictive
constant. Results on the estimation of As for the ceramic nickel zinc ferrite lies in
the range 13.44 x 10⁻⁵ to a lower value of 0.51 x 10⁻⁵. The As values of RFCs are
found to be less compared with the ceramic ferrite samples.

Chapter VIII
Summary and Conclusion
Magnetism is one of the oldest phenomena known to the mankind. The area of
magnetism and especially the field of ferrimagnetism is the most widely studied
phenomenon by engineers and scientists for possible exploitation for commercial
applications. Among many ferrimagnetic materials studied ferrites received the
utmost attention and still most of the devices based on ferrites are yet to be replaced
by other materials. This speaks volumes about the importance of these class of
materials. Mouldability and flexibility of ceramic magnetic materials is one of the
problem areas as far as applications are concerned. This is where magnetic
composites can play a very crucial role. RFCs are magnetic components and can fill
these voids where in they can be moulded in to complex shapes. Flexibility with the
required mechanical strength is another hallmark of these composites. These
composites can be potential microwave absorbers in a wide range of frequencies.
The main focus of the present work was to synthesize ferrite fillers belonging to the
series Nh-xZnxFe204 in the single phasic form and to incorporate them in a butyl
rubber matrix for various loadings. The first chapter presents a general introduction
to this area and the second chapter gives a general discussion of the experimental
techniques employed for the characterisation at different times. Chapter 3 - 7 gives
the details of the findings of the work carried out on the subject of RFCs. The
following section provides a glimpse of the conclusions drawn from the present
study and the scope for future work.
An inspection of table 3.4 and 3.5 in chapter 3 indicates that the calculated and
measured values of the ~B for the Nil-xZnxFe204 do not tally each other. Though this
has been explained successfully by invoking canting of spins this needs to be
investigated further. This is stated in the light of the observations made in the
laboratory on a series of Ni l -xZnxFe204 samples prepared with different particle
Chapter VIII 111
sizes. This indicates that the cation distribution in the fine particle regime could be
entirely different and nickel could be occupying A sites also. In order to extract solid
evidence one needs to carryout detailed studies by using Mossbauer spectroscopy
and low temperature magnetisation measurements. Investigations on fine particle
Ni l _xZnxFe204 and ZnFe204 may be combined and this will throw light on the
magnetic behaviour of spineI ferrite system in the nanoregime.
So far not much attention was devoted to the area of nanoregime, though chemists
have devoted a great deal of attention and efforts to this area, most of the work has
been on the surface chemistry and surface structure of catalyst materials. These
efforts were towards synthesizing high surface area catalysts and understanding the
surface chemistry of these materials. The solid state properties of these systems have
not been probed in depth. After the discovery of nanomaterialsl nanocomposites and
the recent findings, people are devoting much attention to this area in minutest
details.
Chapter 4 dealt with the anomalous behaviour of zinc ferrite systems. The
anomalous behaviour of ZnFe204 in the nano regime was successfully explained by
conducting a series of experiments by using Mossbauer spectroscopy, Low Energy
Ion Scattering (LEIS) and magnetisation measurements using Vibrating Sample
Magnetometer (VSM). These studies were of preliminary in nature and scope exists
to carryout further studies in a more systematic manner. For example, it has been
only concluded tentatively that the occupation of Zn on the B site is dependent on
the particle size or rather the surface area. It has not been established whether the
amount of inversion is dependent on the size. Similarly the existence of clusters, if
any on the surface of fine particle spinel ferrites needs to be investigated separately.
It has been reported that the magnetisation of ZnFe204 is extraordinarily large in
small particle forms, compared to the value reported for the bulk. The origin of
these magnetisation in these small particles has been interpreted to be the presence
of higher concentration of magnetic clusters, which are expected to be formed by A
B interactions of Fe3+ ions produced by a small deviation in cation distribution from
the normal spinel structure. Clusters are formed by the A-B interactions caused due
to the occupancy of small number of Fe3+ ions in tetrahedral A-sites with the Fe3
+
ions at octahedral B sites. In the literature there are also reports suggesting that
----1'--- . ---
surface spins also contribute to the total magnetisation. In the above case the total
susceptibility contains a contribution of spins coupled in the clusters and of the free
spins of the remaining Fe3+ ions in the B-site. It would be appropriate to carryout
further studies on fine particle zinc ferrite system by preparing ZnFe20 4 of different
particle size and study the various properties, like magnetisation and conductivity as
a function of size of the particle. In this context it must be mentioned here that these
properties are to be studied with respect to the single domain (SD)/
superparamagnetic (SP) nature of these magnetic particles and must be correlated.
Moreover surface studies also can be conducted to evaluate the surface structure of
the spinel system by using Low Energy Ion Scattering (LEIS) and Electron
Spectroscopy for Chemical Analysis (ESCA). Scope also exists to evaluate the
magnetic structure of ZnFe20 4 in the nano regime by employing neutron scattering
experiments. From a fundamental point of view more studies on similar spinel
systems could also be undertaken in order to establish the magnetic structure of
similar compounds. The information thus gathered would enable material scientist to
synthesise new magnetic materials with improved magnetic and electrical properties.
Similar systems belonging to the spineI family, not necessarily magnetic, can serve
as ideal platforms to test the above hypothesis. It has been established earlier that
cations like Zn2+ and Cd2+ have a strong tetrahedral site preference, and it would be
appropriate to delve the energy consideration under which they migrate to the
octahedral voids in the nanoregime.
The evaluation of processability parameters indicates that the materials are
processable and can be moulded i4)o different shapes with the required mechanical
properties. The processability is not affected and the percolation threshold is also
not reached for a maximum loading of 120phr. This means that along with magnetic
fillers some reinforcing fillers like carbon black (HAF N330) could be introduced iri~
Jo the matrix for enhancing the mechanical properties of these composites.
Microwave absorbers are important because of the ever increasing electromagnetic
interference (EMI) due to the immense growth in the utilisation of electronic and
electrical devices in industrial and other commercial applications. One of the
solutions to the problem of EMI is to use shielding or absorbing material to absorb
v.naprer v 111 ID'
the corresponding electromagnetic waves. Gadgets based on rubber ferrite
composites can play a very crucial role here. Research carried out on these
composites by various researchers have shown that rubber ferrite composites are
very good microwave absorbers for a wide range of frequencies over intrinsic
ceramic ferrites. It is also known from the literature that carbon black enhances the
microwave absorbing properties of RFCs. So as a continuation of the present
research carried out on RFCs one can undertake a series of studies on the microwave
absorption of these composites with carbon black incorporation. The effect of
loading of carbon black in increasing or decreasing the bandwidth of microwave
absorption of RFCs will be a very good futuristic proposition.
The purpose of studying microwave absorbing characteristics of these RFCs is to
bring out a more quantitative relationship between the magnetic and dielectric
characteristics of these composites and its microwave absorbing properties. In the
literature already relationship for calculating surface impedance exists for the design
of microwave absorbers especially for single layer absorbers. For a microwave
absorbing layer the normalised input impedance at the absorber surface (Zin) is given
by
r;; [. 2nd ~]z, =V7· tanh J.T·V,u·£ (8.1)
.where A. is the wavelength of microwave in free space and d is the thickness of the
absorber material. 1.1.. E· are the complex permeability and complex permitivity of the
material and is given by 1.1.. = 1.1./ - j I.I.r 11 and E· = Er1 - j Er11 •The complex
permeability and permitivity of the constituent materials of the microwave absorbers
play a key role in determining the reflection or attenuation properties. They can be
determined from the reflected and transmitted scattering parameters obtained from
network analyser. The reflection loss which is a function of Zin is then expressed as
Reflection loss (dB) = 20.log. 2 in -1 (8.2)z; +1
The absorbing properties of the sample is calculated at a given A. and d. It is to be
noted that the reflection loss is found to depend sensitively on the absorber thickness

'--IH'IJlt:I- v III 14V
wavelength, complex permittivity and complex permeability. The absorption
performance can be improved by increasing the filler permeability, filler
concentration and material thickness. A control of magnetic permeability is possible
by preparing ferrite fillers with different chemical compositions. High permitivity is
achievable and is possible by nitrogen sintering ,of the ferrite fillers. It was also
reported that non-spherical magnetic particles exhibit a higher permeability and
hence better absorption in the radar band, when compared to spherical magnetic
particles. Here it is to be noted that acicular precursors for the synthesis of acicular
ferrites can be prepared by the employment of complexing agents/media. Ferrite
fillers with needle shaped particles can be synthesized and the same can be
incorporated in appropriate matrixes.
The formulation of an empirical relationship for the evaluation of M, of RFCs will
be of use in predetermining the magnetic properties. The same empirical relationship
can be applied for a composite containing a mixed ferrite series obeying a Gaussian
pattern with respect to the composition versus magnetisation. Experiments also
prove that the He of the filler and the filler incorporated composites remains the
same. If the He of the composite is to be modulated impurities like cobalt, which
derives it's coercivity enhancing property from the magnetocrystalline anisotropy is
to be incorporated. So composites with Co modified ferrite fillers can be a good
candidates for RFCs with a large He. Results obtained from magnetic and dielectric
studies (chapter 3 and 5) indicates that the dielectric and magnetic properties can be
tailored. These semi empirical equations can be combined with the surface
impedance equation. These together will form the basis for the synthesis of RFCs for
microwave absorption applications. Emphasis was laid on the evaluation of E and M,
and similar studies can be extended for the evaluation of E and Il in the microwave
frequencies by using vector network analysers. Scope also exists to make emulsions
and try it as a coating especially for antiradar applications. It will be interesting to
disperse these fillers in latex (natural rubber) and study the properties. Gaskets based
on RFCs could easily be moulded and this can form part of microwave devices,
which will prevent electromagnetic radiations. Polar matrixes like Nitrile can be a
suitable matrix for RFC preparation, Nitrile, which has superlative properties, will
be suitable for specific applications.

Lhapter v III 121
Thermal properties of polymer composites are important because these materials are
required to be suitable for applications over a wide range of temperatures, perhaps a
few hundred degrees both above and below room temperature. Polymer composites
often undergo comparatively large volume changes with respect to temperature
during fabrication. Hence they have very large coefficients of thermal expansion
than many other structural materials. This will result in a quite mis-match in
expansion between polymer system and the filler materials with which they might be
in contact. Hence thermal expansion of the composite materials is important. Due to
this mis-match in expansion of the filler and the polymer, differential shrinkage is
possible during cooling of a composite. Similarly heating can produce significant
stress changes, which in turn may have a profound effect on the mechanical
properties. These stresses will produce micro cracks at the interface while preparing
composite materials.
One of the most important stages in the preparation of polymer composites is the
process of distributing the filler in an even manner through out the polymer matrix.
Micro structural studies using optical micrographs or SEM can asses the efficiency
of a particular mixing and dispersion of the fillers. It has been concluded that there
exists no interaction between the filler and matrix. This inference has been arrived at
based on the evaluation of bulk properties of the composites namely magnetic and
electrical. These conclusions are applicable at the macroscopic level. There exist
possibilities of interactions between filler or matrix at the microscopic level. Tools
like Electron Paramagnetic Resonance (EPR) can be utilised to probe the possible
microscopic interactions taking place during ferrite incorporation. This is beyond the
scope of the present work.
In chapter seven the estimation of magnetostriction constant As from the hysterisis
loop parameters was attempted. This gives only a rough estimate of the As, and that
too evaluated by employing 0"0, which was assumed to be universal in nature. The
theories governing the determination of stress occurring in ferrite filled composites
is not clear. Scope also exists to evaluate the magnetostriction constant As by
effective experimental tools. This will determine the utility of these composites as
possible sensors.
Chapter VIII 122
Now that the use of rare earth magnets has come in a big way, there is a huge
potential for carrying out research on polymer bonded magnets based on rare earths.
The present work when viewed from a broad viewpoint is minuscule considering the
vastness of this subject and magnetism will be always be a fascinating subject for
scientists for the years to come. This field will be ever attractive in nature and at the
same time reveal more and more about less and less.
References
1. Benjamin Lax, Kenneth J Button, Microwave ferrites and ferrimagnets, Me
Graw-Hill Book Co. (1962).
2. F.Brailsford, Magnetic materials, Methun's Physical monographs (1948).
3. H.V.Keer, Priciples of the solid state, Weily Eastern Limited (1993) New
Delhi.
4. F.Brailsford, Physical principles of magnetism, D Van Nostrand Co. Ltd.
(1966).
5. R.S.Tebble, Magnetic domains, Methuen Co. Ltd. (1969).
6. R.Carey, E.D.lsaac, Magnetic domains and techniques for their
observations, Academic press (1966) New York.
7. J.C.M.Li Microstructure and properties of materials, world scientific (1996)
Singapore.
8. J.H.Nam, H.HJung, J.Y.Shin and J.H.Oh, IEEE Trans. Magn. Vol. 31 No.6
(1995) p 3985 -87
9. M.Pal, P.Brahma, D.Chakravorty, J. Magn. Magn. Mater. 152 (1996) p
370-374.
10. C.M.Williams, M.Abe and T.itoh, P.Lubitz, IEEE Trans. Magn. Vol.30
No.6 (1994) p4896-4899.
11. Sung-soo Kim , Dae-Hee Han, Sung -Baeg Cho, IEEE Trans. Magn.
Vol.30, No.6 (1994)p4554-4556.
12. Safari Ardi M, Dick Wand McQueen D.H, Plastic rubber and composites
processing and applications 24 (1995) p 157 - 164
13. C.P.bean and J.D.Livingstone, J. Appl. Phys. 30 (1959) 120.
14. E.M.Chudnovsky and L.Gunther, Phys. Rev. B 37 (1988) P 9455.
15. R.D.Mc Micheal, R.D.Shull, L.J.Swartzondruber, L.H.Bennet and
R.E.Watson, J. Magn. Magn. Mater. 111(1992) 29.
16. K.A.Gschneidner Jr. and V.K. Pecharsky, J. Appl. Phys. 85
No.8(1999)p5365
l<eterences 11
17. Dishovaski N.Petkov A, Nedkov I and Razkazov I, IEEE Trans. Mag.Mag.
30 (1994) 969.
18. Naito Y and Suetake K, IEEE Trans. Micro. Theo. Tech. , 19 (1971) 65.
19. Gruberger W, Spreingman B, Brusberg M, Schmit M and Jahnke R , J.
Mag. Mag. Mat. 101 (1991) 173.
20. Nedkov I Petkov A and Karpov V, IEEE Trans. Mag. Mag. , 26 (1990)
1483.
21. Shin J.Y and Oh T.H IEEE Trans. Mag. Mag. ,29 (1993) 3437.
22. Kim S.S, Jo S.B, Choi K.K, Kim J.M and Churn K.S, IEEE Trns. Mag. 27
(1991) 5462.
23. Mingzhong Wu, Huahui He, Zhensheng Zhao and Xi Yao, J.Phys. D: Appl.
Phys. 33 (2000) 2398 - 2401.
24. Stoyan I ganchev, Jay Bhattacharya, Sasan bakhtiari, Nasser Qaddoumi,
Deborah Brandenburg and reza Zoughi, IEEE Trans. Micro. Theo. And
Tech. Vol.42, No.l (1994) 18-24.
25. William B Weir, Proceedings of the IEEE Vol. 62, No.l (1974) 33-36.
26. Praveen Singh and T.C. Goel, Ind. Journal Pure. Appl. Phys. , 38 (2000)
213-219
27. S.A.Mirtaheri, J.Yin, H.Seki, T.Mizumoto and Y.naito, The Trans. The
IEICE , Vol. E72 No.12 (1989) pI447-1452.
28. D.Y.Kim, Y.C.Chung, T.W.kang and K.C.Kim, IEEE Trans. Magn. Vol.
32 , No.2 (1996) p555-558.
29. Y.Naito, J.Yin, T.Mizumoto, Elec. Commun. Japan, Part 2 Vol. 71, No.7
(1988) p77-82.
30. Nitendar kumar, Prankishan, J. Mater. Sci. Lett. 10 (1991) P 217-219.
31. H.M.Musal Jr. and H.T.Hahn, IEEE Trans. Magn. Vol. 25 (1989) p3851 -
3853.
32. H.T.Hahn, J. Appl. Phys. Vol. 69 (1991) P 6192 - 6194.
33. H.T.hahn, 1. Appl. Phys. Vol. 69 (1991) p 6195-6197.
34. M.Matsumoto and Y.Miyata ,IEEE Trans. Magn. 33 (1997)p4459-4464.
35. Olmedo L, Chateau G, Deleuze.C and Forveillei 1.L., J. Appl. Phys. 73
(1993) p6992-6994.
36. Rinchao Che, Yong Qing Li, Zhaohin Chen, Hongji Lin, 1. Mater. Sci. Lett.
18(1999) pI963-1964.
l\.t:lt:n::nu:~ lU
37. S.AMirtaheri, T.Mizumoto, Y.Naito, The Trans. The IEICE Vol. E73 No.
10 (1990) p1746 - 1752.
38. Kyung Ho Lee, Dang Hoe Cho, Seung suk Jeung, J. Mater. Sci. Lett. 16
(1997) p 83-87.
39. D.C.Khan, M.Misra, Bull. Mater. Sci. 7 (1985) p253.
40. K.Ishino, Y.Narumiya, Cenn. Bull. 66 (1987) p1469.
41. B.V.Bhise, M.B.Dangare, S.APatil, S.R.Sawant, J. Mater. Sci. Lett. 10
(1991) p 922.
42. Simon Foner, Rev. Sci. Instrum. Vol. 30, No.7 (1959) p548-557.
43. Joseph A Pesch, Rev. Sci. Instrum, Vol.54, No.4 (1983)p480.
44. R.V.Krishnan and ABanerjee, Rev. Sci. Instrum., Vol.70 No.I (1999)p85.
45. H.H.Brongersama, N.Hazewindus, J.M. Van Niewland, AM.M. Otten,
AJ. Smels, Rev. Sci. Instrum. 49 (6) (1978) p 707
46. H.H.Brongersma and P.M.Mul, Chem. Phys. Lett. 14 (1972) 380,
47. H.H.Brongersma and P.M.Mul, Surf. Sci. 35 (1973) 393.
48. M.Manivel Raja, ANarayanasamy, V.Ravichandran, J. Mag. Mag. Mater.
10607 (1996)xxxC.
49. C.W.Kimball, Water C.Philips, M.V.Nevitt and K.S.Preston, Phys. Rev.
Vol. 146 No.2 (1966) p 375-378.
50. V.R.K.Murthy, S.Chitra sankar, K.V.Reddy and J.Sobhanadri, Ind. J. Pure.
Appl. Phys. Vol. 16 (1978) p 79- 83.
51. S.K.Date, Ind. J. Chem. Edu. VoU No. 2 (1970)
52. A.Goswami, Thin Film Fundamentals, New age international Publishers
Ltd. New Delhi (1996).
53. JozefSlama, Anna Gruskova, Ludovit Keszesh, Mojmir Kollar, IEEE
Trans. Mag. Vol. 30 No.2 (1994) p1101-1103.
54. Z.Osawa, K.Kawaguchi, M.Iwata, H.Harada, 1. Mater. Sci. 23 (1988) p
2637- 44
55. T.Nakamura, T.Tsutaoka,K.Hatekeyama, J. Mag. Mag. Mater. 138 (1994) p
319-328.
56. H.Takei, H.Tokumasu, H.Rikukawa and I.Sasaki, IEEE Trans. Mag. Vol
MAJ 23 (1987) p3080-3082.
57. A.M.Sankpal, S.S.Suryavanshi, S.V.Kakatbar, G.G.Tengshe, R.S.Patil,
N.D.Chaudhari, S.R.Sawant, 1. Mag. Magn. Mater. 186 (1998) p349-356.
rvererences 1 V
58. Ferrite materials - Science & Technology, B.Viswanathan and
V.R.K.Murthy
59. ASTM 10- 325 (Ni ferrite) Nat. Bur. Stands (V.S) circ. 539 - 1044
(1960).
60. Smit and Wijn, Philips Technical reports - 144 , 1959
61. Materials science, J.C. Anderson , K.D.Leaver - Thomas Nelson and sons
Ltd. , 1969, Great Britain.
62. Physics of magnetism, Soshin Chikazumi, John Wiley and sons, Inc. ,
New York
63. Lattice defects and non stochiometry, N.N.greenwood, Butterworth and Co
Ltd. (1968).
64. M.Andres Verges, C.de Julian, lM.Genzalez, C.lSeina, J. Mater. Sci. 28
(1993)p2962-2966.
65. E.J.Verway, P.W.Haayman and F.C.romeijn, J. Chem. Phys. Vol. 15 No. 4
(1947) pI81-187.
66. E.J.W.Verwey, F.De Boer and J.H.Van Santen, J. Chem. Phys. vet. 16 No.
12 (1948) P 1091 - 1092
67. S.Besenicar, M.Drofenik, T.Kosmac, V. Krasevec, IEEE Trans. Magn. Vol.
24 No.2 (1988)p 1838-1840.
68. C.lChen, K.Bridger, S.R.Winzer and V.Paiverneker , l Appl. Phys. 63
No.8 (1988)p 3786 - 3788.
69. T.T.Srinivasan, P.Ravindranathan, L.E. Cross, R.Roy and R.E.Newnhan,
S.G.Sankar, K.C.Patil, J. Appl. Phys. 63 No.8 (1988) p 3789 - 3791.
70. Introduction to magnetic materials, B.D.Cullity, Addison Wesley
publishing Company.
71. L.K.Leung, B.J.Evans, A.H.Morrish, Phy. Rev. B, 8 No.l (1973) p29-43.
72. V.C.Wilson and J.S.Kasper, Phys. Rev. 95, 1408 (1954),
73. N.S.Satyamurthy, M.G.Nater, S.I.Yousef, R.J.Begum and C.M.Srivastava,
Phys. Rev. 181, 969 (1969),
74. V.I.Goldonskii, V.F.Belov, M.N.Devisheva and V.A.Trukhtanov, SOy.
Phys. JETP 22, 1149 (1966),
75. J.M.Daniels and A.Rosencwaig, Can. J. Phys. 48, 381 (1970).
76. Landolt bornstein, Magnetic properties, Springer - Verlag(1962)
References v
77. R.Valenzuela, Magnetic Ceramics, Cambridge University press, Cambridge
(1994).
78. B.D.Cullity, Introduction to magnetic Materials, Addison - Wesley,
Reading, MA, (1972).
79. J.Smit, and H.PJ. Wijn, Ferrites, Philips Technical Library (1959).
80. V.R.K.Murthy, B.Viswanathan, Ferrite Materials, Science and
Technology (Narosa Publishing House) 1990.
81. EJ.W.Verwey and E.L. Heilmann, J. Chem. Phys. 15,174 (1947), E.F.
Bertaut, l Phys. Et radium 12, 252 (1951)
82. L.Neel, Ann. Phys. 3,139 (1948)
83. G.F.Goya, H.R.Rechenberg, M.Chen and W.B. Yelon, J. Appl. Phys. Vol.
87 No.ll (2000) p 80005 - 7.
84. T.Pannaparayil, S.Komarneni, R.Marande and M.Zadarko, J. Appl. Phys.
67 No. 9 (1990) p 5509- 5511.
85. M.Balanda, A.Szytala, Dimitrijevi and lTodorouic, Phy. Stat. Soli. 32 K91
(1969) K 91- 93.
86. lM.Hastings and L.M.Corliss, Rev. of Modern Phys., 25 No.l (1953) pp
114- 121.
87. Tadashi Mizoguchi and Midori Tanaka, J. Phys. Soc. Japan, 18 No. 9
(1963) p 1301 - 1306.
88. D.M.Grimes and Edgar F Westrum , J. Appl. Phys. ,29 No.3 (1958) p
384-85.
89. Y. Yafet and C.Kittel, Phys. Rev. Vol. 87 No. 2 (1952) p 290 - 94.
90. V.G.Volgin, SOy. Phys. Solid State, 29 No. 8 (1987 ) p 1339 - 1344.
91. Yu.G. Chukalkch and V.R. Shtirts, SOy. Phys. Solid State 30 No. 10
(1988) p 1683 - 86.
92. H.H.Hamdeh, lC.Ho, S.A. Oliver, RJ Willey, lKramer, y'y'Chen , S.H.
Lin, Y.D.Yao, M.Daturi and G.Busca, IEEE Trans. Mag. Vol. 31 No. 6
(1995) p 3808- 3810.
93. J.C.Ho, H.H.Hamdeh, Y.Y.Chen, S.H.Lin, Y.D.yao, R.J.Willey ,
S.A.Oliver, Phy. Rev. B Vol. 52, No. 14 (1995) P 10122 -10126.
94. H.H.Hamdeh, J.C.Ho, S.A.Oliver, RJ.Willey, G.Oliveri, G.Busca, J. Appl.
Phys. Vol. 81 No. 4 ( 1997) p 1851 -1857.
95. V.Sepelak, K.Tkacova, V.V.Boldyrev, S.Wibmann, K.D.Beilier, Physica B,
(1997) 617-619.
96. Ted M.Clark and B.J.Evans, IEEE Trans. On Mag. Vol. 33 No. 5 (1997)
p 3745 - 3747.
97. R.V.Upadhyay, Pramana-J. Phys. Vol. 49 No.3 (1997) p 309 - 316.
98. L.Torres, F.Walz , C.De Francissco and J.Iniguez, Phys. Stat. Solidi. (a)
163, (1997) p p221-231.
99. E.F.Westrum, D.M.Grimes, 1. Phys. Chem., 61,(1957) 761.
100. F.K.Lotgering, J. Phys. Chem. Solids 27, (1966) 139
101. B.N.Brockhouse, L.M.Corliss, J.M.Hastings, Phys. Rev. 98, (1975)
1721,
102. T.Kamiyama, K.Haneda, T.Sato, S.Ikeda and H. Asano, Solid State
communications Vol. 81, No.7, (1992) pp 563 - 566
103. B.N.Brockhouse, L.M.Corliss, J.M.Hastings, Phys. Rev. 98, (1975) 1721
104. T.Sato, K.Haneda, N.Seki and T.Iijima, Appl. Phys. A 50 (1990) 13
16.
105. Raul Valenzuela, Magnetic Ceramics,(Cambridge University Press)
1994
106. R.H.H.Smits, K.Seshan and J.R.H.Ross, Cat. Today. 16 (1993) 513.
107. J.P.Jacobs, S.Reijne, R.J.M.Eifrink ,S.N.Mikhailov, N.Wuttingand
H.H.Brongersma, J.Vac.Sci.Techn.,A 12 (1994)2308.
108. H.Knozinger and P.Ratnasamy , catl. Rev. Sci. Eng. 17 (1979) 31
109. 1.Ziolkowski and Y.Barbaux,1.Mol.Cat.,67(199l)199
lID. M.Shelef, M.A.Z.Wheeler and H.C.Yao, Surf.ScL,47(1975)697
Ill. 1.P.Beaufils and Y.Barbaux, 1. Chem. Phys. 78 (1981) P 387
112. 1.PJacobs,A.Maltha,J.G.H.Reinjes, 1.Drimal, V.Ponec and
H.H.Brongersma, 1.Catal.,147 (1994) 294-300
113. M.R.Anantharaman, S.Reijne, J.P.Jacobs, K.Seshan and
H.H.Brongersma, Journal of Mater. Sci. 34 (1999) P 4279 - 4283
114. B.Window, 1. Phys. E. Sci. Instrum. 4,401 (1971)
115. BJayadevan, K.Tohji and K.Nakatsuka,1. Appl. Phys. 76 No. IQ
(1994) P 6325-6327.

rcererences vu
116. W.Schiessel, W.Potzel, H.Karzel, M.Steiner, G.N.Kalvius, A.Martin,
N.K.Karause,I.Halevy, J.Gal, W.Schafer, G.Will, M.Hillberg and
R.Wappling, Phys.Rev.B. Vo1.53, No.14 (1996) 9143-9151
117. Z.Gigbi and L.Jilken, 1. Magn. Magn. Mater. 37 (1983) 267,
118. D.R.Saini, A.V.Sheony and V.M. Nadkarni, J. Appl. Polym. Sci. 29
(1983) 4123
119. Kuanr B K, Singh P K, Kishan P, Kumar N, Rao S L N, Prabhat K Singh,
Srivastava G P 15 April J.AppI.Phys.63(8) (1988 )p3780-3782.,
120. El Hiti M A, 1.Mag. and Mag. Mat. 164 (1996) p 187-196.,
121. Josyulu 0 and Sobhanadri J , Phys.Status Solidi(a) 59 (1980) p323.,
122. Ahmed M A, El Hiti M A, Mosaad M M and Attia S M ,1. Magn. Magn.
Mater. 146 (1995) p84.,
123. Murthy V R K and Sobhanadri J , Phys. Status Solidi(a) 36 (1976) p133.
124. Reddy P V and Rao T S ,1. Less. Common. Met. 86 (1982) p255
125. Ramasastry C and Syamasundara RaoY, 1.Phys.E:Sci.Instrum.12 (1979)
p1023-4.
126. C.G.Koops, Phys. Rev. 83 (1951) p 121-124.
127. Rezlescu.N and Reslescu. E. Physica status solidi (a) 23 (1974) 575
128. Kyung Ho Lee, Oong Hoe Cho and Seung Suk Jeung , J. Mater. Sci.
Letters 16 (1997) p83-87
129. Van Gitert L.G. , J. Chem. Phys. 24 (1956) p 306.
130. Chandra Prakash and Baijal J.S, 1. Less. Commn. Metals 107 (1985)
p51-57.
131. Patil R.S., Kakatkar S.V, Maskar P.K. ,Patil S.A and Sawant S.R, Ind. 1.
Pure Appl. Phys. 29 (1991) P 589 - 592.
132. Chandraprakash and Baijal 1.S., 1. Less Commn. Metals 106 (1985)
p 257 - 261.
133. Tareev B 1979 Physics of Dielectric Materials (Mir Publishers) Moscow
134. Frank E Karasz 1972 Dielectric Properties of Polymers (Plenum Press)
New York
135. Musal Jr. H M, Hahn H T and Bush G G 1.Appl. Phys.63(8) (1988 )
p3768-3770.
136. Ki Chulhan, Hyung 00 Choi, Tak Jin Moon, Wang Sup Kim and Kyung
Yong Kim 1.Mater.Sci. 30(1995) p3567-3570.
icererences V 111
137. Andrej lnidarsie and Miha Drofenik J. Ame. Ceram. Soc. 82 (1999)
p 359-365.
138. Yootarou Yamazaki and Minuru Satou Jap. J. Appl. Phy. 12 No.7 (1973)
p998-1000.,
139. Ahmed M.A. and Elhiti M.A 1995 Journal de Physique III 5 775-781.,
140. Shaikh AM., Bellad S.S. and Chougule B.K J. Mag. Mag. Mater. 195
(1999 ) p384-390.,
141. Elhiti M.A, Ahmed M.A, Mosaad M.M and Attia S.M, J. Mag. Mag.
Mater. 150 (1995) p399-402.,
142. Ahmed M.A, Elhiti M.A, El Nimr M.K and Amer M.A, J. Mag. Mag.
Mater. 152 (1996) p391-395.,
143. Pal M, Brahma P and Chakravorty D, 1. Phys. Soc. Jap. 63 No.9 (1994)
p3356- 3360.
144. Jankowski S, 1. Amer. Ceram. Soc. 71 (1988) c- 176.
145. Brockman F.G and White R.P, 1. Amer. Ceram. Soc. 54 (1971) p183
146. Abdeen AM, J. Mag. Mag. Mater. 185 (l998)pI99-206.,
147. Elhiti M.A, J. Mag. Mag. Mater. 164 (1996) 187 - 196.,
148. Pal M, Brahma P and Chakravorty D, J. Mag. Mag. Mater.152 (1996)
p370- 374.
149. Samokhvalov A.A and Rustamov AG, Soviet Physics - Solid State 6
No.4 (1964) 749 -752
150. G.KJoshi, S.A.Desh Pande, A.Y. Khot, S.R.Sawant, 1. Appl. Phys. A 61
(1987) 251
151. R. Satyanaryana, S.R. Murthy, T.S.Rao, 1. Less Commn. Met. 90 (1983)
243
152. B.V.Bhise, M.B.Donger, S.A.Patil, S.R.Sawant, 1. Metr. Sci.lett. 10C
(1991) 922
153. G.KJoshi, A.Y.Khot, S.R.Sawant, Solid State Commun. 65 (1988) 1593
154. H.D.Pati!, RV.Upadhyay, N.RShamkamar, R.G.Kulkarni, Solid State
Commun. 81 (1992) 1001
155. RBJotamia, R.V.Upadhyay, R.G.Kulkarni, IEEE Trans. Magn. 28 (1992)
1889
156. J.S.Bijal, S. Phanjouban, d.Kothari, C.Prakash, P.kishan, Solid State
Commun. 83 (1992) 679
157. P.V.Reddy, T.S.Rao, S.M.D.Rao, J. Less Commn. Met. 79( 1981) 1
158. P.V.Reddy, T.S.Rao, S.M.D. Rao, J. Less Commn. Met. 79 (1981) 191
159. E. Iguchi, A. Tamenori and N.Kubota, Phys. Rev. B ,45 (1992) 697
160. E.Iguchi, N. Kubota, T.Nakamori, N. yamamoto and K.J.Lee, Phys. Rev. B
43 (1991) 8646
161. N.F.Mott, J. Non. Cryst. Solids 1 (1968) 1
162. D.Chakravorthy and A.Srivastava, J. Phys. D : Appl. Phys. ,19 (1986)
2185
163. D.Emin and T.Hostein, Ann. Phys. N.Y. ,53 (1969) 439
164. W.A.Philips, Phil. Mag., 34 91976) 983
165. S.R. Elliott, Adv. Phys. 36(2) (1978) 135
166. G.E.Pike, Phys. Rev B 6 (1972) 1572
167. S.R.Elliot, Phi1. Mag. 36 (1977) 1291
168. A.R. Long, Adv. Phys. 31 (1982) 553
169. L.G.Austin and N.F. Mott, Adv. Phys. 18 (1969) 41
170. M.A.EI Hiti, J. Phys. D: Appl. Phys. 29(1996) 501
171. M.A.EI Hiti Phase Trans. 54 (1995) 117
172. M.A.Ahmed, M.A.EI Hiti, M.K.EI Nimr, M.A.Amer, J. Magn. Magn.
Mater. 152 (1996)391
173. M.A.E1 Hiti, M.K. El Nimr, M.A. Ahmed, Phase Trans. 54 (1995) 137
174. M.M.Mosaad, M.A.Ahmed, M.A.Ahmed, J. Magn. Magn. Mater. 150
(1995) 51
175. M.A.Ahmed, M.A.E1 Hiti , M.M.Mosaad, S.M.Ahmed, J. Magn . Magn.
Mater. 146 (1995) 84
176. M.A.E1 Hiti, J.Magn. Magn. Mater. ,164 (1996) 187
177. M.A.EI Hiti, J. Magn. Magn. Mater. 136 (1994) 138
178. Largeteau, J.M. Reau and J.Raves, Phys. Stat. Sol. (a) 121 (I 990) 627
179. S.Jankowski, J.Amer. Ceram. Soc.,71 (1988) C-176
180. F. haberey, H.J.P.Wijn, Phys. Stat. Sol. (a) 26 (1968) 231
181. P.V.Reddy, R.Satyanarayana, T.S.Rao, Phys. Stat. Sol. (a)78 (1983)109
182. C.Prakash, J.S.Bijal, P.Kishan, J. Less- common Met. 106 (1985) 243
183. R.Satyanarayana, S.R.Murthy, Crystal Res. Technol. 20 {1985) 701

kererencea
184. A.B.Naik, J.J.Powar ,Ind. J. Pure Appl. Phys. 2391985) 436.
185. Anantharaman M.R, Sindhu S, Jagatheesan S, Malini K.A and Kurian P
1999 J.Phys. D: Appl. Phys. 32 1801-1810.
186. Patil R.S, Kakatkar S.V, Maskar P.K, Patil S.A and Sawant S.R 1991 Ind.
J. Pure Appl. Phys. 29 589- 592.
187. Terje A. Skotheim 1986 Handbook of Conducting Polymers, Vol. I & 11,
Marcel Dekker Inc. USA.
188. R.Smolllchowski, Phys, Rev. Vol.59 (1941) p 309-317.
189. E.Callen, J. Appl. Phys. Vol. 36No.3 (1965)p976.
190. N.Buiron,L.Hirsinger, R.Billarden, J. Magn. Magn. Mater. 196-197 (1999)
p868-870.
191. Ce-Wen Nan and Yong Huang, G.1.Weng, J. Appl. Phys. Vol. 88 No.l
(2000) p 339-343.
192. L.Lanotte, G.Ausamo, V.Iannotti, 1. Magn. Magn. Mater. , 196-197 (1999)
p 865-867.
193. K.Inomata and Y.Saito, J. Magn. Magn. Mater. , 198-199 (1999) p 18-20
194. Hiroaki samata, Nobuto Fujiwara, Yujiro Nagata, Takayuki Uchida, Ming
Der Lan, 1. Magn. Magn. Mater. 195 (1999) p 376-383.
195. H.Morita, S.W.Kim, H.Yoshida, H.Fujimori, J. Magn. Magn. Mater. 177
181 (1998)pl13-114.
196. Vasile Z. lusan and Aurora Gh. Stanci, IEEE Trans. Magn. Vol. 30 No.2
(1994) P 1104-1106.
197. Wu Mei , Toshimitsu Okane and Takateru Umeda , J. Appl. Phys. Vol. 84,
No.l1 (1998) p 6208- 6216.
198. T. Kimura, Y.Tomioka, A.Asamitsu, Y.Tokura, Phys. Rev. Lett. Vol. 81,
No.26 (1998) p 5920-5923.
199. Min Hyoung Kim, Kyung Shik Lee, Sang Ho Lim, J. Magn. Magn. Mater.
191 (1999) P 107-112.
200. George H.Bellesis, Peter S Harilee, Andrew Renema and David N.
Lambeth, IEEE Trans. Magn. Vol. 29 No.6 (1993) p 2989-2991.
201. L.Gates and G.Stroink, Rev. Sci. Instrum. 63 No.3 (1992) p 2017-2025.
202. David Markham and Neil Smith, IEEE Trans. Magn. Vol. 25 No.5 (1989)
p4198 - 4200.
uererences Xl
203. Hiroshi takahashi, Shigeru Tsunashima , Stoshin Iwata and Susumu
Chiyama, Jpn. J. Appl. Phys., Vol. 32 (1993) p Ll328 - L1331.
204. C.Gourdin, L. Hirsinger, G.Barbier, R.Billardon, J.Magn. Magn. Mater.
177 -181 (1998) p 201-202.
205. C.Sierks, M.Doer, A.Kreyssig, M.Loewenhaupt, Z.Q.Peng. K.Winzer, J.
Magn. Magn. Mater. 192 (1999) 473-480.
206. Etienne du Tremolet de Lacheisserie, Magnetostriction - Theory and
applications of mgnetoelastisity, CRC Press, Boca Raton, Florida,(1993)
207..Murthy S.R and Rao T.S. magnetostriction ofNi-Zn and Co-Zn ferrites,
Phys. Status solidi, a - 90, 631 (1985)
208. C.N.Chinnasamy, A.Narayanasamy, N.Ponpandian, JustinJoseph (phys.
Rev. B in press).