dynamics of co-operative marketing in tribiai. economies - dyuthi
TRANSCRIPT

DYNAMICS OF CO-OPERATIVE MARKETINGIN TRIBIAI. ECONOMIES
A STUDY OF NON—TIMBER FOREST PRODUCE MARKETINOWIN KERALA{/1 5 ' A
- I.- L-F."-7"*"\v“' IV ’.E ;'" 'z_ ...: _ A., ,,. C. _If’ -V
T
Thesis submitted to theCochin University of Science and Technology
for the award of the degree ofDOCTOR OF PHILOSOPHY
under the Faculty of Social Sciences
By
PHILIP THOMAS
Under the supelvision of
Dr. M. MEERA BAI
DEPARTMENT OF APPLIED ECONOMICS
COCHIN UNIVERSITY OF SCIENCE AND TECHNOLOGY
COCHIN—682 022. KERALA
MAY 1996

COCHIN UNIVERSITY OF SCIENCE AND TECHNOIZOGY5
DEPARTMENT OF APPLIED ECONOMICS K;I
Telephone: 85-6030KOCHI- 682 022
KERALA,|ND|A
CERTIFICATE
Certified that the thesis "DYNAMICS OF CO-OPRATIVE
MARKETING IN ‘TRIBAL ECONOMIBS- A STUDY OF NON—TIMBER FOREST
PRODUCE MARKETING IN KERALA" is the record of bonafide
research carried out by Mr. Philip Thomas under my guidance.The thesis is worth submitting for the degree of Doctor of
X _, II/ . /'I _. , V I C . I.4. '_ '
1 _ _ _ _Cochin Dr. M. Meera Bai
Philosophy in Social Sciences.
Date: 14.5.1996. (Supervising guide)

DECLARATION
I declare that the thesis entitled "DYNAMICS OFCO-OPERATIVE MARKETING IN TRIBAL ECONOMIES- A STUDY OF
NON-TIMBER FOREST PRODUCE MARKETING IN KERALA” is the record of
bonafide research carried out by me under the supervision ofDr.M. Meera Bai. Lecturer. Department of Applied Economics.Cochin University of Science and Technology. I further declarethat this has not previously formed the basis of the award ofany degree, diploma, associateship. fellowship or other similartitles of recognition.
Cochin—22 Phi 1”‘ 1 En’? éi°k5___(;g__1_P__Date: 14-5-1996.

ACKNOWLEDGMENT

" AcknowledgmentI wish to express my indebtedness and sincere gratitude to Dr.M.Meera Bai, Lecturer,
Dept. of Applied Economics, Cochin University of Science and Technology, for her invaluable guidance and wholehearted support through out the study.
My boundless gratitude is due to Dr.K.C.Sankaranarayanan, Director, School of SocialSciences, Cochin University of Science and Technology, for his motivation and invaluable guidance.But for his patience and timely help throughout the course of my thesis, this work would not havebeen possible.
I owe a lot to the Indian Council of Social Science Research, New Delhi for the award ofOpen Doctoral Fellowship for pursuing this course. I also thank Dr. E.G.Silas, the then Vice Chancellor, Kerala Agricultural University for permitting me to undertake the research work.
I express my deep sense of gratitude to Dr.M.K_.Sukumaran Nair, Dr.Rajasenan, Professors,Dept. of Appl_ied Economics, Cochin University of Science and Technology, for their valuable suggestions regarding the issues involved in the study.
I wish to express my sincere thanks to Dr.M.Mohandas, Associate Dean, College of Cooperation and Banking and Dr.N.Rajan Nair, Professor and Head, Dept. of Rural Marketing Management, College of Cooperation and Banking, Kerala Agricultural University with whom I had enlightened discussions.
I will be failing in my duty if I do not express my deep sense of gratitude to Dr.K.P.Mani,Assistant Professor, College of Co-operation and Banking, Kerala Agricultural University, Mannuthy,for reading the manuscript and making valuable suggestions.
I am gratefiil to Srileffrey Y. Cambell, Programe Officer, Ford Foundation, New Delhi,Dr.M.P Shiva, Managing Director, Centre for Minor Forest Products, DehraDun, Sri. R.B.MathurI.F.S. (retd.), Centre for Minor Forest Products, DehraDun, Dr.Walter Fernandez, Indian SocialInstitute, New Delhi, who inspired me to work in this direction and provided the right perspectivefor the study.
I have had the benefit of getting the comments and criticisms of a number of people. Amongthem, Dr. N.Mohanan, Deputy Director, National Institute of Rural Development, Hyderabad,Dr.Kunhaman, Reader, Kerala University, Dr.Balakn'shnan, Reader, Dept. of Statistics, Cochin University of Science and Technology, Dr. K.A. Suresh and Sri.Philip Sabu Assistant Professors, College of Co-operation and Banking, Kerala Agricultural University, Sri.Kumaran and Sajeev.V. P.Research Scholars, Cochin University of Science and Technology, deserve special mention. I amgrateful to them for the discussions I had with them in the various stages of my work.
My sincere thanks are to Dr.P.C.Mathew and Dr. N.Raveendranathan, Professors College ofCooperation and Banking Kerala Agricultural University for their kind cooperation in completingthis work.

I wish to express my sincere thanks to Dr.K. Krishnan Nampoothiri, Lecturer, School ofManagement Studies, and Dr. G.Antony, Reader School of Management studies Cochin Universityof Science and Technology, for their valuable guidance in the early stages of my thesis work.
My sincere thanks are due to Managing Director, Branch Managers and staffs of SC/STFederation, Thiruvananthapuram and Dr.D.Ramanadhan, Managing Director, Seetharam AyurvedicPharmacy Thrissur, for their whole hearted cooperation and timely supply of relevant informationfor the study.
I am specially indebted to the tribes of the study regions for the wealth of infomiation theysupplied to me in informal conversations. Without their friendly and inspiring cooperation, such awork would have been impossible.
I will be failing in my duty if I don't gratefully acknowledge the cooperation and sincere helpreceived from Miss.Elizabeth, Librarian, Dept. of Applied Economics, Cochin University of Scienceand Technology.
My sincere thanks are due to Sri. Unni, Sri George, Smt.K.K.Ambika and Smt.Indira, Section Ofiicers, Mr.Rajan, Asst. Registrar Cochin University of Science and Technology, who tookreal interest to get things done during the course of the study.
My heartful thanks are due to the librarians of Institute for Social and Economic Change,Bangalore, National Council of Applied Economic Research, New Delhi, Indian Council of SocialScience Research, New Delhi, Forest Research Institute, DehraDun, Centre for Minor Forest Products, DehraDun, National Institute of Rural Development, Hyderabad, Centre for DevelopmentStudies, Thiruvananthapuram, and College of Co-operation and Banking,I(crala Agricultural University, Marmuthy, Thrissur.
The analysis of data was mostly done at Centre for Research and Consultancy, Emakulam.Iam greatefiil to all those at the Centre, particularly to Dr. Ajith Kurnar. N, Sri. Krishna Kumar, SriReji Raman and Miss. Suja.
My sincere and deep hearted thanks to my beloved parents, brothers particularly Mr.JoseA.T and sisters who are always a major source of inspiration to me.
I wish to express my warmest feelings towards my wife Mini and my Kids Chinnu andMinnu. I really missed them during the course of my research work. It would have been impossiblefor me to complete the thesis without their cooperation and moral support.
My duty is complete only by thanking The Almighty for the timely completion of my task.
Cochin - 22,14-5-1996. Philip Thomas

CONTENTS

CHAPTER
II
VI
VII
VIII
CONTENTS
TITLE
LIST OF TABLES
DESIGN OF THE STUDY
REVIEW OF LITERATURE
TRIBAL DEVELOPMENT IN KERALA
COLLECTION AND MARKETING OFNTFP - AN OVERVIEW
PROFILE OF THE STUDY AREA
COLLECTION AND MARKETING OF NTFP BY TRIBES
INDIAN SYSTEM OF MEDICINE AND ITS LINKAGE WITHC0-OPERATIVE MARKETING SOCIETIES IN KERALA
PARTICIPATION AND RESPONSE ANALYSIS
SUMMARY AND CONCLUSION
BIBLIOGRAPHY
APPENDICES
PAGE No.
1-28
29-62
63-104
105-168
169-220
221-282
283-304
305-332
333-357

LIST OF TABLES

LIST OF TABLES
Table No. TITLE Page No.3.1 Tribal Population of Kerala-District—wise 64
from 1961-1991
3.2 District ST Population as Percentage of 67State ST Population-1991 Census
3.3 Domination of Tribal Communities in the 70Districts of Kerala
3.4 Age and Sex-Composition of ST Population 71of Kerala
3.5 Literacy of STs of Kerala from 1961-1991 733.6 Occupational Status of Tribal Population 75
of Kerala 1971-1991
3.7 Distribution of Tribal Households by Size 77of Landholdings
3.8 Plan Outlay and Expenditure for Tribal 81Development Programmes in India
3.9 Rural Development in Kerala Outlays and 83Expenditures
3.10 Investment for Tribal Development in 86Kerala—outlay and Expenditure from1984 to 1994
3.11 District-wise Investment for Tribal 87Development and Tribal Population ofDistricts- A Comparison 1965-86 to1993-94
3.12 Sector-wise Investment on Tribal 90Development in Kerala (1987-88 to1992-93)
3.13 Number of Tribal Families Living Below 91Poverty Line
3.14 Sectors Through Which the Families 93Crossed the Poverty Line 1992-93 &1993-94
3.15 ITDP Projects and the Area Covered 96

-h-b-I.‘-B-B
.16
.10
.11
.12
.13
.14
.15
.16
Marketing Facilities in ITDP AreaNet Economic Values of NTFP
Area Under Different Forest Types andForest Plantations in KeralaLease Rent Remittance 1982-83 to1991-1992
Region wise Remittance of Lease Rent1982-83 to 1991-92
Number of Ranges Alloted to Each Region1982-83 to 1991-92
No. tof TCS. Membership and the NTFPCollectors from 1982-83 to 1991-92 inKerala
Collection of NTFP by TCS from 1982-83 to1993-94
Compound Growth Rate (CGR) and theAverage Annual Growth Rate(AAR) of theCollection of (kg) NTFP in Kerala1982-83 to 1993-94
Collection and Marketing of NTFP inKerala- Region wise 1982-83 to 1993-94Stock of Medicinal Items 1982-83 to1988-89
Stock of Oil Seeds 1982-83 to 1988-89
Stock of Spices-1982-83 to 1988-89Stock of Edible Items 1982-83 to 1988-89
Stock of Dye and Paint Items 1988-89Stock of Other1982-83 to 1988-89
Non-medicinal Items
Marketing of NTFP by the Kerala StateFederation of SC/ST DevelopmentCo-operatives 1990-91 to 1993-94
Marketing Channel of Medicinal Items bythe Kerala State Federation of SC/STDevelopment Co—o;ieratives 1990-91 to1993-94
97
106
113
119
120
121
122
130
131
133
135
136
137
138
139
140
142
143

4.17
4.18
4.19
4.20
4.21
4.22
4.23
4.24
4.25
4.26
4.27
5.1
5.2
5.3
5.4
5.5
5.6
5.7
5.8
5.9
Marketing of Non-Medicinal Items by theKerala State Federation of SC/STDevelopment Co-operative 1990-91 to1993-94
Marketing Channel of ThiruvanathapuramBranch for NTFP 1990-91 T0 1993-94
Marketing Channel of Adimaly Branch forNTFP from 1990 - 91 to 1993 — 94
Marketing Channel of Thrissur Branch forNTFP from 1990 — 91 to 1993 - 94
Marketing Channel of Kalpetta Branch forNTFP from 1990 - 91 to 1993 — 94
Average Collection and Sale rate 1982 — 83to 1990 — 91
Average Collection and Sale rate 1991 - 92to 1993 — 94
Average Collection and Sale rate 1982 — 83to 1993 — 94
NTFP Advance and NTFP Stock Advance givento TCS from 1982 — 83 to 1991 — 92
NTFP Advance and NTFP Stock Advance Branch—wise
Region-wise Analysis of Overdues on NTFPAdvance and Stock Advance 30 — 6 -1992.
Family Size
Total Family Members (includingrespondents) Age and Sex Compositon
Age group of NTFP Collectors
Level of LiteracyOccupational Structure — Main
Occupational Structure — Subsidiary
Type of Dwelling House
Drinking Water FacilitiesLand Holding and Cultivating Area.
147
150
151
152
153
159
161
162
165
166
167
171
173
175
177
179
181
183
185
187

.10
.11
.12
.13
.14
.15
.16
.17
.18
.19
.20
Average Distance of Basic Facilities Fromthe Tribal Households
Basic facilities and scores assigned
Basic Facilities Index (BFI)of TribalHouseholdArea of Operation of the Selected TCS1993—94
Staff Position in Selected TCS 1993 — 94
Average Distance of Tribal Colonies fromthe Head office of TCS
No. of Collection Depots
Distance of Collection Depots from TCS
No. of Collection Depots havingTransport Facilities (Bus) within ThreeKms from Tribal Colonies
Collection and Sale Details of NTFP byTCS Selected for the Study 1982 - 83 to1993 - 94
Average Collection Charges paid andSales Value received by TCS for NTFP 1982- 83 to 1993 - 94NTFP Collection Season— item wise
NTPP Collection Season and the Potentialdays of employment Region—wise / StateNTFP Collection — Potential and theActual Collection Days — Region-wise
Non—Notified NTFPs Collected by Tribes
Difference in Nomenclature of NTFP itemsin Regions under study
No. of Respondents who owned NTFPCollection Kit
NTFP Collection Kit Possessed by theTribes and the Expected Value of a Kit
No. of mandays engaged by the Tribals forVarious Operations
192
195
196
198
208
211
213
214
215
217
219
223
225
226
227
230
232
234
236

6.9 Employment in Mandays of Tribes of MoreEffective, Effective and Less EffectiveTCS
No. of Mandays engaged for the Collectionand Marketing of Classified Items of NTFPby Tribes — Region—wise Comparison.
Collection and Marketing of NTFP byTribes- Region-wise comparison
Marketing of NTFP by Tribes- Region-wise
Marketing Channels of NTFP by tribes
Collection and Marketing of NTFP byTribes in More Effective. Effective andLess Effective TCS
Inter-tribal Variations" per TribalHousehold in Collection and Marketing ofNTFP and Their Marketing Channel.
Average Income from Different NTFP Itemsfor a Manday
Income Details of Tribes in Study Region
Average NTFP Collection Charge Paid toTribes by TCS and Floor Price Fixed forNTFP by SC/ST Federation from 1982-83 to1990-91 — A Comparison
Average NTFP Collection Charge Paid toTribes by TCS and Floor Price Fixed forNTFP by SC/ST Federation from 1991-92 to1993 — 94 — A Comparison
NTFP Collection Charge Paid to Tribes byTCS and Floor Price fixed for NTFP bySC/ST Federation/NTFP Committee 1982 — 83to 1993 - 94 - Comparison
't' Values of Collection Charge Paid byCo-operatives and Fixed by NTFP Committee
Average Sales Price of NTFP- Expected andRealised by SC/ST Federation from 1982-83to 1990-91
Average Sales Price of NTFP -Expected andRealised by SC/ST Federation from 1991-92to 1993-94
237
239
241
244
246
249
252
254
257
260
263
265
267
269
270

.24
.25
.26
.27
.28
.29
Average Sales Price of NTFP Expected andRealised by SC/ST Federation from 1982-83to 1990-91
't' Values of Sales price RealisedSales price Expected by SC/ST Federation
Collection Charge as Percentage to ActualSales price RealisedAverage Sales Value of NTFPS of Tribesunder Co-operative and Non—Co-operativeMarketing Channel
Price Spread
Sharing of Price Spread BetweenIntermediaries in the Marketing Channel
No. of Ayurveda Medical Institutions andPatients Treated from 1980-81 to 1992-93in Kerala
Growth of Registered Ayurvedic MedicinalManufacturing Units in Kerala 1975-76 to1992-93
District—wise registered Ayurvedicmedicinal manufacturing units 1992-93
Demand for Medicinal Items by theAyurvedic Medicinal ManufacturingIndustry in KeralaAverage Collection and Marketing ofMedicinal Herbs by TCS and theRequirements by Ayurvedic MedicinalManufacturing units of Kerala 1989-90 to1993 — 94
Suppliers of Raw Materials to theAyurvedic Meicinal Manufacturing units ofKerala
Purchase Rate of Medicinal Items by theAyurvedic Medicinal Manufacturing unitsand Sale of Medicinal Items byCo-operatives - A Comparison
Mode of Taking Membership in TCS
Reasons for Becoming Members in TCS
Response Towards Becoming Members in TCS
271
272
274
276
279
281
286
288
289
292
294
296
298
306
307
308

8.4
8.5
8.6
8.7
8.8
8.9
8.10
8.11
8.12
Response Towards Ownership of TCS
Response Towards the voting in theElection of TCS
Opinion about the Efficiency of TCS
Organisation—wise Participation of Tribes
Principal Methods of PartcipationReasons for Patronising Co—operative andNon-co—operative channels for DisposingNTFP by Tribes
Comparative Analysis of OpinionStatements of Board of Directors ofSelected TCS
Homogeneity in Opinions of Directors ofME. EF and LE TCS
Homogeneity in Opinions of Directors ofEffective and Less effective TCS
309
311
313
314
316
318
326
327
329

DESIGN OF THE STUDY

CHAPTER I
DESIGN OF THE STUDY
1.1 Introduction
Tribes, the most down—trodden community of thecountry constitute a substantial segment of the Indianpopulation. According to 1991 census they constitute about8.01 per cent of the total population of the country. So far.about 250 scheduled tribe communities. speaking about 105major languages and 225 subsidiary dialects have beenidentified in the country as a whole. They live mainly inhilly and forest regions. which are mostly inaccessible.Their economy is mainly agriculture and forest based. Theyproduce food as well as commercial crops but not with an eyeon market. But their stark realities of life force them tomarket a part of their agriculture produce. They also collectMinor Forest Produce (MFP) to make both ends meet. But the
marketing system that existed was crude and exploitative.Hence the need for strengthening the marketing system with aView to help the tribals to enjoy their fruits of labour.This assumes significance particularly in view of the variousdevelopmental programmes contemplated by the Government in the
tribal areas. with the objective of raising the income levelsof the tribals. In the absence of a well organised net workof marketing system. the fruits of these developmentalactivities may not accrue to the tribals.

Keeping in view of the intensity of relationsbetween the tribals and the forests, integrated development ofthe forest and forest dwellers have been rightly proposed byvarious bodies and individuals from time to time. lihnphasishas been laid on this point in the reports of the DhebarCommission (1961). the Harisingh Committee (1967). TheNational Commission on Agriculture (1976). The Conference of
the state Ministers in Charge of Forest and Tribal Development(1978), The Working Group on Tribal Development during 1980-85and The Committee on Forest and Tribals in India (1982).
Even though India was one of the few countries which
formulated forest policies since 1894. it was only from theVth plan period onwards that the relevance of Minor Forestproduce (MP?) in the socio-economic development of thevillage/forest dwellers including tribals was emphasised. Itwas then onwards that MFP was integrated with overalldevelopment in the country under the tribal sub-plan in the‘United Agency Approach’. Since more than 80 per cent of thetribes are directly or indirectly attached with forests and itis they who possess the required talent to extract the variousitems of MFP, that most of the states in India including
_l(erala exclusively entrusted the right of collection of MFP tothe tribes. But as per the recommendation of the BawaCommittee (1 971) for an integrated approach to tribaldevelopment , the Tribal Co-operative Societies (TCS) , aresupposed to undertake all functions such as credit. collection

and marketing of MP and other tribal products anddistribution of consumer goods to tribes. The purpose was toeliminate middlemen/private traders from the tribal economyand to empower the tribal people to pursue a sustained andeelf-controlled economic activity in their day to day life.
Multi-purpose co—operatives exclusively for thetribals were started in Kerala in 1960s1. As these societieswere not re-financed by the Reserve bank of India. the HighLevel Committee on Co-operative Credit in Kerala recommended
to re-structure them on the lines of service co-operativesocieties. Initially.the tribal co-operative societiesconcentrated mainly on agricultural as well as consumptioncredit. But most of these loans became overdued and hence the
functioning of most of the tribal co—operative societiesnnnined paralised. But the recognition of the symbioticrelationship between tribes and forest and the introduction ofcollection and marketing of MT? through tribes and tribalco-operative societies by eliminating the contractor systemgave a new impetus to the activities of Tribal Co-operativeSocieties of the state. The tribal life now centers round theHnun'Forest Produce and the efficiency of tribal co—operativesocieties to fetch a better price for the tribal produce.
Philip sabu and Paranjothi T.. (1989). "Co-operativeaction for Tribal Development - Case Study of AttappadyCo-operative Farminig Society Ltd.. Agaly".SahakarithaSamshodan. July—December. p.12.

1.2. Definition and Nomenclature of Minor Forest Produce(HF?)/Non-Wood Forest Produce (NWFP)/Non-Timber Forest
Produce (NTFP)
In View of the importance of MFP in the creation oftenployment, generation of income and the ability to earn*foreign exchange to the country. experts and researchers inthis field differ on the nomenclature used for this branch offorest produce as Minor Forest Produce.
Minor Forest Produce (MFP) includes a wide varietyof forest products such as medicinal herbs, edible plants.drugs. spices, insecticides, essential oils. fatty oils. gumsand resins. fibres and flosses, bamboos and cane, beedi'fleaves. honey, lac and shellac and silk. etc. MTPs have beenFfilguely defined as forest products other than wood for timber.Elhflp wood and fuel. The nomenclature used by foresters wasQfised on the meagre revenue earned by the forest department inQfiumarison with timber and wood.,
2.9‘: According to the Kerala Hillmen Rules 1964 , the
3_
,2‘ 4
1Jrm Minor Forest Produce is defined as "All Forest resources
Kerala Agricultural University (KAU). Kerala Institutefor Research, Training and Development of SC/ST KIRTADS(1984).Training Programme for SC/ST youths in Agricultureand Animal rfiusbandry. Directorate of ‘Extension. KAU.
issur,p.25.

except tree. bamboo, etc. cane and ivory" from kerala forest.
ficcordingly 120 items (See Appendix I) from Kerala forest aredesignated as Minor Forest Produce.
Tirath Gupta and Amar Gupta3 and the Food andAgricultural Organisation4 in their work point out that thisnomenclature (MFP) seems to be a misnomer with the gradualincrease in value of MFPS in terms of their revenue. foreignexchange earning and capability of creating employment in thesociety. Tirath Gupta observed that the contribution of MTPsto total net revenue from the forestry sector in Indiaincreased from 30 to 40 per cent during the period 1968-69 to1976-77. Similarly. average annual exports of MFPs accounted{or gross foreign exchange earnings worth Rs.307 millions over
a ten year period beginning 1967-68 and contributed more than70 per cent to the total foreign exchange earnings from forestproducts. It has been estimated that current employment in
collection of MFPs accounts more than 1.6 million man years,and the minimum potential employment in these activities wereworked out to be over 4 million man years. But. current and
potential employment opportunities available throughout the
1 Iirath Gupta, Amar Gupta, (1980). Non—Wood Forest Productsin India - Economic Potentials, Centre for Management in‘‘ Agriculture, Indian Institute of Management. Rhmedabad.Shiva M.P., (1992). “Production and Utilisation of MT? in.1 India". Paper present in a National Seminar on
socio—Economic Research in Forestry held at Kerala ForestResearch Institute. Peechi. Thrissur on 18-20, May.Sponsored by Ford Foundation.

year was estimated at 68000 and 2.40.000 man yearsrespectively. It has therefore been concluded that systematicefforts at harnessing these renewable resources would not onlyfruitfully engage some of the unemployed labour force in ruralIndia. but also create conditions for dynamic and sustainedchange in the socio-economic fabric in general. Therefore.they pointed out that it is unfair on our part to call theseproducts as Minor. They considered appropriate to use theterm Non-Wood Forest Products (NWFP) in place of Minor.
According to Shivas, the above nomenclature alsodoes not appear appropriate as some woods obtained fromSantalum album. Petro Carpus, Santalinus, Quebracho colorodo,
Cedrus deodra yield the so called MTP. Therefore he suggestedan alternative nomenclature as 'Multi-use Forest Produce(HP). However he advocates the nomenclature given by FordPmnmation for Non-Wood Forest Products as Non Timber Forest
Products (NTFP).
According to Campbell (1993)6. if the challenge ofmanaging forests for multiple objectives is to be achieved.the distinctions of ‘major’ and ‘minor’ forest products must
Ibid...p.10.Jeffrey Y. Campbell. (1993). "Changing Objectives. newProducts and Management Challenges. Making the shiftfrom major VS minor to many forest products" Paperpresent at the National Seminar on Forest Produce atCoimbatore.

be erased and the concern must focus on ‘many’ forestproducts.
Krishna Murthy (1993)7. points out that MP createsan erroneous impression in the mind of a forester andunconsciously he feels that they are of minor importance and
"as such they do not deserve much attention.
According to Crucher Jack (1992)B. the termnon-timber forest products encompasses all biologicalmaterials. other than timber which are extracted from natural
forests for human use. General categories of NTFP of majorimportance include : fruit. edible oils. fipices. herbs. fishand meat : medicines; fodder, fuel wood and charcoal;structural materials. such as rattan. bamboo poles, variousfibres; chemically useful materials such as resins, essentialoils. gums, latexes. tannins, and dyes; animal products suchas honey, eggs. silk. reptile skins feathers and otherdecorative wild life products; live animals and ornamentalplants.
7 Krishnamurthy T, (1993). "Non-Wood Forest Products Their role in rural economy", paper presented at theNational seminar on Forest Produce, Coimbatore.
8 Crucher Jack, (1992). Non-Timber Forest ProductsCommercialisation Feasibility Study for India and Nepal,A.T. international, 1331 4-street. NW. Swite 1200.Washington DC. 30005, USA.

The key point of distinction between these materials
1d timber is that the latter is harvested and managed on anndustrial scale by and for interests well outside forestsagions. While certain non-timber forest products mayventually become inputs for large scale urban basedadustries, all of them share the characteristic that they arenracted. using simple technologies by rural people living inrnear the forests. The alternative label ‘non-wood‘ is notrecise since it excludes important material resources derivedtom the forests by rural people. such as fuel-wood, buildingdos and small wood for handicrafts and tools.
The present study supports the views of Tirathlpta, Shiva. Krishnamurthy and the Food and Agricultureganisation. So far only a part of the larger treasure ofn forest wealth has been identified. If it can create thisafliamount of employment opportunities and bring a goodxmnt of export earnings to the country, it is improper ton1 these products as minor. The researcher also supports1e views of the above mentioned experts and name these branch
?products as Non-Timber Forest Produce (NTPP).
.3 Theoretical framework of the study
The need to market a product is closely linked withu need to produce a product. Marketing in its developmentalmse is expected to educate people, cultivate changes in

public attitude. spread civilization and improve the quality61 lifeg. Marketing environment is a major factor that is toH considered while marketing a product from an area. Sincethe tribes are far away from the main tracts it is all theDre applicable in the case of tribal economy. Two types ofhrketing environment have already been experienced in theCollection and marketing of NTFP in the tribal economy viz.‘he informal marketing environment through contractors andformal or controlled marketing environment. Under these twolystems. the tribals and the tribal products were subjected toIxploitation mainly by the non-tribes. The informal system ofIarketing was followed till the co-operatives were started.
The tribal produce transfer existed even before theBritishers came to India. In those days, the tribes used toyive gifts to Kings in occasions like festivals and birthlays. A patron-client relationship existed in those days.The major gifts of those days were N'I'FP items like honey”,Bark of trees. flesh of animals etc. In turn they were not inI position to get any gratification except the permission tolive in forest without any disturbance.
’ Philip Kotler and Gerald Zaltman. (1971). '‘socialMarketing an Approach to Planned Social Change". Journalof Marketing, Vol.XXXV. Chicago. p.5.
[0 Kunhaman. (1989). Development of Tribal Economy.Classical Publishing Tompany. New Delhi, p.42.

10
Britishers in an attempt to make India a wide marketfor their products. developed railways, roads and their systemof education. All of them indirectly hit the tribal economy.Britishers did not make any effort to bring them to themainstream of national life. Instead they used ‘eliminationtechnique‘ to administer the tribal area. Their life wasmoved around the forest and lived in the forest eco—system.
11 However. the itinerantIheir economy was self-sufficienttraders penetrated the tribal economy and exchanged theirproducts mainly salt, arrack. beedi, tobacco etc. for NTFP onbarter basis. The tribes were not in a position to know thevalue and use of their exchanged produces of NTFP.
Growth with social justice has been avowed’ as theobjective of planned development in India. Immediately afterindependence, many measures have been initiated by the Centraland State Governments to preserve their culture and improvethe socio-economic conditions of the tribes in the country.Article 46 of the Directive Principles of the State Policyltates
"the state shall promote with special care theeducational and economic interests of the weakersections of the people, and in particular of SC and ST
11 Kumaran. (1993). Kerala Tribal Land Act: Problems andPerspectives - An ’Emperical Study with Reference toWazanad, Préiect Report Submitted to the Department of
w. ochin University of Science and Technology. Cochin22.

11
and shall protect them from social injustice and allforms of exploitation".
During 1949-70 nearly about 18 Commissions and Study
Groups have been appointed from time to timeby the UnionGovernment to study the different aspects of tribal life. Asa result different policy measures have been adopted by theGovernment through five year plans. All along the plan periodmuch stress was given on the income generating activities oftribes. But marketing which is as important as production forthe development of tribals was totally neglected. Theplanners were seemed to be under the impression that thetribal produce would create its own competitive market. Theyfailed to oversee the unscrupulous activities of contractorsand traders who were competent enough to eat even the resultof all developmental programmes for tribes.
\
12The revenue-oriented forest polices of thebvernment brought nationalisation of forest produce,teervation of forests, entrusting contractors to collect andirket the NTFP. The single minded pursuit of commercialL
: Hiehra K. Kamal. (1999). "National Forest Policy andTribal Development", in Pati R.N. and Jena B.(eds.).Tribal Development in India, Ashish Publishing Company,New Delhi.

12
plantations also had grossly neglected the needs of tribalsla.The tribals who formerly regarded themselves as lords of theforests, were through a deliberate process of law, turned into subjects and brought under the control of forestDepartment. The traditional rights of the tribals were nolonger recognised. In 1894 they became ‘rights andprivileges‘ and in 1952 they became ‘rights and concessions'14now it has turned to mere 'concessions'15. Introduction ofcontractor system to collect Non—Timber Forest Produce. forcedthe tribes to work as labourers of these contractors andextract N'I'FPs for them. The tribals did not have any rightover these products .
Eh/en after a long period of planning for tribaldevelopment the tribals are economically weak and sociallyexploited by contractors. middlemen. money lenders and petty
traders due to the insufficient institutional arrangements forigproviding credit and marketing facilities for theiragricultural and forest produces. Various Conmittees and‘gfltudy Teams such as the Special Working Group on Co-operation
Rucha S. Ghate. (1988). Forest Policy and its Economic1111 act on Tribals in Maharashtra. Ph.D Thesis submitted0 agapur University.
, Dube P.N.. (1990). "Afforestation. Environment and Waste;_-'-- Land Development in Tribal Areas of Rajastan", in,_; Chaurasia B.P.. (ed). SC and ST in India. Chugh:11: Publications. Allahabad.
Singh . (1936) , Common Property and Common Poverty,India's Forest . I-‘Forest Dwellers and Law. OxfordUniversity Press , New Delhi . p . 76.

13
for Backward Classes (1961), The Committee on Tribal Economy
in Forest Areas (1962), the study Team on Co-operativeStructure in Tribal Development Project Areas (1971), StudyGroup on Relief of Indebtedness, Land Alienation andRestoration in Tribal Development Agency Areas (1973) and the
study Team on Marketing Credit and Co-operation in TribalAreas (1978) have all repeatedly emphasised the significanceof co—operativisation of the tribal economy in the countryls.
In order to improve the operational efficiency ofco-operatives in tribal areas, The Committee on Co—operativeStructure in Tribal areas (1971) has recommended theorganisation of new pattern of integrated credit cumjmarketingco-operative societies (LAMS) at the primary level.Fbderations at the state levels and TRIPED at the Nationallevel. Marketing co-operatives can exploit opportunities inthe sphere and area of 'their operations through theestablishment of clear goals and an effective organisation.Co-operative marketing societies are not only to ensure alfigher price to the members but also at the same time toprotect the consumers from the aggressive extortionary price;Dolicies of the private traders. Though it was accepted andimplemented by the Government. the working of these
,}6 Hahalingam s.. (1989). "Role of Co—operatives in TribalEconomy". Yojana. Vol.33, No.22. p.B.

14
institutional arrangement also showed a gloomy picture in thetribal scenario.
The co-operativisation of tribal economy of Keralaled to monopoly procurement and marketing of NTFP by tribesand Tribal Co—operative Societies way back in 197817 (till 1987
the TCS were known as Girijan Service Cooperative Societies).Wfiflnn the formal institutional arrangement, the tribes haveno right to sell the collected NTFP.to outsiders. They wereforced to market the produce at the price fixed by the tribalco-operative societies under the floor price of the SC/STfederation. As per the system they were denied theopportunity to take advantage of the changed situation fortheir products. The Kerala Pharmaceutical Corporationle andthe Forest Department19 failed to fetch reasonable price forNTFP. It was observed that monopoly procurement by anyorganisation under the pretext of tribal developmentultimately lead to the failure of the system. Even after theletting of SC/ST federationzo. it could not collect the entire
17 Government of Kerala, (1978). G.0. M.S.200/78/AD dt.28-7-1978, Agriculture (Forest Misc.) Department,Thiruvananthapuram.
18 Government of Kerala, (1978), G.O. M.S. 3.5/78/AD dt.1 25.11.1978, Agriculture (Forest Misc.) Department.
Thiruvananthapuram.19 Government of Kerala. (1981). G.O. M.S. 25/81/AD dt.wk 2-2-1981. Agriculture (Forest Misc.) Department,* Thiruvananthapuram.
Government of Kerala, (1982), G.O. M.S. 4/82/AD dt.21-1-1982, Agriculture (Forest Misc.) DepartmentThiruvananthapuram.

15
NTFP from tribes. It was observed that both these systems —formal and informal, were not fully accepted by tribaleconomy. Therefore it is argued that the monopoly collectionand marketing of any product through any particulararrangement will limit the market. It also denies theopportunities for tribes to have good interaction with thesociety. The marketing system of the tribal economy is notthe free play of demand and supply of products as the
21economists visualised . The rhythm and periodicity of marketsand social life of the people are closely enmeshed”. Sincethe tribal economy is inter-related and inter-lockedza. theland. labour and credit transactions of the tribal economy
will also make a great dent in the product market to determineexchange relations. Tribal development would not be possiblethrough water-tight compartment policies. A free market withproper control of co-operatives will enable the tribes todecide the time and place of marketing and to realise the fullvalue of their marketed surplus. In an imperfect marketIituation with the active operation of intermediaries thesechoices of tribes get restricted and consequently they arehandicapped in realising the full value of the marketed
"1 Polayani Karl. et.al.. (eds.). (1957). Trade and Marketyé in the Early Empires. The Free Press. Glencoe. Illinois.
Karve Irawati and Acharya Hemalatha. (1970), The Role ofWeekly Markets in the Tribal Rural and Urban §etting,
fieccan College. Pune.Kunhaman . (1989) . Op.Cit.

.. 1 6E:
vplus. Therefore, it is understood that existence of apeed institutional arrangement will not help the tribes to
btch a better price for their NTFP. It would be possiblefily when the tribes get a chance to contact the end—users
octly. A competitive environment alone will fetchaonable price for tribal produce. It is possible only when
figintroduce an alternative system for tribal producejrketing ie., regulated market for tribal produce marketing.bra direct interaction between the suppliers and thefl-uders of NTFP would be possible and the co-operatives canI. as a catalyst and watch dog for tribal development.l’
L Statement of the Problem
H.
A marketing system can be considered efficient and{ective only if it caters to the needs of market targets andfiicularly those below the poverty line. It is unfortunatet: the marketing system in India is not well developed anda. result a large section of the people in the rural andtdcularly in tribal areas are deprived of the benefits thatmefrom an efficient marketing system24. The tribalflopment approach and the designated programmes for tribalglopment gave great thrust only on the production orientedwities of tribes. But little attention had been given to,7Elana I.H.K.. (1988). Marketing in Tribal Economy. Inter-igndia Publications, New Delhi.in

17
ihe market orientation of tribal products. However the formalanrketing arrangement i.e., the co-operative approach tofiribal development and the monopoly procurement and marketing
bf non-timber forest produce through tribal co—operatives alsodid not pay much dividends to tribes. The tribes are stillmnder the clutches of private traders. Some of the tribesnven now consider the non-co-operative channel as the bestchannel to market their NTFP. It is a challenge to theexisting formal institutional arrangement for the marketing ofQHT? in Kerala. However, it is also observed that the tribalmo-operative societies have also fallen as a victim to thentrong lobby of private traders in the market to market theirqwoduces. Even though Kerala is very famous for the Ayurvedic
treatment and about 887 Ayurvedic medicinal manufacturingunits have already been registered in Kerala, and inspite oftheir high potential demand to collect the entire medicinalherbs from co-operatives, it was observed that the tribalpo-operatives in the state — the real potential suppliers of!fiTP— have failed to create a forward linkage with theand-users of this product. As a result, the tribes as well asfine society at large are very much affected by thenmscrupulous activities of the private traders.he
m On account of the low operations of the tribalL
to-operative societies and lack of co-ordination among otherVnstitutions for the collection and marketing of NTFP such asforest department. SC/ST federation, Oushadhi, Tribal

18
Department and Co—operation Department, almost all tribal25 fromco—operative societies have been incuring heavy losses
year to year and the Tribal Co-operative Societies even findit very difficult to dispose their collected produce fromtribes. Most of the tribal co-operative societies in thestate are experiencing accumulation of stock of NTFP from year
to year.
As an integrated approach to tribal development. thetribal co-operative societies are supposed to undertake allthe marketing. credit, and consumer activities of tribes bybringing all the tribes under its umbrella. But it wasobserved that the tribal participation in their organisationis very low.
It can be understood from the foregoing discussionthat the co-operative marketing system constituted for theprocurement and marketing of NTFP have not been properlyaccepted by tribes in the state. Both the system i.e.. theinformal and the existing formal marketing arrangements havefailed to fetch a reasonable price for NTFP and to check theexploitative practices in the tribal economy. The cooperativemarketing system also failed to bring all the tribes under itsumbrella for marketing of NTFP.
25 Government of Kerala. Handbook on Co—operation. 1981-82to 1991-92. Department of Co—operation.Thiruvanantfiapurm.

19
1.5 Objectives of the Study
The following objectives have been formulated forthe study.
To assess the procurement and marketing practices ofNon—Timber Forest Produce by tribes and TribalCo-operative Societies and examine the role ofco—operatives in liberating the tribes from the clutchesof private traders.
To study the relative efficiency of marketing channels.
To analyse the inter—difference between tribes andregions in the collection and marketing of Non—TimberForest produce.
To examine the forward linkage of tribal co-operativesocieties with the Ayurvedic Medicinal ManufacturingUnits of the state.
To examine the impact of marketing on employment andincome of tribes and
To examine the extent of involvement of tribes in Tribal
Co-operative Societies in policy formulation andimplementation.

20
1.6 Hypotheses of the Study
The following hypotheses have been formulated for
‘the study.
Monopoly power in procurement and marketing of NTFP lead
to institutional inefficiencies, which result in lowprices for the tribal products.
There is institutionaldirect relationship betweennetwork and employment opportunities for tribes.
Procurement and marketing practices are directly relatedto economies of scale.
There is significant difference in the price of NTPPunder co-operative and non—co—operative channels.
There is functional association between AyurvedicMedicinal Manufacturing units and Tribal Co-operativeSocieties in the state.
Collection and marketing of NTFP by TCS generatedsubstantial employment opportunities and income.
There is strong association between member participationand decision making in Tribal Co-operative Societies.
21
"E7 Methodology
-xdfi
.:d The study is based on primary as well as secondaryLdeta. The primary data was collected from the Tribal‘Households, Tribal Co-operative Societies (TCS), Privatetraders. Forest Officials, Ayurvedic Medicinal Manufacturing
Units. Collection agents of TCS and Board of Directors of TCS.The secondary data were collected from published records of
:;_Department of Co-operat ion . Thiruvananthapuram: Forest;:Department , Thiruvananthapuram; Tribal Department ,
iruvananthapuram; State Planning Board. Thiruvananthapuram:
‘rfhe Kerala State Federation of SC/ST Development Co—operatives
_:(-SC/ST Federation), Thiruvananthapuram; The PharmaceuticalCorporation (I.M) Kerala Ltd (Oushadhi) Thrissur; and various"Other National institutions like Forest Research Institute
,BehraDun. National Social Science Documentation Centre(NASSDOC) New Delhi; Indian Social Science Institute. New
‘Delhi. National Council for Applied Economic Research, NewBelhi and the National Institute for Rural Developmentiuunn). Hyderabad.
At the macro level. the co-operative management of' marketing was analysed by collecting data from SC/ST
federation. Thiruvananthapuram. The perception of committeeI of TCS. tribes, collection agents of TCS and responsesofficials of tribal department, forest department and SC/STadoration were also collected through schedules.

22
sllti-stage sampling technique was employed in the samplelosign of the study. A detailed description of the samplelosigns at various levels are given below. The primary data
for the study was collected during the period between February% Hay 1994.F
@.7.1 Sample Design
g
EC. Selection of Tribal Co-operative Societiesh
h At first, Tribal Co-operative Societies which had aiinimum of ten year service in the collection and marketing of
were considered for the study from the four regions of
e SC/ST federation viz. Thiruvananthapuram. Adimaly.i rissur and Kalpetta regions. Secondly the averagefiollection charge paid by these TCS from 1982-83 to 1991-92:availability of secondary data) from a forest range to tribes;-s considered. Since there was inter-difference among
gions about the availability of NTFP, each region waslleated separately. Thirdly considering the range of payment2 collection charge to tribes for NTFP, the TCS of eachD-ion was arranged in three classes- More Effective (ME).Ftective (BF) and Less Effective (LE). Fourthly. three TCS} vveach region. representing one each from More Effective,ffoctive and Less Effective were selected randomly. Sincewere was only one TCS in Adimaly region which had a ten year
;cord in the collection and marketing of NTFP and fourth rank

23
among the best NTFP collecting societies in the state. italone was selected from that region. Altogether 10 TCS wereselected for the detailed analysis of the study. The totalnumber of TCS which were exclusively engaged in the collection
and marketing of NTFP was only 30. Achencoil TCS (ME)Potomavu TCS (BF) and Njaraneeli TCS (LE) were selected from
the Thiruvananthapuram region. The Adimaly region wasrepresented by Adimaly TCS (ME). Malampuzha TCS (ME).Sholayoor TCS (BF) and Palappilly TCS (LE) represented theThrissur region. The Kalpetta region was represented bySultan Battery TCS (ME) Tirunelly TCS (BF) and Kannavam'l'CS(LE).
b. Selection of Tribal Households
Multi-stage sampling technique was employed for theselection of tribal households. Firstly. the number of tribalhouseholds who had been going for NTFP collection wereidentified with the help of secretaries of each TCS byexamining the books and records of the society. Secondlythrough proportionate sampling method. ten percent of the NTFP
collectors from each TCS was selected subject to a minimum of
15 tribal households from a TCS. Altogether 254 tribalhouseholds were selected. representing 55 tribal householdsfrom Thiruvananthapuram region, 75 from Thrissur region, 84from Kalpetta region and 40 tribal households from Adimaly

"‘ ’ -‘~ ""‘;frT‘-7*‘ WFE*fi€
:'?egion.
_institutions.
24
While selecting the tribal households, due weightagewas given to tribal communities also.
.c. Selection of Ayurvedic Medicinal Manufacturing Units
As per the records of the Drug Controllers Office(Ayurveda). Thiruvananthapuram, there were 887 registeredAyurvedic medicinal manufacturing units had been establishedin Kerala 1993-94. Since there was no secondaryby
information readily available to know the turnover of thesefive per cent of these units were selected for
the study in consultation with the secretary AyurvedicMedicinal Manufactures Association, Kerala. Since there was
wide differences in the number of units registered amongdistricts of Kerala, proportionate sampling method wasemployed to select five per cent of the total units for thestudy. Units such as the Kerala State PharmaceuticalCorporation (I.M). Kerala Ltd., Thrissur. The Kottackal AryaVaidyasala. Kottackal. S.D. Pharmacy. Thiruvananthapuram.Nagarjuna Herbal Concentrates. Thodupuzha. Seetharam Ayurvedic
Pharmacy. Thrissur etc. were a few among the 45 units selectedfor the study.
Selection of Collection Agents
Since collection agents appointed by TCS were a mainlink between the TCS and tribal households, a total of 25 of
f_them were selected subject to a minimum of two from each TCS.

25
Selection of Forest Officials
Fourteen range officers in the area of operation ofTCS were covered in the study. Minimum one range officer
mlthe area of operation of TCS was selected for the study.
Selection of Board of Directors
All the Board of Directors of the selected TCS were
{« sidered for the study. Altogether 41 members of the Board
ii . The primary data for the study were collected inlfluwe ways- Participatory observation method, schedule method
d questionnaire method.
Participatory as well as schedule methods werel mloyed to collect information from tribal households.
formation such as the socio—economic conditions of tribes,
~ir collection and marketing channels of NTPP. price at each-annel. their participation with TCS etc. were collected
ough participatory and schedule method. Schedule method:,a also employed to collect information from collection
-ante, Board of Directors. officials of departments and

idotails.
:1
1.7.3 Analysis of
26
flwuvedic Medicinal Manufacturing units. HoweverQuestionnaire method was employed to collect information from
{forest officials (Rangers). Even though questionnaire wasglont to all the range officers in the area of operation of 303ICS in the state. only 14 of them responded with the requisite
Through a structured schedule, information relating
{to the collection and marketing of NTFP and the link between’1CS and end-users of NTFP were collected from TCS.
Data
The collected data were analysed by usingappropriate statistical tools such as averages. indices and
;!t' test.
? 1.8 Scope of the Study
.four
"in Ernakulam and Alappuzha districts).
(
The study has covered the entire state of Kerala.The area of operation of the SC/ST Federation is divided in to
regions viz. North (Kalpetta region), South(Thiruvananathapuram region), East (Adimaly region) andCentral (Thrissur region). All districts of the state except
Ernakulam and Alappuzha are covered by these regions (No TCS
Data relating to thecollection and marketing of various NTFP's, its marketingchmuwls, pricing etc. for the period from 1982-83 to 1993-94were collected from TCS and tribes for the study. The study

27
use covered the end users of medicinal herbs such as 45wurvedic medicinal manufacturing units in the state. Inwder to examine the linkage among different institutionalwrangement for the procurement and marketing of NTFP,wsponses from forest rangers. collection agents of TCS,xibal department. Forest Department and SC/ST federation,nre collected and analysed in the study.
L9 Scheme of the Study
The study is organised under nine chapters. TheHrst chapter is the Design of the study. It covers themtroduction, definition and nomenclature of NTFP. theoretical
frame work of the study. statement of the problem, objectives,iypotheses, methodology. scope. scheme and limitations of theRudy. The second chapter reviews the literature. The tribalhvelopment in Kerala is discussed in the third chapter. Thefourth chapter gives an over all view about the collection andnarketing of NTFP at the international, national and statelevels. Profile of the study region is depicted in the fifthchapter. Collection and marketing of NTFP by tribes, pricespread under co—operative and non—co-operative marketingshannels etc. are discussed in the sixth chapter. Chapterseven provides an overview of the demand of the Indian system
ofnwdicine and its linkage with Tribal Co—operative marketingsocieties in the state. Tribal participation in Tribaluroperative societies and the responses of officials were

28
Hscussed in the eighth chapter. The last chapter presentsme summary and conclusions.
L9 Limitations of the Study
The study has the following limitations: Statisticsplating to some aspects of the collection and marketing ofHTP are scattered and inadequate. Secondly. the manufacturesK Ayurvedic medicines were not milling to give data onmveral aspects of their firms. Thirdly, the limitations ofxibal memory might have crept in the study and finally themchange relations of product market with other segments ofxibal life could not be established at the expected level.

RE VIEW OF LITERATURE
CHAPTER II
REVIEW OF LITERATURE
The study on tribal economy was started way back inhe 18th century. But most of these studies were in the areaI enthnosociology or anthropology. Though the tribes havefifferent products to market as a result of the variousmogrammes for their development. little attention had beenfiven by planners or researchers as to fact that the marketingdone would determine the purchasing power of the tribes.Wen though the tribes collect various NTFPs from forest andnrket it through different channels, no specific work wasmne so far to examine the effectiveness of the system.bwever, the relevant literature available on tribal economymd their marketing of various products especially NTFP werewllected and reviewed here under three heads: viz.. 1) thekibal Development Programes and the gocio economicmnditions of tribes, 2) Tribes and forest and 3) thehrketing in the tribal economy. The relevant literaturewnnected with the tribal economy of Kerala and the marketingK products in the tribal economy were separately reviewedmder the heading Kerala studies.

30
Tribal Development Programnes and Soc i o-Economi c
Condit ions of ‘Tribes
Verrior Elwin (1955) points out that the British, in
pn attempt to make India. a wide market for their produce.Qeveloped railways. roads, introduced their own education. allgndirectly hit the tribal development. Britishers probablypade an attempt to keep the tribals as museum specimen.pegregated them from the rest of Indian people. With thepdvent of nationalisation of forest, tribals had been leftgyith very nominal privileges and restricted rights to collectforest produce and to cultivatable patches lying within theboundary limits. Though forest villages had been establishedthat also did not benefit them much.
ll
1. Committee on Special Multipurpose Tribal Blocks11960) found out that the tribal development programmesllacked a specific tribal bias. with the result thatnon-tribals residing within the project areas were benefited
r
{gram the funds expended more than the tribals. The committee
$180 pointed out that the officials in charge of the projectswere more about spending the allocated funds more often on and
-elaborate buildings. than on meeting the urgent needs of thetribals.

E 31The Report of the Commissioner of SC and ST 1962-63
3~(Part 1, New Delhi. 1965, p.81) pointed out that the size of
Elloldings of SC and ST in the country was very limited and also
lithe quality of land owned by these groups was much inferior.filo regards the indebtedness of SC and ST, it has often beenlaid that these groups are born in debt, live in debt and die‘in debt. despite several remedial measures initiated by"Government during post-independence period. The report[pointed out that mere allotment of land by itself might nothelp these weaker sections to come out of their backwardness.
ghnless this land was made into an asset by providing necessary
infrastructure facilities.Fr
Bharadwaj (1979) points out that the allocations eariparked for SC and ST had not been able to create anygpignificant impact on ameliorating the conditions of SC and.51‘. He stressed that very little effort had been made allround to evaluate and assess the impact of developmental
[programmes on improving the status and the conditions of SCfind ST. The study observed that the tribals were not able toget a remunerative price for their produce from the tradersigphile they had to buy the cormnodities of their need atigxorbitant rates. Though he mentioned about problems likeZnntouchability, woeful tales of atrocities. poor economicpicture of tribes. under utilisation of plan-wise expenditure
rte” none of these problems were studied factually.

32
p: Das B.Kumar (1986). in an article stressed two mainpoints for the development of tribal economy: (1) The need forylecentralised planning for economic and social development,‘me (2) Diversification of activities of tribes - need forestablishing forest based industries. The article points outthat the market mechanism in the complex town is beyond thenomprehension of tribals. The tribal producers do not get afair deal. The market is entirely -controlled by marwadies.and dominated by middlemen. With the increasing tempo ofmodern economic activities the area of exploitation has alsobeen broadened. Mostly tribal settlements are isolated.dispersed and inaccessible. Socio-economic conditions andresource potentials vastly differ from region to region in the
tribal economy. This diversity necessitates a special type ofplanning at the micro level for the redressal of tribalpoverty .
1 I-lanumantha Rayappa and Mutharayappa (1986) in theirotudy on Backwardness and Welfare of Scheduled Castes and
ficheduled Tribes examined the asset ownership. employment,Income. indebtedness and skill of SC and ST population. Theypointed out that the attempts of the Government during thepre-independence period were mostly in the form of socialreforms based on humanitarian principles. Organised attemptsboth at the national and state levels were made by theGovernment, since independence, in the light of constitutional

33
mpvisions. These attempts had not made any significantImpact on the scheduled groups. The observations brings tolight that still the socio-economic conditions of tribes arePery poor.V
Rao's (1988), study pointed out that there were 24tribal communities dwelling in the agency areas of theHstrict. But while framing the samples. the tribeIifferences were not noticed or not considered. When aEonsumer takes a particular course of activity. it is theresult of many influences — cultural, social and economic. ItIs appropriately said that all social group influence onumsumer behaviour start with the culture in which theconsumer lives. But the present study fails in short of thisInjor consideration which is very essential for tribalItudies. since there is a very clear cut distinction existingbetween and among tribal communities. Therefore. an inter and
mtra and regional aspect in respect to tribes had also to beconsidered while framing the samples for the study. The studyuvermufluthrust on the buying operations of tribes fromlifferent shandis. However. the researcher ignored the factthat the buying power of a tribal household was greatlyInfluenced by his produce marketing.
Rao and Shankar Girija (1988), in their paperObserved the reasons for the failure of majority of the

34
--rammes and strategies of Government for tribes. They
finted out that the authorities who were responsible forfulementing the programs had failed to convince theurneficiaries to get involved in development programmes foryou the development activities had been formulated.
Dinesh Kumar and Deep Kishore Srivastava (1990) in
Tioir study concluded that the scheduled category had not beenhofited fully by whatever the efforts made by the;5 ernment. The advantage was, not going to the really needyd poor people. The problem they pointed out was not
éharcity of resources but mismanagement of resources availableE0 the scheduled category. The agencies which were carrying
flit these programems were usually involved in corrupt;~actices and did not pay proper attention to the advantagesin the implementation of the programes.
Baker David (1991) examined the tribal decline in:9 northern central Provinces between 1861-1920 and assessed
{he role of state policies and the market system in thatilocess. He point out that increasing regulations governingjho use of forests deepened tribal poverty and exposed them tolurther exploitation. Tribals were concentrated in or nearlorest areas, yet regulations deprived them of the use. Thejdministrators attempt to impose an alien economic and social

35
system on the tribal community was an important element in itsdecline.
Naidu and Ramakrishna (1992) in their work pointedout the indebtedness of tribal people. They pointed out theindebtedness was the major cause of exploitation. The mostimportant reason for their indebtedness was considered to betheir dependence mainly on primitive agriculture and low levelof economic operations. Their customs of marriage, death andreligious ceremonies — which were generally beyond their means
- further aggravated the deficit nature of their economy andcompelled them to borrow.
Ksrala Studies
Ayyappan (1948) made several systematic andscientific studies on the various tribes of Kerala. Thesocio—economic conditions of the aboriginal tribes of theprovince of Madras and a social and anthropological account ofthe Nayadies of Malabar were systematically prepared in hisstudies.
Krishna Iyer (1937) also did similar ethnographicwork in the Travancore and Cochin area. He concentrated his
éstudy on the hill tribes. who were fast dying out or were;getting detribalised. In the first volume he described seven

36
E1
ihill tribes.llalapandaram, the Malapulaya. the Malavedan.
‘their mode of living.
-and the Malasar.
ghe accounts of the tribes of Travancore.
namely the Kanikkar. the Malakurumbars. thethe Malayarayan
The second and the third volumes deal with
In a later study.he described the hill tribes of Kerala as pre—Dravidians.
Luiz (1962) has made a detailed study of the 48tribes/comunities of Kerala. He has discussed at length
occupation, diet. religions. taboos.marriage and rituals. But no reference about the tribalproducts and their marketing was given.
Mathur's work (1977) was a descriptive study on theIocflrdinguistic evolution of the tribals in Kerala. Inaddition to providing valuable statistical information. theauthor has noticed some important problems of tribals ofUynad. like land alienation. bonded labour. and indebtedness
in Attappady. Some general problems like non electrification.pmm'status of women etc. were also studied. The author has.mwnver. just described the problems without analysing themamiinvestigating the underlying factors.
Krishnan Nair (1986) in his article brought out twoissues for tribal development:

37
The regulation of the Government and the forest policy ofthe state should be in accordance with economic system oftribes, and
‘I. The institutional arrangement for tribal development..t i.e.. Girijan Service Co—operative Societies shouldE“ diversify the activities of tribes. train them iniv planting medicinal herbs in forests and teach them how to
extract the MFP without losing the quality of theproducts.
“7 Paul (.1988) examined the problem of spatialQflisparity in the socio-economic standard to the hill tribes ofKorala with special attention on tribes of Wynad district.The study also analysed the problem from both inter-communal
ind :intra-communal perspectives. The study proved that the
fipatial disparity had an influence in the socio-economicstandard of the hill tribes and it also made some influence inthe inter-communal and intra-communal aspects of tribes. The"Study claims that the developmental programmes undertaken by
\he various agencies of the government appear to have createdexogenous pulls to the tradition-bound tribal economy for-htructural changes .
£5
“ Kunhaman (1989) points out that the problems of the:Scheduled Tribes of Kerala began to receive increasing

38
fiattention from planners and administrators only afterindependence. Several welfare and developmental programmes;have been adopted both by the Central and State Governments to
.bring about the ultimate integration of these people in to thegnainstream of national life. Nevertheless, by any standard,;these people remain the most backward section of the society.mmwver he does not go much ahead in establishing its findingsjwith facts and figures.
Radhakrishnana Pillai (1991), in his study revealsthat the intensity of tribals of Wynad on traditional systemofuwdicines had declined. Indigenous health systems werediscouraged and a new health culture was promoted that forcedthe individual to depend on modern drugs and other medicinalinterventions. The study also proved that the health statusamong the tribals of Wynad were very poor mainly due to theirsocial and economic disabilities.
Mohandas (1992). in his study revealed that the=Injor economic impacts of large scale influx of sttlers in the
Euestern ghat region was the progressive alientation of tribalilands. It also resulted in the destruction of common propertygreaources like forests. At the same time it had influenced;the tribal life in many ways. These relate to the structure)
Eofincome, pattern of employment, extent of entitlements.S
,V

39
differential accessibility to public consumption. change incropping pattern, extent of consumption of liquor etc.
II Tribes and Forest
The Dhebar Commission (1961), The Committee on
Tribal economy in Forest Areas (Hari singh committee 1967).The National Commission on Agriculture (1976). The NationalCommittee on the Development of Back ward areas (1981) and the
aeports of the Commissioner for SC/ST from time to time,stressed the need for considering the tribal economy with anyof the programmes of forest as the tribes had a symbioticrelationship with forests. They also stressed forestablishment of forest based industries for tribaldevelopment.1.
Jacob (1984) and Westoby (1987). highlight thatE
large scale timber extraction from tropical forests has to bea process which do not lead to a considerable reduction inother economic and non—economic assets of the forest. Such
assets include a vide variety of non—timber forest products.The role which these products play in the local economies oftropical regions has long been over looked.
l
Mohapatro Chandro Prafullo (1987), revealed that theV.
mmmrous beliefs and practices of tribals were closely
40
Taasociated with forests. Special sacrifices were made to theforests Gods before cutting a tree or before or after hunting.Their unhindered full rights over the forests and forestsproducts since time immemorial has given them a convictionthat forest is their own. The forest has thus become a partof their spiritual and economic heritage.
Ghate S. Rucha (1988), in her thesis examined theeconomic impact of forest policy on the tribals. The studypointed out that the dwindling forest cover has severelyaffected tribal dependence on forests and adversely affecttheir standard of living. Insufficient employment and lowopportunities of self employment have forced the tribals toindulge in illegal activities like encroaching forest lands.illicit felling. At the same time, the revenue-oriented
iforest policy of the Government, by its single-minded pursuitiofcwmmercial plantations. has grossly neglected the needs ofltribals. It seems that many forest officials are not aware of-the tribal problems, and consider the forest dwellers only aslabourers for forestry works. The privileges and concessions
.enjoyed by the tribals are considered as burden on forests.
Maheswari (1990). highlights that tribals are therepository of vast knowledge on the uses of biologicalmaterials which is often kept secret and is passed on by‘verbal traditions only. As the tribal scene in the tropics is

41
fast changing due to deforestation. there is an urgent need toprepare ethnobiological inventories and to evolve strategiesfor conservation of ethnobiologically important species andoverall protection of the forests.
Melkania (1990), highlights that the essence offorest management is to raise productivity on sustained yield
basis through an integrated approach on land. labour andcapital. By pointing out the alarming rate of deforestationi.e. by 11 million hectares or by 0.6 per cent a year (studyby FAO 1982). the analiser called for people's participationin forest management by making suitable changes in the presentinternal structure of institutional arrangement for forestmanagement.
Panayoton Theodore (1990). brings to the concernthat managing tropical forests only for timber to theexclusion or neglect of non-timber products may fail to
I maximise the social values of a scarce resource and to ensure
its sustainability over time.
Rajaraja Varma (1990). in his article points outthat tribals form an important part of the forest eco—system.What is needed is that any activity in the name of biosphere
.reserve should begin with a genuine understanding of the lifestyles and problems of the tribal people in the concerned

42
area. He stressed that the most important measure to ensuretribal welfare is providing them uninterrupted employment.
Indurkar Pushpa (1992). pointed out that there wasclose symbolic relationship between tribal people and forests.Considering their dependence on forest. they should beidentified as part and parcel of forest. Therefore it was theduty of all agencies responsible for forest managementincluding Forest Development Corporations to ensure theirparticipation in the protection, regeneration and developmentof forests. Efforts should be made for the upliftment oftribal community through forestry oriented schemes.
Sanjeev Kumar Chadha (1993). observes that thetribals have a symbiotic relationship with forests and theirdependence on MTP is all the more same. But with the mounting
biotic pressure, efforts need to be done to maintain acontinuous supply of MFP, thereby sustaining the tribaleconomy. Chadha argue that one important step in this regardis for MFP plantations in pre-dominantly tribal areas withtheir active participation.
Mathur and Shiva (1993). in their paper ‘issues forHFP oriented. need—based forest management’ stress the need
fifor maintaining a satisfactory balance between protection oflithe resource and its use for the poor and forest —dependent

43
communities. The paper discusses the various impediments and
draws attention for drawing up the action plans both in theforestry and the farming Sectors. The role of Minor ForestProducts has been stressed in Forest management with moreemphasis to switch over to MT? oriented management. especially
in areas near habitations on compared to the timber dominatedmanagement erstwhile in vogue. Introduction of need based MTP
dominated management has potential to help in alleviatingpoverty among the weaker sections of the society.
Tewari (1993). in his keynote address mentioned that'Tribal community in India (as well as in other parts of theworld) largely occupy forest regions where for long periods intheir history they have lived in isolation but in harmony withnature. They draw sustenance largely from the forest. Triballife is connected one way or the other with forest right frombirth to death. In time of distress like famine. forest aretheir last succour. Tribal life is profoundly affected withwhatever happens to the forests. Forest represent for them away of life: home: culture: worship: food and wherewithal:employment: and income. Local tribal community. which hassymbiotic relationship with the forests, should be accepted aspartner in the local forestry development efforts in eacharea. The new national forest policy has rightly recognisedthe role of minor forest produce in poverty alleviation andtherefore, all attempts should be made for their regeneration,

44
collection, processing, marketing and scientific managementfor improving the ecology and economy of the country."
Korala Studi es
Muraleedharan and Shankar (1990) pointed out thatinteraction between human beings and natural resources werethe core of any development process; An understanding of thereciprocal influences between these two systems was essentialfor evolving suitable policies for sustainable resourcemanagement and eco-restorat i on.
Kumaran (1993) in his study brings to our noticethat the tribal communities depended on the forests as aresource and a source for living and food supply. Thus theyhmian almost self sufficient economy and depended on theoutside very little. But now their situation is deplorable.for. in every aspect of life they are locked in a sub-humanstandard. Poverty and deaths due to starvation and diseasesGusto malnutrition are their eternal masters. One of theinin causes for this murky state of tribal life according tothe study was the unabated process of land alienation, whichEonverts year by year a large number of tribal people‘endless. Thus land has become one of the main questions forildivasi.E
I

45
III Marketing in the Tribal Economy
Stine (1962) in his study on periodic marketsexpressed his opinion that most explanations for periodicmarkets and mobile trading have been developed in an economic
pattern which is free from social and cultural factors. Hefelt that periodic markets are no doubt developed on economicprinciples but at the same time they are also influenced bythe social and cultural factors of the people living in thesesettlements.
Belsha (1965). was of the opinion that markets didnot originate as places for local subsistence producers todispose of their surplus production. but they were the resultof increasingly specialised division of labour and growingexploitation of regional resources.
Irawati Karve and I-Iemalatha Acharya (1970) observed
that the weekly markets represent an agency of modernisationand urbanisation. Exchange is a feature that expands the areaof interactions. The study pointed out that the marketpenetrated the tribal life long before the study as itinerant
traders and money lenders made their way as soon as theythought it profitable. The rhythm and periodicity of marketand social life of the people are closely enmeshed. SuchIocio-cultural factors do affect transactions in the market.

46
Rao Raghava (1973). made a study about the marketing
of produce and indebtedness among tribals of VisakhapatnamDistrict. The study pointed out that a part of the marketedminor forest produce also was flowing to the private agenciesinspite of the monopoly rights of the Girijan Co—operativeCorporation. This is because (1) the sellers are unaware ofthe market condition. (2) the corporation could not adequatelylink up credit with marketing and (3) the trader influencesthe tribal by timely credit and his personal touch in thetransaction. The development programmes of the TribalDevelopment Blocks could not achieve the expected results asthey are too sophisticated and unsuitable for tribal areas.The study also points out that the tribals prefer to selltheir produce to the traders because of their long—standingcontact and intimacy. The co—operatives and the corporationcould not replace the private traders and money lenders in themarketing of produce and the supply of credit. The study hasits own limitations. It did not consider the inter and intradifferences between tribes in the marketing of produce. Muchconcentration was given on agricultural produce marketing.
, The role or the effort of each institutional agencies in theproduce marketing did not touch properly. Minor ForestProduce includes variety of items. some are medicinal herbs
; and others are purely commercial in nature. There is
}difference in price also. The study did not make any attempt

47
to compare the price offered by co—operatives and privatechannels for different items.
Brously 35.31. (1975) postulated that exchangesystems and patterns vary with the type of society and arefounded upon value systems that are shaped by culturalprocesses. They further observed that exchange patterns areummg the most important social relationship which bind thesociety together, and they make an impact on all aspect ofsocial life.
Bhati (1975) in his study observed that the triba1s'agriculture was not market-oriented and the advantages of bulkowning was not obtained to them. A major proportion of
[surplus production‘ was sold in the village itself to then»
traders and hawkers and they received a price for their;roduce which was much less than the prevailing market rates.
IV Henry A. Walter's (1976) research was an initial2ttum to bring empirical data to bear on the concept of
M
'lture and its possible impact on consumer behaviour. Theyudy proved that the culture is an underlying determinant of
sumer behaviour.
Hartman (1976). argued thatintangible environmentalofit of a tree exceeded or outweighed the timber benefits
F
that tree.

48
Pareek (1977), indicates that Barter system wasprevalent during the reign of Britishers in India in thetribal economy and often the merchants encouraged the tribalfolk to buy varying fancy clothes. cosmetics and other thingswhich they really did not need. The tribal people werehabituated to borrow money for various requirements such asmarriage, illness. purchase of cattle. land and seeds and topay the interest on loans. The study also highlights that theattached agricultural labourer gets his payment in a lesserunit of weight or measurement, while in repayment he is madeto give against a bigger unit of weight or measure.
According to Brian Morris (1979). tribal communities
inhabiting the Western ghats maintained trade contacts withtheir agricultural neighbours. During the Sangam period. theTamil Kingdom had trading relations with the Roman Empire.Fhey exported peacocks etc. besides forest products likeIandal wood from the Malabar Coast. The local chieftains and
Iamindars had control over the forests and royalties wereaccordingly levied on such forest exports. Further more,Ieryices of the local tribal people were placed at thelisposal of the Rajas or the members of the families of thechieftains when they went out on hunting expeditions.
r . Punalekar (1980). has made an elaborate study of thepeekly markets in tribal areas of Surat—Valsad region of

49
Gujarat. His study was mainly concentrated on the variety orrange of commodities brought for exchange, social composition"of the traders, behaviour of tribals as sellers or buyers ofcommodities and the market participation of tribals belongingto different socio—economic background. The author classifiedthe tribals into small and middle farmers and the landless.It was observed that the private merchants were making hugeprofits as there was no restriction on them for purchasing thenhuu~forest produce from the tribals. However, the study hadits own drawbacks. Since there is inter and intra differencebetween tribes and regions in the collection and marketing oftribal product, it has not been considered in the study. Thebtmhralso could not see or establish any exchange relationsin the marketing of tribal products.
Gupta Tirath and Guleria Amar (1980). in their studyIseessed the current and potential contributions of Non-WoodRwest Products to (1) revenue, (2) employment, and (3) exporthrnings. They observed that a considerable number of NWFP,kd not been identified, and very little efforts had been madehr scientific management of the known resources.l
’ Ghanshyam shah (1984), in his study points out thatNuithough the tribes whose yield is insufficient for his ownbeds, sell a part of the crop imediately after harvest toitty shopkeepers or money lenders against their debt. But

50
the study is silent about the role of organised marketingarrangement such as co-operatives in the field of marketing or
[credit to tribes.
Rameshwar Singh, and Singh et.al., (1984), in their{study made it clear that the marketing cost is very less whenthe product is marketed through co—operatives, as comparedwith the general marketing arrangement. In 1954, the RuralCredit Survey Report observed that of the 75 districtslurveyed, only in 5. produce sold through co—operativeexceeded 1 per cent of the total sales through all agencies.Even though the authors point out that the marketing cost inco-operatives is less. they failed in explaining the reasonsfor non-preference or non-marketing of products throughco-operatives in the country.
Patil et. al. (1985), in their study examined themarketing efficiency of Co—-operative organisation in themarketing of mangoes in Bombay city. Input output or costbenefit model could be used for analysing the efficiency. Thestudy proved that the higher the layer, the lower would be theproducer's share in consumer price that had to be paid by theconsumer for the products.
Shah (1986). in his article stressed the importanceiof co-operatives for bringing about radical change in the

51
conditions of the tribal people. The tribal economy speciallyin the interior areas, is largely non-monetised and the centreof exchange is the weekly market place or ‘hats’, where amajor portion of the transactions is carried on by barter.The tribals are exploited in this process mercilessly bytraders. merchants and the moneylenders. Since the tribalsrequire credit not only for his daily requirements but alsofor social functions. they suffer great exploitation at thehands of money 1ender—cum—trader.
John Gaikwad (1987). through his article points outthat the MP collection scheme has not been able to make amajor headway in ameliorating the living conditions of thetribals mainly because (1) MFP quantity collection has gonedown. (2) local processing could not be organised and (3)better price could not be obtained for the material sold inthe market. The article also observed that there is anover-exploitation of accessible areas while the resources inmore interior areas are likely to remain untapped. However.the authors observation was not supported with adequate factsand figures.
E Rao Gopala (1987). in his study brought out the two.channels of marketing of MFP in the state of Andhra Pradesh.
Flhe study had the following limitations:

52
1. The different MFP items and its share in the tribalincome did not look in to.
2. The inter and intra differences between tribes andregions had not been considered in the study.
3. The study could not bring out the efficiency of eachmarketing channel for MFP.
4. The study was also silent about the reason forleaking the MT? in the hands of private traders.
5. The study was also not explained about the method bywhich the MFP had to be priced.
Christoph Von Furer — Haimendorf (1989), examinedthe relations between tribes and Government. The policy ofnon-interference and protection of British India enabled thetribal population to retain their land and their traditionallife style. A small volume of barter trade between hills andplains were carried on by tribes men from the fort hills. Noplains men were allowed to acquire land in the hills and theindigenous system of land tenure was retained virtuallyunchanged.
In terms of market size and pricing Khare (1990).noted that limited access to markets as well as great
.dependence on intermediaries. both Government and private.
lhave a direct bearing in NTFP's prices. The cost of thelproduce as sold by the producer, whether to consumers or to

53
intermediaries, seems to have no relation to the cost oflabour, inputs and transportation.
Mahalingam (1990),observed that the MFP collection,
processing and marketing can generate a gainful employment of
10 million standard persons per year. The article covered thesalient features of tribal marketing structure, institutionaltribal market and basic constraint and policy implicationsrequired for tribal market. But how the present tribalmarketing arrangement had helped the tribes in marketing oftheir various products would not be covered in the discussion.
Chambers et.al. (1990), argue that nationalisationwas the primary reason for a decline in the production of NTFPin India. Inspite of good intentions, they argue thatnationalisation has become a disincentive to NTI-"P collectors.
Nationalisation reduces the number of legal buyers, chokes the
free flow of goods, and delays payments to gather. asGovernment agencies find it difficult to make prompt payment.
This results in contractors entering from the back door. butthey must now operate with higher margins required to cover
iuncertain and delayed payments by Government agencies. as wellPas to make the police and other authorities ignore theirlillegal activities. This all reduces tribal’s collection and‘v,
‘incomes .

54
Bapuji (1990), in his study on Tribal Development%Agencies in Visakhapatnam District pointed out that the tribal
Edevelopment agencies — the T.D. Blocks, the ITDA and the'Girijan Co-operative Corporation had come to stay. They were.on the march to uplift the tribals through their packageschemes. Even though, the tendency of these agencies was tcconcentrate on the agricultural development programmes, thedelivery system of these programmes.was not effective. Thoug}
the researcher suggested a change in the present pricingpolicy of which was not realistic enough to ensureremunerative prices to the tribals for their minor foresiproduce and agricultural produce. it was not properl)supported with facts and figures.
Indra Kumar and Alok Kumar (1990). in their studypoint out that the Forest Corporation which is set up mainl)to avoid the contractor system in the marketing of timber ancother forest produce has failed to achieve the result.Apparently the forest corporation seems to have achieved thisobjective of eliminating contractor's agency from exploitatiorbut in today's situation the middlemen become necessarycomponents of timber and other forest produce trade, so thesame contractors and middleman who were to be removed from the
scene are very much there but in a new role as purchasers ancFagents under the state monopoly of forest produce trade

55
There has only been a change of masters, from the erstwhile;. 'Maldars' (Forest contractors) to the Forest Corporation.
Mahalingam and Rajendran Vasanthi (1991). in theirlgltudy observed that the agricultural practices in tribal areas;were mostly subsistence in nature and were characterised by
the production of food grains and millets. They were justsufficient to meet their own requirements at low living.._1l!_owever, to meet their urgent consumption needs. socialpurposes and to clear their old debts, would force them to
pull the ‘Surplus Agricultural Produce’ in the market. Theilpthors pointed out that the market places were not merely[nrket places for products but also social centres aroundQiich most of the life of the tribals revolves.t
,;_ Prasad Mahesh (1991), strongly advocates marketyientation to rural development. He points out that while inhe case of extreme poverty, deprivation and destitution. itRy be necessary to extend financial or material help forunetime. but to continue it on an ongoing basis for yearsngether would make the population dependent on this package
if over. Therefore, stress should be on helping the poor topage themselves in the income—generating activities and[wing a market orientation to the economy. The co-operativeIdol can be successfully replicated to market the products.

56
Das (1992). pointed out that planning of sustainableutilization of the forest resources has become mandatory tomeet the economic needs and environmental security of the‘people. Therefore correct valuation of the forest wealth hasbecome important which will guide us in taking decisions for asustainable utlisation of the forest resources. He alsoobserved that the structure. operation channels and conditionsof the market for NTFP's are crucial for determining the value
; of the timber and N'I'FP's.
Bawa and Hall Pamela (1992). observe that theefforts to value NTI-"Ps have two basic aims. One is to show
that the value of NTFPS on a per hectare basis can exceed orV equal the value obtained from on-sustainable extraction of‘. timber or conversion to other land uses. The other is to
demonstrate that a system based on utilisation of N'l'FPs canprovide rural communities as well as forest dwellers withlupplemental income and lead to their participation inpconservation of bio diversity.IE
it Kumari Punam and Sinha (1992), in their study pointt that the MFP collection scheme has not been able to make aEjor headway in ameliorating the living conditions of the
I ibals. The reasons they attributed were (a) MFP Quantity‘llection had gone down (b) Local processing could not be_ anised and (c) better price could not be obtained for the

57
materials sold in the market. They point out that overexploitation of accessible areas, untapping of MFP's frominterior areas and unscientific and indiscriminateexploitation of MFPS have been making serious inroads into our
resource base. Processing is essential for enhancement ofvalue which can be done stage wise - at the household level.at the society level and finally at the apex level.Processing can be a great source of employment for the tribalsand would prevent much of the migration from among thetribals. Improved storage techniques need to be evolved byIcientific methods. However, the study did not touch the rolepf institutional arrangement in the procurement and marketingD! HFP.
I
I Mahalingam (1992). through his paper pointed out abut of institutions in the organised sector for marketing thetribal products. But he failed in projecting the efficiencyht these institutional arrangements in the marketing of tribalIfoducts. The article also pointed out that the imperfectIrketing system in the tribal areas also led to theIvelopment of a pernicious social system called 'gothi' orEnded labour. But none of his arguments were supported bylear evidence .
D Godey Ricardo and Lubowski Ruben (1992). criticallylenined the different methods of valuing of MT? in tropical

58
regions. The work brought out the problems like thisincompatibility of different results. failure to value wildlife. lack of attention to sustainability etc. They highlight that the most accurate method of valuing the goods takenby people from the forest is to count, weigh. measure andvalue them as they enter the village each days.
Bawa Kamaljit (1993), brings to light that thesustainability is the critical but ignored issue in theexploration of NTFP's. If the extraction rates of NTFP's fromnatural forests are not sustainable over time, then the oftenproposed linking of conservation of biodiversity with multipleuse of tropical forests through harvest of NTTFP is untenable.It is not the harvester's interest to harvest sustainablysince short term gains can always potentially exceed gainsmade from sustainable extraction if market costs do notincorporate environmental costs of harvest (eg.loss ofenvironmental services etc.). Hence the researcher arguedthat the economic as well as the ecological sustainabilityumst be considered while valuing the price of NTFP. He gavemore stress on ecological sustainability in the valuation ofNTFP.
Marothia K. Dinesh (1993). made an overview ofco-operative management of Minor Forest Products (MTP) inlladhya Pradesh. The study concludes that the current states

59
of co-operative management seems to be ‘Government orientedco-operate network,‘ and hence co—operation has not been ableto provide substantial benefits to the members except toensure proper wages. The quantity of MTP's collection hasalso been fluctuating over the years due to governmentpolicies and natural calamities. The primary co—operativesocieties are poorly equipped with infrastructural facilitiesand members do not have much participation except to collectHTPs and dispose it of.
Chandrakanth and Lokamanya (1993). point out thatthe gatherers of the forest based medicinal tree parts. whoformed the prime source of supply of the medicines werereported to receive a very small proportion of the consumerprice. This calls for market regulation to reduce theunhealthy market practices for the healthy promotion of thesystem of forest based Indian system of medicine.
Shiva (1994), through his article indicates thatmnte skillful forest management is essential to harness theIflresources for rationalising the status of tribals in thepmnnry. In addition to MP—based industries. tribal areaspave great opportunities to develop wood based industries likepod carving. toy making. sports goods industries andpdustries for makings tool handles. agriculture implements.pncils etc. The improvement in the quality of life of the

I
3
I
I
l
D
1
60
tribals thus will. not only go a long way in amelioratingtheir own lots but will also provide good quality finishedproducts for the use of rural and urban population as well. ifappropriate marketing avenues will be created.
Kerala Studies
From the available literature it appears that thefirst information about the South Indian tribes was providedby Edger Thruster (1907) in his monumental six volumes workduring the pre—independence period. In volume II he mentioned
that the Irular of Chigleput exchanged fire wood in return forprice. rice. and sour fermented rice gruel which was kept byhigher classes. Though volume IV make some references about
the tribes of Wynad. Calicut and the Ernad Taluk of Malabarand the different products of tribes. the volume does notmention anything about how these products were being sold bythem.
Ethrenfels (1952). had held that the advent of thecmmractors at the beginning of the century had changed theKhdan food gathering subsistence economy to the collection offorest produce for Barter. Ethrenfels. for example.Iaintained that the Kadans of Cochin were "isolated in theirIorests“ for a long period and were not influenced by thefiains' culture. Brian Morris holds that there is "ample

61
evidence to show that the external trading contacts had beengoing on since earlier times among South Indian hunter gathering communities - the Kadar. Paniyan and Hill Pandaram".
According to Mathur (1980). the collection andmarketing Minor Forest produce plays a very important role inthe cultural and economic life style of cholanaicken ofKerala. They collected forest products for barter and fallsunder three categories. Firstly, there is illicit barter ofhoney which is common in interior forests. Secondly pepper.cardamom and ginger were sometimes bartered with the localMuslim traders. Finally, there is the barter of minor forestproducts through Muslim contractors. Since the contractor hasthe exclusive right to collect the minor forest produce, thecholanaickans are obliged to sell their collections at anominal price. They cannot influence these prices as "theyhave to be accepted on a take it or leave it basis".
Conclusion
While reviewing the various studies on tribaleconomy and the marketing of NTFP, it is understood thatlittle importance had been given either by the researchers orby the planners to bring together these two arena to examinethe eocio—economic improvement of tribes in the country. Thetribal life is more attached with the forest economy. A

62
symbiotic relationship exists between forest and tribal life.Even though we created organised instituional arrangement ie..co~operatives. for marketing the tribal produce particularlyNTFP, so far no attempt has been made to examine theeffectiveness of the system. The inter and intra differenceof tribes and regions in the collection and marketing ofmedicinal as well as non-medicinal items of NTFP and theforward and backward linkages of organised institutions fortribal development and tribal participation in their owninstitutions etc. had not been covered in any of the studiesunder review. Therefore the present study is an attempt tofill the gap.

TRIBAL DEVELOPMENT IN KERAI

CHAPTER III
TRIBAL DEVELOPMENT IN KERALA
Tribes in Kerala account for 1.1 per cent of thetotal population (3.21 lakh as per 1991 census) of the stateand are mostly concentrated in Wayanad, Palakkad and Idukki-districts. Even though 45 comunities have been identified astribes in the state, so far only 35 tribalcommunities(Appendix II) have been notified as scheduledtribes under the provisions of the Indian constitution. Thetribal people of Kerala. like their counterparts as elsewherein India, live in the midst of poverty, suffering andexploitation in every sphere of their life. Being the mostbackward community. their economy is characterised. by landuienation1‘2'3. indebtedness, exploitation, bonded labourwstem and poverty. Over the years the Central and Statebvernments have initiated a number of measures to ameliorate
heir economic conditions and to preserve their culture.Mnver. these measures have been sporadic and lack anntegrated approach.
Mathur P.R.G., (1977), Tribal Situation in Kerala, KeralaHistorical Society, Thiruvananthapuram.
Kunhaman M.. (1989). Development of Tribal Economy,Classical Publishing Company. New Delhi.
Mohandas M., (1992). Impact of New Settlers in theWestern Ghat Region — on the socio—economic conditions ofthe Tribal Population, The case of’ Wayanad District inKerala. fieport of the Research ‘Project Sponsored bylinistry of Environment and Forest. Government of India.Kerala Agricultural University, Thrissur.

64
.1 District-wise Tribal Population of Kerala
Table 3.1 depicts the district—wise Tribalapulation of Kerala.
Table 3.1
Tribal Population of Kerala— District—wise
(from 1961 to 1991)1. . . Xm Name of D1atr1cts 1961 1971 1981 1991 1961_91
Thiruvananthnpuram 9784 11059 14145 16181 1.67(4.6) (4.1) (5.4) (5.3)Kollam 3799 3737 7442 3884(1.8) (1.4) (2.8) (1.2)
2.82Pathanamthitta -— -- -- 6922(2.1)
Alappuzha 584 435 3273 2801 2.82(.002) (.001) (1.3) (0.9)Kottayam 21391 23172 15227 17996 -1.03(10.1) (8.6) (5.9) (5.6)Ernakulam 10030 11648 3551 4941
(4.7) (4.3) (1.3) (1.5) 1 80Idukki -— -— 38712 50269
(14.9) (15.6)g Thrissur 5878 9383 3227 4051 -1.96(2.7) (3.5) (1.2) (1.2)1 Palakkad 20433 25594 28794 35465 1.90(9.6) (9.5) (11.0) (11.0)p. Malappuram -— 8882 7955 10555 1.72(3.3) (3.0) (3.3) ‘1. Kozhikode 69958 84982 3888 5407t (32.9) (31.5) (1.5) (1.7) 1.953. Wayanad -- -- 95557 114969' (36.5) (35.3)

65
B. Kannur 70905 90464 39704 13243(33.5) (33.6) (15.2) (5.7)W -1.33.4 Kasargod —- —- —— 292831 (9.1)
R,,212762 269356 251475 320967 1.3N (100) (100) (100) (100)
.Census of 1961, Special Tables for SC/ST Kerala,Vol. VII. Census Commissioners Office. Thiruvanan—thapuram.
'55O0 1
’ 2.Census of India 1971. Special Tables for SC/ST.Kerala Series 9, Part VA. Census Commission Office,
"' Thiruvananthapuram.i 3.Census Of India 1931 and 1991.. special Tables for
SC/ST Census Commission Office. Thiruvananthapuram.
lote : 1.Figures in parentheses indicate percentage tocolumn total.
2.The compound growth rate indicate change int population from 1961 to 1991.I;
t_ Table 3.1 indicates the district-wise tribalgopulation of Kerala and its compound growth rate over aperiod of 30 years. During 1961, there were only nineflistricts in Kerala where the highest tribal population wasQccounted in Kannur District (33.5%) and the least inIlappuzha District (.002%). The Malappuram District wasformed in 1969 and, of the 10 districts in 1971, the highestIhare tribal population was accounted to again to KannurDistrict (33.6%). The Idukki and Wayanad districts wereformed in 1972 and 1982 respectively. The Wayanad districtwas formed by clubbing certain areas of Kannur and Kozhikode
A

66
iistricts of the State. Thus the highest share of tribalpulation of 1981 census was found to be in Wayanadfistrict(C-36.596). The Pathanamthitta and Kasaragode districts, re formed in 1982 and 1984 receptively. According to 1991
ensus, of the total 14 districts of Kerala. still 35.8 per‘ant of the state's tribal population inhabits in WayanadU strict. The compound growth rate of tribal population in
e state for the period 1961 to 1991 is 1.3 per cent. But it
ifltowed a declining compound growth rate (0.296) between 1971
1981. Among districts. negative growth rate was accountedKottayam, Trichur and Kannur districts.. 4'
2
Table 3.2 points out that more than 10 per cent ofthe district population of Wayanad, Palakkad and Idukki are
tribes. Wayanad district is considered to be the most thicklytribal populated district in Kerala where 35.82 per cent ofLhe population are tribes. Therefore in any blueprint for[istrict development. adequate attention must be given toribes. The sex ratio of tribes in Kerala is 996 as againsthe state level sex ratio of 1036. However. the sex ratio ofribes at the all India level remains to be 972 (1991 Census).

67
3. Table 3.2District ST Population as Percentage of State
ST Population 1991 Census
181- District STEHO. Name of District ¥§g:) F?Sg;? Totaliogglgfiggg gg
Population1 Thiruvananthapuram 7860 8321 16181 5.03_2 Kollam 1943 1941 3334 1.21fa. Pathanamthitta 3459 3463 6922 2.16f Kottayam B902 9094 17996 5.625 Alapuzha 1407 1394 2801 0.875% Ernakulam 2551 2390 4941 1.5400. Idukki 25512 24757 50269 15.6613 Thrissur 1990 2061 4051 1.26_9. Palakkad 17927 17533 35465 11.05jio. Malappuram 5213 5342 10555 3.29511. Kozhikode 2654 2753 5407 1.69j12. Wayanad 57336 57533 114969 35.32T13. Kannur 9167 9076 13243 5.63,i4 Kasargod 14341 14442 29233 9.12
Total 160312 160155 320967 100.00Vsource : Government of Kerala (1994). Tribal Sub-Plan. Annual
Plan 1995-96, Directorate of ST Development,Thiruvananthapuram.
.3.2 Tribal Communities of Kerala
Thirty five tribal communities of Kerala have beenidosignated as Scheduled Tribe. It includes Paniyans. Adiyans,lrandan, Kadar, Kurichiyans, Irular, etc. The predominant
iamong them are Paniyans and Irulas. They inhabit in the

68
Edistricts of Wayanad. Kozhikode. Malappuram and Palakkad. In
iaddition to the above classifications. tribes such asEcholanaickens. Kurumbars, Kadars. Kattunaickens and Koragas
{yore designated as primitive tribes. But it is observed thatithe tribal community cholanaickens so far not included either.in the Scheduled Tribe or other eligible communities lists.—Of the tribal communities. only 9 are considered as’numerically4 important. They are Paniyar, Irular or Irulan.ilhratti. Malayarayar, Kurichiyan. Kurumans, Kanikkar, Ulladan
and Muthuvan. In between 1961 and 1971, 38 tribal communities
‘yore declared as scheduled tribes. But in the 1981 ce m~Jthree of the communities viz. Pulayan. Vishavan andAllalayekandi were deleted from the existing list. This was onfthe plea that the enumerators could not locate any member inithe Vishavan community, it had been deleted from the r’ ig§T1ist of 1976, which formed the basis for 1981 census. It{might be one of the reasons for showing a lower ST population:in 1981 as compared to 1971. But the report of theLsmfio-economic survey of tribals in Kerala brought to lightithat the Vishavan community still exists with 237 members. As
§pu*the report. the tribal population had declined by 25.7 perScent in 1976-78 as compared to 1971 census. (1976-78- tribalpopulation was 2.00.042). This phenomenon raised some doubt
Number of tribal population in each community if exceeds10,000 is considered as a numerically important tribalcommunity.

69
in the researcher that whether any natural extinction hasstarted in the tribal community.
3.3 Domination of Tribal Connnunities in the District ofKera 1 a
Formation of the state and the division of the state
in to different districts horizontally left the tribalpopulation scattered in all districts of Kerala. mostly inhilly areas. The population growth and the re; ‘tantmigration of people from one place to another in search Jfbetter living also resulted in the scattering of tribesespecially in hilly tracts. The horizontal division, of thedistricts even did not grant them a district exclusive fortheir development and put the same tribe who spec. ,dialect, having same socio-economic conditions in seperategeographical locations. Wayanad is the only district inKerala where all the tribes are living in rural areas. Table3.3 highlights the domination of tribal communities in thedistricts of Kerala.

70
Table 3.3Domination of Tribal Communities in the
Districts of KeralaMajority IInd Majority31. . . Tribal X Dst. ST Tribal % Dst. ST
No. Dlstrlcts Community population Comunity populationIt1. Kannur Marati 55.9 Paniyan 22.4
2. Wayanad Paniyan 42.9 Kuruman 21.23. Kozhikode Paniyan 50.8 Kurichian 26.84. Malappuram Paniyan 62.0 Muduger/ 16.7' Muthuvan5 Palakkad Irular 64.0 " 7.66 Thrissur Malayen 27.0 Ulladen 20.07. Ernakulam Ulladan 69.3 Malyarayar 7.80 Idukki Malayarayar 32.4 Muthuvan 18.89 Kottayam Malayarayar 40.7 Ulladan 19.410. Alappuzha Ulladan 80.4 Malayarayar 6.111. Kollam Ulladan 21.5 Malayarayar 16.812. Thiruvanatha- Kanikkar 88.8 Malivedan 2.4
puramSource : Compiled from census of India - 1981
* Since the formation of kasargod district.Kannur districtis dominated with paniyan population. All Maratishappened to be in Kasargod district.
Table 3.3 shows that even though there are 35 tribalcommunities in the state. only eight tribal communities havedominated in the state (1981 census). While the northern partof Kerala is dominated by the Paniyans. the southern part isdominated by various tribal communities such as Kanikkar andlflladan. It is also observed that there was no district in
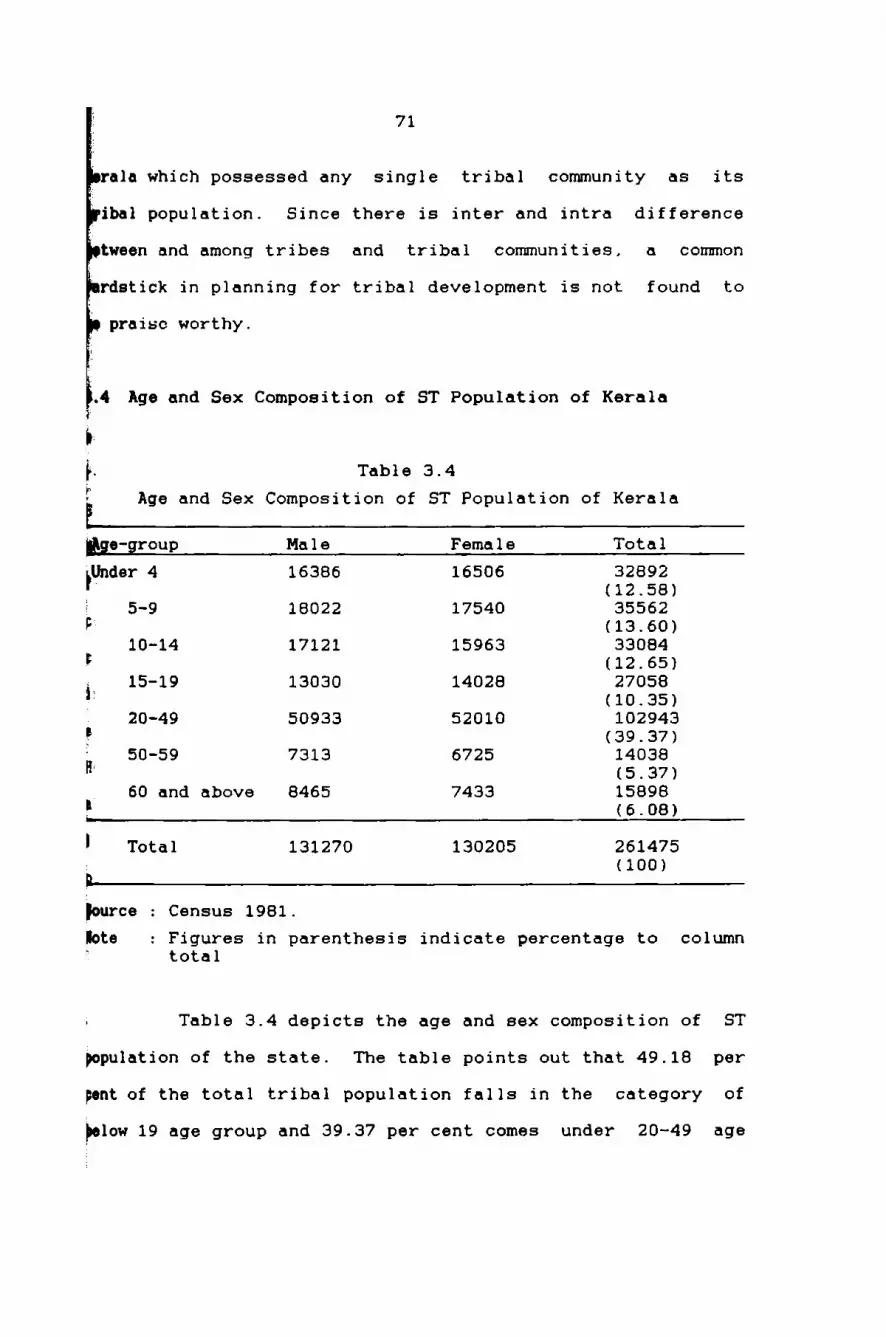
71
irala which possessed any single tribal community as itsd_ ibal population. Since there is inter and intra differenceItween and among tribes and tribal communities. a commonrdstick in planning for tribal development is not found topraise worthy.
44 Age and Sex Composition of ST Population of Kerala
Table 3.4Age and Sex Composition of ST Population of Kerala
age-group Mal e Female Total‘Under 4 16386 16506 32892_ ' (12.58)3 5-9 18022 17540 35562F‘ (13.60)10-14 17121 15963 33084F (12.65)15-19 13030 14028 27058l: (10.35).. 20-49 50933 52010 102943F (39.37)- 50-59 7313 6725 14038H‘ (5.37)60 and above 8465 7433 15898L (6.08)l Total 131270 130205 261475: (100)D‘
:|ource : Census 1981.
rte : Figures in parenthesis indicate percentage to columntotal
» Table 3.4 depicts the age and sex composition of STpopulation of the state. The table points out that 49.18 perpent of the total tribal population falls in the category oftolow 19 age group and 39.37 per cent comes under 20-49 age

72
oup which can be treated as the work force in the tribalmwnity.
5 Literacy of Tribes
In all the five year plans, priority was given toucational development of the Scheduled Tribes. The mainneon for the very slow spread of education among theheduled Tribes is the peculiar nature of their habitations.jority of the Scheduled Tribes are living in remote areasr away from educational institutions. The socio-economicnditions prevailing in the tribal settlements are notnducive for studies. Lack of sufficient educationalstitutions in tribal areas. their poverty etc., curtailedfective educational development among Scheduled Tribes.waver, the literacy rate of the tribes in Kerala is farsad of the tribal areas in India and even higher than theteracy rate of the total population of the country (52.19r cent). Table 3.5 depicts the literacy rate and change ofteracy rate of the tribes of Kerala from 1961 to 1991.

E. 73Table 3.5
h Literacy of Scheduled Tribes of Keralaie from 1961 to1991
(Figures in Percentage)
ii: District/State 1961 1971 1931 19911. Thiruvananthapuram 23.32 42.17 58.06 74.002. Kollam 24.22 32.59 50.30 62.423. Alappuzha 17.03 60.23 53.71 74.434. Kottayam 31.14 33.44 73.63 33.695. Idukki 43.35 62.736. Ernakulam 38.57 45.12 52.6 76.967. Thrissur 22.97 25.06 29.9 51.403. Palakkad 4.46 7.13 12.04 34.379. Malappuram 13.67 16.33 43.9310. Kozhikode 13.36 23.24 21.45 52.3611. Wayanad 14.24 50.6312. Kannur 15.67 25.52 33.13 53.6113. Pathanamthitta 73.2114 Kasargod 66.38’ State 17.26 25.72 31.79 57.22State's General Literacy 60.42 70.42 39.31iource ; Census of India 1961, 1971, 1931 and 1991.1
Table 3.5 indicates that the level of literacy hashwreased from 17.26 per cent in 1961 to 57.22 per cent in591. Among the different disticts, the highest tribalfiteracy was noted in Kottayam district (88.69 per cent) whichhe declared as the cent per cent literate district in theRate. Palakkad seems to be the district with lowest tribalHteracy in the state.

74
{A The major chunk of the non-plan provision ofTcheduled Tribes Development Department is being utilised for
;yucational development activities including scholarships.Ewarding and lodging charges and incentives to parents.l'ring 1993-94. 63170 pre—metric scholarships and 2596
}ost—metric scholarships have been distributed5.During5994-95, Rs.563.21 lakhs has been budgeted for these purposesI der non—plan expenditure. To facilitate the tribaljoducational programmes the state at present conducts 30‘hlawadies. 14 Nursery Schools and 115 Tribal hostels6.
:.6 Occupational Status
According to 1991 census, 46 per cent of thegficheduled Tribe population are workers. Agriculture 8’ orgrovides employment to 88 per cent of the Scheduled Tribes.
‘)bre than 55 per cent of the Scheduled Tribes are agriculturalidabourers, while the cultivators constitute 16.66 per cent.Idvestock. forestry. fishing, hunting and plantation provideZcmployment to 15.47 per cent of the total work. TheAnmragricultural sector like household industry (.47).bervices (2.96). construction (.48). Trade and commerce (1.38)
ansport storage and communication (1.50) and other services
:5 Government of Kerala (1994). Tribal Sub-Plan : Annual Plan1995-96. Directorate of Scheduled Tribes Development.Thiruvananthapuram.
ibid.. Dp.28-31.

75
(5.28) together provides 12 per cent of employmc
kcomparative analysis of the occupational :tribal population of the state from 1971 tofame 3.6.. Table 3.6
Occupational Status of Tribal Population of Kerala1971 to 1991. ‘,_ -T‘,E1 Figures in PercentageELNO. Occupation 1971 1981 1991i 1. Main workers 41.55 40f53 40.285 2. Marginal workers —— 4.72 5.76
Non-workers 58.45 54.75 53.96Work participationRate %Total Tribes 41.55 45.25 46.04Male 50.71 53.84 55.14Female" 28.99 36.60 36.90Percentage of workersCultivation 18.42 18.39 16.66Agricultural labour 63.31 51.47 55.47Livestock. Forestry.Fishing, Hunting etc. NAS NAS 15.47Other Sectors 18.27 30.14 12.4
:Figures for 1971 and 1981 compiled from the censusreport 1971 and 1981 and for 1991. from the primarycensus Abstract for SC/ST published by the censusDirectorate. Kerala
:0ther sectors include mining and quarryingmanufacturing and processing. servicing andrepairing in household industry and otherindustries, construction. Trade and commerce.transport. storage and communication. In all theabove cases. the work participation state wasmarginal (less than 3 per cent).:Not Available separately
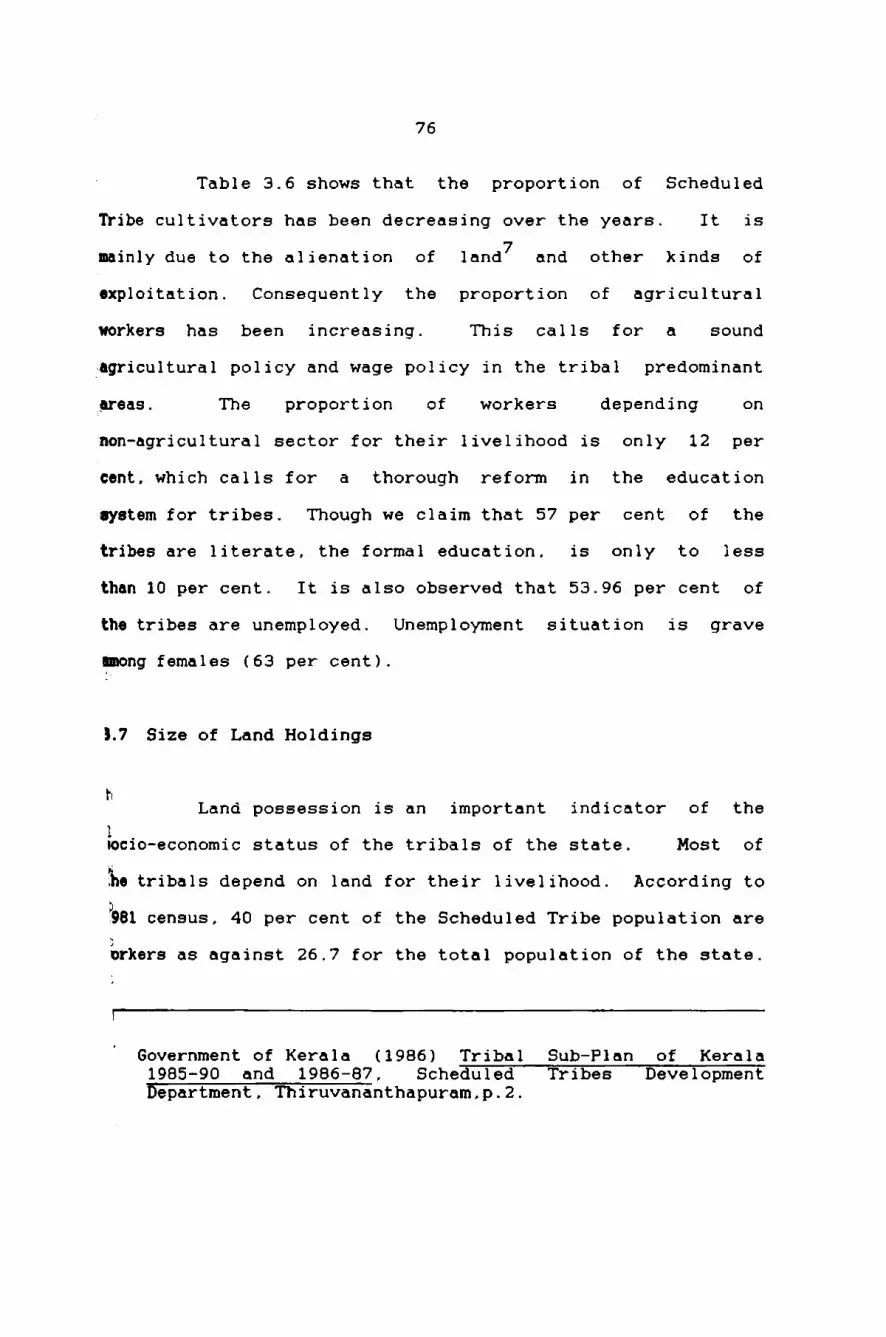
76
Table 3.6 shows that the proportion of ScheduledTribe cultivators has been decreasing over the years. It ismainly due to the alienation of land7 and other kinds ofexploitation. Consequently the proportion of agriculturalworkers has been increasing. This calls for a sound‘agricultural policy and wage policy in the tribal predominantareas. The proportion of workers depending onnon-agricultural sector for their livelihood is only 12 percent. which calls for a thorough reform in the educationsystem for tribes. Though we claim that 57 per cent of thetribes are literate, the formal education. is only to lessthan 10 per cent. It is also observed that 53.96 per cent ofthe tribes are unemployed. Unemployment situation is grave
Illlong females (63 per cent).
3.7 Size of Land Holdings
I‘I Land possession is an important indicator of theIuocio-economic status of the tribals of the state. Most of510 tribals depend on land for their livelihood. According to.3981 census, 40 per cent of the Scheduled Tribe population are
brkers as against 26.7 for the total population of the state.
Government of Kerala (1986) Tribal Sub-Plan of Kerala1985-90 and 1986-87, Scheduled Tribes DevelopmentDepartment . Thiruvananthapuram , p . 2.

77
Table 3.7Distribution of Tribal Households by size
of land holding (Percentage)Below 4 hects. of land AboveNo Below 2-4 4-10 4 hects.
Land 2 acres acres acres of landThiruvananthapuram 0.46 0.09 0.46 19.39 79.60
District/State
Kollam 3.39 3.03 4.81 45.05 45.72Alappuzha 23.80 18.20 48.10 9.70 0.20Kottayam 5.37 4.75 8.31 24.78 56.79Idukki 10.03 0.37 1.32 13.62 74.75Ernakulam 16.71 10.68 48.23 14.52 9.86Thrissur 12.77 5.88 29.08 36.13 16.14Palakkad 20.31 17.34 5.55 8.65 48.15Malappuram 25.01 13.89 30.32 15.98 14.80Kozhikode 40.25 10.89 8.01 17.40 23.45Kannur 52.34 1.29 7.43 17.52 21.42State 29.62 6.63 8.16 17.34 38.25
'nurce : Government of Kerala. (1991) Notes on Schedule TribesDevelopment in Kerala. Directorate of ScheduledTribes Development. Thiruvananthapuram.
Table 3.7 shows that 29.62 per cent of the tribaliuuseholds are landless. The highest number (40.25) offandless tribes could be seen in the former Kozhikode districtiiich includes Wayanad also where the highest number of tribal
Tpulation of the state inhabits. It is observed that 70.38fr cent of the tribal households hold their own land. Of the_tal tribal population, 38.25 per cent holds land above 4bctares. The highest holding could be seen inlfruvananthapuram district where the percentage of landlessluseholds is only 0.46. According to the socio-economic
ey (1976-78), 29172 tribal families possessed 66646 acres

78
land of which 73.3 per cent is cultivated. Idukki District:ounts 17 per cent of households possessing 33.4 per cent ofM The average area possessed by a tribal household in theme is 296 cents. ranging from 9 cents in Alappuzha district383 cents in Idukki district. An area of 24100 acresL3%) is under seasonal crops. Main perennial crops are)per (18.9%) Qoffee (18.2%) Cardamom (13.4%) Rubber (10%)
acanut (9%) coconut (8.9%) etc. Important seasonal cropsapaddy (33.4%) tapioca (41.1%), cholam (maize) (6.7%) andfi (5.4%). The main reasons for keeping the landzultivated are: lack of finance (69.13%). threat of animals.66%), lack of irrigation (11.64%). rocky and waste land.53) and other reasons (6.07%). According to the survey,avalue of commodities sold or exchanged to the non-tribalsiintermediaries covers more than 90 per cent of the totallue.
B Tribal Development Programmes and Investment for TribalDevelopment
Tribals in India. geographically and culturallyBaking. are at widely different stages of social as well asanemic development and their problems differ from area toBa and even within their own groups. From a historicalint of view. the tribal communities were approached in ammr of ways by the Government. Initially the Scheduledstrict Act of 1874 introduced by the British Administratorsikept most of the tribal areas administratively separate.a same situation was allowed to continue under the

79
flmwrnment of India Acts of 1919 and 1935. However, after
independence this policy was abandoned and a new policy oftribal development was initiated. The special multi-purposetribal blocks and tribal development blocks were startedfining the second and third five year plan respectively. Ammmer of new programmes were introduced during the fourthfllan period, besides intensifying tribal developmentmwnrammes which were already popular. For the first time,land colonisation schemes. co—operative farming societies andtIoveral tribal colonies were introduced in most of the tribalF
weas. To focus on tribal development Tribal Sub-Plan wasm
@itiated by the Union Government during the fifth fiveflan period. During the sixth plan, pockets with a totalLpulation of 10,000 and more than 50 per cent of tribalimcentration were delineated under a Modified AreaIn
year
gvelopment Approach (MADA) as part of the Tribal Sub-Planirategy. This has been further relaxed to smaller areas withtotal population of 5000 and with more than 50 per cent of
Iheduled Tribes in the seventh plan under a cluster approach.t present tribal sub—plan covers 184 integrated TribalMmlopment Projects, 256 pockets of tribal concentration. 8lusters, and 73 projects for primitive tribal groups coveringnut 5.01 lakh sq. km and catering to a tribal population of?2lakhs in 19 states and Union Territoriese. For the
Mahalingam 8., "Role of Co—operatives in Tribal Economy".Yojana. Dec. 1-15. 1989.

80
seventh plan period, 40 lakh ST families below the povertyline were targeted to be provided with economic assistance.In the first year of the VII plan period (1985-86) as againstthe target of assisting 8.43.537 ST families 8.73.100 familieswere assisted
3.9 Tribal Development Programmes
The tribal development . programmes are mainlychannalised through two routes. One is through Tribal SubPlan implemented by various Heads of Departments underdifferent sectors and the other through Scheduled Tribesfbevelopment Department. The various major schemes undertakeniunder the Tribal sub plan can be broadly classified into 24
Selectors such as crops husbandry, animal husbandry.Vco-operation. fisheries, village and small scale industriesItc.
The various schemes being implemented by the'cheduled Tribes Development Department can be broadlylassified under four categories.
I Educational ProgrammesII Economic Development Programmes
III housing Programme and
IV Health Programme

81
3.10 Investment for Tribal Development
The total investment made in the tribal areas duringthe plan periods for economic betterment of tribal communitiesin the country is given in Table 3.8.
Table 3.8
Plan Outlay and Expenditure for Tribal Development
Programes in IndiaRs in crores
Tribal. Total Developent %Sl.No. Plans Period Plan outlay programme
(R5) (R5)1. First Plan (x) 1960 19.93 1.02. Second Plan (X) 4672 42.92 0.93. Third Plan (x) 8577 50.53 0.64. Annual Plans (x) 6756 32.32 0.5
(1966-69)5. Fourth Plan (xx) 15902 75.0 0.56. Fifth Plan (xx) 39322 1182 3.017. Sixth Plan (xx) 97500 5535 5.678. Seventh Plan (xx) 180000 12000 6.67
Note :Expenditure (x) Outlay (xx)Emnwe :Ministry of Home Affairs, Occasional papers on Tribal
development. 1986, pp.19~24.
Table 3.8 reveals that till the end of the IVthflan, allocation for Tribal development was only marginal. Anight increase in the allocation for tribal development washtkmd only after the introduction of Tribal sub Plan ina

y . -.u:.-r ~.
%.
s
1
1
énot in accordance with total population.lthe average outlay for a tribe during the
82
Though the tribal population accounted 7.76 per cent ofthe total population of the country in 1981 and it increasedto 8.01 per cent in 1991. allocation for tribal development is
It is estimated thatsixth plan period
was only Rs.1073/— i.e. . Rs.2l5/- per year. (Total investmentRs.5535 crores/ total population 5.16 crores)
3J1 Allocation and Expenditures for Rural Development
in Kerala through Plan periods
Kerala is a unique state where it would be veryfiificult to distinguish an area as rural and urban.E
is per 1991 census. it is reportedHowever,
9that 73.6 per cent ofbrala's population inhabits in rural areas.
10 per cent of them reside in rural and hilly tractsAs regards to
xibes, 97
E Kerala. Wayanad is the only district where the entireribal population reside in rural areas. Though the TribalmoPlan was introduced in the beginning of the fifth fiveoar plan. the real allocation and expenditure throughIcentralised planning was introduced in Kerala onlyM3.
in JuneTill that time. tribal development was part of rural
nwlopment. Separate allocation for Tribal Sub Plan through
Government of Kerala. (1995), Census of India 1991 series12. Paper 3 of 1991. Final Population Totals, Director ofcensus Operations, Thiruvananthapuram.Government of Kerala, G.O. M.S. 11/ Harijan WelfareDepartment, 16-6-1983. Thiruvananthapuram.
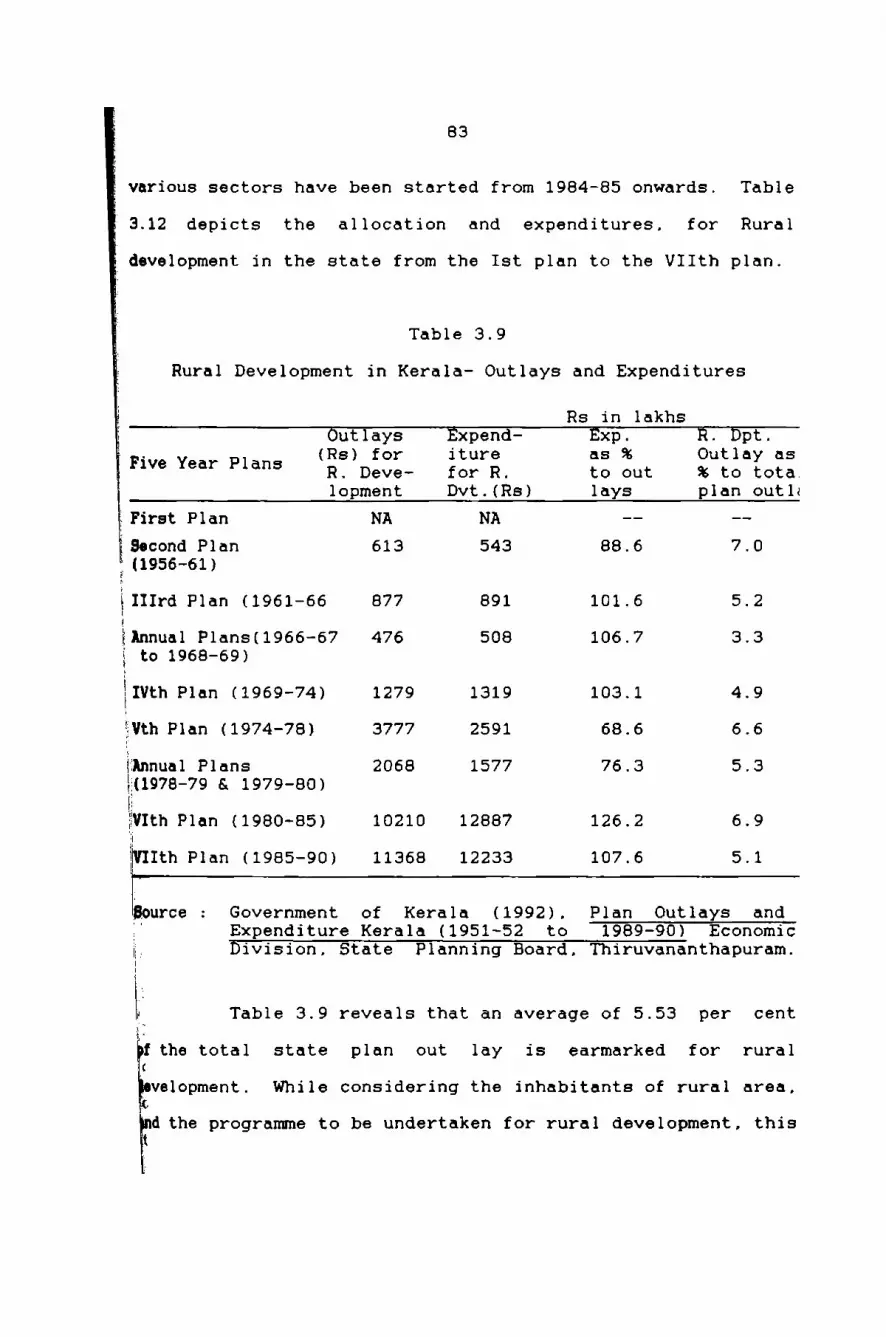
B3
; various sectors have been started from 1984-85 onwards.
V3.12 depicts the allocation andidevelopment in the state from the Ist plan to the VIIth plan.
Table 3.9
Rural Development in Kerala- Outlays and Expenditures
Rs in lakhs
Table
expenditures. for Rural
Outlays Expend- Exp. R. Dpt.23:32- 22:2: :2 :5... 2122.2:lopment Dvt.(Rs) lays plan outL;First Plan NA NA -- -Lfiecond Plan 613 543 88.6 7.0
?(1956-61)
%IIIrd Plan (1961-66 877 891 101.6 5.2a
Elnnual P1ans(1966—67 476 508 106.7 3.3g to 1968-69)
i‘1vth Plan (1959-74) 1279 1319 103.1 4.9EVU1P1an (1974-78) 3777 2591 68.6 6.6"Annual Plans 2068 1577 75.3 5.3E11975-79 5. 1979-90)WIU1Plan (1980-85) 10210 12887 126.2 6.9yum. Plan (1985-90) 11368 12233 107.6 5.1L‘
Lgurce : Government of Kerala (1992). Plan Outlays and5 Expenditure Kerala (1951—52 to 1989-90) Economicg, Division. State Planning Board. Thiruvananthapuram.1|
Table 3.9 reveals that an average of 5.53 per centithe total state plan out lay isc
Avelopment.
earmarked for ruralWhile considering the inhabitants of rural area.
rdthe programme to be undertaken for rural development. thist
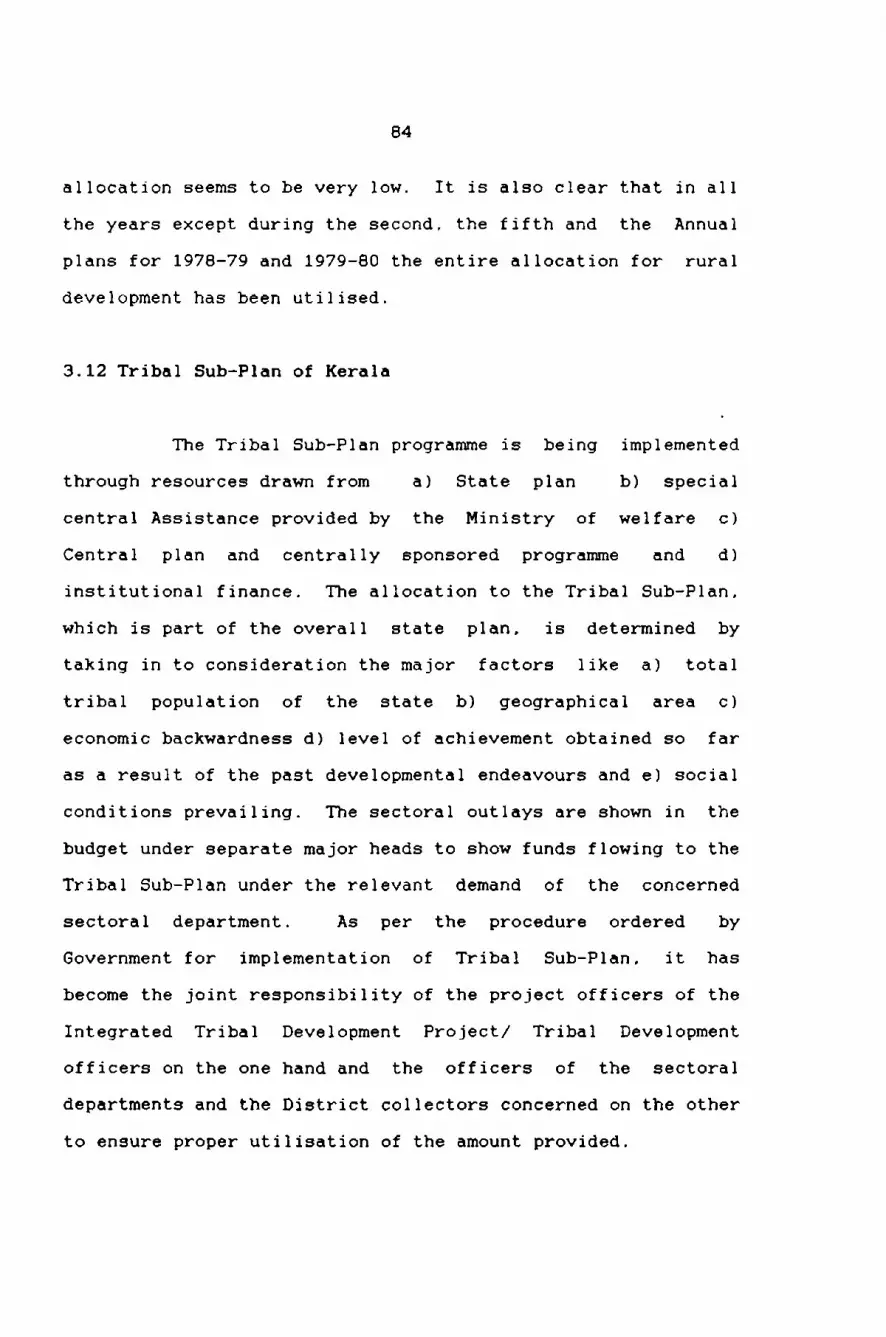


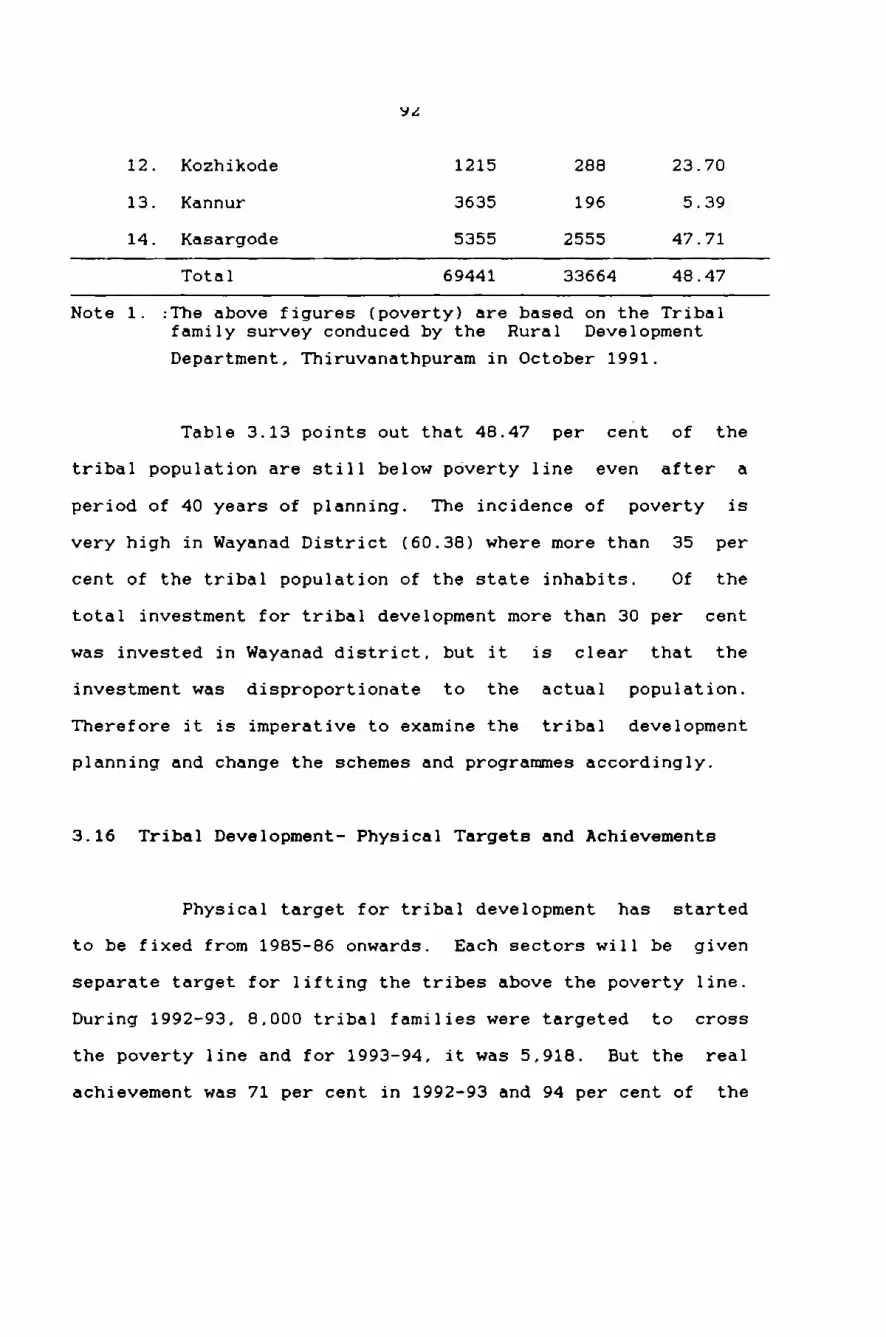


102
fiwduled caste Development Director, Scheduled Tribenwlopment Director, and the Managing Director of SC/STIderation as members. Even though the TCs are the members of
lo SC/ST federation, so far no representation has been givenDthem in the management of the federation. An organisationally owned by tribes is managed by non—owners or under thelutches of bureaucrats who lack proper vision about tribalHo. their culture. and their need.
19.1.2 Source and Finance
The authorised share capital of the federation is
u50O lakhs divided in to shares of R.100 each. The[oration receives share capital contribution and otherants from state Governments and other institutions towards
; functioning. Share capital contribution. working capitalant. Managerial subsidy. furniture grant. margin moneyaistance from NCDC. loan and grants from NCDC towardsnstruction of godowns, purchase of vehicles. processing ofnay, etc. are the major source of finance to SC/STloration. As on 30-6-1987 Rs.114.693 have been received as
Ire capital assistance ‘and other scheme assistance fromno Government and NCDC14.
The Kerala State Federation of SC/ST developmentCo-operatives, (1987), Annual Reports of SC/ST Federation1987. Thiruvananthapuram.

103
3.19.1.3 Organisational Set up of SC/ST Federation
The organisational set up of SC/ST federationdepicted in the following chart.
Organisational Set up of SC/ST Federationv vManagerial set up Business set uv
Managing DirectorBranches
. L L i _ L'I'h1ruvan— Ad1— ’l'hr1— Kalthapuram maly ssur petta
' l
( Affihated TCS IDevelopment Of f i cerI I IV V V.Chief Business OfficeAccountant Manager Manager4, J, , \ll .Accountant Section Section
Assistants Assistants
As per the organisational set up. the whorganisation is managed by Managing Director. It is fothat the SC/ST federation is ill equipped with competstaff. Almost all are deputed either from co—operatdepartment or from forest department. The various staffthe federation ranging from Managing Director at the top leto clerks at the lower level are deputed from co—operat
Pepartment. while the Development Officer is deputed f4
5

1U‘!
forest department. It is imperative that they lack interestin SC/ST federation. Even though it is a marketingOrganisation, mainly dealing NTFP products, it does not have a
marketing officer/Manager. All branch managers of SC/STFbderation lack professional competence in the marketing ofMT? in the state. Even though organisational set up isnamed, each section is managed by incompetent person,nsulting in failure of the organisation to reach the desirelevel of performance. The performance of the SC/ST federation
hes not show a rosy picture from 1981-82 onwards. The losses15nfiferred by the federation have accumulated to Rs.11.18
mkhs by the end of 1987-88.
L5 The Kerala State Federation of SC/ST developmentCo—operatives, Annual reports of SC/ST federation 1982-83to 1987-88, Thiruvananthapuram.

COLLECTION AND MARKETING OFNTFP-AN OVER VIEW

cmpmn IVCOLLECTION AND MARKETING o1=‘ NTFP — AN ovmvxsw
3} This Chapter examines the collection and marketingioflflTP at the global. national. and state
4
level infiarticular. NTFP plays a very important role not only in theficonomy of forest dwellers but also the economy of the countryas a whole. According to the National Commission onagriculture. various items of NTFP have a potential to bring
!bmn.an economic revolution for tribal and other rural peopleIn the country. Even in a country like India where there hasE
hen nmssive deforestation over the last 150 years.gpproximately 50 million people depend on forest products forE
flair existencel. Excluding the value of the products used byan forest dwellers themselves. the government generatesbvenues approximately 135 million dollars a year from theseInductsz. On a global basis the value of NTPP is estimated
Plw approximately 50 dollars per hectares. The survey ofIt Economic values of NTFP is shown in Table 4.1.I
I
NCHSE (1987). Documentation on Forest and Rights.' Vol.1,National Centre for Human Settlements and Environment.New Delhi. p.30.
‘-7 Pant .M.M (1977). "Forestry Sector — its contribution togross national products", Indian Forester, 103: 739-769.
Godoy .R and Lubowski .R (1992), "How much is the ForestWorth? Guidelines for the valuation of Non—TimberTropical Forest Products" In: Bawa .S Kamaljit and HallPamela "Non—Timber Tropical Forest Products: EcologicalSustainability." paper presented in the workshop onMethods for Social Science Research on NTFP. Bangkok.Thailand. May 18-20. 1992.

106
Table 4.1Net Economic Values of NTFP
l:_ Location and Net value Commentsb country (US $/ha/year)1 Venezuela 0.75 Herbal studiesI Mudumalal
Sanctuary,1. South India 3.0 Wild life studiesI. Ituri ForestZaire 3.18 to Herbal studiesE 0.50L Amazon.Brazil 4.8 Herbal studiesn SarwakEast Malaysia 8 Wild life studiesL Iquitos. Peru 16 to 22 Based partly on
community diaries‘. Hantana, Srilanka 50 Herbal studies1. Kalimantam.Indonesia 53 Herbal studies
Brazilian Amazon 59 Herbal studies, Unclear whether‘ returns are net, or gross..0. State of Para,2 Brazil 110 Herbal studiesL1. Veracruz, Mexico 116 Estimate leaves out
lumber and coffeeAmazon. Ecuador 120 Wild life studyJenaro Herrera,Peru 167 Wild life study notclear if estimate
is gross or net.14. Iquitos. Peru 420 Herbal studyburce: Godoy Ricardo and Brokaw L.V. Nicholas (1992) "The
effects of Economic development on the extraction ofNTFP. Hypotheses, Methods and informationrequirements," paper collected from Ford Foundation.New Delhi.

107
Table 4.1 depicts the value of NTFP available inIach area per hectare. But it is argued that the per hectareialculation of NTFP is unscientific since there is wide{ariation in the availability of NTFP from each area.loreover, most of the studies have concentrated on theY
'aluation of wild life.
c
H1 NTFP In IndiaQ
I
Z All other products. other than timber and wild life?
f India's incredibly diverse forests were classified as MinorE
crest Products and these were extracted from the forest withr.
omparatively little attention given to their management andpr
Iqeneration within the natural forest. Although the forestgpartment has recognised a number of rights and 'privilages'or local collection of dead wood. or cattle grazing and hasrganised the collection of 'M1“P', these products have beenIgarded as merely incidental byproducts of management.
The actual commercial value and the present andbtential benefits for employment and rural income generationfem NTFP underline the critical importance of these forest
ipsources for rural development. The commercial value of NTFP3 the public sector within India has always beenInsiderable, representing approximately 20 percent of the

108
5. This inputtotal. forest revenue in the 1950's and '60s4.
has grown substantially as indicated by the increase innational revenue from NTFP from Rs. 30.3 million in 1947 to
gm. 1.3 billion in 1977. In the state of Karnataka alone theflgovernment now earns over Rs. 10 million from the sale of over£150 NTFP6. Government statistics show that NTFP now account
;for 38 percent of the Forest Departments total internalaevenue and constitutes 67%7.8 of India's net export earnings
grow forest products. Further more NTFP harvesting organised
fy the Forest Department alone employed 55 percent of totaljeasonal forest labour accounting for 346.1 million man days
9fin 1978. Pant (1976) indicated that the potential forbmphnmwnt for NTFP was as high as 556.62 million mandays. cause the bulk of NTFP remains unharvested. In the same
I:L,
4 Campbell .Y Jeffrey (1988). “Putting people's products_ first. Multiple use management for NWFP in India.' Indian Forest. FRI Press Dehradun.
K‘ Thapar .S (1975). India's Forest Resources. BirlaInstitute of Scientific Research. The MacMi11an Companyof India Ltd.. Delhi, p.75.
Reddy .A (1985), "Non—Wood Natural Resources. kconomicactivity and regional development". in My Forest 21 (1).pp.1—7.
' Campbell .J (1987), “Tropical Forestry and BiologicalDiversity in India and the role ofUSAID/NEWDELHI",Internal paper AG/RM. USAID New Delhi, p.72
Ramachandran .P (1987). "Interview on rain ForestManagement", Evergreen. News letter of Kerala ForestResearch Institute 18, Peechi. Thrissur.Pant .M (1978), "Forestry for employment promotion,"Indian Journal of Forestry 1(2) pp.87—96.

109
fl udy self employment in the NTFP sector including fire wood
umwal. cattle grazing, lopping and grass cutting and NTFFollection was calculated at a staggering 3537.49 million man
} At a more profound level these NTFP represent angnegral component in the economy. diet, health, culture andlnligion of a large population of India's forest dwellers,
Fral farmers and urban epicurians since ancient timesEcampbell. 1937)”
Bostromll (1985) highlights that the NTFP sector can
p linked to the development of small scale and localPdustries and the collection. processing and distrihution offlTP also promote co—operation in village and district level.
1
Op.Cit.. 1987.
Bostrom .K (1985). "Land evaluation for forestryproduction with special reference to non-wood forestproducts," Paper presented at: Expert Consultation onLand Evaluation for Forestry Planning at District level,
' Bangkok, December 1-7, 1985 FAO document GCP/RAS/106/JPN.

110
12 (1985) estimates that 8-10 percent ofAgarwal
India's population depend directly on forests and forestindustries for their livelihood.
Given these impressing contributions there is everyreason to develop NTFP as a rational utilisation of theproduction capacity of India's remaining natural forests.
4.2 Collection and Marketing of Non-Timber Forest Produce InKerala
In Kerala 120 items have been notified as Non-Timber
Forest produces. It includes both medicinal as _well asnon-medicinal items. The medicinal items have again beenclassified as Tuber Crops, Root items, Fruits, Barks, Bushesand Creepers, Liquids, Seeds. flowers and Miscellaneous andthe non medicinal items include Oil seeds, Spices, Edibleitems. Dye and paint items. Soap and shampoo items and othermiscellaneous items (Appendix I). The classificationcriterian is mainly based on the items having major use eitherin the medicinal or non—medicinal fields. Though Marottiennahas include in liquids, so far no collection and marketing hasbeen done on this item by tribes. Majority of these NTFP hasbeen traditionally being collected by the tribal people with
12 Agarwal .V (1985). Forests in India—Environmental andProduction Frontiers. Oxford & IBH Publishing Company.New Delhi. p.341.

111
i or without processing and used either as food items for theiiridirect sustenance or traded in local markets. In fact. the
}‘tribal economy was subsisted on the NTFP since time;immemorial. Even though a large tribal population ar<iiinhabitants of the forest areas and have been collecting NTFI%for many years. the National Forest Policy of 1952 did no1ifully take in to account the relationship between tribals anc
fiforest and almost completely ignored the symbiosis in thisirelationship. Even the claims of the tribals in forests whicl;they had enjoyed for years, were subordinated to the nationaiilnterest and were reduced to mere rights and concessionslailhe problem of tribals. who depended on the forests in man:E%>ars. were thus accentuated first on account of this polio}éfind later on account of the Forest (conservation) Act 1980I e intensity of the National Forest Policy 1952. has beerjomoved to a large extent in the newly announced National
14. which gives due recognition to theI crest Policy. 1933
.nuiotic relationship between the tribals and the forests. 0 new policy provides for protection of rights ancQwncessions enjoyed by the tribals traditionally. Besides th<
fluve. the policy also lays emphasis on the active involvemeni
Mahalingam .S (1995) "Finance for Agriculture Marketingin Tribal India," In: Bhatia B.S and Verma H.L. et.a1.(ed): Encyclopedia of Co-operative Management, Co-operatcMarketing Vol.4, Deep and Deep Publications. New Delhip.121.Government of India (1994). India. Initiatives ozConservation of Forests, Ministry of Environment 01Forests, New Delhi. pp.1~2.

112
f-of tribals on the development of forest which provides th"livelihood. NTFP items are, thus important sourceHllustenance and cash income of forest dwellers particularly ttribal people living in and around forests.
4.3 Natural Habitats of NTFP Plants in Kerala
Most of the NTFP plants of the state are confined
the natural forests and very less to forest plantation‘zgllatural forests of the state which form the major habitat
'fll'l'FP plants are of four major types. They are evergreen, seElvergreen. moist deciduous and dry deciduous forests. withximum area under the moist deciduous type. Table 4.2 givévthe extent of natural and man-made forests of ' Keraliconstituting the natural habitat of NTFP plants.

113
Table 4.2
Area Under Different Forest Types and Forest Plantationsin Kerala
(Approximate Km?)
3%.: Forest we/species $25222; plifiiiflu1 Evergreen 2400j 2 Semi—Evergreen 1080F 3 Moist deciduous 41003 4 Dry deciduous 94E 5 Temperate forests andF grass lands 188i 6 Plantations* 1653.4a. Teak 733.55
b. Eucalyptus 372.7!c. Mixed plantations '328.6d. Miscellaneous 218.5
?Source: Forest Statistics. 1992.* Includes also plantations belonging to the Ker
Forest Development Corporation. Kerala.
5 (1990) had shown 1it A recent assessment by BashalFibre than 26 percent of the medicinal plants of the stateivound in the evergreen forests. which contribute to a me
Basha .S Chand (1990). "Medicinal Plants in the fortof Kerala: Past. present and future,“ paper presentedthe National Seminar on Medicinal and Arnonotic plan1April 6-7, 1990, State Forest Institute. Jabalpur.

114
iihare of NTFP resource of the state. Though many-characteristic items of NTFP come from the evergreen and semi
rvergreen forest areas, it is the moist deciduous forest;racts which are more rich and diverse in species belonging to
is plant group in general16.
Moist deciduous forests of Kerala cover an area ofthan 4100 Kmf. Even though not very compact
up-ologically, they are floristically much diverse, formingfile habitat of maximum number of NTFP plants. Bash (1990) has
:?ported that about 44 percent of the medicinal plant species;1OM in this type of forest. Together with about 17 percentI Ayurvedic dry plants in the dry deciduous forests oflrala. altogether 61 percent of the medicinal plant componentl-NTFP plants are found in the deciduous forest areas of the
As per the estimation of SC/ST federation NTFP worth
.,210 lakhs can be collected from Kerala forest in an year.target fixed for the year 1982-83 was Rs.82 lakhs whereassales value of the product was only Rs.25.33 lakhs. The
7aet was revised in the year 1985-86 for Rs.10O lakhsgreas the collection was only for Rs.46.23 lakhs. Again the
Basha .S Chand and Nair K.K.N (1993). "Non-Wood ForestProduce Plants of Kerala State, India: An Overview",
; Paper presented at the National Research on Forest3 Products, Coimbatore, 0cto.15-16.

115
target was revised to Rs.200 lakhs in 1992-93 and the actua
fl achievement was only for 133 lakhs. During 1993-94. the SC/S
: federation could market NTFP worth Rs.199.8 lakhs from Kerali.Forest registering an achievement of 95 percent. However, 0
};an average, from 1982-83 to 1993-94, the co—operative set uiicould collect and market only 50 percent of the target fixefishy them.
v?4.4 Kerala State Forest Policy and NTFP Collection
The Kerala forest Act 1961 was a_boon to the Keral
ltribes till it was declared as unconstitutional by the KeralVdfigh Court. As per section 76(a) of the Act. state Governmenéframed Hillmen Rules 1964 for protecting and advancing th
firibes of Kerala.
As per the state forest policy for triba5»velopment, the right of the tribals for NTFP was recogniseE_d the exclusive collection of NTFP is entrusted to them fro
;_e year 1977-78. In order to check the illicit collectioh_d traffic of NTFP by non—tribes, identity cards and movemen
hT:ses are issued to tribes and TCS respectively by Divisiona'- est officer of the concerned forest area. Identity cardslter the signature of secretary and president of the TCS, i
ded over to tribals for NTFP collection. Since 1990 eaclllection passes must also hold his/her photos. It may als
hgended to check effectively the transfer of collection pas

116
éfrom one tribe to another or non-tribe. Forest officials arejiupposed to give necessary protection to tribe in collectinggihe NTFP from forest and check illicit collection andjfrafficking by non-tribe. Since the collection of NTFP is thelfibnopoly of tribals and marketing is the monopoly of TCS for:;he betterment of tribals, the forest officials have got everyfight to take action against those tribe or non—tribe who;~rket the NTFP to non—co-operative channels. The overalli-nagement of the NTFP trade in the state is vested in theof the NTFP committee.
is NTFP ConmitteeJ
The NTFP committee is constituted by Government of
I-rala by drawing officials from different GovernmentalV-anisations which are directly involving the collection and.'keting of NTFP for tribal development. The ChiefMnservator of forest is the Chairman of the committee. The
Vlmr members in the committee are Health Secretary, Registrar
l'Co-operative Societies. The Director ,Tribal Developmentjfipartment and the Managing Director of the SC/ST Federation.
!cisions regarding the procurement value of NTFP, Sale valued NTFP by SC/ST Federation and the important decisions'1ating to the collection of NTFP to the TCS are taken by
' committee and informed to TCS through SC/ST Federation.
¢5 executive committee of each TCS has the full liberty to
lLfix the NTFP price but should not be less than the price
117
tlixed by NTFP committee. It was noted that the NTPP committee
hid not have any representatives from secretaries of TCS or}{rom tribals who are the real persons who know the actual
lpihmtion in the collection and marketing of NTFP and havinggthwct contact with the NTFP collectors in the state.
L.6 Fixation of Lease Rent
Lease rent is the rent that should be payable by the
ipibal Co-operative Societies to the Government of Kerala for55- use of forest ranges in the collection of NTPPS by its
ibes in an year. The NTFP committee has the power to allot
i» forest ranges and fix the lease rent to each NTFPUllecting tribal co-operative society in the state.
The NTFP comittee initially decides the lease renteach range usually at 50 percent of the average bid amountthe last three years plus 10 percent margin for general
? ard market trend in respect of the territorial foresti gas and at 100 percent plus 10 percent margin in respect ofLe special (vested) forest ranges. Thus there is concession
lease rent for territorial ranges only. The lease rent is:;iewed and refixed at the request of individual societies onLwuine ground of deforestation. forest plantation. exclusion
‘areas etc. The chief conservator of forests issues theIual allotment order specifying the lease rent for each1190 unit. items permitted for collection as well as

118
ibrocurement and sale prices of the NTFP by the SC/STfederation. The lease rent remittance by TCS in the stateiron 1982-83 to 1991-92 is given in Table 4.3.
By considering Dr. Ambedkar centenary celebration.
J-e collection of lease rent from TCS have been suspended for';.years from 1992-93 on wards . Table 4.3 points out that theQperage remittance by a TCS towards lease rent was Rs.12844 in‘ year from 1982-83 to 1991~92. Average remittance for aB« ge is amounted to Rs.5563. Region wise remittance of lease
is shown in Table 4.4. The table points out that 57'— cent of the total lease rent is drawn from Thrissur Region
; areas only 37 percent of the forest ranges are coming underivissur region. Though the Adimaly region has 23 percent of'19 total forest ranges, its contribution to total lease rent”? only 17 percent (Table 4.5). Only in two years (1989-90
‘id 90-91) the SC/ST Federation took direct initiative tofillect NTFP from the wild life sanctuaries of the forest with
‘He help of Forest Department.

119
Table 4.3
Lease Rent Remittance 1982-83 to 1991-92
Amount Average re- Average leaN°'°f N°'°f remitted mittance of se rent fromYearTCS ranges (Rs) a TCS (Re) a range (Rs)
1982-83 33 68 396090 12003 58251983-84 33 68 396090 12003 58251984-85 33 67 391289 11857 58401985-86 32 68 393789 12306 57911986-87 32 68 393789 12306 57911987-88 29 67 376346 12977 56171988-89 29 69 378356 13046 54831989-90 26 76 396861 15264 52221990-91 30 81 406700 13557 .50211991-92 31 78 406702 13119 5214Average 12844 5563Source :Compi1ed from the various records of SC/ST Federation,
Thiruvananthapuram from 1982-83 to 1991-92.

120
Table 4.4
Region wise Remittance of Lease Rent 1982-83 to 1991-92Figures in Rs.
RegionsY°°’ TVM TCR 44_KAL ADI FEDN T°t°11902-03 69179 223767 55010 47326 -- 396090(17.5) (56.5) (14.1) (11.9) (100)
1933-04 69179 223767 55013 47326 -— 396090(17 5) (56.5) (14.1) (11.9) (100)1904-05 69179 223767 51017 47326 —— 391209(17.7) (57.2) (13.0) (12.1) (100)1905-06 69179 223422 51017 50171 -- 393709(17.6) (56.7) (12.9) (12.0) (100)1986-87 69179 223422 51017 50171 -— 393709(17.6) (56.7) (12.9) 12.3) (100)1907-00 65003 223422 37350 49771 -— 376346(17.5) (59.4) (9.9) (13.2) (100)1903-39 69170 221591 40010 46769 —— . 370356(13.2) (50.6) (10.3) (12.4) (100)1909-90 69179 232393 41110 46251 7920 396361(17.4) (53.5) (10.4) (11.7) (2.0) (100)1990-91 69100 235497 43975 45631 12367 406700(17.0) (57.9) (10.0) (11.2) (3.1) (100)1991-92 69177 234350 54060 40315 -— 406702(17.0) (57.6) (13.5) (11.9) (100)Source :Compi1ed from the records of SC/ST Federation
Thiruvananthapuram. 1982-83 to 1991-92.
Note :1. Figures in parentheses indicate percentage to rowtotal2. TVM - Thiruvananthapuram, TCR — Thrissur. KAL —
Kalpetta. ADI — Adimaly. FDN — SC/ST Federation

121
Table 4.5
Number of Ranges Alloted to each Region 1982-83 to 1991-92
Re ions (Number)Y°°" “T’v‘M TCR KAL ADI FEDN T°t"'”1982-83 14 27 11 16 -- 68(20.6) (39.7) (16.2) (23.5) (100)1983-84 14 27 11 16 —— 68(20.6) (39.7) (16.2) (23.5) (100)1984-85 14 27 10 16 -- 67(20.9) (40.3) (14.9) (23.9) (100)1985-86 14 26 10 18 —— 68(20.6) (38.2) (14.7) (26.5) (100)1986-87 14 26 10 18 —— 68(20.6) (38.2) (14.7) (26.5) (100)1987-88 11 26 13 17 -- 57(16.4) (38.8) (19.4) (25.4) (100)1988-89 16 25 14 14 -- 69(23.2) (36.2) (20.3) (20.3) (100)1989-90 16 26 15 15 4 76(21.0) (34.2) (19.7) (19.7) (5.4) (100)1990-91 16 27 18 14 6 81(19.7) (33.3) (22.2) (17.3) (7.5) (100)1991-92 16 26 20 16 — 78(20.5) (33.3) (25.7) (20.5) (100)Source :Compi1ed from the records of 2 SC/ST Federation
Thiruvananthapuram. 1982-83 to 1991-92.
Note :Figures in parentheses indicate percentage to row
there was no rationale in fixing the lease rent.should be linked with he potentiality of NTFP inIt was observed that for some TCS the lease amount
very low as compared to other TCS
total
On an examination of the system it was noticed thatActually
each range.
and potentiality offixed was
it
the
122
area. The secretaries of TCS alleged that they have bepaying almost the same amount of lease rent from inceptionwards. They point out that cases of deforestation, foreplantation and fire in the area were intimated to tofficials for getting possible reduction in lease rent. butfar no action has been taken in this regard.
4.7 Tribal Co-operative Societies and Members engaged in NTcollection
The co—operative approach to tribal development ga
birth to 86 TCS in Kerala by 1991-92. Out of this 30 TCS weexclusively selected for collection and marketing of NTFPthe state by the NTFP committee in consultation with the SC/federation. which is the Apex level institution of all tSC/ST societies in the state. The TCS are also supposedcarry out the agricultural surplus and products from othoccupations of tribe too. It was visualised that these Tshould carry out all the credit and marketing operationtribes in their area. Table 4.6 depicts the total membershin these 86 TCS and the number of TCS selected for NTcollection and marketing etc. Though basic informatirelated with membership, NTPP collection etc. were sought fr
all the NTFP collecting societies. only 20 to 28 TCS respondwith full details. As per the system. the tribes are supposto collect all the notified items of NTFP from the designatforest area and market the same through their 0

Table 4.6
No.01 TCS. lenbersnip. and the NTFP Collectors from 1982-83 to 1991-92 Xernla
................................................................................................. -Average 11TFPco11- 14o.of Membership Average IITFP
TCS lielhers Ielbers coleecting 1l'l'1-‘F Col- in res- le|ber- Collectors Average(Nos) (Nos) inn TCS TCS lecting ponded ship in in resp. HTTP 1
(Nos) TCS res- TCS reap. TCS (Nos) Collectors 10 to 8ponded TCS (Nos) in a TC5
2”"; '4 """" '3 """ "3 """" "3 """" "5 """" '3 """"" "I3 """ '11’
""" " 69 27555 401 '35"'""'é6'"'"§§3£'""'§;§"""§5£I'"""I£I"'""3?
72 33873 470 31 20 0925 446 3470 174 3972 29454 409 29 20 10075 504 3049 152 30 272 35203 489 32 20 10762 538 4158 208 38 774 37323 504 32 21 11665 556 4062 193 34 776 41062 540 31 21 12421 592 4821 230 38 977 42559 553 31 21 12741 607 5040 240 39.577 46110 599 30 27 15830 586 5518 204 34 884 49083 584 30 28 16926 605 5820 208 34 486 49556 576 30 26 16999 654 6008 231 35 3................................................................................................... -
1. Column 264: Government of Kerala, Handbook on co-operative lovenent in Keraln.Dept. of Co-operation, Thiruvananthapural. 1982-83 to 1991-92.
2. Column 5 conpiled for: the records of SC/ST Federation Thiruvananthapuran1982-83 to 1991-92.

123
co-operatives at the price fixed by the co—operatives ascollection charge.
4.8 Price Fixation Mechanism for NTFP
Generally the NTFP committee will fix three pricesevery year viz.. collection charge, procurement value andsales value. Collection charge denotes the rate at which thetribal co-operative society procure NTPP's from tribes whereasthe procurement value implies the rate at which the SC/STfederation will procure the same items of NTFP from thesociety. In other words. procurement value denotes the salevalue of NTFP of Tribal co-operative societies. The salesvalue of NTFP comittee denotes the expected sale value ofNTFP by the SC/ST federation in the market. All these priceswill be fixed in advance and will be sent to tribalco-operative societies even before the collection of NTFPstarts. Pricing of NTFP is one of the ticklish problemsfacing by all people who are connected with the collection andmarketing of NTFP. Since NTFP's are a free gift of nature.its availability and production cannot be predicted so easily.The researchers differed in their views on the collection ofcost of production of NTFP and its pricing. Das17 (1992)stressed the Net Present Value method for valuation of NTFP.
17 Das J.K.. (1992). "Valuation of Timber and Non-TimberForest Produce". paper presented in a workshop on Methodsfor Social Sciences Research on NTFP, Bangkok. May18-20. 1992.

124
According to him net present value of NTFP is
n
VII =i: (q‘ * P,‘ - Ci)
Where
VII = Net present value of NTFP for year 1.n = total number of NTFP'sq = quantity of NTFP collected in year 1.p = price of the NTFP (average)c = Marginal cost of collection.
Since the production of NTFPs are not predicted and
the supplies are not of in regular nature due to a_ lot ofexogenous factors like fire, difference in extraction methodsand sustainability. this method is not found suitable to valuethe NTFP.
Godoy Ricardo and Lubowski Rubenla (1992) highlightthat the most accurate method of valuing NTFP is throughcount. weigh and measure them in each days. But the criteriaby which the cost is assigned to the NTFPs had not beenmentioned in the study.
18 Godoy Ricardo and Lubowski Ruben (1992). "How much is theForest Worth? - Guidelines for the valuation of NTFP“.In: Bawa S. Kamaljit and Hall Pamela in "NTFP:Ecological Sustainability”. paper presented in theworkshop on methods for Social Science Research on NTFP.Bangkok. Thailand. May 18-20.

125
Muraleedharanlg (1991) brings out a model for pricingof NTFPS in Kerala . The model is
Pm = Cu + N5 + C+P.
Where Pm is the price of NTFP, O1 is the opportunity cost ofland. FL is the maintenance cost of land, C is the collectioncharge and P is the profit.
While analysing the above models it was found thatnone of these models made any attempt to fix any criterion fordetermining the collection charge of NTFP for tribes. It is avery crucial factor that should be solved very carefully.Otherwise the system itself will end in failure. It was alsoobserved that the NTFP committee did not conduct any survey on
either supply or demand of NTFP to fix the price. It seemsthat their price fixation is mainly based on some randommethod. To fix the price of any product, firstly the cost ofproduction has to be ascertained. Since the product is a freesupply of nature. the opportunity cost method can be bestemployed to determine the collection charge of NTFPs. Sincethe researcher advocates for a regulated market, theco-operative should also be there with a Minimum Support Price(MSP). The MSP for a day should be fixed rationally byconsidering the opportunity cost of the tribe.
19 Muraleedharan (1991). "Valuation of NTFP in Kerala”.Evergreen. News Letter of KFRI, Peechi. Thrissur.

126
MSP/CC = W + WQ + X
Where
MSP/CC = Minimum Support Price/Collection Charge.
W = Wages in the agricultural sector for a man day.WQ = Risk element in the collection of NTFP. which
is normally assumed to be a fixed proportion towages.
A = transport charge or any other cost connectedwith bringing the produce from the productioncentre to the society and the wear and tear ofNTFP kit.
To make the market competitive, the private traders1nd end users may be asked to register their names, in the[arket Committee to participate in the closed tender system.s license fee should be collected from them which can beLdjusted against the lease rent fixed for the ranges.
Two serious drawbacks were noticed in the present’ixation of NTFP price by the NTFP committee. The NTFP:ommittee did not conduct any systematic survey to ascertain.he prices of NTFP items or their demand and supply inlifferent districts in Kerala or outside before fixing thenrices of NTFPs. The records show that only once (in 1987);he committee gathered the market price of NTFP items fromIozhikode market through an anthropologist of KIRTADS. Prices
af about 65 items had been collected by him and the same was

127
conveyed to the committee. But there is no evidence to showthat the committee has refixed the prices accordingly.Another defect noticed in the price fixation was that thecommittee generally fixed NTFP prices for dried items only.But the tribals supply fresh NTFP items to TCS. Therefore tomake payment. the TCS had to work out the prices for freshitems of NTFP equivalent to the price fixed by the NTFPcommittee. This situation creates a lot of room for confusion
among secretaries and collection agents of differentsocieties. This also add a room for further exploitation oftribes by the collection agents of societies. To fix theprice. the TCS has to consider the possible reduction of freshNTFP during the process of drying. Unless the NTFP committeefixes a uniform price for fresh NTFP, there is every chancefor variation in the payment of price by different TCS totribes. It may create disunity among TCS and confusion in theminds of tribes about the authenticity of formal institutionalarrangement in the collection of marketing of their product inthe state.
The price fixation policies of SC/ST Federation from1982-83 is examined here.
4.8.1 Fixation of Collection charge 1982-83 to 1990-91
As per the direction of SC/ST Federation and theprice fixed by the NTFP committee, 75 percent of the

128
procurement value of NTFP was given to tribes as collectioncharge. The TCS were given only the guaranteed procurementvalue by SC/ST federation. As per the system, even if theSC/ST federation sold the produce at a high price. the fruitsof high sale rate was not passed on either to TCS or to tribestill 1990-91. As regards to this policy a general tendencymay exist to fix the rate always at the minimum level tosafeguard the interest of the institutional arrangementespecially SC/ST federation.
4.8.2 Collection Charge from 1991-92 onwards
From 1991-92 onwards. even though the NTFP comittee
fixes procurement price and sales price of NTFP. it adoptedthe policy of giving 75 percent to 80 percent of the actualsales price of NTFP as collection charge to tribes. It was awelcome change and for the first two years of the policy.(1991-92 and 92-93) the SC/ST Federation had taken 10 percentof the sales value as commission for its service. The breakup of the sales value was as follows.
75 percent of sales value as collection chargeto tribes
15 percent of sales value to TCS10 percent of sales value to SC/ST Federation.
The 10 percent comission to SC/ST Federation hasinvited severe criticism from different corners especiallyfrom TCS. As a result the comission has reduced from 10

129
percent to 5 percent from 1993-94 onwards. The present levelof sharing of sales value of NTFP is as follows.
80 percent of the sales value as collectioncharge to tribes15 percent of sales value to TCSand
5 percent of sales value to SC/ST Federation.
A major lacuna could be noticed in the fixation ofcommission to SC/ST Federation under this system. Suppose, ifSC/ST Federation was able to sell a particular item of NTFPonly at a cost price, by naming it as sales price. 5 percentcommission is to be given to SC/ST Federation. It means, the
TCS are forced to give commission to SC/ST Federation out ofits owned fund. which is against the spirit of co—operation.Therefore it is unfair to fix the comission to SC/STFederation on sales value but it can be on the basis of thesurplus (Sales value - Cost) generated through NTFPs sale.
4.9 Collection of NTFP from 1982-83 to 1993-94
Table 4.7 observed the collection of NTFP in thestate through TCS. All items are given in dry quantities.The Compound Growth Rate of (CGR) NTFP from 1982-83 to 1993-94
and the Average Annual Growth Rate (AAG) for the first nineyears and the subsequent 3 years to know the result of pricingpolicies in the collection of NTFP are given in Table 4.7.1.

130
Table 4.7
Collection of I17!’ by TCS fru 1982-83 to 1993-94Figures in [gs
F1’ item 1982-83 1983-84 1984-85 1985-06 1986-87 1987-88 1988-89 1989-90 1990-91 1991-92 1992-93 1993-94
icinnl Itees
Tuber Crop 55078 40304 41237 46578 32689 31767 35422 14549 26243 81877 21488 4609
Root itels 17581 59530 64310 157859 166517 80206 86002 92962 33406 56207 198180 21863
Fruits 28283 85503 64572 52973 59910 38130 62933 9554 10850 10952 8375 20T7
lurks 55219 5311 20273 6530 8371 2435 33256 27544 21832 10166 5122 2853
Bushes and Creepers 22851 72704 73291 92754 135671 48796 59879 42231 22548 37003 46748 8477
Liquids (honey) 71733 39024 32950 30063 29460 47751 34784 32401 29345 41265 80142 4253
Seeds 28780 40082 23942 34870 47289 26941 30349 22124 19613 37573 23423 3182
Flowers 3771 4475 6366 8355 7800 2104 5009 3463 2005 1773 835 64
liscellueons 4458 31082 48648 51604 18827 14241 34111 1379 2141 6416 7855 334
n-ledicinal Itne
. 011 seeds 35527 16918 23019 32529 10200 28852 33674 49654 18696 23040 18857 3641
. Spices 6559 8932 12154 15534 22646 41509 6369 1810 8732 7245 3123 336
. Edible 115954 57469 54362 60258 21699 48540 36662 18111 16040 1198 32616 618
. we and paint ideas 43235 119199 48598 115983 45584 66396 107356 62221 64492 74141 112129 22410
. Soap and shnpoo 237125 274398 280180 474849 381190 606493 3961115 394984 391455 318437 311886 47627
. liscolleneou 26240 3239 72614 10290 29007 100493 93343 1263 3939 5316 1781 1535
: Caupiled fun the Iecorda of 188 free 1982-83 to 1993-94.

131
Table 4.7.1
Compound Growth Rate (CGR) and the Average Annual Growth Rate
(AAR) of the Collection of (Kg) NTFP in Kerale —1982-83 to 1993-94
NT” items 193383 to 1932-83 361991-92 to1993-94 1990-91 1993-94I Medicinal items
1. Tuber crops -2.72 -7.91 -1.742 Roof items 10.15 7.39 57.263 Fruits -35.28 10.09 23.794. Barks -.0078 -9.79 41.825 Bushes & Creepers -1.64 -14.82 31.826. Liquids 0.67 -9.45 1.027 Seeds -2.54 -4.17 -5.388. Flowers -16.63 -6.77 -91.739 Miscellaneous -16.8 -7.82 -19.55
II Non-Medicinal10. Oil seeds 1.21 -6.88 16.4711. Spices -10.71 3.23 -22.5412. Edible items -25.35 -19.73 72.8113. Dye & Paint items 6.78 4.54 44.5814. Soap and Shampoo 3.42 5.78 14.36
items15. Miscellaneous -13.68 -18.99 42.42

132
Table 4.7.1 reveals a steady compound growth rateonly in classified NTFP items like root. dye and paint itemsand soap and shampoo items. Among classified items highestcompound growth rate was accounted in root items. However,over the period. the collection of NTPF in the state indicatesa negetive growth rate. But the average annual growth ratesince '91-'92 indicates a positive growth in almost all items.It may be mainly due to the shift in pricing policy of NTFPcommittee from '91-92 onwards. This phenomenon shows the fact
that if NTFPs are properly priced. it would be regularlycollected and marketed through co-operatives.
4.10 Region—wise Collection and Marketing of NTPP in the State
Region-wise Collection and Marketing of NTFP isgiven in Table 4.8.

Tnblo 4.8
133
Collection and lnrkoting of I11’? in term Region visa 1982-83 to 1993-94Pigms in Is.
TV! TC! 111. 101 88110 10111.Co11oc- Sale Co]loc- Sole 0olIoc- Sale Collar Sale Colloc- Solo
Your tion value 8 lion value 8 tion value 8 tion value I tion vnlno 8charge charge chnrgc charge charge1982-83 178530 240540 74 1104384 1611628 69 232013 319565 73 278242 360984 77 1793169 2532717 71
1983-84 283194 380041 75 1786270 2663082 57 244849 349758 70 79700 105416 76 2394013 3498297 68
1984-85 418894 518768 81 1826364 3200660 57 400339 559226 72' 24491 32516 75 2670088 4311170 62
1985-86 224296 237960 94 2573766 3725767 69 465560 637535 73 25972 22635 115 3289594 4623897 71
1986-87 324561 419162 77 1629083 2251780 72 590704 722788 82 3878 6704 58 2548226 3480434 75
1987-88 254003 337902 75 2259399 3474653 65 1009173 1285126 79 120892 129746 93 3643467 5227427 70
1988-89 301434 458448 83 1944296 3203835 61 810528 1036851 78 17981 27486 65 3154239 4726620 67
1989-90 480771 619999 T7 1626428 2657508 61 1069524 1379425 78 51341 59597 86 3228064 4716529 68
1990-91 771599 955024 81 2645784 3852610 69 1355095 1790195 76 27784 70349 39 4800262 6668178 72
1991-92 989349 1934546‘ 51 2587223 4037281 64 1573493 2844222 55 449313 590300 76 5599378 9406349 60
1992-93 1829742 2055491 89 4232794 7086699 60 1850237 2539275 73 1223598 1683001 73 913637113364466 68
1993-94 1253000 2238000 56 5646000 9739000 58 3031000 5352000 57 2110000 2651000 801204000019980000 60
hvernge 615781 866323 71 2488483 3958709 63 1052710 1567997 67 367766 478311 77 4524739 6871340 66
Source: Gonpilod fran the record of SC/ST Federation, Thirnvnnnnthnpcrnn nodITPP collecting TCS in the state 1982-83 to 1993-94
Iota: Sale valno includes the stock of IT}? nt nnrlot ulna

134
Table 4.8 shows the region wise collection andmarketing of NTFP in the state. The table also explains theextent of payment of collection charge over sales value totribes. The table indicates that there exists differencebetween regions in the payment of collection charges totribes. The average collection charge paid by all regionstogether has come to Rs.45.24 lakhs and the sales pricerealised has amounted to Rs.68.71 lakh. It is observed that66 percent of the sales value of NTEP alone has paid to tribesas collection charge. Wide difference and fluctuations in thepayment of collection charge to tribes among regions were alsonoted. The collection charges of Thiruvananthapuram regionvaried from 51 percent to 94 percent during the period understudy. As regards to Thrissur region it varies from 57percent to 72 percent, Kalpetta 55 percent to 82 percent andfor Adimaly region 39 percent to 115 percent. Though there isan increase in the collection and marketing of NTFP since1991-92 in absolute terms the share of tribes as collectioncharge from 1991-92 as compared to earlier years hasdecreased. Among regions. Thrissur is the highest collectorand marketer of NTFP in the state, but its share of payment totribes is comparatively low. The payment of 115 percent ofthe sales value as collection charge by the Adimaly regionduring 1985-86 also indicates the inefficiency of the systemto market the collected produce at a remunerative price to thetraders. It is also observed that the tribal co-operativeshave failed to distribute 80 percent of the sales price as

135
collection charge to tribes. The stock of NTFP in the godownsof SC/ST federation also indicates the marketing problems ofSC/ST federation for NTFP.
4.11 Stock of NTFP
Tables 4.9 to 4.14 depicts the stock of variousitems of NTFP in the godowns of the SC/ST Federation from1982-83 to 1988-89. The accumulation of stock indicate themarketing problem of NTFP facing by SC/ST federation.Separate sales quantities of each items are not available from1989-90 onwards. Therefore the stock of NTFP as percentage to
collection (Qty) plus previous years stock for the above saidperiod are considered.
Table 4.9
Stock of Medicinal Items — 1982-83 to 1988-89
0o11ect- Stock asYear C°%i;€ti°“ (g;§e ?§;€k 3:33; $::r's T1::t::;stock (Kg) + stock1982-83 287754 239560 48194 287754 16.751983-84 386015 266742 167467 434209 38.571984-85 375589 334639 208417 543056 38.381985-86 481586 380479 309524 690003 44.861986-87 506534 430956 384922 815878 47.181987-88 292371 248586 428707 677293 63.301988-89 381745 334284 476168 810452 58.75Source :Compiled from the records of The Kerala State
Federation of SC/ST Development Co-operatives.

136
Table 4.9 indicates that there is accumulation ofmedicinal herbs in the godowns of the SC/ST Federation. Thestock has increased from 16.75 percent in 1982-83 to 63.3percent in 1987-88. Even though 887 Ayurvedic medicinalmanufacturing units are there in Kerala, their yearlyrequirement are so high to absorb the entire collection ofmedicinal herbs from TCS, the tendency of the accumulation ofstock indicates that there is lack of co-ordination or linkagebetween the potential suppliers and demanders of NTFP in thestate.
Table 4.10
Stock of Oil Seeds - 1982-83 to 1988-89
0ol1ect- Stock asYear °°},;;§ti°n (3318 flgggk 5233; 52395 ’f1ZZt‘§Z;stock (Kg) + stock1982-83 35527 29111 6416 35527 18.061983-84 16918 15398 7936 23334 34.011984-85 23019 5937 25018 30955 80.821985-86 32529 29374 28173 57547 48.961986-87 10200 5972 32401 38373 84.441987-88 28852 25307 35946 61253 58.681988-89 33674 20726 48894 69620 70.23Source :Compiled from the records of The Kerala State
Federation of SC/ST Development Co-operatives.Thiruvananthapuram, 1982-83 to 1988-89.

137
Table 4.10 indicates heavy accumulation of oil seeds
in the co—operative organisation. Though the organisationcollects items like Odakkuru. Kattupunnakkai, Poovanathari.etc. it find it difficult to market these items.
Table 4.11
Stock of Spices - 1982-83 to 1988-89
' 0o11ect- Stock asYear °°;;;;ti°" fggj Sfggfi 5233; 523;-5 §c§?o§°"'stock (Kg) + stock1982-83 6559 4156 2403 6559 36.641983-84 8932 980 10355 11335 91.351984-85 12154 456 22053 22509 97.971985-86 15534 6086 31501 37587 83.811986-87 22646 5307 48840 54147 90.201987-88 41509 5280 85069 90349 94.161988-89 6369 2379 89059 91438 97.40Source :Compiled from the records of The Kerala State
Federation of SC/ST Development Co—operatives.Thiruvananthapuram, 1982-83 to 1988-89.
Table 4.11 points out that there is accumulation ofspices in SC/ST Federation. More than 98 percent of thecollection of spices is cardamom. The stock position in theSC/ST federation ranged between 36.64 percent in 1982-83 to97.40 percent in 1988-89.

138
Table 4.12
Stock of Edible Items - 1982-83 to 1988-89
0o11ect— Stock as
Year C°},§;§ti°" (ggge §;;;<;k 5:23;‘ lY3'::;"S ’f12‘:.‘§Z;stock (Kg) + stock1982-83 115954 68879 47075 115954 40.601983-84 57465 60607 43933 104540 42.031984-85 54362 41808 56487 98295 57.471985-86 60258 46109 70636 116745 60.501986-87 21699 15487 76848 92335 83.231987-88 48540 39023 86365 125388 68.881988-89 36662 38410 84617 123027 68.78Source :Compiled from the records of The Kerala State
Federation of SC/ST Development Co—operatives.Thiruvananthapuram, 1982-83 to 1988-89.
Table 4.12 reveals that there is stock in the caseof edible items too. Major edible items collected by theSC/ST Federation are Narumpuli, Kudampuli and Eemthapanakkai.The stock has increased from 40.60 percent to 83.23 percent inthe period under observation.

139
Table 4.13
Stock of Dye and Paint items - 1982-83 to 1988-89
§o11ect— Stock as
Year C°g;;§ti°" (§;;° fggfk EESEE 523;-S Tliitfifistock (Kg) + stock1982-83 43235 30550 12685 43235 23.341983-84 119199 57677 74207 131884 56.271984-85 48598 51704 71101 122805 57.901985-86 115983 55695 131389 187084 70.231986-87 45584 40219 136754 176973 77.271987-88 66396 65977 137173 203150 67.521988-89 107356 71597 172932 244529 70.72Source :Compiled from the records of The Kerala State
Federation of SC/ST Development Co-operatives.Thiruvananthnpuram, 1982-83 to 1988-89.
Table 4.13 depicts the picture of marketing problemfor the most needed items of the varnish and paint industryi.e.. Kundirikkam and Pathiripoove. The stock position hasincreased from 23.34 percent in 1982-83 to 70.72 percent in1988-89.

140
Table 4.14
Stock of other Non-medicinal items - 1982-83 to 1988-89Collect- Stock as. tion+ Pre— % to co
Year Cogéegtlon (:a§e ?§°€k vious Year's llectiong g 9 stock (Kg) + stock1982-83 26240 20023 6217 26240 23.691983-84 3239 7046 2410 9456 25.491984-85 72614 61206 13818 75024 18.421985-86 10290 15392 8716 24108 36.151986-87 29007 23405 14318 37723 37.951987-88 100493 62494 52317 114811 45.571988-89 93343 103480 42180 145660 28.96Source :Compiled from the records of The Kerala State
Federation of SC/ST Development Co-operatives,Thiruvananthapuram, 1982-83 to 1988-89.
Table 4.14 explains the stock of other non-medicinalitems in SC/ST Federation, showing comparatively lessmarketing problem. The major other non-medicinal itemscollected by the Federation are Kolinja and Panjikkai.Usually it would be collected only according to the advanceinformation of the interested parties for the product. It maybe reason for showing less stock of these items in the godowns
SC/STAn enquiry in to the stock position ofFederation for NTFP showed that the SC/ST federation i.e.,co—operative set up find it very difficult to market theircollected produces whether it is medicinal or non—medicinal in

141
the market in time. If the collected produces are notmarketed immediately or within a time. definitely it mayaffect the quantity as well as the quality of the product.Therefore it is worth while to examine the marketing channelsof the co—operatives for NTFP in the state.
4.12 Marketing Channel of the Kerala State Federation ofSC/ST Development Co-operatives for NTFP from 1990-91 to1993-94
The Kerala State Federation of SC/ST DevelopmentCo—operative being the apex institution of the SC/STCo-operatives in the state, has vested with the responsibilityof marketing the NTFP at a remunerative price in the market.It effects collection and sale of NTFP through its four viz..Thiruvananthapuram. Adimaly, Thrissur and Kalpetta branchescovering all the NTFP collecting societies in the state. TheTCS which are coming under each branch (region) will informthe collection of NTFP to respective branches for sale. Thebranch managers will publish the items, quantity. venue. anddate of sale of NTFP and will also inform the matter totraders in this field through post.

142
Table 4.15
Marketing of NTFP by the Kerala State Federation of SC/ST
Development Co—operatives 1990-91 to 1993-94
Rupees in lakhsTotal sale Classified itemsYear of NTFP Medicinal Non-Medicinal(Rs) (Rs) (Rs)
1990-91 66.68 20.99 45.69(100) (31.5) (68.5)1991-92 94.06 30.98 63.08(100) (32.9) (67.1)1992-93 133.64 51.12 82.52(100) (38.3) (61.7)1993-94 199.80 70.28 129.52(100) (35.2) (64.8)Total 494.18 173.37 320.81(100) (35.08) (64.92)
Source :Compi1ed from the records of The Kerala StateFederation of SC/ST Development Co-operatives,Thiruvananthapuram. 1982-83 to 1988-89.
Note :Figures in Parentheses indicate percentage to row total
Table 4.15 indicates the marketing of NTFP by theSC/ST Federation for a period of four years. During thisperiod of the total sales. about 65 percent of the sales valuewas accounted for non-medicinal items and 35 percent was formedicinal items collected and marketed by tribes.

143
4.12.1 Marketing Channel of Medicinal Herbs
The marketing channel of the SC/ST federation formedicinal herbs include the pharmaceutical corporation ofKerala Ltd., (A Government of Kerala undertaking known asOushedhi), the other Ayurvedic medicinal manufacturing unitsin Kerala and private traders in and outside Kerala. Table4.16 examines the marketing channel of SC/ST federation formedical herbs in the state.
Table 4.16Marketing Channel of Medicinal Items by The Kerala
StateFederation of SC/ST Development Co-operatives1990-91 to 1993-94
Rs in lakhsMarketing ChannelTotal 3°13 Other Ayur— Private Pvt. TradeYear of Medici- 0usha. . vedic Medi- Traders rs outsidenal Items dbl cinal Manu- in Kerala
facturing Keralaunits
1990-91 20.99 3.81 5.17 6.78 5.23(100) (18.2) (24.6) (32.2) (25.0)1991-92 30.98 3.61 5.27 12.55 9.55(100) (11.6) (17.1) (40.5) (30.8)1992-93 51.12 2.20 12.41 15.11 21.40(100) (4.3) (24.3) (29.5) (41.9)1993-94 70.28 7.29 15.40 21.71 25.88(100) (10.4) (21.9) (30.9) (36.8)Total 173.37 16.91 38.25 56.15 62.06(100) (9.7) (22.1) (32.4) (35.8)Source :Compiled from the records of The Kerala State
Federation of SC/ST Development Co-operatives.Thiruvananthapuram, 1982-83 to 1988-89.
Note :Figures in Parentheses indicate percentage to row total

144
Table 4.16 clearly indicates that the medicinalherbs marketing in Kerala is managed and controlled by privatetraders in and outside Kerala (68.2 percent). Of the totalmarketing more than thirty five percent of the products havebeen marketed outside Kerala. The SC/ST Federation couldmarket only 31.8 percent of the produce directly to AyurvedicMedicinal Manufacturing units in Kerala. Though there are 887Ayurvedic medicinal manufacturing units in Kerala. and theirrequirements are so high, the federation has failed toestablish good rapport with these end-users of the product.The marketing channel of medicinal herbs can be depicted indiagram 1.
Diagram 1 clearly indicates that the federationplays only a very limited role in the marketing of medicinalherbs. It just pushes or removes the medicinal items from thepremises. Really speaking the private traders take advantageout of it.

145
Marketing Channels of Medicinal Itemsof the SC/ST Federation
Other Ayurvedlc Uta.22%
OushadhlPvt. Tr aders-Kerala 10%32%
Pvt. Traders’Q:utsIde3695
Figure 1

146
4.12.2 Marketing channel of Non-Medicinal Items by SC/STFederation
The study observed that the entire collection ofnon-medicinal herbs of the co—operatives are marketed through
private traders. The institutional arrangement so far did notcreate any liaison with the end—users of this product or itdid not make any research on the use of these products. As aresult they are forced to market the entire non-medicinalherbs through private traders. These private traders eitheract as agents of the end—users of the product or act as thedirect sellers of the these product to them.
Table 4.17 depicts the marketing channel ofnon—medicina1 items in Kerala.

147
Table 4.17
Marketing of Non—Medicina1 items by The Kerala State
Federation of SC/ST Development co—operatives
1990-91 to 1993-94
Rs in lakhsTotal sale Marketing channel
Year of Non-Medi— Pvt. Tra— Pvt. Traderscinal items ders in outside Kerala(Rs) Kerala (Rs) (Rs)1990-91 45.69 9.16 36.53(100) (20) (80)1991-92 63.08 15.07 48.01(100) (23.9) (76.1)1992-93 82.52 25.17 57.35(100) (30.5) (69.5)1993-94 129.52 28.57 100.95(100) (22.1) (77.9)Total 320.81 77.97 242.84(100) (24.3) (75.7)
Source :Compi1ed from the records of The Kerala StateFederation of SC/ST Development Co—operatives.Thiruvananthapuram, 1982-83 to 1988-89.
Note :Figures in Parentheses indicate percentage to row total
Table 4.17 indicates that the private traders ofKerala collect only 24 percent of the items from SC/STFederation. More than seventy five percent of the productsdirectly marketed to companies or agents of companies outsideKerala. Most of the companies collect items through agentsappointed in Kerala. The NTFP's are marketed to other statesin raw form. If Co-operatives can enter the field of

Marketing Channels of Non-MedicinalItems of the SC/ST Federation

149
processing more industries may come up and the unemployment
situation especially in tribal areas can be solved to acertain extent. The study makes it clear that the value ofNTPP in Kerala is determined by outsiders i.e, people fromother states. The collectors i.e., tribes or the marketersi.e.. institutional arrangement - co-operatives virtually haveno role either in the fixation of collection charge ordetermination of sales value of NTFP. The institutional setup is still under the strong lobby of private traders. Themarketing channel of Non-medicinal herbs is depicted indiagram 2.
4.13 Branch-wise Marketing Channel of NTFP
The branch-wise marketing channel of NTFP of SC/ST
Federation is given in Tables 4.18 to 4.21.

150
Table 4.18
Marketing Channel of Thiruvananthapuram Branch
for NTFP from 1990-91 to 1993—94
(Rs.in lakh)
Marketing channelof medicinal items
Marketing channel ofNon-medicinal itemTotal Medicinal Nonzar sale of Private Medicinal PrivateNTFP Private traders Items Private traderstraders outside traders outside
in Keralakerala in Kerala Kerala(Rs.) (Rs.) (Rs.) (Rs.) (Rs.) (Rs.) (Rs.)I90-91 9.55 3.15 0.8 2.35 6.4 2.13 4.27
(100) (25.4) (74.6) (100) (33.3) (66.7)[100] [33] [67]191-92 19.34 7.16 1.75 5.41 12.18 4.2 7.98
(100) (24.5) (75.5) (100) (34.5) (65.5)[100] [37] [63]192-93 20.55 6.6 2.1 4.5 13.95 5.15 8.8
(100) (31.9) (68.1) (100) (36.9) (63.1)[100] [32]
*93-94 22.38 7.39 3.21 4.18 14.99 6.21 8.98(100) (43.4) (56.6) (100) (40) (60)[100] [33] [67]
tal 71.82 24.3 7.85 16.44 47.52 17.49 30.03(100) (32.3) (67.7) (100) 36.8 (63.2)[100] [33.8] [66.2]
burce: Compiled from the records of the Thiruvananthapuram branch of SC/STFederation 1990-1991 to 1993-94.
ta: 1. Figures in ( ) brackets indicate percentage to row total ofmedicinal and non~medicina1 items.
. Figures in [total sale of NTFP items.
] brackets indicate percentage to row total of

1551
Table 4.19
larketing Channel of hdinaly Branch for ITFP fro: 1990-91 to 1993-94
(0s.in lath)
larketing channel oflarleting Channel of ledicinal itels Ion-nedicinal itels
Total non- --------------------------------------------------------- -Year sale of ledicinal ledicinal Other Private Private Private
lTFP- Oushadhi lyurvedic traders treders Private tradersIedicinal in Kerala outside traders outside
Kerala in Kerala Kerala(R5,) 10s.) 103.) (Rs.) (0s.) (Rs.) 123.) (Rs.) (03.1
1990-91 0.7 0.29 0.41 0.00 0.1 0.05 0.00 0.1 0.1(100) (100) (20.2) (25) (10.7) (44.1) (34.6) (65.4)
[100] [42] [50]1991-92 5.9 4.7 1.2 0.35 - 0.73 0
(100) (100) (29.2) (60.9) (9.[100] [00] [20]
.12 1.4 3.39) (29.0) (70.2)
1992-93 16.03 7.04 9.79 0.39 1.6 2.77 5.02 6.01 1.03(100) (100) (4) (16.4) (20.3) (51.3) (05.3) (14.7)
[100] [42] [50]1993-94 26.51 12.7 13.01 3.1 2.12 . 3.14
(100) (100) (22.7) (15.4) (29.7) (32.2) (24.7) (75.[100] [40] [$0.5]
Total 49.94 24.73 25.21 3.96 3.(100) (100) (15.7) (15.
[100] [49.5] [50.5]
Source: Conpiled from the records of the ldinali branch of SC/ST Federation from 1990-91 to 1993-94
Note: 1. Figures in ( ) brackets indicate percentage to row total of Iedicinal andnon-medicinal items.
2. Figures in [ 1 brackets indicate percentage to row total of total sale value of ITFP itens

1.552
Table 4.20
larketinq Channel of Thrissur Branch for ITFP frol 1990-91 to 1993-94
(Rs.in lalh)
larketing channel oflarkating Channel of ledicinal itens Ion-nedicinal itens
Total non- --------------------------------------------------------- -Year sale of ledicinal ledicinal Other Private Private Private
ITFP Oushadhi lyurvedic traders traders Private tradersIedicinal in Kerala outside traders outside
Kerala in Kerala Kerala(Rs.) IRS.) 193.) IE5.) 113.) (03.1 (Rs.) [Rs.) (93.1
1990-91 30.52 23.11 15.41 2.61100) (100) (16.9) (3 .
[100] [60] [40]1991-92 40.37 23.41 16.96 3.25 5.76 6.94 1.01
(100) (100) 119.2) (34.0)[100] [50] [42]
1992-93 70.07 46.06 24.01 1.01 10.21 6.43 6.31 10.81 35.25.(100) 1100) (7.3) (41.1) (26.1) (25.5) 23.5) 176.5)
[100] [65] [35]1993-94 97.39 61.35 36.04 4.16 13.16 10.11 0.61 11 21 50.14
1100) (100) (11 5) 136 5) (20.1) 123 9) (18 3) (01.7)
nob) (52) (as)(100) (100) (12.7) (36.7) (31.2) (19.4) (20.5) (79.2)
Source: Conpiled iron the records of the Thriesur branch of SC/STFederation 1990-1991 to 1993-94.
Note: 1. Figures in 1 ) brackets indicate percentage to row total of medicinal andnon-sedicinal ites.
2. Figures in [ ] brackets indicate percentage to row total of total sale of NTFP itens.

153
Table 4.21
larketing Channel of Kalpatta Branch for ITPP frol 1990-91 to 1993-94
larketing channel oflarketing Channel of ledicinal itens Ion-Iedicinal itens
Total -------------------------------------------------------------- -Year sale of other Private Private PrivateITFP ledicinal Oushadhi lyurvedic traders traders non- Private traders
aedicinal in lerala outside ledicinal traders outsideUnits Kerala in Kerala Xarala
(R3,) 1115.] 1113.) (Rs.) (05,) (03.1 His.) 1113.) (113.1.................................................................................................... -1990-91 17.9 2.02 1.12 - 0.3 0.6 15.00 2.12 13.76
11001 (55.5) (15) (29.51 1100) (13.4) (06.6)[100] [11] [09]1991-92 20.44 5.67 - 0.51 1.13 4.03 22.77 4.21 10.56
(1001 (9.0) 120] (71) 1100) (10.5) 101.5)[100] [20] [00]1992-93 25.39 9.93 - 0.6 3.76 5.57 15.46 3.21 l2_.25
1100) (6) (37.01 (56.21 (1001 (20.0) (79.2)[100] [39] [61]1993-94 53.52 13.06 - 0.13 4.29 0.64 40.46 0.22 32.24
1100) (I) (32.0) 166.21 (100) (20.3) 179.7)[100] [24] [76]Total 125.25 30.60 1.12 1.24 9.40 10.04 94.57 17.76 76.01[100] [24] [76]
(1001 (3.6) (4.11 (30.9) (61.4) 1100) (10.0) (01.2)
Source: Coapiled iron the records of the Kalpettn branch of SC/51'Federation 1990-1991 to 1993-94.
late: 1. Figures in ( 1 brackets indicate percentage to rev total of medicinal andnon-Iedicinal itens.
2. Figures in { } brackets indicate percentage to rov total of total sale of ITPP itens.

154
Table 4.18 indicates that 66.6 percent of the totalmarketing value of NTFP of Thiruvananthapuram branch duringthe period is due to the sale of medicinal herbs. The entirecollection of medicinal items were marketed through privatetraders, of which more than sixty seven percent of themedicinal items were sold through private traders outsideKerala. The study proved that the Thiruvananthapuram branchvirtually has no connection with the potential demanders ofmedicinal herbs in the state. The study also reveals that theentire collection of Kundirikkam is sold to companies in TamilNadu through agents. The branch Manager also points out theinstances of auctioneers lobby which tried to depress the salerate in several occassions. He observed that in certainoccassions. the branch was forced to fall in line with theselobbies due to scarcity of finance.
Table 4.19 indicates that 49.5 percent of the totalsale of NTFP of Adimaly branch was accounted by non—medicinal
items and 50.5 percent accounted by medicinal items. It isclear that about 69.1 percent of the medicinal herbs weremarketed through private traders, and the share of privatetraders outside Kerala amounted to 38.8. As regards theNon-medicinal items the private traders outside Kerala werevirtually controlling the NTFP trade in the Adimaly region.
Table 4.20 explains the marketing channel followedby Thrissur branch. It brings to light that 62 percent of the

155
total sale of the branch was accounted by non—medicinal itemsand 38 percent by medicinal items. The marketing channel ofthe medicinal herbs points out that 49.4 percent of the totalsale of medicinal herbs were directly sold to the Ayurvedicmedicinal manufacturing units in Kerala. In total 80.6percent of the total sale of medicinal items were marketedwithin Kerala. As regards to non-medicinal items 79 percentof the total sale were made to private traders outsideKerala.
Kottackal Aryavydyasala. Kottackal: ThePharmaceutical corporation of Kerala Ltd. Thrissur: TheNagarjuna Herbal Concentrates Ltd. Thodupuzha: The CKKM. S.D
Pharmacy. Thiruvananthapuram: and the Seetharam ‘AyurvedicPharmacy. Thrissur, were the major collectors of medicinalherbs from the Thrissur branch. More than 80 percent of thenon-medicinal items. particularly Kundirikkam, were sold inTamil Nadu. So also the entire collection of Pathiripoove wassold to a private trader in Kerala who was found to be anagent of a wholesale trader in Tamil 'Nadu. The entirecollection of cheevakkai from this branch have gone to TamilNadu. The companies mostly collect the items through agentsappointed in Kerala.
About 60 percent of honey was sold to KottackalAryavydyasala, Kottackal, Seetharam Ayurvedic Limited,Thrissur and the Nagarjuna Herbal Concentrates Ltd.

156
Thodupuzha. About twenty percent was sold to ShivaramApiaries Kannambra. Palakkad (Dist.) and the balance 20percent is sold on retail basis. It was also observed thatthe Shivaram Apiaries of Kannambra is the major supplier ofhoney to Pharmaceutical Corporation of Kerala Ltd at a pricelower than the price by which honey has been collected by theinstitution. Hence the possibility of adulterating theproduce cannot be ruled out.
Table 4.21 indicates that 76 percent of the totalsale of NTFP of Kalpetta branch is contributed bynon—medicinal items and only the rest by medicinal items. Itis also noticed that 61.4 percent of the total sale ofmedicinal herbs and 81.2 percent of the non-medicinal herbsare marketed through private traders from outside Kerala. Inshort the Kalpetta branch mainly depends on private tradersfrom outside Kerala to market their NTFP items.
The major items collected in the branch areCheevakkai. Honey, Uruvanjica. Nellicca. Kundirikkam andKakkumkai. It also collects Tubers and roots. The branchsells items not only in Tamil Nadu but also in karnataka. ThePrabhat Trading Company. Sree Vijaya & Co, Madras Chillies,Shiva Jyothi, O.M.S. Tamarind and B. Muhammad Hariff. all of
them from Tamil Nadu are the major collectors of NTFP from the
branch. Subramaniaswara, Bangalore is the sole companyparticipating in auction from Karnataka. The Crescent

157
industries. Iritty. Kerala collects the entire collection ofKundirikkam from the branch. It is also noticed that theShivaram Apiaries. Kannambra, Palakkad District collects morethan 75 percent of the honey from the branch. Most of thecollection of the above companies are made through agentsappointed in Kerala.
An analysis of the marketing channels of thebranches of SC/ST Federation clearly brings to our concernthat the co-operative marketing set up is under the clutchesof private traders especially traders from outside Kerala.Though the basic objective of selling co-operative is toeliminate the middlemen from the marketing arena of tribalproducts. it is clearly proved that not only the tribes butalso the co—operatives are now under the strong hold ofprivate traders. in and from outside Kerala.
4.14 Collection and Sale Rate of NTFP and the Share of Tribesfrom19B2—83 to 1993-94
Collection charge is one of the major determinantwhich motivate the tribes to engage in the collection andmarketing of NTFP, which also depends on how effectively theco-operative marketing societies can market the collectedproduce from tribes. As per the policy, till 1990-91, the TCSare directed to give 75 percent of the procurement value ofNTFP as collection charge to tribes. Since 1991-92, it was

158
directed that 80 percent of the sales value of NTFP must begiven to tribes as collection charge. Table 4.22 to 4.24examine the collection charge and sale values of NTFP and theshare of collection charge to sales value of NTFP. Sincethere is change in the policy of fixation of collectioncharge. 1982-83 to 1990-91 and 1991-92 to 1993-94, to know the
effect of the policy. a comparison of pricing under thesepolicy periods are attempted here. _Since there is significantvariation between the prices of Adapathiankizhangu and theprices of other items in tuber crops. the price ofAdapathiankizhangu has been eliminated from calculationthroughout the study. The price of each fresh item of NTFPhas been converted to equivalent dry value of NTFP accordingto the norms developed (Appendix III) in consultation with theexperts in the field.

159
Table 4.22
Average Collection & Sale Rate —— 1982-83 to 1990-91
Average Procur— Average Col1ec— CollecionS1. . Collect. ement sales tion cha- charege asNo. NTFP Items charge value price arge as % to pro
per Kg per Kg per Kg % sales curement(Rs) (Rs) (Rs) value valueI Medicinal Items
A.Tuber crops ‘4.28 5.32 7.09 60 80B.Root items 1.59 1.42 2.93 54 112C.Fruits 0.87 1.29 _1.32 66 67D.Barks 1.52 0.98 2.14 71 155E.Bushes 1.88 1.57 3.12 60 120
& Creepers
F.Liquids 12.77 11.25 17.39 73 114(honey)
G.Seeds 3.13 2.49 5.25 60 126H.Flowers 10.97 2.95 15.93 69 ' 372I.Miscellaneous 16.35 14.91 25.15 65 110
II Non-MedicinalItems
A.0i1 seeds 1.08 1.14 2.58 42 95B.Spices 20.91 21.9 90.08 23 95C.Edible items 5.99 2.95 7.69 78 203D.Dye and paint 5.55 2.21 8.99 62 251
itemsE.Soap and 2.27 2.14 5.29 43 106
Shampoo itemsF.Miscellaneous 2.21 3.83 3.36 66 58
Source zcompiled from the records of The Kerala StateFederation of SC/ST Development Co-operatives and TCSof the State from 1982-83 to 1990-91.
Table 4.22 shows that the share of collection chargeto sales price of medicinal items varied from 54 percent to 73percent and for non-medicinal items from 23 percent to 77

160
percent during the period under reference. In the case ofspices. soap and shampoo items, dye and paint items,oil seeds.the share given to tribes seems to be very low. At the sametime these items have very high demand in the industrialsector too. It seems that the rate of exploitation in thecase of highly demanded and high valued items are very high.However, the share of collection charge to procurement valueindicate that the TCS have strictly adhered to the directionsof the SC/ST federation and in almost all NTFPs except fruits.the TCS paid more than 75 percent of procurement value ascollection charge. Since the procurement value is theguaranteed sales price or the only price that were availableto TCS from SC/ST Federation till 1990-91, it is very clearthat till that time the Federation was exploiting not onlythe TCS but also the tribes for whose benefit the institutionwas established.
4.15 Collection and sales rate and the Share to Tribes forNTFP Collection- 1991-92 to 1993-94
Even though a welcome change was introduced in the
fixation of collection charge of NTFP to tribes (based onsales value), it was noted that except for flowers. bushes andcreepers and miscellaneous non-medicinal items, the collectioncharge even did not touch 75 percent of the sales value. Thisis evident from Table 4.23.

161
Table 4.23Average Collection & Sale Rate —- 1991-92 to 1993-94
Average Average Collection£33.: NT1-‘P items §§ii§2“°“ 3322 °2°‘;‘i’?e2SPeels? Pfmg “meI Medicinal Items
A. Tuber crops 11.97 24.55 49B. Root items 3.56 6.33 56C. Fruits 1.95 3.30 59D. Barks 3.37 5.66 53E. Bushes & Creepers 5.34 7.07 75F. Liquids 26.34 38.61 68G. Seeds 6.19 9.00 69H. Flowers 28.37 35.56 80I. Miscellaneous 32.68 54.86 60
II Non-Medicinal ItemsA. Oil seeds 2.70 4.02 67B. Spices 55.47 128.16 43C. Edible items 13.37 21.20 63D. Dye and paint items 15.63 31.24 50E. Soap & Shampoo items 5.11 9.86 52F. Miscellaneous 7.66 8.10 95
Source :Compiled from the records of The Kerala StateFederation of SC/ST Development Co—operatives and TCSof the State from 1991-92 to 1993-94.
While comparing Table 4.23 with Table 4.22, it isquite evident that for items like Tuber crops. Fruits. barksLiquids (honey), Miscellaneous items of medicinal herbs,Edible items, Dye and paint items, and soap and shampoo items.the share of collection charge over sales value for the laterperiod. (1991-92 to 1993-94) given to tribes was comparatively

162
very low. Though there was absolute enhancement in sale ratesand collection charge during the period. the correspondingchange in the determination of collection charge is notcoincided with change in the sales value of NTFP. Table 4.24depicts the average collection charge and sale rate for theentire period under study (1982-83 to 1993-94).
Table 4.24Average Collection Rate and Sale Rate — 1982-83
to 1993-94
Average Average Collection33,: WP items §Zi‘i.§“°"g° S2.‘-‘i.3°“° 3322?: ‘S(Rs) (Rs) rateI Medicinal Items
A. Tuber crops 6.20 11.45 54B. Root items 2.08 3.78 55C. Fruits 1.14 1.82 63D. Barks 2.16 3.10 70E. Bushes & Creepers 2.75 4.11 67F. Liquids 16.19 22.70 71G. Seeds 3.89 6.19 63H. Flowers 15.32 20.84 731. Miscellaneous 20.44 32.58 63
II Non-Medicinal ItemsA. Oil seeds 1.49 2.94 51B. Spices 29.55 99.60 30C. Edible items 7.84 11.07 71D. Dye and paint items 8.07 14.55 55E. Soap & Shampoo items 2.98 6.43 46F. Miscellaneous 3.70 4.54 81
Source :Compiled from the records of The Kerala StateFederation of SC/ST Development Co-operatives and TCSof the State from 1982-83 to 1993-94.

163
Table 4.24 points out that over the years 1982-83 to1993-94. the collection charge to sales value of NTFP variesfrom 54 percent to 73 percent for medicinal items and 30percent to 71 percent for non-medicinal items exceptmiscellaneous items where it is 81 percent. In any of theyears the co-operative set up could not pay even 75 percent ofsales value as collection charge to tribes.
4.16 NTFP Advance and NTFP Stock Advance
Collection of NTFP by a Tribal co—operativeSocieties is mainly depended upon a lot of factors such asavailability of credit. in collection seasons rates offered totribes the topography of region, lease rent to be remitted byco-operatives etc. Of this the availability of credit plays avery important role to exercise the full controllability ofcollection on NTFP. If the TCS is not in a portion to meetthe collection charge, immediately after the collection ofproduces from tribes. the tribes may resort to private tradersto market their products. It may ultimately lead to develop arelation between the tribes and private traders and theco-operatives may fail to capture business. and ultimatelyresulting to inefficiencies.
Since most of the TCS have a very poor financialbase. they have to be helped either by the Government or by

164
contribution may always limit to the share capitalcontribution TCS. But the TCS require specific fund asworking capital to enter in to the field of NTFP in season andeffectively carried out the collection operation. To this theTCS always look to SC/ST federation which is the soleinstitution to control the NTFP trade in the co—operativearea. The advances of the federation are generally of two
types viz.. NTFP advance and NTFP stock advance. The formercarries an interests of 12.5 percent per annum and the latteris made available to co—operatives on the basis of stock ofNTFP kept by TCS. Both these loans should be repaid within anyear. Table 4.25 reveals the NTFP advance NTFP stock advancegiven to TCS of the state from 1982-83 to 1991-92.

165
Table 4.25NTFP Advance and NTFP Stock Advance given to TCS
from 1982-83 to 1991-92
NTFP AverageYear Aggizce Stock Total AdvanceAdvance per TCS(Rs) (Rs) (Rs) (Rs)
1982-83 135000 —— 135000 4219(100) (100)1983-84 112000 —- 112000 3613(100) (100)1984-85 90000 190000 3103(100) (100)1985-86 280000 132000 412000 12875(68) (32) (100)1986-87 117500 10000 127500 3984(92) (8) (100)1987-88 390000 142500 532500 17177(73) (27) (100)1988-89 505000 135000 640000 20645(79) (21) (100)1989-90 287000 387000 674000 22467(43) (57) (100)1990-91 75000 277700 352700 11757(21) (79) (100)1991-92 —- 82000 82000 2733(100) (100)Average (Rs) 10257
Source zcompiled from the records of SC/ST Federation,Thiruvananthapuram 1982-83 to 1991-92.
Note :Figures in parenthesis indicate percentage to rowtotal.
Table 4.25 points out that the SC/ST Federationinitially used to give only NTFP advance for NTFP collectionto TCS. During 1985-86 onwards it started to give NTFP stockadvance and the average advance per society also increased.The average loan obtained by a TCS over the period wasRs.10257/- which is considered to be very low to carry out the11'!!!-I1‘: __'I1__A__°__ _,, ,L_- ,_ _-_

166
that till 1988~89 the Federation has given maximum loan asNTFP advance but later it is shifted to NTFP stock advance.It may be due to the financial stringency of the Federationdue to the overdue situation of the Federation by theaffiliated societies.
4.17 NTFP Advance and NTFP Stock Advance-Branch—wise
Table 4.26 depicts the branch—wise disbursement ofadvances to TCS from 1982-83 to 1991-92. Wide difference inthe disbursement could be noticed.
Table 4.26NTFP Advance and NTFP Stock Advance —— Branch wise
Yea’ TVM TCR KAL ADI Total1932-33 30000 35000 30000 40000 135000
(22.2) (25.9) (22.2) (29.7) (100)1933-34 17000 35000 30000 30000 112000(15.2) (31.2) (26.3) (26.3) (100)1934-35 —— -- 30000 60000 90000(33.3) (66.7) (100)1935-36 120000 97000 35000 110000 412000(29.1) (23.5) (20.6) (26.3) (100)1936-37 20000 25000 22500 60000 127500(15.7) (19.6) (17.6) (47.1) (100)1937-33 52500 295000 35000 100000 5323500(9.3) (55.4) (16) (13.3) (100)1933-39 165000 265000 145000 65000 640000(25.3) (41.4) (22.6) (10.1) (100)1939-90 456000 10000 161000 47000 674000(67.7) (1.5) (23.9) (6.9) (100)1990-91 302700 10000 10000 30000 352700(35.3) (2.3) (2.3) (8.6) (100)1991-92 52000 —— —— 30000 32000(63.4) (36.6) (100)Average 12i520 77200 59350‘ 57200 10257per branch(38) (25) (19) (18) (100)Source :Compi1ed from the records of SC/ST Federation,
Thiruvananthapuram 1982-83 to 1991-92.Note :Figures in parenthesis indicate percentage to rowtotal

167
The Region wise/Branch wise analysis of the advance:
from 1982-83 to 1991-92 points out that the highest share 01the loan (38 percent) has gone to Thiruvananthapuram brancland the lowest to Adimaly branch. As regards to the NTFIcollection from forest ranges, the highest share was accounte<from Thrissur and Kalpetta region/Branch, whereas thcdisbursement of loans were comparatively low.
4.18 Branch wise Analysis of Overdues on NTFP Advance. StoclAdvance and Lease Rent Remittance by SC/ST Federation mon 30-6-92
Table 4.27
Region—wise Analysis of Overdue on NTFP Advance and
Stock Advance 30-6-1992
Figures in RsN'l FFS1. . NTFP LeaseNo_ Region Advance Stock Rent Totaladvance
1. Thiruvananthapuram 206178 247065 72215 525458(45.7)
2. Thrissur 163601 19009 9741 192351(16.7)
3. Kalpetta 363357 13000 33222 82579(7.2)
4. Adimaly 330986 10000 7446 348432(30.4)Total 1148820
(100)
Source: Compiled from the records of SC/ST FederationThiruvananthapuram. 1994.

168
Table 4.27 indicates that the highest overdue hasfallen on Thiruvananthapuram Branch (45.7 percent) and thelowest by Kalpetta branch (16.7) followed by the ThrissurBranch (16.7 percent).

PROFILE OF THE STUDYAREA
CHAPTER V
PROFILE OF THE STUDY AREA
In this chapter it is proposed to discuss theprofile of the study area. The discussion is divided into twoparts. Part I deals with the socio-economic conditions of the254 tribal households selected for the study from the fourregions of Kerala. Socio—economic variables such as familysize. age and sex composition, age group of NTFP collectors.level of literacy, occupational structure, nature of dwellinghouses, drinking water facilities. land holdings andcultivating area, family expenditure, etc. were collected andanalysed. Part II gives an account of performance of the 10tribal co-operative societies collected for the study from thefour regions of Kerala.
Part I
5.1 Socio-economic Profile of Tribes in the Study Area
It is needless to say that the socio-economiccharacteristics have an important bearing on the behaviour oftribes in the collection and marketing of NTFP and otherproducts in their day-to—day life. The behaviour in thiscontext consists of the acts of individuals directly involvedin obtaining and selling economic goods and services.including the decision processes that precede and determine

170
these acts. When a consumer takes a particular course ofaction it is the result of many influences - cultural. socialand economic. It is appropriately said that all social groupinfluences on consumer behaviour start with the culture inwhich the consumer livesl.
The study covered 10 TCS in the fourregions\branches of the Kerala State Federation of SC/STDevelopment Co-operatives. A total, of 254 tribal house holdscovering 11 tribal communities have been covered in the study.Muduvan and Mannan from Adimaly region. Kanikkar and Malai
Pandaram, from Thiruvananthapuram region, Irulur, Paniyan and
Malayan from Thrissur region, Kattunaicken, Paniyan. 'Kurumar,Adiyan and Kurichiyan from Kalpetta region have become part of
the study.
5.1.1 Family Size of the Selected NTFP Collectors
The size of the family, however, points out thesocio—po1itico—economic prospects of any society. The region
wise. community wise. family size of tribals under study aregiven in Table 5.1
Water A. Henry. (1976)."Culture Values Do Correlate withConsumer Behaviour," Journal of Marketing Research.Chicago. May. pp.121-127.

171
Table 5.1
Family Size
Size of the Fully Image size51. legion/Tribal Totallo. Collonity Tribal 2-4 4-6 6 and Total lalo PonaloFonily aboveI TllllllN2lllI‘l'lllPUlll Ill.
1 lalai Paodaral 15 3 B 4 5 3 22 lanikkar 40 11 22 7 4 2 2Total WI. Ill. 55 14 30 ll 4 2 2
[100] [25] [551 [20]
II mlssun ll.3 lrular 33 12 17 4 4 2 24 Paniyan 17 4 l0 3 5 2 35 Ialayan 25 8 ll 6 4 2 2Total Tcll. ill. 75 24 38 13 4 2 2
[100] [32] [51] ll?)III IILPETTA ll.
6 Kattunaickon 28 ll 12 5 4 2 27 Paniyan 8 2 2 4 5 2 3ll lurnlar 17 3 9 5 5 2 39 ldiyan 16 6 7 3 4 2 2l0 Knrichiyan 15 2 6 7 6 3 3Total lll.. ll. 34 24 36 24 5 2 3
[100] [20] [44] [28]IV IDIIILY II.
II luduvan 25 5 16 4 4 2 2l2 lannan 15 4 8 3 4 2 2Total In]. ll. 40 9 24 7 4 2 2
[100] [22] [60] [18]
Grand Total 254 71 120 55 4 , 2 2(I+II+III4IV) [100] I20] [50] [221

172
Table 5.1 points out that the average size of afamily is 4. It is observed that there is not much disparityJetween tribal communities and regions in case of the size of:he families. Fifty per cent of tribal families surveyed hadnembers ranging from 4 to 6. Among tribal communities.3aniyans. Kurumans and Kurichiyans are having a slightlynigger families as compared with other tribal communities
5.1.2 Age and Sex Composition
Age. as an index of a person's capability. is asignificant measure of a nation's vitality. It also revealsiuality of population, which is useful for education. lifeinsurance and other welfare programmes. It affects peopleaoth as producers and consumers of wealth and is affected byfertility, mortality and migration. The socio-economicactivities affect the age structurez. The tribal age classias been divided in to three classess.
Juvenile (< 15 years age group)Mature ( 15 to 44 years age group)Older mature and senile 45 +
2 Hanuman Prasad (1990), "The Socio—Economic status of theSC and ST. A Case Study of Azamgarh Dt.“, In: Chaurasia(ed): §cheduled Castes and Scheduled Tribes in India.Chugh Publications. Allahabad. p.i67.
3 Ibid..... pp.107 s 103.

173
Table 5.2
Total Family loabers (including mpondonto)- Age and Sex Conposition
Ago class and the total tribes in each class5|. legion] Triballo. Couunity (15 15-45 45 and above Total Grand
lalo hlale lalo hula lalo Folalo lalo hula Tom
1 ‘l'1112lW1lkI'l'11lPllll4I ll.
1 lalai Pandora: 10 11 24 16 6 4 712 humor 25 24 30 45 22 14 05 03 160Total TVI. lll.(a| 35 62 61 20 125 114 239(30) 151) (19) (1001
II TIIIISSUR Ill.
3 Irular 12 35 30 13 10 1294 Paniyan 13 11 15 23 10 5 775 lalayan 9 14 29 35 13 111-Total TCII. ll.(b) 43 37 79 96 36 26 158 159 317(25) (55) (20) (100)
III IILPETTA ll.
6 Kattnnaiclen 22 24 30 27 6 5 58 56 1147 Poniyan 6 10 13 11 1 1 20 22 42B Knrunar 9 13 20 26 11 3 40 42 829 ldiyan 6 10 20 20 7 5 33 35 6010 llnrichiyon 20 16 10 7 4 44 42 06
Total BL. Ill. (cl 62 77 101 102 32 10 195 197 392135) (52) (13) (100)IV IDIIILY ll.
11 luduvan 15 20 0 6 54 11112 Human 14 20 17 16 - - 67
Total 101. ll. (0) 29 40 40 47 0 6 05 93 170(39) (53) (0) 11001

174
The juvenile comprising of infants and adolescentsLs largely biologically as well as economically1on—productive. Mature is biologically the most reproductive,aconomically productive and demographically the most mobilennd supports the bulk of the other two groups. Table 5.2lepicts the age and sex composition of tribes under study.
Table 5.2 represents that 53 per cent of the tribesfrom the survey has fallen in the most productive class ofL5—45 age group. the juvenile class accounted to 32 per centand the old class accounted to 15 per cent. Though there isrot much disparity in the composition. Thrissur regionnccounted the highest productive class with 55 per cent mature:lass.
5.1.3 Age Group of NTFP Collectors
The age group and the sex composition of NTFP:ollectors are given in Table 5.3
Table 5.3 reveals that 69 per cent of the NTFP:ollectors are in the age group of 15-45 and 22 per cent. 45and above. It is a pity to note that 9 per cent of the totalTTFP collectors are children. Among others more belong to(alpetta region followed by Adimaly.

175
Table 5.3
Ago Group of I11’? Collectors
ITFP collectors and their age groupS). llogionl TribalIo. Conunity 5 - 15 15-45 45 and above Toto) Grand
Totallolo I-‘mlo lalo Pmlo Halo I-‘oulo lolo Paula
I TllIRUVllLI'l'lflPl)lIlI II.
l mu Pamlam 2 3 23 12 6 3 31 (6 492 lonikhr 5 2 33 22 22 4 60 26 66Total WI. ill. (I) 7 5 56 34 26 7 91 46 137(9) (66) (25) (166)
II THIISSIJI ll.
3 lrulor 1 - 36 26 12 5 33 764 Paniyan 6 - 13 15 9 3 16 465 Halcyon - 1 19 16 7 31 _ 26 57Total ‘ICE. 6!. (la) 7 1 62 61 15 102 77 179(4) (69) (27) (160)
III ILLPEITI RI.
6 mtunoiclen l3 2 32 21 6 4 5) 27 767 Paniyon 3 - 11 3 3 2 17 5 226 lurnnr 3 2 14 7 9 — 26 9 359 ldiyan - - 17 10 3 l 26 ll 311)) lurichiyon - - 12 7 4 l 16 6 24Total In. II. (c) 19 4 66 46 25 6 130 60 196(12) (71) (17) (100)
I6 IDIIILY ll.
11 lmlmo 6 2 26 15 9 6 23 6612 loom 2 - 16 7 - - 16 7 25Total 661. ll. (d) 6 2 44 22 9 6 61 36 91(11) (73) (16) (166)Grand Total 41 )2 246 165 95 36 364 213 597(:4-h+cHl) (9) (69) (22) (160)

176
5.1.4 Level of Literacy
Literacy is essential for economic development andsocial advancement of scheduled tribes. The level of literacyof scheduled tribes under the surveyed families is depictedin Table 5.4.
Table 5.4 indicates that only 47 per cent of thetribes are literate of which 56 per cant do not have g anyschool level education. They know only how to write theirnames in malayalam. They even did not know how to put theirsignature. They affix their thumb impression in vouchers orreceipts of the TCS to get their NTFP advances and the sellingprice of NTFP. It is also observed that most of the tribeshaven't completed their primary education. The researcherfound that the distance of the school from the dwelling place.remoteness, employing children to collect NTFP. the illiteracyof parents, and poverty are the major reasons that preventchildren from going to school. Though the effectiveliteracy rate of tribes as per 1991 was found to be 57.22percentage , the literacy rate of NTFP collectors was found tobe only 20.45 per cent (482-271)\1032 x 100). The level ofliteracy of tribes is higher in Thiruvananthapuram region (60percent) and the lowest in the regions of Thrissur andKalpetta. It is also observed that the neo-literateprogrannms of the Government of Kerala have not made anysignificant impact in the tribal area. They should be taught

177Table 5.4
Level of Literacy
Total
5). Region] Tribal tribes Literate Level of Literacyllo. Co-unity above 5 Total Iithoat ---------------------------- -
years Literate education Priaary Secondary Collegegroup levelI TllIRUVlltll'l'lllPl)lll Ill.1 Ielai Pandaran 69 30 20 10 4 42 lanitkar 160 99 65 15 10 . 1Total Tlll. II. (a) 229 137 05 25 22 5
[100] [60](100) (62) (10) (16) (4)
ll nmssun (ll.3 lrular 111 I3 2 1 4 Paniyen 71 30 12 1 5 lalayan 108 73 29 6 1Total T(.'l. ll.(h) 290 124 43 0 I
[100] [43](100) (50) (35) (6) (1)III nmrra Ill.6 Iattunaicten 107 20 10 B 2 7 Paniyan 37 14 9 5 - 0 Iuruaar 75 47 20 l6 ll 9 Idiynn 64 25 15 6 4 10 lurichiyen 77 47 10 6 1
Total 111.. lll.(o) 360 153 64 23 1[100] [43]
(100) (42) (42) (15) (1)IV IDIIILY Ill.11 Iodnvan 103 47 34 ll 2 12 Hannah 50 21 16 5 -
Total 101. llll.((|) 153 60 50 16 2 [100] [44]
(100) (73) (23) (4)Grand Total 1031 462 271 149 55 7(a+lm:+¢l) [100] [47](100) (56) (31) (ll) (2)
lote:l. Figures in [ 1 brackets indicate total literatee in percentages.2. Piuurea in ( l hrackata indicate the aarcantaaan of the level

178
lessons pertaining to collection and marketing of NTFP.extraction methods of NTFP. marketing channels, healthdetails, bad effects of liquors. excessive chewing of tobacco,beedi etc.
5.1.5 Occupational Structure
Occupational structure exerts vital influence on thesocio-cultural character of a region and provides somebackground for formulating plans for their socio-economicdevelopment. The size of labour force, and sex-wiseparticipation in different economic activities reveal thenatural resource base. socio-cultural organisation, stage ofcivilization and development of a region. Table 5.5‘ depictsthe main occupational structure of all the tribes covered inthe study.
Table 5.5 reveals that of the total work force 768(1126— children in the age group of < 15~ Table 5.2). 622 areengaged in occupations (81 per cent) such as collection andmarketing of NTFP. cultivation. agricultural labour, forestry.collection and marketing of firewood, weaving, etc. The Tablepoints out that 52.4 per cent of the workers treat NTFPcollection as their main occupation. and 40.4 per cent aslabourers (Agricultural labour + forest labour). It is to benoted that 4 per cent of the tribes alone cultivate their ownland.

179
Table 5.5
Oocapatioaal Stnctm - Ilia
Oocapaliou - Iaapoadaata and fail) laabara3). Region] Tribal madlo. Couaaity ITFP Cultivators laboarara Samoa Otbar oocapatioa Total Total
lala rule hlo Paaala lala Paaala lala Puala Iala Paula hle Paula
I mnamummaa1 Ialai Paadaru 26 1|) - - 3 3 l - I!) 21 512 laainar 42 21 2 1 16 4 - - 3 3 63 29 92Total ml. mm as 39 2 1 )9 7 1' - 3 3 93 so 143(75) (2) (10) (1) (4) (100)
II (‘E15500 ll.3 Iralar 25 14 0 5 20 ll 3 2 56 29 054 Paaiyaa 4 4 - - 16 10 - - 1 - 21 22 435 lalayaa 11 - - 10 20 - - - 2 I) 33 66Total ('0. lI.(l)) 44 29 0 5 54 46 - - 4 4 110 - 64 194(30) (7) (51) (4) (100)
III nmrn II.6 lattuaickaa 36 25 - - l 3 - - - - 37 20 657 Paaiyaa 1 1 - - 11 6 - - 2 3 14 10 240 lama: ll 2 - - 16 10 - - l 1 20 21 499 lcliyaa 1 - - - 10 12 - - - - 11 12 2310 laricliyaa 5 2 2 2 17 7 - - - - 24 ll 5Total In. l.(c) 54 ll) 2 2 55 46 - - 3 4 114 62 196(43) (2) (52) (3) (100)
II l0IIll.l ll.ll Nam 20 )6 1 I 7 9 - - - - 36 26 6212 laaaaa 12 6 1 - 5 3 - - - - 10 9 27Total 10). 01(4) 40 22 2 l 12 12 - - - - 54 35 69(70) (3) (27) (mo)Gm! Total 206 120 14 9 140 ll) 1 - 10 11 371 251 622(a+Mc+1l) (52.4) (4) (40.4) (0.06) (3.14) (100)
Inigo‘ ‘inn:-an in lurnnikannn {Ilia}. aununinan On an halnl

180
A wide range of disparity could be noticed amongregions and tribes in the occupational structure. While thetribes of Thiruvananthapuram and Adimaly regions made theirboth ends meet through NTFP collection. the tribes of Thrissurand Kalpetta region mainly concentrate on agricultural andforestry work for their livelihood. Among tribes theKattunaikkan of Kalpetta region, Muduvans of Adimaly region,Malaipandaram and Kanikkars of Thiruvananthapuram region and
Irulars of Thrissur region mainly concentrate on NTFPcollection for meeting their day to day requirements.
5.1.6 Subsidiary Occupational Structure
Table 5.6 depicts the subsidiary occupation oftribes in the study region.
Table 5.6 points out that of the 599 tribes who wereengaged in different subsidiary occupations, 45 per cent treatNTFP collection and marketing as their subsidiary occupation.Among regions, 58 per cent of the tribes of Thrissur and 67per cent of the tribes of Kalpetta consider NTFP collectionand marketing as their subsidiary occupation and most of thetribes of Adimaly and Thiruvanananthapuram regions treatlabour income as their main subsidiary income.

181
Table 5.6
Occupational Stnctm - Subsidiary
Occupations - lospoadaat no fnily himSI. Iogioal Tribal Grandlo. Cuaaaity am Oaltivaton Labourers Otbor occupation Total Total
lalo Paulo bio hale lala halo hlo Paolo lalo halo Ialo Poaalo
I IIIRIJIIIHTIIPIDI ll.1 lalai Paadam 9 7 2 2 21 10 2 35 21 562 laaikkar 18 7 2 1 32 29 - 90Total Til. ll. 27 14 4 3 53 39 2 08 56 146(23) (5) (63) (4) (100)
11 ml Illa)3 Inlar 19 20 2 2 1|) )1 3 41 36 774 Paaiyaa 17 14 - - 2 3 6 20 23 435 lalayaa 16 15 I 1 12 0 - 1) 24 54Total TCI. ll.(h) 52 49 3 3 32 22 9 91‘ 83 174(56) (3) (31) (B) (100)
III HLPETII ll.6 lattaaaima 10 5 - - 10 5 1 2! 11 327 Paaiyaa 12 5 - - - - - 12 5 17B larnar 15 5 1 - 9 3 1 25 9 349 Him 24 16 - - 1 - - 25 16 4110 luiciiyaa 12 7 10 3 3 3 - 29 13 42Total In. .(c) 73 38 ll 3 22 ll 2 112 54 166(67) I9) (20) (2) (100)
ll IDIIILI ll.11 Ham 9 2 - - 27 14 21 46 37 0312 luaaa 6 1 2 1 11 0 1 11 3)Total 22!. ll“) 15 3 2 I 33 22 22 65 48 113(16) (3) (53) (23) (100)Gm! Iota) 167 104 20 10 I45 94 35 356 243 599Iamcil) (45) (5) (40) (9) (100)
Iota : Finns ia Pamthuo ialinto parentage to too grand total.

182
5.1.7 Children as NTFP Collectors
While comparing Table 5.2 with 5.3. it is clear thatchildren in the age group of 5-15 are also engaged in NTFPcollection and marketing. The total number of children < 15years was 358 and the survey showed that the number of infantsas 103. Hence it is understood that of the 255 children inthe age group of 5-15, 53 are engaged in NTFP collection (21per cent). Employing children in the field of collection andmarketing of NTFP may ultimately deny education to children at
the very younger age. It may be one of the major reasons forshowing a very poor literacy rate among NTFP collectors of thestate.
5.1.8 Type of Dwelling House
Table 5.7 depicts the type of dwelling houses of thetribes.
Table 5.7 indicates that 53.9 per cent of thehouseholds are having thatched houses. They are generallybuilt by bamboos and leaves of certain trees. Every year thethatched houses have to be repaired or replaced with newleaves and poles. Among regions, more than 50 per cent oftribes of Thrissur and Kalpetta regions are having tiledhouses for living. It is also observed that the plight ofthese tiled houses have become deplorable. Among tribalcommunities. considerable difference in the type of dwellinghnusmn were also noticed.

183
Table 5.7
Type of Dwelling House
31. Region/ Tribal Total Type of dwelling houseNo. Community households
Concrete Tiled Thatched Asbetose
I THIRUVANANTHAPURAM1 Malai Pandaram 15 7 8 2 Kanikkar 40 — 6 34Total TVM. RN.(a) 55 - 13 42(100) (23.6) (76.4)
II THRISSUR RN.3 Irular 33 12 214 Paniyan 17 1 13 35 Malayan 25 22 3Total TCR. RN.(b) 75 1 47 27(100) (1.3) (62.7) (36)
III KALPETTA RN.6 Kattunaicken 28 24 47 Paniyan 8 4 48 Kurumar 17 8 99 Adiyan 16 2 1410 Kurichiyen 15 8 7
Total KAL. RN.(c) 84 — 46 38(100) (54 B) (45.2)IV ADIMALY RN.11 Muduvan 25 5 1612 Mannan 15 1 14
Total ADI. RN.(d) 40 - 6 30 4(100) (15) (75) (10)Grand Total 254 1 112 137 4(a+b+c+d) (100) (0.6) (44) (53.9) (1.5)
Note : Figures in Parenthese indicate percentage to row total

184
5.1.9 Drinking Water Facilities
Table 5.8 depicts the drinking water facilitiesavailable to tribes in the study region.
Table 5.8 points out that 41 per cent of the tribalhouseholds collect drinking water from small ponds. 30 percent from well. 16 per cent from nearby river and 13 per centfrom pipe. Considerable difference in the collection ofdrinking water among regions are evident. Though theGovernment dug wells in some area. they were not properlymaintained. They were filled with leaves. poles. dusts etc.and so the tribes had to travel miles to collect drinkingwater. Water shortage is found to be very acute in Sholayoorareas where the tribes had to spent at least half a day tocollect drinking water from distant places.

185
Table 5.8
Drinking water Facilities
S1. Region/ Tribal Total tribal Type of drinking waterNo. Community households River Hell Pipe PondI THIRUVANANTHAPURAM1 Malai Pandaram 15 6 4 — 52 Kanikkar 40 - 13 — 27Total TVM. RN.(a) 55 6 17 - 32(100) (11) (31) (58)
II THISSUR RN.3 Irular 33 1 6 5 214 Paniyan 17 — 1 15 15 Malayan 25 2 23 - —Total TCR. RN.(b) 75 3 30 20 22(100) (4) (40) (26) (30)
III KALPETTA RN.6 Kattunaicken 28 14 8 5 17 Paniyan 8 1 7 - 8 Kurumar 17 9 5 - 39 Adiyan 16 — 2 6 810 Kurichiyen 15 9 2 1 3
Total KAL. RN.(c) 34 33 24 12 15(100) (39) (29) (14) (18)IV ADIMALY RN.11 Muduvan 25 - 5 - 2012 Mannan 15 - — — 15
Total ADI. RN.(d) 40 — 5 — 35(100) (12) (88)Grand Total 254 42 76 32 104(a+b+c+d) (100) (16) (30) (13) (41)
Note : Figures in Parentheees indicate percentage to row total

186
5.1.10 Land Holding and Cultivating Area
The study points out that all tribal households arehaving land of their own. Considerable difference in holdingsare revealed in Table 5.9.
Table 5.9 points out that 45 per cent of the tribalhouseholds are having land less than one acre and 12 per centof the households keep above 3 acres) However. the averageholdings of a tribal household is 1.26 acres. Significantdifference among regions in the holdings were also noticed.The tribes of Thiruvananthapuram and Adimaly regions hold 1.79
and 1.71 acres respectively whereas it is 1.22 and 0.75 acresat Thrissur and Kalpetta regions respectively. Significantdifference in cultivating areas of the regions and tribalcommunities within and among regions were also noticed. Ofthe total holdings 53 per cent of the area alone were broughtunder cultivation. As per record4. 55.59 percentage of thetribal households of Kerala have holdings above 4 acres.
4 Government of Kerala (1992). Notes on Scheduled TribesDevelopment in Kerala, Directorate of Scheduled TribesDevelopment, Thiruvananthapuram, p.24.

187
Table 5.9
Land Holdings and Cultivating Area
TotalTribal Average AverageSl.Region/ Tribal Households Size of the area holdings Cultivat:No.Community (Nos.) (acres) area< 1 1 to 2 2 to 3 3 and (acre:acre acres acres aboveI THIRUVANANTHAPURAM1 Malai Pandaram 15 6 — 9 - 1.5 0.52 Kanikkar 40 4 16 13 7 1.9 1.0Total TVH. RN.(a) 55 10 16 22 7 1.79 0.86(100) (18) (29) (40) (13) [48]
II THISSUR RN.3 Irular 33 11 5 6 11 2.19 1.54 Paniyan 17 3 14 — - 0.83 0.355 Malayan 25 23 2 0.20 0.20Total TCR. RN.(b) 75 37 21 6 11 1.22 0.81(100) (49) (28) (8) (15) [66]
IIIKALPETTA RN.6 Kattunaicken 28 28 — - - 0.10 0.007 Paniyan 8 7 1 — — 0.23 0.108 Kurumar 17 9 6 1 1 1.03 0.759 Adiyan 16 15 1 — — 0.4 0.4010 Kurichiyen 15 1 5 3 6 2.3 2.0
Total KAL. RN.(c) 84 60 13 _4 7 0.75 0.27(100) (71) (15) (5) (9) [36]IV ADIHALY RN.11 Muduvan 25 8 6 6 5 1.53 1.2512 Hannan 15 - 7 7 1 2.00 1.63
Total ADI. RN.(d) 40 8 13 13 6 1.71 1.39(100) (20) (33) (33) (14) [81]Grand Total 254 115 63 45 31 1.26 0.67(a+b+c+d) (100) (45) (25) (18) (12) [53]
Notezl. Figures in (
2. Figures in [
) brackets indicate percentage to total tribal households.
] brackets indicate percentage to Average holdings.

188
Kunhaman (19e9)5, Mohan Das (1992)5. and Kumaran (1993)7 all
projected the case of land alienation in the tribal economy ofKerala. Mohan Das reveals that 46.44 per cent of the areapossessed by tribes in Wayanad (Kalpetta region) prior to themigration of the settlers were alienated. On account of thisphenomenon the land under the custody of tribes is very lessfor cultivation.
5.1.11 Family Expenditure
The expenditure pattern of tribal households wasanalysed and the same was presented in Appendix IV.
The analysis shows that 55 percent of the tribalhousehold expenditure is on food items. Even though not muchdifference is seen on expenditure on food among tribalhouseholds and comunities of Thiruvananthapuram, Thrissur and
Kalpetta regions, wide difference was noticed in this respectamong the tribal families of Adimaly region. They spent 60
5 Kunhaman, M. (1989). Development of Tribal Economy.Classical Publishing Co.,New Delhi.
Mohan Das (1992), Impact of New Settlers in Western GhatRegion on the Socio—economic Conditions of the TribalPopulation— The Case of Wayanad District. KeralaAgricultural University, College of Co-operation andBanking. Kerala.
7 Kumaran. (1993). Kerala Tribal Land Act: Problems andPerspectives- An Empirical Study with Reference toWayanad. Project Report submitted to Dept. of Eaw. CochinUniversity of Science and Technology.

189
per cent of their income on food items. It was also noticedthat about 4 to 10 per cent of the expenditure on food was onaccount of the ‘eating out’ habit of the tribes. Next to foodcomes liquor and that accounts about 12 per cent of thehousehold expenditure. Liquor and tobacco chewing togetheraccount 21 per cent of the total expenditure and recreationand festivals celebrations together. 7 per cent. Only one percent of their income was spent on medical purpose. The use ofMedicinal herbs by the tribals and free availability oftreatment in Ayurvedic and Allopathy hospitals may be thereason for spending very negligible amount on medicinalpurposes. The survey showed that the nearest institutionfunctioning within a radius of one kilometre in the tribalarea is liquor shop. Figure 3 gives the break-up of thetotal expenditure of the tribal households.

190
Family Expenditure Break-up
Food65%
Fesuvam
Reofgguon3%
Eaung out335 Clothing8%
Medmal
Liquors Tobacco 1%21%
Figure 3

191
5.2 Basic Facilities Index (BFI) of Tribal Households
Kerala displays a set of unusually high developmentindicators in the field of literacy. life expectancy. infantmortality and birth rate. The Physical Quality of Life Index(PQLI) of Kerala is very high to any of the states in thecountry8 and any low income countries9 of the world. Asregards to the provision for basic services since the 1970sshowed that the state stands first in all—weather roads. postoffices. bus stops. primary schools, secondary schools, rationshops. health dispensaries and health centres within twokilometers of every householdlo. It is also observed thatwithin five kilometers we have higher education facilities.hospitals. fertilizer depots, agriculture pump repair shops.veterinary dispensaries, credit co-operative banks and otherbanksll. While we claim these as advantageous so far noattempt has been made to assess the availability of thesebasic facilities in the tribal areas of Kerala. Table 5.10indicates the average distance of basic facilities from thetribal households of Kerala.
12 Richard W. Franks and Barbae H. Chasin. (1992). Kerala.Development through Radical Reform. Promilla and Company,New’Delhi, in collaboration with the Institute for Foodand Development Policy. San francisco. p.10.
9 Ibid.....p111° Ibid . . . . . ..p 1311 -..- -_

192
Table 5.10
Average distance of Basic Facilities from the TribalHouseholds
Sl.No _basic facilities Distance(in kilometer)
1. Ration shop 3.102. Provision shop 2.443. Health centre 6.714. Primary school 4.245. Secondary school 8.716. Post office 3.547. ‘Liquor shop 2.178. Tribal co—operative societies 7.719. Drinking water facilities 3.3410. Electricity 3.1011. Co-operative banks 9.3612. Other banks 10.32Source: Compiled from the records of Tribal Co-operative
Societies. Government Records and from the Primarydata of 254 tribal households.
Table 5.10 points out that none of the basicinstitutions under reference is within two kilometers oftribals households or hamlets. The nearest institution, asalready been pointed out is the liquor shop. It was revealedthat most of these liquor shops are the illicit sale centres

193
of arrack contractors. The second nearest institution to thetribal area is private provision shops. They also exploit thetribes by supplying inferior quality products at exhorbitantprices. They also collect NTPPB from tribes. Primaryschools. secondary schools. tribal co—operative socieities areknown in the vicinity of tribal households. If transportfacilities are made available that will reduce the effect ofdistance. It will facilitate mobility for the tribal people.That will also help them to market their NTFP. Therefore itis proposed to develop a basic facilities index with thefollowing factors to compare the basic facilities available inthe tribal households of the four regions of the SC/STFederation.
1) The average distance (Km) of each institutionfrom the tribal hamlets.
2) The availability of transport facilities and
3) Assigned score to these basic facilitiesaccording to the importance assigned by tribalhouseholds under study.
The effect of distance on basic facilities isbrought through reciprocals. transport facilities through 3and the tribals importance to each basic facility is scored(based on the survey result of 254 tribal households). Themodel developed to assess the Basic Facilities Index is

194
_ 1B“ " xwwere
BFI = Basic Facilities Index
a = The ideal distance where all facilities areavailable. For items 1-7, a is treated as 2and for items 8-13 a is 5 (see table 5.11).
B = Measure the availability of transportfacilities in tribal hamlets. The value offl is either 1 or 0
d = The average distance (Km) of each basicfacility from the tribal households and
W The assigned score value of each basicfacility.
The scores assigned to each basic facility is given1 Table 5.11.

195
Table 5.11
Basic Facilities and Scores Assigned
3;‘ Basic facilities ScoresI-* Ration shop 10
Provision shopHealth centre
Primary school
Secondary schooll\JO\\l(DmPost office
Liquor shop (within 2 Km) IO1
Tribal Co—operative Societies|OOJ\'lOIUl-b(.n)t\) Drinking water facilities9 0 Electricity0-‘ I-‘ Co-operative banksI-* N QJU'|O1\I03Other banks
9- OJ Liquor shops (within 5 Km) -3
The data collected from the 254 tribal householdswith respect to the basic facilities from the four regions ofthe SC/ST federation which cover the entire state have beenfitted in the model and the result of the study is given inTable 5.12.

196
Table 5.12
Basic Facilities Index (BFI) of Tribal Households
Sl.No Region/Tribal household BFIA Thiruananthapuram RegionTME 23TEF 12TLB 26Region Total (A) 21B Thrissur RegionTHE 37TEF 21TLE 37Region Total (B) 32C Kalpetta RegionTME 37TE? 31TLE 19Region Total (C) 30D Adimaly RegionTME 21Grand Total 27
(A+B+C+D)Grouping TME 29TE? 23TLE 28
Table 5.12 indicates that the BFI of the tribalhouseholds in the state is 27 and the BFI ofThiruvananthapuram and Adimaly regions are seem to be thelowest. It is also observed that there is inter and intradifferences in BFI between and among regions.

197
Part II
5.3 Profile of Tribal Co-operative Societies
Methodologically ten Tribal Co—operative Societiehave been selected for the study. Achencovil TCS, PottamaxTCS and Njaraneeli TCS were selected from Thiruvananthapure
region as more effective, effective and less effectixsocieties respectively. Malampuzha TCS. Sholayoor TCS anPalappilly TCS were selected as more effective. effective atless effective TCS from the Thrissur region. Sultan BatteiTCS. Tirunelli TCS and Kannavem TCS represented Kalpetiregion as More Effective (ME) effective (BF) and 1e:effective (LF) societies from Kalpetta region. Though the:are seven TCS which engage in the collection and marketing <
NTFP in the Adimaly region by 1993-94, the Adimaly TCS alot
has a ten year continuous trade record in collection atmarketing of NTFP in that region and in performan<(collection and marketing) it secured 4th rank, in the stateTherefore the Adimali TCS alone was selected from that regi<and designated as more effective TCS.
5.3.1 Area of Operation and Coverage on Tribes
The area of operation of TCS and the total number <
tribes in that area and the coverage of TCS etc. are depictcin Table 5.13.

Tahl} 3
lm of Operation of the Selected TCS 1993-94
lumber of ITFPlo.of Area of Forest Tribes in lenhers 0 HTTP t collector
51 Regions PanchayatePanchayat Ranges the area in TCS (7 to 6] Collec- (9 to 7) in triballo. (lo.) (Sq.K|.) covered (los) (Nos) tors(losl household1 2 3 4 5 6 7 0 9 10 11I Trivandrun ll.IE 2 326.7 2 699 160 24 04 50 100
BF 1 217.9‘ 2 2492' 120 5 40 30 130L3 1 217.9‘ 4 2492' 720 29 10 253
Total 19! Rn.(al 4 544.6 0 3191 1000 32 179 10 403ll Thrissur RII 4 350.0 3 7077 961 14 300 40 265
E? 2 564.2 1 14721 1457 10 350 24 240LE 2 205.9 4 039 667 79 225 34 250
Total TC! Rn.(h) 0 1120.9 0 17243 3005 10 955 31 755llIKalpetta RI .I 2 353.2 2 13107 1323 10 1250 94 350EF 1 201.1 2 9153 607 0 125 10 291L2 2 61.7 1 2106 635 29 56 9 200
Total KIL Rn.[c) 5 616 5 24446 _ 2645 11 1431 54 041IV ldilaly llIE 3 302.1 3 4922 1412 29 200 14 395
Total 10 Rn.(d) 3 302.1 3 4922 1412 29 200 395Grand Total 20 2671.6 24 49002 0150 2765 34 2474(a+b+c+d)
Society SroupingeIE 11 1420.0 10 20411 3064 19 1914 50 1110If 4 903.2 5 26366 2264 9 515 23 661L0 5 405.5 9 5517 2022 37 356 10 703
Source: ltens 3,4 and 6 are conpiled Iron the census report 1991. series 12 paper-3 of 1991,Director of Census Operation. lerala.
- ltens 5.7.9 and 11 ere conpiled tron the record of reepective trihel co-operativeSocieties nnder study for the year 1993-94.
late 1. ' Sane panchayat end trihel populationfor polonavn {E1} and ljaraneeli (LP) TCS for ITPP collection.
2.lE-stands for more efficient tribal Society. BF-Efficient TCS, LE-Less efficient ICS.

199
For collection and marketing of NTFP, the Achencovil
TCS covers two panchayats viz.. Aryankavu and Piravathoor ofKollam district. the Potamavu and Njaraneeli TCS cover thePeringanmala panchayat of Thiruvananthapuram district. Theresearcher found that since there was overlapping of area inthe functioning of these two TCS, the TCS could not exerciseproper control in the collection and marketing of NTFP fromthis panchayat.
The Malampuzha TCS covers four panchayats viz..Akathethara, Malampuzha, Pudupariyaram and Pudussery ofPalakkad district. The Sholayoor TCS covers Sholayoor andPudur panchayats of Palakkad district. The Palappilly TCScovers the Varandarappally and Mattathoor panchayats ofThrissur district.
For the collection of NTFP the Sultan Battery TCS ofKalpetta region covers two panchayats viz., Noolpuzha andSultan Battery. The Thirunelly TCS covers only one panchayatof Wayanad district viz.. Thirunelly. However, the KannavamTCS of Kalpetta region covers two panchayats of Kannurdistrict viz.. Pattiam and Chittariparamba for the collectionof NTFP.
The Adimaly TCS of Adimaly region covers threepanchayats of Idukki district for the collection of NTFP viz..Mannamkandam. Pallivasal, Vellathooval and part of Kuttampuzha
panchayat also.

200
Table 5.13 also points out that. of the totalmembers of TCS only 34 per cent of tribes alone go for NTFPcollection in the area designated to them. The coverage ofTCS on the area of operation seem to be very poor i.e.. 16 percent of the tribes alone have become members in TCS.
While examining the region wise details it is veryevident that the coverage on tribal population by TCS iscomparatively better in Thiruvananthapuram region and verypoor in Kalpetta region. But the per cent of NTFP collectorsto total members in TCS showed a reverse result. The Kalpettaregion stands first by 54 per cent and Thiruvananthapuramstands the lowest by 18 per cent.
While examining the area covered by TCS. theThrissur region stands by 1128.9 Sq. Km. and the Kalpettaregion by 616 Sq. Km and 544.6 Sq. Km. by Thiruvananthapuram
region.
The efficiency-wise analysis showed a veryinteresting picture. Though the coverage of more efficientTCS on tribes in the area is only 19 per cent. 50 per cent ofthe members are engaged in collection and marketing of NTFPfrom that area. In case of efficient TCS. only 9 per cent ofthe tribes in the area were covered by TCS, even though 23 percent of the members are engaged in NTFP collection andmnrlrnf-inn nnf in 1-ho r-Ann n'F fha lanai‘ nffinianf TFR fhnnnh

201
the coverage on tribes as compared to the other two classesare more (37 per cent), the percentage of members who engagedin NTFP collection is only 18 per cent.
Though the highest number of tribes are seen inKalpetta region (24446). the coverage of TCS on tribes in thisregion is only 11 per cent.
5.3.2 Objectives of Tribal Co-operative Societies
In addition to the main objectives of collection andmarketing of Non-Timber forest produces. the TribalCo-operative Societies were established with the followingobjectives.
1 To carry out tribal welfare schemes and to develop savinghabits. self reliance and co—operation among themembers.
2. To receive money from individuals, institutions andgovernment to carry out the vested aims of the society.
3. To supply necessary agricultural inputs such as seed.chemical fertilizers. pesticides. agricultural implementsetc. to members for the development of agriculture.
4. To give short, medium and long term loans to members forcultivation of land.
5. To promote bee—keeping. poultries. animal husbandry etc.and

202
6. To supply necessary consumer items to members byestablishing consumer stores.
5.3.3 Functions
The TCS have undertaken a number of functions to
carry out their objectives. But since 1977-78 the onlyfunction that has been carried out by the TCS collection andmarketing of NTFP from their area.
The Achencovil TCS was registered in 1980. Till1989-90 it met some of the credit requirements of members too.But due to over dues the same facilities could not beextended. It supplies consumer items through collectionagents of NTFP. The Potomavu TCS was registered in 1976 with
the main objective of undertaking forest job for the benefitof tribes. It also undertake agricultural operations in thetribal land by employing the tribes at specified wages.One—third of the agricultural produce was distributed amongtribes. The surplus if any, of agricultural produce weredistributed among the tribes as bonus according to their wagesdrawn from TCS. The main agricultural crop cultivated wastapioca. But the system was stopped by 1986-87 due tonon—co-operation of tribes. The only function which the TCSnow perform the collection and marketing of NTPP from itsarea. To collect these items, advances were given to tribesthrough Board of Directors. But due to non—payment of

203
advances by Board members to tribes. the system of advancingcash to tribes is now vested with the of secretary of the TCS.The Njaraneeli TCS was registered in 1979 with the objectiveof collection and marketing of NTFP from its area ofoperation. Till 1989~90, it gave credit to members and laterthe system stopped due to heavy over dues.
The Malampuzha TCS which was registered in 1976 had
undertaken agricultural operations at Chavadippara in 15 acresof land with the help of agricultural department for thebenefit of tribes. It cultivated ground nut, paddy.vegetables and ginger. In Anakkallu also the TCS supervisedthe 15 acre rubber plantation of the tribes. In Achankovilalso the society with the participation of tribes cultivated20 acre land with ground nut, and paddy. But due to theftfrom its own members, the society was forced to stopcultivation there. The secretary of the TCS revealed theresearcher that every year each cultivating tribal family wasgiven Rs.1000/— as bonus for celebrating the festival.However. the operation of the TCS is now confined only to thecollection and marketing of NTFP from the ranges alloted toit. All the agricultural operations had been suspended due tonon-cooperation of tribes. The Sholayoor TCS was registeredin 1961. It was started as a Multi—purpose co—operativesociety allowing even the non-tribes to become members in thesociety. During 1977 it was converted to a TCS. Till 1991-92the TCS distributed consumer goods and extended credit

204
facilities to members. But due to non—cooperation of members
in remitting their dues, the facilities had been suspended.The TCS now confines only to collection and marketing of NTFPof the members.
The Sultan Battery TCS of Kalpetta region wasregistered in 1959 as a TCS mainly to undertake forest job byemploying tribes. Now its main function is confined tocollection and marketing of NTFP of members. Till 1990-91 the
TCS used to give loans to tribes. But due to overdues, thesystem had been stopped. The TCS has a very good consumerstore situated near the office of the society. It suppliesproducts of all varieties required by the tribes. Credits arealso allowed and the value of the provisions is adjustedagainst the price of NTFP.
The Thirunelli TCS was registered in 1975 as acredit society for tribes. Since 1977-78 its operations aremainly confined to collection and marketing of NTFP from thedesignated area.
The Kannavam TCS was registered in 1974 as a jointfarming society. But since 1977-78 its main function isconfined to collection and marketing of NTFP from the area forits members.

205
The Adimaly TCS of the Adimaly region was registered
in 1956 primarily as a credit society. But since 1977-78 itsfunction is confined to collection and marketing of NTFP fromits area of operation.
While analysing the objectives and functions of TCSin the study area it was found that the only functionundertaken by the TCS is collection and marketing of NTFP from
their area of operation. Even though a lot of otherobjectives were also framed to enhance the production in thefield of agriculture. dairy. and other areas, none of theseobjectives is carried out by TCS mainly due to heavy overduesin TCS.
5.3.4 Share Capital of tribal Co-operatives
Tribes are considered as A class members and theinstitutional agencies are treated as B class members of thesocieties. The value of an A class share is Rs.10/— whereasit is Rs.100/- for B class members. In addition to the directcontribution towards the share capital of the TCS. thegovernment also indirectly contribute 90 per cent of the costof share capital of the tribal members. Tribes needcontribute only Rs.1/— to get memberships from TCS.

206
5.3.5 Sources of Funds
The funds of the society comprises of the following.1. Share capital contribution from members.2. Working capital grant from Tribal Welfare Department and
Co—operative Department.
3. NTFP advance and NTFP stock Advance from SC/STfederation.
4. Borrowings and Deposits.5. Donations6. Reserve fund and7. Agriculture Development grant from Agriculture
Department.
It is observed that the working capital position ofalmost all less effective and effective TCS is very poor.Most of the TCS depend on NTFP advance and NTFP stock advanceto collect and market NTFP in the state.
5.3.6 Management and Administration
The management of TCS is vested in the hands ofBoard of Directors elected from among the members of thesociety. The minimum number of the Board of Directors isseven and the maximum. eleven. In addition to elected Boardmembers. two ex-officio members are selected at the discretion
of the TCS. The ex-officio members may be persons who have

207
some interest in the activities of the TCS. Generally theTribal Extension Officer or Unit Co-operative Inspector orRange officer or any officer from Agricultural Departmentwould be selected as ex-officio members of the society. Theterm of office of the Board of Directors is 3 years from thedate on which they assume office. The day-to-dayadministration of the society is carried out by the secretaryand other employees of the societies in consultation with theBoard of Directors.
While examining the management of TCS in the studyarea it was found that all Boards are democraticallyconstituted. But most of them are based on politics. TheBoard of Directors do not have any knowledge about eitherco—operation or politics. They act either to the tune ofsecretaries of TCS or to the tune of politicians. In factthey are not the members of TCS. The influence of secretariesand their politics were also observed in the constitution ofBoard at least in four TCS under the study.
5.3.7 Staff Position
The staff position of TCS under the study isdepicted in Table 5.14.

ZUB
Table 5.14Staff Position in Selected TCS 1993-94
Trihel steifSI. Regions] Pernenent Colle- Total ------------------- -- lonlo. TC5 Staff ction Perleaent Collection TribalAgents lgents StaffI Trivendrun Bl.IE 2 2 4 - - 4BF 2 4 6 - - 6LE 2 4 6 1 2 3Total TV! In.(al 6 10 16 I 2 13
II Thrissnr RNIE 4 15 19 l - 18BF 1 6 7 - - 7LE 2 4 6 - 1 5Total TC! Rn.(b) 7 25 32 1 l 30
Illlalpette 2]IE 2 4 6 - - 6BF 1 10 11 - 6 5LE 2 3 5 2 3 Total KAL ln.(cl 5 17 22 2 9 11
IV ldinely RNHE 3 16 19 - 12 7Total IDI ln.(d) 3 16 19 - 12 7Grand Total 21 68 B9 4 24 61fa+b+c+dl (100) (5) (27) (68)Society GroupingsIE 11 37 48 1 12 35ET 4 20 24 - 6LB 6 ll 17 3 6 8
Source: Coepiled from the records of TCS in the study region 1993-94.
Iote : Figures in parentheses indicate percentage to row total.I - lore effective TCS BF - Effective TCS LB - Less effective TCS

209
Table 5.14 points out that the average number ofpermanent staff in a TCS is two. Of the total staff who areengaged in the collection and marketing of NTFP, 68 per centare non—tribes. All TCS except Kannavam TCS have non—tribesas secretaries. It is found that the TCS even did not like toappoint tribes as collection agents. To a query allsecretaries pointed out that they tried with the tribes ascollection agents, but they were found inefficient andirresponsible. The Adimaly TCS as a matter of policy appoint
their own Board of Directors as collection agents in therespective cdT1ection centres of the society.
The table also highlights that the staff position inmore effective TCS are far ahead than effective and lesseffective TCS. The number of collection agents in moreeffective TCS have come to 48 whereas it was only 41 ineffective and less effective.
5.3.8 Own Building and Godown
It is observed that all Tribal Co-operativesocieties except the Achancovil of Thiruvananthapuram regionand Tirunelly of Kalpetta region own their own officebuildings and godowns. But the godowns which they possessedare inadequate to accommodate all their collections of NTFP.One of the major problems they all highlighted was theinsufficient godown facilities which they had. So most of the

210
societies even did not encourage the tribes to collect theroot items especially in rainy season. If they collect. thesociety may be forced to keep the items outside. and they maybe subjected to rain and hot and that will affect the quantityand quality of the product. This will force the traders orAyurvedic medicinal manufacturing units, to keep away fromparticipating in the auctions of NTFP conducted by TCS. Thisinvariably force the TCS to sell the product at a throw-awayprice. The researcher observed accumulation of decayed itemsof NTFP mainly root items. piled in the premises of Sholayoor.Kannavam Njareneeli and Potomavu TCS.
5.3.9 Tribal Colonies. Collection Depots and TransportFacilities
It was observed that all tribes live in colonies.The number of houses in a colony may vary from 3 to 28.Almost all colonies are headed by Moopans who is supposed tohave a say in matters relating to marriage, rituals, death orbirth etc. in colonies. But as regards to the economicaspects of families viz.. collection and marketing of NTFPS.agricultural labour or any financial schemes undertaken byhouseholds, the Moopans generally will not interfere.However, he will keep an over all control in the colony.Since most of the colonies and the tribal land holdings are‘near to forest. alienated from the main land. They do nothave proper irrigation. transport, communication or marketing

211
facilities. Since the colonies are always subject to attackfrom wild animals. most of the tribal families do not like tocultivate their land. Since the colonies are far away fromthe office of the tribal co-operative societies. the TCS needto set up NTFP collection centres either near to their tribalcolonies or in a place commonly agreed upon by tribes.Appendix gives an overall picture about the number ofcolonies covered by TCS, collection depots, the distance andtransport facilities within the area of operation of TCS andcolonies.
Table 5.15
Average Distance of Tribal Colonies fromthe Head Office of the TCS
No. of Tribal ColoniesAverage Thirudistance anantha— Thrissur Kalpetta Adimaly Total(Kms) puram< 10 9 10 10 -— 29(56) (6) (5) (7)10-20 , 3 24 93 —— 120(19) (14) (50) (31)20-30 4 —— 83 20 107(25) (45) (100) (27)30 and —— 134 —— —- 134above (80) (35)Total 16 168 186 20 390Colonies (100) (100) (100) (100) (100)Sourcezsurvey Data.Note : Figures in parentheses indicate percentage to columntotal.

212
Table 5.15 indicates that the tribal colonies afar away from the premises of tribal co-operatives undstudy. Of the 390 tribal colonies which come under the arof operation of 10 TCS. only 7 per cent are situated in lethan ten kilometer distance of the tribal co-operatisocieties. Since the TCS are far away from the coloniestribes it naturally affects the participation of tribeRegion—wise differences are also noticed.Thiruvananthapuram region 56 per cent of the colonies are neto the office of the TCS, whereas in Thrissur region 80 pcent of the colonies are far away from the office of TCS. Ein Kalpetta region 50 per cent of the colonies are 10 tokilometers away from tribal co—operative societies.Adimaly region all the 20 colonies are 20 to 30 kilometeaway from TCS. This shows that the TCS are far away from ttribal activities. It may be one of the reason for pcparticipation of tribes in TCS.

213
Table 5.16
Number of Collection Depots
Tribal Regionsco-opera- Thiru—tive anantha- Thrissur Kalpetta Adimaly Totalsocieties puramME 3(3) 14(3) 5(2) 18(4) 40(12)
[491
EF 6(1) 7(1) 15(1) —— 28(3)[35]LE 3(1) 4(2) 6(1) 13(4)[16]
Total Colle- 12(5) 25(6) 26(4) 18(4) 81(19)ction depots [100]Note :1. Figures in ( ) indicate number of collection depots
are of in permanent nature. All other collectiondepots are temporary/seasonal in nature.
2. Figures in [ ] indicate percentage to column total
Table 5.16 highlights that altogether 81 NTFPcollection centres/depots are operating in the four regionsunder the study. Of which 49 per cent are owned by moreeffective tribal co—operative societies. The less effectivetribal co—operative societies are operating with 13 collectioncentres. It was also observed that the more effective tribalco—operative societies are having 12 permanent collectioncentres, averaging 4 to collect NTFP through out the year.whereas it is only three in more effective and four in lesseffective TCS. The number of collection centres and thenature of collection centre are also playing a very importantrole in the collection of NTFP in the tribal areas.

214
Table 5.17
Distance of Collection Depots from TCSDistance in Km.
Region/No.of collection depotsThiru~ _Distance anantha— Thrissur Kalpetta Adimaly Total(Kms) puram< 10 3 3(25) (4)10-20 9 4 26 39(75) (16) (100) (48)20-30 030 and 21 18 39above (84) 100) (48)Total co1le- 12 25 26 18 81ction depots (100) (100) (100) (100) (100)Note : Figures in parenthesis indicate percentage to columtotal.
Table 5.17 points out that only 4 per cent of thcollection depots are at a distance of less than 10 Kms. an48 per cent of the collection depots are at a distance of 1to 20 kms. However, 48 per cent of the collection depots arat a distance of 30 Kms. and above from the head office 0TCS.

215
5.3.10 Collection depots and Transport facilities from TribalHouseholds
Table 5.18 points out that of the 81 collectiondepots, 40 are connected by bus route within 3 kms. of thetribal colonies. It is observed that the transport facilitiesavailable to effective and less effective TCS are higher whencompared with more effective collection depots. It may be oneof the reasons for leaking out NTFP-to private traders.
5.3.11. Distance of Principal Private NTFP Marketing Shop fromthe Collection Centres of Tribal Co-operative Societies
It is also observed that the principal marketcentres of NTFP for more effective TCS of Thiruvananthapuramand Thrissur regions are about 40 to 70 kms. away from theircollection centres. But as regards to more effective TCS ofKalpetta and Adimaly regions, the principal NTPP privatemarketing shops are within one kilometer of the collectioncentre. The remoteness and nearness of private marketingshops- both are disadvantages to tribes who wish to markettheir products illicitly through private traders. Hence thetribes of more effective TCS force to market their producethrough co-operative channel. But in the case of effectiveand less effective tribal co-operatives their depots are somewhat connected by bus routes and the principal privatemarketing centres are not as far as the selling centres of

Table 5.18
No.0! Collection Depots Raving Transport facilities (has) Iitbin 3 ts. tron tribal colonies
llliruvananthapuran Thrissnr llalpetta Mliaaly Grand total
Total Having Total Having Total Having Total llaving Total HavingCollectionTransport Collection'l'ransport CollectionTrensport Collectionhansport Collectioifiransport
Depots Facilities Depots Facilities Depots Facilities Depots Facilities Depots FacilitiesIE 3 H 5 5 3 16 3 4|} 11(28)El‘ 6 5 7 2 15 10 28 17(42)LE 3 3 4 3 6 6 13 12(30)
Grand 12 8 25 10 26 19 18 3 B1 40Total (100)lots: Figures in Parentheses indicate percentage to grand total collection depots.

216
more effective TCS. there is every chance to leak the NTFP tothe hands of private traders.
5.3.12 NTPP Collection by the Tribal Co—operatives under Study
The study brings to light that there is significantdifferences among regions and tribal co-operatives in thecollection and marketing of NTFP items. The region wisedifference indicates that there is difference in theavailability of different herbs in regions. The itemsgenerally collected by tribal co—operative societies are givenin Appendix V. Even though about 120 items have been listedas NTFP for collection, the TCS collect only less than 50 percent of the listed items. The survey among tribes point outthat the TCS are not engaged in collecting all the itemscollected by the tribes. Most of the societies point out thatcollection of certain items always amount to loss to them.This attitude of TCS force the tribes to sell these items tothe private traders. This may ultimately lead to leak all theNTFP collected by tribes to private traders. On an average aTCS collects only 14 to 21 items notified in the NTFP list bythe NTFP committee.

217
5.3.13 Collection and Marketing of NTPP by TCS Selected forthe Study 1982-83 to 1993-94
Table 5.19 depicts the collection and marketing ofNTFP by the TCS selected for the study. They collect producesdirectly from tribes and market the same through thedesignated channels.
Table 5.19
Collection and Sale details of NTFP by TCS Selected for
the Study 1982-83 to 1993-94
Collection chargeCollection Sales valueYear charge (Rs) (Rs) ::1g:r3:?fi:g° to1982-83 527901 714638 74
1983-84 574157 906647 631984-85 1006330 1811227 561985-86 1381516 2220111 621986-87 1524150 2085391 731987-88 1767920 2558939 691988-89 1460926 2201785 661989-90 1167207 1741164 671990-91 1725342 2546977 681991-92 2046884 3385152 601992-93 4316035 6281144 691993-94 4925000 7078000 69Source: Compiled from the Records of TCS from 1982-83 to
1993-94.

218
Table 5.19 points out that the tribals were able toget only 60 to 74 per cent of the sales price of NTFP ascollection charge from 1982-83 to 1993-94. The tribals sharefrom sales price all over the years showed a fluctuatingtrend. As per the system, the tribal collectors of NTFP areeligible to get 80 per cent of the sales value of NTFP ascollection charge. but it was found that in none of the yearsthe tribal co—operative societies was able to give at least 75per cent of the sales value as collection charge.
5.3.14 The Region-wise Average Collection and Marketing ofNTFP by a TCS from 1982-83 to 1993-94
The average collection and marketing value of NTPPby a TCS from the study region during the period 1982-83 to1993-94 is given in table 5.20.

219Table 5.20
Average Collection Charge paid and SalesValue received by TCS for NTFP
1982-83 to 1993-94
CollectionS1. Regions/ Collection Sales chare asNo. TCS charge value % to sales(R5) (R5) valueI Trivandrum RN.ME ' 185521 251946 74
EF 103015 137844 75LE 47086 59210 79
Region total(A) 335622 449000 75II Thrissur RNME 581491 923915 63
EF 108742 220088 49LE 116823 192066 61
Region total(B) 807056 1336069 60IIIKa1petta RNME 385914 501820 77
BF 184833 289386 64LE 34809 76353 46
Region total(C) 605559 867559 70IV Adimaly RNME 142618 190168 75
Region total(D) 142618 190168 75Society groupingsME 323886 466962 69.3
EF 132197 215773 61.3LE 66239 109210 60.6
Grand total(A+B+C+D) 1890855 2842796 66.5cc-....____.___—.-—¢....—_.___._____.-pa-o-o_.--—.--..-——_.___.______
Source: Compiled from the records of TCS from1982-83 to 1993-94.

220
Table 5.20 points out that the average collectioncharge paid by a TCS for NTFP collection is 66.5 per cent.Region-wise analysis indicates that the more effective TCS ofthe Thiruvananthapuram. Kalpetta and Adimaly region paid more
than 75 per cent of their sales value as collection charge totribes. The Njaraneeli TCS of Thiruvananthapuram region is anexception among less effective TCS, which paid 79 per cent oftheir sales value as collection charge. However, it isobserved that almost all less effective TCS paid only lessthan 66 per cent of their sales value as collection charge totribes.

COLLECTIONAND MARKETING OF NTFP BY TRIBES

CHAPTER VI
COLLECTION AND MARKETING OF NTPP BY TRIBES
6.1 Introduction
The right of the tribals for NTFP collection fromthe Kerala forest was recognised from the year 1977-78.Though the tribes enjoy the monopoly right to collect NTFPfrom the forest, they are obliged to market the produce onlythrough their own organisations i.e., Tribal Co—operativeSocieties. The monopoly procurement of NTFP through TCS wasintroduced with a view to liberate the tribes from theexploitative practices of private traders and to ensure areasonable return for their produce. In this chapter it isproposed to examine the marketing channel of NTPP of tribes,the effectiveness of co—operative channel and the price spreadunder co—operative and non co-operative channels and theimpact of income from NTFP collection on the total life of thetribes in the state.
Methodologically tribal co—operative societies havebeen classified as more effective, effective and lesseffective. Hence the tribes of more effective. effective andless effective TCS have been abbreviated as THE, TEF and TLE
respectively.

222
The TCS of the Thiruvananthapuram region have twotypes of tribal communities as members viz. Malaipandaram, andKanikars. The entire tribes of the more effective TCS of theregion is Malaipandaram and the whole tribes of effective andless effective TCS are Kanikars. Likewise the study area ofThrissur region has three types of tribal communities viz.Irular, Paniyan and Malayan. Irulas and Paniyans are themembers of more effective TCS of the region. Irulas andMalayans respectively are the members of effective TCS of theregion. The study of the Kalpetta region has encompassed fivetribal comunities namely viz, Kattunaicken, Paniyan KurumanKuruchiyan and Adiyan. Kattunaicken. Paniyans and Kurumarshave become members of the more effective TCS, Adiyan andKurumars in effective TCS and Paniyans and Kurichiyans in less
effective TCS. Altogether eleven tribal communities have beencovered by the study.
6.2 NTFP collection Season and the Potential days ofEmployment
Most of the NTFPS are seasonal in nature. Butmedicinal herbs particularly root and tuber items can becollected throughout the year. But it is observed that mostof the tribes engage in the collection of those items whichwould fetch a high return to them. It was also observed thatsome of the TCS would encourage the tribes to collect onlycertain specified items which had a high value in the market

and high return to TCS.
223
Table 6.1 depicts the NTFP collectionduring the collection season of major NTFPS commonly collected
by the tribes of Kerala.
Table 6.1
NTFP Collection Season — Item Wise
No: NTFP's Collection season1. Pathripoove January + April & May2. Kanjirakuru January & February3. Honey (Vanthean) Feb.. march. April & May4. Cheevaccai February, march & April5. Marotti March, April & may6. Vayanapoove March. April & May7. Pattinja March, April & May8. Pachotti March, April & May9. Chittaratha March, April & May10. Urunjiccai March & April11. Kattukurumulake April-May12. Honey (cheruthean) June, July & August13. Kudampuli August - September14. Kasturimanjal August. Sept.. Octo. + Feb.15. Nellicca November - December16. Kattupadavalam December — January17 All root items like Kurumthottiveru. Orila. Moovila etc..
tubers like Adapathiyan, Amalpori, etc. Dyeitems like Kundirikkam, and Koppuvella arethe forest in almost all seasons.
and paintavailable in

224
Table 6.1 shows that NTFP can be collectedthroughout the year. Almost all root and tuber items can becollected round the year. But it was observed that due tointer regional differences in availability of NTFPS, all rootand tuber items are not generally available in all regions.The number of days these products can be collected in an yearis depicted in table 6.2.
Table 6.2 points out that the total potential daysof employment that can be generated in the Thiruvananthapuram
region is 242. Thrissur region, 267 and 248 in Kalpettaregion. The average mandays that can be generated throughNTFP collection for tribes have come to 253 in an year. Ofthese collection days, it is estimated that the tribes canengage 152 days for the collection of medicinal herbs. Regionwise difference in potential days of employment indicate thatthe Thrissur region was more gifted with medicinal items.

l‘-J l‘~.‘l Ul
Table 6.2
NTFP Collection Season and the Potential days of Employment
— Region wise/State
Potential days ofS1. employment (mandays) StabNo. NTFP items Collection season leveTVM TCR KAL (Aver
Region Region Region
I MEDICINAL ITEMS
1 Tuber Crops All season 14 16 10 132 Root items All season 27 81 74 613 Fruits Octo. Nov. Dec. 29 17 15 204 Barks Apri1—May 9 5 5 65 Bushes and Creepers All season 18 10 7 126 Liquids (Honey) February to May 22 28 45 327 Seeds November—Dec. 3 6 2 48 Flowers March, April.May 5 3 5 4
Total (I) 127 166 163 152(52) (62) (66) (60II NON-MEDICINAL
9 Oil seeds March, Apri1,May 3 10 5 610 Spices April, May 13 13 10 1211 Edible items Aug.-Sept. 20 8 10 1312 Dye and paint items All seasons 48 17 25 3013 Soap and Shampoo Peb.. March. April 31 53 35 40
items
Total (II) 115 101 85 101(48) (38) (34) (40Grand total 242 267 248 253(I+II) (100) (100) (100) (100Source: Survey data
_ L

226
A comparison between the potential days ofemployment and actual days of employment is given in Table 6.3
Table 6.3
NTFP Collection ~ Potential and the actual Collection days —Region — Wise
S1 Potential Actual % of actualNo‘ Region/State days of days of to potent' employment employment ial days1. Thiruvananthapuram 242 115 482. Thrissur 267 135 513. Kalpetta 248 126 51State 253 132 52Source: Survey data.
Table 6.3 reveals that even though 253 days ofemployment per person can be created through collection andmarketing of NTFPs the actual days of employment generated was
only 132 i.e., only 52 percent of the potential daysemployment. Wide fluctuations among the regions could also be
noticed. Even though the Thrissur region can offer employmentto 267 days for NTFP collection the tribes of this region hasactually engaged only 51 percent of the potential days ofemployment. However amongst regions Thrissur region accounted
for the the maximum number of days of employment to tribesthrough NTFP collection.

227
6.3 Collection of Non-listed NTFP Items by Tribes
The tribes in the study region collect a lot ofnon-listed NTFP items from Kerala forest. Legally.collection of these items are not allowed and the TCS cannotundertake their marketing . Table 6.4 depicts the collectionof non-notified items OF NTFP by tribes and marketing thesame through non-co-operative channels in the region.
Table 6.4
Non-Notified NTFP Collected by Tribes
fig: NTFP items
1. Erila veru 12. Edanapatta2. Malayarayan 13. Cherutheam3. Akkaram Kolli B. NON-MDICINAL4. Naagaandhi 14. Kaniram5. Kuruppa veru 15. Kattulli6. Dharba 16. Teak seed7. Kattuvellari 17. Nilambomb
(Available only8. Thannikka at Sholayoor)9. Umgin kuru 18. Elithadi
(Available only10. Karuvapatta at Palappilly)11. Karinjalipatta
Source: Survey data.
Since the tribal co—operative societies are notundertaking procurement and marketing of these produces.thetribes depend on private traders to market such products. This

228
brings them in close contact with private traders.Suchcontacts prompt the tribes to market even the listed NTFPSthrough the hands of private traders. Therefore urgent stepshave to be undertaken to list the non-listed items also in theNTFP list.
6.4 Extraction Methods, Training Programmes and Sustainability
It is also observed that-the tribes adopt differentmethods for the extraction of the same items from the forest.For eg. while in Thiruvananthapuram region the tribes uselong bamboo in Adimaly region they use a pointed wooden knife
to climb the tree and collect honey from the branches oftrees. The Range Officers of the region hold the view thatthe use of pointed wooden knife will damage tree. andultimately affect the sustainability of the forest. InKalpetta and Thrissur regions the tribes use either rope orbarks of trees to climb the tree and extract honey. It wasalso found that they all use ‘smoking technique’ to avoid beesand collect honeys from the trees. It often destroys the beesand finally affect the availability of honey in future.
It is also pointed out that when they collectCheevaccai. soap nuts and gooseberry tribes knowingly orunknowingly damage the trees. To collect Cheevaccai. they cutthe creepers and for soap nuts and gooseberry they cut thebranches of the trees. The range officers of the area pointed

229
out that these action of the tribe also affect thesustainability of the forest.
In collecting Kundirkkam, the tribes damage thetrees by making holes in the barks of the tree. In certainareas of Thiruvananthapuram region the tribes smoke the tree.They claim that it will help them to get the sap immediately.The range officers of the areas have indicated that theseactions of the tribes ultimately leads to drying up of thetrees.
Though the root and tuber items are available roundthe year. the tribes collect them only at times of distressie. when the collection of other items are not remunerativeand not available. It is observed by the forest officer thatsince most of these items are not collected at the rightseason, it affects the regeneration of the plant andultimately the sustainability of the species.
The study reveals that so far no training has beengiven to tribes about the collection methods or aboutidentification of species with their features. They collectitems according to their age old experience.
6.5 Nomenclature Difference of NTFP_Items
The study also reveals that there is some differencein nomenclature with reference to the same item of NTFP indifferent areas.
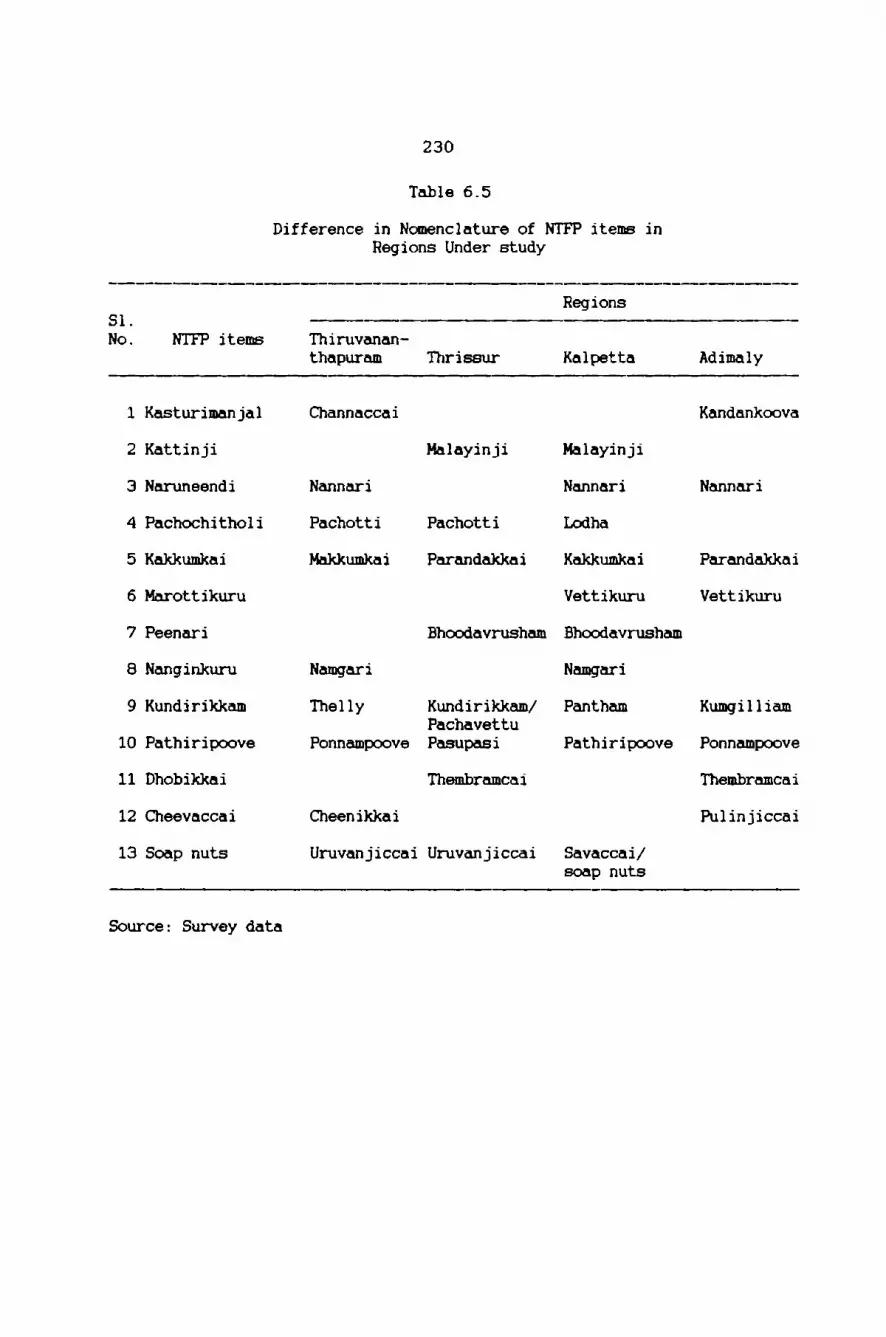
230
Table 6.5
Difference in Nomenclature of NTFP item inRegions Under study
RegionsSl.No. NTFP items ‘I'hiruvanan
thapuram Thrissur Kalpetta Adimaly
1 Kasturimanjal Channaccai Kandankoova2 Kattinji Malayinji Malayinji3 Naruneendi Nannari Nannari Nannari4 Pachochitholi Pachotti Pachotti Lodha5 Kakkumkai Makkumkai Parandakkai Kakkumkai Parandakkai6 Mnrottikuru Vettikuru Vettikuru7 Peenari Bhoodavrusham Bhoodavrusham8 Nanginkuru Namgari Namgari9 Kundirikkam Thelly Kundirikkam/ Pantham Kumgilliam
Pachavettu10 Pathiripoove Ponnampoove Pasupasi Pathiripoove Ponnampoove11 Dhobikkai Thembramcai Thembramcai12 Cheevaccai Cheenikkai Pulinjiccai13 Soap nuts Uruvanjiccai Uruvanjiccai Savaccai/
soap nuts
Source: Survey data

231
Table 6.5 reveals the nomenclature difference ofthe same NTFP in different places and regions.
6.6 NTFP Collection Kit
Tribes need collection Kit to extract varioustypes of NTFP from forest. They require tin for thecollection of honey, sack for the collection of items likeNellicca, Qheevaccai. etc.. iron bar - big and small tocollect roots and tubers and axe and knife to facilitate thecollection of NTFPs. Table 6.6 indicates the number ofrespondents who owned the collection Kit.
Table 6.6 indicates that all the respondents did notpossess all the tools required for collection of NTFP. Theypossess different tools in different degrees. Fifty-sixpercent of them have tins, 84 per cent. sack, 71 per centKnives, 30 percent axe and 25 and 31 percent iron bar big andsmall respectively. It highlights the fact that the NTFPcollectors are il1—equipped with tools. It will definitelyhave an impact in the quality as well as the quantity of theproduce.

232
Table 6.6
Number of Respondents who Owned NTFP Collection Kit
S1. Total Number of respondents who owned kitNo. Regions/TCS respon- _dents 1 2 3 4 5‘\_ 6I Thiruvananthapuram 1region ‘\ 'ms 15 12 14 14 6 X3 11TEF 15 8 11 11 5 5 13TLE 25 11 24 22 6 5 7TVM Rn. total (A) 55 31 49 47 17 13 31(56) (89) (85 (31 (2 (56)II Thrissur regionTHE 26 17 26 24 10 11 10TEF 24 2 20 18 2 1 10TLE 25 13 14 10 5 6 8TCR Rn. total (B) 75 32 60 52 17 18 28(43) (80) (69 (2 (2 (37)III Kalpetta regionTM 35 32 30 22 12 9 8TEF 29 17 20 19 7 6 1TLE 20 1 17 8 5 3 2Kal. Rn. total (C) 84 50 67 49 24 18 11(59) (80) (58 (29 (2 (13)IV Adimaly regionTHE 40 30 37 33 17 15 10
GroupingsTHE 116 91 107 93 45 38 39(78) (92 (80 (3 (3 (34)TE? 68 27 51 48 14 12 24(40) (75 (7 (2 (1 (36)TLE 70 25 55 40 16 14 17(36) (79 (5 (2 (2 (24)Grand total 254 143 213 181 75 64 80(A+B+C) (56 (84 (71 (3 (2 (31)Note : . Number 1 to 6 carry NTFP kit items.1
1. Patta (Tin). 2.Chacke (sack). 3.Vettukathi (knife). 4.Koda1i (Axe)5. Kambi (Iron bar) and 6.Sma11 iron rod.
2 . Figures in parentheses one to six indicate percentage of number ofrespondents to total respondents.

233
6.7 Cost of NTFP Collection Kit
The study revealed that none of the institutionaagency helps the tribes to procure the NTFP tool kit requirefor them. The total cost incurred by the tribes for thvarious tools possessed by them and the expected cost ofNTFP collection kit is given in Table 6.7
Table 6.7 points out that the average cost incurreby the tribe for a NTPP kit is Rs. 308 and by considering trlife of NTFP kit the yearly Cost is calculated as Rs. 146By considering the requirements of NTFP kit the expected cosof a Kit would come to Rs.345/- and the yearly average coswould be Rs.159/

234
Table 6.7
NTFP Colletion Kit Possessed by Tribes and Expected Cost of a Kit
Tools required byNTFP a NTFP collector Life expCollection No.of Total Average Average ----——-————~-————ectancyTools items Cost Cost items- Total of a toolpossessed possessed No. cost(Rs) (Rs) (Nos.) (Rs) (Years)Tin 233 5191 22 1.6 2 44 1Sack 483 7271 15 2.2 2 30 1Knife 188 11568 62 1 1 62 3Axe 75 B490 113 1 1 113 5Iron bar 65 4475 69 1 1 69 5Small iron rod 76 1986 27 1 1 27 2Cost(Rs.) 308 345Source: Survey data

235
6.8 Employment in Mandaya
The study reveals that most of the tribes undertakeoperations such as agricultural work. estate labour , forestwork. weaving and cultivation of their own land in additionto NTFP collection. Table 6.8 explains the number of mandaysto each type of activities engaged by a tribe and his family.
Table 6.8 indicates that the average days ofemployment by a tribe through all his operations account 236(The average number of workers from a tribal family isestimated to be 2), of which 132 days was spent on NTFPcollection and marketing. Signifiant differences inemployment among tribes of more effective. effective and lesseffective TCS were noticed. Table 6.9 indicates that 68 percent of the total mandays of employment generated by moreeffective TCS was through NTFP collection and marketingwhereas it was only 39 per cent in effective and 45 per centin less effective TCS.

2136
Table 6.8
llulber of lendays Engaged by the Tribe): for Various Operations
. ¢ - _ _ . . . . . . . . - . . . . . _ . . . . . . . _ . . . . _ . . . ¢ — — . - . . . . - . — u — - . — . . . . . . . . . . - . . . . . - — . . . . . . . . . . . . - . - - . - - . — _ . _ . . . . . . . . . . _ . - . ._
TYPE OF OPERATIONS
. ------------------------------------------------- --Total lwerage AverageI. Regions/TCS 110. of )('l'FP Agri. Estate Forest Ieawing Cultivation lendeys nendaye per Iandaya
fenilies Labour Labour Iork household per workerThiruvenanthepural
regionTHE 15 5824 559 - 1945 - 300 8628 575TE? 15 3775 1260 - 1503 1034 555 8127 542TL}: 25 5868 2839 - 303 3319 1180 13509 540
‘ml Rn. total (1) 55 15467 4658 - 3751 4353 2035 30264 550X (51) (15) (12) (14) (8) (100)landeys per worker 115 34 - 27 3'1 18 225Thriseur regionTI}! 26 11407 2798 856 24 - 60 15145 583TE? 24 3542 2396 3680 - - 450 10068 420
118 25 5399 1676 423 1621 204 390 9713 389'1'C11)1n. total (8) 75 20348 6870 4959 1645 204 900 34926 466I (58) (20) (14) (5) (1) (2) (100)Iendaye per worker 135 46 33 11 2 6 233
1 ltalpetta regionTHE 35 13728 1368 180 515 - 120 15911 455T21‘ 29 4189 5116 - 1014 - 665 10984 37911.3 20 3140 3750 - 970 - 953 8813 441
la]. Rn. total (C) 84 21057 10234 180 2499 - 1738 35708 425S (59) (29) (1) (7) (4) (100)landays per worker 126 62 1 15 - 9 213' ldinely region
THE (D) 40 9365 4420 2120 462 2195 801 19363 4848 (48) (23) (10) (2) (11) (6) (100)landays per worker 117 55 26 6 27 11 242Grand total 254 56872 21762 5139 7895 4557 4673 100898 472(1+B+Ce0) I (56) (22) (5) (8) (4) (5) (100)landaye per worker 132 52 12 19 9 12 236............................................................................................................. -
mrce: Survey data
rte: 1. Figures in parenthese indicate percentage to row total of nndays2. 1'lE- Tribes of lore effective T08: T12P- Tribes of Effective TCS
TLE- Tribes of less effective TC5

237
Table 6.9
hploynent in landays of Tribes of lore Effective. Effective andLess Effective TCS
. _ . . . . . . . _ _ _ . . . . . . . . . . . . . _ . . _ . _ . . . . . — . . . . . . . _ _ _ - - . . . . . - . . - . . _ . . . . . . . . . . _ . o u . - . . . _ . . _ . . . . . -
Types of operations AverageTribes of --------------------------------------------------- -- Total landaysClassified ITFP Agr. Estate Forest Weaving Cu)tiva- landays perTCS Labour Labour Iork tion workerTIE -10324 9145 3156 2946 2195 1281 59047
(58) (15) (6) (5) (4) (2) (100)landays per worker 173 38 15 13 11 5 255TE? 11506 8772 363)) 2517 1034 _ 1670 29179(39) (30) (13) (9) (4) (5) ((00)Ifandays per worker ()4 65 30 18 B 10 215
TLI-‘ 14367 8265 423 2894 3523 2523 31995(45) (26) (1) (9) (11) (8) (100)
landays per vorker 103 60 2 21 25 18 229Source: Survey data
(Iota: Figures in parentheses indicate percentage to rev totalof nndays

238
6.9 Number of Mandays Employed for each Classified items ofNTFP
Table 6.10 depicts the average number of daysengaged by tribes for each classified items of NTFP.
Table 6.10 points out that 65 per cent of the totalmandays created through the collection and marketing of NTFPwas on account of the collection and marketing of medicinalherbs and the non-medicinal items accounted only for 35 percent of the total mandays generated. Among the tribes ofdifferent regions, except Thrissur. tribes spent more days forthe collection of liquids ie. honey. Whereas in Thrissurregion 47.6 per cent of the total days are spent on ‘medicinalitems mainly root items such as Kurunthotti. Orila, Movila,etc. It is also observed that 35.3 per cent of the mandaysgenerated in Kalpetta region relate to the collection andmarketing of root items, whereas it was only 6.6 per cent inThiruvananthapuram region. The region—wise analysis showsthat there exists significant differences among regions withregard to availability and collection of NTFP in the State.
Of the days spent by the tribes on the collectionand marketing of non-medicinal items 49.5 percent were spenton the collection and marketing of soap and shampoo items suchas Cheevaccai. Uruvanjiccai and dye and paint items such asKundirikkam and Koppuvella. Considerable difference existed

223$)
Table 6.10
lulber of landays Engaged for the Collection and larleting ofClassified Itels of ITYP by Tribes - legion-vise Comparison
Figures in no. of Iandays
legions
S1 Thirnanantha- Thrieaur Kalpetta Totallo ITFP itels puran landaysI IEDICIIIL ITEIS1 Tuber Crops l763llB.B) l092(9.2) l043l6.6) 3098(l0.6)
2 Root iteas 636(6.B) 5604{47.6) §543(35.3) 11703132)
3 Fruits l923[20.5) l633(l3.9) 3140[20) 6704{l0.2)
4 Barks 56(0.6) " -- 56(0.2)5 Bushes and Creepers 690(7.4) 590(5) -- l280(3.5)
6 Ljquidslfloneyl 3033[32.4) 2531(2l.5) 5799(36.9) 11363(30.8)
7 Seeds 533(5.7) 263l2.2) l70(l.2) 966l2.6)0 Flowers 420[4.4) “ -- 420(l.1)9 liscellaneous 307(3.4) 66(0.6) -- 373(1)
Total la) 93611100) 1l779(l00) l5703ll00) 36043ll00)[60] [50] [75] [65]II l0l-IEDICIIIL10 Oil seeds l00(l.6) 494l5.7) -- 594l2.9)ll Spices 65(1) 37814.4) -- 443[2.2)12 Edible itess 2040.1) -- 552(l0.4) 572(2.2)
13 Dye and paint itels 4634(75.9) 1407(l6.3) l216(22.9) 7257l36.2)
14 Soap and Shalpoo 1277(20.9) 6235l72.4) 240ll45.2) 9913l49.5)itels
15 liscellaneous l0(0.2) 95ll.2) ll45l2l.5) l250(6.4)
Total lb) 6l06(100) 0609(l00) 53141100) 20029[l00)I40) I41) I25) I35)Grand total
la+b) l5467[l00] 203401100] 21017[l00} 560721100]
Source: Survey data
Note : Figures in 1) indicate percentage to colann total.

240
in this among regions. The tribes of Thiruvananthapuramregion spent 75.9 per cent of their mandays on the collectionand marketing of dye and paint items. This was only 16.3 percent and 22.9 per cent respectively for Thrissur and Kalpettaregions. It is also observed that Thrissur and Kalpettaregions were able to generate more days of employment totribes with respect to the collection and marketing of soapand shampoo items. It is to be noted here that considerabledifferences exist in the availability of non-medicinal itemsamong the regions under study.
6.10 Collection and Marketing of NTPP by Tribes in the StudyRegion- Region-wise Comparison
As already pointed out the tribes in Keralacollect medicinal as well as non-medicinal herbs from theforest ranges of Kerala for their livelihood. The entirefamily of tribes directly or indirectly are involved in thecollection and marketing of NTFP. Even though they collectmedicinal herbs they sell the entire items either in tribalco-operative societies or to non-co—operative channels.Whenever they feel some discomfort. or affect any disease itis observed that they either contact the tribal physician orresort to their own way of treatment by collecting medicinalherbs from the vicinity of their hamlets. It is also notedthat some of the tribes even cultivate certain herbs in theirhomesteads for treatment. But when ever they collect NTFP

2411
Table 6.11
Collection and larletjng of I??? by tribes - Regions Iiso Cosparison
Figures in lg.
Regions
S1. Thirusnanths- 16rissur Kalpstta TotalNo. ITFP itsls pural Collection1--iEDICIl1L ITEIS ---------------------------------- -1 Tuber Crops 5662115.3) 210911.!) 14161(10.6) 21612[6.9)
2 Root itels 2145l5.0) 46340130.3) 66601(47.0) 115006135)
3 Fruits 0213[22.2) 027015.41 19610114) 36109111)
4 Barks 5410.2) “ -- 5410.02)5 Bushes and Creepers 3429(9.3) 592113.9) -- 935012.0)
6 Liqnidolflonoy) 3944{10.7) 1320(0.9) 705S(5.6) 1312714)
7 Seeds 99312.7) 20631l.3) 27910.2) 333511)
0 Flowers 54111.5) " -- 54110.2)9 liscollansous 17610.5) 21110.1) -- 30710.1)
Total (a) 25157 66330 109114 200601(60.1) 143.4) 170.3) 160.9)
11 I0!-IDICIIIL10 Oil seeds 20010.0) 1207010.!) -- 13150(4.0)
11 Spices 4610.1) l20310.0) -- 1249(0.3)12 Edible itons 100(0.3) -- 05210.6) 95210.2)
13 Dye and point itels 4927(13.3) 606015.31 12l9l0.9) 14206(1.3)
14 Soap and Shanpoo 6420(17.2) 64036(41.9) 24011117.0) 95267120.9)itns
15 liscsllsnsona 2510.1) 43010.3) 339412.5) 304911.20)
Total 10) 11790 06599 30276 120673(31.9) (56.6) 121.7) (39.1)
Grand total1t+b) 369551100) 1529291100) 1393901100) 3292741100)
Source: Survey data
lots : flgusos in psroothosos 1ndicato_osrcsntago=to grand column total.
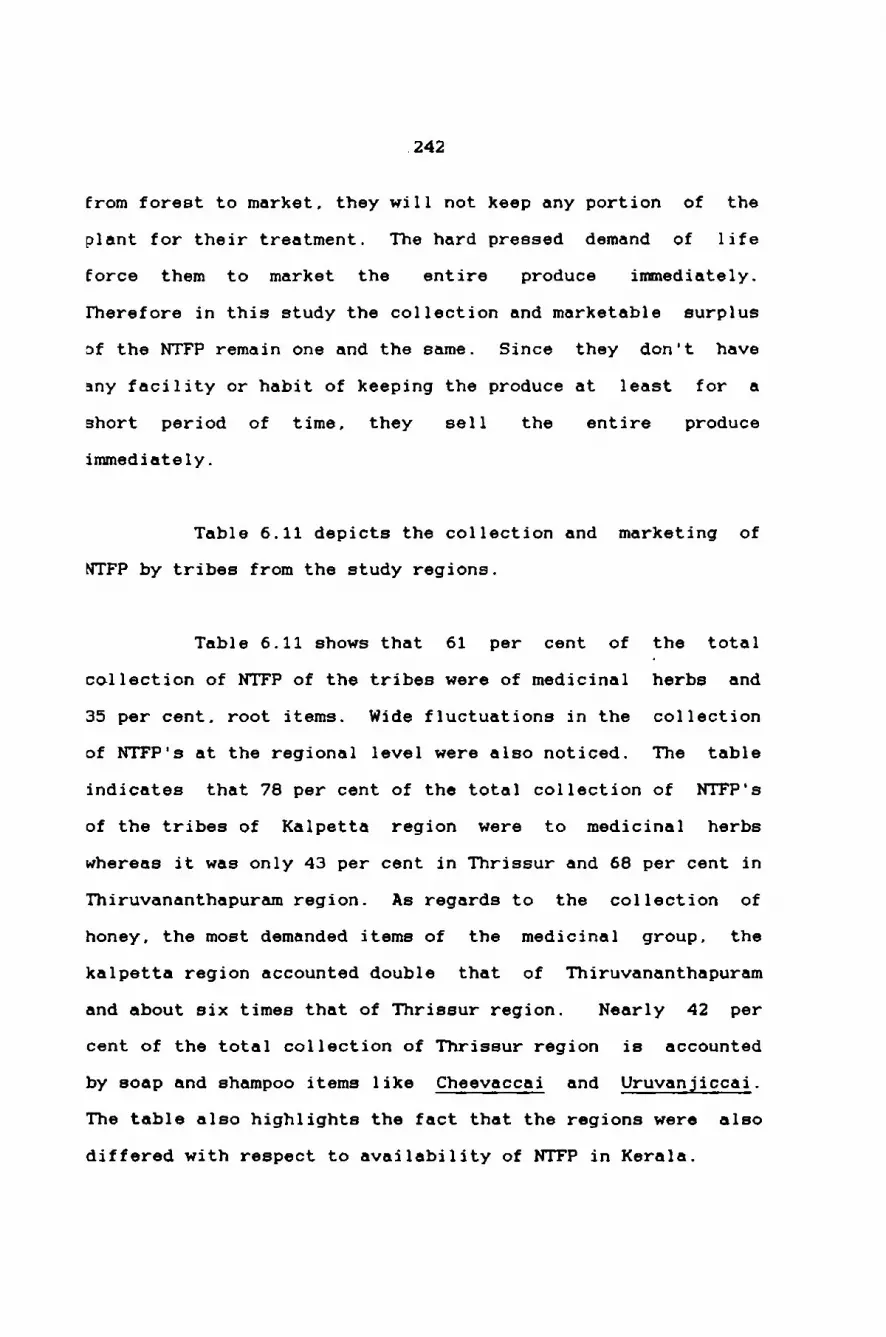
.242
from forest to market. they will not keep any portion of theplant for their treatment. The hard pressed demand of lifeforce them to market the entire produce immediately.Therefore in this study the collection and marketable surplusof the NTFP remain one and the same. Since they don't haveany facility or habit of keeping the produce at least for ashort period of time, they sell the entire produceimmediately.
Table 6.11 depicts the collection and marketing ofNTFP by tribes from the study regions.
Table 6.11 shows that 61 per cent of the totalcollection of NTFP of the tribes were of medicinal herbs and
35 per cent. root items. Wide fluctuations in the collectionof NTFP's at the regional level were also noticed. The tableindicates that 78 per cent of the total collection of NTFP‘sof the tribes of Kalpetta region were to medicinal herbswhereas it was only 43 per cent in Thrissur and 68 per cent inThiruvananthapuram region. As regards to the collection ofhoney, the most demanded items of the medicinal group, thekalpetta region accounted double that of Thiruvananthapuramand about six times that of Thrissur region. Nearly 42 percent of the total collection of Thrissur region is accountedby soap and shampoo items like Cheevaccai and Uruvanjiccai.The table also highlights the fact that the regions were alsodiffered with respect to availability of NTFP in Kerala.

243
6.11 Marketing of NTFPs-Region-wise Comparison
Table 6.12 presents a comparative position regardingmarketing of NTPP by tribes in the study region.
Table 6.12 indicates that 59 per cent of the totalsale value of NTFP of tribes was contributed by the sale ofmedicinal items, of which the liquid i.e. honey contributed amajor portion of the sale value. However it is observed thatamong all NTFPs soap and shampoo items have contributed thehighest share to tribe's income ie., 24.1 per cent of thetotal sale value of NTPP. The least contribution comes fromBarks. The Bark items were seemed to be collected only fromone region viz.. Thiruvananthapuram. The study thus makes itclear that the collection and marketing of medicinal herbs hadplayed and does play a very important role in the tribal life.
Significant difference among regions could benoticed with respect to marketing of NTFP among regions.While the tribes of Thiruvananthapuram and Kalpetta regionsmobilise more money by the sale of medicinal items. the tribes
of Thrissur region generates more income through the sale ofnon-medicinal items especially by the sale of soap andshampoo items. The table makes it clear that there existsconsiderable differences even in the availability of differentproduces in different regions.

Table 6.12
244
arketing of NTFP by tribes - Regions Wise
Figures in Rs.
Regions
S1. Thiruanantha~ Thrissur Kalpetta TotalNo. NTFP items puram MarketingI MEDICINAL ITEMS1 Tuber Crops 43916(9.1) 25254(4.1) 35555(5.5) 108725(6)2 Root items 11586(2.4) 93398(15.2) 120738(16.7) 225722(12.4)3 Fruits 66956(13.3) 55713(9.1) 173788(24) 296457(16.3)4 Barks 1405(O.4) -— —- 1405(0.1)5 Bushes and Creepers 14440(3) 18280(3) - 32720(1.8)6 Liquids(Honey) 127815(26.6) 43535(7.1) 200703(27.7) 372053(20.5)
7 Seeds 659B(1.4) 11763(1.9) 1307(0.2) 19673(1.1)8 Flowers 12874(2.7) - —— 12874(0.7)9 Miscellaneous 5527(1.1) 4001(0.6) - 9528(0.5)
Total (a) 291117 251949 536091 1079157[61] [41] [74] [59]II NON—MEDICINAL10 Oil seeds 1120(0.2) 1090B(1.8) - 12028(O.6)11 Spices 1400(0.4) 7307(1.2) -— 8707(0.4)12 Edible items 550(0.1) —- 14685(2) 15235(O.8)13 Dye and paint items 157736(32.8) 61458(10) 11824(1.6) 23101B(12.7)
14 Soap and Shampoo 28052(5.8) 279027(45.5) 131136(1B.1) 438215(24.1)items
15 Miscellaneous 105(0 1) 2140(0.5) 29946(4.2) 32191(2)Total (b) 138963 360840 187591 737394[39] [59] [26] [41]
Grand total(a+b) 480080(100) 61289(100) 7236B2(10) 1816551(100)
Source: Survey data
Note : Figures in brackets indicate percentage to grand column total.

245
6.12 Marketing Channel of NTFP by Tribes
As per the system the tribes are expected tomarket the entire collection of NTFPB through their ownorganisation — ie. Tribal Co—operative Societies. Table 6.13shows that only 67 per cent of the total sale of NTFP waseffected through Co-operatives. Among the non-co-operativechannels, the private traders collect 21 per cent of the totalsales of NTFP. They also appoint ‘agents-tribal as well asnon-tribals to collect NTFP on behalf of them. Altogetherthey collect 31 per cent of the total sale of NTFP oftribes.
Region—wise analysis of the marketing channel alsoindicate that the tribes of Thiruvananthapuram region hadmarketed only 47 percent of their produce throughco-operatives. It was the only region where the tribesthemselves act as agents of private traders in the collectionand marketing of NTFP. The tribes of Potamavu and NjaraneeliTCS of Thiruvananthapuram region marketed 24 per cent of theirproduce through tribal agents. The tribes of less effectiveTCS had marketed products worth Rs.89016 through tribalagents whereas they marketed only produces worth Rs. 33245through co—operatives. In Thrissur and Kalpetta regions. thetribes marketed more than 65 percent of their produce throughco—operatives. However , the instances of marketing of NTPPthrough employers were widely prevalent in Sholayoor area

246
Table 6.13
Marketing Channels of NTFP by TribesFigures in Rs.
Marketing ChannelTotalvalue of Door step31. produces Co~opera— Private marketing Tribal
lo. Regions/TCS marketed tives traders Employer (Agents of Agentsdirectly (Pvt.traders).E Thiruvananthepuram
regionTHE 178570 165734 5061 7775 - TEF 115248 25412 59051 1130 3000 26655TLE 186262 33245 54391 — 9610 89016TVM Rn. total (A) 480080 224391 118503 8905 12610 115671(100) (47) (24) (2) (3) (24)
[I Thrisur regionTHE 343178 287520 49903 - 5755 TEF 132309 44265 21263 37561 29220 —TLE 137302 67801 65661 400 3440 —TCR Rn. total (B) 612789 399586 136827 37961 38415 (100) (65) (22) (6) (7)[II Kalpetta region .THE 470889 457273 10016 1000 2600 TEF 161927 91989 68483 300 1155 TLE 90866 42699 48167 - - Kal. Rn. total (C) 723682 591961 126666 1300 3755 _(100) (82) (17) (0.3) (0.7)
[V Adimaly regionTHE 350882 145855 146073 — 58954 (100) (41) (42) (17)society GroupingTHE 1343519 1056382 211053 8775 67309(100) (79) (16) (1) (5)
TEF 409484 161666 148797 38991 33375 26655(100) (39) (36) (10) (8) (7)TLE 414430 143745 168219 400 13050 89016(100) (35) (41) (0.09) (3) (20.91)
Grand total 1816551 1215938 381996 48166 54780 115671(A+B+C) (100) (67.7) (21) (2) (3) (7)Source: Survey data
Note : Figures in parenthese indicate percentage to respective row total

247
(TEF). The Bhavani Tea Estate Sholayoor . the Goundans ofTamil Nadu etc used to employ the tribes in their cardamom andcoffee plantations were the major collectors of NTFP fromtribes. All tribes pointed out that the price they get fordifferent NTPP's through different channels were almost thesame. The rate for these items would always be equal to therates of the private traders. But. at the same time thetribes pointed out that some of the unscrupulous personsinvolved in these marketing channels exploit them throughfaulty weighing practices. They usually weigh the producesthrough ”Tholas'. (A crude weighing rode). The tribes. alsopointed out the instances of forcing the tribes to markettheir produces through their employers. The topography of theforest area near to the Bhavani Tea Estate, the fear. of lossof job the various punishment measures that can be adopted bythe employer. force the tribes to market their producesespecially honey, Cheevaccai. Kundirikkam and soap nutsthrough them. The study thus brings to light that theexchange relations in the tribal economy is also attached withthe poor socio—economic conditions of the tribes. The demandand supply of the produce. and the formal institutionalarrangements created for the exclusive welfare of tribes didnot pay much dividends to them. While analysing the marketingchannel of the tribes of more effective. effective and lesseffective TCS. it was found that the tribes of more effectivetribal co-operative societies (THE) have marketed 79 per centof their total collection through co—operatives and they did

248
not have any marketing channel through tribal agents Whereasthe tribes of effective and less effective Tribal Co-operative‘Societies have marketed only 39 per cent and 35 per cent oftheir producer respectively through co-operatives. Diagram 4gives a more vivid picture about the marketing channels ofNTFP of tribes.
6.13 Collection and Marketing of NTFP by Tribes of MoreEffective, Effective and Less" Effective TCS and theAverage Sale Rate Per Kg.
The tribes select co-operatives as well asnon—co-operative channel to market their produce. Table 6.14clearly indicates the average sale value of each NTPP bytribes in the study region.
Table 6.14 indicates that the tribes of lesseffective tribal co—operative societies were able to markettheir produce at a very high rate as compared to the salerates of effective and more effective tribal co—operativesocieties, Particularly on medicinal items such as Tubercrops, Root items. Fruits, Barks, Bushes and Creepers, liquids(honey) and bee wax and non-medicinal items like spices. dyeand paint items and soap and shampoo items. It was alsoobserved (Table 6.13) that only 35 per cent of the totalsale of NTFP of tribes of less effective tribal co-operativesocieties were effected through co-operatives. On account of

249
Table 6.14
Collection and larleting of l'1TP by Tribes in More Effective. Effective and Less Effective 1’CS
lore effective Effective Less effectiveITTP Itels ---- ---- --51. Quantity Sales Rate Quantity Salas Rate Quantity Sales Ratelo. larketed Value per 89. larketed Value per Kg. larketed Value per Kg.
Ufg.) 1113.} (113.1 1119.) (119.1 ills.) flfg.) (113.1 (115.1
1 IEDICIIAL ITBIS
1 Tuber Crops 22891 138117 6.03 0608 15067 4.18 1748 18190 10.41
2 Root itels 82964 142235 1.71 26615 42688 1.6 6017 34319 5.7
3 Fruits 31438 240363 7.65 3139 30613 9.75 1518 20481 13.49
4 Barks 160 930 5.81 -- -- -- 54 1405 265 Bushes and Creepers 8938 48617 5.44 2238 8662 3.87 2224 15841 7.12
6 Liquidsffloney) 10892 278929 25.61 2758 79950 28.99 1384 62849 45.41
7 Seeds 2941 18410 6.26 414 3662 8.85 421 1290 3.068 Flowers -- -- -- 360 9166 25.46 181 3708 20.499 liscellaneous 840 23837 28.38 139 6555 47.16 52 2307 44.37
I 1' I011-IEDIC 1811.
10 011 seeds 13150 12028 0.92 -- -- -- -- -- -11 Spices 5 330 66 151 8257 54.68 1 120 12012 Edible itels 103 1880 18.25 115 850 7.39 837 14385 17.19
13 Dye and paint itels 6851 140402 20.49 7557 55781 7.38 3952 118053 29.87
14 Soap and Shanpoo 58045 267495 4.61 30479 146208 4.8 18768 120662 6.43items
15 liscelleneous 3394 29946 8.82 405 2025 5 50 220 4.4Source: Coapiled fro: the data collected fro: 254 tribal households.

250
Marketing Channels of NTFP by Tribes
Co-operatives6795
Tribal Agents7%
Agents of Pvt.TraderEmployer 3%
2%
Pvt. Traders21%
Figure 4

251
this low market share through co—operatives. these societiewere termed as less effective. Thus the study makes it clecthat there existed considerable differences in the market rat
among co—operatives and private trading channels of NTFP jthe state. Without ignoring the importance of co-operatixmarketing, from the study it can be stated that the monopolprocurement and marketing of NTFPs, by tribal co-operativefailed to fetch remunerative prices to tribals for the:produce. Actually it is seen that the existing monopolprocurement led to inefficiency in the marketing system. 11argument will be more clear when we examine the price spreein the later part of this thesis.
6.14 Inter-Tribal Variations in Marketing
The Inter-tribal variations in collection atmarketing of NTFP is explained in Table 6.15.
Table 6.15 points out that. of the 11 tribecommunities the Kattunaikens do the maximum collection a1
marketing of NTFP (Rs. 14744 per annum). They are followed 1
MalaiPandaram (Rs. 11904 per annum). Wide variations amoltribal communities in the collection and marketing of the:products were also noticed. Among the tribal communities aAdiyan family collects produce worth Rs. 3285/- in an yea}the lowest collection among tribal communities under study.

252
Table 6.15
Inter Tribe] Variations per Tribal Household in Collectionand lerteting of ITFP and their marketing Channel
Figures in Rs.
Tribal lerketing ChennelConunity -Total Co-ope- Privete Employer llooretep TribalSale rntivee Traders Delivery Agent
1 10060 4271 5601 - 996lndnven (100) (39) (52) (9)2 5270 2606 409 - 2263lennen (100) (49) (0) (43)3 7445 1454 2700 20 315 2050
llanihr (100) (20) (37) (ll (4) (30)4 11904 11049 337 510 -
lelei Pnncleren (100) (93) (3) (4)5 1474 14339 311 - 94
Kettunnicken (100) (97) (2) (1)6 0270 5260 2957 10 35
Kurulen (100) (63) (36) (0.37) (0.66)7 3399 490 290 -
Kurichiyen (100) (15) (05)0 10967 9050 1666 40 203
Peniyen H00) (02) (15) (1) (2)9 3205 2001 1169 - 35Adiyen (100) (63) (36) (1)10 0104 5000 1060 1130 906
Iruler (100) (62) (13) (14) (ll)11 5492 2712 2626 16 130
leleyen (100) (49) (40) (1) (2)Source: Survey data
lote: Figures in parentheses indicate percentage to row totalof each tribal oonunity

253
The marketing channels of tribal communities showed
a mixed picture. The highest collectors. Kattunaickens ofWayanad district market 97 per cent of their produce throughco—operatives followed by MalaiPandarams of Achancovil TCS(93
per cents) (both the tribal communities were members of moreeffective TCS). But the Kanikkars and the Kurichiyans marketonly 20 and 15 per cent respectively through co—operatives.Kanikkar is the only community who market their producethrough tribal agents. However. wide variations among tribalcommunities exist not only in the collection but also in themarketing channels.
6.15 NTFP Collection- Average Income for a Manday
The average income from different NTPP items for amanday is depicted in Table 6.16.
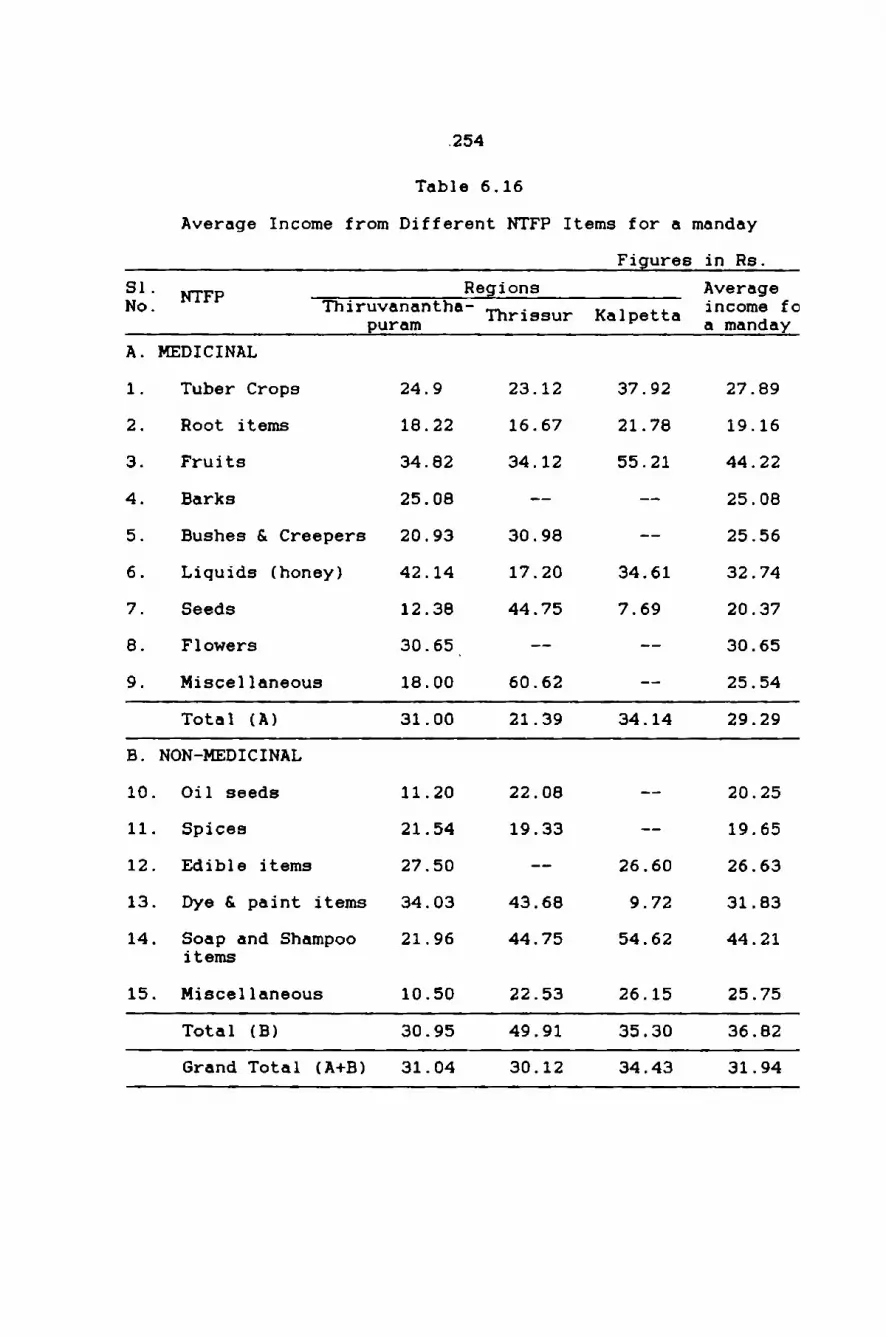
.254
Table 6.16
Average Income from Different NTFP Items for a manday
Figures in Rs.
33. NTFP Thiruvenanthafiegjofis gnggmgefopuram Thrissur Kalpetta a manday
A. MEDICINAL
1. Tuber Crops 24.9 23.12 37.92 27.892. Root items 18.22 16.67 21.78 19.163. Fruits 34.82 34.12 55.21 44.224. Barks 25.08 -- -- 25.085. Bushes & Creepers 20.93 30.98 -- 25.566. Liquids (honey) 42.14 17.20 34.61 32.747. Seeds 12.38 44.75 7.69 20.378. Flowers 30.65_ —- —— 30.659. Miscellaneous 18.00 60.62 -— 25.54
Total (A) 31.00 21.39 34.14 29.29B. NON-MEDICINAL
10. Oil seeds 11.20 22.08 —- 20.2511. Spices 21.54 19.33 —- 19.6512. Edible items 27.50 -- 26.60 26.6313. Dye & paint items 34.03 43.68 9.72 31.8314. Soap and Shampoo 21.96 44.75 54.62 44.21
items
15. Miscellaneous 10.50 22.53 26.15 25.75Total (B) 30.95 49.91 35.30 36.82Grand Total (A+B) 31.04 30.12 34.43 31.94

255
Table 6.16 reveals that the average income from NT
collection and marketing for a person for a day is Rs. 31.9The Kalpetta region is observed to fetch the highest incofor a manday i.e.. Rs. 34.43. This is followedThiruvananthapuram region (Rs. 31.04). The collectorsnon-medicinal herbs were able to generate Rs. 36.62 per mandwhereas it was Rs. 29.29 for medicinal items. Among tregions. the Kalpetta region was able to fetch Rs. 34.14 fa manday for medicinal herbs whereas it was only Rs. 21.39Thrissur region. But the Thrissur region stood first wirespect to the payment for non—medicinal items i.e., Rs. 41.per manday. Among different NTFP items. the fruit items weable to generate Rs.44.22 per manday. This is followedsoap and shampoo items (Rs.44.21). Wide fluctuations amodifferent NTFP as was noticed in fetching income per mandaAmong items, the root items were able to generate only R19.16 per manday. At the same time it is also observed thit is the most demanded item to the Ayurvedic medicinmanufacturing industry as a whole. Collection and marketiof spices brought only Rs.19.65 per manday to tribes. Whicomparing the income per manday of medicinal as wellnon-medicinal items. it seems that the income derived frnon-medicinal items are slightly higher than the incoderived from medicinal items. but one could easily make 0that the level of exploitation for non—medicinal itemscertainly higher than for medicinal items.

256
6.16 Household income of tribes in the study region
The region-wise tribal household income is given intable 6.17
Table 6.17 points out that 52.5 per cent of thetotal income of tribes is from the collection and marketingof NTFP and altogether 62.6per cent of the total income isderived from the sale of different. products by the tribes.The wage income is accounted only by 36.9 per cent of thetotal income. It is also noted that 0.5 per cent of the totalincome is from leasing of land of the tribes. Urgent steps areto be taken to check leasing of land. Kalpetta regionaccounted for the maximum share of NTPP income of tribes and
Thrissur region. the lowest. The study makes it clear thatthe NTFP has a major role in the life of tribes in the state.

257
Table 6.17
Iaocne Details of Tribes ia the study Regions
[Figures in Is.)
REGIOIS
IICIII DETIILS TTI I to Total TC! 3 to Total H1. 3 to Total 101 8 to Total Grand Total 6 to Grand(03.7 Iaome (05.7 Ilene lb.) Iacole (ls.l Iaono (ls.l Total Ilene
1. ITFP Sale 400000 49.4 612709 40.4 723602 59.6 150002 52 2167433 52.52. Cultivation 90007 10.1 23602 1.9 52455 4.3 40554 7.2 222690 5.4
3. leaving 55142 5.7 7000 0.6 - - 35652 5.3 97794 2.34. Pimood 3116 0.3 40321 3.0 20674 2.3 10464 2.7 90575 2.4
Total (I) 636345 65.5 691792 54.7 W401] 66.2 453552 67.2 2506500 62.6
0. I160 IICOIE
5. hr]. Lalaoar 105996 19.1 232616 10.4 313054 - 25.0 132361 19.6 064027 20.9
6. Estate Labour - - 170446 13.5 5940 0.5 60904 10.2 245290 5.9
7. Forest lorl 125790 12.9 100670 0 02101 6.0 15200 2.3 323777 7.0
0. Service 20600 2.1 60400 5.3 2400 0.2 2400 0.3 93903 2.3Total (0) 332394 34.1 572140 45.2 403495 33.3 210065 32.4 1526902 36.9
C. 0‘l'lT2 0000110
9. Lease 3590 0.4 1230 0.1 4900 0.5 2625 0.4 12353 0.5Total (C) 3590 0.4 1230 0.1 4900 0.5 2625 0.4 12353 0.5
Total Iacole (14946) 972337 100 1265170 100 1213206 100 675042 100 4125755 100
Image lame per 17679 16069 14443 16076 16243Boaselold 193.1
Scarce: Samy data
TTl:Thimaaaa1|apIraa T11: Tlrisslr 111.: lalpotta 101: Miaaly

258
6.17 Pricing of NTFP under co-operative Set up
Generally speaking, the value of a product isbased on its demand and supply in the market. It was observedthat so far no agency either co—operatives or nonco—operatives made any calculation about the potential demandand supply of NTFP's in Kerala. Therefore the price fixationof these institutional arrangements remained to be tardy andinefficient. The private traders always seem to fix a pricewhich is always higher than what is fixed by co—operatives.
The floor price of NTFP‘s will be fixed every
year by SC/ST federation on the recommendation of ‘the NTFPcommittee. The Board of Management of each TribalCo-operatives has the liberty to re-fix the prices. The priceso re-fixed should not be less than what is fixed by thecomittee. It was observed that the NTFP committee would fix
three prices, namely collection charge.procurement value andthe expected sales value of each NTFP items. The NTFPcommittee generally fix the price for dry items of NTFP whereas the tribes supply the items in fresh quantities toco-operatives. Therefore, the TCS had to work out a norm forconverting the fresh items into dry quantities and itsequivalent prices. So far no scientific work has been undertaken by any agency to solve this issue. As a result. thetribes were being exploited even by the collection agents ofthe tribal co-operative societies. However, the researcher in

259
consultation with the secretaries of tribal co—operati\societies. collection agents, Ayurvedic medicinemanufacturing units and traders of NTFPs developed a standaifor converting fresh items in to dry items which is givenAppendix III.
Since there has been change in the pricing policiqwith respect to NTFP and the sharing of the sales valtbetween tribes and TCS and TCS and Apex level Co-operati‘Organisation from 1982-83 to 1993-94, the collection chargfixed and paid by tribal co-operative societies and its shalto tribes have been divided in to two periods — 1982-83 11990-91 and 1991-92 to 1993-94 and is presented in Tables 6Jto 6.20.
6.18 Collection Charge Fixed and Paid by TCS from 1982-83 '1990-91
The collection charge fixed and paid by co-operatives ‘tribes is presented in Table 6.18

260
Table 6.18
Average NTFP Collection Charge Paid to Tribes by TCS and FloorPrice Fixed for NTFP by SC/ST Federation from
1982-83 to 1990-91 - A Comparison
Figures in Rs.Collection Collection Collection
S1. NTFP charge paid charge fixed charge as XNo. to tribes by SC/ST collectionfederation charge fixed
A. MEDICINAL
1. Tuber Crops 4.27 5.32 80.262. Root items 1.59 1.42 111.973. Fruits 0.87 1.29 67.974. Barks 1.52 0.98 155.105. Bushes & Creepers 1.88 1.57 119.746. Liquids (honey) 12.77 11.25 113.517. Seeds 3.13 2.49 125.708. Flowers 10.97 2.95 371.869. Miscellaneous 16.35 14.91 109.66B. NON—MEDICINAL
10. Oil seeds 1.08 1.14 94.7411- Spices 20.91 21.90 95.4812. Edible items 5.99 2.95 203.0513. Dye & paint items 5.55 2.21 251.1314. Soap and Shampoo 2.27 2.14 106.07
items
15. Miscellaneous 2.21 3.83 57.7Source: Compiled from the records of SC/ST Federation and TCS
under study from 1982-83 to 1990-91.

261
Table 6.18 indicates that the collection charge paidby c—operatives for all NTFP items except Tuber crops. Fruits.Oil seeds. Spices and Miscellaneous items of non-medicinalherbs were always higher than the price fixed by NTFPcommittee. It can be very well understood that the pricefixation mechanism of the SC/ST Federation was not dependingupon the potential demand of the products. The collectioncharge fixed by NTFP comittee for different years alsorevealed that there was not much variation in prices ofdifferent commodities over the years. During the period itwas observed that the TCS did not follow a uniform patternwith regard to the fixation of collection charge for NTFP.Some societies especially the less effective societies hadgiven only 75 per cent of the price fixed by NTFP committee ascollection charge to tribes for various NTFP and for others aprice above the collection charge fixed by the NTFP committeewas given as collection charge.
6.19 Collection Charge Fixed and Paid by TCS from 1991-92 to1993-94
As per the change in the pricing policies 80 percentof the sales value of NTFP must be given to tribes ascollection charge. There was an inherent drawback in thispolicy i.e.. the collection charge could be finally fixed onlyafter the sale of the collected produce. Since the tribesrequire the collection charge then and there, the tribal

262
co-operative societies used to fix a collection charge notbelow the one fixed in the previous year. The balance if any.should be paid to tribes as bonus. But it was observed thatnone of the societies under study had paid any bonus on thisaccount. Some societies especially Malampuzha and SultanBattery had introduced a system of keeping a certainpercentage of their collection charge in the society asdeposit and at the end of the year it is repaid as bonus.Strictly speaking it is not bonus. It is only anundistributed portion of the real wages of the tribes.
The collection charge fixed and paid to tribesduring the period 1991-92 to 1993-94 is given in Table 6.19.

263
Table 6.19
Average NTFP Collection Charge Paid to Tribes by TCS and Floor
Price Fixed by SC/ST Federation from 1991-92 to 1993-94
Figures in Rs/per Kg.
Collection Collection Collection chSl. NTFP charge paid charge fixed arge paid as %No. to tribes by SC/ST collection
federation charge fixedA. MDICINAL
1. Tuber Crops 11.97 12.07 99.172. Root items 3.56 3.05 116.723. Fruits 1.95 3.86 50.524. Barks 3.87 2.68 144.405. Bushes & Creepers 5.34 3.19 167.406. Liquids (honey) 26.43 21.00 125.867. Seeds 6.19 4.96 124.808. Flowers 28.37 6.20 457.589. Miscellaneous 32.68 35.42 92.26B. NON—MEDICINAL
10. Oil seeds 2.70 2.00 13511. Spices 55.47 83.10 66.7512. Edible items 13.37 5.15 259.6113. Dye & paint items 15.63 3.86 404.9214. Soap and Shampoo 5.11 4.17 122.54
items
15. Miscellaneous 7.67 8.60 89.06Source: Compiled from the records of SC/ST Federation and TCS
under study from 1982-83 to 1990-91.
264
Table 6.19 indicates that except for items such astuber crops. fruits. spices, miscellaneous (medicinal-beewax). and the miscellaneous items of the non—medicina1categories. the price paid by TCS were higher than what wasfixed by NTFP committee. By comparing tables 6.18 and 6.19 we
could understand that the pricing policy has considerableeffect in the payment of collection charge to tribes byco—operative especially from 1991-92 onwards.
6.20 Collection Charge Fixed by NTFP Committee and Paid byTribal Co-operative Societies from 1982-83 to 1993-94
The average collection charge fixed by NTFPCommittee and paid by tribal co-operative societies during theentire period from 1982-83 to 1993-94 is given in Table 6.20.

265
Table 6.20NTFP Collection Charge Paid to Tribes by TCS and Floor Price
Fixed for NTFP by SC/ST Federation/NTFP Committee — 1982-83to 1993-94 — Comparison
Figures in Rs/per Kg.
Collection Collection Collection ch31. NTFP charge paid charge fixed arge paid asNo. to tribes by SC/ST collection
federation charge fixedA. MEDICINAL
1. Tuber Crops 6.20 7.01 88.452. Root items 2.08 1.83 113.663. Fruits 1.14 1.93 59.074. Barks 2.16 1.44 150.005. Bushes & Creepers 2.75 1.98 138.896. Liquids (honey) 16.19 13.98 128.267. Seeds 3.89 3.11 125.088. Flowers 15.32 3.76 407.459. Miscellaneous 20.44 20.04 102.00B. NON-MEDICINAL
10. Oil seeds 1.49 1.36 109.5611. Spices 29.55 37.20 79.4412. Edible items 7.84 3.50 22413. Dye & paint items 8.07 2.62 308.0114. Soap and Shampoo 2.98 2.65 112.45
items
15. Miscellaneous 3.70 5.13 72Source: Compiled from the records of SC/ST Federation and TC
under study from 1982-83 to 1990-91.

266
Table 6.20 indicates that the overall payment ofcollection charge to tribes was always higher than the pricefixed by NTFP committee and SC/St federation. But for itemslike tuber crops, fruits, spices and non—medicinalmiscellaneous items. the prices paid by co-operatives wereless than the floor price fixed by NTFP committee. It clearlyindicates that the tribes were not even given the guaranteedprice offered by the NTFP committee by TCS.
Table 6.21 depicts the ‘t' values of collectioncharge fixed by NTFP committee and paid by TCS to tribes forNTFPB for three periods 1982-83 to 1993-94, 1982-83 to 1990-91
and 1991-92 to 1993-94. The table brings to our notice thatthere was significant difference between the price fixed andpaid by co-operatives for NTFP's in almost all the threeperiods.

267
Table 6.21't' Values of Collection Charge paid by Co-operatives and
Fixed by NTFP Committee51. ‘t' valuesNo_ NTFP 1932-33 to 1932-33 to 1991-92 to1993-94 1990-91 1993-94A. MEDICINAL
1. Tuber Crops 1.46 12.07 0.122. Root items 1.89 1.51 2.153. Fruits 3.90’ 1.06 12.57*4. Barks 3.45* 5.30‘ 3.415. Bushes & Creepers 2.50‘ 2.30‘ 5.20*6. Liquids (honey) 3.10’ 2.06 3.357. Seeds 1.49 1.80 0.583. Flowers 4.33* 4.34 5.62’9. Miscellaneous 0.23 0.78 0.673. NON-MDICINAL
10. Oil seeds 0.91 0.56 2.6611 Spices 0.92 0.51 4.59‘12. Edible items 3.09‘ 2.05 3.1013. Dye & paint items 4 05' 3.43* 3.70‘14. Soap and Shampoo 2.52' 1.27 9.19*
items
15. Miscellaneous 1.72 1.64 0.50Significant at 5% level.

268
6.21 Sales Price expected and the Actual Sales Price realisedfor NTFP
Every year the NTFP committee will fix thecollection charge, procurement value and the expected salesvalues of NTFP in advance and the same list will be send toTCS through SC/ST federation. Tables (6.22. 6.23 & 6.24)present the average expected and realised value of NTFP andthe by SC/ST Federation during the periods 1982-83 to 1990-91.1991-92 to 1993-94 and 1982-83 to 1993-94
Table 6.22 points out that as regards to allmedicinal items except tuber crops, fruits and seeds theactual sales value was below than the expected value. Thesame thing was happened to non-medicinal items like oil seeds,edible items. and soap and shampoo items. Among the fruititems. Nellicca is seasonal which is a highly required item infresh quantities for medicinal preparation. Since there is notechnology to preserve Nellicca in freshness for long periodof time, the market value of the products always depends uponthe availability and the unscrupulous activities of traders.Among edible items Kudampuli is in hot demand. Likewise.Cheevaccai, Soap and Shampoo items which have very good market
especially in Tamil Nadu and other northern states. but due tolack of proper liaison with the end—users of these products,the TCS were not in a position to realise good price for theseI-\v~r\4-Iunrvl-5

269
Table 6.22
Average Sales price of NTFP - Expected and Realised by SC/STFederation - 1982-83 to 1990-91
Figures in Rs/per Kg.
Sl. Sales price Actual sales Actual salesNo. NTFP expected value value as X ofexpectation
A. MEDICINAL
1. Tuber Crops 8.24 7.09 86.02 Root items 2.35 2.93 124.73 Fruits 2.66 1.32 49.64 Barks 1.87 2.14 114.45 Bushes & Creepers 1.64 3.12 190.26. Liquids (honey) 10.55 17.39 164.87 Seeds 17.94 5.25 29.38 Flowers fl.06 15.93 392.49 Miscellaneous 4.82 25.15 521.8B. NON-MEDICINAL
10. Oil seeds 5.47 2.58 47.211. Spices 63.00 90.08 143.012. Edible items 15.67 7.69 49.113. Dye & paint items 4.88 8.99 184.214. Soap and Shampoo 10.56 5.29 50.0
items
15. Miscellaneous 3.52 3.36 95.5Source: Compiled from the records of SC/ST Federation and TCS
under study from 1982-83 to 1990-91.

270
Table 6.23
Average Sales price of NTFP - Expected and Realised by SC/STFederation 1991-92 to 1993-94
Figures in Rs/per Kg.
31. Sales price Actual sales Actual salesNo. NTFP expected value value as % ofexpectation
A. MEDICINAL
1. Tuber Crops 16.09 24.55 152.62. Root items 4.08 6.33 115.13. Fruits 4.29 3.30 76.94. Barks 4.83 5.66 117.25. Bushes & Creepers 3.58 7.07 197.26. Liquids (honey) 24.26 38.61 159 17. Seeds 28.0 9.00 32.18. Flowers 6.62 35.56 537.29. Miscellaneous 18.27 54.86 300.3B. NON-MEDICINAL
10. Oil seeds 7.22 4.02 55.711. Spices 72.51 128.16 176.712. Edible items 16.0 21.20 132.013. Dye & paint items 16.87 31.24 185.214. Soap and Shampoo 18.35 9.86 53.7
items
15. Miscellaneous 5.56 8.10 145.7Source: Compiled from the records of SC/ST Federation and TCS

271
While comparing the Tables. 6.22 and 6.23 it wasobserved that unit sales price has considerably improved from1991-92 onwards and the SC/ST federation was able to realise
the higher prices for NTFP except for fruits. seeds. oil seedsand soap and shampoo items. The expected and the realisedsales price of NTFP for the period 1982-83 to 1993-94 isdepicted in Table 6.24.
Table 6.24Average Sales Price of NTFP - Expected and Realised by SC/ST
Federation from 1982-83 to 1993-94Figures in Rs/per Kg.
S1. Sales price Actualsales Actual salesNo. NTFP expected value value as % ofexpectation
A. MEDICINAL
1 Tuber Crops 10.21 11.45 112.12 .Root items 2.78 3.78 136.03 Fruits 3.07 1.82 59.34. Barks 2.65 3.10 117.05 Bushes & Creepers 2.12 4.11 193.46 Liquids (honey) 14.97 22.70 151.67 Seeds 20.46 6.19 30.38 Flowers 4.70 20.84 443.49 Miscellaneous 5.68 32.58 573.6B. NON-MEDICINAL10. Oil seeds 4.41 2.94 66.711. Spices 62.13 99.60 160.312. Edible items 19.75 11.07 56.113. Dye & paint items 8.37 14.55 173.814. Soap and Shampoo 12.51 6.43 51.4
items15 Minnnllannnlnq 4 fl’? 4 R4 117 '7

272
Table 6.24 reveals that there exists marketingproblems for items like fruits. seeds. oil seeds. edible itemsand soap and shampoo items. The actual realised value ofthese items were much lower than the expected value. The 't'values of sales price realised and sales price expectedrevealed that there is significant difference between thesetwo prices.
Table 6.25't' Values of Sales Price Realised and Sales Price Expected by
SC/ST FederationS1_ 't' valuesNTFP 1982-83 to 1982-83 to 1991-92 toN°' 1993-94 1990-91 1993-94A. MEDICINAL
1. Tuber Crops 0.75 0.83 5.162. Root items 2.52‘ 1.31 9.39*3. Fruits 6.99’ 7.66‘ 1.334. Barks 1.39 0.99 0.875. Bushes & Creepers 4.50‘ 3.25‘ 6.5B*6. Liquids (honey) 5.57‘ 9.49* 6.74‘7. Seeds 10.32" 9.63" 11.92‘3. Flowers 5.50‘ 10.35’ 3.35‘9. Miscellaneous 6.24‘ 5'.oo 13.40B. NON—MEDICINAL10. Oil seeds 7.o7' 5.53‘ 1o.5o*11. Spices 5.o4* 3.69* 4.25’12. Edible items 3.72’ 7.46* 13.65*13. Dye a paint items 2.63’ 1.35 14.26‘14. Soap and Shampoo 6.59‘ 4.77’ 23 09*
items15. Miscellaneous 0.51 0.14 1.39

273
Table 6.25 indicates that there has been significantdifference between the fixation of expected sales value andactual realisation of price for NTFP from 1982-83 to 1993-94.Significant difference could be noted in the case of almostall items of NTFP. It highlights the inefficiencies of theco—operative marketing system to extract a reasonable salesprice for NTFP. It would be possible only through a detailedsurvey about these products in the market. When theexpectation of sales value is low, naturally the fixation ofcollection charge will also be low. Therefore the low pricefixed by the co-operatives force the tribes to market theircollected produce through private channels.
6.22 Collection Charge as Percentage to Actual Sales PriceRealised
Table 6.26 depicts the collection charge aspercentage to sales price realised.
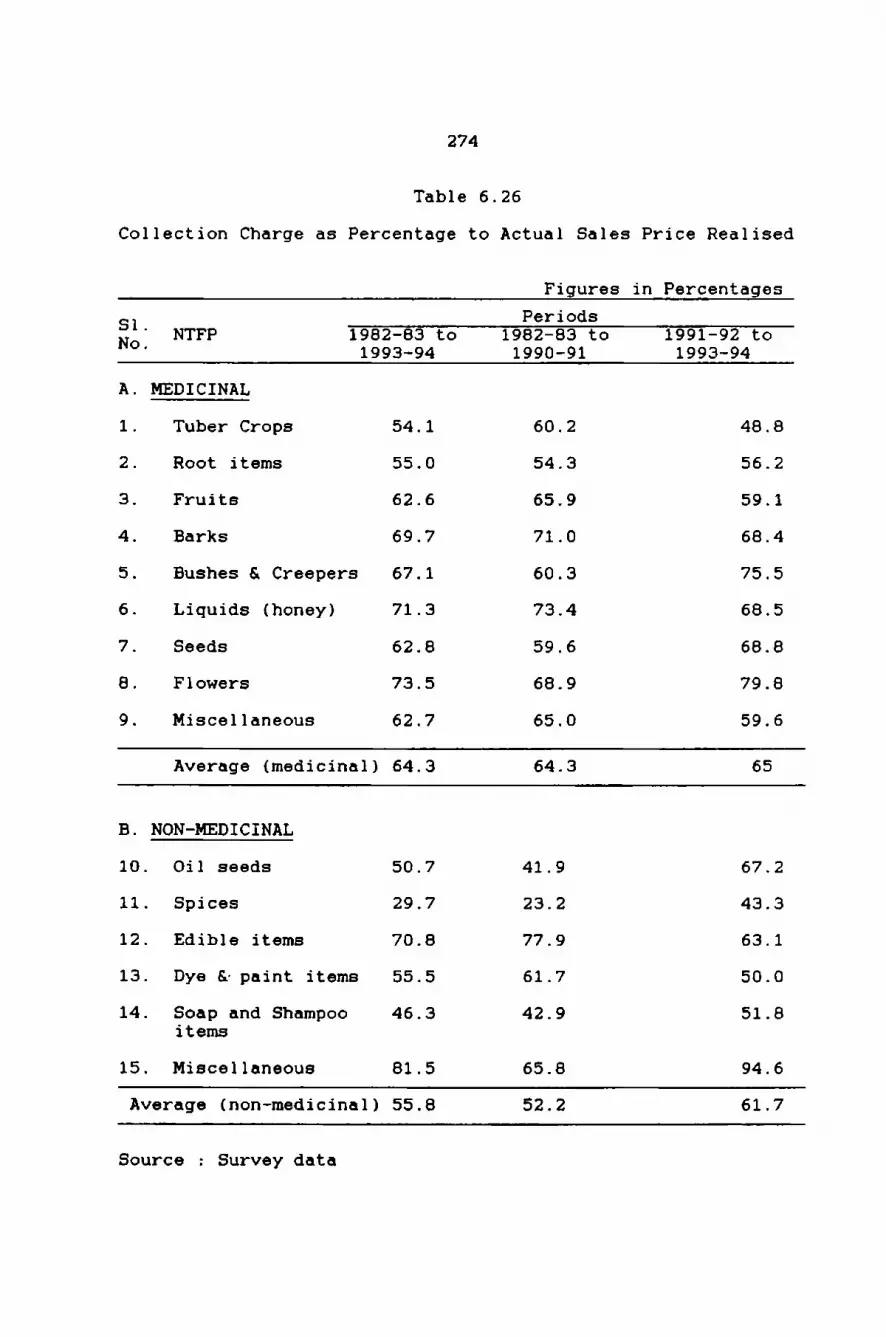
274
Table 6.26
Collection Charge as Percentage to Actual Sales Price Realised
Figures in PercentagesS1 PeriodsNo‘ NTFP 1982-83 to 1982-83 to 1991-92 to' 1993-94 1990-91 1993-94A. MEDICINAL
1. Tuber Crops 54.1 60.2 48.82. Root items 55.0 54.3 56.23. Fruits 62.6 65.9 59.14. Barks 69.7 71.0 68.45. Bushes & Creepers 67.1 60.3 75.56. Liquids (honey) 71.3 73.4 68.57. Seeds 62.8 59.6 68.88. Flowers 73.5 68.9 79.89. Miscellaneous 62.7 65.0 59.6
Average (medicinal) 64.3 64.3 65B. NON-MEDICINAL
10. Oil seeds 50.7 41.9 67.211. Spices 29.7 23.2 43.312. Edible items 70.8 77.9 63.113. Dye &-paint items 55.5 61.7 50.014. Soap and Shampoo 46.3 42.9 51.8
items
15. Miscellaneous 81.5 65.8 94.6Average (non—medicinal) 55.8 52.2 61.7
Source : Survey data

275
Table 6.26 points out that over the years 64.3percent of the realised value of medicinal herbs had beengiven to tribes as collection charge and for non-medicinalitems it was only 55.8 percent. While comparing the periods.
for medicinal herbs the share given to tribes has increasedfrom 64.3 percent during 1982 - 91 to 65 percent in 1991 —94. The corresponding figure for non-medicinal items was 52.2percent to 61.7 percent. But it is a pity to note that in thecase of most of the TCS could not give 75 to 80 percent of therealised value as collection charge to tribes as was promised.
6.23 Sale rate of NTFP under Co-operative and Non-Co—operativeChannel
Table 6.13 point out that 33 percent of the productseven under this institutional arrangement is marketed throughnon-co—operative channels. One of the major reasons is theexistence of a wide gap between the price offered byco-operatives and non—co—operatives. The price offered by the
non—co—operative channel was always higher than what wasoffered by co-operatives which is very evident in Table 6.27.

276
Table 6.27
verage Sale Value of NTFP's of Tribes under Co—operative and
Non-Co—Operative Marketing Channel
Figures in Rs/per Kg.
7,; NTFP ::2;::‘?:::‘ <3 1% M3 4 5MEDICINAL
Tuber Crops 11.97 14.37 83.3Root items 3.56 5.27 67.6Fruits 1.95 4.94 39.5Barks 3.87 22.60 17.1Bushes & Creepers 5.34 9.51 56.2Liquids (honey) 26.43 45.52 58.1Seeds 6.19 12.51 49.5Flowers 28.37 30.38 93.4Miscellaneous 32.68 39.89 81.9
NON-MEDICINAL
1. Oil seeds 2.70 5.50 49.1Spices 55.47 80.00 69.3
2. Edible items 13.37 16.93 79.03. Dye & paint items 15.63 27.29 57.3I. Soap and Shampoo 5.11 7.33 69.7
items
5. Miscellaneous 7.67 10.23 75.0>urce: For Column No.3. compiled from the records of TCS
Table 6.18) and for column No.4 directly from tribesthrough survey of 254 tribal fami1ies._

‘Z77
Table 6.27 makes it clear that the price offered b}non-co—operative channel was always higher than the priceoffered by co—operatives. As regards items like fruitsbarks. seeds. and oil seeds the price offered by co—operative:even did not touch 50 percent of the price offered by privatetraders. While analysing the tribal economy one coulcunderstand that the tribes are more concerned about thcsharing of benefits. Their participation with antorganisation can be attributed to the benefits which they gelfrom that organisation. They are more concerned witlimmediate benefits rather than waiting for future benefitfrom the organisation. If a trader offers five paise highento a commodity. the tribes may be tempted to sell the producto the private trader, and not to their own organisationnamely. co—operatives.
Though we have seen the price paid by TCS were mucl
higher than the price fixed by NTFP committee, it was alenoted that the price paid by TCS to tribes was also much thanthe price paid by the non—co~operative channel. However manalysis of the price spread will reveal the real picture 0:the role of different agencies in the collection and marketingof NTFP in the state and will also reveal the rate aexploitation of tribes even under the well designated systmof co—operative marketing of NTFP.

278
6.24 Price Spread
Price spread indicates the price difference betvthe collection charge received by tribes and the actpayment made by the end users of the products. It was aobserved that even though 887 Ayurvedic medicjmanufacturing units are there in Kerala, they also had n
forward linkage with the private traders in and outside Kerto get raw material in time. Really speaking.non—co-operative channel is controlling the NTFP marketKerala. To ascertain the price spread on medicinal items Cwere collected from 45 Ayurvedic medicinal manufacturunits. Since more than sixty percent of the total employnwas located for the collection of medicinal herbs and tconstitute 59 per cent of the income from NTFP income.following analysis (Table 6.28) would be much useful to rethe prices of medicinal herbs in the state and thereby hethe TCS to have some forward linkage with Ayurvedic medici
manufacturing units of the state.

2779
Table 6.20
Price Spread
51. Collection Procure- Sale value Final sale value Price larketlo. HTTP itele Charge eent value of SC/ST of Pvt traders Spread largin
(Rn) TCS federation to Ryurvadic (0-1) 0[Re] (Re) industry (Re) [Re]A 0 C 0 E F
1. Tuber crops 11.97 23.32 24.55 57.60 45.63 79.2[20.70]
2. Root itene 3.56 6.01 6.33 13.50 9.94 73.6[26.4}
3. Fruits 1.95 3.13 3.30 10.60 0.65 81.6[10.4]
4. Barks 3.07 5.30 5.66 92.70 00.03 95.0[4.2}
5. Bushes and 5.34 6.72 7.07 19.30 13.96 72.3creepers [27.7]
6. Liguidelfioneyl 26.43 36.60 30.61 52.10 25.67 49.3[50.7]
7. Seeds 6.19 0.55 9.00 17.30 11.11 64.2[35.0]
0. Flowers 20.37 33.70 35.56 50.00 21.63 43.3[$6.70]
9. Oil eeede 2.70 3.02 4.02 9.00 6.30 70[30.0}
10.Kundiriktae 15.63 29.60 31.24 76.00 60.37 179.4[20.60]
11.Spicee 55.47 121.75 120.16 420.00 372.53 071131
— . - - . . . . . _ . . -. ---- -----.--.----.-_--go-_-go--nu----qu-----—-----------qIote: All figures l,0.C and D, have been coepiled iron the records of the respective1. Organisation iron 1991-92 to 1993-94.2. Collection charge: The rates paid to Tribes for HTTP.3. Procnrelent Value : The rate at which the Tribal co-operatives Sold lTPP'e to
SC/ST Federation4. Sales Value of : The rate at which the SC/ST Federation sold the lTTP‘e to endueere
SC/ST federation5. Figures in parentheses indicate percentage of trihel'e share of end-user‘: price
which is calculated hy the folloling iorlula.P5 = IP/CF I 100where PS= Trihal'e share in end-ueer'e price
lP= let price received by the tribe

280
Table 6.28 highlights that there existed big gapbetween the price received by tribes and actually paid by theusers of the tribal products. On an average only 27.65percent of the sales value is given to tribes as collectioncharge. The market margin varies between 43.3 per cent to95.8 percent. The highest market margin indicates the level3f inefficiencies of the created institution to market thetribal produce at a reasonable price to the end—users. Theactual sales value realised by SC/ST federation and thepurchase price of the Ayurvedic medicine manufacturing unitsfor medicinal herbs indicate a big gap which shows that thesetwo institutional arrangements are not properly linked.
6.25 Sharing of Spread
The marketing channel is mainly linked by threeintermediaries viz.. Tribal Co—operatives. SC/ST Federationand private traders. Even though tribal agents and employersare there. they are excluded from the purview of the analysisrelating to the sharing of price-spread as they pay similarprice as what the private traders offer to tribes. Table 6.29
indicates the sharing of spread by intermediaries in thenarketing channel.

281
Table 6.29
Sharing of Price Spread between Intermediaries in the Marketing Channel
Figures in Rs.
Sharing of SpreadS1. NTFP items TotalNo. Spread SC/ST Mid1lemen/TCS federation Pvt. Traders
I Medicinal Items
1. Tuber crops 45.63 11.35 1.23 33.05(100) (24.9) (2.6) (72.5)2. Root items 9.94 2.45 0.32 7.17(100) (24.6) (3.2) (72.2)3. Fruits 8.65 1.18 0.17 7.30(100) (13.6) (2.0) (84.4)4. Barks 88.83 1.51 0.28 87.04(100) (1.7) (0.3) (98)5. Bushes and 13.96 1.38 0.35 _ 12.23creepers (100) (9.9) (2.5) (87.6)6. Liquids(Honey) 25.67 10.25 1.93 13.49(100) (39.9) (7.5) (52.6)7. Seeds 11.11 2.36 0.45 8.30(100) (21.2) (4. ) (74.8)8. Flowers 21.63 5.41 1.78 14.44(100) (25) (8.2) (66.8)9. Oil seeds 6.30 1.12 0.20 4.98(100) (17.8) (3.1) (79.1)10.Kundirikkam 60.37 14.05 1.56 44.76(100) (23.3) (2.5) (74.2)11.Spices 372.53 66.28 6.41 299.84(100) (17.8) (1.7) (80.5)Total Spread 100 19.1 2.4 78.50Sharing (8)
Note : Figures in Parentheses indicate percentage to column total.

282
Table 6.29 points out that 78.5 percent of thespreads were swallowed by private traders. 19.1 percent bytribal co-operative and 2.4 percent by SC/ST federation. Thehigh spread was mainly due to poor linking of co-operativeswith the potential end-users of the tribal products. Eventhough the TCS got a monopoly right to employ and collect theNTFPS from Kerala forest, it failed in establishing a rapportwith the potential end-users of the product. As a result theinstitutional arrangement itself had fallen as a prey at thehands of the unscrupulous private traders who virtuallycontrol the NTFP market to their own advantage. The studyreveals that the existing formal marketing arrangement limitsthe market and it leads to institutional inefficiencies.

INDIAN SYSTEM OF MEDICINE AND ITS LINKAGEWITH C 0-OPERA TI VE MARKETING SOCIETIES IN
KERALA

CHAPTER VII
INDIAN SYSTEM OF MEDICINE AND ITS LINKAGE WITH CO-OPERATIVE
MARKETING SOCIETIES OF KERALA
The success of a marketing institution lies mainlyon its linkage with the potential customers of their produce.The effectiveness of TCS also heavily depends on their linkagewith the Indian system of medicine —— Ayurveda. Siddha andUnani. The Indian system of medicine mainly relies oningredients from the medicinal plants and trees in the forest.This chapter examines the linkage of TCS with the Indiansystem of medicine patricularly Ayurveda in the collection andmarketing of NTFP in the state.
7.1 Indian Forest and Medicinal Items
Nature has endowed India with a wide range ofclimatic, soil and topographic conditions suited for ourtraditional system of medicine. Ayurveda believes that allherbs are medicines. This is expressed expressed as under
”JAGATHEYVA ANOUSHADHAM
NA VIDHYATHE KINCHITH“
our land, which is a punyabhoomi, is gifted with almost all

284
the medicinal life—saving drugs and raw herbsl. The bestmedicine for people living in any particular area is the onethat grows in that area2 (Charaka Samhita). It indicates thatwhatever items or herbs we see around us are having medicinalvalue. It is found that about 20000 species are grown inIndia.3 of which it is believed that about 2000 species arehaving medicinal value and importance. About 80 percent ofthe non—medicina1 plants grow in forest. It is estimated thatof this 2000. about 800 medicinal herbs are used in the Indian
system of medicine especially in Ayurveda for variouspreparations of medicine. It is found out that about 2000different types of medicinal formulations are used in ourcountry. of which 1500 are prepared out of herbs4. More than80 per cent of the ingredients in the preparation of Ayurvedicmedicine are medicinal herbss. The Kerala Forest has about
Sitaraman S. (1994),”International marketing of Ayurvedicmedicines“ Paper presented in a Seminar on technologyClinic on Ayurvedic Medicines and Herbal Cosmetic.Organised by the Science and Technology EnterpreneurshipDevelopment Project, Kozhikode. at Thrissur. on 17th and8th of August, p.6-8.Unnikrishnan. (1993),”Medicina1 herbs - an Overview",Paper Presented in theForest Medicinal herbs SeminarOrganised by the Kerala Ayurvedic Medicine manufacturesAssociation, Forest Department and SC/ST Federation atThrissur on 10.5.1993,p.2.Aravindaksha Panicker. (1993). "Forest Medicinal Herbs —Conservation and Usage — An Overview," Paper Presented inthe forest Medicinal herbs, Seminar organised by KAMA,Forest Department and SC/ST Federation on 10-5-1993 atThrissur.
Ibid.. p.3.Unnikrishnan. (1993). 0pcit...p.4.

285
550 medicinal herbs in its abode. But it is observed thatonly 69 items alone are included in the NTFP list of the stateas medicinal herbs and listed by the TCS for collections
7.2 Indian System of Medicine and Kerala
Among Indian System of Medicines. Ayurveda is very
famous and widely accepted in Kerala. Kerala has a uniquetradition in Ayurveda. The book 'Sahasrayoga' is aMagna Carta in the field of Ayurveda which describes thescience of life. The Ashtavydyas of Kerala were very famousin the field of Ayurveda. Kerala has also gone ahead in thefield of Ayurveda education also. We have five AyurvedaColleges situated at Thiruvananthapuram, Thripunithara,Kotteckal. Ollur and Kannur. Kerala also keeps medicinalgardens at Kulathupuzha. Konny, Sasthamkotta and Begur to meet
the raw-material requirements of the Ayurvedic educationalinstitutions and industry. Amongst the Ayurvedic medicinesmanufactured today, 57.4 percent are only herbal 28.7 percent.herbo—minero-metallic and the remaining 13.9 percentminero—metal1ic preparations7. The use of herbs in lattertwo categories are either as ingredients of the formulation oras processing materials. It is quite evident from the above6 . . .
Compiled from the MFP list published by The Kerala StateFederation of SC/ST Development Co-operatives,Thiruvananthapuram. 1993-94.
7 Lucas D.S. (1993). "Forest Produce. A source forAyurvedic Medicine“. Paper presented at the NationalSeminar on Forest Produce organised by the Institute ofForest Genetics and Tree Breeding, (ICFRE). ForestCampus. Coimbatore. 15 - 16 October 1993.

286
data that plants have indispensable role in manufacturingAyurvedic medicines. The number of Ayurveda medicalinstitutions (it includes 7 Unani and 3 Siddha dispensaries)and the patients treated in these institutions are presentedin Table 7.1.
Table 7.1Number of Ayurveda Medical Institutions and Patients Treated
From 1980-81 to 1992-93 in Kerala
No.of Patents trea
Year $)i’:;::g:— Total Q36: in m(Nos.) ries (Nos.) (2+3) Hospitals (in lakhs)1 2 3 4 5 61980-81 85 419 504 1818 1631981-82 92 439 531 1639 1521982-83 93 453 546 1674 1531983-84 93 455 548 1702 1521984-85 94 457 551 1679 1591985-86 94 473 567 1689 1401986-87 97 497 594 1769 1411987-88 101 496 597 1829 1431988-89 101 498 599 1929 1411989-90 101 506 607 1979 1601990-91 106 529 635 2229 4451991-92 106 550 656 2229 3661992-93 107 566 673 2259 536Compound 1.8 2.3 2.2 1.7 9.5Growth rate
Source : Government of Kerala. Economic Review 1981 to 1993.Directorate of Economics and Statistics.

287
Table 7.1 shows that between 1980-81 to 1992-93
there was a compound growth rate of 9.5 per cent in patientsdepend on Ayurveda medicine . The growth has increased to 35percent after 1990s. Since Ayurveda medicine has no sideeffects, the Keralites as well as the non—Keralites started togive more importance to this type of medicine. Of the 673Ayurvedic institutions, more than 60 per cent functions inrural areas.
7.3 Growth of registered Ayurvedic Medicinal ManufacturingUnits in Kerala
Table 7.2 shows a booming growth of Ayurvedic unitsin Kerala especially after 1990. The total number ofregistered units has reached to 887. During 1992-93 about 126units have been registered in Kerala.

288
Table 7.2
Growth of Registered Ayurvedic Medicinal Manufacturing unitsin Kerala- (1975-76 to 1992-93)
Year Regigtrztion Aggigggge4_ (Nos)1975-76 15 151976-77 17 321977-78 13 451978-79 27 721979-80 '16 881980-81 28 1161981-82 14 1301982-83 25 1551983-84 36 1911984-85 45 2361985-86 52 2881986-87 58 3461987-88 69 4151988-89 61 4761989-90 67 5431990-91 117 6601991-92 101 7611992-93 126 887Source : Compiled from the Records of drug Controllers Office
(Ayurveda) Kerala State, Thriruvananthapuram.1975-76 to 1992-93
7.4 [District-wise Registered Ayurvedic Medicine Manufacturingunits in Kerala
Table 7.3 points out that of the 887 registeredAyurvedic medicine manufacturing units, 190 units i.e.. 21.42per cent have been registered in Thrissur District. This is

followed by Kollam (113 units).number
districts.of units
289
in
are very low.
Table 7.3
Wayanad Pathanmthitta
and Ernakulam (100 units).
and
the
Kasargod
District—wise Registered Ayurvedic Medicine ManufacturingUnits— 1992-93.
Total unitsSl.No. Name of Districts Registered
1. Thiruvananthapuram 82 9.252. Kollam 113 12.743. Pathanamthitta 4 .044. Kottayam 85 9.585. Idukki 14 1.586. Alappuzha 76 8.577. Ernakulam 100 11.278. Thrissur 190 21.429. Malappuram 23 2.5910. Wayanad 2 .0211. Kozhikode 86 9.7012. Kannur 59 6.6513. Palakkad 47 5.3014. Kasargode 6 1.29Total 887 100
Source :Compiled from the records of the Drug ControllersOffice (Ayurveda) Kerala state, Thiruvananthapuram.

290
7.5 Classification of Ayurvedic Medicine
The Ayurvedic industry produces two types of drugsfor treatment promotive drugs and curative drugse. Thepromotive drugs range from drugs for improving water quality(Cyparus Rotundus and Vetiver) and improving appetite (Piperlangum), to drugs for improving eye sight (Aloe barbadensis)memory (Bacopa Monnieri) and enhancing immunity (Timos pora
cordifolia). Jacob V. Cheeran (1994)9 also highlights thepotentialities of Ayurvedic drugs to cattle as feedsupplements to enhance production. by way of high weight, moreyield etc.
The curative drugs cover all therapeutic conditionsranging from drugs for healing simple wounds to diseases ofall types including conditions related to the brain and heart.
The preparation of Ayurvedic Medicine in Kerala can
be broadly classified in to 9 classes such Kashayams,Asavarishtangal, Pills, Grihithams. Choornam, Tailam/Kuzhambu.
B Darsan Sankar. (1994), "Securing the Future of Ayurveda.”Paper Presented in a Seminar on Technology Clinic onAyurvedic Medicines and Herbal Cosmetics, Organised bythe Science and Technology at Thrissur on 17th & 18thAugust 1994.
9 Jacob V. Cheeran, (1994). Production and Marketing ofAyurvedic Medicines in Animal Husbandry Area" PaperPresented in a Seminar on Technology Clinic on AyurvedicMedicines and Herbal Cosmetics, Organised by the Scienceand Technology Enterpreneurship Development Project.Kozhikode at Thrissur on 17th & 18th August 1994.

291
Bhasmams, Kasharams, Avalehas. Special Medicines (AllAyurvedic Medicinal Manufacturing units are not ProducingSpecial Medicines but the Ashoka Pharmacy Kannur, SreesadanKannur. Oushadhi Thrissur etc. have their own specialmedicines. Most of these special medicines are promotivedrugs.)
About 480 products of Homeopathic, 444 products ofAyurveda. 440 products of Unani and, 248 products of Siddha
10treatment are prepared with medicinal herbs Nearly 80 percent of ingredients of Ayurveda products are medicinal herbs.This will be very low in other branches of medicines. EvenAllopathy also uses medicinal herbs in some of itspreparations — eg. Thippalli and Keezharnaelli. All theseindicate that there will be great demand for NTFP as rawmaterials for the preparation of Indian system of medicines.
7.6 Demand for Medicinal Herbs by the Ayurvedic Industry inKerala
The demand for medicinal herbs and other items varyfrom industry to industry. Since almost all industriesproduce all sorts of medicines, they all demand Tuber Crops.root items, fruits, barks. etc. in varying quantities. The
10 Aravindaksha Panicker. (1993). "Forest Medicinal herbsConservation and usage — An Overview," Paper Presented inthe Forest Medicinal herbs Seminar Organised by KAMA.Forest Department and SC/ST Federation at Thrissur on10-5-1993.

yearly requirement
292
of medicinal items by the AyurvedicIndustry of Kerala is depicted in Table 7.4.
Table 7.4
Demand for Medicinal Items by the Ayurvedic MedicinalManufacturing Industry of Kerala
Sl. Medicinal Range of Qty. Average QuantityNo. Items Required (kg) Required/Unit (kg)1. Tuber Crops 636525- 777975 717-877
(11.97)2 Root items 3351600-4096400 3778-4618_ (58.95)3 Coats 45000- 550000 508-620(7.92)4 Fruits 146700- 179300 166-202(2.58)5 Barks 32400- 39600 37-45(.06)6. Bushes and 554850- 678150 625-765Creepers (9.76)
7 Liquids (Honey) 166500- 203500 188-230(2.93)8 Seeds 144810- 176990 163-200' (2.54)9 Flowers 11250- 13750 13-15
10 Oil seeds 37800- 46200 42-52(.07)11. Kundirikkam 95850- 117150 64-78
12. Miscellaneous 106500 108-132(1.68)
Source Ramanathan D. (1993), "Problems and Prospects ofAyurvedic Manufacturing Industry in Kerala." PaperPresented in a Seminar on strategies forConservation and Development of Medicinal Plants.held at Odakkali on 31-12-1993, Organised by KeralaAgricultural University in 1993.
Note :1.All items are in dry quantities.2.0ut of 120 items of NTPP only 69 items are
3.Average quantity
found toIndustry of Kerala. The
considered‘be used by Ayurvedicrequirements of those 69 items alone havein the above Table.
byrequired for a unit is arrived at

293
Table 7.4 highlights the fact that the industryrequires different medicinal herbs in different degrees.Nearly 59 per cent of their total requirements are for rootitems like Adalodaka veru, Orila veru. Kattuthippalli.Kattumulakin veru, Kattuthulasi veru, Kumizhin veru.Moovila veru. Kurunthotti veru. etc.
7.7 Collection and Marketing of Medicinal herbs by TribalCo-operatives and the Requirements of Ayurvedic Medicinal
Manufacturing Units
Table 7.5 depicts the average supply of medicinalherbs by co-operatives and the demand for the same item by theAyurvedic Medicinal Manufacturing Units of Kerala.
Table 7.5 brings to light that the co—operatives ofKerala could not meet the requirements of medicinal herbs ofAyurvedic units of Kerala. As regards to the root items theco—operatives can suffice only 3.2 percent requirements of themedicinal units of Kerala. The low availability of medicinalherbs through co-operatives and their stipulated terms andconditions force the Ayurvedic medicinal manufacturing unitsto resort to non-co-operative channel to get their rawmaterials requirements. Since the co-operatives have verypoor linkages with the end—users of the products. it affectstheir bargaining power to fetch reasonable prices for tribalproducts. Had the co—opratives were able to collect theentire availabile NTFPS and controll the market by

294
establishing direct contact with the medicinal manufacturingunits. The tribes and the society at large might havebenefitted considerably.
Table 7.5
Average Collection and Marketing of Medicinal herbs by TCSand the Requirements by Ayurvedic Medicinal Manufacturing
Units of Kerala - 1989-90 to 1993-94
Av.Qty.Col1. Qty avai- Qty. reS1. Medicinal by co-op. . lable to quired for %No. item (Kg) Ay. units Ay. units(Kg) (Kg) (4 to5)1 2 3 4 5 61. Tuber Crops 38050 43 797 5.42. Root items 119878 135 4198 3.23. Coats —— —- 564' -4. Fruits 12102 14 184 7.65. Barks 16414 19 41 46.36. Bushes and 46661 53 695 7.6
Creepers7. Liquids (Honey) 45138 51 303 16.88. Seeds 26911 30 182 16.59. Flowers 1064 1 14 7.110 Oil seeds 29332 33 47 70.211. Kundirikkam 107414 121 71 170.412. Miscellaneous 4444 5 120 4.2Note: 1. Column No.3 is the average collection of medicinal
herbs by co-operatives in the state from 1989-90 to1993-94.
2. Column No.4 is the result of dividing column No.3with the total number of registered Ayurvedicmedicinal manufacturing units in Kerala
3. Column No.5 is derived from Table 7.4.
295
7.8 Suppliers of Medicinal Items to the Ayurvedic MedicinalManufacturing Units of Kerala
An enquiry regarding the major suppliers of rawmaterials to the Ayurvedic medicine manufacturing units inKerala revealed that there were about 46 agencies who supplyraw materials to the industry. Of the 45 Ayurvedic medicinalmanufacturing units surveyed, none has any effective linkagewith co—operative set up i.e.. SC/ST Federation for their rawmaterial. Occasionally they collect certain items from thebranches of SC/ST federation. Table 7.6 gives an account ofthe number of agencies and the states and stations to whichthey belong for the supply of raw materials to the Ayurvedicunits of Kerala.
Table 7.6 depicts that all units under study hadsome linkage with about 20 private medicinal dealers inKerala. These medicinal dealers are mainly concentrated inthree towns of the state viz, Thrissur. Kozhikode andThiruvananthapuram. Forty ayurvedic medicinal manufacturingunits (89 per cent of the units surveyed) had linkages withseven suppliers in Tamil Nadu for almost all items. It isfound that of the 46 agencies which supply raw materials tothe Ayurvedic Medicine manufacturing units in Kerala. 25agencies are from outside Kerala. It is also found that thePharmaceutical Corporation of Kerala Ltd. purchases only lessthan one per cent of their requirement of the 69 medicinalitems from the co-operatives (SC/ST federation). All other

296
units under the study still meet their demand either fromprivate traders from Kerala or outside Kerala. Tamil Nadu andvery recently Andhra Pradesh emerged as the best dependentsources for the medicinal herbs for the manufacturing units irKerala.
Table 7.6Suppliers of Raw Materials to the Ayurvedic Medicinal
Manufacturing Units of KeralaS1. No.of No.of unit. Supp- having Major itemsNo. State/country Location liars linkage supplied1. Kerala (Pvt.) Thrissur
KozhikodeThiruvananth~ 20 45 All materialspuram
2. Tamil Nadu Coimbatore. Root items.Salem,Madras 7 40 gur. oils,Kunnathoor ghee.fruits
3. Punjab Ludhiana, Gulgu1u.AmukkuJalandar, 6 23 ram.Kottam. KarChandigarh pooram,Kungumapoovu.Kunthiri—kkam. Saffron
4. Bengal Calcutta 3 30 Black grapes,Amukkaram
5. Madhya Pradesh Neemuch 2 10 Amukkaram6. Andhra Pradesh Hyderabad 2 8 All Herbs7. Maharashtra Bombay 1 10 All Herbs8. Jamu Kashmir 1 25 Kayam,Karpooram
Kanmadam
9. Haryana Delhi 1 10 All Herbs10. Karnataka Bangalore 1 4 Packingmaterials11. Afghanisthan 1 1 Black grapes12. SC/ST Federa- Thiruvananth— Root items &tion (Kerala) apuram 1 6 Tuber itemsQnnv-an . Qnv-uav Ania

297
7.9 Wide Gap Between Ayurvedic Medicine ManufacturingIndustry and Tribal co-operative Societies.
Lack of proper and effective linkages between thepotential suppliers of medicinal herbs, TCS and the AyurvedicMedicine Manufacturing units in Kerala (potential demanders)the real fruits of tribal development effort is enjoyed by themiddlemen who now play a double role in the market —— one as
an illicit procurer of NTFP directly from tribes and the otheras a controller of medicinal herbs market in the state. Thestudy reveals that most of the traders from Tamil Nadu andKerala who directly purchase or participate in the auctions ofco—operatives and collect items in bulk quantities andsupplies the same at a high price to the Ayurvedic MedicineManufacturing Units in Kerala. In reality, the TCS as well asthe medicinal manufacturing units of Kerala have fallen asvictims at the hands of these unscrupulous traders. Accordingto Joshi Damodarll 90 per cent of ayurvedic drug manufacturersonly depend on market supplies of raw drugs which are eitheradulterated or 5ub—standard or outdated and thus the drugproduced with these could not be of desired quality. Eventhough the TCS got the monopoly procurement and marketingrights of NTFP in the state. they failed to exercise the same
11 Joshi Damodar (1993). "Scope of MFPs in AyurvedicPharmaceutical Industry". Paper Presented in theInternational Seminar on 'MFP in Forestry‘, held atInstitute of Management Development, Dehradun. 17~18April 1993.

296
monopoly in the distribution of medicinal items to theindustry.
7.10 Purchase and Sales Rate of Medicinal Items-Linkagebetween Ayurvedic Industry and Co-operative Marketing
Table 7.7
Purchase Rate of Medicinal Items by the AyurvedicMedicinal Manufacturing Units and Sale of Medicinal Items by
Co—operatives- A Comparison
Sl.No. Medicinal items X Y Z1. Tuber Crops 57.60 24.55 33.052. Root items 13.50 6.33 7.173. Fruits 10.60 3.30 7.304. Barks 92.70 5.66 87.045. Bushes & Creepers 19.30 7.07 12.236. Liquids (Honey) 52.10 38.61 13.497. Seeds 17.30 9.00 8.308. Flowers 50.00 35.56 14.449. Oil seeds 9.00 4.02 4.9810. Kundirikkam 76.00 31.24 44.7611. Spices 428.00 128.16 299.8412. Miscellaneous 82.00 54.86 27.14Note: 1. X denotes the average purchase rate of medicinal
items by the Ayurvedic Medicinal Manufacturing unitsof Kerala from 1990-91 to 1993-94.
2. Y denotes the average sales rate of Medicinal itemsby the SC/ST Federation from 1990—91 to 1993-94.
3. 2 denotes the price difference (X—Y)

299
Table 7.7 explains the purchase and sale rates ofdifferent medicinal items purchased by the Ayurvedic MedicinalManufacturing units in Kerala for the preparation of AyurvedicMedicine and the sale rate of the same items by theco-operatives in the state. Out of 45 units studied. almostall are collecting their requirements from private traders.column x denotes the average rate at which they collected theitems from private traders from 1990-91 onwards. Column Ydenotes the rate at which the co—operatives have marketed thesame items in Kerala. It shows that the co—operatives havefailed to establish a link between Ayurvedic MedicineManufacturing Industry in the state. It is very clear thatthe middlemen by controlling the market, pocket a huge amountas profit. The difference in price. may be one of the reasonsfor sidelining the co—operatives by tribes and marketing theproduce through private traders/middlemen. Since theco—operatives are not aware about the potential demand of theproducts by the Ayurvedic industry. (so far no survey has beenconducted) it could not fix a realistic price for theproducts. As a result. not only the co-operatives but alsothe tribes are being exploited by the private channel. Thetable also points out that the level of exploitation is muchhigh especially in high value items like tuber crops. Barks,flowers, kundirikkam and cardamom. The classification. viz.,miscellaneous, mainly includes bee wax, there also the levelof exploitation is very high.

300
Since there is no co-ordination between thepotential suppliers and potential customers of medicinalherbs, the industry as well as the consumers are adverselyaffected. Though the Government envisaged a system with noble
objectives, it is proved that the benefit of the system isultimately not giving to tribes but to middlemen or privatetraders. Therefore it is imperative that urgent steps shouldbe undertaken to rectify the system.
The study proved that the gatherers of medicinalherbs receive only a very small proportion of the price theconsumer pays. This calls for market regulation to reduce theunhealthy market practices for the healthy promotion of thesystem of forest based Indian system of medicine. Byliberalising the marketing practices for NTFP in the tribaleconomy the industry would be assured of getting rightmaterial of right quality, at the right place and the rightprice. This will provide incentives to the gatherers tocollect the right material of the right quality and receivethe right payment, reflecting their opportunity cost of wageand the opportunity cost of the valuable knowledge theypossess in identifying and gathering the forest medicines.12
12 Chandra Kanth M.G. and Lokamanya D.S.(1993). "MarketImperfections in Forest Based Medicinal Tree Parts— ACase Study,” Paper Presented in the International Seminaron 'MTP in Forestry‘ held at Dehradun, 17-18 April 1993

301
7.11 Response of Officials of Ayurvedic Medicin<Manufacturing Units
Since almost all units collect their raw materiaLdirectly from private traders, the advantages of thinon—co-operative trade relationship over co-operativehavebeen collected and placed on record here.
7.11.1. Advantages of Non-cooperative Channel OveCo—operative Channel
1. Supply of raw materials in the factory premises.
Eighty per cent of the respondents point out that 0their request the raw materials will be supplied in thgodowns of the units. Since they get regular and continuousupply, there is no need to keep big quantities in theigodowns.
2. Credit base:
All the responding units under study pointed outhat they get raw materials on credit basis. The period 0credit varies from one to three months. In the case oco-operatives advance payment is required even to participatin auctions.

302
3. Formalitiesz
All officials highlighted the various formalities ofco-operatives in releasing and removing the productimmediately after auctions. They have to wait for pass fromForest Department. In some cases payment of bribe isnecessary to get the movement pass for NTFP. Such thingsforce them not to turn to co—operatives on a second time.
4. Advance Information:
Seventy five per cent of the respondents pointed outthat they get advance information from different traders abouttheir stock of items, their prices etc.. whereas fromco—operatives they don't get any information.
5. Required quantity and Availability
All officials highlighted that their timelyrequirement and the availability with co—operatives will nevercoincide. The Ayurvedic units require raw materials formedicinal preparations. They require small quantities ofdifferent items at different times. But the co—operativescollect items only seasonally. Since they don't have thefacility to store the items for long period, they release theitems in bulk quantities through auction. Eighty per cent of

303
the Ayurvedic units pointed out that they don't have properstorage facilities.
6. Age Old Relation with Certain Suppliers
Of the 45 units under survey, 30 units were familymanaged units. They have their own formulations in thepreparation of medicine and treatment. They point out thatthey have certain regular customers and suppliers of rawmaterials. Immediately after giving order. they get thematerials in their door steps.
7. Quality of raw materials
Out of the 45 units that exists. only 6 have madesome connections with co-operatives in getting raw materials.They all pointed out that the materials supplied byco-operatives are of good qualities.
7.12 Problems Faced by the Ayurvedic Medicinal ManufacturingUnits of Kerala
All respondents pointed out that one of the majorproblems facing the industry is raw materials shortage. Theavailability of medicinal herbs from Kerala forest isdecreasing. Reduction in forest area, unscientific collectionmethods. encroachment. fire etc. are the major reasons for

304
shortage. Of the 45 medicinal manufacturing units. it isfound that none except Kottackal Arya Vydyssla and NagarjunaHerbal Concentrates Ltd. has any medicinal gardens of its own.
The medicinal garden of Kottackal Aryavaidyasala and NagarjunaHerbal Concentrates Ltd. will not be sufficient for even tomeet one per cent of their total requirements. The plannershave to take note of this situation and initiate steps toencourage the cultivation of medicinal herbs on a large scale.
The co-operatives should also try to make a good rapport withAyurvedic units, consider their requirement etc. and makesuitable changes in their marketing strategies includingenlarging items in NTFP list. Only then the system will helpthe tribes as well as the industry and ultimately the society.

PARTICIPATION AND RESPONSE ANALYSIS

CHAPTER VIII
PARTICIPATION AND RESPONSE ANALYSIS
Participation is a widely used term in the currentliterature on development. Tribal co-operative societies aredesigned as participatory ventures for tribal development.They are expected to be free from historical lethargy ancbureaucratic indifferencel. But the participatory efforts areconspicuous by their absence in the working of TCS.
8.1 Membership
The earlier chapters have highlighted the fact tha1the coverage of tribal co—operative societies among tribes isvery poor. It was observed that only 20.1 per cent of th<tribals had taken shares from TCS voluntarily. The rest toolshares at the advice or influence of their friends.secretaries of TCS and or co—operative inspectors (Table 8.1).To a question of why they have become members in TCS, 35.4 pei
cent answered that they became members for marketing theiiNTFP. More than 16 per cent do not have any idea of theiimembership in TCS (Table 8.2). It was found that 55 of thetribes also had membership in other credit co—operativ<institutions in their area. They took such membership on th(advice of their own friends and members of the Board 01directors of the respective societies. Forty five per cent oi
Suresh. K.A.. (1990). “Participation of beneficiaries itthe development programmes of Non—GovernmentalOrganisations in Kerala“. Journal of Rural Development.Vol.9(5). pp.911—915. NIRD. Hyderabad.

306
those who have membership in other co-operative institutionrevealed that they took membership in such societies ftavailing loans while 42 per cent became members on politic:reasons. Thirteen per cent do not have any idea regarding Iflthey became members in other societies.
Table 8.1Mode of Taking Membership in TCS
Advice Co—op.Regions 'Volu- of Board Secre- Ins- Totentary friends members tary pectors
1. Thiruvananthapuram 3THE — 1 7 6 1 1!TEF 8 2 5 — - ETLE 3 5 9 6 2 2Total(A) 11 8 21 12 3 E(20) (14.5) (38.2) (21.8) (5) (10
2. ThrissurTHE 2 3 10 9 2 ZTEF 1 2~ 15 4 2 2TLE 5 4 6 6' - 4 2Total(B) 8 9 31 19 8 7!(10.7) (12) (41.3) (25.3) (10.7) (1m
3. Kalpetta Rn.THE 5 4 13 13 - ETEF 4 4 14 6 1 2TLE 6 3 5 2 4 mTotal(C) 15 11 32 21 5 8(17.8) (13.1) (38.1) (25) (6) (1m
4. Adimaly RnTHE 17 4 9 8 2 4|Total(D) 17 4 9 8 2 4!(42.5) (10) (22.5) (20) (5) (10Grand Total 51 32 93 60 18 25(20.1) (12.6)(36.6) (23.6) (7.1) (100
GroupingsTHE 24 12 39 36 5 1n(20.7)(10.3) (33.6) (31.0) (4.4) (100TEF 13 8 34 10 3 m(19.1) (11.8) (50) (14.7) (4.4) (1001TLE 14 12 20 14 10 7!
(20)(17.1) (28.6) (20) (14.3) (100Note:(1);?igures in parentheses indicate percentage to row t4
(2) TME : Tribes of More Effective TCS.TEF : Tribes of Effective TCS.TLE : Tribes of Less Effective TCS.

307Table 8.2
Reasons for Becoming Members in TCS
Regions 1 2 Reasgns 4 5 TotalA. Thiruvananthapuram RnTHE 1 - 3 5 6 15TEF 3 1 4 3 4 15TLB 10 5 6 1 3 25Tota1(A) 14 6 13 9 13 55
(25.5)(10.9) (23.6) (16.4) (23.6)(100)B. Thrissur RnTHE 11 4 7 2 2 26TEF 5 4 5 3 7 24TLE 9 — 10 3 3 25Tota1(B) 25 8 22 8 12 75
(33.3) (10.7) (29.3) (10.7) (16) (100)C. Kalpetta Rn.THE 12 1 10 6 6 35TBF 10 2 7 5 5 29TLE 4 2 7 5 2 20Tota1(C) 26 5 24 16 13 84
(31) (6) (28.6) (19) (15.4)(100)D. Adimaly Rn‘HEB 25 2 5 5 - 3 40Total (D) \5 2 5 5 3 40
(62.5) (5) (12.5) (12.5) (7.5) (100)Grand Total 90 21 64 38 41 254(A+B+C+D) (35.4) (8.3) (25.2) (15) (16.1)(100)GroupingsTME 49 7 25 18 17 116
(42.2) (6.0) (21.6) (15.5) (14.7)(100)TEF 18 7 16 11 16 68(26.5)(10.3) (23.5) (16.2) (23.5)(100)TLE 23 7 23 9 8 70(32.8) (10) (32.8) (12.9)(11.5) (100)
Note:(1) Figures in parentheses indicate percentage to rowtotal.(2) Reasons (1) To market NTFP (2) to Avail provisions.
(3) to get pass for NTFP collection(4) to avail loan facilities (5) don't know.

308
8.2 OwnershipTable 8.3
Response Towards Ownership of TCS
Ownership
Reglons Govt. Members §::;:_ gggggtors TotalA. Thiruvananthapuram RnTME 1 14 — — 15TEF 5 9 - 1 15TLE 8 10 3 4 25Tota1(A) 14 33 3 5 55(25.5) (60) (5.4) (9.1) (100)B. Thrissur RnTME 4 19 1 2 26TEF 12 5 5 2 24TLE 7 11 4 3 25Tota1(B) 23 35 10 7 75(30.7) (46.7) (13.3) (9.3) (100)C. Kalpetta Rn.THE 7 20 2 6 35TEF 4 20 1 4 29TLE 2 16 - 2 20Total(C) 13 56 3 12 84
(15.5) (66.7) (3.5) (14.3) (100)D. Adimaly RnTHE 8 23 5 4 40Tota1(D) 8 23 5 4 40(20) (57.5) (12.5) (10) (100)Grand Total 58 147 21 28 254(A+B+C+D) (22.8) (57.9) (8.3) (11) (100)GroupingsTHE 20 76 8 12 116
(17.2) (65.5) (6.9) (10.4) (100)TEF 21 34 6 7 68(30.9) (50) (8.8) (10.3) (100)TLE 17 37 7 - 9 70(24.3) (52.8) (10) (12.9) (100)
Note:(1) Figures in parentheses indicate percentage to rowtotal.(2) THE: Tribes of More effective Tribal Co-operative
Society. TEF: Tribes of Effective Co-operativeSociety. TLE: Tribes of Less Effective TribalCo-operative Society.
Table 8.3 explain the concern of tribes with respectto TCS. About 58 per cent of the members consider TCS astheir own institution. 22.8 per cent as the government

309
institutions, 8.3 percent as employees institutions and 11 percent as the institution of Board of Directors.
8.3 Voting in the Election
Table 8.4Response Towards Voting in the Election of TCS
Region VotedYes No TotalA. Thiruvananthapuram RnTHE 6 9 15TEF - 15 15TLE 9 16 25Tota1(A) 15 40 55(27.3) (72.7) (100)E. Thrissur RnTHE 15 11 26TEF - 24 24TLE 10 15 25Tota1(B) 25 50 75(33.3) (66.7) (100)C. Kalpetta Rn. ,THE 18 17 35TE? 9 20 29TLE - 20 20Tota1(C) 27 57 84(32.1) (67.9) (100)D. Adima1y4RnTME 11 29 40.Tota1(D) 11 29 40(27.5) (72.5) (100)Grand Total f8 176 254(A+B+C+D) (30.7) (69.3) (100)GroupingsTME 50 66 116(43.1) (56.9) (100)TE? 9 59 68(13.2) (86.8) (100)TLE 19 51 70(27.1) (72.9) (100)Note:(1) Figures in Parentheses indicate percentage to rowtotal.
(2) THE: Tribes of More effective Tribal Co-operativtSociety, TEF: Tribes of Effective Co—operativeSociety, TLE: Tribes of Less Effective TribaiCo-operative Society.

310
More than 69 per cent of the tribal members of T(had not exercised their voting rights so far (Table 8.42They do not know anything about the system of election to t}Board of management of the society. Most of the triberevealed that they attended meetings of the TCS on the advi<of their friends and headman of their hamlet. They al:revealed that they could not make out anything from tlproceedings in the meetings as it was conducted in a mann<
and language which are not familiar to them.
8.4 Opinion about the Efficiency of TCS
Fifty two percent of the tribes (Table 8.!expressed bad opinion about the overall efficiency of tribeco-operative societies in their area. Significant differencqin their opinion also could be seen among different regions.

311
Table 8.5
Opinion about the Efficiency of TCS
Regions gggg Good gggézry d vggg TotalThiruvananthapuram RnTME 3 5 7 — — 15TEF - — — 15 - 15TLE — — 5 19 1 25.ta1(A) 3 5 12 34 1 55
(5.4) (9.1) (21.8) (61.8) (1.9) (100)Thrissur RnTM 4 9 8 4 1 26TEF - 2 3 15 4 24TLE - - - 25 - 25ata1(B) 4 11 11 44 5 75
(5.3) (14.6) (14.6) (58.8) (6.7) (100)Kalpetta Rn.THE 3 22 7 3 — 35TEF — 1 6 17 5 29TLE - - — 14 6 20.ta1(C) 3 23 13 34 11 84
(3.6) (27.4) (15.5) (40.5) (13.0) (100)Adimaly RnTHE 2 7 11 20 — 40.ta1(D) 2 7 11 20 - 40(5) (17.5) (27.5) (50) (100)-and Total 12 46 47 132 17 254
(+B+C+D) (4.7) (18.1) (18.5) (52.0) (6.7) (100)-oupingsTM 12 43 33 27 1 116
(10.3) (37.1) (28.4) (23.2) (1.0) (100)TBF - 3 9 47 9 68(4.4) (13.2) (69.1) (13.3) (100)TLE — - 5 58 7 70. (7.1) (82.8) (10.1) (100)
ute:(1) Figures in parentheses indicate percentage to rowtotal.
5 Extent of Participation of Tribes
Participation was measured by assigning individualxlues to respondents according to their score values of 12nlected parameters taken for participation. The identified

312
rameters werez: (1) consultation during pre-planningriod. (2) Monitoring/supervision during implementation.) receipt of benefits. (4) Sharing of cost. (5) Involvementevaluation/follow-up measures. (6) Discussing problems of
agramems with secretaries/Board of Directors/others. (7)siting the office of the organisaiton. (8) makingggestions for programme improvement. (9) Contacting people
tside the organisation for programme. (10) Attendingstings of organisation/training camps. (11) Assisting theganisation and (12) briefing/propagating programme toDOTS.
The maximum participation value of tribes is, thusThis has been classified as very low (1-3) low (4-6).
ierate (7-9) and high (10-12). The minimum desirable degreeparticipation has been taken at a score value of seven.
The degree of participation, methods. opinions andportant reasons for patronising co-operative and1-co-operative channels and responses were analysed intail.
Ibid. p.912.

313
8.6 Degree of Participation
Degree of participation of tribes of more effective.effective and less effective TCS at the different stages ofthe collection and marketing of NTFP is presented in Table8.6.
Table 8.6
Organisation—wise Participation of TribesLevel of aparticipation TME TEF TLE All typesVery low 2.81 2.79 2.75 2.78(27.58) (41.18) (62.86) (40.94)Low 4.51 4.79 4.50 4.59(63.79) (55.88) (37.14) (54.33)Moderate 8.1 8.0 —- 8.08(8.63) (2.94) “ (4.73)High Nil Nil Nil NilAverage 4.35 4.06 3.4 4.01(45.67) (26.77) (27.56) (100)Note: THE - Tribes of More Effective Tribal Co-op.Societies.1.
2. TE? - Tribes of Effective Tribal Co—op. Societies.3. TLE— Tribes of Less Effective Tribal Co-op.Societies.4 Figures in brackets indicate percentage distribution
of respondents to corresponding column totals. Forlast row (average percentage is worked out to grandtotal.
Table 8.6 reveals that only 4.73 per cent of thetribes have satisfactory level of participation. No one hasattained high degree of participation. The rate ofparticipation is the highest in more effective TCS followed byeffective TCS. About 95 per cent of the tribes have not

314
attained the desirable degree of participation in collectimand marketing of NTFP or any of the developmental programme
of TCS. The methods opened to tribes for participation wilthrow more light on this aspect.
8.7 Methods of Participation
Table 8.7
Principal Methods of Participation
fiiz Method/Area Sum Rank1. Pre-planning/Planning 17 11
Period. consultation
2. Monitoring/supervision 40 08at implementation3. Discussion 39 104. Visit 166 025. Suggestions 111 04
6. Attendance in meetings 40 087. Assistance 57 068. Receipt of benefits 254 O19. Sharing of Costs 142 0310. Evaluation/follow up Zero 1211. Contact outside 86 0512. Briefing/propaganda 52 07
The principal methods of particpation wercalculated by summing up the values scored by the 1

315
methods/areas opened to the respondents and ranking them in at
ascending order. Since one method can score one value each.the maximum value of a method will be 254 for all therespondents and the minimum is of course. zero. Since 1:methods are taken. the lowest rank is twelfth unless there isa tie. The results are presented in Table 8.7.
Table 8.7 points out that the most important methoc
of participation is receiving the benefits i.e.. receipt oithe value of sale proceeds, consumer goods. NTFP advance etc.Tribes were hardly taken into confidence for evaluating theexisting system of tribal produce marketing. They were leastconsulted even during the pre-planning period in mattersrelating to price and the potential supply of NTFP ,in theirarea. Their participation in the meetings are also very low.Tribes get some share of the benefits out of the operation 01TCS. but at times they are forced to share the cost also. Theopinions of tribes regarding this aspect of participation ismore revealing. This is explained below.
8.8 Opinion about Participation
Since the participation rates of tribes are low, itwill be interesting to note the opinion of beneficiariestowards participation. Their responses to six levels ofparticipation are recorded. ranked and presented in Table 8.8.

316
Table 8.8
Opinion about Participation
Situation RankParticipation in management 04Planning 01Representation in the Board 02Advice at implementation 06Assistance during distress season 03Assistance in monitoring/evaluation 05
The tribes in general feel that their participatiois required at planning especially in the determination ocollection charge for NTPP. items to be collected from forestadvance for collection. consumer goods etc. They also feethat their voice in the management of TCS must also brepresented. The researcher also found that none of the NT?collectors has ever become members in the Board of managemen
of their own organisation or any of the Board of directorhave any experience in collection and marketing of NTFP. Thcollection and marketing of NTFP and the management of TCwere treated separately. The collectors do not have any ideabout the functioning of their own organisation. Thereforthe NTFP collectors feel that_ if they get properepresentation in the Board, they would be able to projectheir issues. It clearly indicates that the present level 0management in TCS are not to the expectation of NTF

317
collectors. Most of the Boards under study were constituteither by selection or by election of those tribes who arethe good book of secretaries or co-operative department stafIt was also observed that the politics of secretaries of Tmay also be reflected in the constitution of Board.account of these facts, the NTFP collectors feel that theparticipation is required only in sharing of benefitslosses of co—operatives. Though they give suggestions fimprovement, it was not properly attended. It may be treason for low participation rate in TCS by the NTcollectors.
8.9 Reasons for patronising Co—operatives aNon—co-operative Channel for Disposing NTFP by Tribes
The foregoing discussions clearly indicate that ttribal participation in co-operative societies are low athey market 32.3 per cent of their product through privatraders. Table 8.9 depicts the important reasons fpatronising non-co-operative channel also for marketing theproducts.

318Table 8.9
Reasons for Patronising Co-operative and Non-co-operativeChannels for Disposing NTFP by Tribes
No.of triS1 No.of tri— bal house- ;::;:_N ' Reasons bal house— holds patro°’ holds patro- nising non— h°ld8. . (Nos.)nisin Co-Qp. co-gp.1. Price difference of NTFP 31 223 254(12.2) (87.8) (100)2. Courtesy 105 149 254(41.3) (58.7) (100)3. Better and prompt service 47 207 254(18.5) (81.5) (100)4. Supply of consumer goods 60 194 254(23.6) (76.4) (100)5. Shares in Co-operative society 176 — 254(69.3) (100)6. Active help from management 29 225 254(11.4) (88.6) (100)7. Old relation with the 66 188 254management of the (26) (74) (100)
business unit8. Fear of forest officials 90 254(35.4) (100)95 Fear of secretaries 208 254(81.9) (100)10. Fear of Board of Directors 60 254(23.6) (100)11. Own feelings 48 254(18.9) (100)12. Incentives during festivals 43 180 254(16.9) (70.9) (100)13. Help during distress season 56 198 254(22.0) (78) (100)14. Delay in completing 185 254formalities in sale (72.8) (100)transactions
15. Lack of storage facilities 163 254with co—operative marketing (64.2) (100)society16. Non—collection of all produces 233 254
(91.7) (100)17. Prior debt obligations to 230 254other agencies (90.6) (100)18. Indifferent attitude and 196 254poor service of employees (77.2) (100)
of co—operative society

319
19. Lack of adequate credit 218 254facilities in co-op. (85.8) (100)marketing society20. Delay in payment 184 254(72.4) (100)21 Alien management 30 224 254(11.8) (88.2) (100)22. Cheating of collection 91 163 254agents employed by TCS (35.8) (64.2) (100)
Note: Figures in parentheses indicate percentage to totalNumber of tribal households
Table 8.9 highlights the fact that pricedifferential. better and prompt services, of non—co-operativechannel, lack of help from the management of TCS, oldrelations of tribes with the private traders, incentivesduring festivals offered by private traders. help duringdistress seasons. non-collection of all NTFPs by TCS; the debtobligations of tribes to private traders. indifferenceattitude and poor service of employees of co-operativesocieties, lack of adequate credit facilities. delay inpayment for NTFP. alien management in co-operatives. cheatingby collection agents of co-operatives in weighing, pricingetc. are the major reasons attributing the tribes to patronisethe non—co-operative channel to market their NTFP.
8.10 Linkages of Various Institutions in the Collection andmarketing of NTFP
The main organisations involved in the collectionand marketing of NTFP's are the Kerala State Federation for

320
SC/ST Development Co-operatives. Arya Vydyasalas. Forestdepartment. Tribal Department and Tribal Co-operativeSocieties in the state. The response of various officers ineach category are collected (schedules) and analysed. Theresponses were mainly classified in two classes viz.,(1)response relating to the general marketing management of theorganisation and (11) the linkages or liaison of theorganisation with other organisation in the marketing channel.
8.10.1 Response of Officials of SC/ST Federation
Responses from Managing Director of SC/STFederation. Business manager, General Manager, Accountantsand clerks were collected and examined. The respondentshighlighted the fact that the co—operatives face problems inmarketing of NTFP and it could not meet the entire creditrequirements of TCS. The institution would not make anydirect finance to tribes. Till now the organisation did notconduct any market survey to know the potential supply anddemand of NTFP in the State. It was observed that there wasno scientific base for the fixation of collection charge.procurement price and sales price of NTFP by the the NTFPcommittee. They generally examine the price offered byOushadhi and the Government Ayurvedic College.Thiruvananthapuram to fix the price of medicinal herbs. Boththese institutions always try their level best to offer areduced price to NTFP. But for non—medicinal herbs the base

321
for fixation is the activities of private traders in thefield. The officials reported that the SC/ST federationundertakes processing activities only for honey andcheevakkai. The honey processing unit is set up at Thrissurand the cheevakkai processing unit is at Wayanad. It wasobserved that the cheevakkai processing unit is not located inan ideal place. Wayanad is a place where the humidity is veryhigh when compared to other districts of Kerala. It willdestroy the products very easily.
Enquiry about the management of SC/ST Federation. itwas understood that the SC/ST Federation does not have anelected Board to manage the day to day affairs of theorganisation. The selected management consists of .officialsof various departments who do not have any knowledge about the
scientific management of co—operatives or knowledge inmarketing of non—timber forest produce. They are also faraway from the tribal life and tribal economy. All officialspoint out that the present system of collection and marketingof NTFP do not liberate the tribes fully from the clutches ofprivate traders or middlemen. Moreover the TCS have very poorlinkage with other departments.
The officials of SC/ST Federation point out that dueto non—co—operation of officials from forest department theillicit collection of NTPP from ranges could not be checked.The collection agents also reported that even if they inform

322
the illicit collection of NTFP to forest officials they willnot register any case or check the collection of NTFP bynon-tribes. The secretaries of TCS point out that they had togo to forest officials three to four times to get a movementpass for NTFP signed by the ranger. The delay in getting thepass and the formalities connected with that, invitedispleasure from traders and they often keep away from TCS.They all reported that a minimum of Rs.600/- they have to giveto forest officials to get a pass. Seventy percent of thesecretaries of TCS reported that they had to give honey, toforest officials to avoid delay in issuing pass.
8.10.2. Response of Department Officials
The responses of officials of co—operative andtribal departments prove that their link with SC/ST Federationin the collection and marketing of NTFP is marginal. Theyhave virtually no role either in management or in marketing ofNTFP. Since the department heads are the members of the Boardof management of SC/ST Federation and the members of NTFPcommittee, their role is limited to attending meetings ofthese two bodies. These departments virtually have no role toplay at the grass root level. They don't have any supervisorystaff to check the payment of NTFP price (guaranteed by TCS)to tribes (Even the TCS donot have supervisory staffs). Theofficials of forest department point out that so far thedepartment did not conduct any survey on the potential

323
availability of these produces in the forest. Even though allthe Rangers agree that the tribes are the part of forest, 30per cent of them disagree about the capability of tribes tocollect all the NTFP's from forest. On an enquiry regardingsustainability. the officials remarked that the deforestationdoes not affect the sustainability and availability of NTFPbut the extraction methods employed by them of certain itemslike cheevaccai. honey, soap nuts. barks. bushes and creepers
affected the sustainability of forest and NTFP. At the sametime the officials pointed out that so for no training hasbeen given either by forest department or by any department totribes as regards to the collection and marketing of NTFP inthe state. All officials of the department have no doubt withregard to improvement of the socio—economic conditions of
tribes through the collection and marketing of NTFP in thestate.
8.10.3. Response of Collection Agents
More than 75 per cent of the collection agentsresponded that they get timely advance for the collection ofNTFP but that is not sufficient for them to procure the entireitem of NTFP from tribes. Since they are asked to collectsome notified items of NTFP. the collection agents point outthat even if the tribes bring non-notified items they wouldnot be able to collect it. Eighty percent of collectionagents revealed that they would not give any advance in any

04%
form either in cash or in consumer goods to tribes. Theypoint out that if they give any advance the tribes may resortto other agencies to market their produce and the recoverywould become difficult. It may result in loosing the tribe tothe co-operative set up once for all. Ninety per cent of thecollection agents said that they would not supply any consumeritems to the tribes through collection centres or the TCSwould not supply it also. All collection agents said thatthey had no role in the management of TCS. Eighty per cent ofcollection agents said they brought to notice the cases ofillicit collection of NTFP by non-tribes from their area toforest officials and secretaries of TCS, but no effectiveaction was taken to this effect.
They all point out that since they don't have goodgodowns to keep NTFP in collection centres the products arealways being subjected to rain, and even sometimes to theft.They all projected that the present system of commission isinadequate even to meet their entire expenses connected withthe collection of NTFP from tribes. All collection agentspoint out that they are supposed to carry out the entire workconnected with the collection and marketing of NTFP fromtribes. The TCS will not have any direct link with tribesespecially with respect to the collection and marketing ofNTFP.

325
8.10.4. Response of Board of Directors
The response of Board of Directors of MoreEffective. Effective and Less Effective tribal co-operativesocieties with respect to the overall management in thecollection and marketing of NTFP's and the linkages of tribalco-operative societies with other functionaries in the systemwere collected through a schedule (Appendix IVD. Altogether
41 Board Members consisting of four members from Adimaly TCS.12 members from the TCS of Thiruvananthapuram region. 13members from the TCS of Thrissur region and 15 members fromTCS of Kalpetta region were selected for interview. Theresponses of these directors to the questions were given inAppendix VH
The model developed by Allen L. Edwards3 (1957) and
subsequently used by Mark Gersovitz4 (1992) and Mani K.P.5(1994) was used in the present analysis. Methodology suggeststhat each factor is to be ranked by the respondents based onthe Kendall Method of ranking.
In the next step the deviations in ranks between thethree groups (A,B.C) of Board of Directors (A= Directors of
3 Allen, L. Edwards (1957). Techniques of Attitude ScaleConstruction, Appleton Century Crafts INC, Washington,p.86.
4 Mark Gersovitz (1992), "Transportation Policy andPanterritonal Pricing”, The World Bank Economic Review,Vol.6, No.2. DP.213—233.
5 Mani, K.P (1994), "Economics of Rubber - An EconometricsExcercise”. Paper presented in the InternationalSymposium on Plantation Crops. Calicut, Dec. 1-3. 1994.

326
More Effective TCS, B= Directors of Effective TCS. C=Directors of Less Effective TCS) were calculated and theiraverage deviations were estimated from the grand average. Ifthe individual average deviations is greater than the grandaverage, it is judged that the difference is significant andhence they do not form a homogeneous group. The homogeneityin opinions of groups are presented in Table 8.10.
Table 8.10Comparative Analysis of Opinion Statements of
Board of Directors of Selected TCSOpinion state— Homogenity in opinion amongments No. group of directors1 AC2 ABC3 ..4 BC5 ABC6 AB7 AB8 ABC9 AC10 BC11 12 ABC13 BC14 BC15 —16 ABC17 BC18 BC19 BC20 BC21 BC22 ABC23 AB24 ABC25 ABC26 ABC
Note: A: Directors of More Effective TCSB: Directors of Effective TCSC: Directors of Less Effective TCS

327
Based on this approach all the 26 opinions werejudged and it was revealed that nine opinions had almost equalranks in the analysis among all groups and hence they form ahomogeneous group. These nine opinions based on their rankingis presented in Table 8.11;
Table 8.11
Homogeneity in Opinions of Directors of M, EF and LE TCS
1. All Directors Attend the Board Meeting without fail
2. There is effective Co-ordination with SC/ST federation3. Bribe has to pay to forest officials to get the
the Movement Pass for NTFP
4. The area of operation of the TCS, still possessnon-listed NTFP items. '5. There is untimely disbursement of NTFP Advance by SC/ST
federation
6. The Board of Directors are not going for NTFP collection7. The Board of Directors are not at all aware about the
forest laws concerning the collection and marketing ofNTFP from forest
8. No training has given either to members for theextraction of NTFP's or to collection agents to collectNTFP's from tribes.
9. None of the Board members receive any training regardingmanagement of co-operative societies.
One of the major observations in Table 8.11 wasthat. all the groups unanimously agreed that they have to givehandsome bribe to the officials to get things done. Anothernotable feature is that even today the TCS still possess

328
non—listed NTFP's in their area. This indirectly enforce thatthe present list of NTFP items is not exhaustive andconsequently collections are also not complete. Hence it ishigh time to revise the list and make facilities to includemore items under the purview of collection. One of the majorweaknesses of co-operative sector as a whole is the lack ofprofessionalisation which is quite relevant in the working ofTCS. The members as well as the Board of Directors of these
societies are not properly and scientifically trained to meetthe present needs and this adversely affects the efficiencyand sustainability. Hence it is important to develop varioustraining module for the TCS and also to implement the trainingprogrames properly.
In the above paragraphs we have identified ninefactors which are relevant to all the groups. However.further splitting showed that there are variations in opinionsamong various groups. To examine this all possiblepermutations and combinations of the three societies weredealt separately. Among the permutations and combinations aclose association was observed between groups B and C.(Directors of Effective and Less Effective TCS respectively).They commonly agreed to nine points which is given in Table3.12.

329Table 8.12
Homogeneity in Opinions of Directors of Effective and LessEffective TCS
1. The TCS could not meet the credit requirements of members2. The TCS would not be able to collect the potential supply
of NTFP from its area
3. The members are not collecting any non-listed items ofNTFP
4. The TCS are not distributing NTFP collection advance tocollection agents
5. The TCS are facing marketing problem for NTFP6. There is enough tribes in the area to collect NTPP7. The Directors prefer to sell the collected NTFP directly
to private parties8. So far no market survey was conducted to fix the
collection charge of NTFP
9. No pre-contract with private parties to market NTFP
Firstly. both the groups agreed that the capitalbase -of the TCS is insufficient to meet the creditrequirements of members. Hence the objectives of TCS. can bewell achieved only if the resource base of the TCS isstrengthened or if appropriate alternative arrangements aremade. The weak credit base leads to twin problems viz., (i)low collection of NTFP and (ii) tribal unemployment. Anotherarea where substantial improvement required is the marketingsystem. The present marketing channels are not sufficient tocater the flow of NTFP. Further the domination of non-tribalseven with the patronage of Directors of TCS. prevent the free
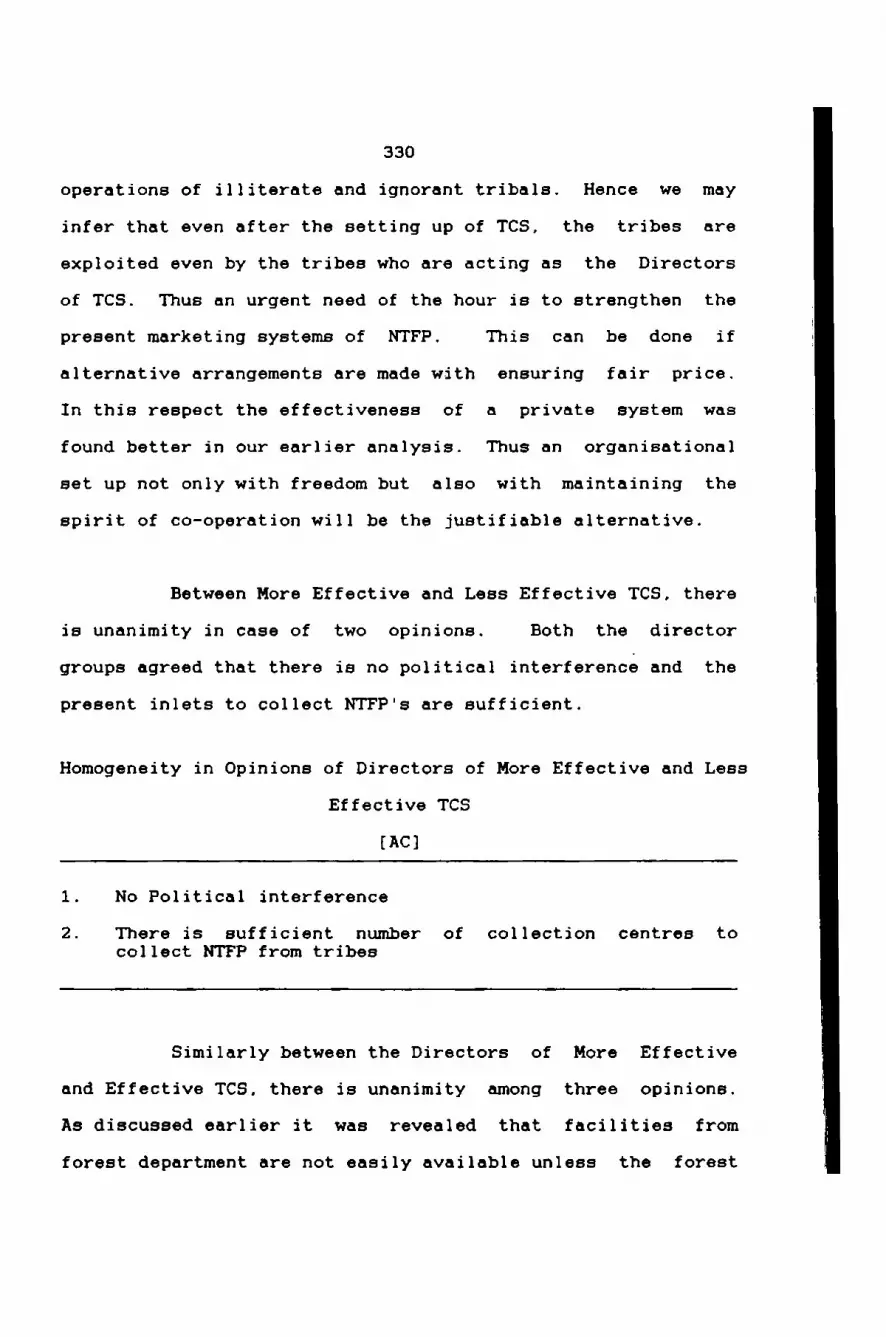
330
operations of illiterate and ignorant tribals. Hence we mayinfer that even after the setting up of TCS. the tribes areexploited even by the tribes who are acting as the Directorsof TCS. Thus an urgent need of the hour is to strengthen thepresent marketing systems of NTFP. This can be done ifalternative arrangements are made with ensuring fair price.In this respect the effectiveness of a private system wasfound better in our earlier analysis. Thus an organisationalset up not only with freedom but also with maintaining thespirit of co-operation will be the justifiable alternative.
Between More Effective and Less Effective TCS, there
is unanimity in case of two opinions. Both the directorgroups agreed that there is no political interference and thepresent inlets to collect NTFP's are sufficient.
Homogeneity in Opinions of Directors of More Effective and LessEffective TCS
[AC]
1. No Political interference2. There is sufficient number of collection centres to
collect NTFP from tribes
Similarly between the Directors of More Effectiveand Effective TCS. there is unanimity among three opinions.As discussed earlier it was revealed that facilities fromforest department are not easily available unless the forest

331
officials are "well treated“. Lack of linkage with otherdepartments also reflected in the analysis between groups Aand B.
Homogeneity in Opinions of Directors of More Effective andEffect TCS
[AB]
1. No assistance from tribal department2. There is difficulty in getting passes from forest
department
3. They are aware about the rules and regulations of a TCS
Between groups A and C and A and B, homogeneity was
found to be very little. Group A consists of directors ofmore effective Tribal Societies only and hence naturally theywill be having more positive responses compared to groups Band C. At the same time there is more unanimity among theopinions of the Board of Directors of groups B and C. This isbecause they belong to moderately efficient and less efficientcategories. Naturally in many cases their problems will besimilar and opinions will be consistent.
From the above analysis it may be inferred thatthere are nine opinions among 26 czver which the Dir-act-cor-s had
similar opinions. Also group A directors considerably differin their views compared to B and C, because they are in a more

332
advantages position. However these observations are based onrankings and these rankings are based on the perceptions andattitudes of Board of Directors. Perceptions may differ andvary from time to time. Thus these findings cannot be giventhe status of rigid rules. This limitation is unavoidable inany analysis using scores. Within the limits theseobservations have a very important role in framing the futurepolicy of tribal co-operative development.

S UMMARYAND CONCLUSION

CHAPTER IX
SUMMARY AND CONCLUSIONS
In this Chapter an attempt is made to highlight themajor inferences with a view to provide guidelines for thepolicies that may be adopted. so as to accelerate thedevelopment of tribal Co-operatives , marketing of NTFP andthe tribal life as a whole. The Tribal Co-operative Societieshave a leading role to play in the marketing of tribalproduce. But it was felt apriori that these formalinstitutional arrangement had failed to carry out theentrusted functions effectively. Hence the present study wasattempted on the collection and marketing of NTFP throughtribal Co—operative Societies of Kerala with the followingobjectives.
1. To assess the procurement and marketing practices of NTFPby tribes and Tribal co—operative societies and examine therole of co~operatives in liberating the tribes from theclutches of private traders.
2. To study the relative efficiency of marketing channel.
3. To analyse the inter—difference between tribes and regionsin the collection and marketing of NTFP.
4. To examine the forward linkages of Tribal Co—operativeSocieties with the Ayurvedic Medicinal Manufacturing Units ofthe State.

334
5. To examine the impact of marketing on employment andincome of tribes and
6. To examine the extent of involvement of tribes in TribalCo—operative societies in Policy formulation andimplementation.
In order to study the stated objectives, data werecollected with the help of pre-tested schedules from 254tribal households. 10 TCS. 25 NTFP collection agents of TCS.
14 Forest Range Officers. 41 Board of Directors of TCS and 45Ayurvedic Medicinal Manufacturing Units from the four regionsof Kerala viz. Thiruvananthapuram (Thiruvananthapuram. kollam
and Pathanamthitta Districts). Adimaly (Idukki and KottayamDistricts). Thrissur (Thrissur, Palakkad and MalappuramDistricts) and Kalpetta (Kozhikode. Kannur and KasargodeDistricts). The findings emerged from the study are thefollowing.
9.1. Socio—Economic Profile of the Sample Population
9.1.1. Sex-wise and age-wise composition
The average size of a tribal family is fourconsisting of two males and two females. Fifty three per centof the tribes fall in the most productive class of 15-45 agegroup. the juvenile class account 32 per cent and the agegroup 45+ account to 15 percent. Among the NTFP collectors.

335. _ 4569 percent are in the age group of 15 45. 22 Percent °b°V°years and the children constitute nine percent. HBDCG it 33observed that the exploitation of child labour is VOFY much
prevalent among the NTFP collectors.
9.1.2. Literacy Level
Even though it was found that the rate of literacyamong the tribals is about 47 percent, the literacy at theeffective level works out only to 20.45 per cent, probably dueto the reasons discussed in earlier chapters. The tribes ofKalpetta region is found to be the most illiterate among allthe tribes under the study. The distance of school from thedwelling place,remoteness. employing children for collectionand marketing of NTFP,illiteracy of parents and poverty arethe root causes for the poor literacy of tribes. It was alsonoted that the neo—literate programmes were not properlyconducted in tribal areas.
9.1.3. Occupational pattern.
The study reveals that 81 per cent of the work forceis engaged in occupations like collection and marketing ofNTFP. Agricultural labour, cultivation, forest and estatework, weaving etc. More than 52 per cent of these tribestreat collection and marketing of NTFP as their mainoccupation and 45 per cent, as their main subsidiary

336
cupation. Only 4 per cent of the tribes are engaged inltivation of their land. Regional disparities were alsoticed, primarily due to the variations in the availabilityNTFPs.
1.4. Land holdings and area cultivated
All tribes in the study area possess land but onlyper cent of them had the ownership right. It was noted
at 45 per cent of the tribal households were having landss than one acre and 12 per cent, keep more than three acresland in their custody. Significant differences in holdings
d cultivating areas were noted among regions .This disparityprobably due to the encroachment of the forest land by theibes in certain regions like Kalpetta andiruvananthapuram. Instances of land alienation and leasingland particularly among tribes of Thiruvananthapuram region
re also reported. However. the average holdings of a tribalusehold in the study area is 1.26 acres which is well belowe state average of 2.96 acres. Of the holdings, only 0.67res are being brought under cultivation.
1.5. Dwelling houses
It was observed that 53.9 per cent of the tribaluses were thatched ones. Most of these houses were in alapidated condition. Among regions. more than 50 per cent

337
’ the tribes of Thrissur and Kalpetta are having tiledauses. but the plight of these houses were also deplorable.a far no concrete sanitation facilities are available in.most all tribal colonies under study.
1.6.Drinking water facilities
Though the NTFP collectors reside near the forest"ea. the study established that in certain seasons these'eas were in utter scarcity of drinking water due to droughtId absence of government supported facilities. The tribes[V8 to travel miles to fetch drinking water.
.1.7. Institutional support
None of the basic institutions such as ration shop.*ovision shop, health centre, schools. post offices. TribalJ-operative societies. electricity, etc. is within twoilometres of tribal hamlets. But it is noted that almost all'ibal areas are well covered by the illicit arrack/toddyiops of contractors which is considered as the most nearestustitution to tribal hamlets.
.2. Collection, Procurement and Marketing of NTPP
As per the system. the tribes are supposed to>llect about 120 items from forest as NTFP. But so far no

338
training has been given to them either by the co—operatives orany other agencies to extract these items from forest. Theirage—o1d practices help them to extract these items. From thesurvey and the discussion with the officials of ForestDepartment, it was ascertained that the crude extractionmethods adopted by tribes hinder the regeneration of theplants and sustainability of the forest.
It is also observed that the NTFP list published bythe authorities are not exhaustive. The regions are stillvested with a lot of NTFPS which can easily be collected. Incertain regions tribes collect these items and market themthrough private traders. Since the TCS are not undertakingmarketing of these products. the tight lipped attitude of theofficials help the tribes to develop some relation withprivate traders and that ultimately may lead the tribes tomarket even the listed NTFPS through private traders. Thestudy also highlights nomenclature differences existing forthe same item of NTFP in different areas. Once the collected
plant got dried. it would be very difficult to recognise theNTFP and the family in which the species belong.
The study also points out that none of the NTFPcollecting families in the State had the full kit required forthe extraction of NTFP. The ill-equipped collection kit maynot only affect the total quantity of NTFP collection but alsothe quality too.

339
The average days of employment of a tribal workerthrough all his operations is 236 mandays, of which 132 isdevoted for the collection of various NTFPs. Non-collection
of all NTFPS by co-operatives. low price offered byco—operatives, and alternate employment opportunities might be
some of the reasons for low number of mandays in thecollection and marketing of NTFP by tribes. Significantdifferences among regions and collections of various itemswere also brought out in the study. Thrissur region accountedfor the maximum number of mandays for the collection of NTFPS.
Of the total mandays for NTFPs. 65 per cent was spent oncollection of medicinal herbs and 35 per cent, was on thecollection of non-medicinal herbs. Hence it is inferred thatinstitutional facilities and employment opportunities aredirectly linked.
Sixty one per cent of the total collection of NTFPSof tribes were of medicinal herbs and 39 per centnon-medicinal items. Among medicinal herbs, root itemsclaimed the maximum share. It is noted that 59 per cent ofthe total sale value of NTFP of tribes was from medicinalherbs and the balance from non-medicinal items. Region-wisedifferences in the collection and marketing of NTPP broughtout that the tribes of Thiruvananthapuram and Kalpetta regionrealised more sales value through the sale of medicinal herbswhereas the Thrissur region account for non-medicinal items.It is interesting to note that the Thrissur region is more

'J4U
gifted with medicinal items as compared to all the otherregions under study.
The tribes are expected to market their entirecollection of NTFP through Co-operatives. The Co~operativesare supposed to play a dynamic role in the marketing of tribalproduce and fetch remunerative price for NTFP. The studyrevealed that the tribes market only 67 per cent of theirproduce (sale value) through co—operatives. It means that thetribes are still under the clutches of non-cooperativechannels even after the introduction of co-operative system oftribal produce marketing in 1978. This monopoly rightresulted in lack of competition. enthusiasm. forward andbackward linkages and ultimately. resulted in low prices forNTFP. It is recalled here that the tribes of 'less effective‘tribal co-operative societies realise a higher unit sale pricethan the tribes of effective and more effective TCS. Hencethe hypothesis that the monopoly procurement and marketing ofNTFP leads to institutional inefficiencies and low prices fortribal products is established.
Marketing theory establishes a functionalrelationship between marketing efficiency and economies ofscale. Economies of scale can arise from different angles.For the time being the concept of economies of scale refers tothe availability of infrastructure and other facilities. Inorder to carry out the analysis the researcher has identified

341
certain parameters like quantity of NTFP collected by TCS,‘collection facilities. transportation facilities, availabilityof marketing channel, involvement of the members, staffposition in TCS. etc. On the basis of these parameters it isfound that the procurement practices and marketing strategiesare relatively good in TCS of Achencoil. Malampuzha, SulthanBattery and Adimaly. These societies altogether constitute 50per cent of the permanent staff in sample societies.Similarly these societies together had 49 per cent ofcollection depots. Also these societies has on an averagethree permanent collection depots compared to one in othersocieties. With regard to collection days. these societieseffectively utilised 68 per cent of the total working days.As a result of these facilities (economies of scale the termused as a rule of thumb) these societies could bring andmarket 79 per cent of their members total collection of NTFPSthrough co-operatives, while the rate is below 40 per cent inother societies. Incidentally these societies belong to thecategory of ” more effective TCS”- the classification made forselecting the samples. These observations establish that thesocieties with better facilities could procure and market morecompared to effective TCS and less effective TCS. Thus ourhypothesis is that procurement and marketing practices aredirectly related to economics of scale (the term as a rule ofthumb) may be accepted.

"342
Inter—difference among tribal communities also exist
in the collection and marketing of NTFP. Among the 11 tribalcommunities under the study. the kattunaicken tribal communitydoes the maximum collection and marketing of NTFP in the study
region (Rs. 14744 per annum). This is followed by MalaiPandaram. The Adiyan tribal community collects and marketsNTFP worth Rs. 3285/— per annum. It is also observed that 97per cent of the total sales of Kattunaicken were throughco-operatives whereas it was only 20 and 15 per cent forKanikkars and Kurichiyen respectively. Kanikkars is the onlytribal community which market a portion of their NTFP throughtribal agents of private traders. Strict supervision andcontrol of TCS, the topography of the tribal area. protectionby the Forest Department, and restricted entry of privatetraders, §omparatively poor socio-economic condition ofKattunaicken especially in the case of literacy may pave theway for marketing this produce through co—operatives.
9.3. Linkages
The marketing channel of Co-operative sector forNTFPS also highlight the fact that it is also under theclutches of private traders. The co—operative sector does nothave proper liaison with the end-users of NTFP. The entirenon—medicinal herbs are being marketed through private tradersin and outside Kerala. In the case of medicinal herbs only31.8 per cent is directly marketed to the end uses of the

343
products during the period 1990-91 to 1993-94. Though weregistered 887 Ayurvedic medicinal manufacturing units in theState and their demands are so high to absorb the entirecollection of medicinal herbs from the state. but the lack ofproper linkage between these institutional arrangements andthe various tactics of the private traders resulted in pilingup of stock in the godowns of SC/ST Federation.
Most of the Ayurvedic manufacturing units are nothaving proper awareness about the co-operative channel ofmedicinal herbs. They try to maintain the old relation withthe private traders to get raw materials in time. It is alsoobserved that the mis—match between the terms and conditions
of co-operatives and end-users. sale of NTFPs usually in bulkquantities from TCS through auctions. formalities andprocedures. untimely supply of items etc. are some of themajor reasons for the low level of association betweenco—operatives and end-users of medicinal herbs. Thus itrejects the hypothesis that there is functional associationbetween Ayurvedic medicinal manufacturing units and tribalco-operative societies in the state.
Since the private traders keep a good rapport withthe end-users of the produces and the failure of TCS to keep aproper linkage with the end-users ,the monopoly procurement ofNTFP by TCS has given much advantage to private traders.They

344
get the produces through a single agency (TCS) and would beable to meet the demands of end-users in time.
The response analysis of the officials from Forestdepartment, Tribal department, the pharmaceutical corporationof Kerala Ltd and Arya Vaidya Salas also indicate that theirlinkage with the co—operative set-up for the collection andmarketing of NTFP is only marginal, Even the role ofCo-operative Department and Tribal Department is limited onlyfor the contribution of share capital, that too in a limitedway to TCS. None of these institutional set up is taking adaring step for the collection and marketing of NTFP and tomake the system effective. Hence it is clear that not onlythe end-users but also the supporting institutionalarrangements are not having proper liaison with TCS thatcollect and market NTFP in the state.
9.4. Pricing Strategies
The study makes it clear that the price fixationmechanism of NTFP committee in the state is tardy andinefficient. The committee normally do not make anyscientific survey to fix the prices. Since they don't haveany liaison with the demand pockets of NTFP, the price whichthey normally fix would be far away from the reality. It isnoted that the price paid by the TCS for various items of NTFPwere always much higher than what was fixed by the NTFP

345
mnittee. Instances of offering less than the guaranteedice of NTFP committee were also observed in items like tuber
ups. fruits, oil seeds and spices. The officials ofibal co-operatives points out that they get very poorrketing support from the SC/ST- Federation to market thellected produce.
The study indicates that during the period underidy 1982-83 to 1993~94 the co-operative set up had paid onlyper cent of the sales value as collection charge to tribes
nugh the institutional arrangement has guaranteed to pay 7580 per cent of the sales value as collection charge.
;ion wise analysis indicate that the Adimaly region has paidper cent of the sales value as collection change but for
rissur it was only 63 per cent. Item—wise analysis indicateat for medicinal items the collection charge varies from.1 per cent to tuber crops to 73.5 per cent for flowers andr non-medicinal items it varies from 29.7 per cent forices to 70.8 per cent for edible items. Though a shift in3 pricing policy has been made from 1990-91 and an increasethe collection and marketing of NTFP had also affected. it
3 also noted that only a slight increase in the share ofles value to tribes as collection charge was made. Whilenparing the share of collection charge for medicinal as wellnon-medicinal herbs, it is very clear that the share giventribes for non-medicinal herbs is very low.

346
It is also noted that the price offered by thenon-co-operative channel were always higher than the priceoffered by co-operative channel. As regards to items likefruits, barks, seeds and oil seeds the price offered byco—operatives were even did not touch 50 per cent of the priceoffered by private traders. Hence it accepts the hypothesisthat significant differences exist in the price of NTFP underco-operative and non-co-operative channels . The price spreadand its sharing clearly indicate that 78.5 per cent of thespread is gone to the hands of private traders. Even thoughthe TCS got a monopoly right to procure and market NTFPB itfailed in establishing a rapport with the real users of theproduct . As a result the institutional arrangement itselfhad fallen a prey at the hands of the unscrupulous privatetraders who virtually control the NTFP trade to their ownadvantage that too at the expense of tribe and TCS. Thus itis also established the fact that any controlled or formalmarketing arrangement without liasion with the end-users willlimit the market and will lead to institutional inefficienciesand low prices for the target group.
9.5. Impact of collection and marketing of NTFP on Income andEmployment
The broad national goal of poverty alleviation isachieved through generation of additional income andemployment. It is a well-established fact that majority of

347
the tribes live below the poverty line due to multiple reasonsand their pathetic situation can be improved only throughlaunching aggressive welfare measures like creation ofemployment opportunities and providing marketing facilities.
The present study explored the extent of employmentand income generation in detail. It was revealed that 69percent of the employment created came from collection andmarketing of NTFPs by the TCS. Analysis also suggest that theaverage employment can go up to 253 mandays in an year ifproper measures are taken by the TCS. Region-wise. maximumemployment opportunities was created in Thrissur regionprobably due to better availability of NTFPS and theappropriate measures launched by the TCS in the district.
The average annual income acquired by a tribalhousehold is worked to Rs.16243, and 52.5 per cent of thisincome is contributed by the sale of NTFP, which issubstantial. The average income for a day for a tribe fromNTFP collection is Rs. 31.94. Kalpetta region is found to begenerating the highest income (Rs.34.43 per day). Amongmedicinal items honey generated the maximum while among thenon—medicinal items soap and shampoo generated the highestincome.
From the above paragraphs it may be inferred thatthe NTFPs could generate sufficient employment opportunities

348
1d provide substantial income to the tribes. Thus we mayanclude that marketing created significant impact. onnployment and income of tribes and hence the hypothesis may9 accepted.
However, a quite interesting phenomenon deservespecial mention. Earlier we have stated that raising theribes above the poverty line is the prime objective of tribalelfare measures. In reality it is found that even though theribes are getting substantial income, majority of them stillive below the “poverty line”. A detailed examination ofhis issue is beyond the scope of the present study becausehe problem is more sociological and psychological . However,t may broadly be inferred that the expenditure pattern is notroper and scientific. For instance majority of the tribespent a substantial portion of their daily income for theonsumption of illicit liquor. tobacco etc.
.6. Tribal Participation
The survey revealed that only 4.73 per cent of theribes have a satisfactory level of participation. The ratef participation is the highest in more effective TCS followedy effective TCS. About 95 per cent of the tribes have notttained the desirable degree of participation. The tribes ineneral feel that their participation is required at planningspecially in the determination of collection charge of NTFP.

349
:ems to be collected from forest, advance for collection.Apply of provisions, etc. They also feel that their voice in16 management of TCS must also be represented . It isaserved that none of the NTFP collectors have ever becomeembers in the Board of Management of their own organisationr any of these Board of Directors had any experience in theallection and marketing of NTFP.It is also observed that theaal management of a TCS is always vested with the secretaryE that society who is a non tribe in majority of cases. Heinstitute the Board at his own “interest” sacrificing theribal involvement. Therefore it rejects the hypothesis thatiere is strong association between member participation andecision making in tribal co—operative societies.
The society-wise grouping revealed that the leastEfective TCS have the highest coverage (37 percent) on tribes3 compared to more effective and effective TCS. It isDserved that only 34 percent of the total members of TCS goJr collection and marketing of NTFP and which is high ( 50ercent ) in more effective TCS followed by effective (27ercent ) and less effective TCS (18 per cent). Byansidering the potentiality of NTFPS in the state. it is highime to bring all the tribes under the co-operative fold andirsue them to engage in the collection and marketing of NTFP.
The study also points out that most of the TCS arear away from the tribal hamlets. Of the 390 colonies which

350
have come under the purview of the study area. only 7 percentof them are within ten kilometeres of the distance of -thesociety. Thirty five percent of the offices of TCS , areabout 35 K.M. away from the tribal hamlets and they are notproperly connected by roads. The distance of tribal hamletsand offices of TCS definitely have a bearing on theparticipation of tribes in the functioning of TCS.
9.7. Suggestions and Policy Implications
On the basis of the findings of the study thefollowing suggestions are made for modifying the policy.
1. The present institutional arrangement and their rolerequires modification.The tribes are to be given a free handto market their produce from a common market yard where theprivate traders as well as the end-users be allowed toparticipate. The best remedy will be the formation of RegulatedMarkets, in each tribal area. The structure of the proposedregulated market is given in Figure 5.
Under this system, all tribes who are in the area ofTCS should take membership in the society and the marketingfacilities must be extended only to the members. Themarketing of tribal produces, particularly NTFP through anyother channel within the area of operation of the regulatedmarket must be banned. The private traders or the end-users

wwowommu aEw>r _S>W_Am_.—.
wfl
OOZMCHSMW maowm
..Emmm
£5: ziznma
a:m=~ A nozzsémm
oocomm
MARKET YARDr
U_mE..>< ooczamwm
fl om>Ezo M... oc>Ea< nozawor
QOUO¢<Z
woxmm mom mm>_.mo amzommm
MARKET YARD
some ]S0d
>iU9E[
9ug11e"[
73 uxoojqwg
Mesuadsgq
mamfiuplupq
Buyeqnzg gegoogJO 99214
EDILNEIO )\.LI"IIC)V.:l NOWWOI)

357
middlemen can be completely eliminated. The researchersuggests the immediate formation of ‘Regulated Market‘ as thebest remedy.
9.8. Areas of Future Research
The scope of the present study was limited only tothe collection. Procurement and marketing of NTFP by tribesand tribal co-operatives in Kerala. However, during thecourse of data collection. discussion and analysis. theresearcher felt that the following areas deserve specificstudies.
1. Demand Analysis of specific NTFPS.
2. Detailed and indepth studies on Non—NTFP collectingTCS and
3. The scope of NTFP as a poverty alleviation and welfaremeasure .

BIBLIOGRAPHY
Books
Agarwal V. (1985). Forest in India-Environmental andProduction Frontiers, Oxford and IBH Publishing Co.. NewDelhi. pp 341.
Ayyappan. A. (1948). Report on the Socio-economic Conditionsof the Aboriginal Tribes of the Province of Madras, Governmentof Madras.
Baker David. (1991). “State Policy. the Market Economy andTribal Decline: The Central Provinces. 1861-1920“. The IndianEconomic and Social History Review. Vol.XXVIII. No.4.Oct.—Dec.
Belshaw Cyril. S. 1965). Traditional Exchange and ModernMarkets, Prentice-Hall. International. Inc.. London.Bhowmick, P.K. (1981). “Forestry. Tribe and the Forest Policyin India”, In: Vidyarthi, L.P.(ed): Tribal Development and itsAdministration. Concept Publishing Co.. New Delhi.Crucher Jack .(1992). Non-Timber Forest ProductsCommercialisation Feasibility Study for India and Nepal. A.T.International 1331 Street. Washington D.C.. USA.
Dande K. Ajit. (1981). "Statutory Provisions SafeguardingInterests of Scheduled Tribes and Scheduled Castes“. In:Vidyarthi. L.P..(ed): Tribal Development and itsAdministration. Concept Publishing Co.. New Delhi.Dubey. P.N.(1990). "Afforestation. Environment and Waste LandDevelopment in Tribal Areas of Rajasthan”, In: Chaurasia.B.P.. (ed..). SC and ST in India. Chugh Publications.Allahabad
Edger Thurston. (1901). Castes and Tribes of Southern India.Comm. Publications. Delhi 110 006. Reprint 1975. Vol.V.
Edward L. Allen. (1957). Techniques of Attitude ScaleConstruction. Appleton Century Crafts Inc.. Washington.Elwin Verrier. (1955). The Religion of an Indian Tribe.Geoffery. Cambridge. Oxford University Press.
Ethrenfels.U.R.. Kadar of Cochin. University of Madras. Madras.Furer-Haimendorf Christoph Von.(1989), Tribes of India- TheStruggle for Survival, Oxford University Press, Delhi.

Gersovitz Mark.(1992). Transportation Policy and PanterritonalPricing, The World Bank Economic Review
Gupta Tirath and Guleria Amar. (1982). Non—Wood Forestproducts in India ’ §conomic Potentials, Oxford & IBHPublishing Co.. New Delhi.
Gupta Tirath and Gupta Amar. (1980), Non-Wood Forest productsin India, Economic Potentials, Centre for Management inAgriculture. IIM, Ahemadabad.
Indra Kumar and Alok Kumar. (1990). Marketing problems ofForest Industry in India, Common Wealth Publishers. New Delhi.Jack Crucher. (1992), Non-Timber Forest ProductsCommercialisation Feasibility Study for India and Nepal,A.T.International, Swite 1200. Washington D.C.
Kamal K.Mishra. (1989). “National Forest policy and TribalDevelopment” In: Patti R.N.and Jena B. (eds): TribalDevelopment in India. Ashish Publishing Company, New Delhi.
Karve Irawati and Acharya Hemalata. (1970), The Role of WeeklyMarkets in the Tribal Rural and Urban Settings. DeccanCollege, Postgraduate and Research Institute, Poona.Kerala Agricultural University and KIRTADS, (1984), TrainingProgramme for SC/ST Youths in Agriculture and Animal HusbandryDirectorate of Extension. Thrissur p.25.Krishna Iyer, L.A. (1937), The Travancore Tribes and Castes,Vol.1, Government Press. Trivandrum
Kumari Punam and Sinha. A.K. (1992), "Role of Minor ForestProduce in Tribal Economy” In: Buddhadeb Chaudhuri , (ed):Tribal Transformation in India. Inter India Publications.Vol.1, New Delhi.
Kunhaman, M.(l989), Development of Tribal Economy. ClassicalPublishing Company, New Delhi.
Leelakrishnan. P. (1992). “Forest Conservation: Dawn ofAwareness" In: Leelakrishanan P., (ed): Law and Environment,Eastern Book Company, Lalbagh, Lucknow.
Luiz. A.A.D. (1962), Tribes of Kerala, Bharatiya AdimjatiSevak Sangh, New Delhi
Mahalingam. S. (1990). Role of Co-operative Organisations inDeveloping Tribal Economy, Mittal Publications, New Delhi.
Mahalingam, S. (1992), Tribal Co—operatives Systems: A Studyof North East India. Rawat Publications, Jaipur, New Delhi.pp.1-6. 23-45 & 146-181.

Mahalingam, S, (1995), "Finance for Agriculture Marketing inTribal India In: Bhatia B.S. and Verma H.L. (eds):Encyclopaedia of Co-operative Management— Co—operativeMarketing Vol IV, Deep and Deep Publications, New Delhi.Mathur, P.R.G. (1977), Tribal Situation in Kerala. KeralaHistorical Society, Thirivananthapuram.NCHSB (1987). Documentation on Forest and Rights. Vol—I.National Centre for Human Settlements and Environment, NewDelhi, p 30.Polanyi Karl, Arensberg and Conard ( ed ):(1957). Trade andMarket in the Early Empires, The Free press Glencos, lllinois.Prasad Hanuman. (1990), "The Socio—economic Status of theSC/ST— A Case Study of Azamgarh District”, In: Chaurasia(ed): Scheduled Castes and Scheduled Tribes in India, ChughPublications, Allahabad
Rajaraj Varma .R (1990). “Tribal life - its interference withforest administration”. in Nair K.K.N. et.al., (ed), TropicalForest Eco—System Conservation and Development in South andSouth East Asia, KFRI, Peechi.
Rao I.M.K. (1988), Marketing in Tribal Economy, Inter IndiaPublications. New Delhi.
Rynjah, L. (1976). Role of Forest and Agriculture in TribalEconomy, North—Eastern Hill University. Department ofEconomics March 29-31.
Sinclair, A. Steven (1992), Forest Products Marketing, McGrawHill, Inc.. Tokyo, Torento. Part 2.Singh. (1986), Common Property and Common Poverty, India'sForest, Forest Dwellers and Law, Oxford University Press,New Delhi
Sinha, S.P, (1981), "Tribal Development Administration - AHistorical Overview”, in Vidyarthi, L.P. (ed) TribalDevelopment and its Administration, Concept Publishing Co.,New Delhi.
Srivastava, A.R.N. (1981). "On the Significance of TribalEconomic Institutions in Development Programmes”. inVidyarthi, LP. (ed) Tribal Development and its Administration.Concept Publishing Co., New Delhi.
Westoby, J. (1987). The Purpose of Forests, Basil. BlackwellOxford, New Delhi.
Articles in Journals
Baker David. (1991), "State Policy. the Market Economy andTribal Decline: The Central Provinces, 1861-1920”, The IndianEconomic and Social History Review, Vol.XXVIII, No.4,Oct.—Dec.
Bardhan Pranab and Rudra Ashok. (1978). “Inter-linkages ofLand, Labour and Credit Relations". Economic and Politicalweekly. Annual number. Feb.
Baxi Upendra. (1990), "Justice Journey of Backward Classes”,Mainstream. Qct.27.
Behari, O.P. (1990), "The Role of the State in MarketDevelopment - Indian Experience”, Gramin Vikas Newsletter,Ministry of Agriculture, Feb.Bhargava, B.S. and Venkatakrishnan. V. (1991). "Towards anEffective Delivery System”, Kurukshetra, Vol.14, No.1.Bhatti, J.P. (1975). "A Multi-dimensional approach toDevelopment of Tribal Agriculture in Tarai Region of U.P.”,Indian Journal of Agricultural Economics, Vol.XXX, No.3,July—Sept.
Bhowmik Kumar Sharit. (1988), “Development Perspectives forTribals“, Economic and Political Weekly, Vo1.XXIII. No.20, May14.
Biran K.B., Kanar, D.V. (1984). “A Study of RelativeEfficiency of Co-operatives vis-a~vis other Agencies formarketing of Jalgon Banana in Delhi Market", IndianCo—operative Review, Vol.XXII, No.2, Oct.
Campbell, Y. Jeffrey. (1988). Putting people's Products First.Multiple Use Management for NWFP in India”, Indian Forest.Forest Research Institute Press, Dehra Dun:
Das, B. Kumar.(1986). "Development of the Tribal Economy: ASpatial Approach”, Kurukshetra, Vol.XXXIV, No.4, January.
Dewan, P.K. (1980). “Window on Wayanad”, Social Welfare,Aug.—Sept.
Divakar, P. and Yegneshwar, V. (1986), "Tusser Culture andTribal Development”. Kurukshetra, Vol. XXXIV, No.4. January.
Dube, S.C. (1984), "Tribal Development: Illusion andReality”, Tribal Research Bulletin, Tribal Research andDevelopment Institute. Bhopal, Vol.XIII. No.1, June.

Edward M.David. (1993), “The Marketing of Non—Timber ForestProducts in East Nepal and India", Odi Rural DevelopmentForestry Network, Network 156, Summer, England.
Gare. G,M. (1984). “Voluntary Agencies in Tribal Areas:Their Roles and Functional Types”, Tribal Research Bulletin,Tribal Research and Training Institute, Pune, Vol.VII, No.1,Sept.
Gopalakrishnan Nair, N.K. (1987), “Vayanattile GirijanaKshema Pravarthanangal”, Aranyam, Forest DepartmentPublication, Trivandrum. April-June(Malayalam).
Hartman R. (1976), “The Harvesting decision when a standingforest has Value.” Economic Enquiry, 14(i):
Henry, A. Walter. (1976), "Culture Values Do Correlate withConsumer Behaviour”, Journal of Marketing Research, Chicago.May, pp 121-127.
Hussain Monirul. (1987), "Tribal Movement for Autonomous Statein Assam“, Economic and Political Weekly, Vo1.XXII, No.32.Aug.8.
Illaiah .(1990), "Scheduled Castes and Scheduled Tribes:Systematic Exploitation”, Economic and Political Weekly, Dec.22.
Jacobs, M. (1984), "The Study of NTFP. The Environmentalist,Supplement No.7.
John Gaikwad, S. (1986), "Role of MFP in Tribal Economy”,Tribal Research Bulletin, Vol.VIII, No.11, March.
John Gaikwad, S. (1991), “Role of Voluntary Organisations inthe Implementation of Tribal Development Programmes", TribalResearch Bulletin, Tribal Research and Training Institute.Pune, Vol.XIII, No.1, March.
Kotler Philip and Zaltman Gerald. (1971)."Social Marketing anApproach to Planned Social Change”, Journal of Marketing.Chicago. Vol XXXV, p.5.
Krishnan Nair. V.R. (1986), "Vanapalanavum GirijanaKshemavum", Aranyam, Department of forest, Trivandrum.July-Sept(Malayalam).
Kulkarni, M.G. (1985), "Economic Development of the TribalPeople", Tribal Research Bulletin, Vol.VII, No.11, March.Kulkarni Sharad. (1987). “Forest Policy: A Draft Statement",Tribal Research Bulletin, Tribal Research and TrainingInstitute, Pune, Vol.X, No.1, Sept.
Mahalingam S. (1989). “Role of Co—operatives in TribalEconomy”, Yojana. Dec. 1-15.
Mahalingam and Rajendran Vasanthi, (1991). "Marketing ofAgricultural Produce through Tribal Co-operation - Replica ofTawang Model in North—East India”. Journal of RuralDevelopment, Vol.10, No.2. March.
Maheswari, J.K. (1987). "Tribal Eco System - An Overview”.Tribal Research Bulletin. Tribal Research and TrainingInstitute. Pune. Vol.IX, No.II, March.Mathur. P.R.G. (1960). “The Cholanaickans — Cavemen ofKerala”, Tribal Research Bulletin. Vo1.III, No.I, Sept.Mathur, P.R.G. (1982). “Anthropology of Tribal Medicine:Disease and Curing Techniques Among the Tribals of NorthWayanad (Kerala)”. Man in India. Sept. pp.295-312.Muraleedharan. (1991), "Valuation of NTFP in Kerala”.Evergreen. News Letter of Kerala Forest Research Institute.Peechi. Thrissur
Narayanan. K.V. (1985). “Tribals in Rural Development”.Kurukshetra. Vo1.XXXIV. No.2. Nov.
Narayan Sanjay. (1977), “The Forest in the Life of theTribals”. Administrator, Vol.XXII. No.1. Spring.Pant M. (1978). “Forestry for Employment Promotion”, IndianJournal of Forestry. 1 (2).Pant. M.M. (1977). "Forestry Sector —Its contrbution to GrossNational Product”, Indian Forester, 103:739—768.
Pant. S.P. and Baghal, A.S. (1987), "Sociological Constraintsand Attitude to Development of Tribal Farmers in the TribalAreas of Madhya Pradesh”, Journal of Rural Development, Vol.6.No.2. March.
Pattil, H.N., Kumar P., and Muraleedharan, M.A. (1985),"Marketing Efficiency of Co—operative Organisations". IndianCo—operative Review. Vo1.XXII, No.4, April.
Purushotham. F. (1986). "Marketing Rural Produce throughCo—operatives: A Study”. Kurukshetra. Vo1.XXXIV. No.9, June.pp.17-19. .Rao. E.N.B. and Girija Shankar, K. Tribals: Are They BetterOff?", Kurukshetra, Vol.XXXIV, No.4. January.
Rao. Gopala. N. (1987), "Significance of MFP in TribalEconomy. A Case Study”. Kurukshetra, Vo1.XXXV, No.10. July.pp.23—25. 28 & 38.

Reddy. A (1985). "Non-Wood Natural Resources, EconomicActivity and Regional Development”. My Forest. 21(1). p.1—7.
Sabu Philip and Paranjothi T. (1989). "Co-operative Action forTribal Development— Case Study of Attappadi Co—operativeFarming Society, Agaly”. Sahakaritha Samshodan. July—Dec..
Shah U.M. (1986). ”Tribals and Co—operatives”. Kurukshetra.Vol.XXXIV. No.4, January.
Suresh K.A. (1990), "Participation of Beneficiaries in theDevelopment Programmes of Non-governmental Organisations inKerala. Journal of Rural Development, Vol.9 (5). NationalInstitute of Rural Development. Hyderabad.
Seminar and Workshop Papers
Basha S.Chand. (1990). "Medicinal Plants in the Forest ofKerala: Past, Present and Future“, Paper presented at theNational Seminar on Medicinal and Arnonotic Plants held atState Forest Institute, Jabalpur, April 6-7. 1990.Basha S.Chand and Nair. K.K.N. (1993). “Non—Wood ForestProduce Plants of Kerala State. India:An Overview“, Paperpresented at the National Seminar on Forest Products.Coimbatore, October 15-16. 1993.
Bawa, S.K. and Pamela Hall. (1992). "Non-Timber TropicalForest Products: Ecological Sustainability". Workshop onMethods for Social Science Research on Non Timber Forestproduces. Bangkok. Thailand, May 18-20.
Bostrom K. (1985), "Land Evaluation for Forestry Productionwith Special Reference to NWFP”, Paper presented at the expertconsultation on land Evaluation for Forestry Planning atdistrict level. Bangok.Campbell. Y. Jeffrey. (1993) “Putting People's Products First.Non—Timber Forests Products and the Challenge of ManagingForests to Enhance Local Income“. Paper presented at theInternational Seminar on 'MTP IN Forestry. organised by theCentre of MFP for RD & EC. Dehra Dun. India. 17-18th April.
-——————————. (1993). "Changing Objectives, New Products andManagement Challenges — Making the Shift from 'Major' vs.'Minor‘ to many forest products", paper presented at theNational Seminar on Forest Products, Coimbatore. Oct. 15-16.

Cheerun V Jacob. (1994). "Production and Marketing of AyurvedicMedicines in Animal Husbandry Area", Paper presented in aSeminar on Technology Clinic on Ayurvedic Medicines and HerbalCosmetics, Organised by the Science and TechnologyEntrepreunership Development Project. Kozhikode at Thrissur on17-18 Aug.
Chandrakanth M.G. and Lokamanya D.S.(1993) "MarketImperfections in Forest based medicinal tree parts — A CaseStudy” paper presented in an International seminar on MFP inForestry held at Dehra Dun on 17-18th April 1993.
Chanda Kumar Sanjeev. (1993), “MFP and Plantation Strategiesin Tribal Areas". paper presented in the InternationalSeminar on ‘MFP in Forestry, organised by the Centre of MFPfor RD & EC. Dehra Dun. India, 17—18th April.
Damodar Joshi. (1993), "Scope of MFPs in AyurvedicPharmaceutical Industry”, Paper presented in the InternationalSeminar on ‘MFP in Forestry, organised by the Centre of MFPfor ED & EC, Dehra Dun, India, 17-18th April.Das, J.K. (1992). "Valuation of Timber ahd Non—Timber ForestProducts". Workshop on Methods for Social Science Research onNon-Timber Forest products. Bangkok, May 18—20.
Dinesh K. Marothia. (1993), "Co-operative Management of MFP inMadhya Pradesh: A Case Study", IRMA Seminar Paper. FordFoundation Office, New Delhi.
Krishna Murthy, T. (1993), "Non-Wood Forest Products - TheirRole in Rural Economy", Paper presented at the NationalSeminar on Forest Produce held at ICFRE, ForestCampus, Coimbatore on Oct. 15-16.
Lucas, C.S. (1993). "Forest Produce — A Source for AyurvedicMedicine”. Paper Presented at the National Seminar on ForestProduce, ICFRE, Forest Campus, Coimbatore.
Maheswari. J.K. (1990). "Interaction of Tribals with theForests“, Paper presented in the Regional Training Workshop —prop. For. Ecosystem — Conserve. Develop, E & SE, Asia.pp.115-126.
Mani K.P. (1994), "Economics of Rubber- An EconometricExercise". Paper Presented in the International Symposium onPlantation Crops, Kozhikode. Dec.1—3.
Mathur. R.B. and Shiva. M.P. (1993), “Issues for MFP—oriented,Need Based Forest Management", Paper presented at the NationalSeminar on Forest produce, Organised by the Institute ofForest Genetics and Tree Breeding, Forest Campus. R.S. Puram.Coimbatore . Oct. 15-16.

Melkania, M.P.. (1990). “Forest Management - People'sparticipation". Paper presented in the Regional TrainingWorkshop Trop. for Ecosyst. Conservation, Development. S & SE.Asia. KFRI. Peechi. pp.149-157.
Ramanathan D. (1993). "Problems and Prospects of AyurvedicManufacturing Industry in Kerala“. Paper presented in aseminar on Strategies for Conservation and Development ofMedicinal Plants, organised by Kerala Agricultural Universityat Odakkali on 31-12-1993.
Rao Subba. N. (1998). “The role of Co-operatives (LAMPS inTribal Development”. Paper presented at the 9th NationalConvention of Indian Society for Studies in Co-operation.Pune. held at Trivandrum. Nov. 19-21.
Rayndu. C.S. (1988). “Institutions in aid of TribalCo-operatives - A Case Study of A.P.”. paper presented at the9th National Convention of Indian Society for Studies inCo-operation. Pune, held at Trivandrum. Nov. 19-21.
Sankar Darsan. (1994), "Securing the Future of Ayurveda”.Paper presented in a Seminar on Technology Clinic on AyurvedicMedicines and Herbal Cosmetics. Organised by the Science andTechnology Entrepreunership Development Project. Kozhikode atThrissur on 17-18 Aug.
Sankar. S. and Muraleedharan, P.K. (1990), "Human Ecology inAttapady Reserve". paper presented in Regional TrainingWorkshop Trop. For. Ecosyt. Conservation Development S & SE.Asia. pp.127—131.
Satyanarayana (1993). “Role of MFP in Tribal Economy“, Seminarpaper presented in the International Seminar on ‘MFP inforestry“, organised by the Centre of MTP for RD & EC. DehraDun. India, 17-18th April.Singh. R.V. (1992). “Role of Non-Timber Forest Produce in aVillage Economy — A Case Study", paper presented at theNational Seminar on Socio-economic Research in forestry heldat KFRI. peechi. Trichur on May 18-20.
Shiva, M.P. (1994). "Solutions to Overcome Impediments inForest Development through MTP based Management”. PaperPresented at the National Seminar on Forest Produce. organisedby IFGTB Coimbatore Oct - 15- 16.
Shiva. M.P. (1992). "Production and Utilization of MFP inIndia”. paper Presented at the National Seminar onSocio-economic Research in Forestry. sponsored by FordFoundation, Organised by KFRI. Peechi. Trichur. Kerala. May.

itaraman S. (1994), International Marketing of Ayurvedicedicines, Paper presented in a Seminar on Technology Clinicn Ayurvedic Medicines and Herbal Cosmetics, Organised by thecience and Technology Entrepreunership Development Project.ozhikode at Thrissur on 17-18 Aug.nnikrishnan. (1993), “Medicinal Herbs— An Overview", Paperresented in a Seminar on Forest Medicinal Herbs organised byhe Kerala Ayurvedic Medicine Manufacturers AssociationKAMA). at Thrissur on 10~5-1993.
eports and Ph.D. Theses
umaran. (1993). Kerala Tribal Land Act: Problems anderspectives- An Empirical Study with reference to Wayanad.roject Report Submitted to the Department of Law, Cochinniversity of Science and Technology. Cochin.iohandas M.(1992), Impact of New Settlers in the Western Ghategion— On the Socio—Economic Conditions of the Tribalopulation- The case of Wayanad District in Kerala. Report ofhe Research Project sponsored by Ministry of Environment andorest, Kerala Agricultural University. Mannuthy. Thrissur.aul, C.T. (1988), Tribal Economy of the Hill Tribes of.era1a with Special Reference to Wayanad, Ph.D. Thesisubmitted to Calicut University. Calicut.adhakrishnan Pillai S. (1991), Socio—Economic Dimensions ofLealth care Development Among Tribals in Kerala: A Study of‘ribal Communities in Wynad, Thesis Submitted to the Cochin'niversity of Science and Technology for the Degree of Doctorf Philosophy.
ao Raghava. D.V. (1973), "Marketing of Produce andndebtedness Among Tribals, Report on a Study in Chint Allilock. Visakhapatnam (Dist.), Agro-Economic Research Centre,ndhra University. Waltair. June.ucha S. Ghate (1988), Forest policy and its Economic Impactn Tribals in Maharashtra, Ph D. Thesis submitted in Nagpur‘niversity in April.’a1ter Fernandez (1985), Forests, Environment and ForestMeller Economy in Chattisgarh, A Report of a Study onreforestation, Marginalisation and Search for Alternatives.ndian Social Institute, New Delhi.

Unpublished Works
Bawa. S. Kamaljit. (1993). The Riches of Tropical Forests:Looking Beyond Timber for Non-Timber products, Paper collectedfrom Ford Foundation, New Delhi.
Campbell J. (1987), Tropical Forestry and Biological Diversityin India and the Role of USAID/New Delhi, Internal Paper,AG/RM. USAID, New Delhi.
Chand Basha, S. and Nair, K K.N.(1993). Non—Wood ForestProduce Plants of Kerala State, India: An Overview. Papercollected from Kerala Forest Research Institute, Peechi
Marothia K. Dinesh (1993) Co-operative management of MinorForest Products in Madhya Pradesh: A Case study, Papercollected from the Ford Foundation, New Delhi.
Mohapatra Ajay (1993), Marketng of MTP in Orissa - Issues andImplications, Status Paper collected from Ford FoundationOffice, New Delhi.
Government Publications
Government of India (1995) Census of India 1991, Series-Ipaper -2 of 1992, Final Population Totals: Brief Analysis ofPrimary Census Abstract, Census Commissioner, New Delhi.
Government of India (1994), India, Initiatives on Conservationof Forests, Ministry of Environment and Forests, New Delhi.Government of India (1994) Union Primary Census. Abstracts forScheduled Tribes. 1991, Census Commissioner. New Delhi.
Government of India (1992), India 1991, A Reference Annual,Ministry of Information and Broad Casting, Research andReference Division, New Delhi.
Government of India (1988), National Forest Policy 1988. NewDelhi.
Government of India (1986), Occassional Papers on Tribaldevelopment. Ministry of Home Affairs. New Delhi.
Government of India (1960). Report of the Committee of SpecialMulti—purpose Tribal Blocks, Ministry of Home Affairs,New Delhi
Government of India (1952), National Forest Policy 1952,Ministry of Food and Agriculture, New Delhi.Government of Kerala (1995), Annual review on SCP and TSP andSpecial Central Assistance for 1985-86 to 1993-94, Planningand Economic Affairs (C) Denartrnant_ Thiruvananthanur-am.

Government of Kerala (1995). Census of India 1991, series 12,Paper 3 of 1991. Final Population Totals. Director of CensusOperations, Thiruvananthapuram.Government of Kerala (1994). Tribal Sub Plan Annual Plan1995-96. Directorate of Scheduled Tribes DevelopmentThiruvananthapuram
Government of Kerala (1994). Scheduled Tribes and ScheduledCastes in the Forests of Kerala. Facts and Figures. ForestDepartment and KFRI, Peechi, Thrissur.Government of Kerala (1992). Forest Statistics 1992. ForestDepartment, Thiruvananthapuram.
Government of Kerala. (1992), Plan Outlays and ExpenditureKerala. Economic Division, State Planning Board,Thiruvananthapuram.
Government of Kerala (1992). Handbook on Co—operative Movementin Kerala 1981-82 to 1991-92, Department of Co—operation,Thiruvananthapuram.
Government of Kerala (1992). Notes on Scheduled TribesDevelopment in Kerala. Directorate of Scheduled TribesDevelopment. Vikas Bhavan, Thiruvananthapuram.
Government of Kerala (1991). Annual Review on SCP and TSP andSpecial Central Assistance 1989-90, Planning and EconomicAffairs Department, Thiruvananthapuram.
Government of Kerala (1988). Plan Progress in brief andperformance of the sixth plan, Central Planning and Monitoringunit, Planning and Economic Affairs Department.Thiruvananthapuram.
Government of Kerala (1982). G.O. M.S. 4/82/AD dt. 21.1.1982,Agriculture (Forest Misc.) Department. Thiruvananthapuram.Government of Kerala (1981). G.O. M.S. 25/81/AD dt. 2.2.1981,Agriculture (Forest Misc.) Department. Thiruvananthapuram.Government of Kerala (1978), G.O. M.S. 200/78/AD dt.38.7.1978, Agriculture (Forest Misc.) Department,Thiruvananthapuram.
Government of Kerala (1978), G.O. M.S. 35/78/AD dt.25 11.1978, Agriculture (Forest Misc.) Department.Thiruvananthapuram.
The Kerala State Federation of SC/ST Development Co—operativesLtd. (1989), "A note in the collection fo MTP and fixation ofprice for MFP items to ensure maximum returns to tribals”.Thiruvananthapuram.

IPPEIDIX - 1
LIST OF IOTIFIED lTFP'S II KERALI
- . . . . _ _ . . _ _ . . . . — . . _ — . . _ . . . . . . . . _ . . . . . - . . . — - — . — . — . . — — . — _ — — . . . . . . . . . . . . . . . _ . . _ _ . . . . _ — . . . _ . . . . _ . . . . - . . . . . . . _ . . . . — . . . . . . . . . - (
Botanical/Scientific lane Fnlily Sanskrit lane lalnyalnn (local) lane
1. IEDICINAL ITEIS
A. TUBER CROPS
l Acorns calalus Linn Arnceae Vachn Vayanpu2 Alpinia calcarata Rose Zingiberaceae Vruchiknli Kolinchi
3 llpinin galanga SI Zingiboraceac Rosana Chittaratha (dry)/lratha4 Asparagus recelosus Iilld Liliacone Sathanuli Sathavari kizhongu
5 Curcuna angustifolia Zingihoraceae Haridra Ianjal loovu6 Curcuna nronntico Kattunnnjal7 Curcunn longa Linn Zingiberaceae flaridra Kasthuri lanjall8 Cycle: peltota (Lalk) lonisperlnceao Pada Padokizhngu9 Cyperus rotundus Linn Cyperaceae luntha luthanga10 Elettaria Cardalun Vnrlinuscula Zyngiberaceae Chittelnn
11 Helidcanus indicua (Linn) Rflr lsclopiadnceae Snriba larunoadi (dry)! lannari
I2 Holostella ada-kodien Schult Asclepisdnceae lrkapunhpi/Jeevanthi ldapathiynn Kizhangu (dry)
13 Iponea Iauritiana Jncq Convolvulnceao Vidhari Palnuthukkun kizhnngn
14 Knenpferia galanga Linn Zingiberaceae Karcurah Xachollnn
(5 Nelunhiun nucifera Gaortn lylphoaceae llbujalllalalall Thnlnrakizhangu
16 Plunbago zoylanica Linn Plulhaginnceae Chithraka Koduveli (Chothikoduve)li)
17 Rauuolfia serpentine (Linn) Apocynaeae Surpagnndha Analpori (Unite)
18 Rauvolfia serpontinn (Linn) lpocynneae Surpagnndhn lnalpori (Red)
)9 Zingibor zerulbot Rose-ox-3| Zingihernccne Knrpuraharidrn Kattinchi (Fresh)
20 Zingiher zerunhet Rose-ex-an Zingiberncoae Karpuraharidra Kattinchi (Dry)

B. ROOT ITEIS
21 ldhntoda zcylanica ledicus
22 Boerhavin diffuse Linn
23 Cassia torn Linn
24 Clerodendrnn sorratun loan
25 Deslodiun gangeticul lLinn) DC
26 Glelina arhoroa Roxb
27 Hibiscus rosn-sinesis Linn
28 Lnucas aspern liilld) Spr.
29 Nilgirianthus ciliutus (Hoes) Broil
30 Ocinun tanuiflorun Linn
31 Piper longul Linn
32 Piper trichostnchyon DC
33 Pseudarthria viscida Linn
34 Rnchidophorn Pertusa
35 Ricilus connunis Linn
36 Sidn cordifolia Linn
37 Side rhonbifolia (Linn) Borss
38 Solanul indicun Linn
39 Tragia involucrata Linn
40 Vetiveria zizanioidos (Linn) Nash
41 Vigna trilobata (Linn) verdcourt
Icanthacenc
Hyctaginaceae
Caesolpiniaceae
Verbenacoae
Fabncoao
Verbonoceae
lalvacene
Lalioceae
Acnnthacoao
Laniacoao
Piperaceae
Piperaceae
Fabncena
Euphorbiacene
lalvacoae
lalvacone
Solanacone
Euphorihinceao
Poacene
Fahaceae
Vasakn
Punarnava
Chakrnladha
Bharnngy
Prsniparni
Kasnari
Jnpn
Dronapushpi
Sahacharn
Vishnnpriyn
Vanahnridra
Iarichan
Brenda
Bola
lthibaln
Durulahhal
Usiral
ldalodakn veru
Thazhutana veru (dry)
Thakarn veru
Cheruthelku veru
Orila veru (dry)
Kunhil veru
Chonparathi veru
Vellathunbn veru
Karilkurinji voru
Krishnathulni veru
Kattuthippally/Thippali
Kattukurunulnke
loovilaveru
Athithippnli
Veluthavanalin veru (dry)
Vanakurunthotti veru
Kurunthotti voru
Puthnrichunda veru
Kodithuvbn veru
Rnnachan (dry)
Knttupnyar (dry)

. FRUITS
Buten nonosperla
Eelicteres isorn Linn
lonordicn chnrnntia Linn
Phyllnnthus enblicn Linn
Phyllanthus enblica Linn
Strychnos potntorun Linn
Terlinnlia bellirica (Gnertn) Roxb
Terninnlia chebuln Retz
D. BARKS
Caesnlpinin sappnn Linn
Cinnanonul cassia
Synplcos cochin chinensis
E.CREEPERS
Aloe bnrbndensis lil)
lndrogrnphis pnniculnta (Burnt)iallichi ex. lees
Aristnlocbia indicn Linn
Cissus qundranguliaris Linn
Cosciniul tonestrntnl Colebr
Bclipta prostrate (Linn) Linn
Indigofera tinctorin Linn
Nilgirianthus ciliatus (lees) Bren)
Phyllnnthus nnnrua Schun 8 Thou
Tinospora cordifolia (Hill)
Trichosnnthes cucunerinn Linn
Sterculinceae
Cucnrbitnceno
Bnphorbiaceae
Euphorbiaceae
Lognnincene
Conbrelaceae
Colhretacene
Caesakouhuncene
Synplocncone
Liliaceae
lcanthnceae
Aristaiochinceae
Vitaceae
Henispernnceae
Asterncene
Fabncene
Acanthaceae
Euphorbiacene
lerispernacoae
Cucurbitacone
lrugasrinngn
Anluki
lnlnki
Kadaka
Vihheethaki
flnreothnki
Lodhnrn
Kunnri
Kiridathikthalhhooninha
Eesveri
Vnjravnlli
Darn haridrn
Bringnraja
leeli
Sahacharn
Thanlnli
Anrutha
Pndoln
Plashe
Ednnpiri/Vnlnlpiri
Kattupnvnccni
lelliccn (fresh)
lellicca (dry)
Thettnnporal
Thnnnicca (Whole dry)
Kadukkn (Whole)
Chappnngatholi (dry)
Elavangnn
Pnchottitholi (lodrn)
Knttnrvnzhn Lenf
Kiriyath
Gnrudaladi (dry)/ Knralnyal
Chnngalan pnranda (fresh)
lnrnnanjnl
Kunjunni/Kaithonni pach
Neelnnari sanoolan
Karinkurinji Snnoolnn
Keezharnelli (fresh)
Chittnnruthu (fresh)
Pndavnlnn snnolan/knipnnpndavnlan/Knttpadnvalan

.IQUIDS
lnocarpus laurifolia Dennsl
iey
Iey
SEEDS
zsalpinia bonduc (Linn) Roxb
aton tigliun Linn
zada phnaaoloides lerril
lnocnrpua laurifolia (Bennaf) Sleuner
:una prurians {Linn} DC
zer tricostachyon BC
'ychnos nuxvolica Linn
zygiun janbolannl (Lanl DC
Ithoxylun linonella (Dennst) Alston
FLOHERS
lophyllul olatun Rodd.
uhorbia thylifolia
vlitsea cassia (Linn) Koaterlans
IISCELLAIEOUS
ahaltul (inferior)
ihaltul (Super)
I lax
2 Iax
:cifer lncca
yllanthus elhlica Linn
srculia ioetida Linn
Flacourtiacaac
Caesalpiniaccae
Euphorbiaceae
linosaceao
Bixaceae
Fabaceao
piperacaae
Loganiaceae
lyrataceao
Rutaceao
Clusiacaaa
Thoovarakan
Kuberakshi
Jayapalan
lthlaguptha
larichan
Karaskaral
Janhn
Sutbajasi
(Not a plant product)
[Not a plant product)
Euphorhiaceae
Sterculiacoaa
lllaki
larotti
Karilthean
Then (rav)
kazhanchikuru
leervalakuru
KakkavallillalananchadilKakkullai
larottienna (seed oil)
Nayakorana parippu
Kattukurunulalu
kanjirakuru
Njavalkuru
Iullilal
Punna poove/Kattupnnna
Chithirapoovu
Vayaria
kannadan (11 grade)
Kannada: (I grade)
Thaan lozhuxa (Raw)
Tnaan lezhuke (Purified)
Kolaraccu
lellicathodo (dried without seed)
Peenari (dry)/Pottakkavalan

nilnnlia belliricn (6aertn) Roxb
Iinalia chehuln Rotz
-MEDICINAL ITEMS
)IL SEEDS
Iirta cocculus Wight S lrn
Jphyllun elatul Bedd
ztun ula hrongn non Knrst
ra nngassnriul (Burn F.) Kosterl
zuiun ellipticul
leichorn oleosd (Lonr) Olen
SPICES
lanthus triphysa (Dennst) Alston
terocnrpus indicus Bedd
ttaria cnrdanonun (Linn) laton
ttnril cardanonun (Linn) Iaton
ttnria cardanonun (Linn) laton
EDIBLE ITEMS
sicun annun var ncculinatun Fingh
as circinnlis Linn
cinia gunli-gutta (Linn) Roxh
cinin gunui-guttn (Linn) Roxb
iscus furcatus Roxh
iscus furcntus Roxb
Colhretnceao
Conbretncene
lenispernacene
Clusiaceae
Gnetaceae
Cluainceae
Sapindncene
Sinnruhiaceae
Dipterocarpncoae
Zyngiberaceae
Zyngiberaceae
Zyngibernccae
Solanaceae
Cycadacene
Clusiaceae
Clusinceae
lalvacene
lalvaceae
Vidhaothakn
flareothnki
Xakannri
Vannpunnaga
Hagakosarnl
lukulaka
Doopa
Vnvrngu
E):
El:
Eln
Varnguna
Thanniccn thode (dry)
Kadukknthode (dry)
Pollacai (Nanchinkuru) dry
Kattupunnncai
Odnkuru
Nankin Kuru
Palikkuru
Poovnn
lattipa)
Knlpasnl
Elan (1 Grade)
Elan (II Grade)
Elan (III Grade)
Knntarilulak (dry)
Eenthalpanacai
Kodulpuli (fresh)
Kodunpuli (dry)
Pu)i/larunpuli (With seed)
Puli/larulpuli (Iithout seed)

APPENDIX—II
LIST OF SCHEDULED TRIBES-KERALA
AdiyanArandanEravallanHill PulayaIrular.KadarKammara (1)
Irulan
Kanikaran. KanikarKattunaicken
KochuvelanKonda KapusKondareddisKoragaKotaKudiya, MelakudiKurichiyanKurumansKurumbasMala MalasarMalai Arayan
In the area comprising the Malabar District as5 of theby Sub section (2) of
2322
23
25
26
27
28
29
3031
35
section
.Malai Vedan
.Malai Pandaram
.Malakkuravan24. Malasar
.Ma1ayan (2)
.Malayaraya
.Mannan
.Marati (3)
.Muthuvan. Mudugar.Muduvan
.Palleyan
.Palliyan32.33.34.
PalliyarPaniyanUlladan
.Uraly.
specifiedState
UTCB:
Re—organisation Act 1956 (37 of 1966).District asthe StatesExcluding the areas comprising the Malabar
specified by Sub Section (2) of section 5 ofRe—organisation Act 1956 (37 of 1956).
In Hosdurg and Kasaragod taluk of Kasaragod District.Government of Kerala. (1992). Notes- on ScheduledTribes Development in Kerala, Directorate ofScheduled Tribes Development. Vikas Bhavan,Thiruvananthapuram.

Appendix III
Base for Converting Fresh Medicinal Items to Dry Items
51 Possible reduct- Redution for stockNo‘ Items kion in weight exceed‘flry items' while drying (%) (1 month)1. Amlpori 702. Adapathiyan 503. Elaccai 804. Kattuthippally 50 105. Karimkuriji 586. Koova 757. Kadukka 308. Padakizhamgu 509. Kolincha 6610. Kattukanjal 6011. Veluthavanikkin veru 7512. Kattukurumulake 6613. Cheruthkku veru 6014. Orila 5315. Moovila 7516. Kurumthotti 6717. Karimkurunji 5318. Kattukurumulaku vally 60 1019. Palakkuru 75 520. Putharichunda 5321. Kattupadavalam 3022. Nannari 6023. Athithippally 1024. Cheevaccai 5 to 1025. Uruvanji 5 to 1026. Honey 2 to 527. Bee wax 2 to 528. Marottikuru 5 to 10Source :Compi1ed from the records of TCS,SC/ST federation anddiscussion with secretaries of TCS in the state.

IPPENDIX IV
Average Fanily Expenditure of Tribal Households under study
(Figures in Rs.)
51. Region] Tribal Average Fanily expenditure break upllo. Couunity Total --------------------------------------------------------------------------- -
Exp. Food Eating Liquor Tobacco ledical Clothing Recreation Festivalsout
I Tl1lllUV1l11l1T1l1PUR111 1111.
1 lalai Pandaran 18853 10868 485 1938 1659 537 2407 313 647
2 Kanililiar 16455 8616 674 1930 1550 289 1300 581 1515Total T111. 1111. (a) 17109 9230 622 1932 1580 357 1602 508 1278
[100] 1541 141 I111 [91 [21 191 [3] [81II THRISSUR 1111.
3 Irular 17054 8572 1261 2909 1627 52 1598 539 4984 Paniyan 16908 9586 1805 1995 1312 205 250 319 2765 lalayan 17164 8946 1878 2325 1855 220 1100 461 357
Total TC1l. 1111.101 17058 0696 1690 2507 1682 193 1126 463 401[1001 1531 1101 115] 1101 111 161 [31 121
III KALPBTTI R11.
6 Kattunaicken 14808 7293 1693 2459 1256 148 1037 402 520
7 Paniyan 14087 7855 885 1558 1646 188 1207 355 3938 Kurunar 13680 7658 1407 1236 1753 101 928 263 3349 Adiyan 14030 7750 880 1315 1216 120 1010 325 141410 Kurichiyen 14820 8315 1320 1230 1326 150 1215 215 1049
Total KAL. l111.(cl 14365 7690 1337 1688 1399 137 1058 321 73511001 [541 191 1121 1191 11] 17] 121 15]
111 10111111 R11.
11 luduvan 16477 10393 847 1374 1242 107 1743 392 37912 lannan 15850 8980 2300 1210 1055 180 1310 280 535
Total 101. 1111.10) 16242 9863 1392 1313 1172 134 1581 350 43711001 160] 19] 13] 171 Ill 1101 121 131
lverage 16194 8945 1260 1860 1458 205 1342 411 713la+b+c+d) [100] [55] [8] [12] [9] [I] [8] [3] [4]............................................................................................................... -

Appendix V
Collection of ITFP by TC5 in the Study Area
Thiruvananthapuran Thrissur Kalpetta ldilaly No. ofNTFP itels --------------------------------------------------------- -- -- —societies2 3 4 5 6 7 B 9 10 Collecting
ACH POTO IJA HAL SHO PILA SB TIRU KAN ADI items
1 Kasturinanjal '2 Kolinji3 Sathavarikizhangu4 Kurunthotti veru5 Nellicca6 Pachottitholi7 KalloorvanjiB Harananjal9 Honey
10 Bee wax11 Kakkulkai12 larottikuru13 Vayanapoove
14 Chithirapoove15 Poovanathnri
16 Nangari17 Pollaccai18 Cardanol
19 Kudanpuli20 Kettunonjnl21 Kundirikkan22 Cheevaklai
23 Kattupayar24 Pattinja25 Analpori26 Koppuvella27 Kannadivella28 Orila29 Pathiripoove30 Kadukka
31 lattipal32 Soap nuts33 Thannikka
34 Edanpiri/Valanpiri35 Gnrudakody36 Naruneendi37 loovila33 Chittalal39 Kurinji veru40 ldapathiyan xxptxxxxx-no-o-on-on-nIt><uo-p-o>£It><-03¢)-<><on:-In->¢><-t>¢><>-< >¢5<3<><><>-I)-¢><><><><><>-($19194DID-unnnnn-Ioaonbnnnnn-I-n-tn-on :-:-on-0-souvlv up
D 9 no -9-I--o
CD9‘
3 D9
DQQQQ3
¢\;t—-Ié.§|\.|i—OV-0|-—€$h|L-i-§(.lI|—<0—-&‘|LF'|>‘£8l~.ILAJlJ|LAJC.nDD-I--|(.a.|CJI?113|—'ta.'DQHiI€kJ1

41 Knttuthippally x x x ' 142 Karinkurinji x x x ' ' ' ' 443 Putharichunda veru x x x ‘ ‘ ' 344 Kattupadavalan x x x ' ‘ 245 Kazhanji kuru x x x x x ' ' 246 Kattu kurunulaku x x x x x ' ' ' ' ' 547 lthithippally x x x x x ' 143 kanjira kuru x x x x x ' ' 249 Kolinja x x x x x x ' ' 250 kalpasan x x x x x x ' 151 Cherutheku veru x x x x x x ' l52 lavanakin veru x x x x x x ' 153 Dharbapullu x x x x x x ' 154 Kolorakke x x x x x x x x ' 155 Chittaratba x x x x x x x x x ' 156 Peenari x x x x x x x x ' 1No.0! items
collected by TCS 21 24 1B 19 9 23 23 11 9 20Source: Survey data
Note: 1. lCH- lchancoil TCS; POT0- Potonavu TCS; flJl- ljaraneeli TCS; lAL- lalalpuzho TCS: 530- Sholayoor TCSPlLl- Falappally TCS; SB- Sultan battery TCS; TIRU- Tirunelli TC5; KAN- Kannonan TCS: lDI- ldinaly TCS
2. ' - RTFP itens collected
3. x - HTFP itels not collected

Appendix .Vl
Schedule to Collect Information from Board of Directors
S1 . Opinion Statements of Directors of TCSNo.
1. Does there any political interference in the managementof TCS? Yes/No2. Do you attend the Board meetings regularly? Yes/No3. Does your organsiation-have adequate staff for executingthe activities of TCS? Yes/No4. Does the TCS meet the entire credit requirements ofmembers? Yes/No5. Does the Board has effective co-ordination with the SC/STFederation? Yes/No6. Do you receive any assistance from Tribal Department?
Yes/No
7. Do you face any difficulty in getting the Movement Passfrom the forest officials? Yes/No8. Do you bribe the forest officials for availing anyservices? Yes/No9. Does the TCS has sufficient number of collection centresfor NTPP? Yes/No10. Does the TCS collect the entire potential supply of NTFP?
Yes/No
11. Are you satisfied with the present system adopted by TCSfor the collection and marketing of NTFP? Yes/No
12. Does your area possess non-listed NTFP? Yes/No13. Does your members collect non-listed NTFP? Yes/No
14. Does the TCS timely disburse the NTFP collection advanceto collection agents? Yes/No15. Do you think the commission charged by the SC/STFederation high? Yes/No16. Does the SC/ST Federation timely disburse the
required NTFP advance to TCS? Yes/No

17.
18.
19.
20.
21.
22.
23.
24.
25.
26.
Does the TCS face any problems in marketing the NTPP?Yes/No
collect theYes/No
Does the TCS face any difficulty to entireNTFP due to paucity of tribes?Do you prefer to the market the collected NTFP directlyto private traders? Yes/NoDo you conduct any market survey or rely on marketinformation for fixing the collection price? Yes/NoDoes the TCS enter in to contract with any demand packetsto market NTFP? Yes/NoDo you go for collecting NTFP after assuming office?
Yes/No
Are you aware of the rules and regulation of TCS? Yes/No
Are you aware of the forestcollection of NTPP?
legislationYes/No
governing the
Have you imparted any training for NTFP collection to themembers and the collection agents? Yes/NoHave you attended any training programmes designed forthe managing comittee members? Yes/No

APPENDIX ViiRESPONSE OF BOARD OF DIRECTORSA B C
OpinionStatements DM DEF DLESl.No. Yes No Yes No Yes No1 6 12 8 5 02 112 18 0 9 4 10 33 16 2 4 9 7 64 8 10 1 12 0 135 15 3 11 2 8 56 0 18 0 13 4 97 12 6 7 6 12 18 13 5 9 4 11 29 11 7 9 4 6 710 66 12 0 13 0 1311 16 2 3 10 7 612 9 9 8 5 6 713 4 14 4 9 6 714 13 5 6 7 4 915 5 13 6 7 7 616 9 9 B 5 5 817 3 15 11 2 11 218 14 4 6 7 4 919 8 10 9 4 10 320 8 10 1 12 0 1321 12 6 2 11 0 1322 5 13 2 11 3 1023 10 8 8 5 4 924 4 14 3 10 2 1125 0 18 0 13 0 1326 0 18 0 13 2 11Note: Figures in each column indicates the number of Board of
Directors responded to opinion statements.A - DME: Directors of More Effective Tribal Co-operativeSocieties
B — DEF: Directors of Effective Tribal Co-operative societies.C - DLE: Directors of Less Effective Tribal co-operativesocieties.

Household Survey
APPENDIX VlflRESEARCH SCHEDULES
Dynamics of Co-operative Marketing in Tribal Economies
—— A Study of NTFP Marketing in Kerala
Schedule No.
P A R T - ISocio — Economic Details
1. Name of the Key Respondent
2. Panchayat3. Village4. Block5. Forest Range6. Forest Division7. District8. Religion9. Caste10. Mother tongue - Speak. Read, Write
11. Knowledge of Regional Language - Speak. Read. Write
12. Demographic Details
Re1_ Rar- Qccupation _ _S1. Name Sex Age ation ital Eduf Main SubsidiaryNo. Ship status cation (1 to 5) (1 to 5)M/UM
1. NTFP collection and marketing 2. Cultivator3. Agricultural labourer 4. Service personnel employed5. Other occupation
(a) Making mats, baskets, etc.(b) Fire wood collection and sales(c) Hunting and fishing activities

13. Education(a) No.
Not attending schoolsof children below the age of 15 years attending/
Attending school Not attending schoolDistance .Name of Day DistanceNo. school Hostel Scholar from house No. (Km )(Km.)
Boys
Girls
(b) Reasons for Non—attendance
(i)(ii) Agricultural work
Children help the family by engaging in NTFP collection
(iii) Collecting eta, bamboo, cane, etc. and make baskets.mats. etc.
(iv).Look—after younger ones while the parents go forwork
(V) Disease
(vi) No schools near by(vii) Feeling of separation
(viii) Handicapped
(ix) Any other (specify)14. Occupational details (Except NTFP collection. cultivation,
service and other occupation)Main Subsidiary31. Name Agl. labour Agl. labourNo. (code) No.of No.of
Season 33:: Daily Hrs. 33:: Daily Hrs.. wage of Season . wage ofIn a (Rs) work In a (Rs) weekweek week
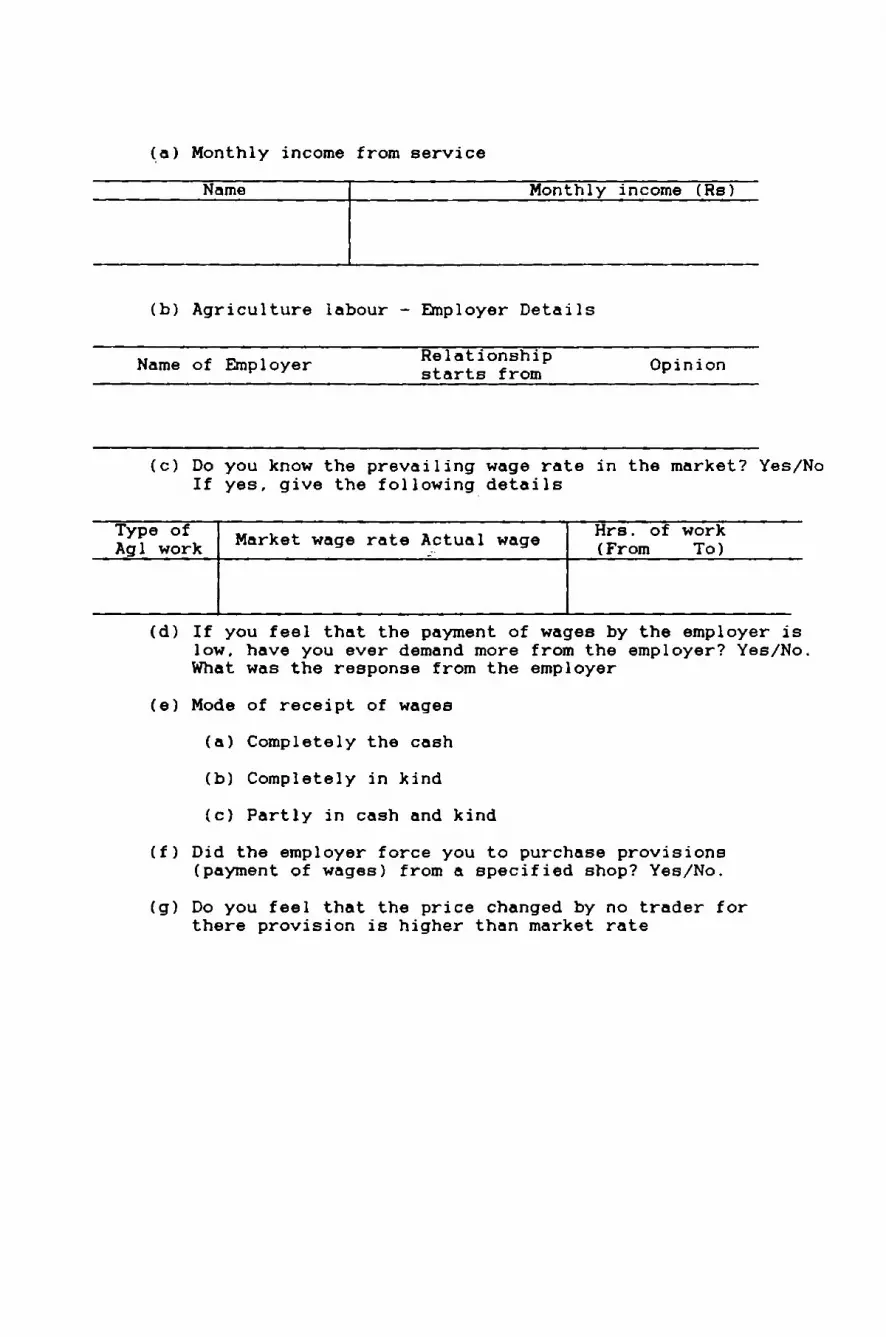
(a) Monthly income from serviceName Monthly income (Rs)
(b) Agriculture labour — Employer Details
Name of Employer gfiigtéogigép Opinion
(c) Do you know the prevailing wage rate in the market? Yes/NoIf yes, give the following details
Type of Hrs. of workA91 work Market wage rate hctual wage (From To)
(d) If you feel that the payment of wages by the employer islow, have you ever demand more from the employer? Yes/No.What was the response from the employer
(6) Mode of receipt of wages
(a) Completely the cash
(b) Completely in kind(c) Partly in cash and kind
(f) Did the employer force you to purchase provisions(payment of wages) from a specified shop? Yes/No.
(g) Do you feel that the price changed by no trader forthere provision is higher than market rate

15. Landed property and details of cultivation.5:222:52:Food Crops
RiceTapiocaMilletsCommercial Crops
Plantation cropPepperCoconutArecanutMixed croppingInter cropping
Plantation crop: Coffee, Tea. Rubber and Cardamom
16. If you are not cultivating the land then who cultivatethe land and how much do you get as rent?
Acre Cultivator Year Rent Payment inTribe Non-Tribe (From) Cash Kind Total lumpsum/Not
17. Purchase and Disposal of land (10 year information)
Year Purchase DisposalArea Value Purpose Party
fromArea Value Party
to whomPurpose
18. Did you alienate your land? (Yes/No) If yes give details.
Area(cents) Party to whom Year Consideration
Cash KindAdjustment or not
19. Reasons for alienation.(a) To clear old debts(d) Effect of Land Reforms Act.
(b) Compulsion (c) Encroachment

0. Did you file any case to recoup the alienated land? (Yes/No)If yes give details.
case filed)Year Place of
petition filed Recouped/Not In the Court
1. Details of Asset Possession (Physical and Financial)A. Physical
Sl.No Type Year of purchase Value
avings in Rs.o-operativesanksoney lendershittiesost Office2. Do you have the following institutions near by to your
dwelling place? Yes/No. Give the following details.
Institutions Distance fromdwelling place
TransportFacilitiesBanks
a) Co-operativeb) Nationalised
BanksGSCSRationshopConsumer Co-op.Post OfficePrivate provisionshopEducationalInstitutions
LPUPHigh School
Liquor Shop
NTFP Selling Shop
Agl. produce/other productsMarketing shop

23. Type of dwelling house Ti1ed/Concrete/Asbestos/Thatched
24. Source of drinking water: River/Well/Pipe/Pond
25. Type of lightingElectricity/Kerosene/Oil of any seed
26. Do you have own house? Yes/No. If not. with whom are youstaying/ Are you paying any rent? (Rs.)
27. Expenditure Pattern (Yearly)1. Food (Weekly)
Qty. Price Agency
2. Liquor . Illicit liquor& : ArrackTobacco Toddy
3. Housing —————————————————————— -
4. Fuel & Lighting —————————————— -
5. Education -------------------- -6. Medical ---------------------- -7. Travelling ——————————————————— -
8. Consumer durables ———————————— -
9. Clothing ————————————————————— -
——..——————_—.-.———__..—__10.Recreation
11.Social Activities ------------ -Marriage
FestivalsBirth & Deathceremonies
Other

1. Cost of Cultivation of Agl. Crops
P A R T - IIPRODUCTION AND MARKETING OF AGRICULTURAL CROPS
ff Cost of cultivation ] Area underCro Planting Cost Variable Cost each cropP Seed Labour Lab Ferti- PeBti- Leased Owned
our lizers cidesFood cropCommercialcrop
2. Production of Agl. crops (Yearly)Crops: . Product MarketFood/Comme— Pr°?;Et1?n C0323; t.on paid as ?:°? able surrcial Y‘ p 1 rent g plus (Kg)
3. Do you have sufficient quantity of agricultural crops to marketIf no. why you want to sell the meagre agricultural cropsYes/No.
(a) To pay off old debt.(b) To clear the debt to the private trader.(C) To meet the production cost.(d) To find money for celebrating festivals/ceremonies.
4. Did you get any help from any agencies for cultivating yourland? Yes/No.
If yes. give details
Dept./Agency Seed Fertil izera Cash Pesticides

5. Marketing of Agricultural crops.
Cro S Marketed AgenciesP surplus Co~operatives Pvt. Traders PVt. Traders II(Kg) Kg. Rate(Rs) Kg. Rate(Rs) Kg Rate(Rs.)
FoodCrops
CommercialCrops
6. Year of association with the present marketing agency.7. When do you sell the agricultural crops?
a) Imediately after harvest.
b) Even before harvest-plant itself.c) Only after waiting for a better price.d) Any other (specify).
8. Receipt of sales price.Agency Cash Kind Party in Cash/Kind Settling debt.
Co—opera—tivesPvt. Traders I .Pvt. Traders II
9. Type of Kinda) Consumer Articles of daily use b) Durables — Radio. Watch.c)
10. Can yIf noa)b)c)d)e)f)9)h)i).3’?
OU
t.
Arrack. Toddy. etc.produce
d) Cosmetics
sufficientproducts required for your family from thestate the reasons.
quantities
Quality of the land is inferiorAnimal attack on cropsAttack of pests and insectsNo financial assistance for cultivationUneconomic holdings of landNo market for the produceNo irrigation facilitiesNot interested in cultivationLand has given for cultivation to outsiderFull-time employment with the landlord
of agriculturalland? Yes/No.
etc.

11.
12.
13.
If you get fertile land, can you cultivate it? Yes/No.If No, why?
a) Employer will not permit. b) Fear of lossingc) Land of finance for cultivations.d) Marketing problem.
Do you have knowledge of cultivating different types ofagricultural crops in your land? Yes/No.Do you think that the imperfections/happenings in the landmarket force you to work as a labourer in the agriculturefield? Yes/No.
If yes, give the priority for each of the following items.a) Land alienation b) Land salec) No market for agl. produce. d) Inferior lande) Age—old relation with the present employerf) Threatening by the employer.

P A R T III
“COLLECTION AND MARKETING OF NON-TIMER FOREST PRODUCE
1. How many members of your family hold passes to collectNTFP?
Experience inNo. holding NTFP collectors NTFP collectionMembers passes (No ) No. Experience
2. Do all the members of your family have NTFP collection Kit?Yes/No. Give the following details.
51. Tools Tools Value(Rs) Life of eachNo. Required Possessed Possessed tools (years)
3. Does the GSCS supply collection Kit? Yes/No.If Yes, specify the items.
Sl.No. Items supplied Amount expended (Rs.)
4. Does the pass transferable? Yes/No.If no, have you ever transferred? If yes, give details.
a) To whom it has transferred?b) For the collection of which NTFP?
c) Consideration if any received (Rs.)5. Does the NTFP procuring agencies declare the items which
they require in advance and the price they propose to givefor each items? Yes/No.A encjes Declare items required Price Quoted9 (Yes/No) (Yes/No)
Co-operatives:Private Traders:6. Do you collect only those items specified by the agencies?
Yes/No.
Details of NTFP collections.Extraction Methods to collect NTFP.

9. Did you face any risk in collecting NTFP in the past?Yes/No.
10.Do you have any insurance cover? Yes/No.
If yes. who pays the insurance premium and amount.
11.Do you face any difficulty from any dept.? Yes/No.If yes. give details.
Dept. Problems usually faces
12.Do you undertake any processing activity before the productto market? Yes/No.
If yes. give the following details.13.Period of selling the NTFP.
a) Immediately after collection b) Weekly c) Monthlyd) At the end of the seasone) Waiting for a remunerative price.
14.Do you think that the present extraction method willreduce the availability of NTFP in future? Yes/No.
15.Have you received any training to extract NTPP? Yes/No.
If yes. for which NTFP?
Items Agency

16.
17.
SALE OF NTFP THROUGH C0-OPERATIVES
Do you sell the entire NTFP collection through GSCS? Yes/NoIf yes. give the following detailsDoes the society collect all collections of NTFP from you?Yes/No.
If no. how do you market them? Pvt. Traders/Other AgenciesSl.No.
Items not collectedby society
Sales price receivedQty‘ pvt. trader/
18
19.
20.
21
22
23.
.Does
.Do
.Mode
the society grade collections andaccordingly? Yes/No.
your priceAre you satisfied with the grading? Yes/No.Does b) lessthan
the price paid by the society a) equal toc) higher than the market value.
b)Does lessthan
the price paid by the society a) equal toc) higher than the price of private traders.
you think that the entry ofcollection of NTFP has ensured.
the society in the
a) a ready market for NTFP
b) a fair price for NTFPc) eliminated the exploration of Pvt. traders.
of collection of NTFP of the societya) Door to door
b) Delivery at the office of the societyc) At the collections centres of the societyd) Collection from the agents of the society
Do you think that the commission agents of the ischeating you in the form of
society
a) Giving a less price (than of thesociety)
b) Unscientific Weighing methods
guaranteed price
c) Taking samples, charities. etc.d) Undesirable cut in weighting

e) Same price for all gradesfl Supplying provisions at a high priceg) Supply of Arrack. Toddy. etc.
24.Do you get bill when you sell produce throughco-operatives? Yes/No.
25.Distance from the
a) dwelling place to the office of the society - Km.b) dwelling place to the collection centre - Km.
(society's)c) dwelling place to the available area — Km.
26.Mode of receipt of NTFP selling price.a) Immediate receipt of full value in cashb) Receipt of full value after the sale of NTFP by
societyc) Partly in cash and kindd) Completely in the form of consumer goods
e) Part payment after the sale by society27.Did you get anything extra (amount after the initial
payment for NT??? Yes/No.
If yes. give details.
3;: Items AmountR;eceived Year
28.Does the society declare any bonus to the tribals who sellNTFP to the society? Yes/No.
If yes, amount of bonus received during the previous year.29.Have you received any NTFP advance from the society?
Yes/No. If yes, give details.
Advance Re aidYear Items Season Cash(Rs.) Kind Adjust Cash(Rs) Outstanding
30.What is the normal repayment period and interest of theadvance?

31 .Details of consumer goods purchased from the society (P.Y.)Sl.No. Items Quantity Price
32. Do you think that the price charged by the society forconsumer goods is
a)
b)
c)
33 .How do you make payment to the consumer goods
Less than that of private tradersHigher than that of private tradersEqual to that of private traders
supplied bythe society?
34.What
35. Do you useYes/No.
are the different other benefits you get from society?NTFP for curing disease (self
If yes, give details.consumption)
Items Method ofapplication
Use for disease(Name)
Quantityapplied
Sales through Private Traders or other Agencies
36.Mode
a)
b)
c)
d)
e)
of collection by the private tradersDoor to door
Delivery at the shop of the traderCollection centres fixed by the trader
the forestCollection from the collection initself point
Other (specify).37.Distance from the
(i) dwelling place to the shop of the trader(ii) dwelling place to the collection centre

36.Mode of receipt of NTFP selling price(i) Full value in cash, imediately on sale(ii) Full value completely on goods(iii)Part1y in cash and kind(iv) Partly in goods and partly in Arrack and cosmetics(V) Others
39.What are the different types of items supplied by thetraders?
Sl.No. Items Quantity Price(Rate) Rs.
40.Do the private traders collect all items of NTFP? Yes/NoIf not. list out the items procured by Private traders
Sl.No. Quantity Reasons for not procurement
Then. how do you market the produce?Society/Other Agencies41.NTFP sale to Private Tradersen en
RateSl.No. Items un untQty. Rate Qty.D
:4
Home, Address, Retailer/Wholesaler
42.Years of acquittance with the private traders?43.Do you know, where the private traders sell NTFP? Yes/No
If yes.Agency Place of sale Buyer (Name and address)
44.Do the private traders grade your NTFP and price itaccordingly? Yes/NoIf yes, are you satisfied with the grading and pricing
45.Do you receive reasonable price for your NTFP from privatetraders? Yes/No
46.Does the price of the private tradera) Equal to b) Less than c) higher than the market price

47.Does the price paid by the private tradera) Less than b) Equal to c) More than the price paid by
the society48.Have you received any loan (advance from pvt. trader
against the future supply of NTFP to them? Yes/NoIf yes, give details.
Year Amount per— Pur— Rate of Amount repaid out st‘ Overinterest —————iod pose Cash(Rs) NTFP ending due
49.Would you be able to get loan from pvt. traders evenwithout the security of NTFP? Yes/No
50.Can you list out the comparative advantages of selling NTFPto pvt. traders.
a) Easy accessibility b) Better pricec) Loan facilities without any intricaciesd) Sale at door step e) Entire collection can be soldf) Supply of provisions as and when neededg) Help during distress season h) Bonusi) Extra payment during festivals
51.Do you think that the availability of NTFP is decliningfrom forest? Yes/No.
If yes, state the reasons for declining and solution tosolve lives problem.
52.Do you get financial help as and when you require? Yes/No.If yes. give the following details
Purpose ofAgency Year borrowing Period Amount Interest
53.Do you feel that the imperfections of credit market forceyou to sell your produce at a throw away price to the moneylenders/traders? Yes/No.
54.Do you get regular flow of NTFP from the specified areas ofsupply? Yes/No.
NTFP items Interval of harvest If not, reasons

1.
I I1 I\ I LVLivestock Holdings (Cattle, Sheep. Poultry. etc.)
Sl.No.
Outputper day(litre)
No.of headsCross Local
CostFixed Daily
cost
Year ofpurchase
Type
2. Marketing of Milk and other products (Annual)
AgenciesCo—operatives _ _Kg /litre RatB(RS.) Pvt. Trader I Pvt. Trader II
Milk
Cowdung
3. Did you purchase the livestock by using loans from anydept.? Yes/No.
Purpose of Amount out— YearAgency loan (Type) Amount standing (period of loan)
4. If you are not marketing the milk and other productsthrough Co-operatives, States the reason for that?Product and Marketing of Mats, Baskets and other produces
5. Cost of productionNo.of
Items produced Materials Hours worked itemsproduced
6. Do you need to expend anything to the forest dept. tocollect eta, bamboo. cane, etc? Yes/No.
Department Expenses (Rs.)

Marketing of Baskets, Mats. etc. (Yearly)
_oductS Co-operatives Pvt. Trader~I Pvt. Trader-IINo. Rate(R5) No. Rate(Rs) No. Rate(Ra)laketsItsrtisticroducts
If you are not marketing these produces throughCo-operatives. state the reason for that?

P A R T - V
TRIBAL PARTICIPATION IN C0-OPERATIVES
1. Membership in the Co-operative Society
. No.of ValueSl.No. Name Years of becoming Shares (Rs)
2. Reasons for becoming member in the societya) To market NTFP b) To avail loan facilitiesc) To avail provision facilitiesd) To market NTFP not collected by the tradere) To get pass for NTFP collectionf) To sell agricultural produce9) To sell baskets. mats. milk, etc. h) Dont'know
3. Membership in other Co-operative SocietiesSl.No. Name No.of shares Year Value
4. Reasons for becoming member in other societies?a) To get agricultural creditb) To sell agricultural produce c) To sell milkd) To exercise votee) To sell products such as baskets. mats. etc.f) Dont' know
5. Mode of taking membership
a) In the society (uses) b) In other societiesi) Voluntary i)ii) Compulsion ii)iii) Advice of friends andrelatives iii)iv) Persuasion by politician iv)v) Others v)
6. Do you know the basic objective of the society?
a) To collect the NTFP members and market.b) To supply consumer items c) To give loans to membersd) To sell agricultural and other produce of memberse) The overall Socio—economic improvement of members

7. Which of the following the society belongs?a) Government b) Members c) Employeesd) Board of Directors e) Others (specify)
8. Status as a member
a) Existing Board Member b) Ex-board member9. When was the last several body meeting of the society held?10.Have you or any member of your family attended the G.B.?
Yes/No. If yes. what did you come to know in themeeting? If not. why?
11.Did you speak or any member of the family at the G.B.?Yes/No. If yes, what subject you spoke?
12.Have you got any other benefit apart from undertaking thesale of produce from the society? If Yes, specify.
Year Type of benefit Amount
13.Have you ever been consulted in the fixation of collectioncharge for NTFP price for agricultural and other produces?Yes/No.
14.Have you ever been consulted to know the availability ofNTFP in the forest region of the society? Yes/No.
15.Did the society arrange any training programme for thecollection of NTFP, to the members?Yes/No. If yes. have you attended?
Type of Type of education Period AttendedYear Agency Training programme or not
16.What is your opinion about the behaviour of employees inthe society?a) Very good b) Goodc) Very bad e) Satisfactory
17.What is your opinion about the overall efficiency of thesociety?
a) In dealing with Very good/Good/Satisfactory/Bad/Worseagl. produce
b) In dealing with Very good/Good/Satisfactory/Bad/WorseNTFP
c) In dealing with Very good/Good/Satisfactory/Bad/Worseproduce fromother occupation

18.Do you know the Cooperative principle?Yes/No.If~yes, what are they?
19.Do you think that the principles you pointed outcoupled in this society? Yes/No.
20.What are the irregularities you have come across inworking of the society?
21.State your suggestions to make the functioning ofsociety more efficient.
22.Do you favour the finding of the present systemprocuring NTFP through co—operatives? Yes/No.
23.What would have happened if there were no co-operativesprocuring NTFP from tribals.
Do you know all the items specified for collection? iNTFP list. Yes/No. If yes, can you mention the namesother NTFP you have come across in the forest and that toincluded for future collection in the NTFP list. Ifmention the items that you have normally collected.24.Rank the rate of participation in the following paramete
Consultation during the pre-planning period. Monitoring / supervision during implementation
Receipt of benefits d. Sharing of costInvolvement in evaluation / followup measuresDiscussing problems of programmes with secretariesboard of directorsVisiting the office of the organisationMaking suggestions for programme improvementContacting people outside the organisationAttending meetings of the organisationcampsAsisting the organisationBriefing / propagating progammes to others
H-cDOb‘DI
/ train
I—-bt‘ L..a.I-I-D‘lQ
25.Rank the opinion about participationa.Planning b.Advice at implementation.Participation in management..Representation in the board.Assistance during distress season
cdef.Advice in monitoring/evaluation
.8
are
the
the
of
for
5%benot
TS
/
ing

Schedule to Collect Information from the Demand Pockets(Ayurvedic medicinal manufacturing units) of NTFP in Kerala
1. Name of the Institution:
2. Type of ownership:
1) Government ‘in 2) Private [:1
3) Co—operative [:3 4) Semi-Government E33. (a) Year of Registration C:
(b) Commencement of operation :34. Objectives of the Organisation:5. Main Functions:
a) Production of Ayurvedic medicines :3b) Distribution of Ayurvedic medicines :3c) Ayurveda hospital :3d) Dispensary with free consultancy [:3e) Production and distribution of Ayurvedic [:3medicines
6. Staff Structure:
Permanent Staff (Office): a) Men C:b) Women ‘:1
Workers Permanent: a) Men :3 b) Women :3Temporary: a) Men 3 b) Women [:1
7. Annual Requirements and Procurement of Medicinal andNon-Medicinal herbs:
8. Collection of Items from MTP List:(Separate sheet attached)(Quantity value) (for the last five years)Items Quantity Rate Value

10.Major suppliers of MFP to Organisation: (Attach MFP lists)
Name of supplier J lflajor items Qty Rate Amountsupplied '
11.Method of collecting MP:
a) Inviting tenders E:b) karticipating in auction [:3c) Direct purchase :3d) Other methods ‘:3
12.If by tender, generally, how many tenders do you get? [:313.Do you feel any grid of suppliers in quoting the price of
herbs? 1) YGS D 2) No aIf yes, how will you tackle the situation?
14.Do all these parties supply the herbs in the factorypremises of the CorporationIf not, how will you get the herbs in the factory premisesand who will bear the transportation cost?
a) Seller [:3 b) Buyer C3 c) Merchants/Traders :315. Do you inspect or check or collect samples before the
purchase of the product from parties?1) YES D 2) NO D
If yes. give the details of the component authority to doit:16.Do you get purchase commission from the supplying parties
including co-operatives?1) YBS D 2) NO D
If yes,a) How much commission % E:b) Minimum purchase for commission Rs. :3c) Mode of receipt Cash [:3 Kind [:1
17.Do you collect advance quotation from parties?1) Y63 D 2) NO D

18. Qoes the Co-operative also participative in quotationevery year?
1) Yes Z. 2) No [:119.Do you make advance payment to parties?
1) YBB D 2) NO DIf yes. give the following details:
(Separate sheet attached)Party to whom For items AdvanceAnountYear . .advance given (name) period
If not. how will you make payment?
a) Immediately in cash
b) Imediately in kindc) Partly in cash/kind
20.Does any supplying party receive medicines (product)¥ inlieu of the price of the herbs? 1) Yes [:3 2) No [:3If yes, give the details:
Medicine/otherName of the party Items supplied product
accepted (Rs.)
21.Do you get herbs on credit?1) YSS S NO EIf yes. give the time lag:
Name of suppliers Time lag Amount
22.Amount pending for payment to parties:'
Amount Due onYear Party to whom (RB ) (Date & Year)

!3.Do.you have any contractual obligation to collect theavailable medicinal herbs from co—operatives?
1) Yes :3 2) No :3If yes, do you act accordingly?
1) YES I: NO :1If not. state the reasons
!4.Do you have any breach of contract from Co—operatives?1) Yes D 2) NO D
If yes. what action would you take?
Reason for breachYear of contract Action taken
25.Do you get sufficient quantities of herbs fromCo-operatives at the specified time?
1) YES 2 2) NO EIf not, how will you replenish the balance?
!6.If there is any breach of contract from other supplyingparties, what action would you take?Year Branch Action taken
l7.Do you comply with the price fixation mechanism (salesprice) of Federation? 1) Yes a NO aIf no, what difficulties would you face?
Z8.Do you exercise any quality testing before:he collection of herbs from parties?1} YES 3 NO I:
If yes. what about the qualities of herbs collected fromCo—operatives when compared to other channels?
Very good Good Satisfaction Bad Very badE3 C3 E3 E2] E3Z9.Do you consider that the co-operatives can supply the
entire medicinal herbs required for you?1) Yes :3 2) No :3
‘If not, why?

30. Do.you think that the supply of herbs from Kerala foresthave been declining from year to year?
1) YGS :1 N0 E.If yes, state the reason for thata) Reduction in forest area :3b) Unscientific MT? collection method :3c) Forests are not maintained sustaninably E:d) Undertaking of more dam consumption C3e) Encroachment E:f) Felling of trees by forest robbers ; CZ]
3l.Do you have any herbs suppliers outside Kerala?1) YES (3 NO D
If yes, give the following details:State to which Approximate
Name of the the party ifiemfiggnerally Qty. Valuebelongs pp32. Do you have any direct collection of herbs from tribes?
1) YES E NO :1If yes. give the following details:
33.Do you have any difficulty in collecting the entiremedicinal herbs collection of GSCS?
1) Yes :3 2) No :3If yes, specify the reasons.
34.Do the seasons of Kerala play any role in the availabilityof herbs and the prices to the organisations?
1) YES D NO [:3If yes, give reasons.
35.Do you have proper storage facilities?1) Yes D NO EIf yes. give details:
Plinth area of Storage E:§?§g:{iongodown capacity (x)If not. what alternative measure do you have to store theitems?

36. Storage details:Sl.No.
Cost ofstorage
(Rs.)
Maximumstorage(Qty.)
Commonly useditems formedicine
Turnoverperiod
37.
38.
39.
40.
41
42.
.Do
Do you require all collections of herbs in thestate?by TCS
1) YES El NO :1Do you face any difficulty in with aco-operative institution?
co-operating
1) Yes :3 2) No CD
If yes, enumerate these difficulties.Do you think that the price quoted by co~operatives toTribes for NTFP collection is lower/higher/equal to marketPrices? :1 :1 :1 '1
Do you pass informationrequirements well
pertaining to yourin advance to co-operatives?
1) YBS E NO Dto
theinformation
NTFP well inthe Co—operativecollection and stock
corganisation?passof
pertainingadvance to
1) YES D NO I:If yes, would you take immediate steps to collect it?
1) Yes Q 2) NO DDo you have any medicinal garden of your own?
1) Yes I: 2) NO IIf yes. give the following details:
Yield per yearHerbs (Kg )Acre
43 .Do you import any medicinal herbs?1) Yes 1-, 2) No CD
If yes give details:Country ValuefromYear Items imported Qty.

44.Do you have any ancillary units for the production ofmedicine? ‘1) YES E 2) NO E)
If yes. give the following details:S1. Name of ancillary Year of DistanceNo. units establishment from HQ
45.Do you have purchase Department?1) YES S 2) NO S
46.Though the Federation has different depots, even then fromwhich depot do you normally collect herbs? Is there anyreason for that?
QuantityName of Depot Collected Amount
47.Which are the major classification of items produced(Output) by the organisation in the last year (1992-93)?Classification No.of items
48.How will you market the products?a) Our own outlets E3
b) Through private agencies C:c) Through Co-operatives :3
49.Marketing Details
Year Total Sale Marketing through(Rs.) Our own Co—operative Private(R5.) (Rs.) (Rs.)50.Do you export medicines?
1) YGS D NO 5If yes,
Items exportedY°°r (classified) Country Qty. Value

51
52.
53.
.Do you collect medicinal herbs from those countries whereyou export medicine?
1) Yes D NO QDo you face any marketing problem?
1) YES E 2) N0 :3If yes. bring out the problems.
Does anyone from Co—operative or Forest Department ortribal Department has become member in the Board ofOushadhi?
1) Yes :3 2) ['10 ZIf yes, give details:
Year in which . . .Designation in theName became Board . .Member Parent Institution
54.Since scientific collection method is very important for the
55.
56
57
NTFP from the point of view of quality as well as sustainedsupply. are you giving any guidelines for collectingmaterials?
1) YES 5 2) N0 EIf not.If any agency organise such training programmes, are youwilling to co-operate?
1) Yes ‘:1 2) No [:1Do you help in identifying economically viable new itemsfor cultivation/procurement?
1) Yes Z, 2) no [:1.Do you help in identifying economically viable new itemsfor cultivation/procurement? 1) Yes D No D
.Though your production prices are stabilised, there is highfluctuation in the prices of MFP. what are the reasons?

10.
11.
12.
13.
14.
15.
16.
17.
“ SCHEDULE OF OPINION SURVEYS
Response of Collection Agents (Yes / No)
Do you get the essential itemscentres timely?
required at collection
Do you receive collection centrestimely?
required money at
Do you have any permanent godown at the centre to storethe NTFP?
Do you have transport facilities to superviseof NTFP?
collection
Do you have the knowledge of checking the adulteration ofNTFP by tribes in its quality?
forestfrom
Do you get proper assistance from society andofficials to check the illicit collection of NTFPyour area?
Do you believe adulteration of NTFP by tribes?Do you able to keep the requiredtribes at the collection centre?
consumer items for
number ofNTFP
Do you get adequatepotential supply ofseasons?
tribes to collect thefrom your area in all the
Does the society allow you to reduce the wastage ofcollection at the centre?NTFP
Do you get your salary/commission at the correct time?Does the management committee of the society call you toattend any meeting pertaining to the NTFP collection andmarketing?
Do you give timely information to thethe‘co1lection of NTFP?
society regarding
Do you give information to the Forest officials regardingthe collection of NTFP?
Do you make any NTFP sale to parties from the collectiondepots?
Do you undertake the marketing of tribalthan NTFP through private traders?
produce other
Do you know co—operative principles?

18.
19.
20.
10.
11.
12.
13.
14.
Have you got any training to deal with Tribal produce?Do you collect NTFP other than that is mentioned in thelist?Does the society collect the non—listed items?
Officials of Tribal Department (Yes / No)Do you attend all the MFP committee meetings?
Do you believe that the present system of monopolyprocurement and marketing of NTFP through co—operativeshave liberated the tribes from the clutches of privatetraders?
Do you give any financial assistance for NTFPsocieties?collecting
Do you believe that the presentprice is scientific?
system of fixing NTFP
Have you conducted any market NTFPprice?
survey to fix the
Do you make any marketing arrangement for marketing thetribal produce other than NTFP?
Do you get any complaints from TCS or tribesregarding the collection and marketing of NTFP?
directly
Do you believe that the price fixed by NTFP committee isreasonable?
Do you believe that tribal development can bethrough market orientation to tribes?
possible
Do you undertake any training programme to tribes toextract NTFP effectively?Do you believe the tribes are as part of forest?Are you a Board member in the SC/ST Federation?
Do you attend all the Board meetings of SC/ST Federation?
Do you exercise any influence on the following departmentfor a better deal to tribal produce marketing?
Forest DepartmentSC/ST FederationOushadhi

10.
11.
12.
13.
14.
15.
16.
17.
Response of Forest Officials (Yes / No)
Do you consider the tribes as part of forest?Did the Forest Policy give any consideration to the needsof tribes?Do you think it possible and desirable to associatetribals in forest management?
fromIf yes, how? By guarding forest/ protecting forestfire/stopping illegal selling/plantation/preventingdeforestation/collection of NTFP/any other?
Do you believe that the deforestation has adverselyaffected the availability of NTFP in you area?Do you think that the tribals are capable of undertakingforest jobs?Did you conduct any survey to know the potential supplyof NTFF from your area?
Do you think that thepotential supply of NTFP?
tribes can extract the full
If the tribes are not capable. do you allow any non—tribeto collect the NTFP from the area?
Do you think that the monopoly procurement and marketingof NTFP given to co—operatives have helped the tribes toget a better price for the produce and to eliminate theexploitative practices of then contractors?Do you favour to delink the tribes from the collection ofNTFP in the state?
Do you favour to delink thecollection and entrusting theother agencies?
co—operatives from theNTFP collection to some
Do you conduct any scientific market survey to fix theprice of NTFP?
Do you think that the extractions methods adopt by tribesaffect the sustain ability of the NTFP in the forest?Do you conduct any training programme to tribes forequipping the tribes to collect NTFP?Do you have any mechanism to ensure thespecified NTFP to tribes by Co—operatives?
payment of
Do you get complaints from tribes?

1e.
19.
20.
21.
22.
23
10.
11.
12.
13.
.Do you get complaints from TCS?*9
Do you know the incomings of NTFP from other state?
Do you know the market price of NTFP?
If the tribes identify some more items as NTFP .would youpermit them to collect?Do you believe the NTFP collection can provide a betterstandard of living to the tribes?Do you know the contribution of NTFP to the total incomeof forest revenue form Kerala forest?
Response of officials of SC/ST Federation
Do you collect all items of NTFP for marketing?Do you face financial the collection oftribal produce?
problem for
Do you believe that the present rate fixed for NTFP isreasonable?
Would you face any marketing problem for NTFP?Medical herbs —Non Medical herbs
Does Oushadhi collect all you medicinal herbs?Can the terms & conditions of Oushadhi beFederation ?
adjustable to
Are you ready to supply all the medicinal herbs at thespecified sale price of NTFP committee?
Can you meet all the financial requirements of TCS forcollection of NTFP?
Would you be able to recoup NTFP advance and stockadvance from TCS within the specified time?Do you believe that the tribal development can bepossible through market orientation to tribes?Do you believe that the present marketing arrangement fortribal produce has eliminated the contractors and theirexploitative practices from the collection areas?Do you attend all the NTFP comittee meeting?
Does the Federation has a marketing Manager?

14.
15.
16.
17.
18.
19.
20.
21.
22.
23.
24.
25.
26.
27.
28.
29.
I‘I
Have you conduct any market survey to knowa) the price of NTFP in various districtsb) the potential demand of the produce in the state ?
r</I
4’%Have you made any scientific survey to know the potentialsupply of NTFP from the forest?
Do you conduct any collectioncollectors of NTFP?
training programme to
Do you think that the crude extraction methods of tribeswill ultimately affect the sustainability of the produce
Do you help tribes during distress season?Do you supply the necessary provisions to tribes throughGSCS?
Do you offer any special benefit to members who engagedin NTFP collection?
Do you convene meetings of secretaries atleast once in amonth ?
Do you convene meetings of Branch Managers atleastin two month?
ODC8
Does the Federation has a Board democratically elected?Does the constituted board has tribal representation?Do you undertake marketing arrangement for mats, basketsetc?
Does the Federation undertake any processing activitiesfor NTFP?
Do the branches are capable of managing all the TCScoming under their jurisdiction?Does the Federation able to supply all the medicinalherbs requirements of Ayurvedic units ofKerala?
manufacturing
Does the federation has any role in the fixation ofa) NTFP priceb) Finalisation of NTFP list?


