predictions of hepatic disposition properties using a mechanistically realistic, physiologically...
TRANSCRIPT
Predictions of Hepatic Disposition Properties Using aMechanistically Realistic, Physiologically Based Model□S
Li Yan, Shahab Sheihk-Bahaei, Sunwoo Park, Glen E. P. Ropella, and C. Anthony Hunt
The UCSF/UCB Joint Graduate Group in Bioengineering, University of California, Berkeley and San Francisco, California(L.Y., S.S.-B., C.A.H.); Department of Bioengineering and Therapeutic Sciences, the BioSystems Group, the University of
California, San Francisco, California (S.P., G.E.P.R., C.A.H.); and Tempus Dictum, Inc., Eagle Creek, Oregon (G.E.P.R.)
Received October 28, 2007; accepted January 24, 2008
ABSTRACT:
Quantitative mappings were established between drug physico-chemical properties (PCPs) and parameter values of a physiolog-ically based, mechanistically realistic, in silico liver (ISL). The ISLplugs together autonomous software objects that represent he-patic components at different scales and levels of detail. Microar-chitectural features are represented separately from the mecha-nisms that influence drug metabolism. The same ISL has beenvalidated against liver perfusion data for sucrose and four cationicdrugs: antipyrine, atenolol, labetalol, and diltiazem. Parameterssensitive to drug-specific PCPs were tuned so that ISL outflowprofiles from a single ISL matched in situ perfused rat liver outflowprofiles of all five compounds. Quantitative relationships were thenestablished between the four sets of drug PCPs and the corre-
sponding four sets of PCP-sensitive, ISL parameter values; thoserelationships were used to predict PCP-sensitive, ISL parametervalues for prazosin and propranolol given only their PCPs. Rela-tionships were established using three different methods: 1) asimple linear correlation method, 2) the fuzzy c-means algorithm,and 3) a simple artificial neural network. Each relationship wasused separately to predict ISL parameter values for prazosin andpropranolol, given their PCPs. Those values were applied in the ISLused earlier to predict the hepatic disposition details for each drug.Although we had only sparse data available, all predicted disposi-tion profiles were judged reasonable (within a factor of 2 of refer-ent profile data). The order of precision, based on a similaritymeasure, was 3 > 2 > 1.
The in silico liver (ISL) (Hunt et al., 2006; Yan et al., 2007) (Fig.1) is a first-generation example of synthetic, discrete, physiologicallybased analogs that are intended for refining, exploring, and testinghypotheses about the details of hepatic drug disposition. Autonomouscomponents represent spatial aspects of hepatic organization andfunction. Different drugs can be represented and studied simulta-neously or separately. Each ISL component can interact uniquely withany drug-representing object that enters its local environment. Theconsequences of simulated systemic and local interactions can bemeasured and studied simultaneously, analogous to how wet-lab ex-periments are conducted.
In Yan et al. (2008), the simulated hepatic disposition of atenolol,antipyrine, labetalol, and diltiazem, along with coadministered su-crose, used only one parameterized ISL structure for all compounds.A subset of components interacted differently with the particularcompounds. Monte Carlo ISL variants simulated compound-specific
outflow profiles that matched referent profiles. The results supportedtwo hypotheses. 1) The mappings in Fig. 2 between ISL componentsand corresponding liver components were sufficiently realistic for thestated model use. 2) The simulated drug-ISL component interactionevents mapped to corresponding hepatic disposition events. A goal forthis project has been to discover and verify ISL counterparts to therelationships between drug physicochemical properties (PCPs) andpharmacokinetic (PK) mechanisms and use them to make predictions.
A vision motivating research on this class of models is identical toone that has motivated development of traditional physiologicallybased PK models: by “accounting for the causal basis of the observeddata, . . . the possibility exists for efficient use of limited drug-specificdata [italics added] to make reasonably accurate predictions as to thepharmacokinetics of specific compounds, both within and betweenspecies, as well as under a variety of conditions” (Rowland et al.,2004). PCP-sensitive, physiologically based PK model parametersnecessarily conflate features and properties of the biology (aspects ofhistology and others) with drug PCPs. In doing so, there is a risk that“the causal basis” becomes obscured because of the conflated biolog-ical features that were especially influential in causing some propertyof the data. Interconnections between sinusoids might be such afeature. In the ISL, because we have built a collection of mechanismsfrom finer-grained components, we have precise control over confla-tion, yet the causal basis is still there in the drug-component interac-tion logic (axioms and rules). Our expectation has been that at some
This work was supported in part by grants (to C.A.H.) and fellowships (toS.S.-B. and S.P.) provided by the CDH Research Foundation and abstracted inpart from the Ph.D. dissertation presented by L.Y. to the Graduate Division,University of California, Berkeley, CA.
Article, publication date, and citation information can be found athttp://dmd.aspetjournals.org.
doi:10.1124/dmd.107.019067.□S The online version of this article (available at http://dmd.aspetjournals.org)
contains supplemental material.
ABBREVIATIONS: ISL, in silico liver; PCP, physicochemical property; PK, pharmacokinetic; CV, central vein; SS, sinusoidal segment; PV,parameter value; CC, correlation coefficient; FCMA, fuzzy c-means algorithm; ANN, artificial neural network; SM, similarity measure.
0090-9556/08/3604-759–768$20.00DRUG METABOLISM AND DISPOSITION Vol. 36, No. 4Copyright © 2008 by The American Society for Pharmacology and Experimental Therapeutics 19067/3323256DMD 36:759–768, 2008 Printed in U.S.A.
759
http://dmd.aspetjournals.org/content/suppl/2008/01/28/dmd.107.019067.DC1.htmlSupplemental material to this article can be found at:
at ASPE
T Journals on June 2, 2016
dmd.aspetjournals.org
Dow
nloaded from
level of granularity, the complexity will be sufficiently unraveled sothat the logic for a given ISL component-drug interaction (the “causalbasis”) will rely heavily on only a small subset of easily specified,drug and biological attributes. In some cases, information about themolecular attributes may be represented adequately by just one or afew PCPs (or, more specifically, knowledge of the drug-environmentinteraction for which a PCP is a measure). Once we have validatedISL models that exhibit some of these characteristics, we will havemoved closer to the above vision of being able to accurately anticipate
the hepatic disposition properties of a new compound, given only itsmolecular formula and structure (and/or validated PCPs).
Are the mechanisms in the current ISL sufficiently realistic toenable such predictions using only limited data? We hypothesized thatthe differences in the tuned values of the 10 PCP-sensitive ISLparameters were due primarily to differences in PCPs. If that is thecase, then quantitative PCP-to-ISL mappings exist and, when discov-ered, should enable us to predict the disposition of a new compoundgiven its PCPs. Failure to provide better than ballpark predictionscould be taken as evidence invalidating that hypothesis and possiblyaspects of the ISL mechanisms. The goal of this project has been tosuggest quantitative PCP-to-ISL mappings and then use them topredict the disposition properties of prazosin and propranolol givenonly their PCPs.
Three different methods were used to implement quantitative PCP-to-ISL mappings: linear regression, an artificial neural network, and awell-established fuzzy clustering algorithm. Each method predictedthe PCP-sensitive, ISL parameter values for prazosin and propranolol.Those predicted values were then combined with the already-vali-dated, drug-insensitive ISL parameter values. Simulation of the re-sulting ISLs gave three different, independent versions of expectedhepatic disposition details for prazosin and propranolol along withexpected liver perfusion outflow profiles. Those profiles were surpris-ingly good matches to the observed profiles, strengthening the ongo-ing validation of ISL mechanisms and supporting the existence of themapping relationships in Fig. 2. Together they represent an importantadvance in our ability to predict PK properties for drugs given onlytheir structure.
Materials and Methods
To distinguish clearly in silico compounds and processes from correspond-ing hepatic structures and processes, we use SMALL CAPS when referring to theformer.
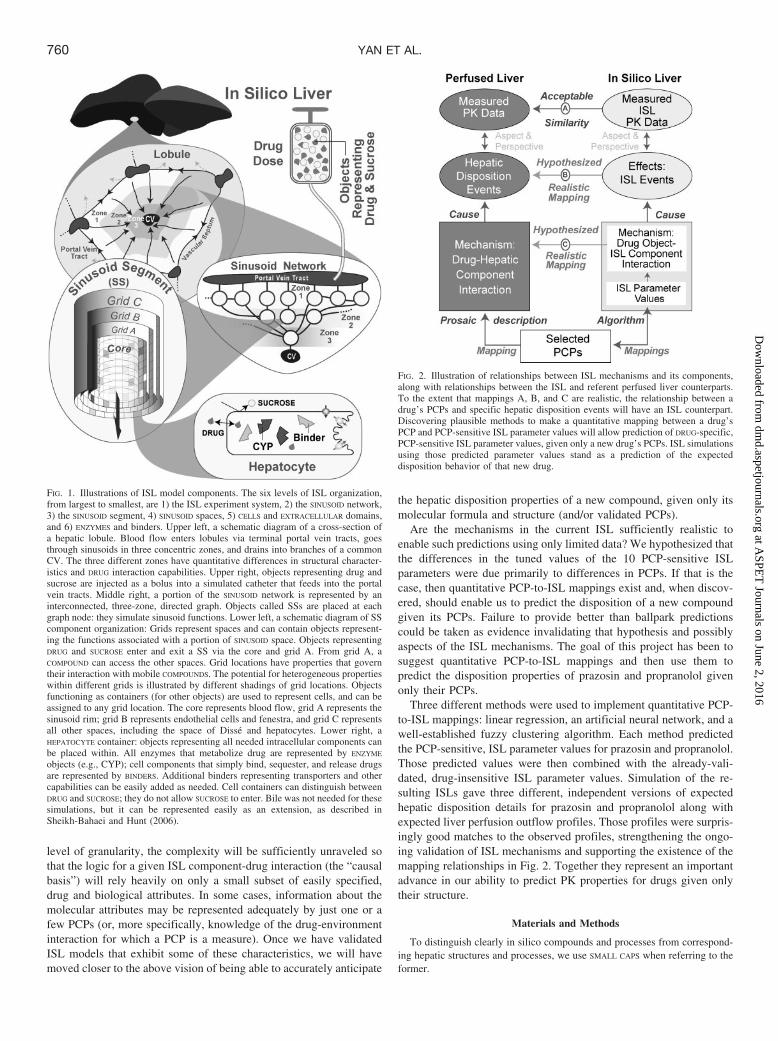
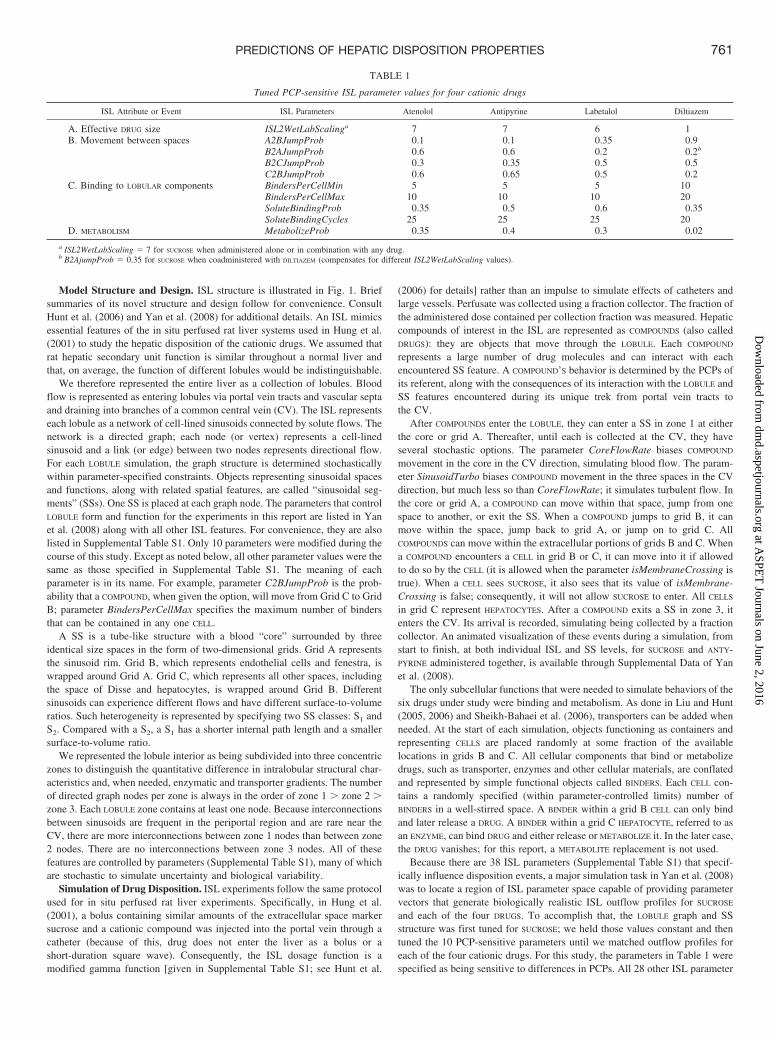
FIG. 1. Illustrations of ISL model components. The six levels of ISL organization,from largest to smallest, are 1) the ISL experiment system, 2) the SINUSOID network,3) the SINUSOID segment, 4) SINUSOID spaces, 5) CELLS and EXTRACELLULAR domains,and 6) ENZYMES and binders. Upper left, a schematic diagram of a cross-section ofa hepatic lobule. Blood flow enters lobules via terminal portal vein tracts, goesthrough sinusoids in three concentric zones, and drains into branches of a commonCV. The three different zones have quantitative differences in structural character-istics and DRUG interaction capabilities. Upper right, objects representing drug andsucrose are injected as a bolus into a simulated catheter that feeds into the portalvein tracts. Middle right, a portion of the SINUSOID network is represented by aninterconnected, three-zone, directed graph. Objects called SSs are placed at eachgraph node: they simulate sinusoid functions. Lower left, a schematic diagram of SScomponent organization: Grids represent spaces and can contain objects represent-ing the functions associated with a portion of SINUSOID space. Objects representingDRUG and SUCROSE enter and exit a SS via the core and grid A. From grid A, aCOMPOUND can access the other spaces. Grid locations have properties that governtheir interaction with mobile COMPOUNDS. The potential for heterogeneous propertieswithin different grids is illustrated by different shadings of grid locations. Objectsfunctioning as containers (for other objects) are used to represent cells, and can beassigned to any grid location. The core represents blood flow, grid A represents thesinusoid rim; grid B represents endothelial cells and fenestra, and grid C representsall other spaces, including the space of Disse and hepatocytes. Lower right, aHEPATOCYTE container: objects representing all needed intracellular components canbe placed within. All enzymes that metabolize drug are represented by ENZYME
objects (e.g., CYP); cell components that simply bind, sequester, and release drugsare represented by BINDERS. Additional binders representing transporters and othercapabilities can be easily added as needed. Cell containers can distinguish betweenDRUG and SUCROSE; they do not allow SUCROSE to enter. Bile was not needed for thesesimulations, but it can be represented easily as an extension, as described inSheikh-Bahaei and Hunt (2006).
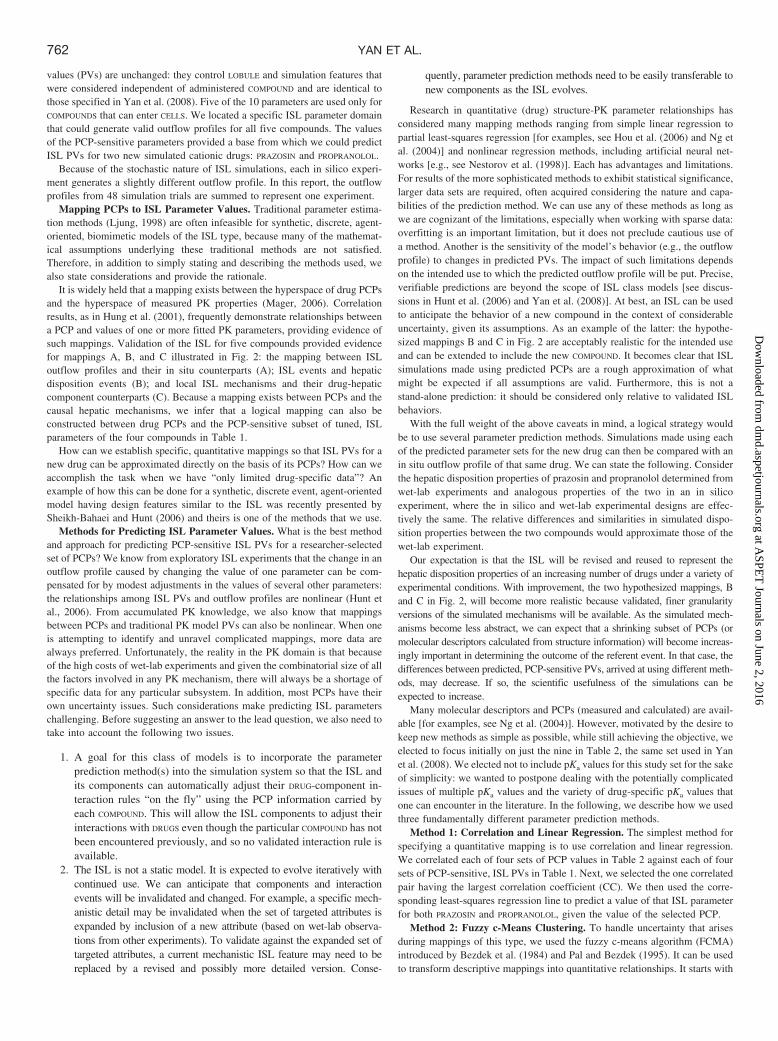
FIG. 2. Illustration of relationships between ISL mechanisms and its components,along with relationships between the ISL and referent perfused liver counterparts.To the extent that mappings A, B, and C are realistic, the relationship between adrug’s PCPs and specific hepatic disposition events will have an ISL counterpart.Discovering plausible methods to make a quantitative mapping between a drug’sPCP and PCP-sensitive ISL parameter values will allow prediction of DRUG-specific,PCP-sensitive ISL parameter values, given only a new drug’s PCPs. ISL simulationsusing those predicted parameter values stand as a prediction of the expecteddisposition behavior of that new drug.
760 YAN ET AL.
at ASPE
T Journals on June 2, 2016
dmd.aspetjournals.org
Dow
nloaded from
Model Structure and Design. ISL structure is illustrated in Fig. 1. Briefsummaries of its novel structure and design follow for convenience. ConsultHunt et al. (2006) and Yan et al. (2008) for additional details. An ISL mimicsessential features of the in situ perfused rat liver systems used in Hung et al.(2001) to study the hepatic disposition of the cationic drugs. We assumed thatrat hepatic secondary unit function is similar throughout a normal liver andthat, on average, the function of different lobules would be indistinguishable.
We therefore represented the entire liver as a collection of lobules. Bloodflow is represented as entering lobules via portal vein tracts and vascular septaand draining into branches of a common central vein (CV). The ISL representseach lobule as a network of cell-lined sinusoids connected by solute flows. Thenetwork is a directed graph; each node (or vertex) represents a cell-linedsinusoid and a link (or edge) between two nodes represents directional flow.For each LOBULE simulation, the graph structure is determined stochasticallywithin parameter-specified constraints. Objects representing sinusoidal spacesand functions, along with related spatial features, are called “sinusoidal seg-ments” (SSs). One SS is placed at each graph node. The parameters that controlLOBULE form and function for the experiments in this report are listed in Yanet al. (2008) along with all other ISL features. For convenience, they are alsolisted in Supplemental Table S1. Only 10 parameters were modified during thecourse of this study. Except as noted below, all other parameter values were thesame as those specified in Supplemental Table S1. The meaning of eachparameter is in its name. For example, parameter C2BJumpProb is the prob-ability that a COMPOUND, when given the option, will move from Grid C to GridB; parameter BindersPerCellMax specifies the maximum number of bindersthat can be contained in any one CELL.
A SS is a tube-like structure with a blood “core” surrounded by threeidentical size spaces in the form of two-dimensional grids. Grid A representsthe sinusoid rim. Grid B, which represents endothelial cells and fenestra, iswrapped around Grid A. Grid C, which represents all other spaces, includingthe space of Disse and hepatocytes, is wrapped around Grid B. Differentsinusoids can experience different flows and have different surface-to-volumeratios. Such heterogeneity is represented by specifying two SS classes: S1 andS2. Compared with a S2, a S1 has a shorter internal path length and a smallersurface-to-volume ratio.
We represented the lobule interior as being subdivided into three concentriczones to distinguish the quantitative difference in intralobular structural char-acteristics and, when needed, enzymatic and transporter gradients. The numberof directed graph nodes per zone is always in the order of zone 1 � zone 2 �zone 3. Each LOBULE zone contains at least one node. Because interconnectionsbetween sinusoids are frequent in the periportal region and are rare near theCV, there are more interconnections between zone 1 nodes than between zone2 nodes. There are no interconnections between zone 3 nodes. All of thesefeatures are controlled by parameters (Supplemental Table S1), many of whichare stochastic to simulate uncertainty and biological variability.
Simulation of Drug Disposition. ISL experiments follow the same protocolused for in situ perfused rat liver experiments. Specifically, in Hung et al.(2001), a bolus containing similar amounts of the extracellular space markersucrose and a cationic compound was injected into the portal vein through acatheter (because of this, drug does not enter the liver as a bolus or ashort-duration square wave). Consequently, the ISL dosage function is amodified gamma function [given in Supplemental Table S1; see Hunt et al.
(2006) for details] rather than an impulse to simulate effects of catheters andlarge vessels. Perfusate was collected using a fraction collector. The fraction ofthe administered dose contained per collection fraction was measured. Hepaticcompounds of interest in the ISL are represented as COMPOUNDS (also calledDRUGS): they are objects that move through the LOBULE. Each COMPOUND
represents a large number of drug molecules and can interact with eachencountered SS feature. A COMPOUND’S behavior is determined by the PCPs ofits referent, along with the consequences of its interaction with the LOBULE andSS features encountered during its unique trek from portal vein tracts tothe CV.
After COMPOUNDS enter the LOBULE, they can enter a SS in zone 1 at eitherthe core or grid A. Thereafter, until each is collected at the CV, they haveseveral stochastic options. The parameter CoreFlowRate biases COMPOUND
movement in the core in the CV direction, simulating blood flow. The param-eter SinusoidTurbo biases COMPOUND movement in the three spaces in the CVdirection, but much less so than CoreFlowRate; it simulates turbulent flow. Inthe core or grid A, a COMPOUND can move within that space, jump from onespace to another, or exit the SS. When a COMPOUND jumps to grid B, it canmove within the space, jump back to grid A, or jump on to grid C. AllCOMPOUNDS can move within the extracellular portions of grids B and C. Whena COMPOUND encounters a CELL in grid B or C, it can move into it if allowedto do so by the CELL (it is allowed when the parameter isMembraneCrossing istrue). When a CELL sees SUCROSE, it also sees that its value of isMembrane-Crossing is false; consequently, it will not allow SUCROSE to enter. All CELLS
in grid C represent HEPATOCYTES. After a COMPOUND exits a SS in zone 3, itenters the CV. Its arrival is recorded, simulating being collected by a fractioncollector. An animated visualization of these events during a simulation, fromstart to finish, at both individual ISL and SS levels, for SUCROSE and ANTY-PYRINE administered together, is available through Supplemental Data of Yanet al. (2008).
The only subcellular functions that were needed to simulate behaviors of thesix drugs under study were binding and metabolism. As done in Liu and Hunt(2005, 2006) and Sheikh-Bahaei et al. (2006), transporters can be added whenneeded. At the start of each simulation, objects functioning as containers andrepresenting CELLS are placed randomly at some fraction of the availablelocations in grids B and C. All cellular components that bind or metabolizedrugs, such as transporter, enzymes and other cellular materials, are conflatedand represented by simple functional objects called BINDERS. Each CELL con-tains a randomly specified (within parameter-controlled limits) number ofBINDERS in a well-stirred space. A BINDER within a grid B CELL can only bindand later release a DRUG. A BINDER within a grid C HEPATOCYTE, referred to asan ENZYME, can bind DRUG and either release or METABOLIZE it. In the later case,the DRUG vanishes; for this report, a METABOLITE replacement is not used.
Because there are 38 ISL parameters (Supplemental Table S1) that specif-ically influence disposition events, a major simulation task in Yan et al. (2008)was to locate a region of ISL parameter space capable of providing parametervectors that generate biologically realistic ISL outflow profiles for SUCROSE
and each of the four DRUGS. To accomplish that, the LOBULE graph and SSstructure was first tuned for SUCROSE; we held those values constant and thentuned the 10 PCP-sensitive parameters until we matched outflow profiles foreach of the four cationic drugs. For this study, the parameters in Table 1 werespecified as being sensitive to differences in PCPs. All 28 other ISL parameter
TABLE 1
Tuned PCP-sensitive ISL parameter values for four cationic drugs
ISL Attribute or Event ISL Parameters Atenolol Antipyrine Labetalol Diltiazem
A. Effective DRUG size ISL2WetLabScalinga 7 7 6 1B. Movement between spaces A2BJumpProb 0.1 0.1 0.35 0.9
B2AJumpProb 0.6 0.6 0.2 0.2b
B2CJumpProb 0.3 0.35 0.5 0.5C2BJumpProb 0.6 0.65 0.5 0.2
C. Binding to LOBULAR components BindersPerCellMin 5 5 5 10BindersPerCellMax 10 10 10 20SoluteBindingProb 0.35 0.5 0.6 0.35SoluteBindingCycles 25 25 25 20
D. METABOLISM MetabolizeProb 0.35 0.4 0.3 0.02
a ISL2WetLabScaling � 7 for SUCROSE when administered alone or in combination with any drug.b B2AjumpProb � 0.35 for SUCROSE when coadministered with DILTIAZEM (compensates for different ISL2WetLabScaling values).
761PREDICTIONS OF HEPATIC DISPOSITION PROPERTIES
at ASPE
T Journals on June 2, 2016
dmd.aspetjournals.org
Dow
nloaded from
values (PVs) are unchanged: they control LOBULE and simulation features thatwere considered independent of administered COMPOUND and are identical tothose specified in Yan et al. (2008). Five of the 10 parameters are used only forCOMPOUNDS that can enter CELLS. We located a specific ISL parameter domainthat could generate valid outflow profiles for all five compounds. The valuesof the PCP-sensitive parameters provided a base from which we could predictISL PVs for two new simulated cationic drugs: PRAZOSIN and PROPRANOLOL.
Because of the stochastic nature of ISL simulations, each in silico experi-ment generates a slightly different outflow profile. In this report, the outflowprofiles from 48 simulation trials are summed to represent one experiment.
Mapping PCPs to ISL Parameter Values. Traditional parameter estima-tion methods (Ljung, 1998) are often infeasible for synthetic, discrete, agent-oriented, biomimetic models of the ISL type, because many of the mathemat-ical assumptions underlying these traditional methods are not satisfied.Therefore, in addition to simply stating and describing the methods used, wealso state considerations and provide the rationale.
It is widely held that a mapping exists between the hyperspace of drug PCPsand the hyperspace of measured PK properties (Mager, 2006). Correlationresults, as in Hung et al. (2001), frequently demonstrate relationships betweena PCP and values of one or more fitted PK parameters, providing evidence ofsuch mappings. Validation of the ISL for five compounds provided evidencefor mappings A, B, and C illustrated in Fig. 2: the mapping between ISLoutflow profiles and their in situ counterparts (A); ISL events and hepaticdisposition events (B); and local ISL mechanisms and their drug-hepaticcomponent counterparts (C). Because a mapping exists between PCPs and thecausal hepatic mechanisms, we infer that a logical mapping can also beconstructed between drug PCPs and the PCP-sensitive subset of tuned, ISLparameters of the four compounds in Table 1.
How can we establish specific, quantitative mappings so that ISL PVs for anew drug can be approximated directly on the basis of its PCPs? How can weaccomplish the task when we have “only limited drug-specific data”? Anexample of how this can be done for a synthetic, discrete event, agent-orientedmodel having design features similar to the ISL was recently presented bySheikh-Bahaei and Hunt (2006) and theirs is one of the methods that we use.
Methods for Predicting ISL Parameter Values. What is the best methodand approach for predicting PCP-sensitive ISL PVs for a researcher-selectedset of PCPs? We know from exploratory ISL experiments that the change in anoutflow profile caused by changing the value of one parameter can be com-pensated for by modest adjustments in the values of several other parameters:the relationships among ISL PVs and outflow profiles are nonlinear (Hunt etal., 2006). From accumulated PK knowledge, we also know that mappingsbetween PCPs and traditional PK model PVs can also be nonlinear. When oneis attempting to identify and unravel complicated mappings, more data arealways preferred. Unfortunately, the reality in the PK domain is that becauseof the high costs of wet-lab experiments and given the combinatorial size of allthe factors involved in any PK mechanism, there will always be a shortage ofspecific data for any particular subsystem. In addition, most PCPs have theirown uncertainty issues. Such considerations make predicting ISL parameterschallenging. Before suggesting an answer to the lead question, we also need totake into account the following two issues.
1. A goal for this class of models is to incorporate the parameterprediction method(s) into the simulation system so that the ISL andits components can automatically adjust their DRUG-component in-teraction rules “on the fly” using the PCP information carried byeach COMPOUND. This will allow the ISL components to adjust theirinteractions with DRUGS even though the particular COMPOUND has notbeen encountered previously, and so no validated interaction rule isavailable.
2. The ISL is not a static model. It is expected to evolve iteratively withcontinued use. We can anticipate that components and interactionevents will be invalidated and changed. For example, a specific mech-anistic detail may be invalidated when the set of targeted attributes isexpanded by inclusion of a new attribute (based on wet-lab observa-tions from other experiments). To validate against the expanded set oftargeted attributes, a current mechanistic ISL feature may need to bereplaced by a revised and possibly more detailed version. Conse-
quently, parameter prediction methods need to be easily transferable tonew components as the ISL evolves.
Research in quantitative (drug) structure-PK parameter relationships hasconsidered many mapping methods ranging from simple linear regression topartial least-squares regression [for examples, see Hou et al. (2006) and Ng etal. (2004)] and nonlinear regression methods, including artificial neural net-works [e.g., see Nestorov et al. (1998)]. Each has advantages and limitations.For results of the more sophisticated methods to exhibit statistical significance,larger data sets are required, often acquired considering the nature and capa-bilities of the prediction method. We can use any of these methods as long aswe are cognizant of the limitations, especially when working with sparse data:overfitting is an important limitation, but it does not preclude cautious use ofa method. Another is the sensitivity of the model’s behavior (e.g., the outflowprofile) to changes in predicted PVs. The impact of such limitations dependson the intended use to which the predicted outflow profile will be put. Precise,verifiable predictions are beyond the scope of ISL class models [see discus-sions in Hunt et al. (2006) and Yan et al. (2008)]. At best, an ISL can be usedto anticipate the behavior of a new compound in the context of considerableuncertainty, given its assumptions. As an example of the latter: the hypothe-sized mappings B and C in Fig. 2 are acceptably realistic for the intended useand can be extended to include the new COMPOUND. It becomes clear that ISLsimulations made using predicted PCPs are a rough approximation of whatmight be expected if all assumptions are valid. Furthermore, this is not astand-alone prediction: it should be considered only relative to validated ISLbehaviors.
With the full weight of the above caveats in mind, a logical strategy wouldbe to use several parameter prediction methods. Simulations made using eachof the predicted parameter sets for the new drug can then be compared with anin situ outflow profile of that same drug. We can state the following. Considerthe hepatic disposition properties of prazosin and propranolol determined fromwet-lab experiments and analogous properties of the two in an in silicoexperiment, where the in silico and wet-lab experimental designs are effec-tively the same. The relative differences and similarities in simulated dispo-sition properties between the two compounds would approximate those of thewet-lab experiment.
Our expectation is that the ISL will be revised and reused to represent thehepatic disposition properties of an increasing number of drugs under a variety ofexperimental conditions. With improvement, the two hypothesized mappings, Band C in Fig. 2, will become more realistic because validated, finer granularityversions of the simulated mechanisms will be available. As the simulated mech-anisms become less abstract, we can expect that a shrinking subset of PCPs (ormolecular descriptors calculated from structure information) will become increas-ingly important in determining the outcome of the referent event. In that case, thedifferences between predicted, PCP-sensitive PVs, arrived at using different meth-ods, may decrease. If so, the scientific usefulness of the simulations can beexpected to increase.
Many molecular descriptors and PCPs (measured and calculated) are avail-able [for examples, see Ng et al. (2004)]. However, motivated by the desire tokeep new methods as simple as possible, while still achieving the objective, weelected to focus initially on just the nine in Table 2, the same set used in Yanet al. (2008). We elected not to include pKa values for this study set for the sakeof simplicity: we wanted to postpone dealing with the potentially complicatedissues of multiple pKa values and the variety of drug-specific pKa values thatone can encounter in the literature. In the following, we describe how we usedthree fundamentally different parameter prediction methods.
Method 1: Correlation and Linear Regression. The simplest method forspecifying a quantitative mapping is to use correlation and linear regression.We correlated each of four sets of PCP values in Table 2 against each of foursets of PCP-sensitive, ISL PVs in Table 1. Next, we selected the one correlatedpair having the largest correlation coefficient (CC). We then used the corre-sponding least-squares regression line to predict a value of that ISL parameterfor both PRAZOSIN and PROPRANOLOL, given the value of the selected PCP.
Method 2: Fuzzy c-Means Clustering. To handle uncertainty that arisesduring mappings of this type, we used the fuzzy c-means algorithm (FCMA)introduced by Bezdek et al. (1984) and Pal and Bezdek (1995). It can be usedto transform descriptive mappings into quantitative relationships. It starts with
762 YAN ET AL.
at ASPE
T Journals on June 2, 2016
dmd.aspetjournals.org
Dow
nloaded from

influence relationships between subsets of PCPs and subsets of PCP-sensitive,ISL PVs from validated ISLs.
Sheihk-Bahaei and Hunt (2006) used the FCMA and only limited drug-specific data to predict parameter values for their analog of sandwich-culturedhepatocytes. They made the estimation method available to the model to enableit to reasonably anticipate (predict) the biliary transport and excretion proper-ties of a new compound, enkephalin, based on the acceptable, already tunedPVs of salicylate, taurocholate, and methotrexate. By assuming that the sim-ilarity among PCPs extends to model PVs, acceptable values of the latter forenkephalin (with PCPs that are very different from the three other drugs) werepredicted that had good similarity to measured values. They established asingle mapping between 13 selected PCPs and 14 PCP-sensitive model PVs(the ISL has just 10). However, correlations between specific PCPs andspecific PK parameter values (Mager, 2006) suggest that a small set of PCPswill have a dominant influence on specific drug-component interactions duringdisposition, an observation confirmed recently by Ng et al. (2004). It thusseemed reasonable to expect that different subsets of PCPs will map to thehepatic counterpart of different ISL events, such as moving between grids Band C and movement into CELLS. Furthermore, the artificial neural networkmethod discussed below provides a mapping between all 9 PCPs and all 10PCP-sensitive, ISL PVs. Therefore, for this second prediction method, weelected to seek usable relationships between subsets of PCPs and the ISLparameters controlling specific ISL events.
Consider the six compounds in Table 2. Each drug’s nine PCP values, com-bined into a vector, can be viewed as a single point in a nine-dimensionalhyperspace. The six vectors or points (also referred to by the name of thecompound that the PCPs describe) can be classified into one to six groups basedin part on their closeness in PCP hyperspace. Any compound can be a member ofmore than one group: the groups or clusters overlap. The researcher can specify thenumber of groups or use the FCMA to search for the optimal number. The FCMAassumes that each point has some degree of membership in each group. It thenassigns a membership degree value to every vector in each cluster. The FCMAinputs are 1) the data set of n cases to be clustered (for our use, each case is a singledrug, a vector of nine PCP values), 2) a parameter m known as the fuzzy exponent,and 3) the number of user specified clusters c. The first two of these inputs arediscussed further in the following sections. As recommended by Pal and Bezdek(1995), we always set m � 2. The output of a FCMA, illustrated in Fig. 3, is ac-by-n matrix, containing the membership values of the fuzzy clusters.
ISL Parameter Categories. There are three categories of ISL parameters.Those that control lobule graph and sinusoid structures are the same for alldrugs. Those that control the PCP-sensitive parameters comprise the thirdcategory. We need only predict the values of PCP-sensitive parameters. Wedivided the 10 PCP-sensitive ISL parameters in Table 1 into four subgroups:those that reflect the influence of a COMPOUND’S 1) effective size, 2) movementbetween spaces, 3) binding to LOBULAR components, and 4) METABOLISM.
We took the nine PCPs in Table 2 and divided them into five groups, asfollows, according to their perceived similarity in influence. Group I includesmolecular weight and volume. Group II is the partition coefficient (logPapp).Group III is the unbound fraction (fuB). Group IV is topological parameters:number of rotatable bonds and topological polar surface area. These two PCPsare known to be good descriptors for characterizing drug absorption, including
intestinal absorption, bioavailability, Caco-2 permeability, and blood-brainbarrier penetration (Ekins et al., 2000; van de Waterbeemd and Gifford, 2003).Group V is hydrogen bond-related parameters: hydrogen bond donor count,hydrogen bond acceptor count, and tautomer count. These three PCPs areknown to be important to a compound’s chemical interactions with othersolutes and migration capabilities in aqueous materials (Ekins et al., 2000;Hansch et al., 2004). Because the relationships between PCPs and ISL param-eters are believed to be nonlinear, we conservatively assumed that more thanone set of PCPs could influence more than one set of ISL parameters. We thenmade the following mapping assumptions (Fig. 4) and took them as specifi-cations for moving forward:
1. logPapp is the primary PCP reflecting a drug’s partitioning abilityand so is expected to map to a compound’s ability to movebetween spaces. We also assumed that parameters in PCP sub-group IV, which reflect drug flexibility and topology, also con-tribute to a compound’s ability to move between spaces: in theISL, that ability is controlled by ISL parameter subgroup B. Wespecify that a quantitative mapping can be established betweenPCP subgroups II and IV and ISL subgroup B. The mapping isillustrated in Fig. 4.
2. In addition to fuB, parameters in PCP subgroup V are expected tocontribute to drug binding to (or sequestration in) various cellularcomponents. We therefore specify that a quantitative mapping canbe established between PCP subgroups III and V and ISL subgroupC (Fig. 4).
3. DRUG METABOLISM (ISL parameter group D) simulates a complicatedprocess and so it may map to a broader range of PCPs. We includedthe following: logPapp (subgroup II) along with the PCPs in sub-groups IV and V.
4. Both molecular weight and volume are known to influence a com-pound’s effective size in biological systems (Hansch et al., 2004).We specify that a quantitative mapping can be established betweenthem and ISL2WetLabScaling.
Fuzzy Cluster Prediction Strategy. In this section, we explain how weused FCMA results to construct quantitative mappings between the PCP andISL parameter spaces and how we used those mappings to predict the PCP-sensitive, ISL PVs for PRAZOSIN and PROPRANOLOL. For clarity, we firstdescribe the prediction method using an example.
The properties in PCP subgroups II and IV are posited to map to the
TABLE 2
Physicochemical properties of sucrose and six cationic drugs
Category Parameters Sucrose Atenolol Antipyrine Prazosin Labetalol Propranolol Diltiazem
I. Size Mol. wt. 342.3 266.3 188.2 383.4 328.4 259.4 414.5Volume 283.6 260.9 178.3 336.0 314.8 257.8 377.8
II. Partitioning logPapp 0.14 0.33 1.88 2.69 3.10 3.53III. Binding fuB 0.74 0.60 0.54 0.52 0.45 0.28IV. Topology related RB count 5 8 1 4 8 6 7
TPSA 189.5 84.6 26.9 107.0 95.6 41.5 59.1V. Hydrogen bound related HBD count 8 3 0 1 4 2 0
HBA count 11 4 2 8 4 3 5Tautomer count 1 2 0 3 7 0 0
logPapp, log of the octanol-water partition coefficient at pH 7.4, 37°C; fuB, unbound fraction of each drugs in the liver perfusion medium as determined in Hung et al. (2001); RB, number ofrotatable bonds, a measure of molecular flexibility; amine C–N bonds are not considered because of their high rotational energy barrier; TPSA, topological polar surface area is a sum of fragmentcontributions; O- and N-centered polar fragments are considered (Ertl et al., 2000); HBD, hydrogen bond donor; HBA, hydrogen bond acceptor; tautomers are organic compounds that areinterconvertible by tautomerization.
FIG. 3. Inputs and output of the FCMA. The FCMA locates c clusters within the setof n points (corresponding to n drugs) in PCP hyperspace and assigns a membershipdegree, �ij, for each point i to each cluster j.
763PREDICTIONS OF HEPATIC DISPOSITION PROPERTIES
at ASPE
T Journals on June 2, 2016
dmd.aspetjournals.org
Dow
nloaded from

PCP-sensitive subgroup B parameters (Fig. 4). We illustrate a method tocalculate a value of B2CJumpProb for PRAZOSIN. The subgroup II and IVvalues are listed in Table 3. We apply the FCMA to these five three-valueparameter vectors, specifying three fuzzy groups: we get the degree of mem-bership in each cluster listed in Table 3. We see that prazosin is primarily amember of a group that contains at least one of the four already-studied drugs.In this case, it is within a group in which labetalol and diltiazem also primarymembers. Atenolol and antipyrine are primarily in different groups. Weassume that the position of prazosin in ISL parameter space relative to theother four drugs is approximately the same as its position in PCP space relativeto the other four drugs. As a first approximation, we specify that it is the case.Given that assumption, we can calculate a value of B2CJumpProb usingPRAZOSIN’S PCP degree membership values in each of the three clusters alongwith the average values of B2CJumpProb for all the members in each of thethree clusters. LABETALOL and DILTIAZEM are members of cluster 1. The averageB2CJumpProb value is 0.5; the value for the only primary member of cluster2 (antipyrine) is 0.35; the value for the only primary member of cluster 3 is 0.3.Given those data, for PRAZOSIN we have B2CJumpProb � (0.506)(0.5) �(0.179)(0.35) � (0.316)(0.3) � 0.41. Additional, detailed calculations areprovided in the Supplemental Data.
The same approach can be used to calculate the remaining three members ofISL subgroup B. The method can also be extended to calculate expected valuesfor the other ISL parameters. The generalized statement of the method follows.
Parameter Estimation via Analysis of Fuzzy Clusters. In this section, wepresent an algorithm that uses fuzzy clustering to estimate simulation param-eters for a new situation given the tuned parameters of several, previouslyvalidated situations. For additional detail, see Sheikh-Bahaei and Hunt (2007).In this work, the new situation is the ISL encountering two new types ofobjects, one representing prazosin and the other representing propranolol. Thealgorithm starts with the highest possible number of clusters and iterativelydecreases the number of clusters until the new compound is placed in a clusterwith at least one of the already-tuned compounds. The compounds in thatcluster represent those “most similar” to the new compound.
In general, for a set S, containing n data points S � {c1, c2, . . . cn} (one datapoint corresponds to one situation—one drug, in our case, with its associatedPCP values), the following algorithm estimates the simulation parameters of anew situation, cn�1:
Step 1. Let q � n, and Snew � {c1, c2 . . . cn, cn�1}.Step 2. If q � 1, go to step 4. Else, classify Snew into q clusters using the
FCMA.Step 3. If cn�1 is not in the same group with at least another member, then
decrease q to q � 1. Repeat steps 2 and 3.
Else, let the G value be the number of group-mates of cn�1.Step 4. Call the q groups G1, G2, . . . Gq, where cn�1 � G1. Let �k be the
membership degree of cn�1 in Gk. Estimate the needed ISL simulation param-eters of cn�1 as
P� X � �k�1
q
�k � P� Gk (1)
where PGkis the weighted average parameter vector of all the members of
group k:
P� Gk � ��j�1
m
�j � P� j����j (2)
The accuracy or usefulness of the resulting estimates depends, of course, onhow many data points similar to cn�1 exist in the data set, i.e., the higher theG value, the better the accuracy. Because we are starting with just fourcompounds, four data points, our expectations must necessarily be modest.
Method 3: Artificial Neural Network. To establish a traditional nonlinearmapping, we used a simple feed-forward ANN having a single hidden node(Hudson and Cohen, 1999). The neuron transfer function is y(x) � b/(1 �e�ax); we chose a � b � 1. We recognized that the small training set wouldlead to an overfitted prediction model. Nevertheless, we used it because themethod is known to be good at finding patterns and establishing quantitativerelationships between data sets based on those patterns. We also used it toprovide an indication of what might be expected from an ANN-based predic-tive mapping, recognizing that such mappings have often done better than oneof the many available multivariate linear mapping options, when the relation-ships between the data sets are known to be complicated, as is the case here.We used a backpropagation training algorithm that utilized normalized valuesof the 4 sets of 9 PCPs in Table 2 as inputs; values of the 4 sets of 10 ISL PVsin Table 1 were obtained as outputs. We then used the trained ANN toseparately predict a full set of 10 PCP-sensitive, ISL PVs for PRAZOSIN andPROPRANOLOL, given their full set of 9 PCPs as inputs.
Values were normalized as follows: divide each point by its vector Norm.For example, if drug (point) X has PCPs A, B, and C, then it was divided by itslength N, i.e., N2 � A2 � B2 � C2 and Xnormalized � (A/N, B/N, C/N). The outputvalues were normalized in the same way. Consequently, the predictions toowere normalized; to be used, the predictions had to be scaled: multiplied by thenorm of the training vector.
Similarity Measure. The similarity measure (SM) used to compare in silicoprofiles with the lag-time adjusted, referent outflow profiles is detailed anddiscussed in Hunt et al. (2006) and Yan et al. (2008). Briefly, we assumed thatthe coefficients of variation of identically timed observations between t � 1and t � 100 s from repeat experiments (referent) are constant. For each referentoutflow profile measure P, we create two curves, Pl � P(1 � d) and Pu � P(1
FIG. 4. Mappings between PCP subgroups and ISL parameter subgroups. The fourISL subgroups are specified in Table 1; the five PCP subgroups are specified inTable 2. Each line represents a hypothesized strong influence, e.g., the partitioning-and topology-related PCPs are thought to have a strong influence on the wet-labcounterpart of the four PCP-sensitive ISL parameters values controlling movementbetween spaces within SSs. The identified PCP subgroups are the ones used by theFCMA to provide the membership degree values used in eq. 1 to predict ISL PVsfor PRAZOSIN and PROPRANOLOL in Table 5. The FCMA treats the identified PCPs ashaving equal influences. The influence of the other PCPs is neglected.
TABLE 3
Values used in the text example for predicting a value of B2CJumpProbfor PRAZOSIN
PCP subgroups II and IV: values comprising PCP subgroups II and IV. Cluster: the resultsof applying the FCMA to the five sets of three PCP values. ISL parameters: tunedB2CJumpProb values for the four drugs already studied along with the predicted value forprazosin.
Boldface: primary cluster membership.
Atenolol Antipyrine Labetalol Diltiazem Prazosin
PCP subgroups II and IVRB count 8 1 8 7 4TPSA 84.58 26.94 95.58 59.09 106.96logPapp 0.14 0.33 2.69 3.53 1.88
ClusterC 1 0.007 0.001 0.930 0.895 0.506C 2 0.006 0.998 0.020 0.045 0.179C 3 0.987 0.001 0.050 0.060 0.316
ISL parametersB2CJumpProb 0.3 0.35 0.5 0.5 (0.41)
RB, number of rotatable bonds; TPSA, topological polar surface area.
764 YAN ET AL.
at ASPE
T Journals on June 2, 2016
dmd.aspetjournals.org
Dow
nloaded from
� d). They form the lower and upper bounds of a band around P. The SMvalue is the fraction of evenly spaced, outflow profile measures falling withinthe band. Here, d is the S.D. of the relative differences between each of sixrepeated in situ experiments and the mean value for a given collection interval,pooled over all collection intervals. In Yan et al. (2008), in which the ISLoutflow profile was iteratively tuned to give a good match to the referentprofile, we used d � 1 (S.D.), and an ISL outflow profile was deemed similarto the referent if 80% or more of ISL outflow values were within the band (SM�0.8). Here, using predicted PVs without any postprediction refinement, wespeculated that having a predicted profile fall within a factor of 2 of thereferent profile could be considered a good result. Nevertheless, we calculatedSM values using two reference bands: d � 1 and 1.5, which corresponds tofactors of 0.45 and 0.675.
ISL Execution. Experiments were executed on an eight-node OSCARcluster (http://oscar.openclustergroup.org/) running RedHat’s Fedora 5. Thedistribution of the runs uses MPICH 1.2.7 (http://www-unix.mcs.anl.gov/mpi/mpich1/). The ISL was compiled using GCC 4.1.1 against the Swarm 2.2.3Objective-C libraries (http://swarm.org/wiki/Main_Page). The initial pseudo-random number seed was extracted from the machine’s clock. Each completedexperiment was archived and logged with the date and time using a Makefile
target. Examination and processing of data from simulations used a combina-tion of Matlab (7.0.0) and R (2.4.0) (http://www.r-project.org/) scripts, andMicrosoft Excel. As done previously (Hunt et al., 2006; Yan et al., 2008), wesmoothed results from each simulation experiment using the Smodu-lus_smoothing function from the Rwave (version 1.22) package of R. For theresults presented, a wavelet window of three observations at 0.5-s intervals wasused.
Results
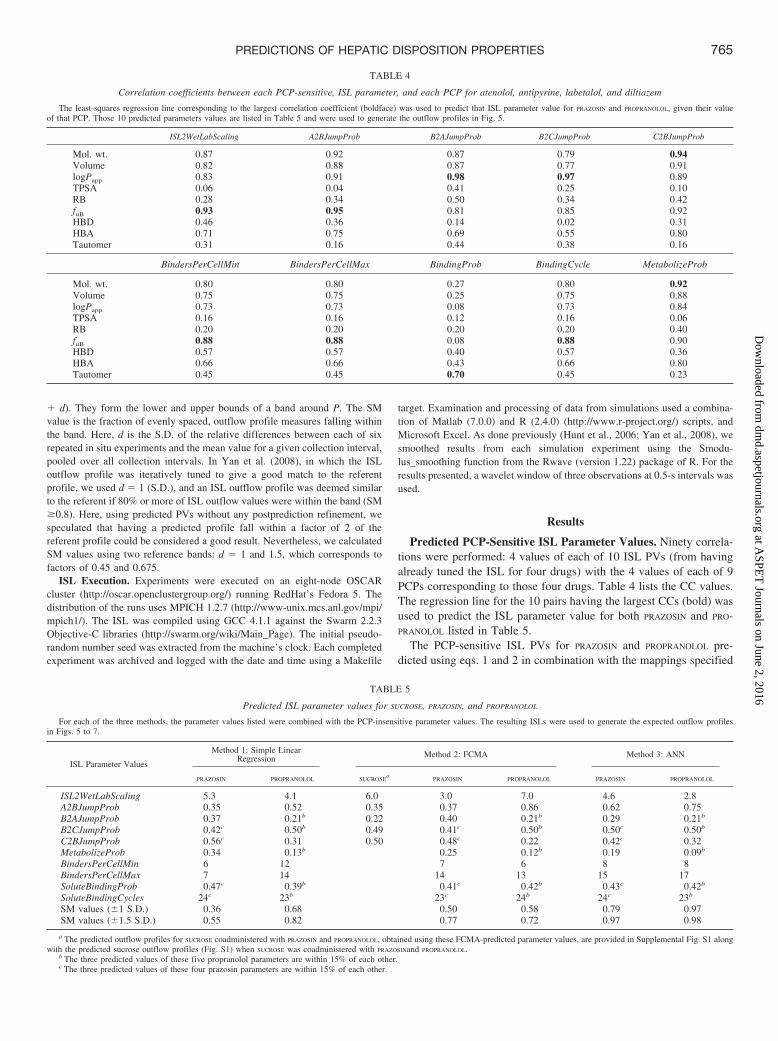
Predicted PCP-Sensitive ISL Parameter Values. Ninety correla-tions were performed: 4 values of each of 10 ISL PVs (from havingalready tuned the ISL for four drugs) with the 4 values of each of 9PCPs corresponding to those four drugs. Table 4 lists the CC values.The regression line for the 10 pairs having the largest CCs (bold) wasused to predict the ISL parameter value for both PRAZOSIN and PRO-PRANOLOL listed in Table 5.
The PCP-sensitive ISL PVs for PRAZOSIN and PROPRANOLOL pre-dicted using eqs. 1 and 2 in combination with the mappings specified
TABLE 4
Correlation coefficients between each PCP-sensitive, ISL parameter, and each PCP for atenolol, antipyrine, labetalol, and diltiazem
The least-squares regression line corresponding to the largest correlation coefficient (boldface) was used to predict that ISL parameter value for PRAZOSIN and PROPRANOLOL, given their valueof that PCP. Those 10 predicted parameters values are listed in Table 5 and were used to generate the outflow profiles in Fig. 5.
ISL2WetLabScaling A2BJumpProb B2AJumpProb B2CJumpProb C2BJumpProb
Mol. wt. 0.87 0.92 0.87 0.79 0.94Volume 0.82 0.88 0.87 0.77 0.91logPapp 0.83 0.91 0.98 0.97 0.89TPSA 0.06 0.04 0.41 0.25 0.10RB 0.28 0.34 0.50 0.34 0.42fuB 0.93 0.95 0.81 0.85 0.92HBD 0.46 0.36 0.14 0.02 0.31HBA 0.71 0.75 0.69 0.55 0.80Tautomer 0.31 0.16 0.44 0.38 0.16
BindersPerCellMin BindersPerCellMax BindingProb BindingCycle MetabolizeProb
Mol. wt. 0.80 0.80 0.27 0.80 0.92Volume 0.75 0.75 0.25 0.75 0.88logPapp 0.73 0.73 0.08 0.73 0.84TPSA 0.16 0.16 0.12 0.16 0.06RB 0.20 0.20 0.20 0.20 0.40fuB 0.88 0.88 0.08 0.88 0.90HBD 0.57 0.57 0.40 0.57 0.36HBA 0.66 0.66 0.43 0.66 0.80Tautomer 0.45 0.45 0.70 0.45 0.23
TABLE 5
Predicted ISL parameter values for SUCROSE, PRAZOSIN, and PROPRANOLOL
For each of the three methods, the parameter values listed were combined with the PCP-insensitive parameter values. The resulting ISLs were used to generate the expected outflow profilesin Figs. 5 to 7.
ISL Parameter Values
Method 1: Simple LinearRegression Method 2: FCMA Method 3: ANN
PRAZOSIN PROPRANOLOL SUCROSEa
PRAZOSIN PROPRANOLOL PRAZOSIN PROPRANOLOL
ISL2WetLabScaling 5.3 4.1 6.0 3.0 7.0 4.6 2.8A2BJumpProb 0.35 0.52 0.35 0.37 0.86 0.62 0.75B2AJumpProb 0.37 0.21b 0.22 0.40 0.21b 0.29 0.21b
B2CJumpProb 0.42c 0.50b 0.49 0.41c 0.50b 0.50c 0.50b
C2BJumpProb 0.56c 0.31 0.50 0.48c 0.22 0.42c 0.32MetabolizeProb 0.34 0.13b 0.25 0.12b 0.19 0.09b
BindersPerCellMin 6 12 7 6 8 8BindersPerCellMax 7 14 14 13 15 17SoluteBindingProb 0.47c 0.39b 0.41c 0.42b 0.43c 0.42b
SoluteBindingCycles 24c 23b 23c 24b 24c 23b
SM values (�1 S.D.) 0.36 0.68 0.50 0.58 0.79 0.97SM values (�1.5 S.D.) 0.55 0.82 0.77 0.72 0.97 0.98
a The predicted outflow profiles for SUCROSE coadministered with PRAZOSIN and PROPRANOLOL, obtained using these FCMA-predicted parameter values, are provided in Supplemental Fig. S1 alongwith the predicted sucrose outflow profiles (Fig. S1) when SUCROSE was coadministered with PRAZOSINand PROPRANOLOL.
b The three predicted values of these five propranolol parameters are within 15% of each other.c The three predicted values of these four prazosin parameters are within 15% of each other.
765PREDICTIONS OF HEPATIC DISPOSITION PROPERTIES
at ASPE
T Journals on June 2, 2016
dmd.aspetjournals.org
Dow
nloaded from
in Fig. 4 are also listed in Table 5, along with the ISL PVs for the twodrugs predicted using the ANN. Because the referent outflow profilesfor prazosin and propranolol included coadministered sucrose, eqs. 1and 2 were also used to calculate new PCP-sensitive ISL PVs forSUCROSE. Those values are also listed in Table 5. Several examples ofusing the FCMA method to predict specific ISL parameter values areprovided in the Supplemental Data along with the predicted sucroseoutflow profiles (Supplemental Fig. S1) when SUCROSE was coadmin-istered with PRAZOSIN and PROPRANOLOL.
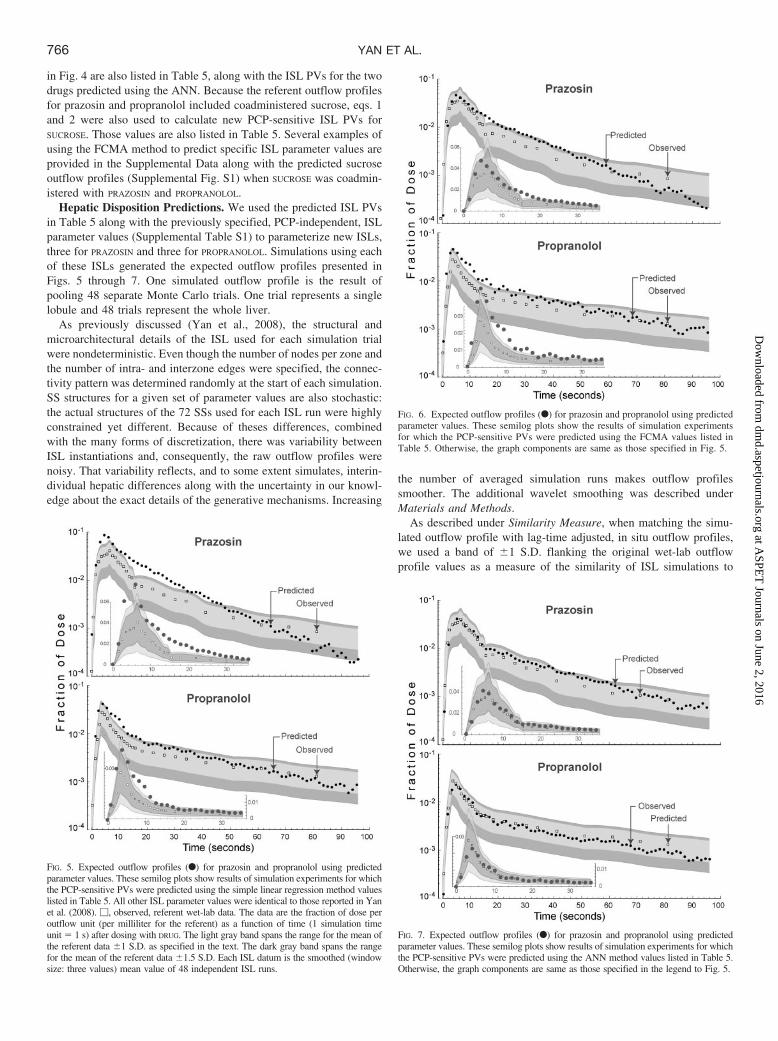
Hepatic Disposition Predictions. We used the predicted ISL PVsin Table 5 along with the previously specified, PCP-independent, ISLparameter values (Supplemental Table S1) to parameterize new ISLs,three for PRAZOSIN and three for PROPRANOLOL. Simulations using eachof these ISLs generated the expected outflow profiles presented inFigs. 5 through 7. One simulated outflow profile is the result ofpooling 48 separate Monte Carlo trials. One trial represents a singlelobule and 48 trials represent the whole liver.
As previously discussed (Yan et al., 2008), the structural andmicroarchitectural details of the ISL used for each simulation trialwere nondeterministic. Even though the number of nodes per zone andthe number of intra- and interzone edges were specified, the connec-tivity pattern was determined randomly at the start of each simulation.SS structures for a given set of parameter values are also stochastic:the actual structures of the 72 SSs used for each ISL run were highlyconstrained yet different. Because of theses differences, combinedwith the many forms of discretization, there was variability betweenISL instantiations and, consequently, the raw outflow profiles werenoisy. That variability reflects, and to some extent simulates, interin-dividual hepatic differences along with the uncertainty in our knowl-edge about the exact details of the generative mechanisms. Increasing
the number of averaged simulation runs makes outflow profilessmoother. The additional wavelet smoothing was described underMaterials and Methods.
As described under Similarity Measure, when matching the simu-lated outflow profile with lag-time adjusted, in situ outflow profiles,we used a band of �1 S.D. flanking the original wet-lab outflowprofile values as a measure of the similarity of ISL simulations to
FIG. 5. Expected outflow profiles (F) for prazosin and propranolol using predictedparameter values. These semilog plots show results of simulation experiments for whichthe PCP-sensitive PVs were predicted using the simple linear regression method valueslisted in Table 5. All other ISL parameter values were identical to those reported in Yanet al. (2008). �, observed, referent wet-lab data. The data are the fraction of dose peroutflow unit (per milliliter for the referent) as a function of time (1 simulation timeunit � 1 s) after dosing with DRUG. The light gray band spans the range for the mean ofthe referent data �1 S.D. as specified in the text. The dark gray band spans the rangefor the mean of the referent data �1.5 S.D. Each ISL datum is the smoothed (windowsize: three values) mean value of 48 independent ISL runs.
FIG. 6. Expected outflow profiles (F) for prazosin and propranolol using predictedparameter values. These semilog plots show the results of simulation experimentsfor which the PCP-sensitive PVs were predicted using the FCMA values listed inTable 5. Otherwise, the graph components are same as those specified in Fig. 5.
FIG. 7. Expected outflow profiles (F) for prazosin and propranolol using predictedparameter values. These semilog plots show results of simulation experiments for whichthe PCP-sensitive PVs were predicted using the ANN method values listed in Table 5.Otherwise, the graph components are same as those specified in the legend to Fig. 5.
766 YAN ET AL.
at ASPE
T Journals on June 2, 2016
dmd.aspetjournals.org
Dow
nloaded from
those wet-lab results. For the outflow profiles generated from thepredicted parameter values, two reference bands were used: �1 S.D.and �1.5 S.D., and SM values were calculated for each. For thesedata, a band of �1 S.D. corresponds to a constant 45% coefficient ofvariation, and a band of �1.5 S.D. corresponds to a constant 67.5%coefficient of variation. The �1 S.D. SM values, in the order PRAZOSIN
and PROPRANOLOL, shown in Table 5, were as follows: method 1(simple linear regression), 0.36 and 0.68; method 2 (the FCMA), 0.50and 0.58; and method 3 (ANN), 0.79 and 0.97. The corresponding�1.5 S.D SM values were as follows: method 1, 0.55 and 0.82;method 2, 0.77 and 0.72; and method 3, 0.97 and 0.98.
Drug-Specific Prediction Strategies. Although the predicted ISLparameter values from the FCMA method generated good predictedPRAZOSIN and PROPRANOLOL outflow profiles, they were the result ofapplying simultaneously a common PCP-to-ISL mapping strategy toboth drugs. We recognize that prazosin and propranolol have signif-icantly different PCPs. What if we had sought parameter predictionsfor each drug separately? Would individualized mappings yield im-proved outflow profile predictions? The mapping between each com-pound’s PCPs and the matched ISL parameter values are not expectedto be identical. We explored the consequences of individualizing themappings. Several dozen mappings were explored. Starting with thestrategy in Fig. 4, we made one mapping change, then predicted param-eter values, and simulated outflow profiles. We then repeated the processfor a second, third, etc., mapping change. For both drugs, we kept thenumber of PCP-ISL mappings constant at four, for four subgroups of ISLparameters, as in Fig. 4. We removed or added single PCP values orsingle PCP groups. Most of the mapping options resulted in expecteddrug outflow profiles having SM values for both PRAZOSIN and PROPRAN-OLOL that were smaller than those in Table 5 for the FCMA method. Inseveral cases, the SM values showed little change. Only a few showedimproved SM values, but they were modest. The individualized map-pings for two of the latter cases (Supplemental Fig. S2) along with thecorresponding simulated outflow profiles (Supplemental Fig. S3) areprovided in the Supplemental Data.
Discussion
Prediction of PK parameter values plays an increasingly importantrole in decision making concerning drug candidates in development.The methods and issues, which have been thoroughly reviewed, fallinto two categories: empirical, data-based approaches (Stouch et al.,2003; Beresford et al., 2004; Yamashita and Hashida, 2004; Li et al.,2007) and structure-based approaches (Ng et al., 2004; Li et al., 2007).Data-based approaches can be subdivided into linear and nonlinearmethods, and each approach may involve clustering. Examples of theformer include multiple linear regression, partial least-squares analy-sis, and linear discriminant analysis. Examples of the latter includeANNs, genetic algorithms, support vector machines, and k-nearestneighbor algorithms. Popular clustering techniques include partitionalalgorithms (including k-means clustering), nearest neighbor cluster-ing, ANNs, evolutionary approaches, search-based approaches (in-cluding simulated annealing), and fuzzy clustering. We used cluster-ing, specifically fuzzy clustering, as one of the three methods becauseit is difficult to classify PCPs and the drugs they characterize intocrisp, disjoint clusters. Conventional clustering produces partitions:each pattern fits in one and only one cluster. Fuzzy clustering assignseach pattern within each cluster a membership value. We speculatedthat this feature may make it an effective tool for clustering PCPs formapping to ISL PVs, especially when data are sparse.
The relative merits of linear and nonlinear methods when dealingwith traditional PK parameter estimation are now reasonably wellunderstood. However, the ISL is representative of a new class of
models. It contains more mechanistic detail than traditional PK mod-els, and only a subset of its parameters is PCP-sensitive. Conse-quently, we had no a priori basis for selecting one of the precedingmethods over another. We chose three quite different methods tobegin building insight into their relative merits for parameter estima-tion within the ISL context, given the multiple levels of uncertainty.
We started with a simple version of each method. We treated thepredictions arising from their use as semi-independent “votes” forhow to parameterize an ISL, given a set of PCPs of prazosin andpropranolol, along with ISL PVs that are independent of PCPs fromhaving validated ISLs for sucrose, altenolol, antipyrine, labetalol, anddiltiazem. Simulations arising from use of the three different sets ofpredicted ISL parameter values gave us different hepatic dispositionand outflow predictions. Because referent data were sparse, we werenot trying to select a best prediction method. We took each outflowprediction in Figs. 5 to 7 as a plausible estimate of what one mightexpect after administration of prazosin and propranolol to a perfusedliver. In the case of the ANN (Fig. 7), we recognized the risksassociated with overparameterization (Hudson and Cohen, 1999). Allthree methods gave rise to predicted profiles that were within a factorof 2 of the actual profiles. We found it noteworthy that the simple,single PCP correlation method (Fig. 5) led to ISL outflow profiles thatwere close to those of FCMA and ANN.
A single point in discretized PCP space represents a unique com-pound. The space is not continuous. Each point can map to a relativelyunique hepatic outflow profile, which is a consequence of manyentangled local, intralobular mechanisms. A mapping from PCP spaceto a disposition outflow profile (an attribute of the drug-liver pheno-type) is complex. A small shift in location in PCP space is expectedto correspond to distinguishable outflow profile changes. Table 2shows that for this work, PCP space has nine dimensions. It isrelatively simple to calculate dozens of additional physicochemicaldescriptors, ranging from simple geometric to sophisticated electro-static and thermodynamic. On the other hand, with larger data sets,one can reduce the number of dimensions using a linear dimension-ality reduction method such as principal component analysis. How-ever, the goal of this work is not finding the optimal size of PCPspace. Rather, it is to explore the usefulness of the new methods in thiscontext.
The ISL is an assembly of componentized mechanisms: purpose-fully separated and abstracted aspects of hepatic form, space, andorganization interacting with COMPOUNDS. Each component mecha-nism has been unraveled from the complex whole of the hepatic-drugphenotype; it has its own unique phenotype, but that phenotype ismuch simpler than that of the entire lobule mechanism. Hence, amapping from component behavior space to PCP space is also simplerand fundamentally different from the PCP-outflow profile mappingdescribed above. For each ISL component, a small location change inPCP space may correspond to a negligible or modest change in theproperties of that component mechanism, as well as to the value of theparameter controlling its behavior. We see evidence of this in Tables1 and 5: there are cases in which different compounds have similarISL PVs. Note also that for both PRAZOSIN and PROPRANOLOL, there arecases for which each of the three methods predicted similar PVs forthe same drug. Therefore, considered in retrospect, it is not surprisingthat even an overly simple estimation method can lead to an accept-able parameterization. Interestingly, the current level of mechanisticgranularity is sufficiently fine-grained so that the subtle patterns inPCPs and in the PCP-sensitive, ISL PVs that are needed to achievelarger SM values (Fig. 7; Table 5) are just enough for the simple ANNparameter estimation technique, the more complicated of the three, tofind them.
767PREDICTIONS OF HEPATIC DISPOSITION PROPERTIES
at ASPE
T Journals on June 2, 2016
dmd.aspetjournals.org
Dow
nloaded from
The results suggest that when use of the synthetic method ofassembling separated aspects of mechanism, a parameter estimationmethod, which reasonably quantifies the relative differences betweencompound-specific behaviors at the level of detail represented bythose mechanisms, will provide satisficing (the minimum satisfactoryoutcome) ballpark estimates. That finding bodes well for using theISL class of models for predicting PK properties, given only molec-ular structure information. However, the six drugs in this study are allweak bases. As such, they occupy a common subregion of PCP space.More drug cases, spanning additional regions, will be needed to buildconfidence that the above apparently favorable parameter predictionsituation is a consequence of the synthetic method and its instantiationfor the ISL (rather than fortuity).
Because it is a synthetic model, the ISL successfully shrinks thePCP-sensitive phenomenal manifold relative to that of tightly coupledmathematical PK models. Traditional equation-based, PK modelsreduce the phenomenal manifold to a set of real-valued parametersinteracting within and assuming a relational continuum. Although onecan reduce the number of parameters being considered with thesemodels, to maintain accurately quantified relationships, the set ofreduced parameters must still accurately capture the aggregated rela-tionships of the larger parameter set. This implies that, for tightlycoupled PK models, the phenomenal manifold remains just as com-plex even though there are fewer parameters in the PK equations. Theparsimony achieved by such reduction is, in a sense, illusory. Thefine-grained relationships that traditional PK models conflate intomathematical parameters are deeply embedded in the coarse-grainedrelationships of these parameters. In contrast, the ISL can be actuallysimplified because it is an assemblage of coupled, abstract mecha-nisms, such as transfer between spaces and entry into cells, whereinthe fine-grained relationships can be completely ignored.
Of course, a negative consequence of the ISL’s componentizedsimplification is that the model can sometimes yield dramaticallyinaccurate and abiotic simulations. Here are three examples: 1) Aparameterization makes too much space available to DRUGS causing aprolonged, abiotic lag-time to occur before a slowly rising wave ofDRUG emerges. 2) When the diversity in travel paths becomes toolimited, travel paths can form distinct clusters, rather than beingsmoothly distributed. That discontinuity in path options can causeabiotic oscillations to occur in outflow profiles. Evidence of oscilla-tions can be seen in the PROPRANOLOL profile prediction in Fig. 6. 3)Inaccurate and abiotic crowding can occur when too many DRUGS
converge too quickly on a too small space; this can occur when toomany edges connect to one SS. However, all models are inaccurate.A central purpose of the synthetic method is to clearly identify anddenote both the accurate and inaccurate assumptions and behaviorsthat characterize a model. Similar phenomena occur with all wet-labmodels. Aspects of the in vitro phenotype are expected to map tocorresponding attributes in animal species or patients. However, com-binations of experimental specifications can cause in vitro behaviorsand phenomena for which there is no counterpart in the referent.
As long as we maintain awareness of the above negative consequence,such effects can be minimized. For research that adopts the motivatingvision of physiologically based PK, it seems important to use both thesynthetic method for chronicling modeling assumptions (heuristic value)and the inductive method to achieve a high-tolerance predictive value.We posit that, by having simplified, yet fine-grained, heuristic models,such as the ISL, which are commensurate with relatively simple param-eter estimation methods, the biological mechanisms become more under-
standable and accessible. Increased accessibility can provide the meth-odological leverage needed to build synthetic analogs that will enable usto explore, digest, categorize, understand, and use the massive amounts ofdata being generated by “omic” technologies.
Acknowledgments. We thank our collaborator Michael S. Robertsfor providing us with the original liver perfusion data; we also thankmembers of the BioSystems Group for helpful discussion andcommentary.
References
Beresford AP, Segall M, and Tarbit MH (2004) In silico prediction of ADME properties: are wemaking progress? Curr Opin Drug Discov Devel 7:36–42.
Bezdek JC, Ehrlich R, and Full W (1984) FCM: The fuzzy c-means clustering algorithm. ComputGeosci 10:191–203.
Ekins S, Waller CL, Swaan PW, Cruciani G, Wrighton SA, and Wikel JH (2000) Progress inpredicting human ADME parameters in silico. J Pharmacol Toxicol Methods 44:251–272.
Ertl P, Rohde B, and Selzer P (2000) Fast calculation of molecular polar surface area as a sumof fragment-based contributions and its application to the prediction of drug transport prop-erties. J Med Chem 43:3714–3717.
Hansch C, Leo A, Mekapati SB, and Kurup A (2004) QSAR and ADME. Bioorg Med Chem12:3391–3400.
Hou T, Wang J, Zhang W, Wang W, and Xu X (2006) Recent advances in computational predictionof drug absorption and permeability in drug discovery. Curr Med Chem 13:2653–2667.
Hudson DL and Cohen ME (1999) Neural Networks and Artificial Intelligence for BiomedicalEngineering (IEEE Press Series on Biomedical Engineering), Wiley-IEEE Press, New York.
Hung DY, Chang P, Weiss M, and Roberts MS (2001) Structure-hepatic disposition relationshipsfor cationic drugs in isolated perfused rat livers: transmembrane exchange and cytoplasmicbinding process. J Pharmacol Exp Ther 297:780–789.
Hunt CA, Ropella GE, Yan L, Hung DY, and Roberts MS (2006) Physiologically based syntheticmodels of hepatic disposition. J Pharmacokinet Pharmacodyn 33:737–772.
Li H, Yap CW, Ung CY, Xue Y, Li ZR, Han LY, Lin HH, and Chen YZ (2007) Machine learningapproaches for predicting compounds that interact with therapeutic and ADMET relatedproteins. J Pharm Sci 96:2838–2860.
Liu Y and Hunt CA (2005) Studies of intestinal drug transport using an in silico epithelio-mimetic device. Biosystems 82:154–167.
Liu Y and Hunt CA (2006) Mechanistic study of the cellular interplay of transport andmetabolism using the synthetic modeling method. Pharm Res 23:493–505.
Ljung L (1999) System Identification: Theory for the User, 2nd ed, Prentice Hall PTR, UpperSaddle River, NJ.
Mager DE (2006) Quantitative structure-pharmacokinetic/pharmacodynamic relationships. AdvDrug Deliv Rev 58:1326–1356.
Nestorov I, Aarons L, and Rowland M (1998) Quantitative structure-pharmacokinetics relation-ships: II. A mechanistically based model to evaluate the relationship between tissue distribu-tion parameters and compound lipophilicity. J Pharmacokinet Biopharm 26:521–545.
Ng C, Xiao Y, Putnam W, Lum B, and Tropsha A (2004) Quantitative structure-pharmacokineticparameters relationships (QSPKR) analysis of antimicrobial agents in humans using simulatedannealing k-nearest-neighbor and partial least-square analysis methods. J Pharm Sci 93:2535–2544.
Pal N and Bezdek J (1995) On cluster validity for the fuzzy c-means model. IEEE Trans FuzzySyst 3:370–379.
Rowland M, Balant L, and Peck C (2004) Physiologically based pharmacokinetics in drugdevelopment and regulatory science: a workshop report (Georgetown University, Washington,DC, May 29–30, 2002). AAPS PharmSci 6:E6.
Sheikh-Bahaei S and Hunt CA (2006) Prediction of in vitro hepatic biliary excretion usingstochastic agent-based modeling and fuzzy clustering, in Proceedings of the 37th Conferenceon Winter Simulation (Perrone LF, Lawson BG, Liu J, and Wieland FP eds); 2006 Dec 3–6;Monterey, CA, pp 1617–1624, Association for Computing Machinery, New York.
Sheikh-Bahaei S and Hunt CA (2007) In silico hepatocyte: agent-based modeling of the biliaryexcretion of drugs in vitro, in Proceedings of the 2006 Agent-Directed Simulation Symposium(Yilmaz L, et al. eds); 2006 April 3–9; Huntsville, AL, pp 147–163,SCS Press, San Diego, CA.
Sheikh-Bahaei S, Ropella GEP and Hunt CA (2006) Parameter estimation via analysis of fuzzyclusters (PEAF): an algorithm to estimate parameters of agent-based models, in Proceedingsof the 20th International Conference on Computer Applications in Industry and Engineering(Hu G ed); 2007 Nov 7–9; San Francisco, CA, pp 23–27, ISCA, Cary, NC.
Stouch TR, Kenyon JR, Johnson SR, Chen XQ, Doweyko A, and Li Y (2003) In silicoADME/Tox: why models fail. J Comput Aided Mol Des 17:83–92.
van de Waterbeemd H and Gifford E (2003) ADMET in silico modelling: towards predictionparadise? Nat Rev Drug Discov 2:192–204.
Yamashita F and Hashida M (2004) In silico approaches for predicting ADME properties ofdrugs. Drug Metab Pharmacokinet 19:327–338.
Yan L, Ropella GEP, Park S, Roberts MS, and Hunt CA (2007) Modeling and simulation ofhepatic drug disposition using a physiologically based, multi-agent in silico liver. Pharm Res,in press.
Address correspondence to: Dr. C. Anthony Hunt, Department of Bioengi-neering and Therapeutic Sciences, University of California, 513 Parnassus Ave.,S-926, San Francisco, CA 94143. E-mail: [email protected]
768 YAN ET AL.
at ASPE
T Journals on June 2, 2016
dmd.aspetjournals.org
Dow
nloaded from