cannabinoid disposition in oral fluid after controlled smoked cannabis
TRANSCRIPT
ORIGINAL ARTICLE
Cannabinoid disposition in oral fluid after controlled vaporizeradministration with and without alcohol
Rebecca L. Hartman • Sebastien Anizan • Moonhee Jang • Timothy L. Brown •
Keming Yun • David A. Gorelick • Gary Milavetz • Andrew Spurgin •
Gary Gaffney • Marilyn A. Huestis
Received: 26 November 2014 / Accepted: 22 January 2015
� Japanese Association of Forensic Toxicology and Springer Japan (outside the USA) 2015
Abstract Oral fluid (OF) is an advantageous matrix for
cannabis detection, with on-site tests available for roadside
drug-impaired driver screening. Limited data exist for de-
vice performance following consumption of vaporized
cannabis, which reduces exposure to harmful combustion
by-products. We assessed cannabinoid OF disposition, with
and without alcohol, and evaluated on-site Drager�
DrugTest 5000 performance (Drager) following controlled
vaporization of cannabis. Forty-three cannabis smokers
(C19/3 months, B3 days/week) reported 10–16 h prior to
dosing, and drank placebo or low-dose alcohol [target
*0.065 % peak breath-alcohol concentration (BrAC)]
10 min prior to inhaling 500 mg of placebo, low-dose
[2.9 % D9-tetrahydrocannabinol (THC)], or high-dose
(6.7 % THC) vaporized cannabis (within-subjects; six
possible alcohol–cannabis combinations; 19 completers).
BrAC readings and OF (QuantisalTM, Drager) were
collected before and up to 8.3 h post-dose. Median [range]
maximum OF concentrations (Cmax) for low and high doses
(no alcohol, N = 19) were 848 [32.1–18,230] and 764
[25.1–23,680] lg/l THC; 6.0 [0–100] and 26.8 [1.0–1106]
lg/l cannabidiol; 54.4 [1.8–941] and 29.7 [0–766] lg/l
cannabinol; and 24.1 [0–686] and 18.0 [0–414] ng/l 11-nor-
9-carboxy-THC (THCCOOH). Lack of significant differ-
ences in THC concentration between low doses and high
doses indicated that participants may have titrated doses.
THC, cannabidiol and cannabinol Cmax values were im-
mediately post-inhalation, but metabolite THCCOOH tmax
showed interindividual variability. Concurrent alcohol did
not affect OF cannabinoid concentrations or on-site test
sensitivity. With a THC confirmation cutoff of 5 lg/l,
Drager sensitivity, specificity, and efficiency were 60.8,
98.2, and 82.5 %. Drager had lower sensitivity after 6.7 %
THC vaporization (53.8 %, THC C2 lg/l confirmation
cutoff) than reported following smoking a 6.8 % THC
cigarette, but high specificity (99.3 %) and comparable
efficiency (65.0 %). Vaporized THC bioavailability may beElectronic supplementary material The online version of thisarticle (doi:10.1007/s11419-015-0269-6) contains supplementarymaterial, which is available to authorized users.
R. L. Hartman � S. Anizan � M. Jang � K. Yun �D. A. Gorelick � M. A. Huestis (&)
Chemistry and Drug Metabolism, Intramural Research Program,
National Institute on Drug Abuse, NIH, 251 Bayview Boulevard
Ste 200 Rm. 05A721, Baltimore, MD, USA
e-mail: [email protected]
M. Jang
National Forensic Service, Seoul, Republic of Korea
T. L. Brown
National Advanced Driving Simulator, University of Iowa,
Iowa City, IA, USA
K. Yun
School of Forensic Medicine, Shanxi Medical University,
Taiyuan, People’s Republic of China
D. A. Gorelick
Department of Psychiatry, University of Maryland School of
Medicine, Baltimore, MD, USA
G. Milavetz � A. Spurgin
College of Pharmacy, University of Iowa, Iowa City, IA, USA
G. Gaffney
Carver College of Medicine, University of Iowa, Iowa City, IA,
USA
123
Forensic Toxicol
DOI 10.1007/s11419-015-0269-6
lower than that when smoked. Confirmation cutoff, time
course, intake histories, and additional cannabinoid ana-
lytes also affect OF interpretation.
Keywords Cannabis � Alcohol � Vaporizer � Oral Fluid �On-site
Introduction
Cannabis is the most prevalent illicit drug identified in
drivers [1, 2]. It is frequently consumed together with al-
cohol, the most common licit drug, and driving under the
influence of drugs (DUID) cases often show this combi-
nation [3, 4]. Both drugs are associated with impairment,
alone and combined [4–8]. States that decriminalized
medical or recreational cannabis observed increased can-
nabis-driving cases [9, 10], presenting challenges for traffic
safety enforcement. Oral fluid (OF) is an advantageous
sampling matrix for drug screening because of ease of
collection, noninvasiveness, and facility for on-site testing
[11]. Observed collection is a deterrent to adulteration, and
drugs in OF are frequently associated with recent intake
[11–13]. OF is often collected in roadside surveys and
case–control studies, wherein participants might elect not
to undergo blood collection [1, 2, 14, 15]. With better
knowledge of OF cannabinoid disposition, new workplace
and DUID OF drug-testing cutoffs [D9-tetrahydrocannabi-
nol (THC, the primary psychoactive phytocannabi-
noid) C2 lg/l, and/or 11-nor-9-carboxy-THC
(THCCOOH) C20 ng/l] were proposed by the Substance
Abuse and Mental Health Services Administration
(SAMHSA) [16]. The European Driving under the Influ-
ence of Drugs, Alcohol, and Medicines (DRUID) project
used THC C1 lg/l to ensure identical analytical cutoffs in
all laboratories participating in the program [17].
To date, most OF cannabinoid disposition research fo-
cused on smoking as the route of administration, because it
remains the most prevalent route of intake [18]. By con-
trolling inhalation topography (the manner in which the
cannabis joint or blunt is smoked), individuals can titrate
doses to their desired level, achieving maximum THC
concentrations prior to the end of smoking [19–21]. Can-
nabis vaporization is increasing as a smoking alternative,
because it produces lower combustion byproduct-to-THC
ratios [22, 23]. Vaporizers reduce exposure to harmful
polycyclic aromatic hydrocarbons and other respiratory-
hazardous combustion products [24–26]. A survey query-
ing 6,883 individuals who consumed cannabis at least once
in the previous month indicated those who utilized vapor-
izers were significantly less likely (OR 0.40 controlling for
age, sex, cigarette smoking, amount of cannabis consumed)
to report respiratory problems than those who smoked or
employed other inhalation techniques [27]. Subjective
effects and plasma THC concentrations are similar for
vaporization and smoking, and studies indicated participant
preference for vaporization [24]. Increasingly, antismoking
legislation in public facilities causes smokers to search for
alternatives; popular e-cigarettes or ‘‘vape pens’’ can con-
ceal cannabis consumption in public settings. As states
continue to decriminalize medical or recreational cannabis,
vaporization may become more common among health-
conscious or discreet smokers. Quantifying OF cannabi-
noid disposition after vaporization is critical for guiding
further development of OF as a test matrix for workplace
and DUID investigation.
On-site cannabis screening tests have become common
tools used in DUID cases in the past decade [2, 28–31].
The goals of these technologies include assisting law en-
forcement officers to evaluate drug-impaired driving at the
roadside—before drug effects recede during lengthy arrest
and booking procedures—and deterring DUID [2, 30]. The
Drager� DrugTest 5000 is considered among the most re-
liable devices for smoked cannabis testing [7, 30, 32, 33],
but limited data exist for on-site OF devices following
vaporization of cannabis [13].
We addressed these knowledge gaps by evaluating OF
cannabinoids and an on-site screening device after vapor-
ization, hypothesizing cannabis vaporization OF results
similar to smoking. We quantified and assessed cannabinoid
OF disposition, with and without alcohol, and evaluated on-
site Drager DrugTest 5000 performance (Drager) following
controlled vaporized cannabis administration.
Materials and methods
Participants
Healthy adult volunteers provided written informed con-
sent for this University of Iowa Institutional Review Board-
approved controlled cannabis administration study. Par-
ticipants received comprehensive medical and psycho-
logical evaluations to ensure eligibility. Inclusion criteria
included: ages 21–55 years; self-reported average cannabis
consumption C19/3 months but B3 days/week over the
past 3 months; self-reported ‘‘light’’ or ‘‘moderate’’ alcohol
consumption according to quantity-frequency-variability
scale; or if ‘‘heavy’’, not more than four servings in a
typical drinking occasion. Exclusion criteria included:
current clinically significant medical history or illness;
history of clinically significant adverse event associated
with cannabis or alcohol intoxication; C450 ml blood do-
nation in 2 weeks preceding drug administration; pregnant
or nursing (pregnancy tests conducted at screening and
each dosing visit); interest in drug abuse treatment within
Forensic Toxicol
123

60 days preceding enrollment; and currently taking drugs
contraindicated with cannabis or alcohol.
Study design
We utilized a 3 9 2 factorial design with three cannabis
levels (placebo, low, high) and two alcohol levels (placebo,
active). Participants entered the research unit approximately
10–16 h prior to drug administration to preclude intoxication
at the time of dosing. Over 10 min ad libitum, participants
drank low-dose 95 % grain alcohol [calculated to produce a
peak breath alcohol concentration (BrAC) of approximately
0.065 %] mixed with juice or placebo (same volume of juice
with alcohol-swabbed rim and topped with 1 ml alcohol for
taste and odor). After drinking, participants inhaled 500 mg
of vaporized cannabis plant material over 10 min (Volcano�
Medic vaporizer, Storz & Bickel, Tuttlingen, Germany).
Participants received placebo [0.008 ± 0.002 % THC,
0.001 ± 0.001 % cannabidiol (CBD), 0.009 ± 0.003 %
cannabinol (CBN)], low (2.9 ± 0.14 % THC,
0.05 ± 0.00 % CBD, 0.22 ± 0.02 % CBN), or high
(6.7 ± 0.05 % THC, 0.19 ± 0.01 % CBD, 0.37 ± 0.03 %
CBN) cannabis [obtained through NIDA Chemistry and
Physiological Systems Research Branch (Research Triangle
Institute, Oxford, MS, USA)] doses. In this within-subjects
design, completing participants received each alco-
hol/cannabis combination, for a total of six sessions. Sessions
were separated by C1 week to prevent carryover from study
drug administration in randomized order.
BrAC was measured with an on-site breath-testing de-
vice (Alco-Sensor� IV, Intoximeters, St. Louis, MO, USA)
on admission, 0.8 h before, and 0.17, 0.42, 1.4, 2.3, 3.3,
4.3, 5.3, 6.3, 7.3, and 8.3 h after cannabis dosing started.
This measurement device reports results in grams per 210 l
of breath [limit of quantification (LOQ) 0.006 g/210 l],
which is equivalent to approximate BAC. OF specimens
were collected immediately following each BrAC mea-
surement (except 0.42 h) with the QuantisalTM collection
device (Immunalysis, Pomona, CA, USA) and the Drager
DrugTest 5000 (Drager Safety Diagnostics, Lubeck, Ger-
many) on-site test, in that order.
The Quantisal consists of an absorbent pad on a plastic
stick, which is placed under the tongue to collect
1.0 ± 0.1 ml of OF. The device comes with a tube con-
taining a standard amount of stabilizing buffer, into which
the pad is deposited after collection. The Drager cassette
contains a polymeric noncompressible pad that is swiped
throughout the mouth, tongue, and cheeks to collect
270 ± 40 ll. Both devices contain a volume adequacy
indicator, which changes color when sufficient sample is
collected. OF for each device was collected until the
indicator turned blue, or after a maximum of 10 min. Low-
volume specimens were noted and no weight correction
was performed. Oral intake (eating, drinking, inhaling/
smoking) was prohibited 10 min prior to OF collection.
Specimen analysis
Drager specimens were analyzed in real time on the
analyzer, producing a qualitative ‘‘Positive’’/‘‘Negative’’ or
‘‘Invalid’’ (if improper lateral flow was detected) response
using a screening cutoff of 5 lg/l of THC as recommended
by the manufacturer. Confirmatory (Quantisal) specimens
were diluted in the elution/stabilization buffer at 4 �C for
at least 12 h prior to pad removal and then transferred to
cryotubes for storage at 4 �C. Specimens were analyzed 1
month ± 1 week after collection based on our previous
stability study [34]. Specimens were quantified for THC,
CBD, CBN, and the THCCOOH metabolite by a published
validated two-dimensional gas chromatography–mass
spectrometry method [35], with minor modifications as
follows. Before loading the initial elution solvent, 0.4 ml of
hexane was added to solid-phase extraction columns. THC,
THCCOOH, CBD, and CBN respective linear ranges were
0.5–50 lg/l, 15–500 ng/l, 1–50, and 1–50 lg/l. Interassay
and intraassay imprecision were \12.3 %, and inaccuracy
was B14.4 % (n = 21). If concentrations exceeded the
upper LOQ, OF specimens were diluted with drug-free
Quantisal buffer to achieve concentrations within the linear
range of the method.
Data analysis
Maximum concentration (Cmax), time to Cmax (tmax), and
time of last detection (tlast) were calculated with concen-
trations observed post-dose. Because some individuals
were cannabinoid-positive at baseline, an additional pa-
rameter was calculated (Cmax as difference from baseline,
Cmax-C0) to account for previously self-administered
cannabis. The area under the curve from baseline to 8.3 h
(AUC0–8.3h) was calculated by a linear trapezoidal method.
If sessions were terminated early (voluntary participant
withdrawal), provided specimens were analyzed and in-
cluded in Drager calculations. Other measures (Cmax, tmax,
tlast) were assessed only if two or more successive subse-
quent samples were negative or \20 % of maximum.
AUC0–8.3h was not evaluated for early terminations.
Statistical evaluation was performed with IBM SPSS
Statistics Version 19 for Windows. For statistical purposes,
concentrations\LOQ were set to 0, and times C8.3 h were
set to 8.3 h. Within-subject medians were compared indi-
vidually (placebo vs low dose vs high dose; with and
without alcohol) with the Wilcoxon Matched-Pairs Test.
Overall alcohol and cannabis effects were compared for
each analyte with factorial repeated measures analysis of
variance (ANOVA, factors: cannabis, alcohol) with
Forensic Toxicol
123
Bonferroni correction for individuals who completed all six
sessions. Friedman’s ANOVA was utilized to confirm that
BrAC did not vary significantly by cannabis dose at any
time. For alcohol-positive sessions, THC Cmax vs BrAC
was compared for placebo, low, and high doses via linear
regression on GraphPad Prism 5 (La Jolla, CA, USA).
Drager sensitivity [100 9 true positives (TP)/(TP? false
negatives (FN))], specificity [100 9 true negatives (TN)/
(TN? false positives (FP))], and efficiency
[100 9 (TN ? TP)/(TN ? TP ? FN ? FP)] were calcu-
lated for different confirmation cutoffs. Low-dose vs high-
dose times of last detection (tlast) were compared for dif-
ferent Drager screening/confirmation cutoffs via the Mann–
Whitney U Test. Fisher’s Exact Test was utilized to com-
pare Drager performance in the presence and absence of
alcohol, at baseline and up to 4.3 h post-inhalation (median
alcohol tlast, to ensure comparison of the same time course
and prevent over-representation from alcohol-negative
sessions). Figures were created on GraphPad Prism 5.
Results
Participants
Forty-three healthy adults (26 men, 17 women), aged
21–42 years, provided OF for this study (Table 1). Self-
reported cannabis history varied considerably between
individuals. Two participants (21 and 25) reported most
recent cannabis intake 4 and 6 months prior to admis-
sion, despite indicating overall average intake at least
once/3 months. However, most had consumed cannabis
within the past week. Nineteen participants completed all
six dosing sessions. The 24 other participants withdrew
for personal reasons (e.g., job obligations, scheduling,
elected to withdraw) or adverse events (e.g., nausea/
emesis or dizziness related to study drugs or other study
procedures) (Table 1 lists doses received and reasons for
withdrawal). There were no significant differences be-
tween completers and noncompleters in age, weight,
body mass index (BMI), or self-reported cannabis history
(p [ 0.21, Mann–Whitney U [exact] test).
Alcohol
Completers’ breath alcohol Cmax, tmax, tlast, and
AUC0–8.3h values are summarized in Table 2. For infor-
mation purposes, pharmacokinetic data from all par-
ticipants (including noncompleters) are provided in
Online Resource 1. Within-subject alcohol doses pro-
duced similar AUC0–8.3h. Alcohol concentration did not
differ significantly between alcohol-positive doses at any
time point, nor did overall alcohol Cmax and AUC0–8.3h
(Fig. 1). Active cannabis (relative to placebo) resulted in
significantly later alcohol tmax (ANOVA v2(2) = 6.621,
p = 0.037), but alcohol tmax did not differ significantly
between active (low vs high) cannabis doses. Alcohol
did not significantly affect THC Cmax (Fig. 2, no slope
differed significantly from 0) or THC tmax. Alcohol
displayed a typical zero-order elimination profile [36,
37], and was not detected after 5.3 h.
Quantisal OF cannabinoids
Completers’ OF THC, CBD, CBN, and THCCOOH phar-
macokinetic data and statistical analysis (Factorial
ANOVA) are presented in Tables 2 and 3. No significant
alcohol–cannabis interactions were observed. All par-
ticipants’ data and pairwise comparisons (Online Re-
sources 2–5) corroborated results from completers. THC
Cmax was significantly higher after low and high doses
(with and without alcohol) than placebo, and AUC0–8.3h
was significantly higher than placebo after the low dose
(high vs placebo had a trend for completers, p = 0.056)
(Table 2, Online Resource 2). No dose difference was
observed in THC tmax (immediately after dosing). After
active cannabis, the median tlast was C8.3 h, which is not
significantly different between low and high doses. No
significant low-dose vs high-dose differences were ob-
served for OF THC at any time post-dose (Fig. 3); how-
ever, the high dose showed greater interindividual
variability, particularly after alcohol (Table 2). Placebo
cannabis contained 0.008 ± 0.002 % THC, and low THC
concentrations were detected in OF after this dose, even
after accounting for baseline. However, OF THC never
exceeded 42.6 lg/l after placebo, except for Participant 30
(described below). When baseline OF THC was 0, placebo
THC tmax did not exceed 21.0 lg/l. Online Resource 6
depicts THC and THCCOOH before dosing and over 8.3 h
for placebo sessions.
CBD Cmax was significantly greater and had substantial
variability after high-dose cannabis when compared to low-
dose cannabis (Table 2; Fig. 3). CBD tmax occurred im-
mediately after inhalation; after placebo and low doses, tlast
was typically 0.17 h. After the high dose, median tlast
shifted significantly (p = 0.033) to 2.3 and 3.3 [0.17 to
C8.3] h for nonalcohol and alcohol conditions, respectively
(Table 2). At individual sampling times over the first 7.3 h,
there was a significant overall dose difference (p \ 0.05,
Fig. 3). Specific differences by post-dose time are provided
in Fig. 3. CBD was only detected in OF after placebo
(0.05 % potency) in one and two sessions without and with
alcohol, respectively. In the placebo-without-alcohol ses-
sion (Participant 24), Cmax-C0 was -0.4 lg/l, indicating
that the detected CBD was carryover from a previous self-
administration. In the active-alcohol sessions, all
Forensic Toxicol
123

Table 1 Self-reported demographic characteristics and recent cannabis and alcohol consumption history of 43 healthy adult occasional cannabis
smokers
Participant Sex Age
(years)
Race
and
ethnicity
BMI
(kg/
m2)
Alcohol
intake
frequency
Typical
drinks
per occasion
Cannabis
intake
frequency
Hours
‘‘stoned’’
on typical
cannabis
occasiona
Time since
last cannabis
consumed
(days)
Amount last
consumedb
(joint or
joint
equivalent)
Doses
received
(reason for
withdrawal)
1 F 30.6 W 21.4 2–49/month 2–4 2–39/week 1–2 1 2 2 (P)
2c M 23.7 W 24.3 2–39/week 2–4 2–49/month 1–2 1 1 6
3c F 28.4 AA 23.8 C49/week 2–4 2–49/month 3–4 14 1 6
4 M 27.8 W 33.2 2–39/week 2–4 2–39/week 1–2 1 1 3 (P)
5c M 21.9 W 24.7 2–39/week 5–6 2–49/month 1–2 6 1 6
6c M 37.8 W 26.1 2–39/week 2–4 2–39/week 1–2 3 2.5 6
7c M 26.6 W 21.6 B19/month 2–4 B19/month 1–2 11 3.5 6
8 F 34.9 W 24.5 2–39/week 2–4 2–39/week 1–2 2 0.25 1 (AE)
9c F 26.3 W 20.0 2–39/week 2–4 2–39/week 3–4 1 0.25 6
10c M 25.8 W 40.6 2–49/month 2–4 2–39/week 1–2 0.3 0.5 6
11c M 26.1 H 31.5 2–49/month 1–2 2–39/week 1–2 3 1 6
12 M 29.5 W 32.6 2–39/week 1–2 B19/month 5–6 21 1 2 (AE)
13 M 26.9 W 22.9 2–39/week 1–2 B19/month 3–4 2 1 3 (P)
14c M 23.2 W 19.5 2–39/week 2–4 2–39/week 3–4 2 1 6
15 F 24.0 As 19.6 2–39/week 2–4 2–49/month \1 3 1 1 (AE)
16c M 23.1 W 23.9 2–49/month 2–4 B19/month 1–2 2 0.25 6
17 M 22.7 W, H 23.4 2–39/week 2–4 2–49/month 1–2 3 2 1 (P)
18 M 21.1 W 20.6 2–39/week 5–6 2–39/week 1–2 2 2 3 (P)
19c M 32.3 O, H 28.9 2–39/week 2–4 2–39/week 1–2 4 1 6
20c F 23.4 W 23.3 2–39/week 2–4 2–49/month 3–4 4 1 6
21c F 30.3 AA 24.1 2–39/week 2–4 B19/month \1 120 1 6
22c M 24.6 W 23.3 2–39/week 2–4 2–49/month 1–2 7 0.8 6
23 F 34.8 W 21.2 2–39/week 2–4 2–49/month 3–4 2 1 1 (AE)
24 M 40.8 W 31.7 2–39/week 2–4 2–49/month 3–4 5 3 2 (P)
25 F 21.8 W 30.8 2–49/month 2–4 2–39/week 1–2 183 0.5 4 (P)
26 M 42.1 W 24.2 2–49/month 1–2 B19/month 1–2 45 2 2 (P)
27 M 39.4 W, As 34.6 2–49/month 2–4 2–49/month 3–4 1 4.5 4 (P)
28 M 21.1 AI, As,
AA, W
24.0 2–49/month 2–4 2–39/week 5–6 2 1 2 (P)
29 F 24.6 W, H 19.1 2–39/week 2–4 2–49/month 3–4 28 0.5 3 (AE)
30c,d M 21.8 W 32.7 B19/month 1–2 2–49/month 1–2 7 0.13 6
31 F 24.8 W, H 26.7 2–39/week 1–2 2–49/month 3–4 21 4 1 (AE)
32 M 29.0 O 28.0 2–39/week 2–4 B19/month \1 30 0.2 2 (P)
33 F 23.0 W 21.0 2–39/week 2–4 2–49/month 5–6 7 0.3 2 (P)
34c F 21.7 AA, W 23.0 2–49/month 1–2 2–39/week 1–2 1.1 1.5 6
35c M 28.7 W 18.3 2–39/week 2–4 B19/month 3–4 45 0.5 6
36 F 24.4 W 21.6 2–39/week 2–4 2–39/week 3–4 2 2 1 (P)
37c M 28.1 W 48.3 2–49/month 2–4 2–49/month 3–4 5 1 6
38c F 22.9 W 21.6 2–49/month 5–6 2–39/week 3–4 1 1 6
39 F 37.3 W 24.8 2–49/month 1–2 2–49/month 1–2 4 1 1 (P)
40 F 22.5 W 19.7 2–39/week 2–4 2–39/week 1–2 1 1 1 (P)
41 M 25.8 AA 28.8 2–39/week 2–4 2–49/month \1 14 1 1 (AE)
42 M 22.7 W 26.1 2–49/month 1–2 2–49/month 1–2 8 1 3 (P)
43 M 26.7 W 23.5 2–39/week 2–4 B19/month 1–2 11 2 1 (AE)
Forensic Toxicol
123

participants were negative for CBD at baseline
(C0 = 0 lg/l), indicating that detected CBD (Participants 6
and 39) came from the placebo cannabis dose (Table 2).
CBD low dose vs high dose differences can be explained
by the fourfold difference in CBD potency of the cannabis.
Participants titrated their dose based on psychoactive THC
concentrations (only twofold low–high dose THC potency
difference); titration was not based on CBD, because CBD
is nonpsychoactive.
Low-dose vs high-dose CBN Cmax and AUC0–8.3h did
not differ significantly (Tables 2 and 3). CBN tmax occurred
within 3.3 h post-dose, but was 0.17 h in 98 % of sessions.
Participants 3 and 37 had CBN tmax values of 1.4 and 3.3 h,
respectively, in their high-dose/no-alcohol sessions; all
other CBN tmax values were 0.17 h. The only significant
pairwise alcohol difference was for tlast with high cannabis
(Online Resource 4). As with CBD, alcohol produced
significantly later CBN tlast. CBN concentrations and
specific differences by post-dose time are provided in
Fig. 3. CBN was only detected in five participants’ OF
after placebo cannabis, in both alcohol conditions.
THCCOOH displayed substantial interindividual OF
concentration variability at all doses, reflecting par-
ticipants’ smoking history (Table 2; Fig. 3). There was no
significant low-dose vs high-dose difference in Cmax or
AUC0–8.3h, but THCCOOH Cmax accounting for baseline
was significantly higher after the high dose than after the
low dose in completers (Table 3). Alcohol had no effect on
any THCCOOH results. Low-dose and high-dose Cmax-C0
were significantly higher than placebo, and Cmax-C0 ran-
ges demonstrated notable differences relative to Cmax
ranges (Table 2). Median THCCOOH tmax occurred
1.4–2.8 h post-dose for every condition; however, sub-
stantial variability attributed to smoking history/body bur-
den and individual metabolic rates was noted. When
detected, THCCOOH tlast was typically C8.3 h.
On admission the night prior to dosing, 51 % of Quan-
tisal specimens were positive for THC (0.52–440.8 lg/l),
5 % for CBD (1.1–41.7 lg/l), 16 % for CBN (1.0–33.3 lg/l),
and 38 % for THCCOOH (15.1–887 ng/l). The following
morning at baseline, 47 % of all specimens remained
positive for THC (0.54–72.9 lg/l), 0.6 % for CBD (2.1 lg/l),
2 % for CBN (1.1–3.6 lg/l), and 34 % for THCCOOH
(15.1–911 ng/l). Participants 6, 7, 10, 27, and 38 were
THCCOOH-positive at baseline (after overnight) for all
doses received, and each had at least one baseline Quan-
tisal OF with THCCOOH [100 ng/l. OF THC was C1 lg/l
and THCCOOH C20 ng/l at baseline across all their
sessions.
Based on pharmacokinetic data, Participant 30 may have
accessed active cannabis during his placebo sessions, de-
spite being under observation throughout his stay (Online
Resource 7). For his placebo with alcohol session, THC
was negative on admission to the unit, but positive prior to
dosing; THC, CBD, and CBN Cmax were 569, 17.8, and
54.8 lg/l, respectively, at 0.17 h. It is possible these high
Table 1 continued
Participant Sex Age
(years)
Race
and
ethnicity
BMI
(kg/
m2)
Alcohol
intake
frequency
Typical
drinks
per occasion
Cannabis
intake
frequency
Hours
‘‘stoned’’
on typical
cannabis
occasiona
Time since
last cannabis
consumed
(days)
Amount last
consumedb
(joint or
joint
equivalent)
Doses
received
(reason for
withdrawal)
Median (all) 25.8 24.0 4.0 1.0
Mean (all) 27.3 25.7 14.8 1.3
SD (all) 5.7 6.0 33.1 1.0
Median
(completers)
25.8 23.9 4.0 1.0
Mean
(completers)
26.1 26.3 12.5 1.0
SD
(completers)
4.1 7.5 27.9 0.8
a Hours ‘‘stoned’’ wording originates from Cannabis Use Disorders Identification Test, source of self-reported cannabis frequency datab Cannabis amount last consumed is based on empirically normalized joint consumption, to account for various administration routes and self-
reported ‘‘sharing’’ between multiple individualsc Participant completed all six study sessionsd May have consumed active cannabis during placebo-cannabis sessions
BMI Body mass index, W white, AA African American, H Hispanic or Latino, As Asian, O other, AI American Indian/Native American,
P withdrew for personal reasons (job obligations/scheduling/choice), AE withdrew because of adverse event (nausea/emesis or dizziness, related
to study drugs or other study procedures), SD standard deviation
Forensic Toxicol
123

Table 2 Median [range] breath alcohol and QuantisalTM oral fluid
pharmacokinetic parameters following controlled vaporized placebo,
low (2.9 %), or high (6.7 %) THC cannabis with or without low-dose
alcohol for 19 occasional to moderate smokers who completed all six
dosing conditions
BrAC (LOQ 0.006 g/210 l) Breath alcohol concentration
(active alcohol sessions)
Cmax (lg/l)
Placebo THC dose 0.063 [0.034–0.135]
Low THC dose 0.062 [0.035–0.097]
High THC dose 0.053 [0.036–0.087]
tmax (h)
Placebo THC dose 0.42 [0.17–1.4]
Low THC dose 0.42 [0.17–2.3]
High THC dose 1.4 [0.17–2.3]
tlast (h)
Placebo THC dose 4.3 [3.3–5.3]
Low THC dose 4.3 [2.3–5.3]
High THC dose 4.3 [2.3–5.3]
AUC0–8.3h (h lg/l)
Placebo THC dose 0.166 [0.103–0.234]
Low THC dose 0.171 [0.074–0.257]
High THC dose 0.151 [0.104–0.226]
THC (LOQ 0.5 lg/l) Oral fluid concentration
No alcohol Alcohol
Cmax (lg/l)
Placebo 5.0 [0–25.9]* 3.9 [0–27.2]*
Low 848 [32.1–18,230]* 735 [72.9–7494]*
High 764 [25.1–23,680]* 952 [22.7–66,200]*
C0 (lg/l)
Placebo 0.62 [0–14.2] 0 [0–11.3]
Low 0.54 [0–30.7] 0 [0–72.9]
High 0 [0–11.7] 0.55 [0–34.2]
Cmax-C0 (lg/l)
Placebo 4.2 [-3.0 to 24] 2.1 [-2.2 to 22.6]
Low 847 [32.1–18,206] 735 [71–7494]
High 762 [25.1–23,671] 952 [22.7–66,192]
tmax (h)
Placebo 0.17 [0.17–1.4] 0.17 [0.17–2.3]
Low 0.17 [0.17–0.17] 0.17 [0.17–0.17]
High 0.17 [0.17–3.3] 0.17 [0.17–0.17]
tlast (h)
Placebo 5.8 [1.4–8.3]* 8.3 [1.4–8.3]*
Low 8.3 [3.3–8.3]* 8.3 [8.3–8.3]*
High 8.3 [7.3–8.3]* 8.3 [4.3–8.3]*
AUC0–8.3h (h lg/l)
Placebo 7.1 [0–56.1] 8.8 [0–39.4]
Low 723 [29.8–3865] 625 [88.8–8146]
High 880 [38.4–19,090] 917 [25.2–53,984]
Table 2 continued
THCCOOH (LOQ 15 ng/l) Oral fluid concentration
No alcohol Alcohol
Cmax (ng/l)
Placebo 0 [0–361] 0 [0–370]
Low 24.1 [0–686] 37.7 [0–992]
High 18.0 [0–414] 24.0 [0–909]
C0 (ng/l)
Placebo 0 [0–249] 0 [0–243]
Low 0 [0–505] 0 [0–911]
High 0 [0–223] 0 [0–468]
Cmax-C0 (ng/l)
Placebo 0 [–18.6–113]* 0 [–17.3–193]*
Low 22.8 [0–182]* 32.5 [0–219]*
High 18.0 [0–192]* 24.0 [0–441]*
tmax (h)
Placebo 2.3 [1.4–8.3] 2.3 [1.4–8.3]
Low 2.3 [0.17–8.3] 1.4 [0.17–7.3]
High 2.3 [0.17–5.3] 1.4 [0.17–3.3]
tlast (h)
Placebo 8.3 [7.3–8.3] 8.3 [1.4–8.3]
Low 8.3 [0.17–8.3] 8.3 [1.4–8.3]
High 8.3 [0.17–8.3] 8.3 [2.3–8.3]
AUC0–8.3h (h ng/l)
Placebo 0 [0–1941] 0 [0–1904]
Low 42.9 [0–2935] 185 [0–5153]
High 14.2 [0–1827] 70.0 [0–3536]
CBD (LOQ 1 lg/l) Oral fluid concentration
No alcohol Alcohol
Cmax (lg/l)
Placebo 0 [0–0]* 0 [0–1.1]*
Low 6.0 [0–100]* 2.4 [0–46.5]*
High 26.8 [1.0–1106]* 37.1 [0–2331]*
C0 (lg/l)
Placebo 0 [0–0] 0 [0–0]
Low 0 [0–0] 0 [0–0]
High 0 [0–0] 0 [0–0]
Cmax-C0 (lg/l)
Placebo 0 [0–0]* 0 [0–1.1]*
Low 6.0 [0–100]* 2.4 [0–46.5]*
High 26.8 [1–1106]* 37.1 [0–2331]*
tmax (h)
Placebo – 0.17 [0.17–0.17]
Low 0.17 [0.17–0.17] 0.17 [0.17–0.17]
High 0.17 [0.17–3.3] 0.17 [0.17–0.17]
tlast (h)
Placebo – 0.8 [0.17–1.4]
Low 0.17 [0.17–2.3]*#lh 0.17 [0.17–3.3]*#lh
High 2.3 [0.17–8.3]*#lh 3.3 [0.17–8.3]*#lh
Forensic Toxicol
123

concentrations resulted from dosing error; however,
records were carefully reviewed and there was no indica-
tion that an error occurred. Because Participant 30 was
negative on admission and positive at baseline, we cannot
rule out clandestine intake prior to dosing. For his placebo
without alcohol session, THC and CBN Cmax were 22.7
and 2.2 lg/l, respectively, at 5.3 h, despite being lower/
negative earlier post-dose. His active doses did not contain
anomalous findings. Data from these placebo-cannabis
sessions were excluded from median [range] calculations
for Cmax, tmax, tlast, and AUC0–8.3h and for matched-pairs
analyses.
Drager DrugTest 5000 performance and confirmation
comparison
In total, 1,723 OF Drager-Quantisal specimen pairs were
obtained. Thirteen Drager specimens (0.8 %) produced
‘‘invalid’’ results, leaving 1,710 for comparison. Drager
performance at various quantitative cutoffs examined pre-
viously for smoking (due to proposed SAMHSA guidelines
or utilized in the DRUID program) [33, 38, 39] is sum-
marized in Online Resource 8. Alcohol presence did not
affect Drager performance. Overall sensitivity at the
manufacturer-specified confirmation cutoff for THC of
5 lg/l was 60.8 % over 8.3 h. Specificity was high at
98.2 %, yielding 82.5 % overall efficiency. At lower
Quantisal THC confirmation cutoffs, sensitivity decreased.
Including CBD and CBN as required confirmatory analytes
produced higher sensitivity [89.2 % (CBD) and 86.4 %
(CBN)] for THC C2 lg/l and for THC C1 lg/l. These
numbers were identical for both THC cutoffs because CBD
and CBN were not present when THC \2 lg/l. This also
explains the higher sensitivity, because fewer confirmatory
specimens were considered positive when CBD or CBN
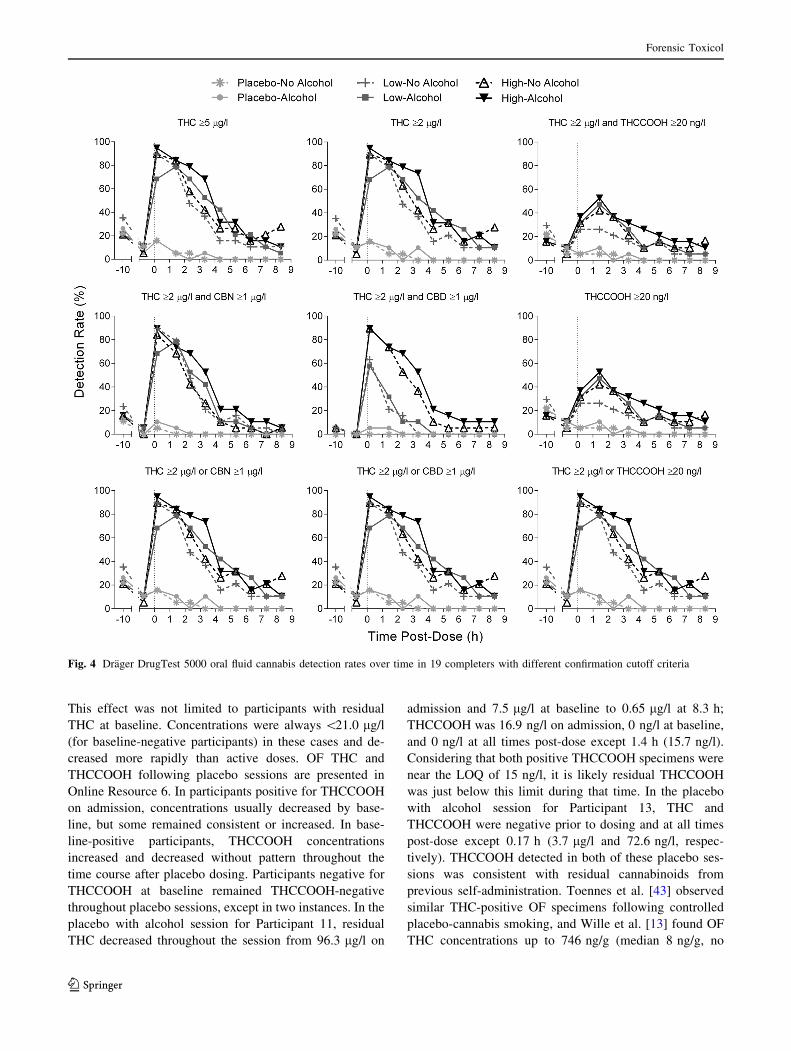
were required. Detection rates (from the 19 completers) vs
post-dose time for several possible confirmation criteria are
presented in Fig. 4. Data were identical for THC C2 or
Table 2 continued
CBD (LOQ 1 lg/l) Oral fluid concentration
No alcohol Alcohol
AUC0–8.3h (h lg/l)
Placebo 0 [0–0] 0 [0–0.82]
Low 3.1 [0–79] 1.7 [0–53.2]
High 30.3 [0.72–912] 38.8 [0–1911]
CBN (LOQ 1 lg/l) Oral fluid concentration
No alcohol Alcohol
Cmax (lg/l)
Placebo 0 [0–1.8] 0 [0–2.1]
Low 54.4 [1.8–941] 49.4 [3.2–312]
High 29.7 [0–766] 31.7 [0–2650]
C0 (lg/l)
Placebo 0 [0–0] 0 [0–0]
Low 0 [0–1.1] 0 [0–3.6]
High 0 [0–0] 0 [0–0]
Cmax-C0 (lg/l)
Placebo 0 [0–1.8] 0 [0–2.1]
Low 54.4 [1.8–941] 49.4 [3.2–312]
High 29.7 [0–766] 31.7 [0–2650]
tmax (h)
Placebo 0.17 [0.17–0.17] 0.17 [0.17–0.17]
Low 0.17 [0.17–0.17] 0.17 [0.17–0.17]
High 0.17 [0.17–3.3] 0.17 [0.17–0.17]
tlast (h)
Placebo 0.17 [0.17–0.17] 0.17 [0.17–1.4]
Low 2.3 [0.17–7.3]#lh 2.3 [0.17–8.3] #lh
High 2.3 [0.17–8.3] #lh 3.3 [0.17–8.3] #lh
AUC0–8.3h (h lg/l)
Placebo 0 [0–1.3] 0 [0–1.5]
Low 44.1 [1.3–246] 39.7 [2.3–405]
High 25.9 [0–617] 29.6 [0–2226]
* Significant overall cannabis dose effect by factorial repeated-mea-
sures analysis of variance (ANOVA)# Significant overall alcohol dose effect by factorial repeated-mea-
sures ANOVAlh Significant overall effects based on low vs high dose THC ANOVA
only, due to insufficient positive placebo
BrAC breath alcohol concentration, THC D9-tetrahydrocannabinol,
LOQ limit of quantification, THCCOOH 11-nor-9-carboxy-THC,
CBD cannabidiol, CBN cannabinol, Cmax maximum concentration, C0
baseline concentration, tmax time to maximum concentration, tlast time
of last detection, AUC0–8.3h area under the curve
Fig. 1 Median [interquartile range] breath alcohol concentration
(BrAC) in 19 completers following drinking placebo and three
equivalent Everclear grain alcohol doses at separate sessions, with
controlled inhalation of placebo, low (2.9 %), or high (6.7 %) D9-
tetrahydrocannabinol (THC) vaporized cannabis. In total, there were
three sessions (placebo, low, high cannabis) with no alcohol; alcohol
was never detected in any of these sessions. Vertical dotted line
represents start of cannabis administration. Asterisk, overall cannabis
p B 0.004 by repeated-measures analysis of variance (ANOVA) with
Bonferroni correction for repeated measures. Significance level set to
p \ 0.05/12 measurements = p \ 0.004
Forensic Toxicol
123

1 lg/l for completers. Drager tlast for the various cutoffs are
presented in Table 4 (low vs high, completers) and Online
Resource 8 (full study population). Overall, the DrugTest
5000 was positive for THC 3.3 [0.17 to C8.3] h [median
(range)] after dosing. The only significant high vs low tlast
difference among the various confirmation cutoffs was
when CBD and THC were required. This corresponds to
the finding that CBD had significantly later low vs high
tlast. To make a comparison to smoking a 6.8 % THC ci-
garette [32], the 546 tests (549, 3 ‘‘invalid’’) from high-
dose sessions were also evaluated (Table 5). Sensitivity for
the high dose only increased relative to overall results (for
all confirmation cutoffs except those requiring CBD), but
sensitivity was lower after vaporization than after smoking
[32].
Discussion
We present, for the first time, THC, CBD, CBN, and
THCCOOH disposition in OF following controlled vapor-
ized cannabis administration. Prior clinical data following
cannabis vaporization are limited. One other study exam-
ined OF after vaporization, but specimens were only col-
lected 0.08 and 1.3 h post-inhalation [13].
Our data represent a broad cannabis history spectrum,
suggested by the highly variable self-report data, residual
cannabinoids present in some participants at baseline, and
large intersubject variability (discussed below). We only
recruited individuals who self-reported cannabis intake
B39/week, less than our cutoff for chronic frequent
smoking (C49/week) [33, 38, 39]. Although some current
study participants were occasional smokers (B29/week),
several fitted into an intermediate category (2 or 39/week),
including eight completers. After a night at the research
unit, previous frequent smokers were still positive for THC
and THCCOOH in 79 and 100 % of participants [39]. In
contrast, participants’ OF baseline (10–16 h after admis-
sion) was still positive in half (THC) and one third
(THCCOOH) of study sessions. Previous frequent smokers
were 100 % negative for CBD and CBN after a night at the
research unit [39], but we detected CBD and CBN in 1/163
and 4/163 baseline specimens. This study was conducted in
a geographic region (Iowa City, IA, USA) different from
our previous work (Baltimore, MD, USA). Possibly, typi-
cal cannabinoid potencies are different in the two areas.
CBD and CBN are often identified as markers of recent
intake [20, 38, 39]; it may be prudent to consider potency
in consumed cannabis when evaluating time since expo-
sure. CBD potency in particular may become more variable
as medical and recreational cannabis decriminalization
increase, because of its other pharmacological properties
(antiemetic, antipsychotic, anti-inflammatory, antiepilep-
tic) [40–42].
Three high-dose THC OF Cmax values, exceeding
20,000 lg/l, were among the highest ever reported [13, 20,
31, 38, 39, 43]. After vaporizing two successive THC doses
80 min apart, Wille et al. [13] found a median (range) OF
THC concentration of 1,952 (77.7–12,360) ng/g. Another
controlled cannabis (smoking) study utilizing the Quantisal
device had lower median (range) THC Cmax [644
(68.0–10,284) lg/l] [20]. Our ranges were considerably
wider, but medians at any dose were\1,000 lg/l (Table 2).
These data resemble those of Toennes et al. [31, 43] after
controlled smoking of cannabis of similar potency. Both ad-
ministration routes showed large intersubject variability. In
that study, median Cmax was 4,800 ng/g. One frequent smoker
displayed 71,747 ng/g maximum OF THC [43], and 5 out of
17 frequent smokers attained OF THC [20,000 ng/g with
0.5–0.7 g/l blood alcohol [31]. The authors asserted that
concentrations in ng/g are comparable to lg/l because OF
specific gravity is only 0.2–1.2 % different from 1 kg/l.
After our low and high doses without alcohol, 75 % of
THC Cmax values were \1,589 and \3,933 lg/l, respec-
tively, compared to 75 % of THC Cmax values B6,236 ng/g
in the Toennes study [31]. With alcohol, 75 % were\2,811
and \5,288 lg/l in our study, compared to 74 % with al-
cohol B9,210 ng/g [31]. As in that study, our findings
indicated that alcohol did not produce significant OF THC
effects. Collectively, these data indicate that vaporization
produces similar but slightly lower OF THC concentrations
relative to smoking.
The relative lack of significant dose effects on cannabi-
noid Cmax and AUC0–8.3h values after high doses vs low
doses suggests that several participants titrated their can-
nabis dose to individual subjective and cardiovascular
comfort levels. Despite similar median THC Cmax across all
Fig. 2 THC maximum oral fluid concentration vs BrAC for placebo,
low (2.9 %), and high (6.7 %) THC doses (all participant data)
following drinking alcohol and inhaling controlled cannabis by
vaporizer. Line correlations were not significantly nonzero (THC
concentrations did not vary with BrAC). Except for Participant 30,
THC concentrations did not exceed 42.6 lg/l after the placebo dose,
and did not exceed 21.0 lg/l when baseline OF THC was negative
Forensic Toxicol
123

Table 3 Overall effects of alcohol, cannabis, and alcohol–cannabis interaction on oral fluid Cmax, tmax, tlast, and AUC0–8.3h for cannabinoids
THC, CBD, CBN, and THCCOOH after inhalation of vaporized cannabis
Analyte
parameter
Overall effect Pairwise comparison by
cannabis dose
N F Degrees of
freedom
Error degrees of
freedom
Effect size
(r)
p value
THC
Cmax Alcohol 19 1.403 1 18 0.27 0.252
Cannabis 4.957 1.10 19.75 0.035a
Low vs placebo 10.097 1 18 0.60 0.005
High vs placebo 6.027 1 18 0.50 0.024
Low vs high 3.227 1 18 0.39 0.089
Alcohol–cannabis 1.963 1.12 20.22 0.176a
Cmax-C0 Alcohol 18 0.917 1 17 0.23 0.352
Cannabis 4.234 1.10 18.62 0.051a
Low vs placebo 8.503 1 17 0.58 0.010
High vs placebo 5.141 1 17 0.48 0.037
Low vs high 2.786 1 17 0.38 0.113
Alcohol–cannabis 1.347 1.13 19.20 0.266a
tmax Alcohol 17 1.250 1 16 0.27 0.280
Cannabis 2.292 1.25 23.61 0.134a
Alcohol–cannabis 0.278 1.21 19.28 0.647a
tlast Alcohol 14 0.019 1 13 0.04 0.894
Cannabis 11.798 1.01 13.11 0.004a
Low vs placebo 11.729 1 13 0.69 0.005
High vs placebo 11.939 1 13 0.69 0.004
Low vs high 0 1 13 0 1.00
Alcohol–cannabis 0.065 1.05 13.71 0.815a
AUC0–8.3h Alcohol 17 1.643 1 16 0.31 0.218
Cannabis 3.283 1.04 16.64 0.087a
Low vs placebo 15.605 1 16 0.70 0.001
High vs placebo 4.231 1 16 0.46 0.056
Low vs high 2.008 1 16 0.33 0.176
Alcohol–cannabis 1.136 1.05 16.85 0.305a
CBD
Cmax Alcohol 19 0.970 1 18 0.23 0.338
Cannabis 5.829 1.00 18.05 0.027a
Low vs placebo 12.461 1 18 0.64 0.002
High vs placebo 6.158 1 18 0.50 0.023
Low vs high 5.487 1 18 0.48 0.031
Alcohol–cannabis 1.098 1.01 18.10 0.309a
Cmax-C0 Alcohol 18 0.626 1 17 0.19 0.440
Cannabis 5.142 1.00 17.04 0.037a
Low vs placebo 11.188 1 17 0.63 0.004
High vs placebo 5.435 1 17 0.49 0.032
Low vs high 4.838 1 17 0.47 0.042
Alcohol–cannabis 0.721 1.01 17.09 0.19 0.408a
tmax Alcohol Low vs highb 11 1 1 10 0.30 0.341
Cannabis Low vs highb 1 1 10 0.30 0.341
Alcohol–cannabis Low vs highb 1 1 10 0.30 0.341
tlast Alcohol Low vs highb 11 7.784 1 10 0.66 0.019
Cannabis Low vs highb 25.339 1 10 0.84 0.001
Alcohol–cannabis Low vs highb 3.272 1 10 0.50 0.101
Forensic Toxicol
123

Table 3 continued
Analyte
parameter
Overall effect Pairwise comparison by
cannabis dose
N F Degrees of
freedom
Error degrees of
freedom
Effect size
(r)
p value
AUC0–8.3h Alcohol 17 1.284 1 16 0.27 0.274
Cannabis 4.245 1.00 16.05 0.056a
Low vs placebo 9.186 1 16 0.60 0.008
High vs placebo 4.564 1 16 0.47 0.048
Low vs high 3.919 1 16 0.44 0.065
Alcohol–cannabis 1.404 1.01 16.11 0.254a
CBN
Cmax Alcohol 19 0.982 1 18 0.23 0.335
Cannabis 3.921 1.23 22.16 0.053a
Low vs placebo 11.606 1 18 0.63 0.003
High vs placebo 5.179 1 18 0.47 0.035
Low vs high 1.110 1 18 0.24 0.306
Alcohol–cannabis 1.494 1.20 21.58 0.240a
Cmax-C0 Alcohol 18 0.775 1 17 0.21 0.391
Cannabis 3.573 1.22 20.80 0.066a
Low vs placebo 9.707 1 17 0.60 0.006
High vs placebo 4.718 1 17 0.47 0.044
Low vs high 1.178 1 17 0.25 0.293
Alcohol–cannabis 1.138 1.20 20.34 0.332a
tmax Alcohol Low vs highb 15 1.775 1 14 0.34 0.204
Cannabis Low vs highb 1.775 1 14 0.34 0.204
Alcohol–cannabis Low vs highb 1.775 1 14 0.34 0.204
tlast Alcohol Low vs highb 16 8.477 1 15 0.60 0.011
Cannabis Low vs highb 0.008 1 15 0.02 0.929
Alcohol–cannabis Low vs highb 2.583 1 15 0.38 0.129
AUC0–8.3h Alcohol 17 1.871 1 16 0.32 0.190
Cannabis 2.666 1.08 17.23 0.119a
Low vs placebo 17.478 1 16 0.72 0.001
High vs placebo 3.634 1 16 0.43 0.075
Low vs high 0.942 1 16 0.23 0.346
Alcohol–cannabis 1.018 1.09 17.40 0.334a
THCCOOH
Cmax Alcohol 19 1.340 1 18 0.26 0.262
Cannabis 3.740 1.43 25.68 0.051a
Low vs placebo 3.873 1 18 0.42 0.065
High vs placebo 5.301 1 18 0.48 0.033
Low vs high 0.087 1 18 0.07 0.772
Alcohol–cannabis 1.273 1.26 22.63 0.282a
Cmax-C0 Alcohol 19 4.314 1 18 0.44 0.052
Cannabis 9.427 1.10 19.66 0.005a
Low vs placebo 14.611 1 18 0.67 0.001
High vs placebo 9.828 1 18 0.59 0.006
Low vs high 4.920 1 18 0.46 0.040
Alcohol–cannabis 1.828 1.19 21.68 0.191a
tmax Alcohol Low vs highb 10 2.018 1 9 0.43 0.189
Cannabis Low vs highb 1.755 1 9 0.40 0.218
Alcohol–cannabis Low vs highb 1.932 1 9 0.42 0.198
Forensic Toxicol
123

active doses, ranges varied more than 1000-fold (Table 2).
However, in only 3 of the 151 complete sessions was the
cannabis balloon not fully inhaled. This occurred twice for
the high dose without alcohol (Participants 19 and 20), and
once for the low dose without alcohol (Participant 20). The
balloons were left approximately one quarter full. Par-
ticipant 19 had an OF THC Cmax of 477 lg/l with this un-
finished balloon. For comparison, his Cmax at low dose/no
alcohol and high dose/alcohol were 209 and 2,348 lg/l,
respectively. This dose-dependent intrasubject variability
markedly contrasts with Participant 20, who had similar
Cmax values for high dose/no alcohol, low dose/no alcohol,
and low dose/alcohol (746, 707, and 735 lg/l, respectively).
This could indicate titration, particularly given that Par-
ticipant 20 did not finish the balloon in two sessions (those
without alcohol). Her high dose/alcohol session produced a
Cmax of 951 lg/l. Apart from these three instances, par-
ticipants consumed the entire bag, except for three other
sessions that were terminated for drug-related adverse
events [panic attack (Participant 23) and emesis/dizziness
(Participants 29 and 31)]. In a recent survey of 96 people
who vaporize cannabis (open-ended questions on ‘‘best’’
and ‘‘worst’’ characteristics of vaporizing), more than 10 %
claimed it provided more effect for the same cannabis
quantity; one respondent indicated it was ‘‘easy to consume
too much’’ [44]. It is unclear from that survey whether
anyone thought it had less effect. Considering that our
participants usually finished the entire balloon, perhaps ti-
tration occurred instead by controlling inhalation rate and
depth, and hold time in the lungs. These factors may affect
absorption and true tmax. Participants were allowed to inhale
ad libitum over 10 min, and the first post-dose specimen
was not collected until after the full time elapsed. Thus,
cannabinoid concentrations may have peaked earlier. Indi-
vidual vaporizer experiences vary considerably with can-
nabis history and inhalation topography, contributing to the
substantial variability observed. Experienced smokers often
achieve higher THC concentrations with more practiced
inhalation technique and some tolerance to its effects. The
within-subjects design of this study was advantageous,
providing a framework for examining participants’ data
relative to their own unique smoking patterns.
High initial OF THC, CBD, and CBN concentrations
arise mainly from contamination of the oral mucosa during
inhalation because of minimal transfer from blood to OF
[11, 12, 20, 31, 39, 45]. However, this effect is strongest
within the first 0.75 h of exposure, dissipating thereafter
such that OF cannabinoids better correlate with plasma,
possibly because of transmucosal absorption [11, 13, 46].
Vaporized THC, CBD, and CBN tmax immediately followed
inhalation (active doses), which is consistent with smoking
data [31, 38, 39], except in two instances after the high dose
without alcohol. Participant 3 had a high-dose tmax of 1.4 h
for THC, CBD, and CBN, but results were within ±10 % at
0.17 and 1.4 h (159 vs 165, 7.1 vs 7.7, and 6.1 vs 6.6 lg/l,
respectively). For both specimens, the Quantisal adequacy
indicator did not turn blue at 0.17 h, indicating insufficient
sample volume. Dry mouth is a well-documented phe-
nomenon following cannabis exposure [47, 48], possibly
explaining these inconsistent results. The concentrations of
these specimens were likely underestimated because of
analysis without weight correction [39]. Even under these
unusual circumstances, initial THC concentrations
[100 lg/l greatly exceeded the proposed SAMHSA [16]
and DRUID analytical [17] cutoffs (2 and 1 lg/l THC, re-
spectively). Although the results may not be quantitatively
accurate, short samples generally contain sufficient
cannabinoid concentrations to document recent exposure.
Because THCCOOH is not present in smoke but pas-
sively diffuses into OF from the bloodstream, it can help
differentiate acute passive exposure from active cannabis
exposure [11, 47, 49, 50]. When present, THCCOOH is
Table 3 continued
Analyte
parameter
Overall effect Pairwise comparison by
cannabis dose
N F Degrees of
freedom
Error degrees of
freedom
Effect size
(r)
p value
tlast Alcohol Low vs highb 10 0.670 1 9 0.26 0.434
Cannabis Low vs highb 0.522 1 9 0.23 0.488
Alcohol–cannabis Low vs highb 0.264 1 9 0.17 0.619
AUC0–8.3h Alcohol Low vs highb 17 1.124 1 16 0.26 0.305
Cannabis Low vs highb 2.041 1.52 24.33 0.160a
Alcohol–cannabis Low vs highb 0.213 1.32 21.15 0.716a
Data are from 19 individuals who participated in all dosing sessions. Statistical analysis performed by factorial repeated-measures analysis of
variance (ANOVA)a Mauchly’s test showed sphericity was violated on main effects, so Greenhouse-Geisser correction was utilizedb Placebo doses not included in ANOVA because of insufficient positive specimens for comparison
Statistical significance is indicated by p \ 0.05. Where ‘‘low vs high’’ is the only overall effect compared, there were insufficient positive
specimens after the placebo dose for statistical comparison
Forensic Toxicol
123

detected at low ng/l concentrations. Even after the high
cannabis dose, THCCOOH was not detected in OF in some
participants. The median Cmax-C0 was similar to Cmax, but
accounting for baseline concentrations produced much
lower maximum THCCOOH Cmax values for all doses.
This demonstrates new vs residual (built up with more
frequent intake) cannabinoid concentrations. THCCOOH
tmax varied throughout the session, reflecting differential
metabolic rates and residual cannabinoid concentrations.
Although our inclusion criteria targeted occasional
to moderate cannabis intake (C19/3 months but B3
days/week over the past 3 months), Participants 6, 7, 10,
27, and 38’s baseline cannabinoids (THCCOOH C20 ng/l
and THC C1 lg/l after an overnight stay, at least one
baseline THCCOOH [100 ng/l) suggested these five in-
dividuals were frequent smokers. Occasional smokers did
not meet these conditions after 13 h post-smoking in a
recent study [38]. Fabritius et al. [51] found mean and
maximum levels of THCCOOH of 100 ng/l and 500 ng/l
at baseline in frequent smokers, but it is unclear how long
participants were admitted prior to baseline. Other par-
ticipants in the current study had THC C1 lg/l and
THCCOOH C20 ng/l at baseline during some, but not all,
of their sessions, and baseline THCCOOH never exceeded
100 ng/l.
Residual THC content in placebo cannabis was only
0.008 ± 0.002 %, but this low vaporized quantity still
produced observable OF THC, shown by Cmax-C0 [0.
Fig. 3 Median (interquartile range) oral fluid a THC, b cannabidiol
(CBD), c cannabinol (CBN), and d 11-nor-9-carboxy-THC
(THCCOOH) vs time after controlled vaporized cannabis inhalation
in 19 completers. Horizontal dotted line represents analyte limit of
quantification (LOQ); vertical dotted line represents start of cannabis
administration. Asterisk, doses significantly different overall by
Friedman’s ANOVA (p B 0.001). Hash symbol, overall dose effect
p \ 0.05 by Friedman’s ANOVA, for informational purposes.
(Bonferroni correction sets significance level at p \ 0.05/11 mea-
surements = p \ 0.005). Plus, all placebo doses significantly differ-
ent to all active THC doses (p \ 0.005), with no significant
differences between any active doses. Double dagger, all placebo
doses different to all active THC doses (p \ 0.05), with no significant
differences between any active doses. Alpha, p \ 0.05 for placebo vs
low (no alcohol), placebo vs high (with and without alcohol), and low
vs high (with alcohol). Beta, p \ 0.05 for placebo vs high (with and
without alcohol), and for low vs high (with and without alcohol).
Gamma, p \ 0.05 for placebo vs high (with and without alcohol), and
for low vs high (with alcohol). Delta, p \ 0.05 for placebo vs low
(with alcohol), and for placebo vs high (with alcohol). Epsilon,
p \ 0.05 for placebo vs high (with alcohol)
Forensic Toxicol
123
This effect was not limited to participants with residual
THC at baseline. Concentrations were always \21.0 lg/l
(for baseline-negative participants) in these cases and de-
creased more rapidly than active doses. OF THC and
THCCOOH following placebo sessions are presented in
Online Resource 6. In participants positive for THCCOOH
on admission, concentrations usually decreased by base-
line, but some remained consistent or increased. In base-
line-positive participants, THCCOOH concentrations
increased and decreased without pattern throughout the
time course after placebo dosing. Participants negative for
THCCOOH at baseline remained THCCOOH-negative
throughout placebo sessions, except in two instances. In the
placebo with alcohol session for Participant 11, residual
THC decreased throughout the session from 96.3 lg/l on
admission and 7.5 lg/l at baseline to 0.65 lg/l at 8.3 h;
THCCOOH was 16.9 ng/l on admission, 0 ng/l at baseline,
and 0 ng/l at all times post-dose except 1.4 h (15.7 ng/l).
Considering that both positive THCCOOH specimens were
near the LOQ of 15 ng/l, it is likely residual THCCOOH
was just below this limit during that time. In the placebo
with alcohol session for Participant 13, THC and
THCCOOH were negative prior to dosing and at all times
post-dose except 0.17 h (3.7 lg/l and 72.6 ng/l, respec-
tively). THCCOOH detected in both of these placebo ses-
sions was consistent with residual cannabinoids from
previous self-administration. Toennes et al. [43] observed
similar THC-positive OF specimens following controlled
placebo-cannabis smoking, and Wille et al. [13] found OF
THC concentrations up to 746 ng/g (median 8 ng/g, no
Fig. 4 Drager DrugTest 5000 oral fluid cannabis detection rates over time in 19 completers with different confirmation cutoff criteria
Forensic Toxicol
123

reported baseline) after vaporized placebo cannabis. In
those studies, THCCOOH was not quantified in OF. This
observation will not likely confound OF THC interpreta-
tion in forensic cases, because outside the laboratory set-
ting there is little cause to consume placebo cannabis.
OF THC and THCCOOH were detectable in Quantisal
specimens C8.3 h post-dose after active cannabis, con-
sistent with smoking administration. Further study is re-
quired to adequately assess extended detection times
following vaporization. Previous studies after smoking
one similar-potency cannabis cigarette documented THC
and THCCOOH in some individuals’ OF C22 h [20, 47]
or C30 h [38, 39] post-smoking, especially for frequent
smokers. During sustained monitored abstinence in
chronic frequent cannabis smokers, THC was often pre-
sent 48 h after admission, and THCCOOH for many days
[52]. Participants in the present study were screened as
occasional or moderate smokers, but because some were
more frequent smokers based on cannabinoid concentra-
tions, we hypothesize that OF detection times would be
similar to or higher than those for occasional smokers.
Such data (THC 13.5 to C30 h, CBD 1–6 h, CBN
2–13.5 h, THCCOOH 0–28 h) exist for other collection
devices (StatSure, Oral-Eze) [38, 39]; our CBD and CBN
data appear similar. Quantisal was only characterized for
frequent smokers (THC and THCCOOH 6 to C22 h, CBD
and CBN 2 to C6 h) [20], with no collection times be-
tween 6 and 22 h.
Although no overall alcohol–cannabis interactive effects
were statistically significant (Table 3), high-dose vs low-
dose AUC0–8.3h was only significantly different with
coadministered alcohol (Online Resource 2). In addition,
alcohol produced later tlast values for CBD and CBN after
high doses (Online Resources 3 and 4). AUC and tlast both
rely on longer-term analyte measurements, extending be-
yond the primary absorption and distribution phases. If
only AUC0–8.3h (THC) and tlast (CBD, CBN) were affected
without impacting on Cmax or tmax, this may imply that
alcohol slowed excretion slightly. Limited other data exist
on OF cannabis combined with alcohol. An early con-
trolled-administration study noted lower THC concentra-
tions (58.3, 73.5 lg/l) 1 h post-dose in two participants
who drank 200 ml of beer immediately after smoking
10 mg of THC, relative to two others (250, 96.0 lg/l) who
did not drink [53]. The authors concluded that the differ-
ences resulted from a ‘‘washing’’ effect from the drink.
This is possible, but given the low number of participants,
it may be difficult to draw such a conclusion. Equally
likely, their observations may have reflected normal in-
terindividual variability unrelated to the beverage. No OF
Table 4 Median [range] low
(2.9 % THC) and high (6.7 %
THC) dose time of last Drager�
DrugTest 5000 on-site test
positive detection in 19
completers only (5 lg/l THC
oral fluid screening cutoff) with
different oral fluid confirmation
cutoffs, following oral
inhalation of cannabis by
Volcano� Medic vaporizer
SAMHSA Substance Abuse and
Mental Health Services
Administration, DRUID Driving
Under the Influence of Drugs,
Alcohol and Medicines
Quantitative confirmation cutoffs
lg/l (THC, CBD, CBN)
ng/l (THCCOOH)
Median [range] tlast (h)
Lowa, Highbp value (low vs high)
THC C 5 3.3a,b [0.17–8.3] 0.189
THC C 2 (SAMHSA) 3.3a,b [0.17–8.3] 0.330
THC C 1 (DRUID) 3.3a,b [0.17–8.3] 0.330
THC C 2 and THCCOOH C 20 3.3a [0.17–8.3]
5.3b [1.4–8.3]
0.171
THC C 1 and THCCOOH C 20 3.3a [0.17–8.3]
5.3b [1.4–8.3]
0.171
THC C 2 and CBD C 1 0.17a [0.17–3.3]
3.3b [1.4–8.3]
\0.001
THC C 2 and CBN C 1 2.3a,b [0.17–8.3] 0.579
THCCOOH C 20 3.3a [0.17–8.3]
5.3b [1.4–8.3]
0.171
THC C 1 and CBD C 1 0.17a [0.17–3.3]
3.3b [0.17–8.3]
\0.001
THC C 1 and CBN C 1 2.3a,b [0.17–8.3] 0.579
THC C 2 or THCCOOH C 20 3.3a,b [0.17–8.3] 0.330
THC C 1 or THCCOOH C 20 3.3a,b [0.17–8.3] 0.330
THC C 2 or CBD C 1 3.3a,b [0.17–8.3] 0.330
THC C 2 or CBN C 1 3.3a,b [0.17–8.3] 0.330
THC C 1 or CBD C 1 3.3a,b [0.17–8.3] 0.330
THC C 1 or CBN C 1 3.3a,b [0.17–8.3] 0.330
Forensic Toxicol
123

was collected prior to 1 h post-dose and all participants
were cannabis-naıve. Another study examining OF THC in
concert with alcohol found no significant difference be-
tween alcohol conditions [31]. The authors further noted
that drinking a 300-ml alcoholic beverage would not affect
roadside THC detectability; our results concur. Despite
similar blood alcohol AUC0–8.3h, THC appeared to slightly
alter the alcohol absorption phase (Fig. 1; Table 2), pro-
ducing significantly lower and later alcohol Cmax. This
corroborates previous findings [54]. It is possible this re-
sulted from the slowing effects of cannabinoids on gas-
trointestinal motility and decreased gastric emptying [55,
56], considering that alcohol is absorbed via passive dif-
fusion along concentration gradients in the stomach and
small intestine [57]. It is important to consider that the
1.4-h median alcohol tmax after the high cannabis dose
(rather than 0.42 h from the low dose) reflected the im-
mediate next alcohol measurement time, so median tmax
data should be interpreted with caution.
Factors affecting apparent on-site performance include
chosen confirmation cutoff, frequency of cannabis intake,
time course, and administration route. The DrugTest 5000
demonstrated good specificity and efficiency for OF ob-
tained over 8.3 h after cannabis vaporization in these oc-
casional smokers, but sensitivity was lower than observed
in frequent smokers after smoking a cannabis cigarette with
the same THC potency (sensitivity 90.7 % at THC C2 lg/l)
[32]. At this confirmation cutoff, we observed 47.0 %
sensitivity, but 99.6 % specificity (because of few FP) for
overall 70.1 % efficiency. Low vaporized sensitivity arose
from high FN rates, even within the first 4.3 h post-dose.
Figure 4 demonstrates the effect of different confirmation
cutoffs when evaluating on-site Drager screening perfor-
mance. After active THC, 70.7 % of tests over the first
3.3 h were positive by Drager and confirmed at
THC C2 lg/l (SAMHSA proposed cutoff). At 5.3 and
8.3 h, detection rates were 28.9 and 14.9 %, respectively.
Confirming with THC C 2 lg/l or another analyte (CBD,
CBN, or THCCOOH) produced the same results, showing
that in this occasional/moderate smoker cohort, when the
Drager was positive and CBD, CBN, or THCCOOH were
C1 lg/l, C1 lg/l, or C20 ng/l, respectively, THC was al-
ways C2 lg/l. THCCOOH was proposed as a potential
additional confirmatory criterion because it helps rule out
passive environmental exposure, detects oral cannabis use,
and can extend detection windows in chronic frequent
cannabis smokers [49, 52]. In this population, THCCOOH
was not always detected; so including THCCOOH as a
requirement for confirmation decreased sensitivity. Addi-
tional CBD or CBN C1 lg/l confirmation requirements
increased apparent sensitivity relative to THC C1 lg/l or
THC C2 lg/l only. However, this finding should be in-
terpreted carefully, because it reflects CBD and CBN as
recent-use cannabinoid markers. FN were reduced by re-
quiring minor cannabinoid detection to be considered
‘‘positive’’. This created an on-site detection window
Table 5 Performance characteristics for the Drager� DrugTest 5000
on-site test (5 lg/l THC oral fluid screening cutoff) with different oral
fluid confirmation cutoffs, following inhalation of high-dose (6.7 %
THC) cannabis by Volcano� Medic vaporizer, for comparison to
smoking a similar-potency cigarette [32]
Quantitative confirmation cutoffs
lg/l (THC, CBD, CBN)
ng/l (THCCOOH)
TP TN FP FN Sensitivity (%) Specificity (%) Efficiency (%)
THC C 5 216 207 6 117 64.9 97.2 77.5
THC C 2 (SAMHSA) 221 134 1 190 53.8 99.3 65.0
THC C 1 (DRUID) 222 90 0 234 48.7 100 57.1
THC C 2 and THCCOOH C 20 108 244 114 80 57.4 68.2 64.5
THC C 1 and THCCOOH C 20 108 239 114 85 56.0 67.7 63.6
THC C 2 and CBD C 1 151 303 71 21 87.8 81.0 83.2
THC C 2 and CBN C 1 150 312 72 12 92.6 81.3 84.6
THCCOOH C 20 108 238 114 86 55.7 67.6 63.4
THC C 1 and CBD C 1 151 303 71 21 87.8 81.0 83.2
THC C 1 and CBN C 1 150 312 72 12 92.6 81.3 84.6
THC C 2 or THCCOOH C 20 221 128 1 196 53.0 99.2 63.9
THC C 1 or THCCOOH C 20 222 89 0 235 48.6 100 57.0
THC C 2 or CBD C 1 221 134 1 190 53.8 99.3 65.0
THC C 2 or CBN C 1 221 134 1 190 53.8 99.3 65.0
THC C 1 or CBD C 1 222 90 0 234 48.7 100 57.1
THC C 1 or CBN C 1 222 90 0 234 48.7 100 57.1
TP true positives, TN true negatives, FP false positives, FN false negatives
Forensic Toxicol
123

similar to the performance-impairment window [4, 6]
(Table 4; Fig. 4). Although CBD and CBN may be markers
of recent intake, their absence does not preclude it. CBD
and CBN decreased confirmed detection rates especially
after 4 h. In a study with a longer time course, requiring
these markers for confirmation would decrease apparent
sensitivity relative to our results [32]. Using the
manufacturer-specified 5-lg/l THC screening cutoff as the
confirmation cutoff showed 60.8 % sensitivity, 98.2 %
specificity, and 82.5 % overall efficiency, higher than all
other evaluated THC cutoffs except those additionally re-
quiring CBD or CBN.
Our results are similar to an early roadside Drager study
whose authors also noted high numbers of FN [58]. In
contrast, recent smoked and roadside studies demonstrated
higher sensitivity (58.3–94.4 %), but lower specificity
(15.4–75 %) sometimes resulting from few TN [29–32,
59]. Some of these studies only quantified plasma rather
than OF confirmations during Drager performance eval-
uation. THC cutoffs in plasma were 1–2 lg/l [29, 30], and
in OF were 2–5 lg/l [31, 32]. Roadside studies may have
inherently fewer TP than controlled-administration studies,
decreasing apparent sensitivity and efficiency (which de-
pend upon total detected TP). Alcohol produced no impact
on Drager performance post-smoking [31], agreeing with
our findings post-vaporization. To date, the only other on-
site testing device evaluated with vaporized cannabis, the
DrugWipe-5S, produced remarkably similar results to the
Drager at a 1-lg/l OF THC cutoff. Wille et al. [13] ob-
served 43, 100, and 57 % DrugWipe-5S sensitivity,
specificity, and efficiency, respectively; here, Drager per-
formance was 40.4, 99.8, and 60.7 %.
Volatilization by hot air is a different heating mechan-
ism from combustion, altering the properties of inhaled
vapor vs smoke [22, 60, 61]. As far as we are aware, pH
and other chemical properties of cannabis smoke and vapor
are not yet elucidated, but tobacco smoke can vary even
during the process of smoking a cigar [62]. Cannabis vapor
may interact with oral mucosa differently to smoke, alter-
ing Drager performance. Lower volatilization heating
temperature (210 �C) releases less THC than smoking
(C230 �C) [22, 63], and some THC could adhere to the
balloon [64]. Vaporization causes less exposure to com-
bustion by-products, cannabinoids, and other chemicals
[22, 23]. It is possible that lower THC contamination of
oral mucosa contributed to the lower vaporized sensitivity.
Another possible explanation is that OF collection with the
Drager collection device involves moving it throughout the
entire mouth, mildly stimulating saliva production,
whereas the Quantisal device is held sublingually. Drager
also recommends collecting the confirmation OF specimen
first, which may help stimulate OF production. We fol-
lowed these guidelines in specimen collection. Stimulation
can decrease OF drug concentrations because of further
dilution [65]. These and other factors may contribute to
observed sensitivity differences relative to smoking. Fi-
nally, the time course of the current experiment was shorter
than our previous studies, and doses included placebo, low
(2.9 %), and a comparable (6.7 %) THC dose. Including
only high-dose results (Table 5) increased sensitivity
overall but still resulted in lower sensitivity relative to
smoking [32]. Another possible consideration is that the
THC cigarettes contained more total cannabis (0.79 g) than
the amount vaporized (0.5 g).
Median Drager tlast was 3–4 h for evaluated cutoffs, but
for all cutoffs some specimens were positive after 8.3 h.
This coincides with previous smoking findings, showing
that some Drager OF specimens were positive C4 h [31]
and 6 to C22 h [32]. More recently, significant differences
in Drager tlast were observed between occasional and fre-
quent smokers when OF confirmation results also consid-
ered the presence of THCCOOH [33]. Drager tlast varied
considerably overall and by chosen confirmation cutoff
criteria, highlighting the importance of careful interpreta-
tion. Further study is required to determine extended de-
tection windows following vaporization.
Conclusions
For the first time following controlled cannabis vaporization,
we have documented cannabinoid disposition in OF over
8.3 h with and without low-dose alcohol, and evaluated the
performance of an on-site screening device. The Drager on-
site device best reflected the cannabis impairment window
when combined with the recent use markers CBD and CBN,
because these analytes shortened the detection windows to
approximately 2–4 h. However, possible increased variability
in CBD potency may result in different or extended CBD
detection; future research with cannabis containing higher
CBD is recommended. Chosen confirmation cutoff, time
since dosing, length of monitoring, frequency of use, and
additional detected analytes all affect interpretation. The
Drager DrugTest 5000 displayed lower sensitivity after va-
porization than smoking, but high specificity and comparable
efficiency. Concurrent alcohol (albeit at least 10 min prior to
vaporization) did not affect cannabinoid OF concentrations or
on-site test sensitivity. Future studies should directly compare
cannabis vaporization to smoking over extended periods.
Acknowledgments We thank the nurses and staff of the University
of Iowa Clinical Research Unit, as well as the staff of the National
Advanced Driving Simulator, for contributions to data collection. We
further acknowledge Cheryl Roe, Jennifer Henderson, Rose Schmitt,
and Kayla Smith for data assembly and coordination, and Allan J.
Barnes for instrumentation expertise. We acknowledge the University
Forensic Toxicol
123

of Maryland, Baltimore Toxicology Program, and the Graduate
Partnership Program, National Institutes of Health (NIH). The Drager
DrugTest 5000, Quantisal, and Volcano devices and supplies were
provided by the manufacturers to NIH through Materials Transfer
Agreements. This research was funded by the Intramural Research
Program, National Institute on Drug Abuse, NIH, the United States
Office of National Drug Control Policy, and the National Highway
Traffic Safety Administration.
Conflict of interest Ms. Hartman and Drs. Anizan, Jang, Yun,
Gorelick, and Huestis report research funding through interagency
agreements from the National Highway Traffic Safety Administration
and the Office of National Drug Control Policy; and nonfinancial
support (devices provided via Materials Transfer Agreements) from
Storz-Bickel, Immunalysis, and Drager, during the course of the
study. Dr. Yun additionally reports grant funding from the National
Key Technology R&D Program of China (2012BAK02B02-2). Drs.
Brown, Milavetz, Spurgin, and Gaffney report contract research
funding from the National Highway Traffic Safety Administration,
the Office of National Drug Control Policy, and the National Institute
on Drug Abuse; and nonfinancial support (devices provided via Ma-
terials Transfer Agreements) from Storz-Bickel, Immunalysis, and
Drager, during the course of the study. No commercial organization
participated in study design, data analysis, or manuscript writing.
References
1. Lacey JH, Kelley-Baker T, Furr-Holden D, Voas RB, Romano E,
Ramirez A, Brainard K, Moore C, Torres P, Berning A (2009)
2007 National roadside survey of alcohol and drug use by drivers:
drug results. DOT HS 811 249 National Highway Traffic Safety
Administration Office of Behavioral Safety Research, Washing-
ton, DC
2. Davey J, Leal N, Freeman J (2007) Screening for drugs in oral
fluid: Illicit drug use and drug driving in a sample of Queensland
motorists. Drug Alcohol Rev 26:301–307
3. Poulsen H, Moar R, Troncoso C (2012) The incidence of alcohol
and other drugs in drivers killed in New Zealand road crashes
2004–2009. Forensic Sci Int 223:364–370
4. Hartman RL, Huestis MA (2013) Cannabis effects on driving
skills. Clin Chem 59:478–492
5. Ramaekers JG, Robbe HWJ, O’Hanlon JF (2000) Marijuana,
alcohol and actual driving performance. Hum Psychopharm
15:551–558
6. Ramaekers J, Kauert G, Theunissen E, Toennes S, Moeller M
(2009) Neurocognitive performance during acute THC intoxica-
tion in heavy and occasional cannabis users. J Psychopharmacol
23:266–277
7. Bosker WM, Theunissen EL, Conen S, Kuypers KP, Jeffery WK,
Walls HC, Kauert GF, Toennes SW, Moeller MR, Ramaekers JG
(2012) A placebo-controlled study to assess standardized field
sobriety tests performance during alcohol and cannabis in-
toxication in heavy cannabis users and accuracy of point of
collection testing devices for detecting THC in oral fluid. Psy-
chopharmacology 223:439–446
8. Charlton SG, Starkey NJ (2013) Driver risk from blood alcohol
levels between 50 mg/100 ml and 80 mg/100 ml. NZ Transport
Agency Research Report Traffic and Road Safety Research
Group. University of Waikato, Hamilton
9. Johnson MB, Kelley-Baker T, Voas RB, Lacey JH (2012) The
prevalence of cannabis-involved driving in California. Drug Al-
cohol Depen 123:105–109
10. Rocky Mountain High Intensity Drug Trafficking Area (2013)
The legalization of marijuana in Colorado: the impact 1:1–66
11. Bosker WM, Huestis MA (2009) Oral fluid testing for drugs of
abuse. Clin Chem 55:1910–1931
12. Drummer OH (2006) Drug testing in oral fluid. Clin Biochem
Rev 27:147–159
13. Wille SM, Di Fazio V, Toennes SW, van Wel JH, Ramaekers JG,
Samyn N (2014) Evaluation of D9-tetrahydrocannabinol detection
using DrugWipe5S screening and oral fluid quantification after
Quantisal collection for roadside drug detection via a controlled study
with chronic cannabis users. Drug Test Anal. doi:10.1002/dta.1660
14. Bogstrand ST, Gjerde H (2014) Which drugs are associated with
highest risk for being arrested for driving under the influence? A
case–control study. Forensic Sci Int 240:21–28
15. Kelley-Baker T, Moore C, Lacey JH, Yao J (2014) Comparing
drug detection in oral fluid and blood: data from a national
sample of nighttime drivers. Traffic Inj Prev 15:111–118
16. Substance Abuse and Mental Health Services Administration
(SAMHSA) (2004) Notice of proposed revisions to the manda-
tory guidelines for federal workplace drug testing programs. Fed
Regist 69:19673–19732
17. Pil K, Raes E, Van den Neste T, Verstraete A (2007) Toxico-
logical analyses in the DRUID epidemiological studies: analy-
tical methods, target analytes and analytical cut-offs. Paper
presented at the The European Integrated Project DRUID 2007
18. Baggio S, Deline S, Studer J, Mohler-Kuo M, Daeppen JB, Gmel
G (2014) Routes of administration of cannabis used for non-
medical purposes and associations with patterns of drug use.
J Adolesc Health 54:235–240
19. Huestis MA, Henningfield JE, Cone EJ (1992) Blood cannabi-
noids I. Absorption of THC and formation of 11-OH-THC and
THCCOOH during and after smoking marijuana. J Anal Toxicol
16:276–282
20. Lee D, Schwope DM, Milman G, Barnes AJ, Gorelick DA,
Huestis MA (2012) Cannabinoid disposition in oral fluid after
controlled smoked cannabis. Clin Chem 58:748–756
21. Huestis MA, Sampson AH, Holicky BJ, Henningfield JE, Cone
EJ (1992) Characterization of the absorption phase of marijuana
smoking. Clin Pharmacol Ther 52:31–41
22. Pomahacova B, Van der Kooy F, Verpoorte R (2009) Cannabis
smoke condensate III: the cannabinoid content of vaporised
Cannabis sativa. Inhal Toxicol 21:1108–1112
23. Fischedick J, Van Der Kooy F, Verpoorte R (2010) Cannabinoid
receptor 1 binding activity and quantitative analysis of Cannabis
sativa L. smoke and vapor. Chem Pharm Bull (Tokyo) 58:201–207
24. Abrams DI, Vizoso HP, Shade SB, Jay C, Kelly ME, Benowitz
NL (2007) Vaporization as a smokeless cannabis delivery system:
a pilot study. Clinic Pharmacol Ther 82:572–578
25. Zuurman L, Roy C, Schoemaker R, Hazekamp A, den Hartigh J,
Bender J, Verpoorte R, Pinquier J, Cohen A, van Gerven J (2008)
Effect of intrapulmonary tetrahydrocannabinol administration in
humans. J Psychopharmacol 22:707–716
26. Van Dam NT, Earleywine M (2010) Pulmonary function in
cannabis users: support for a clinical trial of the vaporizer. Int J
Drug Policy 21:511–513
27. Earleywine M, Barnwell SS (2007) Decreased respiratory
symptoms in cannabis users who vaporize. Harm Reduct J 4:11
28. Toennes SW, Kauert GF, Steinmeyer S, Moeller MR (2005)
Driving under the influence of drugs—evaluation of analytical
data of drugs in oral fluid, serum and urine, and correlation with
impairment symptoms. Forensic Sci Int 152:149–155
29. Musshoff F, Hokamp EG, Bott U, Madea B (2014) Performance
evaluation of on-site oral fluid drug screening devices in normal
police procedure in Germany. Forensic Sci Int 238:120–124
30. Wille SM, Samyn N, Ramırez-Fernandez Mdel M, De Boeck G
(2010) Evaluation of on-site oral fluid screening using Drugwipe-
5?, RapidSTAT and Drug Test 5000 for the detection of drugs of
abuse in drivers. Forensic Sci Int 198:2–6
Forensic Toxicol
123

31. Toennes SW, Schneider K, Wunder C, Kauert GF, Moeller MR,
Theunissen EL, Ramaekers JG (2013) Influence of ethanol on the
pharmacokinetic properties of D9-tetrahydrocannabinol in oral
fluid. J Anal Toxicol 37:152–158
32. Desrosiers NA, Lee D, Schwope DM, Milman G, Barnes AJ,
Gorelick DA, Huestis MA (2012) On-site test for cannabinoids in
oral fluid. Clin Chem 58:1418–1425
33. Desrosiers NA, Milman G, Mendu DR, Lee D, Barnes AJ,
Gorelick DA, Huestis MA (2014) Cannabinoids in oral fluid by
on-site immunoassay and by GC-MS using two different oral
fluid collection devices. Anal Bioanal Chem 406:4117–4128
34. Lee D, Milman G, Schwope DM, Barnes AJ, Gorelick DA,
Huestis MA (2012) Cannabinoid stability in authentic oral fluid
after controlled cannabis smoking. Clin Chem 58:1101–1109
35. Milman G, Barnes AJ, Lowe RH, Huestis MA (2010) Simulta-
neous quantification of cannabinoids and metabolites in oral fluid
by two-dimensional gas chromatography mass spectrometry.
J Chromatogr A 1217:1513–1521
36. Welling PG, Lyons L, Elliott R, Amidon GL (1977) Pharma-
cokinetics of alcohol following single low doses to fasted and
nonfasted subjects. J Clin Pharmacol 17:199–206
37. Wilkinson PK (1980) Pharmacokinetics of ethanol: a review.
Alcoholism Clin Exp Res 4:6–21
38. Newmeyer MN, Desrosiers NA, Lee D, Mendu DR, Barnes AJ,
Gorelick DA, Huestis MA (2014) Cannabinoid disposition in oral
fluid after controlled cannabis smoking in frequent and occasional
smokers. Drug Test Anal 6:1002–1010
39. Anizan S, Milman G, Desrosiers N, Barnes AJ, Gorelick DA,
Huestis MA (2013) Oral fluid cannabinoid concentrations fol-
lowing controlled smoked cannabis in chronic frequent and oc-
casional smokers. Anal Bioanal Chem 405:8451–8461
40. Bergamaschi M, Queiroz R, Zuardi A, Crippa J (2011) Safety and
side effects of cannabidiol, a Cannabis sativa constituent. Curr
Drug Saf 6:237–249
41. Bergamaschi MM, Queiroz RHC, Chagas MHN, de Oliveira
DCG, De Martinis BS, Kapczinski F, Quevedo J, Roesler R,
Schroder N, Nardi AE, Martin-Santos R, Hallak JEC, Zuardi AW,
Crippa JAS (2011) Cannabidiol reduces the anxiety induced by
simulated public speaking in treatment-naive social phobia pa-
tients. Neuropsychopharmacology 36:1219–1226
42. Szaflarski JP, Martina Bebin E (2014) Cannabis, cannabidiol, and
epilepsy—from receptors to clinical response. Epilepsy Behav.
doi:10.1016/j.yebeh.2014.08.135
43. Toennes SW, Ramaekers JG, Theunissen EL, Moeller MR,
Kauert GF (2010) Pharmacokinetic properties of D9-tetrahydro-
cannabinol in oral fluid of occasional and chronic users. J Anal
Toxicol 34:216–221
44. Malouff JM, Rooke SE, Copeland J (2014) Experiences of
marijuana-vaporizer users. Subst Abus 35:127–128
45. Lee D, Vandrey R, Mendu DR, Murray JA, Barnes AJ, Huestis
MA (2014) Oral fluid cannabinoids in chronic frequent cannabis
smokers during ad libitum cannabis smoking. Drug Test Anal.
doi:10.1002/dta.1718
46. Huestis MA, Cone EJ (2004) Relationship of D9-tetrahydro-
cannabinol concentrations in oral fluid and plasma after controlled
administration of smoked cannabis. J Anal Toxicol 28:394–399
47. Milman G, Schwope DM, Gorelick DA, Huestis MA (2012)
Cannabinoids and metabolites in expectorated oral fluid follow-
ing controlled smoked cannabis. Clin Chim Acta 413:765–770
48. Verstraete AG (2005) Oral fluid testing for driving under the
influence of drugs: history, recent progress and remaining chal-
lenges. Forensic Sci Int 150:143–150
49. Moore C, Coulter C, Uges D, Tuyay J, van der Linde S, van
Leeuwen A, Garnier M, Orbita J Jr (2011) Cannabinoids in oral
fluid following passive exposure to marijuana smoke. Forensic
Sci Int 212:227–230
50. Milman G, Barnes AJ, Schwope DM, Schwilke EW, Darwin WD,
Goodwin RS, Kelly DL, Gorelick DA, Huestis MA (2010) Dis-
position of cannabinoids in oral fluid after controlled around-the-
clock oral THC administration. Clin Chem 56:1261–1269
51. Fabritius M, Chtioui H, Battistella G, Annoni JM, Dao K, Favrat
B, Fornari E, Lauer E, Maeder P, Giroud C (2013) Comparison
of cannabinoid concentrations in oral fluid and whole blood
between occasional and regular cannabis smokers prior to and
after smoking a cannabis joint. Anal Bioanal Chem 405:9791–
9803
52. Lee D, Milman G, Barnes AJ, Goodwin RS, Hirvonen J, Huestis
MA (2011) Oral fluid cannabinoids in chronic, daily cannabis
smokers during sustained, monitored abstinence. Clin Chem
57:1127–1136
53. Maseda C, Hama K, Fukui Y, Matsubara K, Takahashi S, Akane
A (1986) Detection of D9-THC in saliva by capillary GC/ECD
after marihuana smoking. Forensic Sci Int 32:259–266
54. Lukas SE, Benedikt R, Mendelson JH, Kouri E, Sholar M, Amass
L (1992) Marihuana attenuates the rise in plasma ethanol levels in
human subjects. Neuropsychopharmacology 7:77–81
55. Abalo R, Vera G, Lopez-Perez AE, Martinez-Villaluenga M,
Martin-Fontelles MI (2012) The gastrointestinal pharmacology of
cannabinoids: focus on motility. Pharmacology 90:1–10
56. Izzo AA, Sharkey KA (2010) Cannabinoids and the gut: new devel-
opments and emerging concepts. Pharmacol Therapeut 126:21–38
57. Dubowski KM (1985) Absorption, distribution and elimination of
alcohol: highway safety aspects. J Stud Alcohol 10:98–108
58. Laloup M, del Mar Ramirez Fernandez M, Wood M, De Boeck
G, Maes V, Samyn N (2006) Correlation of D9-tetrahydro-
cannabinol concentrations determined by LC-MS-MS in oral
fluid and plasma from impaired drivers and evaluation of the on-
site Drager DrugTest. Forensic Sci Int 161:175–179
59. Logan BK, Mohr AL, Talpins SK (2014) Detection and preva-
lence of drug use in arrested drivers using the Drager Drug Test
5000 and Affiniton DrugWipe oral fluid drug screening devices.
J Anal Toxicol 38:444–450
60. Gieringer D, St. Laurent J, Goodrich S (2004) Cannabis vaporizer
combines efficient delivery of THC with effective suppression of
pyrolytic compounds. J Cannab Therapeut 4:7–27
61. Chemic Laboratories (2003) Evaluation of Volcano vaporizer for
the efficient emission of THC, CBD, CBN and the significant
reduction and/or elimination of polynuclear-aromatic (PNA)
analytes resultant of pyrolysis. Report No. 1311619-0103-2563,
Canton; pp 1–57
62. Henningfield JE, Fant RV, Radzius A, Frost S (1999) Nicotine
concentration, smoke pH and whole tobacco aqueous pH of some
cigar brands and types popular in the United States. Nicotine Tob
Res 1:163–168
63. Hazekamp A (2010) The Volcano Medic cannabis vaporizer:
optimal temperature for single-dose administration of 100 mg
cannabis or 10 mg dronabinol. LabAssistent Phytochemical
Services Project No. 2010-003c, Leiden; pp 1–13
64. Hazekamp A, Ruhaak R, Zuurman L, van Gerven J, Verpoorte R
(2006) Evaluation of a vaporizing device (Volcano) for the pul-
monary administration of tetrahydrocannabinol. J Pharm Sci
95(6):1308–1317
65. Drummer OH (2005) Review: pharmacokinetics of illicit drugs in
oral fluid. Forensic Sci Int 150:133–142
Forensic Toxicol
123