prediction of earthquake damage to urban water distribution systems: a case study for denizli,...
TRANSCRIPT
ORIGINAL PAPER
Prediction of earthquake damage to urban water distributionsystems: a case study for Denizli, Turkey
Selcuk Toprak Æ Filiz Taskin Æ A. Cem Koc
Received: 27 June 2008 / Accepted: 27 July 2009 / Published online: 14 August 2009
� Springer-Verlag 2009
Abstract Prediction of damage to water supply lines
during an earthquake is a critical part of seismic planning.
This study evaluates the performance of the water supply
system in Denizli, Turkey, in the event of an M6, M6.3,
M6.5 and M7 earthquake associated with the Pamukkale
and Karakova-Akhan Faults. The relative effects of tran-
sient ground deformations and permanent ground defor-
mations based on maps of liquefiable soil and zones of
predicted lateral ground displacements are compared. The
relative effects of the different magnitude earthquakes and
pipeline damage relationships on the pipeline performance
following a seismic event are assessed.
Keywords Earthquake hazards � Ground shaking �Lateral spreading � Liquefaction � Pipeline damage, Denizli
Introduction
The devastating 1999 M7.4 Kocaeli and M7.2 Duzce,
earthquakes were a turning point in Turkey’s approach to
earthquake preparedness as they caused substantial damage
to the water services and in some areas the supply could not
be restored until many months after the earthquake. As a
consequence, many new laws were enacted in an attempt to
reduce the effect of any future earthquake on structures and
communities. Municipalities took actions (e.g., PAU 2002)
and some cities created ‘‘disaster masterplans’’ (KOERI
2000). However, such essential services as water and gas
distribution systems were given less attention and to date,
very few municipalities and companies have evaluated the
performance of their pipelines and structures against future
earthquakes.
Earthquake damage to buried pipelines can be attributed
to transient ground deformation (TGD) or to permanent
ground deformation (PGD) or both. TGD occurs as a result
of wave propagation or ground shaking effects while PGD
occurs as a result of surface faulting, liquefaction, land-
slides and differential settlement from consolidation of
cohesionless soils. The relative magnitudes of TGD and
PGD determine which will have the predominant influence
on pipeline response.
The paper first describes the changes in water supply
distribution systems in urban areas of Turkey including the
shift from brittle pipelines such as asbestos cement (AC)
and cast iron (CI) to more ductile pipelines such as poly-
ethylene (PE) and ductile cast iron (DI), and then assesses
the potential damage to the water pipelines of Denizli City,
Turkey, during future earthquakes both from the TGD and
liquefaction induced PGD.
Eight earthquake scenarios with four different earth-
quake magnitudes (M6, M6.3, M6.5 and M7) caused by
two different fault ruptures (Pamukkale and Karakova-
Akhan faults) were studied. The Pamukkale and Karakova-
Akhan faults are historically active faults and located to the
northwest of Denizli city (Fig. 1). Previous studies (e.g.,
Celik 2003) indicate that the Pamukkale and Karakova-
Akhan faults produce higher shaking intensities in Denizli
than some other active faults in the area (e.g., Honaz fault).
S. Toprak (&) � A. C. Koc
Civil Engineering Department, Pamukkale University,
Kinikli Campus, 20070 Denizli, Turkey
e-mail: [email protected]
A. C. Koc
e-mail: [email protected]
F. Taskin
Turkiye Sinai Kalkinma Bank (TSKB), Appraisal Section,
Izmir, Turkey
e-mail: [email protected]
123
Bull Eng Geol Environ (2009) 68:499–510
DOI 10.1007/s10064-009-0230-1
In order to analyze TGD and PGD effects on the pipelines,
peak horizontal ground velocity (PGV) and liquefaction
induced lateral ground displacement maps of the area were
prepared for each scenario earthquake.
Denizli has a population of more than 300,000 and is the
second largest city in the Aegean region of Turkey (Fig. 1).
It is an important centre for industry, tourism and exports.
The water distribution system was initially commissioned
in 1953 and has been progressively enlarged as the popu-
lation increased from 48,925 in the 1960s to 275,480 in the
2000s. As part of this study, the water pipelines of the city
were digitized and analyzed using Geographical Informa-
tion Systems (ArcGIS program, ESRI 2001).
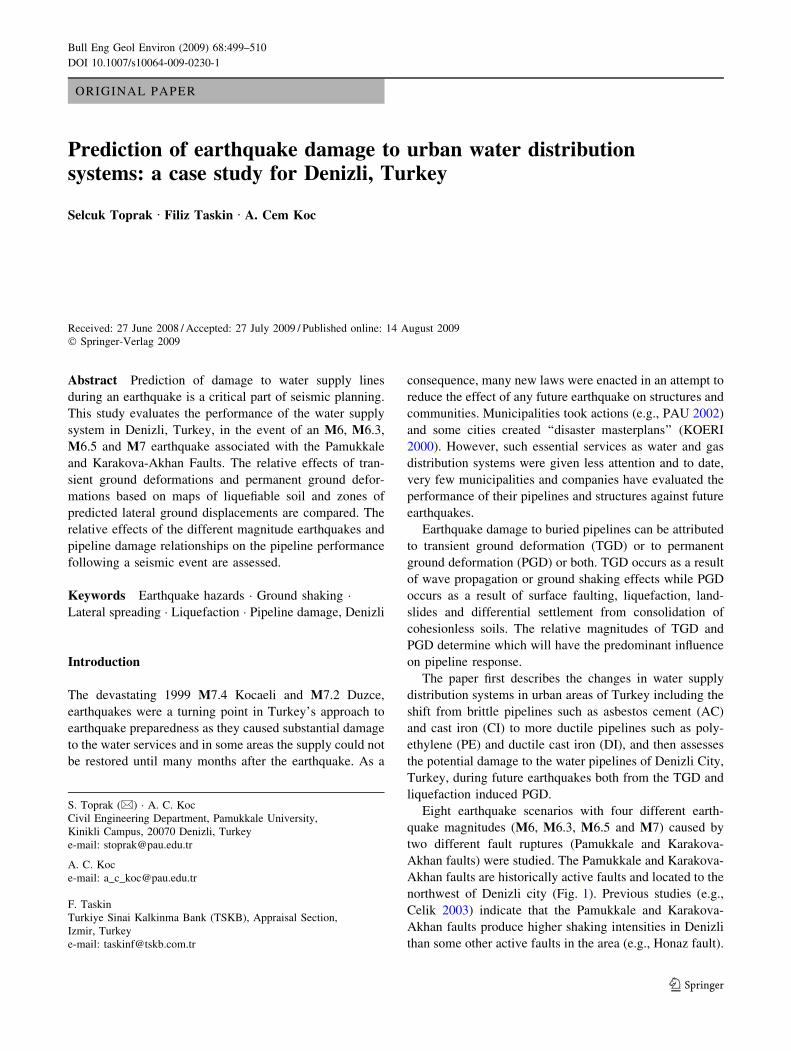
Located on the western side of Turkey, Denizli is in the
seismic region affected by the NW–SE extending Gediz
Graben and E–W extending Menderes Graben as well as a
number of active faults (Saroglu et al. 1992). The Denizli
basin is situated close to the confluence of the two grabens
(Fig. 1i). The figure also shows the maximum intensity of
the historic earthquakes recorded prior to 1900 as well as
the earthquakes with a magnitude of [5 recorded between
1900 and 2004 (KOERI 2004). As shown in Fig. 1i, prior
to 1900 there were many earthquakes with intensities of IX
and X, some of which caused heavy damage and casualties
in the Denizli area. The magnitude-recurrence intervals
systems of Aydan et al. (2001a) suggests future earth-
quakes in the Denizli basin could have magnitudes of
between M6.0 and M7.2. In this paper, a M7.0 earthquake
is used to represent the maximum probable earthquake
while M6.3 is used as the most probable magnitude, based
on the study by Aydan et al. (2001b) which considered the
mean stress distributions in western Turkey.
Figure 1ii shows the general geology of the Denizli
basin consists of Neogene aged sedimentary rocks and
Quaternary deposits. Further information on the seismicity
and geology of the area can be found in Toprak and Taskin
(2007).
History of water distribution systems in Turkey
Primarily, the municipalities are the owners of the water
distribution networks in urban areas, and they control and
sell water to the consumers. However, the Bank of Prov-
inces (Iller Bankasi) in Turkey has historically had a con-
siderable influence, providing financial and technical
assistance to local authorities. According to the Bank of
Provinces statistics, some 175,000 km of pipelines was
constructed in Turkey with its support between 1969 and
2005 (Iller Bankasi, Bank of Provinces, 2008). Until the
mid 1990s, it was the Bank’s policy to use primarily AC
pipes for water supply systems, although in the following
years, the use of PVC pipes has increased, especially for
100–200 mm diameters. In recent years, however, PE and
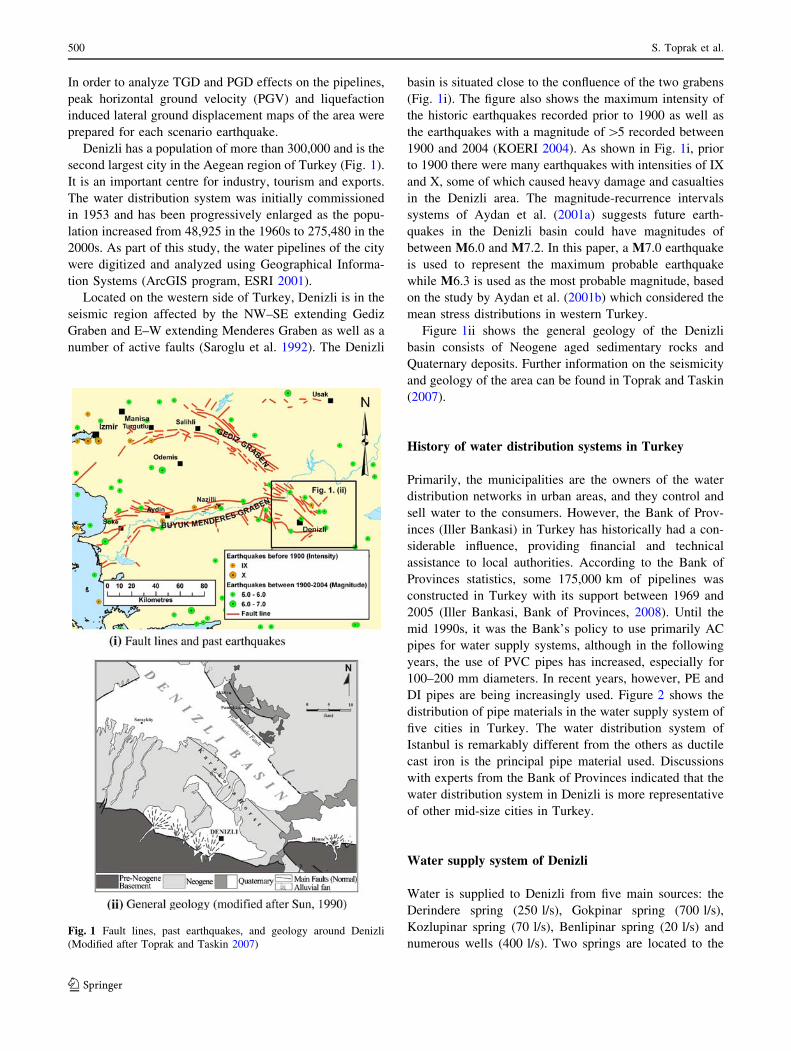
DI pipes are being increasingly used. Figure 2 shows the
distribution of pipe materials in the water supply system of
five cities in Turkey. The water distribution system of
Istanbul is remarkably different from the others as ductile
cast iron is the principal pipe material used. Discussions
with experts from the Bank of Provinces indicated that the
water distribution system in Denizli is more representative
of other mid-size cities in Turkey.
Water supply system of Denizli
Water is supplied to Denizli from five main sources: the
Derindere spring (250 l/s), Gokpinar spring (700 l/s),
Kozlupinar spring (70 l/s), Benlipinar spring (20 l/s) and
numerous wells (400 l/s). Two springs are located to theFig. 1 Fault lines, past earthquakes, and geology around Denizli
(Modified after Toprak and Taskin 2007)
500 S. Toprak et al.
123
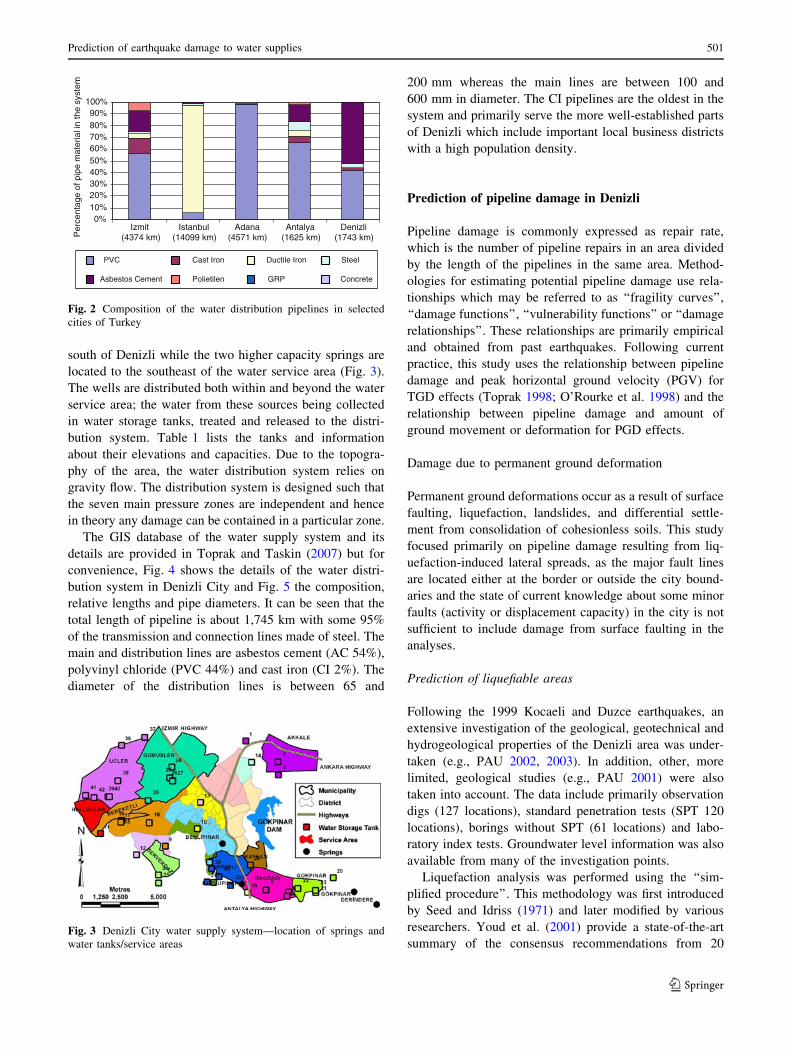
south of Denizli while the two higher capacity springs are
located to the southeast of the water service area (Fig. 3).
The wells are distributed both within and beyond the water
service area; the water from these sources being collected
in water storage tanks, treated and released to the distri-
bution system. Table 1 lists the tanks and information
about their elevations and capacities. Due to the topogra-
phy of the area, the water distribution system relies on
gravity flow. The distribution system is designed such that
the seven main pressure zones are independent and hence
in theory any damage can be contained in a particular zone.
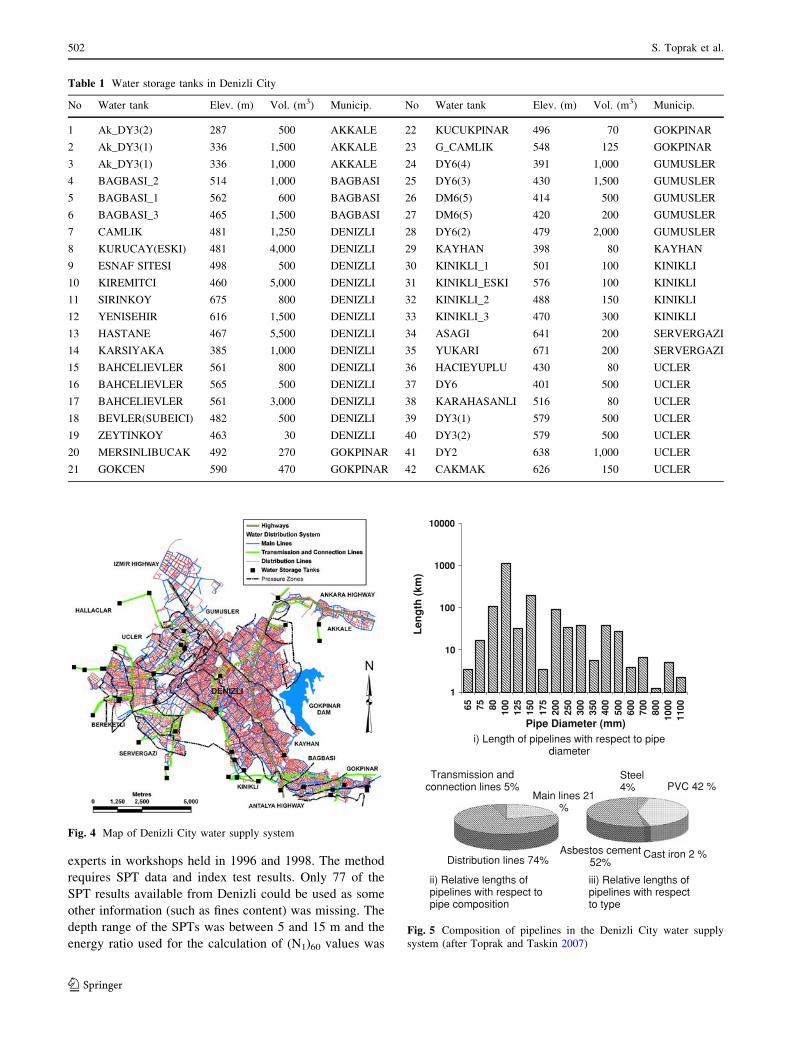
The GIS database of the water supply system and its
details are provided in Toprak and Taskin (2007) but for
convenience, Fig. 4 shows the details of the water distri-
bution system in Denizli City and Fig. 5 the composition,
relative lengths and pipe diameters. It can be seen that the
total length of pipeline is about 1,745 km with some 95%
of the transmission and connection lines made of steel. The
main and distribution lines are asbestos cement (AC 54%),
polyvinyl chloride (PVC 44%) and cast iron (CI 2%). The
diameter of the distribution lines is between 65 and
200 mm whereas the main lines are between 100 and
600 mm in diameter. The CI pipelines are the oldest in the
system and primarily serve the more well-established parts
of Denizli which include important local business districts
with a high population density.
Prediction of pipeline damage in Denizli
Pipeline damage is commonly expressed as repair rate,
which is the number of pipeline repairs in an area divided
by the length of the pipelines in the same area. Method-
ologies for estimating potential pipeline damage use rela-
tionships which may be referred to as ‘‘fragility curves’’,
‘‘damage functions’’, ‘‘vulnerability functions’’ or ‘‘damage
relationships’’. These relationships are primarily empirical
and obtained from past earthquakes. Following current
practice, this study uses the relationship between pipeline
damage and peak horizontal ground velocity (PGV) for
TGD effects (Toprak 1998; O’Rourke et al. 1998) and the
relationship between pipeline damage and amount of
ground movement or deformation for PGD effects.
Damage due to permanent ground deformation
Permanent ground deformations occur as a result of surface
faulting, liquefaction, landslides, and differential settle-
ment from consolidation of cohesionless soils. This study
focused primarily on pipeline damage resulting from liq-
uefaction-induced lateral spreads, as the major fault lines
are located either at the border or outside the city bound-
aries and the state of current knowledge about some minor
faults (activity or displacement capacity) in the city is not
sufficient to include damage from surface faulting in the
analyses.
Prediction of liquefiable areas
Following the 1999 Kocaeli and Duzce earthquakes, an
extensive investigation of the geological, geotechnical and
hydrogeological properties of the Denizli area was under-
taken (e.g., PAU 2002, 2003). In addition, other, more
limited, geological studies (e.g., PAU 2001) were also
taken into account. The data include primarily observation
digs (127 locations), standard penetration tests (SPT 120
locations), borings without SPT (61 locations) and labo-
ratory index tests. Groundwater level information was also
available from many of the investigation points.
Liquefaction analysis was performed using the ‘‘sim-
plified procedure’’. This methodology was first introduced
by Seed and Idriss (1971) and later modified by various
researchers. Youd et al. (2001) provide a state-of-the-art
summary of the consensus recommendations from 20
0%10%20%30%40%50%60%70%80%90%
100%
Izmit(4374 km)
Istanbul(14099 km)
Adana(4571 km)
Antalya(1625 km)
Denizli(1743 km)P
erce
ntag
e of
pip
e m
ater
ial i
n th
e sy
stem
PVC Cast Iron Ductile Iron Steel
Asbestos Cement Polietilen GRP Concrete
Fig. 2 Composition of the water distribution pipelines in selected
cities of Turkey
Fig. 3 Denizli City water supply system—location of springs and
water tanks/service areas
Prediction of earthquake damage to water supplies 501
123
experts in workshops held in 1996 and 1998. The method
requires SPT data and index test results. Only 77 of the
SPT results available from Denizli could be used as some
other information (such as fines content) was missing. The
depth range of the SPTs was between 5 and 15 m and the
energy ratio used for the calculation of (N1)60 values was
Table 1 Water storage tanks in Denizli City
No Water tank Elev. (m) Vol. (m3) Municip. No Water tank Elev. (m) Vol. (m3) Municip.
1 Ak_DY3(2) 287 500 AKKALE 22 KUCUKPINAR 496 70 GOKPINAR
2 Ak_DY3(1) 336 1,500 AKKALE 23 G_CAMLIK 548 125 GOKPINAR
3 Ak_DY3(1) 336 1,000 AKKALE 24 DY6(4) 391 1,000 GUMUSLER
4 BAGBASI_2 514 1,000 BAGBASI 25 DY6(3) 430 1,500 GUMUSLER
5 BAGBASI_1 562 600 BAGBASI 26 DM6(5) 414 500 GUMUSLER
6 BAGBASI_3 465 1,500 BAGBASI 27 DM6(5) 420 200 GUMUSLER
7 CAMLIK 481 1,250 DENIZLI 28 DY6(2) 479 2,000 GUMUSLER
8 KURUCAY(ESKI) 481 4,000 DENIZLI 29 KAYHAN 398 80 KAYHAN
9 ESNAF SITESI 498 500 DENIZLI 30 KINIKLI_1 501 100 KINIKLI
10 KIREMITCI 460 5,000 DENIZLI 31 KINIKLI_ESKI 576 100 KINIKLI
11 SIRINKOY 675 800 DENIZLI 32 KINIKLI_2 488 150 KINIKLI
12 YENISEHIR 616 1,500 DENIZLI 33 KINIKLI_3 470 300 KINIKLI
13 HASTANE 467 5,500 DENIZLI 34 ASAGI 641 200 SERVERGAZI
14 KARSIYAKA 385 1,000 DENIZLI 35 YUKARI 671 200 SERVERGAZI
15 BAHCELIEVLER 561 800 DENIZLI 36 HACIEYUPLU 430 80 UCLER
16 BAHCELIEVLER 565 500 DENIZLI 37 DY6 401 500 UCLER
17 BAHCELIEVLER 561 3,000 DENIZLI 38 KARAHASANLI 516 80 UCLER
18 BEVLER(SUBEICI) 482 500 DENIZLI 39 DY3(1) 579 500 UCLER
19 ZEYTINKOY 463 30 DENIZLI 40 DY3(2) 579 500 UCLER
20 MERSINLIBUCAK 492 270 GOKPINAR 41 DY2 638 1,000 UCLER
21 GOKCEN 590 470 GOKPINAR 42 CAKMAK 626 150 UCLER
Fig. 4 Map of Denizli City water supply system
1
10
100
1000
10000
65 75 80 100
125
150
175
200
250
300
350
400
500
600
700
800
1000
1100
Pipe Diameter (mm)
Len
gth
(km
)
i) Length of pipelines with respect to pipe diameter
Asbestos cement 52%
Steel4% PVC 42 %
Cast iron 2 %
iii) Relative lengths of pipelines with respect to type
Transmission and connection lines 5%
Main lines 21 %
Distribution lines 74%
ii) Relative lengths of pipelines with respect to pipe composition
Fig. 5 Composition of pipelines in the Denizli City water supply
system (after Toprak and Taskin 2007)
502 S. Toprak et al.
123
45%. Correction factors for fines content, overburden
pressure, borehole diameter, rod length and sampling
method were used following Youd et al. (2001). The sub-
soil in the study area varies from clays to gravels; detailed
descriptions and discussions of the subsoil conditions are
available in PAU (2001, 2002, 2003).
Although previous PAU work (2001, 2003) includes
liquefaction analysis reports, they were not included in the
present study as they were based on an M6.3 earthquake
caused by various fault ruptures and attenuation relation-
ships based on Aydan et al. (2001a). In this study (related
to M6, M6.3, M6.5, and M7 earthquakes associated with
the Pamukkale and Karakova-Akhan Faults), Campbell and
Bozorgnia (2003) were followed as their attenuation rela-
tionship can be used to calculate both peak ground accel-
eration (PGA) and velocity (PGV). However, the results
from the two studies are comparable.
Both the PAU studies and the observations and mea-
surements undertaken indicate that the soils in the study
area, in general, would be classified as C (stiff soils) or D
(very dense soil and weak rock), with some weak layers,
according to FEMA-368. These would indicate shear wave
velocities of between 360–760 and 180–360 m/s, respec-
tively (FEMA-368 2000).
Factors of safety against liquefaction were computed at
each hole using the simplified procedure, i.e. dividing the
liquefaction cyclic resistance ratio (determined from the
SPT) by the cyclic shear ratio produced by the earthquake.
The lowest SPT value at each sounding was used. It is
appreciated that in a borehole, more than one layer may be
susceptible to liquefaction and there are indices which take
this into account (e.g., Toprak and Holzer 2003). However,
as the primary purpose of the liquefaction analysis was to
determine where lateral spread analysis should be under-
taken, the use of the lowest SPT value was sufficient. The
damage to pipelines was calculated using lateral displace-
ments in the liquefiable areas.
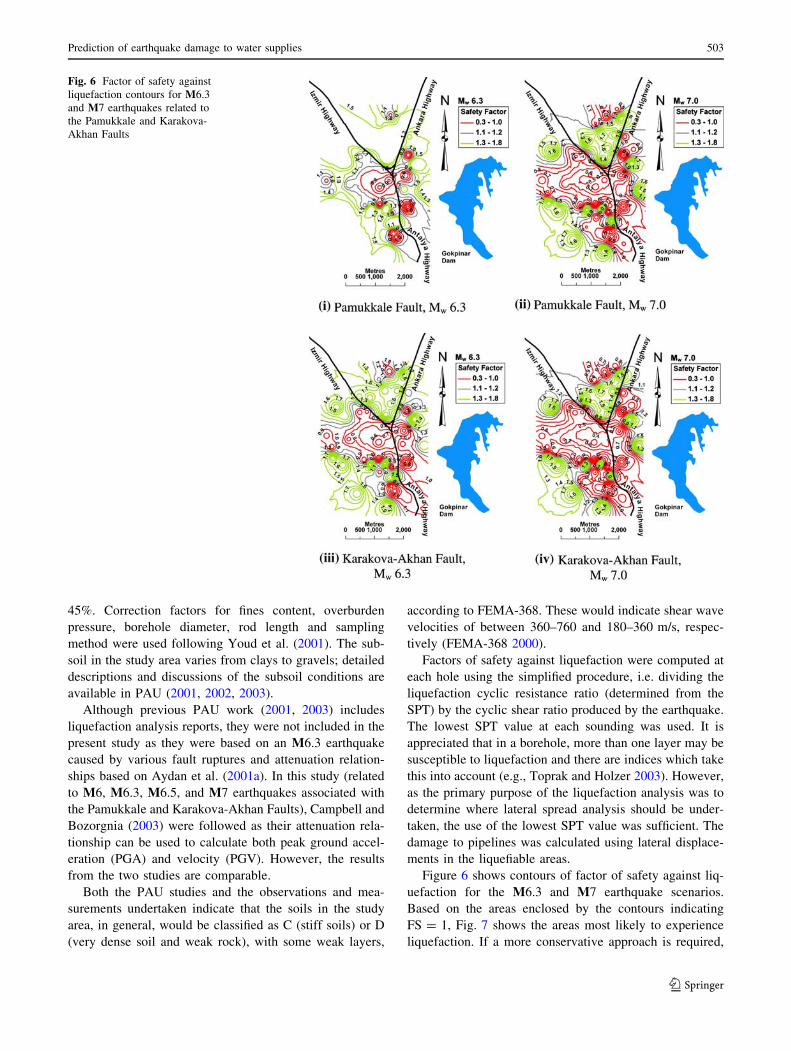
Figure 6 shows contours of factor of safety against liq-
uefaction for the M6.3 and M7 earthquake scenarios.
Based on the areas enclosed by the contours indicating
FS = 1, Fig. 7 shows the areas most likely to experience
liquefaction. If a more conservative approach is required,
Fig. 6 Factor of safety against
liquefaction contours for M6.3
and M7 earthquakes related to
the Pamukkale and Karakova-
Akhan Faults
Prediction of earthquake damage to water supplies 503
123
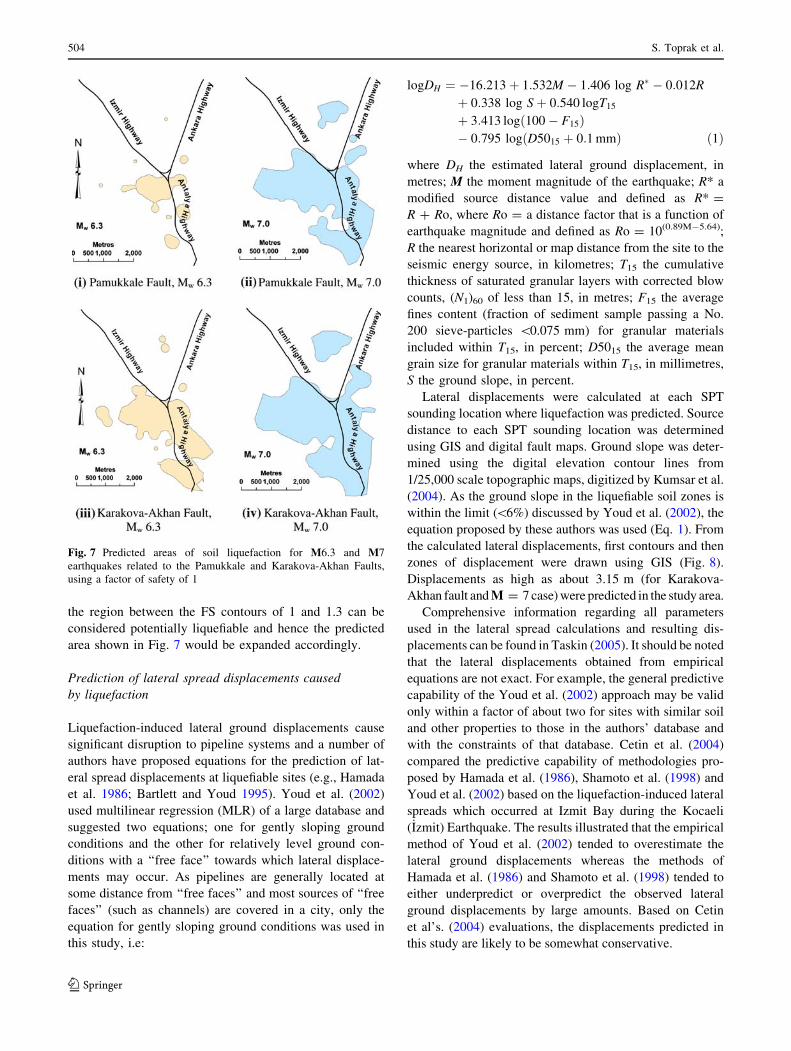
the region between the FS contours of 1 and 1.3 can be
considered potentially liquefiable and hence the predicted
area shown in Fig. 7 would be expanded accordingly.
Prediction of lateral spread displacements caused
by liquefaction
Liquefaction-induced lateral ground displacements cause
significant disruption to pipeline systems and a number of
authors have proposed equations for the prediction of lat-
eral spread displacements at liquefiable sites (e.g., Hamada
et al. 1986; Bartlett and Youd 1995). Youd et al. (2002)
used multilinear regression (MLR) of a large database and
suggested two equations; one for gently sloping ground
conditions and the other for relatively level ground con-
ditions with a ‘‘free face’’ towards which lateral displace-
ments may occur. As pipelines are generally located at
some distance from ‘‘free faces’’ and most sources of ‘‘free
faces’’ (such as channels) are covered in a city, only the
equation for gently sloping ground conditions was used in
this study, i.e:
logDH ¼ �16:213þ 1:532M � 1:406 log R� � 0:012R
þ 0:338 log Sþ 0:540 logT15
þ 3:413 log 100� F15ð Þ� 0:795 log D5015 þ 0:1 mmð Þ ð1Þ
where DH the estimated lateral ground displacement, in
metres; M the moment magnitude of the earthquake; R* a
modified source distance value and defined as R* =
R ? Ro, where Ro = a distance factor that is a function of
earthquake magnitude and defined as Ro = 10(0.89M-5.64);
R the nearest horizontal or map distance from the site to the
seismic energy source, in kilometres; T15 the cumulative
thickness of saturated granular layers with corrected blow
counts, (N1)60 of less than 15, in metres; F15 the average
fines content (fraction of sediment sample passing a No.
200 sieve-particles \0.075 mm) for granular materials
included within T15, in percent; D5015 the average mean
grain size for granular materials within T15, in millimetres,
S the ground slope, in percent.
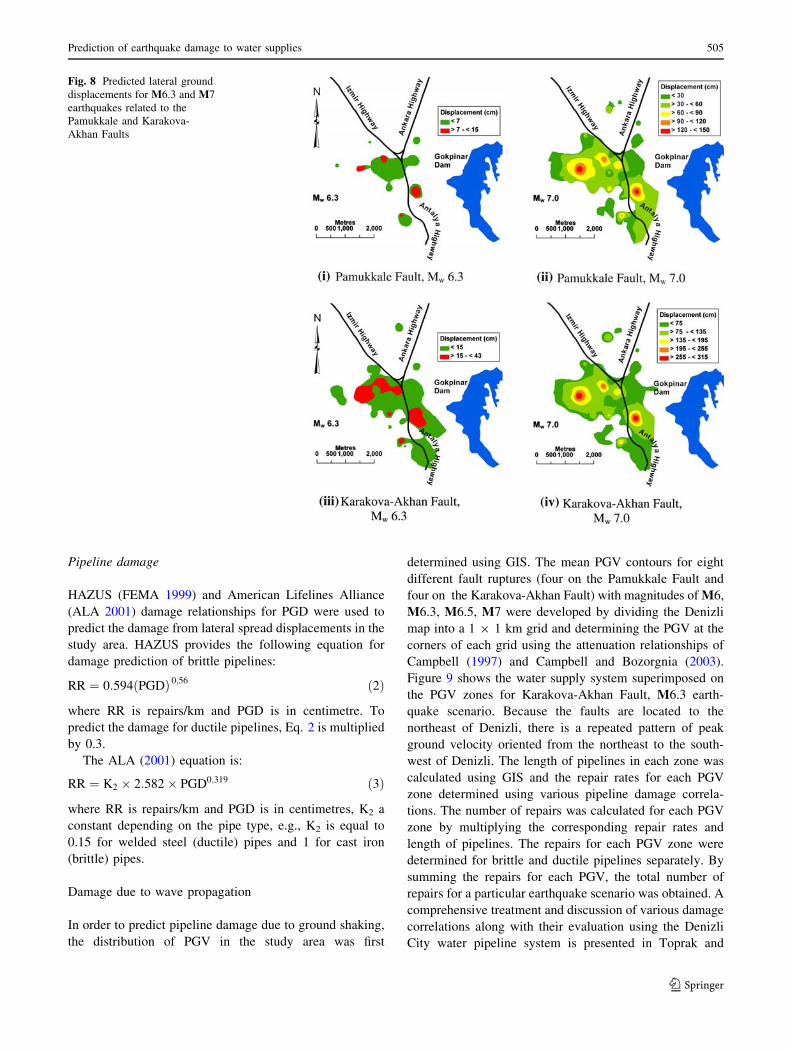
Lateral displacements were calculated at each SPT
sounding location where liquefaction was predicted. Source
distance to each SPT sounding location was determined
using GIS and digital fault maps. Ground slope was deter-
mined using the digital elevation contour lines from
1/25,000 scale topographic maps, digitized by Kumsar et al.
(2004). As the ground slope in the liquefiable soil zones is
within the limit (\6%) discussed by Youd et al. (2002), the
equation proposed by these authors was used (Eq. 1). From
the calculated lateral displacements, first contours and then
zones of displacement were drawn using GIS (Fig. 8).
Displacements as high as about 3.15 m (for Karakova-
Akhan fault and M = 7 case) were predicted in the study area.
Comprehensive information regarding all parameters
used in the lateral spread calculations and resulting dis-
placements can be found in Taskin (2005). It should be noted
that the lateral displacements obtained from empirical
equations are not exact. For example, the general predictive
capability of the Youd et al. (2002) approach may be valid
only within a factor of about two for sites with similar soil
and other properties to those in the authors’ database and
with the constraints of that database. Cetin et al. (2004)
compared the predictive capability of methodologies pro-
posed by Hamada et al. (1986), Shamoto et al. (1998) and
Youd et al. (2002) based on the liquefaction-induced lateral
spreads which occurred at Izmit Bay during the Kocaeli
(_Izmit) Earthquake. The results illustrated that the empirical
method of Youd et al. (2002) tended to overestimate the
lateral ground displacements whereas the methods of
Hamada et al. (1986) and Shamoto et al. (1998) tended to
either underpredict or overpredict the observed lateral
ground displacements by large amounts. Based on Cetin
et al’s. (2004) evaluations, the displacements predicted in
this study are likely to be somewhat conservative.
Fig. 7 Predicted areas of soil liquefaction for M6.3 and M7
earthquakes related to the Pamukkale and Karakova-Akhan Faults,
using a factor of safety of 1
504 S. Toprak et al.
123
Pipeline damage
HAZUS (FEMA 1999) and American Lifelines Alliance
(ALA 2001) damage relationships for PGD were used to
predict the damage from lateral spread displacements in the
study area. HAZUS provides the following equation for
damage prediction of brittle pipelines:
RR ¼ 0:594 PGDð Þ 0;56 ð2Þ
where RR is repairs/km and PGD is in centimetre. To
predict the damage for ductile pipelines, Eq. 2 is multiplied
by 0.3.
The ALA (2001) equation is:
RR ¼ K2 � 2:582� PGD0;319 ð3Þ
where RR is repairs/km and PGD is in centimetres, K2 a
constant depending on the pipe type, e.g., K2 is equal to
0.15 for welded steel (ductile) pipes and 1 for cast iron
(brittle) pipes.
Damage due to wave propagation
In order to predict pipeline damage due to ground shaking,
the distribution of PGV in the study area was first
determined using GIS. The mean PGV contours for eight
different fault ruptures (four on the Pamukkale Fault and
four on the Karakova-Akhan Fault) with magnitudes of M6,
M6.3, M6.5, M7 were developed by dividing the Denizli
map into a 1 9 1 km grid and determining the PGV at the
corners of each grid using the attenuation relationships of
Campbell (1997) and Campbell and Bozorgnia (2003).
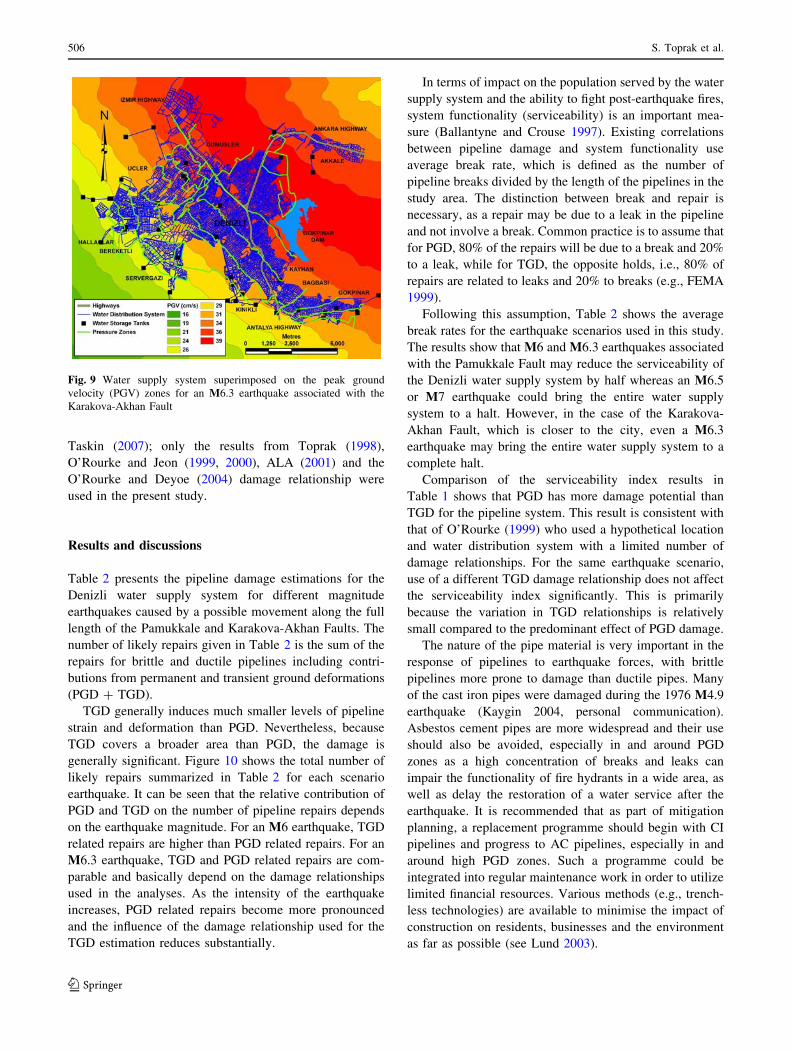
Figure 9 shows the water supply system superimposed on
the PGV zones for Karakova-Akhan Fault, M6.3 earth-
quake scenario. Because the faults are located to the
northeast of Denizli, there is a repeated pattern of peak
ground velocity oriented from the northeast to the south-
west of Denizli. The length of pipelines in each zone was
calculated using GIS and the repair rates for each PGV
zone determined using various pipeline damage correla-
tions. The number of repairs was calculated for each PGV
zone by multiplying the corresponding repair rates and
length of pipelines. The repairs for each PGV zone were
determined for brittle and ductile pipelines separately. By
summing the repairs for each PGV, the total number of
repairs for a particular earthquake scenario was obtained. A
comprehensive treatment and discussion of various damage
correlations along with their evaluation using the Denizli
City water pipeline system is presented in Toprak and
Fig. 8 Predicted lateral ground
displacements for M6.3 and M7
earthquakes related to the
Pamukkale and Karakova-
Akhan Faults
Prediction of earthquake damage to water supplies 505
123
Taskin (2007); only the results from Toprak (1998),
O’Rourke and Jeon (1999, 2000), ALA (2001) and the
O’Rourke and Deyoe (2004) damage relationship were
used in the present study.
Results and discussions
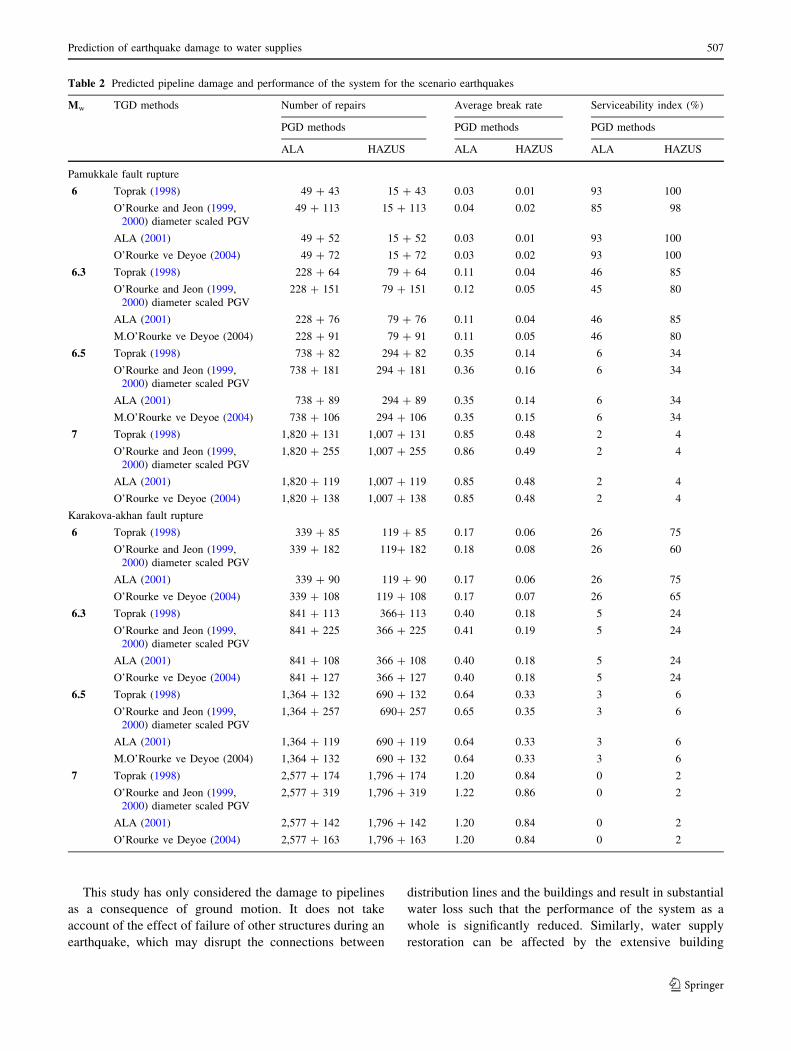
Table 2 presents the pipeline damage estimations for the
Denizli water supply system for different magnitude
earthquakes caused by a possible movement along the full
length of the Pamukkale and Karakova-Akhan Faults. The
number of likely repairs given in Table 2 is the sum of the
repairs for brittle and ductile pipelines including contri-
butions from permanent and transient ground deformations
(PGD ? TGD).
TGD generally induces much smaller levels of pipeline
strain and deformation than PGD. Nevertheless, because
TGD covers a broader area than PGD, the damage is
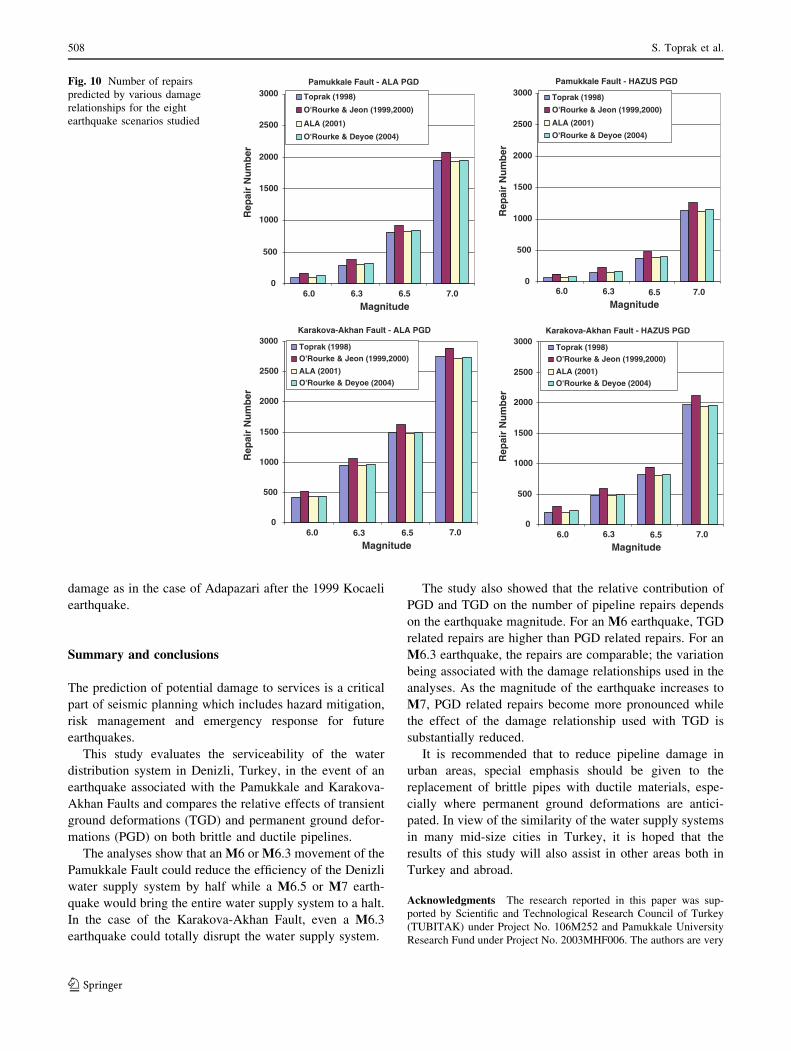
generally significant. Figure 10 shows the total number of
likely repairs summarized in Table 2 for each scenario
earthquake. It can be seen that the relative contribution of
PGD and TGD on the number of pipeline repairs depends
on the earthquake magnitude. For an M6 earthquake, TGD
related repairs are higher than PGD related repairs. For an
M6.3 earthquake, TGD and PGD related repairs are com-
parable and basically depend on the damage relationships
used in the analyses. As the intensity of the earthquake
increases, PGD related repairs become more pronounced
and the influence of the damage relationship used for the
TGD estimation reduces substantially.
In terms of impact on the population served by the water
supply system and the ability to fight post-earthquake fires,
system functionality (serviceability) is an important mea-
sure (Ballantyne and Crouse 1997). Existing correlations
between pipeline damage and system functionality use
average break rate, which is defined as the number of
pipeline breaks divided by the length of the pipelines in the
study area. The distinction between break and repair is
necessary, as a repair may be due to a leak in the pipeline
and not involve a break. Common practice is to assume that
for PGD, 80% of the repairs will be due to a break and 20%
to a leak, while for TGD, the opposite holds, i.e., 80% of
repairs are related to leaks and 20% to breaks (e.g., FEMA
1999).
Following this assumption, Table 2 shows the average
break rates for the earthquake scenarios used in this study.
The results show that M6 and M6.3 earthquakes associated
with the Pamukkale Fault may reduce the serviceability of
the Denizli water supply system by half whereas an M6.5
or M7 earthquake could bring the entire water supply
system to a halt. However, in the case of the Karakova-
Akhan Fault, which is closer to the city, even a M6.3
earthquake may bring the entire water supply system to a
complete halt.
Comparison of the serviceability index results in
Table 1 shows that PGD has more damage potential than
TGD for the pipeline system. This result is consistent with
that of O’Rourke (1999) who used a hypothetical location
and water distribution system with a limited number of
damage relationships. For the same earthquake scenario,
use of a different TGD damage relationship does not affect
the serviceability index significantly. This is primarily
because the variation in TGD relationships is relatively
small compared to the predominant effect of PGD damage.
The nature of the pipe material is very important in the
response of pipelines to earthquake forces, with brittle
pipelines more prone to damage than ductile pipes. Many
of the cast iron pipes were damaged during the 1976 M4.9
earthquake (Kaygin 2004, personal communication).
Asbestos cement pipes are more widespread and their use
should also be avoided, especially in and around PGD
zones as a high concentration of breaks and leaks can
impair the functionality of fire hydrants in a wide area, as
well as delay the restoration of a water service after the
earthquake. It is recommended that as part of mitigation
planning, a replacement programme should begin with CI
pipelines and progress to AC pipelines, especially in and
around high PGD zones. Such a programme could be
integrated into regular maintenance work in order to utilize
limited financial resources. Various methods (e.g., trench-
less technologies) are available to minimise the impact of
construction on residents, businesses and the environment
as far as possible (see Lund 2003).
Fig. 9 Water supply system superimposed on the peak ground
velocity (PGV) zones for an M6.3 earthquake associated with the
Karakova-Akhan Fault
506 S. Toprak et al.
123
This study has only considered the damage to pipelines
as a consequence of ground motion. It does not take
account of the effect of failure of other structures during an
earthquake, which may disrupt the connections between
distribution lines and the buildings and result in substantial
water loss such that the performance of the system as a
whole is significantly reduced. Similarly, water supply
restoration can be affected by the extensive building
Table 2 Predicted pipeline damage and performance of the system for the scenario earthquakes
Mw TGD methods Number of repairs Average break rate Serviceability index (%)
PGD methods PGD methods PGD methods
ALA HAZUS ALA HAZUS ALA HAZUS
Pamukkale fault rupture
6 Toprak (1998) 49 ? 43 15 ? 43 0.03 0.01 93 100
O’Rourke and Jeon (1999,
2000) diameter scaled PGV
49 ? 113 15 ? 113 0.04 0.02 85 98
ALA (2001) 49 ? 52 15 ? 52 0.03 0.01 93 100
O’Rourke ve Deyoe (2004) 49 ? 72 15 ? 72 0.03 0.02 93 100
6.3 Toprak (1998) 228 ? 64 79 ? 64 0.11 0.04 46 85
O’Rourke and Jeon (1999,
2000) diameter scaled PGV
228 ? 151 79 ? 151 0.12 0.05 45 80
ALA (2001) 228 ? 76 79 ? 76 0.11 0.04 46 85
M.O’Rourke ve Deyoe (2004) 228 ? 91 79 ? 91 0.11 0.05 46 80
6.5 Toprak (1998) 738 ? 82 294 ? 82 0.35 0.14 6 34
O’Rourke and Jeon (1999,
2000) diameter scaled PGV
738 ? 181 294 ? 181 0.36 0.16 6 34
ALA (2001) 738 ? 89 294 ? 89 0.35 0.14 6 34
M.O’Rourke ve Deyoe (2004) 738 ? 106 294 ? 106 0.35 0.15 6 34
7 Toprak (1998) 1,820 ? 131 1,007 ? 131 0.85 0.48 2 4
O’Rourke and Jeon (1999,
2000) diameter scaled PGV
1,820 ? 255 1,007 ? 255 0.86 0.49 2 4
ALA (2001) 1,820 ? 119 1,007 ? 119 0.85 0.48 2 4
O’Rourke ve Deyoe (2004) 1,820 ? 138 1,007 ? 138 0.85 0.48 2 4
Karakova-akhan fault rupture
6 Toprak (1998) 339 ? 85 119 ? 85 0.17 0.06 26 75
O’Rourke and Jeon (1999,
2000) diameter scaled PGV
339 ? 182 119? 182 0.18 0.08 26 60
ALA (2001) 339 ? 90 119 ? 90 0.17 0.06 26 75
O’Rourke ve Deyoe (2004) 339 ? 108 119 ? 108 0.17 0.07 26 65
6.3 Toprak (1998) 841 ? 113 366? 113 0.40 0.18 5 24
O’Rourke and Jeon (1999,
2000) diameter scaled PGV
841 ? 225 366 ? 225 0.41 0.19 5 24
ALA (2001) 841 ? 108 366 ? 108 0.40 0.18 5 24
O’Rourke ve Deyoe (2004) 841 ? 127 366 ? 127 0.40 0.18 5 24
6.5 Toprak (1998) 1,364 ? 132 690 ? 132 0.64 0.33 3 6
O’Rourke and Jeon (1999,
2000) diameter scaled PGV
1,364 ? 257 690? 257 0.65 0.35 3 6
ALA (2001) 1,364 ? 119 690 ? 119 0.64 0.33 3 6
M.O’Rourke ve Deyoe (2004) 1,364 ? 132 690 ? 132 0.64 0.33 3 6
7 Toprak (1998) 2,577 ? 174 1,796 ? 174 1.20 0.84 0 2
O’Rourke and Jeon (1999,
2000) diameter scaled PGV
2,577 ? 319 1,796 ? 319 1.22 0.86 0 2
ALA (2001) 2,577 ? 142 1,796 ? 142 1.20 0.84 0 2
O’Rourke ve Deyoe (2004) 2,577 ? 163 1,796 ? 163 1.20 0.84 0 2
Prediction of earthquake damage to water supplies 507
123
damage as in the case of Adapazari after the 1999 Kocaeli
earthquake.
Summary and conclusions
The prediction of potential damage to services is a critical
part of seismic planning which includes hazard mitigation,
risk management and emergency response for future
earthquakes.
This study evaluates the serviceability of the water
distribution system in Denizli, Turkey, in the event of an
earthquake associated with the Pamukkale and Karakova-
Akhan Faults and compares the relative effects of transient
ground deformations (TGD) and permanent ground defor-
mations (PGD) on both brittle and ductile pipelines.
The analyses show that an M6 or M6.3 movement of the
Pamukkale Fault could reduce the efficiency of the Denizli
water supply system by half while a M6.5 or M7 earth-
quake would bring the entire water supply system to a halt.
In the case of the Karakova-Akhan Fault, even a M6.3
earthquake could totally disrupt the water supply system.
The study also showed that the relative contribution of
PGD and TGD on the number of pipeline repairs depends
on the earthquake magnitude. For an M6 earthquake, TGD
related repairs are higher than PGD related repairs. For an
M6.3 earthquake, the repairs are comparable; the variation
being associated with the damage relationships used in the
analyses. As the magnitude of the earthquake increases to
M7, PGD related repairs become more pronounced while
the effect of the damage relationship used with TGD is
substantially reduced.
It is recommended that to reduce pipeline damage in
urban areas, special emphasis should be given to the
replacement of brittle pipes with ductile materials, espe-
cially where permanent ground deformations are antici-
pated. In view of the similarity of the water supply systems
in many mid-size cities in Turkey, it is hoped that the
results of this study will also assist in other areas both in
Turkey and abroad.
Acknowledgments The research reported in this paper was sup-
ported by Scientific and Technological Research Council of Turkey
(TUBITAK) under Project No. 106M252 and Pamukkale University
Research Fund under Project No. 2003MHF006. The authors are very
Pamukkale Fault - ALA PGD
0
500
1000
1500
2000
2500
3000
6.0 6.3 6.5 7.0 6.0 6.3 6.5 7.0
Magnitude
Rep
air
Nu
mb
er
Toprak (1998)
O'Rourke & Jeon (1999,2000)
ALA (2001)
O'Rourke & Deyoe (2004)
Pamukkale Fault - HAZUS PGD
0
500
1000
1500
2000
2500
3000
Magnitude
Rep
air
Nu
mb
er
Toprak (1998)
O'Rourke & Jeon (1999,2000)
ALA (2001)
O'Rourke & Deyoe (2004)
Karakova-Akhan Fault - ALA PGD
0
500
1000
1500
2000
2500
3000
Magnitude
Rep
air
Nu
mb
er
Toprak (1998)O'Rourke & Jeon (1999,2000)
ALA (2001)O'Rourke & Deyoe (2004)
Karakova-Akhan Fault - HAZUS PGD
0
500
1000
1500
2000
2500
3000
Magnitude
Rep
air
Nu
mb
er
Toprak (1998)O'Rourke & Jeon (1999,2000)
ALA (2001)O'Rourke & Deyoe (2004)
6.0 6.3 6.5 7.0 6.0 6.3 6.5 7.0
Fig. 10 Number of repairs
predicted by various damage
relationships for the eight
earthquake scenarios studied
508 S. Toprak et al.
123
grateful to the Water Works staff of various municipalities for their
interest and assistance in assembling the water system data and in
particularly to Orhan Kaygin, Sule Vardar, Sibel Cukurluoglu and
Yusuf Ornek of Denizli Municipality Water Works Department for
their continuous support and discussions. Thanks are also extended to
Mehmet Genc of General Directorate of Disaster Affairs, Denizli
Branch, and the Geology Department of PAU, especially Prof. Halil
Kumsar for providing base maps for Denizli area and valuable
comments and discussions.
References
American Lifelines Alliance (ALA) (2001) Seismic fragility formu-
lations for water systems. Part 1-guideline. http://www.
americanlifelinesalliance.org
Aydan O, Kumsar H, Ulusay R (2001a) How to infer the possible
mechanism and characteristics of earthquakes from the striations
and ground surface traces of existing faults, seismic fault
induced failures, pp 153–162
Aydan O, Kumsar H, Ulusay R (2001b) Is there a relation between the
temperature changes of thermal waters in Denizli region and the
earth crust at the Denizli fault zone? In: JEOTEKNIKIII, 3rd
Earthquake and Geotechnical Conference on Izmir and its
Surroundings, 12–14 November, Izmir, Turkey (in Turkish)
Ballantyne DB, Crouse CB (1997) Reliability and restoration of water
supply systems for fire suppression and drinking following the
earthquakes, National Institute of Standards and Technology,
Department of Commerce, NIST GCR 97-730
Bartlett SF, Youd TL (1995) Empirical prediction of liquefaction-
induced lateral spread. Geotech Eng ASCE 121:316–329
Campbell KW (1997) Empirical near-source attenuation relationships
for horizontal and vertical components of peak ground acceler-
ation, peak ground velocity, and pseudo-absolute acceleration
response spectra. Seismol Res Lett 68:154–179
Campbell KW, Bozorgnia Y (2003) Updated near-source ground-
motion (attenuation) relations for the horizontal and vertical
components of peak ground acceleration and acceleration
response spectra. Bull Seismol Soc Am 93:314–331
Celik SB (2003) Evaluation of Denizli city center lands with respect
to geological and geotechnical properties and assessment of their
liquefaction susceptibility, Pamukkale University, Denizli,
Turkey, M.Sc. thesis (in Turkish)
Cetin KO, Youd TL, Seed RB, Bray JD, Stewart JP, Durgunoglu HT,
Lettis W, Yılmaz MT (2004) Liquefaction-induced lateral
spreading at Izmit Bay during the Kocaeli (_Izmit)-Turkey
Earthquake. J Geotech Geoenviron Eng 24(3):189–197
Environmental Systems Research Institute (ESRI) (2001) ArcGIS
9-What is ArcGIS? Redlands, Environmental Systems Research
Institute Inc
Federal Emergency Management Agency (FEMA) (1999) Earthquake
Loss Estimation Methodology. HAZUS 99: technical manual,
prepared by the National Institute of Building Sciences
FEMA-368 (2000) NEHRP recommended provisions for seismic
regulations of new buildings and other structures, Part 1
provisions
Hamada M, Yasuda S, Isoyama R, Emoto K (1986) Study on
liquefaction-induced permanent ground displacements. Associ-
ation for the Development of Earthquake Prediction, Japan
Iller Bankasi (Bank of Provinces) (2008) http://www.ilbank.gov.tr
Kandilli Observatory and Earthquake Research Institute (KOERI)
(2000) Izmir Earthquake Disaster Master Plan for the City of
Izmir, 2000. Prepared by Kandilli Observatory and Earthquake
Research Institute (in Turkish). Available at http://www.koeri.
boun.edu.tr
Kandilli Observatory and Earthquake Research Institute (KOERI)
(2004) http://www.koeri.boun.edu.tr
Kumsar H, Celik SB, Kaya M (2004) Geological and geotechnical
urban information system for Denizli City (JEO-KBS), Confer-
ence on information technologies, Denizli, pp 25–31 (in Turkish)
Lund LV (2003) Pipeline seismic mitigation using trenchless
technology. In: Proceedings of the Eight US-Japan workshop
on earthquake resistant design lifeline facilities and counter-
measures against liquefaction, Tokyo, Japan, Technical report
MCEER-03-0003. Buffalo, NY. Multidisciplinary Center for
Earthquake Engineering Research, pp 91–99
O’Rourke M (1999) Estimation of post-earthquake water system
serviceability. In: Proceedings of the seventh US-Japan work-
shop on earthquake resistant design of lifeline facilities and
countermeasures against soil liquefaction. Technical report
MCEER 99-0019, pp 391–403
O’Rourke M, Deyoe E (2004) Seismic damage to segmented buried
pipe. Earthquake Spectra 20:1167–1183
O’Rourke TD, Jeon SS (1999) Factors affecting the earthquake
damage of water distribution systems, optimizing post-earth-
quake lifeline system reliability. In: Elliott WM, McDonough P
(eds) Proceedings, fifth US conference on lifeline earthquake
engineering, Seattle, WA, ASCE, pp 379–388
O’Rourke TD, Jeon SS (2000) Seismic zonation for lifelines and
utilities, invited keynote paper on lifelines. Proceedings sixth
international conference on seismic zonation, Palm Springs, CA,
EERI CD ROM
O’Rourke TD, Toprak S, Sano Y (1998) Factors affecting water
supply damage caused by the Northridge earthquake. In:
Proceedings of the 6th US National Conference on Earthquake
Engineering, Seattle, WA, USA, pp 1–12
Pamukkale University (PAU) (2001) Geological, geotechnical, and
hydrogeological properties of Bagbasi (Denizli) Municipality
lands, Geology Department, Engineering Faculty, Pamukkale
University, Denizli, p 57 (in Turkish)
Pamukkale University (PAU) (2002) Geological, geotechnical, and
hydrogeological properties of Denizli Municipality lands. Geol-
ogy Department, Engineering Faculty, Pamukkale University,
Denizli, p 763 (in Turkish)
Pamukkale University (PAU) (2003) Geological and geotechnical
properties of Gumusler (Denizli) Municipality lands. Geology
Department, Engineering Faculty, Pamukkale University,
Denizli, p 247 (in Turkish)
Saroglu F, Emre O, Kuscu I (1992) Active fault map of Turkey,
printed by General Directorate of Mineral Research and
Exploration of Turkey
Seed HB, Idriss IM (1971) Simplified procedure for evaluating soil
liquefaction potential. J Soil Mech Found Div 97:1249–1273
Shamoto Y, Zhang J, Tokimatsu K (1998) New charts for predicting
large residual post-liquefaction ground deformations. Soil Dyn
Earthquake Eng 17:427–438
Sun S (1990) Geology and coal resources between Denizli and Usak,
MTA Report no 9985 (in Turkish)
Taskin F (2005) Earthquake performance assessment of water supply
systems using geographical information systems (GIS), Pam-
ukkale University, Denizli, Turkey, M.Sc. thesis (in Turkish)
Toprak S (1998) Earthquake effects on buried lifeline systems. Ph.D.
thesis Cornell University, Ithaca, NY
Toprak S, Holzer TL (2003) Liquefaction potential index: field
assessment. J Geotech Eng 129(4):315–322
Toprak S, Taskin F (2007) Estimation of earthquake damage to buried
pipelines caused by ground shaking. Nat Hazards 40:1–24
Youd TL, Idriss IM, Andrus RD, Arango I, Castro G, Christian JT,
Dobry R, Liam Finn WD, Harder LF Jr, Hynes ME, Ishihara K,
Koester JP, Liao SSC, Marcuson WFIII, Martin GR, Mitchell
JK, Moriwaki Y, Power MS, Robertson PK, Seed RB, Stokoe
Prediction of earthquake damage to water supplies 509
123

KHII (2001) Liquefaction resistance of soils: summary report
from the 1996 NCEER and 1998 NCEER/NSF workshops on
evaluation of liquefaction resistance of soils. J Geotechn
Geoenviron Eng ASCE 127:817–833
Youd TL, Hansen CM, Bartlett SF (2002) Revised multilinear
regression equations for prediction of lateral spread displace-
ment. ASCE J Geotech Geoenviron Eng 128:1007–1017
510 S. Toprak et al.
123