prediction of antibacterial activity of pleuromutilin derivatives by genetic algorithm–multiple...
TRANSCRIPT
ORIGINAL PAPER
Prediction of antibacterial activity of pleuromutilin derivativesby genetic algorithm–multiple linear regression (GA–MLR)
Mohsen Dolatabadi • Mehdi Nekoei •
Alireza Banaei
Received: 6 December 2009 / Accepted: 16 March 2010 / Published online: 20 April 2010
� Springer-Verlag 2010
Abstract Use of quantitative structure–activity relation-
ships for prediction of the antibacterial activity of
pleuromutilin derivatives was studied. A suitable set of
molecular descriptors was calculated and the important
descriptors were selected by using the variable selections
of stepwise multiple linear regression and genetic algo-
rithm. Principal-components analysis was used to select the
training set. The models were validated by use of leave-
one-out (LOO) cross-validation, external test set, and the
Y-randomization test. Comparison of the results obtained
revealed the superiority of the genetic algorithm over the
stepwise multiple regression method for feature selection.
One genetic algorithm–multiple linear regression (GA–
MLR) model with six selected descriptors was obtained.
The root mean square errors of the training and test sets for
the GA–MLR model were calculated to be 0.423 and
0.523, and the correlation coefficients were 0.839 and
0.807. The statistical parameter of LOO cross validation
test correlation coefficients on the GA–MLR model was
0.760. The predictive ability of the model was satisfactory
and it can be used for designing similar groups of anti-
bacterial compounds.
Keywords QSAR � Genetic algorithm �Multiple linear regression � Antibacterial � Pleuromutilin
Introduction
Antibacterial resistance by hospital-acquired Gram-positive
bacterial pathogens, for example methicillin-resistant
Staphylococcus aureus (MRSA), penicillin-resistant Strep-
tococcus pneumoniae (PRSP), and vancomycin-resistant
enterococci (VRE), has become a serious medical problem
[1, 2]. Although antibacterial agents including linezolid,
quinupristin/dalfopristin, and teicoplanin are now available
for treatment of infections caused by resistant bacteria,
these agents produce undesirable side effects and their
efficacy is restricted because of the development of resistant
mutants. To combat such drug-resistant bacterial strains,
there is an increasing need to discover and develop novel
classes of antibiotics, particularly agents with new mecha-
nisms of action and, consequently, no cross-resistance to
marketed antibacterial agents. Recently, novel antibiotic
pleuromutilin analogues have been reported by Hirokawa
et al. [3–5].
Although several experimental methods are available for
screening the estrogenic activity of chemicals (e.g., in-vivo
and in-vitro assay tests), and these all have also been car-
ried out using receptors and other biological materials of
human, rat, mouse, and calf origin, at least [6], they are
costly, time-consuming, and can potentially produce toxic
side products from the experimental methods used today.
An efficient way of obtaining a complete set of the data
without the need to perform expensive laboratory experi-
ments is application of quantitative structure–activity
relationship (QSAR) techniques. A QSAR model describes a
mathematical relationship between the structural attribute(s)
M. Dolatabadi
Department of Chemistry, Faculty of Science,
University of Birjand, Birjand, Iran
M. Nekoei (&)
Department of Chemistry, Faculty of Science,
Islamic Azad University, Shahrood Branch, Shahrood, Iran
e-mail: [email protected]
A. Banaei
Department of Chemistry, Payame Noor University,
Ardabil, Iran
123
Monatsh Chem (2010) 141:577–588
DOI 10.1007/s00706-010-0299-z
and activity of a set of chemicals. The potential promise of
using QSAR models for screening of chemical databases or
virtual libraries before their synthesis seems equally
attractive to chemical manufacturers, pharmaceutical
companies, and government agencies, particularly in times
of shrinking resources [7]. Many different modeling tech-
nologies, for example multiple linear regression (MLR),
partial least squares (PLS), and different types of artificial
neural networks (ANN) have been widely used in QSAR
modeling [8–10]. The application of these techniques
usually requires variable selection for building well-fitted
models. In this work, we employed the stepwise (SW) and
the genetic algorithm (GA) selection method for the vari-
able selection in the MLR method. The main objective of
this work was to establish a new QSAR model for pre-
dicting the antibacterial activity of novel pleuromutilin
derivatives using the GA–MLR technique. The perfor-
mance of this model was compared with that of the SW–
MLR method.
Results and discussion
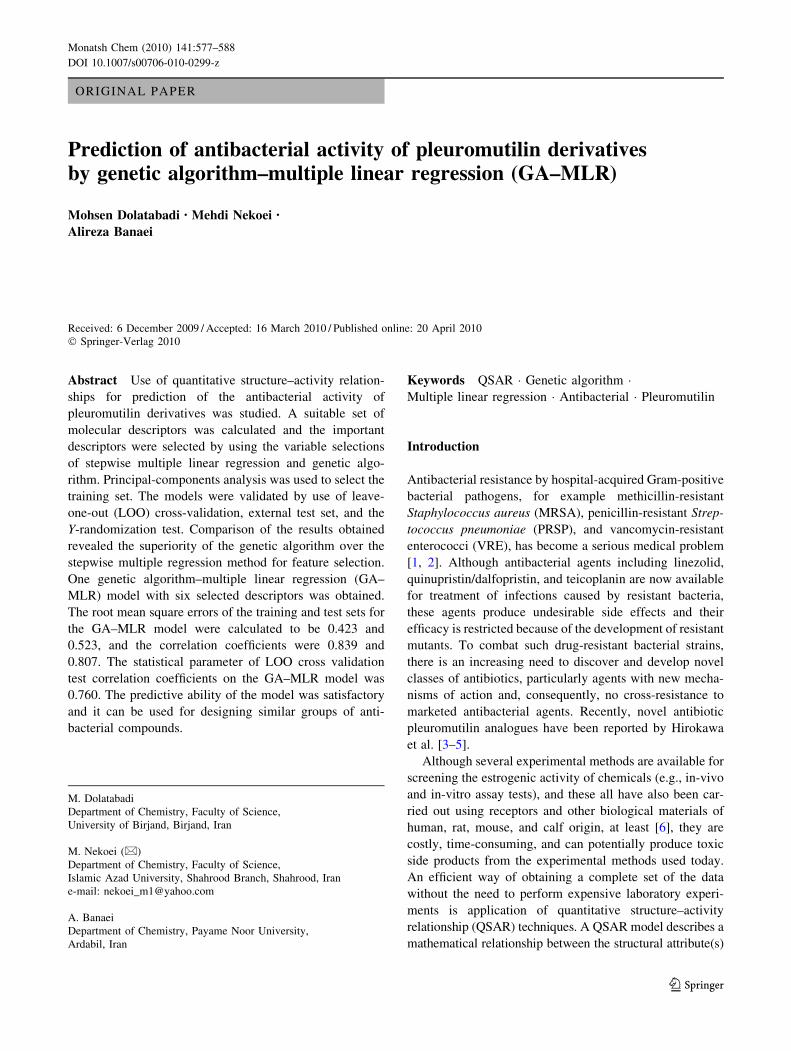
Principal-components analysis (PCA) was performed with
the calculated structure descriptors for the whole data set to
detect the homogeneities in the data set and to show spatial
location of samples to assist separation of the data into
training and test sets. The PCA results show that two prin-
cipal components (PC1 and PC2) describe 58.60% of the
overall variables, as follows: PC1 = 34.93%, PC2 =
23.67%. Because almost all variables can be accounted for
by the first two PCs, their score plot is a reliable represen-
tation of the spatial distribution of the points for the data set.
The plot of PC1 against PC2 (Fig. 1) displays the distribu-
tion of compounds over the first two principal components
space.
According the results of PCA, all the data were divided
into a training set of 44 compounds to develop the models
and a test set of 11 compounds to evaluate the models
based on two rules:
1 the range of the activity values of both the training set
and the test set should be covered from the lowest to the
highest;
2 the points corresponding to the training set in the PCA
plot should not be out of the main clusters.
The two sets are listed in Table 1.
After analyzing splitting of the data set into the training
and test sets, the next step was to select the main factors
which were most important for the antibacterial activity of
pleuromutilin derivatives. After descriptor calculation,
both stepwise and genetic algorithms were performed to
select descriptors correlated with the activity based on the
training set samples. First, MLR analysis with stepwise
selection and variables elimination was used to model the
structure–activity relationships with a different set of
descriptors. The stepwise MLR analysis led to the deriva-
tion of one model with six variables. It is described by the
equation:
ED50¼ 67:634 �11:809ð Þ�568:889 �123:974ð ÞX4A
þ4:196 �2:523ð ÞGGI10�6:884 �2:622ð ÞGATS5e
�2:799 �1:133ð ÞMor30vþ104:582 �57:281ð ÞR3pþ
�0:126 �0:047ð ÞH�053 ð1Þ
The model was then used to predict ED50 values for the
compounds in the test set. The prediction results are given
in Tables 1 and 2. The correlation coefficient, R2, obtained
was 0.793 for the training set and 0.723 for the test set.
From Table 2 it can be seen that the SW–MLR model was
not sufficiently accurate. Therefore, we applied genetic
algorithms as the variable selection procedure to select
only the best combinations of those most relevant to
obtaining models with the highest predictive power by
using the training set.
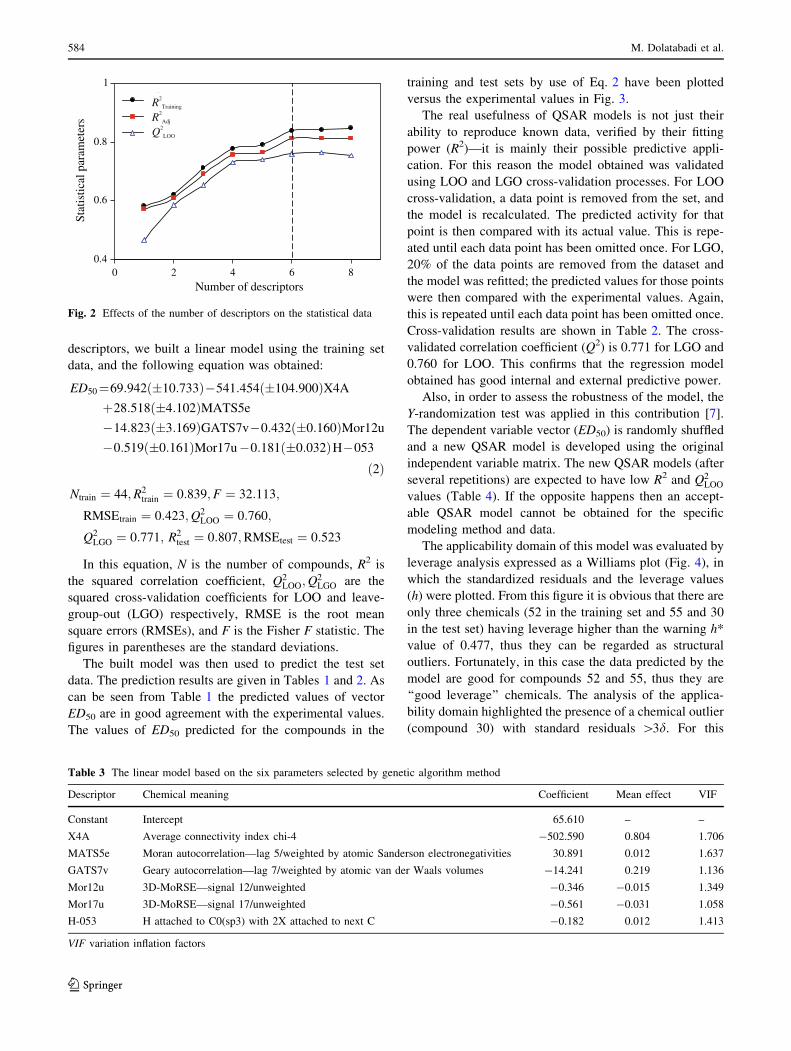
Results of the GA–MLR method
To select the optimum number of descriptors, the effects of
the number of descriptors were investigated for one to eight
descriptors. The effects of the number of descriptors on the
coefficients of determination (R2), the adjusted R2 (R2adj)
[11], and the coefficient of leave-one-out (LOO) cross-
validation (Q2) for the training set are shown in Fig. 2.
As can be seen, the models with seven and eight
descriptors did not improve significantly the statistics of the
model, thus it was determined that the optimum subset size
had been achieved with a maximum of six descriptors. The
six most significant descriptors according to the GA–MLR
-2
-1
0
1
2
3
-2 0 2 4 6
PC1 (34.93 %)
PC2
(23.
67 %
)
Fig. 1 Principal-components analysis of the training and test sets
578 M. Dolatabadi et al.
123
Table 1 Experimental and predicted antibacterial activity (ED50) of pleuromutilin derivatives by SW–MLR and GA–MLR models
Number R2 R3 ED50 SW-MLR GA-MLR
1 H NH2 2.89 2.64 2.57
2 N NH NH2 1.86 2.46 2.23
3 N NH H 2.94 2.34 2.33
4N NH
NH2 2.21 2.19 2.42
5 N NH2 NH2 1.86 2.17 1.97
6 N NH2 H 1.50 1.58 1.47
7N
NH2
NH 2 2.21 2.32 2.35
8N
NH2
H 2.21 2.14 2.33
9 N NH NH 2 1.41 1.77 1.68
10 N NH H 2.21 1.15 1.18
11 N N NH2 1.72 1.99 2.18
NN
R3
R2
N
N
O
N
S
O
O
O
OH
CH2
12N
NH2
NH2 3.05 2.25 2.20
13N
NH2
H 1.47 1.58 1.61
Prediction of antibacterial activity of pleuromutilin derivatives 579
123
Table 1 continued
Number R2 R3 ED50 SW-MLR GA-MLR
14N
NH
NH2 1.72 2.31 2.26
15N
NH
H 1.61 1.64 1.63
16N
NNH2 3.00 2.44 2.67
17 NNH2 NH2 2.84 2.24 1.90
18 NNH2 H 0.59 1.43 1.12
19 NNH NH2 1.01 1.50 1.49
20 NNH H 0.76 1.26 1.44
21 N NH2 NH2 3.04 3.31 3.38
22 NHN NH2 3.97 3.40 3.67
Number R1N SPACER ED 50 SW-MLR GA-MLR
23A Vinyl N S 1.86 2.36 1.89
24B Vinyl N S 1.47 1.44 1.61
N
N
R3
R2
N
N
O
N
O
O
O
OHR1
SPACER
580 M. Dolatabadi et al.
123
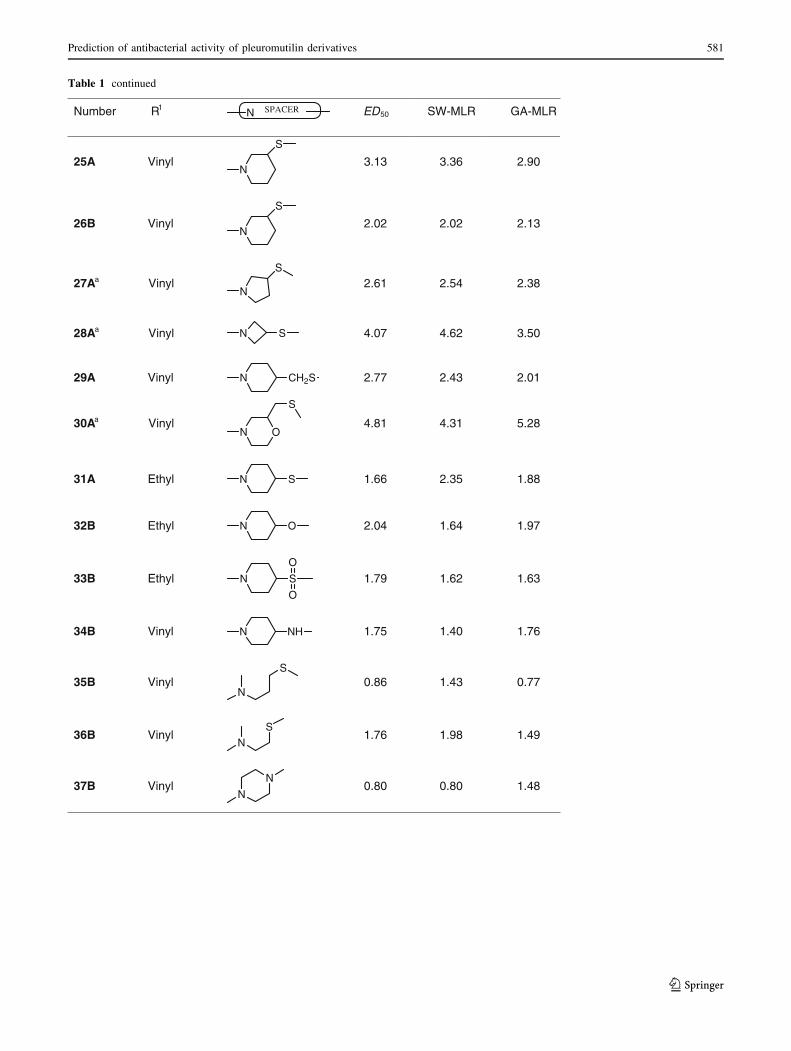
Table 1 continued
Number R1N SPACER ED50 SW-MLR GA-MLR
25A VinylN
S
3.13 3.36 2.90
26B VinylN
S
2.02 2.02 2.13
27Aa Vinyl N
S
2.61 2.54 2.38
28Aa Vinyl N S 4.07 4.62 3.50
29A Vinyl N CH2S 2.77 2.43 2.01
30Aa Vinyl N O
S
4.81 4.31 5.28
31A Ethyl N S 1.66 2.35 1.88
32B Ethyl N O 2.04 1.64 1.97
33B Ethyl N S
O
O
1.79 1.62 1.63
34B Vinyl N NH 1.75 1.40 1.76
35B VinylN
S0.86 1.43 0.77
36B VinylN
S1.76 1.98 1.49
37B VinylN
N0.80 0.80 1.48
Prediction of antibacterial activity of pleuromutilin derivatives 581
123
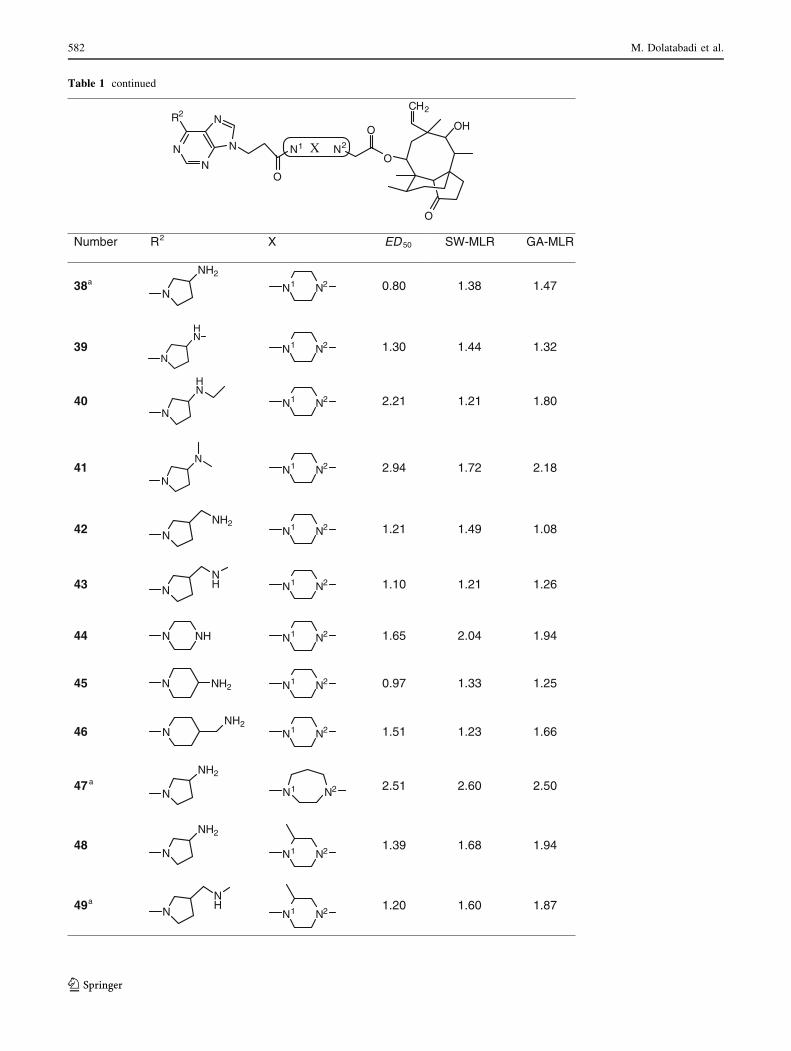
Table 1 continued
Number R2 X ED 50 SW-MLR GA-MLR
38a
N
NH2
0.80 1.38 1.47
39N
HN
1.30 1.44 1.32
N
N
R2
N
N
O
N1 N2
O
O
O
OH
CH2
X
N1 N2
N1 N2
40N
HN
2.21 1.21 1.80
41N
N2.94 1.72 2.18
42 NNH2
1.21 1.49 1.08
43 NNH 1.10 1.21 1.26
44 N NH 1.65 2.04 1.94
45 N NH2 0.97 1.33 1.25
46 NNH2
1.51 1.23 1.66
47 a
N
NH2
2.51 2.60 2.50
48N
NH2
1.39 1.68 1.94
49a
NNH 1.20 1.60 1.87
N1 N2
N1 N2
N1 N2
N1 N2
N1 N2
N1 N2
N1 N2
N2N1
N1 N2
N1 N2
582 M. Dolatabadi et al.
123
algorithm are: X4A, MATS5e, GATS7v, Mor12u, Mor17u,
and H-053.
The chemical meaning and the mean effect (MF) of
these descriptors are shown in Table 3. Also, multi-col-
linearity between these six descriptors was detected by
calculating their variation inflation factors (VIF); these are
shown in Table 3.
As can be seen from this table, most variables have
VIF values less than 5, indicating that the model obtained
has obvious statistical significance. With the selected
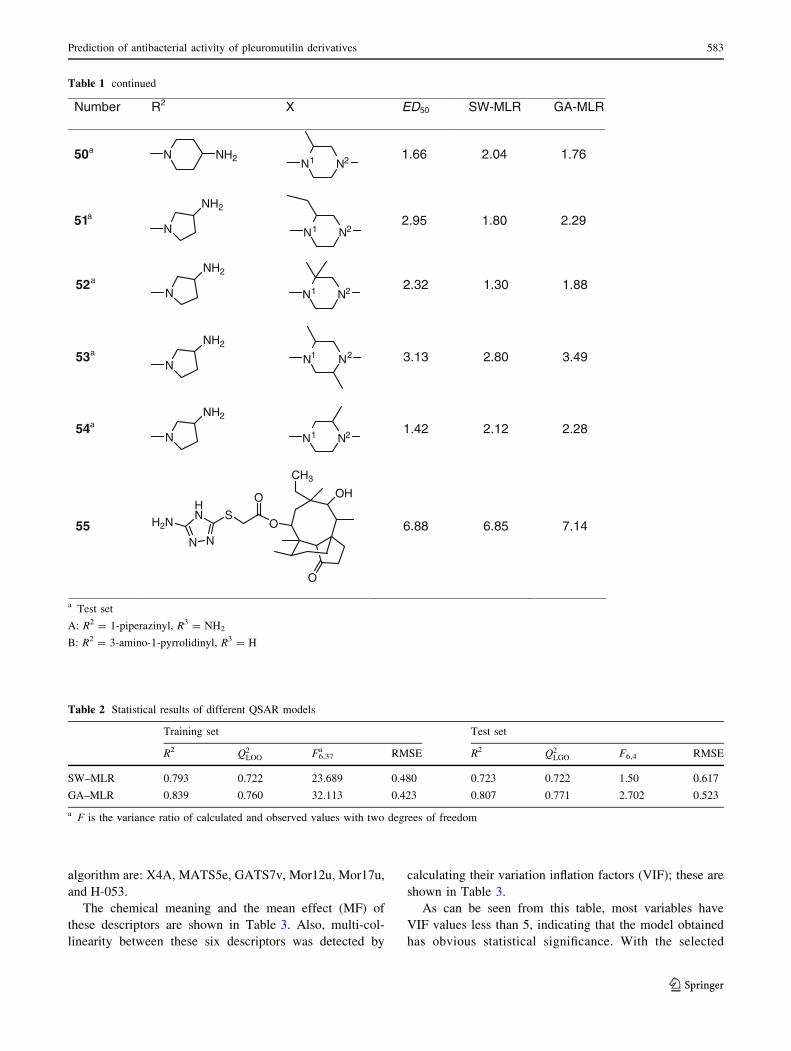
Table 1 continued
Number R2 X ED50 SW-MLR GA-MLR
50a N NH2 1.66 2.04 1.76
51a
N
NH2
2.95 1.80 2.29
N1 N2
N1 N2
52a
N
NH2
2.32 1.30 1.88
53a
N
NH2
3.13 2.80 3.49
54a
N
NH2
1.42 2.12 2.28
55S
O
O
O
OH
CH3
HN
N N
H2N 6.88 6.85 7.14
N1 N2
N1 N2
N1 N2
a Test set
A: R2 = 1-piperazinyl, R3 = NH2
B: R2 = 3-amino-1-pyrrolidinyl, R3 = H
Table 2 Statistical results of different QSAR models
Training set Test set
R2 Q2LOO F6,37
a RMSE R2 Q2LGO F6,4 RMSE
SW–MLR 0.793 0.722 23.689 0.480 0.723 0.722 1.50 0.617
GA–MLR 0.839 0.760 32.113 0.423 0.807 0.771 2.702 0.523
a F is the variance ratio of calculated and observed values with two degrees of freedom
Prediction of antibacterial activity of pleuromutilin derivatives 583
123
descriptors, we built a linear model using the training set
data, and the following equation was obtained:
ED50¼69:942 �10:733ð Þ�541:454 �104:900ð ÞX4A
þ28:518 �4:102ð ÞMATS5e
�14:823 �3:169ð ÞGATS7v�0:432 �0:160ð ÞMor12u
�0:519 �0:161ð ÞMor17u�0:181 �0:032ð ÞH�053
ð2Þ
Ntrain ¼ 44;R2train ¼ 0:839;F ¼ 32:113;
RMSEtrain ¼ 0:423;Q2LOO ¼ 0:760;
Q2LGO ¼ 0:771; R2
test ¼ 0:807;RMSEtest ¼ 0:523
In this equation, N is the number of compounds, R2 is
the squared correlation coefficient, Q2LOO;Q
2LGO are the
squared cross-validation coefficients for LOO and leave-
group-out (LGO) respectively, RMSE is the root mean
square errors (RMSEs), and F is the Fisher F statistic. The
figures in parentheses are the standard deviations.
The built model was then used to predict the test set
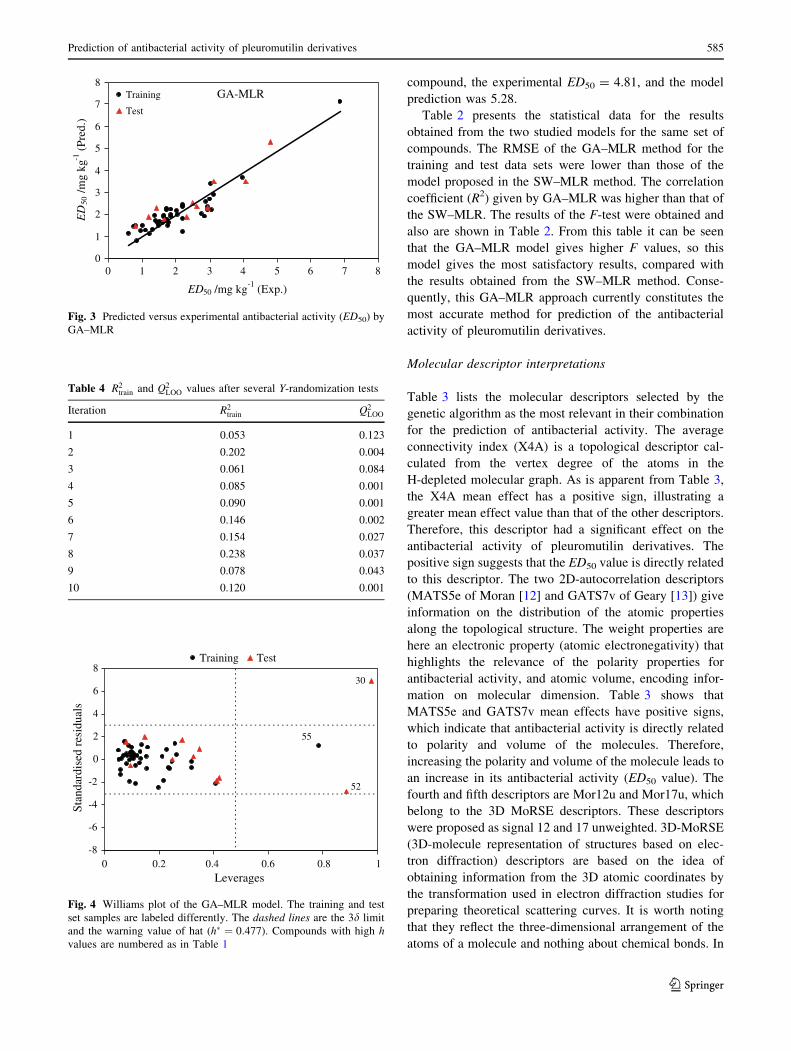
data. The prediction results are given in Tables 1 and 2. As
can be seen from Table 1 the predicted values of vector
ED50 are in good agreement with the experimental values.
The values of ED50 predicted for the compounds in the
training and test sets by use of Eq. 2 have been plotted
versus the experimental values in Fig. 3.
The real usefulness of QSAR models is not just their
ability to reproduce known data, verified by their fitting
power (R2)—it is mainly their possible predictive appli-
cation. For this reason the model obtained was validated
using LOO and LGO cross-validation processes. For LOO
cross-validation, a data point is removed from the set, and
the model is recalculated. The predicted activity for that
point is then compared with its actual value. This is repe-
ated until each data point has been omitted once. For LGO,
20% of the data points are removed from the dataset and
the model was refitted; the predicted values for those points
were then compared with the experimental values. Again,
this is repeated until each data point has been omitted once.
Cross-validation results are shown in Table 2. The cross-
validated correlation coefficient (Q2) is 0.771 for LGO and
0.760 for LOO. This confirms that the regression model
obtained has good internal and external predictive power.
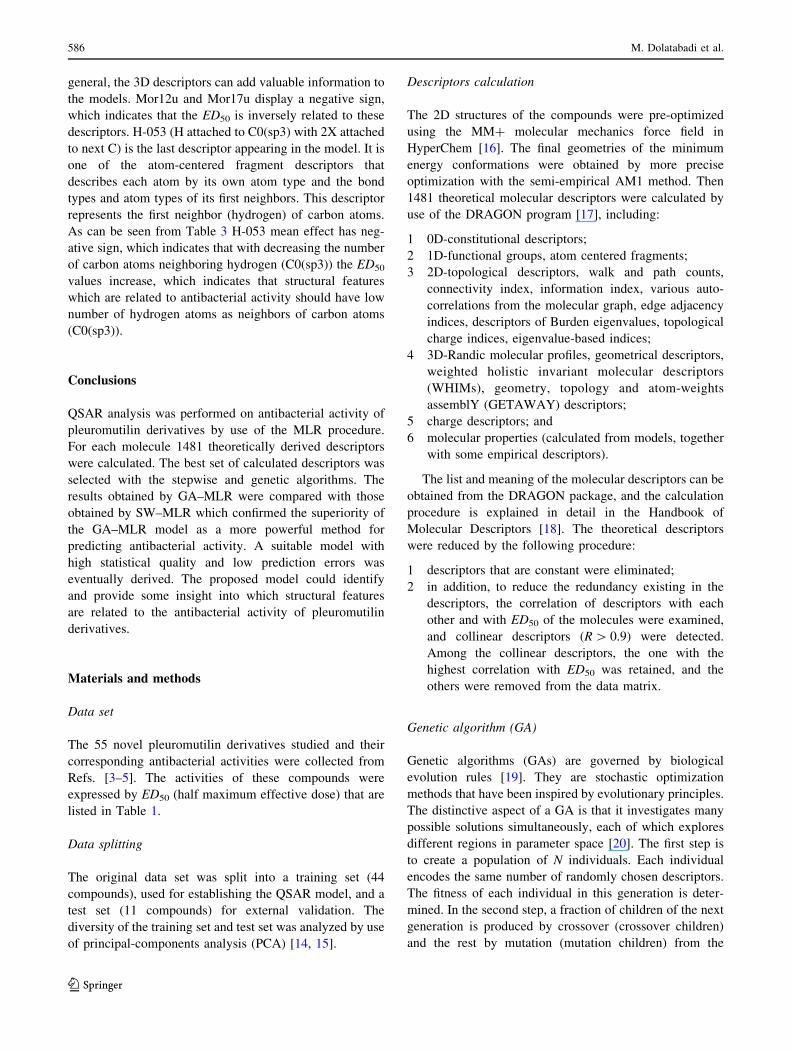
Also, in order to assess the robustness of the model, the
Y-randomization test was applied in this contribution [7].
The dependent variable vector (ED50) is randomly shuffled
and a new QSAR model is developed using the original
independent variable matrix. The new QSAR models (after
several repetitions) are expected to have low R2 and Q2LOO
values (Table 4). If the opposite happens then an accept-
able QSAR model cannot be obtained for the specific
modeling method and data.
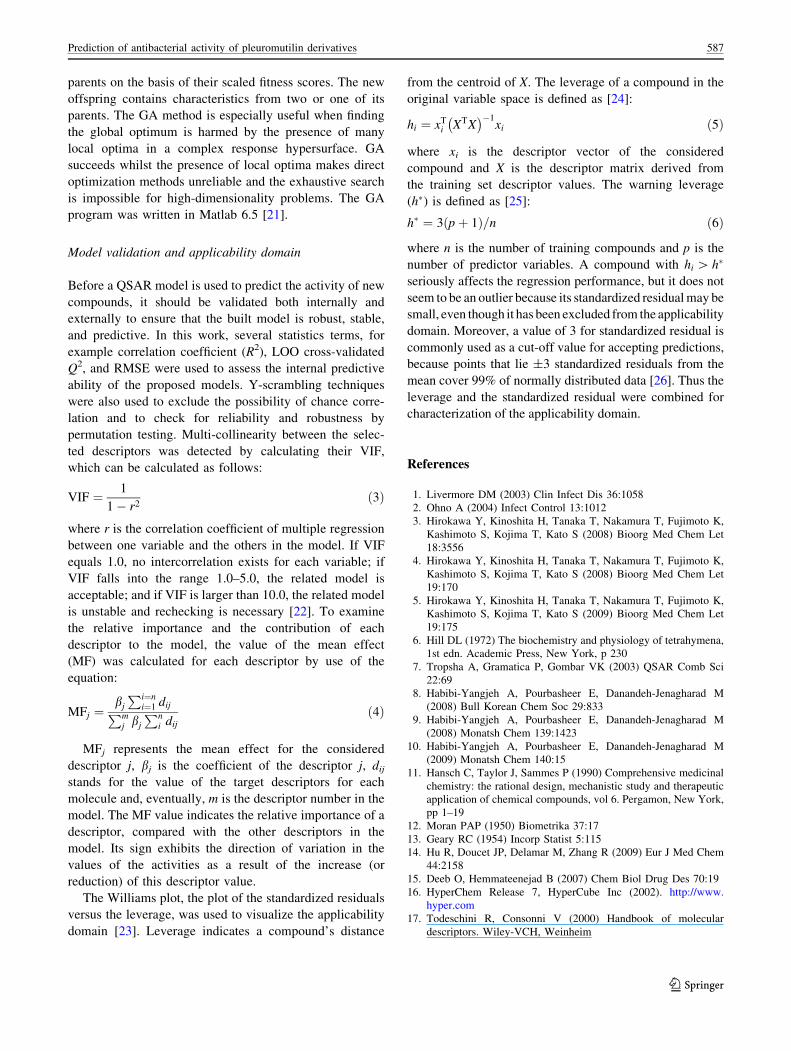
The applicability domain of this model was evaluated by
leverage analysis expressed as a Williams plot (Fig. 4), in
which the standardized residuals and the leverage values
(h) were plotted. From this figure it is obvious that there are
only three chemicals (52 in the training set and 55 and 30
in the test set) having leverage higher than the warning h*
value of 0.477, thus they can be regarded as structural
outliers. Fortunately, in this case the data predicted by the
model are good for compounds 52 and 55, thus they are
‘‘good leverage’’ chemicals. The analysis of the applica-
bility domain highlighted the presence of a chemical outlier
(compound 30) with standard residuals [3d. For this
0.4
0.6
0.8
1
0 2 4 6 8Number of descriptors
Stat
istic
al p
aram
eter
s.
R2
Training
R2
Adj
Q2
LOO
R2
Training
RQ
2
2Adj
LOO
Fig. 2 Effects of the number of descriptors on the statistical data
Table 3 The linear model based on the six parameters selected by genetic algorithm method
Descriptor Chemical meaning Coefficient Mean effect VIF
Constant Intercept 65.610 – –
X4A Average connectivity index chi-4 -502.590 0.804 1.706
MATS5e Moran autocorrelation—lag 5/weighted by atomic Sanderson electronegativities 30.891 0.012 1.637
GATS7v Geary autocorrelation—lag 7/weighted by atomic van der Waals volumes -14.241 0.219 1.136
Mor12u 3D-MoRSE—signal 12/unweighted -0.346 -0.015 1.349
Mor17u 3D-MoRSE—signal 17/unweighted -0.561 -0.031 1.058
H-053 H attached to C0(sp3) with 2X attached to next C -0.182 0.012 1.413
VIF variation inflation factors
584 M. Dolatabadi et al.
123
compound, the experimental ED50 = 4.81, and the model
prediction was 5.28.
Table 2 presents the statistical data for the results
obtained from the two studied models for the same set of
compounds. The RMSE of the GA–MLR method for the
training and test data sets were lower than those of the
model proposed in the SW–MLR method. The correlation
coefficient (R2) given by GA–MLR was higher than that of
the SW–MLR. The results of the F-test were obtained and
also are shown in Table 2. From this table it can be seen
that the GA–MLR model gives higher F values, so this
model gives the most satisfactory results, compared with
the results obtained from the SW–MLR method. Conse-
quently, this GA–MLR approach currently constitutes the
most accurate method for prediction of the antibacterial
activity of pleuromutilin derivatives.
Molecular descriptor interpretations
Table 3 lists the molecular descriptors selected by the
genetic algorithm as the most relevant in their combination
for the prediction of antibacterial activity. The average
connectivity index (X4A) is a topological descriptor cal-
culated from the vertex degree of the atoms in the
H-depleted molecular graph. As is apparent from Table 3,
the X4A mean effect has a positive sign, illustrating a
greater mean effect value than that of the other descriptors.
Therefore, this descriptor had a significant effect on the
antibacterial activity of pleuromutilin derivatives. The
positive sign suggests that the ED50 value is directly related
to this descriptor. The two 2D-autocorrelation descriptors
(MATS5e of Moran [12] and GATS7v of Geary [13]) give
information on the distribution of the atomic properties
along the topological structure. The weight properties are
here an electronic property (atomic electronegativity) that
highlights the relevance of the polarity properties for
antibacterial activity, and atomic volume, encoding infor-
mation on molecular dimension. Table 3 shows that
MATS5e and GATS7v mean effects have positive signs,
which indicate that antibacterial activity is directly related
to polarity and volume of the molecules. Therefore,
increasing the polarity and volume of the molecule leads to
an increase in its antibacterial activity (ED50 value). The
fourth and fifth descriptors are Mor12u and Mor17u, which
belong to the 3D MoRSE descriptors. These descriptors
were proposed as signal 12 and 17 unweighted. 3D-MoRSE
(3D-molecule representation of structures based on elec-
tron diffraction) descriptors are based on the idea of
obtaining information from the 3D atomic coordinates by
the transformation used in electron diffraction studies for
preparing theoretical scattering curves. It is worth noting
that they reflect the three-dimensional arrangement of the
atoms of a molecule and nothing about chemical bonds. In
GA-MLR
0
1
2
3
4
5
6
7
8
0 1 2 3 4 5 6 7 8
ED50 /mg kg-1 (Exp.)
ED
50 /m
g kg
-1 (P
red.
)Training
Test
Fig. 3 Predicted versus experimental antibacterial activity (ED50) by
GA–MLR
Table 4 R2train and Q2
LOO values after several Y-randomization tests
Iteration R2train Q2
LOO
1 0.053 0.123
2 0.202 0.004
3 0.061 0.084
4 0.085 0.001
5 0.090 0.001
6 0.146 0.002
7 0.154 0.027
8 0.238 0.037
9 0.078 0.043
10 0.120 0.001
-8
-6
-4
-2
0
2
4
6
8
0 0.2 0.4 0.6 0.8 1Leverages
Stan
dard
ised
res
idua
ls.
Training Test
30
55
52
Fig. 4 Williams plot of the GA–MLR model. The training and test
set samples are labeled differently. The dashed lines are the 3d limit
and the warning value of hat (h� ¼ 0:477). Compounds with high hvalues are numbered as in Table 1
Prediction of antibacterial activity of pleuromutilin derivatives 585
123
general, the 3D descriptors can add valuable information to
the models. Mor12u and Mor17u display a negative sign,
which indicates that the ED50 is inversely related to these
descriptors. H-053 (H attached to C0(sp3) with 2X attached
to next C) is the last descriptor appearing in the model. It is
one of the atom-centered fragment descriptors that
describes each atom by its own atom type and the bond
types and atom types of its first neighbors. This descriptor
represents the first neighbor (hydrogen) of carbon atoms.
As can be seen from Table 3 H-053 mean effect has neg-
ative sign, which indicates that with decreasing the number
of carbon atoms neighboring hydrogen (C0(sp3)) the ED50
values increase, which indicates that structural features
which are related to antibacterial activity should have low
number of hydrogen atoms as neighbors of carbon atoms
(C0(sp3)).
Conclusions
QSAR analysis was performed on antibacterial activity of
pleuromutilin derivatives by use of the MLR procedure.
For each molecule 1481 theoretically derived descriptors
were calculated. The best set of calculated descriptors was
selected with the stepwise and genetic algorithms. The
results obtained by GA–MLR were compared with those
obtained by SW–MLR which confirmed the superiority of
the GA–MLR model as a more powerful method for
predicting antibacterial activity. A suitable model with
high statistical quality and low prediction errors was
eventually derived. The proposed model could identify
and provide some insight into which structural features
are related to the antibacterial activity of pleuromutilin
derivatives.
Materials and methods
Data set
The 55 novel pleuromutilin derivatives studied and their
corresponding antibacterial activities were collected from
Refs. [3–5]. The activities of these compounds were
expressed by ED50 (half maximum effective dose) that are
listed in Table 1.
Data splitting
The original data set was split into a training set (44
compounds), used for establishing the QSAR model, and a
test set (11 compounds) for external validation. The
diversity of the training set and test set was analyzed by use
of principal-components analysis (PCA) [14, 15].
Descriptors calculation
The 2D structures of the compounds were pre-optimized
using the MM? molecular mechanics force field in
HyperChem [16]. The final geometries of the minimum
energy conformations were obtained by more precise
optimization with the semi-empirical AM1 method. Then
1481 theoretical molecular descriptors were calculated by
use of the DRAGON program [17], including:
1 0D-constitutional descriptors;
2 1D-functional groups, atom centered fragments;
3 2D-topological descriptors, walk and path counts,
connectivity index, information index, various auto-
correlations from the molecular graph, edge adjacency
indices, descriptors of Burden eigenvalues, topological
charge indices, eigenvalue-based indices;
4 3D-Randic molecular profiles, geometrical descriptors,
weighted holistic invariant molecular descriptors
(WHIMs), geometry, topology and atom-weights
assemblY (GETAWAY) descriptors;
5 charge descriptors; and
6 molecular properties (calculated from models, together
with some empirical descriptors).
The list and meaning of the molecular descriptors can be
obtained from the DRAGON package, and the calculation
procedure is explained in detail in the Handbook of
Molecular Descriptors [18]. The theoretical descriptors
were reduced by the following procedure:
1 descriptors that are constant were eliminated;
2 in addition, to reduce the redundancy existing in the
descriptors, the correlation of descriptors with each
other and with ED50 of the molecules were examined,
and collinear descriptors (R [ 0.9) were detected.
Among the collinear descriptors, the one with the
highest correlation with ED50 was retained, and the
others were removed from the data matrix.
Genetic algorithm (GA)
Genetic algorithms (GAs) are governed by biological
evolution rules [19]. They are stochastic optimization
methods that have been inspired by evolutionary principles.
The distinctive aspect of a GA is that it investigates many
possible solutions simultaneously, each of which explores
different regions in parameter space [20]. The first step is
to create a population of N individuals. Each individual
encodes the same number of randomly chosen descriptors.
The fitness of each individual in this generation is deter-
mined. In the second step, a fraction of children of the next
generation is produced by crossover (crossover children)
and the rest by mutation (mutation children) from the
586 M. Dolatabadi et al.
123
parents on the basis of their scaled fitness scores. The new
offspring contains characteristics from two or one of its
parents. The GA method is especially useful when finding
the global optimum is harmed by the presence of many
local optima in a complex response hypersurface. GA
succeeds whilst the presence of local optima makes direct
optimization methods unreliable and the exhaustive search
is impossible for high-dimensionality problems. The GA
program was written in Matlab 6.5 [21].
Model validation and applicability domain
Before a QSAR model is used to predict the activity of new
compounds, it should be validated both internally and
externally to ensure that the built model is robust, stable,
and predictive. In this work, several statistics terms, for
example correlation coefficient (R2), LOO cross-validated
Q2, and RMSE were used to assess the internal predictive
ability of the proposed models. Y-scrambling techniques
were also used to exclude the possibility of chance corre-
lation and to check for reliability and robustness by
permutation testing. Multi-collinearity between the selec-
ted descriptors was detected by calculating their VIF,
which can be calculated as follows:
VIF ¼ 1
1� r2ð3Þ
where r is the correlation coefficient of multiple regression
between one variable and the others in the model. If VIF
equals 1.0, no intercorrelation exists for each variable; if
VIF falls into the range 1.0–5.0, the related model is
acceptable; and if VIF is larger than 10.0, the related model
is unstable and rechecking is necessary [22]. To examine
the relative importance and the contribution of each
descriptor to the model, the value of the mean effect
(MF) was calculated for each descriptor by use of the
equation:
MFj ¼bj
Pi¼ni¼1 dij
Pmj bj
Pni dij
ð4Þ
MFj represents the mean effect for the considered
descriptor j, bj is the coefficient of the descriptor j, dij
stands for the value of the target descriptors for each
molecule and, eventually, m is the descriptor number in the
model. The MF value indicates the relative importance of a
descriptor, compared with the other descriptors in the
model. Its sign exhibits the direction of variation in the
values of the activities as a result of the increase (or
reduction) of this descriptor value.
The Williams plot, the plot of the standardized residuals
versus the leverage, was used to visualize the applicability
domain [23]. Leverage indicates a compound’s distance
from the centroid of X. The leverage of a compound in the
original variable space is defined as [24]:
hi ¼ xTi XTX� ��1
xi ð5Þ
where xi is the descriptor vector of the considered
compound and X is the descriptor matrix derived from
the training set descriptor values. The warning leverage
(h�) is defined as [25]:
h� ¼ 3 pþ 1ð Þ=n ð6Þ
where n is the number of training compounds and p is the
number of predictor variables. A compound with hi [ h�
seriously affects the regression performance, but it does not
seem to be an outlier because its standardized residual may be
small, even though it has been excluded from the applicability
domain. Moreover, a value of 3 for standardized residual is
commonly used as a cut-off value for accepting predictions,
because points that lie ±3 standardized residuals from the
mean cover 99% of normally distributed data [26]. Thus the
leverage and the standardized residual were combined for
characterization of the applicability domain.
References
1. Livermore DM (2003) Clin Infect Dis 36:1058
2. Ohno A (2004) Infect Control 13:1012
3. Hirokawa Y, Kinoshita H, Tanaka T, Nakamura T, Fujimoto K,
Kashimoto S, Kojima T, Kato S (2008) Bioorg Med Chem Let
18:3556
4. Hirokawa Y, Kinoshita H, Tanaka T, Nakamura T, Fujimoto K,
Kashimoto S, Kojima T, Kato S (2008) Bioorg Med Chem Let
19:170
5. Hirokawa Y, Kinoshita H, Tanaka T, Nakamura T, Fujimoto K,
Kashimoto S, Kojima T, Kato S (2009) Bioorg Med Chem Let
19:175
6. Hill DL (1972) The biochemistry and physiology of tetrahymena,
1st edn. Academic Press, New York, p 230
7. Tropsha A, Gramatica P, Gombar VK (2003) QSAR Comb Sci
22:69
8. Habibi-Yangjeh A, Pourbasheer E, Danandeh-Jenagharad M
(2008) Bull Korean Chem Soc 29:833
9. Habibi-Yangjeh A, Pourbasheer E, Danandeh-Jenagharad M
(2008) Monatsh Chem 139:1423
10. Habibi-Yangjeh A, Pourbasheer E, Danandeh-Jenagharad M
(2009) Monatsh Chem 140:15
11. Hansch C, Taylor J, Sammes P (1990) Comprehensive medicinal
chemistry: the rational design, mechanistic study and therapeutic
application of chemical compounds, vol 6. Pergamon, New York,
pp 1–19
12. Moran PAP (1950) Biometrika 37:17
13. Geary RC (1954) Incorp Statist 5:115
14. Hu R, Doucet JP, Delamar M, Zhang R (2009) Eur J Med Chem
44:2158
15. Deeb O, Hemmateenejad B (2007) Chem Biol Drug Des 70:19
16. HyperChem Release 7, HyperCube Inc (2002). http://www.
hyper.com
17. Todeschini R, Consonni V (2000) Handbook of molecular
descriptors. Wiley-VCH, Weinheim
Prediction of antibacterial activity of pleuromutilin derivatives 587
123
18. Todeschini R, Milano Chemometrics and QSPR Group (2002).
http://www.disat.unimib.it/chm
19. Holland H (1975) Adaption in natural and artificial systems. The
University of Michigan, Ann Arbor
20. Cartwright HM (1993) Applications of artificial intelligence in
chemistry. Oxford University, Oxford
21. The Mathworks Inc (2002) Genetic algorithm and direct search
toolbox users guide, Massachusetts
22. Agrawal VK, Khadikar PV (2001) Bioorg Med Chem 9:3035
23. OECD (2007) Guidance document on the validation of (quantita-
tive) structure–activity relationships [(Q)SAR] models. Organi-
sation for Economic Co-Operation and Development, Paris
24. Netzeva TI, Worth AP, Aldenberg T, Benigni R, Cronin MTD,
Gramatica P, Jaworska JS, Kahn S, Klopman G, Marchant CA,
Myatt G, Nikolova-Jeliazkova N, Patlewicz GY, Perkins R,
Roberts DW, Schultz TW, Stanton DT, van de Sandt JJM, Tong
W, Veith G, Yang C (2005) Altern Lab Anim 33:155
25. Eriksson L, Jaworska J, Worth AP, Cronin MTD, McDowell RM,
Gramatica P (2003) Environ Health Perspect 111:1361
26. Jaworska JS, Nikolova JN, Aldenberg T (2005) Altern Lab Anim
33:445
588 M. Dolatabadi et al.
123