prediction of aesthetic reconstruction effects in edentulous
TRANSCRIPT
1SCiENTifiC REPORtS | (2017) 7:18077 | DOI:10.1038/s41598-017-17065-y
www.nature.com/scientificreports
Prediction of aesthetic reconstruction effects in edentulous patientsFusong Yuan1, Cheng Cheng2, Ning Dai2 & Yuchun Sun1
The aim of the study is to establish a virtual prediction method to predict aesthetic reconstruction effects in edentulous patients. The facial soft tissue surface data before and after wearing complete dentures of ten edentulous patients were acquired with a facial Three-dimension scanner. Then, the two sets of scanned data were entered into the same coordinate system. Manual interaction was performed to extract the external boundary of the perioral appearance deformation area, and the proportional relationships of key facial anatomical features were measured. A virtual prediction software module was developed based on back-propagation neural networks and a Laplacian deformation algorithm. Virtual prediction of the aesthetic reconstruction effects in the overall appearance of the lower third of the face was performed in 10 edentulous patients. The mean accuracy of the virtual predictions was approximately 0.769 ± 0.205 mm, and there were statistically significant differences between the 10 patients (p < 0.05). The scope of the changes in facial appearance of edentulous patients was smaller than the scope of the lower third of the face. This method can achieve the virtual prediction of soft tissue appearance in the lower third of the face after wearing complete dentures to an extent.
When humans lose all their teeth, the condition is known as missing dentition or complete edentulism. Edentulous patients experience a loss of basic masticatory function, and the progressive absorption of alveolar bone. Different degrees of collapse occur in facial soft tissue, with the lack of teeth and sufficient support from alveolar bone. This leads to shortening in the lower third of the face, deeper wrinkles, drooping of the labial com-missures, and other changes1. The aesthetic reconstruction of facial appearance in edentulous patients is one of the crucial objectives in complete denture prosthodontics.
The wearing of complete dentures by edentulous patients is equivalent to local plastic surgery. To achieve sat-isfactory aesthetic restoration, dentists need to be able to predict the patient’s post-restoration facial appearance and changes in facial soft tissue prior to performing restoration. This prediction can then be incorporated into the design of the artificial dentition and denture base for complete dentures. Currently, the prediction of facial deformation is mainly dependent on the dentist’s subjective judgment and experience, rather than quantitative scientific analysis. A number of researchers have striven to achieve the quantitative prediction of changes in facial soft tissue after maxillofacial restoration2. These studies can be divided into three types based on their calculation methods, the mass-spring model (MSM), the finite element model (FEM), and the mass tensor model (MTM).
Due to the physical implications and computational efficiency of MSM, it was the earliest method to be applied to real-time facial simulation. Koch et al. used computed tomography (CT) data to reconstruct facial and skull models, and established a MSM between the facial and skull models, in order to perform deformation simulations3. Due to the complex structural mechanics of facial soft tissue, MSM often leads to the occurrence of hyperelasticity during the simulation process, which can lead to greater distortion.
While the FEM has relatively good biomechanical relevance, its computational costs are high. Sarti et al. pro-posed a computationally-intensive FEM based on voxel elements4. Zachow et al. proposed the simulation of soft tissue models using FEM based on tetrahedral elements to enhance computation speed, and applied this approach for clinical use5. Gladilin applied FEM based on tetrahedral elements on facial muscles6. Due to the high com-putational load and long computing time of FEM, many studies have focused on optimizing the computational strategies and models7,8.
1Center of Digital Dentistry, Peking University School and Hospital of Stomatology; Department of Prosthodontics, Peking University School and Hospital of Stomatology; National Engineering Laboratory for Digital and Material Technology of Stomatology; Research Center of Engineering and Technology for Digital Dentistry of Ministry of Health; Beijing Key Laboratory of Digital Stomatology, Beijing, China. 2College of Mechanical and Electrical Engineering, Nanjing University of Aeronautics and Astronautics, Nanjing, China. Correspondence and requests for materials should be addressed to N.D. (email: [email protected]) or Y.S. (email: [email protected])
Received: 25 August 2017
Accepted: 21 November 2017
Published: xx xx xxxx
OPEN
www.nature.com/scientificreports/
2SCiENTifiC REPORtS | (2017) 7:18077 | DOI:10.1038/s41598-017-17065-y
MTM was initially developed to balance computational speed and accuracy. Mollemans et al. applied MTM to the simulation of facial soft tissue deformations for maxillofacial surgery9. They used CT data to reconstruct facial and skull models, and applied MTM to simulate post-surgical skull displacement and facial deformations. MTM can be regarded as a hybrid of FEM and MSM. While the model retains the simple structure of MSM, it also has the biomechanical relevance of FEM. Nevertheless, when analyzing soft tissue models, CT scans of the soft tissue are needed to determine the boundary conditions of the model. However, the radiation dose associated with CT scans is potentially harmful to the human body.
Artificial neural networks have been widely applied in various fields, and are particularly suitable for solving multi-parameter operations and non-linear interpolation problems. Back-propagation (BP) neural networks are typical artificial neural networks that can solve complex non-linear problems. Scott et al. employed artificial neu-ral networks to predict the properties of ceramic materials10. Neural networks have also been used to accurately predict the performance of highly complex materials11,12.
Our research group has previously established a deformation algorithm based on the as-rigid-as-possible (ARAP) technique for the simulation of edentulous maxillofacial soft tissue after wearing complete dentures. The approach has high computational accuracy and efficiency, and does not require CT scanning13. The present study combined this approach with facial color 3D scanning technology to establish a data registration method suitable for quantitative investigation of changes in facial soft tissue appearance before and after the wearing of complete dentures in edentulous patients. The method was then used to measure the boundaries of the pre-operative and post-operative appearance deformation areas in 10 Chinese edentulous patients, followed by the preliminary construction of statistical models for these boundaries. Based on the resulting data, a virtual prediction algo-rithm was established using BP neural networks and a Laplacian deformation algorithm to determine the overall aesthetic reconstruction effects in the lower third of maxillofacial soft tissues. Virtual prediction was performed on the overall post-operative 3D appearance of the lower third of the facial soft tissue in 10 Chinese edentulous patients, and the predictions were evaluated by quantitative comparison with the actual post-operative appear-ance. Our results have laid the foundation for studies on the accurate digital reconstruction of oral and maxillo-facial aesthetics.
Materials and MethodsExperimental equipment and software. The current study used a facial 3D scanner (Facescan, 3D Systems, USA) with a scanning precision of 0.1 mm. Geomagic Qualify 2012 (Geomagic Inc., USA) 3D anal-ysis software was used, as were an Intel® CoreTM i5–3550 processor with 8GB RAM, a 1TB hard-drive, and a ViewSonic VG920 color monitor. The MicrosoftVisual C++ 6.0 (Bell Labs, USA) programming language was utilized.
Experimental methods. Sample collection. Ten patients with edentulous jaws [five males (50.0%) and five females (50.0%)] with a mean age of 73.2 ± 4.3 years (range 68–80 years) were enrolled in the study. They under-went complete denture prosthodontics at the Department of Prosthodontics of the Peking University School of Stomatology, Beijing, China. Inclusion criteria for patients were edentulous patients who wore complete den-tures made in the Department of Prosthodontics of the Peking University School of Stomatology. Patients were excluded if they were rated ≤20 points on the Revised Hasegawa Dementia Scale, which is a scale of dementia, or if they had symptoms of severe myopia or daltonism. No patient was excluded after these preliminary examina-tions. From preliminary tests, the sample size (n = 10) was determined with a power analysis to provide statistical significance (a = 0.05) at 80% power. The study was approved by the Bioethics Committee of the Stomatological Hospital of Peking University ((No.PKUSSIRB-201627042. Date: 27/6/2016). All of the experimental protocols and procedures were approved by the licensing committee and performed in accordance with the approved guidelines and regulations. The patients were informed that the extracted teeth would be used in the in vitro study, and informed consent was obtained from all of the subjects.
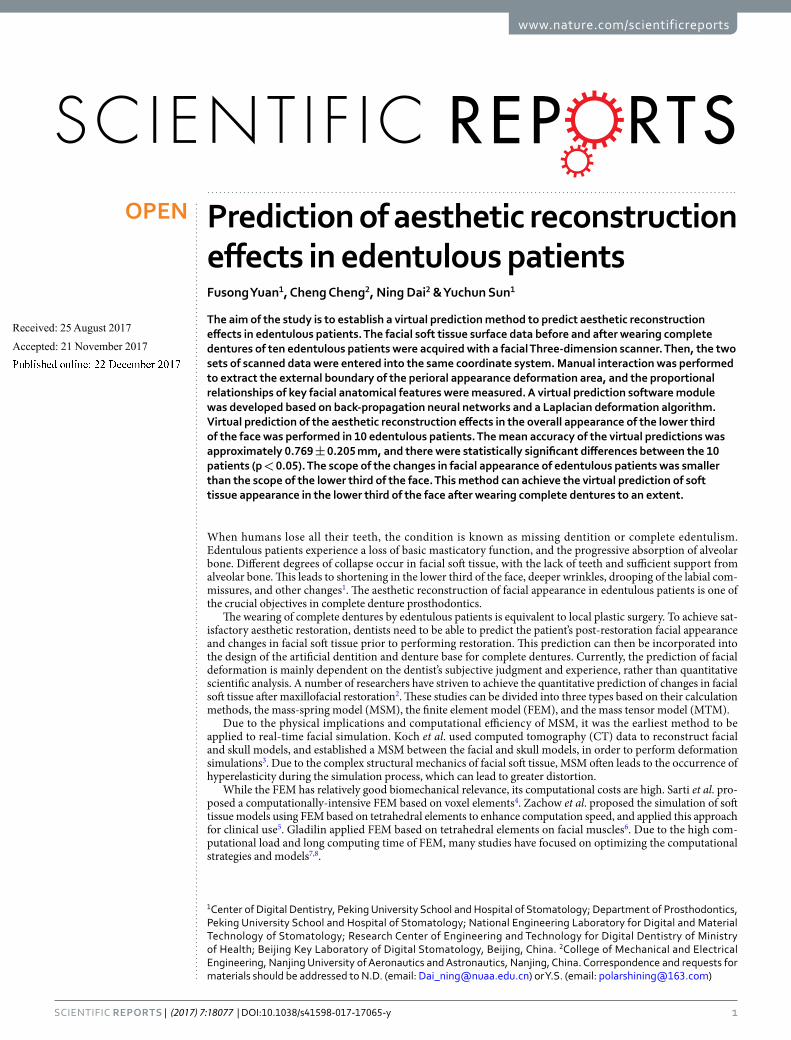
Data acquisition. The patients were asked to sit upright with their heads positioned naturally and their mandi-bles in the mandibular postural position. A black marker pen was used to make three circular marks on a rela-tively flat area on the bilateral tragus and the nasal tip. A facial 3D color scanner was used to acquire true color 3D data from the patients’ faces before and after wearing complete dentures. The pre-operative data were labeled A, and the post-operative data were labeled B. All data were stored in OBJ format (Fig. 1).
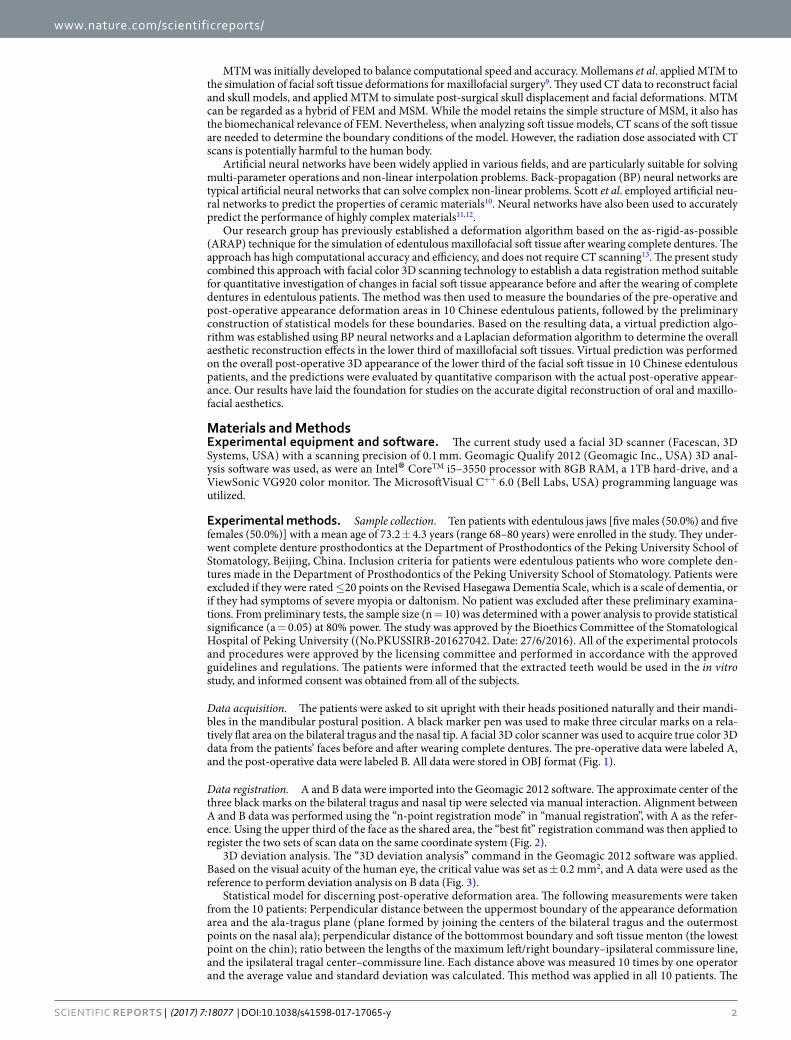
Data registration. A and B data were imported into the Geomagic 2012 software. The approximate center of the three black marks on the bilateral tragus and nasal tip were selected via manual interaction. Alignment between A and B data was performed using the “n-point registration mode” in “manual registration”, with A as the refer-ence. Using the upper third of the face as the shared area, the “best fit” registration command was then applied to register the two sets of scan data on the same coordinate system (Fig. 2).
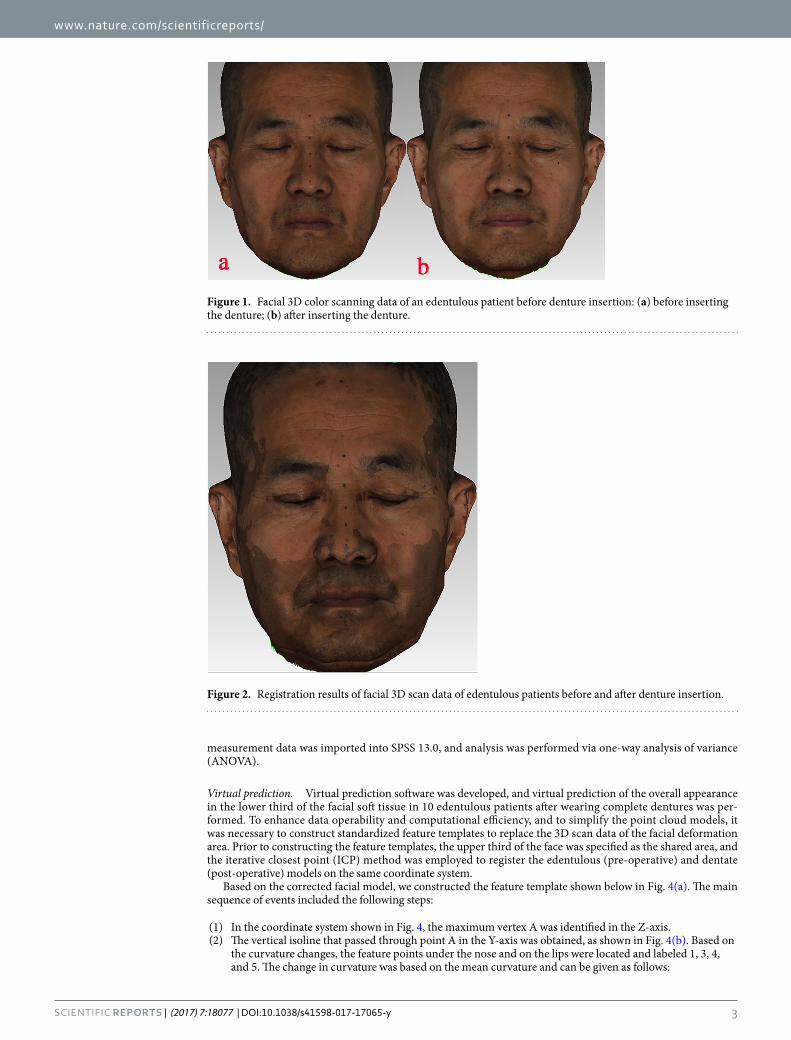
3D deviation analysis. The “3D deviation analysis” command in the Geomagic 2012 software was applied. Based on the visual acuity of the human eye, the critical value was set as ± 0.2 mm2, and A data were used as the reference to perform deviation analysis on B data (Fig. 3).
Statistical model for discerning post-operative deformation area. The following measurements were taken from the 10 patients: Perpendicular distance between the uppermost boundary of the appearance deformation area and the ala-tragus plane (plane formed by joining the centers of the bilateral tragus and the outermost points on the nasal ala); perpendicular distance of the bottommost boundary and soft tissue menton (the lowest point on the chin); ratio between the lengths of the maximum left/right boundary–ipsilateral commissure line, and the ipsilateral tragal center–commissure line. Each distance above was measured 10 times by one operator and the average value and standard deviation was calculated. This method was applied in all 10 patients. The
www.nature.com/scientificreports/
3SCiENTifiC REPORtS | (2017) 7:18077 | DOI:10.1038/s41598-017-17065-y
measurement data was imported into SPSS 13.0, and analysis was performed via one-way analysis of variance (ANOVA).
Virtual prediction. Virtual prediction software was developed, and virtual prediction of the overall appearance in the lower third of the facial soft tissue in 10 edentulous patients after wearing complete dentures was per-formed. To enhance data operability and computational efficiency, and to simplify the point cloud models, it was necessary to construct standardized feature templates to replace the 3D scan data of the facial deformation area. Prior to constructing the feature templates, the upper third of the face was specified as the shared area, and the iterative closest point (ICP) method was employed to register the edentulous (pre-operative) and dentate (post-operative) models on the same coordinate system.
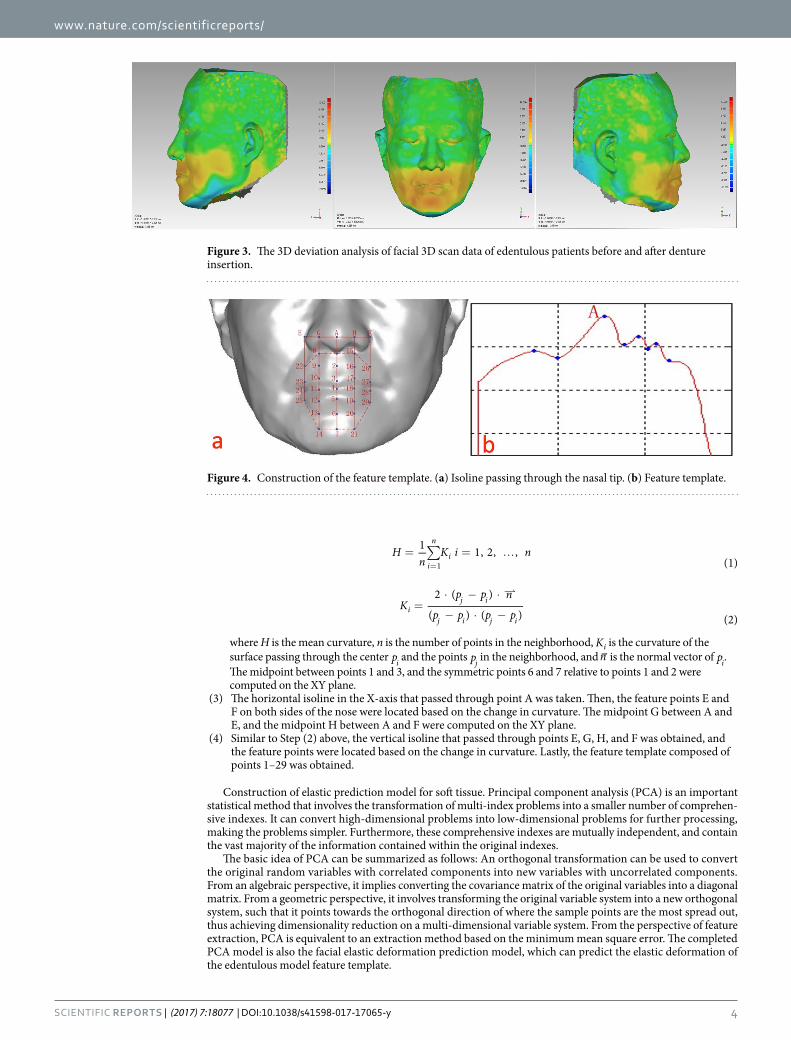
Based on the corrected facial model, we constructed the feature template shown below in Fig. 4(a). The main sequence of events included the following steps:
(1) In the coordinate system shown in Fig. 4, the maximum vertex A was identified in the Z-axis. (2) The vertical isoline that passed through point A in the Y-axis was obtained, as shown in Fig. 4(b). Based on
the curvature changes, the feature points under the nose and on the lips were located and labeled 1, 3, 4, and 5. The change in curvature was based on the mean curvature and can be given as follows:
Figure 1. Facial 3D color scanning data of an edentulous patient before denture insertion: (a) before inserting the denture; (b) after inserting the denture.
Figure 2. Registration results of facial 3D scan data of edentulous patients before and after denture insertion.
www.nature.com/scientificreports/
4SCiENTifiC REPORtS | (2017) 7:18077 | DOI:10.1038/s41598-017-17065-y
∑= = …=
Hn
K i n1 1, 2, ,(1)i
n
i1
=⋅ − ⋅
− ⋅ −K
p p n
p p p p
2 ( )
( ) ( ) (2)i
j i
j i j i
where H is the mean curvature, n is the number of points in the neighborhood, Ki is the curvature of the surface passing through the center pi and the points pj in the neighborhood, and ��n is the normal vector of pi. The midpoint between points 1 and 3, and the symmetric points 6 and 7 relative to points 1 and 2 were computed on the XY plane.
(3) The horizontal isoline in the X-axis that passed through point A was taken. Then, the feature points E and F on both sides of the nose were located based on the change in curvature. The midpoint G between A and E, and the midpoint H between A and F were computed on the XY plane.
(4) Similar to Step (2) above, the vertical isoline that passed through points E, G, H, and F was obtained, and the feature points were located based on the change in curvature. Lastly, the feature template composed of points 1–29 was obtained.
Construction of elastic prediction model for soft tissue. Principal component analysis (PCA) is an important statistical method that involves the transformation of multi-index problems into a smaller number of comprehen-sive indexes. It can convert high-dimensional problems into low-dimensional problems for further processing, making the problems simpler. Furthermore, these comprehensive indexes are mutually independent, and contain the vast majority of the information contained within the original indexes.
The basic idea of PCA can be summarized as follows: An orthogonal transformation can be used to convert the original random variables with correlated components into new variables with uncorrelated components. From an algebraic perspective, it implies converting the covariance matrix of the original variables into a diagonal matrix. From a geometric perspective, it involves transforming the original variable system into a new orthogonal system, such that it points towards the orthogonal direction of where the sample points are the most spread out, thus achieving dimensionality reduction on a multi-dimensional variable system. From the perspective of feature extraction, PCA is equivalent to an extraction method based on the minimum mean square error. The completed PCA model is also the facial elastic deformation prediction model, which can predict the elastic deformation of the edentulous model feature template.
Figure 3. The 3D deviation analysis of facial 3D scan data of edentulous patients before and after denture insertion.
Figure 4. Construction of the feature template. (a) Isoline passing through the nasal tip. (b) Feature template.
www.nature.com/scientificreports/
5SCiENTifiC REPORtS | (2017) 7:18077 | DOI:10.1038/s41598-017-17065-y
Deformation simulation based on Laplacian deformation technique. Laplacian mesh processing uniformly regards its processing target as a discrete scalar field defined on the vertex of the 3D mesh model. It uses the dif-ferential properties of this scalar field on a discrete face to effectively express the local features of this field. After performing certain operations, it reconstructs the differential properties using a global optimization process into a scalar field containing the initial meaning.
For each vertex vi in the mesh model, we can use the linear combination of its adjacent edge vectors to define the differential coordinates di of one vertex via the following equation:
∑= = = −∈d (d , d , d ) L(v) w (v v) (3)i i(x)
i(y)
i(z) T
i j N(i) ij i j
where di is also known as the Laplacian coordinates, and wij is the weight of the edge (ij). The Laplacian coordi-nates (di) of all mesh vertices can be combined to give matrix = … =D (d , d , , d ) (d , d , d )1
T2T
nT T (x) (y) (z) , and we
can use the Laplacian matrix =L (l )ij to more conveniently express Equation (4):
∑= =
=
− ∈
.
∈
li j
D LV, wherew , ,
w , j N(i),0, otherwise (4)
ij
j N(i) ij
ij
The Laplacian matrix L is also known as the Laplacian operator defined on mesh M.By using vi to denote the ith vertex in the mesh model, and δi to denote the Laplacian coordinates correspond-
ing to vi, we can compute the center of the neighborhood points for this vertex as follows:
∑=∈
v 1d
v(5)
ii j N(i)
j
where vi represents the center of all vertices directly adjacent to the vertex vi, and di represents the number of vertices directly linked to the ith point. The Laplacian operator represents the amount of displacement of the cur-rent point from the center of all its neighboring points.
Under uniform weighting, the Cartesian coordinates of the triangular mesh can be transformed into Laplacian coordinates using the following equation:
∑δ = = − ∈L(v) v 1d
v(6)i i i
ij N(i) j
Let A be the adjacency matrix of the mesh. Then, according to discrete mathematics, A can be expressed as follows:
∈A i1, ( , j) edge0, otherwise (7)ij
Let D be the diagonal matrix, where =D dii i. Thus, the matrix for the transformation of Cartesian coordinates to Laplacian coordinates, i.e., matrix L, can be expressed as L=I − D−1 A. Lastly, the new coordinates can be given by:
′ =
δ
LI
V w (8)
where I is the weights of the control points, w is the coordinates of the control points, and ′V is the coordinates of the final model points. Based on the constraints, the feature points of the feature template and the points in the deformation were used to construct the Laplacian equation. Then, deformation simulation was performed on the edentulous facial mode according to changes in the feature points.
Comparative evaluation of virtual prediction results. 10 virtual predictions were performed for each patient by one operator. The virtual prediction data and the patients’ post-operative scan data were imported simultane-ously into the Geomagic 2012 software. By specifying the upper third of the face as the shared area, the “best fit” registration command was used to register both datasets onto the same coordinate system, and deviation analysis was performed on the appearance deformation area. After that, each patient got 10 sets of error values, and the average and standard deviation were calculated. Each patient was treated with this method, and then all the error values of 10 patients were statistically analyzed.
ResultsWith regard to the appearance deformation area of the 10 patients before and after wearing complete dentures, the maximum value of the distance between the uppermost boundary and the ala-tragus plane was 2.402 mm, the minimum value was 0.181 mm, and the mean value was 1.221 ± 0.657 mm. The maximum value of the distance between the bottommost boundary and soft tissue menton was 1.518 mm, the minimum value was 0.029 mm, and the mean value was 0.735 ± 0.491 mm. The distance from the left maximum boundary to the commissure = a straight line from the left tragal center to the commissure *(0.794 ± 0.021). The distance from the right maximum boundary to the commissure = a straight line from the right tragal center to the commissure *(0.789 ± 0.019). One-way ANOVA of the data showed that the differences were not statistically significant (P > 0.05).
www.nature.com/scientificreports/
6SCiENTifiC REPORtS | (2017) 7:18077 | DOI:10.1038/s41598-017-17065-y
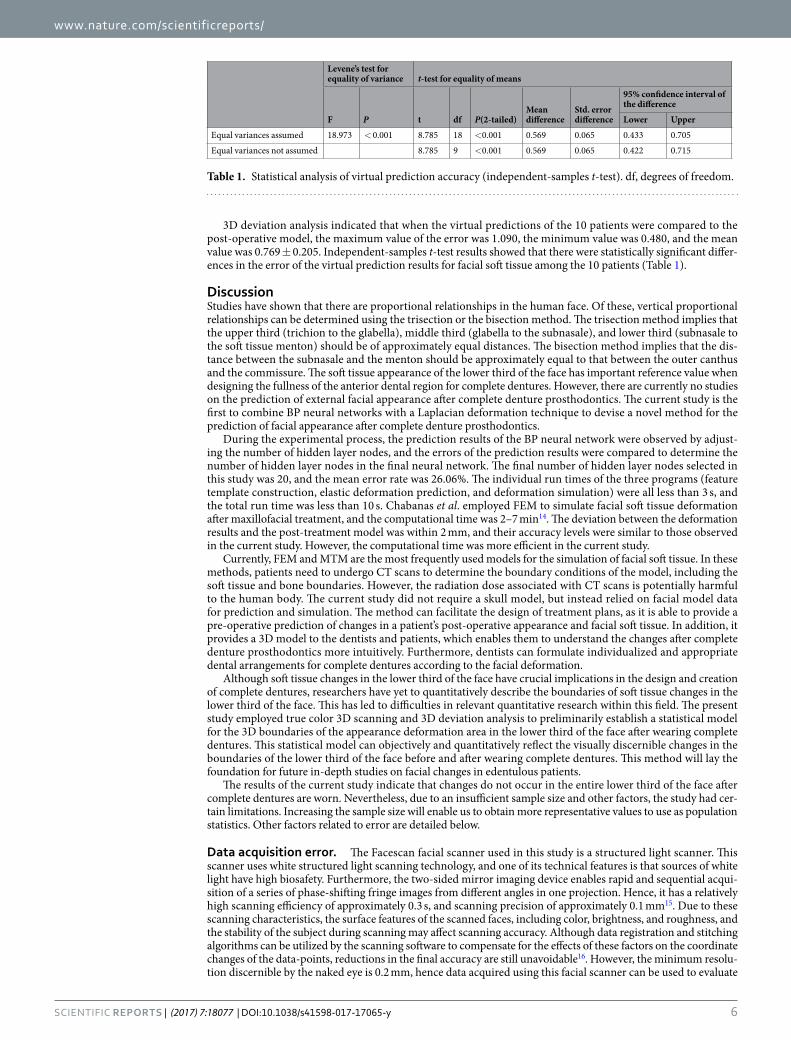
3D deviation analysis indicated that when the virtual predictions of the 10 patients were compared to the post-operative model, the maximum value of the error was 1.090, the minimum value was 0.480, and the mean value was 0.769 ± 0.205. Independent-samples t-test results showed that there were statistically significant differ-ences in the error of the virtual prediction results for facial soft tissue among the 10 patients (Table 1).
DiscussionStudies have shown that there are proportional relationships in the human face. Of these, vertical proportional relationships can be determined using the trisection or the bisection method. The trisection method implies that the upper third (trichion to the glabella), middle third (glabella to the subnasale), and lower third (subnasale to the soft tissue menton) should be of approximately equal distances. The bisection method implies that the dis-tance between the subnasale and the menton should be approximately equal to that between the outer canthus and the commissure. The soft tissue appearance of the lower third of the face has important reference value when designing the fullness of the anterior dental region for complete dentures. However, there are currently no studies on the prediction of external facial appearance after complete denture prosthodontics. The current study is the first to combine BP neural networks with a Laplacian deformation technique to devise a novel method for the prediction of facial appearance after complete denture prosthodontics.
During the experimental process, the prediction results of the BP neural network were observed by adjust-ing the number of hidden layer nodes, and the errors of the prediction results were compared to determine the number of hidden layer nodes in the final neural network. The final number of hidden layer nodes selected in this study was 20, and the mean error rate was 26.06%. The individual run times of the three programs (feature template construction, elastic deformation prediction, and deformation simulation) were all less than 3 s, and the total run time was less than 10 s. Chabanas et al. employed FEM to simulate facial soft tissue deformation after maxillofacial treatment, and the computational time was 2–7 min14. The deviation between the deformation results and the post-treatment model was within 2 mm, and their accuracy levels were similar to those observed in the current study. However, the computational time was more efficient in the current study.
Currently, FEM and MTM are the most frequently used models for the simulation of facial soft tissue. In these methods, patients need to undergo CT scans to determine the boundary conditions of the model, including the soft tissue and bone boundaries. However, the radiation dose associated with CT scans is potentially harmful to the human body. The current study did not require a skull model, but instead relied on facial model data for prediction and simulation. The method can facilitate the design of treatment plans, as it is able to provide a pre-operative prediction of changes in a patient’s post-operative appearance and facial soft tissue. In addition, it provides a 3D model to the dentists and patients, which enables them to understand the changes after complete denture prosthodontics more intuitively. Furthermore, dentists can formulate individualized and appropriate dental arrangements for complete dentures according to the facial deformation.
Although soft tissue changes in the lower third of the face have crucial implications in the design and creation of complete dentures, researchers have yet to quantitatively describe the boundaries of soft tissue changes in the lower third of the face. This has led to difficulties in relevant quantitative research within this field. The present study employed true color 3D scanning and 3D deviation analysis to preliminarily establish a statistical model for the 3D boundaries of the appearance deformation area in the lower third of the face after wearing complete dentures. This statistical model can objectively and quantitatively reflect the visually discernible changes in the boundaries of the lower third of the face before and after wearing complete dentures. This method will lay the foundation for future in-depth studies on facial changes in edentulous patients.
The results of the current study indicate that changes do not occur in the entire lower third of the face after complete dentures are worn. Nevertheless, due to an insufficient sample size and other factors, the study had cer-tain limitations. Increasing the sample size will enable us to obtain more representative values to use as population statistics. Other factors related to error are detailed below.
Data acquisition error. The Facescan facial scanner used in this study is a structured light scanner. This scanner uses white structured light scanning technology, and one of its technical features is that sources of white light have high biosafety. Furthermore, the two-sided mirror imaging device enables rapid and sequential acqui-sition of a series of phase-shifting fringe images from different angles in one projection. Hence, it has a relatively high scanning efficiency of approximately 0.3 s, and scanning precision of approximately 0.1 mm15. Due to these scanning characteristics, the surface features of the scanned faces, including color, brightness, and roughness, and the stability of the subject during scanning may affect scanning accuracy. Although data registration and stitching algorithms can be utilized by the scanning software to compensate for the effects of these factors on the coordinate changes of the data-points, reductions in the final accuracy are still unavoidable16. However, the minimum resolu-tion discernible by the naked eye is 0.2 mm, hence data acquired using this facial scanner can be used to evaluate
Levene’s test for equality of variance t-test for equality of means
F P t df P(2-tailed)Mean difference
Std. error difference
95% confidence interval of the difference
Lower Upper
Equal variances assumed 18.973 < 0.001 8.785 18 <0.001 0.569 0.065 0.433 0.705
Equal variances not assumed 8.785 9 <0.001 0.569 0.065 0.422 0.715
Table 1. Statistical analysis of virtual prediction accuracy (independent-samples t-test). df, degrees of freedom.
www.nature.com/scientificreports/
7SCiENTifiC REPORtS | (2017) 7:18077 | DOI:10.1038/s41598-017-17065-y
changes in appearance. In addition, breathing, heart beats, and other factors can also lead to micro-movements in the face. A study has shown that when the sampling frequency was >60 Hz, the effects of micro-movements of the human body on scanning accuracy could be maintained within 30 µm17. Micro-movements may still have an impact on the scanning accuracy of facial scanners. In subsequent studies, scanners with higher scanning speed should be used to improve the accuracy of data acquisition.
Registration measurement errors during experimental software operation. In order to achieve the registration and measurement of different datasets, the present study had to utilize the processing software that came with the scanner, and reverse engineering software such as Imageware and Geomagic. The registra-tion algorithms used in the above software are all ICP algorithms. The ICP algorithm was proposed by Besl and Mckay in 199218. It is the foundation of all point cloud registration algorithms, and can effectively resolve the problem of matching free-form curves. The original ICP algorithm was groundbreaking in point cloud matching. However, the actual establishment of the best matching point is extremely time-consuming. Moreover, the ICP algorithm often has high requirements for the initial positions of the point cloud views to be registered—otherwise the algorithm would be prone to obtaining local optima, which would lead to registration errors19. In addition, the experimenter’s familiarity with software operation, understanding of different functions, and daily mental state may affect the accuracy of registration and measurement, thereby influencing the accuracy of the experimental results.
Limitations of the statistical model. The present study used visual inspection and manual interaction to extract the boundaries of the appearance deformation area in the lower third of the face in 10 clinical edentulous patients. Based on these data, a preliminary mathematical model was established for the 3D boundary of the appearance deformation area in the lower third of the face after edentulous patients wore complete dentures. As this was an exploratory study, the number of cases was small, which would also affect the accuracy of the math-ematical model to a certain extent. A larger sample size would ensure higher accuracy of the statistical model. Moreover, associations should be made with the elasticity coefficient of the local soft tissue for the classification of the relevant indicators, in order to further strengthen the accuracy of the statistical model.
Future research plans. Based on the limitations of the current method, appropriate measures will be taken to address each shortcoming in future research. The number of cases included in a subsequent study will be increased. Grouped analysis will also be performed based on the elasticity features of the lower third of the face. Furthermore, additional specialized scanning and software training will be undertaken by the experimenters, in an effort to reduce the effects of erroneous operations and experimenters’ emotional changes on the measurement results.
ConclusionsThe extent of changes in appearance caused by insertion of complete dentures in edentulous patients was roughly below the base of the nose and above the menton (This range was less than 1/3 of the area below the surface), and the anterior four-fifth of the bilateral lines connecting the midpoint of each tragus with the ipsilateral angle of the mouth. And this method can achieve the virtual prediction of soft tissue appearance in the lower third of the face after wearing complete dentures to an extent.
References 1. Feng, H. L. & Xu, J. In Prosthodontics (ed. 2 Feng, H. L. & Xu, J.) Ch.2, 41–68 (Peking University Medical Press, 2013). 2. McCollum, A. G. H. & Evans, W. G. Facial Soft Tissue: The Alpha and Omega of Treatment Planning in Orthognathic Surgery. Semin
Orthod. 15, 196–216 (2009). 3. Koch, R. M., Gross, M. H., Carls, F. R., & Von Buren, D. F. Simulating Facial Surgery Using Finite Element Models. Proceedings of
SIGGRAPH, 421–428 (1999). 4. Sarti, A., Gori, R. & Lamberti, C. A physically based model to simulate maxillo-facial surgery from 3D CT images. Future Gener.
Comp. Sy. 15, 217–222 (1999). 5. Zachow, S., Gladiline, E., Hege, H., & Deuflhard, P. Finite-element simulation of soft tissue deformation. Computer Assisted
Radiology and Surgery (CARS), Elsevier Science B.V, 23–28 (2000). 6. Gladilin, E. Biomechanical Modeling of Soft Tissue and Facial Expressions for Craniofacial Surgery Planning. (ed.Von, D.)101–105
(Berlin, 2003). 7. Cousley, R. R., Grant, E. & Kindelan, J. D. The validity of computerized orthognathic predictions. J Orthod. 30, 149–154 (2003). 8. Picinbono, G., Delingette, H. & Ayache, N. Non-linear anisotropic elasticity for real-time surgery simulation. Graph. Models. 65,
305–321 (2003). 9. Mollemans, W., Schutyser, F., Nadjmi, N., Maes, F. & Suetens, P. Predicting soft tissue deformations for a maxillofacial surgery
planning system: from computational strategies to a complete clinical validation. Med. Image Analy. 11, 282–301 (2007). 10. Scott, D., Coveney, P., Kilner, J., Rossiny, J. & Alford, N. M. N. Prediction of the func-tional properties of ceramic materials from
composition using artificial neural networks. J. Eur. Ceram. Soc. 27, 425–442 (2007). 11. Suganthi, X. H., Natarajan, U., Sathiyamurthy, S. & Chidambaram, K. Prediction of quality responses in micro-edm process using
an adaptive neuro-fuzzy inference system (ANFIS) model. Int. J. Adv. Manuf. Tech. 68, 339–347 (2013). 12. Oktem, H. An integrated study of surface roughness for modelling and optimization of cutting parameters during end milling
operation. Int. J. Adv. Manuf. Tech. 43, 852–861 (2009). 13. Cheng, C. et al. Prediction of facial deformation after complete denture prosthesis using BP neural network. Comput. Biol. Med. 66,
103–112 (2015). 14. Chabanas, M., Luboz, V. & Payan, Y. Patient specific finite element model of the face soft tissues for computer-assisted maxillofacial
surgery. Med. Image Analy. 7, 131–151 (2003). 15. Hartmann, J., Meyer-Marcotty, P., Benz, M., Hausler, G. & Stellzig-Eisenhauer, A. Reliability of a Method for Computing Facial
Symmetry Plane and Degree of Asymmetry Based on 3D-data. J. Orofac. Orthop. /Fortschritte Kieferorthopädie 68, 477–490 (2007). 16. Fechteler P., Eisert P. & Rurainsky J. Fast and High Resolution 3D Face Scanning. IEEE International Conference on Image Processing
(ICIP), 3, https://doi.org/10.1109/ICIP.2007.4379251 (2007).

www.nature.com/scientificreports/
8SCiENTifiC REPORtS | (2017) 7:18077 | DOI:10.1038/s41598-017-17065-y
17. Li, H., Lyu, P. J., Sun, Y. C., Wang, Y. & Li, X. Y. A quantitative study of 3D-scanning frequency and Δd of tracking points on the tooth surface. Sci. Rep. 5, 1435, https://doi.org/10.1038/srep14350 (2015).
18. Besl, P. J. & McKay, N. D. Method for registration of 3-D shapes. Robotics-dl Tentative. 14, 239–256 (1992). 19. Sharp, G. C., Lee, S. W. & Wehe, D. K. ICP registration using invariant features. IEEE Transactions on Pattern Analysis & Machine
Intelligence 24, 90–102 (2002).
AcknowledgementsThis study was supported by the National Natural Science Foundation of China (grant no. 51475004), the capital health research and development of special, Being, China (2016-1-4101), Program for New Clinical Techniques and Therapies of Peking University School and Hospital of Stomatology, Beijing, China (PKUSSNCT-16A06) and Beijing science and technology plan (1100000116092).
Author ContributionsY.C.S. designed the research. F.S.Y. and C.C. performed the experiments and analysed the experimental data. N. D. and Y.C.S. provided guidance for the experiments. F.S.Y. and Y.C.S. wrote and finalized the paper.
Additional InformationCompeting Interests: The authors declare that they have no competing interests.Publisher's note: Springer Nature remains neutral with regard to jurisdictional claims in published maps and institutional affiliations.
Open Access This article is licensed under a Creative Commons Attribution 4.0 International License, which permits use, sharing, adaptation, distribution and reproduction in any medium or
format, as long as you give appropriate credit to the original author(s) and the source, provide a link to the Cre-ative Commons license, and indicate if changes were made. The images or other third party material in this article are included in the article’s Creative Commons license, unless indicated otherwise in a credit line to the material. If material is not included in the article’s Creative Commons license and your intended use is not per-mitted by statutory regulation or exceeds the permitted use, you will need to obtain permission directly from the copyright holder. To view a copy of this license, visit http://creativecommons.org/licenses/by/4.0/. © The Author(s) 2017