pre-paid customer churn prediction using spss
TRANSCRIPT
Pre-paid Customer Churn Prediction Using SPSS
Sanket Jain GBS Business Analytics and Optimization Center of Competence, CMS Analytics India
Date of writing: November 15 2010
ABSTRACT Given the dynamic nature of pre-paid mobile phone subscribers and the ease with which they can stop using their phone services without giving any notice, combined with the increasing influence of their group of close friends/family/peers, the task of managing churn has become of prime importance to CSPs. Here, I used SPSS to predict churn. The model takes as input data of customer demographics, social network behavior, call usage and tariff plan. The model has been compared with FOAK (First Of A Kind) assets that make use of social networking based highly sophisticated churn prediction models, and it yielded 95% accuracy with C5.0 modeling technique. Reasons have been explored for the superior performance of C5.0. Then, additional input variables that can further increase the model accuracy and explain more its variability have been enlisted. Later, some campaigns and offers for the pre-paid subscribers have been discussed. Offering pre-paid plan as Next Best Offer to those who are currently using post-paid connections but of late have been exhibiting behavior that more fits pre-paid plan package - came out as one of the future research areas. Another conclusion is to offer such plan packages as “flex-pay” package that can tie post-paid kind of services to relevant pre-paid customers so as to increase their stickiness with their service provider. This paper is dedicated to TM Forum Organization. Keywords – ARPU; MOU; Recharge; C5.0; MNP; Loyalty; Next Best Offer. 1. INTRODUCTION
Mobile phones are now fast becoming a commodity. Most cellular circles in growing countries like India now have as many as 5-7 offerings such as GSM and CDMA being provided by service providers. In such a competitive market, it becomes very easy to switch your cellular service provider merely at the drop of a hat. Rapid advancement in next-generation services has drawn the attention of teenagers and rural subscribers by features like free SMS. It has also enabled the service providers with tools to attract working professional by offering them free STD minutes, bundling and VAS. Tumbling ARPU figures, an ever increasing MOU (Minutes of Usage), together with the fact that ARPU’s rate of decline has outpaced the MOU’s rate of increase, there is an increasing pressure on service providers to maintain their margins. (ARPU is declining because more and more subscribers are signing up and a constant decline in rate plans and an upsurge in attractive tariff plans.) Soon, such a commoditization will cause the market price of mobile telephone services to fall to the marginal cost of lowest-cost volume producer.
This is causing churn. The problem of churn originated from European countries where the matured markets gave an incentive to the operators to try to attract customers from competitors. From a global perspective, churn of mobile operators led them to loss of ~$100 billon USD per year (Berson et al., 2000). It has assumed alarming proportions in growth markets like India as well. According to Gartner research, India’s churn rate is a high 3.5 – 6% a month, aggregating to
~40-50% every year. This fact combined with the high installation and marketing costs, makes it 5-10 times more expensive to acquire a new customer than to retain an existing one (Ruta et al., 2006). All this shows that the churn of an existing customer, especially in pre-paid category, could hit the bottom-line of these operators. Also, today, most of Chinese and South African service providers are selling handsets along with the tariff plans, which means that handset in itself is giving the customers an incentive to churn. These factors make the task of predicting churn as one of high priority for service providers. To stay competitive in this market, they must be able to correctly predict risky subscribers on whom the subsequent retention efforts should be focused. On top of that, MNP (Mobile Number Portability) is looming as a threat to service providers. MNP can provide flexibility to subscriber by letting him change the service provider at will. It can also fuel a hard-nosed battle between providers. The only flip side to MNP for the customer is that the operators will charge maintenance and monthly fees from them, and the time taken to port the number from one provider to another will cause some inconvenience to the customer. So, MNP will cause churn. Unlike post-paid subscribers, pre-paid subscribers can annul their service without giving any prior indication because they are not bound by any contract. They might churn if their current needs charge or if they get influenced by their social network of family and friends. This dynamic situation makes the task of predicting the likelihood (and timing) of churn very important in the context of pre-paid segment. So, in order to survive competition, telecommunications service providers must detect the main reasons for both the expected churn and the churn that happens after the event has taken place in pre-paid category because this information can help them to customize their offers. It can be a tool to effectively anticipate the demands of their key customers who have the highest churn propensity, fully knowing that retention can have a huge impact on LTV. The churn propensity is calculated on a contract basis rather than a per customer basis (http://www.analysisdatabase.com/descargas/ANALISIS%20DE%20ABANDONOS%20RETENCION.pdf). The main reason for this is that many important predictor variables such as LOS (Length Of Service) are associated with contracts rather than customers. Also, if a subscriber has multiple contracts, then each of these contracts contributes to revenue for the service provider. On the other hand, the mailings and other follow-up actions target customers, not contracts, thereby shifting the focus of analysis at customer-level rather than at contract-level. To resolve this problem, some post-analysis processing must be carried out to summarize the predictions for customers as individuals. We are currently trying to find a solution to this. The customer attributes typically considered in a churn analysis can be categorized into:
• Demographics (age, socio-professional category), • Contractual data (subscriptions and cancellation of services), • Quality data (number of dropped calls, number of complaints related calls), • Billing data (recharge amount, amounts withdrawn for the services, current tariff plan,
net present value of subscriber), and • Usage data (total numbers of calls, LOS, percentage share of Local/STD/International
calls, peak call consumption and average consumption). An enterprise can increase its profits by 25-95% by reducing its churn by just 5% (Reichheld et al., 1990), which shows the impact of doing analytics. In order to reduce the losses caused by churn, operators have to find the most valuable customers who are inclined to churn, and then carry out retention policies for them.
Here is a formula to correlate churn problem with the ultimate goal of achieving loyalty: Higher the churn, lower the chances of being loyal. So, Churn% ~= 100% – Loyalty%. Now that we know the reasons for churn, let’s look at the typical category of customers who prefer pre-paid phones to post-paid phones in the first place. Some of these users are:
• Price-sensitive user (especially in countries like India), • Those who know that their usage is going to be too low to justify investing in a high
MOU post-paid plan, • Students, • People who want to stay anonymous, • People with poor credit history, and • Customers who want to try different networks.
It is very important to know the business goal along with the data mining goal. For e.g., the business goal could be to reduce churn rate by 15% in next 6 months. Whereas, the data mining goal could be to achieve ~95% accuracy in prediction with a Lift of > 2 being captured in top 20 percentile users (where accuracy is defined as the ratio of predicted churn to actual churn). Also, it is the proportion of correct churn predictions, not the number of absolute correct predictions, which should be more important for the business to analyze. According to Burez et al. (2009), Lift is defined as ratio of precision to overall churn rate. According to http://www.siam.org/proceedings/datamining/2010/dm10_064_richtery.pdf , only a small fraction of the subscriber base can be contacted at any given time, and the subscribers with the highest churn scores are assigned top priority. So, a churn prediction system should be measured by its ability to identify churners within its top predictions. Performance is measured using lift. For any given fraction 0 < T < 1, lift is the ratio of the number of churners among the fraction of T subscribers that are ranked highest by the proposed system, to the expected number of churners in a random sample from the general subscribers pool of equal size. For e.g., Lift of 5 at a fraction T = 0.01 means that if we contact the 1% of subscribers ranked highest by the proposed system, we expect to see five times more people who planned to churn in this population than in a 0.01 fraction random sample of the population. The performance of a churn prediction system is completely characterized by its derived lift curve, which maps each fraction 0 < T < 1 (horizontal axis) to the lift (vertical axis) that is obtained by the system. In general, the lift curve is monotonically decreasing, since it is usually harder to provide a substantial lift for larger fractions. 2. DATA AND VARIABLES
A Call Detail Record (CDR) is the computer record produced by a telephone exchange containing details of a call that passed through it (http://en.wikipedia.org/wiki/Call_detail_record). It is the automated equivalent of the paper toll tickets that were written and timed by operators for long distance calls in a manual telephone exchange. There were 31,769 records of pre-paid customers that were available, out of which the Partition node in SPSS did the split (a 70:30 split ratio was chosen), thereby causing 22,179 records in training data set and 9,590 records in validation data set. In a typical scenario, churn occurs only 2-3% of the times. This causes imbalanced data. This problem is crucial in churn prediction because we need to maximize the instances of recognizing the minority class. Two methods for dealing with class imbalances are: oversampling and
downsizing. Oversampling consists of re-sampling the small class at random until it contains as many examples as the other class. Downsizing consists of the randomly removed samples from the majority class population until the minority class becomes some specific percentage of the majority class. Using one of these two techniques, the churn population was made 46.3%. 3. CHURN PREDICTION MODELS Existing churn prediction methods like decision tree (DT) classify customers as churners or non-churners while ignoring the timing of churn event. DT builds interpretable models that show the patterns discovered. It is more on classifying the customers into two groups. Hence, it can take into account both churn and non-churn; whereas ANN and regression have been trained to make calculations to decide if customers are churners. Accuracy depends mainly on the weights for the neural networks and coefficients for the regression. Also, the churn prediction models like decision trees, logistic regression, etc. can give the probability to churn for a customer. Because of such fierce competition in the pre-paid phone market over the last few years, we assume that higher the churn probability score, sooner he will churn (typically, no activity in past 20-30 days). This assumption simplifies our task of building accurate prediction models because it obviates the need to build survival analysis models that take into account the customer life cycle. Also, this definition removes those cases that are involuntarily churned by the CSP. 3.1 Defining the framework for churn prediction model
The general framework of the churn predicting model is shown in Figure 1. It first samples subscribers for training of the predictor and then pre-processes it for missing data, outliers, etc. After Feature Selection (FS), data can be used for the predictor training and testing (not for validation). Models based on expertise first conduct FS before other preprocessing methods. During FS, the variables that got excluded were for national call cost and international call minutes. Social networks have also been addressed by IBM Research. They try to answer whether the decision of a subscriber to churn is dependent on existing members of community with whom he is related. SNAzzy shows that diffusion models built on call graphs have superior performance to baseline model. TABI, another asset of IBM, finds “Groups” and subsequently “Group Leaders”. However, I feel that, although their approach and results might be very good, we should try to build our own data model that is separate from both TABI and SNAzzy, and we must consider including data from handset, account balance and inactivity. 4. EXPERIMENTS AND RESULTS USING SPSS MODELER
The data used for this study was CDR, Social Network, Tariff and Customer Information. It was only synthetic data. We are still trying to get some real data. The time horizon selected was six months. The data used was having six months of information. Total of twenty five variables were given. The data had already been cleansed for missing values, outliers, etc. The churn population had also been boosted from 2-3% to 46.3% so as to allow for meaningful prediction of churn.
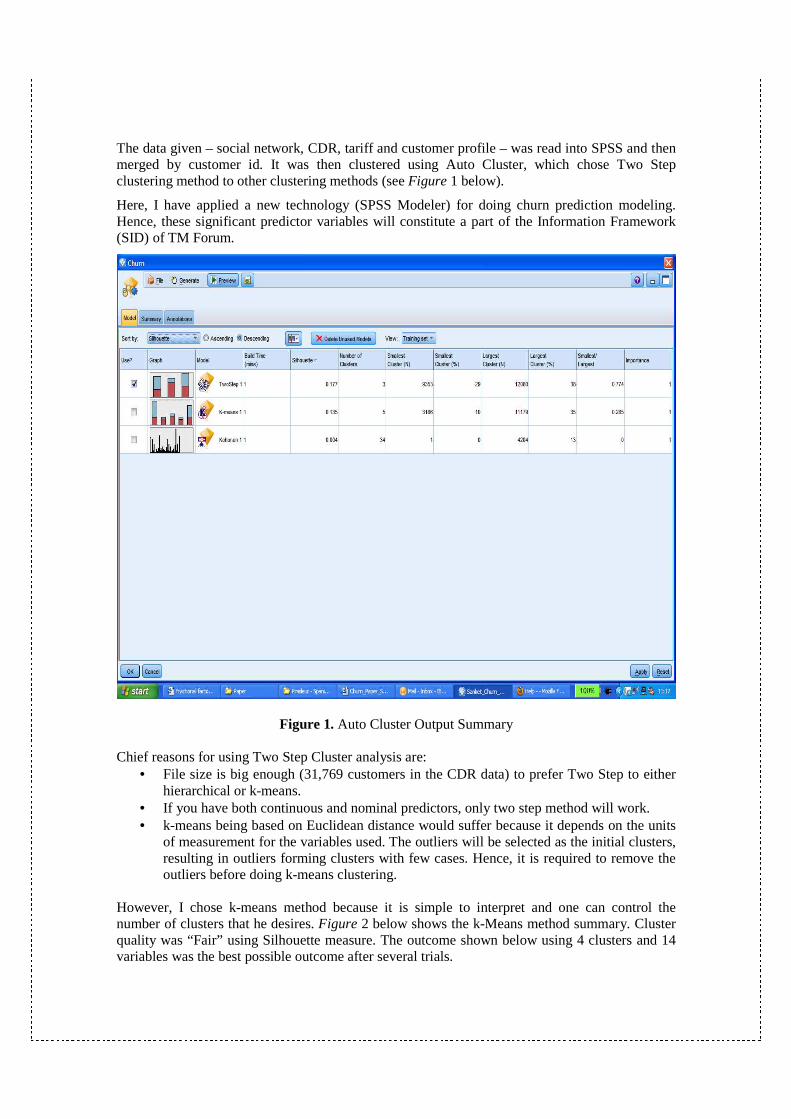
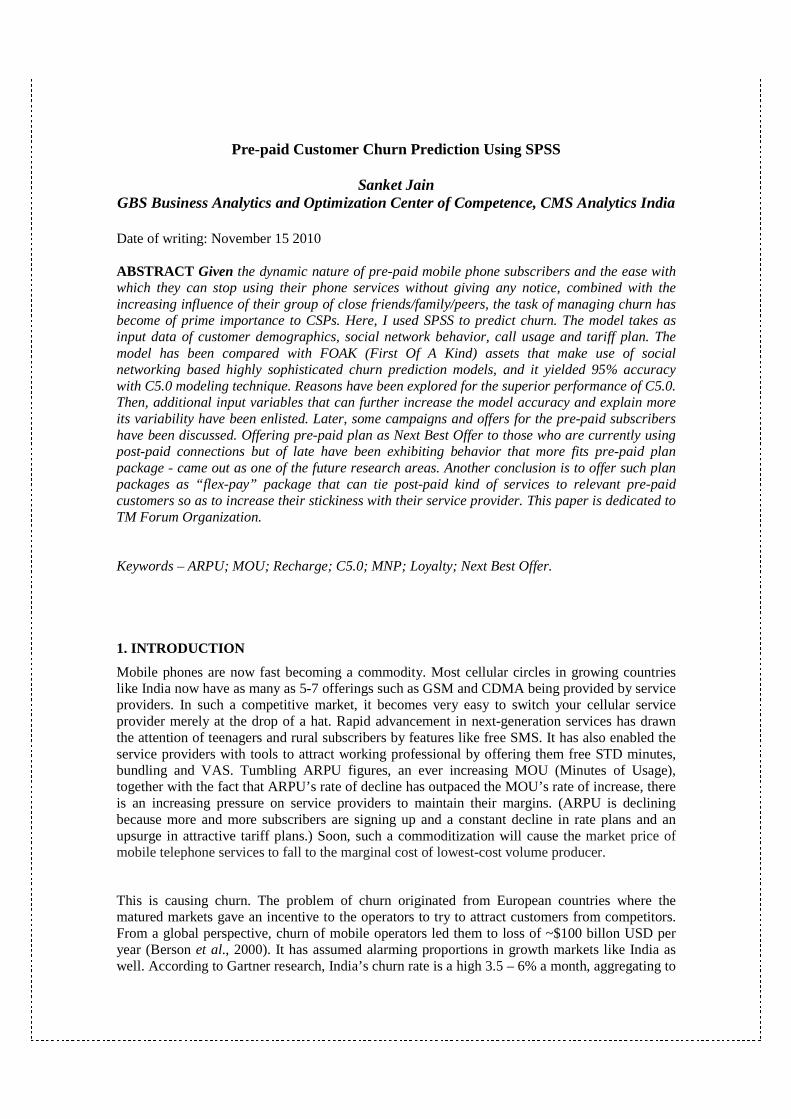
The data given – social network, CDR, tariff and customer profile – was read into SPSS and then merged by customer id. It was then clustered using Auto Cluster, which chose Two Step clustering method to other clustering methods (see Figure 1 below).
Here, I have applied a new technology (SPSS Modeler) for doing churn prediction modeling. Hence, these significant predictor variables will constitute a part of the Information Framework (SID) of TM Forum.
Figure 1. Auto Cluster Output Summary Chief reasons for using Two Step Cluster analysis are:
• File size is big enough (31,769 customers in the CDR data) to prefer Two Step to either hierarchical or k-means.
• If you have both continuous and nominal predictors, only two step method will work. • k-means being based on Euclidean distance would suffer because it depends on the units
of measurement for the variables used. The outliers will be selected as the initial clusters, resulting in outliers forming clusters with few cases. Hence, it is required to remove the outliers before doing k-means clustering.
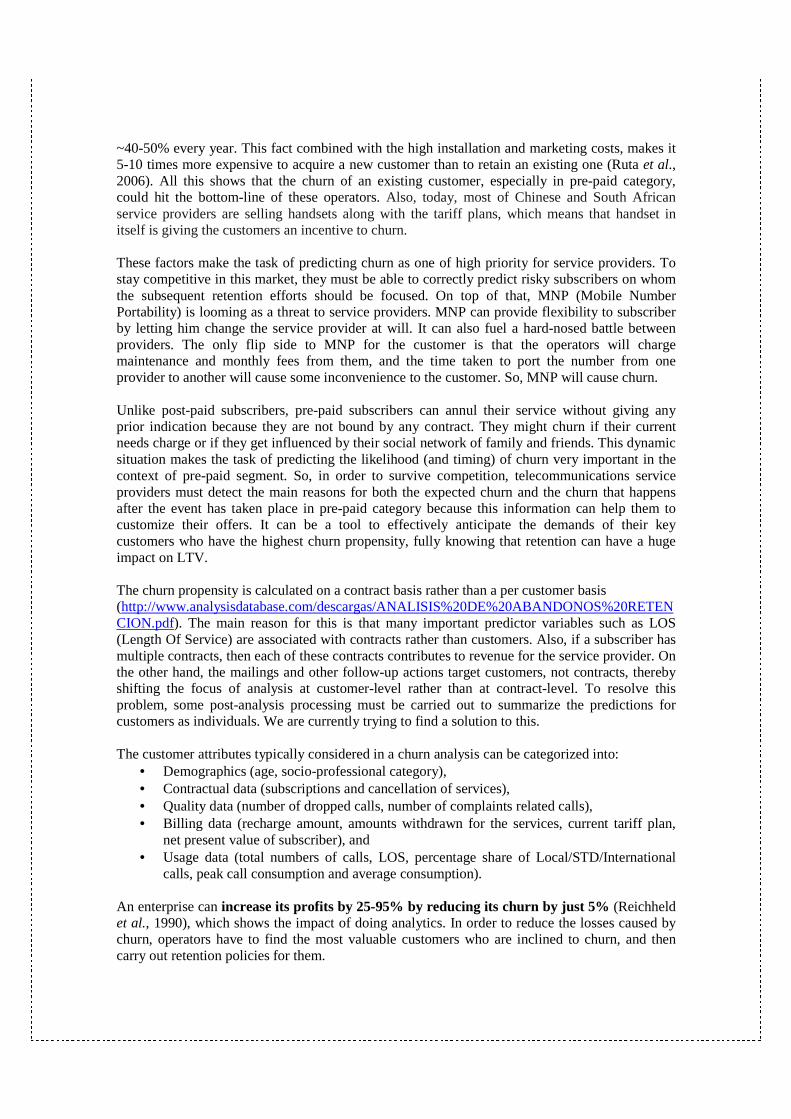
However, I chose k-means method because it is simple to interpret and one can control the number of clusters that he desires. Figure 2 below shows the k-Means method summary. Cluster quality was “Fair” using Silhouette measure. The outcome shown below using 4 clusters and 14 variables was the best possible outcome after several trials.
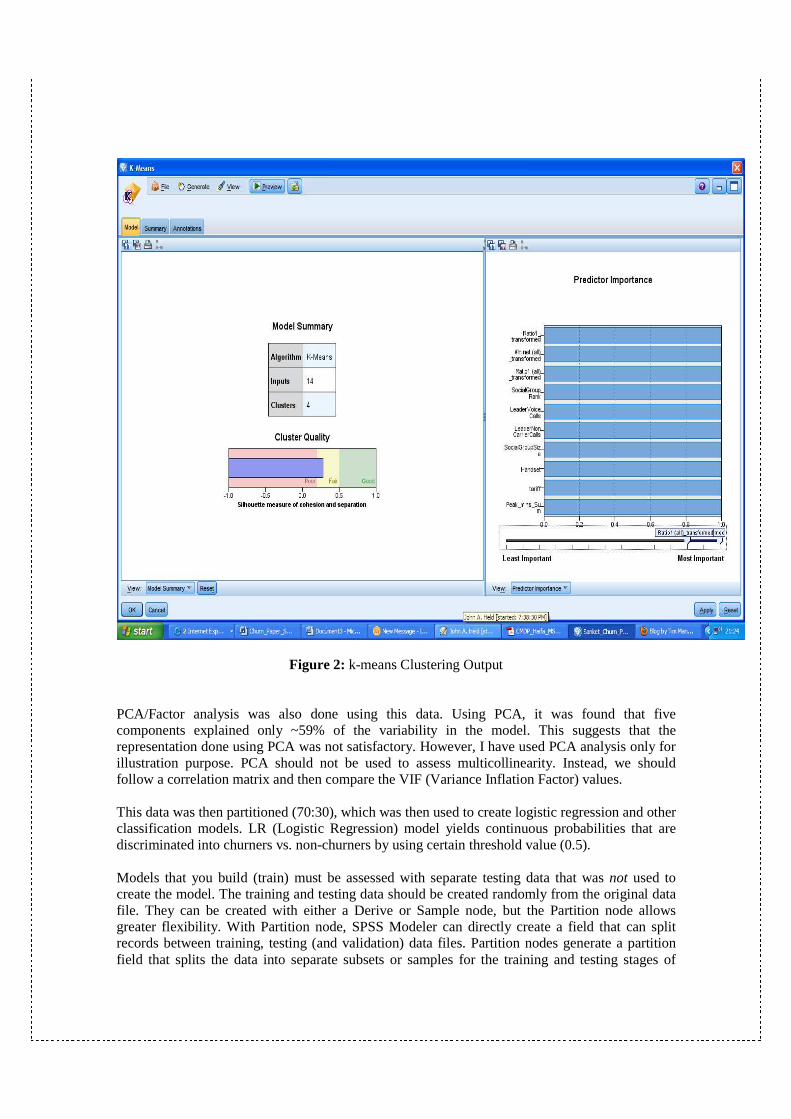
Figure 2: k-means Clustering Output PCA/Factor analysis was also done using this data. Using PCA, it was found that five components explained only ~59% of the variability in the model. This suggests that the representation done using PCA was not satisfactory. However, I have used PCA analysis only for illustration purpose. PCA should not be used to assess multicollinearity. Instead, we should follow a correlation matrix and then compare the VIF (Variance Inflation Factor) values. This data was then partitioned (70:30), which was then used to create logistic regression and other classification models. LR (Logistic Regression) model yields continuous probabilities that are discriminated into churners vs. non-churners by using certain threshold value (0.5). Models that you build (train) must be assessed with separate testing data that was not used to create the model. The training and testing data should be created randomly from the original data file. They can be created with either a Derive or Sample node, but the Partition node allows greater flexibility. With Partition node, SPSS Modeler can directly create a field that can split records between training, testing (and validation) data files. Partition nodes generate a partition field that splits the data into separate subsets or samples for the training and testing stages of
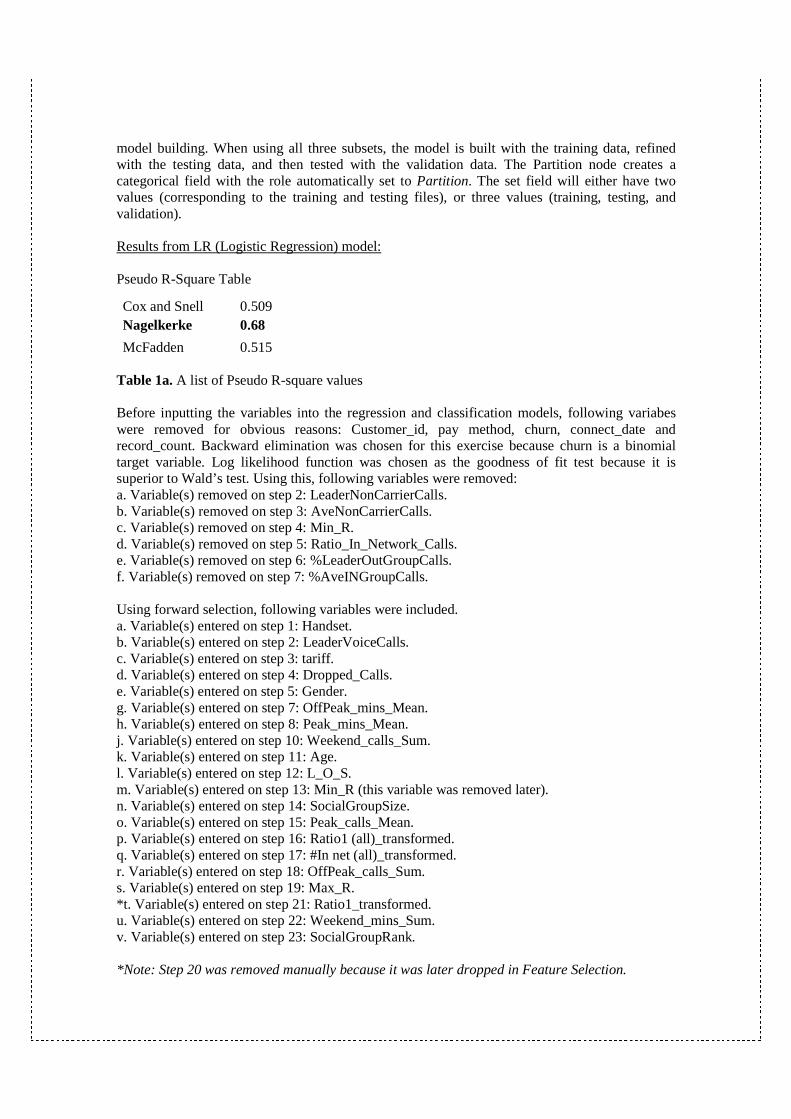
model building. When using all three subsets, the model is built with the training data, refined with the testing data, and then tested with the validation data. The Partition node creates a categorical field with the role automatically set to Partition. The set field will either have two values (corresponding to the training and testing files), or three values (training, testing, and validation). Results from LR (Logistic Regression) model: Pseudo R-Square Table
Cox and Snell 0.509 Nagelkerke 0.68
McFadden 0.515 Table 1a. A list of Pseudo R-square values Before inputting the variables into the regression and classification models, following variabes were removed for obvious reasons: Customer_id, pay method, churn, connect_date and record_count. Backward elimination was chosen for this exercise because churn is a binomial target variable. Log likelihood function was chosen as the goodness of fit test because it is superior to Wald’s test. Using this, following variables were removed: a. Variable(s) removed on step 2: LeaderNonCarrierCalls. b. Variable(s) removed on step 3: AveNonCarrierCalls. c. Variable(s) removed on step 4: Min_R. d. Variable(s) removed on step 5: Ratio_In_Network_Calls. e. Variable(s) removed on step 6: %LeaderOutGroupCalls. f. Variable(s) removed on step 7: %AveINGroupCalls. Using forward selection, following variables were included. a. Variable(s) entered on step 1: Handset. b. Variable(s) entered on step 2: LeaderVoiceCalls. c. Variable(s) entered on step 3: tariff. d. Variable(s) entered on step 4: Dropped_Calls. e. Variable(s) entered on step 5: Gender. g. Variable(s) entered on step 7: OffPeak_mins_Mean. h. Variable(s) entered on step 8: Peak_mins_Mean. j. Variable(s) entered on step 10: Weekend_calls_Sum. k. Variable(s) entered on step 11: Age. l. Variable(s) entered on step 12: L_O_S. m. Variable(s) entered on step 13: Min_R (this variable was removed later). n. Variable(s) entered on step 14: SocialGroupSize. o. Variable(s) entered on step 15: Peak_calls_Mean. p. Variable(s) entered on step 16: Ratio1 (all)_transformed. q. Variable(s) entered on step 17: #In net (all)_transformed. r. Variable(s) entered on step 18: OffPeak_calls_Sum. s. Variable(s) entered on step 19: Max_R. *t. Variable(s) entered on step 21: Ratio1_transformed. u. Variable(s) entered on step 22: Weekend_mins_Sum. v. Variable(s) entered on step 23: SocialGroupRank. *Note: Step 20 was removed manually because it was later dropped in Feature Selection.
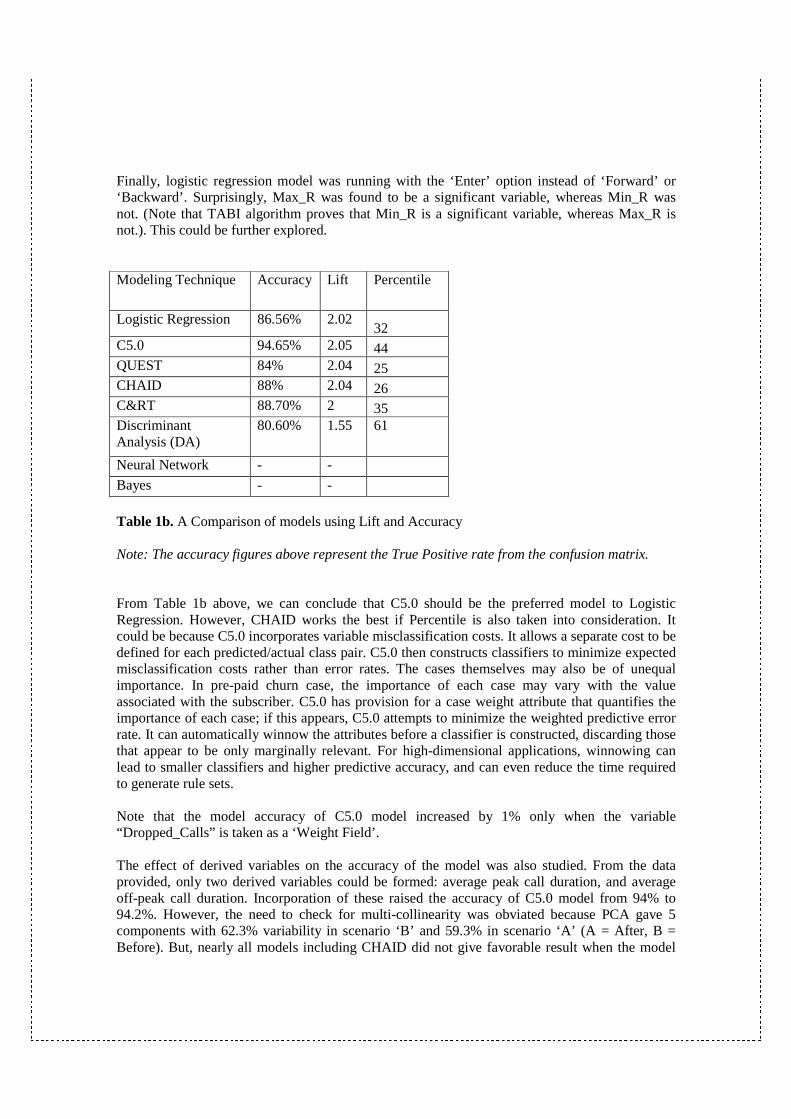
Finally, logistic regression model was running with the ‘Enter’ option instead of ‘Forward’ or ‘Backward’. Surprisingly, Max_R was found to be a significant variable, whereas Min_R was not. (Note that TABI algorithm proves that Min_R is a significant variable, whereas Max_R is not.). This could be further explored. Modeling Technique Accuracy Lift Percentile
Logistic Regression 86.56% 2.02 32
C5.0 94.65% 2.05 44 QUEST 84% 2.04 25 CHAID 88% 2.04 26 C&RT 88.70% 2 35 Discriminant Analysis (DA)
80.60% 1.55 61
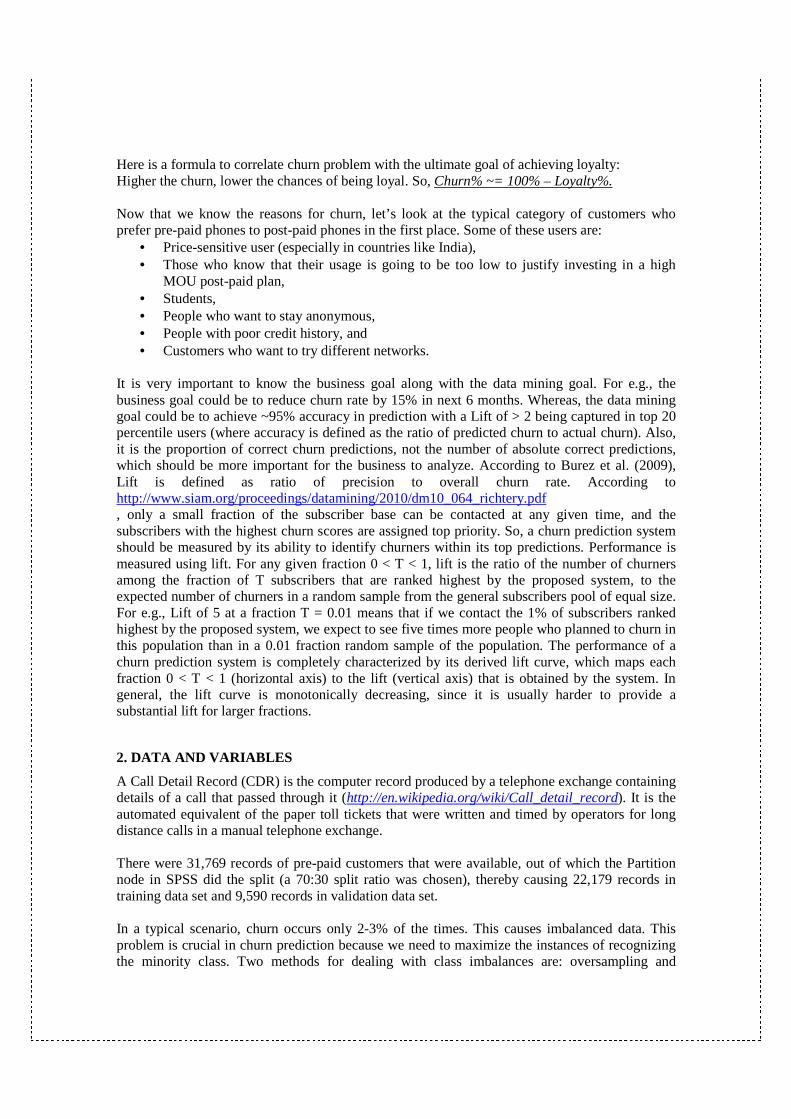
Neural Network - - Bayes - - Table 1b. A Comparison of models using Lift and Accuracy Note: The accuracy figures above represent the True Positive rate from the confusion matrix. From Table 1b above, we can conclude that C5.0 should be the preferred model to Logistic Regression. However, CHAID works the best if Percentile is also taken into consideration. It could be because C5.0 incorporates variable misclassification costs. It allows a separate cost to be defined for each predicted/actual class pair. C5.0 then constructs classifiers to minimize expected misclassification costs rather than error rates. The cases themselves may also be of unequal importance. In pre-paid churn case, the importance of each case may vary with the value associated with the subscriber. C5.0 has provision for a case weight attribute that quantifies the importance of each case; if this appears, C5.0 attempts to minimize the weighted predictive error rate. It can automatically winnow the attributes before a classifier is constructed, discarding those that appear to be only marginally relevant. For high-dimensional applications, winnowing can lead to smaller classifiers and higher predictive accuracy, and can even reduce the time required to generate rule sets. Note that the model accuracy of C5.0 model increased by 1% only when the variable “Dropped_Calls” is taken as a ‘Weight Field’. The effect of derived variables on the accuracy of the model was also studied. From the data provided, only two derived variables could be formed: average peak call duration, and average off-peak call duration. Incorporation of these raised the accuracy of C5.0 model from 94% to 94.2%. However, the need to check for multi-collinearity was obviated because PCA gave 5 components with 62.3% variability in scenario ‘B’ and 59.3% in scenario ‘A’ (A = After, B = Before). But, nearly all models including CHAID did not give favorable result when the model
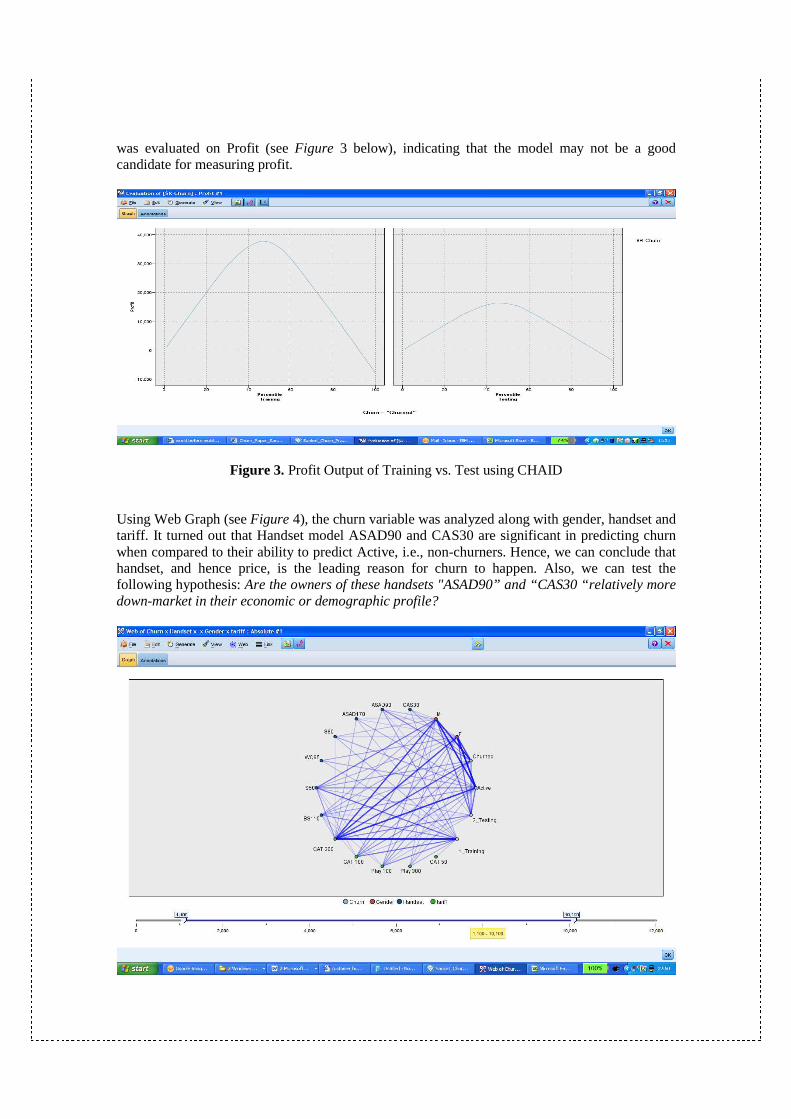
was evaluated on Profit (see Figure 3 below), indicating that the model may not be a good candidate for measuring profit.
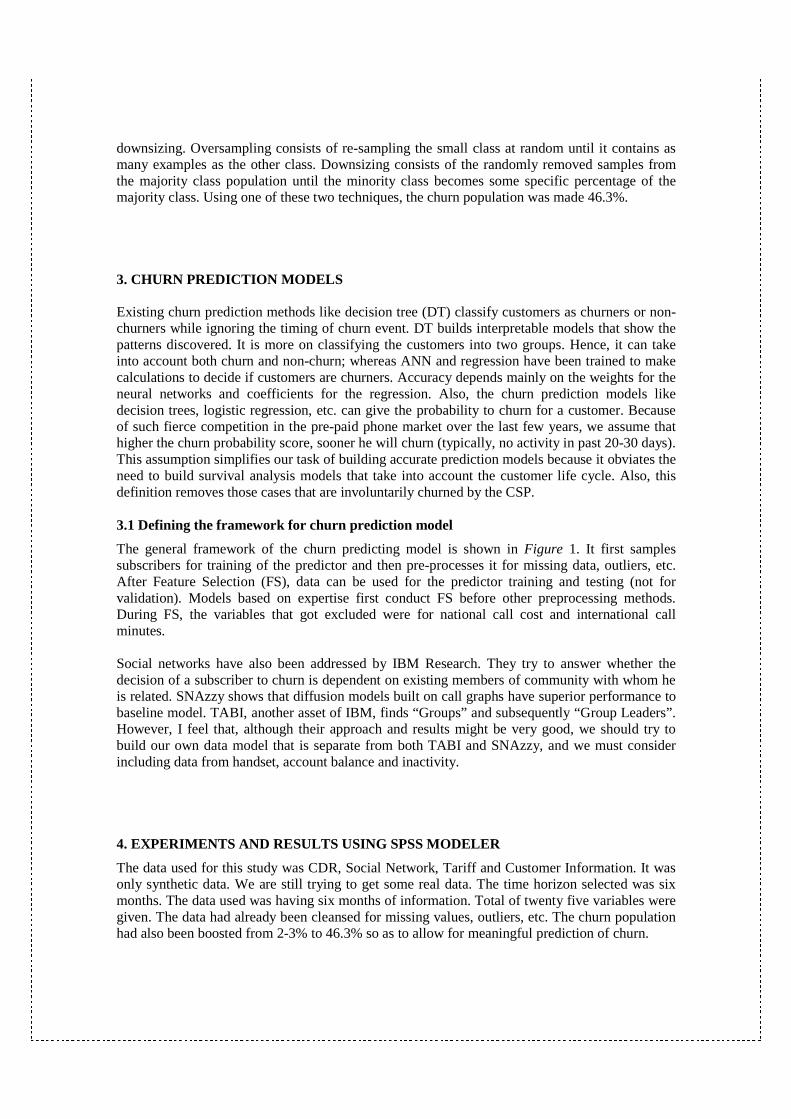
Figure 3. Profit Output of Training vs. Test using CHAID Using Web Graph (see Figure 4), the churn variable was analyzed along with gender, handset and tariff. It turned out that Handset model ASAD90 and CAS30 are significant in predicting churn when compared to their ability to predict Active, i.e., non-churners. Hence, we can conclude that handset, and hence price, is the leading reason for churn to happen. Also, we can test the following hypothesis: Are the owners of these handsets "ASAD90” and “CAS30 “relatively more down-market in their economic or demographic profile?
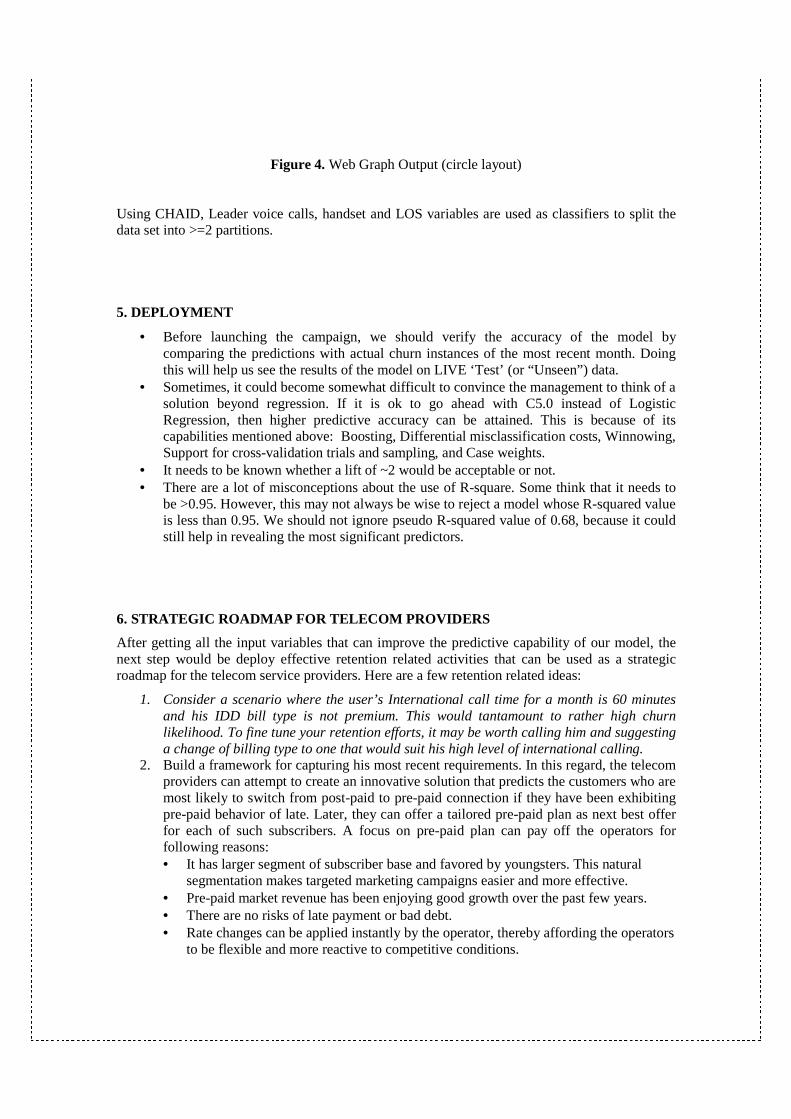
Figure 4. Web Graph Output (circle layout)
Using CHAID, Leader voice calls, handset and LOS variables are used as classifiers to split the data set into >=2 partitions. 5. DEPLOYMENT
• Before launching the campaign, we should verify the accuracy of the model by comparing the predictions with actual churn instances of the most recent month. Doing this will help us see the results of the model on LIVE ‘Test’ (or “Unseen”) data.
• Sometimes, it could become somewhat difficult to convince the management to think of a solution beyond regression. If it is ok to go ahead with C5.0 instead of Logistic Regression, then higher predictive accuracy can be attained. This is because of its capabilities mentioned above: Boosting, Differential misclassification costs, Winnowing, Support for cross-validation trials and sampling, and Case weights.
• It needs to be known whether a lift of ~2 would be acceptable or not. • There are a lot of misconceptions about the use of R-square. Some think that it needs to
be >0.95. However, this may not always be wise to reject a model whose R-squared value is less than 0.95. We should not ignore pseudo R-squared value of 0.68, because it could still help in revealing the most significant predictors.
6. STRATEGIC ROADMAP FOR TELECOM PROVIDERS
After getting all the input variables that can improve the predictive capability of our model, the next step would be deploy effective retention related activities that can be used as a strategic roadmap for the telecom service providers. Here are a few retention related ideas:
1. Consider a scenario where the user’s International call time for a month is 60 minutes and his IDD bill type is not premium. This would tantamount to rather high churn likelihood. To fine tune your retention efforts, it may be worth calling him and suggesting a change of billing type to one that would suit his high level of international calling.
2. Build a framework for capturing his most recent requirements. In this regard, the telecom providers can attempt to create an innovative solution that predicts the customers who are most likely to switch from post-paid to pre-paid connection if they have been exhibiting pre-paid behavior of late. Later, they can offer a tailored pre-paid plan as next best offer for each of such subscribers. A focus on pre-paid plan can pay off the operators for following reasons: • It has larger segment of subscriber base and favored by youngsters. This natural
segmentation makes targeted marketing campaigns easier and more effective. • Pre-paid market revenue has been enjoying good growth over the past few years. • There are no risks of late payment or bad debt. • Rate changes can be applied instantly by the operator, thereby affording the operators
to be flexible and more reactive to competitive conditions.

3. Set up a model to intelligently detect the latest competitor offerings in real time. 4. If he has been found to be ‘high risk’, and if he is valuable with a business professional
profile, currently traveling to a different location from his home location, then offer him five free SMS as soon as he reaches the away location.
5. Upon his completion of say, 6 months of service, offer the following: (a) Points for outgoing calls, file transfer, SMS, etc. (b) Tiered points for high monthly recharge amount, and points for every top-up. (c) Tiered points for 1/2/3 years of sign up. (d) Special incentives for choosing lifetime service. (e) More points for referring a friend who then becomes your subscriber.
6. Self-serviced kiosks for providing convenient e-service as a differentiator. 7. Accept credit cards as mode of payment. 8. Develop a contact strategy and promote a product like service upgrade during the call. 9. Engage them in communication and thank them for their service every month. Set thank
you messages on IVR to thank them upon every monthly recharge! 10. Get involved in content partnerships to offer VAS to key users. For e.g., while offering
him SMS service, offer account balance inquiry, cheque book request, balance transfer capability among authorized accounts only – all using FREE SMS.
11. New products and services development such as VAS are now necessary to retain him. Voice mail and Alert features can be bundled and offered to those who can’t take a call because (a) their phone is switched off, or (b) they may be travelling outside their networks, or (c) to those who need to know the folks who tried to reach him while they were busy. Another example of VAS could be an offering that sends an SMS to the user with a list of all the missed calls in case his phone was switched off.
12. Factor the following in your pre-paid network’s structure: International roaming, IN, etc. 13. Offer him free SMS for next month if he tops up by a preset amount this month. 14. Operator branded self-service kiosks with data, voice, wireless, etc. 15. If both the scope and the infrastructure allow, then, to deal with the churn threat of MNP
in India, you can offer a family pack with bundled services (pre-paid mobile telephone service with Broadband) to the user.
16. Educate a new prospect of your unique selling propositions to avoid him from accepting another offer from a competitor.
17. Companies like Videocon in India have started offering cable service along with their TVs. So, companies like IDEA Cellular should offer bundled service of cable service, TV and mobile phone so that they can offer a combo-package to its most valuable customers so that it can gain a strategic position in this ever-competitive environment.
18. There are many people especially in India where a young working professional settles down at his home city after working for some duration in cosmopolitan cities like Bangalore. So, if we can find the average duration (say, ‘x’ days) for which he goes to a big city for working (e.g., Bangalore), where he has been using the pre-paid service from a provider “P”, and let us say that he returns to his hometown ‘H’ and spends at least a month there (say, ‘y’ days, where ‘y’ is greater than thirty days). Then, we can predict both ‘x’ and ‘y’. This is because if he has already spent ‘y’ days at ‘H’, then it is quite likely that he would continue living there for a longer time. This predictive information can have good value to the provider “P” by giving him an offer that is more relevant to the location ‘H’, assuming that ‘H’ falls under one of its circles. Another takeaway from this is that the provider “P” can focus on what areas it needs a large presence. This can be done if they come to know the top 3 cities where the customers leave Bangalore to settle down at their home.

7. WHAT LIES AHEAD
Here are the additional variables required to increase our model’s predictive power: 1. Migration data (from say, ‘Active’ status to ‘Grace period’, ‘Grace’ to ‘Active’, ‘Grace’
to ‘Churn’, etc. Hypothesis: If there is a pattern of such migration, then it can be a predictor of future behavior.
2. Number of days between inactivity and recharge. Hypothesis: If there is a pattern of say, 10 days of inactivity before which he generally recharges, and if he has been inactive recently for more than 10 days, then we can use it as a churn indicator.
3. Remaining balance: Hypothesis: Lower the remaining account balance, higher his churn likelihood. Also, it could be important to analyze the ratio of balance to top-up. In other words, how much of his balance goes unutilized when his validity period gets expired. Another pattern worth exploring could be to explore how many customers opt for recharge just one or two days within the expiration of their validity period.
4. Location data. Hypothesis: Voluntary churn could be higher in Kolkata than in Bangalore because of higher social connectivity of customers in Kolkata.
5. Assigning weights to a service provider. For e.g. Sprint may be having more coverage in USA than T-Mobile. So, Sprint should be assigned more weight than T-Mobile.
6. A high standard deviation of calls received from customers using other GSM (or CDMA, depending on which country you are based out of) providers can impact high churn. Likewise, another hypothesis could be: Low standard deviation of incoming calls from other providers (“away-net” providers) can impact high churn.
7. ‘Roaming’ data. 8. If he has made several complaints throughout the year, we can create a new variable that
records his frequency of raising complains. Hypothesis: Someone with an average of six complaints every month may differ from a customer with the same number of complaints but that were either made in a very short duration of time (less than 2 weeks) or those that were staggered across a very long timeframe (12 months).
9. Watching churn events more closely. Hypothesis: If a negative event is followed by another negative event (e.g., filing a complaint twice), it can lead to churn.
10. Brand data. Hypothesis: Brand can impact a customer’s decision of churning. 11. If he has a history of high billing mainly due to STD calls from Airtel and later it is found
that he is calling a number from Airtel itself but in another location, then offer him an Airtel calling pack. OR offer him a tailored tariff plan.
12. Handset cost. Hypothesis: Low handset rates can increase churn, especially in countries like China and South Africa.
13. National (NAT) Call Costs and International (INT) Call Costs data. Using this data, it would be worthwhile to look at the ratio of NAT calls to INT calls.
14. Billing dispute data. Hypothesis: High number of billing disputes and billing fraud is one of the chief reasons for churn to happen.
15. Blocked calls data (blockage due to demand for that network area exceeding the supply capacity). Hypothesis: Other than dropped calls, blocked calls can also be a reason for customer leaving your service.
16. We have got 6 months of data here. We can split the data into two halves of three months each and then monitor the % relative decrease in top-up frequency, top-up amount, incoming calls, outgoing calls, etc. Hypothesis: It is enough to use 3 months to do a robust and reliable churn prediction because of the dynamic nature of this business. So, if there is any non-sequential pattern in the 6-month data, then it could be discovered and thereby help in making a more accurate churn prediction.

17. Data for virtual churners (incidental churn). There are many subscribers who are no longer active simply because they have changed their phone number but neither their tariff plan nor their service provider. This phenomenon of virtual churn can lead to a loss of data of their previous phone number. This data loss can affect out analysis too. To deal with this situation, we can suggest the operators to keep an active database of Nationality and Date of Birth for each customer. Doing this can almost always guarantee the chances of locating a unique customer (by looking for his full name, nationality and date of birth). The introduction of NID (National Identification) can also help in avoiding this data loss.
18. The number of unique individuals called by your subscriber. 19. The number of people who churned and also featured in prior month’s top 10 frequently
called list of your subscriber. 20. The number of people from your customer’s close contact list (the top 10 list) who, 3-4
months ago, were not using your service (say you are Cingular), but who churned from their service provider (say AT&T) and then joined your service. Hypothesis: From these “Top 10 contacts” list, greater the number of people who that subscriber is able to influence and bring them to you as your customer, higher the chances that he would be an “influencer” for you, and hence, more attention should be paid to retain him. In fact, a special weightage can also be assigned to this kind of variable. We can consider only those people in his contact list who have at least one instance of two-way call with our customer. A similar variable to be considered could be “Top 10 contacts with highest MOU”.
21. Separate churn prediction models for “1-month to be” and “3-month to be” churners should be made. This is because there could be cases with only 0.4 churn propensity score for the next month, but with a high 0.8 score for churning after three months.
Once these variables have been obtained, they need to be prioritized such that only the top 5-10 that would be retained as the key predictors. Here is an analytical approach that can act as a blueprint for telecom providers:
• How to treat those who will most likely not churn soon: A customer’s churn score generally shows a gradual increase over the time. Let’s say that at one point of time, it will cross 0.5 score. If there is a sizeable proportion of customers, say, 70%, who had churned three months after they had attained a 0.5 score, then we can conclude with 70% confidence that my customer will not churn in next ninety days if he has got a score of say, 0.1. Such an approach can help the telecom operator by telling them the customers who are currently not at any significant risk of churning.
• How to treat those have an “in between” churn score, i.e., who will neither churn soon nor remain for a long time (with say, a score of 0.2 to 0.7): Explore a 2-way prediction approach where subscriber base is first analyzed for non-churners using one model and then analyzed for churners using the other model. This would lead to certain customers appearing in both the churn and non-churn groups, therefore a third group of ‘fuzzy customers’ would be created. An analysis of this idea can lead to make a decision of whether these customers should belong to the non-churner group, the churner group or remain in their own group as customers requiring no immediate attention.
• How to treat those who will most likely churn soon (as indicated by a high SPSS based churn score): Offer special incentives to those who meet all these conditions: (1) they made at least one outgoing activity in the last 3 days, (2) their first activity date after taking connection was at least 90 days before, and (3) they have been recharging their balance every month since the day they got activated.
For prepaid users, there must be some users who have reasonably large validity period of say, six months but consume all their minutes in a very short span of time, say two weeks. It would be interesting to know the proportion of such users. Then, we can possibly design some special offers for them. These customers would either be very rich or very irrational. They would be irrational if they are young students with low income, if any. Whereas rational users (i.e., the rich ones) would be those who have their income greater than the average income of that particular country and/or the standard deviation of their income is close to zero (standard deviation is taken to take care of the fact that they are not new to earning). We can call these categories of users as "A1" and "A2" respectively. On the contrary, if they consistently miss their validity period and consistently stretch their usage to grace period, then they can be treated opposite to those in categories A1 and A2. We can call this category of users as "B. All other "in between" customers would fall in category "C". Doing this will form a unique and novel way of customer segmentation. Next, we can explore hypothesis such as the one below: These “early-out” customers belonging to categories A1 and A2 could be significantly more susceptible to churn as compared to the “late-out” customers who belong to category B. In addition to churn, this type of analysis could have some impact on network capacity usage contribution from the pre-paid users. Also, if there is a sizeable proportion of such users (say 20%) who constrain the network in those couple of weeks, then it is worth sending them offers so that they can spread their usage across six months. Offers could be designed such as six months free talk time if they spread their consumption of their current minutes to at least three months. Once it is known that these customers are pre-paid - we can do this in two ways: (1) their phone number will indicate whether it is a post-paid connection or pre-paid, and (2) The IBM’s master data management would contain the information whether a customer is carrying a post-paid connection or pre-paid – we can look at certain descriptive, preventive and predictive metrics for checking network capacity usage contribution from the pre-paid users. Metrics like bandwidth traffic and bandwidth utilization are very seasoned metrics, though you will have to further differentiate by wire-line and wire-less technologies; and then within wireless by 2G, EDGE, 3G, 4G for the current technologies. However, both these metrics - traffic and utilization - are "after-the-fact" metrics. Real value-add would come from finding "preventive" metrics like bandwidth optimization, bandwidth balancing, bandwidth switching, etc. Also, some predictive metrics could be explored like bandwidth capacity planning, bandwidth disaster recovery, optimal point at which to switch from 2G to 3G and vice versa, optimal point at which to switch from 3G to 4G and vice versa, and point at which to switch from EDGE (2.75G) to 3G and vice versa. 8. CAN WE TIE PRE-PAID CHURN WITH LOYALTY?
Since churn prediction and prevention are linked to the company’s retention activities, so this entire exercise falls under the Loyalty and Retention part of the TM Forum’s eTOM (a business process framework). The website below demonstrates the role of Loyalty and Retention in the life cycle of the business process framework of TM Forum. Note that this typically starts with your customer calling the call center representative to complain about poor quality of service, dropped calls, incorrect bills, etc.
http://www.tmforum.org/BusinessProcessFramework/6775/home.html
We can work out some focused and creative promotions with targeted offers that could help the service providers to move from simply doing churn management to the loyalty game. Some of these promotions could be launched as follows: Attracting Early Adopters
• Social media awareness campaign: Provision to upload your photos directly to your Facebook account, and also grant free unlimited access to Facebook, Flickr, etc.
• Nex-Gen campaign: Offer strong brand device by offering next gen services such as e-browsing, GPS navigation, email services and 3G/3.5G/4G services (GPRS) like video, broadband, MMS, data download.
• Smart campaign: When your subscriber reaches the threshold for a bonus, you can automatically provision that reward for the subscriber and then notify him in real-time of this reward (http://www.businesslogicsystems.com/documents/bls_end_to_end_pre-paid_campaign_lifecycle_toolkit.pdf). Also, send him “Thank you” SMS every time he does a topup beyond a certain minimum amount say 50 INR.
• Higher away-network usage campaign: The higher score on "away-net usage" signifies that he has called very frequently to other networks (http://ezinearticles.com/?SAS---Business-Intelligence---Churn-and-Campaign-Management-Solution-For-Telecom-Industry&id=2598262). A targeted campaign can be performed with the price plan beneficial to call other networks. A further analysis of the called away-net numbers can result in identifying frequently called off-net numbers which can be targeted by campaigns as a candidate of acquisition.
Retention Offers
• Short talk campaign: If your customer typically makes a call of 2-5 minutes duration only, then send him with an automated SMS with 5 additional minutes of top-up.
• First five minutes campaign: If the customer is making calls that do not even last for 5 minutes, then encourage him to talk more by offering him to pay only for 1st 5 minutes, then remaining minutes upto 30 minutes would be free of charge.
• Night users campaign: Pay less for evenings if you predominantly call during nights. • Student campaign: For student segment, who like to play with iPOD and other gadgets,
offer free iPod devices to those who have been shopping for at least 500 INR every month since the last 6 months.
Cross-sell Offers
• FlexPay offer campaign: monthly fee of 50 INR for 200 minutes of usage, and then topup if need arises for “filling up” a few days of “outage” (http://www.pre-paid-loyalty.com/e-Book-Rafi-Kretchmer.pdf). You can also give post-paid services like free voice minutes to qualified pre-paid customers. This could increase their stickiness with you because post-paid customers are typically more loyal than pre-paid users.
• Bundle your services to build a large subscriber base by offering pre-paid services combined with other products/services that you may have, combined with free caller tunes for a month, free voice mail, and free traffic alerts. For instance, according to http://www.canto.org/members/members_section/caribbean-telecoms-briefing/pre-paid-strategies-and-minimising-churn, Virgin Mobile UK managed to build a large subscriber base by offering pre-paid services combined with other products/services from the Virgin Group (i.e. airline-ticket contests, DVDs, etc.).

Up-sell Offer • Customer experience campaign: On March 8 (Women’s day for women only), send a
promotion via SMS (or email) for recharge of > 30 INR (Indian Rupees) this week before March 15 and you will be eligible for lucky draw where 1000 free SMS or 1000 free outgoing calls will be offered to 1000 lucky winners. Then, on March 15, activate the trigger, and send SMS saying: “If you are eligible, then reply to this text with your name and phone number”. A reminder SMS needs to be sent and then the user will enter the lucky draw (random draw). If he qualifies as one of the 1000 winners, then call center will send him SMS on April 1 saying “Congratulations! 1000 free SMS have got activated for this month for you!”
9. CONCLUSIONS AND FUTURE WORK
In this paper a customer churn analysis was presented for pre-paid mobile phones. The analysis focused on churn prediction based on logistic regression and other classification techniques using SPSS Modeler (formerly Clementine). The different models predicted the actual churners with greater than 85% accuracy, which was quite good. A low of 68% model variability being explained by the chosen predictors in logistic regression could be due to the dynamic nature of the churning customer profile. We can do better by considering more variables. The findings of this study indicate that the user should update the logistic regression model to be able to produce predictions with high accuracy. Also, the C5.0 model can be the model of choice because it proved to be more accurate than any other model, including logistic regression. The effect of derived variables on the accuracy of the model was also studied. From the data provided, only two derived variables could be formed: average peak call duration, and average off-peak call duration. Incorporation of these further raised the accuracy of the C5.0 model. We could further explore derived variables of Outgoing call duration as: Avg_Outgoing_Calls_ Greater_Than_Five_Min, and Standard_Deviation_Outgoing_Calls_Greater_Than_Five_Min (where standard deviation is measured month over month variability in usage behavior). CSPs can attempt to create an innovative solution that predicts the customers who are most likely to switch from post-paid to pre-paid connection if they have been exhibiting pre-paid behavior of late. Later, they can offer a tailored pre-paid plan as next best offer for each of such subscribers. If the need be, then we can also calculate the aggregated proportion of subscribers who are about to churn. Although individual churn score would be the most important to look at, yet the CSPs can get a sense of the extent to which churn is hurting them if they look at aggregate proportion of those who are most likely to defect. Other variables worth exploring would be:
• Is he with or without discount package? (Discount package is one of the top reasons to churn, because it is closely linked to price, which is actually the biggest reason for customers to churn. In some countries, as much as 40-50% people churn primarily because of price. Other significant reasons for churn are extent of coverage of a provider’s service area, Quality of Service, the kind of advertisement carried out by it to attract prospective customers, whether he is carrying only a pre-paid connection, and the customer’s curiosity to switch to competitor.)
• Average number (and duration) of outgoing calls made to GSM operators. • Does he have a second number? • Standard deviation (and average) of calls more than 5 minutes. • Average of maximum (and minimum) calls.
However, there is one caveat while using any modeling tool such as SPSS Modeler. If the customer has been showing an increasing trend of his phone’s usage, then our SPSS churn prediction model would tend to suggest that the CSP should focus its efforts on sending him a higher rate plan that can eventually generate potentially higher revenues. However, he may have increased his recent usage only because of a battery problem that resulted in frequent email synchronization. So, at times, the churn prediction itself could be misleading. If we can detect such patterns in data that can give meaningful predictions, then it could help enhance the value of next offer for him. This is akin to the false alert, and needs to be studied carefully. REFERENCES
A. Berson, S. Smith, and K. Thearling, “Building data mining applications for CRM,” New York: McGraw-Hill (2000). F. F. Reichheld, W. E. Jr. Sasser, “Zero defections: Quality comes to services,” Harvard Business Review, Vol.68, 1990, pp. 105-111 (1990). Behara, R. S., Fisher, W. W. and Lemmink, J. Modelling and Evaluating Service Quality Measurement Using Neural Networks. International journal of operations and production management, 22, 10, 1162-1185 (2002). Sherali, D., Hanif, Hobeika, G., Antoine and Jeenanunta, Chawalit. An Optimal Constrained Pruning Strategy for Decision Trees (2007). Hadden, J., Tiwari, A., Roy, R., Ruta D.: Churn prediction: Does technology matter (2006). Hong X., Zigang, Z., Yishi, Zhang. Churn Prediction in Telecom Using a Hybrid Two-phase Feature Selection Method. Third International Symposium on Intelligent Information Technology Application (2009). Ruta, D., Nauck, D., Azvine, B.: K nearest sequence method and its application to churn prediction. In: Corchado, E., Yin, H., Botti, V., Fyfe, C. (eds.) IDEAL 2006. LNCS, vol. 4224, pp. 207–215. Springer, Heidelberg (2006). Eastwood, M., Gabrys, B.: A Non-sequential Representation of Sequential Data for Churn Prediction. Computational Intelligence Research Group, School of Design, Engineering and Computing, Bournemouth University (2009). Rosset S., Abe N.: Data Analytics for Marketing Decision Support, IBM T.J. Watson Research Center (2006). S. Rosset, C. Perlich, B. Zadrozny, S. Merugu, S. Weiss and R. Lawrence, Customer Wallet Estimation. 1st NYU workshop on CRM and Data Mining (2005). S. Merugu, S. Rosset and C. Perlich, A New Multi-View Regression Method with an Application to Customer Wallet Estimation. The Twelfth ACM SIGKDD International Conference on Knowledge Discovery and Data Mining, August (2006). R. Koenker, Quantile Regression. Econometric Society Monograph Series, Cambridge University Press (2005). Archaux, C., Laanaya, H., Martin, A., Khenchaf, A.: An SVM based Churn Detector in Pre-paid Mobile Telephony (2004). Dasgupta, K., Singh, R., Viswanathan, B., Chakraborty, D., Mukherjea, S., & Nanavati, A. A.: Social Ties and their Relevance to Churn in Mobile Telecom Networks. Proceedings of the 11th international conference on Extending database technology pp. 668—677 (2008). S. Y. Hung, D. C. Yen and H. Y. Wang, “Applying data mining to telecom churn management,” Expert Systems with Applications, Vol.31, pp. 515–524 (2006).

Ascarza, E., Hardiey, B. Modeling Churn and Usage Behavior in Contractual Settings, March (2009). Bauer H., Hammerschmidt M., Braechler M.:The customer lifetime value concept and its contribution to corporate valuation. Yearbook of Marketing and Consumer Research, vol. 1 (2003). Buckinx W., Van den Poel D.: Customer base analysis: partial detection of behaviorally loyal clients in a noncontractual FMCG retail setting. European, Journal of Operational Research 164 (2005) 252268. Buckinx W., Verstraeten G., Van den Poel D.: Predicting customer loyalty using the internal transactional database. Expert Systems with Applications xxx (2005). Hwang H., Jung T., Suh E.: An LTV model and customer segmentation based on customer value: a case study on the wireless telecommunication industry. Expert Systems with Applications 26 (2004) 181188. Gürsoy, Umman Tuğba Şimşek: Customer churn analysis in telecommunication sector, Department of Quantitative Methods, School of Business Administration, Istanbul University, Istanbul, Turkey, Istanbul University Journal of the School of Business Administration Cilt/Vol:39 (2010), 35-49. Burez, J., Van den Poel, D.: Handling class imbalance in customer churn prediction, Expert Systems with Applications 36 (2009) 4626–4636.
TM Forum Best Practices and Standards: http://www.tmforum.org/BestPracticesStandards/1669/home.html
http://www.indepay.com/is_telecom.htm http://www.mobilephone-news.com/2010/11/mnp-to-cost-rs-19/ http://www.outlookindia.com/article.aspx?264134 http://www.mshare.net/why/customer-loyalty.html http://strategy-redefined.blogspot.com/2010/09/customer-churn-management-in-telecom.html http://retailbusinessnewsletter.com/page/3/ http://www.tmcnet.com/usubmit/2008/01/29/3237095.htm http://www.norusis.com/pdf/SPC_v13.pdf http://userwww.sfsu.edu/~efc/classes/biol710/logistic/logisticreg.htm