potential of best practice technology to improve energy efficiency in the global chemical and...
TRANSCRIPT

lable at ScienceDirect
Energy 36 (2011) 5779e5790
Contents lists avai
Energy
journal homepage: www.elsevier .com/locate/energy
Potential of best practice technology to improve energy efficiency in the globalchemical and petrochemical sectorq
D. Saygin a,*, M.K. Patel a, E. Worrell b, C. Tam c, D.J. Gielen d,1
aUtrecht University, Group Science, Technology and Society, Copernicus Institute, Faculty of Science, Budapestlaan 6, 3584 CD Utrecht, The NetherlandsbUtrecht University, Department of Innovation and Environmental Sciences, Faculty of Geosciences, Heidelberglaan 2, 3584 CS Utrecht, The Netherlandsc International Energy Agency (IEA), 9, rue de la Fédération, 75739 Paris Cedex 15, Franced International Renewable Energy Agency (IRENA), IITC, Robert-Schuman-Platz 3, 53175 Bonn, Germany
a r t i c l e i n f o
Article history:Received 26 July 2010Received in revised form13 May 2011Accepted 15 May 2011Available online 4 August 2011
Keywords:Chemical and petrochemical sectorEnergy indicatorsBest practice technology
q � OECD/IEA 2011 (Note: This article is based onentitled “Chemical and Petrochemical Sector: Potentiaand other measures for improving energy efficiency”* Corresponding author. Tel.: þ31 30 253 3750; fax
E-mail address: [email protected] (D. Saygin).1 The work undertaken by D.J. Gielen on this pap
employee of the International Energy Agency.2 Final energy is the sum of fuel demand (for fuel
steam and electricity use.
0360-5442/$ e see front matter � 2011 OECD/IEA. Pudoi:10.1016/j.energy.2011.05.019
a b s t r a c t
The chemical and petrochemical sector is by far the largest industrial energy user, accounting for 30% ofthe industry’s total final energy use. However, due to its complexity its energy efficiency potential is notwell understood. This article analyses the energy efficiency potential on a country level if Best PracticeTechnologies (BPT) were implemented in chemical processes. Two approaches are applied and animproved dataset referring to Europe has been developed for BPT energy use. This methodology has beenapplied to 66 products in fifteen countries that represent 70% of chemical and petrochemical sector’senergy use worldwide. The results suggest a global energy efficiency potential of 16% for this sector,excluding savings in electricity use and by higher levels of process integration, combined heat and power(CHP) and post-consumer plastic waste treatment. The results are more accurate than previous esti-mates. The results suggest significant differences between countries, but a cross-check based on twodifferent methods shows that important methodological and data issues remain to be resolved. Furtherrefinement is needed for target setting, monitoring and informing energy and climate negotiationprocesses. For the short and medium term, a combination of benchmarking and country level analysis isrecommended.
� 2011 OECD/IEA. Published by Elsevier Ltd. All rights reserved.
1. Introduction
Worldwide, the chemical and petrochemical sector consumesapproximately 35 EJ (Exajoules) of final energy2 per year and itrepresents more than 30% of the global industrial energy use(including feedstocks). The sector is faced with the challenge ofsaving energy primarily for economic and environmental reasons.In response to the G8 “Plan of Action for Climate Change, CleanEnergy and Sustainable Development” in Gleneagles in 2005[1], the International Energy Agency (IEA) published the book“Tracking Industrial Energy Efficiency and CO2 Emissions” [2] onenergy efficiency and CO2 emission reductions in manufacturing
the IEA Information Paperl of best practice technology� OECD/IEA 2009).: þ31 30 253 7601.
er occurred while he was an
and feedstock purposes) and
blished by Elsevier Ltd. All rights
industries. For the energy intensive industry sectors, an indicatorsanalysis was applied to estimate the technical potentials of energyefficiency improvements by implementation of Best AvailableTechnology (BAT). Industry recognized the importance of energyand CO2 indicators and is working on sectoral accounting frame-works and datasets as a basis for climate policy discussions.Although the chemical and petrochemical sector is increasinglyactive in this area, still major progress needs to be made to reachthe level of energy and CO2 analysis as performed by other sectors.
The chemical and petrochemical sector poses a special challengebecause of its complexity and due to the large number of products itmanufactures. Other factors that make the analysis a challengingtask are: lack of publicly available detailed energy use and energyefficiency data, complex production sites with a high level of heatintegration, a large diversity of process routes for producing thesame product, the very high levels of combined heat and power(CHP) that can be attained, and in some cases integration withrefineries. Despite the sector’s long tradition of energy analysis viabenchmarking surveys (e.g., for steam cracking, ammonia, otherorganic and inorganic chemicals), there are still several unresolvedproblems concerning data availability: First, these initiatives do notcover total energy use of the sector worldwide, second is they are
reserved.

5 EUI differs from the original term energy efficiency index (EEIIEA) used in theIEA publications [2e5]. By choosing the acronym EUI we aim to avoid confusionwhich could arise from the fact that EEIIEA has been defined in different ways in IEApublications as opposed to earlier publications (EEIUU [6,7];). EUI as used in thispublication is the reciprocal of the indicator EEIUU; EUI is identical with EEIIEA, thelatter being the definition applied in earlier IEA publications.
6 The data refers to BPT in new industrial plants. Savings by revamping existing
D. Saygin et al. / Energy 36 (2011) 5779e57905780
almost never done on a country or site level, but rather for specificprocesses, and third, many of these studies are confidential and it isunlikely that the data will ever become publicly available.
In the framework of IEA’s G8 work, IEA assessed and reportedthe short-term country level energy efficiency improvementpotentials by application of Best Practice Technology (BPT)3 in thechemical and petrochemical sector [2,3] and by other measureswhich are related to the sector’s activities, namely CHP, and recy-cling [2]. Worldwide energy efficiency improvement potentials byapplication of BPT were estimated at approximately 18% and 21%for 2004 and 2005 respectively. Further research was conductedand the results are presented in this paper. Themain improvementsare the extended product scope and the use of improved BPTvalues. By updating these results, deeper insight into the short-term energy efficiency improvement potentials in the chemicaland petrochemical sector is gained.
Results similar to those presented in this paper have been partlypublished in an IEA Information paper [4] and in IEA’s new industrybook “Energy Technology Transitions for IndustryeStrategies forthe Next Industrial Revolution” [5]. We will refer to these docu-ments wherever they provide a greater level of detail.
In the next section, we explain our methodology and givedetailed insight on the data sources used in our analysis. In Section3, we present the results of our indicator analysis by applyingtwo different approaches, namely a Top-down4 and a Bottom-upapproach. In Section 4, we discuss the validity of our findings in thelight of uncertainties in the methodology and input data. We endwith conclusions and recommendations (for policy makers,industry associations and national statistics offices).
2. Methodology and input data
In this section, we first introduce the methodology to establishthe savings potential for process heat by BPTs and we provideexplanations about the input data used in our analysis. We thendescribe the methodology to estimate energy savings by increasedCHP use and increased recycling.
2.1. Energy use indicator and energy efficiency improvementpotentials
We apply an indicator analysis to estimate the energy efficiencyimprovement potentials by implementing BPTs for the 57 mostimportant chemical and petrochemical processes (these processesproduce the 66 most important chemicals in terms of physicalproduction volumes and cover approximately 95% of the sector’stotal final energy use worldwide, see below). We present results forthe world and for fifteen countries that have large chemical andpetrochemical industries (70% of the sector’s total final energy useworldwide).
The first method we apply for comparing the current perfor-mance of the sector (for 2006) by BPT is a Top-down approach. Thisapproach is similar to the methodology applied in previous IEApublications [2,3]. However, we include more processes in theanalysis (57 compared to originally 49) and we choose to
3 While for all other sectors IEA establishes the potentials for energy savings andCO2 emissions assuming the adoption of BATs (Best Available Technologies), for thechemical and petrochemical sector the analyses are based on BPTs (Best PracticeTechnologies). We refer the reader to Section 2 for definitions of BAT and BPT.
4 Top-down approach as used in this article differs from the typical term top-down used in energy modeling studies. In this study, we refer to top-down approachas an estimation method for calculating improvement potentials on the basis ofenergy statistics. We use this term in order to be consistent with the earlier IEApublication [2].
determine the energy saving potentials using best practice tech-nology (BPT) instead of best available techniques (BAT). BPTrepresents best practice technologies that are currently in use atindustrial scale and they are therefore, by definition, economicallyviable [2].
The Energy Use Indicator (EUI)5 is the ratio of the sector’s energyuse if all processes were to adopt BPTs and the sector’s actualenergy use as reported in energy statistics. The EUI of country (orregion) j is calculated as
EUIj ¼Pn
i¼1�BPTi � Pi;j
�
c� TFEUj(1)
where BPT (gigajoule (GJ) final energy per tonne of output) is thespecific energy consumption (SEC) of the best practice tech-nology6 of process i, P is the total physical production volume ofprocess i in country j (megatonnes (Mt)/yr), c is the coveragecorrection coefficient, TFEUj (PJ/yr) is the actual total final fueland steam use of country j reported in energy statistics (includingfeedstocks) and n is the number of processes. For the coveragecorrection coefficient (c), a fixed value of 95% is used. We esti-mate this based on the selected 57 processes for several countriesand more importantly, for the world as a whole (see Table 7 inSection 4).
As an alternative to the Top-down approach, we also test thefeasibility of a Bottom-up approach. The major difference betweenthe two methodologies is that the Bottom-up approach establishesthe potentials on the basis of the difference between the averagecurrent SEC and BPTof each process and therefore it is not based onenergy statistics. According to this approach which was appliedearlier by [8,9] to estimate the sector’s total energy use, EUI isestimated as
EUIj ¼ 1�Pn
i¼1��SECi;j � BPTi
�� Pi;j�
Pni¼1 SECi;j � Pi;j
(2)
where SEC (GJ final energy per tonne of output) is the averagecurrent specific energy consumption of process i in country j. Basedon Equations (1) and (2), the energy efficiency improvementpotential of country j is 1 � EUIj.
When applying Equations (1) and (2), we use three types ofdata: (i) IEA Energy Statistics, (ii) production data and (iii) SECdata for BPTs and for the average current situation. IEA publishesenergy statistics for OECD and non-OECD countries on a yearlybasis [10,11]. Production data of most chemicals are based on SRI[12] while we use several other sources for selected otherchemicals.7 We provide an overview of the BPT and averagecurrent SEC values for the 57 processes (for 66 chemicals; see
plants can be smaller. However, in this analysis, we estimate the improvementpotentials if the whole industry switches to new plants according to BPT.
7 For the purpose of this study, production volumes (in physical terms) for 39organic chemicals and polymers (except for polycarbonate) have been provided bySRI [12] for fifteen countries and the world. We estimate the production volumes ofmost inorganics and of polycarbonate based on production capacities given inChemweek [13e16] using a capacity utilization rate of 85% ([8,17]; in reality actualutilization rates could differ across countries). We take the production volumes ofother inorganics from the US Geological Survey Minerals Yearbook [18,19]. Forethanol production, we use data fromRenewable Fuels Association [20].We receivedthe production volume of urea from International Fertilizer Association [21].

D. Saygin et al. / Energy 36 (2011) 5779e5790 5781
Table 1 and Table 2). Both the Top-down approach and theBottom-up approach refer exclusively to fuel use (including steamand feedstocks); we do not present results for electricity usebecause our Bottom-up calculations cover only one third of total
Table 1BPT and average current SEC values for the production of key chemicals, 2006 (in final e
BPT A
Feedstock Heat Steam F
Organic chemicals
Acetic acid 4.1Acetone 9.8Acrylonitrile (ACN) 0.3 �6.4Adipic acidc 1.0 18.5Benzene (steam cracking)d 0.0 13.1 �1.4 SBenzene (aromatics extraction)d 40.1 1.9 4Butadiene (steam cracking) 0.0 13.1 �1.4 SButadiene (C4 separation) 44.6 5.5 4Butylene 45.0 1.9 4Caprolactam 0.2 �3.2Cumene 2.1 �2.8Cyclohexanec �1.6Dimethyl terephthalate (DMT)c 4.7Diphenylmethane diisocyanate (MDI)c 0.9Ethanolc,e 13.9 8.3 1Ethylenef 45.0 13.1 �1.4 SEthylbenzene (EB)b 3.3Ethylene dichloride (EDC)b 4.4Ethylene glycol (EG) 0.8 3.5Ethylene oxide (EO) 2.5Formaldehydeb,g �4.8Isopropyl alcohol (IPA)b 5.2 5.4Maleic anhydrideb 2.0Melamineg 7.9 3.9
Methacrylate 2.0Methanol from natural gash 19.9 8.5 SMethanol from coalh 19.9 12.8 SMethyl tert butyl ether (MTBE) 0.8Oxo-alcoholsb 2.1Phenol 9.1Phthalic anhydrideb 20.0Propylene (steam cracking) 45.0 13.1 �1.4 SPropylene (FCC)i 45.0 1.9 4Propylene oxidec 14.2Purified terephthalic acid (PTA) 2.6Styreneb 7.7Toluene (aromatics extraction)j 20.4 1.9 2Toluene diisocyanate (TDI)g 21.7Xylene (aromatics extraction) 40.8 1.9 4p-Xylene 6.3 0.8Vinyl acetate monomer 2.8Vinyl chloride monomer 2.7Urea 2.2Plastics
Phenolic resinsg 10.0Polycarbonateb 10.3Polyethylene, high density (HDPE) 1.0Polyethylene, low density (LDPE) �2.1Polyethylene, linear low density (LLDPE)k 1.6Polyethylene terephthalate (PET)b 4.1Polypropylene (PP) 0.1Polystyrene (PS) 0.5Polyvinyl chloride (PVC) 0.5 1.2Urea formaldehyde (UF) & other resins
& fibersl2.0
Synthetic rubber & latexl 19.9Inorganic chemicals
Ammonia from natural gash 20.7 10.9 �3.9 SAmmonia from coalh 20.7 17.3 �1.3 SAmmonia from oilh 20.7 16.1 �1.5 SCarbon Blackm 37 3
electricity use [4]. The remainder is probably used by motorsystems (e.g., pumps, compressors, fans) and auxiliary uses forwhich no detailed data are available. Electricity savings areroughly estimated in Section 3.3.
nergy terms, without electricity use; GJ/tonne of output).a
verage current SEC References for
eedstock Heat Steam BPT Average current SEC
5.7 [22] Industrial sources13.9 [23] [23]
0.3 �4.5 [24] [24]1.2 25.7 [23] [23]
ee Table 2 [24] See Table 20.1 3.2 [24] [24]ee Table 2 [24] See Table 24.6 7.3 [24] [24]5.0 3.2 [24] [24]
0.2 4.1 [24] [24]1.8 [22] Industrial sources
�1.3 Industrial sources Industrial sources5.9 Industrial sources Industrial sources
1.1 Industrial sources Industrial sources3.9 10.4 [25] [25]ee Table 2 [24] See Table 2
3.9 [22] e
5.3 IEA Estimate e
0.9 4.4 Industrial sources Industrial sources3.1 Industrial sources Industrial sources
�5.7 [26] e
6.2 6.5 [23] e
2.4 IEA Estimate e
9.0 19.4 [24] [24][24] [24]
10.0 7.7 IEA Estimate [23]ee Table 2 IEA Estimate See Table 2ee Table 2 IEA Estimate See Table 2
1.5 [24] [24]2.5 [22] e
9.6 [22] [23]24.0 IEA Estimate e
ee Table 2 [24] See Table 25.0 3.2 [24] [24]
18 Industrial sources Industrial sources1.6 1.7 [22] [27]
9.2 [28] e
0.4 3.2 [24] [24]24.8 7.3 IEA Estimate [23]
0.8 3.2 [24] [24]1.4 6.7 [22] [26]
4.8 Industrial sources Industrial sources3.6 0.5 [22] [26]
3.9 [24] [24]
12.0 IEA Estimate e
12.9 IEA Estimate e
2.9 [24] [24]0.1 [24] [24]1.4 [29] [29]
4.9 [27] e
1.0 [24] [24]0.5 [30] [30]0.6 1.4 [24] [24]
2.5 Industrial sources Industrial sources
22.9 [24] [24]
ee Table 2 [24] See Table 2ee Table 2 [31,32] See Table 2ee Table 2 [32] See Table 27 19.9 [33,34] [33,34]
(continued on next page)

Table 1 (continued )
BPT Average current SEC References for
Feedstock Heat Steam Feedstock Heat Steam BPT Average current SEC
Chlorinen 1.9 See Table 2 [35] See Table 2Titanium dioxideo 4.1 8.4 13.0 11.7 [36] [36]Oxygen Only electricity use [2] [2]Soda ashp 10.0 See Table 2 [37] See Table 2
Note: All BPT and average current SEC data are expressed in lower heating values (LHV).a We use the data displayed in this table for the analysis of the global chemical and petrochemical sector. However, most data originate from Europe because data for other
world regions and for individual countries were not available for this study. The use of this data for other world regions is a limitation of the analysis since SEC variessubstantially across theworld (for example [6] quantifies the variations across US and several European and Asian countries for ethylene and ammonia productionwhere thereis a difference of 30% and 55% respectively between the most and least efficient countries). We discuss the potential uncertainties that arise from this issue in Section 4.Furthermore some BPT data is based on sources representing the technology level two decades ago. Since we did not find more recent data we use these data in the analysis.This is limited to six chemicals only (see those based on [23]). Final energy can be converted into primary energy assuming a steam production efficiency of 85% and a powerplant efficiency of 40%.
b Average current SECs were not available; we therefore estimate them assuming that they are 20% higher than the BPT. A change of �10 percentage points in thisassumption result in less than 1% change in the estimated total final energy use.
c BPTs were not available, we estimate them assuming that they are 20% lower than then average current SEC.d Steam cracking and aromatics extraction are counted as one process each.e The feedstock use is the production of ethanol from fermentable sugar (13.9 GJ/t) and the steam use refers to the production of fermentable sugar from agricultural crops
(8.3 GJ/t).f We use this dataset for the entire ethylene production except for ethylene production by steam cracking of ethane, for which the fuel use is estimated to be 5 GJ/t higher.
One reason for this higher fuel use is that ethane crackers are generally designed with less heat integration and higher flue gas temperatures. Another reason is that ethanesteam crackers essentially yield only ethylene whereas naphtha steam crackers produce also other compounds (propylene, butadiene, BTX); as a consequence the averagecalorific value of the output is larger (by approx. 2 GJ/t) in the case of ethane and propane steam crackers compared to steam crackers operated on naphtha and gas oil andtherefore the process energy is also somewhat larger (higher endothermicity).
g No feedstock value is given for formaldehyde, melamine, TDI and phenolic resins because this has already been accounted for in the production of the relevant rawmaterials (i.e., ammonia, methanol, propylene, benzene, toluene, urea).
h The BPT value for oil-based ammonia production is assumed to be 30% higher compared to natural gas-based ammonia production [31,32]. The BPT value for coal-based ammonia production is assumed to 50% higher than natural gas-based ammonia production [32]. The BPT value for coal-based production of methanol is assumedto be 50% higher compared to natural gas-based methanol production (process energy use for natural gas: 10 GJ/tonne of methanol, for coal: 15 GJ/tonne of methanol;see Table 2). Methanol from natural gas and coal are counted as two processes. By analogy ammonia production from natural gas, oil, and coal are counted as threeprocesses.
i Energy data for propylene extraction in fluid catalytic cracking (FCC) process was not available and have therefore been approximated using the dataset for aromaticsextraction.
j Half of all toluene consumption is utilized as raw material in other aromatics production, i.e. for xylene production via hydroproportionation and for benzene productionvia dealkylation. Thus, we cannot assign the full calorific value (40.8 GJ/t) to each of these chemicals as feedstock value because this will lead to substantial double counting.Therefore we correct the feedstock value of toluene by the share of its consumption processed to other aromatics (by 50%).
k The BPT value for steam use is higher than the average current SEC which is not possible. However, when the energy uses including electricity are compared then the BPTtechnology is more energy efficient than the average current SEC (2.08 vs. 2.45 GJ/t).
l The BPT value is for urea formaldehyde (UF) resin production only, however we use the data for the entire product group due to lack of representative BPT data for eachproduct. With this process, we cover the production of: acrylic fibers, nylon fibers, polyester fibers, acrylontrile-butadiene-styrene (ABS), styrene acrylonitrile (SAN) resins,Melamine-formaldehyde resin, UF resin and polyester solid state resins. The BPT value for ‘Synthetic rubber & latex’ actually stands for ethylene propylene rubber (EPDM)production. Due to lack of data, we use the same BPT value for the production of polybutadiene (PB) rubber, styrene-butadiene rubber (SBR) and related styrene-butadiene (SB)polymers. Furthermore, synthetic rubber is an exception: the BPT data we use refers to the global situation, i.e. not to Europe.We count the product group “Urea Formaldehyde(UF) & Other resins & fibers” and the product group “Synthetic rubber & latex” as one process each.m These values are net energy requirements. This means that we credit the released energy in the form of steam or electricity. For example, tail gas in carbon black production
may be used for heating of dryers process and partly for steam (and sometimes electricity) generation. Therefore we deduct the output of tail gas from the gross energyrequirements in order to calculate the net energy requirements.
n Energy values refer to one tonne of chlorine production, but cover the electrolysis of sodium chloride as a whole, i.e. including the concentration of sodium hydroxide to50% concentration. The BPT (membrane process) has a current density of 0.3e0.4 A/cm2. It may not be possible to operate the plant full-time at the energy efficient currentdensity. Therefore we refer to a range of current densities for the BPT.We also account for the quantity of steam consumed for brine preparation and sodium hydroxide (NaOH)concentration as well as the electricity requirements for rectifiers. We exclude electricity required for NaOH cooling, hydrogen cooling and drying, liquefaction/evaporation ofchlorine and its gas compression from the system boundaries. We do not give credits for the by-product hydrogen (approximately 3.4 GJ per tonne of chlorine based on theLHV of hydrogen by-produced).
o The values refer to the lowest recorded energy use of chloride process route among the two processes employed worldwide. The other is sulfate process. We estimateaverage current SEC based on global shares of chloride and sulfate processes and the average current SEC as given in [36]. The SEC for TiO2 includes the following processes:TiO2 usage ore preparation and oxidation/calcinations, TiO2 usage finishing and effluent treatment.
p BPT values refer to synthetic production only. In North America (USA and Canada), soda ash is exclusively produced by mining which requires less energy than thesynthetic routes. Therefore we do not estimate any savings for soda ash production in North America.
D. Saygin et al. / Energy 36 (2011) 5779e57905782
We apply the methodology simultaneously for process energyand feedstock energy in order to reduce uncertainties caused bydifferences in system boundaries of energy statistics.8 Weiss et al.[17] showed that process energy and feedstock energy cannot bereliably separated given the lack of consistent reporting in inter-national energy statistics.
8 Using IEA Energy Statistics, we combine (i) process energy: the total finalenergy consumption of the chemical and petrochemical sector by type of fuels andheat (excl. electricity) and (ii) feedstock energy: the memo-item “feedstock use inpetrochemicals”.
We equate the feedstock use to the calorific value of the basicchemicals produced from the first conversion of fossil fuels, e.g.benzene, ethylene and ammonia. These basic chemicals are rawmaterials for the production of intermediates and their derivatives.As a result, we do not attribute energy efficiency improvements tothe feedstock used for the production of chemicals. To avoid doublecounting, we exclude the calorific values of intermediates andderivatives that are made from the basic chemicals.
Since we were not able to collect worldwide information,average current SEC and BPT data refer to the situation of Europe(see Table 1). We uniformly use these values for the global and for

Table 2Best estimates for average current SEC for the production of key chemicals in studiedcountries, 2006 (without electricity and excluding feedstock use; data in finalenergy terms; GJ/tonne of output).
Steam crackinga Ammoniab Methanolc Chlorined Soda ashe
Japan 12.6 14.3 e 1.9 10.6Benelux 15.3 14.3 10.0 1.2 11.6Germany 15.7 16.6 12.4 2.3 11.6USA 18.3 17.3 11.4 4.7 6.9Brazil 17.1 15.3 10.0 4.4 11.7Canada 18.3 17.2 10.0 4.7 6.9China 16.7 28.9 15.0 2.7 13.8France 15.4 16.5 e 2.3 11.6India 16.7 19.5 10.9 0.6 13.6Italy 15.9 15.0 e 0.4 12.6Korea 12.6 21.3 e 1.9 10.6Saudi Arabia 18.3 15.3 10.0 2.9 11.6Taiwan 16.7 16.3 e 2.9 13.7World 16.9 20.9 10.9 2.9 10.9
Note: If any of these chemicals were not produced in these countries in year 2006,then we do not provide any SEC value for the production of that chemical in thatcountry.
a The output of steam cracking process is high value chemicals (HVC), see belowin main text for the definition.
b The fuel use values account for the differences in process energy that are due tofeedstock mix [2,38].
c Process fuel use for natural gas-based methanol production is 10 GJ/tonne ofmethanol [2]. The SEC of the coal-fed methanol production process is 50% higherthan the natural gas-based one [2].
d We account for the differences in process shares across the countries and theSEC values are based on literature [35,39e42].
e We account for the differences in process type across the countries and the SECvalues are based on literature [2,37,40,41].
9 Although FCC plants are part of refineries, propylene production via this route isaccounted for under the chemical and petrochemical sector in production statistics.In contrast, the energy use is reported under petroleum refineries in IEA energystatistics (see below in Section 4).10 A study by Daniëls and van Dril [49] analyzes the potential of CHP until 2020 forseveral electricity prices and subsidy levels. We estimate based on the results of thisstudy that implementation barriers could halve the theoretical potential of low andmedium temperature heat demand covered by CHP. Since our study excludes thebarrier effects against technology implementation, we do not provide furtherresults and discussion on the reductions of the savings potentials due to barriers.
D. Saygin et al. / Energy 36 (2011) 5779e5790 5783
the chemical and petrochemical sector of all countries. However,when applying the Bottom-up approach, given the significantdifferences in feedstock composition and the SEC values among theselected countries, country-specific SEC values should be used.Using a variety of sources we estimated the SEC per world regionfor the five most important processes (leading to the production ofnine chemicals and accounting for half of the sector’s energy useincluding electricity), i.e. steam cracking, and the production ofammonia, methanol, chlorine (incl. sodium hydroxide) and sodaash (see Table 2). The values are partly based on literature andpersonal communication with industry experts. We quantitativelyassess the uncertainties in the improvement potentials and theenergy savings by applying standard error propagation analysis(assuming all data shows normal distribution). We do this for thebottom-up approach by assuming uncertainty ranges for eachmethodology component, namely for production statistics, averagecurrent SEC and BPT. In our view it would not be sensible to conductan uncertainty analysis for the top-down approach since theuncertainties in the reported values for feedstock and processenergy use in international energy statistics are very high ([17]; seealso the background document). We neither measure the uncer-tainties in our results due to methodological limitations. However,we provide a qualitative discussion of all uncertainties in Section 4.
System boundaries of the values in Table 1 and Table 2 refer todirect fuel use consumed per tonne of product associated with theentire chemical processes covering both chemical conversion anddownstream processing. Energy use of processes outside thechemical production processes, e.g. mining and extraction ofmaterials, plastic waste management, are outside the systemboundaries. We account for steam exports of production processeswith exothermic reactions (denoted as negative values, e.g. steamfrom steam cracking). We assume that all excess heat can be usedonsite. As we consider energy credits (as steam or fuel), our valuescan be referred to as specific net energy requirements. All energydata are expressed as lower heating values.
Most processes of the chemical and petrochemical sector resultin more than one product, requiring particular attention whenspecifying energy use. Steam cracking is by far the largest multi-product process in this sector. In this paper we use the definitionof High Value Chemicals (HVC) used by Solomon Associates.According to this definition, HVC includes ethylene, propylene fromthe pyrolysis gas of steam crackers, contained amounts of benzeneand butadiene in the HVC mix of steam crackers (but excluding theshare of benzene from naphtha reforming), acetylene and hydrogensold as fuel [24]. Unlike the definition followed in earlier IEApublications [2,3], toluene and xylene are excluded in the HVCdefinition in spite of being extracted for subsequent use (forconsistency reasons with established industry benchmarkingpractice). This raises the SEC for HVC produced compared to the SECvalue in earlier studies.
The extraction of aromatics from the pyrolysis gas of steamcrackers and from refinery flows is a separate activity and it isexcluded from the steam cracker energy use. We assume that theseprocesses use an average of 2 GJ final energy per tonne of extractedbenzene, toluene and xylene [24]. We assume the same value forthe separation of butylenes and propylene from FCC.9
For all countries except for China and India, we assume naturalgas for the BPT values of ammonia and methanol production as thisis the most common feedstock. In China, most ammonia is madefrom coal (next to some natural gas and a small amount of oil) andin India a mix of natural gas and oil is used [43]. Methanolproduction is almost exclusively coal-based in China [44]. In China,as a result of recent major investments, coal-fed processes willcontinue to be used [45]. However, there is an over-capacity of theproducts made from the coal-based processes and therefore nonew investments will be done in the next 3 years [46]. Furthermore,the chemical and petrochemical sector in China, particularly theeast coast, will be able to benefit from the availability of importednatural gas from increased LNG shipments [47].
2.2. Combined heat and power (CHP)
CHP generally increases the efficiency compared to separateelectricity and heat generation. CHP has a long tradition in thechemical and petrochemical sector due to the large demand forboth steam and electricity. Typically the power capacity of CHPplants is designed to cover the site’s base load heat demand in thelow and medium temperature range (100e400 �C). This isapproximately half of the sector’s total heat demand. Theremainder is high temperature heat [48]. We define the differencebetween the maximum theoretical CHP capacity and the currentinstalled capacity as the maximum additional theoretical CHPcapacity, allowing maximum energy savings.10 For meeting thehigh temperature heat demand, we assume no additional CHPcapacity.
The reference efficiency of separate power and separate heatproduction can be chosen in different ways: the CHP unit can becompared with the grid average (average approach) or to a newpower plant that would deliver power to the grid (marginal

Table 3Summary of efficiency assumptions and the relevant context.
Average approach Marginalapproacha
Rationale No capacityincrease in gridpower generation
Grid powergeneration isincreasing (orbeing renewed)
Relevant context DevelopedeconomiesExisting chemicalplantsGrid power basedon current energymix (withsubstantial amountof coal and/ornuclear energy)
Emergingeconomies (ordevelopedeconomies)New chemicalplantsGrid power basedon natural gas
Reference efficiency for separategeneration of power and heat
Boiler Electricity Boiler Electricity�85% 40%b �85% 52.5e60%
Primary energy savingsc 20% 4e10%
a The application of the marginal approach can also be adequate in a developedeconomy where existing power plants are gradually replaced by highly efficientmodern power plants and where it therefore needs to be decided whether invest-ment are made in CHP or in separate generation.
b The average electricity efficiency is estimated based on IEA Energy Statistics forthe world in year 2006 [11]. It represents the efficiency of grid electricity generatedfrom all energy sources. It includes hydropower and wind, tide/wave/ocean andsolar photovoltaics which are accounted for with 100% efficiency according to theIEA methodology. Excluding hydropower would result in an overall power gener-ation efficiency of 36%.
c Primary energy savings are compared to average CHP efficiency of 81% (this isthe default assumption representing current best practice at the national level). Ifthe CHP efficiency increases (from currently 81%), to the efficiency level of new CHPsystems (85e90%) such as big and small gas turbines and gas engines [54], then theprimary savings increase by 7e8 percent points.
D. Saygin et al. / Energy 36 (2011) 5779e57905784
approach). Depending on the reference chosen, the calculatedsavings can differ substantially. In extreme cases, the range ofoutcomes may vary from significant savings to no savings at all.
We apply the following rationale: If a CHP plant is installed at anexisting chemical site in a developed economy with low energydemand growth, energy savings can be calculated by comparing theCHP unit’s power output to the average power grid efficiency, orcompared to the oldest and least efficient plants that will be phasedout when the new CHP unit is installed. For example in the UnitedStates, a country with very few new investments during the pastdecade, a net average efficiency of at least 30%11 for a sub-criticalcoal fired unit is common [50]. Somewhat higher efficiencies inthe order of 35e40% can be assumed as reference in other parts ofthe world where coal or even nuclear may be the technology ofchoice for new units [50]. In contrast, in countries where the shareof gas in power generation has been rising and where there issubstantial investment in the power sector, it may be more plau-sible to compare a new CHP unit with a new grid connected NGCCplant (natural gas combined cycle plant). This type of reference canbe used for countries such as South Korea, the Netherlands or theUnited Kingdom [51].
As for the heat generation reference, the typical efficiency ofaverage large-scale boilers is approximately 85% [52]. Withimprovements, new stand-alone boiler efficiencies can be higherthan 90% [53]. To some extent the fuel choice and the temperatureof the heat generated influence the boiler efficiency (up to 107%efficiency for generation of low-temperature heat in a condensinggas boiler but below 100% for typical industrial steam boilers).Table 3 summarizes the assumptions made in the average approachand the marginal approach. We apply both approaches for esti-mating primary energy savings by CHP plants (with an overall CHPefficiency of 81% for electricity and heat).
2.3. Recycling
At the end of the useful life of plastics, it is possible to saveenergy by recycling (either mechanically or as feedstock). However,incineration and landfilling are the most common practices todispose of post-consumer plastic waste. However, there are, inprinciple, large technical potentials to save energy by increasedrecycling. Among the recycling options, mechanical recycling is byfar the most common world-wide. Once polymers are recycled ona larger scale, feedstock demand could decrease (less demand forraw materials due to the availability of recycled equivalents), thusleading to energy savings in the related production processes.
Total polymer consumption in 2006 is reported as 245 Mt (excl.55 Mt consumption of non-plastics, i.e. polymers used as coatings,adhesives and other applications [55]). This gives rise to an esti-mated plastic waste volume of 120Mt per year, equivalent to half oftotal global plastics consumption (the remainder is currentlyaccumulated in the economy). Today, worldwide less than 10% ofthe total plastic waste is recycled [2]. For comparison, in Europe(EU-27 countries, Norway and Switzerland), 20% of the total shareof post-consumer plastics is mechanically recycled and 30% isincinerated with energy recovery [55]. The remaining half isdisposed of either by landfilling or by incineration without energyrecovery. In Japan the share of unrecovered waste is less than inEurope (40% compared to 50% [56]), with energy recovery playingthe most important role.
As a first assumption for best practice, we assume that 25% ofthe total post-consumer plastic waste is mechanically recycled. Weassume that landfilling will be phased out. We make a rough
11 All efficiency values are expressed in lower heating values (LHV).
estimation of the savings by mechanical recycling (remaining 30Mt) to polymer substitutes (in first cycle) by multiplying thequantities that are recycled with the specific energy savingscompared to landfilling (50 GJ/t according to Patel et al. [57];accounting for the current global plastic mix). Compared to theirequivalents produced from primary raw materials, the mechanicalproperties of recycled products deteriorate in the course of therecycling process. We account for this by an estimated substitutionfactor of one third. We assume that the remaining output ofmechanical recycling will be used as non-polymers substitutes(two-thirds); we neglect the related energy savings because theyare relatively small and very varied. Throughout this analysis we donot credit any primary energy savings due to waste incineration(with energy recovery) because waste management is outside thesystem boundaries of the chemical and petrochemical sector.
3. Results
3.1. Energy efficiency improvements in process heat
As Table 4 shows, the BPT energy use of the global chemical andpetrochemical sector according to the Top-down approach is 26.5 EJand according to the Bottom-up approach is 26.9 � 4.5 EJ (excl.electricity). Compared to the sector’s current energy use of 31.5 EJ(as reported in energy statistics in 2006 and excl. electricity), this isequivalent to an energy saving potential of 5.0 EJ and 4.6 � 1.1 EJrespectively. The ten most energy consuming processes account formore than 85% of the final BPT energy use (including feedstock) ofthe chemical and petrochemical sector. Steam cracking accounts for35%, ammonia production from natural gas and coal accounts for17%, the extraction of aromatics accounts for 15%, and methanoland butylene production account for 4% each. While the results
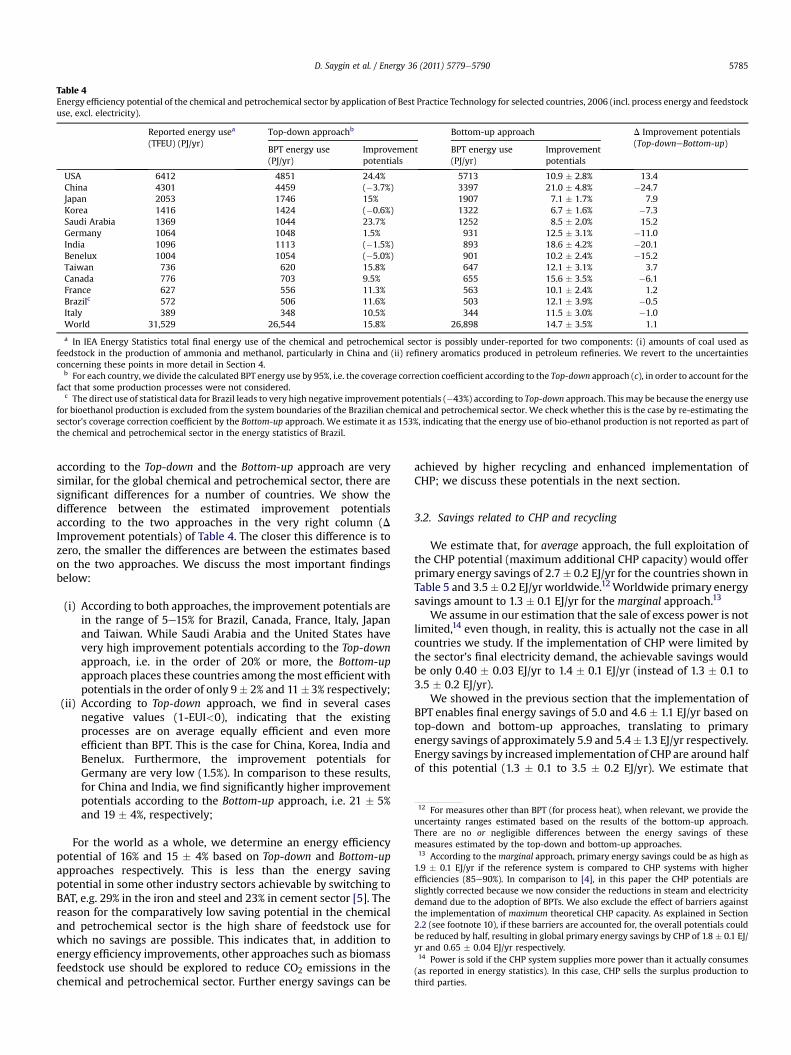
Table 4Energy efficiency potential of the chemical and petrochemical sector by application of Best Practice Technology for selected countries, 2006 (incl. process energy and feedstockuse, excl. electricity).
Reported energy usea
(TFEU) (PJ/yr)Top-down approachb Bottom-up approach D Improvement potentials
(Top-downeBottom-up)BPT energy use(PJ/yr)
Improvementpotentials
BPT energy use(PJ/yr)
Improvementpotentials
USA 6412 4851 24.4% 5713 10.9 � 2.8% 13.4China 4301 4459 (�3.7%) 3397 21.0 � 4.8% �24.7Japan 2053 1746 15% 1907 7.1 � 1.7% 7.9Korea 1416 1424 (�0.6%) 1322 6.7 � 1.6% �7.3Saudi Arabia 1369 1044 23.7% 1252 8.5 � 2.0% 15.2Germany 1064 1048 1.5% 931 12.5 � 3.1% �11.0India 1096 1113 (�1.5%) 893 18.6 � 4.2% �20.1Benelux 1004 1054 (�5.0%) 901 10.2 � 2.4% �15.2Taiwan 736 620 15.8% 647 12.1 � 3.1% 3.7Canada 776 703 9.5% 655 15.6 � 3.5% �6.1France 627 556 11.3% 563 10.1 � 2.4% 1.2Brazilc 572 506 11.6% 503 12.1 � 3.9% �0.5Italy 389 348 10.5% 344 11.5 � 3.0% �1.0World 31,529 26,544 15.8% 26,898 14.7 � 3.5% 1.1
a In IEA Energy Statistics total final energy use of the chemical and petrochemical sector is possibly under-reported for two components: (i) amounts of coal used asfeedstock in the production of ammonia and methanol, particularly in China and (ii) refinery aromatics produced in petroleum refineries. We revert to the uncertaintiesconcerning these points in more detail in Section 4.
b For each country, we divide the calculated BPT energy use by 95%, i.e. the coverage correction coefficient according to the Top-down approach (c), in order to account for thefact that some production processes were not considered.
c The direct use of statistical data for Brazil leads to very high negative improvement potentials (�43%) according to Top-down approach. This may be because the energy usefor bioethanol production is excluded from the system boundaries of the Brazilian chemical and petrochemical sector. We check whether this is the case by re-estimating thesector’s coverage correction coefficient by the Bottom-up approach. We estimate it as 153%, indicating that the energy use of bio-ethanol production is not reported as part ofthe chemical and petrochemical sector in the energy statistics of Brazil.
12 For measures other than BPT (for process heat), when relevant, we provide theuncertainty ranges estimated based on the results of the bottom-up approach.There are no or negligible differences between the energy savings of thesemeasures estimated by the top-down and bottom-up approaches.13 According to the marginal approach, primary energy savings could be as high as1.9 � 0.1 EJ/yr if the reference system is compared to CHP systems with higherefficiencies (85e90%). In comparison to [4], in this paper the CHP potentials areslightly corrected because we now consider the reductions in steam and electricitydemand due to the adoption of BPTs. We also exclude the effect of barriers againstthe implementation of maximum theoretical CHP capacity. As explained in Section2.2 (see footnote 10), if these barriers are accounted for, the overall potentials couldbe reduced by half, resulting in global primary energy savings by CHP of 1.8 � 0.1 EJ/yr and 0.65 � 0.04 EJ/yr respectively.14 Power is sold if the CHP system supplies more power than it actually consumes(as reported in energy statistics). In this case, CHP sells the surplus production tothird parties.
D. Saygin et al. / Energy 36 (2011) 5779e5790 5785
according to the Top-down and the Bottom-up approach are verysimilar, for the global chemical and petrochemical sector, there aresignificant differences for a number of countries. We show thedifference between the estimated improvement potentialsaccording to the two approaches in the very right column (DImprovement potentials) of Table 4. The closer this difference is tozero, the smaller the differences are between the estimates basedon the two approaches. We discuss the most important findingsbelow:
(i) According to both approaches, the improvement potentials arein the range of 5e15% for Brazil, Canada, France, Italy, Japanand Taiwan. While Saudi Arabia and the United States havevery high improvement potentials according to the Top-downapproach, i.e. in the order of 20% or more, the Bottom-upapproach places these countries among themost efficient withpotentials in the order of only 9� 2% and 11�3% respectively;
(ii) According to Top-down approach, we find in several casesnegative values (1-EUI<0), indicating that the existingprocesses are on average equally efficient and even moreefficient than BPT. This is the case for China, Korea, India andBenelux. Furthermore, the improvement potentials forGermany are very low (1.5%). In comparison to these results,for China and India, we find significantly higher improvementpotentials according to the Bottom-up approach, i.e. 21 � 5%and 19 � 4%, respectively;
For the world as a whole, we determine an energy efficiencypotential of 16% and 15 � 4% based on Top-down and Bottom-upapproaches respectively. This is less than the energy savingpotential in some other industry sectors achievable by switching toBAT, e.g. 29% in the iron and steel and 23% in cement sector [5]. Thereason for the comparatively low saving potential in the chemicaland petrochemical sector is the high share of feedstock use forwhich no savings are possible. This indicates that, in addition toenergy efficiency improvements, other approaches such as biomassfeedstock use should be explored to reduce CO2 emissions in thechemical and petrochemical sector. Further energy savings can be
achieved by higher recycling and enhanced implementation ofCHP; we discuss these potentials in the next section.
3.2. Savings related to CHP and recycling
We estimate that, for average approach, the full exploitation ofthe CHP potential (maximum additional CHP capacity) would offerprimary energy savings of 2.7� 0.2 EJ/yr for the countries shown inTable 5 and 3.5� 0.2 EJ/yr worldwide.12Worldwide primary energysavings amount to 1.3 � 0.1 EJ/yr for the marginal approach.13
We assume in our estimation that the sale of excess power is notlimited,14 even though, in reality, this is actually not the case in allcountries we study. If the implementation of CHP were limited bythe sector’s final electricity demand, the achievable savings wouldbe only 0.40 � 0.03 EJ/yr to 1.4 � 0.1 EJ/yr (instead of 1.3 � 0.1 to3.5 � 0.2 EJ/yr).
We showed in the previous section that the implementation ofBPT enables final energy savings of 5.0 and 4.6 � 1.1 EJ/yr based ontop-down and bottom-up approaches, translating to primaryenergy savings of approximately 5.9 and 5.4�1.3 EJ/yr respectively.Energy savings by increased implementation of CHP are around halfof this potential (1.3 � 0.1 to 3.5 � 0.2 EJ/yr). We estimate that

Table 5Additional theoretical CHP capacity for different countries and primary energy savings by CHP according to average approach for selected countries.a
CHP capacity in use(GWe)b
Maximum theoretical CHPcapacity (GWe)
Additional theoreticalCHP capacity (GWe)
Primary energy savings(EJ/yr)
Reference
United States (2007) 25.3 37.9 12.5 0.4 [58]Japan (2006)c 5.7 11.8 6.1 0.2 [59]Germany (2006) 2.6 3.8 1.1 0.03 [60]Netherlands (2006) 1.7 2.5 0.8 0.03 [61]Spain (2003) 0.6 2.6 2.0 0.07 [2]China (2005) 3.0 42.2 39.2 1.3 [2]Italy (2003) 0.7 2.4 1.7 0.06 [2]Russia (2004) 0.7 16.2 15.5 0.5 [2]Canada (2004) 1.7 2.1 0.4 0.01 [2]United Kingdom (2007) 1.2 2.7 1.5 0.05 [62]Brazil (2005) 0.7 3.6 2.9 0.09 [63]Total 44.1 127.7 83.7 2.7 e
Note: These countries cover 77% of the global chemical and petrochemical sector’s power use as reported in energy statistics [10,11].a We apply a load factor of 8000 h that is assumed to be identical to the actual operation rate of chemical plants. However, this might not be the case in all countries, e.g. in
USA where the annual operation rate is less than 7000 h [58]. In order to convert from heat production to power generation, we apply a power-to-heat ratio of 1. In reality thisratio varies by country and depends on the type of cogeneration technology applied.While new combined cycle gas turbines would have such a high power-to-heat ratio, oldertechnologies such as gas turbines have ratios as low as 0.25. Therefore by applying the power-to-heat ratio of 1, we assume that the current capacity will convert to newer CHPtechnologies.
b Years in brackets refer to the year, installed capacity data is recorded in.c For year 2008, Japan Cogeneration Center (JPCA) reports a power capacity of 1.74 GWe for CHP systems installed in the chemical industry of Japan. Based on commu-
nication with industry experts, we know that this capacity excludes the boiler and generator systems and the capacity established in soda industry [59]. According to thisinformation, we correct the potential from 1.74 GWe to 5.7 GWe.
D. Saygin et al. / Energy 36 (2011) 5779e57905786
0.40 � 0.04 EJ primary energy can be saved per year by increasedrecycling relative to landfilling. The saving potentials at the end oflife of polymers are hence clearly lower compared to our savingestimates for CHP.
15 In comparison to [4], in this paper the savings in motor systems are correctedupwards from 20% to 25% based on [66,68].16 In comparison to [4], in this paper the process integration potentials are slightlycorrected upwards from 3% to 5% of savings compared to BPT based on [70].
3.3. Energy efficiency improvement potentials in other systems
There are further opportunities for energy efficiency improve-ment in the area of electricity use and by improved process inte-gration. While it goes beyond the scope of this paper to study theseoptions indetail,wemake afirst attempt to quantify thesepotentials.
3.3.1. Electricity savingsIn order to estimate the electricity efficiency potentials, we first
disaggregate the sector’s electricity use as reported in energystatistics by end-uses, e.g. motor systems, electricity use for elec-trolysis processes, etc. Secondly we estimate the saving potentialsfor the most important demand categories. According to DeAlmeida et al. [64], 70% of the chemical and petrochemical’s sector’selectricity use in Western Europe is consumed by motor systems,i.e. primarily by pumps, fans, compressors and other machine driveuses. The Manufacturing Energy Consumption Survey [65] reportsa somewhat lower value for US chemical and petrochemical sector,i.e. 57% (for the activity level of 2002). According to [66], we assumean average share of 65% (based on the share of motor systems in thetotal manufacturing industry of EU-25). The remaining electricityuse is mainly for the electrolysis of brine to produce chlorine andsodium hydroxide. We estimate that this process accounts forapproximately 13% of the sector’s final electricity use world-wide(based on the global shares of the major process routes in 2005according to [67], namely membrane (47%), diaphragm (33%) andmercury (20%), and the respective average SEC values in Europe forthese processes according to [35]). The remainder electricity (22%)is used by other electrolyses and some electric arc processes as wellas monitoring and control and non-process related categories suchas lighting and other appliances in office buildings balance the totaldemand where we have no detailed further information on theirend-use shares.
For motor systems, we assume savings potentials of at least 25%due to the use of more efficient motors, variable speed drives and
other systems optimization15 [66,68]. For the chlor-alkali industry,we assume that the entire sector will switch to the most efficientmembrane electrolysis process (w20% savings). For the remainingelectricity demand categories, it is reasonable to also assumea saving potential of 20% (e.g.,15e25% savings for lighting accordingto Mills [69]). To conclude, we expect a potential for electricitysaving of approximately 23% for the world and even higher fordeveloping countries and some newly industrialized countries. Thisis equivalent to savings of at least 0.9 EJ/yr world-wide.
3.3.2. Process integrationAccording to [70], process integration can save 10e15% of all
fuels in process industries. We determine the potentials of processintegration by a conservative estimate assuming 5% additionalsavings (compared to BPT); this includes heat cascading, site inte-gration, hydrogen pinch, batch process optimization and optimizedintegration of material flows (e.g., by using by-products as rawmaterials). This translates to savings of 1.3 � 0.2 EJ/yr.16
3.4. Summary of energy efficiency improvement potentials
Adding up the components, we estimate the total energysavings at 11.1 and 10.8 � 1.6 EJ of final energy world-wide (for theactivity level of 2006) based on the top-down and the bottom-upapproach respectively. This translates to approximately 13.7 EJand 13.3 � 1.8 EJ in primary energy terms (see Table 6 and Figs. 1and 2). These savings are equivalent to an improvement potentialof 31% in comparison to the sector’s current final energy demand(35 EJ/yr).
4. Discussion of the results
The results of the indicator analysis show significant differencesbetween countries and the overall results point to uncertaintiesthat concern both approaches, Top-down and Bottom-up. Our

0
2,000
4,000
6,000
8,000
10,000
12,000
World USA Japan China SaudiaArabia
WE Korea Canada Brazil India Taiwan
Fin
al en
erg
y savin
g po
ten
tial (P
J/yr)
0
5
10
15
20
25
30
35
Sp
ecific en
erg
y savin
gs (G
J/t p
ro
du
ct)
BPT (Process heat) Electricity savings potential Process integration
Recycling CHP Specific energy savings
Fig. 1. Regional breakdown of final energy saving potentials by means of BPT and othermeasures related to the chemical and petrochemical sector according to the top-downapproach, 2006 (values represented by the bars refer to the y-axis on the left-handside, while the points refer to the y-axis on the right-hand side)Notes: We do not show any BPT energy saving potential for those countries withnegative improvement potentials. CHP potentials are given in two bars. The first barrefers to the CHP energy savings if the marginal approach is applied, and the secondbar refers to the additional CHP energy savings if the average approach is applied.Specific energy savings are estimated by dividing the total final energy saving potentialby the cumulative production volume of HVCs, BTX, ammonia and methanol, i.e. basicchemicals produced from the first conversion of raw materials (adding up theproduction volume of these chemicals does not lead to any double counting).
Table 6World-wide energy saving potential by means of BPT and other measures related tothe chemical and petrochemical sector, 2006 (in EJ/yr).
Top-downapproach
Bottom-up approach
Finalenergy
Primaryenergy
Finalenergy
Primaryenergy
BPTeProcess heata 5.0 5.9 4.6 � 1.1 5.4 � 1.3BPTeElectricitya,b 0.9 2.3 0.9 2.3Process integrationa 1.3 1.6 1.3 � 0.2 1.6 � 0.3Recyclinga 0.4 0.5 0.43 � 0.04 0.51 � 0.05CHP (Average approach) 3.5 3.5 3.5 � 0.2 3.5 � 0.2Total 11.1 13.7 10.8 � 1.5 13.3 � 1.8CHP (Marginal approach) 1.3 1.3 1.3 � 0.1 1.3 � 0.1Total 9.0 11.5 8.6 � 1.4 11.1 � 1.6
a We estimate primary energy savings assuming 40% average power generationefficiency and 85% steam production efficiency.
b No uncertainty ranges are provided because for electricity savings energystatistics were used.
D. Saygin et al. / Energy 36 (2011) 5779e5790 5787
Top-down approach may overestimate the improvement potentials,in particular for Japan, USA and Saudi Arabia. The results for USAseem to be confirmed by other industrial benchmark studies (NorthAmerica requires on average about twice as much as energycompared to the most energy efficient plant in the world [71,72]).Furthermore, EUI values larger than 1 are found for China, India,Benelux and Korea. Negative improvement potentials (1 - EUI < 0)could be explained by limitations in the methodology and uncer-tainties in input data, e.g. technology data, statistics, affect thereliability of the EUI:
(i) Themethodology and the average current SEC and BPT data donot account for energy integration by heat cascading;17 themethodology neither takes energy efficiency improvementsby CHP into account. As a result, the comparison of estimatedprocess heat with the energy statistics is not fully consistent(in the Top-down approach) as the latter reflects the currentlevel of applied process integration, e.g. energy integration,and CHP. Due to complexity of the sector the current level ofprocess integration achieved cannot be quantified. The CHP inenergy statistics are subject to uncertainty since there is nointernationally harmonized method to allocate fuel used inCHP plants to heat production and power;18
17 We mean by heat cascading that if a process uses high-pressure steam, this maybe reusable as medium pressure steam and subsequently possible also as low-pressure steam. However, we do not distinguish various pressure levels in ouranalysis in and we do not have insight into the extent of heat cascading applied inthe chemical and petrochemical sector. As a note of caution, heat cascading shouldnot be confused with crediting potential steam export from exothermic processes.We account for this separately in our values (see Table 1). Besides steam import byheat cascading and from exothermic processes, steam could internally be generatedby combustion of undesired hydrocarbons which are by-produced due to imperfectselectivity of reactions (so-called non-specs). These by-products generally have no/low market value and are too difficult to separate from the reaction mixture.Another source of steam is the combustion of post-consumer waste, e.g. plasticbarrels. Next to heat cascading, our methodology excludes the potentials of energyrecovery also from these processes. Their inclusion would lead to lower estimates inour Bottom-up approach.18 IEA questionnaires [73] provide a methodology for partitioning fuel inputsutilized in CHP plants for co-production of electricity and heat. These question-naires suggest that countries which have not already developed a methodology forthe partitioning of fuel input to CHP should follow the IEA approach. This meansthat a given country applied makes its own methodological choice, i.e. there isa lack of harmonization. An example of a country that has its own methodology isGermany. It partitions the fuel input to CHP plants according to Finnish method [74]which deviates from the IEA approach.
(ii) Regarding technology data, BPT data represents the situationin Europe rather than the world (because data for the worldwere not available). This is also true for most of the averagecurrent SEC values that are used in the Bottom-up approach.While this may explain negative improvement potentials forKorea (and in principle also for India and China), it is nota reason for Benelux;
(iii) In international energy statistics, the scope of the chemicaland petrochemical sector as opposed to the refinery sector isa source of uncertainty. By contrast to production statistics,which list all pure chemicals, including those produced atrefinery sites (e.g., aromatics from aromatic plants orpropylene from FCC), under the chemical and petrochemicalsector, international energy statistics most likely report theenergy use for the production of chemicals in refineries underthe refinery sector. According to Weiss et al. [17], the IEA oilquestionnaires [75] remain to some extent unclear in whethere.g., refinery aromatics are regarded as chemicals or as energycarriers. The IEA oil questionnaires [75] are likely to follow aninstitutional sector definition (i.e., a company is eithera refinery or a chemical company) instead of a technical sectordefinition. Refinery aromatics are thus likely to be regarded asenergy carriers, which are reported under column of other oilproducts as non-energy use. Based on this consideration, [76]argues there is thus strong indication that refinery aromaticsare not accounted for in international energy statistics asmemo-item: feedstock use, but under total non-energy use item(for industry/transformation/residential, including refineries).Such a reporting practice would lead to serious under-reporting of the chemical and petrochemical sector’s energyuse and it would furthermore explain negative values. Also itdistorts cross-country comparisons if the share of chemicalsproduced in refineries differs substantially in the countriesstudied. In order to correct for this error, it would be necessaryto know the quantities of all chemicals produced in refineries

Table 7Country level coverage correction coefficients of 57 processes (66 chemicals) esti-mated according to Bottom-up approach (excl. electricity), 2006.
Estimated energyuse (PJ/yr)
Reported energyuse (TFEU) (PJ/yr)
Coverage correctioncoefficient (%)
USA 5172 6412 81%China 5364 4301 125%Japan 1786 2053 87%Korea 1450 1416 102%Saudia Arabia 1084 1369 79%India 1298 1096 118%Germany 1138 1064 107%Benelux 1115 1004 111%Canada 791 776 102%Taiwan 670 736 91%France 587 627 94%Brazil 547 572 96%Italy 374 389 96%Worlda 29,558 31,529 94%
a The electricity use estimated by Bottom-up approach for 57 processes amountsto 1210 PJ/yr. When compared to reported electricity use in energy statistics(3688 PJ/yr), this is equivalent to an electricity use coverage correction coefficient of33% [4].
0
2,000
4,000
6,000
8,000
10,000
12,000
World USA Japan China SaudiaArabia
WE Korea Canada Brazil India Taiwan
Fin
al e
ne
rg
y s
av
ing
po
te
ntia
l (P
J/y
r)
0
5
10
15
20
25
30
35
40
Sp
ec
ific
en
erg
y s
av
ing
s (
GJ
/t p
ro
du
ct)
BPT (Process heat) Electricity savings potential Process integration
Recycling CHP Specific energy savings
Fig. 2. Regional breakdown of final energy saving potentials by means of BPT andother measures related to the chemical and petrochemical sector according to thebottom-up approach, 2006 (values represented by the bars refer to the y-axis on theleft-hand side, while the points refer to the y-axis on the right-hand side)Notes: CHP potentials are given in two bars. The first bar refers to the CHP energysavings if the marginal approach is applied, and the second bar refers to the additionalCHP energy savings if the average approach is applied. Specific energy savings areestimated by dividing the total final energy saving potential by the cumulativeproduction volume of HVCs, BTX, ammonia and methanol, i.e. basic chemicalsproduced from the first conversion of raw materials (adding up the production volumeof these chemicals does not lead to any double counting).
D. Saygin et al. / Energy 36 (2011) 5779e57905788
andmore detailed insight into country reporting practices (seealso background document);
(iv) Similar under-reporting of the sector’s energy use is apparentin international energy statistics for China for the amounts ofcoal used as feedstock for petrochemicals. While natural gas(used for production of ammonia and methanol) and oil areincluded under the memo-item feedstock use, coal does notappear to be;
(v) Production data of most chemicals we use differs from thosereported by industry associations and national productionstatistics.19 This is due to the high complexity of the sector:Numerous multi-product processes are operated, for manychemicals more than one production process is employed, andthere are complex material flows across sub-sectors poten-tially leading to double counting, but possibly also some aremissed. However, differences in production data were shownto have low impacts over the coverage correction coefficient(see background document);
(vi) There are several quality issues around the BPT data used.Details about the process type are often not available, but thisis essential for the correct choice of the BPT value;
(vii) Finally, we scale the estimated BPT energy use by a coveragecorrection coefficient which is identical for all countries (95%).However, more detailed analysis shows that this value isrepresentative only for the worldwide sector and for numberof countries (see Table 7), for some countries it is not. In thebackground document, detailed discussion on the coveragecorrection coefficient is provided for countries where alter-native datasets were available for further analysis.
19 We compare the default production data to (i) German national productionstatistics [77], (ii) US production data published by American Chemistry Council[78] and (iii) Japanese production data provided by Japan Petrochemical IndustryAssociation [79].
In conclusion, our Top-down approach is subject to uncertaintiesand is nomore than an indication of actual energy saving potentials.It is not robust enough to provide a basis either for target setting orfor country comparisons or for ranking the countries with regard totheir energy efficiency. Nevertheless it provides energy efficiencyvalues in the right range. The new results presented in this paperfurther develop and improve upon the analysis in previous IEApublications [2,3], in particular due to improved BPT values (seeTable 1) and the extended product range included. Furthermore, weapply the Bottom-up approach as an alternative method. Weacknowledge that its use offers currently limited additional insights,mainly due to the lackof country-specific average current SECvaluesfor various processes. This approach provides sector’s energy effi-ciency improvement potential within uncertainty range of �25%(4.6�1.1 EJ). Finally, it is an important step aheadmadeby this paperthat we pinpoint sources of uncertainty.
A time-series analysis based on the bottom-up approach toestimate EUI for years before 2006 would be useful to quantify theenergy efficiency improvements achieved in each country. As newdata is collected, the analysis should also be updated for each yearin order to improve and cross-check the findings of this paper. Thiswould help set meaningful sectoral targets.
Internationally standardized methods are needed to accuratelyand consistently collect and process energy and production data,especially for thosemajor (petro-) chemical manufacturing countrieswhere no such systems exists. Such data are already collected forsteam crackers, for the production of ammonia and of numerousorganic (incl. polymers) and inorganic chemicals in the context ofvoluntary sectoral agreements or energy benchmarking projects(conducted by independent consulting firms). However, results aregenerallyconfidential andtheregional coverage is limited.Moreeffortis required to extend the coverage of these studies. Comparablecountry level analyses should be conducted: thus benchmarkingcouldbe themajordecisionmaking tool, notonlygiven its importancefor increasing industry performance, but also for defining sectoraltargets, allocating emission rights and other possibilities related toclimate change policies such as in the 3rd phase of the EU-ETS(European Union Greenhouse Gas Emission Trading System [80]).Since such studies can complement the country level indicators pre-sented in this paper, future analysis should be a combination of both.
Furthermore, it is recommended to study process integration,i.e. energy integration and integration of material flows. Thisrequires site by site analysis and is a challenging task, but could be

D. Saygin et al. / Energy 36 (2011) 5779e5790 5789
an interesting next step for future research. Similar analysis onchemical sites would also be useful for the analysis of the sector’selectricity use.
5. Conclusions
This paper updated the earlier results of IEA indicators analysiswith the activity level of 2006 as well as extending sector coverageand also revising the BPT assumptions. Two approaches wereapplied, namely Top-down and Bottom-up. The analysis via thesetwo approaches is workable, but quality of the input data is criticaland, in most cases needs to be improved. This especially concernsenergy statistics, production data and SEC data both for the averagecurrent situation and for BPT. If successfully managed, this willprovide the basis for improving and refining our approach, e.g.allowing separate analysis for process energy (without feedstockenergy). Datasets collected in benchmarking studies can comple-ment the analysis. Therefore we recommend that future analysisshould be a combination of both. To conclude, a stronger collabo-ration is required between industry, associations and energy stat-isticians to establish methodologies and standards that areapplicable globally. It is an important task for the chemical andpetrochemical sector to catch up with the energy and CO2 meth-odology development and data collection currently undertaken byother sectors such as iron and steel and cement.
Acknowledgments
This research was funded by the Dutch Ministry of Economics.We thank industry experts and reviewers for the fruitful coopera-tion during this research which was originally conducted for Inter-national Energy Agency. We also would like to thank the threeanonymous reviewers for their valuable contributions to this article.
Nomenclature
AbbreviationsBAT best available technologyBPT best practice technologyBTX benzene, toluene, xyleneCHP combined heat and powerEJ exajoulesEU European UnionEUI energy use indicatorFCC fluid catalytic crackingGJ gigajoulesGW gigawattsHVC high value chemicalsIEA International Energy AgencyLHV lower heating valuesLNG liquefied natural gasMt mega tonnesNGCC natural gas combined cycleOECD Organization for Economic Co-operation and
DevelopmentPJ petajoulesSEC specific energy consumptionWE Western Europe (includes Benelux, France, Germany,
Italy)
SymbolsBPTi specific energy consumption of the best practice
technology of process i, GJ/tc coverage correction coefficient, unitless
EUIj energy use indicator of country (or region) j, unitlessn total number of processesPi,j production volume of process i in country j, Mt/yrSECi,j average current specific energy consumption of process i
in country (or region) j, GJ/tTFEUj total final fuel and steam consumption of country j as
reported in energy statistics, PJ/yr
Appendix. Supplementary data
Supplementary data associated with this article can be found, inthe online version, at doi:10.1016/j.energy.2011.05.019.
References
[1] G8. 31st G8 Summit. Gleneagles, United Kingdom, http://www.g8.gov.uk;2005.
[2] IEA-International Energy Agency. Tracking industrial energy efficiency andCO2 emissions. Paris, France: OECD/IEA, http://www.iea.org/textbase/nppdf/free/2007/tracking_emissions.pdf; 2007.
[3] IEA-International Energy Agency. Worldwide trends in energy use and effi-ciency. Paris, France: OECD/IEA, http://www.iea.org/papers/2008/indicators_2008.pdf; 2008.
[4] IEA-International Energy Agency. Potentials of best practice technology andother measures for improving energy efficiency. IEA Information Paper onenergy efficiency indicators. Paris, France: OECD/IEA, http://www.iea.org/papers/2009/chemical_petrochemical_sector.pdf; 2009.
[5] IEA-International Energy Agency. Energy technology transitions forindustry: strategies for the next industrial revolution. Paris, France: OECD/IEA; 2009.
[6] Phylipsen D, Blok K, Worrell E, de Beer J. Benchmarking the energy efficiencyof Dutch industry: an assessment of the expected effect on energyconsumption and CO2 emissions. Energy Policy 2002;30:663e79.
[7] Neelis M, Ramirez-Ramirez A, Patel M, Farla J, Boonekamp P, Blok K. Energyefficiency developments in the Dutch manufacturing industry, 1980e2003.Energy Policy 2007;35:6112e31.
[8] Neelis M, Patel M, Blok K, Haije W, Bach P. Approximation of theoreticalenergy-saving potentials for the petrochemical industry using energybalances for 68 key processes. Energy 2007;32:1104e23.
[9] Saygin D, Marscheider-Weidemann F, Patel MK. Material and energy flows inthe chemical sector of Germany by processes and Subsectors. Non-confidential report version. Prepared for DeStatis (Statistisches Bundesamt,German statistics office), Wiesbaden, Germany. Utrecht, the Netherlands:Utrecht University; May 2008.
[10] IEA-International Energy Agency. Energy balances for OECD countries e 2008edition. Paris, France: OECD/IEA; 2008.
[11] IEA-International Energy Agency. Energy balances for non-OECD countries e
2008 edition. Paris, France: OECD/IEA; 2008.[12] SRI Consulting. Production, capacity and capacity average age data for
selected chemicals and for selected countries and for OECD regions. MenloPark, CA, USA; 2008.
[13] Chemweek. Product focus: carbon black; January 31 2007.[14] Chemweek. Product focus: chlor-alkali; April 25 2007.[15] Chemweek. Product focus: polycarbonate; November 28/December 5 2007.[16] Chemweek. Product focus: titanium dioxide; February 14/21 2007.[17] Weiss M, Neelis ML, Zuidberg MC, Patel MK. Applying bottom-up analysis to
identify the system boundaries of non-energy use data in international energystatistics. Energy 2008;33:1609e22.
[18] USGS-United States Geological Survey. “Nitrogen” (advance release), mineralsyearbook. Reston, VA, USA: United States Geological Survey; October 2008.
[19] USGS-United States Geological Survey. “Soda ash” (advance release), mineralsyearbook. Reston, VA, USA: United States Geological Survey; October 2008.
[20] RFA-Renewable Fuels Association. Statistics. Washington, DC, USA, http://www.ethanolrfa.org/industry/statistics/; 2009.
[21] IFA-International Fertilizer Association. Urea production for year 2006.Personal communication with Mr. Michel Prud’Homme. Paris, France: Inter-national Fertilizers Association; 2009.
[22] Meyers RH, editor. Handbook of petrochemicals production processes. NewYork, USA: McGraw-Hill; 2005.
[23] Chauvel A, Lefebvre G. Petrochemical processes-technical and economiccharacteristics. Two Volumes. Paris, France: Editions Technip; 1989.
[24] Schyns V. Towards a simple, robust and predictable EU emissions tradingscheme, benchmarks from concrete to practice. Geleen, the Netherlands:Utility Support Group, http://www.usgbv.nl/uploads/files/level0/Benchmarks%20to%20practice%20EU%20ETS%20Schyns%2021march06.pdf; 2006.
[25] Project BREW, Patel MK, Crank M, Dornburg V, Hermann N, Roes L, et al.Medium and long-term opportunities and risk of biotechnological productionof bulk chemicals from renewable resources. Utrecht, the Netherlands:Utrecht University; 2006.

D. Saygin et al. / Energy 36 (2011) 5779e57905790
[26] IPTS/EC. Institute for Prospective Technology Studies (IPPC)-reference docu-ment on best available techniques for large volume organic chemical industry.Brussels, Belgium: IPTS/EC; February 2003.
[27] Boustead I. Eco-profiles of the European plastics industry, Reports by I.Boustead for PlasticsEurope, http://lca.plasticseurope.org/main2.htm; 2008(continuously updated).
[28] JPCA-Japan Petrochemical Industry Association. Personal communication withMr. Nobuaki Mita. Tokyo, Japan; 2008.
[29] IPTS/EC. Institute for Prospective Technology Studies (IPPC)-reference docu-ment on best available techniques in the production of polymers. Brussels,Belgium: IPTS/EC; August 2007.
[30] Hydrocarbon Processing. Petrochemical processes 2003. Hydrocarbon Pro-cessing 2003;82(3):72e124.
[31] AIChE-American Institute of Chemical Engineers. Safety in ammonia plants &related facilities symposium. AIChE Technical Manual 2008;49:341e52.
[32] IFA-International Fertilizer Association. Best practice technology for ammoniaproduction from coal. Personal communication with Mr. Keith Wilson. Paris,France: International Fertilizers Association; 2009.
[33] Leendertse A, van Veen J. Dutch notes on BAT for the carbon black industry.The Hague, the Netherlands: Ministry of Housing, Spatial Planning and theEnvironment; April, 2002.
[34] Ullmann’s Encyclopaedia of industrial chemistry e the ultimate referencerelease. 7th ed. Weinheim: Wiley-VCH; 2002.
[35] IPTS/EC. Institute for Prospective Technology Studies (IPPC)-reference docu-ment on best available techniques in the chlor-alkali manufacturing industry.Brussels, Belgium: IPTS/EC; December 2001.
[36] IPTS/EC. Institute for Prospective Technology Studies (IPPC)-reference documenton best available techniques for the manufacture of large volume inorganicchemicals - solids and others industry. Brussels, Belgium: IPTS/EC; August 2007.
[37] CEFIC-European Chemical Industry Council. Process BREF for soda ash, Insti-tute for Prospective Technology Studies (IPPC) BAT reference document, largevolume solid inorganic chemicals family. Brussels, Belgium: CEFIC; March2004.
[38] Karangle HS. Energy efficiency and CO2 emissions in the Indian ammoniasector, IFA IEA Workshop on energy efficiency and CO2 reduction Prospects inammonia production, 13 March. Ho Chi Minh City, Vietnam, http://www.fertilizer.org/ifa/Home-Page/LIBRARY/Conference-papers/Technical-Conferences/2007-IFA-Technical-Meeting; 2007.
[39] Energetics. Energy and environmental profile in the US chemical industry,prepared for the DoE/OIT. Columbia, MD, USA; 2000.
[40] Sathaye J, Price L, de laRueduCan S, FridleyD. Energy savingpotential in selectedindustrial sectors in India. LBNL-57293. Berkeley, CA, USA; March, 2005.
[41] Weishan S. Energy saving and emissions reductions of the petroleum andchemical industry. Shanghai, China: China Petroleum & Chemical IndustryAssociation; 2008.
[42] Worrell E, Phylipsen D, Einstein D, Martin D. Energy use and energy Intensityof the U.S. Chemical industry. LBNL-44314. Berkeley, CA, USA; April 2000.
[43] IFA-International Fertilizer Association. Fertilizers, climate change andenhancing agricultural productivity sustainably. Paris, France. 1st ed.; July, 2009.
[44] MI-Methanol Institute. Globalmethanol capacity. Alexandria, VA,USA:MethanolInstitute, http://www.methanol.org/pdf/WorldMethanolPlantsEndOf2006.pdf;2009.
[45] Chemweek. Coal to chemicals. coming out of the dark; January 31 2007.[46] China5e. China to rein in coal chemical projects, http://www.china5e.com/
show.php?contentid¼51715; December 10 2009.[47] Reuters. Factbox-China’s LNG import terminals and plans, http://uk.reuters.
com/article/idUKTOE60309520100104; January 4 2010.[48] Euroheat and Power. Euroheatcool work package 1. The European heat
market, final report. Brussels, Belgium; 2006.[49] Daniëls BW, van Dril AWN. Save production: a bottom-up energy model for
Dutch industry and agriculture. Energy Economics 2007;29:847e67.[50] Graus W, Voogt HJM, Worrell E. International comparison of energy efficiency
of fossil fuel power generation. Energy Policy 2007;35:3936e51.[51] Park H-C, KimH. Heat supply systems using natural gas in the residential sector:
the case of the agglomeration of Seoul. Energy Policy 2008;36:3843e53.[52] Einstein D, Worrell E, Khrushch M. Steam systems in industry: energy use and
energy efficiency improvement potentials. In: Proc. 2001 ACEEE summer studyon energy efficiency in industry, vol. 1. Tarrytown, NY, USA, July 24e27; 2001.
[53] Hendriks C, Harmelink M, Burges K, Ramsel K. Power and heat production:plant development and grid losses. EEP 03038. Prepared for RIVM (Rijksin-stitut voor Volksgezondheid en Milieu). Bilthoven, the Netherlands; January2004.
[54] Hers JS, Wetzels W, Seebregts AJ, van der Welle AJ. Onrendable top bereke-ningen voor nieuw WKK-vermogen 2008. ECN-Ee08e016. Petten, theNetherlands; May 2008 [in Dutch].
[55] Plastics Europe. The compelling facts about plastics 2007, an analysis ofplastics production, demand and recovery for 2007 in Europe. Brussels,Belgium; October 2008.
[56] Ida O. Current status of plastics recycling in Japan. IEA/CEFIC workshop. In:Proceedings: feedstock substitutes, energy efficient technology and CO2reduction for petrochemical products. Paris, France; 12e13 December2006.
[57] Patel M, Jochem E, Marscheider-Weidemann F, Radgen P, von Thienen N.C-STREAMSeestimation of material, energy and CO2 flows for model systemsin the context of non-energy use, from a life cycle perspective e status andscenarios. In: Estimates for the total system (in German; original title:C-STRÖME: abschätzung der Material-, Energie- und CO2-Ströme für Mod-ellsysteme im Zusammenhang mit dem nichtenergetischen Verbrauch, ori-entiert am Lebensweg e Stand und Szenarienbetrachtung. Band I:abschätzungen für das Gesamtsystem), vol I. Karlsruhe, Germany: FraunhoferInstitute for Systems and Innovation Research (ISI); October, 1999.
[58] EEA-Energy and Environmental Analysis. Personal communication with Ms.Anne Hampson; 2009.
[59] JPCA-Japan Petrochemical Industry Association. Combined heat and powercapacity in Japanese chemical industry. Personal communication with Mr.Nobuaki Mita. Tokyo, Japan; 2009.
[60] DeStatis-Statistisches Bundesamt. Fachserie 4, Reihe 6.4: ProduzierendesGewerbe. Stromerzeugungsanlagen der Betriebe im Bergbau und im Verar-beitenden Gewerbe. Wiesbaden, Germany; 2007 [in German].
[61] CBS-Centraal Bureau voor de Statistiek. Statline, www.cbs.nl; 2009.[62] BIS-Department for Business Innovation and Skills. Energy statistics:
combined heat and power. London, United Kindgom, http://www.berr.gov.uk/energy/statistics/source/chp/page18528.html; 2009.
[63] EPE-Empresa de Pesquisa Energética. Balanço Energético Nacional. Rio deJaneiro, Brazil, http://www.ben.epe.gov.br; 2009.
[64] De Almeida AT, Fonseca P, Ferreira F, Guisse F, Blaise J, Clair E, et al. Improvingthe penetration of energy efficient motors and drives. Brussels, Belgium:European Commission; 2000.
[65] EIA-U.S. Energy Information Administration. 2002 Energy consumption bymanufacturers e data tables. Washington, DC, USA: U.S. Department ofenergy, Energy Information Administration, http://www.eia.doe.gov/emeu/mecs/mecs2006/pdf/alltables2002.pdf; June 2009.
[66] De Keulenaer H. Energy efficient motor driven systems. Energy & Environ-ment 2004;15(5):873e905.
[67] WCC-World Chlorine Council. Sustainability commitments and actions.Brussels, Belgium; 2007.
[68] IEA-International Energy Agency. Industrial motor systems energy efficiency:towards a plan of action. Final version. Paris, France: OECD/IEA; July 2006.
[69] Mills E. Global lighting energy savings potentials. Light & Engineering 2002;10(4):5e10.
[70] Neelis M, Worrell E, Masanet E. Energy efficiency improvement and costsaving opportunities for the petrochemical industry. An ENERGY STAR�
guide for energy and plant managers. LBNL-964E. Berkeley, CA, USA; June2008.
[71] Harmsen J. Dutch chemical technology top of the world. AIChE Lecture,chemicals manufacturing facts, Innovation position, future of the Dutchchemical industry. The Hague, the Netherlands; October 10 2006.
[72] Keuken H. Benchmarking presentation. K VIV 5 March 2009. Antwerpen,Belgium; 2009 [in Dutch].
[73] IEA-International Energy Agency. Electricity and heat annual questionnaire2008 and historical revisions. Paris, France: OECD/IEA, http://www.iea.org/stats/questionnaire/Eleeng.pdf; July 2009.
[74] AGE-Arbeitsgemeinschaft Energiebilanzen. Vorwort zu den Energiebilanzenfür die Bundesrepublik Deutschland. Stand. Berlin, Germany, http://www.ag-energiebilanzen.de; November 2008 [in German].
[75] IEA-International Energy Agency. Oil annual questionnaire 2008 and historicalrevisions. Paris, France: OECD/IEA, http://www.iea.org/stats/questionnaire/Oileng.pdf; July 2009.
[76] Weiss M. Personal communication with Mr. Martin Weiss. Ispra, Italy: Euro-pean Commission-DG JRC Institute for Environment and SustainabilityTransport and Air Quality Unit; 2010.
[77] DeStatis-Statistisches Bundesamt. Fachserie 4, Reihe 3.1: ProduzierendesGewerbe. Produktion in ProduzierendenGewerbe.Wiesbaden,Germany; 2007.
[78] ACC-American Chemistry Council. US business of chemistry annual data.Arlington, VA, USA; 2009.
[79] JPCA-Japan Petrochemical Industry Association. Production data of chemicals.Personal communication with Mr. Nobuaki Mita. Tokyo, Japan; 2009.
[80] EU. Benchmarks for free allocation. Brussels, Belgium: European Commission,EU-ETS, http://ec.europa.eu/environment/climat/emission/benchmarking_en.htm; 2010.