post-tensioned tendon losses in a spliced-girder bridge
TRANSCRIPT
Post-tensioned Tendon Losses ina Spliced-Girder Bridge,Part 2: Analysis of Losses
Chris P. Pantelides, Ph.D., P.E.ProfessorDepartment of Civiland Environmental EngineeringUniversity of UtahSalt Lake City, Utah
BrandtW. Saxey, M.Sc.-larris Saxey Consultants Inc.Salt Lake City, Utah
This paper presents analytical procedures for determining post-tensioning tendon losses in a typical spliced, precast concrete girderused in the 4500 South Bridge at Interstate 15 in Salt Lake City, Utah.The bridge is composed of eight post-tensioned, spliced, precast concrete girders that have three segments each to produce a single clearspan of 61.44 m (201.6 ft). The analysis procedure specified in thernAmerican Association of State Highway and Transportation Officials’AASHTO LRFD Bridge Design Specifications is used and comparedwith experimental measurements of losses in the post-tensioned,spliced, precast concrete girders monitored at the 4500 South Bridge,as described in the companion paper, “Post-tensioned Tendon Lossesin a Spliced-Girder Bridge, Part 1: Field Measurements,” in the May—June 2007 PCI Journal.The time-dependent method predicts measured post-tensioning lossesin the precast concrete girders with sufficient accuracy at the abutments and at midspan. The measured modulus of elasticity of the girderconcrete was found to be predicted more accurately by the equationproposed by AC! Committee 363. Concrete shrinkage and creep testsperformed on the girders were used to obtain the ultimate creep coefficient and ultimate shrinkage strain. These results were compared withvalues recommended by AC! Committee 209. Shrinkage and creeptests indicate an asymptotic achievement of ultimate shrinkage strainand ultimate creep coefficient in approximately eight months, a resultsupported by strain readings from vibrating wire strain gauges embedded in the concrete of the spliced girders.
A
PCI JOURNAL
As indicated in the PCI Journal companion paper,
“Post-tensioned Tendon Losses in a Spliced-Girder
Bridge, Pait 1: Field Measurements,” research on
monitored losses in post-tensioned, spliced, precast concrete
girders is limitecL’ In preparation for the 2002 Olympic Win
ter Games, which were held in Salt Lake City, Utah, exten
sive interstate highway reconstruction work was undertaken,
including construction of 81 prestressed concrete I-girder
bridges. The 4500 South Bridge at Interstate 15 (1-15) in Salt
Lake City, a typical spliced, precast concrete girder bridge,
was selected for monitoring of post-tensioning tendon losses.
This paper presents the analytical procedures used to deter
mine post-tensioning losses in the spliced, precast concrete
bridge girders. Shrinkage and creep test results are presented
and compared with recommended values.
LITERATURE REVIEW
The American Concrete Institute (ACT) and the American
Society of Civil Engineers (ASCE) Joint Committee 3232 rec
ommended lump-sum losses, for routine design purposes, in
prestressed concrete construction as early as 1958. For post-
tensioned members, the recommended value of lump-sum
losses was 172 MPa (25 ksi). Lump-sum losses include those
due to elastic shortening, shrinkage, creep, and relaxation but
exclude those due to friction and anchorage slip. Branson and
Kripanarayanan3presented equations for predicting loss of
prestress and camber in concrete members subjected to either
full or partial prestressing. Equations were presented to ac
count for the time-dependent effects of loss of prestress and
the results were compared with experimental data.Meyers et al.4 provided simple empirical equations for de
termining the long-term creep and shrinkage of concrete byusing experimental results. Using these equations, prediction
accuracy that previously required four months of testing could
be achieved with only 28 days of creep and shrinkage data.Modifications of the lump-sum method were subsequently
included in the 1975 American Association of State Highway
and Transportation Officials’ (AASHTO) Interim Specica
tions—Bridges.5The treatment of losses as lump-sum quantities, however, was recommended only for standard condi
tions. For members with unusual proportions, exceptionally
long spans, or lightweight concrete, AASHTO recommended
a separate estimate of the individual losses.In 1975, the PrecastlPrestressed Concrete Institute (PCI)
Committee on Prestress Losses6 issued “Recommendations
for Estimating Prestress Losses.” This document presented
both general and simplified methods for computing prestress
ing tendon losses. In the general method, the total loss for post-tensioned construction was separated into one-time losses and
time-dependent losses. The one-time losses included friction,anchorage, and elastic shortening, and the time-dependent
losses were creep, shrinkage, and losses due to steel relax
ation. Tadros et al.7 presented an analytical method to predict
time-dependent prestressing losses, axial strain, and curva
ture at a section of a prestressed concrete beam or frame. The
method was applicable for non-composite pretensioned and
post-tensioned structures.Tadros et al.8 presented a step-by-step computer method
for predicting the stress distribution due to creep and shrink
age of concrete and relaxation of prestressing steel. In a dif
ferent paper, Tadros et al.9 presented multipliers and design
aids for predicting time-dependent deflections. In that paper,
the design aids considered the influence of creep and shrink
age of concrete, relaxation of prestressing steel, and the presence of nonprestressed steel on time-dependent deflection of
prestressed concrete members.The PCI Design Handbook: Precast and Prestressed Con
crete’° provides simple equations for estimating losses of
prestress that enable designers to estimate the various types
of prestressing losses rather than using a lump-sum value.
Although a number of methods are available for determining
loss of prestress, all handbook methods must be modified for
use in post-tensioned concrete construction.Abdel-Karim and Tadros” reviewed the state of the art for
spliced-girder bridges. They presented a computer-based pro
cedure for analyzing composite precast concrete girder bridges
with cast-in-place concrete topping. The computer program
evaluates stresses in concrete and steel at any cross section in
a statically indeterminate composite beam or plane frame and
gives the deflection at various stages of construction.Oh and Yang12 presented a method for improving the long-
term prediction of prestressing force changes in prestressed
concrete structures. The method used short-term measure
ments in the field before opening the structure to traffic, and
the measurements were then used to update predictions of
prestress losses due to creep and shrinkage. The method was
supported by statistical data.Stallings et al.’3 recorded camber and strains from 31 gird
ers from the time of prestressing force transfer until construc
tion completion. An incremental time-step analysis was used
to predict girder strains, camber, and prestressing losses up
to the time of deck construction. The authors concluded that
current analytical techniques are adequate provided that the
correct time-dependent material properties are appropriately
integrated into the procedure.Wollmann et al.’4 used the age-adjusted concrete modu
lus approach in the time-dependent analysis of spliced, pre
cast concrete girder composite bridges. The approach allows
designers to take advantage of the greater concrete strength
at the time of post-tensioning and the resulting reduction in
creep and shrinkage strains when determining prestressing
losses for design.The authors use a time-dependent loss method described
in the AASHTO LRFD Bridge Design Specfications’5in this
paper to analyze the losses of a post-tensioned, spliced, precast
concrete girder at the anchorage zones and at midspan. They
compare the method with actual losses measured through load
cells at the anchorage zones and vibrating wire strain gauges
at midspan. They also compare predictions for the concrete
modulus of elasticity, the ultimate creep coefficient, and ulti
mate shrinkage strain to test results of the same concrete used
to construct the post-tensioned spliced girder.
CONCRETE PROPERTIES
The authors performed creep and shrinkage tests to evalu
ate the ultimate creep coefficient and ultimate shrinkage
July—August 2007 59

1.OE-03
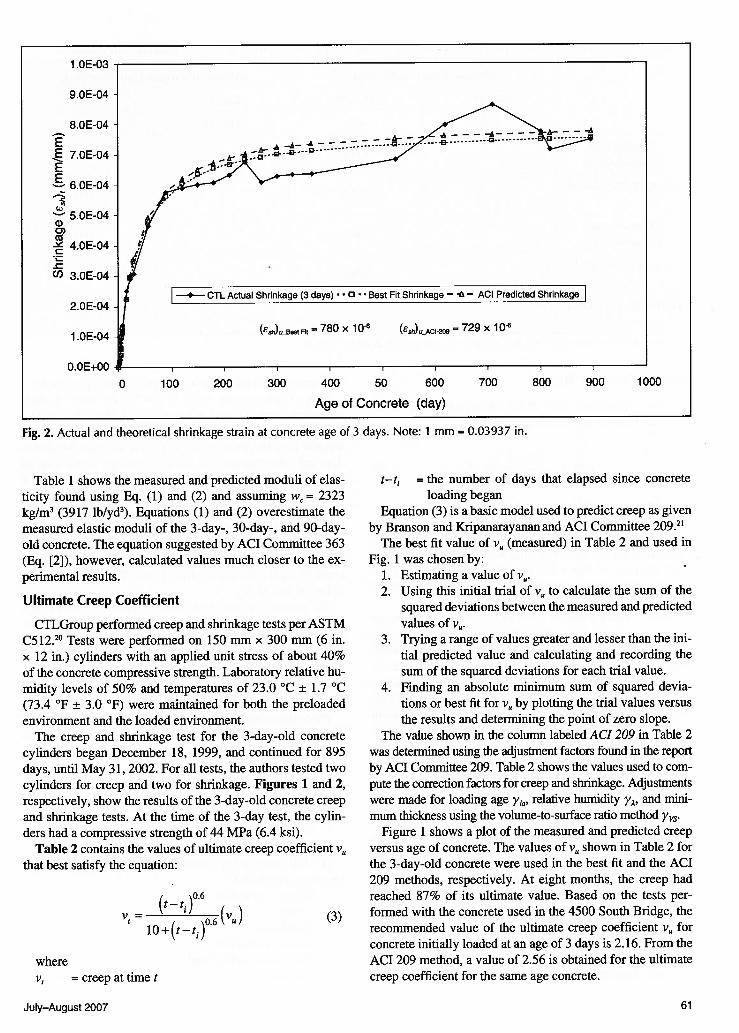
Fig. 2. Actual and theoretical shrinkage strain at concrete age of 3 days. Note: 1 mm = 0.03937 in.
Table 1 shows the measured and predicted moduli of elasticity found using Eq. (1) and (2) and assuming w, = 2323kg/m3 (3917 lbIyd3). Equations (1) and (2) overestimate themeasured elastic moduli of the 3-day-, 30-day-, and 90-day-old concrete. The equation suggested by ACT Committee 363(Eq. [2]), however, calculated values much closer to the experimental results.
Ultimate Creep Coefficient
CTLGroup performed creep and shrinkage tests per ASTMC512.2°Tests were performed on 150 mm x 300 mm (6 in.x 12 in.) cylinders with an applied unit stress of about 40%of the concrete compressive strength. Laboratory relative humidity levels of 50% and temperatures of 23.0 °C ± 1.7 °C(73.4 °F ± 3.0 °F) were maintained for both the preloadedenvironment and the loaded environment.
The creep and shrinkage test for the 3-day-old concretecylinders began December 18, 1999, and continued for 895days, until May 31, 2002. For all tests, the authors tested twocylinders for creep and two for shrinkage. Figures 1 and 2,respectively, show the results of the 3-day-old concrete creepand shrinkage tests. At the time of the 3-day test, the cylinders had a compressive strength of 44 MPa (6.4 ksi).
Table 2 contains the values of ultimate creep coefficient v
that best satisfy the equation:
‘ 0.6t_t1)
— 0.610 + (t — t1)
t—t1 = the number of days that elapsed since concreteloading began
Equation (3) is a basic model used to predict creep as givenby Branson and Kripanarayanan and ACT Committee 209.21
The best fit value of v (measured) in Table 2 and used inFig. 1 was chosen by:
1. Estimating a value of v.
2. Using this initial trial of v to calculate the sum of thesquared deviations between the measured and predictedvalues of v.
3. Trying a range of values greater and lesser than the initial predicted value and calculating and recording thesum of the squared deviations for each trial value.
4. Finding an absolute minimum sum of squared deviations or best fit for V by plotting the trial values versusthe results and determining the point of zero slope.
The value shown in the column labeled ACI 209 in Table 2was determined using the adjustment factors found in the reportby ACT Committee 209. Table 2 shows the values used to compute the correction factors for creep and shrinkage. Adjustmentswere made for loading age y, relative humidity y, and minimum thickness using the volume-to-surface ratio method 2’vs
Figure 1 shows a plot of the measured and predicted creepversus age of concrete. The values of v shown in Table 2 forthe 3-day-old concrete were used in the best fit and the ACT209 methods, respectively. At eight months, the creep hadreached 87% of its ultimate value. Based on the tests performed with the concrete used in the 4500 South Bridge, therecommended value of the ultimate creep coefficient v forconcrete initially loaded at an age of 3 days is 2.16. From theACI 209 method, a value of 2.56 is obtained for the ultimatecreep coefficient for the same age concrete.
9.OE-04
8.OE-04
E7.OE-04
E6.OE-04
5.OE-04
4.OE-04
(1) 3.OE-04
2.OE-04
1.OE-04
O.OE+OO
0 100 200 300 400 50 600 700 800 900 1000
Age of Concrete (day)
wherev = creep at time
(3)
July—August 2007 61
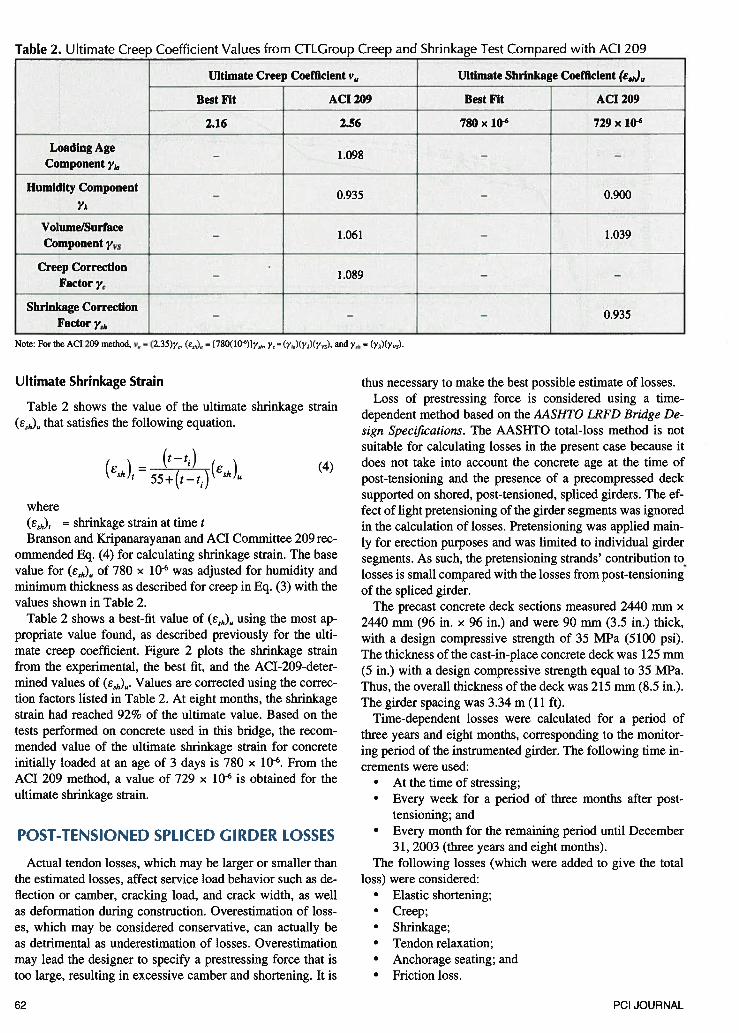
Table 2. Ultimate Creep Coefficient Values from CTLGroup Creep and Shrinkage Test Compared with ACI 209
Ultimate Creep Coefficient v, Ultimate Shrinkage Coefficient (e51J,
Best Fit ACI 209 Best Fit ACT 209
2.16 2.56 780 x 10.6 729 x 10.6
Loading Age— 1 098
Component y,
Humidity Component— 0.935 — 0.900
YA
Volume/Surface— 1.061 — 1.039
Component
Creep Correction —
1.089 — —
Factor y
Shrinkage Correction — —
— 0.935Factor 2’s,,
Note: For the ACI 209 method, v=(235)y, (e,) = [780(10j]yh, y=(y)(Ya)(yv), and Ysh =0’)(Yys).
Ultimate Shrinkage Strain
Table 2 shows the value of the ultimate shrinkage strain(sh) that satisfies the following equation.
where
(t — t)(ESh), =
(r,,), = shrinkage strain at time t
Branson and Kripanarayanan and ACI Committee 209 recommended Eq. (4) for calculating shrinkage strain. The basevalue for (ES6)u of 780 x 106 was adjusted for humidity andminimum thickness as described for creep in Eq. (3) with thevalues shown in Table 2.
Table 2 shows a best-fit value of (Eh)U using the most appropriate value found, as described previously for the ultimate creep coefficient. Figure 2 plots the shrinkage strainfrom the experimental, the best fit, and the ACI-209-deter-mined values of (eh). Values are corrected using the correction factors listed in Table 2. At eight months, the shrinkagestrain had reached 92% of the ultimate value. Based on thetests performed on concrete used in this bridge, the recommended value of the ultimate shrinkage strain for concreteinitially loaded at an age of 3 days is 780 x 106. From theACT 209 method, a value of 729 x 10.6 is obtained for theultimate shrinkage strain.
POST-TENSIONED SPLICED GIRDER LOSSES
Actual tendon losses, which may be larger or smaller thanthe estimated losses, affect service load behavior such as deflection or camber, cracking load, and crack width, as wellas deformation during construction. Overestimation of losses, which may be considered conservative, can actually beas detrimental as underestimation of losses. Overestimationmay lead the designer to specify a prestressing force that istoo large, resulting in excessive camber and shortening. It is
thus necessary to make the best possible estimate of losses.Loss of prestressing force is considered using a time-
dependent method based on the AASHTO LRFD Bridge Design Specifications. The AASHTO total-loss method is notsuitable for calculating losses in the present case because it
(4) does not take into account the concrete age at the time ofpost-tensioning and the presence of a precompressed decksupported on shored, post-tensioned, spliced girders. The effect of light pretensioning of the girder segments was ignoredin the calculation of losses. Pretensioning was applied main
ly for erection purposes and was limited to individual girdersegments. As such, the pretensioning strands’ contribution tolosses is small compared with the losses from post-tensioningof the spliced girder.
The precast concrete deck sections measured 2440 mm x2440 mm (96 in. x 96 in.) and were 90 mm (3.5 in.) thick,with a design compressive strength of 35 MPa (5100 psi).The thickness of the cast-in-place concrete deck was 125 mm(5 in.) with a design compressive strength equal to 35 MPa.Thus, the overall thickness of the deck was 215 rrun (8.5 in.).The girder spacing was 3.34 m (11 ft).
Time-dependent losses were calculated for a period ofthree years and eight months, corresponding to the monitoring period of the instrumented girder. The following time increments were used:
• At the time of stressing;• Every week for a period of three months after post-
tensioning; and• Every month for the remaining period until December
31, 2003 (three years and eight months).The following losses (which were added to give the total
loss) were considered:• Elastic shortening;• Creep;• Shrinkage;• Tendon relaxation;• Anchorage seating; and• Friction loss.
62 PCI JOURNAL
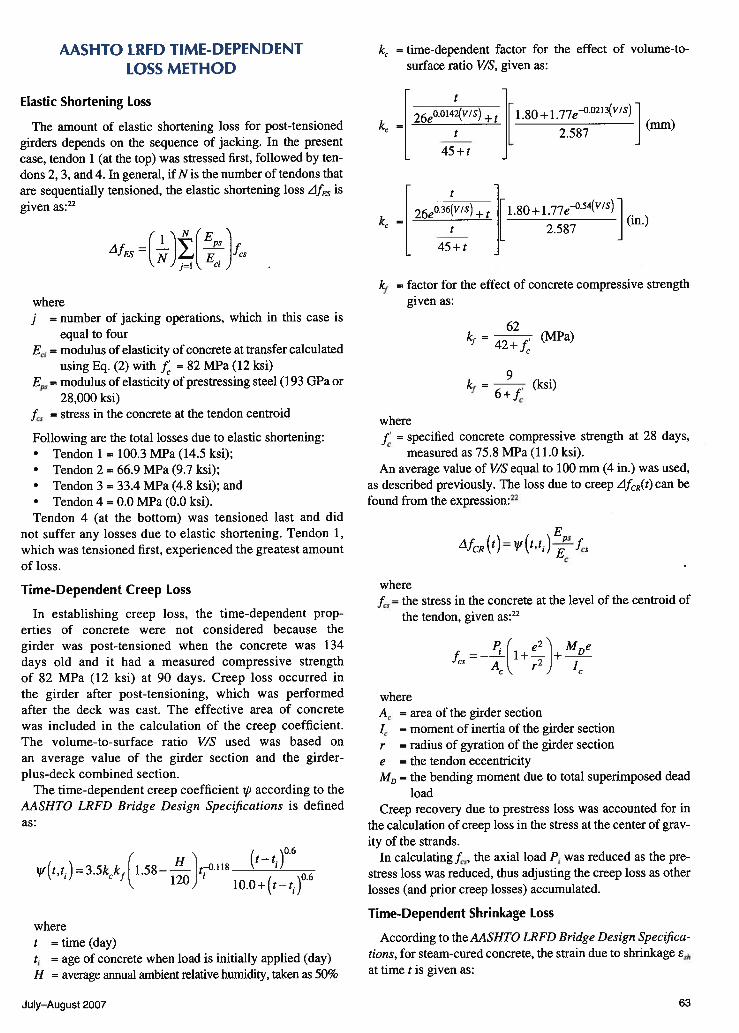
AASHTO LRFD TIME-DEPENDENTLOSS METHOD
Elastic Shortening Loss
The amount of elastic shortening loss for post-tensionedgirders depends on the sequence of jacking. In the presentcase, tendon 1 (at the top) was stressed first, followed by tendons 2, 3, and 4. In general, if N is the number of tendons thatare sequentially tensioned, the elastic shortening loss 4fEs iS
given as:22
where
j
I
LlfES=(--l\
)EiJ CS
= number of jacking operations, which in this case isequal to four
= modulus of elasticity of concrete at transfer calculatedusing Eq. (2) with f = 82 MPa (12 ksi)
E5 = modulus of elasticity of prestressing steel (193 GPa or28,000 ksi)
f5 = stress in the concrete at the tendon centroid
Following are the total losses due to elastic shortening:• Tendon 1 = 100.3 MPa (14.5 ksi);• Tendon 2 = 66.9 MPa (9.7 ksi);• Tendon 3 = 33.4 MPa (4.8 ksi); and• Tendon 4 = 0.0 MPa (0.0 ksi).Tendon 4 (at the bottom) was tensioned last and did
not suffer any losses due to elastic shortening. Tendon 1,which was tensioned first, experienced the greatest amountof loss.
Time-Dependent Creep Loss
In establishing creep loss, the time-dependent properties of concrete were not considered because thegirder was post-tensioned when the concrete was 134days old and it had a measured compressive strengthof 82 MPa (12 ksi) at 90 days. Creep loss occurred inthe girder after post-tensioning, which was performedafter the deck was cast. The effective area of concretewas included in the calculation of the creep coefficient.The volume-to-surface ratio V/S used was based onan average value of the girder section and the girder-plus-deck combined section.
The time-dependent creep coefficient J.’ according to theAASHTO LRFD Bridge Design Specifications is definedas:
wheret = time (day)
= age of concrete when load is initially applied (day)H = average annual ambient relative humidity, taken as 50%
= time-dependent factor for the effect of volume-to-surface ratio V/S, given as:
26e00142(WS) + t 1.80 + 1 .77eO213(W5)k,
= 2.587(mm)
45 + t
kf = factor for the effect of concrete compressive strengthgiven as:
where
62kf
= 42+f(MPa)
= 6+f(ksi)
f = specified concrete compressive strength at 28 days,measured as 75.8 MPa (11.0 ksi).
An average value of V/S equal to 100 mm (4 in.) was used,as described previously. The loss due to creep AfcR(t) can befound from the expression:22
where
E4fcR(t)= f(t,t1)—-f
ECCS
f. = the stress in the concrete at the level of the centroid ofthe tendon, given as:22
f =----1i4-2÷QCS r2,) 1
whereA = area of the girder section
= moment of inertia of the girder sectionr = radius of gyration of the girder sectione = the tendon eccentricityMD = the bending moment due to total superimposed dead
loadCreep recovery due to prestress loss was accounted for in
the calculation of creep loss in the stress at the center of gravity of the strands.
In calculating the axial load P, was reduced as the prestress loss was reduced, thus adjusting the creep loss as otherlosses (and prior creep losses) accumulated.
Time-Dependent Shrinkage Loss
According to the AASHTO LRFD Bridge Design Specifications, for steam-cured concrete, the strain due to shrinkage 6ch
at time t is given as:
k (in.)
(t—t.)
0.6H
= 3.5k.kf (1.58 120)ti
lO.0÷(t_ t1)0.6
July—August 2007 63
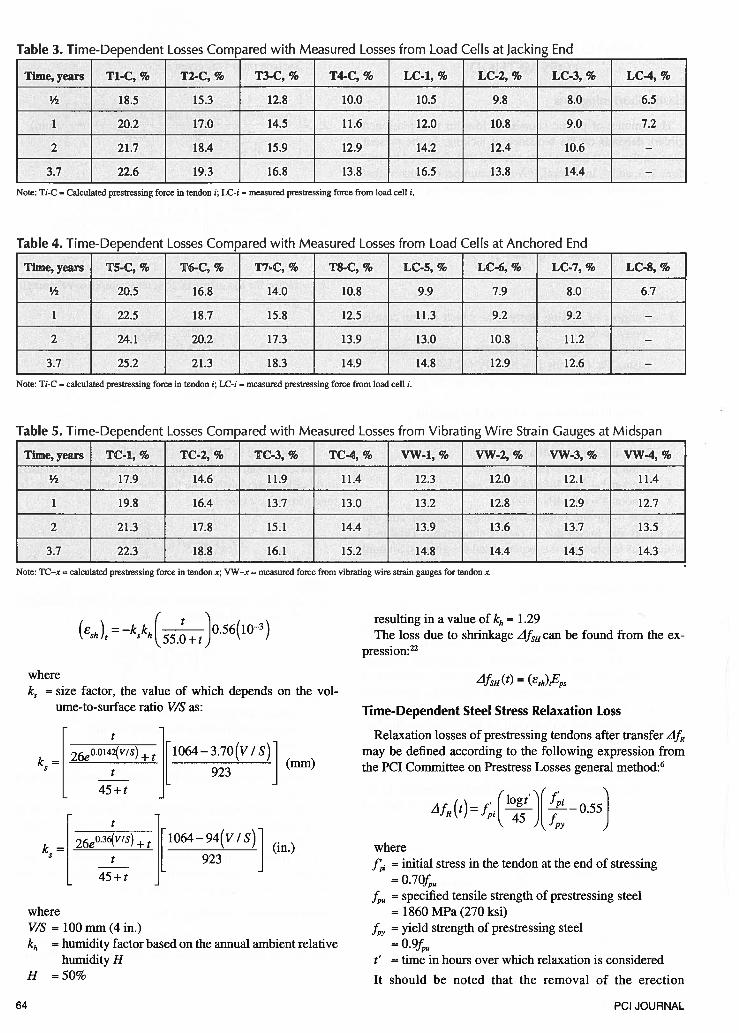
Table 3. Time-Dependent Losses Compared with Measured Losses from Load Cells at Jacking End
Time, years Ti-C, % T2-C, % T3-C, % T4-C, % LC-i, % LC-2, % LC-3, % LC-4, %
½ 18.5 15.3 12.8 10.0 10.5 9.8 8.0 6.5
1 20.2 17.0 14.5 11.6 12.0 10.8 9.0 7.2
2 21.7 18.4 15.9 12.9 14.2 12.4 10.6 —
3.7 22.6 19.3 16.8 13.8 16.5 13.8 14.4 —
Note: Ti-C Calculated prestressing force in tendon i; LC-i = measured prestressing force from load cell i.
Table 4. Time-Dependent Losses Compared with Measured Losses from Load Cells at Anchored End
Time, years T5-C, % T6-C, % T7-C, % T8-C, % LC-5, % LC-6, % LC-7, % LC-8, %
½ 20.5 16.8 14.0 10.8 9.9 7.9 8.0 6.7
1 22.5 18.7 15.8 12.5 11.3 9.2 9.2 —
2 24.1 20.2 17.3 13.9 13.0 10.8 11.2 —
3.7 25.2 21.3 18.3 14.9 14.8 12.9 12.6 —
Note: Ti-C calculated prestressing force in tendon i; LC-i measured prestressing force from load cell i.
Table 5._Time-Dependent Losses_Compared_with Measured Losses from_Vibrating_Wire Strain Gauges at Midspan
Time, years TC-1, % TC-2, % TC-3, % TC-4, % VW-1, % VW-2, % VW-3, % VW-4, %
½ 17.9 14.6 11.9 11.4 12.3 12.0 12.1 11.4
1 19.8 16.4 13.7 13.0 13.2 12.8 12.9 12.7
2 21.3 17.8 15.1 14.4 13.9 13.6 13.7 13.5
3.7 22.3 18.8 16.1 15.2 14.8 14.4 14.5 14.3
Note: TC—x = calculated prestressing force in tendon x; VW—x — measured force from vibrating wire strain gauges for tendon x.
(e ) =—k k ( 056(10-3)h55o+t)
wherek5 = size factor, the value of which depends on the vol
ume-to-surface ratio V/S as:
resulting in a value of kh = 1.29The loss due to shrinkage zJf11 can be found from the ex
pression:22
zifSH (t) = (Esh)t.Eps
Time-Dependent Steel Stress Relaxation Loss
Relaxation losses of prestressing tendons after transfer AfRmay be defined according to the following expression fromthe PCI Committee on Prestress Losses general method:6k
— [ 26eOO142) +1064— 3.70 (v / s)]
(mm)
45 + t
k (in.)
whereV/S = 100 mm(4in.)kh = humidity factor based on the annual ambient relative
humidity HH =50%
zlfR (t) = f [[ 0.55]
where
f, = initial stress in the tendon at the end of stressing= 0.70f
f = specified tensile strength of prestressing steel= 1860 MPa (270 ksi)= yield strength of prestressing steel= 0.9ff,= time in hours over which relaxation is considered
It should be noted that the removal of the erection
PCI JOURNAL64
(shoring) towers affected the strain in the girders asshown in the companion paper,’ but shoring removal hadno effect on the relaxation losses because post-tensioning lifted the girders off the supports as post-tensioningwas applied.
Anchorage-Seating Loss
Losses due to anchorage seating zlfpA are calculated basedon an estimated slip of 10 mm (0.4 in.). The assumption ofa slip z14 equal to 10 mm, also referenced in AASHTO, resulted in an anchorage loss given as:
where
‘-1fPA =
L tendon lengthmodulus of elasticity of prestressing steel
The length of tendon affected by anchorage set was considerably less than half the girder span. Thus, this loss did notaffect the calculation of losses at midspan.
Friction Losses
Losses due to friction between the internal tendon and theduct wall AfPF were calculated according to the expression:23
4fF=fpj(l_e_(Ki))
where
f = stress in the prestressing steel at jackingx = length of a prestressing tendon from the jacking end
to any point under considerationK = wobble friction coefficient per unit length of tendon
= coefficient of frictiona sum of the absolute values of angular change of the
prestressing steel path from jacking end to the pointunder investigation
For example, a is calculated from the jacking end to mid-span approximately as:22
Lg
wherey’ total vertical change of tendon path, that is, the height
of the tendon at girder end minus the height of thetendon at the girder midspan
L5 = girder span
The measurements taken were not sequenced correctly, sothe coefficient of friction and the wobble friction coefficientK could not be found for evaluating friction losses. However,Wollmann et al. recently provided site-specific data for dU andK for a similar girder located at the 7200 South Bridge atthe 1-15 overpass in Salt Lake City, near the location of thebridge used in the present study. The 7200 South Bridge wasconstructed using the same girder cross section and with the
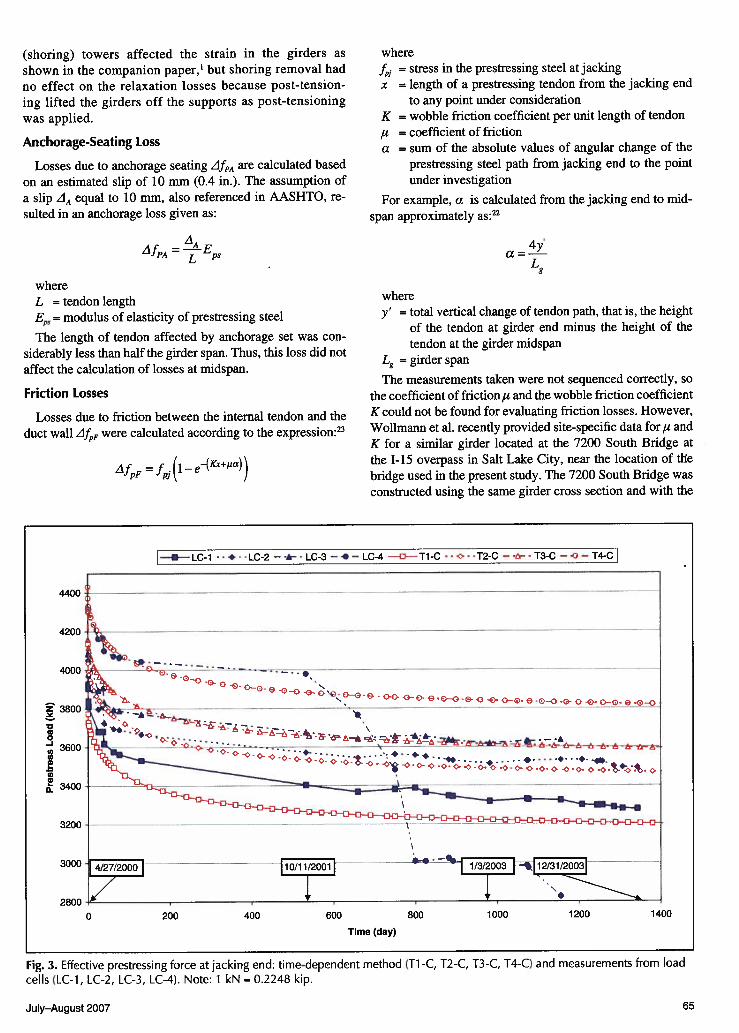
Fig. 3. Effective prestressing force at jacking end: time-dependent method (Ti -C, T2-C, T3-C, T4-C) and measurements from loadcells (LC-1, LC-2, LC-3, LC-4). Note: 1 kN = 0.2248 kip.
4400
4200
I—.—-LC-1 +--LC-2—-h---LC-3—•—LC-4 —a-—Ti-C •“>“T2-C —t--T3-C —.o—T4-CI
4000
3800
0
3600
3400
3200
3000
2800
Time (day)
0 200 400 600 800 1000 1200 1400
July—August 2007 65
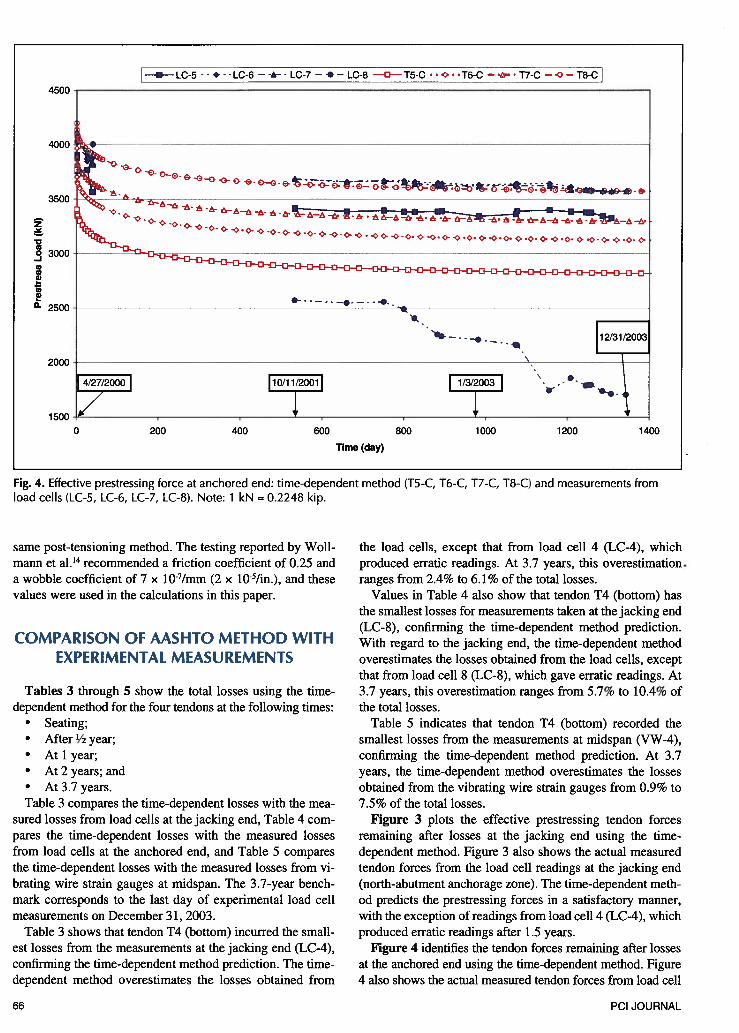
—*— LC-5 - - + - - LC-6 — -A- - LC-7 — — LC-8 —0--— T5-C “0 T6-C — T7-C — 0— T8-C
Fig. 4. Effective prestressing force at anchored end: time-dependent method (T5-C, T6-C, T7-C, T8-C) and measurements from
load cells (LC-5, LC-6, LC-7, LC-8). Note: 1 kN = 0.2248 kip.
same post-tensioning method. The testing reported by Wollmann et al.14 recommended a friction coefficient of 0.25 anda wobble coefficient of 7 x 10⁷/mm (2 x 10⁻⁵Iin.), and thesevalues were used in the calculations in this paper.
COMPARISON OF AASHTO METHOD WITHEXPERIMENTAL MEASUREMENTS
Tables 3 through 5 show the total losses using the time-dependent method for the four tendons at the following times:
• Seating;• After ½ year;• Atlyear;• At 2 years; and• At 3.7 years.Table 3 compares the time-dependent losses with the mea
sured losses from load cells at the jacking end, Table 4 compares the time-dependent losses with the measured lossesfrom load cells at the anchored end, and Table 5 comparesthe time-dependent losses with the measured losses from vibrating wire strain gauges at midspan. The 3.7-year benchmark corresponds to the last day of experimental load cellmeasurements on December 31, 2003.
Table 3 shows that tendon T4 (bottom) incurred the smallest losses from the measurements at the jacking end (LC-4),confirming the time-dependent method prediction. The time-dependent method overestimates the losses obtained from
the load cells, except that from load cell 4 (LC-4), whichproduced erratic readings. At 3.7 years, this overestimation.ranges from 2.4% to 6.1% of the total losses.
Values in Table 4 also show that tendon T4 (bottom) hasthe smallest losses for measurements taken at the jacking end(LC-8), confirming the time-dependent method prediction.With regard to the jacking end, the time-dependent methodoverestimates the losses obtained from the load cells, exceptthat from load cell 8 (LC-8), which gave erratic readings. At3.7 years, this overestimation ranges from 5.7% to 10.4% ofthe total losses.
Table 5 indicates that tendon T4 (bottom) recorded thesmallest losses from the measurements at midspan (VW-4),confirming the time-dependent method prediction. At 3.7years, the time-dependent method overestimates the lossesobtained from the vibrating wire strain gauges from 0.9% to7.5% of the total losses.
Figure 3 plots the effective prestressing tendon forcesremaining after losses at the jacking end using the time-dependent method. Figure 3 also shows the actual measuredtendon forces from the load cell readings at the jacking end(north-abutment anchorage zone). The time-dependent method predicts the prestressing forces in a satisfactory manner,with the exception of readings from load cell 4 (LC-4), whichproduced erratic readings after 1.5 years.
Figure 4 identifies the tendon forces remaining after lossesat the anchored end using the time-dependent method. Figure4 also shows the actual measured tendon forces from load cell
L
4500
‘fUVU
3500
z
U00
G
0--
-A— ---•
9nn - . — - . —.- — - - -._ .
_________________________________________
4/27/2000
0 200
Jr400
Time (day)
600 800 1000 1200 1400
66 PCI JOURNAL
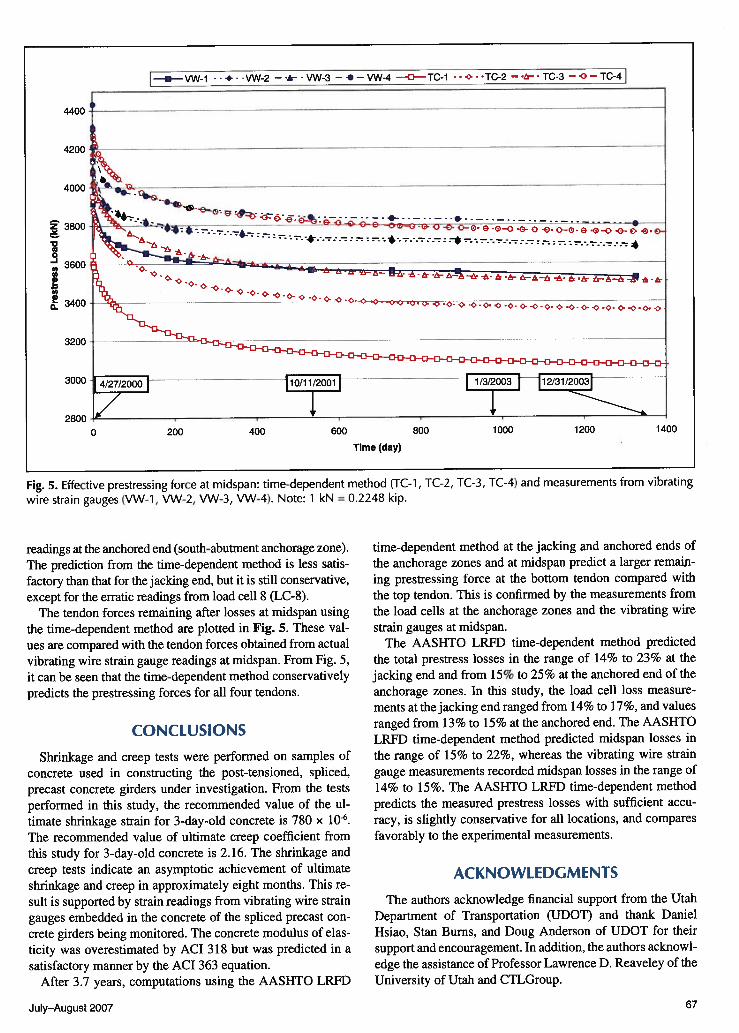
Fig. 5. Effective prestressing force at midspan: time-dependent method (TC-l, TC-2, TC-3, TC-4) and measurements from vibrating
wire strain gauges (VW-1, VW-2, VW-3, VW-4). Note: 1 kN 0.2248 kip.
readings at the anchored end (south-abutment anchorage zone).The prediction from the time-dependent method is less satisfactory than that for the jacking end, but it is still conservative,except for the erratic readings from load cell 8 (LC-8).
The tendon forces remaining after losses at midspan usingthe time-dependent method are plotted in Fig. 5. These values are compared with the tendon forces obtained from actualvibrating wire strain gauge readings at midspan. From Fig. 5,it can be seen that the time-dependent method conservativelypredicts the prestressing forces for all four tendons.
CONCWSIONS
Shrinkage and creep tests were performed on samples ofconcrete used in constructing the post-tensioned, spliced,precast concrete girders under investigation. From the testsperformed in this study, the recommended value of the ultimate shrinkage strain for 3-day-old concrete is 780 x 10.The recommended value of ultimate creep coefficient fromthis study for 3-day-old concrete is 2.16. The shrinkage andcreep tests indicate an asymptotic achievement of ultimateshrinkage and creep in approximately eight months. This result is supported by strain readings from vibrating wire straingauges embedded in the concrete of the spliced precast concrete girders being monitored. The concrete modulus of elasticity was overestimated by ACI 318 but was predicted in asatisfactory manner by the ACT 363 equation.
After 3.7 years, computations using the AASHTO LRFD
time-dependent method at the jacking and anchored ends ofthe anchorage zones and at midspan predict a larger remaining prestressing force at the bottom tendon compared withthe top tendon. This is confirmed by the measurements fromthe load cells at the anchorage zones and the vibrating wirestrain gauges at midspan.
The AASHTO LRFD time-dependent method predictedthe total prestress losses in the range of 14% to 23% at thejacking end and from 15% to 25% at the anchored end of theanchorage zones. In this study, the load cell loss measurements at the jacking end ranged from 14% to 17%, and valuesranged from 13% to 15% at the anchored end. The AASHTOLRFD time-dependent method predicted midspan losses inthe range of 15% to 22%, whereas the vibrating wire straingauge measurements recorded midspan losses in the range of14% to 15%. The AASHTO LRFD time-dependent methodpredicts the measured prestress losses with sufficient accu
racy, is slightly conservative for all locations, and comparesfavorably to the experimental measurements.
ACKNOWLEDGMENTS
The authors acknowledge financial support from the UtahDepartment of Transportation (UDOT) and thank DanielHsiao, Stan Bums, and Doug Anderson of UDOT for theirsupport and encouragement. In addition, the authors acknowl
edge the assistance of Professor Lawrence D. Reaveley of theUniversity of Utah and CTLGroup.
z
a01aaaaaa-
200 400 600 800 1000 1200 1400
Time (day)
July—August 2007 67

APPENDIX
Notation
= area of concrete girder section
E = modulus of elasticity of concrete
E1 = modulus of elasticity of concrete at transfer= modulus of elasticity of prestressing steel
e = eccentricity of the tendon
f = concrete compressive strength
f = stress in the concrete at the level of the centroid ofthe prestressing tendons
= initial stress in prestressing steel
f = specified tensile strength of prestressing steelyield strength of prestressing steel
H = average annual ambient relative humiditymoment of inertia of the girder section
j = number of jacking operationsL = tendon lengthLg = girder spanMD = bending moment due to the total superimposed
dead loadN = number of identical tendonsP. = axial loadr = radius of gyration of the girder sectiont = time (day)
= age of concrete when load is initially applied (day)= time (hour)
V/S = volume-to-surface ratiow = concrete densityx = length of a prestressing tendon from the jacking
end to any point under considerationy’ = total vertical change of tendon patha = sum of the absolute values of angular change of
prestres sing steel path from jacking end to the pointunder investigation
= creep coefficient
Ysh = shrinkage coefficient
Yla = loading age adjustment factor= shrinkage (creep) correction factor for humidity
Yvs = shrinkage (creep) correction factor for volume-to-surface ratio
4fcR (t) = loss due to creep of concrete at concrete age t
4fEs = loss due to elastic shortening
4fR (t) = loss due to relaxation of steel after transfer
4fsH (t) = loss due to shrinkage
(ESh)r = time-dependent shrinkage strain
(s5h) = ultimate shrinkage strainK = wobble friction coefficient per unit length of
tendonk = creep factor for the effect of volume-surface ratiokf = creep factor for the effect of concrete strength
kh = shrinkage factor for the effect of humidityk5 = shrinkage factor for the effect of volume-to-surface
ratio= coefficient of friction= time-varying creep= ultimate creep coefficient= time-dependent creep coefficient
/4
Vt
Vu
(t,t1)
July—August 2007 69