possible impact of snow depth and ungulate carcasses on red fox (vulpes vulpes) populations in...
TRANSCRIPT
Possible impact of snow depth and ungulate carcasses onred fox (Vulpes vulpes) populations in Norway, 1897–1976
V. Selas & J. O. Vik�
Department of Ecology and Natural Resource Management, Norwegian University of Life Sciences, As, Norway
Keywords
carcasses; rodents; snow; ungulates; Vulpes
vulpes.
Correspondence
Vidar Selas, Department of Ecology and
Natural Resource Management, Norwegian
University of Life Sciences, PO Box 5003,
N-1432 As, Norway.
Email: [email protected]
�Current address: Division of Zoology,
Department of Biology, University of Oslo,
PO Box 1050 Blindern, N-0316 Oslo,
Norway.
Received 9 March 2005; accepted
8 September 2005
doi:10.1111/ j.1469-7998.2006.00048.x
Abstract
During the 1900s, the number of red foxes Vulpes vulpes increased in northern
Europe. At higher altitudes and latitudes, red fox populations are likely to be
limited by thick snow cover, which makes small rodents less available. The
negative effects of snow could, however, be compensated for by high ungulate
numbers, because of increased availability of carcasses in snow-rich winters. In the
period 1897–1932, the number of foxes (mainly red foxes) killed was negatively
related to snow depth indices in 13 of the 17 Norwegian counties. During
1947–1976, after a strong increase in ungulate and red fox numbers, the number
of red foxes killed was negatively related to snow in only one county. The counties
where ungulate density increased the most also had higher increases in the number
of red fox bounties paid. The absence of large predators may at least partly be
responsible for the strong increase in red fox populations, because eradication of
large predators such as wolf Canis lupus in the late 1800s and early 1900s probably
was a necessary condition for the strong increase in ungulate numbers, especially
roe deer Capreolus capreolus.
Introduction
The red fox Vulpes vulpes is a generalist and keystone
predator that in Fennoscandia has a strong impact on the
population level of both prey and competitive predator
species (Marcstrom, Kenward & Engren, 1988; Marcstrom
et al., 1989; Lindstrom et al., 1994, 1995; Selas, 1998a;
Smedshaug et al., 1999). During the 20th century, there was
a strong increase in red fox numbers in northern Europe
(Lund, 1963; Hjeljord, 1980). In this period, the red fox may
have benefited from reduced hunting pressure and reduced
populations of natural enemies. Interspecific killing among
carnivores is common (Palomares & Caro, 1999), and
mesopredator release and trophic cascades after removal of
top predators may be a general phenomenon (Crooks &
Soule, 1999). However, red foxes may have also benefited
from improved carrying capacity. Major changes in carrying
capacity could have been caused by general increases in food
availability due to regional warming (Semb-Johansson,
1988; Hersteinsson & Macdonald, 1992), increased supply
of human garbage due to increased living standards (Lund,
1963; Hjeljord, 1980), increased populations of small ro-
dents due to modern forestry (Christiansen, 1979; Hentto-
nen, 1989) and increased availability of ungulate carcasses
(Smedshaug & Sonerud, 1997; Selas, 1998b). Here we use
hunting indices to evaluate the latter of these (not mutually
exclusive) hypotheses.
At higher altitudes and latitudes, winter food is probably
a limiting factor for red fox populations, not only
by influencing winter survival but also by affecting
fox reproduction, through their body condition in spring.
The red fox is a less efficient hunter of resident medium-
sized prey, such as mountain hare Lepus timidus and
forest grouse, although it may scavenge on prey remains
from predators specialized on these prey, such as goshawk
Accipiter gentilis and eagle owl Buteo buteo. But unless
red foxes can benefit from human garbage, the main
food resources in winter will probably be small rodents
and ungulate carcasses (Lund, 1962; Jedrzejewski &
Jedrzejewska, 1992). In years with deep snow, which
makes small rodents less available (Halpin & Bissonette,
1988; Jedrzejewska & Jedrzejewski, 1998), carcasses may
be of vital importance for both winter survival and
spring condition, and thus the overall reproduction, of red
foxes.
It has commonly been assumed that foxes benefit from
carcass leftovers from wolf Canis lupus and lynx Lynx lynx,
but it should be noted that these predators also kill foxes
(Jedrzejewska & Jedrzejewski, 1998), and that their leftovers
therefore may not be easily available for foxes. In Norway,
both wolf and lynx were almost eradicated during the period
1850–1900 (Johnsen, 1929). As the strongest increase in red
fox numbers occurred several decades later, there is no
Journal of Zoology 269 (2006) 299–308 c� 2006 The Authors. Journal compilation c� 2006 The Zoological Society of London 299
Journal of Zoology. Print ISSN 0952-8369
obvious link between the population level of red fox and
large predators.
Wolf eradication may, however, have had a delayed effect
on red fox populations. If wolves are removed, ungulates
will usually increase in number and eventually reach a
carrying capacity determined by food availability (e.g.
Okarma, 1995; Boertje, Valkenburg & McNay, 1996).
Hunting by man may to some extent compensate for the
lack of natural predation, but humans are in general
less selective with regard to the body condition of their
prey (e.g. Boyd et al., 1994; Solberg et al., 2000). If wolf
extermination results in increasing populations and/or
higher numbers of ungulates in poor condition, we should
expect a higher total number of ungulates to die from
starvation in snow-rich winters (e.g. Okarma et al., 1995).
Their carcasses can then be utilized by foxes with no risk of
being killed by wolves, improving food availability for red
foxes in critical periods.
During the 20th century, the number of moose Alces
alces, red deer Cervus elaphus and reindeer Rangifer taran-
dus increased dramatically in Norway (Jacobsen & Ander-
sen, 1990; Langvatn, 1990; Skogland, 1990). In addition, roe
deer Capreolus capreolus invaded the country, and became a
common ungulate species in large parts of the country
(Østbye & Bjørnson, 1990). The roe deer is probably the
most important species for the red fox, because it suffers
high mortality in snow-rich winters, when it may even be
killed by the red fox (Kjos-Hanssen, 1962; Borg, 1970;
Raiby, 1970; Cederlund & Lindstrom, 1983). The roe deer
is also less regulated by man than the larger cervid species,
and therefore a higher proportion of the population will die
for reasons other than hunting.
Small rodent fluctuations influence the reproduction of
red foxes (Englund, 1970; Lindstrom, 1989), especially in the
north, where the fluctuations are strongest (Hansson &
Henttonen, 1985). According to studies from the late 1900s
(Englund, 1970; Lindstrom, 1989), fox reproduction should
be expected to be influenced mainly by rodent numbers in
the current spring and summer. However, as these studies
were carried out in a period when there probably was a
relatively high availability of carcasses and human leftovers
in winter, they may have missed the possible positive impact
of high rodent numbers before snow-rich winters, as well as
the possible negative impact of deep snow before rodent
peak years.
To document any impact of winter conditions and un-
gulate carcasses on red fox reproduction in Norway, we first
studied the covariation between the number of fox bounties
paid and snow depth measurements within each county
before and after the strong increase in ungulate numbers in
the mid-1900s. Thereafter we used hunting statistics from
the period of ungulate increase to test for relationships
between ungulate and red fox populations. Because the red
fox is difficult to control by hunting (Hewson, 1986),
fluctuations in hunting statistics of this species will usually
reflect fluctuations in the relative population levels (e.g.
Kolb & Hewson, 1980). Because of the general high mortal-
ity and reproduction rate of foxes, we assumed that most
bounties paid referred to juveniles, and thus reflected annual
reproduction.
Methods
Hunting bounties
Bounties were paid for foxes in most Norwegian counties
during 1880–1932 and 1946–1976 (Central Bureau of Statis-
tics of Norway, 1978), referred to as ‘period 1’ and ‘period 2’
below. In Finnmark, bounties were not paid for foxes killed
in winter during 1910–1932, and therefore we omitted this
county from our analyses. Red foxes and arctic foxesAlopex
lagopus were not distinguished in the statistics, but after the
strong decline in the arctic fox populations in 1905–1910
(Johnsen, 1929; Høst, 1935), most bounties paid will refer to
red foxes. Before this decline, Collett (1912) estimated arctic
foxes to constitute c. 20% of the total number of foxes killed
in Norway, although with a much higher proportion in
North Norway (Nordland, Troms and Finnmark) than in
South Norway.
Timing of population indices and covariates
The majority of foxes hunted were probably killed during
winter (Johnsen, 1929) and reported at the end of the winter.
This is confirmed by the data from Finnmark, where the
mean annual number of foxes killed was 1176.3 (� 691.6 SD)
during 1880–1909 and only 33.96 (� 23.2 SD) during
1910–1932, when bounties were paid only in summer. Thus,
to reveal any impact of snow on red fox reproduction, we
compared the red fox index with snow indices of the
previous year. For each county, the red fox index is the
annual number of fox bounties paid, and the snow indices
are the maximum snow depth measured at the selected
meteorological station in March and April. Snow depth
measurements provided by the Norwegian Meteorological
Institute were available from one to two stations per county
from 1896 onwards. Hence, we analysed for relationships
between red fox hunting bags and snow depth in the
previous year for the periods 1897–1932 and 1947–1976.
Meteorological data
For counties with two meteorological stations, we selected
the one situated closest to the coast (Akershus, Telemark,
Vest-Agder, Hordaland, Sogn og Fjordane, Møre and
Romsdal, Sør-Trøndelag) or at the lowest altitude (Hed-
mark, Oppland), based on the assumption that red foxes
were most abundant in coast-near areas and at low altitudes.
For Buskerud, we used a more coast-near station situated in
Telemark, close to the border of Buskerud, rather than any
of the two stations situated at higher altitudes north-west in
Buskerud.
Snow depths
In Norway, the amount of snow left in late winter or spring
will often reflect past winter conditions. We therefore used
Journal of Zoology 269 (2006) 299–308 c� 2006 The Authors. Journal compilation c� 2006 The Zoological Society of London300
Fox numbers, snow depth and ungulate carcasses V. Selas and J. O. Vik
snow depth in March or April as explanatory variables.
During 1896–1932, there was a highly significant correlation
between the two stations, for both March and April snow
depths, for most of the 11 counties with two sets of snow
measurements. The exceptions were the large counties
Hedmark (March: r=0.14, P=0.470), Oppland (March:
r=0.49, P=0.470; April: r=0.29, P=0.207), Sogn og
Fjordane (April: r=0.12, P=0.528) and Troms (March:
r=0.09, P=0.610; April: r=0.09, P=0.609).
North Atlantic Oscillation (NAO)
Because not all snow indices used may be representative for
the whole county, we also used the NAO for December–
March (Hurrell, 1995) as an index to account for year-to-
year variation in winter snow conditions. The NAO is an
alternation in atmospheric pressures over the Atlantic
Ocean. In Norway, there is a positive relationship between
the NAO index on the one hand and winter temperatures
and precipitation on the other (Hurrell, 1995). At lower
altitudes inhabited by red foxes, a high NAO index will
usually be associated with less snow accumulation in late
winter and spring (Mysterud et al., 2000), partly because
much of the precipitation during winter comes as rain and
partly because of an earlier thaw. Although temperature
variability has been better simulated by variations in atmo-
spheric circulation patterns in recent years than for the
period 1900–1924 (Hanssen-Bauer & Førland, 2000), we
found a significant negative correlation between the NAO
index and snow depth in April (Po0.050) during 1896–1932
for seven of the 17 counties (all situated in South Norway).
For three of the remaining counties, there was a significant
negative correlation between NAO and snow depth in May.
During 1946–1976, the NAO index was significantly nega-
tively correlated with snow in April in six counties.
Rodent indices
For period 1, information on rodent numbers (low=0 or
high=1) is given by Wildhagen (1952) for eastern (Østfold,
Vestfold, Akershus, Hedmark, Oppland, Buskerud), south-
ern (Telemark, Aust-Agder, Vest-Agder), western (Roga-
land, Hordaland, Sogn og Fjordane), central (Møre og
Romsdal, Sør-Trøndelag, Nord-Trøndelag) and northern
Norway (Nordland, Troms, Finnmark). Only for Sør-Trøn-
delag there was a significant correlation between the rodent
index and the snow depth index used (snow year t vs.
rodents year t�1; r=�0.34, P=0.046). For period 2,
information on rodent peaks is fromMyrberget (1965, 1982)
and Christiansen (1983). For both periods, the red fox index
was compared with the rodent index of the 2 previous years.
Raptor index
We used the number of goshawks hunted as a covariate to
account for variation that might otherwise obscure any
effects of snow and ungulate carcasses. The goshawk index
may reflect fluctuations in small game, which are important
prey for this species, and also in rodent numbers, which
often fluctuate in synchrony with small game (Hagen, 1952;
Selas, 1997; Selas & Steel, 1998). Additionally, the goshawk
index may reflect changes in hunting effort (Johnsen, 1929;
Myrberget, 1988), which would otherwise be difficult to
account for. Hence, the main purpose of using this index
was to improve the statistical power of the regression
models. However, we did not use the goshawk index for the
counties Sogn og Fjordane, Møre og Romsdal, Sør-Trønde-
lag, Nord-Trøndelag and Nordland for period 1, because of
a highly significant positive correlation with the rodent
index of the previous year. For the remaining counties,
goshawk numbers were not significantly related either to
rodent numbers or to the snow indices used. Because
goshawks also were hunted throughout the year, a time lag
between this species and the red fox should not be expected
unless nestlings or fledglings accounted for the majority of
the hawk bounties paid.
Variable transformation
Hunting indices were converted to annual relative rates of
change by log transformation followed by differencing. In
the fox–snow analyses, we also differenced the explanatory
variables. The transformation improved the statistical prop-
erties of the time series, stabilizing the variance and remov-
ing any exponential trend (i.e. any trend in abundance is
replaced by a nonzero expectation in growth rate).
Regression models of fox versus snow
For each county and each of the two periods, we constructed
a multiple linear regression model with the fox index as
response variable, and snow, rodents and hawks as expla-
natory variables. In a forward procedure, all explanatory
variables with a P-value o0.10 were selected, given that the
sign of the parameter estimate was as expected (negative for
snow, positive for NAO and the rodent/hawk indices). In
the case of serially correlated residuals, we substituted the
response variable with the residuals from an autoregression
model, with autoregressive order corresponding to the lag of
the autocorrelation in the original residuals.
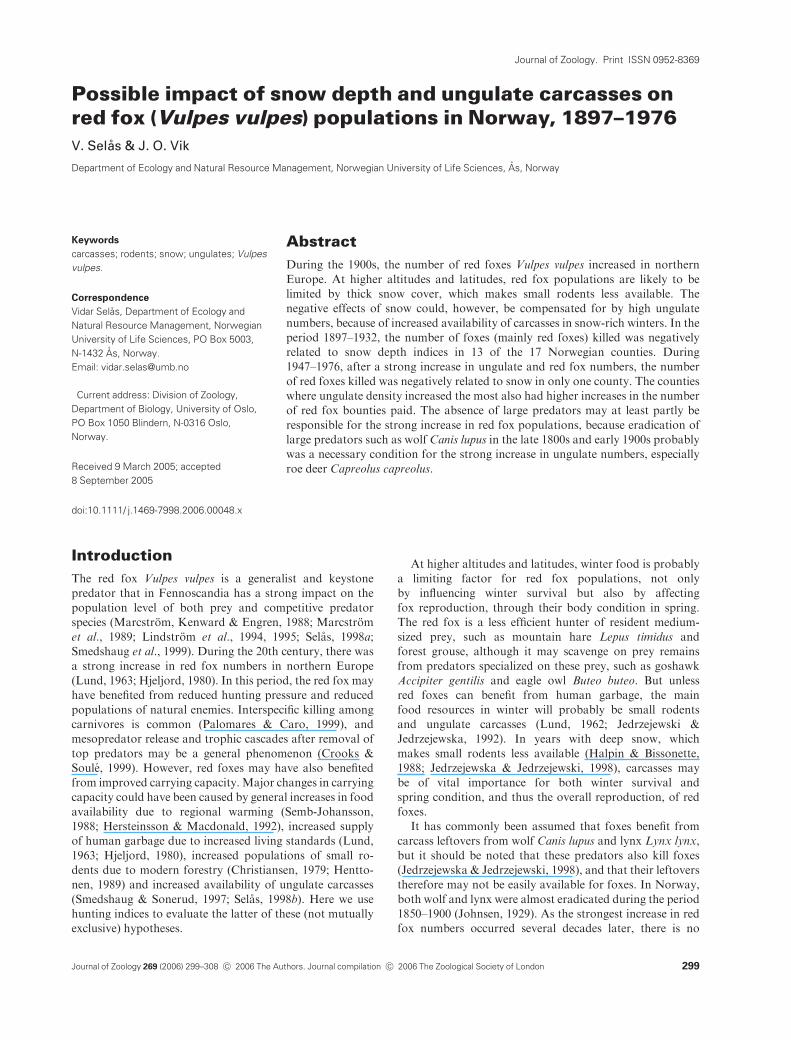
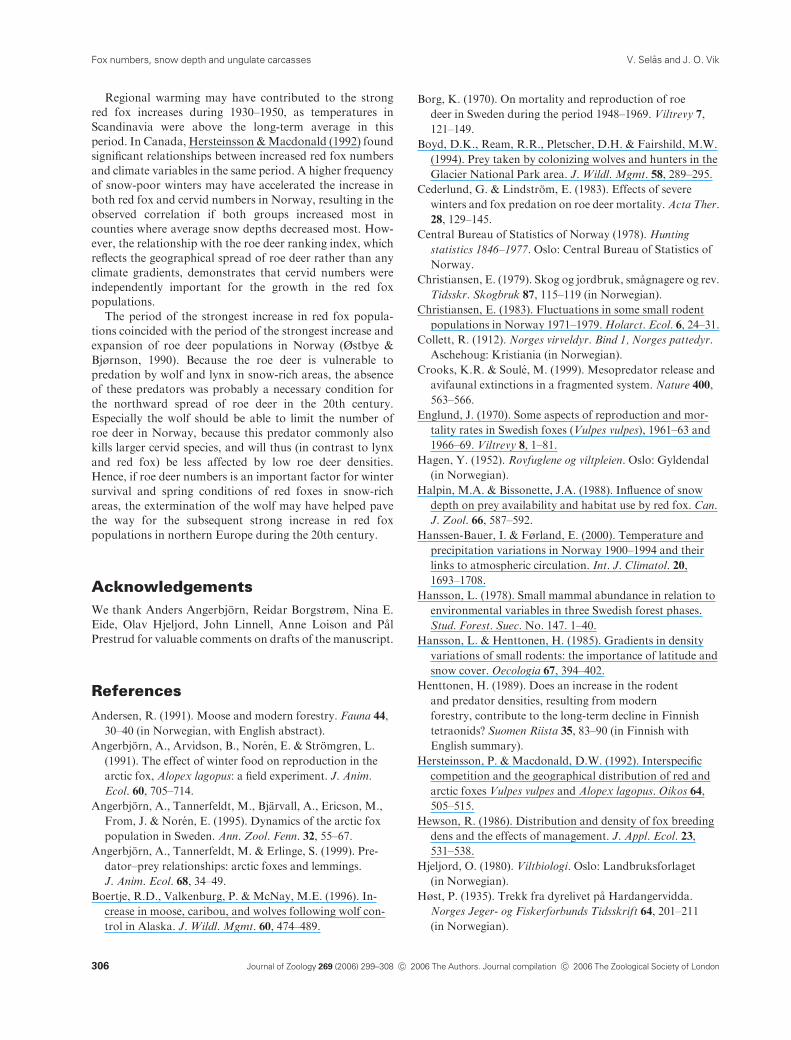
Population growth of fox and cervids
The strongest increase in both red fox and ungulate popula-
tions occurred during the 1930s and 1940s, and before the
strongest increase in human living standard (Fig. 1). In
testing for a possible influence of ungulate population levels
on red fox population growth, we could not use hunting
statistics for the whole period because few bounties were
paid for foxes from 1933 to 1945 (Fig. 1). Instead, we defined
an ‘index of population growth’ for red fox and ungulates.
For each species and county, the index was the average
number killed per year in 1951–1960, divided by the average
for 1921–1930 (data taken from Central Bureau of Statistics
of Norway, 1978). The three counties from North Norway,
with only domestic reindeer, were not used because changes
in reindeer management may have also influenced the
Journal of Zoology 269 (2006) 299–308 c� 2006 The Authors. Journal compilation c� 2006 The Zoological Society of London 301
Fox numbers, snow depth and ungulate carcassesV. Selas and J. O. Vik
availability of carcasses in this region (Skjenneberg &
Slagsvold, 1968).
Moose and reindeer indices
In the analyses we included only counties with at least
150 deer killed during 1921–1930. For moose, this criterion
was fulfilled for the nine eastern and central counties of
Østfold, Vestfold, Akershus, Hedmark, Oppland, Buskerud,
Telemark, Sør-Trøndelag and Nord-Trøndelag. The re-
maining six southern and western counties had less than
75 moose killed, but here there was a sufficient number of
reindeer killed. Also in Oppland, Buskerud and Telemark,
more than 150 reindeer were killed during 1921–1930. Red
deer was not included in the analyses because there were too
few counties with enough kills before 1930.
Roe deer indices
Few roe deer were hunted before 1950, and therefore it was
not possible to compare the increase in bounties paid for red
foxes in each county with a population increase index of roe
deer. During 1930–1950, the roe deer populations probably
reached their highest levels in the counties where the species
first occurred (the species spread from the south-east). We
therefore ranked the South Norwegian counties according
to the first year of continuous annual roe deer hunting
(Central Bureau of Statistics of Norway, 1978). Against this
ranking index we regressed the population-growth index for
red fox.
We assumed that the annual number of ungulates hunted
is an appropriate index of their population levels. However,
because of hunting restrictions given by the game autho-
rities, hunters are not allowed to respond to population
increases of cervids in the same way as for the red fox.
Hence, there will probably be a delay in the increase in the
hunting statistics of ungulates compared with the increase in
their real population levels. This was especially evident for
the moose statistics in some counties in the early 1920s,
where the number of moose killed suddenly increased from a
relatively low to a much higher level. For these counties,
we omitted the first 2 or 3 years of low values when we
calculated the mean annual number of moose hunted during
the 1920s.
Regression models of fox versus cervids
We used linear regression when comparing population-
growth indices of red fox and cervids (n is the number of
counties). The population-growth index for red fox was also
compared with human population densities, because in-
creased living standards in the 1950s, and thus increased
availability of human garbage, may have contributed to the
red fox increase. As, in general, there will be an increase in
winter severity with increasing altitude and latitude, in-
creased availability of cervid carcasses or human leftovers
may have been most important in mountains and in north-
ern counties. We therefore included latitude (measured
midway between the northernmost and southernmost point
in each county) and the proportion of mountains as addi-
tional explanatory variables in models with significant
relationships between fox and cervids.
Results
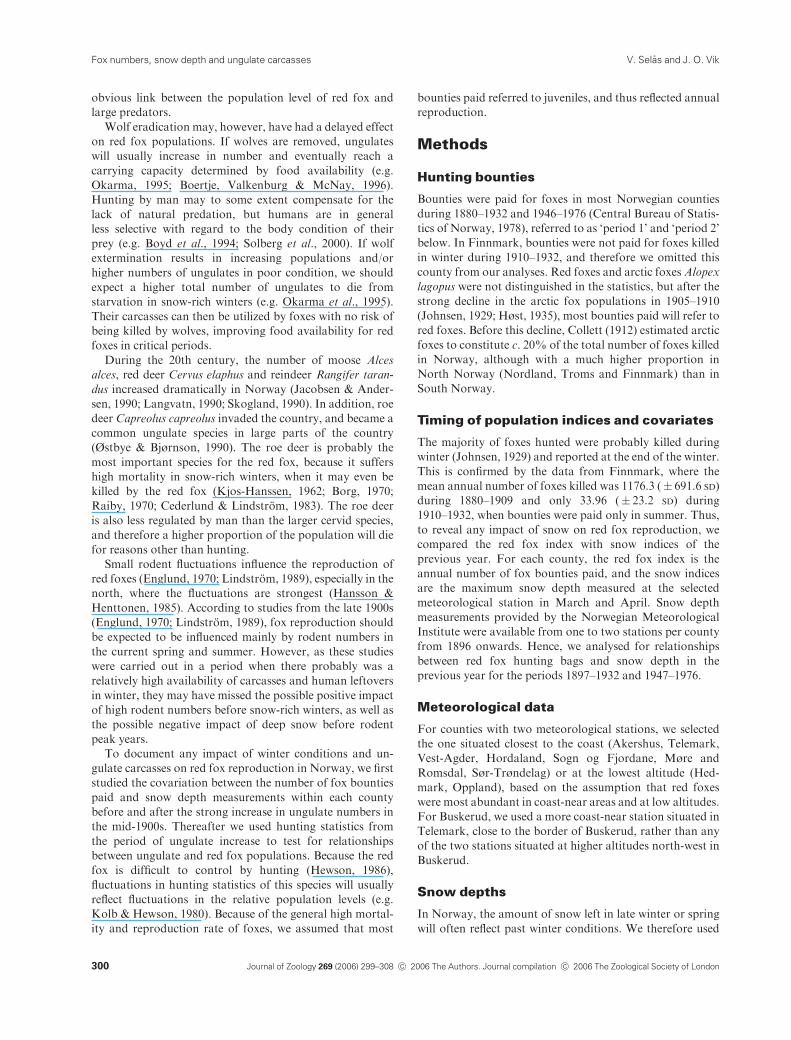
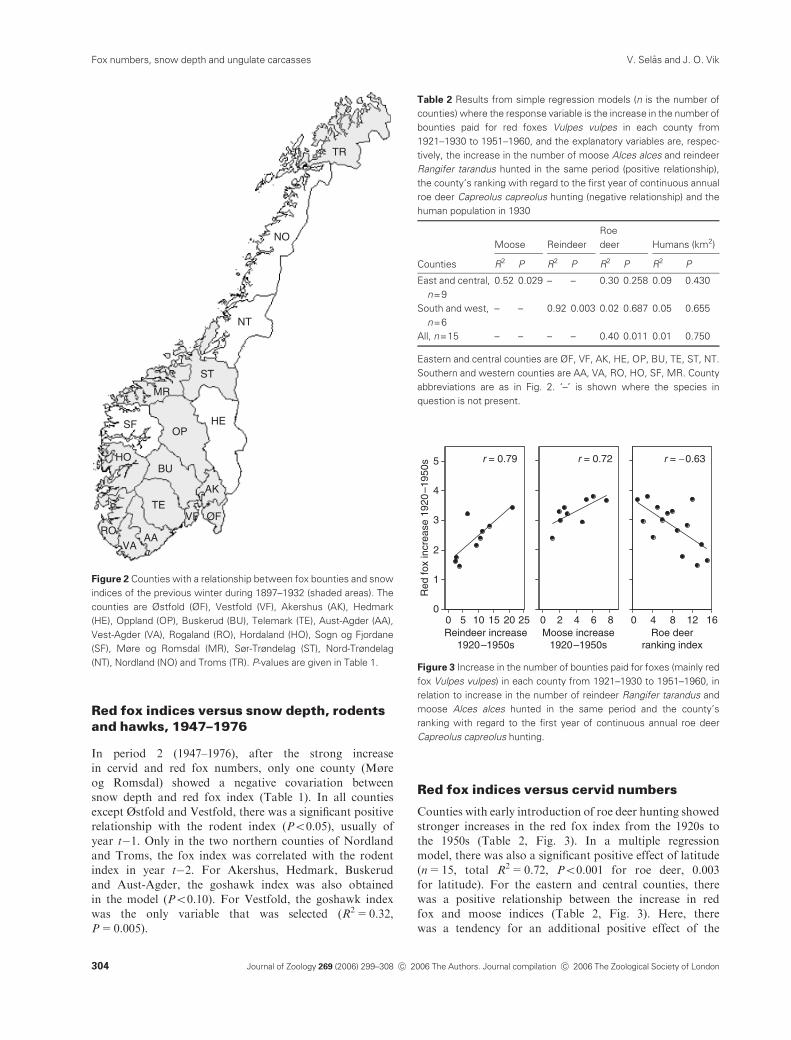
Red fox indices versus snow depth, rodentsand hawks, 1897–1932
In multiple regression models for period 1 (1897–1932), the
red fox index was significantly related to one of the snow
indices (snow depth inMarch or April, or the NAO index) in
13 of the 17 counties (Table 1, Fig. 2). Additionally, in Sogn
og Fjordane, there was a tendency for a negative relation-
ship with snow depth in April (n=28,R2=0.11,P=0.079).
For the three large counties of Hedmark, Nord-Trøndelag
and Nordland, no relationships with snow or the NAO
index were found. In two other large counties, Oppland
and Hordaland, as well as in the small county Vestfold,
there was a significant relationship only with the NAO
index, and not with March or April snow depths (Table 1).
The NAO index was, however, negatively related to snow
depth in April in both Oppland (n=28, r=�0.37,P=0.043) and Vestfold (n=28, r=�0.64, Po0.001).
In five of the 13 counties with effect of snow on the red fox
index in period 1, there was also a positive relationship
between the fox index and rodent numbers in year t�1 and/
0
1500
3000
4500
6000
Roe
dee
r
0
2500
5000
7500
10 000
Moo
se Roe deer
Moose
0
150 000
300 000
450 000
600 000
GN
P (
mill
ion
kr)
0
10 000
20 000
30 000
40 000R
ed fo
x GNP
Red fox
0
1000
2000
3000
4000
Red
dee
r
0
2500
5000
7500
10 000
Rei
ndee
r
1890 1910 1930 1950 1970Year
Red deer
Reindeer
Figure 1 Number of red fox Vulpes vulpes, moose Alces alces, roe
deer Capreolus capreolus, red deer Cervus elaphus and reindeer
Rangifer tarandus hunted in Norway from 1889 to 1968, and the gross
national product of Norway (in 2000 prices), reflecting human living
standard. Data taken from Central Bureau of Statistics of Norway.
Journal of Zoology 269 (2006) 299–308 c� 2006 The Authors. Journal compilation c� 2006 The Zoological Society of London302
Fox numbers, snow depth and ungulate carcasses V. Selas and J. O. Vik
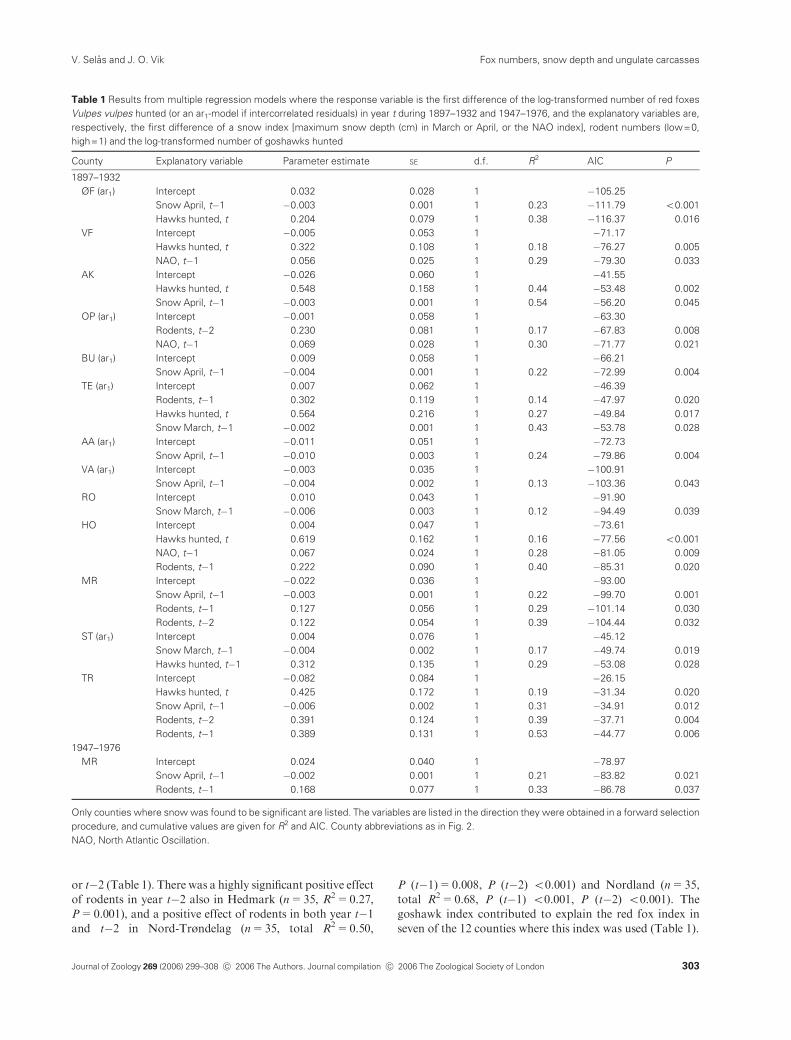
or t�2 (Table 1). There was a highly significant positive effectof rodents in year t�2 also in Hedmark (n=35, R2=0.27,
P=0.001), and a positive effect of rodents in both year t�1and t�2 in Nord-Trøndelag (n=35, total R2=0.50,
P (t�1)=0.008, P (t�2) o0.001) and Nordland (n=35,
total R2=0.68, P (t�1) o0.001, P (t�2) o0.001). The
goshawk index contributed to explain the red fox index in
seven of the 12 counties where this index was used (Table 1).
Table 1 Results from multiple regression models where the response variable is the first difference of the log-transformed number of red foxes
Vulpes vulpes hunted (or an ar1-model if intercorrelated residuals) in year t during 1897–1932 and 1947–1976, and the explanatory variables are,
respectively, the first difference of a snow index [maximum snow depth (cm) in March or April, or the NAO index], rodent numbers (low=0,
high=1) and the log-transformed number of goshawks hunted
County Explanatory variable Parameter estimate SE d.f. R2 AIC P
1897–1932
ØF (ar1) Intercept 0.032 0.028 1 �105.25
Snow April, t�1 �0.003 0.001 1 0.23 �111.79 o0.001
Hawks hunted, t 0.204 0.079 1 0.38 �116.37 0.016
VF Intercept �0.005 0.053 1 �71.17
Hawks hunted, t 0.322 0.108 1 0.18 �76.27 0.005
NAO, t�1 0.056 0.025 1 0.29 �79.30 0.033
AK Intercept �0.026 0.060 1 �41.55
Hawks hunted, t 0.548 0.158 1 0.44 �53.48 0.002
Snow April, t�1 �0.003 0.001 1 0.54 �56.20 0.045
OP (ar1) Intercept �0.001 0.058 1 �63.30
Rodents, t�2 0.230 0.081 1 0.17 �67.83 0.008
NAO, t�1 0.069 0.028 1 0.30 �71.77 0.021
BU (ar1) Intercept 0.009 0.058 1 �66.21
Snow April, t�1 �0.004 0.001 1 0.22 �72.99 0.004
TE (ar1) Intercept 0.007 0.062 1 �46.39
Rodents, t�1 0.302 0.119 1 0.14 �47.97 0.020
Hawks hunted, t 0.564 0.216 1 0.27 �49.84 0.017
Snow March, t�1 �0.002 0.001 1 0.43 �53.78 0.028
AA (ar1) Intercept �0.011 0.051 1 �72.73
Snow April, t�1 �0.010 0.003 1 0.24 �79.86 0.004
VA (ar1) Intercept �0.003 0.035 1 �100.91
Snow April, t�1 �0.004 0.002 1 0.13 �103.36 0.043
RO Intercept 0.010 0.043 1 �91.90
Snow March, t�1 �0.006 0.003 1 0.12 �94.49 0.039
HO Intercept 0.004 0.047 1 �73.61
Hawks hunted, t 0.619 0.162 1 0.16 �77.56 o0.001
NAO, t�1 0.067 0.024 1 0.28 �81.05 0.009
Rodents, t�1 0.222 0.090 1 0.40 �85.31 0.020
MR Intercept �0.022 0.036 1 �93.00
Snow April, t�1 �0.003 0.001 1 0.22 �99.70 0.001
Rodents, t�1 0.127 0.056 1 0.29 �101.14 0.030
Rodents, t�2 0.122 0.054 1 0.39 �104.44 0.032
ST (ar1) Intercept 0.004 0.076 1 �45.12
Snow March, t�1 �0.004 0.002 1 0.17 �49.74 0.019
Hawks hunted, t�1 0.312 0.135 1 0.29 �53.08 0.028
TR Intercept �0.082 0.084 1 �26.15
Hawks hunted, t 0.425 0.172 1 0.19 �31.34 0.020
Snow April, t�1 �0.006 0.002 1 0.31 �34.91 0.012
Rodents, t�2 0.391 0.124 1 0.39 �37.71 0.004
Rodents, t�1 0.389 0.131 1 0.53 �44.77 0.006
1947–1976
MR Intercept 0.024 0.040 1 �78.97
Snow April, t�1 �0.002 0.001 1 0.21 �83.82 0.021
Rodents, t�1 0.168 0.077 1 0.33 �86.78 0.037
Only counties where snow was found to be significant are listed. The variables are listed in the direction they were obtained in a forward selection
procedure, and cumulative values are given for R2 and AIC. County abbreviations as in Fig. 2.
NAO, North Atlantic Oscillation.
Journal of Zoology 269 (2006) 299–308 c� 2006 The Authors. Journal compilation c� 2006 The Zoological Society of London 303
Fox numbers, snow depth and ungulate carcassesV. Selas and J. O. Vik
Red fox indices versus snow depth, rodentsand hawks, 1947–1976
In period 2 (1947–1976), after the strong increase
in cervid and red fox numbers, only one county (Møre
og Romsdal) showed a negative covariation between
snow depth and red fox index (Table 1). In all counties
except Østfold and Vestfold, there was a significant positive
relationship with the rodent index (Po0.05), usually of
year t�1. Only in the two northern counties of Nordland
and Troms, the fox index was correlated with the rodent
index in year t�2. For Akershus, Hedmark, Buskerud
and Aust-Agder, the goshawk index was also obtained
in the model (Po0.10). For Vestfold, the goshawk index
was the only variable that was selected (R2=0.32,
P=0.005).
Red fox indices versus cervid numbers
Counties with early introduction of roe deer hunting showed
stronger increases in the red fox index from the 1920s to
the 1950s (Table 2, Fig. 3). In a multiple regression
model, there was also a significant positive effect of latitude
(n=15, total R2=0.72, Po0.001 for roe deer, 0.003
for latitude). For the eastern and central counties, there
was a positive relationship between the increase in red
fox and moose indices (Table 2, Fig. 3). Here, there
was a tendency for an additional positive effect of the
TR
NO
NT
ST
HEOP
MR
SF
BU
TE
AAVA
HO
RO
AK
ØFVF
Figure 2 Counties with a relationship between fox bounties and snow
indices of the previous winter during 1897–1932 (shaded areas). The
counties are Østfold (ØF), Vestfold (VF), Akershus (AK), Hedmark
(HE), Oppland (OP), Buskerud (BU), Telemark (TE), Aust-Agder (AA),
Vest-Agder (VA), Rogaland (RO), Hordaland (HO), Sogn og Fjordane
(SF), Møre og Romsdal (MR), Sør-Trøndelag (ST), Nord-Trøndelag
(NT), Nordland (NO) and Troms (TR). P-values are given in Table 1.
Table 2 Results from simple regression models (n is the number of
counties) where the response variable is the increase in the number of
bounties paid for red foxes Vulpes vulpes in each county from
1921–1930 to 1951–1960, and the explanatory variables are, respec-
tively, the increase in the number of moose Alces alces and reindeer
Rangifer tarandus hunted in the same period (positive relationship),
the county’s ranking with regard to the first year of continuous annual
roe deer Capreolus capreolus hunting (negative relationship) and the
human population in 1930
Counties
Moose Reindeer
Roe
deer Humans (km2)
R2 P R2 P R2 P R2 P
East and central,
n=9
0.52 0.029 – – 0.30 0.258 0.09 0.430
South and west,
n=6
– – 0.92 0.003 0.02 0.687 0.05 0.655
All, n=15 – – – – 0.40 0.011 0.01 0.750
Eastern and central counties are ØF, VF, AK, HE, OP, BU, TE, ST, NT.
Southern and western counties are AA, VA, RO, HO, SF, MR. County
abbreviations are as in Fig. 2. ‘–’ is shown where the species in
question is not present.
Roe deer ranking index
r = −0.63
0 2 4 6 8 0 4 8 12 16Moose increase
1920–1950s
r = 0.72
0
1
2
3
4
5
Red
fox
incr
ease
192
0–1
950s
0 5 10 15 20 25Reindeer increase
1920–1950s
r = 0.79
Figure 3 Increase in the number of bounties paid for foxes (mainly red
fox Vulpes vulpes) in each county from 1921–1930 to 1951–1960, in
relation to increase in the number of reindeer Rangifer tarandus and
moose Alces alces hunted in the same period and the county’s
ranking with regard to the first year of continuous annual roe deer
Capreolus capreolus hunting.
Journal of Zoology 269 (2006) 299–308 c� 2006 The Authors. Journal compilation c� 2006 The Zoological Society of London304
Fox numbers, snow depth and ungulate carcasses V. Selas and J. O. Vik
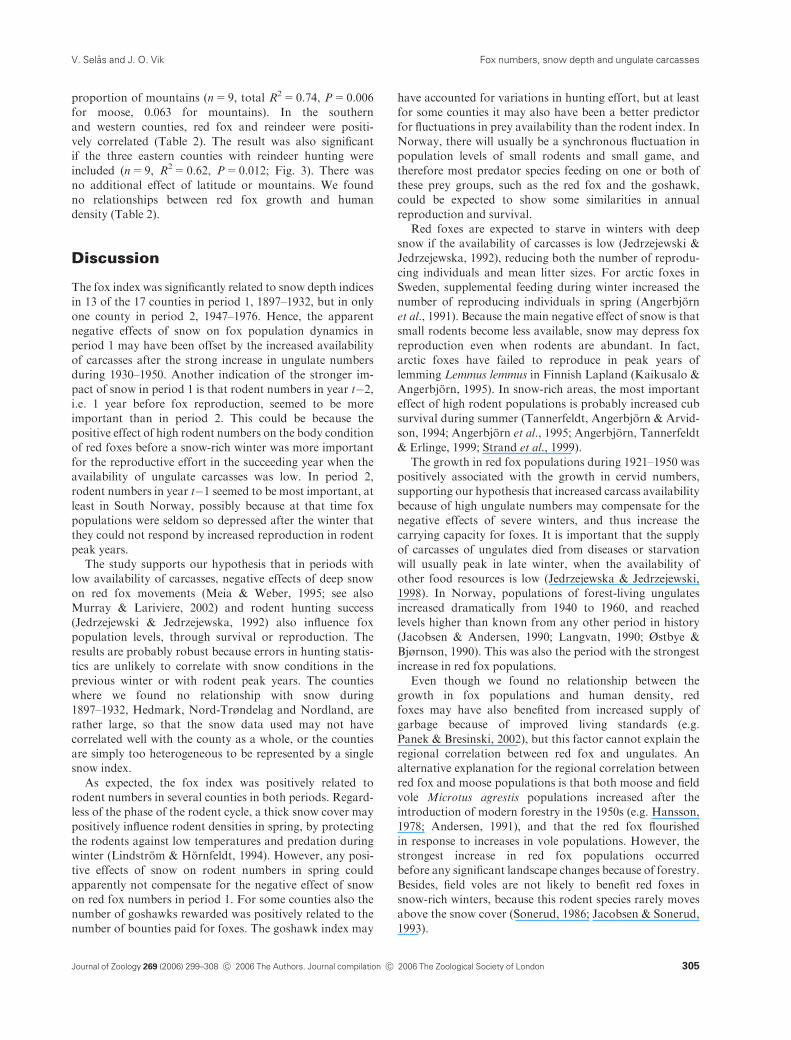
proportion of mountains (n=9, total R2=0.74, P=0.006
for moose, 0.063 for mountains). In the southern
and western counties, red fox and reindeer were positi-
vely correlated (Table 2). The result was also significant
if the three eastern counties with reindeer hunting were
included (n=9, R2=0.62, P=0.012; Fig. 3). There was
no additional effect of latitude or mountains. We found
no relationships between red fox growth and human
density (Table 2).
Discussion
The fox index was significantly related to snow depth indices
in 13 of the 17 counties in period 1, 1897–1932, but in only
one county in period 2, 1947–1976. Hence, the apparent
negative effects of snow on fox population dynamics in
period 1 may have been offset by the increased availability
of carcasses after the strong increase in ungulate numbers
during 1930–1950. Another indication of the stronger im-
pact of snow in period 1 is that rodent numbers in year t�2,i.e. 1 year before fox reproduction, seemed to be more
important than in period 2. This could be because the
positive effect of high rodent numbers on the body condition
of red foxes before a snow-rich winter was more important
for the reproductive effort in the succeeding year when the
availability of ungulate carcasses was low. In period 2,
rodent numbers in year t�1 seemed to be most important, at
least in South Norway, possibly because at that time fox
populations were seldom so depressed after the winter that
they could not respond by increased reproduction in rodent
peak years.
The study supports our hypothesis that in periods with
low availability of carcasses, negative effects of deep snow
on red fox movements (Meia & Weber, 1995; see also
Murray & Lariviere, 2002) and rodent hunting success
(Jedrzejewski & Jedrzejewska, 1992) also influence fox
population levels, through survival or reproduction. The
results are probably robust because errors in hunting statis-
tics are unlikely to correlate with snow conditions in the
previous winter or with rodent peak years. The counties
where we found no relationship with snow during
1897–1932, Hedmark, Nord-Trøndelag and Nordland, are
rather large, so that the snow data used may not have
correlated well with the county as a whole, or the counties
are simply too heterogeneous to be represented by a single
snow index.
As expected, the fox index was positively related to
rodent numbers in several counties in both periods. Regard-
less of the phase of the rodent cycle, a thick snow cover may
positively influence rodent densities in spring, by protecting
the rodents against low temperatures and predation during
winter (Lindstrom & Hornfeldt, 1994). However, any posi-
tive effects of snow on rodent numbers in spring could
apparently not compensate for the negative effect of snow
on red fox numbers in period 1. For some counties also the
number of goshawks rewarded was positively related to the
number of bounties paid for foxes. The goshawk index may
have accounted for variations in hunting effort, but at least
for some counties it may also have been a better predictor
for fluctuations in prey availability than the rodent index. In
Norway, there will usually be a synchronous fluctuation in
population levels of small rodents and small game, and
therefore most predator species feeding on one or both of
these prey groups, such as the red fox and the goshawk,
could be expected to show some similarities in annual
reproduction and survival.
Red foxes are expected to starve in winters with deep
snow if the availability of carcasses is low (Jedrzejewski &
Jedrzejewska, 1992), reducing both the number of reprodu-
cing individuals and mean litter sizes. For arctic foxes in
Sweden, supplemental feeding during winter increased the
number of reproducing individuals in spring (Angerbjorn
et al., 1991). Because the main negative effect of snow is that
small rodents become less available, snow may depress fox
reproduction even when rodents are abundant. In fact,
arctic foxes have failed to reproduce in peak years of
lemming Lemmus lemmus in Finnish Lapland (Kaikusalo &
Angerbjorn, 1995). In snow-rich areas, the most important
effect of high rodent populations is probably increased cub
survival during summer (Tannerfeldt, Angerbjorn & Arvid-
son, 1994; Angerbjorn et al., 1995; Angerbjorn, Tannerfeldt
& Erlinge, 1999; Strand et al., 1999).
The growth in red fox populations during 1921–1950 was
positively associated with the growth in cervid numbers,
supporting our hypothesis that increased carcass availability
because of high ungulate numbers may compensate for the
negative effects of severe winters, and thus increase the
carrying capacity for foxes. It is important that the supply
of carcasses of ungulates died from diseases or starvation
will usually peak in late winter, when the availability of
other food resources is low (Jedrzejewska & Jedrzejewski,
1998). In Norway, populations of forest-living ungulates
increased dramatically from 1940 to 1960, and reached
levels higher than known from any other period in history
(Jacobsen & Andersen, 1990; Langvatn, 1990; Østbye &
Bjørnson, 1990). This was also the period with the strongest
increase in red fox populations.
Even though we found no relationship between the
growth in fox populations and human density, red
foxes may have also benefited from increased supply of
garbage because of improved living standards (e.g.
Panek & Bresinski, 2002), but this factor cannot explain the
regional correlation between red fox and ungulates. An
alternative explanation for the regional correlation between
red fox and moose populations is that both moose and field
vole Microtus agrestis populations increased after the
introduction of modern forestry in the 1950s (e.g. Hansson,
1978; Andersen, 1991), and that the red fox flourished
in response to increases in vole populations. However, the
strongest increase in red fox populations occurred
before any significant landscape changes because of forestry.
Besides, field voles are not likely to benefit red foxes in
snow-rich winters, because this rodent species rarely moves
above the snow cover (Sonerud, 1986; Jacobsen & Sonerud,
1993).
Journal of Zoology 269 (2006) 299–308 c� 2006 The Authors. Journal compilation c� 2006 The Zoological Society of London 305
Fox numbers, snow depth and ungulate carcassesV. Selas and J. O. Vik
Regional warming may have contributed to the strong
red fox increases during 1930–1950, as temperatures in
Scandinavia were above the long-term average in this
period. In Canada, Hersteinsson &Macdonald (1992) found
significant relationships between increased red fox numbers
and climate variables in the same period. A higher frequency
of snow-poor winters may have accelerated the increase in
both red fox and cervid numbers in Norway, resulting in the
observed correlation if both groups increased most in
counties where average snow depths decreased most. How-
ever, the relationship with the roe deer ranking index, which
reflects the geographical spread of roe deer rather than any
climate gradients, demonstrates that cervid numbers were
independently important for the growth in the red fox
populations.
The period of the strongest increase in red fox popula-
tions coincided with the period of the strongest increase and
expansion of roe deer populations in Norway (Østbye &
Bjørnson, 1990). Because the roe deer is vulnerable to
predation by wolf and lynx in snow-rich areas, the absence
of these predators was probably a necessary condition for
the northward spread of roe deer in the 20th century.
Especially the wolf should be able to limit the number of
roe deer in Norway, because this predator commonly also
kills larger cervid species, and will thus (in contrast to lynx
and red fox) be less affected by low roe deer densities.
Hence, if roe deer numbers is an important factor for winter
survival and spring conditions of red foxes in snow-rich
areas, the extermination of the wolf may have helped pave
the way for the subsequent strong increase in red fox
populations in northern Europe during the 20th century.
Acknowledgements
We thank Anders Angerbjorn, Reidar Borgstrøm, Nina E.
Eide, Olav Hjeljord, John Linnell, Anne Loison and Pal
Prestrud for valuable comments on drafts of the manuscript.
References
Andersen, R. (1991). Moose and modern forestry. Fauna 44,
30–40 (in Norwegian, with English abstract).
Angerbjorn, A., Arvidson, B., Noren, E. & Stromgren, L.
(1991). The effect of winter food on reproduction in the
arctic fox, Alopex lagopus: a field experiment. J. Anim.
Ecol. 60, 705–714.
Angerbjorn, A., Tannerfeldt, M., Bjarvall, A., Ericson, M.,
From, J. & Noren, E. (1995). Dynamics of the arctic fox
population in Sweden. Ann. Zool. Fenn. 32, 55–67.
Angerbjorn, A., Tannerfeldt, M. & Erlinge, S. (1999). Pre-
dator–prey relationships: arctic foxes and lemmings.
J. Anim. Ecol. 68, 34–49.
Boertje, R.D., Valkenburg, P. & McNay, M.E. (1996). In-
crease in moose, caribou, and wolves following wolf con-
trol in Alaska. J. Wildl. Mgmt. 60, 474–489.
Borg, K. (1970). On mortality and reproduction of roe
deer in Sweden during the period 1948–1969. Viltrevy 7,
121–149.
Boyd, D.K., Ream, R.R., Pletscher, D.H. & Fairshild, M.W.
(1994). Prey taken by colonizing wolves and hunters in the
Glacier National Park area. J. Wildl. Mgmt. 58, 289–295.
Cederlund, G. & Lindstrom, E. (1983). Effects of severe
winters and fox predation on roe deer mortality. Acta Ther.
28, 129–145.
Central Bureau of Statistics of Norway (1978). Hunting
statistics 1846–1977. Oslo: Central Bureau of Statistics of
Norway.
Christiansen, E. (1979). Skog og jordbruk, smagnagere og rev.
Tidsskr. Skogbruk 87, 115–119 (in Norwegian).
Christiansen, E. (1983). Fluctuations in some small rodent
populations in Norway 1971–1979.Holarct. Ecol. 6, 24–31.
Collett, R. (1912). Norges virveldyr. Bind 1, Norges pattedyr.
Aschehoug: Kristiania (in Norwegian).
Crooks, K.R. & Soule, M. (1999). Mesopredator release and
avifaunal extinctions in a fragmented system. Nature 400,
563–566.
Englund, J. (1970). Some aspects of reproduction and mor-
tality rates in Swedish foxes (Vulpes vulpes), 1961–63 and
1966–69. Viltrevy 8, 1–81.
Hagen, Y. (1952). Rovfuglene og viltpleien. Oslo: Gyldendal
(in Norwegian).
Halpin, M.A. & Bissonette, J.A. (1988). Influence of snow
depth on prey availability and habitat use by red fox. Can.
J. Zool. 66, 587–592.
Hanssen-Bauer, I. & Førland, E. (2000). Temperature and
precipitation variations in Norway 1900–1994 and their
links to atmospheric circulation. Int. J. Climatol. 20,
1693–1708.
Hansson, L. (1978). Small mammal abundance in relation to
environmental variables in three Swedish forest phases.
Stud. Forest. Suec. No. 147. 1–40.
Hansson, L. & Henttonen, H. (1985). Gradients in density
variations of small rodents: the importance of latitude and
snow cover. Oecologia 67, 394–402.
Henttonen, H. (1989). Does an increase in the rodent
and predator densities, resulting from modern
forestry, contribute to the long-term decline in Finnish
tetraonids? Suomen Riista 35, 83–90 (in Finnish with
English summary).
Hersteinsson, P. & Macdonald, D.W. (1992). Interspecific
competition and the geographical distribution of red and
arctic foxes Vulpes vulpes and Alopex lagopus. Oikos 64,
505–515.
Hewson, R. (1986). Distribution and density of fox breeding
dens and the effects of management. J. Appl. Ecol. 23,
531–538.
Hjeljord, O. (1980). Viltbiologi. Oslo: Landbruksforlaget
(in Norwegian).
Høst, P. (1935). Trekk fra dyrelivet pa Hardangervidda.
Norges Jeger- og Fiskerforbunds Tidsskrift 64, 201–211
(in Norwegian).
Journal of Zoology 269 (2006) 299–308 c� 2006 The Authors. Journal compilation c� 2006 The Zoological Society of London306
Fox numbers, snow depth and ungulate carcasses V. Selas and J. O. Vik

Hurrell, J.W. (1995). Decadal trends in the North Atlantic
Oscillation: regional temperatures and precipitation.
Science 269, 676–679.
Jacobsen, B.V. & Sonerud, G.A. (1993). Synchronous switch
in diet and hunting habitat as a response to disappearance
of snow cover in Tengmalm’s owl Aegolius funereus. Ornis
Fenn. 70, 78–88.
Jacobsen, H. & Andersen, R. (1990). Elgen. In Norges Dyr,
Pattedyrene, Vol. 2: 104–127. Semb-Johansson, A. & Fri-
slid, R. (Eds). Oslo: Cappelen (in Norwegian).
Jedrzejewska, B. & Jedrzejewski, W. (1998). Predation in
vertebrate communities. The Bialowieza primeval forest as
a case study. In Ecological studies, Vol. 135: 1–45. Berlin:
Springer.
Jedrzejewski, W. & Jedrzejewska, B. (1992). Foraging and diet
of the red fox Vulpes vulpes in relation to variable food
resources in Bialowieza National Park, Poland. Ecography
15, 212–220.
Johnsen, S. (1929). Rovdyr- og rovfuglstatistikken i Norge.
Bergens Mus. Arbok. Naturvidensk. Rekke 1929, 140 pp. (in
Norwegian).
Kaikusalo, A. & Angerbjorn, A. (1995). The arctic fox
population in Finnish Lapland during 30 years 1964–93.
Ann. Zool. Fenn. 32, 69–77.
Kjos-Hanssen, B. (1962). Rødreven som regulerende faktor i
smaviltbestanden. Jakt, fiske og friluftsliv 91, 501–503, 523
(in Norwegian).
Kolb, H.H. & Hewson, R. (1980). A study of fox populations
in Scotland from 1971–1976. J. Appl. Ecol. 17, 7–19.
Langvatn, R. (1990). Hjorten. In Norges Dyr, Pattedyrene, 2:
81–100. Semb-Johansson, A. & Frislid, R. (Eds). Oslo:
Cappelen (in Norwegian.).
Lindstrom, E. (1989). Food limitation and social regulation in
a red fox population. Holarct. Ecol. 12, 70–79.
Lindstrom, E. &Hornfeldt, B. (1994). Vole cycles, snow depth
and fox predation. Oikos 70, 156–160.
Lindstrom, E.R., Andren, H., Angelstam, P., Cederlund, G.,
Hornfeldt, B., Jaderberg, L., Lemnell, P.-A., Martinsson,
B., Skold, K. & Swenson, J.E. (1994). Disease reveals the
predator: sarcoptic mange, red fox predation, and prey
populations. Ecology 75, 1042–1049.
Lindstrom, E.R., Brainerd, S.M., Helldin, J.O. & Overskaug,
K. (1995). Pine marten–red fox interactions: a case of
intraguild predation? Ann. Zool. Fenn. 32, 123–130.
Lund, H.M.-K. (1962). The red fox in Norway II. The feeding
habits of the red fox in Norway. Papers of the Norwegian
State Game Research Institute, 2. Series, no. 12. Orkanger.
(in Norwegian, with English summary).
Lund, H.M.-K. (1963). Vilt og Viltstell no. 3. Reven.
Smaskrifter utgitt av Viltstyret og Statens Viltundersøkel-
ser (in Norwegian).
Marcstrom, V., Keith, L.B., Engren, E. & Cary, J.R.
(1989). Demographic responses of arctic hares (Lepus
timidus) to experimental reductions of red foxes (Vulpes
vulpes) and martens (Martes martes). Can. J. Zool. 67,
658–668.
Marcstrom, V., Kenward, R.E. & Engren, E. (1988). The
impact of predation on boreal tetraonids during vole
cycles: an experimental study. J. Anim. Ecol. 57, 859–872.
Meia, J.S. & Weber, J.M. (1995). Home ranges and move-
ments of red foxes in central Europe: stability despite
environmental changes. Can. J. Zool. 73, 1960–1966.
Murray, D.L. & Lariviere, S. (2002). The relationship be-
tween foot size of wild canids and regional snow condi-
tions: evidence for selection against a high footload?
J. Zool. (Lond.) 256, 289–299.
Myrberget, S. (1965). Changes in small rodent population levels
in Norway 1946–60. Papers of the Norwegian State Game
Research Institute, 2. Series, no. 19. Orkanger. (in
Norwegian, with English summary).
Myrberget, S. (1982). Population fluctuations in Norwegian
microtines 1932–1971. Fauna 35, 29–32 (in Norwegian,
with English abstract).
Myrberget, S. (1988). Hunting statistics as indicators of game
population size and composition. Stat. J. United Nations
ECE 5, 289–301.
Mysterud, A., Yoccoz, N.G., Stenseth, N.C. & Langvatn, R.
(2000). Relationships between sex ratio, climate and den-
sity in red deer: the importance of spatial scale. J. Anim.
Ecol. 69, 959–974.
Okarma, H. (1995). The trophic ecology of wolves and their
prey predatory role in ungulate communities of forest
ecosystems in Europe. Acta Ther. 40, 335–386.
Okarma, H., Jedrzejewska, B., Jedrzejewski, W., Krasinski,
Z.A. & Milkowski, L. (1995). The roles of predation, snow
cover, acorn crop, and man-related factors on ungulate
mortality in Bialowieza Primeval Forest, Poland. Acta
Ther. 40, 197–217.
Østbye, E. & Bjørnson, B. (1990). Radyret. In Norges Dyr,
Pattedyrene, 2: 128–147. Semb-Johansson, A. & Frislid, R.
(Eds). Oslo: Cappelen (in Norwegian).
Palomares, F. & Caro, T.M. (1999). Interspecific killing
among mammalian carnivores. Am. Nat. 153,
492–508.
Panek, M. & Bresinski, W. (2002). Red fox Vulpes vulpes
density and habitat use in a rural area of western Poland in
the end of 1990s, compared with the turn of 1970s. Acta
Ther. 47, 433–442.
Raiby, M. (1970). Winter mortality rate in roe-deer in relation
to weather conditions. Fauna 23, 284–290 (in Norwegian,
with English summary).
Selas, V. (1997). Cyclic population fluctuations of herbivores
as an effect of cyclic seed cropping of plants: the mast
depression hypothesis. Oikos 80, 257–268.
Selas, V. (1998a). Does food competition from red fox
influence the breeding density of goshawk? Evidence
from a natural experiment. J. Zool. (Lond.) 246,
325–335.
Selas, V. (1998b). Hønsehaukbestanden i tilbakegang – ogsa i
Aust-Agder. Var Fuglefauna 21, 149–154 (in Norwegian).
Selas, V. & Steel, C. (1998). Large brood sizes of pied
flycatcher, sparrowhawk and goshawk in peak microtine
Journal of Zoology 269 (2006) 299–308 c� 2006 The Authors. Journal compilation c� 2006 The Zoological Society of London 307
Fox numbers, snow depth and ungulate carcassesV. Selas and J. O. Vik
years: support for the mast depression hypothesis. Oecolo-
gia 116, 4499–4455.
Semb-Johansson, A. (1988). Faunal changes in Norway in
recent time. Fauna 41, 73–90, 109–132 (in Norwegian, with
English abstract).
Skjenneberg, S. & Slagsvold, L. (1968). Reindriften og dens
naturgrunnlag. Oslo: Universitetsforlaget (in Norwegian).
Skogland, T. (1990). Reinen. In Norges Dyr, Pattedyrene, 2:
148–170. Semb-Johansson, A. & Frislid, R. (Eds). Oslo:
Cappelen (in Norwegian).
Smedshaug, C.A., Selas, V., Lund, S.E. & Sonerud, G.A.
(1999). The effect of a natural reduction of red fox Vulpes
vulpes on small game hunting bags in Norway. Wildl. Biol.
5, 157–166.
Smedshaug, C.A. & Sonerud, G.A. (1997). Can predation on
small game be limited by manipulation of offal? Fauna 50,
146–154 (in Norwegian, with English abstract).
Solberg, E.J., Loison, A., Sæther, B.-E. & Strand, O. (2000).
Age-specific harvest mortality in a Norwegian moose Alces
alces population. Wildl. Biol. 6, 41–52.
Sonerud, G.A. (1986). Effect of snow cover on seasonal
changes in diet, habitat, and regional distribution of
raptors that prey on small mammals in boreal zones of
Fennoscandia. Holarct. Ecol. 9, 33–47.
Strand, O., Linnell, J.D.C., Krogstad, S. & Landa, A.
(1999). Dietary and reproductive responses of arctic
foxes to changes in small rodent abundance. Arctic 52,
272–278.
Tannerfeldt, M., Angerbjorn, A. & Arvidson, B. (1994). The
effect of summer feeding on juvenile arctic fox survival – a
field experiment. Ecography 17, 88–96.
Wildhagen, A. (1952). Fluctuations in small rodent populations
in Norway 1871–1949. Drammen: Statens Viltundersøkel-
ser (in Norwegian, with English summary).
Journal of Zoology 269 (2006) 299–308 c� 2006 The Authors. Journal compilation c� 2006 The Zoological Society of London308
Fox numbers, snow depth and ungulate carcasses V. Selas and J. O. Vik