possibility of company goodwill valuation: verification in
TRANSCRIPT
DOI: 10.2478/mmcks-2019-0024
Possibility of Company Goodwill Valuation: Verification in Slovak and Czech Republic
Ivana Podhorska
University of Zilina, Department of Economics, Univerzitna 1, 010 26 Zilina, Slovak Republic
Katarina Valaskova University of Zilina, Department of Economics, Univerzitna 1, 010 26 Zilina,
Slovak Republic [email protected]
Vojtech Stehel
The Institute of Technology and Business in Ceske Budejovice, School of Expertness and Valuation, Okruzni 517/10, 370 01 Ceske Budejovice, Czech Republic
Tomas Kliestik University of Zilina, Department of Economics, Univerzitna 1, 010 26 Zilina,
Slovak Republic [email protected]
Abstract. The paper deals with the possibilities of company goodwill valuation and verification. The value of company goodwill is still an actual issue for the scientific community. Goodwill as an economic phenomenon has attracted the attention of economic experts since the nineteenth century. Nowadays, there are many approaches to goodwill valuation. However, its identification and quantification are still a challenge. The paper aim is to identify significant sources of company goodwill creation and their verification on the sample of 2 European countries with the similar business environment, political stability and regulatory platform - Slovak and Czech companies. The sample for the identification of significant sources of company goodwill creation consists of the financial statements of Slovak companies in 2015. The sample for data verification consists of the financial statements of Slovak and Czech companies in 2016. The paper identifies the determinants of goodwill creation by multiple regression analysis. The paper also verifies the total explanatory power of these determinants by matrixes of changes. Volatility and deviation of the results are captured by descriptive statistical methods. The paper’s results point to a necessity to identify the key determinants of goodwill creation. They bring the construction of an econometric model for company goodwill valuation. It could be used to compute the value of company goodwill of the individual companies in the Slovak economic conditions. Key words: goodwill, determinants, valuation, residual income, multiple regression, verification.
Introduction In general, goodwill is often defined as the business reputation, image, prestige, legend or brand. It is reflected in the relationship between the company and other market participants and its perception in the eyes of its customers. A company with goodwill has more satisfied and loyal customers and employees. It has suppliers who are more willing to cooperate, as well as investors who are more tolerant and willing to finance business development. (Zapletalova, 2017; Moravcikova et al., 2017)
MMCKS 339
Vol. 14, No. 3, Autumn, pp. 338-356, ISSN 2069–8887| Management & Marketing. Challenges for the Knowledge Society
Goodwill as an economic phenomenon has attracted the attention of economic experts since the nineteenth century. The topicality of this issue is confirmed by the number of papers published in the Web of Science database (more than 70 papers about goodwill valuation, measurement and so on) or in the Scopus database (more than 50 papers). During these years there have been created various methods for its valuation and quantification. This study primary works with residual income valuation methods. The issue of company goodwill is an interdisciplinary question; sources of goodwill creation can be found in financial management, economics, law, marketing, sociology, etc. Knowledge and understanding of company goodwill sources are still a managerial challenge. Their identification can lead to its effective creation and management, and ultimately to be a powerful tool in the competitive struggle.
The importance of this issue is proven by an amount of papers, e.g. Lord Eldon (1842), Lord Macnaughton (1891), Leake (1921), Nelson (1953), Hughes (1982), Courtis (1983), Feltham and Ohlson (1995), Lonergan (1995), Canibano et al. (2000), Fernandez (2002), Curtis and Fargher (2003), Begley et al. (2006), Lundholm (2006), Bean (2011), Herz (2011). Recency of this issue is proven by an amount of current papers, e.g. Kariuki et al. (2013), Skogsvik and Juettner-Nauroth (2013), Reilly (2015), Tsai (2012, 2016), Kimbro and Xu (2016), Kliestik et al. (2018), Sadaf et al. (2018).
The aim of the paper is to identify significant sources of company goodwill creation and their verification on the sample of Slovak and Czech companies. The following questions represent basic research tasks: are we able to find potential sources of goodwill creation based on the theory of residual income? Subsequently, is it possible to verify their total explanatory power and accuracy? What limitations and extensions does this research have? The body of paper consists of (i) literature review of company goodwill identification and valuation, (ii) methodology, focused on possibility of company goodwill valuation and description of sample and data collection, (iii) results, focused on data analysis and verification, and (iv) discussion, focused on the research limitations and extensions.
„Goodwill has been created for years, but it can be destroyed almost every day.” (Casson, 1997)
Literature review "None of us can buy goodwill; we must earn it". (Goodman, 2016).
Over the years there have been created several approaches to the definition of company goodwill. The first approach was "law direction". In the beginning, goodwill was described as a part of lawsuits. In 1842 judge Lord Eldon, a pioneer in this area of law direction defined goodwill as a part of lawsuits: “The good-will, which has been the subject of sale is nothing more than the probability that the old customers will resort to the old place.” (Tregoning, 2004). The issue of goodwill was also described in 1891 by Lord Macnaghten as a part of different lawsuits: “Goodwill is composed of a variety of elements. It differs in its composition in different trades and in different business in the same trade. One element may preponderate here and another element there.” (Groves, 2011). In 1901, in IRC v Muller and Co´s Margarine Ltd, judge Lord Macnaughton asked and answered the following question: “What is goodwill? It is a thing very easy to describe, very difficult to define. Goodwill is the benefit and advantage of the good name, reputation and connection of a business.” (Groves, 2011). Law direction is closed by the definition of Lord Justice Lindely (1901): “Goodwill as a part of company assets does not make sense. It only makes sense if it is connected with some business. It means term goodwill includes
MMCKS 340
Vol. 14, No. 3, Autumn, pp. 338-356, ISSN 2069–8887| Management & Marketing. Challenges for the Knowledge Society
everything that adds the value to the company from various reasons, e.g. place, reputation, image, relationships, customer’s loyalty and so on.”
The second approach, which was created later, is the “economic direction”. In 1922, Paton, an American accountancy scholar and founder and first editor of its flagship journal The Accounting Review, defined goodwill in Ronald Press as follows: “Goodwill represents intangible assets and its value represents the difference between the total value of the company and the sum of every company physical assets. Goodwill represents company ability to create abnormal earnings“. Yang (1927) published a paper „Goodwill and Other Intangible Assets“ in which he provided the following goodwill definition: Goodwill represents the current value of expected future earnings of an established enterprise, which the new company would not achieve. Catlett and Olson (1968) provided the study „Accounting Research Study No. 10“, where they described goodwill as „abnormal earning capacity“. Tearney (1973) in his study “Accounting for Goodwill: A Realistic Approach” described goodwill as: “item which includes many other intangible items”. Hughes (1982), the author who wrote historically the most comprehensive study focused on the accounting goodwill, admitted that the debate around goodwill was possible because even though the origin of goodwill can be determined, its nature will always be prone to interpretation. Peasnell (1982) described company goodwill, in his paper “Some Formal Connections Between Economic Values and Yields and Accounting Numbers”, as follows: “Goodwill is the amount of value that a corporate good reputation adds to its overall value”.Shenkar and YuchtmanYaar (1997) argued that reputation, image, prestige, and goodwill are concepts used by different disciplines, e.g., economics, marketing, sociology, and accounting, to denote the general standing of organizations among their counterparts. According to Casson (1997): “Goodwill is like a health – unappreciated wealth that everyone wants to have, but few are willing to make efforts to preserve it.” Maly (2002): “Goodwill represents the good reputation of enterprise for its business partners, financial institutions, the public and customers in domestic country and also in abroad.” According to Bloom (2008) there is a high controversy in detecting what is goodwill and what is it composed of because it is used interdisciplinary.
Important findings and connections are provided by many other authors, e.g. Boyarko (2011), Cavalinhos and Carreira (2015), Cygler and Sroka (2017), D´Amico et al., (2014), Da Silva et al. (2015), Fanelli and Ryden (2018), Hyuna (2017), Ionescu (2017), Mazzola and Gerace (2015), Maleki (2010), Nica et al. (2017), Reimsbach (2013), Sadaf et al. (2018). The recency of this issue in Slovak and Czech research is proven by authors, e.g. Maly (2002), Zelenka (2006), Hvozdarova (2006), Kylianova and Lalikova (2010), Jansky (2011), Marik et al. (2011), Jakubec et al. (2011), Svabova and Durica (2016), Rajnoha and Lesnikova (2016), Slavik and Zagorsek (2016), Vojtovic (2016), Dvorsky et al. (2017), Siekelova (2017), Ivanova and Cepel (2018), Kliestik et al. (2018).
Methodology The chapter provides the basic steps of the methodology of this paper. The chapter consists of the brief review of the methods of company goodwill valuation, subsequently captures sample and data collection for calculation and searching of key indicators of company goodwill creation, then data analysis and at the end data verification. Company goodwill valuation Generally, one problem is the definition and content of the term goodwill itself. On the other hand, in practice there exists another problem – quantification of its value. Economic experts from all the world have suggested several possibilities of its quantification. These methods include for example: the super-profit theory of goodwill
MMCKS 341
Vol. 14, No. 3, Autumn, pp. 338-356, ISSN 2069–8887| Management & Marketing. Challenges for the Knowledge Society
described by Leake (1921); the momentum theory of goodwill described by Nelson (1953); goodwill analysed through its components described by Lonergan (1995) and the residual income valuation method Preinreich (1936).
This study works with the application of the residual income valuation method to evaluate the company goodwill. The residual income valuation theory was described by Preinreich in 1936. Later, a renewed attention was paid to the residual income, as to an economic profit (Skogsvik and Juettner-Nauroth, 2002) or abnormal earnings (Ohlson, 1995). Based on the idea of residual income the Residual Income Valuation Models were created. One of them is the model, which was created by Feltham and Ohlson in 1995. In their model, they suppose that the value of the company is formed by the sum of the book value of the company equity and the present value of the expected future residual income. It is the residual income, which creates the difference between the market value of the company and the book value of the company. Considering the review of scientific literature, we can state that it is the company goodwill, which creates the difference between the market value of company and the book value of company. Subsequently, the value of the residual income should be equal to the company goodwill, in accordance with (Fernandez, 2002; Longhofer, 2005; Fanelli and Ryden, 2018; Sadaf et al., 2018).
The basic idea of the residual income says that the income, which the company creates over the level of the income required by its owners, represents the residual income. However, it is necessary to determine the required income for the company owners. According to the residual income theory in the Feltham-Ohlson model (1995) the required income for owners is equal to the cost of equity. The disadvantages are the special barriers in the cost of equity calculation, especially in Slovak conditions with the inefficient capital market. The quantification of the residual income has the following form:
𝑅𝐼 = 𝑁𝐼 − 𝑒𝑞𝑢𝑖𝑡𝑦 𝑐ℎ𝑎𝑟𝑔𝑒 (1)
where RI residual income NI net income equity charge the product of the book value of equity and the cost of equity
The determination of the equity charge represents the key calculation of the residual income. Because the equity charge is the product of the cost of equity and the book value of equity. This fact is depicted in the following equation (2).
𝑒𝑞𝑢𝑖𝑡𝑦 𝑐ℎ𝑎𝑟𝑔𝑒 = 𝑟𝑒 ∗ 𝐵𝑉𝐸 (2)
where re cost of equity BVE book value of equity
The cost of equity could be quantified by various methods. According to authors (Feltham &Ohlson, 1995; Longhofer, 2005; Synek, 2006; Chrysafis, 2012; D´Amico et al., 2014; Laghi and Di Marcantonio, 2016; Mazzola and Gerace, 2015); Ionescu, 2017; Cygler and Sroka, 2017). This study works with the Capital Asset Pricing Model:
𝑟𝑒 = 𝑟𝑓 + 𝑟𝑝 ∗ 𝛽 + 𝑟𝑠 (3)
where
MMCKS 342
Vol. 14, No. 3, Autumn, pp. 338-356, ISSN 2069–8887| Management & Marketing. Challenges for the Knowledge Society
re cost of equity rf risk-free rate rp market risk premium β beta coefficient rs specific risk premium for company size Sample and data collection The sample for the identification of significant sources of company goodwill creation consists of the financial statements of Slovak companies in 2015. These data were obtained from the Amadeus database system – A comprehensive European database on public and private companies. Research on possible sources of company goodwill, their analysis, selection, quantification, etc. represents a very difficult and time-consuming process that requires a carefully compiled data sample. For these reasons, into the relevant sample for the identification of significant sources of company goodwill, 11,483 financial statements of Slovak companies in 2015 were used. The sample creation contained 2 conditions - (i) limited companies, (ii) domestic ownership. The representation of the individual Slovak regions in the sample is uniform -approximately 10 % for each region. The sample is also diversified to companies with various SK NACE classification.
For the verification of the research findings data from two countries were used – Slovak Republic and the Czech Republic. These data included financial statements of 481 Slovak companies and 481 Czech companies in 2016. The same sample size will ensure better comparability of the results. The creation of verification data included the same conditions for their creation as in the test data.
Data analysis The aim of the paper was to identify significant sources of company goodwill creation and their verification on the sample of Slovak and Czech companies. The following questions represent basic research tasks: are we able to find potential sources of goodwill creation based on the theory of residual income? Subsequently, is it possible to verify their total explanatory power and accuracy? What limitations and extensions does this research have? The answers to these questions could be provided by multiple linear regression. For the identification of the relationship the multiple linear regression analysis was used. Because this analysis represents the most important statistical tool for the quantitative description of the relationship between economic and financial quantities, referred to as variables, and for creation of the econometric model. (Nan, 2010)
For the identification of significant sources of company goodwill creation, it was necessary to find the existence of the statistically significant relationship between variables. Multiple linear regression works with two types of variables: (i) independent variable – represented by the residual income; (ii) dependent variables – represented by the potential sources of company goodwill creation. The role of multiple linear regression is to explain the changes in the values of the dependent variable by changes in the values of independent variables. Multiple linear regression has its own Gauss-Mark assumptions: (i) sample size; (ii) quantitative variables; (iii) outliers; (iv) multicorrelation; (v) linear relationship; (vi) autocorrelation and (vii) normal distribution. These assumptions were also tested, by relevant statistical methods, during the process of identifying significant sources of company goodwill creation. We had taken into account potential barriers in calculations and the possible necessity to reduce the sample size. This chapter has two results: (i) the identification of significant sources of company goodwill creation; (ii) a
MMCKS 343
Vol. 14, No. 3, Autumn, pp. 338-356, ISSN 2069–8887| Management & Marketing. Challenges for the Knowledge Society
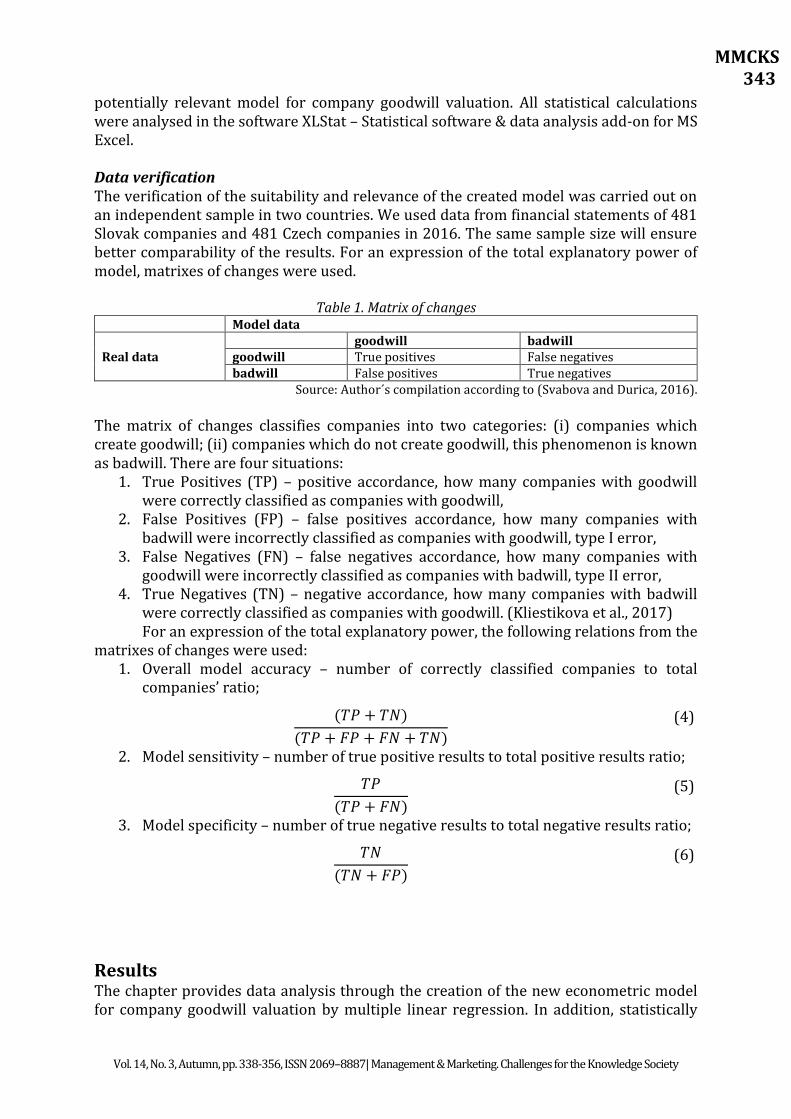
potentially relevant model for company goodwill valuation. All statistical calculations were analysed in the software XLStat – Statistical software & data analysis add-on for MS Excel. Data verification The verification of the suitability and relevance of the created model was carried out on an independent sample in two countries. We used data from financial statements of 481 Slovak companies and 481 Czech companies in 2016. The same sample size will ensure better comparability of the results. For an expression of the total explanatory power of model, matrixes of changes were used.
Table 1. Matrix of changes Model data
Real data goodwill badwill
goodwill True positives False negatives badwill False positives True negatives
Source: Author´s compilation according to (Svabova and Durica, 2016).
The matrix of changes classifies companies into two categories: (i) companies which create goodwill; (ii) companies which do not create goodwill, this phenomenon is known as badwill. There are four situations:
1. True Positives (TP) – positive accordance, how many companies with goodwill were correctly classified as companies with goodwill,
2. False Positives (FP) – false positives accordance, how many companies with badwill were incorrectly classified as companies with goodwill, type I error,
3. False Negatives (FN) – false negatives accordance, how many companies with goodwill were incorrectly classified as companies with badwill, type II error,
4. True Negatives (TN) – negative accordance, how many companies with badwill were correctly classified as companies with goodwill. (Kliestikova et al., 2017) For an expression of the total explanatory power, the following relations from the
matrixes of changes were used: 1. Overall model accuracy – number of correctly classified companies to total
companies’ ratio;
(𝑇𝑃 + 𝑇𝑁)
(𝑇𝑃 + 𝐹𝑃 + 𝐹𝑁 + 𝑇𝑁)
(4)
2. Model sensitivity – number of true positive results to total positive results ratio;
𝑇𝑃
(𝑇𝑃 + 𝐹𝑁)
(5)
3. Model specificity – number of true negative results to total negative results ratio;
𝑇𝑁
(𝑇𝑁 + 𝐹𝑃)
(6)
Results The chapter provides data analysis through the creation of the new econometric model for company goodwill valuation by multiple linear regression. In addition, statistically
MMCKS 344
Vol. 14, No. 3, Autumn, pp. 338-356, ISSN 2069–8887| Management & Marketing. Challenges for the Knowledge Society
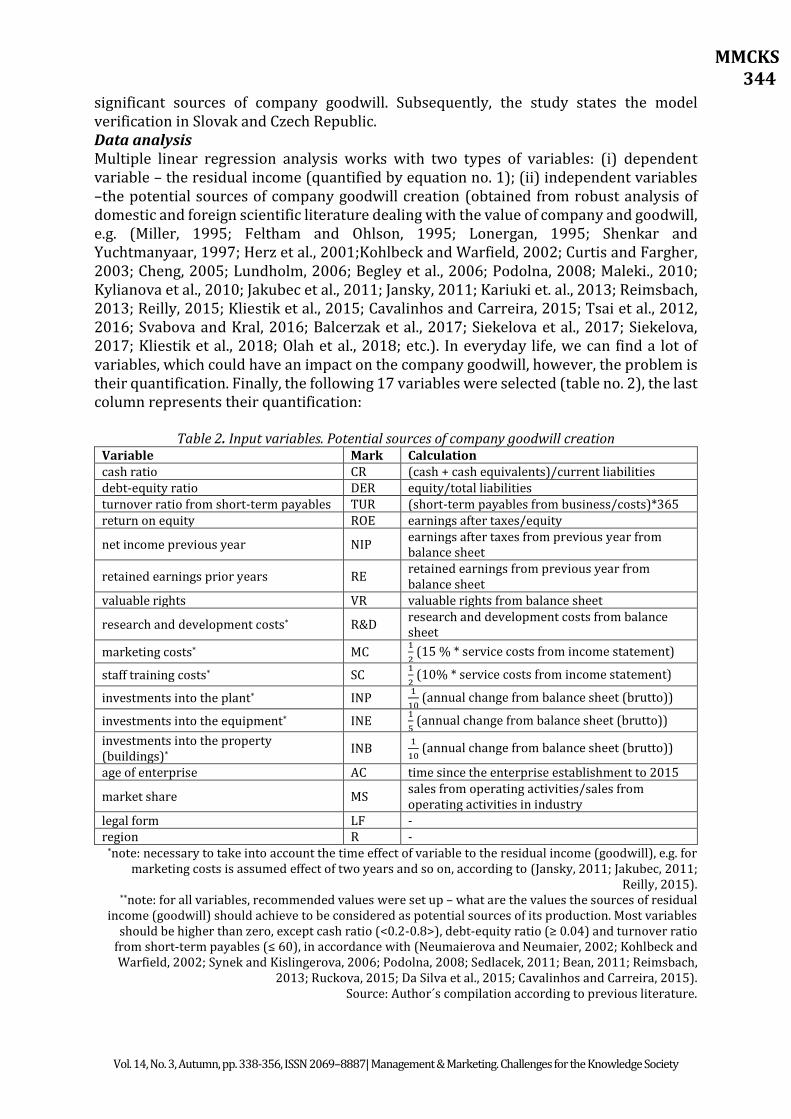
significant sources of company goodwill. Subsequently, the study states the model verification in Slovak and Czech Republic. Data analysis Multiple linear regression analysis works with two types of variables: (i) dependent variable – the residual income (quantified by equation no. 1); (ii) independent variables –the potential sources of company goodwill creation (obtained from robust analysis of domestic and foreign scientific literature dealing with the value of company and goodwill, e.g. (Miller, 1995; Feltham and Ohlson, 1995; Lonergan, 1995; Shenkar and Yuchtmanyaar, 1997; Herz et al., 2001;Kohlbeck and Warfield, 2002; Curtis and Fargher, 2003; Cheng, 2005; Lundholm, 2006; Begley et al., 2006; Podolna, 2008; Maleki., 2010; Kylianova et al., 2010; Jakubec et al., 2011; Jansky, 2011; Kariuki et. al., 2013; Reimsbach, 2013; Reilly, 2015; Kliestik et al., 2015; Cavalinhos and Carreira, 2015; Tsai et al., 2012, 2016; Svabova and Kral, 2016; Balcerzak et al., 2017; Siekelova et al., 2017; Siekelova, 2017; Kliestik et al., 2018; Olah et al., 2018; etc.). In everyday life, we can find a lot of variables, which could have an impact on the company goodwill, however, the problem is their quantification. Finally, the following 17 variables were selected (table no. 2), the last column represents their quantification:
Table 2. Input variables. Potential sources of company goodwill creation Variable Mark Calculation cash ratio CR (cash + cash equivalents)/current liabilities debt-equity ratio DER equity/total liabilities turnover ratio from short-term payables TUR (short-term payables from business/costs)*365 return on equity ROE earnings after taxes/equity
net income previous year NIP earnings after taxes from previous year from balance sheet
retained earnings prior years RE retained earnings from previous year from balance sheet
valuable rights VR valuable rights from balance sheet
research and development costs* R&D research and development costs from balance sheet
marketing costs* MC 1
2 (15 % * service costs from income statement)
staff training costs* SC 1
2 (10% * service costs from income statement)
investments into the plant* INP 1
10 (annual change from balance sheet (brutto))
investments into the equipment* INE 1
5 (annual change from balance sheet (brutto))
investments into the property (buildings)*
INB 1
10 (annual change from balance sheet (brutto))
age of enterprise AC time since the enterprise establishment to 2015
market share MS sales from operating activities/sales from operating activities in industry
legal form LF - region R -
*note: necessary to take into account the time effect of variable to the residual income (goodwill), e.g. for marketing costs is assumed effect of two years and so on, according to (Jansky, 2011; Jakubec, 2011;
Reilly, 2015). **note: for all variables, recommended values were set up – what are the values the sources of residual
income (goodwill) should achieve to be considered as potential sources of its production. Most variables should be higher than zero, except cash ratio (<0.2-0.8>), debt-equity ratio (≥ 0.04) and turnover ratio
from short-term payables (≤ 60), in accordance with (Neumaierova and Neumaier, 2002; Kohlbeck and Warfield, 2002; Synek and Kislingerova, 2006; Podolna, 2008; Sedlacek, 2011; Bean, 2011; Reimsbach,
2013; Ruckova, 2015; Da Silva et al., 2015; Cavalinhos and Carreira, 2015). Source: Author´s compilation according to previous literature.
MMCKS 345
Vol. 14, No. 3, Autumn, pp. 338-356, ISSN 2069–8887| Management & Marketing. Challenges for the Knowledge Society
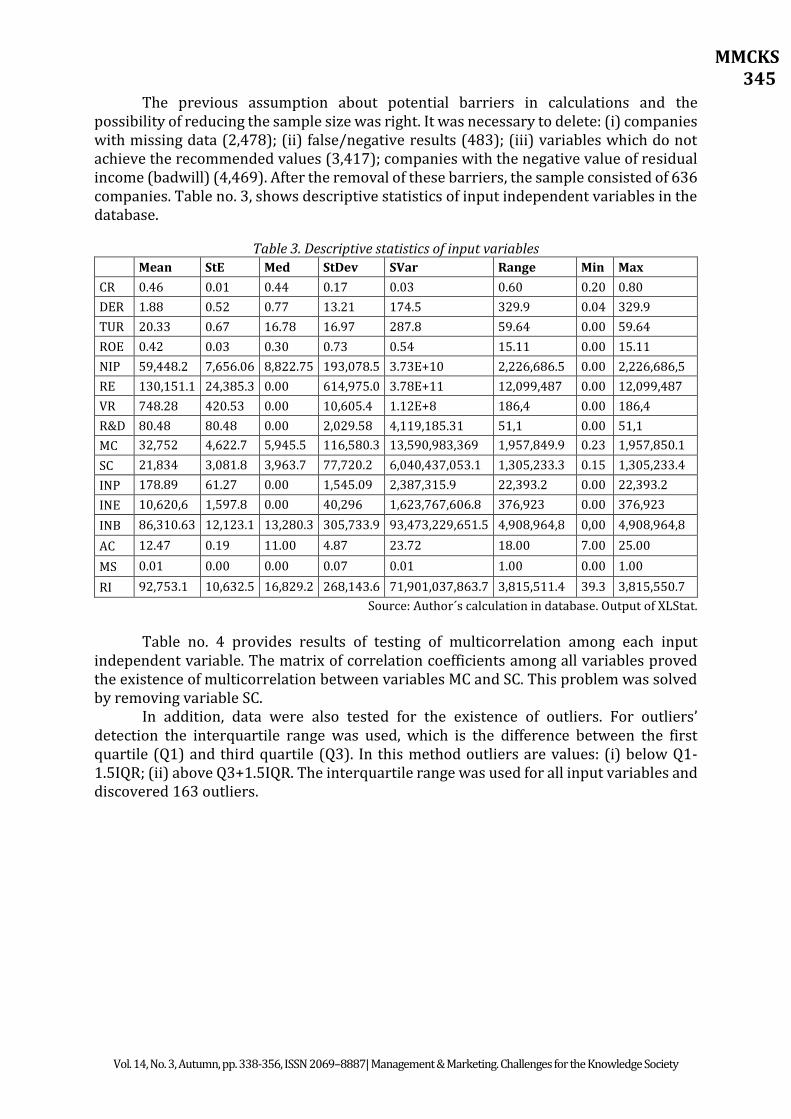
The previous assumption about potential barriers in calculations and the possibility of reducing the sample size was right. It was necessary to delete: (i) companies with missing data (2,478); (ii) false/negative results (483); (iii) variables which do not achieve the recommended values (3,417); companies with the negative value of residual income (badwill) (4,469). After the removal of these barriers, the sample consisted of 636 companies. Table no. 3, shows descriptive statistics of input independent variables in the database.
Table 3. Descriptive statistics of input variables Mean StE Med StDev SVar Range Min Max
CR 0.46 0.01 0.44 0.17 0.03 0.60 0.20 0.80
DER 1.88 0.52 0.77 13.21 174.5 329.9 0.04 329.9
TUR 20.33 0.67 16.78 16.97 287.8 59.64 0.00 59.64
ROE 0.42 0.03 0.30 0.73 0.54 15.11 0.00 15.11
NIP 59,448.2 7,656.06 8,822.75 193,078.5 3.73E+10 2,226,686.5 0.00 2,226,686,5
RE 130,151.1 24,385.3 0.00 614,975.0 3.78E+11 12,099,487 0.00 12,099,487
VR 748.28 420.53 0.00 10,605.4 1.12E+8 186,4 0.00 186,4
R&D 80.48 80.48 0.00 2,029.58 4,119,185.31 51,1 0.00 51,1
MC 32,752 4,622.7 5,945.5 116,580.3 13,590,983,369 1,957,849.9 0.23 1,957,850.1
SC 21,834 3,081.8 3,963.7 77,720.2 6,040,437,053.1 1,305,233.3 0.15 1,305,233.4
INP 178.89 61.27 0.00 1,545.09 2,387,315.9 22,393.2 0.00 22,393.2
INE 10,620,6 1,597.8 0.00 40,296 1,623,767,606.8 376,923 0.00 376,923
INB 86,310.63 12,123.1 13,280.3 305,733.9 93,473,229,651.5 4,908,964,8 0,00 4,908,964,8
AC 12.47 0.19 11.00 4.87 23.72 18.00 7.00 25.00
MS 0.01 0.00 0.00 0.07 0.01 1.00 0.00 1.00
RI 92,753.1 10,632.5 16,829.2 268,143.6 71,901,037,863.7 3,815,511.4 39.3 3,815,550.7
Source: Author´s calculation in database. Output of XLStat.
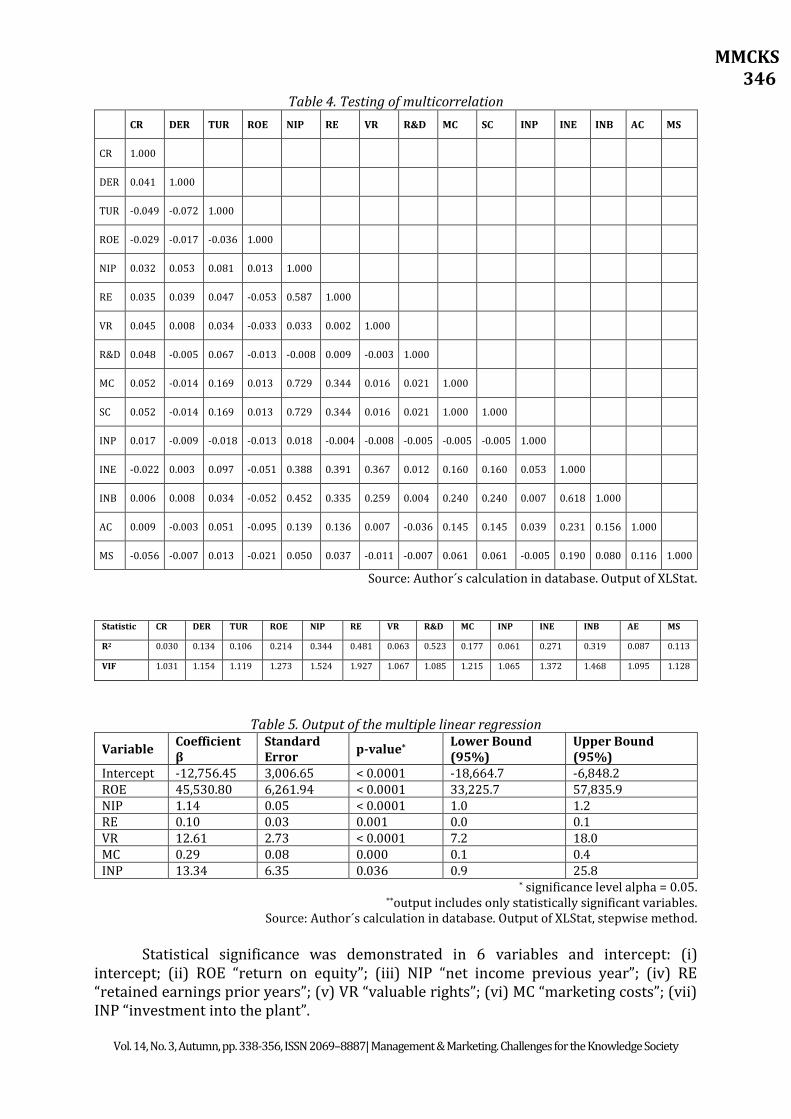
Table no. 4 provides results of testing of multicorrelation among each input independent variable. The matrix of correlation coefficients among all variables proved the existence of multicorrelation between variables MC and SC. This problem was solved by removing variable SC.
In addition, data were also tested for the existence of outliers. For outliers’ detection the interquartile range was used, which is the difference between the first quartile (Q1) and third quartile (Q3). In this method outliers are values: (i) below Q1-1.5IQR; (ii) above Q3+1.5IQR. The interquartile range was used for all input variables and discovered 163 outliers.
MMCKS 346
Vol. 14, No. 3, Autumn, pp. 338-356, ISSN 2069–8887| Management & Marketing. Challenges for the Knowledge Society
Table 4. Testing of multicorrelation
CR DER TUR ROE NIP RE VR R&D MC SC INP INE INB AC MS
CR 1.000
DER 0.041 1.000
TUR -0.049 -0.072 1.000
ROE -0.029 -0.017 -0.036 1.000
NIP 0.032 0.053 0.081 0.013 1.000
RE 0.035 0.039 0.047 -0.053 0.587 1.000
VR 0.045 0.008 0.034 -0.033 0.033 0.002 1.000
R&D 0.048 -0.005 0.067 -0.013 -0.008 0.009 -0.003 1.000
MC 0.052 -0.014 0.169 0.013 0.729 0.344 0.016 0.021 1.000
SC 0.052 -0.014 0.169 0.013 0.729 0.344 0.016 0.021 1.000 1.000
INP 0.017 -0.009 -0.018 -0.013 0.018 -0.004 -0.008 -0.005 -0.005 -0.005 1.000
INE -0.022 0.003 0.097 -0.051 0.388 0.391 0.367 0.012 0.160 0.160 0.053 1.000
INB 0.006 0.008 0.034 -0.052 0.452 0.335 0.259 0.004 0.240 0.240 0.007 0.618 1.000
AC 0.009 -0.003 0.051 -0.095 0.139 0.136 0.007 -0.036 0.145 0.145 0.039 0.231 0.156 1.000
MS -0.056 -0.007 0.013 -0.021 0.050 0.037 -0.011 -0.007 0.061 0.061 -0.005 0.190 0.080 0.116 1.000
Source: Author´s calculation in database. Output of XLStat.
Statistic CR DER TUR ROE NIP RE VR R&D MC INP INE INB AE MS
R2 0.030 0.134 0.106 0.214 0.344 0.481 0.063 0.523 0.177 0.061 0.271 0.319 0.087 0.113
VIF 1.031 1.154 1.119 1.273 1.524 1.927 1.067 1.085 1.215 1.065 1.372 1.468 1.095 1.128
Table 5. Output of the multiple linear regression
Variable Coefficient β
Standard Error
p-value* Lower Bound (95%)
Upper Bound (95%)
Intercept -12,756.45 3,006.65 < 0.0001 -18,664.7 -6,848.2 ROE 45,530.80 6,261.94 < 0.0001 33,225.7 57,835.9 NIP 1.14 0.05 < 0.0001 1.0 1.2 RE 0.10 0.03 0.001 0.0 0.1 VR 12.61 2.73 < 0.0001 7.2 18.0 MC 0.29 0.08 0.000 0.1 0.4 INP 13.34 6.35 0.036 0.9 25.8
* significance level alpha = 0.05. **output includes only statistically significant variables.
Source: Author´s calculation in database. Output of XLStat, stepwise method.
Statistical significance was demonstrated in 6 variables and intercept: (i) intercept; (ii) ROE “return on equity”; (iii) NIP “net income previous year”; (iv) RE “retained earnings prior years”; (v) VR “valuable rights”; (vi) MC “marketing costs”; (vii) INP “investment into the plant”.
MMCKS 347
Vol. 14, No. 3, Autumn, pp. 338-356, ISSN 2069–8887| Management & Marketing. Challenges for the Knowledge Society
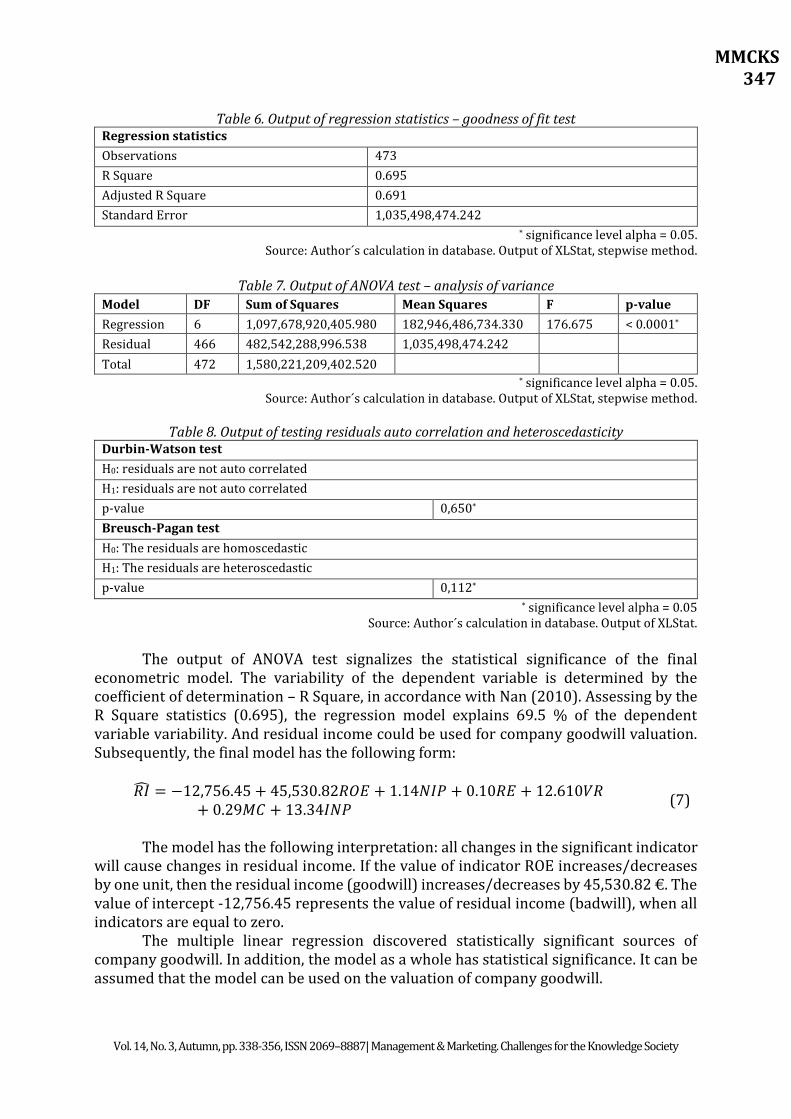
Table 6. Output of regression statistics – goodness of fit test
Regression statistics
Observations 473
R Square 0.695
Adjusted R Square 0.691
Standard Error 1,035,498,474.242 * significance level alpha = 0.05.
Source: Author´s calculation in database. Output of XLStat, stepwise method.
Table 7. Output of ANOVA test – analysis of variance Model DF Sum of Squares Mean Squares F p-value
Regression 6 1,097,678,920,405.980 182,946,486,734.330 176.675 < 0.0001*
Residual 466 482,542,288,996.538 1,035,498,474.242
Total 472 1,580,221,209,402.520 * significance level alpha = 0.05.
Source: Author´s calculation in database. Output of XLStat, stepwise method.
Table 8. Output of testing residuals auto correlation and heteroscedasticity Durbin-Watson test
H0: residuals are not auto correlated
H1: residuals are not auto correlated
p-value 0,650*
Breusch-Pagan test
H0: The residuals are homoscedastic
H1: The residuals are heteroscedastic
p-value 0,112* * significance level alpha = 0.05
Source: Author´s calculation in database. Output of XLStat.
The output of ANOVA test signalizes the statistical significance of the final econometric model. The variability of the dependent variable is determined by the coefficient of determination – R Square, in accordance with Nan (2010). Assessing by the R Square statistics (0.695), the regression model explains 69.5 % of the dependent variable variability. And residual income could be used for company goodwill valuation. Subsequently, the final model has the following form:
𝑅�̂� = −12,756.45 + 45,530.82𝑅𝑂𝐸 + 1.14𝑁𝐼𝑃 + 0.10𝑅𝐸 + 12.610𝑉𝑅+ 0.29𝑀𝐶 + 13.34𝐼𝑁𝑃
(7)
The model has the following interpretation: all changes in the significant indicator
will cause changes in residual income. If the value of indicator ROE increases/decreases by one unit, then the residual income (goodwill) increases/decreases by 45,530.82 €. The value of intercept -12,756.45 represents the value of residual income (badwill), when all indicators are equal to zero.
The multiple linear regression discovered statistically significant sources of company goodwill. In addition, the model as a whole has statistical significance. It can be assumed that the model can be used on the valuation of company goodwill.
MMCKS 348
Vol. 14, No. 3, Autumn, pp. 338-356, ISSN 2069–8887| Management & Marketing. Challenges for the Knowledge Society
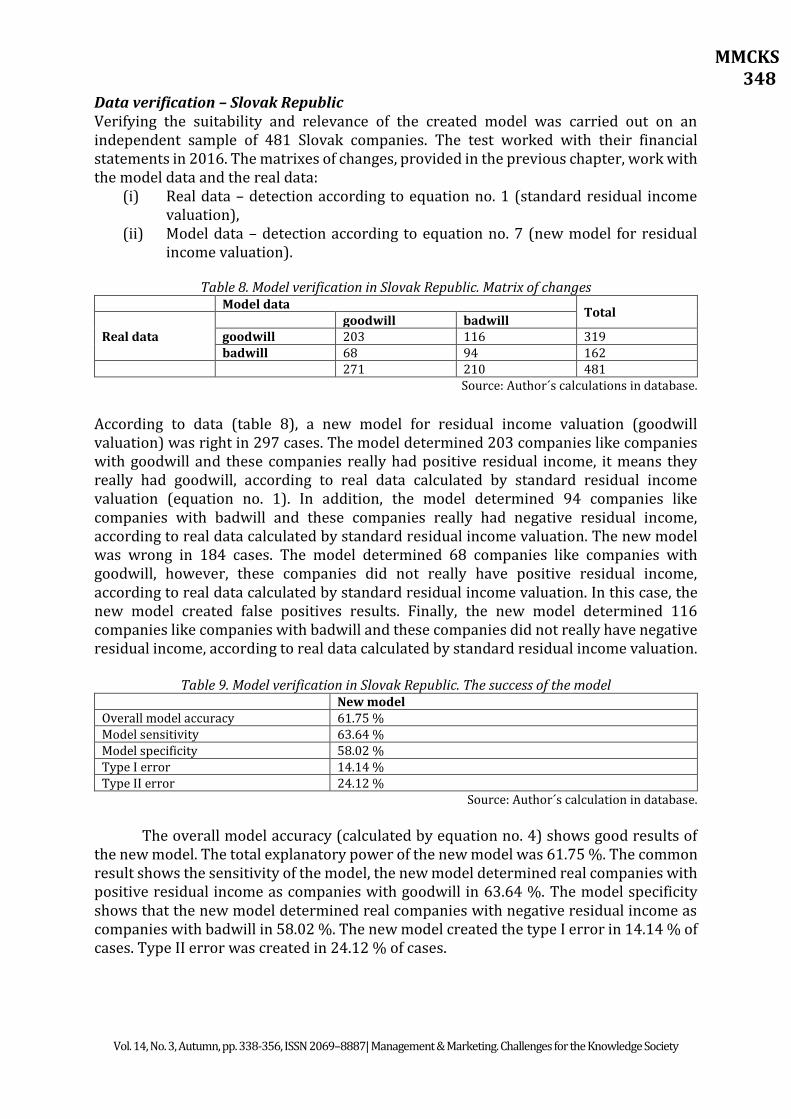
Data verification – Slovak Republic Verifying the suitability and relevance of the created model was carried out on an independent sample of 481 Slovak companies. The test worked with their financial statements in 2016. The matrixes of changes, provided in the previous chapter, work with the model data and the real data:
(i) Real data – detection according to equation no. 1 (standard residual income valuation),
(ii) Model data – detection according to equation no. 7 (new model for residual income valuation).
Table 8. Model verification in Slovak Republic. Matrix of changes
Model data Total
Real data goodwill badwill goodwill 203 116 319 badwill 68 94 162
271 210 481 Source: Author´s calculations in database.
According to data (table 8), a new model for residual income valuation (goodwill valuation) was right in 297 cases. The model determined 203 companies like companies with goodwill and these companies really had positive residual income, it means they really had goodwill, according to real data calculated by standard residual income valuation (equation no. 1). In addition, the model determined 94 companies like companies with badwill and these companies really had negative residual income, according to real data calculated by standard residual income valuation. The new model was wrong in 184 cases. The model determined 68 companies like companies with goodwill, however, these companies did not really have positive residual income, according to real data calculated by standard residual income valuation. In this case, the new model created false positives results. Finally, the new model determined 116 companies like companies with badwill and these companies did not really have negative residual income, according to real data calculated by standard residual income valuation.
Table 9. Model verification in Slovak Republic. The success of the model New model Overall model accuracy 61.75 % Model sensitivity 63.64 % Model specificity 58.02 % Type I error 14.14 % Type II error 24.12 %
Source: Author´s calculation in database.
The overall model accuracy (calculated by equation no. 4) shows good results of the new model. The total explanatory power of the new model was 61.75 %. The common result shows the sensitivity of the model, the new model determined real companies with positive residual income as companies with goodwill in 63.64 %. The model specificity shows that the new model determined real companies with negative residual income as companies with badwill in 58.02 %. The new model created the type I error in 14.14 % of cases. Type II error was created in 24.12 % of cases.
MMCKS 349
Vol. 14, No. 3, Autumn, pp. 338-356, ISSN 2069–8887| Management & Marketing. Challenges for the Knowledge Society
Data verification – Czech Republic Verifying the suitability and relevance of the created model was carried out on an independent sample of 481 Czech companies. The test worked with their financial statements in 2016. The matrixes of changes, provided in the previous chapter, work with the model data and the real data:
(i) Real data – detection according to equation no. 1 (standard residual income valuation),
(ii) Model data – detection according to equation no. 7 (new model for residual income valuation).
Table 10. Model verification in Czech Republic. Matrix of changes
Model data Total
Real data goodwill badwill goodwill 185 159 344 badwill 38 99 137
223 258 481 Source: Author´s calculation in database.
According to data (table 10), the new model for residual income valuation
(goodwill valuation) was right in 284 cases. The model determined 185 companies like companies with goodwill and these companies really had positive residual income, it means they really had goodwill, according to real data calculated by standard residual income valuation (equation no. 1). In addition, the model determined 99 companies like companies with badwill and these companies really had negative residual income, according to real data calculated by standard residual income valuation. The new model was wrong in 197 cases. The model determined 38 companies like companies with goodwill, however, these companies did not really have positive residual income, according to real data calculated by standard residual income valuation. In this case, the new model created false positives results. Finally, the new model determined 159 companies like companies with badwill and these companies did not really have negative residual income, according to real data calculated by standard residual income valuation.
Table 11. Model verification in Czech Republic. The success of the model
New model Overall model accuracy 59.04 % Model sensitivity 53.78 % Model specificity 72.27 % Type I error 7.90 % Type II error 33.06 %
Source: Author´s calculation in database.
The overall model accuracy (calculated by equation no. 4) shows good results of the new model. The total explanatory power of the new model was 59.04 %. The common result shows the sensitivity of the model, the new model determined real companies with positive residual income as companies with goodwill in 53.78 %. The model specificity shows that the new model determined real companies with negative residual income as companies with badwill in 72.27 %. The new model created the type I error in 7.90 % of cases. Type II error was created in 33.06 % of cases.
MMCKS 350
Vol. 14, No. 3, Autumn, pp. 338-356, ISSN 2069–8887| Management & Marketing. Challenges for the Knowledge Society
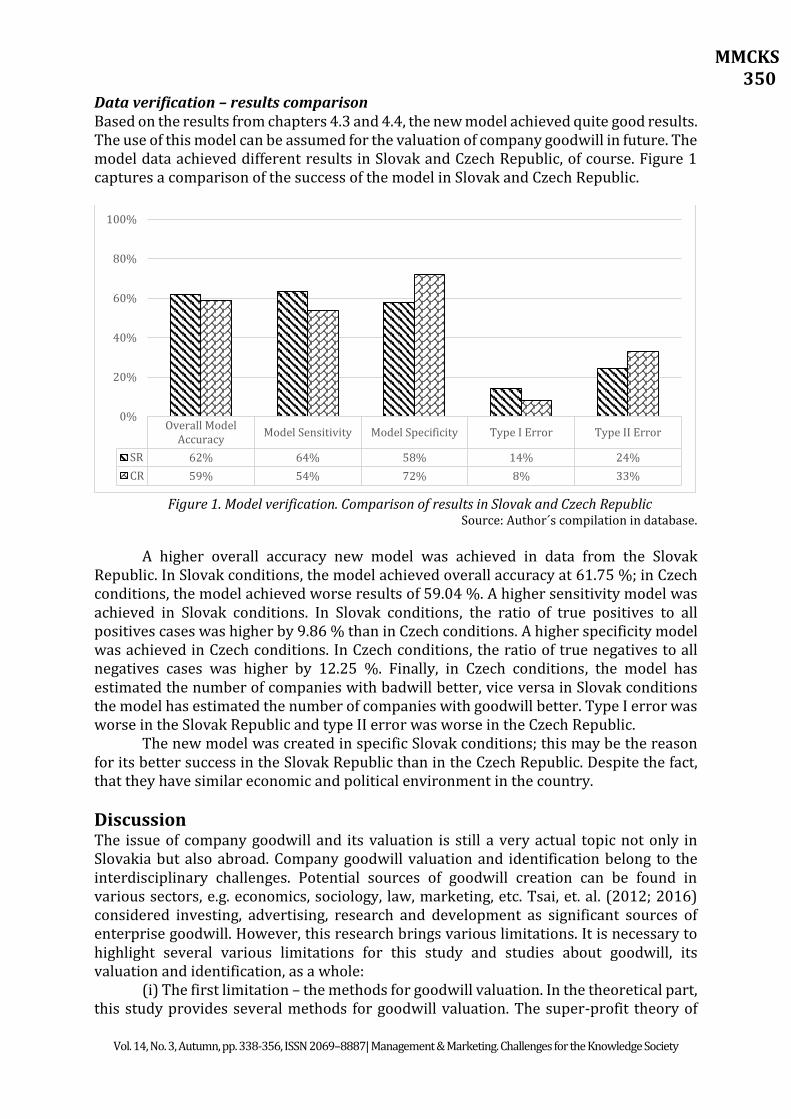
Data verification – results comparison Based on the results from chapters 4.3 and 4.4, the new model achieved quite good results. The use of this model can be assumed for the valuation of company goodwill in future. The model data achieved different results in Slovak and Czech Republic, of course. Figure 1 captures a comparison of the success of the model in Slovak and Czech Republic.
Figure 1. Model verification. Comparison of results in Slovak and Czech Republic
Source: Author´s compilation in database.
A higher overall accuracy new model was achieved in data from the Slovak Republic. In Slovak conditions, the model achieved overall accuracy at 61.75 %; in Czech conditions, the model achieved worse results of 59.04 %. A higher sensitivity model was achieved in Slovak conditions. In Slovak conditions, the ratio of true positives to all positives cases was higher by 9.86 % than in Czech conditions. A higher specificity model was achieved in Czech conditions. In Czech conditions, the ratio of true negatives to all negatives cases was higher by 12.25 %. Finally, in Czech conditions, the model has estimated the number of companies with badwill better, vice versa in Slovak conditions the model has estimated the number of companies with goodwill better. Type I error was worse in the Slovak Republic and type II error was worse in the Czech Republic.
The new model was created in specific Slovak conditions; this may be the reason for its better success in the Slovak Republic than in the Czech Republic. Despite the fact, that they have similar economic and political environment in the country.
Discussion The issue of company goodwill and its valuation is still a very actual topic not only in Slovakia but also abroad. Company goodwill valuation and identification belong to the interdisciplinary challenges. Potential sources of goodwill creation can be found in various sectors, e.g. economics, sociology, law, marketing, etc. Tsai, et. al. (2012; 2016) considered investing, advertising, research and development as significant sources of enterprise goodwill. However, this research brings various limitations. It is necessary to highlight several various limitations for this study and studies about goodwill, its valuation and identification, as a whole:
(i) The first limitation – the methods for goodwill valuation. In the theoretical part, this study provides several methods for goodwill valuation. The super-profit theory of
Overall ModelAccuracy
Model Sensitivity Model Specificity Type I Error Type II Error
SR 62% 64% 58% 14% 24%
CR 59% 54% 72% 8% 33%
0%
20%
40%
60%
80%
100%
MMCKS 351
Vol. 14, No. 3, Autumn, pp. 338-356, ISSN 2069–8887| Management & Marketing. Challenges for the Knowledge Society
goodwill described by Leake (1921); the momentum theory of goodwill described by Nelson (1953); goodwill analysed through its components described by Lonergan (1995) and residual income valuation method Preinreich (1936). Furthermore, specific laws and regulations in individual countries governing the valuation of intangible assets, e.g. in Slovak Republic Regulation of the Ministry of Justice no. 492/2004 about the determination of the general value of the company. Different methods bring different results, of course. Choosing the relevant method is always a challenge and an individual matter. These circumstances have opened a space for creation of new models for company goodwill valuation. The new possibilities for company goodwill valuation and creation of the new model for its valuation are also addressed in this study.
(ii) The second limitation – the sources of goodwill creation and their quantification. The issue of goodwill is interdisciplinary. Its sources can be found in various disciplines. The disadvantage is represented by their detection and quantification. Goodwill represents intangible property and its components are the mostly intangible and qualitative character. This fact creates a problem with their quantification. In addition, goodwill can be formed by quantitative components. Quantitative components also have their disadvantage, which is represented by the various ways of their quantification. In scientific literature there exist several methods for the quantification of some indicators, furthermore significant differences are also among their recommended values. These circumstances also represent limitations also in this study, in the process of the new model of creation.
(iii) The third limitation – the quantification of input variables. The important input variables have had various methods for their quantification. It is necessary to make a decision in the calculation method for the cost of equity, net income and other input variables. This study worked with the capital assets pricing model for quantification of the cost of equity.
(iv) The fourth limitation – the statistical methods. The econometric model creation requires various statistical methods. In this study, the multiple linear regression analysis was used. The problem could be the testing of the Gauss-Mark assumptions. The detection and removal of outliers can make a difference in the relevance of the results. In this study the interquartile range for outliers detection was used.
The difficulty and interdisciplinarity of goodwill issue, have opened the space for the extensions of its research.
(i) The first extension – the methods for goodwill valuation. The choice of the method can affect the relevance of the results. This is the space for the creation of the new model for company goodwill valuation. This study provides the new view on the company goodwill valuation, through the creation of the new model for goodwill valuation. The starting point for this model is the theory of residual income valuation. The choice of another method can bring more relevant results for goodwill valuation.
(ii) The second extension – the sources of goodwill creation and their quantification. The choice of different input variables for new model creation can bring more relevant results for goodwill valuation. Various ways of their quantification can affect the relevance of the results and bring new findings. It is possible to add/remove other input quantitative or qualitative variables.
(iii) The third extension – the quantification of input variables. Elementary input variables can be calculated in a different way. For the cost of equity the build-up method can be used, this method is recommended in countries with an inefficient capital market. Net income can be replaced by earnings before taxes or earnings before taxes and interests, etc.
MMCKS 352
Vol. 14, No. 3, Autumn, pp. 338-356, ISSN 2069–8887| Management & Marketing. Challenges for the Knowledge Society
(iv) The fourth extension – the statistical methods. This study worked with multiple linear regression. However, other methods can affect the relevance of the results. More qualitative variables would require another statistical method. For the detection of outliers the Grubbs test for outliers, Z-score, etc. can be used.
(v) The fifth extension – the verification of the new model. In this study the new model for company goodwill valuation was created, by multiple linear regression analysis and based on the theory of residual income valuation. Subsequently, the study verified its overall accuracy and explanatory power on the data from two countries (Slovak and the Czech Republic). The verification was done through the matrixes of changes. These matrixes provided the view on the total number of right results of the model, on the other hand, they do not provide information about the accuracy of model results. These circumstances have opened the space for testing the model accuracy by other methods, e.g. volatility of model results and real results/values. This future testing will bring a comprehensive view on the possibilities of using the new model both in the theory and practice of financial management and other disciplines.
Conclusion Goodwill as an economic phenomenon has attracted the attention of economic experts since the nineteenth century. Knowledge and understanding of company goodwill sources are still a challenge. This issue is really interdisciplinary. Potential sources of goodwill creation can be found in various sectors, e.g. economics, sociology, law, marketing, etc. They could have quantitative or qualitative characters. This study was focused on the detection of potential sources of company goodwill creation and the creation of the new econometric model for its valuation. The aim of the study was to identify significant sources of company goodwill creation and their verification on the sample of Slovak and Czech companies. The study addressed the new econometric model created by multiple linear regression and based on the theory of residual income valuation. In the beginning, the study worked with the sample of 11,483 financial statements of Slovak companies in 2015 and 17 input variables (potential sources of company goodwill valuation). Finally, model discovered 6 statistically significant sources of company goodwill: (i) ROE “return on equity”; (ii) NIP “net income previous year”; (iii) RE “retained earnings prior years”; (iv) VR “valuable rights”; (v) MC “marketing costs”; (vi) INP “investment into the plant”. Assessing by the R Square statistics (0.695), the regression model explains 69.5 % of the dependent variable variability. And the residual income could be used for company goodwill valuation. Subsequently, the study verified its overall accuracy and explanatory power on the data in two countries (481 financial statements of Slovak companies in 2016 and 481 financial statements of Czech companies in 2016). Verification was done through the matrixes of changes. The model achieved better results in Slovak conditions, overall model accuracy was 61.75 %, vice versa 59.04 % in Czech conditions. Type I error was worse in the Slovak Republic (14.14 %) and type II error was worse in Czech Republic (33.06 %). In the discussion section, the study provided possible limitations and extensions of future research. These circumstances have opened the space for testing the model accuracy by other methods, e.g. volatility of model results and real results/values. This future testing will bring a comprehensive view on the possibilities of using the new model both in the theory and practice of financial management and other disciplines. The study aim can be considered as fulfilled.
MMCKS 353
Vol. 14, No. 3, Autumn, pp. 338-356, ISSN 2069–8887| Management & Marketing. Challenges for the Knowledge Society
Acknowledgement The research leading to these results has received funding from the project entitled "Creation of new paradigms of financial management at the threshold of the 21st century in conditions of the Slovak republic" in the frame of the program of Slovak Scientific Grant Agency VEGA under the grant agreement number VEGA 1/0428/17.
References Balcerzak, A.P., Kliestik, T., Streimikiene, D., & Smrcka L. (2017). Non-Parametric
Approach to Measuring the Efficiency of Banking Sectors in European Union Countries. ActaPolytechnicaHungarica, 14(7), 51-70.
Bloom, M. (2008). Double Accounting for Goodwill: A Problem Redefined. New York: Taylor & Francis Group.
Bean, L.A. (2011). Hunting Goodwill: Personal Goodwill as Property in Corporate Acquisitions. Journal of Corporate Accounting & Finance, 23(2), 55-61.
Begley, J., Chabmerlmn, S.L., & Li, Y.H. (2006). Modeling Goodwill for Banks: A Residual Income Approach with Empirical Tests. Contemporary Accounting Research, 23, 31-68.
Boyarko, I.M., & Samusevych, Y.V. (2011). Role of Intangible Assets in Company's Value Creation. Actual Problems of Economics, 117, 86-94.
Canibano, L.&Garcia-Ayuso, M., & Sanchez, P. (2000). Accounting for Intangibles: A Literature Review. Journal of Accounting Literature, 19, 102-130.
Catlett, G.&Olson, N.O. (1968). Accounting research studies. No. 10. New York: American Institute of Certified Public Accountants.
Cavalinhos, P., & Carreira, F. (2015). The Impact of the Goodwill in Profit. RevistaUniversoContábil, 196-210.
Courtis, J.K. (1983). Business Goodwill: Conceptual Clarification Via Accounting, Legal and Etymological Perspectives. The Accounting Historians Journal, 10, 1-38.
Curtis, A., & Fargher, N.L. (2003). A Comparison of Residual Income and Comparable Firm Valuation of Initial Public Offerings. SSRN Electronic Journal.
Cygler, J., & Sroka, W. (2017). Coopetition Disadvantages: The Case of the High Tech Companies.InzinerineEkonomika-Engineering Economics, 28(5), 494-504.
D´Amico, G., Di Biase, G., Janssen, J., & Manca, R. (2014). A Duration Dependent Rating Migration Model: Real Data Application and Cost of Capital Estimation. Finance a Uver-Czech Journal of Economics and Finance, 64(3), 233-245.
Da Silva, I.D., Igarashi, D.C.C., Igarashi, W. & da Silva Faia, V. (2015). Intangible Assets: Relationship with Tangible Assets and Financial Ratios. RevistaGestaoOrganizacional, 8(2), 26-40.
Dvorsky, J., Sopkova, G., & Janoskova, M. (2017). Evaluation of the Social Environment and Access to Financial Resources for Business: Case Study of the Czech and Slovak Republic. Ekonomicko-manazerske Spektrum, 11(1), 62-73.
Fanelli, V., & Ryden, A.K. (2018). Pricing a Swing Contract in a Gas Sale Company. Economics, Management, and Financial Markets, 13(2), 40-55.
Feltham, G.A., & Ohlson, J.A. (1995). Valuation and Clean Surplus Accounting for Operating and Financial Activities. Contemporary Accounting Research, 11, 689-731.
Fernandez, P. (2002). Three Residual Income Valuation Methods and Discounted Cash Flow Valuation. SSRN Electronic Journal.
Goodman, T. (2016). Forbes Book of Quotations: 10,000 Thoughts on the business of life. New York: Black Dog & Leventhal.
MMCKS 354
Vol. 14, No. 3, Autumn, pp. 338-356, ISSN 2069–8887| Management & Marketing. Challenges for the Knowledge Society
Groves, P. (2011). A Dictionary of Intellectual Property Law. Cheltenham: Edward Elgar Publishing Limited.
Herz, R.H. , Iannaconi, T.E., Maines, L.A., Palepu, K., Ryan, S.G., Schipper, K., Schrand, C.M., Skinner. D.J., &Vincent, L. (2001). Equity Valuation Models and Measuring Goodwill Impairment. Accounting Horizons, 15(2), 161-170.
Hughes, H.P. (1982). Goodwill in Accounting: A History of the Issue and Problems. Atlanta: Georgia State University, [Research Monograph].
Hyuna, P. (2017). Intangible Assets and the Book-to-market effect. European Financial Management. 0(0).
Hvozdarova, J. (2006). Goodwill a Jeho Testovanie. Bratislava: Účtovníctvo, audítorstvo, daňovníctvo.
Cheng, Q. (2005). What Determines Residual Income? The Accounting Review, 80, 85-112.
Chrysafis, K.A. (2012). Corporate Investment Appraisal with Possibilistic CAPM. Mathematical and Computer Modelling, 55, 1041-1050.
Ionescu, L. (2017). Public Perceptions of Government Corruption: An Empirical Investigation. Journal of Self-Governance and Management Economics, 5(4), 81-86.
Ivanova, E., & Cepel, M. (2018). The Impact of Innovation Performance on the Competitiveness of the Visegrad 4 Countries. Journal of Competitiveness, 10(1), 54-72.
Jakubec, M., Kardos, P., & Kubica, M. (2011). Riadenie Hodnoty Podniku, Bratislava: Kartprint.
Jansky, M. (2011). The Feltham-Ohlson Model: Goodwill and Price Volatility. Prague: Charles University. [Working paper].
Kariuki, B.W., & Qyugi, L.A. (2013). Testing the Residual Income Valuation Model in a Nascent Stock Market: The Case of Nairobi Securities Exchange. International Journal of Business and Social Science, 4, 69-77.
Kimbro, M.B., & Xu, D. (2016). The Accounting Treatment of Goodwill, Idiosyncratic Risk, and Market Pricing. Journal of Accounting Auditing and Finance, 31, 365-387.
Kliestik, T., Misankova, M., & Bartosova, V. (2015). Application of Multi Criteria Goal Programming Approach for Management of the Company. Applied Mathematical Sciences, 9(115), 5715-5727.
Kliestik, T., Misankova, M., Valaskova, K., & Svabova, L. (2018). Bankruptcy Prevention: New Effort to Reflect on Legal and Social Changes. Science and Engineering Ethics, 24(2), 791-803.
Kliestik, T, Kovacova, M., Podhorska, I., &Kliestikova, J. (2018). Searching for Key Sources of Goodwill Creation As New Global Managerial Challenge. Polish Journal of Management Studies, 17(1), 144-154.
Kliestikova J., Misankova M., & Kliestik T. (2017). Bankruptcy in Slovakia: international comparison of the creditor´s position. Oeconomia Copernicana, 8(2), 221-237.
Kohlbeck, M., & Warfield, T. (2002). The Role of Unrecorded Intangible Assets in Residual Income Valuation: The Case of Banks. SSRN Electronic Journal.
Kylianova, D., & Lalikova L. (2010). Hodnota Značky a jej Podiel na Nehmotnom Majetku Podniku. Banská Bystrica: Koprint, s.r.o.
Laghi, E., & Di Marcantonio, M. (2016). Beyond CAPM: Estimating the Cost of Equity Considering Idiosyncratic Risks. Quantitative Finance, (16), 1273-1296.
Leake, P.D. (1921). Commercial Goodwill. Its History, Value and Treatment in Accounts, London: Sir Isaac Pitman and Sons, Ltd.
MMCKS 355
Vol. 14, No. 3, Autumn, pp. 338-356, ISSN 2069–8887| Management & Marketing. Challenges for the Knowledge Society
Lonergan, W. (1995). Goodwill and Bad Ideas; Fact and Fiction in the Amortisation Debate. Jassa, 4, 2-7.
Longhofer, R.S. (2005). The Residual Income Method of Business Valuation. Business Valuation Review, 24(2), 65-70.
Lundholm, R.J. (2006). Discussion of „Modeling Goodwill for Banks: A Residual Income Approach with Empirical Tests“. Contemporary Accounting Research. 23(1), 69-71.
Maleki, M.A. (2010). Value Relevance of Accounting-based Valuation Models: The Accuracy of the Abnormal Earnings Growth and Residual Income Model: Evidence from Europe, Amsterdam. [Dissertation thesis].
Maly, J. (2002). Obchod Nehmotnými Statky, Praha: C.H. Beck. Mazzola, P., & Gerace, D., (2015). A Comparison between a Dynamic and Static Approach
to Asset Management Using CAPM Models on the Australian Securities Market. Australasian Accounting Business and Finance Journal,9, 43-58.
Miller, W.D. (1995). Commercial Bank Valuation, US: John Wiley and Sons. Moravcikova, D., Krizanova, A., Kliestikova, J., & Rypakova, M. (2017). Green marketing
as the source of the competitive advantage of the business, Sustainability, 9(12), art.no. 2218.
Nan, Y.Z. (2010). Research on Various Tests and Their Mutual Relations of Simple Linear Correlation and Regression Analysis. Data Processing and Quantitative Economy Modeling, 590-594.
Nelson, H.R. (1953). The Momentum Theory of Goodwill. The Accounting Review, 28, 491-499.
Nica, E., Comanescu, M., & Manole, C. (2017). Digital Reputation and Economic Trust in the Knowledge Labor Market. Journal of Self-Governance and Management Economics, 5(3), 83-88.
Ohlson, J. (1995). Earnings, Book Values, and Dividends in Equity Valuation. Contemporary Accounting Research, 661-687.
Olah, J., Zeman, Z., Balogh, I., & Popp, J. (2018). Future Challenges and Areas of Development for Supply Chain Management.Logforum, 14(1), 127-138.
Peasnell, K. (1982). Some Formal Connections between Economic Values and Yields and Accounting Numbers. Journal of Business Finance and Accounting, 9, 361-381.
Podolna, V.V. (2008). Key Aspects of Formation and Development of Positive Goodwill of an Enterprise. Actual Problems of Economics, 87, 128-134.
Preinreich, G. (1936). The Fair Value and Yield of Common Stock. The Accounting Review, 130-140.
Rajnoha, R., & Lesnikova, P. (2016). Strategic Performance Management System and Corporate Sustainability Concept – Specific Parameters in Slovak Enterprises. Journal of Competitiveness, 8(3), 107-124.
Reilly, R.F. (2015). Goodwill Valuation Approaches, Methods, and Procedures. American Bankruptcy Institute Journal, 34, 10-24.
Reimsbach, D. (2013). Intangible Assets as Drivers of Firm's Market Value? - Empirical Evidence from German DAX 30-companies 1998-2007. BetriebswirtschaftlicheForschung Und Praxis, 65, 653-680.
Ruckova, P. (2015). FinančníAnalýza. Metody, Ukazovatele, Využití v Praxi. Praha: Grada Publishing, a.s.
Sadaf, R., Olah, J., Popp, J., & Mate, D. (2018). An Investigation of the Influence of the Worldwide Governance and Competitiveness on Accounting Fraud Cases: A Cross-Country Perspective. Sustainability, 10, ar. no: 588.
MMCKS 356
Vol. 14, No. 3, Autumn, pp. 338-356, ISSN 2069–8887| Management & Marketing. Challenges for the Knowledge Society
Sedlacek, J. (2011). Finanční Analýza Podniku. Praha: Computer Press. Shenkar, O., & Yuchtmanyaar, E. (1997). Reputation, Image, Prestige, and Goodwill: An
Interdisciplinary Approach to Organizational standing. Human Relations, 50, 1361-1381.
Siekelova, A. (2017). Using Rating for Credit Risk Measurement. In: 17th Annual Conference on Finance and Accounting. Book Series: Springer Proceedings in Business and Economics, 689-697.
Siekelova, A., Svabova, L., Kliestik, T. & Androniceanu, A. (2017). Receivables Management: The Importance of Financial Indicators in Assessing the Creditworthiness. Polish Journal of Management Studies, 15(2), 217-228.
Skogsvik, K., & Juettner-Nauroth, B.E. (2013). A Note on Accounting Conservatism in Residual Income and Abnormal Earnings Growth Equity Valuation. British Accounting Review, 45, 70-80.
Slavik, S., & Zagorsek, B. (2016). Relationship Between Business Strategy and Business Model Studied in a Sample of Service Companies. Journal of Competitiveness, 8(4), 72-84.
Svabova, L., & Durica, M. (2016). Correlation analysis of predictors used in banknote prediction models in Slovakia. Ekonomicko-manazerske Spektrum, 10(1), 76-89.
Svabova, L., & Kral, P. (2016). Selection of Predictors in Bankruptcy Prediction Models for Slovak Companies. In:10th International days of statistics and economics. Conference proceedings, 1759-1768.
Synek, M. & Kislingerova, E. (2006). Podniková Ekonomika. Praha: C.H.Beck. Tregoning, I. (2004). Lord Eldon´s Goodwill. King´s Law Journal, 15, 93-116. Tsai, C.F., Lu, Y.-H., Hung, Y.C. & Yen, D.C. (2016). Intangible Assets Evaluation: The
Machine Learning Perspective. Neurocomputing, 175, 110-120. Tsai, C.F., Lu, Y.-H. & Yen, D.C. (2012). Determinants of Intangible Assets Value: The Data
Mining Approach. Knowledge-Based Systems, 31, 67-77. Vojtovic, S. (2016). The Impact of The Structural Funds on Competitiveness of Small and
Medium-Sized Enterprises. Journal of Competitiveness, 8(4), 30-45. Zapletalova, S. (2017). Competitive Strategies of the SMEs: Empirical Evidence from the
Czech Republic. Forum Scientiae Oeconomia, 5(3), 9-26. Zelenka, V. (2006). Goodwill Principy Vykazování v Podniku. Praha: Ekopress, s.r.o.