positive peace report
TRANSCRIPT

2022
POSITIVE PEACE REPORT Analysing the factors that build, predict and sustain peace.
Institute for Economics & Peace
POSITIV
E PEAC
E REPO
RT 20
22

Quantifying Peace and its BenefitsThe Institute for Economics & Peace (IEP) is an independent, non-partisan, non-profit think tank dedicated to shifting the world’s focus to peace as a positive, achievable, and tangible measure of human well-being and progress.
IEP achieves its goals by developing new conceptual frameworks to define peacefulness; providing metrics for measuring peace; and uncovering the relationships between business, peace and prosperity as well as promoting a better understanding of the cultural, economic and political factors that create peace.
IEP is headquartered in Sydney, with offices in New York, The Hague, Mexico City, Brussels and Harare. It works with a wide range of partners internationally and collaborates with intergovernmental organisations on measuring and communicating the economic value of peace.
For more information visit www.economicsandpeace.org
Please cite this report as: Institute for Economics & Peace. Positive Peace Report 2022: Analysing the factors that build, predict and sustain peace, Sydney, January 2022. Available from: http://visionofhumanity.org/resources (accessed Date Month Year).

POSITIVE PEACE REPORT 2022 | 1
Section 2: The Benefits of Societal Resilience 49The Benefits of Positive Peace 50COVID-19 and Societal Resilience 54Predicting Future Changes in Peace 57Wellbeing, Life Satisfaction and Culture 62
Section 1: Positive Peace Index, Results & Trends 182022 Positive Peace Index Rankings 21Global Trends in Positive Peace 23Risers and Fallers in Positive Peace 31Special Section: US, China, EU, UK and Russia 42
23
4
1
Why Positive Peace is Transformational 2Executive Summary 4Key Findings 6Positive Peace: A Measure of Societal Resilience 8
Contents
Section 4: Implementing Positive Peace 80 Education Programmes 81Academic Programmes 82Partnerships 83Positive Peace Workshops 84
Appendix A: Positive Peace Index Methodology 87Appendix B: Positive Peace Index Rankings 90Endnotes 94
Section 3: Halo: A Framework for Analysing Societal Systems 69The Attributes of a System 70Approaches to Analysing the Attributes of Systems 74

POSITIVE PEACE REPORT 2022 | 2
A parallel can be drawn with medical science. The study of pathology has led to numerous breakthroughs in our understanding of how to treat and cure disease. However, it was only when medical science turned its focus to the study of healthy human beings that we understood what was needed to do to stay healthy: physical exercise, a good mental disposition, a balanced diet and a sense of purpose. This could only be learned by studying what was working. In the same way, the study of conflict is different from the study of peace, producing very different insights. Understanding what creates sustainable peace cannot be found in the study of violence alone.
Humanity is nearing a tipping point and facing challenges unparalleled in its short history. Many of these problems are global in nature, such as climate change, ever decreasing biodiversity, depletion of the earth’s freshwater, and overpopulation. Such global challenges call for global solutions and require cooperation on a scale unprecedented in human history. In a hyper-connected world, the sources of many of these challenges are multidimensional, increasingly complex and span national borders. For this reason, finding solutions requires fundamentally new ways of thinking.
Peace is the prerequisite for the survival of humanity in the 21st century. Without peace, it will not be possible to achieve the levels of trust, cooperation and inclusiveness necessary to solve these challenges, let alone empower international institutions and organisations necessary to address them. In the past, peace may have been the domain of the altruistic; but in the current interconnected and highly mobile global society it is clearly in everyone’s self-interest.
Positive Peace provides a framework to understand and address the many complex challenges the world faces. It is transformational in that it is a cross-cutting facilitator of progress, making it easier for businesses to sell, entrepreneurs and scientists to innovate, individuals to produce and governments to effectively regulate.
Positive Peace is systemic and understanding systems thinking is required to grasp it in its entirety. Systems thinking originated in the study of organisms and has been extended into sociology. A system is a set of parts that interact to achieve a desired purpose/function or intent.
Systems thinking can also assist in understanding the way countries and nations function and evolve. When combined with Positive Peace, it provides new ways of conceptualising and explaining societal change. As one example — a system is more than the sum of its parts, and cannot be understood merely by breaking it down and analysing its constituent parts. Positive Peace consists of eight Pillars, but each of these Pillars does not correlate with peace as strongly as the sum of all components. This highlights that the whole is more than the simple sum of its components.
Such an approach distinctly contrasts with the traditional notion of linear causality, which dominates decision making today: identify a problem, decide upon its causes and tackle it in isolation. Without a fuller understanding of the underlying system dynamics, the linear approach is often ineffective and creates unintended consequences. The failure to solve some of society’s fundamental challenges is a testimony to this. Systems thinking opens new ways of understanding nations and how they evolve. In systems, relationships and flows are more important than events. Events or problems represent the outcomes of the relationships and flows. This is why it is important to look at the multidimensional concept of Positive Peace as a holistic, systemic framework.
Positive Peace defines the goals towards which a system needs to evolve. Interventions should incrementally nudge the system towards ever higher levels of Positive Peace, rather than creating radical change, which is disruptive, disorienting and can create unease and resentment.
Importantly, viewing nations as systems provides a framework for understanding the relationships between humanity and the broader systems, such as the atmosphere and biosphere, which we intersect and depend upon. Systems are self-regulating and self-modifying and operate on two levels: first as a collection of interconnected subsystems and second as part of the larger systems surrounding it. Understanding these interdependencies is essential to meeting the global challenges of our age.
Different countries have different aims, or intent. Societies also have both formal and informal rules, referred to as encoded norms, which govern social behaviour, and aim to maintain the system in a stable state. They regulate inputs, creating feedback
Positive Peace is a transformational concept because it shifts the focus away from the negative by describing the necessary conditions for peace and society to flourish. Due to its systemic nature, improvements in Positive Peace not only strengthen peace, but are also associated with many other desirable outcomes for society, such as higher GDP growth, better measures of wellbeing, higher levels of resilience and more harmonious societies. Importantly, it provides a theory of social change, explaining how societies transform and evolve. Positive Peace describes an optimal environment under which human potential can flourish.
WHY POSITIVE PEACE IS TRANSFORMATIONAL
Sub System

loops. This can be observed in many societal processes, such as when a government stimulates the economy in response to a drop in GDP or deploys more policing resources when there is a rise in crime. Each country’s system will be unique with different social norms and governance, although following the same general principles.
With the diversity in intent and encoded norms, any two nations may react differently to the same stimulus. Tipping points also occur within systems due to lagged and non-linear relationships. IEP’s research uncovers evidence of tipping points in relation to peace and corruption and peace and per capita income, to name just two examples. In the past, societies have been investigated through the lens of causality; in the future, embracing these holistic, systemic approaches will forge our ability to navigate an age of unprecedented challenges.
Seen in this light, Positive Peace and systems thinking comprise an overarching framework for understanding and achieving progress not only in the level of global peacefulness, but in many other interrelated areas, including better economic progress, better ecological performance, happiness, stronger development and social advancement. All of these factors have a robust statistical relationship with Positive Peace.
Positive Peace provides the optimal environment for human potential to flourish.
Sub System
POSITIVE PEACE REPORT 2022 | 3

POSITIVE PEACE REPORT 2022 | 4
Executive Summary
Positive Peace is defined as the attitudes, institutions and structures that create and sustain peaceful societies. It is conceptually and empirically related to many constructive aspects of social development and can be used in multiple contexts. It can also be used to compile an index – the Positive Peace Index (PPI). This allows for the comparison and tracking of the factors that create flourishing societies. These and other concepts related to Positive Peace are covered in the first section of this report, as well as general PPI results, including rankings and changes over time.
Positive Peace is closely associated with system concepts to the extent that it is difficult to separate the two. IEP has further deepened its unique understanding of how societal systems function and has developed a framework called Halo which provides a comprehensive approach to analysing societal systems.
The same factors that create lasting peace also lead to many other positive outcomes to which societies aspire. For example, countries with higher levels of Positive Peace:
• are more resilient, • are associated with robust and thriving economies,• have better performance on ecological measures, • higher levels of wellbeing and happiness, • stronger measures of social cohesion, • greater satisfaction with living standards and more.
All these qualities are systemically linked and are a by-product of the quality of the system. Such societies are less encumbered by the costs and wastage of violence or political instability, have higher productivity, better access to information and are not heavily weighed down by corruption or ineffective governments, to name some.
As a result, Positive Peace can be described as creating an optimal environment for human potential to flourish.
Social systems that operate with higher degrees of resilience are capable of offering more effective protection to their citizens against adverse shocks, whether political, environmental or economic. High-resilience societies are also more likely to take advantage of positive disruptions or opportunities arising from the creation of new economic paradigms and technological innovation. Frequently, after shocks, societies high in Positive Peace evolve systemically to be stronger and more capable of recovering from future shocks.
Positive Peace can be used as a predictor of future substantial falls in peace many years in advance, thereby giving the international community forewarnings and time to act. Through
the modelling of the relationship between the PPI and the actual peace of a country, as measured through the Global Peace Index (GPI), it is possible to predict large falls in peace. IEP’s Positive Peace deficit model shows that 80 per cent of the countries predicted to fall substantially in peace did so. This remarkable predictive power is discussed in the second section of this report.
Additionally, nations with a surplus of Positive Peace generally record substantial improvements in peace in the subsequent decade. This underscores the importance of Positive Peace as a gauge of societal resilience and the predictive role it plays in assessing future societal development. It is also important for business, as countries with better Positive Peace outcomes have superior economic performance than their peers. The GDP per capita in countries that improve in the PPI outgrew that of their peers by 2.7 percentage points per year over the past decade.
Similarly, corporate profitability is higher among nations improving their Positive Peace scores. In the industrial, construction and manufacturing sectors, corporate profits among PPI improvers outgrew that of other nations by 3 percentage points per year on average since 2009. Household demand grows twice as fast as elsewhere, inflation is three times less volatile, foreign direct investment and international trade growth is higher, while exchange rates and demand for sovereign bonds also improve.
COVID-19 had an impact on Positive Peace. The improvement in Positive Peace recorded until 2019, weakened substantially in 2020, as a result of the social and economic disruptions stemming from policy responses to the pandemic. Future editions of the PPI will be better placed to more fully assess the impact of COVID-19 on the global social system.
In regards to the management of the pandemic, nations with higher levels of societal resilience, as measured by Positive Peace, were better at protecting their citizens – they had more hospital beds, higher vaccination rates and lower mortality rates. These outcomes are the result of many systemic factors which are captured in the Positive Peace model.
Globally, Positive Peace has strengthened over the past decade, with the PPI score improving by 2.4 per cent since 2009. Improvements in Positive Peace generally happen gradually due to the system-wide nature of change. A total of 126 countries – or 77 per cent of the 163 nations assessed in the PPI – improved their scores over the past decade.
Much of this improvement came in the form of economic development, better health outcomes and greater access to technologies, especially in the information and communication
This report showcases the findings of the Institute for Economics and Peace’s (IEP) research, including its latest results on Positive Peace and systems thinking.

POSITIVE PEACE REPORT 2022 | 5
areas. There has been an increase in per-capita income, a reduction in aggregate levels of poverty and a big rise in the number of persons accessing the Internet. These economic and technological developments are captured in the Structures domain of Positive Peace, which improved by 8 per cent since 2009.
However, these advancements have been partially offset by a deterioration in social attitudes, captured by the Attitudes domain, which deteriorated by 1.8 per cent over the last decade. Sixty per cent of countries deteriorated in this domain. There have been deteriorations in the level of trust in governments, grievances between groups, measures of corruption, press freedoms, conflict between elites and misinformation. Some of the countries in which this domain deteriorated pronouncedly in the past decade were the US, Brazil, Venezuela, Turkey, the UK and India.
The Institutions domain, which gauges the effectiveness, transparency and reliability of the formal and informal organisations that manage societies, recorded a negligible improvement in the decade. However, there were deteriorations in some key measures including access to public services and government openness.
Seven of the eight Pillars of Positive Peace posted improvements since 2009. Free Flow of Information posted the largest improvement – over 10 per cent – on the back of more widespread access to the Internet. Good Relations with Neighbours and Equitable Distribution of Resources also posted large improvements. The improvements in High Levels of Human Capital and Well-Functioning Government were only marginal, reflecting weak outcomes in youth unemployment, government openness and transparency.
The only Pillar of Positive Peace to record a deterioration was Low Levels of Corruption, deteriorating by 1.8 per cent since 2009. This Pillar deteriorated in 99 countries, or 61 per cent of the nations assessed in the PPI and improved in only 64 countries.
The research also incorporates systems thinking, which provides a more accurate understanding of how nations operate and societies develop over time, rather than the traditional approach of cause-and-effect linear thinking. The introductory section of the report describes the fundamental concepts associated with systems thinking.
In the third section, IEP develops a new unique framework and holistic methodology for analysing societies from a systems perspective.
The model identifies the key attributes of societal systems and delineates techniques for studying them, leading to a better understanding of the overall system and its dynamics. Written in an accessible, non-technical way, the section highlights how the methodology can be used and adapted for different applications. The set of steps can be expanded or reduced depending on need and is applicable for country as well as community studies. It can also be used in simple exercises, lasting days or lengthy analyses involving months or years. This Halo methodology is at the core of IEP’s process to engage in systems thinking and is successfully used in research and consulting by the Institute.
When combined with systems thinking, the analysis of Positive Peace produces a new theory of social change. Developments in Positive Peace precede societal changes in peacefulness and human development, either for better or worse. Stimuli and shocks have cascading effects, due to the feedback loops contained within national systems, pushing societies into virtuous or vicious cycles. However, these cycles can be understood, planned and moulded to produce the best social outcomes. Positive Peace provides a roadmap of the things societies need to change, to either consolidate virtuous cycles or break vicious ones.
Section four of this report describes practical examples of how IEP’s Positive Peace framework has been operationalised. This work is developed through the Positive Peace Ambassador Program, the Positive Peace workshops and a number of partnerships with organisations with global and local reach.
Taken together, the findings in this report have important implications for building and sustaining peace.
• There are no quick and easy solutions. Building and sustaining societal development requires a large number of society-wide improvements progressing in concert with one another over long periods of time.
• Resilience should be the priority. Through focusing on the factors that are most critical, it is possible to build resilience in cost-effective ways.
• Stopping or averting conflict is not an end in itself. As Positive Peace progresses, it enables an environment where human potential may more easily flourish.
Without a deeper understanding of how societies operate, it will not be possible to solve humanity’s major global challenges. Positive Peace provides a unique framework from which to manage human affairs and relate to the broader ecosystems upon which we depend. Positive Peace in many ways is a facilitator, making it easier for workers to produce, businesses to sell, entrepreneurs and scientists to innovate and governments to serve the interests of the people.

POSITIVE PEACE REPORT 2022 | 6
Positive Peace Fundamentals • Positive Peace is defined as the attitudes,
institutions and structures that create and sustain peaceful societies.
• These same factors also lead to many other positive outcomes that society feels are important, such as economic strength, resilience and wellbeing.
• Therefore, Positive Peace creates the optimal environment for human potential to flourish.
• The most peaceful countries in the world perform strongly on all eight Pillars of Positive Peace.
• High Positive Peace countries are more likely to maintain stability, adapt and recover from shocks.
• Countries that perform well in Positive Peace are more likely to achieve and sustain high levels of peace.
Global and Regional Trends • More countries improved in Positive Peace — 126
in total, or 77 per cent of all countries assessed — than deteriorated from 2009 to 2020.
• Positive Peace improved 2.4 per cent globally in the past decade.
• This improvement was mainly driven by the Structures domain of Positive Peace, which
Key Findings
improved by 8 per cent since 2009. This domain measures the technological and economic foundations that support social development.
• The Attitudes domain deteriorated by 1.8 per cent in the past decade. This demonstrates greater political polarisation, more intolerance of different views and opinions and less trust in governments. The Institutions domain recorded a marginal improvement in the period.
• Seven of the eight Pillars of Positive Peace improved since 2009, although the improvements in High Levels of Human Capital and Well-Functioning Government were minimal.
• Low Levels of Corruption was the only Pillar to deteriorate. This was either a reflection of greater corruption or an increase in awareness of it around the world.
• Almost all regions of the globe recorded improvements in Positive Peace over the past decade, with the Middle East and North Africa improving only marginally. The only region to record a deterioration was North America.
• The largest country improvements in the PPI over the decade were recorded for Uzbekistan, Georgia, Armenia, Côte d’Ivoire and Kazakhstan. The steepest deteriorations were in Syria, Libya, Venezuela, Yemen and South Sudan.

POSITIVE PEACE REPORT 2022 | 7
The Benefits of Societal Resilience
• From 2009 to 2020, the per capita GDP of countries that improved in the PPI rose by an average of 3.1 per cent per year. This compares with 0.4 per cent per year for the other nations.
• Inflation in countries where the PPI improved was on average three times less volatile than where Positive Peace deteriorated in the past decade. Inflation volatility is detrimental to growth because it creates uncertainty, thereby reducing demand and business investment.
• Household consumption in nations where Positive Peace improved grew two times faster from 2009 to 2020 than where the PPI deteriorated.
• A model based on Positive Peace suggests that the global number of COVID-19 cases by the end of 2021 was almost 700 million, instead of the officially reported 290 million. The number of fatalities was most likely around 12 million persons, instead of the reported 5.4 million.
• Nations with higher levels of resilience have been more effective in shielding their populations from the COVID-19 pandemic,
recording excess mortality rates half the size of those in countries with low levels of societal resilience.
• Of the countries with a substantial Positive Peace Deficit in 2009, almost 80 per cent deteriorated in the GPI in the subsequent decade. A Positive Peace deficit is where the actual peacefulness of a country is substantially higher than what its levels of Positive Peace would suggest.
• High levels of societal resilience are associated with greater life satisfaction because individuals are not weighed down by concerns about survival or excessive poverty.
• In a large proportion of Western European nations and full democracies, females are more satisfied with their own standards of living than males. In contrast, women are less satisfied than men in authoritarian regimes.

POSITIVE PEACE REPORT 2022 | 8
POSITIVE PEACE: A MEASURE OF SOCIETAL RESILIENCE
• Positive Peace is a gauge for societal resilience. Communities, societies and countries that operate with high levels of Positive Peace are more capable of protecting their populations for adverse shocks, such as economic downturns, political crises or natural disasters. These societies also tend to rebuild their internal structures and recover more rapidly in the aftermath of such shocks.
• Positive Peace is defined as the attitudes, institutions and structures that create and sustain peaceful societies. These same factors also lead to many other positive outcomes that society feels are important. Higher levels of Positive Peace are statistically linked to higher GDP growth, better environmental outcomes, higher measures of wellbeing, better developmental outcomes and stronger resilience.
• Positive Peace has been empirically derived by IEP through the analysis of tens of thousands of cross-country measures of socio-economic development, including surveys and expert assessments, to determine which have statistically significant relationships with actual peace as measured by the Global Peace Index (GPI).
• Positive Peace is measured by the Positive Peace Index (PPI), which consists of eight Pillars, each containing three indicators. This provides a baseline measure of the effectiveness of a country’s capabilities to build and maintain peace. It also provides a
NEGATIVEPEACE
... is the absence of violence or fear of
violence.
POSITIVEPEACE... is the attitudes,
institutions & structures that create and sustain
peaceful societies.
FIGURE A.2
The Pillars of Positive PeaceA visual representation of the factors comprising Positive Peace. All eight factors are highly interconnected and interact in varied and complex ways.
measure for policymakers, researchers and corporations to use for effective interventions, design, monitoring and evaluation.
• Positive Peace can be used as the basis for empirically measuring a country’s resilience — its ability to absorb, adapt and recover from shocks, such as climate change or economic transformation. It can also be used to measure fragility and help predict the likelihood of conflict, violence and instability.
FIGURE A.1
Free Flow of Information
Low Levels of Corruption
High Levels of Human
Capital
PEACE
Well-FunctioningGovernment
Acceptance of the Rights
of Others
Good Relations with
Neighbours
Sound Business
Environment
Equitable Distribution
of Resources

POSITIVE PEACE REPORT 2022 | 9
POSITIVE PEACE & SYSTEMS THINKING
Positive Peace as a term was first introduced in the 1960s by Norwegian sociologist Johan Galtung and has historically been understood qualitatively based on idealistic or moral concepts of a peaceful society. The distinguishing feature of IEP’s work on Positive Peace is that it is empirically derived and therefore conceptually different from Galtung’s version. Statistical analysis and mathematical modelling was used to identify the common characteristics of the world’s most peaceful countries. It therefore forms an important evidence base to understand Positive Peace and avoids subjective value judgements.
To construct the Positive Peace Index nearly 25,000 national data series, indexes and attitudinal surveys were statistically compared to the internal measures of the Global Peace Index to determine which factors had the highest statistical correlations. Indicators were then qualitatively assessed and where multiple variables measured similar phenomena, the least significant or indicators with the poorer data were dropped. The remaining factors were clustered using statistical techniques into the eight Pillars of Positive Peace. Three indicators were selected for each Pillar that represent distinct but complementary conceptual aspects. The index was constructed with the weights for the indicators being assigned according to the strength of the correlation coefficient to the GPI Internal Peace score. This
This section describes how Positive Peace can reinforce and build the attitudes, institutions and structures that allow societies to flourish. These same factors create resilient and adaptive societies that pre-empt conflict and help societies channel disagreements productively.
The Global Peace Index (GPI), is produced annually by IEP, and ranks 163 independent states and territories according to their level of peacefulness and stands as the world’s leading measure of global peacefulness. The GPI is composed of 23 qualitative and quantitative indicators from highly respected sources, covering 99.7 per cent of the world’s population. The index measures global peace using three broad themes: the level of safety and security in society; the extent of domestic or international conflict; and the degree of militarisation. For the full 2021 report or to explore the interactive map of global peace, visit www.visionofhumanity.org.
The Positive Peace Index (PPI) measures the level of Positive Peace in 163 countries. The PPI is composed of 24 indicators that capture the eight Pillars of Positive Peace. Each indicator was selected based on the strength of its statistically significant relationship with the GPI. For more information and the latest results of the PPI, refer to Section 1 of this report.
BOX A.1
Measuring peace: the positive peace index and the global peace index
empirical approach to the construction of the index means it is free from pre-established biases or value judgements. It is also highly robust. Various tests have been performed, including using alternative methods of weighting which have produced similar results.
Human beings encounter conflict regularly — whether at home, at work, among friends or on a more systemic level between ethnic, religious or political groups. But the majority of these conflicts do not result in violence. Conflict provides the opportunity to negotiate or renegotiate to improve mutual outcomes. Conflict, provided it is nonviolent, can be a constructive process. There are aspects of society that enable this, such as attitudes that discourage violence or legal structures designed to reconcile grievances.
The Pillars of Positive PeaceIEP has identified eight key factors, or Pillars, that comprise Positive Peace:
• Well-functioning Government – A well-functioning government delivers high-quality public and civil services, engenders trust and participation, demonstrates political stability and upholds the rule of law.
• Sound Business Environment – The strength of economic conditions as well as the formal institutions that support the operation of the private sector. Business competitiveness and economic productivity are both associated with the most peaceful countries and are key to a robust business environment.
• Equitable Distribution of Resources – Peaceful countries tend to ensure equity in access to resources such as education, health and, to a lesser extent, equity in income distribution.
• Acceptance of the Rights of Others – Peaceful nations enforce formal laws that guarantee basic human rights and freedoms and the informal social and cultural norms that relate to behaviours of citizens.
• Good Relations with Neighbours – Harmonious relations with other countries or between ethnic, religious and cultural groups within a country are vital for peace. Countries with positive internal and external relations are more peaceful and tend to be more politically stable, have better functioning governments, are regionally integrated and have lower levels of organised internal conflict.
• Free Flow of Information – Free and independent media disseminates information in a way that leads to greater knowledge and helps individuals, business and civil society make better decisions. This leads to better outcomes and more rational responses in times of crisis.
• High Levels of Human Capital – A skilled human capital base reflects the extent to which societies educate citizens and promote the development of knowledge, thereby improving

POSITIVE PEACE REPORT 2022 | 10
economic productivity, care for the young, political participation and social capital.
• Low Levels of Corruption - In societies with high levels of corruption, resources are inefficiently allocated, often leading to a lack of funding for essential services, which in turn can lead to dissatisfaction and civil unrest. Low corruption can enhance confidence and trust in institutions as well as improve the efficiency of business and the competitiveness of the country.
Positive Peace can be described as the attitudes, institutions and structures that create and sustain peaceful societies. IEP does not specifically set out what interventions should be done for each of the Pillars, as these will very much be dependent on cultural norms and development path of a specific country. What is appropriate in one country may not be appropriate in another.
What sets Positive Peace apart from other studies of peace is that its framework is empirically derived. The indicators chosen to measure each Pillar are based on the factors that have the strongest statistically significant with peacefulness and as such form both a holistic and empirical framework2.
Characteristics of Positive PeacePositive Peace has the following characteristics:
• Systemic and complex: progress occurs in non-linear ways and can be better understood through relationships and communication flows rather than through a linear sequence of events.
• Virtuous or vicious: it works as a process where negative feedback loops or vicious cycles can be created and perpetuated. Alternatively, positive feedback loops and virtuous cycles can likewise be created and perpetuated.
• Preventative: though overall Positive Peace levels tend to change slowly over time, building strength in relevant Pillars can prevent violence and violent conflict.
• Underpins resilience and nonviolence: Positive Peace builds capacity for resilience and incentives for nonviolent conflict resolution. It provides an empirical framework to measure an otherwise amorphous concept: resilience.
• Informal and formal: it includes both formal and informal societal factors. This implies that societal and attitudinal factors are as important as state institutions.
• Supports development goals: Positive Peace provides an environment in which development goals are more likely to be achieved.
• Underpins progress more generally. Positive Peace also creates an environment of better performance for the environment, well-being, economic development and inclusion.
Implementing Positive PeaceIEP implements Positive Peace in communities around the world using two approaches. The first approach is predicated on Systems Thinking. It uses the concepts of societal systems to guide the design of intervention programs and organisations dedicated to building resilience in fragile regions as well as developed states. This approach is discussed in Section 3 of this Report.
The second approach uses targeted interventions through workshops and direct training to shore up resilience at the local community level. In some cases, these interventions engage The Charitable Foundation (TCF), IEP’s sister organisation, which develops programs for communities to improve their physical infrastructure and become progressively self-reliant. This is discussed in Section 4 of this Report.
Systems ThinkingSystems theory first originated while attempting to better understand the workings of biological systems and organisms, such as cells or the human body. Through such studies, it became clear that understanding the individual parts of a system was inadequate to describe a system as a whole, as systems are much more than the sum of their parts. Think of human beings, our consciousness is more than sum of our parts. Extending these principles to societal systems is a paradigm shift, allowing for a more complete understanding how societies work, how to better manage the challenges they face and how to improve overall wellbeing. This approach offers alternatives to traditional understanding of change.
All systems are considered open, interacting with the sub-systems within them, other similar systems and the super-system within which they are contained. A societal system is made up of many actors, units and organisations spanning the family, local communities and public and private sectors. As all of these operate individually and interact with other institutions and organisations, each can be thought of as their own open system within the societal system. Sub-systems may, for instance, include companies, families, civil society organisations, or public institutions, such as the criminal justice system, education or health. All have differing intents and encoded norms. Similarly, nation states interact with other nations through trading relations, regional body membership and diplomatic exchanges, such as peace treaties or declarations of war.
Figure A.3 illustrates the different levels that are relevant to the nation or country. It shows that the nation state itself is made up of these many sub-systems, including the individual, civil society and business community. Scaling up, the nation can be seen as a sub-system of the international community, in which it builds and maintains relationships with other nations and international organisations. Finally, the international community forms a sub-system of a number of natural systems, such as the atmosphere and biosphere.
Any sub-system within the following diagram can interact with a super system at any level. For example, an individual can interact with the nation they belong to, other nations, the international community or the natural environment. Therefore, the systems are not hierarchical in structure, rather they co-evolve and change together.
Systems thinking offers a more complex view of causality. Causal thinking is generally used in problem solving — find the cause of the problem and fix it. Such an approach is useful for explaining discrete and well-isolated physical phenomena. However, when multiple variables are involved, it becomes increasingly difficult to identify a cause. Further, such thinking has the implicit implication that all outcomes can be tracked

POSITIVE PEACE REPORT 2022 | 11
These are some of the key properties of complex systems:
• The system is a whole. It cannot be reduced to its component parts. The simple aggregation or combination of behaviour patterns of individual parts is insufficient to describe the full operation of the whole. This is known as systemic complexity.
• It is difficult or impossible to ascertain causality. Given this systemic complexity, the notion of causality – so commonly used in traditional socio-economic analysis - loses meaning in systems thinking. Rather, systems’ components are thought of as mutually determining one another.
• The evolution of a system is path-dependent. Systems have memory, in that they retain information about the path taken to reach a given state. For example, consider two countries now experiencing exactly the same degree of peacefulness and social order. If one country has just emerged from a long period of internal conflict, while the other has always been peaceful, the first country will more easily be nudged into unrest and turmoil by a negative shock, as old rivalries and resentments flare up again.
• The social system has intent. The intent of a system is its willing pursuit of desired outputs or states. For example, the intent of a school system is to provide pupils with the best possible education through the most efficient use of resources.
• The social system has norms. Norms are patterns of conduct that members should or usually follow. Norms can change over time or in response to a disruptive shock. For example, the COVID-19 pandemic changed social norms about how individuals greet one another, congregate and work. Norms can also be expressed through the legal frameworks.
• The system is self-regulating. It aims to maintain a steady state by stabilising itself through feedback loops. The system adjusts to create balance between
BOX A.2
A summary of the properties of systems
back to a set of initial conditions. This discounts the potential for genuine novelty or innovation and is in contrast to our experience of reality.
Through the mechanics of mutual feedback loops, systems thinking blurs the separation between cause and effect. A mutual feedback loop is where two interacting entities modify each other through feedback. Conversations and negotiations are good examples of mutual feedback loops. A further example can be observed in the relation between the Free Flow of Information and a Well-Functioning Government. Governments can regulate what information is available; however, information can also change governments. Both will respond to the action of the other. In systems thinking, a
“cause” is seen not as an independent force, but as an input into a system which then reacts, thereby producing an effect. The difference in reaction is due to different encoded norms, or values by which society self-organises. The same input can have very distinct results in different societies.
The concept of mutual feedback loops gives rise to the notion of causeless correlations and forms the basis of Positive Peace. Statistically significant correlations describe macro relationships, but the interactions within the dynamics of the system and the causal relationships will vary depending on the particular circumstances.
inputs, outputs and internally coded requirements. Feedback loops may lead to virtuous or vicious cycles, depending on whether the self-regulation mechanism places the system in states of greater or lesser peacefulness.
• The system is self-modifying. When there is a persistent mismatch between inputs and desired outputs, the system searches for a new pattern of operation. For example, a corporation that is consistently not achieving its profit goals, will modify itself by reducing or re-purposing the workforce, redesigning production processes or changing the product it manufactures.
• The system does not operate in isolation. Social systems interact with one another, for example as two nations interact through trade, economic investment, migration, exchange of knowledge and other means. Systems interact with other systems of higher or lower hierarchy, as for example, a city interacts with both the national ‘super-system’ and the household ‘sub-system’, as well as the household interacting with the state.
• The system operates non-linearly and may contain tipping points. The interrelationships among components of a system are often non-linear. That means the relationship changes depending on the level of development of a nation. In some cases, relationships change more abruptly when certain thresholds are reached. These thresholds are called tipping points. For example, corruption and per capita income exhibit tipping points. Changes in corruption only have a small effect on the overall peace until a certain point is past, after which small changes have large impacts.

POSITIVE PEACE REPORT 2022 | 12
Furthermore, from a systems perspective, each ‘causal’ factor does not need to be understood. Rather, multiple interactions that stimulate the system in a particular way negate the need to understand all the causes. Processes can also be mutually causal. For example, as corruption increases, regulations are created, which in turn changes the way corruption is undertaken. Similarly, improved health services provide for a more productive workforce, which in turn provides the government with revenue and more money to invest in health. As conflict increases, the mechanisms to address grievances are gradually depleted increasing the likelihood of further violence.
Systems are also susceptible to tipping points in which a small action can change the structure of the whole system. The Arab Spring began when a Tunisian street vendor set himself alight because he couldn’t earn enough money to support himself. The relationship between corruption and peace follows a similar pattern. IEP’s research has found that increases in corruption have little effect until a certain point, after which even small increases in corruption can result in large deteriorations in peace. Similar tipping points can be seen between peace and per capita income, inflation and inequality.
Homeostasis & Self-ModificationHomeostasis is the process by which systems aim to maintain a certain state or equilibrium. An example of this is the self-regulation of the body temperature of a mammal. If the body starts to overheat, then it begins to sweat; if the body becomes cold, then the metabolism will become faster. The system attempts to make small adjustments based on the way inputs are interpreted by its encoded norms so that future inputs are within acceptable bounds. The same model of understanding can be applied to nations. Nations maintain homeostasis through their encoded norms, such as accepted levels of social behaviour. Even the social norms around queuing can be seen as maintaining an equilibrium. Another example would be governments raising taxes to fund services to a particular level. Tax rates are more or less kept the same, with the budgets for government departments only changing gradually. We expect the health and education systems to behave in a certain way.
One of the key differences between natural systems, such as the weather or the oceans, and biological systems is that biological systems have intent. Similarly, countries or nations also have intent. For example, when Costa Rica abolished its military in 1948, the government at the time arguably had the intent not to go to war.
Source: IEP
FIGURE A.3
Systems and the nations
The smallest sub system can interact directly with the largest super system.
The nation state is both a super and sub system depending on the field of view.
The nation is both a super and sub-system depending on the field of view. The smallest sub-system can interact directly with the largest super system.
Markets
NATION STATE
Super System
ATMOSPHERE,BIOSPHERE, OCEANS
INTERNATIONAL COMMUNITY
Sub System
NationState
NationState
NationState
NationState
INTERNATIONAL COMMUNITY
Govts
Households

POSITIVE PEACE REPORT 2022 | 13
Encoded norms can also create mutual feedback loops. When the input comes from another system, the response may attempt to alter future inputs to that system. Think of two groups who are continuously modifying their responses based on the actions of the other, such as two football teams who are continuously modifying their tactics based on the interactions in the game. In a democratic nation, this continual change based on the actions of the other can be observed in the interactions and adjustments between two political parties, or the shaping of news based on public sentiment. The sentiment shapes the news, but the news also shapes sentiment.
Systems have the ability to modify their behaviour based on the input that they receive from their environment. For example, the desire to seek food when hungry or the release of T-cells in response to infection are encoded reactions to inputs. For the nation state, as inflation increases, interest rates are raised to dampen demand. When an infectious disease outbreak occurs, medical resources are deployed to fix it.
Feedback loops provide the system with knowledge of its performance or non-performance in relation to its intentions. Given this, it is possible to analyse political systems through their feedback loops to understand how successfully they may be performing. An example would be measuring how political organisations within a society respond to inputs that align or misalign with their intentions. Similarly, social values can be better recognised using the mutual feedback model. For example, the mutual feedback model can help us understand what behaviours are shunned and what behaviours are encouraged within a society and why.
When unchecked or operating in isolation, feedback loops can lead to runaway growth or collapse. In cultures, their role can be constructive or destructive. However, feedback loops are fundamental in promoting self-modification, which allows the societal system state to evolve to a higher level of complexity. The effect of mutual feedback loops can be the accumulation of capital, the intensification of poverty, the spread of disease or the proliferation of new ideas.
If the external or internal factors of the societal system pressure the system into persistent imbalance, then a new level of complexity needs to be developed to maintain stability. Within the biosphere, it could be the mutation of a species so its offspring are better adapted to their environment. For the nation, this may take the form of major shifts within the system, such as policies to reduce carbon emissions when CO2 emissions become too high or the implementation of an anti-corruption commission when foreign investment falters.
Successful adaptation to systemic imbalances is more likely when the societal system has higher levels of Positive Peace. This is empirically demonstrated through the relationship between high Positive Peace and the reduced impact of shocks. For example, increases in the population of a country place stress on agricultural resources. The nation can respond by implementing measures that improve the yield of the available land while building an export industry to produce capital for the importation of food. Without an adequate response, the system would slowly degrade and potentially lead to collapse.
Figure A.4 shows the process for homeostasis and self-modification. Encoded norms and intent set the goals for the societal system. The performance of the nation in relation to its intent and encoded norms is then assessed by receiving either internal or external input. When the societal system is fulfilling its intentions, the feedback loops make minor adjustments to maintain homeostasis. However, when the societal system’s performance is persistently mismatched to its intent, it can begin a process of self-modification. This allows the system to adjust its encoded norms or intent so that it adapts to the new conditions. Though figure A.4 depicts this process using a simple process diagram, in reality, these mechanisms are complex and dynamic.
The relationship between the nation state and other systems, such as the biosphere and atmosphere, is key to the survival of humanity. If these systems become incapacitated, then nations are also weakened. Similarly, acknowledging the interdependence between nation states and other systems should fundamentally alter the way in which we handle these complex relationships.
When applying systems thinking to societal systems, it is important not to overcomplicate the analysis. What is essential is to view the system as a set of relationships, rather than a set of events, and to understand the most important feedback loops. Positive Peace provides a framework through which we can understand and approach systemic change, moving from simple causality to holistic action.
SELF- MODIFICATION
FEEDBACK LOOPS
ENCODEDNORMS AND
INTENT
GOALSETTING
PERFORMANCEASSESSMENT
Homeostasis
PERFORMANCE INPUT
Persistent mismatch of performance
and goals
Source: IEP
FIGURE A.4Homeostasis and self-modificationHomeostasis occurs when there is balance between a system’s internal goals and its performance. If performance persistently mismatches a nation state’s goals, the system will self-modify and adapt. Once this change has occurred, the nation state will redefine its goals and attempt to maintain the new homeostasis.

POSITIVE PEACE REPORT 2022 | 14
Over the years, IEP has carried out a program of applied research on systems thinking relating to socio-economic development. This research has produced practical applications for social systems theory that have consolidated the knowledge of how societies evolve and respond to shocks. This box contains a compilation of this research program. Most references cited can be accessed from www.visionofhumanity.org.
1. Detecting the components of a system The study of societal systems is hindered by a relative
scarcity of data (i.e. in comparison to engineering or biological systems). Social systems are complex, multi-faceted and fluid structures, which makes it difficult for analysts, international organisations and even national statistical offices to produce data capturing their complexity and dynamism accurately. For this reason, societal systems are often studied indirectly through statistical indicators of economic activity, opinion surveys or expert assessments. The Global Terrorism Index 2020 (section ‘Correlates of Terrorism,’ page 68) contains a methodology for finding the statistical indicators that are most closely associated with terrorism systems. The methodology is based on structural equation modelling and can be used to delineate the differences in systemic structure across diverse types of countries. Terrorism systems in advanced economies were associated with internal conflict and human rights violations, whereas the same systems in the rest of the world were also linked with societal polarisation and religious or ethnic tensions.
2. Identifying intent The Positive Peace Index 2017 (section ‘Intent of a Nation
State,’ page 38) contains a methodology for statistically deriving the intent of a nation state in four key areas: economic structure, political framework, international relations and social policy. The section shows how nations can be clustered according to the affinity of their social intent. It also finds that these intent similarities form very well-defined geographical blocs across the world that map out zones of economic and cultural influencing.
3. Feedback loops The complexity inherent to social systems arises as a
result of feedback loops, as discussed above. The Mexico Peace Index 2021 (section ‘Dynamics that Lead to Increases in Crime,’ page 68) discusses an analytical tool to study what social dynamics lead to changes in violence levels. It finds that indicators of the Well-Functioning Government and Low Levels of Corruption Pillars of Positive Peace deteriorate together, forming a vicious cycle – a feedback loop leading to greater levels of violence. This was particularly noticeable in Mexico, but other nations have different dynamic cycles of violence. In another example, the Global Terrorism Index 2020 (section ‘Disrupting Terrorist Groups and
BOX A.3
Compilation of IEP's work on societal systems
Networks,’ page 76) delineates the feedback loops of intent, resourcing and outcomes that keep a terrorist group functional. Disrupting these loops at specific nodes maximises the chances of such groups being dismantled.
4. Predicting economic outperformance The Business and Peace Report 2021 (section ‘Positive
Peace as a Predictor of Economic Outperformance,’ page 17) shows how financial analysts can use feedback loops in Positive Peace systems to predict superior economic performance by groups of countries improving in the PPI.
5. Non-linearities Social systems often evolve non-linerarly, that is, the
nature of the interrelationships between variables changes depending on the developmental stage of a nation. The Business and Peace Report 2021 (section ‘Relationship Between Peace and Business Conditions,’ page 9) shows the analysis of non-linearity applied to gauges of worker productivity. The section shows that higher worker productivity is associated with greater levels of peace. But it also shows that the relationship becomes steeper at higher developmental levels. That is, in more peaceful countries, further improvements in peace are associated with higher gains in worker productivity. A similarly non-linear relationship between the PPI and the Foundations of Wellbeing from the Social Progress Imperative is discussed in the Positive Peace Report 2020 (section ‘Positive Peace, Ethical Investment and Resilience,’ page 49).
6. Tipping points Tipping points are a special case of non-linearity. They
describe instances where the relationship between two statistical variables change abruptly, instead of gradually. The 2020 book Peace in the Age of Chaos by IEP founder Steve Killelea describes how statistical analysis identifies tipping points between peacefulness and corruption. It describes how a deterioration in corruption past a certain tipping point leads to a drastic increase in violence (Peace in the Age of Chaos, 2020, Hardy Grant Books, section ‘Peace and Corruption,’ page 167). The 2015 IEP report Peace and Corruption contains several examples of tipping points where the relationships between indicators of perceived corruption and indicators of peace change abruptly past a certain developmental threshold. In another application, research showed how Colombia and Venezuela, two originally similar countries in their GPI and PPI stances in 2009, diverged dramatically in peacefulness in the following decade. This was discussed in the Positive Peace Report 2020 (section ‘Tipping Points in the Positive and Negative Peace Systems,’ page 64).

POSITIVE PEACE REPORT 2022 | 15
7. Path dependency The Positive Peace Report 2020 (section ‘Positive and
Negative Peace Systems Dynamics Model,’ page 63) shows that countries can have different developmental trajectories in the future depending on the trajectories they traced in their past. The section gives the example of two countries, Egypt and Syria, that had similar GPI scores in 2009 but developed along different paths since, partly due to their histories.
8. Self-modification When faced with a shock, societal systems may modify
their internal structures to protect citizens and
facilitate a post-shock recovery. Self-modification is an important component of societal resilience and has been studied in the Global Terrorism Index 2020 (section ‘The Impact of 9/11 on the US Socio-Economic System,’ page 71). The shock-response analysis shows that the terrorist attacks in New York and Washington DC were so disruptive that led the American socio-political system to undergo fundamental changes. Some of these changes lasted only a few years after 2001, but others have not yet been unwound twenty years after the trigger event.

POSITIVE PEACE REPORT 2022 | 16
POSITIVE PEACE AS A PROCESS OF CHANGE
Positive Peace consists of eight Pillars that have been empirically derived. It describes the major factors that govern change within a society. These factors operate inter-dependently, mutually affecting each other, therefore making it difficult to understand the true cause of any event. Systems thinking provides a model to explain the interactions and changes within the system. This means that more emphasis is placed on the relationships and flows within the system than on a single event, such as a terrorist attack or the election of a controversial leader.
When programmes or policies achieve measurable improvements in the Pillars of Positive Peace, they accelerate social progress. Immediate programme
outputs can help raise standards of living, improve information flows and can build trust and confidence. Other programmes can help to resolve immediate grievances, thereby reducing the amount of conflict in society. If momentum is maintained, these successes can reinforce one another and set the stage for further progress. As successes build upon one another, the system moves to a more peaceful equilibrium. Feedback loops help the system ‘reset,’ so its homeostasis is at a higher level of peace and wellbeing. The system will persistently return to homeostasis through feedback loops, which is why building Positive Peace requires a number of sustained interventions. Positive Peace works slowly over time. Radical changes to systems are likely to
Positive Peace provides a process of change that explains the functioning of a nation or society and why highly peaceful societies thrive.
The ‘process of change’ framework is a tool that shows the logical steps from the inputs behind a policy or programme to the outputs and outcomes that are expected to result.
MISSIONTo help create a world that is more peaceful and fulfilling for the
majority of the people on the planet
STATEMENTPositive Peace
creates the optimal environment for
human potential to flourish
PROCESS OF CHANGE FRAMEWORK

POSITIVE PEACE REPORT 2022 | 17
POSITIVE PEACE AS A PROCESS OF CHANGEPositive Peace provides a process of change that explains the functioning of a nation or society and why highly peaceful societies thrive.
disrupt the system, therefore change is more like continually nudging the system in the right direction. The most effective systemic change is widespread and incremental.
Interventions to improve Positive Peace can be implemented by governments, businesses, civil society organizations or others, as has been the case in IEP’s Positive Peace workshops. Outputs are the measurable things that the programmes produce, such as a 30 per cent increase in school attendance and the outcomes are the social changes that result, for example, improved High Levels of Human Capital in the community.
PROGRAMMES & POLICIES
OUTPUTSOUTCOMES
Short term* Medium term* Long term*
Interventions to improve Positive Peace can take many forms, but they will be most effective if they:
• Focus on all 8 Pillars• Improve many
aspects of Positive Peace at once
• Are locally-owned• Provide local
solutions to local problems
Measurable improvements in the Pillars of Positive Peace
• Improvements in material well-being and the business environment
• Increased participation by citizens
• Reduction in grievances and improvements in perceptions of fairness
• Successes are reinforced via positive feedback loops
• Starting of a virtuous cycle with broad based improvements across society
• Greater resources and pathways to solve problems
• Moves the system to a higher level of peace, creating a new, more peaceful and productive homeostasis which can self-modify to create higher level of functioning
• Fewer grievances and conflicts arise, and those that do are resolved nonviolently
*One to five years *Five to ten years *Ten to twenty years
Although this framework is usually applied to specific activities and interventions, the learnings from IEP’s Positive Peace research can be represented in the same way.
The diagram above presents IEP’s most up-to-date understanding of how increasing levels of Positive Peace creates the optimal environment for human potential to flourish and leads to societies reducing violence. Interventions to improve Positive Peace can be implemented by governments, businesses, civil society organisations, or groups of people or volunteers, as has been the case in IEP’s Positive Peace workshops.

POSITIVE PEACE REPORT 2022 | 18
The Positive Peace Index (PPI) measures the level of societal resilience of 163 countries, covering 99.7 per cent of the world’s population. The PPI is the most comprehensive global, quantitative approach to defining and measuring the positive qualities of peace. This body of work provides an actionable platform for development and improvements in peace. It can also help improve social factors, including governance and economic development as well as peace. It stands as one of the few holistic and empirical studies to identify the positive factors that create and sustain peaceful societies.
The Global Peace Index (GPI) is an inverted measure of peace,
that is, scores close to 1 indicate lower levels of violence and
scores close to 5 indicate greater levels of violence. To preserve
consistency with the GPI, the PPI is also constructed such that
lower scores indicate better socio-economic development, and
higher scores indicate less development.
IEP takes a systems approach to peace, drawing on recent
research into systems, especially societal systems. In order to
construct the PPI, IEP analysed over 24,700 different data series,
Key Findings • More countries improved in Positive Peace —
126 in total — than deteriorated — 36 countries — from 2009 to 2020.
• These improvements were mainly driven by Free-Flow of Information, Good Relations with Neighbours, Equitable Distribution of Resources and Sound Business Environment.
• The only Pillar of Positive Peace to record a deterioration since 2009 was Low Levels of Corruption.
• Well-Functioning Government and High Levels of Human Capital recorded the slightest improvement, remaining almost unchanged.
• Positive Peace improved 2.4 per cent globally from 2009 to 2020.
• The global PPI improved every year without interruption since 2015, although the improvement from 2019 to 2020 was very small. The slower pace of improvement in 2020 was associated with COVID-19 and the global recession created by the policy responses to the pandemic. However, some of the indicator sources still have not updated their data for 2020. Thus, it is possible that the change in the PPI from 2019 to 2020 could be revised as more up-to-date information becomes available.
• The deterioration in the global PPI in 2015 coincided with different economic crises in
emerging markets and migration crises in the US and Europe that exacerbated socio-political polarisation.
• Eight out of the nine world regions improved in Positive Peace from 2009 to 2020, with North America being the only exception.
• Russia and Eurasia, Asia Pacific and South Asia had the largest regional improvements. All countries in these three regions recorded improvements in their PPI scores.
• Improvements in the PPI are mainly due to the Structures domain of Positive Peace, which showed substantial development since 2009, while the Institutions domain recorded only a small improvement in the period.
• In contrast, the Attitudes domain deteriorated by 1.8 per cent globally from 2009 to 2020. This domain deteriorated in 97 of the total 163 countries assessed, reflecting increased polarisation of views on political and economic administration matters, as well as a deterioration in the quality of information disseminated to the public.
• The largest deteriorations in Positive Peace occurred in Syria, Libya, Venezuela, Yemen, and South Sudan. All of these countries are affected by conflict.
Positive Peace Index, Results & Trends1

POSITIVE PEACE REPORT 2022 | 19
TABLE 1.1
Indicators in the Positive Peace IndexThe following 24 indicators have been selected in the Positive Peace Index by showing the strongest relationships with the absence of violence and the absence of fear of violence.
Pillar Domain Indicator Description SourceCorrelation coefficient (to the GPI)
Acceptance of the Rights of Others
Attitudes Gender InequalityThe Gender Inequality Index (GII) reflects women’s disadvantage in three dimensions: reproductive health, political empowerment and the labour market.
United Nations Development Programme
0.71
Attitudes Group Grievance
The Group Grievance Indicator focuses on divisions and schisms between different groups in society – particularly divisions based on social or political characteristics – and their role in access to services or resources, and inclusion in the political process.
Fragile States Index 0.64
Attitudes Exclusion by Socio-Economic Group
Exclusion involves denying individuals access to services or participation in governed spaces based on their identity or belonging to a particular group.
Varieties of Democracy (V-Dem) 0.72
Equitable Distribution of Resources
Structures Inequality-adjusted life expectancy index
Measures the overall life expectancy of a population accounting for the disparity between the average life expectancy of the rich and that of the poor. The smaller the difference the higher the equality and that is a reflection of the equality of access to the health system.
United Nations Development Programme
0.62
Institutions Access to Public Services
Measures the discrepancies in access to public services distributed by socio-economic position.
Varieties of Democracy (V-Dem) 0.76
Attitudes Equality of Opportunity
Assesses whether individuals enjoy equality of opportunity and freedom from economic exploitation. Freedom House 0.70
Free Flow of Information
Structures Freedom of the Press A composite measure of the degree of print, broadcast and internet freedom.
Reporters Without Borders (RSF) 0.50
Attitudes Quality of Information
Measured by Government dissemination of false information domestically: How often governments disseminate false or misleading information.
Varieties of Democracy (V-Dem) 0.60
StructuresIndividuals using the Internet (% of population)
Internet users are individuals who have used the Internet (from any location) in the last three months. The Internet can be used via a computer, mobile phone, personal digital assistant, games machine, digital TV etc.
International Telecommunication Union
0.61
Good Relations with Neighbours
AttitudesLaw to Support Equal Treatment of Population Segments
This is a measure of how population segments interrelate with their domestic neighbours. It assesses whether laws, policies and practices guarantee equal treatment of various segments of the population.
Freedom House 0.66
Structures International Tourism
Number of tourists (number of arrivals per 100,000 population) who travel to a country (staying at least one night) other than that in which they have their usual residence.
World Tourism Organization 0.63
Institutions External Intervention
The external intervention indicator considers the influence and impact of external actors in the functioning - particularly security and economic - of a state.
Fragile States Index 0.71
indices and attitudinal survey variables in conjunction with
current thinking about the drivers of violent conflict, resilience
and peacefulness.
The result is an eight-part taxonomy of the factors associated with
peaceful societies. These eight areas, known as the Pillars of
Positive Peace, were derived from the datasets that had the
strongest correlation with internal peacefulness, as measured by
the Global Peace Index, an index that defines peace as “absence of
violence or the fear of violence”. The PPI measures the eight Pillars
using three indicators for each. The indicators represent the best
available globally-comparable data with the strongest statistically
significant relationship to levels of peace. The 24 indicators that
make up the PPI are listed in Table 1.1

POSITIVE PEACE REPORT 2022 | 20
High Levels of Human Capital
Structures
Share of youth not in employment, education or training (NEET)
Proportion of people between 15 and 24 years of age that are not employed and are not in education or training.
International Labour Organization 0.75
Structures Researchers in R&DThe number of researchers engaged in Research & Development (R&D), expressed as per one million population.
UNESCO 0.67
Structures Healthy life expectancy (HALE)
Average number of years that a newborn can expect to live in full health.
World Health Organisation 0.59
Low Levels of Corruption
Institutions Control of CorruptionControl of Corruption captures perceptions of the extent to which public power is exercised for private gain.
World Bank 0.78
Attitudes Factionalised ElitesMeasures the fragmentation of ruling elites and state institutions along ethnic, class, clan, racial or religious lines.
Fragile States Index 0.72
Institutions Public Sector TheftAssesses perceptions of how often public sector employees steal, embezzle or misappropriate public funds or other state resources.
Varieties of Democracy (V-Dem) 0.73
Sound Business Environment
Institutions Regulatory Quality
Captures perceptions of the ability of the government to formulate and implement sound policies and regulations that permit and promote private sector development.
World Bank 0.76
Institutions Financial Institutions Index
Part of the financial development index, this indicator measures the quality of the financial institutions, including the depth of the financial sector and the access to financial products.
International Monetary Fund 0.62
Structures GDP per capita GDP per capita (current US$) is gross domestic product divided by midyear population.
International Monetary Fund 0.67
Well-Functioning Government
InstitutionsGovernment Openness and Transparency
Assesses to what extent government operations can be legally influenced by citizens and are open to scrutiny from society.
Freedom House 0.63
Institutions Government Effectiveness
Government Effectiveness captures perceptions of the quality of public services, the quality of the civil service and the degree of its independence from political pressures, the quality of policy formulation and implementation, and the credibility of the government's commitment to such policies.
World Bank 0.79
Institutions Rule of Law
Rule of Law captures perceptions of the extent to which agents have confidence in and abide by the rules of society, and in particular the quality of contract enforcement, property rights, the police, and the courts, as well as the likelihood of crime and violence.
Bertelsmann Transformation Index 0.68

POSITIVE PEACE REPORT 2022 | 21
1 Sweden 1.228 long-arrow-alt-up 12 Denmark 1.238 LONG-ARROW-ALT-DOWN 13 Finland 1.258 Arrows-alt-h4 Norway 1.274 Arrows-alt-h5 Switzerland 1.279 Arrows-alt-h6 Netherlands 1.362 Arrows-alt-h7 Canada 1.366 Arrows-alt-h8 Australia 1.394 Arrows-alt-h9 Germany 1.397 Arrows-alt-h
10 Ireland 1.433 Arrows-alt-h11 New Zealand 1.451 long-arrow-alt-up 212 Japan 1.466 long-arrow-alt-up 613 Iceland 1.543 LONG-ARROW-ALT-DOWN 214 Singapore 1.561 long-arrow-alt-up 515 Austria 1.566 LONG-ARROW-ALT-DOWN 316 Belgium 1.567 Arrows-alt-h17 France 1.574 LONG-ARROW-ALT-DOWN 318 United Kingdom 1.693 LONG-ARROW-ALT-DOWN 319 South Korea 1.694 long-arrow-alt-up 620 Portugal 1.698 Arrows-alt-h21 Spain 1.833 Arrows-alt-h22 Slovenia 1.859 Arrows-alt-h23 Estonia 1.900 long-arrow-alt-up 124 United States 1.949 LONG-ARROW-ALT-DOWN 725 Italy 1.979 long-arrow-alt-up 126 Czech Republic 1.988 LONG-ARROW-ALT-DOWN 327 Taiwan 2.000 Arrows-alt-h28 Lithuania 2.010 long-arrow-alt-up 329 Uruguay 2.083 long-arrow-alt-up 6
30 Latvia 2.135 long-arrow-alt-up 631 Poland 2.141 LONG-ARROW-ALT-DOWN 232 Chile 2.147 Arrows-alt-h33 Slovakia 2.180 LONG-ARROW-ALT-DOWN 3
=34 Greece 2.234 LONG-ARROW-ALT-DOWN 6=34 Israel 2.234 long-arrow-alt-up 2
36 Cyprus 2.259 LONG-ARROW-ALT-DOWN 3
37 United Arab Emirates 2.297 long-arrow-alt-up 4
38 Croatia 2.313 Arrows-alt-h39 Costa Rica 2.314 Arrows-alt-h40 Hungary 2.358 LONG-ARROW-ALT-DOWN 641 Romania 2.527 long-arrow-alt-up 242 Bulgaria 2.529 Arrows-alt-h43 Mauritius 2.572 LONG-ARROW-ALT-DOWN 344 Malaysia 2.587 long-arrow-alt-up 745 Argentina 2.632 long-arrow-alt-up 346 Kuwait 2.658 LONG-ARROW-ALT-DOWN 1
47 Trinidad and Tobago 2.682 Arrows-alt-h
48 Botswana 2.686 long-arrow-alt-up 149 Qatar 2.693 LONG-ARROW-ALT-DOWN 550 Panama 2.718 long-arrow-alt-up 251 Georgia 2.766 long-arrow-alt-up 1752 Montenegro 2.790 LONG-ARROW-ALT-DOWN 253 Jamaica 2.833 long-arrow-alt-up 754 Tunisia 2.865 LONG-ARROW-ALT-DOWN 155 Oman 2.866 long-arrow-alt-up 356 Macedonia 2.874 LONG-ARROW-ALT-DOWN 157 Mongolia 2.922 long-arrow-alt-up 8
58 South Africa 2.925 long-arrow-alt-up 159 Albania 2.927 LONG-ARROW-ALT-DOWN 360 Thailand 2.937 long-arrow-alt-up 661 Serbia 2.958 LONG-ARROW-ALT-DOWN 462 Armenia 2.968 long-arrow-alt-up 1963 Brazil 2.982 LONG-ARROW-ALT-DOWN 1764 Ghana 2.986 LONG-ARROW-ALT-DOWN 165 Bhutan 2.992 long-arrow-alt-up 12
=66 China 3.004 long-arrow-alt-up 6=66 Peru 3.004 long-arrow-alt-up 4
68 Belarus 3.080 long-arrow-alt-up 1169 Namibia 3.081 LONG-ARROW-ALT-DOWN 870 Vietnam 3.083 long-arrow-alt-up 1671 Russia 3.088 LONG-ARROW-ALT-DOWN 2
=72 Bahrain 3.106 LONG-ARROW-ALT-DOWN 8=72 Moldova 3.106 long-arrow-alt-up 1
74 Ukraine 3.111 long-arrow-alt-up 275 Kazakhstan 3.118 long-arrow-alt-up 1676 Mexico 3.123 LONG-ARROW-ALT-DOWN 1477 Kosovo 3.136 LONG-ARROW-ALT-DOWN 778 Senegal 3.156 long-arrow-alt-up 279 Saudi Arabia 3.158 long-arrow-alt-up 1380 Morocco 3.177 LONG-ARROW-ALT-DOWN 781 Colombia 3.180 long-arrow-alt-up 2
82 Dominican Republic 3.185 long-arrow-alt-up 8
=83 Bosnia and Herzegovina 3.189 LONG-ARROW-ALT-DOWN 8
=83 Jordan 3.189 LONG-ARROW-ALT-DOWN 1785 India 3.216 LONG-ARROW-ALT-DOWN 3
RANK COUNTRY SCORE CHANGERANK COUNTRY SCORERANK COUNTRY
2022 POSITIVE PEACE INDEXA SNAPSHOT OF THE GLOBAL LEVELS OF POSITIVE PEACE
THE STATE OF POSITIVE PEACE
1 2.53 3.18 5
Not includedVery high High Medium Low
3.66
SCORE CHANGE CHANGE

POSITIVE PEACE REPORT 2022 | 22
86 Ecuador 3.217 long-arrow-alt-up 287 Indonesia 3.220 long-arrow-alt-up 1288 Turkey 3.231 LONG-ARROW-ALT-DOWN 3489 Paraguay 3.241 Arrows-alt-h90 Benin 3.258 LONG-ARROW-ALT-DOWN 691 Cuba 3.259 long-arrow-alt-up 492 El Salvador 3.275 LONG-ARROW-ALT-DOWN 1493 Bolivia 3.277 LONG-ARROW-ALT-DOWN 894 Guyana 3.292 LONG-ARROW-ALT-DOWN 795 Sri Lanka 3.322 long-arrow-alt-up 596 Algeria 3.386 long-arrow-alt-up 297 Philippines 3.405 long-arrow-alt-up 598 Kyrgyz Republic 3.431 long-arrow-alt-up 1099 Burkina Faso 3.436 long-arrow-alt-up 5
100 Uzbekistan 3.467 long-arrow-alt-up 36101 Lesotho 3.479 long-arrow-alt-up 2102 Tanzania 3.503 LONG-ARROW-ALT-DOWN 8103 Kenya 3.536 long-arrow-alt-up 12104 The Gambia 3.553 long-arrow-alt-up 26105 Lebanon 3.554 LONG-ARROW-ALT-DOWN 12106 Palestine 3.556 long-arrow-alt-up 3107 Honduras 3.566 LONG-ARROW-ALT-DOWN 11108 Iran 3.567 long-arrow-alt-up 8109 Nicaragua 3.574 LONG-ARROW-ALT-DOWN 8110 Sierra Leone 3.576 Arrows-alt-h111 Timor-Leste 3.592 long-arrow-alt-up 18
=112 Azerbaijan 3.594 long-arrow-alt-up 6=112 Zambia 3.594 LONG-ARROW-ALT-DOWN 7114 Egypt 3.596 LONG-ARROW-ALT-DOWN 1
115 Rwanda 3.612 long-arrow-alt-up 5116 Cambodia 3.625 long-arrow-alt-up 15117 Malawi 3.627 LONG-ARROW-ALT-DOWN 3118 Gabon 3.638 LONG-ARROW-ALT-DOWN 6
=119 Cote d'Ivoire 3.642 long-arrow-alt-up 21=119 Togo 3.642 long-arrow-alt-up 8
121 Guatemala 3.652 LONG-ARROW-ALT-DOWN 10122 Eswatini 3.657 long-arrow-alt-up 4123 Madagascar 3.663 long-arrow-alt-up 4124 Laos 3.664 long-arrow-alt-up 9125 Mozambique 3.695 LONG-ARROW-ALT-DOWN 18126 Nepal 3.698 LONG-ARROW-ALT-DOWN 4
127 Papua New Guinea 3.713 LONG-ARROW-ALT-DOWN 4
128 Myanmar 3.716 long-arrow-alt-up 23129 Liberia 3.718 LONG-ARROW-ALT-DOWN 4130 Pakistan 3.736 long-arrow-alt-up 9131 Ethiopia 3.737 long-arrow-alt-up 6132 Djibouti 3.751 long-arrow-alt-up 2133 Niger 3.766 LONG-ARROW-ALT-DOWN 12134 Bangladesh 3.806 long-arrow-alt-up 1135 Nigeria 3.836 LONG-ARROW-ALT-DOWN 3136 Angola 3.838 long-arrow-alt-up 12137 Mali 3.844 LONG-ARROW-ALT-DOWN 13138 Uganda 3.845 LONG-ARROW-ALT-DOWN 19139 Mauritania 3.876 LONG-ARROW-ALT-DOWN 1140 Turkmenistan 3.889 long-arrow-alt-up 7141 Guinea 3.911 long-arrow-alt-up 3142 Guinea-Bissau 3.943 LONG-ARROW-ALT-DOWN 1
143 Tajikistan 3.960 LONG-ARROW-ALT-DOWN 1144 Zimbabwe 3.980 long-arrow-alt-up 11
145 Republic of the Congo 4.002 LONG-ARROW-ALT-DOWN 2
146 Cameroon 4.005 Arrows-alt-h147 Venezuela 4.010 LONG-ARROW-ALT-DOWN 42148 Haiti 4.041 long-arrow-alt-up 1149 North Korea 4.064 long-arrow-alt-up 3
150 Equatorial Guinea 4.077 Arrows-alt-h
151 Burundi 4.089 LONG-ARROW-ALT-DOWN 6152 Libya 4.097 LONG-ARROW-ALT-DOWN 55153 Afghanistan 4.099 long-arrow-alt-up 6154 Iraq 4.103 LONG-ARROW-ALT-DOWN 1155 Sudan 4.214 long-arrow-alt-up 5156 Eritrea 4.290 Arrows-alt-h157 Syria 4.304 LONG-ARROW-ALT-DOWN 40
158Democratic Republic of the Congo
4.306 long-arrow-alt-up 3
159 Chad 4.374 long-arrow-alt-up 3
160 Central African Republic 4.432 LONG-ARROW-ALT-DOWN 2
161 Yemen 4.542 LONG-ARROW-ALT-DOWN 7162 South Sudan 4.553 LONG-ARROW-ALT-DOWN 5163 Somalia 4.590 Arrows-alt-h
RANK COUNTRY SCORERANK COUNTRY SCORERANK COUNTRY SCORE CHANGE CHANGE CHANGE

POSITIVE PEACE REPORT 2022 | 23
GLOBAL TRENDS IN POSITIVE PEACE
The global score for the PPI has improved by 2.4 per cent since 2009, with 126 countries improving in Positive Peace, 36 countries deteriorating and one country score being little changed. The score is calculated by taking the average country score for the 163 countries included in the index.
Changes in Attitudes, Institutions and StructuresAlthough the progression of Positive Peace seems to be almost
uniform from year to year, the changes for each of the three
domains vary considerably. While Structures have been
improving each year and by 8 per cent since 2009, Attitudes
have deteriorated almost every year, declining by 1.8 per cent
since 2009. Institutions have slightly improved by 1.4 per cent.
Figure 1.1 highlights the global trend in Positive Peace. Changes
in Positive Peace generally occur slowly and may take many
years for the benefits to show because institution building and
changes in social norms are long-term processes. As such, global
changes in the PPI Pillars happen relatively slowly, and even
slight changes in global Positive Peace can be considered
important.
Positive Peace has improved almost continuously since 2009,
largely on the back of greater technological and economic
development. The year 2015 was the only instance in which the
global PPI score deteriorated, although the deterioration was
small – around 0.3 per cent. That year saw a number of
economic and financial crises in emerging markets (including
Russia and China), which affected global economic growth. This
coincided with a deep humanitarian crisis which saw large
refugee inflows into Europe and North America.
0.0%
0.5%
1.0%
1.5%
2.0%
PPI P
ERC
ENTA
GE
IMR
OV
EMEN
T
By 2020, the global average Positive Peace score had improved by 2.4 per cent since 2009.
Cumulative improvement in Positive Peace from 2009
FIGURE 1.1
Source: IEP
2010 2011 2012 2013 2014 2015 2016 2017 2019 20202018
0.975
0.95
0.925
1.00
The improvement in PPI since 2009 was largely driven by structural improvements globally. Institutional functioning has remained broadly the same over the period while attitudes have deteriorated.
Changes in the Attitudes, Institutions and Structures of Positive Peace, 2009–2020
2010 2012 2014 2016 20202018
Source: IEP
FIGURE 1.2
AV
ERA
GE
SCO
RE
(NO
RM
ALI
SED
TO
20
09
= 10
0)
Less
pe
acef
ulM
ore
peac
eful Attitudes
InstitutionsPPI Overall ScoreStructures

POSITIVE PEACE REPORT 2022 | 24
Global Trends
Positive Peace improved 2.4 per cent globally from 2009 to 2020.
Eight out of the nine world regions improved in Positive Peace from 2009 to 2020, with North America being the only exception.
2.4%
Table 1.1 classifies the 24 indicators in the PPI into one of these
three domains using the following typology:
• Attitudes if they assess how members of a society view and
relate to one another.
• Institutions if they measure the effectiveness,
transparency and inclusiveness of administrative
organisations.
• Structures if they gauge the technological, scientific and
economic foundations that support social development.
Using this classification, Figure 1.2 shows that the improvement
in the PPI since 2009 is largely driven by structural
improvements. Access to information, GDP per capita and life
expectancy have generally improved rapidly over the time
window of analysis. Globally, institutional effectiveness has also
improved over the past decade, albeit at a much slower pace
than structural factors. However, the attitudinal indicators have
been deteriorating over the period. The indicators showing the
deepest deteriorations are quality of information and
factionalised elites.
Changes in the Positive Peace PillarsFigure 1.3 shows the percentage change from 2009 to 2020 for
all eight Pillars of Positive Peace. These scores reflect gradual
changes within complex social systems and typically do not
fluctuate drastically year to year. As such, since 2009, the
average Pillar score has changed by just 2.4 per cent, and with
the exception of Free Flow of Information, no Pillar score has
changed by more than five per cent. The slow-moving nature of
Positive Peace calls for long-term planning and sustained
investment to improve the Pillars.
Thirteen out of the total 24 indicators used in the PPI recorded
improvements from 2009 to 2020. This is just above half of the
total number of indicators. However, the average improvement
among indicators was of a greater quantum than the average
deterioration. This led to an overall improvement in Positive
Peace over the period.
The indicators that showed the most substantial improvements
were those related to the Structures domain. Some examples are
individuals using the Internet, inequality-adjusted life
expectancy and international tourism (Figure 1.4). On the other
hand, the quality of information, factionalised elites and
freedom of the press indicators recorded the deepest
deteriorations.
Low Levels of Corruption
0.0% 2.5% 5.0% 7.5% 10.0%
Well-Functioning Government
Acceptance of the Rights of Others
Good Relations with Neighbours
PPI Overall Score
High Levels of Human Capital
Equitable Distribution of Resources
Sound Business Environment
Free Flow of Information
PERCENTAGE CHANGE
Changes in the Pillars of Positive Peace, 2009–2020Seven of the eight Pillars have improved since 2009. Low Levels of Corruption deteriorated by around 1.8 per cent over the period.
FIGURE 1.3
Source: IEP
ImprovementDeterioration

POSITIVE PEACE REPORT 2022 | 25
Quality of information
Government openness and transparency
Factionalised elites
Equality of opportunity
Group grievance
Exclusion by socio-economic group
Youth not in employment, education or training (NEET)
Access to public services
Control of corruptionRegulatory quality: Estimate
Government e�ectivenessRule of law
Freedom of the press
Law to support equal treatment of population segments
Public sector theftGDP per capita
Research in R&D
Financial Institutions Index
International tourismGender inequality
Healthy life expectancy (HALE)
X1: External intervention
Inequality-adjusted life expectancyIndividuals using the Internet (% of population)
PERCENTAGE CHANGE
Percentage change in PPI indicators, 2009–2020Individuals using the Internet recorded the largest improvement while hostility to foreigners and quality of information recorded the largest deteriorations.
FIGURE 1.4
20% 30%10%0.0%
Source: IEP
ImprovementDeterioration
Regional OutcomesAll geographical regions of the world recorded improvements in
their PPI scores since 2009, except North America (Figure 1.5).
The largest improvements occurred in Asia-Pacific, Russia and
Eurasia, and South Asia, improving respectively by 6.4 per cent,
6.1 per cent and 4.2 per cent respectively. The improvement in
South Asia was mainly driven by improvements in Bhutan and
Sri Lanka.
The improvement in the Middle-East and North Africa was
marginal. Overall, 15 of the 20 countries that comprise this
region improved in Positive Peace over the period. However, the
deteriorations recorded by Libya, Syria, Yemen, Lebanon and
Jordan were numerically large and almost offset the PPI gains
elsewhere in the region.
The only region in the world to record a deterioration in its PPI
score from 2009 to 2020 was North America. At nine per cent
over the period, the overall deterioration in the North American
score was the sharpest movement of any region. However, this
region consists only of two countries – Canada and the US – and
as such, a greater variability in the average regional score is to
be expected.
Asia-Pacific showed the largest regional improvement, by 6.4
per cent. All 19 countries from this region covered in the
analysis improved in Positive Peace (Table 1.2). In addition, all
eight Pillars improved for the region. The largest improvements
were:
• Free Flow of Information experienced the largest improvement, by 12.2 per cent. This was due to individuals
FIGURE 1.5Change in average regional scores, 2009–2020North America is the only region to record a deterioration in Positive Peace between 2009 and 2020.
PERCENTAGE CHANGE IN PPI SCORE0.0% 2.5% 5.0% 7.5%
North America
MENA
Europe
Sub-Saharan Africa
South America
Central America and the Caribbean
Asia-Pacific
South Asia
Russia and Eurasia
Source: IEP
ImprovementDeterioration
using the internet more than offsetting deteriorations in quality of information and freedom of the press.
• Good Relations with Neighbours improved by 11.1 per cent, driven by increases in international tourism and external intervention.
• Sound Business Environment improved by 8.8 per cent due to significant increases in financial institutions index and regulatory quality indicators.

POSITIVE PEACE REPORT 2022 | 26
The most notable negative results were deteriorations in the
region’s youth not in employment, education or training and
factionalised elites indicators. The freedom of the press indicator
deteriorated in 13 countries of the 19 countries in the region
since 2009.
South Asia recorded improvements in all of the eight Pillars,
with the region’s score improving by 4.2 per cent (Table 1.3).
Well-Functioning Government was the best performing Pillar,
improving by 6.5 per cent. The region also improved by 6.2 per
cent in its Equitable Distribution of Resources score, based on
significant improvement in inequality-adjusted life expectancy
and government openness and transparency. Individuals using
the Internet and international tourism also posted substantial
improvements albeit off a relatively low base. The region
recorded large deteriorations in the quality of information and
youth not in education, employment or training indicators.
Bhutan is a remarkable success story in the region, having risen
twelve places to rank 65th in the PPI. The country recorded
substantial improvement in all Pillars of Positive Peace, with the
exception of Good Relations with Neighbours. Afghanistan also
recorded improvements from 2009 to 2020, although such
improvement in societal resilience was insufficient to fend off
the threat of the Taliban, a violent insurgent group that took
control of the country in 2021 (Box 1.1).
Afghanistan recorded a slight improvement in Positive Peace over the past decade. Since 2009, the PPI Overall Score for the country improved by 4.4 percent, broadly in line with other countries in South Asia. However, this improvement comes off a very low base and by 2020 the country still ranked 153rd out of the 163 countries evaluated in the PPI. One lingering problem with the country is that it had high levels of corruption and government ineffectiveness, which hampered social-economic development and kept the unemployment rate at over 11 per cent.
Its poor score leaves the country with a low level of societal resilience. Afghanistan fares poorly in both the PPI and the GPI rankings, which left the country vulnerable to the Taliban. With the withdrawal of the US and allied security forces, the Taliban resumed overt operations, overwhelmed the local security forces and took control of the government in August 2021. The Taliban offensive had begun as early as May, at the time the US forces began to withdraw. It is likely that these developments and the Taliban rule may cause a deterioration in Afghanistan’s Positive Peace stance from 2021 onwards.
BOX 1.1
Positive Peace in Afghanistan
Regional Rank Country
Overall Score in 2020
Change in score from 2009 to 2020 (%)*
Global Rank in 2020
1 Australia 1.394 -1.8 8
2 New Zealand 1.451 -6.1 11
3 Japan 1.466 -12.1 12
4 Singapore 1.561 -7.5 14
5 South Korea 1.694 -14.3 19
6 Taiwan 2.000 -1.7 27
7 Malaysia 2.587 -10.4 44
8 Mongolia 2.922 -6.7 57
9 Thailand 2.937 -6.2 60
10 China 3.004 -6.7 66
11 Viet Nam 3.083 -9.4 70
12 Indonesia 3.220 -8.6 87
13 Philippines 3.405 -3.9 97
14 Timor-Leste 3.592 -5.6 111
15 Cambodia 3.625 -5.5 116
16 Laos 3.664 -5.2 124
17 Papua New Guinea 3.713 -1.7 127
18 Myanmar 3.716 -9.9 128
19 North Korea 4.064 -1.6 149
REGIONAL AVERAGE 2.795 -6.4
* a negative change is an improvement in Positive Peace.Source: IEP
TABLE 1.2
Regional scores, Asia-Pacific, 2009–2020All countries in Asia-Pacific recorded improvements in Positive Peace since 2009.
Regional Rank Country
Overall Score in 2020
Change in score from 2009 to 2020 (%)*
Global Rank in 2020
1 Bhutan 2.992 -8.2 65
2 India 3.216 -2.8 85
3 Sri Lanka 3.322 -5.8 95
4 Nepal 3.698 -1.7 126
5 Pakistan 3.736 -5.3 130
6 Bangladesh 3.806 -1.8 134
7 Afghanistan 4.099 -4.4 153
REGIONAL AVERAGE 3.553 -4.2
* a negative change is an improvement in Positive Peace.Source: IEP
TABLE 1.3
Regional scores, South Asia, 2009–2020All countries in South Asia recorded improvements in Positive Peace.

POSITIVE PEACE REPORT 2022 | 27
Improvement in the MENA region’s Free Flow of Information
stems from a 44.8 per cent improvement in the region’s access
to internet indicator score. The region’s gender inequality
indicator score has improved by 13.4 per cent, although off a low
base.
The PPI for the Russia and Eurasia region improved by 6.1 per
cent. All Pillars improved with the exception of High Levels of
Human Capital, which recorded 2.5 per cent deterioration. The
Pillars with the largest improvements were Good Relations with
Neighbours and Free Flow of Information, reflecting the benign
economic and diplomatic performance of the area. Georgia,
Armenia and Uzbekistan posted strong improvements in their
scores (Table 1.6).
Positive Peace improved in South America from 2009 to 2020,
with the region’s PPI improving by 2.2 per cent (Table 1.7). The
region posted a 10.9 per cent improvement in the Free Flow of
Information Pillar of Positive Peace since 2009, as a result of
greater access to information technology. South America also
recorded a 5.8 per cent improvement in the Sound Business
Environment Pillar from 2009 to 2020. This reflects the greater
economic prosperity enjoyed by many countries in the region
North America’s overall Positive Peace score has deteriorated
by nine per cent since 2009 (Table 1.4). This was due to a
substantial deterioration in the Positive Peace score of the
United States, whereas Canada has recorded a Positive Peace
improvement. Low Levels of Corruption showed a distinct
deterioration, a 30.6 per cent decline since 2009. The United
States’ factionalised elites, government openness and
transparency, and quality of information indicator scores also
deteriorated by more than 30 per cent each, reflecting increased
political polarisation and an opaque government. More
information on the US can be found in the ‘Special Section: US,
China, EU and UK’ below.
The Middle East and North Africa (MENA) has seen a
marginal 0.1 per cent improvement in Positive Peace since 2009
(Table 1.5). MENA experienced a small, but notable 3.6 per cent
deterioration in Low Levels of Corruption. The region’s Well-
Functioning Government score has deteriorated by 4.3 per cent,
pulled down by weaker administrative effectiveness as
government resources are diverted to address ongoing armed
conflicts in the region. The deterioration in these two Pillars
have been partly offset by improvements in Free Flow of
Information, which improved by 14 per cent.
Regional Rank Country
Overall Score in 2020
Change in score from 2009 to 2020 (%)*
Global Rank in 2020
1 Canada 1.366 -1.3 7
2 United States 1.949 17.6 24
REGIONAL AVERAGE 1.658 9.0
* a negative change is an improvement in Positive Peace.Source: IEP
TABLE 1.4
Regional scores, North America, 2009–2020The US recorded a substantial deterioration in its PPI score.
Regional Rank Country
Overall Score in 2020
Change in score from 2009 to 2020 (%)*
Global Rank in 2020
1 Israel 2.234 -5.6 34
2 United Arab Emirates 2.297 -9.6 37
3 Kuwait 2.658 -4.2 46
4 Qatar 2.693 -2.6 49
5 Tunisia 2.865 -1.2 54
6 Oman 2.866 -5.0 55
7 Bahrain 3.106 -0.4 72
8 Saudi Arabia 3.158 -8.2 79
9 Morocco 3.177 -1.5 80
10 Jordan 3.189 1.5 83
11 Algeria 3.386 -3.7 96
12 Lebanon 3.554 2.9 105
13 Palestine 3.556 -2.3 106
14 Iran 3.567 -4.1 108
TABLE 1.5
Regional scores, Middle-East and North Africa, 2009–2020Fifteen countries in MENA recorded improvements in Positive Peace since 2009.
Regional Rank Country
Overall Score in 2020
Change in score from 2009 to 2020 (%)*
Global Rank in 2020
1 Georgia 2.766 -12.9 51
2 Armenia 2.968 -10.2 62
3 Belarus 3.080 -6.3 68
4 Russia 3.088 -3.2 71
5 Moldova 3.106 -4.2 72
6 Ukraine 3.111 -4.3 74
7 Kazakhstan 3.118 -9.3 75
8 Kyrgyz Republic 3.431 -5.0 98
9 Uzbekistan 3.467 -10.9 100
10 Azerbaijan 3.594 -3.5 112
11 Turkmenistan 3.889 -4.4 140
12 Tajikistan 3.960 -0.6 143
REGIONAL AVERAGE 3.298 -6.1
* a negative change is an improvement in Positive Peace.Source: IEP
TABLE 1.6
Regional scores, Russia and Eurasia, 2009–2020All countries in the region recorded improvements in Positive Peace.
15 Egypt 3.596 -2.1 114
16 Libya 4.097 16.6 152
17 Iraq 4.103 -1.4 154
18 Sudan 4.214 -2.5 155
19 Syria 4.304 15.7 157
20 Yemen 4.542 8.6 161
REGIONAL AVERAGE 3.358 -0.1
* a negative change is an improvement in Positive Peace.Source: IEP

POSITIVE PEACE REPORT 2022 | 28
following the period of economic turmoil of the late 1990s and
early 2000s. Good Relations with Neighbours also improved
considerably in the region, by 5.6 per cent. In contrast,
corruption worsened, with the Low Levels of Corruption Pillar
deteriorating by 3.1 per cent since 2009.
Sub-Saharan Africa recorded higher levels of Positive Peace in
comparison to 2009. The region’s PPI improved by 1.6 per cent
since 2009 and almost three quarters of the countries in the
region recorded PPI improvements (Table 1.8). Key contributors
were greater Acceptance of the Rights of Others and Equitable
Distribution of Resources. Free Flow of Information also posted
substantial gains. Low Levels of Corruption, Well-Functioning
Government and High Levels of Human Capital were the only
Pillars to record deteriorations in the region.
Regional Rank Country
Overall Score in 2020
Change in score from 2009 to 2020 (%)*
Global Rank in 2020
1 Uruguay 2.083 -8.0 29
2 Chile 2.147 -3.6 32
3 Argentina 2.632 -6.3 45
4 Brazil 2.982 7.4 63
5 Peru 3.004 -6.0 66
6 Colombia 3.180 -4.8 81
7 Ecuador 3.217 -5.5 86
8 Paraguay 3.241 -5.4 89
9 Bolivia 3.277 -3.4 93
10 Guyana 3.292 -3.3 94
11 Venezuela 4.010 12.3 147
REGIONAL AVERAGE 3.006 -2.2
* a negative change is an improvement in Positive Peace.Source: IEP
TABLE 1.7
Regional scores, South America, 2009–2020Venezuela and Brazil were the only countries to record PPI deteriorations in the region.
Regional Rank Country
Overall Score in 2020
Change in score from 2009 to 2020 (%)*
Global Rank in 2020
1 Mauritius 2.572 1.7 43
2 Botswana 2.686 -4.9 48
3 South Africa 2.925 -3.4 58
4 Ghana 2.986 -3.8 64
5 Namibia 3.081 -0.2 69
6 Senegal 3.156 -4.3 78
7 Benin 3.258 -3.6 90
8 Burkina Faso 3.436 -3.8 99
9 Lesotho 3.479 -2.4 101
10 Tanzania 3.503 0.0 102
TABLE 1.8
Regional scores, Sub-Saharan Africa, 2009–2020A quarter of the sub-Saharan countries improved in Positive Peace from 2009.
11 Kenya 3.536 -4.6 103
12 The Gambia 3.553 -6.6 104
13 Sierra Leone 3.576 -1.9 110
14 Zambia 3.594 0.6 112
15 Rwanda 3.612 -3.6 115
16 Malawi 3.627 -1.9 117
17 Gabon 3.638 -1.0 118
=18 Cote d'Ivoire 3.642 -8.4 119
=18 Togo 3.642 -3.9 119
20 Swaziland 3.657 -3.3 122
21 Madagascar 3.663 -3.3 123
22 Mozambique 3.695 2.6 125
23 Liberia 3.718 -1.7 129
24 Ethiopia 3.737 -4.5 131
25 Djibouti 3.751 -3.1 132
26 Niger 3.766 0.2 133
27 Nigeria 3.836 -0.5 135
28 Angola 3.838 -6.0 136
29 Mali 3.844 1.7 137
30 Uganda 3.845 3.0 138
31 Mauritania 3.876 -1.5 139
32 Guinea 3.911 -2.1 141
33 Guinea-Bissau 3.943 -0.8 142
34 Zimbabwe 3.980 -5.1 144
35 Republic of the Congo 4.002 0.4 145
36 Cameroon 4.005 -0.1 146
37 Equatorial Guinea 4.077 -1.1 150
38 Burundi 4.089 2.1 151
39 Eritrea 4.290 1.9 156
40 Democratic Rep. of the Congo 4.306 -2.0 158
41 Chad 4.374 -2.4 159
42 Central African Republic 4.432 4.8 160
43 South Sudan 4.553 7.7 162
44 Somalia 4.590 -1.9 163
REGIONAL AVERAGE 3.711 -1.6
* a negative change is an improvement in Positive Peace.Source: IEP

POSITIVE PEACE REPORT 2022 | 29
The PPI for Central America and the Caribbean improved by
2.7 per cent since 2009 (Table 1.9). This result reflected
substantial improvement in the Free Flow of Information,
Acceptance of the Rights of Others and Good Relations with
Neighbours Pillars. The Low Levels of Corruption and Well-
Functioning Government Pillars were the only Pillars to record a
deterioration from 2009 to 2020.
Europe’s PPI improved by 0.8 per cent over the past decade
(Table 1.10). Most of this came from Eastern Europe, although
some Western nations such as Switzerland, Norway and Belgium
also posted strong improvements in their PPI scores. There were
substantial improvements in the Free Flow of Information, High
Levels of Human Capital and Good Relations with Neighbours
Pillars. Europe deteriorated in the Well-Functioning
Government, Low Levels of Corruption, Acceptance of the Rights
of Others and Sound Business Environment. A more detailed
discussion on Europe can be found at the end of this section.
Regional Rank Country
Overall Score in 2020
Change in score from 2009 to 2020 (%)*
Global Rank in 2020
1 Costa Rica 2.314 -5.8 39
2 Trinidad and Tobago 2.682 -4.2 47
3 Panama 2.718 -6.0 50
4 Jamaica 2.833 -6.7 53
5 Mexico 3.123 1.1 76
6 Dominican Republic 3.185 -7.3 82
7 Cuba 3.259 -7.0 91
8 El Salvador 3.275 -0.3 92
9 Honduras 3.566 1.7 107
10 Nicaragua 3.574 1.1 109
11 Guatemala 3.652 0.0 121
12 Haiti 4.041 -1.9 148
REGIONAL AVERAGE 3.185 -2.7
* a negative change is an improvement in Positive Peace.Source: IEP
TABLE 1.9
Regional scores, Central America and the Caribbean, 2009–2020Four countries in the region did not progress in the PPI since 2009.
Regional Rank Country
Overall Score in 2020
Change in score from 2009 to 2020 (%)*
Global Rank in 2020
1 Sweden 1.228 -0.4 1
2 Denmark 1.238 2.9 2
3 Finland 1.258 -2.9 3
4 Norway 1.274 -4.2 4
5 Switzerland 1.279 -5.5 5
6 Netherlands 1.362 -0.4 6
7 Germany 1.397 -1.6 9
8 Ireland 1.433 -1.8 10
9 Iceland 1.543 4.8 13
10 Austria 1.566 1.8 15
11 Belgium 1.567 -4.3 16
12 France 1.574 -0.1 17
13 United Kingdom 1.693 5.6 18
14 Portugal 1.698 -2.4 20
15 Spain 1.833 2.5 21
16 Slovenia 1.859 2.0 22
17 Estonia 1.900 -3.6 23
18 Italy 1.979 -0.6 25
19 Czech Republic 1.988 4.9 26
20 Lithuania 2.010 -7.0 28
21 Latvia 2.135 -8.3 30
22 Poland 2.141 2.2 31
23 Slovakia 2.180 1.3 33
24 Greece 2.234 7.9 34
25 Cyprus 2.259 1.4 36
26 Croatia 2.313 -3.8 38
27 Hungary 2.358 5.4 40
28 Romania 2.527 -7.8 41
29 Bulgaria 2.529 -3.1 42
30 Montenegro 2.790 -2.7 52
31 Macedonia 2.874 -4.5 56
32 Albania 2.927 -2.9 59
33 Serbia 2.958 -1.9 61
34 Kosovo 3.136 -1.8 77
35 Bosnia and Herzegovina 3.189 -1.7 83
36 Turkey 3.231 8.2 88
REGIONAL AVERAGE 2.041 -0.8
* a negative change is an improvement in Positive Peace.Source: IEP
TABLE 1.10
Regional scores, Europe, 2009–2020Almost two-thirds of European countries improved in the PPI.

POSITIVE PEACE REPORT 2022 | 30
Results By Income Level and Government Type
As a measure of societal development, Positive Peace is highly
correlated with a nation’s income level. Income influences and is
influenced by societal resilience, such that nations with higher
levels of per-capita income are those with greater resources and
internal organisation to protect their citizens from and recover
after shocks (Figure 1.6).
This section uses the World Bank classification of income type,
which groups countries into four tiers of per capita gross
national income (GNI): high income; upper-middle income;
lower-middle income; and low income. High-income countries
tend to be the most peaceful and low-income countries tend to
be the least peaceful.
The countries at the top of the PPI are all high-income
countries, illustrating a recognisable correlation between
Positive Peace and economic prosperity. Positive Peace can often
act as a driver of economic prosperity while economic
FIGURE 1.6Positive Peace by income group, 2020High income countries have the highest levels of Positive Peace.
AV
G P
PI S
CO
RE
3
4
2
1
0
Wea
ker
Stro
nger
High income
Upper middleincome
Lower middleincome
Lowincome
Source: World Bank, IEP Source: World Bank, IEP
FIGURE 1.7Positive Peace by government type, 2020Full democracies have the highest levels of Positive Peace, as measured by the PPI.
AV
G P
PI S
CO
RE
Full Democracy
HybridRegime
AuthoritarianRegime
Flawed Democracy
0
1
2
3
Wea
ker
Stro
nger
prosperity also acts as a driver of peace, highlighting how
societies develop systemically through continuous feedback
loops.
Government type has a statistically strong relationship with
Positive Peace as well, as shown in Figure 1.7. Globally, there are
23 full democracies, 52 flawed democracies, 35 hybrid regimes
and 57 authoritarian regimes. Indicators of democracy do not
measure the transparency and representativeness of elections
directly, but rather nations’ democratic structures such as
separation of power, effectiveness of courts, and others. Full
democracies tend to score better on the PPI, while authoritarian
regimes record relatively poorer scores (Figure 1.7). These
results reflect the important role that the systemic influence of
Positive Peace plays on effective government.
There are rare exceptions to this trend, with a few authoritarian
regimes, flawed and hybrid democracies scoring well in Positive
Peace. Only two authoritarian regimes are in the top 50
countries on Positive Peace, while the top ten countries are all
full democracies.

POSITIVE PEACE REPORT 2022 | 31
However, the other two domains, when combined recorded a
deterioration of 0.4 per cent. The Attitudes domain deteriorated
by 1.8 per cent, while Structures improved by 1.4 per cent.
Within the Attitudes domain, there were some troubling trends
with quality of information and factionalised elites deteriorating
by 6.5 per cent or more.
When looking at Attitudes, the proportion of nations that
improved in this domain dropped to 40.5 per cent of the
countries. The Attitudes indicator, quality of information
improved in only 28.8 per cent of countries and factionalised
elites improved in only 20.2 per cent of the nations assessed.
Two other indicators of the Attitudes domain – Equality of
opportunity and exclusion by socio-economic group – also
deteriorated in the period. The deterioration in this domain is
indicative of greater polarisation of the social and political
debates and an increase in intolerance of dissenting views.
There is also an increasing dissatisfaction with one’s own
standards of living which appears to be associated with greater
access to information and people perhaps adopting unrealistic
benchmarks against which to compare their own situations.
This is further discussed in Section 2 of this report.
Progress in Positive Peace materialises slowly. Countries may
show little change in a single year, which means that Positive
Peace changes should be investigated over longer periods of
time. This is important as social changes tends to be long-lasting
and self-perpetuating. This section presents the countries that
have demonstrated the largest changes, positively or negatively,
since 2009 (Figure 1.8). Note that a reduction in score indicates
an improvement in Positive Peace.
The countries that experienced the largest improvements in PPI
scores between 2009 and 2020 were Uzbekistan, Georgia,
Armenia, Côte d'Ivoire and Kazakhstan, each improving by at
least eight per cent. Four of the most improved countries are
from the Russia and Eurasia region and one is from sub-Saharan
Africa.
Syria, Libya, Venezuela, Yemen and South Sudan are the
countries with the largest deteriorations. Two of the largest
deteriorating countries are from MENA, two are from sub-
Saharan Africa and one is from South America.
The majority of countries in the PPI — 126 out of 163 countries, or 77.3 per cent — posted an improvement in Positive Peace from 2009 to 2020. This was brought about by improvements in the Structures domain, especially reflecting the spread of technology and increases in income. Almost 94 per cent of countries improved in this domain.
RISERS & FALLERS IN POSITIVE PEACE
With a relative improvement in its PPI score of 9.9 per cent since 2009, Myanmar is one of the biggest improvers in Positive Peace in the past decade. The country saw improvements in all Pillars and had made substantial progress, albeit off a low base, with substantial improvements in combating corruption and supporting business activity. Of all 24 indicators of Positive Peace, only three saw deteriorations in Myanmar from 2009 to 2020. The country of 54 million people saw its per-capita GDP rise from US$840 in 2009 to US$1,400 in 2020.
However, all this societal development is being negatively impacted by the 2021 coup. In February, the country witnessed a coup d’état in which the military seized control of the government ousting Aung San Suu Kyi’s National League for Democracy (NLD), which had won a 2020 election.
These developments will most likely cause a substantial deterioration in Myanmar’s Positive Peace scores in the next edition.
BOX 1.2
Positive Peace in Myanmar
Source: IEP
Largest changes in Positive Peace, 2009–2020Uzbekistan and Georgia recorded the largest improvements in Positive Peace, while Syria recorded the largest deterioration.
0.0 0.2 0.4 0.6
Uzbekistan
Georgia
Armenia
Côte d’Ivoire
Kazakhstan
South Sudan
Yemen
Venezuela
Libya
Syria
ABSOLUTE CHANGE IN PPI SCORE
ImprovementDeterioration
FIGURE 1.8

POSITIVE PEACE REPORT 2022 | 32
Uzbekistan recorded the largest improvement in Positive Peace
of all countries assessed over the past decade. The country’s
score improved by 0.422 points from 2009 to 2020, or 10.9 per
cent over the period. The country improved in all Domains and
Pillars of Positive Peace, with particularly large changes being
recorded in Free Flow of Information, Good Relations with
Neighbours and Equitable Distribution of Resources.
While substantive, these improvements come off a relatively low
base, with Uzbekistan still ranking 100th out of the 163 nations
assessed in the PPI.
Most of the country’s progress in societal resilience took place
from 2016 onwards. Around that time, Uzbekistan implemented
deep administrative reforms, effectively ending the last remains
of post-Soviet isolationism. The country liberalised the exchange
rate regime, began easing visa requirements and announced a
series of tax changes aiming to attract international investors.
There was also a program for reducing state intervention on the
economy and in private affairs.
Uzbekistan CHANGE IN OVERALL SCORE, 2009-2020:
to 3.467 from 3.889-0.422
to 100 from 136
CHANGE IN RANK, 2009-2020:
long-arrow-alt-up
Largest changes in Positive Peace in Uzbekistan
Pillar Indicator Value in 2009
Value in 2020 Change
Free Flow of Information Individuals using the Internet 4.49 1.98 -2.51
High Levels of Human Capital
Youth not in employment, education or training (NEET) 3.13 1.64 -1.48
Good Relations with Neighbours International tourism 4.71 3.36 -1.35
Low Levels of Corruption Public sector theft 3.97 4.10 0.12
Acceptance of the Rights of Others Gender inequality 2.13 2.27 0.14
High Levels of Human Capital Researchers in R&D 4.03 4.58 0.55
FIVE LARGEST IMPROVEMENTS IN POSITIVE PEACE
There has been some progress in combating corruption,
especially with the passing of the “On Anti-Corruption” legal
framework. It was put in place in 2003 and has been gradually
implemented and enhanced ever since. Despite this, the level of
corruption remains high, with the country ranking 139th out of
the 163 nations assessed in the Low Levels of Corruption Pillar.
The social, economic and international relations reforms have
driven large improvements in the country’s individuals using
the Internet, youth not in employment, education and training
(NEET) and international tourism indicators. There have also
been substantial improvements in the areas of government
openness and transparency, regulatory quality and group
grievance.
Source: IEP
Trend in the PPI score, Uzbekistan, 2009–2020Positive Peace improved by 10.9 per cent since 2009.
PPI S
CO
RE
Less
pe
acef
ulM
ore
peac
eful
3.5
3.6
3.7
3.8
3.9
2010 2012 2014 2016 20202018
36

POSITIVE PEACE REPORT 2022 | 33
Georgia holds the highest Positive Peace rank in the Russia and
Eurasia region, with a PPI score of 2.766 in 2020. Over the past
decade, the country improved its global ranking by 17 places and
now stands at rank 51 of the 163 nations assessed in the PPI.
The country improved in all domains of Positive Peace, with the
only exception being Attitudes, which was broadly unchanged
from 2009 to 2020.
All Pillars of Positive Peace improved in Georgia over the past
decade, with the largest changes being recorded in Well-
Functioning Government, Good Relations with Neighbours and
Sound Business Environment.
Since gaining independence in 1991, the country implemented a
series of reforms that sought to liberalise the economy, improve
foreign relations, combat corruption and increase administrative
efficiency. In the timeframe of one generation, Georgia reduced
its heavy reliance on agriculture and shifted its economic
activity towards the service industry, particularly the tourism
and hospitality sectors. This has lifted average incomes and
reduced unemployment and underemployment rates. Such
developments led to a substantial 11.8 per cent improvement in
the Equitable Distribution of Resources Pillar. From 2005 to 2019
– before the COVID-19 pandemic – Georgian GDP grew by 5 per
cent per year on average, which reduced poverty and inequality.
In 2008, Georgia was involved in a conflict with Russia. The two
countries clashed over the regions of South Ossetia and
Abkhazia, with the result being the expulsion of ethnic
Georgians from these areas. However, the conflict was short
Georgia CHANGE IN OVERALL SCORE, 2009-2020:
to 2.766 from 3.174-0.408
to 51 from 68
CHANGE IN RANK, 2009-2020:
17
Largest changes in Positive Peace in Georgia
Pillar Indicator Value in 2009
Value in 2020 Change
Free Flow of Information Individuals using the Internet 4.14 1.89 -2.25
Good Relations with Neighbours International tourism 4.64 3.12 -1.52
Sound Business Environment Financial institutions index 4.05 2.78 -1.27
High Levels of Human Capital Researchers in R&D 3.40 3.71 0.31
Low Levels of Corruption
Public sector theft 1.77 2.42 0.65
Free Flow of Information
Quality of information 2.80 3.70 0.91
FIVE LARGEST IMPROVEMENTS IN POSITIVE PEACE
lived and did not have a substantial negative impact on
Georgia’s overall level of societal resilience.
Following the conflict, Georgia continued to implement its
reform agenda, liberalising the economy and improving
relations with European countries. This led to the signing of an
Association Agreement with the European Union (EU) in 2016.
This agreement stipulated Deep and Comprehensive Free Trade
Area status for Georgia, which allowed preferential trade regime
for the country with EU nations. The country’s Good Relations
with Neighbours Pillar improved by almost 20 per cent over the
past decade.
Source: IEP
Trend in the PPI score, Georgia, 2009–2020Positive Peace improved by 12.9 per cent since 2009.
PPI S
CO
RE
Less
pe
acef
ulM
ore
peac
eful
2.8
2.9
3.0
3.1
2010 2012 2014 2016 20202018
long-arrow-alt-up

POSITIVE PEACE REPORT 2022 | 34
The Armenian PPI score improved by 10.2 per cent since 2009, placing the country as the second highest ranking in its region of Russia and Eurasia. All Domains of Positive Peace improved in the country over the past decade.
All Pillars recorded substantial improvements in Armenia, with the exception of High Levels of Human Capital. Free Flow of Information recorded an improvement of almost 30 per cent, and Acceptance of the Rights of Others improved by 20 per cent.
The deterioration in High Levels of Human Capital was driven by a reduction in the overall number of researchers and technical professionals who left the country, with the researchers in R&D indicator of Positive Peace deteriorating by 46.4 per cent since 2009. This diaspora took place mainly as a result of the 2009 recession and the subsequent sluggish growth in employment. From 2008 to 2013, Armenia’s GDP grew by just 1.7 per cent per year, a low level for a middle income country. This prompted a number of skilled professionals to seek employment in the US, Germany, France and other countries.
The largest improvement was in internet access, with the score for individuals using the Internet improving by 50.5 per cent since 2009. This, coupled with a 19.6 per cent improvement in the quality of information resulted in the overall improvement in the Free Flow of Information. Freedom House reported that “there were no major restrictions on press freedom during the 2018 parliamentary election campaign,” and that independent media outlets provide a diversity of perspectives in the country.
Tourism in the country has been increasing, at the same time that Armenia strengthened its ties with the EU. Tourist arrivals in the first quarter of 2018 were up 14 per cent over the same period of the prior year, contributing to the 6.6 per cent
Armenia CHANGE IN OVERALL SCORE, 2009-2020:
to 2.968 from 3.306-0.338
to 62 from 81
CHANGE IN RANK, 2009-2020:
19
Largest changes in Positive Peace in Armenia
Pillar Indicator Value in 2009
Value in 2020 Change
Free Flow of Information Individuals using the Internet 4.34 2.15 -2.19
Low Levels of Corruption Public sector theft 3.87 2.74 -1.13
Well-Functioning Government
Government openness and transparency 4 3 -1
Good Relations with Neighbours External intervention 3.20 3.24 0.04
Low Levels of Corruption Factionalised elites 3.62 3.67 0.04
High Levels of Human Capital Researchers in R&D 3.42 5 1.58
FIVE LARGEST IMPROVEMENTS IN POSITIVE PEACE
improvement seen in the international tourism indicator from 2009 to 2020.
One vulnerability is the on-going border tensions with Azerbaijan over the disputed Nagorno-Karabakh region, following a short conflict in 2020. In the absence of a peaceful resolution to the dispute, the Armenian progress in societal resilience thus far could be partially unwound.
Source: IEP
Trend in the PPI score, Armenia, 2009–2020Positive Peace improved by 10.2 per cent since 2009.
PPI S
CO
RE
Less
pe
acef
ulM
ore
peac
eful
3.0
3.1
3.2
3.3
2010 2012 2014 2016 20202018
long-arrow-alt-up

POSITIVE PEACE REPORT 2022 | 35
Côte d'Ivoire has improved its Positive Peace score by 8.4 per
cent since 2009, based on improvements in all Pillars with the
exception of High Levels of Human Capital. The country
recorded substantial improvements in the Attitudes and
Institutions domains over the decade, both improving by 8.8 per
cent and 10.1 per cent, respectively. Structures also improved,
albeit at a milder pace of 4.1 per cent.
However, this progress comes off a relatively low base, with Côte
d'Ivoire remaining near the bottom of the ‘medium Positive
Peace’ classification. The country holds the 119th position in the
global PPI rankings.
Côte d'Ivoire recently endured two ethnic and racially charged
civil wars from 2002 to 2007 and 2011 to 2012. Both conflicts
resulted from escalating tensions between native-born nationals
of Côte d'Ivoire and the country’s large immigrant population,
mainly from Burkina Faso, Mali, Guinea and Senegal. Before the
escalation of violence, the immigrant population was estimated
to be up to 50 per cent of the total population.
The first civil war resulted in over 4,000 people killed. At the
end of 2003, the number of internally displaced persons was
estimated to be between 700,000 and 1,000,000, or four to six
per cent of the population. The second civil war broke out in
2011 following a disputed election between long-standing
Ivorian President Gbagbo and newly elected President Alassane
Ouattara. Though the post-electoral crisis lasted less than a year,
the resulting violence caused over 3,000 deaths. Since 2012, Côte
d'Ivoire has become more stable, though violent protests and
strikes still arise occasionally.
Côte d'Ivoire CHANGE IN OVERALL SCORE, 2009-2020:
to 3.642 from 3.974-0.332
to 119 from 140
CHANGE IN RANK, 2009-2020:
21
Largest changes in Positive Peace in Côte d'Ivoire
Pillar Indicator Value in 2009
Value in 2020 Change
Free Flow of Information Individuals using the Internet 4.91 3.45 -1.47
Equitable Distribution of Resources
Equality of opportunity 4 3 -1
Good Relations with Neighbours
Law to support equal treatment of population segments 4 3 -1
Free Flow of Information Quality of information 2.96 3.16 0.20
Low Levels of Corruption Factionalised elites 4.33 4.60 0.27
High Levels of Human Capital
Youth not in employment, education or training (NEET) 1.96 3.67 1.71
FIVE LARGEST IMPROVEMENTS IN POSITIVE PEACE
In the aftermath of the second civil war, the country established
a Truth and Reconciliation Commission (Commission Dialogue,
Vérité et Reconciliation – CDVR), which investigated past
human rights violations and contributed to the appeasement of
sectarian pressures. The country also implemented deep
economic and fiscal reforms, which contributed to the country
being assessed as one of the best performing economies of the
West African Economic and Monetary Union (WAEMU) by 2019.
This is reflected in a 10.7 per cent improvement in Well-
Functioning Government and an 8.6 per cent improvement in
Sound Business Environment.
Source: IEP
Trend in the PPI score, Côte d'Ivoire, 2009–2020Positive Peace improved by 8.4 per cent since 2009.
PPI S
CO
RE
Less
pe
acef
ulM
ore
peac
eful 3.7
3.8
3.9
2010 2012 2014 2016 20202018
long-arrow-alt-up

POSITIVE PEACE REPORT 2022 | 36
The Positive Peace score for Kazakhstan improved by 9.3 per
cent since 2009. Large improvements in the Structures and
Institutions domains were only partially offset by a deterioration
in Attitudes.
The 20.9 per cent improvement in the Structures domain
reflected the implementation of economic reforms that opened
up the economy, reduced state intervention and reduced overall
levels of poverty. The country has large reserves of hydrocarbon
resources, including oil, natural gas and coal. In addition, it has
rich deposits of ferrous metals, copper, aluminium, zinc and
uranium. These resource exports supported the economy, with
GDP growth averaging above 4 per cent per year in the decade
before the COVID-19 pandemic. There has also been a rise in
international tourism, which has been incentivised by
government campaigns promoting the country abroad.
Kazakhstan has also implemented reforms to reduce
government red-tape and corruption, contributing to an
improvement of 10.3 per cent in the Structures domain since
2009.
However, all this progress was partially negated by poor
performance in Attitudes. The domain deteriorated by 4.5 per
cent in the past decade, largely reflecting a sharp deterioration
in the group grievance indicator. Kazakhstan has a chequered
history in regards to the rights of groups and individuals.
Kazakhstan CHANGE IN OVERALL SCORE, 2009-2020:
to 3.118 from 3.439-0.321
to 75 from 91
CHANGE IN RANK, 2009-2020:
16
Largest changes in Positive Peace in Kazakhstan
Pillar Indicator Value in 2009
Value in 2020 Change
Free flow of Information Individuals using the Internet 4.22 1.32 -2.9
Good Relations with Neighbours External intervention 3.42 2.05 -1.36
Good Relations with Neighbours International tourism 4.08 2.93 -1.15
Well-Functioning Government
Government openness and transparency 5 5 0
Free Flow of Information Quality of information 3.69 3.95 0.26
Acceptance of the Rights of Others Group grievance 3.00 4.21 1.21
FIVE LARGEST IMPROVEMENTS IN POSITIVE PEACE
Source: IEP
Trend in the PPI score, Kazakhstan, 2009–2020Positive Peace improved by 9.3 per cent since 2009.
PPI S
CO
RE
Less
pe
acef
ulM
ore
peac
eful
3.1
3.2
3.3
3.4
2010 2012 2014 2016 20202018
long-arrow-alt-up

POSITIVE PEACE REPORT 2022 | 37
Syria has recorded the largest deterioration in Positive Peace of
any country in the index – 0.583 index points, the equivalent to
a 15.7 per cent change. All Domains and Pillars deteriorated
since 2009, as did 17 out of the 24 indicators of Positive Peace.
The country has dropped 41 places in the PPI ranking and is
now the seventh lowest Positive Peace nation in the world.
The Syrian civil war, which started in 2011 and continues to this
day, devastated the physical and economic infrastructure of the
country. Social resilience has been depleted, with 6.8 million
Syrians leaving the country and another 6.7 million having been
displaced within Syria.
The country’s Good Relations with Neighbours Pillar has
deteriorated the most sharply of any Pillar of Peace – a change
of 25.9 per cent in the decade. The external intervention
indicator deteriorated by 1.76 points or 54.2 per cent, largely
reflecting the involvement of neighbours in Syria’s civil war.
Thousands of foreign fighters have flocked to Syria to take up
arms against the Assad regime. In 2013, the number of foreign
fighters in Syria exceeded that of any previous conflict in the
modern history of the Muslim world.
Syria did improve on some indicators. At least two thirds of the
population had mobile internet access as early as 2017.
According to UNHCR, refugees say mobile phones and internet
access are as important to their security as food, shelter and
water. Mobile internet access among Syrian refugees also helps
them connect with aid organisations. Press freedoms have also
improved, albeit off a rather low base.
FIVE LARGEST DETERIORATIONS IN POSITIVE PEACE
Syria CHANGE IN OVERALL SCORE, 2009-2020:
to 4.304 from 3.721+0.583
to 157 from 116
CHANGE IN RANK, 2009-2020:
41
Largest changes in Positive Peace in Syria
Pillar Indicator Value in 2009
Value in 2020 Change
Good Relations with Neighbours External intervention 3.24 5 1.76
Free Flow of Information Quality of information 3.50 5 1.50
Well-Functioning Government Rule of law 3.32 4.70 1.37
Acceptance of the Rights of Others Gender inequality 3.47 3.30 -0.17
Free Flow of Information Freedom of the press 4.68 4.37 -0.30
Free Flow of Information Individuals using the Internet 4.26 3.53 -0.73
Trend in the PPI score, Syria, 2009–2020Positive Peace deteriorated by 15.7 per cent since 2009.
Source: IEPPP
I SC
OR
ELe
ss
peac
eful
Mor
epe
acef
ul 3.8
4.0
4.2
2010 2012 2014 2016 20202018
long-arrow-alt-up

POSITIVE PEACE REPORT 2022 | 38
The PPI score for Libya deteriorated by 0.582 index points – the
second largest in the period after Syria’s. Between 2009 and
2020, the scores for all three domains deteriorated in Libya, as
did seven out of the eight Pillars. The only Pillar to improve was
Free Flow of Information, buoyed by the quality of information
and individuals using the Internet indicators.
The Pillar with the largest deterioration was Well-Functioning
Government, deteriorating by 31.4 per cent since 2009. This was
brought about by the civil war which has effectively seen the
country controlled by militias with competing interests after the
fall of the Gaddafi government.
In 2020, a ceasefire agreement was reached between the
combatants, although peace remains fragile to this day. The
future for Libya is uncertain due to deep divides within the
ruling class. Chronic instability makes it difficult for governance
to improve and social resilience to be strengthened without
lasting peace.
Libya is rich in oil and natural resources, which means the
country is constantly coveted and interfered with by
international powers. This is behind the steep deterioration of
the external intervention indicator.
There is mounting pressure on the healthcare system due to the
COVID-19 pandemic. Humanitarian interventions are unable to
reach many of the communities in Libya due to the restrictions
imposed during the pandemic and associated lockdowns.
FIVE LARGEST DETERIORATIONS IN POSITIVE PEACE
Libya CHANGE IN OVERALL SCORE, 2009-2020:
to 4.097 from 3.515+0.582
to 152 from 97
CHANGE IN RANK, 2009-2020:
55
Largest changes in Positive Peace in Libya
Pillar Indicator Value in 2009
Value in 2020 Change
Good Relations with Neighbours External intervention 2.80 4.91 2.11
Well-Functioning Government
Government openness and transparency 3 5 2
Low Levels of Corruption Factionalised elites 3.71 4.87 1.16
Equitable Distribution of Resources
Inequality-adjusted life expectancy 2.26 2.06 -0.20
Free Flow of Information Individuals using the Internet 4.54 4.07 -0.47
Free Flow of Information Quality of information 4.33 3.33 -1.00
Trend in the PPI score, Libya, 2009–2020Positive Peace deteriorated by 16.6 per cent since 2009.
Source: IEP
PPI S
CO
RE
Less
pe
acef
ulM
ore
peac
eful
3.5
3.7
3.6
3.8
3.9
4.0
4.1
2010 2012 2014 2016 20202018
long-arrow-alt-up

POSITIVE PEACE REPORT 2022 | 39
Positive Peace in Venezuela deteriorated by 12.3 per cent since
2009. The Attitudes domain deteriorated by 19.6 per cent and
the Institutions domain, by 15.4 per cent. The Structures domain
improved slightly by 0.4 per cent.
The political and socio-economic crises continue in Venezuela,
with all Pillars of Positive Peace recording substantial
deteriorations over the past decade. Equitable Distribution of
Resources deteriorated by 39.3 per cent in the period, as poverty
and inequality have risen sharply in the Latin American country.
A study by the Andrés Bello Catholic University in Caracas
found that three in every four Venezuelans now face extreme
poverty.3
After years of shortages and hyperinflation, President Nicolás
Maduro’s government was challenged in January of 2019 when
the head of the National Assembly Juan Guaidó declared himself
president. Despite international support for Guaidó, Maduro
retained official power, with the backing of the military. The
impasse saw the Well-Functioning Government Pillar of Positive
Peace deteriorate by 17.8 per cent over the past decade. The
uncertainty and the collapse of governance and rule of law saw
5.9 million Venezuelans flee the country as a result of the crisis.
FIVE LARGEST DETERIORATIONS IN POSITIVE PEACE
Venezuela CHANGE IN OVERALL SCORE, 2009-2020:
to 4.01 from 3.57+0.44
to 147 from 104
CHANGE IN RANK, 2009-2020:
43
Largest changes in Positive Peace in Venezuela
Pillar Indicator Value in 2009
Value in 2020 Change
Equitable Distribution of Resources
Equality of opportunity 3 5 2
Free Flow of Information Quality of information 3.83 5 1.17
Equitable Distribution of Resources
Access to public services 3.50 4.63 1.13
High Levels of Human Capital Researchers in R&D 4.79 4.74 -0.05
Sound Business Environment GDP per capita 3.54 3.00 -0.54
Free Flow of Information Individuals using the Internet 3.60 2.56 -1.04
Trend in the PPI score, Venezuela, 2009–2020Positive Peace deteriorated by 12.3 per cent since 2009.
Source: IEPPP
I SC
OR
ELe
ss
peac
eful
Mor
epe
acef
ul
3.6
3.8
3.7
3.9
4.0
2010 2012 2014 2016 20202018
long-arrow-alt-up

POSITIVE PEACE REPORT 2022 | 40
The Yemeni PPI deteriorated by 8.6 per cent since 2009, largely
reflecting a 14.2 per cent deterioration in the Institutions
domain and a 12.4 per cent deterioration in Attitudes. The
Structures domain improved by a comparatively moderate 3.8
per cent. Yemen, which already ranked poorly in the 2009 PPI,
shed an additional seven places to rank 161st out of the 163
nations assessed in the 2020 rankings.
All Pillars of Positive Peace deteriorated in the country over the
past decade.
Yemen’s deterioration in Positive Peace was largely caused by the
prolonged civil war. The country has been split by a north-south
divide that led to a civil war in 1994, and then subsequently to
another armed conflict between the government and Houthi
rebels in 2009. This escalated to a full civil war in 2014.
Yemen’ social and political systems remain extremely fragile.
The civil war that started seven years ago left the country’s
economic infrastructure destroyed and resources depleted. The
UN described the humanitarian crisis in the country as the
“worst in the world.”
UNHCR estimates that 24.1 million Yemenis, or 75 per cent of
the population, are in need of humanitarian assistance. Roughly
15 million people, or more than half of Yemen’s population, are
food insecure and 400,000 children are suffering from severe
malnutrition. Over 3.65 million Yemenis have been internally
displaced; this corresponds to 12 per cent of the overall
population.
FIVE LARGEST DETERIORATIONS IN POSITIVE PEACE
Yemen CHANGE IN OVERALL SCORE, 2009-2020:
to 4.542 from 4.184+0.358
to 161 from 154
CHANGE IN RANK, 2009-2020:
7
Largest changes in Positive Peace in Yemen
Pillar Indicator Value in 2009
Value in 2020 Change
Free Flow of Information Quality of information 3.26 4.57 1.31
Good relations with Neighbours External intervention 3.81 5.00 1.19
Well-Functioning Government Government effectiveness 3.97 5.00 1.03
Equitable Distribution of Resources
Inequality-adjusted life expectancy 3.49 3.20 -0.29
Free Flow of Information Freedom of the press 4.20 3.64 -0.56
Free Flow of Information Individuals using the Internet 4.57 3.86 -0.72
Trend in the PPI score, Yemen, 2009–2020Positive Peace deteriorated by 8.6 per cent since 2009.
Source: IEP
PPI S
CO
RE
Less
pe
acef
ulM
ore
peac
eful
4.2
4.3
4.4
4.5
2010 2012 2014 2016 20202018
Yemen's social and political systems remain extremely fragile.
long-arrow-alt-up

POSITIVE PEACE REPORT 2022 | 41
South Sudan is a young nation formed in 2011 after secession
from Sudan. The separation of the mostly Christian and animist
nation from its northern Muslim neighbour followed a 22-year-
old conflict that depleted both nations.
However, independence did not appease internal tensions and
South Sudan saw itself again immersed in war from 2013. This
South Sudanese civil war took hold of the country as multiple
groups vied for political power in the capital Juba.
All Domains and Pillars of Positive Peace deteriorated in South
Sudan over the past decade, with the PPI overall score
deteriorating by 7.7 per cent in the period. South Sudan is now
the second lowest Positive Peace nation among the 163 countries
assessed in the PPI.
South Sudan’s deterioration took place from 2013 to 2018, with
the country’s PPI score having since stabilised. In 2018, a peace
deal was struck between the established government and the
Sudan People’s Liberation Army-in Opposition (SPLA-IO),
although inter-community fighting and human rights abuses
continued on. Fighting among communities results from
grievances about land and cattle, with political and military
leaders adding to the instability by supplying communities in
their sphere of influence with weapons and ammunition.
FIVE LARGEST DETERIORATIONS IN POSITIVE PEACE
South Sudan CHANGE IN OVERALL SCORE, 2009-2020:
to 4.553 from 4.226+0.327
to 162 from 157
CHANGE IN RANK, 2009-2020:
5
Largest changes in Positive Peace in South Sudan
Pillar Indicator Value in 2009
Value in 2020 Change
Good Relations with Neighbours
Law to support equal treatment of population segments 3 5 2
Well-Functioning Government
Government openness and transparency 4 5 1
Equitable Distribution of Resources
Equality of opportunity 4 5 1
Equitable Distribution of Resources
Inequality-adjusted life expectancy 4.34 4.11 -0.23
Good Relations with Neighbours External intervention 5 4.76 -0.24
Acceptance of the Rights of Others Group grievance 5 4.60 -0.40
Trend in the PPI score, South Sudan, 2009–2020Positive Peace deteriorated by 7.7 per cent since 2009.
Source: IEPPP
I SC
OR
ELe
ss
peac
eful
Mor
epe
acef
ul
4.2
4.3
4.4
4.5
4.6
2010 2012 2014 2016 20202018
long-arrow-alt-up

POSITIVE PEACE REPORT 2022 | 42
The US experienced a slow and steady deterioration in its PPI
score since 2009. However, this trend has accelerated since 2015
(Figure 1.9). From 2009 to 2020, the country’s PPI Overall Score
deteriorated by 17.6 per cent, with ten percentage points of this
deterioration taking place since 2015. This was the 6th highest
drop of any country over the last decade. However, the country
is still ranked highly on overall levels of Positive Peace at 24th
compared to 120th on the GPI.
This was driven by deteriorations in the Attitudes and
Institutions domains of Positive Peace. The other domain,
Structures, recorded a mild improvement. The biggest
deterioration was in the quality of information indicator — the
perceived quality of information disseminated by members of
society, the media and authorities. This indicator deteriorated by
150 per cent. This contributed to the Free Flow of Information
Pillar deteriorating by 28.1 per cent between 2009 and 2020, a
large change for a developed nation.
The factionalised elites indicator deteriorated by 114 per cent
since 2009 (Figure 1.10). This highlights the growing
polarisation and intolerance that has been present in the
political debate. The indicator is one of three that forms the Low
Levels of Corruption Pillar, which deteriorated by 48 per cent.
Government openness and transparency also deteriorated
markedly. These findings reflect the widening gap between
dissenting political groups and the radicalisation of views on
economic management, personal freedoms, immigration and
foreign relations. Deteriorations in these three indicators have
been disproportionately large relative to movements recorded
for all other indicators of Positive Peace for the country.
SPECIAL SECTION: US, CHINA, EU, UK AND RUSSIA
This analysis covers the world’s leading powers. The EU has been included as a block due to the interconnected nature of their economies and foreign relations.
What is striking is that the levels of Positive Peace for these countries tend to be much higher than their levels of actual peace as recorded by the Global Peace Index (Table 1.11). This is especially the case for Russia, the UK, China and the US, because these countries maintain large military forces and are involved in external conflicts which detract from their GPI rankings. However, they operate with a level of domestic socio-economic development that is relatively high. These large Positive Peace surpluses are unlikely to change. Countries with strong geopolitical ambitions maintain large militaries with which to pursue strategic goals.
Regional Rank Country PPI Ranking
2020GPI Ranking 2020
1 US 24 120
2 UK 18 39
3 Russia 71 154
4 China 66 94
5 Europe (average of countries in region) 30 32
TABLE 1.11
PPI and GPI rankings, 2020Selected countries and regions with Positive Peace surpluses.
United States
100%
90%
140%
130%
110%
120%
Positive Peace deteriorated in the US from 2015 on the back of poorer scores for institutional and attitude indicators.
Changes in Attitudes, Institutions and Structures in the PPI, United States, 2009–2020
2010 2012 2014 2016 2018 2020
Source: IEP
FIGURE 1.9
AV
ERA
GE
SCO
RE
(IN
DEX
ED T
O 2
00
9)Le
ss
peac
eful
Mor
epe
acef
ul
Attitudes
InstitutionsPPI Overall Score
Structures

POSITIVE PEACE REPORT 2022 | 43
PERCENTAGE CHANGE
Percentage change in Positive Peace indicators, United States, 2009–2020Quality of information and fractionalised elites deteriorated the most among US indicators.
FIGURE 1.10
100% 150%50%0.0%
Source: IEP
ImprovementDeterioration
Quality of information
Government openness and transparencyFactionalised elites
Equality of opportunity
Group grievance
Exclusion by socio-economic groupAccess to public services
Control of corruptionRegulatory quality: Estimate
Government e�ectiveness
Rule of lawFreedom of the press
Law to support equal treatment of population segmentsPublic sector theft
GDP per capita
Research in R&D
Financial Institutions Index
International tourism
Gender inequality
Healthy life expectancy (HALE)
X1: External intervention
Inequality-adjusted life expectancyYouth not in employment, education or training (NEET)
Individuals using the Internet (% of population)
China has improved in its PPI score by 6.7 per cent since 2009,
broadly in line with other developing countries. China is now
ranked 66th on the Positive Peace Index compared to 94th on the
GPI.
To a large extent, the improvement has reflected advances in the
economic, health and physical infrastructure, which comprise
the Structures domain of Positive Peace (Figure 1.11).
Accordingly, China posted strong improvements in its Sound
Business Environment and the Equitable Distribution of
Resources Pillars of Positive Peace, which improved by 14.7 per
cent and seven per cent, respectively. All Pillars recorded
improvements since 2009, although some – especially Free Flow
of Information, Low Levels of Corruption and Sound Business
Environment – come off very low bases.
In 2013, the Attitudes domain deteriorated markedly. This
coincided with the Chinese Banking Liquidity Crisis, which saw
an end to easy credit and had a negative impact on gold and
stock markets. At the time, there were noticeable deteriorations
recorded in the group grievance, factionalised elites and
exclusion by socio-economic group indicators.
Individuals using the Internet, financial institutions and
inequality-adjusted life expectancy were the indicators to post
the largest improvements since 2009 (Figure 1.12). On the other
end of the scale, China has seen a large deterioration in the
quality of information disseminated by the government
domestically. Press freedoms have also been curtailed.
China
90%
105%
95%
100%
Improvements in indicators of social structures – economic, health and physical infrastructure – have o�set deteriorations caused by worsening scores for Attitudes indicators.
Changes in Attitudes, Institutions and Structures in the PPI, China, 2009–2020
2010 2012 2014 2016 2018 2020
Source: IEP
FIGURE 1.11
AV
ERA
GE
SCO
RE
(IN
DEX
ED T
O 2
00
9)Le
ss
peac
eful
Mor
epe
acef
ul
Attitudes
InstitutionsPPI Overall Score
Structures

POSITIVE PEACE REPORT 2022 | 44
PERCENTAGE CHANGE
Percentage change in Positive Peace indicators, China, 2009–2020Improvements reflecting economic prosperity and physical infrastructure development contrast with the deterioration in the quality of information disseminated within the country.
FIGURE 1.12
30% 40%10% 20%0.0%
Source: IEP
ImprovementDeterioration
Quality of information
Government openness and transparencyFactionalised elites
Equality of opportunity
Group grievanceExclusion by socio-economic group
Access to public services
Control of corruption
Regulatory quality: Estimate
Government e�ectiveness
Rule of law
Freedom of the press
Law to support equal treatment of population segments
Public sector theft
GDP per capita
Research in R&D
Financial Institutions Index
International tourism
Gender inequality
Healthy life expectancy (HALE)
X1: External interventionInequality-adjusted life expectancy
Youth not in employment, education or training (NEET)
Individuals using the Internet (% of population)
Positive Peace in Europe has recorded a minor improvement
over the past decade as shown in Figure 1.13. This reflects
improvements in the Structures category of indicators. This
was influenced by continued economic development, especially
in some southern and eastern nations, following the European
debt crisis of the early 2010s. There has been substantial growth
in internet usage and in cross-border tourism visitation — both
within the continent and from outside (Figure 1.14).
Business conditions and health outcomes have also improved.
The European PPI overall score improved by 0.8 per cent from
2009 to 2020. However, this improvement was largely a result
of the development of eastern European economies, with the
Western European scores improving by just being 0.2 per cent.
The Attitudes domain deteriorated noticeably across the region,
as did the Institutions domain.
In line with global trends, the quality of information has
deteriorated among European nations, particularly as some
political groups took to the internet to disseminate radical
views of both right-wing and left-wing persuasions. Freedom of
the press has also been curtailed in some nations, which further
contributed to a perceived deterioration of informed debate.
Economic inequality has increased, albeit at rates below those
recorded in other regions of the world.4 This has contributed
to greater social tensions and a radicalisation of the political
debate — as captured by the factionalised elites indicator.
Europe
90%
105%
100%
95%
Improvements in the economy of southern and eastern European nations have contributed to benign structural outcomes for the region. In contrast, Attitudes deteriorated markedly.
Changes in Attitudes, Institutions and Structures in the PPI, Europe, 2009–2020
2010 2012 2014 2016 2018 2020
Source: IEP
FIGURE 1.13
AV
ERA
GE
SCO
RE
(IN
DEX
ED T
O 2
00
9)Le
ss
peac
eful
Mor
epe
acef
ul
Attitudes
InstitutionsPPI Overall Score
Structures

POSITIVE PEACE REPORT 2022 | 45
Turkey was the European country to post the largest
deterioration in the region. The country’s PPI score deteriorated
by 8.2 per cent since 2009, largely driven by the Well-
Functioning Government and Low Levels of Corruption Pillars.
In 2016 the country experienced a failed military coup that
greatly destabilised the nation and exacerbated sectarian
tensions. This contributed to a financial crisis from 2018
onwards that further depleted societal resilience. Positive
Peace also deteriorated in Greece, with the country’s PPI score
changing by 7.9 since 2009. The global financial crisis of 2009
curtailed credit provision to the country leading to a default in
the following year. The ensuing economic crisis saw Greece’s
Sound Business Environment Pillar deteriorate by 42.5 per cent
in the last decade. In Western Europe, Iceland, Austria, Spain
all recorded substantial deteriorations, although their levels of
Positive Peace remain very high.
The Nordic Countries recorded improvements in Positive Peace,
with the exception of Denmark and the aforementioned Iceland.
Norway saw a 4.2 per cent improvement in its score, largely
driven by large improvements in quality of information, external
intervention and regulatory quality. Finland also improved,
albeit more modestly, while Sweden’s score was very little
changed.
PERCENTAGE CHANGE
Percentage change in Positive Peace indicators, Europe, 2009–2020Substantial improvements in economic and health indicators were partially o�set by worsening political radicalisation and quality of informed debate.
FIGURE 1.14
30%20% 40%10%0.0%
Source: IEP
ImprovementDeterioration
Quality of information
Government openness and transparency
Factionalised elites
Equality of opportunity
Group grievance
Exclusion by socio-economic groupAccess to public services
Control of corruption
Regulatory quality: Estimate
Government e�ectivenessRule of law
Freedom of the press
Law to support equal treatment of population segments
Public sector theft
GDP per capita
Research in R&D
Financial Institutions Index
International tourism
Gender inequality
Healthy life expectancy (HALE)
X1: External intervention
Inequality-adjusted life expectancy
Youth not in employment, education or training (NEET)
Individuals using the Internet (% of population)

POSITIVE PEACE REPORT 2022 | 46
The UK had one of the poorest performances of any European
nation in the last decade, deteriorating by 5.6 per cent in its
Positive Peace score (Figure 1.15). It is ranked 18th on the PPI, a
relatively high rank, compared to 39th on the GPI.
The UK elected to leave the European Union in a 2016
referendum. That initiated a period of economic and political
uncertainty. In the wider public, the antagonism intensified
between those who elected to leave and those wanted to stay
within the EU. Businesses delayed investment decisions as a
result of the uncertainty, which has affected economic growth
and COVID-19 has further affected economic growth.
After the UK officially left the EU at the end of 2020, some
border checks were introduced between Northern Ireland and
the Republic of Ireland. This risks exacerbating sectarian
tensions in Northern Ireland and may result in further
deteriorations in Positive Peace in the UK in coming years.
This tension has manifested as a deterioration in the UK PPI
score from 2016 onwards, reversing the improving trend of the
previous five years. Both the Attitudes and Institutions domains
deteriorated in the past few years, more than offsetting gains in
Structure indicators. British Attitudes deteriorated sharply in
2011. This coincided with the rise of Islamic State of Iraq and
the Levant. Another sharp deterioration took place from 2016
onwards corresponding with the Brexit debate.
Since 2009, three indicators deteriorated markedly:
factionalised elites, group grievance and freedom of the press
(Figure 1.16). These underline tensions between ‘Brexiteers’ and
‘Remainers’ as well as a more adverse view on immigration. It is
possible for the UK to reverse these trends in the years ahead.
But it will require clarity and resolution from authorities, as
well as policies that promote the inclusion of different societal
views.
United Kingdom
90%
110%
100%
British Attitudes deteriorated substantially over the past decade. This has been partially o�set by better outcomes for the Institutions and Structures domains.
Changes in Attitudes, Institutions and Structures in the PPI, United Kingdom, 2009–2020
2010 2012 2014 2016 2018 2020
Source: IEP
FIGURE 1.15
AV
ERA
GE
SCO
RE
(IN
DEX
ED T
O 2
00
9)Le
ss
peac
eful
Mor
epe
acef
ul
Attitudes
InstitutionsPPI Overall Score
Structures
PERCENTAGE CHANGE
Percentage change in Positive Peace indicators, United Kingdom, 2009–2020Factionalised elites and group grievance saw large deteriorations in the United Kingdom.
FIGURE 1.16
40% 60%20%0.0%
Source: IEP
ImprovementDeteriorationQuality of information
Government openness and transparency
Factionalised elites
Equality of opportunity
Group grievance
Exclusion by socio-economic groupAccess to public services
Control of corruption
Regulatory quality: Estimate
Government e�ectiveness
Rule of law
Freedom of the press
Law to support equal treatment of population segmentsPublic sector theft
GDP per capita
Research in R&D
Financial Institutions Index
International tourism
Gender inequality
Healthy life expectancy (HALE)
X1: External intervention
Inequality-adjusted life expectancyYouth not in employment, education or training (NEET)
Individuals using the Internet (% of population)

POSITIVE PEACE REPORT 2022 | 47
Russia has recorded a slight improvement (around 0.1 per cent)
in its PPI score from 2009 to 2020. This saw the country lose
two places over the past decade to rank 71st in the PPI. This
compares with a rank of 154th in the GPI.
The Structures domain improved by 17.2 per cent in the period,
especially due to greater access to the internet, the development
of financial markets and improvements in life expectancy. The
Institutions domain also improved, albeit more modestly at 4.7
per cent. This reflected some progress in controlling corruption
and increasing the efficiency of the administrative procedures.
However, Russian Attitudes deteriorated markedly by 11.3 per
cent, especially in the first half of the past decade (Figure 1.17).
The country was seriously affected by the Global Financial
Crisis of 2008 and 2009, with the ruble losing two-thirds of its
value and unemployment rising from 6 per cent in 2007 to 8.3
per cent by the end of 2009. The economic downturn was a
trigger for a political crisis that saw mass protests on the streets
of Moscow and other cities from 2011 to 2012. The economy has
also been affected by western sanctions on business and the
country’s elite. Frictions are also increasing along its borders,
including with Ukraine and the EU. In response the country has
drawn itself closer to China and some of its own neighbours,
such as Belarus.
The government had stern responses to the demonstrations, but
the rallies continued throughout 2012 and 2013. The turbulence
and the government’s response were reflected in substantial
deteriorations in the quality of information and law to support
equal treatment of population segments (Figure 1.18). Freedom of
the press and group grievances also deteriorated.
Russia
90%
110%
100%
The deterioration in Russia’s Attitudes domain from 2010 to 2014 has been o�set by improvements in Structures.
Changes in Attitudes, Institutions and Structures in the PPI, Russia, 2009–2020
2010 2012 2014 2016 2018 2020
Source: IEP
FIGURE 1.17
AV
ERA
GE
SCO
RE
(IN
DEX
ED T
O 2
00
9)Le
ss
peac
eful
Mor
epe
acef
ul
Attitudes
InstitutionsPPI Overall Score
Structures
PERCENTAGE CHANGE
Percentage change in Positive Peace indicators, Russia, 2009–2020Russia has seen strong improvements in Internet usage, the quality of financial institutions and life expectancy.
FIGURE 1.18
40% 60%20%0.0%
Source: IEP
ImprovementDeterioration
Quality of information
Government openness and transparency
Factionalised elites
Equality of opportunity
Group grievance
Exclusion by socio-economic group
Access to public services
Control of corruption
Regulatory quality: Estimate
Government e�ectiveness
Rule of law
Freedom of the pressLaw to support equal treatment of population segments
Public sector theftGDP per capita
Research in R&D
Financial Institutions Index
International tourism
Gender inequalityHealthy life expectancy (HALE)
X1: External intervention
Inequality-adjusted life expectancy
Youth not in employment, education or training (NEET)
Individuals using the Internet (% of population)

POSITIVE PEACE REPORT 2022 | 48
A Note on Methodology: The Robustness of the PPI FrameworkThis section describes an alternate weighting methodology that
was developed for the index. The analysis found that the results
were similar even though the weighting for some indicators was
nearly 400 per cent higher. This highlights the robustness of the
current index methodology.
The indicators in the index are weighted directly proportional to
their individual correlations with Internal Peace from the Global
Peace Index (GPI). These correlations can be seen in Table 1.1 in
the beginning of this section.
The higher the correlation of an indicator with the Internal Peace
scores, the higher will be indicator’s weight in calculation of
overall Positive Peace score. The rationale for this is to prioritise
the importance of each indicator according its relation with
internal safety, security and development of the national system.
As the correlations are numerically commensurate, all indicators
are factored in the index with similar weights. This produces a
framework close to an equal-weights index.
As a robustness check, a new methodology was formulated to
test the impact of changing the weighing. The objective was to
increase the disparities between individual indicator weights to
reduce the equal-weights effect described above.
Weight values were ascribed to indicators according to specific
groupings of correlations. Indicators with correlations of up
to 0.5 were grouped together. Those with correlations between
0.5 and 0.6 formed a second grouping, and so forth. Indicators
within the same grouping received the same weights. But the
weights increased sharply from one grouping to the next.
This created a greater variability of weights, with some
indicators receiving weights many multiples higher than the
weights of other indicators.
The results were:
• Greater standard deviations of country scores – the
individual scores of countries were more spread out along
the scale 1 to 5.
• Less occurrence of score and ranking draws. The number of
countries sharing one same numerical score (and therefore
sharing the same rank in the PPI) was reduced.
However, the two methodologies produced highly consistent
results, with the correlation coefficient between the
conventional and alternative methodology scores being 0.99.
This highlights the high level of robustness of the PPI
framework.
This alternative methodology has some advantages over the
conventional methodology. But it also has drawbacks. It is
computationally more complex, which reduces the ability of
the wider public to replicate and engage with the PPI. And the
weights of the indicator groupings are arbitrary, which reduce
the transparency of the framework.
Thus, this report continues to use weights proportional to
the internal peace correlations, with the certainty that the
framework is robust and transparent.

POSITIVE PEACE REPORT 2022 | 49
Key Findings • On average, every one index-point
improvement in the PPI is associated with a tenfold rise in GDP per capita. The direct relationship between PPI and GDP outcomes can be seen for all Pillars of Positive Peace.
• From 2009 to 2020, the per capita GDP of countries that improved in the PPI rose by an average of 3.1 per cent per year. This compares with a growth of 0.4 per cent per year for the other countries.
• Inflation in countries where the PPI improved was on average three times less volatile than where Positive Peace deteriorated in the past decade.
• Household consumption in nations where Positive Peace improved grew two times faster from 2009 to 2020 than where the PPI deteriorated.
• A model based on Positive Peace suggests that the global number of COVID-19 cases by the end of 2021 was almost 700 million, instead of the officially reported 290 million. The number of fatalities was most likely around 12 million persons, instead of the reported 5.4 million. These are underestimates and are consistent with published epidemiological research.
• Nations with higher levels of resilience have been more effective in shielding their populations from the COVID-19 pandemic, recording excess mortality rates half that of countries with low levels of societal resilience.
• Of the countries with a substantial Positive Peace deficit in 2009, 79 per cent deteriorated in the GPI in the subsequent decade. A Positive
Peace deficit is where the actual peacefulness of a country is substantially higher than what its levels of Positive Peace would suggest.
• Countries with a high Positive Peace deficit in 2009 recorded an average deterioration of 11.6 per cent in the GPI in the subsequent decade. This compares with a small improvement recorded by stable countries and a substantial 3.1 per cent improvement recorded by surplus countries.
• Of the countries with a Positive Peace surplus in 2009, 68 per cent recorded improvements in their GPI scores by 2020.
• High levels of societal resilience are associated with greater life satisfaction because individuals are not weighed down by concerns about survival or excessive poverty. Correlation coefficients between the PPI and measures of life satisfaction are around 0.90.
• The deterioration detected by the PPI Domain Attitudes is corroborated by other measures of dissatisfaction with global society. This dissatisfaction is strongest among young people, those with lower levels of education, the unemployed and the underemployed.
• In a large proportion of Western European nations and full democracies, women are more satisfied with their own standards of living than men. In contrast, women tend to be less satisfied than men in authoritarian regimes.
The Benefits of Societal Resilience 2

POSITIVE PEACE REPORT 2022 | 50
THE BENEFITS OF POSITIVE PEACE
Previous research has demonstrated a clear direct link between high levels of Positive Peace and favourable economic outcomes. High Positive Peace countries tend to be more economically developed than low Positive Peace ones. This is also true across time. Countries that improve in Positive Peace over the years are more likely to develop faster than comparable nations. High Positive Peace countries tend to outperform their counterparts on a number of macroeconomic and wellbeing gauges. They have also been capable of protecting their populations more effectively from shocks such as the COVID-19 pandemic that started early in 2020.
This section discusses the PPI as an empirical gauge of societal resilience. At a superficial level, equating Positive Peace to societal resilience and a producer of superior socio-economic outcomes may seem self-evident. However, comparing the PPI with development yardsticks allows the quantification of the differences and similarities between countries that at first glance may have comparable levels of socio-economic development. It also helps shed light on how these differences can be abridged and these similarities leveraged to promote the non-violent resolution of grievances and the achievement of higher degrees of development and wellbeing.
This section contains an updated compilation of some benefits of Positive Peace especially in relation to macroeconomic outcomes, value for business and governance.
IncomeHigher levels of Positive Peace are associated with greater per-capita income (Figure 2.1). This is because the factors that create a robust business environment are the same factors that
create highly peaceful societies. Some of the factors are lower levels of corruption, better governance, free flow of information through society and higher levels of human capital.
There is also a clear relationship between developments in Positive Peace and growth in per capita income across time. From 2009 to 2020, per capita GDP in countries that recorded improvements in the PPI rose by 3.1 per cent per year as shown in Figure 2.2. This compares with 0.4 per cent per year for countries in which Positive Peace deteriorated.
POSITIVE PEACE INDEX
GD
P PE
R C
API
TA (C
UR
REN
T U
S$, L
OG
SC
ALE
)
More peaceful Less peaceful
r=-0.84
21 3 4 5
On average, every one index-point improvement in the PPI is associated with a tenfold rise in US$ GDP per capita.
Positive Peace and GDP per capita, 2020
Source: IEP, IMF
FIGURE 2.1
100
100,000
10,000
1,000
1,000,000

POSITIVE PEACE REPORT 2022 | 51
Source: IEP, IMF
FIGURE 2.2Positive Peace and growth in GDP per capita, 2009–2020Countries that improved in Positive Peace from 2009 to 2020 recorded an average annual growth rate in per capita GDP 2.7 percentage points higher than nations where Positive Peace had deteriorated.
PER
CEN
TAG
E G
RO
WTH
Positive Peace Improvers
Positive Peace Deteriorators
-10.0%
0.0%
-5.0%
5.0%
10.0%
Minimum growth rate
Maximum growth rate
3.10%
0.40%
75th percentile
25th percentile
Median growth rate
Volatility of InflationThe volatility of inflation is an impediment to economic development. It makes it difficult to forecast future prices and demand for goods and services, prompting firms to cut back on investment as well as employment; and households to reduce consumption.
Countries that improved in Positive Peace from 2009 to 2020 experienced substantially lower volatility of inflation over this time (Figure 2.3). Over the past decade or so, the volatility of inflation rates in countries where Positive Peace deteriorated was three times higher than in those countries where it improved.
Household and Business ActivityHousehold consumption is particularly responsive to improvements in Positive Peace. Among countries that recorded such improvements, the average annual growth in household consumption from 2009 to 2020 was 3.5 per cent, around twice the rate for countries in which Positive Peace deteriorated (Figure 2.4). This confirms previous IEP findings that consumption is a key component of how socio-economic systems respond to improvements in peacefulness.
The business sector is responsible for almost all of the production of goods and services in most economies. A gauge of activity in this sector is the gross value added (GVA), which measures the value of all goods and services produced minus the variable cost of producing them. Thus, firms’ profits equal GVA minus fixed costs (overheads).
The GVA of the industry and construction sector is most responsive to improvements in Positive Peace. Growth in this sector’s GVA was 3.8 per cent per year among countries in which Positive Peace improved. This compares with 0.6 per cent where Positive Peace deteriorated (Figure 2.5). Similarly,
FIGURE 2.3Volatility of inflation rates by Positive Peace outcome, 2009–2020Countries in which Positive Peace improved had less volatile inflationary outcomes.
Source: IEP, World Bank
0
2.5
5.0
7.5
Positive Peace Improvers
Positive Peace Deteriorators
STA
ND
AR
D D
EVIA
TIO
N O
F IN
FLA
TIO
N
RA
TES
(PER
CEN
TAG
E PO
INTS
PER
YEA
R)
FIGURE 2.4Changes in household consumption by Positive Peace, 2009–2020Among countries where Positive Peace improved, household consumption rose between 2009 and 2020 at a rate almost twice as high as countries where the PPI deteriorated.
Source: IEP, World Bank
0.0%
2.0%
4.0%
3.0%
1.0%
Positive Peace Improvers
Positive Peace Deteriorators
AN
NU
ALI
SED
PER
CEN
TAG
E C
HA
NG
E
manufacturing is also highly reliant on Positive Peace improvements. The agricultural GVA growth differential for Positive Peace improvers is smaller but still positive. This is because the sector depends on a number of factors unrelated to Positive Peace, such as climatic patterns and geographical features.

POSITIVE PEACE REPORT 2022 | 52
Trade and OpennessNations that consistently develop in Positive Peace are more attractive to foreign direct investment (FDI) because of:
• greater economic returns;
• improved governmental transparency and efficiency;
• enhanced rule of law, protection of private property and enforcement of contracts; and
• cheaper and less burdensome dispute, compensation and remediation procedures.
From 2009 to 2019, FDI for PPI improvers rose at an annual rate of 5.2 per cent, contrasting with an increase of 2.6 per cent for nations in which Positive Peace retreated (Figure 2.6). Similarly, trade growth, both imports and exports, is larger among countries with favourable performance in the PPI. The data used covered 2009 to 2019 to avoid the distortionary impact caused by the COVID-19 pandemic.
As discussed above, nations that progress in Positive Peace have more robust internal activity, which boosts demand for foreign goods and services. Accordingly, imports among Positive Peace improvers grew almost two percentage points faster than in other nations over the past decade. Positive Peace also benefits the export sector, as firms are more agile, less weighed-down by inefficient regulation, and are not held back by socio-political disruptions. Trade and openness to foreign investment are two critical channels through which societal resilience generates economic outperformance.
GovernanceThere is a conceptual link between the quality of governance exercised by authorities and the level of peacefulness enjoyed by a society. Empirically, the nexus between Positive Peace and governance measures compiled by the World Bank’s Country Policy and Institutional Assessment (CPIA) is particularly strong.
Nations that improved in the PPI also advanced their CPIA ratings, especially in the areas of education, equity, quality of administration and business regulation (Figure 2.7). This is in stark contrast to countries where Positive Peace deteriorated over the past decade, which were downgraded in all CPIA criteria.
There were some CPIA indicators that deteriorated globally, including fiscal policy, financial sector and macroeconomic management. However, countries that improved in Positive Peace recorded smaller deteriorations in such indicators than other nations.
0%
2%
1%
4%
3%
Construction is the sector most responsive to improvements in Positive Peace, with the GVA in countries improving in the PPI growing at almost four per cent per year.
Changes in business value added by Positive Peace outcome, 2009–2020
FIGURE 2.5
Source: IEP, World Bank
AN
NU
ALI
SED
PER
CEN
TAG
E C
HA
NG
E
Industry (including construction), value added (current US$)Manufacturing, value added (current US$)Agriculture, foresty, and fishing, value added (current US$)
Positive Peace Improvers
Positive Peace Deteriorators
0%
3%
2%
1%
4%
6%
5%
FDI flows towards countries that improved in Positive Peace grew strongly over the decade, while countries where Positive Peace declined became less attractive in global capital markets.
Changes in FDI and trade by Positive Peace outcome, 2009–2019
FIGURE 2.6
Source: IEP, World Bank
AN
NU
ALI
SED
PER
CEN
TAG
E C
HA
NG
E
Export of goods, sevices and primary income (BOP, curent US$)Imports of goods and services (BOP, current US$)Foreign Direct Investment, net inflows (BOP, curent US$)
Positive Peace Improvers
Positive Peace Deteriorators

POSITIVE PEACE REPORT 2022 | 53
Nations that improved in the PPI advanced their CPIA governance ratings especially in the areas of education, equity and quality of administration.
PERCENTAGE IMPROVEMENT
Governance ratings by Positive Peace outcome, 2009–2020Countries that improve in Positive Peace tend to fare better in the CPIA assessment by the World Bank.
FIGURE 2.7
-20% 20%10%0-30%
Source: IEP, World Bank
CPIA fiscal policy rating
CPIA macroeconomic management ratingCPIA economic management cluster average
CPIA financial sector rating
CPIA gender equality rating
CPIA trade rating
CPIA structural policies cluster average
CPIA social protection rating
CPIA transparency, accountability, and corruption in the public sector rating
CPIA e�iciency of revenue mobilization rating
CPIA public sector management and institutions cluster average
CPIA property rights and rule-based governance rating
CPIA business regulatory environment rating
CPIA debt policy rating
CPIA quality of public administration rating
CPIA policies for social inclusion/equity cluster average
CPIA quality of budgetary and financial management rating
CPIA building human resources rating
CPIA policy and institutions for environmental sustainability ratingCPIA equity of public resource use rating
Positive Peace Deteriorators
Positive Peace Improvers

POSITIVE PEACE REPORT 2022 | 54
COVID-19 AND SOCIETAL RESILIENCE
The COVID-19 pandemic has been and continues to be the most
disruptive shock to the global society in a generation. By the end
of 2021, the virus had reportedly infected over 290 million
people and contributed to 5.4 million deaths. Responses to the
pandemic have reduced economic activity, limited the free
movement of people and changed social norms in fundamental
ways.
Yet, epidemiologists and statisticians are almost unanimous in
stating that official infection and fatality figures underestimate
the true severity of the crisis. The Institute for Health Metrics
and Evaluation (IHME) suggest that the total number of deaths
across the world is more than double the reported numbers.1
Researchers from the UT Southwestern Medical Center estimate
that the number of COVID-19 infected people in the US could be
almost three times what official reports show.2
This section assesses the problem of under-reporting of
COVID-19 figures and demonstrates how Positive Peace, as a
gauge for societal resilience, has contributed to a more effective
management of the pandemic.
Underreporting in Low-Resilience Countries An important difficulty in handling this crisis has been
ascertaining its actual severity and reach. There is anecdotal
evidence that a large number of cases have remained unreported
because some infected persons never develop symptoms
and therefore do not get tested. Another issue regards co-
morbidities, which make it difficult for medical practitioners to
determine if a patient died directly of COVID-19 or of another
condition that was aggravated by the virus.
However, an arguably deeper problem relates to the incapacity
of countries with low levels of societal resilience and
administrative effectiveness to record, let alone treat, COVID-19
cases.
Countries with lower levels of Positive Peace tend to have larger
populations and rapid population growth. Yet, the volume of
reported COVID-19 cases has been low (Figure 2.8).
Early in the pandemic, there was some speculation that
COVID-19 would affect primarily developed societies, infecting
workers in air-conditioned offices, commuters in air-tight
public transport systems or shopping centre patrons. Indeed,
people living or working in open-air and low population density
conditions such as farmers or herders would hardly be exposed
to contagion. However, the claim that COVID-19 prevalence is
mostly limited to the developed world is false for two reasons.
Firstly, the characteristics of the disease, including the rate of
deaths among the officially reported cases is similar across all
levels of societal resilience (Figure 2.9). The case fatality rates
for medium and low Positive Peace countries are broadly aligned
with their very high Positive Peace counterparts. Given this,
it is difficult to argue that other features of the disease, such
as infection rates, would be substantially different between
developing and developed nations. In the beginning of the
pandemic, there was speculation that the virus could be more
contagious and lethal in colder climates. While contagion
increases during colder months in some countries (similarly to
other types of flu), COVID-19 also proved to be very disruptive in
warm countries such as India, Brazil and Colombia.
The second reason has to do with excess mortality – the actual
number of deaths in a given period relative to the projected
deaths based on historical patterns. There is evidence that
excess mortality in 2020 was higher for countries displaying
lower levels of Positive Peace (Figure 2.10). Excess mortality
data for medium or low Positive Peace countries is sparse, but
where data exists, rates for these countries were much higher on
average than among developed nations.
Source: IEP, John Hopkins University, Our World in Data
FIGURE 2.8Population and COVID cases, by Positive Peace levelCountries with lower level of societal resilience reported lower rates of infection.
POPU
LATI
ON
(BIL
LIO
NS,
20
20)
LEVEL OF POSITIVE PEACE, 2020
0
0.5
3.0
2.0
1.0
2.5
1.5
Very high Medium LowHigh
TOTA
L R
EPO
RTE
D C
ASE
S (E
ND
20
21,
% O
F TO
TAL
POPU
LATI
ON
)
LEVEL OF POSITIVE PEACE, 2020
0
2
10
8
4
6
Very high Medium LowHigh

POSITIVE PEACE REPORT 2022 | 55
Source: IEP, Johns Hopkins University
FIGURE 2.9Reported case fatality rate due to COVID-19Fatality rates among reported cases are similar across di�erent levels of societal resilience.
CA
SE F
ATA
LITY
RA
TES
(% O
F C
ASE
S, E
ND
20
21)
LEVEL OF POSITIVE PEACE, 2020
0
0.5
3.5
3.0
2.0
1.0
2.5
1.5
Very high Medium LowHigh
It can be assumed that these excess deaths were largely
attributable to the pandemic, as it was the only factor in global
health patterns that was substantially different in 2020 from
2019. Therefore, it seems obvious that the pandemic was more
severe in low-resilience countries than official numbers indicate.
The low case and fatality numbers reported in developing
countries mainly resulted from underreporting.
This highlights a key benefit from higher degrees of societal
resilience. Countries that perform well in Positive Peace have
superior administrative resources to gauge the impact of the
pandemic on their populations. Substantial development in
the Well-Functioning Government and High Levels of Human
Capital Pillars allows these nations to detect and monitor case
numbers more timely and precisely. This information is critical
to formulating response plans to the pandemic. Additionally,
they have more resources to deploy and a more robust health
system with which to assist the sick.
Less peacefulMore peaceful
FIGURE 2.10Cumulative excess mortalityCountries with lower levels of Positive Peace recorded greater excess death numbers.
Source: IEP, Human Mortality Database, World Mortality Dataset, Our World in Data
4,000
3,000
2,000
1,000
0
-1,000EXC
ESS
MO
RTA
LITY
(NU
MBE
R O
F EX
CES
S D
EATH
S PE
R M
ILLI
ON
PO
PULA
TIO
N, E
ND
20
20)
POSITIVE PEACE INDEX, 2020
r=0.41
1 2 3 4
GTM
KGZ
KAZ
QAT
AZEBIH
IRN
EGY
LBN
COLUKR
MDA
BOLECUMEX
BLRSRBPER
SRB
ALBBGR
CZEUSA
FRA CHLSVKGRC
SWENLD
ISRLVA CRI OMNTWN
PANMNEZAF
THA
PRY
CUBPHL
UZB
MUS
MKD
MNG
BRA
MKD
ARM
POL GEO
ARG
MYSDNK
LTUITA
EST
ESP
NOR
CHE
IRL SGPISL
BEL
PRT
CYP
SVN
NZLURY
TWN
AUT
FINDEU
AUS
CAN
GBRHRV
HUN
ROU
KOR
JPN
Analysts may gauge the extent of underreporting by replicating
the pandemic patterns seen in high Positive Peace countries
throughout the entire world. Countries in the very high
category of Positive Peace recorded total COVID-19 cases of
approximately 8.9 per cent of their population by end 2021. Of
the COVID-19 cases recorded in these countries, around 1.7 per
cent resulted in the death of the patient.
Hypothetically, if these proportions could be applied also for
high, medium and low Positive Peace countries, the global
number of COVID-19 cases would reach 694.8 million and
fatalities would climb to 11.8 million persons by end 2021.
This is two and a half times the officially reported numbers
(Table 2.1). This result, estimated through a Positive Peace
methodology, is broadly consistent with other conclusions
published in medical literature.3,4,5
Reported Prediction using rates from high Positive Peace countries
Total Cases 291 million 694.8 million
Total Deaths 5.4 million 11.8 million
Source: IEP, John Hopkins University
TABLE 2.1COVID-19 reported and predicted global numbers, end 2021A extrapolation suggests that the actual number of cases could be 2½ times greater than reported. And the actual number of deaths, twice that in official reports.
If, as it seems to be the case, the fatality rates in less resilient
countries are greater than 1.7 per cent, the predicted 11.8 million
deaths could be an underestimation.
Societal Resilience in the PandemicSocietal resilience creates the environment for governments
and private organisations to protect national populations from
the impact of the pandemic. This can be seen as countries in
the very high Positive Peace category are capable of supplying
their populations with more medical resources to combat the
pandemic (Figure 2.11 and Figure 2.12).
Source: IEP, World Bank
FIGURE 2.11Hospital beds by level of Positive PeaceHigher resilience countries have superior medical resources for the management of the pandemic.
HO
SPIT
AL
BED
S (P
ER T
HO
USA
ND
PO
PULA
TIO
N, 2
021
)
LEVEL OF POSITIVE PEACE, 2020
0
50
200
150
100
Very high Medium LowHigh

POSITIVE PEACE REPORT 2022 | 56
Less peacefulMore peaceful
FIGURE 2.12COVID-19 TestsHigher resilience countries have provided tests in orders of magnitude superior to lower resilience nations.
Source: IEP, Johns Hopkins University, Our World in Data
10,000
1,000
100
10
0
CO
VID
-19
TEST
S (P
ER T
HO
USA
ND
PO
PULA
TIO
N, L
OG
SC
ALE
, EN
D 2
020
)
POSITIVE PEACE INDEX, 2020
r=-0.53
1 2 3 4
BGR
MEXTHAGTM
PHLIRNPRY
RUSBLR
KAZBIHCOLCUB
QATSRB
MKDMNG
UKRBRAMKD
ARM
ZAF
PAN
PERBOLECU
ALBARGMYS
CRI
DNK
USALTU
ITAESTESPISLSGP
NORCHE
IRL BELPRTISRCYP
SVKGRC
LVACHL
BOLSVNNZL
URY
TWN
AUTFIN DEUAUSCAN
NLD
GBR
HRVHUNROU
KOR
JPN
Countries with very high levels of Positive Peace had been able
to vaccinate around 60 per cent of their populations in 2021
(Figure 2.13). The vaccination rates in very high Positive Peace
countries sharply contrasts with the 20 per cent and less in
other countries.
To a large extent, the difference in immunisation rates is due
to most laboratories where the vaccines were produced being
located in developed countries, as well as rich countries being
able to afford the vaccines. Most developed countries gave
priority to their domestic populations before allowing vaccines
to be exported, which placed less developed nations at a
disadvantage.
available, was at least double that of very high Positive Peace
countries by the end of the first year of the pandemic.
Source: IEP, Johns Hopkins University
FIGURE 2.13Fully COVID-19 vaccinated personsSixty per cent of the population in very-high Positive Peace countries had been vaccinated in 2021.
FULL
Y V
AC
CIN
ATE
D P
ERSO
NS
(% O
F PO
PULA
TIO
N, A
VER
AG
E O
F 20
21)
LEVEL OF POSITIVE PEACE, 2020
0
10
20
40
70
60
50
30
Very high Medium LowHigh
The outcome of higher levels of resilience can be seen in the
form of substantially lower cumulative excess mortality rates
among developed nations (Figure 2.14, which summarises the
data displayed in Figure 2.10 above). The excess mortality in
high and medium Positive Peace countries, where data was
Countries with higher levels of Positive Peace recorded lower excess mortality rates in 2020.
Source: IEP, Human Mortality Database, World Mortality DatasetNotes: * Partial data only. Samples: Very High Positive Peace: 40 countries; High Positive Peace: 26 Countries; Medium Positive Peace: 13 Countries
FIGURE 2.14Cumulative excess mortalityCountries with lower levels of Positive Peace recorded greater excess death numbers.
EXC
ESS
MO
RTA
LITY
(NU
MBE
R O
F EX
CES
S D
EATH
S PE
R M
ILLI
ON
PO
PULA
TIO
N, E
ND
20
20)
LEVEL OF POSITIVE PEACE, 2020
0
200
400
800
1,400
1,200
1,000
600
Very high Medium* Low
No Data
High*

POSITIVE PEACE REPORT 2022 | 57
One important benefit of the Positive Peace framework is the probabilistic prediction of groups of countries more likely to experience substantial falls in peace. This section describes the Positive Peace deficit model, a framework based on systems thinking that examines countries according to their relative levels of peace and Positive Peace.
Of the 39 countries with large Positive Peace deficits in 2009, 79
per cent recorded deteriorations in the GPI over the subsequent
decade. This model now has had seven iterations since the
publication of the 2015 Positive Peace Report, with the accuracy
of the model increasing over that period.
The four countries with the largest deficits in 2020 are
Equatorial Guinea, Laos, Sierra Leone and Liberia. These are the
nations most likely to have falls in peace in the future.
The Positive Peace Deficit as a Predictor of ViolenceAs a measure of societal resilience, Positive Peace assesses
nations’ capacity to obtain and sustain high levels of peace,
as measured by the GPI. In turn, high levels of peace create a
socio-economic dividend that fosters development and promotes
resilience. This systemic virtuous cycle is the main mechanism
through which societies thrive.
Most nations operating with high levels of peacefulness will also
enjoy high levels of Positive Peace. Thus, countries that rank
well in the GPI tend to rank well in the PPI also. Those with low
PREDICTING FUTURE CHANGES IN PEACE
levels of peace according to the GPI on average, will also display
low levels of societal resilience as measured by Positive Peace.
For this reason, when nations are assessed in terms of the GPI
rankings versus their PPI rankings at a given point in time, most
countries will feature near the diagonal line (Figure 2.15).
However, this is not always the case. Some nations may operate
with a high level of peace but without the socio-economic
development needed to sustain it. This manifests as a PPI rank
that is materially inferior to the corresponding GPI rank. These
nations are said to be in a Positive Peace deficit.
There are many reasons for a society to be in deficit. Some
cultures are naturally pacifist and conciliatory and may develop
peaceful societies even in the absence of high levels of economic
prosperity, education and technology. Nations such as Bhutan
and Mauritius are possible examples for this category. However,
this type of deficit is rare.
In most cases, deficits are the result of a state of peace being
artificially maintained by a non-democratic regime. History
shows that such situations are unstable, as peace obtained
through forceful means tends be volatile. Additionally, many
of these countries have weak institutions and are susceptible
to outside interference, such as in the cases of Libya, Syria
and Yemen. Suppression by force without socio-economic
development simply smothers the underlying grievances,
without truly resolving them. Most of the countries with the
largest Positive Peace deficits in 2009 deteriorated into higher
levels of violence by 2020.
PPI R
AN
K 2
00
9
Some of the countries with Positive Peace deficits in 2009 recorded large deteriorations in peace subsequently. The red arrows point towards the location of selected countries by 2020. Countries above the diagonal show a deficit in Positive Peace.
Positive Peace deficits and selectd changes in GPI, 2009–2020FIGURE 2.15
Source: IEP
80
60
40
0
20
120
140
100
180
160
20 40 60 80 100 120 140 160 1800
GPI INTERNAL PEACE RANK 2009 Less Peaceful
Less
Pea
cefu
l
More Peaceful
Mor
e Pe
acef
ul

POSITIVE PEACE REPORT 2022 | 58
The Positive Peace Deficit ModelExpanding on the previous section, countries can be grouped
into three categories below.
• Positive Peace Deficit: when countries rank at least 20 places
higher on the GPI than the PPI.
• Positive Peace Surplus: when countries rank at least 20
places lower on the GPI than the PPI.
• Stable: countries have a rank difference between the GPI
and PPI of less than 20 places.
Country PPI Rank 2009(A)
GPI Internal Peace Rank 2009
(B)
Positive Peace Deficit 2009
(A) – (B)
Change in GPI Internal Peace 2009-2020(%)
Change in GPI Internal Peace
2009-2019
Equatorial Guinea 150 59 91 5.1 Deterioration
Timor-Leste 129 52 77 6.1 Deterioration
Angola 148 77 71 6.4 Deterioration
Syria 116 53 63 88.6 Deterioration
Djibouti 134 74 60 12.7 Deterioration
Burkina Faso 104 47 57 37.0 Deterioration
The Gambia 130 75 55 -2.8 Improvement
Rwanda 120 66 54 5.1 Deterioration
Laos 133 80 53 -8.9 Improvement
Sierra Leone 110 57 53 3.2 Deterioration
Vietnam 86 33 53 10.0 Deterioration
Egypt 113 63 50 28.4 Deterioration
Eritrea 156 106 50 0.3 Deterioration
Cameroon 146 97 49 32.1 Deterioration
Liberia 125 79 46 1.1 Deterioration
Bhutan 77 32 45 -11.2 Improvement
Malawi 114 72 42 6.8 Deterioration
Indonesia 99 58 41 0.1 Deterioration
Turkmenistan 147 107 40 -4.1 Improvement
Nicaragua 101 62 39 52.5 Deterioration
Zambia 106 67 39 6.2 Deterioration
Eswatini 126 88 38 2.8 Deterioration
Tajikistan 142 104 38 0.1 Deterioration
Togo 128 91 37 4.8 Deterioration
Azerbaijan 118 86 32 1.4 Deterioration
Bangladesh 135 103 32 -1.5 Improvement
Myanmar 151 121 30 6.2 Deterioration
Libya 97 68 29 73.1 Deterioration
Madagascar 127 98 29 -2.7 Improvement
Mozambique 107 78 29 16.0 Deterioration
Qatar 44 15 29 4.0 Deterioration
Bosnia and Herzegovina 75 48 27 9.6 Deterioration
Republic of the Congo 143 116 27 4.5 Deterioration
Tanzania 94 68 26 1.3 Deterioration
Haiti 149 124 25 -2.6 Improvement
Jordan 67 42 25 8.4 Deterioration
Central African Republic 158 135 23 28.5 Deterioration
Cambodia 131 109 22 -10.8 Improvement
Yemen 154 132 22 34.7 Deterioration
Source: IEP
TABLE 2.2Positive Peace deficits in 2009 and changes in GPI scores from 2009 to 2020Of the 39 nations in deficit in 2009, 31, or 79 per cent, recorded deteriorations in peace in the subsequent decade.
Of the 39 countries with Positive Peace deficits in 2009, 31
nations – or 79 per cent – had recorded deteriorations in the
GPI Internal Peace Score by 2020 (Table 2.2). Many of the most
extreme examples of collapse into violence over the past decade
– countries such as Syria, Libya, Yemen, Nicaragua, Egypt,
Burkina Faso and others – were deficit countries one decade
ago.
For countries with a surplus in 2009, 32 per cent had
deteriorated in peace in the subsequent ten years (Figure 2.16).
Thus, 68 per cent of the countries with a Positive Peace surplus
in 2009, recorded improvements in their GPI scores by 2020.

POSITIVE PEACE REPORT 2022 | 59
GPI internal peace improved from 2009 to 2020
GPI internal peace deteriorated from 2009 to 2020
FIGURE 2.16Positive Peace deficits and deteriorations in Peace, 2009–2020Seventy-nine per cent of countries in Positive Peace deficit in 2009 deteriorated into further violence in the subsequent decade.
Source: IEP
0%
60%
80%
40%
100%
20%
PRO
POR
TIO
N O
F C
OU
NTR
IES
IN C
ATE
GO
RY
(%)
POSITIVE PEACE STATUS IN 2009
Deficit
79
Surplus
32
Stable
44
On average, the countries that held a Positive Peace deficit in
2009 deteriorated by 11.6 per cent in their GPI scores from 2009
to 2020 (Figure 2.17). This compares with a small improvement
recorded by stable countries and a substantial 3.1 per cent
improvement recorded by surplus countries in the same period.
FIGURE 2.17Changes in GPI from 2009 to 2020 by Positive Peace status in 2009Countries in deficit in 2009 recorded an average deterioration in their GPI scores of 11.6 per cent from 2009 to 2020. This compares with improvements for the other categories.
Source: IEP
Det
erio
ratio
nIm
prov
emen
t
-4
2
4
0
12
10
6
8
-2
PER
CEN
T O
F 20
09
GPI
INTE
RN
AL
PEA
CE
POSITIVE PEACE STATUS IN 2009
Deficit
11.6
Stable
-0.6
Surplus
-3.1
Taken together, the proportion of deteriorations among deficit
countries and the size of such deteriorations show that the
Positive Peace deficit model is an accurate probabilistic
predictor of future deteriorations in peace. The fact that surplus
countries improved in peacefulness further underscores the
predictive value of this framework.
These results were obtained with a materiality threshold of 20
rank places underpinning the definitions of deficits and
surpluses. If this threshold is increased to a 50-place difference
between the GPI and PPI, the model has an 86 per cent
predictive rate (Figure 2.18). However, the number of nations
deemed to be in deficit or surplus for analysis would decrease.
Source: IEP
Positive Peace deficits thresholdsFIGURE 2.18
If the materiality threshold rises to 50 rank places, the accuracy of the model rises to 86 per cent.
PRO
POR
TIO
N O
F D
EFIC
IT C
OU
NTR
IES
IN 2
00
9 TH
AT
DET
ERIO
RA
TED
IN T
HE
GPI
INTE
RN
AL
PEA
CE
BY 2
020
(%)
NUMBER-OF-RANKS THRESHOLD THAT DEFINES DEFICITS/SURPLUSES
60
65
100
95
90
85
80
75
70
5 10 15 20 25 30 35 40 45 50 55 60
Countries that held a Positive Peace surplus in 2009 experienced less violence on average in the subsequent decade.

POSITIVE PEACE REPORT 2022 | 60
The Positive Peace deficit model can be seen as one tool, among
others, that stakeholders and supranational agencies could use
to anticipate and prepare for possible increases in violence in
the future. Table 2.3 displays the 34 countries in Positive Peace
deficit in 2020. It is possible that most of these countries could
experience higher levels of violence over the next decade or so.
Of particular concern, Sierra Leone and the Equatorial Guinea
combine large Positive Peace deficits with a long-deteriorating
trend in the GPI since at least 2016.
Country PPI Rank 2020(A)
GPI Internal Peace Rank 2020
(B)
Positive Peace Deficit 2020
(A) – (B)
Equatorial Guinea 150 63 87
Laos 124 52 72
Sierra Leone 110 56 54
Liberia 129 76 53
Angola 136 86 50
Timor-Leste 111 61 50
Nepal 126 78 48
Turkmenistan 140 92 48
The Gambia 104 57 47
Eritrea 156 111 45
Rwanda 115 70 45
Bhutan 65 22 43
Cambodia 116 73 43
Bangladesh 134 94 40
Tajikistan 143 104 39
Tanzania 102 64 38
Uganda 138 100 38
Zambia 112 74 38
Indonesia 87 50 37
Madagascar 123 87 36
Guinea 141 106 35
Djibouti 132 98 34
Malawi 117 83 34
Eswatini 122 91 31
Uzbekistan 100 69 31
Guinea-Bissau 142 112 30
Jordan 83 53 30
Qatar 49 19 30
Haiti 148 119 29
Azerbaijan 112 84 28
Vietnam 70 47 23
Croatia 38 17 21
Senegal 78 57 21
Chad 159 139 20
Source: IEP
TABLE 2.3Countries with a Positive Peace deficit in 2020Countries in this list are more likely to experience increasing levels of violence over the next decade.
Transition Zones and Attractor BasinsThis section expands the analysis of the Positive Peace deficit
model using two concepts of the dynamics of societal systems:
transition zones and attractor basins.
As discussed above, the nations with a Positive Peace deficit in
2009 tended to deteriorate in peace over the subsequent years.
These nations were situated on the top-left panel of the GPI –
PPI diagram, as shown in Figure 2.15 above. The areas in the
diagram from which nations tended to deteriorate in peace –

POSITIVE PEACE REPORT 2022 | 61
that is, to fall in the GPI rankings – were marked in red, forming
a new visualisation of the GPI-PPI diagram shown in Figure 2.19.
The areas in the diagram from which nations tended to improve
in peace – that is, obtain higher GPI rankings over time – were
painted in blue. Yellow shaded areas are those where the was
little to no movement in the GPI rankings from 2009 to 2020.
The top-right quadrant is shaded almost entirely in yellow.
This shows a situation where nations have both low levels of
peace and low levels of Positive Peace. This is where conflict
and economic underdevelopment reinforce one another in a
vicious cycle of long lasting violence. This condition is termed
as ‘Conflict Trap.’ It is very hard for countries to move out of this
situation.
The bottom-left quadrant is also one of little movement. Nations
with high levels of peace and high levels of socio-economic
development stay in this area, as their levels of societal
resilience prevent countries from collapsing into violence.
In this area, Positive Peace sustains peace. This area is called
‘Sustainable Peace.’ In the 15 years that the GPI has been
produced, there has not been a substantial fall in peace for any
country among the top ranks of the index.
Both the Sustainable Peace and the Conflict Trap areas are
attractor basins – a concept in systems dynamics that refers
to particular homeostasis states to which societal systems are
attracted. These are areas where entities tend to move towards
or away from, however, once an entity is in an attractor basin it
is very hard to escape. More details on attractor basins can be
found in Section 3 of this report.
The areas of Positive Peace deficit and surplus are transition
zones. These are states that can cause societal systems to
change at a faster pace.
Based on empirical evidence, Positive and negative peace change more rapidly depending on countries’ starting levels in the PPI and the GPI.
IEP systems dynamics of GPI and PPI trajectories, 2009–2020FIGURE 2.19
Source: IEP
Less
pea
cefu
lM
ore
peac
eful
PPI S
CO
RE
200
9
1
2
3
4
Improvement
Stability
Deterioration
Change in GPI from 2009 to 2020
Less peacefulMore peaceful GPI SCORE 20091 2 3 4
Conflict Trap(Attractor Basin)
Positive Peace Surplus(Transition Zone)
Sustainable Peace(Attractor Basin)
Positive Peace Deficit(Transition Zone)

POSITIVE PEACE REPORT 2022 | 62
Nations with higher levels of societal resilience are also those with greater degrees of social wellbeing. A resilient society is capable of shielding its population from social, economic and environmental shocks. It is also more effective in implementing post-shock recoveries. This means that citizens are not overly weighed down by concerns about survival, unemployment or excessive poverty. These residents have a wider choice of socio-economic activities through which to seek personal fulfilment.
As a gauge for societal resilience, Positive Peace is highly
correlated with measures of wellbeing and life satisfaction.
Indicators of wellbeing from the Social Progress Imperative
(SPI) display correlation coefficients against the PPI overall
score of around 0.90 (Figure 2.20 and Figure 2.21).
However, Positive Peace encompasses more than social
wellbeing because it incorporates all aspects of societal
resilience in the form of the different Domains and Pillars.
As discussed in Section 1, the global scores for the Attitudes,
Institutions and Structures Domains developed in different
ways over the past decade. The Structures Domain recorded a
strong improvement on the back of technological and economic
improvement since 2009. The Institutions Domain was little
changed, as the formal and informal organisations that oversee
societies demonstrated only small average gains in effectiveness
and transparency. In contrast, Attitudes deteriorated in the same
period, reflecting greater polarisation and intolerance in politics
and society at large.
The SPI indicator foundations of wellbeing recorded an 8.2 per
cent improvement from 2009 to 2020, aligning itself with the
WELLBEING, LIFE SATISFACTION AND CULTURE
Structures Domain of Positive Peace (Figure 2.22). This suggests
this indicator has a strong conceptual and empirical link with
the economic and technological underpinnings of wellbeing.
However, the deterioration in the Attitudes Domain of Positive
Peace is picking up an additional signal relating to the increased
polarisation of socio political views and greater intolerance of
dissenting opinions, as will be discussed below.
Less peacefulMore peaceful
Mor
e w
ellb
eing
Less
wel
lbei
ng
FIGURE 2.20Foundations of wellbeing and Positive Peace, 2020SPI's Foundations of Wellbeing indicator is highly correlated with the Positive Peace Index.
Source: IEP, Social Progress Imperative
100
90
80
70
50
60
40
30
20
FOU
ND
ATI
ON
S O
F W
ELLB
EIN
G
POSITIVE PEACE INDEX
r=-0.93
1 2 3 54
Less peacefulMore peaceful
Mor
e W
ellb
eing
Less
Wel
lbei
ng
FIGURE 2.21Health and wellbeing and Positive Peace, 2020Countries with higher levels of Positive Peace report greater satisfaction with living standards.
Source: IEP, Social Progress Imperative
100
90
80
70
50
60
40
30
20
HEA
LTH
AN
D W
ELLB
EIN
G
PPI ATTITUDES
r=-0.87
1 2 3 54
FIGURE 2.22Foundations of wellbeing and the Positive Peace domains, 2009–2020Measures of wellbeing are mostly picking up economic and technological progress. A closer look at societal Attitudes shows a deterioration over the past decade.
Source: IEP, Social Progress ImperativeNotes: * Change from 2011 to 2020
-4
2
0
10
8
4
6
-2
PPI Attitudes
PPI Institutions
PPI Structures
Foundations of Wellbeing*
PPI Overall Score
CH
AN
GE
IN IN
DIC
ATO
R F
RO
M
200
9 TO
20
20 (%
)

POSITIVE PEACE REPORT 2022 | 63
For cultural and historical reasons, the Japanese tend to report lower levels of satisfaction with life than other nationalities of comparable level of development. In Figure 2.24, Japan has a PPI score of 1.47 in 2020, broadly aligned with Ireland, France, Belgium and Germany. But the country has a level of satisfaction with life that is close to the bottom of the OECD range.
Loneliness and isolation are widespread among the population, especially for men. Work and schooling pressures weigh heavily on the population and are partly to blame for the country’s relatively high suicide rates. The Japanese culture imposes a heavy work and schooling burden on citizens, to the point that death by exhaustion or suicide linked to overwork has its own cultural designation: karoshi. The World Health Organisation stated that there were 12.2 suicides per 100,000 people in Japan in 2019. This is a high rate in comparison to other similarly developed countries, although it is still lower than South Korea’s 21.2 suicides per 100,000 people.
There is also a relatively common practice whereby some Japanese recluses withdraw from society and do not leave their homes sometimes for many years. This practice is known as hikikomori, and a government survey estimated a total of 542,000 people – or 1.6 per cent of the population – were living in these conditions. Academics and experts believe the actual figures are much higher than official statistics show.
Some sociologists attribute hikikomori to the high societal expectations for individuals to excel at work and school.
BOX 2.1
Cultural Influences on Attitudes in Japan
As discussed in Section 1 of this report, Attitudes was the only
Domain of Positive Peace to deteriorate over the past decade.
This deterioration means that political and social views have
become more polarised, people have become less tolerant of
opinions different from their own and people have become
less trusting of others and of the institutions that manage the
social system. This deterioration took place despite increasing
economic prosperity, improvements in health treatments and
outcomes, and the development and widespread dissemination
of new technologies.
This deterioration is consistent with an increase in the
proportion of persons that have negative emotions. The
Gallup Negative Emotions Index captures the proportion of
respondents reporting to have felt negative emotions – anger,
sadness, anxiety, stress and pain – in the day before taking
the survey. This proportion has increased from 24 per cent
of respondents in 2009 to 32 per cent of respondents in 2020
(Figure 2.23). This deterioration corroborates the findings
concerning the Attitudes Domain of Positive Peace.
Life SatisfactionMeasures of life satisfaction also see more satisfactory outcomes
among high Positive Peace countries. Among OECD countries,
life satisfaction correlates with the PPI with a non-linear
coefficient of 0.71 in absolute terms (Figure 2.24). Residents
in OECD countries reported a level of satisfaction with life
that is broadly proportional with these countries’ levels of
Positive Peace. One exception appears to be Japan, which has
a comparatively low level of life satisfaction for the country’s
high level of societal resilience (Box 2.1). On the other hand,
Mexico displays a level of fulfilment and contentment that is
disproportional to the country’s standing in the PPI (Box 2.2).
Less peacefulMore peaceful
Mor
e Sa
tisfa
ctio
nLe
ss S
atis
fact
ion
FIGURE 2.24OECD life satisfaction and Positive PeaceCountries with superior outcomes in the OECD Life Satisfaction framework tend to be those with higher Positive Peace.
Source: IEP, Sustainable Governance indicators
8
7.5
7
6.5
6
5.5
5
4.5
4
3.5
3
OEC
D -
LIFE
SA
TISF
AC
TIO
N -
2019
POSITIVE PEACE INDEX - 2020
r=-0.71
1 2 3 4
BGR
MEX
TUR
DNK
CZEUSA
ISL
BELIRL ISR
GRC
SVK
NOR AUT
AUSNZL
DEUCAN
CHESWE
FIN
ESP
SVN
NLD
GBR
POL
ITA
HRV
CHLLTU
ESTPRT LVA
HUNROU
KOR
FRA
JPN
FIGURE 2.23Global negative emotions and social attitudes, 2009–2020Both the Gallup Negative Emotions Index and the Attitudes Domain of Positive Peace demonstrate a worsening of social attitudes and behaviors over the past decade.
Source: IEP, Gallup
0
20
40
30
10
2.95
3.05
3.10
3.00
2009 2020
PRO
POR
OTI
ON
OF
RES
PON
DEN
TS W
HO
R
EPO
RTE
D N
EGA
TIV
E EM
OTI
ON
S (%
)
GALLUP NEGATIVE EMOTIONS INDEX
PPI ATTITUDES DOMAIN
2009 2020
SCO
RE
Less
pea
cefu
lM
ore
peac
eful

POSITIVE PEACE REPORT 2022 | 64
Mexico presents a mirror-image picture to that of Japan’s. The country’s PPI score in 2020 was 3.12, among the lowest levels of societal resilience in the OECD. Yet, Mexicans reported a degree of life satisfaction that is comparable to France, Spain and Italy: towards the middle of the OECD range.
A survey by the Pew Research Centre found Mexicans to be the happiest people on the globe among 43 nations assessed in 2014. Mexicans reported a life satisfaction of 79 per cent which was highest in the survey. The Economist stated this result showed a “fraying link between happiness and income.” The same report showed that advanced countries like Germany, France, Japan, and the US had their median life satisfaction levels to be 53 per cent. Israel was the only advanced country to report life satisfaction close to Mexico’s, at 75 per cent.
Some features of the Mexican culture may help explain the comparatively higher level of contentment among the country’s population. Firstly, Mexicans tend to rank religious beliefs highly among their personal and societal values. Religious people tend to enjoy a greater level of fulfilment and contentment – or resignation when facing difficulties – than the non-religious. Secondly, Mexicans also value highly family interactions, including with extended family. Interaction with aunts, uncles and cousins create a strong support network upon which individuals can rely in times of difficulty. The effects of lack of trust in governments and official support institutions is partly compensated for by access to reliable and tightly knit personal support networks including family members and friends.
BOX 2.2
Cultural Influences on Attitudes in Mexico
The OECD results are consistent with the Gallup Institute’s
survey outcomes. Respondents stated to be more satisfied
with their own standards of living among countries displaying
greater levels of societal resilience (Figure 2.25).
Satisfaction by Gender Responses to Gallup’s satisfaction with one’s own standard
of living survey find differing levels of satisfaction by gender
depending on cultural backgrounds. More countries had men
reporting a lower level of satisfaction than women where the
difference between the genders was more than two percentage
points: 29 countries compared to ten for women.
Both genders find greater degrees of satisfaction in countries
with higher levels of Positive Peace (Figure 2.26 and Figure
2.27). However, cultural peculiarities also influence the
responses. For instance, in countries such as the United Arab
Emirates (ARE), Bahrain (BHR) and Saudi Arabia (SAU) males
are far more likely to be satisfied with their standard of living
than females. However, men are less satisfied than women in
many western democracies.
Less peacefulMore peaceful
FIGURE 2.25Satisfaction with standard of living and Positive Peace, 2020Countries with higher levels of Positive Peace report greater satisfaction with living standards.
Source: IEP, Gallup
60%
50%
40%
30%
20%
10%
SATI
SFIE
D W
ITH
ON
E'S
STA
ND
AR
D O
F LI
VIN
G
PPI ATTITUDES
r=-0.73
1 2 3 54
Less peacefulMore peaceful
FIGURE 2.26Satisfaction with standard of living, females, 2020Women are more satisfied with their own standards of living in countries where Positive Peace levels are high.
Source: IEP, Gallup
70%
60%
50%
40%
30%
20%
10%SATI
SFIE
D W
ITH
ON
E'S
STA
ND
AR
D O
F LI
VIN
G (P
RO
POR
TIO
N O
F R
ESPO
ND
ENTS
)
PPI ATTITUDES
r=-0.70
1 2 3 54
USA
ARE
KOR
RUS
ZMB
IRN
ZWETUR
LBN
UKR
TUNMDA
SRB
DNK TWN
BEL
ALB
JAM
CHL
IRLISR
CHN
DOM
MAR
INDHRVECUBRABOL
COL
PAK
EGY
BHR
SAU
NORAUTAUS
NZLDEU
CAN
CHESWEFIN
ESPSVKSVN
NLD GBR
POLCYP
HRV
MUSPRTURY
FRAITAJPN
The levels of satisfaction with own standard of living between
men and women showed some distinctly different patterns.
For the following analysis, only differences of two percentage
points or more between the proportions for men and women
are considered. A total of 39 countries, or 70 per cent of the 57
countries polled had a discrepancy between the genders equal
to or greater than this threshold.
Of these 39 countries, ten nations, or 17.9 per cent of the
countries polled, reported males being more satisfied with their
own living standards than women (Table 2.4). Twenty-nine
nations, or 51.8 per cent, reported females being more satisfied
with their own living standards (Table 2.5).

POSITIVE PEACE REPORT 2022 | 65
Less peacefulMore peaceful
FIGURE 2.27Satisfaction with standard of living, males, 2020Men in the United Arab Emirates (ARE), Saudi Arabia (SAU), Bahrain (BHR) and Egypt (EGY) report higher levels of satisfaction with their living standards than in countries with similar levels of Positive Peace.
Source: IEP, Gallup
70%
60%
50%
40%
30%
20%
10%SATI
SFIE
D W
ITH
ON
E'S
STA
ND
AR
D O
F LI
VIN
G
(PR
OPO
RTI
ON
OF
RES
PON
DEN
TS)
PPI ATTITUDES
r=-0.42
1 2 3 54
USA
ARE
KOR
RUS
ZMB
IRN
ZWETUR
LBN
UKR
TUNMDA SRB
DNKISL
TWNBEL
ALBJAM
CHL
IRI ISR BOL CHNDOMMARINDBRA
ECU COLPAK
EGY
BHRSAU
NOR
AUSAUTNZLDEUCAN
CNESWL
FIN
SVR
ESPSVNNLD
GBRPOLCYP
HRVMUSPRTURY FRA
ITAJPN
For men the highest differences tended to be in authoritarian
states, whereas the highest differences for women tended to
be in more democratic regimes, especially countries with full
democracies.
The largest difference between genders was recorded in the
United Arab Emirates, where 23.4 per cent of females were
satisfied with their own standard of living compared to 63.9
per cent for males. This is a 40.5 percentage point difference in
favour of men.
Country
Proportion of Respondents Satisfied with Own Standard of Living
Males (%)
Females (%)
Average (%)
Difference between genders
(percentage points)
Taiwan 39.0 47.2 43.1 8.2
Turkey 17.9 25.3 21.6 7.4
Iran 24.1 30.9 27.5 6.7
Slovakia 34.3 40.7 37.5 6.5
Mauritius 34.8 41.2 38.0 6.4
Tunisia 27.2 32.2 29.7 5.1
South Korea 32.2 37.1 34.7 4.8
Australia 40.7 45.4 43.1 4.7
France 37.1 41.7 39.4 4.6
Colombia 33.5 38.0 35.8 4.5
Portugal 36.7 41.2 39.0 4.5
Russia 22.1 26.5 24.3 4.4
Moldova 27.8 32.0 29.9 4.2
United Kingdom 40.6 44.8 42.7 4.2
Austria 42.4 46.3 44.3 3.9
Italy 34.9 38.6 36.8 3.6
Uruguay 36.1 39.6 37.8 3.5
Chile 32.4 35.9 34.2 3.5
Lebanon 12.5 15.8 14.1 3.3
Finland 42.0 45.0 43.5 3.1
Switzerland 45.0 47.9 46.4 2.9
New Zealand 42.3 45.2 43.8 2.9
Cyprus 36.4 39.2 37.8 2.8
Ireland 40.3 42.9 41.6 2.6
Germany 43.7 46.3 45.0 2.6
Zimbabwe 18.9 21.4 20.2 2.5
Ecuador 32.8 35.2 34.0 2.5
Japan 34.9 37.2 36.1 2.3
Denmark 45.4 47.5 46.5 2.1
Source: Gallup
Country
Proportion of Respondents Satisfied with Own Standard of Living
Males (%)
Females (%)
Average (%)
Difference between genders
(percentage points)
United Arab Emirates 63.9 23.4 43.6 40.5
Bahrain 49.8 30.2 40.0 19.7
Saudi Arabia 50.8 37.9 44.4 12.9
Dominican Republic 37.4 30.6 34.0 6.8
Pakistan 35.4 29.7 32.6 5.7
India 36.9 32.3 34.6 4.6
Bolivia 39.0 34.5 36.7 4.5
China 40.5 36.4 38.5 4.1
Egypt 43.6 39.9 41.7 3.7
Slovenia 45.5 42.0 43.8 3.4
Source: Gallup
TABLE 2.4Countries where males are more satisfied with their own standards of living than females by more than two percentage points, 2020 Most countries where males are more satisfied with their own standards of living than females are not full democracies.
TABLE 2.5Countries where females are more satisfied with their own standards of living than males by more than two percentage points, 2020 In a large proportion of Western European nations and full democracies, females are more satisfied with their own standards of living than males.

POSITIVE PEACE REPORT 2022 | 66
Satisfaction by AgeThe relationship between satisfaction with one’s own standard
of living and the PPI Overall Score changes substantially
depending on the age group of the respondent (Figure
2.28). Very young respondents – those between 15 years of
age and 20 years of age – report an inverse relationship
between satisfaction and Positive Peace. In this demographic,
respondents in countries with high degrees of societal resilience
declared to be less satisfied with their own living standards than
those in lower Positive Peace country. Only around 21 per cent
of young people in high and very high Positive Peace nations
claimed to be satisfied with their living standards (Figure
2.28, Panel A). This compares with an average of around 24
per cent in lower Positive Peace countries. Interestingly, this
also compares with an average of 25 per cent for respondents
between 30 years of age and 49 years of age (Figure 2.28, Panel
B), and an average of 28 per cent for respondents above 50 years
of age (Figure 2.28, Panel C).
This low satisfaction rate among young people in developed
nations could be related to excessively high expectations for
their future lives, health problems such as mental health issues
or obesity, concerns about global inequality, environmental
threats or other matters. This counter-intuitive result that
wealthier youngsters appear more dissatisfied than less wealthy
ones has been confirmed multiple times, including by UNICEF,
The Children’s Society and others.7,8,9
For respondents between 30 years of age and 49 years of age,
the relationship between satisfaction with one’s own standard
of living and Positive Peace becomes marginally statistically
significant. However, for those of 50 years of age and older, the
relationship between satisfaction and Positive Peace is highly
significant with greater satisfaction levels being found in higher
resilience nations.
Satisfaction by Education Level Another peculiar result comes from assessing satisfaction
by maximum level of education achieved. For respondents
with elementary education, there is no relationship between
satisfaction with one’s own living standards and the national
level of Positive Peace (Figure 2.29, Panel A). In fact, there is
a weak ‘inverted’ relationship whereby nations with higher
resilience tend to see more dissatisfaction among those with an
elementary level of education.
Among respondents with a secondary education the relationship
between satisfaction and Positive Peace is particularly strong
(Figure 2.29, Panel B). Interestingly, those more highly educated
have lower overall levels of satisfaction than those with only
secondary education (Figure 2.29, Panel C).
Source: IEP, GallupNotes: * Number of countries: Very High: 30, High: 14, Medium: 7, Low: 7
FIGURE 2.28Satisfaction with standard of living, by age group, 2020For young respondents, the relationship between satisfaction and Positive Peace is weak or even inverted. Older respondents see a strong relationship whereby very high levels of Positive Peace in the form of the Attitudes Domain are associated with greater satisfaction.
SATI
SFIE
D W
ITH
OW
N S
TAN
DA
RD
O
F LI
VIN
G (P
RO
POR
TIO
N O
F R
ESPO
ND
ENTS
)
POSITIVE PEACE LEVELS - ATTITUDES DOMAIN*
(A) AGES 15 YRS TO 20 YRS
40%
30%
20%
10%
0%
50%
60%
18%
Very High
24%
High
22%
Medium
26%
Low
Higher resilience
Lower resilience
Higher resilience
Lower resilience
SATI
SFIE
D W
ITH
OW
N S
TAN
DA
RD
O
F LI
VIN
G (P
RO
POR
TIO
N O
F R
ESPO
ND
ENTS
)
POSITIVE PEACE LEVELS - ATTITUDES DOMAIN*
(B) AGES 30 YRS TO 49 YRS
40%
30%
20%
10%
0%
50%
60%
27%
Very High
23%
High
21%
Medium
26%
Low
Higher resilience
Lower resilience
SATI
SFIE
D W
ITH
OW
N S
TAN
DA
RD
O
F LI
VIN
G (P
RO
POR
TIO
N O
F R
ESPO
ND
ENTS
)
POSITIVE PEACE LEVELS - ATTITUDES DOMAIN*
(C) AGES 50 YRS AND HIGHER
40%
30%
20%
10%
0%
50%
60%
37%
Very High
19%
High
17%
Medium
11%
Low
Among those with higher education, satisfaction with one's own standard of living is greater in countries with higher levels of Positive Peace.

POSITIVE PEACE REPORT 2022 | 67
Source: IEP, GallupNotes: * Number of countries: Very High: 30, High: 14, Medium: 7, Low: 7
FIGURE 2.29Satisfaction with standard of living, by education level, 2020Those with secondary education reported higher levels of satisfaction with their own living standards than any other education demographic.
SATI
SFIE
D W
ITH
OW
N S
TAN
DA
RD
O
F LI
VIN
G(
PRO
POR
TIO
N O
F R
ESPO
ND
ENTS
)
POSITIVE PEACE LEVELS - ATTITUDES DOMAIN*
(A) ELEMENTARY
40%
30%
20%
10%
0%
50%
60%
12%
Very High
15%
High
22%
Medium
17%
Low
Higher resilience
Lower resilience
Higher resilience
Lower resilience
SATI
SFIE
D W
ITH
OW
N S
TAN
DA
RD
O
F LI
VIN
G(
PRO
POR
TIO
N O
F R
ESPO
ND
ENTS
)
POSITIVE PEACE LEVELS - ATTITUDES DOMAIN*
(B) SECONDARY
40%
30%
20%
10%
0%
50%
60%
51%
Very High
36%
High
31%
Medium
31%
Low
Higher resilience
Lower resilience
SATI
SFIE
D W
ITH
OW
N S
TAN
DA
RD
O
F LI
VIN
G(
PRO
POR
TIO
N O
F R
ESPO
ND
ENTS
)
POSITIVE PEACE LEVELS - ATTITUDES DOMAIN*
(C) TERTIARY
40%
30%
20%
10%
0%
50%
60%
20%
Very High
15%
High
7%
Medium
14%
Low
Satisfaction by Employment StatusEmployment is another determinant of the level of satisfaction
and the relationship between this satisfaction and the national
level of resilience. Those with a full time position provided by
an employer showed the highest overall level of satisfaction
with their own living standards (Figure 2.30, Panel A). This
category also recorded the strongest relationship between
satisfaction and the level of societal resilience as measured by
the PPI. Comparatively, those self-employed full time reported
much lower levels of satisfaction (Figure 2.30, Panel B).
Persons outside of the workforce – those not looking for or
not needing employment – also demonstrated a high level of
satisfaction overall (Figure 2.30, Panel C). In addition, their
satisfaction was far less dependent on national Positive Peace
levels than other groups.
Persons working part time demonstrated low levels of
satisfaction (Figure 2.30, Panels D and E). But among these,
the underemployed – those who would prefer to be working
full time – demonstrated no relationship between the level of
satisfaction and the national level of Positive Peace (Figure 2.30,
Panel E).
The unemployed have an extremely low level of satisfaction. In
addition, the relationship between their level of satisfaction and
national Positive Peace is inverted (Figure 2.30, Panel F).
Those with a full-time position provided by an employer showed the highest overall level of satisfaction with their own living standards in very high resilience countries.

POSITIVE PEACE REPORT 2022 | 68
Source: IEP, GallupNotes: * Number of countries: Very High: 30, High: 14, Medium: 7, Low: 7
FIGURE 2.30 Satisfaction with standard of living, by employment status, 2020Those employed full time by an employer, i.e. not self employed, display higher levels of satisfaction.
SATI
SFIE
D W
ITH
OW
N S
TAN
DA
RD
O
F LI
VIN
G�(
PRO
POR
TIO
N O
F R
ESPO
ND
ENTS
)
POSITIVE PEACE LEVELS - ATTITUDES DOMAIN*
(A) EMPLOYED FULL TIME - BY AN EMPLOYER
40%
30%
20%
10%
0%
50%
60%
33%
Very High
22%
High
14%
Medium
19%
Low
Higher resilience Lower resilienceSA
TISF
IED
WIT
H O
WN
STA
ND
AR
D
OF
LIV
ING
�(PR
OPO
RTI
ON
OF
RES
PON
DEN
TS)
POSITIVE PEACE LEVELS - ATTITUDES DOMAIN*
(B) EMPLOYED FULL TIME - SELF-EMPLOYED
40%
30%
20%
10%
0%
50%
60%
6%
Very High
9%
High
7%
Medium
6%
Low
Higher resilience Lower resilience
SATI
SFIE
D W
ITH
OW
N S
TAN
DA
RD
O
F LI
VIN
G�(
PRO
POR
TIO
N O
F R
ESPO
ND
ENTS
)
POSITIVE PEACE LEVELS - ATTITUDES DOMAIN*
(C) OUT OF THE WORKFORCE
40%
30%
20%
10%
0%
50%
60%
30%
Very High
22%
High
24%
Medium
26%
Low
Higher resilience Lower resilience
SATI
SFIE
D W
ITH
OW
N S
TAN
DA
RD
O
F LI
VIN
G�(
PRO
POR
TIO
N O
F R
ESPO
ND
ENTS
)
POSITIVE PEACE LEVELS - ATTITUDES DOMAIN*
(D) EMPLOYED PART TIME - BUT DOES NOT WANT TO WORK FULL TIME
40%
30%
20%
10%
0%
50%
60%
6%
Very High
4%
High
3%
Medium
2%
Low
Higher resilience Lower resilience
SATI
SFIE
D W
ITH
OW
N S
TAN
DA
RD
O
F LI
VIN
G�(
PRO
POR
TIO
N O
F R
ESPO
ND
ENTS
)
POSITIVE PEACE LEVELS - ATTITUDES DOMAIN*
(E) EMPLOYED PART TIME - BUT WANTS FULL TIME (UNDEREMPLOYED)
40%
30%
20%
10%
0%
50%
60%
4%
Very High
6%
High
6%
Medium
4%
Low
Higher resilience Lower resilience
SATI
SFIE
D W
ITH
OW
N S
TAN
DA
RD
O
F LI
VIN
G�(
PRO
POR
TIO
N O
F R
ESPO
ND
ENTS
)
POSITIVE PEACE LEVELS - ATTITUDES DOMAIN*
(F) UNEMPLOYED
40%
30%
20%
10%
0%
50%
60%
3%
Very High
4%
High
5%
Medium
6%
Low
Higher resilience Lower resilience

POSITIVE PEACE REPORT 2022 | 69
This section is not aimed at explaining the philosophy behind systems theory. Rather it proposes a practical guide on how to analyse societal systems to provide decision makers with the necessary information on how the societal system functions. For background on IEP’s philosophical approach to systems please refer to sections ‘Systems Thinking’ and ‘What is Positive Peace’ in the beginning of this report.
The results from implementing this systems design approach will allow for more informed policy decisions because before starting systemic interventions, a thorough understanding of the system is needed. This means that institutions can now be structured to match the needs of the system.
In most cases, governments, multilaterals and other institutions engaging in societal development initiatives do not address their initiatives systemically. This can create unforeseen consequences and lead to only partially successful outcomes, since there is not a wider understanding of the dynamics of that society. If institutions themselves are not set up systemically, often it will result in inefficiencies, partial solutions, inter-organisational disagreements and duplication, to name some of the issues.
There are many approaches to systems analysis, all with varying strengths and weaknesses. One that is commonly used in conflict analysis and business is Structures, Attitudes and Transactions (SAT), others are more suited to ecology, including the Social-Ecological Systems (SES) framework. There are many more.
What sets IEP’s approach apart from other systems analysis methods is the multimodal approach and modularity, along with a bias towards data and an analysis
framework borne out IEP’s decade long research on Positive Peace and systems thinking. It is practical and based on real-world analysis. Since it is modular, it can be scaled according to the necessary level of sophistication, available data and knowledge of the participants. It is a sophisticated framework specifically designed for assessing societal systems. It can be applied for analysing a nation, a region or a small community.
Systems also evolve slowly over time; therefore, systems analysis can be used successfully and meaningfully again at future points in time. Analysis can be iteratively updated and additional complexity added, creating a living analysis.
The Halo approach has been designed as a set of building blocks. This allows for an adaptive approach that can be uniquely tailored based on many dependencies, including the size of the societal system and also the sophistication required in the analysis. Workshops and programs can be as short as two days or as long as one year using this building block approach. Different building blocks can be utilised depending on the strengths of the design team, what may suit the project best and the length of time allocated for the analysis.
This section is divided in two parts. The first describes each of the design components, or building blocks, that are called system attributes, along with examples. The second provides a process for using some of the attributes in a design and then how to bring them together to develop the understanding of the system. The example is comprised of a 14-step process, however more steps can be added or subtracted depending on need.
Halo: a framework for analysing societal systems
3

POSITIVE PEACE REPORT 2022 | 70
THE ATTRIBUTES OF A SYSTEM
What is the outcome you hope to achieve? A system can be
understood from many different perspectives; however, the
starting point is what you wish to achieve from the analysis. For
example, if the aim was to improve family planning or the
containment of terrorism within the same social system, the
knowledge needed and the approach taken would be very
different even though many of the components and dynamics of
the system may be the same.
The attributes contained below have varying amounts of text.
Many of the more important attributes have short explanations
due to the simplicity of the concepts. Additionally, the aim was
to keep the text concise as many of the systems concepts are
more fully explained in Section 1 of this report.
Define the Bounds of the SystemSystems have boundaries. These boundaries can be described
according to a geographic area or social grouping. For example,
a system can be defined by a geographic area, such as a nation,
state or a forest. These types of geographic boundaries are the
easiest to define. It is more difficult if the system is an ethnic
group or a societal function. Social functions include the
education system, military, policing or a local health system. It is
best to approach these as simplistically as possible at first. Some
questions that help are what are the sub-systems which lie
within the system. What are the legal frameworks affecting the
system? For example, the health system consists of hospitals,
doctors, pharmacists, government health departments,
psychologists, etc. For the analysis, it may not consist of
alternative medicines, aged care homes or psychic healers.
Sometimes it is helpful to stipulate what is not included in a
system to simplify the analysis.
Often relations and flows can be confused as systems, for
example a conflict is an exchange between two or more systemic
groups. A conflict is not a social system, but a series of
relationships and flows between systems.
What are the Sub-Systems Contained within a System? Systems do not exist in a vacuum, as they form parts of larger
systems. For example, states are systems that form part of a
larger national system. However, they are also comprised of
systems, such as education, policing, business associations and
others. Identifying the core systems, or sub-systems, within a
greater system provides the basis for understanding its
dynamics.
What Are the Other Major Systems It Interacts with? Systems interact with other systems. This could be an adjacent
country, or district. It could be another ethnic group or an area
of governance. For instance, the military, the police, the
judiciary and border control can all be seen as systems that
interact with one another to achieve a certain objective. Another
example could be a school which interacts with families, the
education department and local leaders to improve literacy rates
in a community.
What is the Intent of the System? The intent of a system is its willing pursuit of desired outputs or
states. For example, the intent of a school system is to provide
pupils with the best possible education through the most
efficient use of resources. If the system of analysis is a social
group occupying a geographic area, its intent may be to control
the area, stop outsiders from accessing it and maximise the use
of that area. There can be multiple intents in the same system.
Attempting to rank the intents is important to understand the
priorities within the system. It is also critical to differentiate
between actual intent and stated or idealised intent, as the two
often differ substantially.
What Measurements Exist for the System?Where accurate and consistent data is available, a system may
be characterised by a set of statistical indicators that could
constitute the foundation for a deeper analysis. However, it is
often the case that statistical data for the specific system or
sub-system is not produced and the analysis needs to be
conducted indirectly through proxy data or via qualitative or
subject matter expert assessments. IEP uses three different
approaches when the data is insufficient, which are described
later in this section.
IEP has curated a set of approximately 400 indicators grouped
by specific systemic areas based around Positive Peace to assess
the level of societal resilience and development in a nation.
These indicators can also be compared across similar or
neighbouring countries, states or communities to provide a
deeper insight. They can be broken down further and can
grouped under IEP’s Positive Peace framework to better analyse
the strengths and weaknesses of the overall system. Figure 3.1
shows that Zimbabwe recorded improvements in 13 of the 19
indicators of governance performance over the past decade.
However, the country’s performance remains inferior to that of
its sub-Saharan African neighbours in many of these indicators,
despite such improvements.
This type of statistical analysis can measure, directly or
indirectly, the dynamics of sectoral components of the systems
and the exchanges, or flows, between them.
Understanding the Importance of Sub-SystemsTo determine the importance of a system, consider the number
of people within it, the number of people affected by the system,
the amount of money revolving within it, the number of
relationships or the extent of the laws or regulations prevailing
in or governing the system.
What is the Direction or Momentum of the System? Momentum is important as it helps explain the changing
dynamics of the system or sub-system, including emergence,
runaway feedback loops, decay and positive functions. The data
can be assessed individually or grouped. By grouping the data,
the momentum of the overall system or sub-system can be
ascertained.

POSITIVE PEACE REPORT 2022 | 71
It is also beneficial to compare the measures to the system's
neighbours'. This gives insight into the relative strengths and
weaknesses as neighbouring systems are often similar.
Momentum is an important concept for systems analysis
because it facilitates the extrapolation or forecasting of future
states the system may find itself in. If those states are
undesirable – according to the intent of the system –
interventions should be designed to slow down and possibly
invert the system’s momentum in that area. Where the
extrapolated future state is desirable, programs can be
developed to reinforce a specific momentum and take advantage
of it to nudge other sub-systems into higher states of
development.
The example of Figure 3.1 shows an improvement in the
momentum in the Zimbabwean governance system in regards to
government effectiveness and government accountability over
the past decade. If this momentum is preserved, Zimbabwe may
reach levels of effectiveness in these indicators on par with its
sub-Saharan African neighbours. However, the country has
recorded a sharp deterioration in institutions’ ability to provide
food security for the population since 2009, with food insecurity
now being more severe than among neighbours. This is a
critical area that should be prioritised in any resilience building
programme for the country.
What is the Path of the System and its Dependencies? Systems are path dependent. This means that the way a system
will develop in the future from a given state depends on the
path taken to reach that state. Path dependency can be
understood as the influence that a social system’s history,
memory and cultural values exert on the future development of
that society. These influences are expressed in the encoded
norms within the system.
Define the Homeostasis StatesAll systems seek a steady state, which is a state of minimal
change in the system’s components, stocks and flows. In the
same way the human body seeks to maintain a core
temperature, societal systems also seek stability.
Comprehending the main processes – encoded norms – which
maintain the steady state are at the crux of understanding how
a system operates. However, systems do have a tendency to
Reso
lvin
g In
solv
ency
Regi
ster
ing
Prop
erty
Prop
erty
Rig
hts
Scor
e
Regu
lato
ry Q
ualit
y: E
stim
ate
Cle
an E
lect
ions
Inde
xRu
le o
f Law
Libe
ral C
ompo
nent
Inde
x
Gov
ernm
ent E
�ect
iven
ess:
Est
imat
e
Tax
Reve
nue
(% o
f GDP
)Ac
coun
tabi
lity
Inde
x
Gov
ernm
ent A
ttac
ks o
n Ju
dici
ary
Libe
ral D
emoc
racy
Inde
x
Polit
ical
Civ
il Li
bert
ies
Inde
xFo
od S
afet
y
Food
Saf
ety
Gov
ernm
ent C
apac
ity to
Reg
ulat
e O
nlin
e C
onte
nt
Hig
h C
ourt
Inde
pend
ence
Gov
ernm
ent’s
Onl
ine
Serv
ice
Loca
l Gov
ernm
ent I
ndex
Example of changes in governance indicators, Zimbabwe and sub-Saharan Africa, 2009–2020Zimbabwe has improved on many governance indicators over the past decade. However, the country remains less developed than its sub-Saharan African neighbours in many areas.
Arrows show how indicators have changed from 2009 to 2020 in Zimbabwe. The begining of the arrow is Zimbabwe’s position in 2009 and the end, the position in 2020. Green arrows represent improvements; red arrows, deteriorations.
Bars represent the average level of the indicator for the sub-Saharan region in 2020
FIGURE 3.1
Source: IEP
1
2
3
4
5
1
2
3
4
5
Wor
seBe
tter
IND
ICA
TOR
SC
OR
E

POSITIVE PEACE REPORT 2022 | 72
grow. The steady state can be one in which the system achieves
growth, or one in which the system stagnates. This can vary by
sub-system.
What are the Main Encoded Norms within the System? Isolating the main encoded norms within a system and the
bounds within which they operate provides an understanding of
the mechanisms that hold the system together. The encoded
norms can sometimes be very subtle and difficult to quantify
and therefore the analysis has to focus on the important ones.
They can be expressed through laws and cultural norms, rules
or regulations, either formal or informal.
What Type of Feedback Loops Are Occurring? There are two main types of feedback loops – reinforcing and
balancing. Reinforcing feedback loops continue to amplify the
effect of the input. A reinforcing feedback loop might include
population growth or economic subsidies. When such feedback
mechanisms are too strong, they become runaway feedback
loops and may completely destabilise the system.
Balancing feedback loops are those in which the outputs
mitigate the effect of the inputs. They keep the system in
balance and support the steady state.
Has the System Passed any Tipping Points? This is important in understanding the path trajectory of the
system. Tipping points are thresholds beyond which the
relationships between components of a system change abruptly.
It is hard to predict the timing of them in the future, however,
they can be seen in the past. They may have been positive, when
they lead to higher levels of societal resilience, or negative. A
tipping point refers to a permanent and irreversible change in
the state of a system. Identifying past tipping points might give
insight into the dynamics which created the current system.
Identifying the exact timing when a system may go through a
future tipping point is extremely difficult, therefore
understanding past system tipping points from its history is the
best approach.
How Resilient and Adaptable is the System? There are two methods for measuring resilience and
adaptability. The first is an analysis of past shocks that the
system has suffered and the speed with which the system
recovered back to a steady state. The second is a data driven
approach based around the Positive Peace framework which is
an accurate measure of resilience. Societies with greater
resilience will more easily absorb the effects of shocks and
recover more quickly in their aftermath.
Efficiency and RedundancyEfficiency means that a system produces a maximum output
with the minimum number of components and with the lowest
level of resources. Redundancy means a system has excess
capacity, or not fully used components or resources. In most
cases, efficiency and redundancy are antagonistic concepts.
Efficient systems produce the highest level of output with the
minimum costs and use of resources. However, if a component
or sub-system is stressed or fails, the lack of alternate paths or
capacity means the system may become disabled. Building
redundancies in a system reduces the expected losses from
failures. However, this comes at a cost to efficiency. Systems
with redundancies tend to be those with the highest levels of
resilience, as they are capable of absorbing shocks. However, too
much redundancy may mean the system is uncompetitive.
Redundancies can be constructed in two different ways.
Redundancy of components means the system has unused, or
only partially used, components. For example, a factory may
operate with two computers instead of one – if one breaks down
the other takes over, thereby creating a failsafe environment.
Another example is an over-capacity in the health system to
deal with any spikes in hospitalisation rates.
Redundancy of relationships takes place when two or more
components are linked by a larger number of connections than
strictly necessary. An example is when two cities are
interconnected through various highways instead of just one.
Follow the MoneyMoney flows within a system often give an idea of the size of
sub-systems or the importance of encoded norms. If the amount
of money is growing over time, the system may be in a virtuous
cycle of development. Conversely, rising monetary power may
also be an indication of an imbalance. An example would be if
industry or special interest groups are subsidised by the tax
payer, which enhances their ability to garner political influence
with which to secure additional government money and
concessions.
Function, Purpose and PotentialAll components of a system can be seen through these three
lenses – function, purpose and potential. All purposes in
systems have functions and functions also have potential.
The function of a system or sub-system is the set of activities
through which output is produced. The purpose of the system
can be seen as similar to intent, however, intent is best applied
to the overall system, while purpose is better applied to
sub-systems. A sub-system can have multiple purposes but the
best analytical approach is to focus on the most important
purpose or purposes.
Potential describes what the function could be if the component
had more resources or its purpose was modified.
For example, a department that collects data on crime for the
government has the function of collecting, compiling and
divulging crime data. Its purpose is to inform policing and the
allocation of the security budget. Its potential may lie in
collecting additional data, operating with an increased budget
to promote its findings or to communicate directly with the
population to improve crime awareness.
Causality in SystemsThis is really about being able to understand the influences that
lead the system to behave in certain ways. However, in systems
cause and effect can become entwined. Think of a mutual
feedback loop.
Different parts, events or trends can mutually influence one
another, such that the differentiation between cause and effect
loses usefulness. This way of thinking avoids the pitfalls and
failures of the old cause/effect approach whereby an
intervention is targeted at the presumed cause of a problem or

POSITIVE PEACE REPORT 2022 | 73
vulnerability. Understanding mutual causality leads to a deeper
perspective on agency, feedback loops, connections and
relationships, which are all fundamental parts of systems
mapping.
Non-Linearity of EffectsThe effect of one part of a system on another is not always linear.
Relationships may change depending on the state of development
of the system. For example, for low peace countries,
improvements in peace lead to small increases in worker
productivity. However, as countries progress in peace, further
reductions in violence lead to ever higher increases in worker
productivity. This non-linear relationship has been discussed in
IEP’s Business and Peace Report 2021.1
Emergent PropertiesA system evolves through time and its current properties may not
fully describe future dynamics. Finding new emerging properties
is important to understand where the system is heading. The
speed with which something is accelerating can help identify
emergence. This can be the increase in money, the number of
people employed or the rate of development of new technologies.
Stocks, Flows and TransformationsA stock is a metric that defines the state of a component, a
sub-system or a system. Examples of stocks could be the number
of people in a country, the balance in a bank account, the amount
of grain in storage or the number of persons incarcerated. Flows
are movements between stocks. Examples could be money
transfers, the movement of a prisoner to the workforce or
immigrants entering the system. These concepts are important in
understanding the dynamics of systems.
Stocks and flows are homogeneous. That means what is stocked
or what is flowing remains the same across time. For instance,
money can be stored in a safe or be transacted between persons,
without losing or changing its attributes.
However, a transformation changes the nature of the object,
service or resource within the system over a given period of time.
For example, materials and electricity flow into a factory to
produce a machine. Another example is people and knowledge in
a research institute creating new forms of knowledge, while a
stock of food may rot and become unusable even if there has been
no outflow from the storage.
Is the System Stuck in an Attractor Plain? An attractor plain is a context or state from which the system
finds it difficult to escape. Within the peace and conflict arena,
the analysis of actual peace, as measured through the GPI, and
Positive Peace has identified two attractor plains, as discussed in
Section 2 of this report. One is called Sustainable Peace and is the
state where countries have high rankings in both the GPI and the
PPI. None of the countries in the Sustainable Peace area of the
GPI x PPI phase plain have had a substantial fall in their levels of
peace in the 15 years of the GPI. These countries tend to remain
peaceful without falling into states of violence as a consequence
of shocks. The other attractor plain is the Conflict Trap, defined as
low rankings in both the GPI and the PPI. Countries in this plain,
find it difficult to improve their societal resilience because of the
losses incurred by high levels of violence. Conversely, without
resilience they cannot achieve higher states of peacefulness.
Nations in the Conflict Trap region find it difficult to exit this
region without external assistance.
ArchetypesArchetypes are common reinforcing themes or patterns of
interactions repeated in many systems. The number of
archetypes varies depending on who is defining them, but
generally there are seven to ten. Examples are ‘limits to growth’,
‘seeking the wrong goals’ and ‘exponential success’. The value in
identifying the archetypes in a system is that it short-cuts the
analysis and helps in identifying solutions which are applicable
for the specific archetype. A number of specific archetypes are
defined in the following section on performing a societal
systems analysis.
Static and Dynamic modellingStatic modelling analyses the system at a given point in time,
while dynamic modelling uses many iterations of data over a
period of time. Static models are useful where there isn’t
sufficient time series data for analysis. It is also useful to
provide a snapshot early in the analysis that is simpler and
easier to understand before building up the dynamics.
Analysis through Positive PeacePositive Peace has been derived empirically to provide a holistic
expression of a system and as such it can be used in this process
as a check on whether the system has been analysed
systemically. Once a model has been derived, each component
can be classified as belonging to a Pillar of Positive Peace. If the
analysis is weak in a particular Pillar or Pillars, then there may
be a flaw in the analysis or a vulnerability in the social system
itself.
Positive Peace can also be used as a method of analysis to better
understand the various sub-systems, stocks, flows and emergent
qualities of the system as explained earlier in the
aforementioned heading ‘What Measurements Exist for the
System?’

POSITIVE PEACE REPORT 2022 | 74
Analysing systems can be lengthy, resource intensive and
expensive. One of the most critical difficulties in the process
is the lack of comprehensive information on the state and
dynamics of a system. Therefore, it is important to understand
the scope of the work that the research team can undertake and
the limitations they face. Arguably the best approach is to start
with the simplest depiction of a system and progressively build
its complexity.
An example of how to perform an analysis is set out below. This
has been done for purely illustrative purposes. However, it does
demonstrate the way the attributes come together to form a
sophisticated analytical framework and the way the attributes
can be used in combination.
Given the complexity and the number of choices of analytical
tools presented above the approach adopted in this analysis is
to focus on the most important concepts and how they could
be analysed and pulled together. The major steps used in this
analysis are:
• Describing the system and the sub-systems contained
within it.
• Ascertaining the system’s intent.
• Gauging stocks and flows.
• Finding encoded norms.
• Mapping path dependencies.
• Determining emergent properties.
Note, this analysis only uses eight of the 24 attributes listed
above.
A schematic of the steps taken in performing this analysis is
presented at the end of this section.
Developing a project plan is the preparatory step. Think through
which of the system attributes will be used and to what end. It
is important to understand why the analysis is being done and
what the outcome will be used for. It is good to do a number of
iterations of the analysis, deepening the depth each time. As a
rough guide, it is useful to cover in the first third of a project all
the selected attributes. That will result in at least a fuzzy view
of the system. It will also provide an opportunity to understand
where additional focus is needed on the next iteration to build
the model out.
If the budget and timeframe allow for the development of new
datasets, for example surveys on people’s values, then generally
undertaking them after the first pass through the methodology
is the best approach. However, in some cases if there is limited
data available surveying may be helpful before starting. Also
if the timeline is short it may not allow the necessary time to
complete a mid-project survey.
There are basically four approaches in this framework for
analysing the attributes of a system.
• Data driven.
• Expert assessment.
• Deliberative forums.
• Survey data.
Generally, to analyse a system all four styles can be used. The
utility of each approach will be dependent on the coverage and
quality of the available data and the availability of funds for the
study. Obviously, undertaking new surveys can be expensive
and the extent to which deliberative forums are used will also
impact budgets.
Deliberative forums are created by bringing together a group
people who represent a community to help guide a decision
about a project or issue that affects them. They form a
deliberative panel, also similar to citizen juries, community
meetings, and consensus conferences. They are usually formed
around a specific issue, and will attend presentations from
experts and make recommendations, based on the expert input
and the discussions within the group. The experts are not
involved in forming the recommendations.
Some of the steps below are discussed more succinctly than
others. However, all steps are important in this analysis.
Step 1 – Defining the System and its BoundsThe first step is to define the boundaries of the system to be
researched for the problem at hand. This can be done through
defining a geographic area or a social grouping. In this sense
a social grouping could be a formal body such as an education
system, or a monetary system, such as a card payment system.
Countries, states and administrative districts are good to use,
if applicable, as their bounds are clearly defined, as well as
their administrative processes and laws. The boundaries of
a system can be detected through different approaches such
as geographical areas, coverage of legal instruments, expert
opinion and ethnicity or religion. Some of these concepts are
clarified in the following examples.
1. A country’s health sector is a system whose boundaries can
be relatively clearly defined through an enumeration of its
components, or sub-systems: the set of medical doctors,
hospitals, the ambulance service, the national health budget
etc. Excluding certain sub-systems is also an important in
describing the bounds of a system. For example, can the
police department be considered part of the health system?
One key purpose of the police is to prevent violent crimes,
and as such, effective policing reduces hospital admissions.
However, police departments are covered by different
legislative, budgetary and administrative frameworks than
the health sector. Therefore, instead of characterising the
police department as a sub-system of the health system, it
would be more precise to think of it as a parallel system
interacting closely with the health sector.
2. The natural environment is clearly a system in which
APPROACHES TO ANALYSING THE ATTRIBUTES OF SYSTEMS

POSITIVE PEACE REPORT 2022 | 75
components and sub-systems interact in complex ways. The
simplest way to define the bounds of the system is to define
the physical boundaries of the ecosystem. For example,
a forest has more or less clearly defined geographical
boundaries which set the limits of that system in broad
terms. However, it may also contain rivers flowing through
it that originate far afield and its atmosphere – or its vertical
upper boundary – is also affected by other systems.
3. The legal system can be characterised by large and complex
sub-systems such as the legislative, the judiciary, law
enforcement, law colleges and others. However, a particular
legal instrument or a specific law is not a component of
the legal system. Rather, it is an encoded norm, that is, a
rule governing the function of a system or sub-system. For
example, the law governing the manufacture of seat belts is
an encoded norm in the car industry.
Step 2 – What are the Major Sub-Systems? Once the boundaries of the system have been defined, it is
important to consider the sub-systems that exist within the
system. It is not necessary to consider every possible sub-
system as there will frequently be many but it is important
to understand the most influential sub-systems. They can be
determined by the same approaches used to identify a system.
As the analysis progresses often subsystems become apparent
which were missed on the initial passes. Stocks, flows and the
available data are some of the items that can give insight into
subsystems.
Step 3 – What is the Intent of the SystemOften the intent of the system is clear, but also the actions
might not accurately reflect the intent. For example, there may
be a school improvement plan, where money is given for the
capital improvements on the neediest schools. However, if the
decision is made by politicians then the allocation may be made
to schools with the most political relevance rather than to the
neediest schools. It is clear that the intents and the outcome are
not aligned.
There may also be multiple intents. One approach is to assess
the system on four different dimensions of activity – economic,
political, social and legal.
Economically, intent may be assessed by the type of system,
ranging from state controlled to free market. This can be
expressed in the nature and scope of the laws governing
economic activity and state ownership of enterprises. A
company’s intent may be expressed by its desire to maximise
growth or profit. The stated intent of many systems or sub-
systems can be self-evident. However, they can be compromised,
for example if the staff in the health or policing systems needed
facility payments from the public to maintain a living wage then
one of the actual primary intents would be to raise income,
despite the stated intent being to provide quality service.
There are two other analytic methods that help in
understanding intent. The first is using expert assessment and
the second is to use a deliberative forum. The latter is comprised
of people who are part of the system. They often know the way
the system functions and can give insight into its non-obvious
intents, but they are not necessarily subject matter experts. If it
was the criminal justice system then it would not only involve
police, judges, lawyers, but also people affected by crime, general
public, criminals and others that the policing function touches.
In some cases, the stated intent of a society may differ from the
actual intent.
The Positive Peace Report 2017 contains an exercise where
nations are assessed according to their beliefs and values in
four dimensions: political, economic, international relations
and social policy.2 Nations were assessed according to a linear
scale in each of these dimensions. For example, along the
political linear scale, nations could be considered authoritarian
on one extreme to democratic on the other extreme, with
several gradations occurring between these levels (Figure
3.2). The combination of a nation’s assessment in these four
dimensions provided an approximation for the national intent.
This approximation could then be fine tuned and enriched by
expert analysis. This national intent tool can be accessed at
nationalintent.visionofhumanity.org.
Intent for each country can be classified based on the country’s position on the four scales of intent.
Plotting country intentFIGURE 3.2
Source: IEP
COUNTRY A COUNTRY B
POLITICAL
Authoritarian Democratic
ECONOMICState owned Free market
INTERNATIONAL RELATIONS
Unilateral Multilateral
SOCIAL POLICYLow safety nets High safety nets

POSITIVE PEACE REPORT 2022 | 76
Step 4 - What is the Purpose, Function and Potential of the Sub-System The next step is to define the purpose of each sub-system, how
it functions and its potential. This process needs to be concise,
because lengthy and detailed descriptions can confuse the
analysis without providing any substantial informational gain.
It is best to use bullet points to describe the purpose and the
function.
There may be more than one purpose, but it is important to
focus on the essentials and not over-describe. Examples may
be a community cooperative whose purpose is to maintain a
seed and fertilizer bank for its members to avoid steep changes
in prices. It may contain ten or more functions related to
purchasing, selling or distributing its stocks. Its potential
may lie in building new purposes and functions, such as the
collective sale of food, improving water sources or setting up a
small-scale canning business.
Potential is often best assessed after the stocks and flows in the
system have been determined.
Note that potential can also be ‘negative’, or more precisely,
lower than the current state of its function. This could happen,
for example, where a system is scaling down due to competition,
obsolescence, legal impositions or regulatory action.
Step 5 – What are the Stocks, Flows and Transformations within the SystemThe next step is to develop the stocks and flows associated with
the functions of the sub-systems. Stocks can accumulate or be
depleted; flows can strengthen, weaken or reverse.
The objective is to map the interrelations between the different
sub-systems. The relationship between the stocks and flows of
sub-systems will show how they relate to each other. Again use
simple bullet points to define the stocks, what flows into it and
what flows out (Figure 3.3). Also map any transformations that
happen inside the sub-system. For example, materials can be
transformed into a final product within a manufacturing plant
or criminals rehabilitated through the criminal justice system.
It is also good to rank the importance of each function. The
number of people involved, the amount of money transferred
or the depth of the laws surrounding an activity can provide a
strong indication of importance.
This approach can be data driven based on available statistics.
It may be the way government funding passes to and through
organisations, it could be the rise and fall in the stock levels or
prices of important commodities or it could be the number of
people employed in the hospitality sector.
The determination of stocks and flows will begin to shed light
on the inefficiencies, constraints and bottlenecks in the system.
The extent of these redundancies and limitations will become
clearer when the analysis reaches step 13.
While stocks, flows and transformations can be ascertained
by expert assessment, if data exists, a quantitative analysis is
preferable.
Transformations occur when one or more flows enter a sub-
system and their nature is changed within the sub-system.
Manufacturing is an obvious example, however, other examples
could be a theater company where money, people, costumes
are transformed into a play; or a forestry regeneration program
where money, people, knowledge, plants are transformed into
ecological capital or multiple flows into a hospital where the
transformation is improved health.
Some stocks and flows are more important than others. A
simple approach is to assign a value of importance. The scale
does not matter, provided it is large enough to cover important
variances in observed stocks and flows. This data can then
be entered into a database. This will provide the ability for a
sophisticated analysis further down the track and also allow
for the visualisation of the data. There are many database
types including relational, graph or Kumu which is specifically
designed for social networks.3
These relationships between stocks and flows within and
between sub-systems are usually ‘one to many’.
Step 6 – Finding the Encoded NormsUnderstanding the stocks and flows will allow for the
elucidation of the encoded norms. Encoded norms refer to
the accepted actions, rules, regulations and cultural norms
within a sub-system. For example, one encoded norm would
be to purchase goods if the inventory dropped below a certain
level, while another would be to change suppliers, if specific
thresholds were met. Identifying the encoded norms may
be the most difficult part of the process, as they are seldom
clearly defined. In these cases, expert assessments are useful
and deliberative assemblies are particularly helpful in the
elucidation of cultural norms. It is usually best to start with
what appears as the simplest areas to define.
Understanding the encoded norms requires the comprehension
of purpose and intent.
Example using data nesting - Education department systemThe listing of all stocks, flows and transformations within a system is a critical step towards understanding the dynamics of the system.
FIGURE 3.3
Source: IEP
SYSTEM
SUB-SYSTEM
STOCK
STOCK
STOCK
FLOW
FLOW
STOCK
STOCK
TRANSFORMATION
...
SCHOOLS
CHILDREN
PRODUCTION OF SCHOOL CURRICULUM
EDUCATION DEPARTMENT
Annual Budget
School Budget Transfers
Government Funding
Teachers
Training Colleges
...

POSITIVE PEACE REPORT 2022 | 77
Encoded norms regulate the flows between stocks, but can also
be cultural values such as employment norms regarding levels
of wages and work safety or discriminatory behaviour. While
most encoded norms change slowly, those that arise from laws
and regulations can change very rapidly in response to legal
reform or new executive directives.
Step 7 – Developing System DiagramsSystem dynamics can be very complex and it can be difficult
to consider all relevant aspects. Visualising information can
make it significantly easier to gain insights into the dynamics
and obtain a more holistic perspective. There are a number
of different approaches. These include cluster maps and
interconnection maps.
Cluster maps are basically free-form association of what a group
of people thinks a system may be. It is a qualitative exercise
involving a small group of three to five people providing insight.
The aim is to generate the cluster map quickly, within a couple
of hours to provide a sanity check on what has been defined
in the prior steps. This is best characterised as a ‘brain dump’
rather than an analytical exercise.
Interconnection maps take the data assembled and create lines
reflecting the relationships between each different bubble. The
bubbles can represent functions, sub-systems or purposes. The
size of the bubble represents the importance of the stock/part
and the thickness of the line represents the strength of the flow/
interconnection. Figure 3.4 is a very simple example these types
of maps, which could have hundreds of items and arrows.
Step 8 – Performing a Static AnalysisOften a good start is to analyse the system at one point in time.
This provides for a simpler understanding of the system.
The use of network maps as described above is appropriate
for static analysis, as such maps are two-dimensional
representations with some three dimensional elements. For
example, if the size of the box is bigger or the colour darker
or the lines thicker, that may represent greater importance or
influence or quality.
Once this analysis is complete, various relationships will
become more apparent.
Step 9 – Performing a Dynamic AnalysisOnce a static analysis has been performed, it can then be
extended to a dynamic analysis for a deeper understanding of
how the system changes over time. This is important because
systems are dynamic, so the data will change over time.
Therefore, time series are important in understanding the
changes in the flows over time. Which stocks are increasing,
which stocks are decreasing and which ones are static. This part
of the analysis is useful for determining existing and emerging
constraints in the system.
This also provides the ability to look for emergent qualities.
These are stocks, flows or sub-systems that are growing in
size. Sun-setting is the opposite of emergence and is typically
something that is fading away; this is where stocks or flows are
dwindling. This may be due to obsolescence, malfunction within
the system, innovation and other factors.
This will give some clear insights into the dynamics of the
system. There may be factors that need to change, due to
innovation or other drivers. Sun-setting may be good or bad
depending on the circumstances. For example, if the role of
local leaders is declining in a pastoralist community and the
government agencies that are now dispensing justice are not
respected or seen as legitimate, then this can lead to further
deteriorations in the system. Alternately, if the number of people
who are under-nourished is falling then that is positive.
Where factors are increasing and this increase comes off a low
base, this is an emerging quality within the system. This again
may be good or bad. If the levels of terrorism or civil unrest
are rising then it is bad, but in the case of increased use of the
Internet, more teachers per student or increases in per capita
income then it is good.
Sun-setting may also occur. This is where a measure of a stock
or flow is falling over time. This may be due to innovation,
such as electric cars replacing traditional cars or the Internet
replacing earlier forms of communication.
Step 10 – Identify the System ArchetypesThere are some basic patterns that keep emerging in different
systems. These are often referred to as archetypes. Analysing
a system from the concept of basic archetypes helps to better
understand common themes and important feedback loops. Six
common archetypes are listed below.
• Limits to growth. All systems have limited resources they
can consume.
• Exponential success. This is a runaway feedback loop where
success increases exponentially, eventually dominating the
system.
GRAIN BANK
FOODRETAILER
HOUSEHOLD
FOODWHOLESALER
REMITTANCES
Money
Food
Grain
Money
Money M
oneyGrain
Source: IEP
FIGURE 3.4Grain subsidy programStocks and flows in a grain subsidy program.

POSITIVE PEACE REPORT 2022 | 78
• Seeking the wrong goal. This is related to the intent of the
system. If the goal is inadequate, its pursuit will damage the
system.
• Rule breaking. Rules are often set up to regulate and
maintain homeostasis. When rules which regulate society
break down the result will be changes in the system’s
internal structure. This can be positive but more often is
destructive.
• Escalation. This can be defined as one-upping. Think of two
groups competing for shrinking resources, escalating wars,
or politicians competing for the highest spending for the
popular vote.
• The commons’ tragedy. This is where a common resource
gets utilised by agents who will aim at maximising their own
benefit from a commonly shared resource. If the resource
gets over-utilised, then it can lead to rule breaking and
escalation.
Step 11 – Path DependencyPath dependency is important as the cultural and historical
conditions of the system will set the bounds in which the system
can operate. It will also give some insight into the intent of the
system. If the system has had a traumatic past, then that will
affect the intent of system. It is likely to lead to an overemphasis
on mechanisms for protection and safety.
Path dependency can be understood through an analysis of
the system’s history. In the case of a country, it can be viewed
through the four lenses of economic, political, social and legal.
The political lens would cover aspects of foreign relations,
including wars. This can be achieved by expert assessment.
Step 12 – Finding the Cultural Values.Cultural values will also affect the bounds or limits of what
the system can do. It will also affect what encoded norms exist
and how they may operate. Cultural values are broader, more
persistent and more fundamental to a societal system than
encoded norms, which are often set by legal or regulatory
frameworks. There can be hundreds of values, however, it
is important to focus on the most relevant ones. This may
start with insights about how different groups of people are
perceived, think or behave. For example, Americans consider
themselves free, Australians easy going, Burmese devout, while
Chinese place an emphasis on family values. In this process,
systems often have myths about who they are and this will
give insight into the system and where it is likely to go. Other
cultures may see themselves as war like, as the natural rulers, or
in the case Iceland as peaceful.
Some examples of important values would be in relation to
corruption – what is considered corrupt, views on minorities,
the use of violence, the availability of guns, telling the truth or
following laws.
From a practical standpoint, deliberative forums are an effective
way of understanding the values of culture. Likewise, surveys
are also a good method of obtaining insight into society’s values.
Step 13 – Bringing it TogetherAfter completing step twelve, there will be a wide variety of data
to be assessed to better understand what are the best actions to
stimulate the system towards the desired result. Some of this
data may lie in databases or lists compiled in the analysis.
There are innumerable variations or permutations based on the
aforementioned analysis. This text will only cover how to bring
the assessment together to understand what actions should be
taken. For example, if a system’s intent is dysfunctional, the
analysis of the purpose and flows of the sub-systems would be
different compared to that of a system whose intent was in most
respects functioning correctly.
• Firstly, assess whether the actual intent and functioning
of the system match its stated intent. There may be
some aspects of the intent of the system that are not
satisfactory. If so, then analyse the sub-systems, relations
and flows to determine what aspects are supporting both
the dysfunctional areas and functional areas of intent.
Reinforcing positives can be as important as correcting
negatives.
• What is the momentum of the system and what are the
variations in the momentum of different components of the
system? When analysing the momentum, focus on the items
that are important and deteriorating, or growing at the
fastest pace. Stocks that are growing rapidly may signal a
runaway feedback loop is taking place or one that may take
place in the future. Use the stocks and size of the flows to
better assess these points.
• What are the encoded norms supporting both the positive
elements and negative elements discovered in the analysis?
What laws or social values affect functions. What needs to be
supported and what needs to change?
• Assess which items within the system match an archetype
and which are the stocks and flows associated with the
archetype.
• Next pull together a list of the things that are not working
appropriately. These may be entire sub-systems, stocks or
encoded norms. Once this is done, take each of the items
and understand the relationships between them. Are there
mutual feedback loops, is one a precedent for the other?
• Once this list is developed, attach it to the function for
which it is meant to perform. In the case of sub-systems, the
functions are part of the sub-system, therefore there will be
stocks or encoded norms associated with it within this list. If
not, then there may be a problem with the analysis.
• Next step is to analyse the functions. Are the functions
appropriate for the performance of the sub-system?
• Cultural values will affect many of the items on the list. How
do the cultural values assessed earlier support the items
or hold the items in check? This is especially important to
understand encoded norms.
• How does the path dependency affect the items on the list?
Do they inhibit change or are they factors that will support
change?
• How does the homeostasis affect the each of the items on
the list? What are the aspects of the homeostasis that are
supporting each of the items? Which aspects are suppressing
them?
Step 14 – Checking Against Positive PeaceBecause of the way it was derived, Positive Peace provides
an ideal framework through which the various interventions
proposed can be viewed to determine whether the sum of the
interventions is truly systemic. Each of the interventions can
be grouped under one of the eight Pillars of Positive Peace.
Assessing the number of interventions under each of the Pillars
provides insight into the completeness of the interventions.
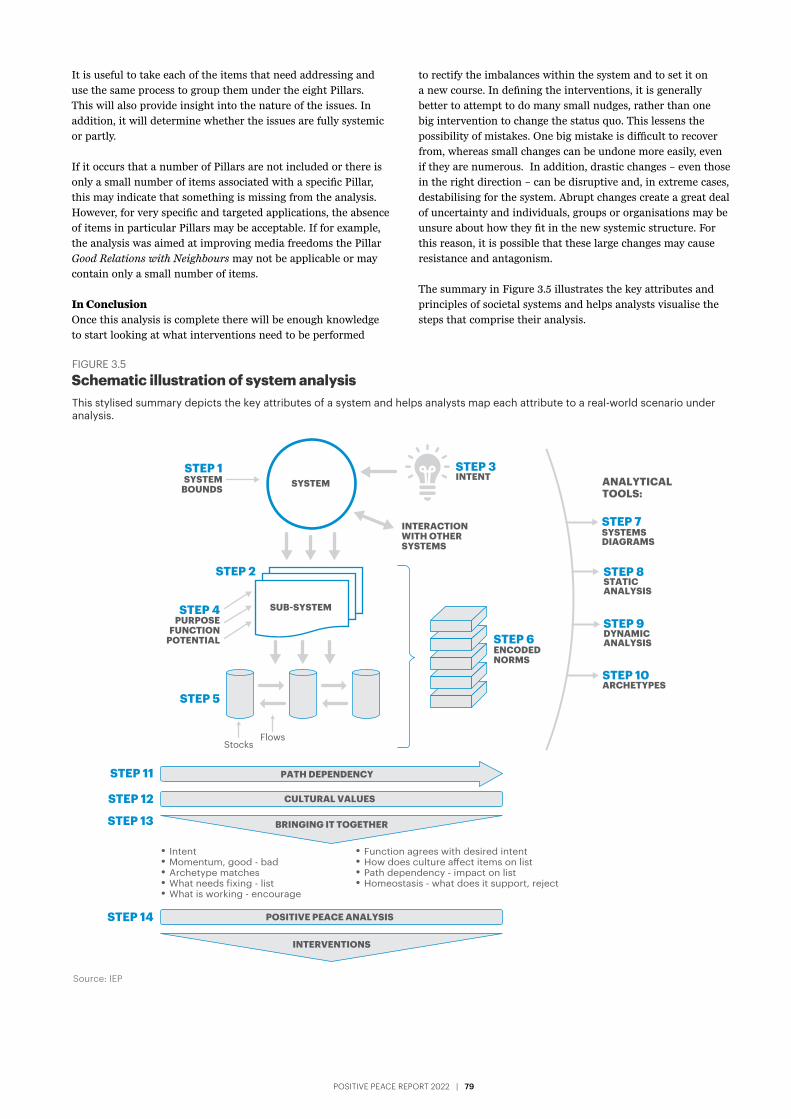
POSITIVE PEACE REPORT 2022 | 79
It is useful to take each of the items that need addressing and
use the same process to group them under the eight Pillars.
This will also provide insight into the nature of the issues. In
addition, it will determine whether the issues are fully systemic
or partly.
If it occurs that a number of Pillars are not included or there is
only a small number of items associated with a specific Pillar,
this may indicate that something is missing from the analysis.
However, for very specific and targeted applications, the absence
of items in particular Pillars may be acceptable. If for example,
the analysis was aimed at improving media freedoms the Pillar
Good Relations with Neighbours may not be applicable or may
contain only a small number of items.
In ConclusionOnce this analysis is complete there will be enough knowledge
to start looking at what interventions need to be performed
to rectify the imbalances within the system and to set it on
a new course. In defining the interventions, it is generally
better to attempt to do many small nudges, rather than one
big intervention to change the status quo. This lessens the
possibility of mistakes. One big mistake is difficult to recover
from, whereas small changes can be undone more easily, even
if they are numerous. In addition, drastic changes – even those
in the right direction – can be disruptive and, in extreme cases,
destabilising for the system. Abrupt changes create a great deal
of uncertainty and individuals, groups or organisations may be
unsure about how they fit in the new systemic structure. For
this reason, it is possible that these large changes may cause
resistance and antagonism.
The summary in Figure 3.5 illustrates the key attributes and
principles of societal systems and helps analysts visualise the
steps that comprise their analysis.
Schematic illustration of system analysisThis stylised summary depicts the key attributes of a system and helps analysts map each attribute to a real-world scenario under analysis.
FIGURE 3.5
Source: IEP
SYSTEM BOUNDS
STEP 1
STEP 2
STEP 6
STEP 5
STEP 11
STEP 12
STEP 13
STEP 14
STEP 3
STEP 7
STEP 8
STEP 9
STEP 10
STEP 4
SYSTEM
PURPOSE FUNCTION
POTENTIAL
PATH DEPENDENCY
CULTURAL VALUES
POSITIVE PEACE ANALYSIS
BRINGING IT TOGETHER
ENCODED NORMS
INTENT ANALYTICAL TOOLS:
SYSTEMS DIAGRAMS
STATIC ANALYSIS
DYNAMIC ANALYSIS
ARCHETYPES
INTERACTION WITH OTHER SYSTEMS
FlowsStocks
• Intent• Momentum, good - bad• Archetype matches• What needs fixing - list• What is working - encourage
• Function agrees with desired intent• How does culture a�ect items on list• Path dependency - impact on list• Homeostasis - what does it support, reject
SUB-SYSTEM
INTERVENTIONS

POSITIVE PEACE REPORT 2022 | 80
The Positive Peace framework can be applied in many
settings and provides a foundation to understand and
address the multiple and complex challenges the world
faces. The framework is applicable at the macro level,
tailored for government and supranational interventions,
but it is also effective at the community level.
Positive Peace projects can be tailored to a variety of
different stakeholders including professionals working in
development, peacebuilding, policing, military, health,
education and government policy. The framework is
non-political, culturally sensitive and impartial, and
provides a neutral baseline from which recipients can
create their own practical approaches to development.
The way the framework is designed makes it culturally
applicable, with workshops having been run in Africa,
Europe, Asia, North America and the Middle East.
Why is Positive Peace different?Peace is often seen as being separate to development, or
perhaps as a consequence of development that is achieved
through mediation or conflict resolution practices.
However, the Positive Peace framework sees peace as an
integral part of societal development. IEP’s Positive Peace
framework is an evidence-based model for sustainable
societal development that emphasises factors that create
thriving societies.
Through the implementation of this framework,
developmental projects translate into peacebuilding
projects without political connotations. By focusing on
and leveraging the strengths of a society or community,
the methodology differs from traditional peacebuilding
approaches that often rely on and are limited to conflict
analysis.
The emphasis of Positive Peace projects is on effective
action led by community stakeholders. There is limited
value in stakeholders identifying actions outside of their
control. They also learn how to think of their actions from
a systemic perspective. This carries forward into other
activities that they may undertake in the future. In
addition, the framework is capable of communicating
complex concepts and research findings in ways that are
simple, practical and effective.
Many development organisations already have good tools
for designing and executing developmental programs. The
Positive Peace framework can provide a unique systemic
approach to help in the development a project. However,
the innovation in the Positive Peace approach teaches the
principles of good governance as a by-product of the
design process. Therefore, it instils a set of values that
will be carried forward into other aspects of life. It also
teaches the community what aspects will help sustain
peace in their context.
This section focuses on the practical application of Positive Peace, highlighting some of the successful workshops and programmes implemented around the world. It includes an overview of IEP’s educational and academic programs, with insights into our partnerships and corresponding Positive Peace activities. This section also describes some recent IEP Positive Peace workshops at strategic, development and grassroots levels. These descriptions can act as a guide for countries, communities, and organisations seeking to improve their levels of resilience and peacefulness.
Implementing Positive Peace4
PEACE Free Flow of Information
Low Levels of Corruption
High Levels of Human
Capital
Acceptance of the Rights
of Others
Good Relations with
Neighbours
Well-FunctioningGovernment
Sound Business
Environment
Equitable Distribution
of Resources

POSITIVE PEACE REPORT 2022 | 81
Educational ProgrammesThe educational programmes are built upon IEP’s
research and resilience building expertise, and can be
tailored for specific needs and audiences.
IEP AMBASSADOR PROGRAMMEThe IEP Ambassador programme provides opportunities
for peacebuilders and other stakeholders, to gather
concrete knowledge and collect resources to help foster
peace among their community networks.
It was first launched in 2016 and is now in its 6th year of
operation. The programme has so far attracted more than
3,500 participants from over 105 countries. Since 2016,
participation levels have steadily risen, with a record
number of over 600 participants in 2021.
The programme consists of an initial online training
course and then three webinars. Participants have the
opportunity to apply the knowledge acquired by
implementing a peace project or presentation by the end
of the three-month programme.
Through the series of webinars, participants receive an
in-depth understanding of IEP’s research and
methodologies, guidance on how to communicate peace
research, and how to activate Positive Peace in their
communities. A key output of the programme is the
adoption of Positive Peace by ambassadors into their
professional practises.
Programme Objectives • To establish and train an international network of
leaders and peace builders who understand and are
equipped to work with the systemic nature of peace.
• To provide participants with an understanding of
IEP’s data driven research to facilitate the
implementation of peacebuilding initiatives.
• To improve participants’ capacity to interpret and
communicate peace research to their respective
communities and through IEP’s networking platforms.
• To demonstrate the importance of an approach to
peacebuilding that leverages societal strengths, rather
than the traditional focus on perceived causes of
conflict.
Ethiopian Ambassador ProgrammeThe flexible nature of the online course allowed IEP to
create bespoke Ambassador programmes for different
communities. For example, a course was created for
Ethiopia in partnership with the Rotary Club of Addis
Ababa West and the Ethiopian Reconciliation
Commission.
This online programme launched shortly after the
outbreak of violence in Ethiopia’s Tigray region. The
conflict between federal and regional forces that began in
November 2020 has pushed tens of thousands of refugees
into neighbouring Sudan and degenerated into a full
humanitarian crisis. The free programme was launched in
February 2021, and attracted Ethiopian youth, local
Rotarians, business leaders, artists and entrepreneurs,
and members of the Ethiopian Reconciliation
Commission.
How Positive Peace was implementedIEP led an online programme that included an
introduction to Positive Peace and the IEP-devised model
for practical implementation of peacebuilding. This
programme was delivered through a series of three
webinars with further instruction on IEP’s research and
methodology. It also provided training on how to
communicate peace research insights. Participants were
supported by a comprehensive Positive Peace resource
pack and project development coaching.
Outputs The initial online workshop attracted over 350
participants, all based in Ethiopia. To complete the
programme, participants put their knowledge to use by
implementing projects that applied Positive Peace in their
respective communities. There were over 130 peace
projects and presentations submitted by workshop
participants.
Some examples of the projects are the creation of a
‘Positive Peace Association’, which builds a platform for
Ethiopian Ambassadors on the ground to connect and
further their work in Positive Peace. A Completion
Certificate from the IEP Ambassador programme is a
requirement to be a part of the association.

POSITIVE PEACE REPORT 2022 | 82
Other projects saw Positive Peace material and
information translated into local Ethiopian languages, to
make Positive Peace learning more accessible, especially
in regional areas. One participant who was also a teacher
used the eight Pillars as a framework to strengthen his
school community. For example, under Well-Functioning
Government the school decided to create identification
cards for all students to improve the tracking of
attendance to classes and extra curricular activities. This
allowed them to give special attention to students who
were missing school and offer assistance. Another Pillar
activated was High Levels of Human Capital by creating a
‘knowledge sharing club.’ This club utilised peer-to-peer
learning and encouraged students to share ideas,
knowledge and questions among themselves and with
their teachers.
IEP PEACE ACADEMIESThe IEP Peace Academy is an online academy aimed at
building greater knowledge of peace. It is applicable to
the general public and those who work in the field and
wish to gain a better understanding of IEP’s products.
The online course provides participants with the skills to
develop peace and take action at grassroots and
institutional levels.
Over the course of 5 modules, participants learn the
history of peace studies and the centrality of Positive
Peace to sustaining peace in societies. The IEP Peace
Academy also affords participants an opportunity to
become deeply knowledgeable of some of IEP’s most
influential publications – such as the Global Peace Index,
Positive Peace Report, Ecological Threat Register, Global
Terrorism Index and IEP’s research into COVID-19 and
peace.
IEP has also developed a Religions and Peace Academy.1
This bespoke course explores the important connections
between religions and peace, highlighting how robust
inter-faith cooperation can aid conflict resolution and
enhance global peacefulness.
The Religions and Peace Academy distils IEP's research
into easily digestible lessons, grounded in the Institute’s
data-based peace and conflict research methodology. The
key takeaways of the programme are:
• A comprehensive understanding of peace and its
implications for humanity.
• Appreciation of the role of interreligious cooperation
as a platform for promoting and maintaining peace.
• Ability to navigate the complex landscape of peace
and conflict studies with an understanding of systems
theory, Positive Peace and negative peace.
• Understanding of how ecological threats and
COVID-19 may impact global peacefulness.
• Knowledge necessary to take the first steps in
becoming an effective peacebuilder in your
community and country — equipped with a plethora
of references to IEP's research and further
peacebuilding opportunities.
Academic Programmes
Positive Peace and IEP’s wider peace research have been
included in many university curriculums around the
world. This has been supported by workshops, webinars
and seminars to various academic institutions around the
globe.
One example is IEP’s partnership with Rotary
International, whereby the Institute has been able to
contribute content into the Rotary Peace Centres. These
centres are hosted in seven different universities around
the world and are designed to form and educate
peacebuilders and development practitioners.
The Rotary Peace Center at Makerere University in
Uganda offers a professional development certificate
programme for peace and development leaders working
in Africa to address the underlying peace issues in the
region. The students become Peace Fellows after
undertaking a year-long programme in peacebuilding,
conflict transformation and development. The topics
covered focus on issues and solutions of particular
relevance throughout the African continent and the world
at large.
The course integrates the Positive Peace framework, with
IEP staff delivering a 5-day workshop to each cohort. The
workshop provides Peace Fellows with deep knowledge of
IEP’s peace research and hands-on skills in peacebuilding
using the Positive Peace framework. The aim of the
workshop is to enable Peace Fellows to use Positive Peace
in their professional lives and in the communities in
which they operate.
The workshop takes a hybrid format, with some content
delivered face-to-face by IEP’s African office staff and
some modules delivered online by IEP's Sydney and
Brussels offices.
Other Rotary Peace Centres that have participated in
Positive Peace workshops or seminars include the Center
at Chulalongkorn University in Thailand, Uppsala
University in Sweden and the University of Queensland in
Australia.

POSITIVE PEACE REPORT 2022 | 83
IEP has also co-designed a Masters Programme with
Blanquerna School of Communication and International
Relations at the Ramon Llull University in Barcelona,
Spain. This is a new university degree in Peace, Conflict
and Security Studies and fuses the data analysis expertise
from IEP with the academic insights of political science
studies.
The programme provides students with the tools to
analyse key issues in peace and conflict around the world,
preparing graduates with the skills to forge a career as
practitioners or researchers in the areas of conflict
analysis, arms control, international security, conflict
prevention, peace-making and peacebuilding.
PartnershipsIEP has developed a wide range of partnerships with
organisations including multilaterals, non-governmental
organisations (NGO), international non-governmental
organisations (INGO), civil society organisations (CSO),
community organisations, universities and governments.
These organisations partner with IEP due to the
recognised value of our research and the expertise in the
application of Positive Peace in real-world scenarios. IEP
is a forerunner in the current shift from conventional
conflict analysis and intervention to the new adaptive
systems approach to peace and resilience building.
One of IEP’s largest and most significant partnerships has
been with Rotary International. Rotary brings together a
global network of volunteer leaders dedicated to tackling
the world’s most pressing humanitarian challenges.
Rotary connects 1.2 million members of more than
35,000 Rotary clubs in over 200 countries and
geographical areas.
The partnership has enabled both organisations to work
together to create the Rotary Positive Peace Academy. The
aim is to teach Rotary members and Rotary Peace Fellows
to apply Positive Peace within Rotary and the
communities Rotary serves. Through the Academy,
Rotary has embedded the Positive Peace framework into
their seven areas of focus:
• Basic education and literacy;
• Disease prevention and treatment;
• Economic community development;
• Maternal and child care;
• Peacebuilding and conflict prevention;
• Water, sanitation and hygiene; and
• Environment.
In addition, the partnership allows for the development
of local workshops hosted by Rotary clubs to educate
communities about Positive Peace. The aim of the
partnership is to foster community-based projects in
peace and conflict resolution that are practical and
impactful.
In 2019, two large-scale Positive Peace workshops in
Mexico and Colombia brought peacebuilders, community
leaders and Rotarians together to identify and develop
local peace projects. In Colombia, Rotary conducted five
regional workshops and one Train-the-Trainer workshop,
educating 214 young peacebuilders. After 12 months, they
had achieved over 50 Positive Peace actions directly
impacting more than 3,000 Colombians. Similarly, Mexico
hosted a national workshop and a Train-the-Trainer
workshop educating 150 young peacebuilders. After 12
months, the participants had delivered peace projects,
reaching up to 17,000 Mexicans.
Due to the successful Rotary Positive Peace workshops,
the Rotary-IEP Partnership created the Rotary Positive
Peace Activator Program.2 This Rotary-led programme is
an international network of facilitators trained in IEP’s
Positive Peace framework and techniques for leading
community-based workshops with Rotary-affiliated
stakeholders. The Program began with cohorts in United
States and Canada in 2020, Latin America and Europe in
2021, with an Asian cohort planned for early 2022. The
Program has seen 90 Activators trained so far, who have
logged 2,035 hours of service, reaching 50,071 people.
Joint programmes will continue to build on IEP’s
expanding research on the attitudes, institutions and
structures of peaceful societies. In addition, they will
promote Rotary’s grassroots work in communities around
the globe.

POSITIVE PEACE REPORT 2022 | 84
Positive Peace WorkshopsPositive Peace workshops place IEP’s research into the
hands of peacebuilders and help communities develop
practical, concrete actions to strengthen the attitudes,
institutions and structures and that build and sustain
peaceful communities.
IEP works with partner organisations to develop
workshops based on their individual community needs.
IEP has developed workshops for peace leadership,
development, preventing violent extremism, improving
community cohesion, community development and
resilience building. The empirically derived Positive Peace
framework is always at the core of our workshop
development.
Workshops can be adapted to local context and language,
varied group sizes, or to include other development
content consistent with Positive Peace values. Workshops
are relevant for emerging leader groups, community
groups, and diverse groups including strategic, emerging
leader and community participants.
Positive Peace Workshops are:
• Versatile;
• Empirically-based;
• Strength-focused;
• Self determined;
• Engaging and interactive; and
• Relevant for local and national contexts.
PEACE 911, PHILIPPINESThe Paquibato district of Davao City in the Philippines has
suffered from the decades-long violence caused by
communist rebel groups seeking to overthrow the
government. Paquibato covers almost a third of the area
of Davao City. Many adults from the area report not
knowing anything but violent conflict since the 1960s,
when the country was placed under Marcos’ martial law
in response to a rebel insurgency.
In 2019, the Davao City mayor Sara Duterte formed the
Davao City Advisory Committee on Peace and
Development to promote peacebuilding in the region. The
committee consulted with the 14 barangays, or villages, in
the surrounding areas and learnt to what extent the locals
were hungry and fearful. The committee launched an
emergency response to address these immediate issues
and subsequently labelled the programme Peace 911.
How Positive Peace was implementedPeace 911 firstly addressed the critical issue of hunger
by bringing basic services to the local villages. Twice a
month, a caravan of services visited the 14 barangays
with representatives from agencies responsible for health,
agriculture, legal services, social services, education,
cooperatives, civil registry, land transportation and other
areas. These city agencies worked with the local officials
to provide services for the community, which contributed
to Equitable Distribution of Resources in the area.
The project arranged training in container gardening
for women in the community, which enabled them to
grow organic vegetables for their families and provided
small income streams through the sale of vegetables
to neighbours. This capacitation initiative lifted the
High Levels of Human Capital and Sound Business
Environment Pillars of Positive Peace in the region by
supporting economic development and improving the
human capital base.
The most significant element of the Peace 911 project was
the installation of a telephone hotline through which local
residents could request assistance or information. This
was a simple communication tool to improve Free Flow
of Information. However, it had the unintended benefit
of providing a safe way for 92 New People's Army (NPA)
insurgents to cease their violent activities and surrender
to the authorities.
OutputsWithin nine months of the Peace 911 project, the military
declared Paquibato clear of violent insurgent activity, a
result far superior than project leaders had anticipated.
In early 2019, the Mayor of Davao City, Sara Duterte,
declared an end to the emergency in Paquibato district,
an area that for more than 40 years had been marred by
violent conflict. The eight Pillars of Positive Peace were
translated into the local language Cebauno/Bisaya and
are used as a conceptual foundation for offshoot local
projects. All barangay halls now display the Walo Ka
Haligi sa Kalinaw (the eight Pillars of Peace) prominently.
Furthermore, Mayor Sara announced that Peace 911 will
now expand to another 18 barangays in five districts of
the city, bringing the total to 32 barangays.
MATAVAI, AUSTRALIAMulticultural New South Wales (MNSW) in collaboration
with IEP and the Western Sydney University (WSU)
selected five communities in the Australian state of New
South Wales (NSW) to deliver an educative framework to
enhance social cohesion and build youth agency.

POSITIVE PEACE REPORT 2022 | 85
The project, called ‘Positive Peace, Cultural Wellbeing and
Youth Agency Initiative: Exploring peaceful solutions to
living well in diverse communities,’ was designed to adapt
IEP’s Positive Peace framework to targeted communities
to foster cultural wellbeing. The project aims to support
the development of community-led projects aiding their
agency and resilience, contributing to broader social
cohesion in an effort to counteract fear, hate, racism and
societal discord.
How Positive Peace was implementedA three-day interactive Positive Peace workshop was held
at Matavai Cultural Arts Center in Liverpool, Sydney with
13 participants. Over the three days, participants explored
IEP’s main research reports, discussed and analysed each
of the eight Pillars and participated in a variety of
interactive activities. Participants were encouraged to
adapt the Positive Peace framework to their own relevant
community setting, exploring ways in which the
framework could further strengthen not only the Matavai
Cultural Arts Centre, but their Pasifika community as a
whole.
OutputsThe Matavai workshop group designed and planned
their own Positive Peace project, a documentary film
exploring Pacific Island cultural heritage and diversity.
The documentary was designed using the Positive Peace
framework, with the eight Pillars as its core. Matavai will
conclude the project by early 2022. From IEP’s pre and
post programme surveys conducted, it was evident that
there were significant and positive outcomes in two main
areas: knowledge and skills acquisition.
IEP’s surveys indicate that the majority of participants
had a limited understanding of peace building before
commencing the training. Observations suggested that
participants significantly shifted their understanding in
peacebuilding activities within the context of learning the
eight Pillars of Positive Peace and how they are applicable
to a majority of context and settings.
Throughout workshop activities, participants were
consistently able to identify the correlations between the
Pillars and were able to link them back to their own
community needs. There were many instances of
intercultural learning, whereby participants connected
traditional indigenous concepts of peace from across the
Pacific Islands and elements of the Positive Peace
framework. Examples were shared about the circular
configuration of the ‘the village’ system within the
Pasifika cultural context and the circular web of Pillars,
which comprises the Positive Peace framework.
The results show only three out of 13 participants were
confident (23 per cent) when asked about their capacity to
organise or facilitate activities that develop peacebuilding
in their community before the workshop. As the
workshop progressed, Matavai participants demonstrated
an in depth understanding of Positive Peace in relation to
opportunities to strengthen their community and
contribute to further social cohesion. This was
demonstrated in discussions about unifying Matavai and
sharing their culture and building relationships with
others outside the Pacific community. Technical
acquisition of Positive Peace knowledge was solidified in
the groups’ articulation of Matavai’s resilience, existing
expressions of peace, potential community building
approaches and the role Positive Peace can play in this.
This was especially evident in the application of the
Pillars exercise and project planning for their
documentary film.
LITERACY PROJECT, UGANDA Jude Kakuba, a Rotarian from Uganda had been running
a programme to improve levels of literacy in a school in
rural Kenya for two years, with little success. After
attending a Positive Peace workshop, Jude decided to
look at his own project through the lens of Positive Peace.
He identified a number of ways to address his project in a
systemic way and engaged his local Rotary club in
supporting a new initiative focusing on activating all the
Pillars of Positive Peace. The original objective of was to
improve student conditions, enrolment rates and
academic performance. The project was later expanded to
include enhancing community resilience by increasing
levels of Positive Peace in and around the school system.
The results were outstanding, with the number of pupils
increasing by 146 per cent and the number of students in
the top two grades in the district increasing by 100 per
cent.
How Positive Peace was implemented: • Well-Functioning Government: The involvement of
local community leaders in the planning and
implementation of the project encouraged
community members to participate fully in all
activities. Local stakeholders were invited to form a
committee to oversee the project.
• Equitable Distribution of Resources: School supplies
were distributed equally, unrelated to a student’s
ability to pay or perform in class.
• Good Relations with Neighbours: Fruit trees and
vegetables were planted to reduce student pilfering
from neighbouring orchards and fields because they
were hungry. More importantly, this was
accompanied by a porridge project, which provided
lunch for pupils. This is what mainly contributed to
improved academic performance; better nutrients
provided pupils with the energy to concentrate in the
afternoons. It also led to higher attendances as
parents knew that the children would get fed and did
not have to look for their own food.

POSITIVE PEACE REPORT 2022 | 86
• High Levels of Human Capital: The provision of
educational materials has served as a driving force to
attract more students and has also improved
creativity and practical learning. The provision of
medical services also ensures that members of the
community were at a low risk of falling ill. This
improved productivity and punctuality amongst
pupils in school.
• Acceptance of the Rights of Others: After identifying
monthly drops in attendance by girls, sanitary pads
were provided on a monthly basis. The provision of
sanitary products as well as hygiene training further
supported higher enrolment rates of girls.
• Low Levels of Corruption: A separate committee on
transparency was formed to monitor funds, donated
items, as well as requests for accountability on how
funds are used. All donated materials were branded as
a gift to the community, increasing the sense of
ownership and accountability. This helped the
community keep regular stock of items and improve
accessibility to items at no cost.
• Sound Business Environment: New classrooms were
constructed using exclusively local materials and
labour. This increased household income in the
community.
• Free Flow of Information: The project partnered with
a local radio station that used the local language to
spread news of the project and provide the
community with regular updates. This made it easier
to disseminate information amongst members of the
community concerning projects. It also helped with
proper monitoring and supervision of project
activities by relaying information in a timely manner.
While all the credit must go to those who led, participated
in and funded this project, IEP’s conceptual Positive Peace
framework was one of the success factors for this project.
To Jude’s further credit, this was the first time the Positive
Peace framework had ever been operationalised in this
way. His idea significantly influenced IEP’s work at the
time and informed the outline of the workshop formula
the organisation uses today. This shows how real-life
examples feedback into the conceptual understanding of
the systemic nature of Positive Peace.
OutputsWithin two years of running the programme, pupil
enrolment more than doubled from 327 to 805 (Table 4.1)
and literacy levels improved substantially. Furthermore,
the proportion of students earning top grades increased
from 30 per cent to 62 per cent. The original objective of
the programme was to improve student conditions,
enrolment rates and academic performance. The project
was later expanded to include enhancing community
resilience by increasing levels of Positive Peace in and
around the school system.
Pupil performanceGrades
1 & 2Lower grades
2016
30%70%
2018
Grades 1 & 2
Lower grades
62%38%
TABLE 4.1
The Positive Peace based intervention produced substantial improvements in enrolment metrics.
Kampala school project: inputs and outputs
Pupil enrolment before and after implementation of project
EnrolmentBefore implementation of project
After implementation of project
Increase (%)
Boys 126 356 182.5
Girls 201 449 123.4
Total 327 805 146.2
Source: Rotary International
ClosingIncreasingly peacebuilders have shifted from conflict
centric approaches to adaptive and systemic approaches
to change social systems. IEP’s Positive Peace framework
is a forerunner for this approach to peacebuilding and is
increasingly adopted by peacebuilding projects,
development organisations and policy makers. IEP
encourages individuals to participate in the online Peace
Academy and the IEP Ambassador programme. IEP also
encourages organisations to adopt Positive Peace
framework through partnership with the Institute.
Source: Rotary International

POSITIVE PEACE REPORT 2022 | 87
IEP takes a systems approach to peace, drawing on recent body
of research on the topic. In order to construct the PPI, IEP
analysed over 24,700 different data series, indices and
attitudinal surveys in conjunction with current thinking about
the drivers of violent conflict, resilience and peacefulness. The
result is an eight-part taxonomy of the factors associated with
peaceful societies. The eight domains, or Pillars of Positive
Peace, were derived from the data series that had the strongest
correlation with internal peacefulness as measured by the GPI,
an index that defines peace as “absence of violence or the fear of
violence”. Each of the eight PPI Pillars is measured by three
indicators. These represent the best available globally-
comparable data with the strongest statistically significant
relationship to levels of peace within a country. The 24
indicators that make up the PPI are listed in Table A.1.
For the 2020 report, PPI indicators were further classified in
three groups: Attitudes, Institutions and Structures.
• Attitudes indicators measure social views, tensions or
perceptions.
• Institutions indicators represent the impact that formal and
informal institutions of a society exert on peacefulness,
social wellbeing and the economy.
• Structures indicators assess the underpinning of the
socio-economic system, such as poverty and equality, or are
the result of aggregate activity, such as GDP. Usually, these
are the indicators that measure infrastructure or socio-
economic development.
The 2020 PPI uses a set of indicators that has been updated
from previous reports. This new set provides a more
representative picture of recent social dynamics. In addition, it
was chosen to reduce missing data, both over time and by
country. To maximise conceptual relevance and data
completeness, the period of analysis was restricted to 2009
– 2020. Remaining instances of missing data were resolved
through statistical imputation methods. The indicators are
weighted proportionally to their correlation coefficient against
the GPI.
The Positive Peace Index (PPI) is the first statistically derived index measuring Positive Peace according to the definition “the attitudes, institutions and structures that create and sustain peaceful societies.” The PPI is similar to the Global Peace Index (GPI) in that it is a composite index built to gauge a multidimensional concept. It covers the same set of 163 countries included in the GPI, covering over 99 per cent of the world’s population. The key objective is to devise a measurement system that is simple, intuitive, auditable, comparable across countries and consistent over time.
Positive Peace Index MethodologyA

POSITIVE PEACE REPORT 2022 | 88
TABLE A.1
Indicators in the Positive Peace IndexThe following 24 indicators have been selected in the Positive Peace Index to show the strongest relationships with the absence of violence and the absence of fear of violence.
Pillar Domain Indicator Description SourceCorrelation coefficient (to the GPI)
Acceptance of the Rights of Others
Attitudes Gender InequalityThe Gender Inequality Index (GII) reflects women’s disadvantage in three dimensions: reproductive health, political empowerment and the labour market.
United Nations Development Programme
0.71
Attitudes Group Grievance
The Group Grievance Indicator focuses on divisions and schisms between different groups in society – particularly divisions based on social or political characteristics – and their role in access to services or resources, and inclusion in the political process.
Fragile States Index 0.64
Attitudes Exclusion by Socio-Economic Group
Exclusion involves denying individuals access to services or participation in governed spaces based on their identity or belonging to a particular group.
Varieties of Democracy (V-Dem) 0.72
Equitable Distribution of Resources
Structures Inequality-adjusted life expectancy index
Measures the overall life expectancy of a population accounting for the disparity between the average life expectancy of the rich and that of the poor. The smaller the difference the higher the equality and that is a reflection of the equality of access to the health system.
United Nations Development Programme
0.62
Institutions Access to Public Services
Measures the discrepancies in access to public services distributed by socio-economic position.
Varieties of Democracy (V-Dem) 0.76
Attitudes Equality of Opportunity
Assesses whether individuals enjoy equality of opportunity and freedom from economic exploitation. Freedom House 0.70
Free Flow of Information
Structures Freedom of the Press A composite measure of the degree of print, broadcast and internet freedom.
Reporters Without Borders (RSF) 0.50
Attitudes Quality of Information
Measured by Government dissemination of false information domestically: How often governments disseminate false or misleading information.
Varieties of Democracy (V-Dem) 0.60
StructuresIndividuals using the Internet (% of population)
Internet users are individuals who have used the Internet (from any location) in the last three months. The Internet can be used via a computer, mobile phone, personal digital assistant, games machine, digital TV etc.
International Telecommunication Union
0.61
Good Relations with Neighbours
AttitudesLaw to Support Equal Treatment of Population Segments
This is a measure of how population segments interrelate with their domestic neighbours. It assesses whether laws, policies, and practices guarantee equal treatment of various segments of the population.
Freedom House 0.66
Structures International Tourism
Number of tourists (Number of arrivals per 100,000 population) who travel to a country (staying at least one night) other than that in which they have their usual residence.
World Tourism Organization 0.63
Institutions External Intervention
The external intervention Indicator considers the influence and impact of external actors in the functioning - particularly security and economic - of a state.
Fragile States Index 0.71
High Levels of Human Capital
Structures
Share of youth not in employment, education or training (NEET)
Proportion of people between 15 and 24 years of age that are not employed and are not in education or training.
International Labour Organization 0.75
Structures Researchers in R&DThe number of researchers engaged in Research & Development (R&D), expressed as per one million population.
UNESCO 0.67
Structures Healthy life expectancy (HALE)
Average number of years that a newborn can expect to live in full health.
World Health Organisation 0.59

POSITIVE PEACE REPORT 2022 | 89
Low Levels of Corruption
Institutions Control of CorruptionControl of Corruption captures perceptions of the extent to which public power is exercised for private gain.
World Bank 0.78
Attitudes Factionalised ElitesMeasures the fragmentation of ruling elites and state institutions along ethnic, class, clan, racial or religious lines.
Fragile States Index 0.72
Institutions Public Sector TheftAssesses perceptions of how often public sector employees steal, embezzle or misappropriate public funds or other state resources.
Varieties of Democracy (V-Dem) 0.73
Sound Business Environment
Institutions Regulatory Quality
Captures perceptions of the ability of the government to formulate and implement sound policies and regulations that permit and promote private sector development.
World Bank 0.76
Institutions Financial Institutions Index
Part of the financial development index, this indicator measures the quality of the financial institutions, including the depth of the financial sector and the access to financial products.
International Monetary Fund 0.62
Structures GDP per capita GDP per capita (current US$) is gross domestic product divided by midyear population.
International Monetary Fund 0.67
Well-Functioning Government
InstitutionsGovernment Openness and Transparency
Assesses to what extent the Government operations can be legally influenced by citizens and are open to scrutiny from society.
Freedom House 0.63
InstitutionsGovernment Effectiveness: Estimate
Government Effectiveness captures perceptions of the quality of public services, the quality of the civil service and the degree of its independence from political pressures, the quality of policy formulation and implementation, and the credibility of the government's commitment to such policies.
World Bank 0.79
Institutions Rule of Law: Estimate
Rule of Law captures perceptions of the extent to which agents have confidence in and abide by the rules of society, and in particular the quality of contract enforcement, property rights, the police, and the courts, as well as the likelihood of crime and violence.
Bertelsmann Transformation Index 0.68

POSITIVE PEACE REPORT 2022 | 90
TABLE B.1
Results of the 2022 Positive Peace Index
Country RankPPI
Overall Score
Well-Functioning Government
Low Levels of Corruption
Sound Business
Environment
Equitable Distribution
of Resources
Acceptance of the Rights
of Others
Free Flow of Information
High Levels of Human
Capital
Good Relations with
Neighbours
Sweden 1 1.23 1.15 1.34 1.31 1.22 1.10 1.04 1.15 1.49
Denmark 2 1.24 1.12 1.15 1.38 1.19 1.42 1.06 1.23 1.37
Finland 3 1.26 1.10 1.23 1.48 1.24 1.01 1.08 1.24 1.74
Norway 4 1.27 1.12 1.23 1.57 1.09 1.37 1.09 1.15 1.59
Switzerland 5 1.28 1.11 1.28 1.10 1.53 1.31 1.14 1.15 1.63
Netherlands 6 1.36 1.20 1.64 1.42 1.28 1.43 1.40 1.14 1.37
Canada 7 1.37 1.23 1.52 1.13 1.38 1.45 1.32 1.54 1.37
Australia 8 1.39 1.29 1.42 1.06 1.34 1.44 1.65 1.26 1.76
Germany 9 1.40 1.33 1.56 1.45 1.39 1.54 1.29 1.18 1.37
Ireland 10 1.43 1.50 1.56 1.52 1.39 1.17 1.28 1.28 1.74
New Zealand 11 1.45 1.21 1.22 1.27 1.71 1.61 1.26 1.34 2.07
Japan 12 1.47 1.35 1.79 1.21 1.43 1.34 1.82 1.07 1.72
Iceland 13 1.54 1.57 1.48 1.55 1.59 1.07 1.39 1.13 2.63
Singapore 14 1.56 1.59 1.60 1.33 1.56 1.15 2.49 1.09 1.76
Austria 15 1.57 1.54 1.99 1.54 1.61 1.54 1.62 1.21 1.37
Belgium 16 1.57 1.59 1.91 1.42 1.68 1.55 1.24 1.27 1.77
France 17 1.57 1.46 1.67 1.30 1.65 1.96 1.85 1.26 1.42
United Kingdom 17 1.69 1.38 2.05 1.16 2.01 2.16 1.82 1.35 1.56
South Korea 19 1.69 2.09 2.23 1.47 1.66 1.32 1.48 1.09 2.04
Portugal 20 1.70 1.63 2.17 2.05 1.85 1.32 1.41 1.23 1.77
Spain 21 1.83 1.73 2.54 1.70 1.83 1.88 1.48 1.81 1.56
Slovenia 22 1.86 1.66 2.11 2.06 1.86 1.63 2.20 1.22 2.12
Estonia 23 1.90 1.57 2.29 2.12 1.61 2.06 1.59 1.52 2.39
United States 24 1.95 1.69 2.71 1.28 2.09 2.21 2.04 1.67 1.81
Italy 25 1.98 2.41 2.80 1.66 1.50 1.60 1.79 2.18 1.76
Czech Republic 26 1.99 2.02 2.85 2.18 1.78 1.75 2.01 1.59 1.53
Taiwan 27 2.00 1.81 2.25 2.50 1.67 1.59 1.79 1.91 2.48
Lithuania 28 2.01 1.98 2.28 2.52 1.76 1.58 1.63 1.84 2.44
Uruguay 29 2.08 1.95 1.96 2.70 2.00 1.70 1.54 2.86 2.01
Latvia 30 2.14 1.96 2.65 2.57 1.75 2.32 1.25 2.25 2.19
Poland 31 2.14 2.59 2.49 2.53 1.76 1.90 2.15 1.78 1.76
Chile 32 2.15 1.68 1.91 2.44 2.22 2.24 1.97 2.80 2.04
Positive Peace Index RankingsB

POSITIVE PEACE REPORT 2022 | 91
Country RankPP
overall score
Well- Functioning Government
Low Levels of
Corruption
Sound Business
Environment
Equitable Distribution
of Resources
Acceptance of the Rights
of Others
Free Flow of Information
High Levels of Human
Capital
Good Relations with
Neighbours
Slovakia 33 2.18 2.53 2.84 2.39 2.03 2.20 1.60 1.87 1.69
Greece 34 2.23 2.46 2.73 2.70 1.67 1.75 2.03 1.69 2.71
Israel 35 2.23 1.88 2.92 1.48 2.08 2.60 2.03 1.34 3.49
Cyprus 36 2.26 1.81 3.13 2.02 1.84 1.93 1.63 2.42 3.33
United Arab Emirates 37 2.30 2.76 2.22 2.07 2.50 1.84 2.51 2.12 2.32
Croatia 38 2.31 2.40 2.83 2.56 1.96 2.00 1.98 2.26 2.42
Costa Rica 39 2.31 2.06 2.46 2.90 2.16 1.94 1.37 2.88 2.75
Hungary 40 2.36 2.61 2.93 2.68 1.99 1.94 2.40 1.85 2.31
Romania 41 2.53 2.62 3.27 2.94 2.17 2.46 1.71 2.73 2.10
Bulgaria 42 2.53 2.54 3.27 2.74 2.44 2.00 2.24 2.23 2.61
Mauritius 43 2.57 2.12 2.52 2.89 2.51 2.24 2.64 3.09 2.72
Malaysia 44 2.59 2.41 3.15 2.70 2.94 2.61 2.02 2.21 2.46
Argentina 45 2.63 2.83 2.67 3.56 2.39 2.36 1.87 2.72 2.53
Kuwait 46 2.66 2.85 3.50 2.25 2.63 2.05 2.22 2.95 2.71
Trinidad and Tobago 47 2.68 2.66 2.99 2.88 2.29 2.07 1.84 3.70 3.07
Botswana 48 2.69 2.63 2.34 3.23 2.26 2.32 2.17 3.76 2.96
Qatar 49 2.69 2.73 2.80 2.13 2.41 2.22 2.29 2.70 4.41
Panama 50 2.72 2.68 2.90 2.94 2.64 2.85 2.27 3.00 2.39
Georgia 51 2.77 2.29 3.20 2.94 2.40 2.62 2.60 2.85 3.28
Montenegro 52 2.79 2.85 3.30 3.23 1.92 2.48 2.36 2.83 3.29
Jamaica 53 2.83 2.88 2.65 3.43 2.48 2.17 1.78 3.87 3.51
Tunisia 54 2.87 2.94 3.29 3.72 2.46 2.44 2.30 2.66 2.94
Oman 54 2.87 3.21 3.12 2.98 2.84 2.21 2.33 2.90 3.24
Macedonia 56 2.87 3.01 3.54 3.16 2.49 2.27 2.07 2.83 3.48
Mongolia 57 2.92 2.81 3.31 3.24 2.79 2.25 2.34 3.33 3.31
South Africa 58 2.93 2.56 3.43 3.02 3.29 3.03 2.09 3.57 2.29
Albania 59 2.93 3.09 3.56 3.45 2.46 2.17 2.48 3.21 2.90
Thailand 60 2.94 3.06 4.05 2.95 2.78 3.04 2.67 2.53 2.09
Serbia 61 2.96 2.97 3.82 3.30 2.36 2.40 2.73 2.34 3.61
Armenia 62 2.97 3.00 3.30 3.35 2.64 2.30 2.38 3.32 3.45
Brazil 63 2.98 3.05 3.26 3.16 2.54 3.12 2.87 2.97 2.82
Ghana 64 2.99 2.71 3.25 3.89 2.79 2.43 2.04 3.62 3.14
Bhutan 65 2.99 2.36 2.64 3.70 2.42 2.93 2.94 3.02 4.16
China 66 3.00 3.14 3.42 3.07 2.58 2.68 3.75 2.62 2.74
Peru 67 3.00 3.12 3.53 3.10 2.89 3.31 2.22 2.99 2.67
Belarus 68 3.08 3.54 3.50 3.76 2.41 1.95 3.02 2.99 3.39
Namibia 69 3.08 2.80 2.78 3.25 3.28 3.02 2.59 3.67 3.38
Vietnam 70 3.08 3.20 3.61 3.70 2.69 2.52 3.20 2.85 2.76
Russia 71 3.09 3.41 4.03 3.17 2.60 2.89 3.05 2.05 3.22
Bahrain 72 3.11 3.22 3.54 2.67 2.79 3.26 2.82 2.96 3.52
Moldova 73 3.11 3.46 3.92 3.45 2.52 2.39 2.11 3.18 3.64
Ukraine 73 3.11 3.26 3.86 3.67 2.80 2.59 2.53 2.81 3.16
Kazakhstan 75 3.12 3.59 3.74 3.35 2.58 2.87 2.88 2.74 2.98
Mexico 76 3.12 3.20 3.52 3.27 2.84 3.21 2.96 3.03 2.81
Kosovo 77 3.14 3.45 3.79 3.58 2.58 2.64 1.87 3.28 3.69
Senegal 78 3.16 2.74 3.20 3.97 3.06 2.91 2.48 3.47 3.45
Saudi Arabia 79 3.16 3.33 3.52 2.91 2.90 3.20 2.99 3.14 3.20
Morocco 80 3.18 3.29 3.43 3.63 3.01 3.27 2.26 3.24 3.11

POSITIVE PEACE REPORT 2022 | 92
Country RankPP
overall score
Well- Functioning Government
Low Levels of
Corruption
Sound Business
Environment
Equitable Distribution
of Resources
Acceptance of the Rights
of Others
Free Flow of Information
High Levels of Human
Capital
Good Relations with
Neighbours
Colombia 81 3.18 2.77 3.54 3.29 2.87 3.64 2.90 3.14 3.25
Dominican Republic 82 3.19 3.16 3.70 3.52 3.04 3.50 1.81 3.28 3.24
Bosnia and Herzegovina 82 3.19 3.49 4.16 3.38 2.52 2.58 2.37 3.00 3.82
Jordan 84 3.19 3.13 3.27 3.46 2.71 3.35 2.91 3.28 3.41
India 85 3.22 2.61 3.56 3.71 3.14 3.44 3.36 3.46 2.43
Ecuador 85 3.22 3.25 3.65 3.89 2.73 3.02 2.81 2.90 3.33
Indonesia 87 3.22 2.99 3.84 3.57 3.00 3.65 2.58 3.20 2.73
Turkey 88 3.23 3.56 3.91 3.27 2.94 3.26 2.99 2.77 2.90
Paraguay 89 3.24 3.29 3.87 3.70 3.17 3.22 2.35 3.08 2.99
Benin 90 3.26 3.02 3.11 4.01 3.45 3.04 2.87 3.41 3.13
Cuba 91 3.26 3.65 3.78 3.92 2.70 1.97 3.66 2.75 3.57
El Salvador 92 3.28 3.06 3.45 3.53 2.96 3.49 3.03 3.36 3.30
Bolivia 93 3.28 3.53 3.97 3.61 3.00 2.67 2.97 2.97 3.30
Guyana 94 3.29 3.20 3.20 3.78 2.96 2.98 2.94 3.67 3.68
Sri Lanka 95 3.32 2.97 3.75 3.68 2.57 3.34 3.28 3.19 3.81
Algeria 96 3.39 3.65 3.83 4.22 2.94 3.07 3.18 2.90 3.07
Philippines 97 3.41 3.08 3.79 3.64 3.02 3.53 3.42 3.22 3.52
Kyrgyz Republic 98 3.43 3.45 3.97 3.99 2.95 3.26 3.02 3.19 3.47
Burkina Faso 99 3.44 3.32 3.52 4.05 3.15 2.79 2.86 3.95 3.90
Uzbekistan 100 3.47 3.73 4.30 3.95 3.19 2.90 3.00 2.79 3.62
Lesotho 101 3.48 3.32 3.56 4.02 3.59 2.68 2.77 4.31 3.65
Tanzania 102 3.50 3.68 3.15 4.21 3.19 3.11 3.45 3.27 4.00
Kenya 103 3.54 3.21 3.98 3.90 3.12 3.55 3.26 3.20 4.02
The Gambia 103 3.55 3.53 3.63 4.20 3.65 2.77 2.58 4.08 3.96
Lebanon 105 3.55 3.76 4.29 3.55 3.02 3.50 2.56 3.25 4.31
Palestine 106 3.56 3.75 3.92 3.47 3.31 3.39 2.45 3.28 4.78
Honduras 107 3.57 3.74 4.01 3.86 2.92 3.13 3.37 3.43 4.01
Iran 108 3.57 3.64 4.31 3.94 3.08 3.70 3.09 2.94 3.59
Nicaragua 109 3.57 3.85 4.21 4.08 3.03 3.29 3.49 2.75 3.67
Sierra Leone 110 3.58 3.27 3.81 4.39 3.41 3.44 3.17 3.31 3.73
Timor-Leste 111 3.59 3.59 3.70 4.18 3.27 3.61 2.92 3.32 4.06
Azerbaijan 112 3.59 3.72 4.23 3.74 3.52 3.05 3.21 3.02 4.10
Zambia 113 3.59 3.30 3.44 4.12 3.61 3.42 3.29 4.02 3.61
Egypt 114 3.60 3.48 4.12 3.99 3.31 3.89 3.23 3.18 3.37
Rwanda 115 3.61 3.12 3.38 3.92 3.49 4.12 3.39 3.62 3.94
Cambodia 116 3.63 3.71 4.41 3.91 3.43 3.64 2.88 2.98 3.75
Malawi 117 3.63 3.28 4.04 4.22 3.51 3.41 2.98 3.70 3.81
Gabon 118 3.64 4.02 3.99 4.05 3.54 2.91 2.84 3.94 3.69
Cote d'Ivoire 119 3.64 3.55 3.92 3.94 3.51 3.57 2.96 3.80 3.81
Togo 120 3.64 3.42 3.89 4.07 3.59 3.37 3.38 3.56 3.84
Guatemala 121 3.65 3.78 3.94 3.61 3.50 4.22 3.07 3.43 3.49
Eswatini 122 3.66 3.87 3.73 3.90 3.57 2.92 3.30 3.95 4.04
Madagascar 123 3.66 3.64 4.06 4.21 3.90 3.53 3.12 3.11 3.51
Laos 124 3.66 3.78 4.01 4.07 3.40 3.41 3.64 3.38 3.52
Mozambique 125 3.70 3.54 3.83 4.18 3.59 3.28 3.31 4.08 3.77
Nepal 126 3.70 3.72 4.02 3.92 3.45 3.44 3.44 3.65 3.90
Papua New Guinea 127 3.71 3.74 3.89 3.99 3.82 4.08 2.90 3.58 3.53
Myanmar 128 3.72 3.93 3.62 4.14 3.61 3.78 3.03 3.19 4.30

POSITIVE PEACE REPORT 2022 | 93
Country RankPP
overall score
Well- Functioning Government
Low Levels of
Corruption
Sound Business
Environment
Equitable Distribution
of Resources
Acceptance of the Rights
of Others
Free Flow of Information
High Levels of Human
Capital
Good Relations with
Neighbours
Liberia 129 3.72 3.71 3.97 4.29 3.63 3.60 3.12 3.30 3.97
Pakistan 129 3.74 3.10 4.03 4.05 3.69 3.53 3.68 3.57 4.31
Ethiopia 131 3.74 3.57 3.93 4.23 3.71 3.67 3.41 3.10 4.16
Djibouti 132 3.75 4.02 3.81 4.04 3.63 3.49 3.50 3.16 4.26
Niger 132 3.77 3.37 3.96 4.17 3.77 3.49 3.36 4.19 3.85
Bangladesh 134 3.81 3.38 4.45 4.12 3.17 4.21 3.82 3.38 3.82
Nigeria 135 3.84 3.58 4.58 4.14 3.85 4.04 2.92 3.76 3.59
Angola 136 3.84 4.20 3.88 4.17 4.14 3.96 3.12 3.65 3.35
Mali 137 3.84 3.83 3.73 4.12 3.93 4.14 2.73 3.64 4.55
Uganda 138 3.85 3.50 4.24 4.10 3.69 3.84 3.54 3.69 4.13
Mauritania 139 3.88 3.56 4.32 4.18 4.06 4.25 3.26 3.49 3.70
Turkmenistan 140 3.89 4.33 4.39 4.37 3.59 3.11 4.44 3.10 3.62
Guinea 141 3.91 3.86 4.28 4.27 3.70 4.12 3.55 3.33 4.01
Guinea-Bissau 142 3.94 4.39 4.65 4.41 3.97 3.30 2.93 3.74 3.85
Tajikistan 143 3.96 4.23 4.29 4.19 3.80 3.64 3.89 3.78 3.73
Zimbabwe 144 3.98 4.02 4.47 4.43 3.76 3.28 3.73 4.07 4.02
Republic of the Congo 145 4.00 4.31 4.08 4.32 3.70 4.20 3.62 3.28 4.32
Cameroon 146 4.01 3.84 4.53 4.19 4.11 4.26 2.97 3.44 4.47
Venezuela 147 4.01 4.80 4.80 4.03 4.12 3.34 3.55 3.18 3.90
Haiti 148 4.04 3.90 4.29 4.35 4.38 4.05 3.37 3.38 4.46
North Korea 149 4.06 4.49 4.50 4.21 3.16 3.39 5.00 3.01 4.72
Equatorial Guinea 150 4.08 4.39 4.41 4.21 4.32 3.72 3.80 3.64 3.94
Burundi 151 4.09 4.39 4.55 4.27 3.71 3.99 4.12 3.15 4.35
Libya 152 4.10 4.72 4.68 4.59 3.50 3.08 3.64 3.45 4.92
Afghanistan 153 4.10 4.25 4.48 4.29 3.78 4.11 3.49 3.91 4.34
Iraq 154 4.10 4.22 4.53 4.15 3.57 4.25 3.54 3.70 4.74
Sudan 155 4.21 4.38 4.35 4.52 4.09 4.25 3.74 3.51 4.71
Eritrea 156 4.29 4.58 4.17 4.81 4.12 3.81 4.70 3.64 4.47
Syria 157 4.30 4.73 4.70 4.53 3.83 3.91 4.30 3.43 4.87
Democratic Republic of the Congo 158 4.31 4.33 4.61 4.62 4.05 4.52 3.78 3.48 4.88
Chad 159 4.37 4.42 4.77 4.43 4.42 4.55 3.74 3.89 4.59
Central African Republic 160 4.43 4.62 4.46 4.61 4.57 4.48 3.90 3.76 4.91
Yemen 161 4.54 4.79 4.73 4.58 4.47 4.95 4.04 3.97 4.61
South Sudan 162 4.55 4.85 4.79 4.79 4.61 4.61 4.14 3.49 4.90
Somalia 163 4.59 4.98 4.78 4.90 4.51 4.49 4.41 3.61 4.82

POSITIVE PEACE REPORT 2022 | 94
SECTION 11 International Alert. 2015. Peace through prosperity: Integrating peacebuilding
into economic development. London: June.; and Rummel, R.J. 1981. “Vol. 5: The Just Peace.” Understanding Conflict and War. Beverly Hills, CA: Sage Publications, ( http://www.hawaii.edu/powerkills/NOTE14.HTM#FULL ).
2 Measured as the correlation between each Positive Peace indicator and internal peace scores from the GPI. The GPI includes measures of both internal and external peace, with internal peacefulness accounting for 60 per cent of country overall scores.
3 Extreme poverty is the condition of someone living with US$1.9 per day or less. Encuesta Nacional sobre Condiciones de Vida (ENCOVI) 2019 – 2020, (https://www.proyectoencovi.com/ ).
4 Stiftung, Hans Boeckler, Inequality in Europe, Social Europe Dossier, Social Europe, 2018.
SECTION 21 Institute for Health Metrics and Evaluation, COVID-19 has caused 6.9 million
deaths globally, more than double what official reports show, 6 May 2021, (http://www.healthdata.org/news-release/covid-19-has-caused-69-million-deaths-globally-more-double-what-official-reports-show).
2 Henderson, Emily, New machine-learning algorithm estimates number of COVID-19 cases in the U.S., Medical Life Science News, 8 February 2021, (https://www.news-medical.net/news/20210208/New-machine-learning-algorithm-estimates-number-of-COVID-19-cases-in-the-US.aspx).
3 World Health Organisation, The true death toll of COVID-19 – estimating global excess mortality, (https://www.who.int/data/stories/the-true-death-toll-of-covid-19-estimating-global-excess-mortality).
4 Institute for Health Metrics and Evaluation, COVID-19 has caused 6.9 million deaths globally, more than double what official reports show, 6 May 2021,( http://www.healthdata.org/news-release/covid-19-has-caused-69-million-deaths-globally-more-double-what-official-reports-show).
ENDNOTES
5 Troeger, Christopher, Just how do deaths due to COVID-19 stack up?, Think Global Health, 22 September 2021, (https://www.thinkglobalhealth.org/article/just-how-do-deaths-due-covid-19-stack).
6 Macias, Amanda, Mexicans are the happiest people in a new global survey, Business Insider Australia, 3 November 2014, (https://www.businessinsider.com.au/heres-how-happy-43-countries-are-2014-10?r=US&IR=T).
7 Deutsche Welle, Rich countries often fail to ensure children's well-being, UN report suggests, 3 September 2020, (https://www.dw.com/en/rich-countries-often-fail-to-ensure-childrens-well-being-un-report-suggests/a-54799208).
8 BBC, English children 'less happy than those in developing countries', 28 August 2014, (https://www.bbc.com/news/uk-28954242).
9 Holton, Kate, Young people in developed countries unhappy, Reuters, 20 January 2007, (https://www.reuters.com/article/us-life-global-survey-s-idUSL1943019520061120).
SECTION 31 Institute for Economics and Peace, Business and Peace Report 2021, May
2021, section ‘Worker Productivity’ page 9, www.visionofhumanity.org.2 Institute for Economics and Peace, Positive Peace Report 2017, section ‘Intent
of the Nation State’, page 38, www.visionofhumanity.org. 3 KUMU – Make sense of your messy world, (https://kumu.io/).
SECTION 41 Religions for Peace Academy, (https://www.rfp.org/the-religions-and-peace-
academy/).2 Rotary, ( https://www.rotary.org/en/institute-economics-and-peace).

Download our latest reports and research briefs for free at:visionofhumanity.org/resources
Our research analyses peace and its economic value.
We develop global and national indices, calculate the economic impact of violence, analyse country level risk and have developed an empirical framework for Positive Peace that provides a roadmap to
overcome adversity and conflict, helping to build and sustain lasting peace.

JANUARY 2022 / IEP REPORT 83
FOR MORE INFORMATION [email protected] EXPLORE OUR WORK WWW.ECONOMICSANDPEACE.ORG AND WWW.VISIONOFHUMANITY.ORG
GlobalPeaceIndex
@GlobPeaceIndex @IndicedePaz
IEP is an independent, non-partisan, non-profit think tank dedicated to shifting the world’s focus to peace as a positive, achievable, and tangible measure of human wellbeing and progress.
IEP is headquartered in Sydney, with offices in New York, The Hague, Mexico City, Harare and Brussels. It works with a wide range of partners internationally and collaborates with intergovernmental organisations on measuring and communicating the economic value of peace.
The Institute for Economics & Peace is a registered charitable research institute in Australia as a Deductible Gift Recipient. IEP USA is a 501(c)(3) tax exempt organization.
POSITIV
E PEAC
E REPO
RT 20
22
9 780645 149456>
ISBN 978-0-6451494-5-6