positive behavioral interventions and supports
TRANSCRIPT

SERC
Positive Behavioral Interventions and Supports Data Report and Summary December 2011
State Education Resource Center 25 Industrial Park Road, Middletown, CT 06457 Phone: 860-632-1485 Fax: 860-632-8870
www.ctserc.org/pbis
Purpose: To summarize the goals, outcomes, and needs of Connecticut’s Positive Behavioral Interventions and Supports
Initiative.
DATA REPORT & SUMMARY: Positive Behavioral Interventions & Supports (PBIS)
Presented by: State Education Resource Center (SERC) Marianne Kirner, Ph.D. Executive Director
Positive Behavioral Interventions & Supports Initiative Alice Henley Assistant Director for Program Development & LEA Services Janina Johnkoski Team Coordinator, School Improvement Team Sarah Brzozowy, Ed.D. Kristina Jordan Tarold Miller Michelle Weaver, J.D. Consultants, PBIS Coordination, Training, and Technical Assistance Sarah-Anne Nicholas Senior Project Assistant
Publications Unit Jeremy Bond Communication & Publications Coordinator Jodylynn Talevi Media/Technology Associate Debbie Williams Education Services Specialist In collaboration with: University of Connecticut Neag School of Education, Center for Behavioral Education and Research (CBER) George Sugai, Ph.D. Professor, CBER Director
Connecticut State Department of Education, Division of Family and Student Support Services Charlene Russell-Tucker Associate Commissioner Anne Louise Thompson Chief, Bureau of Special Education Cheryl Resha Education Manager © 2011 State Education Resource Center
Contents What is Positive Behavioral Interventions and Supports?
1 Figure A: PBIS Integrated Elements 2 What is the purpose of PBIS? 2 What does implementation of PBIS look like? 2 Figure B: PBIS Subsystems 3 Figure C: PBIS Continuum of Support 4 How does PBIS align with Connecticut’s Scientific Research-Based Interventions (SRBI) Framework?
5 What is the history of PBIS in Connecticut? 5 Figure D: PBIS Systems Implementation Logic 5 How many Connecticut districts and schools are adopting PBIS? 6 Figure E: Connecticut Schools and Districts Trained in PBIS (from 2005) 6 Figure F: Summary of Schools Adopting PBIS between 2006-2007 and 2010-2011 7 What is the current status of scaling-up PBIS across Connecticut? 8 Training Data 8 Figure G: Summary of Schools Adopting PBIS by Grade Level, 2010-2011 8 Figure H: Connecticut Districts Trained by SERC/CBER Since 2005 9 Are Connecticut schools implementing PBIS to criterion? 10 Implementation Data 10 Figure I: Percentage of Schools Meeting SET for SERC/UConn PBIS 2008-2009 Training Cohort 11 Figure J: Percentage of Schools Meeting SET for SERC/UConn PBIS 2008-2009 Training Cohort by Grade Level 11 Figure K: Percentage of Schools Meeting SET for SERC/UConn PBIS 2009-2010 Training Cohort 12 Figure L: Percentage of Schools Meeting SET for SERC/UConn PBIS 2009-2010 Training Cohort by Grade Level 12 Figure M: Percentage of Schools Meeting SET for SERC/UConn PBIS 2010-2011 Training Cohort 13 Figure N: Percentage of Schools Meeting SET for SERC/UConn PBIS 2010-2011 Training Cohort by Grade Level 13 School-wide Information System (SWIS) 14 What are the patterns for ODRs for Connecticut’s PBIS schools? 15 Documented Behaviors 15 Figure O: Office Discipline Referrals by Problem Behavior, 2010-2011 (All Training Cohorts)
16
Figure P: Problem Behavior for SERC/UConn PBIS Elementary Schools in 2009-2010 Training Cohort 17 Figure Q: Problem Behavior for SERC/UConn PBIS Middle Schools in 2009-2010 Training Cohort 17 Figure R: Problem Behavior for SERC/UConn PBIS High Schools in 2009-2010 Training Cohort 18 Figure S: Problem Behavior for SERC/UConn PBIS Elementary Schools in 2010-2011 Training Cohort 18 Figure T: Problem Behavior for SERC/UConn PBIS Middle Schools in 2010-2011 Training Cohort 19 Figure U: Problem Behavior for SERC/UConn PBIS High Schools in 2010-2011 Training Cohort 19 Figure V: Problem Behavior for SERC/UConn PBIS K-8 Schools in 2010-2011 Training Cohort 20 Gender 20 Figure W: Office Discipline Referrals by Gender, 2009-2010 Training Cohort (Two Year Comparison) 21 Figure X: Office Discipline Referrals by Gender, 2010-2011 Training Cohort 21 Ethnicity 22 Figure Y: Referrals by Ethnicity, K-6, 2008-2009 23 Table 1: Referrals by Ethnicity, K-6, 2008-2009 23 Figure Z: Referrals by Ethnicity, K-6, 2009-2010 24 Table 2: Referrals by Ethnicity, K-6, 2009-2010 24 Figure AA: Referrals by Ethnicity, K-6, 2010-2011 25 Table 3: Referrals by Ethnicity, K-6, 2010-2011 25 Figure BB: Referrals by Ethnicity, 6-9, 2008-2009 26 Table 4: Referrals by Ethnicity, 6-9, 2008-2009 26 Figure CC: Referrals by Ethnicity, 6-9, 2009-2010 27 Table 5: Referrals by Ethnicity, 6-9, 2009-2010 27 Figure DD: Referrals by Ethnicity, 6-9, 2010-2011 28 Table 6: Referrals by Ethnicity, 6-9, 2010-2011 28 Figure EE: Referrals by Ethnicity, 9-12, 2008-2009 29 Table 7: Referrals by Ethnicity, 9-12, 2008-2009 29 Figure FF: Referrals by Ethnicity, 9-12, 2009-2010 30 Table 8: Referrals by Ethnicity, 9-12, 2009-2010 30 Figure GG: Referrals by Ethnicity, 9-12, 2010-2011 31 Table 9: Referrals by Ethnicity, 9-12, 2010-2011 31
Is PBIS resulting in positive outcomes for Connecticut? 32 Outcomes Data 32 Figure HH: Connecticut Average ODRs Compared to National Average ODRs (2010-2011) 32 Figure II: Major ODRs per 100 Students per Day, 2007-2008 through 2010-2011 33 Figure JJ: National Distributions for ODRs, 2011 35 Figure KK: Major Referral Distribution Triangle, K-6, 2010-2011 36 Figure LL: Major Referral Distribution Triangle, 6-9, 2010-2011 36 Figure MM: Major Referral Distribution Triangle, 9-12, 2010-2011 37 Figure NN: Major Referral Distribution Triangle, PK-8, 2010-2011 37 Impact Data 38 What are Connecticut’s Model PBIS Schools? 38 Figure OO: ODRs per 100 Students per Day – Middle School of Plainville 40 Figure PP: CMT Performance During PBIS Implementation - Middle School of Plainville (One Class Cohort) 40 Figure QQ: ODRs per 100 Students per Day – Colchester Elementary School 41 Figure RR: CMT Performance During PBIS Implementation – Colchester Elementary (One Class Cohort) 41 Figure SS: ODRs per 100 Students per Day – Housatonic Valley Regional High School 42 Figure TT: CAPT Performance During PBIS Implementation – Housatonic Valley Regional High School (One Class Cohort) 42 Figure UU: ODRs per 100 Students per Day – William J. Johnston Middle School 43 Figure VV: CMT Performance During PBIS Implementation – William J. Johnston Middle School (One Class Cohort) 43 Figure WW: ODRs per 100 Students per Day – Windham Middle School 44 Figure XX: CMT Performance During PBIS Implementation – Windham Middle School (One Class Cohort) 44 What is the current need/demand for PBIS training and support in Connecticut? 45 Systems Needs 45 Local Demand 45 The National Perspective 45 How do schools get involved in PBIS training? 46 Summary 46 References 48
What is Positive Behavioral Interventions and Supports? Positive Behavioral Interventions and Supports (PBIS) is a systems approach to teaching and managing behavior in schools. The goal of establishing a PBIS system is to enhance the capacity of schools, families, and communities to create and maintain positive school environments so all students can achieve socially and academically. PBIS involves a continuum of evidence-based practices for all students, supported by all staff, and sustained in classroom and non-classroom settings (such as hallways, buses, and restrooms). Under the PBIS model, otherwise isolated parts of the school operate in tandem. A behavioral approach to school-wide discipline creates an environment where staff is an important part of helping students achieve outcomes by choosing more effective, efficient, and desirable behaviors. Schools using PBIS focus on creating and sustaining primary (school-wide), secondary (small group), and tertiary (individual) systems of support that improve lifestyle results (personal, health, social, family, work, recreation) for students and families [Office of Special Education Programs (OSEP): Center on Positive Behavioral Interventions and Supports, 2011]. These multiple levels of intervention allow for a more comprehensive response to students’ behavioral needs because the focus is on layers of prevention and the logical distribution of resources. An established and organized continuum of support allows human and fiscal resources to be redistributed to the students with the greatest need, while ensuring behavioral and social learning success for all students. Schools achieve comprehensive student behavioral success by examining the factors that impact behavior as well as the relationship between environment and behavior. PBIS also works to improve the overall school climate, decrease reactive management, maximize academic achievement for all students, integrate academic and behavioral initiatives, and address the specific needs of students with severe emotional and behavioral concerns (OSEP: Center on Positive Behavioral Interventions and Supports, 2011).
1 PBIS Data Report and Summary ©2011
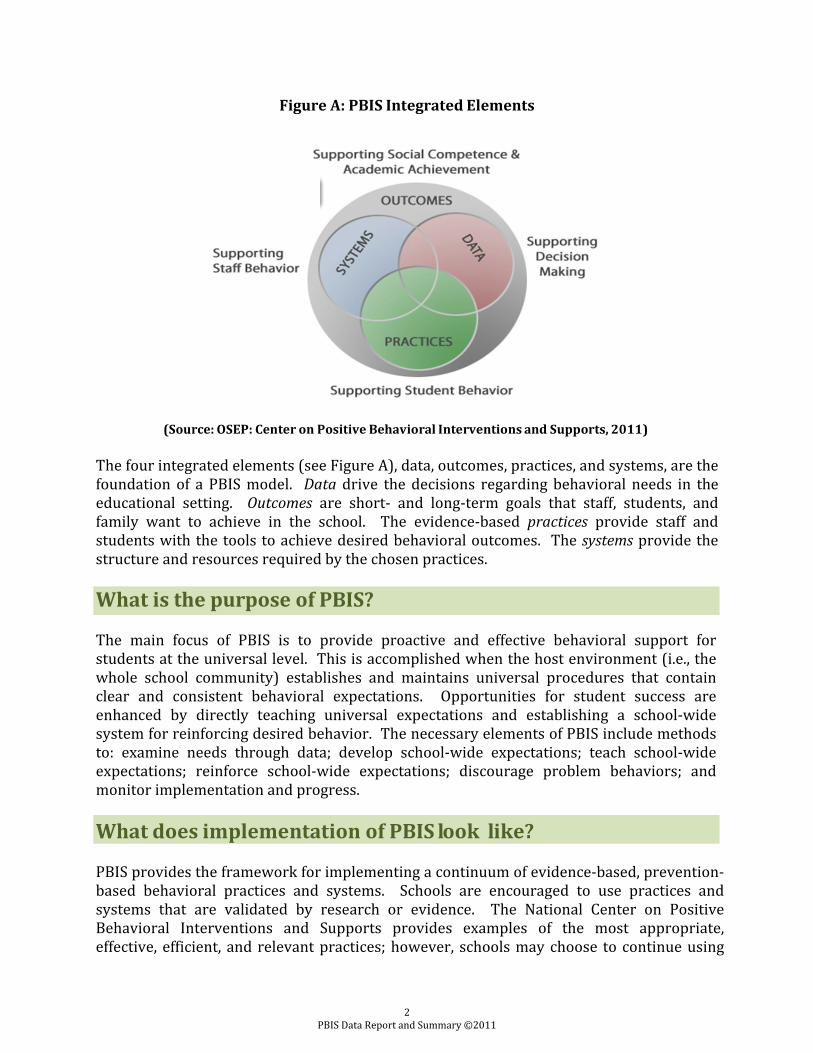
Figure A: PBIS Integrated Elements
(Source: OSEP: Center on Positive Behavioral Interventions and Supports, 2011) The four integrated elements (see Figure A), data, outcomes, practices, and systems, are the foundation of a PBIS model. Data drive the decisions regarding behavioral needs in the educational setting. Outcomes are short- and long-term goals that staff, students, and family want to achieve in the school. The evidence-based practices provide staff and students with the tools to achieve desired behavioral outcomes. The systems provide the structure and resources required by the chosen practices.
What is the purpose of PBIS? The main focus of PBIS is to provide proactive and effective behavioral support for students at the universal level. This is accomplished when the host environment (i.e., the whole school community) establishes and maintains universal procedures that contain clear and consistent behavioral expectations. Opportunities for student success are enhanced by directly teaching universal expectations and establishing a school-wide system for reinforcing desired behavior. The necessary elements of PBIS include methods to: examine needs through data; develop school-wide expectations; teach school-wide expectations; reinforce school-wide expectations; discourage problem behaviors; and monitor implementation and progress. What does implementation of PBIS look like? PBIS provides the framework for implementing a continuum of evidence-based, prevention- based behavioral practices and systems. Schools are encouraged to use practices and systems that are validated by research or evidence. The National Center on Positive Behavioral Interventions and Supports provides examples of the most appropriate, effective, efficient, and relevant practices; however, schools may choose to continue using
2 PBIS Data Report and Summary ©2011
ms
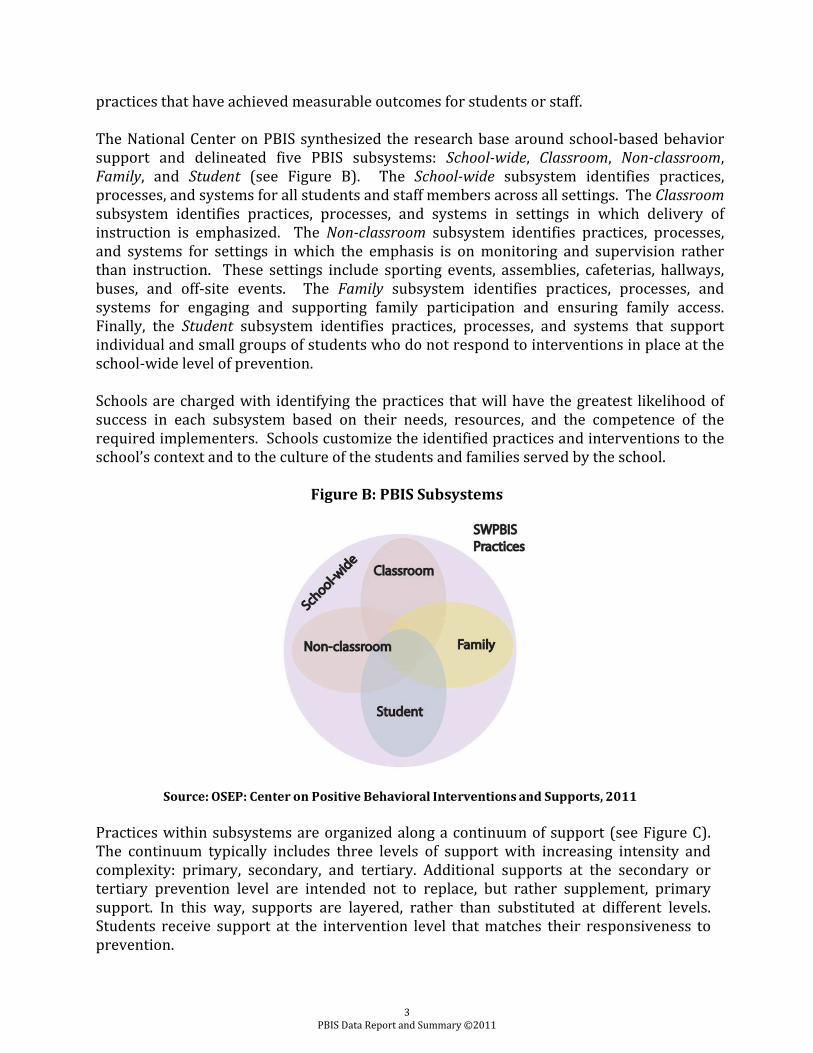
practices that have achieved measurable outcomes for students or staff. The National Center on PBIS synthesized the research base around school-based behavior support and delineated five PBIS subsystems: School-wide, Classroom, Non-classroom, Family, and Student (see Figure B). The School-wide subsystem identifies practices, processes, and systems for all students and staff members across all settings. The Classroom subsystem identifies practices, processes, and systems in settings in which delivery of instruction is emphasized. The Non-classroom subsystem identifies practices, processes, and systems for settings in which the emphasis is on monitoring and supervision rather than instruction. These settings include sporting events, assemblies, cafeterias, hallways, buses, and off-site events. The Family subsystem identifies practices, processes, and systems for engaging and supporting family participation and ensuring family access. Finally, the Student subsystem identifies practices, processes, and systems that support individual and small groups of students who do not respond to interventions in place at the school-wide level of prevention. Schools are charged with identifying the practices that will have the greatest likelihood of success in each subsystem based on their needs, resources, and the competence of the required implementers. Schools customize the identified practices and interventions to the school’s context and to the culture of the students and families served by the school.
Figure B: PBIS Subsystems Source: OSEP: Center on Positive Behavioral Interventions and Supports, 2011 Practices within subsystems are organized along a continuum of support (see Figure C). The continuum typically includes three levels of support with increasing intensity and complexity: primary, secondary, and tertiary. Additional supports at the secondary or tertiary prevention level are intended not to replace, but rather supplement, primary support. In this way, supports are layered, rather than substituted at different levels. Students receive support at the intervention level that matches their responsiveness to prevention.
3 PBIS Data Report and Summary ©2011
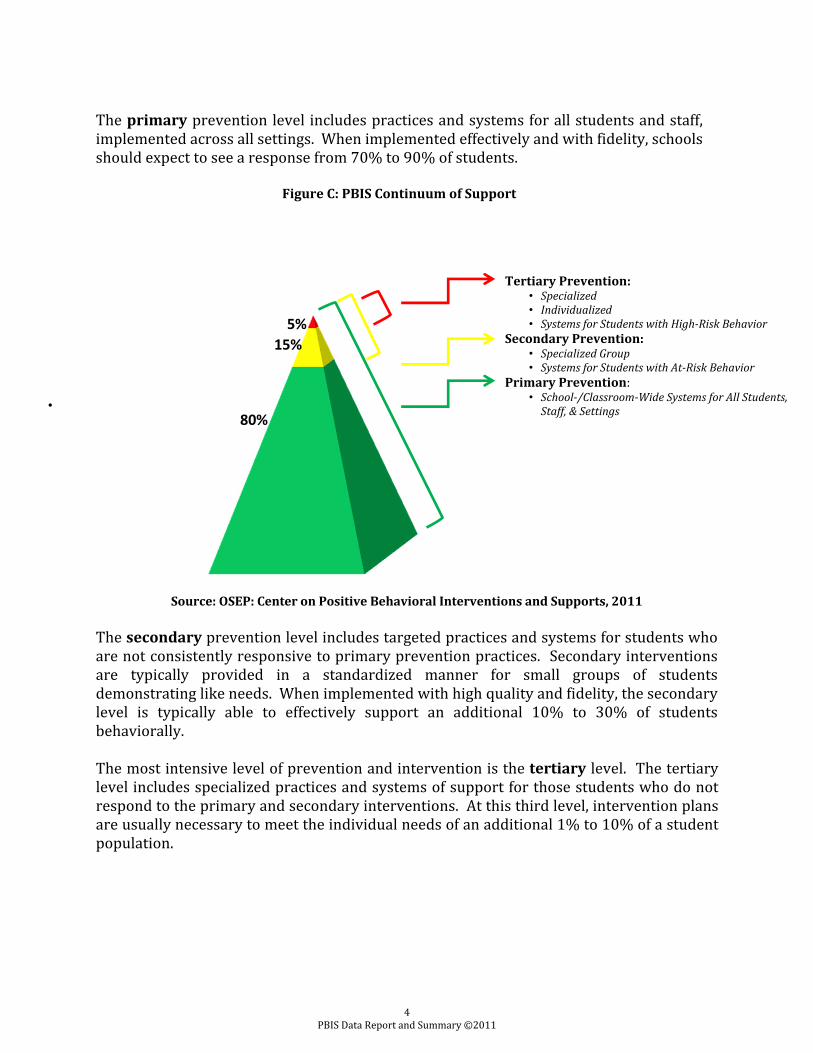
The primary prevention level includes practices and systems for all students and staff, implemented across all settings. When implemented effectively and with fidelity, schools should expect to see a response from 70% to 90% of students. Figure C: PBIS Continuum of Support
• Source: OSEP: Center on Positive Behavioral Interventions and Supports, 2011 The secondary prevention level includes targeted practices and systems for students who are not consistently responsive to primary prevention practices. Secondary interventions are typically provided in a standardized manner for small groups of students demonstrating like needs. When implemented with high quality and fidelity, the secondary level is typically able to effectively support an additional 10% to 30% of students behaviorally. The most intensive level of prevention and intervention is the tertiary level. The tertiary level includes specialized practices and systems of support for those students who do not respond to the primary and secondary interventions. At this third level, intervention plans are usually necessary to meet the individual needs of an additional 1% to 10% of a student population.
80%
15%5%
Tertiary Prevention: • Specialized • Individualized • Systems for Students with High-Risk Behavior
Secondary Prevention: • Specialized Group • Systems for Students with At-Risk Behavior
Primary Prevention: • School-/Classroom-Wide Systems for All Students,
Staff, & Settings
4 PBIS Data Report and Summary ©2011
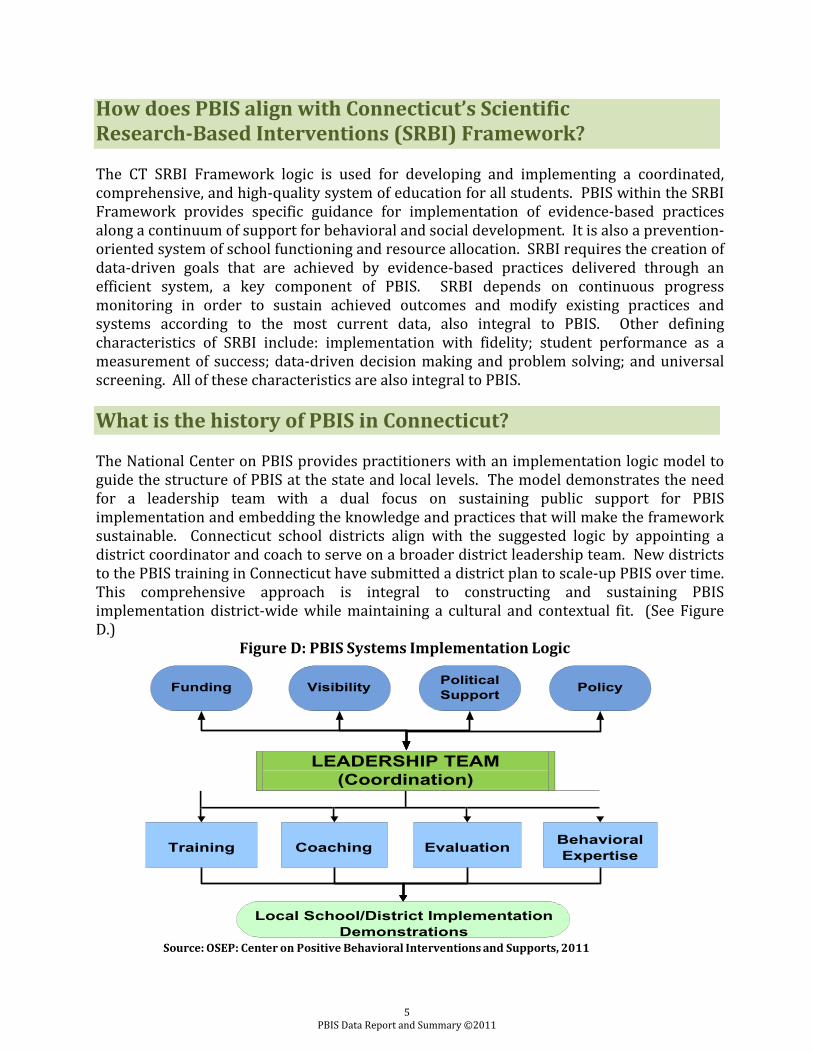
How does PBIS align with Connecticut’s Scientific Research-Based Interventions (SRBI) Framework? The CT SRBI Framework logic is used for developing and implementing a coordinated, comprehensive, and high-quality system of education for all students. PBIS within the SRBI Framework provides specific guidance for implementation of evidence-based practices along a continuum of support for behavioral and social development. It is also a prevention-oriented system of school functioning and resource allocation. SRBI requires the creation of data-driven goals that are achieved by evidence-based practices delivered through an efficient system, a key component of PBIS. SRBI depends on continuous progress monitoring in order to sustain achieved outcomes and modify existing practices and systems according to the most current data, also integral to PBIS. Other defining characteristics of SRBI include: implementation with fidelity; student performance as a measurement of success; data-driven decision making and problem solving; and universal screening. All of these characteristics are also integral to PBIS. What is the history of PBIS in Connecticut? The National Center on PBIS provides practitioners with an implementation logic model to guide the structure of PBIS at the state and local levels. The model demonstrates the need for a leadership team with a dual focus on sustaining public support for PBIS implementation and embedding the knowledge and practices that will make the framework sustainable. Connecticut school districts align with the suggested logic by appointing a district coordinator and coach to serve on a broader district leadership team. New districts to the PBIS training in Connecticut have submitted a district plan to scale-up PBIS over time. This comprehensive approach is integral to constructing and sustaining PBIS implementation district-wide while maintaining a cultural and contextual fit. (See Figure D.)
Figure D: PBIS Systems Implementation Logic Funding Visibility Political
Support
Policy
LEADERSHIP TEAM (Coordination)
Training Coaching Evaluation Behavioral
Expertise
Local School/District Implementation Demonstrations
Source: OSEP: Center on Positive Behavioral Interventions and Supports, 2011
5 PBIS Data Report and Summary ©2011
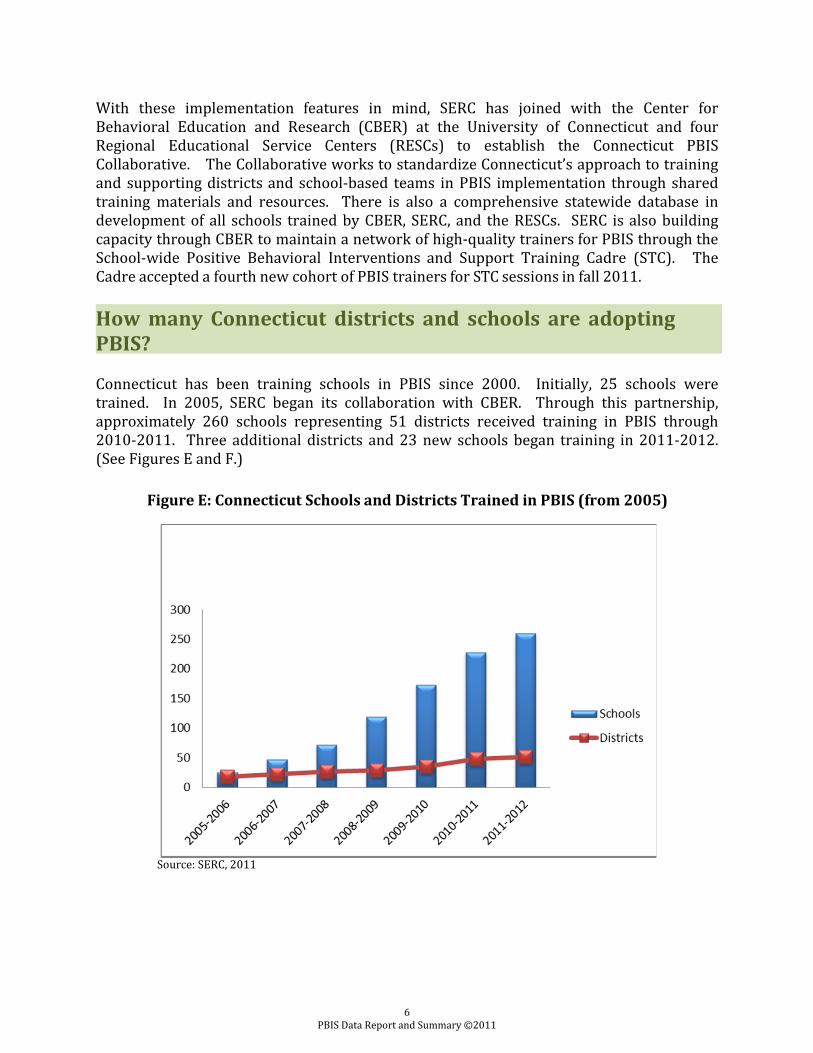
With these implementation features in mind, SERC has joined with the Center for Behavioral Education and Research (CBER) at the University of Connecticut and four Regional Educational Service Centers (RESCs) to establish the Connecticut PBIS Collaborative. The Collaborative works to standardize Connecticut’s approach to training and supporting districts and school-based teams in PBIS implementation through shared training materials and resources. There is also a comprehensive statewide database in development of all schools trained by CBER, SERC, and the RESCs. SERC is also building capacity through CBER to maintain a network of high-quality trainers for PBIS through the School-wide Positive Behavioral Interventions and Support Training Cadre (STC). The Cadre accepted a fourth new cohort of PBIS trainers for STC sessions in fall 2011. How many Connecticut districts and schools are adopting PBIS? Connecticut has been training schools in PBIS since 2000. Initially, 25 schools were trained. In 2005, SERC began its collaboration with CBER. Through this partnership, approximately 260 schools representing 51 districts received training in PBIS through 2010-2011. Three additional districts and 23 new schools began training in 2011-2012. (See Figures E and F.)
Figure E: Connecticut Schools and Districts Trained in PBIS (from 2005) Source: SERC, 2011
6 PBIS Data Report and Summary ©2011
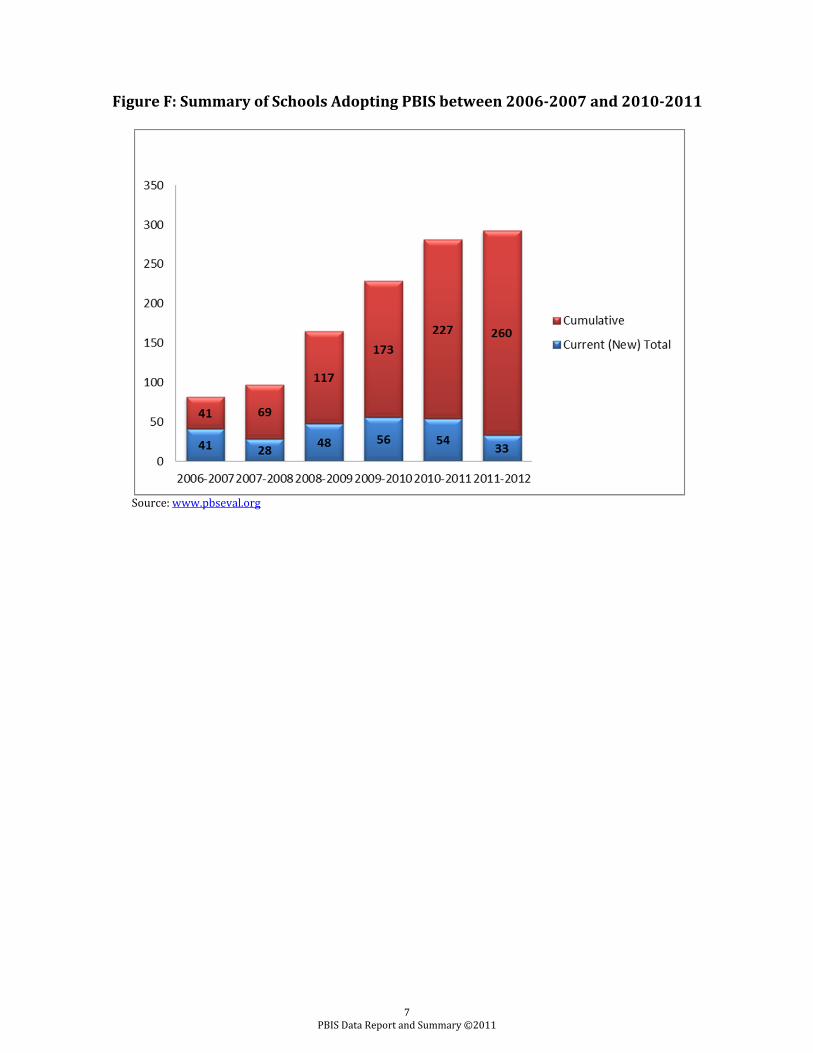
Figure F: Summary of Schools Adopting PBIS between 2006-2007 and 2010-2011
Source: www.pbseval.org
7 PBIS Data Report and Summary ©2011
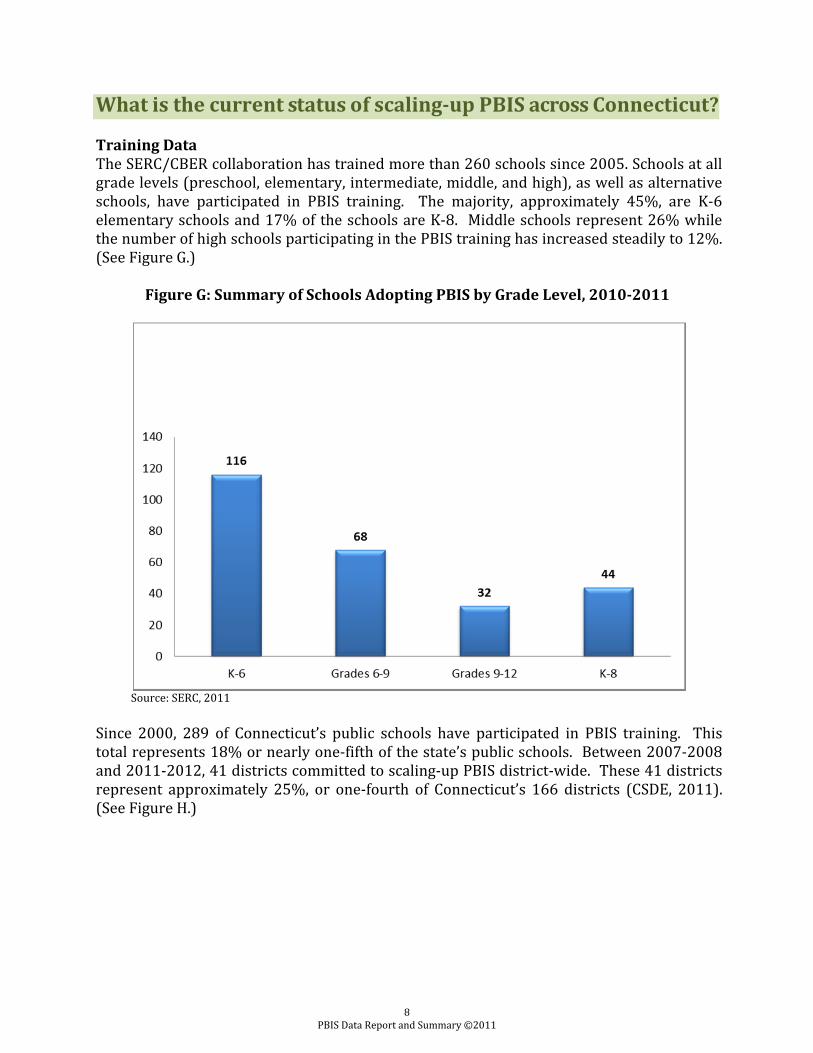
What is the current status of scaling-up PBIS across Connecticut? Training Data The SERC/CBER collaboration has trained more than 260 schools since 2005. Schools at all grade levels (preschool, elementary, intermediate, middle, and high), as well as alternative schools, have participated in PBIS training. The majority, approximately 45%, are K-6 elementary schools and 17% of the schools are K-8. Middle schools represent 26% while the number of high schools participating in the PBIS training has increased steadily to 12%. (See Figure G.)
Figure G: Summary of Schools Adopting PBIS by Grade Level, 2010-2011
Source: SERC, 2011 Since 2000, 289 of Connecticut’s public schools have participated in PBIS training. This total represents 18% or nearly one-fifth of the state’s public schools. Between 2007-2008 and 2011-2012, 41 districts committed to scaling-up PBIS district-wide. These 41 districts represent approximately 25%, or one-fourth of Connecticut’s 166 districts (CSDE, 2011). (See Figure H.)
8 PBIS Data Report and Summary ©2011
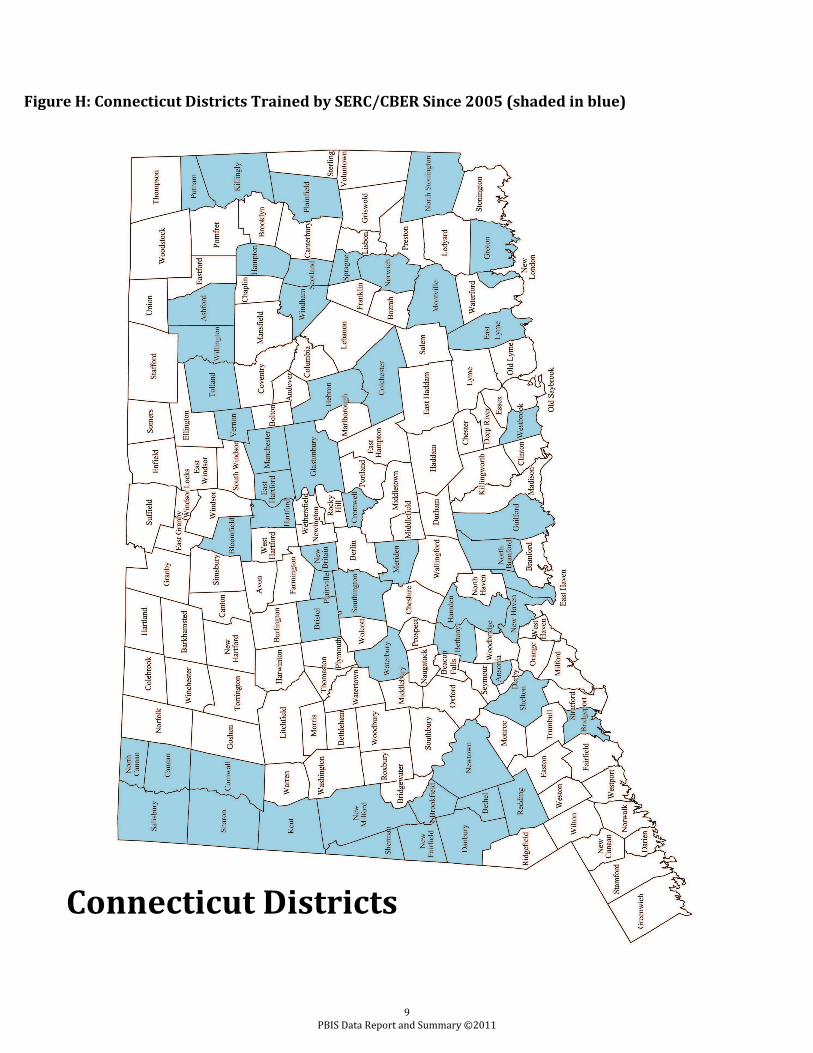
Figure H: Connecticut Districts Trained by SERC/CBER Since 2005 (shaded in blue)
Connecticut Districts
9 PBIS Data Report and Summary ©2011
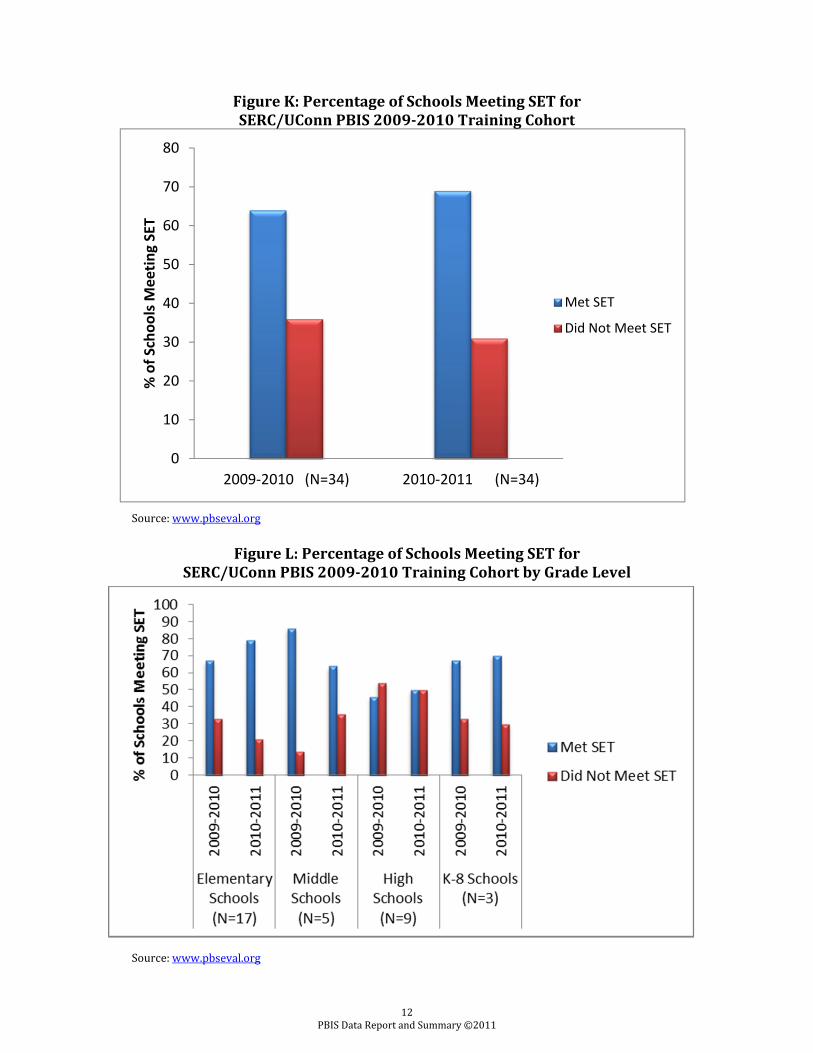
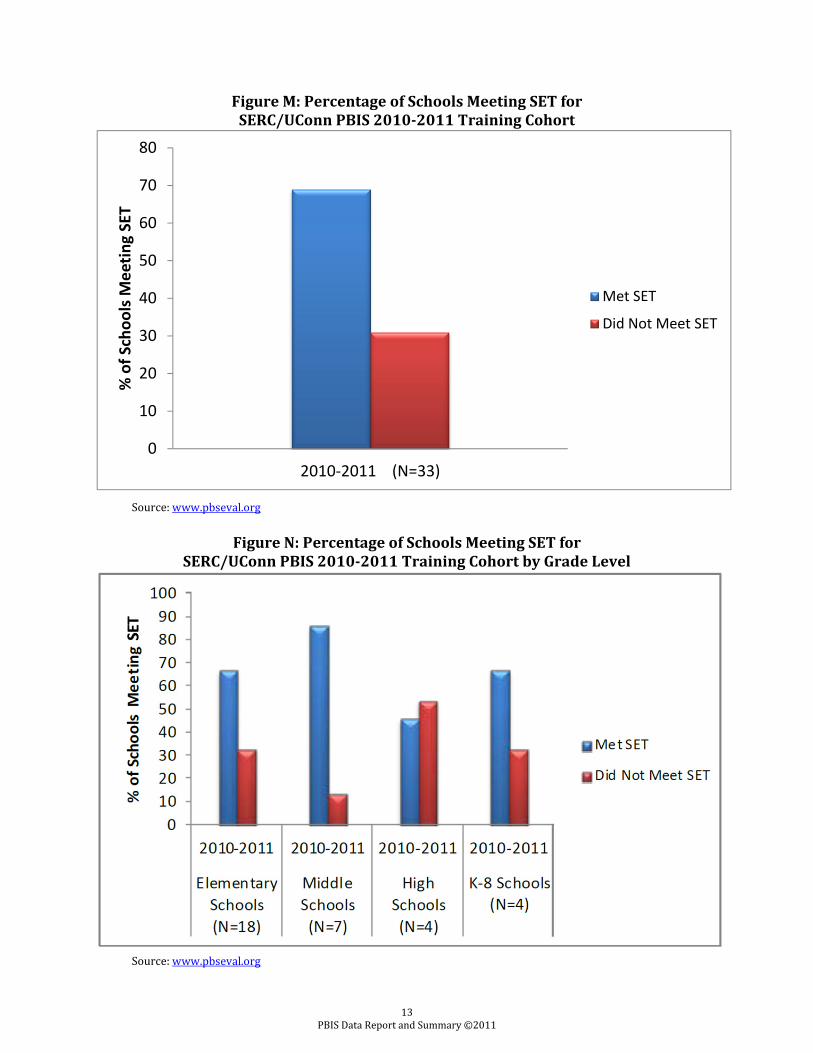
Are Connecticut schools implementing PBIS to criterion? In determining how schools are implementing PBIS, it is important to note that the data discussed in this report represent Connecticut schools that participate in Web-based progress monitoring. Since 2009-2010 all schools have been required to use the School-wide Information System (SWIS) and PBIS Assessment during the three-year training series. Additionally, some schools in the data set began training before 2009-2010 and chose to subscribe to these systems. Schools may choose to continue using the Web-based programs beyond training. These data from schools across Connecticut can be accessed through a centralized database, PBIS Evaluations (www.pbiseval.org), maintained by Educational and Community Supports (ECS) at The University of Oregon. Schools must volunteer to share their data in order to be included in the database. Implementation Data Connecticut uses the School-wide Evaluation Tool (SET) to measure implementation fidelity of PBIS. The SET is a research-validated tool designed to assess the degree of implementation of critical features as defined by the National Technical Assistance Center on PBIS. Schools are labeled as having “met SET” or implementing to criterion when they have received a SET score of 80% for the measurement of “expectations taught” and an overall average score of 80% (Sprague & Walker, 2005). The initial SET establishes a baseline. Schools are then evaluated on an annual basis to determine implementation success and to show long-term sustainability of school-wide practices and systems. The majority of schools do not meet criterion until they have implemented for one year. The PBIS Systems Implementation Logic creates the capacity for SETs to be conducted in many schools by the district coach or coordinator. Expanded evaluation capacity in the state allows for an increase in the number of SETs conducted at PBIS-trained schools. During 2010-2011, 134 SETs were conducted in SERC/UConn PBIS schools. This is an increase from 103 SETs conducted during 2009-2010, and 42 SETs conducted in 2008-2009. Larger numbers of SET evaluations enhance the ability to assess the degree of PBIS implementation fidelity in Connecticut. The following figures represent implementation data from a subset of the schools that have been involved in PBIS training. As districts move toward fluency with PBIS implementation, they may choose other tools to measure fidelity. According to the data shown, the 2008-2009 SERC/UConn training cohort shows an increase in full implementation fidelity in elementary and high schools, and a slight decrease in implementation fidelity at the middle school level (Figures I and J). In the SERC/UConn PBIS 2009-2010 training cohort, elementary, K-8, and high schools demonstrated growth in implementation between 2009-2010 and 2010-2011 (Figures K and L). Middle school SET data shows a slight decrease in implementation fidelity. In the SERC/UConn PBIS 2010-2011 training cohort, 69% of the elementary schools, 89% of the middle schools, and 45% of the high schools met SET in their baseline year (Figures M and N).
10 PBIS Data Report and Summary ©2011
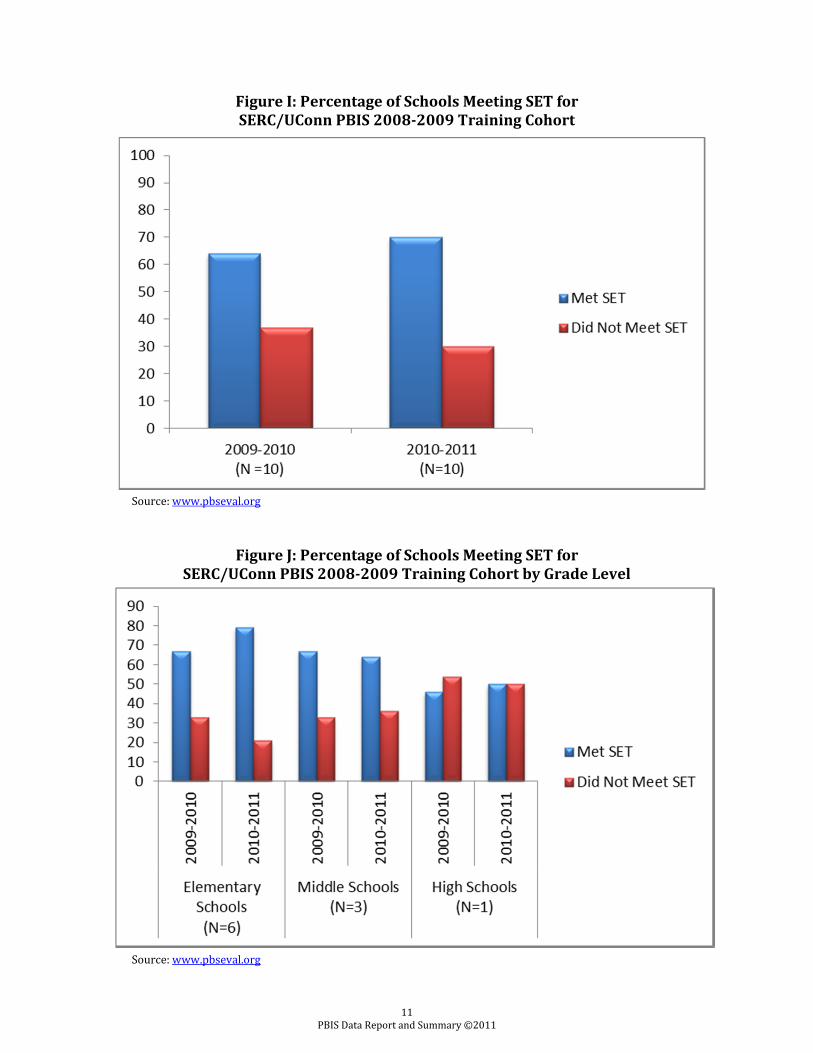
Figure I: Percentage of Schools Meeting SET for SERC/UConn PBIS 2008-2009 Training Cohort
Source: www.pbseval.org
Figure J: Percentage of Schools Meeting SET for SERC/UConn PBIS 2008-2009 Training Cohort by Grade Level
Source: www.pbseval.org
11 PBIS Data Report and Summary ©2011
0
10
20
30
40
50
60
70
80
2009-2010 (N=34) 2010-2011 (N=34)
% o
f Sch
ools
Mee
ting
SET
Met SET
Did Not Meet SET
Figure K: Percentage of Schools Meeting SET for SERC/UConn PBIS 2009-2010 Training Cohort Source: www.pbseval.org
Figure L: Percentage of Schools Meeting SET for SERC/UConn PBIS 2009-2010 Training Cohort by Grade Level
Source: www.pbseval.org 12
PBIS Data Report and Summary ©2011
0
10
20
30
40
50
60
70
80
2010-2011 (N=33)
% o
f Sch
ools
Mee
ting
SET
Met SET
Did Not Meet SET
Figure M: Percentage of Schools Meeting SET for SERC/UConn PBIS 2010-2011 Training Cohort
Source: www.pbseval.org Figure N: Percentage of Schools Meeting SET for
SERC/UConn PBIS 2010-2011 Training Cohort by Grade Level Source: www.pbseval.org
13 PBIS Data Report and Summary ©2011
School-wide Information System (SWIS) All PBIS schools are taught to use the integrated elements (data, outcomes, practices, and systems) to process current strengths and needs and to devise an ongoing action plan. Review of up-to-date data is essential to making relevant and durable decisions about changes to the school-wide system and program. Beginning in 2009-2010, schools that applied to participate in Connecticut’s PBIS Training Series were required to use SWIS for, at minimum, the three years in which they are involved in the training series. SWIS is a Web-based data collection system that tracks Office Discipline Referral (ODR) information. It allows school staff to distinguish between major and minor infractions. SWIS provides five standard reports, commonly known as the “Big 5,” on a monthly and annual basis. The “Big 5” reports are: Average Referrals Per Day Per Month; Referrals by Problem Behavior; Referrals by Time; Referrals by Location; and Referrals by Student. The system also allows staff to produce a wide variety of custom graphs and reports defined by a myriad of parameters (e.g., location, time of day, behavior, administrative decision, individual student, ethnicity, referring staff). Schools are asked to review, at minimum, the SWIS Big 5 at every team meeting and team training event. Together, the Big 5 highlight the essential information about the current condition of behavior in the school and enable teams to detect areas of success and immediate concern. State-level evaluators may access aggregate statewide data for three of these charts (referrals by problem behavior, time, and location) through PBIS Evaluations. SWIS is primarily a school-based progress monitoring tool. Schools are encouraged to begin entering ODR information before the first year of implementation so that they have a baseline with which to compare subsequent years. Most PBIS schools in Connecticut use the SWIS system. Those that choose not to do so may have difficulty reviewing the data necessary during team meetings and trainings to engage fully in the decision-making process.
14 PBIS Data Report and Summary ©2011
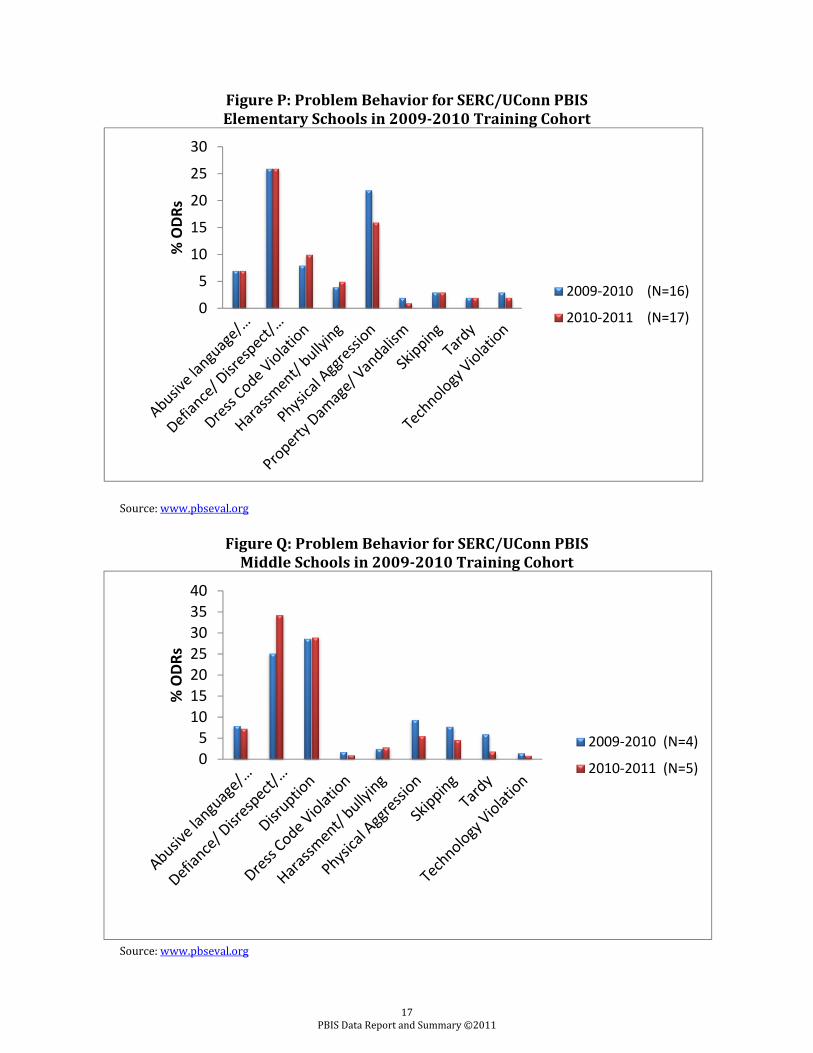
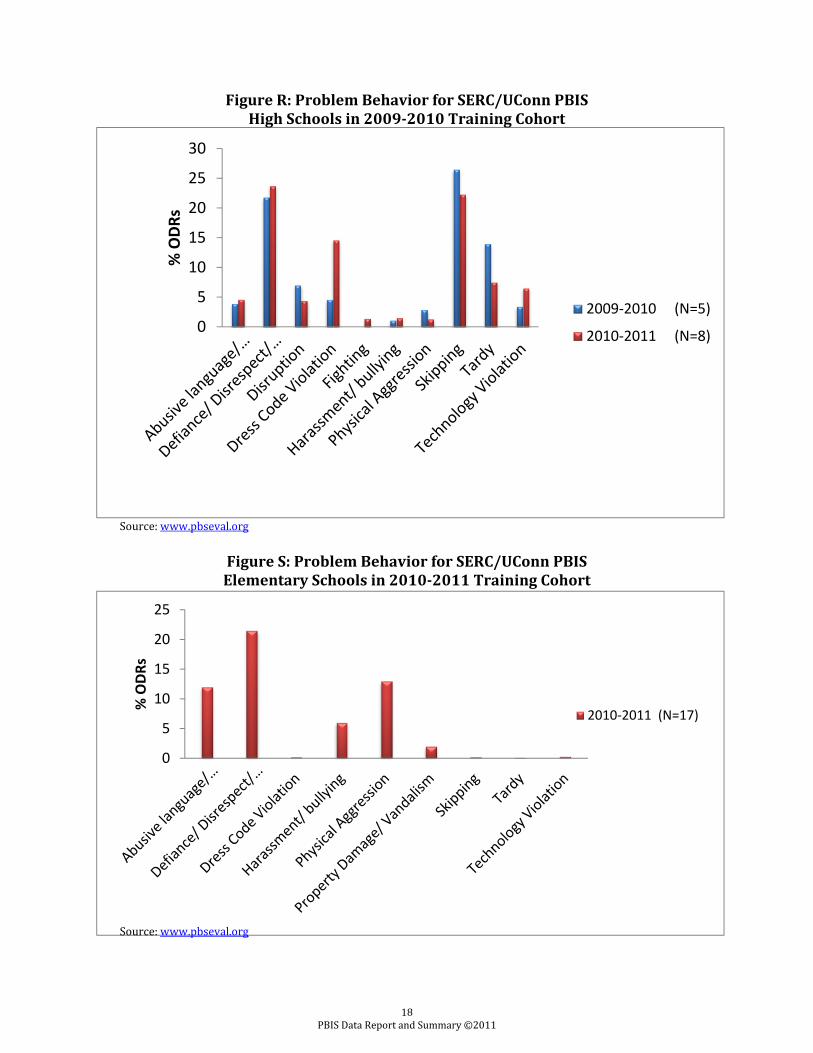
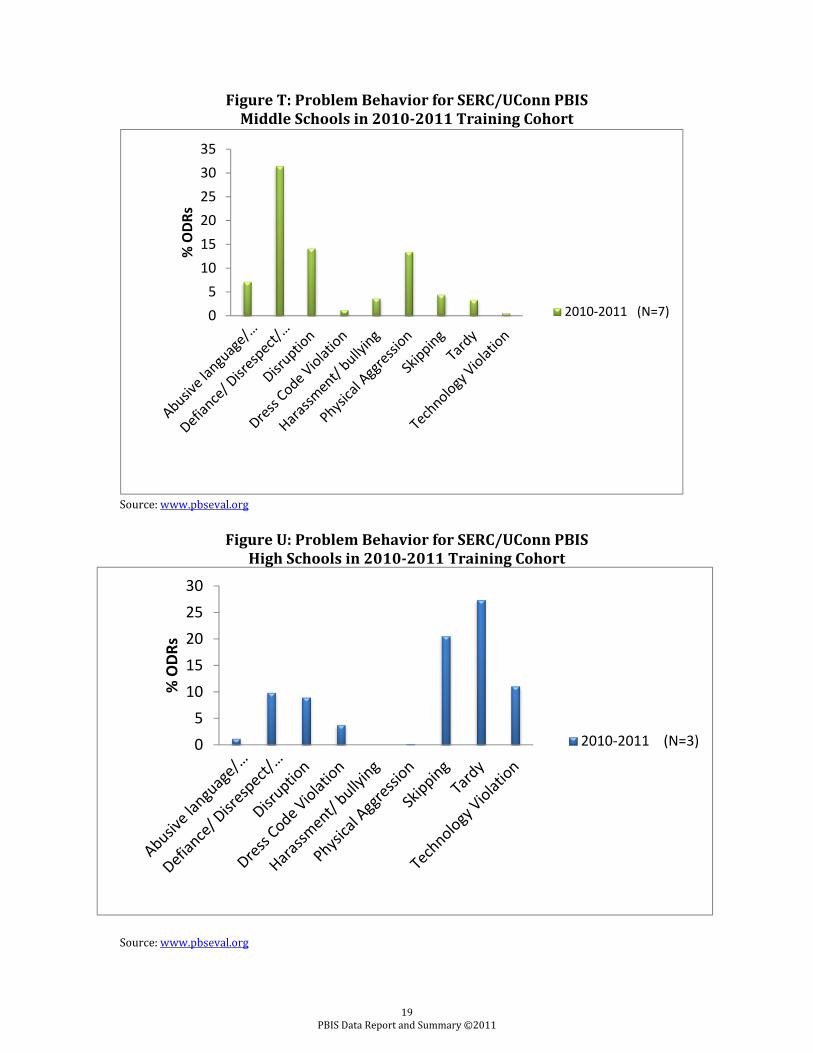
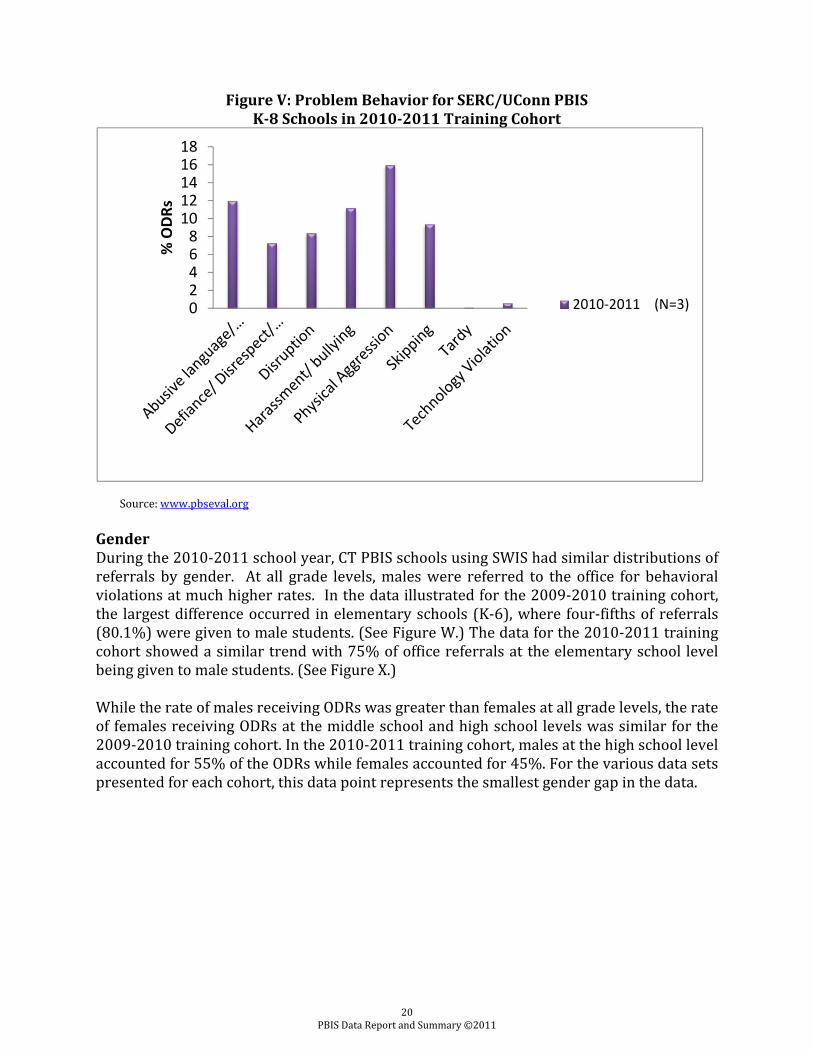
What are the patterns for ODRs for Connecticut’s PBIS schools? Documented Behaviors The following figure (Figure O) represents 152 schools, grades K-12, and depicts the standard set of problem behaviors that are documented in SWIS. Each bar represents the percentage of referrals given for specific behavioral violations. The data are disaggregated by grade. Among elementary schools (K-6), more than 50% of all referrals were for physical aggression (27.1%) and defiance (26%). Among middle schools (Grades 6-9), almost 60% of all referrals were for defiance (29.7%), disruption (19.6%), and skipping (10.6%). The high schools documented over 50% of their referrals for skipping (27.1%) and defiance (23.4%). Similar to elementary and middle schools, schools with grades K-8 had a high percentage of referrals for defiance (25.7%). Another 22.2% of the referrals in grades K-8 were for physical aggression (12.6%) and fighting (9.6%), bringing the percentage of the top three behavioral violations in grades K-8 to 47.9%. Discipline data, disaggregated by training cohort and grade level, are depicted below. (See Figures P, Q, R, S, T, U, and V.) Recent Connecticut legislation and an increased focus on the issue of bullying heighten the importance of tracking harassment/bullying behaviors. PBIS includes certain components that facilitate a school’s ability to meet the data gathering requirement of the law. Bullying/Harassment represent close to 5% of all referrals at every grade level with the exception of high schools. In high schools, while referrals for bullying constitute only 1.3%, referrals for skipping comprise 27.1% of infractions. Further investigation is required to determine the relationship between these data points. Please see PBIS as an Effective Approach to Bullying Prevention and Intervention: Complying with CT Public Act 11-232 (SERC, 2012) for additional information.
15 PBIS Data Report and Summary ©2011
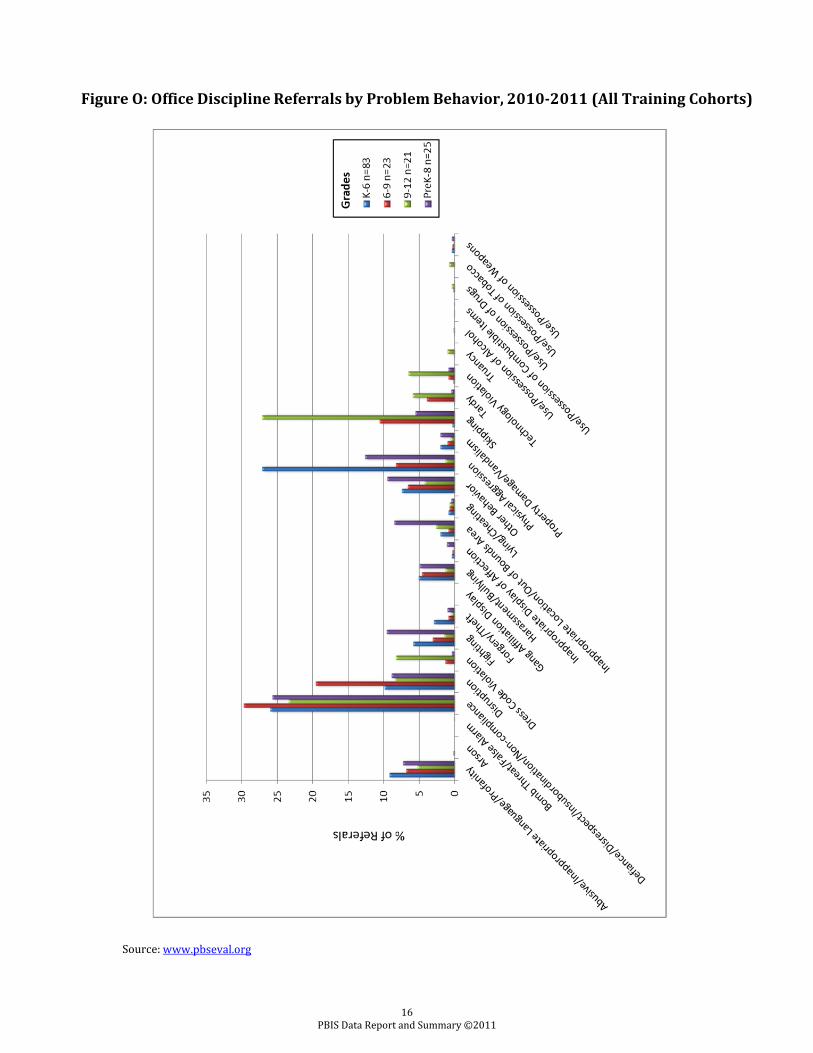
Figure O: Office Discipline Referrals by Problem Behavior, 2010-2011 (All Training Cohorts) Source: www.pbseval.org
16 PBIS Data Report and Summary ©2011
0
5
10
15
20
25
30
% O
DRs
2009-2010 (N=16)
2010-2011 (N=17)
05
10152025303540
% O
DRs
2009-2010 (N=4)
2010-2011 (N=5)
Figure P: Problem Behavior for SERC/UConn PBIS Elementary Schools in 2009-2010 Training Cohort
Source: www.pbseval.org
Figure Q: Problem Behavior for SERC/UConn PBIS Middle Schools in 2009-2010 Training Cohort
Source: www.pbseval.org
17 PBIS Data Report and Summary ©2011
0
5
10
15
20
25
30%
ODR
s
2009-2010 (N=5)
2010-2011 (N=8)
0
5
10
15
20
25
% O
DRs
2010-2011 (N=17)
Figure R: Problem Behavior for SERC/UConn PBIS High Schools in 2009-2010 Training Cohort
Source: www.pbseval.org
Figure S: Problem Behavior for SERC/UConn PBIS Elementary Schools in 2010-2011 Training Cohort
Source: www.pbseval.org
18 PBIS Data Report and Summary ©2011
05
101520253035
% O
DRs
2010-2011 (N=7)
05
1015202530
% O
DRs
2010-2011 (N=3)
Figure T: Problem Behavior for SERC/UConn PBIS Middle Schools in 2010-2011 Training Cohort
Source: www.pbseval.org
Figure U: Problem Behavior for SERC/UConn PBIS High Schools in 2010-2011 Training Cohort
Source: www.pbseval.org
19 PBIS Data Report and Summary ©2011
02468
1012141618
% O
DRs
2010-2011 (N=3)
Figure V: Problem Behavior for SERC/UConn PBIS K-8 Schools in 2010-2011 Training Cohort
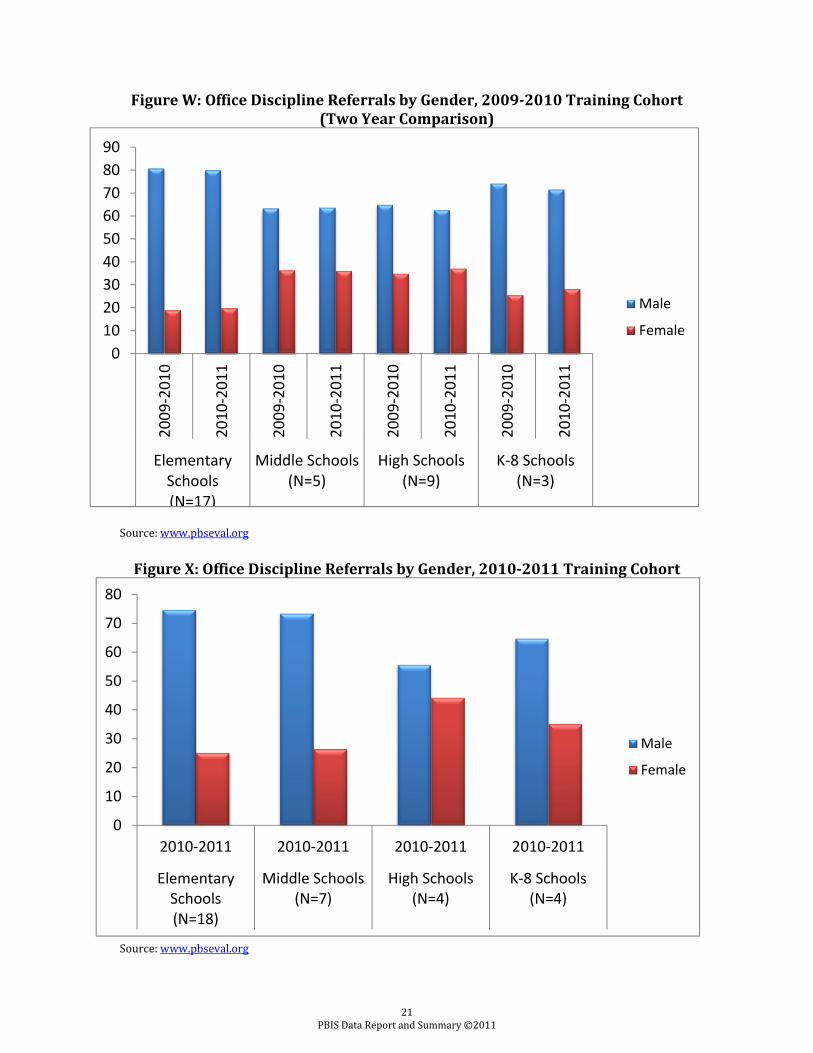
Source: www.pbseval.org Gender During the 2010-2011 school year, CT PBIS schools using SWIS had similar distributions of referrals by gender. At all grade levels, males were referred to the office for behavioral violations at much higher rates. In the data illustrated for the 2009-2010 training cohort, the largest difference occurred in elementary schools (K-6), where four-fifths of referrals (80.1%) were given to male students. (See Figure W.) The data for the 2010-2011 training cohort showed a similar trend with 75% of office referrals at the elementary school level being given to male students. (See Figure X.) While the rate of males receiving ODRs was greater than females at all grade levels, the rate of females receiving ODRs at the middle school and high school levels was similar for the 2009-2010 training cohort. In the 2010-2011 training cohort, males at the high school level accounted for 55% of the ODRs while females accounted for 45%. For the various data sets presented for each cohort, this data point represents the smallest gender gap in the data.
20 PBIS Data Report and Summary ©2011
0102030405060708090
2009
-201
0
2010
-201
1
2009
-201
0
2010
-201
1
2009
-201
0
2010
-201
1
2009
-201
0
2010
-201
1
ElementarySchools(N=17)
Middle Schools(N=5)
High Schools(N=9)
K-8 Schools(N=3)
Male
Female
0
10
20
30
40
50
60
70
80
2010-2011 2010-2011 2010-2011 2010-2011
ElementarySchools(N=18)
Middle Schools(N=7)
High Schools(N=4)
K-8 Schools(N=4)
Male
Female
Figure W: Office Discipline Referrals by Gender, 2009-2010 Training Cohort (Two Year Comparison)
Source: www.pbseval.org
Figure X: Office Discipline Referrals by Gender, 2010-2011 Training Cohort
Source: www.pbseval.org
21 PBIS Data Report and Summary ©2011
Ethnicity One of the features in SWIS allows schools to view ODR data by student ethnicity. In 2010-2011, only one-third of Connecticut schools using SWIS enabled the ethnicity feature. SERC plans to increase assistance and support with SWIS to encourage more schools to use the ethnicity feature. With this feature, school staff can compare the percentage referrals of students within an ethnic group to their own school-wide ethnicity distribution to examine equity around behavioral practices. Reschly (1997) highlights the use of the “ten percent of the population standard” to determine disproportionate representation in a group. Disproportionality exists when a group’s representation in a particular data set exceeds or falls below ten percent of its representation in the population. Connecticut’s PBIS data demonstrate a degree of disproportionality by ethnicity at all grade levels, with some groups overrepresented in the data and some underrepresented. Data are available for elementary (K-6), middle (6-9), high (9-12), and PreK-8 schools from 2008-2009 through 2010-2011. (See Figures Y-GG and Tables 1-9.) In 2010-2011, the largest overrepresentation was found among Black students in elementary schools. (See Figure AA and Table 3.) Black students constituted 13.4% of the total elementary student population. According to the “ten percent of the population standard,” overrepresentation would exist at 14.7%. However, this subgroup represented 26.6% of the students being referred. White students were consistently underrepresented in the data. The largest variation for White students was also in elementary schools in the 2010-2011 cohort (see Figure AA and Table 3), where White students constituted 61% of the total student population, but only 47.5% of the students with referrals. Using the “ten percent of the population standard,” underrepresentation would exist for Connecticut’s White student at 55%. The largest gap for Latino students is seen at the middle school level in the 2010-2011 cohort (see Figure DD and Table 6). Latino students represented 25.5% of the student population, yet 36.6% of students with referrals. According to the “ten percent of the population standard,” overrepresentation of this group would have existed at levels of 28%. Ethnicity data for 2008-2009 through 2010-2011 consistently show that students of color are overrepresented at all grade ranges.
22 PBIS Data Report and Summary ©2011
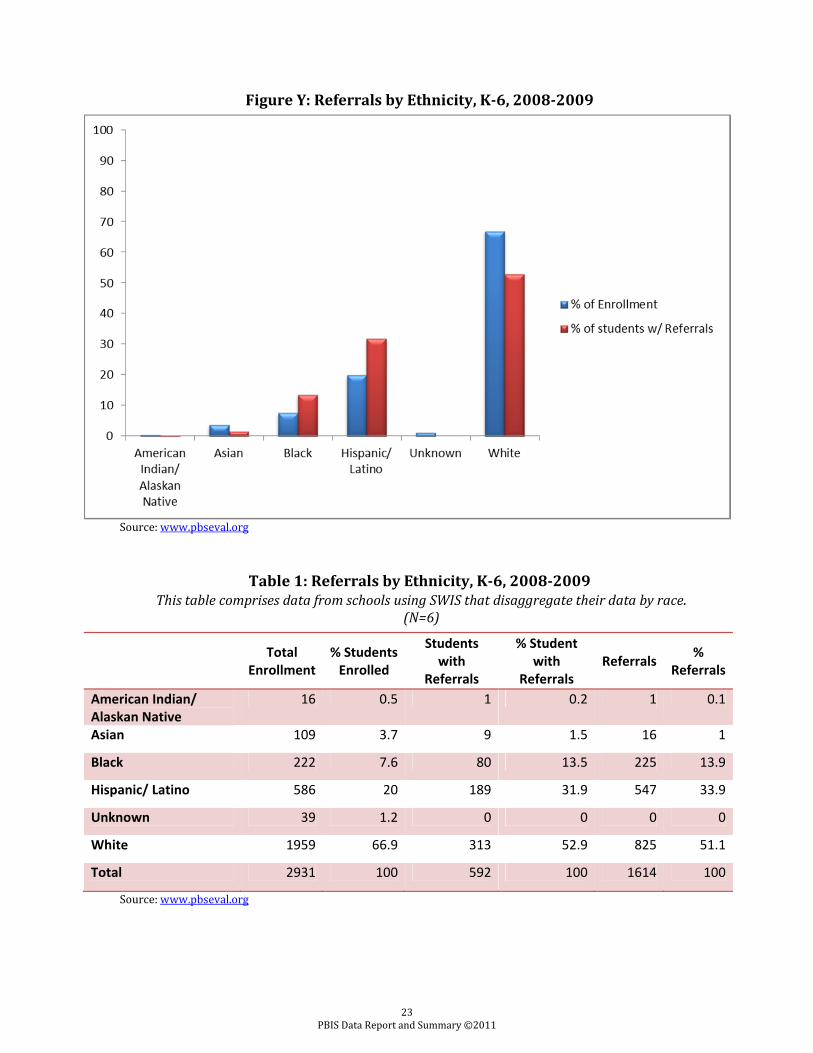
Figure Y: Referrals by Ethnicity, K-6, 2008-2009 Source: www.pbseval.org
Table 1: Referrals by Ethnicity, K-6, 2008-2009 This table comprises data from schools using SWIS that disaggregate their data by race.
(N=6)
Total
Enrollment % Students
Enrolled
Students with
Referrals
% Student with
Referrals Referrals %
Referrals
American Indian/ Alaskan Native
16 0.5 1 0.2 1 0.1
Asian 109 3.7 9 1.5 16 1
Black 222 7.6 80 13.5 225 13.9
Hispanic/ Latino 586 20 189 31.9 547 33.9
Unknown 39 1.2 0 0 0 0
White 1959 66.9 313 52.9 825 51.1
Total 2931 100 592 100 1614 100 Source: www.pbseval.org
23 PBIS Data Report and Summary ©2011
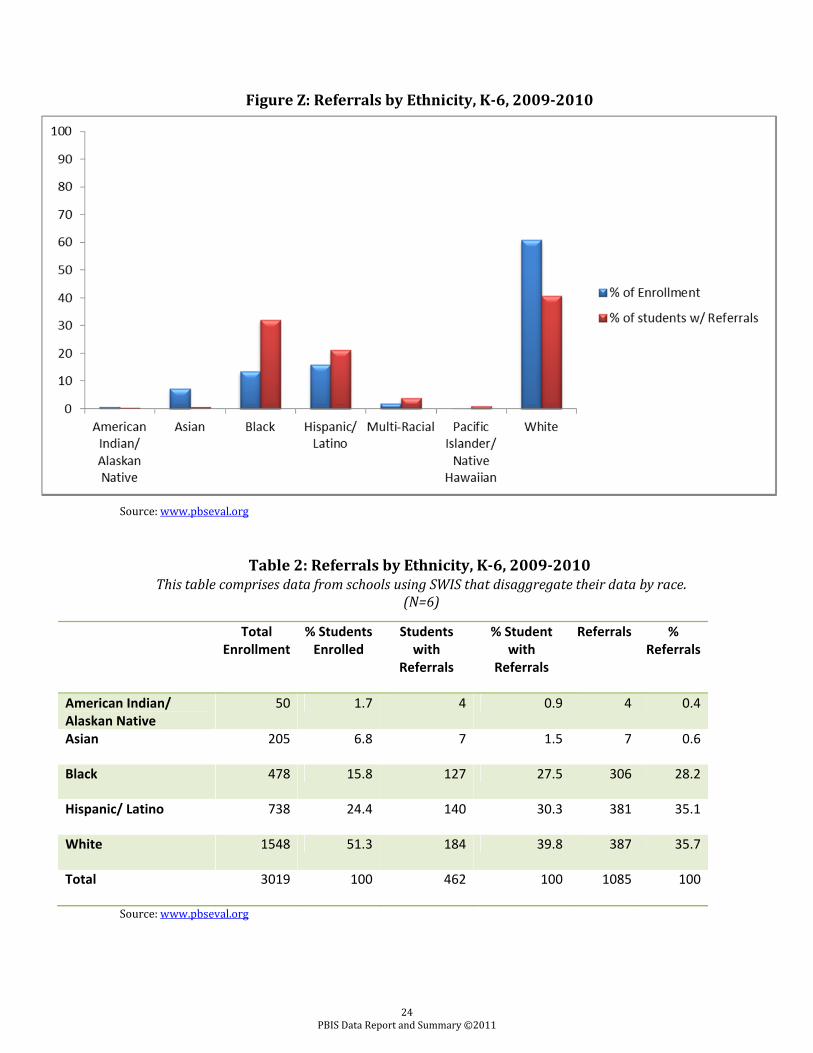
Figure Z: Referrals by Ethnicity, K-6, 2009-2010 Source: www.pbseval.org
Table 2: Referrals by Ethnicity, K-6, 2009-2010 This table comprises data from schools using SWIS that disaggregate their data by race.
(N=6)
Source: www.pbseval.org
Total Enrollment
% Students Enrolled
Students with
Referrals
% Student with
Referrals
Referrals % Referrals
American Indian/ Alaskan Native
50 1.7 4 0.9 4 0.4
Asian 205 6.8 7 1.5 7 0.6
Black 478 15.8 127 27.5 306 28.2
Hispanic/ Latino 738 24.4 140 30.3 381 35.1
White 1548 51.3 184 39.8 387 35.7
Total 3019 100 462 100 1085 100
24 PBIS Data Report and Summary ©2011
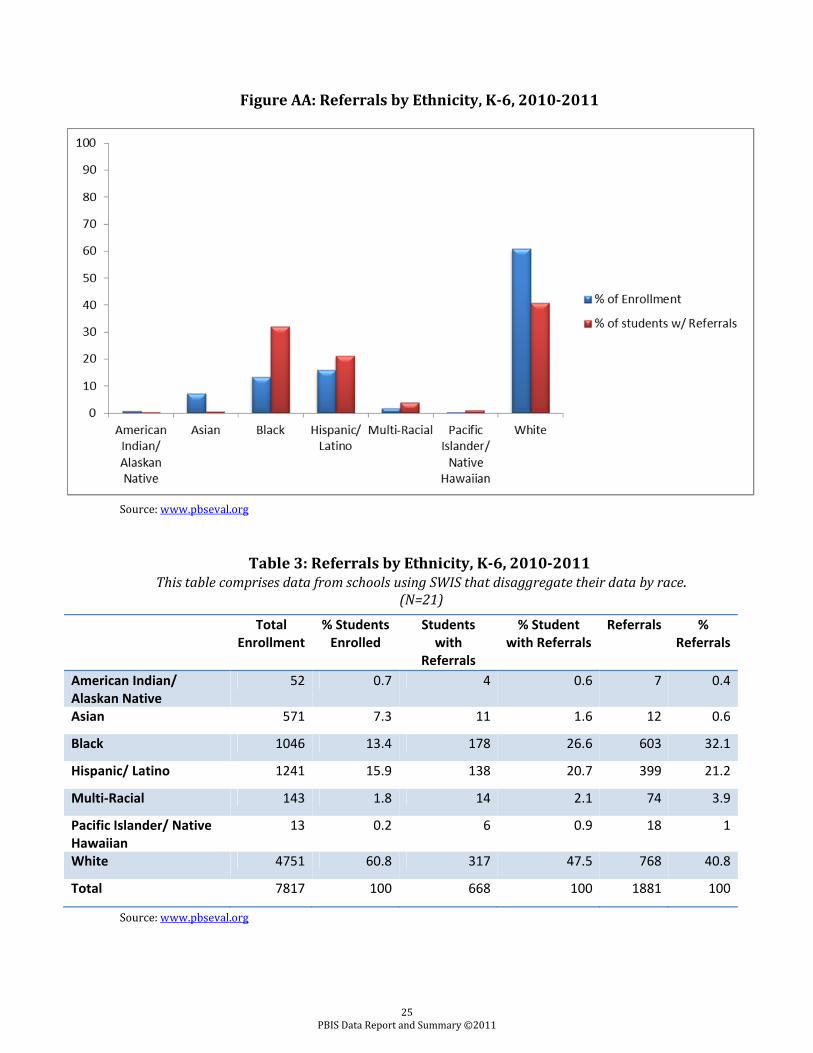
Figure AA: Referrals by Ethnicity, K-6, 2010-2011 Source: www.pbseval.org
Table 3: Referrals by Ethnicity, K-6, 2010-2011 This table comprises data from schools using SWIS that disaggregate their data by race.
(N=21)
Total Enrollment
% Students Enrolled
Students with
Referrals
% Student with Referrals
Referrals % Referrals
American Indian/ Alaskan Native
52 0.7 4 0.6 7 0.4
Asian 571 7.3 11 1.6 12 0.6
Black 1046 13.4 178 26.6 603 32.1
Hispanic/ Latino 1241 15.9 138 20.7 399 21.2
Multi-Racial 143 1.8 14 2.1 74 3.9
Pacific Islander/ Native Hawaiian
13 0.2 6 0.9 18 1
White 4751 60.8 317 47.5 768 40.8
Total 7817 100 668 100 1881 100Source: www.pbseval.org
25 PBIS Data Report and Summary ©2011
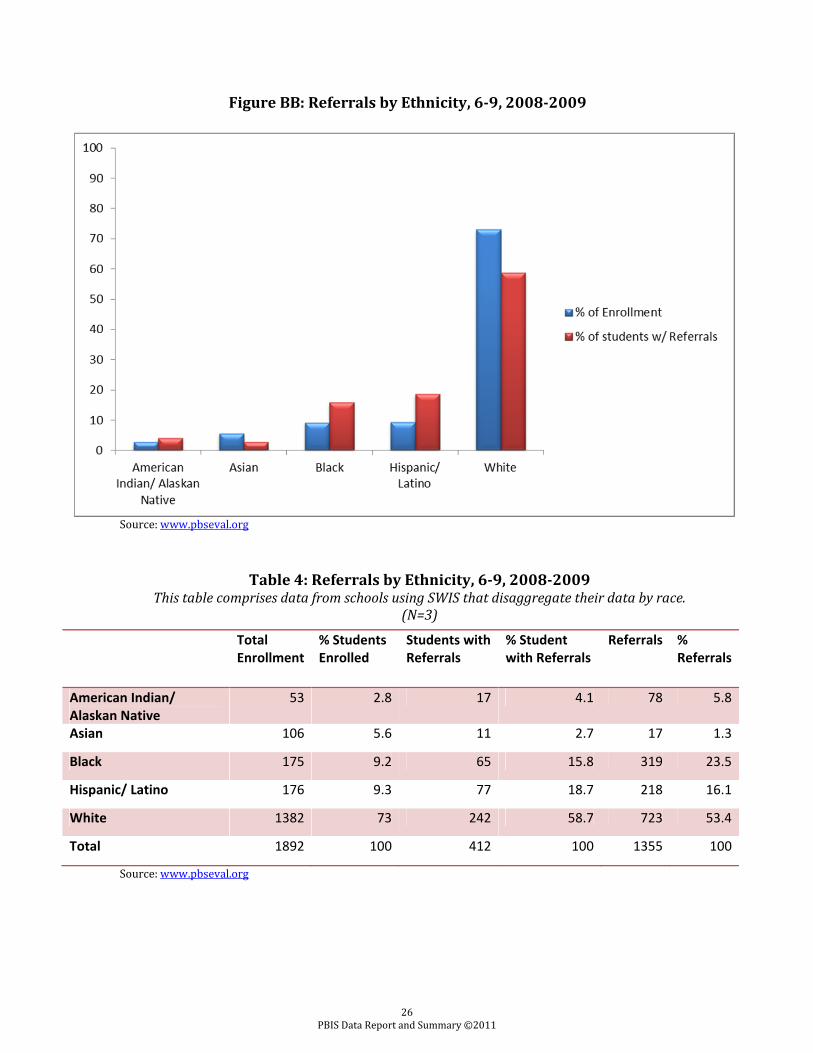
Figure BB: Referrals by Ethnicity, 6-9, 2008-2009
Source: www.pbseval.org
Table 4: Referrals by Ethnicity, 6-9, 2008-2009 This table comprises data from schools using SWIS that disaggregate their data by race.
(N=3)
Total Enrollment
% Students Enrolled
Students with Referrals
% Student with Referrals
Referrals % Referrals
American Indian/ Alaskan Native
53 2.8 17 4.1 78 5.8
Asian 106 5.6 11 2.7 17 1.3
Black 175 9.2 65 15.8 319 23.5
Hispanic/ Latino 176 9.3 77 18.7 218 16.1
White 1382 73 242 58.7 723 53.4
Total 1892 100 412 100 1355 100Source: www.pbseval.org
26 PBIS Data Report and Summary ©2011
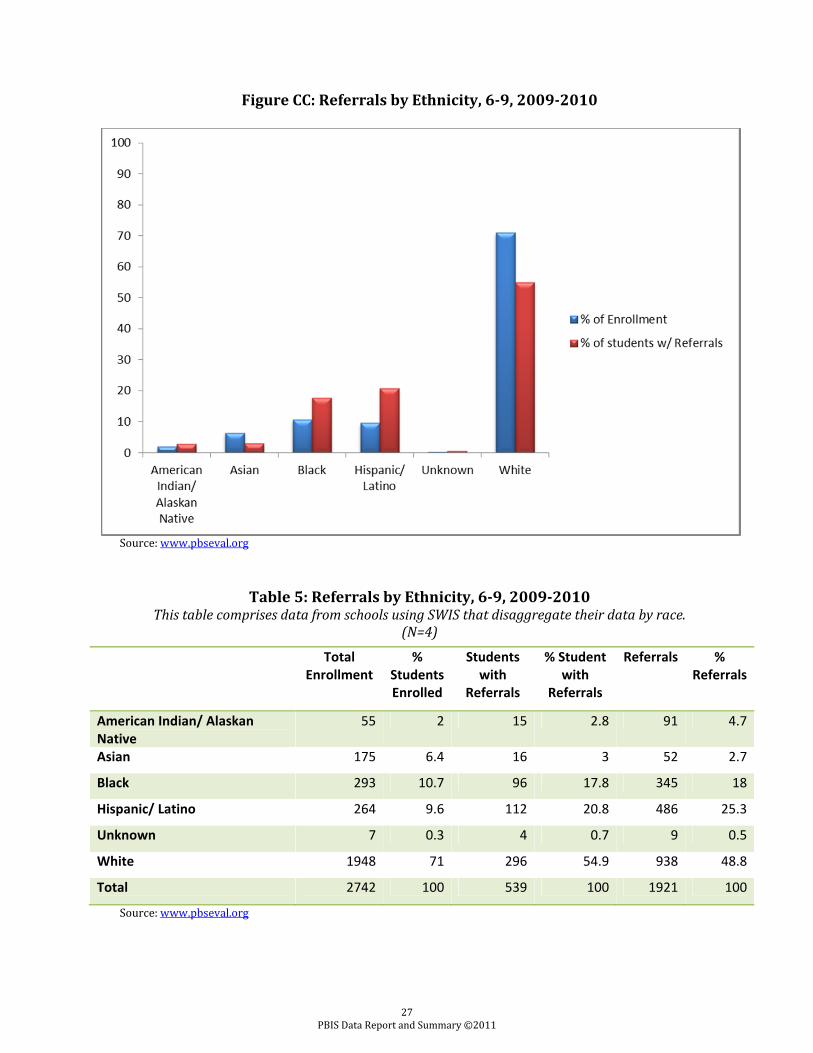
Figure CC: Referrals by Ethnicity, 6-9, 2009-2010
Source: www.pbseval.org Table 5: Referrals by Ethnicity, 6-9, 2009-2010
This table comprises data from schools using SWIS that disaggregate their data by race. (N=4)
Total Enrollment
% Students Enrolled
Students with
Referrals
% Student with
Referrals
Referrals % Referrals
American Indian/ Alaskan Native
55 2 15 2.8 91 4.7
Asian 175 6.4 16 3 52 2.7
Black 293 10.7 96 17.8 345 18
Hispanic/ Latino 264 9.6 112 20.8 486 25.3
Unknown 7 0.3 4 0.7 9 0.5
White 1948 71 296 54.9 938 48.8
Total 2742 100 539 100 1921 100Source: www.pbseval.org
27 PBIS Data Report and Summary ©2011
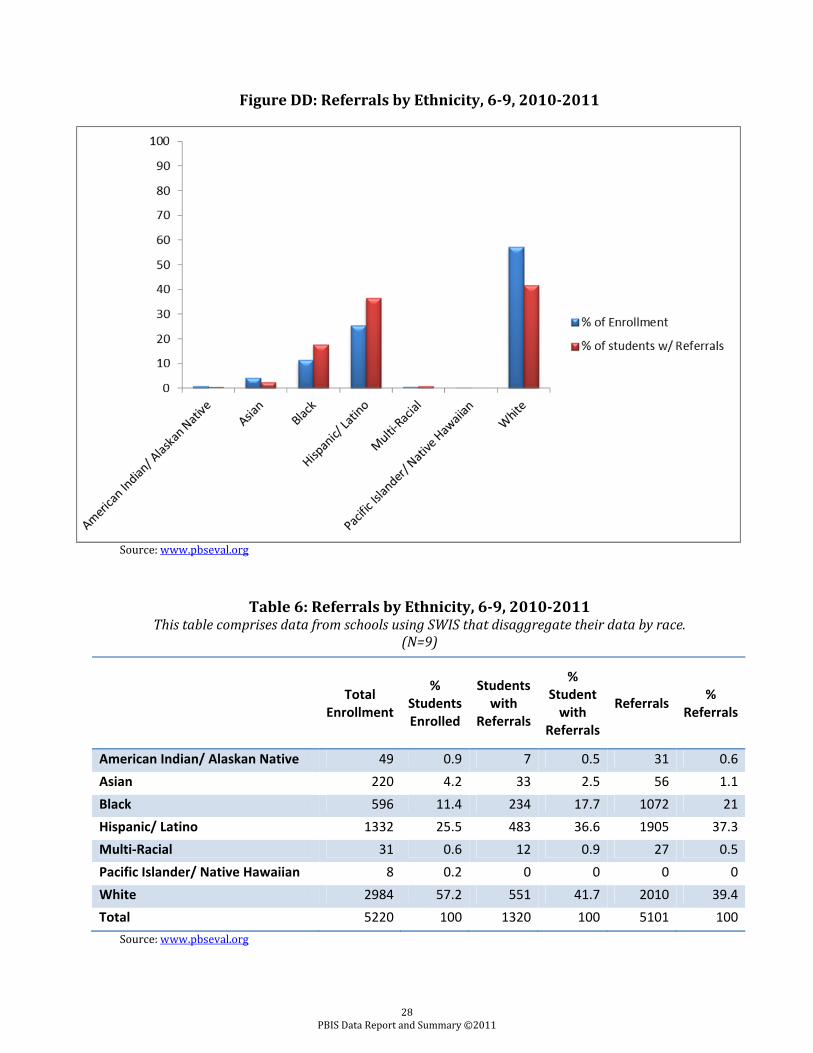
Figure DD: Referrals by Ethnicity, 6-9, 2010-2011
Source: www.pbseval.org
Table 6: Referrals by Ethnicity, 6-9, 2010-2011 This table comprises data from schools using SWIS that disaggregate their data by race.
(N=9)
Total
Enrollment
% Students Enrolled
Students with
Referrals
% Student
with Referrals
Referrals % Referrals
American Indian/ Alaskan Native 49 0.9 7 0.5 31 0.6Asian 220 4.2 33 2.5 56 1.1Black 596 11.4 234 17.7 1072 21Hispanic/ Latino 1332 25.5 483 36.6 1905 37.3Multi-Racial 31 0.6 12 0.9 27 0.5Pacific Islander/ Native Hawaiian 8 0.2 0 0 0 0White 2984 57.2 551 41.7 2010 39.4Total 5220 100 1320 100 5101 100Source: www.pbseval.org
28 PBIS Data Report and Summary ©2011
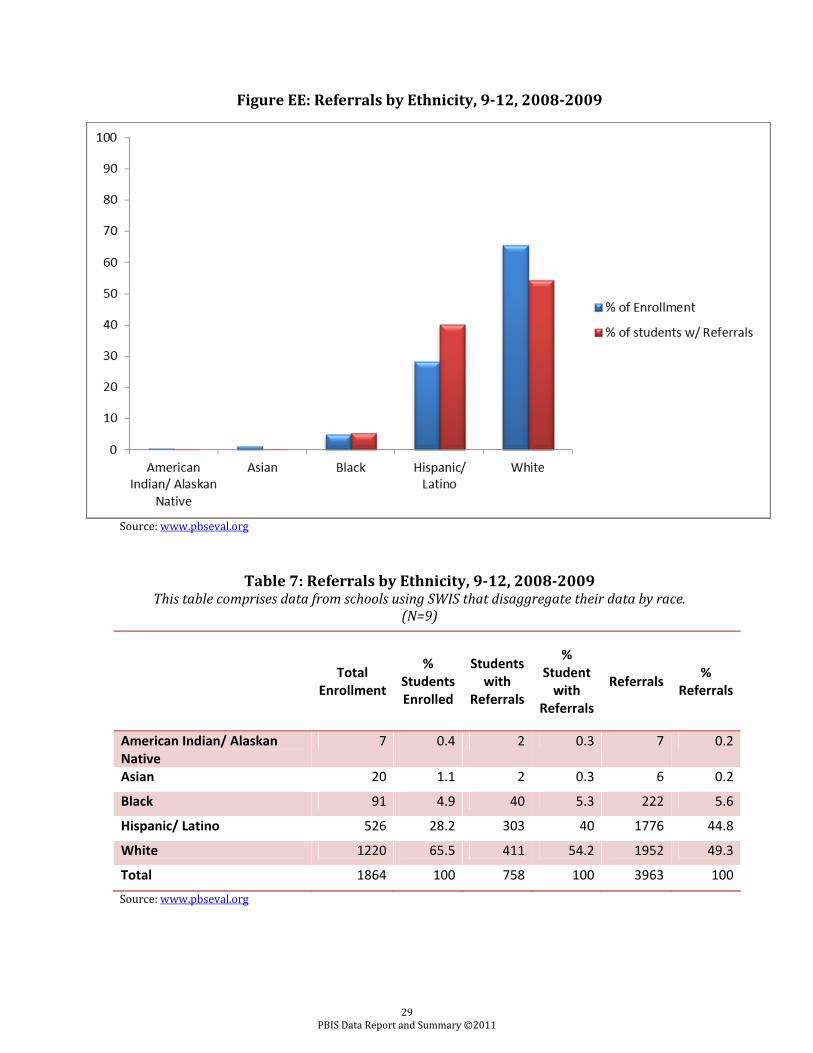
Figure EE: Referrals by Ethnicity, 9-12, 2008-2009
Source: www.pbseval.org
Table 7: Referrals by Ethnicity, 9-12, 2008-2009 This table comprises data from schools using SWIS that disaggregate their data by race.
(N=9)
Total Enrollment
% Students Enrolled
Students with
Referrals
% Student
with Referrals
Referrals % Referrals
American Indian/ Alaskan Native
7 0.4 2 0.3 7 0.2
Asian 20 1.1 2 0.3 6 0.2
Black 91 4.9 40 5.3 222 5.6
Hispanic/ Latino 526 28.2 303 40 1776 44.8
White 1220 65.5 411 54.2 1952 49.3
Total 1864 100 758 100 3963 100Source: www.pbseval.org
29 PBIS Data Report and Summary ©2011
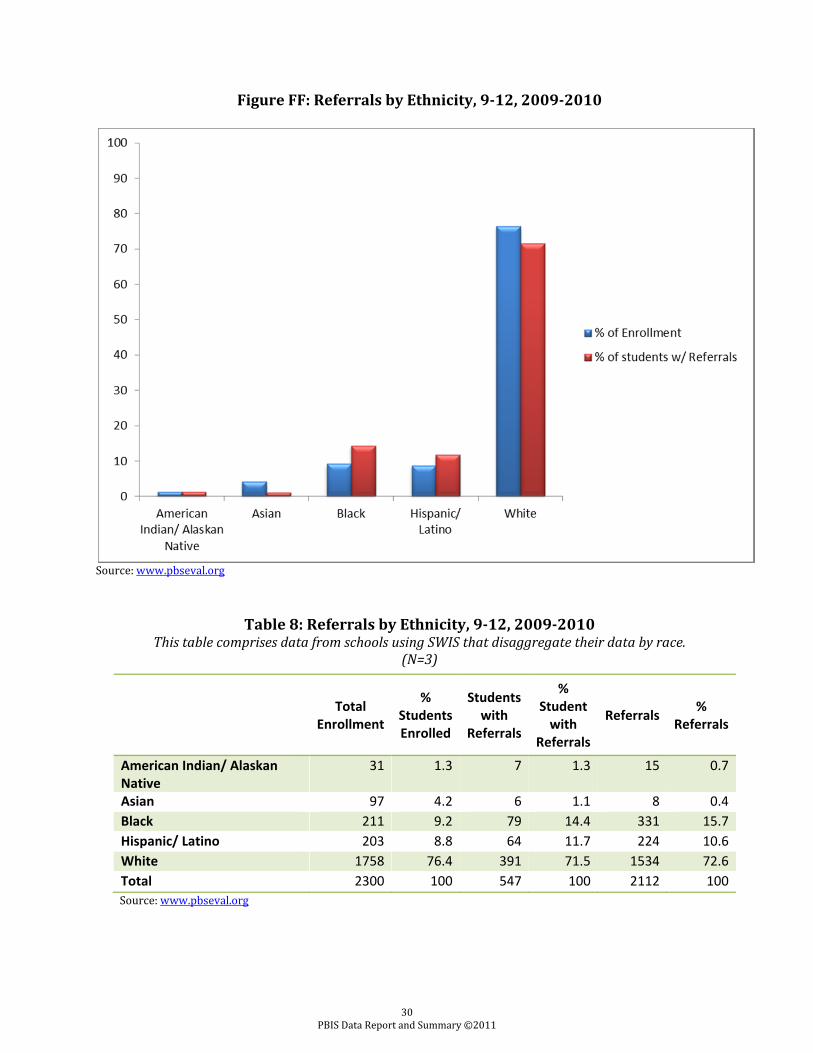
Figure FF: Referrals by Ethnicity, 9-12, 2009-2010
Source: www.pbseval.org
Table 8: Referrals by Ethnicity, 9-12, 2009-2010 This table comprises data from schools using SWIS that disaggregate their data by race.
(N=3)
Total
Enrollment
% Students Enrolled
Students with
Referrals
% Student
with Referrals
Referrals % Referrals
American Indian/ Alaskan Native
31 1.3 7 1.3 15 0.7
Asian 97 4.2 6 1.1 8 0.4Black 211 9.2 79 14.4 331 15.7Hispanic/ Latino 203 8.8 64 11.7 224 10.6White 1758 76.4 391 71.5 1534 72.6Total 2300 100 547 100 2112 100Source: www.pbseval.org
30 PBIS Data Report and Summary ©2011
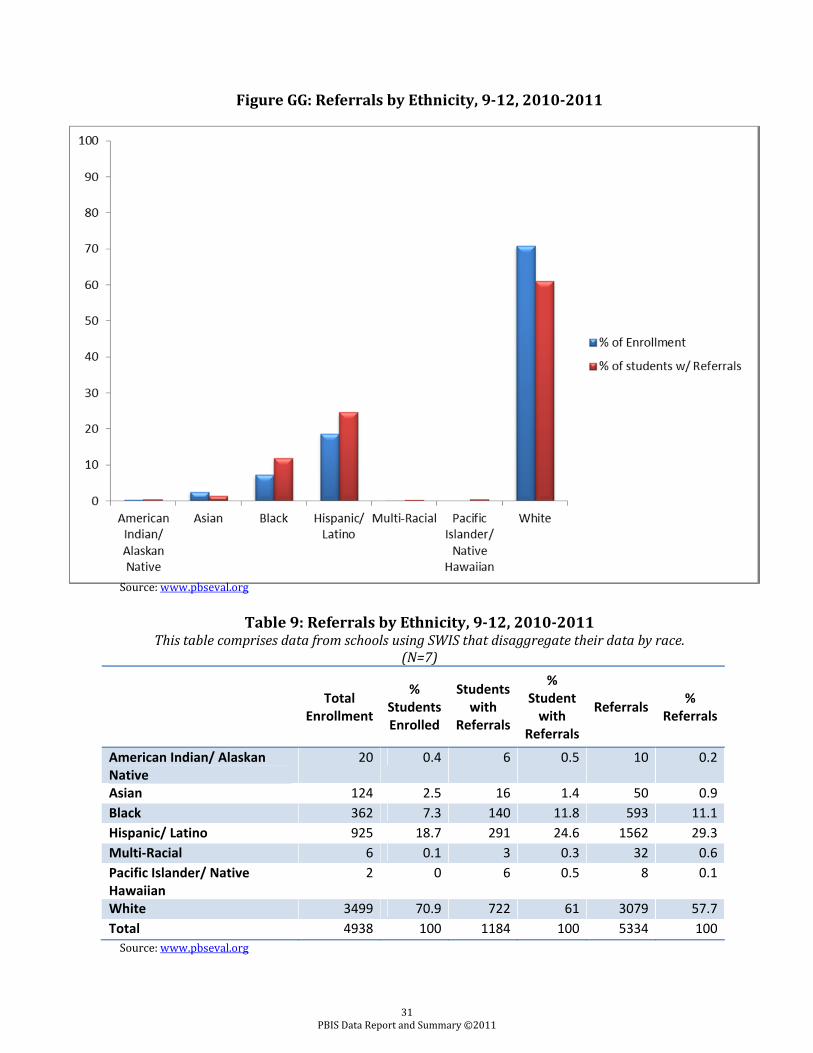
Figure GG: Referrals by Ethnicity, 9-12, 2010-2011
Source: www.pbseval.org
Table 9: Referrals by Ethnicity, 9-12, 2010-2011
This table comprises data from schools using SWIS that disaggregate their data by race. (N=7)
Total
Enrollment
% Students Enrolled
Students with
Referrals
% Student
with Referrals
Referrals % Referrals
American Indian/ Alaskan Native
20 0.4 6 0.5 10 0.2
Asian 124 2.5 16 1.4 50 0.9Black 362 7.3 140 11.8 593 11.1Hispanic/ Latino 925 18.7 291 24.6 1562 29.3Multi-Racial 6 0.1 3 0.3 32 0.6Pacific Islander/ Native Hawaiian
2 0 6 0.5 8 0.1
White 3499 70.9 722 61 3079 57.7Total 4938 100 1184 100 5334 100Source: www.pbseval.org
31 PBIS Data Report and Summary ©2011
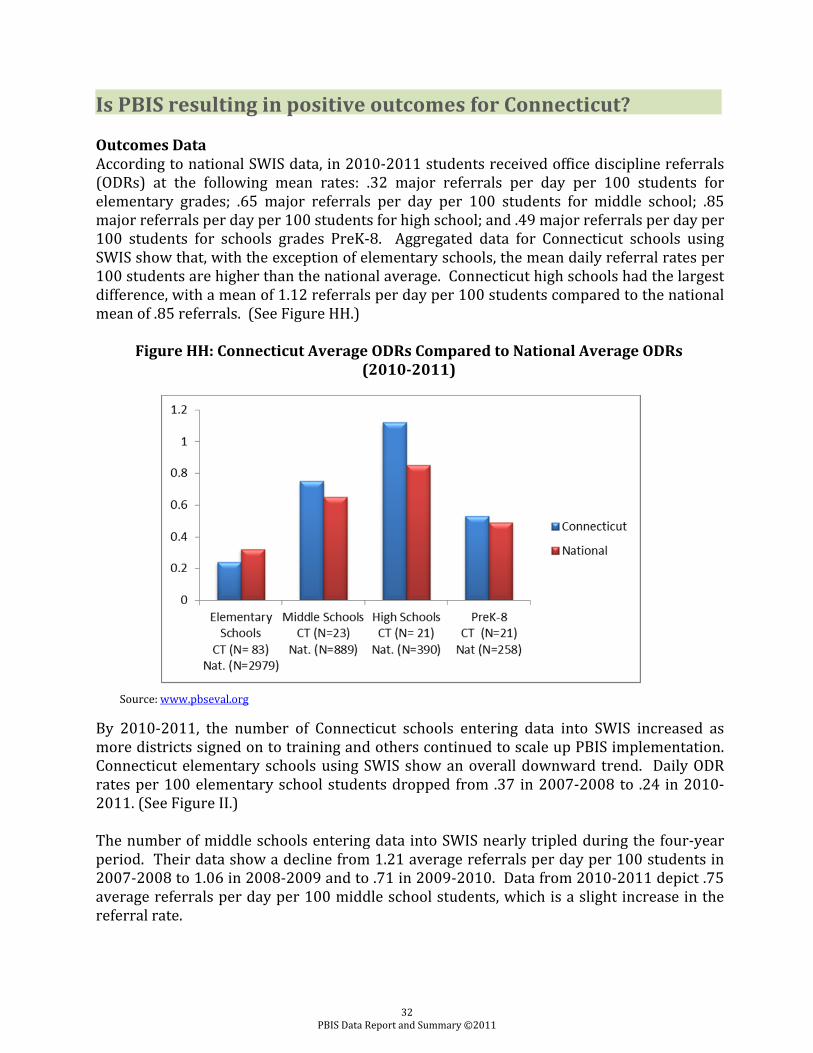
Is PBIS resulting in positive outcomes for Connecticut? Outcomes Data According to national SWIS data, in 2010-2011 students received office discipline referrals (ODRs) at the following mean rates: .32 major referrals per day per 100 students for elementary grades; .65 major referrals per day per 100 students for middle school; .85 major referrals per day per 100 students for high school; and .49 major referrals per day per 100 students for schools grades PreK-8. Aggregated data for Connecticut schools using SWIS show that, with the exception of elementary schools, the mean daily referral rates per 100 students are higher than the national average. Connecticut high schools had the largest difference, with a mean of 1.12 referrals per day per 100 students compared to the national mean of .85 referrals. (See Figure HH.)
Figure HH: Connecticut Average ODRs Compared to National Average ODRs (2010-2011) Source: www.pbseval.org By 2010-2011, the number of Connecticut schools entering data into SWIS increased as more districts signed on to training and others continued to scale up PBIS implementation. Connecticut elementary schools using SWIS show an overall downward trend. Daily ODR rates per 100 elementary school students dropped from .37 in 2007-2008 to .24 in 2010-2011. (See Figure II.) The number of middle schools entering data into SWIS nearly tripled during the four-year period. Their data show a decline from 1.21 average referrals per day per 100 students in 2007-2008 to 1.06 in 2008-2009 and to .71 in 2009-2010. Data from 2010-2011 depict .75 average referrals per day per 100 middle school students, which is a slight increase in the referral rate.
32 PBIS Data Report and Summary ©2011
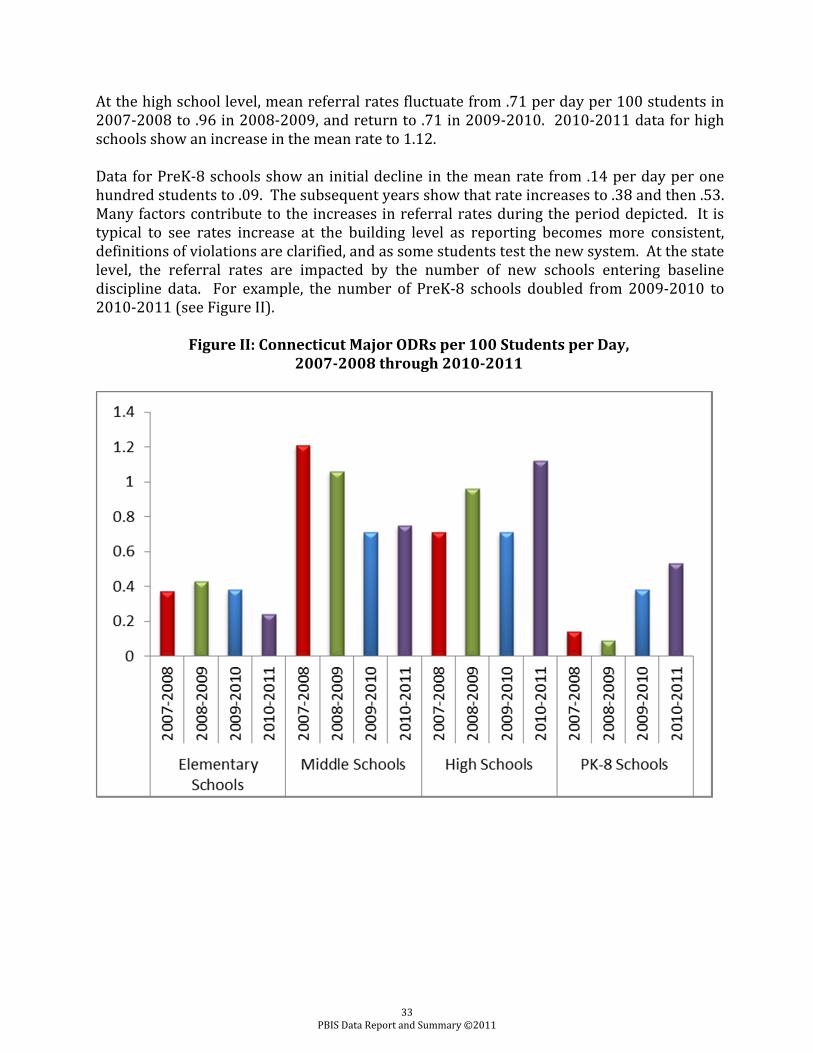
At the high school level, mean referral rates fluctuate from .71 per day per 100 students in 2007-2008 to .96 in 2008-2009, and return to .71 in 2009-2010. 2010-2011 data for high schools show an increase in the mean rate to 1.12. Data for PreK-8 schools show an initial decline in the mean rate from .14 per day per one hundred students to .09. The subsequent years show that rate increases to .38 and then .53. Many factors contribute to the increases in referral rates during the period depicted. It is typical to see rates increase at the building level as reporting becomes more consistent, definitions of violations are clarified, and as some students test the new system. At the state level, the referral rates are impacted by the number of new schools entering baseline discipline data. For example, the number of PreK-8 schools doubled from 2009-2010 to 2010-2011 (see Figure II). Figure II: Connecticut Major ODRs per 100 Students per Day,
2007-2008 through 2010-2011
33 PBIS Data Report and Summary ©2011
Another informative method of analyzing the SWIS data is through triangle distributions. While establishing leveled systems of support, schools review the distribution of referrals by the student in order to determine whether the leveled prevention system is effective. The National Center on PBIS has identified ideal goal distributions for schools at various grade levels (see Figure JJ). When systems of positive behavioral support are working efficiently and effectively, schools can expect the vast majority of students to receive 0-1 office discipline referrals. Nationally, 91% of elementary students (K-6), 83% of middle school students (6-9), and 78% of students in high schools (9-12) receive 0-1 referrals. Subsequently, the numbers of students in need of level two and three intervention vary by grade level as well. Generally, because of higher referral rates, 7% of students in elementary schools require secondary level interventions and, at most, 2% of students receive support at the tertiary level. In middle school, it is common that secondary level supports are offered to 11% of students and that, at most, 6% of students receive tertiary level interventions. Similarly, in high schools, 15% and, at most, 8% of students receive secondary level and tertiary level interventions respectively.
34 PBIS Data Report and Summary ©2011
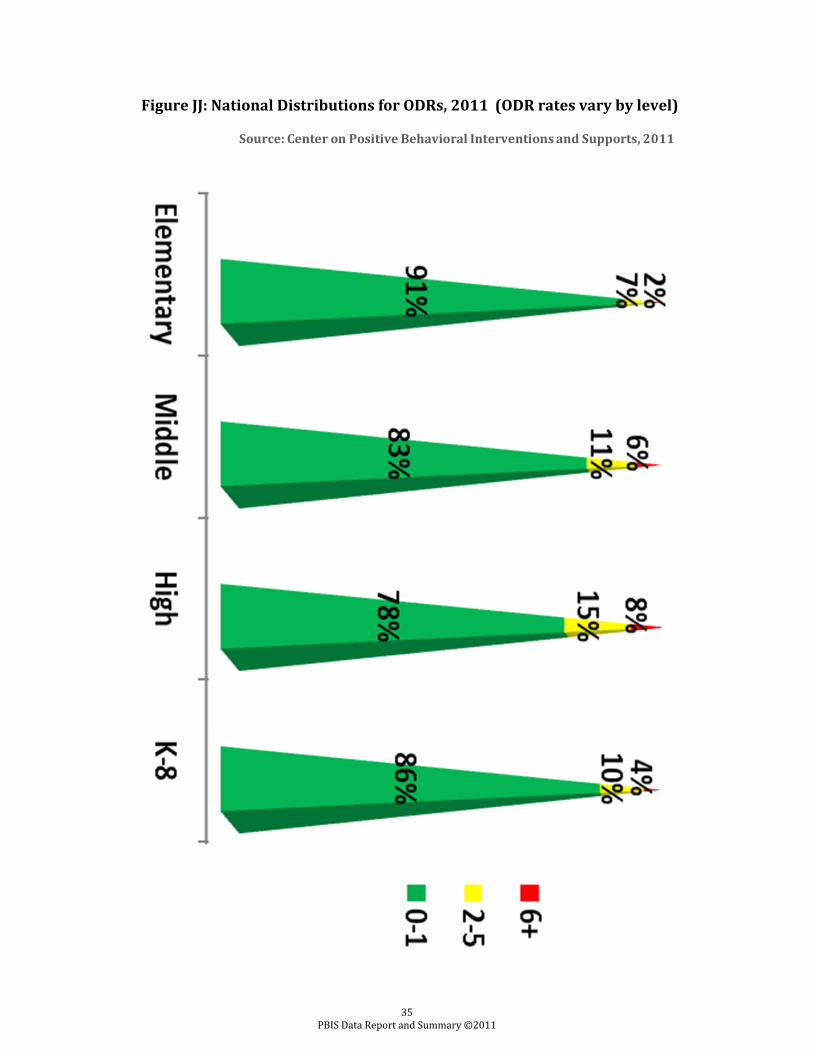
Figure JJ: National Distributions for ODRs, 2011 (ODR rates vary by level)
Source: Center on Positive Behavioral Interventions and Supports, 2011
35 PBIS Data Report and Summary ©2011
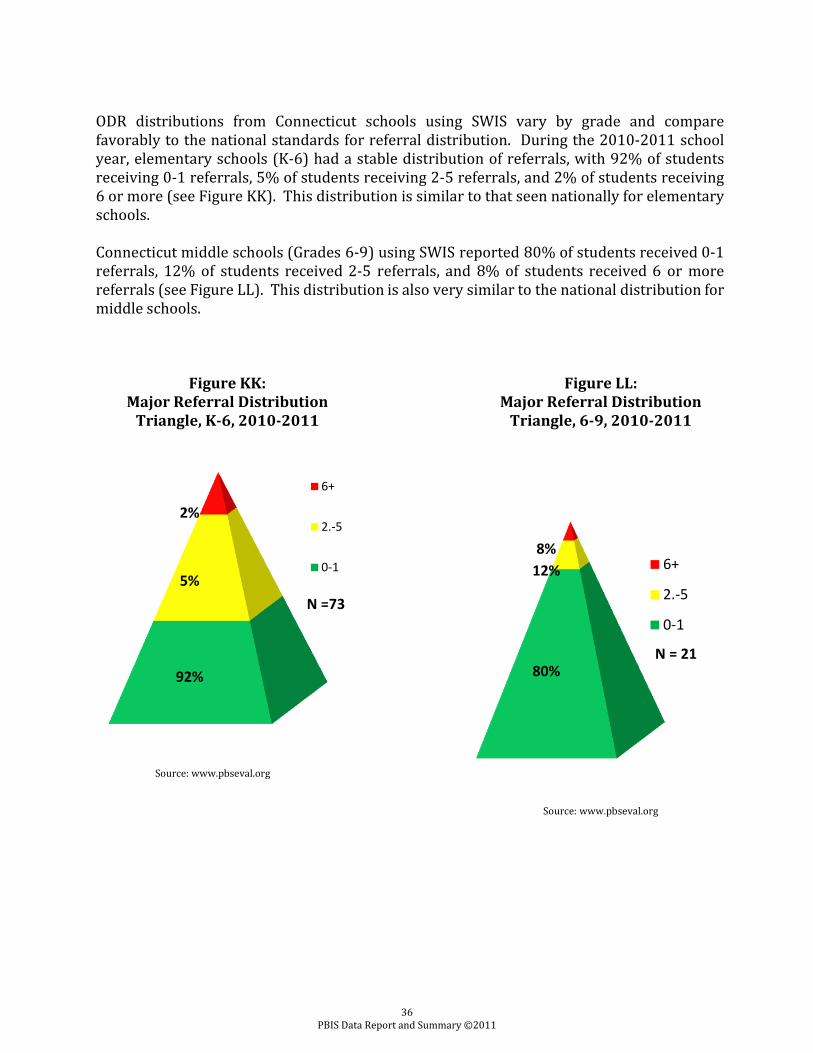
ODR distributions from Connecticut schools using SWIS vary by grade and compare favorably to the national standards for referral distribution. During the 2010-2011 school year, elementary schools (K-6) had a stable distribution of referrals, with 92% of students receiving 0-1 referrals, 5% of students receiving 2-5 referrals, and 2% of students receiving 6 or more (see Figure KK). This distribution is similar to that seen nationally for elementary schools. Connecticut middle schools (Grades 6-9) using SWIS reported 80% of students received 0-1 referrals, 12% of students received 2-5 referrals, and 8% of students received 6 or more referrals (see Figure LL). This distribution is also very similar to the national distribution for middle schools.
Figure KK: Major Referral Distribution
Triangle, K-6, 2010-2011
Source: www.pbseval.org
Figure LL:
Major Referral Distribution Triangle, 6-9, 2010-2011
Source: www.pbseval.org
92%
5%
2%
N =73
6+
2.-5
0-1
80%
12%8%
N = 21
6+
2.-5
0-1
36 PBIS Data Report and Summary ©2011
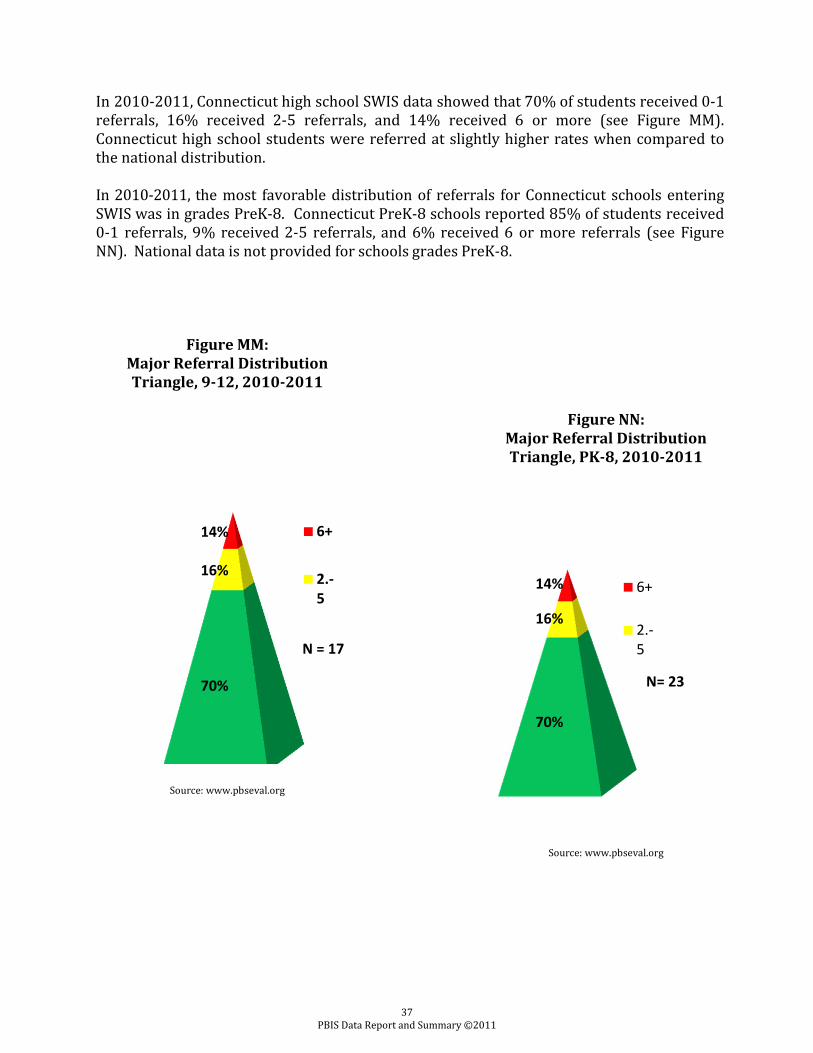
In 2010-2011, Connecticut high school SWIS data showed that 70% of students received 0-1 referrals, 16% received 2-5 referrals, and 14% received 6 or more (see Figure MM). Connecticut high school students were referred at slightly higher rates when compared to the national distribution. In 2010-2011, the most favorable distribution of referrals for Connecticut schools entering SWIS was in grades PreK-8. Connecticut PreK-8 schools reported 85% of students received 0-1 referrals, 9% received 2-5 referrals, and 6% received 6 or more referrals (see Figure NN). National data is not provided for schools grades PreK-8.
Figure MM:
Major Referral Distribution Triangle, 9-12, 2010-2011
Source: www.pbseval.org
Figure NN: Major Referral Distribution Triangle, PK-8, 2010-2011
Source: www.pbseval.org
70%
16%
14%
N = 17
6+
2.-5
70%
16%
14%
N= 23
6+
2.-5
37 PBIS Data Report and Summary ©2011
Impact Data ODR distribution data can also be used to highlight the changes in student referral rates in schools that implement PBIS. As stated previously, schools are evaluated annually using the SET. Schools scoring 80% for “expectations taught” and 80% for an overall average are said to have “met SET” or to be implementing to criterion. At the elementary level, schools that met SET showed at least 90% of students achieving behavioral success (i.e. 0-1 office referrals) at the primary prevention level. Elementary schools implementing to criterion had 6% of their students receiving 2-5 referrals and 4% receiving 6 or more. Middle schools that met SET showed 83% of students responding well at the primary level with 11% receiving 2-5 ODRs and 6% receiving 6 or more. None of the 9 high schools in the data set were scored as implementing to criterion. The PreK-8 schools that met SET reported that interventions were successful. In these schools, 84% of students received 0-1 office referrals, 9% of students received 2-5 referrals, and 7% received 6 or more. What are Connecticut’s Model PBIS Schools? The Model Schools Project is designed to recognize schools for successfully implementing school-wide systems for PBIS. Criteria for recognition are based on effective implementation of key features as outlined by the National Technical Assistance Center on PBIS and are consistent with the outcomes of Connecticut’s PBIS Training Series. In Spring 2011, SERC awarded six Connecticut schools Model status. Five schools earned distinction as Model Demonstration Schools and one school was recognized as a Model Banner School. The Demonstration Sites were Colchester Elementary School, William J. Johnston Middle School, Middle School of Plainville, Housatonic Valley Regional High School, and Windham Middle School. Tyl Middle school received the Model Banner School award. Eligibility for Model Banner School status includes current SET scores of 80/80 or higher; a current, active action plan; and two years of data that show evidence of positive behavioral outcomes. Schools applying for Model Demonstration School status meet the eligibility for Banner School and also agree to host a number of visits during the school year that give interested implementers and other stakeholders an opportunity to see PBIS in action and to hear a school-wide leadership team’s perspective on the process in their building. In 2010-2011, the Model Demonstration Schools hosted approximately seventy- five visitors. The following graphs compare office referral data and academic achievement, measured by performance on the Connecticut Mastery Test (CMT) or Connecticut Academic Performance Test (CAPT), for each of the Model Demonstration Schools during the last three to six years.
38 PBIS Data Report and Summary ©2011
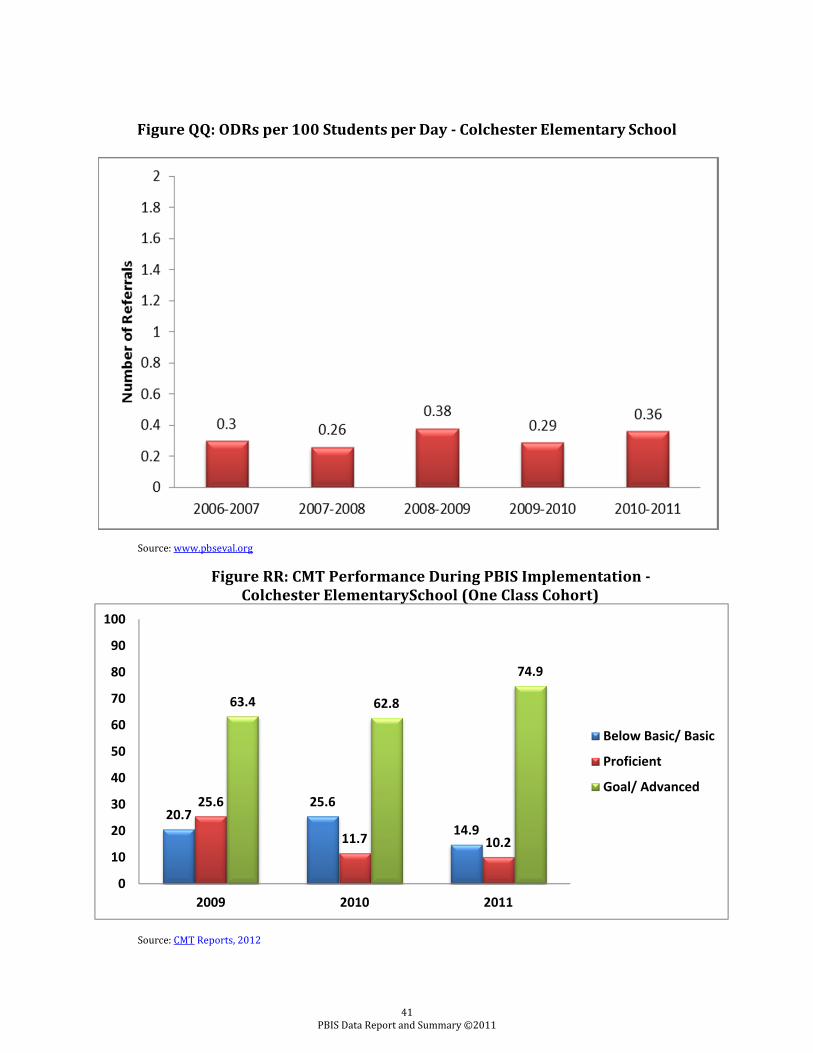
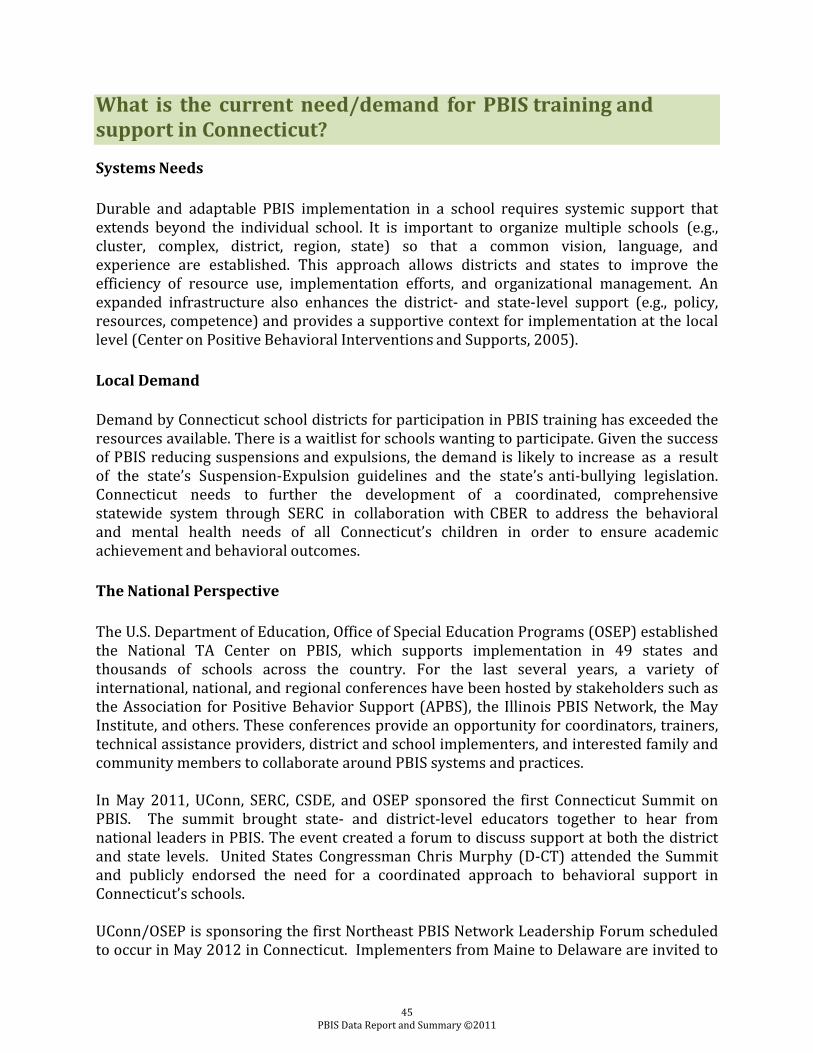
Since implementing PBIS in 2005-2006, ODRs at Middle School of Plainville have declined each year. ODRs per one hundred students per day at Middle School of Plainville decreased by eighty-six percent from 1.72 in 2005-2006 to .24 in 2010-2011 (see Figure OO). During the last three years of the same time period, Middle School of Plainville saw an increase in CMT Reading Performance, following the same cohort of students (see Figure PP). ODRs per one hundred students per day at Colchester Elementary School have remained low and somewhat constant, ranging from 0.3 in 2006-2007 and .36 in 2010-2011 (see Figure QQ). Similar to Middle School of Plainville, Colchester Elementary School saw an increase in student academic achievement. Figure RR shows an increase in performance on the Reading CMT for a cohort of students over a three year period. At Housatonic Valley Regional High School, ODRs declined from 1.1 referrals per one hundred students per day to .23 referrals between 2008-2009 and 2010-2011 (see Figure SS). With the exception of writing performance in 2010, there was an increase in student achievement on all areas of the CAPT (see Figure TT). William J. Johnston Middle School data shows that ODRs per one hundred students per day declined from .75 to .69 over a four-year span (see Figure UU). There was an increase in student proficiency on the Reading CMT during the years of PBIS implementation (see Figure VV). Windham Middle School boasts a yearly decline and a thirty-five percent decrease in ODRs over the last four school years. In 2007-2008, 2.42 ODRs per one hundred students per day were recorded compared to 1.57 by 2010-2011 (see Figure WW). In addition to the decrease in ODRs, Windham Middle School saw an overall increase in Reading CMT Performance over a three year period for one cohort that was tracked (see Figure XX). ODRs at Middle School of Plainville and Housatonic Valley Regional High School for 2010-2011 calculate below the national averages of .46 and .62 referrals per one hundred students per day for middle school and high school, respectively.
39 PBIS Data Report and Summary ©2011
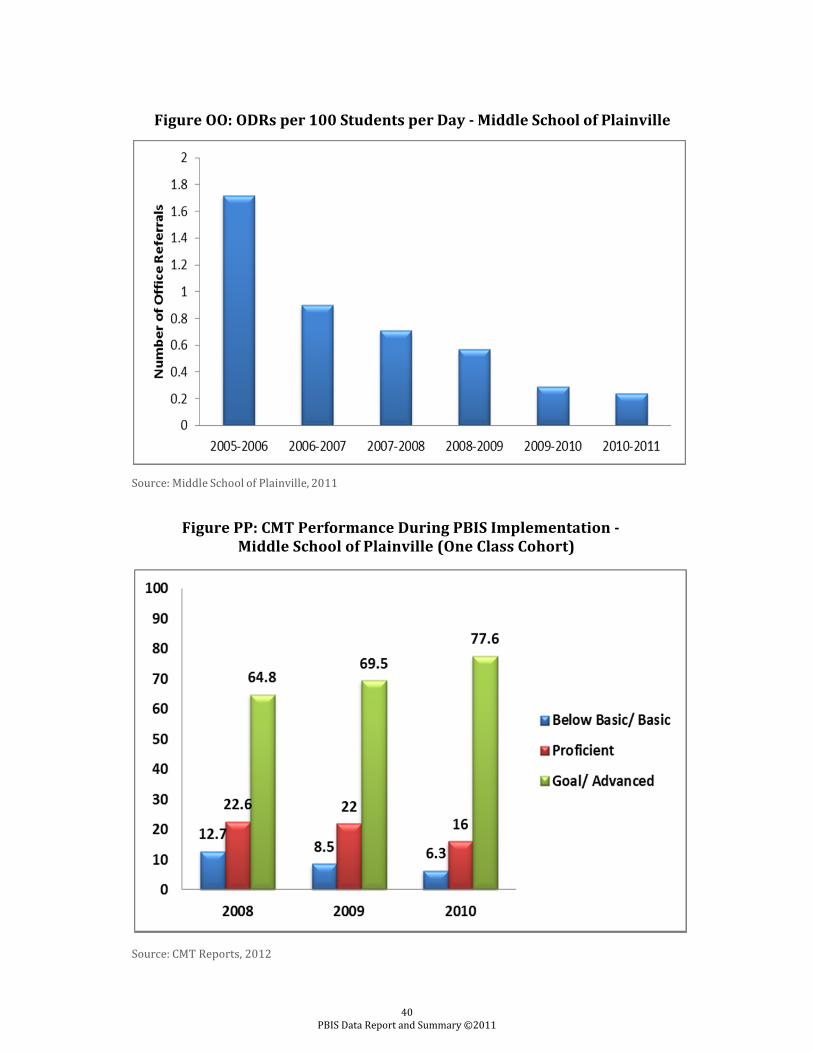
Figure OO: ODRs per 100 Students per Day - Middle School of Plainville
Source: Middle School of Plainville, 2011
Figure PP: CMT Performance During PBIS Implementation - Middle School of Plainville (One Class Cohort)
Source: CMT Reports, 2012 40
PBIS Data Report and Summary ©2011
20.725.6
14.9
25.6
11.7 10.2
63.4 62.8
74.9
0
10
20
30
40
50
60
70
80
90
100
2009 2010 2011
Below Basic/ Basic
Proficient
Goal/ Advanced
Figure QQ: ODRs per 100 Students per Day - Colchester Elementary School
Source: www.pbseval.org
Figure RR: CMT Performance During PBIS Implementation - Colchester ElementarySchool (One Class Cohort)
Source: CMT Reports, 2012
41 PBIS Data Report and Summary ©2011
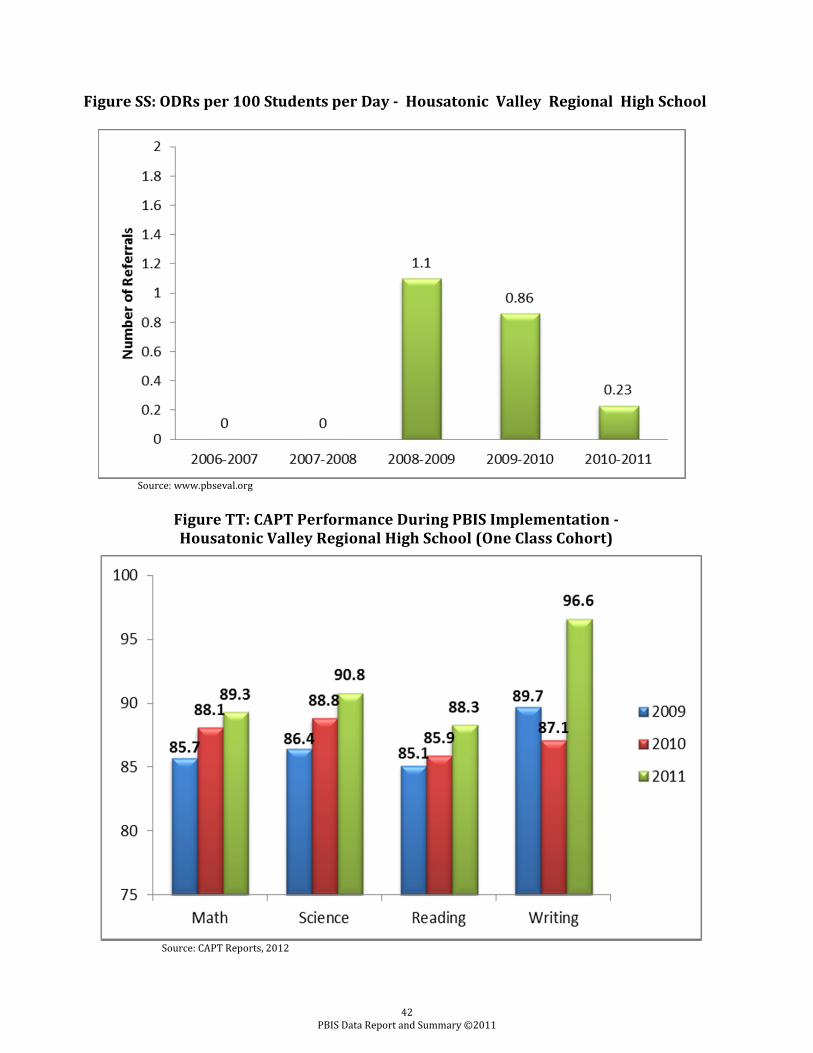
Figure SS: ODRs per 100 Students per Day - Housatonic Valley Regional High School
Source: www.pbseval.org
Figure TT: CAPT Performance During PBIS Implementation - Housatonic Valley Regional High School (One Class Cohort)
Source: CAPT Reports, 2012
42 PBIS Data Report and Summary ©2011
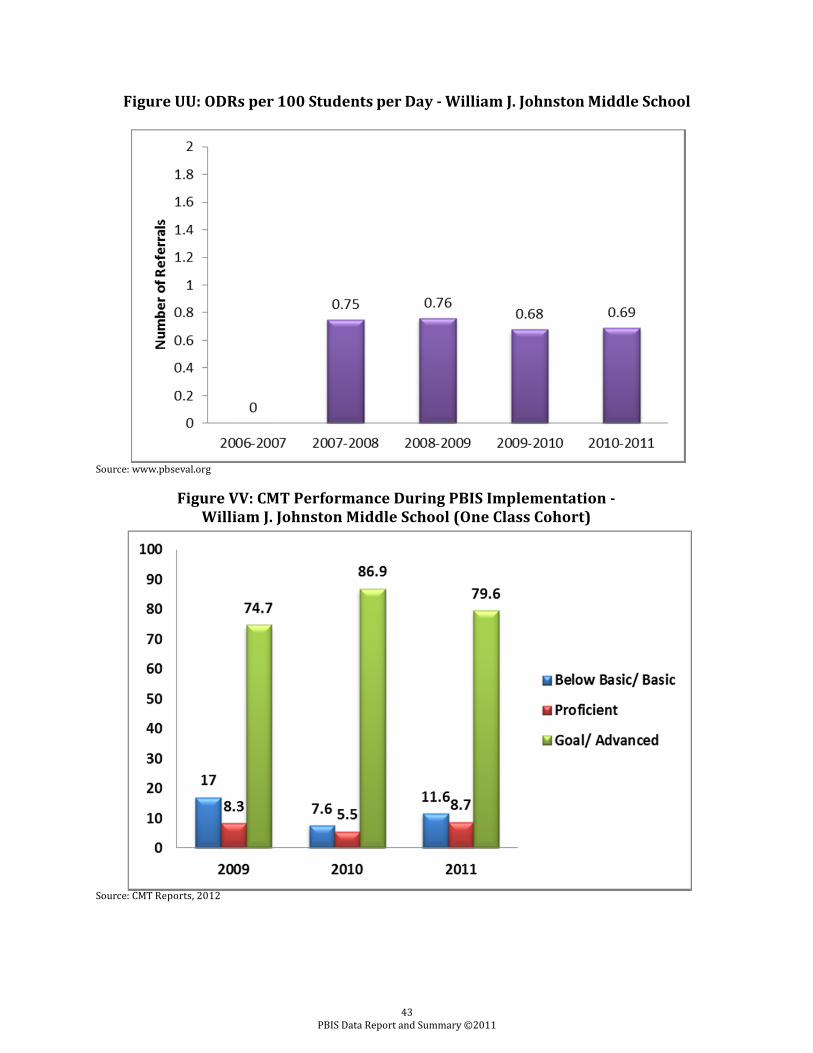
Figure UU: ODRs per 100 Students per Day - William J. Johnston Middle School
Source: www.pbseval.org Figure VV: CMT Performance During PBIS Implementation -
William J. Johnston Middle School (One Class Cohort) Source: CMT Reports, 2012
43 PBIS Data Report and Summary ©2011
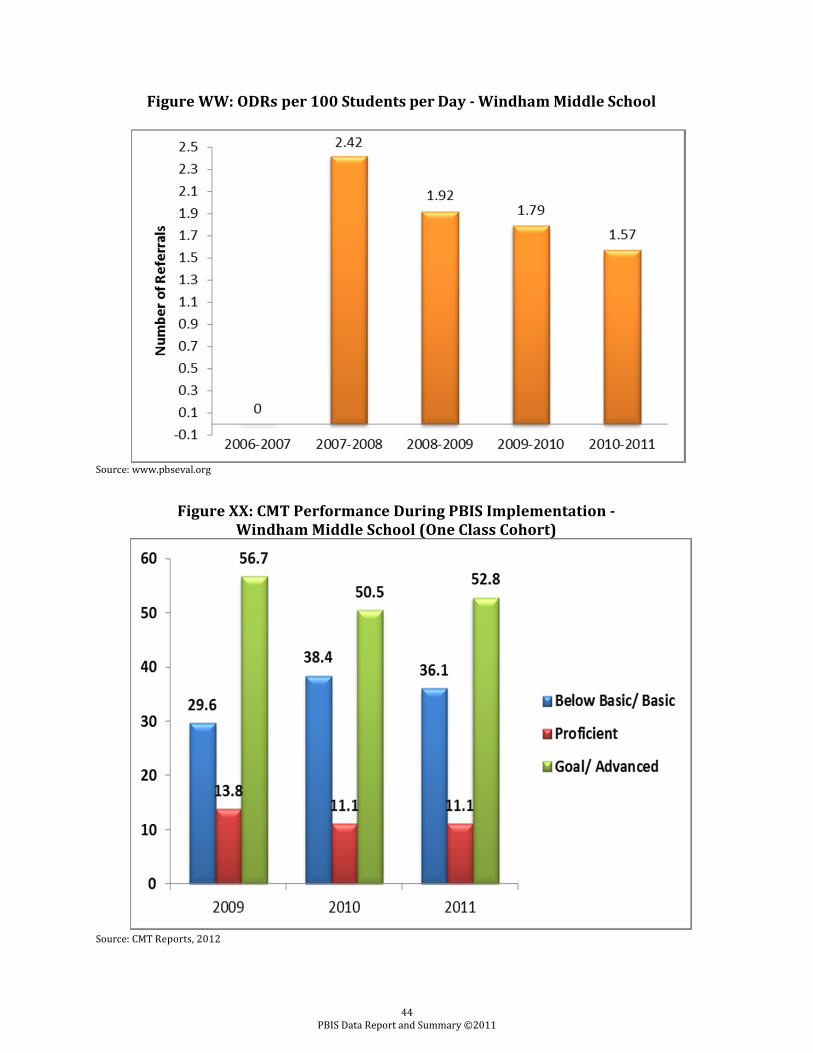
Figure WW: ODRs per 100 Students per Day - Windham Middle School
Source: www.pbseval.org
Figure XX: CMT Performance During PBIS Implementation - Windham Middle School (One Class Cohort)
Source: CMT Reports, 2012
44 PBIS Data Report and Summary ©2011
What is the current need/demand for PBIS training and support in Connecticut? Systems Needs Durable and adaptable PBIS implementation in a school requires systemic support that extends beyond the individual school. It is important to organize multiple schools (e.g., cluster, complex, district, region, state) so that a common vision, language, and experience are established. This approach allows districts and states to improve the efficiency of resource use, implementation efforts, and organizational management. An expanded infrastructure also enhances the district- and state-level support (e.g., policy, resources, competence) and provides a supportive context for implementation at the local level (Center on Positive Behavioral Interventions and Supports, 2005). Local Demand Demand by Connecticut school districts for participation in PBIS training has exceeded the resources available. There is a waitlist for schools wanting to participate. Given the success of PBIS reducing suspensions and expulsions, the demand is likely to increase as a result of the state’s Suspension-Expulsion guidelines and the state’s anti-bullying legislation. Connecticut needs to further the development of a coordinated, comprehensive statewide system through SERC in collaboration with CBER to address the behavioral and mental health needs of all Connecticut’s children in order to ensure academic achievement and behavioral outcomes. The National Perspective The U.S. Department of Education, Office of Special Education Programs (OSEP) established the National TA Center on PBIS, which supports implementation in 49 states and thousands of schools across the country. For the last several years, a variety of international, national, and regional conferences have been hosted by stakeholders such as the Association for Positive Behavior Support (APBS), the Illinois PBIS Network, the May Institute, and others. These conferences provide an opportunity for coordinators, trainers, technical assistance providers, district and school implementers, and interested family and community members to collaborate around PBIS systems and practices. In May 2011, UConn, SERC, CSDE, and OSEP sponsored the first Connecticut Summit on PBIS. The summit brought state- and district-level educators together to hear from national leaders in PBIS. The event created a forum to discuss support at both the district and state levels. United States Congressman Chris Murphy (D-CT) attended the Summit and publicly endorsed the need for a coordinated approach to behavioral support in Connecticut’s schools. UConn/OSEP is sponsoring the first Northeast PBIS Network Leadership Forum scheduled to occur in May 2012 in Connecticut. Implementers from Maine to Delaware are invited to
45 PBIS Data Report and Summary ©2011
discuss improving efficacy of implementation and to share and refine ideas for systems and practices around behavioral support. President Barack Obama, who introduced the Positive Behavior for Effective Schools Act (S.2111) on September 27, 2007, as Senator Obama, continues to promote innovative, systemic efforts to support schools and students. President Obama’s support for PBIS as a senator suggests that the framework will continue to be a part of the nation’s education agenda. The 112th Congress is considering proposed legislation that would increase the implementation of PBIS in schools throughout the nation. How do schools get involved in PBIS training? A new cohort of schools begins the Training Series in the fall of each school year. Districts and schools interested in participating in the Training Series begin the planning and application process during the winter preceding their first year of training. Interested schools and districts should contact SERC immediately to receive additional information about informational meetings, the application process, and anticipated openings in the next training cohort. Summary Since 2000, SERC/UConn and the CT PBIS Collaborative have provided PBIS training that has reached almost one-fifth of Connecticut’s schools. Most participating schools are elementary schools, but increasing numbers of middle and high schools have begun training during the last two years. A look at the most recent data give insight as to the most common behavioral problems in schools and whether office referrals are given equitably with regard to gender and race/ethnicity. The data also reveal the patterns of distribution among the total student population. Connecticut PBIS schools are meeting the needs of the majority of their students with practices and systems in place at the primary prevention level. The Connecticut PBIS SET data reflect fluctuations in fidelity during the last three years. Contributing factors to the variations in the data may include changes in faculty/staff, typical changes in student population, inconsistent social skills instruction, and competing initiatives at the school level. The CT PBIS Collaborative proposes to address implementation fidelity through training, technical assistance, and coaching. Recent behavioral data from Connecticut schools implementing PBIS and using SWIS indicate that defiance and disrespect are behaviors that occur frequently at all grade levels. This reflects teacher tolerance and classroom management practices. The CT PBIS Collaborative and UConn have been discussing the need to embed specific classroom training into the universal (Year 1) curriculum.
46 PBIS Data Report and Summary ©2011
High schools report a high percentage of referrals for skipping and a low incidence rate of referrals for bullying/harassment. SERC will seek input from statewide/national experts to join the conversation in order to examine the potential relationship between high school students’ elevated rates of absence from class and low referrals for harassment. The last four years have seen a general decline in the average number of referrals reported across all behaviors tracked. Middle schools have shown the greatest decline in average referrals while elementary school data depict a steady downward trend. ODR rates for high schools and schools with grades PreK-8 have fluctuated during the last four years. However, Connecticut continues to refer students of color and male students disproportionately for behavioral violations. Male students across all grade levels and subgroups are referred at much higher rates than their female peers. The data reflect that Latino and Black students follow a similar disproportionate pattern of referral rates. Equity in Education: A Transformational Approach (SERC, 2011) highlights Dr. Russell Skiba’s research from Indiana University. The research states that students of color receive ODRs for subjective behavioral infractions (e.g., disrespect) at a higher rate than White students. This disproportionate response, however, is not evident for more objective behavioral concerns, such as fighting. The CT PBIS Collaborative/UConn is utilizing these behavioral data to plan professional development that integrates content focused on culturally relevant pedagogy and adult-student relationships. This planning group is also developing coaching content for school-based team leaders and preparing technical assistance providers for conversations regarding equity. These data will continue to be monitored to inform future iterations of the content for training, coaching, and technical assistance. In an effort to develop a comprehensive, statewide system of academic and behavioral interventions and supports, Connecticut applied for, and was selected to receive, a federal State Personnel Development Grant (SPDG) from the Office of Special Education Programs (OSEP). Using Connecticut’s SRBI Framework, this integrated model of literacy instruction and behavior supports will promote the improved achievement of all learners, particularly students with disabilities, students of color, and students acquiring English. The integration of academic and behavior supports proposed in this grant aligns the systems of decision-making, instruction, and assessment. It will assist Connecticut to meet the demand for PBIS training by allowing 100 chosen schools to participate over the five-year grant. An additional component of the grant will facilitate statewide efforts to expand the availability and efficacy of PBIS trainers and coaches.
47 PBIS Data Report and Summary ©2011
References Connecticut State Department of Education. (2008). The Condition of Education in Connecticut. Hartford, CT. Glen Martin Associates. (2010). Model Site Project Evaluation Summary. Albany, NY. Office of Special Education Programs: Center on Positive Behavioral Interventions and Supports. (2010). School-wide Positive Behavior Support Implementer’s Blueprint and Self-Assessment. Eugene, OR: University of Oregon. PBIS Web site. http://pbis.org. Retrieved August 2010 through December 2011. Reschly, D. (1997) Disproportionate minority representation in general and special education programs: Patterns, issues, and alternatives. Des Moines, IA: Mountain Plains Regional Resource Center. Skiba, R.J., R.S. Michael, A.C. Nardo, and R.L. Peterson. (2002). The color of discipline: Sources of racial and gender disproportionality in school punishment. The Urban Review, 34(4). Sprague, J.R., & Walker, H.M. (2005). Safe and Healthy Schools: Practical Prevention Strategies. New York: Guilford Press. State Education Resource Center. (2011). Equity in Education: A Transformational Approach. Middletown, CT. State Education Resource Center. (2012). PBIS as an Effective Approach to Bullying Prevention and Intervention: Complying with CT Public Act 11-232. Middletown, CT.
48 PBIS Data Report and Summary ©2011

SERC