polygenic type 2 diabetes prediction at the limit of common variant detection
TRANSCRIPT
Seediscussions,stats,andauthorprofilesforthispublicationat:https://www.researchgate.net/publication/260150517
PolygenicType2DiabetesPredictionattheLimitofCommonVariantDetection
ARTICLEinDIABETES·FEBRUARY2014
ImpactFactor:8.1·DOI:10.2337/db13-1663·Source:PubMed
CITATIONS
23
READS
22
11AUTHORS,INCLUDING:
JasonVassy
HarvardMedicalSchool
39PUBLICATIONS824CITATIONS
SEEPROFILE
marie-franceHivert
UniversitédeSherbrooke
105PUBLICATIONS2,287CITATIONS
SEEPROFILE
MarcoDauriz
UniversityofVerona
14PUBLICATIONS81CITATIONS
SEEPROFILE
JoseeDupuis
BostonUniversity
190PUBLICATIONS13,332CITATIONS
SEEPROFILE
Availablefrom:MarcoDauriz
Retrievedon:05February2016

Jason L. Vassy,1,2,3 Marie-France Hivert,1,4,5 Bianca Porneala,6 Marco Dauriz,1,6,7 Jose C. Florez,1,8,9
Josée Dupuis,10,11 David S. Siscovick,12 Myriam Fornage,13 Laura J. Rasmussen-Torvik,14
Claude Bouchard,15 and James B. Meigs1,6
Polygenic Type 2 DiabetesPrediction at the Limit ofCommon Variant DetectionDiabetes 2014;63:2172–2182 | DOI: 10.2337/db13-1663
Genome-wide association studies (GWAS) may havereached their limit of detecting common type 2 diabetes(T2D)–associated genetic variation. We evaluated the per-formance of current polygenic T2D prediction. Using datafrom the Framingham Offspring (FOS) and the CoronaryArtery Risk Development in Young Adults (CARDIA) stud-ies, we tested three hypotheses: 1) a 62-locus genotyperisk score (GRSt) improves T2D prediction compared withprevious less inclusive GRSt; 2) separate GRS for b-cell(GRSb) and insulin resistance (GRSIR) independently pre-dict T2D; and 3) the relationships between T2D and GRSt,GRSb, or GRSIR do not differ between blacks and whites.Among 1,650 young white adults in CARDIA, 820 youngblack adults in CARDIA, and 3,471 white middle-agedadults in FOS, cumulative T2D incidence was 5.9%,14.4%, and 12.9%, respectively, over 25 years. The 62-locus GRSt was significantly associated with incidentT2D in all three groups. In FOS but not CARDIA, the 62-locus GRSt improved the model C statistic (0.698 and0.726 for models without and with GRSt, respectively;P < 0.001) but did not materially improve risk reclassifi-cation in either study. Results were similar among blackscompared with whites. The GRSb but not GRSIR predicted
incident T2D among FOS and CARDIA whites. At the endof the era of common variant discovery for T2D, poly-genic scores can predict T2D in whites and blacks butdo not outperform clinical models. Further optimization ofpolygenic prediction may require novel analytic methods,including less common as well as functional variants.
Type 2 diabetes (T2D) is a common complex disease withgenetic and environmental determinants. Risk factors,including overnutrition, sedentary behavior, and lack ofphysical exercise, make the disease amenable to pre-vention through lifestyle modification (1,2), but the mosteffective behavior change programs can be cost-intensive(3). Because the genome-wide association study (GWAS)era has discovered dozens of genetic loci associated withT2D risk, there has been hope that genotype might helpclinicians and public health practitioners target limitedprevention resources to those at greatest risk. Althoughgenotype predicts incident T2D (4–9), studies using lim-ited genetic information from the first waves of GWAShave demonstrated that the addition of genotype to T2Dprediction models based on routinely measured clinical
1Harvard Medical School, Boston, MA2Section of General Internal Medicine, VA Boston Healthcare System, Boston, MA3Division of General Internal Medicine and Primary Care, Brigham and Women’sHospital, Boston, MA4Department of Population Medicine, Harvard Pilgrim Health Care Institute,Boston, MA5Division of Endocrinology, Department of Medicine, Université de Sherbrooke,Sherbrooke, Quebec, Canada6General Medicine Division, Massachusetts General Hospital, Boston, MA7Division of Endocrinology and Metabolic Diseases, Department of Medicine,University of Verona Medical School and Hospital Trust of Verona, Verona, Italy8Diabetes Research Center (Diabetes Unit), and Center for Human Genetic Re-search, Massachusetts General Hospital, Boston, MA9Program in Medical and Population Genetics, Broad Institute, Cambridge, MA10Department of Biostatistics, Boston University School of Public Health, Boston, MA11National Heart, Lung, and Blood Institute’s Framingham Heart Study,Framingham, MA
12Cardiovascular Health Research Unit, Departments of Medicine and Epidemiol-ogy, University of Washington, Seattle, WA13Center for Human Genetics, University of Texas Health Science Center at Hous-ton, Houston, TX14Department of Preventive Medicine, Northwestern University Feinberg School ofMedicine, Chicago, IL15Human Genomics Laboratory, Pennington Biomedical Research Center, LouisianaState University System, Baton Rouge, LA
Corresponding author: James B. Meigs, [email protected].
Received 31 October 2013 and accepted 3 February 2014.
This article contains Supplementary Data online at http://diabetes.diabetesjournals.org/lookup/suppl/doi:10.2337/db13-1663/-/DC1.
© 2014 by the American Diabetes Association. See http://creativecommons.org/licenses/by-nc-nd/3.0/ for details.
2172 Diabetes Volume 63, June 2014
GENETIC
S/G
ENOMES/P
ROTEOMIC
S/M
ETABOLOMIC
S

risk factors (6,10,11) does not substantively improve riskstratification (4,8,9).
The DIAbetes Genetics Replication And Meta-analysis(DIAGRAM) Consortium recently published the largestT2D GWAS meta-analysis to date (DIAGRAMv3), identi-fying many additional common variants associated withT2D and bringing the total number of independent T2Dloci to 65 (12). Together, these loci explained ;5.7% ofthe variance in genetic susceptibility to T2D. DIAGRAMv3also modeled the theoretical existence of 488 additionalcommon variants likely associated with T2D on the arraysused in their analyses but with effect sizes too small fordetection. These hundreds of single nucleotide polymor-phisms (SNPs) would increase the proportion of explainedT2D susceptibility to 10.7%. Subsequent models usinggenome-wide complex trait analysis suggested that 63%of T2D susceptibility might be attributable to commongenetic variation in the full set of GWAS SNPs (12). Still,current GWAS methodology is likely nearing its limit(13,14) to identify the additional specific common SNPsassociated with T2D. Recent analyses have suggested thateven a tripling of the GWAS discovery sample size wouldnot materially increase the C statistic of polygenic T2Dmodels (15). Ongoing next-generation sequencing effortsmay identify additional variants with major allele fre-quency .1%, although SNP genotype and imputationdata from GWAS arrays have likely already capturedmost of this common variation.
Thus, the 65 DIAGRAMv3 loci may represent themajority of common and significant T2D-association ge-netic variants expected to be identified. If so, it is opportuneto evaluate the performance of currently available geneticinformation for T2D risk prediction and classification. Theadditional loci discovered in DIAGRAMv3 may improvepolygenic T2D prediction over previous attempts usingpolygenic models with fewer loci (4,5,9,16). Because GWASuse a cross-sectional case-control design, it is importantto determine how well these loci prospectively predictincident T2D. Moreover, polygenic models may be im-proved by taking into consideration the biological path-ways underlying these T2D-associated loci. Althoughmost of these remain to be elucidated, some functionalstudies and analyses of more specific metabolic pheno-types have implicated some loci in pancreatic b-celldysfunction or, less commonly, insulin resistance (IR)(17,18). Individuals carrying a high genetic burden forb-cell dysfunction and IR might be at especially highrisk of developing T2D. Finally, although DIAGRAMv3used data from populations of mostly European ances-try, it is important for clinical practice and public healthto know whether these associations hold in nonwhitepopulations.
RESEARCH DESIGN AND METHODS
We used data from the Framingham Offspring (FOS) andthe Coronary Artery Risk Development in Young Adults(CARDIA) studies to examine the performance of updated
polygenic prediction models for T2D among young andmiddle-aged adults of European and African ancestry. Wetested three primary hypotheses. First, we hypothesizedthat an updated total genotype risk score (GRSt) with upto 65 T2D-associated risk loci improves the prediction ofincident T2D in young and middle-aged adulthood com-pared with previously published scores with fewer loci. Weexamined genotype-only and also genotype-plus-clinicalprediction models. Second, because b-cell dysfunctionand IR represent two distinct pathways in the pathogen-esis of T2D, we hypothesized that separate GRS consist-ing of SNPs postulated to influence b-cell (GRSb) or IR(GRSIR) independently predict incident T2D. In subsidiaryanalyses, we investigated whether GRSb and GRSIR to-gether exhibit a multiplicative effect on T2D risk andwhether the association between T2D risk and GRSb orGRSIR varies between lean and obese individuals. Third,we hypothesized that the relationships between incidentT2D and GRSt, GRSb, or GRSIR do not differ betweenblack and white individuals.
Study ParticipantsFOS and CARDIA are both large well-described prospec-tive cohort studies (19–21). The FOS began in 1971 andconsists of offspring of the original Framingham HeartStudy participants and their spouses. At the first exami-nation, FOS participants were between 5 and 70 years ofage. They were examined again after 8 years and thenevery 4 years thereafter through examination 8 (2005–2008). The CARDIA Study is a multicenter prospectivestudy of 5,115 white and black participants recruited in1985–1986 from four United States cities (20,21). Partic-ipants were aged 18 to 30 years at the baseline examina-tion and were invited to participate in serial follow-upexaminations over the subsequent 25 years. Written in-formed consent was obtained from all FOS and CARDIAparticipants, and the institutional review board at eachparticipating center approved the original studies. Welimited the present analyses to FOS and CARDIA partic-ipants with at least two study examinations, genotypeinformation, and baseline data available for all predictorsof interest. We excluded any participant with diabetes orpregnancy at the baseline examination. CARDIA partici-pants who reported diabetes treatment exclusively withinsulin during the observation period were considered tohave type 1 diabetes and were also excluded from analy-ses. We did not apply this exclusion to the older FOScohort; greater than 99% of the FOS diabetes cases areT2D (11). The Partners Human Research Committee ap-proved these analyses.
T2DThe primary outcome was incident T2D during the obser-vation period. Each FOS examination included an assess-ment of medical history, a physical examination, and afasting blood sample (22). All CARDIA Study visits includedan updated medical history assessment, including medica-tions, and fasting glucose was measured at years 0, 7, 10, 15,
diabetes.diabetesjournals.org Vassy and Associates 2173
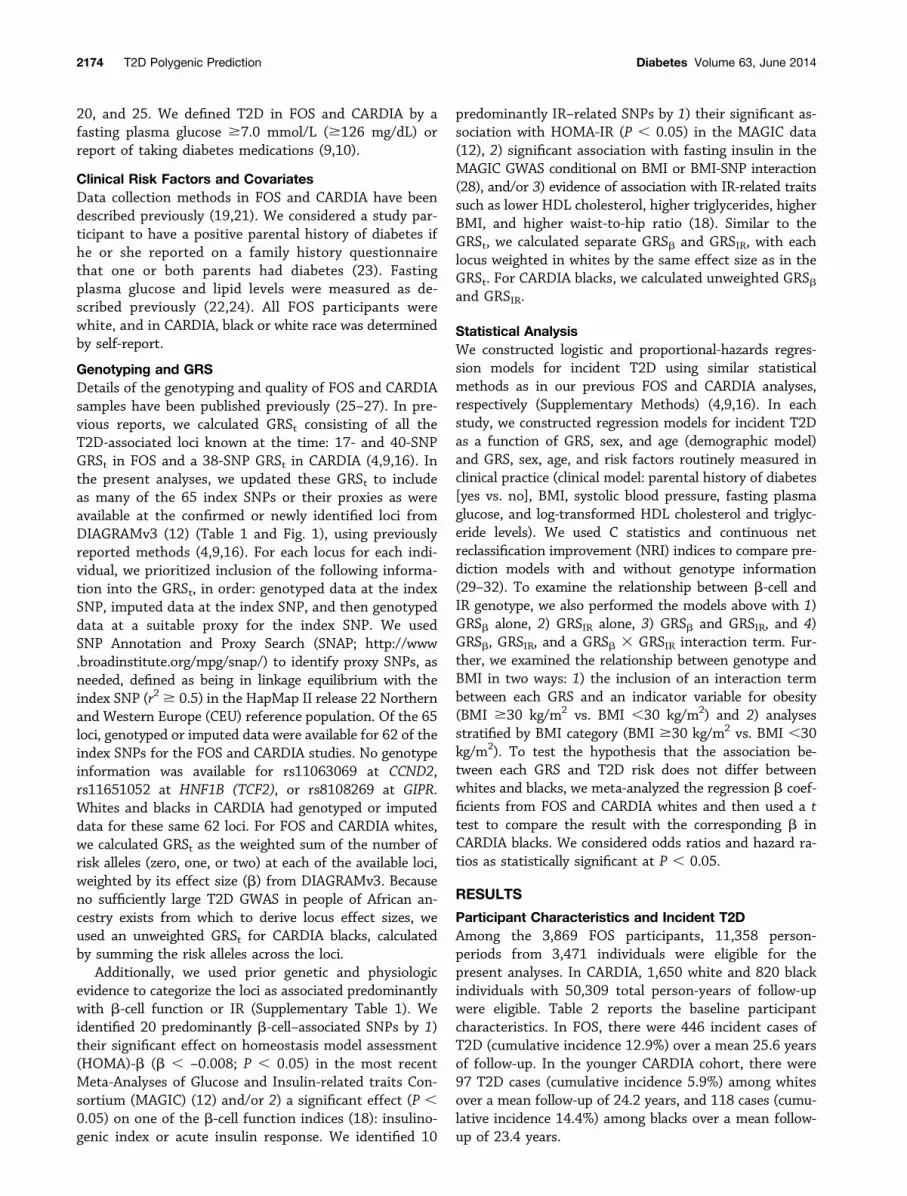
20, and 25. We defined T2D in FOS and CARDIA by afasting plasma glucose $7.0 mmol/L ($126 mg/dL) orreport of taking diabetes medications (9,10).
Clinical Risk Factors and CovariatesData collection methods in FOS and CARDIA have beendescribed previously (19,21). We considered a study par-ticipant to have a positive parental history of diabetes ifhe or she reported on a family history questionnairethat one or both parents had diabetes (23). Fastingplasma glucose and lipid levels were measured as de-scribed previously (22,24). All FOS participants werewhite, and in CARDIA, black or white race was determinedby self-report.
Genotyping and GRSDetails of the genotyping and quality of FOS and CARDIAsamples have been published previously (25–27). In pre-vious reports, we calculated GRSt consisting of all theT2D-associated loci known at the time: 17- and 40-SNPGRSt in FOS and a 38-SNP GRSt in CARDIA (4,9,16). Inthe present analyses, we updated these GRSt to includeas many of the 65 index SNPs or their proxies as wereavailable at the confirmed or newly identified loci fromDIAGRAMv3 (12) (Table 1 and Fig. 1), using previouslyreported methods (4,9,16). For each locus for each indi-vidual, we prioritized inclusion of the following informa-tion into the GRSt, in order: genotyped data at the indexSNP, imputed data at the index SNP, and then genotypeddata at a suitable proxy for the index SNP. We usedSNP Annotation and Proxy Search (SNAP; http://www.broadinstitute.org/mpg/snap/) to identify proxy SNPs, asneeded, defined as being in linkage equilibrium with theindex SNP (r2 $ 0.5) in the HapMap II release 22 Northernand Western Europe (CEU) reference population. Of the 65loci, genotyped or imputed data were available for 62 of theindex SNPs for the FOS and CARDIA studies. No genotypeinformation was available for rs11063069 at CCND2,rs11651052 at HNF1B (TCF2), or rs8108269 at GIPR.Whites and blacks in CARDIA had genotyped or imputeddata for these same 62 loci. For FOS and CARDIA whites,we calculated GRSt as the weighted sum of the number ofrisk alleles (zero, one, or two) at each of the available loci,weighted by its effect size (b) from DIAGRAMv3. Becauseno sufficiently large T2D GWAS in people of African an-cestry exists from which to derive locus effect sizes, weused an unweighted GRSt for CARDIA blacks, calculatedby summing the risk alleles across the loci.
Additionally, we used prior genetic and physiologicevidence to categorize the loci as associated predominantlywith b-cell function or IR (Supplementary Table 1). Weidentified 20 predominantly b-cell–associated SNPs by 1)their significant effect on homeostasis model assessment(HOMA)-b (b , –0.008; P , 0.05) in the most recentMeta-Analyses of Glucose and Insulin-related traits Con-sortium (MAGIC) (12) and/or 2) a significant effect (P ,0.05) on one of the b-cell function indices (18): insulino-genic index or acute insulin response. We identified 10
predominantly IR–related SNPs by 1) their significant as-sociation with HOMA-IR (P , 0.05) in the MAGIC data(12), 2) significant association with fasting insulin in theMAGIC GWAS conditional on BMI or BMI-SNP interaction(28), and/or 3) evidence of association with IR-related traitssuch as lower HDL cholesterol, higher triglycerides, higherBMI, and higher waist-to-hip ratio (18). Similar to theGRSt, we calculated separate GRSb and GRSIR, with eachlocus weighted in whites by the same effect size as in theGRSt. For CARDIA blacks, we calculated unweighted GRSband GRSIR.
Statistical AnalysisWe constructed logistic and proportional-hazards regres-sion models for incident T2D using similar statisticalmethods as in our previous FOS and CARDIA analyses,respectively (Supplementary Methods) (4,9,16). In eachstudy, we constructed regression models for incident T2Das a function of GRS, sex, and age (demographic model)and GRS, sex, age, and risk factors routinely measured inclinical practice (clinical model: parental history of diabetes[yes vs. no], BMI, systolic blood pressure, fasting plasmaglucose, and log-transformed HDL cholesterol and triglyc-eride levels). We used C statistics and continuous netreclassification improvement (NRI) indices to compare pre-diction models with and without genotype information(29–32). To examine the relationship between b-cell andIR genotype, we also performed the models above with 1)GRSb alone, 2) GRSIR alone, 3) GRSb and GRSIR, and 4)GRSb, GRSIR, and a GRSb 3 GRSIR interaction term. Fur-ther, we examined the relationship between genotype andBMI in two ways: 1) the inclusion of an interaction termbetween each GRS and an indicator variable for obesity(BMI $30 kg/m2 vs. BMI ,30 kg/m2) and 2) analysesstratified by BMI category (BMI $30 kg/m2 vs. BMI ,30kg/m2). To test the hypothesis that the association be-tween each GRS and T2D risk does not differ betweenwhites and blacks, we meta-analyzed the regression b coef-ficients from FOS and CARDIA whites and then used a ttest to compare the result with the corresponding b inCARDIA blacks. We considered odds ratios and hazard ra-tios as statistically significant at P , 0.05.
RESULTS
Participant Characteristics and Incident T2DAmong the 3,869 FOS participants, 11,358 person-periods from 3,471 individuals were eligible for thepresent analyses. In CARDIA, 1,650 white and 820 blackindividuals with 50,309 total person-years of follow-upwere eligible. Table 2 reports the baseline participantcharacteristics. In FOS, there were 446 incident cases ofT2D (cumulative incidence 12.9%) over a mean 25.6 yearsof follow-up. In the younger CARDIA cohort, there were97 T2D cases (cumulative incidence 5.9%) among whitesover a mean follow-up of 24.2 years, and 118 cases (cumu-lative incidence 14.4%) among blacks over a mean follow-up of 23.4 years.
2174 T2D Polygenic Prediction Diabetes Volume 63, June 2014
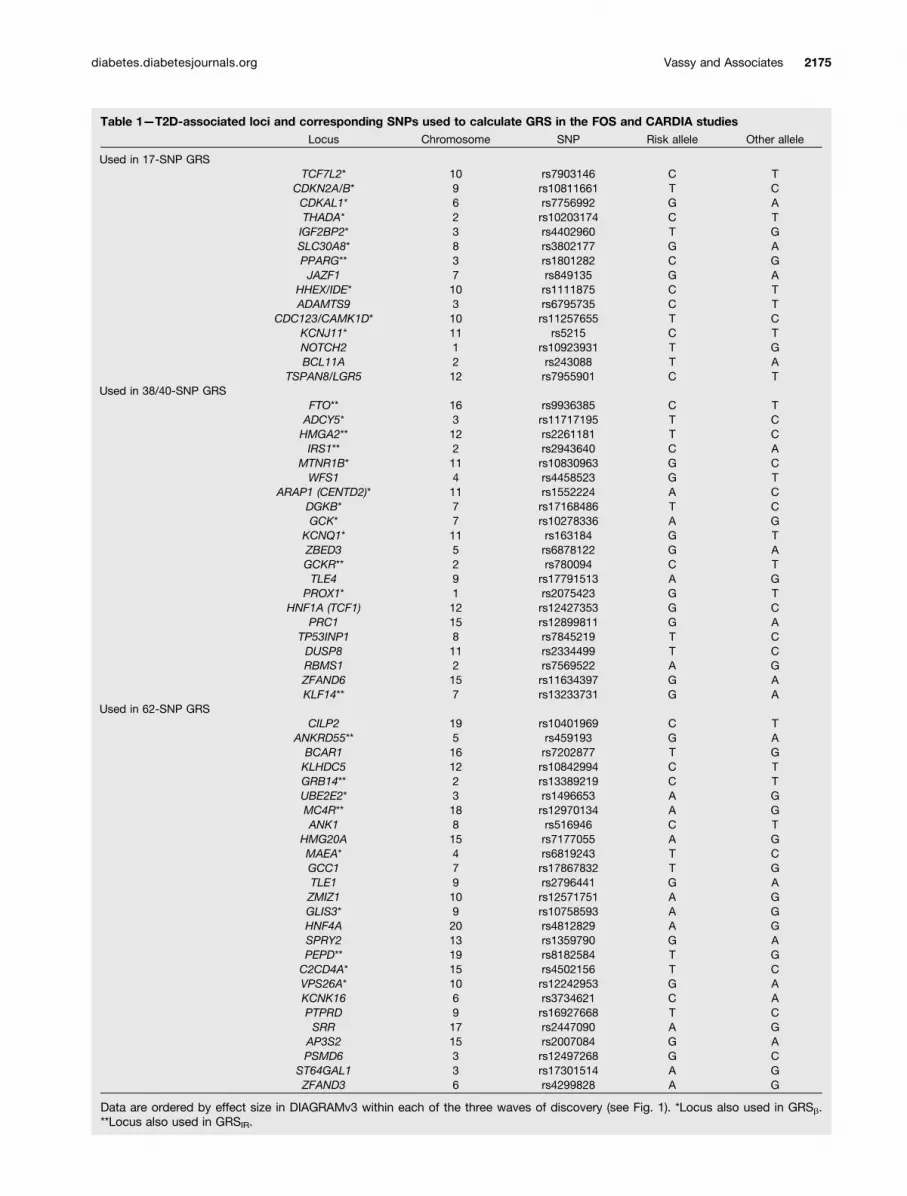
Table 1—T2D-associated loci and corresponding SNPs used to calculate GRS in the FOS and CARDIA studiesLocus Chromosome SNP Risk allele Other allele
Used in 17-SNP GRSTCF7L2* 10 rs7903146 C T
CDKN2A/B* 9 rs10811661 T CCDKAL1* 6 rs7756992 G ATHADA* 2 rs10203174 C TIGF2BP2* 3 rs4402960 T GSLC30A8* 8 rs3802177 G APPARG** 3 rs1801282 C GJAZF1 7 rs849135 G A
HHEX/IDE* 10 rs1111875 C TADAMTS9 3 rs6795735 C T
CDC123/CAMK1D* 10 rs11257655 T CKCNJ11* 11 rs5215 C TNOTCH2 1 rs10923931 T GBCL11A 2 rs243088 T A
TSPAN8/LGR5 12 rs7955901 C TUsed in 38/40-SNP GRS
FTO** 16 rs9936385 C TADCY5* 3 rs11717195 T CHMGA2** 12 rs2261181 T CIRS1** 2 rs2943640 C A
MTNR1B* 11 rs10830963 G CWFS1 4 rs4458523 G T
ARAP1 (CENTD2)* 11 rs1552224 A CDGKB* 7 rs17168486 T CGCK* 7 rs10278336 A G
KCNQ1* 11 rs163184 G TZBED3 5 rs6878122 G AGCKR** 2 rs780094 C TTLE4 9 rs17791513 A G
PROX1* 1 rs2075423 G THNF1A (TCF1) 12 rs12427353 G C
PRC1 15 rs12899811 G ATP53INP1 8 rs7845219 T CDUSP8 11 rs2334499 T CRBMS1 2 rs7569522 A GZFAND6 15 rs11634397 G AKLF14** 7 rs13233731 G A
Used in 62-SNP GRSCILP2 19 rs10401969 C T
ANKRD55** 5 rs459193 G ABCAR1 16 rs7202877 T GKLHDC5 12 rs10842994 C TGRB14** 2 rs13389219 C TUBE2E2* 3 rs1496653 A GMC4R** 18 rs12970134 A GANK1 8 rs516946 C T
HMG20A 15 rs7177055 A GMAEA* 4 rs6819243 T CGCC1 7 rs17867832 T GTLE1 9 rs2796441 G AZMIZ1 10 rs12571751 A GGLIS3* 9 rs10758593 A GHNF4A 20 rs4812829 A GSPRY2 13 rs1359790 G APEPD** 19 rs8182584 T GC2CD4A* 15 rs4502156 T CVPS26A* 10 rs12242953 G AKCNK16 6 rs3734621 C APTPRD 9 rs16927668 T CSRR 17 rs2447090 A G
AP3S2 15 rs2007084 G APSMD6 3 rs12497268 G C
ST64GAL1 3 rs17301514 A GZFAND3 6 rs4299828 A G
Data are ordered by effect size in DIAGRAMv3 within each of the three waves of discovery (see Fig. 1). *Locus also used in GRSb.**Locus also used in GRSIR.
diabetes.diabetesjournals.org Vassy and Associates 2175

GRSt and Prediction of Incident T2DThe mean 62-SNP GRSt was greater among T2D casesthan noncases in FOS (P , 0.001), CARDIA whites(P, 0.001), and CARDIA blacks (P = 0.01; Table 3). Amongall three cohorts, each GRSt was significantly associatedwith incident T2D in both the demographic and clinicalprediction models (Tables 4 and 5). In the demographicmodels in FOS, each additional weighted allele in the 17-,40-, and 62-SNP GRSt was associated with an increasedodds for incident T2D of 11% (7–15%), 8% (6–11%), and8% (6–10%), respectively. Among CARDIA whites, eachadditional weighted allele in the 38- and 62-SNP GRStwas associated with an increase in the adjusted hazardfor incident T2D of 12% (6–18%) and 7% (3–12%); thecorresponding increases among CARDIA blacks were 5%(0–11%) and 5% (1–9%). The addition of each successiveSNP to the GRSt lowered the per-allele odds ratio for in-cident T2D in FOS (Fig. 1). The addition of the 62-SNP GRStto the demographic and clinical prediction models in FOSweakly improved risk reclassification (continuous NRI
0.286 [95% CI 0.192–0.380] and 0.256 [95% CI 0.162–0.351], respectively) (Table 4).
Reclassification was moderate among FOS individualsyounger than 50 years and weak among those 50 years orolder (Table 4). Reclassification was not markedly higherin the younger CARDIA cohort. Among CARDIA whites,the addition of the 62-SNP GRSt to the demographic andclinical models resulted in a continuous NRI of 0.311(95% CI 0.088–0.525) and 0.306 (95% CI 0.073–0.517),respectively. Similarly, the resulting NRI among CARDIAblacks were 0.243 (95% CI 0.031–0.455) and 0.296 (95%CI 0.098–0.513), respectively. Compared with our previ-ous GRSt consisting of fewer loci, the 62-SNP GRSt in-creased model C statistics but did not increase the NRI inFOS (Table 4); NRI indices in CARDIA whites and blackswere generally higher than with the 38-SNP GRSt but stillindicated weak reclassification improvement (Table 5).The effect size of the 62-SNP GRSt did not differ betweenwhites (meta-analyzed between FOS and CARDIA) and
Figure 1—T2D-associated genetic loci. Loci on the x-axis are ordered by inclusion in published 17-, 40- and 62-SNP GRS. Black bars (lefty-axis) indicate published DIAGRAMv3 odds ratio (OR) for T2D per risk allele at each locus. The black line plots the T2D OR in the FOS perallele increase in a GRS containing the loci up to that point on the x-axis. Points with error bars plot the C statistics (95% CI) from pooledlogistic regression models for T2D in FOS including 17-, 40-, and 62-SNP GRS in demographic and clinical models. Loci used in separateb-cell and IR GRS in the present analyses are also indicated.
2176 T2D Polygenic Prediction Diabetes Volume 63, June 2014
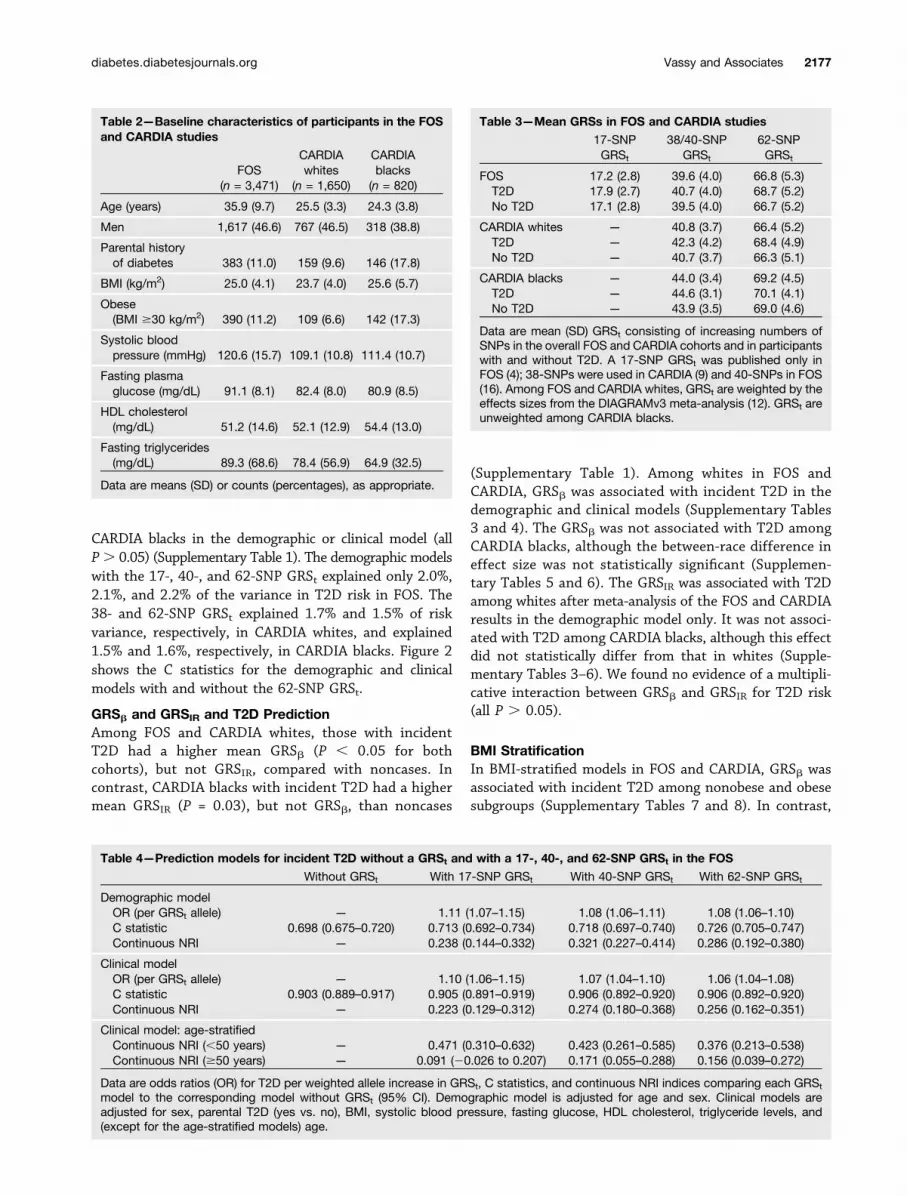
CARDIA blacks in the demographic or clinical model (allP. 0.05) (Supplementary Table 1). The demographic modelswith the 17-, 40-, and 62-SNP GRSt explained only 2.0%,2.1%, and 2.2% of the variance in T2D risk in FOS. The38- and 62-SNP GRSt explained 1.7% and 1.5% of riskvariance, respectively, in CARDIA whites, and explained1.5% and 1.6%, respectively, in CARDIA blacks. Figure 2shows the C statistics for the demographic and clinicalmodels with and without the 62-SNP GRSt.
GRSb and GRSIR and T2D PredictionAmong FOS and CARDIA whites, those with incidentT2D had a higher mean GRSb (P , 0.05 for bothcohorts), but not GRSIR, compared with noncases. Incontrast, CARDIA blacks with incident T2D had a highermean GRSIR (P = 0.03), but not GRSb, than noncases
(Supplementary Table 1). Among whites in FOS andCARDIA, GRSb was associated with incident T2D in thedemographic and clinical models (Supplementary Tables3 and 4). The GRSb was not associated with T2D amongCARDIA blacks, although the between-race difference ineffect size was not statistically significant (Supplemen-tary Tables 5 and 6). The GRSIR was associated with T2Damong whites after meta-analysis of the FOS and CARDIAresults in the demographic model only. It was not associ-ated with T2D among CARDIA blacks, although this effectdid not statistically differ from that in whites (Supple-mentary Tables 3–6). We found no evidence of a multipli-cative interaction between GRSb and GRSIR for T2D risk(all P . 0.05).
BMI StratificationIn BMI-stratified models in FOS and CARDIA, GRSb wasassociated with incident T2D among nonobese and obesesubgroups (Supplementary Tables 7 and 8). In contrast,
Table 2—Baseline characteristics of participants in the FOSand CARDIA studies
FOS(n = 3,471)
CARDIAwhites
(n = 1,650)
CARDIAblacks
(n = 820)
Age (years) 35.9 (9.7) 25.5 (3.3) 24.3 (3.8)
Men 1,617 (46.6) 767 (46.5) 318 (38.8)
Parental historyof diabetes 383 (11.0) 159 (9.6) 146 (17.8)
BMI (kg/m2) 25.0 (4.1) 23.7 (4.0) 25.6 (5.7)
Obese(BMI $30 kg/m2) 390 (11.2) 109 (6.6) 142 (17.3)
Systolic bloodpressure (mmHg) 120.6 (15.7) 109.1 (10.8) 111.4 (10.7)
Fasting plasmaglucose (mg/dL) 91.1 (8.1) 82.4 (8.0) 80.9 (8.5)
HDL cholesterol(mg/dL) 51.2 (14.6) 52.1 (12.9) 54.4 (13.0)
Fasting triglycerides(mg/dL) 89.3 (68.6) 78.4 (56.9) 64.9 (32.5)
Data are means (SD) or counts (percentages), as appropriate.
Table 3—Mean GRSs in FOS and CARDIA studies
17-SNPGRSt
38/40-SNPGRSt
62-SNPGRSt
FOS 17.2 (2.8) 39.6 (4.0) 66.8 (5.3)T2D 17.9 (2.7) 40.7 (4.0) 68.7 (5.2)No T2D 17.1 (2.8) 39.5 (4.0) 66.7 (5.2)
CARDIA whites — 40.8 (3.7) 66.4 (5.2)T2D — 42.3 (4.2) 68.4 (4.9)No T2D — 40.7 (3.7) 66.3 (5.1)
CARDIA blacks — 44.0 (3.4) 69.2 (4.5)T2D — 44.6 (3.1) 70.1 (4.1)No T2D — 43.9 (3.5) 69.0 (4.6)
Data are mean (SD) GRSt consisting of increasing numbers ofSNPs in the overall FOS and CARDIA cohorts and in participantswith and without T2D. A 17-SNP GRSt was published only inFOS (4); 38-SNPs were used in CARDIA (9) and 40-SNPs in FOS(16). Among FOS and CARDIA whites, GRSt are weighted by theeffects sizes from the DIAGRAMv3 meta-analysis (12). GRSt areunweighted among CARDIA blacks.
Table 4—Prediction models for incident T2D without a GRSt and with a 17-, 40-, and 62-SNP GRSt in the FOS
Without GRSt With 17-SNP GRSt With 40-SNP GRSt With 62-SNP GRSt
Demographic modelOR (per GRSt allele) — 1.11 (1.07–1.15) 1.08 (1.06–1.11) 1.08 (1.06–1.10)C statistic 0.698 (0.675–0.720) 0.713 (0.692–0.734) 0.718 (0.697–0.740) 0.726 (0.705–0.747)Continuous NRI — 0.238 (0.144–0.332) 0.321 (0.227–0.414) 0.286 (0.192–0.380)
Clinical modelOR (per GRSt allele) — 1.10 (1.06–1.15) 1.07 (1.04–1.10) 1.06 (1.04–1.08)C statistic 0.903 (0.889–0.917) 0.905 (0.891–0.919) 0.906 (0.892–0.920) 0.906 (0.892–0.920)Continuous NRI — 0.223 (0.129–0.312) 0.274 (0.180–0.368) 0.256 (0.162–0.351)
Clinical model: age-stratifiedContinuous NRI (,50 years) — 0.471 (0.310–0.632) 0.423 (0.261–0.585) 0.376 (0.213–0.538)Continuous NRI ($50 years) — 0.091 (20.026 to 0.207) 0.171 (0.055–0.288) 0.156 (0.039–0.272)
Data are odds ratios (OR) for T2D per weighted allele increase in GRSt, C statistics, and continuous NRI indices comparing each GRSt
model to the corresponding model without GRSt (95% CI). Demographic model is adjusted for age and sex. Clinical models areadjusted for sex, parental T2D (yes vs. no), BMI, systolic blood pressure, fasting glucose, HDL cholesterol, triglyceride levels, and(except for the age-stratified models) age.
diabetes.diabetesjournals.org Vassy and Associates 2177

GRSIR was not significantly associated with T2D in eithersubgroup in either study. In models adjusted for age, sex,and (for CARDIA) race, there were no statistically signifi-cant interactions between obesity and GRSt, GRSb, or GRSIR(Supplementary Tables 9 and 10). The effect sizes of GRSbwere 1.14 (95% CI 1.09–1.19) and 1.10 (95% CI 1.05–1.15)in lean and obese individuals in FOS, respectively, and 1.08(95% CI 1.04–1.11) and 1.10 (95% CI 1.06–1.14) in thelean and obese in CARDIA, respectively.
DISCUSSION
In clinical medicine and public health, there is greatinterest in identifying individuals and population sub-groups at increased T2D risk before disease onset. Genotypehas a certain appeal as a risk predictor because the germlinegenetic code is fixed from birth. The largest T2D GWASmeta-analysis to date (12) may include all of the commonT2D-associated loci of at least modest effect size that canbe expected to be specifically identified. If so, it marks anappropriate time to evaluate the contribution of knowncommon genetic variation to such risk stratification. Us-ing data from two large well-characterized prospectivecohort studies, we have shown that a polygenic score,GRSt, consisting of 62 of the known T2D-associatedloci, is significantly associated with incident T2D during25 years of observation.
First, we hypothesized that the inclusion of a greaternumber of T2D-associated loci in the GRSt would improveT2D prediction compared with less inclusive GRSt andwith a clinical prediction model. Our prior analyses inFOS and CARDIA demonstrated that GRSt consisting of
up to 40 loci do predict incident T2D from young andmiddle adulthood but do not improve upon clinical mod-els, as measured by C statistics and NRI indices (4,9,16).An updated risk score might improve prediction for atleast two reasons. First, a greater number of loci shouldexplain a larger proportion of the heritability of T2D.Second, we updated the weight we used for each locusin our GRSt based on the effect sizes from the largestT2D GWAS meta-analysis to date (12). For each locusdiscovered in previous smaller GWAS, the larger samplesize of the DIAGRAMv3 discovery set should reduce theerror around its effect size on T2D risk (33). The greaterprecision of these weights might improve the ability ofthe composite GRSt to distinguish future T2D cases fromnoncases.
In the present analyses, we found that the addition ofa greater number of loci to the GRSt steadily improved theC statistic of the simple demographic prediction model inFOS but not in CARDIA. These polygenic models, usingonly data available from birth (sex, genotype, and age),achieved C statistics of 0.6–0.7, comparable with othernongenetic T2D prediction models (5–7). However, theinclusion of multiple clinical risk factors to the predictionmodels overwhelmed any additional improvement in dis-crimination from genotype information, even though allGRSt remained significantly associated with incident T2Dafter adjustment for these factors.
Moreover, we did not find evidence that additionalSNPs improved risk reclassification over the less inclu-sive GRSt. Indeed, among FOS participants, the updated62-SNP GRSt lowered the NRI in the demographic and
Table 5—Prediction models for incident T2D without a GRSt and with a 38- and 62-SNP GRSt among whites and blacks in theCARDIA Study
Without GRSt With 38-SNP GRSt With 62-SNP GRSt
WhitesDemographic modelHR (per GRSt allele) — 1.12 (1.06–1.18) 1.08 (1.04–1.12)C statistic 0.613 (0.548–0.678) 0.663 (0.604–0.722) 0.661 (0.604–0.717)Continuous NRI — 0.344 (0.129–0.556) 0.311 (0.088–0.525)
Clinical modelHR (per GRSt allele) — 1.10 (1.04–1.16) 1.06 (1.02–1.10)C statistic 0.846 (0.803–0.889) 0.853 (0.810–0.896) 0.853 (0.810–0.896)Continuous NRI — 0.219 (20.011 to 0.434) 0.306 (0.073–0.517)
BlacksDemographic modelHR (per GRSt allele) — 1.05 (1.00–1.11) 1.05 (1.01–1.09)C statistic 0.571 (0.515–0.628) 0.597 (0.546–0.649) 0.595 (0.544–0.647)Continuous NRI — 0.083 (20.137 to 0.311) 0.243 (0.031–0.455)
Clinical modelHR (per GRSt allele) — 1.06 (1.01–1.12) 1.05 (1.00–1.09)C statistic 0.762 (0.717–0.807) 0.768 (0.724–0.813) 0.771 (0.727–0.814)Continuous NRI — 0.164 (20.051 to 0.394) 0.296 (0.098–0.513)
Data are hazard ratios (HR) for T2D, C statistics, and continuous NRI indices comparing each GRSt model with the corresponding modelwithout GRSt (95% CI). HR are per weighted GRSt allele in whites and per unweighted allele in blacks. Demographic models areadjusted for age and sex. Clinical models are adjusted for age, sex, parental T2D (yes vs. no), BMI, systolic blood pressure, fastingglucose, log-transformed HDL cholesterol, and log-transformed triglyceride levels.
2178 T2D Polygenic Prediction Diabetes Volume 63, June 2014

clinical models compared with a 40-SNP GRSt, although itdid perform better than the 17-SNP GRSt. An exceptionto this observation occurred among black young adults inCARDIA. Compared with our previous 38-SNP GRSt, the62-SNP GRSt increased the NRI from 0.083 to 0.243 inthe demographic model and from 0.164 to 0.296 in theclinical model. Nonetheless, the magnitudes of these NRIindices still indicate weak reclassification improvement.Moreover, the relatively small number of cases amongCARDIA blacks likely makes these NRI estimates moresusceptible to imprecision.
Compared with demographic and clinical predictionmodels without genotype information, the addition of the62-SNP GRSt resulted in relatively small risk reclassifica-tion in most of the subgroups examined. Prediction mod-els use risk factors to assign each individual a probabilityof having the event of interest: here, incident T2D. Thecontinuous NRI measures one model’s ability to improveupon the risk classification predicted by another model.Compared with nongenetic models, the addition of a62-SNP GRSt generally achieved NRI indices of 0.1 to0.3, indicative of weak reclassification improvement. The
Figure 2—Receiver operating characteristic (ROC) curves for models predicting incident T2D with and without a 62-locus GRS among theFOS (A) and white (B) and black (C) young adults in the CARDIA Study. Graphs plot the sensitivity vs. (1 2 specificity) for diabetes at eachpossible model cut point. The area under a ROC curve corresponds to the C statistic of that model. The full clinical model is adjusted forage, sex, parental diabetes (yes vs. no), BMI, systolic blood pressure, fasting glucose, HDL cholesterol, and triglyceride levels.
diabetes.diabetesjournals.org Vassy and Associates 2179

exception was among FOS participants younger than50 years old at baseline, among whom the 62-SNP GRStachieved moderate reclassification improvement (NRI0.376 compared with the clinical model). Reclassificationwas much weaker among older FOS participants. Thisobservation suggests that, when added to routine clinicalrisk factors, genotype information may have greater pre-dictive utility among younger age-groups in whom riskfactors, such as obesity and impaired fasting glucose,might not yet be fully manifest compared with amongolder adults. However, we did not observe that the addi-tion of a GRSt to prediction models among even youngeradults in CARDIA resulted in similar reclassification im-provement. Because T2D-associated loci included in theGRSt were discovered in cohorts of largely middle-agedand older adults, they may exert their greatest effect onT2D risk in those decades of life. These loci may onlyimprove T2D prediction among younger adults whenthe prediction time horizon is extended beyond the25 years of follow-up available in the CARDIA Study.
Our second hypothesis was that separate b-cell and IRpolygenic scores independently predict incident T2D. Theearliest discoveries among common T2D-associated ge-netic variants pointed toward genes involved in b-cellfunction. With the DIAGRAMv3 publication and exami-nation in MAGIC of more refined phenotypes among indi-viduals without diabetes, there are now ;10 loci possiblyimplicated in insulin action as well (18). We also hypothe-sized that GRSb might have a stronger effect in leaner indi-viduals than in obese individuals. In 2010, the DIAGRAMinvestigators reported that 23 of 30 T2D loci investigatedshowed greater effect sizes among individuals with a BMI#30 kg/m2 compared with those with a BMI .30 kg/m2,although this difference was statistically significant onlyfor TCF7L2 and BCL11A (34). BMI-stratified GWAS anal-yses by Perry et al. (35) replicated different sets of pre-viously identified T2D associations among the lean to theobese and identified a novel association with T2D atLAMA1 only among lean individuals. A polygenic scoreof 36 known T2D loci had a stronger association withT2D among the lean compared with the obese. On theother hand, genetic variants associated with fasting in-sulin were more easily detected in MAGIC data whenBMI was included in the models, and the effect sizeswere generally larger in individuals with a higher BMI(28). Given this heterogeneous genetic architecture ofT2D and related traits, we examined whether the associ-ation between T2D risk and GRSb and GRSIR might differby obesity status. Among whites in FOS and CARDIA,GRSb and GRSIR were associated with incident T2D. Nei-ther score met statistical significance among CARDIAblacks, but the between-race differences were not statis-tically significant. In contrast to the cross-sectional anal-yses by Perry et al. (35) that examined subgroups withBMI ,25 kg/m2 and BMI $30 kg/m2, we found no evi-dence that GRSt has a different effect size on incidentT2D among individuals with a BMI ,30 kg/m2 compared
with those with a BMI $30 kg/m2. This difference may bedue to the lower power from the smaller sample sizes ofour analyses, the larger number of loci used in our GRSt,or our use of prospective data instead of the case-controldesign used by Perry et al. (35).
The third aim of our analyses was to examine whetherpolygenic prediction of T2D differs between individuals ofself-reported white and black race. The DIAGRAMv3meta-analysis consisted predominantly of populations ofEuropean ancestry (12). Genome-wide analyses in Africanpopulations have been limited by smaller sample sizes(25,36). First efforts have replicated the association be-tween TCF7L2 and T2D in populations of African ancestry(36) but have otherwise been largely unrevealing aboutthe genetic architecture in this group. Examinations ofthe association between individual European-derived lociand T2D among African populations have inconsistentlyreplicated only a small fraction of these (37,38), but poly-genic scores consisting of these same European-derivedloci are nonetheless associated with T2D among AfricanAmericans (8,9,38). The biracial composition of the CARDIAStudy allowed us to compare the association of the 62-SNP GRSt with T2D between the two subgroups. The GRStwas significantly associated with incident T2D amongblacks and whites in the demographic and clinical models,and the effect sizes of the GRSt, GRSb, and GRSIR did notdiffer between the two racial groups. We observed this con-sistency of effect despite the higher BMI among CARDIAblacks compared with whites (17.3% vs. 6.6% with base-line obesity) and their higher cumulative incidence of T2D(14.4% vs. 5.9%). Most individual European-derived SNPsare only proxies for the true causal variants driving theassociations between given loci and T2D, and differencesin linkage disequilibrium between ancestral groups likelymagnify this imprecision when examining the relation-ship between these SNPs and T2D in populations in whichthey were not originally discovered. Although this impre-cision may explain why individual European-derived SNPsmay not replicate in populations of African ancestry, whya composite polygenic score consisting of these imprecisemarkers would significantly predict T2D in these samepopulations remains unclear. It is likely that the sameloci, if not the specific SNPs themselves, are implicatedin T2D across ancestral groups (39) and that our un-weighted GRSt in CARDIA blacks essentially representsa count of these loci.
Some key lines of inquiry may overcome the limita-tions of the present analyses and move the field ofpolygenic risk prediction forward. Polygenic scores suchas ours are simple weighted counts of T2D risk allelesacross the genome. Such scores significantly predictincident T2D in a number of studies (40). However, othermethods of combining genetic risk markers, which do notassume the independence of loci or the additivity of theireffects, may improve the performance of prediction mod-els (41,42). Improved polygenic models may also need toaccount for epistatic genetic effects and the interactions
2180 T2D Polygenic Prediction Diabetes Volume 63, June 2014

between loci and environmental factors such as diet andphysical activity, although some analyses have suggestedthat the incremental predictive value of such models maybe limited (43). Our examination of the differentialeffects of b-cell and IR polygenic scores on T2D risk isa first attempt to account for potential differences ata physiologic level, but more complex molecular pathwaysmay need to be considered. The use of sequencing toidentify the causal variants at each T2D-associated locus,for which most of the SNPs included in our GRS areimperfect proxies, should also further improve the pre-dictive ability of polygenic models (33). In the meantime,except perhaps in younger subgroups, polygenic predic-tion of T2D using most of the common genetic variationexpected to be found in the GWAS era has modest clinicalvalue.
Funding. This work was supported by National Institutes of Health grants(R01-DK-078616 and K24-DK-080140 to J.B.M. and U01-HG-006500 andL30-DK089597 to J.L.V.). The CARDIA Study is conducted and supported bythe National Heart, Lung, and Blood Institute (NHLBI) in collaboration withthe University of Alabama at Birmingham (HHSN268201300025C andHHSN268201300026C), Northwestern University (HHSN268201300027C), Uni-versity of Minnesota (HHSN268201300028C), Kaiser Foundation ResearchInstitute (HHSN268201300029C), and Johns Hopkins University School ofMedicine (HHSN268200900041C). CARDIA is also partially supported by theIntramural Research Program of the National Institute on Aging. This manuscriptwas reviewed by CARDIA personnel for scientific content. The Framingham HeartStudy was supported by the NHLBI (contract number N01-HC-25195) and itscontract with Affymetrix, Inc., for genotyping services (contract number N02-HL-6-4278). A portion of this research was conducted using the Linux Clusters forGenetic Analysis (LinGA) computing resources at the Boston University MedicalCampus.Duality of Interest. No potential conflicts of interest relevant to this articlewere reported.Author Contributions. J.L.V., M.-F.H., B.P., M.D., J.C.F., J.D., and J.B.M.conceived the analyses. J.L.V., M.-F.H., B.P., and J.D. performed the analyses. J.L.V.,M.-F.H., B.P., M.D., J.C.F., J.D., D.S.S., M.F., L.J.R.-T., C.B., and J.B.M. analyzedthe results. J.L.V., M.-F.H., and J.B.M. wrote the manuscript. J.L.V., M.-F.H.,B.P., M.D., J.C.F., J.D., D.S.S., M.F., L.J.R.-T., C.B., and J.B.M. reviewed themanuscript. J.B.M. is the guarantor of this work and, as such, had full accessto all the data in the study and takes responsibility for the integrity of the data andthe accuracy of the data analysis.
References1. Knowler WC, Barrett-Connor E, Fowler SE, et al.; Diabetes Prevention
Program Research Group. Reduction in the incidence of type 2 diabetes withlifestyle intervention or metformin. N Engl J Med 2002;346:393–4032. Tuomilehto J, Lindström J, Eriksson JG, et al.; Finnish Diabetes Prevention
Study Group. Prevention of type 2 diabetes mellitus by changes in lifestyle amongsubjects with impaired glucose tolerance. N Engl J Med 2001;344:1343–13503. Diabetes Prevention Program Research Group. The 10-year cost-effec-
tiveness of lifestyle intervention or metformin for diabetes prevention: an intent-to-treat analysis of the DPP/DPPOS. Diabetes Care 2012;35:723–7304. Meigs JB, Shrader P, Sullivan LM, et al. Genotype score in addition to
common risk factors for prediction of type 2 diabetes. N Engl J Med 2008;359:2208–22195. Lyssenko V, Jonsson A, Almgren P, et al. Clinical risk factors, DNA variants,
and the development of type 2 diabetes. N Engl J Med 2008;359:2220–2232
6. Talmud PJ, Hingorani AD, Cooper JA, et al. Utility of genetic and non-genetic risk factors in prediction of type 2 diabetes: Whitehall II prospectivecohort study. BMJ 2010;340:b4838–b48387. van Hoek M, Dehghan A, Witteman JC, et al. Predicting type 2 diabetesbased on polymorphisms from genome-wide association studies: a population-based study. Diabetes 2008;57:3122–31288. Vassy JL, Dasmahapatra PD, Meigs JB, et al. Genotype prediction of adulttype 2 diabetes from adolescence in a multiracial population. Pediatrics 2012;130:e1235–e12429. Vassy JL, Durant NH, Kabagambe EK, et al. A genotype risk score predictstype 2 diabetes from young adulthood: the CARDIA study. Diabetologia 2012;55:2604–261210. Wilson PW, Meigs JB, Sullivan L, Fox CS, Nathan DM, D’Agostino RB Sr.Prediction of incident diabetes mellitus in middle-aged adults: the FraminghamOffspring Study. Arch Intern Med 2007;167:1068–107411. Meigs JB, Cupples LA, Wilson PW. Parental transmission of type 2 diabetes:the Framingham Offspring Study. Diabetes 2000;49:2201–220712. Morris AP, Voight BF, Teslovich TM, et al.; Wellcome Trust Case ControlConsortium; Meta-Analyses of Glucose and Insulin-related traits Consortium(MAGIC) Investigators; Genetic Investigation of ANthropometric Traits (GIANT)Consortium; Asian Genetic Epidemiology Network–Type 2 Diabetes (AGEN-T2D)Consortium; South Asian Type 2 Diabetes (SAT2D) Consortium; DIAbetes Ge-netics Replication And Meta-analysis (DIAGRAM) Consortium. Large-scale as-sociation analysis provides insights into the genetic architecture andpathophysiology of type 2 diabetes. Nat Genet 2012;44:981–99013. Hunt KA, Mistry V, Bockett NA, et al. Negligible impact of rare autoim-mune-locus coding-region variants on missing heritability. Nature 2013;498:232–23514. Morrison AC, Voorman A, Johnson AD, et al.; Cohorts for Heart and AgingResearch in Genetic Epidemiology (CHARGE) Consortium. Whole-genome se-quence-based analysis of high-density lipoprotein cholesterol. Nat Genet 2013;45:899–90115. Chatterjee N, Wheeler B, Sampson J, Hartge P, Chanock SJ, Park JH.Projecting the performance of risk prediction based on polygenic analyses ofgenome-wide association studies. Nat Genet 2013;45:400–405, 405e1–316. de Miguel-Yanes JM, Shrader P, Pencina MJ, et al.; MAGIC Investigators;DIAGRAM+ Investigators. Genetic risk reclassification for type 2 diabetes by agebelow or above 50 years using 40 type 2 diabetes risk single nucleotide poly-morphisms. Diabetes Care 2011;34:121–12517. Ingelsson E, Langenberg C, Hivert MF, et al.; MAGIC investigators. Detailedphysiologic characterization reveals diverse mechanisms for novel genetic Lociregulating glucose and insulin metabolism in humans. Diabetes 2010;59:1266–127518. Dimas AS, Lagou V, Barker A, et al.; MAGIC Investigators. Impact of type 2diabetes susceptibility variants on quantitative glycemic traits reveals mecha-nistic heterogeneity. Diabetes 2014;63:2158–217119. Kannel WB, Feinleib M, McNamara PM, Garrison RJ, Castelli WP. An in-vestigation of coronary heart disease in families. The Framingham offspringstudy. Am J Epidemiol 1979;110:281–29020. Cutter GR, Burke GL, Dyer AR, et al. Cardiovascular risk factors in youngadults. The CARDIA baseline monograph. Control Clin Trials 1991;12(Suppl.):1S–77S21. Friedman GD, Cutter GR, Donahue RP, et al. CARDIA: study design, re-cruitment, and some characteristics of the examined subjects. J Clin Epidemiol1988;41:1105–111622. Meigs JB, Nathan DM, Wilson PW, Cupples LA, Singer DE. Metabolic riskfactors worsen continuously across the spectrum of nondiabetic glucose toler-ance. The Framingham Offspring Study. Ann Intern Med 1998;128:524–53323. Murabito JM, Nam BH, D’Agostino RB Sr, Lloyd-Jones DM, O’Donnell CJ,Wilson PW. Accuracy of offspring reports of parental cardiovascular diseasehistory: the Framingham Offspring Study. Ann Intern Med 2004;140:434–440
diabetes.diabetesjournals.org Vassy and Associates 2181

24. Bild DE, Jacobs DR Jr, Liu K, et al. Seven-year trends in plasma low-density-lipoprotein-cholesterol in young adults: the CARDIA Study. Ann Epidemiol1996;6:235–24525. Lettre G, Palmer CD, Young T, et al. Genome-wide association study ofcoronary heart disease and its risk factors in 8,090 African Americans: the NHLBICARe Project. PLoS Genet 2011;7:e100130026. Lemaitre RN, Tanaka T, Tang W, et al. Genetic loci associated with plasmaphospholipid n-3 fatty acids: a meta-analysis of genome-wide association studiesfrom the CHARGE Consortium. PLoS Genet 2011;7:e100219327. Gabriel SB, Schaffner SF, Nguyen H, et al. The structure of haplotype blocksin the human genome. Science 2002;296:2225–222928. Manning AK, Hivert MF, Scott RA, et al.; DIAbetes Genetics Replication AndMeta-analysis (DIAGRAM) Consortium; Multiple Tissue Human Expression Re-source (MUTHER) Consortium. A genome-wide approach accounting for bodymass index identifies genetic variants influencing fasting glycemic traits andinsulin resistance. Nat Genet 2012;44:659–66929. Pencina MJ, D’Agostino RB Sr, Steyerberg EW. Extensions of net re-classification improvement calculations to measure usefulness of new bio-markers. Stat Med 2011;30:11–2130. Pencina MJ, D’Agostino RB Sr, D’Agostino RB Jr, Vasan RS. Evaluating theadded predictive ability of a new marker: from area under the ROC curve toreclassification and beyond. Stat Med 2008;27:157–172; discussion 207–21231. DeLong ER, DeLong DM, Clarke-Pearson DL. Comparing the areas undertwo or more correlated receiver operating characteristic curves: a nonparametricapproach. Biometrics 1988;44:837–84532. Pencina MJ, D’Agostino RB. Overall C as a measure of discrimination insurvival analysis: model specific population value and confidence interval esti-mation. Stat Med 2004;23:2109–212333. Wray NR, Yang J, Hayes BJ, Price AL, Goddard ME, Visscher PM. Pitfalls ofpredicting complex traits from SNPs. Nat Rev Genet 2013;14:507–515
34. Voight BF, Scott LJ, Steinthorsdottir V, et al.; MAGIC investigators; GIANTConsortium. Twelve type 2 diabetes susceptibilty loci identified through large-scale association analysis. Nat Genet 2010;42:579–58935. Perry JR, Voight BF, Yengo L, et al.; MAGIC; DIAGRAM Consortium; GIANTConsortium. Stratifying type 2 diabetes cases by BMI identifies genetic riskvariants in LAMA1 and enrichment for risk variants in lean compared to obesecases. PLoS Genet 2012;8:e100274136. Palmer ND, McDonough CW, Hicks PJ, et al.; DIAGRAM Consortium; MAGICInvestigators. A genome-wide association search for type 2 diabetes genes inAfrican Americans. PLoS ONE 2012;7:e2920237. Lewis JP, Palmer ND, Hicks PJ, et al. Association analysis in africanamericans of European-derived type 2 diabetes single nucleotide polymorphismsfrom whole-genome association studies. Diabetes 2008;57:2220–222538. Cooke JN, Ng MC, Palmer ND, et al. Genetic risk assessment of type 2diabetes-associated polymorphisms in African Americans. Diabetes Care 2012;35:287–29239. Liu CT, Ng MC, Rybin D, et al. Transferability and fine-mapping of glucoseand insulin quantitative trait loci across populations: CARe, the Candidate GeneAssociation Resource. Diabetologia 2012;55:2970–298440. Bao W, Hu FB, Rong S, et al. Predicting risk of type 2 diabetes mellitus withgenetic risk models on the basis of established genome-wide associationmarkers: a systematic review. Am J Epidemiol 2013;178:1197–120741. Abraham G, Kowalczyk A, Zobel J, Inouye M. Performance and robustnessof penalized and unpenalized methods for genetic prediction of complex humandisease. Genet Epidemiol 2013;37:184–19542. Che R, Motsinger-Reif AA. A new explained-variance based genetic riskscore for predictive modeling of disease risk. Stat Appl Genet Mol Biol 2012;11:1543. Aschard H, Chen J, Cornelis MC, Chibnik LB, Karlson EW, Kraft P. Inclusionof gene-gene and gene-environment interactions unlikely to dramatically improverisk prediction for complex diseases. Am J Hum Genet 2012;90:962–972
2182 T2D Polygenic Prediction Diabetes Volume 63, June 2014