pollen allergy - the triggers - uk-air
TRANSCRIPT

Pollen allergy - the triggers
Dr Matt Smith
National Pollen and Aerobiology Research Unit
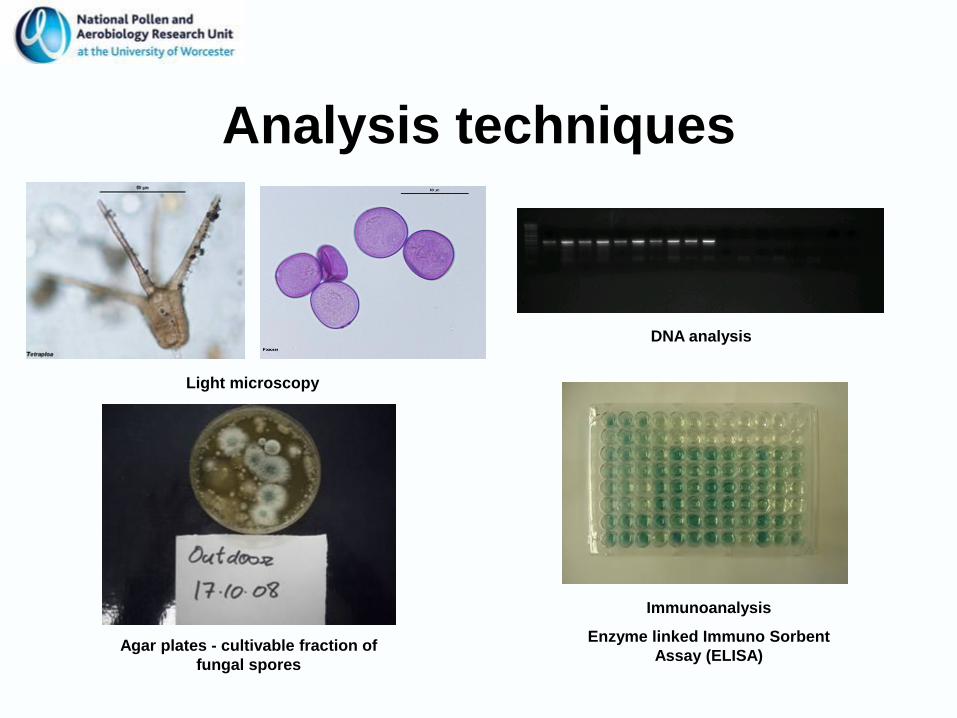
Analysis techniques
Immunoanalysis
Enzyme linked Immuno Sorbent
Assay (ELISA)
DNA analysis
Light microscopy
Agar plates - cultivable fraction of
fungal spores
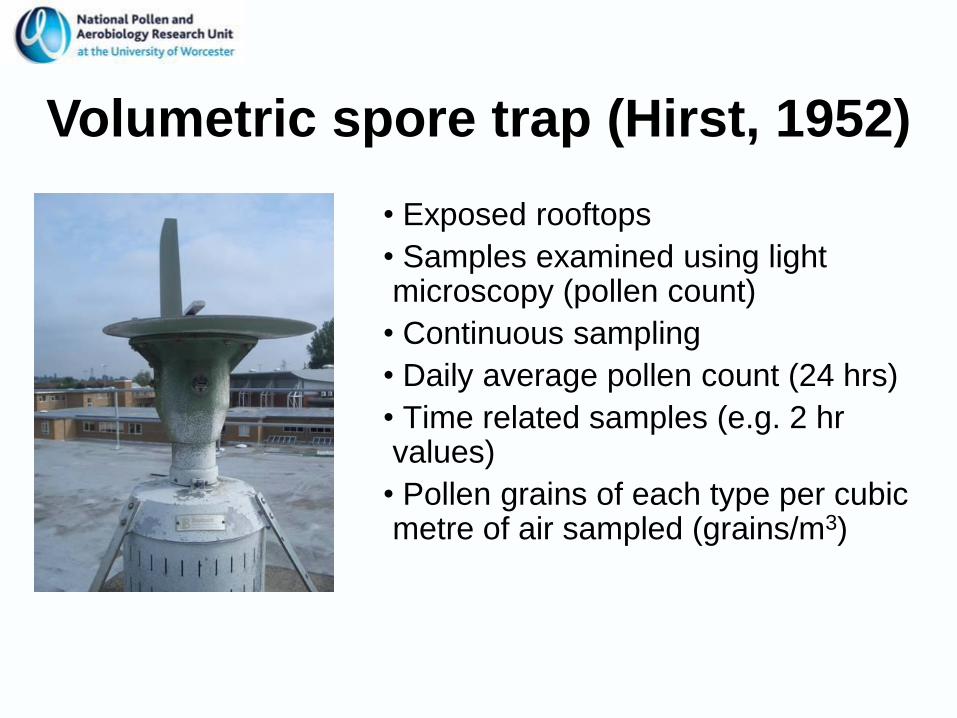
• Exposed rooftops
• Samples examined using light microscopy (pollen count)
• Continuous sampling
• Daily average pollen count (24 hrs)
• Time related samples (e.g. 2 hr values)
• Pollen grains of each type per cubic metre of air sampled (grains/m3)
Volumetric spore trap (Hirst, 1952)
• Pollen grains from anemophilous
(wind pollinated) plants
• Characterised by
– Produced in huge numbers
– Small (~20-40 µm),
– Thin exine and smooth sculpture
– However, many have larger grains and/or a more
complex exine structure and features such as air sacs.
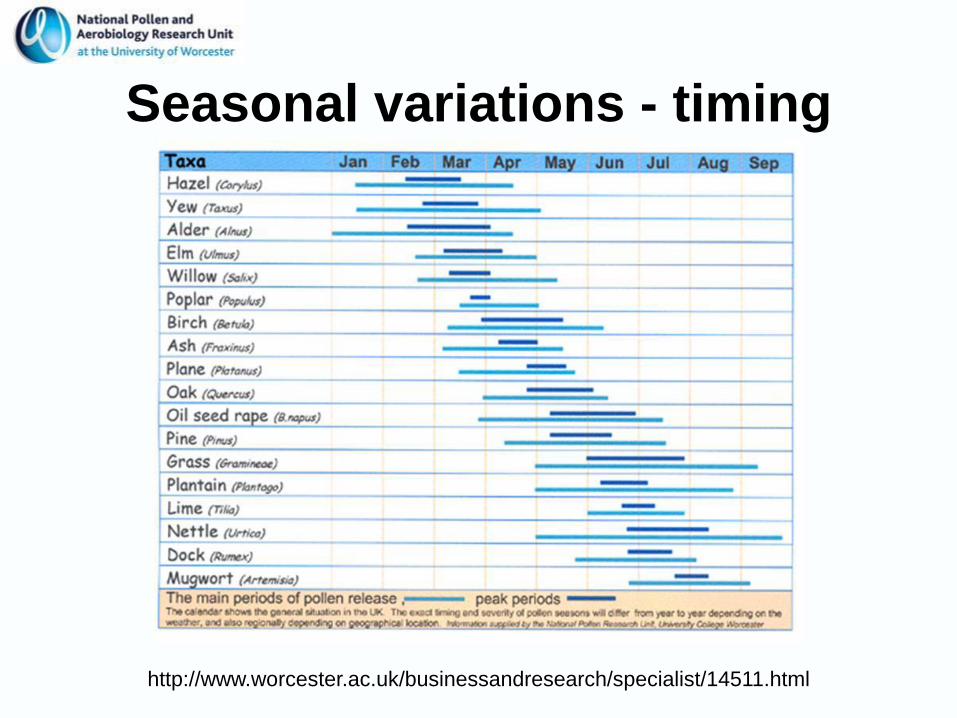
Seasonal variations - timing
http://www.worcester.ac.uk/businessandresearch/specialist/14511.html
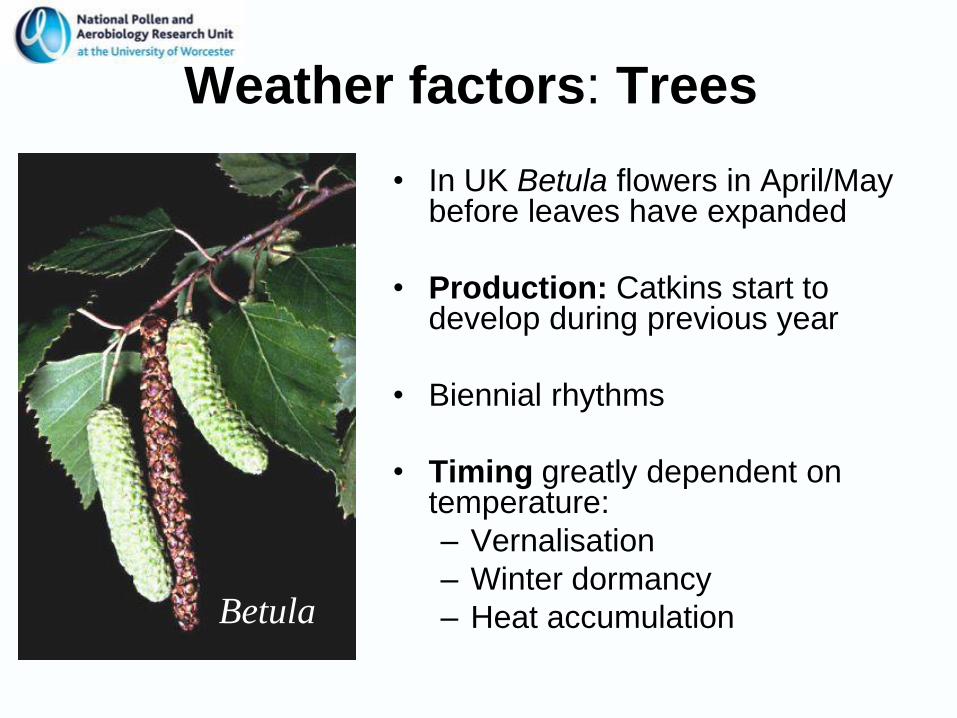
Weather factors: Trees
• In UK Betula flowers in April/May before leaves have expanded
• Production: Catkins start to develop during previous year
• Biennial rhythms
• Timing greatly dependent on temperature:
– Vernalisation
– Winter dormancy
– Heat accumulationBetula
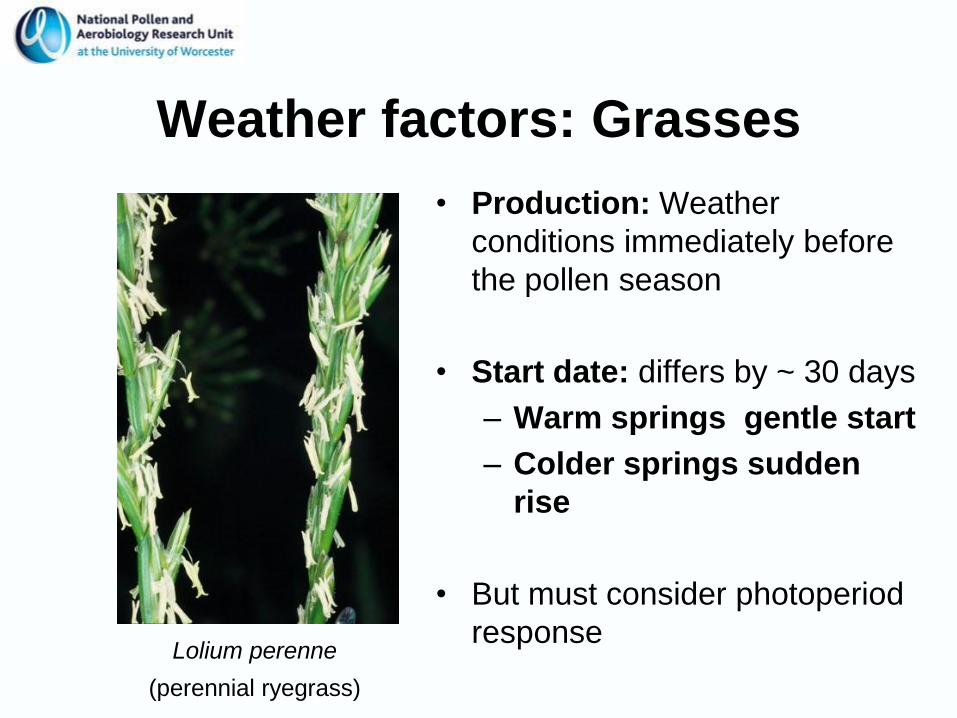
Weather factors: Grasses
• Production: Weather
conditions immediately before
the pollen season
• Start date: differs by ~ 30 days
– Warm springs gentle start
– Colder springs sudden
rise
• But must consider photoperiod
responseLolium perenne
(perennial ryegrass)
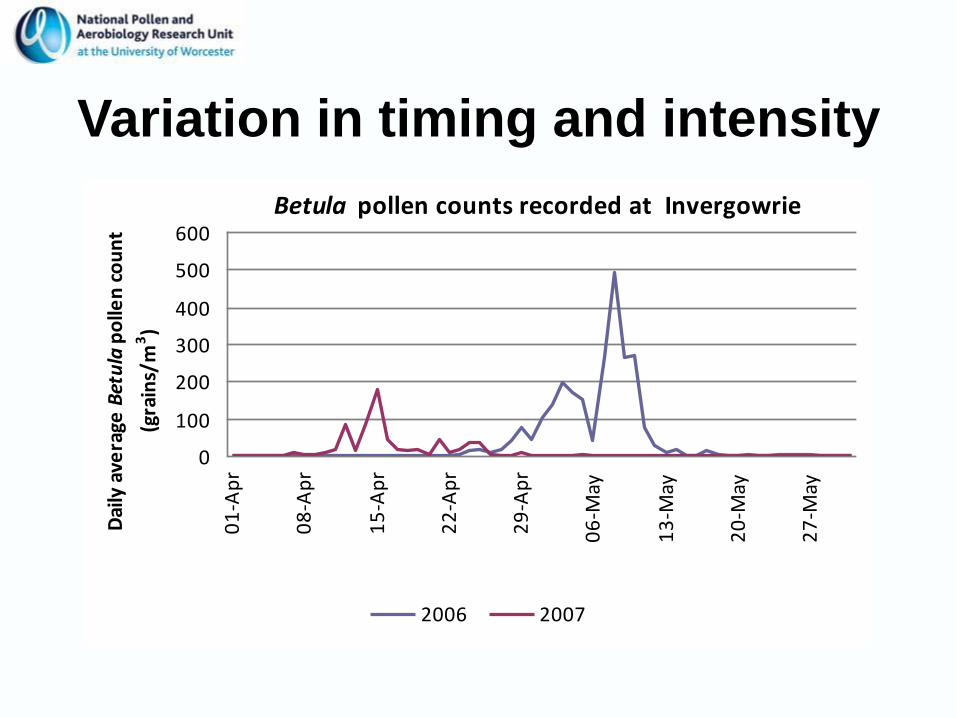
Variation in timing and intensity
Betula pollen counts recorded at Invergowrie
0
100
200
300
400
500
60001-Apr
08-Apr
15-Apr
22-Apr
29-Apr
06-M
ay
13-M
ay
20-M
ay
27-M
ay
Dai
ly a
vera
ge B
etu
lap
olle
n c
ou
nt
(gra
ins/
m3)
2006 2007
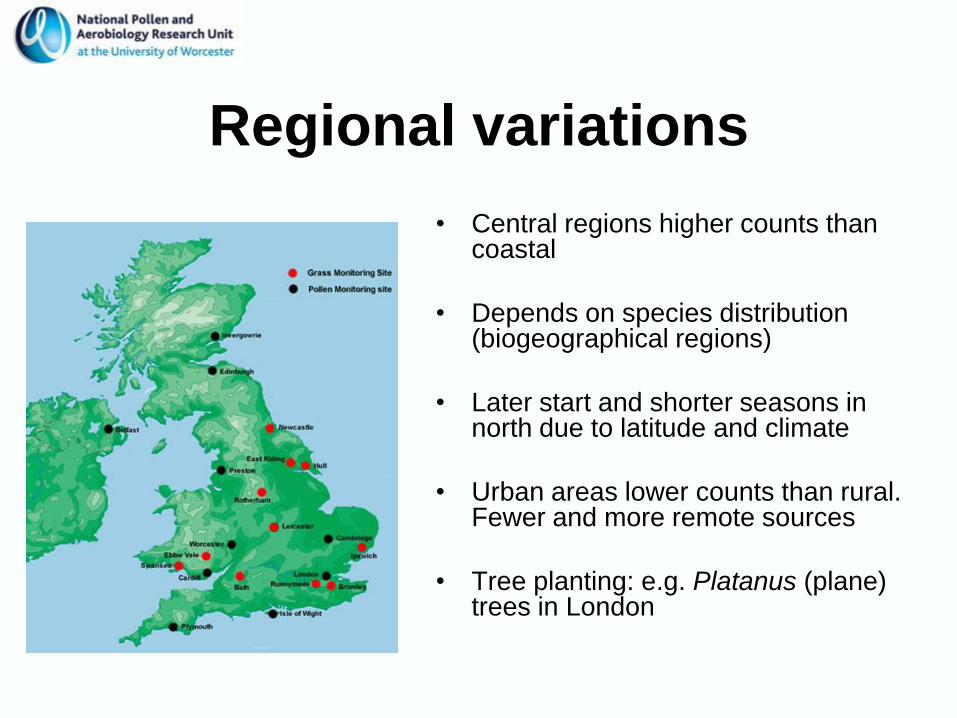
Regional variations
• Central regions higher counts than coastal
• Depends on species distribution (biogeographical regions)
• Later start and shorter seasons in north due to latitude and climate
• Urban areas lower counts than rural. Fewer and more remote sources
• Tree planting: e.g. Platanus (plane) trees in London
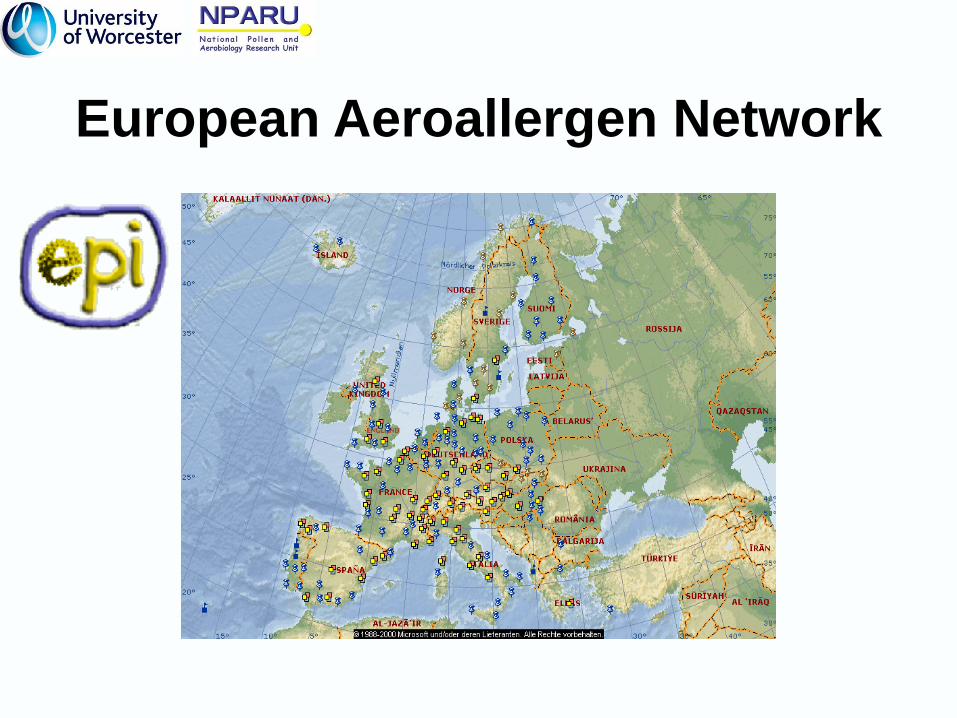
European Aeroallergen Network
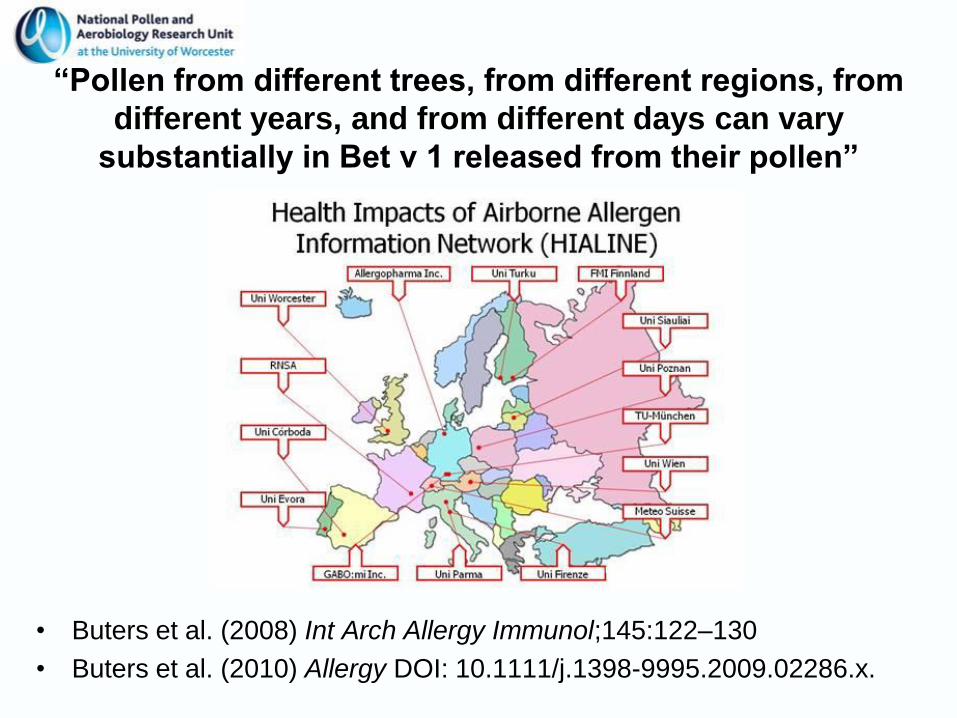
“Pollen from different trees, from different regions, from
different years, and from different days can vary
substantially in Bet v 1 released from their pollen”
• Buters et al. (2008) Int Arch Allergy Immunol;145:122–130
• Buters et al. (2010) Allergy DOI: 10.1111/j.1398-9995.2009.02286.x.
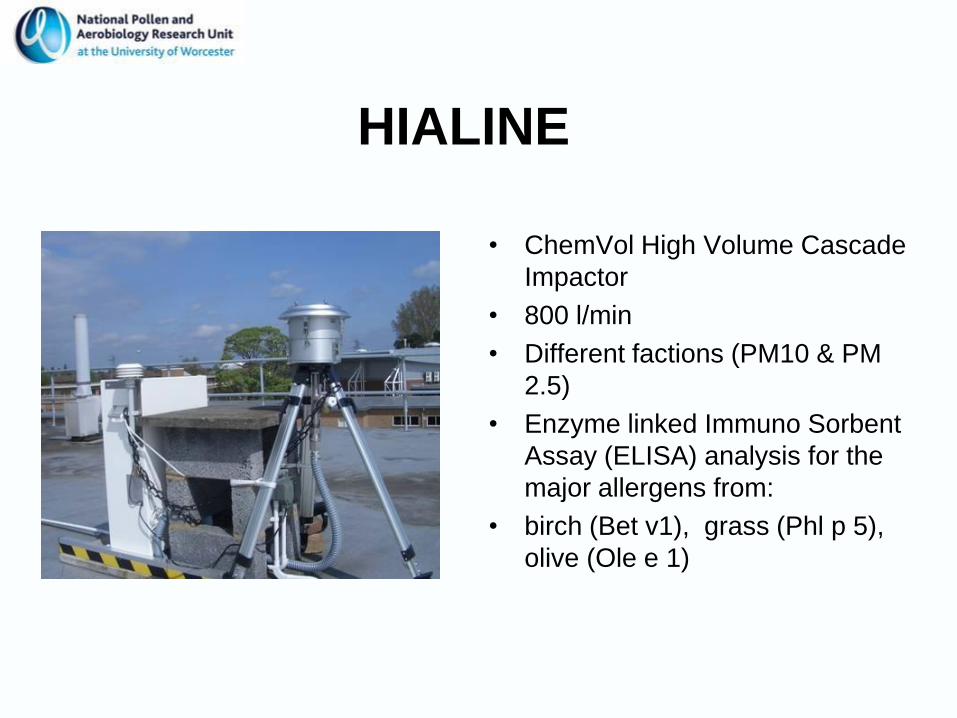
HIALINE
• ChemVol High Volume Cascade
Impactor
• 800 l/min
• Different factions (PM10 & PM
2.5)
• Enzyme linked Immuno Sorbent
Assay (ELISA) analysis for the
major allergens from:
• birch (Bet v1), grass (Phl p 5),
olive (Ole e 1)
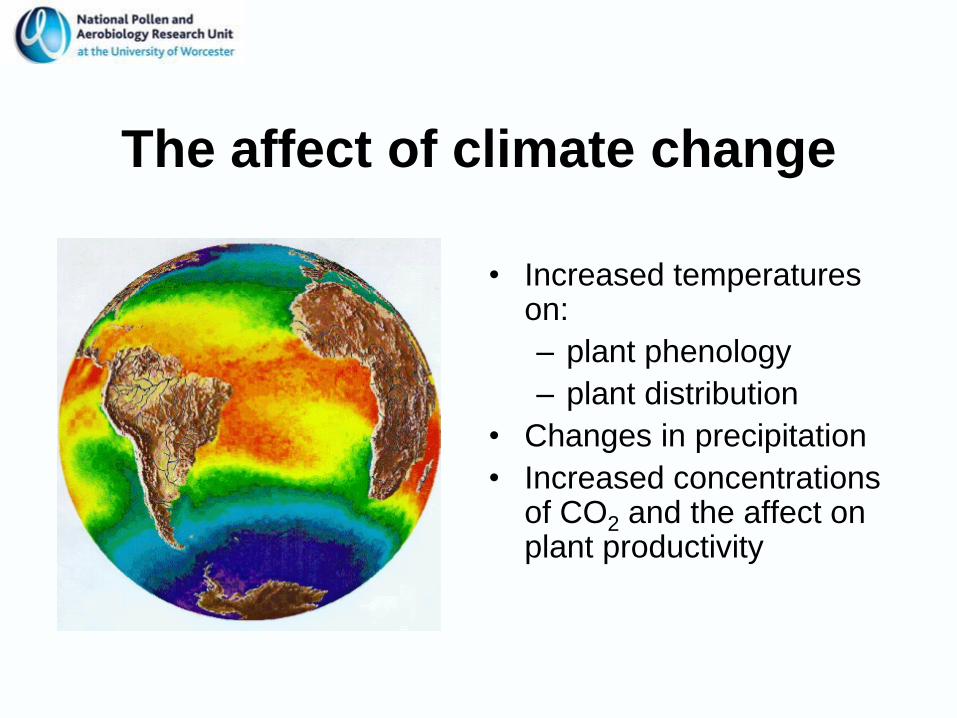
The affect of climate change
• Increased temperatures on:
– plant phenology
– plant distribution
• Changes in precipitation
• Increased concentrations of CO2 and the affect on plant productivity
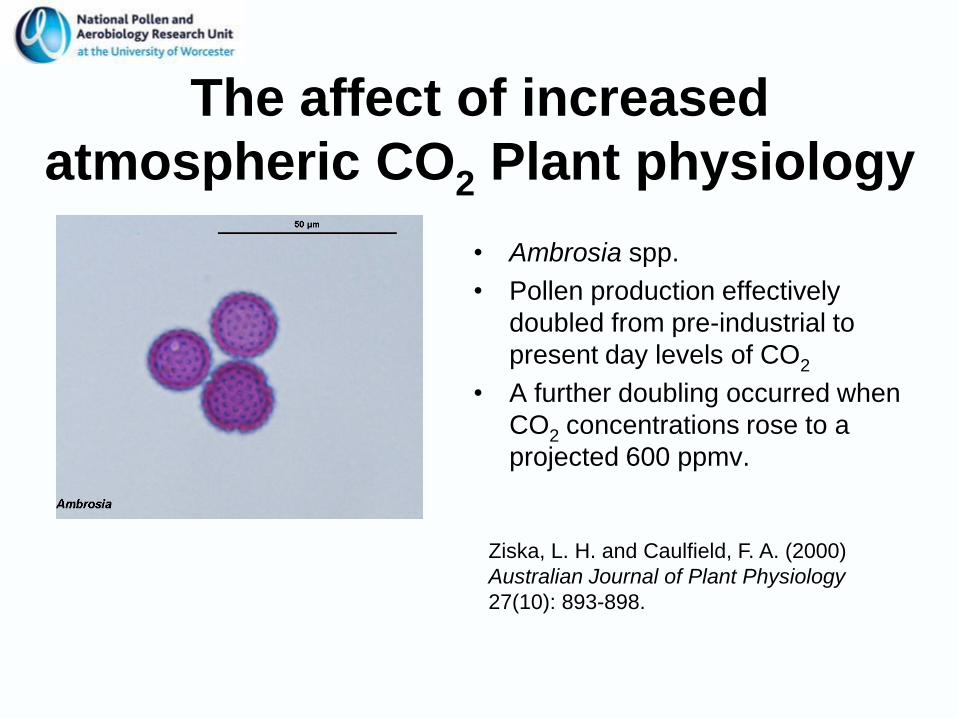
The affect of increased
atmospheric CO2 Plant physiology
• Ambrosia spp.
• Pollen production effectively
doubled from pre-industrial to
present day levels of CO2
• A further doubling occurred when
CO2 concentrations rose to a
projected 600 ppmv.
Ziska, L. H. and Caulfield, F. A. (2000)
Australian Journal of Plant Physiology
27(10): 893-898.
Direct affects of atmospheric
pollution• Pollen counts ~ 50% lower in
cities than in rural areas but prevalence rates of seasonal allergic rhinitis generally as high or higher
• Pollutants may affect allergenicity of pollen directly via:
– Contamination of the anthers
– During flight of pollen through the air when dispersed
Emberlin, J (1998) Eur Resp Rev 8(53): 164-167
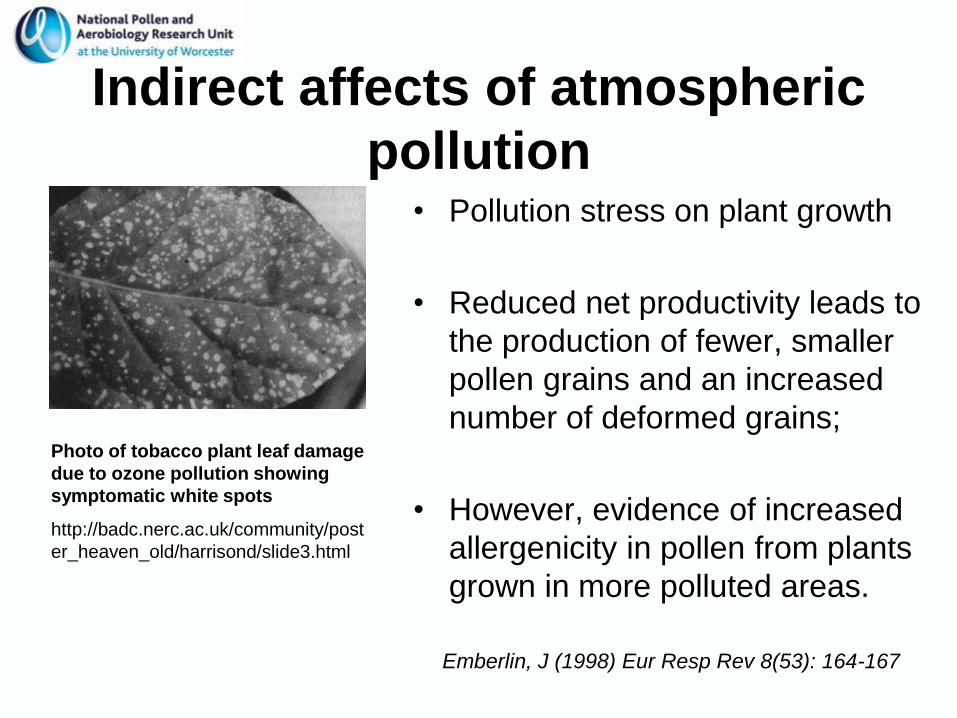
Indirect affects of atmospheric
pollution• Pollution stress on plant growth
• Reduced net productivity leads to
the production of fewer, smaller
pollen grains and an increased
number of deformed grains;
• However, evidence of increased
allergenicity in pollen from plants
grown in more polluted areas.
Emberlin, J (1998) Eur Resp Rev 8(53): 164-167
Photo of tobacco plant leaf damage
due to ozone pollution showing
symptomatic white spots
http://badc.nerc.ac.uk/community/post
er_heaven_old/harrisond/slide3.html

• e.g. NO2 and O3 produced by vehicles can add the chemical group nitrate to protein molecules, particularly birch pollen proteins including the allergen Bet v 1
• Contact with nitrated proteins or nitrating substances from the environment might trigger immune reactions
• Nitration could boost the power of existing allergens, or even make benign proteins allergenic
Franze et al. (2005) Environmental Science & Technology, 39, 1673-1678
Synergistic effects between
aeroallergens and pollutants
• Pollen from wind pollinated plants most important in terms of allergy
• Meteorological data used to predict temporal variations in pollen counts
• New techniques in aerobiology include the analysis of airborne allergen concentrations
• Climate change can affect the timing and intensity of pollen seasons as well as the distribution of allergenic plants.
• Chemical air pollutants can affect the allergenicity of pollen
Conclusion
Pollen allergy - the triggers
Dr Matt Smith
National Pollen and Aerobiology Research Unit