political participation of migrants in the netherlands since 1986
TRANSCRIPT
Michon, Tillie, van Heelsum 2007 Draft version
Political participation of migrants in the Netherlands since 1986
Laure Michon, Jean Tillie & Anja van HeelsumInstitute for Migration and Ethnic StudiesUniversiteit van Amsterdam
Paper to be presented at the Barcelona Seminar on Political Rights 19-20 July 2007
Introduction........................................................................................................................2I. Political participation at the local level.......................................................................3
a. Turnout of migrants at municipal elections................................................................4b. Party choice of migrants at the local level.................................................................5
II. Political participation at the national level.................................................................9III. The use of passive voting rights..............................................................................12
a. At the local level......................................................................................................12b. At the national level.................................................................................................15
IV. Explaining voting behaviour and the role of ethnicity..............................................16a. Explaining turnout....................................................................................................16b. Explaining party choice............................................................................................18c. Ethnicity and its role for migrant councillors............................................................21
Conclusion........................................................................................................................24References........................................................................................................................26
1

Michon, Tillie, van Heelsum 2007 Draft version
Introduction
Whereas civil and social rights have been granted to foreigners over time, political rights were often seen as a last privilege of national citizens. Moreover, most European countries have for long used nationality to define the political community (Jacobs, 1998, p.27). Currently however, a majority of the European Union member states offers the possibility to non-nationals to vote: 14 out of the 25 member states have enfranchised foreigners, although often only at the local level (Bauböck, 2006, p.121). For those countries where nationality remained the only path for access to political rights, the Maastricht Treaty introduced a radical change: since 1992 EU-citizens living in another EU-country have the right to vote at local and European parliamentary elections, and to stand in these elections. In the Netherlands EU-citizens already had full voting rights at the local level. This right had been granted in 1985 to all non-nationals who had lived (legally) in the Netherlands for at least five years.
One of the main reasons for granting this right was to promote integration, in particular of non-western immigrants. The argument was that once they would have the right to vote, the interest of immigrants in the Dutch political system would increase. This was seen as beneficial for their integration within the Dutch society (Jacobs, 1998, p.114; Tillie, 2000, p.12). Of course not everyone was happy with the extension of political rights to non-nationals. Some feared that migrants would set up their ‘own’ political parties (on an ethnic or religious basis), which would lead to segregation (Jacobs, 1998, p.119). Twenty years later, it appears that this happened only occasionally, and without success.
In this paper, we will present research results on the use of political rights by migrants in the Netherlands since 1986 (section I). We will rely on several surveys conducted during municipal elections focussing on turnout and party choice of migrants, and consequently look at these issues at the national level (section II) – for which there has been, however, fewer interest. This paper will also address the issue of the use of passive voting rights (section III), although research on candidates and elected councillors and officials of foreign origin has been conducted less frequently and less systematically than research on the use of active voting rights. We will consequently focus on explanations of voting behaviour, and more specifically on the role of ethnicity (section IV) in patterns of political participation of migrants in the Netherlands.
Although in the Dutch context, speaking of ‘migrant voters’ or ‘migrant politicians’ is somehow obvious, who we aim with these terms needs to be clarified. Migrants (also called allochtonen, as opposed to the autochthonous Dutch population) are first and second generation immigrants. In the registers of the Dutch municipalities, there are categorized in ethnic groups. Ethnicity is determined on the basis of information on the country of birth of a person and on the country of birth of both his/her parents, following the rules of Dutch municipalities (VNG – Vereniging van Nederlandse Gemeenten).1 1 Following these rules, if a person is born in a foreign country, the ethnicity of the person would be that of the country in question, unless the person was born in a developed country and the parents weren’t. If the person was born in the Netherlands, the country of the mother is dominant, unless she was born in a developed country
2

Michon, Tillie, van Heelsum 2007 Draft version
Research on turnout and party choice of migrants at the local level has relied on this definition since 1994.
I. Political participation at the local level
Research on the use of local voting rights by migrants, which has been carried out since 1986, has not always applied the same definition to the research population. Surveys were held in different cities at all municipal elections since 1985 (in 1986, see Pennings, 1987; 1990, see Rath, 1990; in 1994 and 1998, see Tillie, 2000; in 2002, see Michon & Tillie, 2003a; and in 2006 see van Heelsum & Tillie, 2006) to measure turnout and analyse party choice of migrant voters, but they are only partially comparable. In 1986, Pennings (1987), when speaking of ethnicity, referred to a subjective identity claimed by the respondents, while Rath (1990) registered their nationality. The rules of the VNG have however been used in the study of turnout and party choice of migrants in 1994 (in Amsterdam, Arnhem, Den Haag, Enschede, Rotterdam, Tilburg and Utrecht), 1998 (in Amsterdam, Arnhem, Den Haag, Rotterdam and Utrecht), 2002 (in Amsterdam – see also for Rotterdam van Rhee, 2002a) and 2006 (in Amsterdam, Rotterdam, Arnhem and Breda). Van Rhee (2002a) also relied on the VNG rules for his study of turnout during the 2002 Rotterdam municipal elections.2 When speaking of turn-out and party choice, we will mostly rely on the data collected during the four last municipal elections. Besides, because ethnicity was defined following the same criteria as in the registers of the municipality, it was also possible to measure turnout.3
The surveys held at each election since 1994 followed the same procedure. On the very day the municipal elections are held, voters coming out of pre-selected polling stations were asked to fill in a questionnaire about their party choice and party preferences. Besides, non-response is registered so as to measure turnout.
In all research on migrants and/or minorities in the Netherlands, thus also in this paper, there has always been a focus on four groups: immigrants from Turkey, Morocco, Surinam and the Antilles. This focus is simply chosen because these are the four major non-Dutch migrant communities. In Rotterdam, Capeverdians form an important group in the population and are therefore included in the analysis.
a. Turnout of migrants at municipal elections
Migrant turnout at elections is usually seen as an indicator of their level of integration. To vote, one must have at least some knowledge of the competing political parties and of the political system. High levels of turnout can therefore mean that political knowledge is
and the father wasn’t.2 Van Rhee was able to use samples of the administration of the voting bureaus, which he combined with (anonymous) data from the register of population.3 The number of registered (potential) voters for each ethnic group was provided in advance by the municipality.
3
Michon, Tillie, van Heelsum 2007 Draft version
well spread among ethnic minority groups. As we have recalled above, this was one of the reasons to grant political rights to migrants.
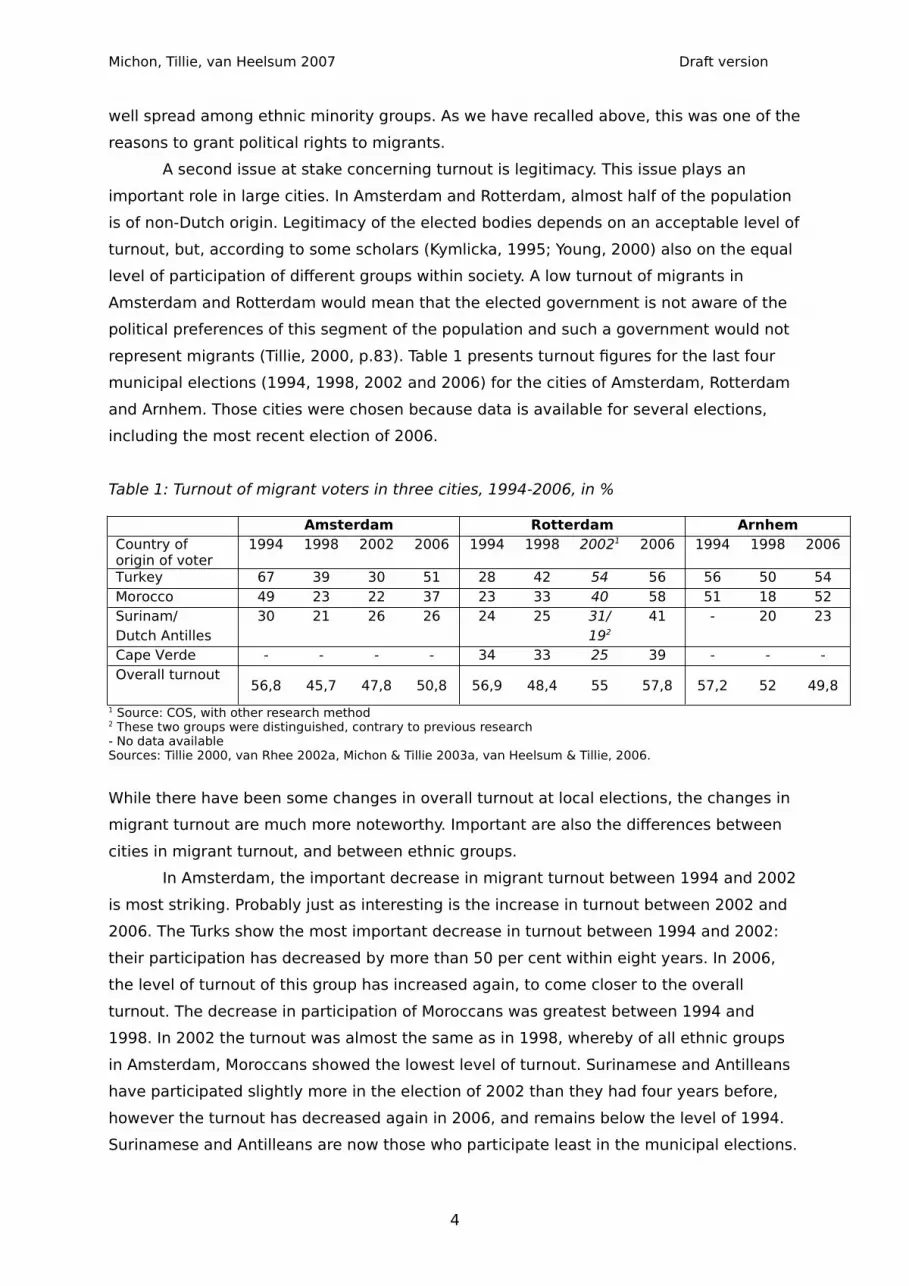
A second issue at stake concerning turnout is legitimacy. This issue plays an important role in large cities. In Amsterdam and Rotterdam, almost half of the population is of non-Dutch origin. Legitimacy of the elected bodies depends on an acceptable level of turnout, but, according to some scholars (Kymlicka, 1995; Young, 2000) also on the equal level of participation of different groups within society. A low turnout of migrants in Amsterdam and Rotterdam would mean that the elected government is not aware of the political preferences of this segment of the population and such a government would not represent migrants (Tillie, 2000, p.83). Table 1 presents turnout figures for the last four municipal elections (1994, 1998, 2002 and 2006) for the cities of Amsterdam, Rotterdam and Arnhem. Those cities were chosen because data is available for several elections, including the most recent election of 2006.
Table 1: Turnout of migrant voters in three cities, 1994-2006, in %
Amsterdam Rotterdam ArnhemCountry of origin of voter
1994 1998 2002 2006 1994 1998 20021 2006 1994 1998 2006
Turkey 67 39 30 51 28 42 54 56 56 50 54Morocco 49 23 22 37 23 33 40 58 51 18 52Surinam/ 30 21 26 26 24 25 31/ 41 - 20 23Dutch Antilles 192 Cape Verde - - - - 34 33 25 39 - - -Overall turnout 56,8 45,7 47,8 50,8 56,9 48,4 55 57,8 57,2 52 49,8
1 Source: COS, with other research method2 These two groups were distinguished, contrary to previous research- No data availableSources: Tillie 2000, van Rhee 2002a, Michon & Tillie 2003a, van Heelsum & Tillie, 2006.
While there have been some changes in overall turnout at local elections, the changes in migrant turnout are much more noteworthy. Important are also the differences between cities in migrant turnout, and between ethnic groups.
In Amsterdam, the important decrease in migrant turnout between 1994 and 2002 is most striking. Probably just as interesting is the increase in turnout between 2002 and 2006. The Turks show the most important decrease in turnout between 1994 and 2002: their participation has decreased by more than 50 per cent within eight years. In 2006, the level of turnout of this group has increased again, to come closer to the overall turnout. The decrease in participation of Moroccans was greatest between 1994 and 1998. In 2002 the turnout was almost the same as in 1998, whereby of all ethnic groups in Amsterdam, Moroccans showed the lowest level of turnout. Surinamese and Antilleans have participated slightly more in the election of 2002 than they had four years before, however the turnout has decreased again in 2006, and remains below the level of 1994. Surinamese and Antilleans are now those who participate least in the municipal elections.
4
Michon, Tillie, van Heelsum 2007 Draft version
In 1994, the difference in turnout between the four minority ethnic groups was very important. In 2002, the situation had completely changed: the turnout of all ethnic groups was dramatically lower than the general turnout, and differences between ethnic groups were small, which increased the discrepancy in turnout between Dutch nationals and migrants. However the situation changed again in 2006, reasserting differences between ethnic groups.
In Rotterdam, figures of turnout show a completely different picture. First of all, there has been a steady increase in migrant turnout since 1994 for all ethnic groups (except for Capeverdians, whose turnout was lower in 2002 than in 1998). Turnout of Turkish and Moroccan voters as doubled between 1994 and 2006. Secondly, turnout of migrants is (much) higher in Rotterdam than in Amsterdam. Thirdly, the differences between ethnic groups are different in the two cities. In Rotterdam, the level of turnout of Turks is quite comparable to the overall turnout since 1998 already, and in 2006 this is also the case for Moroccans. Surinamese, Antillean and Capeverdian voters stay behind, with lower levels of turnout – but higher than in Amsterdam.
Results of the research in Arnhem give, again, a completely different outcome. In the 1994 elections, ethnicity was not a crucial factor for turnout, as the level of turnout of Turks and Moroccans was very close to the overall turnout. In 1998 and 2006, the level of turnout of Turks stayed very stable, and in line with the overall level of turnout. In 2006, Turkish voters even relatively showed up more often than the population of Arnhem. If we look at Moroccan voters, their level of turnout fell dramatically in 1998, but showed an important increase again in 2006, reaching the level of the overall turnout. Surinamese voters – for whom we have figures for the 1998 and 2006 elections – stay far behind with low levels of participation.
In other cities, no recent data is available. Tillie (2000, pp.91-92) gave an overview of data for Den Haag and Utrecht for 1994 and 1998, which shows that turnout was very low for all ethnic groups in both cities in 1998, whereas in Utrecht the level of participation of Turkish voters was average in 1994, and for Moroccans slightly under the level of overall turnout.
b. Party choice of migrants at the local level
For results concerning party choice of immigrants, we can rely on figures of the elections of since 1986. However, as we mentioned in the introduction, in 1986 and 1990 different methods were used to determine ethnicity, while in 1994, 1998, 2002 and 2006 a similar method was used.
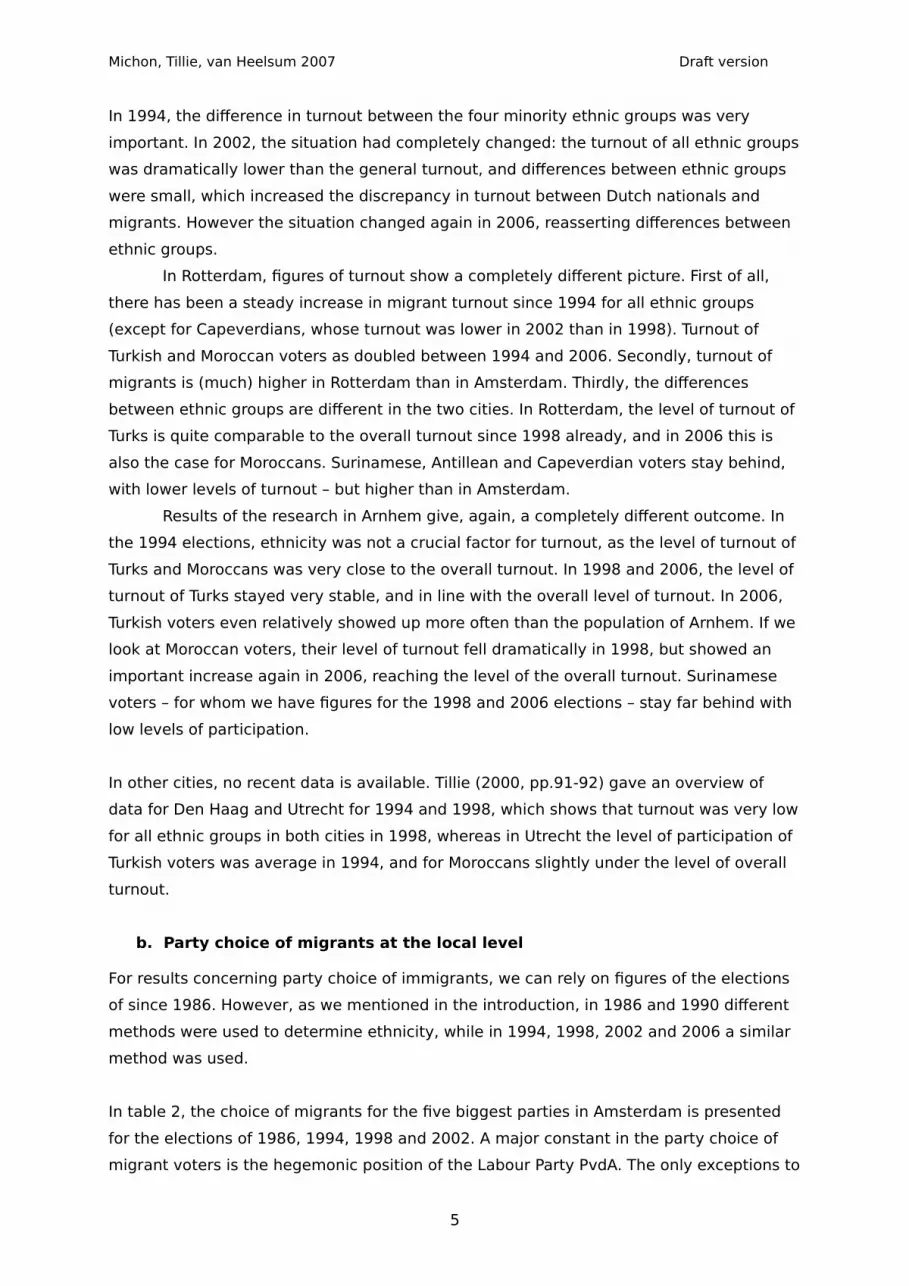
In table 2, the choice of migrants for the five biggest parties in Amsterdam is presented for the elections of 1986, 1994, 1998 and 2002. A major constant in the party choice of migrant voters is the hegemonic position of the Labour Party PvdA. The only exceptions to
5
Michon, Tillie, van Heelsum 2007 Draft version
this ‘rule’ occurred in 1994, when the Turks showed a strong preference for the Christian Democratic CDA and the Moroccans for the Green party GroenLinks. In all other election years, the Labour party has been the first choice of migrant voters in Amsterdam.
Table 2: Migrant party choice at municipal elections in Amsterdam, 1986-2006, in %
Country of originof voter
Year SP GroenLinks
PvdA D66 CDA VVD Other parties
Turkey 1986 * 5 78 0 8 2 21994 * 12 35 13 37 2 11998 1 18 47 7 18 1 02002 2 25 44 7 2 19 32006 5 4 87 1 1 1 1
Morocco 1986 * 4 77 1 4 61994 * 50 39 6 2 2 11998 0 35 55 3 2 1 22002 4 29 57 1 2 - 112006 7 12 77 1 2 1 1
Surinam 1986 * 9 84 0 2 1 11994 * 27 48 13 3 4 51998 4 20 56 3 2 4 32002 1 11 63 1 3 3 192006 6 4 82 0 1 3 4
Ducth Antilles 1986 * * * * * * *1994 * 23 40 14 9 5 91998 3 22 57 2 7 7 22002 4 17 53 3 7 1 192006 10 10 58 0 5 8 8
* not know.Parties are shown on a left-wing continuum.SP: socialist party; GroenLinks: Green party, in 1986 known as Links Akkoord; PvdA: Labour Party; D66: social liberal party; CDA: Christian democratic party; VVD: right-wing liberal party.Source: Tillie 1994; Tillie 2000; Michon & Tillie 2003b; van Heelsum & Tillie 2006.
The Turkish electorate has been relatively loyal to the Labour party over time, and its overwhelming choice for this party in 2006 is striking. The score of the right-wing liberal party VVD in 2002 among the Turkish voters appears to have been a one-time phenomenon: this party had never been able to attract the votes of migrants, and suddenly obtained a fifth of the Turkish votes, but the share of votes for this party dropped to only one per cent in 2006. Moroccans have always voted overwhelmingly for left-wing parties. The score of the PvdA among Moroccans had been halved between 1986 and 1994, but this party retains a leading position, especially in 2006, followed by the green party GroenLinks. GroenLinks has lost many of the Moroccans votes over time. The PvdA has also been very popular since 1986 among the Surinamese. The Green party was however also able to gain numerous votes from this group in 1994 and 1998. In 2002, the choice of Surinamese voters for local parties (included in ‘other parties’ in table 3), has strongly increased. This is particularly due to the success of the local party Toekomst 21, a party led by a Surinamese politician and including Surinamese, Antillean and Dutch politicians. This party, which was left out of table 2, received 9 per cent of the voters from Surinam. Among Antillean voters, a similar pattern of party-choice can be noted, with
6
Michon, Tillie, van Heelsum 2007 Draft version
much more votes for the local parties. Antilleans significantly voted for a small Christian democratic party, the ChristenUnie, in 2002 and in 2006.
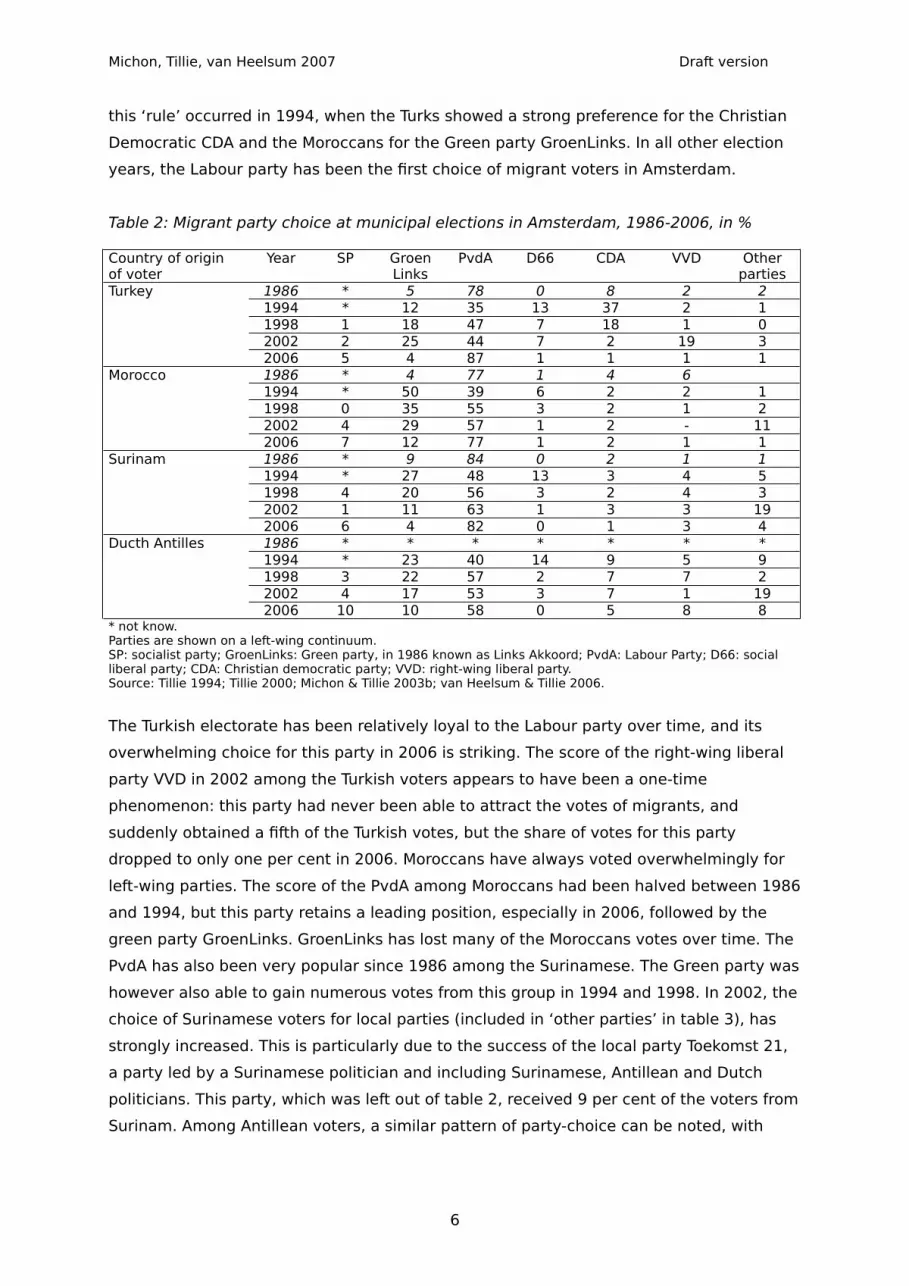
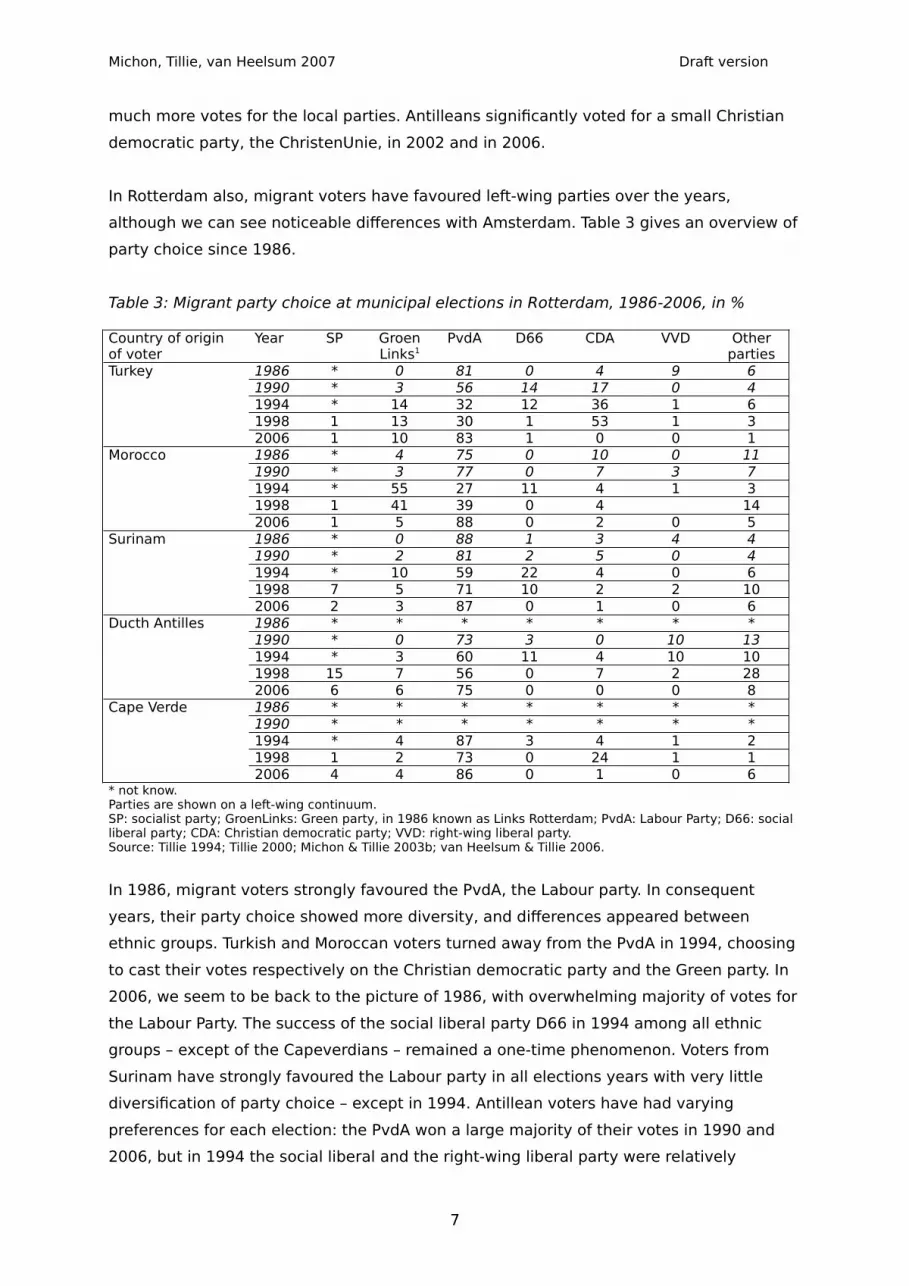
In Rotterdam also, migrant voters have favoured left-wing parties over the years, although we can see noticeable differences with Amsterdam. Table 3 gives an overview of party choice since 1986.
Table 3: Migrant party choice at municipal elections in Rotterdam, 1986-2006, in %
Country of originof voter
Year SP GroenLinks1
PvdA D66 CDA VVD Other parties
Turkey 1986 * 0 81 0 4 9 61990 * 3 56 14 17 0 41994 * 14 32 12 36 1 61998 1 13 30 1 53 1 32006 1 10 83 1 0 0 1
Morocco 1986 * 4 75 0 10 0 111990 * 3 77 0 7 3 71994 * 55 27 11 4 1 31998 1 41 39 0 4 142006 1 5 88 0 2 0 5
Surinam 1986 * 0 88 1 3 4 41990 * 2 81 2 5 0 41994 * 10 59 22 4 0 61998 7 5 71 10 2 2 102006 2 3 87 0 1 0 6
Ducth Antilles 1986 * * * * * * *1990 * 0 73 3 0 10 131994 * 3 60 11 4 10 101998 15 7 56 0 7 2 282006 6 6 75 0 0 0 8
Cape Verde 1986 * * * * * * *1990 * * * * * * *1994 * 4 87 3 4 1 21998 1 2 73 0 24 1 12006 4 4 86 0 1 0 6
* not know.Parties are shown on a left-wing continuum.SP: socialist party; GroenLinks: Green party, in 1986 known as Links Rotterdam; PvdA: Labour Party; D66: social liberal party; CDA: Christian democratic party; VVD: right-wing liberal party.Source: Tillie 1994; Tillie 2000; Michon & Tillie 2003b; van Heelsum & Tillie 2006.
In 1986, migrant voters strongly favoured the PvdA, the Labour party. In consequent years, their party choice showed more diversity, and differences appeared between ethnic groups. Turkish and Moroccan voters turned away from the PvdA in 1994, choosing to cast their votes respectively on the Christian democratic party and the Green party. In 2006, we seem to be back to the picture of 1986, with overwhelming majority of votes for the Labour Party. The success of the social liberal party D66 in 1994 among all ethnic groups – except of the Capeverdians – remained a one-time phenomenon. Voters from Surinam have strongly favoured the Labour party in all elections years with very little diversification of party choice – except in 1994. Antillean voters have had varying preferences for each election: the PvdA won a large majority of their votes in 1990 and 2006, but in 1994 the social liberal and the right-wing liberal party were relatively
7
Michon, Tillie, van Heelsum 2007 Draft version
successful among this group, and in 1998 votes were scattered from the far-left (SP) to local parties. Capeverdians show the most stable party choice over the years, with a strong favour for the PvdA, and a one-time increase of votes for the Christian democratic party in 1998.
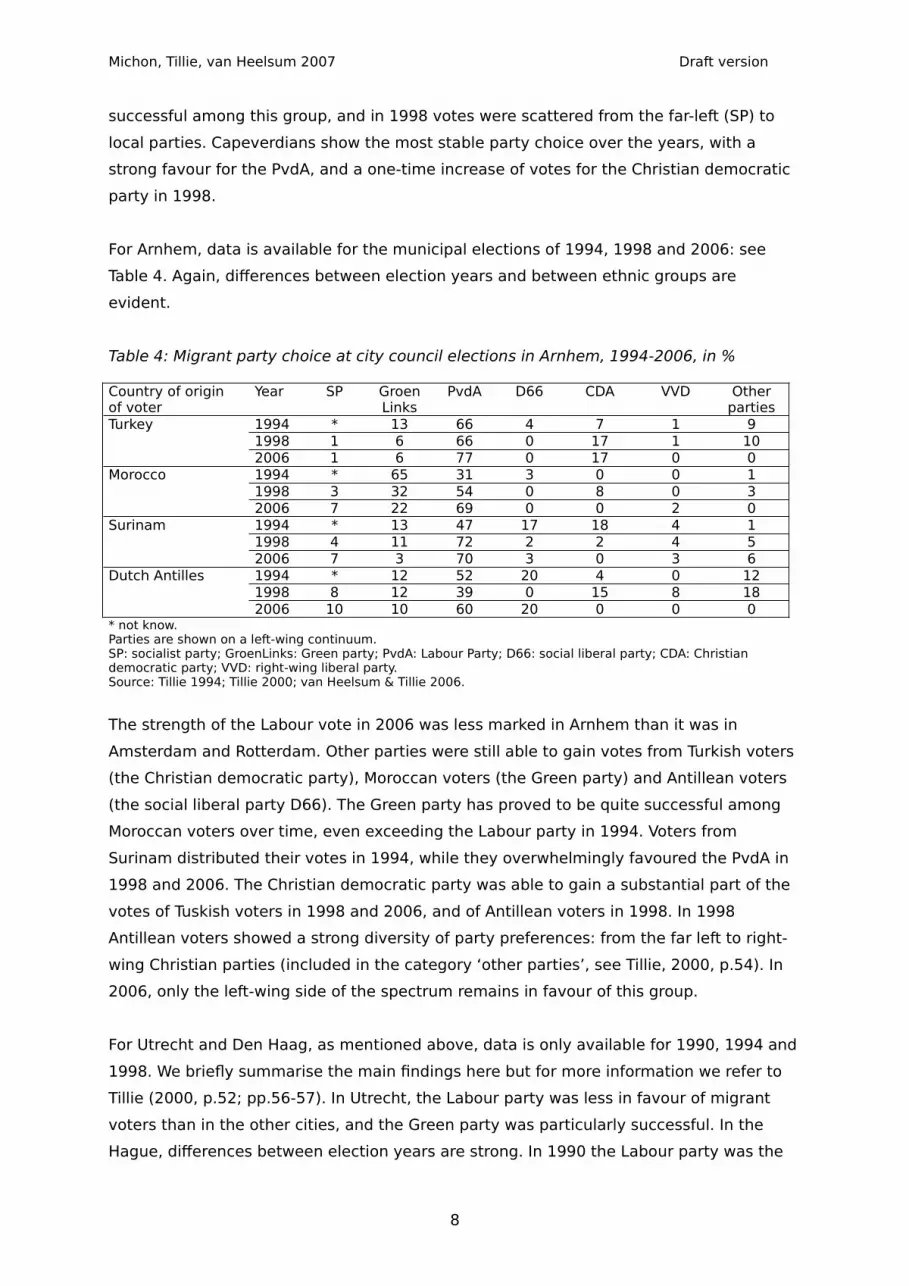
For Arnhem, data is available for the municipal elections of 1994, 1998 and 2006: see Table 4. Again, differences between election years and between ethnic groups are evident.
Table 4: Migrant party choice at city council elections in Arnhem, 1994-2006, in %
Country of originof voter
Year SP GroenLinks
PvdA D66 CDA VVD Other parties
Turkey 1994 * 13 66 4 7 1 91998 1 6 66 0 17 1 102006 1 6 77 0 17 0 0
Morocco 1994 * 65 31 3 0 0 11998 3 32 54 0 8 0 32006 7 22 69 0 0 2 0
Surinam 1994 * 13 47 17 18 4 11998 4 11 72 2 2 4 52006 7 3 70 3 0 3 6
Dutch Antilles 1994 * 12 52 20 4 0 121998 8 12 39 0 15 8 182006 10 10 60 20 0 0 0
* not know.Parties are shown on a left-wing continuum.SP: socialist party; GroenLinks: Green party; PvdA: Labour Party; D66: social liberal party; CDA: Christian democratic party; VVD: right-wing liberal party.Source: Tillie 1994; Tillie 2000; van Heelsum & Tillie 2006.
The strength of the Labour vote in 2006 was less marked in Arnhem than it was in Amsterdam and Rotterdam. Other parties were still able to gain votes from Turkish voters (the Christian democratic party), Moroccan voters (the Green party) and Antillean voters (the social liberal party D66). The Green party has proved to be quite successful among Moroccan voters over time, even exceeding the Labour party in 1994. Voters from Surinam distributed their votes in 1994, while they overwhelmingly favoured the PvdA in 1998 and 2006. The Christian democratic party was able to gain a substantial part of the votes of Tuskish voters in 1998 and 2006, and of Antillean voters in 1998. In 1998 Antillean voters showed a strong diversity of party preferences: from the far left to right-wing Christian parties (included in the category ‘other parties’, see Tillie, 2000, p.54). In 2006, only the left-wing side of the spectrum remains in favour of this group.
For Utrecht and Den Haag, as mentioned above, data is only available for 1990, 1994 and 1998. We briefly summarise the main findings here but for more information we refer to Tillie (2000, p.52; pp.56-57). In Utrecht, the Labour party was less in favour of migrant voters than in the other cities, and the Green party was particularly successful. In the Hague, differences between election years are strong. In 1990 the Labour party was the
8

Michon, Tillie, van Heelsum 2007 Draft version
uncontested winner among migrant voters, followed by the Christian democratic party. In 1994 the Green party was successful, in particular among Moroccan voters, while those from Surinam increased their votes for the Christian democrats. In 1998, differences between ethnic groups strengthened: Turkish voters massively voted for the Green party and the Christian democrats, while Moroccans voted for the Labour party and the Greens, and Surinamese and Antillean voters chose the Labour party.
Summarising the findings about the political participation of migrants at the local level, we are struck by the differences between election years, between cities, and, in some cases more than others, between ethnic groups. When we look at turnout figures, the local context seems to play an important role, as we can see from the difference between Rotterdam (steady increase for all groups) and Amsterdam (decrease until 2002, increase in 2006). The data about party choice shows one consistent ‘rule’, despite all variations that we have described, namely that migrants vote for left-wing parties. Some groups do more than others: Turkish voters have proved to be more keen on diversifying their party choice, while Surinamese voters have a marked preference for the Labour party and Moroccan voters have a preference for the Green party. The conclusion for 2006 is unmistaken: the Labour party is an overwhelming winner of migrant votes.
II. Political participation at the national level
Research about turnout and party choice of migrants at any other level than the local level is rare. There is an important difference regarding who is entitled to vote: only Dutch citizens can participate in national elections. For the group of migrants, it means that only naturalised Dutch citizens and (to a certain extent) people from the former colonies are enfranchised at the national level (for example: those from Surinam born before 1975 automatically hold the Dutch nationality). For long, it was assumed that few migrants were allowed to cast a vote at the national level, but figures about nationality prove that a large part of them can indeed participate in these elections. In 2002, about 725.000 Dutch citizen of foreign descent (of all origins) had the right to vote at the parliamentary elections, representing more or less 6% of the total electorate (Michon & Tillie, 2003b, p.128). In 2006, 1.2 million persons of non-western origin were said to have the right to vote, 235.000 of them being of Turkish origin, 235.000 of Surinamese origin, 195.000 of Moroccan descent, and 85.000 coming from the Dutch Antilles (Dekker, 2006).
Research focusing on the national level is diverse, and has been conducted using different methods. NIPO, the Dutch Institute for Public Opinion and Market Research, held four opinion polls among voters of foreign origin in January 2002, at the time of the parliamentary elections. Van Rhee (2002b) measured the turnout of voters of foreign
9

Michon, Tillie, van Heelsum 2007 Draft version
origin for these same elections but only in the city of Rotterdam. At the parliamentary elections of 2006, the marketing institute Foquz conducted a poll on election day among voters of foreign origin. The results of these different studies will be outlined here.
NIPO held polls every week of the month of January, starting three weeks before the elections, and with one poll after the election (source: www.forum.nl). Between 209 and 262 voters of foreign origin were questioned at each poll about their intended participation in the election and their (provisional) party choice. The results of this study are presented in table 5. The turnout results rose each week: on January 7th 2003, 76 percent of the respondents said that they will cast their vote on the 22nd, while two weeks later that percentage rose to 84 percent. In the last poll, conducted after the elections, 94 percent of the respondents stated that they have cast their vote. Knowing that the overall turnout on election day was of 79 percent, and bearing in mind the figures of turnout of migrants at the local level, such levels of turnout are surprisingly high. Van Rhee, who studied the turnout of voters of foreign origin in Rotterdam in the parliamentary elections of 2002 (2002b), reach a less optimistic conclusion. He found out that 59 percent of the Turkish Dutch, 55 percent of the Moroccan Dutch, 52 percent of the Surinamese Dutch and 35 per cent of the Antillean Dutch went to the polls.
When we look at party choice of voters of foreign origin, we can see that there is a strong preference for the Labour party, much more than among the whole electorate. The score of the two other left-wing parties, SP and GroenLinks, was also high among voters of foreign origin, when compared to the result on election day of these parties. However, the SP lost many votes among migrant voters between the first and the last poll. The share of D66, VVD and LPF votes was almost equal among migrant voters and among the whole electorate. Concerning the LPF, Fortuijn’s party, this might be a surprise, knowing the stands of this party on immigration and integration. Moreover, it’s share of votes increased from one poll to the other. The Christian democratic party, on the other hand, was relatively unpopular among migrant voters.
Table 5: Party choice of voters of foreign origin at the parliamentary elections of January 22nd, 2003, polls held in January1, in %
Poll7-1-2003
Poll14-1-2003
Poll21-1-2003
Poll28-1-2003
Election results22-1-2003
SP 23 15 14 8 6,3GroenLinks 6 7 7 8 5,1PvdA 31 39 43 38 27,3D66 4 4 3 5 4,1CDA 12 9 10 13 28,9ChristenUnie 3 3 2 3 2,1VVD 18 19 17 19 17,9LPF 2 4 4 5 5,7Other parties 1 0 0 0 2,9Turnout 76 77 84 94 791The polls were held during the weekends preceding election day, and during the weekend after election dayParties are ordered from left-wing to right-wing: SP: socialist party; GroenLinks: Green party; PvdA: Labour Party; D66: social liberal party; CDA: Christian democratic party; ChristenUnie: small Christian party; VVD: right-wing liberal party; and LPF: Fortuijn’s party.
10

Michon, Tillie, van Heelsum 2007 Draft version
Source: www.forum.nl
For figures on the participation of migrant voters at the parliamentary elections of 2006, we have to rely on data from marketing research institute Foquz (Table 6). Their research showed that 69.7 percent of the voters of foreign origin cast their vote in the 2006 election (Foquz, 22-11-2006). This is more than what we can see at the local level, but less than the turnout level of the whole electorate. Moreover, there are important differences between ethnic groups: voters of Turkish and Surinamese origin cast their vote more often than voters of Antillean origin. Table 6 summarises both turnout and party choice of the different ethnic groups.
Table 6: Party choice of migrant voters, parliamentary elections 2006, in %
Country of origin of voter
SP GrL PvdA D66 CDA VVD Other partie
s
Turnout N
Turkey 22 21 36 12 7 3 - 71.5 227Morocco 18 5 69 2 3 1 3 69.1 187Surinam 21 8 43 6 13 7 3 74.0 195Dutch Antilles 24 11 35 7 10 7 8 61.6 153Election results 16.6 4.6 21.2 2.0 26.5 14.7 14.5 80.35Parties are ordered on the left-right spectrum.Source: Foquz Etnomarketing, 2006; www.cbs.nl
The differences between ethnic groups are striking, especially when compared to the data for the national elections of 2003, and with the municipal elections of 2006. The Labour party gets a majority of votes of the voters of Moroccan origin only. Still, the share of votes for this party is much more important among voters of foreign origin than among the whole electorate. The left-wing party SP is very successful among all ethnic groups, and much more than among the whole electorate. This party was the big winner of the 2006 elections, as it more than doubled its score compared to the previous elections. On the other hand, the Christian democratic party and the right-wing liberal party are relatively unpopular among migrant voters.
There is little diversity of party choice among Moroccan voters: SP and PvdA get the vast majority of their votes. Other ethnic groups spread out their votes much more, although essentially on the left-wing side of the political spectrum. We will come back later on the surprisingly high share of Turkish votes for the social liberal party D66.
The different electoral population and the small number of respondents at the national level make a comparison between results at the local level (previous section) and the national level difficult, if not impossible. However, it appears clearly that left-wing preferences among migrant voters are equally present at both levels.
III. The use of passive voting rights
11

Michon, Tillie, van Heelsum 2007 Draft version
a. At the local level
Foreigners are not only entitled to vote at local elections, they can also stand for office in Dutch municipalities. Two different types of studies can be identified on the incorporation of migrants in the Dutch political system. On the one hand, there are exploratory studies on the number of migrant politicians, the parties they are elected for, their ethnicity and gender (ISP, 2002; IPP, 2006). On the other hand, a few analytical studies have been conducted on the position of migrant politicians, their connection to the electorate in general and migrant voters in particular, and their position within the party and within elected bodies (Berger et al., 2001; Cadat & Fennema, 1998; Goudt, 1989).
The ‘Institute for Public and Politics’ (IPP) has made an overview of the number of municipal councillors of foreign origin elected in the Netherlands since 1994. The outcomes are presented in Table 7.
Table 7: number of councillors of foreign origin in the Netherlands, 1994-2006
Year of electionCountry of origin 1994 1998 2002 2006Turkey 32 74 113 157Morocco 7 21 26 66Surinam 21 33 36 38Dutch Antilles 1 8 5 6Other 12 14 24 35Total 73 150 204 302Source: IPP 2006, p.8.
There has been a clear increase in the number of migrant councillors in the Netherlands over time: between 1994 and 2006 their number quadrupled. The number of councillors of Turkish origin as particularly increased, and now half of all migrant councillors in the Netherlands are of Turkish origin. This should however not conceal that 302 migrant councillors represents only 3 percent of the total number of councillors in the Netherlands in 2006. There is an important difference between the Dutch countryside and cities, however: the bigger the cities, the more migrants are present in local assemblies (IPP, 2006, p.8).
In 2002 and in 2006, most migrant councillors were elected for the Labour party (in both cases more than 80 councillors), the Christian democratic party (+/- 40 councillors) and the Green party (in both years 33 councillors – IPP, 2006, p.9; ISP 2002). It is clear that the vast majority of migrants are elected for mainstream parties with a national basis; local parties appear to offer only little space for migrants, and initiatives of migrants themselves are rather unsuccessful.
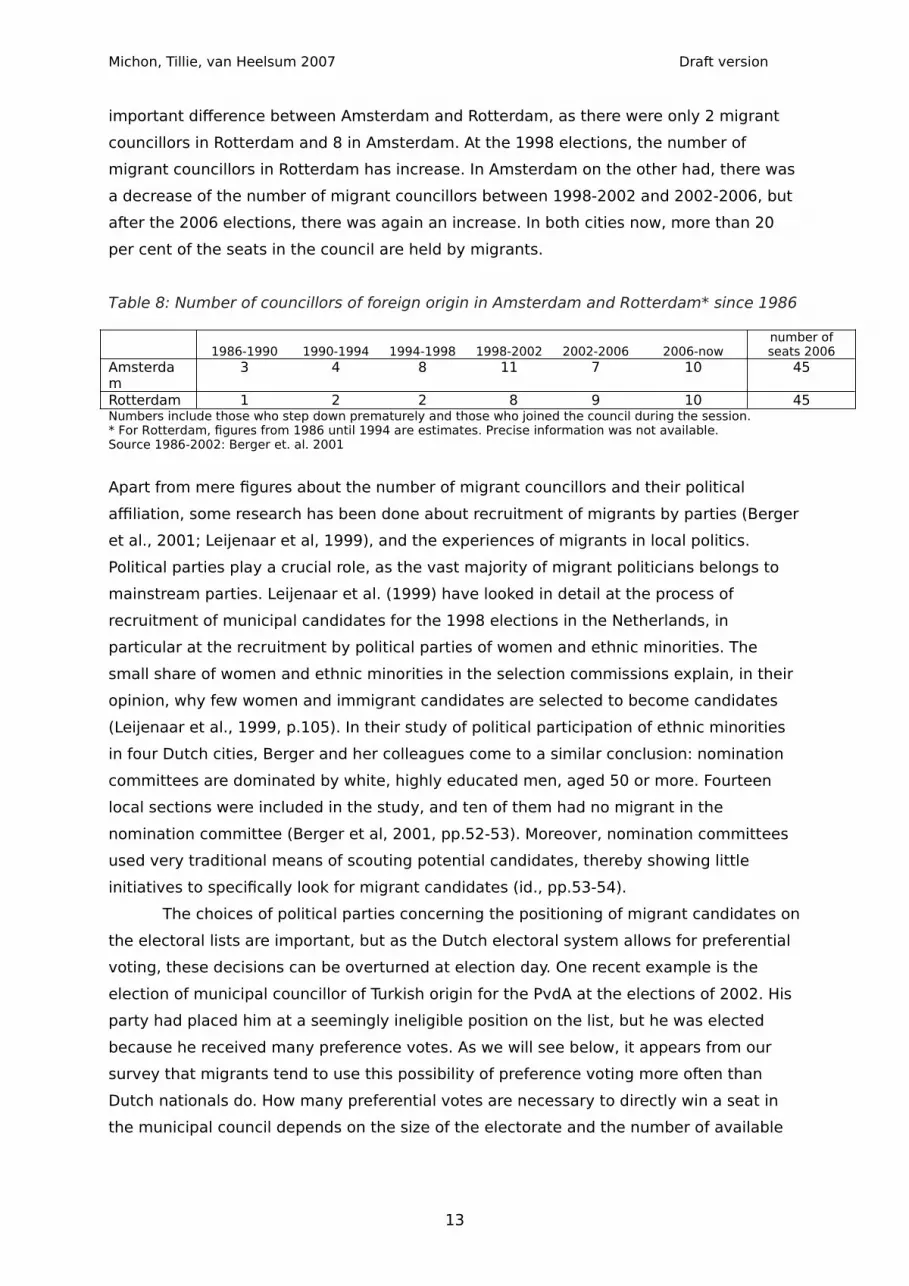
If we look at Amsterdam and Rotterdam – as we have focused on these cities in the previous sections – we can see that the number of migrants in the municipal councils has been steadily growing over time as well. During the period 1994-1998, there was an
12
Michon, Tillie, van Heelsum 2007 Draft version
important difference between Amsterdam and Rotterdam, as there were only 2 migrant councillors in Rotterdam and 8 in Amsterdam. At the 1998 elections, the number of migrant councillors in Rotterdam has increase. In Amsterdam on the other had, there was a decrease of the number of migrant councillors between 1998-2002 and 2002-2006, but after the 2006 elections, there was again an increase. In both cities now, more than 20 per cent of the seats in the council are held by migrants.
Table 8: Number of councillors of foreign origin in Amsterdam and Rotterdam* since 1986
1986-1990 1990-1994 1994-1998 1998-2002 2002-2006 2006-nownumber of seats 2006
Amsterdam
3 4 8 11 7 10 45
Rotterdam 1 2 2 8 9 10 45Numbers include those who step down prematurely and those who joined the council during the session.* For Rotterdam, figures from 1986 until 1994 are estimates. Precise information was not available.Source 1986-2002: Berger et. al. 2001
Apart from mere figures about the number of migrant councillors and their political affiliation, some research has been done about recruitment of migrants by parties (Berger et al., 2001; Leijenaar et al, 1999), and the experiences of migrants in local politics. Political parties play a crucial role, as the vast majority of migrant politicians belongs to mainstream parties. Leijenaar et al. (1999) have looked in detail at the process of recruitment of municipal candidates for the 1998 elections in the Netherlands, in particular at the recruitment by political parties of women and ethnic minorities. The small share of women and ethnic minorities in the selection commissions explain, in their opinion, why few women and immigrant candidates are selected to become candidates (Leijenaar et al., 1999, p.105). In their study of political participation of ethnic minorities in four Dutch cities, Berger and her colleagues come to a similar conclusion: nomination committees are dominated by white, highly educated men, aged 50 or more. Fourteen local sections were included in the study, and ten of them had no migrant in the nomination committee (Berger et al, 2001, pp.52-53). Moreover, nomination committees used very traditional means of scouting potential candidates, thereby showing little initiatives to specifically look for migrant candidates (id., pp.53-54).
The choices of political parties concerning the positioning of migrant candidates on the electoral lists are important, but as the Dutch electoral system allows for preferential voting, these decisions can be overturned at election day. One recent example is the election of municipal councillor of Turkish origin for the PvdA at the elections of 2002. His party had placed him at a seemingly ineligible position on the list, but he was elected because he received many preference votes. As we will see below, it appears from our survey that migrants tend to use this possibility of preference voting more often than Dutch nationals do. How many preferential votes are necessary to directly win a seat in the municipal council depends on the size of the electorate and the number of available
13

Michon, Tillie, van Heelsum 2007 Draft version
seats, and therefore varies from one city to the other, and from one city district to the other. ‘Ethnic voting’ is an issue we will come back to in section IV.
The study conducted by Berger and her colleagues also focused on the experiences of migrant councillors, and showed that migrant politicians are aware of their specific position as migrant councillor – and thus capable of attracting votes – and that parties therefore have a rationale to put them forward as candidates (Berger et al, 2001, p.69). However, respondents of Berger et al. do not wish to be seen as representing migrants only. The issue of the relationship to the ethnic community, and of the role of ethnicity in the political work was address ed at length in this study, but we this is something we will come back to in section IV.
If they encounter specific obstacles in their political careers (half of the respondents say that they do), these lay within the party, and not within the council. Existing networks and specific habits (like the many meetings and discussion session the Dutch are so keen on) are difficult to cope with (id., p.67). However, a large majority of the respondents states that they have no experience of discrimination (id., p.68)
Research conducted by Castenmiller and his colleagues addressed the question of why councillors resign their post. Part of this research focused on councillors of foreign origin, based on a questionnaire filled in by 29 respondents. Castenmiller et al. report that migrant councillors stay in office for shorter periods of time (on average) than autochthonous councillors, with an average difference of two years more for the latter group (Castenmiller et al, 2002, p.90). It also appears from this study that migrant councillors more often resign prematurely than their Dutch colleagues do. Moreover, compared to Dutch councillors, it was often not out of their own initiative that migrant councillors were put on an ineligible position on the electoral list (id., p.91). Castenmiller et al. also asked about how councillors evaluate their time in the municipal council: migrant councillors are often more negative about, f.i., council meetings (too much talking and too much details) and the amount of information they had to handle, and they report more problems (in combining personal life and political activities, time management and rewards – id., pp.93-94).
b. At the national level
In 1933, an Indonesian communist was elected as MP (Rath, 1985, p.53) – but Indonesia was still a colony of the Netherlands. Therefore, the first migrant MP is said to be John Lilipaly, a Labour politician of Moluccan origin elected in 1986. Until 1994, he remained the only MP of foreign origin in the Second Chamber of the Dutch Parliament. After the elections of 1994, there were seven MPs of foreign origin: Dutch citizens of Moroccan, Surinamese and Moluccan origin, who stood in Parliament for the Labour party, the Green party, the social liberal party and the right-wing liberal party. Over time, the number of
14
Michon, Tillie, van Heelsum 2007 Draft version
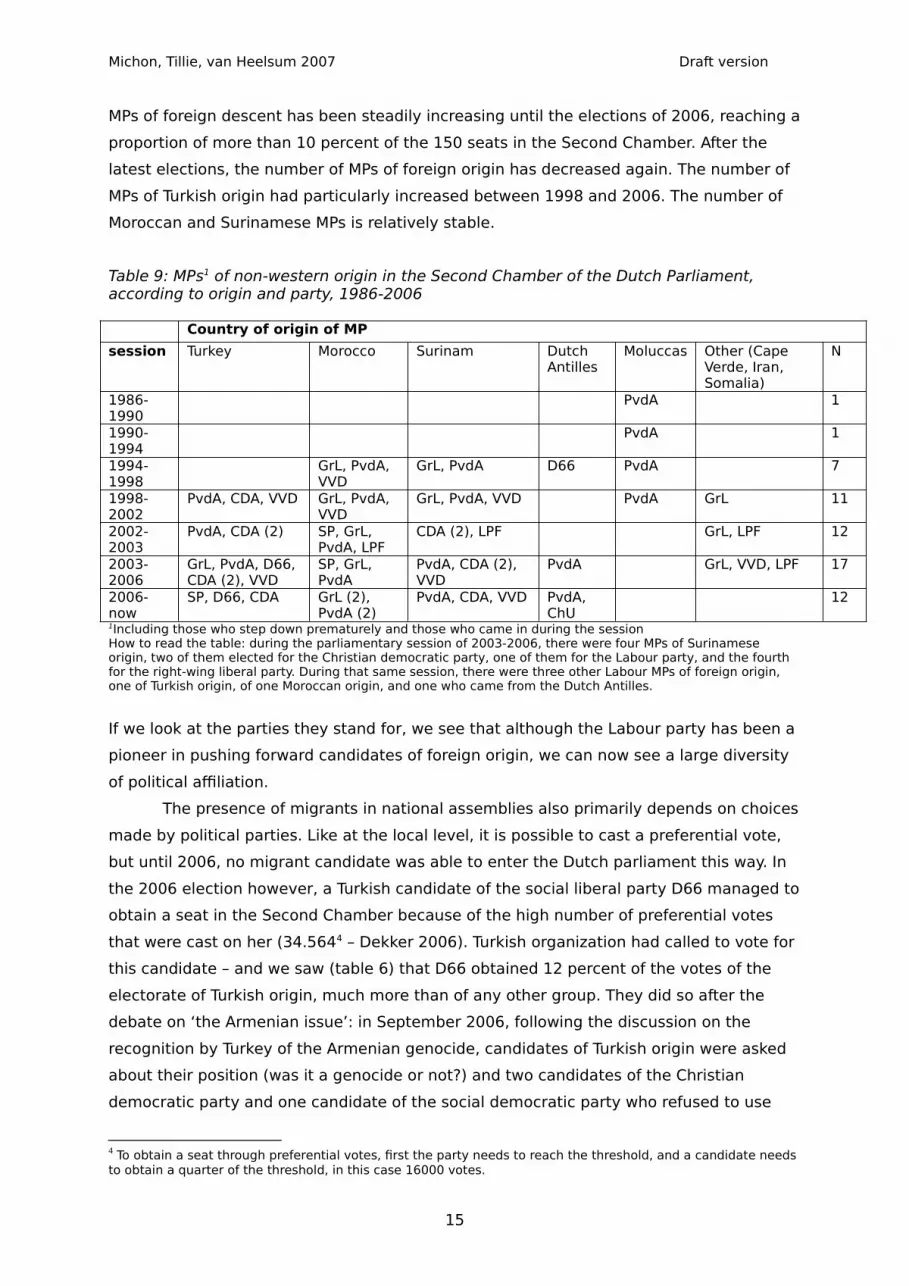
MPs of foreign descent has been steadily increasing until the elections of 2006, reaching a proportion of more than 10 percent of the 150 seats in the Second Chamber. After the latest elections, the number of MPs of foreign origin has decreased again. The number of MPs of Turkish origin had particularly increased between 1998 and 2006. The number of Moroccan and Surinamese MPs is relatively stable.
Table 9: MPs1 of non-western origin in the Second Chamber of the Dutch Parliament, according to origin and party, 1986-2006
Country of origin of MPsession Turkey Morocco Surinam Dutch
AntillesMoluccas Other (Cape
Verde, Iran, Somalia)
N
1986-1990
PvdA 1
1990-1994
PvdA 1
1994-1998
GrL, PvdA, VVD
GrL, PvdA D66 PvdA 7
1998-2002
PvdA, CDA, VVD GrL, PvdA, VVD
GrL, PvdA, VVD PvdA GrL 11
2002-2003
PvdA, CDA (2) SP, GrL, PvdA, LPF
CDA (2), LPF GrL, LPF 12
2003-2006
GrL, PvdA, D66, CDA (2), VVD
SP, GrL, PvdA
PvdA, CDA (2), VVD
PvdA GrL, VVD, LPF 17
2006-now
SP, D66, CDA GrL (2), PvdA (2)
PvdA, CDA, VVD PvdA, ChU
121Including those who step down prematurely and those who came in during the sessionHow to read the table: during the parliamentary session of 2003-2006, there were four MPs of Surinamese origin, two of them elected for the Christian democratic party, one of them for the Labour party, and the fourth for the right-wing liberal party. During that same session, there were three other Labour MPs of foreign origin, one of Turkish origin, of one Moroccan origin, and one who came from the Dutch Antilles.
If we look at the parties they stand for, we see that although the Labour party has been a pioneer in pushing forward candidates of foreign origin, we can now see a large diversity of political affiliation.
The presence of migrants in national assemblies also primarily depends on choices made by political parties. Like at the local level, it is possible to cast a preferential vote, but until 2006, no migrant candidate was able to enter the Dutch parliament this way. In the 2006 election however, a Turkish candidate of the social liberal party D66 managed to obtain a seat in the Second Chamber because of the high number of preferential votes that were cast on her (34.5644 – Dekker 2006). Turkish organization had called to vote for this candidate – and we saw (table 6) that D66 obtained 12 percent of the votes of the electorate of Turkish origin, much more than of any other group. They did so after the debate on ‘the Armenian issue’: in September 2006, following the discussion on the recognition by Turkey of the Armenian genocide, candidates of Turkish origin were asked about their position (was it a genocide or not?) and two candidates of the Christian democratic party and one candidate of the social democratic party who refused to use
4 To obtain a seat through preferential votes, first the party needs to reach the threshold, and a candidate needs to obtain a quarter of the threshold, in this case 16000 votes.
15

Michon, Tillie, van Heelsum 2007 Draft version
the word genocide were removed from the electoral lists. D66 refused to position itself in this debate, and also refused to ask their candidate of Turkish origin to do so. Turkish associations consequently launched a support action for this candidate. This was apparently successful.
Knowing that the Dutch electoral system allows to vote for a specific candidate on a list (which constitute one connection between the use of active and passive voting rights) a few question emerge. Do Turkish voters vote for Turkish candidates, and if yes to what extent? Do some ethnic groups issue more ‘ethnic votes’ (votes for a candidate of the same ethnicity) than other ethnic groups? How do migrant elected representatives react to this phenomenon? These are issues we will now turn to, in the frame of an attempt to explain party choice of migrants.
IV. Explaining voting behaviour and the role of ethnicity
As more detailed data is available, and research has been done with comparable methods over time at the local level, we will not focus on the national level in this section.
a. Explaining turnout
We have seen above that there are important differences between ethnic groups in turnout figures. Turkish immigrants in Amsterdam always participate more in elections than Moroccan, Surinamese and Antillean immigrants. In Rotterdam, differences between ethnic groups are also visible and with (with few exceptions) the same ‘ranking’. To explain this, Fennema and Tillie (1999, pp. 712-714) have built on the work of Robert Putnam. In Making democracy work (1993), Putnam demonstrated that a community of citizens showing a balanced mix of vertical (hierarchy) and horizontal (reciprocity) social relations appears to have more social and political trust, which is necessary to the pursuit of collective goals. To measure ‘civicness’ among ethnic groups in the case of Amsterdam, Fennema and Tillie have focused on ethnic organisations. Their hypothesis was that the more organisations there would be within an ethnic group, and the more these organisations would form a civic network, the more the individuals of this group would show interest in local politics, trust in political institutions and would participate in elections. The number of interlocking directorates in the boards of organisations measures the density of this network. This means that individuals are considered links between organisations. These interlocking directorates are seen as a way for trust to spill over from one organisation to another. Together with Putnam, Fennema and Tillie speak of social capital when there is a large amount of trust within a group. When leaders of the ethnic group are integrated within the local political system, social trust turns into political trust (Fennema et al. 2000, p.19).
16
Michon, Tillie, van Heelsum 2007 Draft version
The network analysis of Fennema and Tillie (1999, p.716) is based on the organisational density of the different ethnic groups (the number of persons of a group divided by the number of organisations within the same group), the number of isolated organisations relative to the total number of organisations (the larger the number of isolated organisation, the less civic the community) and the number of links (interlocking directorates) relative to the number of organisations in the network (the larger this number, the more civic the community). It appears from the network analysis that the Turkish community in Amsterdam is the most civic, followed by the Moroccan community, the Surinamese and the Antillean (Fennema & Tillie, 1999, p.721). This rank order is the same as the rank order found for turnout at elections. The conclusion drawn by Fennema and Tillie is that the degree of civic community can explain the differences in turnout between ethnic groups. In their words: ‘the more an ethnic group is engaged in the own community’s affairs, the more it participates in local politics’ (1999, p.721).
One question we will have to address in further research is the increase and decrease of turnout over time. The question why turnout has decreased so dramatically in 2002 is difficult to answer, as there has been no research on migrants who do not cast their vote. However, we also know that while migrant turnout has decreased in Amsterdam in 2002, it has increased, and keeps increasing in Rotterdam. Considering the civic community argument, it is important to note (without going into the details of the policies of the municipalities), that ethnic organisations have less been supported (via funding for example) in Amsterdam than they has been in Rotterdam before 2002. The trend in Amsterdam has been to stop focusing policy on ethnic groups as such, at to have instead a ‘diversity policy’ equally addressing women, the young, the elderly and ethnic groups. Rotterdam has chosen for the opposite strategy until 20025, actively supporting migrant organisations, implementing ‘specific policies’ and promoting turnout through ethnic organisations. The argument of civic community shows that highly organised communities with strong interactions favour turnout at elections. The policy of the municipality in Rotterdam seems to have had this effect, whereas the policy of Amsterdam seems to have severed ethnic communities. Turnout has decreased there. A multicultural democracy, in which ethnic groups participate in elections to the extent that they provide reliable information on their political choices to the political elite (Fennema et al. 2000, p.2), highly depends on civic communities. Civicness has to be supported and preserved, and local policies supporting voluntary organisations can play an important role in this. However, the figures for 2006 blur these elements of analysis, as with no change in policy in Amsterdam, turnout has increased again, while with more harsh policies towards migrants between 2002 and 2006 turnout has continued to increase in Rotterdam. This puzzle shall be addressed in future research.5 In March 2002, Fortuyn’s party ‘Leefbaar Rotterdam’ (meaning ‘liveable Rotterdam’) became the main party in the municipal council of Rotterdam. The municipality has than consciously broken with the previous line of policy, in particular regarding integration and the funding of ethnic and/or migrant organisations.
17
Michon, Tillie, van Heelsum 2007 Draft version
b. Explaining party choice
Two models, which stem from electoral research, are most applicable with respect to the question of why migrants vote for certain parties (Tillie, 1998). One of them is the sociological model, in which cleavages are crucial. These cleavages, which can differ from one country to another and are constructed historically, structure the party system and the alignments of groups of voters. Throughout the 19th and the 20th century, the main cleavages in Europe used to be class and religion. With the decline of class and religion as main identification, some scholars, following Inglehart, claim that new cleavages have developed, like materialism vs. post-materialism, which would structure party systems and determine party choice nowadays (Tillie, 2000, p.62).
The second model is the so-called ‘economic’ model of voting behaviour. In this model developed by Downs (1957), ‘each citizen casts his vote for the party he believes will provide him with more benefits than any other (Downs, 1957, p.36). Because it is (almost) impossible to calculate the benefits one may gain with one party or another, ideologies play a crucial role. According to this school of thought, a left-wing voter will vote for a left-wing party (Tillie, 2000, p.64).
The economic model applies to anyone, whatever his or her ethnicity may be. There wouldn’t be much to add to it from the perspective of migrant voters. But following this model, migrants voters would particularly vote for a migrant candidate. Within the sociological model however, we can specify voting strategies from the perspective of migrant voters. In this model migrants can theoretically develop three kinds of sociological identifications: according to ethnicity, to class or to race. If migrants identify with their own ethnic group, they will wish to vote for a party based on ethnicity, and for a person of the same ethnicity. If class identification would play a major role in voting patterns – which, in the case of migrants, would mainly be a working class identification – migrants would only vote for the party representing the working class and ethnicity would not play a role. Finally, one can think of a process of anti-racism unity, uniting all those who are victim of racial discrimination. Migrants following this strategy would make the choice of parties best representing their interests, in other words a progressive party fighting discrimination. Ethnicity as such would not play a role in this strategy either, but any non-Dutch candidate would be supported (Lawrence, 1974; Rath, 1988).
We can now examine which of these hypotheses provides the best explanation for migrant political participation in the Netherlands. The only party that can be seen as a representative of the working class is the Socialist Party SP, a party still based on Marxist theory. Only during the last elections, the SP was able unable to attract a substantial part of the votes of the migrant electorate. Given that in previous years, this party remained marginal in the political contest, holding the hypothesis of ‘class unity’ as determining
18
Michon, Tillie, van Heelsum 2007 Draft version
migrant party choice to be true would be slightly premature. The hypothesis of ethnic organisation as such certainly does not hold. There have been ethnic-based parties (during the last local elections in Amsterdam, there was an ‘Arabic Democratic Party’) but these have remained very marginal, never being able to win a seat in the municipal council. The parties most successful in attracting migrants’ votes are the PvdA and GroenLinks, as we have seen above. The hegemonic position of these parties would make the hypothesis of an anti-racism strategy most probable.
But besides the choice of the party, we can look at the choice of the candidate to test the hypotheses. It appears from the 2002 survey (Michon & Tillie, 2002, p.32) that, in Amsterdam, migrants tended to use the possibility of preference voting more often than Dutch nationals do: Dutch voters usually voted for the first candidate on a list. The vote for another candidate than the first on the list is seen as a more ‘conscious’ vote: the voter does not only make a choice about a party, but also thinks about who he/she thinks represents him/her best. It may be someone the voter knows, or someone chosen because of his/her political ideas, because he is a man or she is woman, or because he/she has the same ethnicity as the voter, and so on.
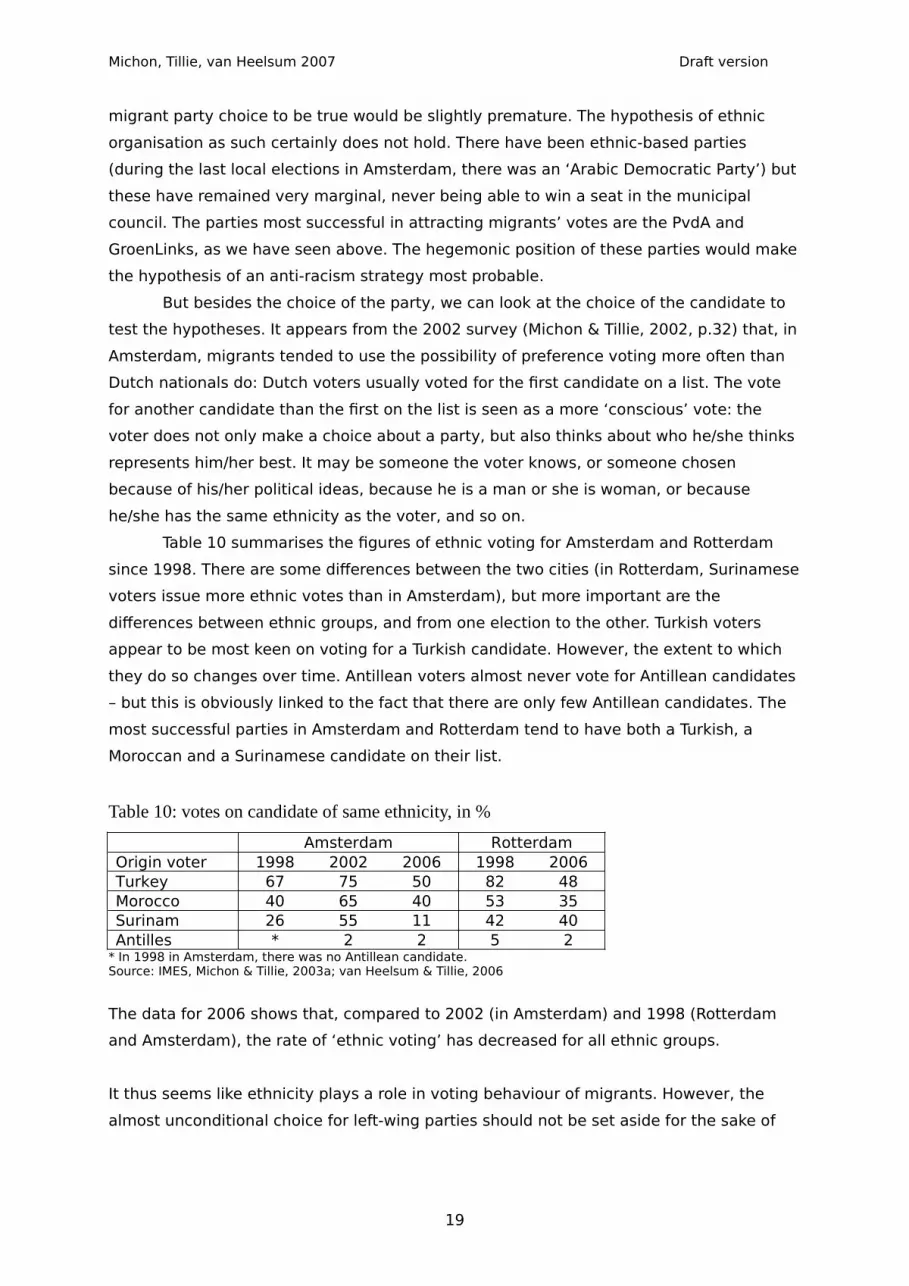
Table 10 summarises the figures of ethnic voting for Amsterdam and Rotterdam since 1998. There are some differences between the two cities (in Rotterdam, Surinamese voters issue more ethnic votes than in Amsterdam), but more important are the differences between ethnic groups, and from one election to the other. Turkish voters appear to be most keen on voting for a Turkish candidate. However, the extent to which they do so changes over time. Antillean voters almost never vote for Antillean candidates – but this is obviously linked to the fact that there are only few Antillean candidates. The most successful parties in Amsterdam and Rotterdam tend to have both a Turkish, a Moroccan and a Surinamese candidate on their list.
Table 10: votes on candidate of same ethnicity, in %
Amsterdam RotterdamOrigin voter 1998 2002 2006 1998 2006Turkey 67 75 50 82 48Morocco 40 65 40 53 35Surinam 26 55 11 42 40Antilles * 2 2 5 2
* In 1998 in Amsterdam, there was no Antillean candidate.Source: IMES, Michon & Tillie, 2003a; van Heelsum & Tillie, 2006
The data for 2006 shows that, compared to 2002 (in Amsterdam) and 1998 (Rotterdam and Amsterdam), the rate of ‘ethnic voting’ has decreased for all ethnic groups.
It thus seems like ethnicity plays a role in voting behaviour of migrants. However, the almost unconditional choice for left-wing parties should not be set aside for the sake of
19
Michon, Tillie, van Heelsum 2007 Draft version
the ‘ethnicity argument’. Moreover, party preferences6 appear to be stable over time and point at ideological consistent choices (Tillie, 2000, p.78; Michon & Tillie, 2003a, p.39). We also ask respondents about the party that they have chosen at the previous elections, and again, choices appear to be ideological consistent: shifts from a right-wing to a left-wing party are rare. An exception occurred in 2006, when a number of migrant voters who had previously voted for a right-wing party chose for the Labour party (van Heelsum & Tillie, 2006, pp.17-19). The political context and the harsh policies of the right-wing government regarding migrants and Muslims in the Netherlands can easily account for this change in party choice.
Despite this last remark, we can conclude that a combination of the above-mentioned theories can account for party choices of migrants. Migrants do tend to cast a vote for the parties seen as the best representatives of their ‘cause’: the left-wing, progressive parties. In this way, the economic theory on voting behaviour applies. However, quite contrary to this theory, ethnicity does play a role, namely, as we have seen above, in the choice of the candidate. In the municipal elections of 2006 however, ideology appeared to play a more important role, at the cost of the role of ethnicity. At the legislative elections that same year however, ethnicity probably played a crucial role for one Turkish candidate, as we saw above. The extent to which ethnicity plays a role therefore appears to depend on contextual factors, which can vary from one election to the other.
c. Ethnicity and its role for migrant councillors
The consequences of ethnic voting are especially salient at the local level: quite a few councillors of foreign origin were elected despite a seemingly ineligible position on the electoral list. In Amsterdam and Rotterdam, many Moroccan and Turkish candidates at the level of the city districts were elected because of the high number of preferential votes that were cast on them. After the elections, some people were concerned about them, as they often had no experience, and, moreover, vote-catching has a back side. The fear was that voters would expect favours in return, and that councillors would feel obliged to help individuals and organisations whose votes and support they had received. Weren’t they used to this code of practice in the country of origin? (Meerhof, 2006) The party leader of the Labour party, Bos, expressed similar concerns, although he supposed that elected second generation migrants would be less sensitive to demands for favours coming from their ethnic community (Soetenhorst, 2006).
How do elected councillors handle both the expectations of their community, and the suspicion of their parties? Those who addressed this question have used qualitative data
6 Party preferences are measured with the question: do you think you will ever vote for this party in the future?
20
Michon, Tillie, van Heelsum 2007 Draft version
only, and the results of research we will now turn to are thus very different from results presented in the previous sections of this paper.
Berger et al. have shown that a majority of migrant councillors in Dutch cities (they interviewed 27 of them in 2000 in four Dutch cities) do not wish to be a representative of their ethnic community only, but of the whole electorate (Berger et al., 2001, p.65). At the same time, these councillors realise that parties wished to have them on the electoral list, so as to attract votes from their communities. But apparently for parties, what applies during election campaigns should not prevail once in office: those councillors who focus too much on migration/integration issues meet suspicion. The interviewed councillors are afraid that their parties will accuse them of returning favours (id., p.69). On the role of ethnicity, Berger et al. have two conclusions: councillors of Surinamese origin appear to know the Dutch political system well, and the participation of Turks is increasing, but the number of councillors of Turkish origin who resign prematurely is high (id., p.73).
In a more recent study, on which Michon hopes to report in her dissertation, fourteen migrant councillors elected in Amsterdam in 1990 and 1994 were re-interviewed about the development of their political careers and the reasons for resigning. The group of respondents forms a quite homogenous group of politicians: they were not selected by any means, but age (30 to 40 years at the time of the first election), education (academic or higher vocational training), migration history (first generation, migration as young adults) and political affiliation (left-wing parties) turned out to be very similar. The average length of stay in office is 7 years, which is comparable to the whole population of councillors in Amsterdam.
It appeared from the interviews that the expectations held by the party and the ethnic community were an important aspect of the political career. Almost all respondents say that they were approached by people of their ethnic group as being ‘one of them’. Some say they received all kinds of invitation – even personal invitations to attend parties and weddings – and some say that they were asked to ‘arrange’ things and solve problems, mainly related to housing and employment. One respondent explains that this has to do with the cultural background of immigrants:
Turks and Moroccans believe that a councillor can do anything. A councillor can solve any problem, has power, opportunities, rights and money. They see it like that, it is the mentality and the culture from the country of origin. Whereas… we talk about money in the council, but we don’t see a penny! (he laughs)
The respondents all state that they were extremely cautious not to trigger the expectations from their ethnic group. They have spent a lot of time explaining, either in radio programs, at various meeting, or in day-to-day contacts, that they could not solve personal problems and that they represented the whole electorate, and not only one specific ethnic group. Very often, the respondents cite examples of councillors who were eager to make promises to people of their ethnic group, and who mainly addressed issues
21
Michon, Tillie, van Heelsum 2007 Draft version
concerning their ethnic group. A Turkish men explains that it is wrong to defend ethnic interests, and moreover, it is not a good strategy in politics. He combines almost moral with strategic arguments:
The practice shows that… Turkish councillors or MPs, there are examples of people who focus on Turks too much, and these persons leave after a while, or they are not supported by their party… Well, even so, you mustn’t do it, it is wrong, it is unjust… All right, you could say: this group has specific problems, et cetera, but you have to be careful. You shouldn’t put it forward, you must formulate things very well, and with care.
From the side of the party, migrant politicians also have to deal with expectations on the basis of their ethnicity. This has mainly to do with an alleged expertise on issues concerning immigrants and the own ethnic group, as was stated in the long extract above. Partly, the respondents think it is a normal phenomenon, and that they do know more about immigrants than many autochthonous politicians. But, as one respondent says, it does not mean that you have solutions to problems. By and large however, the respondents say that they were able to focus on the issues they were expert on, or wanted to focus on, and that they were not constantly reminded of their origins in the party group and the council.
Another important issue put forward by the interviews is that ethnic identities can be used against a person in politics. A few respondents raise this issue in the context, mainly, of the candidacy process, when they are reduced to their ethnic identity. In the case of a Surinamese respondent, who was unsuccessful in the national candidacy procedure, this meant a competition with other immigrants within the party:
The candidacy process has three rounds. I came through the three rounds, and I ended at position 52. My section started a lobby to get me higher on the list. There was a Moluccan man on the list, and a Surinamese woman, and me. So they were trying to secure a higher position for me. And the chairman of the commission said, during the meeting: Mr. X is a good candidate, but we already have a Surinamese on the list. And, he said, if you want to have Mr. X higher on the list, than the Moluccan candidate will end op lower on the list, which will lead to all sorts of problems.
Outside the selection procedure, migrant politicians may also experience that ethnicity is a disadvantage. Only a few examples were given during the interviews, and the respondents appear to conceive these as being more anecdotic than intrinsic to their position. One person was alderman in a city district but had a conflict with his party because he did not want to step down and leave the position for a colleague. He said that his Surinamese background played a role in the conflict as he was accused of a typically immigrant ‘mistake’, namely ethnic vote-catching and the phenomenon of returning favours. Another respondent reports discrimination coming from an ethnic group – which his party thought he belonged to. This respondent, a Syrian-orthodox born in Turkey, wanted to become a candidate at the municipal level, but he says that a lobby was issued
22

Michon, Tillie, van Heelsum 2007 Draft version
against him by Turkish groups, because he is not a Turk, not a Muslim, and because holds progressive ideas. “I had no support in the Turkish community”, he explains.
On the other hand, ethnicity can also be an asset, and again, especially at the time of elections, when lists of candidates are put together. Parties wish to have diverse electoral lists and favour ethnic minorities. Almost all respondents say that they are aware of the fact that they were put forward as candidate because of their origins. But this can of course not be the only criterion, and many respondents stressed the fact that they were chosen on the basis of their qualification and their history within the party.
Another respondent believes that ethnicity sometimes is too much of an asset in politics, in the sense that political parties are too eager to find migrant candidates, and they don’t always apply the basic rules of selection. This is done for electoral motives: to gain the votes of an ethnic group. In the contact with the electorate, ethnicity can also be seen as an asset. One respondent was the only immigrant in the district council, at the time he held a seat. He experienced that migrants in the district had a more easy contact with him.
It is not contradictory to say that ethnicity can be an asset and a handicap all together. One respondent explains that it has to do with different phases in the political process:
Up to a specific point, it is an asset to be an immigrant, there is positive discrimination. Put past that point, you have to be better than the others if you want to stand your ground and to make progress. If Aboutaleb or Albayrak were to become minister7, it would be a case of positive discrimination: the Labour party would appoint them to set an example. But in order to keep their position, or come back after elections, they would have to excel in their work.
It thus appears from the interviews that migrant politicians have to deal with expectations both from the party and from the ethnic group, and that these expectations can be positive or negative. The respondents say that migrant politicians – they often see themselves as an exception! – are often not aware of all the hopes and fears they can arouse. It looks as if the hopes of the ethnic community were the most dominant in daily life, but that the ethnic labelling by the party during election time was the most difficult phenomenon, for those who mention it, to cope with and to oppose.
Conclusion
Since the Netherlands opened up political rights to non-nationals in 1985, turnout and party choice of migrants have been the subject of electoral research. This research has demonstrated some changes and some constants in migrant electoral behaviour. As for the constants, one is strong and does not surprise: migrants favour left-wing parties. 7 Both are secretary of state since February 2007.
23
Michon, Tillie, van Heelsum 2007 Draft version
Another constant is that the degree of migrant turnout is generally lower than for the overall population. But at the same time, turnout varies from one election to the other and from one city to the other. In Amsterdam, it had decreasing for eight years and suddenly increased again in 2006, while increase in turnout has been more steady in Rotterdam. The figures concerning the use of passive voting rights show a steady increase of the number of representatives of foreign origin in Dutch assemblies, both at the local and at the national level. However, it is important to note that migrants are mostly present in the national parliament and in the municipal councils of the largest cities.
When it comes to understanding, increase and decrease in turnout appear to be difficult to explain. Research on migrant abstention at elections would be necessary to fully understand turnout. The general political context probably influences turnout at elections. After September 11th 2001, the political climate grew harsh towards migrants, especially towards Muslims. The tone of the discussion about the future of multicultural society was to a large extent quite hostile. This probably resulted in migrants staying home on election day in 2002. In 2006 quite on the contrary, it has been suggested that they actively favoured the social democratic party to counterbalance the general political context. This is one of the matters on which we shall focus on in further research. We shall also look at the role of the local context – local policies and political climate, which appears to lead to different local patterns of political participation. In order to understand migrant turnout at local elections, the local context appears to be more important than the national.
Patterns of party choices – which also show constants (preference for left-wing parties) and changes (one-time favourites) – appear to be best explained with a combination of models. Ideology appears to play an important role – especially for the choice for a party, but ethnicity plays a role too, namely in the choice of the candidate.
We have particularly focused on the role of ethnicity – asking whether is plays a role or not in voting patterns of migrants. Ethnic voting appears to be an important element of the voting pattern of ethnic minorities in the Netherlands. It is possible because of the right to issue a preferential vote, and migrant voters have been keen on using this right. It has an impact, especially at the local level, as migrant candidates were elected because (or thanks) to it. Ethnicity also plays a role for migrant councillors. From interviews, it appears that migrants councillors themselves usually don’t mobilise ethnicity in their political activities themselves. They are, however, confronted with expectations held both by their party and their ethnic community regarding the role ethnics ties should, or could play. These ethnic ties have often been helpful during elections, but are mostly presented by interviewees as a burden, more than as a blessing. Ethnicity can therefore be seen as a factor of importance in the political participation of migrants in the Netherlands, but it is by no means the variable that explains everything.
24

Michon, Tillie, van Heelsum 2007 Draft version
After 20 years of research, important aspects of migrant political participation remain open for further refining studies.
25

Michon, Tillie, van Heelsum 2007 Draft version
References
Academic sources
Berger, M., M. Fennema, A. van Heelsum, J. Tillie & Rick Wolff (2001), Politieke participatie van etnische minderheden in vier steden, een onderzoek in opdracht van het Ministerie van Binnenlandse Zaken en Koninkrijksrelaties, Amsterdam: IMES.
Bauböck, R. (2006), ‘Migration und politische Beteiligung: Wahlrechte jenseits von Staatsgebiet und Staatsangehörigkeit’, in Oberlechner, M. (ed.) Die missglückte Integration? Wege und Irrwege in Europa, Braumüller, Wien, pp.115-129.
Cadat, B.-Y. & M. Fennema (1998), ‘Les hommes politiques issus de l’immigration à Amsterdam: image de soi, image des autres’, Revue Européenne des Migrations Internationales, 14 (2), pp.97-121.
Castenmiller, P., M. Leijenaar, K. Niemöller & H. Tjalma-den Oudsten (2002), Afscheid van de raad. Een terugblik op het raadslidmaatschap, Den Haag: SGBO.
Dekker, L. (2006) ‘Vrouwen en allochtonen in de nieuw gekozen Tweede Kamer 2006’, Amsterdam: IPP, webarticle 30/11/2006 (http://www.publiek-politiek.nl/thema_s/allochtonen/in_de_politiek/cijfers/tweede_kamer_2006)
Downs, A. (1957), An Economic Theory of Democracy, New York: Harper and Row.Fennema, M., J. Tillie, A. van Heelsum, M. Berger & R. Wolff (2000), Sociaal kapitaal en
politieke participatie van etnische minderheden, Amsterdam: het Spinhuis.Fennema M. & J. Tillie (1999), ‘Political participation and political trust in Amsterdam: civic
communities and ethnic networks’, Journal of Ethnic and Migration Studies Vol.25: 703-726.
Goudt, M. (1989), In de gemeenteraad! Gesprekken met de eerste zwarte en migrantenraadsvrouwen in Nederland. Leiden: Stichting Burgerschapskunde/ Nederlands Centrum voor Politieke Vorming.
Heelsum, A. van & J. Tillie (2006), Opkomst en partijvoorkeur van mirganten bij de gemeenteraadsverkiezingen van 7 maart 2006, Amsterdam: IMES.
Jacobs, D. (1998), Nieuwkomers in de politiek. Het parlementaire debat omtrent kiesrecht voor vreemdelingen in Nederland en België (1970-1997), Gent: Academia Press.
Kymlicka, W. (1995), Multicultural Citizenship, A liberal theory of minority rights, New York: Oxford University Press.
Lawrence, D (1974), Black migrants, white natives. A study of race relations in Nottingham, Cambridge: Cambridge University Press.
Leijenaar, M., K. Niemöller & A. van der Kooij (1999), Kandidaten gezocht, politieke participatie en het streven naar een grotere diversiteit onder gemeenteraadsleden, Amsterdam: Instituut voor Publiek en Politiek.
Michon, L. & J. Tillie (2003a), Amsterdamse polyfonie, opkomst en stemgedrag van allochtone Amsterdammers bij de gemeenteraads- en deelraadsverkiezingen van 6 maart 2002, Amsterdam: IMES.
Michon, L. & J. Tillie (2003b), ‘Politieke participatie van migranten in Nederland sinds 1986’, in H. Pellikaan & M. Trappenburg (eds), Politiek in de multiculturele samenleving, Amsterdam: Boom, pp.126-159.
O+S, (2002), Verkiezingen 2002 gemeenteraad, Amsterdam: O+S.Pennings, P. (1987), Migrantenkiesrecht in Amsterdam. Een onderzoek naar de
participatie en mobilisatie van etnische groepen bij de gemeenteraadsverkiezingen van 19 maart 1986, Amsterdam: Gemeente Amsterdam, Bestuursinformatie, Afdeling Onderzoek en Statistiek & Universiteit van Amsterdam, Subfaculteit Politicologie, Vakgroep Collectief Politiek Gedrag.
Putnam, R. (1993) Making Democracy Work: Civic Traditions in Modern Italy, Princetown: Princetown University Press.
Rath, J. (1985), ‘Immigrant candidates in the Netherlands’, Cahiers d’Etudes sur la Mediterranée Orientale et le Monde Turco-Iranien (CEMOTI), 1, pp. 46-62.
Rath, J. (1990), Kenterend tij. Migranten en de gemeenteraadsverkiezingen van 21 maart 1990 te Rotterdam, Utrecht: RUU, Vakgroep Culturele Antropologie.
Rhee, M.van (2002a), Analyse van de opkomst bij de gemeenteraadsverkiezingen in Rotterdam op 6 maart 2002, Rotterdam: COS.
Rhee, M.van (2002b), Analyse opkomst Tweede Kamerverkiezing 2002, Rotterdam: COS.
26
Michon, Tillie, van Heelsum 2007 Draft version
Tillie, J. (1998), ‘Explaining migrant voting behaviour in the Netherlands. Combining the electoral research and ethnic studies perspectives’, Revue Européenne des Migrations Internationales, 14, 2, pp. 71-94.
Tillie, J. (2000), De etnische stem, opkomst en stemgedrag van migranten tijdens gemeenteraadsverkiezingen, 1986 - 1998, Utrecht: Forum.
Young, I.M. (2000), Inclusion and Democracy, Oxford: Oxford University Press.
Other sources
Foquz etnomarketing, Perspericht (2006), ‘Allochtonen bepalen door hoge opkomst 13 Kamerzetels, bijna allemaal gaan naar links’, 22-11-2006 http://www.foquz.nl/etnomarketing/persberichten/stemvoorkeuren-allochtonen-tweedekamerverkiezing-2006.html; (visited on 14-02-2007)
Informatie Service Punt Nieuwsbrief 7, 3 (2002), Amsterdam: Instituut voor Publiek en Politiek.
Instituut voor Publiek en Politiek (2006), Nieuwsbrief Zomer 2006, Amsterdam: IPP.Centraal Bureau voor de Statistiek
http://statline.cbs.nl/ (visited on 22-02-2007)Meerhof, R., (2006), ‘ Rotterdam: zwart zit links, wit rechts; In Rotterdam is sinds de
gemeenteraadsverkiezingen de wereld heel overzichtelijk - dat is ook meteen een probleem’, in de Volkskrant, 10/03/2006.
Soetenhorst, B (2006), ‘Wij veranderen niet’, de Volkskrant, 17/10/2006.
27