policy measures for micro, small and medium food processing
TRANSCRIPT

Cover photographs:
Top left: Hiroyuki KonumaTop right: Zulkarnaen SyrilokesywaraBottom left: Roby Hartono PutroBottom right: Norbert Ambagan
i
Policy measures for micro, small andmedium food processing enterprises
in the Asian region
RAP PUBLICATION 2014/27
FOOD AND AGRICULTURE ORGANIZATION OF THE UNITED NATIONSREGIONAL OFFICE FOR ASIA AND THE PACIFIC
Bangkok, 2014
ii
The designations employed and the presentation of material in this information product do not implythe expression of any opinion whatsoever on the part of the Food and Agriculture Organization of theUnited Nations (FAO) concerning the legal or development status of any country, territory, city or areaor of its authorities, or concerning the delimitation of its frontiers or boundaries. The mention of specificcompanies or products of manufacturers, whether or not these have been patented, does not imply thatthese have been endorsed or recommended by FAO in preference to others of a similar nature that arenot mentioned.
The views expressed in this information product are those of the author(s) and do not necessarily reflectthe views or policies of FAO.
ISBN 978-92-5-108682-7
© FAO, 2015
FAO encourages the use, reproduction and dissemination of material in this information product. Exceptwhere otherwise indicated, material may be copied, downloaded and printed for private study, researchand teaching purposes, or for use in non-commercial products or services, provided that appropriateacknowledgement of FAO as the source and copyright holder is given and that FAO’s endorsement ofusers’ views, products or services is not implied in any way.
All requests for translation and adaptation rights, and for resale and other commercial use rights shouldbe made via www.fao.org/contact-us/licence-request or addressed to [email protected].
FAO information products are available on the FAO website (www.fao.org/publications) and can bepurchased through [email protected].
For copies write to: Rosa S. RolleFAO Regional Office for Asia and the PacificMaliwan Mansion, 39 Phra Atit RoadBangkok 10200THAILANDTel: (+66) 2 697 4194Fax: (+66) 2 697 4445E-mail: [email protected]
iii
Foreword
The importance of micro, small and medium enterprises (SMEs) in contributing to food security andnutrition and to the well-being of Asian economies cannot be overstated. Formal and informal SMEstogether account for 60 percent of gross domestic product (GDP) and for more than 90 percent ofemployment in both developing and advanced economies. In Asia-Pacific, SMEs account for over97 percent of all enterprises and employ over half of the workforce.
The Food and Agriculture Organization of the United Nations (FAO) has been providing support to micro,small and medium food processing enterprises since its inception in 1945. This support has taken theform of technical assistance and advice to member countries to support livelihoods development in thecontext of value chain development. Equally important, FAO supports the generation and documentationof knowledge on the experiences of different countries and regions of the world in agro-food processing.
This publication provides status reports on agro-industrial policy measures for micro, small and mediumfood processing enterprises (MSMFEs) in nine Asian countries at different levels of development –Bangladesh, Bhutan, China, Indonesia, Malaysia, Philippines, Republic of Korea, Sri Lanka and Thailand. Thestudies were commissioned by the Food and Agriculture Organization of the United Nations, RegionalOffice for Asia and the Pacific (FAO-RAP) during the period 2010–2012. Key issues highlighted in thesereports were discussed during a Regional Workshop to Promote Agro-industrial Policy Measures for Micro,Small and Medium Food Processing Enterprises in the Asian Region convened by FAO-RAP in 2013.Participants included 21 representatives from the public and private sectors, as well as from academicand research institutions, representing 15 countries in Asia. Representatives came from a diversity ofbackgrounds including food science, food policy, environment, agri-business and finance.
This publication includes an overall analytical review of the key issues and policy recommendationsbased on the findings and deliberations of the regional workshop and the nine country reports. It ishoped that the information documented in this publication provides a useful basis for countries indeveloping and upgrading their policies on micro, small and medium food processing enterprises.
Hiroyuki KonumaAssistant Director-General and
FAO Regional Representative for Asia and the Pacific

iv
v
Table of Contents
Page
Foreword ....................................................................................................................................................................... iii
POLICY MEASURES FOR MICRO, SMALL AND MEDIUM FOOD PROCESSING ENTERPRISES(MSMFEs) IN THE ASIAN REGION ......................................................................................................................... 1
Rosa S. RolleFAO Regional Office for Asia and the Pacific
1. Introduction .............................................................................................................................................. 1
2. Micro, small and medium food processing enterprises in Asia andthe Pacific region .................................................................................................................................... 1
3. External forces that currently shape MSMFE development in the region ........................ 34. Critical issues for MSMFEs .................................................................................................................... 4
5. Policy recommendations ..................................................................................................................... 6
References .................................................................................................................................................. 7
POLICIES AND STRATEGIES FOR THE DEVELOPMENT OF SMALL AND MEDIUM SCALE FOODPROCESSING ENTERPRISES IN BANGLADESH ................................................................................................. 8Indrajit RoyIndependent Consultant
1. Introduction .............................................................................................................................................. 8
2. Review of SMFEs and their contribution to development in the country ........................ 93. Status of food processing in the country with a specific focus on SMFEs ....................... 14
4. External forces that shape the SMFE sector in the country ................................................... 44
5. Government policy and legal frameworks .................................................................................... 466. Status of national institutional infrastructure .............................................................................. 48
7. Status of industrial infrastructure ..................................................................................................... 54
8. Analysis of constraints and strategic priorities for enhancing competitivenessin SMFEs ..................................................................................................................................................... 60
9. Summary and conclusions .................................................................................................................. 67References .................................................................................................................................................. 68
POLICIES AND STRATEGIES FOR THE DEVELOPMENT OF SMALL AND MEDIUM SCALE FOODPROCESSING ENTERPRISES IN BHUTAN ............................................................................................................. 71Sonam TobgayIndependent Consultant
1. Introduction .............................................................................................................................................. 71
2. Review of small and medium food processing enterprises in Bhutan .............................. 743. Critical issues and considerations for sectoral development ................................................ 78
4. Status of government policy and legal frameworks ................................................................. 80
5. Status of industrial institutions .......................................................................................................... 846. Status of industrial infrastructure ..................................................................................................... 88
7. Analysis of constraints and strategic priorities ............................................................................ 90
8. Conclusion and recommendations .................................................................................................. 92References .......................................................................................................................................................... 93
vi
POLICIES AND STRATEGIES FOR THE DEVELOPMENT OF SMALL AND MEDIUM SCALE FOODPROCESSING ENTERPRISES (SMFEs) IN CHINA ............................................................................................... 94
Wu JingxueChinese Academy of Agricultural Sciences
1. Introduction .............................................................................................................................................. 94
2. Contribution of SMEs to the development of China ................................................................. 943. Status of food processing industry in China ................................................................................ 99
4. External forces that shape the SMFEs sector in China ............................................................. 101
5. Government policy and legal framework ...................................................................................... 1026. Status of institutional mechanisms .................................................................................................. 104
7. Status of industrial infrastructure ..................................................................................................... 107
8. Constraints and strategic priorities for enhancing the competitiveness of SMFEs ....... 1099. Summary and conclusions .................................................................................................................. 110
POLICIES AND STRATEGIES FOR THE DEVELOPMENT OF SMALL AND MEDIUM SCALE FOODPROCESSING ENTERPRISES IN INDONESIA ....................................................................................................... 111
Hadi K. Purwadaria, Muhammad Firdaus and Nanik PurwantiSwiss German University
1. Introduction .............................................................................................................................................. 111
2. Review of small and medium food processing enterprises (SMFEs) and theircontribution to development in the country............................................................................... 112
3. Status of food processing in the country with a specific focus on SMFEs ....................... 117
4. Status of national institutional infrastructure .............................................................................. 118
5. Government policy and legal frameworks .................................................................................... 1226. Status of industrial infrastructure ..................................................................................................... 123
7. Impact of rural and urban community behaviour on MSMFEs’ products ......................... 124
8. External forces that shape the SMFE sector in the country ................................................... 1269. Analysis of constraints and strategic priorities for enhancing Competitiveness
of SMFEs ..................................................................................................................................................... 12710. Summary and conclusions .................................................................................................................. 128
References .................................................................................................................................................. 128
POLICIES AND STRATEGIES FOR THE DEVELOPMENT OF SMALL AND MEDIUM SCALE FOODPROCESSING ENTERPRISES (SMFEs) IN THE REPUBLIC OF KOREA ......................................................... 130
Ji-Hyeon ChoiKorea Rural Economic Institute
1. Introduction .............................................................................................................................................. 1302. Review of SMFEs and their contribution to development in the Republic of Korea .... 131
3. Status of food processing in the Republic of Korea with a specific focus on SMFEs ... 138
4. External forces that shape the SMFEs sector in the Republic of Korea ............................. 1395. Government policy and legal frameworks .................................................................................... 141
6. Status of national institutional infrastructure .............................................................................. 143
7. Analysis of constraints and strategic priorities for enhancing competitiveness ............ 1468. Summary and conclusions .................................................................................................................. 148
Bibliography .............................................................................................................................................. 149
References .................................................................................................................................................. 150
Table of Contents (continued)
Page
vii
POLICIES AND STRATEGIES FOR THE DEVELOPMENT OF SMALL AND MEDIUM SCALE FOODPROCESSING ENTERPRISES IN MALAYSIA ......................................................................................................... 151Fatimah Mohamed Arshad, Kusairi Mohd. Noh and Mohd. Yusof SaariUniversiti Putra Malaysia
1. Introduction .............................................................................................................................................. 151
2. Review of small and medium food processing enterprises (SMFEs) and theircontribution to development in Malaysia ..................................................................................... 152
3. Status of small-scale food processing ............................................................................................. 1564. External forces that shape the SMFE sector in Malaysia .......................................................... 157
5. Government policy and legal frameworks .................................................................................... 158
6. Status of the national institutional infrastructure ...................................................................... 1617. Status of industrial infrastructure and resources ........................................................................ 167
8. Analysis of constraints and strategic priorities for enhancing competitivenessin SMFEs ..................................................................................................................................................... 171
9. Summary and conclusions .................................................................................................................. 174
Bibliography and references ............................................................................................................... 175
POLICIES AND STRATEGIES FOR THE DEVELOPMENT OF SMALL AND MEDIUM SCALE FOODPROCESSING ENTERPRISES IN THE PHILIPPINES ............................................................................................ 177
Larry DigalUniversity of the Philippines Mindanao
1. Introduction .............................................................................................................................................. 177
2. Small and medium food processing enterprises (SMFEs) and their contributionto development in the country ......................................................................................................... 178
3. Status of food processing in the country ...................................................................................... 182
4. External forces that shape the SMFE sector in the country ................................................... 1885. Government policy and legal frameworks .................................................................................... 192
6. Status of national institutional and industrial infrastructure ................................................. 194
7. Analysis of constraints and strategic priorities for enhancing Competitivenessof SMFEs ..................................................................................................................................................... 196
References .................................................................................................................................................. 198
POLICIES AND STRATEGIES FOR THE DEVELOPMENT OF SMALL AND MEDIUM SCALE FOODPROCESSING ENTERPRISES IN SRI LANKA ........................................................................................................ 241Parakrama SamaratungaInstitute of Policy Studies
1. Introduction .............................................................................................................................................. 241
2. Sri Lanka: Background ........................................................................................................................... 241
3. Small and medium food processing enterprises (SMFEs) and their contribution ......... 2424. Definitions of SMEs in Sri Lanka ........................................................................................................ 242
5. Contribution to GDP .............................................................................................................................. 243
6. Enterprise creation and job creation ............................................................................................... 2457. Investment promotion .......................................................................................................................... 246
8. Analysis of survey findings .................................................................................................................. 247
9. Constraints and recommendations.................................................................................................. 251References .......................................................................................................................................................... 251
Table of Contents (continued)
Page
viii
POLICIES AND STRATEGIES FOR THE DEVELOPMENT OF SMALL AND MEDIUM SCALE FOODPROCESSING ENTERPRISES IN THAILAND.......................................................................................................... 252
Thailand Development Research Institute (TDRI)
1. Introduction .............................................................................................................................................. 252
2. Review of small and medium food processing enterprises (SMFEs) and theircontribution to development in the country............................................................................... 255
3. Status of food processing in Thailand with specific focus on SMFEs ................................. 2644. External forces that shape the SMFEs in Thailand ..................................................................... 265
5. Government policy and legal framework ...................................................................................... 267
6. National institutional infrastructure ................................................................................................ 2717. Analysis of constraints and strategic priorities for enhancing competitiveness
in SMFEs ..................................................................................................................................................... 2738. Conclusion and recommendations .................................................................................................. 275
References .......................................................................................................................................................... 278
Table of Contents (continued)
Page
1
POLICY MEASURES FOR MICRO, SMALL AND MEDIUM FOOD PROCESSINGENTERPRISES (MSMFEs) IN THE ASIAN REGION
byRosa S. Rolle
FAO Regional Office for Asia and the Pacific
1. Introduction
The importance of Small and Medium Enterprises (SMEs) in the well-being of Asian economies cannotbe overstated. SMEs play an important economic role in virtually all countries across the region. Formaland informal SMEs together account for 60 percent of gross domestic product (GDP) and for more than90 percent of employment in both developing and advanced economies.
In Asia-Pacific, SMEs account for over 97 percent of all enterprises, employ over half of the workforceand contribute significantly to economic growth, with SMEs’ share of GDP ranging from 20 percent to50 percent but only accounting for 35 percent or less of direct exports (APEC, 2014). Many countries, andparticularly developing Asian countries, owe their resilience to SMEs which provide a major source ofemployment. Between 50 and 90 percent of the workforce in many economies across the region isemployed by SMEs.
“SMEs are a source of employment, competition, economic dynamism, and innovation, they stimulate theentrepreneurial spirit and the diffusion of skills. Because they enjoy a wider geographical presence than big companies,SMEs also contribute to better income distribution.”
Supachai Panitchpakdi, Secretary-General of UNCTAD, 2006
The food value chain is comprised of SMEs, both as suppliers and value adders (storage, processing,distributors etc.). Micro, small and medium food processing enterprises (MSMFEs) constitute a majorsegment of the SME sector and are the subject of this paper.
This paper documents key findings of country reports prepared for and discussions held duringa Regional Workshop to Promote Agro-industrial Policy Measures for Micro, Small and Medium FoodProcessing Enterprises in the Asian Region convened by FAO in 2013. The paper also documentsrecommendations for addressing challenges to MSMFE development in the region. Concreterecommendations for the sustained development of MSMFEs in the Asian region are also proposed inview of their significant contribution to food security, employment and economic stability.
2. Micro, small and medium food processing enterprises in Asia and the Pacific region
Micro, small and medium food processing enterprises, or MSMFEs, play an important role in the survivaland development of countries at different stages of development across the Asian region. They employa majority of the workforce in all countries, with employment in the sector averaging approximately90 percent. MSMFEs also play a critical role in socio-economic development through their contributionto food security, poverty reduction in urban and rural areas, their income generating activities and theircontribution to exports.
MSMFEs have the advantage of producing foods that are culturally accepted across the region. Theycontinue to provide the poor with an affordable source of food and contribute significantly to nutrition.At the same time, they are heavily reliant on labour and absorb a significant proportion of the unskilledlabour force in the region, while making a substantial contribution to employment. They, however, tendto work in isolation with limited interaction with other MSMFEs or institutions in their surroundingenvironment.
2
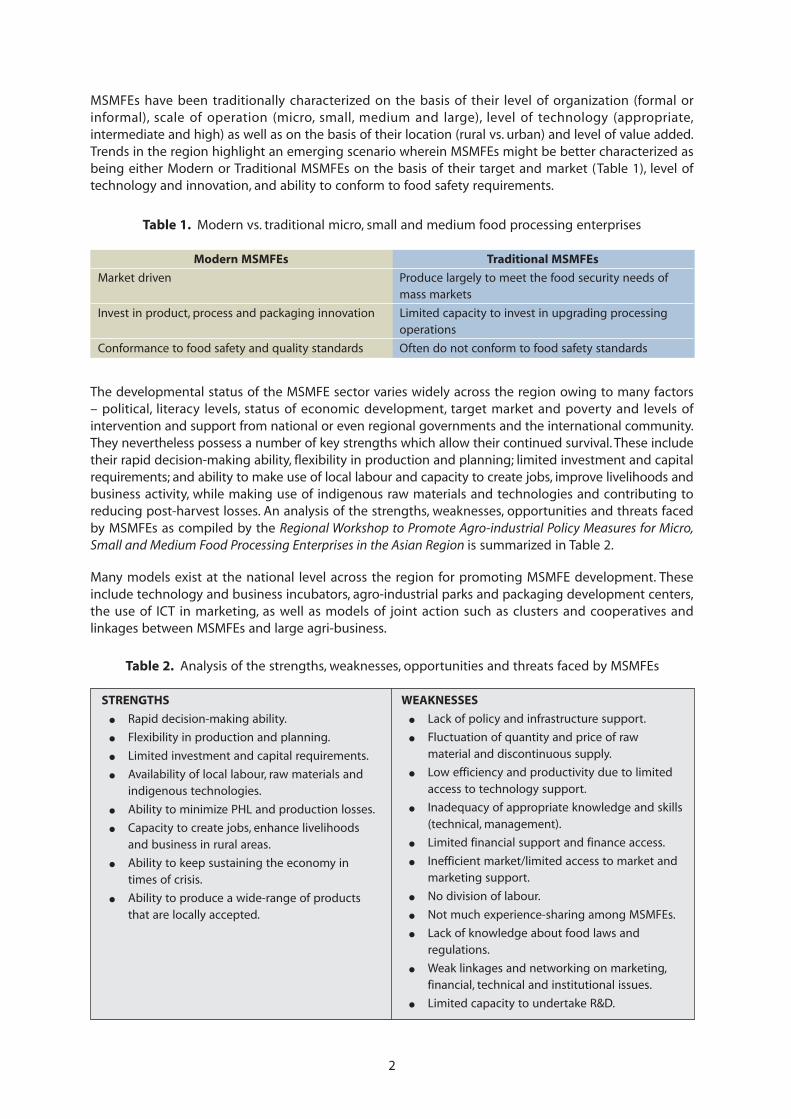
MSMFEs have been traditionally characterized on the basis of their level of organization (formal orinformal), scale of operation (micro, small, medium and large), level of technology (appropriate,intermediate and high) as well as on the basis of their location (rural vs. urban) and level of value added.Trends in the region highlight an emerging scenario wherein MSMFEs might be better characterized asbeing either Modern or Traditional MSMFEs on the basis of their target and market (Table 1), level oftechnology and innovation, and ability to conform to food safety requirements.
Table 1. Modern vs. traditional micro, small and medium food processing enterprises
Modern MSMFEs Traditional MSMFEs
Market driven Produce largely to meet the food security needs ofmass markets
Invest in product, process and packaging innovation Limited capacity to invest in upgrading processingoperations
Conformance to food safety and quality standards Often do not conform to food safety standards
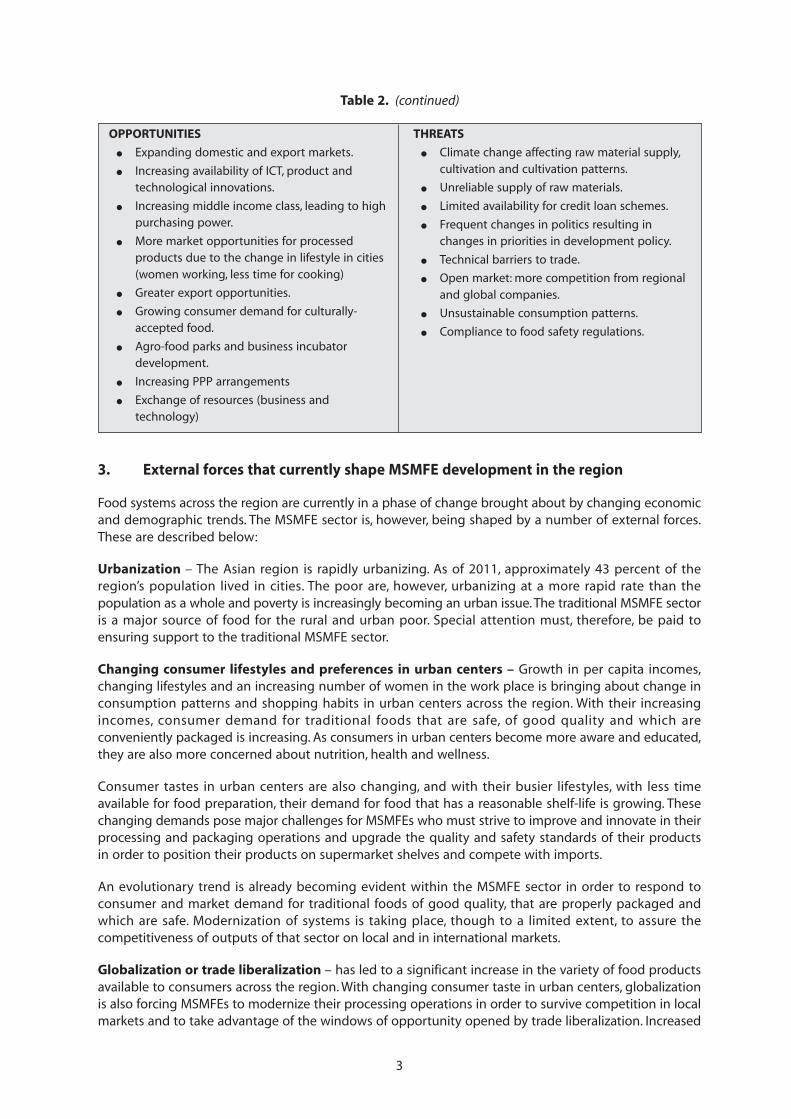
The developmental status of the MSMFE sector varies widely across the region owing to many factors– political, literacy levels, status of economic development, target market and poverty and levels ofintervention and support from national or even regional governments and the international community.They nevertheless possess a number of key strengths which allow their continued survival. These includetheir rapid decision-making ability, flexibility in production and planning; limited investment and capitalrequirements; and ability to make use of local labour and capacity to create jobs, improve livelihoods andbusiness activity, while making use of indigenous raw materials and technologies and contributing toreducing post-harvest losses. An analysis of the strengths, weaknesses, opportunities and threats facedby MSMFEs as compiled by the Regional Workshop to Promote Agro-industrial Policy Measures for Micro,Small and Medium Food Processing Enterprises in the Asian Region is summarized in Table 2.
Many models exist at the national level across the region for promoting MSMFE development. Theseinclude technology and business incubators, agro-industrial parks and packaging development centers,the use of ICT in marketing, as well as models of joint action such as clusters and cooperatives andlinkages between MSMFEs and large agri-business.
Table 2. Analysis of the strengths, weaknesses, opportunities and threats faced by MSMFEs
STRENGTHS
● Rapid decision-making ability.
● Flexibility in production and planning.
● Limited investment and capital requirements.
● Availability of local labour, raw materials andindigenous technologies.
● Ability to minimize PHL and production losses.
● Capacity to create jobs, enhance livelihoodsand business in rural areas.
● Ability to keep sustaining the economy intimes of crisis.
● Ability to produce a wide-range of productsthat are locally accepted.
WEAKNESSES
● Lack of policy and infrastructure support.
● Fluctuation of quantity and price of rawmaterial and discontinuous supply.
● Low efficiency and productivity due to limitedaccess to technology support.
● Inadequacy of appropriate knowledge and skills(technical, management).
● Limited financial support and finance access.
● Inefficient market/limited access to market andmarketing support.
● No division of labour.
● Not much experience-sharing among MSMFEs.
● Lack of knowledge about food laws andregulations.
● Weak linkages and networking on marketing,financial, technical and institutional issues.
● Limited capacity to undertake R&D.
3
3. External forces that currently shape MSMFE development in the region
Food systems across the region are currently in a phase of change brought about by changing economicand demographic trends. The MSMFE sector is, however, being shaped by a number of external forces.These are described below:
Urbanization – The Asian region is rapidly urbanizing. As of 2011, approximately 43 percent of theregion’s population lived in cities. The poor are, however, urbanizing at a more rapid rate than thepopulation as a whole and poverty is increasingly becoming an urban issue. The traditional MSMFE sectoris a major source of food for the rural and urban poor. Special attention must, therefore, be paid toensuring support to the traditional MSMFE sector.
Changing consumer lifestyles and preferences in urban centers – Growth in per capita incomes,changing lifestyles and an increasing number of women in the work place is bringing about change inconsumption patterns and shopping habits in urban centers across the region. With their increasingincomes, consumer demand for traditional foods that are safe, of good quality and which areconveniently packaged is increasing. As consumers in urban centers become more aware and educated,they are also more concerned about nutrition, health and wellness.
Consumer tastes in urban centers are also changing, and with their busier lifestyles, with less timeavailable for food preparation, their demand for food that has a reasonable shelf-life is growing. Thesechanging demands pose major challenges for MSMFEs who must strive to improve and innovate in theirprocessing and packaging operations and upgrade the quality and safety standards of their productsin order to position their products on supermarket shelves and compete with imports.
An evolutionary trend is already becoming evident within the MSMFE sector in order to respond toconsumer and market demand for traditional foods of good quality, that are properly packaged andwhich are safe. Modernization of systems is taking place, though to a limited extent, to assure thecompetitiveness of outputs of that sector on local and in international markets.
Globalization or trade liberalization – has led to a significant increase in the variety of food productsavailable to consumers across the region. With changing consumer taste in urban centers, globalizationis also forcing MSMFEs to modernize their processing operations in order to survive competition in localmarkets and to take advantage of the windows of opportunity opened by trade liberalization. Increased
OPPORTUNITIES
● Expanding domestic and export markets.
● Increasing availability of ICT, product andtechnological innovations.
● Increasing middle income class, leading to highpurchasing power.
● More market opportunities for processedproducts due to the change in lifestyle in cities(women working, less time for cooking)
● Greater export opportunities.
● Growing consumer demand for culturally-accepted food.
● Agro-food parks and business incubatordevelopment.
● Increasing PPP arrangements
● Exchange of resources (business andtechnology)
THREATS
● Climate change affecting raw material supply,cultivation and cultivation patterns.
● Unreliable supply of raw materials.
● Limited availability for credit loan schemes.
● Frequent changes in politics resulting inchanges in priorities in development policy.
● Technical barriers to trade.
● Open market: more competition from regionaland global companies.
● Unsustainable consumption patterns.
● Compliance to food safety regulations.
Table 2. (continued)
4
travel in the region is also creating market opportunities for ethnic foods in international markets. At thesame time, the growing number of tourists who visit the region also increasingly demand locallyprocessed food products that are safe and of good quality as souvenirs.
All of these changes being brought about by globalization necessitate that countries recognize the needto adjust to the rules and requirements of other countries and economic blocks, and to adhere tointernational trade standards such as Codex, ISO, HACCP and regulations (WTO), in order to survive andmaximize opportunities presented by a globalized trading environment. Compliance with safety andquality requirements and meeting volume requirements of export markets, however, poses a majorchallenge for many MSMFEs.
Countries have recognized that globalization is an opportunity that must be met with preparation,concerted action by all relevant stakeholders and long-term vision. This hugely expanded market – theglobal community of consumers of food products – requires many things before the producers andmarketers can benefit. These include efficiency in the production and delivery of goods; sufficient capital/resources on the part of every element of the value chain, particularly producers; appropriate/modernequipment and facilities; improved skills; and high quality products that conform to safety standards andpackaging, and rules and regulations that allow trade facilitation and market access.
Developments in information technology – have leveled the playing field between MSMFEs and largeenterprises and have reduced the role of the middleman in the supply chain. Information technologyalso facilitates access to market information and serves as an excellent mechanism for product marketing.
All of the countries highlighted the critical role of information technology in all aspects of the work ofMSMFEs – starting from production to marketing and sales. Information technology is required byMSMFEs to fast-track each process and ensure accuracy at every step of the chain. Participants in theworkshop also identified the increasing availability and affordability of ICT as a key opportunity forMSMFEs.
Environmental and sustainability concerns – The need to preserve natural resources and optimise theuse of inputs is increasingly focusing attention towards sustainability and the use of processingtechnologies that can assist in preserving the environment while delivering social and economic benefits.Few MSMFEs in the region, however, pay attention to addressing environmental and sustainabilityconcerns in their operations. Issues of sustainability apply along the whole food chain and warrantgreater attention to upgrading the quality of equipment used in food processing operations, maximisingefficiency in processing operations, increasing the efficiency of water and energy use in processingoperations, while reducing and/or preventing waste.
4. Critical issues for MSMFEs
Government support – is pivotal to MSMFE development in many countries across the region.Governments across the region provide support to the sector primarily through the development andimplementation of appropriate policies and by providing an enabling environment. All countrieshighlighted the need for governments to strengthen the enabling environment in the areas of accessto finance, infrastructure, advisory support, support for research and development, and technical andtraining support.
Countries also highlighted the critical need for an articulated vision that is translated into rational andsupportive policies and programs (e.g. law, master plan, fund, etc.) for the continued growth,development, long-term competitiveness and sustainability of their MSMFEs.
The need for policies and programs to improve infrastructure, access to indigenous and low-priced rawmaterials, as well as financial support and credit, were highlighted by all countries as key areas requiringgovernmental support. Countries also emphasized the requirement for greater cooperation betweengovernment and farmer-operated cooperatives to assure the supply of raw materials. The establishment
5
of linkages and networks with various stakeholders such as chambers of commerce, food associations,academic and research institutes, development agencies, and consumer groups, was also prioritized.
All countries aspire for MSMFE-friendly regulations that facilitate the ease of doing business, moreleniency in the requirements for start-up businesses such as registration and licensing, as well as taxincentives and subsidies, as appropriate.
Assuring food safety and product quality – With growing consumer education and awareness on foodsafety issues and in order to enter into modern trade, MSMFEs must comply with stringent national andinternational standards and guidelines. While market oriented MSMFEs are able to comply with foodsafety requirements, traditional MSMFEs lag behind in terms of improving their capacity to comply withfood safety requirements.
Human resource capacity – The level of skill and capacity in food processing in MSMFEs across theAsian region is, in general, still low owing largely to a shortage of trained and skilled labour. This low levelof formal education in food processing not only reduces the ability of MSMFEs to innovate, butconsiderably reduces opportunities for accessing credit to upgrade food processing enterprises. Manytraditional MSMFEs in fact suffer from a state of inertia and do not see the need to change the statusquo, having been routinely conducting the same processing operations for generations.
MSMFEs also suffer from a dearth of skilled managers to guide enterprises toward feasibility andprofitability. In many instances, competent and skilled workers are attracted to larger food processingcompanies that offer better compensation than MSMFEs.
Markets and marketing – MSMFEs are plagued with a number of problems along the supply chain,which negatively impacts on their market opportunities. Unstable supplies of raw materials poses a majorconstraint to MSMFE growth. Poor quality packaging also reduces the quality and competitiveness oftheir products on local and international markets.
Price fluctuations and the unreliability of local and foreign markets also pose major constraints forMSMFEs. Moreover, few MSMFEs invest in long-term planning in the marketing of their processedoutputs.
Access to finance – Access to finance is critical if MSMFEs are to improve the quality andcompetitiveness of their outputs. Poor and/or limited access to finance across most countries posesa serious challenge for MSMFEs. Many MSMFEs resort to borrowing at usurious lending rates in order toaccess financial resources.
Access to suitable levels of technology – Across much of the region, relatively little attention is paidto technology development that is geared toward meeting the needs of MSMFEs. Much of thetechnology used for processing by SMEs is still at the bottom end of the technology gradient. In manycases this is due to the absence of modern technology suited to their specific processing applicationsand/or to their limited access to finance to upgrade their equipment requirements. Quite often, thistechnology is locally fabricated and is inefficient in use with no maintenance support. Some importedtechnology such as canning, freezing, pasteurization and sterilization is used in the production ofconventionally processed foods.
All countries highlighted the need for technology of an appropriate level that is suited to the needs ofMSMFEs. Appropriate levels of technology must synchronize with the skills of the local labour force andtheir ability to sustain its operation.
Few countries invest in research that is targeted to meeting the technological requirements of MSMFEs,and relatively few MSMFEs invest in higher-end new and innovative technologies such as microfiltration,controlled fermentations or in innovations in food packaging.
6
Innovation – Relatively few MSMFEs engage in research and product development targeted toaddressing changing consumer demands – e.g. demand for low fat, low sugar, etc. Little attention is paidto research designed to address product, process and packaging innovation in line with growing andchanging consumer demand trends in the region.
Few countries have invested in redesigning and upgrading small-scale processing equipment that issuited to the requirements of MSMFEs. In situations where prototypes have been developed, they havenot been transferred to the private sector for use.
Networking – MSMFEs often work in isolation and are weakly linked to research institutions. Relativelyfew engage in networking with other MSMFEs or with larger agri-businesses and consequently miss outon learning opportunities. Few participate in trade fairs and exhibitions to promote their outputs.
Models of success have, however, been achieved where MSMFEs work together and in partnership withlarger agri-businesses. The One Tambon One Product model (OTOP), is an example of one such modelthat has been successful in Thailand. Scope, therefore, exists for sharing and exchange among and acrosscountries.
OTOP
One Tambon One Product (OTOP) is a local entrepreneurship stimulus of the Royal Thai Government, which is aimedto support the locally-made and marketed products of each Thai tambon (sub-district). It encourages villagecommunities to improve the local products’ quality and marketing, selecting one superior product from each tambonto receive formal branding as its “starred OTOP product.” It provides both local and national stage to promote theseproducts.
Linkages and collaboration – With increasing demands and growing sophistication of urban andinternational consumers, there is a growing interest in the development of partnerships andcollaboration between MSMFEs and larger agri-business entities. Considerable opportunity exists forMSMFEs to improve their operations through such linkages. Such arrangements can also guarantee themarket for MSMFEs in schemes such as contract processing. This, however, necessitates a supportiveenabling environment.
5. Policy recommendations
Prioritize the MSMFE food processing sector
● Given their critical importance for nutrition and health, for the creation of entrepreneurs, forequitable growth of economies, food MSMFEs should not be considered within the genericcontext of SMEs, but warrant a specific focus by governments in the region.
● Develop a statistical database on MSMFEs to guide policy development within the sector.
● Align development within the MSMFE sector with country growth strategies.● Develop and implement policies to support continued growth, long-term competitiveness and
sustainability of MSMFEs.
Strengthen human resource capacity development in the MSMFE sector
● Strengthen educational institutions (public and private) to support human resource capacitydevelopment in support of MSMFE development.
● Provide vocational training to MSMFEs.● Support continuous training and capacity building to improve knowledge and skills of relevance
to sustainability principles in MSMFE operations.● Establish networks for information and technology exchange.
● Promote knowledge sharing and exchange through South-South collaboration.
7
Support research, development and innovation in MSMFEs
● Create awareness among MSMFEs on the need to innovate and utilize appropriate levels ofenvironmentally sound technologies that reduce drudgery, increase efficiency and assure thequality and safety of their outputs.
● Provide support to research and development including the establishment of a fund to supportwork on product development, packaging innovation, and processing equipment.
● Establish innovation centers designed to nurture the development of MSMFEs.
● Promote the development of effective branding and packaging.
● Promote linkages between MSMFEs and universities/research institutions.
Provide an enabling environment to support MSMFE development
● Support training and capacity building across a range of specializations and programs that meetthe needs of MSMFEs.
● Establish business and technology incubators/agro-industrial parks to nurture the growth anddevelopment of MSMFEs.
● Promote cluster approaches to improve linkages between MSMFEs and large agri-businesses.● Facilitate MSMFE access to finance.
● Provide assistance and support to MSMFEs in identifying market opportunities.
● Promote contract farming as a way of increasing clean\safe sourcing of raw material inputs forMSMFEs.
● Infrastructure development to support MSMFE operations and ensure access to technology.
References
Asia-Pacific Economic Cooperation. 2014. The promoting Innovation Seminar-How Smart IPR Policies can encourageSMME’s Research and Development. https://aimp2.apec.org/sites/PDB/Lists/Proposals/DispForm.aspx?ID=1344
8
POLICIES AND STRATEGIES FOR THE DEVELOPMENT OF SMALL ANDMEDIUM SCALE FOOD PROCESSING ENTERPRISES
IN BANGLADESH
byIndrajit Roy
Independent Consultant
1. Introduction
Bangladesh is a South Asian country bordered by India on all sides except for a narrow strip on thesoutheast where it is bordered by Myanmar and on the south where it is bordered by the Bay of Bengal.It is the world’s largest delta situated at the confluence of the three mighty river systems – Ganges,Brahmaputra, and Meghna – that drain into the sea flowing through a vast catchment area of 1.72 millionkm2, 93 percent of which lies in the upper riparian countries – China, Nepal, Bhutan, andIndia.1 Bangladesh is a parliamentary democracy, a country of 147 570 km2 land area and inhabited by142.32 million people2 with extraordinary resilience and capability to rebuild life following frequentenvironmental disasters. The tropical monsoon is the dominant feature of the country’s climate withabout 80 percent of the annual rainfall typically occurring in the monsoon period from late May tomid-October.
Bangladesh is a low-income country but has set sights on graduating into the ranks of the middle-income economies in 2021.3 Despite persistent chaos in the political system, the presence of a vibrantnon-state sector remains a beacon of hope for the nation. It is represented by strong civil institutionsincluding world class think tanks, citizens’ anti-corruption bodies, a lively free press and an expandingculture of investigative journalism, a community of NGOs with a global outreach, and an emergingentrepreneurial class poised to take Bangladesh into the big league of the global economy.
Bangladesh enjoyed an annual growth of GDP in excess of 6 percent per annum since 2004 except fora slight decline to 5.7 percent amid the global economic recession in the fiscal year 2008/2009. Theeconomy rebounded in the post-recession period and grew at 6.1 percent in 2009/2010. The country’sGDP in 2010/2011, provisional estimates suggest, stood at BDT7.87 trillion (USD111.69 billion) growingat 6.7 percent annually.
As a result, per capita GDP rose to BDT53 236 (USD755)4 in 2010/2011 from USD392 in 2004.5 Theincidence of poverty declined from 25.1 percent in 2005 to 17.6 percent in 2010, daily per capita intakeof food increased by 5.5 percent, and standard of living in terms of non-food indicators also increasedsignificantly.6 This was also reflected in the country’s performance on meeting its MDG goals. It has beenranked as eleventh in a list of top 20 performers in making the most progress overall in meeting theMDGs based on aggregation of rankings of the annual rate of progress for selected MDG indicators.7
Bangladesh’s strong growth and gains in poverty reduction have also drawn the attention of theinternational community. The Goldman Sachs investment Bank mooted the concept of Next 11(N11) in
1 Fazlur, R. 2010. Development of Eco-efficient Water Infrastructure in Bangladesh. Paper presented at the third regionalWorkshop on Eco-efficient Infrastructures in Asia and the Pacific, 23–25 November 2010, Bangkok, Thailand.2 Bangladesh Bureau of Statistics. 2011. Population and Housing Census, Preliminary Results, July 2011.3 Board of Investment. Bangladesh Government Vision 2021, (available at http://boi.gov.bd).4 BDT (Bangladesh Taka, the exchange rate used in this paper is 1USD=BDT70.51).5 Bangladesh Ministry of Finance (MOF). 2011. Bangladesh Economic Review, (available at http://www.mof.gov.bd).6 Bangladesh Bureau of Statistics. 2011. Preliminary Report on Household Income and Expenditure Survey (HIES)-2010,June 2011.7 Overseas Development Institute. 2010. Millennium Development Report Card: Learning from Progress, (available athttp://www.odi.org.uk/resources/download/4908/pdf ).
9
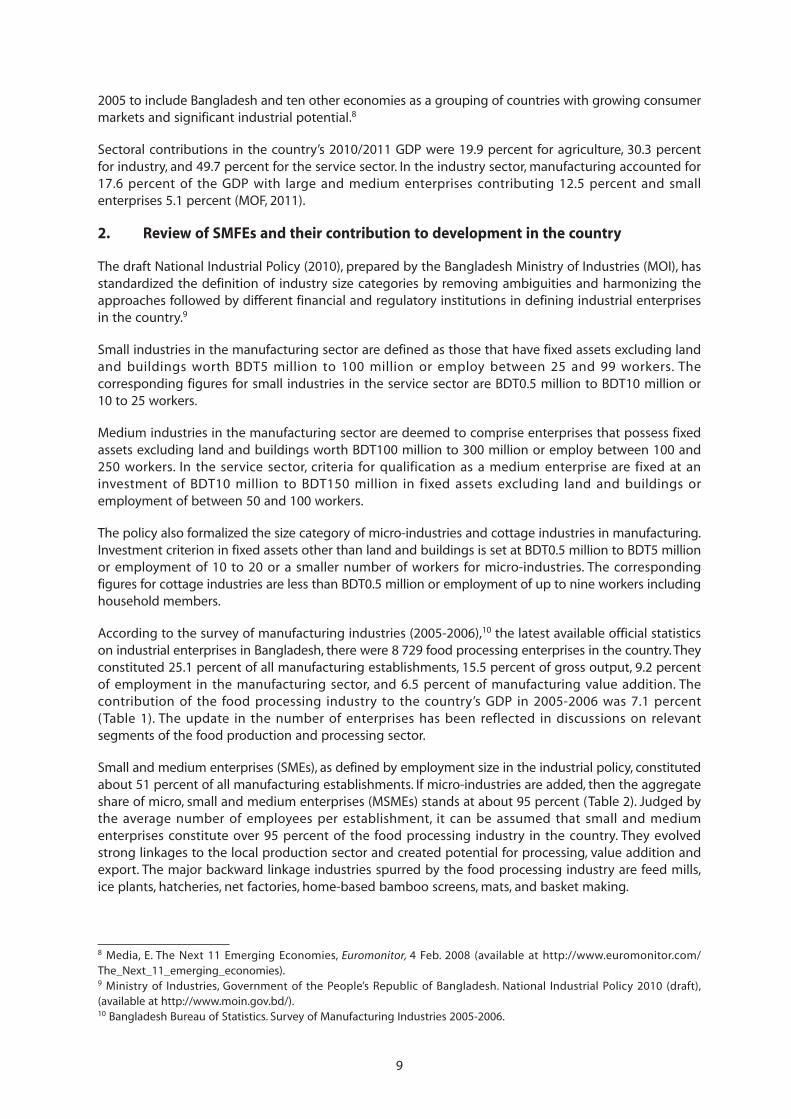
2005 to include Bangladesh and ten other economies as a grouping of countries with growing consumermarkets and significant industrial potential.8
Sectoral contributions in the country’s 2010/2011 GDP were 19.9 percent for agriculture, 30.3 percentfor industry, and 49.7 percent for the service sector. In the industry sector, manufacturing accounted for17.6 percent of the GDP with large and medium enterprises contributing 12.5 percent and smallenterprises 5.1 percent (MOF, 2011).
2. Review of SMFEs and their contribution to development in the country
The draft National Industrial Policy (2010), prepared by the Bangladesh Ministry of Industries (MOI), hasstandardized the definition of industry size categories by removing ambiguities and harmonizing theapproaches followed by different financial and regulatory institutions in defining industrial enterprisesin the country.9
Small industries in the manufacturing sector are defined as those that have fixed assets excluding landand buildings worth BDT5 million to 100 million or employ between 25 and 99 workers. Thecorresponding figures for small industries in the service sector are BDT0.5 million to BDT10 million or10 to 25 workers.
Medium industries in the manufacturing sector are deemed to comprise enterprises that possess fixedassets excluding land and buildings worth BDT100 million to 300 million or employ between 100 and250 workers. In the service sector, criteria for qualification as a medium enterprise are fixed at aninvestment of BDT10 million to BDT150 million in fixed assets excluding land and buildings oremployment of between 50 and 100 workers.
The policy also formalized the size category of micro-industries and cottage industries in manufacturing.Investment criterion in fixed assets other than land and buildings is set at BDT0.5 million to BDT5 millionor employment of 10 to 20 or a smaller number of workers for micro-industries. The correspondingfigures for cottage industries are less than BDT0.5 million or employment of up to nine workers includinghousehold members.
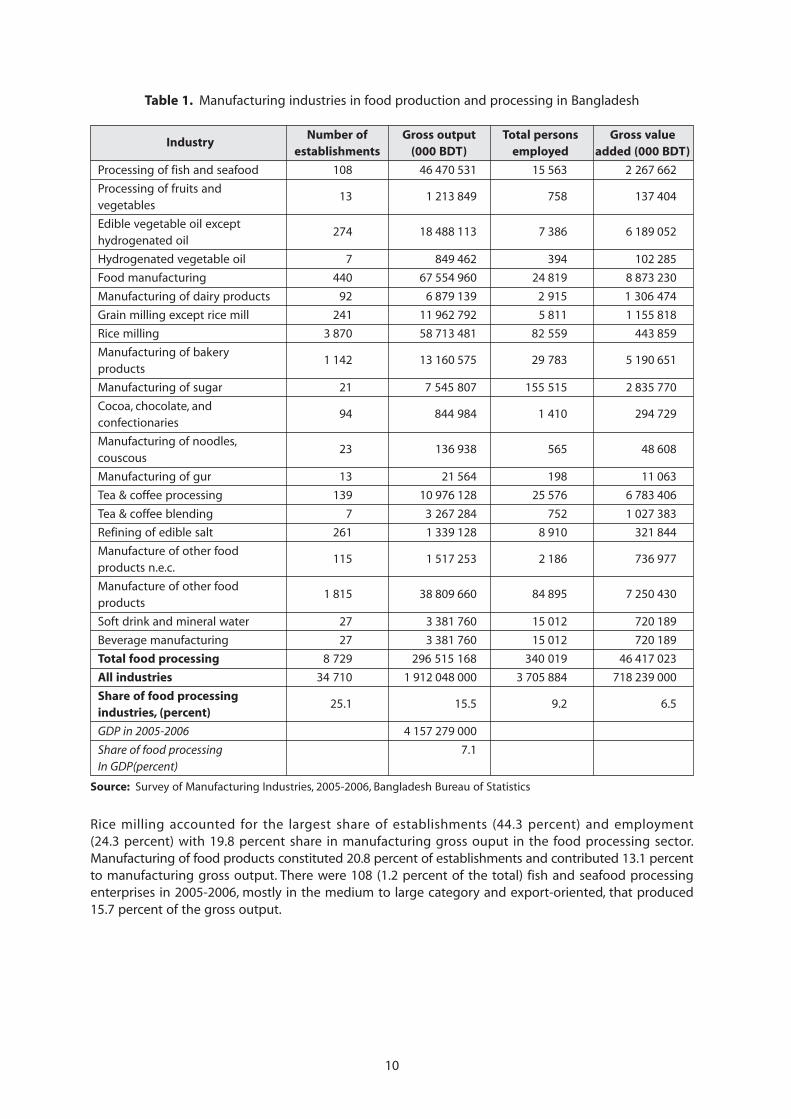
According to the survey of manufacturing industries (2005-2006),10 the latest available official statisticson industrial enterprises in Bangladesh, there were 8 729 food processing enterprises in the country. Theyconstituted 25.1 percent of all manufacturing establishments, 15.5 percent of gross output, 9.2 percentof employment in the manufacturing sector, and 6.5 percent of manufacturing value addition. Thecontribution of the food processing industry to the country’s GDP in 2005-2006 was 7.1 percent(Table 1). The update in the number of enterprises has been reflected in discussions on relevantsegments of the food production and processing sector.
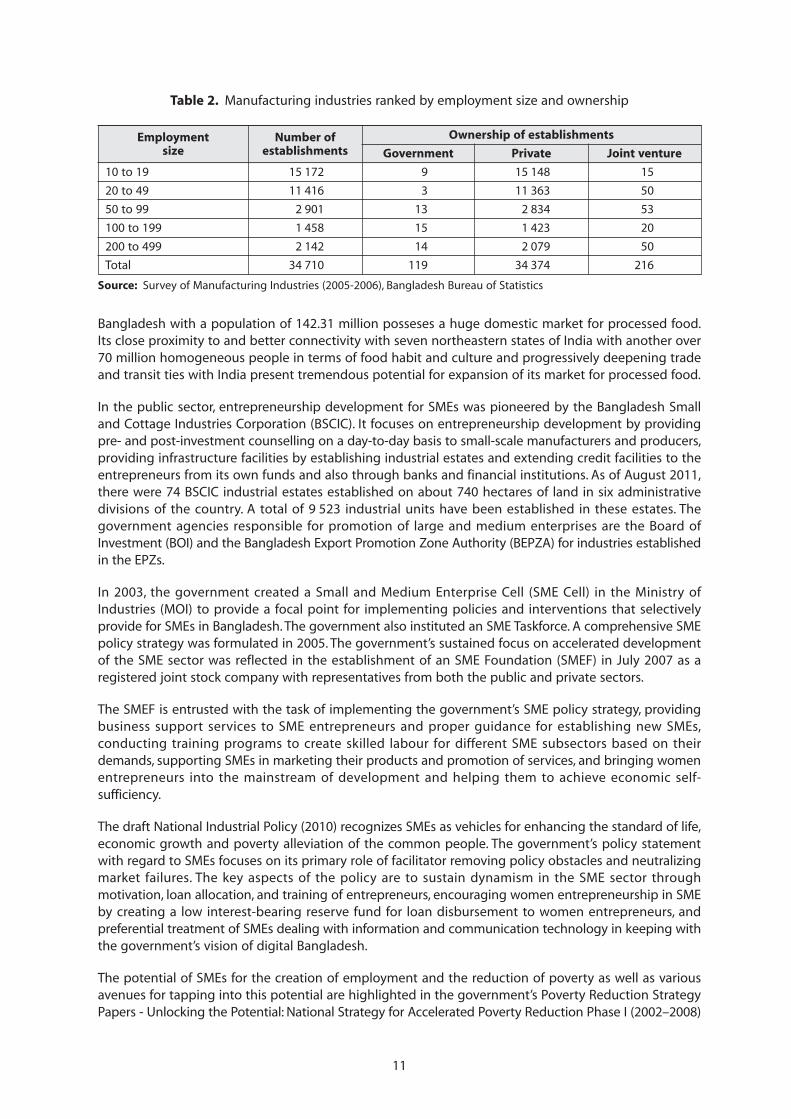
Small and medium enterprises (SMEs), as defined by employment size in the industrial policy, constitutedabout 51 percent of all manufacturing establishments. If micro-industries are added, then the aggregateshare of micro, small and medium enterprises (MSMEs) stands at about 95 percent (Table 2). Judged bythe average number of employees per establishment, it can be assumed that small and mediumenterprises constitute over 95 percent of the food processing industry in the country. They evolvedstrong linkages to the local production sector and created potential for processing, value addition andexport. The major backward linkage industries spurred by the food processing industry are feed mills,ice plants, hatcheries, net factories, home-based bamboo screens, mats, and basket making.
8 Media, E. The Next 11 Emerging Economies, Euromonitor, 4 Feb. 2008 (available at http://www.euromonitor.com/The_Next_11_emerging_economies).9 Ministry of Industries, Government of the People’s Republic of Bangladesh. National Industrial Policy 2010 (draft),(available at http://www.moin.gov.bd/).10 Bangladesh Bureau of Statistics. Survey of Manufacturing Industries 2005-2006.
10
Rice milling accounted for the largest share of establishments (44.3 percent) and employment(24.3 percent) with 19.8 percent share in manufacturing gross ouput in the food processing sector.Manufacturing of food products constituted 20.8 percent of establishments and contributed 13.1 percentto manufacturing gross output. There were 108 (1.2 percent of the total) fish and seafood processingenterprises in 2005-2006, mostly in the medium to large category and export-oriented, that produced15.7 percent of the gross output.
Table 1. Manufacturing industries in food production and processing in Bangladesh
IndustryNumber of Gross output Total persons Gross value
establishments (000 BDT) employed added (000 BDT)
Processing of fish and seafood 108 46 470 531 15 563 2 267 662
Processing of fruits andvegetables
13 1 213 849 758 137 404
Edible vegetable oil excepthydrogenated oil
274 18 488 113 7 386 6 189 052
Hydrogenated vegetable oil 7 849 462 394 102 285
Food manufacturing 440 67 554 960 24 819 8 873 230
Manufacturing of dairy products 92 6 879 139 2 915 1 306 474
Grain milling except rice mill 241 11 962 792 5 811 1 155 818
Rice milling 3 870 58 713 481 82 559 443 859
Manufacturing of bakeryproducts
1 142 13 160 575 29 783 5 190 651
Manufacturing of sugar 21 7 545 807 155 515 2 835 770
Cocoa, chocolate, andconfectionaries
94 844 984 1 410 294 729
Manufacturing of noodles,couscous
23 136 938 565 48 608
Manufacturing of gur 13 21 564 198 11 063
Tea & coffee processing 139 10 976 128 25 576 6 783 406
Tea & coffee blending 7 3 267 284 752 1 027 383
Refining of edible salt 261 1 339 128 8 910 321 844
Manufacture of other foodproducts n.e.c.
115 1 517 253 2 186 736 977
Manufacture of other foodproducts
1 815 38 809 660 84 895 7 250 430
Soft drink and mineral water 27 3 381 760 15 012 720 189
Beverage manufacturing 27 3 381 760 15 012 720 189
Total food processing 8 729 296 515 168 340 019 46 417 023
All industries 34 710 1 912 048 000 3 705 884 718 239 000
Share of food processingindustries, (percent)
25.1 15.5 9.2 6.5
GDP in 2005-2006 4 157 279 000
Share of food processing 7.1In GDP(percent)
Source: Survey of Manufacturing Industries, 2005-2006, Bangladesh Bureau of Statistics
11
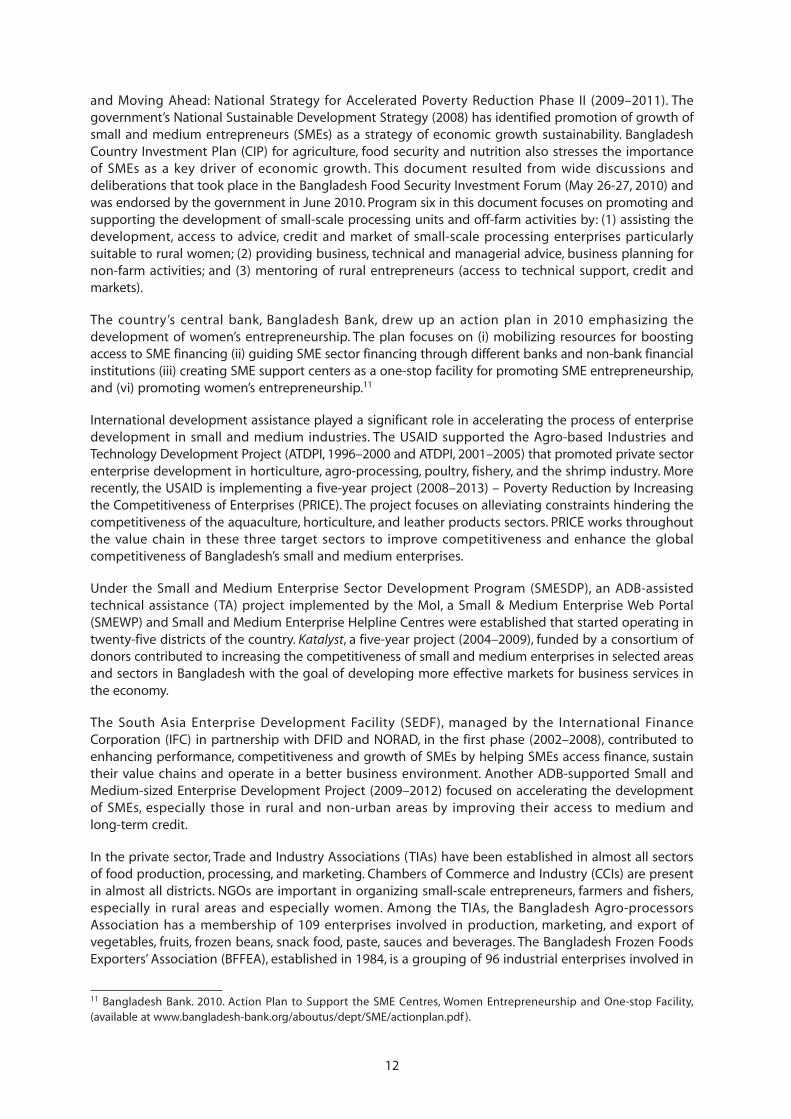
Bangladesh with a population of 142.31 million posseses a huge domestic market for processed food.Its close proximity to and better connectivity with seven northeastern states of India with another over70 million homogeneous people in terms of food habit and culture and progressively deepening tradeand transit ties with India present tremendous potential for expansion of its market for processed food.
In the public sector, entrepreneurship development for SMEs was pioneered by the Bangladesh Smalland Cottage Industries Corporation (BSCIC). It focuses on entrepreneurship development by providingpre- and post-investment counselling on a day-to-day basis to small-scale manufacturers and producers,providing infrastructure facilities by establishing industrial estates and extending credit facilities to theentrepreneurs from its own funds and also through banks and financial institutions. As of August 2011,there were 74 BSCIC industrial estates established on about 740 hectares of land in six administrativedivisions of the country. A total of 9 523 industrial units have been established in these estates. Thegovernment agencies responsible for promotion of large and medium enterprises are the Board ofInvestment (BOI) and the Bangladesh Export Promotion Zone Authority (BEPZA) for industries establishedin the EPZs.
In 2003, the government created a Small and Medium Enterprise Cell (SME Cell) in the Ministry ofIndustries (MOI) to provide a focal point for implementing policies and interventions that selectivelyprovide for SMEs in Bangladesh. The government also instituted an SME Taskforce. A comprehensive SMEpolicy strategy was formulated in 2005. The government’s sustained focus on accelerated developmentof the SME sector was reflected in the establishment of an SME Foundation (SMEF) in July 2007 as aregistered joint stock company with representatives from both the public and private sectors.
The SMEF is entrusted with the task of implementing the government’s SME policy strategy, providingbusiness support services to SME entrepreneurs and proper guidance for establishing new SMEs,conducting training programs to create skilled labour for different SME subsectors based on theirdemands, supporting SMEs in marketing their products and promotion of services, and bringing womenentrepreneurs into the mainstream of development and helping them to achieve economic self-sufficiency.
The draft National Industrial Policy (2010) recognizes SMEs as vehicles for enhancing the standard of life,economic growth and poverty alleviation of the common people. The government’s policy statementwith regard to SMEs focuses on its primary role of facilitator removing policy obstacles and neutralizingmarket failures. The key aspects of the policy are to sustain dynamism in the SME sector throughmotivation, loan allocation, and training of entrepreneurs, encouraging women entrepreneurship in SMEby creating a low interest-bearing reserve fund for loan disbursement to women entrepreneurs, andpreferential treatment of SMEs dealing with information and communication technology in keeping withthe government’s vision of digital Bangladesh.
The potential of SMEs for the creation of employment and the reduction of poverty as well as variousavenues for tapping into this potential are highlighted in the government’s Poverty Reduction StrategyPapers - Unlocking the Potential: National Strategy for Accelerated Poverty Reduction Phase I (2002–2008)
Table 2. Manufacturing industries ranked by employment size and ownership
Employment Number of Ownership of establishmentssize establishments Government Private Joint venture
10 to 19 15 172 9 15 148 15
20 to 49 11 416 3 11 363 50
50 to 99 2 901 13 2 834 53
100 to 199 1 458 15 1 423 20
200 to 499 2 142 14 2 079 50
Total 34 710 119 34 374 216
Source: Survey of Manufacturing Industries (2005-2006), Bangladesh Bureau of Statistics
12
and Moving Ahead: National Strategy for Accelerated Poverty Reduction Phase II (2009–2011). Thegovernment’s National Sustainable Development Strategy (2008) has identified promotion of growth ofsmall and medium entrepreneurs (SMEs) as a strategy of economic growth sustainability. BangladeshCountry Investment Plan (CIP) for agriculture, food security and nutrition also stresses the importanceof SMEs as a key driver of economic growth. This document resulted from wide discussions anddeliberations that took place in the Bangladesh Food Security Investment Forum (May 26-27, 2010) andwas endorsed by the government in June 2010. Program six in this document focuses on promoting andsupporting the development of small-scale processing units and off-farm activities by: (1) assisting thedevelopment, access to advice, credit and market of small-scale processing enterprises particularlysuitable to rural women; (2) providing business, technical and managerial advice, business planning fornon-farm activities; and (3) mentoring of rural entrepreneurs (access to technical support, credit andmarkets).
The country’s central bank, Bangladesh Bank, drew up an action plan in 2010 emphasizing thedevelopment of women’s entrepreneurship. The plan focuses on (i) mobilizing resources for boostingaccess to SME financing (ii) guiding SME sector financing through different banks and non-bank financialinstitutions (iii) creating SME support centers as a one-stop facility for promoting SME entrepreneurship,and (vi) promoting women’s entrepreneurship.11
International development assistance played a significant role in accelerating the process of enterprisedevelopment in small and medium industries. The USAID supported the Agro-based Industries andTechnology Development Project (ATDPI, 1996–2000 and ATDPI, 2001–2005) that promoted private sectorenterprise development in horticulture, agro-processing, poultry, fishery, and the shrimp industry. Morerecently, the USAID is implementing a five-year project (2008–2013) – Poverty Reduction by Increasingthe Competitiveness of Enterprises (PRICE). The project focuses on alleviating constraints hindering thecompetitiveness of the aquaculture, horticulture, and leather products sectors. PRICE works throughoutthe value chain in these three target sectors to improve competitiveness and enhance the globalcompetitiveness of Bangladesh’s small and medium enterprises.
Under the Small and Medium Enterprise Sector Development Program (SMESDP), an ADB-assistedtechnical assistance (TA) project implemented by the MoI, a Small & Medium Enterprise Web Portal(SMEWP) and Small and Medium Enterprise Helpline Centres were established that started operating intwenty-five districts of the country. Katalyst, a five-year project (2004–2009), funded by a consortium ofdonors contributed to increasing the competitiveness of small and medium enterprises in selected areasand sectors in Bangladesh with the goal of developing more effective markets for business services inthe economy.
The South Asia Enterprise Development Facility (SEDF), managed by the International FinanceCorporation (IFC) in partnership with DFID and NORAD, in the first phase (2002–2008), contributed toenhancing performance, competitiveness and growth of SMEs by helping SMEs access finance, sustaintheir value chains and operate in a better business environment. Another ADB-supported Small andMedium-sized Enterprise Development Project (2009–2012) focused on accelerating the developmentof SMEs, especially those in rural and non-urban areas by improving their access to medium andlong-term credit.
In the private sector, Trade and Industry Associations (TIAs) have been established in almost all sectorsof food production, processing, and marketing. Chambers of Commerce and Industry (CCIs) are presentin almost all districts. NGOs are important in organizing small-scale entrepreneurs, farmers and fishers,especially in rural areas and especially women. Among the TIAs, the Bangladesh Agro-processorsAssociation has a membership of 109 enterprises involved in production, marketing, and export ofvegetables, fruits, frozen beans, snack food, paste, sauces and beverages. The Bangladesh Frozen FoodsExporters’ Association (BFFEA), established in 1984, is a grouping of 96 industrial enterprises involved in
11 Bangladesh Bank. 2010. Action Plan to Support the SME Centres, Women Entrepreneurship and One-stop Facility,(available at www.bangladesh-bank.org/aboutus/dept/SME/actionplan.pdf ).
13
the production, processing and export of frozen foods, notably shrimp and fish. The Bangladesh MarineFisheries Association is an organization of eighteen trawler-owning companies that have deep-sea fishingoperations. The Bangladesh Fruits, Vegetables, and Allied Products Exporters’ Association hasa membership of 108 enterprises involved in the production, marketing and export of fresh vegetablesand fruits. Other industry organizations are: the Horticultural Export Foundation; the Bangladesh Shrimpand Fish Foundation; the Bangladesh Salted and Dehydrated Marine Foods Exporters’ Association; andthe Tea Traders’ Association of Bangladesh.
These organizations provide a platform for entrepreneurs in relevant industries to access resources forinformation, training, and networking with prospective buyers. The Federation of Bangladesh Chambersof Commerce and Industry (FBCCI) is the apex body of the country’s trade bodies representing245 members, of which 70 are CCIs and 175 TIAs. It plays an influential role in promoting dialogue andpartnership with government and civil society to shape investment and policy discourse in relation tosustaining dynamism in growth and the contribution of the private sector to the national economy. Inaddition, representatives of the business community sit on many committees set up by the governmentand their representatives are included in government delegations abroad. The community’s clout andits ability to affect policy changes are reportedly greater than at any time in the past.
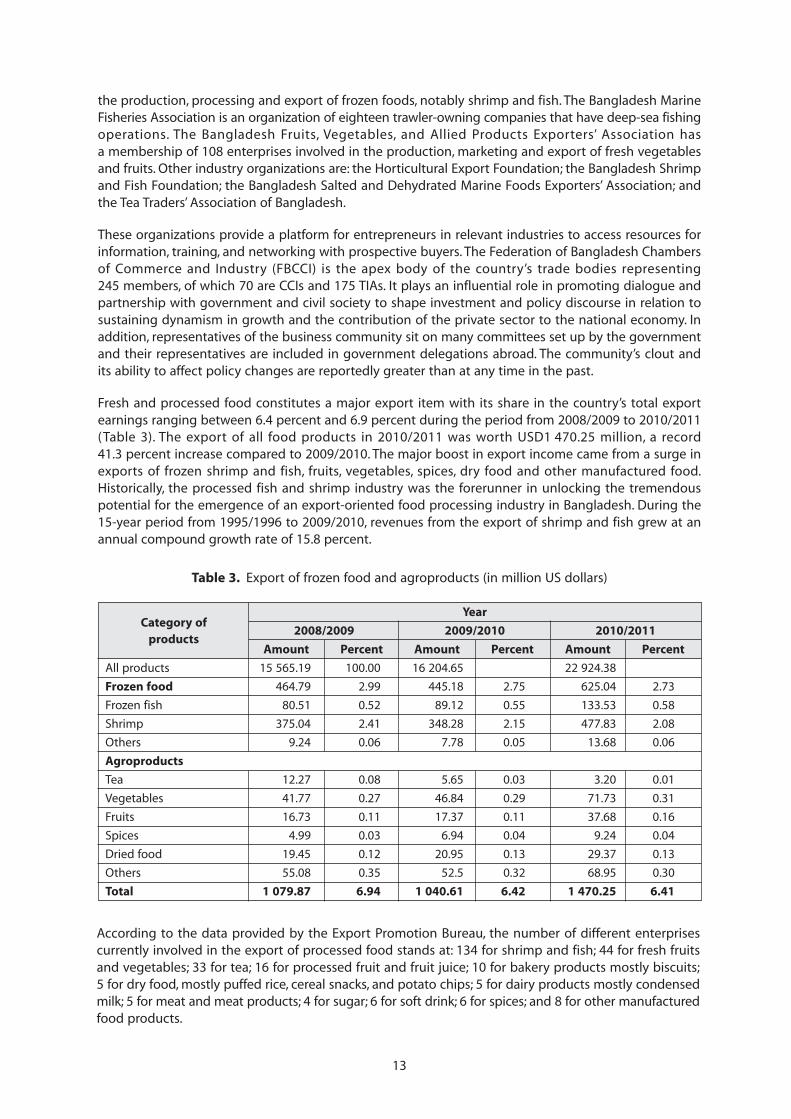
Fresh and processed food constitutes a major export item with its share in the country’s total exportearnings ranging between 6.4 percent and 6.9 percent during the period from 2008/2009 to 2010/2011(Table 3). The export of all food products in 2010/2011 was worth USD1 470.25 million, a record41.3 percent increase compared to 2009/2010. The major boost in export income came from a surge inexports of frozen shrimp and fish, fruits, vegetables, spices, dry food and other manufactured food.Historically, the processed fish and shrimp industry was the forerunner in unlocking the tremendouspotential for the emergence of an export-oriented food processing industry in Bangladesh. During the15-year period from 1995/1996 to 2009/2010, revenues from the export of shrimp and fish grew at anannual compound growth rate of 15.8 percent.
Category ofproducts
Table 3. Export of frozen food and agroproducts (in million US dollars)
Year
2008/2009 2009/2010 2010/2011
Amount Percent Amount Percent Amount Percent
All products 15 565.19 100.00 16 204.65 22 924.38
Frozen food 464.79 2.99 445.18 2.75 625.04 2.73
Frozen fish 80.51 0.52 89.12 0.55 133.53 0.58
Shrimp 375.04 2.41 348.28 2.15 477.83 2.08
Others 9.24 0.06 7.78 0.05 13.68 0.06
Agroproducts
Tea 12.27 0.08 5.65 0.03 3.20 0.01
Vegetables 41.77 0.27 46.84 0.29 71.73 0.31
Fruits 16.73 0.11 17.37 0.11 37.68 0.16
Spices 4.99 0.03 6.94 0.04 9.24 0.04
Dried food 19.45 0.12 20.95 0.13 29.37 0.13
Others 55.08 0.35 52.5 0.32 68.95 0.30
Total 1 079.87 6.94 1 040.61 6.42 1 470.25 6.41
According to the data provided by the Export Promotion Bureau, the number of different enterprisescurrently involved in the export of processed food stands at: 134 for shrimp and fish; 44 for fresh fruitsand vegetables; 33 for tea; 16 for processed fruit and fruit juice; 10 for bakery products mostly biscuits;5 for dry food, mostly puffed rice, cereal snacks, and potato chips; 5 for dairy products mostly condensedmilk; 5 for meat and meat products; 4 for sugar; 6 for soft drink; 6 for spices; and 8 for other manufacturedfood products.
14
Despite consistent growth of the country’s GDP over the last five years, investment remains virtuallystagnant at about 24 percent of GDP since 2003/2004. In 2009/2010, investment constituted24.96 percent of GDP of which 20.19 percent came from the private sector. This trend significantly lagsbehind the estimates of the Ministry of Finance that projects an increase of private sector investmentbetween 30 and 32 percent of GDP so as to deliver 8 percent growth of GDP by 2013 as targeted in thegovernment’s “Vision 2021”.
Currently the private sector accounts for about 79 percent of total investment. Steps are, however,underway to attract both local and foreign investment to raise the investment profile that exists as ofnow. The government’s export policy (2009–2012) has identified agroproducts and agroprocessedproducts as one of the eight designated highest priority sectors. This entitles the sector to receive a rangeof benefits and facilities: (a) project loans at reduced interest rates; (b) income tax exemptions; (c) possiblefinancial benefits or subsidies consistent with WTO Agreement on Agriculture, and Agreement onSubsidies and Countervailing Measures, including concessionary rates for utility services such aselectricity, water and gas; (d) export loans with soft terms and at reduced interest rates; (e) air transportfacilities at concessionary rates; (f ) duty draw back and bond facilities; (g) facilities for setting up ofbackward linkage industries including infrastructural development; (h) expansion of institutional andtechnical facilities to improve and control the quality of products; (i) assistance in product marketing;(j) assistance in searching for foreign markets; and (k) necessary initiatives to attract foreign investment.
In addition, the export policy announces additional incentives for the frozen food industry. These include:(1) provision of venture capital; (2) initiatives for establishing a “seal of quality organization” to ensurethe quality of shrimp and shrimp products; (3) establishment of an accredited testing laboratory toensure the high quality of products and SPS-related standards; (4) development of a traceability systemfor all the steps from hatching to production of fish, processing and packaging; (5) expansion andconsolidation of the markets for frozen food by exploring markets abroad, organizing single countryfrozen food fairs, arranging and participating in international trade fairs at home and abroad;(6 ) establishment of a monitoring cell to control the quality of exportable shrimps; and (7) pre-releaseinspection by customs authorities of imported fish feed to ensure absence of contamination byprohibited substances and safety of use.
The Industrial Policy 2010 envisages a number of measures to boost investment in the private sector.These are: (a) setting up of special economic zones (SEZs); industrial park and high-tech park; and privatesector export processing zones (EPZs); (b) simplification of customs procedure in handling importedmachineries and equipment, tax exemption and tax holidays, expansion of export credit supply schemefor export-oriented and export-linkage industries; (c) policy advocacy and lobbying by the governmentto ensure access to Custom Duty and quota free market for the country in the multiple trade systemunder WTO.
3. Status of food processing in the country with a specific focus on SMFEs
The food processing industry in the country is extremely diverse in its use of technology, the quality ofits products and its processing, preserving, marketing and distributions systems. This includes theprocessing of fish and sea foods, the processing of fruits and vegetables, the manufacture of dairyproducts, the manufacture of processed food including bakery products, sugary and non-sugary snacks,grain milling including rice milling, carbonated and non-carbonated drinks, fruit juices and otherbeverages, blending of tea/coffee, and various other food items.
Processing of fish and seafood
Enterprise development in Bangladesh’s fish and seafood processing industry is mostly export-oriented.The bulk of the national aquaculture production is consumed domestically, mostly in fresh form.Processing involves the use of simple preservation techniques to prevent spoilage during handlingand transportation from the point of catch/production to the point of sale at retail market outlets. In2010/2011, exports constituted 1.9 percent as evidenced from the export of 58 877 tons of frozen shrimp
15
and fish12 out of a total production of 3.1 million tons (MOF, 2011). Yet it ranks in importance andcontribution to export earnings next only to the ready-made-garments (RMG), the country’s flagshipexport industry.
In 2010/2011, the revenue from the export of frozen shrimp and fish stood at USD611.36 millioncontributing 2.7 percent to aggregate export earnings of the country. Of this amount, shrimpsconstituted 78.2 percent and fish 21.8 percent. As evident from data in Table 3, the growth performanceof the sector remains dynamic with a record 39.8 percent annual increase in growth of export revenuescompared to USD437.40 million in 2009/2010. This boom in export earnings, as the data from the ExportPromotion Bureau show, was because of expansion of market share in existing markets and gainingaccess to new markets, product diversification, more value addition, and better commodity prices.
There are at present 148 fish processing plants in the country, of which 88 are licensed by thegovernment for export.13 Seventy five plants are approved for export to the European Union, of which46 are situated in the Khulna Division, 23 in the Chittagong Division and six elsewhere in the country.14
Besides, there are 182 modern trawlers or fishing vessels, with very limited onboard fish processingfacilities operating in the deep sea.15 One hundred and thirty four enterprises are listed as exporters bythe Export Promotion Bureau.
In the decades since the 1980s, shrimp/fish processing plants were established at an accelerated pacein a narrow geographical zone along the coastal estuarine belt in southern and southwestern parts ofthe country. This triggered the process of seasonal conversion of rice fields into shrimp ponds in thesurrounding areas and the emergence of organized shrimp farming as a network of suppliers toprocessing plants. The number of shrimp/prawn farms is estimated at 202 000, of which 186 000 havebeen registered.16
These farms vary widely in size from as low as 1.29 ha to as large as 36.5 ha, and are owned and operatedindividually or as a group enterprise. The average productivity of shrimp farming is low, 150 to 200 kg/ha compared to 4 to 7 t/ha in Thailand, the leading shrimp exporter in the region. The technology usedis traditional extensive or improved extensive. Semi-intensive production technology is practised in lessthan 20 percent of the shrimp/prawn farms. The stocking density in shrimp/prawn farms is low (2 to 15post-larvae per square metre), compared to international practices.17
In contrast to shrimp/prawn and brackish water aquaculture, where private sector entrepreneurshipplayed the key role in stimulating growth of the industry, commercial-scale operations in freshwateraquaculture were facilitated through public sector investment involving large-scale project assistance bybilateral agencies such as the Danish International Development Agency (DANIDA), the United Kingdom’sDepartment for International Development (DFID) and multilateral support from the Asian DevelopmentBank (ADB) and the World Bank. These projects focused, among others, on improving the productivityof small-scale freshwater pond aquaculture through development and dissemination of improvedextensive and semi-intensive carp pond polyculture technology.
Enterprise development was supported through the diffusion of knowledge, boosting farmer-to-farmercontact, capacity development of seed producers, and effective engagement of non-governmentorganizations in provision of training and input supply. These investments led to the emergence of at
12 Export Promotion Bureau, (available at http://www.epb.gov.bd).13 Bangladesh Frozen Foods Exporters Association (BFFEA), (available at http://www.bffea.net).14 Country Bangladesh Section Fishery Products, (available at https//webgate.ec.europa.eu/sanco/traces/output_BD_en.pdf ).15 Opportunities in Food Processing in Bangladesh with Special Focus on Fishery, (available at http://www.ambdhaka.um/dk/FoodprocessinginBangladesh/Summary_des).16 European Commission DG (Sanco). 2011: Final Report of an Audit carried out in Bangladesh, 24 March –2 April 2011,(available at http://ec.europa.eu/food/fvo/act_get pdf ).17 Alam S.M.N. and M.J. Philipps. 2004. Coastal Aquaculture Systems in Southwestern Bangladesh. Asian Fisheries Science,17: 175–189.
16
least 500 small enterprises along the Dhaka-Mymensingh corridor of the country with productivityreaching 10 to 15 t/ha. Such enterprises employ 2 to 4 persons/ha.18 A total of 5 440 export-orientedaquaculture farms have been identified but their registration with the DOF is pending (EC, 2011).
The fish processing industry has stimulated growth of backward linkage industries, small-scale and micro-enterprises. These are nurseries and hatcheries, feed mills, ice mills, processing units for value addedproducts, numerous small-scale traders, merchants, input sellers, and fry collectors along the value chain.There are at present 982 finfish hatcheries for freshwater species, of which 120 are government-ownedand 862 are privately-owned.19 There are 140 shrimp hatcheries including 60 for seawater shrimp and80 for freshwater prawn,20 126 feed establishments (including importers, producers, stores and retailers)licensed by the DOF, and more than 0.4 million shrimp fry collectors along the coastal zone of thecountry. About 1 million people are somehow involved in backward and forward linkage activities ofshrimp aquaculture (BSFF).
According to the Bangladesh Frozen Foods Exporters Association (BFFEA), the assortment of processedfish products that Bangladesh exports are broadly classified into ten categories: frozen shrimp and prawn;frozen fish; fresh and chilled fish; frozen fillets and steaks of fish, sharks’ shells, skates and rays; shark finsand fish maws; salted and dehydrated fish; dry fish; live crabs and tortoises; fish meals and crushed; valueadded shrimp and fish products.
The processing of fish involves primarily the application of preservation techniques in order to retainquality and increase shelf life. It also means adding value to produce a wide variety of products.A number of technologies are used to preserve fish based on temperature control using ice, refrigeration,or freezing, such as instant quick freezing (IQF). Other technologies are based on inhibiting microbialactivity through controlling water activity. These are sun-drying, dehydration, salting, smoking, and freeze-drying. Often a combination of methods and techniques are used in fish processing – sorting, dressing,cutting, eviscerating, skinning, pre-cooking, breading, blanching, and filleting.
Large fish is frozen whole (using IQF method), or frozen headless and gutted (belly-clean) or after beingprocessed as slices, fillets or steaks (using IQF method or block frozen). Small fish are whole block frozen.Large whole frozen fish or blocks are wrapped with polyethylene sheets or put in polyethylene bags andthen packed into a master carton wrapped with hessian cloth. Chilled fish is mostly sold as whole guttedheadless fish, also some in fillets, sticks or mince block form. Packaging is generally 5 to 20 kg fish packedwith 20 percent flaked ice or 1 percent (200 g) dry ice in styrofoam boxes in sizes according to thecustomer’s specifications.21 A large number of export processors are now producing increasing amountsof value added products that have contributed to an increase in export revenues. These are peeled anddeveined, peeled but not deveined, and butterfly cut shrimp, individually quick frozen, cooked andsemi-cooked.
In 2010/2011, fish and shrimp products under 57 different export categories, as opposed to 48 in2009/2010, were exported to about 60 countries in the world. The European Union was the largestdestination (contributing 60.1 percent of export revenue) with the United Kingdom’s share of14.3 percent, followed by the United States (14.3 percent), India (9.2 percent), the countries in the NearEast (3.9 percent), Japan (2.7 percent), ASEAN countries (2.7 percent), and China (1.9 percent).22
18 Asian Development Bank. 2005. An Evaluation of Small-Scale Freshwater Rural Aquaculture Development for PovertyReduction. pp. 47–50.19 Department of Fisheries (DOF), Ministry of Fisheries and Livestock, (available at http://www.fisheries.gov.bd).20 Bangladesh Shrimp and Fish Foundation (BSFF), (available at http://www.shrimpfoundation/org/index?phpscript=statistics).21 Ahmed, H. 2007. Pre- and Post-harvest Handling and Processing Procedures for the Production of Safe and High QualityFresh Fisheries Products in Bangladesh. Final Project Report, The United Nations University, Reykjavik, Iceland.22 Compiled from Export Statistics provided by the Export Promotion Bureau Bangladesh, (available at http://www.epb.gov.bd).
17
The key constraint to boosting the output of Bangladesh’s shrimp industry is the low productivity ofshrimp/prawn farms. As a result, the supply of raw materials to processing plants remains low creatinga large deficit in meeting the demand. This has led to severe underutilization of the installed capacityof shrimp/fish processing in the country. In 2010/2011, only 19.6 percent of the total capacity could beutilized. The major factors causing low productivity of shrimp farms are: limited supply of good-quality,particularly disease-free post larvae (PL) for seeding the shrimp ponds; unavailability of quality fish feeds;and also inadequate technical knowledge and skills of shrimp farmers. The government policydiscourages harvesting of shrimp fries in the wild out of concern for irreversible depletion of naturalstocks. But the alternative option – production of PL in hatcheries and nurseries is not keeping pace withthe growth of demand and often hatchery-bred PL is of inferior quality.
Food safety and quality continue to remain important elements in industry development. Existingregulations in this field trace their origin to European Union and USFDA regulations as they are the majorconsumers of Bangladesh’s exported fisheries products. Pioneering attempts at developing productstandards, regulations, and inspection protocols in the country’s fisheries sector were launched by theFAO in the early 1980s. In 1983, the Bangladesh government promulgated a Fish and Fish Product(Inspection and Quality Control) (FIQC) ordinance and in 1985 upgraded the inspection laboratory andits personnel under the Department of Fisheries (DOF). FAO initiated a project in 1996 to assist in thepreparation of a fish safety and quality control program for the shrimp and fish establishments inBangladesh, based on the Hazard Analysis Critical Control Point (HACCP) approach.23
The major boost to strengthening quality systems for the fish processing industry came in the wake ofthe ban the European Union slapped on imports of Bangladeshi fishery products in 1997 because ofserious lapses in infrastructure, sanitation, hygiene, and process control that European Union inspectorsrevealed in several shrimp processing plants in the country. The ban jolted the shrimp industry, triggereda significant contraction of the country’s export revenues and sent an unmistakeable signal to theindustry for a major overhaul of its food safety and quality control systems. The ban was lifted followingan investment of about USD18 million that the government, industry, and the development partnersmade in plant upgrades, laboratory and personnel upgrades, and employee training programs. Thelegal and regulatory framework was also revamped by introducing FIQC Rules 1997 that require theHACCP-based food safety system in shrimp processing plants, including annual testing for chemicalresidues.24 These FIQC rules were amended in 2008 to include requirements for traceability.
Corrective actions initiated since then were followed through in subsequent years. Multilateraldevelopment assistance channelled through the public sector institutions and private sector industries,associations, and cooperatives focused on continuous improvement of the national capacity forprocessing, manufacturing, and exporting a variety of fisheries products in conformity withinternationally accepted food safety standards and business practices. The Agro-based Industries andTechnology Development Project (ATDP), the major USAID initiative to stimulate private sector growthin a range of industries and implemented in two phases (1996–2000; 2001–2005), provided a major boostto quality improvement. The project established a modern laboratory in the private sector equipped withpolymerase chain reaction (PCR)-based molecular screening technology for detection of white syndromewhite virus (WSSV), a major cause of mortality of post-larvae (PL) used in seeding the shrimp ponds. Italso conducted demonstrations of improved production practices and HACCP training for differentstakeholders in the shrimp and fish industry. The project also invested substantial resources in attemptingto introduce a shrimp certification scheme – the shrimp seal of quality (SSOQ).25
The European Union and NORAD under their multisector Bangladesh Quality Support Programme(BQSP), executed by UNIDO (2006–2009), strengthened the capacity of the Fish Inspection and Quality
23 Food and Agriculture Organization (FAO) of the United Nations. 1996. Preparation of a HACCP-Based Fish QualityAssurance Programme, TCP/BGD/4555.24 Cato C.J. & Subasinge, S. 2003. Food Safety in Food Security and Food Trade, Case Study: The Shrimp Industry ofBangladesh, (available at http://www.agecondearch.umm.edu/bitstream/16555/1fo031009.pdf ).25 USAID/Dhaka. 2005. An Evaluation of the Bangladesh Agro-based Industries and Technology Development (ATDP II),Prepared by Development Associates Inc. Arlington, VA, USA.
18
Control (FIQC) wing of the Department of Fisheries by establishing three new modern laboratories; bytraining laboratory personnel; and by improving environmental practices including waste management.26
A follow-up second phase project (2010–2014) is now in implementation to build on the lessons andexperiences learned in the first phase (DOF).
The USAID’s ongoing assistance to the fish and shrimp industry, as part of its approach of private sectorenterprise development, is provided through the PRICE project (2008–2013). The project assisted thegovernment’s FIQC laboratories so that consignments can be tested and screened for chemical residuesaccurately before export. PRICE arranged five training programs for 100 FIQC trainees in compliance withEuropean Union food safety requirements. It assisted seven shrimp processing plants to increase theircapacity to adopt GMPs, follow HACCP procedures, and substantially boost in-house laboratorycapacities.27
These efforts are being undertaken to address ongoing concerns in relation to aquaculture food safetyand quality control in the country. The suppliers of raw materials often resort to malpractices such asinjecting shrimp with banned drugs and chemicals while they hold the product in storage in depots andsub-depots. These drugs include chloramphenicol, tetracycline, oxytetracycline and nitrofuranmetabolites, malachite green/leucomalachite green and crystal violet/leucocrystal violet. The presenceof banned chemical residues in processed fish products has also been reported to result from the useof imported fish feed. The processing plants have laboratories to test the levels of bacteria and salmonellabefore export, and these factors are under control. The FIQC is in charge of testing fish products goingto the market. There is no government or private system to monitor the production at farm level andto test chemical residues in the product before going to the market.28
This has prompted the government to launch a series of legislative initiatives. In the revised FIQC Rules(2011), the government has widened and specified the regulatory requirements for follow-upinvestigation of the national residue control program and pre-export non-compliances, finaldisposition of non-compliant consignments originated from pre-export testing. The proposed Fish FeedRules 2011 require operators to ensure that feed does not contain certain listed banned and harmfulsubstances. In addition, any importer or feed producer must obtain a test report from a recognizedlaboratory stating that the feed or ingredients do not contain any of the listed banned or harmfulsubstances. The proposed Rules also forbid commercial feed producers from manufacturing medicatedfeed. The scientific laboratories in the country responsible for conducting tests on processed fishproducts are scheduled to get accreditation from a reputed accreditation body before the end of 2014targeting ISO 17025.
The private sector also extended its cooperation in strengthening the control and regulatory framework.The Bangladesh Shrimp and Fish Foundation (BSFF), an umbrella organization representing the interestsof the fish processing industry, assisted the government in drafting a non-binding voluntary code ofconduct for key segments of the shrimp industry value chain, namely shrimp hatchery, shrimp farm,shrimp depot (assembly points), ice plants, fishing boat, fish carrier transport van/vessel, and shrimp/fishfeed mill. The code of conduct was formally launched in March 2010 with the expectation that concernedstakeholders in respective segments of the industry will adhere to the principles and procedures laiddown in the code.29 The BSFF is also currently implementing a project funded by Katalyst to develop anoperational pilot-scale traceability system to facilitate an industry-wide traceability system.
26 Building Trade Capacity UNIDO in Bangladesh: Enhancing Export Competitiveness through Quality Support Program,UNIDO South Asia-In Action, 2008, Vo. 2, No. 4.27 USAID/Poverty Reduction By Increasing the Competitiveness of Enterprises (PRICE) Project. Quarterly Progress Report,January-March 2011.28 Private Sector Development Program in Bangladesh: Assessment of Business Conditions and Sector Potentials, (availableat http://www.landsider.no/Pagesfiles/18354/NORAD_report_BMMP.pdf ).29 Department of Fisheries/Bangladesh Shrimp and Fish Foundation. 2011. Code of Conduct for Selected segments of theAquaculture Industry in Bangladesh, p. 31.
19
In contrast to the export-oriented segment of fish handling and fish processing, there is little capacityto ensure food safety and quality of fish and fish products sold in the domestic market. An overwhelmingquantity of fish is transported to distant markets and urban centers in primitive packaging andinadequate ice-refrigeration exposing consignments to microbial spoilage and deterioration, and thenunloaded, handled, and sold in retail markets with minimum basic sanitary facilities. A recent study hasdocumented the malpractice of treating fish with formalin, a carcinogenic chemical posing a seriouspublic health hazard, in samples of fish sold in domestic retail markets.30 Adding formalin extends theshelf-life of fish transported and held in storage without adequate refrigeration. The DOF is currentlyimplementing a development project to create capacity of DOF and other stakeholders to detectformalin in fish and create mass awareness among fish traders and consumers about the health hazardsposed by consumption of formalin-treated fish.
The complex fish marketing system with numerous actors in the chain from the point of production toconsumption creates loopholes for contamination and adulteration of fish with unauthorized andbanned chemicals. Four categories of markets are involved in the distribution of fish in the country,namely primary markets, secondary markets (assembly markets), higher secondary markets (wholesalemarkets) and central markets. A fish farmer receives 56 percent of the price paid by the final consumer,in other words 44 percent of the retail price is taken by the various intermediaries.31
To improve marketing in the shrimp sector, PRICE assists groups of farmers to organize synchronizedharvesting and bulk supply of shrimp to depots. The scale enhances their bargaining strength, price andprofitability. The project also helped to diversify export markets by facilitating participation by ninerepresentatives from five shrimp processing plants to attend the Dubai Gulf Food Fair that led to forginglinkages with new buyers in the Near East and elsewhere. In the public sector, the National AgricultureTechnology Project (2008–2013) has developed common interest groups (CIGs) among primaryproducers to improve market linkages.
The physical facilities for unloading, storage, and handling of fish in wholesale and retail fish markets aremostly dilapidated with poor hygiene and sanitation. There are currently no standard practices forhandling, washing, sorting, grading, cleaning and icing of fish. The DOF is currently implementinga USD1.2 million project for establishment of fish marketing facilities in Dhaka metropolis to meet HACCPstandards in fish landing, marketing, and distribution.
Public sector investment in upgrading physical facilities, laboratory and scientific human capacities andextension services remains crucial in generating technical knowledge and its dissemination to industryand farmers. At present, about 20 development projects involving an investment of USD59.84 million areunder implementation by the Department of Fisheries. In March 2011, a USD3.2 million new facility –Shrimp Research Centre went into operation.32
The private sector is also actively engaged in sourcing, adapting, and disseminating improved technology.An FAO/UNDP project “Empowerment of coastal fishing communities for livelihood security”, completedin 2007, developed and disseminated a range of low-cost improved technologies – quality dried fishthrough improved drying techniques, quality dried fish using a low-cost solar fish dryer, and reducingpost-harvest losses through improved handling.
PRICE in partnership with the World Fish Center (WFC) launched the Greater Harvest and EconomicReturn from Shrimp (GHERS) initiative aimed at increasing productivity of farmed shrimps. The conceptembraces three categories of improved farming, namely closed system pond technology, modified
30 Yeasmin T., Reza, M.S., Khan, M.N.A. Shikha, F.H. & Kamal, M. 2010. Present status of marketing of formalin-treated fishesin domestic markets at Mymensingh district of Bangladesh. Int. J. Bio Res. 1(4): 21–24.31 FAO. 2005. National Aquaculture Sector Review Bangladesh, (available at http://www.fao.org/fishery/countrysector/naso_bangladesh/en).32 Compiled by the author from the Revised Annual Development Program (RADP) 2010-2011, Planning Commission,Government of Bangladesh, (available at http://www.planncom.gov.bd/radp_2010_2011.asp).
20
traditional technology and traditional best management practices. A contract farming scheme with theuse of quality inputs, principally virus-free screened PL, was followed to strengthen the value chain andenhance dissemination of improved technology. The project also addressed a large gap in technicalknowledge and skills by training 15 235 shrimp farmers on improved management and 4 479 workerson improved production practices.
In August 2010, IFAD approved a new USD500 000 project to be implemented in partnership with WFCto promote two innovative technologies: (i) improved carp-prawn polyculture that also includes nutrientrich small fish in ponds; and (ii) improved wetlands management systems, specifically designed toincrease the production of small fish species.33
Clearly Bangladesh’s processed fish and seafood industry is at a crossroads now. Although theopportunities are immense, particularly the target of achieving USD1 billion exports of fisheries productsis within reach in a few years, there remain significant constraints. The most worrisome is low utilizationof existing processing capacities in shrimp plants. This can be overcome by diversifying into processingof a variety of fish and value-added products through additional investment in modern machinery andequipment, acquisition of improved technologies, and training of employees for enhancement ofknowledge and skills.
There are vast opportunities for the growth of small and medium enterprises in shrimp/aquaculturefarming, the development of nurseries and hatcheries, fish feed manufacturing and marketing, and small-scale low-cost processing based on drying, dehydration, and salting. These opportunities can be suitablytapped by building on existing cooperatives, associations, and other organized groups of fishers alongwith knowledge, skills, and market linkages created through a large number of donor-funded projectsin the aquaculture sector over the past decade.
Processing of other frozen products
This is a relatively new segment of the frozen food industry targeting the domestic market of the higher-income urban middle class and the export market dominated by the expatriate Bangladeshi and SouthAsian community.
The products in this category include a wide variety of pre-cooked ready-to-serve delicious snack foodsmanufactured on the basis of recipes fitting the diverse taste of Bangladeshi and South Asian cuisine.The list includes roti (tortillas), chapatti, tanduri-nan, paratha, singara, samosa, chop, puri, spring rollsstuffed with a variety of vegetables, spices, and breaded meat fillings, pitta breads made from rice flourwith coconut, milk and sweet fillings. These are vacuum-packed in plastic bags in different pack sizesbased on the number of pieces and weight per packet and refrigerated requiring cool chaintransportation and storage until consumption. The raw materials are procured through a network of localsuppliers and contract growers. The key players in this sector, such as Pran Foods and Eurasia Foods, areHACCP and ISO-certified and follow internationally accepted food safety standards.
Processing of dairy products
Milk production in Bangladesh draws its strength from 16.98 million small-scale farm households.34 Theyown milk cows as part of their farming systems and as an option for income generation and livelihoodsecurity. The poorer households, often landless and without assets, produce milk for economic return onsurplus milk usually owning up to three cows. The market-oriented producers are linked to milkprocessors through cooperatives or associations, or individually by milk traders/middlemen. Initially, they
33 International Fund for Agricultural Development (IFAD). 2011. Results from IFAD’s Bangladesh Country Program: InMaking a Difference in Asia and the Pacific, Special Issue: January 2011.34 Bangladesh Bureau of Statistics. 2010. Report of the Household-based Livestock and Poultry Survey (HLPS), 2009,(available at http://www.bbs.gov.bd/).
21
start with one animal but have potential to grow, with ownership of 20 or more milk cows with a largerproportion of crossbred species.35
Enterprise development in small-scale dairy production targeting this segment of milk producers wasthe focus of public sector investment and donor-supported projects involving the assistance of DANIDA,ADB, and FAO over the past decade. Major activities focused on provision of veterinary care, artificialinsemination services for breed development, provision of subsidies and credit for purchase of animals,farmers’ training on improved dairy practices, development of market linkages for access to quality inputsand better services, and organizing them in community-based organizations (CBOs), cooperatives andassociations to enhance the scale of economies in business operations. These efforts created conditionsfor transforming a segment of subsistence smallholder milk producers into small commercial dairyfarmers.
To help facilitate this process within a regional approach, FAO recently launched a USD7.2 millionSmallholder Dairy Development Program36 to be implemented in Bangladesh, Myanmar, and Thailand.The expected outcome is increased productivity and improved market access of smallholder milkproducers to be achieved through adapting and demonstrating successful complete cow-to-consumerdairy chain models.
The animal resource base for milk production in Bangladesh, although one of the highest in cattledensities, ranks lowest in productivity. Milk yields are extremely low: 200 to 250 litre during a ten monthlactation period in contrast to 800 litres for Pakistan, 500 litres for India, and 700 litres for all Asia.37 Thisexplains a somewhat sluggish growth in milk production, 4.7 percent per annum from 2.12 million tonsto 3.09 million tons over the period 2000–2009.38 This was also accompanied by rising imports of drymilk powder because the increase in domestic production was too inadequate to meet the yawning gapbetween demand and supply of milk. In 2008, the total import of whole and skimmed milk powder was30 099 tons, worth USD116 million, equivalent to 280 532 tons of liquid milk and accounted for9.3 percent of domestic milk production. In terms of availability per capita per day, even the combinedsupply of domestic production and import could provide only 62 ml as against the recommended intakeof 250 ml. This illustrates the scale of demand-driven challenges facing the country’s dairy sector.
Large enterprises in Bangladesh’s formal “organized” dairy sector are represented by 14 establishmentsthat are engaged in processing liquid milk and manufacturing milk products using modern technologyand marketing them through their distribution outlets throughout the country. The key player in thissegment of the dairy industry is Bangladesh Milk Producer’s Cooperative Union Limited (BMPCUL) thatsells its product under the brand name “Milk Vita”. It has 66 percent market share of processed liquid milk.It collects milk from more than 100 000 smallholder members affiliated with some 1 200 primary villagecooperatives.39 It has three dairy plants, manufacturing facilities, and 16 chilling centers. The Unioncollects about 200 000 litres of milk per day, of which 160 000 litres is sold as liquid, and the balance isconverted into a variety of processed milk products.
BRAC, a leading NGO, runs the second largest milk processing facility under the brand name Aarong with32 percent market share of liquid milk in 2010. It has a dairy plant, 100 collection and chilling stationslocated in 25 districts. It collects about 102 000 litres of milk daily through commission agents whodeliver milk to the chilling centers. About 65 percent is sold as pasteurized liquid milk and the rest is
35 Hemme T., Garcia, O. & Khan, A.R. 2002. A Review of Milk Production in Bangladesh with Particular Emphasis on Small-scale Producers, Pro-Poor Livestock Policy Initiative. PPLI Working Paper No. 7.36 Smallholder Dairy Development Program in Bangladesh, Myanmar and Thailand. ”A Glass of Asian Milk a Day for EveryAsian Child”, (available at http://dairyasia.org/projects).37 National Livestock Development Policy 2007, Ministry of Fisheries and Livestock.38 Author’s calculation based on FAOSTAT, Database of the Food and Agriculture Organization of the United Nations,(available at http://www.faostat.fao.org).39 FAO/Animal Production and Health Commission for Asia and the Pacific. 2009. Smallholder dairy development: Lessonslearned in Asia, Bangkok, pp. 8–17.

22
processed into a variety of milk products.40 Pran Dairy Ltd. has a plant with 85 000 litres processingcapacity, a chilling center, and nine farm coolers. Milk is collected from the company’s contract farmersby vendors, who deliver it to the farm coolers.41 The company is currently implementing a USD15 millionproject with assistance from the IFC that will upgrade and modernize milk processing machineries,processing and packing lines and elevating milk processing capacity to 150 000 litres per day.42 AftabMilk and Milk Products limited, a relatively new starter in the dairy industry, has a modern milkpasteurization plant with the capacity to process and pack 1 500 litres per hour. The total amount of milkprocessed per day in the country’s 14 large dairy enterprises is 384 000 litres, which constitutes only4.4 percent of national milk production.43
The informal dairy sector is unorganized and is represented by an estimated 200 000 manufacturers andvendors of a variety of sweet products. Eighty-one percent of milk produced domestically is processedby this sector. Individually, they process between 80 and 1 600 litres of milk per day, which they procurethrough traditional milk collectors (known as the community of goala). They generate about 500 000 jobsper year. The value addition in production of these sweets is extremely high. It can be four times higherthan the farm gate price with additional input of sugar, the value of which is less than milk solids. Bettertechnologies can improve the quality of these products, help to produce them on a relatively large scale,substantially increase their shelf life and generally help the unorganized sector grow by providing betterreturns to milk producers.44
In the formal sector milk is processed and packaged into a variety of products. These include pasteurizedliquid milk, condensed milk, dairy-based fruit drink such as strawberry-flavoured yogurt drink, ice cream,skimmed milk powder, full cream powder milk, butter, ghee, flavoured milk, yogurt fortified with vitaminsand minerals.
Thermal processing using both “high temperature for a short time” (HTST) pasteurization (product shelflife of up to three weeks in refrigerated storage) and ultra high treatment (UHT) sterilization (with asepticpackaging product shelf life of up to nine months and not requiring refrigerated storage); chilling;homogenization; lactic acid fermentation; blending with additives, evaporation, are key technologiesapplied in milk processing and manufacturing of dairy products. Processed milk is packaged in bulk inpolyethylene bags, laminated pouch packet containers of different sizes, paper boxes, and tin containers.
Food safety and quality control is a major issue of concern in the dairy industry. There is little demand-driven pressure on the industry to focus adequately on this issue because of its orientation primarily tothe domestic market. The laws and regulations are weak and inadequate and are designed primarily tomeet country obligations under sanitary and phytosanitary (SPS) and technical barriers to trade (TBT)regulations in the framework of WTO. The government’s key policy document in this sector, the LivestockDevelopment Policy announced in 2007, reiterates its commitment to developing the capacity of theDirectorate of Livestock Services (DLS) through institutional reform to address SPS and HACCPrequirements.
At present, the resources of the DLS, in terms of technical, managerial, and operational capabilities areextremely inadequate to undertake inspection, testing, and control functions to satisfy HACCP-basedfood safety requirements. At the industry level, there is little effort to create incentives for primary milkproducers to invest in quality. At the collection centers, milk is not tested for fat and solid-not-fats (SNF)contents and the farmers are paid the same price regardless of quality. At every stage in the milk supplychain except the processing plants, there is scope for adulterating milk, usually by adding water, with theresults that at the end of the chain milk solids need to be added to adhere to Bangladesh Standards andTesting Institution (BSTI) standards (World Bank, 2008).
40 BRAC Dairy: A BRAC Social Enterprise, (available at http://www.brac.net/content/brac-dairy).41 Pran Dairy, (available at http://www.pranfood.net).42 PRAN-Summary of Proposed Investment, (available at http://www.ifc.org/ifcext).43 See http://www.aftabmilk.com).44 World Bank. 2008. High-value Agriculture in Bangladesh: An Assessment of Agro-business Opportunities and Constraints.Bangladesh Development Series Paper No. 21, pp. 81–91.
23
These standards are already liberal with 3.5 percent fats and 8 percent SNF. Milk quality is alsocompromised because of time lag and absence of temperature control in transporting milk procuredfrom primary producers to nearby collection centers with chilling facilities. No standard operatingprocedures in compliance with GMPs are followed in handling and transportation of milk up tothe processing plants. In the informal milk processing sector, even basic hygiene and sanitation isnon-existent. There is no standard GMP procedure for employee personnel practices, cleaning andsanitation, receiving, handling and processing of raw material, and storage and distribution of finishedproducts.
Milk processing plants equipped with modern processing and packaging lines have in-built mechanismsof process control, and have in place food safety systems based on HACCP and GMPs. Some havecertifications from competent accreditation bodies, for example, BRAC dairy became ISO 22000 certifiedin 2011.45 The need to compete and capture a greater share of the market, where middle class urbanconsumers is becoming increasingly quality conscious and willing to drink locally produced pasteurizedmilk has prompted large milk processors to adhere to internationally accepted standards of food safetyand quality control.
The opportunities for development of SMEs in the dairy sector lie in organizing milk collectors andscaling up their operations by improving capacities including modern facilities for testing milk quality,cool storage; cool-chain transportation, and contractual arrangement with large milk processors for thesupply of raw material at prices matching quality against benchmarks. Opportunities also exist insupporting development of small-scale commercial dairy farms from among smallholder milk producersby facilitating their access to improved breeds of animal, quality inputs including feeds and fodder andcredit, better veterinary and AI services, improved marketing including contractual supply to milkcollection centers. There is also plenty of space for the development of SMEs in manufacturing ofimproved animal feeds and the provision of low-cost para-veterinary services.
Poultry farming
Poultry farming ranks top among the country’s food industries in its potential to spur development ofsmall and medium enterprises, create employment opportunities, and contribute to poverty alleviation.The sector has experienced dramatic growth since the early 1990s that witnessed sustained investmentin the development of smallholder livestock production systems through donor-supported projectsinvolving the assistance of DANIDA, FAO, ADB, IFAD, and DFID. These projects implemented between 1992and 2010 covered 263 subdistricts of the country and involved 1.54 million farmers as beneficiaries.46
Working in close collaboration with NGOs and capitalizing on their organizational skills and servicedelivery models, these projects facilitated upgrading of many subsistence-oriented poultry farmers tosmall-scale commercial operations. BRAC, the country’s major NGO, successfully elevated a significantproportion of the beneficiaries of these projects to commercial producers and integrated them assuppliers under a contract farming scheme in its commercial poultry enterprise.
In Bangladesh, poultry rearing is based on both traditional and commercial systems. The traditionalsystem uses local breeds and scavenging and semi-scavenging methods of rearing involving the use offamily labour and is geared toward meeting household consumption needs and generation of income.About 55 percent of households in the country report owning poultry and only 0.44 percent reportedhaving improved breeds (HLPS, 2010). The commercial system, as defined in the National PoultryDevelopment Policy, refers to rearing under confinement (on floor or in cage) of 100 or more exoticspecies of broiler and layer birds for commercial purposes.
Commercial operations significantly expanded over the past decade and now account for 60 percent ofthe supply of poultry meat and 50 percent of eggs in the domestic market. The production of eggs in
45 “Aarong Milk gets ISO: 22000 Certification”, (available at http://www.brac.net/node/1008).46 Raihan S. & N. Mahmud. 2008. Trade and Poverty Linkages: A Case Study of the Poultry Industry in Bangladesh, (availableat www.cuts-citee.org/pdf/TDP-Book-Volume-1.pdf ).
24
shells, at 0.22 million tons in 2009, grew at an average annual rate of 3.5 percent over the period 2000to 2009. The production of poultry meat increased to 0.18 million tons growing at an average annualrate of 5.6 percent over the same period.47 The demand for poultry products (eggs and meat) is alsogrowing rapidly. Between 2005 and 2010, per capita daily consumption of eggs and of meat increasedfrom 5.2 g to 7.25 g and from 8.4 g to 19.07 g respectively (HIES, 2010). This translates to an annualproduction requirement of 0.38 million tons of eggs and 0.99 million tons of meat indicating amplescope for the demand-driven expansion of the country’s poultry industry.
The industry expanded at an average 5.9 percent rate between 2000 and 2009. The total poultrypopulation was estimated at 245.30 million in 2009 and total investment in the poultry sector was valuedat USD2.12 billion. About 5 million people are directly and indirectly employed in the poultry sector.48
The growth of the SMEs in the poultry sector was impressive. In 2005, there was about 130 000 SMEs withan average of 1 000 birds. The outbreak of highly pathogenic avian influenza (HPAI) in the country, firstdetected in February 2007, took a heavy toll on the SME segment of the poultry industry contractingits size down to 75 000 in the middle of 2011 as estimated by the Poultry Industries Protection NationalCouncil.49
In addition to SMEs, there are about 40 large commercial farms with an average of 10 000 birds. Severalfarms ranking top in this category – BRAC Poultry, Aftab Bahumukhi Farm Limited (ABFL), Kazi Farms,Paragon Poultry – have integrated commercial production of broiler and layer chickens with productionof improved genetic stock (GP, Parent stock/DOC), and manufactured feed for meeting their own demandand sale in the market. This segment of industry also experienced a significant growth. There are noweight grandparent stock farms and 123 parent stock farms in the country. Whereas a number of farmsimport day-old-chicks (DOC) as parent stock, the share of locally produced DOCs has gone up from2.5 percent in 2003 to 47 percent in 2005. At present, weekly production of DOCs of broiler and layerchicken has exceeded the demand as estimated by industry insiders.50 The feed industry has also grown.Currently about 54 medium and small feed mills produce about 4 000 tons of feed per day (World Bank,2008).
Estimates indicate that about 80 percent of broiler birds are produced by SMEs and only 20 percent bylarge integrated commercial operations (World Bank, 2008). Major integrated commercial producers suchas BRAC and ABFL use the contract growing system. In many cases this involves a buyback guaranteeand provision of key production inputs – DOC, all vaccines, medicine, feed, and technical supervision atregular intervals.
In Bangladesh, poultry meat is consumed mainly by slaughtering bought live animals on the spot in theopen market or at home. The market for dressed or processed poultry is very limited and the potentialfor expansion depends on the consumption preference of richer urban consumers shifting to theconvenience of processed poultry and the demand coming from emerging fast food chains. Two largeproducers – BRAC Poultry and ABFL – have started producing processed poultry on a limited scale.BRAC’s facility currently processes about 5 000 birds per day and it recently signed a contract for supplyof processed poultry to KFC food chain outlets in the country. A seasonal surplus of production withdepressing effects on prices is likely to stimulate further expansion of the market for processed poultryproducts. In fact, greater processing of poultry products is a basic precondition for balancing the hugeprice fluctuations experienced in the industry.
The marketing system in the poultry industry is complex and involves many intermediaries outside thecontract growing system. Typically it involves broiler/egg producer-trader-wholesaler-retailer-consumer.Profit margins are quite low for small and medium producers of commercial broilers and eggs and this
47 Author’s calculation based on FAOSTAT data.48 National Poultry Development Policy. 2008, (available at http://www.mofl.gov.bd).49 See http://www.worldpoultry.net/background/bangladesh-poultry-production-in-rapid-decline-8761.html.50 Meat Trade News Daily, 29 May 2013. Bangladesh – poultry imports, (available at http://www.meattradenewsdaily.co.uk/news/260511/bangladesh___poultry_imports.aspx).
25
segment of the industry tends to bear the greatest share of business risks than other stakeholders, atleast among the non-contract producers.
Food safety, biosecurity and quality control are major issues of concern in Bangladesh’s poultry industry.The urgency of addressing these issues adequately has been driven home by the outbreak of HPAI. Toprotect a booming industry from the disaster caused by HPAI and contain its fallout, the governmentquickly moved to implement targeted initiatives under a World Bank-funded USD2.2 million avianinfluenza preparedness and response project (2007–2012) and developed a strategy and guidelines forcompensation of farm losses incurred because of HPAI. But its capacity to address larger issues of safetyand quality remain poor and inadequate.
Existing rules, regulations, and standards are weak and institutional capabilities to undertake thenecessary inspection, testing and control functions are limited. As a result, basic public health, food safetyand environmental safety issues are ignored in the operation of live bird marketplaces in metropolitanand urban centers where poultry birds are held in extremely unhygienic conditions in close proximitywith other food commodities, slaughtered and dressed on the spot, and the wastes are not properlydisposed. The control of quality is poor for practically all inputs including day-old-chicks, feed, vaccinationand medicine. There is no trustworthy and independent system of verification of the quality ofdomestically produced or manufactured feed.
The National Livestock Development Policy, adopted in 2008 specifies a number of regulatory steps toaddress many of these concerns. This includes a requirement for environmentally-sound waste disposalmethods in project plans for establishment of poultry farms and hatcheries and criteria for maintenanceof isolation from populated areas in the establishment of breeding farms. The policy requires localgovernment authorities, including city corporations and municipalities, to implement specific measuresto improve biosafety and waste management in live bird markets. To contain disease outbreaks andstrengthen biosafety, it recommends authorities to discourage selling live birds in retail market outletsunder city corporations and municipalities and instead encourage the selling of dressed poultry throughcool chain storage and transportation. The policy has also specified standards for quality control of keyproduction inputs, namely day-old-chicks, poultry feed, and poultry vaccinations and medicines. Thepolicy has laid down a broad regulatory framework and more specific legislation is required to establishbenchmarks and performance standards, a balanced set of incentives for attracting investment, andpunitive measures for violation and non-compliance to promote a healthy private sector driven marketfor inputs and service delivery.
Apart from the ongoing incidence of HPAI, there are a number of obstacles to sustained growth of SMEsin the poultry sector. Technical knowledge of intensive poultry production including productiontechnology and methods, nutrition, water quality, and biosecurity is inadequate leading to inefficienciesand higher costs. There is a lack of effective technical advisory services to address specific problemsfarmers encounter in production and management. Farmers under the contract growing system receivetechnical assistance from the contracting company. Others have to rely on limited advice from inputsellers. The extension service provided through the public sector Directorate of Livestock Services (DLS)is mainly focused on provision of veterinary health care and diagnostic services. The capacity of DLS toprovide competent expert service to solve practical problems of poultry producers is extremely limited.Training for poultry producers is inadequately funded and their access to finance and credit is limited.The profitability of poultry SMEs is also coming under stress because of falling prices of eggs and broilerchickens and increasing prices of poultry feed in the wake of the HPAI outbreak.
Processing of vegetables and fruits
Horticultural production in Bangladesh recorded significant growth over the period 2000 to 2010.Production of fresh vegetables rose from 0.59 million tons in 2000 at an average annual rate of6.2 percent to 1.146 million tons in 2010. Production of potatoes increased at a much faster rate at11.98 percent per annum from 2.98 million tons in 2000 to 7.01 million tons in 2010. Total domestic
26
production of vegetables and potatoes was 8.16 million tons in 2010.51 Consumption of vegetables,keeping pace with the increase in production, rose from 157g/capita/day in 2005 to 166.08 g/capita/dayin 2010 (HIES, 2010). Growth in fruit production was more robust at 13.1 percent per annum, reaching3.63 million tons over the same period.52 Per capita consumption of fruits also rose from 32.5 g/day in2005 to 44.8 g/day in 2010.
In Bangladesh, fruits and vegetables are consumed mostly in fresh form. A small amount of domesticproduction of fruits and vegetables is processed into a variety of microbiologically stable products withextended shelf life. The key technologies used are freezing, thermal processing followed by asepticpackaging in sterile containers, drying, dehydrating, and fermentation. Vegetables are usually blanchedbefore freezing, whereas fruits can be frozen fresh. Thermal processing is widely applied in the productionof jam, jellies, sauces, canned and bottled fruits and vegetables. Fruits and vegetables are dried usingsimple sun and solar drying and modern technologies such as freeze drying and spray drying.Dehydration treatment involves introducing vegetables and fruits into brine solutions or aqueoussolutions of high sugar content. Fermentation is used in the production of a range of pickled fruits andvegetables – achars, chutneys, etc.
Minimal processing is now increasingly applied to preserve freshness, aroma, texture and colour of fruitsand vegetables while enhancing the storability of the product. This involves an integrated approach ofhandling, processing, packaging, and distribution of raw fruits and vegetables with application of goodmanufacturing practices and HACCP-based food safety control procedures.
The export trade of vegetables and fruits is rapidly expanding. In 2010/2011, Bangladesh exported110 650 tons of vegetables, 9.65 percent of domestic production, valued at USD74.22 million.53 This wasa significant increase compared with vegetable export revenues of USD41.77 million earned in2008/2009. Of the total exports, fresh vegetables with minimum processing (chilled) accounted for74.3 percent, vegetables processed with the use of preservatives 24.4 percent, freezing 1.1 percent anddrying 0.2 percent. The export of fruits was 44 948 tons, 1.24 percent domestic production, and valuedat USD42.02 million compared with USD16.73 million in 2008/2009. Fresh fruits comprised 94.4 percentof total exports, frozen fruits comprised 0.004 percent and processed fruits – jams, jellies, marmaladesand sugar preserved fruits – comprised 5.5 percent.54
There are, now, 108 enterprises, affiliated with the Bangladesh Fruits, Vegetables, and Allied ProductsExporters Association (BFVAPEA), that are engaged in production, processing, and marketing ofvegetables and fruits. The Export Promotion Bureau maintains a roster of active exporters: 44 companiesthat export fresh fruits and vegetables; 12 companies that export jam and jelly; 2 that export canned fruit.
The supply chain of fresh horticultural produce in Bangladesh is underdeveloped, fragmented, and poorlymanaged. The focus on quality control along the chain from production, post-harvest handling, storage,transportation, processing, packaging, and marketing of commodities is grossly inadequate. There is littledirect linkage between primary producers and exporters and so the reliance on middlemen and tradersas suppliers of raw materials is overwhelming.55
The bulk of the exporters are small and medium enterprises that for the most part target the ethnicsegment (expatriate and immigrant community of Bangladeshis) of overseas markets, which is far lessdemanding on quality than consumers in mainstream supermarkets. This is evident from the pattern ofselling in overseas markets. Although the export destination of Bangladesh’s fruit and vegetable productsspreads to 35 countries, the United Kingdom and the Near East remain the major buyers. In the Near East,
51 Author’s calculation based on Bangladesh Bureau of Statistics and the Department of Agricultural Extension (DAE) data.52 Author’s calculation.53 Export Promotion Bureau data, (available at http://www.epb.gov.bd/).54 Author’s calculation based on Export Promotion Bureau data.55 Akmal, H. 2004. National Case Study on Environmental Requirement, Market Access/Entry, and Export Competitivenessin Horticulture in Bangladesh, A study undertaken for UNCTAD, Geneva.
27
the major market outlets are Saudi Arabia, United Arab Emirates, Kuwait, Qatar, Bahrain and Oman. Theseare all countries that hold the highest number of ethnic Bangladeshis.
This group of exporters fills the orders on short notices by arranging procurement of produce throughmiddlemen and traders. The latter, in turn, buy in rural wholesale markets from small-scale farmers whosell the surplus of their household production of vegetables and fruits grown with little concern forquality, particularly pesticide application. Transportation is usually arranged in conventional trucks andupon arrival in designated locations the produce is cleaned, sorted, graded, and repacked in bamboobaskets or secondhand cartons.
However, systematic efforts are in place in both the public and the private sector aimed at creatingcapacities for quality control and improved supply chain management of high value agriculturalproducts. The USAID-funded ATDPII (2001–2005) project assisted several private sector organizations,such as Eurasia Food Processing and BRAC, to source, market, and air freight fresh fruits and vegetablesfor foreign markets. The project has trained farmers on production and post-harvest management ofvegetables. It has assisted BRAC to arrange for European Union Retail Parties Good Agricultural Practices(EUREGAP) to certify BRAC’s co-operating farmers, with attention to pesticide use and other farmingpractices.
Under the nationally executed World Bank-funded National Agricultural Technology Project (2008–2013),about 4 000 farmers were trained in high value commodity production and marketing. These farmerswere organized in about 160 common interest groups (CIGs). Over 500 of CIG members adoptedimproved post-harvest technologies disseminated under the project. The Horticultural ExportDevelopment Foundation (Hortex), a non-government business service provider in the horticulturesubsector, has developed a modern packaging and palletization system with the use of locallymanufactured international standard cartons. It also maintains a fleet of three reefer trucks thatmanufacturers and exporters can rent for cool chain transportation of their products and produce.
In the short to medium term, however, the prospects for greatest value addition in the horticulture sectorlie within the nation’s domestic markets. A World Bank study suggests that gains from improving post-harvest technology and market infrastructure, as well as addressing basic productivity issues at the farmlevel, will have a far wider impact in the domestic market rather than the export market. It calculatedan annual loss of 2 million tons assuming 26 percent, a very conservative estimate, of national productionof vegetables and fruits lost at different stages of post-harvest operations (World Bank, 2008).
Processing of spices
Spices are widely consumed in Bangladesh as a seasoning and flavouring agent in the preparation andprocessing of different foods and culinary items. Some of the main spice crops grown are onion, chili,garlic, turmeric, ginger, cumin, coriander, cloves, cinnamon, and bay leaf. Domestic production of thesecrops rose rapidly from 48 000 tons in 2000/2001 at 14.5 percent annually to 140 113 tons in 2009/2010.56
The processing of spices involves grinding seeds and other non-leafy plant parts into powder,pulverization and sealing into laminated pouches or cartons of different pack sizes. Modern processingtechnologies use cryogenic grinding that reduces the material to particle sizes, which is difficult to attainwith ambient temperature grinding in conventional grinding plants. The dry, cold, inert atmospheregenerated by a liquid nitrogen vapor blanket or circulation in the grinding chamber minimizes thermalreaction with the material and reduces the loss of volatile compounds from spices during processing.
The major food processing companies – Pran Foods, Square Consumer Products, ACI Foods –manufacture a range of processed spice products and market under brand names. The products are basicspices such as chili powder, turmeric powder, cumin powder, coriander powder and mixtures of spicessuch as curry powder and other special-purpose powders tailored for flavouring specific recipes of fish
56 Author’s calculation based on BBS/DAE data.
28
and meat-based local cuisines. The major brands are Radhuni, Pure, and Pran. Locally produced brandedspices are also exported. In 2010/2011, Bangladesh exported 3 628.98 tons of processed spices valuedat USD9.24 million up from USD4.99 million in 2008/2009.57 Six companies are listed as exporters by theExport Promotion Bureau.
Rice processing
Rice processing is the largest food processing industry in Bangladesh. Over the last three decades therehas been sustained long-term growth in rice production that led to the emergence of the country as thefourth largest producer of rice in the world. In the past decade production of paddy rice increased from37.6 million tons in 2000 to 47.7 million tons in 2009 at an average annual rate of 3.0 percent.58 Thedemand for rice in the years ahead is set to remain strong fuelled by population and per capita incomegrowth and hence there will be a substantial domestic market for increased production.
Almost all of paddy rice produced annually, barring the amount farmers save for seed and sell togovernment procurement programs, is processed for the production of edible rice. The technology forprocessing 90 percent of paddy rice in the country consists of parboiling followed by milling, and theremaining 10 percent is dry milled.
Parboiling is a three-step process: soaking the paddy in cold water for typically 24 to 48 hours until thekernel is saturated; then boiling the soaked paddy at 100ºC for typically one hour to obtain 80 percentgelatinized starch; and finally sun-drying the boiled paddy until the moisture content is reduced to14 percent.59 Milling is the process of removal of husk and bran layers from the kernel and productionof an edible white rice kernel free of impurities. In an ideal process this will result in 20 percent husk,8 to 12 percent bran depending on the milling degree and 68 to 72 percent milled rice or white ricedepending on the variety. Total milled rice contains whole grains or head rice, and broken grains. Theby-products in rice milling are rice husk, rice germ and bran layers, and fine broken grains.60
In the rice industry, milling recovery is the term used to express efficiency of the milling operation. Itrefers to total milled rice obtained out of paddy, expressed as a weight percentage of milled rice(including broken) obtained from a sample of paddy. Milling recovery is affected by variety, moisturecontent, pre-treatment such as parboiling, and milling equipment and methods. The maximum millingrecovery is 69 to 70 percent depending on rice variety, but because of grain imperfections and thepresence of unfilled grains, commercial millers are happy when they achieve 65 percent milling recovery.Some huller rice mills have 55 percent or lower milling recovery.61
Rice milling in Bangladesh is almost fully mechanized. Depending on the level of technology used,milled rice in Bangladesh is of five distinct classes: husked rice (also known as brown rice, hulled rice);under-milled rice; medium-milled rice; well-milled rice; and extra well-milled rice. There are about100 400 registered small and large rice mills in the country. The small huller type mills in rural areasprocess about 16 tons of paddy per week. Large huller and rubber roll mills process about 30 metric tonsof paddy per week per unit. Fully automatic rice mills with modem in-built parboiling units process about200 metric tons per week.62 According to Bangladesh Rice Mills Association, there are now about600 automatic and semi-automatic rice mills in the country.63
57 Export Promotion Bureau data.58 Author’s calculation based on FAOSTAT data.59 Miah M.A.K., Haque, A., Douglass, M.P., & Clarke, B. 2002. Parboiling of Rice. Part II: Effect of hot soaking time on the degreeof starch gelatinization. International Journal of Food Science and Technology, 37: 539–545.60 A Consumer’s Guide to Rice – International Rice Research Institute, (available at http://www.irri.org/knowledge/rice-today).61 Nurul Afsar A.K.M., Baqui, M., Rahman, M., & Abdur Rouf, M. 2001. Grades, Standards, and Inspection Procedures of Ricein Bangladesh. FMRSP Working Paper No. 20, Ministry of Food/International Food Policy Research Institute.62 Bangladesh Rice Foundation, (available at http://www.ricefoundation-bd.org/).63 The Daily Star, 9 November 2013. Sown & Reaped. Rice mills going automatic, (available at http://www.thedailystar.net/newDesign/news-details.php?nid=206220).
29
About 40 000 rice mills have their own parboiling units with a capacity of processing 7.5 to 16 tons ofpaddies per batch (three days). The majority of these rice mills are small-scale enterprises employingbetween 13 to 26 persons per mill, with an average of 17.75 persons, of which 28 percent compriseswomen. The employment generation potential of this segment of the rice processing industry isestimated at 1.8 million, of which 0.5 million are women.
The rice processing industry has also tremendous potential for spawning SME development in backwardlinkage industries in the energy sector, particularly in fabrication, installation and servicing of improvedfurnaces and vessels used in rice parboiling. Apart from edible milled rice, rice processing yields vastamounts of biomass energy resources in the form of husk and bran mixtures. A conservative estimatewould suggest production of about 13.5 million tons of rice husk assuming 45 million tons of paddy riceis processed annually. About 87 percent of this biomass energy resource is consumed in rice parboiling.Husk consumption in traditional parboiling systems varies from 60 kg to 200 kg per ton of paddyparboiled.64
Increasing energy use efficiency in rice parboiling by replacing primitive steam vessels and furnaces withimproved field-tested designs has the potential to achieve about 50 percent savings in husk used inparboiling and thus stimulate alternative uses of surplus husk. The environmental benefits are also quitesubstantial. Improved parboiling technology has been shown to reduce CO emission from burning ricehusk from more than 10 000 ppm to a very low 1 000 to 500 ppm.65
System loss in rice processing can also be reduced by replacing old Engleberg type mills with a rubberroller system. A pilot project on the installation of a rubber roller system in a rice mill in northernBangladesh demonstrated that from an input of 700 kg paddy, the output was 471 kg under rubber rollermilling compared to 459 kg under Engleberg type huller and broken percentage of rice was 2.5 percentlower in the improved milling system.66 This is a significant untapped potential. If implemented industry-wide, a 2 percent increase in milling outturn would be translated into an additional production of about1 million ton of rice and better returns to rice millers.
The government has also provided policy support to rapid replacement of Engleberg type hullers. TheMinistry of Food and Disaster Management, in its internal food grain procurement policy 2010,announced an incentive of 20 percent additional allotment of purchase limit to those millers who haveadopted a rubber sheller and a rubber polisher in their rice mills.67
It will also assign priority in procurement to those rice mills who have installed a metred and certifiedsteel boiler equipped with a 40 feet high chimney in their parboiling systems and installed a rubbersheller, a rubber polisher, and a sorter in their rice mills. The government has also made it mandatory forall rice mills to install a rubber sheller and a rubber polisher by 2014 in order to continue to qualify asa supplier of rice to government procurement centers.
Quality control in rice processing is mainly concerned with standardization of grades of milled rice forthe purpose of internal and external trade. In Bangladesh, standard specification for grades on milled ricewas introduced by BSTI in 1986 and includes the following quality parameters to be applied to a specificlot of milled rice: moisture content in the grain; percentage share of head rice; big broken grain; brokenand small broken grains; damaged grain; contrasting varieties’ chalky/immature grain; paddy; foreignmatter; and degree of milling. BSTI has also specified GMP procedures for production and handling
64 Dasgupta, N., Baqui, M.A., Dhingra, S., Raman, P., Ahiduzamman, M. & Kishore, V.V.M. 2003. Benefits of Improved Rice HuskCombustion, Bangladesh. Department for International Development Project No. R7659, Knowledge and ResearchProgramme.65 Baqui M.A., Ahiduzamman, M., & Rahman, M.M. Experiences in Installation and Operation of Energy Efficient RiceParboiling Systems, (available at http://www.Iged-rein.org/archive).66 Ministry of Public Administration, Bangladesh and DFID, United Kingdom. Managing at the Top 2, (available atwww.matt2.org).67 Internal Foodgrain Procurement Policy. 2010, (available at http://www.fd.gov.bd/images/smilies/internalpercent20policy.pdf ).
30
of milled rice; packing and labelling of containers taking into account the Codex AlimentariusCommission’s standards. BSTI standards serve mostly as a benchmark and they are not enforced by lawand rarely followed in domestic markets (Nurul Afsar, A.K.M. et al. 2001).
The Directorate General of Food (DGF), under the Ministry of Food and Disaster Management, hasformulated its own “Fair Average Quality (FAQ)” standard that it enforces in its procurement of rice fromfarmers and millers. The FAQ is very similar to BSTI standards and includes the following parameters:moisture content; big broken; small broken; admixture of other varieties; damaged grain; dead grain;discoloured grain; chalky grain; paddy; foreign matter; underboiled; and milling degree.68
The institutional capacity for quality control in the rice industry is mostly limited in the public sector andis mainly concerned with procurement, inspections, testing, handling, transportation, long-term andshort-term storage and marketing of rice that comprise stockpiles of strategic grain reserve. Thegovernment maintains this reserve through its annual procurement from the domestic market,commercial imports, and external assistance targeted to vulnerable groups through food aid.
The DGF maintains a countrywide network of modern warehouses of different capacities – centralstorage depots (CSDs), local storage depots (LSDs), central and regional laboratories for analytical testing,and grading, and a cadre of administrative and technical personnel to undertake inspection, testing, andcontrol responsibilities.
The government is currently implementing five large infrastructure projects at a cost of USD1.36 billionto reconstruct and refit with ancillary infrastructure existing warehouses, construct new food warehouseswith larger storage capacities, and build a concrete grain silo with modern ancillary facilities at Monglaport in the south of the country.69 Upon completion of these projects, the DGF’s capacity to handlemanagement and quality control of public sector food grain operations will be greatly enhanced.
Whereas the DGF is able to apply quality standards through its internal procurement program atadministered prices, no such mechanism exists in the private sector at other levels of procurement andmarketing. Efforts in quality control in the private sector are fragmented and extremely inadequate. Thereis no effective mechanism for involving key private sector stakeholders (for example, Bangladesh RiceMill Owners’ Association, Bangladesh Rice Merchants’ Association, Bangladesh Rice Exporters’ Association)in designing a National Grain Standard for uniform application to all levels of procurement, trade, andmarketing and a code of good manufacturing practices for processing, handling, storage, transportation,packaging and labeling of milled rice. An appropriate structure of incentives for investment in quality,regulatory oversight for compliance through inspection and testing, and capacity building throughupgrading infrastructure and training in the private sector will be the keys to bringing the entire riceindustry under effective quality control.
Bangladesh exports a limited number of rice products and these include milled rice, paddy, brown rice,rice flour, and broken rice. Export volumes increased from 700 tons in 2000 to 8 810 tons in 2008.70 Theexport of milled rice was 5 445 ton in 2008, of which 2 992.9 tons (55 percent) were fine aromatic riceworth USD3.92 million.71 The remainder comprises medium varieties (Pajam and Minicate varieties). Mostof the fine rice is sold in individual packs in Near Eastern countries, United Kingdom, European Union,United States, and Canada targeting the niche ethnic markets in these countries. Medium varieties aremarketed to the European Union and United Kingdom and sold in bulk (sacks). There is a substantialpossibility for small and medium scale enterprise development in the export-oriented fine and aromaticrice industry. This can be done through the promotion of contract farming of specialty rice in thenorthwestern part of the country within integrated commercial operations linked with improved milling
68 Internal Foodgrain Procurement Policy. 2010. Food Division, Ministry of Food and Disaster Management. pp. 4–6.69 Compiled by the author from the government’s revised annual development programme, 2010-2011, (available athttp://www.planncom.gov.bd/).70 FAOSTAT data.71 Bangladesh Agro-Processors’ Association, (available at http://www.bapabd.org).
31
using multistage automatic rice mills, and adoption of good manufacturing practices for handling,sorting, grading, packaging, and labeling of the finished product.
The traditional rice marketing system of Bangladesh is dominated by many intermediaries. They arelocally known as Faria (small traders who buy paddy from farmers in village markets) and Bepari (largepaddy wholesalers who buy from Faria). These two categories are primary-level market participants.Paikar (rice wholesalers) and Aratdar (rice commission agents) are terminal market operators. Millers aresecondary market agents that operate between paddy Beparis on one side and Pikers and Aratdars onthe other. During the harvest season, farmers can also sell directly to government procurement centers.72
Apart from private sector stakeholders, the government remains a key player in the rice marketingsystem because of the strategic role of rice in maintenance of food security at household and nationallevels. In recent years the government has moved to step up its footprint in the rice industry. This wasprompted by extreme volatility of rice prices in international markets, spiraling prices in domestic ricemarkets in 2007/2008 and little availability of rice for international trade because of the ban on exportsthat many rice exporting countries imposed to address their own shortfalls. Despite a brief decline in2009, rice prices continue to remain at high levels and there is little sign of prices reversing back topre-crisis levels. Technological changes in rice milling are also occurring because of the introduction oflarge automatic rice mills. It may trigger localized shortfalls in rice supply and speculative increases inrice prices because of movement and storage of large amounts of paddy from outside the commandarea of these mills to meet the demand for processing in these mills.
The government uses a range of regulatory controls and policy measures to intervene in the rice marketwith a focus on correcting market imperfections, creating a pro-poor bias in availability of rice forconsumption and placing rice in the larger context of implementing the National Food Policy (2006) andoperationalizing the Country Investment Plan (2011) for strengthening national food security.
The government intervenes in the rice market through buying foodgrain from domestic producers forbuilding up its stockpiles of grain reserve and selling rice from this reserve at administered prices so thatthese prices are fair to primary producers and affordable to consumers. It also resorts to large-scalecommercial imports as needed to replenish its reserve. The government tailors its grain reserves toconduct its social safety net operations by creating rural employment in the lean season through foodfor work and test relief programs, providing food assistance to the ultra-poor, women, and othervulnerable groups, and selling food at low prices under ration cards to low and limited income persons.The government also exercises vigilance on the movement and availability of foodgrain in the market.
The Ministry of Food and Disaster Management issued an executive order in May 2011 to amend theControl of Essential Commodities Act 1956.73 The amendment imposed restrictions on both physicalquantities and duration that essential foodgrain and foodstuff (paddy/rice, wheat, sugar, edible oil, andpulses) can be held in storage at any level of market operations – wholesale, retail, import or milling. TheMinistry also adopted in 2008 a policy for rapid and smooth movement of food grain and foodstuff toensure availability of and access to food as stipulated in the National Food Policy. The movement policyfocused on streamlining the Ministry’s logistic resources to optimize its operations through the least costroute, least cost mode of transportation, and least cost combination with the use of movementprogramming software.74 To step up this effort, a DGF-proposed the USD4.6 million “Expansion of DigitalPublic Food Distribution System”, which is in the pipeline for approval by the government.
There is also a concerted focus on increasing institutional capacity to exercise effective regulatoryoversight and undertake cross-sectoral initiatives to strengthen national food security. The Ministry ofFood is currently implementing a National Food Policy Capacity Strengthening Programme (2009–2012)
72 National Food Policy Capacity Strengthening Program, FAO/Food Planning and Monitoring Unit supported by EuropeanUnion and USAID.73 Essential Commodities Act, 2011, (available at http://www.mofdm.gov.bd).74 Movement Policy, 2008, (available at http://www.mofdm.gov.bd).
32
at a cost of USD10.3 million funded by the European Union and USAID and technical assistance providedby FAO. The project will strengthen the capacity of the ministry’s Food Planning and Monitoring Unit(FPMU) to conduct effectively its surveillance, forecasting, monitoring, planning, maintaining and sharingdata and information with other government agencies to undertake programs and initiatives aimed atstrengthening national food security.75
Milling other grains
Wheat processing has emerged as an important segment of the food processing industry because ofexpanding demand for bread, baked goods, and other wheat-based processed food products. The useof wheat grains as poultry feed is also expanding. Against the backdrop of a rapid decline (7.3 percentannually) in the domestic production of wheat from 1.84 million tons in 2000 to 0.97 million tons in 2011,commercial imports of wheat grain increased at 5.0 percent annually and reached 3.8 million tons in2010/2011 with the private sector accounting for more than 70 percent of the imports.76 This suggestsa rapid increase in demand for wheat grain coming from wheat processing and animal feedmanufacturing industries.
The consumption of wheat (per capita per day) more than doubled from 12.08 g in 2005 to 26.09 g in2010 (HIES, 2010). This alone would have required a supply of 1.35 million tons leaving a shortfall of about0.5 million tons in domestic production. The demand of wheat as poultry feed is also projected toincrease to about 0.15 to 0.17 million tons between 2010 and 2015.77 Imports used to account for about45 to 58 percent of the total supply of wheat at the beginning of the past decade; its share now standsat over 80 percent to meet the increase in demand from wheat processing and poultry feed industries.
Wheat grain is milled to produce different products – whole wheat flour (atta), refined wheat flour(maida), semolina (suji), and bran. There are two types of flour mills in Bangladesh – old type chakki millsconcentrated in rural areas and modern roller mills in urban centers catering to a large-scale commercialdemand. A chakki mill is a micro-enterprise, basically a two-person operation with a simple electricity-operated grinder. The milling capacity is about 2 tons of wheat per day and produces only wholewheatflour (atta). There are thousands of such mills in the country. Roller mills are industrial-scale and are themain sources of processed wheat products for urban consumers. There are about 260 roller mills inBangladesh, most of which are small to medium enterprises. A typical roller mill has a milling capacityof 50 to 150 tons of wheat per day and employs over 50 workers.78
The roller mills are of various designs and origin. Some are old dating back to the 1960s and importedfrom the United States and the United Kingdom. Some are locally manufactured copying the design ofthe original imports but incorporating imported rollers. More recent mills are of Japanese and Swissmanufacture. Very recently several state-of-the art large flour mills, manufactured by Buhler companySwitzerland, have been established and employ over 300 workers and have a processing capacity of asmuch as 175 000 tons of wheat per year.
These mills produce various grades of maida (refined wheat flour) estimated at 75 to 80 percent of flourproduction; atta (wholewheat flour) at 20 to 25 percent; semolina (suiji) and bran. Bran is added to maidato make atta, and excess bran is sold for cattle feed. Mills with more sophisticated equipment often maketwo or three grades of maida – with the whitest going as their premium quality – whereas other millsmake two grades of atta. Atta produced by roller mills is different from that produced by chakki mills inthat it normally contains less bran. It also varies in nutritional content, depending on the extraction rate.Roller-mill production is estimated at about 48 percent of the wheat flour consumed in Bangladesh.
75 National Food Policy Capacity Strengthening Program, (available at http://www.nfpcsp.org/agridrupal/).76 Author’s calculation based on FAOSTAT data.77 Islam K.M.N. 2001. Demand for Poultry Feed: Implications for Wheat and Maize Production in Bangladesh. FMRSP WorkingPaper No. 31, Ministry of Food/International Food Policy Research Institute.78 USAID/MOST. 2003. Wheat Flour Fortification Program in Bangladesh, (available at http://www.a2zproject.org).
33
Most mills package a significant amount of their product in large (25–75 kg) burlap gunny sacks. Theseare sold to bakeries and to small vendors who re-sell in bulk to consumers, small bakeries, and restaurantsfrom stalls at traditional markets located throughout urban and nearby rural areas. Several large flourmills with modern technology have conspicuously targeted upscale urban consumers by establishingbrand names and adopting good manufacturing practices in processing, packaging, and labelling. Theypackage products in food grade HDPE airtight containers with printed labels containing the brand nameand promotional information in smaller stock keeping units, typically 2 kg, 1 kg, and 500 g. The majorbrands in the country’s flour market are ACI, Fresh, Ifad, Pusti, Shwad, Fauji, and Teer. The market forpremium-grade and packed flour and semolina is estimated at nearly 0.5 million tons.
The entire flour mill industry in Bangladesh is in the private sector. The government’s intervenes in thewheat grain market through internal procurement and selling wheat at administered prices from itsPublic Food Distribution System. The distribution channels in the flour market appear to vary dependingon mill size and business management capabilities. Some smaller mills sell most of their flour directlyfrom the mill door to established customers. Larger mills have established networks of dealersresponsible for selling and delivering to their own customers (market stall owners, small shops,restaurants), although these mills still wholesale directly to larger accounts on their own.
Wheat flour is processed into dough and mixed with other ingredients in upscale food manufacturingto produce noodles, pasta, couscous, and baked products such as bread, biscuits, wafers, cakes, andpastries. There were an estimated 1 142 bakery manufacturers in the country in 2005/2006 that employedabout 29 783 persons with a gross output of USD188 million (SMI, 2005-2006). Eleven manufactures haveexport-oriented operations. The export of bread, biscuits, wafers and other baked products in 2010/11constituted about 5 351.3 ton valued at USD8.96 million. Twenty-three industries produced pasta,noodles and couscous worth USD1.96 million. The export of these items in 2010/2011 was valued at0.92 million.79
Maize is the third most important cereal in Bangladesh’s grain industry after rice and wheat. It is usedprimarily as a feedstuff in poultry, cattle, and fisheries production. Demand for maize in the countryremains very strong because of its expanding use as animal feed particularly in the poultry sector. Annualconsumption of maize grew at 22.7 percent annually since 2000 and stood at 1.46 million tons in 2008.80
Although domestic production rapidly increased from a low base to about 1.0 million tons in 2009/2010in response to growing demand, commercial imports constitute about 25 to 30 percent of the supplyof maize grain in the domestic market.81
Expansion of maize cultivation in Bangladesh in a brief span of time was driven by concerted efforts atenterprise development in maize production, processing and marketing to support an expanding poultryfeed manufacturing sector. The focus of these initiatives was on scaling up maize production throughorganizing small-scale maize producers in cluster areas in the northwestern part of the country intocontract growing schemes linked with large-scale maize traders and producers. Many of these small-scalemaize producers graduated from various maize-related projects implemented with support from DFID,Winrock International and Katalyst targeting livelihood security and income generation for resource-poorfarmers living in marginal environments.
A USAID-funded project ATDPII (2001–2005) provided a substantial boost to establishing a contractgrowing system and providing business development services, including sourcing appropriate maizeprocessing equipment. This endeavour was highly productive and done in collaboration with DOELAgro-Industrial Complex, a private sector company that doubled its maize output by expanding thenumber of its contract growers from 349 to 2 000 between 2003 and 2004.
79 Estimated from the Export Promotion Bureau’s data.80 Calculated from FAOSTAT data.81 Overview of Maize Cultivation, (available at http://www.katalyst.com.bd/op_Maize.php).
34
Public sector backstopping came through development and dissemination of improved maize varietiesand seeds, maize-based cropping systems, production and post-harvest technology, provision of farmers’training on improved maize cultivation practices, and promotion of diversified uses of maize. Severallarge-scale projects in the public sector – Crop Diversification Program, Northwest Crop DiversificationProject, and Integrated Maize Promotion Project – were implemented from the mid 1990s to supportprivate sector capacity building in maize cultivation. International technical assistance from theInternational Maize and Wheat Improvement Center (CIMMYT) was made available under a USAID-grantproject implemented between 2002 and 2007. CIMMYT worked in partnership with four governmentorganizations in the national research and extension system, two NGOs, a private entrepreneur, and eightprivate seed companies. This endeavour resulted in development and release of high yielding hybridvarieties of maize, distribution of seeds to partners for multiplication and provision of training to farmfamilies on maize cultivation practices across 35 districts in Bangladesh.82
Several partners, such as the Supreme Seed Company Limited and LalTeer Seed Limited are scaling uptheir capability by initiating their own programs of breeding high-yielding varieties of maize incollaboration with CIMMYT and the national research system in efforts to establish their own brands inthe market. In the NGO sector, BRAC has an advanced maize breeding program integrated with CIMMYT’sinternational hybrid testing program through which it developed and released two hybrid varieties thatare now widely cultivated.83
Post-harvest processing of maize begins with drying and shelling of maize grains. At farm level, sun-drying for two or three days under protective cover is the most prevalent practice. Farmers cannot holdmaize in storage for long since with sun-drying it is difficult to achieve moisture reduction to the required10 to 12 percent level. Shelling is done manually, which is an expensive labour-intensive operation orusing sheller machines that farmers can rent for a fee depending on their availability. There are about12 000 hand-driven maize shellers and 2 000 power-driven maize shellers in the country.84
The maize marketing system is entirely in private hands. The government doesn’t control maize pricesthrough its internal procurement program. A number of intermediaries dominate the market outside thecontract growing system.
Small traders buy maize from farmers in village markets and sell them to wholesalers (Paikar). The lattersell to commission agents of feed processing enterprises or wholesale directly to feed processingplants.85
Industrial maize milling in Bangladesh is based on dry milling that converts maize into grits, corn meal,and corn flour. The process flow of dry milling entails the following steps: cleaning, conditioning,de-germinating, drying and cooling, grading and grinding, sifting and classifying, purifying, drying, andpackaging. Almost 95 percent of maize is milled for animal feed and only 5 percent is used as flour. Maizeflour mixed with wheat flour is used in baking tortillas (chapattis). Most of the maize milling capacity inthe country is installed in the feed mills supplying poultry feed.
The quality of maize seed as production input is controlled by the government’s Seed CertificationAgency. Quality control in the private sector is voluntary and in the absence of feed analyticallaboratories it is difficult to independently verify the safety and authenticity of nutritional claims printedon the labels of packaged feed.
82 Khatun, F. & Meisner, C.A. 2005. Success Story of Maize Production in Bangladesh, (available at http://www.rwc.cgiar.org/RSCRTCC/2005/Sessions/Firoza_consort.pdf ).83 FAO. 2010. Plant breeding and seed systems for rice, vegetables, maize and pulses in Bangladesh. FAO Plant Productionand Protection Paper 207, pp. 35–40.84 Yusuf Ali, M., Waddington, S.R., Hodson, D.P., Timsins, J. & Dixon, J. 2008. Maize-rice cropping systems in Bangladesh: Statusand research opportunities. No. 56106, Maize Production Systems Papers from CIMMYT: International Maize and WheatImprovement Center.85 Abdur, R. 2010. CLP Market Assessment – Maize, (available at http://www.clp-bangladesh.org/).
35
The major constraints impeding the sector’s growth are: a) low productivity because of lack of access toimproved production technology and quality inputs including credit and finance; b) low quality of maizebecause of inadequate post-harvest facilities including drying and storage; c) high dependence on thepoultry industry making it vulnerable to market shocks in that industry; and (d) inadequate efforts topromote maize processing for other uses such as edible oil, starch, corn meal and flour.
Processing of oilseed and manufacturing of edible oil
Processing of oilseed is a fast growing sector in the country’s food processing industry. Oilseeds areprocessed to manufacture edible oil and animal feed, particularly soybean meal for poultry feed. Twolocal companies also produce soymilk and soy protein-fortified nutrition biscuits from soybean.
The annual per capita consumption of edible oil increased to 9.4 kg in 2010 from 6.6 kg in 2000 and thecurrent demand for edible oil in the country is estimated at about 1.40 million tons. The major crops usedfor extraction of edible oil grown in the country are mustard/rapeseed with about 60 percent of domesticproduction, soybean 17 percent, groundnut 13 percent, sesame 9 percent, and linseed 1 percent.86 Thetotal production of edible oilseeds in the country was 0.348 million tons in 2009 increasing at2.35 percent annually from 0.306 million tons in 2000.87 This growth in oilseeds production wasequivalent to about 0.104 million tons of edible oil, far too low to come anywhere close to meeting thedemand.88
The import of edible oil and oilseeds has steadily increased to close the deficit between demand andsupply from local production. The import of edible oil including refined rapeseed oil, crude palm oil andsoybean oil increased at 2.63 percent annually from 1.07 million tons in 2000 to 1.27 million tons in 2009.The import of oilseeds – rapeseed, soybean, mustard, and groundnut – widely fluctuated in response toprices in international markets and was 0.36 million tons in 2009. The share of palm oil in imports roseat a much faster rate, 4.53 percent per annum, and contributed 69 percent to total imports and soybeanoil (crude, degummed) had a share of about 30 percent. The total supply of edible oil in the market was1.49 million tons in 2009 in which the share of domestic production was only 7.02 percent. The importof soybean meal climbed to 372 596 tons in 2009 increasing at 15.3 percent annually since 2000 to caterto the rising demand for poultry feed.89
Palm oil remains the highest consumed edible oil in the country catering to 59 percent of the demandin 2009, followed by soybean 30.3 percent and mustard/rapeseed 7.2 percent. Imported palm oil is madeup of three categories (crude palm olein; crude palm oil; and refined, bleached, deodorized palm oil) withvarious levels of saturated fatty acid composition. Loose oil (oil sold to consumers from open bulkcontainers) occupies about 75 percent of the market share, whereas the bottled edible oils make up theremaining 25 percent. Palm oil dominates in the loose oil market, but soybean oil leads in the bottledoil market.90
The oilseed processing industry in Bangladesh is composed of oilseed crushing and extraction units andcrude oil refining units. According to a survey of manufacturing industries (2005/2006), there were274 such establishments in the country. Currently there are 86 registered edible oil refineries in thecountry. Most of them are small-scale processing units with capacity ranging from 30 tons to 60 tons perday with the total annual refining capacity of over 3.5 million tons.91
86 Lutfor, R. 2010. Agricultural Research Priority: Vision 2030 and Beyond, Sub-sector: Pulses and Oil Crops, (available athttp://www.barc.bgd.org/).87 Author’s calculation based on FAOSTAT data.88 Based on average 30 percent oil extraction from the grains.89 Author’s calculation based on FAOSTAT time-series data.90 Malaysian Palm Oil Council (MPOC): Edible Oil Industries in Bangladesh, (available at http://mpoc.org.bd/edible_oil_industry_in_bangladesh.php/).91 Bangladesh: One of the biggest markets of edible oil. Blitz, 6 (40) Dhaka, October 5, 2011.
36
Oilseeds are processed using mechanical expellers, solvent extraction technology or a combination ofboth. Expeller presses range in capacity from less than 1 to over 50 tons per day. The newly installededible oil refineries are medium to large scale industrial operations with state-of-the-art machineryimported from Switzerland, Germany and Italy and based on solvent extraction technology. They areequipped with dry fractionation plants and programmable logic controller (PLC) systems with processingcapacities ranging from 400 to 1 000 tons per day. The currently active 18 refining units produce aboutone million tons of refined edible oils annually of which about 65 to 70 percent is refined palm oleinand super palm olein and the rest refined soybean oil. Several oil refineries have also integratedoperations for crushing soybean seeds to produce soybean meal and crude degummed soybean oil.Soybean meal is used as raw material for the production of poultry feed in their sister plants. Theby-products of oilseed processing are rich in protein and are an important source of cattle feed.
Most Bangladeshi importers import refined edible oil in steel drums and a few import in polyethyleneterephthalate (PET) bottles. Crude edible oil is imported in bulk tankers and after unloading at theChittagong port, the shipments are routed to refineries at Chittagong and Dhaka, where crude oil isconverted to good quality edible oil through several steps of physical and chemical treatment, filtration,and fractionation that remove impurities such as free fatty acids, gums, dirt, shell, moisture and impurities,trace metal, and oxidation products.
The finished product is designed for sale as bottled product, packed in pouches, food grade PET bottles,bags in boxes, and tin containers in different consumer pack sizes ranging from 200 millilitres to 8 litresunder different brand names with printed label affixed on the container. The product targeting ruralconsumers is packed in bulk drums for distribution and sale as loose oil in rural market outlets. The majorbrands in Bangladesh’s edible oil market are: Rupchanda, Fresh, Teer for soybean oil; Meizan, Super Pure,Natural, Lucky, Shakti, Hilsha for palm oil; and Fresh, Teer, Radhuni, and Pure for mustard oil. Bangladeshibranded edible oil is also exported. In 2010/2011, Bangladesh exported 1 877 tons of rape and mustardoil and 607.7 tons of sesame oil valued at USD4.8 million.92
Food safety and quality control in manufacturing and marketing of edible oil in the country is theresponsibility of the Bangladesh Standards and Testing Institution. It has developed standards for ediblepalm oil, soybean oil, and mustard oil. All refineries are required to obtain certification of BSTI formarketing of their products.93 But the capacity of BSTI to enforce its standards through inspection offacilities and conducting random checks is limited. Occasionally, BSTI officials acting on media reportsconduct market surveillance and regulatory inspection with support from law enforcement agencies andinitiate legal procedures against violators of food standards.
At the industry level there are efforts for voluntary conformance to international standards driven byintense competition among producers to establish brand names and capture a larger market share fortheir products. Some industries, for example the Meghna Group producing Fresh brand of edible oil, areISO 9001:2000 certified.94 All major producers have explicit quality policy for producing good quality,wholesome and nutritious edible oil.
The government exercises control on the quality of imported crude oil through provisions of importpolicy (2009–2012)95 that require importers to submit samples of imported RBD palm oil to the BSTI/Bangladesh Council for Scientific and Industrial Research (BCSIR) for performance of purity test andproduce a certificate of radioactivity levels in the consignment issued by a competent authority of theexporting country. However, control of food safety after breaking the seal of large bulk drums for saleas loose oil in retail outlets is virtually non-existent. Ideally in a HACCP-based food safety system, this isa critical control point (CCP) meaning loss of control at this point will result in occurrence of a hazardthat seriously endangers public health. But there is no effective control at this step, and, as a result,
92 Estimated from Export Promotion Bureau’s data.93 Product List under Certification Marks Scheme, (available at http://www.bsti.gov.bd/cert_mark_productlist.html).94 See http://meghnagroupbiz./index.php?option.95 The Import Policy Order 2009–2012, (available at http://www/mincom.gov.bd/acts.php).
37
adulteration with prohibited substances and misrepresentation through blending costlier soybean oilwith palm oil and selling at exorbitant prices has become widespread.
The marketing of oilseeds involves a number of intermediaries. Small traders (Faria) buy oilseed grainsfrom farmers in village markets and sell to wholesalers (Paikar). They in turn sell to large commissionagents (Aratdar) who have supply contracts with oilseed crushing mills and refineries.
The Government intervenes in the edible oil marketing through a combination of its internal revenueand tax policy and regulatory control to ensure the smooth supply of food essentials, including edibleoil, and combat spiraling of consumer prices. It has recently reduced VAT on imported crude oil to checkupward pressure on retail consumer prices and controlled movement of refined edible oil along thesupply chain by limiting duration and the size of the stock that can be held in storage for refinedsoybean oil and palm oil at all levels of market participation – wholesaler, retailer, and importer. It hasalso sought to address inefficiencies in the supply chain by requiring oil millers to appoint distributorsthroughout the country.
Import substitution of edible oil by boosting local production of key oilseed crops including mustard andrapeseed, groundnut, soybean, and sesame is an avowed policy goal of successive governments.Intensification of oilseed production in a technology mission mode within a framework of ongoing andupcoming crop diversification projects and ancillary development of SME services for better marketingand processing of locally grown oilseeds is currently a top national priority.
Production and processing of edible salt
Crude salt production is a farming activity concentrated in the coastal areas of southeastern Bangladesh.It covers a land area of about 28 340 hectares and involves more than 50 000 farmers. The technologyof salt production is based on the solar evaporation of seawater trapped in salt beds. The quality of crudesalt varies depending on the substrate used for collecting deposits of sediments in the salt bed. Whenthe substrate is soil, the salt produced is black and of inferior quality because it contains a substantialproportion of mud (10 to 20 percent) and other impurities.96
This method of production is traditional and less expensive but it involves substantial additional cost indownstream processing. When a polythene sheet, a gradually expanding innovation in the productionmethod, is used as a substrate, crystallizing salt particles remain physically separated from soil particlesand the salt produced is white and is of better quality. The yield is also 30 percent higher than thetraditional method and its market price is also higher. Of the total crude salt produced in the country,black salt accounts for about 50 percent; white salt (polythene sheet) 30 percent, and light white20 percent (improved traditional).97 Crude salt is processed in salt refining industries into three end-usecategories: edible salt for human consumption; common salt as ingredient in poultry and cattle feed; rawmaterial in industrial manufacturing.
The current demand for edible salt in the country is estimated at 0.881 million tons and the total saltdemand is 1.368 million tons. The domestic production generally keeps pace with the demand althoughit fluctuates considerably in response to abnormal weather conditions and natural disasters affecting thecoastal areas. Between 2007/2008 and 2009/2010, salt production was in the range of 1.22 million tonsto 1.707 million tons and in 2010/2011, it dropped to 0.964 million tons.98 Edible salt is not importedexcept following poor salt harvests. But there is illegal crossborder smuggling of relatively cheap non-iodized salt from India and Myanmar. The government announced a National Salt Policy in March 2011in an effort to steer long-term development of the country’s salt industry and instructed concernedauthorities to initiate proposals to implement policy recommendations. The policy includes measures
96 Centre for Environmental and Geographic Information System. 2007. GIS-based Salt Industries Information System inBangladesh, Dhaka, Bangladesh.97 National Salt Policy 2011, (available at http://www.moind.gov.bd).98 Statistics on Salt Production, (available at http://www.bscic.gov.bd/).
38
discouraging salt import, fixing a fair price of salt, providing farmers and mill owners’ loans on single digitinterest, developing a buffer stock of salt for price stabilization, increasing salt production throughtechnical assistance to the farmers, collection and preservation of information related to salt andproviding farmers with infrastructural assistance during natural calamities.
There are 300 salt refining industries in the country of which more than 50 percent are SMEs.Approximately half a million people are employed in the production, sale, processing and marketing ofsalt in the country. The Bangladesh Small and Cottage Industries Corporation (BSCIC), a public sectororganization under the Ministry of Industry, is mandated to develop and promote quality salt productionand processing in the country.
It does so through capacity building in the private sector by demonstrating improved methods of qualitysalt production, providing training to salt growers, motivating them to adopt improved methods of saltproduction, and organizing salt production in new areas along the coastal zone. All domestic saltindustries are registered and licensed with BSCIC. The BSCIC keeps a record of operating salt factoriesand wholesalers in the country using a Web-enabled GIS-based Salt Industries Information Systeminstalled at its head office in Dhaka and in its nine regional offices.
The salt supply chain from producers to consumers involves salt growers who produce crude salt inclusters of salt beds and transport it to adjacent processing mills. Then processors refine the crude saltand add potassium iodate to produce food-grade salt fit for human consumption. The mill owners marketthe finished product through their network of distributors and wholesalers who in turn sell to retailersfor sale to consumers. There are more than 150 wholesalers appointed by salt mills throughout thecountry.
Processed and iodized salts are packed in different consumer packs with labels affixed that contain thefollowing information as set in BSTI and BSCIC standards: name and address of manufacturer, license/registration number, “iodized salt”, iodine level, net weight, maximum retail price, manufacturers’ trademark, date of manufacture, expiry date, and educational message.
The key food safety issue in manufacturing of edible salt is its fortification with iodine to combat theiodine deficiency disorder (IDD), a major public health concern in Bangladesh. The legislative support touniversal salt iodization in Bangladesh was provided in 1989 when the government passed the IodineDeficiency Disorders (IDD) Prevention law making it mandatory that all edible salt be iodized. The lawprohibits the production, distribution, marketing and selling of non iodized salt in the country, andstipulates that all salt for human consumption must contain 45 to 50 ppm of iodine at the time ofproduction and not less than 20 ppm iodine at the time of retail.
The salt by-law of 1994 describes the procedures for packaging of iodized salt, inspection proceduresand the role of Salt Committees, which are appointed by the government to monitor the implementationof the law and penalize the violators.99
The BSCIC, in its effort to ensure industry compliance of the law, has implemented a USD8.7 million“Control of Iodine Deficiency Disorder through Universal Iodization of Salt” project between 2000 and2010 with UNICEF’s technical assistance. The project established 267 salt iodization plants (SIPs) in267 salt mills throughout the country and the new mills established SIPs on their own initiatives. It alsodistributed the chemical input – potassium iodate to salt mills for iodization of edible salt. A cost-sharingscheme for potassium iodate was established between the Salt Mill Owner’s Association and BSCIC toensure the sustainability of salt iodization in Bangladesh, wherein the private sector gradually increaseits contribution to the financial cost of potassium iodate from 25 percent in 2001 to 100 percent in 2003.This means that all costs of potassium iodate are now covered through a revolving system, without anyaddition external resources input (NSEID).
99 Current Iodine Nutrition Situation in Bangladesh. Network for Sustained Elimination of Iodine Deficiency (NSEID),(available at http://www.iodinenetwork.net/countries/Bangladesh.htm).
39
A comprehensive monitoring and control of quality of edible salt procedure was developed withUNICEF’s assistance and is in place now. This is effectively linked with the private sector’s own qualitycontrol mechanisms. BSCIC inspectors analyze salt samples from each salt factory twice a month. TheInternational Council for the Control of Iodine Deficiency Disorders (ICCIDD) provides independentmonitoring of salt quality by conducting a salt factory survey twice a year. In addition a specializedIntensive Monitoring Team from BSCIC visits each factory every day for one month, two or three timesa year, for daily monitoring of salt quality. The findings from the biannual salt factory survey and IntensiveMonitoring Team are disseminated to factory owners. Sixteen salt factories have invested in salt-testinglaboratories, which they use to test the iodine concentration of each batch of iodized salt produced. TheSalt Committees at the district levels are also responsible for making spot checks on salt factories,wholesalers and retailers.
Quality control of crude salt production is hindered by lack of credit and loans for farmers to purchasepolythene sheets at the beginning of the production season. Additionally large-scale commercialproduction of polythene sheets faces difficulties because of the government’s policy of discouragingplastic bags for the sake of the environment. The new Salt Policy (2011) includes provision for supply tosalt farmers of eco-friendly and biodegradable polythene sheets at a low price. Although quality controlhas been strengthened through regular supervision and monitoring, some salt factories, particularlysmaller factories, have not complied with the salt iodization at all, or at an optimal concentration level.Law enforcement has been handicapped because of low availability of mobile courts in each district andbecause of the low penalty for non-compliance with the law. Consumer demand and properunderstanding of the importance of salt iodization has increased, but there are still a significantpercentage of households who do not perceive its importance and who are not sufficiently motivatedor empowered to demand iodized salt.
Processing of sugarcane and manufacturing of sugar and sugar-based processed food
Sugarcane is the main sugar producing crop in Bangladesh currently grown on 0.16 million hectares ofland. About 51 percent of the crop is grown within the command areas of sugar mills and 49 percent isgrown outside the mill zone areas. Production of sugarcane in the country has declined at 0.23 percentannually since 2000 and was 7.1 million ton in 2009.100
Sugarcane processing in mills is directed at the production of cane sugar (sucrose) through thesequential steps of: mechanical crushing of cane and extraction of juice; clarification of extracted juicewith heat treatment at 95ºC and addition of lime and often a small amount of soluble phosphates;centrifugation to separate the clarified juice from insoluble precipitates; pre-heating of the clarified juicein heat exchangers followed by evaporation in vacuum pans for crystallization of sugar; drying; cooling;and packaging of the finished product.
Other products of the processing include bagasse, molasses, and press-mud. Bagasse, the residual woodyfibre of the cane, is primarily used as fuel for the boilers in the generation of process steam. Molasses isused as a sweetening agent or processed to produce liquor and alcoholic drink. One public sector sugarmill is equipped with a distillery plant for processing molasses into a variety of alcoholic and liquorproducts with annual production capacity of 2.8 to 3.0 million litres. A new facility has been added inthis mill to produce organic bio-fertilizer from press-mud. A new development project is also in thepipeline for manufacturing of biofuel (ethanol) from molasses in this mill.101 In the private sector, theBangladesh Sugar Refiners’ Association is also building a manufacturing plant for production of ethanolbiofuel.102
100 Author’s calculation based on sugar statistics maintained by the Bangladesh Sugarcane Research Institute, (availableat http://www.bsri.gov.bd/).101 Compiled from the revised annual development program (2010–2011), (available at http://www.plancomm.gov.bd/).102 Bangladesh looks to supply sugar to GCC, (available at http://www.gulfnews.com/business/general/bangladesh).
40
The principles of mechanical crushing followed by thermal processing of extracted juice are also appliedin the processing of sugarcane in artisanal cane crushing units that consist of three metal rollers drivenby either animal or diesel power. The extracted juice is filtered through a cloth to remove any solids andimpurities and then heated in large pans over simple furnaces using bagasse as fuel. Heating is continuedfor 2 to 2.5 hours till the juice attains a temperature of 118ºC. Properly concentrated juice is taken outof the fire and allowed to cool and solidify in moulds of different shapes and sizes and then stored inearthen pots, wooden boxes, or in metal drums. The product thus produced is known as jaggery or morecommonly as gur. It is cheaper than white sugar and easily available to the local people.103 There were13 industrial units engaged in gur production that employed 198 people and had a gross output ofTk. 21.6 million (SMI 2005-2006).
The sugar industry of Bangladesh is the second largest agroprocessing industry in the country andcontributes significantly to the rural economy, employment generation, industrial growth and the GDP.More than 0.6 million farm families are dependent on sugarcane cultivation and about 5 million peopleare employed in production, processing, marketing and trade in the sugar industry. The industry is madeup of 15 large sugar mills run by the state-owned Bangladesh Sugar and Food Industries Corporation(BSFIC), six private sector sugar refineries, and a large number of cane processing micro-enterprises inrural areas.104
The bulk of the domestic production of sugarcane is processed into gur in micro-level processing units.In 2009, 68.9 percent of sugarcane was processed into gur and only 16.7 percent was available forindustrial processing in sugar mills; the remaining 14.4 percent was saved as seed and consumed as rawjuice drink (Bangladesh Sugarcane Research institute). Domestic production of both sugar and gurdeclined between 2000 and 2009 – at 2.83 percent annually for gur and 1.45 percent for sugar.105 Theaverage annual production of gur over the period 2000–2009 was 359 000 tons. The average annualproduction of sugar was 136 800 tons against the annual demand of 1.2 to 1.4 million tons. Increasingthe volume of commercial imports of raw and refined sugar closed the growing gap between demandand supply. Imports now constitute more than 80 percent of the total market supply of sugar. Thecombined supply of sugar from domestic production and imports grew 17.2 percent annually since 2000and in 2009 constituted 1.49 million tons.106
The total crushing capacity installed in the public sector sugar mills is 21 044 tons of cane per day (TCD)and the annual capacity of sugar production is 0.207 million tons. The average sugar recovery from canecrushing is about 8.0 percent. Because of the unavailability of adequate raw material for processing,capacity utilization of the public sector mills was on average 66 percent during the period from 2000to 2009.107 The private sector refineries have much higher sugar production capacity. The City SugarIndustries Limited, for example, has a capacity of producing 50 000 tons of refined sugar per daycompared to 20 320 tons per year in a public sector sugar mill. The Bangladesh Sugar Refiners Associationfacilitates imports of raw material into the country for processing into white refined sugar. Brazil has beenone of the top sources of raw material. In 2009, Bangladesh imported 1.29 million tons of raw sugar.
Food safety and quality control in operations of the public sector sugar mills is implemented by the CaneDevelopment and Research Division of the BSFIC through a system of monitoring, inspection and reviewof technical specifications and calibration of processing and laboratory equipment, the quality of seedsand cane varieties proposed for cultivation in mill zones, and disease and pest control programs. Thefinished product specifications conform to standards for sugar and refined sugar defined in relevant BSTIstandards. In addition, private sector sugar refineries have their own quality control systems; some have
103 Rao, J.M.K.V., Das, M., & Das, M.K. 2007. Jaggery – a traditional Indian sweetener. Indian Journal of Traditional Knowledge.6(1): 95–102.104 Rahman M. & Mondal, R.I. 2010. Agricultural Research Priority: Vision 2030 and Beyond, (available at http://www.barc.bgd.gov/).105 Author’s calculation based on BSRI data.106 Author’s calculation based on FAOSTAT data.107 Bangladesh Sugar and Food Industries Corporation, (available at http://www.bsfic.gov.bd).
41
implemented international food safety standards, and are ISO 9001 certified. In BSFIC mills sugar ispackaged in large PP woven bags with an inner liner. Private sector refineries package sugar in smallconsumer pack sizes in addition to bulk packaging and sell sugar under brand names. The private sectorhas developed a substantial capacity for export of refined sugar. In 2010, Bangladesh exported refinedsugar worth USD104 496 and 85 tons of molasses worth USD160 thousand.108 The recent transitmemorandum of understanding between Bangladesh and India has opened up considerableopportunities for the export of sugar to the northern states of India and Nepal.
The public sector sugar mills procure sugarcane from cane growers in the mill zone areas througha system of permits. In order to eliminate the influence of middlemen restricting farmers’ direct accessto mills under the traditional procurement system, the government has recently introduced an electronicsystem of issuance of permit (e-purjee) whereby the permit is downloaded in farmers’ mobile phones.This ensures farmers better farmgate prices, and saves time and cost in making extra visits for makingprocurement arrangements. The mills sell the finished goods through a network of distributors. Thegovernment intervenes in the sugar market through regulation of the Essential Commodities Act thathas fixed the amount and duration of the stocks of refined sugar that can be held in storage at wholesale,retail, and import level. It also imposes administered prices on the retail sale of refined sugar to keep theprices affordable for ordinary consumers by selling sugar from its stockpiles or undertaking large-scalecommercial imports. The government also slaps tariffs and duties on imports of raw sugar to protect thedomestic sugar industry. The decline in domestic production of sugar results from both inefficiency inmanufacturing in public sector mills with ageing machineries and equipment and stagnation insugarcane cultivation in mill zone areas in the face of an overall declining trend in sugarcane cultivationareas. Access to adequate raw material is a major constraint to full utilization of currently installedprocessing capacity in the sugar industry. It should be noted that the BSFIC has been incurringlosses since 2001/2002 with only 2005/2006 an exception. Its loss in 2009/2010 alone constitutedBDT1.69 billion (USD24 million).109
Sugar is used as key ingredient in manufacturing of chocolates and confectioneries. There are94 enterprises in the country manufacturing these items and some industries also produce for export.In 2010/2011, Bangladesh exported about 551 tons of confectioneries and chocolates valued atUSD350 thousand. The major export destinations were United Arab Emirates, Australia, United Kingdom,India, Pakistan, Saudi Arabia, Thailand, United States.110
Processing of tea
Tea production is an important sector of the national economy. It employs directly about 118 000 peoplemost of whom are women and an additional 0.8 million people depend on its manufacturing, marketing,distribution, and support industries. Tea is a traditional export commodity. Thirty-three companies arelisted by the Export Promotion Bureau as active exporters of tea. The tea industry also generates internalrevenues of about Tk. 800 million as value added tax and various other taxes.
Tea is grown in 163 tea gardens (estates) concentrated mainly in the hilly zones of the northeastern partof the country. There are five distinct categories in the management of these gardens: Sterling companies,National Tea Company Limited, Bangladesh Tea Board, Bangladeshi Private Limited Companies, andBangladeshi proprietors. The tea gardens are categorized according to their production capacities:Category A includes the four foreign-owned companies – James Finlay, Duncan Brothers, Deundi TeaCompany and the New Sylhet Tea Company – which own 27 gardens and have the highest productivity;Category B includes companies owned by the Bangladesh government, Bangladeshi tea companies, orBangladeshi individuals; Category C includes small and low productive estates with the lowest wagesand the worst working conditions. There are 116 tea processing factories in Bangladesh, most of which
108 Estimated from Export Promotion Bureau’s data.109 Compiled from statistics provided in Bangladesh Economic Review 2010, (available at http://www.mof.gov.bd/).110 Estimated from Export Promotion Bureau’s data.
42
are small and medium scale enterprises. The majority of tea plantations have their own on-site teaprocessing plants.111
Tea production in Bangladesh remains mostly stagnant. The harvested area under tea has increased atonly 1.13 percent since 2000 and now constitutes 54 106 ha (Bangladesh Tea Board). Growth inproduction was sluggish, 1.27 percent annually and in 2010 constituted 60 620 tons. Strong growth inthe supply of tea in world markets in the face of sluggish demand has resulted in long-term pricedeclines that have negatively impacted on Bangladesh’s tea exports. Since 2007 exports of tea steadilydeclined from 10 790 tons to 1 160 tons in 2010. The share of tea in national export revenue dwindledfrom 1 percent in 2007 to 0.01 percent in 2010. The growth in internal demand in the context of stagnantdomestic production is one reason for decline of exports. The growth in internal consumption oftea remains robust at an annual rate of 3.9 percent per annum since 2000 and in 2010 accounted for96.4 percent of the domestic production of tea.112
The legislative support for the promotion of the tea industry in the country was provided in the TeaOrdinance that the government promulgated in 1977 providing for the establishment of the BangladeshTea Board (BTB) and for levying a cess on tea produced in the country. BTB, a public sector autonomousorganization with representation from the private sector, is responsible for exercising regulatory controlover all aspects of the country’s tea industry – tea cultivation and its promotion, sale, and export – bygranting licenses to planters, manufacturers, and other dealers engaged in the tea industry, providingassistance in the establishment of new tea gardens and improving the productivity of existing gardensand the quality of tea, and requiring tea estates to register with the board.
Apart from the BTB, other players in the industry are the Tea Traders Association of Bangladesh,Bangladesh Cha Sangsad (Tea Council), and Bangladesh Cha Sramik Union (Tea labourers’ Union).TheBangladesh Tea Research Institute (BTRI), a component organization of the National Agricultural ResearchSystem under the administrative control of the TBT, is responsible for development of improved varieties,seed propagation techniques and production practices for increasing production and quality of tea inthe country.
The tea processing plants use the cut, tear, curl (CTC) method that involves various key processing steps,namely plucking leaves and their handling – withering, rolling, fermentation (leaf oxidation), drying,sorting and packaging. All tea processing plants are well equipped with CTC machineries. Quality systemsbased on international food safety standards, such as ISO 9001 are in place for foreign-owned companiesand all local major producers that sell tea under brand names. The major established tea brands in thecountry are Lipton Taaza, Finlay, Mirzapore Ispahani, National tea, etc. These companies sell their teaproducts through their network of distributors throughout the country.
Tea is processed and graded into a variety of finished products – bulk and instant CTC black tea, packettea, and green tea. Tea is packaged in different pack sizes and airtight packing containers for protectionof freshness and aroma – laminated pouch, double chamber tea bag, food-grade jar, “bag-in-bag” tea bagetc. Marketing of tea is based on sale through auctions. Manufactured tea from the estates is sold tobuyers in bulk through Chittagong auction. The buyers then sell it in the local market or export eitherin bulk or in packets. Some of the teas are also sold at estate level with prior permission of theBangladesh Tea Board either directly to overseas buyers or to the internal traders. The Tea TradersAssociation of Bangladesh organizes the weekly tea auction in Chittagong through the appointed teabrokers of Bangladesh Tea Board.
The prospect of export-oriented growth of Bangladesh’s tea industry remains bleak in the context ofcontinuing decline in prices driven by strong competition from new entrants, particularly Africanproducers, into the tea market. The strong growth in domestic consumption of tea is likely to emergeas the key driver of further expansion of tea production in the country.
111 Bangladesh Tea Board, (available at http://www.teaboard.gov.bd/).112 Author’s calculation based on Bangladesh Tea Board data.
43
Manufacturing of processed dry snack foods
A significant part of agroprocessing in Bangladesh is concerned with production of a wide range of dryfood widely consumed as breakfast cereal and snack food. These items are puffed rice, flattened rice,potato flakes, potato chips, Bombay Mix (locally known as chanachur and consisting of a mix of spicydried ingredients including lentils, chick peas, groundnuts, flour noodles, flaked rice, fried onion), friedpeas and lentils, chapatti mix, preparation of ready-to-use mixes of dried vegetables and meat, drinkpowder etc. Puffed rice, locally known as muri, is produced by exposing grains to a very high steampressure released rapidly that causes the grains to burst open. It is also traditionally produced by fryingrice on heated sand in ovens. Flattened rice, locally known as chira, is produced by applying pressure onrice grains through rollers. The key process steps in the production of snack foods are boiling, frying, anddrying.
Dry food constitutes a major item in Bangladesh’s export of processed food with its share steadilyincreasing. In 2010/2011, the total export revenue earned from this sector was USD29.37 million, up from19.45 million in 2008/2009. Eleven establishments are registered with the Export Promotion Bureau asactive exporters under this category. The key industry players are Pran Foods, Bombay Sweets andCompany, ACI Foods, Square Consumer Products, BRAC Agro-fresh Limited.113
The BSTI under its compulsory certification mark scheme has developed standards for chanachur (mixedspicy cereal snack), chips/crackers. The major export-oriented facilities are equipped with modernprocessing lines and follow quality control procedures consistent with international food safetystandards. The safety of processed dry foods manufactured in micro and small enterprises in the informalsector is poorly controlled. Food authorities with support from law enforcement agencies occasionallyundertake inspection of such facilities, but food adulteration with the use of prohibited substances andunhygienic practices of handling remain widespread.
Manufacturing of soft drinks and beverages
There were 27 establishments engaged in manufacturing of drinks and beverages in the country withgross output of Tk. 3,381.8 million (USD49 million) and employing 15 012 people (SMI, 2005-2006). Theestimated production of soft drinks in 2009/2010 was 37.6 million dozens of bottles.114 Nineteencompanies are at present manufacturing and marketing carbonated soft drinks.
The key players in the beverage industry are Transcom Beverage Limited, Tabani Beverage Limited(a state-owned enterprise), AM Beverage, Suncrest Beverage industries, Partex Beverage, Pran Foods, andAkij Food and Beverage Limited. Some of them are contract manufacturers and distributors of globalbrand soft drinks.
Transcom has the exclusive license for manufacturing and marketing in Bangladesh of the Pepsico brandproducts: Pepsi Cola, 7 Up, Mirinda Orange, Mirinda Lemon Slice, and Soda. It has three modern bottlingplants in the country and has the largest share of the carbonated soft drink markets. Two companiesshare the license for production and marketing of Coca Cola brand products in the country: Coca Cola,Sprite, and Fanta. Tabani Beverage is designated for Dhaka and Rajshahi regions; AM Beverage Industriesfor the rest of the country. Partex Beverage is the franchisee for RC (Royal Crown) products: RC Cola, RCOrange, Upper 10, and RC Lemon. Al-Amin group, a recent entrant into the soft drinks market, has startedproduction of Double Cola, a US brand product.
Other companies manufacture a wide range of private label products. Pran Foods produce Maxx cola,Cloudy Lemon, Cloudy Lime, and Power Drink. Akij Foods produces Mojo brand Cola, Lemu brand Lemon,and Speed brand energy drink. The key processing steps in manufacturing of carbonated soft drink arewater purification – carbon dioxide and carbonation – adding of flavouring syrup, and finishing. The
113 Data compiled from Export Promotion Bureau.114 Industrial Production Statistics, November 2010, (available at http://www.bbs.gov.bd/).
44
finished product is hot-filled in PET bottles of different pack sizes. The contract manufacturers followprocess control, standard operating procedures, and quality control systems specified by parentcompanies. Other major producers have implemented quality control systems consistent withinternational food safety standards.
Besides carbonated drinks, a variety of juices are also manufactured. These include orange juice,grapefruit juice, pineapple juice, apple juice, mango juice, banana juice, guava juice and fruit juice cocktail.The major juice brands are Pran, Danish, Vita Fresh, and ACME. Juice processing is based on UHTpasteurization, hot-filling, and aseptic packaging in tetra packs and PET bottles of different pack sizes.Juices are also packaged in tin containers. Exports account for a significant share of sales of domesticallyproduced soft drinks and juices. Twelve companies are listed as active exporters of fruit juices andsix companies as exporters of soft drinks by the Export Promotion Bureau. In 2010/2011, Bangladeshexported 5 551.78 tons of carbonated drink worth USD4.79 million and 19 837 tons of fruit juices worthUSD16.42 million.115
4. External forces that shape the SMFE sector in the country
Environmental issues
Environmental issues rank at the top of the external factors that shape the development of small andmedium food processing enterprises in the country. Expansion of shrimp culture along the coastal beltby submerging rice fields with sea water has led to increased levels of soil salinity that threatens thesustainability of crop production systems. There are at present very few crop varieties that can withstandhigher levels of soil salinity. A portion of mangrove forests has also been cleared to pave the way for theconstruction of shrimp ponds. The current low-density semi-intensive shrimp production systems involveminimal use of chemicals and the effluents can be kept within environmentally sustainable limitsprovided this technology is consistently promoted.
Despite the increasing use of hatchery-bred post-larvae for seeding the shrimp ponds, the reliance onfry caught in the wild is still overwhelming, leading to a steep decline of coastal stocks of seawater prawnand other marine aquatic resources that are also caught and wasted in the process of catching shrimpfries. The shrimp processing plants were established with little consideration for the availability ofadequate raw material within their command areas and as a result many function much belowtheir installed capacities. Bangladesh’s semi-intensive shrimp production system with involvement ofsmall-scale shrimp farmers can be turned into a comparative advantage over other competitors in theglobal market by keeping the environmental impacts within sustainable limits through appropriatepolicies, technology development, and training of stakeholders in the shrimp industry.
Because of its geographical location, frequencies of hazards arising from drought, flood and other naturalcalamities are on the increase in Bangladesh. The surface water of the country is being polluted throughcapricious disposal of untreated industrial effluents and municipal wastewater, runoff pollution fromchemical fertilizers and pesticides and oil and lubes spillage in the coastal area from the operation ofsea and river ports and ship wreckages. Now in Bangladesh, the presence of high-level arseniccontamination in groundwater is a national problem especially at Chadpur, Shatkhira, Noakhali, Comilla,Gopalgonj and some other districts (Ministry of Finance, Bangladesh Economic Review 2010).
Globalization/trade liberalization
In the 1990s, the Bangladesh government made a concerted move away from highly protectionist,inward-looking import substitution policies to a liberal trade-oriented policy aimed at integration intothe global economy through introducing fundamental changes in international commerce and finance,reducing transportation costs, modernizing telecommunications technology, and lowering policy barriers.Tariffs were significantly reduced and rationalized, with average unweighted customs duties falling from
115 Estimated from Export Promotion Bureau’s data.
45
100 percent in 1985 to roughly 13 percent in 2008. Similarly, maximum tariff rates declined from350 percent in 1990 to 25 percent in 2008. Trade-related quantitative restrictions, which covered21 percent of HS 4-digit tariff categories in 1990, have been virtually eliminated, and import licenses areno longer needed. Additionally, foreign exchange regime liberalization has resulted in a unified exchangerate and the removal of most foreign exchange restrictions. The establishment of preferential trade accessafforded to developing countries, and multilateral agreements eliminating quotas and reducing tariffs,have helped open markets and expand trade opportunities for Bangladesh.116
Information technology
Bangladesh’s entry into the information superhighway through submarine cable and optical fibrenetwork has vastly extended the global outreach of the country’s businesses and industries. More than400 ICT companies are now active in the country employing more than 12 000 professionals. The majorexport market for ICT services from Bangladesh is United States, Denmark, United Kingdom, Japan andAustralia.117
The ICT sector is now poised for rapid expansion with the government’s announcement of a NationalICT policy in 2009 to implement its vision of “Digital Bangladesh 2021”. The policy has 10 broadobjectives, 56 strategic themes and 306 action items to be implemented by 49 Ministries/Divisions/Departments either in the short term (18 months or less), medium term (5 years or less) or long term(10 years or less). Meanwhile some immediate action items have been implemented. Steps have beentaken to introduce e-governance, e-commerce, and e-banking in the country. Major ministries, divisionsand departments have already launched their websites. Now mobile phones can be used to payelectricity and gas bills, reserve railway tickets, and transmit advanced information about impendingdisasters.
Software applications and IT-related services are also available in the field of custom businessapplications, contract programming services, web content development, Internet-e-government softwaretools, data conversion and transcription services, call centers and Business Process Outsourcing (BPO)services etc. (Ministry of Finance, Bangladesh Economic Review, 2010).
Health and safety issues
Work-related accidents and diseases continue to be a serious problem in Bangladesh. The ILO estimatesthat every year in Bangladesh 11 700 workers die from work-related accidents, 24 500 die fromwork-related diseases and 8 million suffer work-related injuries, many of which result in permanentdisability.118 Based on newspaper reports, the Bangladesh Occupational Safety, Health and EnvironmentFoundation estimates that at least five workers are killed and 20 are critically injured in their workplacesevery day. About 8 000 industrial accidents, including 20 to 40 fatal accidents, are annually reported tothe Department of Inspection for Factories and Establishments under the Ministry of Labour andEmployment (MOLE).119
Bangladesh’s existing Labour Law (2006) requires owners of industries and businesses to provideadequate facilities and implement standard operating procedures for sanitation and cleanliness,hazardous waste disposal, preventive maintenance of machineries and equipment, health and safety ofworkers including first-aid measures, and employee compensation for illnesses and injuries suffered inworkplaces. To bring about a more focused approach on the issues of occupational safety and health(OSH), the ILO under its Decent Work Country Programme (2006–2009) and in cooperation with the WHOprovided technical and financial support for the formulation of a national OSH policy.
116 USAID. 2010. Bangladesh Economic Growth Assessment, pp. 16-17.117 UNICO International Corporation; Software/ITES Industry in Bangladesh, February 2008.118 International Labour Organization, Bangladesh Decent Work Country Programme, (available at http://www.ilo.org/wcmsp5/groups/public).119 Bangladesh Occupational Health, Safety, and Environment Foundation, (available at http://www.oshebd.com).
46
Following an ILO subregional tripartite workshop on OSH in 2007, the Government constituted a NationalCouncil for Industrial Health and Safety, which is responsible for developing and implementing thenational OSH policy. A Government Technical Committee on National OSH Policy, headed by the MOLE,prepared a draft of the policy in 2008 and is currently seeking input through workshops in each ofBangladesh’s six divisions and at the national level. The revised draft will be submitted to the OSHCouncil. To inform the ongoing process to revise the Labour Act, the ILO and the WHO are supportinga study that will compare the Labour Act with the ILO’s OSH Conventions. The ILO will conduct activitiesto promote Bangladesh’s ratification of the ILO Occupational Safety and Health Convention, 1981(No. 155) and other OSH-related Conventions.
5. Government policy and legal frameworks
The legal framework of Bangladesh is not supportive of creating the enabling environment foragrobusinesses to remove impediments to growth and lower the costs of doing business. Current legalprocedure has loopholes that allow one to adopt delaying tactics and, as a result, the court faces a bigbacklog of cases. Existing labour laws are inadequate to discourage politicization of labour relations,which has been a major deterrent to investment.120
The World Bank in its Doing Business (DB) 2012 report121 ranked Bangladesh 122nd out of 183 countriesby the ease of doing business index. The country slid by four ranks compared to the 2010/2011assessment. The DB index is based on average performance on ten activities: starting a business, dealingwith construction permits, getting electricity, registering property, getting credit, protecting investors,paying taxes, trading across borders, enforcing contracts and resolving insolvency. The ranking on eachactivity is the simple average of the percentile rankings on its component indicators.
Enforcement of contracts is very weak in Bangladesh. On average, the process requires 41 procedures,1 442 days, and costs approximately 63.3 percent of the value of the contract. Bankruptcy proceedingsare relatively cumbersome in the country. To close a business requires four years and the recovery rateof firms that file to close their business is estimated at 25.8 percent. Bankruptcy law has recently beenenacted but its implementation is yet to be tested. Registration of property is also burdensome. Itrequires, on average, 8 steps, 245 days, and costs 6.6 percent of the total property value, which may posea hurdle to entrepreneurs seeking to use property as collateral for loans.
The country ranked dismally at the bottom (182nd) with respect to the getting electricity index. It requires7 steps, 372 days, and 3 526 percent of per capita income to get access to electricity. There are areas inwhich Bangladesh’s performance was better. The country ranked 86th in starting a business; 82nd indealing with construction permits; 78th in getting credit. Its performance was better in protectinginvestors, 24th compared to India’s 46th. With regard to copyright protection Bangladesh is covered by theTRIPS agreement, but local firms lack the knowledge of their rights and obligations. The Ministry ofIndustries has recently prepared draft legislation “Geographical Indication Act 2011” to strengthen IPRprotection.
The legal framework is an essential prerequisite for fostering competitiveness in national economies. TheWorld Economic Forum (WEF) defines competitiveness as the set of institutions, policies, and factors thatdetermine the level of productivity and uses the Global Competitiveness Index (GCI) as a comprehensivetool to measure macroeconomic and microeconomic foundations of national competitiveness. A totalof 111 indicators are used to measure GCI. These are grouped under 12 pillars that are aggregated intothree categories – basic requirements, efficiency enhancers, and innovation and sophistication factors– defining the competitiveness of the economy.
120 Bakht Zaid. Development of SME Sector in Bangladesh, (available at http://www.newagebd.com/newspaper1/special/36625.html).121 World Bank/The International Finance Corporation. 2011. Doing Business 2012: Doing Business in a More TransparentWorld.
47
The WEF in its 2011/2012122 report ranked Bangladesh’s performance on GCI as 108th out of 142 countriesand assigned a score of 3.7 on a scale of 1 to 7. It was a downgrade by one rank compared to the2010/2011 GCI assessment. Bangladesh’s rank on basic requirements (institutions, innovation, macro-economic environment, health and primary education) was 112; on efficiency enhancers (highereducation and training, goods market efficiency, labour market efficiency, financial market development,technological readiness, and market size) 99; and on innovation and sophistication (businesssophistication and innovation) 113.
Despite an overall low ranking on GCI, Bangladesh exhibited a higher competitive edge onseveral component indicators: strength of investor protection (rank 20); gross national savings as percentof GDP (33); business impact of rules on FDI (25); agricultural policy costs (13); hiring and firing practices(20); financing through local equity market (22); domestic market size index (41); state of clusterdevelopment in business (45).
The annual DB and GCI assessments provide important feedback to ongoing public-private initiatives tofocus on weaknesses so as to improve Bangladesh’s ranking in inter-country comparisons of competitivebusiness-friendly environments. One such initiative is the Bangladesh Investment Climate Fund (BICF),a multi-donor advisory facility, established in 2007 to advise the government on creating a betterbusiness operating environment that would design and implement business-friendly policies, laws, andregulations and strengthen institutions that implement them. The other is the government’s RegulatoryReform Commission (RRC) established to review and recommend elimination of redundant regulationsand streamline the existing regulations (USAID, 2010).
Policymaking is a key tool to address shortcomings in the regulatory framework. The major policiesrelevant for small and medium food enterprise development in Bangladesh are: National AgriculturalPolicy (NAP) 2010, and National Industrial Policy (NIP) 2010. The NAP envisages the government’s supportfor private entrepreneurs and farmers in sourcing technologies and creating conditions for expandinglocal and overseas markets for agribusiness opportunities. The NIP envisages tax holidays for newlyestablished industries in agroprocessing and reduction and exemption on special cases of VAT for agroand fisheries and dairy industry. It also outlines a broad framework of institutional support, refinancing,and other incentives for development of SMEs.
To simplify administrative procedures with regard to starting a business and getting access to physicalamenities, the NIP pledges the government’s commitment to establishing, operating, and sustaininga highly professional One-Stop Service Centre under the management of the Board of Investment (BOI).The Centre will be responsible for relieving prospective domestic and foreign investors fromtime-consuming bureaucratic tangles in getting access to electric power, gas, water, and telephone. It willbe staffed with a specialized Environmental Protection Unit with responsibility for providing approvalcertificates to industries that conform to environmental standards. The real challenge, however, lies inimplementing the NIP through developing specific administrative procedures and methods involving greaterinteragency and interdepartmental cooperation.
In Bangladesh existing food safety laws and regulations for the most part are outdated and theirenforcement responsibilities are scattered over 11 ministries and departments. This makes coordinationextremely difficult and effective enforcement of regulations weak. The country’s progress towardfollowing through FAO’s 2004 recommendations for a comprehensive food safety policy andstrengthening institutional mechanisms for enforcement remains inadequate.123 As described elsewherein this paper, major agro- and food processing companies and exporters have implemented modern foodsafety systems in their export supply chain and have received HACCP and ISO certification.
These efforts need to be mainstreamed in the entire domestic food supply chain. The government iscurrently implementing a European Union-funded three-year (2009–2012) project “Improving Food
122 World Economic Forum. 2011. The Global Competitiveness Report 2011-2012, Geneva, Switzerland, pp. 110–114.123 See http://www.fao.org/docrep/meeting/006/ad730e/ad70e00.htm.
48
Safety, Quality, and Food Control in Bangladesh (IFSQFCB)” under the Ministry of Health and FamilyWelfare with FAO’s technical assistance.124 The goal of the project is to develop food safety policies andstrategies, a preventive approach to food safety management, food inspection and enforcement services,food analysis capability and capacity. In order to make the outputs of project-based food safety initiativessustainable, there is need for a comprehensive institutional approach backed by national food safetylegislation, laws, and regulations for quality control of all types inputs including agrochemicals, feed, andmedicine.
Such an approach should ideally result in a unified food law with responsibility for enforcementdelegated to a single administrative authority. India overcame the same problems that Bangladeshcurrently faces with respect to food safety by passing an integrated food law, “the Food Safety andStandards Bill 2005” in August 2006. The bill unites diverse legislation under a single umbrella law andcreates a Food Safety and Standards Authority of India responsible for enforcement of the law (WorldBank, 2008). Such an approach provides a durable institutional basis for a modern and dynamic foodsafety control and administration system capable of meeting the present and emerging challenges insupplying safe raw and processed food for domestic consumption and export as the food processingindustry matures and increasingly participates in international trade in food and feed substances.
6. Status of national institutional infrastructure
Technology and innovation
Bangladesh boasts a significant scientific research capacity consisting of research institutions, laboratoriesand universities engaged in research, innovation, and technology development. The key institutionsengaged in industrial technology development with applications in agroprocessing, food processing andpreservation, food and animal feed manufacturing are the Institute of Food and Radiation Biology underthe Bangladesh Atomic Energy Commission, the Bangladesh Council for Scientific and Industrial Research(BCSIR) with its network of nine research laboratories and institutes including the Institute of FoodScience and Technology, the Institute of Appropriate Technology under the Bangladesh University ofEngineering and Technology (BUET), and the Bangladesh Industrial Technical Assistance Centre (BITAC).Agricultural Research Institutes are engaged in the development of post-harvest processing, storage, andprocessed food manufacturing technologies.
Agricultural mechanization units of the agricultural research institutes are also actively involved in designand development of a range of post-harvest processing, milling, thermal treatment and storagetechnologies. There are more than 40 000 small and medium-sized light engineering workshops in thecountry, a considerable technical support base for fabrication and manufacturing of locally developedand designed production and processing machineries and equipment.125
Bangladesh has a fairly developed infrastructure for agricultural research. The National AgriculturalResearch System (NARS) is a publicly-financed system of six research institutes concerned withcrop-related research, and one each concerned with soils, livestock, fisheries and forestry research witha countrywide network of 23 research stations, 70 substations and 13 specialized research centers withan exclusive focus on selected commodities. These institutes are under the administrative control of theMinistry of Agriculture, the Ministry of Fisheries and Livestock, the Ministry of Environment and Forests,and the Ministry of Commerce with their own budget and policy-making boards. An apex institution, theBangladesh Agricultural Research Council (BARC), coordinates, monitors, reviews, and evaluates researchin component research institutes.
At the time of writing this paper, the total manpower in the NARS was 5 856 including 1 514 trainedscientists against a sanctioned staff of 6 890 including 1 913 trained scientists. The concept of integration
124 See http://www.bdsafety.org/inner.php?SubMenuld=23.125 Kabir, W. & Ahmed, S. 2005. Status of Research and Development Institutes of Agricultural Engineering in Bangladesh.Paper presented at the 4th session TC/GC meeting of APCAEM held during 21–24 November 2005, New Delhi, India.
49
of the agriculture research institutes into a system under the leadership of BARC is yet to deliver thedesired effectiveness and efficiency in research and technology development because of failure toproduce a suitable mechanism for BARC to exercise meaningful administrative and financial control overthe NARS institutions that with varying levels of autonomy in decision-making remain under effectiveadministrative control of their respective parent ministries. This brings to the fore a crucial issue ofgovernance in NARS with respect to fostering effectiveness and efficiency in the system, namely thatinserting an umbrella organization at the top for coordination with little meaningful integration at thebottom backed by adequate administrative reforms is unable to produce the desired results.
Agricultural research is also conducted in agricultural universities, agriculture and life sciences facultiesof regular universities, and in the private sector. Academic research is poorly integrated with themainstream research system. More recently, several seed companies have initiated their own programsof scientific breeding in partnership with international agricultural research centers.
The publicly-funded extension service in the agriculture sector is also involved in technologydevelopment and innovation through testing, refinement, adaptation, and transfer to primary producers.It is comprised of the Department of Agricultural Extension (DAE), the Department of Fisheries (DOF),and the Directorate of Livestock Services (DLS). The DAE under the MOA is responsible for transfer/extension of crop-related technologies. It employs some 24 000 staff with a total field-level staff of10 280 sub-assistant agricultural officers. The DOF under the MOFL is responsible for extension, training,conservation, and enforcement in the fisheries sector. It employs a total staff of about 5 000 including1 553 professionals, 2 000 sub-professionals, and 2 000 support staff. The DOF facilities include three fishinspection and quality control stations, a marine fisheries station, a fisheries training centre, two farms,and 77 hatcheries. The DLS, also under the MOFL, is responsible for the provision of animal health,training and extension services in the livestock subsector. It employs about 8 428 staff including about1 500 technical staff and 3 500 sub-technical staff. The DLS facilities include five laboratories, threetraining institutes, one cattle breeding station, and seven farms.
The private sector in Bangladesh is steadily emerging in the role of extension service provider (ESP). Thekey players are major NGOs such as BRAC, Proshika, and Caritas. BRAC now has a broad-based extensionprogram involving 250 agriculturists and 8 903 agricultural extension workers in 64 districts ofBangladesh. Through its 136 320 village organizations, 500 000 small and medium farm families receiveregular advice and services in agricultural activities.
The private organizations have started to feature only recently as ESPs and are largely composed of inputsupply companies producing and/or marketing seed, irrigation/farm equipment, fertilizers, pesticides,hatcheries, feed and veterinary products. Extension advice is usually tied with product sale. Theseorganizations, with some exceptions, e.g. pesticide companies, provide minimal after sale support.
The level of government funding for agricultural research is low despite increases in recent years. Totalspending for agricultural research as a share of agricultural GDP was 0.80 percent in 2010/2011compared to 0.22 percent in 2004/2005. But agricultural research is receiving a lower priority than itactually deserves in the government’s spending portfolio for the Ministry of Agriculture. In 2010/2011,only 38.9 percent of resources under the government’s annual development program earmarked for theMinistry of Agriculture was allocated to NARS institutions compared to 62.7 percent allocated to theDepartment of Agricultural Extension. The reverse should have been the case as this would have allowedSARS to step up efforts toward building an indigenous research and technology base to support rapidgrowth in the agro-industrial sector.
Significant capacities for innovation and dissemination of agricultural technologies have been developedin the private sector. The key players in this field are large seed companies with a sprawling program ofcrop breeding in cooperation with international agricultural research centers, large NGOs, for exampleBRAC, and industry organizations, particularly the Horticulture Export Foundation, Bangladesh ShrimpFoundation and Bangladesh Frozen Food Exporters’ Association.
50
Commercially-oriented research and development
The BCSIR has so far innovated 908 process technologies of which 273 are concerned with processingand manufacturing of food and animal feed including drinks, beverages, and carbonated drinks fromlocally produced raw materials. Of these technologies 70 are patented in Bangladesh and licensed forcommercial production.126 The Bangladesh Agricultural Research Institute has developed 14 post-harvestprocessing, storage, and processing technologies of fruits and vegetables for extended shelf life.127 Butthe indigenous technology base for agroprocessing, food processing, and food manufacturing is notadequate to meet the growing need for innovative process, storage, transportation and packagingtechnologies for a rapidly expanding food processing industry in the country. Sourcing the global marketand facilitating access to innovative technologies is one way to meet the technology needs in enterprisedevelopment.
For small and medium enterprises, the SME foundation and BSCIC promote access by assistingcompanies in sourcing innovative technologies, and creating institutional links with foreign companiesfor technology transfer and capacity building. The new industrial policy envisages a number of measuresfor accelerating industrial technology development. These include government’s support for university,technology institutes, laboratories, and private sector investors to establish Technology IncubationCentres (TIC) to facilitate development of technology entrepreneurs and allocation of space for successfulentrepreneurs in the high-tech park equipped with all infrastructural facilities. Other measures includesteps toward protection of intellectual property rights consistent with the TRIPS agreement of WTO toencourage innovation and transfer of modern technologies.
Financial and fiscal systems
The financial system of the country is dominated by commercial banks. Four state-owned commercialbanks (SCBs) hold 28.6 percent of deposits and account for 46.8 percent of bank branches operating inthe country.128 There are also five publicly-owned specialized banks or development financial institutions(DFIs) that manage extensive subsidized credit programs characterized by a high-ratio of non-performingto total loans (24.6 percent) and low levels of efficiency. Additionally, a dynamic group of 39 privatelyowned commercial banks (PCBs) including nine foreign-owned banks has expanded activities. Thesebanks generally have a lower level of nonperforming loans (2.4 to 3.7 percent), higher efficiency and haveexperienced the fastest growth in the banking sector, benefiting from the liberalization of the sector inthe 1990s. The assets of these banks constituted 64.5 percent of the total banking sector assets in 2010.There are also 29 non-bank financial institutions (NBFIs) and 298 microcredit organizations licensed bythe Microcredit Regulatory Authority (MRA).
SME loans account for roughly 18 percent of total credit in Bangladesh. In September 2009,approximately BDT 425 billion in SME loans was outstanding. The bulk of SME loans are from the publicsector banks often under mandated and subsidized credit programs, as is the case for agriculture. TheBangladesh Bank refinances a considerable proportion of this SME lending. Privately owned banks alsoaccount for about a quarter of these loans, whereas nonbank financial institutions account for 14 percent(USAID, 2010).
The IMF in its Financial System Stability Assessment in 2009 highlighted the steadily improved soundnessof the country’s financial sector since the 2003 assessment. Nonperforming loans in the banking systemhave decreased steadily since 2003 and the stated capital position of the banks has strengthened. Amongthe weaknesses and vulnerabilities identified, the major ones related to loan classification, provisioning,and uneven capital in the banking system. The stress tests conducted suggest credit risk continues tohave a larger impact relative to other single factor shocks129 (IMF).
126 See http://www/bcsir.gov.bd/accepted.php.127 See http://www.bari.gov.bd/index.php?option=com_advanced.128 As of June 2010, Bangladesh Bank, (available at http://www.bangladesh-bank.org).129 International Monetary Fund. 2010. Bangladesh Financial System Stability Assessment 2009, IMF Country ReportNo. 10/38, Washington, D.C.
51
The National Board of Revenue (NBR) is at the apex of the country’s fiscal system. It is responsible formobilizing domestic resources through the collection of import duties and taxes, VAT, and income taxfor the government. The NBR administers the excise, VAT, customs and income tax services with itssanctioned staff capacity of 3 434 officers of various grades and 10 195 support service personnel.130
Between 1982 and 2010, the total revenue as share of GDP increased from 6.5 percent to 11.2 percentand tax receipts as share of GDP rose from 5.5 percent to 9.4 percent. The tax-GDP ratio is significantlylow compared to the average 12 percent share of tax revenue in GDP in South Asian countries.Notwithstanding various fiscal reforms of the recent past, the Bangladesh fiscal system continues to sufferfrom weaknesses, namely a low level of revenue mobilization, regressive nature of taxation, high taxincidence, low tax base, high degree of tax evasion, limited administrative capacity, resource constraints(human and logistics), and cumbersome legal procedures.131
Human resource capacity
The national capacity for human resources development in Bangladesh draws its strength from thepublic sector education system. Government spending in the education sector in 2010/2011 was BDT98.24 billion, which constituted 7.43 percent of the national budget.132 To achieve its goal in theeducation sector, the government has adopted policies – the Non-Formal Education Policy of 2006, theNational Training Policy of 2008 and the National Education Policy of 2010.
The Ministry of Education (MOE) with its constituent technical and administrative departments isresponsible for administration of the public sector education system. In addition, the University GrantsCommission (UGC), a statutory apex body, provides regulatory, technical, financial, and quality controloversight of the public sector university education system, one of the highly subsidized higher educationsystems in South Asia. The UGC has also brought under its regulatory oversight the sprawling networkof private universities to ensure appropriate infrastructure, faculty strength, academic curriculum, andquality of education.
There are at present 31 publicly-funded universities in Bangladesh including 16 specialized universities.Four are agriculture universities, six are science and technology universities, five are engineering andtechnology universities, and there is one veterinary and animal science university.133 The Directorate ofTechnical Education (DTE), under the MOE, is responsible for training and skills development in a varietyof modern industrial technologies and professional trades through its network of 122 Technical andVocational Education and Training (TVET) institutes. The TVET system is comprised of five institutesoffering degree programs, 49 institutes offering diploma courses, and 68 offering trade certificates.In addition the DTE provided technical assistance in introducing professional trade courses in500 privately-run secondary schools, 200 higher secondary schools, and 300 self-supported private skillsdevelopment centers.
Besides the Ministry of Education, there are other organizations involved in the development of humanresources capacity. These are other public sector organizations belonging to different ministries,commercial training institutions in the private sector, NGOs, particularly BRAC running a five-tier systemof non-formal schools and training programs, and institutions managed by industry where training isdelivered in the workplace, including apprenticeships.
In the agriculture sector, training for officers, extension staff and farmers is conducted by the NationalAgricultural Training Academy and 11 training institutes under the DAE, 8 training institutes under theDOF, and 3 training institutes under the DLS. Training for scientists in NARS is conducted by BARC within
130 See http://www.nbr-bd.org/131 Rahman, M. 2010. Fiscal Reforms in Bangladesh: Evolution and Future Initiatives. Paper presented at the Workshop onCollaborative Research on South Asia Tax Systems. Singapore, 8-9 August, 2010.132 Compiled from Education Budget, (available at http://www.moedu.gov.bd/).133 See http://www.ugc.gov.bd/
52
a framework of strategic planning for human resources development for agricultural research. Trainingfor senior-level management in public administration, banking and finance are conducted by theBangladesh Public Administration Training Centre, Bangladesh Institute of Management, and theBangladesh Institute of Bank Management. The Small and Cottage Industries Training Institute (SCITI)conducts training courses for management in the small business sector.
To modernize the country’s human resources development capacity in keeping with the rising demandfor sophistication, specialization, quality and relevance of technical education to industry needs, thegovernment has formulated a National Skills Development Policy (2009) with assistance provided by theILO and the European Union. The policy proposes a three-pronged approach for building the country’sskills development system: the National Technical and Vocational Qualifications Framework (NTVQF);Competency Based Industry Sector Standards and Qualifications; and the Bangladesh Skills QualityAssurance System.
The government’s ongoing policy initiatives and structural transformation of the education sector isdriven by the need to address the puzzling reality of the country’s education system. The design of thecourses and curricula in the technical stream of specialized university education is heavily orientedtoward acquiring traditional scientific knowledge rather than acquiring practical skills with a problem-solving approach for effective performance in challenging workplaces in a modern industrial setting. Theresult is an abundant supply of university and college graduates, but few with the right skills andknowledge to work in highly-demanding and performance-oriented jobs in the private sector. And theshortage of a quality labour force limits the performance of the public sector, too. The private sectorseems to fill the gap by hiring expatriates, whereas the public sector does not have that option. Majorbusinesses, particularly export-oriented firms hire expatriates for high-level management and technicalpositions. As many as 200 000 professionals from Pakistan, India, and the Philippines fill seniormanagement or technical jobs in Bangladesh (USAID, 2010). The private sector shrimp hatcheries seemexcessively reliant on foreign experts and the lack of qualified technicians in the poultry sector is alsoa major drawback in terms of delivering effective services to SMEs.
The draft National Industrial Policy recognizes the contemporary challenges in developing a skilledworkforce to fuel the country’s economic growth. It recommends a seven-point strategy for investmentin skills development, including a Corporate Leadership Development program to foster and nurturea corporate and entrepreneurial culture. It also envisages making the training activities under thedifferent ministries focused on human resources development in the industrial sector more dynamic andeffective.
Marketing strategies
The agricultural marketing system of Bangladesh serves over 10 million farm households widelydispersed throughout the country. Farm households are small in size and have very small quantities ofmarketable surplus. The farmers generally sell their produces from their homes or in the nearest ruralprimary/assembly markets. Marketing of the agricultural products in Bangladesh typically involvesa number of intermediaries such as small traders, assembly traders, wholesalers/commission agents,retailers and consumers. The participation of a large number of marketing agents makes the marketingsystem competitive for most commodities.
Marketing strategies are focused on improving market infrastructure, building market-related knowhow,exploring overseas markets for promotion of exports, and providing institutional support and incentivesto local entrepreneurs.
Market-related know-how involves building capacity for market research and intelligence, developmentof market information systems and effective value chain linkages among commercial stakeholders suchas farmers, traders, processors, and business service providers. The Department of Agricultural Marketing(DAM), the public sector agency responsible for providing agricultural marketing services, is engaged indeveloping a user-friendly web-enabled information system to collect commodity prices from local retail
53
and wholesale markets on a daily basis, compile, process, and analyze data to make short-term and long-range price forecasts and trends and make the information available for use by farmers, traders,government officials and other stakeholders.
For small farmers with limited access to computers and the Internet, the DAM has developed a mobilephone-based agricultural market information system (AMIS) in cooperation with a local softwarecompany with assistance provided by SIDA and a Swedish university. From the AMIS server, data istransmitted to a wireless carrier and delivered as SMS to phone users. There are now 16 million mobilephones in operation and these are being increasingly used in rural villages. There are now 122 000 villagecell phone women who have the potential to connect poor farmers to a market price information system.
Industry organizations, such as Hortex Foundation, BAPA, and BFFEA support export-oriented foodenterprises with market research to identify particular segments/niches of the export markets so thatthey can tailor product quality for a particular group of customers and design a promotional strategyfor that group. Value chain linkages often do not exist or when they do, the management of value chainlinkages is poor. Contract farming is one way to strengthen market linkages by directly entering intocontract with the purchaser to produce and supply agricultural commodities at predetermined pricesin return for production support (input supply, technical advice, and credit). There are already manysuccessful examples of contract farming in Bangladesh.
Safety, quality and consumer protection
The Bangladesh Standards and Testing Institution (BSTI), under the Ministry of industries, is the publicsector agency tasked with setting standards, issuance of certification marks, conducting surveillance andtesting across multiple industry sectors. It enforces conformance to safety and quality standards throughundertaking inspections and surveillance operations with the help of mobile courts consisting ofmagistrates and law enforcement personnel from general administration to dispense on-the-spotpenalties for non-compliance and gross violation of safety laws. To enhance the capacity and capabilityof BSTI, the new industrial policy envisages extending its institutional coverage in different areas,developing its technical capacity, and appointing more skilled professionals in different technicalactivities. In the agriculture sector, the government’s initiatives in quality assurance will be reflected inpromotion of GAP in production and supply chain management, compliance with SPS measures duringproduction, processing, and marketing, and strengthening quarantine services to meet the needs of bothdomestic and export markets (NAP).
Apart from the BSTI, there are other public sector organs belonging to eleven different Ministries thatconduct standard setting, certification, and control functions with respect to specific segments of thefood production and processing industry. In the private sector, many processors and entrepreneurs haveadopted modern proactive food safety and quality control systems based on GAP, GMP, and HACCP intheir export supply chain and have ISO certifications.
Bangladesh Accreditation Board (BAB), a statutory body established in 2006, is the national authority foraccreditation in Bangladesh. It is responsible for upgrading quality assurance infrastructure andconformity assessment procedures in Bangladesh and enhancing the recognition and acceptance ofproducts and services in international, regional, and domestic markets. To step up efforts onenhancement of quality and product standardization, the new industrial policy requires the Ministry ofIndustry and the National Productivity Organization (NPO) to actively promote the adoption of ISOstandards of certification particularly the ISO 9000 family of standards for quality management of theenterprises.
Bangladesh adopted the Consumer Rights Protection Act in 2009. The stated purpose of the law is toprotect the rights of consumers and take necessary preventive measures against actions that violateconsumers’ rights. The law provides for the establishment of a National Consumer Rights ProtectionCouncil chaired by the Minister in charge of the Ministry of Commerce as a policy-making body toprovide guidance and coordinate all activities to protect consumers’ rights, and District Consumer Rights
54
Protection Committees chaired by the District Commissioner. The law also envisages the establishmentof a National Consumer Rights Protection Directorate led by a Director General with adequateadministrative authority including the authority to issue arrest warrants in order to implement theprovisions of the law.
The rights of the consumers to be protected under the law include: (1) the right to be sheltered againstthe promotion of merchandise and services that pose a risk to life and possessions; (2) the right to beinformed about the quality, quantity, energy, purity, standard and price of goods and services so as toprotect the consumer against unfair trade practices; (3) the right to have access to a mixture of goodsand services at competitive prices; (4) the right to be heard and to be confident that consumers’ interestswill receive due consideration at correct forums; (5) the right to seek out redress for inequitable tradepractices/restrictive trade practices or unprincipled operation of clients; (6) the right to consumeredification. In the private sector, the Consumers’ Association of Bangladesh is the national organizationtasked to create mass awareness and protection of consumers’ rights.
7. Status of industrial infrastructure
Power, transport, and communication
Electricity generation in Bangladesh significantly lags behind the demand and is a major constrainton accelerating the country’s economic growth. The contribution of electricity to GDP in 2009/2010 was1.32 percent, almost the same as it was in 2002/2003 (1.30 percent) despite a 3.96 percent annualcompound growth rate in electricity generation between 2001 and 2010.134
Currently, 49 percent of the total population has access to electricity and per capita generation is only236 kWh, which is very low compared to other developing countries. As of June 2011, three utilities inthe public sector had an installed generation capacity of 3 534 MW (53 percent) and five utilities in theprivate sector 3 193 MW (47 percent) with a total installed capacity of 6 727 MW. The actual generationof power was in the range of 4 600 to 4 900 MW against a peak demand of 6 000 MW (with so-calleddemand side management) and up to 1 000 MW of load shedding during hot summer days. The networkof transmission lines is 8 500 km and that of distribution lines 270 000 km.135 In addition to the powersystem’s limited coverage, load shedding and erratic power supply was found to reduce industrial outputby about USD1 billion and GDP growth by about 0.5 percent a year.136
To bring about sustained improvement in the power sector, the government has drawn up an ambitiousmix of policy, incentives, and security mechanism for attracting private investment including FDIalongside assistance from the country’s development partners. The government’s medium termeconomic targets (2013) envisage boosting electricity supply to 7 000 MW and long-term economictargets (2021) to 20 000 MW. At present, 26 power generation and four transmission projects are atdifferent stages of construction to fulfill the targets of power generation and extension of powercoverage.134
The shortages of electricity supply are not only because of inadequate technical capacity for powergeneration but, to large extent, also because of poor governance of the power sector resulting in poorquality of power supply, weak financial management and regulation, and large payment arrears of thepower utilities. The Bangladesh Power Development Board (BPDB), the main public sector agency inpower generation, is a loss-making enterprise with a growing trend of annual increase in losses. Itincurred a loss of BDT14.15 billion in 2009/2010. The total debt service liabilities of the six governmentand semi-government utilities in the power sector to the government constituted a staggeringBDT421.72 billion (USD6.02 billion) as of 30 June 2010.137
134 Author’s calculation based on data from the Bangladesh Power Development Board, (available at http://www.bpdb.gov.bd).135 Azad A.K. 2011. Bangladesh’s Power Sector: Investment Opportunities, (available at http://www. usea.org/USEA_Events/Bangladesh_Briefing_July_2011).136 Economic Policy Paper on Cost of Doing Business in Bangladesh, (available at http://www.dhakachamber.com).137 Statistical Appendices, Bangladesh Economic Review (2010), (available at http://www.mof.gov.bd/en/index.php?option=com_content&view=article&id=229&Itemid=1).
55
The well-known “system loss” plaguing the power sector results primarily from theft of power from thenational grid through illegal connections and underbilling facilitated by collusion between utilityemployees and consumers. The official data indicate that the system loss has decreased from28.4 percent in 2000/2001 to 15.9 percent in 2009/2010 because of improvement in the managementof the power distribution system. Yet the existing system loss is a substantial drag on governmentfinances, draining funds away from other uses that could accelerate growth and poverty reduction. Todeal with erratic power supply from the national grid many businesses are forced to install their ownpower generators, but at great expense. On average, these generators cost more than USD20 000 topurchase and 50 percent more per kWh to operate than the price of power from the national grid.135
The road transportation network in Bangladesh consisted of 20 948 km of paved roads as of 2010 builtby the Roads and Highways Department (RHD) under the Ministry of Communication. This included3 478 km of national highway, 4 222 km of regional highway, 13 248 km of feeder roads. To connect theroad network interrupted by the river system, the RHD operates 153 ferry boats at 60 transfer points.138
The Local Government Engineering Department, the public sector agency responsible for ruralinfrastructure development, has built a network of 64 691 km of unpaved and 70 622 km of paved ruralroads including 9 82 658 km of bridges and culverts as of 2010.139 The Bangladesh Road TransportAuthority (BRTA) is the government’s regulatory agency responsible for issuance of vehicle registrationand fitness certificates, driving license, improvement of road safety and performance of other controlfunctions as per the Motor Vehicle Ordinance.
The existing road infrastructure and management of vehicular traffic has reached its limit inaccommodating a rapid increase in passenger and freight traffic in recent years. To build additionalinfrastructure, the RHD initiated in 2009/2010 a total of 119 investment projects at a cost ofBDT23.1 billion. The other major infrastructure project is the construction of a 6.15 km long bridge acrossthe river Padma at a cost of USD2.97 billion.140 When completed, the bridge will connect 19 districts ofthe southwestern part of the country with the eastern part, including the capital, leading to thedevelopment of an integrated transportation network in Bangladesh.
Inadequate transport infrastructure, inefficient traffic management, and a swelling population createda nightmare for road traffic in the capital city Dhaka in recent years. Navigating through the trafficgridlock in the city and moving people, goods, and services to reach destinations on schedule hasbecome a herculean task. In efforts to improve the situation, the government has created the DhakaTransport Coordination Board (DTCB) to improve transport infrastructure facilities and trafficmanagement and prepare a long-term transport development plan. As part of this effort, thegovernment has completed preparations for the initiation of a 26 km long Dhaka Elevated Expresswayproject on public-private partnership basis that will be implemented through build-operate-transferprinciple. A feasibility study is being conducted to build a metro rail system in Dhaka city.
The Bangladesh Railways (BR), a government agency under the Ministry of Communication, is responsiblefor running and maintaining the railroad transportation system in the country. The rail infrastructurecurrently consists of 2 835 route km of railway tracks, including 659 km of broad gauge tracks, 1 801 kmof metre gauge tracks, 375 km of dual gauge tracks, 279 diesel locomotives, 1 455 passenger coaches,31 other coaches, and 8 992 wagons.141 Despite the cost-effectiveness and environment-friendliness ofrail transportation, poor governance, political meddling in its affairs and underinvestment in the pastrendered the BR a loss-making enterprise. Notwithstanding a modest increase in passenger traffic inrecent years, the volume of freight traffic has recorded a negative growth.
To modernize railway communication, the government has approved 28 new projects in the past twoyears including five projects for expansion of rail network by 454.6 km to connect the emerging growthcentres and the Mongla sea port, and 12 projects against an Indian credit line for beefing up the rail
138 Department of Roads and Highways, Ministry of Communication, (available at http://www.rhd.gov.bd/).139 See http://www.lged.gov.bd/).140 Calculated from the revised annual development programme (2010-2011).141 See http://www.railway.gov.bd/).
56
infrastructure through procurement of locomotives, coaches, different categories of railway wagons,construction of additional bridges, modernization of the signalling system and maintenance workshops.The government has also plans for doubling Dhaka-Chittagong railway corridor connecting the capitalwith the main port city.
The government with technical assistance from ADB is engaged in transforming the BR into a profitablemarket-oriented enterprise though administrative, managerial and financial reforms. As part of this effort,the Bangladesh Railway Authority (BRA) has been formed and the workforce has been trimmed from58 000 to 28 282. Other steps include growing involvement of the private sector in different activities ofrail management, traffic fixation on commercial principles, and closure of loss-making functions andservices. Bangladesh signed the “Intergovernmental Agreement on the Trans-Asian Railway (TAR)Network”. Steps have been taken to establish the Trans-Asian Railway Network and regional/subregionalconnectivity in Bangladesh.
The country’s water transportation system is comprised of inland water transportation, maritimetransportation, and handling of incoming and outgoing cargo through the seaports. The Chittagong PortAuthority (CPA) is responsible for administration and management of the Chittagong port, the mainseaport that handles about 92 percent of the country’s maritime trade. The average turnaround time ofvessels in the port was 5.15 days in 2009/2010 compared with two days in Bangkok and one day inSingapore; waiting time of ships 2.75 day, and service time of ships 4.78 days.142 Against this overallperformance, a recent research study aimed at evaluating operating performance of 69 major Asiancontainer ports ranked the Chittagong container port as the most efficient one with a super-efficiencyscore of 0.219 and assigned it the topmost rank among the top twelve performers.143 This finding comesas a surprise to local businesses that usually complain about delays and cargo handling inefficiency atthe Chittagong port. But it is likely that recent efforts in automation, infrastructural development andport management are producing results in terms of overall performance improvement. The BangladeshShipping Corporation is the state-owned organization responsible for providing shipping services forinternational sea trade. It operates a fleet of 13 vessels shifting 6 to 7 percent of the country’s exportsand imports.
The Bangladesh Inland Water Transport Corporation (BIWTC) is the largest commercial service-orientedinland water transport authority in the public sector operating 189 river transportation vessels andproviding ferry services.144 The Bangladesh Inland Water Transport Authority (BIWTA) is the regulatorygovernment agency responsible for providing infrastructure facilities for river transportation,development of waterways, maintaining navigability and providing essential services in 6 000 km ofwaterways in the monsoon and 3 800 km in the dry season. The government’s major investment projectsto upgrade inland water transport infrastructure include: capital dredging for 53 river routes, introductionof circular waterways around Dhaka city; construction of an inland container terminal to ease congestionat Chittagong port; and rehabilitation and reclaiming of the Buriganga and Turag rivers flowing aroundthe city of Dhaka from widespread human encroachment and environmental pollution.145
Bangladesh’s air transportation infrastructure is comprised of three international and five domesticairports. The Civil Aviation Authority of Bangladesh (CAAB), a public sector organization under theMinistry of Civil Aviation and Tourism, is responsible for building and maintaining airports, controllingair traffic and air navigation, installing telecommunication services and providing other facilities for thepassengers. Biman Bangladesh Airlines, popularly known as Biman, is the state-owned national carrierthat operates a fleet of 12 aircrafts flying passengers and cargo to 18 destinations in Asia and Europe.146
142 Chittagong Port Authority. 2011. Port Performance Indicators, (available at http://www.cpa.gov.bd/).143 Muniswami, S. & G. Singh. 2011. Benchmarking the efficiency of Asian container ports. African Journal of BusinessManagement, Vol. 5(4): 1397–1407.144 See http://www.biwtc.gov.bd/function.php145 See http://www.biwta.gov.bd/146 Ministry of Civil Aviation and Tourism, (available at http://www.mocat.gov.bd/).
57
In the private sector there are ten airlines that operate flights in domestic, regional, and internationalroutes. Biman subsidizes the export of fresh and processed food by offering a special inducement price(SIP) to local agroprocessors and exporters in airfreight.
The Bangladesh Telecommunications Regulatory Commission (BTRC), an independent statutory bodyestablished under the Telecommunications Act 2001, is responsible for regulating the development ofthe telecommunications sector in the country. The Bangladesh Telecommunications Company Limited(BTCL) is the provider of telecommunications services in the public sector and is operating theinternational telecommunications system. Bangladesh has formally been connected with the informationsuper highway through a submarine cable since May, 2006. International voice circuits have beenincreased by more than 200 percent. An international private leased circuit has been opened with thecooperation of different companies. BTCL has an Internet connection with Singapore, France and Italythrough 12 X STM-1. The router capacity of BTCL has been enhanced through upgrading the digital datanetwork. Access networking through copper cable, optical fibre, x-DSL, and Wi-MAX is being processedto bring broadband connectivity and other facilities of the submarine cable system to the door-step ofthe subscribers.147 The mobile phone sector is served by five private companies – Grameen phone, Robi,Banglalink, Airtel Bangla, Citycell – one state-owned company – TeleTalk.
The number of mobile subscribers in the country as of 2010 was 68.6 million and fixed phone subscribers1.10 million with a total of 69.7 million people having access to telecommunications services. Between2005 and 2010, mobile phone services expanded at an annual rate of 43.9 percent pushing theavailability of telephone lines to about 47.8 for every 100 people in the country.148
Water
Basic infrastructure for the supply of piped water to the majority of the population, businesses, andindustries is in place. Furthermore, sanitation and stormwater drainage are in place in four major citiesand their suburbs. Water Supply and Sewerage Authorities (WASA), public sector utilities under theMinistry of Local Government, Rural Development and Cooperatives, are responsible for water supply inthe cities of Dhaka, Chittagong, and Khulna. Water is supplied from both groundwater and surface watersources. In the city of Dhaka, water supply by Dhaka WASA is heavily dependent on groundwater (about88 percent of the supply as of June 2011) and four surface water installations including one watertreatment plant play a secondary role (12 percent of the supply). Groundwater is abstracted from586 deep tube wells (DTWs).149 There is little progress toward developing bulk supplies from surfacewater systems as proclaimed in the National Water Management Plan (2004) to meet the rising demandfor water in the Dhaka metropolitan area because of rapid population growth and industrialization.
Dhaka WASA provides safe water supply to about 75 percent of the population in Dhaka. The numberof people who receive piped water in their homes is estimated to be 5.5 million, of which 75 percentobtain 24-hour supply and 25 percent an intermittent supply. Another 500 000 have access to pipedwater via stand posts. An additional 3 million people who live in slums obtain the bulk of their supplyof water from the DWASA pipe network.150 Close to three million people who live in large privateapartment blocks, commercial entities and industries derive water from their own DTW-based systems.
There were about 654 privately-owned DTWs in operation in 2010 which pay WASA a fee. Otherimportant water infrastructure includes embankments for protection from floods, sewerage of wastewater, and drainage of stormwater. Flood protection embankments, polders, and dykes are built andmaintained by the Bangladesh Water Development Board and Local Government EngineeringDepartment, two major public sector institutions tasked with the construction of physical infrastructureimpacting water resources and related environmental management.
147 Transport and Communication Sectors, Bangladesh Economic Review (2010), (available at http://www.mof.gov.bd/en/index.php?option=com_content&view=article&id=229&Itemid=1).148 Bangladesh Telecommunication Regulatory Commission, (available at http://www.btrc.gov.bd/).149 MIS Report, Dhaka Water Supply and Sewerage Authority, (available at http://www.dwasa.org.bd/).150 Asian Development Bank. 2005. Technical Assistance to the People’s Republic of Bangladesh for preparing the DhakaWater Supply Project, TAR: BAN 39405.
58
In other parts of the country, the Department of Public Health Engineering (DPHE), under the Ministryof Local Government and Rural Development, is responsible for the provision of water supply andsanitation services in cooperation with other organs of the local government – city corporations andmunicipalities in cities and towns and union councils in rural areas. Water is supplied through small-scalepiped water systems and hand tubewell-based potable drinking water systems. The NWMP has set thegoal of bringing piped water supply to 90 percent of households in towns and to 40 percent in ruralareas by 2025 with increased private sector participation in water supply systems.
The major issue in water supply infrastructure, particularly in Dhaka city, is overexploitation ofgroundwater that has caused severe groundwater mining and continuous falling of groundwater levels.Because of the falling water tables and erratic electricity supply, the existing DTWs cannot operate attheir full capacity leading to serious water shortages in the dry season. The quality of water is poorbecause of cross contamination of water resulting from leaks in old distribution lines with wastewatercoming from old and dilapidated sewerage pipes and storm drains. The efficiency and profitability ofWASA as a service providing organization is seriously constrained because of unauthorized connections,leaks in the system, inadequate operation and maintenance, poor quality of metering and meter reading,and underbilling.
To improve infrastructure and management in water supply, the government undertook16 infrastructural projects that were at different stages of implementation during 2010/2011, includingeleven projects by Dhaka WASA; four by Chittagong WASA, and one by Khulna WASA at an investmentcost of BDT 76.2 billion. The development partners in the existing water sector development projects arethe ADB, the World Bank, and DANIDA. These projects were concerned with: construction of watertreatment plant for surface water systems; rehabilitation and expansion of water supply lines withimproved monitoring system for water quality; enhancing the policy framework for improved physicalcondition of the water supply system; installation of stormwater pumping stations; rehabilitation ofcanals to help improve drainage and minimize urban flooding; rehabilitation, repair, and expansion ofthe sewerage network and treatment plant to help improve the urban environment; improving drainageand minimizing temporary urban flooding; construction and rehabilitation of sewerage network; andconstruction of sewage treatment plant. In addition, eight investment projects were underimplementation during 2010/2011 by DPHE at a cost of BDT243.65 billion. These projects were concernedwith water supply and sanitation in other cities, towns and pilot projects for supply of piped water inrural areas.151
In relation to infrastructure development for meeting the growing demand of water by industries, theNational Water Policy envisages zoning regulations for location of new industries in consideration of freshand safe water availability and effluent discharge possibilities. The new Industrial Policy considersinstituting a land-satellite based system to map the land and water terrains in Bangladesh with a viewto deciding allocation of land and water resources for industrial projects and to monitor land and wateruse.
Land
Land is a scarce resource in Bangladesh and competition for access to it is intense among its users – cropproduction; fisheries and livestock; housing and settlement; building of physical infrastructure such asroads, highways, bridges, embankments; and commercial activities including industries and businesses.The total land area of the country was 13.02 million hectares in 2009, of which the agricultural areaaccounted for 9.15 million hectares; arable land and permanent crops 8.55 million hectares; fallow land0.61 million hectares; forest area 1.44 million hectares, and other land 2.42 million hectares.
The Ministry of Land is in charge of land administration and land management in Bangladesh. It isresponsible for land acquisition, collection of land development tax, conducting land surveys, overseeing
151 Compiled from the revised annual development program (2010-2011), (available at http://www.planncom.gov.bd/).
59
land use planning, implementing land reforms; and managing government land developmentprograms. The Department of Land Registration under the Ministry of Law, Justice, and ParliamentaryAffairs records land transactions and collects the immovable property transfer tax. The CapitalDevelopment Authority (RAJUK) is responsible for development, planning, and land use management inDhaka city.
The government introduced a land use policy in 2001.152 One of the major objectives of the policy is tointroduce the concept of land zoning to ensure the best possible use of land according to its suitability.The policy also seeks to introduce legislation to ensure compliance of zone-specific use of land uponcompletion of the task of assignment of different activities to specific land zones. Currently a land zoningproject is under implementation in 19 districts of the coastal area to designate land zones for shrimpculture, agriculture, forestry and livestock, nature reserves and industrial development.
The complex and multilayered land administration in the country makes acquisition of land one of thegreatest hurdles for prospective entrepreneurs to establish their businesses and industries. As statedabove, registration of property by businesses involves eight procedures, consumes 245 days and entails6.6 percent cost of the property value. Being aware of this reality, the government institutions responsiblefor promotion of industrialization – the BSCIC, the Board of Investment, the Bangladesh Export ProcessingZone Authority (BEPZA) – have assumed the responsibility of land acquisition and other supportmeasures to ensure investors have instant access to suitable land plots and other physical amenities. TheMinistry of Industries introduced in 2010 regulatory guidelines to streamline the procedures for allotmentof industrial plots to prospective entrepreneurs in new or existing BSCIC estates.
Environmental protection
The concern for environmental protection lies at the core of Bangladesh’s physical existence as a statebecause of the uniqueness of its exposure to natural calamities and man-made environmentaldegradation. It deeply permeates the national consciousness and, in response, successive governmentshave developed a fairly robust institutional mechanism to deal with environmental issues originatingfrom its own national boundaries as well as those emanating from its obligation as a signatory of variousenvironment-related laws, treaties, and conventions.
A top-level two-tier Designated National Authority (DNA) is in place to approve projects funded from theClean Development Mechanism (CDM) established under the Kyoto Protocol with a view to reducing theemission of greenhouse gases (GHGs) along with facilitating adaptation mechanisms. The first tier of theDNA is the National CDM Board consisting of five members: the Principal Secretary to the Prime Ministeras Chair and Director General, the Department of Environment (DOE) as the Member-Secretary. Thesecond tier is the 22-member National CDM Committee chaired by the Secretary, Ministry of Environmentand Forests and Director (Technical), Department of Environment as the Member-Secretary. Until now,National CDM Committee has approved eight projects for implementation.153
A sound policy framework is in place to address environmental issues. The government’s various policiesfor natural resources management, namely National Land Use Policy, National Water Policy, NationalEnvironmental Policy, National Environment Act and Rules, and National Forestry Policy, have a focus onenvironmental management in implementing sectoral initiatives.
Bangladesh as a signatory of the United Nations Framework Convention on Climate Change (UNFCCC)and the Kyoto Protocol prepared and submitted the National Adaptation Programme of Action (NAPA)in 2005 as a step towards implementing the decisions adopted by the Conference of Parties to UNFCCC.This was followed by the adoption in 2008 of the Bangladesh Climate Change Strategy and Action Plan(BCCSAP) to address environmental issues in the broader context of climate change over the next ten
152 Ministry of Land. 2001. National Land Use Policy (2001), (available at http://www.minland.gov.bd/policy/NationalLandUse/pdf ).153 See http://www.cdmbangladesh.net/dns_structure.htm/
60
years. The plan envisions a financing need of about USD5 billion during the first five years through 2014.The government has established a Climate Change Fund (CCF) from its own resources with an initialcapitalization of USD45 million. To complement this initiative with a matching fund, the developmentpartners have agreed to establish a multidonor trust fund (MDTF) for climate change. The latter will beadministered by the World Bank with an initial contribution of about USD100 million.154
The Department of Environment (DOE), the government agency for environmental management, isimplementing a number of projects to control air pollution. Under the Air Quality Management Project(AQMP) funded by the World Bank, the DOE installed five continuous air-quality monitoring stations(CAMS) in the country’s four major cities. With the World Bank’s financial assistance, the DOE isimplementing a five-year (2009–2014) coordinated project “Clean Air and Sustainable Environment” ata cost of BDT4.45 billion with participation of the Ministry of Environment and Forest, the Dhaka CityCorporation, and the Dhaka Transport Coordination Board.155
The environment component of this project is aimed at strengthening DOE’s capacity and capability toeffectively address air pollution issues and demonstrate the effectiveness and efficacy of new approachesfor reducing air pollution emissions through application to the brick-burning industry and transportsector. The transport component focuses on national capacity building through technical assistance anddemonstration initiatives in urban transport in Dhaka with an emphasis on reducing conflict betweenmotorized and non-motorized transport and traffic congestion. It also focuses on strengtheninginstitutional, policy, and regulatory framework for public transport and helping mainstream environmentconsiderations into urban transport-related decision-making.
The DOE has established the mechanism for issuance of environmental clearance certificates and thishas been introduced for new industries or projects after assessing the project area and pollutants to beemitted or discharged by the industries or projects to be set up. For highly polluting industries,environmental clearance is given after setting up an effluent treatment plant (ETP). Steps have beentaken to set up ETPs for the existing industries with the support of the Chamber of Commerce andIndustries and the concerned sector-associations.
Mindful of the challenge to control environmental pollution caused by manufacturing industries and itsdisastrous impact on public health, the new Industrial Policy envisages focused efforts in implementingthe Environment Protection Act 1995 and other relevant legislations in consultation with the MOEF, majorstakeholders, and regulatory bodies. The policy considers provision of incentives by way of tax and dutyconcessions in order to encourage SMEs and other large industries to adopt environmentally-soundmanufacturing processes and practices so as to protect land and water resources. It also envisagesproactive steps by the Board of Investment to encourage investors from developed countries to investin greenhouse gas emissions reduction projects under the Clean Development Mechanism.
8. Analysis of constraints and strategic priorities for enhancing competitiveness inSMFEs
Opportunities and growth prospects of small and medium food processing enterprises in specificcommodity areas have been discussed in detail in previous sections. In this section we examine thoseissues in a broader perspective to identify strategic areas where investment, policy support, research andtechnology transfer will help improve competitiveness of these enterprises.
Modernizing food safety and quality control
The issues of food safety and quality control clearly rank top as new technologies and trade policies openup more opportunities for expanding the market for processed food. The responsibility for food safetycontrol in Bangladesh as described in Section five is split among various government ministries and
154 Environment Sector, Bangladesh Economic Review (2010), (available at http://www.mof.gov.bd/en/index.php?option=com_content&view=article&id=229&Itemid=1).155 Department of Environment website at http//www.doe-bd.org/
61
departments. The interdepartmental coordination in enforcement of food safety laws and regulations ispoor and ineffective. The existing food safety control agencies have to rely on the assistance of lawenforcement agencies in the form of mobile courts to launch surveillance and impose sanctions onviolators of food safety rules. The effectiveness of this approach is constrained by shortages of trainedmanpower and is largely reactive, acted on particularly in response to revelations in national media ofinstances of food adulteration and outbreaks of food-borne illnesses.
The lack of a proactive approach to quality control for meeting standard specifications and ensuringsafety for human consumption along the entire food supply chain is conspicuous. Many entrepreneursand businesses have adopted modern food safety systems based on proactive and preventiveapproaches – HACCP, GMP, and GAP – for their export supply chain and have ISO certifications. Privatesector investment in quality control is driven by the need to conform to safety and quality standards thatwould enable them to target the upstream niches of overseas markets for their products, for example,frozen shrimp and fish.
Quality control in the domestic supply chain doesn’t have the same focus and, in fact, lack of effectiveinstitutional control has led to rapid deterioration of food safety because of widespread use of prohibitedchemical substances including carcinogens in food processing and manufacturing of processed food.Failure to adequately address food safety and quality concerns not only poses a significant public healthhazard but also ruins consumers’ confidence in the safety of processed foods and this in turn inhibitsexpansion of the domestic market for processed food.
The government’s current initiatives in upgrading human resources and technical capacities for providingexpanded testing and control services and capacity building in the private sector for quality controlfunctions, modernizing quality assurance infrastructure through strengthening national accreditationbodies should be focused on devising suitable mechanisms for improving its food control functions.
The present effort centred on strengthening the Bangladesh Standard and Testing Institution willproduce additional technical capacities and extend its outreach. But it will be far short of the need toexercise a professionally-focused control and regulatory oversight of an expanding food production andfood processing industry. In fact, the challenge of food safety and quality control in the context of a risingdemand for a variety of processed food from a rapidly urbanizing middle class and increasing trade ofraw and processed food in regional and upstream markets is so vast and complex that it is hardlypossible to address it in the institutional framework of BSTI with its current mandate extended over theentire industry.
Instead, the goal should be seeking better coordination of inspection, testing, and control functions ofdifferent public sector institutions in the agriculture and food sector. Ideally, this can be achieved bymerging the existing laboratories, testing, and inspection services in crop agriculture, fisheries, andlivestock subsectors under a single autonomous authority for food safety administration with adequatetrained staff and logistics. This should be supported by revamping the legislative framework, for exampleby repealing outdated laws and enacting a unified food safety law encompassing all aspects of food andanimal feed production, veterinary drugs and medicine, processing, packaging, and labelling. Thereshould be adequate provisions in the law to confer sufficient authority on the Food Safety Administrationto carry out its functions, including the authority to impose penalties and sanctions.
The establishment of a single food safety administration will provide a substantial boost tocompetitiveness of SMFEs by providing them with guidance and technical assistance in gap analysis andimplementing modern structured approaches to food safety and quality – GAP, GMP, and HACCP – andaccord them recognition for compliance which would enable them to prepare for third-party certificationand gain access to upper segments of the export and domestic markets. It will also create a singlenational focal point for diplomatic negotiations with foreign counterparts and international rule-makingand standard-setting agencies for enhancement of food safety. A nationally focused and proactiveapproach to food safety will contribute to building trust, enhancing the brand image and will helpbusinesses to reposition themselves to the highest segment of overseas markets in terms of price andquality.
62
Improving the enabling environment for doing business
The strategic priority in this area is to continue reforms aimed at eliminating inadequacies ininfrastructure, simplifying administrative procedures in meeting regulatory requirements and accessingnecessary services, and promoting good governance that would allow entrepreneurs to lower the costof doing business.
In an executive opinion survey based on a sample of 69 firms, of which 38 were SMEs, conducted as partof the World Economic Forum’s global competitiveness report (2011-2012), 21.8 percent of therespondents ranked inadequate supply of infrastructure as the most problematic factor in doingbusiness, followed by corruption (18.5 percent) and inefficient government bureaucracy (17.3). Policyinstability, access to financing, and inadequately educated workforce were identified as other majorconstraints.
Streamlining administrative procedures
In the World Bank’s latest Doing Business assessment, Bangladesh was ranked 122nd overall out of183 economies in the world by how easy it is for a local entrepreneur to open and run a small tomedium-size business when complying with relevant regulations in ten areas that affect the life cycleof a business. This performance points to a rather difficult business environment leading to increasedcosts of doing business. Bangladesh’s performance was even worse in terms of getting electricity (ranking182), enforcing contracts (180), registering property (173) and trading across borders (115).
The logistics time and costs for Bangladesh to import and export are higher than regional comparators– India, Pakistan, Viet Nam, and Thailand. According to USAID’s TCBoost Trade Facilitation calculator,a five-day reduction in export processing time could increase Bangladesh’s GDP anywhere fromUSD2.4 billion to USD3.8 billion annually (USAID, 2010). Lack of significant progress with respect to powergeneration and distribution is particularly frustrating, despite improvements in other areas. For example,between 2008 and 2012, the number of procedures in starting a business was reduced from eight toseven, the number of days to wait from 74 to 19, and the cost (percent of income per capita) involvedfrom 46.2 percent to 30.6 percent through introducing and further enhancing an online registrationsystem and by eliminating the requirement to buy adhesive stamps and by making lawyers’ involvementin company registration optional. In registering property, there was no change in the number ofprocedures between 2008 and 2012, but the time was reduced from 425 to 245 days and the cost(percent of property value) from 10.3 percent to 6.6 percent through reforms at the Municipal DeedRegistry Office and reducing the property transfer tax to 6.7 percent of the property value.156 Furtherreform in regulations that constrain ease of doing business will also contribute to growth andcompetitiveness of small and medium food processing enterprises.
Tailoring policy incentives to growth in productivity and competitiveness
As discussed in Section 2, the Export Policy (2009–2012) has designated agroproducts and agroprocessedproducts as one of the eight highest priority sectors. This entitles the entrepreneurs in this sector toreceive a range of benefits including bank loans at reduced interest rates, income tax exemptions,concessionary rates for utility services such as electricity, water, and gas, and air transport atconcessionary rates. Many processing plants use this incentive framework to finance or reduce taxes onother businesses (World Bank, 2008). This perhaps explains the establishment of new shrimp processingplants despite shortages of raw material resulting in underutilization of the installed capacity forprocessing. In 2010/2011, only 19.6 percent of the total capacity could be utilized.
The concessionary air transportation provided under the Special Inducement Price (SIP) offered by thenational flag carrier Biman, according to a World Bank study, is actually acting as a disincentive forvegetable and fruit exporters to use carriers other than Biman and creating a bias against market
156 World Bank/The International Finance Corporation. 2011. Doing Business 2012: Doing Business in a More TransparentWorld, pp. 33–74.
63
development in destinations not served by Biman. SIP can be replaced with an equivalent increase inthe export subsidy to shift exporters’ attention from securing cargo space on Biman to other measuresto improve overall movement of exports, and also explore sea freight as an alternative to air freightwhere appropriate.
There is growing evidence that many policy incentives offered in the form of tax benefits, cash subsidiesfor export, duty-free import of equipment and machineries, and concessionary bank loans for beefingup growth in agrofood and agroprocessing are no longer producing the desired outcome. Rather thanincreasing competitiveness, they are distorting the production environment and stifling growth. This callsfor periodically reviewing the effectiveness of policy support measures and, where necessary, makingnecessary changes in the way of these measures are administered.
Upgrading infrastructure
According to World Bank’s 2010 Logistics Performance Index (LPI), Bangladesh ranks 79 out of155 countries. This is an improvement from its overall rank of 87 on the 2007 index, but trails significantlybehind India (47), and Viet Nam (53). The LPI is an aggregate qualitative evaluation in six areas of businesslogistics, namely customs, infrastructure, international shipments, logistics quality and competence,tracking and tracing, and timeliness. Bangladesh performed poorly, particularly in customs (ranking 90),and logistics quality and competence (ranking 96), although its performance was better in internationalshipment (ranking 61) and infrastructure (ranking 72).157 The development of a multimodal transportnetwork consisting of roads, railways, ports, and inland waterways is vital to increasing thecompetitiveness of SMFEs through a reduction of trade costs and increasing trade efficiency. Thegovernment has undertaken a significant number of infrastructure projects with participation by majorinternational development partners. But immediate upgrades in rail and road connectivity are requiredin the Dhaka-Chittagong transportation corridor that accounts for 16 percent of the area of the country,50 percent of the population, 57 percent of the nation’s economic activity, and two-thirds of the country’sexports and imports.
Power generation and distribution remain major bottlenecks and agrofood processing firms(manufacturing firms in general) have consistently rated electricity outages as the most seriousconstraint. The number of electrical outages in a typical month in 2007 was 101.6 with an average1.1 hours duration that cost the businesses 10.6 percent loss of annual sales.158 There is also a seriousgap in effective transportation of perishables to reduce post-harvest losses and protect product quality.This relates to construction of packing houses, chilling centers, cold storages, and cool chaintransportation system consisting of reefer vans and refrigerated containers. For exports of fresh produceby air freight, there is a pressing need to upgrade offloading and cool in the cargo shed at the country’smajor international airports.
Efficient and competitive markets are essential for the promotion of SMFEs and significant upgrades inmarket infrastructure are needed. There are about 16 476 markets in the country, of which 2 050 aredesignated as growth centers and 392 are notified markets. Many of these markets need significantimprovements in infrastructure to provide adequate space, protective cover, and storage facilities forhighly perishable fruit, vegetable, fish, and animal products. A large part of the marketing problem,however, stems from how markets are managed. Responsibilities for day-to-day market operation, feecollection, and infrastructure maintenance are split among different entities. In general, there is norelationship between fees collected from a market and services provided to traders. A review of relevantmarketing legislation, including leasing policies and how market revenues are used, is required to identifyareas for reform.
157 Logistics Performance Index, (available at http://www.info.worldbank.org/etools/tradesurvey).158 World Bank/International Finance Corporation. 2007. Enterprise Surveys: Bangladesh Country Profile 2007, pp. 13–15.
64
Improving workforce quality
The supply of adequately trained professionals, technicians, and workers in a range of skills and practicalknowledge relevant to the needs of the private sector food industry is a major concern that is widelyshared in different branches of the industry. Among the business executives surveyed by WEF for the2011/2012 global competitiveness report, 6.2 percent ranked an inadequately educated workforce asa constraint on doing business. As discussed in Section 6, the reliance on foreign experts is most acutein the shrimp industry and the provision of advisory services to SMEs in the poultry sector is alsoconstrained by shortages of skilled technicians. The science and technology stream of universityeducation in the country is not focused on producing graduates with skills that meet the needs ofindustry. The strategic priority in this area is to undertake periodic review of the curricula and the coursesoffered with participation of industry organizations to ensure they promote practical knowledge so thatgraduates are better prepared to meet the needs of the private sector.
Apart from formal degrees, the universities should also be able to design continuous learning programsto be offered at flexible schedules for people seeking to change professional track or acquire new skills.The government’s ongoing reform for transforming the technical and vocational education systemshould also be replicated in the university education system. The goal should be tilting the focus fromcreating an elite class of people educated in science and technology looking for a career in academiaand general administration to producing professionals equipped with necessary skills and practicalknowledge capable of making a living by selling these in competitive markets. The revamping of theuniversity education system will also create opportunities for the government to create necessaryinfrastructure for introducing new progressive methods and approaches for skill development. Skilldevelopment programs should also focus on training for workers and farmers. India’s experience ofoverhauling its management, science and technology education system and making it work forproducing a skilled workforce to fuel its economic growth can serve as an example for Bangladeshstriving to stimulate same dynamism in its economy setting a target of 8 percent GDP growth by 2013and 10 percent by 2017.
Promoting good governance
Corruption remains endemic in Bangladesh and it exacts a heavy toll on the development efforts. InBangladesh, an investor often has to find ingenious and resourceful ways of negotiating the dense setof regulations and bureaucratic entanglements despite apparently straightforward proceduresproclaimed in the government’s policies. Bangladesh continues to remain at the bottom end of theCorruption Perception Index of Transparency International. In the Global Competitiveness Report2011-2012, business executives ranked corruption as the second-most significant constraint on doingbusiness after inadequate supply of infrastructure.
The most rabid form of corruption that farmers, traders, transporters, and businesses encounter is thesystem of illegal tolls and levies exacted from them anywhere in the supply chain – in assembly and retailmarkets, on roads and highways, in ports and railway stations. Then there is need for informal paymentfor routine handling of export shipments at Chittagong port and Dhaka international airport. Thesefacilitating payments along with informal road tolls add costs to businesses that have to be shared byprimary producers and consumers. Annually they eat away a substantial portion of the nation’s GDP andnegatively impact on consumers’ welfare. In the framework of ongoing initiatives in fighting corruption,to accelerate enterprise development in the food industry the government should undertake immediatetime-bound short-term steps to eradicate the system of informal road tolls and payment of speedmonies.
Access to credit
SMEs encounter great difficulties in mobilizing fixed and working capital because of the reluctance ofbanks to provide loans to SMEs. Banks are reluctant to lend to SMEs because of high processing and
65
monitoring costs of loans to SMEs.159 In the World Bank’s 2007 Enterprise Survey, bank financingfor investment was available only to 18 percent of SMEs. Internal financing accounted for investment in77.6 percent of SMEs. Of the firms surveyed, 42.5 percent identified access to finance as a majorconstraint. Other studies estimate that there is demand for roughly BDT200 billion in additional SMEcredit and that SMEs in specific industries have less than 10 percent of the funds employed coming fromcredit, whereas the rest comes from their own and family funds.160
A World Bank study estimates that only 7 percent of the one million potentially eligible small andmedium businesses have access to bank credit. Bank procedures for lending to SMEs are too complex.On average it requires a bank 29 steps, 9 staff, 50 documents, 9 meetings with the borrower, and 20 hoursof borrower time leading to a total approval time of 30 to 80 days once all the documents have beensubmitted. In addition, borrowing from banks involves high transaction costs beyond interest payments.For a BDT 0.3 million loan, the borrower must pay, on average, an additional 6.6 percent for legal fees,collateral registration, and documentation.161
The Bangladesh Bank undertook a significant step in 2009 to enhance access to finance by SMEs bycreating a separate department “SME and Special Programmes Department (SME&SPD)” and announcedseveral refinance funds under which a refinance facility at cheaper interest rates is provided to banks andfinancial institutions to encourage them to offer SME financing. One such facility is the “RefinanceScheme for Agro-Processing Industries” created from its own fund under which BDT1.25 billion has beendisbursed till June 2010. The other facilities are the Small Enterprise Fund (SEF), Enterprise Growth andBank Modernization Programme (EGBMP) supported by IDA, and the ADB Fund. A total of 42 banks andFIs have signed participation agreements with Bangladesh Bank for financing the SME sector under theseschemes.162 Although these initiatives are a significant step toward alleviating the constraint on SMEfinancing from the supply side, the banks should be encouraged to implement additional measures tosimplify loan disbursement procedures making it easier for SMEs to access these funds and developsuitable financial products attractive to SMEs.
Strengthening knowledge and technology systems for agro-food and agro-processing
The status of research, technology development and dissemination in agriculture and food processinghas been discussed in Section 6. The availability of a fairly developed national research infrastructure isa solid foundation to build on new opportunities and engage a broad range of stakeholders includingscientists, farmers, NGOs, businesses, and entrepreneurs. A major constraint is inadequate funding ofagricultural research, although after years of neglect it is picking up. But it is still low compared to mostdeveloping countries and receives less priority in government spending in the agriculture sector, wherethe majority of budgetary resources is spent on agricultural extension programs. Redressing thisimbalance would be key to acknowledging the importance of upstream knowledge and advancedtechnology for supporting future growth and boosting competitiveness in food production systems.
The government also spends from its science and technology budget to support research in foodproduct development, processing, and preservation technologies in industrial research centers andlaboratories. The lack of a suitable institutional mechanism for effective coordination of these twostreams of funding is a constraint to the effective utilization of resources and the development ofa framework for fostering a long-term focused approach to research and technology development foran emerging agrofood sector. The concept of agrofood in Bangladesh is a relatively new one linked withthe emergence of a retail food sector, growing sales of food packaged in brand names in differentconsumer packs, and value addition through processing and the growing export of processed food. The
159 Rahman, K.A. 2010. Development of small and medium scale enterprise in Bangladesh: prospects and constraints,(available at http://ssrn.com/abstract=1583707).160 Ahmed, M.U. 2009. Role of Institutional Financing in the Development of Small and Medium Enterprise (SMEs) inBangladesh, pp. 27–30 in the brochure SME Financing Fair 2009, Dhaka, December 8-9, 2009.161 Ferrari, A. 2008. Increasing access to rural finance in Bangladesh: the forgotten “missing middle”. World Bank, pp. 49–52.162 Bangladesh Bank. 2010. Annual Report for 2009-2010, pp. 83-84.
66
agriculture research institutes in Bangladesh are at an initial stage of crafting a coherent response totechnology needs for a fledgling agrofood industry.
A strategic priority for NARS institutions would be to reassess the balance in resource allocation forcommodity and non-commodity research and seek avenues for strengthening their institutionalcapacities for undertaking research in such areas as post-harvest management, development oftechnologies for processing and value addition, storage and transportation, packaging, and other topicsthat would support the growth of the agroprocessing industry.
These efforts can be scaled up through upgrading existing relevant non-commodity-related researchunits and functions into an autonomous institute of agroprocessing within the framework of NARS.Initial steps in these directions have been taken by the Bangladesh Agricultural Research Council andin its recently launched Strategic Plan “Agricultural Research Vision 2030 and Beyond”, it conducteda long-term priority setting exercise for allocation of research resources.163
In vegetable and fruit production, it assigned high priority to: the development of appropriate packagingand transportation systems for local and export markets; the development of preservation technologiesfor extended shelf life; and the standardization of post-harvest handling, packaging, transportation, andstorage techniques for selected fruits. Other high priority researchable areas include processing ofdifferent spices for powder and paste and design of packaging materials, rice milling for higher recovery,and diversified utilization of rice by-products.
Improving market linkages
Promoting contract farming
Contract farming is an operational arrangement that allows firms to participate in and exert control overthe production process without owning or operating the farms, leaving production responsibilities withgrowers who own or lease the land.164 For the producers, the benefit of having a prior agreement liesin having access to a predetermined price for their produce, quality inputs and technical advice, andoften credit. By eliminating the intermediaries in the marketing chain, contract farming reducestransaction costs and improves returns for farmers.
In Bangladesh, the economic reform processes created enough encouragement for private enterprisesand NGOs to set up contract farming ventures mainly in the case of poultry, dairy and high valuevegetables.165 BRAC, a leading NGO, has developed a “centralized limited management contract” modelwith a verbal or unwritten contract. The supply chain starts from the production of high value vegetablesthrough contract farmers and ends in exporting to the major supermarkets of the world. The grossmargins, net returns and partial budgeting analysis showed that the contract growers significantlybenefited much more than the non-contract growers.166 In the private sector, companies like Pran andABFL introduced contract growing system in their poultry and high value vegetable productionsystems.164 Future expansion of contract farming in the country will depend largely on improvingenforceability of contracts which is clearly a challenge now because of weaknesses in the judicial systemthat allow both producers and purchasers to breach the terms of contract. The NGO model that relieson existing trust and uses less rigid and semi-formal mechanisms for building contractual relationshipholds the best promise for the expansion of contract farming.
163 Bangladesh Agricultural Research Council. 2011. Agricultural Research Vision 2030 and Beyond. Research Priorities inBangladesh Agriculture, Dhaka, Bangladesh.164 World Bank. 2005. Revitalizing the Agricultural Technology System in Bangladesh, Bangladesh Development Series PaperNo. 7, Dhaka, pp. 72–80.165 Mandal, M.A.S., Bairagi, S.K. & S. Rahman, S. 2005. Vertical Integration in BangladeshAgriculture: The Case of Contract Farming for High Value Food Products. BangladeshJournal of Political Economy. Vol. 22, No. 1 & 2: 1–12.166 Hasan M.R. & Mondal, M.A.S. 2011. Contract Farming for Production and Export of Vegetables in Bangladesh. P. 144.
67
Improving value-addition and supply chain
In Bangladesh, the unit cost of processed food in dairy, poultry, fruits, and vegetables is higher than inneighbouring India because of high overhead costs. Bangladesh’s competitiveness in export markets isalso constrained by inefficiencies in the supply chain, which for many commodities is underdeveloped,fragmented, and poorly managed. Significant research and extension effort is needed to identify andeliminate weak linkages in the value addition and supply chain in selected vegetables, fruits, poultry andthe dairy sector.
Improving market-related know-how
This essentially refers to developing capacities for market research and market information systems sothat farmers, traders, processors and exporters can access market information in real time. In thepreceding section we explored the strategies pursued by the Department of Agricultural Marketing(DAM) in upgrading market-related knowhow through the introduction of Internet and mobile phone-based market information dissemination systems.
In view of the rapid expansion of the mobile phone market, particularly in rural areas of the country,a key priority should be to examine options for increasing the efficiency of SMS-based marketinformation systems through improving the content of messages, timeliness, and service delivery incooperation with mobile phone service providers. The efficiency of the Internet-based system isconstrained by inadequacy of supporting infrastructure and trained manpower at district units of theDAM to collect market data from local retail and wholesale markets, compile and transmit to centralprocessing units at the headquarters so that the web content is updated in order to have value for usein real time.
A strategic priority should be to invest in market research capacities, which are almost non-existent now,with a focus on undertaking studies and assessment of regulatory regimes in prospective markets. Suchresearch should be able to produce quality data and information that would help exporters gain accessto upstream markets in East Asia, Australia, the European Union, and North America.
Private sector capacity building
Despite the presence of industry and trade organizations and associations in all sectors of foodproduction and processing in the country, their activities are heavily tilted toward lobbying withconcerned government agencies and exerting organized pressure to create a framework of incentivesand concessions that mostly subsidize their operations and act little to improve their competitiveness.A strategic priority in private sector entrepreneurship capacity building will be to help industry and tradeassociations to redirect their focus to in-house capacity building for undertaking significantresponsibilities for market research, market promotion and quality compliance.
9. Summary and conclusions
This paper explored the current state of development of small-and medium-scale food enterprises inBangladesh. It examined the government’s current policies for agro-industrial development with a focuson small and medium enterprises. For all of the major segments of food production and processingindustry, the existing scenario was discussed in detail with regard to production and demand,technologies for processing, potential for export, issues affecting food safety and quality control. Theexternal policy environment, institutional infrastructure including physical infrastructure, technology andinnovation, human resources, finance and fiscal systems affecting capability of enterprises in doingbusiness, and their growth potential and competitiveness were examined in detail.
The study highlighted several areas where investment is necessary and where a range of policy initiativesshould be introduced to overcome the existing constraints and stimulate a sustainable growthmomentum in small and medium-scale food enterprises in Bangladesh.
68
References
Abdur, R. 2010. CLP Market Assessment – Maize, (available at http://www.clp-bangladesh.org/).
Ahmed, H. 2007. Pre- and Post-harvest Handling and Processing Procedures for the Production of Safe and HighQuality Fresh Fisheries Products in Bangladesh. Final Project Report, The United Nations University, Reykjavik, Iceland.
Ahmed, M.U. 2009. Role of Institutional Financing in the Development of Small and Medium Enterprise (SMEs) inBangladesh, pp. 27–30 In SME Financing Fair 2009 (brochure), Dhaka, December 8-9, 2009.
Akmal, H. 2004. National Case Study on Environmental Requirement, Market Access/Entry, and ExportCompetitiveness in Horticulture in Bangladesh, A study undertaken for UNCTAD, Geneva.
Alam S.M.N. & M.J. Philipps. 2004. Coastal Aquaculture Systems in Southwestern Bangladesh. Asian Fisheries Science,17: 175–189.
Asian Development Bank. 2005. An Evaluation of Small-Scale Freshwater Rural Aquaculture Development for PovertyReduction. pp. 47–50.
Asian Development Bank. 2005. Technical Assistance to the People’s Republic of Bangladesh for preparing the DhakaWater Supply Project, TAR: BAN 39405.
Azad A.K. 2011. Bangladesh’s Power Sector: Investment Opportunities, (available at http://www. usea.org/USEA_Events/Bangladesh_Briefing_July_2011).
Bakht Zaid. Development of SME Sector in Bangladesh, (available at http://www.newagebd.com/newspaper1/special/36625.html).
Bangladesh Agricultural Research Council. 2011. Agricultural Research Vision 2030 and Beyond. Research Prioritiesin Bangladesh Agriculture, Dhaka, Bangladesh.
Bangladesh Bank. 2010. Action Plan to Support the SME Centres, Women Entrepreneurship and One-stop Facility,(available at www.bangladesh-bank.org/aboutus/dept/SME/actionplan.pdf ).
Bangladesh Bank. 2010. Annual Report for 2009-2010, pp. 83-84.
Bangladesh Bureau of Statistics. 2010. Report of the Household-based Livestock and Poultry Survey (HLPS), 2009,(available at http://www.bbs.gov.bd/).
Bangladesh Bureau of Statistics. 2011. Population and Housing Census, Preliminary Results, July 2011.
Bangladesh Bureau of Statistics. 2011. Preliminary Report on Household Income and Expenditure Survey (HIES)-2010,June, 2011.
Bangladesh Bureau of Statistics. Survey of Manufacturing Industries 2005-2006.
Baqui M.A., Ahiduzamman, M., & Rahman, M.M. Experiences in Installation and Operation of Energy Efficient RiceParboiling Systems, (available at http://www.Iged-rein.org/archive).
Board of Investment. Bangladesh Government Vision 2021, (available at http://boi.gov.bd).
Bangladesh Ministry of Finance (MOF). 2011. Bangladesh Economic Review, (available at http://www.mof.gov.bd).
Cato C.J. & Subasinge, S. 2003. Food Safety in Food Security and Food Trade, Case Study: The Shrimp Industry ofBangladesh, (available at http://www.agecondearch.umm.edu/bitstream/16555/1fo031009.pdf ).
Centre for Environmental and Geographic Information System. 2007. GIS-based Salt Industries Information Systemin Bangladesh, Dhaka, Bangladesh.
Chittagong Port Authority. 2011. Port Performance Indicators, (available at http://www.cpa.gov.bd/).
Dasgupta, N., Baqui, M.A., Dhingra, S., Raman, P., Ahiduzamman, M. & Kishore, V.V.M. 2003. Benefits of Improved RiceHusk Combustion, Bangladesh. Department for International Development Project No. R7659, Knowledge andResearch Programme.
Department of Fisheries/Bangladesh Shrimp and Fish Foundation. 2011. Code of Conduct for Selected segments ofthe Aquaculture Industry in Bangladesh, p. 31.
European Commission DG (Sanco). 2011: Final Report of an Audit carried out in Bangladesh, 24 March –2 April 2011,(available at http://ec.europa.eu/food/fvo/act_get pdf ).
69
FAO. 1996. Preparation of a HACCP-Based Fish Quality Assurance Programme, TCP/BGD/4555. Rome.
FAO. 2005. National Aquaculture Sector Review Bangladesh, (available at http://www.fao.org/fishery/countrysector/naso_bangladesh/en).
FAO. 2010. Plant breeding and seed systems for rice, vegetables, maize and pulses in Bangladesh. FAO PlantProduction and Protection Paper 207, pp. 35–40.
FAO/Animal Production and Health Commission for Asia and the Pacific. 2009. Smallholder dairy development:Lessons learned in Asia, Bangkok, pp. 8–17.
Fazlur, R. 2010. Development of Eco-efficient Water Infrastructure in Bangladesh. Paper presented at the Thirdregional Workshop on Eco-efficient Infrastructures in Asia and the Pacific, 23–25 November, 2010, Bangkok, Thailand.
Ferrari, A. 2008. Increasing access to rural finance in Bangladesh: the forgotten “missing middle”. World Bank,pp. 49–52.
Hasan M.R. & Mondal, M.A.S. 2011. Contract Farming for Production and Export of Vegetables in Bangladesh. P. 144.
Hemme T., Garcia, O. & Khan, A.R. 2002. A Review of Milk Production in Bangladesh with Particular Emphasis on Small-scale Producers, Pro-Poor Livestock Policy Initiative. PPLI Working Paper No. 7.
International Fund for Agricultural Development (IFAD). 2011. Results from IFAD’s Bangladesh Country Program.In Making a Difference in Asia and the Pacific, Special Issue: January 2011.
International Monetary Fund. 2010. Bangladesh Financial System Stability Assessment 2009, IMF Country ReportNo. 10/38, Washington, D.C.
Islam K.M.N. 2001. Demand for Poultry Feed: Implications for Wheat and Maize Production in Bangladesh. FMRSPWorking Paper No. 31, Ministry of Food/International Food Policy Research Institute.
Kabir, W. & Ahmed, S. 2005. Status of Research and Development Institutes of Agricultural Engineering in Bangladesh.Paper presented at the 4th session TC/GC meeting of APCAEM held during 21–24 November 2005, New Delhi, India.
Lutfor, R. 2010. Agricultural Research Priority: Vision 2030 and Beyond, Sub-sector: Pulses and Oil Crops, (availableat http://www.barc.bgd.org/).
Mandal, M.A.S., Bairagi, S.K. & S. Rahman, S. 2005. Vertical Integration in Bangladesh
Agriculture: The Case of Contract Farming for High Value Food Products. Bangladesh Journal of Political Economy,Vol. 22, No. 1 & 2: 1–12.
Media, E. The Next 11 Emerging Economies, Euromonitor, 4 Feb 2008 (available at http://www.euromonitor.com/The_Next_11_emerging_economies).
Miah M.A.K., Haque, A., Douglass, M.P., & Clarke, B. 2002. Parboiling of Rice. Part II: Effect of hot soaking time on thedegree of starch gelatinization. International Journal of Food Science and Technology, 37: 539–545.
Ministry of Industries, Government of the People’s Republic of Bangladesh. 2010. National Industrial Policy 2010(draft), (available at http://www.moin.gov.bd/).
Ministry of Land. 2001. National Land Use Policy (2001), (available at http://www.minland.gov.bd/policy/NationalLandUse/pdf).
Muniswami, S. & G. Singh. 2011. Benchmarking the efficiency of Asian container ports. African Journal of BusinessManagement, Vol. 5(4): 1397–1407.
Nurul Afsar A.K.M., Baqui, M., Rahman, M., & Abdur Rouf, M. 2001. Grades, Standards, and Inspection Procedures ofRice in Bangladesh. FMRSP Working Paper No. 20, Ministry of Food/International Food Policy Research Institute.
Overseas Development Institute. 2010. Millennium Development Report Card: Learning from Progress, (available athttp://www.odi.org.uk/resources/download/4908/pdf).
Rahman, K.A. 2010. Development of small and medium scale enterprise in Bangladesh: prospects and constraints,(available at http://ssrn.com/abstract=1583707).
Rahman, M. 2010. Fiscal Reforms in Bangladesh: Evolution and Future Initiatives. Paper presented at the Workshopon Collaborative Research on South Asia Tax Systems. Singapore, 8-9 August, 2010.
70
Rahman M. & Mondal, R.I. 2010. Agricultural Research Priority: Vision 2030 and Beyond, (available at http://www.barc.bgd.gov/).
Raihan S. & N. Mahmud. 2008. Trade and Poverty Linkages: A Case Study of the Poultry Industry in Bangladesh,(available at www.cuts-citee.org/pdf/TDP-Book-Volume-1.pdf ).
Rao, J.M.K.V., Das, M., & Das, M.K. 2007. Jaggery – a traditional Indian sweetener. Indian Journal of TraditionalKnowledge. 6(1): 95–102.
USAID. 2010. Bangladesh Economic Growth Assessment, pp. 16-17.
USAID/Dhaka. 2005. An Evaluation of the Bangladesh Agro-Based Industries and Technology Development(ATDP II), Prepared by Development Associates Inc. Arlington, VA, USA.
USAID/MOST. 2003. Wheat Flour Fortification Program in Bangladesh, (available at http://www.a2zproject.org).
World Bank. 2005. Revitalizing the Agricultural Technology System in Bangladesh, Bangladesh Development SeriesPaper No. 7, Dhaka, pp. 72–80.
World Bank. 2008. High-value Agriculture in Bangladesh: An Assessment of Agro-business Opportunities andConstraints. Bangladesh Development Series Paper No. 21, pp. 81–91.
World Bank/International Finance Corporation. 2007. Enterprise Surveys: Bangladesh Country Profile 2007, pp. 13–15.
World Bank/The International Finance Corporation. 2011. Doing Business 2012: Doing Business in a More TransparentWorld.
World Economic Forum. 2011. The Global Competitiveness Report 2011-2012, Geneva, Switzerland, pp. 110–114.
Yeasmin T., Reza, M.S., Khan, M.N.A. Shikha, F.H. & Kamal, M. 2010. Present status of marketing of formalin-treatedfishes in domestic markets at Mymensingh district of Bangladesh. Int. J. Bio Res. 1(4): 21–24.
Yusuf Ali, M., Waddington, S.R., Hodson, D.P., Timsins, J. & Dixon, J. 2008. Maize-rice cropping systems in Bangladesh:Status and research opportunities. No. 56106, Maize Production Systems Papers from CIMMYT: International Maizeand Wheat Improvement Center.
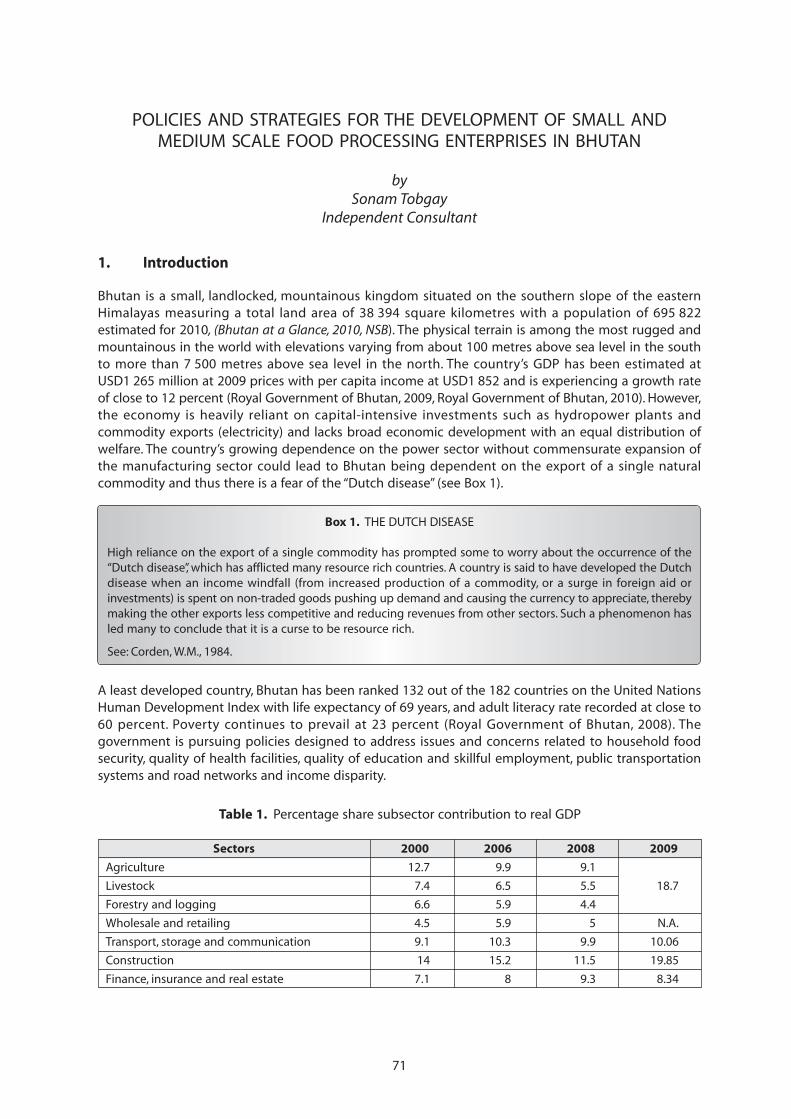
71
POLICIES AND STRATEGIES FOR THE DEVELOPMENT OF SMALL ANDMEDIUM SCALE FOOD PROCESSING ENTERPRISES IN BHUTAN
bySonam Tobgay
Independent Consultant
1. Introduction
Bhutan is a small, landlocked, mountainous kingdom situated on the southern slope of the easternHimalayas measuring a total land area of 38 394 square kilometres with a population of 695 822estimated for 2010, (Bhutan at a Glance, 2010, NSB). The physical terrain is among the most rugged andmountainous in the world with elevations varying from about 100 metres above sea level in the southto more than 7 500 metres above sea level in the north. The country’s GDP has been estimated atUSD1 265 million at 2009 prices with per capita income at USD1 852 and is experiencing a growth rateof close to 12 percent (Royal Government of Bhutan, 2009, Royal Government of Bhutan, 2010). However,the economy is heavily reliant on capital-intensive investments such as hydropower plants andcommodity exports (electricity) and lacks broad economic development with an equal distribution ofwelfare. The country’s growing dependence on the power sector without commensurate expansion ofthe manufacturing sector could lead to Bhutan being dependent on the export of a single naturalcommodity and thus there is a fear of the “Dutch disease” (see Box 1).
Box 1. THE DUTCH DISEASE
High reliance on the export of a single commodity has prompted some to worry about the occurrence of the“Dutch disease”, which has afflicted many resource rich countries. A country is said to have developed the Dutchdisease when an income windfall (from increased production of a commodity, or a surge in foreign aid orinvestments) is spent on non-traded goods pushing up demand and causing the currency to appreciate, therebymaking the other exports less competitive and reducing revenues from other sectors. Such a phenomenon hasled many to conclude that it is a curse to be resource rich.
See: Corden, W.M., 1984.
A least developed country, Bhutan has been ranked 132 out of the 182 countries on the United NationsHuman Development Index with life expectancy of 69 years, and adult literacy rate recorded at close to60 percent. Poverty continues to prevail at 23 percent (Royal Government of Bhutan, 2008). Thegovernment is pursuing policies designed to address issues and concerns related to household foodsecurity, quality of health facilities, quality of education and skillful employment, public transportationsystems and road networks and income disparity.
Table 1. Percentage share subsector contribution to real GDP
Sectors 2000 2006 2008 2009
Agriculture 12.7 9.9 9.1
Livestock 7.4 6.5 5.5 18.7
Forestry and logging 6.6 5.9 4.4
Wholesale and retailing 4.5 5.9 5 N.A.
Transport, storage and communication 9.1 10.3 9.9 10.06
Construction 14 15.2 11.5 19.85
Finance, insurance and real estate 7.1 8 9.3 8.34
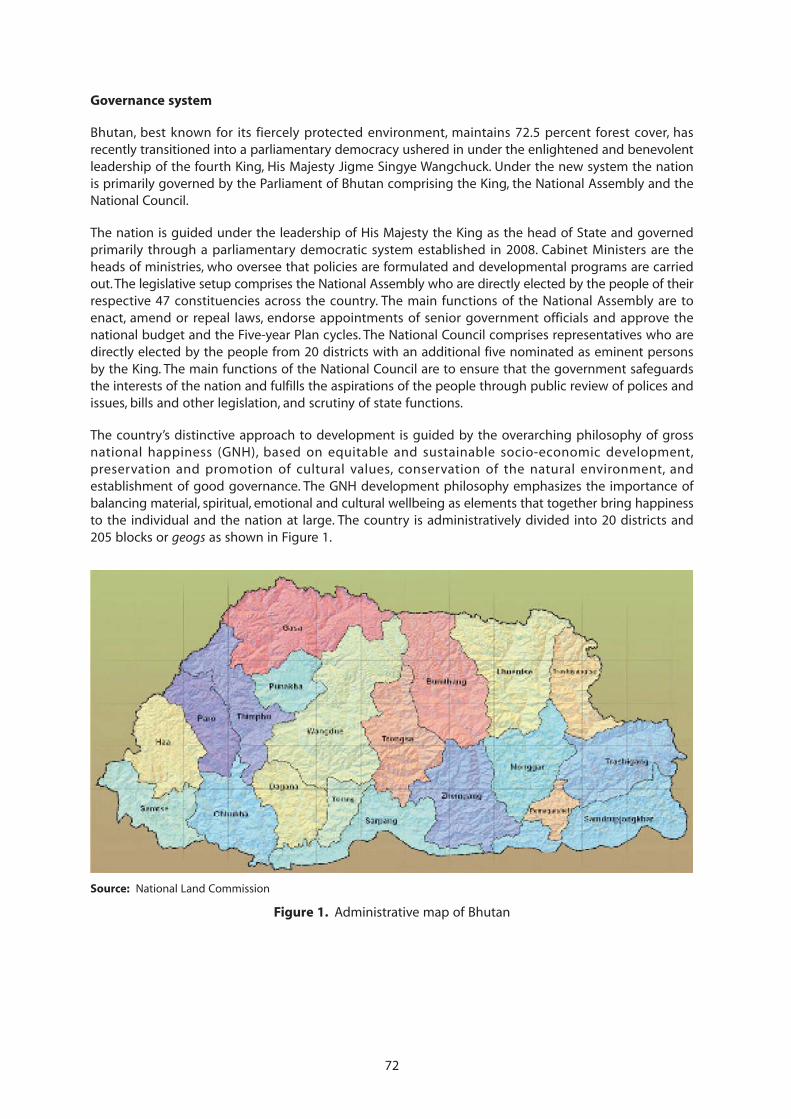
72
Governance system
Bhutan, best known for its fiercely protected environment, maintains 72.5 percent forest cover, hasrecently transitioned into a parliamentary democracy ushered in under the enlightened and benevolentleadership of the fourth King, His Majesty Jigme Singye Wangchuck. Under the new system the nationis primarily governed by the Parliament of Bhutan comprising the King, the National Assembly and theNational Council.
The nation is guided under the leadership of His Majesty the King as the head of State and governedprimarily through a parliamentary democratic system established in 2008. Cabinet Ministers are theheads of ministries, who oversee that policies are formulated and developmental programs are carriedout. The legislative setup comprises the National Assembly who are directly elected by the people of theirrespective 47 constituencies across the country. The main functions of the National Assembly are toenact, amend or repeal laws, endorse appointments of senior government officials and approve thenational budget and the Five-year Plan cycles. The National Council comprises representatives who aredirectly elected by the people from 20 districts with an additional five nominated as eminent personsby the King. The main functions of the National Council are to ensure that the government safeguardsthe interests of the nation and fulfills the aspirations of the people through public review of polices andissues, bills and other legislation, and scrutiny of state functions.
The country’s distinctive approach to development is guided by the overarching philosophy of grossnational happiness (GNH), based on equitable and sustainable socio-economic development,preservation and promotion of cultural values, conservation of the natural environment, andestablishment of good governance. The GNH development philosophy emphasizes the importance ofbalancing material, spiritual, emotional and cultural wellbeing as elements that together bring happinessto the individual and the nation at large. The country is administratively divided into 20 districts and205 blocks or geogs as shown in Figure 1.
Source: National Land Commission
Figure 1. Administrative map of Bhutan
73
Climate and agriculture in Bhutan
Bhutan’s climate is as varied as its altitudes and, like most of Asia, it is affected by the monsoons. WesternBhutan is particularly affected by monsoons that bring between 60 percent and 90 percent of theregion’s rainfall. The climate is humid and subtropical in the southern belts whereas the central beltenjoys a temperate climate with an alpine climate in the northern regions. The southern foothills aremostly covered by dense and thick deciduous trees whereas the inner regions are dotted by an infinitevariety of plants, flowers and trees including birch, pine, chestnut, and oak. Apples, peaches and plumsare also grown in the fertile valleys. The northern part is the habitat of coniferous trees and other alpineflora such as magnolia, rhododendrons, birch, fir and spruce.
The agriculture sector dominated by livestock rearing and animal husbandry provides livelihoods toabout 67 percent (RGB, 2007) of the Bhutanese population and contributes 18.5 percent to grossdomestic product. This raises concerns for hidden unemployment and low productivity in the agriculturalsector. Hydropower and the construction sector’s GDP share were 19.85 percent and 12.55 percentrespectively. Similarly, the steadily expanding manufacturing sector comprising cement, wood andagriculture industries jointly stood at 8.19 percent share of the GDP (Royal Government of Bhutan, 2009).
Agriculture is practiced on a meagre 8 percent arable land with the remaining area under deep gorgesand high mountains. Agriculture in Bhutan is popularly referred to as the Renewable Natural Resource(RNR) sector, and includes crop production, livestock rearing and animal husbandry, forest resourceutilization and horticulture. The RNR sector has largely been for subsistence and has not been market-driven, not yielding adequate surpluses for processing, and coupled with the low yields of crops.A majority of farmers continue to survive on subsistence farming dependent largely on the vagaries ofthe weather. With an average landholding size of 0.89 hectares (Tobgay and McCullough, 2008),subsistence farmers continue to be the backbone of the food system in the country. With improved roadsand marketing infrastructure provided by the government, modest marketable surpluses are seen incommodities such as potatoes, chilies, apples, areca nut and mandarin oranges. Agro-processing is limitedto cottage scale fruit processing industries, tetra pack milk (UHT treated), processed cheese and yogurt,bottled honey, bottled water, alcoholic beverages, canned mushrooms, confectionary products, and teasachets.
Labour and employment
Although provision of gainful employment is the highest priority of the government, there is a seriousmismatch between skill levels and market demands. The growing number of Bhutanese joining thelabour force do not possess the necessary skills or the experience required for specialized occupations.For example, the private sector requirements today are mainly for low skilled manual labour and highlyskilled technically competent labour, whereas the school-leavers possess few specialized skills and areaverse to manual jobs. In addition, youth expectations about income are also not matched by the typesof jobs available. The expectations and preferences are based not on skill levels but on a sense of socialstatus derived from the level of education achieved and degree of literacy attained. Each year about4 000 students are entering the job market and an estimated 93 000 people were looking for jobs overthe period of 2008 to 2013 (Royal Bhutan Government, 2002). The government’s target is to bring downthe unemployment rate from 4 percent in 2009 to 2.5 percent by the end of 2013. With theunemployment rate of 3.3 percent, and the anticipated slow growth in the public sector, there is anurgent need to rapidly create new employment opportunities.
Because of heavy reliance on raw material imports from India, the promotion of capital-intensiveindustrial sectors and a high percentage of low-cost Indian workers employed in the boomingconstruction sector, the impact of the quickly expanding industrial sector on employment, in particularin rural Bhutan, has been limited. Against this background and the World Bank estimates (RoyalGovernment of Bhutan, 2002) indicating that between 2005 and 2010 approximately 65 000 persons willenter the labour market, the development of more labour-intensive domestic resource-based businessesis needed to cope with the anticipated labour force. Labour-intensive businesses can be found inmanufacturing, tourism and services.
74
2. Review of small and medium food processing enterprises in Bhutan
Food processing industries in Bhutan are essentially agro-based enterprises revolving around traditionaland indigenous food types. Small and medium food processing in Bhutan is characterized by traditionalfood processing practices constituting as high as 90 percent of the subsector in the rural areas of thecountry. Usually they are family owned, employing three to five workers and cater for householdconsumers and the domestic market. This industry is characterized by manual and batch type processes,labour-intensive, with minimal mechanization. The main food processing industries in Bhutan, especiallythe rural-based food processing industries, are rice dehusking mills, flour mills, dairy farms, poultry, bakeryand confectionery, cheese making and homemade pickles. These backyard enterprises produce theirproducts mainly for the local markets, and a few products are also exported. Equipment is fabricatedusing local raw materials and the overall result is rather low productivity and efficiency. Upgrading ofthese enterprises offers a window of opportunity in local markets where the economy is growing. A fewexport-oriented food processing industries are located in the southern belt of the country, capitalizingon cheap imported labour and easy access to raw materials.
The overall potential of agrofood processing in Bhutan is seen in high value niche areas capitalizing onthe country’s clean environment, fresh water resources and organic origin. However, there are a numberof constraints that limit the further development of small-scale food processing in the country. Startingand developing a small business in a developing country is no easy task. Entrepreneurs face manychallenges, especially with the erratic input supply, high and inadequate transportation costs, access tofinance, inadequate cold storage facilities, and unreliable markets. The subsector also suffers fromshortage of trained, skilled labour and technical competence in agriculture, especially in the traditionalfood industry sector. This, coupled with poor management, leads to inefficiency and poorcompetitiveness. Labour costs have also risen markedly resulting in higher production costs for labour-intensive operations. Moving the operation to lower labour cost areas such as in the southern belt of thecountry, or automation, is the response of modern food companies. Currently, the country has only foursmall-scale food processing industries, namely Bhutan Agro Industries Limited (BAIL) – a governmentowned corporation, Bhutan Dairy and Products Limited, Zimdra Food Products Ltd., and Bhutan FruitProducts Ltd., all operated by private entrepreneurs.
Policy environment
Although there is no specific policy dedicated to small and medium food processing enterprises, thegovernment has realized the importance of Bhutan’s micro, small and medium enterprise (MSME) sectorfor broad based economic growth, employment, and poverty reduction. This has prompted acceleratedcreation of new businesses, and the growth of existing MSMEs through establishment of new institutions,markets and policy support. A recent initiative is the cost sharing facility provided by the Departmentof Cottage and Small Industries where the government provides 50 percent of the cost of the enterprisein addition to technical backstopping and administrative support.
Profile of food processing industries
Since agriculture is the primary producing sector of the country with 69 percent of the populationdependent on subsistence farming, food processing is mainly home-based for self consumption asidefrom a few small processing factories located in the southern belt of the country. Food processingenterprises in Bhutan are limited to micro, small and medium scale, exhibiting certain characteristics thatdistinguish them from their large-scale counterparts. They are usually organized as a backyard familybusiness, or have a single proprietor and are found in both rural and urban areas, although somebusinesses have already been relocated to industrial areas. Many micro and small-scale food enterprisesoperate under a simple organizational structure, consisting of the owner as the manager and sometimesassisted by a few workers. The products are generally relatively cheap and marketing is done directly orthrough retail agents.
75
Food processing in Bhutan is focused on a few products as discussed below
Milk and dairy products
Two principal tetra pack milk brands in the country are Zimdra and Dugyul produced by privateentrepreneurs. Dugyul is owned by Bhutan Dairy Limited and the company purchases milk froma government-owned farm located in the southern part of the country and also from other milkcooperative societies in the locality. A large amount of fresh milk is also imported across the border intanker containers from the Indian towns of Bihar and Kolkata. Small farmer groups owning few milkingcows distributed across the country collect fresh milk and retail it through various milk processing units.The milk processing units also produce cottage cheese balls and unsalted butter with proceeds beingploughed back to the farmer groups. In addition, the Ministry of Agriculture and Forest with support fromits development partners has started producing yogurt and operates a small retail outlet branded asFarm Fresh. Similarly, home based gouda cheese and unsalted butter is processed in Bumthang witha 1 000 litres per day capacity but currently operates at 500 litres per day. The main input is cow’s milkpurchased locally from the Brown Swiss government farm. The main markets are domestic customers andtravelers who pass through the valley either en route to eastern Bhutan or returning to Thimphu thecapital city after visiting other eastern districts.
Butter and cheese
Processing of butter and cottage cheese or datse is done at farm level in the traditional way to extendthe shelf life of milk. It is practiced by all the farmers with no or little access to milk marketing. Dependingon the quantity of milk available, milk is stored from one to three days before churning. The mostwidespread churner is a piston churner curved out of a large log. Depending on the temperature,30 minutes to 1 hour is required to churn a 1 kg of butter. Once the small butter grain has coagulated,the buttermilk is drained into a container and the butter is washed with fresh water prior to letting itfreeze naturally. The buttermilk is heated until the cheese formation starts to appear. Once the cheeseparticles flocculate, heat is reduced and the cheese is manually squeezed into small balls by pressingbetween the palms to extract the excess whey. If consumed fresh, as soft cheese, it is called datse andis served best with a mix of chilies called ema datsi’– a local delicacy. Datsi is generally sold in balls of150 gm to 200 gm but can also be sold in blocks of 500 gm to 1 kg in the southern part of the country(Samtse) and in eastern Bhutan (Trashigang). The fresh cheeses are dried and sold as hard cheese, chugo,or left fermented and sold as fermented cheese, Yeatpa.
Butter and cheese are traditionally wrapped in rhododendron and banana leaves as effective packagingmaterials. In central Bhutan, butter is sold in phok of 1.75 kg, a practice probably inherited from thepre-modern taxation system. To extend their shelf life, the products are not packed immediately afterprocessing. The cheese balls are kept in whey and butter is stored in sealed bamboo containers. Herdersstore butter in hide bags weighing 10 to 14 km over a period of six months at their summer grazingcamps prior to bringing it to the urban markets.
Yak cheese
Yak cheese is the popular name for a cheese produced from yak and yak cattle-hybrid milk. Yak cattlecan graze pastures at altitudes from 6 000 to 18 000 feet above mean sea level. Approximately 4 000people are directly dependent on the industry for their livelihood. Yak cheese can be made into bothhard and soft cheese. Cheese production requires only a limited investment in equipment. The majorequipment required are a 300 litres copper pot, a milk separator, milk cans, cheese hoops, cheese cloth,brine tank, various tools and shelter.
Fresh yak flat cheese is used mainly when preparing a traditional delicacy called chugu-margo, however,it is also used as a necessary ingredient when preparing other dishes like the morning porridge or thuemespecially during religious festivals. The product is normally sold fresh with consumers slicing them intobite sizes for future use, however, with modern refrigeration technology, the shelf life can be increased
76
to facilitate fresh consumption. On the other hand, chugo or dried cheese is cut into cubes and stringed.Yak chugo varies in quality depending on the type of ingredients used, the method of drying leadingto the level of moisture content resulting in the level of hardness and its chewable nature.
Bakery and confectionary
The production of cakes and pastries is limited to 37 micro bakery outlets distributed across the country.With a fledgling market, bakery entrepreneurs are experiencing high growth rates with products suchas cakes, pastries and biscuits. Healthy profit margins characterize the bakery industry and a reputationfor reliability and quality has driven growth, at least in terms of the number of establishments. Whereascakes and pastries cater to the affluent consumers, biscuits are a mass-consumption product witha domestic market share estimated at 70 percent.
Fruit and vegetable processing
Fruits and vegetable processing is spearheaded primarily by Bhutan Agro-industries Limited (BAIL) andBhutan Fruit Products Limited (BFPL). BAIL with plant capacity of 4 800 metric tons (single shift) haswitnessed an unprecedented growth of 14.6 percent in 2009 with profits of 4.56 million ngultrums. Saleshave hit record heights of 66 million ngultrums as against 55.6 million in 2008 (undated report from BAILmanagement). Processed product lines include canned fruit juices and squash, jams and marmalades,peach and apricot halves, cordials, pickles using assorted fruits and vegetables, bottled asparagus andmushrooms, and bottled water. BAIL started partnerships with farmers through contract farming for highvalue cash crops covering an area of 311 acres, and involving about 400 farmers. Under the contract, thefarmers are provided interest free loans in kind such as planting and fencing materials, payable after fiveyears, which was deducted from the value of the crops supplied to the factory. Over the last 15 years,the company has procured about 3 963 metric tons of fruits and vegetables valued at 25 millionngultrums from the farmers in western and central Bhutan, including orange fruit pulp from theIntegrated Food Processing Plants (IFPP) at Dagapela, Goling in Zhemgang and Pema Gatshel.
Bhutan Fruit Products Limited is a private company located in the southern part of Bhutan. NeighbouringIndia supplies most of its raw materials through imports across the border. Cheap procurement of inputsincluding labour, is capitalized from India. Food processing product lines include fruit juices and squash,cordials, jams and marmalades, pickles, and bottled water.
Honey
Honey production is more pronounced among Bumthang and Tsirang farmers in Bhutan. In both areasproduction is organized through farmer groups and associations. The Bumthang Bee Keepers Association(BEKAP) pays 123 ngultrums a kg for honey purchased from BEKAP members. The association, in the firstharvesting season, produces yellow golden clover honey from mixed flowers, white transparent springhoney from white clover and dark black buckwheat honey from buckwheat as well as cream honey andcrystal honey. Dark buckwheat honey is produced only during winter. Bee keeping with the Europeanspecies of honeybees, Apis mellifers, was first introduced to Bumthang by a private beekeeper in 1987.Total honey production was estimated at 16 000 metric tons in 2010.
In 2009, the total honey collected from Tsirang was estimated at 150 kg. In a year, a farmer earns anaverage of 40 000 ngultrums, depending on the season. Apis cerana being the main honey produced bythe farmer groups is of good quality. Bio-Bhutan an upcoming community-oriented enterprise,successfully integrated with upstream production, supports and provides a ready market for honey bybuying in bulk volumes at farm level. It is later packed into sizable bottles and marketed. Bio-Bhutanworks with a total of eight farmer groups in six districts in line with their goal to improve income andemployment opportunities for rural communities( and to contribute to the sustainable use of naturalresources.
77
Beverages – tea, beer, spirits
Alcoholic beverages are generally categorized under beer, whisky, brandy, rum and vodka produced bythe Army Welfare Project – a government-owned company whose proceeds are used to support militarywelfare. The distillery produces 18 established brands and has recorded sales of 234 million ngultrumsin 2004 (Project report titled Comprehensive Development Strategy, 2004). In addition, a local liquorpopularly known as ara is produced and mostly consumed in the rural areas by farmers. Ara is made froma variety of raw materials such as wheat, barley, millet and rice. Herbal tea in sachets is produced inmodest quantities by the Institute of Traditional Medicine – now known as Menjong Sowa RigpaPharmaceuticals, a government-owned processing facility.
Meat
Meat processing in Bhutan is confined to home-based production of major traditional products suchas sausages (juma), dried strips of beef (shakam), and wind dried sliced pork popularly known asphasha-sikam is processed for domestic markets. Most of the country’s demand for fresh meat isimported from India on a daily regime with meat vans plying the Phuentsholing-Thimphu highway atlife-threatening speeds. Currently, there are no registered or licensed enterprises in the meat subsectoremploying modern commercialized processing facilities.
The main ingredients used in making sausages are fresh animal blood, minced meat, wheat or rice flour,spices and other condiments. The ingredients mix is encased inside animal intestines. Upon completingthe pouring of ingredients into the intestine casings, segments are made by tying knots leaving about20 centimetres gap, traditionally, hemp cords are used to tie the segment knots. It is then put to boil forabout an hour and hung dry to freeze for later consumption. The process also increases shelf life andfacilitates storage. Once dried, sausages can be stored for more than six months. There is increasingdemand for sausages (both yak and regular beef flavours) in urban towns from wholesale and retailoutlets such as restaurants, hotels, local bars and eateries. Sanitized packaging and convenient quantitieshas sparked further increase in demand. The quality of yak sausages far outweighs that of beef or porksausages and has proven a price leader in the market with people willing to pay a higher price for qualityand availability. However, premium quality in terms of ingredient mix and taste determines the successof the product.
Likewise, fresh yak meat is supplied during the winter months between November and January by thehighland nomadic herders. Some meat is cooked fresh whereas most of it is wind dried and stored forlater consumption. Yak meat is of higher quality especially as the animal feeding on natural alpinegrasslands produces a tasty lean meat. Standard chopped sizes and an attractive arrangement insideplastic packing has prompted demand for the meat for personal consumption, fulfilling the desire forconvenient shopping and cooking. Currently, the yak beef sector is constrained by inadequateinfrastructure, an inadequate marketing system, the prevalence of animal diseases, inadequate feedresources, especially during winter months, weak livestock farmers’ organizations and inadequatetechnical support services. Similarly, dried beef bones or ruto are now processed into chewable bite sizeand packed into standardized packages of 0.5 kg to 1 kg and sold at retail prices through the farm shopor other commercial outlets. Ruto is a necessary ingredient used in preparing Bhutanese dishes and goeswell with all kinds of vegetables, especially when preparing hot beef broth and other traditional meals.Because of the strong flavour, ruto has an added advantage over other meat types and easily fetchespremium prices for the value added services.
Dried fish or dosem
A small community in western Bhutan continues the ancient tradition of baking fresh water trout byplacing the whole fish between two hot stone plates. The practice has been legalized recently with thegovernment empowering communities by providing ownership to local streams and rivers. Sustainablefishing is allowed at seasonal intervals with communities engaging in the baking process whereby thewomen gather wood and water whereas the men go out fishing. A treasured delicacy popularly knownas dosem continues to be prepared employing indigenous methods and fetches a premium price of1 000 ngultrums a piece.
78
Rice
Rice milling in the country was initiated by the government through the formation of farmer’scooperatives such as the Chuzergang Rice Milling Cooperative. This is probably the only cooperativeoperating at a commercial scale incorporating a brand name and packing the rice in various weightsranging from 10 to 25 kg. In contrast to the past, when paddy was de-husked using hand pounding withindigenous implements, the small-sized motorized hullers are now for milling. Choro Tsongdrel Tsogpa– a private owned milling enterprise exports milled red rice in modest quantities to markets in the UnitedStates of America and Europe. In 2010, close to 42 metric tons of semi-milled red rice was exported wortha total value of USD 42 000 to the two markets mentioned (Royal Government of Bhutan, 2010).
3. Critical issues and considerations for sectoral development
Technology in the SMFE sector
Food processing enterprises in Bhutan encounter problems with technology, particularly with theapplication of the knowledge or methods of operating the software part of the system. It is importantto point out that technology is not simply the importation of a new technological system in a countryor the contractual agreements for supply of technology, but is also linked to the country’s existingsocio-economic environment. The process of technology transfer in the country, thus, must be seenwithin a larger framework, which takes into account the historical and socio-economic context becausetechnology is applied in a productive system, in which hardware interacts with knowledge. Furthermore,a social structure and organization appropriate to the level and characteristics of the technology usedare also considered. Without each of these three components, imported technology cannot be absorbed,diffused and assimilated into the system efficiently.
Bhutanese entrepreneurs are no exception to the common characteristics of entrepreneurs in developingcountries, where more attention is given to the hardware part than to the conditions required to ensurethe efficient use of the technology. SMFE entrepreneurs are not in a position to pay for technologyassessment and also lack knowledge about the trends in technological change. Even if they could affordto do so, there is a lack of appropriate mechanisms and human resources required for this purpose. It istherefore necessary for the government to have an appropriate system in place to provide technologyassessment and matchmaking services to the industries and entrepreneurs.
The country does not have a technology transfer policy to facilitate the effective incorporation of theimported technology into the socio-economic environment of the country. Adaptation of importedtechnology and innovation of new technology is not happening in the Bhutanese industrial sectorbecause of the lack of research and development facilities. Technology developed in foreignindustrialized countries is, in general, created at a higher level of development, with different economiesof scale, and often with different technological requirements. It thus becomes necessary for a recipientcountry to adapt the imported technology to avoid the negative effects on employment, culturalpatterns and habits, and effects leading to increasing dependence on imported raw materials and spareparts. Thus, there is also a need for appropriate mechanisms for technology adaptation, reproduction/modification, innovation and absorption, which, in the long run, help to build the nation’s owntechnological capability. Technology development and transfer mechanisms are needed for continuousinnovation at the firm level. But SMEs do not have technology creation mechanisms because of limitedresources, therefore, it is necessary for the government to build the required technology infrastructure.
It is also important to point out that there is a lack of clear provision for training of technical people fromthe industries leading to inadequate expertise to handle and maintain the technology. This has led todependency on foreign experts through visiting consultants even to run and maintain the machinery,but this is not affordable for most SMFEs. One of the appropriate measures for resolving this problemis to ensure that training programs for skilled workers and technicians are included in the technicalcontracts. Often production operations are jeopardized because of delay in procuring spare parts ofmachinery imported from foreign countries or suppliers. Moreover, rapid obsolescence of the imported
79
machinery further makes it increasingly difficult to obtain spare parts. One of the best ways to resolvesuch problems is to develop an indigenous technological capability to absorb and adapt the importedtechnology rather than to look for short-term solutions.
Environmental issues
Sound conservation ethics and far-sighted conservation leadership, underpinned by age-old traditionsand a way of life that revere nature, have influenced Bhutan’s approach to the management of theenvironment. This has an affect also on the small and medium food processing industries in the countrywith insignificant environmental issues in terms of pollution of any kind both to the natural andsociocultural environment. Most processing factories are located in the southern belt of the country anddiligently adhere to strict environmental standards set out by the National Environment Commission –a government policy and regulatory authority. Environmental sustainability continues to remain a highpriority for the Royal Government of Bhutan. For instance, the Constitution of the Kingdom of Bhutanreinforces the country’s longstanding commitment to environmental conservation with Article 5mandating the government to: protect, conserve and improve the pristine environment and safeguardthe biodiversity of the country; prevent pollution and ecological degradation; secure ecologicallybalanced sustainable development; and ensure a safe and healthy environment. It further stipulates thatthe government shall maintain at least 60 percent of the country under forest cover for all time.
However, in the face of the new development needs of a modernizing and growing population,environmental management is becoming increasingly challenging and, hence, more crucial than everbefore. Forest fires, overgrazing, and unsustainable use of timber, fuelwood, and non-wood forestproducts continue to persist, whereas new environmental problems such as industrial pollution, solidwaste and climate change have emerged in the country in recent times. Furthermore, the country’stransition from a subsistence economy to a market economy is translating into more infrastructuredevelopment, rapid urbanization, and industrial expansion. Being potentially environmentally intrusive,these activities can have costly adverse impacts on the environment if necessary safeguards andmitigation measures are not adequately and timely employed.
Health and safety issues
Food safety and quality in terms of hygiene and safety are ensured through the food inspectorate systemmanaged by Bhutan Agriculture and Food Regulatory Authority (BAFRA). Compliance and enforcementare carried out through the implementation of the Food Act Bhutan, 2005. Two major food processingcompanies namely, Bhutan Agro-industries Limited and Bhutan Fruit Products Limited follow TotalQuality Management (TQM) and best practices in terms of food safety along the processing floor, startingfrom procuring quality raw materials until the final product. Strict benchmarks on quality control withphysical and sensory, and microbial quality checks are frequently administered for raw materials,ingredients, production processes, water quality and packaging materials. Both the companies haveHazardous Analysis of Critical Control Points (HACCP) certification. Other informal home-based foodprocessing enterprises are kept under the surveillance and advice of authorities such as BAFRA and alsothe Public Health Department of the Ministry of Health. Being small in nature and a majority of themhome-based, enterprises are also not able to maintain product consistency because of the lack of trainedmanpower, technology and absence of appropriate testing and quality control measures.
Globalization and trade liberalization
Globalization or trade liberalization has had little impact on the SMFEs in Bhutan. Despite thegovernment’s policy on 100 percent equity ownership to outside investments through the Foreign DirectInvestment Policy 2010, the sector has been largely under national ownership and domestic in nature.This is partly attributed to the competitive nature of the industry with the high costs of raw materialsand long distance transportation both for inputs and output markets. For instance, most small enterprisesare not able to maintain price competitiveness as they purchase raw materials in small quantities andcannot avail themselves of bulk discounts. Furthermore, because of small volumes of purchase,
80
processing enterprises are often discriminated against when there is a shortage of raw materials.Therefore, enterprises must build up their competitive edge by improving operational efficiency and byadopting strategies to ensure flexibility in response to externally induced changes. It is essential for firmsto market products that have consistently good quality and are competitively priced to break into newmarkets and obtain high sales levels.
In terms of trade, Bhutan is party to a free trade agreement with India and is a member of the SouthAsian Free Trade Area (SAFTA) and the Bay of Bengal Initiative for Multisectoral Technical and EconomicCooperation (BIMSTEC). With the liberalization of markets, there is an increasing trend towards outward-oriented policies, with export markets seen as an important source of economic growth. However, to takeadvantage of these opportunities, SMFEs must be able to participate in productive activities in whichthey have a competitive advantage. This implies access to well-organized marketing, distribution andpost-harvest systems, effective market information and technologies that allow them to be competitivein price and quality. India is by far the most important trading partner of Bhutan with 80 percent of allexports from Bhutan destined for India. The most important reasons for this situation are geographicalproximity, the free trade agreement between the two countries and the financial and technical assistanceIndia provides to Bhutan. Bangladesh is the second largest export market for Bhutan, with a share ofabout 4 percent and Japan is the second largest source of imports, also with a share of 4 percent.Agricultural exports are confined to potatoes, oranges and apples for the Bangladeshi and Indianmarkets.
The country is limited to a handful of mini-supermarkets in the capital selling mostly imported packagedand processed products. Whereas 90 percent of the population are consuming primarily straight fromthe farm produce, the urban population is beginning to depend on processed products. However, sincemost families have one spouse staying at home, fresh produce is still preferred, although it requires moretime dedicated to processing it at home.
4. Status of government policy and legal frameworks
The government is strongly committed to the growth of the private sector. Whereas several institutional,policy, and labour constraints remain, the government has been active in privatizing state-owned firms,promoting institutional and legislative reform, and upgrading domestic skills. Both small and mediumfood processing enterprises have received equal attention in terms favourable credit, technical assistance,supply chain development among other government supports designed to promote their development.The following are the existing legal frameworks that govern small and medium food processingenterprises in the country.
Legal and policy instruments for agroprocessing and industrial development include regulation oftechnology transfer and industrial ownership, fiscal incentives for research and development, as well astraining, financing of operations through risk capital contributions, commercial protection and foreigninvestment regulation. Some of the important instruments are described below.
Bhutan Vision 2020
Private sector development has been given priority by the government since the Sixth Five Year Plan(1987–1992), and Vision 2020 envisages the private sector as the main engine of the nation’s futureeconomic growth. The private sector is expected to play an increasing role in fostering economicdevelopment and as a source of employment, especially for the youth. The Bhutan 2020 – Vision forPeace, Happiness and Prosperity is a 20 years perspective strategy document outlining policy andprogramme support towards small and cottage industries comprising agrofood processing. It aims atenlarging access for small-scale producers to technology, credit and markets so as to enable them toproduce profitably for the domestic market.
81
Tenth Five-year Plan Document 2008–2013
The plan supports agro-industrial development with the focus on sustainable industrial development ofmicro, small and medium enterprises (MSMEs). This has prompted the establishment of new institutionssuch as the Department of Cottage and Small Industries (DCSI) and the Agency for Promotion ofIndigenous Craft, both of which are housed in the Ministry of Economic Affairs. Subsequentdevelopments include the establishment of the Private Sector Development Committee (PSDC) tocoordinate the MSME development program implementation with other government ministries andagencies wherever necessary. The overall policy framework and actions aim to strengthen the businessenvironment through: (a) better business laws and regulations; (b) simplification and acceleration ofbusiness formalization removing unnecessary requirements for both business registration and licensing;and (c) increasing accountability and administrative efficiency of regional trade offices.
The Food Act of Bhutan 2005
The Food Act of Bhutan 2005 is the legal framework for protecting, regulating, processing, and tradingfood in the country. The National Food Quality and Safety Commission formulates policies to maximizeindustry development and fosters trade. The Bhutan Agriculture and Food Regulatory Authority (BAFRA)is the implementing agency for the legal framework through a national food inspectorate system. Theinspectorate oversees and ensures food safety and quality parameters in the country of bothdomestically produced foods and imported foods. Bhutan food standards are aimed to be in compliancewith Codex Alimentarius food safety and quality standards both for domestic and imported foodproducts. The import of genetically modified food items are prohibited in the country. BAFRA alsoprovides quarantine and certification systems preventing the entry and establishment of pests anddiseases, and controlling the spread of pests and diseases to prevent genetic resources erosion.
Given that food safety issues are multifaceted and multidisciplinary, the country has been successful inintegrating efforts among and between agriculture, industry and health authorities ensuring that qualityissues are resolved successfully. Monitoring food quality and safety has become more important bothin the domestic and export market. Bhutan has prioritized food safety and quality in order to preventthe adulteration of foodstuffs and to safeguard the rights and well-being of the consumers by effectiveimplementation of the Food Act of Bhutan 2005, thus retaining the standard of quality for food productsduring production, processing, import and export. BAFRA also provides laboratory services for foodquality control, import/export trade and industrial output. There is a central food laboratory located inYusipang authorized to investigate the quality and safety of food products in accordance with the FoodAct of Bhutan 2005 and regulations. The laboratory has the capability to analyze all major foodcommodities, has facilities for monitoring pesticide residues, heavy metals, mycotoxins, and undertakesmicrobiological analysis. Among other equipment, the CFL is equipped with an atomic absorptionseptophotometer, a flame photometer, a UV septophotometer, a becquerel monitor for gamma radiation,a pH meter as well as equipment for conducting thin layer chromatography.
RNR support for agro-industrial and food processing
The renewal natural resource sector implemented by the Ministry of Agriculture and Forest has institutedthe National Post-Harvest Center (NPHC) since 1997 to institute appropriate post-harvest productiontechnologies. NPHC also promotes improved inputs and packaging materials, refrigerated vehicles andcold storage warehousing in addition to enhancing home-scale food processing. The organization hasprovided technical inputs in the areas of pickling and jam making, and increased food shelf life byintroducing frying and drying as two primary food processing techniques that are easily adoptable byfarmers. Under the Rural Enterprise Development Program (REDP), NPHC has set up an integrated foodprocessing plant in Dagapela, Zhemgnag and Pemagyaltshel. Farmer groups and cooperatives areengaged in orange pulp making in these three districts and each has received significant technicalbackstopping and other support from the NPHC. The Center also introduced drying technologies thatuse simple locally available raw materials and affordable capacities by the rural people.
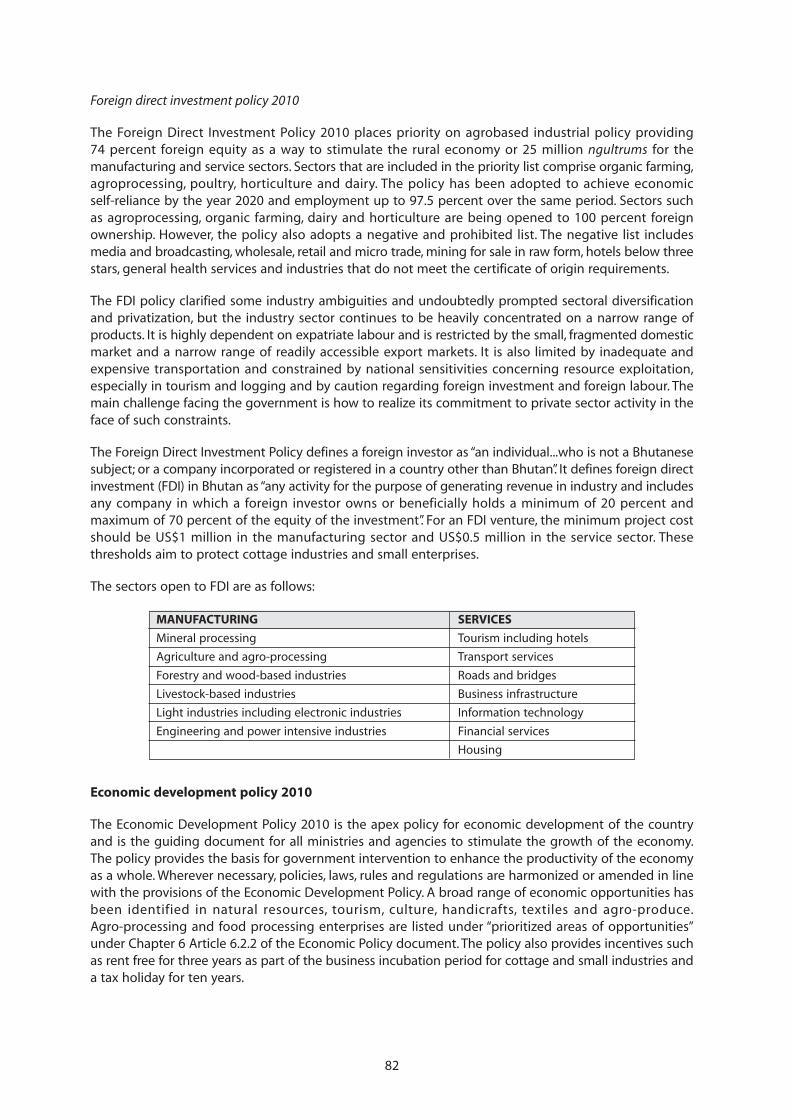
82
MANUFACTURING SERVICES
Foreign direct investment policy 2010
The Foreign Direct Investment Policy 2010 places priority on agrobased industrial policy providing74 percent foreign equity as a way to stimulate the rural economy or 25 million ngultrums for themanufacturing and service sectors. Sectors that are included in the priority list comprise organic farming,agroprocessing, poultry, horticulture and dairy. The policy has been adopted to achieve economicself-reliance by the year 2020 and employment up to 97.5 percent over the same period. Sectors suchas agroprocessing, organic farming, dairy and horticulture are being opened to 100 percent foreignownership. However, the policy also adopts a negative and prohibited list. The negative list includesmedia and broadcasting, wholesale, retail and micro trade, mining for sale in raw form, hotels below threestars, general health services and industries that do not meet the certificate of origin requirements.
The FDI policy clarified some industry ambiguities and undoubtedly prompted sectoral diversificationand privatization, but the industry sector continues to be heavily concentrated on a narrow range ofproducts. It is highly dependent on expatriate labour and is restricted by the small, fragmented domesticmarket and a narrow range of readily accessible export markets. It is also limited by inadequate andexpensive transportation and constrained by national sensitivities concerning resource exploitation,especially in tourism and logging and by caution regarding foreign investment and foreign labour. Themain challenge facing the government is how to realize its commitment to private sector activity in theface of such constraints.
The Foreign Direct Investment Policy defines a foreign investor as “an individual...who is not a Bhutanesesubject; or a company incorporated or registered in a country other than Bhutan”. It defines foreign directinvestment (FDI) in Bhutan as “any activity for the purpose of generating revenue in industry and includesany company in which a foreign investor owns or beneficially holds a minimum of 20 percent andmaximum of 70 percent of the equity of the investment”. For an FDI venture, the minimum project costshould be US$1 million in the manufacturing sector and US$0.5 million in the service sector. Thesethresholds aim to protect cottage industries and small enterprises.
The sectors open to FDI are as follows:
MANUFACTURING SERVICES
Mineral processing Tourism including hotels
Agriculture and agro-processing Transport services
Forestry and wood-based industries Roads and bridges
Livestock-based industries Business infrastructure
Light industries including electronic industries Information technology
Engineering and power intensive industries Financial services
Housing
Economic development policy 2010
The Economic Development Policy 2010 is the apex policy for economic development of the countryand is the guiding document for all ministries and agencies to stimulate the growth of the economy.The policy provides the basis for government intervention to enhance the productivity of the economyas a whole. Wherever necessary, policies, laws, rules and regulations are harmonized or amended in linewith the provisions of the Economic Development Policy. A broad range of economic opportunities hasbeen identified in natural resources, tourism, culture, handicrafts, textiles and agro-produce.Agro-processing and food processing enterprises are listed under “prioritized areas of opportunities”under Chapter 6 Article 6.2.2 of the Economic Policy document. The policy also provides incentives suchas rent free for three years as part of the business incubation period for cottage and small industries anda tax holiday for ten years.
83
The Economic Development Policy 2010 also states that the government shall promote cottage andsmall industries (CSI) to generate employment, support equitable distribution of income and bring aboutbalanced regional development. The Department of Cottage and Small Industries has been createdmainly for the promotion and development of these industries.
Cost sharing facility and business development services
As most of the industries are still at the infant stage in Bhutan, the Ministry of Economic Affairs hasinitiated the Cost Sharing Facility (CSF). The newly established Department of Cottage and Small Industryunder the Ministry of Economic Affairs is implementing the CSF project, funded by the AsianDevelopment Bank. The objective of the project is to improve the overall performance of micro, smalland medium enterprises through the provision of Business Development Services (BDS). BDS are thoseservices that help entrepreneurs to overcome their weaknesses and improve their overall businessperformance and growth. The project aims to facilitate the provision of BDS to the micro, small andmedium enterprises in the manufacturing and service sector, by co-financing projects of successfulapplicants at a flat rate of 50 percent of the total cost of BDS. The program is expected to operate fora period of three years.
Draft MSME policy
The draft MSME policy is intended to define and develop a reasoned set of policy statements to fosterthe mobilization of input supplies, entrepreneurship and innovation for the benefit of the MSME sectorin Bhutan. The policy was drafted in response to the challenges of globally integrated markets, emergingtechnologies and the competitive differentiations they are conferring on Bhutan’s trading partners, thegrowing incorporation of knowledge in production networks and the growing importance of energy-efficiency and “green” technologies. The draft policy also emphasizes that MSMEs receive all legitimatesupport from the government and ensure that MSMEs become and remain learning, resilient, dynamicand outward-looking enterprises.
Environmental policies and associated frameworks
The National Environmental Protection Act (NEPA) 2007 lays down the principles and directives for theprotection of environmental quality and the maintenance of forests, biodiversity and ecosystem integrity.Salient features include the right to environmental information and citizen participation in environmentalmanagement, and provision for establishment of an Environmental Tribunal as a quasi-judicial authoritywith the power to hear, investigate and make decisions on environmental disputes. NEPA 2007 alsoenhances the legal status of the National Environment Commission as an independent, apex governmententity for decision-making on all matters related to the environment and its management. Theimplementation of NEPA 2007 is taking place in general through the enforcement of other environmentallaws such as the Environment Assessment Act 2000, Forest and Nature Conservation Act 1995 and theirsupporting regulations. The Water Act, which regulates environmental discharge limits to regulate air andwater pollution by industries and vehicles, has been revised and enhanced based on an analysis of dataaccrued from industrial environmental monitoring and vehicular emission tests.
The Bhutan Environmental Outlook 2008 (RGB, 2008) provides an assessment of the environmentalconditions and trends in the country and responses of the country to the environmental challenges,based on the “pressure-state-response (PSR)” model that is internationally used for reporting the stateof the environment. Some 80 measurable indicators have been used to describe the PSR state of the air,water, land, and biodiversity environments. These indicators effectively serve as baselines forenvironmental monitoring and planning. Examples include the enactment of the Waste Prevention andManagement Act, incorporation of the Polluter Pays Principle in NEPA 2007, and preparation of theNational Action Plan to combat land degradation.
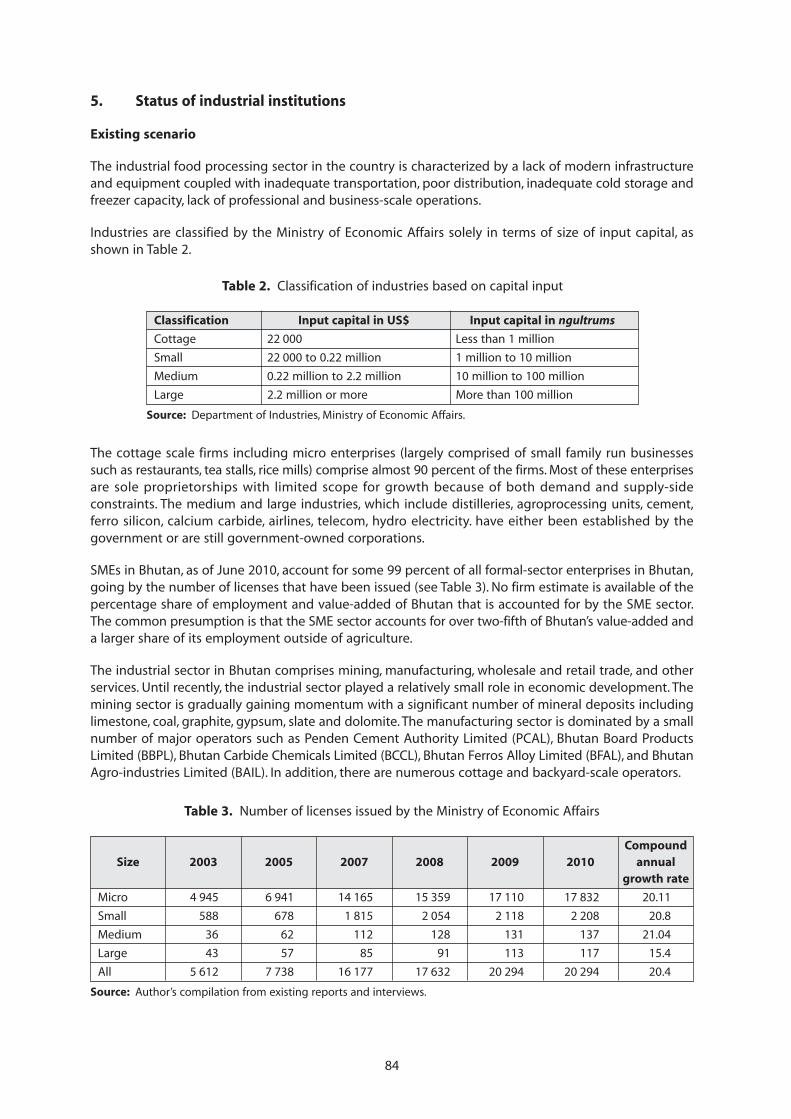
84
5. Status of industrial institutions
Existing scenario
The industrial food processing sector in the country is characterized by a lack of modern infrastructureand equipment coupled with inadequate transportation, poor distribution, inadequate cold storage andfreezer capacity, lack of professional and business-scale operations.
Industries are classified by the Ministry of Economic Affairs solely in terms of size of input capital, asshown in Table 2.
Table 2. Classification of industries based on capital input
Classification Input capital in US$ Input capital in ngultrums
Cottage 22 000 Less than 1 million
Small 22 000 to 0.22 million 1 million to 10 million
Medium 0.22 million to 2.2 million 10 million to 100 million
Large 2.2 million or more More than 100 million
Source: Department of Industries, Ministry of Economic Affairs.
The cottage scale firms including micro enterprises (largely comprised of small family run businessessuch as restaurants, tea stalls, rice mills) comprise almost 90 percent of the firms. Most of these enterprisesare sole proprietorships with limited scope for growth because of both demand and supply-sideconstraints. The medium and large industries, which include distilleries, agroprocessing units, cement,ferro silicon, calcium carbide, airlines, telecom, hydro electricity. have either been established by thegovernment or are still government-owned corporations.
SMEs in Bhutan, as of June 2010, account for some 99 percent of all formal-sector enterprises in Bhutan,going by the number of licenses that have been issued (see Table 3). No firm estimate is available of thepercentage share of employment and value-added of Bhutan that is accounted for by the SME sector.The common presumption is that the SME sector accounts for over two-fifth of Bhutan’s value-added anda larger share of its employment outside of agriculture.
The industrial sector in Bhutan comprises mining, manufacturing, wholesale and retail trade, and otherservices. Until recently, the industrial sector played a relatively small role in economic development. Themining sector is gradually gaining momentum with a significant number of mineral deposits includinglimestone, coal, graphite, gypsum, slate and dolomite. The manufacturing sector is dominated by a smallnumber of major operators such as Penden Cement Authority Limited (PCAL), Bhutan Board ProductsLimited (BBPL), Bhutan Carbide Chemicals Limited (BCCL), Bhutan Ferros Alloy Limited (BFAL), and BhutanAgro-industries Limited (BAIL). In addition, there are numerous cottage and backyard-scale operators.
Table 3. Number of licenses issued by the Ministry of Economic Affairs
CompoundSize 2003 2005 2007 2008 2009 2010 annual
growth rate
Micro 4 945 6 941 14 165 15 359 17 110 17 832 20.11
Small 588 678 1 815 2 054 2 118 2 208 20.8
Medium 36 62 112 128 131 137 21.04
Large 43 57 85 91 113 117 15.4
All 5 612 7 738 16 177 17 632 20 294 20 294 20.4
Source: Author’s compilation from existing reports and interviews.
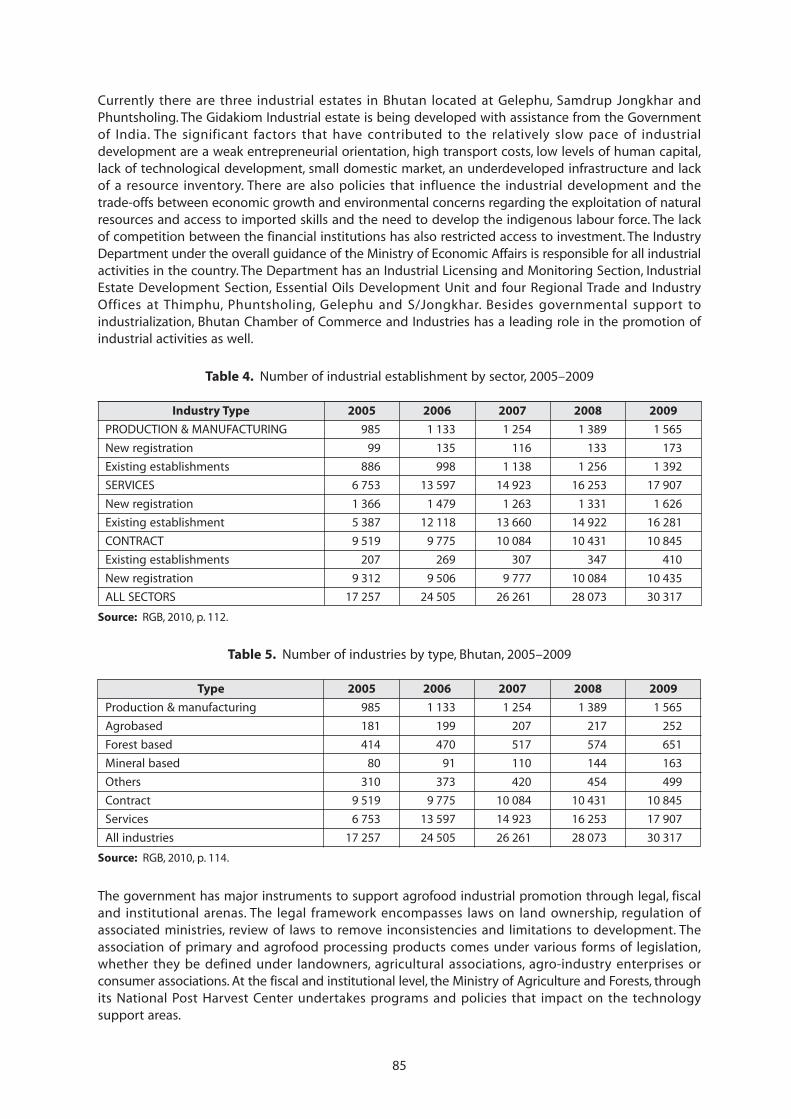
85
Currently there are three industrial estates in Bhutan located at Gelephu, Samdrup Jongkhar andPhuntsholing. The Gidakiom Industrial estate is being developed with assistance from the Governmentof India. The significant factors that have contributed to the relatively slow pace of industrialdevelopment are a weak entrepreneurial orientation, high transport costs, low levels of human capital,lack of technological development, small domestic market, an underdeveloped infrastructure and lackof a resource inventory. There are also policies that influence the industrial development and thetrade-offs between economic growth and environmental concerns regarding the exploitation of naturalresources and access to imported skills and the need to develop the indigenous labour force. The lackof competition between the financial institutions has also restricted access to investment. The IndustryDepartment under the overall guidance of the Ministry of Economic Affairs is responsible for all industrialactivities in the country. The Department has an Industrial Licensing and Monitoring Section, IndustrialEstate Development Section, Essential Oils Development Unit and four Regional Trade and IndustryOffices at Thimphu, Phuntsholing, Gelephu and S/Jongkhar. Besides governmental support toindustrialization, Bhutan Chamber of Commerce and Industries has a leading role in the promotion ofindustrial activities as well.
Table 4. Number of industrial establishment by sector, 2005–2009
Industry Type 2005 2006 2007 2008 2009
PRODUCTION & MANUFACTURING 985 1 133 1 254 1 389 1 565
New registration 99 135 116 133 173
Existing establishments 886 998 1 138 1 256 1 392
SERVICES 6 753 13 597 14 923 16 253 17 907
New registration 1 366 1 479 1 263 1 331 1 626
Existing establishment 5 387 12 118 13 660 14 922 16 281
CONTRACT 9 519 9 775 10 084 10 431 10 845
Existing establishments 207 269 307 347 410
New registration 9 312 9 506 9 777 10 084 10 435
ALL SECTORS 17 257 24 505 26 261 28 073 30 317
Source: RGB, 2010, p. 112.
Table 5. Number of industries by type, Bhutan, 2005–2009
Type 2005 2006 2007 2008 2009
Production & manufacturing 985 1 133 1 254 1 389 1 565
Agrobased 181 199 207 217 252
Forest based 414 470 517 574 651
Mineral based 80 91 110 144 163
Others 310 373 420 454 499
Contract 9 519 9 775 10 084 10 431 10 845
Services 6 753 13 597 14 923 16 253 17 907
All industries 17 257 24 505 26 261 28 073 30 317
Source: RGB, 2010, p. 114.
The government has major instruments to support agrofood industrial promotion through legal, fiscaland institutional arenas. The legal framework encompasses laws on land ownership, regulation ofassociated ministries, review of laws to remove inconsistencies and limitations to development. Theassociation of primary and agrofood processing products comes under various forms of legislation,whether they be defined under landowners, agricultural associations, agro-industry enterprises orconsumer associations. At the fiscal and institutional level, the Ministry of Agriculture and Forests, throughits National Post Harvest Center undertakes programs and policies that impact on the technologysupport areas.
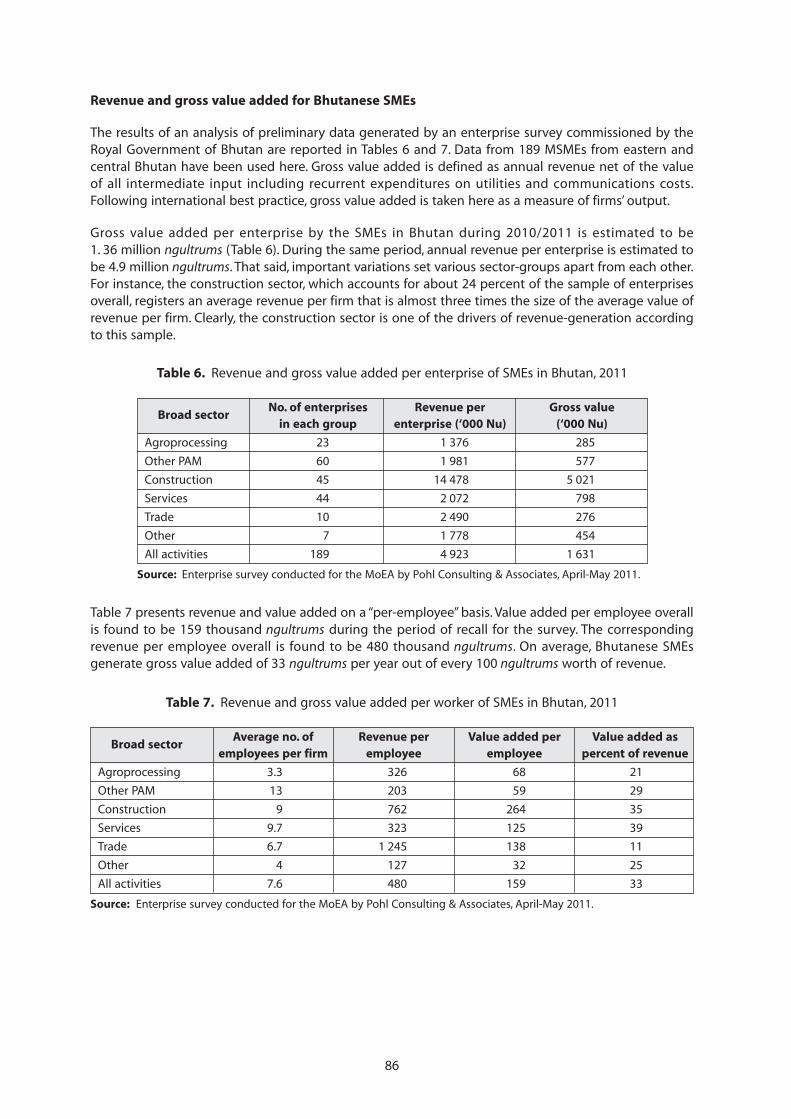
86
Revenue and gross value added for Bhutanese SMEs
The results of an analysis of preliminary data generated by an enterprise survey commissioned by theRoyal Government of Bhutan are reported in Tables 6 and 7. Data from 189 MSMEs from eastern andcentral Bhutan have been used here. Gross value added is defined as annual revenue net of the valueof all intermediate input including recurrent expenditures on utilities and communications costs.Following international best practice, gross value added is taken here as a measure of firms’ output.
Gross value added per enterprise by the SMEs in Bhutan during 2010/2011 is estimated to be1. 36 million ngultrums (Table 6). During the same period, annual revenue per enterprise is estimated tobe 4.9 million ngultrums. That said, important variations set various sector-groups apart from each other.For instance, the construction sector, which accounts for about 24 percent of the sample of enterprisesoverall, registers an average revenue per firm that is almost three times the size of the average value ofrevenue per firm. Clearly, the construction sector is one of the drivers of revenue-generation accordingto this sample.
Table 6. Revenue and gross value added per enterprise of SMEs in Bhutan, 2011
Broad sectorNo. of enterprises Revenue per Gross value
in each group enterprise (‘000 Nu) (‘000 Nu)
Agroprocessing 23 1 376 285
Other PAM 60 1 981 577
Construction 45 14 478 5 021
Services 44 2 072 798
Trade 10 2 490 276
Other 7 1 778 454
All activities 189 4 923 1 631
Source: Enterprise survey conducted for the MoEA by Pohl Consulting & Associates, April-May 2011.
Table 7 presents revenue and value added on a “per-employee” basis. Value added per employee overallis found to be 159 thousand ngultrums during the period of recall for the survey. The correspondingrevenue per employee overall is found to be 480 thousand ngultrums. On average, Bhutanese SMEsgenerate gross value added of 33 ngultrums per year out of every 100 ngultrums worth of revenue.
Table 7. Revenue and gross value added per worker of SMEs in Bhutan, 2011
Broad sectorAverage no. of Revenue per Value added per Value added as
employees per firm employee employee percent of revenue
Agroprocessing 3.3 326 68 21
Other PAM 13 203 59 29
Construction 9 762 264 35
Services 9.7 323 125 39
Trade 6.7 1 245 138 11
Other 4 127 32 25
All activities 7.6 480 159 33
Source: Enterprise survey conducted for the MoEA by Pohl Consulting & Associates, April-May 2011.
87
Institutions and other players
Bhutan Agriculture and Food Regulatory Authority (BAFRA)
Among others, BAFRA is responsible for ensuring compliance on food safety and quality standards andis the main regulatory body in the country for setting up an effective surveillance mechanism, developingregulations and ensuring safe food. BAFRA undertakes market inspections, industry inspections as wellas import inspections so that safety is ensured. It has been very difficult to set monitoring indicators todetermine the effectiveness of the implemented programs. The authority at present is facing seriousconstraints in terms of human, financial and infrastructure capacities and lack of effective coordinationamong and between stakeholders. Officials of BAFRA monitor and regulate activities starting fromimports, domestic processing and other links in the value chain.
National Post-harvest Center (NPHC)
The National Post Harvest Center, established in 1997, is a government organization with a mandate tominimize food loss and maximize food products from agriculture resources through research anddevelopment of appropriate post-harvest technologies. The NPHC provides assistance to farmers and theprivate food processing enterprises on scientific methods of food preservation using simple tools,equipment, and methods. Among other mandates, the NPHC promotes improved input facilities such aspackaging materials, refrigerated trucks, home-scale processing, and helps establish viable small-scale andcommunity level food processing enterprises to enhance rural incomes.
Bhutan Development Bank (BDB)
Bhutan Development Bank provides both industrial and agricultural lending, including microcredit. Thegovernment’s current mandate requires Bhutan Development Bank to operate as a development bankto promote the expansion of economic and social development through accelerated industrial and, inparticular, agricultural development in rural areas. Given the dominance of agriculture in Bhutan’s overalleconomic development, BDB plays a continuing role in financing agriculture, including micro-finance, inaddition to industrial activities. Considering 70 percent of the population is dependent on agricultureand livestock, BDB caters to this market segment through the agriculture and animal husbandry loanschemes using either the small individual loan scheme or the commercial agriculture loan scheme or thegroup guarantee and lending scheme.
Department of Agriculture Marketing and Cooperatives
The former Agriculture Marketing Services has now been upgraded to a newly established Departmentof Agriculture Marketing and Cooperatives (DAMC). Among other mandates, DAMC is responsible forfacilitating the efficient marketing of RNR products including processed food products. The departmentis currently lacking adequate market infrastructure in terms of qualified human resources, infrastructureand well-developed market linkages. Lack of well functioning farmer groups and poor access to marketshas perpetually deprived commercialization of agriculture and livestock products except for fewhousehold level weekly vendors. DAMC is stretched over facilitating marketing of all RNR productsranging from cereals, non-wood forest products, horticulture products, mushrooms, livestock products,including fish and poultry products.
Development partners
Development partners like the Danida (Danish Assistance to Bhutan), European Union, Government ofIndia, Food and Agriculture Organization, International Livestock Research Institute (ILRI) have beenproviding resources towards the development of the processing industry. They have been providingassistance in terms of funding and technical assistance in different interventions implemented inprograms to achieve the set objectives and propel the economy of the country into sustainable growth.It is therefore expected that development partners will continue to support the development of theprocessing industry.
88
Coordinating mechanism
Successful development of the processing industry/improved performance of the food processingindustry will depend on both vertical and horizontal coordination. This includes the coordination withother agricultural sector related ministries, institutions, development partners, agencies and otherstakeholders such as farmers and their associations. Some of the instruments that will be used to ensureparticipation of all stakeholders, are laws and regulations, stakeholder fora, research findings, availabletechnical support services, early warning system, different professional fora and marketing systems.
6. Status of industrial infrastructure
Road network
Road transport is the dominant mode of transportation for passengers and freight within the countryand to the neighbouring states of India. The country’s vehicle fleet has increased significantly from about13 600 at the end of 1997 to over 58 511 vehicles as of first quarter 2011, amounting to the ratio of onevehicle per 11 people or 88 vehicles for every 1 000 people (Kuensel, September 17, 2011). Bhutan hasa total road network of 4 393 km, with Phuentsholing as the main point of trade with India. All 20 districtsare connected by motor roads with districts further connected to the block villages through farm roadswith 53 percent of farmers within one hour walking distance from the nearest motor road (RGB, 2009).Major SMFE have adequate access to road transport, although the distance of raw material input hasbecome a major cost component of the business. The leading SMFEs maintain their own standing fleetof trucks for purposes of procurement and distribution.
Regardless of its efforts to construct new roads, Bhutan still suffers significant difficulties in connectingscattered villages into a road network. According to the recent Population and Housing Census Survey2005, 21 percent of Bhutanese households live one to four hours walking distance from the nearestall-season road and another 21 percent live more than four hours walking distance away. In addition, thecountry’s terrain of rugged mountains and steep slopes means the costs of transporting goods betweenBhutan and India are high and account for a significant proportion of total production and marketingcosts.
Power supply or energy requirements
Hydroelectric power has long been a very important aspect of Bhutan’s economic development asa low-cost energy source supporting more capital-intensive industries such as mining, cement,ferrosilicon, small and medium agroprocessing and calcium carbide production. Bhutan’s steepmountains, deep gorges and fast-flowing rivers create abundant hydroelectric potential, which thegovernment began to develop in the early 1960s. The major expansion of hydroelectric facilitiesstarted in 1975 on the Wang Chhu river between Thimphu and Phuntsholing, known as the ChhukhaHydro Power Corporation Ltd., which helped to boost the nation’s fledgling industrial development. The336-megawatt Chhukha project came online in 1986 and was synchronized with the Indian grid thatsame year, and additional capacity became available in 1988. Besides the Chhukha project, thegovernment installations include seven mini-hydroelectric plants, each averaging 7 350 kilowattscapacity; twelve micro-hydroelectric plants, each averaging 340 kilowatts capacity and eightdiesel-powered generating stations, each averaging 6 000 kilowatts capacity.
Production facilities
Existing SMFEs have imported new technology in terms of the processing facilities with BAIL havinginstalled a canning line – a Danish technology that controls natural biochemical processes to protectagainst microbiological spoilage and improve sensory taste. The enterprise also has a Gable Top Fillingmachine with a capacity of 3 000 packets an hour allowing the packing of fruit juices using the latestavailable technology and producing about seven different product lines. The enterprise is housed withina 1.5 acres total land area. Similar production facilities in the assembly floor have been purchased byBhutan Fruit Products Limited. Bhutan Dairy and Agro Products Limited has invested close to 95.7 million
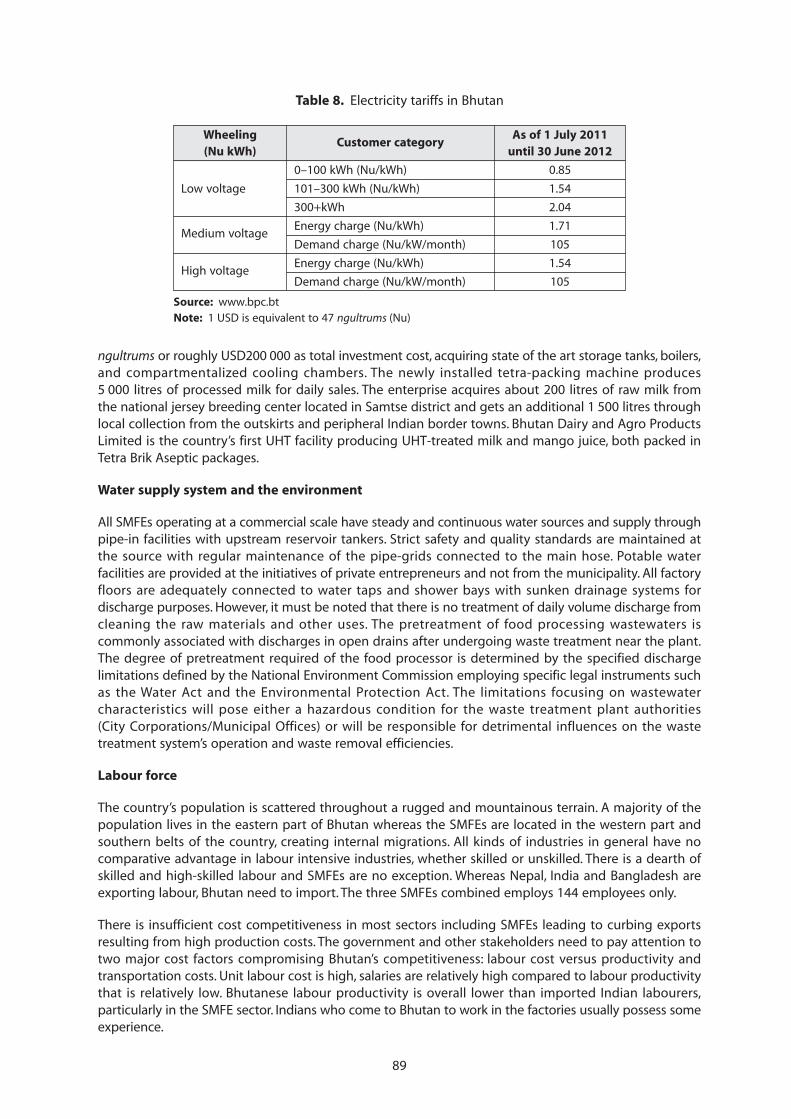
89
ngultrums or roughly USD200 000 as total investment cost, acquiring state of the art storage tanks, boilers,and compartmentalized cooling chambers. The newly installed tetra-packing machine produces5 000 litres of processed milk for daily sales. The enterprise acquires about 200 litres of raw milk fromthe national jersey breeding center located in Samtse district and gets an additional 1 500 litres throughlocal collection from the outskirts and peripheral Indian border towns. Bhutan Dairy and Agro ProductsLimited is the country’s first UHT facility producing UHT-treated milk and mango juice, both packed inTetra Brik Aseptic packages.
Water supply system and the environment
All SMFEs operating at a commercial scale have steady and continuous water sources and supply throughpipe-in facilities with upstream reservoir tankers. Strict safety and quality standards are maintained atthe source with regular maintenance of the pipe-grids connected to the main hose. Potable waterfacilities are provided at the initiatives of private entrepreneurs and not from the municipality. All factoryfloors are adequately connected to water taps and shower bays with sunken drainage systems fordischarge purposes. However, it must be noted that there is no treatment of daily volume discharge fromcleaning the raw materials and other uses. The pretreatment of food processing wastewaters iscommonly associated with discharges in open drains after undergoing waste treatment near the plant.The degree of pretreatment required of the food processor is determined by the specified dischargelimitations defined by the National Environment Commission employing specific legal instruments suchas the Water Act and the Environmental Protection Act. The limitations focusing on wastewatercharacteristics will pose either a hazardous condition for the waste treatment plant authorities(City Corporations/Municipal Offices) or will be responsible for detrimental influences on the wastetreatment system’s operation and waste removal efficiencies.
Labour force
The country’s population is scattered throughout a rugged and mountainous terrain. A majority of thepopulation lives in the eastern part of Bhutan whereas the SMFEs are located in the western part andsouthern belts of the country, creating internal migrations. All kinds of industries in general have nocomparative advantage in labour intensive industries, whether skilled or unskilled. There is a dearth ofskilled and high-skilled labour and SMFEs are no exception. Whereas Nepal, India and Bangladesh areexporting labour, Bhutan need to import. The three SMFEs combined employs 144 employees only.
There is insufficient cost competitiveness in most sectors including SMFEs leading to curbing exportsresulting from high production costs. The government and other stakeholders need to pay attention totwo major cost factors compromising Bhutan’s competitiveness: labour cost versus productivity andtransportation costs. Unit labour cost is high, salaries are relatively high compared to labour productivitythat is relatively low. Bhutanese labour productivity is overall lower than imported Indian labourers,particularly in the SMFE sector. Indians who come to Bhutan to work in the factories usually possess someexperience.
Table 8. Electricity tariffs in Bhutan
WheelingCustomer category
As of 1 July 2011(Nu kWh) until 30 June 2012
0–100 kWh (Nu/kWh) 0.85
Low voltage 101–300 kWh (Nu/kWh) 1.54
300+kWh 2.04
Medium voltageEnergy charge (Nu/kWh) 1.71
Demand charge (Nu/kW/month) 105
High voltageEnergy charge (Nu/kWh) 1.54
Demand charge (Nu/kW/month) 105
Source: www.bpc.btNote: 1 USD is equivalent to 47 ngultrums (Nu)
90
Capital
Lack of capital is a major obstacle to enterprise expansion and export growth. Credit facilities are limitedwith banks only extending credit on collateral of land and buildings, without recognizing designs,inventory, export management capability, experience, etc. This makes access to finance critical in Bhutan.The Bhutanese banking sector comprises only six banks. All of them are heavily secured with highinterest rates and the collateral required is huge. For example, for a 1 million ngultrum loan, the collateralrequired amounts to 2.5 million ngultrum.
7. Analysis of constraints and strategic priorities
Bhutan’s food processing industry faces many impediments. Raw materials are uncompetitive becauseof low crop yields, low productivity and high transport costs. Value-adding activities are hampered bythe lack of scale, old technology, inadequate packaging, lack of branding and costly freight. Managementlack the skills and experience to offset these higher costs through innovation and marketing.Government support is provided in the areas of high-value, low-volume products (mushrooms, essentialoils, fruits and vegetables, herbs and traditional medicines) in niche markets, based on such competitiveadvantages as Bhutan’s biodiversity, organic production methods and the range of microclimates.
The establishment and successful operation of small-scale food processing enterprises face severalconstraints. Some of them are listed below.
Insufficient supply of good-quality raw materials
Vegetable and fruit production in Bhutan is mainly on a small scale. Mixed cropping is practiced, andfarmers grow crops mainly for personal consumption. There are usually insufficient vegetables and fruitsfor processing. Small and medium processing enterprises lack a proper post-harvest handling system andfruits are seasonal and perishable and grown in scattered pocket farms, resulting in inefficient collection.Since production is on many small, scattered farms, collection is not only inefficient but entails hightransaction costs.
Low level of technology and management
Small-scale food processing enterprises in the rural areas generally use traditional methods of processingsuch as pickling and snack food production. This is because of supply and financial constraints, whichmeans that they cannot afford sophisticated machinery, and a lack of technical information. Mostsmall-scale food enterprises are managed by home-owners who do not know modern techniques ofmanagement, including bookkeeping and maintaining proper records, and they lack innovation andcreativity. Entrepreneurs with an elementary school education tend to be less receptive to newtechnologies compared to their counterparts who have a college education. This has made it difficult totransfer new technology and improve productivity.
Competitive market
Many small-scale food enterprises are processing much the same type of products, such as pickles, driedminced meat pickles, chilies and condiments, potato chips, beverages and bakery products. These are allitems that require a low initial capital investment and a low level of technology. Because of the numberof firms involved, they face stiff competition in terms of their market share. However, some enterprisesare able to expand their enterprises because they are innovative and have an aggressive market strategy.
Quality control gaps
The product quality of small-scale food enterprises is inconsistent because of a lack of facilities for qualitycontrol or awareness of the need for these, and because of poor manufacturing practices. Dominatedby rural players at backyard scale, an integrated GMP-HACCP system is non-existent let alone accreditedto ISO and HACCP standards. The HACCP system is a valuable tool to diagnose pertinent hazards and
91
their ramifications and a means of initiating preventative and proactive quality control measures in thefood industry. However, it should not be conceived as a panacea for addressing all issues relating to foodsafety and quality control operations.
Lack of small-scale food processors’ associations
There are no associations of small-scale food processors, or if such an association exists it is inactive andnon-functional. The lack of any organization to safeguard the interests of its members has led enterprisesto compete among themselves for the same market share by lowering their selling prices.
Food packaging
Food packaging is packed in low-quality packaging material with rather unprofessional packaging designand brand.
Poor infrastructure
Establishment of basic infrastructure such as roads, water supply and power is recognized as essentialfor the growth of small and medium food processing industries. Bhutan’s rugged terrain presents manytopographical challenges. Thus providing little alternative to road transport improvements that wouldallow a maximum tonnage of 8 to 10 metric tons and speeds of up to 40 km per hour when plying onsteep and narrow road terrain. The closest port in Kolkata (a border town in India) is located about950 kilometres from Phuntsholing. Druk Air the national carrier is limited by cargo space with thefrequency of flight schedules dependent on weather conditions. Railways and water transport are absent.Furthermore, selected post-harvest facilities like cool stores and drying facilities as well as farm-to-factoryroads, although important, are often deficient for the proper delivery of raw materials.
A consistent supply of quality raw materials for agro-processing industries is lacking with inefficienthandling and transportation systems. This situation can improve when a mutually beneficial and stablerelationship between the producer and processor develops and matures, whether in contractual or otherforms. Moreover, this would allow a continuous effort to increase production and productivity of foodand fibre crops and improve the quality of their products as well as increase production of other foodand commercial crops, fruits and vegetables, meat, poultry and dairy, oilseeds and plantation crops.
Lack of access to both domestic and foreign markets
SMFEs face several problems related to the physical distance between source of raw materials andpotential markets. This has been exacerbated by limited transportation facilities and constrained by highcosts as a result of low passenger and freight volumes. SMFEs face greater challenges in developingexport markets as they lack information on market opportunities and do not have sufficient financialresources to exploit these markets effectively. For these small firms market identification, promotion anddevelopment are based on personal contacts and information gathered from informal sources. Smallfood processing enterprises are not able to establish credibility and enter into the international supplychain, as large firms are not willing to commit themselves to small and unknown companies coming froma developing nation in South Asia.
Strategic actions
Like other businesses, SMFEs will develop and grow only if the overall economic environment isconducive for business. From the discussion above, it is evident that the private sector in general andthe SMFEs in particular in Bhutan face numerous obstacles arising from structural and locationalconstraints. Therefore, the creation of an enabling policy environment for the private sector developmentthat captures the long-term national interest and a leadership that can take bold and decisive action areurgent as the benefits of boosting the private sector will have very significant long run social, economicand political benefits.
92
The inadequate access to finance from banks is a major constraint. The establishment of a creditguarantee scheme can open a new avenue for more small enterprise development. The availability ofresources should be enhanced, but not at the expense of making the firms dependent on concessionalfinancing that could jeopardize the financial viability of the firms in the long run and could alsocompromise their competitiveness.
At the enterprise level, to overcome constraints related to product development and marketing it isimportant to improve the access of potential entrepreneurs to business development services. Currently,the Department of Cottage and Small Industries offer Business Development Services (BDS) such as theCost Sharing Facility grant but are largely based in the capital, thereby effectively excluding those livingin other parts of the country. At the same time the merits of provision of BDS by a government agencyshould also be assessed in terms of economic cost and practical feasibility. Other modes of deliveringBDS through non-government organizations and business associations could be considered to meet theneeds for smaller groups of people outside Thimphu.
8. Conclusion and recommendations
It is envisaged that cottage and small-scale food processing enterprises will continue to play animportant role in the Bhutanese culture and rural economy. To maintain industrial growth, thegovernment has various policies and incentives, applicable not only to food processing but to otherindustries also. Many government agencies such as the newly created Department of Cottage and SmallIndustries are also involved in supporting the development of small-scale food processing enterprisesby providing technical expertise, financial and marketing support.
Given the scenario of small and medium food processing industries in the country the followingrecommendations are proposed:
1. Physical and social infrastructure need to be upgraded in various areas. Despite recentimprovements in infrastructure development, road transport urgently needs improvement. Inaddition, vocational training needs to be strengthened, particularly in technical and semi-skilledsmall and medium food processing occupations in which workers are in short supply.
2. Significant work is required to gain acceptance for quality control by industry. Investment in thisarea would reduce costs and improve the efficiency of the processing systems and improvequality. Therefore, quality management systems will have to start embracing the use of GoodManufacturing Practices (GMP) and the Hazard Analysis Critical Control Point (HACCP) system astools to upgrade quality and guarantee food safety.
3. Considering the growing health consciousness of consumers, the ISO 22000 which integratesHACCP with the ISO 9000 Quality Management System, is expected to become a key requirementfor doing business in the food processing sector and to achieve export competitiveness in thelong run.
4. A number of training activities should be conducted to enhance capacity building for qualityassurance services in the food processing sector. Likewise, farmers and other backyard foodprocessors need to be educated in food safety and quality.
5. Food legislation in Bhutan should be updated and reviewed taking into consideration thesanitary and phytosanitary and environment-related aspects and preventative compliance toimprove food safety management.
6. Capacity building in human capital, infrastructure and laboratories needs to be carried out tomeet the emerging challenges being presented in food processing.
93
References
Corden, W.M. 1984. Booming sector and Dutch disease economics, survey and consolidation. Oxford EconomicsPapers. Vol. 36, No. 3: 359–380.
Royal Government of Bhutan. 2002. Bhutan Private Sector Survey, 2002. A study undertaken by then Ministry of Tradeand Industry in collaboration with Bhutan Chamber of Commerce, United Nations Development Programme andthe World Bank.
Royal Government of Bhutan. 2006. Results of the Population and Housing Census of Bhutan 2005. Office of the CensusCommissioner, Thimphu, Bhutan.
Royal Government of Bhutan. 2007. Bhutan Living Standards Survey 2007. National Statistical Bureau. Thimphu.
Royal Government of Bhutan. 2008. Bhutan Environmental Outlook 2008. National Environment Commission. Thimphu.
Royal Government of Bhutan. 2008. Poverty Analysis Report 2007. National Statistical Bureau.Thimphu.
Royal Government of Bhutan. 2009. Statistical Year Book of Bhutan 2009. Ch. 5, p. 9. National Statistical Bureau.Thimphu.
Royal Government of Bhutan. 2010. Statistical Year Book of Bhutan 2010. National Statistical Bureau. Thimphu.
Royal Government of Bhutan. 2010. National Accounts Statistics, 2009. National Statistical Bureau. Thimphu.
Tobgay S. & McCullough E. 2008. Linking small farmers in Bhutan with markets: the importance of market roadaccess. In: McCullough, E., Pingali, P., & Stamoulis, K. The transformation of agrifood systems: globalization, supply chainsand smallholder agriculture. Earthscan, London.
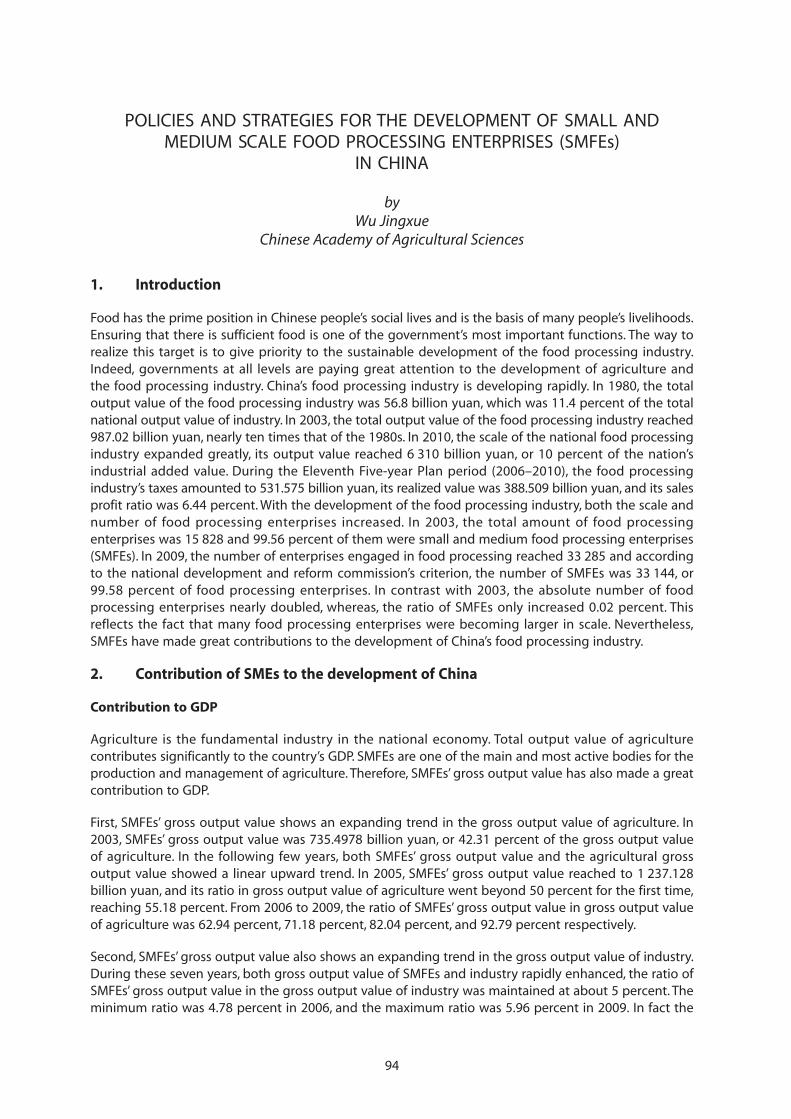
94
POLICIES AND STRATEGIES FOR THE DEVELOPMENT OF SMALL ANDMEDIUM SCALE FOOD PROCESSING ENTERPRISES (SMFEs)
IN CHINA
byWu Jingxue
Chinese Academy of Agricultural Sciences
1. Introduction
Food has the prime position in Chinese people’s social lives and is the basis of many people’s livelihoods.Ensuring that there is sufficient food is one of the government’s most important functions. The way torealize this target is to give priority to the sustainable development of the food processing industry.Indeed, governments at all levels are paying great attention to the development of agriculture andthe food processing industry. China’s food processing industry is developing rapidly. In 1980, the totaloutput value of the food processing industry was 56.8 billion yuan, which was 11.4 percent of the totalnational output value of industry. In 2003, the total output value of the food processing industry reached987.02 billion yuan, nearly ten times that of the 1980s. In 2010, the scale of the national food processingindustry expanded greatly, its output value reached 6 310 billion yuan, or 10 percent of the nation’sindustrial added value. During the Eleventh Five-year Plan period (2006–2010), the food processingindustry’s taxes amounted to 531.575 billion yuan, its realized value was 388.509 billion yuan, and its salesprofit ratio was 6.44 percent. With the development of the food processing industry, both the scale andnumber of food processing enterprises increased. In 2003, the total amount of food processingenterprises was 15 828 and 99.56 percent of them were small and medium food processing enterprises(SMFEs). In 2009, the number of enterprises engaged in food processing reached 33 285 and accordingto the national development and reform commission’s criterion, the number of SMFEs was 33 144, or99.58 percent of food processing enterprises. In contrast with 2003, the absolute number of foodprocessing enterprises nearly doubled, whereas, the ratio of SMFEs only increased 0.02 percent. Thisreflects the fact that many food processing enterprises were becoming larger in scale. Nevertheless,SMFEs have made great contributions to the development of China’s food processing industry.
2. Contribution of SMEs to the development of China
Contribution to GDP
Agriculture is the fundamental industry in the national economy. Total output value of agriculturecontributes significantly to the country’s GDP. SMFEs are one of the main and most active bodies for theproduction and management of agriculture. Therefore, SMFEs’ gross output value has also made a greatcontribution to GDP.
First, SMFEs’ gross output value shows an expanding trend in the gross output value of agriculture. In2003, SMFEs’ gross output value was 735.4978 billion yuan, or 42.31 percent of the gross output valueof agriculture. In the following few years, both SMFEs’ gross output value and the agricultural grossoutput value showed a linear upward trend. In 2005, SMFEs’ gross output value reached to 1 237.128billion yuan, and its ratio in gross output value of agriculture went beyond 50 percent for the first time,reaching 55.18 percent. From 2006 to 2009, the ratio of SMFEs’ gross output value in gross output valueof agriculture was 62.94 percent, 71.18 percent, 82.04 percent, and 92.79 percent respectively.
Second, SMFEs’ gross output value also shows an expanding trend in the gross output value of industry.During these seven years, both gross output value of SMFEs and industry rapidly enhanced, the ratio ofSMFEs’ gross output value in the gross output value of industry was maintained at about 5 percent. Theminimum ratio was 4.78 percent in 2006, and the maximum ratio was 5.96 percent in 2009. In fact the
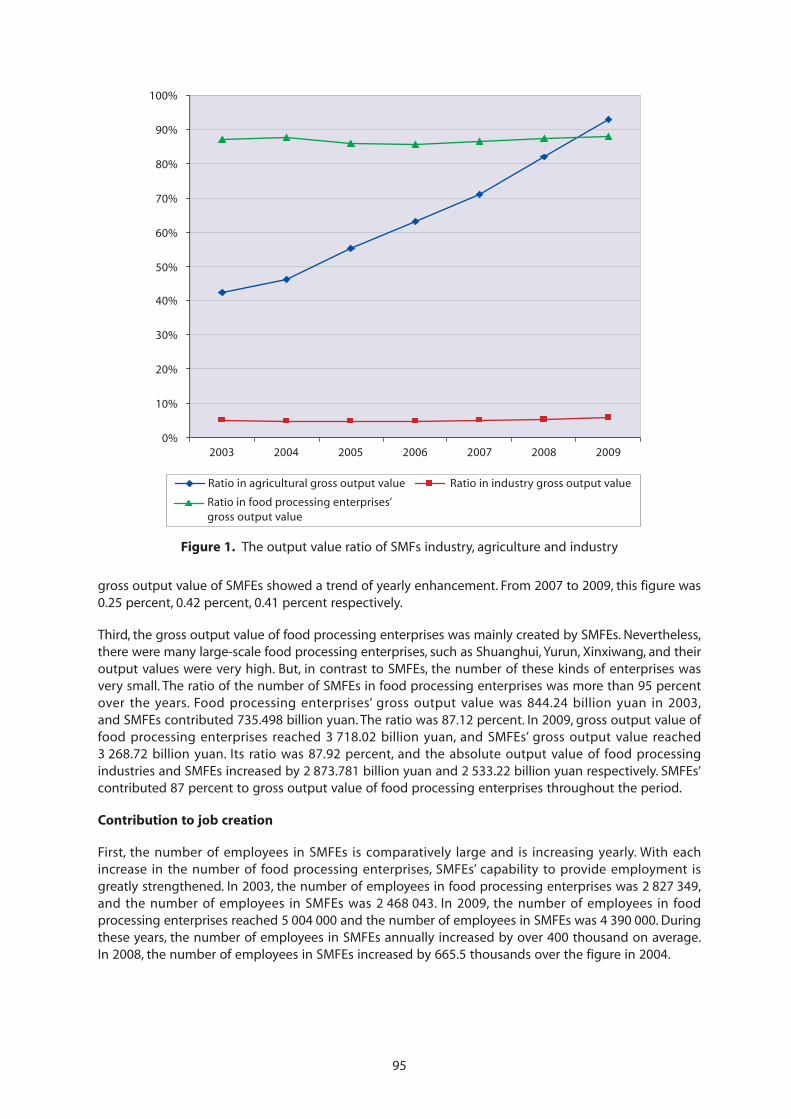
95
gross output value of SMFEs showed a trend of yearly enhancement. From 2007 to 2009, this figure was0.25 percent, 0.42 percent, 0.41 percent respectively.
Third, the gross output value of food processing enterprises was mainly created by SMFEs. Nevertheless,there were many large-scale food processing enterprises, such as Shuanghui, Yurun, Xinxiwang, and theiroutput values were very high. But, in contrast to SMFEs, the number of these kinds of enterprises wasvery small. The ratio of the number of SMFEs in food processing enterprises was more than 95 percentover the years. Food processing enterprises’ gross output value was 844.24 billion yuan in 2003,and SMFEs contributed 735.498 billion yuan. The ratio was 87.12 percent. In 2009, gross output value offood processing enterprises reached 3 718.02 billion yuan, and SMFEs’ gross output value reached3 268.72 billion yuan. Its ratio was 87.92 percent, and the absolute output value of food processingindustries and SMFEs increased by 2 873.781 billion yuan and 2 533.22 billion yuan respectively. SMFEs’contributed 87 percent to gross output value of food processing enterprises throughout the period.
Contribution to job creation
First, the number of employees in SMFEs is comparatively large and is increasing yearly. With eachincrease in the number of food processing enterprises, SMFEs’ capability to provide employment isgreatly strengthened. In 2003, the number of employees in food processing enterprises was 2 827 349,and the number of employees in SMFEs was 2 468 043. In 2009, the number of employees in foodprocessing enterprises reached 5 004 000 and the number of employees in SMFEs was 4 390 000. Duringthese years, the number of employees in SMFEs annually increased by over 400 thousand on average.In 2008, the number of employees in SMFEs increased by 665.5 thousands over the figure in 2004.
Figure 1. The output value ratio of SMFs industry, agriculture and industry
0%
10%
20%
30%
40%
50%
60%
70%
80%
90%
100%
2003 2004 2005 2006 2007 2008 2009
Ratio in food processing enterprises’ gross output value
Ratio in industry gross output valueRatio in agricultural gross output value
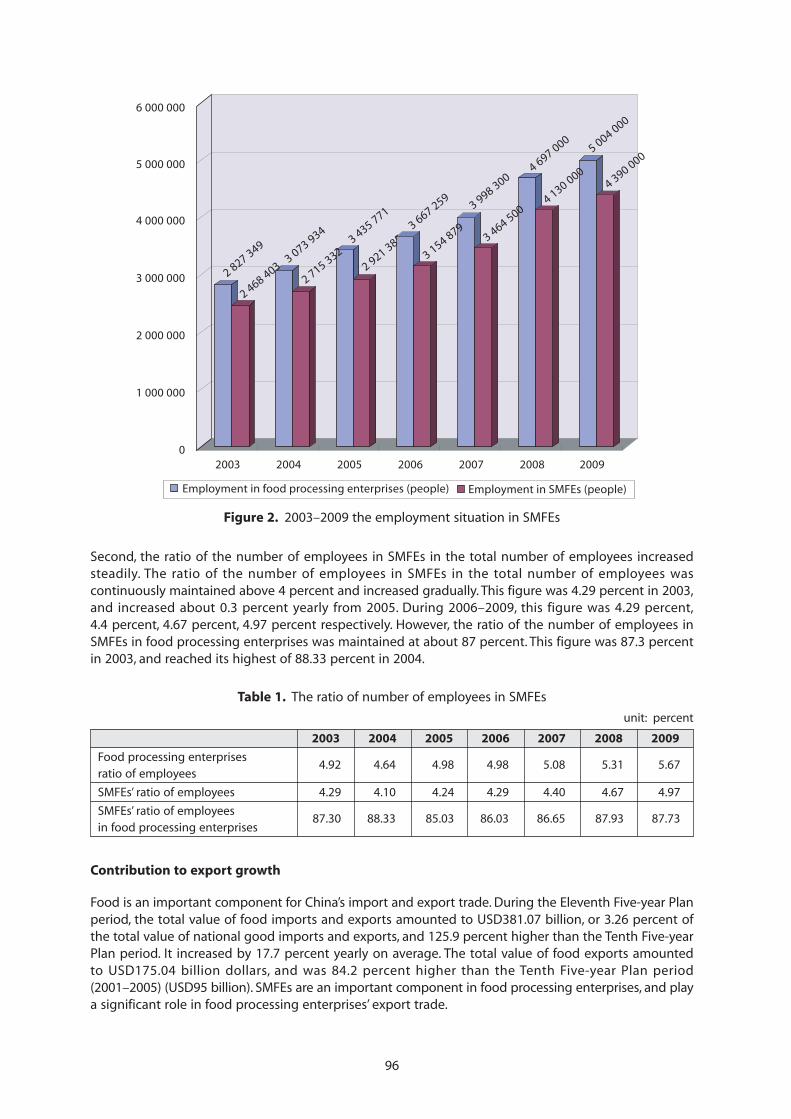
96
Second, the ratio of the number of employees in SMFEs in the total number of employees increasedsteadily. The ratio of the number of employees in SMFEs in the total number of employees wascontinuously maintained above 4 percent and increased gradually. This figure was 4.29 percent in 2003,and increased about 0.3 percent yearly from 2005. During 2006–2009, this figure was 4.29 percent,4.4 percent, 4.67 percent, 4.97 percent respectively. However, the ratio of the number of employees inSMFEs in food processing enterprises was maintained at about 87 percent. This figure was 87.3 percentin 2003, and reached its highest of 88.33 percent in 2004.
Figure 2. 2003–2009 the employment situation in SMFEs
2 827 3493 073 934
3 435 771
2 921 3853 667 259
3 998 3004 697 000
5 004 000
4 390 000
2003 2004 2005 2006 2007 2008 2009
Employment in SMFEs (people)Employment in food processing enterprises (people)
0
1 000 000
2 000 000
3 000 000
4 000 000
5 000 000
6 000 000
3 464 5004 130 000
3 154 879
2 715 332
2 468 403
Table 1. The ratio of number of employees in SMFEs
unit: percent
2003 2004 2005 2006 2007 2008 2009
Food processing enterprisesratio of employees
4.92 4.64 4.98 4.98 5.08 5.31 5.67
SMFEs’ ratio of employees 4.29 4.10 4.24 4.29 4.40 4.67 4.97
SMFEs’ ratio of employeesin food processing enterprises
87.30 88.33 85.03 86.03 86.65 87.93 87.73
Contribution to export growth
Food is an important component for China’s import and export trade. During the Eleventh Five-year Planperiod, the total value of food imports and exports amounted to USD381.07 billion, or 3.26 percent ofthe total value of national good imports and exports, and 125.9 percent higher than the Tenth Five-yearPlan period. It increased by 17.7 percent yearly on average. The total value of food exports amountedto USD175.04 billion dollars, and was 84.2 percent higher than the Tenth Five-year Plan period(2001–2005) (USD95 billion). SMFEs are an important component in food processing enterprises, and playa significant role in food processing enterprises’ export trade.
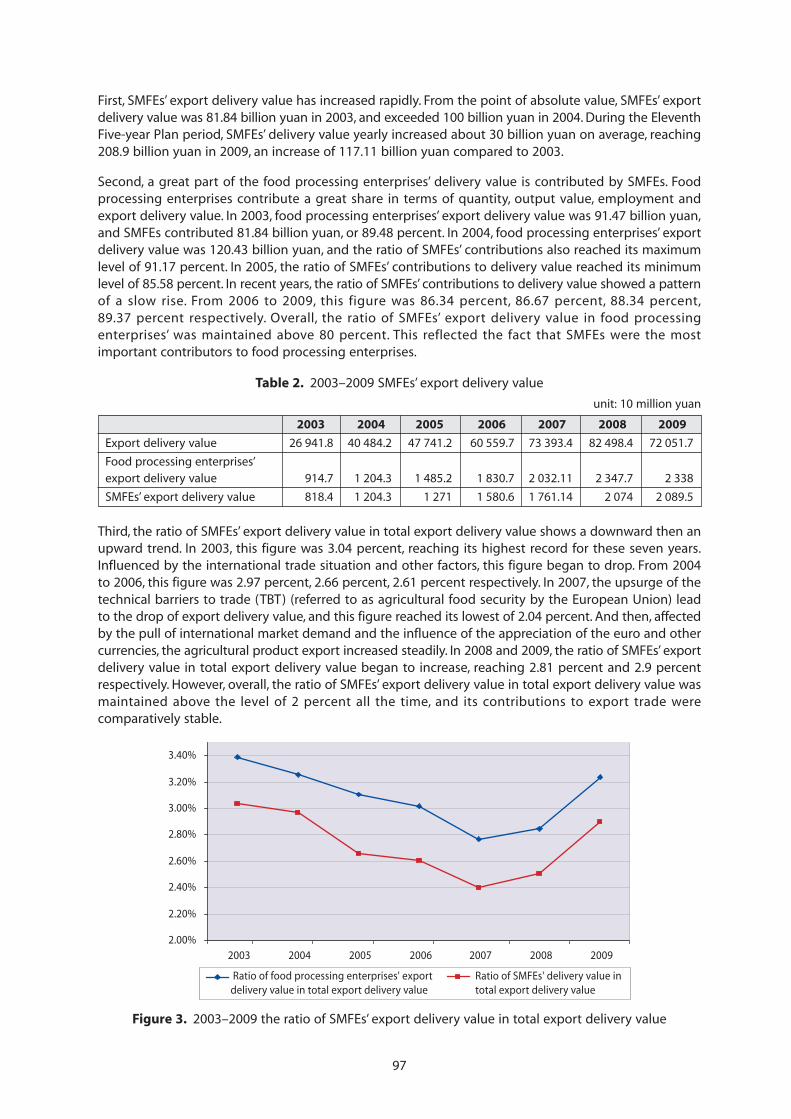
97
First, SMFEs’ export delivery value has increased rapidly. From the point of absolute value, SMFEs’ exportdelivery value was 81.84 billion yuan in 2003, and exceeded 100 billion yuan in 2004. During the EleventhFive-year Plan period, SMFEs’ delivery value yearly increased about 30 billion yuan on average, reaching208.9 billion yuan in 2009, an increase of 117.11 billion yuan compared to 2003.
Second, a great part of the food processing enterprises’ delivery value is contributed by SMFEs. Foodprocessing enterprises contribute a great share in terms of quantity, output value, employment andexport delivery value. In 2003, food processing enterprises’ export delivery value was 91.47 billion yuan,and SMFEs contributed 81.84 billion yuan, or 89.48 percent. In 2004, food processing enterprises’ exportdelivery value was 120.43 billion yuan, and the ratio of SMFEs’ contributions also reached its maximumlevel of 91.17 percent. In 2005, the ratio of SMFEs’ contributions to delivery value reached its minimumlevel of 85.58 percent. In recent years, the ratio of SMFEs’ contributions to delivery value showed a patternof a slow rise. From 2006 to 2009, this figure was 86.34 percent, 86.67 percent, 88.34 percent,89.37 percent respectively. Overall, the ratio of SMFEs’ export delivery value in food processingenterprises’ was maintained above 80 percent. This reflected the fact that SMFEs were the mostimportant contributors to food processing enterprises.
Table 2. 2003–2009 SMFEs’ export delivery value
unit: 10 million yuan
2003 2004 2005 2006 2007 2008 2009
Export delivery value 26 941.8 40 484.2 47 741.2 60 559.7 73 393.4 82 498.4 72 051.7
Food processing enterprises’export delivery value 914.7 1 204.3 1 485.2 1 830.7 2 032.11 2 347.7 2 338
SMFEs’ export delivery value 818.4 1 204.3 1 271 1 580.6 1 761.14 2 074 2 089.5
Third, the ratio of SMFEs’ export delivery value in total export delivery value shows a downward then anupward trend. In 2003, this figure was 3.04 percent, reaching its highest record for these seven years.Influenced by the international trade situation and other factors, this figure began to drop. From 2004to 2006, this figure was 2.97 percent, 2.66 percent, 2.61 percent respectively. In 2007, the upsurge of thetechnical barriers to trade (TBT) (referred to as agricultural food security by the European Union) leadto the drop of export delivery value, and this figure reached its lowest of 2.04 percent. And then, affectedby the pull of international market demand and the influence of the appreciation of the euro and othercurrencies, the agricultural product export increased steadily. In 2008 and 2009, the ratio of SMFEs’ exportdelivery value in total export delivery value began to increase, reaching 2.81 percent and 2.9 percentrespectively. However, overall, the ratio of SMFEs’ export delivery value in total export delivery value wasmaintained above the level of 2 percent all the time, and its contributions to export trade werecomparatively stable.
Figure 3. 2003–2009 the ratio of SMFEs’ export delivery value in total export delivery value
2.00%
2.20%
2.40%
2.60%
2.80%
3.00%
3.20%
3.40%
2003 2004 2005 2006 2007 2008 2009
Ratio of food processing enterprises' export delivery value in total export delivery value
Ratio of SMFEs' delivery value in total export delivery value
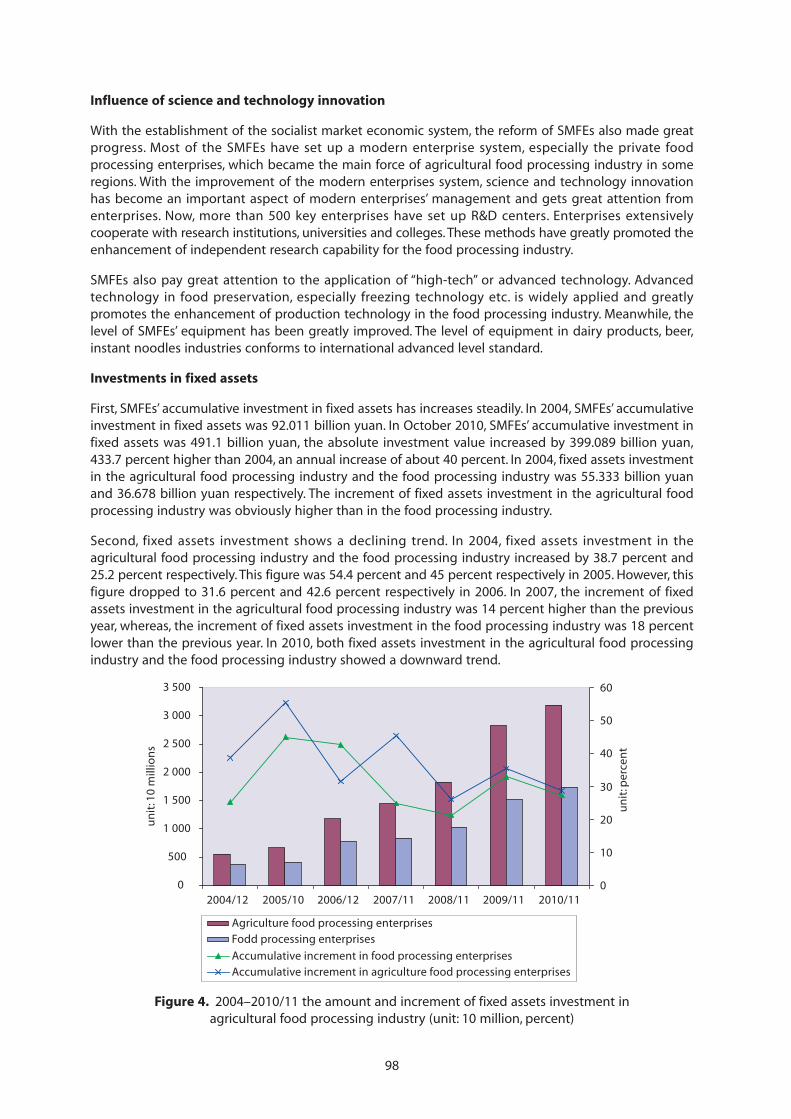
98
Influence of science and technology innovation
With the establishment of the socialist market economic system, the reform of SMFEs also made greatprogress. Most of the SMFEs have set up a modern enterprise system, especially the private foodprocessing enterprises, which became the main force of agricultural food processing industry in someregions. With the improvement of the modern enterprises system, science and technology innovationhas become an important aspect of modern enterprises’ management and gets great attention fromenterprises. Now, more than 500 key enterprises have set up R&D centers. Enterprises extensivelycooperate with research institutions, universities and colleges. These methods have greatly promoted theenhancement of independent research capability for the food processing industry.
SMFEs also pay great attention to the application of “high-tech” or advanced technology. Advancedtechnology in food preservation, especially freezing technology etc. is widely applied and greatlypromotes the enhancement of production technology in the food processing industry. Meanwhile, thelevel of SMFEs’ equipment has been greatly improved. The level of equipment in dairy products, beer,instant noodles industries conforms to international advanced level standard.
Investments in fixed assets
First, SMFEs’ accumulative investment in fixed assets has increases steadily. In 2004, SMFEs’ accumulativeinvestment in fixed assets was 92.011 billion yuan. In October 2010, SMFEs’ accumulative investment infixed assets was 491.1 billion yuan, the absolute investment value increased by 399.089 billion yuan,433.7 percent higher than 2004, an annual increase of about 40 percent. In 2004, fixed assets investmentin the agricultural food processing industry and the food processing industry was 55.333 billion yuanand 36.678 billion yuan respectively. The increment of fixed assets investment in the agricultural foodprocessing industry was obviously higher than in the food processing industry.
Second, fixed assets investment shows a declining trend. In 2004, fixed assets investment in theagricultural food processing industry and the food processing industry increased by 38.7 percent and25.2 percent respectively. This figure was 54.4 percent and 45 percent respectively in 2005. However, thisfigure dropped to 31.6 percent and 42.6 percent respectively in 2006. In 2007, the increment of fixedassets investment in the agricultural food processing industry was 14 percent higher than the previousyear, whereas, the increment of fixed assets investment in the food processing industry was 18 percentlower than the previous year. In 2010, both fixed assets investment in the agricultural food processingindustry and the food processing industry showed a downward trend.
Figure 4. 2004–2010/11 the amount and increment of fixed assets investment inagricultural food processing industry (unit: 10 million, percent)
0
500
1 000
1 500
2 000
2 500
3 000
3 500
2004/12 2005/10 2006/12 2007/11 2008/11 2009/11 2010/11
un
it: 1
0 m
illio
ns
0
10
20
30
40
50
60
un
it: p
erce
nt
Agriculture food processing enterprisesFodd processing enterprises
Accumulative increment in food processing enterprisesAccumulative increment in agriculture food processing enterprises
99
Contributions to regional development
During the Eleventh Five-year Plan period, under the direction of sets of regional development policies,the regional economy of the food processing industry showed a trend of balanced and harmoniousdevelopment. The eastern region’s food processing industry continued to keep the leading position. In2010, output value of the eastern region’s food processing industry was 3,260 billion yuan, an increaseof 173.9 percent compared to 2005 (1 190 billion yuan). In 2010, the output value of Shandong province’sfood processing industry was 1 150 billion yuan, taking the leading position in China. Relying onagricultural resources, the middle region is trying to turn them into industry advantages. In 2010, outputvalue of the middle region’s food processing industry was 1 850 billion yuan, an increase of 293.6 percentcompared to 2005 (470 billion yuan). The output value of the food processing industry in Henan, Hubei,Hunan increased by 28.8 percent, 43.2 percent and 31.6 percent respectively compared to last year. Theoutput value of the food processing industry in Henan was 502.066 billion yuan in 2010, maintaining thesecond position since 2007. The western region has taken advantage of government policy to promotethe development of the food processing industry. In 2010, the output value of the western region’s foodprocessing industry was 1 200 billion yuan, an increase of 215.8 percent compared to 2005 (380 billionyuan). In 2010, the output value of Sichuan province’s food processing industry was 397.073 billion yuan,taking the third position in China. In terms of speed of development, during the Eleventh Five-year Planperiod, the food processing industry in the middle region developed faster than in other regions, andthe western region took second position.
3. Status of food processing industry in China
Key player in the nation’s economic development
First, the food processing industry promotes the development of the Chinese economy. For nearly20 years, the food processing industry has developed rapidly. In 2010, the gross output value of foodprocessing enterprises above a designated size amounted to 5 300 billion yuan, which was an increaseof 13.1 percent on average, 1.6 percent higher than the average level for industry, and the realized profitwas 356.13 billion yuan. Thus the food processing industry accumulates capital for national development.
Second, the food processing industry has close relations with agriculture, industry, and services. The foodprocessing industry acts as a bridge between the agricultural industry and industry. Food processingenterprises’ factories are usually built to integrate urban and rural areas. The rapid development of thefood processing industry will promote the development of the agricultural industry, accelerate thegrowth of rural industry, advance the development of the rural economy, and strengthen the basis ofincreases in farmers’ incomes. The development of the food processing industry can promote theadjustment of the agricultural industry and the production industry, and advance the development ofother related industries. The food processing industry is a labour-intensive industry. It can employ lotsof rural labour, and promote the development of services. Third, the food processing industry has a directinfluence on the health of people’s body and mind. The food processing industry can directly affectpeople’s quality of life and health, and increase farmers’ consumption by increasing their householdincomes.
Advanced technology can be applied, but does not flow freely
In the development plan of the food processing industry for the Eleventh Five-year Plan period, thegovernment puts great emphasizes on strengthening the food processing industry’s science andtechnology innovations. In 2010, the output value of food processing industry’s new products was275.60 billion yuan, an increase of 22.9 percent compared to 2009, or 4.37 percent of the total outputvalue of the food processing industry. From the perspective of profit capability of new products, thewine-making industry, including fruit wine and health wine, has a comparatively strong profit capability.Next is cigarette manufacturing, canned aquatic products manufacturing, rice wine and liquormanufacturing.
100
In developed countries, various types of advanced technologies such as biological technology andelectronic technology are applied in the food processing industry to enhance product quality, improveproduct flavour and raise efficiency. During the transition period, the application of advanced technologyin the food processing industry also accelerates the adoption of improved food processing technology.For example: new packaging technologies; ultra high pressure processing technology to improve productflavour; microcapsule technology; microwave technology to keep food fresh; food irradiation technologyin food sterilization; and biological technology in genetic engineering.
The extensive applications of advanced technology play great roles in promoting the development ofthe food processing industry. But, advanced technology doesn’t flow freely. According to related reports,the conversion rate of agricultural technology in agricultural industrialization has reached 40 to80 percent, far above other industries including the food processing industry. However, the foodprocessing industry, as a follow-up industry of agriculture, is still at a low level.
High level of emphasis on food safety
Food safety has a close relationship with people’s health and lives, the image of the nation and thereputation of enterprises. It is the foundation of industrial survival. During the Eleventh Five-year Planperiod, food safety received greater attention, because of the many food safety accidents that occurred.The Food Safety Law of the People’s Republic of China was formally enacted on 1 June 2009. Closeattention from the whole society makes most of the food processing enterprises pay more attention tofood safety, strengthens industry self-regulation, and promotes the advancement of the science andtechnology in the food safety field.
Rapid development of foreign trade
During the Eleventh Five-year Plan period, the trade volume of food amounted to USD381.07 billion, or3.26 percent of the national goods trade volume, an increase of 125.9 percent over the Tenth Five-yearPlan period. The value of food export amounted to USD175.04 billion, an increase of 84.2 percentcompared to the Tenth Five-year Plan period (USD95.03 billion). The value of food imports amounted toUSD206.03 billion, an increase of 179.8 percent compared to the Tenth Five-year Plan period (USD73.63billion). Before 2008, the basic pattern of food foreign trade was that exports slightly exceeded imports.The surplus was USD4.68 billion in 2006 and was USD1.67 billion in 2007. Since 2008, the amount andvalue of food imports have greatly increased and the pattern of food foreign trade has been transformedfrom a small surplus to large trade deficit. From 2008 to 2010, the food foreign trade deficit wasUSD13.16 billion, USD9.47 billion, USD14.72 billion respectively. In 2010, the value of food imports wasUSD59.86 billion, an increase of 190.8 percent compared to 2005. The value of food exports wasUSD45.14 billion, an increase of 85.3 percent compared to 2005.
There are great differences in brand maturity between different food processing industries. For example,there are many famous brands in these industries, such as dairy products, edible oils, instant noodles. Incontrast, the brand maturity in other industries is comparatively low, such as in the fermentation productsindustry, salt mining, sugar, spices industry. No matter the degree of brand maturity, although there aremany famous brands in different industries, the industries still had many problems, such as counterfeitfoods, lack of standardized management, and so on. The main obstacle for enterprises wanting to exportfood products abroad is lack of competitive advantages.
Urban and rural market disequilibrium
Now, China’s food processing industry pays more attention to the urban market than the rural market.With the acceleration of urbanization, the population of urban areas is growing rapidly. Though there aremore people in rural areas than in urban areas, their incomes are comparatively low. Subsistence foodconsumption hinders the development of food commercialization. Therefore, it is rational for enterprisesto put more focus on the urban market. However, it may lead to excessive development in urban areas,and the neglect of the development of rural markets. The government has carried out a strategy of
101
balancing urban and rural development, the gap between urban and rural income has been greatlyreduced and there are now opportunities to develop rural food markets. However, the presentproduction structure is not well adjusted to the demand of rural food markets.
4. External forces that shape the SMFEs sector in China
Sustainable development of agricultural resources
The Chinese government has always attached great importance to sustainable development, especiallysince, the World Commission on Environment and Development when it was defined as developmentthat meets the needs of the present generation without compromising the ability of future generationsto meet their needs. In 1997, at the 15th national congress of the Chinese Communist Party (CCP),sustainable development was considered the basis of China’s modernization. In 2002, the 16th nationalcongress of the CCP made the enhancement of the capability for sustainable development one of goalsfor the comprehensive construction of a well-off society. Under the sustainable development strategy,China is adjusting its strategic economic structure with new industries to provide support forurbanization and agricultural modernization, promoting the gathering of production resources and theshift of rural labour to urban areas to speed up industrialization and agricultural modernization. This willcreate a new pattern of development with industrialization, urbanization, agricultural modernizationbecoming mutually supportive and harmonious.
Great momentum to promote import and export trade
With the rapid development and globalization of the economy, China has become the most attractiveconsumer market in the world. In 2010, China’ food imports were USD59.86 billion, an increase of29.4 percent compared to 2009, 10.9 percent higher than food exports. Before 2008, the basic patternof food foreign trade was that exports slightly exceeded imports. The surplus was USD4.68 billion in 2006.The surplus was USD1.67 billion in 2008. Since 2008, the amount and value of food imports greatlyincreased, and the pattern of food foreign trade has been transformed from a small surplus to a largetrade deficit. From 2008 to 2010, the food foreign trade deficit was USD13.16 billion, USD9.47 billion,USD14.72 billion respectively. In 2010, the value of food imports was USD59.86 billion, an increase of190.8 percent compared to 2005. China’s exports were valued at USD45.14 billion, an increase of85.3 percent compared to 2005.
Further clarification of functions between different departments
Since 1 January 2004, the state council has stipulated that the agricultural department is responsible forsupervising agriculture production, the quality inspection department is responsible for supervising foodprocessing, the industry and commerce department is responsible for supervising food circulation, thehealth department is responsible for supervising restaurants and canteens, the food and drug regulatoryauthority is responsible for supervising food safety. Moreover, food supervision information will bepublished by these departments. According to the Food Safety Law and various regulations, the Ministryof Health, the Ministry of Industry and Information, the State Administration for Industry and Commerce,the General Administration of Quality Supervision, Inspection and Quarantine, the Food and DrugAdministration have their own specific functions.
Although recently the government readjusted and clarified the various food safety supervisiondepartments and their functions, there are still contradictions in the system, mostly arising from the lackof cooperation. The food processing industry comprises the production of raw materials, the productionof equipment and technologies, and services related to distribution and commerce etc.
Many problems, such as vicious competition have caused enterprises’ losses, and seriously blocked thedevelopment of the Chinese food processing industry. Although there is a plethora of documentsproviding guidance, the lack of strong regulatory organizations and mechanisms, has resulted in the foodprocessing industry being inefficient and of poor quality.
102
Rapid growth of the scale of the food processing industry
The scale of the food processing industry is growing rapidly along with associated economic benefits.In 2010, the number of food processing enterprises above the designated size (i.e. having annual salesfrom its principal activity of five million yuan or more) was 41 867, an increase of 17 828 compared to2005, or an increase of 74.2 percent. The gross output value of food processing enterprises above thedesignated size was 6 310 billion yuan, an increase of 208.1 percent compared to 2005. Tax revenuesamounted to 531.575 billion yuan, an increase of 145.9 percent compared to 2005. Realized profit was388.509 billion yuan, an increase of 215.1 percent compared to 2005. The sales profit ratio was6.44 percent, an increase of 0.26 percent compared to 2005. The number of employees was 6.54 million,an increase of 1.90 million compared to 2005. The food processing industry has become an importantindustry providing much needed employment and improving people’s lives. The ratio of the output valueof the food processing industry in industry has risen from 8.1 percent (2005) to 9.2 percent (2010). Thefood processing industry’s position as a pillar industry in the national economy has been furtherconsolidated. Nevertheless, further adjustment of the food processing industry’s structure is stillnecessary.
Improvement in the status of food safety
In recent years, although there are still many problems, the overall status of food safety has improved.The government pays great attention to food safety, and carries out all kinds of measures to supervisefood safety, but still there is a wide gap between the status of food safety in China and that of the moredeveloped countries. Many food safety accidents occurred in 2010. Contaminated milk powder was foundin Gansu province, Qinghai province, and Jilin province. It seriously damaged consumer confidence andhad negative impacts on the development of the dairy industry and the food processing industry.
Moreover, industry security is also confronted by great challenges. Soybean oil processing in thevegetable oil industry has high degree of dependence on external sources of raw materials. In 2009, thevolume of soybean imports was 42.55 million tons, and the value of soybean imports was USD18.8 billion.In 2010, the volume of soybean imports was 54.80 million tons, an increase of 28.8 percent, and the valueof soybean imports was USD25.1 billion, an increase of 33.5 percent. The ratio of soybean oil in vegetableoil is about 50 percent to 60 percent. The high degree of dependence on external sources of rawmaterials poses a potential threat to the country’s vegetable oil industry security. The dairy industry alsois confronted by great challenges. Contaminated milk powder accidents that occurred in 2008 causedChinese consumers to turn to foreign milk powder. In 2010, the import of milk powder was 0.4173 milliontons, or 67.9 percent higher than in 2009, and nearly 30 percent of national production. The value ofimports was USD1.395 billion, or 138.8 percent higher than in 2009.
5. Government policy and legal framework
Legal framework
Since China’s economic reforms, people are paying more and more attention to the legal and regulatorysystem of the food industry, especially as the food processing industry is developing rapidly. Since the1980s until now, China has established an integrated system of laws and regulations pertaining to foodsafety and this provides sufficient safeguard of food safety and enhances the quality of people’s lives.The laws include: the Food Safety Law of the People’s Republic of China; the Product Quality Law of thePeople’s Republic of China; the Standardization Law of the People’s Republic of China; the Metrology Lawof the People’s Republic of China; the Law of the People’s Republic of China on Protection of Consumers;the Law of the People’s Republic of China on the Safety of Agricultural Products; the Criminal Law of thePeople’s Republic of China; the Food Hygiene Law of the People’s Republic of China; the Law of thePeople’s Republic of China on Import and Export Commodity Inspection; the Law of the People’s Republicof China on the Entry and Exit Animal and Plant Quarantine; the Frontier Health and Quarantine Law ofthe People’s Republic of China; the Animal Epidemic Prevention Law of the People’s Republic of China.The regulations include: Special Rules of the State Council on Strengthening the Supervision and
103
Management of the Safety of Food and Other Products; Measures for the Implementation of theRegulation of the People’s Republic of China on the Administration of Production License for IndustrialProducts; Regulations of the People’s Republic of China on Certification and Accreditation; Regulationsfor the Implementation of the Law of the People’s Republic of China on the Entry and Exit Animal andPlant Quarantine; Regulations of the People’s Republic of China on Administration of Veterinary Drugs;Regulations of the People’s Republic of China on the Control of Agricultural Chemicals; Rules of thePeople’s Republic of China on the Origin of Export Goods; Regulations for the Implementation of theStandardization Law of the People’s Republic of China; Measures for Investigating, Punishing and BanningUnlicensed Business Operations; Regulations on Administration of Fodder and Fodder Additives;Regulations of the People’s Republic of China on the Administration of the Import and Export ofEndangered Wild Animals and Plants. Divisional regulations include: Measures for the Administration ofFood Hygiene Licenses; Measures for the Hygienic Administration of Food Additives; Measures for theAdministration of the Inspection and Quarantine of Meat Products at Entry and Exit; Regulations onInspection and Quarantine of Entry and Exit Aquatic Products; Measures for the Administration of FoodSafety in the Circulation Sector; Administrative Measures for the Safety of Places of Origin of AgriculturalProducts; Administrative Measures for the Packaging and Marking of Agricultural Products, AdministrativeProvisions on the Sanitation Registration and List Entry of Export Food Manufacturing Enterprises.
Agro-industrial policy
In 2010, China kept the price of agricultural products stable, extended circulation channels, and increasedthe quality of the products. The State Council proposed several policies such as “eight rules of agriculturalrevitalization”, “agricultural subsidies”, “crops’ minimum purchase prices”, “grain collection and storage”,“regional planning of planting”, “grain program for medium and long-term”, “program for forestryrevitalization”, “the rate of export rebate of agricultural products” and so on. It has improved the policyof agriculture, but also consolidated the foundations of agricultural development, as well as promotedthe development of the agro-food industry.
The “eight rules of agricultural revitalization” is the policy promulgated by the State Council that aimsto stabilize agricultural development and increase the incomes of peasants. It includes measures toguarantee agricultural production, especially crops, stabilize the development of animal husbandry,support the development of leading companies and the agricultural products processing industry,promote the development of agricultural products distribution, increase the employment of migrantworkers, improve people’s lives and infrastructure in the countryside. Moreover, it emphasizes theimportance of agricultural production, makes the direction of agricultural development clear, andpromotes the long-term sustainable development of the agro-food industry.
The program for forestry revitalization is another significant policy to help agricultural development. Thisclarifies the four goals of forestry development. First, make sure that the total output value of the forestryindustry increases steadily, from 1,440 billion yuan in 2008 to 2 026 000 billion yuan in 2012, and keepthe growth rate increasing at 12 percent per year. Second, stabilize the export market of forest products;– according to one estimation, the total volume of international trade of forest products will rise to aboveUSD90 billion and the total volume of exports will be more than 50 billion yuan. Third, optimize thestructure of the forestry industry, and try to increase the output of the secondary forestry industry andthe tertiary forestry industry, which focuses on ecotourism, to 50 percent and 18 percent respectively ofthe gross forestry output. Fourth, support the development of leading companies, develop 100 nationalforest companies and ten characteristic industrial clusters in three years, and cultivate asa pillar industry the cultivation of forest resources, wood-based panels, biological drugs manufacture,woody grain and oil, and biomass energy.
In 2009, based on the expanding domestic demand and to stabilize employment, the State Councilpromulgated the “Notification of raising export rebate rate for some commodities”, which increased theexport rebate rate of further processing of agricultural products. The rate of canned food, juice and silkhas increased to 15 percent whereas the rate of corn, starch, and alcohol has risen to 5 percent.
104
Food safety regulations
The food safety problems have caused concern all over the world. It is also a significant problem for theChinese government in meeting its goals of managing state affairs and bringing peace to the Chinesepeople. Therefore, the government promulgated the “Food Hygiene Law of the People’s Republic ofChina” in 1995, according to which, the “Food Safety Law of the People’s Republic of China” was approvedat the Seventh Session of the Eleventh National People’s Congress. This law has detailed provisions aboutrisk monitoring and assessment of food safety, standards for food safety, food production andmanagement, food inspection, food import and export, the disposal of food safety incidents, supervisionand administration and legal obligations. This law is designed to meet the demands of the current foodsafety situation, and serves as a legal weapon that can contribute to the creation of a harmonious society.In order to solve the food safety problem institutionally and eliminate the hidden damage, the Chinesegovernment has also enacted the “Law of the People’s Republic of China on Agricultural Product QualitySafety”, the “Product Quality Law of the People’s Republic of China”, and the “Food Hygiene Standards”.
6. Status of institutional mechanisms
Technology (including indigenous technology) and innovation
In recent years, the Chinese food industry has been in a good situation with the support of thegovernment. During “the tenth five-year project”, the annual growth rate of the food industry’s gross valuewas above 20 percent, whereas the annual growth rate of its sales income was 18 percent, and thegrowth rate of profits (tax included) reached 17 percent. This rapid development would not have beenachieved without the help of scientific and technological innovation.
In 2002, according to laws and regulations such as “Law of the People’s Republic of China on Science andTechnology Progress” and “Measures for the Administration of the Establishment of Science andTechnology Awards by Non-governmental Sectors”, China’s National Food Industry Associationestablished science and technology awards, which are approved by the Ministry of Science andTechnology and aim to reward the enterprises, programs and talents that have made major contributionsin terms of scientific and technological innovations in the food industry. In order to promote the scientificand technological progress of the food industry as well as change the way the food industry grows,China has carried out a series of activities such as innovation-based pilot enterprises of the food industry,which give impetus to enterprises to enhance their independent innovation capability, assists them toestablish and improve an independent innovation system, leads different types of enterprises tomake a strategy of technological innovation, explores the most effective mode of innovation anddevelopment, as well as guides more enterprises along the road of independent innovation.
The China National Food Industry Association has proposed the Outline of National Food IndustryScience and Technology Development from 2006 to 2016 in order to thoroughly encourage and supportindependent innovation and promote the food industry’s sustainable, stable and healthy development.The outline has provided a guiding ideology, cardinal principles and a direction for the next ten yearsof food industrial technological development, elaborated the contents of technological development andproposed policies and measures aiming at promoting strategic adjustment and upgrading of thestructure of food industry and accelerating its progress toward being brought in line with internationaladvanced level.
In December 2005, the Ministry of Science and Technology, the State-owned Assets Supervision andAdministration Commission of the State Council together with the All China Federation of Trade Unionsstarted to implement the program of Technology Innovation Guide Engineering, which includes siximportant items: (i) carry out a pilot program for innovative enterprises; (ii) encourage the building ofmarket-oriented industry-university-research alliance in several realms; (iii) optimize resources, supportoriginal innovations and integrated innovations of strategic industries; (iv) strengthen the constructionof enterprises’ R&D institutions and industrialization base; (v) strengthen the construction of a publicservice platform; and (vi) strengthen skills training and encourage technological innovation amongemployees.
105
Commercially oriented research and development
With the promotion of IT-based globalization, the Chinese food industry has advanced a strong demandfor independent research and development and technological innovation. The food enterprises mustupdate their technology with the help of technological independent innovation so as to maintain theindustry’s advantage and expand its market share. Meanwhile, only if the independent technologicalinnovation of the enterprise is market-oriented and maintains its lead in technology, will it realizesustainable development and ensure enterprise competitiveness. This is the key for those enterpriseswanting to upgrade themselves and make the transition to a modern, globally competitive enterprise.Among the many factors that influence strategic decisions, independent innovation is one of the mostsignificant. If enterprises expect to make the shift from relying on increasing material resourceconsumption to relying on scientific and technological progress, enhancing labour quality andmanagement innovation, they will have to rely on autonomous innovation. The key to this lies inknowledge strengthening and technological investment, which will provide a firm foundation forinnovation in the industry.
Under the approval of the government, the Ministry of Science and Technology of China haspromulgated the Suggestions for Allocation Systems of Corporation Innovation, which is to carry out theNational Guideline on Medium and Long Term Program for Science and Technology Development(2006–2020), supporting the innovation and intellectual property rights of researchers. The Suggestionsencouraged companies to set up management systems of intellectual property rights and properlybenefit researchers in terms of distribution. The purpose of the Suggestions is to enhance the role ofinnovation in realizing stable and sustainable development.
Development of human resources
Human resources, known as the First Resources, are the most significant strategic resources and thedecisive factors of comprehensive national power in the twenty-first century. In modern times, scienceand technology have never been so powerful in terms of rapidly developing and deeply influencing thesociety and economy. Therefore, the ability and efficiency of innovation and application of knowledgeand information is one of the most decisive factors in a country’s economic and social development, andthe quality of human resources are the core elements in the knowledge-based economy. Recently, manycountries have been taking positive measures to promote the development of human resources andhave achieved a certain amount of progress. However, there are still needs for improvement to satisfypractical needs. There are problems of shortage of human resources, of unfair and unreasonablecompetition among international talents, of the gap between developing and developed countries, andof the loss of talents of the developing countries. If such problems are not solved practically, the growthof developing countries will be inhibited.
The nurturing of talents is highly valued by the Chinese government, which has proposed andimplemented the Strategy of Invigorating China through Science and Education, as well as advocatedrespect for knowledge and distinguished scientists, making human resources an important stimulus tothe sustainable development of the economy and society. The government also insists on giving priorityto scientific and educational development, promoting the integral exploitation of human resources,reforming systems of personnel employment, creating conditions for different kinds of talents, as wellas constantly enhancing moral and intellectual levels of the nation to promote their skills and knowledge.Consequently, China has achieved great accomplishments since reform and opening up, yet remains oneof the developing countries because of its large population, weak foundations, and unbalanceddevelopment. Unable to meet the demands of the society and economy as yet, the exploitation ofhuman resources in China is falling far behind the advanced level of the developed countries. Therefore,the government is proactively developing talent as well as exploiting and comprehensively enhancingthe basic qualities of human resources, in order to close this gap.
106
Financial and fiscal systems
China is now implementing the “revenue-sharing-scheme” financial management system, under whichthe range of expenditure is divided according to the authority of central and local government.To be specific, central authority financial institutions are in charge of national security and diplomacythe operation of state organs, the adjustment of the economic structure, regional development andmacro-control, as well as other directly supervised national level projects. In contrast, local financialinstitutions are mainly responsible for the expenditure of local government operations, and localeconomic and social projects.
The total government budgetary expenditure share of GDP in China is still below the overall level of thedeveloped countries when they were experiencing rapid growth in the sixties and seventies. Moreimportantly, each financial reformation since 1980 is focusing on the division of government incomerather than on substantive changes in the structure of the government expenses. Thus, the alteration isjust in the amount rather than the nature, despite the change of share of various kinds of governmentexpenditures, which include the decline in terms of economic construction and national defense, andthe rise of administrative, cultural and educational expenses.
This framework of non-market-oriented government expenditure is a concrete representation of theoverall way of thinking that centered on economic growth instead of social equity or environmentalprotection. In the case of scarcity, it is still very unclear what the government should do, and moreimportantly, what it shouldn’t do. For example, the total nominal price of budgetary expenditure of thegovernment in the 1990s has increased by four times yet is still in short supply. The reason for thissituation is that government expenditure is still used for projects that should have been undertaken bythe market. With limited funds, responsibilities that are or should have been assumed by the governmentare especially short of investment. The absence, especially in key expenditure fields, leads to problemsof insufficient total quantity, unreasonable structure and inferior management.
Promotional strategy
A marketing strategy is a customer-oriented activity based on information on demand, purchasing abilityas well as commercial expectations. It aims at providing satisfying products and services to realize theobjectives of the corporation through coordinated methods of providing products, deciding pricing, andensuring distribution channels and products promotion. It is also necessary for the food industry todevelop strategies from those four aspects. The strategy of products include deciding a product name,advertising the products, establishing a trademark, deciding appropriate packaging, ensuring consumerconvenience and positive feeling. The strategy of price includes leading the price, following the price andselling at a low price. The channel strategy focuses on exploring and controlling end customers, as wellas fully accessing information about customers. The promotion strategy involves publicity materials, andarranging a product display according to the principle of shelves display.
Safety, quality and consumer protection
The status of food quality safety is a significant symbol to measure the level of economic developmentand the people’s quality of life. The Chinese government has always been people oriented, attachinggreat importance to food safety and giving priority to strengthening food quality safety. China hasimproved the system of food safety supervision, and enhanced the role of food safety laws and standards.It has also implemented rigorous supervision of food quality safety, and actively promoted internationalcommunication and cooperation, which has obviously enhanced the consciousness of food safety of thewhole society. The overall level of food quality in China is steadily improving as a result of thegovernment’s constant efforts to improve food safety.
Consumer protection movements started late in China. In 1983, the International Organization ofConsumers Unions (IOCU) confirmed the 5th of March as World Consumer Rights Day. In China, the firstconsumer organization was set up in Guangzhou and was named the Consumer Council of Guangzhou.The Consumers Association of China was approved by State Council in December 1984. After that,consumers associations at all levels were established in succession. The Consumer Association of China
107
was admitted to the IOCU in September 1987. After China entered the WTO, the protection of consumers’rights was given greater importance. Shanghai was the first to change the name of the consumersassociation to the Committee of Consumers’ Rights and Interests Protection, which better representedthe trend of the movement of consumer protection, showed the essentials and functions of thecommittee and made them more clear to the consumers. As consumers protection organizationsdevelop, consumers’ rights and interests are increasingly protected. Meanwhile, the relevant laws andregulations pertaining to Chinese consumers’ protection are improving, and the rights of consumers arebeing given legal recognition, and are being standardized and expanded. Through the consideration ofthe experience of consumer protection abroad and also the domestic situation, China has establisheda legal system for protection of consumers’ rights and interests, which is composed of the Law of thePRC on the Protection of the Rights and Interests of Consumers, the Product Quality Law of the People’sRepublic of China, the Food Hygiene Law of the People’s Republic of China, and the Anti-UnfairCompetition Law of the People’s Republic of China. This legal system effectively guarantees theprotection of consumers’ rights.
7. Status of industrial infrastructure
Power, transport and communications
In terms of electrical supply, the capacity to generate electricity is increasing at a relatively high speed,and the electrical structure has obviously been improved. In 2008 China, as a result of investing morein hydroelectricity than any other source of power, had a total of 90 510 000 kilowatts of newly addedpower capacity. The increase of hydropower that year, including the last seven units of the Three GorgesDam, was 20 100 000 kilowatts, which accounted for 22.21 percent of the total invested power capacity.Moreover, the additional wind power generating capacity reached 4 660 000 kilowatts, giving a totalgenerating capacity of 12 800 000 000 kilowatts per hour with a year-on-year growth of 126.79 percent.The share of thermal power stations has continually reduced, with only four million-kilowatt unitsnewly added. Moreover, each thermal generating unit, with at least 600 000 kilowatts, accounted for63.11 percent of the newly invested generating capacity. In 2009, the generating capacity in China wasmore than 800 000 000 kilowatts (among which the hydroelectricity and thermal station accounted for22.51 percent and 74.60 percent respectively), with the use of No. 6 Laxiwa Hydropower station of ChinaPower Investment Corporation. The grid is constantly expanding, from 6 475 kilometres of 35 000 voltsafter the founding of China, to 1 250 000 kilometres. Therefore, the rapid growth of the electrical industryhas provided a firm foundation for the food industry.
From the perspective of transport, the length of railway in service was 85 500 kilometres, which was tenthousand kilometres longer than it was in 2005. Meanwhile, the length of road was 3 860 800 kilometres,520 000 kilometres longer than it used to be in 2005, of which 6 510 000 kilometres are highways,240 000 kilometres longer than the situation in 2005. Besides, other means of transportation have beengreatly improved as well. For example, the range of civil aviation was 2 345 100 kilometres, together withthat of an oil pipeline 69 000 kilometres and inland waterways 123 700 kilometres, with each one of them346 600, 25 000, and 400 kilometres longer than they used to be in 2005, respectively. Of all means oftransportation, road traffic has seen the largest increase of 520 000 kilometres, whereas the minimumgrowth lies in the inland waterways. Generally speaking, rapid development of transportation is playinga fundamental role in the logistics of the food industry.
As far as the development of communications technology is concerned, the IT-based food industry hasbeen ensured by developing technologies, such as data communication, Internet, wireless and opticalcommunication. Data communication basically includes using e-mail and visiting the websites to givean impetus to related businesses in various domains, involving file transfer, voice mail, videotex, directoryinquiries, information retrieval, as well as intelligent telex. The Internet, as the carrier of voice, data, andvideo, has become the most important information infrastructure in the modern world. The crucialtechnology is becoming more and more practical, manageable, and safe. What’s more, wirelesscommunication is heading towards 3G and wifi/wimax, which makes voice communication possible, suchas video calls and browsing. Therefore, communications technology has facilitated online sales of thefood industry, eliminating the restrictions of cable and regions.
108
Water resources
China is a country of severe water shortage problems. Although the total fresh water resources are2 800 billion cubic metres, which accounts for 6 percent of the earth’s water resources, ranking Chinafourth in the world, after Brazil, Russia and Canada. The fresh water resources per capita are only about2 300 cubic metres, which is only a fourth of the average amount per capita globally and a fifth of thatof America, ranking China 121st on earth. That situation has made China one of the thirteen most waterscarce countries in the world. Except for the floods and groundwater in the remote areas, fresh wateravailability is minimal. There is only 1 100 billion cubic metres of fresh water left, 900 cubic metres percapita with an unbalanced distribution. By the end of the twentieth century, roughly 400 cities out of600 were struggling against water shortage problems, 110 of which were suffering from severe scarcity.The gross shortage of water is 6 billion cubic metres. Moreover, the underground water of most citiesin China, according to researchers, is suffering from certain degrees of point-like or planar pollution. Andthe trend is accelerating. This is threatening the sustainable development the government isimplementing. Worse still, the safety and health of all citizens are at risk as well. The Ministry of WaterResources predicted that there will be 1.6 billion people and only 1 750 cubic metres of fresh water percapita for Chinese people. Therefore, taking water conservation into consideration, the estimated totalwater usage will be 700 or 800 billion cubic metres, requiring a further 130 to 230 billion cubic metresof water supply. However, the actual amount of available water resources is already near the upper level,leaving the issue of water exploitation a tough one to address.
Land
The basic reality of land in China is harsh. Although there is a considerable amount of land in total, theland per capita is much less, with few excellent or reserve land resources. According to research on theexploitation of land, there are 122 082 700 hectares of ploughed land nationally, 11 549 000 hectares ofgardens, 235 741 100 hectares of woodland, 262 142 800 hectares of grassland, 25 520 900, hectares offarm land for other uses, 26 015 100 hectares of residential, working and mining areas, 2 308 500 hectaresof land for transportation, 3 598 700 hectares for hydraulic engineering, and the rest being unexploitedland. Following the progress of urbanization and industrialization, national cultivatable areas arecontinually on the decrease. Compared to 2004, the net decrease in 2005 was 361 600 hectares. To bespecific, ploughed land has reduced by 0.30 percent and grassland by 0.21 percent. In contrast, gardenareas have increased by 2.31 percent, woodland by 0.30 percent, residential, working and mining areasby 1.11 percent, lands for transportation by 3.37 percent, and lands for hydraulic engineering by0.26 percent. It’s not difficult to conclude that 138 700 hectares of ploughed land was exploited for otheruses. Besides, ploughed lands are being reduced by many means: there are 73 400 hectares of alteredyet unreported ploughed lands; 52 500 hectares of destroyed ploughed lands; 390 400 hectares ofploughed lands that have changed ecologically; and 12 300 hectares that have reduced because of thestructural adjustment of agriculture. The only increase comes from reclaimed land, which accounts for306 700 hectares, or 144.56 percent of construction land. Therefore, the government should earnestlyprotect farmland, save the intensively cultivated land, control the supply of non-agricultural fields, andgradually complete the system of the land market.
Environmental protection
The environment provides the basis of human existence, and thus needs to be protected. Thanks to thegovernment’s efforts to protect the environment, China has made substantial progress afterimplementing various protective measures. However, the agricultural ecology is still threatened. Soilerosion, water pollution, desertification, polluted farmlands, are all serious environmental problems.Besides, regional water shortages and pollution are significantly constraining the development ofagriculture and related industries. Unfortunately, rural industrialization and the transfer of urbanindustries to the countryside are the basic sources of rural pollution. Each factor addressed above hasa direct influence of safety problems and even sustainable development of the agricultural based foodindustry.
109
8. Constraints and strategic priorities for enhancing the competitiveness of SMFEs
Strategic priorities of SMFEs
Specialized and refined strategies
It is difficult for SMFEs to survive severe competition without specializing. In order to attain vitality in themarket-oriented economy, SMFEs need to specialize on the basis of certain features and integrate theirsuperior resources, through which they will benefit from economies of scale. Consequently, theconcentrated target will give SMFEs an advantage in terms of management, operations and a favourableposition in the market. In order to do that, there are several steps to take: (i) make the target market clearthrough investigation; (ii) cooperate with institutions to gain access to better technology; (iii) dominatethe market by taking advantage in terms of the cost or uniqueness of products; (iv) open up more saleschannels and apply better marketing methods, for example, strengthening coordination with the sellers,expanding the market range, adopting flexible price strategies; and (v) highlight the enterprise’s uniqueoperating characteristics that can form the basis of business initiatives and give a competitive advantage.
Cooperate with strong corporations
First of all, for close cooperation with big enterprises, implement coordination of franchised operationsor industrial-chain-based operations. Second, carry out joint initiatives among SMFEs, which could realizecomplementary cooperation and economies of scale effects in terms of capital, technology and humanresources. Third, specialize within each SMFE and associate on the basis of their specialties to make upfor any individual deficiency. Moreover, through market research, SMFEs could also look for newopportunities that are ignored by big companies or that are not economic for them.
Implement an IT-based development strategy
SMFEs are required to master various marketing information activities in this era of informationtechnology so that they can react efficiently to the changing demand of the market. First of all, to obtainprompt information of product demand and supply, SMFEs could take advantage of all kinds ofconsultative agents. Second, for productive skills and knowledge, SMFEs could offer access to seminarsand advanced studies for specialized technicians and engineers. Third, for timely information aboutqualified human resources, enterprises could turn to campuses or social recruiting websites.
Establish an export-oriented international development strategy
As the major supplier in the domestic market and contributor to the international food industry trade,SMFEs need to break new ground to succeed in international food markets. This requires seizingopportunities in terms of technology, talented human resources and marketing, looking positively forinternational participation, starting cooperative fields, as well as exploiting advanced techniques andmanagement skills with their own comparative advantages.
Constraints
Lack of management skills and systems
Most SMFEs in China are in the non-public sector of the economy and their development is literallybased on the “gut feelings” of their initiators. In terms of corporations’ life cycle, most of them are still inthe early stages, although some are rapidly expanding. A lot of unfavourable factors are restrainingSMFEs’ development, such as management by households with individual or joint owners, out-of-dateadministrative mechanisms, traditional management thinking, and so on.
Lack of competitiveness in the market
It is through scientific optimization of various factors such as capital, techniques, and labour thatenterprises can achieve distinctive advantages as a whole. The reason why food products are weak incompetition is that SMFEs are restricted by capital and personnel factors. These elements contribute to
110
low-level techniques and little innovation, especially weak research capabilities, inefficient production andlow added value of the product.
Shortage of qualified human resources and weakness in terms of lack of innovation
The reason why SMFEs lack innovation is that most of the better qualified human resources tend to workat big companies. This has resulted in obstacles to spreading and applying new techniques and corporateculture. To be more specific, there is a serious shortage of qualified human resources in SMFEs, especiallycompound specialists. To make things worse, the existing workforce in SMFEs often leave for highersalaries, which raises the cost of training recruits. Therefore, a shortage of qualified labour and theinstability of the existing qualified workforce directly influences companies’ abilities to manage andinnovate.
Difficulties in financing
Basically, the ratio of loaning to SMFEs is much lower than that of small and medium-sized enterprises(5 percent). Most SMFEs, unable to find support from the national financial systems, have turned toirregular ways of financing. According to research, the cause of difficult financing lies in SMFEs’ lowcredibility, the high cost of financial management, problems related to the evaluation systems andprocedures of the bank, together with the inability of the of SMFEs to offer realistic guarantees.
9. Summary and conclusions
As has been shown above, the rapid development of SMFEs is very significant for the national economy.In return, the establishment of related regulations, the expanding scale of food industry, and thestrengthening of the industrial infrastructure is providing a supportive external environment to theSMFEs. SMFEs give an impetus to the growth of the national economy, exports and investment of fixedassets. SMFEs also play an important role in realizing economies of scale effects, and provide jobs,especially for the non-agricultural sector. Their rapid development is pushing the spread and applicationof technology, and technological innovation and this contributes significantly to improving food safety.SMFEs are driven by the healthy development of the national food processing industry. External factorscontributing to the development of SMFEs are related regulations, the division and definition of relevantadministrative authorities, as well as various exporting firms of the food industry. Besides, the rapidexpansion of electrical transportation and communications technology is providing a solid foundationfor SMFEs. However, the development of SMFEs is restricted by shortages of qualified human resources,weakness in innovation, and difficulties of financing. Therefore, specialized and IT-based internationalstrategies must be implemented without delay.
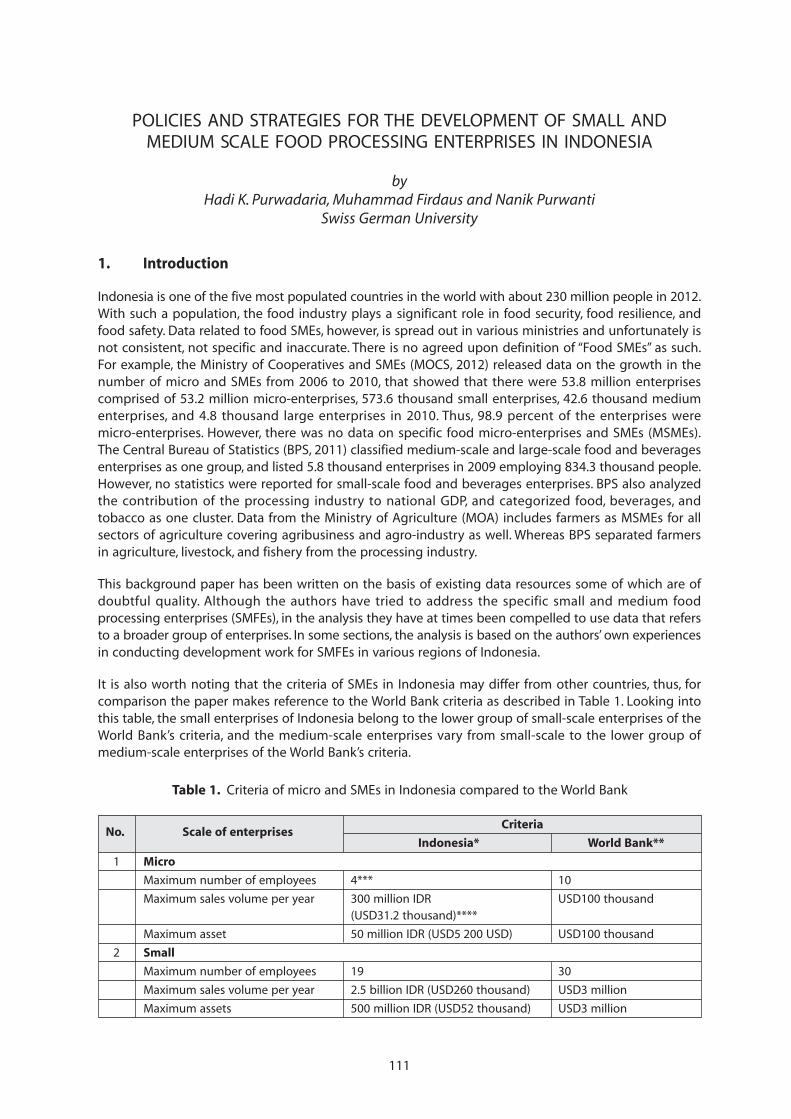
111
POLICIES AND STRATEGIES FOR THE DEVELOPMENT OF SMALL ANDMEDIUM SCALE FOOD PROCESSING ENTERPRISES IN INDONESIA
byHadi K. Purwadaria, Muhammad Firdaus and Nanik Purwanti
Swiss German University
1. Introduction
Indonesia is one of the five most populated countries in the world with about 230 million people in 2012.With such a population, the food industry plays a significant role in food security, food resilience, andfood safety. Data related to food SMEs, however, is spread out in various ministries and unfortunately isnot consistent, not specific and inaccurate. There is no agreed upon definition of “Food SMEs” as such.For example, the Ministry of Cooperatives and SMEs (MOCS, 2012) released data on the growth in thenumber of micro and SMEs from 2006 to 2010, that showed that there were 53.8 million enterprisescomprised of 53.2 million micro-enterprises, 573.6 thousand small enterprises, 42.6 thousand mediumenterprises, and 4.8 thousand large enterprises in 2010. Thus, 98.9 percent of the enterprises weremicro-enterprises. However, there was no data on specific food micro-enterprises and SMEs (MSMEs).The Central Bureau of Statistics (BPS, 2011) classified medium-scale and large-scale food and beveragesenterprises as one group, and listed 5.8 thousand enterprises in 2009 employing 834.3 thousand people.However, no statistics were reported for small-scale food and beverages enterprises. BPS also analyzedthe contribution of the processing industry to national GDP, and categorized food, beverages, andtobacco as one cluster. Data from the Ministry of Agriculture (MOA) includes farmers as MSMEs for allsectors of agriculture covering agribusiness and agro-industry as well. Whereas BPS separated farmersin agriculture, livestock, and fishery from the processing industry.
This background paper has been written on the basis of existing data resources some of which are ofdoubtful quality. Although the authors have tried to address the specific small and medium foodprocessing enterprises (SMFEs), in the analysis they have at times been compelled to use data that refersto a broader group of enterprises. In some sections, the analysis is based on the authors’ own experiencesin conducting development work for SMFEs in various regions of Indonesia.
It is also worth noting that the criteria of SMEs in Indonesia may differ from other countries, thus, forcomparison the paper makes reference to the World Bank criteria as described in Table 1. Looking intothis table, the small enterprises of Indonesia belong to the lower group of small-scale enterprises of theWorld Bank’s criteria, and the medium-scale enterprises vary from small-scale to the lower group ofmedium-scale enterprises of the World Bank’s criteria.
Table 1. Criteria of micro and SMEs in Indonesia compared to the World Bank
No. Scale of enterprisesCriteria
Indonesia* World Bank**
1 Micro
Maximum number of employees 4*** 10
Maximum sales volume per year 300 million IDR USD100 thousand(USD31.2 thousand)****
Maximum asset 50 million IDR (USD5 200 USD) USD100 thousand
2 Small
Maximum number of employees 19 30
Maximum sales volume per year 2.5 billion IDR (USD260 thousand) USD3 million
Maximum assets 500 million IDR (USD52 thousand) USD3 million
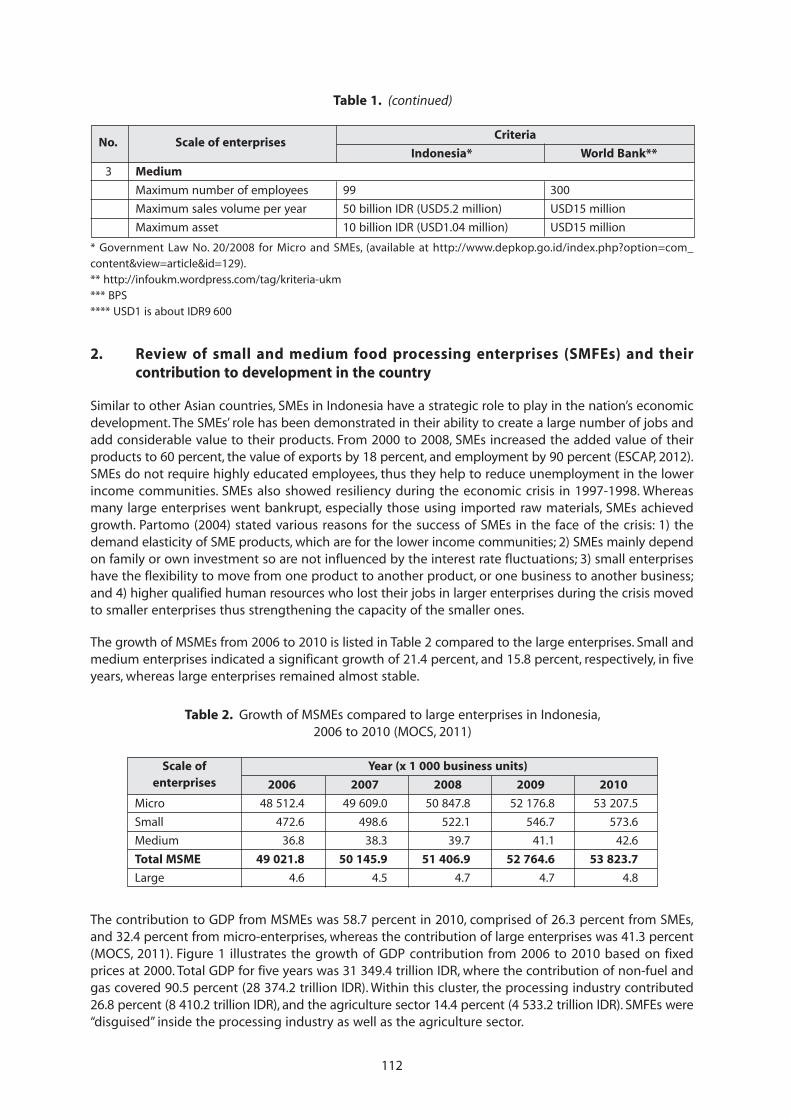
112
2. Review of small and medium food processing enterprises (SMFEs) and theircontribution to development in the country
Similar to other Asian countries, SMEs in Indonesia have a strategic role to play in the nation’s economicdevelopment. The SMEs’ role has been demonstrated in their ability to create a large number of jobs andadd considerable value to their products. From 2000 to 2008, SMEs increased the added value of theirproducts to 60 percent, the value of exports by 18 percent, and employment by 90 percent (ESCAP, 2012).SMEs do not require highly educated employees, thus they help to reduce unemployment in the lowerincome communities. SMEs also showed resiliency during the economic crisis in 1997-1998. Whereasmany large enterprises went bankrupt, especially those using imported raw materials, SMEs achievedgrowth. Partomo (2004) stated various reasons for the success of SMEs in the face of the crisis: 1) thedemand elasticity of SME products, which are for the lower income communities; 2) SMEs mainly dependon family or own investment so are not influenced by the interest rate fluctuations; 3) small enterpriseshave the flexibility to move from one product to another product, or one business to another business;and 4) higher qualified human resources who lost their jobs in larger enterprises during the crisis movedto smaller enterprises thus strengthening the capacity of the smaller ones.
The growth of MSMEs from 2006 to 2010 is listed in Table 2 compared to the large enterprises. Small andmedium enterprises indicated a significant growth of 21.4 percent, and 15.8 percent, respectively, in fiveyears, whereas large enterprises remained almost stable.
Table 1. (continued)
No. Scale of enterprisesCriteria
Indonesia* World Bank**
3 Medium
Maximum number of employees 99 300
Maximum sales volume per year 50 billion IDR (USD5.2 million) USD15 million
Maximum asset 10 billion IDR (USD1.04 million) USD15 million
* Government Law No. 20/2008 for Micro and SMEs, (available at http://www.depkop.go.id/index.php?option=com_content&view=article&id=129).** http://infoukm.wordpress.com/tag/kriteria-ukm*** BPS**** USD1 is about IDR9 600
Table 2. Growth of MSMEs compared to large enterprises in Indonesia,2006 to 2010 (MOCS, 2011)
Year (x 1 000 business units)
2006 2007 2008 2009 2010
Micro 48 512.4 49 609.0 50 847.8 52 176.8 53 207.5
Small 472.6 498.6 522.1 546.7 573.6
Medium 36.8 38.3 39.7 41.1 42.6
Total MSME 49 021.8 50 145.9 51 406.9 52 764.6 53 823.7
Large 4.6 4.5 4.7 4.7 4.8
Scale ofenterprises
The contribution to GDP from MSMEs was 58.7 percent in 2010, comprised of 26.3 percent from SMEs,and 32.4 percent from micro-enterprises, whereas the contribution of large enterprises was 41.3 percent(MOCS, 2011). Figure 1 illustrates the growth of GDP contribution from 2006 to 2010 based on fixedprices at 2000. Total GDP for five years was 31 349.4 trillion IDR, where the contribution of non-fuel andgas covered 90.5 percent (28 374.2 trillion IDR). Within this cluster, the processing industry contributed26.8 percent (8 410.2 trillion IDR), and the agriculture sector 14.4 percent (4 533.2 trillion IDR). SMFEs were“disguised” inside the processing industry as well as the agriculture sector.
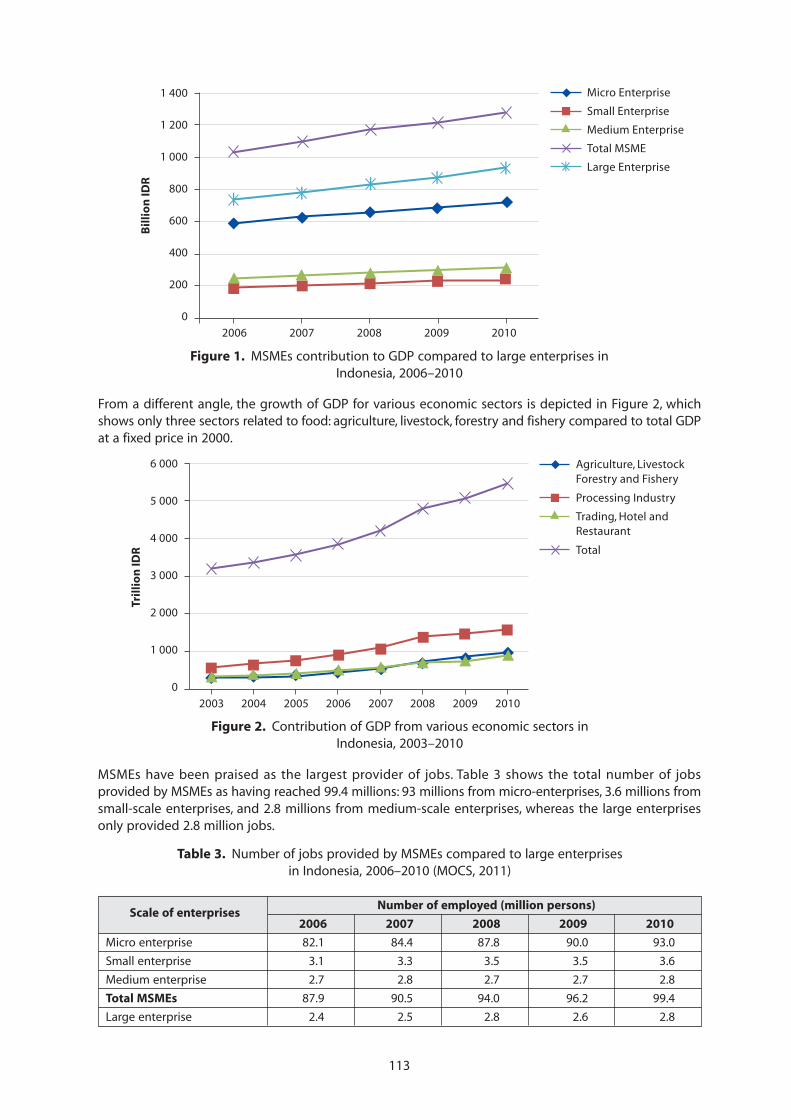
113
From a different angle, the growth of GDP for various economic sectors is depicted in Figure 2, whichshows only three sectors related to food: agriculture, livestock, forestry and fishery compared to total GDPat a fixed price in 2000.
Figure 1. MSMEs contribution to GDP compared to large enterprises inIndonesia, 2006–2010
1 400
1 200
1 000
800
600
400
200
0
Bil
lio
n ID
R
2006 2007 2008 2009 2010
Micro Enterprise
Small Enterprise
Medium Enterprise
Total MSME
Large Enterprise
Figure 2. Contribution of GDP from various economic sectors inIndonesia, 2003–2010
Agriculture, Livestock Forestry and Fishery
Processing Industry
Trading, Hotel and Restaurant
Total
6 000
5 000
4 000
3 000
2 000
1 000
0
Tril
lio
n ID
R
2003 2004 2005 2006 2007 2008 2009 2010
MSMEs have been praised as the largest provider of jobs. Table 3 shows the total number of jobsprovided by MSMEs as having reached 99.4 millions: 93 millions from micro-enterprises, 3.6 millions fromsmall-scale enterprises, and 2.8 millions from medium-scale enterprises, whereas the large enterprisesonly provided 2.8 million jobs.
Table 3. Number of jobs provided by MSMEs compared to large enterprisesin Indonesia, 2006–2010 (MOCS, 2011)
Scale of enterprisesNumber of employed (million persons)
2006 2007 2008 2009 2010
Micro enterprise 82.1 84.4 87.8 90.0 93.0
Small enterprise 3.1 3.3 3.5 3.5 3.6
Medium enterprise 2.7 2.8 2.7 2.7 2.8
Total MSMEs 87.9 90.5 94.0 96.2 99.4
Large enterprise 2.4 2.5 2.8 2.6 2.8
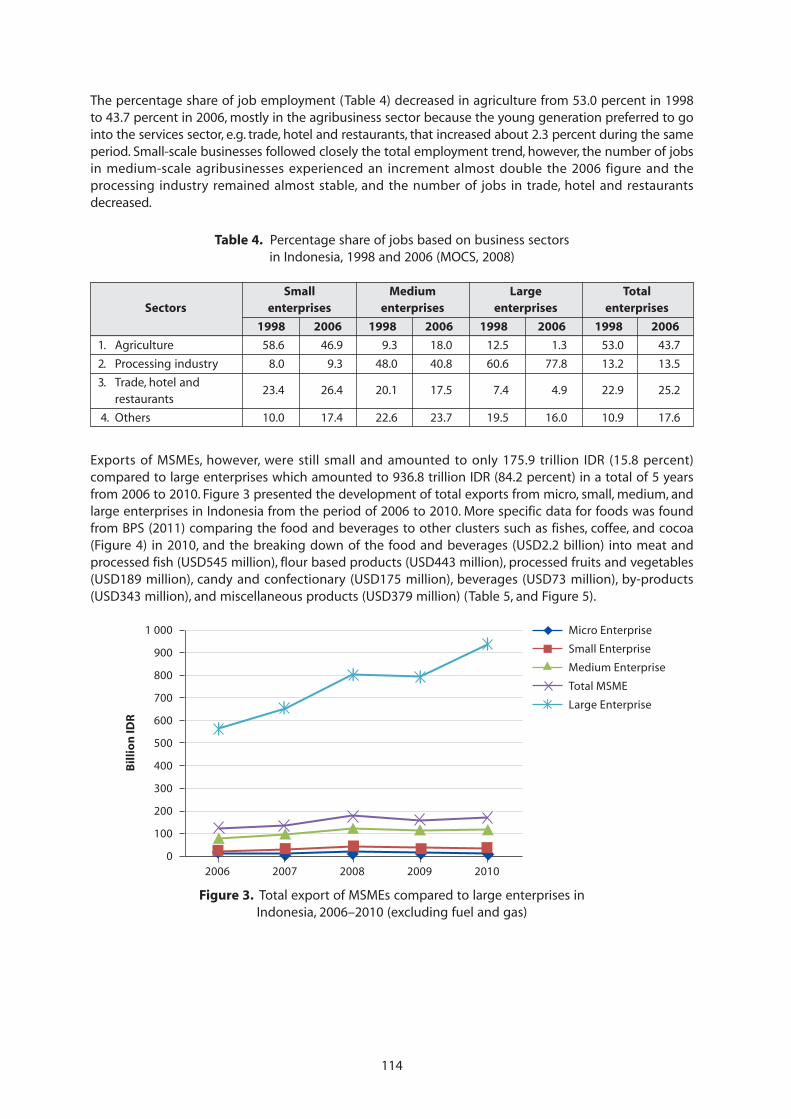
114
The percentage share of job employment (Table 4) decreased in agriculture from 53.0 percent in 1998to 43.7 percent in 2006, mostly in the agribusiness sector because the young generation preferred to gointo the services sector, e.g. trade, hotel and restaurants, that increased about 2.3 percent during the sameperiod. Small-scale businesses followed closely the total employment trend, however, the number of jobsin medium-scale agribusinesses experienced an increment almost double the 2006 figure and theprocessing industry remained almost stable, and the number of jobs in trade, hotel and restaurantsdecreased.
Table 4. Percentage share of jobs based on business sectorsin Indonesia, 1998 and 2006 (MOCS, 2008)
Small Medium Large TotalSectors enterprises enterprises enterprises enterprises
1998 2006 1998 2006 1998 2006 1998 2006
1. Agriculture 58.6 46.9 9.3 18.0 12.5 1.3 53.0 43.7
2. Processing industry 8.0 9.3 48.0 40.8 60.6 77.8 13.2 13.5
3. Trade, hotel andrestaurants
23.4 26.4 20.1 17.5 7.4 4.9 22.9 25.2
4. Others 10.0 17.4 22.6 23.7 19.5 16.0 10.9 17.6
Exports of MSMEs, however, were still small and amounted to only 175.9 trillion IDR (15.8 percent)compared to large enterprises which amounted to 936.8 trillion IDR (84.2 percent) in a total of 5 yearsfrom 2006 to 2010. Figure 3 presented the development of total exports from micro, small, medium, andlarge enterprises in Indonesia from the period of 2006 to 2010. More specific data for foods was foundfrom BPS (2011) comparing the food and beverages to other clusters such as fishes, coffee, and cocoa(Figure 4) in 2010, and the breaking down of the food and beverages (USD2.2 billion) into meat andprocessed fish (USD545 million), flour based products (USD443 million), processed fruits and vegetables(USD189 million), candy and confectionary (USD175 million), beverages (USD73 million), by-products(USD343 million), and miscellaneous products (USD379 million) (Table 5, and Figure 5).
Figure 3. Total export of MSMEs compared to large enterprises inIndonesia, 2006–2010 (excluding fuel and gas)
1 000
900
800
700
600
500
400
300
200
100
0
Bil
lio
n ID
R
2006 2007 2008 2009 2010
Micro Enterprise
Small Enterprise
Medium Enterprise
Total MSME
Large Enterprise
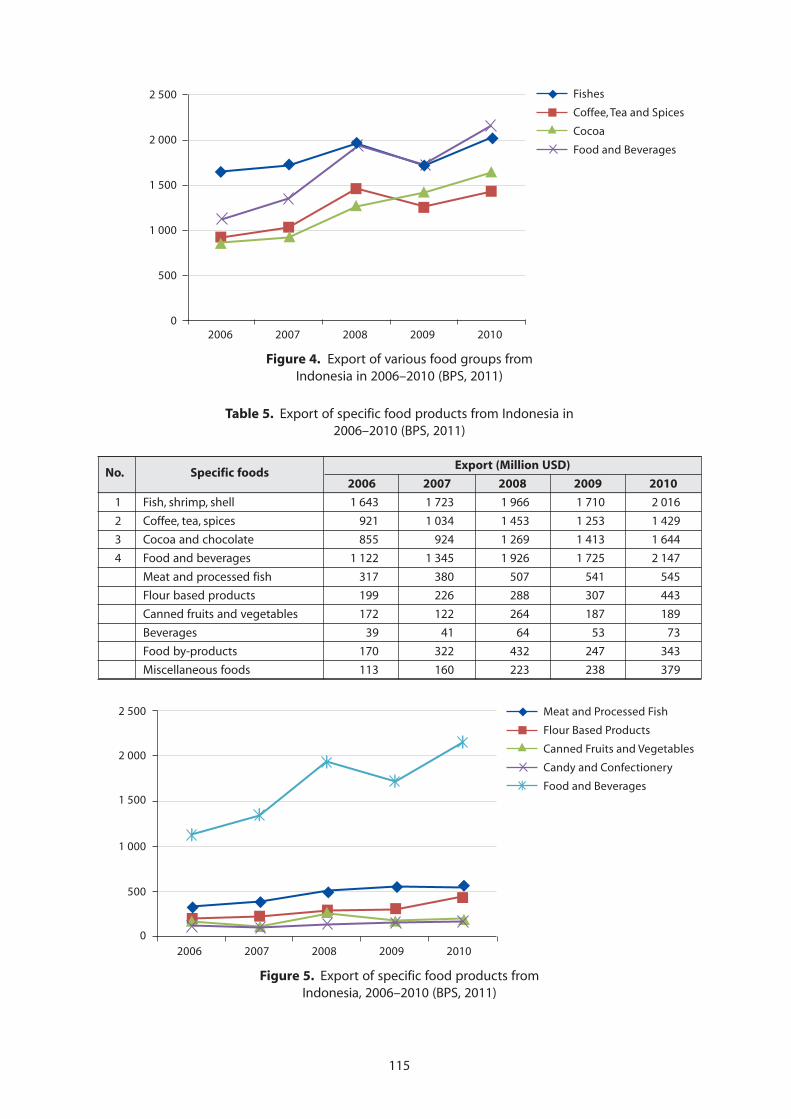
115
Figure 4. Export of various food groups fromIndonesia in 2006–2010 (BPS, 2011)
2006 2007 2008 2009 2010
Fishes
Coffee, Tea and Spices
Cocoa
Food and Beverages
2 500
2 000
1 500
1 000
500
0
Table 5. Export of specific food products from Indonesia in2006–2010 (BPS, 2011)
No. Specific foodsExport (Million USD)
2006 2007 2008 2009 2010
1 Fish, shrimp, shell 1 643 1 723 1 966 1 710 2 016
2 Coffee, tea, spices 921 1 034 1 453 1 253 1 429
3 Cocoa and chocolate 855 924 1 269 1 413 1 644
4 Food and beverages 1 122 1 345 1 926 1 725 2 147
Meat and processed fish 317 380 507 541 545
Flour based products 199 226 288 307 443
Canned fruits and vegetables 172 122 264 187 189
Beverages 39 41 64 53 73
Food by-products 170 322 432 247 343
Miscellaneous foods 113 160 223 238 379
Figure 5. Export of specific food products fromIndonesia, 2006–2010 (BPS, 2011)
2006 2007 2008 2009 2010
2 500
2 000
1 500
1 000
500
0
Meat and Processed Fish
Flour Based Products
Canned Fruits and Vegetables
Candy and Confectionery
Food and Beverages
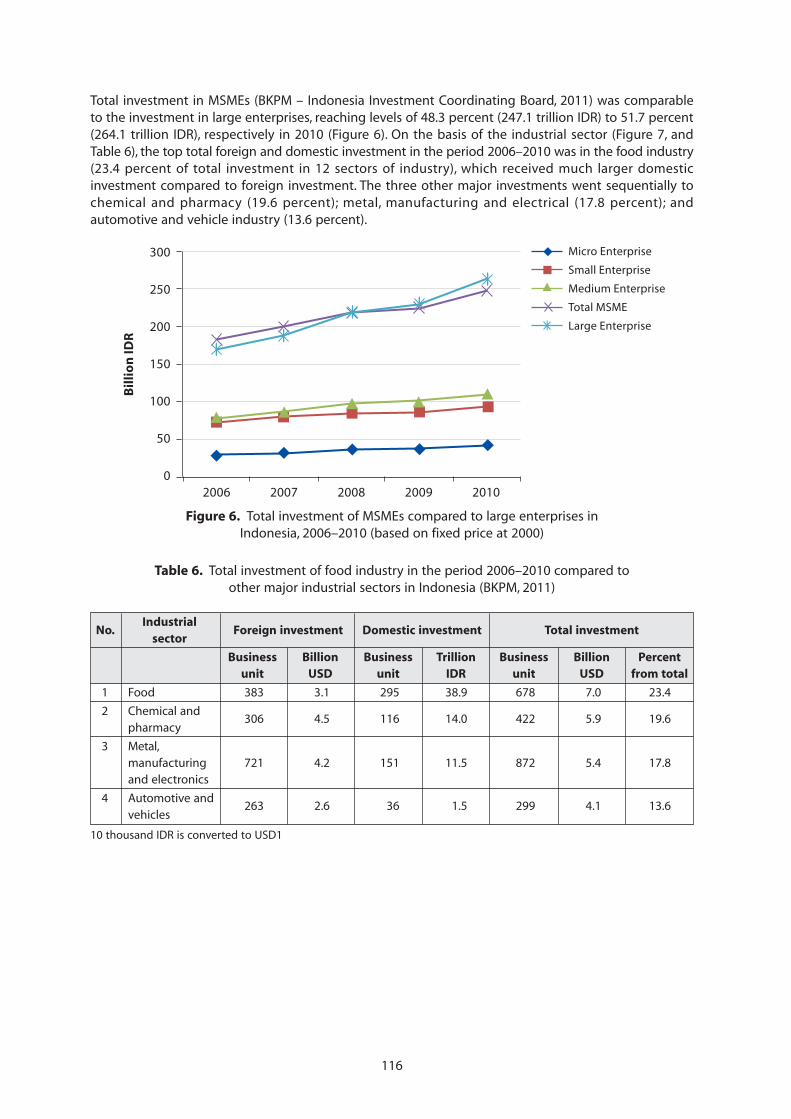
116
Total investment in MSMEs (BKPM – Indonesia Investment Coordinating Board, 2011) was comparableto the investment in large enterprises, reaching levels of 48.3 percent (247.1 trillion IDR) to 51.7 percent(264.1 trillion IDR), respectively in 2010 (Figure 6). On the basis of the industrial sector (Figure 7, andTable 6), the top total foreign and domestic investment in the period 2006–2010 was in the food industry(23.4 percent of total investment in 12 sectors of industry), which received much larger domesticinvestment compared to foreign investment. The three other major investments went sequentially tochemical and pharmacy (19.6 percent); metal, manufacturing and electrical (17.8 percent); andautomotive and vehicle industry (13.6 percent).
Figure 6. Total investment of MSMEs compared to large enterprises inIndonesia, 2006–2010 (based on fixed price at 2000)
300
250
200
150
100
50
0
Bil
lio
n ID
R
2006 2007 2008 2009 2010
Micro Enterprise
Small Enterprise
Medium Enterprise
Total MSME
Large Enterprise
Table 6. Total investment of food industry in the period 2006–2010 compared toother major industrial sectors in Indonesia (BKPM, 2011)
No.Industrial
Foreign investment Domestic investment Total investmentsector
Business Billion Business Trillion Business Billion Percentunit USD unit IDR unit USD from total
1 Food 383 3.1 295 38.9 678 7.0 23.4
2 Chemical andpharmacy
306 4.5 116 14.0 422 5.9 19.6
3 Metal,manufacturing 721 4.2 151 11.5 872 5.4 17.8and electronics
4 Automotive andvehicles
263 2.6 36 1.5 299 4.1 13.6
10 thousand IDR is converted to USD1
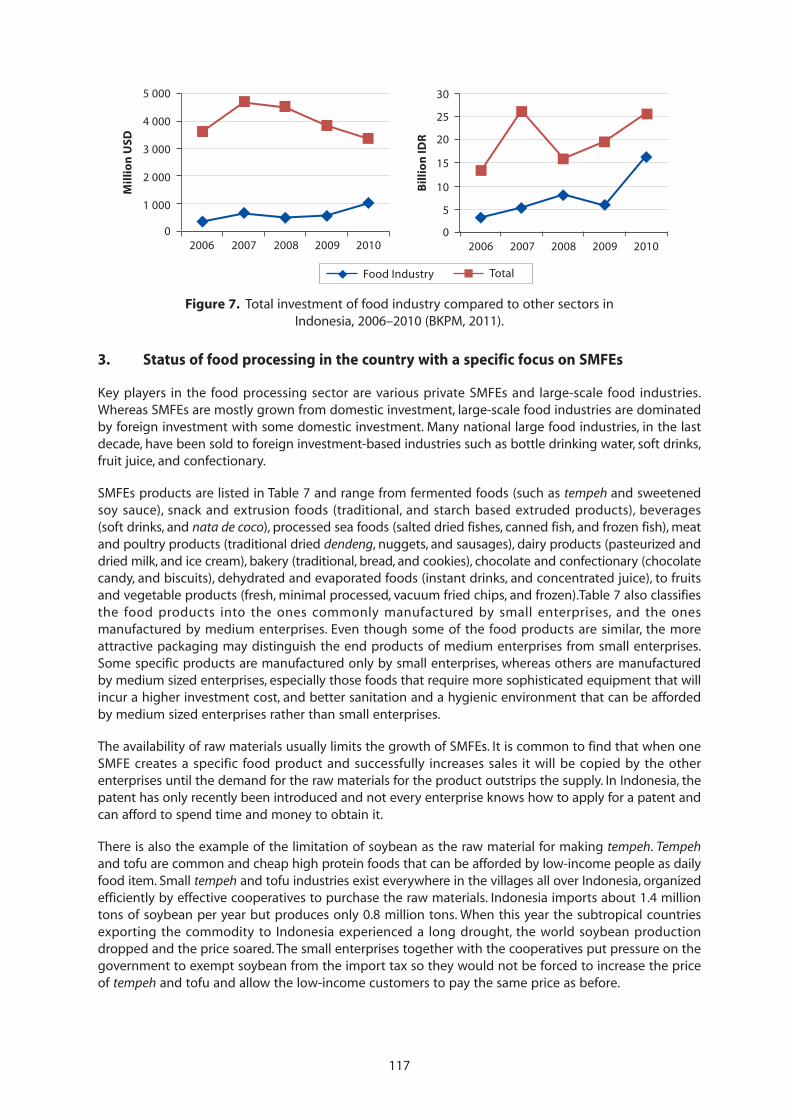
117
3. Status of food processing in the country with a specific focus on SMFEs
Key players in the food processing sector are various private SMFEs and large-scale food industries.Whereas SMFEs are mostly grown from domestic investment, large-scale food industries are dominatedby foreign investment with some domestic investment. Many national large food industries, in the lastdecade, have been sold to foreign investment-based industries such as bottle drinking water, soft drinks,fruit juice, and confectionary.
SMFEs products are listed in Table 7 and range from fermented foods (such as tempeh and sweetenedsoy sauce), snack and extrusion foods (traditional, and starch based extruded products), beverages(soft drinks, and nata de coco), processed sea foods (salted dried fishes, canned fish, and frozen fish), meatand poultry products (traditional dried dendeng, nuggets, and sausages), dairy products (pasteurized anddried milk, and ice cream), bakery (traditional, bread, and cookies), chocolate and confectionary (chocolatecandy, and biscuits), dehydrated and evaporated foods (instant drinks, and concentrated juice), to fruitsand vegetable products (fresh, minimal processed, vacuum fried chips, and frozen).Table 7 also classifiesthe food products into the ones commonly manufactured by small enterprises, and the onesmanufactured by medium enterprises. Even though some of the food products are similar, the moreattractive packaging may distinguish the end products of medium enterprises from small enterprises.Some specific products are manufactured only by small enterprises, whereas others are manufacturedby medium sized enterprises, especially those foods that require more sophisticated equipment that willincur a higher investment cost, and better sanitation and a hygienic environment that can be affordedby medium sized enterprises rather than small enterprises.
The availability of raw materials usually limits the growth of SMFEs. It is common to find that when oneSMFE creates a specific food product and successfully increases sales it will be copied by the otherenterprises until the demand for the raw materials for the product outstrips the supply. In Indonesia, thepatent has only recently been introduced and not every enterprise knows how to apply for a patent andcan afford to spend time and money to obtain it.
There is also the example of the limitation of soybean as the raw material for making tempeh. Tempehand tofu are common and cheap high protein foods that can be afforded by low-income people as dailyfood item. Small tempeh and tofu industries exist everywhere in the villages all over Indonesia, organizedefficiently by effective cooperatives to purchase the raw materials. Indonesia imports about 1.4 milliontons of soybean per year but produces only 0.8 million tons. When this year the subtropical countriesexporting the commodity to Indonesia experienced a long drought, the world soybean productiondropped and the price soared. The small enterprises together with the cooperatives put pressure on thegovernment to exempt soybean from the import tax so they would not be forced to increase the priceof tempeh and tofu and allow the low-income customers to pay the same price as before.
Figure 7. Total investment of food industry compared to other sectors inIndonesia, 2006–2010 (BKPM, 2011).
5 000
4 000
3 000
2 000
1 000
0
Mil
lio
n U
SD
2006 2007 2008 2009 2010 2006 2007 2008 2009 2010
30
25
20
15
10
5
0
Bil
lio
n ID
R
Food Industry Total
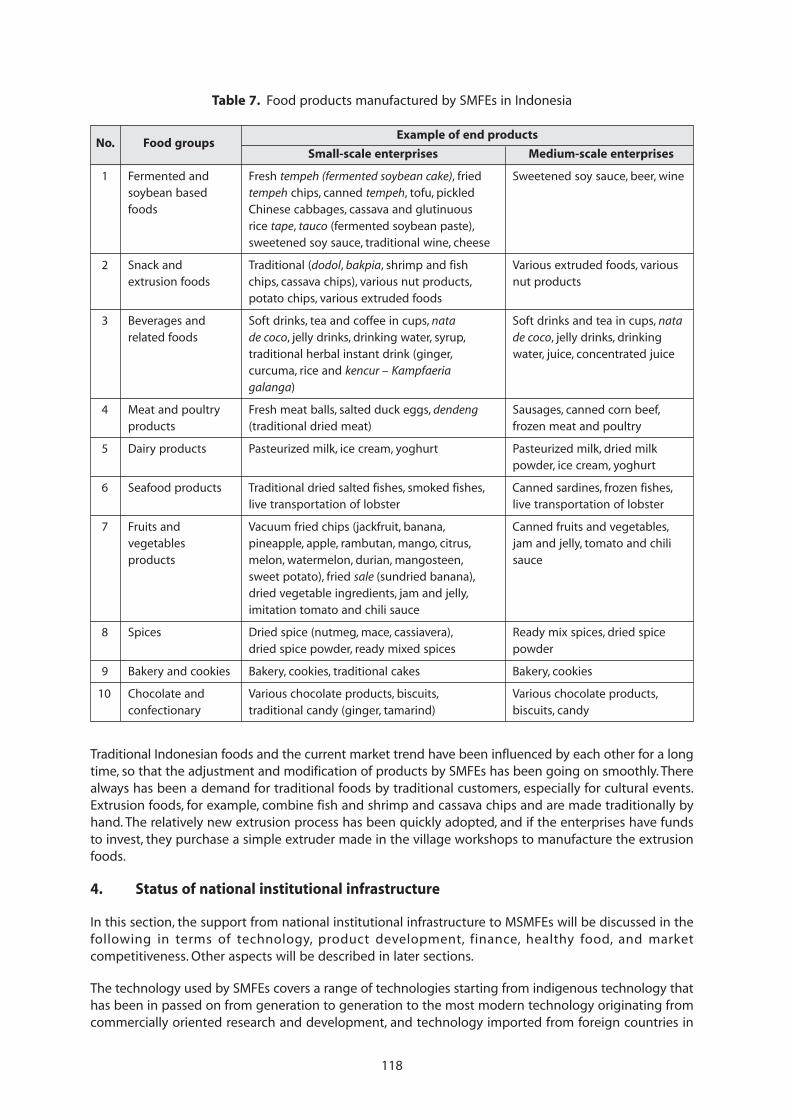
118
Traditional Indonesian foods and the current market trend have been influenced by each other for a longtime, so that the adjustment and modification of products by SMFEs has been going on smoothly. Therealways has been a demand for traditional foods by traditional customers, especially for cultural events.Extrusion foods, for example, combine fish and shrimp and cassava chips and are made traditionally byhand. The relatively new extrusion process has been quickly adopted, and if the enterprises have fundsto invest, they purchase a simple extruder made in the village workshops to manufacture the extrusionfoods.
4. Status of national institutional infrastructure
In this section, the support from national institutional infrastructure to MSMFEs will be discussed in thefollowing in terms of technology, product development, finance, healthy food, and marketcompetitiveness. Other aspects will be described in later sections.
The technology used by SMFEs covers a range of technologies starting from indigenous technology thathas been in passed on from generation to generation to the most modern technology originating fromcommercially oriented research and development, and technology imported from foreign countries in
Table 7. Food products manufactured by SMFEs in Indonesia
No. Food groupsExample of end products
Small-scale enterprises Medium-scale enterprises
1 Fermented and Fresh tempeh (fermented soybean cake), fried Sweetened soy sauce, beer, winesoybean based tempeh chips, canned tempeh, tofu, pickledfoods Chinese cabbages, cassava and glutinuous
rice tape, tauco (fermented soybean paste),sweetened soy sauce, traditional wine, cheese
2 Snack and Traditional (dodol, bakpia, shrimp and fish Various extruded foods, variousextrusion foods chips, cassava chips), various nut products, nut products
potato chips, various extruded foods
3 Beverages and Soft drinks, tea and coffee in cups, nata Soft drinks and tea in cups, natarelated foods de coco, jelly drinks, drinking water, syrup, de coco, jelly drinks, drinking
traditional herbal instant drink (ginger, water, juice, concentrated juicecurcuma, rice and kencur – Kampfaeriagalanga)
4 Meat and poultry Fresh meat balls, salted duck eggs, dendeng Sausages, canned corn beef,products (traditional dried meat) frozen meat and poultry
5 Dairy products Pasteurized milk, ice cream, yoghurt Pasteurized milk, dried milkpowder, ice cream, yoghurt
6 Seafood products Traditional dried salted fishes, smoked fishes, Canned sardines, frozen fishes,live transportation of lobster live transportation of lobster
7 Fruits and Vacuum fried chips (jackfruit, banana, Canned fruits and vegetables,vegetables pineapple, apple, rambutan, mango, citrus, jam and jelly, tomato and chiliproducts melon, watermelon, durian, mangosteen, sauce
sweet potato), fried sale (sundried banana),dried vegetable ingredients, jam and jelly,imitation tomato and chili sauce
8 Spices Dried spice (nutmeg, mace, cassiavera), Ready mix spices, dried spicedried spice powder, ready mixed spices powder
9 Bakery and cookies Bakery, cookies, traditional cakes Bakery, cookies
10 Chocolate and Various chocolate products, biscuits, Various chocolate products,confectionary traditional candy (ginger, tamarind) biscuits, candy
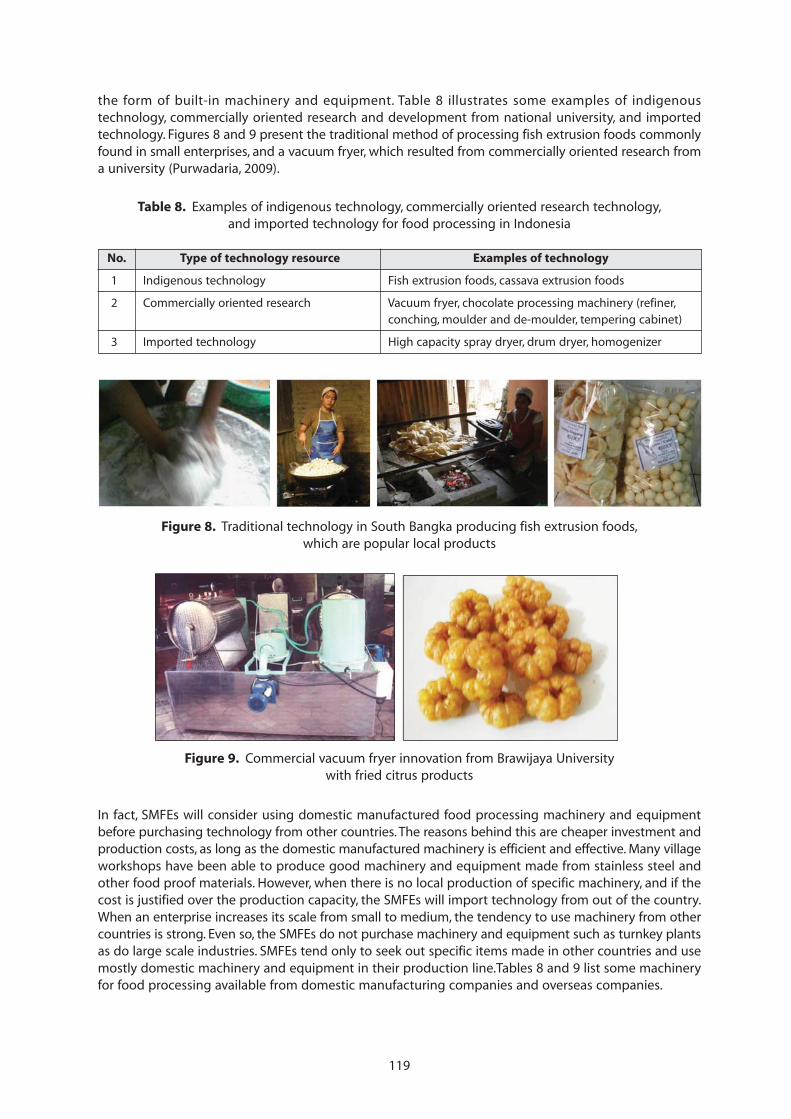
119
the form of built-in machinery and equipment. Table 8 illustrates some examples of indigenoustechnology, commercially oriented research and development from national university, and importedtechnology. Figures 8 and 9 present the traditional method of processing fish extrusion foods commonlyfound in small enterprises, and a vacuum fryer, which resulted from commercially oriented research froma university (Purwadaria, 2009).
Table 8. Examples of indigenous technology, commercially oriented research technology,and imported technology for food processing in Indonesia
No. Type of technology resource Examples of technology
1 Indigenous technology Fish extrusion foods, cassava extrusion foods
2 Commercially oriented research Vacuum fryer, chocolate processing machinery (refiner,conching, moulder and de-moulder, tempering cabinet)
3 Imported technology High capacity spray dryer, drum dryer, homogenizer
Figure 9. Commercial vacuum fryer innovation from Brawijaya Universitywith fried citrus products
Figure 8. Traditional technology in South Bangka producing fish extrusion foods,which are popular local products
In fact, SMFEs will consider using domestic manufactured food processing machinery and equipmentbefore purchasing technology from other countries. The reasons behind this are cheaper investment andproduction costs, as long as the domestic manufactured machinery is efficient and effective. Many villageworkshops have been able to produce good machinery and equipment made from stainless steel andother food proof materials. However, when there is no local production of specific machinery, and if thecost is justified over the production capacity, the SMFEs will import technology from out of the country.When an enterprise increases its scale from small to medium, the tendency to use machinery from othercountries is strong. Even so, the SMFEs do not purchase machinery and equipment such as turnkey plantsas do large scale industries. SMFEs tend only to seek out specific items made in other countries and usemostly domestic machinery and equipment in their production line.Tables 8 and 9 list some machineryfor food processing available from domestic manufacturing companies and overseas companies.
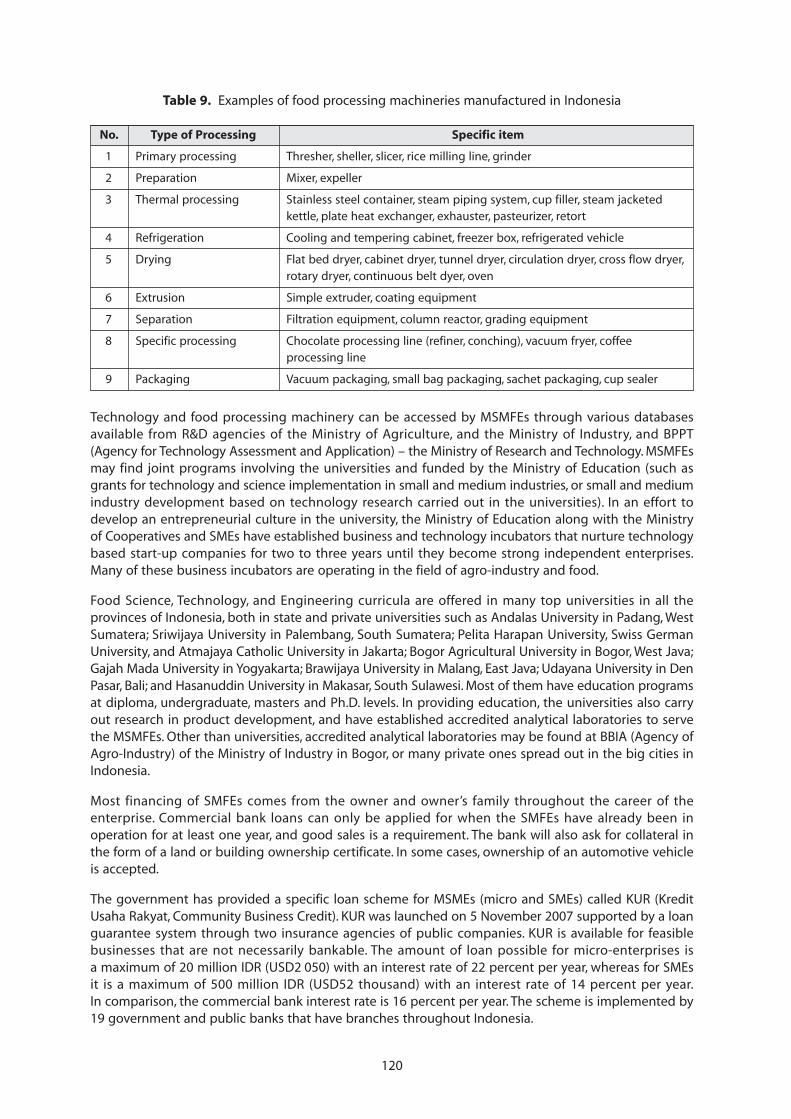
120
Technology and food processing machinery can be accessed by MSMFEs through various databasesavailable from R&D agencies of the Ministry of Agriculture, and the Ministry of Industry, and BPPT(Agency for Technology Assessment and Application) – the Ministry of Research and Technology. MSMFEsmay find joint programs involving the universities and funded by the Ministry of Education (such asgrants for technology and science implementation in small and medium industries, or small and mediumindustry development based on technology research carried out in the universities). In an effort todevelop an entrepreneurial culture in the university, the Ministry of Education along with the Ministryof Cooperatives and SMEs have established business and technology incubators that nurture technologybased start-up companies for two to three years until they become strong independent enterprises.Many of these business incubators are operating in the field of agro-industry and food.
Food Science, Technology, and Engineering curricula are offered in many top universities in all theprovinces of Indonesia, both in state and private universities such as Andalas University in Padang, WestSumatera; Sriwijaya University in Palembang, South Sumatera; Pelita Harapan University, Swiss GermanUniversity, and Atmajaya Catholic University in Jakarta; Bogor Agricultural University in Bogor, West Java;Gajah Mada University in Yogyakarta; Brawijaya University in Malang, East Java; Udayana University in DenPasar, Bali; and Hasanuddin University in Makasar, South Sulawesi. Most of them have education programsat diploma, undergraduate, masters and Ph.D. levels. In providing education, the universities also carryout research in product development, and have established accredited analytical laboratories to servethe MSMFEs. Other than universities, accredited analytical laboratories may be found at BBIA (Agency ofAgro-Industry) of the Ministry of Industry in Bogor, or many private ones spread out in the big cities inIndonesia.
Most financing of SMFEs comes from the owner and owner’s family throughout the career of theenterprise. Commercial bank loans can only be applied for when the SMFEs have already been inoperation for at least one year, and good sales is a requirement. The bank will also ask for collateral inthe form of a land or building ownership certificate. In some cases, ownership of an automotive vehicleis accepted.
The government has provided a specific loan scheme for MSMEs (micro and SMEs) called KUR (KreditUsaha Rakyat, Community Business Credit). KUR was launched on 5 November 2007 supported by a loanguarantee system through two insurance agencies of public companies. KUR is available for feasiblebusinesses that are not necessarily bankable. The amount of loan possible for micro-enterprises isa maximum of 20 million IDR (USD2 050) with an interest rate of 22 percent per year, whereas for SMEsit is a maximum of 500 million IDR (USD52 thousand) with an interest rate of 14 percent per year.In comparison, the commercial bank interest rate is 16 percent per year. The scheme is implemented by19 government and public banks that have branches throughout Indonesia.
Table 9. Examples of food processing machineries manufactured in Indonesia
No. Type of Processing Specific item
1 Primary processing Thresher, sheller, slicer, rice milling line, grinder
2 Preparation Mixer, expeller
3 Thermal processing Stainless steel container, steam piping system, cup filler, steam jacketedkettle, plate heat exchanger, exhauster, pasteurizer, retort
4 Refrigeration Cooling and tempering cabinet, freezer box, refrigerated vehicle
5 Drying Flat bed dryer, cabinet dryer, tunnel dryer, circulation dryer, cross flow dryer,rotary dryer, continuous belt dyer, oven
6 Extrusion Simple extruder, coating equipment
7 Separation Filtration equipment, column reactor, grading equipment
8 Specific processing Chocolate processing line (refiner, conching), vacuum fryer, coffeeprocessing line
9 Packaging Vacuum packaging, small bag packaging, sachet packaging, cup sealer
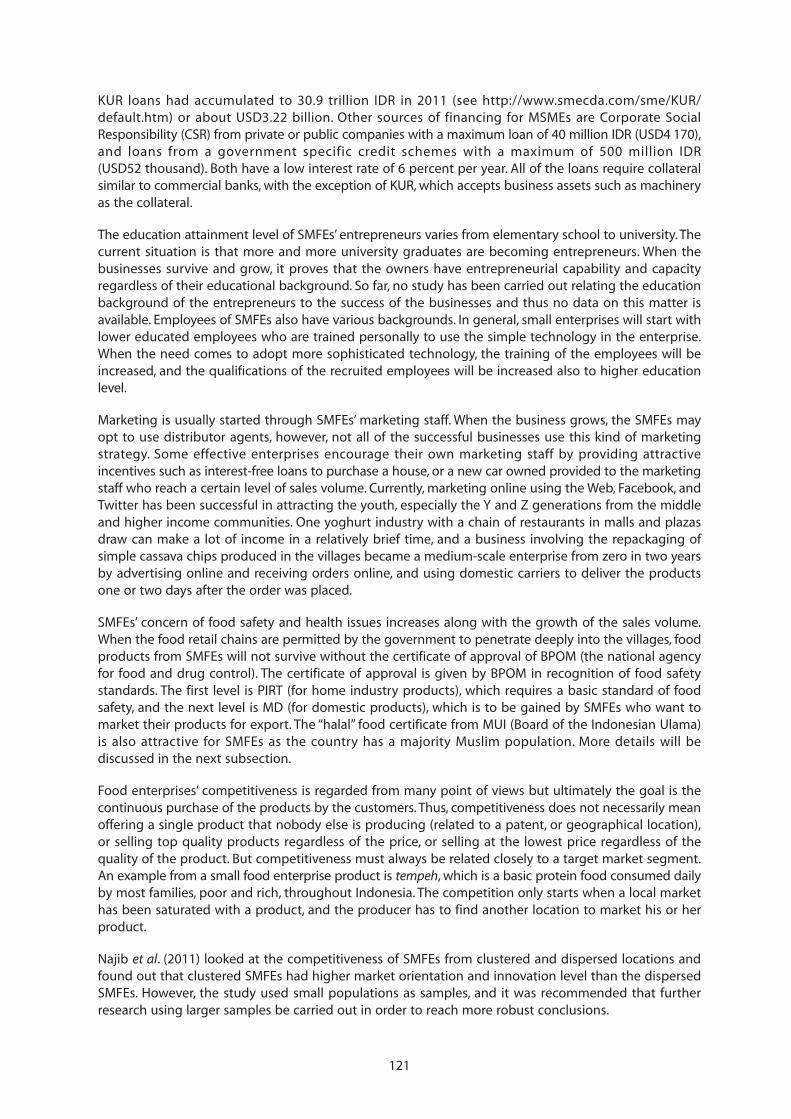
121
KUR loans had accumulated to 30.9 trillion IDR in 2011 (see http://www.smecda.com/sme/KUR/default.htm) or about USD3.22 billion. Other sources of financing for MSMEs are Corporate SocialResponsibility (CSR) from private or public companies with a maximum loan of 40 million IDR (USD4 170),and loans from a government specific credit schemes with a maximum of 500 million IDR(USD52 thousand). Both have a low interest rate of 6 percent per year. All of the loans require collateralsimilar to commercial banks, with the exception of KUR, which accepts business assets such as machineryas the collateral.
The education attainment level of SMFEs’ entrepreneurs varies from elementary school to university. Thecurrent situation is that more and more university graduates are becoming entrepreneurs. When thebusinesses survive and grow, it proves that the owners have entrepreneurial capability and capacityregardless of their educational background. So far, no study has been carried out relating the educationbackground of the entrepreneurs to the success of the businesses and thus no data on this matter isavailable. Employees of SMFEs also have various backgrounds. In general, small enterprises will start withlower educated employees who are trained personally to use the simple technology in the enterprise.When the need comes to adopt more sophisticated technology, the training of the employees will beincreased, and the qualifications of the recruited employees will be increased also to higher educationlevel.
Marketing is usually started through SMFEs’ marketing staff. When the business grows, the SMFEs mayopt to use distributor agents, however, not all of the successful businesses use this kind of marketingstrategy. Some effective enterprises encourage their own marketing staff by providing attractiveincentives such as interest-free loans to purchase a house, or a new car owned provided to the marketingstaff who reach a certain level of sales volume. Currently, marketing online using the Web, Facebook, andTwitter has been successful in attracting the youth, especially the Y and Z generations from the middleand higher income communities. One yoghurt industry with a chain of restaurants in malls and plazasdraw can make a lot of income in a relatively brief time, and a business involving the repackaging ofsimple cassava chips produced in the villages became a medium-scale enterprise from zero in two yearsby advertising online and receiving orders online, and using domestic carriers to deliver the productsone or two days after the order was placed.
SMFEs’ concern of food safety and health issues increases along with the growth of the sales volume.When the food retail chains are permitted by the government to penetrate deeply into the villages, foodproducts from SMFEs will not survive without the certificate of approval of BPOM (the national agencyfor food and drug control). The certificate of approval is given by BPOM in recognition of food safetystandards. The first level is PIRT (for home industry products), which requires a basic standard of foodsafety, and the next level is MD (for domestic products), which is to be gained by SMFEs who want tomarket their products for export. The “halal” food certificate from MUI (Board of the Indonesian Ulama)is also attractive for SMFEs as the country has a majority Muslim population. More details will bediscussed in the next subsection.
Food enterprises’ competitiveness is regarded from many point of views but ultimately the goal is thecontinuous purchase of the products by the customers. Thus, competitiveness does not necessarily meanoffering a single product that nobody else is producing (related to a patent, or geographical location),or selling top quality products regardless of the price, or selling at the lowest price regardless of thequality of the product. But competitiveness must always be related closely to a target market segment.An example from a small food enterprise product is tempeh, which is a basic protein food consumed dailyby most families, poor and rich, throughout Indonesia. The competition only starts when a local markethas been saturated with a product, and the producer has to find another location to market his or herproduct.
Najib et al. (2011) looked at the competitiveness of SMFEs from clustered and dispersed locations andfound out that clustered SMFEs had higher market orientation and innovation level than the dispersedSMFEs. However, the study used small populations as samples, and it was recommended that furtherresearch using larger samples be carried out in order to reach more robust conclusions.
122
5. Government policy and legal frameworks
The development of SMFEs as a part of SMEs is encouraged by the government. As a start-up companythe small enterprise is not required to go through the process of legal registration, but is recommendedto do so when it starts to grow. The first step of legal registration is to apply for TDP (BusinessRegistration), NPWP (Tax Identification Number), and then SIUP (Permission for Business and Trade). Whenthe enterprise has been stable and has reached a certain sales volume, it can then formally register thecompany. The legal registration is generally processed through a notary for CV (Business Company), andPT (Limited Company as the legal body), or through the government for cooperatives.
Government programs and expenditures, especially those that have been used to support thedevelopment of SMEs, have been assessed by Tambunan (2008), who claimed that they have positiveimpacts on the growth of SMEs. Tambunan further argued that SMEs in less developed countries cansurvive and grow in the future since they are capable of building a niche market for themselves anddeveloping linkages to larger enterprises, e.g. as a subcontractor.
The government has the Ministry of Agriculture to support the farmers development, and threeministries for the SMFEs: the Ministry of Cooperatives and SMEs, the Ministry of Industry, and the Ministryof Trade. There are also other ministries that have an indirect relationship with the SMEs such as theMinistry of Public Works, The Ministry of Energy and Mineral Resources, and the Ministry of Environment.Thus, SMFEs in Indonesia cannot be only viewed from the perspective of agro-industrial policy. Adoptinga more holistic approach, the government policy puts priority in supporting:
1. SMFEs using local raw materials to manufacture local food products with advantage andcompetitive capabilities;
2. SMFEs producing food products for the global market, especially specific original Indonesianfoods;
3. SMFEs that can be established in the rural areas to help promote rural development;
4. SMFEs that are capable of creating a cluster of food industries in the neighbourhood; and
5. SMFEs that are capable of providing a lot of jobs.
The policy of supporting SMFEs can be described as follows:
1. Strengthening the farmer institutions and capability in an effort to maintain a continuous supplyof raw materials for SMFEs;
2. Providing programs to guarantee export quality and certification such as GAP (Good AgriculturePractice), GMP (Good Manufacturing Practice), and HACCP (Hazard Analysis at Critical ControlPoints);
3. Facilitating a loan credit scheme that is accessible for the growing SMFEs, and stimulating largeenterprises to participate in this program through the CSR system;
4. Strengthening the infrastructure to support the SMFEs operations such as energy, water,transportation, and shipping facilities; and
5. Promoting domestic and export products through various fora: exhibitions, trade missions etc.
The related ministries will translate the overall policy into their own tasks and functions, and make theirannual programs, hopefully coordinated so as to result in synchronized actions to leverage the SMFEs’development.
Up until recently, the government has been most lenient with respect to the application of taxregulations on the SMEs. However, in 2012, the government drafted a law for SME tax regulation. Thishas sparked a lot of debates about when the tax should be applied. The suggestion is to exempt SMEswith an annual sale volume of 200 million IDR or less (USD20.8 thousand) from paying tax.
Food safety is imposed and controlled by the government through BPOM, and Ministry of Agricultureat the farm level. Training for Food Safety, HACCP, GAP, and GMP is done by the agencies, regional
123
government, and the association of private food companies through universities, and NGOs. The PIRT(Approved Home Industry) label from BPOM is mandatory, whereas halal certification from MUI ispracticed widely. SMFEs are aware that their products will have better sales if a PIRT number and a “halal”symbol are printed on their product labels. PIRT and halal certification are easy to apply for as long asthe SMFEs meet the basic legal conditions such as a registered location, an industrial permit, anda registered tax identity. The regional industry office provides training to SMFEs for two days prior to thedeliverance of PIRT. To further protect the consumers, an expiry date printed on the product label isencouraged, and courses by universities are delivered to SMFEs under government programs or requestsfrom SMFEs. In practice, an expiry date not only protects the consumers, but also protects the SMFEssince the sale of food products after the expiry date is a breach of the regulations and can result ina penalty being imposed on the retailer.
The next level of qualification from the BPOM is MD – a certification required for domestic products thatare going to be exported. This qualification requires formal application submitted along with the legalregistration of the enterprise, the results of food analysis by an accredited laboratory based on SNI(Indonesian National Standard) reference for each type of food, a flow chart of the food productionprocess, the plant layout with the through flow of materials, sanitation procedures, and the design of thepackaging label where the content of the food is mentioned. After a thorough inspection from theregional BPOM office with respect to the standard requirements of GMP, and HACCP, and a site visit tothe food industry, the application will be sent to the BPOM in Jakarta for approval. Imported foodproducts are subjected to mandatory certification of ML, which has a similar procedure as the MDcertificate with the site visit to the plant or factory being optional. However, if the imported productswant to have halal certification, then a team from MUI is dispatched to inspect the factory in theexporting countries and this visit is fully funded by the applicants.
Competitive issues are addressed by the implementation of Intellectual Property Rights (IPR), and a policynot to allow monopoly, especially by a large-scale food enterprise, or a group of food enterprises.Branding is encouraged, and registration of a food brand is facilitated with a simple procedure. Importof wheat flour is now allowed, whereas previously, for a long time, it was manufactured domestically andcontrolled by a large food group. Thus, fairer competition is facilitated. The government is also trying toimpose stricter regulations on the quality of imported fresh foods such as fruits, vegetables, and meatto give the domestic products room for expansion.
6. Status of industrial infrastructure
In 2010 the electrical power available to the country amounted to 169.8 thousand GWH comprised of131.7 GWH produced by public companies, and 38.1 GWH by the private sector, and the electricitydistribution network was equivalent to 48.5 thousand km. The customers receiving services included48.7 thousand industries, 1.9 million businesses other than industry, and 39.3 million residences. Eventhough the number of industrial customers was small (0.12 percent), industries consumed the largestshare of power capacity – a total of 15.6 MVA or an average of 32 KVA per customer, compared to otherbusinesses with a total of 13.8 MVA or an average of 7.26 KVA per customer, and residences with a totalof 33.2 MVA or an average of 845 VA per customer. The Ministry of Energy announced a strategic planfrom 2010 to 2018 (Minister of Energy Regulation No. 04, 2010) to increase the electricity availability by8 percent per year, and the distribution network by 6 percent per year. The overall plan is to: 1) increasethe energy capacity; 2) increase the accessibility of energy for the customers; and 3) reduce the economicprice of energy for customers.
In reality, many small enterprises consider the use of generators to increase their electrical power capacityespecially in the early stages of their businesses, since the application to increase it from the grid maytake a long time. Bigger enterprises applying for a considerably larger increase of power capacity willreceive better services that point to the government priority of providing larger installments of electricalcapacity to a few customers rather than small installments to a large number of customers. However,most medium and large enterprises will also have a reserve generator to overcome electricity disruptionbecause of technical problems. In some provinces, cities, and villages disruptions occur more often,whereas in the big cities such as the capital, and provincial capitals they happen less frequently.
124
The main strategic plan for roads, water, and sanitation was decreed in 2010 by the Minister of PublicWorks in the form of Regulation No. 02/PRT/M/2010, which involves regional development and crosssector support, with development carried out in consideration of environmental and climate change, andgender mainstreaming will be given priority. The program’s activities target:
1. road extension of 13 thousand km, and broadening the existing road for 19.4 thousand km witha minimum 7 m wide on the inter-province main road at eastern Sumatera, northern Java,southern Kalimantan, and western Sulawesi;
2. access road development to various seaports, and dry ports in Java, Bali, Sumatera, and Riau;
3. increasing capacity of drinking water to reach 9.47 l/s in 32 provinces, and water infrastructuredevelopment for 4 650 villages;
4. access to bank loans for 107 drinking water public companies spread out all over Indonesia; and
5. community sanitation in 220 regions, and socio-economic infrastructure for the environment of185 regions.
It is worth noting, though, that the road condition in some provinces is good such as in Yogyakarta,Central and East Java, but in other provinces the condition is not good such as in West Java, and SouthSumatera, and Jambi. Most SMFEs have their own well or deep well pump to keep sufficient supply inaddition to purchasing water from public companies and/or the private sector.
To protect the environment, the construction of plants and factories of medium and large enterprisesrequires prior approval from the Ministry of Environment after conducting AMDAL (EnvironmentalImpacts Assessment) for the area of the plant site, and an industrial waste treatment plan. Smallenterprises commonly get training and consultation from extension officers of BPOM, the Ministry ofIndustry, and MOCS on plant sanitation and waste treatment.
7. Impact of rural and urban community behaviour on MSMFEs’ products
According to the Trading Economics Web site, World Bank data in 2012 (available at http://www.tradingeconomics.com/indonesia/rural-population-wb-data.html) showed that there was a distinctshift of population in Indonesia from rural areas to urban areas. The rural population changed from115.44 millions before 2012 to 114.05 millions in 2012, decreasing at the rate of 1.2 percent. The urbanpopulation increased from 117.02 millions to 120.90 millions at the rate of 3.3 percent in the same periodof time. This had a positive impact on the processed foods sector and thus on the development ofMSMFEs, since urban communities have a greater tendency to buy processed foods than ruralcommunities. This is supported by data published by BPS (National Bureau of Statistic) in 2003 indicatingthat people with incomes higher than Rp 200 thousands per month spent 19 to 30 percent of theirincome on prepared food and beverages compared to lower than 14 percent by people who haveincomes below Rp 150 thousands per month. According to the same data, rural communities comprisedabout 82 percent of the population with incomes lower than Rp 150 thousand per month, whereas urbancommunities comprised about 57 percent of the population with incomes higher than Rp 200 thousandsper month.
Muzayyamah (2011) concluded from her study that meat and milk were considered to be luxury foodsin the rural and urban communities in Java, whereas eggs were a necessary food. Increasing prices ofmeat and milk would result in these products being substituted by eggs as a source of protein. In termsof MSMFEs involvement, meat, milk and eggs can be processed into various end products.
Expenditure per capita for eggs and milk was 4 to 6 percent in rural areas, and 7 to 8 percent in urbanareas (BPS, 2003). One of the popular processed egg foods is salted duck egg, consumed by both ruraland urban communities, and is produced commonly in home industries since the process is simple, andthe selling price is accessible to the low income class. However, data is not available to allowa comparison of the production of salted eggs and fresh eggs. A rough estimate is that salted eggproduction is less than 10 percent of total fresh egg production. It should be noted that eggs becamea necessary food because increases in the price of eggs have always left them affordable, even by low
125
income people, compared to increases in the price of meat and milk. Thus, MSMFEs working in saltedegg production enjoyed more market stability compared to meat and milk processors. Most milknowadays is pasteurized milk, manufactured by both MSMFEs and large companies. The averageconsumption of milk in rural communities was 1.99 kg per capita per year, and in urban communitieswas 13.16 kg per capita per year – almost seven times higher (Muzayyamah, 2011).
The average expenditure for meat consumption per capita was 2 to 4 percent of incomes in rural areas,and 6 to 9 percent in urban areas. The most popular meat product produced by MSMFEs in Indonesiais bakso or meat balls consumed with any kind of noodles such as wheat or rice noodles. Together, theyare cooked and named mie bakso and sold by peddlers going around the housing areas of rural andurban communities. It is also available in small, medium and large and prestigious restaurants, whichsometimes sell only mie bakso. The food is consumed as a main meal or as a snack food between meals.
Utami (2004) conducted a thorough study for her doctorate degree on mie bakso as an animal proteinresource food compared to Kediri fried tofu as a plant protein resource food for both rural and urbancommunities in Malang, East Java. Her study also investigated processor (MSMFEs) strategies to deal withthe fluctuating demand of the consumers. Other factors investigated were the attitudes and social normsof rural and urban consumers towards four characteristics of mie bakso: i) sensory attributes (taste, aroma,and texture); ii) freshness and halal label; iii) appearance; and iv) price. However, the factor thatsignificantly increased the intention to purchase mie bakso by urban consumers was gender: femaleswere much more likely to buy mie bakso than males and in fact figures show that females boughtmie bakso much more frequently than males. Surprisingly, brand image, variety, self-service, and maritalstatus of the prospective purchaser did not appear to influence the urban consumers when decidingwhether to purchase the meatballs.
The rural consumers neglected the taste, aroma and texture, the appearance. What was important forthem was information regarding nutrition, food quality, and halal status of the product, andenvironmental factors (they were more likely to purchase in cold weather, and if they could servethemselves). It seemed eating mie bakso between meals was considered a sign of higher social status,similarly self-service was assumed to be something to be proud of. To maintain or to possibly increasethe consumer demand, three strategies were commonly adopted by the meatball MSMFEs, they were:i) using machinery for meat cutting; ii) using machinery for mixing; and iii) mixing the meat with a varietyof spices and ingredients.
Hartono et al. (2011) continued the study on mie bakso at the same location at Malang, East Java, andrevealed that people with an income higher than Rp 2 millions per month purchased mie bakso morefrequently than those with an income lower than Rp 1 million per month. In contrast with this statement,he further found that various factors were considered by all consumers in selecting mie bakso; in orderof priority these were price, food appearances, income, accessibility, and previous satisfaction. Thus,income only came as the third consideration, even though price was the first.
Fish is another protein resource food that is commonly consumed in a more or less stable amount(6 to 9 percent) by rural and urban communities as indicated by the BPS survey (2003). However, whereasthe type of fresh fishes (salt water and fresh water fishes) might be similar in both urban and rural areas,the types of processed fish purchased in rural areas might be different from the ones purchased in urbanareas. Urban consumers tend to buy canned fish and smoked fish, whereas rural consumers buy moresalted fish and pindang (steamed or boiled fish packaged in traditional bamboo packaging).
One of the fish foods observed frequently in the studies was bandeng presto, a type of brackishwater fishpopular with the upper middle income level in Indonesia. The fish is cooked in a pressure cooker so itcan be eaten together with the (now) soft bones and spices, including a lot of turmeric, and candle nutis added after cooking. The fish might also undergo a smoking process, which is optional. Tambunan andWidiyanto (2012) found that even though the price of bandeng presto influenced the consumerspurchasing decision, it was less influential than brand image and the perceived quality of the food. Hence,for bandeng presto, the increase in price might be insensitive to the consumer demand.
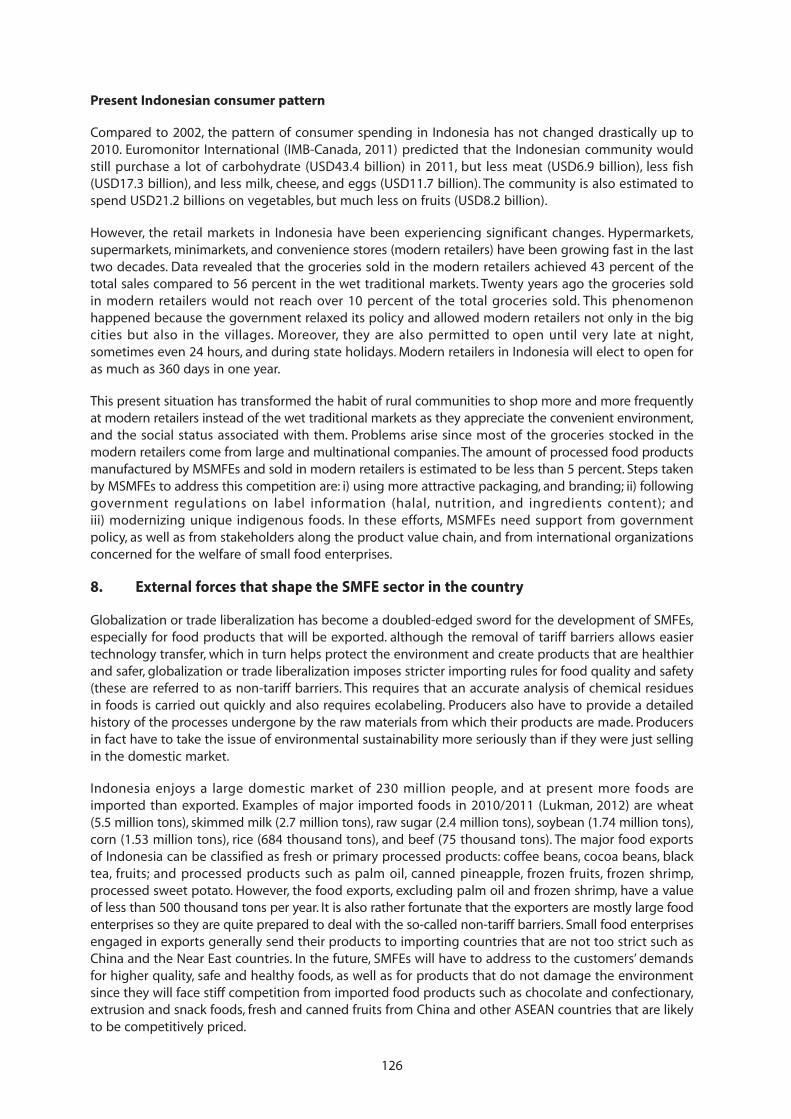
126
Present Indonesian consumer pattern
Compared to 2002, the pattern of consumer spending in Indonesia has not changed drastically up to2010. Euromonitor International (IMB-Canada, 2011) predicted that the Indonesian community wouldstill purchase a lot of carbohydrate (USD43.4 billion) in 2011, but less meat (USD6.9 billion), less fish(USD17.3 billion), and less milk, cheese, and eggs (USD11.7 billion). The community is also estimated tospend USD21.2 billions on vegetables, but much less on fruits (USD8.2 billion).
However, the retail markets in Indonesia have been experiencing significant changes. Hypermarkets,supermarkets, minimarkets, and convenience stores (modern retailers) have been growing fast in the lasttwo decades. Data revealed that the groceries sold in the modern retailers achieved 43 percent of thetotal sales compared to 56 percent in the wet traditional markets. Twenty years ago the groceries soldin modern retailers would not reach over 10 percent of the total groceries sold. This phenomenonhappened because the government relaxed its policy and allowed modern retailers not only in the bigcities but also in the villages. Moreover, they are also permitted to open until very late at night,sometimes even 24 hours, and during state holidays. Modern retailers in Indonesia will elect to open foras much as 360 days in one year.
This present situation has transformed the habit of rural communities to shop more and more frequentlyat modern retailers instead of the wet traditional markets as they appreciate the convenient environment,and the social status associated with them. Problems arise since most of the groceries stocked in themodern retailers come from large and multinational companies. The amount of processed food productsmanufactured by MSMFEs and sold in modern retailers is estimated to be less than 5 percent. Steps takenby MSMFEs to address this competition are: i) using more attractive packaging, and branding; ii) followinggovernment regulations on label information (halal, nutrition, and ingredients content); andiii) modernizing unique indigenous foods. In these efforts, MSMFEs need support from governmentpolicy, as well as from stakeholders along the product value chain, and from international organizationsconcerned for the welfare of small food enterprises.
8. External forces that shape the SMFE sector in the country
Globalization or trade liberalization has become a doubled-edged sword for the development of SMFEs,especially for food products that will be exported. although the removal of tariff barriers allows easiertechnology transfer, which in turn helps protect the environment and create products that are healthierand safer, globalization or trade liberalization imposes stricter importing rules for food quality and safety(these are referred to as non-tariff barriers. This requires that an accurate analysis of chemical residuesin foods is carried out quickly and also requires ecolabeling. Producers also have to provide a detailedhistory of the processes undergone by the raw materials from which their products are made. Producersin fact have to take the issue of environmental sustainability more seriously than if they were just sellingin the domestic market.
Indonesia enjoys a large domestic market of 230 million people, and at present more foods areimported than exported. Examples of major imported foods in 2010/2011 (Lukman, 2012) are wheat(5.5 million tons), skimmed milk (2.7 million tons), raw sugar (2.4 million tons), soybean (1.74 million tons),corn (1.53 million tons), rice (684 thousand tons), and beef (75 thousand tons). The major food exportsof Indonesia can be classified as fresh or primary processed products: coffee beans, cocoa beans, blacktea, fruits; and processed products such as palm oil, canned pineapple, frozen fruits, frozen shrimp,processed sweet potato. However, the food exports, excluding palm oil and frozen shrimp, have a valueof less than 500 thousand tons per year. It is also rather fortunate that the exporters are mostly large foodenterprises so they are quite prepared to deal with the so-called non-tariff barriers. Small food enterprisesengaged in exports generally send their products to importing countries that are not too strict such asChina and the Near East countries. In the future, SMFEs will have to address to the customers’ demandsfor higher quality, safe and healthy foods, as well as for products that do not damage the environmentsince they will face stiff competition from imported food products such as chocolate and confectionary,extrusion and snack foods, fresh and canned fruits from China and other ASEAN countries that are likelyto be competitively priced.
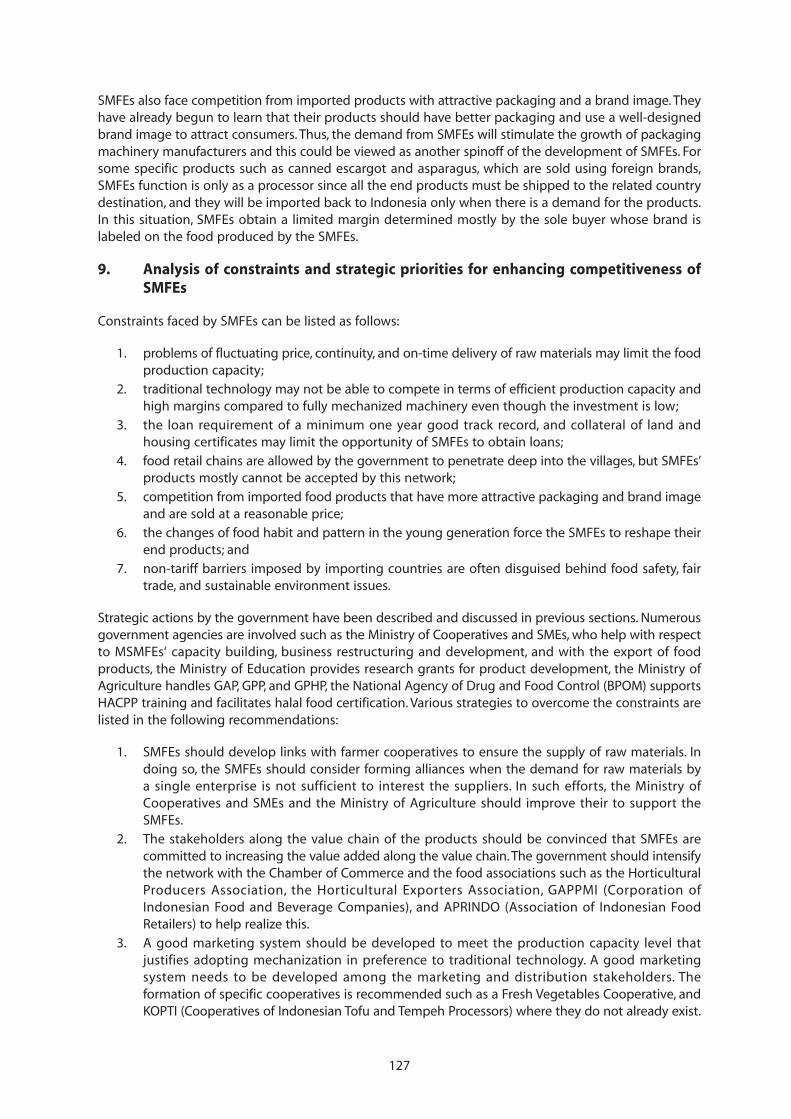
127
SMFEs also face competition from imported products with attractive packaging and a brand image. Theyhave already begun to learn that their products should have better packaging and use a well-designedbrand image to attract consumers. Thus, the demand from SMFEs will stimulate the growth of packagingmachinery manufacturers and this could be viewed as another spinoff of the development of SMFEs. Forsome specific products such as canned escargot and asparagus, which are sold using foreign brands,SMFEs function is only as a processor since all the end products must be shipped to the related countrydestination, and they will be imported back to Indonesia only when there is a demand for the products.In this situation, SMFEs obtain a limited margin determined mostly by the sole buyer whose brand islabeled on the food produced by the SMFEs.
9. Analysis of constraints and strategic priorities for enhancing competitiveness ofSMFEs
Constraints faced by SMFEs can be listed as follows:
1. problems of fluctuating price, continuity, and on-time delivery of raw materials may limit the foodproduction capacity;
2. traditional technology may not be able to compete in terms of efficient production capacity andhigh margins compared to fully mechanized machinery even though the investment is low;
3. the loan requirement of a minimum one year good track record, and collateral of land andhousing certificates may limit the opportunity of SMFEs to obtain loans;
4. food retail chains are allowed by the government to penetrate deep into the villages, but SMFEs’products mostly cannot be accepted by this network;
5. competition from imported food products that have more attractive packaging and brand imageand are sold at a reasonable price;
6. the changes of food habit and pattern in the young generation force the SMFEs to reshape theirend products; and
7. non-tariff barriers imposed by importing countries are often disguised behind food safety, fairtrade, and sustainable environment issues.
Strategic actions by the government have been described and discussed in previous sections. Numerousgovernment agencies are involved such as the Ministry of Cooperatives and SMEs, who help with respectto MSMFEs‘ capacity building, business restructuring and development, and with the export of foodproducts, the Ministry of Education provides research grants for product development, the Ministry ofAgriculture handles GAP, GPP, and GPHP, the National Agency of Drug and Food Control (BPOM) supportsHACPP training and facilitates halal food certification. Various strategies to overcome the constraints arelisted in the following recommendations:
1. SMFEs should develop links with farmer cooperatives to ensure the supply of raw materials. Indoing so, the SMFEs should consider forming alliances when the demand for raw materials bya single enterprise is not sufficient to interest the suppliers. In such efforts, the Ministry ofCooperatives and SMEs and the Ministry of Agriculture should improve their to support theSMFEs.
2. The stakeholders along the value chain of the products should be convinced that SMFEs arecommitted to increasing the value added along the value chain. The government should intensifythe network with the Chamber of Commerce and the food associations such as the HorticulturalProducers Association, the Horticultural Exporters Association, GAPPMI (Corporation ofIndonesian Food and Beverage Companies), and APRINDO (Association of Indonesian FoodRetailers) to help realize this.
3. A good marketing system should be developed to meet the production capacity level thatjustifies adopting mechanization in preference to traditional technology. A good marketingsystem needs to be developed among the marketing and distribution stakeholders. Theformation of specific cooperatives is recommended such as a Fresh Vegetables Cooperative, andKOPTI (Cooperatives of Indonesian Tofu and Tempeh Processors) where they do not already exist.
128
The joint members will create a sufficient production volume to allow for mechanization.Programs from the Ministry of Cooperatives and SMEs in creating OVOP (One Village OneProduct) also help in combining resources and make technology implementation viable.
4. Possible existing resources such as incubation programs provided by the business andtechnology incubation centers in universities that have access to soft loans with more relaxedrequirements should be used and networked to prospective customers. Many businessincubators focus on MSMFEs, especially at those universities that have major agricultural faculties.
5. SMFEs should learn about and improve packaging design and brand imaging as a continuousprocess. This learning program could be outsourced to the experts at a university, businesspractitioners, and the Ministry of Industry.
6. Non-traditional means of promotion such as the Web, Facebook, and Twitter should be used toadvertise the products with appropriate jargon for the young generation. Training for IT-enabledapplications for MSMFEs can be accessed from programs under the Ministry ofTelecommunication, the Ministry of Industry, and business incubators in the university.
7. Training should be obtained from the government, business associations, NGOs, universityand research centers to learn about current food safety regulations and issues related toenvironmental protection and sustainable business.
10. Summary and conclusions
SMFEs have contributed significantly to the nation’s economic development by contributing significantlyto the GDP, providing a large number of jobs, supporting exports, and stimulating the businesses offarmers and machinery manufacturers. Thus, the government and other stakeholders are encouraged toimprove the policy and strategy in continuous support to SMFEs in their efforts to overcome constraintsboth in the domestic and the global environment.
References
BKPM. 2011. Investment in Large and SMEs. Indonesia Investment Coordinating Board (BKPM), Jakarta, Indonesia.
BPS. 2003. Expenditure for Consumption of Indonesia. National Bureau of Statistics (BPS), Jakarta, Indonesia.
ESCAP. 2012. Statistical Yearbook for Asia and the Pacific 2012: Country Profiles. UNESCAP, Bangkok.
Hartono, B., U.W. Ningsih, & N.T. Septiarini. 2011. Perilaku konsumen dalam pembelian bakso di Malang (ConsumerBehaviour in Meat Ball Purchasing in Malang). Balit Peternakan 35(2): 137–142.
IMB-Canada. 2011. The Indonesian Consumer Behaviour, Attitudes, and Perceptions toward Food Products. MarketAnalysis Report January 2011. International Markets Bureau, Agriculture and Agri-Food Canada.
Lukman, A. 2012. Innovations along the supply chain: can smallholder producers ever succeed in export supply chains?Paper in WEDF (World Export Development Forum) on Linking Growth Markets: New Dynamics in Global Trade.Jakarta, Indonesia, 15–17 October 2012.
Muzayyamah, A.U. 2011. Socio-economic determinant of livestock products consumption in urban and rural Java,Indonesia. J. International Development and Cooperation 17(1): 89–102.
Najib, M., A. Kiminami, & H. Yogi. 2011. Competitiveness of Indonesian small and medium food processing industry:does the location matter? Int. J. Business and Management 6(9): 57-66.
Partomo. 2004. Formulasi Strategi Pengembangan Ekowisata di Taman Nasional Gunung Gede Pangrango.(Formulation of Ecotourism Development Strategy at Mountain Gede Pangrango National Park). MS Thesis. BusinessManagement School. IPB, Bogor, Indonesia.
Purwadaria, H.K. 2009. Inovasi Teknologi yang Membawa Nilai Komersial (Technology Innovation Brings CommercialValue). Training on National Business Incubator Manager. Bogor, Indonesia, 08 October 2009.

129
Tambunan, K., & I. Widiyanto. 2012. Analisis pengaruh citra merek, persepsi kualitas, dan harga terhadap keputusanpembelian bandeng presto (Analysis of influences of brand image, perceived quality, and price on purchasingdecision of bandeng presto). Diponegoro J. Management 1(2): 58–66.
Tambunan, T. 2008. SME development, economic growth, and government intervention in developing country: TheIndonesian story. J. Int. Entrpr. 6: 147–167.
Utami, H.D. 2004. Consumers Behaviour and Food Processor Response Towards Ethnic Food in East Java, Indonesia.Ph.D. Dissertation. Massey University, Palmerston North, New Zealand.
130
POLICIES AND STRATEGIES FOR THE DEVELOPMENT OF SMALL ANDMEDIUM SCALE FOOD PROCESSING ENTERPRISES (SMFEs)
IN THE REPUBLIC OF KOREA
byJi-Hyeon Choi
Korea Rural Economic Institute
1. Introduction
In association with the high economic growth rate of the Republic of Korea, eco-friendly products,a lifestyle of health and sustainability (LOHAS), a high value placed on personal wellbeing, and organicfarming are becoming a consumer trend. Moreover, because of the increase in two income householdsand single households, food consumption patterns are being simplified and dining out is increasing andthe convenience food market for fast food, home meal replacements (HMR) and the food service industryare growing significantly. As consumers can afford more, they have come to consider the qualitativeaspects such as health and safety as more important than the quantitative aspects (e.g. price) when theyselect food.
The food processing industry enhances added value using agricultural products, livestock products andfishery products as raw materials, and it contributes to the stabilization of agricultural and fisheryproduction through the adjustment of the demand and supply of the products. The food processingindustry also contributes to the increase in rural household incomes through the stable purchase of rawmaterials produced by the agriculture and fisheries sectors. In the 1950s and 1960s, the food processingindustry of the Republic of Korea was comprised of canning, milling, oil manufacture, sugar manufacture,noodle making and fermented Korean pastes, which mainly involved simple processing. In the 1970s,processing technology for products such as instant noodle and raw juice was developed, and diverseprocessed foods were developed, many of them high quality foods. Thanks to the increase in nationalincome resulting from rapid economic growth, foods were further diversified together with the growingawareness of the importance of safety and healthiness of food in the 1990s, whereas in the 2000s thedevelopment of functional health foods and diet foods was carried out more actively and the numberof new technologies in the food industry field grew very fast.
When the Lee Myung-bak administration was inaugurated in 2008, it decided that it was necessary topromote the food industry. Accordingly, the Ministry of Agriculture and Forestry was given the task ofpromoting the food industry and the name of the ministry was changed to the Ministry of Food,Agriculture, Forestry and Fisheries with the food industry becoming an object of policy. Pursuant to this,a full-scale promotion plan for the food industry was implemented with the enactment of the “FoodIndustry Promotion Act” (Act No. 8796). In the Republic of Korea, 93 percent of the food processingindustry comprises business entities with fewer than ten employees, which means the majority of foodprocessing industries are small and medium enterprises (SMFEs). As SMFEs are vulnerable in terms oftechnology, they need government support, but regulation is required from the point of view ofsanitation and safety. In this report, we reviewed the status of the food processing industry and thechanges in the external environment that the food processing industry is faced with. Under sucha situation, the pertinent laws and regulations which the Korean government applies for thedevelopment of the food processing industry will be reviewed, the constraints on the growth of the foodprocessing industry will be analyzed and the strategy to intensify the competitiveness of the foodprocessing SMEs will be presented.
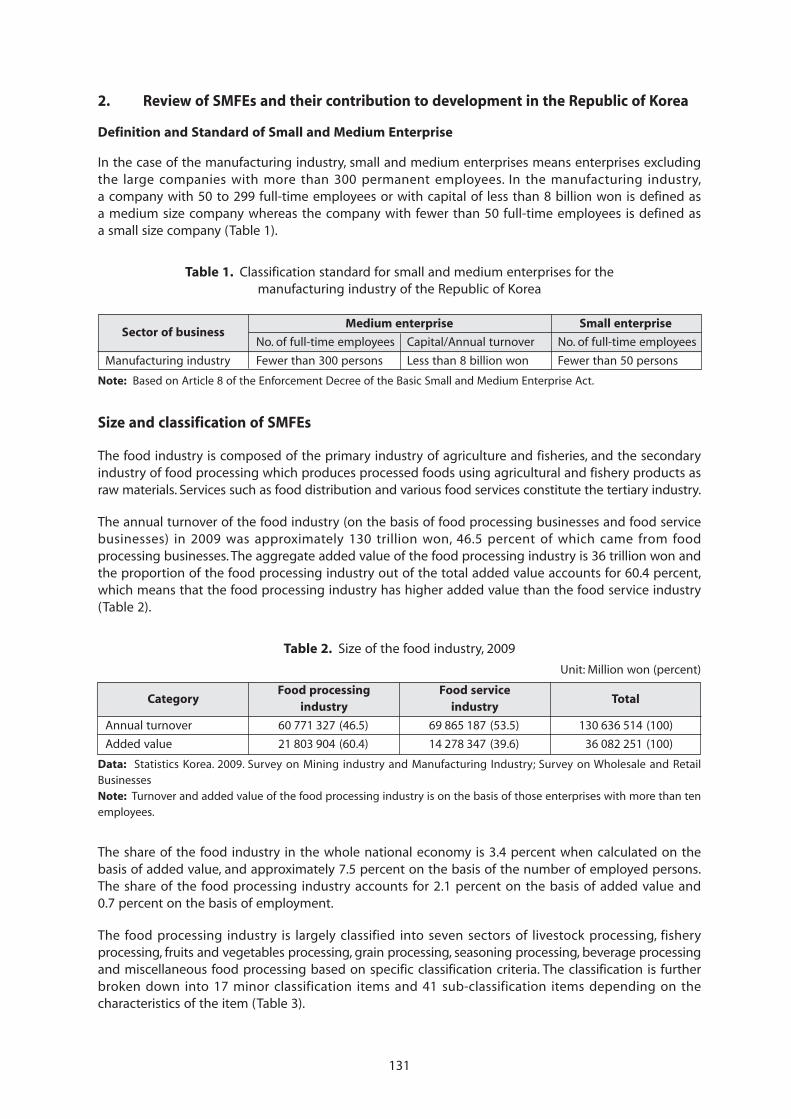
131
2. Review of SMFEs and their contribution to development in the Republic of Korea
Definition and Standard of Small and Medium Enterprise
In the case of the manufacturing industry, small and medium enterprises means enterprises excludingthe large companies with more than 300 permanent employees. In the manufacturing industry,a company with 50 to 299 full-time employees or with capital of less than 8 billion won is defined asa medium size company whereas the company with fewer than 50 full-time employees is defined asa small size company (Table 1).
Size and classification of SMFEs
The food industry is composed of the primary industry of agriculture and fisheries, and the secondaryindustry of food processing which produces processed foods using agricultural and fishery products asraw materials. Services such as food distribution and various food services constitute the tertiary industry.
The annual turnover of the food industry (on the basis of food processing businesses and food servicebusinesses) in 2009 was approximately 130 trillion won, 46.5 percent of which came from foodprocessing businesses. The aggregate added value of the food processing industry is 36 trillion won andthe proportion of the food processing industry out of the total added value accounts for 60.4 percent,which means that the food processing industry has higher added value than the food service industry(Table 2).
The share of the food industry in the whole national economy is 3.4 percent when calculated on thebasis of added value, and approximately 7.5 percent on the basis of the number of employed persons.The share of the food processing industry accounts for 2.1 percent on the basis of added value and0.7 percent on the basis of employment.
The food processing industry is largely classified into seven sectors of livestock processing, fisheryprocessing, fruits and vegetables processing, grain processing, seasoning processing, beverage processingand miscellaneous food processing based on specific classification criteria. The classification is furtherbroken down into 17 minor classification items and 41 sub-classification items depending on thecharacteristics of the item (Table 3).
Table 1. Classification standard for small and medium enterprises for themanufacturing industry of the Republic of Korea
Sector of businessMedium enterprise Small enterprise
No. of full-time employees Capital/Annual turnover No. of full-time employees
Manufacturing industry Fewer than 300 persons Less than 8 billion won Fewer than 50 persons
Note: Based on Article 8 of the Enforcement Decree of the Basic Small and Medium Enterprise Act.
Table 2. Size of the food industry, 2009
Unit: Million won (percent)
CategoryFood processing Food service
Totalindustry industry
Annual turnover 60 771 327 (46.5) 69 865 187 (53.5) 130 636 514 (100)
Added value 21 803 904 (60.4) 14 278 347 (39.6) 36 082 251 (100)
Data: Statistics Korea. 2009. Survey on Mining industry and Manufacturing Industry; Survey on Wholesale and RetailBusinessesNote: Turnover and added value of the food processing industry is on the basis of those enterprises with more than tenemployees.
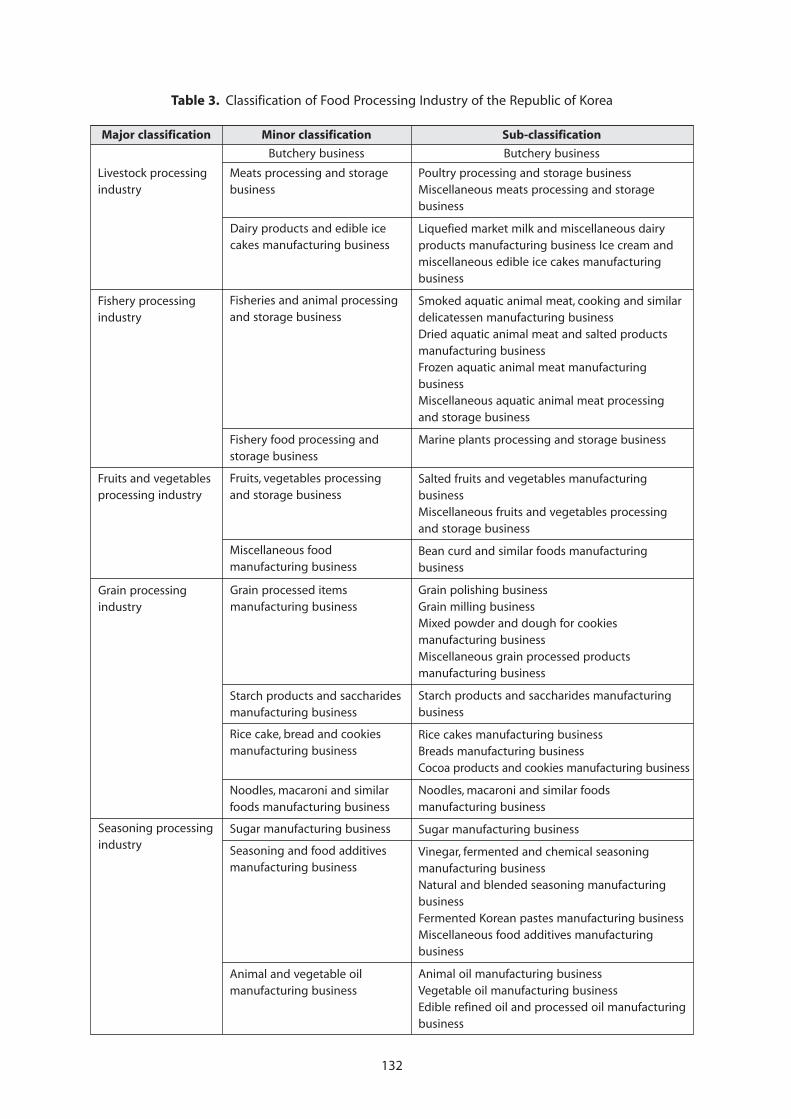
132
Table 3. Classification of Food Processing Industry of the Republic of Korea
Major classification Minor classification Sub-classification
Butchery business Butchery business
Livestock processingindustry
Meats processing and storagebusiness
Poultry processing and storage businessMiscellaneous meats processing and storagebusiness
Liquefied market milk and miscellaneous dairyproducts manufacturing business Ice cream andmiscellaneous edible ice cakes manufacturingbusiness
Smoked aquatic animal meat, cooking and similardelicatessen manufacturing businessDried aquatic animal meat and salted productsmanufacturing businessFrozen aquatic animal meat manufacturingbusinessMiscellaneous aquatic animal meat processingand storage business
Marine plants processing and storage business
Salted fruits and vegetables manufacturingbusinessMiscellaneous fruits and vegetables processingand storage business
Bean curd and similar foods manufacturingbusiness
Grain polishing businessGrain milling businessMixed powder and dough for cookiesmanufacturing businessMiscellaneous grain processed productsmanufacturing business
Starch products and saccharides manufacturingbusiness
Rice cakes manufacturing businessBreads manufacturing businessCocoa products and cookies manufacturing business
Noodles, macaroni and similar foodsmanufacturing business
Sugar manufacturing business
Vinegar, fermented and chemical seasoningmanufacturing businessNatural and blended seasoning manufacturingbusinessFermented Korean pastes manufacturing businessMiscellaneous food additives manufacturingbusiness
Animal oil manufacturing businessVegetable oil manufacturing businessEdible refined oil and processed oil manufacturingbusiness
Fishery processingindustry
Dairy products and edible icecakes manufacturing business
Fisheries and animal processingand storage business
Fishery food processing andstorage business
Fruits, vegetables processingand storage business
Miscellaneous foodmanufacturing business
Fruits and vegetablesprocessing industry
Grain processingindustry
Grain processed itemsmanufacturing business
Starch products and saccharidesmanufacturing business
Rice cake, bread and cookiesmanufacturing business
Noodles, macaroni and similarfoods manufacturing business
Sugar manufacturing businessSeasoning processingindustry Seasoning and food additives
manufacturing business
Animal and vegetable oilmanufacturing business
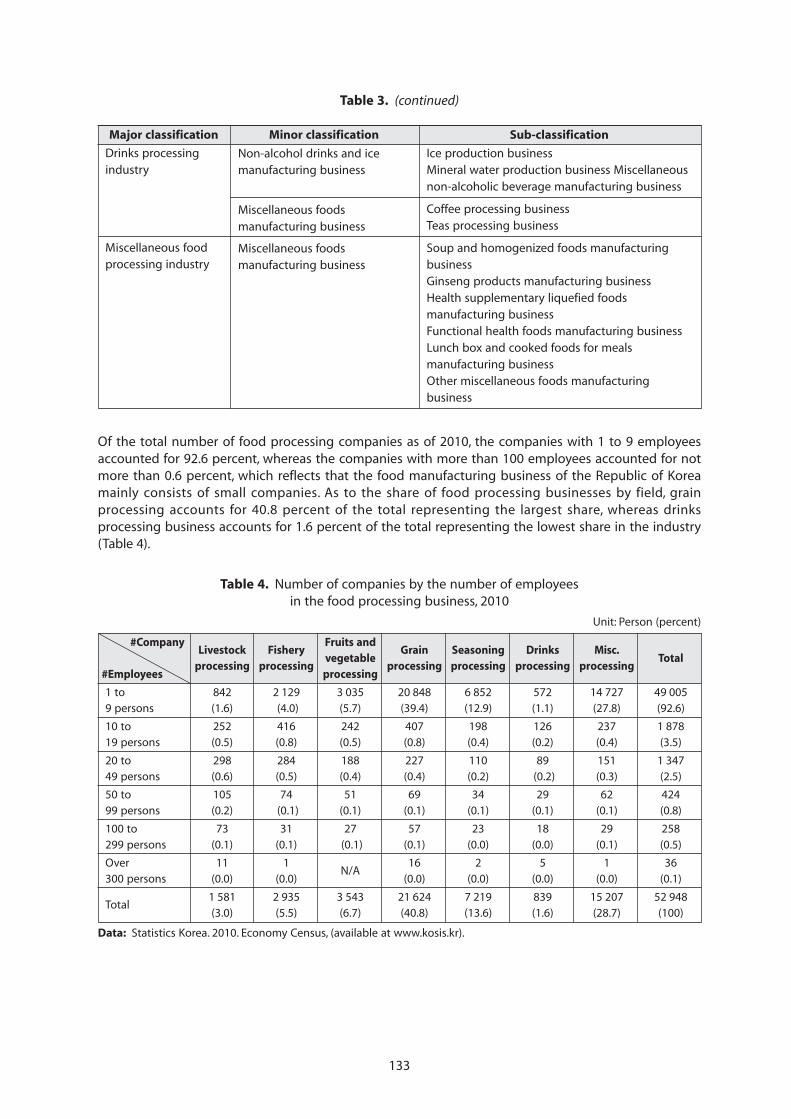
133
Of the total number of food processing companies as of 2010, the companies with 1 to 9 employeesaccounted for 92.6 percent, whereas the companies with more than 100 employees accounted for notmore than 0.6 percent, which reflects that the food manufacturing business of the Republic of Koreamainly consists of small companies. As to the share of food processing businesses by field, grainprocessing accounts for 40.8 percent of the total representing the largest share, whereas drinksprocessing business accounts for 1.6 percent of the total representing the lowest share in the industry(Table 4).
Ice production businessMineral water production business Miscellaneousnon-alcoholic beverage manufacturing business
Coffee processing businessTeas processing business
Soup and homogenized foods manufacturingbusinessGinseng products manufacturing businessHealth supplementary liquefied foodsmanufacturing businessFunctional health foods manufacturing businessLunch box and cooked foods for mealsmanufacturing businessOther miscellaneous foods manufacturingbusiness
Drinks processingindustry
Non-alcohol drinks and icemanufacturing business
Miscellaneous foodsmanufacturing business
Miscellaneous foodsmanufacturing business
Miscellaneous foodprocessing industry
Table 3. (continued)
Major classification Minor classification Sub-classification
Table 4. Number of companies by the number of employeesin the food processing business, 2010
Unit: Person (percent)
#CompanyLivestock Fishery
Fruits andGrain Seasoning Drinks Misc.
processing processingvegetable
processing processing processing processingTotal
#Employees processing
1 to 842 2 129 3 035 20 848 6 852 572 14 727 49 0059 persons (1.6) (4.0) (5.7) (39.4) (12.9) (1.1) (27.8) (92.6)
10 to 252 416 242 407 198 126 237 1 87819 persons (0.5) (0.8) (0.5) (0.8) (0.4) (0.2) (0.4) (3.5)
20 to 298 284 188 227 110 89 151 1 34749 persons (0.6) (0.5) (0.4) (0.4) (0.2) (0.2) (0.3) (2.5)
50 to 105 74 51 69 34 29 62 42499 persons (0.2) (0.1) (0.1) (0.1) (0.1) (0.1) (0.1) (0.8)
100 to 73 31 27 57 23 18 29 258299 persons (0.1) (0.1) (0.1) (0.1) (0.0) (0.0) (0.1) (0.5)
Over 11 1N/A
16 2 5 1 36300 persons (0.0) (0.0) (0.0) (0.0) (0.0) (0.0) (0.1)
Total1 581 2 935 3 543 21 624 7 219 839 15 207 52 948(3.0) (5.5) (6.7) (40.8) (13.6) (1.6) (28.7) (100)
Data: Statistics Korea. 2010. Economy Census, (available at www.kosis.kr).
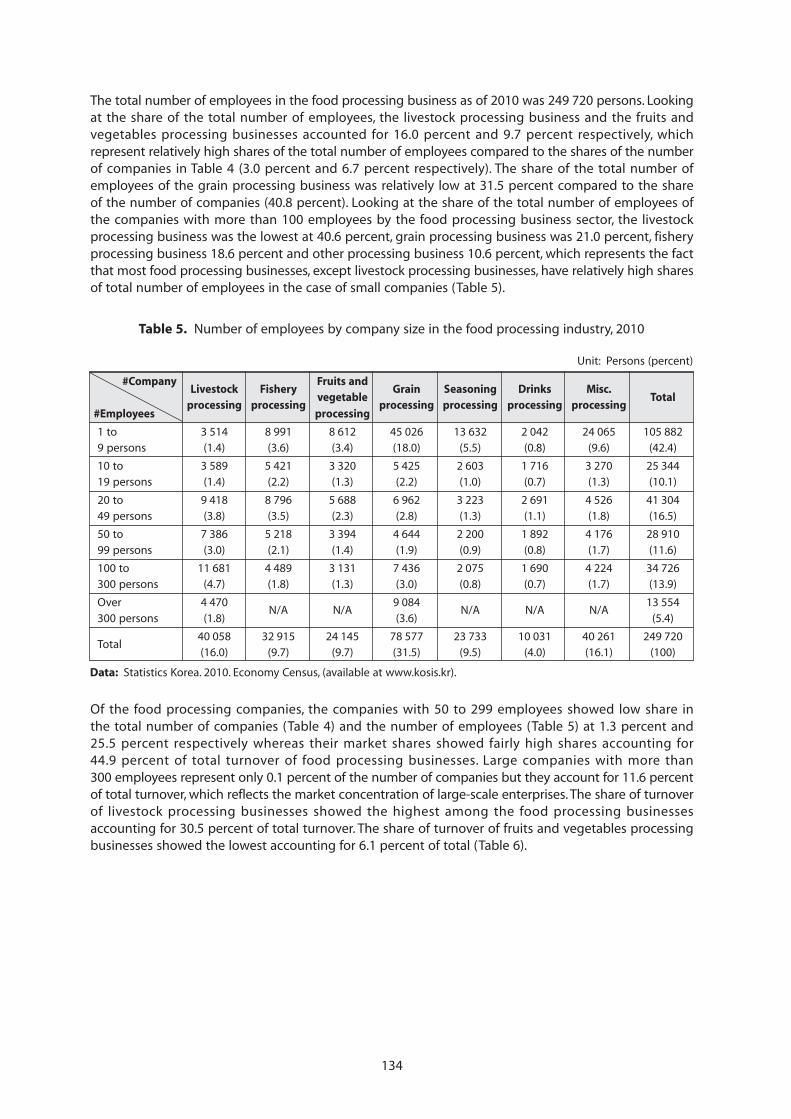
134
The total number of employees in the food processing business as of 2010 was 249 720 persons. Lookingat the share of the total number of employees, the livestock processing business and the fruits andvegetables processing businesses accounted for 16.0 percent and 9.7 percent respectively, whichrepresent relatively high shares of the total number of employees compared to the shares of the numberof companies in Table 4 (3.0 percent and 6.7 percent respectively). The share of the total number ofemployees of the grain processing business was relatively low at 31.5 percent compared to the shareof the number of companies (40.8 percent). Looking at the share of the total number of employees ofthe companies with more than 100 employees by the food processing business sector, the livestockprocessing business was the lowest at 40.6 percent, grain processing business was 21.0 percent, fisheryprocessing business 18.6 percent and other processing business 10.6 percent, which represents the factthat most food processing businesses, except livestock processing businesses, have relatively high sharesof total number of employees in the case of small companies (Table 5).
Table 5. Number of employees by company size in the food processing industry, 2010
Unit: Persons (percent)
#CompanyLivestock Fishery
Fruits andGrain Seasoning Drinks Misc.
processing processingvegetable
processing processing processing processingTotal
#Employees processing
1 to 3 514 8 991 8 612 45 026 13 632 2 042 24 065 105 8829 persons (1.4) (3.6) (3.4) (18.0) (5.5) (0.8) (9.6) (42.4)
10 to 3 589 5 421 3 320 5 425 2 603 1 716 3 270 25 34419 persons (1.4) (2.2) (1.3) (2.2) (1.0) (0.7) (1.3) (10.1)
20 to 9 418 8 796 5 688 6 962 3 223 2 691 4 526 41 30449 persons (3.8) (3.5) (2.3) (2.8) (1.3) (1.1) (1.8) (16.5)
50 to 7 386 5 218 3 394 4 644 2 200 1 892 4 176 28 91099 persons (3.0) (2.1) (1.4) (1.9) (0.9) (0.8) (1.7) (11.6)
100 to 11 681 4 489 3 131 7 436 2 075 1 690 4 224 34 726300 persons (4.7) (1.8) (1.3) (3.0) (0.8) (0.7) (1.7) (13.9)
Over 4 470N/A N/A
9 084N/A N/A N/A
13 554300 persons (1.8) (3.6) (5.4)
Total40 058 32 915 24 145 78 577 23 733 10 031 40 261 249 720(16.0) (9.7) (9.7) (31.5) (9.5) (4.0) (16.1) (100)
Data: Statistics Korea. 2010. Economy Census, (available at www.kosis.kr).
Of the food processing companies, the companies with 50 to 299 employees showed low share inthe total number of companies (Table 4) and the number of employees (Table 5) at 1.3 percent and25.5 percent respectively whereas their market shares showed fairly high shares accounting for44.9 percent of total turnover of food processing businesses. Large companies with more than300 employees represent only 0.1 percent of the number of companies but they account for 11.6 percentof total turnover, which reflects the market concentration of large-scale enterprises. The share of turnoverof livestock processing businesses showed the highest among the food processing businessesaccounting for 30.5 percent of total turnover. The share of turnover of fruits and vegetables processingbusinesses showed the lowest accounting for 6.1 percent of total (Table 6).
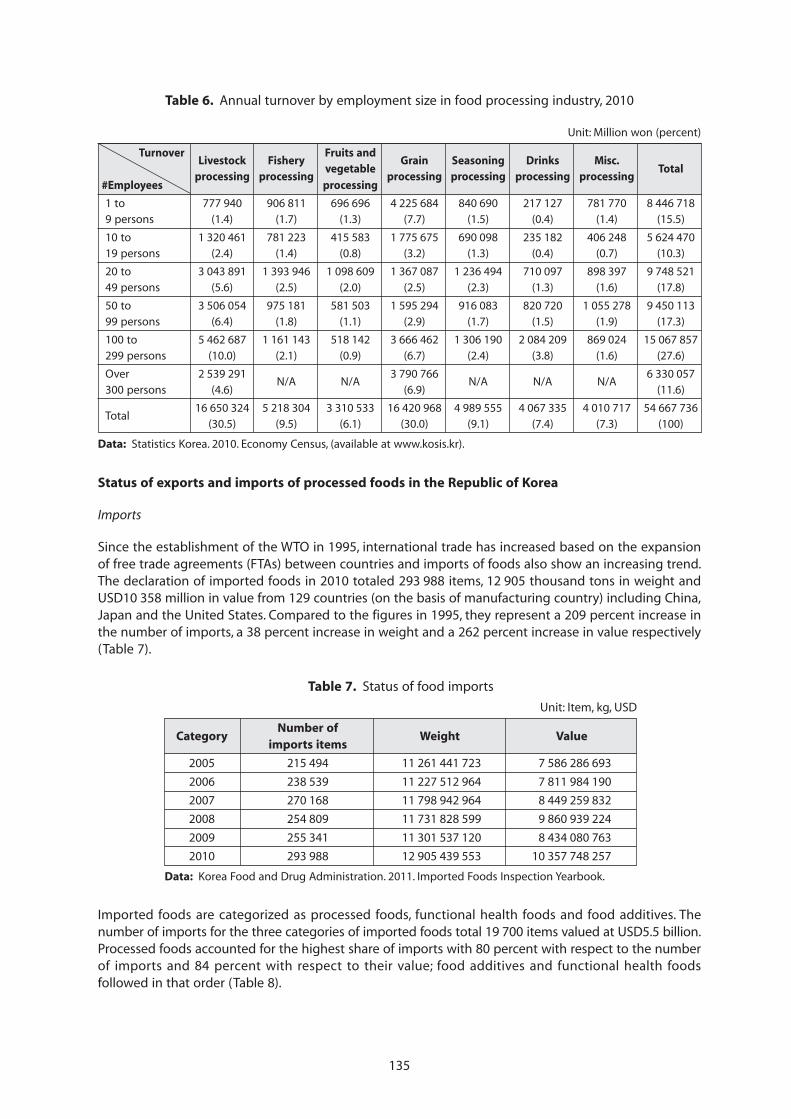
135
Status of exports and imports of processed foods in the Republic of Korea
Imports
Since the establishment of the WTO in 1995, international trade has increased based on the expansionof free trade agreements (FTAs) between countries and imports of foods also show an increasing trend.The declaration of imported foods in 2010 totaled 293 988 items, 12 905 thousand tons in weight andUSD10 358 million in value from 129 countries (on the basis of manufacturing country) including China,Japan and the United States. Compared to the figures in 1995, they represent a 209 percent increase inthe number of imports, a 38 percent increase in weight and a 262 percent increase in value respectively(Table 7).
Table 6. Annual turnover by employment size in food processing industry, 2010
Unit: Million won (percent)
TurnoverLivestock Fishery
Fruits andGrain Seasoning Drinks Misc.
processing processingvegetable
processing processing processing processingTotal
#Employees processing
1 to 777 940 906 811 696 696 4 225 684 840 690 217 127 781 770 8 446 7189 persons (1.4) (1.7) (1.3) (7.7) (1.5) (0.4) (1.4) (15.5)
10 to 1 320 461 781 223 415 583 1 775 675 690 098 235 182 406 248 5 624 47019 persons (2.4) (1.4) (0.8) (3.2) (1.3) (0.4) (0.7) (10.3)
20 to 3 043 891 1 393 946 1 098 609 1 367 087 1 236 494 710 097 898 397 9 748 52149 persons (5.6) (2.5) (2.0) (2.5) (2.3) (1.3) (1.6) (17.8)
50 to 3 506 054 975 181 581 503 1 595 294 916 083 820 720 1 055 278 9 450 11399 persons (6.4) (1.8) (1.1) (2.9) (1.7) (1.5) (1.9) (17.3)
100 to 5 462 687 1 161 143 518 142 3 666 462 1 306 190 2 084 209 869 024 15 067 857299 persons (10.0) (2.1) (0.9) (6.7) (2.4) (3.8) (1.6) (27.6)
Over 2 539 291N/A N/A
3 790 766N/A N/A N/A
6 330 057300 persons (4.6) (6.9) (11.6)
Total16 650 324 5 218 304 3 310 533 16 420 968 4 989 555 4 067 335 4 010 717 54 667 736
(30.5) (9.5) (6.1) (30.0) (9.1) (7.4) (7.3) (100)
Data: Statistics Korea. 2010. Economy Census, (available at www.kosis.kr).
Table 7. Status of food imports
Unit: Item, kg, USD
CategoryNumber of
Weight Valueimports items
2005 215 494 11 261 441 723 7 586 286 693
2006 238 539 11 227 512 964 7 811 984 190
2007 270 168 11 798 942 964 8 449 259 832
2008 254 809 11 731 828 599 9 860 939 224
2009 255 341 11 301 537 120 8 434 080 763
2010 293 988 12 905 439 553 10 357 748 257
Data: Korea Food and Drug Administration. 2011. Imported Foods Inspection Yearbook.
Imported foods are categorized as processed foods, functional health foods and food additives. Thenumber of imports for the three categories of imported foods total 19 700 items valued at USD5.5 billion.Processed foods accounted for the highest share of imports with 80 percent with respect to the numberof imports and 84 percent with respect to their value; food additives and functional health foodsfollowed in that order (Table 8).
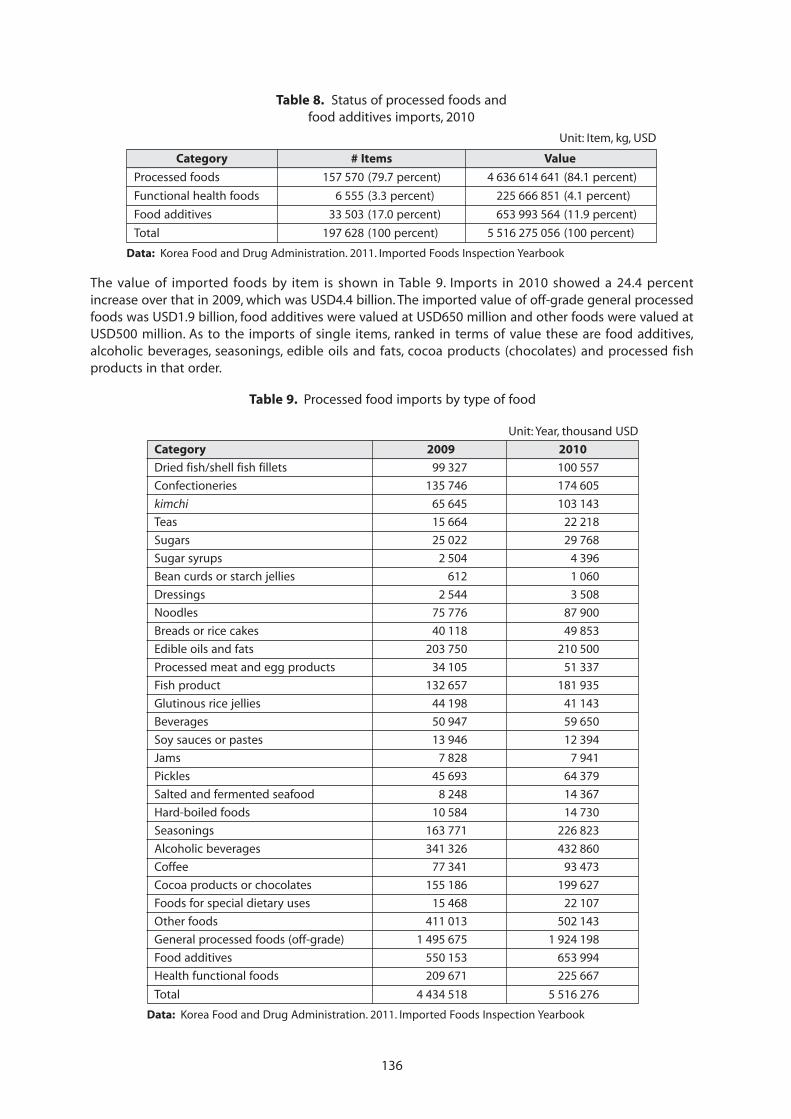
136
The value of imported foods by item is shown in Table 9. Imports in 2010 showed a 24.4 percentincrease over that in 2009, which was USD4.4 billion. The imported value of off-grade general processedfoods was USD1.9 billion, food additives were valued at USD650 million and other foods were valued atUSD500 million. As to the imports of single items, ranked in terms of value these are food additives,alcoholic beverages, seasonings, edible oils and fats, cocoa products (chocolates) and processed fishproducts in that order.
Table 8. Status of processed foods andfood additives imports, 2010
Unit: Item, kg, USD
Category # Items Value
Processed foods 157 570 (79.7 percent) 4 636 614 641 (84.1 percent)
Functional health foods 6 555 (3.3 percent) 225 666 851 (4.1 percent)
Food additives 33 503 (17.0 percent) 653 993 564 (11.9 percent)
Total 197 628 (100 percent) 5 516 275 056 (100 percent)
Data: Korea Food and Drug Administration. 2011. Imported Foods Inspection Yearbook
Table 9. Processed food imports by type of food
Unit: Year, thousand USD
Category 2009 2010
Dried fish/shell fish fillets 99 327 100 557
Confectioneries 135 746 174 605
kimchi 65 645 103 143
Teas 15 664 22 218
Sugars 25 022 29 768
Sugar syrups 2 504 4 396
Bean curds or starch jellies 612 1 060
Dressings 2 544 3 508
Noodles 75 776 87 900
Breads or rice cakes 40 118 49 853
Edible oils and fats 203 750 210 500
Processed meat and egg products 34 105 51 337
Fish product 132 657 181 935
Glutinous rice jellies 44 198 41 143
Beverages 50 947 59 650
Soy sauces or pastes 13 946 12 394
Jams 7 828 7 941
Pickles 45 693 64 379
Salted and fermented seafood 8 248 14 367
Hard-boiled foods 10 584 14 730
Seasonings 163 771 226 823
Alcoholic beverages 341 326 432 860
Coffee 77 341 93 473
Cocoa products or chocolates 155 186 199 627
Foods for special dietary uses 15 468 22 107
Other foods 411 013 502 143
General processed foods (off-grade) 1 495 675 1 924 198
Food additives 550 153 653 994
Health functional foods 209 671 225 667
Total 4 434 518 5 516 276
Data: Korea Food and Drug Administration. 2011. Imported Foods Inspection Yearbook
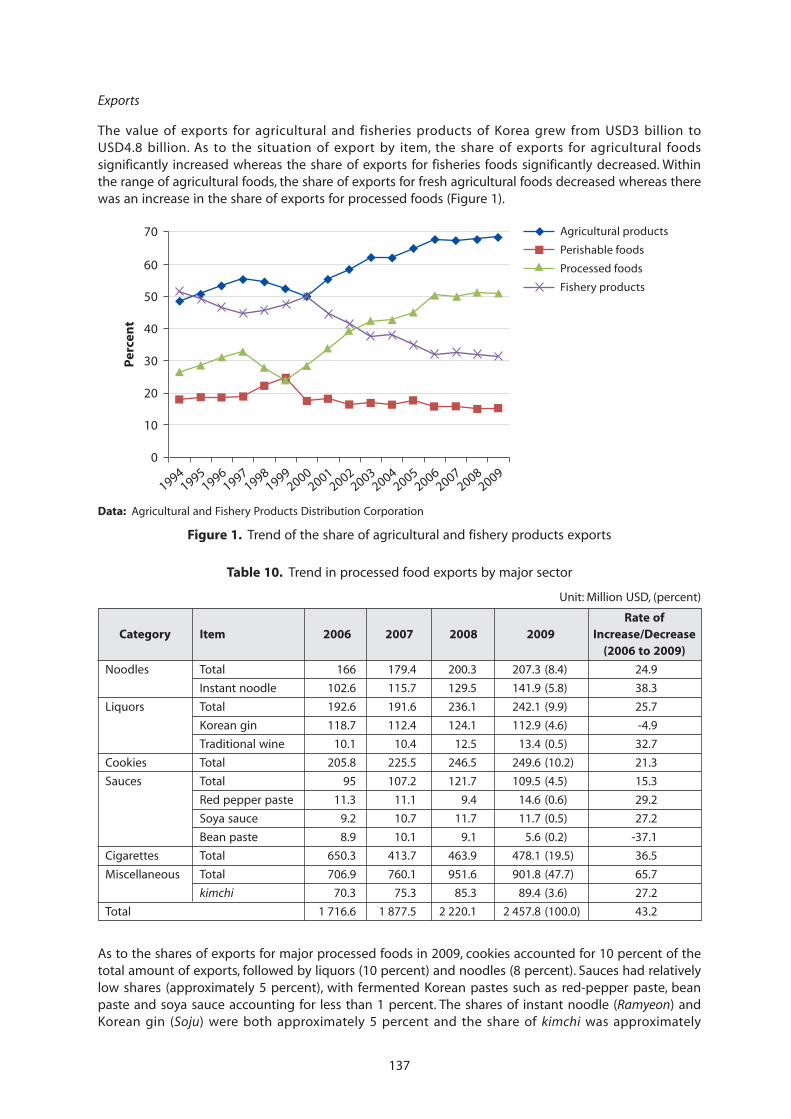
137
Exports
The value of exports for agricultural and fisheries products of Korea grew from USD3 billion toUSD4.8 billion. As to the situation of export by item, the share of exports for agricultural foodssignificantly increased whereas the share of exports for fisheries foods significantly decreased. Withinthe range of agricultural foods, the share of exports for fresh agricultural foods decreased whereas therewas an increase in the share of exports for processed foods (Figure 1).
Data: Agricultural and Fishery Products Distribution Corporation
Figure 1. Trend of the share of agricultural and fishery products exports
Table 10. Trend in processed food exports by major sector
Unit: Million USD, (percent)
Rate ofCategory Item 2006 2007 2008 2009 Increase/Decrease
(2006 to 2009)
Noodles Total 166 179.4 200.3 207.3 (8.4) 24.9
Instant noodle 102.6 115.7 129.5 141.9 (5.8) 38.3
Liquors Total 192.6 191.6 236.1 242.1 (9.9) 25.7
Korean gin 118.7 112.4 124.1 112.9 (4.6) -4.9
Traditional wine 10.1 10.4 12.5 13.4 (0.5) 32.7
Cookies Total 205.8 225.5 246.5 249.6 (10.2) 21.3
Sauces Total 95 107.2 121.7 109.5 (4.5) 15.3
Red pepper paste 11.3 11.1 9.4 14.6 (0.6) 29.2
Soya sauce 9.2 10.7 11.7 11.7 (0.5) 27.2
Bean paste 8.9 10.1 9.1 5.6 (0.2) -37.1
Cigarettes Total 650.3 413.7 463.9 478.1 (19.5) 36.5
Miscellaneous Total 706.9 760.1 951.6 901.8 (47.7) 65.7
kimchi 70.3 75.3 85.3 89.4 (3.6) 27.2
Total 1 716.6 1 877.5 2 220.1 2 457.8 (100.0) 43.2
70
60
50
40
30
20
10
0
Per
cen
t
Agricultural products
Perishable foods
Processed foods
Fishery products
19941995
19961997
19981999
20002001
20022003
20042005
20062007
20082009
As to the shares of exports for major processed foods in 2009, cookies accounted for 10 percent of thetotal amount of exports, followed by liquors (10 percent) and noodles (8 percent). Sauces had relativelylow shares (approximately 5 percent), with fermented Korean pastes such as red-pepper paste, beanpaste and soya sauce accounting for less than 1 percent. The shares of instant noodle (Ramyeon) andKorean gin (Soju) were both approximately 5 percent and the share of kimchi was approximately
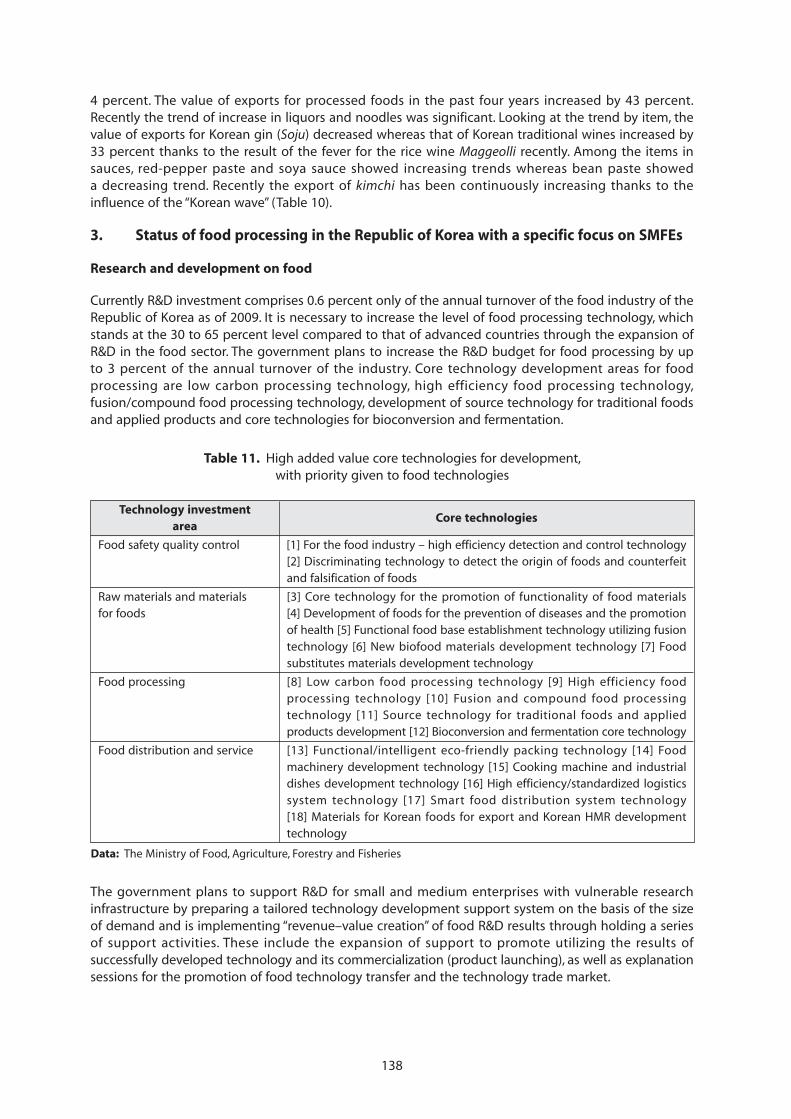
138
4 percent. The value of exports for processed foods in the past four years increased by 43 percent.Recently the trend of increase in liquors and noodles was significant. Looking at the trend by item, thevalue of exports for Korean gin (Soju) decreased whereas that of Korean traditional wines increased by33 percent thanks to the result of the fever for the rice wine Maggeolli recently. Among the items insauces, red-pepper paste and soya sauce showed increasing trends whereas bean paste showeda decreasing trend. Recently the export of kimchi has been continuously increasing thanks to theinfluence of the “Korean wave” (Table 10).
3. Status of food processing in the Republic of Korea with a specific focus on SMFEs
Research and development on food
Currently R&D investment comprises 0.6 percent only of the annual turnover of the food industry of theRepublic of Korea as of 2009. It is necessary to increase the level of food processing technology, whichstands at the 30 to 65 percent level compared to that of advanced countries through the expansion ofR&D in the food sector. The government plans to increase the R&D budget for food processing by upto 3 percent of the annual turnover of the industry. Core technology development areas for foodprocessing are low carbon processing technology, high efficiency food processing technology,fusion/compound food processing technology, development of source technology for traditional foodsand applied products and core technologies for bioconversion and fermentation.
Table 11. High added value core technologies for development,with priority given to food technologies
Technology investmentCore technologies
area
Food safety quality control [1] For the food industry – high efficiency detection and control technology[2] Discriminating technology to detect the origin of foods and counterfeitand falsification of foods
Raw materials and materials [3] Core technology for the promotion of functionality of food materialsfor foods [4] Development of foods for the prevention of diseases and the promotion
of health [5] Functional food base establishment technology utilizing fusiontechnology [6] New biofood materials development technology [7] Foodsubstitutes materials development technology
Food processing [8] Low carbon food processing technology [9] High efficiency foodprocessing technology [10] Fusion and compound food processingtechnology [11] Source technology for traditional foods and appliedproducts development [12] Bioconversion and fermentation core technology
Food distribution and service [13] Functional/intelligent eco-friendly packing technology [14] Foodmachinery development technology [15] Cooking machine and industrialdishes development technology [16] High efficiency/standardized logisticssystem technology [17] Smart food distribution system technology[18] Materials for Korean foods for export and Korean HMR developmenttechnology
Data: The Ministry of Food, Agriculture, Forestry and Fisheries
The government plans to support R&D for small and medium enterprises with vulnerable researchinfrastructure by preparing a tailored technology development support system on the basis of the sizeof demand and is implementing “revenue–value creation” of food R&D results through holding a seriesof support activities. These include the expansion of support to promote utilizing the results ofsuccessfully developed technology and its commercialization (product launching), as well as explanationsessions for the promotion of food technology transfer and the technology trade market.
139
Moreover, the Ministry of Food, Agriculture, Forestry and Fisheries plans to maximize investmentefficiency by realizing the research which enterprises are actually in need of through the establishmentof a joint R&D cooperation system between the private sector and the public sector. In this case therewill be an exemption of the R&D technology fee for those food enterprises whose annual turnover is lessthan 500 million won. The government plans also to reinforce the research network between privateenterprises and national research institutes.
Linkage of food industry with agriculture and fisheries
Looking at the structure of the use of raw materials for agricultural products in the food manufacturingindustry, the industry relies on imports for more than 50 percent of major raw materials, and thereforethe linkage of the industry with agriculture is weak. Moreover, recently the proportion of importedagricultural products in the form of 1st level processing such as simple processing, freezing and curingas the raw materials of food manufacturing and the food materials for food service companies isincreasing.
The reason why the food manufacturing industry uses fewer domestic raw materials is because of highprices, the difficulty of securing the required quantity and inconsistent quality. To develop domesticagriculture and a stable supply of raw materials for the food industry, the linkages between agricultureand food industry need to be intensified.
Production corresponding to demand
Production of functional health foods
With an aging population and the increased consciousness of the importance of well-being, the healthfood and functional food markets are growing very rapidly. With growth in the aging population, thanksto the extension of the average lifespan, dietary treatment has been emphasized as the primarycontribution to the prevention of “lifestyle diseases.” Consciousness of the importance of self-care is alsoincreasing as people seek to avoid the burden of medical expenses.
Launching the convenience food market
In association with increases in income and urbanization, the convenience food market is growing veryrapidly. With changes in the population structure such as the increase in the number of aged personsand single households and the changes in lifestyle such as “cocooning” (spending more and more timein the home) and “grazing” (eating snacks throughout the day rather than eating cooked meals madefrom fresh ingredients), the consumption of convenience foods is increasing and thus the staple dietbased on grains is being replaced by processed and convenience foods.
Expansion of the production of safe native traditional foods
Because of the increase in the consumption of processed foods and the frequency of eating out, threatsto the safety of food such as “mad cow” disease and foot-and-mouth disease are rapidly diffused to thepublic. Increased consumer awareness about the importance of food safety and interest in securing foodsafety are leading to the expansion of traditional food markets through the promotion of the benefitsof consuming indigenous foods. Moreover, ethnic foods are being diffused as a result of the globalizationefforts of domestic food enterprises.
4. External forces that shape the SMFEs sector in the Republic of Korea
Environmental issues
Since the 1980s, the Earth’s temperature has shown a marked difference. The average temperature hasincreased by 0.74±0.18ºC in the twentieth century, and in the twenty-first century it is expected thattemperature will increase by 1.1 to 6.4ºC as a result of greenhouse gas emissions. This increase will see
140
the sea level rising by 18 cm to 59 cm. In the case of the Republic of Korea, the average temperature inthe twentieth century increased by 1.5ºC which is more than the average for the whole earth (includingthe urban heat island effect). The higher the increase in temperature, the greater the shortage of waterin the middle latitude regions with high population densities, the more rapidly the degradation of theecological system, the lower the agricultural land productivity, the more frequent the damages fromflood and drought are incurred and the worse the health of mankind becomes. Accordingly, it isnecessary to build up a sustainable food chain that will contribute to enhancement of the quality of theenvironment.
The quantity of food wastes generated per capita is continuously increasing because of the increase infood consumption and the number of people eating out as income levels increase. Accordingly,government is trying to establish a sustainable food chain.
Establishment of a low carbon food chain
Efforts are underway to reduce the environmental load associated with the import of raw materials forfood by reinforcing the linkage between domestic agriculture and fisheries and the food industry. Thegovernment should further stimulate the consumption of low carbon type foods through expanding theprovision of carbon consumption related information such as the origin of food and the food mileage.A carbon labeling or marking system (which marks carbon emissions on products) in agricultural andfisheries foods should be implemented for the whole country as per the Basic Law on Low Carbon andGreen Growth.
Health and safety issues
The share of the expenses for eating out in total food consumption expenditure per household in theRepublic of Korea increased from 8 percent in 1985 to 47 percent in 2007. This is an increase of 6 timeswhereas the imports of agricultural products have only doubled since 1998 and the imports of processedfoods have increased by more than 3 times. Large-scale food safety incidences have occured frequentlyas food consumption has steadily increased. Cases of food poisoning increased from 2 980 persons in2002 to 10 833 persons in 2006 whereas the number of patients per incident showed an increasing trendfrom 38 persons to 42 persons for the same period. In line with the increases in eating out, theconsumption of processed foods and the imports of processed foods, the uncertainty of people withrespect to food safety is increasing. In response to this, government has presented the following strategyto enhance food safety.
● Early settlement of food safety management system including GAP, traceability and HACCP
Continuous expansion of the production of GAP certified agricultural products and efforts to enhanceconsumers’ trust in the food safety management system are necessary. Traceability will be expanded toinclude eco-friendly agricultural products and the traceability system will be made more accurate andconvenient particularly through improving the information input method used by farmers. Othermeasures will be the implementation of a management and supervision of the traceability system, theimprovement of the operation level of the Safe Food Company Certification Program and the expansionof the HACCP system.
● Expansion of consumers’ participation for the enhancement of food safety reliability anddissemination of safety related information
Prevention of food safety accidents and the enhancement of efficiency in food safety administration willbe implemented through continuous expansion of R&D for risk assessment and sharing of agriculturalfood safety information between ministries of the central government, between the central governmentand local governments, and between producers, wholesalers and consumers. Moreover, a system for theexpansion of food safety communications and reinforcement of information sharing with people will beintroduced and operated and will include: a Consumer Monitoring Group, a Food Safety InformationCenter, a Consumers’ Sanitation Inspection Request System, a Safety Certification System for superior foodmanufacturing facilities and a GMO labeling expansion and post control system.
141
● Intensification of advanced monitoring function for harmful substances
Safety standards for harmful substances such as food additives, pesticide residues, antibiotics andcarcinogens will be intensified to the level of advanced countries, and harmful substances will beintensively collected and inspected by selecting 500 items of national mass consumption foods such askimchi and red-pepper powder. Agricultural product safety related accidents will be prevented throughintensification of the advanced monitoring function for imported foods for further reinforcement of thesafety of agricultural products.
● Efficiency of food safety management system
The Food safety management system of the Republic of Korea has separate food risk assessmentinstitutions and food safety management institutions, but their organizations and functions areoverlapping. To improve the efficiency of food safety policy, currently overlapping organizations andfunctions will be merged.
● Prevention of the occurrence of food accidents and reinforcement of prompt post-accidentcountermeasures
Currently the government is implementing diverse policies for modernization and improvement ofschool meals, e.g. by providing facilities through the establishment of a Pan Government Food PoisoningGeneral Countermeasure Council and intensive guidance and checking of the facilities used byvulnerable layers in youth training camps and schools. Continuous improvement of food facilities andthe sanitation environment and implementation of a green labeling or marking system for superiorfavourite foods is required and their operations need to be intensified. Various systems for the preventionof the occurrence of food accidents and prompt post-accident countermeasures such as the Food SafetyAccident Emergency Countermeasure Group, the Prompt Inspection Order, the Recall Grade System andthe Food History Traceability Management System will be introduced soon and their operation will bestrengthened through time.
● Reinforcement of safety management for imported foods
Local food inspection institutions will be installed in the importing country so that the only productswhich pass domestic safety standards will be allowed entry. Introducing a Superior Importer System willhelp to stimulate the imports of superior foods by confirming and checking the sanitation level of localmanufacturers in advance. For all imported foods, inspection at the customs declaration stage will beintensified, heavy metal inspection standards for imported agricultural products will be strengthened tointernational level (Codex), and post management for quarantine and distribution stages for importedlivestock products and site sanitation inspection for fisheries product processing factories and aqua farmsin exporting countries will be intensified.
5. Government policy and legal frameworks
With the restructuring of the government organization in 2008, the existing fishing and fisheries workof the Ministry of Maritime Affairs and Fisheries and the food industry work of the Ministry of Health andWelfare were consolidated in the existing Ministry of Agriculture and Forestry which was expanded andrestructured and renamed the Ministry of Food, Agriculture, Forestry and Fisheries (MFAFF). After theestablishment of the MFAFF, a food industry promotion policy was implemented fully and the FoodIndustry Promotion Act and the Food Safety Basic Act were enacted and a General Plan for the FoodIndustry was announced. In 2011 with five policies focusing on: the stable supply of foods, securing foodsafety, materialization of a sound dietary life, sustainable food chains and the establishment ofa governance system, government presented Vision 2020 – National Food System and announced the2011 Basic Plan for Food Industry Promotion as an action plan for implementing the vision.
Basic Plan for Food Industry Promotion
The Basic Plan for Food Industry Promotion is a major policy tasked with accomplishing the vision forthe cultivation of a global food industry that leads agriculture and fisheries, and the tasks in the planare the expansion of infrastructure of the food industry, reinforcement of linkages with agriculture and
142
fisheries, intensification of global competitiveness and provision and protection of consumer information.Diverse tasks for action were included with each policy task. Among the action tasks, detailed tasks foraction concerning food processing businesses are as follows:
The first task is the expansion of food R&D, i.e. to enhance the current technology level of 30 to65 percent of advanced countries to 85 percent. Tailored technology development support systems bythe size of demand will be prepared to support R&D for small companies, whose research infrastructureis vulnerable.
The second task is the establishment of an agricultural food enterprises support center. With theobjective to cultivate 2 000 superior small and medium food enterprises with an annual turnover of morethan 1 billion won by 2017. An integrated support system will be prepared to address difficulties relatedto business management for export, marketing, administration, laws and regulations and technicalinformation.
The third task is the cultivation of agriculture-industry-commerce fusion type enterprises. There is a planto cultivate 300 enterprises of such fusion type with an annual turnover of more than 5 billion won by2017. In order to enhance the infrastructure for the promotion of the fusion of agriculture/fisheries andsmall and medium food manufacturing companies, across-the-board support will be provided for thenetwork, supply of raw materials, product development and the product sales of fusion companies.Assistance will also be given to help with the conversion of farmers engaged in agriculture and fisheriesto food businessmen to stimulate the food processing industry.
The fourth task is to support the expansion of exports of agricultural foods. It is planned to increase thevalue of exports from USD5.9 billion as of 2010 to USD20 billion by 2017. The market for local peoplewill be exploited by selecting strategic items, excessive competition among exporters will be preventedthrough the activation of an Export Council for each export item, and a high quality product image willbe established through the launching of brands. Moreover, information on the importing countries willbe provided to food manufacturing companies by establishing an export support information system.Support will also be provided to establish links with buyers of export products. The cultivation of globalfood enterprises will be supported through support for the overseas launching of food enterprises.
The last task is the provision and protection of consumer information. A communication system toprovide food information to consumers will be built up while reinforcing healthy dietary education bygender and by age group. And through the expansion of an advanced safety management system calledFrom the Farm to the Dining Table, GAP and HACCP, safe agricultural products will be provided to peoplewhile enhancing their trust in the country’s foods.
The Food Safety Basic Act
The Food Safety Basic Act includes the details on the establishment and implementation system of foodsafety policies, emergency countermeasures and inspection for tracing, scientific food safetymanagement, information disclosure and mutual cooperation and consumers’ participation.Substantively, with the Food Safety Basic Act, food related policies that were focused on food sanitationin the past are being converted to “the securing of food safety”. This is an attempt to consolidate the oldpluralistic systems in which respective different administrative agencies regulate different individual actsof production, processing and consumption. Under the Office of the Prime Minister, the Food SafetyPolicy Committee was established to facilitate discussions among the heads of respective administrativeagencies together with external members. Moreover, an upper level screening and coordinationinstitution was newly established for the purpose of consolidation and adjustment of food safety policiesand certain matters subject to implementation, and thus from a procedural perspective, the foodadministration system is now better integrated.
The basic purposes of the Food Safety Basic Act, which was enacted in 2008 are as follows: First, the basicprinciple of food safety shall be the principle of prevention. Second, food safety monitoring activities willbe organized with the participation of people. Third, damage from the occurrence of food accidents shall
143
be minimized through prompt countermeasure. Fourth, safety management for imported foods shall beintensified. Fifth, production and distribution of counterfeit foods shall be blocked by specialadministration of regulations related to food sanitation offenses. Sixth, a pan government food safetyimplementation system shall be intensified.
Food safety management of the Republic of Korea is scattered by food item and by handling stage.Safety management for agricultural, fisheries and livestock foods are under the dual control of theMinistry of Food, Agriculture, Forestry and Fisheries and the Ministry of Health and Welfare (Korea Foodand Drug Administration) whereas safety management functions for some food items are dealt with bydifferent ministries depending on the characteristics of the food items. Food safety management for theproduction stage is handled by the Ministry of Food, Agriculture, Forestry and Fisheries whereas theprocessing, distribution and consumption stages after shipping are handled by the Ministry of Healthand Welfare (Korea Food and Drug Administration). Food safety management for livestock foods ishandled by the Ministry of Food, Agriculture, Forestry and Fisheries – from the production to distributionstages – and the consumption stage is handled by the Ministry of Health and Welfare. Fisheries foodsare handled by the Ministry of Health and Welfare, except for the production stage and for non-simpleprocessing based imports. Moreover, the Ministry of Environment is in charge of water, the Ministry ofStrategy and Finance (National Tax Service) is in charge of liquors and the Ministry of Education, Scienceand Technology is in charge of safety management of school meals.
6. Status of national institutional infrastructure
Ministry of Food, Agriculture, Forestry and Fisheries (MIFAFF)
The Ministry of Food, Agriculture, Forestry and Fisheries is a central administrative institution that handlesagriculture, fisheries and food industry related tasks. With the restructuring of government organizationin 2008, the existing fishing and fisheries tasks of the Ministry of Maritime Affairs and Fisheries and foodindustry tasks of the Ministry of Health and Welfare were consolidated in the existing Ministry ofAgriculture and Forestry, which was expanded and restructured, and renamed as the Ministry of Food,Agriculture, Forestry and Fisheries (MFAFF). Under the plural Deputy Minister system, two DeputyMinisters are appointed. The first Deputy Minister handles planning and policies whereas the secondDeputy Minister is handles production areas such as agricultural and fisheries products and foods. TheMinistry is operated with three major “axles” of: the Food Industry Division, which was newly establishedin order to cultivate the domestic food industry that was faced with trade liberalization such as free tradeagreements (FTA); the Agricultural Policy Division; and Fisheries Policy Division. Its major mission is tomanage the work related to “Agricultural, fisheries and livestock products, food, farmland andhydrographical matters, promotion of food industry, development of farming and fishing villages anddistribution of agricultural and fisheries products.”
Ministry of Food and Drug Safety
The Ministry of Food and Drug Safety (MFDS, Korean: formerly known as the Korea Food and DrugAdministration (KFDA), is a South Korean government agency responsible for promoting public healthby ensuring the safety and efficiency of foods, pharmaceuticals, medical devices and cosmetics as wellas supporting the development of the food and pharmaceutical industries. The main goal is to offerpeople safe foods and drugs.
The Ministry designates and administers testing and inspection institutions for food sanitation inspection,cosmetics quality inspection and medicine quality inspection. The major work of the administrationincludes: Survey and research for the safety of food sanitation; consolidated coordination of safetymanagement policies on foods, food additives, apparatus, containers and packing; granting permissionfor the sale of medicines and clinical administration; manufacturing of medicines; licensing and filing ofexport and import items; quality control and securing the safety and validity of medical items, outsidemedical items, cosmetics and sanitary items; development of verification and analysis methods for qualitycontrol of distributed medicines or medicines to be distributed; securing of efficacy and safety of herbalmedicines; establishment of specifications for herbal medicines and medicines prepared for crude drugs;
144
investigation of harmful substances (pesticides residue, harmful heavy metals) contained in herbalmedicines; quality control and verification of medical equipment and screening of medical tools. TheMinistry is also in charge of radiation standards and measuring.
Korea Agro-Fisheries and Food Trade Corporation
Korea Agro-Fisheries and Food Trade Corporation is a quasi-government institution established tostabilize the prices of agricultural, forestry, livestock and fisheries products, to promote exports, improvedistribution and develop the food industry. Major work which the corporation is performing is as follows:Storage, handling, processing and selling of agricultural and fisheries products and the improvement oftheir distribution, investment, loan and arrangement of funding and technology guidance, introductionand arrangement of foreign technology, management guidance, survey, research and training on foreigntechnology, market exploitation for agricultural and fisheries products and their processed products andexport and imports and quality control, testing and research on food processing and technical supportand service projects, purchase, storage and sale of agricultural and fisheries products for demand andsupply adjustment and price stability.
Animal, Plant and Fisheries Quarantine and Inspection Agency (QIA)
The Animal, Plant and Fisheries Quarantine and Inspection Agency is a national quarantine andinspection institution established for securing the safety of agricultural, livestock and fisheries foods andthe improvement of the livestock disease prevention system. The division was established in June 2011merging quarantine and inspection institutions in the three fields of livestock (National VeterinaryResearch and Quarantine Service), plant (National Plant Research and Quarantine Service) and fisheries(National Fisheries Products Quality Inspection Service). The objectives of the division are to: performquarantine inspections for agricultural, livestock and fisheries foods; prevent diseases in agricultural,livestock and fisheries foods; manage sanitation matters; and provide information related to research onveterinary and plant quarantine technology development. The major tasks that the division is performingare as follows: inspection of agricultural and livestock products and sanitation management;implementing preventive measures for livestock diseases; developing biological medicines; inspectingand evaluating veterinary medicines; developing and implementing policies on the protection,management and the enhancement of animal welfare; arranging quarantine and inspection for exportingand imported plants; inspecting domestic plants; country of origin marking; arranging qualitycertification; carrying out standard shipping specification administration; investigating the safety offisheries products; managing sanitation for export processing facilities; arranging inspection andquarantine for fisheries products and testing, surveying and carrying out any research required for theabove tasks.
Korea Rural Economic Institute (KREI)
Korea Rural Economic Institute is a government-supported research institution established to contributeto the development of the national economy and the promotion of national welfare by carrying outcomprehensive surveys and research on the development of the agricultural and forestry economy andfarming and fishing villages. Major tasks performed by the institute are as follows: surveys and researchfor mid- to long-term and short-term agricultural and forestry economics planning and policy-making;surveys and research on short-term policies of agricultural and forestry sectors; surveys and research onagricultural food policies; surveys and research on the promotion of welfare of people in farming andfishing villages and their social problems; research on international agricultural cooperation; research ondemand and supply trends by item through the observation of agriculture and mid- to long-termprospective; surveys and research for the promotion of national understanding for agricultural andforestry policies; and surveys of public opinion. Especially since the 1990s, and the entry into the age ofagricultural liberalization, the institute has been carrying out research in relation to the WTO and theDoha Development Agenda (DDA), and in response to agricultural negotiation, and the need for policiesto prepare for FTAs, site research for the enhancement of competitiveness and the reinforcement ofmultifunctions of agriculture under liberalized trade environment and research on the development ofthe food industry and the promotion of food safety.
145
Korea Food Research Institute (KFRI)
Korea Food Research Institute is a government-supported research institution under the Ministry ofKnowledge and Economy and was established for the purpose of assisting in the development ofagriculture, forestry and fisheries as well as the food industry, especially in developing source technology,diffusing research results and providing technical support in the field of food. Major tasks that theinstitute performs are as follows: investigating the functionality of foods and carrying out R&D for newmaterials and new processes; carrying out R&D on food storage, distribution and safety technology;carrying out R&D in relation to the globalization of traditional foods; carrying out R&D in food analysis,information, standardization and the creation of baseline information; Fifth, carrying out the projectsentrusted by the government, civil organizations and corporations such as the support of technologypolicy, technical support, test evaluation and certification, manpower cultivation and creation oftechnology business; and carrying out the projects necessary for the accomplishment of the missionsof the institute. Moreover, the institute implements public support projects such as food standardizationprojects, food analysis and inspection, sensory testing, industrial property rights diagnosis and evaluation,Hazard Analysis Critical Control Point (HACCP) and sanitation education, operation of an agriculturalproducts distribution technique management course, holding an agriculture business start-up contest,and liquor quality certification system.
Korea Agency of Education, Promotion and Information Service in Food, Agricultural, Forestry andFisheries (EPIS)
Korea Agency of Education, Promotion and Information Service in Food, Agricultural, Forestry andFisheries is an incorporated foundation established for the utilization of agricultural and fisheriesinformation through agriculture and fisheries and farming and fishing villages information projects. Theobjective of the institute is to secure competitiveness of agriculture and fisheries as well as farming andfishing villages through the implementation of future-oriented projects such as food safety informationsystem, which is an information system that guarantees the safety of agricultural and fisheries foods,a traceability system which prepares a digital distribution system for agricultural and fisheries productsand an integrated production and distribution system which is a resource management system foragricultural and fisheries business entities. Major projects which the institute is carrying out are as follows:information service project for providing information for agriculture and fisheries as well as farming andfishing villages, safety information project to build up a reliable agricultural product network, traceabilityfor agricultural products to provide reliable food information, integrated agricultural educationinformation project which is a future-oriented education information system, farmers information andeducation project to cultivate the frontier for farming innovation, agricultural and fisheries business entityinformation project for the digital management of agriculture and fisheries and imported beefdistribution route traceability system.
Korea Livestock Products HACCP Accreditation Service
Korea Livestock Products HACCP Accreditation Service is a public institution established to efficientlyperform the designated works for HACCP applicable workplaces. Major tasks that are carried out by theservice are as follows: Designation of workplaces to which HACCP is applicable, investigation andevaluation on the compliance of the standards for HACCP applicable workplaces, survey and researchprojects on the operation of HACCP, education and technology support project on livestock sanitationand HACCP and the certification of eco-friendly agricultural and livestock products.
Korea Institute of Planning and Evaluation for Technology in Food, Agriculture, Forestry andFisheries (IPET)
Korea Institute of Planning and Evaluation for Technology in Food, Agriculture, Forestry and Fisheries isa quasi-government institution established under the Ministry of Food, Agriculture, Forestry and Fisheries.It is in charge of planning, management and evaluation works for research and development projectsin the fields of agriculture, forestry, fisheries and food science. The mission of the institute is to promoteagriculture, forestry, fisheries and food science technology for the enhancement of the competitiveness
146
of agriculture, forestry, fisheries and the food industry. The major tasks which are carried out by theinstitute are as follows: establishment of a comprehensive plan for the promotion of agriculture, forestry,fisheries and food science technology and support for policy development and carrying out planning,management and evaluation of agricultural, forestry, fisheries and food science technology and thediffusion and promotion of the results of research and development projects and support for thepromotion of technology development manpower in the fields of agriculture, forestry, fisheries and food.The institute is comprised of the Strategy and Planning Department, the R&D Management Departmentand the Project Management Department.
Rural Development Administration (RDA)
Rural Development Administration is a government institution that is in charge of the development ofagriculture and science technology for take-off of agriculture. The area related to agricultural foods andfood processing in the administration is industrialization technology area such as industrial materialsusing agricultural and livestock products. Detailed areas for R&D are converting agricultural organismsinto industrial materials through advanced fusion technology such as BT, IT and NT and functional GMOdevelopment for the increase added value using animals and plants. For the period so far, theadministration has contributed to the industrialization through the exploration of functional materialsof silkworm, silk and bee-farming products. Recently the administration is implementing researches inthe fields such as globalization of Korean dishes, industrialization of traditional foods and thedevelopment of traditional liquors.
7. Analysis of constraints and strategic priorities for enhancing competitiveness
Constraints
Small-scale of food manufacturing businesses
The size of turnover is small and the competitiveness of food manufacturing companies in the Republicof Korea is weak. The annual turnover of Nestlé, the largest food enterprise in the world, is almost 63times that of Cheil Jedang (CJ) (1.9 trillion won), the number one food enterprise in the Republic of Korea.Their small-scale is considered to be a major cause of the shortage of global competency of Korean foodenterprises. In the case of the Republic of Korea, small food manufacturing companies with fewer thanfive employees account for more than 85 percent of total food manufacturing businesses. As theshortages of capital and manpower lead to the shortage of infrastructure such as market information,marketing competency and professional manpower, the enterprises are locked into a vicious circle.
Insufficient investment in research and development in the field of food
Investment in research and development in the field of food was 105.6 billion won as of 2009representing a very low share of not more than 0.6 percent of the total value of the food industry in theRepublic of Korea. Technology level of food processing in the Republic of Korea reached only to 30 to65 percent of the level of advanced countries. Owing to the changes in the trend of consumption basedon increase in income and the diffusion of awareness of the importance of well-being, consumers prefermore diversified and functional foods. The demand for those foods is increasing because of the shortageof food processing technology and its development. As food manufacturing companies in the Republicof Korea are small, they have no room for investment in research and development and also they arein a situation in which they cannot get government support.
Difficulty in securing raw materials
The total cost for purchasing raw materials by food manufacturing companies in Korea was estimatedto be 22.2 trillion won in 2009. The amount represents 52.5 percent of total annual turnover of foodprocessing companies, which indicates that food processing businesses use a large amount of rawmaterials. Among 34 major raw materials for food processing businesses, the imported productswhose value constitutes a large proportion of the importing enterprises total annual turnover are flour
147
(85.9 percent), pollack (82.9 percent), beef (72.1 percent), sesame (70.9 percent) and peanuts(63.1 percent) whereas for domestic products such as rice, fruits, leaf and root vegetables, laver andginseng the proportion of the annual turnover is small. Even though the Korean food industry showsa high growth rate, the proportion of imported raw materials is increasing whereas the use of domesticagricultural products is not increasing. Actually, the first reason for domestic food processing companiesto purchase imported raw materials is the high prices of domestic products (flour, corn, carrot,red-pepper, garlic, beef, pork, chicken, pollack, squid, sesame and peanuts) whereas instability of demandand supply and the difference in taste and quality were said to be another major reason. In order toincrease the quantity of domestic raw materials used by food enterprises despite low competitivenessfor prices of domestic raw materials (agricultural products), there needs to be incentives such as a stablesupply of raw materials, reduction of distribution costs and the enhancement of quality competitiveness.Moreover, we can say that the growth of food industry in the Republic of Korea is attributed more toexternal factors such as international grain prices, international oil price increase and foreign exchangerate increase than to domestic internal factors such as increase in turnover and new productdevelopment. However, enterprises are experiencing difficulties in securing the required quantity offoreign raw materials because of the instability of foreign variables.
Strategies
Expansion of investment in research and development
Ensuring the success of small and medium food companies in the Republic of Korea, necessitatesinvestment in research and development. Although large corporations invest in research anddevelopment in many cases, small and medium companies have neither the capacity to invest in researchand development, nor the facilities and manpower for product development. Government support is,therefore required to support small and medium enterprises in carrying out research jointly withuniversities. The Korea Institute of Planning and Evaluation for Technology in Food, Agriculture, Forestryand Fisheries (IPET), which was established in September 2009, could increase its support by providingmore research funding for small and medium companies.
Securing stability in all food chains
As consumers’ incomes increase, consumers give high priority to food safety when purchasing food. Inorder to supply safe foods, the food manufacturing environment of small and medium food companiesmust be more sanitary, and the introduction of HACCP is essential to maintain the safety and sanitationof food. Currently the introduction of HACCP is required only for major foods, but the number of itemsfor which the introduction of HACCP is mandatory should be increased continuously.
In order to secure the safety of agricultural, livestock and fisheries products, which are the raw materialsfor processing, an advanced food safety management system such as Good Agriculture Practices (GAP)should be introduced at the production stages of the products. Together with this, traceability shouldbe expanded fully to enhance the trust of consumers, and the safety throughout the food chain shouldbe secured through thorough safety management at the production, processing and distribution stages.
Reinforcement of the linkage between agriculture and the food industry
As the Republic of Korea relies on the importation of raw materials for food processing, it is importantto reinforce the linkage between agriculture and the food industry. First of all, raw material producingareas should be expanded for the supply of necessary agricultural products through right-sizing andcollectivization. The government provides support to value adding toto agricultural and livestockproducts through the enhancement of quality and brand value by establishing the Agricultural ProductCenter (APC), the Livestock Product Center (LPC), the Rice Products Center (RPC) and Producers’Processing Facilities. A plan is also required to organically link the transactions between producers’organizations or farming association corporations and food processing companies, food materialssuppliers, distributors and food service companies.
148
In order to increase the use of domestic raw materials by food enterprises, consumption of domesticprocessed foods should be increased. Pertinent information on functionality, safety and nutritional qualityof domestic processed products must be provided to consumers and consumer awareness must beraised on quality certification standards and post control standards. It is also necessary for thegovernment to cultivate and support the food enterprises that are jointly owned by farmers and foodprocessing companies or the enterprises that farmers have invested in and own the equity. Thegovernment should also encourage local governments or regional NACF’s to coordinate and connectwith food companies and farmers.
Exploitation of overseas markets for export
Continuous efforts to exploit overseas markets are necessary. Although there are a number of productsamong Korean traditional foods that have functionality and appeal to foreign consumers, the exploitationof overseas markets is currently insufficient.
Consulting services should be provided to small and medium enterprises to help them export theirproducts. The establishment of a Food Enterprise Support Center could play a major role here. For thereduction of logistics costs of small and medium enterprises, a joint logistics system could assist byproviding information on export markets. As food exports are closely related to the globalization ofKorean dishes as well, the exports of food materials and processed foods should be increased in linkagewith food enterprises and Korean restaurants launched overseas.
8. Summary and conclusions
Thanks to its rapid economic growth, the Republic of Korea is pursuing a food consumption strategybased on high quality, diverse and simple products. Food processing businesses have grown fast as thehealth-oriented consumption trend including eco-friendly products, organic farming and LOHAS hasdeveloped together with the growing culture of well being.
In the midst of such changes in the business environment, the need to promote the food industry wasrecognized as necessary for the purpose of creating high added value to raw agricultural materials.
Small and medium companies with fewer than ten employees account for 93 percent of food processingcompanies in the Republic of Korea. Most food processing companies located in rural areas arecategorized as small and medium enterprises (SMEs). As the level investment in research anddevelopment in the field of food stands at less than 1 percent, SMEs fall behind large corporations inthe development of new products, which is why they exhibit low levels of competitiveness.
Small and medium food companies are vulnerable in terms of food safety and sanitation. Consumers’awareness on the importance of food safety is rising and the issue of food safety is an importantobjective of national policy. To ensure safety throughout the food chain, the government will have tomonitor food safety management systematically from the production to processing (manufacturing),distribution and to consumption and prepare the necessary countermeasures.
Food processing companies are experiencing difficulties in securing a stable supply of raw materials forprocessing because of the instability of the international grain market and the price increase in rawmaterials for domestic foods. They are faced with the task of intensifying the linkages betweenagriculture and food industry to expand the use of domestic raw materials for agricultural products.
In order to overcome the factors that restrain the competitiveness of such small food processingcompanies, the government should reinforce support to research and development for food processingbusinesses to help the small and medium food companies succeed. In order to strengthen the linkagesbetween food processing enterprises and agriculture, which supplies the raw materials for food, right-sizing and collectivization of raw material producing areas are necessary, and issues such as qualityenhancement of raw materials for processing and the coordinator role of NACF and local governmentsare also important.
149
The development of small and medium food companies should be planned through the expansion ofexports of processed foods. Consulting services should be provided to help the small food companiesexport their products. Reduction of logistics costs and provision of market information have a significantpart to play here. Moreover, the export of food materials and processed foods should be increased byestablishing linkage with food companies and Korean restaurants overseas.
Bibliography
Choi, Ji-hyeon. 2009. Mid/Long-Term Development Strategies of Food Industry for Creation of New Agricultural andFishery Added Values (1/5th Year). Seoul: Korea Rural Economic Institute Press.
Choi, Ji-hyeon. 2010. Mid/Long-Term Development Strategies of Food Industry for Creation of New Agricultural andFishery Added Values (2/5th Year). Seoul: Korea Rural Economic Institute Press.
Choi, Ji-hyeon. 2011. Mid/Long-Term Development Strategies of Food Industry for Creation of New Agricultural andFishery Added Values (3/5th Year). Seoul: Korea Rural Economic Institute Press.
Choi, Ji-hyeon. 2012. Efficient Way of Access to Raw Material for Developing FOODPOLIS. Seoul: Korea Rural EconomicInstitute Press..
Hwang, Soochoel. 2005. Comparison study on specific program for enhancing linkage between agriculture and foodindustry”. Whereas Policy Research Center.
Hwang, Yoonjae & Han, Jaehwan. 2009. Revising safety system of agricultural product and food according to theBasic Food Safety Plan. Seoul: Korea Rural Economic Institute Press.
Jeon, Hyekyung. 2009. Strategy of R&D on Korean food and globalization by Rural Development Administration. FoodIndustry and Nutrition 14.1, pp.12–20.
Kim, Sungmin. 2010. Food industry policy and cluster in Korea. Seoul: Baek-San Press.
Kim, Sunghoon. 2011. Strategy for the promotion of exportation of Korean processed food. Seoul: Korea RuralEconomic Institute Press. Agriculture Outlook Center.
Korea Food and Drug Administration. 2011. Year book of imported food inspection, Vol. 13. Seoul: KFDA Press.
Korea Agro-Fisheries and Food Trade Corporation. 2012. Food industry and globalization of Korean dishes. Seoul.
Korea Health Industry Development Institute. 2010. Global trend of food industry. Statistical analysis report. Vol. 01.Osong: KHDI Press.
Ministry of Food, Agriculture, Forestry and Fisheries. 2008. Comprehensive development measures for food industryin the Republic of Korea. Seoul: MFAFF Press.
Ministry of Food, Agriculture, Forestry and Fisheries. 2010. Survey on raw material consumption in food industry.Seoul: MFAFF Press.
Ministry of Food, Agriculture, Forestry and Fisheries. 2011. Basic Plan for Food industry Promotion, Seoul: MFAFF,pp. 12–17.
Small and Medium Business Administration. 2010. Yearbook of Small and Medium Business. Seoul: SMBA Press.
Small and Medium Business Administration. 2011. Statistics of Small and Medium Business.Seoul: SMBA Press.
150
References
Choi, Ji-hyeon. 2009. Mid/Long-Term Development Strategies of Food Industry for Creation of New Agricultural andFishery Added Values (1/5th Year). Seoul: Korea Rural Economic Institute Press. 10. R595.
Korea Food and Drug Administration. 2011. Yearbook of imported food inspection. Seoul: KFDA Press. Vol. 13.
Korea Food and Drug Administration. 2011. Food and Drug Statistical Yearbook. Seoul: KFDA Press. Vol. 13.
Korea Agro-Fisheries and Food Trade Corporation. 2012. Food industry and globalization of Korean dishes. Seoul:Korea Agro-Fisheries and Food Trade Corporation.
Korea Health Industry Development Institute. 2010. Global trend of food industry. Osong: KHDI Press. Statisticalanalysis report. Vol. 01.
Ministry of Food, Agriculture, Forestry and Fisheries. 2011. Basic Plan for Food industry Promotion. Seoul: MFAFF.
Ministry of Food, Agriculture, Forestry and Fisheries. 2008. Comprehensive developing measures for food industryin the Republic of Korea. Seoul: MFAFF Press.
Small and Medium Business Administration. 2010. Yearbook of Small and Medium Business. Seoul: SMBA Press.
Small and Medium Business Administration. 2011. Statistics of Small and Medium Business. Seoul: SMBA Press.
Statistics Korea. 2010. Report on Mining and Manufacturing Survey for 2009. Daejeon: Statistics Korea.
Statistics Korea. 2012. Economy Census 2010. Daejeon: Statiscics Korea.
Works used but not cited
Choi, Ji-hyeon. 2010. Mid/Long-Term Development Strategies of Food Industry for Creation of New Agricultural andFishery Added Values (2/5th Year). Seoul: Korea Rural Economic Institute Press. Research report. 10. R611
Choi, Ji-hyeon. 2012. Efficient Way of Access to Raw Material for Developing FOODPOLIS. Seoul: Korea Rural EconomicInstitute Press.
Choi, Ji-hyeon. 2011. Mid/Long-Term Development Strategies of Food Industry for Creation of New Agricultural andFishery Added Values (3/5th Year). Seoul: Korea Rural Economic Institute Press. Research report. 10. R633
Hwang, Soochoel. 2005. Comparison study on specific program for enhancing linkage between agriculture and foodindustry. Whereas Policy Research Center.
Hwang, Yoonjae and Han, Jaehwan. 2009. Revising safety system of agricultural product and food according to theBasic Food Safety Plan. Seoul: Korea Rural Economic Institute Press. Research report. R588
Jeon, Hyekyung. 2009. Strategy of R&D on Korean food and globalization by Rural Development Administration. FoodIndustry and Nutrition 14.1: 12–20.
Kim, Sungmin. 2010. Food industry policy and cluster in the Republic of Korea. Seoul: Baek-San Press.
Kim, Sunghoon. 2011. Strategy for the promotion of exportation of Korean processed food. Seoul: Korea RuralEconomic Institute Press. Agriculture Outlook Center.
151
POLICIES AND STRATEGIES FOR THE DEVELOPMENT OF SMALL ANDMEDIUM SCALE FOOD PROCESSING ENTERPRISES IN MALAYSIA
byFatimah Mohamed Arshad,1 Kusairi Mohd. Noh2 and Mohd. Yusof Saari3
Universiti Putra Malaysia
1. Introduction
Malaysia has undergone a transformation from a commodity-dependent economy (between the 1960sand the 1980s) to an export-oriented economy through product diversification and industrialization inthe 1990s and early twenty-first century. The transformation is reflected in the changing role of itseconomic sectors. In 1970, the mainstay of the economy, the agriculture sector, accounted for about29 percent of the GDP and 55.7 percent of the employment (DoSM, 2012a). However, by 2010 itscontributions have reduced to 7.3 percent and 11.8 percent, respectively. Despite the reduction of itscontribution to GDP in percentage terms, the absolute value of the output has increased. The strengthof the Malaysian agriculture sector lies in its industrial crops such as rubber and palm oil, both of whichhave a long history dating as far back as the early 1950s, initiated and developed by the colonialadministrators. Their efforts proved fruitful as the crops yielded good returns as industrial raw materialsfor high value industrial products such as tyres (from rubber), and food and non-food applications forpalm oil. A large amount of resources, investments and supports were channeled to these sectors at theexpense of food commodities.
Malaysia’s food sector is lagging on all fronts compared to the industrial crops and other sectors suchas manufacturing and services because of policy bias and neglect. In terms of land usage, the industrialcrops accounted for 68 percent of the land use in 1970 and thus only 32 percent was planted with foodcrops. However by 2010, the share of these industrial crops had increased to 84.1 percent whereas foodcrops had reduced to 15.9 percent. In terms of trade, Malaysia is a net food importer of major food itemssuch as cereals, fruits and vegetables, beef and mutton, dairy products, sugar, food and beverages andfeedstuff for livestock. Its food trade’s deficit has widened from RM1 billion in 1990 to RM13 billion in2011. Food commodities that show surpluses include poultry meat, eggs, fisheries and lately processedfood such as prepared foods, fruit juices and beverages. Despite the deficits, the food manufacturingsector is a growing industry and lately received more attention in the country’s industrial plan becauseof its export potentials, in particular the “halal” market and employment creation. The food manufacturingsector is largely run by the small and medium food processing enterprises (SMFEs), which suffer manysetbacks compared to the large scale commercialized firms, as well as other types of SMEs. The SMEs ingeneral have shown a tremendous growth between 2004 and 2010 with an average annual growth rateof 6.8 percent compared to 4.9 percent for the overall economic growth (SME Corp, 2012). Theproductivity growth of the SME was estimated at 3.4 percent per year compared to the overall economyof 2.3 percent. This was largely because of definitive policies by the Government through the NationalSME Development Council (NSDC), which mobilizes 15 ministries and 60 agencies to support this sector.In view of the good prospects of the sector, this paper intends to review the performance and issuesbesetting the SMFEs in Malaysia and identify relevant policy options.
1 Director, Institute of Agricultural and Food Policy Studies, Universiti Putra Malaysia, Serdang 43400 Selangor Malaysia.2 Head of the Bio-resource and Environmental Policy Laboratory, Institute of Agricultural and Food Policy Studies, UniversitiPutra Malaysia, Serdang 43400 Selangor Malaysia.3 Tutor, Faculty of Economics and Management, Universiti Putra Malaysia, Serdang 43400 Selangor Malaysia.The authors thank Suryani Darham and Ahmad Hanis Izani Abdul Hadi for their assistance in preparing the report.
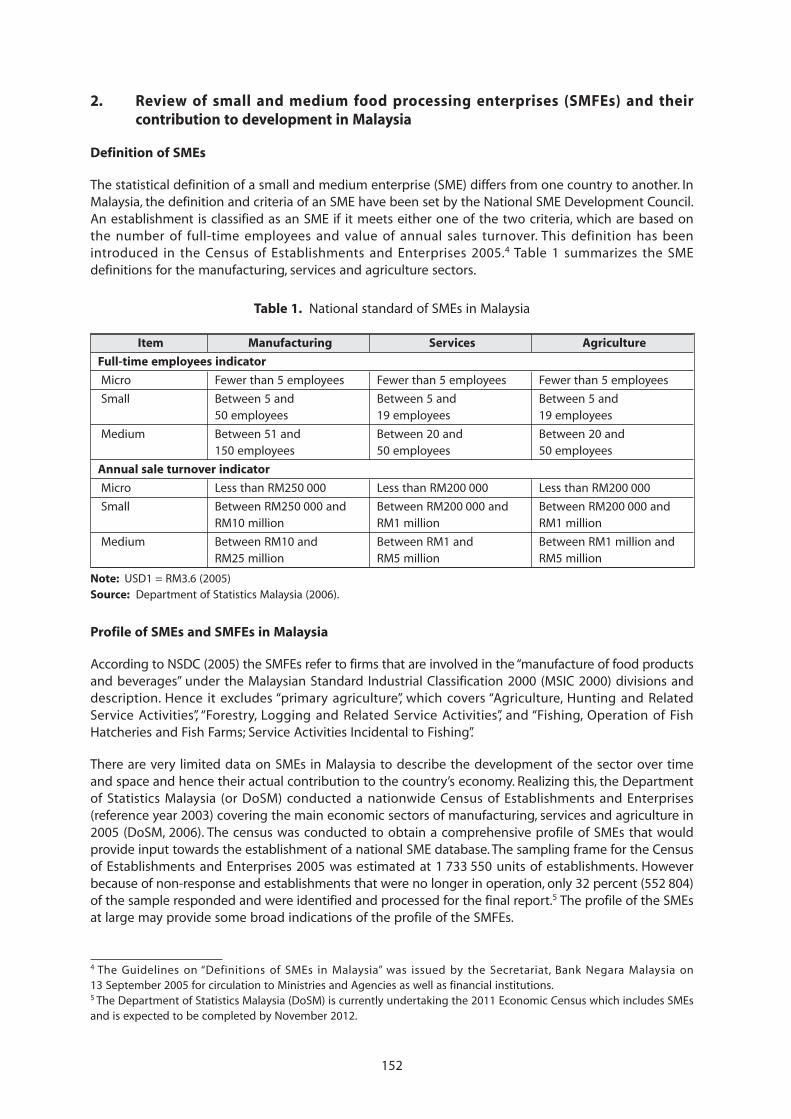
152
2. Review of small and medium food processing enterprises (SMFEs) and theircontribution to development in Malaysia
Definition of SMEs
The statistical definition of a small and medium enterprise (SME) differs from one country to another. InMalaysia, the definition and criteria of an SME have been set by the National SME Development Council.An establishment is classified as an SME if it meets either one of the two criteria, which are based onthe number of full-time employees and value of annual sales turnover. This definition has beenintroduced in the Census of Establishments and Enterprises 2005.4 Table 1 summarizes the SMEdefinitions for the manufacturing, services and agriculture sectors.
Table 1. National standard of SMEs in Malaysia
Item Manufacturing Services Agriculture
Full-time employees indicator
Micro Fewer than 5 employees Fewer than 5 employees Fewer than 5 employees
Small Between 5 and Between 5 and Between 5 and50 employees 19 employees 19 employees
Medium Between 51 and Between 20 and Between 20 and150 employees 50 employees 50 employees
Annual sale turnover indicator
Micro Less than RM250 000 Less than RM200 000 Less than RM200 000
Small Between RM250 000 and Between RM200 000 and Between RM200 000 andRM10 million RM1 million RM1 million
Medium Between RM10 and Between RM1 and Between RM1 million andRM25 million RM5 million RM5 million
Note: USD1 = RM3.6 (2005)Source: Department of Statistics Malaysia (2006).
Profile of SMEs and SMFEs in Malaysia
According to NSDC (2005) the SMFEs refer to firms that are involved in the “manufacture of food productsand beverages” under the Malaysian Standard Industrial Classification 2000 (MSIC 2000) divisions anddescription. Hence it excludes “primary agriculture”, which covers “Agriculture, Hunting and RelatedService Activities”, “Forestry, Logging and Related Service Activities”, and “Fishing, Operation of FishHatcheries and Fish Farms; Service Activities Incidental to Fishing”.
There are very limited data on SMEs in Malaysia to describe the development of the sector over timeand space and hence their actual contribution to the country’s economy. Realizing this, the Departmentof Statistics Malaysia (or DoSM) conducted a nationwide Census of Establishments and Enterprises(reference year 2003) covering the main economic sectors of manufacturing, services and agriculture in2005 (DoSM, 2006). The census was conducted to obtain a comprehensive profile of SMEs that wouldprovide input towards the establishment of a national SME database. The sampling frame for the Censusof Establishments and Enterprises 2005 was estimated at 1 733 550 units of establishments. Howeverbecause of non-response and establishments that were no longer in operation, only 32 percent (552 804)of the sample responded and were identified and processed for the final report.5 The profile of the SMEsat large may provide some broad indications of the profile of the SMFEs.
4 The Guidelines on “Definitions of SMEs in Malaysia” was issued by the Secretariat, Bank Negara Malaysia on13 September 2005 for circulation to Ministries and Agencies as well as financial institutions.5 The Department of Statistics Malaysia (DoSM) is currently undertaking the 2011 Economic Census which includes SMEsand is expected to be completed by November 2012.
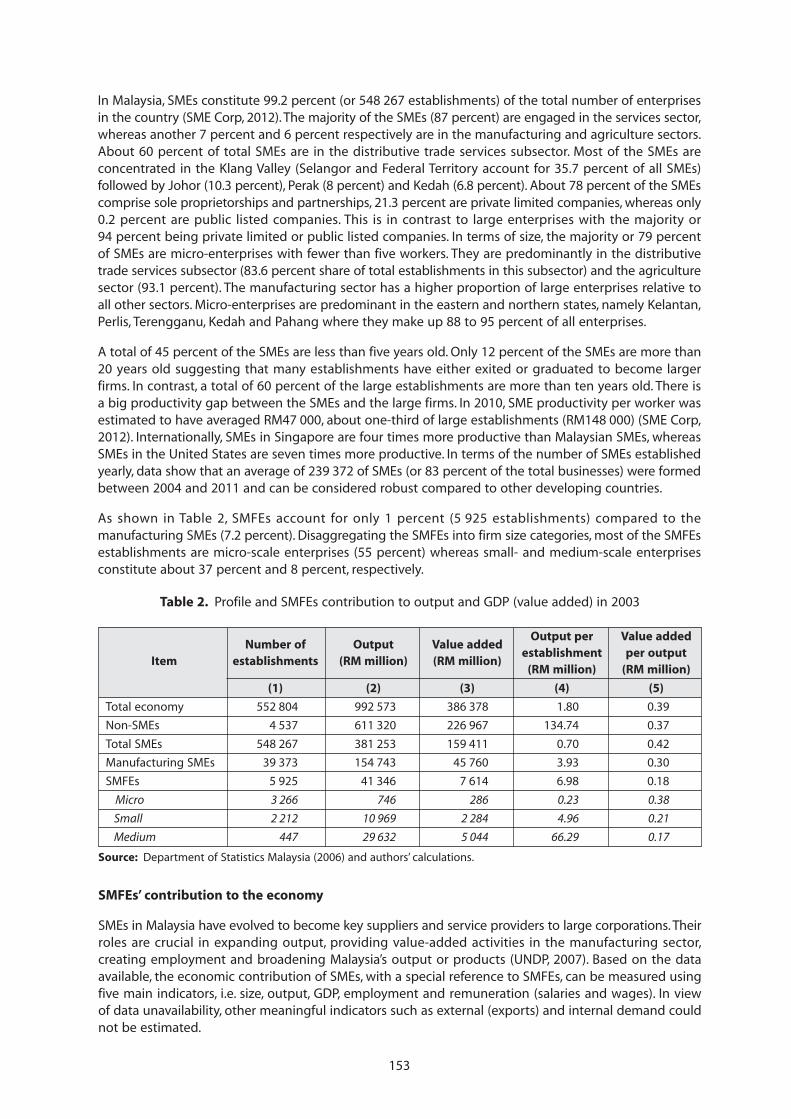
153
In Malaysia, SMEs constitute 99.2 percent (or 548 267 establishments) of the total number of enterprisesin the country (SME Corp, 2012). The majority of the SMEs (87 percent) are engaged in the services sector,whereas another 7 percent and 6 percent respectively are in the manufacturing and agriculture sectors.About 60 percent of total SMEs are in the distributive trade services subsector. Most of the SMEs areconcentrated in the Klang Valley (Selangor and Federal Territory account for 35.7 percent of all SMEs)followed by Johor (10.3 percent), Perak (8 percent) and Kedah (6.8 percent). About 78 percent of the SMEscomprise sole proprietorships and partnerships, 21.3 percent are private limited companies, whereas only0.2 percent are public listed companies. This is in contrast to large enterprises with the majority or94 percent being private limited or public listed companies. In terms of size, the majority or 79 percentof SMEs are micro-enterprises with fewer than five workers. They are predominantly in the distributivetrade services subsector (83.6 percent share of total establishments in this subsector) and the agriculturesector (93.1 percent). The manufacturing sector has a higher proportion of large enterprises relative toall other sectors. Micro-enterprises are predominant in the eastern and northern states, namely Kelantan,Perlis, Terengganu, Kedah and Pahang where they make up 88 to 95 percent of all enterprises.
A total of 45 percent of the SMEs are less than five years old. Only 12 percent of the SMEs are more than20 years old suggesting that many establishments have either exited or graduated to become largerfirms. In contrast, a total of 60 percent of the large establishments are more than ten years old. There isa big productivity gap between the SMEs and the large firms. In 2010, SME productivity per worker wasestimated to have averaged RM47 000, about one-third of large establishments (RM148 000) (SME Corp,2012). Internationally, SMEs in Singapore are four times more productive than Malaysian SMEs, whereasSMEs in the United States are seven times more productive. In terms of the number of SMEs establishedyearly, data show that an average of 239 372 of SMEs (or 83 percent of the total businesses) were formedbetween 2004 and 2011 and can be considered robust compared to other developing countries.
As shown in Table 2, SMFEs account for only 1 percent (5 925 establishments) compared to themanufacturing SMEs (7.2 percent). Disaggregating the SMFEs into firm size categories, most of the SMFEsestablishments are micro-scale enterprises (55 percent) whereas small- and medium-scale enterprisesconstitute about 37 percent and 8 percent, respectively.
Table 2. Profile and SMFEs contribution to output and GDP (value added) in 2003
Number of Output Value addedOutput per Value added
Item establishments (RM million) (RM million)establishment per output
(RM million) (RM million)
(1) (2) (3) (4) (5)
Total economy 552 804 992 573 386 378 1.80 0.39
Non-SMEs 4 537 611 320 226 967 134.74 0.37
Total SMEs 548 267 381 253 159 411 0.70 0.42
Manufacturing SMEs 39 373 154 743 45 760 3.93 0.30
SMFEs 5 925 41 346 7 614 6.98 0.18
Micro 3 266 746 286 0.23 0.38
Small 2 212 10 969 2 284 4.96 0.21
Medium 447 29 632 5 044 66.29 0.17
Source: Department of Statistics Malaysia (2006) and authors’ calculations.
SMFEs’ contribution to the economy
SMEs in Malaysia have evolved to become key suppliers and service providers to large corporations. Theirroles are crucial in expanding output, providing value-added activities in the manufacturing sector,creating employment and broadening Malaysia’s output or products (UNDP, 2007). Based on the dataavailable, the economic contribution of SMEs, with a special reference to SMFEs, can be measured usingfive main indicators, i.e. size, output, GDP, employment and remuneration (salaries and wages). In viewof data unavailability, other meaningful indicators such as external (exports) and internal demand couldnot be estimated.
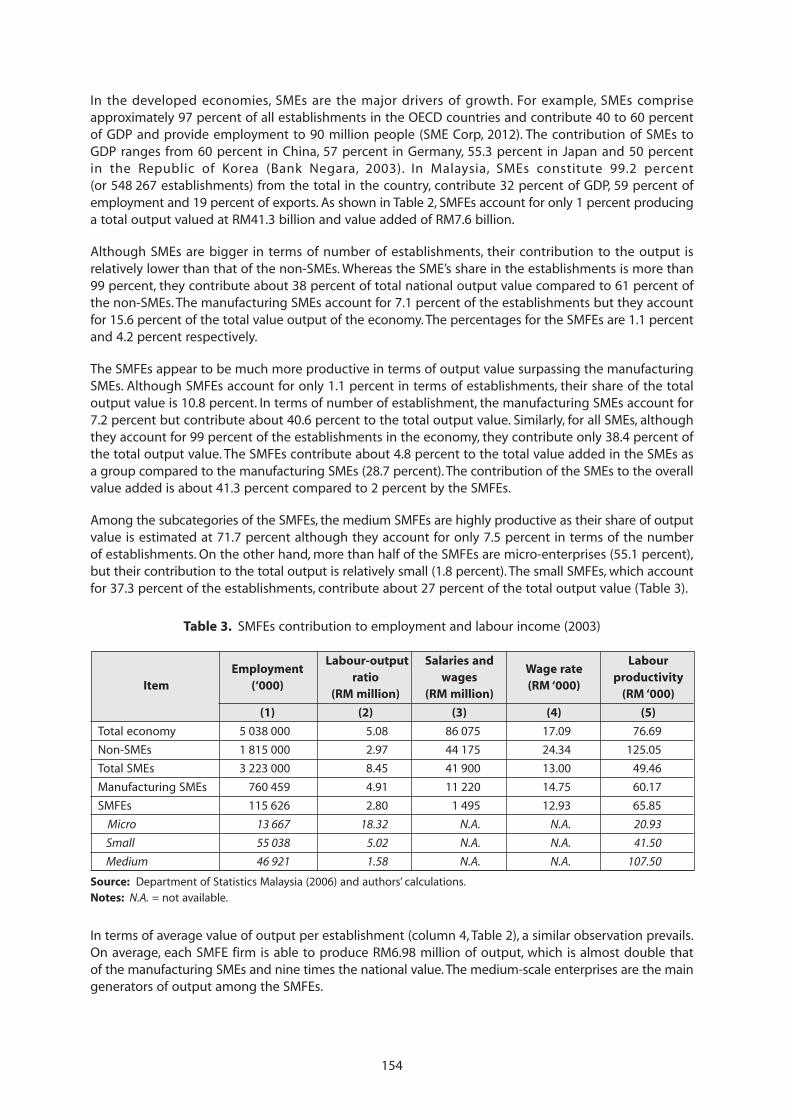
154
In the developed economies, SMEs are the major drivers of growth. For example, SMEs compriseapproximately 97 percent of all establishments in the OECD countries and contribute 40 to 60 percentof GDP and provide employment to 90 million people (SME Corp, 2012). The contribution of SMEs toGDP ranges from 60 percent in China, 57 percent in Germany, 55.3 percent in Japan and 50 percentin the Republic of Korea (Bank Negara, 2003). In Malaysia, SMEs constitute 99.2 percent(or 548 267 establishments) from the total in the country, contribute 32 percent of GDP, 59 percent ofemployment and 19 percent of exports. As shown in Table 2, SMFEs account for only 1 percent producinga total output valued at RM41.3 billion and value added of RM7.6 billion.
Although SMEs are bigger in terms of number of establishments, their contribution to the output isrelatively lower than that of the non-SMEs. Whereas the SME’s share in the establishments is more than99 percent, they contribute about 38 percent of total national output value compared to 61 percent ofthe non-SMEs. The manufacturing SMEs account for 7.1 percent of the establishments but they accountfor 15.6 percent of the total value output of the economy. The percentages for the SMFEs are 1.1 percentand 4.2 percent respectively.
The SMFEs appear to be much more productive in terms of output value surpassing the manufacturingSMEs. Although SMFEs account for only 1.1 percent in terms of establishments, their share of the totaloutput value is 10.8 percent. In terms of number of establishment, the manufacturing SMEs account for7.2 percent but contribute about 40.6 percent to the total output value. Similarly, for all SMEs, althoughthey account for 99 percent of the establishments in the economy, they contribute only 38.4 percent ofthe total output value. The SMFEs contribute about 4.8 percent to the total value added in the SMEs asa group compared to the manufacturing SMEs (28.7 percent). The contribution of the SMEs to the overallvalue added is about 41.3 percent compared to 2 percent by the SMFEs.
Among the subcategories of the SMFEs, the medium SMFEs are highly productive as their share of outputvalue is estimated at 71.7 percent although they account for only 7.5 percent in terms of the numberof establishments. On the other hand, more than half of the SMFEs are micro-enterprises (55.1 percent),but their contribution to the total output is relatively small (1.8 percent). The small SMFEs, which accountfor 37.3 percent of the establishments, contribute about 27 percent of the total output value (Table 3).
Table 3. SMFEs contribution to employment and labour income (2003)
Employment Labour-output Salaries and
Wage rateLabour
Item (‘000)ratio wages
(RM ‘000)productivity
(RM million) (RM million) (RM ‘000)
(1) (2) (3) (4) (5)
Total economy 5 038 000 5.08 86 075 17.09 76.69
Non-SMEs 1 815 000 2.97 44 175 24.34 125.05
Total SMEs 3 223 000 8.45 41 900 13.00 49.46
Manufacturing SMEs 760 459 4.91 11 220 14.75 60.17
SMFEs 115 626 2.80 1 495 12.93 65.85
Micro 13 667 18.32 N.A. N.A. 20.93
Small 55 038 5.02 N.A. N.A. 41.50
Medium 46 921 1.58 N.A. N.A. 107.50
Source: Department of Statistics Malaysia (2006) and authors’ calculations.Notes: N.A. = not available.
In terms of average value of output per establishment (column 4, Table 2), a similar observation prevails.On average, each SMFE firm is able to produce RM6.98 million of output, which is almost double thatof the manufacturing SMEs and nine times the national value. The medium-scale enterprises are the maingenerators of output among the SMFEs.
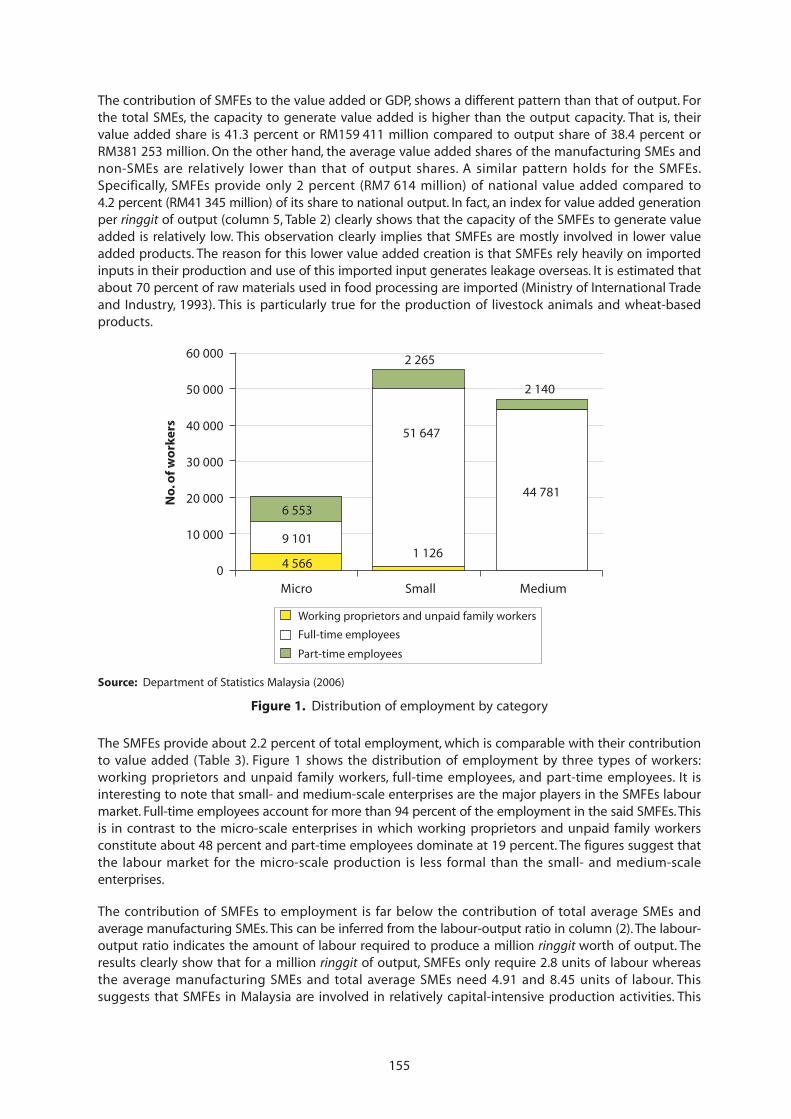
155
The contribution of SMFEs to the value added or GDP, shows a different pattern than that of output. Forthe total SMEs, the capacity to generate value added is higher than the output capacity. That is, theirvalue added share is 41.3 percent or RM159 411 million compared to output share of 38.4 percent orRM381 253 million. On the other hand, the average value added shares of the manufacturing SMEs andnon-SMEs are relatively lower than that of output shares. A similar pattern holds for the SMFEs.Specifically, SMFEs provide only 2 percent (RM7 614 million) of national value added compared to4.2 percent (RM41 345 million) of its share to national output. In fact, an index for value added generationper ringgit of output (column 5, Table 2) clearly shows that the capacity of the SMFEs to generate valueadded is relatively low. This observation clearly implies that SMFEs are mostly involved in lower valueadded products. The reason for this lower value added creation is that SMFEs rely heavily on importedinputs in their production and use of this imported input generates leakage overseas. It is estimated thatabout 70 percent of raw materials used in food processing are imported (Ministry of International Tradeand Industry, 1993). This is particularly true for the production of livestock animals and wheat-basedproducts.
Source: Department of Statistics Malaysia (2006)
Figure 1. Distribution of employment by category
4 566 1 126
9 101
51 647
44 781
6 553
2 265
2 140
10 000
0
20 000
30 000
40 000
50 000
60 000
Micro Small Medium
No.
of
wo
rker
s
Working proprietors and unpaid family workers
Full-time employees
Part-time employees
The SMFEs provide about 2.2 percent of total employment, which is comparable with their contributionto value added (Table 3). Figure 1 shows the distribution of employment by three types of workers:working proprietors and unpaid family workers, full-time employees, and part-time employees. It isinteresting to note that small- and medium-scale enterprises are the major players in the SMFEs labourmarket. Full-time employees account for more than 94 percent of the employment in the said SMFEs. Thisis in contrast to the micro-scale enterprises in which working proprietors and unpaid family workersconstitute about 48 percent and part-time employees dominate at 19 percent. The figures suggest thatthe labour market for the micro-scale production is less formal than the small- and medium-scaleenterprises.
The contribution of SMFEs to employment is far below the contribution of total average SMEs andaverage manufacturing SMEs. This can be inferred from the labour-output ratio in column (2). The labour-output ratio indicates the amount of labour required to produce a million ringgit worth of output. Theresults clearly show that for a million ringgit of output, SMFEs only require 2.8 units of labour whereasthe average manufacturing SMEs and total average SMEs need 4.91 and 8.45 units of labour. Thissuggests that SMFEs in Malaysia are involved in relatively capital-intensive production activities. This
156
argument is further supported by the fact that the salaries and wages component (payment to labour)constitutes only 20 percent of total value added (whereas another 80 percent of value added goes tocapital).
Labour productivity measures how much output can be produced for a unit of labour. In practice, labourproductivity is calculated by taking a ratio between value added (monetary unit) and total number oflabour (value added/labour). Table 3 shows that SMFEs achieve the highest productivity comparedto the total average of all SMEs and manufacturing SMEs. Each unit of labour in the SMFEs producesRM65.85 thousand worth of output. There is also a positive relationship between labour productivity andsize of firms. Larger firms tend to indicate higher labour productivity.
A major concern about wages (or more accurately labour compensation) is whether it is consistent withthe level of productivity. The relation between productivity and wages has been a source of substantialcontroversy because of its inherent importance. Productivity and wages are key determinants of thestandard of living of the employed population as well as of the distribution of income between labourand capital. Usually, the wages paid by a competitive firm should rise at the same rate as the rise inlabour productivity. To investigate this issue, we calculated wage rates that were defined as wages perlabour in column (4). Relating the results in columns (4) and (5), it shows that the wages paid by theSMFEs are below the level of productivity in a relative measure. For example, the productivity of SMFEsis 9 percent higher than the average manufacturing SMEs but their wage rate is 12 percent lower thanthe latter.
3. Status of small-scale food processing
This section gives a short overview of the major categories of SMFEs that make up more than 80 percentof the total number of establishments in this sector. They are mainly involved in producing fish and fishproducts, livestock and livestock products, fruits and vegetables, and cocoa-based products.
Processed livestock products. Chicken meat contributes 60 percent to the total production ofprocessed meats. Major processed meat products are sausages, burgers, nuggets, meatballs and floss, andcanned meat. There is also an increasing trend towards the production of convenience foods, mainlychilled and frozen foods, including pre-cooked and retort pouch products. They are produced both forhome consumption as well as exports. The export value of processed poultry meat increased from RM38million in 1990 to RM58 million in 2006.
Processed fisheries products. The fisheries products produced include processed fish and seafoodproducts such as frozen and canned fish, crustaceans and molluscs, surimi and surimi products. Otherpopular items that are commonly produced in rural areas are dried fish crackers, salted dried fish andfermented fish. The total value of sales increased from RM1 billion in 2008 to RM1.2 billion in 2011 (DoSM,2012). The value of prepared/preserved fish exports has increased from RM139 million in 2000 to RM228million in 2008 indicating an increase of more than 60 percent. However the export of shrimps hasdecreased by 23 percent from RM144 million to RM121 million during the said period (GTIS, 2009).
Processed fruits. Pittaya or dragon fruit has contributed to the manufacture of value-added productssuch as juices and colouring. Fruits such as jackfruit, banana and papaya are utilized for the productionof snack foods whereas noni and roselle are used to produce health products. Canning is mainlyundertaken for pineapples and pineapple juice. Although in general Malaysia is a net importer of fruits,there are processed products that show surpluses such as processed and preserved fruits and fruit juice.
Processed vegetables. Most vegetables are grown for fresh consumption. However, there are somevegetables such as chili, tomatoes and peas that are processed in the form of sauces, canned or frozen.The main problem in vegetable processing is the shortage of raw materials. For example, many small-scale entrepreneurs in the production of chili-based products have to depend on imported dried chilifrom India or China. Similarly, tomato puree, which is the main ingredient for tomato sauce is importedfrom the United States of America (USA), China and Canada.
157
Cocoa products. Malaysia is the largest cocoa processing (cocoa grinder) country in Asia and it iscurrently ranked fourth in the world. However, there is increasing dependence on imports of cocoa beans,in particular from Indonesia and Ghana, to support the production of cocoa. Cocoa butter is processedfor export whereas cocoa powder and chocolate are sold in the domestic market. The total sales of cocoaproducts increased from RM3.7 billion in 2008 to RM4.6 billion in 2011 (DoSM, 2012b).
Cereals. Malaysia is a net importer of rice amounting to 1.85 million tonnes, which is equivalent to30 percent of its domestic requirement. Other cereals imported include corn (mainly as feedstuff for thelivestock industry) and wheat (for bakeries). The trade data show that the exports of the “Preparationsof Cereals, Flour, Starch or Milk; Bakers’ Wares” increased from RM0.4 billion in 1997 to RM2.3 billion in2009. The trade surplus is estimated at RM898 million. The types of products exported includebread, pastry, cakes, biscuits and other bakers’ wares. This category of products indicates a surplus ofRM280 million. The total sales value of flour produced reduced from RM2 billion in 2008 to aboutRM1.9 billion in 2011 whereas the sales of biscuits have increased from RM0.88 billion to RM1 billion inthe same period (DoSM, 2012b).
4. External forces that shape the SMFE sector in Malaysia
According to the survey carried by Bank Negara (2008), because of their small size, the majority of theSMEs cater mainly for the domestic market. Only 8 percent of the SMEs export their products. However,as for food products, trade data show that some products show significant growth in exports. The tradedata from DoSM indicate that the exports of food items such as fisheries products, cereals preparations(foods), edible preparations and beverages have shown tremendous export growth. For instance, cocoaand cocoa preparations, edible preparations has each registered an annual rate of growth of 15 percentbetween 1997 and 2008 (GTIS, 2009). However in the international arena, Malaysia’s food products facemany challenges and hindrances.
Globalization opens up trade and enhances competitiveness among nations. Market liberalization, freetrade agreements (FTA) at regional or international levels have intensified not only the trade volume butalso competition. However, to struggling SMEs, globalization and trade liberalization prove to be roughbattlegrounds as efficiency and competitive edge rule the trade, traits that most of Malaysia’s SMEs andSMFEs do not have. Globalization opens up new emerging economies in the Far East and South Asia aswell as in the ASEAN region. China has emerged as the economic powerhouse of the world with its massproduction of cheap and competitive products. At the same time India is emerging as the new ICTsuperpower in the region which gives an extra edge to their SMEs. Viet Nam and other ASEAN countriesare becoming popular destinations for international Foreign Direct Investment (FDI), which further helpsthe growth of their SMEs. Most of the ASEAN competitors (particularly Indonesia and Thailand) areproducing more or less similar products to Malaysia’s food products, but are labour intensive and hencecheaper and price competitive.
The other major trade challenges that are at times insurmountable to the local SMFEs are the tariff andnon-tariff barriers set by the consuming countries, particularly in the developed economies. The strictphytosanitary requirements for instance are a big challenge to the local SMFEs to meet because of lackof technology as well as capital to invest in product quality and certification.
The volatility of the world economy in the last decade affected the SMEs to some extent though not asdisastrously as the other sectors, particularly the financial sector. The survey carried out by the SME Corpand the Federation of Malaysian Manufacturers in 2008 indicated that the SMEs at large were notseriously affected by the 2008 crisis (NSDC, 2011). However, the 2009 crisis proved otherwise, in thatabout 77 percent of the SMEs surveyed stated that they were badly affected by the contraction ofdemand because of the crisis. However, by 2010, almost all of them had recovered from the crisis.Although the SMEs showed resilience during the crisis periods, what lies ahead could pose a seriouschallenge to the sustainability of the SMFEs. This is because volatility is expected to be a market normin the future because the speed of information flow worldwide encourages speedy responses fromplayers creating violent price swings. As Malaysia’s SMFEs rely on imports for most of its inputs, theseprice swings may affect their capacity to remain in the industry.
158
5. Government policy and legal frameworks
This section looks at the government policy and the legal frameworks affecting SMEs in Malaysia. Fong(1990) gives a brief but comprehensive evolution of the policy towards SMEs in Malaysia up to the 1980sand concludes that a more positive assistance was accorded to SMIs by the late 1980s after a policy biastowards larger enterprises since independence. The bias for larger enterprises in terms of investmentsand employment was relaxed to promote the diversification and growth of the economy overall.
Legal framework
The Small and Medium Industries Development Corporation Act 1995 is the basic legislation affectingSMEs. This Act establishes the Small and Medium Industries Development Corporation (SMIDEC)(Section 3). According to Section 4, the members of SMIDEC comprise: (a) a Chairman; (b) a DeputyChairman who shall be a representative from the Ministry of International Trade and Industry;(c) a representative of the Ministry of Finance; (d) a representative of the Economic Planning Unit of thePrime Minister’s Department; (e) the Chief Executive Officer of the Corporation; and (f ) such othermembers, not exceeding six, as the Minister may determine. Except for the CEO, the members areappointed for a term not exceeding three years (Section 5).
Section 12 of the Act lists the functions of SMIDEC as to:
i. promote and co-ordinate the development of small and medium industries in Malaysia;ii. undertake studies related to the development of small and medium industries;
iii. undertake promotional activities in the country to promote the growth of small and mediumindustries;
iv. establish a comprehensive database and information system on small and medium industriesdevelopment programmes;
v. become the centre for collection, reference and dissemination of information related to smalland medium industries;
vi. provide technical support and management counseling services with the co-operation of otheragencies involved in the enhancement of small and medium industries;
vii. promote mutual co-operation among small and medium industries through amalgamation ofbusinesses, technical co-operation, establishment of mutual fund or co-operative enterprise andthe procurement of common equipment;
viii. encourage industrial linkages with large industries;
ix. promote human resource development in the small and medium industries; and
x. do all such matters as may be incidental to or consequential upon the discharge of itsfunctions, from time to time.
Another important feature of the Act is the establishment of the Small and Medium IndustriesDevelopment Fund (Section 18).
The Food Act 1983 (Act 281) is the parent legislation for food matters in Malaysia. Its objective is“to protect the public against health hazards and fraud in the preparation, sale and use of food, and formatters incidental thereto or connected therewith”. It is interesting to note that “food” is defined as “everyarticle manufactured, sold or represented for use as food or drink for human consumption or whichenters into or is used in the composition, preparation, preservation, of any food or drink and includesconfectionery, chewing substances and any ingredient of such food, drink, confectionery or chewingsubstances” whereas “animal” is defined as “any quadruped or bird either domesticated or otherwise, fish,reptile or insect, whole or part of which are used for human consumption”. Since they are definedseparately this has been interpreted as the exclusion of live animals in the meaning of food under theAct (Ismail, 2011, p. 5).The other legislations based on the Food Act include Food Regulations 1985 andFood Hygiene Regulations 2004.
159
Agro-industrial policy
Established in June 2004, The National SME Development Council (NSDC) is the highest policy-makingbody responsible for the development of SMEs in Malaysia. The objectives of the NSDC are to:(a) formulate broad policies and strategies, as well as provide direction for comprehensive andcoordinated development of SMEs across all sectors; and (b) oversee and guide overall SME developmentinitiatives to ensure effectiveness in policy implementation and outreach. The NSDC is chaired by thePrime Minister and other members who include the Ministers of the following ministries: the Ministryof International Trade and Industry (MITI), the Ministry of Finance (MOF), the Ministry of Agriculture andAgro-based Industry (MOA), the Ministry of Human Resources (MOHR), the Ministry of Science,Technology and Innovation (MOSTI), the Ministry of Rural and Regional Development (MRRD), theMinistry of Housing and Local Government (MHLG), the Ministry of Higher Education (MOHE), theMinistry of Tourism (MOTOUR), the Ministry of Domestic Trade, Cooperatives and Consumerism (MDTCC),the Ministry of Women Family and Community Development (MWFCD), the Ministry of PlantationIndustries and Commodities (MPIC), the Ministry of Industrial Development Sabah (MID SABAH),the Ministry of Industrial Development Sarawak (MID SARAWAK). Non-ministerial members include theChief Secretary to the Government, the Director-General of the Economic Planning Unit of the PrimeMinister’s Department (EPU), the Governor of the Bank Negara Malaysia (BNM), the Director-General ofPerbadanan Usahawan Nasional Berhad (PUNB) and the Chief Executive Officer of the MultimediaDevelopment Corporation (MDC).
The Bank Negara Malaysia served as the Secretariat to the Council until 2009 when SMIDEC wasupgraded to an Agency in October of that year and was renamed SME Corp Malaysia. The various policiesand programs are highlighted in the SME Development Blueprints for 2005, 2006, and 2007. Recently theBlueprint series was renamed the SME Integrated Plan of Action (SMEIPA).
Since the bulk of Malaysian enterprises are SMEs, policies with respect to SMEs must be aligned with thecountry’s overall economic policies. The latest policies are elaborated in the tenth five-year economic plan(RMK10), which incorporates the Government Transformation Program and the New Economic Model.
The RMK10 document refers to the need to develop SMEs as the engine of growth and innovation tocreate domestic, regional and global enterprises (pp. 94–99). Five initiatives were outlined: (1) reducingthe regulatory costs borne by SMEs; (2) building capacity and capabilities of SMEs; (3) supporting thecreation of an entrepreneurial culture; (4) strengthening support systems for SMEs; and (5) enhancingaccess to financing for SMEs.
The Government Transformation Program (GTP) refers to the New Economic Model (NEM) as the guideto the economic strategies of Malaysia (Sect 3.2.1, p. 56).The NEM document presents a series of structuralreform initiatives (SRI) to be undertaken for the nation’s transformation to achieve the aspirations of highincome nation status by 2020. The SRIs are: (1) re-energizing the private sector; (2) developing a qualityworkforce and reducing dependency on foreign labour; (3) creating a competitive domestic economy;(4) strengthening the public sector; (5) transparent and market-friendly affirmative action; (6) buildingthe knowledge base and infrastructure; (7) enhancing the sources of growth; and (8) ensuringsustainability of growth.
Even though all initiatives can affect SMEs as business enterprises, SME is specifically mentioned in SRI1(Re-energizing the private sector) as the need to promote SME growth. Two possible policy measuresconcern the provision of support for SMEs in innovative and technologically advanced areas and thefacilitation of timely access to funding for business activities (p.19).
The SME development framework consists of three strategic thrusts. The first is to strengthen enablinginfrastructure, which includes physical infrastructure such as business premises and facilities, as well asregulatory and information infrastructure. The second is to enhance the capacity and capability of humancapital. These require upscaling of skills and knowledge and the entrepreneurial capabilities of thoseinvolved. The final thrust is to enhance continued access to financing. The measures include theestablishment of special funds and the development of financial institutions focused on SMEs.
160
In April 2011 the Cabinet endorsed the first phase of the SME Master Plan (2012–2020). Monitoring ofall SME development programs under the various Ministries and Agencies will be made more transparentvia the online Annual SME Integrated Plan of Action (SMEIPA).
Food safety regulations
Since the passage of the Food Act 1983, several regulations pertaining to food have been passed inMalaysia. These include Food Regulations 1985, Food (extensions of the Food Act 1983 to tobacco andothers) Regulations 1993, Control of Tobacco Product Regulations 2004, Food (Issuance of HealthCertificate for Export of Fish and Fish Products to the European Union) Regulations 2009 and FoodHygiene Regulations 2009. More recently the Food Analyst Act 2011 (Act 727) establishing the Councilof Food Analysts was passed.
The National Food Safety and Nutrition Council (NFSNC). NFSNC is the highest national advisory bodythat provides advice related to food safety and nutrition in Malaysia. It was established on 21 March 2001superseding the National Nutrition Council, which was part of the National Nutrition Action Plan in theSeventh Malaysia Plan (1996–2000). The objectives are to ensure the health of the people bystrengthening food safety at all levels of the food supply chain in the country and to ensure Malaysiansachieve optimum nutrition status.
The NFSNC is chaired by the Minister of Health, Malaysia, with 48 members comprising 16 Secretary-Generals of the Ministries, 25 Director-Generals of Agencies, the Attorney General and Presidents of FMM,FOMCA, Malaysian Institute of Food Technology (MIFT), Nutrition Society of Malaysia (NSM), MalaysianAssociation of Environmental Health (MAEH), and the Malaysian Institute of Chemistry. The Secretariatis located in the Food Safety Committee of the Food Safety and Quality Division of the Ministry of Health.The two main committees in the NFSNC are the Food Safety Main Committee and the NationalCoordinating Committee for Food and Nutrition (NCCFN). The Nutrition Technical Working Group (NTWG)is under the latter whereas the Food Analysis Committee is under the former. To date, the NFSNC hasissued the National Food Safety Policy, National Food Safety Action Plan (2006–2009), National FoodSafety Action Plan (2010–2020), National Food Analysis Action Plan, National Nutrition Policy, NationalNutrition Action Plan II (2006–2015) and the Model on National Collaboration in Food Safety along thefood supply chain.
Competitiveness issues
Numerous and diverse factors determine the competitiveness of a nation. These range from a soundinstitutional environment that protects the property rights of intellectual contributions, fair and justadministrative and judicial systems free from corruption, a sound macro-economic environment forgrowth to factors influencing microproductivity levels such as education and training.
The APO groups various initiatives to improve competitiveness into six areas: promotion ofentrepreneurial culture; administrative environmental framework; entrepreneurship training andeducation; network and linkages for SME development; technology and ICT development; financialsupport; and advancing responsible business practices.
In Malaysia, the programs affecting SMEs cut across almost all the ministries and agencies under them.All of the programs are listed in the Annual Reports of SME Corp Malaysia. In 2011 there were218 programs grouped into the three strategic thrust areas of building capacity and capability(143 programs), strengthening enabling infrastructure (18 programs); and enhancing access to financing(57 programs). The corresponding figures for 2010 were 151 total programs grouped into buildingcapacity and capability (81 programs); strengthening enabling infrastructure (33 programs); andenhancing access to financing (37 programs).
More recently, SME Corp unveiled the SME Master Plan 2012–2020 with the overall vision of creating“globally competitive SMEs across all sectors that enhance wealth creation and contribute to the socialwell-being of the nation”. This vision is to be realized by increasing business formation, expanding the
161
number of high-growth innovative firms, increasing productivity and intensifying formalization of theeconomy. The areas of focus are innovation and technology adoption; human capital development;access to financing; market access; the legal and regulatory environment, and infrastructure. The macrotargets to be achieved are: (i) to increase the contribution of the sector to GDP to 41 percent in 2020(compared to 32 percent in 2010); (ii) 62 percent share of employment (compared to 59 percent in 2010);and 25 percent share of exports (compared to 19 percent in 2010).
It highlights 32 initiatives grouped into six High-Impact Programs and four themes of (i) promoteresource pooling and shared services to overcome scale disadvantages (three initiatives); (ii) createdemand for SME products for greater market access (three initiatives); (iii) reduce information asymmetryto enhance opportunities (four initiatives); (iv) building capacity through knowledge acquisition and skillsupgrade (four initiatives); and five initiatives for East Malaysia; and other supporting measures (seveninitiatives). All the programs within the initiatives are expected to increase business formation, expandthe number of high growth and innovative firms, raise productivity and/or intensify formalization.
6. Status of the national institutional infrastructure
Good institutional infrastructure is a prerequisite to any SME development. This section provides anoverview of the major institutions that are crucial to enhancing the performance of SMEs .
Research and development and technology
In terms of R&D, Malaysia has shown some progress. In 2006, the ratio of R&D to GDP for Malaysia was0.6 percent and this increased to 0.82 percent in 2008, which is higher than that of Thailand(0.21 percent), Philippines (0.1 percent) and India (0.7 percent), but lower than Singapore (2.6 percent),United States (2.7 percent) and Japan6 (3.4 percent) (World Bank, 2012). Malaysia’s R&D expenditures arelargely generated through government budgetary allocation, which accounts for 64 percent. The threemain fields of research are information and communications technology (ICT) (62 percent), engineeringsciences (10.8 percent) and agricultural sciences (5.8 percent) (MOSTI, 2012). In 2008, Malaysia had a totalof 31 442 researchers and 40 840 R&D personnel. The total number of researchers per 10 000 labour forcewas 28.5 and R&D expenditure per R&D personnel was RM148 648. In terms of research institutions, thereare 52 government agencies and research institutions, 37 institutions of higher learning and 944 privatecompanies. The premier research institution for food and agriculture in the country is the MalaysianAgricultural Research and Development Institute (MARDI), which carries out R&D on scientific, technical,economic and sociological issues related the production, processing and use of crops (excluding palmoil, cocoa and rubber) and livestock. In general, the number of innovations resulting from R&D in Malaysiais small and there is poor collaboration between the universities and industries and a low rateof commercialization. In 2011, the rate of commercialization among the public universities wasabout 5.1 percent of R&D grants. This is considered low as the international standard for the rate ofcommercialization of R&D is 10 per cent (Chandran et al., 2009).
In terms of R&D among SMEs, the picture is not very rosy. Generally SMEs conduct very little researchor produce innovative technology. In terms of total national R&D expenditure, businesses with revenueunder RM10 million, account for only 9 percent of research expenditures. This is largely because a largepercentage of SMEs (86 percent) is concentrated in the services sector and also because of their limitedcapability. According to DoSM (2006), the range of R&D investment in the Malaysian manufacturingsector is below 2 percent. The capital intensive industries tend to have higher investment rates in R&Dwhereas resource based and labour intensive sectors such as food tend to have a lower R&D investmentrate. For example, the R&D expenditure as a percentage of the total intermediate input in the food andbeverages subsector stands at 0.04 percent compared to the highest (1.13 percent) for the motor,vehicles, trailers and semi-trailers subsectors. Only 46 percent of the firms in the food and beveragescategory are involved in innovations and most of them are product and process innovations (Chandranet al., 2009).
6 Data for Thailand, Philippines, India, Singapore refer to 2007, whereas the data for Japan refer to 2008 (World Bank, 2012).
162
Generally, there are not many food processing technologies that Malaysia can be proud of with theexception of the home grown milling and refining engineering of crude palm oil. Generally, the level oftechnology in the food manufacturing subsector is less advanced than that of other countries in theASEAN region, particularly Thailand. There are a number of reasons for this. Fundamentally, Malaysia isa net food importer as it is cheaper to import rather than produce locally. Hence, there is not enoughimpetus or need to innovate. Secondly, the focus on the industrialization process in the 1980s and 1990shas marginalized the food sector as few resources were channelled into R&D and relevant infrastructuraldevelopment. The agricultural and food subsectors were given a new lease of life under the RMK10 aswell as under the new Economic Transformation Plan. As R&D takes a long time to produce majorinnovations, the recent re-emphasis on food is yet to see results.
Human resource capacity
In terms of labour force education and skill, Malaysia lags behind Singapore and other advanced Asiancountries. The labour force that has undergone tertiary education accounted for 23.4 percent of the totalin 2007 compared to 35.9 percent in Singapore (World Bank, 2008). Education expenditures haveaveraged 17 percent of total public expenditure and about 5 percent of GDP. Primary school enrollmentis almost 100 percent and 68 percent of students attend secondary school. Only 20 percent of the tertiarystudents enroll in graduate programs. Malaysia has only about 4 000 Ph.D. holders and about half aregraduates from overseas. About 27 percent of students graduating from local higher educationinstitutions in 2009 remained unemployed six months after completion of their studies. Of thegraduating students who were employed, 29 percent in 2006 and 33 percent in 2000 earned less thanRM1 500 per month (Malaysia, 2010). There is a sizeable gap between the competency level of graduatesand comparable international standards. It is estimated that 100 000 or 22 percent of Malaysian studentsin 2009 entered the workforce directly upon completion of only 11 years of schooling after achievingMalaysian Certificate of Education (SPM). In short, the Malaysian workforce remains relatively unskilled,with 77 percent educated only up to 11 years of basic education at the SPM level or equivalent, and only28 percent secured jobs in the higher skilled bracket.
The education system has failed somewhat in producing the “right” skills that match the industry needs,resulting in a mismatch between supply and demand. This is attributed to the lack of industryperspective in the curriculum, including up-to-date industry knowledge as well as poor linkages betweenthe institutions of higher learning and industry. This has affected the quality of students from universities,colleges, technical schools and polytechnics. The jobs at the SMEs are perceived “undesirable” becauseof the low wages and this has limited the size of the quality workforce available to SMEs.
The labour requirements in the SMEs sector concentrate on semi- as well low-level skilled labour becausethe production processes are not capital intensive. But the supply of such workers is fairly limitedbecause of the stronger pull of better wages in other sectors. Hence, the SMEs have to resort to cheapimmigrant labour from Indonesia, Bangladesh and Myanmar. The agricultural sector employed thehighest number of immigrants in 2010 with about 32 percent of the total, followed by construction(14 percent) and services (12 percent), wholesale and retail (11 percent) and accommodation servicessuch as hotels (7 percent) (World Bank 2013). In the absence of data, it is most probable that the majorityof the workers in the SMFEs are low-skilled workers as 59.4 percent of the businesses are micro-enterprises (largely family run) and small-scale businesses.
In terms of productivity, sectors that have a high dependence on foreign labour have low productivity.For example, the construction sector’s productivity is estimated as RM21 000, the agriculture sector’s asRM26 000 and the manufacturing sector’s as RM58 000. Malaysia’s dependence on low-cost unskilledforeign workers, has depressed wages and hampered the move of firms to higher value-added activities.The influx of low-skilled foreign labour has doubled since 2000 to 1.9 million in 2010. The abundanceof cheap labour has discouraged moves towards automation and mechanization and innovationparticularly in manufacturing and agriculture.
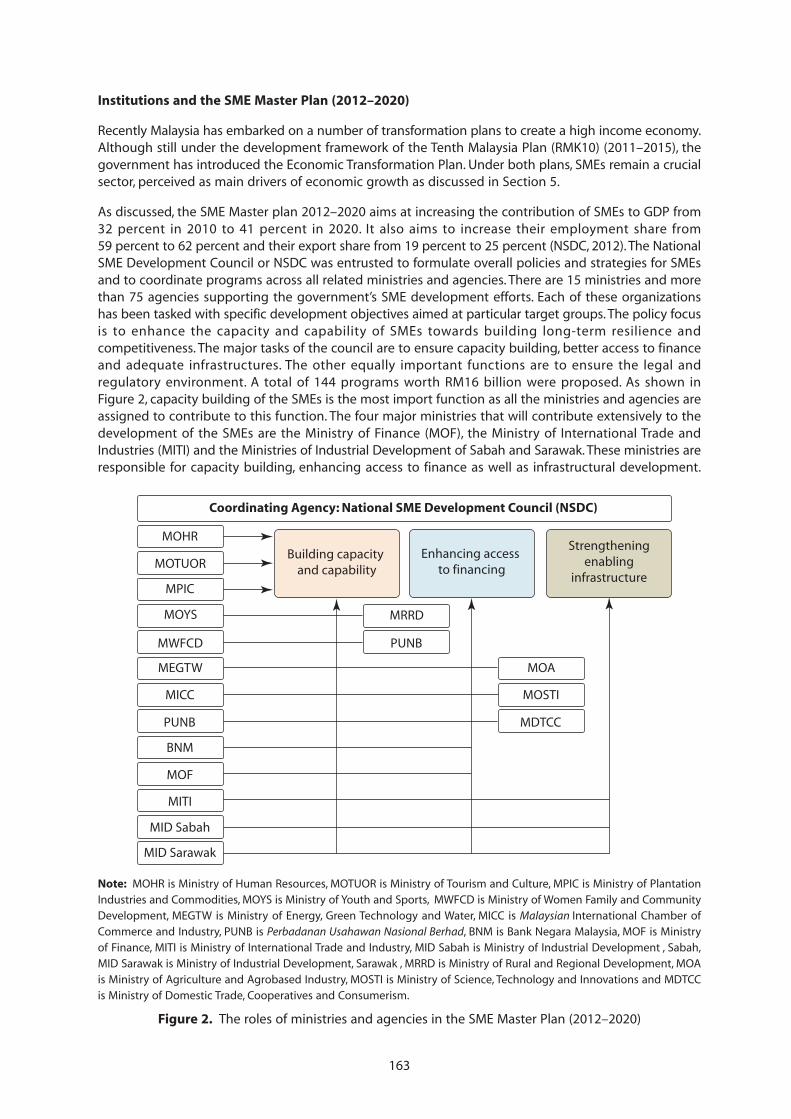
163
Institutions and the SME Master Plan (2012–2020)
Recently Malaysia has embarked on a number of transformation plans to create a high income economy.Although still under the development framework of the Tenth Malaysia Plan (RMK10) (2011–2015), thegovernment has introduced the Economic Transformation Plan. Under both plans, SMEs remain a crucialsector, perceived as main drivers of economic growth as discussed in Section 5.
As discussed, the SME Master plan 2012–2020 aims at increasing the contribution of SMEs to GDP from32 percent in 2010 to 41 percent in 2020. It also aims to increase their employment share from59 percent to 62 percent and their export share from 19 percent to 25 percent (NSDC, 2012). The NationalSME Development Council or NSDC was entrusted to formulate overall policies and strategies for SMEsand to coordinate programs across all related ministries and agencies. There are 15 ministries and morethan 75 agencies supporting the government’s SME development efforts. Each of these organizationshas been tasked with specific development objectives aimed at particular target groups. The policy focusis to enhance the capacity and capability of SMEs towards building long-term resilience andcompetitiveness. The major tasks of the council are to ensure capacity building, better access to financeand adequate infrastructures. The other equally important functions are to ensure the legal andregulatory environment. A total of 144 programs worth RM16 billion were proposed. As shown inFigure 2, capacity building of the SMEs is the most import function as all the ministries and agencies areassigned to contribute to this function. The four major ministries that will contribute extensively to thedevelopment of the SMEs are the Ministry of Finance (MOF), the Ministry of International Trade andIndustries (MITI) and the Ministries of Industrial Development of Sabah and Sarawak. These ministries areresponsible for capacity building, enhancing access to finance as well as infrastructural development.
Note: MOHR is Ministry of Human Resources, MOTUOR is Ministry of Tourism and Culture, MPIC is Ministry of PlantationIndustries and Commodities, MOYS is Ministry of Youth and Sports, MWFCD is Ministry of Women Family and CommunityDevelopment, MEGTW is Ministry of Energy, Green Technology and Water, MICC is Malaysian International Chamber ofCommerce and Industry, PUNB is Perbadanan Usahawan Nasional Berhad, BNM is Bank Negara Malaysia, MOF is Ministryof Finance, MITI is Ministry of International Trade and Industry, MID Sabah is Ministry of Industrial Development , Sabah,MID Sarawak is Ministry of Industrial Development, Sarawak , MRRD is Ministry of Rural and Regional Development, MOAis Ministry of Agriculture and Agrobased Industry, MOSTI is Ministry of Science, Technology and Innovations and MDTCCis Ministry of Domestic Trade, Cooperatives and Consumerism.
Figure 2. The roles of ministries and agencies in the SME Master Plan (2012–2020)
Coordinating Agency: National SME Development Council (NSDC)
MOHR
MOTUOR
MPIC
MOYS
MWFCD
MRRD
PUNB
MEGTW
MICC
PUNB
MOA
MOSTI
MDTCC
BNM
MOF
MITI
MID Sabah
MID Sarawak
Building capacity and capability
Enhancing access to financing
Strengthening enabling
infrastructure
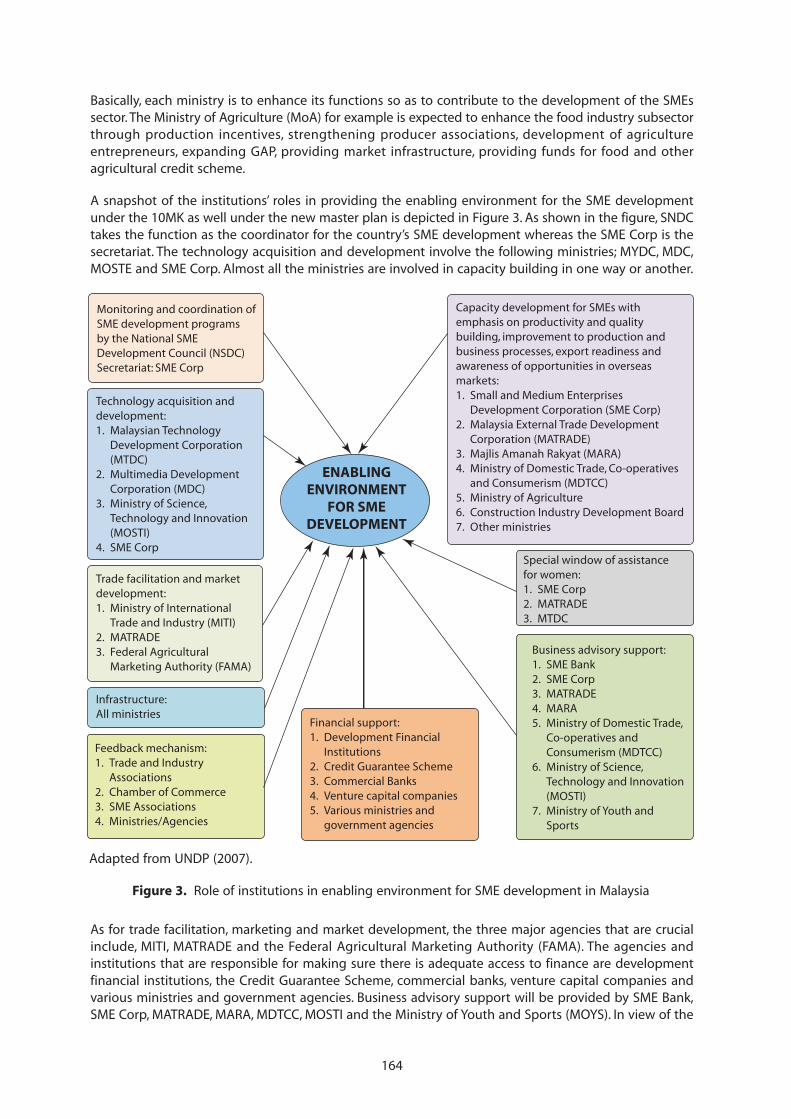
164
Basically, each ministry is to enhance its functions so as to contribute to the development of the SMEssector. The Ministry of Agriculture (MoA) for example is expected to enhance the food industry subsectorthrough production incentives, strengthening producer associations, development of agricultureentrepreneurs, expanding GAP, providing market infrastructure, providing funds for food and otheragricultural credit scheme.
A snapshot of the institutions’ roles in providing the enabling environment for the SME developmentunder the 10MK as well under the new master plan is depicted in Figure 3. As shown in the figure, SNDCtakes the function as the coordinator for the country’s SME development whereas the SME Corp is thesecretariat. The technology acquisition and development involve the following ministries; MYDC, MDC,MOSTE and SME Corp. Almost all the ministries are involved in capacity building in one way or another.
Adapted from UNDP (2007).
Figure 3. Role of institutions in enabling environment for SME development in Malaysia
ENABLINGENVIRONMENT
FOR SMEDEVELOPMENT
Monitoring and coordination of SME development programs by the National SME Development Council (NSDC)Secretariat: SME Corp
Technology acquisition and development:1. Malaysian Technology
Development Corporation (MTDC)
2. Multimedia Development Corporation (MDC)
3. Ministry of Science, Technology and Innovation (MOSTI)
4. SME Corp
Trade facilitation and market development:1. Ministry of International
Trade and Industry (MITI)2. MATRADE3. Federal Agricultural
Marketing Authority (FAMA)
Infrastructure:All ministries
Feedback mechanism:1. Trade and Industry
Associations2. Chamber of Commerce3. SME Associations4. Ministries/Agencies
Financial support:1. Development Financial
Institutions2. Credit Guarantee Scheme3. Commercial Banks4. Venture capital companies5. Various ministries and
government agencies
Business advisory support:1. SME Bank2. SME Corp3. MATRADE4. MARA5. Ministry of Domestic Trade,
Co-operatives and Consumerism (MDTCC)
6. Ministry of Science, Technology and Innovation (MOSTI)
7. Ministry of Youth and Sports
Capacity development for SMEs with emphasis on productivity and quality building, improvement to production and business processes, export readiness and awareness of opportunities in overseas markets:1. Small and Medium Enterprises
Development Corporation (SME Corp)2. Malaysia External Trade Development
Corporation (MATRADE)3. Majlis Amanah Rakyat (MARA)4. Ministry of Domestic Trade, Co-operatives
and Consumerism (MDTCC)5. Ministry of Agriculture6. Construction Industry Development Board7. Other ministries
Special window of assistance for women:1. SME Corp2. MATRADE3. MTDC
As for trade facilitation, marketing and market development, the three major agencies that are crucialinclude, MITI, MATRADE and the Federal Agricultural Marketing Authority (FAMA). The agencies andinstitutions that are responsible for making sure there is adequate access to finance are developmentfinancial institutions, the Credit Guarantee Scheme, commercial banks, venture capital companies andvarious ministries and government agencies. Business advisory support will be provided by SME Bank,SME Corp, MATRADE, MARA, MDTCC, MOSTI and the Ministry of Youth and Sports (MOYS). In view of the
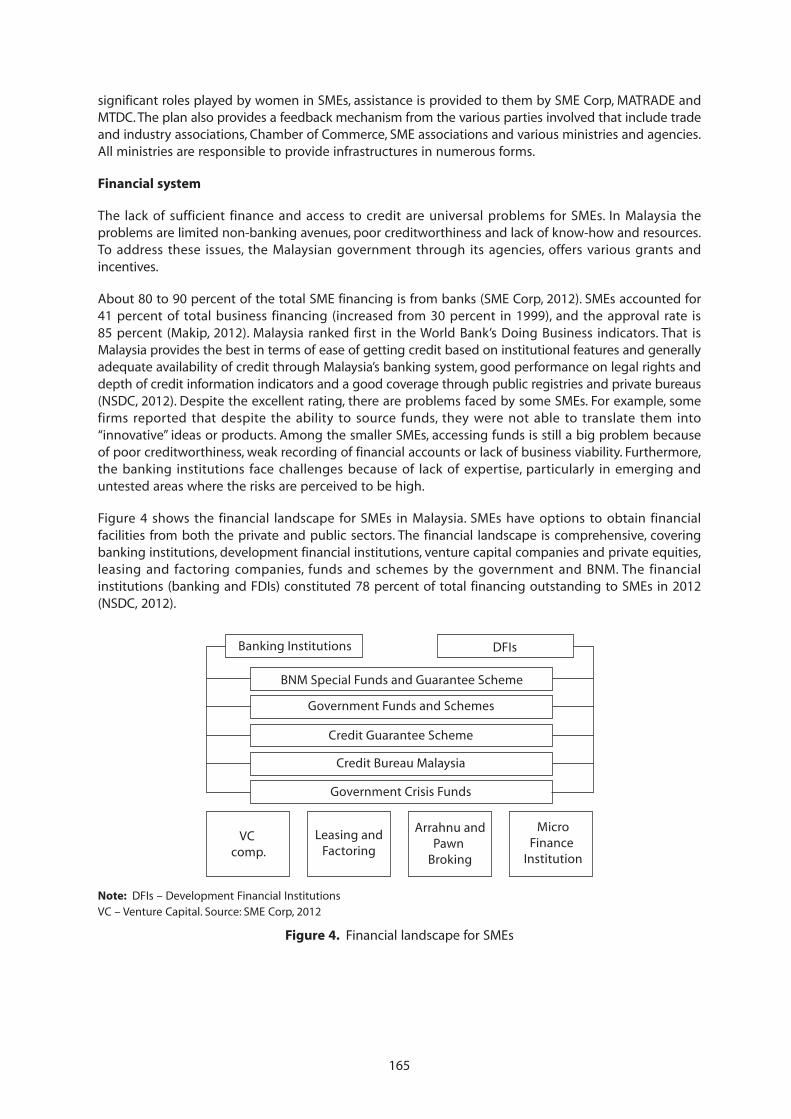
165
significant roles played by women in SMEs, assistance is provided to them by SME Corp, MATRADE andMTDC. The plan also provides a feedback mechanism from the various parties involved that include tradeand industry associations, Chamber of Commerce, SME associations and various ministries and agencies.All ministries are responsible to provide infrastructures in numerous forms.
Financial system
The lack of sufficient finance and access to credit are universal problems for SMEs. In Malaysia theproblems are limited non-banking avenues, poor creditworthiness and lack of know-how and resources.To address these issues, the Malaysian government through its agencies, offers various grants andincentives.
About 80 to 90 percent of the total SME financing is from banks (SME Corp, 2012). SMEs accounted for41 percent of total business financing (increased from 30 percent in 1999), and the approval rate is85 percent (Makip, 2012). Malaysia ranked first in the World Bank’s Doing Business indicators. That isMalaysia provides the best in terms of ease of getting credit based on institutional features and generallyadequate availability of credit through Malaysia’s banking system, good performance on legal rights anddepth of credit information indicators and a good coverage through public registries and private bureaus(NSDC, 2012). Despite the excellent rating, there are problems faced by some SMEs. For example, somefirms reported that despite the ability to source funds, they were not able to translate them into“innovative” ideas or products. Among the smaller SMEs, accessing funds is still a big problem becauseof poor creditworthiness, weak recording of financial accounts or lack of business viability. Furthermore,the banking institutions face challenges because of lack of expertise, particularly in emerging anduntested areas where the risks are perceived to be high.
Figure 4 shows the financial landscape for SMEs in Malaysia. SMEs have options to obtain financialfacilities from both the private and public sectors. The financial landscape is comprehensive, coveringbanking institutions, development financial institutions, venture capital companies and private equities,leasing and factoring companies, funds and schemes by the government and BNM. The financialinstitutions (banking and FDIs) constituted 78 percent of total financing outstanding to SMEs in 2012(NSDC, 2012).
Note: DFIs – Development Financial InstitutionsVC – Venture Capital. Source: SME Corp, 2012
Figure 4. Financial landscape for SMEs
Banking Institutions DFIs
BNM Special Funds and Guarantee Scheme
Government Funds and Schemes
Credit Guarantee Scheme
Credit Bureau Malaysia
Government Crisis Funds
VC comp.
Leasing andFactoring
Arrahnu andPawn
Broking
MicroFinance
Institution
166
As of 2010, the government has approved funds of RM57.4 billion to 2.2 million SMEs through 83 fundsschemes (SME Corp, 2012). About 30 percent of funds were disbursed through the nine minstries andagencies and the balance through financial institutions. The key funds and grants include: (i) the InitiateFinancing Scheme by the MOF and Amanah Ikhtiar Malaysia to reduce the poverty rate of poorhouseholds; (ii) financial assistance to Bumiputra SMEs; (iii) microcredit financing by the MOA;(iv) Franchise Scheme by the MDTCC; (v) Rural Economy Funding Scheme by the MRRD; (vi) MaritimeFund by MOF; and (vii) BNM funds such as Fund for Food, New Entrepreneur Funds, Funds for SMEs, MicroEnterprise Funds and Bumiputra Entrepreneurs Project Fund.
The government has implemented a number of guarantee schemes to enable SMEs to have betteraccess to financing. These include the schemes offered by Credit Guarantee Corp. Malaysia Berhad (CGC).Since its establishment, CGC has guaranteed about 410 000 SMEs valued at RM48 billion. CreditBureau Malaysia Sdn Bhd is established to provide SME credit information about ratings of SMEs,micro-businesses and individuals. Its activities support micro-businesses and individual start-ups towardsfinancial inclusion in the economy. The Bureau also provides Risk Reports as well as an online data formonitoring and evaluation of the financial situation of the SMEs. The microfinancing scheme which wasestablished in 2006 provides financial assistance without collateral to micro entrepreneurs, whereas VCfunds are provided to high risk and high growth sectors.
Agencies involved in marketing strategies
One of the four themes listed in the SME Masterplan concerns the creation of demand for the productsand services of SMEs. The initiatives grouped under this theme include the creation of a specificgovernment procurement policy for SMEs; the vendor development programs to encourage MNCs toprocure from SMEs; and the provision of financial support to enable SMEs to comply with marketstandards and certification. A high impact program, Going Export (GoEx) Program, specifically providessupport for SMEs to gain access to export markets (SME Master plan, pp. 92–94).
The government agencies involved in the exports of Malaysian products are the Ministry of InternationalTrade (MITI) and the Malaysia External Trade Corporation (MATRADE) established by the Malaysia ExternalTrade Corporation Act 1992 (Act 490). The functions of MATRADE include the promotion of Malaysia’sexternal trade and to formulate and implement a national export marketing strategy. MATRADE isempowered to maintain offices overseas to facilitate its functions.
Safety, quality and consumer protection
As indicated in the above section, food safety is governed by the Food Act 1983, Food Regulations 1985,Food Hygiene Regulations 2009, and Food Analysts Act 2011 under the purview of the Ministry of Health.As food safety has to be considered all along the food chain, other legislations that impact food safetyissues are the Pesticides Act 1974, Fisheries Act 1985, Veterinary Surgeons Act 1974, Animal Ordinance1953, all under the jurisdiction of the Ministry of Agriculture and Agrobased Industry, and the TradeDescriptions Act 2011 under the purview of the Ministry of Domestic Trade, Cooperatives andConsumerism. The Department of Standards, Ministry of Science Technology and Innovation is alsoinvolved in the setting of general as well as specific standards for various food-related products.
Besides legislation, and this must be reviewed periodically, the food safety infrastructure includesinspection and enforcement activities, laboratory services, certification, management of food safetyassurance and potential crisis, and education on food safety (FAO, 2004).
The Ministry of Agriculture and Agro-based Industry is responsible for enforcing food safety issues at thefarm level as required by food quality assurance schemes such as the Farm Certification Scheme, GoodAgricultural Practice, Aquaculture Farm Certification Scheme, and Good Husbandry Practice. The Ministryof Health is responsible for the HACCP Certification Scheme. The Department of Standards Malaysia isresponsible for certification of the various ISO MS Quality Systems (ISO MS9000, 14000 and 17025).
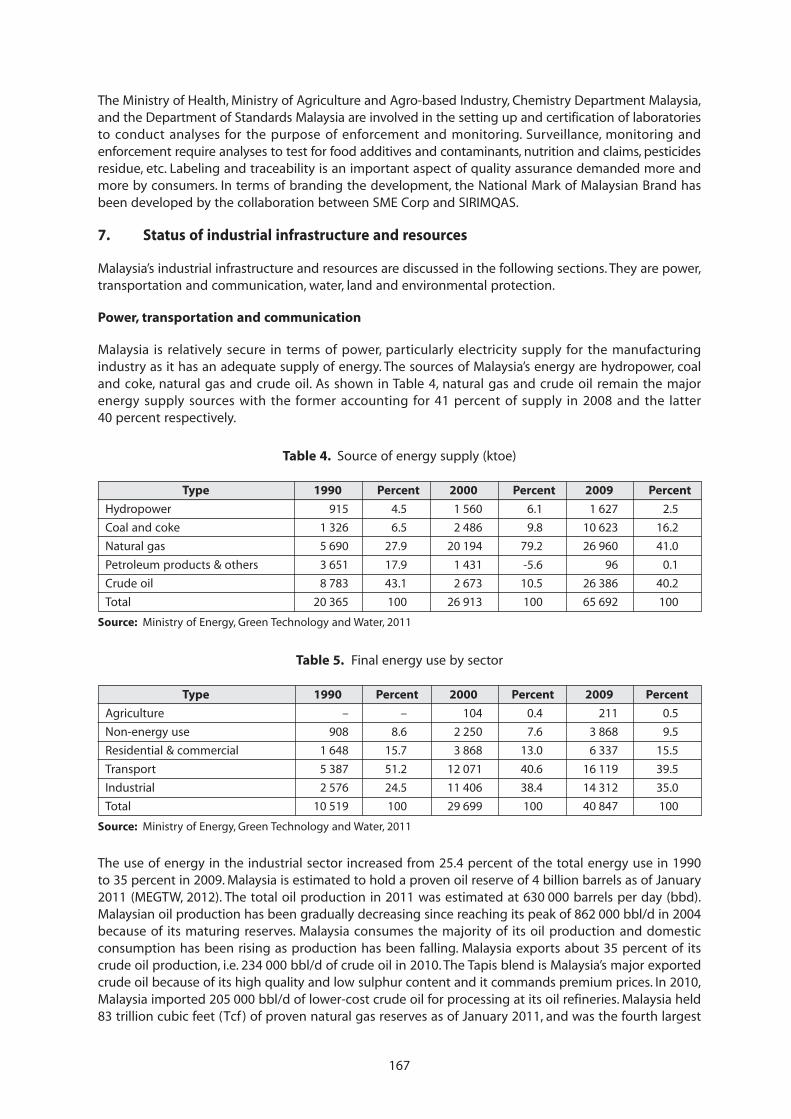
167
The Ministry of Health, Ministry of Agriculture and Agro-based Industry, Chemistry Department Malaysia,and the Department of Standards Malaysia are involved in the setting up and certification of laboratoriesto conduct analyses for the purpose of enforcement and monitoring. Surveillance, monitoring andenforcement require analyses to test for food additives and contaminants, nutrition and claims, pesticidesresidue, etc. Labeling and traceability is an important aspect of quality assurance demanded more andmore by consumers. In terms of branding the development, the National Mark of Malaysian Brand hasbeen developed by the collaboration between SME Corp and SIRIMQAS.
7. Status of industrial infrastructure and resources
Malaysia’s industrial infrastructure and resources are discussed in the following sections. They are power,transportation and communication, water, land and environmental protection.
Power, transportation and communication
Malaysia is relatively secure in terms of power, particularly electricity supply for the manufacturingindustry as it has an adequate supply of energy. The sources of Malaysia’s energy are hydropower, coaland coke, natural gas and crude oil. As shown in Table 4, natural gas and crude oil remain the majorenergy supply sources with the former accounting for 41 percent of supply in 2008 and the latter40 percent respectively.
Table 4. Source of energy supply (ktoe)
Type 1990 Percent 2000 Percent 2009 Percent
Hydropower 915 4.5 1 560 6.1 1 627 2.5
Coal and coke 1 326 6.5 2 486 9.8 10 623 16.2
Natural gas 5 690 27.9 20 194 79.2 26 960 41.0
Petroleum products & others 3 651 17.9 1 431 -5.6 96 0.1
Crude oil 8 783 43.1 2 673 10.5 26 386 40.2
Total 20 365 100 26 913 100 65 692 100
Source: Ministry of Energy, Green Technology and Water, 2011
Table 5. Final energy use by sector
Type 1990 Percent 2000 Percent 2009 Percent
Agriculture – – 104 0.4 211 0.5
Non-energy use 908 8.6 2 250 7.6 3 868 9.5
Residential & commercial 1 648 15.7 3 868 13.0 6 337 15.5
Transport 5 387 51.2 12 071 40.6 16 119 39.5
Industrial 2 576 24.5 11 406 38.4 14 312 35.0
Total 10 519 100 29 699 100 40 847 100
Source: Ministry of Energy, Green Technology and Water, 2011
The use of energy in the industrial sector increased from 25.4 percent of the total energy use in 1990to 35 percent in 2009. Malaysia is estimated to hold a proven oil reserve of 4 billion barrels as of January2011 (MEGTW, 2012). The total oil production in 2011 was estimated at 630 000 barrels per day (bbd).Malaysian oil production has been gradually decreasing since reaching its peak of 862 000 bbl/d in 2004because of its maturing reserves. Malaysia consumes the majority of its oil production and domesticconsumption has been rising as production has been falling. Malaysia exports about 35 percent of itscrude oil production, i.e. 234 000 bbl/d of crude oil in 2010. The Tapis blend is Malaysia’s major exportedcrude oil because of its high quality and low sulphur content and it commands premium prices. In 2010,Malaysia imported 205 000 bbl/d of lower-cost crude oil for processing at its oil refineries. Malaysia held83 trillion cubic feet (Tcf ) of proven natural gas reserves as of January 2011, and was the fourth largest
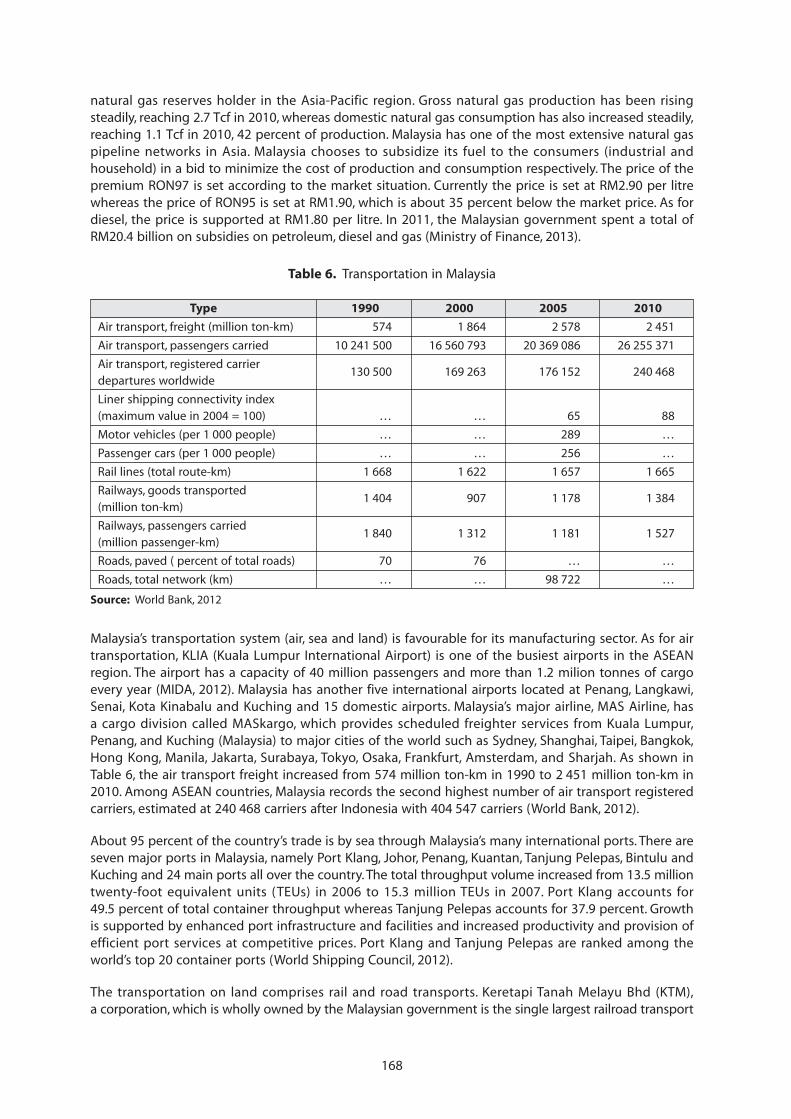
168
natural gas reserves holder in the Asia-Pacific region. Gross natural gas production has been risingsteadily, reaching 2.7 Tcf in 2010, whereas domestic natural gas consumption has also increased steadily,reaching 1.1 Tcf in 2010, 42 percent of production. Malaysia has one of the most extensive natural gaspipeline networks in Asia. Malaysia chooses to subsidize its fuel to the consumers (industrial andhousehold) in a bid to minimize the cost of production and consumption respectively. The price of thepremium RON97 is set according to the market situation. Currently the price is set at RM2.90 per litrewhereas the price of RON95 is set at RM1.90, which is about 35 percent below the market price. As fordiesel, the price is supported at RM1.80 per litre. In 2011, the Malaysian government spent a total ofRM20.4 billion on subsidies on petroleum, diesel and gas (Ministry of Finance, 2013).
Table 6. Transportation in Malaysia
Type 1990 2000 2005 2010
Air transport, freight (million ton-km) 574 1 864 2 578 2 451
Air transport, passengers carried 10 241 500 16 560 793 20 369 086 26 255 371
Air transport, registered carrierdepartures worldwide
130 500 169 263 176 152 240 468
Liner shipping connectivity index(maximum value in 2004 = 100) … … 65 88
Motor vehicles (per 1 000 people) … … 289 …
Passenger cars (per 1 000 people) … … 256 …
Rail lines (total route-km) 1 668 1 622 1 657 1 665
Railways, goods transported(million ton-km)
1 404 907 1 178 1 384
Railways, passengers carried(million passenger-km)
1 840 1 312 1 181 1 527
Roads, paved ( percent of total roads) 70 76 … …
Roads, total network (km) … … 98 722 …
Source: World Bank, 2012
Malaysia’s transportation system (air, sea and land) is favourable for its manufacturing sector. As for airtransportation, KLIA (Kuala Lumpur International Airport) is one of the busiest airports in the ASEANregion. The airport has a capacity of 40 million passengers and more than 1.2 milion tonnes of cargoevery year (MIDA, 2012). Malaysia has another five international airports located at Penang, Langkawi,Senai, Kota Kinabalu and Kuching and 15 domestic airports. Malaysia’s major airline, MAS Airline, hasa cargo division called MASkargo, which provides scheduled freighter services from Kuala Lumpur,Penang, and Kuching (Malaysia) to major cities of the world such as Sydney, Shanghai, Taipei, Bangkok,Hong Kong, Manila, Jakarta, Surabaya, Tokyo, Osaka, Frankfurt, Amsterdam, and Sharjah. As shown inTable 6, the air transport freight increased from 574 million ton-km in 1990 to 2 451 million ton-km in2010. Among ASEAN countries, Malaysia records the second highest number of air transport registeredcarriers, estimated at 240 468 carriers after Indonesia with 404 547 carriers (World Bank, 2012).
About 95 percent of the country’s trade is by sea through Malaysia’s many international ports. There areseven major ports in Malaysia, namely Port Klang, Johor, Penang, Kuantan, Tanjung Pelepas, Bintulu andKuching and 24 main ports all over the country. The total throughput volume increased from 13.5 milliontwenty-foot equivalent units (TEUs) in 2006 to 15.3 million TEUs in 2007. Port Klang accounts for49.5 percent of total container throughput whereas Tanjung Pelepas accounts for 37.9 percent. Growthis supported by enhanced port infrastructure and facilities and increased productivity and provision ofefficient port services at competitive prices. Port Klang and Tanjung Pelepas are ranked among theworld’s top 20 container ports (World Shipping Council, 2012).
The transportation on land comprises rail and road transports. Keretapi Tanah Melayu Bhd (KTM),a corporation, which is wholly owned by the Malaysian government is the single largest railroad transport
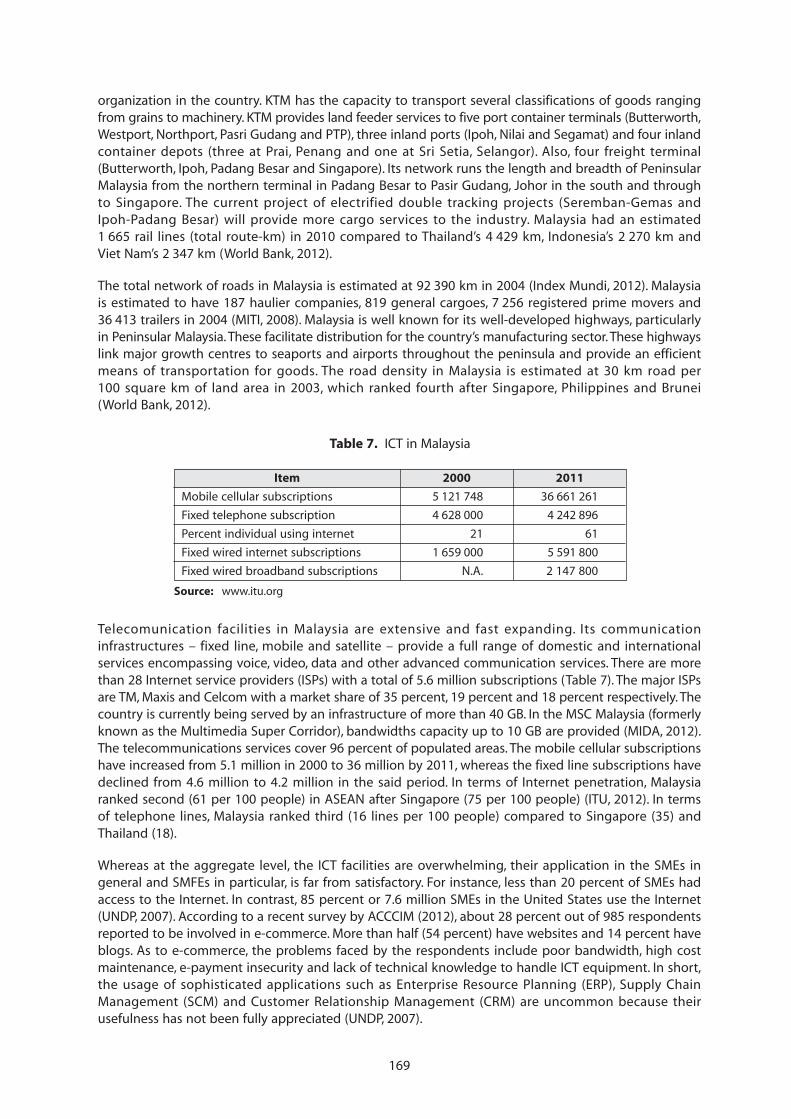
169
organization in the country. KTM has the capacity to transport several classifications of goods rangingfrom grains to machinery. KTM provides land feeder services to five port container terminals (Butterworth,Westport, Northport, Pasri Gudang and PTP), three inland ports (Ipoh, Nilai and Segamat) and four inlandcontainer depots (three at Prai, Penang and one at Sri Setia, Selangor). Also, four freight terminal(Butterworth, Ipoh, Padang Besar and Singapore). Its network runs the length and breadth of PeninsularMalaysia from the northern terminal in Padang Besar to Pasir Gudang, Johor in the south and throughto Singapore. The current project of electrified double tracking projects (Seremban-Gemas andIpoh-Padang Besar) will provide more cargo services to the industry. Malaysia had an estimated1 665 rail lines (total route-km) in 2010 compared to Thailand’s 4 429 km, Indonesia’s 2 270 km andViet Nam’s 2 347 km (World Bank, 2012).
The total network of roads in Malaysia is estimated at 92 390 km in 2004 (Index Mundi, 2012). Malaysiais estimated to have 187 haulier companies, 819 general cargoes, 7 256 registered prime movers and36 413 trailers in 2004 (MITI, 2008). Malaysia is well known for its well-developed highways, particularlyin Peninsular Malaysia. These facilitate distribution for the country’s manufacturing sector. These highwayslink major growth centres to seaports and airports throughout the peninsula and provide an efficientmeans of transportation for goods. The road density in Malaysia is estimated at 30 km road per100 square km of land area in 2003, which ranked fourth after Singapore, Philippines and Brunei(World Bank, 2012).
Table 7. ICT in Malaysia
Item 2000 2011
Mobile cellular subscriptions 5 121 748 36 661 261
Fixed telephone subscription 4 628 000 4 242 896
Percent individual using internet 21 61
Fixed wired internet subscriptions 1 659 000 5 591 800
Fixed wired broadband subscriptions N.A. 2 147 800
Source: www.itu.org
Telecomunication facilities in Malaysia are extensive and fast expanding. Its communicationinfrastructures – fixed line, mobile and satellite – provide a full range of domestic and internationalservices encompassing voice, video, data and other advanced communication services. There are morethan 28 Internet service providers (ISPs) with a total of 5.6 million subscriptions (Table 7). The major ISPsare TM, Maxis and Celcom with a market share of 35 percent, 19 percent and 18 percent respectively. Thecountry is currently being served by an infrastructure of more than 40 GB. In the MSC Malaysia (formerlyknown as the Multimedia Super Corridor), bandwidths capacity up to 10 GB are provided (MIDA, 2012).The telecommunications services cover 96 percent of populated areas. The mobile cellular subscriptionshave increased from 5.1 million in 2000 to 36 million by 2011, whereas the fixed line subscriptions havedeclined from 4.6 million to 4.2 million in the said period. In terms of Internet penetration, Malaysiaranked second (61 per 100 people) in ASEAN after Singapore (75 per 100 people) (ITU, 2012). In termsof telephone lines, Malaysia ranked third (16 lines per 100 people) compared to Singapore (35) andThailand (18).
Whereas at the aggregate level, the ICT facilities are overwhelming, their application in the SMEs ingeneral and SMFEs in particular, is far from satisfactory. For instance, less than 20 percent of SMEs hadaccess to the Internet. In contrast, 85 percent or 7.6 million SMEs in the United States use the Internet(UNDP, 2007). According to a recent survey by ACCCIM (2012), about 28 percent out of 985 respondentsreported to be involved in e-commerce. More than half (54 percent) have websites and 14 percent haveblogs. As to e-commerce, the problems faced by the respondents include poor bandwidth, high costmaintenance, e-payment insecurity and lack of technical knowledge to handle ICT equipment. In short,the usage of sophisticated applications such as Enterprise Resource Planning (ERP), Supply ChainManagement (SCM) and Customer Relationship Management (CRM) are uncommon because theirusefulness has not been fully appreciated (UNDP, 2007).
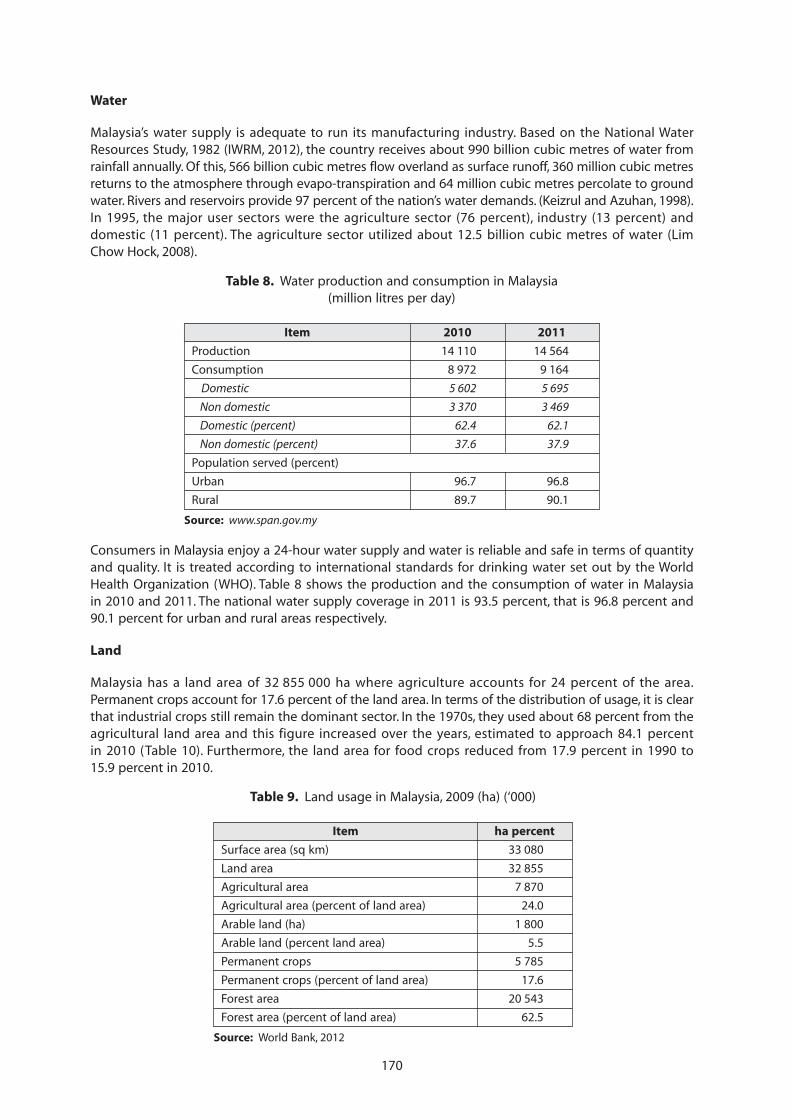
170
Water
Malaysia’s water supply is adequate to run its manufacturing industry. Based on the National WaterResources Study, 1982 (IWRM, 2012), the country receives about 990 billion cubic metres of water fromrainfall annually. Of this, 566 billion cubic metres flow overland as surface runoff, 360 million cubic metresreturns to the atmosphere through evapo-transpiration and 64 million cubic metres percolate to groundwater. Rivers and reservoirs provide 97 percent of the nation’s water demands. (Keizrul and Azuhan, 1998).In 1995, the major user sectors were the agriculture sector (76 percent), industry (13 percent) anddomestic (11 percent). The agriculture sector utilized about 12.5 billion cubic metres of water (LimChow Hock, 2008).
Table 8. Water production and consumption in Malaysia(million litres per day)
Item 2010 2011
Production 14 110 14 564
Consumption 8 972 9 164
Domestic 5 602 5 695
Non domestic 3 370 3 469
Domestic (percent) 62.4 62.1
Non domestic (percent) 37.6 37.9
Population served (percent)
Urban 96.7 96.8
Rural 89.7 90.1
Source: www.span.gov.my
Consumers in Malaysia enjoy a 24-hour water supply and water is reliable and safe in terms of quantityand quality. It is treated according to international standards for drinking water set out by the WorldHealth Organization (WHO). Table 8 shows the production and the consumption of water in Malaysiain 2010 and 2011. The national water supply coverage in 2011 is 93.5 percent, that is 96.8 percent and90.1 percent for urban and rural areas respectively.
Land
Malaysia has a land area of 32 855 000 ha where agriculture accounts for 24 percent of the area.Permanent crops account for 17.6 percent of the land area. In terms of the distribution of usage, it is clearthat industrial crops still remain the dominant sector. In the 1970s, they used about 68 percent from theagricultural land area and this figure increased over the years, estimated to approach 84.1 percentin 2010 (Table 10). Furthermore, the land area for food crops reduced from 17.9 percent in 1990 to15.9 percent in 2010.
Table 9. Land usage in Malaysia, 2009 (ha) (‘000)
Item ha percent
Surface area (sq km) 33 080
Land area 32 855
Agricultural area 7 870
Agricultural area (percent of land area) 24.0
Arable land (ha) 1 800
Arable land (percent land area) 5.5
Permanent crops 5 785
Permanent crops (percent of land area) 17.6
Forest area 20 543
Forest area (percent of land area) 62.5
Source: World Bank, 2012
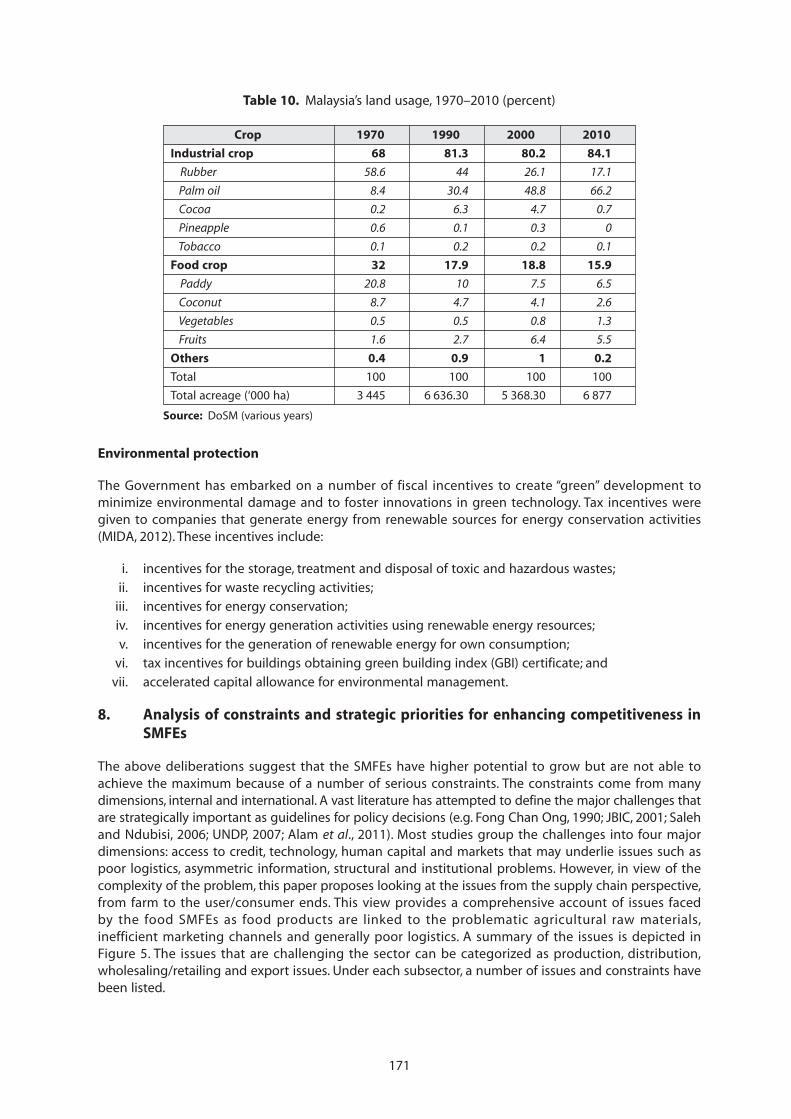
171
Environmental protection
The Government has embarked on a number of fiscal incentives to create “green” development tominimize environmental damage and to foster innovations in green technology. Tax incentives weregiven to companies that generate energy from renewable sources for energy conservation activities(MIDA, 2012). These incentives include:
i. incentives for the storage, treatment and disposal of toxic and hazardous wastes;
ii. incentives for waste recycling activities;iii. incentives for energy conservation;
iv. incentives for energy generation activities using renewable energy resources;
v. incentives for the generation of renewable energy for own consumption;vi. tax incentives for buildings obtaining green building index (GBI) certificate; and
vii. accelerated capital allowance for environmental management.
8. Analysis of constraints and strategic priorities for enhancing competitiveness inSMFEs
The above deliberations suggest that the SMFEs have higher potential to grow but are not able toachieve the maximum because of a number of serious constraints. The constraints come from manydimensions, internal and international. A vast literature has attempted to define the major challenges thatare strategically important as guidelines for policy decisions (e.g. Fong Chan Ong, 1990; JBIC, 2001; Salehand Ndubisi, 2006; UNDP, 2007; Alam et al., 2011). Most studies group the challenges into four majordimensions: access to credit, technology, human capital and markets that may underlie issues such aspoor logistics, asymmetric information, structural and institutional problems. However, in view of thecomplexity of the problem, this paper proposes looking at the issues from the supply chain perspective,from farm to the user/consumer ends. This view provides a comprehensive account of issues facedby the food SMFEs as food products are linked to the problematic agricultural raw materials,inefficient marketing channels and generally poor logistics. A summary of the issues is depicted inFigure 5. The issues that are challenging the sector can be categorized as production, distribution,wholesaling/retailing and export issues. Under each subsector, a number of issues and constraints havebeen listed.
Table 10. Malaysia’s land usage, 1970–2010 (percent)
Crop 1970 1990 2000 2010
Industrial crop 68 81.3 80.2 84.1
Rubber 58.6 44 26.1 17.1
Palm oil 8.4 30.4 48.8 66.2
Cocoa 0.2 6.3 4.7 0.7
Pineapple 0.6 0.1 0.3 0
Tobacco 0.1 0.2 0.2 0.1
Food crop 32 17.9 18.8 15.9
Paddy 20.8 10 7.5 6.5
Coconut 8.7 4.7 4.1 2.6
Vegetables 0.5 0.5 0.8 1.3
Fruits 1.6 2.7 6.4 5.5
Others 0.4 0.9 1 0.2
Total 100 100 100 100
Total acreage (‘000 ha) 3 445 6 636.30 5 368.30 6 877
Source: DoSM (various years)
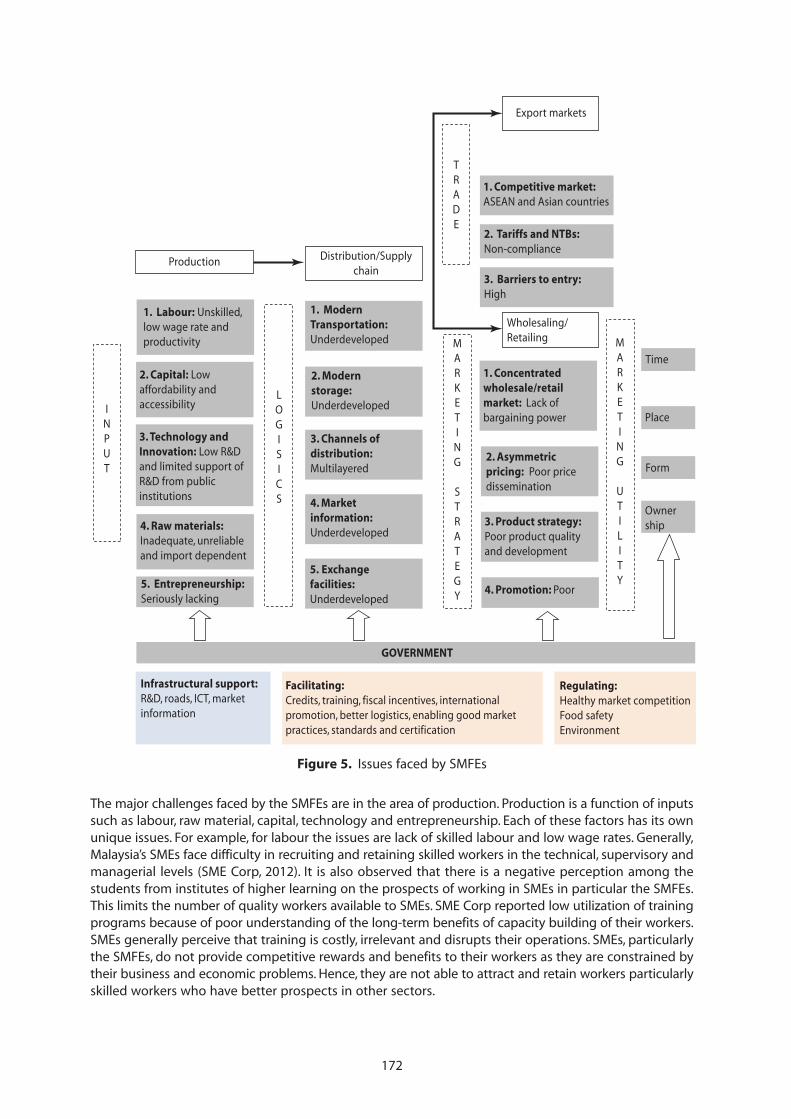
172
Figure 5. Issues faced by SMFEs
Production
1. Labour: Unskilled, low wage rate and productivity
2. Capital: Low affordability and accessibility
3. Technology and Innovation: Low R&D and limited support of R&D from public institutions
4. Raw materials: Inadequate, unreliable and import dependent
5. Entrepreneurship: Seriously lacking
Infrastructural support: R&D, roads, ICT, market information
LOGISICS
INPUT
Distribution/Supply chain
1. ModernTransportation:Underdeveloped
2. Modernstorage:Underdeveloped
3. Channels of distribution:Multilayered
4. Market information:Underdeveloped
5. Exchange facilities:Underdeveloped
GOVERNMENT
Facilitating:Credits, training, fiscal incentives, international promotion, better logistics, enabling good market practices, standards and certification
Regulating:Healthy market competitionFood safetyEnvironment
TRADE
MARKETING
STRATEGY
MARKETING
UTILITY
Export markets
1. Competitive market: ASEAN and Asian countries
2. Tariffs and NTBs:Non-compliance
3. Barriers to entry:High
Wholesaling/Retailing
1. Concentrated wholesale/retail market: Lack of bargaining power
2. Asymmetricpricing: Poor price dissemination
3. Product strategy:Poor product quality and development
4. Promotion: Poor
Time
Place
Form
Ownership
The major challenges faced by the SMFEs are in the area of production. Production is a function of inputssuch as labour, raw material, capital, technology and entrepreneurship. Each of these factors has its ownunique issues. For example, for labour the issues are lack of skilled labour and low wage rates. Generally,Malaysia’s SMEs face difficulty in recruiting and retaining skilled workers in the technical, supervisory andmanagerial levels (SME Corp, 2012). It is also observed that there is a negative perception among thestudents from institutes of higher learning on the prospects of working in SMEs in particular the SMFEs.This limits the number of quality workers available to SMEs. SME Corp reported low utilization of trainingprograms because of poor understanding of the long-term benefits of capacity building of their workers.SMEs generally perceive that training is costly, irrelevant and disrupts their operations. SMEs, particularlythe SMFEs, do not provide competitive rewards and benefits to their workers as they are constrained bytheir business and economic problems. Hence, they are not able to attract and retain workers particularlyskilled workers who have better prospects in other sectors.
173
Generally, SMEs view productivity improvement activities as a burdening cost rather than as a long-termhuman capital investment. As such, SMEs are hesitant to invest in automation as they perceive that thelong-term productivity gains may not compensate for the high initial cost in acquiring machinery orequipment. The lack of capital forces the SMEs to employ cheap labour that is readily available from theforeign markets which in turn discourages them from developing new technologies and moving intohigher value-added activities. ACCCIM’s survey in 2012 indicated that close to two-thirds of respondents(62 percent) faced labour problems. Only 26 percent of the SMEs are reported to carry out trainingperiodically. Those who provide training, generally only provide technical training consisting of basic,on-the-job skills. Only 43.6 percent of SMEs provided training modules on business and managementissues (Bank Negara Malaysia, 2008).
Technological advancement and innovations among SMFEs are very minimal either by the SMFEsthemselves or from the public agencies. Most SMEs do not engage in R&D activities (R&D expenditureof SMEs only accounted for 0.05 percent of GDP in 2006 (MOSTI, 2006)) as the capital investment isusually beyond the means of SMEs. The reasons for not getting involved in R&D include financialconstraints, risky markets in the future, unable to understand new technology and lack of R&D personnel(Mohd.Fauzi, 2011 and ACCCIM, 2012). Bank Negara Malaysia (2008) observed that about 52 percent ofSMEs do not have access to advisory services. Those which have access rely on the private sector. Only14 percent sought advice from government agencies.
Lack of capital is a major stumbling block for SMEs worldwide. Malaysia has been successful in thisrespect as based on the Doing Business Report by the World Bank, Malaysia has been ranked numberone for four consecutive years for “getting credit” (SME Corp, 2012). At present, banking institutionsrepresent 80 to 90 percent of all SME lending. The share of SME financing outstanding to total businessloans increased from 30 percent in 1999 to 41 percent in 2011. However at the firm level, the situationmay not appear as rosy as at the aggregate level. SMEs reported problems of high collateralrequirements, bank charges, bank bureaucracy, banks ignoring loan proposals, time consuming loandisbursement, costly preparation of business plans and refusal of bank finance – all major concerns toa majority of SMEs. Almost three-quarters of the SMEs obtain financing from banks and developmentfinancial institutions. About 30 percent obtain from the shareholders or business owner funds andretained earnings (22 percent) (NSDC, 2011). The avenues for non-banking sources such as venturecapital, angel investment and capital markets are not fully developed just yet.
SMEs particularly micro-enterprises also face challenges in obtaining bank financing because of poorcreditworthiness, weak recording of financial accounts or lack of business viability. Furthermore, thebanking institutions face challenges because of lack of expertise, especially in emerging and untestedareas where the risks are perceived to be high.
Lack of entrepreneurship is the biggest loophole in the development of SMFEs. Moving on to thedistribution of SMFEs products, poor logistics are very apparent, especially in terms of backwardness oftransportation and storage and exchange facilities. At the wholesale and retail level, market informationflow is a problem because of “structural distance” between production and consumption centres causedby an inefficient marketing system. Both the wholesale and, more recently, the retail markets are highlyconcentrated. In the case of retail markets, the advent of multinational companies (MNCs) through largescale super/hypermarkets has created high barriers to entry as these retailers have their own preferredsuppliers and impose high quality standards and certifications that the SMFEs find impossible to complywith.
The export market is equally challenging because of the intense competition from newcomers both fromthe ASEAN countries (Viet Nam, Cambodia) and China and India. These new economies enjoy low costsof production because of cheap raw material and abundant labour supply. As for domestic marketing,most SMEs do not employ consumer oriented marketing strategies. For instance, the study carried byACCIM (2012) indicated that only 8 percent of the respondents focused on branding their products.Typically, SMEs do not consider branding and marketing as a competitive tool as they lack the awarenesson the importance of such efforts. Even if they do, SMEs often have limited resources to undertake
174
in-house marketing and branding activities or to employ marketing and branding consultants. With thiskind of perception and financial constraint, it is no wonder that most SMFEs failed to deliver the“marketing utilities” demanded by the consumers – time, form, place and ownership utilities. About60 percent of the SMEs rely on their own marketing effort to sell and only 7 percent sell through tradingcompanies (Bank Negara Malaysia, 2008).
In addressing these challenges, the Malaysian government has come up with the SME Master Plan(2012–2020) to create dynamic and competitive SMEs. The government has prioritized strategic areasthat are perceived to be instrumental in bringing change to the sector, namely innovation andtechnology adoption, human capital development, access to financing, market access, legal andregulatory environment, and infrastructure.
9. Summary and conclusions
As in other economies the SMEs in Malaysia function as the major drivers that generate income,employment and growth. In recent years, the SMEs’ average rate of growth of 6.8 percent exceeded thatof the overall economy which was 4.9 percent. Despite their favourable performance, their contributionto output and value added are far below the optimum being constrained by numerous structural andinstitutional factors. In the developed nations, the contributions of the SMEs to GDP range between40 and 60 percent compared to 32 percent in Malaysia. One of the subsectors of the SMEs, i.e. the SMFEsare showing some positive trends as reflected in the increase in the total output and productivity. Thetrade surpluses in selected food products are growing despite the growing trade deficit for food itemsin general suggesting an expansion of the sector. The performance of the SMFEs too is very much belowthe optimum level because of serious structural weaknesses as well as challenges in the domestic andinternational markets.
The SMFEs’ contribution to the national economy is fairly significant, contributing 10.8 percent to thetotal SMEs’ output, 4.8 percent to value added and 3.6 percent to employment. The SMFEs are plaguedwith problems all along the supply chain. The most serious constraint is experienced at the productionlevel where SMFEs face serious challenges on all types of inputs such as unstable supply of raw material,lack of labour, poor access to capital (particularly credit), limited improvement in technologicaladvancement and innovations and lack of entrepreneurship. Almost all studies on SMFEs indicate thatthese constraining factors are the major hindrances that may limit the growth of SMFEs, unless they arerectified. In the distribution sector, because of the lack of finance, SMFEs are not able to invest in moderntransportation and storage equipment resulting in high post-harvest losses and inability to meet theneeds of the consumers. Similarly, the SMEs rarely invest in marketing strategies that may increase salesand consumer acceptance.
Recognizing the strategic role of the SMEs, the government has launched the SME Master Plan(2012–2012) to accelerate the growth of SMEs through productivity improvement and innovation.A number of strategies and high impact programs have been identified to achieve these goals. It hasbeen observed that the favourable growth of the SMEs during 2004 to 2010 was partly attributed toinstitutional supports, particularly the establishment of the NSDC in 2004 with much more coordinateddevelopment programs for the SMEs. It is also envisaged that the new Master Plan (2012–2012) will bringfurther progress and achievement of the SMEs.
However, to assume that all SMEs are subjected to a more or less similar path of industrial developmentmay be misleading as the SMFEs are unique compared to the other SMEs such as manufacturing andservices. One of the major differences of SMFEs compared to the others is that they depend heavily onagricultural raw materials that are known to be problematic in supply. The supply of agricultural rawmaterials is highly sensitive to the weather and natural hazards as proven in the 2008 food price crisisand again in early 2009. Commodity price volatility has intensified and magnified in the last decadebecause of a structural shift in the market, i.e. demand is chasing a highly constrained supply. Theproblem is further aggravated by the heavy dependence on imports for almost all inputs for foodprocessing such as wheat, sugar, meat and preparations and fruits and vegetables. The recent hikes in
175
crude oil price are also impacting the SMFEs as they have resulted in high costs of inputs andtransportation despite the fact that the prices of crude oil and diesel are subsidized by the government.This implies that under a free market SMFEs may find it hard to survive as the costs of energy and rawmaterials constitute significant components of the production costs. Hence, SMFEs may require specificstrategies to address price volatility and instability of supply both in the domestic and internationalmarkets. In a broader context, the progress of SMFEs is a function of factors of macro-policies that arebeyond the SME framework. Much more than the other SMEs, the growth of the SMFEs is dependent onthe growth of the food sector at large, particularly the primary production sector. As summarized byFatimah and Amna, (2010), Malaysia’s food sector is lagging behind on all fronts because of decades ofpolicy neglect and limited support in terms of infrastructure, extension and R&D. Unless these issues areaddressed, the development of SMFEs will not be as intended in the blueprints of the new Master Plan(2012–2020).
Bibliography and references
Abdullah, K. & Mohamed, A. 1998. Water – A Situation Appraisal and Possible Actions at the Community Level. Seminaron “Local Communities and the Environment II”, Environmental Protection Society Malaysia, Petaling Jaya,Malaysia.
Alam, S.S. Jani, M.F.M. Senik, Z.C. & Domil, A.K.A. 2011. Assessing barriers of growth of food processing SMIs inMalaysia: A factor analysis. International Business Research, Vol. 4(1), pp. 252–259, January.
Associated Chinese Chambers of Commerce & Industry of Malaysia (ACCCIM). 2012. Report of 2012 SMEs Survey,(available at http://www.acccim.org.my/file/2012 percent20SME_EN.pdf ).
Bank Negara Malaysia (BNM). 2003. A Comprehensive Framework for the Development of Small and MediumEnterprises in Malaysia. Kuala Lumpur.
Bank Negara Malaysia (BNM). 2008. Small and Medium Enterprise (SME) Annual Report 2007. Kuala Lumpur.
Chandran V.G.R., Rajah, R. & Wad, P. 2009. Malaysian Manufacturing System of Innovation and Internationalisation ofR&D. CBDS Working Paper Series, No. 200, Copenhagen Business School, Handelshojskolen.
Department of Statistics Malaysia (DoSM). 2006. Census of Establishments and Enterprises 2005. Department ofStatistics Malaysia: Kuala Lumpur.
Department of Statistics Malaysia (DoSM). 2012a. Malaysia Economics Statistics – Time Series 2011. Putrajaya: DoSM.
Department of Statistics Malaysia (DoSM). 2012b. Monthly Manufacturing Statistics, January 2012. Putrajaya: DoSM.
Fatimah Mohamed Arshad and Amna Awad Abdel Hameed. 2010. Global food prices: Implications for food securityin Malaysia, CRRC Consumer Review, Vol. 1(1) March, pp. 21–38. ISSN: 2180-2815
Fong, C.O. 1990. Small and medium industries in Malaysia: economic efficiency and entrepreneurship. The DevelopingEconomies, 28: 152–179.
Food and Agriculture Organization (FAO). 2004. Prioritization and coordination of capacity building activities: Foodsafety control system in Malaysia. FAO/WHO Regional Conference on Food Safety for Asia and the Pacific,24–27 May 2004, Seremban, Malaysia.
Global Trade Information Services Inc. 2009. Global Trade Statistics (2009), (available at www.gtis.com).
Government of Malaysia. 2006. Laws of Malaysia Act 539 Small and Medium industries Development CorporationAct 1995 (Reprint Incorporating all amendments up to 1 Jan 2006).
Government of Malaysia. 2006 Government of Malaysia. 2006. Laws of Malaysia Act 281 Food Act 1983 (ReprintIncorporating all amendments up to 1 Jan 2006).
Government of Malaysia. 2010. Tenth Malaysia Plan (RMK10) (2011–2015). Putrajaya: The Economic Planning Unit.
Index Mundi. 2012. Country Facts, (available at www.indexmundi.com).
Ismail, R. 2011. Food and consumer protection: A study on food legislation of selected countries. ASLI Working PaperNo. 017, Asian Law Institute.
Japan Bank for International Cooperation (JBIC). 2001. Issues of Sustainable Development in Asian Countries: Focusedon SMIs in Malaysia. JBIC Research Paper No. 8-2.
176
Lim Chow Hock. 2008. Dialogue on “Water Environment Partnership in Asia (WEPA)”, Ministry of Natural Resourcesand Environment, Oct 2008.
Makip, M.R. 2012. Challenges and obstacles in access to financing. Presentation at Workshop on Enhancing theCompetitiveness of SMEs in the OIC Member States, 12 June 2012, Ankara, Turkey.
Malaysian Industrial Development Authority (MIDA). 2012. Invest in Malaysia, (available at http://www.mida.gov.my).
Ministry of Energy, Green Technology and Water (MEGTW). 2012. Energy Balance 2009, (available at http://og.ssb.no/ogmeetings/sixthmeeting/Presentations_OG6/DAY_4_Aizah_National_Energy_Balance.PDF).
Ministry of Finance (MOF). 2013. Public Sector Finance in Economic Report 2012/2013, (available at http://www.treasury.gov.my/pdf/ekonomi/le/1213/chap4.pdf ).
Ministry of International Trade and Industry (MITI). 1993. Policy and status of SMIs in Malaysia. Ministry ofInternational Trade and Industry: Kuala Lumpur.
Ministry of International Trade and Industry (MITI). 2008. Trade and Transport in Malaysia: Overview of the LogisticsServices, (available at http://www.unescap.org/tid/projects/egmtf_s3Damiri.pdf ).
Ministry of Science, Technology and Innovation (MOSTI) (2012). National Survey of Research and Development (R&D).Available at http://www.mastic.gov.my/documents/10156/eb78e5b9-9f86-4724-a816-d02f9a92059b
National SME Development Council (NSDC. 2012). SME Annual Report 2010/11: Leveraging Opportunities, RealisingGrowth, (available at http://www.smecorp.gov.my/v4/node/460)/).
Ministry of Science, Technology and Innovation (MOSTI). 2008. National Survey on R&D, Ministry of Science,Technology and Innovation. Malaysia.
Mohd. Fauzi Mohd Jani. 2011. Barriers to Innovation of Food Processing SMIs in Malaysia: An empirical Study AGSEInternational Entrepreneurship Research Exchange. Proceedings of the 8th AGSE InternationalEntrepreneurship Research Exchange, Swinburne University of Technology, Melbourne, Australia,1–4 February, 725–733, (available at http://www.swinburne.edu.au/lib/ir/onlineconferences/agse2011/000171.pdf )
National SME Development Council (NSDC). 2005. Definitions for small and medium enterprises in Malaysia. Issuedby: Secretariat to National SME Development Council. Malaysia.
National SME Development Council (NSDC). 2010. SME Annual Report 2009/10). Malaysia.
National SME Development Council (NSDC). 2011. SME Annual Report 2010/11. Malaysia.
IWRM National Integrated Water Resource Management Information Repository, Department of Irrigation andDrainage Malaysia. 2012. National Water Studies, 1982 by JICA. Malaysia.
Saleh, A.S. & Ndubisi, O. 2006. An Evaluation of SME Development in Malaysia, International Review of BusinessResearch Papers, Vol. 2(1): 1–14.
SMECORP. 2012. SME Master Plan 2012-2012, (available at http://www.smecorp.gov.my/v4/node/2124).
United Nation Development Programme (UNDP). 2007. Malaysia Small and Medium Enterprises: Building an EnablingEnvironment. Kuala Lumpur, UNDP.
World Bank. 2012. World Development Indicators, (available at http://databank.worldbank.org).
World Bank. 2013. Immigration in Malaysia: Assessment of its Economic Effects, and a Review of the Policy andSystem, (available at http://psu.um.edu.my/images/psudoc8%20july%20Internatinal%20Conference,%20migration,%20urbanization%20and%20development/5-%20Extended%20Abstract_Mauro%20Testaverde_Malaysia%20Migration%20WB%20Executive%20Summary.pdf )
World Shipping Council. 2012. Top 50 World Container Ports, (available at http://www.worldshipping.org/about-the-industry/global-trade/top-50-world-container-ports).
Websites
Economic Planning Unit. 2012. www.epu.my
International Telecommunication Union. 2012. www.itu.org
177
POLICIES AND STRATEGIES FOR THE DEVELOPMENT OF SMALL ANDMEDIUM SCALE FOOD PROCESSING ENTERPRISES
IN THE PHILIPPINES
byLarry Digal
University of the Philippines Mindanao
1. Introduction
The Philippine economy has been improving in the last decade, growing annually by 4.6 percent onaverage with a marked increase of at least 5 percent from 2003 to 2007. However, it declined in 2008 and2009 because of the world financial crisis and picked up in 2010 with an increase of 7.6 percent fromthe previous year (Table 1). The main source of growth in the last decade came mainly from the servicesector, which increased annually by 5.6 percent from 2001 to 2010 compared to industry and agriculture,which grew only by 4.2 percent and 2.9 percent respectively. Thus, by the end of last year, only the servicesector expanded its share to the country’s gross domestic product from 52 percent in 2001 to about56 percent in 2010, whereas the agriculture, fishery and forestry and industry sectors decreased theirshares (Table 2).
The bulk of the industry sector’s output came primarily from the manufacturing subsector, whichaccounts for more than 70 percent of the sector’s total output and about a quarter of the gross domesticproduct. However, it grew only by 4 percent annually on average from 2001 to 2010, lower than the othersectors such as mining and quarrying and construction. Hence, its share of the total output did notincrease in the last decade (Table 2).
However, the food manufacturing and beverages industry, which accounts for approximately 40 percentof the total output of the manufacturing sector, expanded its volume of production faster than did theentire manufacturing sector. Compared to 2000, the volume of production in 2010 is 36 percent higher(Table 3). On the other hand, the entire manufacturing sector during this period declined by 8 percent.In addition, the value of production grew even faster by 139 percent during this period (Table 4).Compared to the entire manufacturing sector, it is the fastest growing subsector in terms of value andsecond in terms of volume next to rubber products. One of the factors that explains this expansion isthe increasing demand for processed food in the local and international markets. The country’spopulation, currently at about 90 million, is the fastest growing population in Asia. Moreover, the numberof dual income households is increasing so women have less time for shopping and for cooking at home.Processed food products have higher shelf-life and are easier to cook hence minimizing the time spentshopping and cooking. Large food manufacturing firms are expanding and developing products to caterto increasing demand for a variety of high quality processed food products.
On the other hand, micro, small and medium enterprises (MSMEs), which comprise most of theenterprises operating in the processed food industry, are constrained when it comes to responding tothis expanding market. This paper examines the performance of the food processing industry and seeksto identify issues, opportunities and challenges in order to develop policies and strategies to improvethe industry. It is organized into 8 sections. Section 1 comprises this introduction. An overview of thesmall and medium food processing enterprises (SMFEs) is presented in Section 2, particularly theirstructure and contribution to the Philippine economy. Section 3 looks carefully at the performance ofthe food processing industry and the role of SMFEs. The external forces that shape the SMFE sector inthe Philippines and government policy and legal frameworks are examined in Sections 4 and 5respectively. The status of national institutional infrastructure and the industrial infrastructure arediscussed in Section 6. Given these discussions, an analysis of the constraints and strategic priorities forenhancing competitiveness of SMFEs is made in Section 7. Finally, concluding comments are presentedin Section 8.
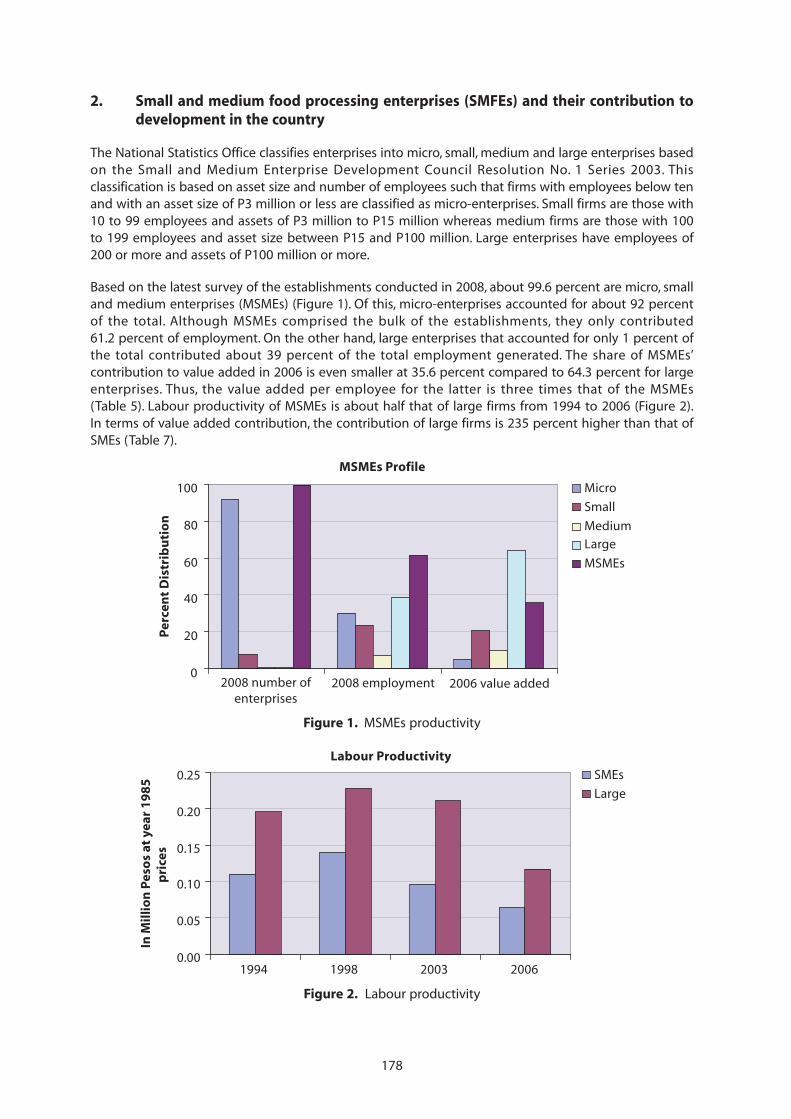
178
2. Small and medium food processing enterprises (SMFEs) and their contribution todevelopment in the country
The National Statistics Office classifies enterprises into micro, small, medium and large enterprises basedon the Small and Medium Enterprise Development Council Resolution No. 1 Series 2003. Thisclassification is based on asset size and number of employees such that firms with employees below tenand with an asset size of P3 million or less are classified as micro-enterprises. Small firms are those with10 to 99 employees and assets of P3 million to P15 million whereas medium firms are those with 100to 199 employees and asset size between P15 and P100 million. Large enterprises have employees of200 or more and assets of P100 million or more.
Based on the latest survey of the establishments conducted in 2008, about 99.6 percent are micro, smalland medium enterprises (MSMEs) (Figure 1). Of this, micro-enterprises accounted for about 92 percentof the total. Although MSMEs comprised the bulk of the establishments, they only contributed61.2 percent of employment. On the other hand, large enterprises that accounted for only 1 percent ofthe total contributed about 39 percent of the total employment generated. The share of MSMEs’contribution to value added in 2006 is even smaller at 35.6 percent compared to 64.3 percent for largeenterprises. Thus, the value added per employee for the latter is three times that of the MSMEs(Table 5). Labour productivity of MSMEs is about half that of large firms from 1994 to 2006 (Figure 2).In terms of value added contribution, the contribution of large firms is 235 percent higher than that ofSMEs (Table 7).
Figure 1. MSMEs productivity
Figure 2. Labour productivity
0
20
40
60
80
100 Micro
Small
Medium
Large
MSMEs
Per
cen
t D
istr
ibu
tio
n
2008 number ofenterprises
2008 employment 2006 value added
MSMEs Profile
0.00
0.05
0.10
0.15
0.20
0.25
1994 1998 2003 2006
In M
illi
on
Pes
os
at y
ear
19
85
p
rice
s
SMEs
Large
Labour Productivity
179
The proportion of MSMEs in the manufacturing sector is 99.17 percent, slightly lower than the averagefor the entire economy. Over time, the proportion of micro-enterprises to total establishments in themanufacturing sector has increased from 87 percent in 1999 to about 90 percent by the end of the 2006.On the other hand, the share of large firms has declined from 1 percent to 0.8 percent during this period(Tables 8 and 9). However, the contribution of large firms in terms of total employment in themanufacturing sector increased from 47 percent in 1999 to about 50 percent in 2006.
Economic contribution of MSMFEs
Based on the Philippine Standard for Industrial Classification, there are ten categories under the foodprocessing subsector. These are: 1) production processing and preservation of meat, fish and otherseafoods, fruit, vegetables, oils and fats, including slaughtering and meat packing; 2) manufacture of dairyproducts; 3) rice/corn milling; 4) manufacture of starches and starch products; 5) prepared animal feeds,and grain mill products except rice and corn milling; 6) manufacture of beverages; 7) manufacture ofbakery products; 8) manufacture of sugar; 9) production of crude coconut oil, copra cake, meals andpellets; 10) manufacture of other food products. (Table 10) shows industries under each category.
It should be noted that the 2006 survey of establishments only covered the formal sector and shows thatthere are 18 929 establishments in the manufacturing sector of which 7 664 firms or 41 percent are inthe food processing and beverages subsector. Based on NSCB Resolution No. 15, firms to be classifiedunder the informal sector should have fewer than ten employees and do not include corporations.However, if we also cover the informal sector, Aldaba et al. (2010) made some adjustments in the NSOsurvey in 2006. Similarly, the Department of Trade and Industry also updated 2008 data from the NationalStatistics Office to come up with the 2009 data on MSMEs. Using the updated information, most of theestablishments in the manufacturing sector in 2006 are in the food products and beverages subsectorwith a total of 55 189 establishments that account for about 47 percent of the total firms in the sector.Of this share, about 44.2 percent are micro-enterprises, 2.7 percent are small and medium enterprisesand only 0.2 percent are large enterprises.
The food products and beverage subsector, particularly the food processing firms, have the highestproportion of micro-enterprises compared to the other manufacturing subsectors (Table 11). The shareof the processed and beverages firms in the total number of establishments and the distribution of micro,small, medium and large enterprises remained almost the same in 2009 (Table 12). A study by Becker(2004) on the informal economies of a number of countries indicated that the contribution of theinformal sector in the Philippines to total domestic product was approximately 17 percent. The majorityof the enterprises in the informal sector belong to vending and selling (e.g. dry goods, raw and cookedfood), sari-sari (variety) store, handicrafts, tailoring and dressmaking and bakery (Alonzo and Mangahas,1990).
In terms of the contribution of MSMEs in the food products and beverage sector, available data are basedon two categories according to size of employment. These are firms with twenty or fewer employees andfirms with 20 or more employees. Following this classification of enterprises, the first category covers allmicro-enterprises and some of the small enterprises. The second category covers some of the small andall of the medium and large enterprises (Table 13).
Based on this classification, micro-enterprises and some small firms accounted for about 27 percent oftotal employment in the food products and beverage subsector. On the other hand, the larger firms with20 employees or more contributed 73 percent of total employment. Compared to the entiremanufacturing sector, firms with fewer than 20 employees contributed 11 percent of total employment,less than those in the food and beverages subsector. This implies that micro-enterprises and some smallenterprises in the food and beverages subsector, on average, are relatively more labour intensivecompared to the similarly sized firms in the manufacturing sector.
In terms of value added, firms with fewer than 20 employees in the food and beverage sector accountedonly for 5 percent of total value added but this is higher than the average of 3 percent for the entiremanufacturing sector. This is the same proportion for gross addition to fixed assets, which indicates
180
investments to improve production capacity and efficiency. However, compared to the entiremanufacturing sector, the share of smaller firms in the food and beverages sector to value added, grossaddition to fixed assets and profit is higher (Table 14). Based on 2003 data, 79 percent of the total valueadded in the manufacturing sector was generated by large firms whereas only 21 percent can beattributed to the small and medium enterprises (Table 15). The large firms in the food manufacturing/processing subsector accounted for about 70 percent of the total value added in this subsector, thebalance of 30 percent was accounted for by the small and medium enterprises. In general, smaller firmshave lower value added and investments as they lack access to capital and better technology.
It should be noted, however, that in terms of the number of establishments, firms in the food andbeverages sector with fewer than 20 employees accounted for 87 percent of total establishments. Thosewith more than 20 employees accounted for the balance of 13 percent. Compared to the manufacturingsector as a whole, the proportion is 73 percent for larger firms and 27 percent for smaller firms. Thus,although there are more small firms in the food and beverages sector compared to the entiremanufacturing sector, their capacity to generate employment, value added, investments in fixed assetsand profit is higher compared to firms of similar size in the manufacturing sector.
Based on the National Statistics Office data updated by the Department of Trade and industry,99.2 percent of the total establishments in the manufacturing sector were MSMEs in 2009. The proportionof MSMEs within the food manufacturing sector is slightly higher at 99.6 percent (Table 16). The bulk ofthese MSMEs in the food sector are micro-enterprises, which account for about 93.2 percent. This ishigher than the entire manufacturing sector (89.6 percent). Rice and corn milling as well as bakeryproducts have larger proportions of MSMEs compared to the other types of food processing firms. In fact,most of these small firms are micro-enterprises accounting for about 96 percent of the total firms inthese two industries (Table 17). Moreover, rice and corn milling and bakery products account for about86 percent of the total MSMEs in the food processing sector and 36 percent of the entire manufacturingsector.
In terms of employment, the share of MSMEs in the food processing subsector was about 63 percent(Table 18). This is larger than the contribution of MSMEs in the entire manufacturing sector, which wasabout 49 percent. Thus, MSMEs in the food processing sector generate more employment per firmcompared to the other subsectors in the manufacturing sector. However, whereas MSMEs firmsaccounted for the bulk of firms in the industry, the large firms that only accounted for less than 1 percentof the total establishments in the sector, generated more than a third of the employment. Within MSMEs,micro-enterprises contributed the bulk of the employment generated by the food processing sectoramounting to 43 percent of the total employment (Table 19). Employment generated came mainly fromrice and corn milling and bakery products. In addition, between 2006 and 2009, the share of MSMEs tototal establishments in the food and beverages industry did not change significantly.
Regional distribution of MSMEs
The Philippines has three major islands: Luzon, Visayas and Mindanao. About 68 percent of MSMEs arelocated on the island of Luzon whereas 18 percent and 14 percent are in Mindanao and Visayasrespectively (Figure 3). These islands are further subdivided into 17 regions. More than half of the MSMEsare concentrated in three Luzon regions, namely the National Capital Region (NCR), Region IV andRegion III (Figure 4). These MSMEs also account for more than half of the country’s gross regionaldomestic product (GDP).1 NCR, where Metro Manila is located, accounted for a quarter of thecountry’s MSMEs, which contributed about a third of the GDP. The large contribution of NCR MSMEs toGDP relative to the other regions is also because of the larger proportion of small and mediumenterprises relative to micro-enterprises. Small and medium enterprises in NCR accounted for about43 percent of the total employment generated by small and medium enterprises in the country(Table 20) where micro-enterprises contributed 27 percent of the country’s total employment. SMEsrelative to micro-enterprises have better access to technology and finance thereby increasing theircapacity to generate higher value added.
1 Gross value added was used as a proxy for gross domestic product (Micro, Small and Medium Enterprise DevelopmentPlan for 2011–2016).
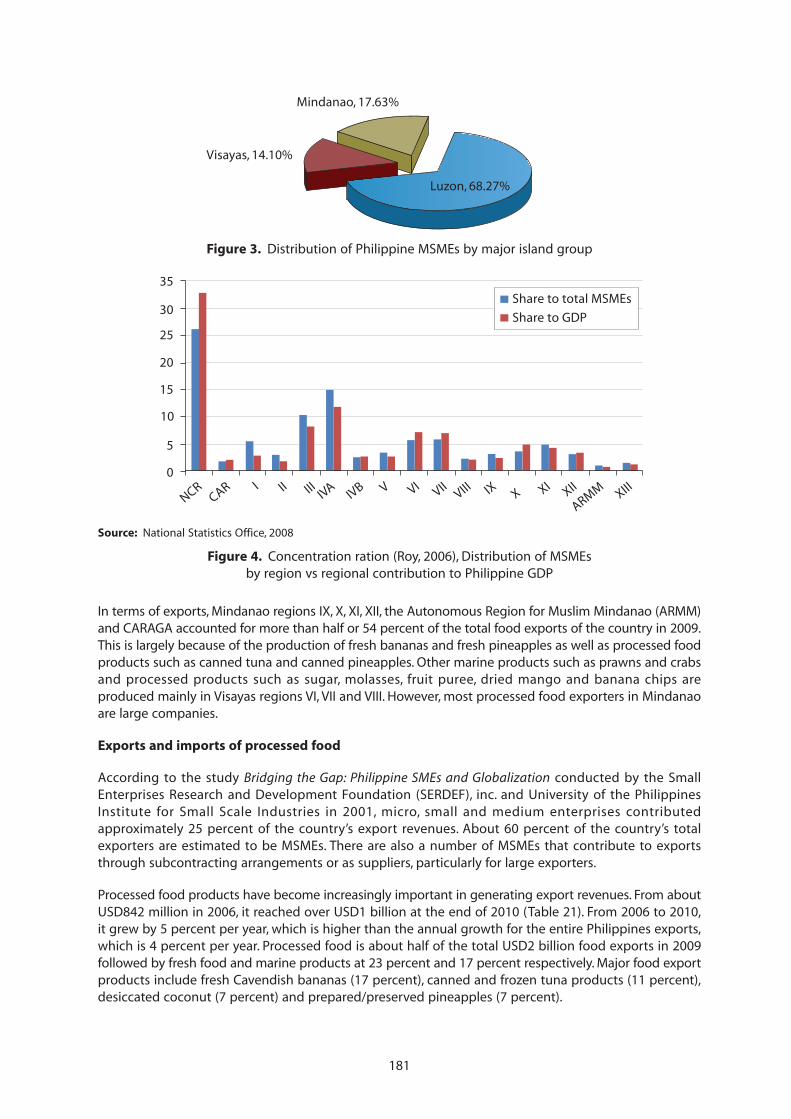
181
In terms of exports, Mindanao regions IX, X, XI, XII, the Autonomous Region for Muslim Mindanao (ARMM)and CARAGA accounted for more than half or 54 percent of the total food exports of the country in 2009.This is largely because of the production of fresh bananas and fresh pineapples as well as processed foodproducts such as canned tuna and canned pineapples. Other marine products such as prawns and crabsand processed products such as sugar, molasses, fruit puree, dried mango and banana chips areproduced mainly in Visayas regions VI, VII and VIII. However, most processed food exporters in Mindanaoare large companies.
Exports and imports of processed food
According to the study Bridging the Gap: Philippine SMEs and Globalization conducted by the SmallEnterprises Research and Development Foundation (SERDEF), inc. and University of the PhilippinesInstitute for Small Scale Industries in 2001, micro, small and medium enterprises contributedapproximately 25 percent of the country’s export revenues. About 60 percent of the country’s totalexporters are estimated to be MSMEs. There are also a number of MSMEs that contribute to exportsthrough subcontracting arrangements or as suppliers, particularly for large exporters.
Processed food products have become increasingly important in generating export revenues. From aboutUSD842 million in 2006, it reached over USD1 billion at the end of 2010 (Table 21). From 2006 to 2010,it grew by 5 percent per year, which is higher than the annual growth for the entire Philippines exports,which is 4 percent per year. Processed food is about half of the total USD2 billion food exports in 2009followed by fresh food and marine products at 23 percent and 17 percent respectively. Major food exportproducts include fresh Cavendish bananas (17 percent), canned and frozen tuna products (11 percent),desiccated coconut (7 percent) and prepared/preserved pineapples (7 percent).
Source: National Statistics Office, 2008
Figure 4. Concentration ration (Roy, 2006), Distribution of MSMEsby region vs regional contribution to Philippine GDP
Figure 3. Distribution of Philippine MSMEs by major island group
Luzon, 68.27%
Visayas, 14.10%
Mindanao, 17.63%
Share to total MSMEs
Share to GDP
35
30
25
20
15
10
5
0
NCRCAR I II III IVA IVB V VI VII VIII IX X XI XII
ARMM XIII
182
More than half of the total processed food exports comprise fruits and fruit preserves as well as coconutproducts. On average, fruits and fruit preserves accounted for about 37 percent of the total processedfood exports from 2006 to 2010. These include products such as preserved/prepared pineapples, driedfruits, puree, juice and concentrates and jams. Coconut products contributed about 18 percent duringthis period. Fruit preserves and coconut products grew higher than the average growth of the processedfood products, albeit not as fast as the other processed food products such as tea/mate, vegetable oil,meat products and cocoa (Table 22).
The top ten market outlets for processed food products accounted for about 70 percent of the totalexports in 2009. These include the United States, Malaysia, Viet Nam, Thailand, Japan, Indonesia, Canada,the Netherlands, the Republic of Korea and Singapore. Although the majority of these are in Asia, theyonly accounted for 29 percent of the total processed food exports compared to United States, whichreached 33 percent in 2009. However, in terms total food products (including fresh food), United Statesand Japan accounted for 23 percent (USD482 million) and 20 percent (USD420 million) respectively.
The global demand for processed products has been increasing but the Philippines’ share, with theexception of desiccated coconut, is very small. From 2004 to 2008, world imports of processed productssuch as beverages, fruits and nuts, sugar and confectionery, breads, biscuits, wafers, cakes and pastriesgrew approximately 13 percent per year. The share of the Philippines of the total imports of theseproducts, which account for 70 percent of the total (USD222 billion), is less than 0.5 percent (Table 23).Furthermore, with the expansion of the food manufacturing sector to respond to increasing demand inthe domestic and foreign markets, locally produced processed products to some extent substitute forimported processed food products.
Food and live animals imported chiefly for food such as dairy products, fish and fish preparation, rice andfruits and vegetables, amounted to an average of USD2 billion per year between 2006 and 2010 andgrew by about 27 percent per year during this period (Table 24A). However, if we include other foodproducts used as raw materials to produce food products such as wheat, corn, cereals and cerealpreparations, meat and meat preparations, coffee, tea and cocoa, total food imports would reach anaverage of over USD5 billion per year during this period. Rice accounted for the bulk of the imports withan average value of USD1 billion per year.
Some of the food products imported such as rice, corn, fruits, fish, fruits and vegetables are also producedin the country. Nevertheless, as demand outstrips supply and as producers in the country are not ableto produce these products more efficiently than the competitors abroad, importation will continue.However, some of these products such as wheat, sugar, meat, dairy and corn are imported as rawmaterials to produce processed food products in the country. The development of new products,particularly for local markets such as snack foods and dairy products (e.g. yoghurt and cheese), hasincreased rapidly in response to increasing local demand. As supply and the quality of locally producedprocessed products continue to increase and improve, demand for similar imported products willdecrease. This opens opportunities for micro, small and medium enterprises either throughsubcontracting or the supply of raw materials.
3. Status of food processing in the country
Based on the latest annual survey of establishments conducted by the National Statistics Office in 2008,the food manufacturing and beverages sector accounted for 41 percent of the total establishments inthe manufacturing sector and contributed 21 percent of total sales, 20 percent of value added and20 percent of the total employment in the manufacturing sector.
The food manufacturing and beverage sector as a whole increased its revenues by 10.3 percent annuallyfrom 2000 to 2008 (Table 24). This is slightly higher than the entire manufacturing sector, which increasedby 8.9 percent per year during this period. The fastest growing sector is the manufacture of starches andstarch products and grain mill products, which grew by 19.1 percent. As shown in Table 24.A thissubsector includes breakfast cereals and flour milling. Starch products use materials such as flour, which
183
are mostly imported, and cassava. From 2006 to 2010, Philippines imported wheat with a valueamounting to an average of USD533 million per year. The second fastest growing subsector is bakeryproducts, which expanded by 18.8 percent per year. This is expected as the flour milling which providesthe raw materials for this subsector also grew fast during this period. The bakery products subsectorincludes bread, cakes, pastries, biscuits, cookies and snack products. Dairy products grew by 16.9 percentper year faster than the growth of the entire sector. Processing of meat, seafood, fish, fruits, vegetables,oils and fats increased by 8.9 percent whereas beverages, sugar, and coconut only grew by 4.0 percent,1.4 percent and 1.6 percent respectively. The processed meat category includes canned and preserved(dried, cured, processed meats, e.g. hot dogs) meat products. Processed fruits and vegetables include fruitpreparations such as canned and dried fruit, preserves, jams and jellies, vegetable preparations (pickled,tokwa, tausi, etc.) Most of the processed food products, particularly those that are branded are producedmainly by large enterprises and a few small to medium size food processors. On the other hand, thereare small and micro-enterprises that produce unbranded and branded products particularly for specialtyproducts, but sold or distributed mostly at the regional or provincial level, but not at the nationallevels. Moreover, there are micro-enterprises that are engaged into producing, selling and vending ofcooked/processed foods that are part of the informal economy and not covered by the census ofestablishments.
Key SMFE players
As previously discussed, there are many firms in the food processing sector, but a few large firmscontribute substantially in terms of revenues, value added, employment, exports and investments in fixedassets. Thus, in terms of output per firm, the large firms dominate the SMFEs to a considerable extent.Most of these large firms supply both the domestic and international markets. Table 25 shows the listof top food manufacturers/exporters in the country. Some large domestic firms have licensingagreements with foreign firms. Republic Flour Mills Corporation (RFM) for example has licensingagreements with Sunkist and Swift Companies in the United States. Unilever Philippines and UniversalRobina Corporation (URC) are part of California Manufacturing and CPC International Inc., respectively.
Whereas all of these firms are multi-product firms, they lead certain processed food product categories.For example, Purefoods-Hormel Company and San Miguel Purefoods Company, Inc., which are bothowned by San Miguel Corporation, lead in the production of processed meat products category. Otherplayers include Pacific Meat Company, Inc. and Virginia Foods.
Dole Philippines and Del Monte Philippines, T’boli Agro Industrial Development corp., Ram Food Products,California Manufacturing corp., and Sysu International inc. are the dominant players in the canned fruits,juice and vegetables sectors. Nestlé Philippines is the top producer of manufacture of powdered milkwhereas Kraft Foods Philippines leads in the production of butter and cheese. Nestlé Philippines inc. isthe market leader in milk products with strong brands such as Nestlé, Bear Brand, Nido and Milo. UnileverFoods Philippines tops in the manufacture of macaroni and noodles whereas Monde Nissin Corporationleads in the baking of biscuits and cookies. For ice cream, Unilever RFM Ice Cream leads whereasLiwayway Marketing inc. is dominant in production of snack products. Baking of bread, cakes and pastriescategory is dominated by Red Ribbon Bake Shop, Grupo Marilena, Gardenia Bakeries and Golden Donuts,inc. Key players in the non-alcoholic beverages sector such as fruit juices, carbonated drinks and bottledwater are Zest-O-Corp, Marina Sales, inc. and CPW Philippines inc., Coca-Cola Bottlers inc. Pepsi ColaProducts Philippines inc., Cosmos Bottling Corp, La Tondeña Distillers, (acquired by SugarlandInternational), Kraft (Tang), Asia Brewery inc. In snack foods and confectionery Universal Robina Corp istaking the lead mainly because of its diversified products and strong Jack ‘n Jill brand.
All of these key players in the food processing sector, aside from exports, cater mainly to retailers in thedomestic markets, particularly supermarkets, convenience stores as well as hotels and restaurants. Detailsof their sales and the number of production plants are presented in Table 26.
184
Per capita contribution of food and beverage firms
The dominance of some of these large multi-products firms can be shown by the contribution per firmin the industry. Of the nine subsectors, the highest revenues per firm is the manufacture of dairy productsat P2.9 billion per firm. In fact, the highest revenue per firm among the 65 categories under the ninesubsectors, the manufacture of powdered and infants milk belongs to this subsector with total revenuesper firm of P10.6 billion. It should be noted that two categories are combined here (manufacture ofpowdered milk and manufacture of infant’s powdered milk) with a total of only 7 firms. As mentionedabove, the leader in this category is Nestlé Philippines with over USD1.35 billion in 2007. In addition, ofthe seven categories under the manufacture of dairy products subsector, three or four belong to the topfive among 65 categories in the food and beverages sector with over P1 billion revenues per year. Theother categories that belong to the top ten with revenues per firm of at least P1 billion are manufactureof malt liquors and malt (beer), manufacture of soft drinks, canning/packing and preserving of vegetablesand fruits, flour milling, sugar refining, sugar milling and manufacture of unprepared animals feeds. Ofthe 65 industries or categories under the nine subsectors of the food and beverages sector, revenue perfirm ranges from P648 000 to P10.6 billon per year (Table 27). The lowest per capita revenue belongs tothe egg processing subsector, including fertilized eggs, whereas the highest is for the manufacture ofpowdered and infant milk.
In terms of employment, the range is from two employees per firm for egg processing including fertilizedeggs to 1 285 employees for canning/packing and preserving of vegetables and vegetable juices. Itshould be noted that the average employment per firm in the food manufacturing and beverage sectoris 30 employees, only half the average figure for the entire manufacturing sector. Rice and corn millingemployment per firm is only nine. This is largely because of the large number of rice and corn millersin the country that accounts for 17 percent of the total establishments in the sector.
In contrast, in terms of value added, the manufacture of dairy products generates the highest valueadded per firm followed by the manufacture of sugar, coconut oil, starches, meat processing, beverages,other processed food products, bakery products and rice and corn milling. Value added is the differencebetween value of output and total costs of materials, fuel, electricity consumed and industrial services.The ranking among product categories is similar to the ranking for revenues. In terms of gross additionsto fixed assets, which indicates improvement in productive capacity, the sugar industry is highest atP101 million per firm followed by manufacture of dairy products. In terms of specific product categories,the highest is the manufacture of milk-based infants products followed by manufacture of malt liquorsand malt and sugar milling.
Profitability, labour efficiency and cost efficiency of firms
The performance of the food manufacturing and beverages sector can be examined by looking at threeindicators: profitability, labour and cost efficiency per firm. At the subsector level in 2008, the mostprofitable is the manufacture of dairy products with profit per firm of about P606 million followed bymanufacture of sugar (P299 million), production of crude coconut oil (P124 million) and manufacture ofstarches (P104 million). The lowest profit per firm is rice and corn milling at P1.9 million (Table 28). Interms of specific categories, the most profitable is the manufacture of milk based products at P1.9 billionfollowed by the manufacture of powdered and infants milk (P1.8 billion), the manufacture of malt liquors(P817 million), soft drinks (P521 million), sugarcane milling (P343 million), sugar refining (P152 million)and muscovado (P146 million).The lowest profit per firm is egg processing at P131 000. Labourproductivity defined at the revenue per employee is also highest for the manufacture of dairy products(P17.7 million) at the subsector level. However, at the product category level the ranking for profitabilityis different from that at the subsector level. The highest labour productivity is the manufacture ofpowdered and infants milk followed by flour milling, coconut oil, ice cream and milk-based products. Interms of revenue generated per peso of cost incurred (cost efficiency) at the category level, ranked firstis the manufacture of sugar at 1.4, whereas the other eight have a ratio of 1.3, except rice and cornmilling and production and processing of meat products including seafoods. At the product levelcategory, the highest is fruit wine manufacturing (1.9) followed by popcorn (1.8), muscovado (1.7),drinking water, powdered and infants milk (1.5) and drinking water (1.5).
185
Performance of firms by size of employment
The data for various performance indicators above are not available for micro, small, medium and largeenterprises. However, data for firms with more than 20 employees and those with fewer than20 employees are available. As mentioned above, micro-enterprises are firms with one to nine employeeswhereas small firms are those with 10 to 99 employees. Thus, all micro-enterprises and some smallenterprises are covered in the first category (fewer than 20) and all medium, large and some smallenterprises are covered in the second category (more than 20).
The contribution of firms with more than 20 employees is also substantially greater than that of firmswith fewer than 20 employees in terms of employment generation, revenues, value added and grossadditions to fixed assets. In the entire food manufacturing and beverages sector in 2006, for example,firms with more than 20 employees generate, per firm, 152 employees, P508 million in revenues,P128 million of value added, P12 gross additions to fixed assets (Table 29). On the other hand, firms withfewer than 20 employees generate, per firm, nine employees, P5 million in revenues, P1.1 million of valueadded and P98 000 gross additions on fixed assets.
Moreover, the difference between the two categories is also significant in terms of performanceindicators such as profit, labour productivity and cost efficiency as defined above. Firms with more than20 employees in the food manufacturing and beverages subsector made profits per firm as much asP128 million in 2008 (Table 30). Compared to all establishments in the same year as data for firms withfewer than 20 employees are not available, profit per firm was only P19 million per firm. This largedifference is true for the subsectors and product categories under the food manufacturing andbeverages sector. In fact for the entire manufacturing sector, profit per firm was P137 million for firmswith more than 20 employees compared to all establishments (including firms with fewer than20 employees) it was P40 million.
For firms with more than 20 employees, the most profitable subsector in 2008 is the manufacture of dairyproducts at P1.0 billion per firm followed by the manufacture of beverage (P294 million), themanufacture of sugar (P289 million), production of crude coconut oil (P245 million), manufacture ofstarches (P184 million), production processing of meat (P71 million), bakery products (P48 million) andrice and corn milling (P28 million). Compared to all establishments regardless of size of employment,profit for the dairy subsector was 65 percent lower. For rice and corn milling, larger firms are1 374 percent higher. In terms of labour productivity and cost efficiency, firms with more than20 employees are significantly higher compared to firms with fewer than 20 employees (Table 31).
In 2006, where data for both categories are available, the same pattern is observed. Firms with more than20 employees in the dairy products subsector made P1.2 billion profits per firm on average followed bysugar, beverages, crude coconut oil, production processing of meat products, starches, bakery productsand rice and corn milling. The ranking is similar to the ranking in 2008 except that sugar and processingof meat products performed better than beverages and starches in 2006 respectively. However, asidefrom the substantial difference in performance indicators, the ranking varies for firms with fewer than20 employees. The most profitable subsector was processing of meat products at P2.6 million per firmfollowed by starches (P2.4 million), rice and corn milling (P1.5 million), dairy products (P1.1 million),bakery products (P706 000) and beverage (P421 000). Production of crude oil posted a negative profitof P339 000. Cost efficiency is highest for beverage whereas crude coconut oil, despite a negative profit,registered the highest revenue per employee.
On a per firm basis, the above data show that larger firms contributed substantially in terms ofemployment, revenues, value added and gross additions to fixed assets. They also performed significantlybetter than the smaller firms, particularly in terms of profitability, labour productivity and efficiency. Itshould be noted that relative to other Asian countries, Philippines has more dominant firms in the foodmanufacturing sector as shown by the highest four firm concentration ratio recorded at about 27 percent(Figure 5). This means that 27 percent of the total sales in the food manufacturing sector is accountedfor by the top four firms in the industry. Available data on concentration ratios for industries in the foodmanufacturing sector also show that average concentration ratio increased by 39 percent from
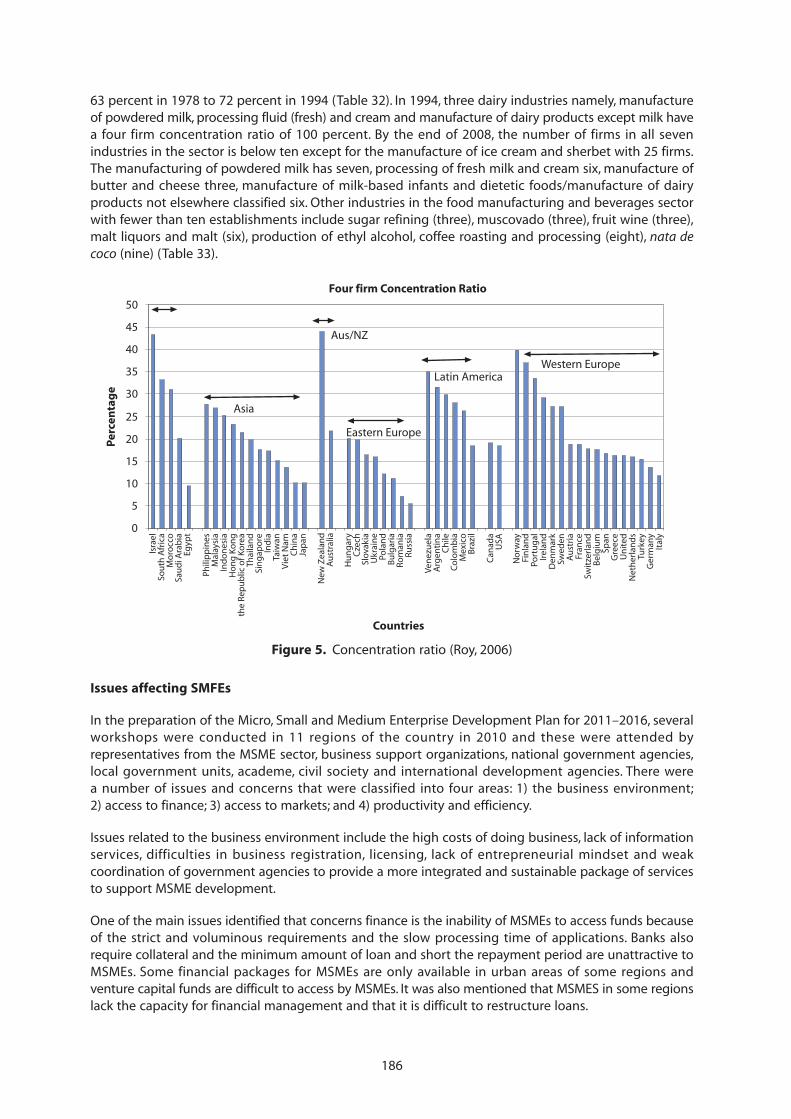
186
0
5
10
15
20
25
30
35
40
45
50
Asia
Aus/NZ
Eastern Europe
Latin America Western Europe
Isra
elSo
uth
Afr
ica
Mo
rocc
oSa
ud
i Ara
bia
Egyp
t
Phili
pp
ines
Mal
aysi
aIn
do
nes
iaH
on
g K
on
gth
e Re
pu
blic
of K
ore
aTh
aila
nd
Sin
gap
ore
Ind
iaTa
iwan
Vie
t N
amC
hin
aJa
pan
New
Zea
lan
dA
ust
ralia
Hu
ng
ary
Cze
chSl
ovak
iaU
krai
ne
Pola
nd
Bu
lgar
iaRo
man
iaRu
ssia
Ven
ezu
ela
Arg
enti
na
Ch
ileC
olo
mb
iaM
exic
oB
razi
l
Can
ada
USA
No
rway
Fin
lan
dPo
rtu
gal
Irel
and
Den
mar
kSw
eden
Au
stri
aFr
ance
Swit
zerl
and
Bel
giu
mSp
anG
reec
eU
nit
edN
eth
erla
nd
sTu
rkey
Ger
man
yIt
aly
Per
cen
tag
e
Four firm Concentration Ratio
Countries
63 percent in 1978 to 72 percent in 1994 (Table 32). In 1994, three dairy industries namely, manufactureof powdered milk, processing fluid (fresh) and cream and manufacture of dairy products except milk havea four firm concentration ratio of 100 percent. By the end of 2008, the number of firms in all sevenindustries in the sector is below ten except for the manufacture of ice cream and sherbet with 25 firms.The manufacturing of powdered milk has seven, processing of fresh milk and cream six, manufacture ofbutter and cheese three, manufacture of milk-based infants and dietetic foods/manufacture of dairyproducts not elsewhere classified six. Other industries in the food manufacturing and beverages sectorwith fewer than ten establishments include sugar refining (three), muscovado (three), fruit wine (three),malt liquors and malt (six), production of ethyl alcohol, coffee roasting and processing (eight), nata decoco (nine) (Table 33).
Figure 5. Concentration ratio (Roy, 2006)
Issues affecting SMFEs
In the preparation of the Micro, Small and Medium Enterprise Development Plan for 2011–2016, severalworkshops were conducted in 11 regions of the country in 2010 and these were attended byrepresentatives from the MSME sector, business support organizations, national government agencies,local government units, academe, civil society and international development agencies. There werea number of issues and concerns that were classified into four areas: 1) the business environment;2) access to finance; 3) access to markets; and 4) productivity and efficiency.
Issues related to the business environment include the high costs of doing business, lack of informationservices, difficulties in business registration, licensing, lack of entrepreneurial mindset and weakcoordination of government agencies to provide a more integrated and sustainable package of servicesto support MSME development.
One of the main issues identified that concerns finance is the inability of MSMEs to access funds becauseof the strict and voluminous requirements and the slow processing time of applications. Banks alsorequire collateral and the minimum amount of loan and short the repayment period are unattractive toMSMEs. Some financial packages for MSMEs are only available in urban areas of some regions andventure capital funds are difficult to access by MSMEs. It was also mentioned that MSMES in some regionslack the capacity for financial management and that it is difficult to restructure loans.
187
Marketing issues include inadequate access to market hubs or centres where they can display theirproducts as well as to organized marketing networks of independent producers and mainstreamdomestic markets such as malls. Most MSMEs are not competitive enough to able to expand in the localand international markets. They also do not proactively seek markets and respond to market needs andthey lack long-term marketing plans. They have poor product packaging and labelling and they lackcertification and accreditation to access new markets. They also have limited capacity for productdevelopment and design and lack access to market information and to modern technology such as theInternet.
Productivity and efficiency issues identified include lack of access to technology and productivityprograms because of their high costs. MSMEs also lack information and education on productivityprograms and most of them do not comply with international quality standards. Their productionsystems and processes are not environmental friendly and gender-sensitive. Working conditions are poorand the cost of utilities is high, particularly for water and power including cost of government servicesfor subsidized technology/packaging and this leads to low productivity. The labour force lacks motivationand skills whereas competent and skilled workers are often lured away to other firms. Governmentprograms on enhancing productivity are not consistent and well-coordinated.
Other studies also reinforce the above issues that affect MSMEs in the country (e.g. Aldaba et al. 2010,Aldaba, 2008; Fukomoto, 1998, Tecson, 2004; FINEX and ACERD, 2006). These studies, however, emphasizedthat the most difficult issue that constrains the growth of SMEs is financing. Availability of funds is nota problem since banks are required by law to allocate 8 percent of their loan portfolios to financing. Theproblem is accessibility of SMEs because of many factors such as limited track record and collateral,inadequate financial statements and business plans, lack of information about credit facilities (Tecson,2004; Hapitan, 2005). Moreover, banks are also reluctant because of high risks in lending to this groupand competition from other government financial institutions that also have their own SME financingprograms. The risk faced by banks in lending to SMEs is mainly because of the various risks and issuesfaced by SMEs that affect their bankability, viability and competitiveness. Issues on product quality forexample arise because of several factors such as limited access to technology, packaging materials andlack of skills. As a result, SMEs find it difficult to access markets and compete with more efficient andlarger firms and this in turn limits their access to finance and lack of funds limits their access totechnology. In many cases, it is a vicious cycle that it is difficult to break. Aldaba, et al. (2010) alsomentioned the limited access to information such as developments in product standards and scanningtechnology as well as the lack of skills to evaluate technology options.
The above issues also apply to the MSMEs in the food processing sector. However, there are also issuesthat are more important and specific to the businesses involved in producing processed food products.In terms of production, the availability of raw materials is a problem particularly in terms of consistencyin quality. Unlike large firms where sourcing of raw materials is well coordinated and sometimescontrolled through vertical integration, MSMEs do not have control over the quality of raw materials. Thecost of raw materials is erratic as they depend on various factors such as production cost, post-harvesthandling, adequacy of infrastructure facilities in production areas and weather. Also the cost of otherinputs is high, particularly sugar and packaging materials. Glass jars, for example are not just expensive,the variety is also limited (Sonido, 2004). In addition, one of the reasons why spoilage is high is becauseof substandard packaging. The latter is because of the high cost of packaging, high production costs ofpackaging materials partly because of high tariff rates on raw materials and equipment and the absenceof packaging standards (Elazegui, 2002). There are also food processors who have difficulty in accessinghigh value, modern markets such as supermarkets as they pay 30 to 90 days after purchase but loansborrowed from microfinance institutions or informal credit are paid on a daily or weekly basis.
A baseline survey was conducted among over a thousand micro-enterprises in various sectors in 2010that included about seventy four food processors in nineteen provinces in the country. In processed meatproducts for example, issues raised included high cost of feeds and veterinary medicine, quality of rawmaterials such as garlic and adulterated pepper, shortage of casing materials for longganisa (Filipinosausage), limited knowledge in identifying breeds for fattening to improve quality raw material,
188
inadequate technology because of manual mixing of spices and ground meat. In addition, the lack ofrequired facilities in the local slaughterhouse causes delays in the delivery of meat.
In processed fruits and vegetables, issues identified include erratic supply of vegetables, lack of highquality bottles for packaging, poor product branding and labelling, limited shelf-life, increasing prices ofindigenous raw materials and difficulty in accessing accreditation from the Bureau of Foods and DrugsAdministration because of high cost of product nutritional analysis. In addition, they also identified issuesrelated to lack of product standardization and equipment to establish and monitor standards as well asproblems in penetrating markets and meeting requirements of buyers because of limited productioncapacity.
In coffee processing, drying and processing of coffee beans are done manually because of lack ofpost-harvest facilities. There are a number of cooperatives and producer organizations in the country thathave ventured into coffee processing. However, aside from issues in branding, labelling and packaging,they also encountered productivity issues in their farms because of poor technology and inadequateextension services. These affect stability of supply of coffee from members of the organization since someof them convert to other crops because of the low price of coffee.
There are food processors (e.g. of pili nut) who are constrained with respect to exporting their productsbecause of the short shelf-life of products and poor product packaging and labelling. The high cost anderratic supply of raw materials also affect their ability to price their products competitively. In the caseof coconut based processors, overpricing of tungog (raw material) and the quality of tuba (raw material)affect their ability to sustain a profitable venture in processing.
In seafoods processing, availability of raw materials is a major concern because of production problems.Supply of milkfish fry is unstable because there is no breeder in the immediate locality. The price ofcommercial feeds has been increasing and fish cage operators are not organized. In the case of seaweedsprocessing, there is no storage facility for dried seaweeds and supply is erratic particularly with outbreakof seaweed disease (ice-ice). All these lead to difficulties in accessing reasonably priced raw materials forprocessing. Moreover, the absence of an ice-plant in the locality also increases costs as does the illegalfees (kotong) that fish vendors have to pay when they deliver the products. All of these things increasethe processing costs of seafood.
In summary, the issues raised in the survey among micro-enterprises in food processing reinforce theissues identified in previous studies and reviews of constraints affecting the development of SMEs. Issuesrelated to access to financing, technology, markets and quality, affordable raw materials are key issuesthat need to be addressed.
4. External forces that shape the SMFE sector in the country
There are various external forces that affect the changing landscape of the SMFE sector in the country.These include changes in demographic and psychographic factors, restructuring in the food system andpolicies in the domestic and overseas markets. This section dwells on the first two factors whereas thepolicy environment that includes legal, institutional and industrial infrastructure factors is discussed insubsequent sections.
Changing demographic and psychographic factors
Changing demographic and psychographic factors in the country and abroad, particularly in the majormarkets, affect the demand for food, especially processed food products. Increase in family income andthe number of dual-income households has expanded demand for processed food products. The latterimplies busier lifestyles for both spouses with less time to do household chores such as food preparation.Thus, there is an increased demand for ready-to-cook meals, or foodstuffs that require less time toprepare and usually that reduce the frequency or time spent shopping for them.
189
As shown earlier, revenues of food manufacturing firms have increased because of increasing demandfor processed food products. San Miguel Purefoods, for example, has increased its share of processedfood sales from 40.7 percent in 2008 to 41.4 percent in 2009 reaching total sales of P13.3 billion. Basedon household consumption data derived from the family income and expenditure survey, foodconsumption expenditures increased by 8.5 percent per year from 2003 to 2009 (Table 34). Expenditureon food consumed outside the home increased by 11.2 percent per year during this period, higher thanthe food consumed at home, which increased only by 8.1 percent. The fastest growing food category forfood consumed at home was cereals and cereals preparation (10.6 percent) followed by coffee, cocoaand tea (9.3 percent), dairy products and eggs (7.6 percent), fish and marine products (7.3 percent), fruitsand vegetables (6.1 percent) and roots and tubers (6.1 percent) and meat and meat preparations(5.8 percent). Whereas the food expenditure categories include both processed and unprocessed food(fresh), there are similarities when we compare the trend for the data on revenues of firms in the foodprocessing sector. For one, expenditure on cereals and cereals preparation increased the most, which isconsistent with the data on revenues. This is also true for dairy products. In addition, data also show thatspending on food consumed outside the home increased faster than spending on the food consumedat home. This indicates an increased demand for processed food products that can reduce time for foodpreparation. In fact, this is also the trend in the international market.
Improving incomes of Filipinos increases consumption of processed food products. Expenditure on dairyproducts and eggs, for example, of a family with less than P40 000 annual income was P800 comparedto a family with income of more than P250 000 who spent P115 000 per year in 2009. For cereals, familiesearning more than P250 000 spent P26 000 per year whereas those earning less than P40 000 spent only9 200 per year (Table 35). Higher income families also consume more food outside the home witha difference in expenditure of about P26 700 per year. Over time, from 2003 to 2009, consumptionincreases across product categories and income levels particularly for higher income brackets (Table 36).
Whereas domestic demand for processed food is expanding, the global demand for processed foodproducts is increasing as well. Exports of processed food increased by at least 5 percent per year from2006 to 2010 (Table 37), higher than the growth of the total exports of the Philippines. As mentionedearlier, about 70 percent of the total processed food exports is accounted for by the top 10 Philippineexport markets with United States contributing the bulk at 33 percent. Thus, demographic andpsychographic changes of consumers in this market affect significantly the demand for Philippineprocessed food exports. The United States’ increasing population, currently at over 300 million, thediversity of the population with various ethnic backgrounds, aging population, busy lifestyles, andincreasingly health-conscious population explain the variety and the type of processed food productsimported from the Philippines (DTI, 2010). Thus, processed fruit and vegetables accounted for a third ofthe processed food exports, most of which go to the United States markets e.g. canned pineapples andjuices. In addition, there is also an increase in ready-to-eat and easy-to-fix meals. Currently, there area number of micro-enterprises that prepare ready-to-eat meals that they deliver to offices packed inplastic bags.
As export demand for Philippine processed food products increases, opportunities for small, medium andmicro-enterprises to supply to exporters through subcontracting also increase. However, this requiressupport systems such as consolidation of small suppliers and assistance to meet volume and qualityrequirements of exporters. Direct exporting of small and micro-enterprises, aside from consolidation tomeet economies of scale, requires more support to provide an integrated package of assistance fromproduct development, marketing and financial assistance.
Expanding modern food markets
Restructuring in the agrifood markets is driven by factors such as changing lifestyles, increasing incomeand the government’s liberalization policies. The growth of convenience stores and supermarkets, forexample, is a response to an increasing demand for convenience. These modern food outlets affectchanges in the food chain (see Berdegue and Peppelenbos, L., 2005; Henson and Reardon, 2005; Reardonet al., 2005). As they continue to grow, there are opportunities open to producers to supply as long as
190
they meet the volume, frequency and quality requirements. Many small producers, however, are unableto tap these opportunities as they lack the resources to compete. Meeting the frequency and volumerequirements of high value markets is difficult because transaction and consolidation costs are high.Moreover, small-scale producers have inadequate financial resources to invest in technology to meet thequality standards of high value markets.
In Southeast Asia, the modern retail sector is also expanding quite rapidly as economies improve andas populations increase. Total retail sales increased by 6.1 percent per year (Table 38). Of this, groceryretail sales grew by 5.2 percent with food retail service even increasing faster at 7.9 percent. In thePhilippines, the number of supermarkets and sales increased by 16 percent and 26 percent per yearrespectively from 1999 to 2008 (www.planetretail.net). In fact, this growth is faster than the growth intotal food spending of 5.4 percent. This implies that consumption of food away from home has alsoincreased. As shown in Table 34 for example, the food consumed outside the home increased fromP110 billion in 2003 to P196 billion in 2009 an average increase of 11 percent per year during thisperiod. Moreover, food consumed at home only increased by 8 percent. In the Philippines, the numberof dual income households has increased. Thus, as incomes and the number of working women increase,the demand for the convenience offered by the modern retail sector and foodservices is expected toexpand.
As demography and lifestyles change in these economies, the way foods are produced, processed anddistributed also change. For example, five years ago ready-to-eat mixed vegetable salads and fruits werenot available in supermarkets. Today, there are a number of brands in the supermarkets that are ownedby the producers of vegetables themselves such as Dizons, Dole Philippines, Eden and Gourmet Foods.This is largely driven by the increasing demand for healthy and ready-to-eat food that is associated withincreasing incomes. Moreover, these changes in the agri-food system are also affected as governmentscontinue to liberalize their economies, bringing in more investments and trading more goods andservices. In the retail trade sector, foreign multinational companies have invested in Southeast Asia,changing the landscape of retail trade distribution, including food distribution.
As the modern retail sector continues to respond to the demand of consumers and as governmentsopen their countries to foreign investment in this sector, various modern retail formats and outlets willcontinue to flourish such as hypermarkets, superstores, supermarkets and convenience stores. Thepopularity of these outlets varies across countries. In Singapore for example, supermarkets andneighbourhood stores account for 61 percent of modern retail sales whereas in Thailand, hypermarketsand supermarkets appear to be more dominant, accounting for more than half (52 percent) of the totalmodern retail sales from 1999 to 2007. However, other countries are catching up. Sales of supermarketsand neighbourhood stores in Viet Nam have been increasing by an average of 40 percent per year.Hypermarkets and supermarkets in Indonesia and the Philippines have been growing annually by54 percent and 28 percent respectively. In fact, retail chains have expanded aggressively in the last fiveyears from Metro-Manila to other cities or urban centres in the country such as Cebu and Davao, andthis helps to expose the variety of processed food products offered in supermarkets. Clearly, there arechanges in the way foods are distributed with an increasing role for modern food retail outlets such assupermarkets and hypermarkets. As procurement strategies of these outlets change, requirements fromsuppliers in terms of volume, quality, frequency, variety, form and packaging also change. Thus, strategiesof the suppliers, including farmers, must also change. Otherwise, if these requirements are not met, accessto these markets is denied and opportunities will be missed.
Moreover, because of the exposure to ethnic restaurant menus and supermarket and grocery selectionsof ethnic products, American consumers increased their demand for a variety of ethnic products that areprice competitive relative to those produced locally (DTI, 2010). There is a rapid increase of supermarketsworldwide that offer increasingly a variety of imported and ethnic products. Although the Philippinesliberalized the retail food industry in 2000, the entry of foreign food retailers or supermarkets is limited.Only Pricemart and Makro came in. The latter was eventually bought by the largest retailer in the country(SM Shoemart). Thus, there is limited opportunity for foreign retailers to carry Philippine processed foodproducts in their outlets abroad. However, with the widespread increase of supermarkets globally,
191
Philippine processed food products gain exposure in the international retail food markets, which helpsincrease demand. In addition, increasing the variety of products carried by supermarkets does not onlyenhance service, it also helps address seasonality of temperate products. Raw material used forprocessing, particularly for fruits and vegetables, are grown year-round in the country and thereforepricing of these products is relatively stable (DTI, 2010). In the Philippines, the influx of importedprocessed food products carried by supermarkets has provided consumers with a wide range of productsand has also enhanced competition for locally produced processed products such as snack foods,chocolates and processed meat products. Philippine products such as canned pineapple and juices,canned tuna and frozen tuna, although sold through importers/wholesalers, are carried by supermarketsin other countries. Thus, expansion of modern retail outlets here and abroad has benefited thePhilippines not only in terms of exports but also in terms of enhancing competition.
Food manufacturing, producer and retailer coordination
With the growth of supermarkets and their proximity to consumers relative to producers, they are ina position to respond to opportunities to changing consumer preferences. Regmi and Gelhar (2005)observed that multinational food retailers and manufacturers are expanding their presence in developingcountries and food retailers and their producers are differentiating their consumers in developedcountries to meet the demands of the consumers in terms of variety, food safety and quality. Thus, thegrowth of private labels of large food retail chains has been observed even in countries such as thePhilippines. This increases the demand for processed food products in the Philippines as private labelsoffer lower price, but brands from large domestic (e.g. San Miguel) and multinational firms (e.g. Nestlé)appear to be more powerful compared to private labels of domestic retailers. Whereas the food industryis increasingly becoming global, food markets are responding to meet local preferences (Regmi andGehlhar, 2005).
As markets become increasingly competitive, the coordination of suppliers (e.g. farmers and foodprocessors) and sellers (e.g. supermarkets and fast food chains) is being enhanced to lower costs andimprove the quality of products produced and sold. In the Philippines, Aldaba (2008) observed thatforward and backward linkages of multinational firms with small and medium enterprises in themanufacturing sector are weak. In the food processing sector, data show that the number of small andmedium subcontractors in 1994 was 116, which increased to 300 in 1994 but declined abruptly to31 in 2003 (Table 39). The corresponding share of SMEs subcontracted output to total SME output alsodeclined during this period from 1.06 percent in 1994 to 1.21 percent in 1998 to 0.91 percent in 2003.The share of subcontracted output to total output is very low. However, in terms of exports, the shareof subcontracted output is significantly higher despite a decline from a share of 36 percent in 1994 to29 percent in 1998. The share of SMEs export of processed food to total exports is higher and increasingcompared to its share total value of output. In 1994, the share of SME export to total industry exportswas 44 percent and increased to 85 percent in 1998. This implies that SMEs play a major role in theexport of processed food products.
Subcontracting is not just happening between multinational/large domestic food processors andsuppliers (large to MSMEs) but also between retailers and suppliers in private labels or supermarketbrands. In addition, some supermarket suppliers diversify from fresh food to processed food productsand develop their own brands. In the last decade, large supermarkets and hypermarkets (e.g. Shoemart,Robinsons) in the Philippines have modified their procurement systems particularly for fresh foodcategories from buying directly from suppliers to a combination of a concessionaire system and directprocurement. Concessionaires rent a space in the supermarket and manage a category or business.Because of proximity of these concessionaires to buyers, they are able to understand consumer needsbetter. Thus, some concessionaires have diversified their products to respond to opportunities to meetconsumer needs. A good example of this is the Dizon group, which is the largest concessionaire for freshfruits and vegetables in supermarkets. In the last few years, the variety of products offered expandedfrom fresh to minimally processed vegetables (e.g. salads), salad dressing and dried mangoes under theirown brands.
192
Economic blocks, trade barriers and standards
The implementation of the ASEAN single market with no barriers to trade is expected by 2015. Currently,the ASEAN internal tariffs for most traded goods are already between 0 to 5 percent and the removalof these barriers is being accelerated. Under this single market initiative, programmes to enhancepromotion and negotiations in ASEAN agricultural products, including processed food products, arebeing pursued to increase ASEAN exports to foreign markets. In 2009, Philippine’s total processed foodexports to ASEAN was valued at approximately USD211 million, which accounted for 21 percent of thecountry’s total processed food exports. Thus, with lower tariffs and minimal trade barriers, Philippinesexports to ASEAN neighbours are expected to increase. Linkage of MSMEs should be strengthened notonly with large exporters but also among themselves to meet market requirements in terms of volume,quality, price and frequency of delivery.
Another potential economic block market for Philippine processed for exports is the European Union(EU) which is composed of 27 member countries with a market size of 375 million consumers with highpurchasing power. In 2009, total processed food exports of the country to EU was about USD123 millionor about 13 percent of the country’s total processed food exports. About 27 percent (valued atUSD33 million) goes to the Netherlands. Most EU consumers are well-travelled and discriminating interms of quality so opportunities are open for high quality ethnic foods. In addition, trade barriers,particularly high tariffs, exist that compound the high transport cost to this market. Its lower five-yeartariff scheme of only 12 percent ended in 2008. Canned tuna, for example, has a tariff of 24 percentcompared to other exporting countries from the African, Caribbean and Pacific Group, which enjoy zerotariffs. This is also the case in the United States market, which imposes export duties between 6 percentand 35 percent, but none for Andean countries such as Colombia, Bolivia, Peru, Ecuador, and Venezuela.
The Japan-Philippines Economic Partnership Agreement (JPEPA) is a bilateral agreement that can furtherimprove trade between Philippines and Japan, particularly in food exports. Japan is the second largestmarket for Philippine food exports and fifth in terms of processed food exports. In 2009, processed foodexports to Japan reached USD45 million. Tariff reduction under this agreement will increase exports forspecialty coffee, dried fruits (papaya, jackfruit, durian, pineapple and banana) marine and aquacultureproducts (shrimps/prawns, octopus, frozen tuna) preserved fruits such as jams/jellies, biscuits (DTI, 2010).
Whereas economic blocks and bilateral economic agreements provide opportunities to enhance theexport of processed food products through removal or reduction in tariff and non-tariff barriers, countriesare increasingly concerned with regulations, particularly in terms of environment and food safety. Thisincreases standards and changes the landscape of competition in the global markets. These includemarket requirements such as Good Manufacturing Practice (GMP), Hazard Analysis Critical Control Point(HACCP), Halal Certification for the Muslim consumers, Fair Trade and Good Agricultural Practice (GAP)and various eco-labels to protect the environment. In fact, the United States, the largest market forPhilippine food processed products, has proposed that exporters should submit a food safety plan underthe United States Food Safety Enhancement Act (HR 2749).
5. Government policy and legal frameworks
The Magna Carta for MSMEs is the landmark legislation enacted in 1991 as the Republic Act No. 6977and amended by the Republic Act No. 8289 in 1997 and further amended by the Republic Act No. 9501in 2008. It is the legal framework for developing MSMEs in the country. Another legislation specific tothe development of micro-enterprises in the country is the Republic Act No. 9178, also known as the“Barangay Micro Business Enterprises (BMBEs) Act” that was signed into law in November 2002.
The Magna Carta (as amended by the Republic Act No. 9501) for MSMEs recognizes the need to developenterprises, particularly rural/agribased enterprises through: 1) training in entrepreneurship and skillsdevelopment; 2) access to sources of funds; 3) access to government contracts and related incentives andpreferences; 4) strengthening financing programs for MSMEs and doing away with stringent andburdensome collateral requirements; 5) instituting safeguards for the protection and stability of the creditdelivery system; 6) raising government efficiency and effectiveness in providing assistance to MSMEs; 7)
193
promoting linkages between large and small enterprises, and by encouraging the establishment ofcommon service facilities; 8) improving private sector partnership in building up MSMEs through thepromotion and participation of private voluntary organizations, viable industry associations, andcooperatives; and 9) assuring balanced and sustainable development through the establishment ofa feedback and evaluation mechanism to identify issues and environmental effects of the developmentof MSMEs.
An important provision of this law particularly in addressing the access to finance issue of MSMEs is thecreation of the Small Business Guarantee and Finance Corporation (now known as Small BusinessCorporation). Already related to addressing this issue is the mandatory allocation of all credit institutionsunder Section 15 of the law to set aside at least 8 percent for micro and small enterprises and at least2 percent for medium enterprises of their total loan portfolio.
The Magna Carta is an attempt by the government to come up with an integrated approach to developSMEs in the country. In the 1970s, the government implemented various programs to develop SMEs interms of financing, market development, technology transfer and entrepreneurship (Aldaba, 2008; Tecson,2004). These continued in the 1980s but focused more on the market access and development tosupport the export development priorities of the government and adapt to an increasingly globalizingeconomy with the implementation of liberalization policies. Then came the Magna Carta in 1991 andeventually amended twice with the latest version in 2008. In 2003, the Republic Act No. 9178 or theBarangay Micro Business Enterprises (BMBEs) Act of 2002 was signed into law. This law focused onintegrating the micro-enterprises in the informal sector into the mainstream economy. Under this law,BMBEs are exempted from income tax and coverage of the minimum wage law and are given priorityto a special credit window for their financing requirements. They can also access programs on technologytransfer, production management and training and marketing assistance.
Agro-industrial policy
The agro-industrial development approach is a core strategy adopted by the government to developrural areas in the country. Various agri-industrial policies have been developed to implement forward andbackward linkages of industries to agriculture. A landmark legislation that promotes this approach is theAgriculture and Fisheries Modernization Act of 1997 (Republic Act No. 8435). There are three objectivesof this policy that promotes agro-industrialization: 1) to enhance profits and incomes in the agricultureand fisheries sectors, particularly the small farmers and fisherfolk, by ensuring equitable access to assets,resources and services, and promoting higher-value crops, value-added processing, agribusiness activities,and agro-industrialization; 2) to induce the agriculture and fisheries sectors to ascend continuously thevalue-added ladder by subjecting their traditional or new products to further processing in order tominimize the marketing of raw, unfinished or unprocessed products; and 3) to adopt policies that willpromote industry dispersal and rural industrialization by providing incentives to local and foreigninvestors to establish industries that have backward linkages to the country’s agriculture and fisheriesresource base. In addition, Republic Act 7916 (as amended by Republic Act No. 8748) also promotes thedevelopment of agro-industrial centres in the country and establishes forward and backward linkagesin and around the economic zones.
Food safety regulations
Food safety regulations in the Philippines are being heightened with the increasing need for safer food,particularly with the increasing incidence of food-borne diseases. The issue of high pesticide residues onvegetables has gained attention especially with the increasing demand for vegetable salads in thecountry. Other issues such as aflatoxin, red tide (fish) and heavy metals (lead) because of the increasedpresence of mining companies in the country have also reinforced that need to implement a PhilippineFood Safety Framework that includes the wide participation of stakeholders in the food chain. Theseinclude government, consumers, wholesalers, food manufacturers, retailers, food service outlets,restaurants, etc. Thus, food safety is not just a public interest issue, it is a business necessity to ensurequality products and enhance competitiveness in the domestic and international markets.
194
In the Philippines, food safety regulations are undertaken via licensing and inspection of foodestablishments, product registration, monitoring of trade outlets and product advertisements.
As indicated in the Philippine Food Safety Framework, there are a number of safety and quality controlmeasures in the food chain being implemented by the Bureau of Food and Drugs (BFAD). These are thehygienic safety manufacturing practices, HACCP and safety and quality standards.
Good manufacturing practice (GMP) is required by BFAD before food processing establishments aregiven the license to operate (LTO). GMP specifies the principles and procedures required to design anenvironment for the production of processed products of acceptable quality. The conditions for thehygienic processing of food are specified in the GMP codes and hygienic requirements. All foodprocessors need to comply with Administrative Order 208 which stipulates GMP. Moreover, HACCP isa tool to ensure food safety by assessing hazards and establishing control measures at various stagesof production. The BFAD has processed food standards but also uses the Codex Alimentarius Commission(Codex) and the United States’ CFR for reference.
A number of food processors, particularly the micro and small enterprises, find it difficult to meet theGMP or HACCP requirements as it entails money to implement the protocols. Large enterprises adoptfood safety measures required by the government as they have the resources and have establishedreputations and brands to protect. For medium and large enterprises, consumer demand for food safetyis a primary driver of adoption. Whereas this is also a concern of smaller enterprises particularlymicro-enterprises, the lack of resources is a serious constraint. However, assistance from the governmentis limited to support micro-enterprises to meet GMP or HACCP requirements. The Rural Micro-enterprisePromotion Program of the Department of Trade and Industry is one example that provides assistanceto micro-enterprises, including those in the food processing sector to meet GMP and HACCPrequirements. The Department of Science and Technology, Food Development Center and the PhilippineTrade and Training Center offer training in HACCP and GMP.
Competitiveness issues: the cost of doing business
As discussed in Section 3, food MSMEs are faced with many constraints that range from access to finance,markets and technology to availability of quality and reasonably priced raw materials. This situation iscompounded by a business environment where the cost of doing business is high and not competitivecompared to other ASEAN countries. In terms of start-up procedures, Philippines has the highest numberand has not improved from 2004 to 2009 relative to her ASEAN neighbours, particularly compared toIndonesia, Thailand and Singapore (Table 40). During the same period covered, the cost to registera business is also highest and whereas most of the ASEAN neighbours have reduced the cost, thePhilippines in fact has made it costlier. Philippines also ranks first in terms of the number of days toenforce contracts.
Even in the business of exporting, Philippines lags behind in terms of providing a conducive environmentfor exporters. As shown in Table 41 the cost to export is highest. In 2004, it used to be costlier forexporters from Thailand compared to Philippine exporters but by the end of 2009, Thailand reduced itscosts whereas Philippines increased the cost.
In terms of ease of doing business, Philippines is ranked by the World Bank 144 out 183 countries(Table 42). Singapore is ranked first whereas her ASEAN neighbours Malaysia, Indonesia, Viet Nam andThailand are all ranked higher than the Philippines.
6. Status of national institutional and industrial infrastructure
Competitiveness of the Philippine processed food industry particularly the MSMEs sector is affectedby the level of institutional and industrial infrastructure support. Institutional infrastructure includestechnology and innovation, commercially oriented research and development, human resource capacity,financial and fiscal systems, marketing strategies, safety quality and consumer protection. Industrialinfrastructure includes power, transport, communication, water, land and environmental protection.
195
The cost of marketing is high because of poor road conditions and the small volume of goods sold. MostMSMEs depend on public transportation, which is inefficient and causes delays in marketing theirproduce. A good example that illustrates the importance of infrastructure facilities, particularly in linkingsmall-scale food producers and processors to high value markets, is the case of kalamansi producers inZamboanga Sibugay province in Southern Philippines. The largest fast food chain in the country wantedto source out fresh kalamansi as part of their corporate social responsibility program. However, althoughthe producers are competitive in terms of production cost compared to the main producing area inNorthern Philippines (Luzon), the marketing cost from the production area to the market in Metro Manilain Luzon is too high. Thus, the producers ventured into processing juice concentrate to avoid theirproduce rotting in the fields when prices are too low to cover the cost of harvesting during a supply glut.Moreover, farm-to-market road conditions are poor and add to the high transportation cost. Cost ofshipping is also high because of several factors such as lack of competition in the shipping industry. Inthe Philippines, because of cabotage law, domestic routes are limited to local shipping lines. Initiativesto reform the cabotage law have been unable to lower the cost of shipping. However, the promotion ofroll-on-roll-off (RORO) has provided an alternative way of increasing competition in the port handlingservice sector.
In rural areas in provinces such as Mindanao, the frequency of brownouts is relatively high because themain source of energy is hydroelectric power. In addition, in some areas, it is necessary to invest intransformers to be able to connect to existing power lines such as the case of small-scale calamansiprocessing in Zamboanga Sibugay province. This increases the cost of investment. Thus, there are somemechanical dryers for rice in rural areas that use charcoal instead of electricity. Moreover, whereas somesmall-scale food processors in rural areas are competitive in terms of production costs because of lowerraw materials costs and labour, their products become uncompetitive when sold to urban centersbecause of high transportation costs, lack of consolidation and inadequate storage facilities. Examplesof these are micro food processors assisted by the Rural Microenterprises Promotion Program (RUMEPP)and the Cordillera Highlands Agricultural and Resource Management Project (CHARMP2). Moreover,communication facilities are also inadequate in the rural areas and this makes it difficult to develop anefficient market information system for small rural-based enterprises.
There are a number of agencies involved in assisting MSMFEs in the country. The Department of Tradeand Industry (DTI) is the lead agency mandated to develop MSMEs together with its associated agenciesengaged in various aspects of SME development. The Bureau of Small and Medium EnterprisesDevelopment (BSMED) coordinates services for MSMEs and serves as the secretariat to the Small andMedium Enterprise Development Council. The Small Business Corporation provides credit andadministers financing programs such as the SME Unified Lending Opportunities for National Growth(SULONG) in collaboration with government financial institutions such as the Land Bank of thePhilippines, Development Bank of the Philippines, Small Business Corporation, Quedan and Rural CreditCorporation, Philippine Export-Import Credit Agency, and the National Livelihood Support Fund. In themarketing field, the Center for International Trade Expositions and Missions (CITEM) provides informationand market access through its various trade fairs and missions whereas the Product Development andDesign Center (PDDC) provides services to improve product quality. The Philippine Trade Training Center(PTTC) offers training on export/import management, entrepreneurial development and trade exhibitionmanagement. Other agencies include the Bureau of Domestic Trade, the Bureau of Export TradePromotion and the different regional offices of the Department of Trade and Industry in various regionsand provinces of the country.
All these agencies support MSMEs in the food processing industry in the Philippines and this reflects thefact that it is one of the priority industries, particularly in accelerating development in the rural areas.Other agencies involved, particularly in the food processing subsector, include the Department of Scienceand Technology (DOST) and the Department of Agriculture. DOST through its Small EnterprisesTechnology Upgrading Program provides assistance in technology improvement for MSMEs. This includesneeds assessment and technology sourcing, provision of seed funds for technology acquisition, technicaltraining on HACCP, good manufacturing practices, quality and environment management systems,technical and productivity consultancy services to participating firms, establishment of product
196
standards, development of networks of accredited regional product-testing laboratories, design andfabrication of cost-reducing equipment. Moreover, the one-town-one-product (OTOP) strategy of the DTIpromotes development of value addition or processing to the main or strategic commodity producedin one municipality.
The private sector, particularly the Philippine Food Processors and Exporters Organization, inc.(Philfoodex), is also involved in the development of the food processing subsector. Services offeredinclude information dissemination, marketing and promotions, policy research and advocacy, training andseminars, technology update, raw material sourcing, forging partnership with government agencies, barcoding services, and technical assistance.
The Small and Medium Enterprise Development Plan (SMED Plan) includes strategies to develop theinstitutional and infrastructure support necessary to develop SMEs in the country. Highlights of the statusof implementation, particularly for the SMED Plan for 2004–2010 are presented in Table 43. Despite theaccomplishments in the implementation of the SMED Plan for 2004–2010 there were still a number ofissues raised. Smaller MSMEs benefited less than the established ones. MSMEs struggled to invest in skills,technology and quality including access to markets. Medium enterprises have not grown compared tosmall and large enterprises. Improvement in access to credit is minimal which is compounded by thehigh cost of doing business (MSMED Council, No date). Full details of the MSMED Plan 2004–2010 canbe found at DTI (No date).
Some of these issues identified from the evaluation of the SMED plan implementation may explainPhilippine’s performance in the global competitiveness report for 2009/2010. In terms of labour marketefficiency, which includes labour productivity, Philippines ranked 111 out of 139 countries (Table 44). Evenin technological readiness Philippines was ranked 95 lower than other ASEAN countries exceptCambodia. The low investment in skills and human resource development and technology of SMES mayexplain why Philippines is ranked 111 in terms of innovation.
In terms of the quality of institutions, including intellectual property right protection, corruption, securityand government efficiency, the country was ranked 125, the lowest in ASEAN. In terms of infrastructure,which includes roads, communication facilities, transport, and electricity, Philippines is ranked 104, lowestin ASEAN except for Cambodia. In all types of transportation infrastructure, Philippines is consistentlyranked below Indonesia and Viet Nam (Table 45). These facts partly explain why the cost of doingbusiness in the Philippines is high. Moreover, other costs such as electricity and building constructioncosts are higher in Philippines than in Malaysia, Indonesia, Thailand and Viet Nam (Table 46).
7. Analysis of constraints and strategic priorities for enhancing competitiveness ofSMFEs
It is important to examine the constraints and strategic priorities to enhance competitiveness of SMFEson the basis of the above discussions. Clearly, the micro, small and medium food enterprises (MSMFEs)play a critical role in the manufacturing sector, particularly in the food processing and beveragessubsector. They account for more than 40 percent of the total establishments in the manufacturingsector. Within the food manufacturing sector, MSMFEs contributed over 63 percent of employment, whichis higher compared to the contribution of MSMEs in the other manufacturing subsectors. They alsocontribute significantly in terms of value added, revenues and profits. This implies a greater potential ofMSMFEs to generate employment, value added, revenues and profits compared to MSMEs in the entiremanufacturing sector. In addition, the number and value of subcontracted work of SMFEs, particularlyfor export markets, are significant and relatively higher compared to other manufacturing subsectors.
Moreover, domestic and foreign markets for processed food products are expanding, largely driven bychanging demographics and psychographics such as increasing population, income and number of dualincome households and changing tastes and preferences for a variety of products that are healthy andcan reduce time to prepare. The proliferation of supermarkets and convenience stores contributes to therapid exposure of consumers to a variety of processed food products. Liberalization policies, development
197
of economic blocks and reduction of trade barriers in some markets also contribute to market expansion.Thus, processed food exports are growing faster than total Philippine exports. This rapid expansion ofmarkets partly explains why revenues and profits per firm in the food manufacturing sector are highercompared to the average for the entire manufacturing sector.
In addition, the commitment of the government, private sector and other stakeholders to address issuessuch as the high cost of doing business, improve infrastructure and provide a more conducive businessenvironment for MSMEs to develop is in place, as articulated in the MSMED Plan for 2011–2016. Moreover,the government is aggressively pursuing rural development to alleviate poverty within an agro-industrialpolicy where forward and backward linkages are strengthened.
However, there are a number of issues and challenges that constrain the development of MSMFEs. Thebulk of MSMFEs are micro-enterprises and small enterprises that are fragmented and unable to takeadvantage of economies of scale and scope. Their production and marketing costs are high given thenature of their raw materials, which are perishable and sourced from the rural sector where infrastructureconditions are poor. Thus, the contribution of MSMFEs to revenues, value added and profits in the entirefood processing sector is much lower compared to large firms despite their large number. In fact, thefood manufacturing and beverage sector is dominated by large firms and characterized by highconcentration ratios.
Moreover, the high costs of sugar, packaging and other inputs increase production costs making theirprices uncompetitive and market access more difficult. These lower profitability and make access tofinance also more challenging. Subsequently, investments to improve quality through better technologyare low (e.g. HACCP, GMP) and this becomes a vicious cycle that perpetuates the lack of competitiveness.
The weak coordination of government agencies to assist the development of MSMFEs also needs to beaddressed, including the strengthening of institutions and infrastructure facilities. But because they arefragmented and operations are small in scale, it is difficult and costly to deliver development assistance.
Given the multidimensional constraints faced by MSMFEs, strategic priorities should be geared towardsproviding an integrated package of services that is delivered in a more efficient and effective manner.The current approach of the agencies involved in implementing the SMED Plan to develop clusters andvalue chains to strengthen forward and backward linkages should be continued and further enhanced.Based on a recent study on agribusiness clusters (World Bank and FAO 2011) in the Philippines, it wasfound that there is a strong relationship between the regional competitive ranking in the agriculturaland food manufacturing sectors. This indicates the strength of clustering or the vertical relationship ofthese two sectors. Region VI ranked first in the growing of sugarcane and sugar milling. Region III alsotopped in broiler production and slaughtering and meat packing as well as fourth in the processing ofmeat products. Region IVA also ranked second in broiler production and processing of meat and meatproducts and third in slaughtering and meat packing. Region XII ranked first in growing of other bananaand packing and preserving of fruits and fruit juices. It should be noted that this region as well asRegion X, should have been ranked highly if data were not suppressed for this industry particularly forthe presence of large pineapple plantations of Dole and Del Monte in these regions (Table 47). WhereasRegion X excelled in slaughtering and meat packing and processing of meat, they also excelled in theproduction of raw materials (beef and hog) for these industries.
Plans to develop the competitiveness of MSMEs, particularly those in the food manufacturing subsector,are clearly outlined in the MSME Development Plan for 2011 to 2016. The strategic priorities fordevelopment in this plan are mapped out in four outcome or result portfolios: 1) improvement ofbusiness environment; 2) access to finance; 3) access to markets; and 4) productivity and efficiency.
Recommendations and conclusions
The above analysis shows that there are opportunities and challenges faced by MSMEs in the foodprocessing subsector. Demand for processed food is increasing both in the domestic and internationalmarkets largely driven by changing demographics, globalization, liberalization policies and
198
modernization of the food agribusiness system. Whereas there are clear market opportunities, MSMEsare not as quick to exploit opportunities or adapt to changing market requirements. Data show that largefirms are more profitable than smaller firms. They have more productive labour and more cost-efficientoperations. Their brands are well-established in modern food markets such as supermarkets andhypermarkets. Whereas farms are fragmenting, the food processing and retail subsectors areconcentrating and are dominated by large firms. Thus, competition is stiff and the bargaining power ofsmall food processors and suppliers is weak. In addition, linkages between large firms and MSMEs areinadequate. The poor infrastructure, particularly in rural areas, and the cost of doing business in thecountry also compound the high production and marketing costs of MSMEs. Increasing requirements,particularly in terms of quality standards in high value markets, also limits access by MSMEs.
These challenges are even more difficult for micro-enterprises, which account for 99 percent of MSMEs.
Thus, it is important to continue to strengthen or reinforce further initiatives in the following areas bygovernment and various stakeholders in the private sector to develop the MSMEs.
First, the industry cluster approach should be continued and strengthened to improve linkages amongMSMEs and with large firms. However, it is critical that strategic areas within the cluster can maximizebenefits for MSMEs. Thus, it is important to identify potential MSMEs in the food processing subsectorthat can be assisted and which can be grouped into producer organizations. These groups should bestrengthened and developed as part of the clusters or value networks. It is essential to analyze valuechains of the products offered by these MSMEs and to identify market opportunities and gaps forinterventions. Profitability of different market outlets or options for these groups of MSMEs should beexamined to establish which market or combination of markets would be most beneficial for theseMSMEs given their limited skills and resources. Various interventions are identified to develop thesesupply groups into clusters.
Second, these interventions must be integrated and market oriented. That is, they must be implementedin order to meet market opportunities. These could include development of the supply of raw materials,value addition (e.g. processing, branding, packaging), market linkage development, investment facilitation,access to credit, development of infrastructure, access to technology, Food and Drugs Administrationstandards accreditation, equipment and logistics support and even development of local and nationalpolicies to provide an environment conducive to the development of MSMEs in the food processingsector.
Third, access to credit needs to be addressed, particularly for micro-enterprises in the food processingsubsector. Currently, there is a lack of available credit facilities to finance requirements ofmicro-enterprises in this subsector because of timing of cash flow. Microfinancing requires daily, weeklyor semi-monthly payments. Hence, there is a need to develop financial products that are suitable tomicro-enterprises in the food processing subsector.
Fourth, development of MSMEs in the food processing subsector is in line with the country’s strategyfor inclusive growth. Apart from the higher employment generation capacity of food processingindustries, strengthening forward and backward linkages in this sector creates greater potential toalleviate poverty in the rural sector and should be prioritized.
References
Aldaba, R., Medalla, F., del Prado, F., & Yasay, D. 2010. Integrating SMEs into the East Asian region: Philippines. PhilippineInstitute for Development Studies (PIDS) Discussion paper series no. 2010-31.
Aldaba, R. 2008. SMEs in the Philippine manufacturing industry and globalization: meeting the development challenges.Philippine Institute for Development Studies (PIDS) Discussion paper series no. 2008-15.
Alonzo, R. & Mangahas, M.A. 1990. The informal sector in Metro Manila: findings from a recent survey. Geneva: ILO.
199
Berdegue, J.A. & Peppelenbos, L. 2005. A method for the analysis of innovative practice in connecting smallholderproducers with dynamic supply chains. Resource paper for component 2 Regoverning Markets Project,2005–2007. International Institute for Environment and Development.
Becker, K. 2004. The informal economy. Fact Finding Study, Swedish International Development Cooperation Agency(SIDA) Report.
Business World. 2007. Business World Top 1,000 Corporations 2007. Business World Publishing Corporation, Manila.
DTI. No date. Micro, Small and Medium Enterprise Development Plan 2011–2016, (available at dti.gov/uploads/DownloadableFiles/2012_DTI_MSMEDPlan_2011-2016.pdf ).
DTI. 2010. Industry Profile Processed Foods and Beverages. Department of Trade and Industry.
Elazegui, D. 2002. Setting quality standards for environmental management policy: how effective is it? Policy Notes No.2002-2003, Philippine Institute for Development Studies.
FINEX and ACERD. 2006. Making SMEs work, making SMEs create work: job creation through small and mediumenterprise development. Financial Executives Institute of the Philippines (FINEX) and Ateneo Center forResearch and Development (ACERD).
Fukumoto, M. 1998. Development policies for small and medium enterprises in APEC – the case of the Philippines. APECStudy Center Institute of Developing Economies.
Hapitan, R. 2005. Competition policy and access of small and medium enterprises (SMEs) to financial services: a reviewof selected SMEs. Philippine Institute for Development Studies.
Henson, S. & Reardon, T. (Eds). 2005. Special Issue on Private Agrifood Standards in Developing Countries, FoodPolicy (30) 3.
Hu, D., Reardon, T., Rozelle, S., Timmer, P. & Wang, H. 2004. The emergence of supermarkets with Chinesecharacteristics: challenges and opportunities for China’s agricultural development. Development Policy Review,Vol. 22, No. 5: 557–586, September.
Reardon, T. & Berdegué, J.A. 2002. The rapid rise of supermarkets in Latin America: challenges and opportunities fordevelopment. Development Policy Review, Vol. 20, No. 4: 317–334.
Reardon, T., Berdegue, J.A. & Timmer, C.P. 2005. Supermarketization of the Emerging Markets of the Pacific Rim:Development and Trade Implications. Journal of Food Distribution Research, 36 1): 3–12.
Regmi, A., & Gehlhar, M. 2005. Processed food trade pressured by evolving global supply chains. Amber Waves,Volume 3 Issue 1, Economic Research Service/USDA.www.ers.usda.gov/amberwaves.
Roy, D. 2006. International Food and Policy Research Institute’s Work on Modern Marketing Channels. Indian Instituteof Management, Ahmedabad.
Sonido, D. G. 2004. Rural-based food processing industry in Asia: Philippines. Report of the APO Multi-Country StudyMission on Rural-Based Food Processing Industry (SME-OS1-00), Japan, 6–13 March 2001, Edited by Dr AlastairHicks, Bangkok, Thailand.
Tecson, G. 2004. Review of existing policies affecting micro, small and medium enterprises (MSMEs) in the Philippines.Makati Philippines: Small and Medium Enterprises and Development for Sustainable Employment Program.
World Bank. 2003. Benchmarking FDI Competitiveness in Asia. Washington, DC, (available at http://documents.worldbank.org/curated/en/2003/10/6444350/benchmarking-fdi-competitiveness-asia).
World Bank. 2006. Doing business in 2006: Creating jobs. Washington, DC, (available at www.doingbusiness.org).
World Bank. 2006. Doing business 2007: How to reform. Washington, DC, (available at www.doingbusiness.org).
World Bank. 2009. Doing business 2010: Reforming through difficult times. Washington, DC, (available at www.doingbusiness.org).
World Bank & Food and Agriculture Organization. 2011. Developing public private partnership in Philippines’agribusiness sector: Agribusiness Industry Clusters 2011.
World Economic Forum. 2010. The Global Competitiveness Report 2010-2011, (available at www3.weforum.org).
200
Websites
UN Comtrade Databasecomtrade.un.org
Department of Trade and Industry (DTI)www.dti.gov.ph
National Statistics Office (NSO)www.census.gov.ph
National Statistical Coordination Board (NSCB)www.nscb.gov.ph
Planet Retail 2007www.planetretail.net
Philippine Institute for Development Studies (PIDS)www.pids.gov.ph
National Economic Development Authority (NEDA)www.neda.gov.ph
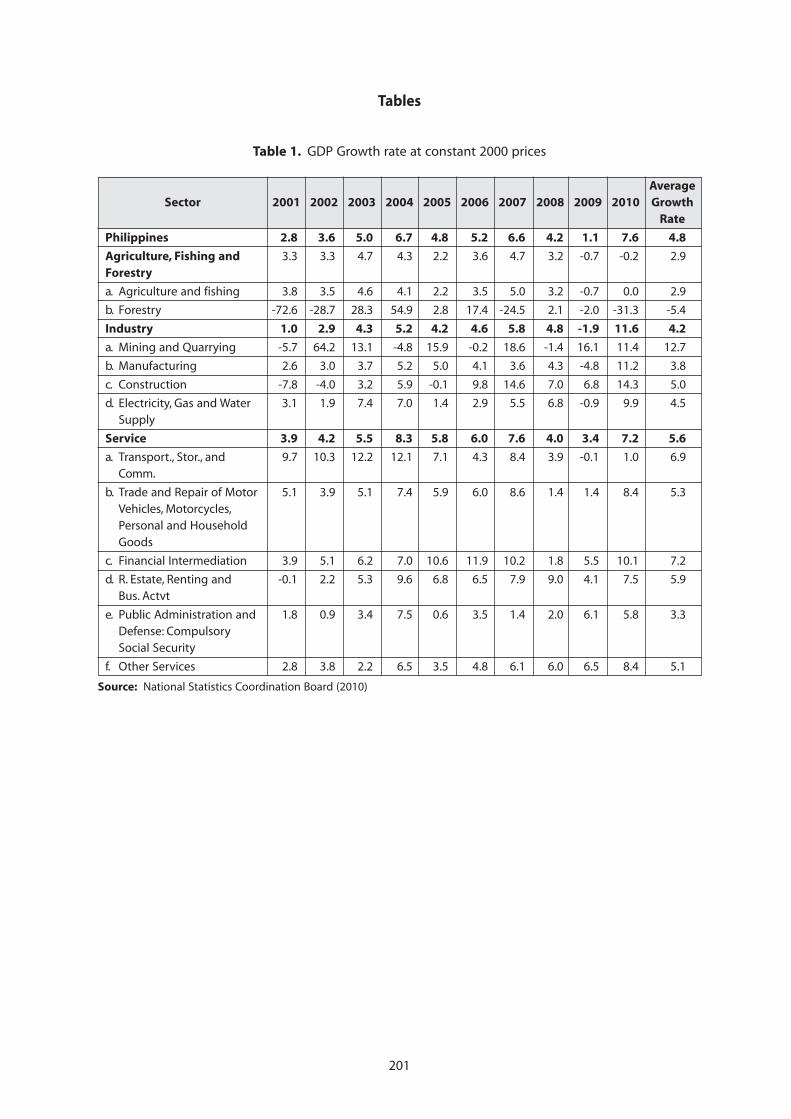
201
Tables
Table 1. GDP Growth rate at constant 2000 prices
AverageSector 2001 2002 2003 2004 2005 2006 2007 2008 2009 2010 Growth
Rate
Philippines 2.8 3.6 5.0 6.7 4.8 5.2 6.6 4.2 1.1 7.6 4.8
Agriculture, Fishing and 3.3 3.3 4.7 4.3 2.2 3.6 4.7 3.2 -0.7 -0.2 2.9Forestry
a. Agriculture and fishing 3.8 3.5 4.6 4.1 2.2 3.5 5.0 3.2 -0.7 0.0 2.9
b. Forestry -72.6 -28.7 28.3 54.9 2.8 17.4 -24.5 2.1 -2.0 -31.3 -5.4
Industry 1.0 2.9 4.3 5.2 4.2 4.6 5.8 4.8 -1.9 11.6 4.2
a. Mining and Quarrying -5.7 64.2 13.1 -4.8 15.9 -0.2 18.6 -1.4 16.1 11.4 12.7
b. Manufacturing 2.6 3.0 3.7 5.2 5.0 4.1 3.6 4.3 -4.8 11.2 3.8
c. Construction -7.8 -4.0 3.2 5.9 -0.1 9.8 14.6 7.0 6.8 14.3 5.0
d. Electricity, Gas and Water 3.1 1.9 7.4 7.0 1.4 2.9 5.5 6.8 -0.9 9.9 4.5Supply
Service 3.9 4.2 5.5 8.3 5.8 6.0 7.6 4.0 3.4 7.2 5.6
a. Transport., Stor., and 9.7 10.3 12.2 12.1 7.1 4.3 8.4 3.9 -0.1 1.0 6.9Comm.
b. Trade and Repair of Motor 5.1 3.9 5.1 7.4 5.9 6.0 8.6 1.4 1.4 8.4 5.3Vehicles, Motorcycles,Personal and HouseholdGoods
c. Financial Intermediation 3.9 5.1 6.2 7.0 10.6 11.9 10.2 1.8 5.5 10.1 7.2
d. R. Estate, Renting and -0.1 2.2 5.3 9.6 6.8 6.5 7.9 9.0 4.1 7.5 5.9Bus. Actvt
e. Public Administration and 1.8 0.9 3.4 7.5 0.6 3.5 1.4 2.0 6.1 5.8 3.3Defense: CompulsorySocial Security
f. Other Services 2.8 3.8 2.2 6.5 3.5 4.8 6.1 6.0 6.5 8.4 5.1
Source: National Statistics Coordination Board (2010)
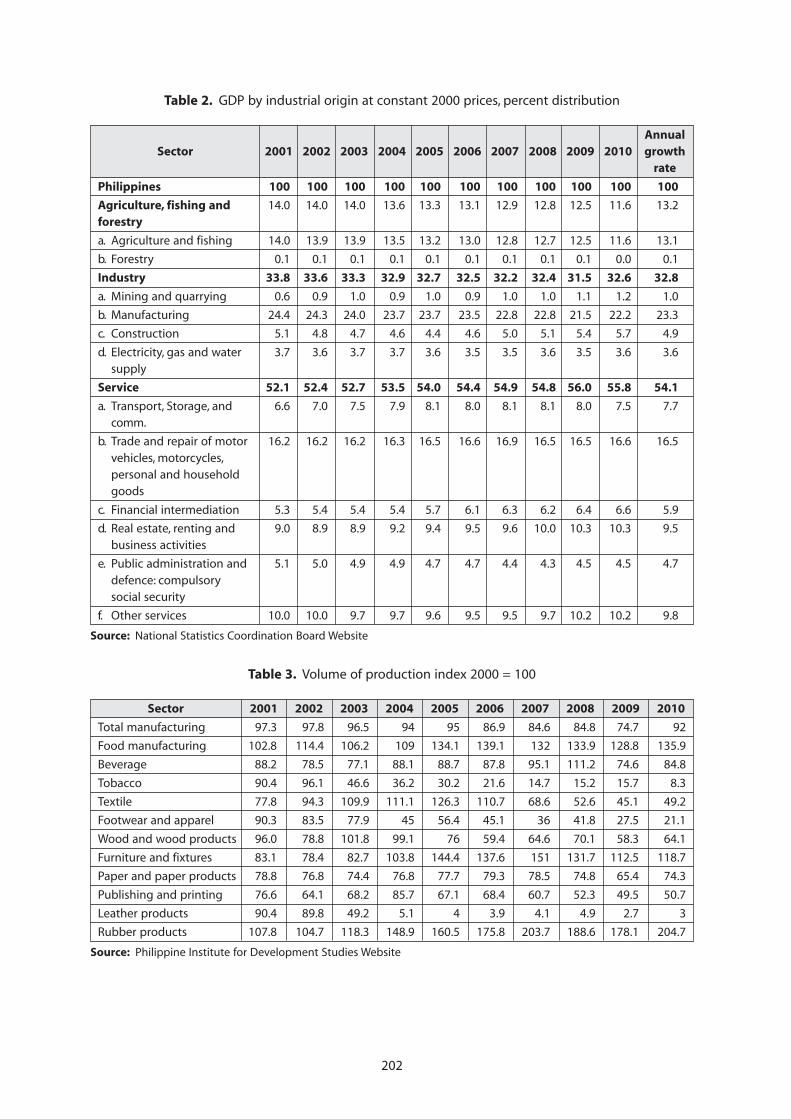
202
Table 2. GDP by industrial origin at constant 2000 prices, percent distribution
AnnualSector 2001 2002 2003 2004 2005 2006 2007 2008 2009 2010 growth
rate
Philippines 100 100 100 100 100 100 100 100 100 100 100
Agriculture, fishing and 14.0 14.0 14.0 13.6 13.3 13.1 12.9 12.8 12.5 11.6 13.2forestry
a. Agriculture and fishing 14.0 13.9 13.9 13.5 13.2 13.0 12.8 12.7 12.5 11.6 13.1
b. Forestry 0.1 0.1 0.1 0.1 0.1 0.1 0.1 0.1 0.1 0.0 0.1
Industry 33.8 33.6 33.3 32.9 32.7 32.5 32.2 32.4 31.5 32.6 32.8
a. Mining and quarrying 0.6 0.9 1.0 0.9 1.0 0.9 1.0 1.0 1.1 1.2 1.0
b. Manufacturing 24.4 24.3 24.0 23.7 23.7 23.5 22.8 22.8 21.5 22.2 23.3
c. Construction 5.1 4.8 4.7 4.6 4.4 4.6 5.0 5.1 5.4 5.7 4.9
d. Electricity, gas and water 3.7 3.6 3.7 3.7 3.6 3.5 3.5 3.6 3.5 3.6 3.6supply
Service 52.1 52.4 52.7 53.5 54.0 54.4 54.9 54.8 56.0 55.8 54.1
a. Transport, Storage, and 6.6 7.0 7.5 7.9 8.1 8.0 8.1 8.1 8.0 7.5 7.7comm.
b. Trade and repair of motor 16.2 16.2 16.2 16.3 16.5 16.6 16.9 16.5 16.5 16.6 16.5vehicles, motorcycles,personal and householdgoods
c. Financial intermediation 5.3 5.4 5.4 5.4 5.7 6.1 6.3 6.2 6.4 6.6 5.9
d. Real estate, renting and 9.0 8.9 8.9 9.2 9.4 9.5 9.6 10.0 10.3 10.3 9.5business activities
e. Public administration and 5.1 5.0 4.9 4.9 4.7 4.7 4.4 4.3 4.5 4.5 4.7defence: compulsorysocial security
f. Other services 10.0 10.0 9.7 9.7 9.6 9.5 9.5 9.7 10.2 10.2 9.8
Source: National Statistics Coordination Board Website
Table 3. Volume of production index 2000 = 100
Sector 2001 2002 2003 2004 2005 2006 2007 2008 2009 2010
Total manufacturing 97.3 97.8 96.5 94 95 86.9 84.6 84.8 74.7 92
Food manufacturing 102.8 114.4 106.2 109 134.1 139.1 132 133.9 128.8 135.9
Beverage 88.2 78.5 77.1 88.1 88.7 87.8 95.1 111.2 74.6 84.8
Tobacco 90.4 96.1 46.6 36.2 30.2 21.6 14.7 15.2 15.7 8.3
Textile 77.8 94.3 109.9 111.1 126.3 110.7 68.6 52.6 45.1 49.2
Footwear and apparel 90.3 83.5 77.9 45 56.4 45.1 36 41.8 27.5 21.1
Wood and wood products 96.0 78.8 101.8 99.1 76 59.4 64.6 70.1 58.3 64.1
Furniture and fixtures 83.1 78.4 82.7 103.8 144.4 137.6 151 131.7 112.5 118.7
Paper and paper products 78.8 76.8 74.4 76.8 77.7 79.3 78.5 74.8 65.4 74.3
Publishing and printing 76.6 64.1 68.2 85.7 67.1 68.4 60.7 52.3 49.5 50.7
Leather products 90.4 89.8 49.2 5.1 4 3.9 4.1 4.9 2.7 3
Rubber products 107.8 104.7 118.3 148.9 160.5 175.8 203.7 188.6 178.1 204.7
Source: Philippine Institute for Development Studies Website
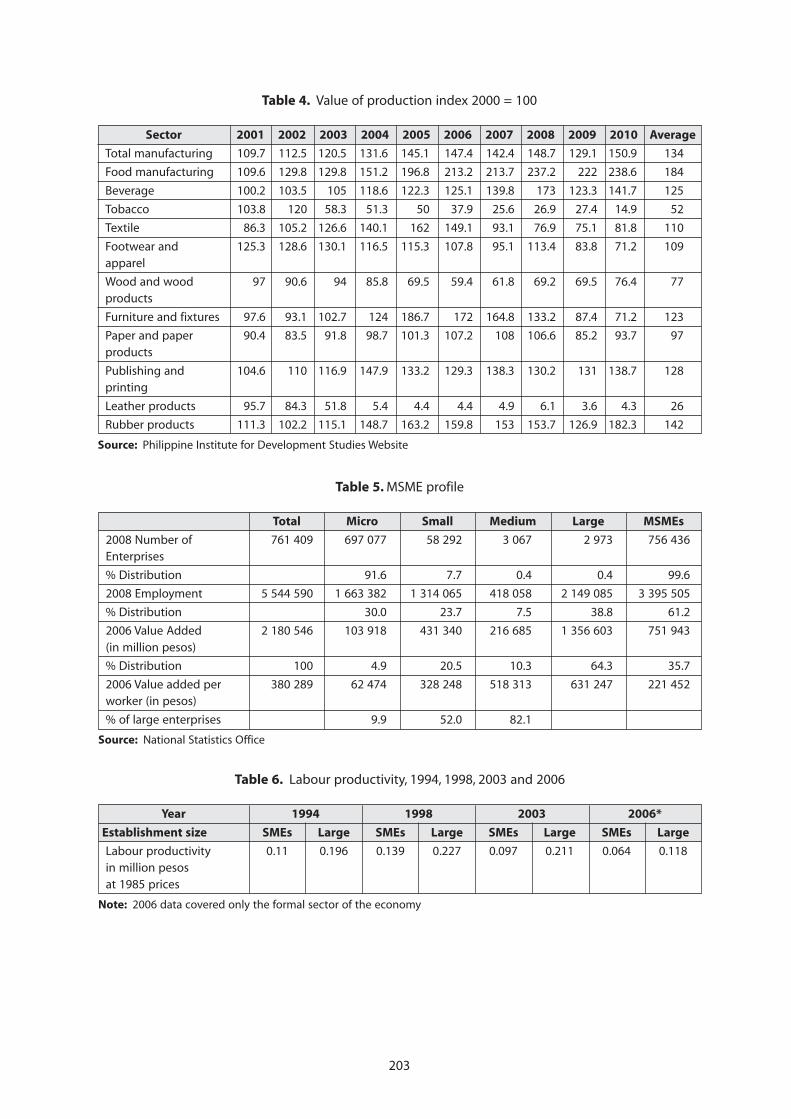
203
Table 5. MSME profile
Total Micro Small Medium Large MSMEs
2008 Number of 761 409 697 077 58 292 3 067 2 973 756 436Enterprises
% Distribution 91.6 7.7 0.4 0.4 99.6
2008 Employment 5 544 590 1 663 382 1 314 065 418 058 2 149 085 3 395 505
% Distribution 30.0 23.7 7.5 38.8 61.2
2006 Value Added 2 180 546 103 918 431 340 216 685 1 356 603 751 943(in million pesos)
% Distribution 100 4.9 20.5 10.3 64.3 35.7
2006 Value added per 380 289 62 474 328 248 518 313 631 247 221 452worker (in pesos)
% of large enterprises 9.9 52.0 82.1
Source: National Statistics Office
Table 4. Value of production index 2000 = 100
Sector 2001 2002 2003 2004 2005 2006 2007 2008 2009 2010 Average
Total manufacturing 109.7 112.5 120.5 131.6 145.1 147.4 142.4 148.7 129.1 150.9 134
Food manufacturing 109.6 129.8 129.8 151.2 196.8 213.2 213.7 237.2 222 238.6 184
Beverage 100.2 103.5 105 118.6 122.3 125.1 139.8 173 123.3 141.7 125
Tobacco 103.8 120 58.3 51.3 50 37.9 25.6 26.9 27.4 14.9 52
Textile 86.3 105.2 126.6 140.1 162 149.1 93.1 76.9 75.1 81.8 110
Footwear and 125.3 128.6 130.1 116.5 115.3 107.8 95.1 113.4 83.8 71.2 109apparel
Wood and wood 97 90.6 94 85.8 69.5 59.4 61.8 69.2 69.5 76.4 77products
Furniture and fixtures 97.6 93.1 102.7 124 186.7 172 164.8 133.2 87.4 71.2 123
Paper and paper 90.4 83.5 91.8 98.7 101.3 107.2 108 106.6 85.2 93.7 97products
Publishing and 104.6 110 116.9 147.9 133.2 129.3 138.3 130.2 131 138.7 128printing
Leather products 95.7 84.3 51.8 5.4 4.4 4.4 4.9 6.1 3.6 4.3 26
Rubber products 111.3 102.2 115.1 148.7 163.2 159.8 153 153.7 126.9 182.3 142
Source: Philippine Institute for Development Studies Website
Table 6. Labour productivity, 1994, 1998, 2003 and 2006
Year 1994 1998 2003 2006*
Establishment size SMEs Large SMEs Large SMEs Large SMEs Large
Labour productivity 0.11 0.196 0.139 0.227 0.097 0.211 0.064 0.118in million pesosat 1985 prices
Note: 2006 data covered only the formal sector of the economy
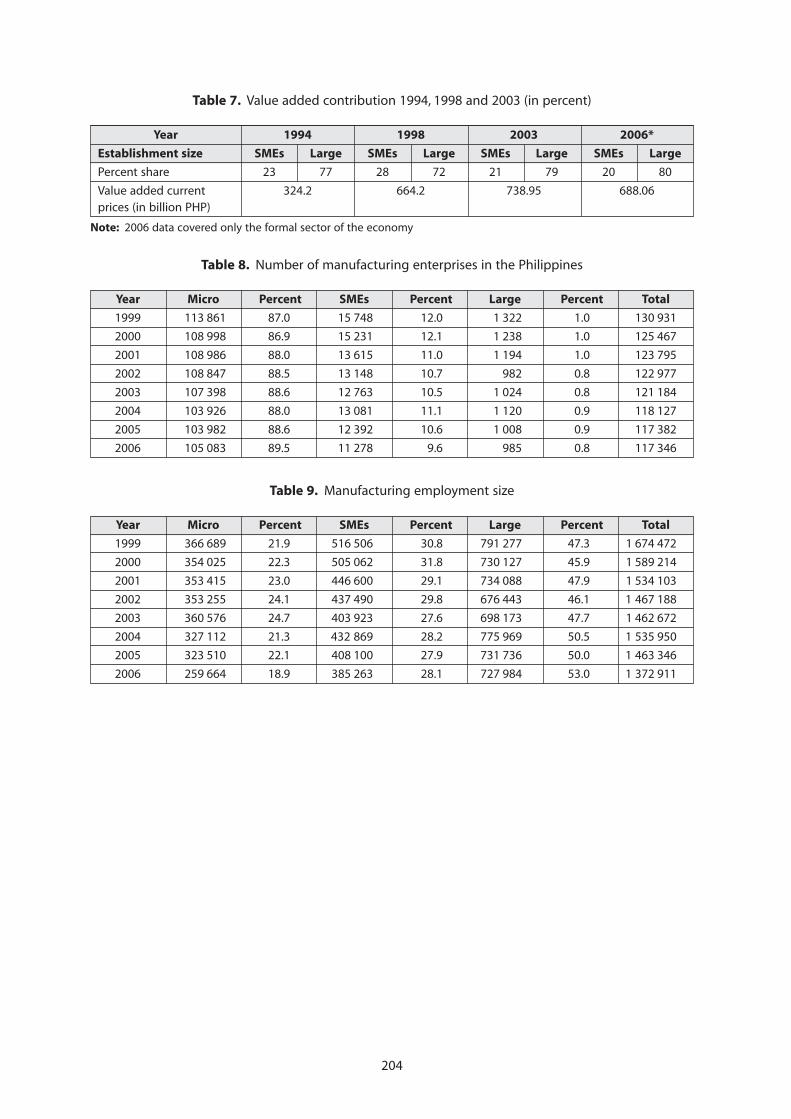
204
Table 7. Value added contribution 1994, 1998 and 2003 (in percent)
Year 1994 1998 2003 2006*
Establishment size SMEs Large SMEs Large SMEs Large SMEs Large
Percent share 23 77 28 72 21 79 20 80
Value added current 324.2 664.2 738.95 688.06prices (in billion PHP)
Note: 2006 data covered only the formal sector of the economy
Table 8. Number of manufacturing enterprises in the Philippines
Year Micro Percent SMEs Percent Large Percent Total
1999 113 861 87.0 15 748 12.0 1 322 1.0 130 931
2000 108 998 86.9 15 231 12.1 1 238 1.0 125 467
2001 108 986 88.0 13 615 11.0 1 194 1.0 123 795
2002 108 847 88.5 13 148 10.7 982 0.8 122 977
2003 107 398 88.6 12 763 10.5 1 024 0.8 121 184
2004 103 926 88.0 13 081 11.1 1 120 0.9 118 127
2005 103 982 88.6 12 392 10.6 1 008 0.9 117 382
2006 105 083 89.5 11 278 9.6 985 0.8 117 346
Table 9. Manufacturing employment size
Year Micro Percent SMEs Percent Large Percent Total
1999 366 689 21.9 516 506 30.8 791 277 47.3 1 674 472
2000 354 025 22.3 505 062 31.8 730 127 45.9 1 589 214
2001 353 415 23.0 446 600 29.1 734 088 47.9 1 534 103
2002 353 255 24.1 437 490 29.8 676 443 46.1 1 467 188
2003 360 576 24.7 403 923 27.6 698 173 47.7 1 462 672
2004 327 112 21.3 432 869 28.2 775 969 50.5 1 535 950
2005 323 510 22.1 408 100 27.9 731 736 50.0 1 463 346
2006 259 664 18.9 385 263 28.1 727 984 53.0 1 372 911
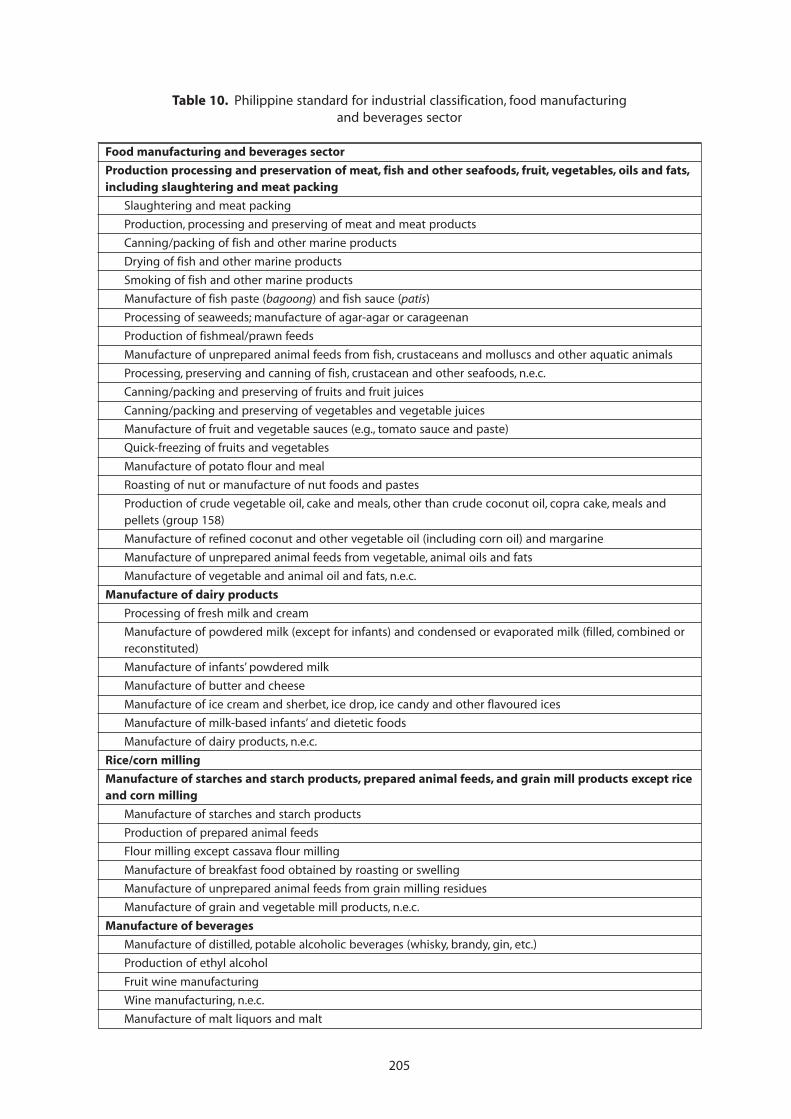
205
Table 10. Philippine standard for industrial classification, food manufacturingand beverages sector
Food manufacturing and beverages sector
Production processing and preservation of meat, fish and other seafoods, fruit, vegetables, oils and fats,including slaughtering and meat packing
Slaughtering and meat packing
Production, processing and preserving of meat and meat products
Canning/packing of fish and other marine products
Drying of fish and other marine products
Smoking of fish and other marine products
Manufacture of fish paste (bagoong) and fish sauce (patis)
Processing of seaweeds; manufacture of agar-agar or carageenan
Production of fishmeal/prawn feeds
Manufacture of unprepared animal feeds from fish, crustaceans and molluscs and other aquatic animals
Processing, preserving and canning of fish, crustacean and other seafoods, n.e.c.
Canning/packing and preserving of fruits and fruit juices
Canning/packing and preserving of vegetables and vegetable juices
Manufacture of fruit and vegetable sauces (e.g., tomato sauce and paste)
Quick-freezing of fruits and vegetables
Manufacture of potato flour and meal
Roasting of nut or manufacture of nut foods and pastes
Production of crude vegetable oil, cake and meals, other than crude coconut oil, copra cake, meals andpellets (group 158)
Manufacture of refined coconut and other vegetable oil (including corn oil) and margarine
Manufacture of unprepared animal feeds from vegetable, animal oils and fats
Manufacture of vegetable and animal oil and fats, n.e.c.
Manufacture of dairy products
Processing of fresh milk and cream
Manufacture of powdered milk (except for infants) and condensed or evaporated milk (filled, combined orreconstituted)
Manufacture of infants’ powdered milk
Manufacture of butter and cheese
Manufacture of ice cream and sherbet, ice drop, ice candy and other flavoured ices
Manufacture of milk-based infants’ and dietetic foods
Manufacture of dairy products, n.e.c.
Rice/corn milling
Manufacture of starches and starch products, prepared animal feeds, and grain mill products except riceand corn milling
Manufacture of starches and starch products
Production of prepared animal feeds
Flour milling except cassava flour milling
Manufacture of breakfast food obtained by roasting or swelling
Manufacture of unprepared animal feeds from grain milling residues
Manufacture of grain and vegetable mill products, n.e.c.
Manufacture of beverages
Manufacture of distilled, potable alcoholic beverages (whisky, brandy, gin, etc.)
Production of ethyl alcohol
Fruit wine manufacturing
Wine manufacturing, n.e.c.
Manufacture of malt liquors and malt
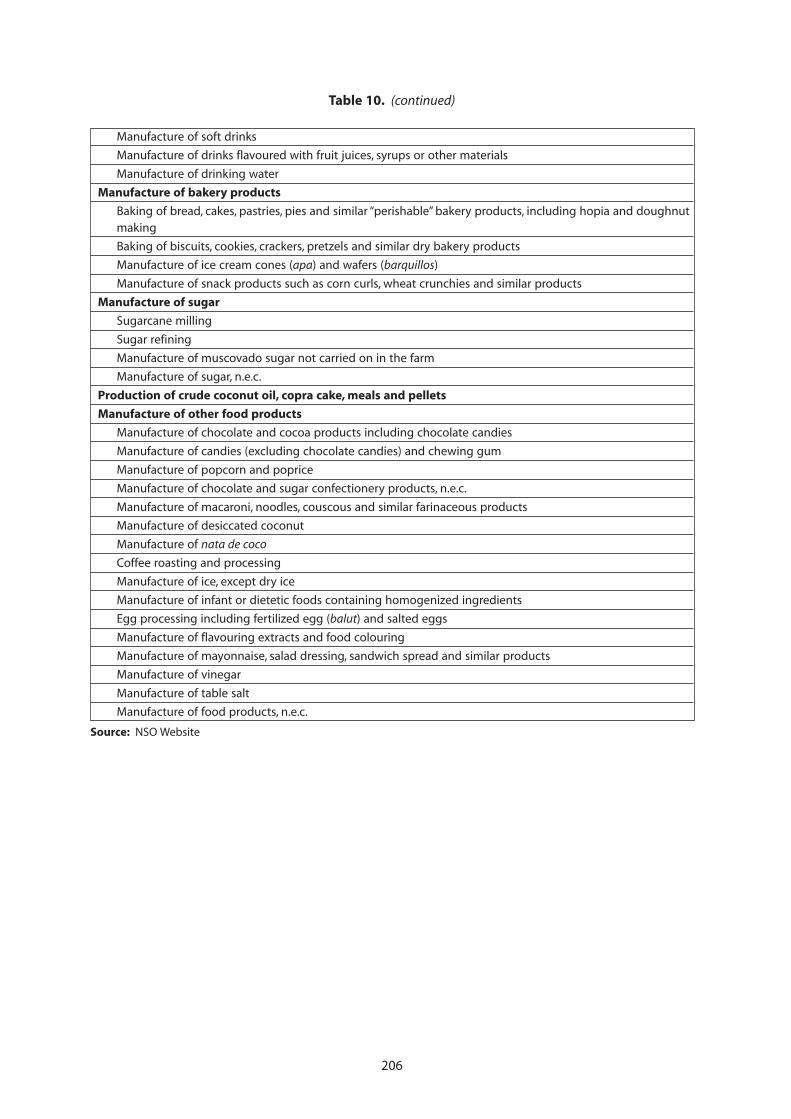
206
Manufacture of soft drinks
Manufacture of drinks flavoured with fruit juices, syrups or other materials
Manufacture of drinking water
Manufacture of bakery products
Baking of bread, cakes, pastries, pies and similar “perishable” bakery products, including hopia and doughnutmaking
Baking of biscuits, cookies, crackers, pretzels and similar dry bakery products
Manufacture of ice cream cones (apa) and wafers (barquillos)
Manufacture of snack products such as corn curls, wheat crunchies and similar products
Manufacture of sugar
Sugarcane milling
Sugar refining
Manufacture of muscovado sugar not carried on in the farm
Manufacture of sugar, n.e.c.
Production of crude coconut oil, copra cake, meals and pellets
Manufacture of other food products
Manufacture of chocolate and cocoa products including chocolate candies
Manufacture of candies (excluding chocolate candies) and chewing gum
Manufacture of popcorn and poprice
Manufacture of chocolate and sugar confectionery products, n.e.c.
Manufacture of macaroni, noodles, couscous and similar farinaceous products
Manufacture of desiccated coconut
Manufacture of nata de coco
Coffee roasting and processing
Manufacture of ice, except dry ice
Manufacture of infant or dietetic foods containing homogenized ingredients
Egg processing including fertilized egg (balut) and salted eggs
Manufacture of flavouring extracts and food colouring
Manufacture of mayonnaise, salad dressing, sandwich spread and similar products
Manufacture of vinegar
Manufacture of table salt
Manufacture of food products, n.e.c.
Source: NSO Website
Table 10. (continued)
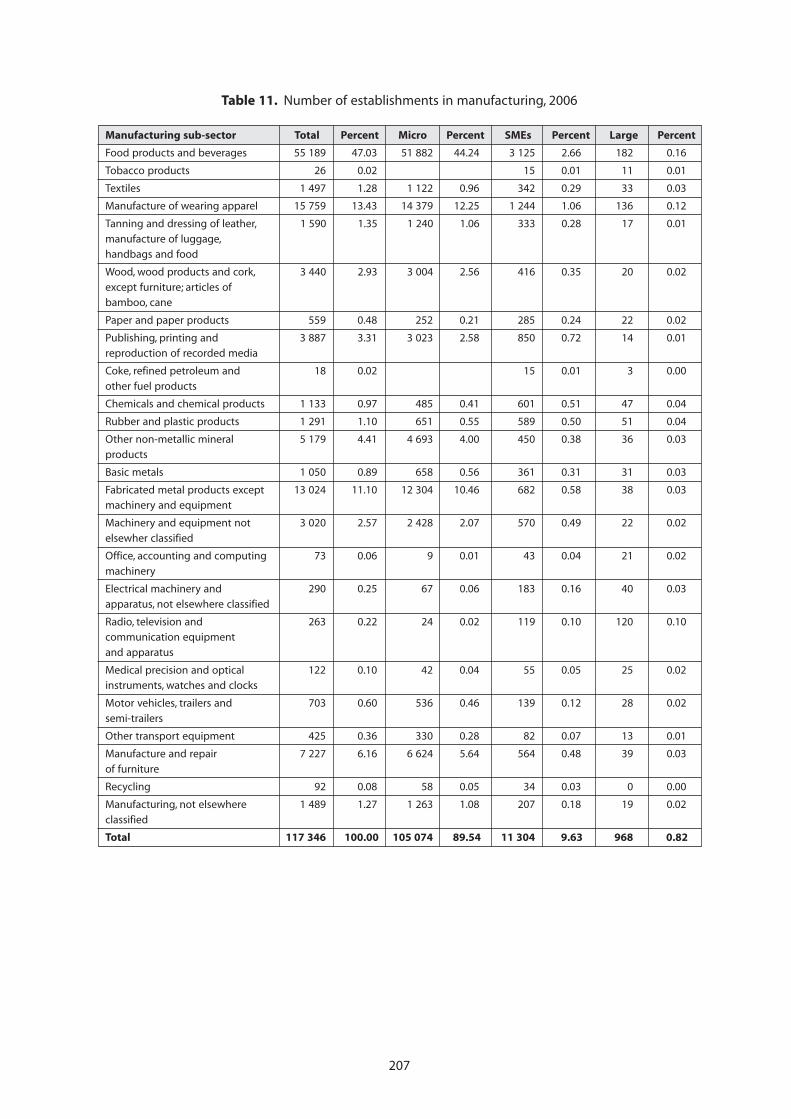
207
Table 11. Number of establishments in manufacturing, 2006
Manufacturing sub-sector Total Percent Micro Percent SMEs Percent Large Percent
Food products and beverages 55 189 47.03 51 882 44.24 3 125 2.66 182 0.16
Tobacco products 26 0.02 15 0.01 11 0.01
Textiles 1 497 1.28 1 122 0.96 342 0.29 33 0.03
Manufacture of wearing apparel 15 759 13.43 14 379 12.25 1 244 1.06 136 0.12
Tanning and dressing of leather, 1 590 1.35 1 240 1.06 333 0.28 17 0.01
manufacture of luggage,handbags and food
Wood, wood products and cork, 3 440 2.93 3 004 2.56 416 0.35 20 0.02
except furniture; articles ofbamboo, cane
Paper and paper products 559 0.48 252 0.21 285 0.24 22 0.02
Publishing, printing and 3 887 3.31 3 023 2.58 850 0.72 14 0.01reproduction of recorded media
Coke, refined petroleum and 18 0.02 15 0.01 3 0.00
other fuel products
Chemicals and chemical products 1 133 0.97 485 0.41 601 0.51 47 0.04
Rubber and plastic products 1 291 1.10 651 0.55 589 0.50 51 0.04
Other non-metallic mineral 5 179 4.41 4 693 4.00 450 0.38 36 0.03products
Basic metals 1 050 0.89 658 0.56 361 0.31 31 0.03
Fabricated metal products except 13 024 11.10 12 304 10.46 682 0.58 38 0.03machinery and equipment
Machinery and equipment not 3 020 2.57 2 428 2.07 570 0.49 22 0.02
elsewher classified
Office, accounting and computing 73 0.06 9 0.01 43 0.04 21 0.02
machinery
Electrical machinery and 290 0.25 67 0.06 183 0.16 40 0.03
apparatus, not elsewhere classified
Radio, television and 263 0.22 24 0.02 119 0.10 120 0.10communication equipment
and apparatus
Medical precision and optical 122 0.10 42 0.04 55 0.05 25 0.02instruments, watches and clocks
Motor vehicles, trailers and 703 0.60 536 0.46 139 0.12 28 0.02
semi-trailers
Other transport equipment 425 0.36 330 0.28 82 0.07 13 0.01
Manufacture and repair 7 227 6.16 6 624 5.64 564 0.48 39 0.03
of furniture
Recycling 92 0.08 58 0.05 34 0.03 0 0.00
Manufacturing, not elsewhere 1 489 1.27 1 263 1.08 207 0.18 19 0.02
classified
Total 117 346 100.00 105 074 89.54 11 304 9.63 968 0.82
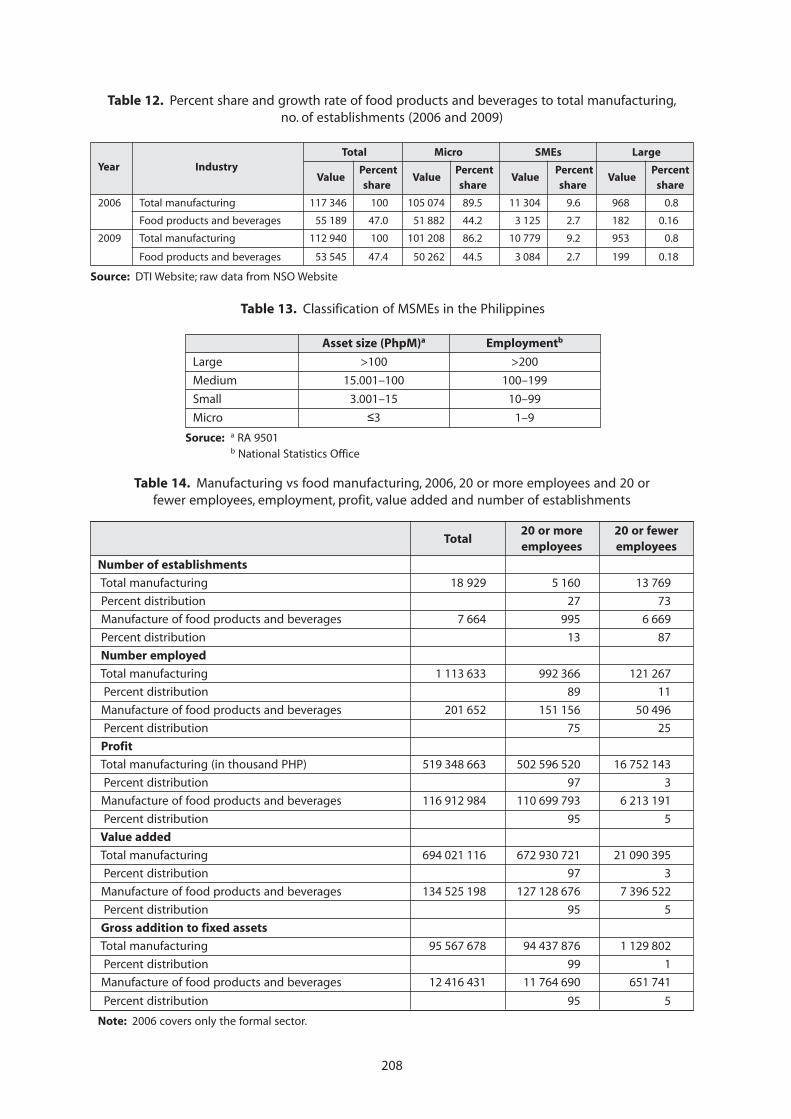
208
Table 12. Percent share and growth rate of food products and beverages to total manufacturing,no. of establishments (2006 and 2009)
Year IndustryTotal Micro SMEs Large
Value Percent
Value Percent
Value Percent
Value Percent
share share share share
2006 Total manufacturing 117 346 100 105 074 89.5 11 304 9.6 968 0.8
Food products and beverages 55 189 47.0 51 882 44.2 3 125 2.7 182 0.16
2009 Total manufacturing 112 940 100 101 208 86.2 10 779 9.2 953 0.8
Food products and beverages 53 545 47.4 50 262 44.5 3 084 2.7 199 0.18
Source: DTI Website; raw data from NSO Website
Table 13. Classification of MSMEs in the Philippines
Asset size (PhpM)a Employmentb
Large >100 >200
Medium 15.001–100 100–199
Small 3.001–15 10–99
Micro ≤3 1–9
Soruce: a RA 9501b National Statistics Office
Table 14. Manufacturing vs food manufacturing, 2006, 20 or more employees and 20 orfewer employees, employment, profit, value added and number of establishments
Total20 or more 20 or feweremployees employees
Number of establishments
Total manufacturing 18 929 5 160 13 769
Percent distribution 27 73
Manufacture of food products and beverages 7 664 995 6 669
Percent distribution 13 87
Number employed
Total manufacturing 1 113 633 992 366 121 267
Percent distribution 89 11
Manufacture of food products and beverages 201 652 151 156 50 496
Percent distribution 75 25
Profit
Total manufacturing (in thousand PHP) 519 348 663 502 596 520 16 752 143
Percent distribution 97 3
Manufacture of food products and beverages 116 912 984 110 699 793 6 213 191
Percent distribution 95 5
Value added
Total manufacturing 694 021 116 672 930 721 21 090 395
Percent distribution 97 3
Manufacture of food products and beverages 134 525 198 127 128 676 7 396 522
Percent distribution 95 5
Gross addition to fixed assets
Total manufacturing 95 567 678 94 437 876 1 129 802
Percent distribution 99 1
Manufacture of food products and beverages 12 416 431 11 764 690 651 741
Percent distribution 95 5
Note: 2006 covers only the formal sector.
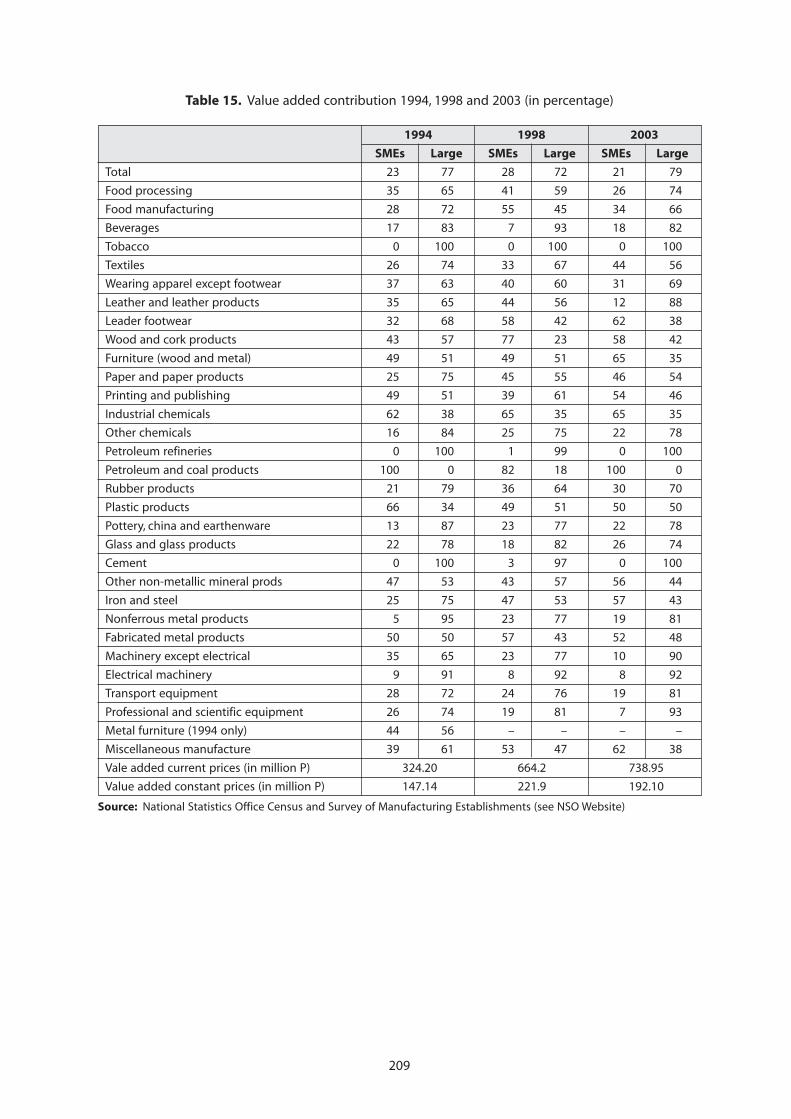
209
Table 15. Value added contribution 1994, 1998 and 2003 (in percentage)
1994 1998 2003
SMEs Large SMEs Large SMEs Large
Total 23 77 28 72 21 79
Food processing 35 65 41 59 26 74
Food manufacturing 28 72 55 45 34 66
Beverages 17 83 7 93 18 82
Tobacco 0 100 0 100 0 100
Textiles 26 74 33 67 44 56
Wearing apparel except footwear 37 63 40 60 31 69
Leather and leather products 35 65 44 56 12 88
Leader footwear 32 68 58 42 62 38
Wood and cork products 43 57 77 23 58 42
Furniture (wood and metal) 49 51 49 51 65 35
Paper and paper products 25 75 45 55 46 54
Printing and publishing 49 51 39 61 54 46
Industrial chemicals 62 38 65 35 65 35
Other chemicals 16 84 25 75 22 78
Petroleum refineries 0 100 1 99 0 100
Petroleum and coal products 100 0 82 18 100 0
Rubber products 21 79 36 64 30 70
Plastic products 66 34 49 51 50 50
Pottery, china and earthenware 13 87 23 77 22 78
Glass and glass products 22 78 18 82 26 74
Cement 0 100 3 97 0 100
Other non-metallic mineral prods 47 53 43 57 56 44
Iron and steel 25 75 47 53 57 43
Nonferrous metal products 5 95 23 77 19 81
Fabricated metal products 50 50 57 43 52 48
Machinery except electrical 35 65 23 77 10 90
Electrical machinery 9 91 8 92 8 92
Transport equipment 28 72 24 76 19 81
Professional and scientific equipment 26 74 19 81 7 93
Metal furniture (1994 only) 44 56 – – – –
Miscellaneous manufacture 39 61 53 47 62 38
Vale added current prices (in million P) 324.20 664.2 738.95
Value added constant prices (in million P) 147.14 221.9 192.10
Source: National Statistics Office Census and Survey of Manufacturing Establishments (see NSO Website)
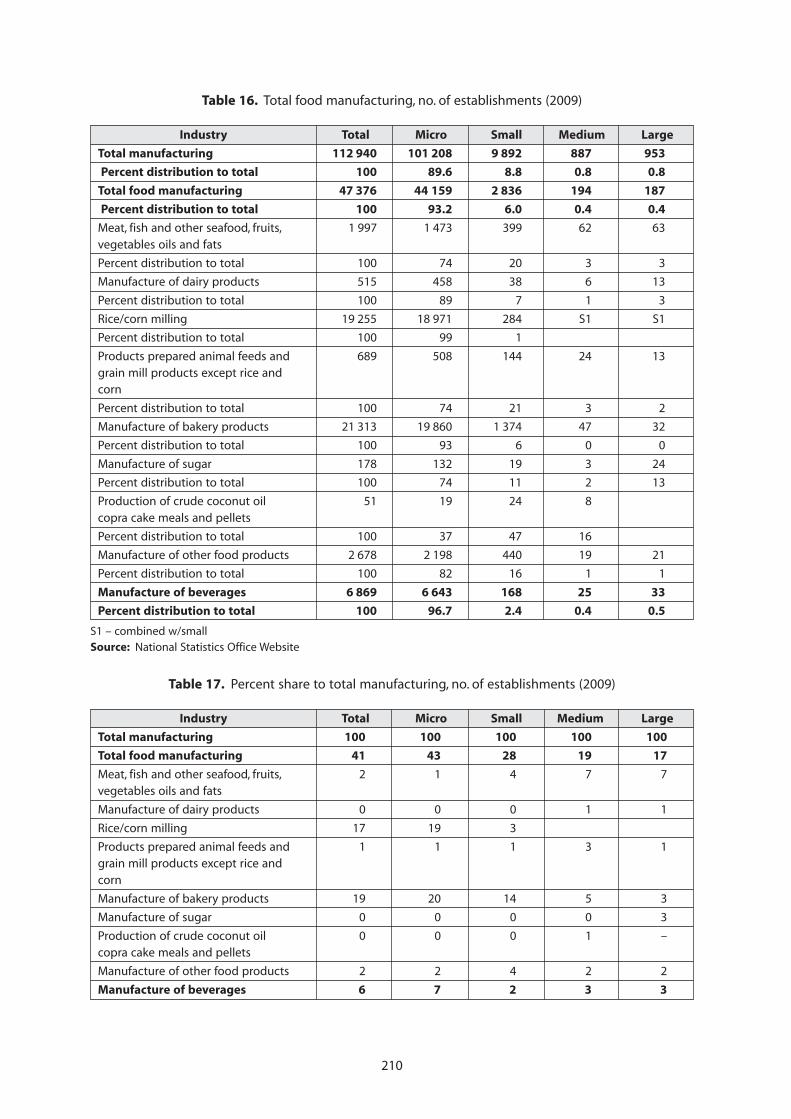
210
Table 16. Total food manufacturing, no. of establishments (2009)
Industry Total Micro Small Medium Large
Total manufacturing 112 940 101 208 9 892 887 953
Percent distribution to total 100 89.6 8.8 0.8 0.8
Total food manufacturing 47 376 44 159 2 836 194 187
Percent distribution to total 100 93.2 6.0 0.4 0.4
Meat, fish and other seafood, fruits, 1 997 1 473 399 62 63vegetables oils and fats
Percent distribution to total 100 74 20 3 3
Manufacture of dairy products 515 458 38 6 13
Percent distribution to total 100 89 7 1 3
Rice/corn milling 19 255 18 971 284 S1 S1
Percent distribution to total 100 99 1
Products prepared animal feeds and 689 508 144 24 13grain mill products except rice andcorn
Percent distribution to total 100 74 21 3 2
Manufacture of bakery products 21 313 19 860 1 374 47 32
Percent distribution to total 100 93 6 0 0
Manufacture of sugar 178 132 19 3 24
Percent distribution to total 100 74 11 2 13
Production of crude coconut oil 51 19 24 8copra cake meals and pellets
Percent distribution to total 100 37 47 16
Manufacture of other food products 2 678 2 198 440 19 21
Percent distribution to total 100 82 16 1 1
Manufacture of beverages 6 869 6 643 168 25 33
Percent distribution to total 100 96.7 2.4 0.4 0.5
S1 – combined w/smallSource: National Statistics Office Website
Table 17. Percent share to total manufacturing, no. of establishments (2009)
Industry Total Micro Small Medium Large
Total manufacturing 100 100 100 100 100
Total food manufacturing 41 43 28 19 17
Meat, fish and other seafood, fruits, 2 1 4 7 7vegetables oils and fats
Manufacture of dairy products 0 0 0 1 1
Rice/corn milling 17 19 3
Products prepared animal feeds and 1 1 1 3 1grain mill products except rice andcorn
Manufacture of bakery products 19 20 14 5 3
Manufacture of sugar 0 0 0 0 3
Production of crude coconut oil 0 0 0 1 –copra cake meals and pellets
Manufacture of other food products 2 2 4 2 2
Manufacture of beverages 6 7 2 3 3
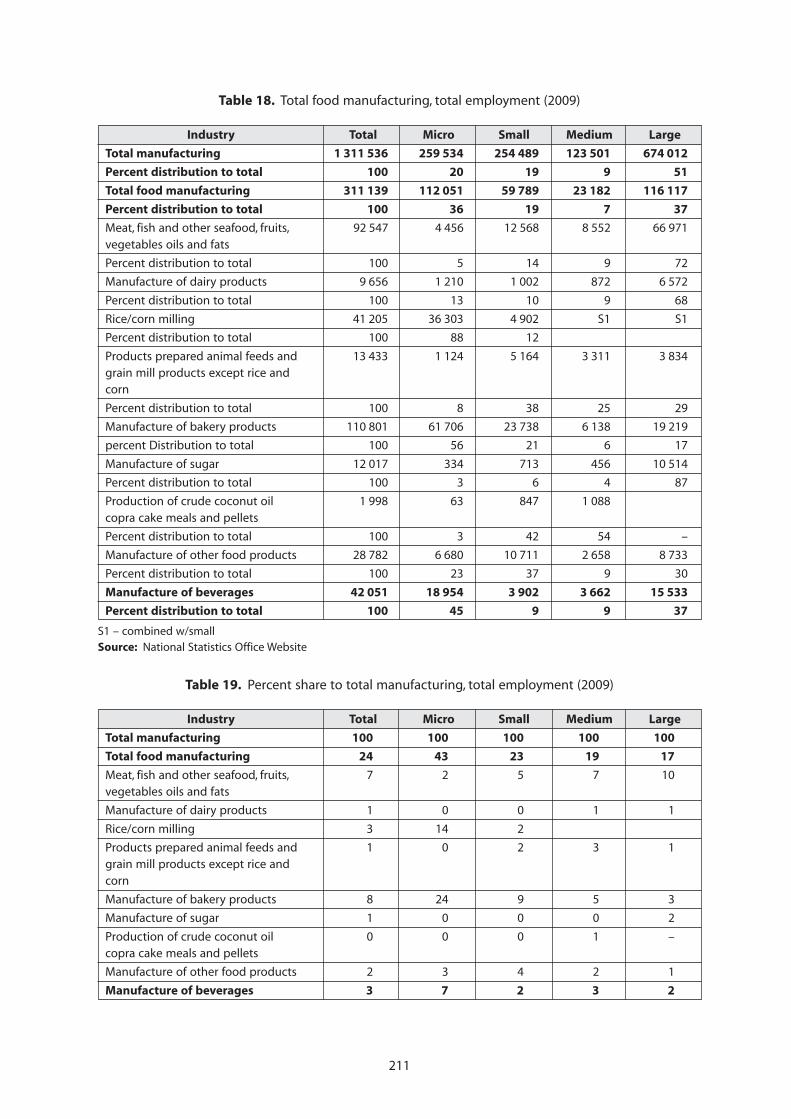
211
Table 18. Total food manufacturing, total employment (2009)
Industry Total Micro Small Medium Large
Total manufacturing 1 311 536 259 534 254 489 123 501 674 012
Percent distribution to total 100 20 19 9 51
Total food manufacturing 311 139 112 051 59 789 23 182 116 117
Percent distribution to total 100 36 19 7 37
Meat, fish and other seafood, fruits, 92 547 4 456 12 568 8 552 66 971vegetables oils and fats
Percent distribution to total 100 5 14 9 72
Manufacture of dairy products 9 656 1 210 1 002 872 6 572
Percent distribution to total 100 13 10 9 68
Rice/corn milling 41 205 36 303 4 902 S1 S1
Percent distribution to total 100 88 12
Products prepared animal feeds and 13 433 1 124 5 164 3 311 3 834grain mill products except rice andcorn
Percent distribution to total 100 8 38 25 29
Manufacture of bakery products 110 801 61 706 23 738 6 138 19 219
percent Distribution to total 100 56 21 6 17
Manufacture of sugar 12 017 334 713 456 10 514
Percent distribution to total 100 3 6 4 87
Production of crude coconut oil 1 998 63 847 1 088copra cake meals and pellets
Percent distribution to total 100 3 42 54 –
Manufacture of other food products 28 782 6 680 10 711 2 658 8 733
Percent distribution to total 100 23 37 9 30
Manufacture of beverages 42 051 18 954 3 902 3 662 15 533
Percent distribution to total 100 45 9 9 37
S1 – combined w/smallSource: National Statistics Office Website
Table 19. Percent share to total manufacturing, total employment (2009)
Industry Total Micro Small Medium Large
Total manufacturing 100 100 100 100 100
Total food manufacturing 24 43 23 19 17
Meat, fish and other seafood, fruits, 7 2 5 7 10vegetables oils and fats
Manufacture of dairy products 1 0 0 1 1
Rice/corn milling 3 14 2
Products prepared animal feeds and 1 0 2 3 1grain mill products except rice andcorn
Manufacture of bakery products 8 24 9 5 3
Manufacture of sugar 1 0 0 0 2
Production of crude coconut oil 0 0 0 1 –copra cake meals and pellets
Manufacture of other food products 2 3 4 2 1
Manufacture of beverages 3 7 2 3 2
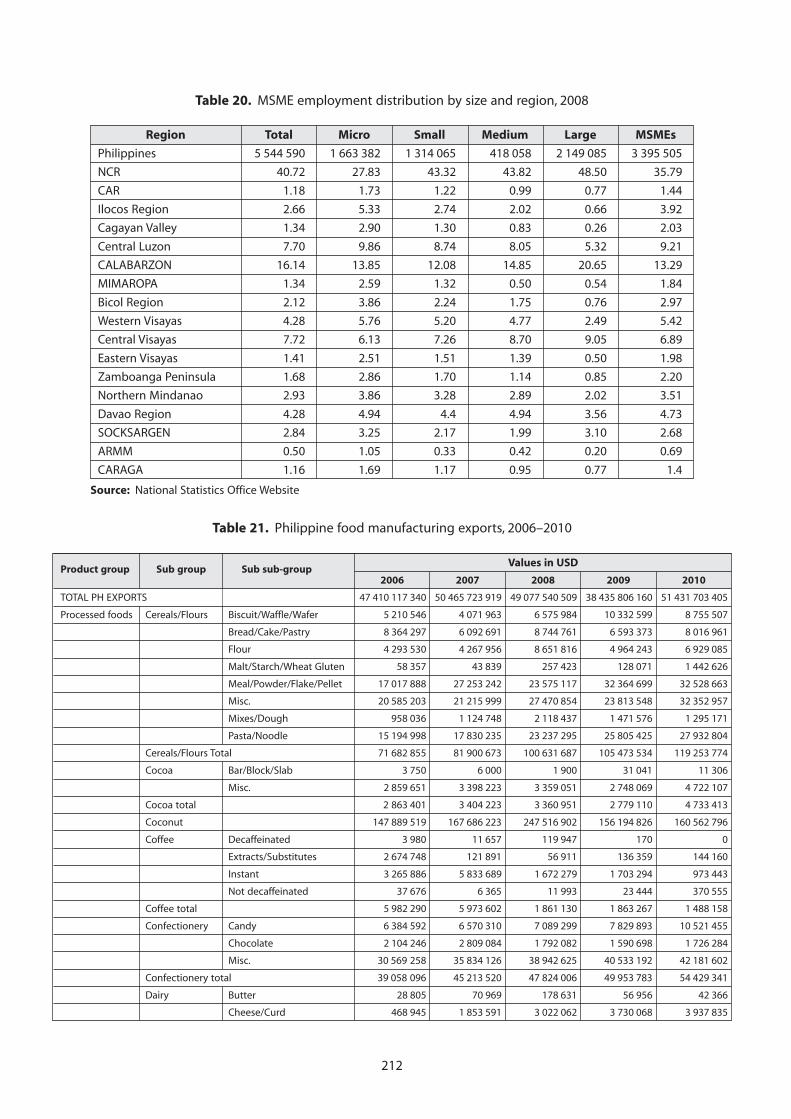
212
Table 20. MSME employment distribution by size and region, 2008
Region Total Micro Small Medium Large MSMEs
Philippines 5 544 590 1 663 382 1 314 065 418 058 2 149 085 3 395 505
NCR 40.72 27.83 43.32 43.82 48.50 35.79
CAR 1.18 1.73 1.22 0.99 0.77 1.44
Ilocos Region 2.66 5.33 2.74 2.02 0.66 3.92
Cagayan Valley 1.34 2.90 1.30 0.83 0.26 2.03
Central Luzon 7.70 9.86 8.74 8.05 5.32 9.21
CALABARZON 16.14 13.85 12.08 14.85 20.65 13.29
MIMAROPA 1.34 2.59 1.32 0.50 0.54 1.84
Bicol Region 2.12 3.86 2.24 1.75 0.76 2.97
Western Visayas 4.28 5.76 5.20 4.77 2.49 5.42
Central Visayas 7.72 6.13 7.26 8.70 9.05 6.89
Eastern Visayas 1.41 2.51 1.51 1.39 0.50 1.98
Zamboanga Peninsula 1.68 2.86 1.70 1.14 0.85 2.20
Northern Mindanao 2.93 3.86 3.28 2.89 2.02 3.51
Davao Region 4.28 4.94 4.4 4.94 3.56 4.73
SOCKSARGEN 2.84 3.25 2.17 1.99 3.10 2.68
ARMM 0.50 1.05 0.33 0.42 0.20 0.69
CARAGA 1.16 1.69 1.17 0.95 0.77 1.4
Source: National Statistics Office Website
Table 21. Philippine food manufacturing exports, 2006–2010
Product group Sub group Sub sub-groupValues in USD
2006 2007 2008 2009 2010
TOTAL PH EXPORTS 47 410 117 340 50 465 723 919 49 077 540 509 38 435 806 160 51 431 703 405
Processed foods Cereals/Flours Biscuit/Waffle/Wafer 5 210 546 4 071 963 6 575 984 10 332 599 8 755 507
Bread/Cake/Pastry 8 364 297 6 092 691 8 744 761 6 593 373 8 016 961
Flour 4 293 530 4 267 956 8 651 816 4 964 243 6 929 085
Malt/Starch/Wheat Gluten 58 357 43 839 257 423 128 071 1 442 626
Meal/Powder/Flake/Pellet 17 017 888 27 253 242 23 575 117 32 364 699 32 528 663
Misc. 20 585 203 21 215 999 27 470 854 23 813 548 32 352 957
Mixes/Dough 958 036 1 124 748 2 118 437 1 471 576 1 295 171
Pasta/Noodle 15 194 998 17 830 235 23 237 295 25 805 425 27 932 804
Cereals/Flours Total 71 682 855 81 900 673 100 631 687 105 473 534 119 253 774
Cocoa Bar/Block/Slab 3 750 6 000 1 900 31 041 11 306
Misc. 2 859 651 3 398 223 3 359 051 2 748 069 4 722 107
Cocoa total 2 863 401 3 404 223 3 360 951 2 779 110 4 733 413
Coconut 147 889 519 167 686 223 247 516 902 156 194 826 160 562 796
Coffee Decaffeinated 3 980 11 657 119 947 170 0
Extracts/Substitutes 2 674 748 121 891 56 911 136 359 144 160
Instant 3 265 886 5 833 689 1 672 279 1 703 294 973 443
Not decaffeinated 37 676 6 365 11 993 23 444 370 555
Coffee total 5 982 290 5 973 602 1 861 130 1 863 267 1 488 158
Confectionery Candy 6 384 592 6 570 310 7 089 299 7 829 893 10 521 455
Chocolate 2 104 246 2 809 084 1 792 082 1 590 698 1 726 284
Misc. 30 569 258 35 834 126 38 942 625 40 533 192 42 181 602
Confectionery total 39 058 096 45 213 520 47 824 006 49 953 783 54 429 341
Dairy Butter 28 805 70 969 178 631 56 956 42 366
Cheese/Curd 468 945 1 853 591 3 022 062 3 730 068 3 937 835
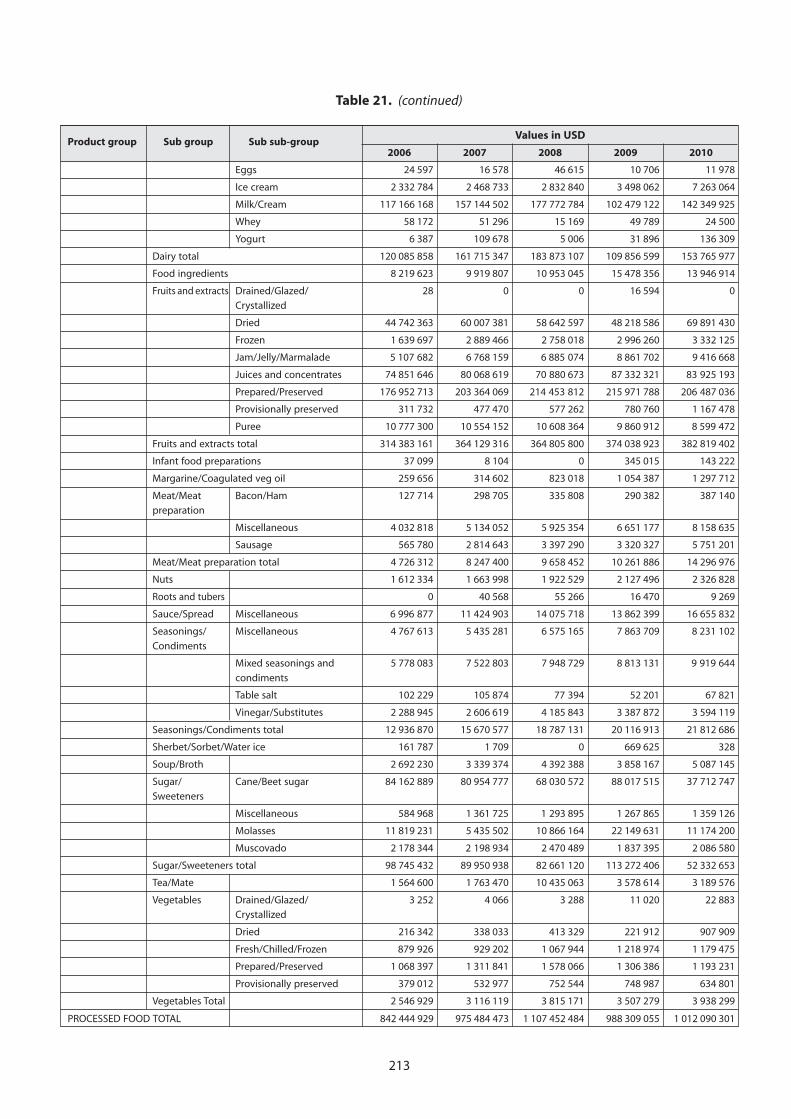
213
Table 21. (continued)
Product group Sub group Sub sub-groupValues in USD
2006 2007 2008 2009 2010
Eggs 24 597 16 578 46 615 10 706 11 978
Ice cream 2 332 784 2 468 733 2 832 840 3 498 062 7 263 064
Milk/Cream 117 166 168 157 144 502 177 772 784 102 479 122 142 349 925
Whey 58 172 51 296 15 169 49 789 24 500
Yogurt 6 387 109 678 5 006 31 896 136 309
Dairy total 120 085 858 161 715 347 183 873 107 109 856 599 153 765 977
Food ingredients 8 219 623 9 919 807 10 953 045 15 478 356 13 946 914
Fruits and extracts Drained/Glazed/ 28 0 0 16 594 0
Crystallized
Dried 44 742 363 60 007 381 58 642 597 48 218 586 69 891 430
Frozen 1 639 697 2 889 466 2 758 018 2 996 260 3 332 125
Jam/Jelly/Marmalade 5 107 682 6 768 159 6 885 074 8 861 702 9 416 668
Juices and concentrates 74 851 646 80 068 619 70 880 673 87 332 321 83 925 193
Prepared/Preserved 176 952 713 203 364 069 214 453 812 215 971 788 206 487 036
Provisionally preserved 311 732 477 470 577 262 780 760 1 167 478
Puree 10 777 300 10 554 152 10 608 364 9 860 912 8 599 472
Fruits and extracts total 314 383 161 364 129 316 364 805 800 374 038 923 382 819 402
Infant food preparations 37 099 8 104 0 345 015 143 222
Margarine/Coagulated veg oil 259 656 314 602 823 018 1 054 387 1 297 712
Meat/Meat Bacon/Ham 127 714 298 705 335 808 290 382 387 140
preparation
Miscellaneous 4 032 818 5 134 052 5 925 354 6 651 177 8 158 635
Sausage 565 780 2 814 643 3 397 290 3 320 327 5 751 201
Meat/Meat preparation total 4 726 312 8 247 400 9 658 452 10 261 886 14 296 976
Nuts 1 612 334 1 663 998 1 922 529 2 127 496 2 326 828
Roots and tubers 0 40 568 55 266 16 470 9 269
Sauce/Spread Miscellaneous 6 996 877 11 424 903 14 075 718 13 862 399 16 655 832
Seasonings/ Miscellaneous 4 767 613 5 435 281 6 575 165 7 863 709 8 231 102
Condiments
Mixed seasonings and 5 778 083 7 522 803 7 948 729 8 813 131 9 919 644
condiments
Table salt 102 229 105 874 77 394 52 201 67 821
Vinegar/Substitutes 2 288 945 2 606 619 4 185 843 3 387 872 3 594 119
Seasonings/Condiments total 12 936 870 15 670 577 18 787 131 20 116 913 21 812 686
Sherbet/Sorbet/Water ice 161 787 1 709 0 669 625 328
Soup/Broth 2 692 230 3 339 374 4 392 388 3 858 167 5 087 145
Sugar/ Cane/Beet sugar 84 162 889 80 954 777 68 030 572 88 017 515 37 712 747
Sweeteners
Miscellaneous 584 968 1 361 725 1 293 895 1 267 865 1 359 126
Molasses 11 819 231 5 435 502 10 866 164 22 149 631 11 174 200
Muscovado 2 178 344 2 198 934 2 470 489 1 837 395 2 086 580
Sugar/Sweeteners total 98 745 432 89 950 938 82 661 120 113 272 406 52 332 653
Tea/Mate 1 564 600 1 763 470 10 435 063 3 578 614 3 189 576
Vegetables Drained/Glazed/ 3 252 4 066 3 288 11 020 22 883
Crystallized
Dried 216 342 338 033 413 329 221 912 907 909
Fresh/Chilled/Frozen 879 926 929 202 1 067 944 1 218 974 1 179 475
Prepared/Preserved 1 068 397 1 311 841 1 578 066 1 306 386 1 193 231
Provisionally preserved 379 012 532 977 752 544 748 987 634 801
Vegetables Total 2 546 929 3 116 119 3 815 171 3 507 279 3 938 299
PROCESSED FOOD TOTAL 842 444 929 975 484 473 1 107 452 484 988 309 055 1 012 090 301
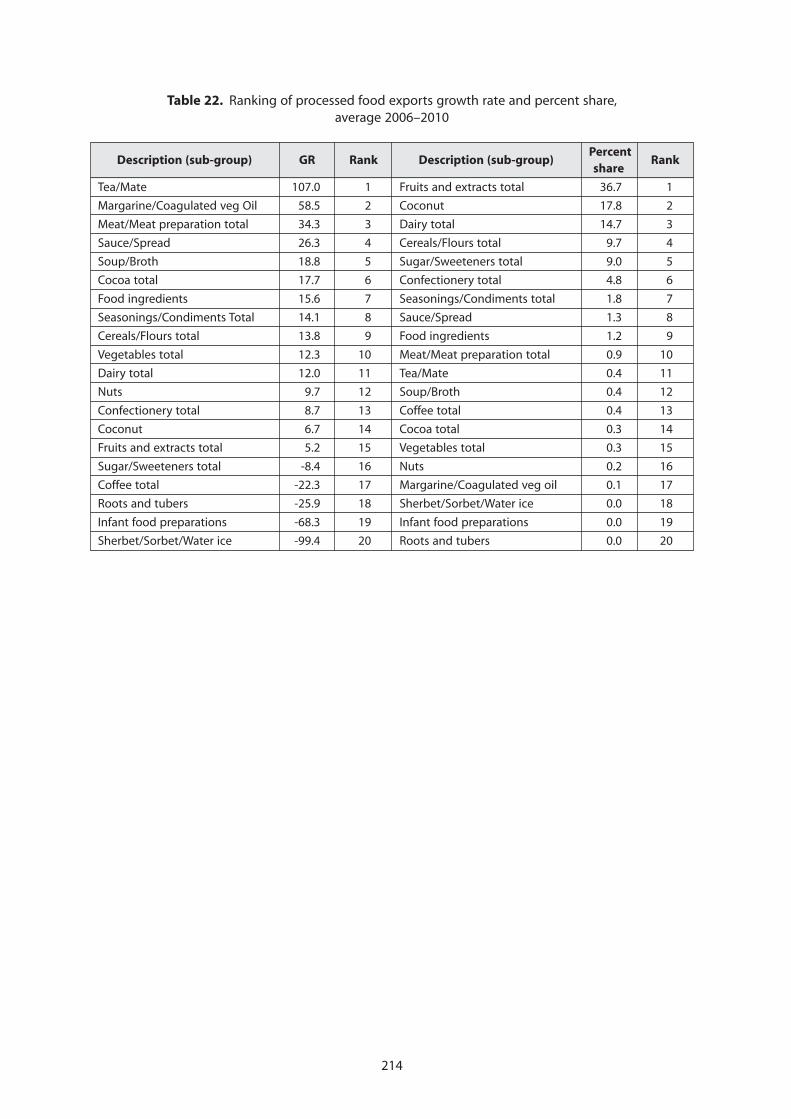
214
Table 22. Ranking of processed food exports growth rate and percent share,average 2006–2010
Description (sub-group) GR Rank Description (sub-group) Percent
Rankshare
Tea/Mate 107.0 1 Fruits and extracts total 36.7 1
Margarine/Coagulated veg Oil 58.5 2 Coconut 17.8 2
Meat/Meat preparation total 34.3 3 Dairy total 14.7 3
Sauce/Spread 26.3 4 Cereals/Flours total 9.7 4
Soup/Broth 18.8 5 Sugar/Sweeteners total 9.0 5
Cocoa total 17.7 6 Confectionery total 4.8 6
Food ingredients 15.6 7 Seasonings/Condiments total 1.8 7
Seasonings/Condiments Total 14.1 8 Sauce/Spread 1.3 8
Cereals/Flours total 13.8 9 Food ingredients 1.2 9
Vegetables total 12.3 10 Meat/Meat preparation total 0.9 10
Dairy total 12.0 11 Tea/Mate 0.4 11
Nuts 9.7 12 Soup/Broth 0.4 12
Confectionery total 8.7 13 Coffee total 0.4 13
Coconut 6.7 14 Cocoa total 0.3 14
Fruits and extracts total 5.2 15 Vegetables total 0.3 15
Sugar/Sweeteners total -8.4 16 Nuts 0.2 16
Coffee total -22.3 17 Margarine/Coagulated veg oil 0.1 17
Roots and tubers -25.9 18 Sherbet/Sorbet/Water ice 0.0 18
Infant food preparations -68.3 19 Infant food preparations 0.0 19
Sherbet/Sorbet/Water ice -99.4 20 Roots and tubers 0.0 20
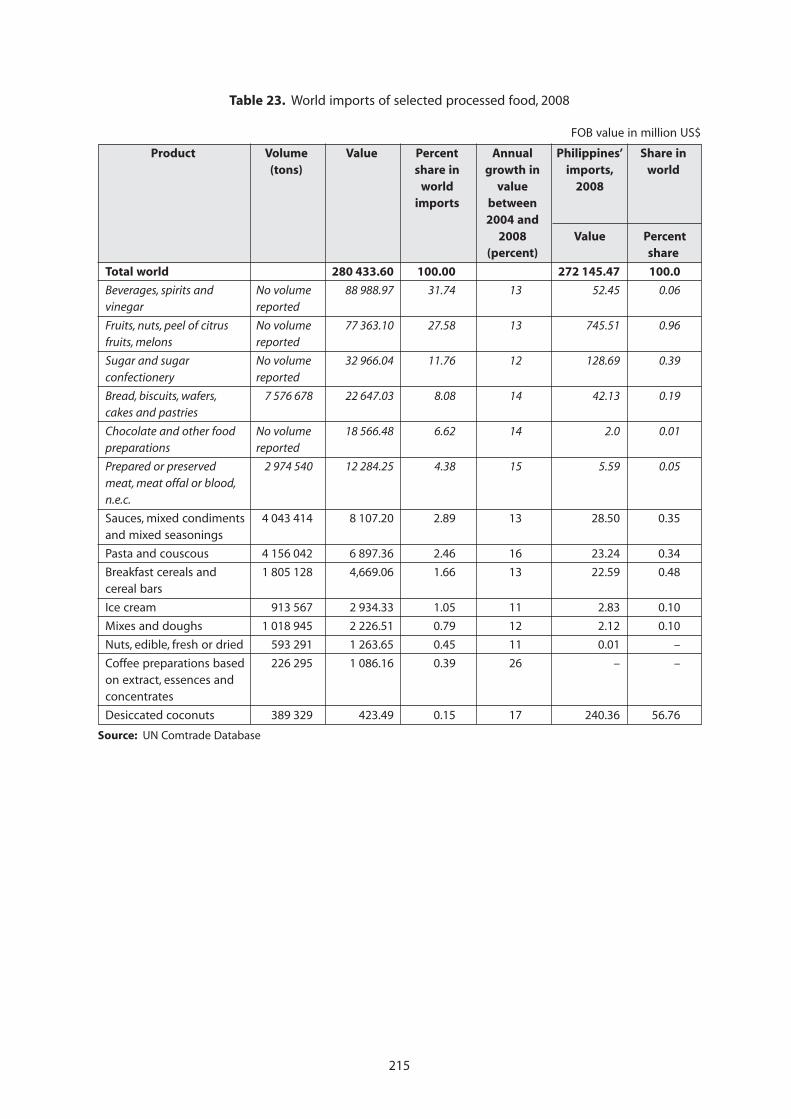
215
Table 23. World imports of selected processed food, 2008
FOB value in million US$
Product Volume Value Percent Annual Philippines’ Share in(tons) share in growth in imports, world
world value 2008imports between
2004 and2008 Value Percent
(percent) share
Total world 280 433.60 100.00 272 145.47 100.0
Beverages, spirits and No volume 88 988.97 31.74 13 52.45 0.06vinegar reported
Fruits, nuts, peel of citrus No volume 77 363.10 27.58 13 745.51 0.96fruits, melons reported
Sugar and sugar No volume 32 966.04 11.76 12 128.69 0.39confectionery reported
Bread, biscuits, wafers, 7 576 678 22 647.03 8.08 14 42.13 0.19cakes and pastries
Chocolate and other food No volume 18 566.48 6.62 14 2.0 0.01preparations reported
Prepared or preserved 2 974 540 12 284.25 4.38 15 5.59 0.05meat, meat offal or blood,n.e.c.
Sauces, mixed condiments 4 043 414 8 107.20 2.89 13 28.50 0.35and mixed seasonings
Pasta and couscous 4 156 042 6 897.36 2.46 16 23.24 0.34
Breakfast cereals and 1 805 128 4,669.06 1.66 13 22.59 0.48cereal bars
Ice cream 913 567 2 934.33 1.05 11 2.83 0.10
Mixes and doughs 1 018 945 2 226.51 0.79 12 2.12 0.10
Nuts, edible, fresh or dried 593 291 1 263.65 0.45 11 0.01 –
Coffee preparations based 226 295 1 086.16 0.39 26 – –on extract, essences andconcentrates
Desiccated coconuts 389 329 423.49 0.15 17 240.36 56.76
Source: UN Comtrade Database
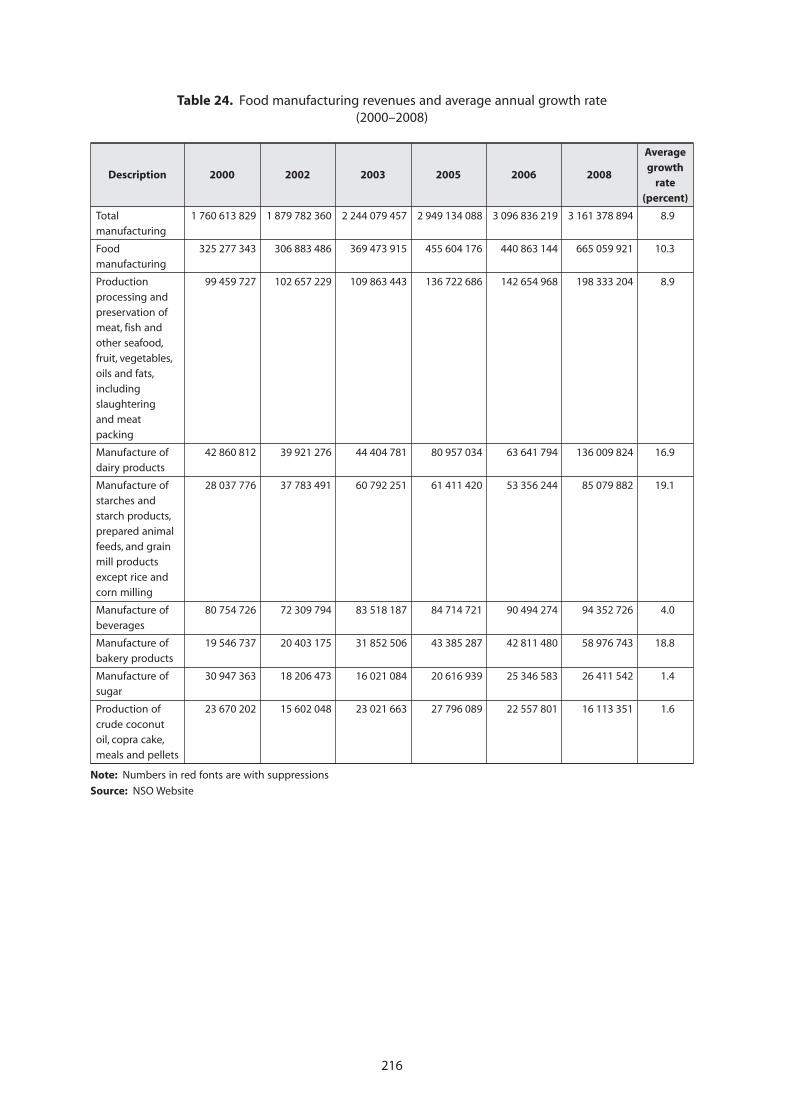
216
Table 24. Food manufacturing revenues and average annual growth rate(2000–2008)
Description 2000 2002 2003 2005 2006 2008
Averagegrowth
rate(percent)
Total 1 760 613 829 1 879 782 360 2 244 079 457 2 949 134 088 3 096 836 219 3 161 378 894 8.9manufacturing
Food 325 277 343 306 883 486 369 473 915 455 604 176 440 863 144 665 059 921 10.3
manufacturing
Production 99 459 727 102 657 229 109 863 443 136 722 686 142 654 968 198 333 204 8.9
processing and
preservation ofmeat, fish and
other seafood,
fruit, vegetables,oils and fats,
including
slaughteringand meat
packing
Manufacture of 42 860 812 39 921 276 44 404 781 80 957 034 63 641 794 136 009 824 16.9dairy products
Manufacture of 28 037 776 37 783 491 60 792 251 61 411 420 53 356 244 85 079 882 19.1
starches andstarch products,
prepared animal
feeds, and grainmill products
except rice andcorn milling
Manufacture of 80 754 726 72 309 794 83 518 187 84 714 721 90 494 274 94 352 726 4.0
beverages
Manufacture of 19 546 737 20 403 175 31 852 506 43 385 287 42 811 480 58 976 743 18.8
bakery products
Manufacture of 30 947 363 18 206 473 16 021 084 20 616 939 25 346 583 26 411 542 1.4sugar
Production of 23 670 202 15 602 048 23 021 663 27 796 089 22 557 801 16 113 351 1.6
crude coconutoil, copra cake,
meals and pellets
Note: Numbers in red fonts are with suppressions
Source: NSO Website
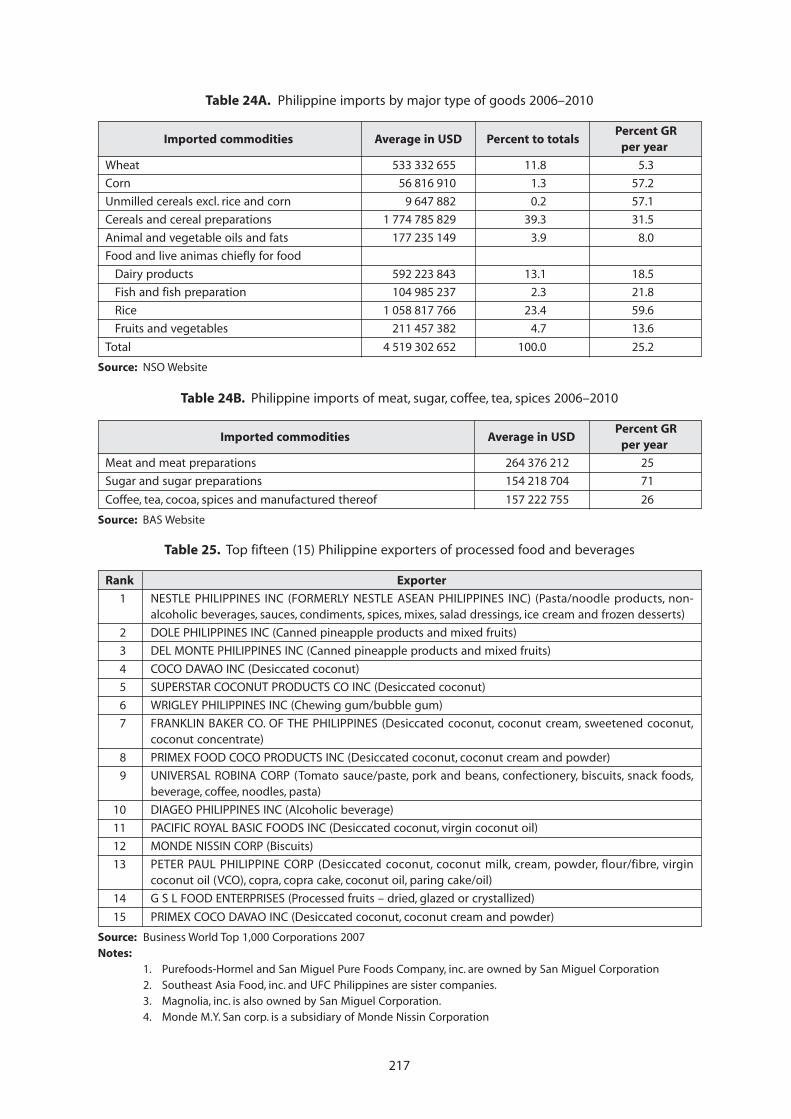
217
Table 24A. Philippine imports by major type of goods 2006–2010
Imported commodities Average in USD Percent to totals Percent GR
per year
Wheat 533 332 655 11.8 5.3
Corn 56 816 910 1.3 57.2
Unmilled cereals excl. rice and corn 9 647 882 0.2 57.1
Cereals and cereal preparations 1 774 785 829 39.3 31.5
Animal and vegetable oils and fats 177 235 149 3.9 8.0
Food and live animas chiefly for food
Dairy products 592 223 843 13.1 18.5
Fish and fish preparation 104 985 237 2.3 21.8
Rice 1 058 817 766 23.4 59.6
Fruits and vegetables 211 457 382 4.7 13.6
Total 4 519 302 652 100.0 25.2
Source: NSO Website
Table 24B. Philippine imports of meat, sugar, coffee, tea, spices 2006–2010
Imported commodities Average in USD Percent GR
per year
Meat and meat preparations 264 376 212 25
Sugar and sugar preparations 154 218 704 71
Coffee, tea, cocoa, spices and manufactured thereof 157 222 755 26
Source: BAS Website
Table 25. Top fifteen (15) Philippine exporters of processed food and beverages
Rank Exporter
1 NESTLE PHILIPPINES INC (FORMERLY NESTLE ASEAN PHILIPPINES INC) (Pasta/noodle products, non-alcoholic beverages, sauces, condiments, spices, mixes, salad dressings, ice cream and frozen desserts)
2 DOLE PHILIPPINES INC (Canned pineapple products and mixed fruits)
3 DEL MONTE PHILIPPINES INC (Canned pineapple products and mixed fruits)
4 COCO DAVAO INC (Desiccated coconut)
5 SUPERSTAR COCONUT PRODUCTS CO INC (Desiccated coconut)
6 WRIGLEY PHILIPPINES INC (Chewing gum/bubble gum)
7 FRANKLIN BAKER CO. OF THE PHILIPPINES (Desiccated coconut, coconut cream, sweetened coconut,coconut concentrate)
8 PRIMEX FOOD COCO PRODUCTS INC (Desiccated coconut, coconut cream and powder)
9 UNIVERSAL ROBINA CORP (Tomato sauce/paste, pork and beans, confectionery, biscuits, snack foods,beverage, coffee, noodles, pasta)
10 DIAGEO PHILIPPINES INC (Alcoholic beverage)
11 PACIFIC ROYAL BASIC FOODS INC (Desiccated coconut, virgin coconut oil)
12 MONDE NISSIN CORP (Biscuits)
13 PETER PAUL PHILIPPINE CORP (Desiccated coconut, coconut milk, cream, powder, flour/fibre, virgincoconut oil (VCO), copra, copra cake, coconut oil, paring cake/oil)
14 G S L FOOD ENTERPRISES (Processed fruits – dried, glazed or crystallized)
15 PRIMEX COCO DAVAO INC (Desiccated coconut, coconut cream and powder)
Source: Business World Top 1,000 Corporations 2007Notes:
1. Purefoods-Hormel and San Miguel Pure Foods Company, inc. are owned by San Miguel Corporation2. Southeast Asia Food, inc. and UFC Philippines are sister companies.3. Magnolia, inc. is also owned by San Miguel Corporation.4. Monde M.Y. San corp. is a subsidiary of Monde Nissin Corporation
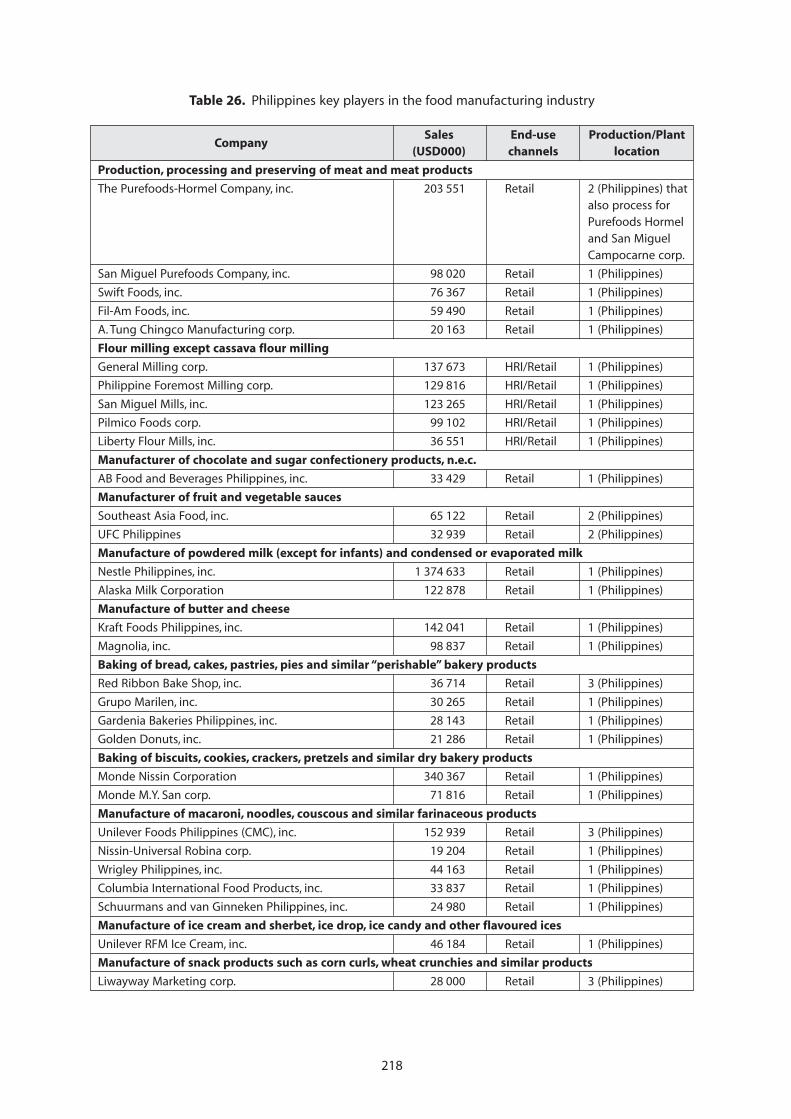
218
Table 26. Philippines key players in the food manufacturing industry
CompanySales End-use Production/Plant
(USD000) channels location
Production, processing and preserving of meat and meat products
The Purefoods-Hormel Company, inc. 203 551 Retail 2 (Philippines) thatalso process forPurefoods Hormeland San MiguelCampocarne corp.
San Miguel Purefoods Company, inc. 98 020 Retail 1 (Philippines)
Swift Foods, inc. 76 367 Retail 1 (Philippines)
Fil-Am Foods, inc. 59 490 Retail 1 (Philippines)
A. Tung Chingco Manufacturing corp. 20 163 Retail 1 (Philippines)
Flour milling except cassava flour milling
General Milling corp. 137 673 HRI/Retail 1 (Philippines)
Philippine Foremost Milling corp. 129 816 HRI/Retail 1 (Philippines)
San Miguel Mills, inc. 123 265 HRI/Retail 1 (Philippines)
Pilmico Foods corp. 99 102 HRI/Retail 1 (Philippines)
Liberty Flour Mills, inc. 36 551 HRI/Retail 1 (Philippines)
Manufacturer of chocolate and sugar confectionery products, n.e.c.
AB Food and Beverages Philippines, inc. 33 429 Retail 1 (Philippines)
Manufacturer of fruit and vegetable sauces
Southeast Asia Food, inc. 65 122 Retail 2 (Philippines)
UFC Philippines 32 939 Retail 2 (Philippines)
Manufacture of powdered milk (except for infants) and condensed or evaporated milk
Nestle Philippines, inc. 1 374 633 Retail 1 (Philippines)
Alaska Milk Corporation 122 878 Retail 1 (Philippines)
Manufacture of butter and cheese
Kraft Foods Philippines, inc. 142 041 Retail 1 (Philippines)
Magnolia, inc. 98 837 Retail 1 (Philippines)
Baking of bread, cakes, pastries, pies and similar “perishable” bakery products
Red Ribbon Bake Shop, inc. 36 714 Retail 3 (Philippines)
Grupo Marilen, inc. 30 265 Retail 1 (Philippines)
Gardenia Bakeries Philippines, inc. 28 143 Retail 1 (Philippines)
Golden Donuts, inc. 21 286 Retail 1 (Philippines)
Baking of biscuits, cookies, crackers, pretzels and similar dry bakery products
Monde Nissin Corporation 340 367 Retail 1 (Philippines)
Monde M.Y. San corp. 71 816 Retail 1 (Philippines)
Manufacture of macaroni, noodles, couscous and similar farinaceous products
Unilever Foods Philippines (CMC), inc. 152 939 Retail 3 (Philippines)
Nissin-Universal Robina corp. 19 204 Retail 1 (Philippines)
Wrigley Philippines, inc. 44 163 Retail 1 (Philippines)
Columbia International Food Products, inc. 33 837 Retail 1 (Philippines)
Schuurmans and van Ginneken Philippines, inc. 24 980 Retail 1 (Philippines)
Manufacture of ice cream and sherbet, ice drop, ice candy and other flavoured ices
Unilever RFM Ice Cream, inc. 46 184 Retail 1 (Philippines)
Manufacture of snack products such as corn curls, wheat crunchies and similar products
Liwayway Marketing corp. 28 000 Retail 3 (Philippines)
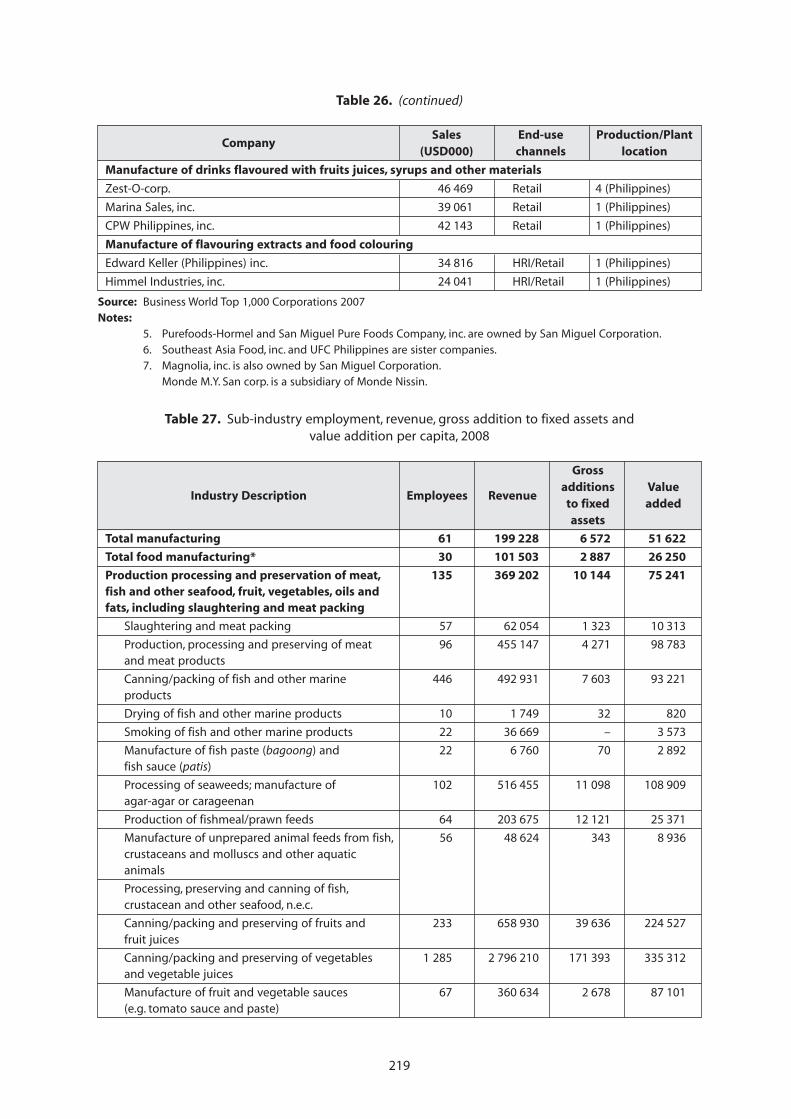
219
Table 26. (continued)
CompanySales End-use Production/Plant
(USD000) channels location
Manufacture of drinks flavoured with fruits juices, syrups and other materials
Zest-O-corp. 46 469 Retail 4 (Philippines)
Marina Sales, inc. 39 061 Retail 1 (Philippines)
CPW Philippines, inc. 42 143 Retail 1 (Philippines)
Manufacture of flavouring extracts and food colouring
Edward Keller (Philippines) inc. 34 816 HRI/Retail 1 (Philippines)
Himmel Industries, inc. 24 041 HRI/Retail 1 (Philippines)
Source: Business World Top 1,000 Corporations 2007Notes:
5. Purefoods-Hormel and San Miguel Pure Foods Company, inc. are owned by San Miguel Corporation.6. Southeast Asia Food, inc. and UFC Philippines are sister companies.7. Magnolia, inc. is also owned by San Miguel Corporation.
Monde M.Y. San corp. is a subsidiary of Monde Nissin.
Table 27. Sub-industry employment, revenue, gross addition to fixed assets andvalue addition per capita, 2008
Industry Description Employees Revenue
Grossadditions Value
to fixed addedassets
Total manufacturing 61 199 228 6 572 51 622
Total food manufacturing* 30 101 503 2 887 26 250
Production processing and preservation of meat, 135 369 202 10 144 75 241fish and other seafood, fruit, vegetables, oils andfats, including slaughtering and meat packing
Slaughtering and meat packing 57 62 054 1 323 10 313
Production, processing and preserving of meat 96 455 147 4 271 98 783and meat products
Canning/packing of fish and other marine 446 492 931 7 603 93 221products
Drying of fish and other marine products 10 1 749 32 820
Smoking of fish and other marine products 22 36 669 – 3 573
Manufacture of fish paste (bagoong) and 22 6 760 70 2 892fish sauce (patis)
Processing of seaweeds; manufacture of 102 516 455 11 098 108 909agar-agar or carageenan
Production of fishmeal/prawn feeds 64 203 675 12 121 25 371
Manufacture of unprepared animal feeds from fish, 56 48 624 343 8 936crustaceans and molluscs and other aquaticanimals
Processing, preserving and canning of fish,crustacean and other seafood, n.e.c.
Canning/packing and preserving of fruits and 233 658 930 39 636 224 527fruit juices
Canning/packing and preserving of vegetables 1 285 2 796 210 171 393 335 312and vegetable juices
Manufacture of fruit and vegetable sauces 67 360 634 2 678 87 101(e.g. tomato sauce and paste)
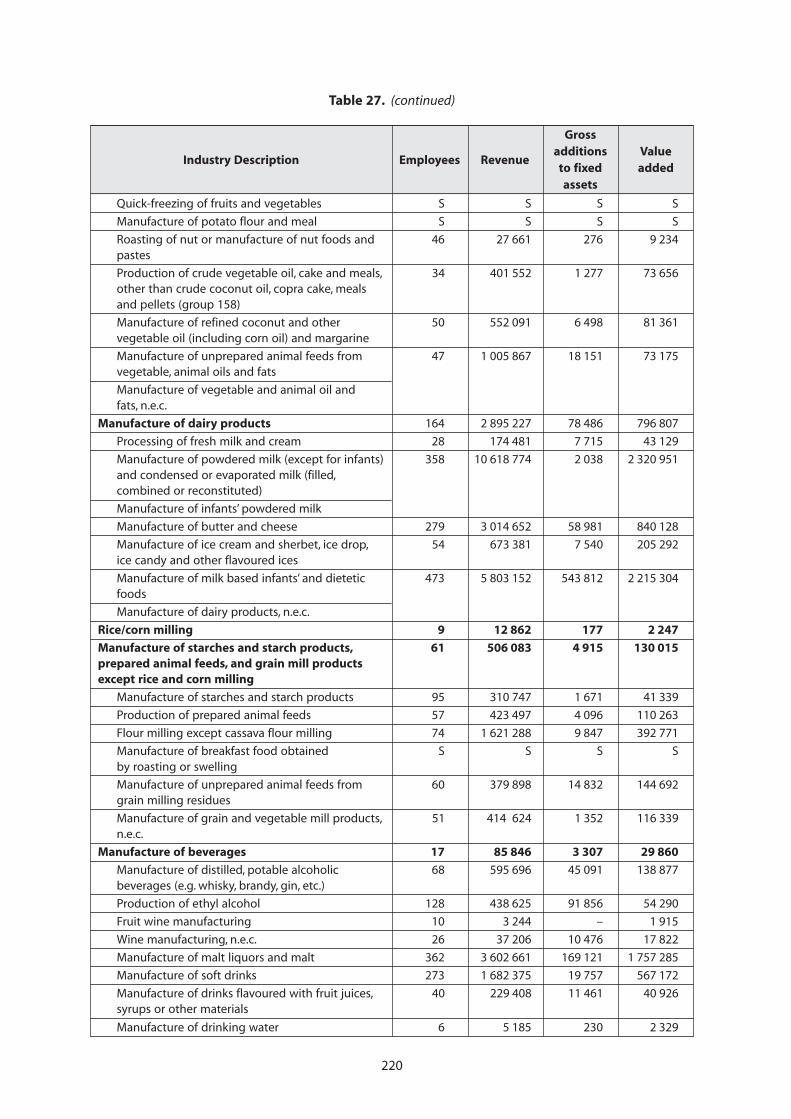
220
Table 27. (continued)
Industry Description Employees Revenue
Grossadditions Value
to fixed addedassets
Quick-freezing of fruits and vegetables S S S S
Manufacture of potato flour and meal S S S S
Roasting of nut or manufacture of nut foods and 46 27 661 276 9 234pastes
Production of crude vegetable oil, cake and meals, 34 401 552 1 277 73 656other than crude coconut oil, copra cake, mealsand pellets (group 158)
Manufacture of refined coconut and other 50 552 091 6 498 81 361vegetable oil (including corn oil) and margarine
Manufacture of unprepared animal feeds from 47 1 005 867 18 151 73 175vegetable, animal oils and fats
Manufacture of vegetable and animal oil andfats, n.e.c.
Manufacture of dairy products 164 2 895 227 78 486 796 807
Processing of fresh milk and cream 28 174 481 7 715 43 129
Manufacture of powdered milk (except for infants) 358 10 618 774 2 038 2 320 951and condensed or evaporated milk (filled,combined or reconstituted)
Manufacture of infants’ powdered milk
Manufacture of butter and cheese 279 3 014 652 58 981 840 128
Manufacture of ice cream and sherbet, ice drop, 54 673 381 7 540 205 292ice candy and other flavoured ices
Manufacture of milk based infants’ and dietetic 473 5 803 152 543 812 2 215 304foods
Manufacture of dairy products, n.e.c.
Rice/corn milling 9 12 862 177 2 247
Manufacture of starches and starch products, 61 506 083 4 915 130 015prepared animal feeds, and grain mill productsexcept rice and corn milling
Manufacture of starches and starch products 95 310 747 1 671 41 339
Production of prepared animal feeds 57 423 497 4 096 110 263
Flour milling except cassava flour milling 74 1 621 288 9 847 392 771
Manufacture of breakfast food obtained S S S Sby roasting or swelling
Manufacture of unprepared animal feeds from 60 379 898 14 832 144 692grain milling residues
Manufacture of grain and vegetable mill products, 51 414 624 1 352 116 339n.e.c.
Manufacture of beverages 17 85 846 3 307 29 860
Manufacture of distilled, potable alcoholic 68 595 696 45 091 138 877beverages (e.g. whisky, brandy, gin, etc.)
Production of ethyl alcohol 128 438 625 91 856 54 290
Fruit wine manufacturing 10 3 244 – 1 915
Wine manufacturing, n.e.c. 26 37 206 10 476 17 822
Manufacture of malt liquors and malt 362 3 602 661 169 121 1 757 285
Manufacture of soft drinks 273 1 682 375 19 757 567 172
Manufacture of drinks flavoured with fruit juices, 40 229 408 11 461 40 926syrups or other materials
Manufacture of drinking water 6 5 185 230 2 329
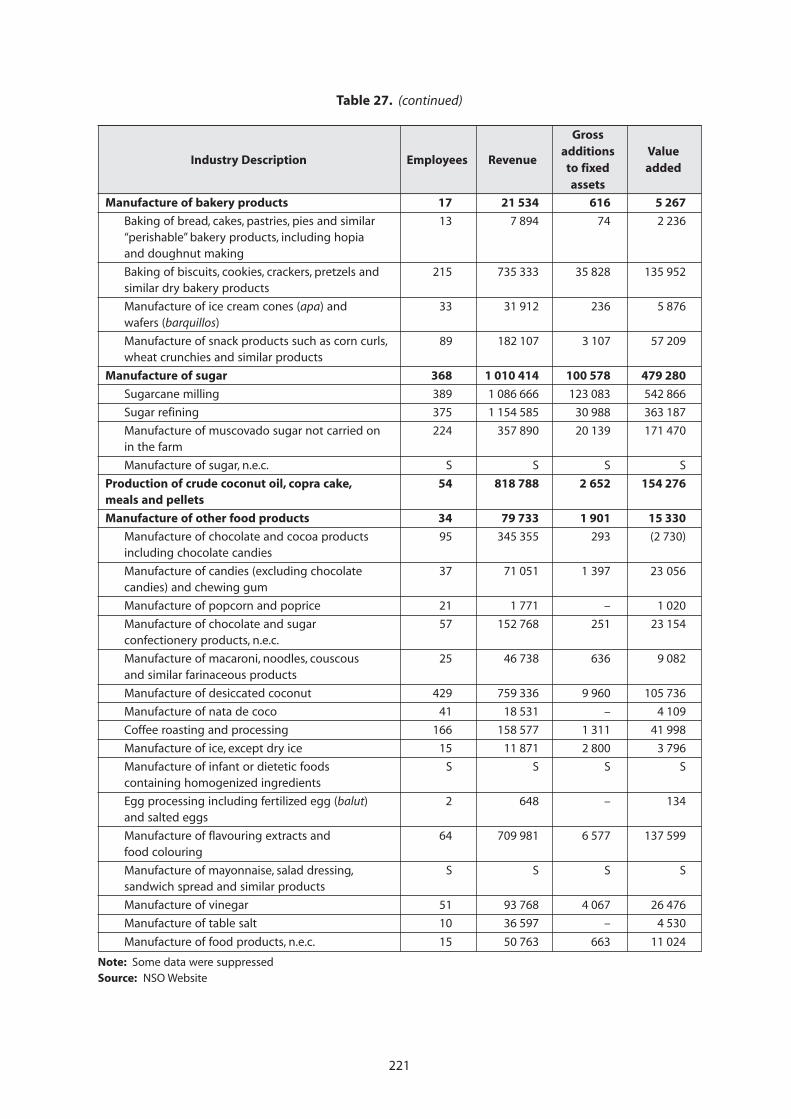
221
Manufacture of bakery products 17 21 534 616 5 267
Baking of bread, cakes, pastries, pies and similar 13 7 894 74 2 236“perishable” bakery products, including hopiaand doughnut making
Baking of biscuits, cookies, crackers, pretzels and 215 735 333 35 828 135 952similar dry bakery products
Manufacture of ice cream cones (apa) and 33 31 912 236 5 876wafers (barquillos)
Manufacture of snack products such as corn curls, 89 182 107 3 107 57 209wheat crunchies and similar products
Manufacture of sugar 368 1 010 414 100 578 479 280
Sugarcane milling 389 1 086 666 123 083 542 866
Sugar refining 375 1 154 585 30 988 363 187
Manufacture of muscovado sugar not carried on 224 357 890 20 139 171 470in the farm
Manufacture of sugar, n.e.c. S S S S
Production of crude coconut oil, copra cake, 54 818 788 2 652 154 276meals and pellets
Manufacture of other food products 34 79 733 1 901 15 330
Manufacture of chocolate and cocoa products 95 345 355 293 (2 730)including chocolate candies
Manufacture of candies (excluding chocolate 37 71 051 1 397 23 056candies) and chewing gum
Manufacture of popcorn and poprice 21 1 771 – 1 020
Manufacture of chocolate and sugar 57 152 768 251 23 154confectionery products, n.e.c.
Manufacture of macaroni, noodles, couscous 25 46 738 636 9 082and similar farinaceous products
Manufacture of desiccated coconut 429 759 336 9 960 105 736
Manufacture of nata de coco 41 18 531 – 4 109
Coffee roasting and processing 166 158 577 1 311 41 998
Manufacture of ice, except dry ice 15 11 871 2 800 3 796
Manufacture of infant or dietetic foods S S S Scontaining homogenized ingredients
Egg processing including fertilized egg (balut) 2 648 – 134and salted eggs
Manufacture of flavouring extracts and 64 709 981 6 577 137 599food colouring
Manufacture of mayonnaise, salad dressing, S S S Ssandwich spread and similar products
Manufacture of vinegar 51 93 768 4 067 26 476
Manufacture of table salt 10 36 597 – 4 530
Manufacture of food products, n.e.c. 15 50 763 663 11 024
Note: Some data were suppressedSource: NSO Website
Table 27. (continued)
Industry Description Employees Revenue
Grossadditions Value
to fixed addedassets
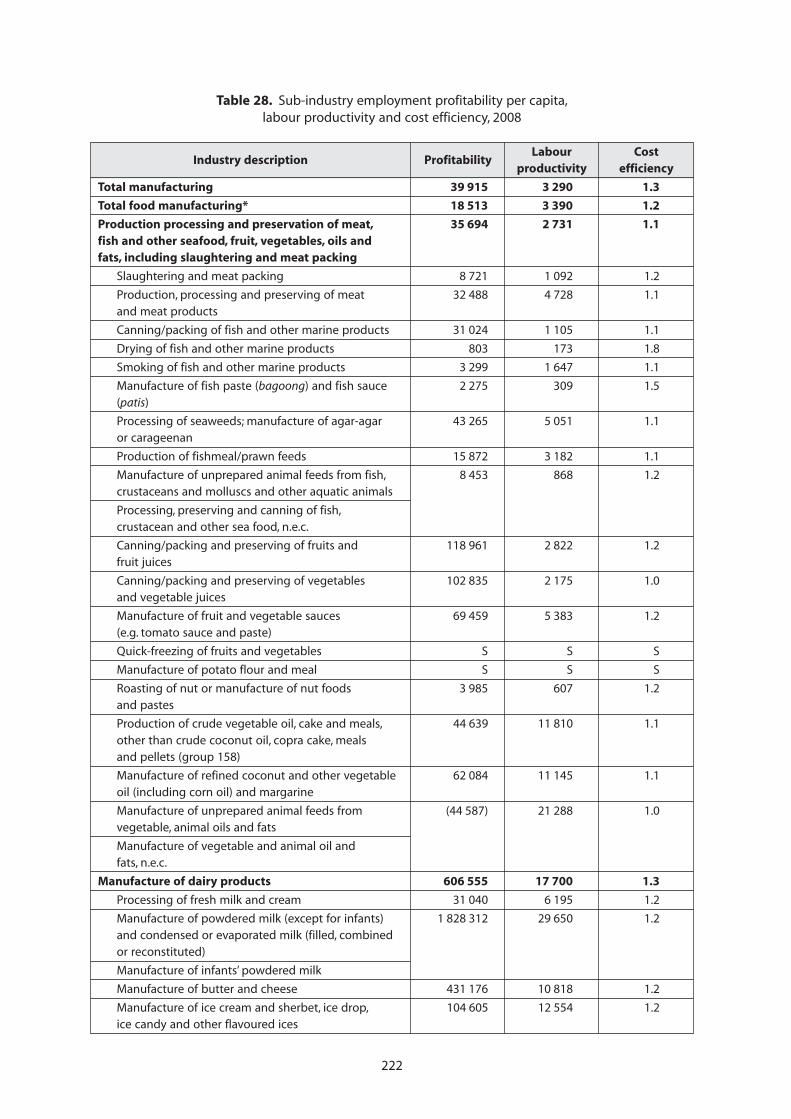
222
Table 28. Sub-industry employment profitability per capita,labour productivity and cost efficiency, 2008
Industry description ProfitabilityLabour Cost
productivity efficiency
Total manufacturing 39 915 3 290 1.3
Total food manufacturing* 18 513 3 390 1.2
Production processing and preservation of meat, 35 694 2 731 1.1fish and other seafood, fruit, vegetables, oils andfats, including slaughtering and meat packing
Slaughtering and meat packing 8 721 1 092 1.2
Production, processing and preserving of meat 32 488 4 728 1.1and meat products
Canning/packing of fish and other marine products 31 024 1 105 1.1
Drying of fish and other marine products 803 173 1.8
Smoking of fish and other marine products 3 299 1 647 1.1
Manufacture of fish paste (bagoong) and fish sauce 2 275 309 1.5(patis)
Processing of seaweeds; manufacture of agar-agar 43 265 5 051 1.1or carageenan
Production of fishmeal/prawn feeds 15 872 3 182 1.1
Manufacture of unprepared animal feeds from fish, 8 453 868 1.2crustaceans and molluscs and other aquatic animals
Processing, preserving and canning of fish,crustacean and other sea food, n.e.c.
Canning/packing and preserving of fruits and 118 961 2 822 1.2fruit juices
Canning/packing and preserving of vegetables 102 835 2 175 1.0and vegetable juices
Manufacture of fruit and vegetable sauces 69 459 5 383 1.2(e.g. tomato sauce and paste)
Quick-freezing of fruits and vegetables S S S
Manufacture of potato flour and meal S S S
Roasting of nut or manufacture of nut foods 3 985 607 1.2and pastes
Production of crude vegetable oil, cake and meals, 44 639 11 810 1.1other than crude coconut oil, copra cake, mealsand pellets (group 158)
Manufacture of refined coconut and other vegetable 62 084 11 145 1.1oil (including corn oil) and margarine
Manufacture of unprepared animal feeds from (44 587) 21 288 1.0vegetable, animal oils and fats
Manufacture of vegetable and animal oil andfats, n.e.c.
Manufacture of dairy products 606 555 17 700 1.3
Processing of fresh milk and cream 31 040 6 195 1.2
Manufacture of powdered milk (except for infants) 1 828 312 29 650 1.2and condensed or evaporated milk (filled, combinedor reconstituted)
Manufacture of infants’ powdered milk
Manufacture of butter and cheese 431 176 10 818 1.2
Manufacture of ice cream and sherbet, ice drop, 104 605 12 554 1.2ice candy and other flavoured ices
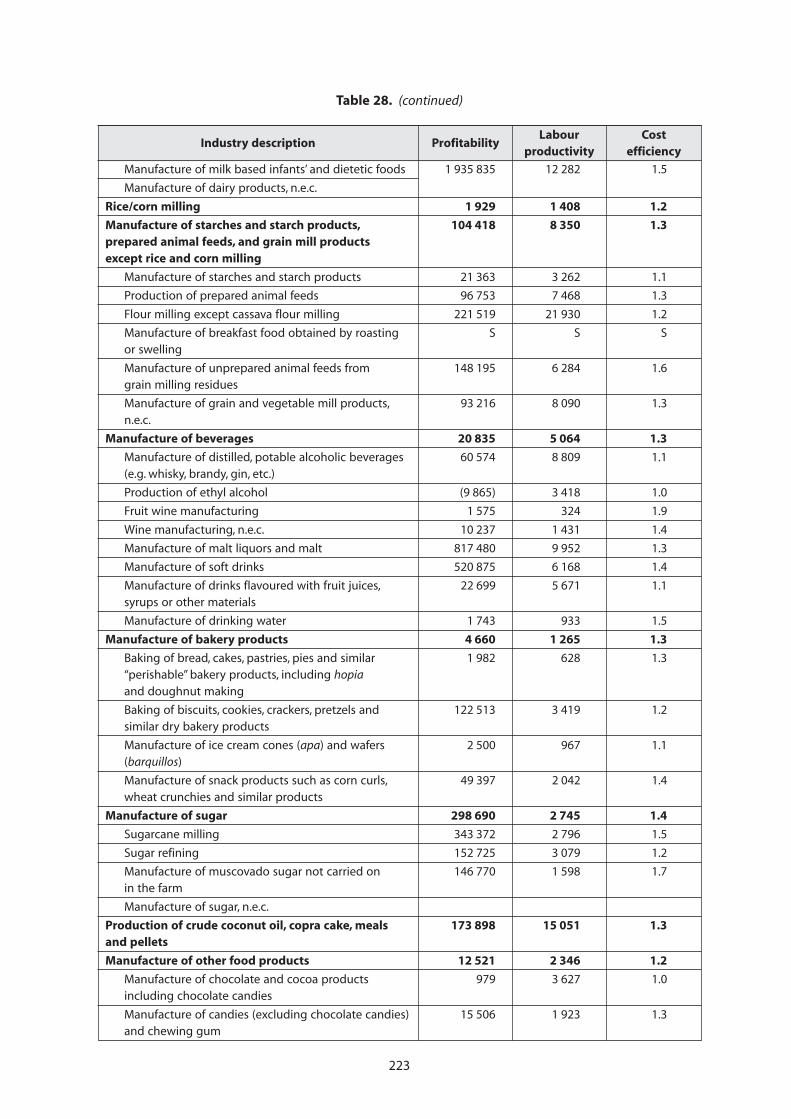
223
Manufacture of milk based infants’ and dietetic foods 1 935 835 12 282 1.5
Manufacture of dairy products, n.e.c.
Rice/corn milling 1 929 1 408 1.2
Manufacture of starches and starch products, 104 418 8 350 1.3prepared animal feeds, and grain mill productsexcept rice and corn milling
Manufacture of starches and starch products 21 363 3 262 1.1
Production of prepared animal feeds 96 753 7 468 1.3
Flour milling except cassava flour milling 221 519 21 930 1.2
Manufacture of breakfast food obtained by roasting S S Sor swelling
Manufacture of unprepared animal feeds from 148 195 6 284 1.6grain milling residues
Manufacture of grain and vegetable mill products, 93 216 8 090 1.3n.e.c.
Manufacture of beverages 20 835 5 064 1.3
Manufacture of distilled, potable alcoholic beverages 60 574 8 809 1.1(e.g. whisky, brandy, gin, etc.)
Production of ethyl alcohol (9 865) 3 418 1.0
Fruit wine manufacturing 1 575 324 1.9
Wine manufacturing, n.e.c. 10 237 1 431 1.4
Manufacture of malt liquors and malt 817 480 9 952 1.3
Manufacture of soft drinks 520 875 6 168 1.4
Manufacture of drinks flavoured with fruit juices, 22 699 5 671 1.1syrups or other materials
Manufacture of drinking water 1 743 933 1.5
Manufacture of bakery products 4 660 1 265 1.3
Baking of bread, cakes, pastries, pies and similar 1 982 628 1.3“perishable” bakery products, including hopiaand doughnut making
Baking of biscuits, cookies, crackers, pretzels and 122 513 3 419 1.2similar dry bakery products
Manufacture of ice cream cones (apa) and wafers 2 500 967 1.1(barquillos)
Manufacture of snack products such as corn curls, 49 397 2 042 1.4wheat crunchies and similar products
Manufacture of sugar 298 690 2 745 1.4
Sugarcane milling 343 372 2 796 1.5
Sugar refining 152 725 3 079 1.2
Manufacture of muscovado sugar not carried on 146 770 1 598 1.7in the farm
Manufacture of sugar, n.e.c.
Production of crude coconut oil, copra cake, meals 173 898 15 051 1.3and pellets
Manufacture of other food products 12 521 2 346 1.2
Manufacture of chocolate and cocoa products 979 3 627 1.0including chocolate candies
Manufacture of candies (excluding chocolate candies) 15 506 1 923 1.3and chewing gum
Table 28. (continued)
Industry description ProfitabilityLabour Cost
productivity efficiency
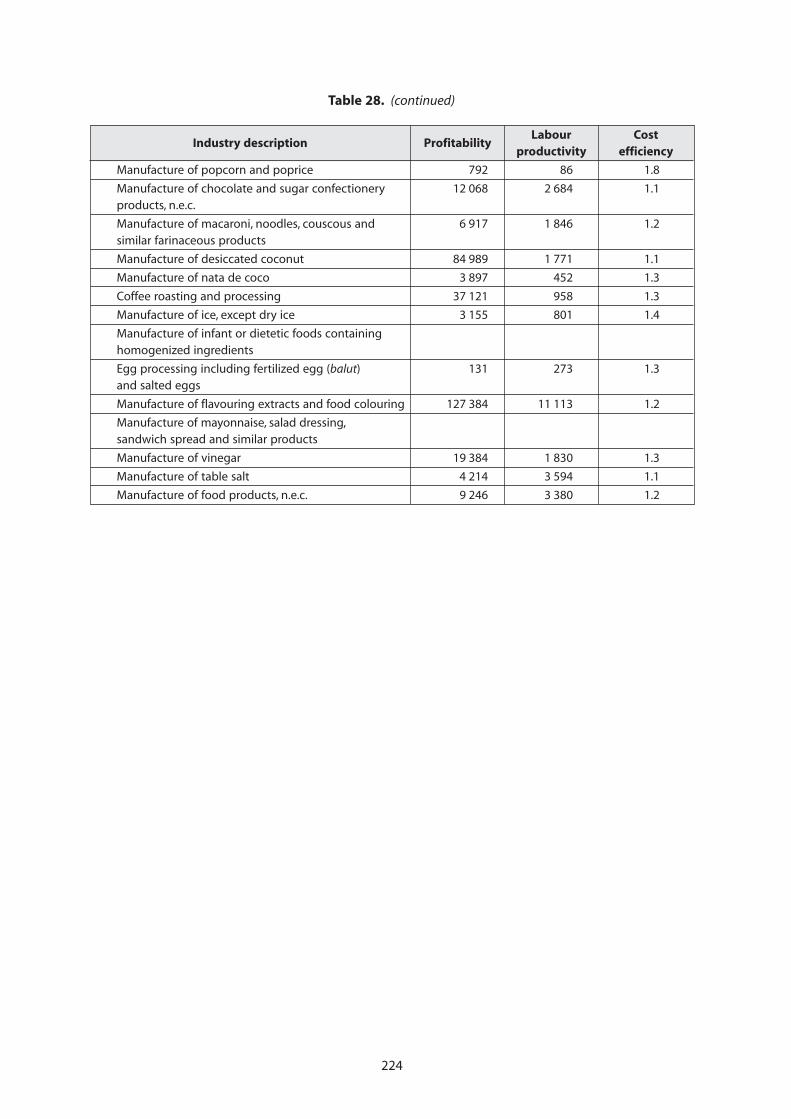
224
Manufacture of popcorn and poprice 792 86 1.8
Manufacture of chocolate and sugar confectionery 12 068 2 684 1.1products, n.e.c.
Manufacture of macaroni, noodles, couscous and 6 917 1 846 1.2similar farinaceous products
Manufacture of desiccated coconut 84 989 1 771 1.1
Manufacture of nata de coco 3 897 452 1.3
Coffee roasting and processing 37 121 958 1.3
Manufacture of ice, except dry ice 3 155 801 1.4
Manufacture of infant or dietetic foods containinghomogenized ingredients
Egg processing including fertilized egg (balut) 131 273 1.3and salted eggs
Manufacture of flavouring extracts and food colouring 127 384 11 113 1.2
Manufacture of mayonnaise, salad dressing,sandwich spread and similar products
Manufacture of vinegar 19 384 1 830 1.3
Manufacture of table salt 4 214 3 594 1.1
Manufacture of food products, n.e.c. 9 246 3 380 1.2
Table 28. (continued)
Industry description ProfitabilityLabour Cost
productivity efficiency
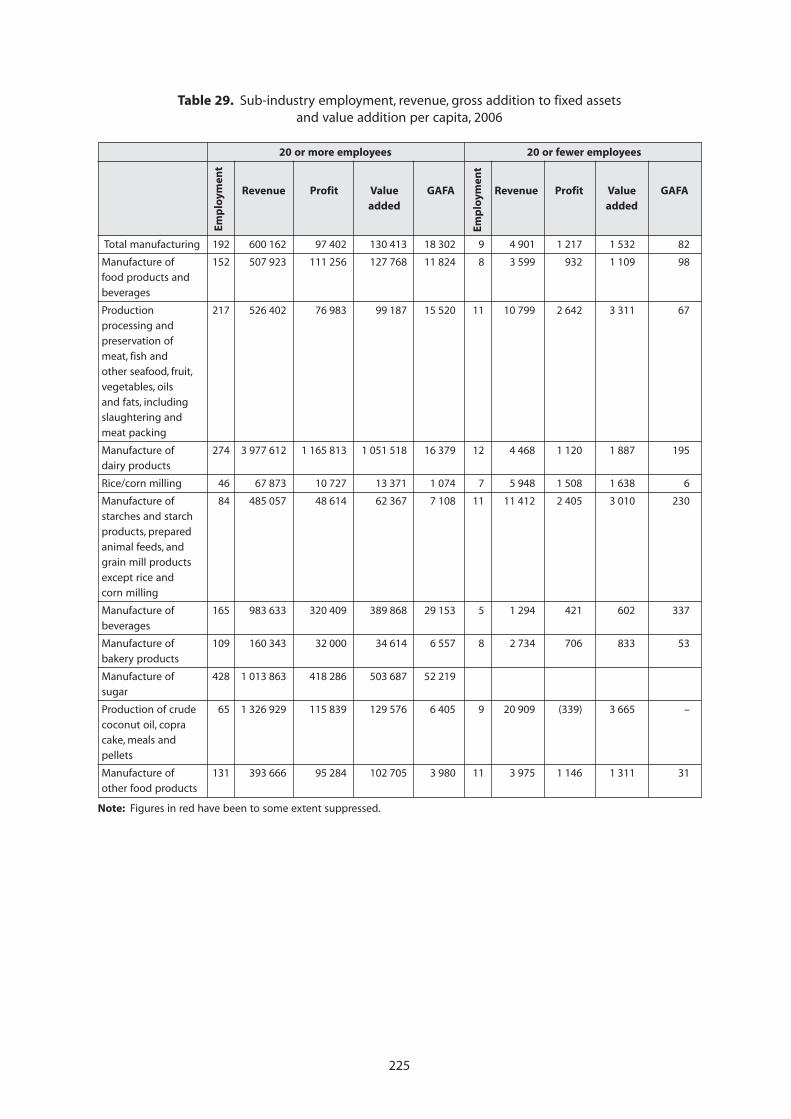
225
Table 29. Sub-industry employment, revenue, gross addition to fixed assetsand value addition per capita, 2006
20 or more employees 20 or fewer employees
Revenue Profit Value GAFA Revenue Profit Value GAFAadded added
Total manufacturing 192 600 162 97 402 130 413 18 302 9 4 901 1 217 1 532 82
Manufacture of 152 507 923 111 256 127 768 11 824 8 3 599 932 1 109 98food products and
beverages
Production 217 526 402 76 983 99 187 15 520 11 10 799 2 642 3 311 67processing and
preservation of
meat, fish andother seafood, fruit,
vegetables, oils
and fats, includingslaughtering and
meat packing
Manufacture of 274 3 977 612 1 165 813 1 051 518 16 379 12 4 468 1 120 1 887 195dairy products
Rice/corn milling 46 67 873 10 727 13 371 1 074 7 5 948 1 508 1 638 6
Manufacture of 84 485 057 48 614 62 367 7 108 11 11 412 2 405 3 010 230starches and starch
products, prepared
animal feeds, andgrain mill products
except rice andcorn milling
Manufacture of 165 983 633 320 409 389 868 29 153 5 1 294 421 602 337
beverages
Manufacture of 109 160 343 32 000 34 614 6 557 8 2 734 706 833 53
bakery products
Manufacture of 428 1 013 863 418 286 503 687 52 219sugar
Production of crude 65 1 326 929 115 839 129 576 6 405 9 20 909 (339) 3 665 –
coconut oil, copracake, meals and
pellets
Manufacture of 131 393 666 95 284 102 705 3 980 11 3 975 1 146 1 311 31other food products
Note: Figures in red have been to some extent suppressed.
Emp
loym
ent
Emp
loym
ent
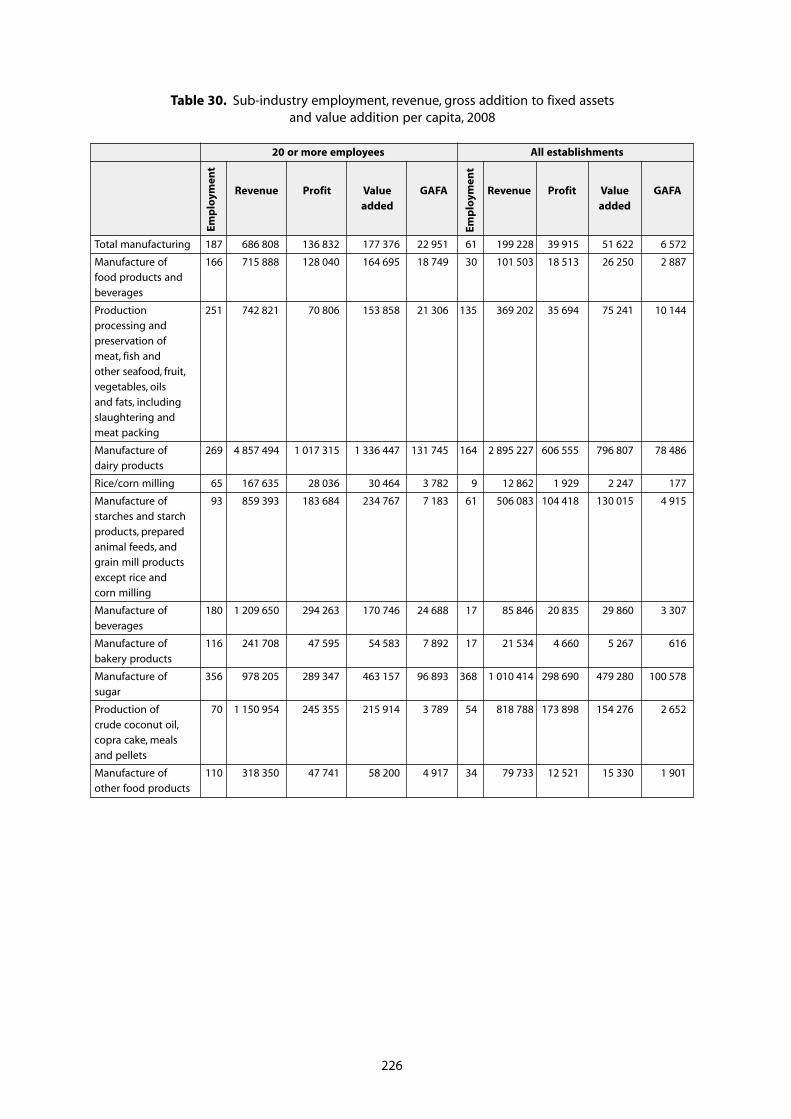
226
Table 30. Sub-industry employment, revenue, gross addition to fixed assetsand value addition per capita, 2008
20 or more employees All establishments
Revenue Profit Value GAFA Revenue Profit Value GAFAadded added
Total manufacturing 187 686 808 136 832 177 376 22 951 61 199 228 39 915 51 622 6 572
Manufacture of 166 715 888 128 040 164 695 18 749 30 101 503 18 513 26 250 2 887food products and
beverages
Production 251 742 821 70 806 153 858 21 306 135 369 202 35 694 75 241 10 144processing and
preservation of
meat, fish andother seafood, fruit,
vegetables, oils
and fats, includingslaughtering and
meat packing
Manufacture of 269 4 857 494 1 017 315 1 336 447 131 745 164 2 895 227 606 555 796 807 78 486dairy products
Rice/corn milling 65 167 635 28 036 30 464 3 782 9 12 862 1 929 2 247 177
Manufacture of 93 859 393 183 684 234 767 7 183 61 506 083 104 418 130 015 4 915starches and starch
products, prepared
animal feeds, andgrain mill products
except rice andcorn milling
Manufacture of 180 1 209 650 294 263 170 746 24 688 17 85 846 20 835 29 860 3 307
beverages
Manufacture of 116 241 708 47 595 54 583 7 892 17 21 534 4 660 5 267 616
bakery products
Manufacture of 356 978 205 289 347 463 157 96 893 368 1 010 414 298 690 479 280 100 578sugar
Production of 70 1 150 954 245 355 215 914 3 789 54 818 788 173 898 154 276 2 652
crude coconut oil,copra cake, meals
and pellets
Manufacture of 110 318 350 47 741 58 200 4 917 34 79 733 12 521 15 330 1 901other food products
Emp
loym
ent
Emp
loym
ent
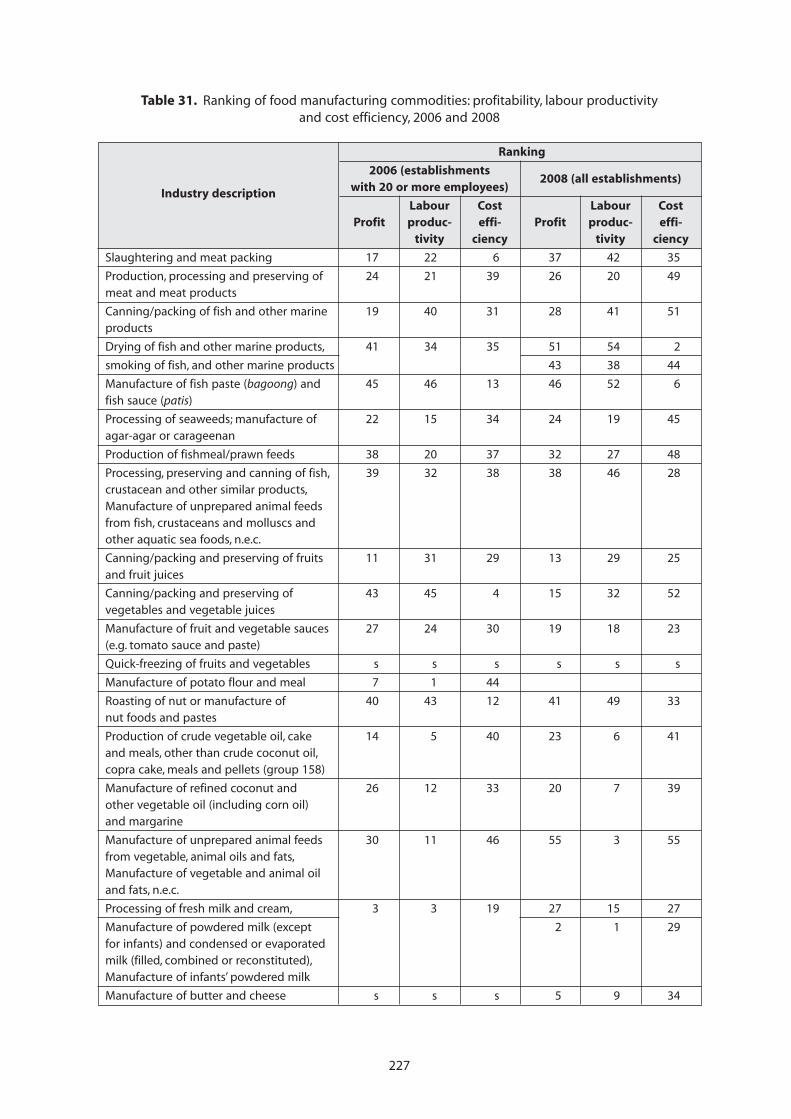
227
Table 31. Ranking of food manufacturing commodities: profitability, labour productivityand cost efficiency, 2006 and 2008
Industry description
Ranking
2006 (establishments2008 (all establishments)
with 20 or more employees)
Labour Cost Labour CostProfit produc- effi- Profit produc- effi-
tivity ciency tivity ciency
Slaughtering and meat packing 17 22 6 37 42 35
Production, processing and preserving of 24 21 39 26 20 49meat and meat products
Canning/packing of fish and other marine 19 40 31 28 41 51products
Drying of fish and other marine products, 41 34 35 51 54 2
smoking of fish, and other marine products 43 38 44
Manufacture of fish paste (bagoong) and 45 46 13 46 52 6fish sauce (patis)
Processing of seaweeds; manufacture of 22 15 34 24 19 45agar-agar or carageenan
Production of fishmeal/prawn feeds 38 20 37 32 27 48
Processing, preserving and canning of fish, 39 32 38 38 46 28crustacean and other similar products,Manufacture of unprepared animal feedsfrom fish, crustaceans and molluscs andother aquatic sea foods, n.e.c.
Canning/packing and preserving of fruits 11 31 29 13 29 25and fruit juices
Canning/packing and preserving of 43 45 4 15 32 52vegetables and vegetable juices
Manufacture of fruit and vegetable sauces 27 24 30 19 18 23(e.g. tomato sauce and paste)
Quick-freezing of fruits and vegetables s s s s s s
Manufacture of potato flour and meal 7 1 44
Roasting of nut or manufacture of 40 43 12 41 49 33nut foods and pastes
Production of crude vegetable oil, cake 14 5 40 23 6 41and meals, other than crude coconut oil,copra cake, meals and pellets (group 158)
Manufacture of refined coconut and 26 12 33 20 7 39other vegetable oil (including corn oil)and margarine
Manufacture of unprepared animal feeds 30 11 46 55 3 55from vegetable, animal oils and fats,Manufacture of vegetable and animal oiland fats, n.e.c.
Processing of fresh milk and cream, 3 3 19 27 15 27
Manufacture of powdered milk (except 2 1 29for infants) and condensed or evaporatedmilk (filled, combined or reconstituted),Manufacture of infants’ powdered milk
Manufacture of butter and cheese s s s 5 9 34
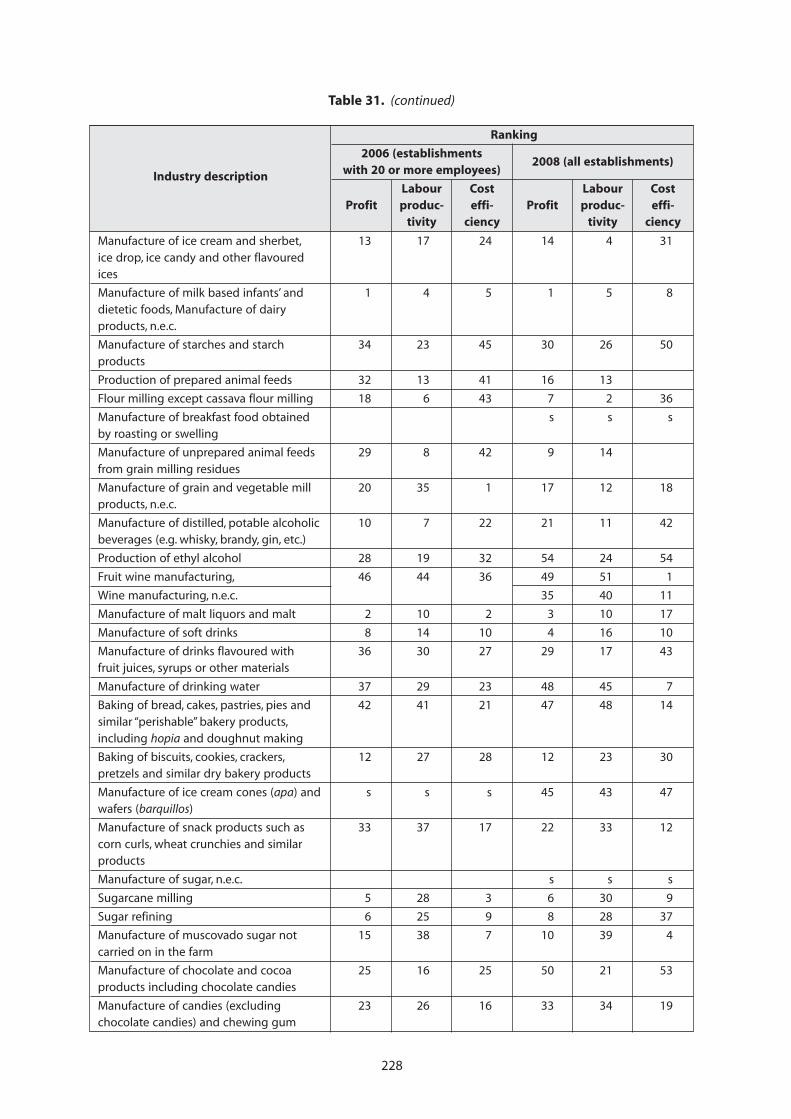
228
Manufacture of ice cream and sherbet, 13 17 24 14 4 31ice drop, ice candy and other flavouredices
Manufacture of milk based infants’ and 1 4 5 1 5 8dietetic foods, Manufacture of dairyproducts, n.e.c.
Manufacture of starches and starch 34 23 45 30 26 50products
Production of prepared animal feeds 32 13 41 16 13
Flour milling except cassava flour milling 18 6 43 7 2 36
Manufacture of breakfast food obtained s s sby roasting or swelling
Manufacture of unprepared animal feeds 29 8 42 9 14from grain milling residues
Manufacture of grain and vegetable mill 20 35 1 17 12 18products, n.e.c.
Manufacture of distilled, potable alcoholic 10 7 22 21 11 42beverages (e.g. whisky, brandy, gin, etc.)
Production of ethyl alcohol 28 19 32 54 24 54
Fruit wine manufacturing, 46 44 36 49 51 1
Wine manufacturing, n.e.c. 35 40 11
Manufacture of malt liquors and malt 2 10 2 3 10 17
Manufacture of soft drinks 8 14 10 4 16 10
Manufacture of drinks flavoured with 36 30 27 29 17 43fruit juices, syrups or other materials
Manufacture of drinking water 37 29 23 48 45 7
Baking of bread, cakes, pastries, pies and 42 41 21 47 48 14similar “perishable” bakery products,including hopia and doughnut making
Baking of biscuits, cookies, crackers, 12 27 28 12 23 30pretzels and similar dry bakery products
Manufacture of ice cream cones (apa) and s s s 45 43 47wafers (barquillos)
Manufacture of snack products such as 33 37 17 22 33 12corn curls, wheat crunchies and similarproducts
Manufacture of sugar, n.e.c. s s s
Sugarcane milling 5 28 3 6 30 9
Sugar refining 6 25 9 8 28 37
Manufacture of muscovado sugar not 15 38 7 10 39 4carried on in the farm
Manufacture of chocolate and cocoa 25 16 25 50 21 53products including chocolate candies
Manufacture of candies (excluding 23 26 16 33 34 19chocolate candies) and chewing gum
Table 31. (continued)
Industry description
Ranking
2006 (establishments2008 (all establishments)
with 20 or more employees)
Labour Cost Labour CostProfit produc- effi- Profit produc- effi-
tivity ciency tivity ciency
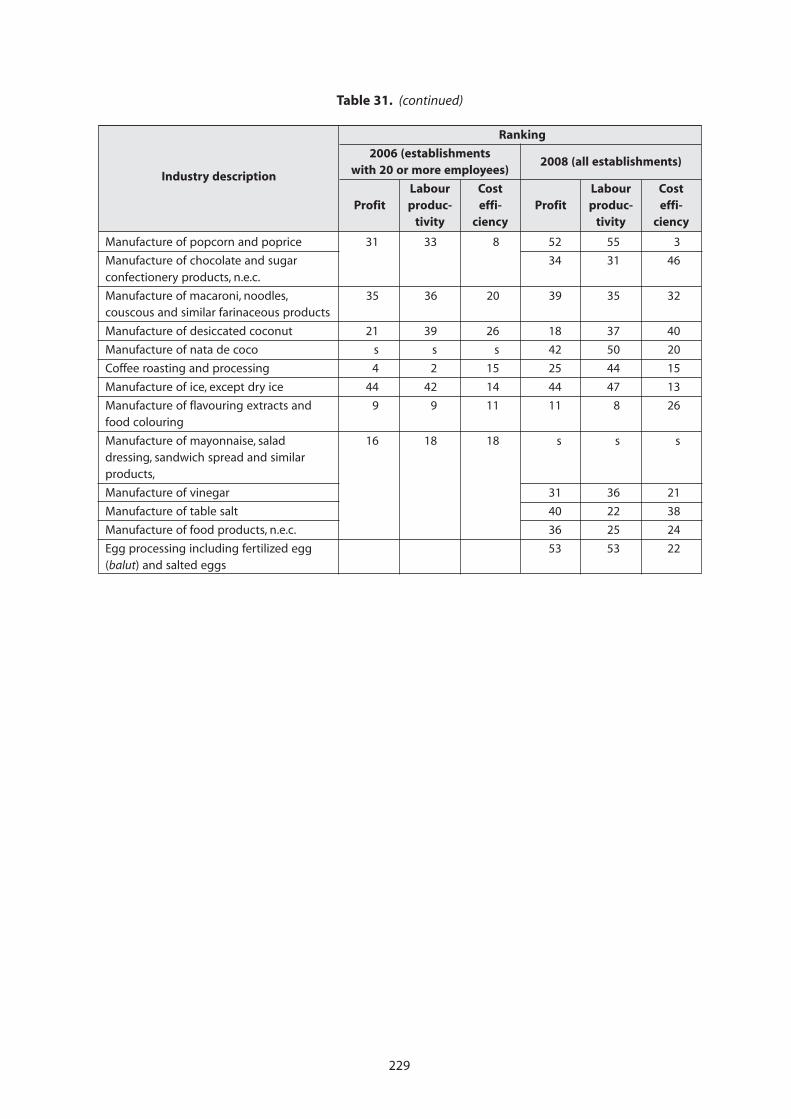
229
Manufacture of popcorn and poprice 31 33 8 52 55 3
Manufacture of chocolate and sugar 34 31 46confectionery products, n.e.c.
Manufacture of macaroni, noodles, 35 36 20 39 35 32couscous and similar farinaceous products
Manufacture of desiccated coconut 21 39 26 18 37 40
Manufacture of nata de coco s s s 42 50 20
Coffee roasting and processing 4 2 15 25 44 15
Manufacture of ice, except dry ice 44 42 14 44 47 13
Manufacture of flavouring extracts and 9 9 11 11 8 26food colouring
Manufacture of mayonnaise, salad 16 18 18 s s sdressing, sandwich spread and similarproducts,
Manufacture of vinegar 31 36 21
Manufacture of table salt 40 22 38
Manufacture of food products, n.e.c. 36 25 24
Egg processing including fertilized egg 53 53 22(balut) and salted eggs
Table 31. (continued)
Industry description
Ranking
2006 (establishments2008 (all establishments)
with 20 or more employees)
Labour Cost Labour CostProfit produc- effi- Profit produc- effi-
tivity ciency tivity ciency
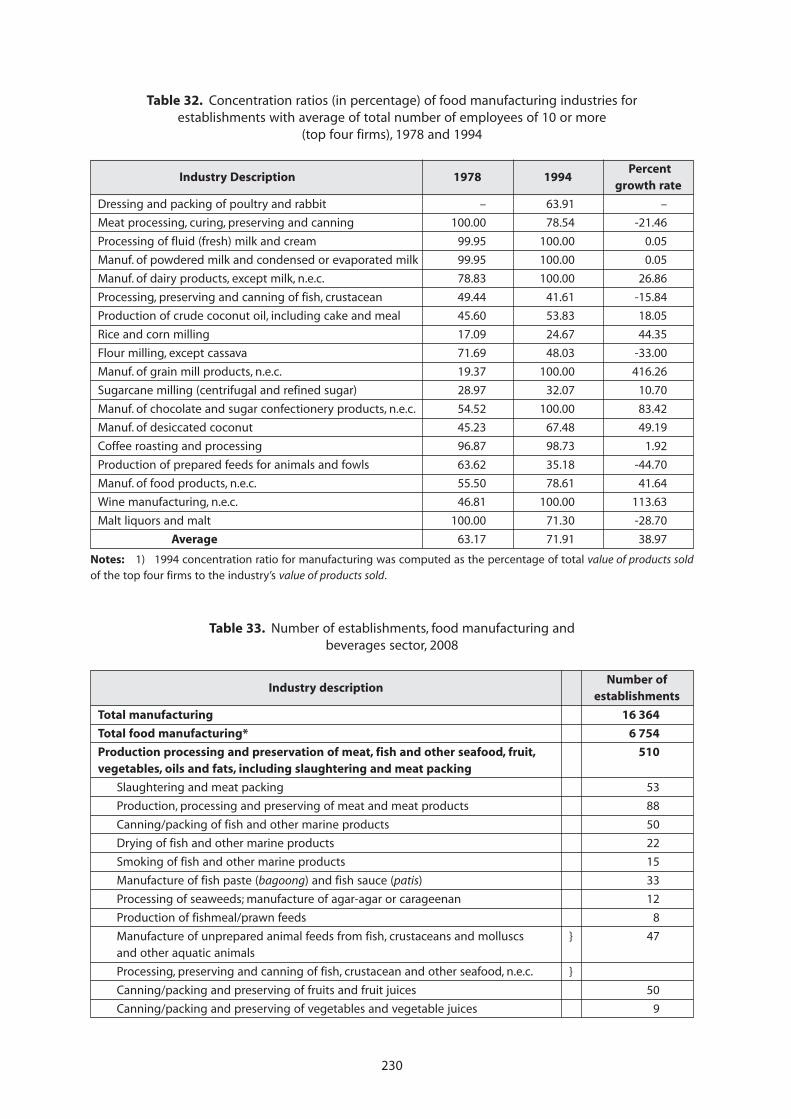
230
Table 32. Concentration ratios (in percentage) of food manufacturing industries forestablishments with average of total number of employees of 10 or more
(top four firms), 1978 and 1994
Industry Description 1978 1994 Percent
growth rate
Dressing and packing of poultry and rabbit – 63.91 –
Meat processing, curing, preserving and canning 100.00 78.54 -21.46
Processing of fluid (fresh) milk and cream 99.95 100.00 0.05
Manuf. of powdered milk and condensed or evaporated milk 99.95 100.00 0.05
Manuf. of dairy products, except milk, n.e.c. 78.83 100.00 26.86
Processing, preserving and canning of fish, crustacean 49.44 41.61 -15.84
Production of crude coconut oil, including cake and meal 45.60 53.83 18.05
Rice and corn milling 17.09 24.67 44.35
Flour milling, except cassava 71.69 48.03 -33.00
Manuf. of grain mill products, n.e.c. 19.37 100.00 416.26
Sugarcane milling (centrifugal and refined sugar) 28.97 32.07 10.70
Manuf. of chocolate and sugar confectionery products, n.e.c. 54.52 100.00 83.42
Manuf. of desiccated coconut 45.23 67.48 49.19
Coffee roasting and processing 96.87 98.73 1.92
Production of prepared feeds for animals and fowls 63.62 35.18 -44.70
Manuf. of food products, n.e.c. 55.50 78.61 41.64
Wine manufacturing, n.e.c. 46.81 100.00 113.63
Malt liquors and malt 100.00 71.30 -28.70
Average 63.17 71.91 38.97
Notes: 1) 1994 concentration ratio for manufacturing was computed as the percentage of total value of products soldof the top four firms to the industry’s value of products sold.
Table 33. Number of establishments, food manufacturing andbeverages sector, 2008
Industry descriptionNumber of
establishments
Total manufacturing 16 364
Total food manufacturing* 6 754
Production processing and preservation of meat, fish and other seafood, fruit, 510vegetables, oils and fats, including slaughtering and meat packing
Slaughtering and meat packing 53
Production, processing and preserving of meat and meat products 88
Canning/packing of fish and other marine products 50
Drying of fish and other marine products 22
Smoking of fish and other marine products 15
Manufacture of fish paste (bagoong) and fish sauce (patis) 33
Processing of seaweeds; manufacture of agar-agar or carageenan 12
Production of fishmeal/prawn feeds 8
Manufacture of unprepared animal feeds from fish, crustaceans and molluscs } 47and other aquatic animals
Processing, preserving and canning of fish, crustacean and other seafood, n.e.c. }
Canning/packing and preserving of fruits and fruit juices 50
Canning/packing and preserving of vegetables and vegetable juices 9
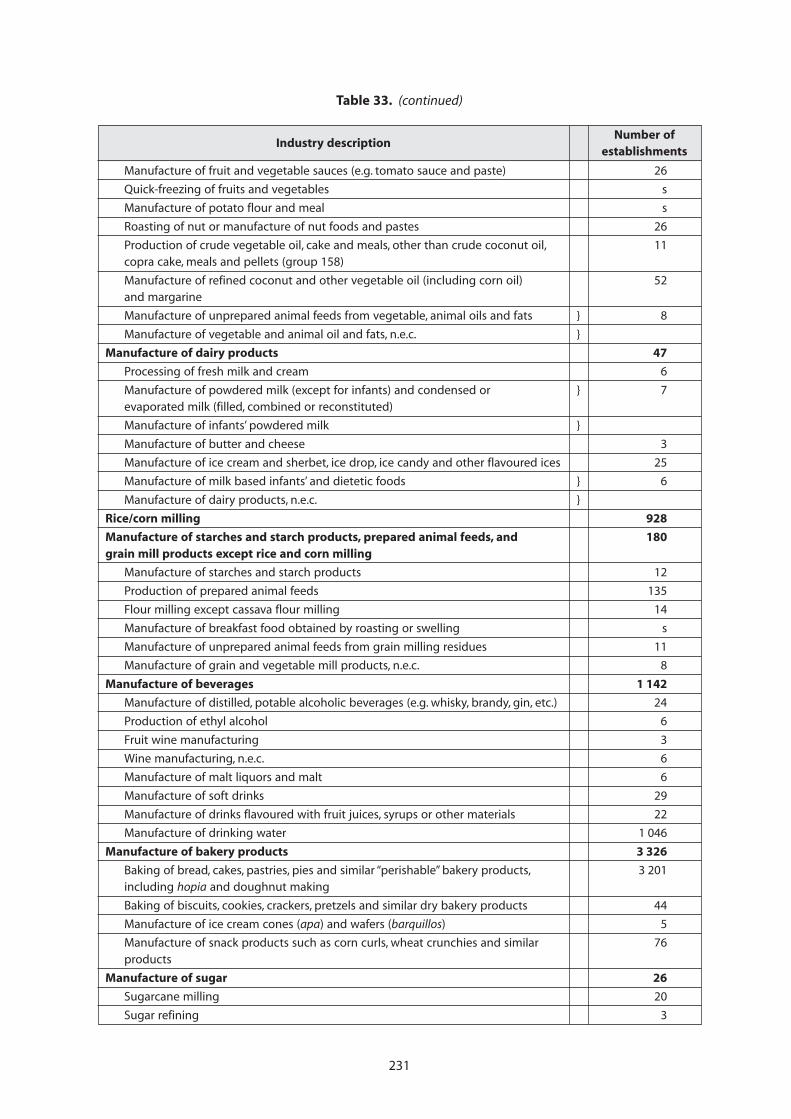
231
Manufacture of fruit and vegetable sauces (e.g. tomato sauce and paste) 26
Quick-freezing of fruits and vegetables s
Manufacture of potato flour and meal s
Roasting of nut or manufacture of nut foods and pastes 26
Production of crude vegetable oil, cake and meals, other than crude coconut oil, 11copra cake, meals and pellets (group 158)
Manufacture of refined coconut and other vegetable oil (including corn oil) 52and margarine
Manufacture of unprepared animal feeds from vegetable, animal oils and fats } 8
Manufacture of vegetable and animal oil and fats, n.e.c. }
Manufacture of dairy products 47
Processing of fresh milk and cream 6
Manufacture of powdered milk (except for infants) and condensed or } 7evaporated milk (filled, combined or reconstituted)
Manufacture of infants’ powdered milk }
Manufacture of butter and cheese 3
Manufacture of ice cream and sherbet, ice drop, ice candy and other flavoured ices 25
Manufacture of milk based infants’ and dietetic foods } 6
Manufacture of dairy products, n.e.c. }
Rice/corn milling 928
Manufacture of starches and starch products, prepared animal feeds, and 180grain mill products except rice and corn milling
Manufacture of starches and starch products 12
Production of prepared animal feeds 135
Flour milling except cassava flour milling 14
Manufacture of breakfast food obtained by roasting or swelling s
Manufacture of unprepared animal feeds from grain milling residues 11
Manufacture of grain and vegetable mill products, n.e.c. 8
Manufacture of beverages 1 142
Manufacture of distilled, potable alcoholic beverages (e.g. whisky, brandy, gin, etc.) 24
Production of ethyl alcohol 6
Fruit wine manufacturing 3
Wine manufacturing, n.e.c. 6
Manufacture of malt liquors and malt 6
Manufacture of soft drinks 29
Manufacture of drinks flavoured with fruit juices, syrups or other materials 22
Manufacture of drinking water 1 046
Manufacture of bakery products 3 326
Baking of bread, cakes, pastries, pies and similar “perishable” bakery products, 3 201including hopia and doughnut making
Baking of biscuits, cookies, crackers, pretzels and similar dry bakery products 44
Manufacture of ice cream cones (apa) and wafers (barquillos) 5
Manufacture of snack products such as corn curls, wheat crunchies and similar 76products
Manufacture of sugar 26
Sugarcane milling 20
Sugar refining 3
Table 33. (continued)
Industry descriptionNumber of
establishments
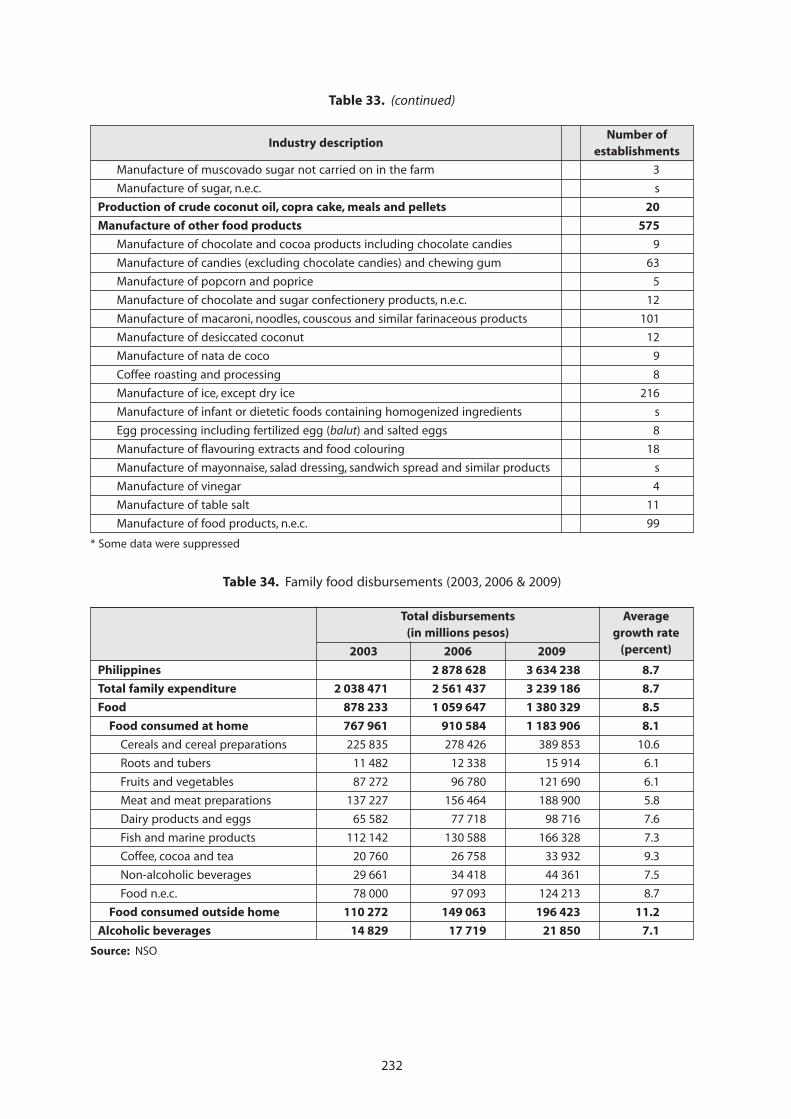
232
Manufacture of muscovado sugar not carried on in the farm 3
Manufacture of sugar, n.e.c. s
Production of crude coconut oil, copra cake, meals and pellets 20
Manufacture of other food products 575
Manufacture of chocolate and cocoa products including chocolate candies 9
Manufacture of candies (excluding chocolate candies) and chewing gum 63
Manufacture of popcorn and poprice 5
Manufacture of chocolate and sugar confectionery products, n.e.c. 12
Manufacture of macaroni, noodles, couscous and similar farinaceous products 101
Manufacture of desiccated coconut 12
Manufacture of nata de coco 9
Coffee roasting and processing 8
Manufacture of ice, except dry ice 216
Manufacture of infant or dietetic foods containing homogenized ingredients s
Egg processing including fertilized egg (balut) and salted eggs 8
Manufacture of flavouring extracts and food colouring 18
Manufacture of mayonnaise, salad dressing, sandwich spread and similar products s
Manufacture of vinegar 4
Manufacture of table salt 11
Manufacture of food products, n.e.c. 99
* Some data were suppressed
Table 33. (continued)
Industry descriptionNumber of
establishments
Table 34. Family food disbursements (2003, 2006 & 2009)
Total disbursements(in millions pesos)
2003 2006 2009
Philippines 2 878 628 3 634 238 8.7
Total family expenditure 2 038 471 2 561 437 3 239 186 8.7
Food 878 233 1 059 647 1 380 329 8.5
Food consumed at home 767 961 910 584 1 183 906 8.1
Cereals and cereal preparations 225 835 278 426 389 853 10.6
Roots and tubers 11 482 12 338 15 914 6.1
Fruits and vegetables 87 272 96 780 121 690 6.1
Meat and meat preparations 137 227 156 464 188 900 5.8
Dairy products and eggs 65 582 77 718 98 716 7.6
Fish and marine products 112 142 130 588 166 328 7.3
Coffee, cocoa and tea 20 760 26 758 33 932 9.3
Non-alcoholic beverages 29 661 34 418 44 361 7.5
Food n.e.c. 78 000 97 093 124 213 8.7
Food consumed outside home 110 272 149 063 196 423 11.2
Alcoholic beverages 14 829 17 719 21 850 7.1
Source: NSO
Averagegrowth rate
(percent)
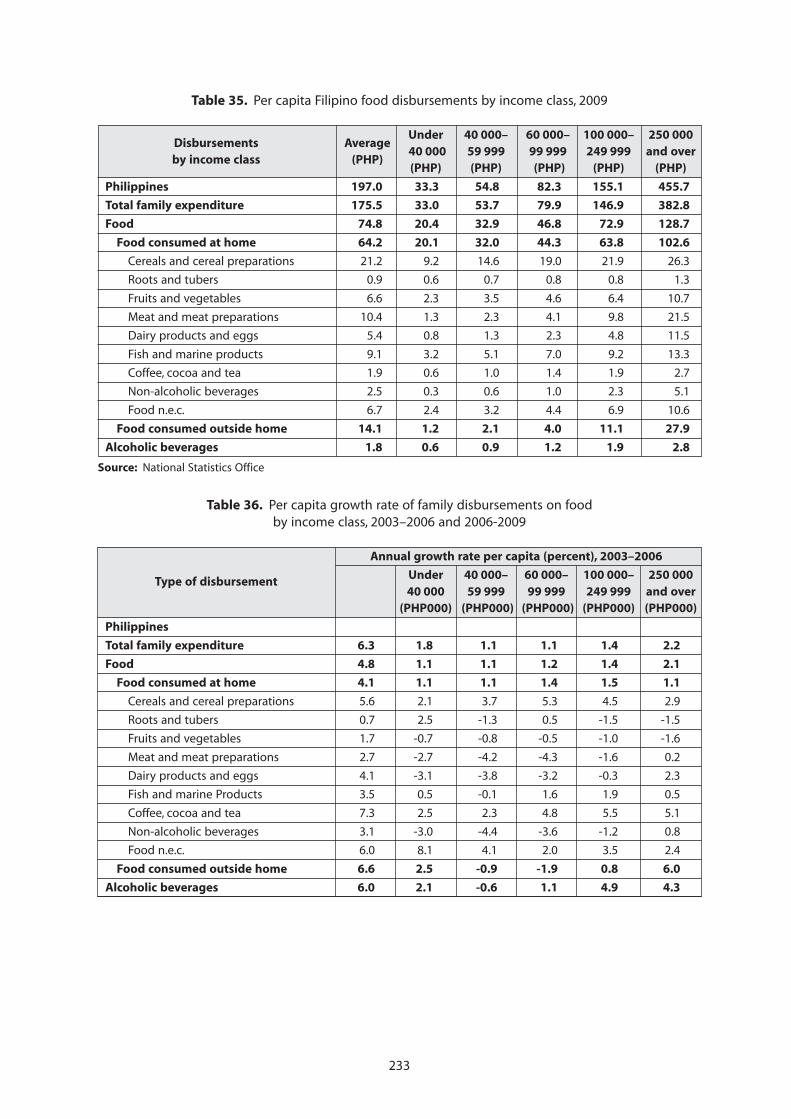
233
Table 35. Per capita Filipino food disbursements by income class, 2009
Disbursements AverageUnder 40 000– 60 000– 100 000– 250 000
by income class (PHP) 40 000 59 999 99 999 249 999 and over(PHP) (PHP) (PHP) (PHP) (PHP)
Philippines 197.0 33.3 54.8 82.3 155.1 455.7
Total family expenditure 175.5 33.0 53.7 79.9 146.9 382.8
Food 74.8 20.4 32.9 46.8 72.9 128.7
Food consumed at home 64.2 20.1 32.0 44.3 63.8 102.6
Cereals and cereal preparations 21.2 9.2 14.6 19.0 21.9 26.3
Roots and tubers 0.9 0.6 0.7 0.8 0.8 1.3
Fruits and vegetables 6.6 2.3 3.5 4.6 6.4 10.7
Meat and meat preparations 10.4 1.3 2.3 4.1 9.8 21.5
Dairy products and eggs 5.4 0.8 1.3 2.3 4.8 11.5
Fish and marine products 9.1 3.2 5.1 7.0 9.2 13.3
Coffee, cocoa and tea 1.9 0.6 1.0 1.4 1.9 2.7
Non-alcoholic beverages 2.5 0.3 0.6 1.0 2.3 5.1
Food n.e.c. 6.7 2.4 3.2 4.4 6.9 10.6
Food consumed outside home 14.1 1.2 2.1 4.0 11.1 27.9
Alcoholic beverages 1.8 0.6 0.9 1.2 1.9 2.8
Source: National Statistics Office
Table 36. Per capita growth rate of family disbursements on foodby income class, 2003–2006 and 2006-2009
Type of disbursement
Annual growth rate per capita (percent), 2003–2006
Under 40 000– 60 000– 100 000– 250 00040 000 59 999 99 999 249 999 and over
(PHP000) (PHP000) (PHP000) (PHP000) (PHP000)
Philippines
Total family expenditure 6.3 1.8 1.1 1.1 1.4 2.2
Food 4.8 1.1 1.1 1.2 1.4 2.1
Food consumed at home 4.1 1.1 1.1 1.4 1.5 1.1
Cereals and cereal preparations 5.6 2.1 3.7 5.3 4.5 2.9
Roots and tubers 0.7 2.5 -1.3 0.5 -1.5 -1.5
Fruits and vegetables 1.7 -0.7 -0.8 -0.5 -1.0 -1.6
Meat and meat preparations 2.7 -2.7 -4.2 -4.3 -1.6 0.2
Dairy products and eggs 4.1 -3.1 -3.8 -3.2 -0.3 2.3
Fish and marine Products 3.5 0.5 -0.1 1.6 1.9 0.5
Coffee, cocoa and tea 7.3 2.5 2.3 4.8 5.5 5.1
Non-alcoholic beverages 3.1 -3.0 -4.4 -3.6 -1.2 0.8
Food n.e.c. 6.0 8.1 4.1 2.0 3.5 2.4
Food consumed outside home 6.6 2.5 -0.9 -1.9 0.8 6.0
Alcoholic beverages 6.0 2.1 -0.6 1.1 4.9 4.3
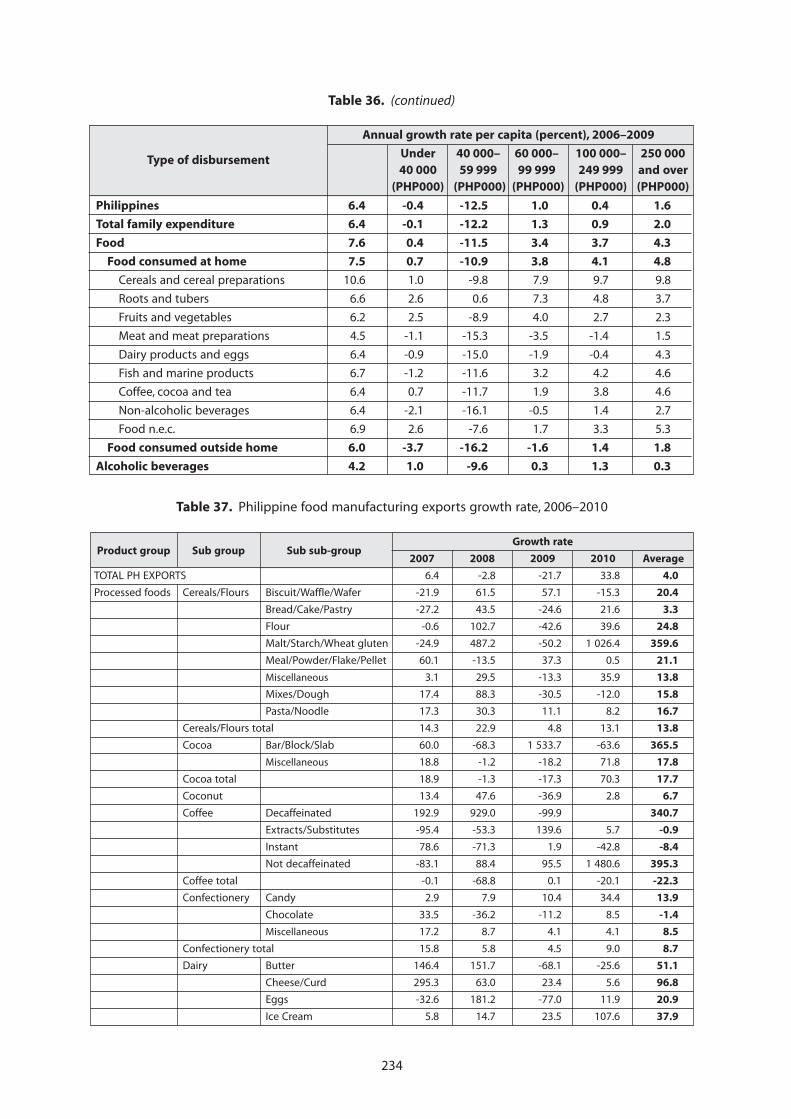
234
Table 36. (continued)
Type of disbursement
Annual growth rate per capita (percent), 2006–2009
Under 40 000– 60 000– 100 000– 250 00040 000 59 999 99 999 249 999 and over
(PHP000) (PHP000) (PHP000) (PHP000) (PHP000)
Philippines 6.4 -0.4 -12.5 1.0 0.4 1.6
Total family expenditure 6.4 -0.1 -12.2 1.3 0.9 2.0
Food 7.6 0.4 -11.5 3.4 3.7 4.3
Food consumed at home 7.5 0.7 -10.9 3.8 4.1 4.8
Cereals and cereal preparations 10.6 1.0 -9.8 7.9 9.7 9.8
Roots and tubers 6.6 2.6 0.6 7.3 4.8 3.7
Fruits and vegetables 6.2 2.5 -8.9 4.0 2.7 2.3
Meat and meat preparations 4.5 -1.1 -15.3 -3.5 -1.4 1.5
Dairy products and eggs 6.4 -0.9 -15.0 -1.9 -0.4 4.3
Fish and marine products 6.7 -1.2 -11.6 3.2 4.2 4.6
Coffee, cocoa and tea 6.4 0.7 -11.7 1.9 3.8 4.6
Non-alcoholic beverages 6.4 -2.1 -16.1 -0.5 1.4 2.7
Food n.e.c. 6.9 2.6 -7.6 1.7 3.3 5.3
Food consumed outside home 6.0 -3.7 -16.2 -1.6 1.4 1.8
Alcoholic beverages 4.2 1.0 -9.6 0.3 1.3 0.3
Table 37. Philippine food manufacturing exports growth rate, 2006–2010
Growth rateProduct group Sub group Sub sub-group
2007 2008 2009 2010 Average
TOTAL PH EXPORTS 6.4 -2.8 -21.7 33.8 4.0
Processed foods Cereals/Flours Biscuit/Waffle/Wafer -21.9 61.5 57.1 -15.3 20.4
Bread/Cake/Pastry -27.2 43.5 -24.6 21.6 3.3
Flour -0.6 102.7 -42.6 39.6 24.8
Malt/Starch/Wheat gluten -24.9 487.2 -50.2 1 026.4 359.6
Meal/Powder/Flake/Pellet 60.1 -13.5 37.3 0.5 21.1
Miscellaneous 3.1 29.5 -13.3 35.9 13.8
Mixes/Dough 17.4 88.3 -30.5 -12.0 15.8
Pasta/Noodle 17.3 30.3 11.1 8.2 16.7
Cereals/Flours total 14.3 22.9 4.8 13.1 13.8
Cocoa Bar/Block/Slab 60.0 -68.3 1 533.7 -63.6 365.5
Miscellaneous 18.8 -1.2 -18.2 71.8 17.8
Cocoa total 18.9 -1.3 -17.3 70.3 17.7
Coconut 13.4 47.6 -36.9 2.8 6.7
Coffee Decaffeinated 192.9 929.0 -99.9 340.7
Extracts/Substitutes -95.4 -53.3 139.6 5.7 -0.9
Instant 78.6 -71.3 1.9 -42.8 -8.4
Not decaffeinated -83.1 88.4 95.5 1 480.6 395.3
Coffee total -0.1 -68.8 0.1 -20.1 -22.3
Confectionery Candy 2.9 7.9 10.4 34.4 13.9
Chocolate 33.5 -36.2 -11.2 8.5 -1.4
Miscellaneous 17.2 8.7 4.1 4.1 8.5
Confectionery total 15.8 5.8 4.5 9.0 8.7
Dairy Butter 146.4 151.7 -68.1 -25.6 51.1
Cheese/Curd 295.3 63.0 23.4 5.6 96.8
Eggs -32.6 181.2 -77.0 11.9 20.9
Ice Cream 5.8 14.7 23.5 107.6 37.9
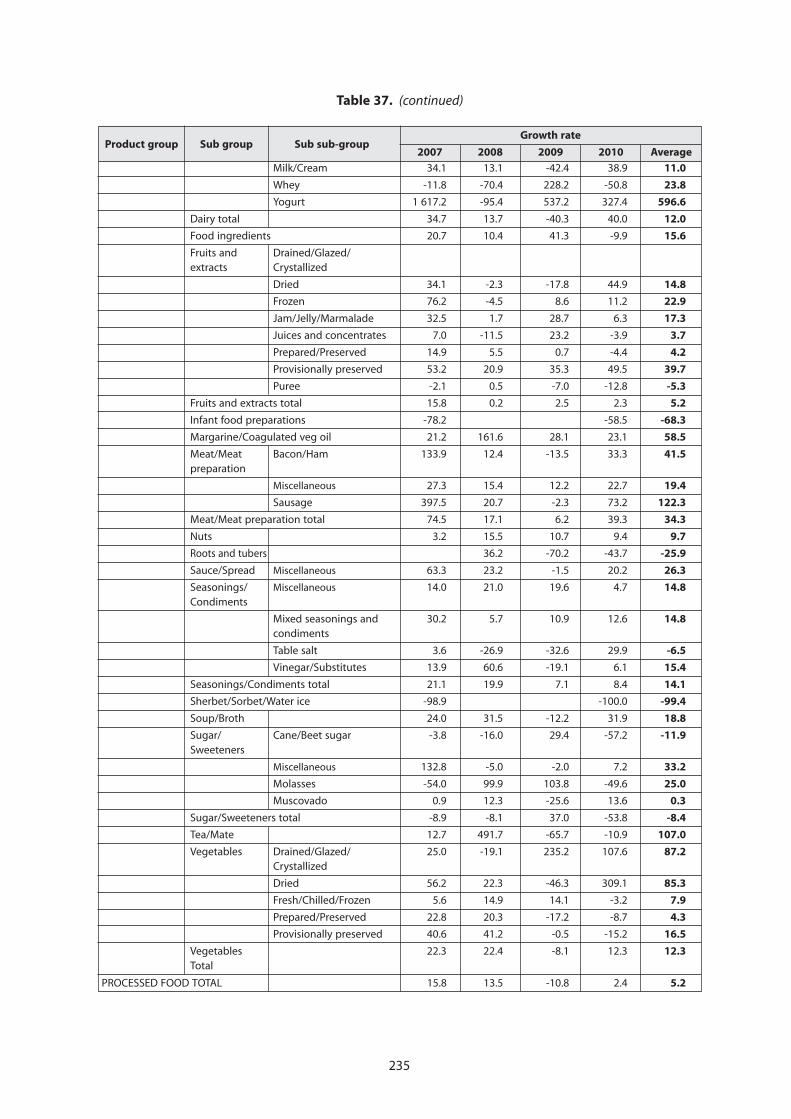
235
Table 37. (continued)
Growth rateProduct group Sub group Sub sub-group
2007 2008 2009 2010 Average
Milk/Cream 34.1 13.1 -42.4 38.9 11.0
Whey -11.8 -70.4 228.2 -50.8 23.8
Yogurt 1 617.2 -95.4 537.2 327.4 596.6
Dairy total 34.7 13.7 -40.3 40.0 12.0
Food ingredients 20.7 10.4 41.3 -9.9 15.6
Fruits and Drained/Glazed/extracts Crystallized
Dried 34.1 -2.3 -17.8 44.9 14.8
Frozen 76.2 -4.5 8.6 11.2 22.9
Jam/Jelly/Marmalade 32.5 1.7 28.7 6.3 17.3
Juices and concentrates 7.0 -11.5 23.2 -3.9 3.7
Prepared/Preserved 14.9 5.5 0.7 -4.4 4.2
Provisionally preserved 53.2 20.9 35.3 49.5 39.7
Puree -2.1 0.5 -7.0 -12.8 -5.3
Fruits and extracts total 15.8 0.2 2.5 2.3 5.2
Infant food preparations -78.2 -58.5 -68.3
Margarine/Coagulated veg oil 21.2 161.6 28.1 23.1 58.5
Meat/Meat Bacon/Ham 133.9 12.4 -13.5 33.3 41.5preparation
Miscellaneous 27.3 15.4 12.2 22.7 19.4
Sausage 397.5 20.7 -2.3 73.2 122.3
Meat/Meat preparation total 74.5 17.1 6.2 39.3 34.3
Nuts 3.2 15.5 10.7 9.4 9.7
Roots and tubers 36.2 -70.2 -43.7 -25.9
Sauce/Spread Miscellaneous 63.3 23.2 -1.5 20.2 26.3
Seasonings/ Miscellaneous 14.0 21.0 19.6 4.7 14.8Condiments
Mixed seasonings and 30.2 5.7 10.9 12.6 14.8condiments
Table salt 3.6 -26.9 -32.6 29.9 -6.5
Vinegar/Substitutes 13.9 60.6 -19.1 6.1 15.4
Seasonings/Condiments total 21.1 19.9 7.1 8.4 14.1
Sherbet/Sorbet/Water ice -98.9 -100.0 -99.4
Soup/Broth 24.0 31.5 -12.2 31.9 18.8
Sugar/ Cane/Beet sugar -3.8 -16.0 29.4 -57.2 -11.9Sweeteners
Miscellaneous 132.8 -5.0 -2.0 7.2 33.2
Molasses -54.0 99.9 103.8 -49.6 25.0
Muscovado 0.9 12.3 -25.6 13.6 0.3
Sugar/Sweeteners total -8.9 -8.1 37.0 -53.8 -8.4
Tea/Mate 12.7 491.7 -65.7 -10.9 107.0
Vegetables Drained/Glazed/ 25.0 -19.1 235.2 107.6 87.2Crystallized
Dried 56.2 22.3 -46.3 309.1 85.3
Fresh/Chilled/Frozen 5.6 14.9 14.1 -3.2 7.9
Prepared/Preserved 22.8 20.3 -17.2 -8.7 4.3
Provisionally preserved 40.6 41.2 -0.5 -15.2 16.5
Vegetables 22.3 22.4 -8.1 12.3 12.3Total
PROCESSED FOOD TOTAL 15.8 13.5 -10.8 2.4 5.2
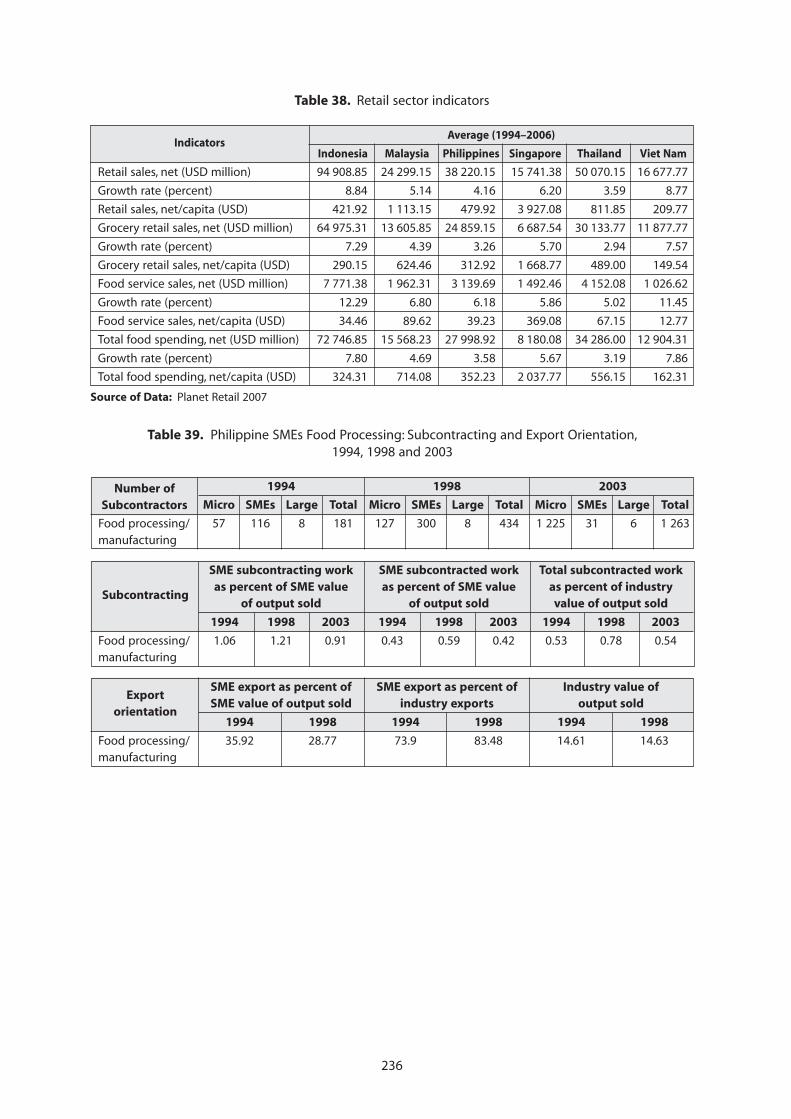
236
ExportSME export as percent of SME export as percent of Industry value of
orientationSME value of output sold industry exports output sold
Table 38. Retail sector indicators
IndicatorsAverage (1994–2006)
Indonesia Malaysia Philippines Singapore Thailand Viet Nam
Retail sales, net (USD million) 94 908.85 24 299.15 38 220.15 15 741.38 50 070.15 16 677.77
Growth rate (percent) 8.84 5.14 4.16 6.20 3.59 8.77
Retail sales, net/capita (USD) 421.92 1 113.15 479.92 3 927.08 811.85 209.77
Grocery retail sales, net (USD million) 64 975.31 13 605.85 24 859.15 6 687.54 30 133.77 11 877.77
Growth rate (percent) 7.29 4.39 3.26 5.70 2.94 7.57
Grocery retail sales, net/capita (USD) 290.15 624.46 312.92 1 668.77 489.00 149.54
Food service sales, net (USD million) 7 771.38 1 962.31 3 139.69 1 492.46 4 152.08 1 026.62
Growth rate (percent) 12.29 6.80 6.18 5.86 5.02 11.45
Food service sales, net/capita (USD) 34.46 89.62 39.23 369.08 67.15 12.77
Total food spending, net (USD million) 72 746.85 15 568.23 27 998.92 8 180.08 34 286.00 12 904.31
Growth rate (percent) 7.80 4.69 3.58 5.67 3.19 7.86
Total food spending, net/capita (USD) 324.31 714.08 352.23 2 037.77 556.15 162.31
Source of Data: Planet Retail 2007
Table 39. Philippine SMEs Food Processing: Subcontracting and Export Orientation,1994, 1998 and 2003
1994 1998 2003
Micro SMEs Large Total Micro SMEs Large Total Micro SMEs Large Total
Food processing/ 57 116 8 181 127 300 8 434 1 225 31 6 1 263manufacturing
SME subcontracting work SME subcontracted work Total subcontracted work
Subcontractingas percent of SME value as percent of SME value as percent of industry
of output sold of output sold value of output sold
1994 1998 2003 1994 1998 2003 1994 1998 2003
Food processing/ 1.06 1.21 0.91 0.43 0.59 0.42 0.53 0.78 0.54manufacturing
Number ofSubcontractors
ExportSME export as percent of SME export as percent of Industry value of
orientationSME value of output sold industry exports output sold
1994 1998 1994 1998 1994 1998
Food processing/ 35.92 28.77 73.9 83.48 14.61 14.63manufacturing
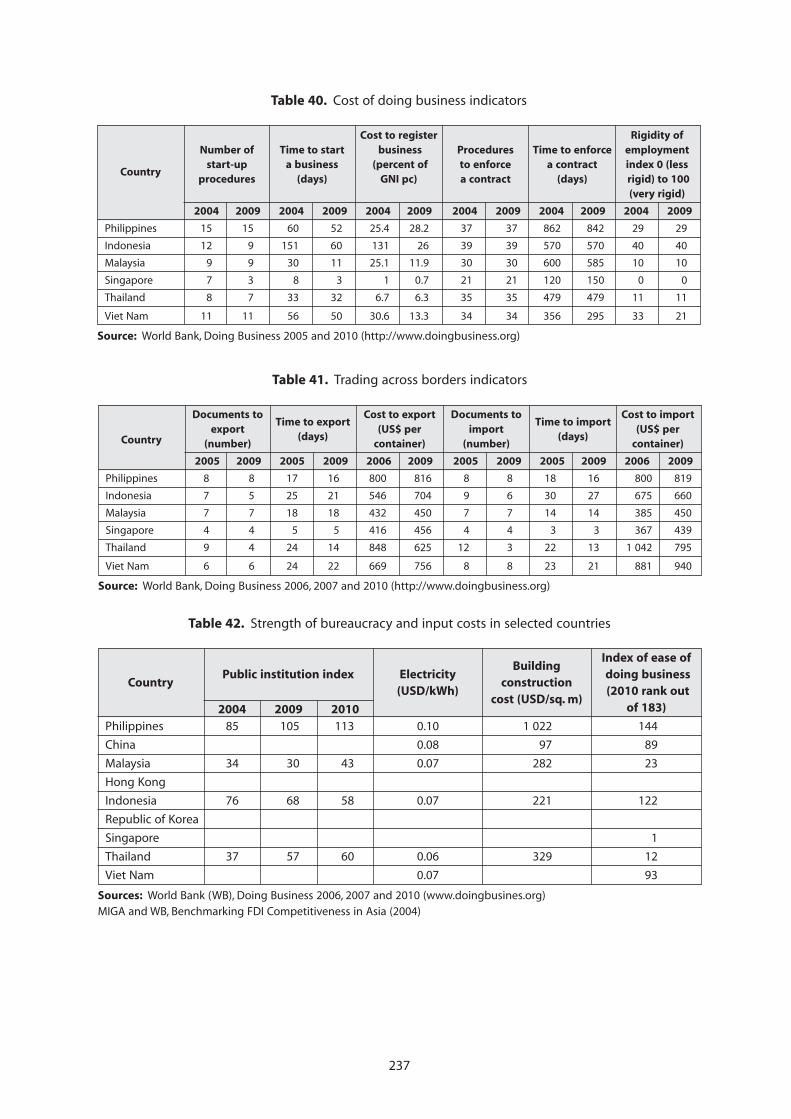
237
Table 40. Cost of doing business indicators
Cost to register Rigidity ofNumber of Time to start business Procedures Time to enforce employment
Countrystart-up a business (percent of to enforce a contract index 0 (less
procedures (days) GNI pc) a contract (days) rigid) to 100(very rigid)
2004 2009 2004 2009 2004 2009 2004 2009 2004 2009 2004 2009
Philippines 15 15 60 52 25.4 28.2 37 37 862 842 29 29
Indonesia 12 9 151 60 131 26 39 39 570 570 40 40
Malaysia 9 9 30 11 25.1 11.9 30 30 600 585 10 10
Singapore 7 3 8 3 1 0.7 21 21 120 150 0 0
Thailand 8 7 33 32 6.7 6.3 35 35 479 479 11 11
Viet Nam 11 11 56 50 30.6 13.3 34 34 356 295 33 21
Source: World Bank, Doing Business 2005 and 2010 (http://www.doingbusiness.org)
Table 41. Trading across borders indicators
Documents toTime to export
Cost to export Documents toTime to import
Cost to importexport
(days)(US$ per import
(days)(US$ per
Country (number) container) (number) container)
2005 2009 2005 2009 2006 2009 2005 2009 2005 2009 2006 2009
Philippines 8 8 17 16 800 816 8 8 18 16 800 819
Indonesia 7 5 25 21 546 704 9 6 30 27 675 660
Malaysia 7 7 18 18 432 450 7 7 14 14 385 450
Singapore 4 4 5 5 416 456 4 4 3 3 367 439
Thailand 9 4 24 14 848 625 12 3 22 13 1 042 795
Viet Nam 6 6 24 22 669 756 8 8 23 21 881 940
Source: World Bank, Doing Business 2006, 2007 and 2010 (http://www.doingbusiness.org)
Table 42. Strength of bureaucracy and input costs in selected countries
BuildingIndex of ease of
CountryPublic institution index Electricity
construction doing business
(USD/kWh)cost (USD/sq. m)
(2010 rank outof 183)
Philippines 85 105 113 0.10 1 022 144
China 0.08 97 89
Malaysia 34 30 43 0.07 282 23
Hong Kong
Indonesia 76 68 58 0.07 221 122
Republic of Korea
Singapore 1
Thailand 37 57 60 0.06 329 12
Viet Nam 0.07 93
Sources: World Bank (WB), Doing Business 2006, 2007 and 2010 (www.doingbusines.org)MIGA and WB, Benchmarking FDI Competitiveness in Asia (2004)
2004 2009 2010
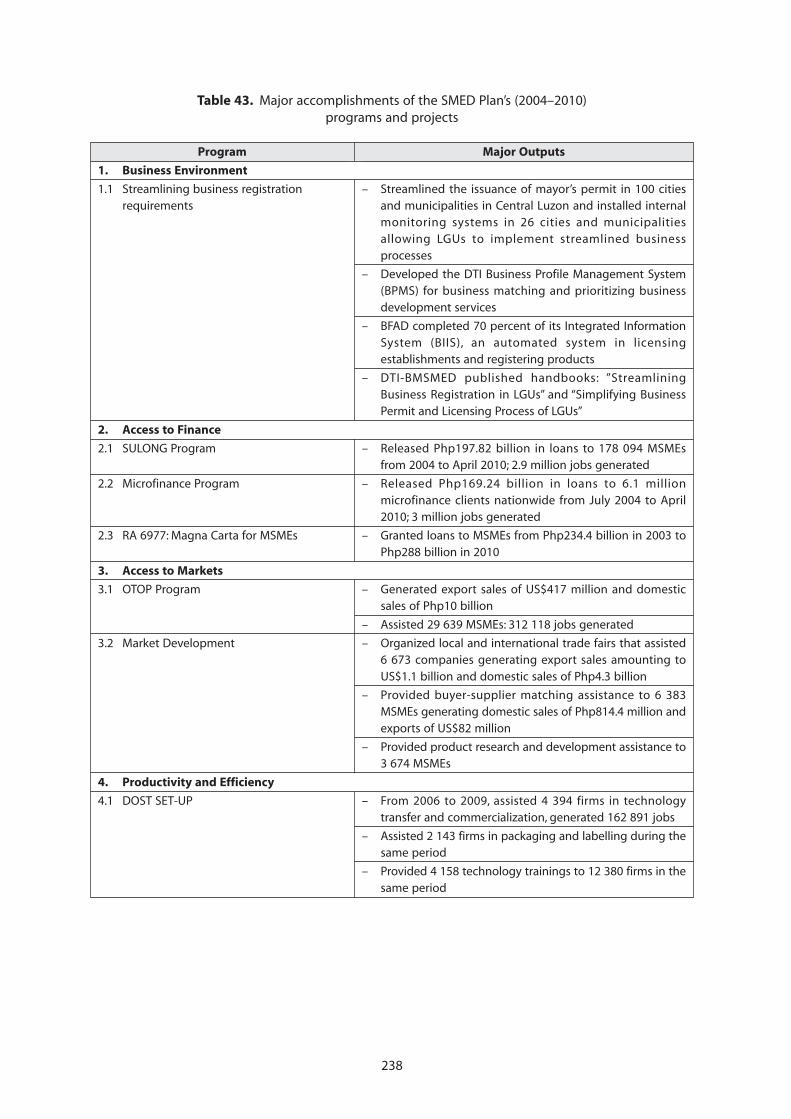
238
Table 43. Major accomplishments of the SMED Plan’s (2004–2010)programs and projects
Program Major Outputs
1. Business Environment
1.1 Streamlining business registration – Streamlined the issuance of mayor’s permit in 100 citiesrequirements and municipalities in Central Luzon and installed internal
monitoring systems in 26 cities and municipalitiesallowing LGUs to implement streamlined businessprocesses
– Developed the DTI Business Profile Management System(BPMS) for business matching and prioritizing businessdevelopment services
– BFAD completed 70 percent of its Integrated InformationSystem (BIIS), an automated system in licensingestablishments and registering products
– DTI-BMSMED published handbooks: ”StreamliningBusiness Registration in LGUs” and “Simplifying BusinessPermit and Licensing Process of LGUs”
2. Access to Finance
2.1 SULONG Program – Released Php197.82 billion in loans to 178 094 MSMEsfrom 2004 to April 2010; 2.9 million jobs generated
2.2 Microfinance Program – Released Php169.24 billion in loans to 6.1 millionmicrofinance clients nationwide from July 2004 to April2010; 3 million jobs generated
2.3 RA 6977: Magna Carta for MSMEs – Granted loans to MSMEs from Php234.4 billion in 2003 toPhp288 billion in 2010
3. Access to Markets
3.1 OTOP Program – Generated export sales of US$417 million and domesticsales of Php10 billion
– Assisted 29 639 MSMEs: 312 118 jobs generated
3.2 Market Development – Organized local and international trade fairs that assisted6 673 companies generating export sales amounting toUS$1.1 billion and domestic sales of Php4.3 billion
– Provided buyer-supplier matching assistance to 6 383MSMEs generating domestic sales of Php814.4 million andexports of US$82 million
– Provided product research and development assistance to3 674 MSMEs
4. Productivity and Efficiency
4.1 DOST SET-UP – From 2006 to 2009, assisted 4 394 firms in technologytransfer and commercialization, generated 162 891 jobs
– Assisted 2 143 firms in packaging and labelling during thesame period
– Provided 4 158 technology trainings to 12 380 firms in thesame period
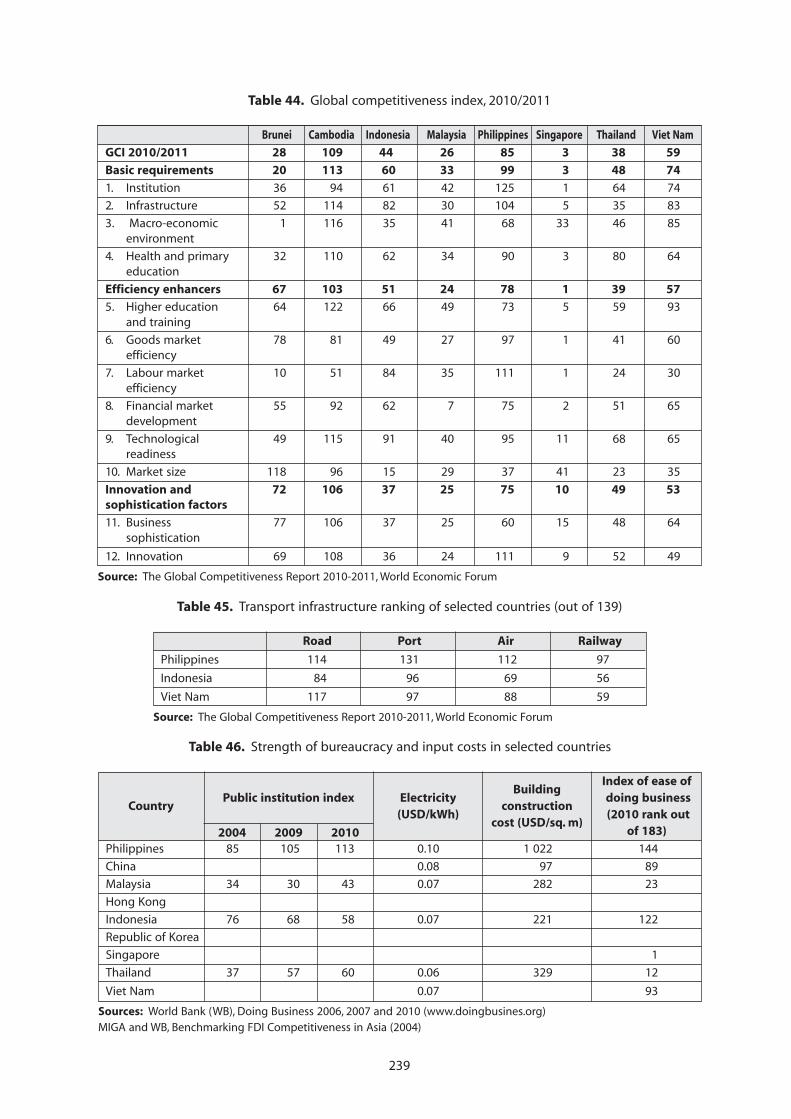
239
Table 44. Global competitiveness index, 2010/2011
Brunei Cambodia Indonesia Malaysia Philippines Singapore Thailand Viet Nam
GCI 2010/2011 28 109 44 26 85 3 38 59
Basic requirements 20 113 60 33 99 3 48 74
1. Institution 36 94 61 42 125 1 64 74
2. Infrastructure 52 114 82 30 104 5 35 83
3. Macro-economic 1 116 35 41 68 33 46 85environment
4. Health and primary 32 110 62 34 90 3 80 64education
Efficiency enhancers 67 103 51 24 78 1 39 57
5. Higher education 64 122 66 49 73 5 59 93and training
6. Goods market 78 81 49 27 97 1 41 60efficiency
7. Labour market 10 51 84 35 111 1 24 30efficiency
8. Financial market 55 92 62 7 75 2 51 65development
9. Technological 49 115 91 40 95 11 68 65readiness
10. Market size 118 96 15 29 37 41 23 35
Innovation and 72 106 37 25 75 10 49 53sophistication factors
11. Business 77 106 37 25 60 15 48 64sophistication
12. Innovation 69 108 36 24 111 9 52 49
Source: The Global Competitiveness Report 2010-2011, World Economic Forum
Table 45. Transport infrastructure ranking of selected countries (out of 139)
Road Port Air Railway
Philippines 114 131 112 97
Indonesia 84 96 69 56
Viet Nam 117 97 88 59
Source: The Global Competitiveness Report 2010-2011, World Economic Forum
Table 46. Strength of bureaucracy and input costs in selected countries
BuildingIndex of ease of
CountryPublic institution index Electricity
construction doing business
(USD/kWh)cost (USD/sq. m)
(2010 rank outof 183)
Philippines 85 105 113 0.10 1 022 144
China 0.08 97 89
Malaysia 34 30 43 0.07 282 23
Hong Kong
Indonesia 76 68 58 0.07 221 122
Republic of Korea
Singapore 1
Thailand 37 57 60 0.06 329 12
Viet Nam 0.07 93
Sources: World Bank (WB), Doing Business 2006, 2007 and 2010 (www.doingbusines.org)MIGA and WB, Benchmarking FDI Competitiveness in Asia (2004)
2004 2009 2010
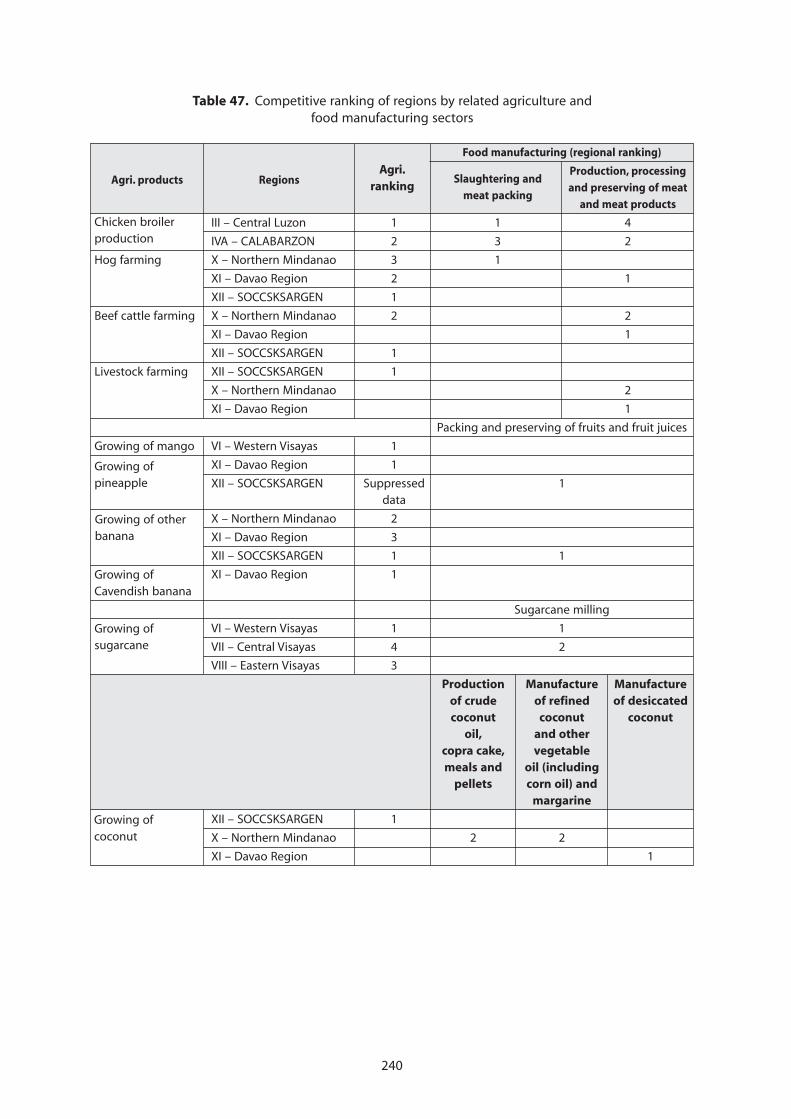
240
Chicken broilerproduction
Growing ofpineapple
Growing of otherbanana
Growing ofCavendish banana
Growing ofsugarcane
Growing ofcoconut
Agri.ranking
Table 47. Competitive ranking of regions by related agriculture andfood manufacturing sectors
Agri. products Regions
Food manufacturing (regional ranking)
Slaughtering andProduction, processing
meat packingand preserving of meat
and meat products
III – Central Luzon 1 1 4
IVA – CALABARZON 2 3 2
Hog farming X – Northern Mindanao 3 1
XI – Davao Region 2 1
XII – SOCCSKSARGEN 1
Beef cattle farming X – Northern Mindanao 2 2
XI – Davao Region 1
XII – SOCCSKSARGEN 1
Livestock farming XII – SOCCSKSARGEN 1
X – Northern Mindanao 2
XI – Davao Region 1
Packing and preserving of fruits and fruit juices
Growing of mango VI – Western Visayas 1
XI – Davao Region 1
XII – SOCCSKSARGEN Suppressed 1data
X – Northern Mindanao 2
XI – Davao Region 3
XII – SOCCSKSARGEN 1 1
XI – Davao Region 1
Sugarcane milling
VI – Western Visayas 1 1
VII – Central Visayas 4 2
VIII – Eastern Visayas 3
Production Manufacture Manufactureof crude of refined of desiccatedcoconut coconut coconut
oil, and othercopra cake, vegetablemeals and oil (including
pellets corn oil) andmargarine
XII – SOCCSKSARGEN 1
X – Northern Mindanao 2 2
XI – Davao Region 1
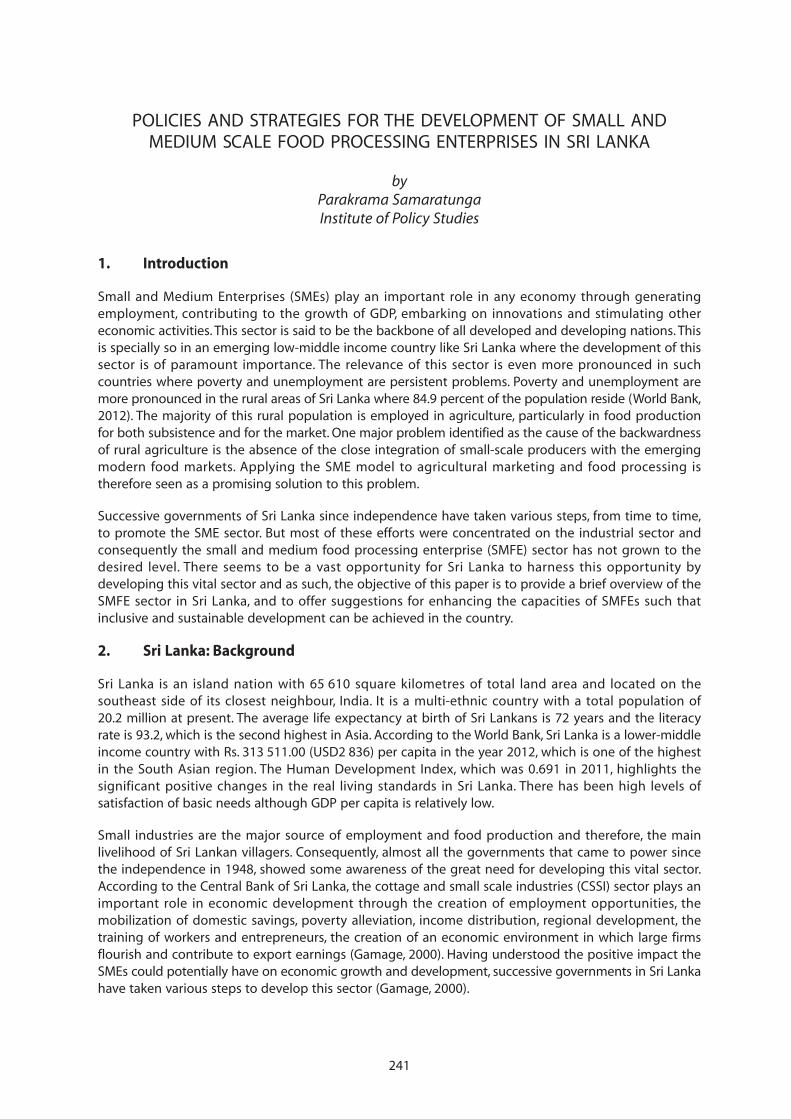
241
POLICIES AND STRATEGIES FOR THE DEVELOPMENT OF SMALL ANDMEDIUM SCALE FOOD PROCESSING ENTERPRISES IN SRI LANKA
byParakrama SamaratungaInstitute of Policy Studies
1. Introduction
Small and Medium Enterprises (SMEs) play an important role in any economy through generatingemployment, contributing to the growth of GDP, embarking on innovations and stimulating othereconomic activities. This sector is said to be the backbone of all developed and developing nations. Thisis specially so in an emerging low-middle income country like Sri Lanka where the development of thissector is of paramount importance. The relevance of this sector is even more pronounced in suchcountries where poverty and unemployment are persistent problems. Poverty and unemployment aremore pronounced in the rural areas of Sri Lanka where 84.9 percent of the population reside (World Bank,2012). The majority of this rural population is employed in agriculture, particularly in food productionfor both subsistence and for the market. One major problem identified as the cause of the backwardnessof rural agriculture is the absence of the close integration of small-scale producers with the emergingmodern food markets. Applying the SME model to agricultural marketing and food processing istherefore seen as a promising solution to this problem.
Successive governments of Sri Lanka since independence have taken various steps, from time to time,to promote the SME sector. But most of these efforts were concentrated on the industrial sector andconsequently the small and medium food processing enterprise (SMFE) sector has not grown to thedesired level. There seems to be a vast opportunity for Sri Lanka to harness this opportunity bydeveloping this vital sector and as such, the objective of this paper is to provide a brief overview of theSMFE sector in Sri Lanka, and to offer suggestions for enhancing the capacities of SMFEs such thatinclusive and sustainable development can be achieved in the country.
2. Sri Lanka: Background
Sri Lanka is an island nation with 65 610 square kilometres of total land area and located on thesoutheast side of its closest neighbour, India. It is a multi-ethnic country with a total population of20.2 million at present. The average life expectancy at birth of Sri Lankans is 72 years and the literacyrate is 93.2, which is the second highest in Asia. According to the World Bank, Sri Lanka is a lower-middleincome country with Rs. 313 511.00 (USD2 836) per capita in the year 2012, which is one of the highestin the South Asian region. The Human Development Index, which was 0.691 in 2011, highlights thesignificant positive changes in the real living standards in Sri Lanka. There has been high levels ofsatisfaction of basic needs although GDP per capita is relatively low.
Small industries are the major source of employment and food production and therefore, the mainlivelihood of Sri Lankan villagers. Consequently, almost all the governments that came to power sincethe independence in 1948, showed some awareness of the great need for developing this vital sector.According to the Central Bank of Sri Lanka, the cottage and small scale industries (CSSI) sector plays animportant role in economic development through the creation of employment opportunities, themobilization of domestic savings, poverty alleviation, income distribution, regional development, thetraining of workers and entrepreneurs, the creation of an economic environment in which large firmsflourish and contribute to export earnings (Gamage, 2000). Having understood the positive impact theSMEs could potentially have on economic growth and development, successive governments in Sri Lankahave taken various steps to develop this sector (Gamage, 2000).
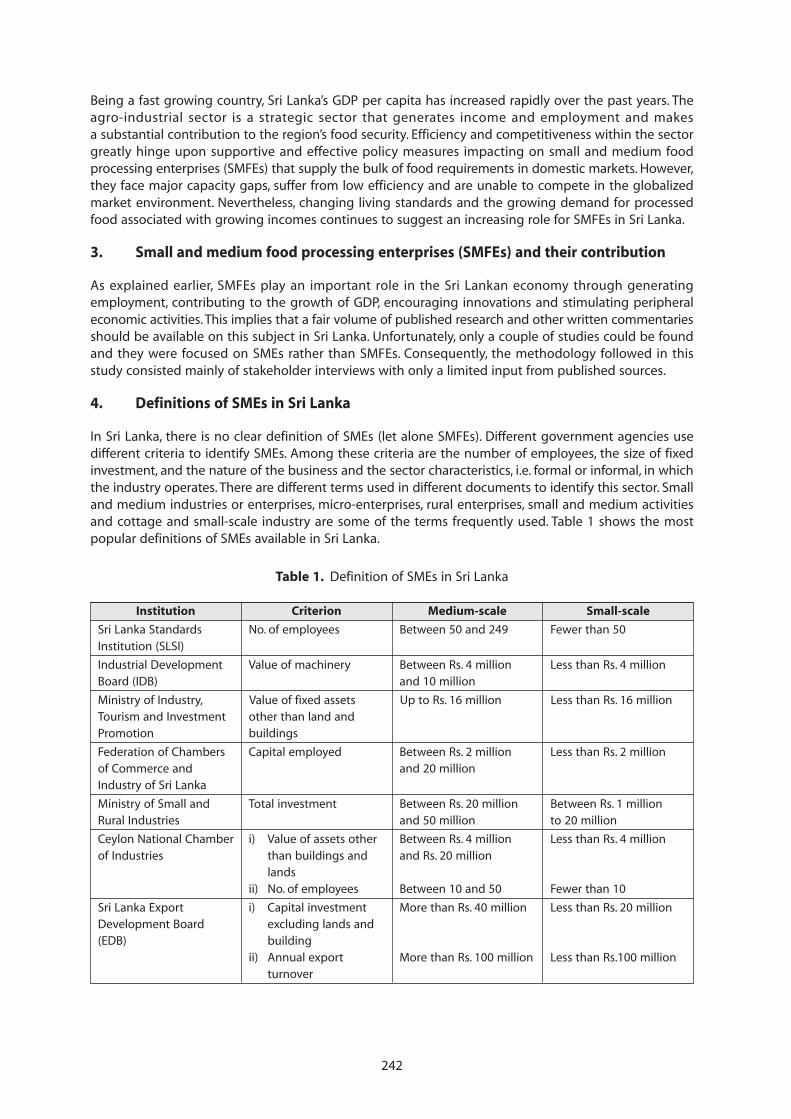
242
Being a fast growing country, Sri Lanka’s GDP per capita has increased rapidly over the past years. Theagro-industrial sector is a strategic sector that generates income and employment and makesa substantial contribution to the region’s food security. Efficiency and competitiveness within the sectorgreatly hinge upon supportive and effective policy measures impacting on small and medium foodprocessing enterprises (SMFEs) that supply the bulk of food requirements in domestic markets. However,they face major capacity gaps, suffer from low efficiency and are unable to compete in the globalizedmarket environment. Nevertheless, changing living standards and the growing demand for processedfood associated with growing incomes continues to suggest an increasing role for SMFEs in Sri Lanka.
3. Small and medium food processing enterprises (SMFEs) and their contribution
As explained earlier, SMFEs play an important role in the Sri Lankan economy through generatingemployment, contributing to the growth of GDP, encouraging innovations and stimulating peripheraleconomic activities. This implies that a fair volume of published research and other written commentariesshould be available on this subject in Sri Lanka. Unfortunately, only a couple of studies could be foundand they were focused on SMEs rather than SMFEs. Consequently, the methodology followed in thisstudy consisted mainly of stakeholder interviews with only a limited input from published sources.
4. Definitions of SMEs in Sri Lanka
In Sri Lanka, there is no clear definition of SMEs (let alone SMFEs). Different government agencies usedifferent criteria to identify SMEs. Among these criteria are the number of employees, the size of fixedinvestment, and the nature of the business and the sector characteristics, i.e. formal or informal, in whichthe industry operates. There are different terms used in different documents to identify this sector. Smalland medium industries or enterprises, micro-enterprises, rural enterprises, small and medium activitiesand cottage and small-scale industry are some of the terms frequently used. Table 1 shows the mostpopular definitions of SMEs available in Sri Lanka.
Table 1. Definition of SMEs in Sri Lanka
Institution Criterion Medium-scale Small-scale
Sri Lanka Standards No. of employees Between 50 and 249 Fewer than 50Institution (SLSI)
Industrial Development Value of machinery Between Rs. 4 million Less than Rs. 4 millionBoard (IDB) and 10 million
Ministry of Industry, Value of fixed assets Up to Rs. 16 million Less than Rs. 16 millionTourism and Investment other than land andPromotion buildings
Federation of Chambers Capital employed Between Rs. 2 million Less than Rs. 2 millionof Commerce and and 20 millionIndustry of Sri Lanka
Ministry of Small and Total investment Between Rs. 20 million Between Rs. 1 millionRural Industries and 50 million to 20 million
Ceylon National Chamber i) Value of assets other Between Rs. 4 million Less than Rs. 4 millionof Industries than buildings and and Rs. 20 million
landsii) No. of employees Between 10 and 50 Fewer than 10
Sri Lanka Export i) Capital investment More than Rs. 40 million Less than Rs. 20 millionDevelopment Board excluding lands and(EDB) building
ii) Annual export More than Rs. 100 million Less than Rs.100 millionturnover
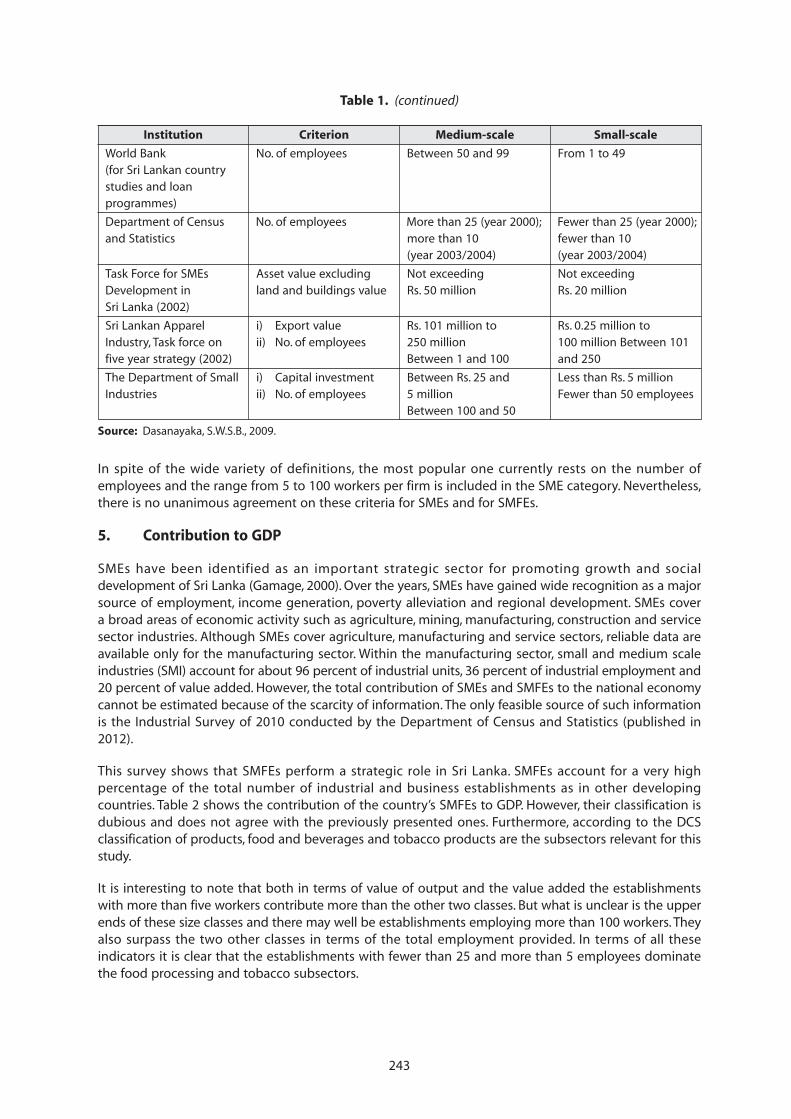
243
In spite of the wide variety of definitions, the most popular one currently rests on the number ofemployees and the range from 5 to 100 workers per firm is included in the SME category. Nevertheless,there is no unanimous agreement on these criteria for SMEs and for SMFEs.
5. Contribution to GDP
SMEs have been identified as an important strategic sector for promoting growth and socialdevelopment of Sri Lanka (Gamage, 2000). Over the years, SMEs have gained wide recognition as a majorsource of employment, income generation, poverty alleviation and regional development. SMEs covera broad areas of economic activity such as agriculture, mining, manufacturing, construction and servicesector industries. Although SMEs cover agriculture, manufacturing and service sectors, reliable data areavailable only for the manufacturing sector. Within the manufacturing sector, small and medium scaleindustries (SMI) account for about 96 percent of industrial units, 36 percent of industrial employment and20 percent of value added. However, the total contribution of SMEs and SMFEs to the national economycannot be estimated because of the scarcity of information. The only feasible source of such informationis the Industrial Survey of 2010 conducted by the Department of Census and Statistics (published in2012).
This survey shows that SMFEs perform a strategic role in Sri Lanka. SMFEs account for a very highpercentage of the total number of industrial and business establishments as in other developingcountries. Table 2 shows the contribution of the country’s SMFEs to GDP. However, their classification isdubious and does not agree with the previously presented ones. Furthermore, according to the DCSclassification of products, food and beverages and tobacco products are the subsectors relevant for thisstudy.
It is interesting to note that both in terms of value of output and the value added the establishmentswith more than five workers contribute more than the other two classes. But what is unclear is the upperends of these size classes and there may well be establishments employing more than 100 workers. Theyalso surpass the two other classes in terms of the total employment provided. In terms of all theseindicators it is clear that the establishments with fewer than 25 and more than 5 employees dominatethe food processing and tobacco subsectors.
World Bank No. of employees Between 50 and 99 From 1 to 49(for Sri Lankan countrystudies and loanprogrammes)
Department of Census No. of employees More than 25 (year 2000); Fewer than 25 (year 2000);and Statistics more than 10 fewer than 10
(year 2003/2004) (year 2003/2004)
Task Force for SMEs Asset value excluding Not exceeding Not exceedingDevelopment in land and buildings value Rs. 50 million Rs. 20 millionSri Lanka (2002)
Sri Lankan Apparel i) Export value Rs. 101 million to Rs. 0.25 million toIndustry, Task force on ii) No. of employees 250 million 100 million Between 101five year strategy (2002) Between 1 and 100 and 250
The Department of Small i) Capital investment Between Rs. 25 and Less than Rs. 5 millionIndustries ii) No. of employees 5 million Fewer than 50 employees
Between 100 and 50
Source: Dasanayaka, S.W.S.B., 2009.
Table 1. (continued)
Institution Criterion Medium-scale Small-scale
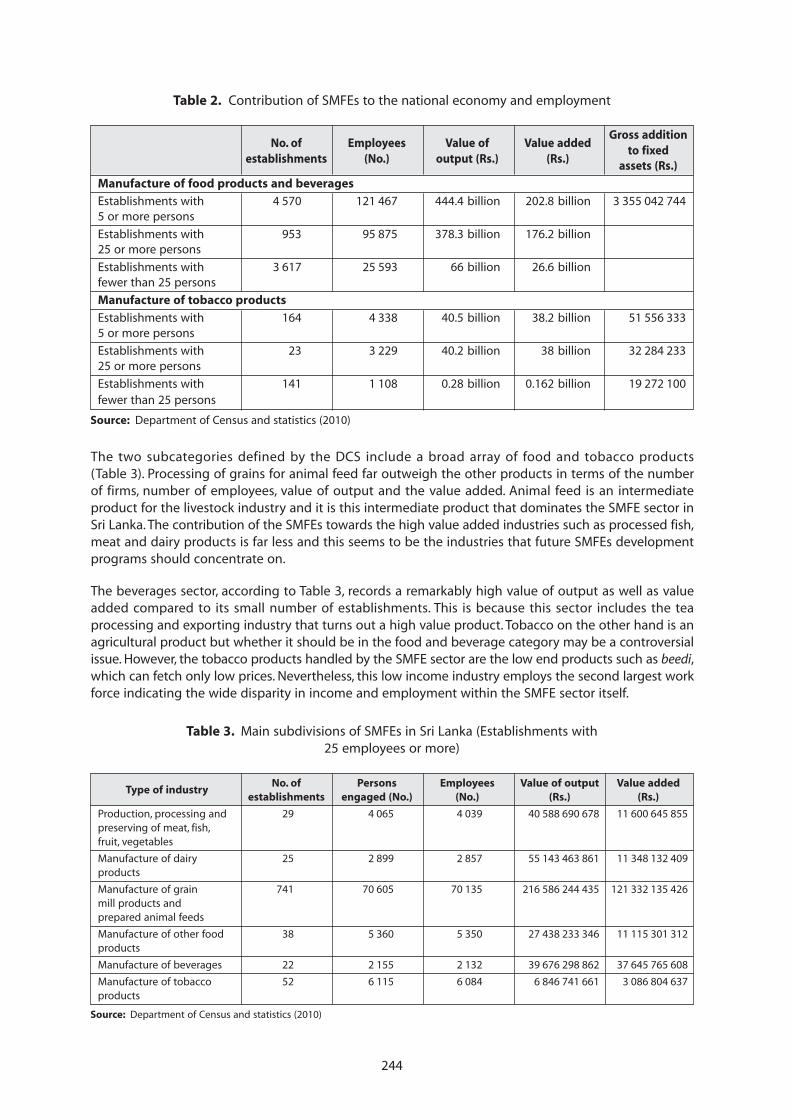
244
The two subcategories defined by the DCS include a broad array of food and tobacco products(Table 3). Processing of grains for animal feed far outweigh the other products in terms of the numberof firms, number of employees, value of output and the value added. Animal feed is an intermediateproduct for the livestock industry and it is this intermediate product that dominates the SMFE sector inSri Lanka. The contribution of the SMFEs towards the high value added industries such as processed fish,meat and dairy products is far less and this seems to be the industries that future SMFEs developmentprograms should concentrate on.
The beverages sector, according to Table 3, records a remarkably high value of output as well as valueadded compared to its small number of establishments. This is because this sector includes the teaprocessing and exporting industry that turns out a high value product. Tobacco on the other hand is anagricultural product but whether it should be in the food and beverage category may be a controversialissue. However, the tobacco products handled by the SMFE sector are the low end products such as beedi,which can fetch only low prices. Nevertheless, this low income industry employs the second largest workforce indicating the wide disparity in income and employment within the SMFE sector itself.
Table 3. Main subdivisions of SMFEs in Sri Lanka (Establishments with25 employees or more)
Type of industryNo. of Persons Employees Value of output Value added
establishments engaged (No.) (No.) (Rs.) (Rs.)
Production, processing and 29 4 065 4 039 40 588 690 678 11 600 645 855preserving of meat, fish,fruit, vegetables
Manufacture of dairy 25 2 899 2 857 55 143 463 861 11 348 132 409products
Manufacture of grain 741 70 605 70 135 216 586 244 435 121 332 135 426mill products andprepared animal feeds
Manufacture of other food 38 5 360 5 350 27 438 233 346 11 115 301 312products
Manufacture of beverages 22 2 155 2 132 39 676 298 862 37 645 765 608
Manufacture of tobacco 52 6 115 6 084 6 846 741 661 3 086 804 637products
Source: Department of Census and statistics (2010)
Table 2. Contribution of SMFEs to the national economy and employment
No. of Employees Value of Value addedGross addition
establishments (No.) output (Rs.) (Rs.)to fixed
assets (Rs.)
Manufacture of food products and beverages
Establishments with 4 570 121 467 444.4 billion 202.8 billion 3 355 042 7445 or more persons
Establishments with 953 95 875 378.3 billion 176.2 billion25 or more persons
Establishments with 3 617 25 593 66 billion 26.6 billionfewer than 25 persons
Manufacture of tobacco products
Establishments with 164 4 338 40.5 billion 38.2 billion 51 556 3335 or more persons
Establishments with 23 3 229 40.2 billion 38 billion 32 284 23325 or more persons
Establishments with 141 1 108 0.28 billion 0.162 billion 19 272 100fewer than 25 persons
Source: Department of Census and statistics (2010)
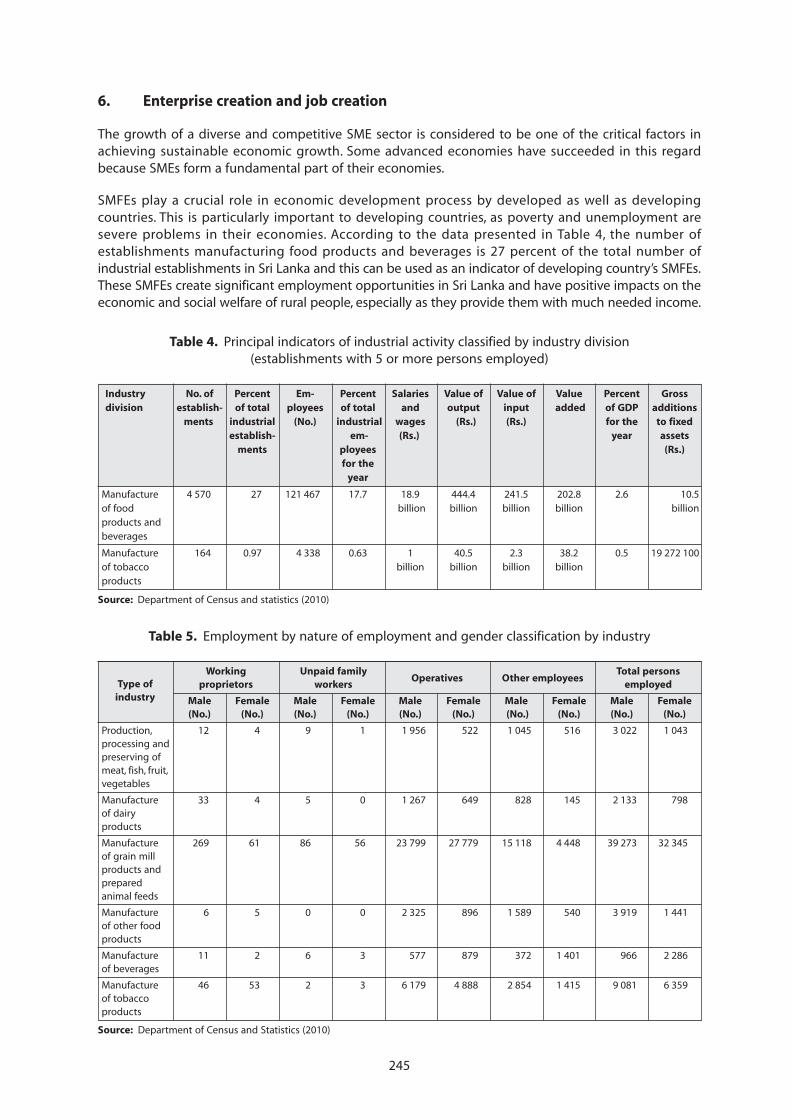
245
6. Enterprise creation and job creation
The growth of a diverse and competitive SME sector is considered to be one of the critical factors inachieving sustainable economic growth. Some advanced economies have succeeded in this regardbecause SMEs form a fundamental part of their economies.
SMFEs play a crucial role in economic development process by developed as well as developingcountries. This is particularly important to developing countries, as poverty and unemployment aresevere problems in their economies. According to the data presented in Table 4, the number ofestablishments manufacturing food products and beverages is 27 percent of the total number ofindustrial establishments in Sri Lanka and this can be used as an indicator of developing country’s SMFEs.These SMFEs create significant employment opportunities in Sri Lanka and have positive impacts on theeconomic and social welfare of rural people, especially as they provide them with much needed income.
Table 4. Principal indicators of industrial activity classified by industry division(establishments with 5 or more persons employed)
Industry No. of Percent Em- Percent Salaries Value of Value of Value Percent Grossdivision establish- of total ployees of total and output input added of GDP additions
ments industrial (No.) industrial wages (Rs.) (Rs.) for the to fixedestablish- em- (Rs.) year assets
ments ployees (Rs.)for the
year
Manufacture 4 570 27 121 467 17.7 18.9 444.4 241.5 202.8 2.6 10.5of food billion billion billion billion billionproducts andbeverages
Manufacture 164 0.97 4 338 0.63 1 40.5 2.3 38.2 0.5 19 272 100of tobacco billion billion billion billionproducts
Source: Department of Census and statistics (2010)
Table 5. Employment by nature of employment and gender classification by industry
Type ofWorking Unpaid family
Operatives Other employeesTotal persons
industryproprietors workers employed
Male Female Male Female Male Female Male Female Male Female(No.) (No.) (No.) (No.) (No.) (No.) (No.) (No.) (No.) (No.)
Production, 12 4 9 1 1 956 522 1 045 516 3 022 1 043processing andpreserving ofmeat, fish, fruit,vegetables
Manufacture 33 4 5 0 1 267 649 828 145 2 133 798of dairyproducts
Manufacture 269 61 86 56 23 799 27 779 15 118 4 448 39 273 32 345of grain millproducts andpreparedanimal feeds
Manufacture 6 5 0 0 2 325 896 1 589 540 3 919 1 441of other foodproducts
Manufacture 11 2 6 3 577 879 372 1 401 966 2 286of beverages
Manufacture 46 53 2 3 6 179 4 888 2 854 1 415 9 081 6 359of tobaccoproducts
Source: Department of Census and Statistics (2010)
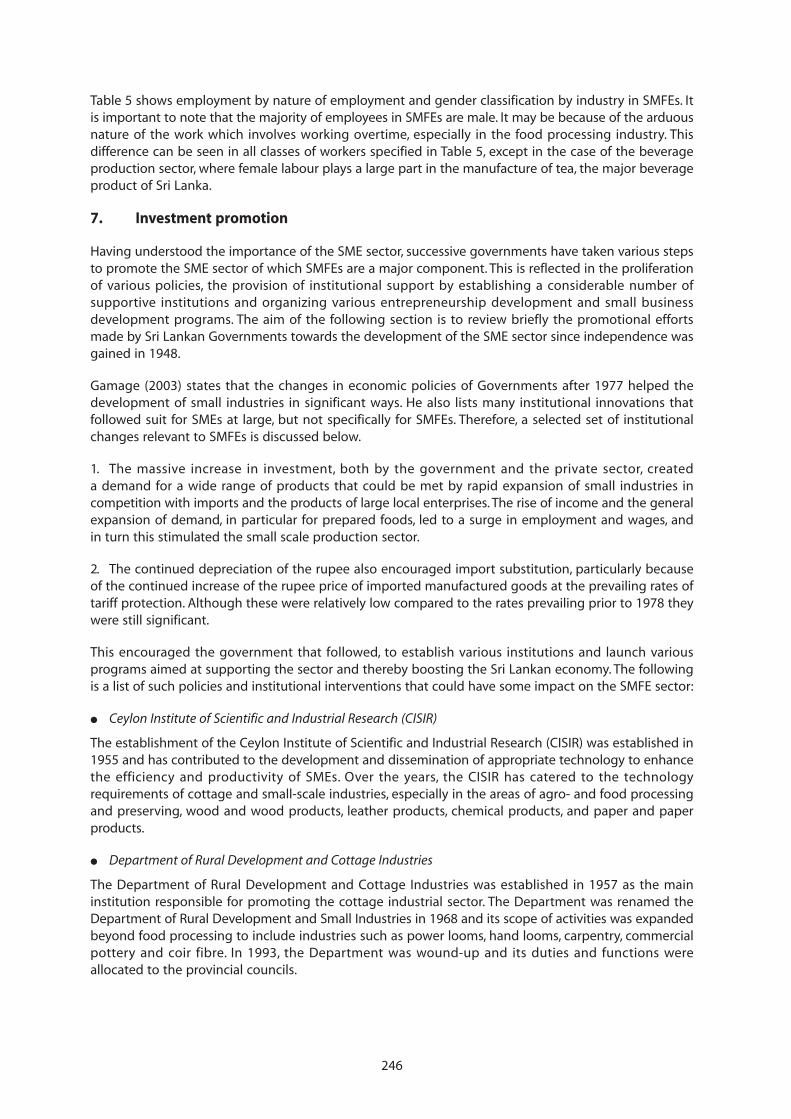
246
Table 5 shows employment by nature of employment and gender classification by industry in SMFEs. Itis important to note that the majority of employees in SMFEs are male. It may be because of the arduousnature of the work which involves working overtime, especially in the food processing industry. Thisdifference can be seen in all classes of workers specified in Table 5, except in the case of the beverageproduction sector, where female labour plays a large part in the manufacture of tea, the major beverageproduct of Sri Lanka.
7. Investment promotion
Having understood the importance of the SME sector, successive governments have taken various stepsto promote the SME sector of which SMFEs are a major component. This is reflected in the proliferationof various policies, the provision of institutional support by establishing a considerable number ofsupportive institutions and organizing various entrepreneurship development and small businessdevelopment programs. The aim of the following section is to review briefly the promotional effortsmade by Sri Lankan Governments towards the development of the SME sector since independence wasgained in 1948.
Gamage (2003) states that the changes in economic policies of Governments after 1977 helped thedevelopment of small industries in significant ways. He also lists many institutional innovations thatfollowed suit for SMEs at large, but not specifically for SMFEs. Therefore, a selected set of institutionalchanges relevant to SMFEs is discussed below.
1. The massive increase in investment, both by the government and the private sector, createda demand for a wide range of products that could be met by rapid expansion of small industries incompetition with imports and the products of large local enterprises. The rise of income and the generalexpansion of demand, in particular for prepared foods, led to a surge in employment and wages, andin turn this stimulated the small scale production sector.
2. The continued depreciation of the rupee also encouraged import substitution, particularly becauseof the continued increase of the rupee price of imported manufactured goods at the prevailing rates oftariff protection. Although these were relatively low compared to the rates prevailing prior to 1978 theywere still significant.
This encouraged the government that followed, to establish various institutions and launch variousprograms aimed at supporting the sector and thereby boosting the Sri Lankan economy. The followingis a list of such policies and institutional interventions that could have some impact on the SMFE sector:
● Ceylon Institute of Scientific and Industrial Research (CISIR)
The establishment of the Ceylon Institute of Scientific and Industrial Research (CISIR) was established in1955 and has contributed to the development and dissemination of appropriate technology to enhancethe efficiency and productivity of SMEs. Over the years, the CISIR has catered to the technologyrequirements of cottage and small-scale industries, especially in the areas of agro- and food processingand preserving, wood and wood products, leather products, chemical products, and paper and paperproducts.
● Department of Rural Development and Cottage Industries
The Department of Rural Development and Cottage Industries was established in 1957 as the maininstitution responsible for promoting the cottage industrial sector. The Department was renamed theDepartment of Rural Development and Small Industries in 1968 and its scope of activities was expandedbeyond food processing to include industries such as power looms, hand looms, carpentry, commercialpottery and coir fibre. In 1993, the Department was wound-up and its duties and functions wereallocated to the provincial councils.
247
● The People’s Bank and the Bank of Ceylon
The establishment of the People’s Bank and the nationalization of the Bank of Ceylon in 1961 werelandmarks in providing institutional credit to SMEs (including SMFEs). The Bank of Ceylon branches andits sub offices at Agrarian Services Centers provided credit facilities under special programs to SMEs.Some domestic private banks have also introduced special facilities for these industries with theexpansion of their branch network.
● Industrial Development Board (IDB)
With the main objectives of encouraging, promoting and developing SMEs in Sri Lanka, the IndustrialDevelopment Board (IDB) was established in 1969. The IDB is considered to be the chief industrialextension institution in the country and was armed with regional offices and industrial extension offices.Over the years, the IDB has concentrated mainly on the development and dissemination of appropriatetechnologies, marketing facilities and, in some cases, financial facilities and conducting entrepreneurshiptraining and small business training for the small-scale industrial sector.
● The Small Scale Industries Credit Scheme (SSI)
The Scheme was introduced in 1974 in order to enlarge the small industry sector credit base. The CentralBank offered credit guarantees from July 1979 on SMI loans provided with financial assistance from theInternational Development Association (IDA).
● National Development Bank (NDB)
In 1979 the Government established the National Development Bank with the primary objective ofproviding project finance for large industry, agriculture and commerce. However, it was also had animportant secondary objective, namely to ensure that small industrialists are given access to projectfinance on the same terms and conditions as afforded to large borrowers. Accordingly, the Small andMedium Industries Loan Scheme was initiated in 1979.
● Small Enterprise Development Division (SEDD)
The self-employment programs assisted by the Ministry of Youth Affairs and Sports (MYUAS), as well asseveral non-government organizations (NGOs) and private institutions have also helped the promotionof the SME sector in the country. In this respect, a separate Small Enterprise Development Division (SEDD)was established under the Ministry of Youth Affairs and Sports in 1984 with the objectives of formulatingstrategies and policies for stimulating self-employment and small-scale enterprises.
● Regional Rural Development Bank (RRDB)
The establishment of a Regional Rural Development Bank (RRDB) in 1985 made available an additionalcredit outlet to the small business sector. Several microcredit schemes were implemented by these banks.The Janasaviya Trust Fund, the Samurdhi Development Loan Scheme or SAHANA for Samurdhibeneficiaries and “Surathura Diriya” also provide financial assistance to this sector.
8. Analysis of survey findings
Definition of SMFEs
The in-depth interviews conducted with several stakeholders in the field of SMFEs revealed theimportance of having a clear definition for the SME sector, especially for SMFEs. Almost everyone(more than 75 percent) suggested that the “turnover” would be the best instrument to classify SMEs.According to them, if the turnover is below Rs.1 million per month it could be categorized as an SME.However, 25 percent suggested that the turnover should be below Rs.600 000 per annum for SMEs.Furthermore, all of them collectively selected turnover as the best instrument to define the SME sectorrather than employment, capital investments etc. It was argued that considering employment asa measure of defining SMEs was not appropriate because mechanization and the introduction of newtechnology have reduced manual labour involvement in many business activities. Furthermore, it was
248
accepted that “capital investment” could be another instrument used to define an SME. Nevertheless,state organizations without fail use number of employees as the sole instrument to define an SME.
Registration
There is no single institution for registering companies in Sri Lanka. Entrepreneurs can register theirbusinesses at the provincial councils or at the Export Development Board (EDB), Board of Investments(BOI) or any other development board depending on the nature of the business (for example, if thebusiness relates to coconut processing they can go to the Coconut Development Board (CDB)).In Sri Lanka most of the SMFEs can be identified as family businesses. Furthermore, there are severalinformal enterprises involved in the SMFEs sector. Such enterprises have established businesses withoutregistering at any state institutions.
It was revealed that in Sri Lanka all SMEFs fall into the category of SMEs and also there are very fewmicro-enterprises. It is very disheartening to note that Sri Lanka does not have a list of SMFEs currently.The Sri Lanka Food Processors Association (SLFPA) is currently preparing a list of all SMEs in operationand it is likely there are 1 000 to 2 000 SMEs in operation and more than 100 of these could be SMFEs.
In Sri Lanka the main SMFEs are SMAK, Harischandra, MA’s Foods, and KVC. Also there are multinationalcompanies such as Nestlé, Fonterra, Unilever and domestic large enterprises such as Cargill, Prima, Keells,Ceylon Biscuit Limited (CBL), all of which compete with the SMFEs in the domestic market.
Labour and employment
Almost all the stakeholders who were interviewed stated that they use both skilled and unskilled labourin their businesses. And it was discovered during interviews that finding youth employment is verydifficult as most of the youngsters are looking for decent “white collar” jobs. More than 50 percent agreedthat Sri Lanka has very rigid labour regulations and firing of an employee is very difficult under thecurrent system. However, the other approximately 50 percent said that it is important to have rigid labourregulations.
Capital and technology
The majority of the stakeholders interviewed initiated their businesses using basic machinery andgradually introduced new machinery and technology. Presently, most of the machines are imported fromdeveloped countries such as Germany, Italy, Japan. After 2003, (after the signing of the Indo-Sri LankaFree Trade Agreement in 1998 and it entering into force on 1 March 2000), nearly 30 percent of theentrepreneurs interviewed attempted to import machinery from India. It was stated that even thoughthe importation of machinery from India is cheap the quality of the machinery is also low. Stakeholderinterviews highlighted that they have to pay nearly 18 percent interest when importing machinery.Nearly 50 percent of the interviewees were not satisfied with the present banking system in Sri Lanka.They stated that banks are not development oriented because in releasing loans they only consider therecovery process, which is demotivating for entrepreneurs.
Food regulations
The entire set of interviewees was satisfied with the existing food regulation system in the country.Sri Lanka has a record of maintaining good food standards because of strong regulations. However,75 percent of them stated that even though the country has good regulations, the implementation andmonitoring processes are not satisfactory because of institutional weakness. Thus, they suggestedestablishing a strong institute to monitor these activities. Presently, the Consumers Affairs Authority (CAA)and the Health Ministry handle monitoring. Furthermore, food testing is very costly and time consuming.They highlighted that government support is very minimal in food testing and Sri Lanka has onlya handful of accredited testing laboratories. In addition, only registered companies are liable to maintainall these food standards and the informal sector is not bothered about the standards. For example, SLS729 is compulsory for all fruit drinks but only a few companies meet the standard. However, most of the
249
consumers still consider only the price and not the quality and as a result non-registered companies canalso survive in the market.
Environmental regulations
All stakeholders responded positively to the environmental levy which was imposed by the governmentand they completely agreed on having strong environmental regulations. But, they expressed theirdissatisfaction with the implementation process. Furthermore, some environmental regulations werethought to be unsuitable for the present day. However, the relevant authorities have not taken any actionto alter those unsuitable regulations.
More than 75 percent of the respondents are of the opinion that a reduction of corporate taxes is inorder. Also they complained that the government involvement in SMFEs is very minimal. They expectgovernment support especially for infant industries and also to maintain smooth market functioning,particularly to reduce the near monopoly situation in packaging material. Sri Lanka has only one packingmaterial factory where all the SMFEs have to face several difficulties in purchasing their requirements.Because of the high cost of packaging materials and other inputs it is difficult for SMFEs to compete withthe multinationals who are operating in the domestic market.
Infrastructure
The respondents also highlighted several issues relating to the general infrastructure. The main issue wasthe poor state of the power supply. The entire sample of stakeholders showed dissatisfaction with theelectricity supply and electricity tariff. It was stated that Sri Lanka has very high electricity tariff rateswhen compared to other countries in the region. However, the entire sample was satisfied with thepresent road network and the newly built expressway, port and the airport.
Furthermore, it was emphasized that there is no level playing field in the SMFE sector. The only supportgiven by the government is providing funds for them to participate in international trade fairs. Thefollowing graphs in Figure 1 indicate the obstacles in Sri Lanka with respect to the business environment.The problems that were identified by the survey respondents are very similar to the Enterprise Surveyfindings.
Figure 1 indicates the top ten constraints as identified by firms in Sri Lanka and the top three constraintsbroken down by large, medium, and small firms in Sri Lanka. According to the enterprise survey, practicesin the informal sector, access to finances, tax rates and electricity are identified as the main obstacles inbusiness operation. Furthermore, according to the size of the firms, the SME category has identifiedpractices in the informal sector, access to finances, tax rates and electricity as the main businessenvironment obstacles.
The following suggestions were highlighted during discussions:
● Establish a separate chamber/institute for SMFEs.
At present Sri Lanka does not have a separate institute for SMFEs. Thus, entrepreneurs had to faceseveral difficulties in business activities. Therefore, it is important to have a separate body thatcould be attached to the National Chamber of Commerce to support SMFEs.
● Provide good guidelines on business operation.
Interviews highlighted that there is no proper mechanism or gradual implantation process inrules and regulations on SMFEs. Thus, it is essential to have proper guidelines for SMFEs.
● Prepare a set of regulations to monitor retailers’ activities.
In the SMFE sector the “retailer” is the person who handles domestic business. He, being themiddleman of the value chain, handles the major segment of monetary activities. According tothe informants these retailers keep money in their hands for long period without transferring itto the producers.
● Promote SMFE clusters as in Italy, Germany and UK and the government has to take the lead inidentifying potential areas to establish industrial zones. One potential area could be Matara-where several SMFEs are in operation.
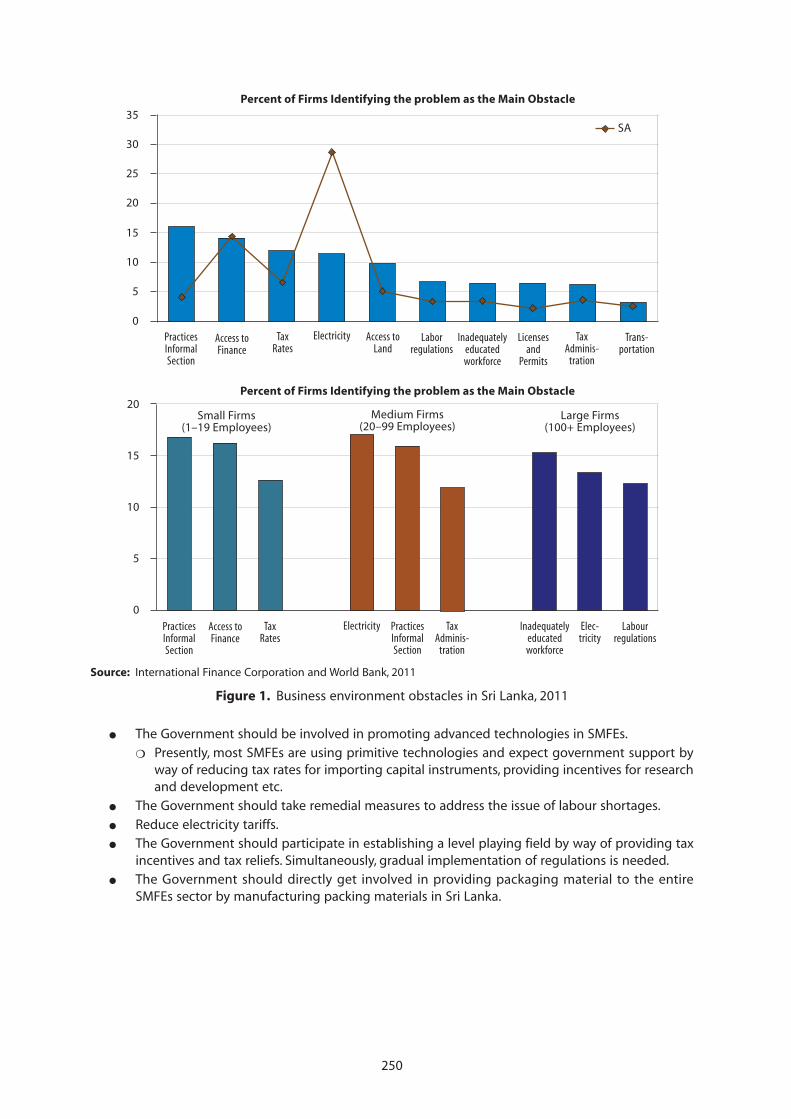
250
● The Government should be involved in promoting advanced technologies in SMFEs.
❍ Presently, most SMFEs are using primitive technologies and expect government support byway of reducing tax rates for importing capital instruments, providing incentives for researchand development etc.
● The Government should take remedial measures to address the issue of labour shortages.
● Reduce electricity tariffs.● The Government should participate in establishing a level playing field by way of providing tax
incentives and tax reliefs. Simultaneously, gradual implementation of regulations is needed.● The Government should directly get involved in providing packaging material to the entire
SMFEs sector by manufacturing packing materials in Sri Lanka.
Source: International Finance Corporation and World Bank, 2011
Figure 1. Business environment obstacles in Sri Lanka, 2011
SA
Percent of Firms Identifying the problem as the Main Obstacle
PracticesInformalSection
Access toFinance
TaxRates
Access toLand
Electricity Laborregulations
Licensesand
Permits
TaxAdminis-
tration
Inadequatelyeducatedworkforce
Percent of Firms Identifying the problem as the Main Obstacle
PracticesInformalSection
Access toFinance
TaxRates
PracticesInformalSection
Electricity TaxAdminis-
tration
Elec-tricity
Labourregulations
Inadequatelyeducatedworkforce
Small Firms(1–19 Employees)
Medium Firms(20–99 Employees)
Large Firms(100+ Employees)
20
15
10
5
0
Trans-portation
35
30
25
20
15
10
5
0
251
9. Constraints and recommendations
Constraints
Shortage of capital because of lack of access to bank facilities and lack of knowledge of bank proceduresare major problems in the SMFE sector in Sri Lanka. Although there are some loan schemes available,the high rate of interest makes the venture unattractive. The sector has a weak institutional base becauseof the lack of management skills. Management skills are the critical factor in the success of all businessesand small businesses are no exception.
The use of obsolete or inappropriate technology results in low productivity, low quality of products, anda high rate of rejection of products, resulting in higher costs to the producer and a reduction in marketcompetitiveness. Again, this is also because of the weak financial base and the lack of managerial skills.The weak financial position may obstruct the upgrading of technology, expansion of production capacity,production efficiency, and prevents the firm from going for new and sophisticated technology andspending on training and development of its workforce to increase productivity. In some cases, althoughfunds are available, the management does not utilize them in areas such as training and developmentsince the management does not understand the positive impact of training on business success.
The lack of SMFE policies and institutional support to protect and encourage SMEs also hampers theprogress of this sector.
Recommendations
● Establish a separate body to monitor SMFE business activities.● Prepare a set of rules and regulations to administrate SMFE activities.
● Ensure the dynamic involvement of the government in several areas❍ reducing electricity tariff, establishing industrial clusters, providing tax incentives, promote
research and development etc.
References
Dasanayaka, S.W.S.B. 2009. Small and Medium Scale Enterprises in Informal Sector in Pakistan and Sri Lankawith Research Agenda, (available at http://www.iariw.org).
Department of Census and Statistics. 2010. Annual Survey of Industries. Colombo.
Gamage, A.S. 2000. Effectiveness of Entrepreneur Development Programs in the creation and Growth of SMEs inSri Lanka, MSc. Research Paper (unpublished), University of Sri Jayawardanapura, Colombo.
Gamage, A.S. 2003. Small and Medium Enterprise Development in Sri Lanka: A Review, (available at http://202.11.2.113/SEBM/ronso/no3-4/aruna.pdf).˝
International Finance Corporation and World Bank. 2011. Enterprise surveys: Sri Lanka (2011), (available at www.enterprisesurveys.org).
World Bank. 2012. World Bank Report, (available at www.tradingeconomics.com/sri-lanka/rural-population-wb-data.html)
252
POLICIES AND STRATEGIES FOR THE DEVELOPMENT OF SMALL ANDMEDIUM SCALE FOOD PROCESSING ENTERPRISES IN THAILAND
byThailand Development Research Institute (TDRI)1
1. Introduction
Thailand is an agriculture-based country and a net food producer supplying both domestic and overseasmarkets. Many studies, e.g. Krishnamurthy (2009), have pointed out that prior to 1960, Thailand exportedprimary agricultural products, particularly rice, and rice exports accounted for 46 percent of the valueof the country’s total exports. The rice premium tax was the major source of revenue for the governmentaccounting for 10 to 15 percent of total state revenues. During the 1970s, other crops such as cassava,kenaf,2 maize and sugarcane were grown primarily for export and the area under rice cultivation wasreduced gradually. Moreover, technologies for producing sweetened condensed milk and canningvegetables and fruits were imported from Taiwan and Japan and since then the Thai food industry hasfocused more on agro-industrial products and the export structure of food commodities has shifted fromagriculture-based commodities to agro-industry commodities.
During the 1990s, the food industry played an important role in the country’s economy, especially asother sectors were seriously affected by the economic and financial crises of 1997 and 1998. The foodindustry became the mechanism by which the Royal Thai Government (RTG) maintained the country’scompetitiveness in the global market. In 1999 the RTG initiated a policy called “Thailand: Kitchen ofthe World”, the aims of which were to: 1) develop Thailand’s food industry to be in the top five of theworld’s food exporters and have Thai food products guaranteed in terms of sanitation and safety;2) stimulate more exports of Thai ingredients and other Thai seasoning products; 3) support Thairestaurants overseas to play a role in promoting Thai tourism and Thai products; and 4) encourage theopening of Thai restaurants abroad and promote the so-called “Real Thai Taste” (Benjasitichai, no date,p. 75). Now, the RTG has established policies and legal frameworks concerning investment promotion,good manufacturing practice and packaging to support Thailand’s food processing industry. Moreover,the country has developed strong cooperative relations with other countries in the region such asLao PDR, Malaysia, Myanmar and Viet Nam to develop joint ventures in the food processing industries.
Thailand has become one of the world’s largest food producers and food exporters and food productsfrom Thailand are widely accepted in terms of quality and safety. In 2010, Thailand was ranked as theworld’s 9th largest food exporter, valued at USD25 638.75 million (National Food Institute, 2011),an increase from 10th position in 2009. The major customers are the ASEAN countries, Japan, theUnited States, and the countries of the European Union (The Customs Department, 2011). The share ofThai food exports was approximately 2.4 percent of the world market and the principle exports were:prepared and preserved fishery products; rice; cane sugar; prepared and preserved fruits; feedstuff; wheatproducts and other food preparations; beverages; sauce and preparations thereof; animal or vegetablefats; prepared and preserved vegetable; and meat and prepared meat.
1 This paper was prepared by Dr Yongyuth Chalamwong, Ms Khanittha Hongprayoon, Ms Jidapa Meepien and MissWanwisa Suebnusorn.2 Kenaf or Hibiscus cannabinus is a plant in the Malvaceae family. Hibiscus cannabinus is in the genus Hibiscus and isprobably native to South Asia, though its exact natural origin is unknown. The name also applies to the fibre obtained fromthis plant. Kenaf is one of the allied fibres of jute and has similar characteristics.
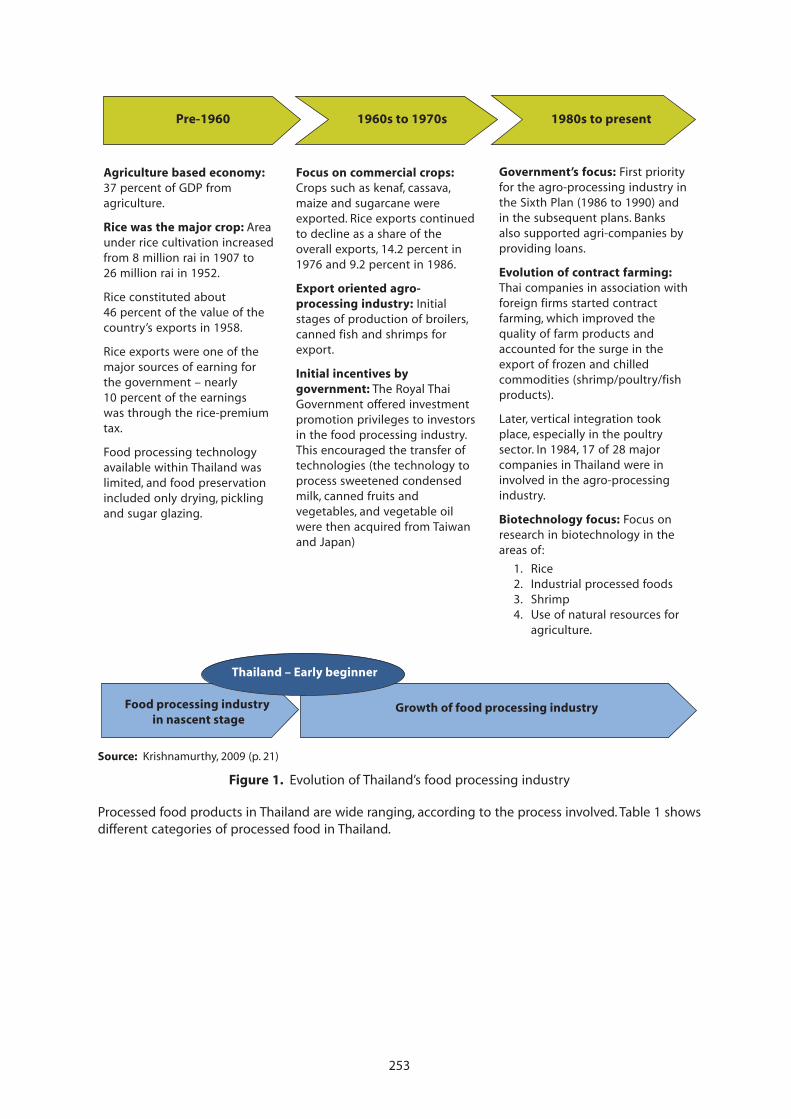
253
Source: Krishnamurthy, 2009 (p. 21)
Figure 1. Evolution of Thailand’s food processing industry
Processed food products in Thailand are wide ranging, according to the process involved. Table 1 showsdifferent categories of processed food in Thailand.
Agriculture based economy: 37 percent of GDP from agriculture.
Rice was the major crop: Area under rice cultivation increased from 8 million rai in 1907 to 26 million rai in 1952.
Rice constituted about 46 percent of the value of the country’s exports in 1958.
Rice exports were one of the major sources of earning for the government – nearly 10 percent of the earnings was through the rice-premium tax.
Food processing technology available within Thailand was limited, and food preservation included only drying, pickling and sugar glazing.
Pre-1960 1960s to 1970s 1980s to present
Focus on commercial crops: Crops such as kenaf, cassava, maize and sugarcane were exported. Rice exports continued to decline as a share of the overall exports, 14.2 percent in 1976 and 9.2 percent in 1986.
Export oriented agro-processing industry: Initial stages of production of broilers, canned fish and shrimps for export.
Initial incentives by government: The Royal Thai Government offered investment promotion privileges to investors in the food processing industry. This encouraged the transfer of technologies (the technology to process sweetened condensed milk, canned fruits and vegetables, and vegetable oil were then acquired from Taiwan and Japan)
Government’s focus: First priority for the agro-processing industry in the Sixth Plan (1986 to 1990) and in the subsequent plans. Banks also supported agri-companies by providing loans.
Evolution of contract farming: Thai companies in association with foreign firms started contract farming, which improved the quality of farm products and accounted for the surge in the export of frozen and chilled commodities (shrimp/poultry/fish products).
Later, vertical integration took place, especially in the poultry sector. In 1984, 17 of 28 major companies in Thailand were in involved in the agro-processing industry.
Biotechnology focus: Focus on research in biotechnology in the areas of:
1. Rice2. Industrial processed foods3. Shrimp4. Use of natural resources for
agriculture.
Growth of food processing industry
Thailand – Early beginner
Food processing industry in nascent stage
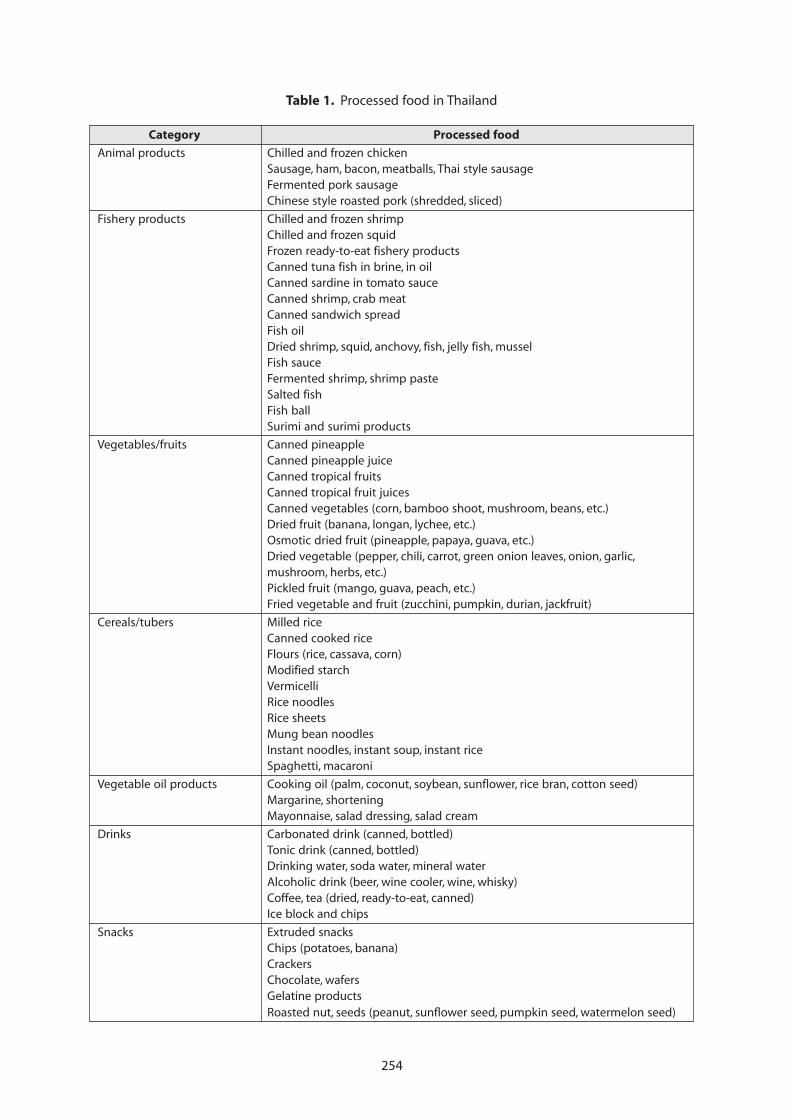
254
Table 1. Processed food in Thailand
Category Processed food
Animal products Chilled and frozen chickenSausage, ham, bacon, meatballs, Thai style sausageFermented pork sausageChinese style roasted pork (shredded, sliced)
Fishery products Chilled and frozen shrimpChilled and frozen squidFrozen ready-to-eat fishery productsCanned tuna fish in brine, in oilCanned sardine in tomato sauceCanned shrimp, crab meatCanned sandwich spreadFish oilDried shrimp, squid, anchovy, fish, jelly fish, musselFish sauceFermented shrimp, shrimp pasteSalted fishFish ballSurimi and surimi products
Vegetables/fruits Canned pineappleCanned pineapple juiceCanned tropical fruitsCanned tropical fruit juicesCanned vegetables (corn, bamboo shoot, mushroom, beans, etc.)Dried fruit (banana, longan, lychee, etc.)Osmotic dried fruit (pineapple, papaya, guava, etc.)Dried vegetable (pepper, chili, carrot, green onion leaves, onion, garlic,mushroom, herbs, etc.)Pickled fruit (mango, guava, peach, etc.)Fried vegetable and fruit (zucchini, pumpkin, durian, jackfruit)
Cereals/tubers Milled riceCanned cooked riceFlours (rice, cassava, corn)Modified starchVermicelliRice noodlesRice sheetsMung bean noodlesInstant noodles, instant soup, instant riceSpaghetti, macaroni
Vegetable oil products Cooking oil (palm, coconut, soybean, sunflower, rice bran, cotton seed)Margarine, shorteningMayonnaise, salad dressing, salad cream
Drinks Carbonated drink (canned, bottled)Tonic drink (canned, bottled)Drinking water, soda water, mineral waterAlcoholic drink (beer, wine cooler, wine, whisky)Coffee, tea (dried, ready-to-eat, canned)Ice block and chips
Snacks Extruded snacksChips (potatoes, banana)CrackersChocolate, wafersGelatine productsRoasted nut, seeds (peanut, sunflower seed, pumpkin seed, watermelon seed)
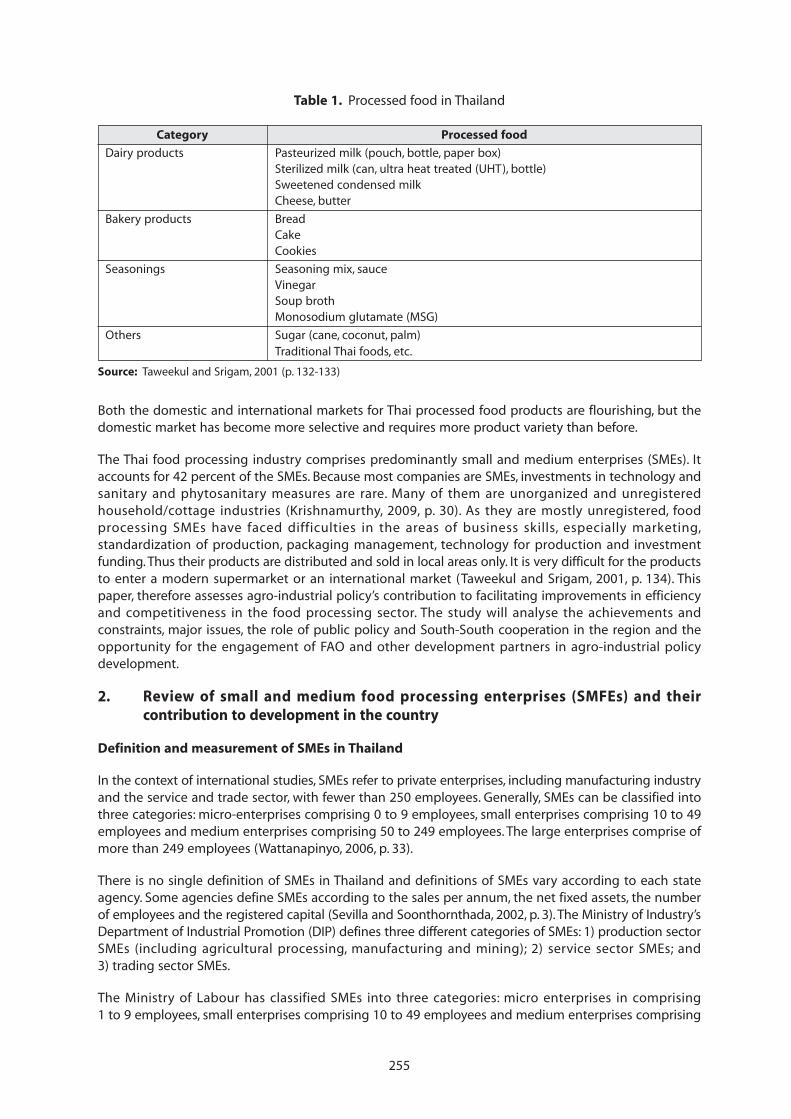
255
Both the domestic and international markets for Thai processed food products are flourishing, but thedomestic market has become more selective and requires more product variety than before.
The Thai food processing industry comprises predominantly small and medium enterprises (SMEs). Itaccounts for 42 percent of the SMEs. Because most companies are SMEs, investments in technology andsanitary and phytosanitary measures are rare. Many of them are unorganized and unregisteredhousehold/cottage industries (Krishnamurthy, 2009, p. 30). As they are mostly unregistered, foodprocessing SMEs have faced difficulties in the areas of business skills, especially marketing,standardization of production, packaging management, technology for production and investmentfunding. Thus their products are distributed and sold in local areas only. It is very difficult for the productsto enter a modern supermarket or an international market (Taweekul and Srigam, 2001, p. 134). Thispaper, therefore assesses agro-industrial policy’s contribution to facilitating improvements in efficiencyand competitiveness in the food processing sector. The study will analyse the achievements andconstraints, major issues, the role of public policy and South-South cooperation in the region and theopportunity for the engagement of FAO and other development partners in agro-industrial policydevelopment.
2. Review of small and medium food processing enterprises (SMFEs) and theircontribution to development in the country
Definition and measurement of SMEs in Thailand
In the context of international studies, SMEs refer to private enterprises, including manufacturing industryand the service and trade sector, with fewer than 250 employees. Generally, SMEs can be classified intothree categories: micro-enterprises comprising 0 to 9 employees, small enterprises comprising 10 to 49employees and medium enterprises comprising 50 to 249 employees. The large enterprises comprise ofmore than 249 employees (Wattanapinyo, 2006, p. 33).
There is no single definition of SMEs in Thailand and definitions of SMEs vary according to each stateagency. Some agencies define SMEs according to the sales per annum, the net fixed assets, the numberof employees and the registered capital (Sevilla and Soonthornthada, 2002, p. 3). The Ministry of Industry’sDepartment of Industrial Promotion (DIP) defines three different categories of SMEs: 1) production sectorSMEs (including agricultural processing, manufacturing and mining); 2) service sector SMEs; and3) trading sector SMEs.
The Ministry of Labour has classified SMEs into three categories: micro enterprises in comprising1 to 9 employees, small enterprises comprising 10 to 49 employees and medium enterprises comprising
Dairy products Pasteurized milk (pouch, bottle, paper box)Sterilized milk (can, ultra heat treated (UHT), bottle)Sweetened condensed milkCheese, butter
Bakery products BreadCakeCookies
Seasonings Seasoning mix, sauceVinegarSoup brothMonosodium glutamate (MSG)
Others Sugar (cane, coconut, palm)Traditional Thai foods, etc.
Source: Taweekul and Srigam, 2001 (p. 132-133)
Table 1. Processed food in Thailand
Category Processed food
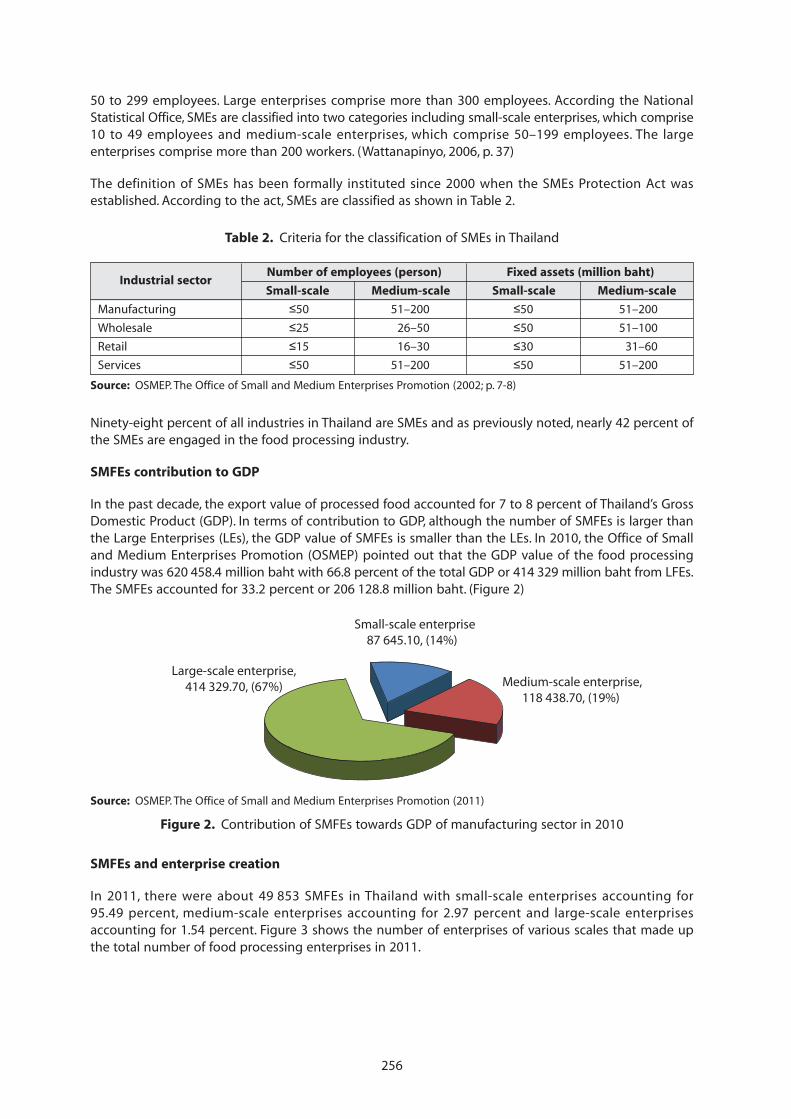
256
50 to 299 employees. Large enterprises comprise more than 300 employees. According the NationalStatistical Office, SMEs are classified into two categories including small-scale enterprises, which comprise10 to 49 employees and medium-scale enterprises, which comprise 50–199 employees. The largeenterprises comprise more than 200 workers. (Wattanapinyo, 2006, p. 37)
The definition of SMEs has been formally instituted since 2000 when the SMEs Protection Act wasestablished. According to the act, SMEs are classified as shown in Table 2.
Table 2. Criteria for the classification of SMEs in Thailand
Industrial sectorNumber of employees (person) Fixed assets (million baht)
Small-scale Medium-scale Small-scale Medium-scale
Manufacturing ≤50 51–200 ≤50 51–200
Wholesale ≤25 26–50 ≤50 51–100
Retail ≤15 16–30 ≤30 31–60
Services ≤50 51–200 ≤50 51–200
Source: OSMEP. The Office of Small and Medium Enterprises Promotion (2002; p. 7-8)
Ninety-eight percent of all industries in Thailand are SMEs and as previously noted, nearly 42 percent ofthe SMEs are engaged in the food processing industry.
SMFEs contribution to GDP
In the past decade, the export value of processed food accounted for 7 to 8 percent of Thailand’s GrossDomestic Product (GDP). In terms of contribution to GDP, although the number of SMFEs is larger thanthe Large Enterprises (LEs), the GDP value of SMFEs is smaller than the LEs. In 2010, the Office of Smalland Medium Enterprises Promotion (OSMEP) pointed out that the GDP value of the food processingindustry was 620 458.4 million baht with 66.8 percent of the total GDP or 414 329 million baht from LFEs.The SMFEs accounted for 33.2 percent or 206 128.8 million baht. (Figure 2)
Source: OSMEP. The Office of Small and Medium Enterprises Promotion (2011)
Figure 2. Contribution of SMFEs towards GDP of manufacturing sector in 2010
Large-scale enterprise, 414 329.70, (67%)
Small-scale enterprise87 645.10, (14%)
Medium-scale enterprise,118 438.70, (19%)
SMFEs and enterprise creation
In 2011, there were about 49 853 SMFEs in Thailand with small-scale enterprises accounting for95.49 percent, medium-scale enterprises accounting for 2.97 percent and large-scale enterprisesaccounting for 1.54 percent. Figure 3 shows the number of enterprises of various scales that made upthe total number of food processing enterprises in 2011.
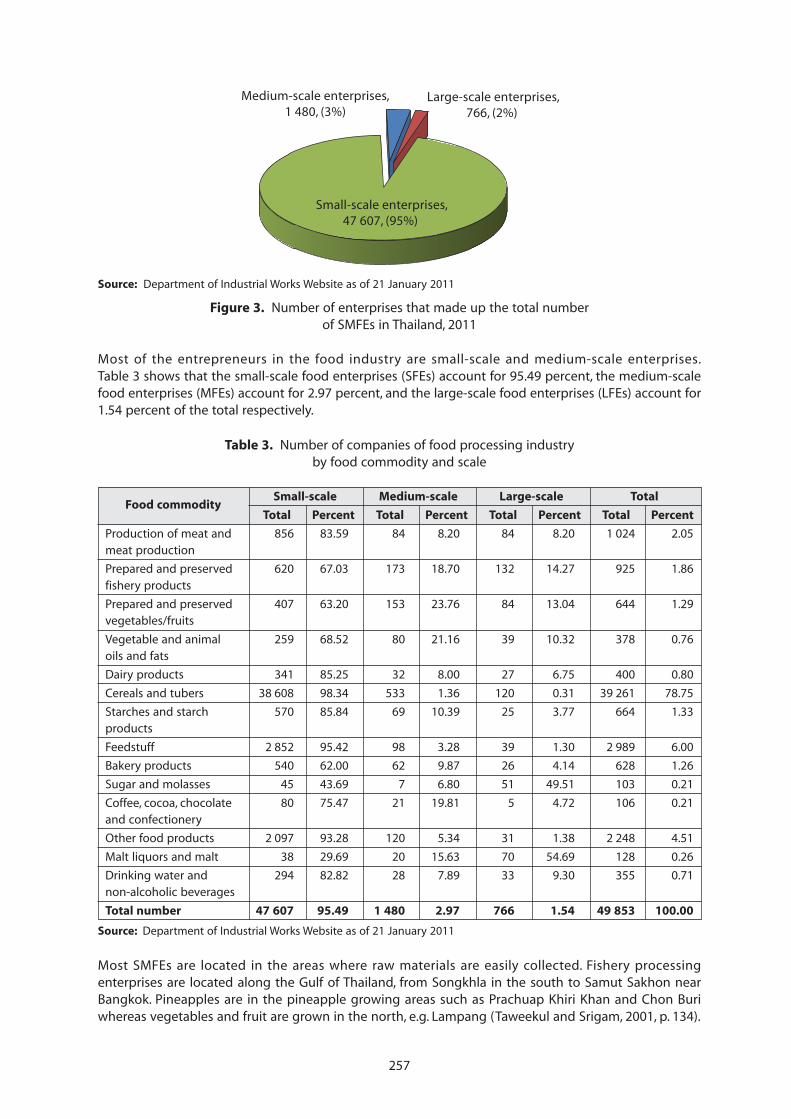
257
Most of the entrepreneurs in the food industry are small-scale and medium-scale enterprises.Table 3 shows that the small-scale food enterprises (SFEs) account for 95.49 percent, the medium-scalefood enterprises (MFEs) account for 2.97 percent, and the large-scale food enterprises (LFEs) account for1.54 percent of the total respectively.
Source: Department of Industrial Works Website as of 21 January 2011
Figure 3. Number of enterprises that made up the total numberof SMFEs in Thailand, 2011
Small-scale enterprises,47 607, (95%)
Medium-scale enterprises,1 480, (3%)
Large-scale enterprises, 766, (2%)
Table 3. Number of companies of food processing industryby food commodity and scale
Food commoditySmall-scale Medium-scale Large-scale Total
Total Percent Total Percent Total Percent Total Percent
Production of meat and 856 83.59 84 8.20 84 8.20 1 024 2.05meat production
Prepared and preserved 620 67.03 173 18.70 132 14.27 925 1.86fishery products
Prepared and preserved 407 63.20 153 23.76 84 13.04 644 1.29vegetables/fruits
Vegetable and animal 259 68.52 80 21.16 39 10.32 378 0.76oils and fats
Dairy products 341 85.25 32 8.00 27 6.75 400 0.80
Cereals and tubers 38 608 98.34 533 1.36 120 0.31 39 261 78.75
Starches and starch 570 85.84 69 10.39 25 3.77 664 1.33products
Feedstuff 2 852 95.42 98 3.28 39 1.30 2 989 6.00
Bakery products 540 62.00 62 9.87 26 4.14 628 1.26
Sugar and molasses 45 43.69 7 6.80 51 49.51 103 0.21
Coffee, cocoa, chocolate 80 75.47 21 19.81 5 4.72 106 0.21and confectionery
Other food products 2 097 93.28 120 5.34 31 1.38 2 248 4.51
Malt liquors and malt 38 29.69 20 15.63 70 54.69 128 0.26
Drinking water and 294 82.82 28 7.89 33 9.30 355 0.71non-alcoholic beverages
Total number 47 607 95.49 1 480 2.97 766 1.54 49 853 100.00
Source: Department of Industrial Works Website as of 21 January 2011
Most SMFEs are located in the areas where raw materials are easily collected. Fishery processingenterprises are located along the Gulf of Thailand, from Songkhla in the south to Samut Sakhon nearBangkok. Pineapples are in the pineapple growing areas such as Prachuap Khiri Khan and Chon Buriwhereas vegetables and fruit are grown in the north, e.g. Lampang (Taweekul and Srigam, 2001, p. 134).
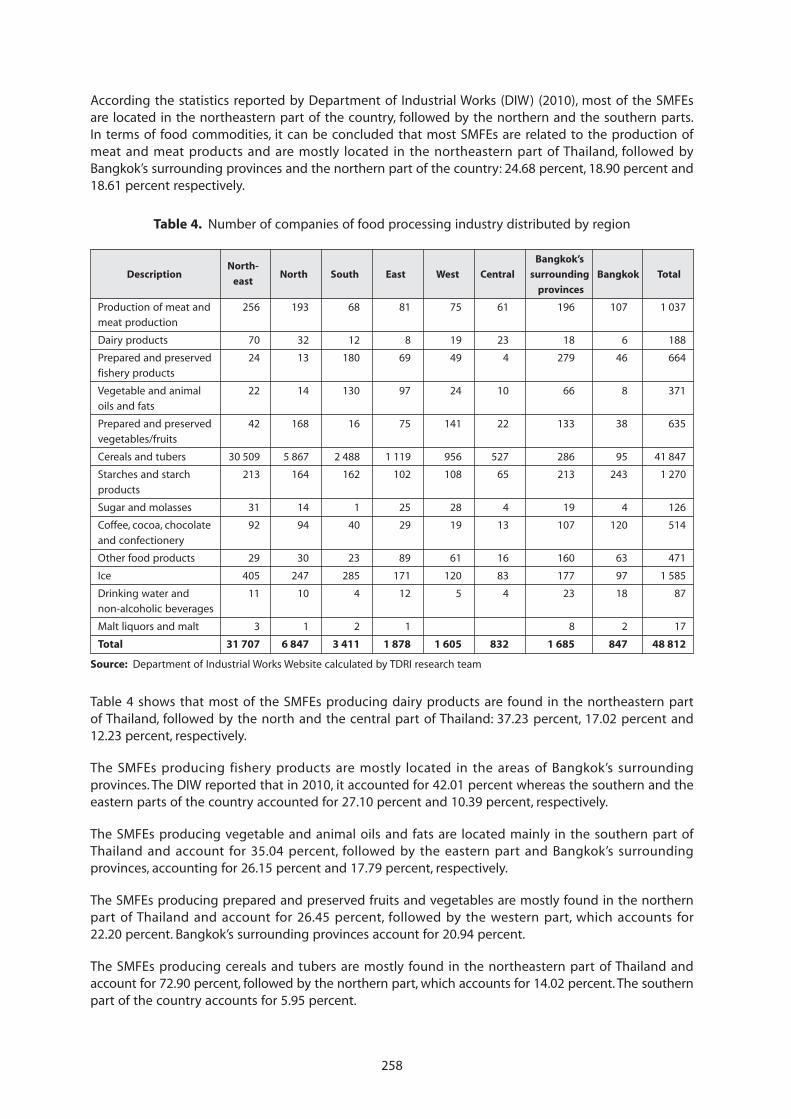
258
According the statistics reported by Department of Industrial Works (DIW) (2010), most of the SMFEsare located in the northeastern part of the country, followed by the northern and the southern parts.In terms of food commodities, it can be concluded that most SMFEs are related to the production ofmeat and meat products and are mostly located in the northeastern part of Thailand, followed byBangkok’s surrounding provinces and the northern part of the country: 24.68 percent, 18.90 percent and18.61 percent respectively.
Table 4. Number of companies of food processing industry distributed by region
North-Bangkok’s
Descriptioneast
North South East West Central surrounding Bangkok Total
provinces
Production of meat and 256 193 68 81 75 61 196 107 1 037meat production
Dairy products 70 32 12 8 19 23 18 6 188
Prepared and preserved 24 13 180 69 49 4 279 46 664fishery products
Vegetable and animal 22 14 130 97 24 10 66 8 371
oils and fats
Prepared and preserved 42 168 16 75 141 22 133 38 635
vegetables/fruits
Cereals and tubers 30 509 5 867 2 488 1 119 956 527 286 95 41 847
Starches and starch 213 164 162 102 108 65 213 243 1 270
products
Sugar and molasses 31 14 1 25 28 4 19 4 126
Coffee, cocoa, chocolate 92 94 40 29 19 13 107 120 514
and confectionery
Other food products 29 30 23 89 61 16 160 63 471
Ice 405 247 285 171 120 83 177 97 1 585
Drinking water and 11 10 4 12 5 4 23 18 87non-alcoholic beverages
Malt liquors and malt 3 1 2 1 8 2 17
Total 31 707 6 847 3 411 1 878 1 605 832 1 685 847 48 812
Source: Department of Industrial Works Website calculated by TDRI research team
Table 4 shows that most of the SMFEs producing dairy products are found in the northeastern partof Thailand, followed by the north and the central part of Thailand: 37.23 percent, 17.02 percent and12.23 percent, respectively.
The SMFEs producing fishery products are mostly located in the areas of Bangkok’s surroundingprovinces. The DIW reported that in 2010, it accounted for 42.01 percent whereas the southern and theeastern parts of the country accounted for 27.10 percent and 10.39 percent, respectively.
The SMFEs producing vegetable and animal oils and fats are located mainly in the southern part ofThailand and account for 35.04 percent, followed by the eastern part and Bangkok’s surroundingprovinces, accounting for 26.15 percent and 17.79 percent, respectively.
The SMFEs producing prepared and preserved fruits and vegetables are mostly found in the northernpart of Thailand and account for 26.45 percent, followed by the western part, which accounts for22.20 percent. Bangkok’s surrounding provinces account for 20.94 percent.
The SMFEs producing cereals and tubers are mostly found in the northeastern part of Thailand andaccount for 72.90 percent, followed by the northern part, which accounts for 14.02 percent. The southernpart of the country accounts for 5.95 percent.
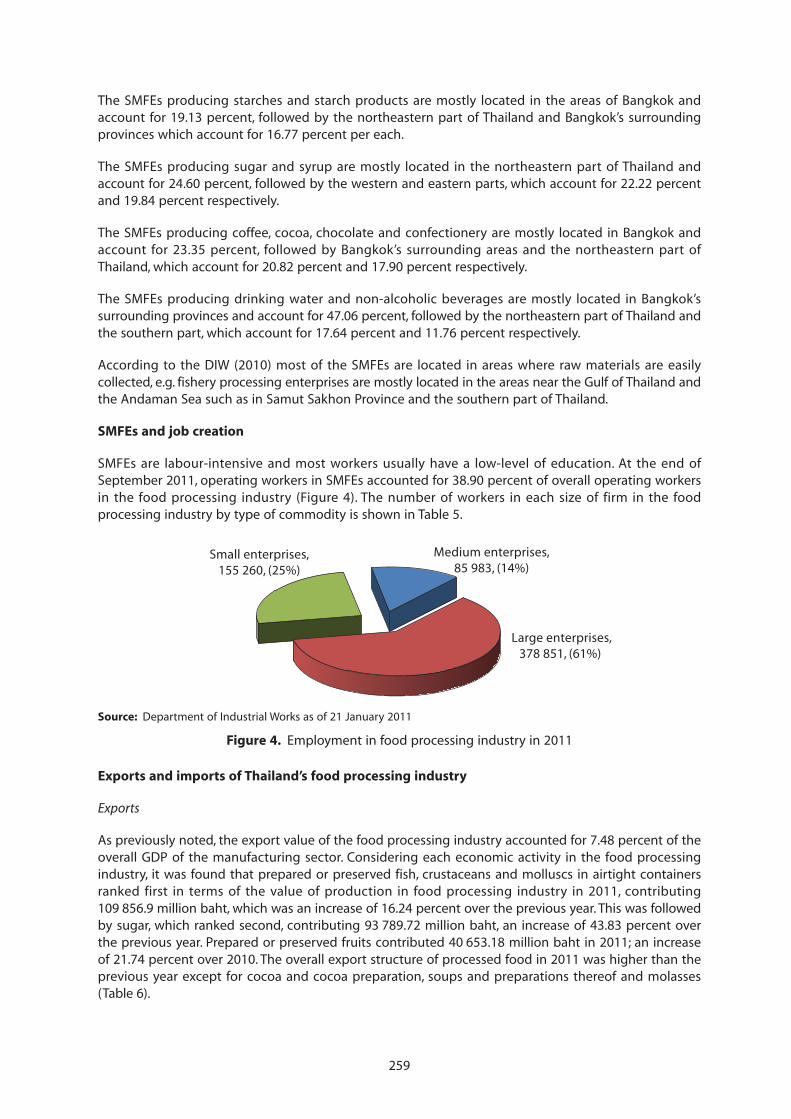
259
The SMFEs producing starches and starch products are mostly located in the areas of Bangkok andaccount for 19.13 percent, followed by the northeastern part of Thailand and Bangkok’s surroundingprovinces which account for 16.77 percent per each.
The SMFEs producing sugar and syrup are mostly located in the northeastern part of Thailand andaccount for 24.60 percent, followed by the western and eastern parts, which account for 22.22 percentand 19.84 percent respectively.
The SMFEs producing coffee, cocoa, chocolate and confectionery are mostly located in Bangkok andaccount for 23.35 percent, followed by Bangkok’s surrounding areas and the northeastern part ofThailand, which account for 20.82 percent and 17.90 percent respectively.
The SMFEs producing drinking water and non-alcoholic beverages are mostly located in Bangkok’ssurrounding provinces and account for 47.06 percent, followed by the northeastern part of Thailand andthe southern part, which account for 17.64 percent and 11.76 percent respectively.
According to the DIW (2010) most of the SMFEs are located in areas where raw materials are easilycollected, e.g. fishery processing enterprises are mostly located in the areas near the Gulf of Thailand andthe Andaman Sea such as in Samut Sakhon Province and the southern part of Thailand.
SMFEs and job creation
SMFEs are labour-intensive and most workers usually have a low-level of education. At the end ofSeptember 2011, operating workers in SMFEs accounted for 38.90 percent of overall operating workersin the food processing industry (Figure 4). The number of workers in each size of firm in the foodprocessing industry by type of commodity is shown in Table 5.
Source: Department of Industrial Works as of 21 January 2011
Figure 4. Employment in food processing industry in 2011
Large enterprises,378 851, (61%)
Medium enterprises,85 983, (14%)
Small enterprises,155 260, (25%)
Exports and imports of Thailand’s food processing industry
Exports
As previously noted, the export value of the food processing industry accounted for 7.48 percent of theoverall GDP of the manufacturing sector. Considering each economic activity in the food processingindustry, it was found that prepared or preserved fish, crustaceans and molluscs in airtight containersranked first in terms of the value of production in food processing industry in 2011, contributing109 856.9 million baht, which was an increase of 16.24 percent over the previous year. This was followedby sugar, which ranked second, contributing 93 789.72 million baht, an increase of 43.83 percent overthe previous year. Prepared or preserved fruits contributed 40 653.18 million baht in 2011; an increaseof 21.74 percent over 2010. The overall export structure of processed food in 2011 was higher than theprevious year except for cocoa and cocoa preparation, soups and preparations thereof and molasses(Table 6).
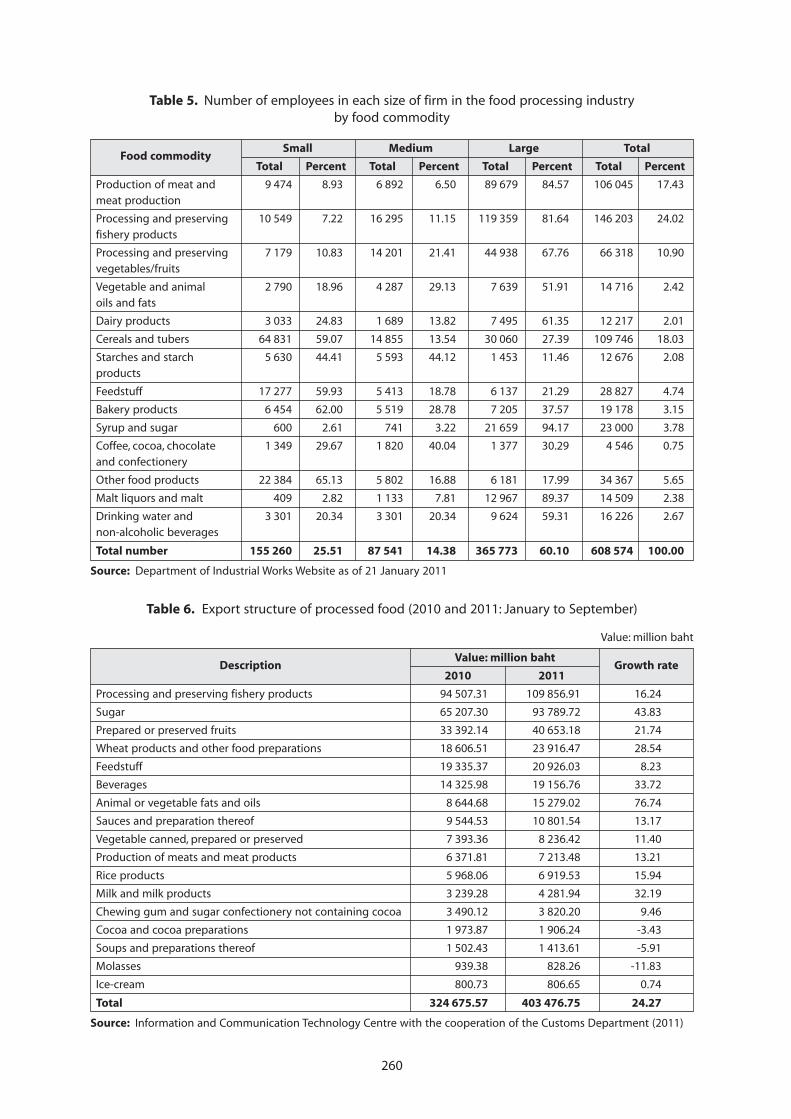
260
Table 5. Number of employees in each size of firm in the food processing industryby food commodity
Food commoditySmall Medium Large Total
Total Percent Total Percent Total Percent Total Percent
Production of meat and 9 474 8.93 6 892 6.50 89 679 84.57 106 045 17.43meat production
Processing and preserving 10 549 7.22 16 295 11.15 119 359 81.64 146 203 24.02fishery products
Processing and preserving 7 179 10.83 14 201 21.41 44 938 67.76 66 318 10.90vegetables/fruits
Vegetable and animal 2 790 18.96 4 287 29.13 7 639 51.91 14 716 2.42oils and fats
Dairy products 3 033 24.83 1 689 13.82 7 495 61.35 12 217 2.01
Cereals and tubers 64 831 59.07 14 855 13.54 30 060 27.39 109 746 18.03
Starches and starch 5 630 44.41 5 593 44.12 1 453 11.46 12 676 2.08products
Feedstuff 17 277 59.93 5 413 18.78 6 137 21.29 28 827 4.74
Bakery products 6 454 62.00 5 519 28.78 7 205 37.57 19 178 3.15
Syrup and sugar 600 2.61 741 3.22 21 659 94.17 23 000 3.78
Coffee, cocoa, chocolate 1 349 29.67 1 820 40.04 1 377 30.29 4 546 0.75and confectionery
Other food products 22 384 65.13 5 802 16.88 6 181 17.99 34 367 5.65
Malt liquors and malt 409 2.82 1 133 7.81 12 967 89.37 14 509 2.38
Drinking water and 3 301 20.34 3 301 20.34 9 624 59.31 16 226 2.67non-alcoholic beverages
Total number 155 260 25.51 87 541 14.38 365 773 60.10 608 574 100.00
Source: Department of Industrial Works Website as of 21 January 2011
Table 6. Export structure of processed food (2010 and 2011: January to September)
Value: million baht
DescriptionValue: million baht
Growth rate2010 2011
Processing and preserving fishery products 94 507.31 109 856.91 16.24
Sugar 65 207.30 93 789.72 43.83
Prepared or preserved fruits 33 392.14 40 653.18 21.74
Wheat products and other food preparations 18 606.51 23 916.47 28.54
Feedstuff 19 335.37 20 926.03 8.23
Beverages 14 325.98 19 156.76 33.72
Animal or vegetable fats and oils 8 644.68 15 279.02 76.74
Sauces and preparation thereof 9 544.53 10 801.54 13.17
Vegetable canned, prepared or preserved 7 393.36 8 236.42 11.40
Production of meats and meat products 6 371.81 7 213.48 13.21
Rice products 5 968.06 6 919.53 15.94
Milk and milk products 3 239.28 4 281.94 32.19
Chewing gum and sugar confectionery not containing cocoa 3 490.12 3 820.20 9.46
Cocoa and cocoa preparations 1 973.87 1 906.24 -3.43
Soups and preparations thereof 1 502.43 1 413.61 -5.91
Molasses 939.38 828.26 -11.83
Ice-cream 800.73 806.65 0.74
Total 324 675.57 403 476.75 24.27
Source: Information and Communication Technology Centre with the cooperation of the Customs Department (2011)
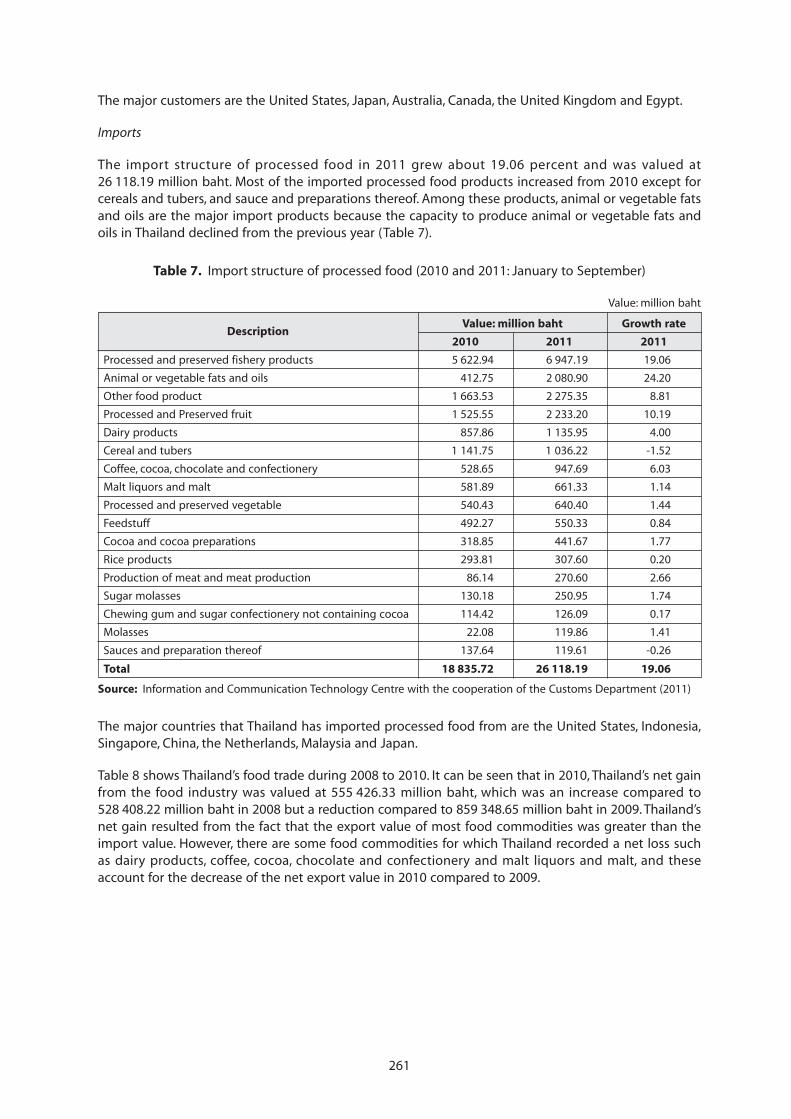
261
The major customers are the United States, Japan, Australia, Canada, the United Kingdom and Egypt.
Imports
The import structure of processed food in 2011 grew about 19.06 percent and was valued at26 118.19 million baht. Most of the imported processed food products increased from 2010 except forcereals and tubers, and sauce and preparations thereof. Among these products, animal or vegetable fatsand oils are the major import products because the capacity to produce animal or vegetable fats andoils in Thailand declined from the previous year (Table 7).
Table 7. Import structure of processed food (2010 and 2011: January to September)
Value: million baht
DescriptionValue: million baht Growth rate
2010 2011 2011
Processed and preserved fishery products 5 622.94 6 947.19 19.06
Animal or vegetable fats and oils 412.75 2 080.90 24.20
Other food product 1 663.53 2 275.35 8.81
Processed and Preserved fruit 1 525.55 2 233.20 10.19
Dairy products 857.86 1 135.95 4.00
Cereal and tubers 1 141.75 1 036.22 -1.52
Coffee, cocoa, chocolate and confectionery 528.65 947.69 6.03
Malt liquors and malt 581.89 661.33 1.14
Processed and preserved vegetable 540.43 640.40 1.44
Feedstuff 492.27 550.33 0.84
Cocoa and cocoa preparations 318.85 441.67 1.77
Rice products 293.81 307.60 0.20
Production of meat and meat production 86.14 270.60 2.66
Sugar molasses 130.18 250.95 1.74
Chewing gum and sugar confectionery not containing cocoa 114.42 126.09 0.17
Molasses 22.08 119.86 1.41
Sauces and preparation thereof 137.64 119.61 -0.26
Total 18 835.72 26 118.19 19.06
Source: Information and Communication Technology Centre with the cooperation of the Customs Department (2011)
The major countries that Thailand has imported processed food from are the United States, Indonesia,Singapore, China, the Netherlands, Malaysia and Japan.
Table 8 shows Thailand’s food trade during 2008 to 2010. It can be seen that in 2010, Thailand’s net gainfrom the food industry was valued at 555 426.33 million baht, which was an increase compared to528 408.22 million baht in 2008 but a reduction compared to 859 348.65 million baht in 2009. Thailand’snet gain resulted from the fact that the export value of most food commodities was greater than theimport value. However, there are some food commodities for which Thailand recorded a net loss suchas dairy products, coffee, cocoa, chocolate and confectionery and malt liquors and malt, and theseaccount for the decrease of the net export value in 2010 compared to 2009.
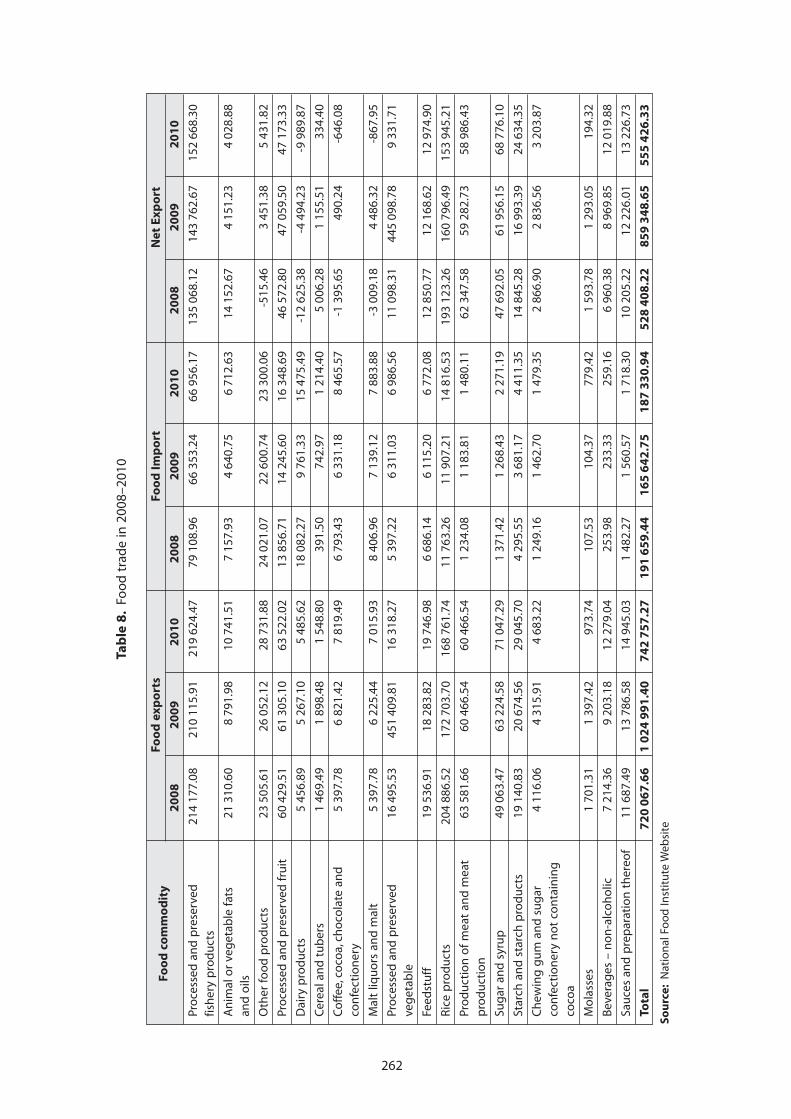
262
Tab
le 8
. Fo
od
tra
de
in 2
008–
2010
Foo
d c
om
mo
dit
yFo
od
exp
ort
sFo
od
Imp
ort
Net
Exp
ort
20
08
20
09
20
10
20
08
20
09
20
10
20
08
20
09
20
10
Pro
cess
ed a
nd
pre
serv
ed21
417
7.08
210
115.
9121
962
4.47
7910
8.96
6635
3.24
6695
6.17
135
068.
1214
376
2.67
152
668.
30fis
her
y p
rod
uct
s
An
imal
or
veg
etab
le f
ats
2131
0.60
879
1.98
1074
1.51
715
7.93
464
0.75
671
2.63
1415
2.67
415
1.23
402
8.88
and
oils
Oth
er fo
od
pro
du
cts
2350
5.61
2605
2.12
2873
1.88
2402
1.07
2260
0.74
2330
0.06
-515
.46
345
1.38
543
1.82
Pro
cess
ed a
nd
pre
serv
ed f
ruit
6042
9.51
6130
5.10
6352
2.02
1385
6.71
1424
5.60
1634
8.69
4657
2.80
4705
9.50
4717
3.33
Dai
ry p
rod
uct
s5
456.
895
267.
105
485.
6218
082.
279
761.
3315
475.
49-1
262
5.38
-449
4.23
-998
9.87
Cer
eal a
nd
tu
ber
s1
469.
491
898.
481
548.
8039
1.50
742.
971
214.
405
006.
281
155.
5133
4.40
Co
ffee
, co
coa,
ch
oco
late
an
d5
397.
786
821.
427
819.
496
793.
436
331.
188
465.
57-1
395.
6549
0.24
-646
.08
con
fect
ion
ery
Mal
t liq
uo
rs a
nd
mal
t5
397.
786
225.
447
015.
938
406.
967
139.
127
883.
88-3
009.
184
486.
32-8
67.9
5
Pro
cess
ed a
nd
pre
serv
ed16
495.
5345
140
9.81
1631
8.27
539
7.22
631
1.03
698
6.56
1109
8.31
445
098.
789
331.
71ve
get
able
Feed
stu
ff19
536.
9118
283.
8219
746.
986
686.
146
115.
206
772.
0812
850.
7712
168.
6212
974.
90
Ric
e p
rod
uct
s20
488
6.52
172
703.
7016
876
1.74
1176
3.26
1190
7.21
1481
6.53
193
123.
2616
079
6.49
153
945.
21
Pro
du
ctio
n o
f m
eat
and
mea
t63
581.
6660
466.
5460
466.
541
234.
081
183.
811
480.
1162
347.
5859
282.
7358
986.
43p
rod
uct
ion
Sug
ar a
nd
syr
up
4906
3.47
6322
4.58
7104
7.29
137
1.42
126
8.43
227
1.19
4769
2.05
6195
6.15
6877
6.10
Star
ch a
nd
sta
rch
pro
du
cts
1914
0.83
2067
4.56
2904
5.70
429
5.55
368
1.17
441
1.35
1484
5.28
1699
3.39
2463
4.35
Ch
ewin
g g
um
an
d s
ug
ar4
116.
064
315.
914
683.
221
249.
161
462.
701
479.
352
866.
902
836.
563
203.
87co
nfe
ctio
ner
y n
ot
con
tain
ing
coco
a
Mo
lass
es1
701.
311
397.
4297
3.74
107.
5310
4.37
779.
421
593.
781
293.
0519
4.32
Bev
erag
es –
no
n-a
lco
ho
lic7
214.
369
203.
1812
279.
0425
3.98
233.
3325
9.16
696
0.38
896
9.85
1201
9.88
Sau
ces
and
pre
par
atio
n t
her
eof
1168
7.49
1378
6.58
1494
5.03
148
2.27
156
0.57
171
8.30
1020
5.22
1222
6.01
1322
6.73
Tota
l7
20
06
7.6
61
02
49
91
.40
74
27
57
.27
19
16
59
.44
16
56
42
.75
18
73
30
.94
52
84
08
.22
85
93
48
.65
55
54
26
.33
Sou
rce:
Nat
ion
al F
ood
Inst
itu
te W
ebsi
te
263
Production trend
The Office of Industrial Economics (OIE) predicts that Thailand’s food processing sector will perform in2011 (The Office of Industrial Economics, 2011) as follows:
● Production of meat and meat products. Although the labour productivity index will increase15.0 percent over the previous year, the OIE predicted that the overall production in 2011 willdecrease. At the end of September 2011, the production index of meat and meat productsdecreased 2.1 percent. The finished goods inventory index declined 13.0 percent over the lastyear. The shipment index declined 2.0 percent over the last year.
● Processing and preserving of fishery products. The production value at the end of September2011 was smaller than the previous year as was the shipment index, which decreased 1.4 percent.However, the finished goods inventory index increased 2.0 percent over the last year.
● Processing of fruits and vegetables. The OIE predicts that the production index of processingfruit and vegetable will increase 21.8 percent over the previous year as well as the shipmentindex, which will increase 6.6 percent.
● Manufacture of vegetable and animal oils and fats. The OIE predicts that the production indexof the manufacture of vegetable and animal oils and fats will increase 15.0 percent over theprevious year as well as the shipment index, which will increase 5.1 percent. However, the finishedgoods inventory index will decline 10.8 percent.
● Manufacture of dairy products. The OIE predicts that the production index of manufacture ofdairy products will increase 12.6 percent over the previous year as well as the shipment index,which will increase 12.2 percent. The finished goods inventory index will decline 25.0 percent.
● Manufacture of starches and starch products. The OIE predicts that the production index ofmanufacture of starches and starch products will increase 14.9 percent over the previous yearas well as the shipment index, which will expand 0.7 percent. The finished goods inventory indexwill decline 47.9 percent.
● Manufacture of prepared animal feeds. The OIE predicts that the production index ofmanufacture of prepared animal feeds will increase 9.9 percent over the previous year as wellas the shipment index, which will expand 9.7 percent. The finished goods inventory index willexpand 8.1 percent.
● Manufacture of bakery products. The OIE predicts that the production index of manufactureof prepared animal feeds will decline 1.4 percent whereas the shipment index will expand0.5 percent and the finished goods inventory index will expand 36.4 percent.
● Manufacture of sugar. The OIE predicts that the production index of manufacture of preparedanimal feeds will increase 16.9 percent over the previous year whereas the shipment index willexpand 16.0 percent and the finished goods inventory index will expand 34.6 percent.
● Manufacture of other food product. The OIE predicts that the production index of Manufactureof prepared animal feeds will decline 1.5 percent and the finished goods inventory will decrease12.3 percent. In contrast, the shipment index will expand 2.9 percent.
● Manufacture of malt liquors and malt. The OIE predicts that the production index ofmanufacture of malt liquors will increase 3.6 percent over the previous year and the shipmentindex will also expand 0.1 percent. The finished goods inventory, conversely, will decline14.5 percent.
● Manufacture of soft drinks and bottling of mineral waters. The OIE predicts that theproduction index of manufacture of soft drinks will decrease 2.4 percent as will as the shipmentindex. The finished goods inventory, conversely, will increase 13.1 percent.
The predictions as aforementioned were not classified according to the size of enterprises.
264
3. Status of food processing in Thailand with specific focus on SMFEs
Thailand’s food processing industry comprises many related organizations including the private sector,the government sector, academic institutions, communities and some non-governmental organizations(NGOs). The status of the food processing industry depends on the support of these organizations. Thevalue chain of the food processing industry includes manufacturers, regulators, R&D and supporters,which are described as follows:
Key players in the food processing sector
Regulators
Before the economic crisis in 1997, the promotion and development of rural-based food industries wereroutine activities of various government agencies. Since then until 1999, the Thai Government put moreeffort into assisting SMFEs in the hope that they would help the country to recover from the crisis. Partof this assistance involved the formulation and implementation of an SMFEs manufacturing sectorrestructuring plan. Under the plan, a project designed to develop the efficiency of SMEs was establishedby the Department of Industrial Promotion, with the collaboration of universities around the country. Theobjective of the project was to assist various groups, including the food processing industry, to upgradeand improve their capability in running their enterprises, through efficiency improvement in the areasof production and management and to improve product quality. Special services were given to500 selected SMEs in 1999. The Department hired university professors in the required fields to serve asconsultants to the SMEs for six months in each industry. The consultants could assist in productionproblem solving, productivity improvement, product development, marketing and financial management.Specific to the quality control systems in manufacturing, three government agencies provided services:the Thailand Industrial Standards Institute, Ministry of Industry; Department of Industrial Promotion,Ministry of Industry; and the National Science and Technology Development Agency. The ThailandIndustrial Standards Institute emphasized ISO 9000, whereas the other two agencies emphasized theirown quality development systems that were considered more appropriate to SMEs.
Manufacturers
The private sector involvement in the food processing industry consists of the industry itself, suppliersof raw materials, other food ingredients, packaging and machinery. Each plays a role in the developmentof the food processing industry. In most rural-based food processing industries, the production efficiencyis low and the product quality is unstable. Moreover, trade information is not accessible. The foodprocessing industries must help themselves in finding relevant, up-to-date information through otherconcerned parties and government agencies in the area. With this information they should be able tomake good judgments to develop their own industries in the areas of productivity, quality andmanagement. Hence food industries themselves play a major role in their own development. Theexpansion or setting up of an affiliated production unit in a remote area, closer to the raw materials, isanother form of rural-based development.
Supporters
Usually, one of the objectives of NGOs concerns the wellbeing of the public, therefore some NGOs havebecome involved in rural-based food processing industries. For example, the Population and CommunityDevelopment Association (PDA) has created and implemented the Thai Business Initiative in RuralDevelopment (TBIRD) Project to involve businesses in rural development work.
Communities
People in rural areas earn their living mainly in agriculture. Their incomes are low, so the governmentagency in rural areas encourages rural people to form a group for doing supplementary businesses intheir free time. If such a business goes well, it can become a main income earner. The businesses areusually based on the agricultural produce in the area, as is the case with the dried banana and ginger
265
drink businesses. These village groups should be formed voluntarily, but should be committed to playinga significant role in the development of the food industry, acting with full responsibility and aiming forcontinual improvement.
Linkages among the government, the private sector, NGOs and village groups
In the past, the government, the private sector, NGOs and village groups worked separately. The transferof information and the establishment of linkages were rare because of factors such as poorcommunication systems, the low level of technology, the lack of supporting agencies, and the lack offunding. Many sectors were involved in and supported rural food processing, especially, governmentagencies such as the Department of Industrial Promotion and the Department of CommunityDevelopment, as well as government universities,. Moreover, NGOs also worked well and sought thecooperation of others to join in rural food processing. The villagers themselves tried to improve foodpreservation in terms of quality, taste, and marketing.
As mentioned earlier, the Thai Business Initiative in Rural Development (TBIRD) was created andimplemented by the PDA, an NGO. The TBIRD’s Rural Industry Project is a concept focusing on “bringingthe factories to the rural people instead of bringing rural people to the factories”. Thus, all industrialsectors, for instance, agriculture, non-agriculture and food processing industries have been encouragedto locate in rural areas.
The concept is to alleviate poverty in the rural areas of Thailand, based on the belief that rural peopleare poor because they lack business skills essential to their economic security, such as organizing,financing, producing and, most important, marketing. In other words, they do not know how to dobusiness or to be entrepreneurs.
The TBIRD Rural Industry Project has been remarkably successful in improving the quality of rural lifethrough creating job opportunities for the rural poor, who hitherto have had to depend on seasonalagricultural income, while remaining vulnerable to unreliable weather patterns and the changingseasons.
From this remarkable success, the government realized that tripartite collaboration among governmentagencies, the private sector and NGOs was important in the Promotion of Rural Industrial Development(PRID) Project. PRID was a joint activity between NGOs such as the PDA, and government agencies(especially the Department of Industrial Promotion under the Ministry of Industry). This strengthened theNGOs in recruiting the private sector to establish manufacturing in rural areas, with an aim being toprovide training and to create employment opportunities for the villagers in the poor rural areas.
4. External forces that shape the SMFEs in Thailand
Globalization/trade liberalization
Like other industries, the food industry in Thailand has been affected by the changing global market. Thelinkage between the global market and food industry in Thailand can be described as shown inFigure 5. This figure points to the mutual relationships among the different actors within the foodindustry, where not only material aspects are involved, but also requirements and pressures to controlthe quality, safety and environmental impacts of food. Globalization signifies a rapid increase in thephysical distance between the producers and the consumers of food and the fast growth in the numberof intermediate actors involved. (Sriwicailamphan, 2007)
Therefore, SMFEs, which play an important role in the food industry, need to adjust themselves toconform to the requirements of the global market, particularly in supplying products that can meet theinternational standards for food safety.
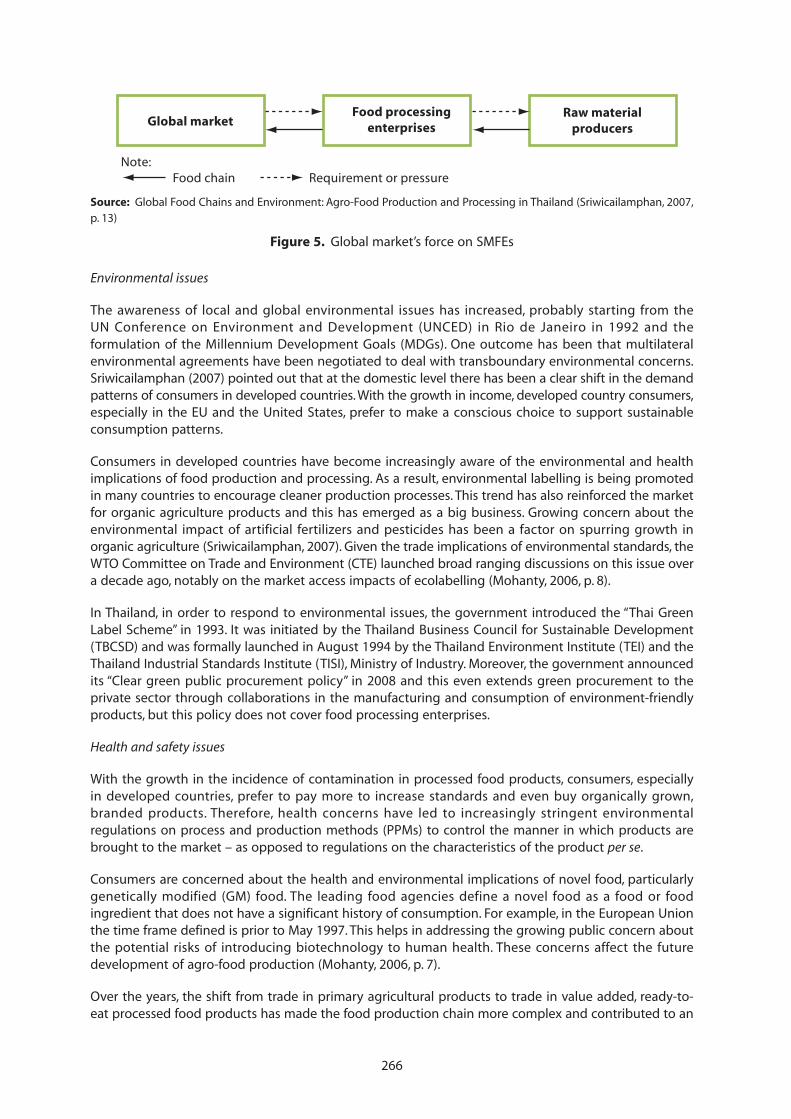
266
Environmental issues
The awareness of local and global environmental issues has increased, probably starting from theUN Conference on Environment and Development (UNCED) in Rio de Janeiro in 1992 and theformulation of the Millennium Development Goals (MDGs). One outcome has been that multilateralenvironmental agreements have been negotiated to deal with transboundary environmental concerns.Sriwicailamphan (2007) pointed out that at the domestic level there has been a clear shift in the demandpatterns of consumers in developed countries. With the growth in income, developed country consumers,especially in the EU and the United States, prefer to make a conscious choice to support sustainableconsumption patterns.
Consumers in developed countries have become increasingly aware of the environmental and healthimplications of food production and processing. As a result, environmental labelling is being promotedin many countries to encourage cleaner production processes. This trend has also reinforced the marketfor organic agriculture products and this has emerged as a big business. Growing concern about theenvironmental impact of artificial fertilizers and pesticides has been a factor on spurring growth inorganic agriculture (Sriwicailamphan, 2007). Given the trade implications of environmental standards, theWTO Committee on Trade and Environment (CTE) launched broad ranging discussions on this issue overa decade ago, notably on the market access impacts of ecolabelling (Mohanty, 2006, p. 8).
In Thailand, in order to respond to environmental issues, the government introduced the “Thai GreenLabel Scheme” in 1993. It was initiated by the Thailand Business Council for Sustainable Development(TBCSD) and was formally launched in August 1994 by the Thailand Environment Institute (TEI) and theThailand Industrial Standards Institute (TISI), Ministry of Industry. Moreover, the government announcedits “Clear green public procurement policy” in 2008 and this even extends green procurement to theprivate sector through collaborations in the manufacturing and consumption of environment-friendlyproducts, but this policy does not cover food processing enterprises.
Health and safety issues
With the growth in the incidence of contamination in processed food products, consumers, especiallyin developed countries, prefer to pay more to increase standards and even buy organically grown,branded products. Therefore, health concerns have led to increasingly stringent environmentalregulations on process and production methods (PPMs) to control the manner in which products arebrought to the market – as opposed to regulations on the characteristics of the product per se.
Consumers are concerned about the health and environmental implications of novel food, particularlygenetically modified (GM) food. The leading food agencies define a novel food as a food or foodingredient that does not have a significant history of consumption. For example, in the European Unionthe time frame defined is prior to May 1997. This helps in addressing the growing public concern aboutthe potential risks of introducing biotechnology to human health. These concerns affect the futuredevelopment of agro-food production (Mohanty, 2006, p. 7).
Over the years, the shift from trade in primary agricultural products to trade in value added, ready-to-eat processed food products has made the food production chain more complex and contributed to an
Source: Global Food Chains and Environment: Agro-Food Production and Processing in Thailand (Sriwicailamphan, 2007,p. 13)
Figure 5. Global market’s force on SMFEs
Global marketFood processing
enterprisesRaw material
producers
Note:Food chain Requirement or pressure
267
increase in health and environmental concerns. As a direct result, the regulatory framework for foodsafety has expanded exponentially. Notwithstanding the many benefits to producers and consumers withrespect to providing information on products, there are serious trade implications of these divergingstandards. The development of international standards is put forward as a way to ensure transparencyand equity. Several multilateral bodies are engaged in the process of standards making in the food sector,such as the joint FAO-WHO Codex Alimentarius. Multilateral Environmental Agreements (MEAs) have alsobeen negotiated to deal with specific environmental issues of relevance to the food and food processingsector, such as genetically modified organisms in the Cartagena Biosafety Protocol (2003).
5. Government policy and legal framework
Agro-industrial policy
The 11th National Economic and Social Development Plan (NESDP) for 2012–2016 has clearly continued thecountry’s ambition to maintain the agricultural sector as a foundation of the society’s resilience and foodsecurity. The strategy of balancing food and energy security covers: (i) developing natural resources tostrengthen the agricultural base; (ii) enhancing agricultural productivity and value creation;(iii) promoting jobs and income security for farmers; (iv) enhancing food and fuel security at householdand community level; (v) developing energy security to support national development and theagricultural sector; and (vi) improving agricultural management to ensure the balance of food and energy(NESDP, 2010).
More specifically, the Royal Thai Government continues to prioritize the food industry. The productionof agricultural products is taken care of by the Ministry of Agriculture and the government has assignedthe Ministry of Industry and the National Food Institute to oversee the manufacturing part of foodproduction, particularly by providing technical support, information support and network support. Theentire value chain of agricultural and agricultural products ranging from cultivation, production andservices to the manufacture of farm machinery and food processing machinery are considered byThailand’s Board of Investment (BOI) as priority activities that enjoy numerous tax and non-tax incentives.
As reported in Thailand’s SME White Paper 2009, the Office of SMEs Promotion (OSMEP) carriesfundamental duties in formulating Thailand’s SME master plans and action plans, as well as in pushingforward implementation schemes under the action plans and monitoring their operational results(OSMEP, 2009). Disappointingly, the setting up of databases is recognized as part of OSMEP plans butthere are only three projects identifiable that are related to information and knowledge in this 2009 SMEAction Plan Project. Two of these are OSMEP international management databases and the third one isa database of Thai SME suppliers, made for ten target industries including processed seafood. The Bankof Thailand Financial Master Plan then makes a number of recommendations and suggestions toencourage more provision of microfinance through different channels, including mobile telephones withmore reliance on the commercial financial sector (OECD, 2011).
The Thai Food Industrial Development Master Plan 2012–2031 has suggested strategies and a plan underthe framework of “Thailand Food Forward”, which focuses on advancing the Thai food industry withtechnology and innovation in processing, productivity, quality control, food safety, along with thedevelopment of new products. Most importantly, the framework is unforgettably focused on strategicmarketing schemes to create consumer awareness, confidence and a good impression of Thai foodproducts. The roadmap determines the vision for the Thai food industry in 2012 that “Thailand will beamong the top leaders in the food industry by providing high quality products to the world market”. Inother words, the value of Thai food exports should increase no less than 10 percent annually. The valueof processed food and ready-to-eat food exports should be no less than 60 percent of the total valueof Thai food exports. Moreover, no less than 50 percent of registered Thai food factories should becertified as international standard. Consumers worldwide should have a prominent image of Thai foodproducts as being high quality and healthful. Lastly, Thailand’s local food standards should be comparablewith the international standard (OIE, 2011).
268
In order to create value for Thai food products by focusing on utilizing technology and innovation toimprove the product quality, the production process and packaging, especially for SMEs, OSMEP set upa model SME incubation centre in 2002 at Kasetsart University (Bangkhaen). The operation focuses mainlyon agricultural and food products and in 2004, OSMEP expanded the operation to Chulalongkorn andKing Mongkut’s University of Technology, Thonburi. A research project to draft a master plan forincubation system development subsequently was carried out by Chulalongkorn University. In thefollowing year, OSMEP additionally integrated Software Park Thailand, which is under the National Scienceand Technology Development Agency (NSTDA), in the operation, making four model centres in 2005.Since 2005 more incubation centres have been developed and subsidized, with 13 centres in 2006,20 in 2007, and a further 2 in 2008, which finally totalled 39 incubation centres (OECD, 2011c).
The government of Thailand is also aware of the importance of a quality assurance system (QAS) in thefood processing industry. Two important factors attracting food processing entrepreneurs to apply a QASfor food quality and safety are: (i) during the last two decades consumers have been more concernedabout health and safety than the price of food; and (ii) increased competition among industries asa result of trade liberalization under the WTO. The Ministry of Industry (MOI) is the major actorresponsible for motivating, promoting, and supporting the small-and medium-sized food processingenterprises to apply different QAS to their processes. It has cooperated with leading organizations suchas the National Food Institute, Food and Drug Administration, Thailand Industrial Standards Institute andThailand Productivity Institute (Chamchong, 2005).
Furthermore, the current Strategic and Action Plan of MOI (2010–2013) is directed towards“Green Productivity”, which entails a triple focus: Environment, Profitability, and Quality. In 2008, OIE andthe National Food Institute cooperatively launched the project “Best Practice on Green Productivity andContinuous Improving” with an attempt to enable entrepreneurs to minimize their manufacturing coststhrough lower consumption of water and energy as well as to improve the integration of a wide rangeof environmental concerns into their production processes. Since the world leaders in the food industryshould demonstrate a high commitment to “Safety and Security”, “Sustainability”, “Standardization”, and“Green Productivity”, this project is expected to enhance Thailand’s competitiveness and gear thesefactories towards ISO 14000 and Carbon Footprint Standards. So far, the National Food Institute reportedlast year that 35 factories have participated in the aforementioned project including those from variousindustries such as canned food, frozen food, milk, juices, flours, and seasonings and others and that allof them were able to reduce their manufacturing costs significantly (see http://www.ryt9.com/s/prg/9813111, accessed 16 November 2011; OIE, 2011). Additionally, this year the National Food Institute hasstarted the project entitled “Good Practices on Productivity and Continuous Improving to Carbon Label”,which focuses on reducing environmental impacts and costs of the food industry (OIE, 2011).
In addition to the above-mentioned policy and programs, various agencies in Thailand areactively responsible for several projects regarding SMEs and entrepreneurship in the country’s foodindustry. These projects include: (1) Project on Enhancing Efficiency and Upgrading the Safety ofFood Products for SMEs – by the National Food Institute; (2) Project on Energy Management andEfficiency Enhancement in the Frozen Foods Industry (Pilot Project) – by Thai Frozen Foods Association;(3) Project on Promoting and Supporting Industrial Sized Food Production – by MOI; (4) Project onEnhancing the Quality of Food Produced by Supply Chain Management by the Joint Public PrivateCommittee, The Office of the Permanent Secretary of the Interior; (5) Project on Enhancing the FoodSafety Management System by the Joint Public Private Committee, the Office of the Permanent Secretaryof the Interior; and (6) Project on Enhancing Productivity and Innovation of the Supply Chains in SMFEsby the Joint Public Private Committee, the Office of the Permanent Secretary of the Interior. Althoughthe policies of SMFEs are well integrated in national development efforts, there still needs to be greatercoherence across government agencies. There is also a noticeable lack of standardized project andprogram evaluation procedures based on cost-benefit or cost-effectiveness analysis, and a limited useof key performance indicators for programs and projects. As a result many headline targets are out ofreach (OECD, 2011c).
269
Legal framework
The Agricultural Standards Act B.E. 2551 (2008) defines an “agricultural commodity” as produce ora product derived from agriculture, fishery, livestock or forestry, or as a by-product of such produce orproducts. Since several types of agricultural commodity produced in Thailand or imported from foreigncountries have not been sufficiently regulated according to international standards, they are of inferiorquality and unsafe for consumers. The public subsequently lacked confidence. As a result, the agriculturalcommodity trade and the competitiveness of Thailand in the world market have been affected and thisfinally has damaged the economy of the country as a whole. The Agricultural Standards Act B.E. 2551(2008)was therefore promulgated to encourage agricultural commodity producers to meet standardrequirements in compliance with international obligations in order to promote safety, or to preventdamage to the public, agricultural commodity trade or the economy of the country. The act, whichentered into force on 20 August 2008, clearly states several mandatory issues including the establishmentof a committee on agricultural standards, the establishment of agricultural standards, the recognition ofthe need for inspection and certification, the selection of a service provider for standard inspection, thecreation of a standard certification mark as well as control of agricultural standards. With reference tothe food industry, it is governed by the Food Act of B.E. 2522 (1979).
The Ministry of Public Health is designated by law to take executive charge of this Act. The Food andDrug Administration (FDA), which is one of its departments, is responsible for food control activities. Since24 July 2003, the Ministerial Notification No. 193, B.E. 2543 (2000), entitled “Method of Food Manufacturingand Equipment for Manufacturing Food and Food Storage”, is enforced on all domestic manufacturersand foreign suppliers of 54 types of products (Preechajarn and Sirikeratikul, 2009).
Food safety regulations
Thailand’s food industry is governed by the Food Act of B.E. 2522 (1979) and subsequent laws stipulatedby the Ministry of Public Health. The Act classifies food into four categories: (i) specifically-controlled food;(ii) standardized food; (iii) food required to bear standard labels; and (iv) general food. Normally, importsof food into the country require an import license and standard labelling according to domesticregulations. Product registration is required only for specifically-controlled food (Preechajarn andSirikeratikul, 2009).
Food manufactures in Thailand are committed to the critical importance of food safety and quality andThailand is home to a number of authorized food safety certifying agencies. Thai standards are compliantwith international standards such as Codex, World Organization for Animal Health (OIE) Standards andthe International Plant Protection Convention. Quality assurance systems such as Good ManufacturingPractice (GMP), Total Quality Management (TQM), Hazard Analysis and Critical Control Point (HACCP) andthe International Organization for Standardization (ISO) are mandatory for certain products such ascanned foods. All of the standards Thailand uses to regulate its food industry have been accepted by themembers of the Asia-Pacific Economic Cooperation (APEC), and the Ministry of Agriculture andCooperatives is accelerating its standards and certification project to ensure that Thailand’s food industrymeets other international standards.
During the 1980s and 1990s, application of GMP and HACCP was promoted among Thai food industries.Since July 2001, GMP has become mandatory for all new food processing plants and in 2003 the standardwas enforced for all factories concerned. HACCP is recognized by food industry entrepreneurs as animportant tool to be used in preventing trade barriers. In 2005, the Thai government launched newstrategies to facilitate HACCP adoption by assigning eight government agencies and one private agencyas the certifying bodies. Nevertheless, this initiative alone is not enough. The measures to increasethe number of HACCP-certified entrepreneurs includes: making HACCP implementation obligatory;a 200 percent tax deduction campaign; provision of credit for HACCP adoption at low interest; anda stronger media campaign to create awareness among people on the benefits of HACCP for allstakeholders (Chotemanee, 2005).
270
In the event that developing countries, as a result of the multiplicity of agencies and their conflicts ofinterests, encounter confusion over or lack of action concerning implementing a standards regime theabove-mentioned efforts enable Thailand, one of the leading exporters of seafood to developedcountries from the Asia-Pacific region, to be a model for developing countries in the region (Satin, 2005).In Thailand, after GMP/HACCP certification is achieved, the companies may move on towards othermanagement systems such as ISO 900, ISO 14000, or Thailand Quality Award through subsidies from theMOI (Chamchong, 2005).
In addition to the regulations pertaining to hygiene and contamination, according to the aforementionedFood Act of B.E. 2522 (1979), any form of food advertisement through any public media requiresthe approval of the FDA. False advertising or misleading qualities or benefit claims are prohibited.On 30 August 2007, the FDA proposed that snack foods should be labelled “Should eat less, and exercisefor better health” in order to encourage consumer awareness on the importance of exercise and limitingtheir consumption of food products that cause obesity. A health claim that states, suggests, implies thata food or nutrient in the food has anything to do with disease of health conditions is not allowed onfood products in Thailand since many factors can be causes of disease for an individual. Besides, wordingssuch as “premium grade” or “grade A” are considered misleading by the FDA and are prohibited. Withregard to Genetically Modified Organism (GMO), on 13 May 2003, the Ministry of Public Health’s labellinglaw for food containing GMO products was stipulated. The government has banned the commercialplanting of transgenic seed but does allow imports of transgenic soybeans and corn for a wide-rangeof domestic uses, in both the feed milling and food processing industries. The regulations were obviouslybased on the Japanese model allowing for a 5 percent tolerance (Preechajarn and Sirikeratikul, 2009).
Recently, according to the Agricultural Standards Act B.E. 2551 (2008), “agricultural commodities should becertified with two types of standards, namely “mandatory standard” and “voluntary standard”. Accordingto Section 3 of the act, the former is “a standard as determined by the Ministerial Regulation with whichagricultural commodities shall comply” whereas the latter means “a standard as determined by theNotification for the promotion of agricultural standards”. To determine mandatory or voluntary standardsfor any agricultural commodities, the following matters may be stipulated including method, treatmentor managerial procedure for production, or characteristics of agricultural commodity regarding qualityand chemical, biological and physical safety, sanitary or phytosanitary issues, or any other relevantcharacteristics (Section 16). The Secretary General of the Food and Drug Administration is also appointedas one of the members of an Agricultural Standards Committee (Section 6). Besides, for the sake of publicconsumers at large, prior to issuing of the Ministerial Regulation on the establishment of mandatorystandards, the National Bureau of Agricultural Commodities and Food Standards shall organize a publichearing for groups of stakeholders or relevant beneficiaries in accordance with the rules and proceduresprescribed by the Committee (Section 18). In cases where the Ministerial Regulations on thedetermination of mandatory standards for any agricultural commodity are in place, a producer, exporter,or importer of such agricultural commodity shall apply for inspection and the certificate shall be grantedby the conformity assessment service provider (Section 27). A license shall be valid for three years.However, the importation of agricultural commodities from foreign countries having standardsequivalent to the mandatory standards shall not require such a certificate if there is the evidence thatthe agricultural commodity in question has been inspected and certified by a country having anagreement or international cooperation on mutual recognition of standards inspection and certification(Section 29).
Thailand’s food processing industry and world competitiveness
According to OIE (2011), the Diamond Model Analysis (see Section 7) discovered that Thailand had thecapability of producing high quality and sufficient materials to support the food industry. It wasequipped with skilled labour with a competitive wage structure. The food crisis in 2008 also had a slighteffect on Thailand relative to other countries because the country experienced no shortage of food inspite of increased food prices. Thus, Thailand, especially its food exporters, was able to use the crisis toits advantage to meet the huge demand in the world market. Two major appealing markets are the halalfoods and health foods markets. The market for sauces, dressings, ready meals, frozen food and chilled
271
food are also growing rapidly and present considerable opportunities for exporters. Moreover, the spiceand condiments industry has benefited significantly from the expansion of Thai restaurants overseas afterthe government carried out its “Kitchen of the World” project. Accordingly, Thailand is considered oneof the world’s leading food exporters, especially of canned pineapples and black tiger prawns. In 2008,approximately 80 percent of Thai food products were exported to supply 250 million people, or aboutfour times of the size of the Thai population (OECD, 2011c).
Food processors in Thailand have access to the ASEAN market of over half a billion consumers, and asa consequence of the ASEAN Free Trade Agreement (AFTA) relevant tariff and non-tariff barriers amongmembers will be eliminated or drastically reduced. Furthermore, the Suvarnbhumi International Airportprovides an effective and sufficient airfreight transport for perishable products. Generally, the economicrelationships between ASEAN and several countries through the FTA unavoidably have significantimpacts on Thai businesses. According to TDRI (2011), in 2010 Thai exports were able to save a total tariffof 102 billion baht (approximately USD 3.2 billion) or 3.09 percent of the total export value to all FTApartners. The corresponding figure for importers was 59 billion baht (approximately USD1.9 billion) or2.74 percent of the total import value from all FTA partners. Similar to the previous year, Thai businessesin the food sectors were still among the top beneficiaries although there have been a number ofbusinesses in various sectors that did not fully utilize the existing preferential arrangements, especiallythose exporting to China and those importing from Japan. The research also discovered that anintroduction of alternative rules of origin where those exporting food are granted alternatives eithera change in tariff rule or a 40 percent value-added (VA40) rule could increase the preference utilizationrate under Japan-Thailand Economic Partnership Agreement (JTEPA) by 10 to 13 percent. Furthermore,a relaxation from 2-digit-level (CC) rule to 4-digit-level (CTH) rule and 6-digit-level (CTSH) rule wouldresult in a 14 to 25 percent increase in the preference utilization rate under Thailand-Australia Free TradeAgreement (TAFTA) by food importers. As to exporters, food export values under ASEAN Free Trade Area(AFTA) would increase 98 billion baht (or increase by 41 percent with a relaxation from CTH or VA40 orP rule to CTSH or VA40 or P rule.
Unfortunately, some agricultural products have been diverted to support the energy industry instead offood because of the energy crisis. Global warming also unavoidably has affected the food industry. Inaddition, the most important weakness of the Thai food industry has been the low utilization oftechnology, e.g. the country allocated only 0.25 percent of GDP for research and development (R&D)investment in 2007. This is one of the great concerns since the world food industrial market has becomeincreasingly competitive. In the rice market, for example, Viet Nam and India are now capable ofproducing greater quantity and better quality rice than hitherto to supply the world market. Thailandshould concentrate on continuously improving quality and safety of its products and position itself asproducer of high quality food products in order to avoid intense competition from low-cost producers.In this respect, a comparative study by OIE (2011c) found that whereas Thailand considers agro-industryas a source of food, alternative energy, and bio-products, Viet Nam focuses its agro-industry mainly onfood. The OECD-FAO Agricultural Outlook 2011–2020 therefore anticipated that high export growth fromViet Nam may exceed that of Thailand over the period. In addition, other countries of Southeast Asia arealso expected to increase exports considerably. However, Thailand plays a unique role in Asia as the onlyconsistent producer of a large sugar surplus, along with Australia, to service the large and ballooningsugar deficit in the region. Exports from Thailand, the second largest sugar exporter in the world, areprojected to grow to about 5.8 million ton (Mt) by 2020/2021, exceeding the 2003 record.
6. National institutional infrastructure
Since the government initiated the “Kitchen of the World” policy, many institutions, including those ofboth the government and the private sector, have been established to support the policy. These comprisethe following:
● The National Center for Genetic Engineering and Biotechnology (BIOTEC), which focuses on R&Dfor the improvement of the Thai food industry. Within BIOTEC there is: 1) the Food BiotechnologyResearch Unit, which focuses on R&D for the improvement of the Thai food industry, especially
272
the development of starter culture for fermented foods. It also focuses on food safety and riskassessment; and 2) the Cassava and Starch Technology Research Unit, based at KasetsartUniversity, which focuses on plant improvement and process development in starch production.It conducts R&D on cassava and starch properties, processing, modification and industrialapplication; coordinates technology between producers and users; and aids the the transfer oftechnology and supporting technical services.
● The National Food Institute (NFI), whose Department of Technological Services assists foodprocessors in the implementation of Good Manufacturing Practice (GMP) or Hazard Analysis andCritical Control Point (HACCP) safety systems in food production.
● the Agricultural Research Development Agency (ARDA), which cooperates with the NFI todevelop processed food production and agro-food human resources.
● Kasetsart University (KU), which can be subdivided into: 1) Institute of Food Research and ProductDevelopment (IFRPD), which performs research on food science and technology to assist foodindustries by providing relevant information to social and academic offices and communities;2) KU Food Innovation Research and Services in Thailand (KU-FIRST), which focuses on increasingthe competitiveness of the Thai food industry in the world market through the development offood safety mechanisms; 3) The Cassava and Starch Technology Research Unit, which is describedabove under BIOTEC.
● The Department of Industrial Promotion, which is responsible for formulating policies andmeasures for their implementation, organizes public relations campaigns to promote variousprojects, provides partial funding for the training of entrepreneurs managed jointly with theprivate sector, provides training sites and production sites for the early stages of productdevelopment, provides low interest loans to entrepreneurs and village groups.
● The Food and Drug Administration (FDA), which ensures product safety by issuing manufacturinglicenses, labelling food products, conducting pre-and post-marketing control and enforcingadherence to GMP. GMP certification is mandatory for manufacturers and importers of54 different food product types.
● The National Bureau of Agricultural Commodity and Food Standards (ACFS), established in 2002to certify the standards applied to agriculture commodities and food for domestic and foreignconsumers. ACFS standards include Good Agricultural Practices (GAP), Good Hygienic Practices(GHP) and HACCP, as well as other, general standards regarding pesticide residues and diagnostictesting for foot and mouth disease and bovine tuberculosis.
● Board of Investment (BOI), which considers the entire value chain of agriculture and agriculturalproducts ranging from cultivation, production and services to the manufacture of farmmachinery and food processing machinery as priority activities which enjoy many compelling taxand non-tax incentives.
● Thai Food Processors Group, which is sub-divided into: 1) Tuna processors group; 2) Seafoodprocessors group; 3) Pineapple processors group; 4) Fruit and vegetable processor’s group;5) Sweet corn processors group; and 6) Food ingredient and ready-to-eat processors group.
● Thai Food Processing Industry Club, which has 204 members in 12 subsectors: beverages; spiceand seasoning; tea, coffee and cocoa; sugar and deserts; milk and dairy products; oil and ediblefats; meat and poultry; flour and flour products; fishery product; fresh and processed vegetablesand fruit; feed and other specialty foods.
Thailand’s food processing industry can compete with other countries in the world food market as it hasmany organizations that can support and increase capacity and productivity. Moreover, theseorganizations can ensure consumers about the quality of Thailand’s processed food products.
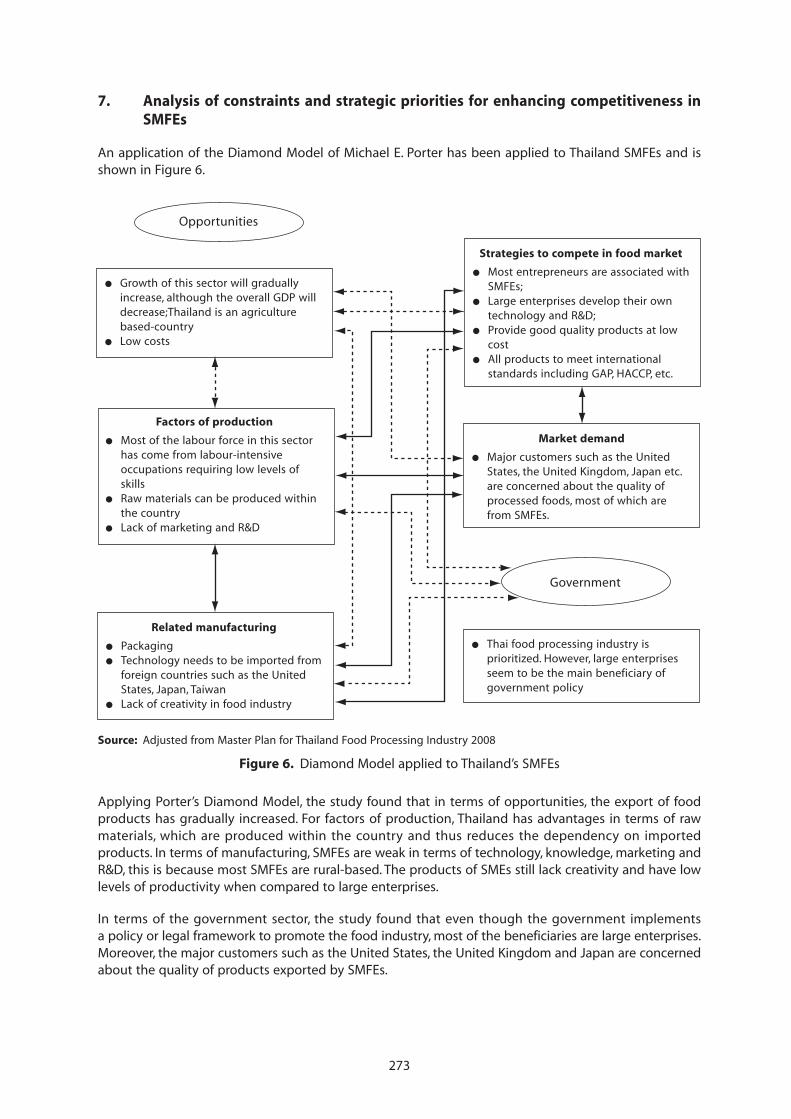
273
7. Analysis of constraints and strategic priorities for enhancing competitiveness inSMFEs
An application of the Diamond Model of Michael E. Porter has been applied to Thailand SMFEs and isshown in Figure 6.
Source: Adjusted from Master Plan for Thailand Food Processing Industry 2008
Figure 6. Diamond Model applied to Thailand’s SMFEs
● Growth of this sector will gradually increase, although the overall GDP will decrease;Thailand is an agriculture based-country
● Low costs
Opportunities
Factors of production
● Most of the labour force in this sector has come from labour-intensive occupations requiring low levels of skills
● Raw materials can be produced within the country
● Lack of marketing and R&D
Related manufacturing
● Packaging ● Technology needs to be imported from
foreign countries such as the United States, Japan, Taiwan
● Lack of creativity in food industry
Strategies to compete in food market
● Most entrepreneurs are associated with SMFEs;
● Large enterprises develop their own technology and R&D;
● Provide good quality products at low cost
● All products to meet international standards including GAP, HACCP, etc.
Market demand
● Major customers such as the United States, the United Kingdom, Japan etc. are concerned about the quality of processed foods, most of which are from SMFEs.
● Thai food processing industry is prioritized. However, large enterprises seem to be the main beneficiary of government policy
Government
Applying Porter’s Diamond Model, the study found that in terms of opportunities, the export of foodproducts has gradually increased. For factors of production, Thailand has advantages in terms of rawmaterials, which are produced within the country and thus reduces the dependency on importedproducts. In terms of manufacturing, SMFEs are weak in terms of technology, knowledge, marketing andR&D, this is because most SMFEs are rural-based. The products of SMEs still lack creativity and have lowlevels of productivity when compared to large enterprises.
In terms of the government sector, the study found that even though the government implementsa policy or legal framework to promote the food industry, most of the beneficiaries are large enterprises.Moreover, the major customers such as the United States, the United Kingdom and Japan are concernedabout the quality of products exported by SMFEs.
274
These considerations lead to the conclusion that the major constraints on the development of SMFEsare as follows:
Raw materials
Most vegetables and fruit production is seasonal, so that in the high season, they are in oversupply andprices are very low. The food processing industry can then choose good quality raw materials. In the lowseason, all this is reversed, although alternating abundance and scarcity is also caused by productionplanning errors. Farmers will grow vegetables that received the highest prices in the previous season,thus creating an inevitable surplus. They will then receive low prices and then decide not to grow thesame crop next season. Competing for raw materials is common in the low season, and the richer or mostpowerful processor usually succeeds. Natural harvesting of fish from the ocean can cause the sameproblem, which affects all processing industries, but has more impact on small industries with less capital.
Whereas the larger industries can partly solve the problem by contract farming or future trading, thesmall and medium industries must turn to processing other vegetables and fruits or stop production.To solve the raw material supply problem for SMFEs, the Department of Agricultural Promotion can helpin raw material production planning, in addition to the usual support.
Workforce
SMFEs are labour-intensive. Operating workers usually have a low level of education that inhibits themfrom acquiring higher skills. The intermittent production because of lack of raw materials, causes workersto leave, especially those who are rice farmers who must leave work to tend the farms at certain times.New workers are then recruited with no skills, thus production efficiency is low.
The other important members of the work force are technicians who operate and maintain machinesand food scientists who oversee the production and quality control. There is a trend that processing willshift from labour-intensive to technology-intensive, therefore, technicians and food scientists will be morein demand. Many SMFEs try to reduce the cost of production by limiting the number of technicians andfood scientists. The ones remaining have no time to improve their knowledge, which would be usefulin improving production efficiency, productivity and product quality.
Training at all levels, from operating workers to management, will improve their performance and resultin production efficiency and product quality. A “friendly” working environment, suitable workload andpayment will maintain the workforce levels in the industry. Educational institutions can supply qualifiedpersonnel to meet the requirements of the industry if these are conveyed to them. Industry andeducational institutions should cooperate in the production of trained human resources for foodindustries.
Technology
Thailand is an agricultural country wherein industrially trained human resources are not well developedand are insufficient to serve industry’s needs. Large food industries can import equipment along withprocessing technology, on a turnkey basis; the small and medium industries cannot do the same.SMFEs are left behind with simple processing equipment that does not require high technology. Fortypical food products, for example, noodles, preserved fruits, the processing lines are usually developedon a “homemade” scale with pieces of simple, locally made equipment, added in stages that often requirehigh labour input. For higher technology processing, for example, canned vegetables and fruits,equipment and process alike are secretly copied from large industries or industries that are alreadyoperating.
Research and development in SMFEs is rare because of high expenses. Technology lies idle from thebeginning of the manufacturing process. If the equipment and process are not well designed, theproduction efficiency is low and the product quality is not stable. When a change of equipment isrecommended, the management is reluctant to accept it because of the high investment costs. The
275
provision of a loan with a holiday period or a low interest rate, with the support of consultancy inputsby an expert in the field, may encourage the management to spend on upgrading its technology.
Technologies used in SMFEs depend on types of product, ranging from simple or traditional ones suchas drying and fermenting, to modern high technology such as canning and UHT sterilization. Fortraditional food products, simple technologies are developed by replacing heavy or tedious work bymachines. In some cases, equipment is used to save time as well as improving quality. For example,a motorized stirrer is used to replace manpower in heating fruit puree for fruit preserve making, a gasor electric dryer is used instead of solar drying of fruits.
When many technologies are needed in a processing operation, the food industry will survey local andoverseas equipment manufacturers for equipment to meet their need. An example of this kind is driednoodle manufacturing. The industry starts at the household production level to supply fresh noodles tothe everyday market. When noodles have export potential, dried noodles are then made by addinga drying step to the production line. To increase the production scale, items of equipment are selectedand installed in the processing line. Occasionally, the equipment selection does not turn out right, andthen the industry suffers throughout the lifetime of the equipment, and the lesson is learned by the nextprocessor of the same product.
We can say that most traditional processing technology still remains the same, whereas equipmenttechnology leans toward more modern technology. However, most equipment using high technologymust be imported.
When considering processing technology, the traditional technologies used in SMFEs are drying,fermentation and special technology for traditional foods. The modern technologies are imported andused for conventional processed food products. These are used for chilling, freezing, pasteurization,sterilization and special technologies are used for specific food products.
Quality management
Apart from low production efficiency or productivity, the poor quality and safety of the products are themain challenge for the development of the industry. This is especially so for products with exportpotential, because importing countries require a proof of quality and safety. For example, Japan, Canada,New Zealand and Australia require ISO 9000 certification and the United States requires HACCPprocedures for fishery products.
The other techniques that food industry should have, to ensure safety and quality, are 5S and GoodManufacturing Practices (GMP). Implementation of any techniques requires clear understanding, andinvestment in setting up the system. In the case of HACCP or ISO 9000, all the food industries find themdifficult to understand, not only the SMFEs, thus each industry must hire quality systems consultants athigh cost. Government institutions can help by conducting training courses and providing consultancyservices, at affordable costs.
To implement and maintain a quality system of any type, management skills play a major role.The management must be able to equip all personnel with quality awareness and be willing to work ina team to continually improve their performance, for the continuous improvement of quality.
8. Conclusion and recommendations
Thailand has the capability of producing high quality and sufficient materials to support the foodindustry. In terms of markets for Thai Food products, both domestic and international markets are stillflourishing, but domestic markets have become more selective and require more product variety thanbefore.
The Royal Thai government has always prioritized the food industry. With the Ministry of Agricultureresponsible for the production of agricultural products, the government has assigned the Ministry of
276
Industry as well as the National Food Institute to oversee the manufacturing part of food production andprovide technical support, information support, and network support. To respond to the internationalstandards such as GAP, HACCP or Codex or MEAs, the government has established policies and legalframeworks to control the quality of the products, so that they are accepted in international markets. Thepolicy and legal frameworks include the Agricultural Standards Act B.E. 2551, The Thai Food IndustrialDevelpment Master Plan 2012–2031.
According to the study, more than 90 percent of entrepreneurs in the food processing industry however,especially those from SMFEs, have encountered limitations in terms of technologies, marketing, R&D,quality of the products. This is because most of them are unregistered entrepreneurs and rural-basedindustries, thus they have less access to infrastructure such as financial support and knowledge supporteven though there are organizations such as academic institutions that can help them. According toPorter’s Diamond Model, SMFEs have low productivities and their products are not accepted by majorcustomers.
In terms of South-South cooperation, the study found that most cooperation is limited to government-to-government cooperation. Most cooperation concerns knowledge exchange and R&D for foodproducts. Thailand has South-South cooperation with China, Japan and neighbouring countries such asCambodia, Lao PDR, Malaysia and Viet Nam. The South-South cooperation includes cooperation on thehalal food industry and investment promotion. However, most of the beneficiaries are large enterprises.
To improve SMFEs in Thailand, the study suggests the following:
● For the short-term plan, SMFEs must be developed and expand in the domestic market. Thegovernment and related organizations need to strengthen SMFEs to be accepted in the domesticmarket. The country needs to promote investment in SMFEs by providing supportinginfrastructure such as finance, land, and other necessities and to encourage local clusters byimplementing the idea of a sustainable food system or cluster. The technologies used must bedeveloped and enhanced to increase productivity to respond to the demands of the domesticmarket.
● For the mid-term and long-term plan, the government needs to: (a) strengthen thecompetitiveness of the Thai food industry by implementing a comparative competitive strategy,supply chain management and benchmarking; (b) transform agriculture to industrialization ofagriculture by implementing business process management, “lean thinking” or even performancemeasurement; (c) ensure food safety by implementing a quality food assurance system anda traceability system that are consistent with national standards. Moreover, the governmentneeds to promote value creation for Thai food products by implementing product development,Good Nutrition Practice (GNP) and to utilize technological and e-business applications, such asby implementing e-commerce, enterprise Resource Planning (ERP), e-procurement.
An important message from the OECD-FAO Agricultural Outlook 2011–2020 (OECD-FAO, 2011) is theneed for both shorter term measures to address the risks associated with volatility and for furtherinvestment to enhance the productivity and resilience of the global food system. As a result, a centralissue for the G20 Summit in Seoul in November 2010 was the implications of high and volatile pricesfor food insecurity and new proposals for action were considered at the June 2011 meeting of G20Agricultural Ministers in Paris.
The OECD-FAO Agricultural Outlook 2011–2020 pointed out that agricultural commodity prices in realterms are likely to remain high and these high prices are a positive signal to a sector that has beenexperiencing declines in prices expressed in real terms for many decades. This could possibly stimulateinvestments in improved productivity and increase output needed to meet the rising demands for food.Unfortunately, supply response is conditioned by the relative cost of inputs whereas the incentivesprovided by higher international prices are not always realized by producers as a result of hightransactions costs or domestic policy interventions. The policy challenge is therefore to promoteproductivity growth, particularly for small producers in order to improve market immunities to external
277
shocks and to reduce waste and increase supplies to local markets at affordable prices. It is alsoimportant to enhance market transparency with greater efforts to raise the quality of global and nationalinformation and surveillance systems on market prospects. These should provide up-to-date informationon production, stocks and trade in sensitive food security commodities.
The quality dimension of food supply is undeniable since urbanization will continue to reshape worldconsumption patterns towards higher value processed products and convenience foods. Growingpopulations and rising incomes in the large emerging economies such as China and India will maintainstrong demand for commodities. Moreover, the rising income will shift diets from staple foods to morevalue-added and higher protein products, especially for consumers in emerging economies who willincreasingly demand meat and dairy products in their consumption choices.
In addition to the need to boost the supply of food, it is also mandatory for Thailand to reduce pricevolatility. In general, the influence of the rising food prices on inflation has been small in OECD countriesover the past twelve months, not only because of the moderate increase of food prices, but also becausethe share of food in consumer expenditures is small. However, for the emerging economies, especiallyin some Asian countries, the contribution was greater than in OECD countries because of higher foodprice inflation and the reality that food constitutes a larger share of the total consumption basket. Thisrobust demand in developing and emerging economies and the increasing costs of some inputs arefactored into the higher price projections in the medium term. Prices for nitrogen fertilizers and otherfarm chemicals are closely linked with crude oil price, so rising oil prices translates into increasingproduction costs. Henceforth, strong production responses can be anticipated in countries whereproduction is less input intensive. This applies both to crop and livestock sectors.
The OECD report on Agricultural Policy and Monitoring and Evaluation 2011 (OECD, 2011a) reveals thatin spite of structural differences across the countries investigated, namely OECD member countries andfive emerging economies (Brazil, China, Russia, South Africa and Ukraine), these 45 countries sharecommon policy interests. Such policies are ensuring a reliable supply of safe, nutritious and affordablefood, reasonable incomes for farms and farm households, a productive and competitive food andagricultural sector, and sustainable use of natural resources. Much of the current policy set is not targetedat coping with volatility, food security and resource use issues. Although higher output prices are goodnews for producers, they contribute to increasing hunger among vulnerable consumers in many partsof the world. It is therefore important that policy approaches should move beyond “status quo”approaches and address the fundamental cause of hunger-poverty to a greater extent.
In the case of Thailand, the desirable policies for SMFEs should entail policies promoting productivitygains while developing an export profile resembling the export basket of wealthier countries. The OECD(2011b) report entitled “Globalization, Comparative Advantage and the Changing Dynamic of Trade”pointed out that countries with comparative advantage, no matter what their income classification is,have a more diversified export profile. They export more goods to more destinations than the averagecountry in their income group. The majority of high-income OECD countries having a comparativeadvantage in processed products normally demonstrate large and productive food beverages andtobacco sectors. Correlations between Revealed Comparative Advantage (RCA) in processed productsand proxy variables for factor endowments and trade facilitation were rather weak suggesting littlerelationship among the variables. Interestingly, the correlation between absence of corruption orcleanliness and RCA is positive. Besides, the profile of the products with comparative advantage is vitalfor income growth. The study found that the computed average productivity level of processed productswas higher than other agricultural products and nonagricultural goods. Comparative advantage is linkedto the productivity level of a country’s export basket. The results revealed that a 10 percent increase inthe productivity level of a country’s processed export products increases income by 0.04 percent.
278
References
Agricultural Standards Act B.E. 2551. 2008. Published in the Royal Gazette, Vol. 125, Part 37a, dated 22nd February2008.
Benjasitichai, D. Undated. Laws and Regulations Influencing Thai Restaurants: A Case Study in the Netherlands, (availableat http://www.maeus.grad.chula.ac.th/newweb/publications/6/Laws%20and%20Regulations%20Influencing%20Thai%20Restaurants.pdf ).
Chamchong, M. 2005. Country Reports: Thailand (1). In M. Satin, ed. Quality Enhancement in Food Processing ThroughHACCP, pp. 160-166. Tokyo: APO.
Chotemanee, S. 2005. Country Report: Thailand (2) In M. Satin, ed. Quality Enhancement in Food Processing ThroughHACCP, pp. 167–171.Tokyo: APO.
Customs Department. 2011. Thailand Foreign Trade by Country, (available at www.ops3.moc.go.th//menucomen).
Krishnamurthy, V. 2009. Enhancing firm level competitiveness of Indian food and agro processing industry: Strategies androadmap development. New Delhi: National Manufacturing Competitiveness Council (NMCC).
Mohanty, S.K. 2006. Trade and Environment Dimensions in the Food and Food Processing Industries in Asia and thePacific. New Delhi, India: The United Nations Economic and Social Commission for Asia and the Pacific.Preliminary Draft.
National Economic and Social Development Board (NESDB). 2010. Summary of the Direction of the Eleventh NationalDevelopment Plan, (available at http://www.nesdb.go.th/).
National Food Institute. 2011. Competitive Index. Retrieved November 10, 2011, (available from http://fic.nfi.or.th:http://fic.nfi.or.th/ci/totalfoodoftheworld.asp?flagfirst=true).
OECD. 2011a. Agricultural Policy Monitoring and Evaluation 2011: OECD Countries and Emerging Economies. Paris, OECDPublishing.
OECD. 2011b. Globalization, Comparative Advantage and the Changing Dynamics of Trade. Paris: OECD Publishing.
OECD. 2011c. OECD Studies on SMEs and Entrepreneurship: Thailand Key Issues and Policies. Paris, OECD.
OIE. The Office of Industrial Economics. (2011, October 1). Industrial Indices. Monthly Report Industrial IndexSeptember 2012 – September 2013: The 50 industrial sectors’ trend by industry of production, shipment,inventory, inventory ratio, capacity utilization rate, labor input and labor productivity, (available at http://www.oie.go.th/industryindex_en.asp).
OSMEP. 2009. White Paper 2009. The Office of Small and Medium Enterprise Promotion. Bangkok.
OSMEP. 2011. White Paper 2011. The Office of Small and Medium Enterprise Promotion. Bangkok.
Preechajarn, S. and Sirikeratikul, S. 2009. Thailand Food and Agricultural Imports Regulations and Standard Narrative:FAIRS Country Report (GAIN Report Number TH 9119), (available at http://gain.fas.usda.gov/Recent%20GAIN%20Publications/Food%20and%20Agricultural%20Impor t%20Regulations%20and%20Standards%20-%20Narrative_Bangkok_Thailand_8-14-2009.pdf ).
Satin, M. 2005. Summary of Findings. In M. Satin, ed. Quality Enhancement in Food Processing Through HACCP, pp. 3–30.Tokyo: APO.
Sevilla, R.C. and Soonthornthada, K. 2002. SME policy in Thailand: Vision and challenges. Bangkok, Thailand: Institutefor Population and Social Research, Mahidol University.
Sriwicailamphan, T. 2007. Global Food Chains and Environment: Agro-Food Production and Processing in Thailand. TheNetherlands, Wageningen: Wageningen University.
Taweekul, K. and Srigam, S. 2001. Present Status of Rural-Based Food Processing Industry. In A. Hicks, ed. Rural-BasedFood Processing Industry in Asia, pp. 132–140. Tokyo: The Asian Productivity Organization.
Thailand Development Research Institute (TDRI). 2011. Increasing the Competitiveness of Thai ManufacturingIndustries under the New International Economic Environment (Phase II) (available at www.oie.go.th/project/Increasing_Phase_II/FinalReport.pdf ).

279
Wattanapinyo, A. 2006. Sustainability of Small and Medium-sized Agro-Industries in Northern Thailand. The Netherlands,Wageningen: Wageningen University.
Websites
Department of Industrial Workshttp://oaep.diw.go.th/diw
Thailand national Food Institutewww.nfi.or.th