polar - ncpor
TRANSCRIPT

NATIONAL CENTRE FOR POLAR AND OCEAN RESEARCHEARTH SYSTEM SCIENCE ORGANISATION, MINISTRY OF EARTH SCIENCES
HEADLAND SADA, VASCO-DA-GAMA, GOA-403 804, INDIAPhone: +91-832-2525600 Fax: +91-832-2520877
http://www.ncaor.gov.in
NATIONAL CENTRE FOR POLAR AND OCEAN RESEARCHEARTH SYSTEM SCIENCE ORGANISATION, MINISTRY OF EARTH SCIENCES
HEADLAND SADA, VASCO-DA-GAMA, GOA-403 804, INDIAPhone: +91-832-2525600 Fax: +91-832-2520877
http://www.ncaor.gov.in
ANNUAL REPORT2018-2019
NATIONAL CENTRE FOR POLAR AND OCEAN RESEARCHEARTH SYSTEM SCIENCE ORGANISATION, MINISTRY OF EARTH SCIENCES
HEADLAND SADA, VASCO-DA-GAMA, GOA-403 804, INDIAPhone: +91-832-2525600 Fax: +91-832-2520877
http://www.ncaor.gov.in

PC @ Mr. Rakesh Rao

CONTENTS Page No.1.0 Overview 05
Director’s Message 06Organizational Structure 08Quality Policy 09NCPOR: Mission Mandate 10
2.0 Polar Sciences 112.1 Indian Antarctic Programme 12
2.1.1 Cryospheric and Ice Core Studies 122.1.2 Remote Sensing Studies 142.1.3 Lacustrine Studies 172.1.4 Environmental Studies 202.1.5 38th Indian Scientific Expedition to Antarctica 23
2.2 Indian Arctic Programme 292.2.1 Atmospheric Studies 292.2.2 Kongsfjorden Monitoring Program 302.2.3 Microbiological and Phytoplankton Studies 352.2.4 Cryospheric Studies 392.2.5 Projects and Participating Organization 43
2.3 Himalayan Cryosphere Programme 443.0 Ocean and Geosciences 49
3.1 Oceanography and Biogeochemistry of the Southern Ocean 503.1.1 Paleoclimatic Studies 503.1.2 Hydrodynamics and Biogeochemistry Studies 53
3.2 Indian Scientific Endeavors in the International Ocean Discovery Program 673.3 Extended Continental Shelf Program of India 683.4 Exploring the Largest Geoid Low on Earth 683.5 Geoscientific Studies of the Exclusive Economic Zone 703.6 Exploration for Hydrothermal Sulphide Mineralisation in the Indian Ocean 74
3.6.1 Chemical Oceanographic Studies 743.6.2 Geological and Geochemical studies of rocks and sediments 763.6.3 Environmental baseline studies 783.6.4 Biological Studies 79
4.0 Operation, Management and Research Support 834.1 Vessel Operation & Management (VOM) 844.2 Information and Communication Technology Division 874.3 Estate Section 884.4 NCPOR-Operations and Management 894.5 NCPOR Scientists on field assignments 904.6 PhD awarded to NCPOR personnel 914.7 Accolades to NCPOR personnel 924.8 Seminar/Meeting/ Training/Workshop 934.9 Official Language Activities at NCPOR 100
4.10 Celebration of National Days 1004.11 Outreach Activities 1024.12 Deputations Abroad 108
5.0 Publications 1126.0 Audited Statement of account for the year ending 31st March 2019 121
ANNUAL REPORT 2018-19
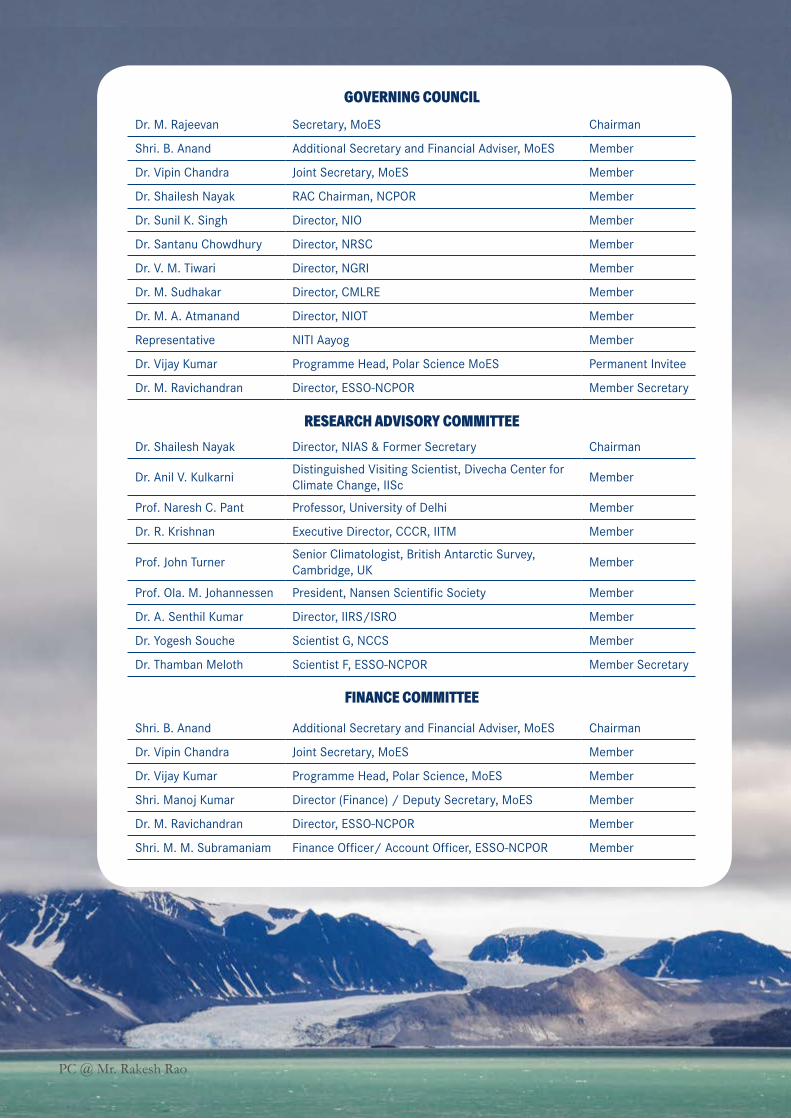
GOVERNING COUNCILDr. M. Rajeevan Secretary, MoES Chairman
Shri. B. Anand Additional Secretary and Financial Adviser, MoES Member
Dr. Vipin Chandra Joint Secretary, MoES Member
Dr. Shailesh Nayak RAC Chairman, NCPOR Member
Dr. Sunil K. Singh Director, NIO Member
Dr. Santanu Chowdhury Director, NRSC Member
Dr. V. M. Tiwari Director, NGRI Member
Dr. M. Sudhakar Director, CMLRE Member
Dr. M. A. Atmanand Director, NIOT Member
Representative NITI Aayog Member
Dr. Vijay Kumar Programme Head, Polar Science MoES Permanent Invitee
Dr. M. Ravichandran Director, ESSO-NCPOR Member Secretary
RESEARCH ADVISORY COMMITTEEDr. Shailesh Nayak Director, NIAS & Former Secretary Chairman
Dr. Anil V. KulkarniDistinguished Visiting Scientist, Divecha Center for Climate Change, IISc
Member
Prof. Naresh C. Pant Professor, University of Delhi Member
Dr. R. Krishnan Executive Director, CCCR, IITM Member
Prof. John TurnerSenior Climatologist, British Antarctic Survey, Cambridge, UK
Member
Prof. Ola. M. Johannessen President, Nansen Scientific Society Member
Dr. A. Senthil Kumar Director, IIRS/ISRO Member
Dr. Yogesh Souche Scientist G, NCCS Member
Dr. Thamban Meloth Scientist F, ESSO-NCPOR Member Secretary
FINANCE COMMITTEE
Shri. B. Anand Additional Secretary and Financial Adviser, MoES Chairman
Dr. Vipin Chandra Joint Secretary, MoES Member
Dr. Vijay Kumar Programme Head, Polar Science, MoES Member
Shri. Manoj Kumar Director (Finance) / Deputy Secretary, MoES Member
Dr. M. Ravichandran Director, ESSO-NCPOR Member
Shri. M. M. Subramaniam Finance Officer/ Account Officer, ESSO-NCPOR Member
PC @ Mr. Rakesh Rao
1.0 OVERVIEW
PC @ Mr. Rakesh Rao
ESSO-NCPOR Annual Report 2018-2019
6 t gives me immense pleasure to present the highlights of the NCPOR activities during the year 2018-19. The institute name has been renamed as “National Centre for Polar and Ocean Research (NCPOR)”, considering the importance of all three poles. The institute made noteworthy contributions in Expeditions to Antarctica, Arctic, and Himalaya, apart from research and development, and in public outreach.
The 38th Indian Scientific expedition to Antarctica was quite unusual due to heavy sea ice conditions and the expedition was delayed about 27 days, but successfully completed all intended tasks. As part of the ongoing project, various glaciological and geophysical measurements were carried out in coastal Dronning Maud Land (cDML) to understand the response of the Antarctic ice shelves to global warming. In addition, field based photochemical experiments, as well as, snow/cryoconite hole sampling was conducted in Larsemann hills, East Antarctica for understanding of biogeochemical process in supraglacial environments. Many new in-sights have been brought out from Ice and sediment core data to understand the past climate.
Polar Aerosol Network (POLARNET) has been initiated to monitor various Green house and aerosol measurements in all three poles. Realizing the need for a modeling effort along with ongoing observational Program, a high-resolution numerical model for Kongsfjorden was set up and validated with in-situ observations. Extensive study was undertaken to study and understand the bacterial diversity and distribution in the glacio-marine system of Ny-Alesund, Arctic. In the Arctic, all the 20 projects of Glaciology, Marine science, Polar biology, Atmospheric science, etc. are successfully completed, including the deployment of aerosol monitoring system.
Glaciological field campaigns are being continued in six benchmark glaciers in Chandra basin of Lahaul-Spiti region of Western Himalaya. First time NCPOR has operated Terrestrial Laser Scanner along with DGPS and GPR for estimation of mass balance,
Director’s Message
I

DIR
OC
TOR
’S M
ESSA
GE
ESSO-NCPOR Annual Report 2018-2019
7
glacier flux, ice flux, etc. Results indicated that Chandra basin experiencing high negative balance and glaciers have been thinning at a significantly high rate. Also, initiated effort to estimate snow cover of Western Himalaya using satellite data.
This year we have not conducted Southern Ocean expedition to take stock of last 10 years of outcome and bring out the results from past expeditions. Many new findings have emerged from the past expeditions. NCPOR scientists were participated CROTALE expedition (France) to retrieve long sediment cores (42 m to 70 m) including water samples in the Southern Ocean to understand past frontal and sea ice variations, and coccolithophores culture. National Polar Data Centre was further populated with many meteorological, glaciological and oceanographic data. Also implemented Live Access Server for Polar data access.
Four Indian Scientists participated in the International Ocean Discovery Program (IODP) during 2018-19, mainly Southern Ocean and Antarctic waters. To understand and narrow down the gap between the dynamics of materials beneath the surface and its surface manifestation as the IOGL geoid anomaly, NCPOR deployed 17 passives broadband OBS in the Indian Ocean for continuous time series acquisition of seismic events.
Utilising the services of ORV SagarKanya, about 57,781 sq.km were surveyed during this year, using multi-beam echo sounder, and hence 83.38% of deep-water blocks of Indian Exclusive Economic zone are mapped. Detailed Geo-scientific analysis and interpretation were undertaken along the Indian shelf regions. Extensive cruise survey was undertaken in the mid-ocean ridge area to identify active hydrothermal plumes and also to generate baseline environmental data. Physical, Chemical, Geological and Biological studies were conducted
in these regions. Many interesting studies were conducted, especially microbial biomass in Hydrothermal plume areas.
ORV SagarKanya has undertaken 11 cruises and completed 275 days at Sea for EEZ mapping, data buoy and OBS deployment, and MEDAS programme of CMLRE.
SAP and E-Office have been implemented to improve the operational efficiency and to reduce the turn around time between various processes. 185 KWp solar panel was installed and made operational.
Outreach activities, including capacity building, were strengthened during this year, by conducting various training, workshops, summer schools, national conferences, etc
I take this opportunity to place on record the guidance, encouragement and support received from Dr. M. Rajeevan, Chairman and other members of the Governing Council, Chairman and members of the Research Advisory Committee, Finance Committee and the officials of the Ministry of Earth Sciences. I am extremely grateful to all of them. I am happy with the progress made in many areas in particular, the scientific outcome and capacity building, essential pillars on which research institutions flourish. The co- operative spirit across our Scientists, with support from the administrative, finance and Purchase staff, has been key in accomplishing this.
I am also thankful to my colleague Dr. Avinash Kumar and all the representatives from each group for their efforts in bringing out this annual report by collecting and collating relevant information. And last but not the least, I thank every one from the NCPOR team for their contribution to the institute’s growth.
M. Ravichandran
PC @ Mr. Rakesh Rao
Quality Policy
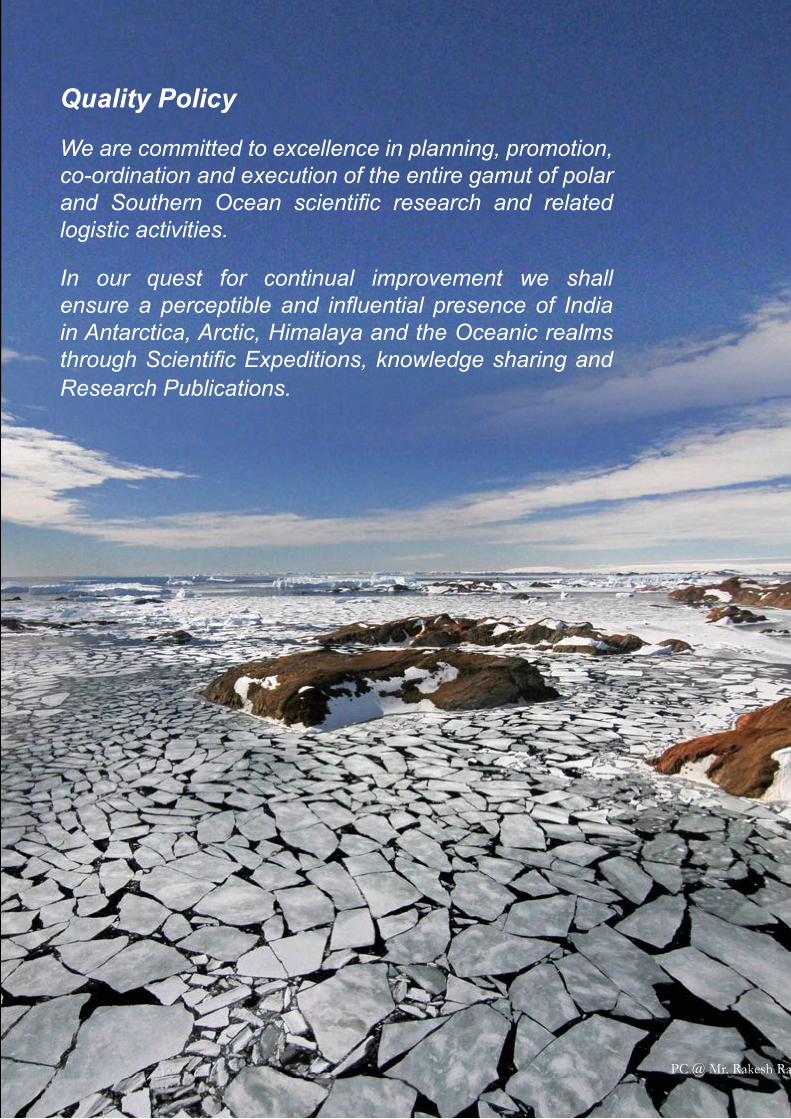
We are committed to excellence in planning, promotion, co-ordination and execution of the entire gamut of polar and Southern Ocean scientific research and related logistic activities.
In our quest for continual improvement we shall ensure a perceptible and influential presence of India in Antarctica, Arctic, Himalaya and the Oceanic realms through Scientific Expeditions, knowledge sharing and Research Publications.
PC @ Mr. Rakesh Rao

NCPOR: Mission Mandate
“To plan, promote, co-ordinate and execute the entire gamut of polar science and logistics activities of the country in order to ensure a perceptible and influential presence of India in the polar regions and to uphold our strategic interest in the global framework of Nations engaged in the studies of the polar regions and surrounding Oceans”
PC @ Dr. Priyanka Dutta

2.0 POLAR SCIENCES
PC @ Rakesh Rao

POLAR
SCIEN
CES
ESSO-NCPOR Annual Report 2018-2019
12
2.1.1a Antarctic Cryospheric Studies
The project “Cryosphere and Climate” studies the glaciology, biogeochemical processes, and ice core records from Antarctica to understand the role and response of cryosphere within the climate system in the Antarctic region and their global linkages. As part of this ongoing project, various glaciological and geophysical measurements were carried out along the 2000-km-long coast in coastal Dronning Maud Land (cDML) which is characterized by loosely connected ice shelves, during 2018-19 to understand the response of the Antarctic ice shelves to global warming. The major field achievements include; 1) Re-occupation of stake locations for DGPS measurements, data collection from autonomous phase-sensitive radar (ApRES) and re-installation of ApRES; 2) Kinematic DGPS and shallow frequency radar survey in ice shelf and ice rises (Figure 1).
In addition, field based photochemical experiments as well as, snow/cryoconite hole sampling was conducted in Larsemann hills, East Antarctica for a better understanding of biogeochemical process in supraglacial environments (Figure 2).
2.1.1b Increased influence of ENSO on Antarctic temperature since the Industrial Era
The influence of recent global warming modulates the frequencies and amplitude of El Niño-Southern Oscillation (ENSO) and its impact on global climate have become great concerns to the global community. Antarctic climate is sensitive to these changes due to tropical and Southern Hemispheric (SH) teleconnections. We have studied multiple oxygen records from the west and east Antarctica and reconstructed past temperature. Our investigation temperature records reveal significant increasing trend at ENSO band and decreasing trend at PDO band since the post-industrial era (Figure 3). Further, greenhouse gas (GHG) forced model simulation results show an increasing trend in PSA activity since the post-industrial era. These observations are also consistent with the earlier report of increasing ENSO activity, reconstructed based on tropical-subtropical tree ring records. Thus, we suggest ENSO activity and its influence on Antarctic temperature are increasing in response to increasing radiative GHG forcing since the post-industrial era.
Figure 1. Summary of the field measurements and the field campaign study area. Blue and the green line indicate the DGPS kinematic, red dots are the static survey points, red line along with DGPS blue line are high frequency radar survey and two yellow stars are the location of wintering ApRES system. The field activities (a) Kinematic DGPS (rover) installed on a Skidoo (b) ApRES and static DGPS measurement (c) Shallow radar measurement and (d) real time crevasse detection and manual inspection.
1 INDIAN ANTARCTIC PROGRAMME 2.1.1 CRYOSPHERIC AND ICE CORE STUDIES
POLA
R S
CIE
NC
ES
ESSO-NCPOR Annual Report 2018-2019
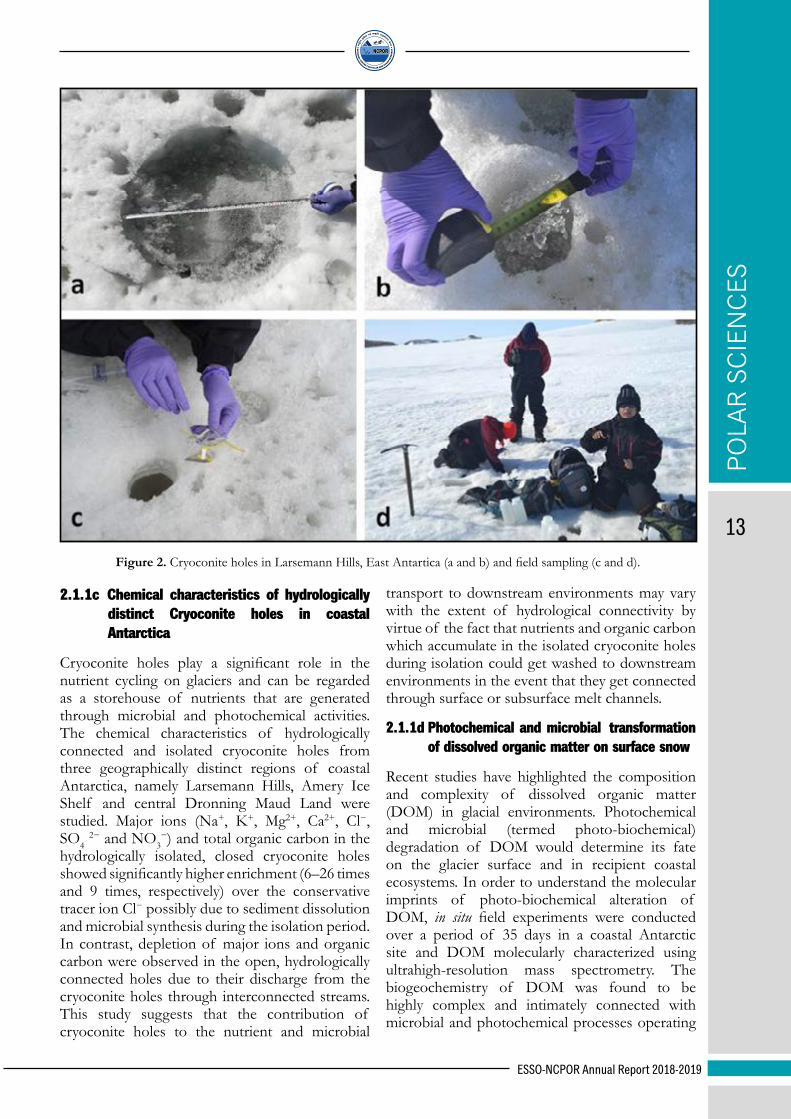
13Figure 2. Cryoconite holes in Larsemann Hills, East Antartica (a and b) and field sampling (c and d).
2.1.1c Chemical characteristics of hydrologically distinct Cryoconite holes in coastal Antarctica
Cryoconite holes play a significant role in the nutrient cycling on glaciers and can be regarded as a storehouse of nutrients that are generated through microbial and photochemical activities. The chemical characteristics of hydrologically connected and isolated cryoconite holes from three geographically distinct regions of coastal Antarctica, namely Larsemann Hills, Amery Ice Shelf and central Dronning Maud Land were studied. Major ions (Na+, K+, Mg2+, Ca2+, Cl−, SO4
2− and NO3−) and total organic carbon in the
hydrologically isolated, closed cryoconite holes showed significantly higher enrichment (6–26 times and 9 times, respectively) over the conservative tracer ion Cl− possibly due to sediment dissolution and microbial synthesis during the isolation period. In contrast, depletion of major ions and organic carbon were observed in the open, hydrologically connected holes due to their discharge from the cryoconite holes through interconnected streams. This study suggests that the contribution of cryoconite holes to the nutrient and microbial
transport to downstream environments may vary with the extent of hydrological connectivity by virtue of the fact that nutrients and organic carbon which accumulate in the isolated cryoconite holes during isolation could get washed to downstream environments in the event that they get connected through surface or subsurface melt channels.
2.1.1d Photochemical and microbial transformation of dissolved organic matter on surface snow
Recent studies have highlighted the composition and complexity of dissolved organic matter (DOM) in glacial environments. Photochemical and microbial (termed photo-biochemical) degradation of DOM would determine its fate on the glacier surface and in recipient coastal ecosystems. In order to understand the molecular imprints of photo-biochemical alteration of DOM, in situ field experiments were conducted over a period of 35 days in a coastal Antarctic site and DOM molecularly characterized using ultrahigh-resolution mass spectrometry. The biogeochemistry of DOM was found to be highly complex and intimately connected with microbial and photochemical processes operating

POLAR
SCIEN
CES
ESSO-NCPOR Annual Report 2018-2019
14
individually or in combination (Figure 4). Photo-biochemical processes resulted in shifts in the nitrogen, sulfur, and phosphorous content of the DOM. These processes are also an important mechanism for transforming refractory DOM,
like dissolved black carbon and carboxylic rich alicyclic molecules from the snow surface. This study provides new molecular-level information on compounds that comprise the photo and bio-labile, photo- and bio-refractory, as well as photo- and bio-produced fractions of the supraglacial DOM pool. These insights into the interactions between microbes, light, and specific components of the DOM pool highlight the need for studies focused on the biogeochemistry of supraglacial carbon and its response to a changing climate.
2.1.2 REMOTE SENSING STUDIES2.1.2a Mapping seasonal surface velocity
changes and contribution of the Eastern and Western Tributary Glaciers to the Amery Ice Shelf, East Antarctica
The study was carried out to compute the glacier surface velocity using the offset tracking method on GRD product of the Sentinel-1 SAR data for eastern and western tributary glaciers of the Amery Ice Shelf (AIS), which is one of the fastest flowing
Figure 4. Venn diagram of light-only, microbe-only, and light+microbe treatments. Areas of overlap are percentages of molecular formulas that are detected at all time points in both or all three of the treatment types. Percentages in areas of no overlap indicate molecular formulas that are unique to that individual treatment.
Figure 3. (a) Comparison of temperature anomaly records of the East (blue) and West Antarctica (red). Thick solid curves represent corresponding 11-year running average. (b) Cross wavelet analysis of the two times series of the East and West Antarctic temperature records. The red color band highlights the common highest power in these two times series. (c, d) Scale-averaged wavelet power over the 2–8, 16–32 and 32–64 yr band which is a measure of the average variance with time. Three curves (red, blue, and light gray) represent average variance of the East and West Antarctic temperature at three different frequency bands: 2–8, 16–32 and 32–64 years.
POLA
R S
CIE
NC
ES
ESSO-NCPOR Annual Report 2018-2019
15
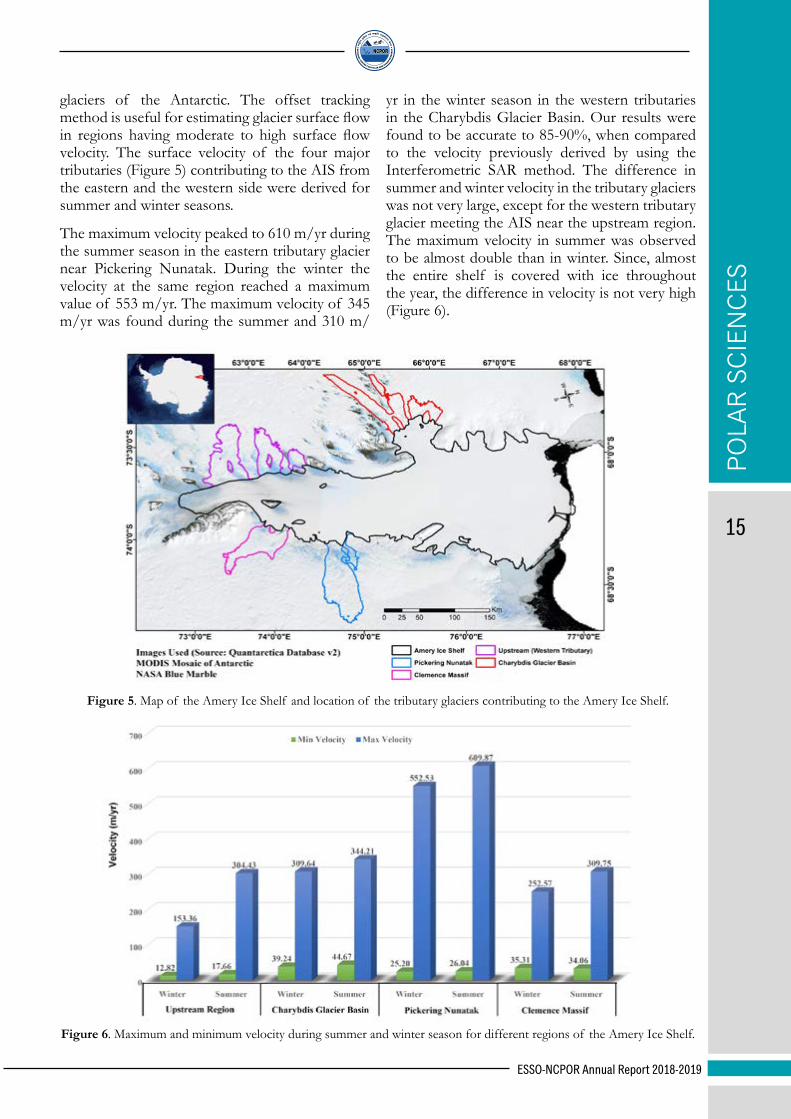
Figure 5. Map of the Amery Ice Shelf and location of the tributary glaciers contributing to the Amery Ice Shelf.
glaciers of the Antarctic. The offset tracking method is useful for estimating glacier surface flow in regions having moderate to high surface flow velocity. The surface velocity of the four major tributaries (Figure 5) contributing to the AIS from the eastern and the western side were derived for summer and winter seasons.
The maximum velocity peaked to 610 m/yr during the summer season in the eastern tributary glacier near Pickering Nunatak. During the winter the velocity at the same region reached a maximum value of 553 m/yr. The maximum velocity of 345 m/yr was found during the summer and 310 m/
yr in the winter season in the western tributaries in the Charybdis Glacier Basin. Our results were found to be accurate to 85-90%, when compared to the velocity previously derived by using the Interferometric SAR method. The difference in summer and winter velocity in the tributary glaciers was not very large, except for the western tributary glacier meeting the AIS near the upstream region. The maximum velocity in summer was observed to be almost double than in winter. Since, almost the entire shelf is covered with ice throughout the year, the difference in velocity is not very high (Figure 6).
Figure 6. Maximum and minimum velocity during summer and winter season for different regions of the Amery Ice Shelf.

POLAR
SCIEN
CES
ESSO-NCPOR Annual Report 2018-2019
16
The accuracy assessment was carried out by computing the root mean square error, using bias between our results and the previous stable velocity map (Figure 7). The maximum bias was found out in the upstream region with errors up to 24 m/yr during the winter, whereas for the other glaciers the upstream region did not yield an RMSE of more than 12 m/yr for both seasons. The velocity bias was observed to be within 30 m/yr for all the four glaciers which gives an accuracy of ~ 85%.
2.1.2b Field work carried out in 38th Indian Scientific Expedition to Antarctica
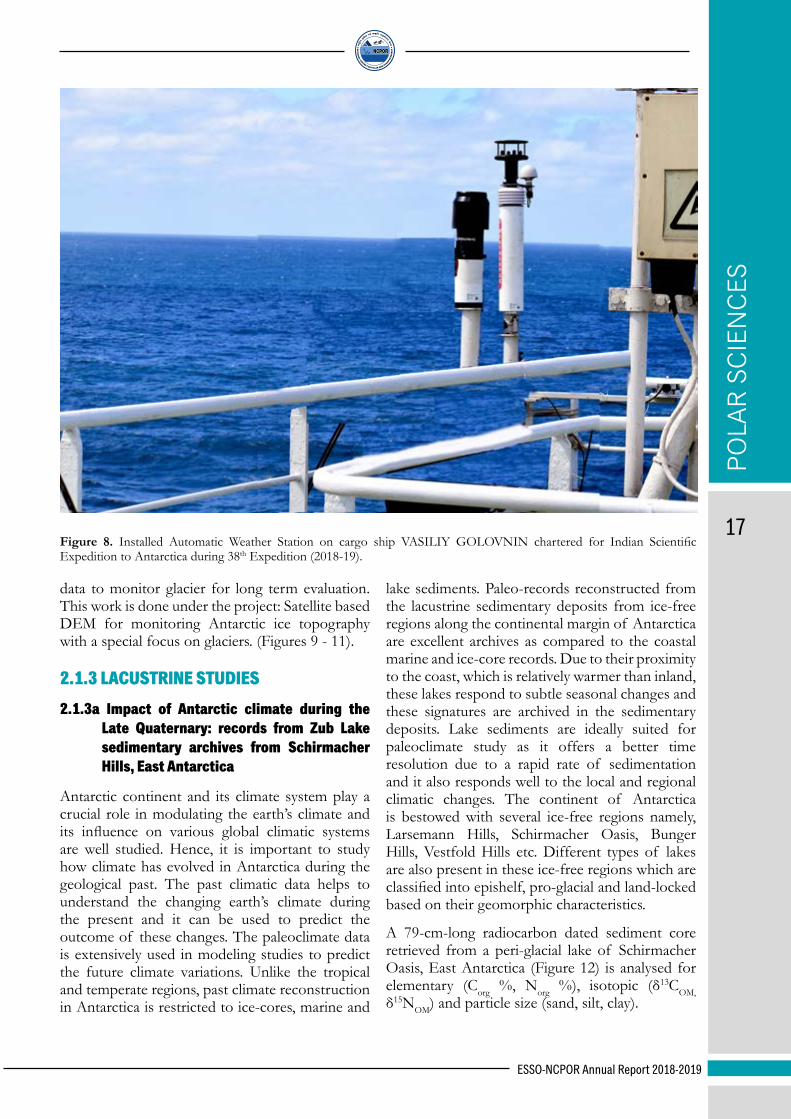
Automatic weather station was installed on the vessel for recording meteorological data along the ship track from Cape Town to Antarctica (Figure 8).
Antarctic environment can significantly reflect global climate change, since glacier ablation is a sensitive indicator of global warming impacts. Monitoring ice flow in Antarctic region is very important for the study of glacier dynamics. The objective of mapping glacier dynamics and topography in the form of Digital Elevation Model (DEM) could make a contribution in improving the evidence base for monitoring fast
moving glaciers of Antarctica. Implication of satellite-based remote sensing techniques with supported ground truth data can help to find the spatio-temporal changes in glacier topography and velocity, which ultimately can be used as an indicator of microclimatic changes and its implication to sea level rise research. This ground truth data also helps in calibrating the modelled based estimates of remote sensing methods. The ground truth data have been collected in the 38th Indian Scientific expedition to Antarctica using Differential Global Positioning System (DGPS) survey that provides improved location accuracy, in mm/cm level, in case of the best implementations. Field survey has been performed on Polar Record glacier near Indian Research Station Bharti and Potsdam glacier near Indian Research Station Maitri. To monitor the elevation profile of ice topography, DGPS based measurement were carried out with profile of about 200m length at each location. Based on this field, remote sensing based estimation will be calibrated and validated to generate a DEM as well as to estimate ice flow speed. In the next year, these glaciers will be monitored again to measure the change in ice topography. In addition to that, every year field measurement will be continued and new glaciers will be explored for the ground truth
Figure 7. Root mean square error (RMSE) for each derived result and bias of the estimated velocity.
POLA
R S
CIE
NC
ES
ESSO-NCPOR Annual Report 2018-2019
17Figure 8. Installed Automatic Weather Station on cargo ship VASILIY GOLOVNIN chartered for Indian Scientific Expedition to Antarctica during 38th Expedition (2018-19).
data to monitor glacier for long term evaluation. This work is done under the project: Satellite based DEM for monitoring Antarctic ice topography with a special focus on glaciers. (Figures 9 - 11).
2.1.3 LACUSTRINE STUDIES2.1.3a Impact of Antarctic climate during the
Late Quaternary: records from Zub Lake sedimentary archives from Schirmacher Hills, East Antarctica
Antarctic continent and its climate system play a crucial role in modulating the earth’s climate and its influence on various global climatic systems are well studied. Hence, it is important to study how climate has evolved in Antarctica during the geological past. The past climatic data helps to understand the changing earth’s climate during the present and it can be used to predict the outcome of these changes. The paleoclimate data is extensively used in modeling studies to predict the future climate variations. Unlike the tropical and temperate regions, past climate reconstruction in Antarctica is restricted to ice-cores, marine and
lake sediments. Paleo-records reconstructed from the lacustrine sedimentary deposits from ice-free regions along the continental margin of Antarctica are excellent archives as compared to the coastal marine and ice-core records. Due to their proximity to the coast, which is relatively warmer than inland, these lakes respond to subtle seasonal changes and these signatures are archived in the sedimentary deposits. Lake sediments are ideally suited for paleoclimate study as it offers a better time resolution due to a rapid rate of sedimentation and it also responds well to the local and regional climatic changes. The continent of Antarctica is bestowed with several ice-free regions namely, Larsemann Hills, Schirmacher Oasis, Bunger Hills, Vestfold Hills etc. Different types of lakes are also present in these ice-free regions which are classified into epishelf, pro-glacial and land-locked based on their geomorphic characteristics.
A 79-cm-long radiocarbon dated sediment core retrieved from a peri-glacial lake of Schirmacher Oasis, East Antarctica (Figure 12) is analysed for elementary (Corg %, Norg %), isotopic (δ13COM, δ15NOM) and particle size (sand, silt, clay).
POLAR
SCIEN
CES
ESSO-NCPOR Annual Report 2018-2019
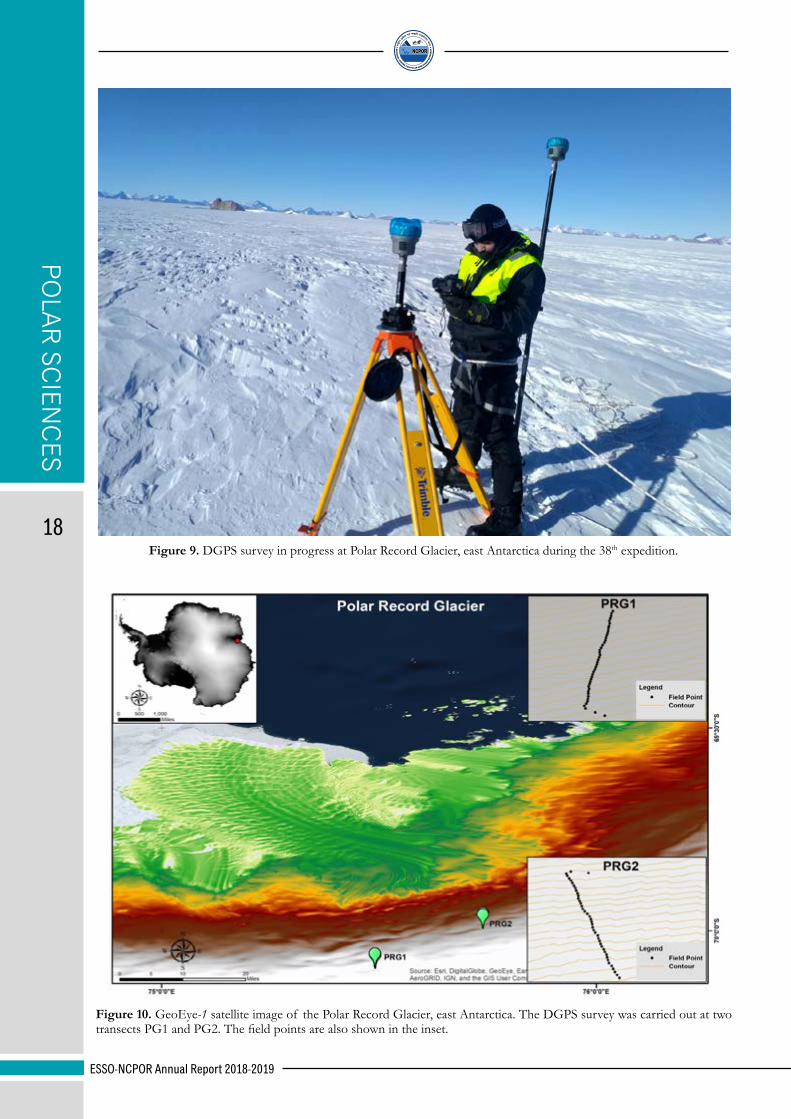
18Figure 9. DGPS survey in progress at Polar Record Glacier, east Antarctica during the 38th expedition.
Figure 10. GeoEye-1 satellite image of the Polar Record Glacier, east Antarctica. The DGPS survey was carried out at two transects PG1 and PG2. The field points are also shown in the inset.
POLA
R S
CIE
NC
ES
ESSO-NCPOR Annual Report 2018-2019
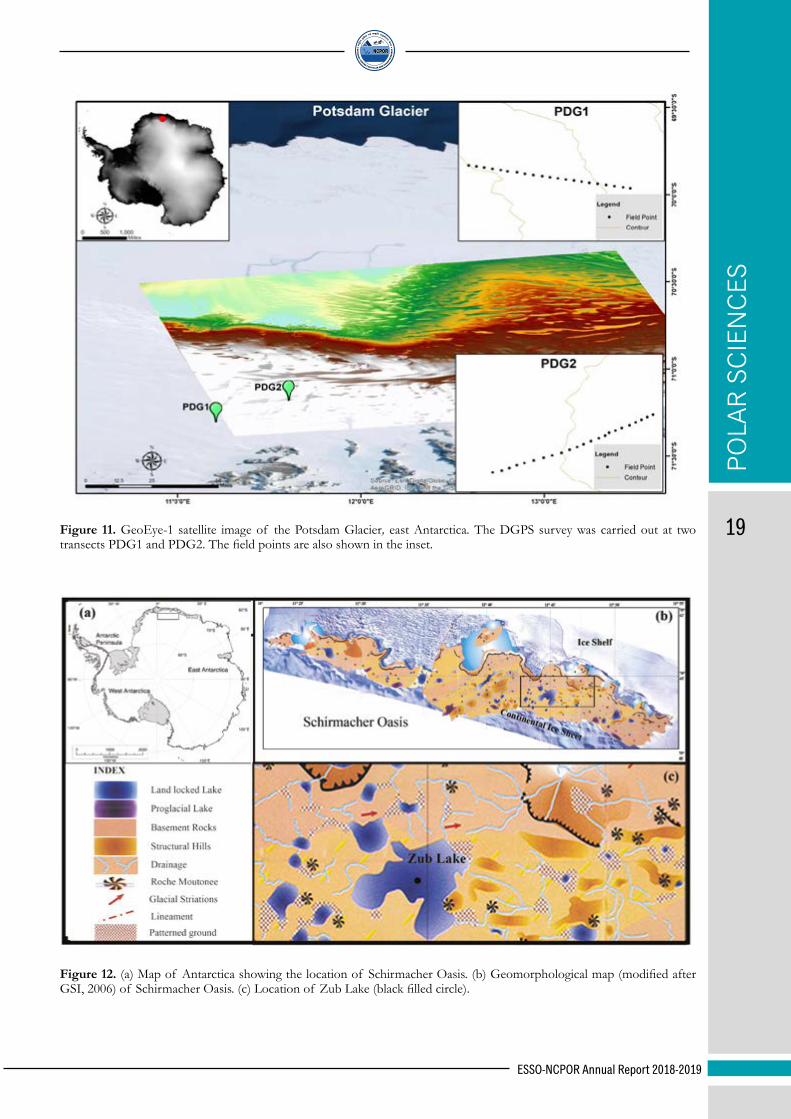
19Figure 11. GeoEye-1 satellite image of the Potsdam Glacier, east Antarctica. The DGPS survey was carried out at two transects PDG1 and PDG2. The field points are also shown in the inset.
Figure 12. (a) Map of Antarctica showing the location of Schirmacher Oasis. (b) Geomorphological map (modified after GSI, 2006) of Schirmacher Oasis. (c) Location of Zub Lake (black filled circle).
POLAR
SCIEN
CES
ESSO-NCPOR Annual Report 2018-2019
20
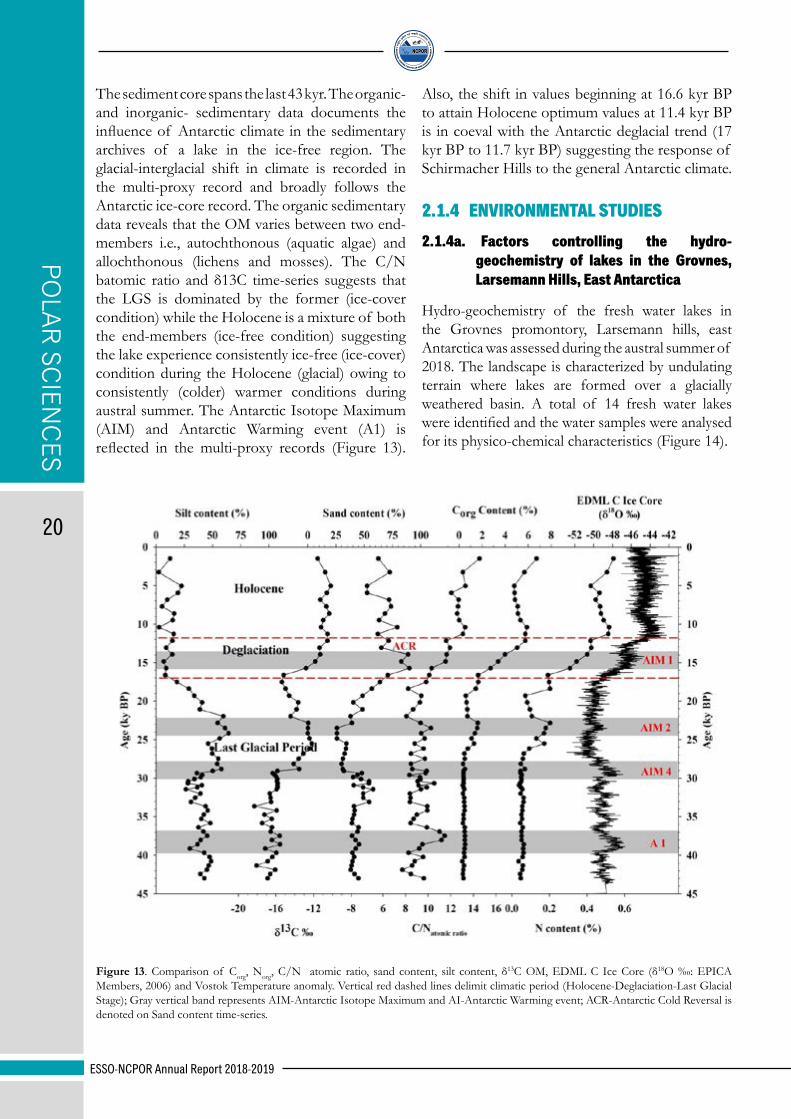
Figure 13. Comparison of Corg, Norg, C/N atomic ratio, sand content, silt content, δ13C OM, EDML C Ice Core (δ18O ‰: EPICA Members, 2006) and Vostok Temperature anomaly. Vertical red dashed lines delimit climatic period (Holocene-Deglaciation-Last Glacial Stage); Gray vertical band represents AIM-Antarctic Isotope Maximum and AI-Antarctic Warming event; ACR-Antarctic Cold Reversal is denoted on Sand content time-series.
The sediment core spans the last 43 kyr. The organic- and inorganic- sedimentary data documents the influence of Antarctic climate in the sedimentary archives of a lake in the ice-free region. The glacial-interglacial shift in climate is recorded in the multi-proxy record and broadly follows the Antarctic ice-core record. The organic sedimentary data reveals that the OM varies between two end-members i.e., autochthonous (aquatic algae) and allochthonous (lichens and mosses). The C/N batomic ratio and δ13C time-series suggests that the LGS is dominated by the former (ice-cover condition) while the Holocene is a mixture of both the end-members (ice-free condition) suggesting the lake experience consistently ice-free (ice-cover) condition during the Holocene (glacial) owing to consistently (colder) warmer conditions during austral summer. The Antarctic Isotope Maximum (AIM) and Antarctic Warming event (A1) is reflected in the multi-proxy records (Figure 13).
Also, the shift in values beginning at 16.6 kyr BP to attain Holocene optimum values at 11.4 kyr BP is in coeval with the Antarctic deglacial trend (17 kyr BP to 11.7 kyr BP) suggesting the response of Schirmacher Hills to the general Antarctic climate.
2.1.4 ENVIRONMENTAL STUDIES2.1.4a. Factors controlling the hydro-
geochemistry of lakes in the Grovnes, Larsemann Hills, East Antarctica
Hydro-geochemistry of the fresh water lakes in the Grovnes promontory, Larsemann hills, east Antarctica was assessed during the austral summer of 2018. The landscape is characterized by undulating terrain where lakes are formed over a glacially weathered basin. A total of 14 fresh water lakes were identified and the water samples were analysed for its physico-chemical characteristics (Figure 14).

POLA
R S
CIE
NC
ES
ESSO-NCPOR Annual Report 2018-2019
21
Figure 14: Location map of the study area showing sampling sites.
The abundance of anions and cations in the lake water samples were analysed and observed in the following order of Cl- > HCO3- > SO4
2- > NO3-
and Na+ > Mg2+ > Ca2+ > K+ respectively. The overall water quality in all the lakes is within the permissible limit of World Health Organization guidelines. Moreover, the lakes exhibit slightly alkaline conditions due to dissolution of alkaline earths and atmospheric fallout. Na+-Cl--HCO3- and Na+-Cl- are the commonly noticed water type in the study area and higher concentrations of Na+-Cl- are due to sea spray effect (Figure 15).
Reverse ion exchange is another phenomenon noticed in most of the lakes due to saline influence thus replacing ions. Three major mechanisms such as rock dominance, precipitation/snow and evaporation/sea spray control the lake water geochemistry in the study area. The lake water samples falling over rock dominance zone signifies the role of rock water interaction in which the dissolution of ions from the rock source contributes ionic load to the lake water. Samples falling in the precipitation dominance zone indicate the role of melt water from the polar ice sheets which is
equivalent to precipitation since ionic content in snow will be significantly less. Samples falling over evaporation dominance zone highlight the role of sea spray and evaporation (during austral summer) on the ionic load of lake water (Figure 16).
Based on the ionic ratio results, the lake water samples in the study area reveals that there is a possibility of plagioclase weathering since (Na++K-
-Cl-)/(Na++K--Cl-+Ca2+) values are in the range of >0.2 and <0.8. The ratio of (Na+/ Na++Cl-) in all the lake water samples shows a value >0.5 which indicates the presence of sodium source other than halite-albite or ion exchange. The possibility of sodium in the lake water is due to sea spray contribution which is evident from the hydro geochemical facies plot. The Cl-/sum of anions shows two different phases in which lakes such as L-4, L-4A, L-6 and L-7 shows seawater influence in the form of sea spray (>0.8) whereas the rest of the lakes are influenced by rock weathering. However, sea spray effect is somehow influenced all the lakes in the study area, certainly the concentration may vary and it is apparent from the ratio of HCO3-/sum of anions indicating a value of <0.8 with low

POLAR
SCIEN
CES
ESSO-NCPOR Annual Report 2018-2019
22 Figure 15: Piper diagram showing hydro-geochemical facies of lake water samples.
Figure 16. Gibbs plot showing the mechanism controlling the lake water chemistry.
POLA
R S
CIE
NC
ES
ESSO-NCPOR Annual Report 2018-2019
23
sulphate concentration. The standard seawater ratio (ca 655) can be compared with Cl-/Br- ratio values. The melt water supply from the polar ice sheets to the lakes such as L-10, L-11 and L-12 have lesser chloride concentration (<10 mg/L) and Cl-/Br- ratio will be always less than seawater. However, influence of sea spray on these ice sheets has a marginal effect in the concentration of chloride. Increase in the concentration of chloride ion from 10 to 100 is noticed in lakes L-1, L-2, L-3, L-5, L-6A, L-8 and L-9. These lakes fall almost in the line of standard seawater ratio (ca 655) except lake L-8 which shows a higher Cl-/Br- ratio as the lake may have a marginal sea spray effect. The lakes which are located within the micro basin (L-4, L-4A, L-6 and L-7) shows a higher Cl-/Br- ratio along with higher chloride concentration. Lakes falling within a micro basin have shown higher Na+-Cl- content which is due to the effect of catchment where snow enriched with Na+-Cl- melts during the austral summer feeding these lakes.
Pearson’s correlation analysis was performed to understand the association among the physico-chemical parameters of the lake water, Significant positive correlations (p<0.01) among major ions reveal sources from bedrock weathering along with sea spray effect. Certain trace elements such as Rb and Sr shows positive correlation with major ions which is attributed to alkali and alkaline earth metals from a common source pH shows negative correlations with other elements indicating near alkaline environment. Strong positive correlation among Fe and Mn attributes to Fe-Mn hydroxides under oxic condition and they precipitate together. Strong correlation between Mo and U indicates bedrock weathering as its source. Moreover, moderate correlation between Mo and NO3
-, DO
indicates that Mo is a key element limiting life in lakes, especially through control of N-fixation.
2.1.5 38th INDIAN SCIENTIFIC EXPEDITION TO ANTARCTICA
38th Indian Scientific Expedition to Antarctica
The project proposals received for the 38th Indian Scientific Expedition to Antarctica (ISEA) were reviewed by a group of experts from different disciplines at a National Workshop held at ESSO-NCPOR during 16th & 17th May, 2018. The panel was chaired by Dr. Shailesh Nayak, SCAR-India President. The review panel comprised of six members viz., Prof. Rasik Ravindra, Prof. N C Pant, Dr. Ashwaghosha Ganju, Dr. S Satyakumar, Dr. R Krishnan and Shri. M. Javed Beg.
Thirty-four project proposals (ongoing and new) were received for the 38th ISEA out of which twenty-five projects were recommended for the expedition. The National Co-ordination Committee for Polar Programme (NCPP) was held on 13th July, 2018 at MoES, New Delhi. The committee assessed the recommendation presented to them by the Group of Experts in different themes such as Climate Process & Linkages to Change, Crustal Evolution, Environmental Processes & Conservation, Ecosystem of Terrestrial & Nearshore, Observational research, Polar Technology and Capacity Building, where the list of participating institutions and expedition members including the leaders were finalized.
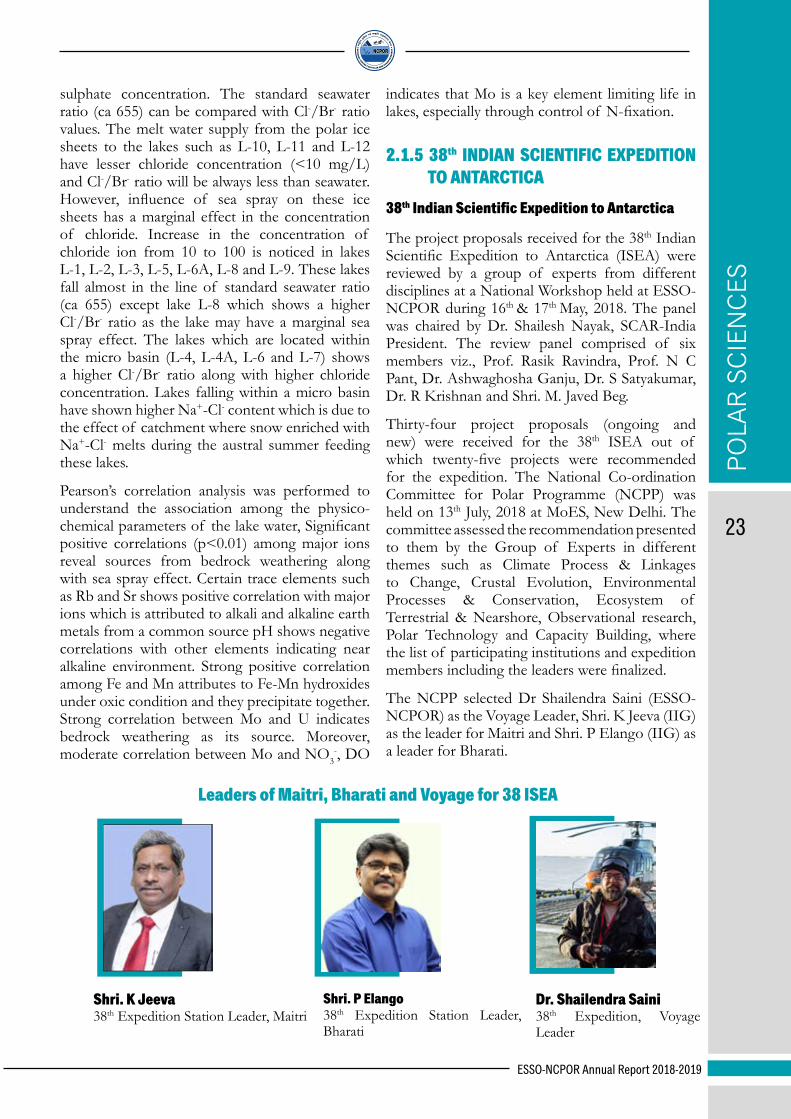
The NCPP selected Dr Shailendra Saini (ESSO-NCPOR) as the Voyage Leader, Shri. K Jeeva (IIG) as the leader for Maitri and Shri. P Elango (IIG) as a leader for Bharati.
Shri. K Jeeva 38th Expedition Station Leader, Maitri
Shri. P Elango 38th Expedition Station Leader, Bharati
Dr. Shailendra Saini38th Expedition, Voyage Leader
Leaders of Maitri, Bharati and Voyage for 38 ISEA

POLAR
SCIEN
CES
ESSO-NCPOR Annual Report 2018-2019
24
The initial phase of Antarctic Season 2018-19 was by and large smooth with no major hiccups/ accidents and operations at Bharati, Larsemann Hills completed smoothly, but for the last leg of the voyage with our chartered vessel MV Vasiliy Golovnin (Figure 17). Vessel while closing in for the ice barrier for Maitri Station encountered heavy sea ice for about 50 km but with great efforts and heavy consumption of fuel manged to penetrate the ice in about 23 days as against 7 days under normal conditions and that too at an alternate discharge site. After successfully discharging about 200 MT of cargo and 575 KL of Jet fuel and thus
building up fuel reserves enough to sustain the station for about a year. The vessel sailed for Cape Town on 27 March 2019 but manged to negotiate only a few kms in 3 days. The sea ice was about 1.5 to 2.0 meters with 30 to 50 cm snow cover which perhaps was beyond vessel’s ice breaking capability with limited fuel reserves just not enough for continuous ice breaking for more than three days. Realizing the limitations of low fuel reserves on board and a long way to go for a distance of about 50 km of intense ice, it was decided to maintain position at 69°55.8’S and 011°53.0’E, conserving fuel and waiting for assistance.
Figure 17. Expedition Vessel – MV Vasiliy Golovnin: near Bharati station in February 2019 (top) and while approaching Indian Barrier near Maitri about 2 weeks later (bottom).

POLA
R S
CIE
NC
ES
ESSO-NCPOR Annual Report 2018-2019
25
Sensing impending danger of vessel getting trapped for the whole of winter season with 82 souls on board (35 expedition members and 44 crew and 3 members of ALCI), efforts were made to garner support from at least three national programs operating in Antarctica having their vessels in vicinity of our chartered vessel Golovnin namely- Russia, Norway and United Kingdom. While Norway and United Kingdom regretted, citing reasons of operational safety with insufficient fuel on their vessels namely, RV Kronpins Haakon and RRS James Clark Ross, respectively for undertaking such a risky rescue mission. Russians however, agreed to help with RV Akademik Federov but only after finishing their operations at Molodezhnaya and at Russian Barrier of Novolazarevskaya which left MV Vasiliy Golovnin stranded in sea ice and nearly 27 days MV Vasily Golovnin came out on its own (Figure 18).
A voyage team of 28 members during onward and 35 members during return voyage on board-chartered expedition vessels MV Vasily Golovnin was led by Dr Shailendra Saini from NCPOR
(Figure 19a). While two teams of 23 members for Bharati Station (Figure 19b) and 25 members for Maitri Station (Figure 19c) , respectively led by Shri. Elango Paramasivan and Shri. Jeeva Krishnamoorthy both from India Institute of Geomagnetism are left behind for the ensuing winter over season.
By and large all scientific and logistic objectives have been met in spite of the restricted ship time due to insurmountable sea ice conditions. Maitri Station that had lost its fuel reserves in season 2011-12, as no fuel could be delivered due to heavy sea ice and was surviving on bare minimum annual supplies just enough for about a year has been successfully augmented. We have been able to deliver 575 KL jet fuel as against an annual requirement of about 320 KL. Taking the leftover fuel of the previous season and a supply of 575 KL in the current season, Maitri now, has a reserve stock of about 384 KL which is good enough for another unexpected dry season or enhanced requirements in view of planned construction activity in the coming years.
Figure 18. Vessel stranded in the fast ice on the return voyage in the end of March 2019 (top) and MV Vasiliy Golovnin following Russian Vessel RV Akademik Fedorov in the Frozen Antarctic sea (bottom).

POLAR
SCIEN
CES
ESSO-NCPOR Annual Report 2018-2019
26
Figure 19a. Voyage team, 38th ISEA
Figure 19b. Winter over team, Bharati 38th ISEA
POLA
R S
CIE
NC
ES
ESSO-NCPOR Annual Report 2018-2019
27
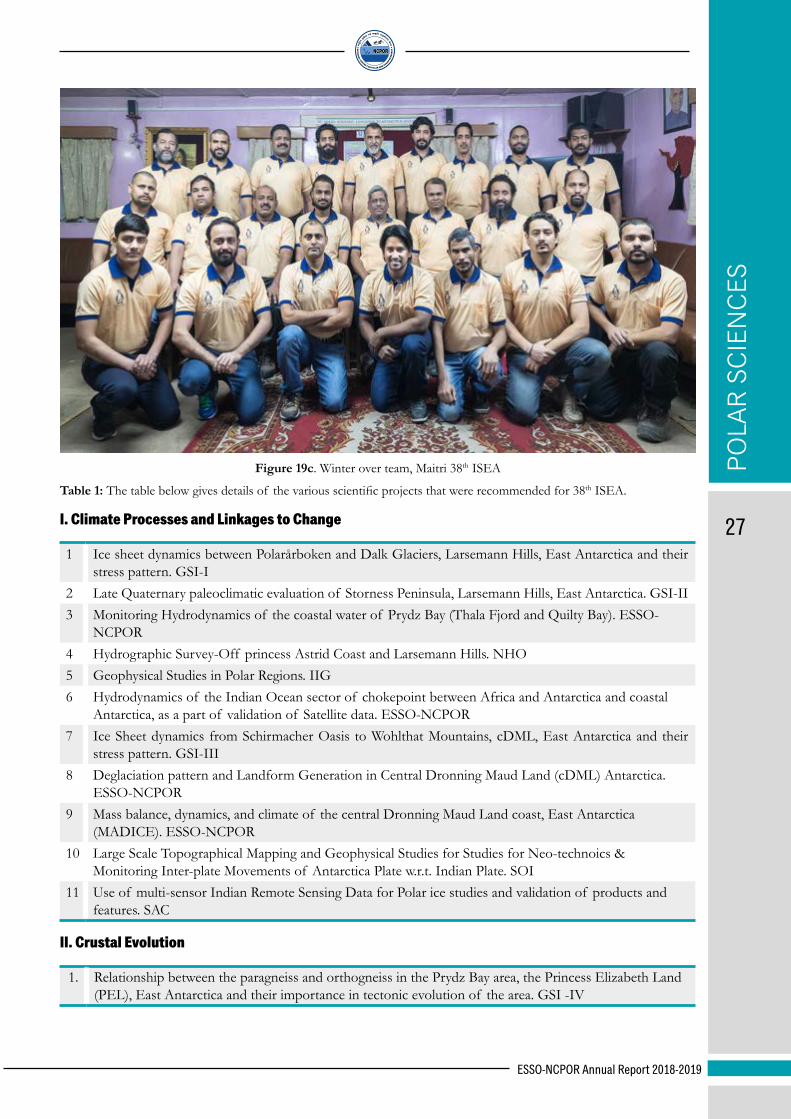
Figure 19c. Winter over team, Maitri 38th ISEA
Table 1: The table below gives details of the various scientific projects that were recommended for 38th ISEA.
I. Climate Processes and Linkages to Change
1 Ice sheet dynamics between Polarårboken and Dalk Glaciers, Larsemann Hills, East Antarctica and their stress pattern. GSI-I
2 Late Quaternary paleoclimatic evaluation of Storness Peninsula, Larsemann Hills, East Antarctica. GSI-II3 Monitoring Hydrodynamics of the coastal water of Prydz Bay (Thala Fjord and Quilty Bay). ESSO-
NCPOR4 Hydrographic Survey-Off princess Astrid Coast and Larsemann Hills. NHO5 Geophysical Studies in Polar Regions. IIG6 Hydrodynamics of the Indian Ocean sector of chokepoint between Africa and Antarctica and coastal
Antarctica, as a part of validation of Satellite data. ESSO-NCPOR7 Ice Sheet dynamics from Schirmacher Oasis to Wohlthat Mountains, cDML, East Antarctica and their
stress pattern. GSI-III8 Deglaciation pattern and Landform Generation in Central Dronning Maud Land (cDML) Antarctica.
ESSO-NCPOR9 Mass balance, dynamics, and climate of the central Dronning Maud Land coast, East Antarctica
(MADICE). ESSO-NCPOR10 Large Scale Topographical Mapping and Geophysical Studies for Studies for Neo-technoics &
Monitoring Inter-plate Movements of Antarctica Plate w.r.t. Indian Plate. SOI11 Use of multi-sensor Indian Remote Sensing Data for Polar ice studies and validation of products and
features. SAC
II. Crustal Evolution
1. Relationship between the paragneiss and orthogneiss in the Prydz Bay area, the Princess Elizabeth Land (PEL), East Antarctica and their importance in tectonic evolution of the area. GSI -IV
POLAR
SCIEN
CES
ESSO-NCPOR Annual Report 2018-2019
28
III. Environmental Processes and Conservation
1. Environmental Impact Assessment of Anthropogenic Activities at Indian Polar Stations- A local and global perspective. ESSO-NCPOR
2. Pharmaceuticals and personal care products in the adjacent sea waters near the Bharati station, Larsemann Hills, East Antarctica. Manipal University
3. Search for Star born, Primordial, and Anthropogenic Radionuclides in Antarctica (SPAR). Saha Institute
4. Multi-year measurements of mercury in the Antarctic environment: assessing trends in global emissions, fate and transport of mercury and bioaccumulation in the Antarctic. IIT, Hyderabad
IV. Ecosytem of Terrestrial and Nearshore
1. Investigation of Antarctic Animal Metavirome: An initiative for Pathogen Discovery with special reference to globally emerging avian influenza and other high risk viruses. ICAR-NIHSAD
2. Ecology and taxonomy of psychrophilic benthic and lithic algal community from inland Antarctica. BSI-Pune
3. Long-term monitoring of Wildlife and its habitats in Antarctica and Southern Indian Ocean. WII
V. Observational Research
1. Study of relationship between lightning activity over Indian region and Global Electric Circuit. IITM, Pune
2. Atmospheric Studies using Moveable Atmospheric Radar for Antarctica. ESSO-NCPOR & Cochin University
3. Response of high latitude ionosphere to the sub-storms and storms. NPL & ESSO-NCPOR4. Ice sheet, glacier, sea ice and lake dynamics study in parts of Antarctic using remote sensing and modelling
approach. IIRS5. Measurement of radiation level due to cosmic rays and terrestrial radiation at and around Bharati Station,
Antarctica. BARC6. Characterizing atmospheric processes, variability and change in Antarctic – Bharati. IMD-I7. Characterizing atmospheric processes, variability and change in Antarctic – Maitri. IMD-II8. Stellar Observations of Variable Stars in Southern Sky using Small Telescope. Jyotividya Parisanstha9. Satellite-based DEM for monitoring Antarctic ice topography, with a special focus on glaciers. ESSO-
NCPOR10. Permanent Seismological and GPS Observatory at Maitri-Antarctica. NGRI
VI. Polar Technology
1. Application of Contingency theory in Antarctica - in context of optimization of resources for Indian Antarctic Expedition with a SAP LAP Framework.IIT Delhi
VII. Capacity Building
1 Deformation and fabric in Sub glacial till exposed in Schirmacher Oasis. IIT, Bhubaneswar
POLA
R S
CIE
NC
ES
ESSO-NCPOR Annual Report 2018-2019
29
2.2.1 ATMOSPHERIC STUDIES2.2.1a Black carbon aerosols over Arctic
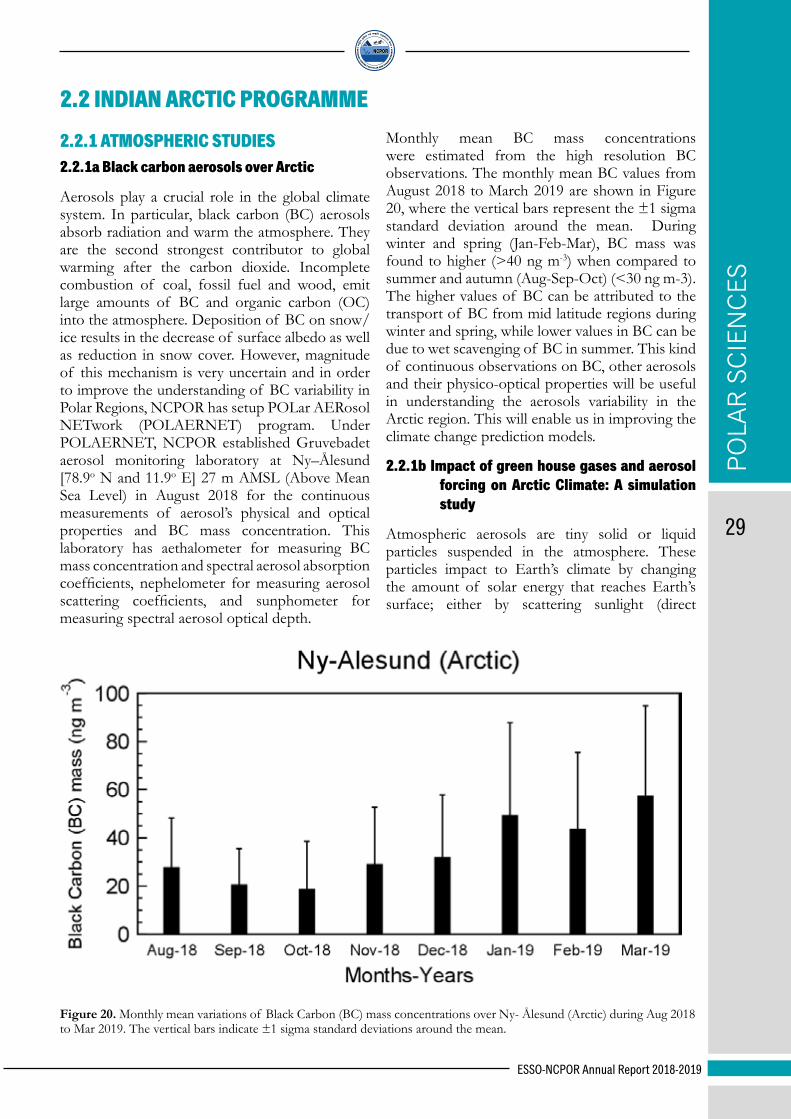
Aerosols play a crucial role in the global climate system. In particular, black carbon (BC) aerosols absorb radiation and warm the atmosphere. They are the second strongest contributor to global warming after the carbon dioxide. Incomplete combustion of coal, fossil fuel and wood, emit large amounts of BC and organic carbon (OC) into the atmosphere. Deposition of BC on snow/ ice results in the decrease of surface albedo as well as reduction in snow cover. However, magnitude of this mechanism is very uncertain and in order to improve the understanding of BC variability in Polar Regions, NCPOR has setup POLar AERosol NETwork (POLAERNET) program. Under POLAERNET, NCPOR established Gruvebadet aerosol monitoring laboratory at Ny–Ålesund [78.9o N and 11.9o E] 27 m AMSL (Above Mean Sea Level) in August 2018 for the continuous measurements of aerosol’s physical and optical properties and BC mass concentration. This laboratory has aethalometer for measuring BC mass concentration and spectral aerosol absorption coefficients, nephelometer for measuring aerosol scattering coefficients, and sunphometer for measuring spectral aerosol optical depth.
Monthly mean BC mass concentrations were estimated from the high resolution BC observations. The monthly mean BC values from August 2018 to March 2019 are shown in Figure 20, where the vertical bars represent the ±1 sigma standard deviation around the mean. During winter and spring (Jan-Feb-Mar), BC mass was found to higher (>40 ng m-3) when compared to summer and autumn (Aug-Sep-Oct) (<30 ng m-3). The higher values of BC can be attributed to the transport of BC from mid latitude regions during winter and spring, while lower values in BC can be due to wet scavenging of BC in summer. This kind of continuous observations on BC, other aerosols and their physico-optical properties will be useful in understanding the aerosols variability in the Arctic region. This will enable us in improving the climate change prediction models.
2.2.1b Impact of green house gases and aerosol forcing on Arctic Climate: A simulation study
Atmospheric aerosols are tiny solid or liquid particles suspended in the atmosphere. These particles impact to Earth’s climate by changing the amount of solar energy that reaches Earth’s surface; either by scattering sunlight (direct
Figure 20. Monthly mean variations of Black Carbon (BC) mass concentrations over Ny- Ålesund (Arctic) during Aug 2018 to Mar 2019. The vertical bars indicate ±1 sigma standard deviations around the mean.
2.2 INDIAN ARCTIC PROGRAMME
POLAR
SCIEN
CES
ESSO-NCPOR Annual Report 2018-2019
30
effect), or by participating in the formation of clouds (indirect effect). Human activities produce both Greenhouse gases (GHGs) and aerosols, could alter regional and global climate. GHGs are globally well distributed, long-lived and mostly responsible for warming. On the contrary, aerosols are short lived, varyingly distributed and more complex; as they can have both a cooling and warming effect. Though studies suggest that cooling due to aerosols could partly offset the GHGs warming, but those the results are not conclusive. Arctic region acts as a heat sink for the Earth. In recent decades, the region is warmer than it used to be and it continues to get warmer. Arctic amplification refers to the phenomenon in which zonally averaged surface temperature changes in response to climate forcing. This is closely related to a variety of feedback mechanisms, however, is not yet clearly understood.
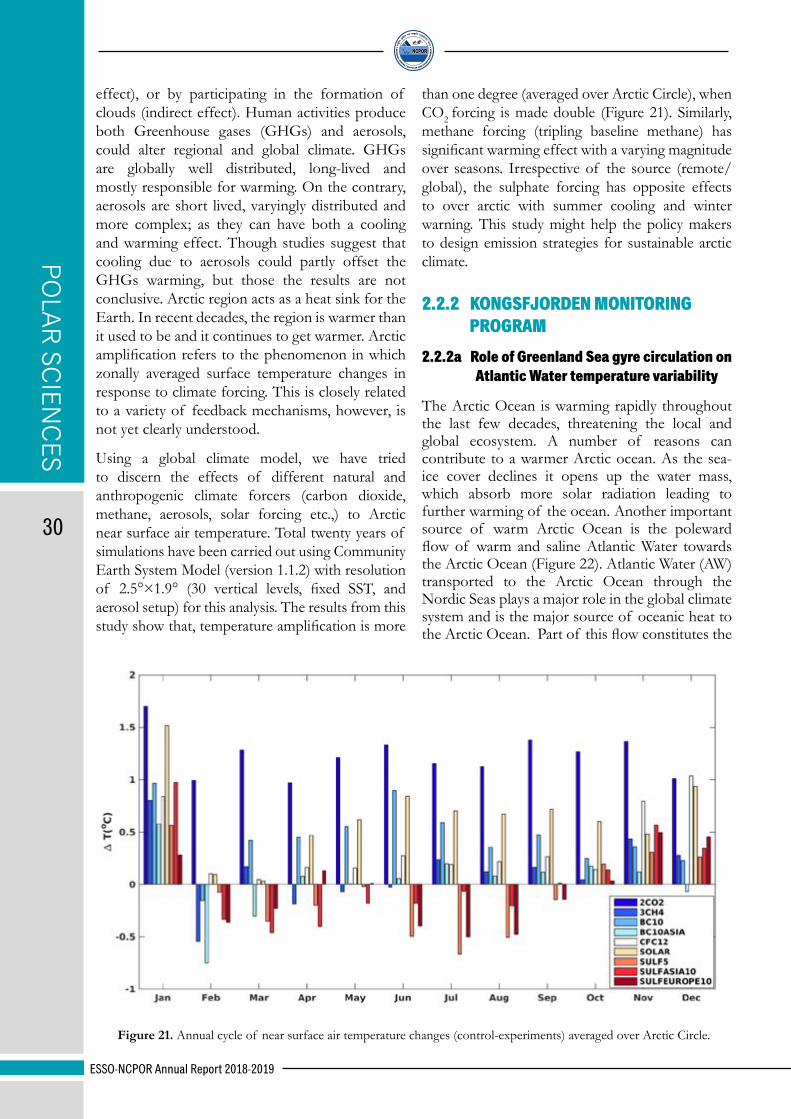
Using a global climate model, we have tried to discern the effects of different natural and anthropogenic climate forcers (carbon dioxide, methane, aerosols, solar forcing etc.,) to Arctic near surface air temperature. Total twenty years of simulations have been carried out using Community Earth System Model (version 1.1.2) with resolution of 2.5°×1.9° (30 vertical levels, fixed SST, and aerosol setup) for this analysis. The results from this study show that, temperature amplification is more
than one degree (averaged over Arctic Circle), when CO2 forcing is made double (Figure 21). Similarly, methane forcing (tripling baseline methane) has significant warming effect with a varying magnitude over seasons. Irrespective of the source (remote/global), the sulphate forcing has opposite effects to over arctic with summer cooling and winter warning. This study might help the policy makers to design emission strategies for sustainable arctic climate.
2.2.2 KONGSFJORDEN MONITORING PROGRAM
2.2.2a Role of Greenland Sea gyre circulation on Atlantic Water temperature variability
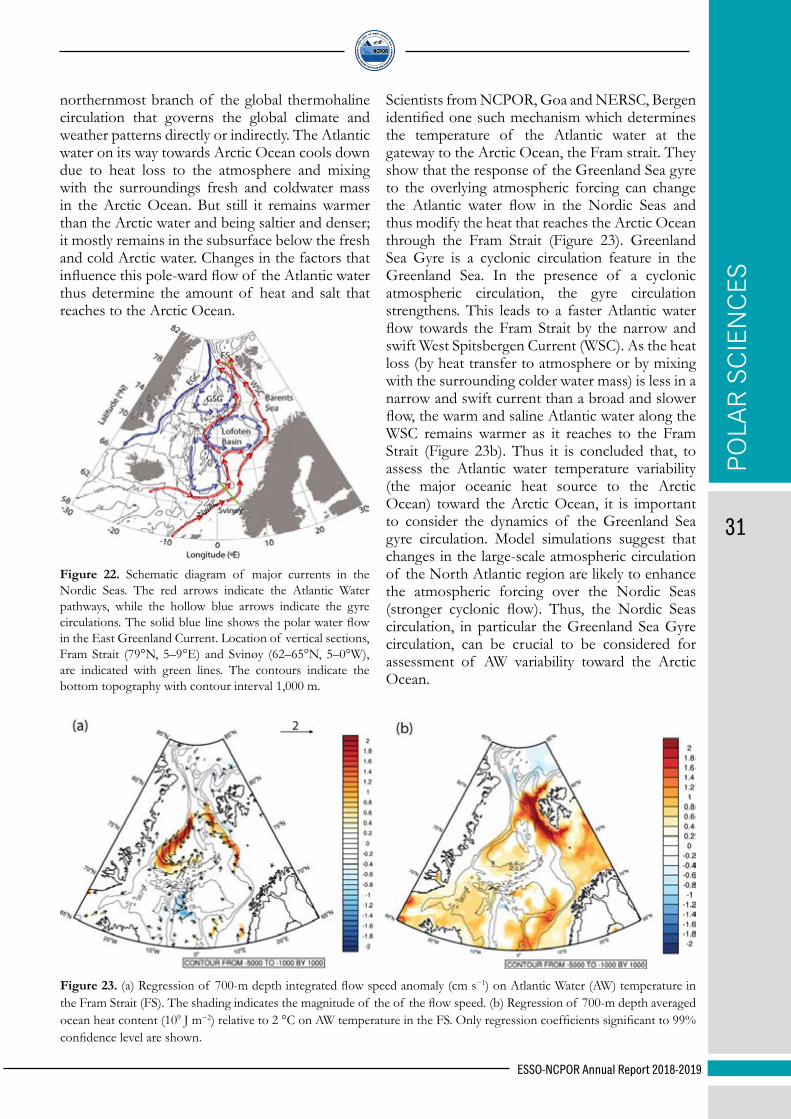
The Arctic Ocean is warming rapidly throughout the last few decades, threatening the local and global ecosystem. A number of reasons can contribute to a warmer Arctic ocean. As the sea-ice cover declines it opens up the water mass, which absorb more solar radiation leading to further warming of the ocean. Another important source of warm Arctic Ocean is the poleward flow of warm and saline Atlantic Water towards the Arctic Ocean (Figure 22). Atlantic Water (AW) transported to the Arctic Ocean through the Nordic Seas plays a major role in the global climate system and is the major source of oceanic heat to the Arctic Ocean. Part of this flow constitutes the
Figure 21. Annual cycle of near surface air temperature changes (control-experiments) averaged over Arctic Circle.
POLA
R S
CIE
NC
ES
ESSO-NCPOR Annual Report 2018-2019
31
northernmost branch of the global thermohaline circulation that governs the global climate and weather patterns directly or indirectly. The Atlantic water on its way towards Arctic Ocean cools down due to heat loss to the atmosphere and mixing with the surroundings fresh and coldwater mass in the Arctic Ocean. But still it remains warmer than the Arctic water and being saltier and denser; it mostly remains in the subsurface below the fresh and cold Arctic water. Changes in the factors that influence this pole-ward flow of the Atlantic water thus determine the amount of heat and salt that reaches to the Arctic Ocean.
Scientists from NCPOR, Goa and NERSC, Bergen identified one such mechanism which determines the temperature of the Atlantic water at the gateway to the Arctic Ocean, the Fram strait. They show that the response of the Greenland Sea gyre to the overlying atmospheric forcing can change the Atlantic water flow in the Nordic Seas and thus modify the heat that reaches the Arctic Ocean through the Fram Strait (Figure 23). Greenland Sea Gyre is a cyclonic circulation feature in the Greenland Sea. In the presence of a cyclonic atmospheric circulation, the gyre circulation strengthens. This leads to a faster Atlantic water flow towards the Fram Strait by the narrow and swift West Spitsbergen Current (WSC). As the heat loss (by heat transfer to atmosphere or by mixing with the surrounding colder water mass) is less in a narrow and swift current than a broad and slower flow, the warm and saline Atlantic water along the WSC remains warmer as it reaches to the Fram Strait (Figure 23b). Thus it is concluded that, to assess the Atlantic water temperature variability (the major oceanic heat source to the Arctic Ocean) toward the Arctic Ocean, it is important to consider the dynamics of the Greenland Sea gyre circulation. Model simulations suggest that changes in the large-scale atmospheric circulation of the North Atlantic region are likely to enhance the atmospheric forcing over the Nordic Seas (stronger cyclonic flow). Thus, the Nordic Seas circulation, in particular the Greenland Sea Gyre circulation, can be crucial to be considered for assessment of AW variability toward the Arctic Ocean.
Figure 22. Schematic diagram of major currents in the Nordic Seas. The red arrows indicate the Atlantic Water pathways, while the hollow blue arrows indicate the gyre circulations. The solid blue line shows the polar water flow in the East Greenland Current. Location of vertical sections, Fram Strait (79°N, 5–9°E) and Svinøy (62–65°N, 5–0°W), are indicated with green lines. The contours indicate the bottom topography with contour interval 1,000 m.
Figure 23. (a) Regression of 700-m depth integrated flow speed anomaly (cm s−1) on Atlantic Water (AW) temperature in the Fram Strait (FS). The shading indicates the magnitude of the of the flow speed. (b) Regression of 700-m depth averaged ocean heat content (109 J m−2) relative to 2 °C on AW temperature in the FS. Only regression coefficients significant to 99% confidence level are shown.

POLAR
SCIEN
CES
ESSO-NCPOR Annual Report 2018-2019
32
2.2.2b Role of Atlantic water advection in Kongsfjorden thermodynamics
Increase in Atlantic water inflow to the eastern part of Arctic Ocean makes the latter more like Atlantic. This is termed as ‘atlantification’. Atlantification brings more heat and salt to the Arctic region including fjord systems. It also leads to subsurface melting of tide water glaciers, changes in biological species and other associated physical and biogeochemical processes. Hence, it becomes important to measure and quantify the Atlantic water and its implications in the Arctic fjords. Kongsfjorden, an Arctic fjord to the west of Svalbard archipelago (79oN and 12oE), is situated along the main northward pathway of Atlantic water and recent studies show an increased warming in the fjord over the last decade. Our underwater observatory in the Arctic Fjord Kongsfjorden (Figure 24) offers a unique possibility to investigate such environmental changes of far reaching consequences in fine details.
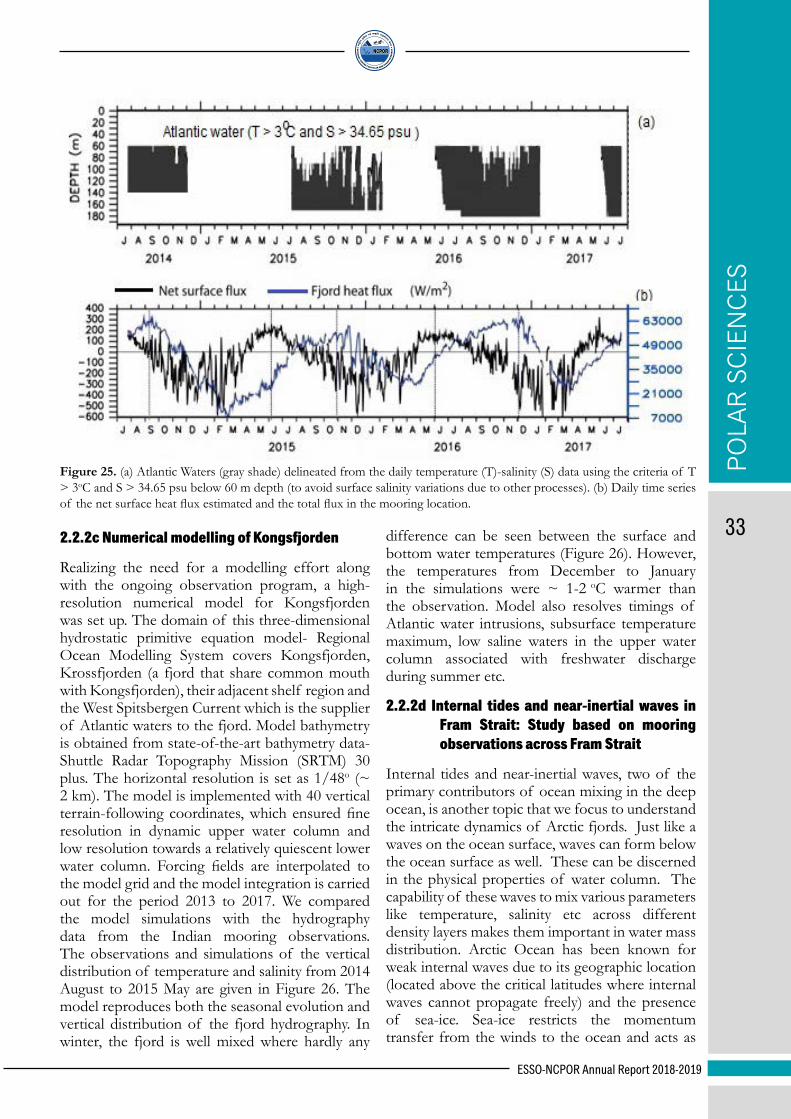
Figure (25a) shows the periods and depths of Atlantic water observed inside Kongsfjorden from
the IndARC mooring data of three years from July 2014 to July 2017. Total heat flux- flow of heat per unit area per unit time, which is a combination of surface fluxes as well as oceanic heat advection by the Atlantic water, was estimated (Figure 25b). The surface heat flux was calculated using permanent weather station data at Ny-Ålesund and European Centre for Medium-Range Weather Forecasts winds (Figure 25b). Positive flux indicated flux from atmosphere to the fjord and vice versa. The total heat flux that is much higher than the net surface heat flux available indicates an additional internal supply of heat to the fjord. The residence period of Atlantic waters inside the fjord corresponds very well with peak total heat fluxes showing the role of Atlantic currents in the heat transported into the fjord through exchange mechanisms. This shows the key role of the Atlantic water intrusions in the fjord thermodynamics. This analysis also turned out to be another way of detecting periods of the Atlantic water advection from the flux data. Hence, the heat flux method can be used to determine advection periods of Atlantic water when current data to show flow directions in the fjord is unavailable.
Figure 24. Model domain. The red stars are ADCP and CTD mooring locations whereas the white stars are current meter mooring locations in the Fram Strait. The yellow circles indicate the CTD data available in the model domain. K1 is the underwater mooring deployed by NCPOR.
POLA
R S
CIE
NC
ES
ESSO-NCPOR Annual Report 2018-2019
33
Figure 25. (a) Atlantic Waters (gray shade) delineated from the daily temperature (T)-salinity (S) data using the criteria of T > 3oC and S > 34.65 psu below 60 m depth (to avoid surface salinity variations due to other processes). (b) Daily time series of the net surface heat flux estimated and the total flux in the mooring location.
2.2.2c Numerical modelling of Kongsfjorden
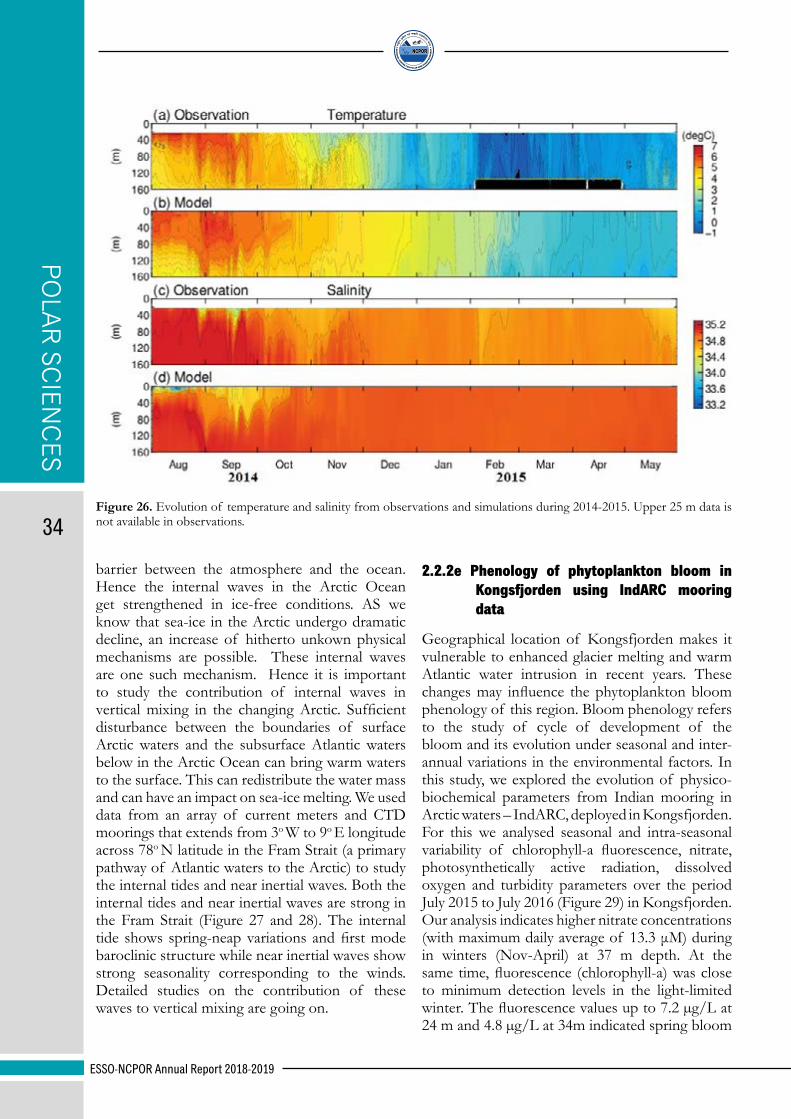
Realizing the need for a modelling effort along with the ongoing observation program, a high-resolution numerical model for Kongsfjorden was set up. The domain of this three-dimensional hydrostatic primitive equation model- Regional Ocean Modelling System covers Kongsfjorden, Krossfjorden (a fjord that share common mouth with Kongsfjorden), their adjacent shelf region and the West Spitsbergen Current which is the supplier of Atlantic waters to the fjord. Model bathymetry is obtained from state-of-the-art bathymetry data- Shuttle Radar Topography Mission (SRTM) 30 plus. The horizontal resolution is set as 1/48o (~ 2 km). The model is implemented with 40 vertical terrain-following coordinates, which ensured fine resolution in dynamic upper water column and low resolution towards a relatively quiescent lower water column. Forcing fields are interpolated to the model grid and the model integration is carried out for the period 2013 to 2017. We compared the model simulations with the hydrography data from the Indian mooring observations. The observations and simulations of the vertical distribution of temperature and salinity from 2014 August to 2015 May are given in Figure 26. The model reproduces both the seasonal evolution and vertical distribution of the fjord hydrography. In winter, the fjord is well mixed where hardly any
difference can be seen between the surface and bottom water temperatures (Figure 26). However, the temperatures from December to January in the simulations were ~ 1-2 oC warmer than the observation. Model also resolves timings of Atlantic water intrusions, subsurface temperature maximum, low saline waters in the upper water column associated with freshwater discharge during summer etc.
2.2.2d Internal tides and near-inertial waves in Fram Strait: Study based on mooring observations across Fram Strait
Internal tides and near-inertial waves, two of the primary contributors of ocean mixing in the deep ocean, is another topic that we focus to understand the intricate dynamics of Arctic fjords. Just like a waves on the ocean surface, waves can form below the ocean surface as well. These can be discerned in the physical properties of water column. The capability of these waves to mix various parameters like temperature, salinity etc across different density layers makes them important in water mass distribution. Arctic Ocean has been known for weak internal waves due to its geographic location (located above the critical latitudes where internal waves cannot propagate freely) and the presence of sea-ice. Sea-ice restricts the momentum transfer from the winds to the ocean and acts as
POLAR
SCIEN
CES
ESSO-NCPOR Annual Report 2018-2019
34Figure 26. Evolution of temperature and salinity from observations and simulations during 2014-2015. Upper 25 m data is not available in observations.
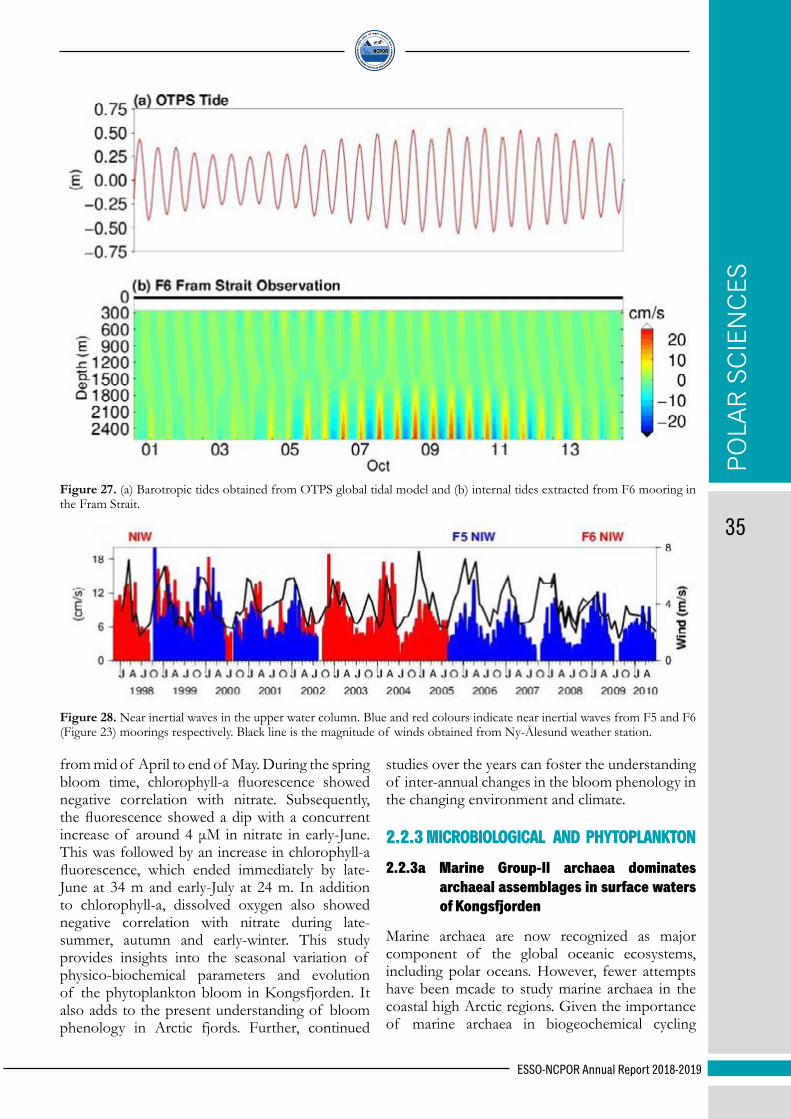
barrier between the atmosphere and the ocean. Hence the internal waves in the Arctic Ocean get strengthened in ice-free conditions. AS we know that sea-ice in the Arctic undergo dramatic decline, an increase of hitherto unkown physical mechanisms are possible. These internal waves are one such mechanism. Hence it is important to study the contribution of internal waves in vertical mixing in the changing Arctic. Sufficient disturbance between the boundaries of surface Arctic waters and the subsurface Atlantic waters below in the Arctic Ocean can bring warm waters to the surface. This can redistribute the water mass and can have an impact on sea-ice melting. We used data from an array of current meters and CTD moorings that extends from 3o W to 9o E longitude across 78o N latitude in the Fram Strait (a primary pathway of Atlantic waters to the Arctic) to study the internal tides and near inertial waves. Both the internal tides and near inertial waves are strong in the Fram Strait (Figure 27 and 28). The internal tide shows spring-neap variations and first mode baroclinic structure while near inertial waves show strong seasonality corresponding to the winds. Detailed studies on the contribution of these waves to vertical mixing are going on.
2.2.2e Phenology of phytoplankton bloom in Kongsfjorden using IndARC mooring data
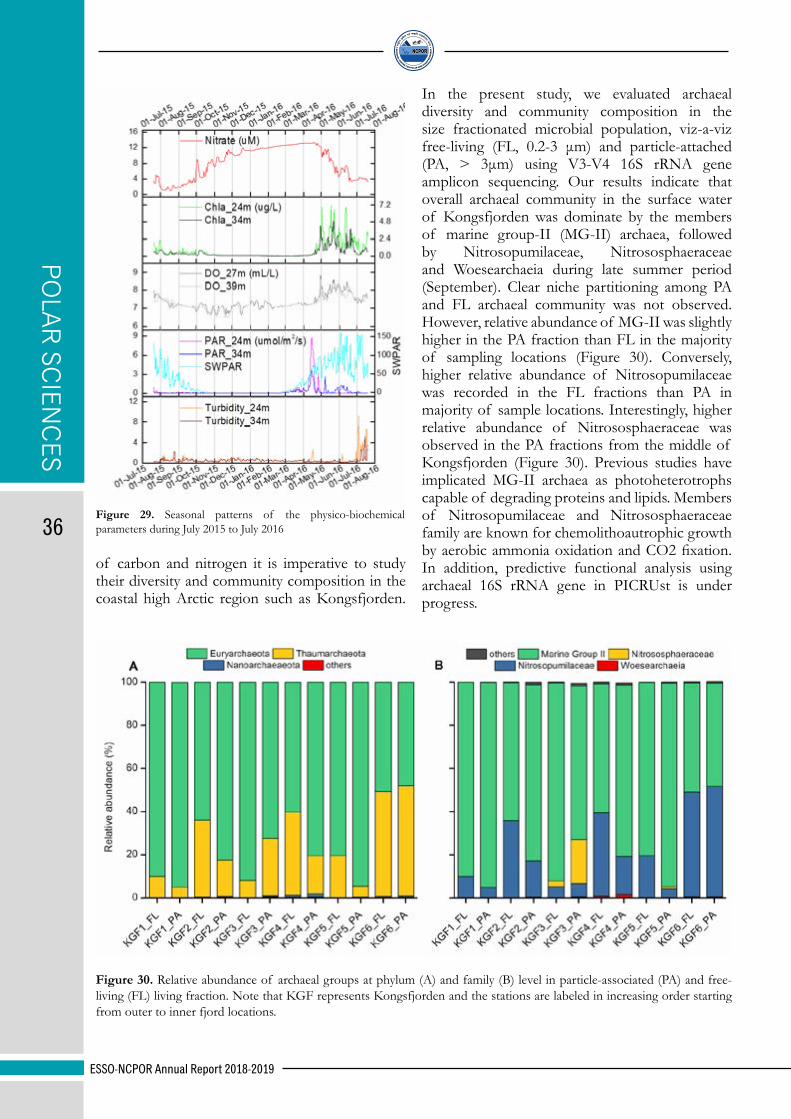
Geographical location of Kongsfjorden makes it vulnerable to enhanced glacier melting and warm Atlantic water intrusion in recent years. These changes may influence the phytoplankton bloom phenology of this region. Bloom phenology refers to the study of cycle of development of the bloom and its evolution under seasonal and inter-annual variations in the environmental factors. In this study, we explored the evolution of physico-biochemical parameters from Indian mooring in Arctic waters – IndARC, deployed in Kongsfjorden. For this we analysed seasonal and intra-seasonal variability of chlorophyll-a fluorescence, nitrate, photosynthetically active radiation, dissolved oxygen and turbidity parameters over the period July 2015 to July 2016 (Figure 29) in Kongsfjorden. Our analysis indicates higher nitrate concentrations (with maximum daily average of 13.3 μM) during in winters (Nov-April) at 37 m depth. At the same time, fluorescence (chlorophyll-a) was close to minimum detection levels in the light-limited winter. The fluorescence values up to 7.2 µg/L at 24 m and 4.8 µg/L at 34m indicated spring bloom
POLA
R S
CIE
NC
ES
ESSO-NCPOR Annual Report 2018-2019
35
Figure 27. (a) Barotropic tides obtained from OTPS global tidal model and (b) internal tides extracted from F6 mooring in the Fram Strait.
Figure 28. Near inertial waves in the upper water column. Blue and red colours indicate near inertial waves from F5 and F6 (Figure 23) moorings respectively. Black line is the magnitude of winds obtained from Ny-Ålesund weather station.
from mid of April to end of May. During the spring bloom time, chlorophyll-a fluorescence showed negative correlation with nitrate. Subsequently, the fluorescence showed a dip with a concurrent increase of around 4 μM in nitrate in early-June. This was followed by an increase in chlorophyll-a fluorescence, which ended immediately by late-June at 34 m and early-July at 24 m. In addition to chlorophyll-a, dissolved oxygen also showed negative correlation with nitrate during late-summer, autumn and early-winter. This study provides insights into the seasonal variation of physico-biochemical parameters and evolution of the phytoplankton bloom in Kongsfjorden. It also adds to the present understanding of bloom phenology in Arctic fjords. Further, continued
studies over the years can foster the understanding of inter-annual changes in the bloom phenology in the changing environment and climate.
2.2.3 MICROBIOLOGICAL AND PHYTOPLANKTON2.2.3a Marine Group-II archaea dominates
archaeal assemblages in surface waters of Kongsfjorden
Marine archaea are now recognized as major component of the global oceanic ecosystems, including polar oceans. However, fewer attempts have been mcade to study marine archaea in the coastal high Arctic regions. Given the importance of marine archaea in biogeochemical cycling
POLAR
SCIEN
CES
ESSO-NCPOR Annual Report 2018-2019
36of carbon and nitrogen it is imperative to study their diversity and community composition in the coastal high Arctic region such as Kongsfjorden.
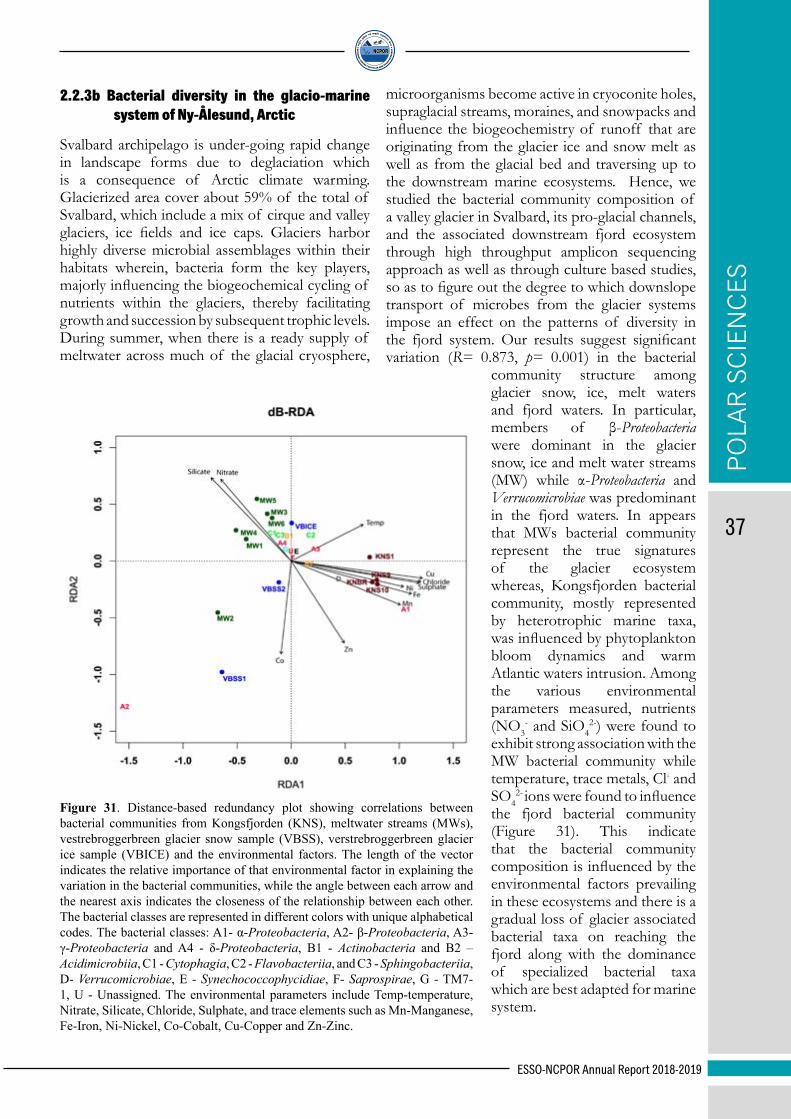
In the present study, we evaluated archaeal diversity and community composition in the size fractionated microbial population, viz-a-viz free-living (FL, 0.2-3 μm) and particle-attached (PA, > 3μm) using V3-V4 16S rRNA gene amplicon sequencing. Our results indicate that overall archaeal community in the surface water of Kongsfjorden was dominate by the members of marine group-II (MG-II) archaea, followed by Nitrosopumilaceae, Nitrososphaeraceae and Woesearchaeia during late summer period (September). Clear niche partitioning among PA and FL archaeal community was not observed. However, relative abundance of MG-II was slightly higher in the PA fraction than FL in the majority of sampling locations (Figure 30). Conversely, higher relative abundance of Nitrosopumilaceae was recorded in the FL fractions than PA in majority of sample locations. Interestingly, higher relative abundance of Nitrososphaeraceae was observed in the PA fractions from the middle of Kongsfjorden (Figure 30). Previous studies have implicated MG-II archaea as photoheterotrophs capable of degrading proteins and lipids. Members of Nitrosopumilaceae and Nitrososphaeraceae family are known for chemolithoautrophic growth by aerobic ammonia oxidation and CO2 fixation. In addition, predictive functional analysis using archaeal 16S rRNA gene in PICRUst is under progress.
Figure 29. Seasonal patterns of the physico-biochemical parameters during July 2015 to July 2016
Figure 30. Relative abundance of archaeal groups at phylum (A) and family (B) level in particle-associated (PA) and free-living (FL) living fraction. Note that KGF represents Kongsfjorden and the stations are labeled in increasing order starting from outer to inner fjord locations.
POLA
R S
CIE
NC
ES
ESSO-NCPOR Annual Report 2018-2019
37
2.2.3b Bacterial diversity in the glacio-marine system of Ny-Ålesund, Arctic
Svalbard archipelago is under-going rapid change in landscape forms due to deglaciation which is a consequence of Arctic climate warming. Glacierized area cover about 59% of the total of Svalbard, which include a mix of cirque and valley glaciers, ice fields and ice caps. Glaciers harbor highly diverse microbial assemblages within their habitats wherein, bacteria form the key players, majorly influencing the biogeochemical cycling of nutrients within the glaciers, thereby facilitating growth and succession by subsequent trophic levels. During summer, when there is a ready supply of meltwater across much of the glacial cryosphere,
microorganisms become active in cryoconite holes, supraglacial streams, moraines, and snowpacks and influence the biogeochemistry of runoff that are originating from the glacier ice and snow melt as well as from the glacial bed and traversing up to the downstream marine ecosystems. Hence, we studied the bacterial community composition of a valley glacier in Svalbard, its pro-glacial channels, and the associated downstream fjord ecosystem through high throughput amplicon sequencing approach as well as through culture based studies, so as to figure out the degree to which downslope transport of microbes from the glacier systems impose an effect on the patterns of diversity in the fjord system. Our results suggest significant variation (R= 0.873, p= 0.001) in the bacterial
community structure among glacier snow, ice, melt waters and fjord waters. In particular, members of β-Proteobacteria were dominant in the glacier snow, ice and melt water streams (MW) while α-Proteobacteria and Verrucomicrobiae was predominant in the fjord waters. In appears that MWs bacterial community represent the true signatures of the glacier ecosystem whereas, Kongsfjorden bacterial community, mostly represented by heterotrophic marine taxa, was influenced by phytoplankton bloom dynamics and warm Atlantic waters intrusion. Among the various environmental parameters measured, nutrients (NO3
- and SiO42-) were found to
exhibit strong association with the MW bacterial community while temperature, trace metals, Cl- and SO4
2- ions were found to influence the fjord bacterial community (Figure 31). This indicate that the bacterial community composition is influenced by the environmental factors prevailing in these ecosystems and there is a gradual loss of glacier associated bacterial taxa on reaching the fjord along with the dominance of specialized bacterial taxa which are best adapted for marine system.
Figure 31. Distance-based redundancy plot showing correlations between bacterial communities from Kongsfjorden (KNS), meltwater streams (MWs), vestrebroggerbreen glacier snow sample (VBSS), verstrebroggerbreen glacier ice sample (VBICE) and the environmental factors. The length of the vector indicates the relative importance of that environmental factor in explaining the variation in the bacterial communities, while the angle between each arrow and the nearest axis indicates the closeness of the relationship between each other. The bacterial classes are represented in different colors with unique alphabetical codes. The bacterial classes: A1- α-Proteobacteria, A2- β-Proteobacteria, A3- γ-Proteobacteria and A4 - δ-Proteobacteria, B1 - Actinobacteria and B2 – Acidimicrobiia, C1 - Cytophagia, C2 - Flavobacteriia, and C3 - Sphingobacteriia, D- Verrucomicrobiae, E - Synechococcophycidiae, F- Saprospirae, G - TM7-1, U - Unassigned. The environmental parameters include Temp-temperature, Nitrate, Silicate, Chloride, Sulphate, and trace elements such as Mn-Manganese, Fe-Iron, Ni-Nickel, Co-Cobalt, Cu-Copper and Zn-Zinc.

POLAR
SCIEN
CES
ESSO-NCPOR Annual Report 2018-2019
38
2.2.3c Diversity and distribution of Planctomycetes and related bacteria in the surface sediments of Kongsfjorden
Planctomycetes are a ubiquitous and numerically abundant bacterial group in the marine system and are well-known for their unusual cellular features such as internal compartmentalization, endocytosis-like pathways, and biosynthesis of sterol and degradation of complex bio-molecules. They play a critical role in various chemical reactions involved in the biogeochemical cycling of carbon and nitrogen. Though Planctomycetes represent one of the major bacterial groups in the marine system with ecological significance, our understanding of Planctomycetes in the Arctic system is limited. Hence to get a better insight into the Planctomycetes diversity with an increased resolution of the 16S rRNA gene, four 16S rDNA clone libraries were constructed from the surface sediment samples collected from the Arctic fjord, Kongsfjorden. A total of 450 clones were selected for sequencing and good quality assembled sequences were selected for further analysis. The total sequences obtained were segregated into 171 OTUs. Based on the analysis in RDP classifier with a 95% confidence threshold, the sequences were grouped into different phyla, while 54% of sequences were grouped as unclassified bacteria. Major phyla observed under the classified bacterial sequences were Planctomycetes (20%), Verrucomicrobia
(15%), Clamadia (2%) and Latescibacteria (7%). Other bacterial phyla such as Parcubacteria, Acidobacteria, Spirochaetes, and Proteobacteria were less abundant (<1%). All the Planctomycetes sequences retrieved were fallen under the family Planctomycetaceae. The major genera observed in the family Planctomycetaceae were Blastopirellula (17%), Gimesia (12%), Rhodopirellula (9%), Thermogutta (5%), Planctomicrobium (3.3%) and Aquisphaera (1.6%) (Figure 32). The remaining sequences (49%) could not classify further from the family level. The majority of the Planctomycetes sequences obtained in the study were unique, and the sequences had phylogenetic affiliations with major lineages in the Planctomycetaceae, as well as several novel groups of deeply divergent Planctomycetes. This study provides a systematic assessment of the diversity of Planctomycetes in the Kongsfjorden sediments and also provides evidence that the diversity of Planctomycetes has not yet been explored in the Arctic system.
2.2.3d Nanopore sequencing based prokaryotic diversity and predicted functional analysis from Kongsfjorden sediment sample
Oxford Nanopore is a portable nucleic acid sequencing platform with a size similar to a mobile phone (Figure 33a). This is one of the latest technologies in long read nucleic acid sequencing. In this study we optimized the nanopore
Figure 32. Pie chart illustrating the relative abundance of different bacterial phyla in the clone library. b) Relative abundance of major genera observed under Planctomycetes sequences in the clone library.

POLA
R S
CIE
NC
ES
ESSO-NCPOR Annual Report 2018-2019
39
sequencing protocol and various bioinformatics tools suitable for QC & data analysis. For this metagenomic DNA isolated from sediment sample was sequenced using R9.4.1 flowcell on Minion ONT platform. Prokaryotic diversity and abundance was analyzed using Kraken2 software, whereas the functional prediction based taxonomy was carried out using PICRUSt. Proteobacteria (64.66 %), Bacteroidetes (14.07 %), Firmicutes (6.63 %), Actinobacteria and Cyanobacteria were the most abundant bacterial phyla in the fjord sediment, whereas Thaumarchaeota and Euryarchaeota were the only detected archaeal phylum representing less than 1 % of total sequences (Figure 33b). Vibirionales was the most dominant order present in the sediment sample. Several pathogenic genera namely, Vibrio, Shewnella and Campylobacter were also present in higher abundance. Membrane transport, amino acid metabolism, carbohydrate metabolism, replication & repair, energy metabolism and xenobiotics biodegradation & metabolism related KEGG_pathways were the top most abundant pathways predicted by PICRUSt at level 2 (Figure 34).
2.2.4 CRYOSPHERIC STUDIESArctic glaciers are known to be particularly susceptible to climate change. The arctic glaciers and ice caps are irregularly distributed in space and are located in very different climatic regimes. As
climatic warming is most pronounced in the Polar Regions, it is necessary to understand how Arctic glaciers will respond to ongoing climate change. The huge ice masses stored in the Arctic and have a significant role to govern the global environment including significant contribution to sea level rise, understanding how glacier flow characteristics change in response to climate is of considerable importance for assessing the future implications for Arctic ice masses. The upwards migration of equilibrium lines and pronounced surface lowering of glaciers in Svalbard region show a clear signal of enhanced retreat of glacier masses in these regions. To understand and investigate glaciological and associated processes in context of climate change in Arctic region, an integrated study of Arctic glaciers at Ny-Alesund under “Indian Arctic Programme” have been carried. The main objective is to understand response of glaciers and its dynamics for ongoing climate change. Since, glacier network provides a highly useful tool for monitoring spatial and temporal changes in climate so that it is extensively used for reconstructing and modelling past and future climatic scenarios. NCPOR has been monitoring Vestre and Feiringbreen (cross the fjord; opposite to Vestre Broggerbreen glacier at Ny-Ålesund from) in Spitsbergen, Svalbard Arctic. To achieve these objectives various scientific studies such as mass and energy balance, terminal monitoring, glacier flow, ice flux, snow and water chemistry
Figure 33. a) Nanopore MinION, b) Phylum level distribution of prokaryotes in Kongsfjord

POLAR
SCIEN
CES
ESSO-NCPOR Annual Report 2018-2019
40
Figure 34. Abundance of different KEGG categories level2 of PICRUSt analysis.
Figure 35. Annual net surface mass balance for last seven year (2012-18) over Vestre Broggerbreen glacier.
etc have conducted during field expeditions (2018-19). Two expeditions during 2018-2019 (one in April–May and second in September –October) have been conducted for winter and summer balance. The detailed activities and output are given below:
i. The winter and summer balance of Vestre Broggerbren is 0.31±0.06 m w.e. and -1.13±0.31 m w.e. for year 2017-18. The winter balance is significantly lower than (25%) than previous year winter balance (0.51±0.1 m w.e.).

POLA
R S
CIE
NC
ES
ESSO-NCPOR Annual Report 2018-2019
41
Figure 36. Specific ablation for last four years (2014-2018) over Feiringbreen glacier.
Figure 37. Graph showing the density (g/cm3) variation in all the snowpits with the refreeze layers in snowpit-1 color-coded blue. The density in snowpit 1 is measured using traditional method whereas in all other snowpits measured using snow fork.
ii. The overall net annual surface mass balance of Vestre Broggerbreen glacier for year 2017-18 was negative (-0.86±0.16 m w.e.) and entire glacier lost 4.03 x 10⁶ tons of glacier ice (Figure 35).
iii. Equilibrium Line Altitude (ELA) was shifted at little higher altitude (375 m amsl) and significantly decreased (22%) the Accumulation Area Ratio (AAR) for year 2017-18 (Figure 35).
iv. The net specific ablation over Feiringbreen glacier ranges from 82 cm to 300 cm slightly higher than Vestre Broggerbreen (Figure 36).
v. Summer balance for this glacier is more variable than winter accumulation due to summer temperature has the most impact on the net balance however the amount of solid precipitation has also one the significant influencing factor to control the net balance.
vi. The mean snow depth ranges from 100-180cm in winter and 60-120cm in summer and density ranges from 0.3 g/cm3 to 0.6 gm/cm3 over Vestre Broggerbreen (Figure 37).
vii. The temperature profile in snow pack deep down up to 1.8 m shows initial decreasing trend deep down to 30 cm in most of the snow pits and then increasing trend however it is also strongly controlled by temporal variation. An average -6.5°C temperature was recorded in air above to snow surface, while mean temperature of surface snow (0-10cm) was below -10.0°C (Figure 38).
viii. At a certain depth, all the snowpits show a distinct peak in 17O-excess values (Figure 39). These variabilities are even more clear and pronounced when we look at the α (17O-excess fractionation factor) profile. In snowpit-1, the signal lies within the refreeze layer (Figure 40).
• α values below 0.528 indicate kinetic fractionation processes
Figure 38. Graph showing the temperature (°C) variation in all the snowpits with the refreeze layers in snowpit-1 color-coded blue.

POLAR
SCIEN
CES
ESSO-NCPOR Annual Report 2018-2019
42
Figure 39. Graph showing 17O-excess (per meg) variation in all the snowpits with the refreeze layers in snowpit-1 color coded blue.
Figure 40. Graph showing α (17O excess fractionation factor) variation in all the snowpits with the refreeze layers in snowpit-1 color-coded blue.
Figure 41. a) AWS over Vestre Broggerbreen b) Mean annual cycle (10 years, 2008-2017) of monthly precipitation, temperature, and relative humidity.
during the time of snow deposition while the α values above 0.528 indicate equilibrium fractionation processes.
• The kinetic fractionation is a measure of turbulence of the system at the time of precipitation (snow) formation. Such a low value indicates that there was some anomalous precipitation event.
• This is in concurrence with the result interpretation from meteorological and ionic profile data.
• All the snowpits show this distinct isotopic signal preserved in the snowpack.
ix. An Automatic Weather Station was installed on Vestre Broggerbreen glacier for surface energy balance studies (Figure 41a.)
x. The mean monthly precipitation was highest in January and September and lowest in the month of Jun during 2018-2017. Anomalously the relative humidity curve follows the same trend as temperature from September-February with two spikes in values in January and March. The January spike

POLA
R S
CIE
NC
ES
ESSO-NCPOR Annual Report 2018-2019
43
in relative humidity value coincides with high precipitation values in Ny-Alesund. However the same does not hold for March.
2.2.5 PROJECTS AND PARTICIPATING ORGANIZATIONS
Sl. No Name of the scientific project Participating
organization1 Monitoring of Arctic clouds precipitation ESSO-NCPOR
2 Long Term Environmental Monitoring of Fjord Ecosystems, Ny-Ålesund M.G. University
3 Studies on the measurement of Ultraviolet-B radiations and its impact on U.V. absorbing pigments in plant species growing in Ny-Ålesund. Avadh University
4 Biogeochemistry of radiatively important gases in the pelagic realms of Arctic fjords (Kongsfjorden) with relation to hydrodynamics and ecosystem functioning ESSO-NCPOR
5 Characterising permafrost degradation in Svalbard: Aerosols, GHGs and Freeze-Thaw Dynamics and its impacts on ecosystem
NRSC-IIT Kanpur
6 Organic matter characterization from Arctic fjord sediments. KUFOS
7 Long-term monitoring of Kongsfjorden system of Arctic region for climate change studies. ESSO-NCPOR
8 Ice dynamics of the glaciers from Broggerbreen Peninsula based on the glaciological studies on VestreBroggerbreen Glaciers, Svalbard, Arctic. GSI
9 Detection of high Z cosmic rays (HZE) at Arctic region and their effects. NIT-Kurukshetra
10 Mass balance and dynamics of selected glaciers of Spitsbergen, Svalbard. JNU, IIT Bombay
11 Bacterial community dynamics in Arctic ecosystem ESSO-NCPOR
12 Characterization of Polar Aerosols: Source processes and climate impacts SPL
13 Ecology and functional diversity of Meiofauna in selected Arctic fjords. CUSAT
14Survival of mesophilic health significant bacteria in the fjord sediment, water and nearby tundra and role of mesophilic intruders in the dissemination of antibiotic resistant genes in the Arctic environment.
CUSAT
15 Plankton ecology and food web dynamics. CMLRE
16 Primary productivity and bio-optical studies for understanding dynamics of Kongsfjorden and Krossfjorden during summer.
ESSO-NCPOR, NRSC
17
Chronological characterization of microbial diversity and physic-chemical parameters of sediment cores of the Arctic fjords. (Kongsfjorden). ESSO-NCPOR
18
Observations of the ocean surface currents, winds and waves in Polar Regions (Ny-Ålesund, Arctic Ocean) to gain knowledge of local climate change ESSO-NCPOR
19
Palaeoenvironmental reconstructions of the Late Pleistocene deposits of (Northwestern) Spitsbergen, Svalbard- constraints from benthic foraminiferal records.
Jadavpur University
20 Vertical Migration of Zooplankton and their role in the biogeochemistry of Kongsfjorden. ZSI
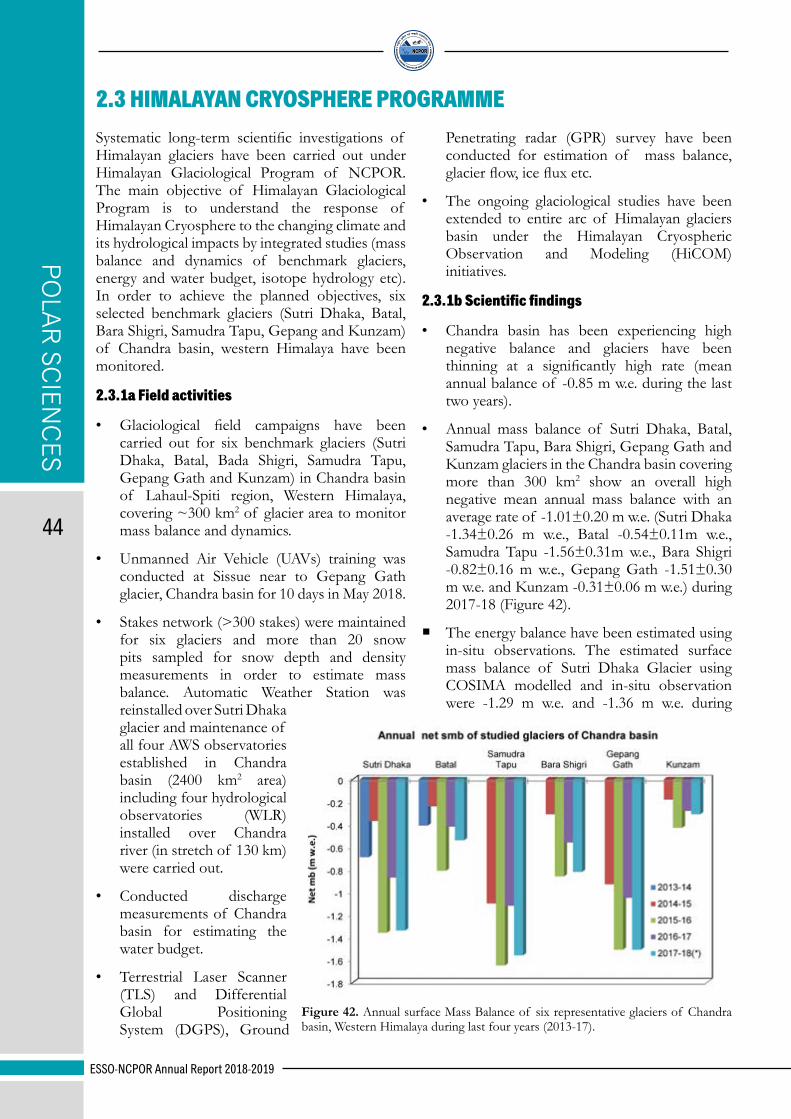
POLAR
SCIEN
CES
ESSO-NCPOR Annual Report 2018-2019
44
Systematic long-term scientific investigations of Himalayan glaciers have been carried out under Himalayan Glaciological Program of NCPOR. The main objective of Himalayan Glaciological Program is to understand the response of Himalayan Cryosphere to the changing climate and its hydrological impacts by integrated studies (mass balance and dynamics of benchmark glaciers, energy and water budget, isotope hydrology etc). In order to achieve the planned objectives, six selected benchmark glaciers (Sutri Dhaka, Batal, Bara Shigri, Samudra Tapu, Gepang and Kunzam) of Chandra basin, western Himalaya have been monitored.
2.3.1a Field activities
• Glaciological field campaigns have been carried out for six benchmark glaciers (Sutri Dhaka, Batal, Bada Shigri, Samudra Tapu, Gepang Gath and Kunzam) in Chandra basin of Lahaul-Spiti region, Western Himalaya, covering ~300 km2 of glacier area to monitor mass balance and dynamics.
• Unmanned Air Vehicle (UAVs) training was conducted at Sissue near to Gepang Gath glacier, Chandra basin for 10 days in May 2018.
• Stakes network (>300 stakes) were maintained for six glaciers and more than 20 snow pits sampled for snow depth and density measurements in order to estimate mass balance. Automatic Weather Station was reinstalled over Sutri Dhaka glacier and maintenance of all four AWS observatories established in Chandra basin (2400 km2 area) including four hydrological observatories (WLR) installed over Chandra river (in stretch of 130 km) were carried out.
• Conducted discharge measurements of Chandra basin for estimating the water budget.
• Terrestrial Laser Scanner (TLS) and Differential Global Positioning System (DGPS), Ground
Penetrating radar (GPR) survey have been conducted for estimation of mass balance, glacier flow, ice flux etc.
• The ongoing glaciological studies have been extended to entire arc of Himalayan glaciers basin under the Himalayan Cryospheric Observation and Modeling (HiCOM) initiatives.
2.3.1b Scientific findings
• Chandra basin has been experiencing high negative balance and glaciers have been thinning at a significantly high rate (mean annual balance of -0.85 m w.e. during the last two years).
• Annual mass balance of Sutri Dhaka, Batal, Samudra Tapu, Bara Shigri, Gepang Gath and Kunzam glaciers in the Chandra basin covering more than 300 km2 show an overall high negative mean annual mass balance with an average rate of -1.01±0.20 m w.e. (Sutri Dhaka -1.34±0.26 m w.e., Batal -0.54±0.11m w.e., Samudra Tapu -1.56±0.31m w.e., Bara Shigri -0.82±0.16 m w.e., Gepang Gath -1.51±0.30 m w.e. and Kunzam -0.31±0.06 m w.e.) during 2017-18 (Figure 42).
� The energy balance have been estimated using in-situ observations. The estimated surface mass balance of Sutri Dhaka Glacier using COSIMA modelled and in-situ observation were -1.29 m w.e. and -1.36 m w.e. during
Figure 42. Annual surface Mass Balance of six representative glaciers of Chandra basin, Western Himalaya during last four years (2013-17).
2.3 HIMALAYAN CRYOSPHERE PROGRAMME

POLA
R S
CIE
NC
ES
ESSO-NCPOR Annual Report 2018-2019
45
Figure 43. Modelled daily mean values of surface energy balance fluxes at Sutri Dhaka Glacier for 4th Oct. 2015 to 15th Sep. 2017. Snet is net shortwave radiation, Lnet is net longwave radiation, Hse is sensible heat flux, Hla is latent heat flux, QG is ground heat flux and Qmelt is the melt energy flux.
Figure 44. Glaciers A comparative study for annual mass balance of Chandra basin, Himalaya and Svalbard Arctic glaciers during 2002–2016.
2015-16 and -0.80 m w.e. and -0.86 m w.e. during 2016-17 hydrological year, respectively. Modelled data shows a strong contribution of the net shortwave radiation (59%) of the total surface energy heat fluxes followed by net longwave radiation (27%), turbulent sensible heat (11%), turbulent latent heat flux (4%), and subsurface heat flux (4%) (Figure 43)
� Hydro-meteorological analysis of Chandra River suggests that the discharge is significantly governed by temperature and snow cover with a total melt water flux of ~ 3536 Million Cubic Meter (MCM) during April –October 2017.
� The estimated Suspended Sediment yield for
Chandra River was 257 tonnes/km2/yr with a total sediment flux of ~ 3 million tonnes during the sampling period. A significant increment in erosion rate from ~0.2 mm/yr to 0.47 mm/yr has been estimated during last two decades.
2.3.1c Glacier response to climate in Arctic and Himalaya during last seventeen years: A case study of Svalbard, Arctic and Chandra basin, Himalaya
The glaciers are melting world over and those in Arctic and Himalaya are no exception. The Svalbard glaciers and ice caps cover an area of 34,600 km2 while Himalaya occupy nearly 38,000 km2 area.
Observation revealed that for the last one and half decades, the process of glacier retreat has been significantly enhanced in both the regions (Figure 44).
The data show that mean annual mass waste of Svalbard glaciers has increased by 16–26% during twentieth century due to high melting rate of glaciers in this region. Similarly, in Chandra basin of Himalaya the mean annual balance decreased substantially and became more negative. In spite of having significant years (25%) of positive mass balance, these glaciers have lost

POLAR
SCIEN
CES
ESSO-NCPOR Annual Report 2018-2019
46
a huge mass of ice during 2000–2017. The mean annual mass wastage of Chandra basin glaciers was -0.21 m w.e. before 2000 which increased significantly to −0.56 m w.e. after 2000.
2.3.1d Switch in chemical weathering caused by the mass balance variability in a Himalayan glacierized basin: a case of Chhota Shigri Glacier
A succession of negative mass balance years has resulted in a decline in solute concentrations in the runoff, as discharge has increased. The (Ca2+
+ Mg2+/Na++ K+) and C-ratio are highest during periods of negative annual mass balance, when the
spatial extent of the channelized drainage system increases (Figure 45a and b). Conversely, these ratios are lowest in positive mass balance years, when the spatial extent of the channelized drainage system decreases, and chemical weathering in the distributed drainage system becomes more dominant.
2.3.1e Snow cover estimation of Western Himalayas using Sentinel -2, High spatial resolution data
The seasonal fractional snow cover area mapping has been mapped for the hydrological year October 2017 to September 2018 in Miyar (Figure 46a) and
Figure 45. a) Multiannual variability of C-ratio, (Ca2+ + Mg2+) / (Na+ + K+) and annual mass balance, b) Inter-annual variability of equilibrium line altitude (ELA), sulphate mass fractionation (SMF) and C-ratio of Chhota Shigri glacier.
Figure 46.a. Fractional Snow cover map of Miyar Basin during 2017-18.
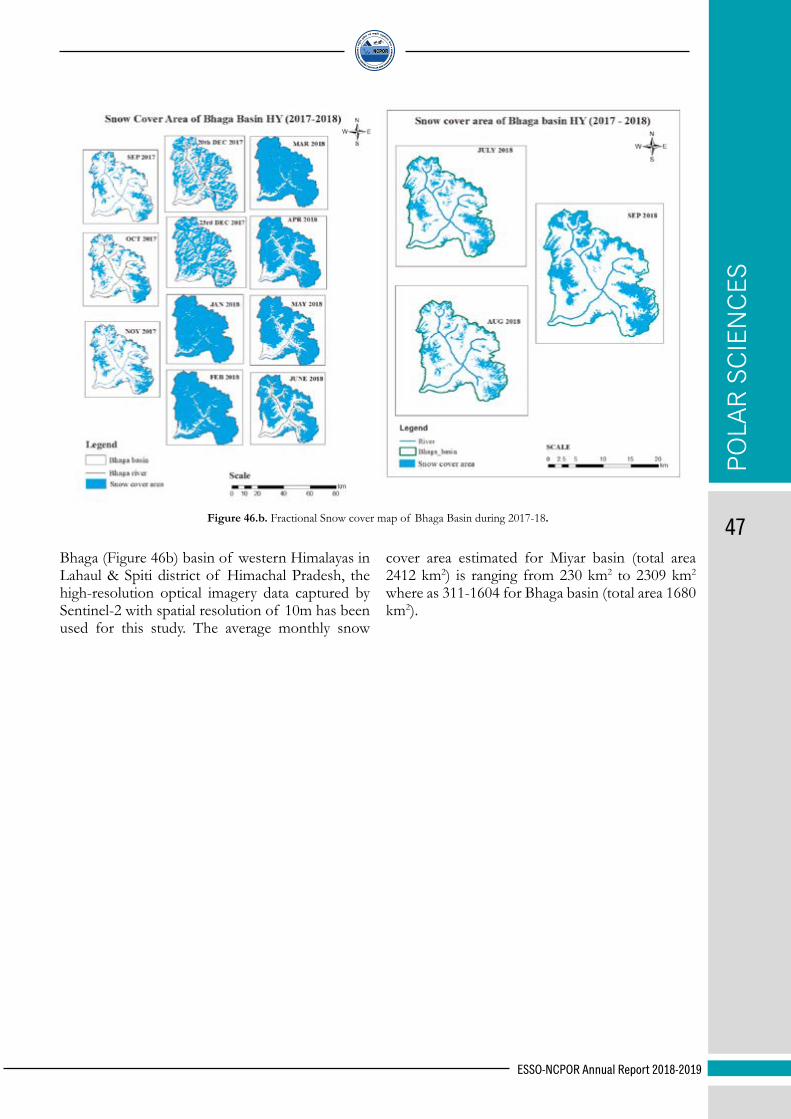
POLA
R S
CIE
NC
ES
ESSO-NCPOR Annual Report 2018-2019
47Figure 46.b. Fractional Snow cover map of Bhaga Basin during 2017-18.
Bhaga (Figure 46b) basin of western Himalayas in Lahaul & Spiti district of Himachal Pradesh, the high-resolution optical imagery data captured by Sentinel-2 with spatial resolution of 10m has been used for this study. The average monthly snow
cover area estimated for Miyar basin (total area 2412 km2) is ranging from 230 km2 to 2309 km2 where as 311-1604 for Bhaga basin (total area 1680 km2).

PC @ Mr. Rakesh Rao

3.0 OCEAN AND GEOSCIENCES
PC @ Mr. Rakesh Rao
PC @ NCPOR, Southern Ocean Team

OC
EAN AN
D G
EOSC
IENC
ES
ESSO-NCPOR Annual Report 2018-2019
50
3.1 OCEANOGRAPHY AND BIOGEOCHEMISTRY OF THE SOUTHERN OCEAN
Figure 47. Study area showing the location of sediment cores SK 200/22a and SK 200/27 (red and yellow boxes respectively) along with location of the supporting dataset (white boxes).
3.1.1 PALEOCLIMATIC STUDIES 3.1.1a Southern Ocean sea ice and frontal
changes during the Late Quaternary and their linkages to Asian summer monsoon
The present study documents the interactions between Southern Hemisphere high-latitude (Antarctica & Southern Ocean), southern Indian Ocean subtropic (Agulhas leakage) and Asian summer monsoon. The study uses SST and sea-ice reconstructions along with diatom absolute abundances and diatom biometry from two sediment cores located at the Subantarctic Front (SAF) and Antarctic Polar Front (APF) in the southwest Indian sector of the Southern Ocean (Figure 47). Sea-ice records suggest the presence of the mean winter sea ice limit at around the modern APF location during MIS 2 and MIS 4 and episodic and unconsolidated winter sea ice far north as ~43°S during LGM, when the SSTs were lowest. Higher diatom productivity and
larger mean sizes of Fragilariopsis kerguelensis and Thalassiosira lentiginosa recorded at the northern core site during the glacial stages suggest a northward shift of the APF. A decrease in diatom productivity and sizes at the southern core site highlights stratified Permanent Open Ocean Zone (POOZ) surface waters in response to longer sea-ice presence during the glacial stages. The comparative study between the records of Southern Hemisphere high-latitude and Asian summer monsoon climate variability revealed that the Asian summer monsoon variability could have been more likely forced by low latitude insolation gradient changes and supported by Antarctic climate changes via meridional shifts of the fronts and sea ice (Figure 48). The past changes in the intensity of Asian summer monsoon along with the Southern Ocean frontal variation might have influenced the Southern Indian Ocean surface circulation by changing the Agulhas leakage intensity (Figure 49).
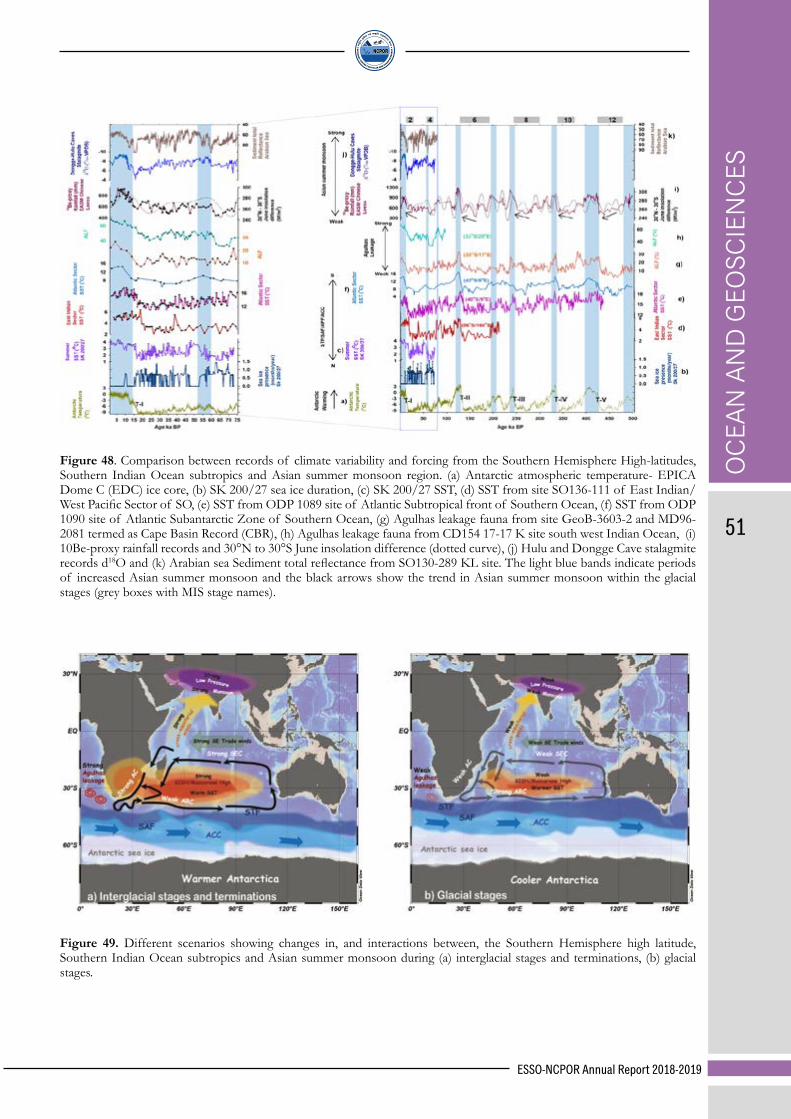
OC
EAN
AN
D G
EOSC
IEN
CES
ESSO-NCPOR Annual Report 2018-2019
51
Figure 48. Comparison between records of climate variability and forcing from the Southern Hemisphere High-latitudes, Southern Indian Ocean subtropics and Asian summer monsoon region. (a) Antarctic atmospheric temperature- EPICA Dome C (EDC) ice core, (b) SK 200/27 sea ice duration, (c) SK 200/27 SST, (d) SST from site SO136-111 of East Indian/West Pacific Sector of SO, (e) SST from ODP 1089 site of Atlantic Subtropical front of Southern Ocean, (f) SST from ODP 1090 site of Atlantic Subantarctic Zone of Southern Ocean, (g) Agulhas leakage fauna from site GeoB-3603-2 and MD96-2081 termed as Cape Basin Record (CBR), (h) Agulhas leakage fauna from CD154 17-17 K site south west Indian Ocean, (i) 10Be-proxy rainfall records and 30°N to 30°S June insolation difference (dotted curve), (j) Hulu and Dongge Cave stalagmite records d18O and (k) Arabian sea Sediment total reflectance from SO130-289 KL site. The light blue bands indicate periods of increased Asian summer monsoon and the black arrows show the trend in Asian summer monsoon within the glacial stages (grey boxes with MIS stage names).
Figure 49. Different scenarios showing changes in, and interactions between, the Southern Hemisphere high latitude, Southern Indian Ocean subtropics and Asian summer monsoon during (a) interglacial stages and terminations, (b) glacial stages.

OC
EAN AN
D G
EOSC
IENC
ES
ESSO-NCPOR Annual Report 2018-2019
52
3.1.1b Developing coccolith based paleotemperature calibration
Laboratory controlled (incubation) experiments were carried out on 26 globally distributed Gephyrocapsa oceanica strains at 5 different temperatures (10°C, 15°C, 20°C, 25°C and 30°C) in duplicates. Coccolithophore cultures were initiated as low as 200 cells ml-1 in 75 ml air tight sterile culture flasks and monitored till abundance reached to 100,000 cells ml-1. During the experiment, samples were obtained for Scanning Electron Microscopic studies and to calculate coccolith mass using SYRACO Software. The preliminary results show diverse response of G. oceanica strains to different temperatures (Figure 50). It is presumed that the
morphometric and mass calculation studies will provide important information which can be related to studies in sediment to develop a new G. oceanica size based paleotemperature proxy. The study was carried out under the SCAR fellowship 2018 scheme at Station Biologique de Roscoff, France.
3.1.1c CROTALE (CROzet Archepelago PaLEoceanography) Expedition
Two researchers from NCPOR participated in MD 218 / CROTALE Expedition from 23rd February-13th March, 2019 from La Reunion undertaken by the French government with Dr. Xavier Crosta as the Chief Scientist. The primary aim of MD 218 / CROTALE expedition was to retrieve a suite of long sediment cores along bathymetric and zonal transects in the under-sampled southwestern Indian sector of the
Southern Ocean (SO). This region is particularly important as it is modulating the redistribution of heat and salt by the Agulhas Current to the global ocean and the redistribution of heat and salt to the SO by the Agulhas Return Current.
During the expedition, four long CALYPSO piston cores (42 m, 46 m, 52 m and 70 m) and three CASQ cores (up to 10 meters) were collected. The paleoceanography of the region will be reconstructed using nanofossil and microfossil-based proxies (coccoliths, foraminifera, diatoms and radiolarians), isotopic studies (Nd, Sr, Mg/Ca and boron isotopes), magnatotactic bacterial analysis and trace metal analysis. The primary objectives of the NCPOR researchers is to study-
(1) diatom based past frontal variations, past sea ice variations, paleocirculation around Crozet archipelago (2) coccolith based –paleoproductivity, paleotemperature and paleosalinity reconstruction and past frontal movements (Figure 51). The role and effect of islands on these biological proxies over the past will be focused to understand their response to the past-climate.
Apart from this, 30 water samples were collected to understand coccolithophore ecology, while, 25 water samples will be used to sort coccolithophores, grow and carry out laboratory-controlled experiments at NCPOR.
Figure 50. Experimental growth rate of G. oceanica strains at 20°C.
Figure 51. Map showing location of sea surface water samples (black filled circles) and sediment core locations (red filled circles)
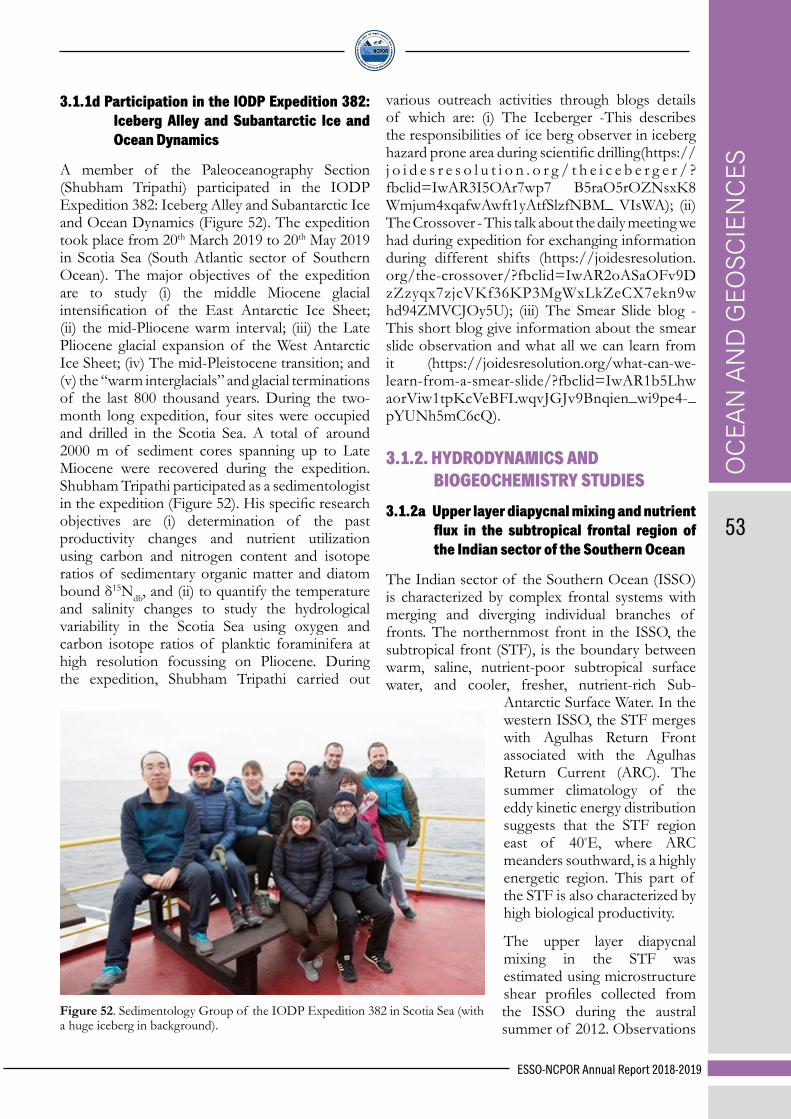
OC
EAN
AN
D G
EOSC
IEN
CES
ESSO-NCPOR Annual Report 2018-2019
53
3.1.1d Participation in the IODP Expedition 382: Iceberg Alley and Subantarctic Ice and Ocean Dynamics
A member of the Paleoceanography Section (Shubham Tripathi) participated in the IODP Expedition 382: Iceberg Alley and Subantarctic Ice and Ocean Dynamics (Figure 52). The expedition took place from 20th March 2019 to 20th May 2019 in Scotia Sea (South Atlantic sector of Southern Ocean). The major objectives of the expedition are to study (i) the middle Miocene glacial intensification of the East Antarctic Ice Sheet; (ii) the mid-Pliocene warm interval; (iii) the Late Pliocene glacial expansion of the West Antarctic Ice Sheet; (iv) The mid-Pleistocene transition; and (v) the “warm interglacials” and glacial terminations of the last 800 thousand years. During the two-month long expedition, four sites were occupied and drilled in the Scotia Sea. A total of around 2000 m of sediment cores spanning up to Late Miocene were recovered during the expedition. Shubham Tripathi participated as a sedimentologist in the expedition (Figure 52). His specific research objectives are (i) determination of the past productivity changes and nutrient utilization using carbon and nitrogen content and isotope ratios of sedimentary organic matter and diatom bound δ15Ndb, and (ii) to quantify the temperature and salinity changes to study the hydrological variability in the Scotia Sea using oxygen and carbon isotope ratios of planktic foraminifera at high resolution focussing on Pliocene. During the expedition, Shubham Tripathi carried out
various outreach activities through blogs details of which are: (i) The Iceberger -This describes the responsibilities of ice berg observer in iceberg hazard prone area during scientific drilling(https://j o i d e s r e s o l u t i o n . o r g / t h e i c e b e r g e r / ? fbclid=IwAR3I5OAr7wp7 B5raO5rOZNsxK8 Wmjum4xqafwAwft1yAtfSlzfNBM_ VIsWA); (ii) The Crossover - This talk about the daily meeting we had during expedition for exchanging information during different shifts (https://joidesresolution.org/the-crossover/?fbclid=IwAR2oASaOFv9DzZzyqx7zjcVKf36KP3MgWxLkZeCX7ekn9whd94ZMVCJOy5U); (iii) The Smear Slide blog - This short blog give information about the smear slide observation and what all we can learn from it (https://joidesresolution.org/what-can-we-learn-from-a-smear-slide/?fbclid=IwAR1b5Lhw aorViw1tpKcVeBFLwqvJGJv9Bnqien_wi9pe4-_pYUNh5mC6cQ).
3.1.2. HYDRODYNAMICS AND BIOGEOCHEMISTRY STUDIES
3.1.2a Upper layer diapycnal mixing and nutrient flux in the subtropical frontal region of the Indian sector of the Southern Ocean
The Indian sector of the Southern Ocean (ISSO) is characterized by complex frontal systems with merging and diverging individual branches of fronts. The northernmost front in the ISSO, the subtropical front (STF), is the boundary between warm, saline, nutrient-poor subtropical surface water, and cooler, fresher, nutrient-rich Sub-
Antarctic Surface Water. In the western ISSO, the STF merges with Agulhas Return Front associated with the Agulhas Return Current (ARC). The summer climatology of the eddy kinetic energy distribution suggests that the STF region east of 40◦E, where ARC meanders southward, is a highly energetic region. This part of the STF is also characterized by high biological productivity.
The upper layer diapycnal mixing in the STF was estimated using microstructure shear profiles collected from the ISSO during the austral summer of 2012. Observations
Figure 52. Sedimentology Group of the IODP Expedition 382 in Scotia Sea (with a huge iceberg in background).

OC
EAN AN
D G
EOSC
IENC
ES
ESSO-NCPOR Annual Report 2018-2019
54
were made in the northern and southern boundary of the highly mesoscale turbulent STF, which is characterized by the presence of the dynamic ARC. During the observational period, the STF was populated with alternating cyclonic and anticyclonic eddies (Figure 53).
During the observation, the SST was in the range 18-19◦C and the mixed layer depth was shallow
indicating that the water column was statistically stable in the upper 120m (Figure 54a). The estimated average eddy diffusivity at the base of the euphotic zone was 5.5×10⁻⁵m2 s−1 in this mesoscale turbulent region. The vertical structure of the chlorophyll (Chl) showed a typical oligotrophic structure with very low Chl concentrations and relatively high DCM concentration (~0.25 mgm-3, Figure 54b).
Elevated Nitrate (NO3) + Nitrite (NO2) were noted at the locations where cyclonic eddies were observed (Figure 54c). The average diapycnal nitrogen flux at the base of the euphotic zone, calculated using direct turbulence measurements, and NO3 and nitrite NO2 concentrations, was 6.4×10⁻⁵ μ mol m−2 s−1 (Figure 54d). The satellite-derived primary production in the STF was ~1000 mg Cm−2 day−1. The observed diapycnal nutrient flux could only sustain <1% of the production observed in the region. Analysis of satellite-derived ocean currents, sea level anomalies, and thermohaline distribution further shows that despite the study area is a highly mesoscale turbulent region, the primary supply of nutrients is a result of advection (vertical or zonal) rather than vertical mixing.
Figure 53. Map of sea level anomaly averaged for the period of January 13th to 23rd, 2012. The overlaid vectors are averaged wind stress during the same period. Red stars in the map represent the station locations.
Figure 54. Station-depth property distribution of (a) temperature, (b) Chlorophyll, (c) NO3+NO2, and (d) NO3+NO2 flux (red) overlaid by averaged eddy diffusivity (blue) within the base of the euphotic layer depth.
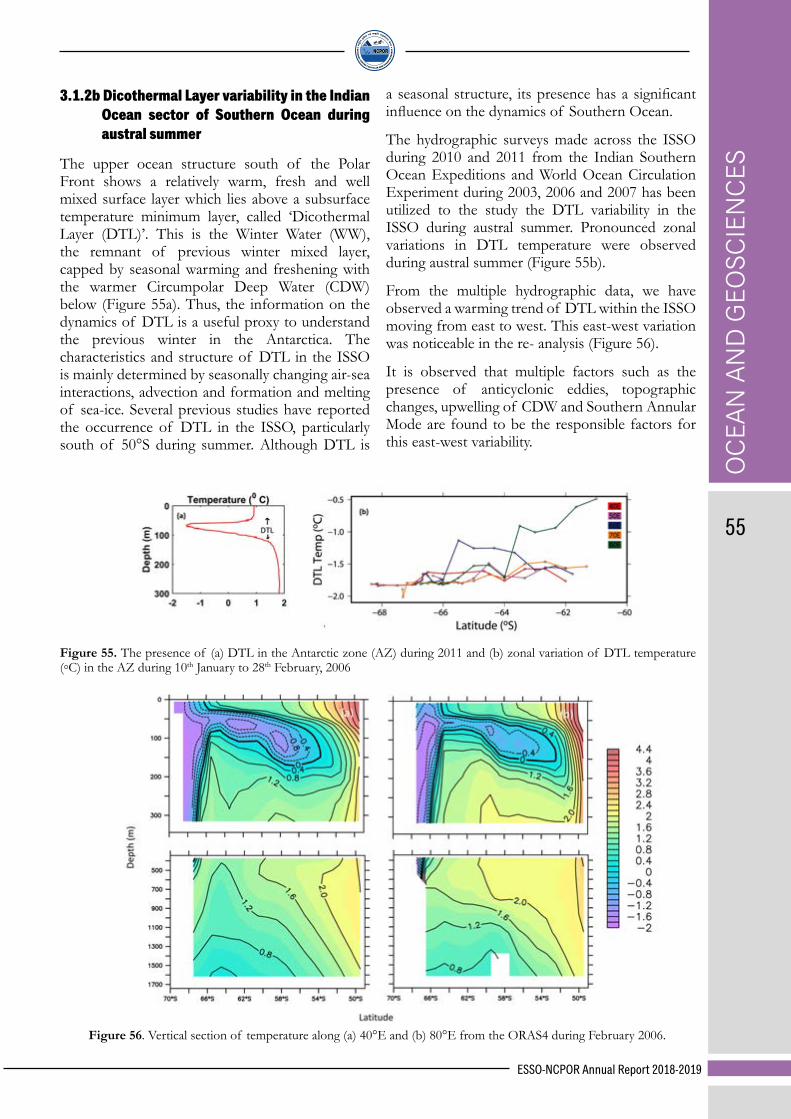
OC
EAN
AN
D G
EOSC
IEN
CES
ESSO-NCPOR Annual Report 2018-2019
55
3.1.2b Dicothermal Layer variability in the Indian Ocean sector of Southern Ocean during austral summer
The upper ocean structure south of the Polar Front shows a relatively warm, fresh and well mixed surface layer which lies above a subsurface temperature minimum layer, called ‘Dicothermal Layer (DTL)’. This is the Winter Water (WW), the remnant of previous winter mixed layer, capped by seasonal warming and freshening with the warmer Circumpolar Deep Water (CDW) below (Figure 55a). Thus, the information on the dynamics of DTL is a useful proxy to understand the previous winter in the Antarctica. The characteristics and structure of DTL in the ISSO is mainly determined by seasonally changing air-sea interactions, advection and formation and melting of sea-ice. Several previous studies have reported the occurrence of DTL in the ISSO, particularly south of 50°S during summer. Although DTL is
a seasonal structure, its presence has a significant influence on the dynamics of Southern Ocean.
The hydrographic surveys made across the ISSO during 2010 and 2011 from the Indian Southern Ocean Expeditions and World Ocean Circulation Experiment during 2003, 2006 and 2007 has been utilized to the study the DTL variability in the ISSO during austral summer. Pronounced zonal variations in DTL temperature were observed during austral summer (Figure 55b).
From the multiple hydrographic data, we have observed a warming trend of DTL within the ISSO moving from east to west. This east-west variation was noticeable in the re- analysis (Figure 56).
It is observed that multiple factors such as the presence of anticyclonic eddies, topographic changes, upwelling of CDW and Southern Annular Mode are found to be the responsible factors for this east-west variability.
Figure 55. The presence of (a) DTL in the Antarctic zone (AZ) during 2011 and (b) zonal variation of DTL temperature (◦C) in the AZ during 10th January to 28th February, 2006
Figure 56. Vertical section of temperature along (a) 40°E and (b) 80°E from the ORAS4 during February 2006.

OC
EAN AN
D G
EOSC
IENC
ES
ESSO-NCPOR Annual Report 2018-2019
56
3.1.2c. Dissolved Oxygen variability in the Indian Sector of the Subantarctic Zone: Insight from a Bio-Argo study
The Southern Ocean (SO) is the one of the largest HNLC (high nutrient-low chlorophyll) region of the world ocean but still plays a critical role in global ocean productivity and carbon cycling. A noticeable increase in dissolved oxygen in the subantarctic region of the SO was observed in the summer (December-February) of 2014-2015 by Bio-Argo float deployed in the SO in 2014 (Figure 57). Temperature and dynamic height structure revealed presence of a cyclonic eddy (Figure 58). A noticeable shoaling of pycnocline was also observed, which corresponded to doming of low temperature water near to the base of the mixed layer. The doming of cold subsurface water also played an important role in the biological productivity. The observed Chl during the summer was also high in the region. The high dissolved oxygen resulted from the co-occurrence of cold core eddy, which upwelled the cold water from
deep to the surface during winter, while during summer the high Chl below the mixed layer depth (MLD) also played role in high dissolved oxygen. This result indicate that the cyclonic eddies plays a key role in supporting supersaturated dissolved oxygen and maintaining the high summer bloom in SO (Figure 59).
3.1.2d. Variability in the thermohaline structure along ship transect in the coastal Indian Ocean sector of Southern Ocean during austral summer 2019
Expendable temperature-salinity-depth data were recorded along a transect from Prydz Bay (66° 39.647’ S, 71° 46.863’ E) to ship berthing site at India Bay (68° 11.894’ S, 12° 53.762’ E) from a cargo ship chartered under Indian Scientific Expedition to Antarctica during austral summer (26th February to 4th March, 2019). The temperature and depth profiles, which were collected at every 45 km spacing, were processed using standard oceanographic data processing protocol. Wind
Figure 57. Trajectories and observation positions of two Bio-Argo floats F1 (WMO ID 2902115) and F2 (WMO ID 2902131) deployed in the SO region.

OC
EAN
AN
D G
EOSC
IEN
CES
ESSO-NCPOR Annual Report 2018-2019
57
Figure 59. Plot demonstrating seasonal evolution in float F1 (2902115) of: dissolved Oxygen (μ mole/kg), density (kg/m3), temperature (°C), salinity (psu) (in upper 600m depth) and chlorophyll (mg/m3; upper 200m depth) from top to bottom panels, respectively. The black line represents MLD.
Figure 58. MADT data (color shaded region) overlaid with AMSAR SST (contours) showing the positions of cyclonic eddy, position of float marked by star.

OC
EAN AN
D G
EOSC
IENC
ES
ESSO-NCPOR Annual Report 2018-2019
58
speed was also collected using a sonic wind sensor installed on the top of the ship’s bridge. True wind speed was computed using ship gyro and speed data. To relate the changes in the upper ocean on sea ice concentration, we used satellite-based Southern Ocean sea ice concentration retrieved for the ship transect using passive microwave radiometers. The wind speed, sea ice concentration, temperature section, salinity section and section of Brunt-Vaisla frequency are portrayed in Figure 60. The wind speed ranged from 1 to 12 ms-1 along the transect. Sea ice concentration exceeded 10% at Prydz bay and India bay ship berthing point. Sea ice concentration exceeding 40% was encountered between 32°E and 50°E. The temperature section depicts pockets of warm water (~0.5°C) and enhanced wind between 15° and 24°E which is the reason for sea ice melting which leads to stable layer in the upper 10 m of water column. Melting of sea ice between 22° and 34°E caused downwelling of cold water and freshening in salinity (33.8 psu). Another upwelling cell was detected 36° and 43°E, but the warm water is constraint below 50 m. The impact of sea ice melting on ocean column stability is observed in the upper 10 m in the lower panel of Brunt vaisala frequency section.
3.1.2e. Reoccurrence of a large open-ocean polynya on the Maud Rise, Antarctica
The polynya plays an important role in the Earth’s climate system by modulating the albedo, air-sea exchange of heat, fresh water, carbon, and ocean-atmospheric circulation. The occurrence of such feature is critical for assessing the role of high latitude ocean-atmospheric dynamics in the global climate and also for the Antarctic
Figure 60. Variation of (a) Wind speed (b) Sea ice (c) Temperature (d) Salinity and (e) Brunt-Vaisala frequency along the transect from Prydz Bay to India Bay.

OC
EAN
AN
D G
EOSC
IEN
CES
ESSO-NCPOR Annual Report 2018-2019
59
marine ecosystem. Satellite observations show that a large and most prolonged Maud Rise polynya (Lazarev Sea), reappeared on 14 September 2017 for the first time since its frequent appearance during the 1970s. On 14 September 2017, the areal extent of the polynya was ~9.3 × 10³ km2 which expanded maximum on 1 December 2017 up to ~298.1 × 10³ km2, lasting for 79 days (Figure
61). The formation of the polynya was due to the combined influence of the (i) existence of the geological features such as seamount (leads to local upliftment of thermocline), (ii) upwelling of warm water into the upper ocean from the thermocline (induced by a large cyclonic ocean eddy and negative wind stress curl), and (iii) the large-scale anomalous atmospheric warming.
Figure 61. High resolution Aqua-MODIS image at 859nm captured an exceptional view of the Maud Rise polynya on 25 September 2017 (1430 hours UTC). Red circles show the locations of an Argo float from 13 August to 5 December 2017. Yellow lines show the depth contours shallower than 2000 m and other white contours are spaced by 500 m. (b) The daily changes in mean (blue) and minimum (red) sea-ice concentration anomaly for August-December 2017 relative to the 1979-2016 climatology (green), spatially averaged over the polynya region within the dashed rectangle shown in Figure 61a. Grey bars show the daily areal extent of the polynya. Profiles from an Argo float indicate (c) potential temperature and (d) vertical density gradient in 2017.
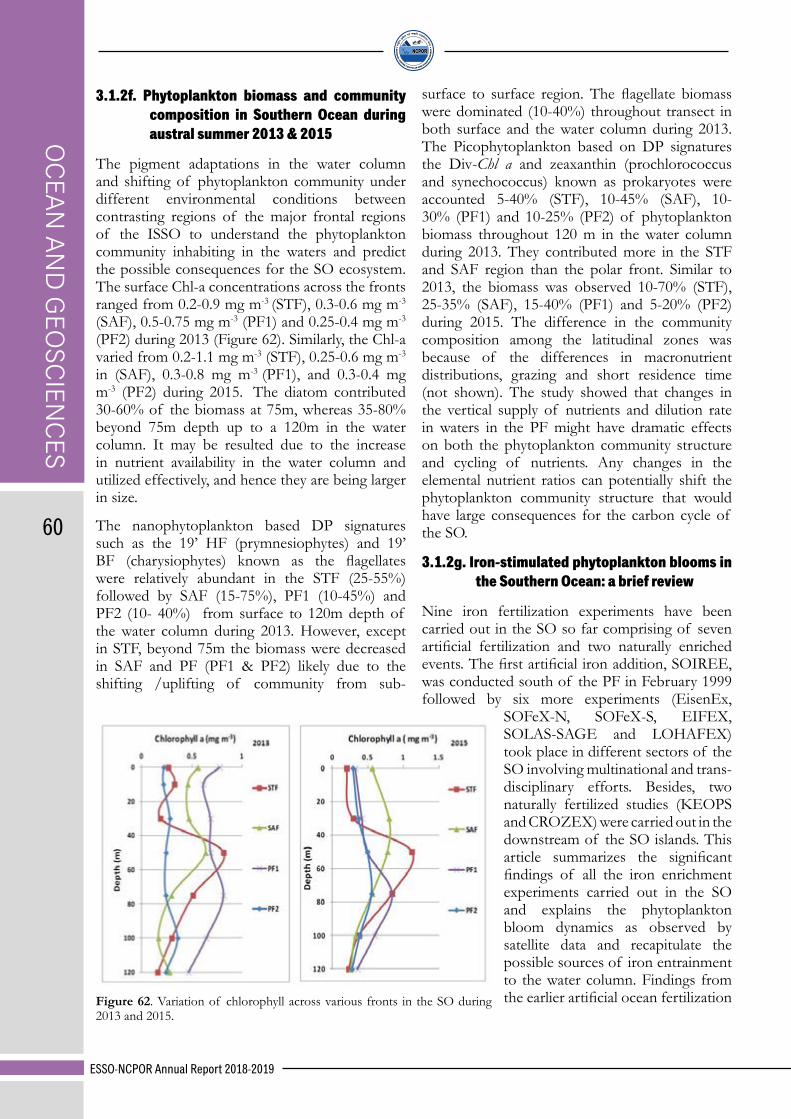
OC
EAN AN
D G
EOSC
IENC
ES
ESSO-NCPOR Annual Report 2018-2019
60
3.1.2f. Phytoplankton biomass and community composition in Southern Ocean during austral summer 2013 & 2015
The pigment adaptations in the water column and shifting of phytoplankton community under different environmental conditions between contrasting regions of the major frontal regions of the ISSO to understand the phytoplankton community inhabiting in the waters and predict the possible consequences for the SO ecosystem. The surface Chl-a concentrations across the fronts ranged from 0.2-0.9 mg m-3 (STF), 0.3-0.6 mg m-3
(SAF), 0.5-0.75 mg m-3 (PF1) and 0.25-0.4 mg m-3 (PF2) during 2013 (Figure 62). Similarly, the Chl-a varied from 0.2-1.1 mg m-3 (STF), 0.25-0.6 mg m-3 in (SAF), 0.3-0.8 mg m-3 (PF1), and 0.3-0.4 mg m-3 (PF2) during 2015. The diatom contributed 30-60% of the biomass at 75m, whereas 35-80% beyond 75m depth up to a 120m in the water column. It may be resulted due to the increase in nutrient availability in the water column and utilized effectively, and hence they are being larger in size.
The nanophytoplankton based DP signatures such as the 19’ HF (prymnesiophytes) and 19’ BF (charysiophytes) known as the flagellates were relatively abundant in the STF (25-55%) followed by SAF (15-75%), PF1 (10-45%) and PF2 (10- 40%) from surface to 120m depth of the water column during 2013. However, except in STF, beyond 75m the biomass were decreased in SAF and PF (PF1 & PF2) likely due to the shifting /uplifting of community from sub-
surface to surface region. The flagellate biomass were dominated (10-40%) throughout transect in both surface and the water column during 2013. The Picophytoplankton based on DP signatures the Div-Chl a and zeaxanthin (prochlorococcus and synechococcus) known as prokaryotes were accounted 5-40% (STF), 10-45% (SAF), 10-30% (PF1) and 10-25% (PF2) of phytoplankton biomass throughout 120 m in the water column during 2013. They contributed more in the STF and SAF region than the polar front. Similar to 2013, the biomass was observed 10-70% (STF), 25-35% (SAF), 15-40% (PF1) and 5-20% (PF2) during 2015. The difference in the community composition among the latitudinal zones was because of the differences in macronutrient distributions, grazing and short residence time (not shown). The study showed that changes in the vertical supply of nutrients and dilution rate in waters in the PF might have dramatic effects on both the phytoplankton community structure and cycling of nutrients. Any changes in the elemental nutrient ratios can potentially shift the phytoplankton community structure that would have large consequences for the carbon cycle of the SO.
3.1.2g. Iron-stimulated phytoplankton blooms in the Southern Ocean: a brief review
Nine iron fertilization experiments have been carried out in the SO so far comprising of seven artificial fertilization and two naturally enriched events. The first artificial iron addition, SOIREE, was conducted south of the PF in February 1999 followed by six more experiments (EisenEx,
SOFeX-N, SOFeX-S, EIFEX, SOLAS-SAGE and LOHAFEX) took place in different sectors of the SO involving multinational and trans-disciplinary efforts. Besides, two naturally fertilized studies (KEOPS and CROZEX) were carried out in the downstream of the SO islands. This article summarizes the significant findings of all the iron enrichment experiments carried out in the SO and explains the phytoplankton bloom dynamics as observed by satellite data and recapitulate the possible sources of iron entrainment to the water column. Findings from the earlier artificial ocean fertilization Figure 62. Variation of chlorophyll across various fronts in the SO during
2013 and 2015.
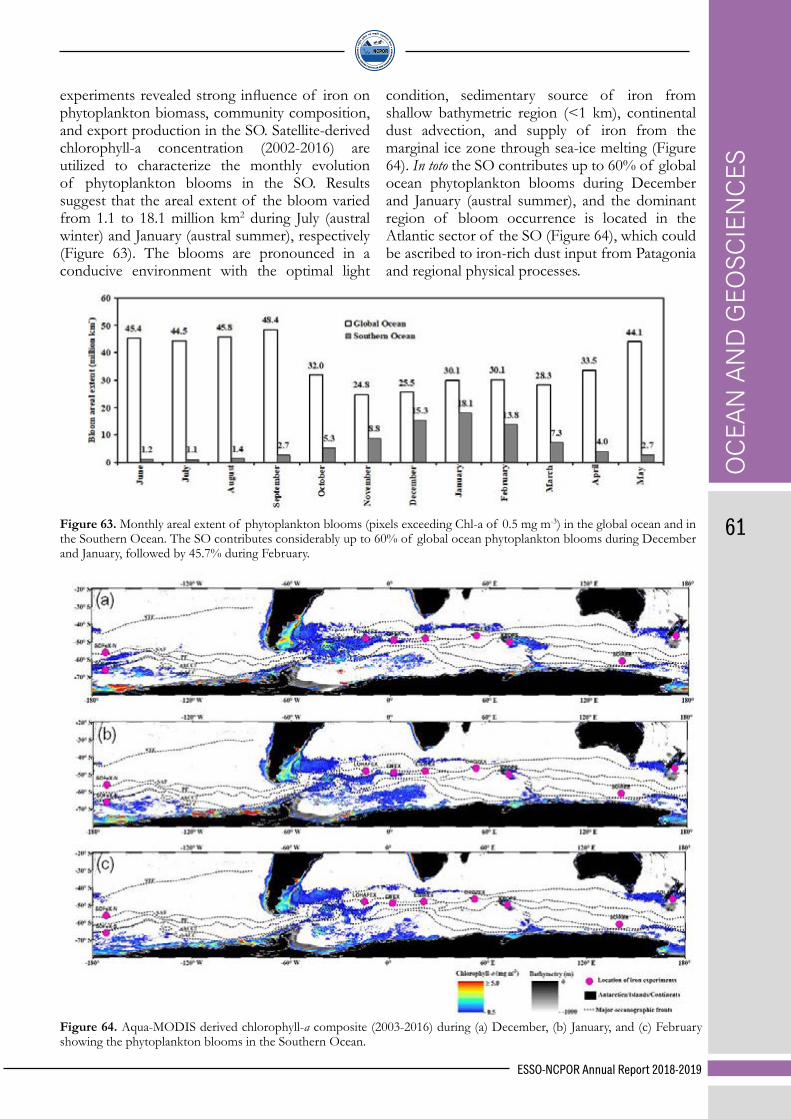
OC
EAN
AN
D G
EOSC
IEN
CES
ESSO-NCPOR Annual Report 2018-2019
61
experiments revealed strong influence of iron on phytoplankton biomass, community composition, and export production in the SO. Satellite-derived chlorophyll-a concentration (2002-2016) are utilized to characterize the monthly evolution of phytoplankton blooms in the SO. Results suggest that the areal extent of the bloom varied from 1.1 to 18.1 million km2 during July (austral winter) and January (austral summer), respectively (Figure 63). The blooms are pronounced in a conducive environment with the optimal light
condition, sedimentary source of iron from shallow bathymetric region (<1 km), continental dust advection, and supply of iron from the marginal ice zone through sea-ice melting (Figure 64). In toto the SO contributes up to 60% of global ocean phytoplankton blooms during December and January (austral summer), and the dominant region of bloom occurrence is located in the Atlantic sector of the SO (Figure 64), which could be ascribed to iron-rich dust input from Patagonia and regional physical processes.
Figure 63. Monthly areal extent of phytoplankton blooms (pixels exceeding Chl-a of 0.5 mg m-3) in the global ocean and in the Southern Ocean. The SO contributes considerably up to 60% of global ocean phytoplankton blooms during December and January, followed by 45.7% during February.
Figure 64. Aqua-MODIS derived chlorophyll-a composite (2003-2016) during (a) December, (b) January, and (c) February showing the phytoplankton blooms in the Southern Ocean.

OC
EAN AN
D G
EOSC
IENC
ES
ESSO-NCPOR Annual Report 2018-2019
62
3.1.2h. Copepod community structure in the Prydz Bay during the austral summer of 2017
The diel vertical migration of Copepoda species, qualitative composition and quantitative distribution of dominant Copepoda species in the continental shelf edge (neritic region) of the Prydz Bay were studied based on the time series data (27th-28th January 2019) collected during the 9th Indian expedition to SO. In general, the zooplankton biovolume was high in the upper euphotic zone, where peak biovolume was noticed within the MLD on day 1 (Figure 65), in some cases higher zooplankton biovolume was observed between 20 – 200 m. Whereas, on day 2 high zooplankton biovolume was restricted within the MLD throughout the day, consistently a sharp decreasing trend in zooplankton biovolume was noticed below MLD. The peaks of zooplankton biovolume 33.33 ml 100 m-3 and 8.33 ml 100 m-3 were noticed in the 0 – 20 m on day 1 and day 2 at 13:15 hrs and 07:45 hrs respectively (Figure 65)
Zooplankton community in this study consisted of Calanoida, Cyclopoida, Chaetognatha, Appendicularia and Polychaete in the upper 500 m. Copepods were the numerically dominant zooplankton group throughout the sampling period. In the upper 500m, the mean relative abundance of calanoids and cyclopoids ranged from 7.09% to 24.40% and 22.52% - 39.09% respectively. In particular, in the upper 500m cyclopoids were predominant throughout the time series observations (Figure 66).
Vertical distributions of zooplankton communities were broadly associated with different depth layers in the present study. Probably depth was the strongest factor influencing zooplankton vertical structure. Many epipelagic species such as, Calanoides acutus, Calanus propinquus, Paraeuchaeta antarctica, Oithona similis and Oithona frigida were clustered with high abundance in the upper 100 m layer. Within the MLD, Oithona similis with the densities varying from 334 to 2267 ind.100 m-3, was the most abundant species among Oithona frigida, Calanoides acutus, Calanus propinquus, Paraeuchaeta antarctica and Metridia gerlachei (Figure 67).
Figure 65. Observed austral summer profiles of the zooplankton biovolume from 27th to 28th January in Prydz Bay.

OC
EAN
AN
D G
EOSC
IEN
CES
ESSO-NCPOR Annual Report 2018-2019
63
Figure 66. Relative abundances of Calanoida and Cyclopoida in the upper 500 m during the austral summer of 2017
We found that temperature appeared to be the most likely controlling factor influencing the species large scale distributions, but probably a combination of physical influences and availability of food, coupled with individual life-cycles contributes to their distributions. Oithona similis and Oithona frigida were important community components and require further study, particularly ongoing monitoring of their biomass and abundance over
various temporal and spatial scales in Prydz Bay. These results highlight the numerical importance of copepods and the species distribution in Prydz Bay marine ecosystem and have a greater implication in the biogeochemical cycles of the ISSO.
3.1.2i. Nutrient dynamics at the merger of Agulhas Return Front and Subtropical Front in the Indian sector of Southern Ocean during austral summer
During Austral summer, a time series study was conducted at the merged ARF-STF region (40°S, 58°30’E) from 13th to 15th January 2012 for 48 hours with sampling at a 6 hour interval. During the study the observed nutrients, especially nitrate and silicate was depleted in the upper 50m, however, there was an influx of nutrients at 6 hours and 18 hours of Day-1 (Figure 68a & 68b) and at 30 and 48 hours (day-2).Even though the nitrate was exceptionally low in the upper 50m, the system was moderately productive suggesting the rapid utilization of nitrate at this location. The deep chlorophyll maximum (DCM) was consistently observed below 50m (Figure 68c) during the 48 hour study. Also, the major contribution towards primary productivity was from below the DCM to 120m. It was evident from the results that the DCM at this location was largely a result of the nutricline and the photic depth. The nutrient
Figure 67. Observed dominant copepod species within the mixed layer depth, during the austral summer of 2017 in Prydz Bay.

OC
EAN AN
D G
EOSC
IENC
ES
ESSO-NCPOR Annual Report 2018-2019
64
dynamics of the region influenced the plankton dynamics causing a shift in the phytoplankton community below the DCM. Although this region is reported to be dominated by the phytoplankton group haptophyes, mostly flagellates, a shift was observed below the DCM from flagellates to diatoms to picoplankton.
The location being study was at the boundary of an anticyclonic eddy (Figure 69), which play a significant role in the periodic influx of nutrients. Nutrient utilization attributes and a significant correlation of nitrates with Chl-a suggests the instantaneous consumption of the available nutrients by the phytoplankton below the DCM. This study revealed that although the vertical mixing was low, there was an influx of nutrients in the upper water column, likely a contribution
from advective mixing. This also implied that even a minor alteration in the nutrient content, in such nutrient depleted region, can be responsible for a switch in the biological community structure and subsequently the biochemical processes.
3.1.2j. Siderophore producing bacteria from Indian Ocean sector of Southern Ocean
Bulk of oceanic bio-available iron, an essential trace element for microbial growth, are attached to organic ligands, considered to be siderophores or siderophores-like compounds, which are low molecular weight compounds produced by microbes. Siderophores are produced under iron limiting conditions (<10-5 mol/litre) to meet bacterial iron-demand, which may synergistically support or compete with primary productivity
Figure 68. Temporal variability of a) nitrate, b) silicate, c) Chlorophyll-a during the 48 hour time series observation at the merger of ARF and STF.
Figure 69. Sampling location (in pink) with the geostrophic velocity overlaid on the sea level height anomaly.

OC
EAN
AN
D G
EOSC
IEN
CES
ESSO-NCPOR Annual Report 2018-2019
65
Figure 71. Gowth measured as Absorption at 540 nm (A-C) and siderophore production as Absorption at 630 nm (D-F) by select isolates obtained from KW and PB grown at different temperature (5°C, 15°C and 25°C)
Figure 70. Sampling locations in Kerguelen waters (KW) and in Prydz Bay (PB) during austral summer 2017.
influencing microbial loop. In order to understand the influence of different concentrations of iron (III), temperature and pH on the growth and siderophore production, laboratory experiments were carried out on selected bacterial isolates obtained from marine waters near Kerguelen islands (KW) and Prydz Bay (PB) during the Indian Southern Ocean expedition 2017 (Figure 70)
Isolates from KW (KW1 & KW2) and two isolates from PB (PB1 and PB3) produced Hydroxamate type siderophores while other three isolates from PB (PB2, 4 and 5) tested positive with for catecholate type siderophores. Iron concentration strongly influenced the growth of bacterial isolates from KW and PB of IOSO, which was significantly delayed at low iron concentrations while siderophore production was greater at lower iron concentrations. Incubation temperature had an impact on growth of the bacterial

OC
EAN AN
D G
EOSC
IENC
ES
ESSO-NCPOR Annual Report 2018-2019
66
isolates but not on siderophore production (Figure 71). Although growth increased with increasing incubation temperature, % siderophore was always >30% at all growth temperatures. Our results suggest that siderophore production by these isolates (especially PB isolates) might not be very different in the natural environment.
Unlike temperature, pH drastically influenced both growth and siderophore production in the microcosm experiment (Figure 72). All isolates flourished at pH 8.5, which was close to the ambient pH in the SO. Siderophore production
also peaked at pH 8.5 (30% to 60%). The decreased siderophore production at lower pH could be a combination of altered bioavailability of iron, effect on iron binding by siderophores and poor growth of bacterial isolates.
In conclusion, the microcosm experiments suggest that bacterial isolates and siderophore production could adjust to warming conditions but acidification of ocean may drastically affect their growth and ability to chelate iron, and in turn affect the carbon biogeochemistry in polar waters.
Figure 72. Gowth measured as Absorption at 540 nm (A-D) and siderophore production as Absorption at 630 nm (E-H) by select isolates obtained from KW and PB grown at different pH (5.5, 6.5, 7.5 and 8.5).
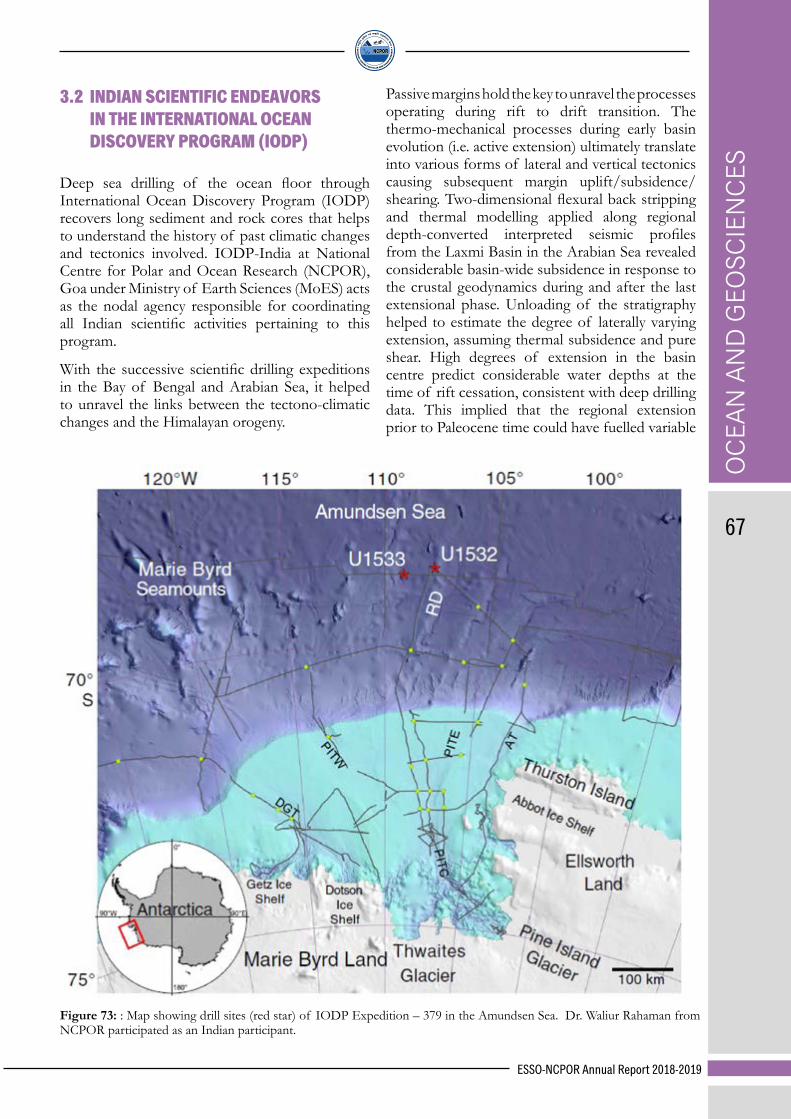
OC
EAN
AN
D G
EOSC
IEN
CES
ESSO-NCPOR Annual Report 2018-2019
67
3.2 INDIAN SCIENTIFIC ENDEAVORS IN THE INTERNATIONAL OCEAN DISCOVERY PROGRAM (IODP)
Deep sea drilling of the ocean floor through International Ocean Discovery Program (IODP) recovers long sediment and rock cores that helps to understand the history of past climatic changes and tectonics involved. IODP-India at National Centre for Polar and Ocean Research (NCPOR), Goa under Ministry of Earth Sciences (MoES) acts as the nodal agency responsible for coordinating all Indian scientific activities pertaining to this program.
With the successive scientific drilling expeditions in the Bay of Bengal and Arabian Sea, it helped to unravel the links between the tectono-climatic changes and the Himalayan orogeny.
Passive margins hold the key to unravel the processes operating during rift to drift transition. The thermo-mechanical processes during early basin evolution (i.e. active extension) ultimately translate into various forms of lateral and vertical tectonics causing subsequent margin uplift/subsidence/shearing. Two-dimensional flexural back stripping and thermal modelling applied along regional depth-converted interpreted seismic profiles from the Laxmi Basin in the Arabian Sea revealed considerable basin-wide subsidence in response to the crustal geodynamics during and after the last extensional phase. Unloading of the stratigraphy helped to estimate the degree of laterally varying extension, assuming thermal subsidence and pure shear. High degrees of extension in the basin centre predict considerable water depths at the time of rift cessation, consistent with deep drilling data. This implied that the regional extension prior to Paleocene time could have fuelled variable
Figure 73: : Map showing drill sites (red star) of IODP Expedition – 379 in the Amundsen Sea. Dr. Waliur Rahaman from NCPOR participated as an Indian participant.

OC
EAN AN
D G
EOSC
IENC
ES
ESSO-NCPOR Annual Report 2018-2019
68
subsidence in the Laxmi Basin. Backstripping of post-rift sediments from interpreted seismic profiles supports the presence of a hyper-thinned crust underneath the Laxmi Basin, with β factors reaching >7 in the basin centre and ∼3 across the basin width.
Investigation on Amundsen Sea West Antarctic Ice Sheet History (IODP-379)
The Amundsen Sea sector of Antarctica has long been considered the most vulnerable part of the West Antarctic Ice Sheet (WAIS) because of the great water depth at the grounding line and the absence of substantial ice shelves. Ice flowing into the Amundsen Sea Embayment is undergoing the most rapid changes of any sector of the Antarctic Ice Sheet outside the Antarctic Peninsula, including changes caused by substantial grounding-line retreat over recent decades, as observed from satellite data. Recent models suggest that a threshold leading to the collapse of WAIS in this sector may have been already crossed and that much of the ice sheet could be lost even under relatively moderate greenhouse gas emission scenarios.
To understand the hypotheses of WAIS dynamics and related paleoenvironmental and paleoclimatic conditions, Expedition-379 (Figure 73) was conducted in the Amundsen Sea during 18 January–20 March 2019. Dr. Waliur Rahaman from NCPOR participated in the expedition representing India as an Inorganic chemist in the team.
3.3 EXTENDED CONTINENTAL SHELF PROGRAM OF INDIAThe edge of the continental margin is one criterion for the delimitation of the boundary of the internationally recognized claims to underwater resources. The project holds crucial economic significance as the provisions of UNCLOS allow a coastal state to extend its jurisdiction beyond 200 M for exploration and utilization of natural resources of seafloor and sub-seabed.
India’s extended continental shelf claim as per Article 76 of the UNCLOS submitted to the UN, which is likely to come up for examination soon. This will have a significant impact on the Indian economy in terms of sovereign rights and deep-sea exploration. National Centre for Polar and
Ocean Research (NCPOR) is playing the lead role in terms of Article 76 submission. In this regard, scientific and technical support to the Government of India towards the settlement of outstanding maritime issues with our neighboring countries is provided from time to time by NCPOR.Using in-house scientific & technical expertise developed, NCPOR has been playing a key role in initiating bilateral/multi-lateral dialogues to settle outstanding maritime issues with Indian neighbors such as Bangladesh, Indonesia, and Myanmar, etc.
3.4 EXPLORING THE LARGEST GEOID LOW ON EARTHIndian Ocean Geoid Low (IOGL) is a long-term scientific program to explore possible reasons behind the largest geoid low on earth in the Indian Ocean. The source of the largest equipotential gravitational field distortion in the world, 106-meter anomaly in the Indian Ocean, remains a mystery implying a significant shift in the subsurface geodynamic conditions.
Several studies have tried to explain this phenomenon, but most of them attribute it to a remnant of earlier ocean plates seated into the Earth’s mantle. However, there has been no convincing explanation of the source till now. To understand and narrow down the gap between the dynamics of materials beneath the surface and its surface manifestation as the IOGL geoid anomaly, NCPOR started a large-scale seismological array deployment in the Indian Ocean. As a pilot project, in May 2018, NCPOR deployed 17 passives broadband OBSs. These sensors will record continuous time series data of seismic events for 1 year. The array extends laterally from the foci of the nearly circular IOGL anomaly to its southern extent.
The prime objective of our experiment is to image the deep mantle structures and their relationship with the geoid low anomaly in the Indian Ocean. We hope to explain the key factors that make the Indian Ocean geoid anomaly different from the geoid anomalies in other parts of the world. Such findings would offer several types of opportunities to geoscientists researching deep-ocean mantle dynamics. Unraveling the origin of IOGL may shed light to seismic hazard status of the Indian subcontinent and the Andaman subduction arc.
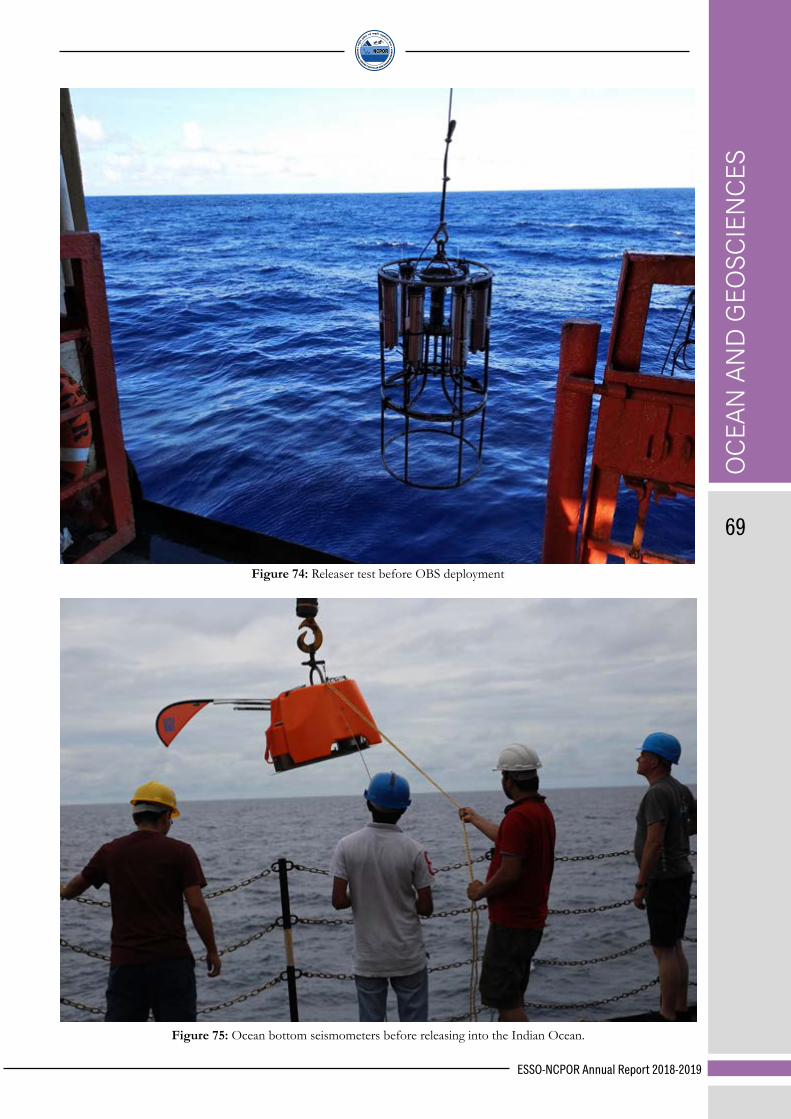
OC
EAN
AN
D G
EOSC
IEN
CES
ESSO-NCPOR Annual Report 2018-2019
69
Figure 75: Ocean bottom seismometers before releasing into the Indian Ocean.
Figure 74: Releaser test before OBS deployment

OC
EAN AN
D G
EOSC
IENC
ES
ESSO-NCPOR Annual Report 2018-2019
70
Figure 76: Releasing the OBS in the Indian Ocean water during deployment phase 2018.
3.5 GEOSCIENTIFIC STUDIES OF THE EXCLUSIVE ECONOMIC ZONEExclusive Economic Zone (EEZ) of India comprises nearly 2 million km2 area and is abound with a wide variety of marine living and non-living resources. Realizing the need to be cognizant about Indian EEZ for the optimum utilization of the resources in its oceanic regime and also to enhance knowledge about the scientific issues related to the Indian Peninsula, Government of India/ Ministry of Earth Science (MoES) is undertaking a program entitled “Geo-Scientific studies of the Exclusive Economic Zone” for scientific mapping of the entire Indian EEZ. The National Centre for Polar and Ocean Research (NCPOR, Goa) is designated as the nodal agency for implementation and ESSO-National Institute for Ocean Technology (NIOT, Chennai), CSIR-National Institute of Oceanography (CSIR-NIO, Goa) and Marine wing of Geological Survey of India (GSI) are participating agencies in the program.
As of now, ESSO-NCPOR has covered a total area of 15,63,730 km2 of the deep-water blocks which
comprises 83.38% of the deeper water regions of Indian EEZ beyond 500m water depth. During 2018-2019, four survey cruises were undertaken by NCPOR in the Bay of Bengal and Andaman Island region onboard national flagship ORV-Sagar Kanya. A total of 52,781 km2 area was covered using MBES along with CTD/SVP casts and sediment sampling using Gravity corer. All acquired underway geophysical datasets were processed using the standard processing techniques. Analysis, integration and interpretation of bathymetric data carried out to infer various morphological and structural features in the region, many of which were mapped and identified for the first time. Integrated interpretation of the various data sets could throw light on the many significant scientific aspects related to sedimentary processes, evolution, morpho-tectonics etc. Establishment of Marine Geo-Scientific Database (MGSDB) is also under progress to archive, visualize and retrieve various geoscientifc datasets being acquired under the program. The datasets collected by participating organizations viz. GSI, NIO and NIOT are also being archived periodically and till date approx. 20TB of data has been archived.

OC
EAN
AN
D G
EOSC
IEN
CES
ESSO-NCPOR Annual Report 2018-2019
71
Detailed Geo-scientific analysis and interpretation were undertaken along the South Western Continental Margin of India (SWCMI) and the South Eastern Continental Margin of India (SECMI) to understand the major morphological features and geohazard potential. Numerous submarine canyons were mapped and identified along Cauvery-Palar margin and classified according to the source of formation (Figure 77). Also, downstream erosional and depositional features have been identified for the first time in the area, providing insights to the nature of turbidity currents and depositional architecture. Numerous geo-hazards such as submarine landslides, slumps, mud diapirs, fault ruptures etc. were also identified in the bathymetric and sub-bottom profiling data. The Cauvery-Palar margin is also being extensively studied to assess the hazard potential in coastal regions and structures placed in deep waters.
Apart from the mapping of well-documented slope failures, mass transport deposits and canyon-channel systems of KG Basin, evolutionary trends and coastal progradation of paleo-shorelines have also been identified off-Vishakhapatnam in the course of this study (Figure 78). An observational paleo-shoreline record formed during higher relative sea levels (85 m, 95 m and 110 m), is discernible in high-resolution multibeam data. The regression and transgression coasts are the paleo-shorelines, parallel to the present shoreline. Sand ridges, abrasion terraces, wave-cut notches, hummocky terraces and canyon head is observed in the vicinity (Figure 78).
The bathymetry analysis in the Kochi offshore region, SWCMI also brought out a large-scale submarine slide within the continental shelf-slope region (Figure 79). Detailed analysis of the geophysical data conveyed insights into the geohazard potential as well as the possible mechanism of this failure. The MBES and other geophysical data in the western region of Laccadive Ridge also improved the knowledge about the morphology of Sagar Kanya Seamount and the adjacent deep-sea region in the entire spatial extent. The high-resolution multibeam bathymetric maps show the presence of several bathymetric high features with different dimensions (Figure 80). These features mainly consist of two prominent seamounts and several linear ridge-like features, together representing a large circular bathymetry high complex surrounding a region of nearly flat
seafloor measuring ~50 km x 30 km, at water depths of 4200-4300 m. Considering all these bathymetric features, the entire bathymetry high complex is inferred as the Sagar Kanya Bathymetric High Complex.
Interactions between water mass and seabed of South-eastern Arabian Sea was studied by conducting geomorphic analysis utilizing Multibeam bathymetry and sediment profiler data along with conductivity, temperature and depth (CTD) measurements to investigate morphological aspects of bottom current features and deduce the prevailing water mass in the South-Eastern Arabian Sea. Deconstructing structural aspects of typical bottom current features such as ‘Contourite Drift’ and ‘Scours’ reveal origin under influence of consistent exogenic bottom current having definitive flow pattern. Prominent trend ranging between 200º to 275º indicating an NNW-SSE orientation of erosive features which is usually synonymous with flow direction in the area (Figure 81). Geomorphic analysis of seabed is an efficient method to understand the flow pattern and of prevailing water masses and can be used as passive indicator of bottom current flow specifically when adequate data and observations for deep water masses are scarce.
A sediment core (ABP24/05), collected at a water depth of 3520 m from the southern Bay of Bengal was studied to determine the factors controlling redox conditions during the Late Quaternary. The low organic carbon (OC), high Mn/Al and Mn-oxides mineral precipitation indicated prevailing oxic conditions during early Holocene (Figure 82). The association of high OC, CaCO3 and Mn peaks indicated the formation of Mn carbonates during the last glacial maximum (LGM) (Figure 82). The preservation of Mn and/or OC during these extreme climatic events is controlled by the significant changes in chemical, oceanographic and sediment supply in the study area. The enhanced ventilation of bottom water, less export of OC to the bottom sediments and low sedimentation (4 cm/kyr) might have resulted in the preservation of less OC and formation of Mn-oxides during the early Holocene. In contrast, the combined influence of the poor ventilation of bottom water, the export of high OC to the bottom sediments and relatively high sedimentation rate (11.5 cm/kyr) could have enhanced better preservation of OC at LGM.

OC
EAN AN
D G
EOSC
IENC
ES
ESSO-NCPOR Annual Report 2018-2019
72
Figure 77. Bathymetry map showing failed canyon and Slump deposit off Chennai, SECMI
Figure 78. Bathymetry map showing the Paleo-shore line, off Vishakhapatnam, ECMI
Figure 79. Bathymetry map showing slope failure, off Cochin, SWCMI
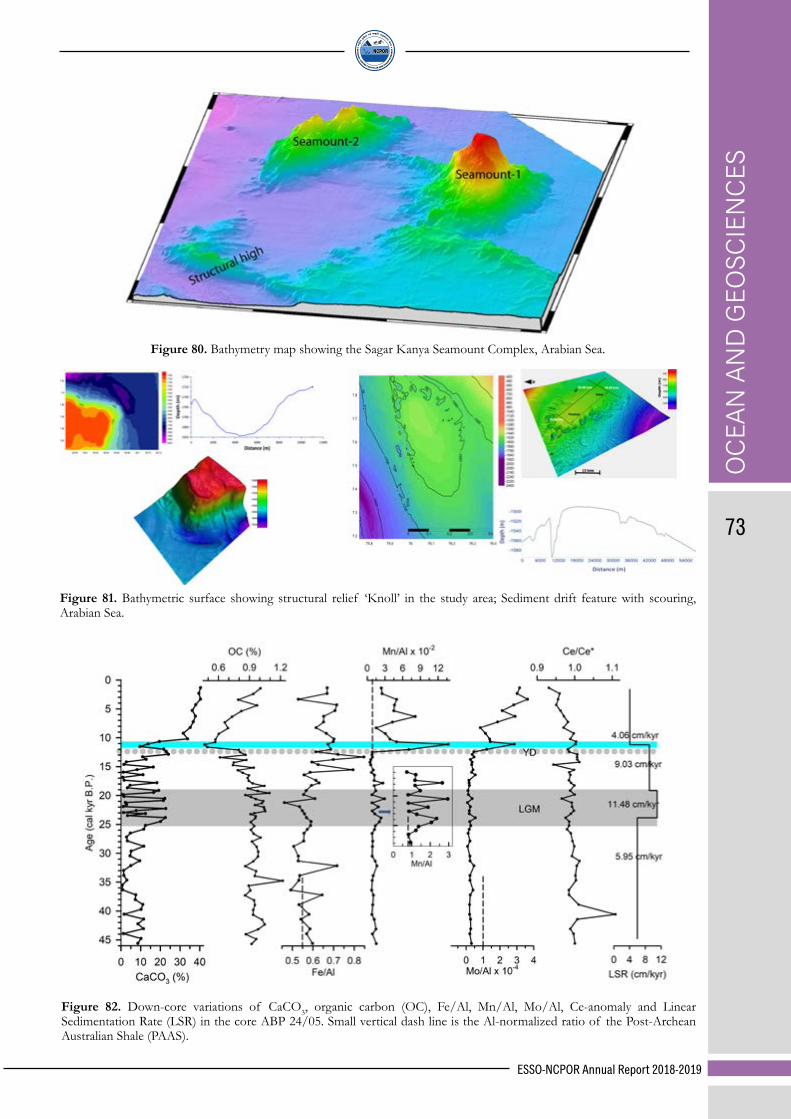
OC
EAN
AN
D G
EOSC
IEN
CES
ESSO-NCPOR Annual Report 2018-2019
73
Figure 80. Bathymetry map showing the Sagar Kanya Seamount Complex, Arabian Sea.
Figure 81. Bathymetric surface showing structural relief ‘Knoll’ in the study area; Sediment drift feature with scouring, Arabian Sea.
Figure 82. Down-core variations of CaCO3, organic carbon (OC), Fe/Al, Mn/Al, Mo/Al, Ce-anomaly and Linear Sedimentation Rate (LSR) in the core ABP 24/05. Small vertical dash line is the Al-normalized ratio of the Post-Archean Australian Shale (PAAS).
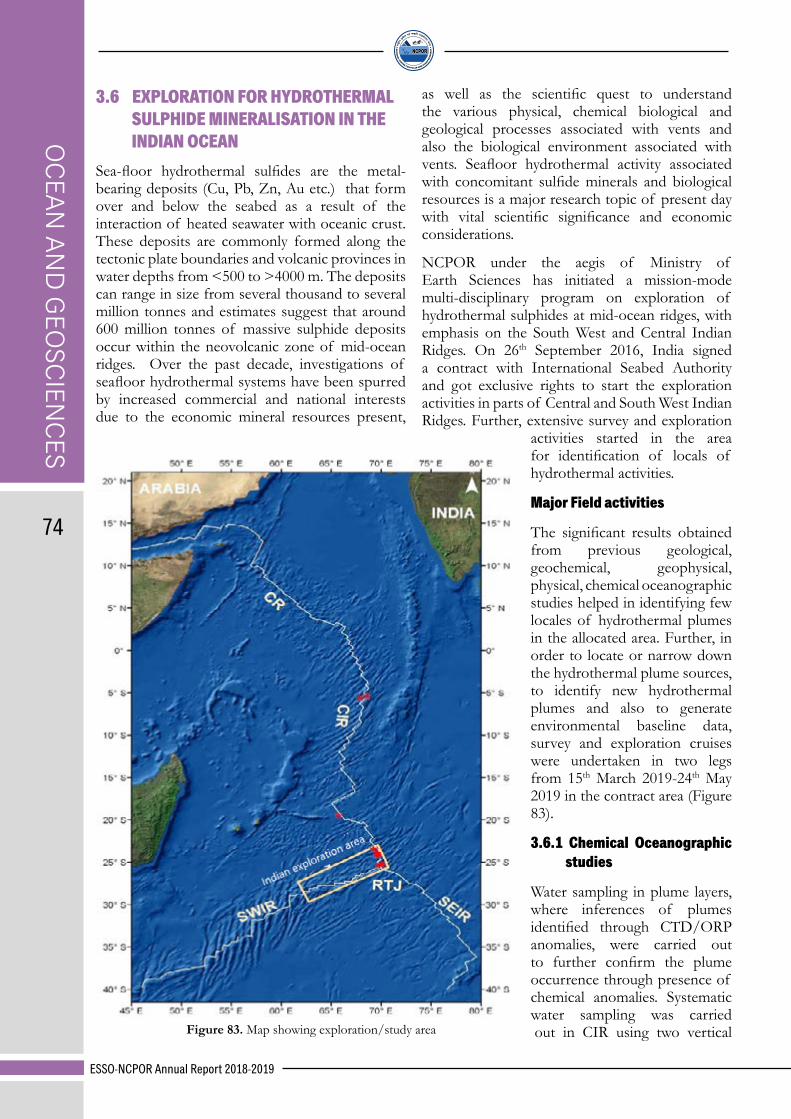
OC
EAN AN
D G
EOSC
IENC
ES
ESSO-NCPOR Annual Report 2018-2019
74
3.6 EXPLORATION FOR HYDROTHERMAL SULPHIDE MINERALISATION IN THE INDIAN OCEAN
Sea-floor hydrothermal sulfides are the metal-bearing deposits (Cu, Pb, Zn, Au etc.) that form over and below the seabed as a result of the interaction of heated seawater with oceanic crust. These deposits are commonly formed along the tectonic plate boundaries and volcanic provinces in water depths from <500 to >4000 m. The deposits can range in size from several thousand to several million tonnes and estimates suggest that around 600 million tonnes of massive sulphide deposits occur within the neovolcanic zone of mid-ocean ridges. Over the past decade, investigations of seafloor hydrothermal systems have been spurred by increased commercial and national interests due to the economic mineral resources present,
as well as the scientific quest to understand the various physical, chemical biological and geological processes associated with vents and also the biological environment associated with vents. Seafloor hydrothermal activity associated with concomitant sulfide minerals and biological resources is a major research topic of present day with vital scientific significance and economic considerations.
NCPOR under the aegis of Ministry of Earth Sciences has initiated a mission-mode multi-disciplinary program on exploration of hydrothermal sulphides at mid-ocean ridges, with emphasis on the South West and Central Indian Ridges. On 26th September 2016, India signed a contract with International Seabed Authority and got exclusive rights to start the exploration activities in parts of Central and South West Indian Ridges. Further, extensive survey and exploration
activities started in the area for identification of locals of hydrothermal activities.
Major Field activities
The significant results obtained from previous geological, geochemical, geophysical, physical, chemical oceanographic studies helped in identifying few locales of hydrothermal plumes in the allocated area. Further, in order to locate or narrow down the hydrothermal plume sources, to identify new hydrothermal plumes and also to generate environmental baseline data, survey and exploration cruises were undertaken in two legs from 15th March 2019-24th May 2019 in the contract area (Figure 83).
3.6.1 Chemical Oceanographic studies
Water sampling in plume layers, where inferences of plumes identified through CTD/ORP anomalies, were carried out to further confirm the plume occurrence through presence of chemical anomalies. Systematic water sampling was carried out in CIR using two vertical Figure 83. Map showing exploration/study area

OC
EAN
AN
D G
EOSC
IEN
CES
ESSO-NCPOR Annual Report 2018-2019
75
CTD casts (CTD-17-P5 & CTD-17-P8) and one tow-yo operation (T-5) with an objective to study the dissolved gases (helium and methane) and dissolved manganese and thus to understand the chemical composition of plumes. The helium, methane and manganese concentrations are relatively very high in these plume layers as shown in Figure 84. CTD casts show varying turbidityat these two stations. The dissolved manganese and methane concentrations in both layers of the two stations varies from 2.5 – 112 nmoles/L and 1.6 – 246 nmol/kg respectively. Both the plume layers are enriched in helium-3 isotope (d3He in %) and follows the manganese and methane concentration pattern and varies from 14-88 %. However, the δ13C of CH4 (methane) shows the plume layers are enriched with heavier isotopes (δ13C ranges from -35‰ to -13‰ in background to plume layers). The heavier isotope enrichment in the plume layers might be from the microbial activity/production. Further the samples collected from the tow-yo operation (T5) also shows very high concentrations of manganese, methane and helium (Figure 85). The dissolved manganese concentrations (Figure
86) in these plume layers shows upto 5.82 nM where the background concentrations are 1.8 nM. The enrichment of about 4 nM is expected mainly because of hydrothermal input to the water column. It has been observed that, there is a variation of concentration among these plume layers (layer-1 maximum manganese concentration is 5.82 nM and in layer-2, 4.01 nM). These high concentrations at two different depths clearly shows that they are originated from two different sources.
The above observations provide the evidence for hydrothermal venting in the near region of CTD station in CIR (CTD-17-P5). The chemical nature of the plume column shows that these plumes might have originated from the high temperature hydrothermal venting. Further, the chemical composition of these plume layers shows the presence of volatiles compared to the metals (CH4/Mn>2) and infers that they are originated from hydrothermal fluids hosted by ultramafic rocks and can be compared to ultramific hosted systems such as Lucky Strike, 37° N, MAR.
Figure 84. Turbidity, dissolved manganese, helium (δ3He), dissolved methane concentrations and its δ13C (‰) of two CTD stations CTD-17-P5 & CTD-17-P8 are given.

OC
EAN AN
D G
EOSC
IENC
ES
ESSO-NCPOR Annual Report 2018-2019
76
Figure 85. Turbidity anomalies in the tow-yo operation (T5) and the filled red circles indicate the samples collected for chemical studies.
Figure 86. Dissolved manganese concentrations (nM) of seawater from Central Indian Ridge.
3.6.2 Geological and Geochemical studies of rocks and sediments
3.6.2a Evidences of Oceanic Core Complex (OCC) at 67.30o E of South West Indian Ridge (SWIR)
The increasing numbers of high-temperature (>200°C) hydrothermal evidences along the slow and ultra-slow spreading centre imply discoveries of hydrothermal sulfide deposition associated with serpentinite, peridotitic ultramafic rocks. Such formational setup of hydrothermal activities and associated rock types are considered to be associated with Oceanic core complexes (OCCs). The geological setting of OCC does favour the possibility of occurrences of hydrothermal mineralization. Hence, identification & characterization of OCCs appear to be a good strategy in exploration of hydrothermal mineralization.
The integrated bathymetric, petrological and microstructural evidences reveal an inverted oceanic crust-mantle rock sequence and associated shear zone at around 67.30o E of northern flank of the South West Indian Ridge (SWIR). The rock assemblages include gabbro and peridotite at the higher bathymetric level of the sea-floor as domal massifs (Figure 87). Microstructural study also showing wide range of shearing conditions initiated at brittle-ductile transitional zone suggest a large-scale shear-zone possibly associated with detachment fault (Figure 88). Combining all the evidences, it is inferred that the site 67.30o E of South West Indian Ridge (SWIR) is a potential site of Oceanic Core Complex (OCC).

OC
EAN
AN
D G
EOSC
IEN
CES
ESSO-NCPOR Annual Report 2018-2019
77
Figure 87. Bathymetry map showing sequential petrological distribution of oceanic rocks resembles to OCC. (A & B) megascopic and microscopic view of basalt, (C & D) megascopic and microscopic view of altered serpentine peridotite, (E & F) megascopic and microscopic view of gabbro.
Figure 88. Systematic shearing microstructures associated with OCC. (A) Back scattered image (BSE) of clinopyroxene showing kink formed as a result of ductile deformation. (B) BSE image of pyroxene twin lamellae showing micro-faulting.
3.6.2b Mineral chemistry of magnetic grains and spherules from Central Indian Ridge
Volcanogenic-hydrothermal materials (vhm), ferro-basalts, spilites, spherules, zeolitites, ferromanganese crusts are key components for tracing the presence of active/inactive hydrothermal vent fields and sulphide deposits. Metalliferous sediments usually consist of an important grain known as Spherule. Spherules separated from the sediments collected from one location in CIR are found rich in Fe and Ti, (Figure 89) shows the presence of magnetite and titanomagnetite minerals phases. EPMA analysis of the spherulesshowspresence of Pb and Fe Figure 89. Spherules from CIR
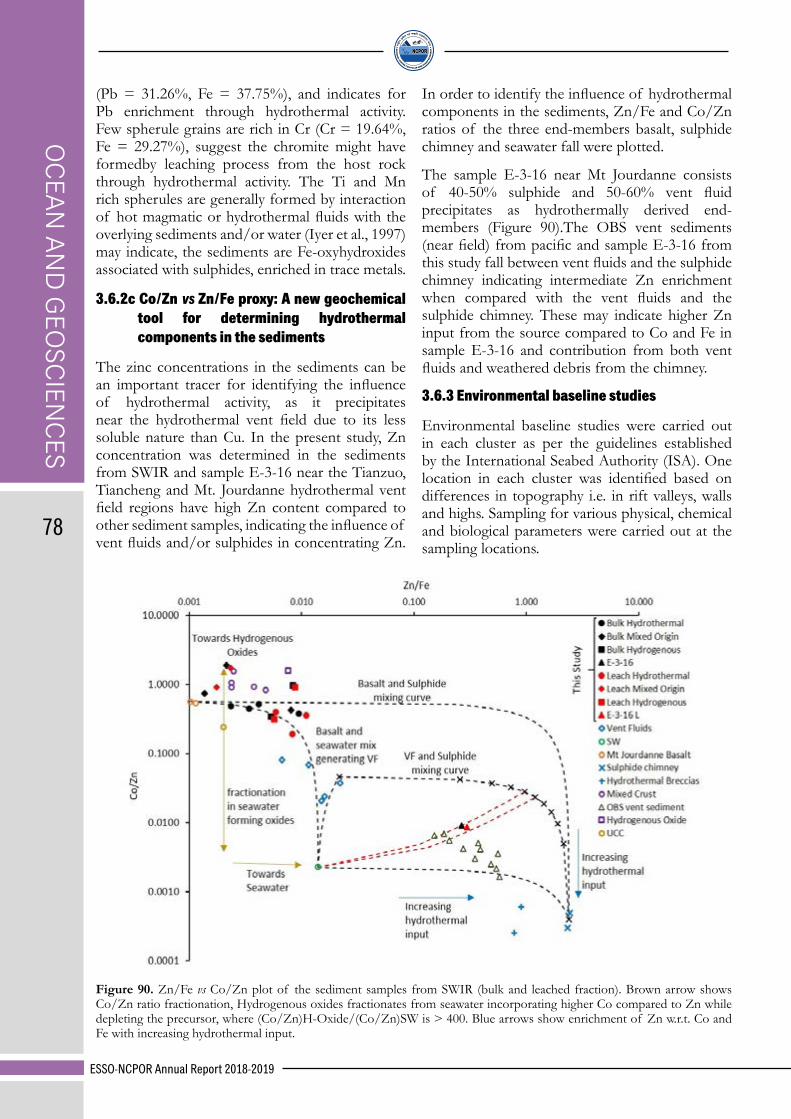
OC
EAN AN
D G
EOSC
IENC
ES
ESSO-NCPOR Annual Report 2018-2019
78
(Pb = 31.26%, Fe = 37.75%), and indicates for Pb enrichment through hydrothermal activity. Few spherule grains are rich in Cr (Cr = 19.64%, Fe = 29.27%), suggest the chromite might have formedby leaching process from the host rock through hydrothermal activity. The Ti and Mn rich spherules are generally formed by interaction of hot magmatic or hydrothermal fluids with the overlying sediments and/or water (Iyer et al., 1997) may indicate, the sediments are Fe-oxyhydroxides associated with sulphides, enriched in trace metals.
3.6.2c Co/Zn vs Zn/Fe proxy: A new geochemical tool for determining hydrothermal components in the sediments
The zinc concentrations in the sediments can be an important tracer for identifying the influence of hydrothermal activity, as it precipitates near the hydrothermal vent field due to its less soluble nature than Cu. In the present study, Zn concentration was determined in the sediments from SWIR and sample E-3-16 near the Tianzuo, Tiancheng and Mt. Jourdanne hydrothermal vent field regions have high Zn content compared to other sediment samples, indicating the influence of vent fluids and/or sulphides in concentrating Zn.
In order to identify the influence of hydrothermal components in the sediments, Zn/Fe and Co/Zn ratios of the three end-members basalt, sulphide chimney and seawater fall were plotted.
The sample E-3-16 near Mt Jourdanne consists of 40-50% sulphide and 50-60% vent fluid precipitates as hydrothermally derived end-members (Figure 90).The OBS vent sediments (near field) from pacific and sample E-3-16 from this study fall between vent fluids and the sulphide chimney indicating intermediate Zn enrichment when compared with the vent fluids and the sulphide chimney. These may indicate higher Zn input from the source compared to Co and Fe in sample E-3-16 and contribution from both vent fluids and weathered debris from the chimney.
3.6.3 Environmental baseline studies
Environmental baseline studies were carried out in each cluster as per the guidelines established by the International Seabed Authority (ISA). One location in each cluster was identified based on differences in topography i.e. in rift valleys, walls and highs. Sampling for various physical, chemical and biological parameters were carried out at the sampling locations.
Figure 90. Zn/Fe vs Co/Zn plot of the sediment samples from SWIR (bulk and leached fraction). Brown arrow shows Co/Zn ratio fractionation, Hydrogenous oxides fractionates from seawater incorporating higher Co compared to Zn while depleting the precursor, where (Co/Zn)H-Oxide/(Co/Zn)SW is > 400. Blue arrows show enrichment of Zn w.r.t. Co and Fe with increasing hydrothermal input.

OC
EAN
AN
D G
EOSC
IEN
CES
ESSO-NCPOR Annual Report 2018-2019
79
3.6.4 Biological studies
3.6.4a Variation in microbial biomass
Microbial ATP (adenosine triphosphate) was determined to estimate their biomass in ridge waters. Similar to TPC in the water column, their biomass varied with depth (Figure 91). An increase in microbial biomass was observed at > 2000 m. Hydrothermally-derived substrates could be responsible for supporting chemoautotrophic microbes in deeper waters.
3.6.4b Microbial biomass studies in hydrothermal plume
Water column surveys for biological studies were conducted between 23° to 23°40’ S in the southern part of CIR through CTD casts. Enrichment of biogeochemical tracers (dissolved Mn (DMn) & ATP (a proxy for microbial biomass)) by up to 4-5 times of the background concentration was observed at a depth where highest turbidity anomaly was found (Figure 92). It has been observed that the higher dissolved Mn (DMn) & ATP values are directly correlating with the high turbidity signals.
3.6.4c Microbial functional gene composition & diversity along CIR and SWIR: A GeoChip-based approach
Stratified water column sampling (surface, mid, turbid layer, near-bottom) was carried out at 4 locations along the CIR and 6 locations along
SWIR. Genomic DNA extracted from the samples was subjected to GeoChip 5.0S microarray analysis. Bioinformatic analysis of the dataset showed that ~ 44% of genes from both locations were involved in C cycling indicating predominance of heterotrophy in these systems (Figure 93). Genes mediating remediation of organic compounds, transformation of nitrogen, sulfur and metals were also abundant (Figure 94). Shannon–Weaver indices for diversity and evenness revealed greater functional gene diversity at SWIR than at CIR (Figure 94).
Depth-wise distribution of functional genes showed that those for C-degradation were found to be 3× higher than for C-fixation indicating
Figure 91. Variation in microbial biomass in the water column.
Figure 92. Turbidity, ATP and DMn profiles in the water column between 23° to 23°40’S, southern CIR.

OC
EAN AN
D G
EOSC
IENC
ES
ESSO-NCPOR Annual Report 2018-2019
80
the pre-dominance of heterotrophy (Figure 95). Genes for metal-resistance, denitrification & sulfur oxidation were marginally higher in turbid layer indicating microbially-aided transformation of hydrothermally-derived substrates.
Taxonomic identification based on functional genes revealed presence of chemolithotrophs e.g. Oscillatoriales, Aquificae & Mollicutes to be more abundant in plume layer at CIR (Figure 96).
3.6.4d: Influence of metals on bacterial community: a culture-independent approach
Near-bottom seawater collected along the CIR and SWIR was amended with metals (Co, Mn and Ni; final concentration = 10 µmol L-1) and incubated for 15-days at 4 °C. Genomic DNA was extracted
and the extracts were subjected to metagenomic analysis in order to detect changes in bacterial community composition in presence and absence of metal ions. Metagenomic analysis of V3-V4 region of 16S rRNA gene showed that members belonging to phylum Proteobacteria were most abundant at both locations (Figure 97a,d) and presence of metals ions sustained their relative abundance to those at ambient level. Members of unknown phylum also formed a significant fraction of the bacterial community involved in metal transformation in ridge waters (Figure 97a,d). At CIR, members of phylum Bacteriodetes were observed to increase in abundance in presence of Mn contributing to ~ 3 % of the total (Figure 97) unlike at SWIR (Figure 97d).
Figure 93. Proportion of genes in major functional gene categories at CIR and SWIR.
Figure 94. Diversity indices for CIR and SWIR samples.
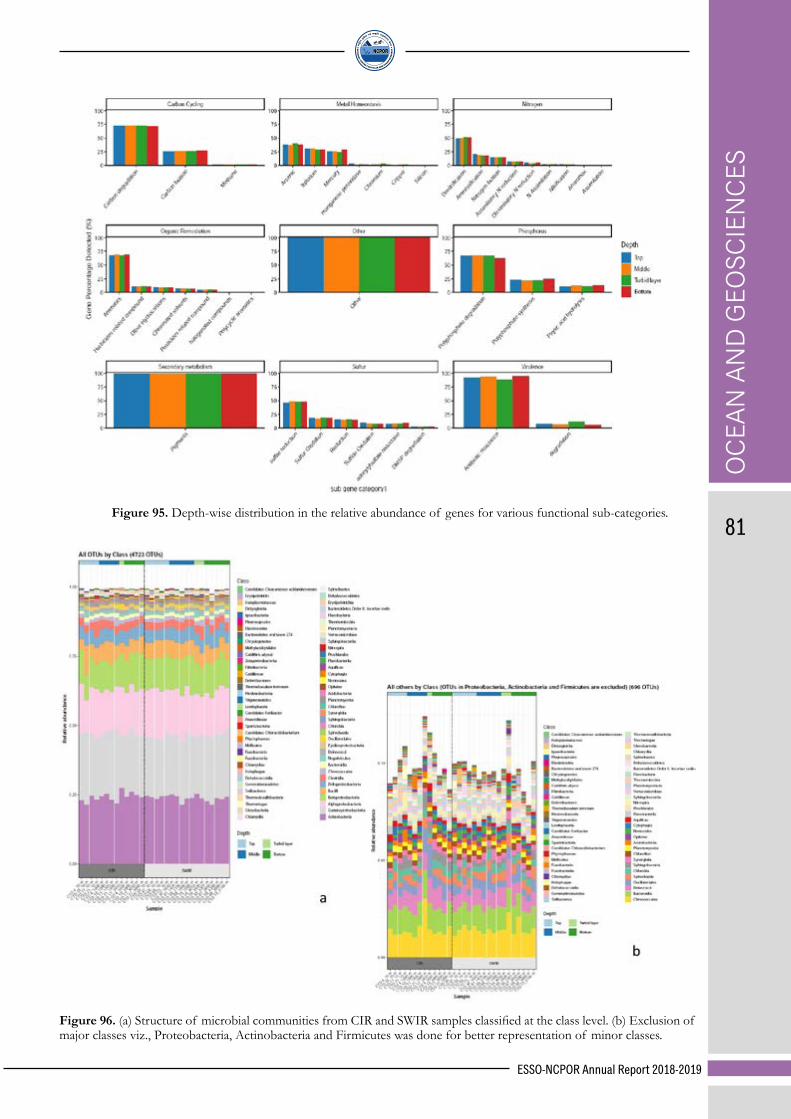
OC
EAN
AN
D G
EOSC
IEN
CES
ESSO-NCPOR Annual Report 2018-2019
81Figure 95. Depth-wise distribution in the relative abundance of genes for various functional sub-categories.
Figure 96. (a) Structure of microbial communities from CIR and SWIR samples classified at the class level. (b) Exclusion of major classes viz., Proteobacteria, Actinobacteria and Firmicutes was done for better representation of minor classes.

OC
EAN AN
D G
EOSC
IENC
ES
ESSO-NCPOR Annual Report 2018-2019
82
Among the three metals, the influence of Mn was strongest on bringing about changes in composition of the bacterial community especially at CIR (Figure 97 b,e). Alphaproteo bacteria and Gammaproteo bacteria made up to 48 and 42% of the total abundance in the presence of Mn (Figure 97b).
3.6.4e Benthic macrofauna studies:
Benthic macrofauna from sediments recovered from CIR during revealed presence of Pycnogonida (sea-spider) sp. (Figure 98a), Hydrozoan sp. (Figure 98b), Nematode (roundworm) sp. (Figure 98c) and Tanaidacean sp. (Figure 98d).
Figure 97. Variation in relative abundance of bacterial communities from CIR and SWIR at phylum (a, d), class (b, e), order (c, f) under metal unamended and amended conditions.
Figure 98 (a-d): Benthic macrofauna from CIR sediments.
a
b c d
OPE
RAT
ION
ESSO-NCPOR Annual Report 2018-2019
834.0 OPERATION,
MANAGEMENT AND RESEARCH SUPPORT
PC @ Mr. Rakesh Rao

OPER
ATION
ESSO-NCPOR Annual Report 2018-2019
84
4.1 VESSEL OPERATION & MANAGEMENT (VOM)
ORV SAGAR KANYA (2018-19)
Figure 99: OBS deployment SK 348
Introduction:
During the year 2018-19, the Ocean Research Vessel (ORV) Sagar Kanya has undertaken 11 cruises and has completed 275 days at sea. Five cruises were undertaken by NCPOR, Goa of which four were for the Geo-scientific Studies of the Exclusive Economic Zone and one was for the IOGL programme in the Equatorial Indian Ocean. Three cruises were undertaken by National Institute of Ocean Technology (NIOT), Chennai for the deployment and retrieval of Ocean Observation System (OOS) buoys. Two cruises were undertaken by Centre for Marine Living Resources and Ecology (CMLRE), Kochi for MEDAS programme in Arabian Sea. Students from various Universities such as Indian School of Mines Dhanbad, Pondicherry University, Indian Institute of Sciences (IISc) Bangalore etc. have participated in these cruises for acclimatization and sampling purposes.
INCOIS OON programme in Bay of Bengal (SK 347)
Cruise SK 347 was undertaken by Indian National Centre for Ocean Information Services (INCOIS) for the Vertical Micro Profiler (VMP) measurements at BD-11 NIOT mooring site and One BIO-Argo deployment. CTD and other standard underway data were also collected during the cruise. Seven students and one faculty member from University of Hyderabad also participated in the cruise for acclimatisation purpose.
NCPOR IOGL programme in Equatorial Indian Ocean (SK 348)
Cruise SK 348 was taken up for deployment of Ocean Bottom Seismometer (OBS) in the Indian Ocean region. Total 17 OBS were deployed at the different locations in Indian Ocean. In both the cruises, bathymetry data were collected throughout the cruise track.

OPE
RAT
ION
ESSO-NCPOR Annual Report 2018-2019
85
NIOT-OOS buoy operations (SK 349, SK 353 & SK 357)
Cruise SK 349 was executed for the retrieval and deployment of a Tsunami buoy and a Deep-sea instrumented buoy. CTD profiles and bathymetric surveys were made at every location. Eleven MSc Students from Goa University also participated in the cruise for acclimatisation and training purposes. Cruise SK 353 was undertaken for deployment and retrieval of Tsunami and data buoy in Arabian Sea. During the cruise 7 data buoy were retrieved and deployed and swapping of one Tsunami buoy was done. Field test of HADAMS (Tsunami buoy) was also carried out during the cruise. CTD profiles and bathymetric surveys were made at every location. Two research scholars from Cochin University of Science and Technology were also participated in the cruise for sampling purposes. Water samples were collected from locations of different depths for the measurement of methane, nitrous oxide,
carbon dioxide, total carbon, microplastic etc. Vertical hauling from 100mtrs depth using MPN and horizontal towing at surface using bongo net was done at planned locations. Cruise SK-357 was executed for NIOT-OOS operations in Arabian Sea. During the cruise, 03 buoys were deployed and 02 buoys were retrieved. Zooplankton Net and CTD was operated at planned locations, water samples were also collected. An additional buoy as requested by INCOIS was sighted, inspected and status was informed by NIOT sailing team to INCOIS.
Marine Ecosystem Dynamics of eastern Arabian Sea (MEDAS) (SK 351 & SK 352)
Cruise SK 351 & SK 352 were undertaken by CMLRE for MEDAS programme in Arabian Sea. Total 73 stations and 94 stations were sampled in SK 351 and SK 352 respectively. Surface waters were collected for taxonomic analysis of phytoplankton. Zooplankton samples were collected using MPN and Bongo nets with concurrent collection of CTD data. The samples were also collected for the measurement of Chlorophyll and accessory Pigments, Phytoplankton absorption (aph), autotrophic and heterotrophic bacterioplankton, total bacterial and viral abundance, Dissolved
Figure 100: Bongo Net Operation during SK 351
Figure 101: Deployment of Piston corer during SK 355

OPER
ATION
ESSO-NCPOR Annual Report 2018-2019
86
Oxygen (DO), Nutrients, Particulate Organic Carbon (POC), Total Organic Carbon (TOC), Dissolved nutrients, Dissolved Inorganic Carbon (DIC), Sediment samples for sediment organic carbon (SOC), XBT and XCTD deployment and isotopic ratios etc. Scientists from National Centre for Coastal Research (NCCR), Chennai, National
Institute of Oceanography (NIO), Kochi & Goa were also participated in the cruise. M.Sc. students from KUFOS, Kochi and Berhampur University, Orissa also participated in the cruise for training / acclimatization purpose.
NCPOR-Geoscientific studies of EEZ (SK-350, SK 354, SK 355 & SK 356)
Cruise SK 350, SK 354, SK 355 and SK 356 were executed by NCPOR for Geoscientific studies of EEZ in Bay of Bengal. Bathymetry data were collected throughout the cruise track. During SK 350, gravity core samples were collected from 2 locations. Five MSc, Geology students from Manipal Institute of Technology, Karnataka were also participated in the cruise for acclimatisation purpose. SK-354 cruise was undertaken for Multibeam bathymetry and Magnetometer survey in Andaman area in Bay of Bengal within the EEZ of India and to conduct CTD/SVP cast at different locations within survey area. In Cruise SK 355, Gravity core sample was collected from 1 location. One research scholar and one M.Sc. student also participated for sediment sampling and acclimatisation purposes in cruise SK 355. Other standard underway data like magnetometer, CTD/SVP were also collected during the cruises. During Cruise 356, the survey was carried out to cover the proposed area of EEZ zone of Bay of Bengal with 13 survey lines and 2 CTD stations. Twenty-one M.Sc. students from Cochin University of Science and Technology (CUSAT) also participated in the cruise for acclimatisation purpose.
Onboard acclimatization / training to students (SK 347, SK 349, SK 350, SK 351, SK 352, SK 353, SK 355 & SK 356)
Total 60 Research scholars and Post Graduate students from various Universities (Goa University; KUFOS, Kochi; Manipal Institute of Technology; Indian School of Mines, Dhanbad; University of Hyderabad; CUSAT, Kochi; Berhampur University, Odisha and Pondicherry University) participated in different cruises for sampling, training and acclimatisation purpose.
Figure 102: NIOT data buoy deployment in Arabian Sea during SK 353
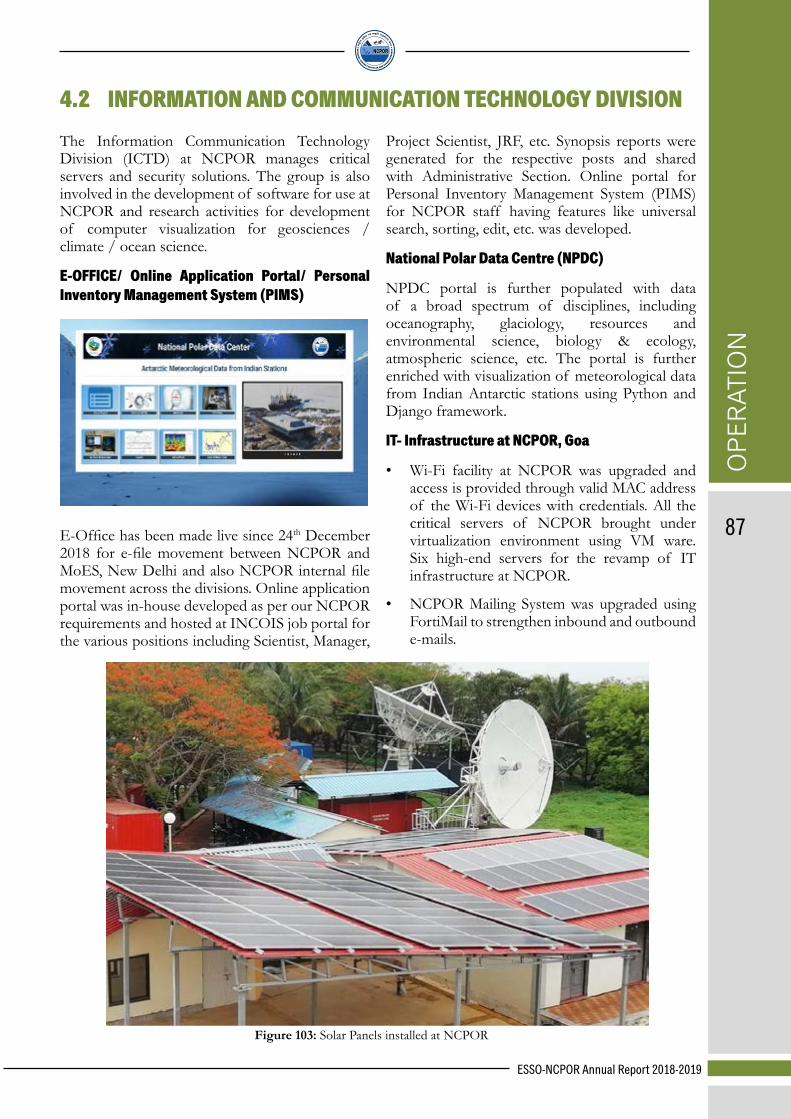
OPE
RAT
ION
ESSO-NCPOR Annual Report 2018-2019
87
4.2 INFORMATION AND COMMUNICATION TECHNOLOGY DIVISIONThe Information Communication Technology Division (ICTD) at NCPOR manages critical servers and security solutions. The group is also involved in the development of software for use at NCPOR and research activities for development of computer visualization for geosciences / climate / ocean science.
E-OFFICE/ Online Application Portal/ Personal Inventory Management System (PIMS)
E-Office has been made live since 24th December 2018 for e-file movement between NCPOR and MoES, New Delhi and also NCPOR internal file movement across the divisions. Online application portal was in-house developed as per our NCPOR requirements and hosted at INCOIS job portal for the various positions including Scientist, Manager,
Project Scientist, JRF, etc. Synopsis reports were generated for the respective posts and shared with Administrative Section. Online portal for Personal Inventory Management System (PIMS) for NCPOR staff having features like universal search, sorting, edit, etc. was developed.
National Polar Data Centre (NPDC)
NPDC portal is further populated with data of a broad spectrum of disciplines, including oceanography, glaciology, resources and environmental science, biology & ecology, atmospheric science, etc. The portal is further enriched with visualization of meteorological data from Indian Antarctic stations using Python and Django framework.
IT- Infrastructure at NCPOR, Goa
• Wi-Fi facility at NCPOR was upgraded and access is provided through valid MAC address of the Wi-Fi devices with credentials. All the critical servers of NCPOR brought under virtualization environment using VM ware. Six high-end servers for the revamp of IT infrastructure at NCPOR.
• NCPOR Mailing System was upgraded using FortiMail to strengthen inbound and outbound e-mails.
Figure 103: Solar Panels installed at NCPOR
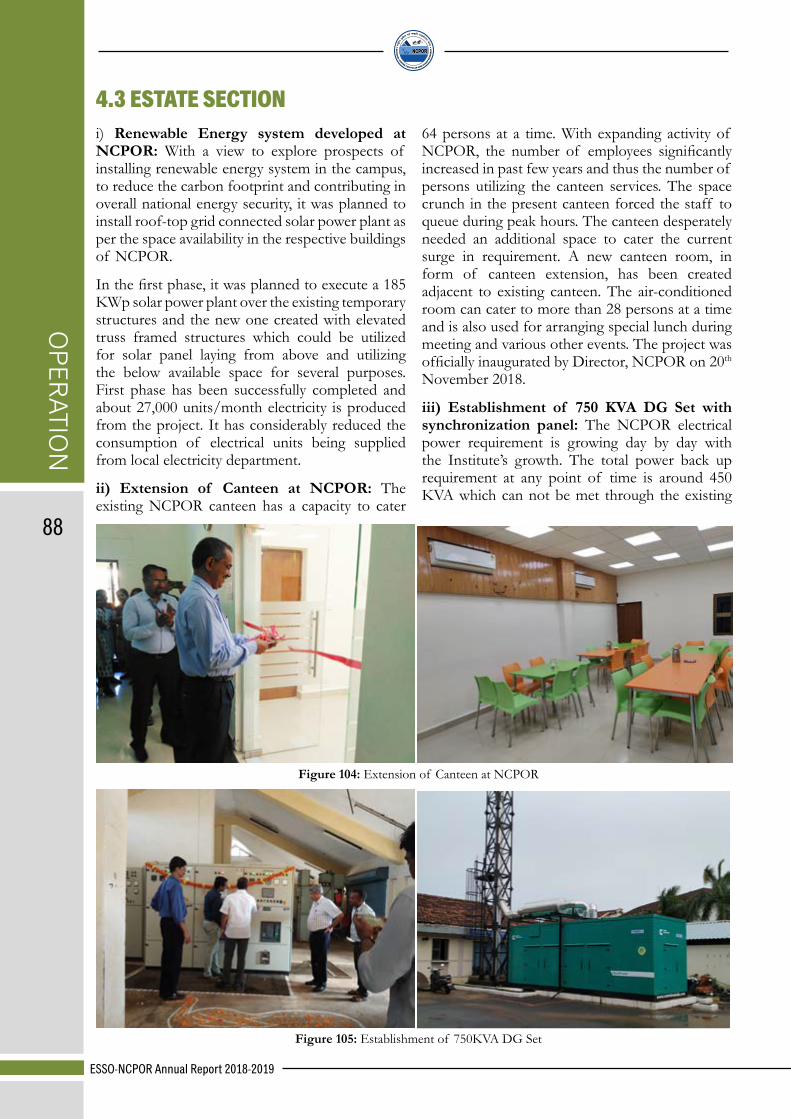
OPER
ATION
ESSO-NCPOR Annual Report 2018-2019
88
i) Renewable Energy system developed at NCPOR: With a view to explore prospects of installing renewable energy system in the campus, to reduce the carbon footprint and contributing in overall national energy security, it was planned to install roof-top grid connected solar power plant as per the space availability in the respective buildings of NCPOR.
In the first phase, it was planned to execute a 185 KWp solar power plant over the existing temporary structures and the new one created with elevated truss framed structures which could be utilized for solar panel laying from above and utilizing the below available space for several purposes. First phase has been successfully completed and about 27,000 units/month electricity is produced from the project. It has considerably reduced the consumption of electrical units being supplied from local electricity department.
ii) Extension of Canteen at NCPOR: The existing NCPOR canteen has a capacity to cater
64 persons at a time. With expanding activity of NCPOR, the number of employees significantly increased in past few years and thus the number of persons utilizing the canteen services. The space crunch in the present canteen forced the staff to queue during peak hours. The canteen desperately needed an additional space to cater the current surge in requirement. A new canteen room, in form of canteen extension, has been created adjacent to existing canteen. The air-conditioned room can cater to more than 28 persons at a time and is also used for arranging special lunch during meeting and various other events. The project was officially inaugurated by Director, NCPOR on 20th November 2018.
iii) Establishment of 750 KVA DG Set with synchronization panel: The NCPOR electrical power requirement is growing day by day with the Institute’s growth. The total power back up requirement at any point of time is around 450 KVA which can not be met through the existing
4.3 ESTATE SECTION
Figure 104: Extension of Canteen at NCPOR
Figure 105: Establishment of 750KVA DG Set

OPE
RAT
ION
ESSO-NCPOR Annual Report 2018-2019
89
320 KVA DG set.The existing power back-up capacity at NCPOR got a major boost with establishment of new 750KVA DG set. The new DG set is equipped with a synchronization panel
which has been synchronized with the existing 320 KVA DG set and being regulated as per the load requirement. The laying and termination of 08 runs of 400 sqmm cable was successfully achieved. The system was officially inaugurated by Director, NCPOR on 12th October 2018.
iv) Modification and automation of NCPOR main gate: The existing sliding main gate of NCPOR was designed to be manually operated. The gate needed a major overhauling as its components were old, rusted and non-functioning leading a severe effort requirement, by the security personnel, for its day to day operation. The NCPOR main gate was modified by automating the existing sliding gate though motorized system equipped with sensors and flashers. This facilitates the security personnel to regulate the gate opening with ease through remote control.
Figure 106: Automation of NCPOR main gate
4.4 NCPOR - OPERATIONS AND MANAGEMENTSTAFF STRENGTH AT NCPOR AS ON 31.03.2019
Category Scientific Scientific /Technical Support
AdministrativeOfficer & Staff MTS
Sanctioned Strength 45 08 26 09Filled 44 08 22 09
APPOINTMENTS/PROMOTIONS/RESIGNATIONS/TRANSFERSDuring the year 2018-2019 (01.04.2018 to 31.03.2019)
1. Appointments:
Sl. No. Name Designation Date of JoiningPermanent
1 Shri. Saurabh Bhatt Jr. Hindi Translator 17.09.20182 Dr. Rohit Srivastava Scientist D 21.12.2018
On Deputation3 Ms. Rupali Rane Jr. Executive (Admin.) 17.01.2019
2 Promotion:
Sl. No. Name Designation Date of PromotionPermanent
1 Shri Lalit Kumar Ahirwar Scientist E 01.07.20182 Dr. Prince Prakash Scientist E 01.01.2019 3 Dr. Nuncio Murukesh Scientist D 01.01.20194 Dr. Runa Antony Scientist D 01.01.2019 5 Shri M.M. Subramaniam Scientist D 01.01.2019 6 Shri Abhishek Tyagi Scientist D 01.01.2019
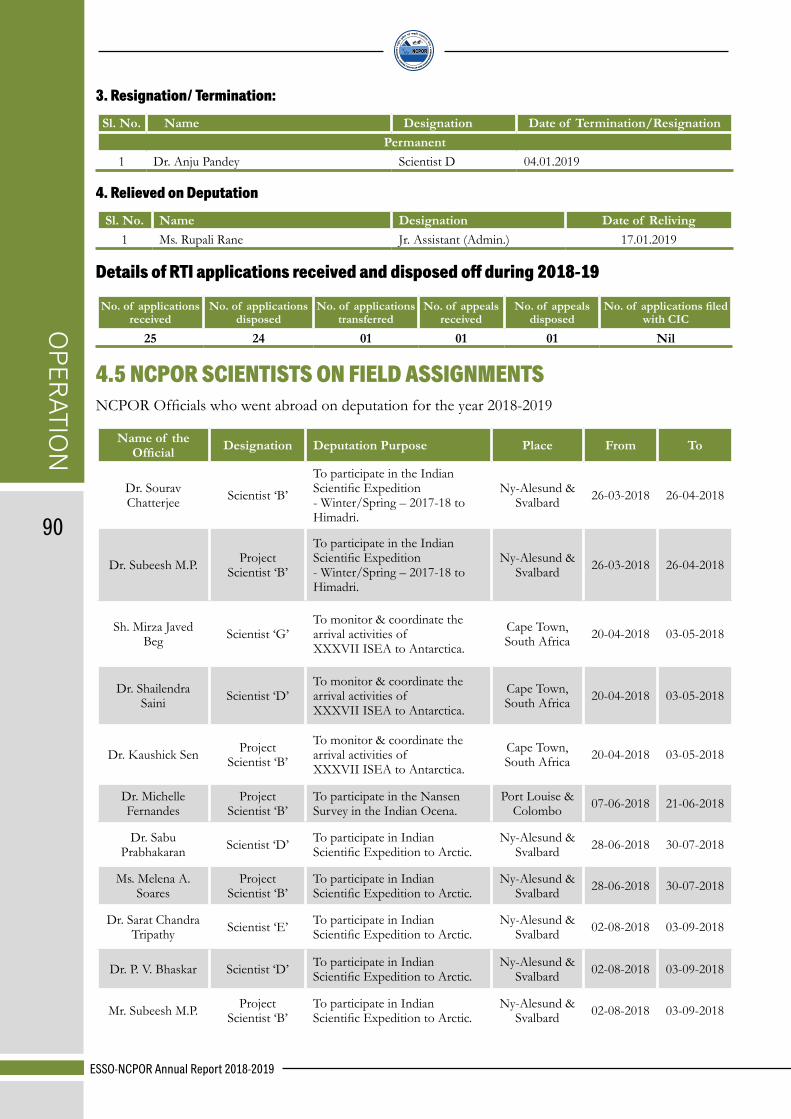
OPER
ATION
ESSO-NCPOR Annual Report 2018-2019
90
3. Resignation/ Termination:Sl. No. Name Designation Date of Termination/Resignation
Permanent1 Dr. Anju Pandey Scientist D 04.01.2019
4. Relieved on Deputation Sl. No. Name Designation Date of Reliving
1 Ms. Rupali Rane Jr. Assistant (Admin.) 17.01.2019
Details of RTI applications received and disposed off during 2018-19
No. of applications received
No. of applications disposed
No. of applications transferred
No. of appeals received
No. of appeals disposed
No. of applications filed with CIC
25 24 01 01 01 Nil
4.5 NCPOR SCIENTISTS ON FIELD ASSIGNMENTS NCPOR Officials who went abroad on deputation for the year 2018-2019
Name of the Official Designation Deputation Purpose Place From To
Dr. Sourav Chatterjee Scientist ‘B’
To participate in the Indian Scientific Expedition - Winter/Spring – 2017-18 to Himadri.
Ny-Alesund & Svalbard 26-03-2018 26-04-2018
Dr. Subeesh M.P. Project Scientist ‘B’
To participate in the Indian Scientific Expedition - Winter/Spring – 2017-18 to Himadri.
Ny-Alesund & Svalbard 26-03-2018 26-04-2018
Sh. Mirza Javed Beg Scientist ‘G’
To monitor & coordinate the arrival activities of XXXVII ISEA to Antarctica.
Cape Town, South Africa 20-04-2018 03-05-2018
Dr. Shailendra Saini Scientist ‘D’
To monitor & coordinate the arrival activities of XXXVII ISEA to Antarctica.
Cape Town, South Africa 20-04-2018 03-05-2018
Dr. Kaushick Sen Project Scientist ‘B’
To monitor & coordinate the arrival activities of XXXVII ISEA to Antarctica.
Cape Town, South Africa 20-04-2018 03-05-2018
Dr. Michelle Fernandes
Project Scientist ‘B’
To participate in the Nansen Survey in the Indian Ocena.
Port Louise & Colombo 07-06-2018 21-06-2018
Dr. Sabu Prabhakaran Scientist ‘D’ To participate in Indian
Scientific Expedition to Arctic.Ny-Alesund &
Svalbard 28-06-2018 30-07-2018
Ms. Melena A. Soares
Project Scientist ‘B’
To participate in Indian Scientific Expedition to Arctic.
Ny-Alesund & Svalbard 28-06-2018 30-07-2018
Dr. Sarat Chandra Tripathy Scientist ‘E’ To participate in Indian
Scientific Expedition to Arctic.Ny-Alesund &
Svalbard 02-08-2018 03-09-2018
Dr. P. V. Bhaskar Scientist ‘D’ To participate in Indian Scientific Expedition to Arctic.
Ny-Alesund & Svalbard 02-08-2018 03-09-2018
Mr. Subeesh M.P. Project Scientist ‘B’
To participate in Indian Scientific Expedition to Arctic.
Ny-Alesund & Svalbard 02-08-2018 03-09-2018
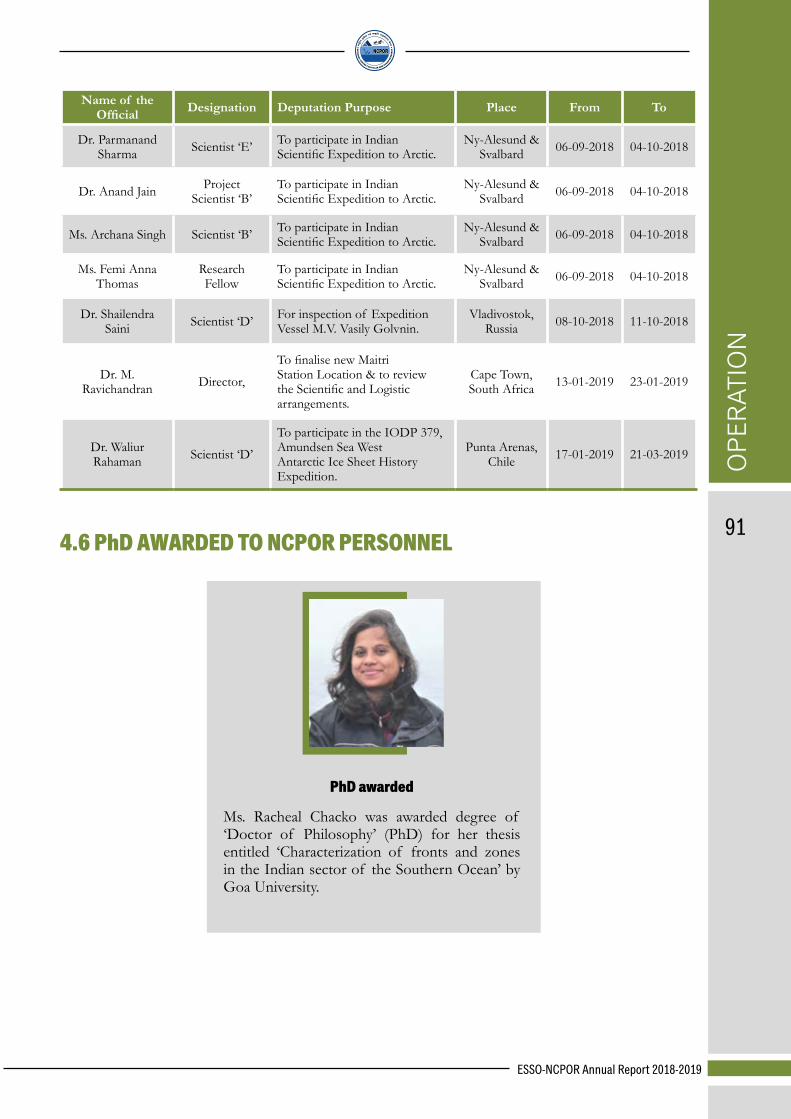
OPE
RAT
ION
ESSO-NCPOR Annual Report 2018-2019
91
Name of the Official Designation Deputation Purpose Place From To
Dr. Parmanand Sharma Scientist ‘E’ To participate in Indian
Scientific Expedition to Arctic.Ny-Alesund &
Svalbard 06-09-2018 04-10-2018
Dr. Anand Jain Project Scientist ‘B’
To participate in Indian Scientific Expedition to Arctic.
Ny-Alesund & Svalbard 06-09-2018 04-10-2018
Ms. Archana Singh Scientist ‘B’ To participate in Indian Scientific Expedition to Arctic.
Ny-Alesund & Svalbard 06-09-2018 04-10-2018
Ms. Femi Anna Thomas
Research Fellow
To participate in Indian Scientific Expedition to Arctic.
Ny-Alesund & Svalbard 06-09-2018 04-10-2018
Dr. Shailendra Saini Scientist ‘D’ For inspection of Expedition
Vessel M.V. Vasily Golvnin.Vladivostok,
Russia 08-10-2018 11-10-2018
Dr. M. Ravichandran Director,
To finalise new Maitri Station Location & to review the Scientific and Logistic arrangements.
Cape Town, South Africa 13-01-2019 23-01-2019
Dr. Waliur Rahaman Scientist ‘D’
To participate in the IODP 379, Amundsen Sea West Antarctic Ice Sheet History Expedition.
Punta Arenas, Chile 17-01-2019 21-03-2019
4.6 PhD AWARDED TO NCPOR PERSONNEL
PhD awarded
Ms. Racheal Chacko was awarded degree of ‘Doctor of Philosophy’ (PhD) for her thesis entitled ‘Characterization of fronts and zones in the Indian sector of the Southern Ocean’ by Goa University.
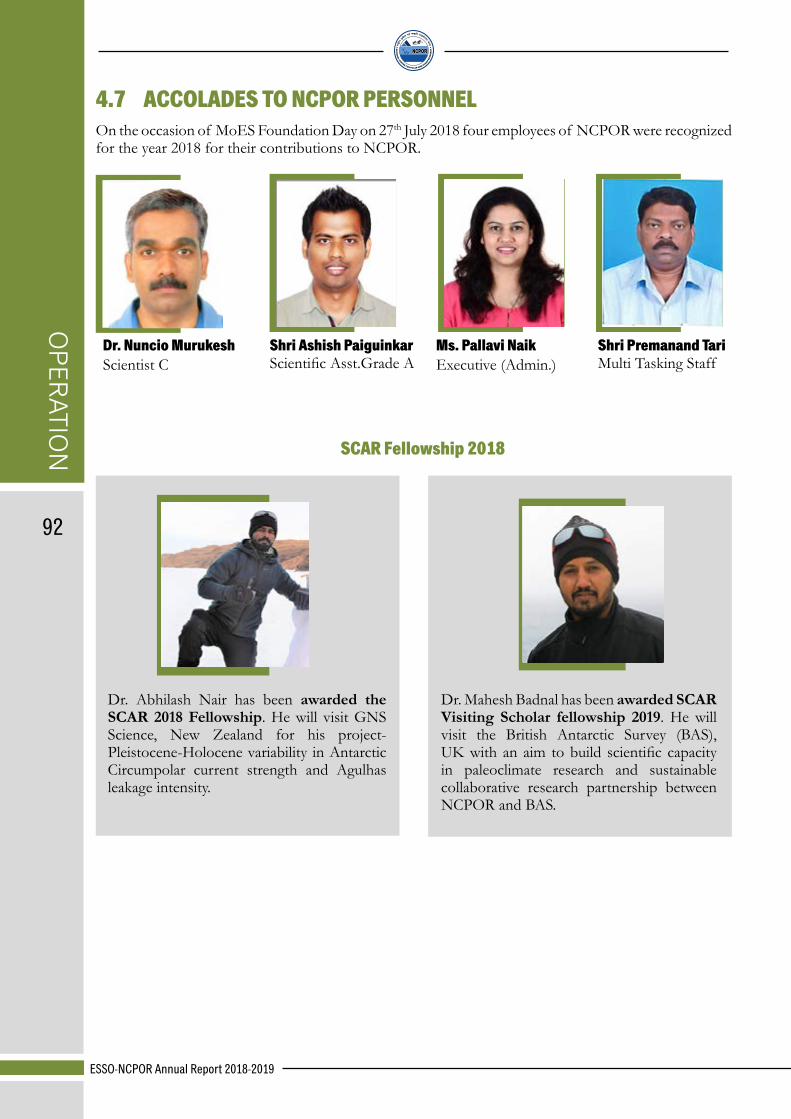
OPER
ATION
ESSO-NCPOR Annual Report 2018-2019
92
4.7 ACCOLADES TO NCPOR PERSONNEL On the occasion of MoES Foundation Day on 27th July 2018 four employees of NCPOR were recognized for the year 2018 for their contributions to NCPOR.
Dr. Nuncio MurukeshScientist C
Shri Ashish PaiguinkarScientific Asst.Grade A
Ms. Pallavi NaikExecutive (Admin.)
Shri Premanand TariMulti Tasking Staff
SCAR Fellowship 2018
Dr. Abhilash Nair has been awarded the SCAR 2018 Fellowship. He will visit GNS Science, New Zealand for his project- Pleistocene-Holocene variability in Antarctic Circumpolar current strength and Agulhas leakage intensity.
Dr. Mahesh Badnal has been awarded SCAR Visiting Scholar fellowship 2019. He will visit the British Antarctic Survey (BAS), UK with an aim to build scientific capacity in paleoclimate research and sustainable collaborative research partnership between NCPOR and BAS.

OPE
RAT
ION
ESSO-NCPOR Annual Report 2018-2019
93
4.8 SEMINAR/MEETING/ TRAINING/WORKSHOP
SPADE Workshop - Scientific Proposals for Andamans Drilling Endeavour
The National Centre for Polar and Ocean Research (NCPOR), India hosted a second international IODP workshop in Goa during September 17-18, 2018 to identify and improve our understanding about of several geological
paradoxes in this region. The primary goal of this workshop was to discuss, deliberate and nurture new scientific drilling proposals in the Andamans and surrounding margins in the Indian Ocean. About 50 international scientists took part, and the workshop was supported by MoES-India, USSP-USA and ECORD-Europe.
Figure 107: Discussion hour in the Geoscience Lab and Group photo during SPADE Workshop-2018

OPER
ATION
ESSO-NCPOR Annual Report 2018-2019
94
IODP Forum and PMO meeting - 2018
The annual IODP Forum meeting 2018 was hosted by IODP India (NCPOR, Goa). During this three-day meeting, scientists from various IODP member countries deliberated upon the progress made so far about their respective activities as well
as forthcoming initiatives. IODP-India (NCPOR) also shared the progress and future plan of IODP-India office at the Forum, emphasising on greater participation of young minds as well as potential outreach. The event was conducted successfully at the Bogmallo Resort, Goa during September 2018.
Figure 108: A glimpse of the PMO meeting 2018
Figure 109: Delegates from IODP member countries during IODP forum and PMO meeting
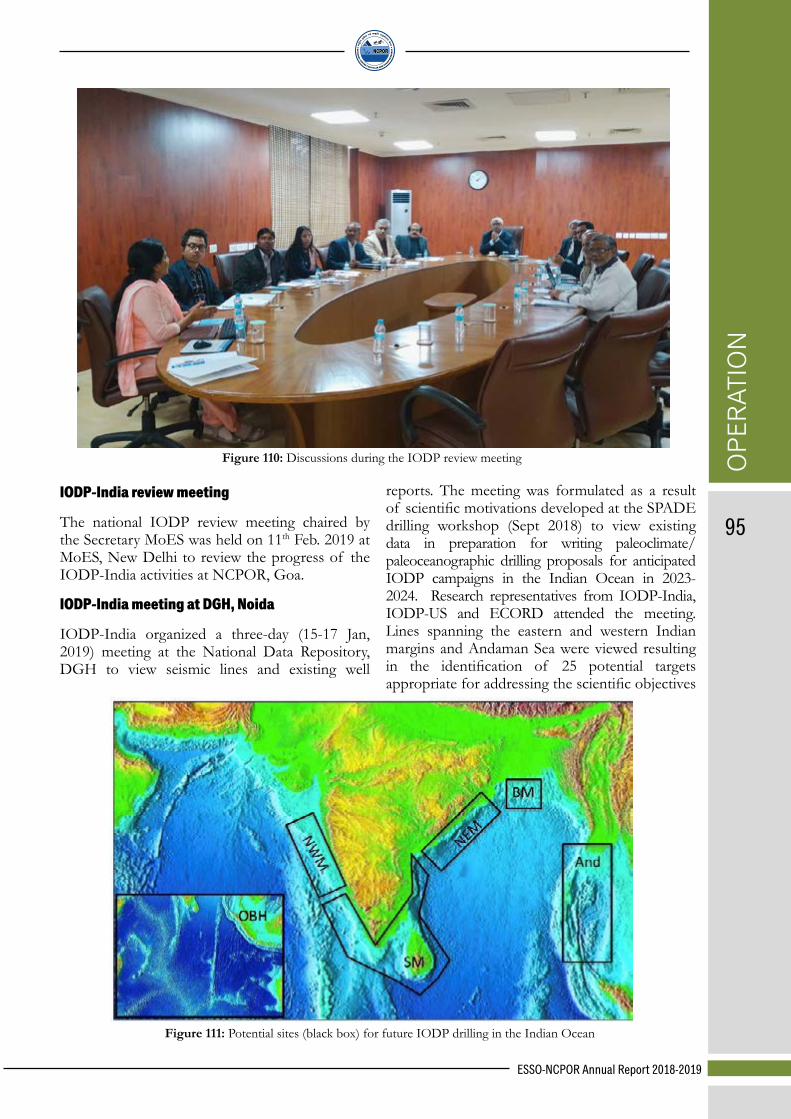
OPE
RAT
ION
ESSO-NCPOR Annual Report 2018-2019
95
IODP-India review meeting
The national IODP review meeting chaired by the Secretary MoES was held on 11th Feb. 2019 at MoES, New Delhi to review the progress of the IODP-India activities at NCPOR, Goa.
IODP-India meeting at DGH, Noida
IODP-India organized a three-day (15-17 Jan, 2019) meeting at the National Data Repository, DGH to view seismic lines and existing well
reports. The meeting was formulated as a result of scientific motivations developed at the SPADE drilling workshop (Sept 2018) to view existing data in preparation for writing paleoclimate/ paleoceanographic drilling proposals for anticipated IODP campaigns in the Indian Ocean in 2023-2024. Research representatives from IODP-India, IODP-US and ECORD attended the meeting. Lines spanning the eastern and western Indian margins and Andaman Sea were viewed resulting in the identification of 25 potential targets appropriate for addressing the scientific objectives
Figure 110: Discussions during the IODP review meeting
Figure 111: Potential sites (black box) for future IODP drilling in the Indian Ocean
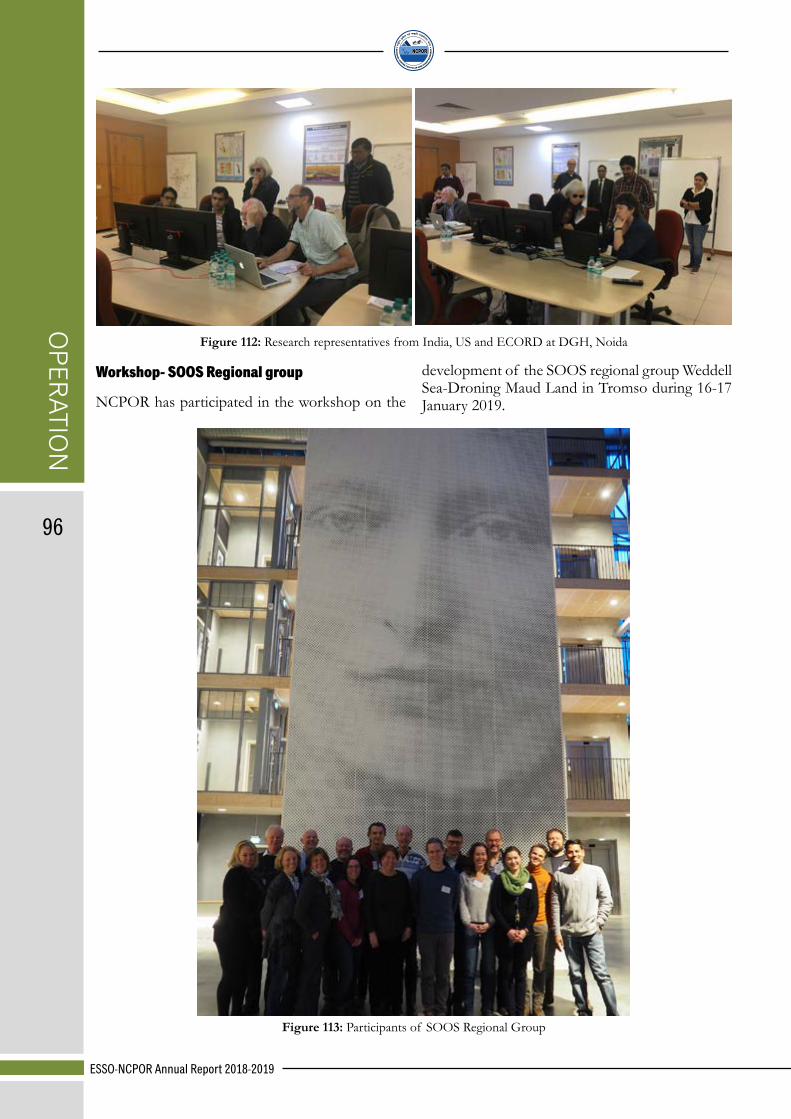
OPER
ATION
ESSO-NCPOR Annual Report 2018-2019
96
Figure 112: Research representatives from India, US and ECORD at DGH, Noida
Workshop- SOOS Regional group
NCPOR has participated in the workshop on the
development of the SOOS regional group Weddell Sea-Droning Maud Land in Tromso during 16-17 January 2019.
Figure 113: Participants of SOOS Regional Group
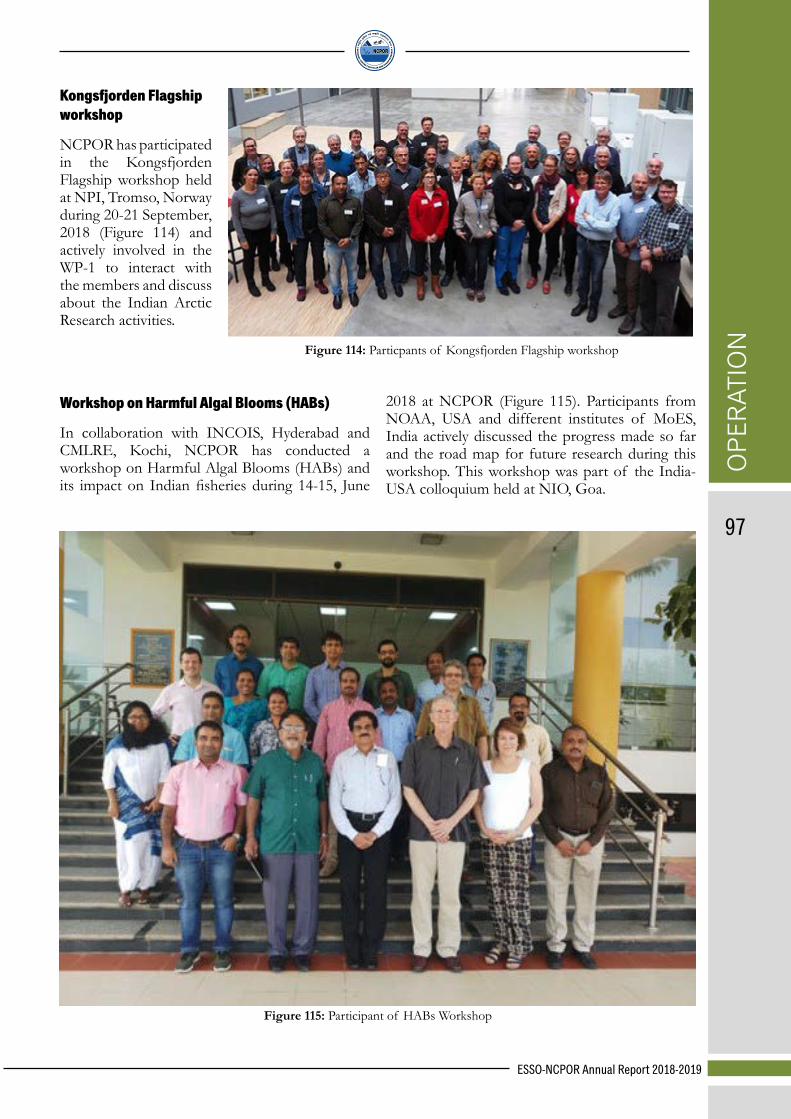
OPE
RAT
ION
ESSO-NCPOR Annual Report 2018-2019
97
Kongsfjorden Flagship workshop
NCPOR has participated in the Kongsfjorden Flagship workshop held at NPI, Tromso, Norway during 20-21 September, 2018 (Figure 114) and actively involved in the WP-1 to interact with the members and discuss about the Indian Arctic Research activities.
Figure 114: Particpants of Kongsfjorden Flagship workshop
Workshop on Harmful Algal Blooms (HABs)
In collaboration with INCOIS, Hyderabad and CMLRE, Kochi, NCPOR has conducted a workshop on Harmful Algal Blooms (HABs) and its impact on Indian fisheries during 14-15, June
2018 at NCPOR (Figure 115). Participants from NOAA, USA and different institutes of MoES, India actively discussed the progress made so far and the road map for future research during this workshop. This workshop was part of the India-USA colloquium held at NIO, Goa.
Figure 115: Participant of HABs Workshop

OPER
ATION
ESSO-NCPOR Annual Report 2018-2019
98
International Seabed Authority Training Programme
Ministry of Earth Sciences, Government of India in accordance with the contract for the exploration for polymetallic sulphides with the International Seabed Authority (ISA) and ISA regulations 29, section 8 of Annexure 4 and in line with the recommendations of the LTC commission contained in the ISBA/19/LTC/14 document, has offered five on-land training places in the field of deep-sea mineral exploration for candidates from developing States from 3rd December 2018-25th January 2019.
The eight-week training was organised by the NCPOR in association with various National Institutes viz. CMLRE, INCOIS, NCESS, NIOT.
The main objective of the training program was to train the scientists/ scholars from developing states/ personal from the Authority so as to be selected by the Legal and Technical Commission ISA, in the field of deep-sea mineral exploration.
Five participants selected by ISA who attended the training program are:
1. Ms. Priscilla Coopen: From Mauritius (3rd December 2018- 25th January 2019)
2. Mr. Abdulqadir Omar Ziyad: From Somalia (17th December 2018- 25th January 2019)
3. Mr. Diogo M Minasi: From Brazil (3rd December 2018- 25th January 2019)
4. Ms. Sadani Achesta Aberyrathna: From Sri Lanka (3rd December 2018- 25th January 2019)
5. Mr. Nicodeme Noel Feuwo: From Cameroon (12th December 2018- 25th January 2019)
Figure 116: Participants of International Seabed Authority Training Programme

OPE
RAT
ION
ESSO-NCPOR Annual Report 2018-2019
99
SCOR-InterRidge workshop on Indian Ocean
A three-day SCOR-Inter Ridge workshop on “Mid Ocean Ridges and other Geological features of the Indian Ocean” was jointly organised by NCPOR and NIO at NIO Goa from 14th-16th November 2018. Dr. John Kurian P. and Dr. Yatheesh Vadakkeyakath were the convenors of the workshop. Total 128 researchers from nine countries participated in the workshop. The workshop was focussed on various geoscientific aspects which are unique to the Indian Ocean.
ATCM, COMNAP and CCAMLR Meetings
Pursuant to Article IX of the Antarctic Treaty, Representatives of the 29 Consultative Parties met in Buenos Aires from 13th May to 18th May 2018, for the purpose of exchanging information, holding consultations and considering and recommending to their Governments measures in furtherance of the principles and objectives of the Treaty. Two information papers on the work carried out during voyage of 38th ISEA were presented during meeting.
The XXX Annual General Meeting of Council of Manager on National Antarctic Programs (COMNAP) was held at Garmisch-Partenkirchen, Germany and in Davos Switzerland in conjunction with Scientific Committee on Antarctica Research (SCAR) from 10th June to 19th June 2018. Delegation from NCPOR represented India in COMNAP.
Commission for Conservation for Antarctic Marine Living Resources (CCAMLR) meeting held in Hobart, Australia from 22 October to 2 November 2018 and was duly represented by Indian delegation.
Figure 117: Participants of SCOR-InterRidge workshop on Indian Ocean
Figure 118: Indian delegates during ATCM, COMNAP and CCAMLR

OPER
ATION
ESSO-NCPOR Annual Report 2018-2019
100
4.9 OFFICIAL LANGUAGE ACTIVITIES AT NCPOR
Rajbhasha Hindi at NCPOR
1. Hindi workshop (28/08/2018):- Hindi workshop was organized at NCPOR on 28/08/2018. Dr. Durgadutt Ozha, Sr. Scientist (Retd.), Ground Water, Organization, Jodhpur, Rajasthan was the Chief Guest.
2. Hindi Saptah: - Hindi Saptah was observed at NCPOR from 01/09/2018 to 07/09/2018. During the week, Quiz, noting writing, dictation writing and letter writing competition were organized for NCPOR staff. In addition competition was also organized for various Central Government Departments situated in South Goa.
4.10 CELEBRATION OF NATIONAL DAYS Independence Day (15th August, 2018) and Republic Day (26th January, 2019) were celebrated at NCPOR with patriotism and national spirit. Director, NCPOR unfurled the tri-color on the national days. About 150 employees and staff of NCPOR attended the functions.
Figure 119: Hindi Saptah celebration at NCPOR
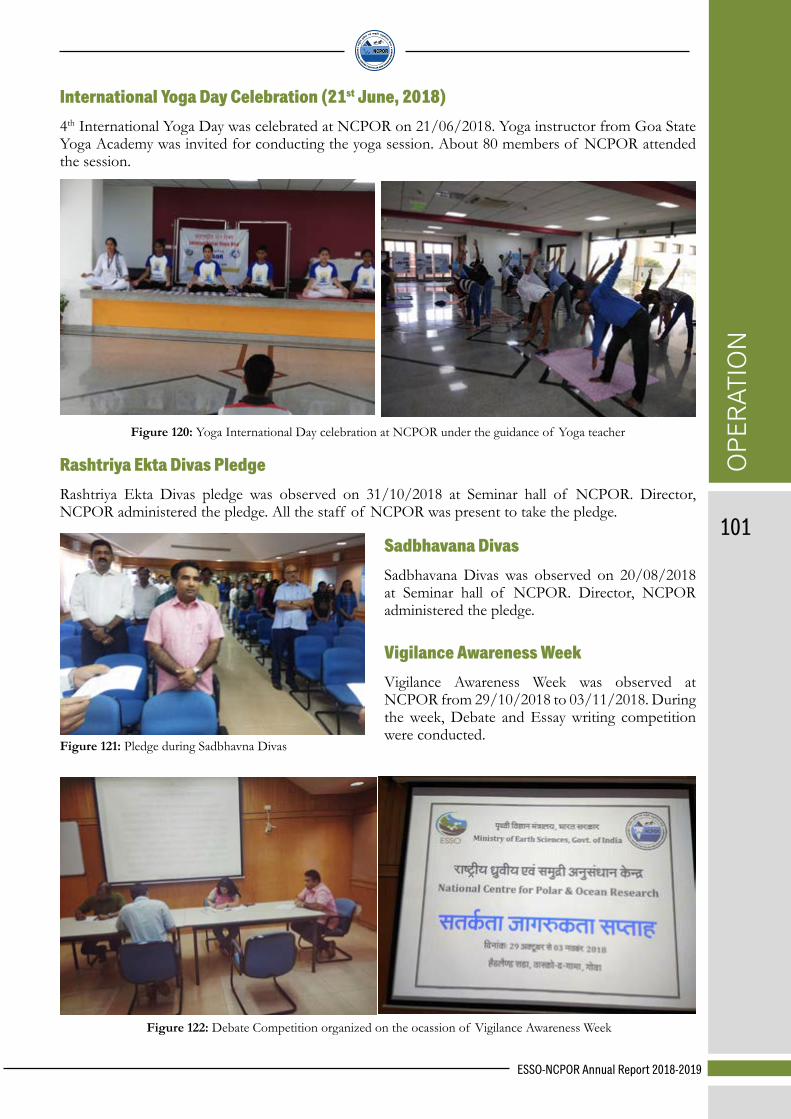
OPE
RAT
ION
ESSO-NCPOR Annual Report 2018-2019
101
International Yoga Day Celebration (21st June, 2018)4th International Yoga Day was celebrated at NCPOR on 21/06/2018. Yoga instructor from Goa State Yoga Academy was invited for conducting the yoga session. About 80 members of NCPOR attended the session.
Figure 120: Yoga International Day celebration at NCPOR under the guidance of Yoga teacher
Rashtriya Ekta Divas PledgeRashtriya Ekta Divas pledge was observed on 31/10/2018 at Seminar hall of NCPOR. Director, NCPOR administered the pledge. All the staff of NCPOR was present to take the pledge.
Sadbhavana DivasSadbhavana Divas was observed on 20/08/2018 at Seminar hall of NCPOR. Director, NCPOR administered the pledge.
Vigilance Awareness WeekVigilance Awareness Week was observed at NCPOR from 29/10/2018 to 03/11/2018. During the week, Debate and Essay writing competition were conducted.
Figure 121: Pledge during Sadbhavna Divas
Figure 122: Debate Competition organized on the ocassion of Vigilance Awareness Week
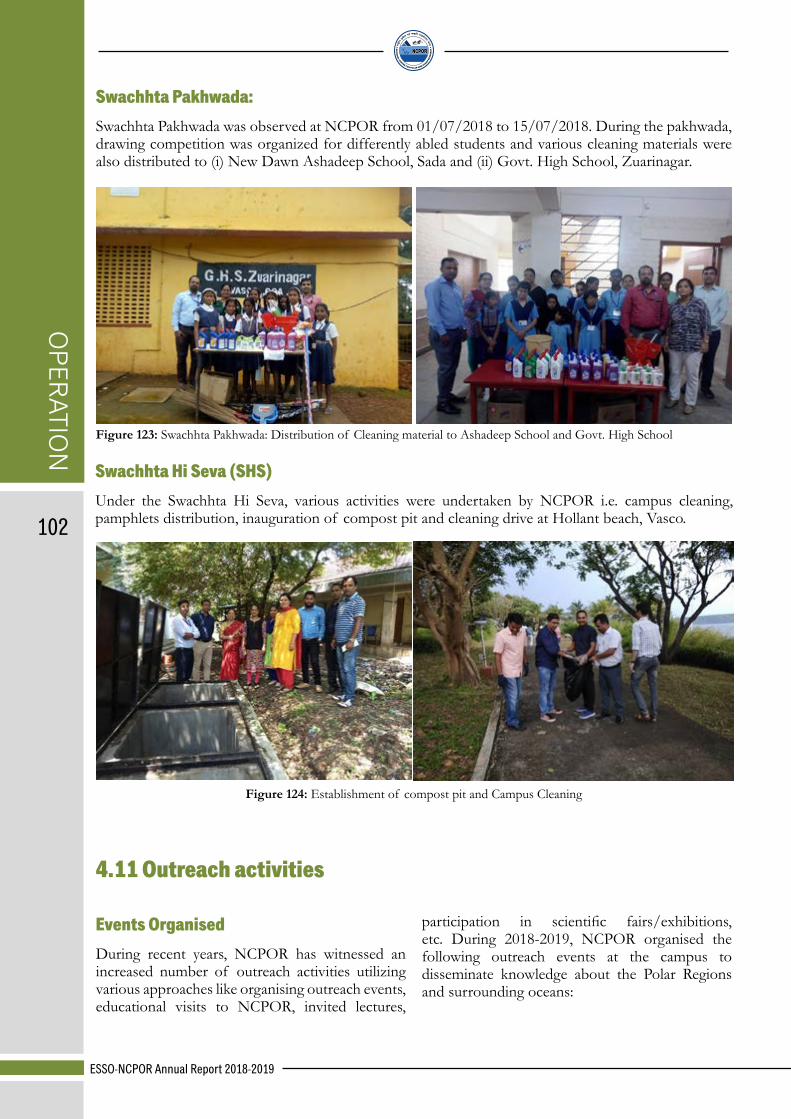
OPER
ATION
ESSO-NCPOR Annual Report 2018-2019
102
Swachhta Pakhwada:Swachhta Pakhwada was observed at NCPOR from 01/07/2018 to 15/07/2018. During the pakhwada, drawing competition was organized for differently abled students and various cleaning materials were also distributed to (i) New Dawn Ashadeep School, Sada and (ii) Govt. High School, Zuarinagar.
Figure 123: Swachhta Pakhwada: Distribution of Cleaning material to Ashadeep School and Govt. High School
Swachhta Hi Seva (SHS)Under the Swachhta Hi Seva, various activities were undertaken by NCPOR i.e. campus cleaning, pamphlets distribution, inauguration of compost pit and cleaning drive at Hollant beach, Vasco.
Figure 124: Establishment of compost pit and Campus Cleaning
4.11 Outreach activities
Events OrganisedDuring recent years, NCPOR has witnessed an increased number of outreach activities utilizing various approaches like organising outreach events, educational visits to NCPOR, invited lectures,
participation in scientific fairs/exhibitions, etc. During 2018-2019, NCPOR organised the following outreach events at the campus to disseminate knowledge about the Polar Regions and surrounding oceans:

OPE
RAT
ION
ESSO-NCPOR Annual Report 2018-2019
103
1. NCPOR Foundation Day celebration
NCPOR celebrated its foundation Day on 5th April, 2018 at its campus. The chief guest, Dr. Somak Raychoudhary from Inter-University Centre for Astronomy and Astrophysics (IUCAA), Pune delivered an interesting talk entitled ‘Indian Astronomy in the 21st Century’. On this occasion, Dr. Manish Tiwari received the best research contribution award for the year 2017.
2. Outreach Workshop
Three day workshop on “The Art and Craft of Science Media Outreach” by Peter Spinks, an acclaimed communicator and broadcaster from Australia from 12th, 13th and 16th April, 2018 was organized at NCPOR. About 24 participants from NCPOR and Goa university have participated. Besides lectures, interactive sessions and interview session was conducted. It was a first of its kind for a small state like Goa.
3. IISF Outreach Program at NCPOR
Seminar for school and college students was organised on 7th September, 2018 as a part of an outreach programme under the aegis of India International Science Festival (IISF) -2018. A total of 205 students from 08 schools and colleges participated in the event. Interaction with polar scientists through popular science lectures, live interaction with scientists at Himadri- Indian Research Base in Arctic and Essay Competition (school and college level) were main highlights of the programme. Chief Guest, Shri. Suhas Godse, President, Vidnyan Parishad, Goa and Dr. M. Ravichandran, Director, NCPOR distributed cash prizes to the winners of Essay Competition. The winners of essay competition under the theme: Climate Change- Problems and Solutions included.
4. Indo-Norwegian Meeting
Two day Indo-Norwegian meeting to share experiences and explore upcoming opportunities for the Indo-European polar science collaboration, H2020 call on Arctic was
IISF winners of Essay CompetitionTheme: Climate Change- Problems and Solutions
Category A: School Level
1st Prize- Nandita Madhu (Navy Children School)2nd prize- Nayden D’Silva (Loyala Higher Secondary School)3rd prize- Anand Kumar Madar (Anjuman Himayatul Islam High School)
Category B: College Level
1st Prize- Rakshanda Naik (Dhempe College of Arts & Science)2nd prize- Kavya Pillai (Carmel College)3rd prize- Sakshi P Navelkar (Dhempe College of Arts & Science)
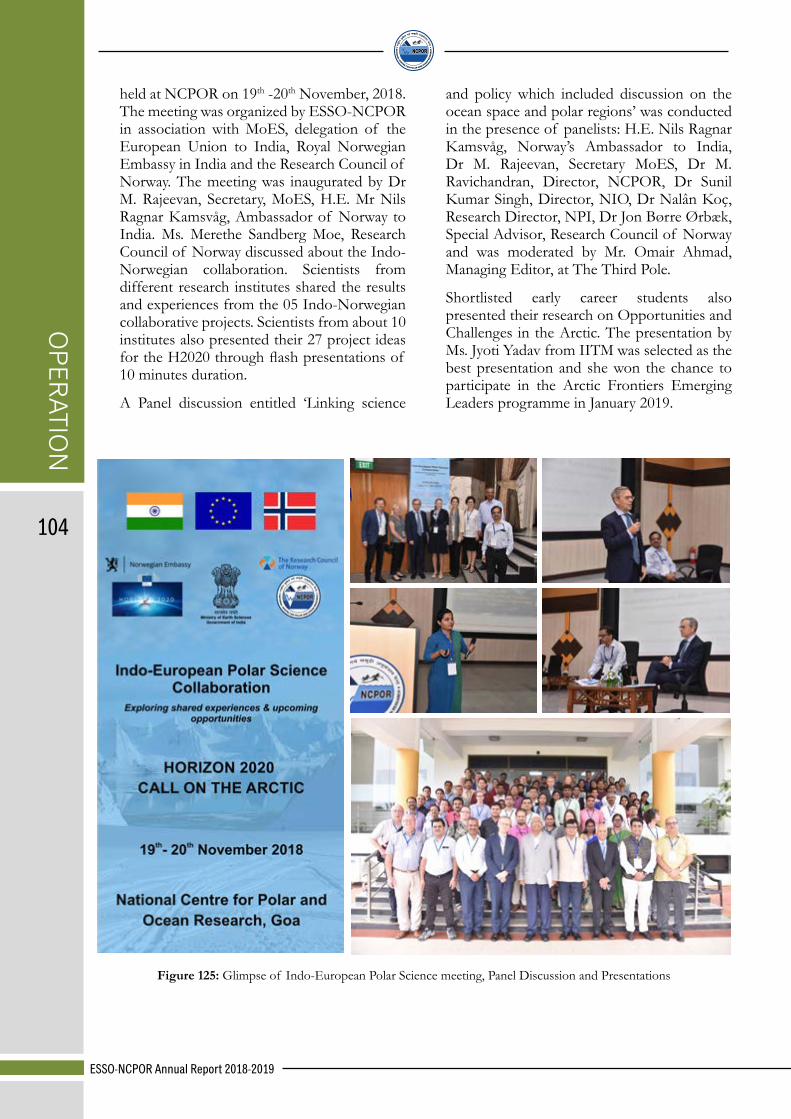
OPER
ATION
ESSO-NCPOR Annual Report 2018-2019
104
held at NCPOR on 19th -20th November, 2018. The meeting was organized by ESSO-NCPOR in association with MoES, delegation of the European Union to India, Royal Norwegian Embassy in India and the Research Council of Norway. The meeting was inaugurated by Dr M. Rajeevan, Secretary, MoES, H.E. Mr Nils Ragnar Kamsvåg, Ambassador of Norway to India. Ms. Merethe Sandberg Moe, Research Council of Norway discussed about the Indo-Norwegian collaboration. Scientists from different research institutes shared the results and experiences from the 05 Indo-Norwegian collaborative projects. Scientists from about 10 institutes also presented their 27 project ideas for the H2020 through flash presentations of 10 minutes duration.
A Panel discussion entitled ‘Linking science
and policy which included discussion on the ocean space and polar regions’ was conducted in the presence of panelists: H.E. Nils Ragnar Kamsvåg, Norway’s Ambassador to India, Dr M. Rajeevan, Secretary MoES, Dr M. Ravichandran, Director, NCPOR, Dr Sunil Kumar Singh, Director, NIO, Dr Nalân Koç, Research Director, NPI, Dr Jon Børre Ørbæk, Special Advisor, Research Council of Norway and was moderated by Mr. Omair Ahmad, Managing Editor, at The Third Pole.
Shortlisted early career students also presented their research on Opportunities and Challenges in the Arctic. The presentation by Ms. Jyoti Yadav from IITM was selected as the best presentation and she won the chance to participate in the Arctic Frontiers Emerging Leaders programme in January 2019.
Figure 125: Glimpse of Indo-European Polar Science meeting, Panel Discussion and Presentations
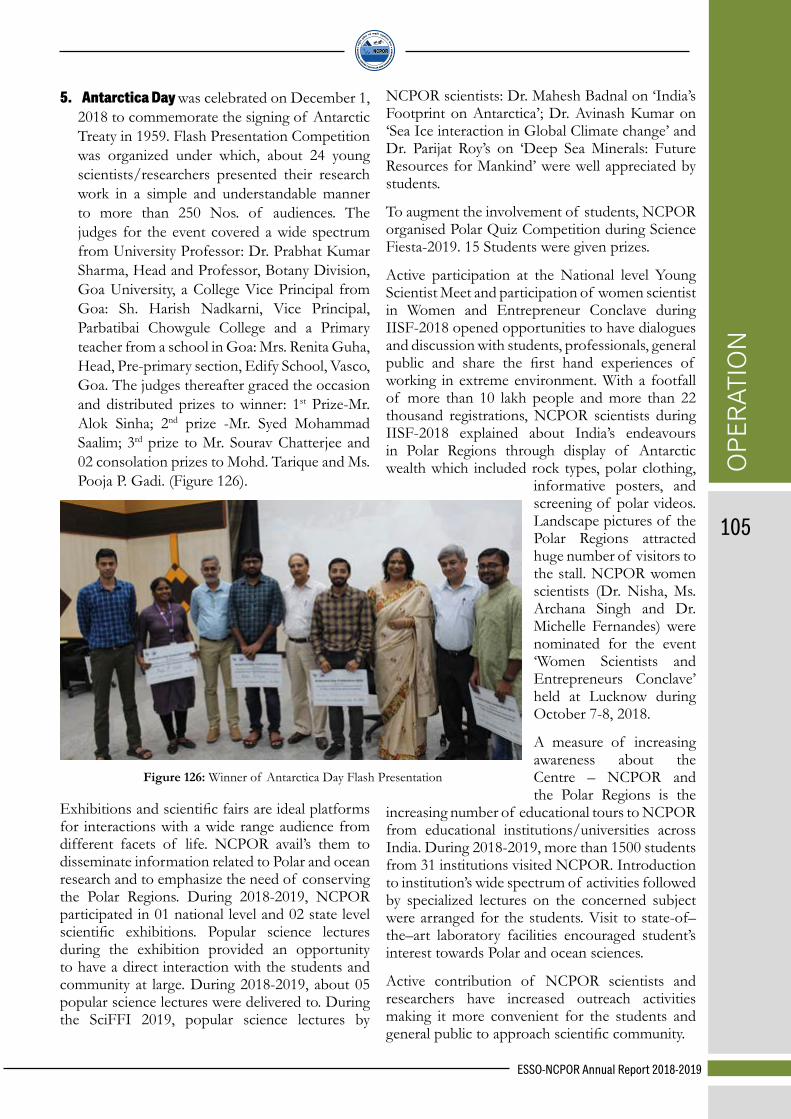
OPE
RAT
ION
ESSO-NCPOR Annual Report 2018-2019
105
5. Antarctica Day was celebrated on December 1, 2018 to commemorate the signing of Antarctic Treaty in 1959. Flash Presentation Competition was organized under which, about 24 young scientists/researchers presented their research work in a simple and understandable manner to more than 250 Nos. of audiences. The judges for the event covered a wide spectrum from University Professor: Dr. Prabhat Kumar Sharma, Head and Professor, Botany Division, Goa University, a College Vice Principal from Goa: Sh. Harish Nadkarni, Vice Principal, Parbatibai Chowgule College and a Primary teacher from a school in Goa: Mrs. Renita Guha, Head, Pre-primary section, Edify School, Vasco, Goa. The judges thereafter graced the occasion and distributed prizes to winner: 1st Prize-Mr. Alok Sinha; 2nd prize -Mr. Syed Mohammad Saalim; 3rd prize to Mr. Sourav Chatterjee and 02 consolation prizes to Mohd. Tarique and Ms. Pooja P. Gadi. (Figure 126).
Exhibitions and scientific fairs are ideal platforms for interactions with a wide range audience from different facets of life. NCPOR avail’s them to disseminate information related to Polar and ocean research and to emphasize the need of conserving the Polar Regions. During 2018-2019, NCPOR participated in 01 national level and 02 state level scientific exhibitions. Popular science lectures during the exhibition provided an opportunity to have a direct interaction with the students and community at large. During 2018-2019, about 05 popular science lectures were delivered to. During the SciFFI 2019, popular science lectures by
NCPOR scientists: Dr. Mahesh Badnal on ‘India’s Footprint on Antarctica’; Dr. Avinash Kumar on ‘Sea Ice interaction in Global Climate change’ and Dr. Parijat Roy’s on ‘Deep Sea Minerals: Future Resources for Mankind’ were well appreciated by students.
To augment the involvement of students, NCPOR organised Polar Quiz Competition during Science Fiesta-2019. 15 Students were given prizes.
Active participation at the National level Young Scientist Meet and participation of women scientist in Women and Entrepreneur Conclave during IISF-2018 opened opportunities to have dialogues and discussion with students, professionals, general public and share the first hand experiences of working in extreme environment. With a footfall of more than 10 lakh people and more than 22 thousand registrations, NCPOR scientists during IISF-2018 explained about India’s endeavours in Polar Regions through display of Antarctic wealth which included rock types, polar clothing,
informative posters, and screening of polar videos. Landscape pictures of the Polar Regions attracted huge number of visitors to the stall. NCPOR women scientists (Dr. Nisha, Ms. Archana Singh and Dr. Michelle Fernandes) were nominated for the event ‘Women Scientists and Entrepreneurs Conclave’ held at Lucknow during October 7-8, 2018.
A measure of increasing awareness about the Centre – NCPOR and the Polar Regions is the
increasing number of educational tours to NCPOR from educational institutions/universities across India. During 2018-2019, more than 1500 students from 31 institutions visited NCPOR. Introduction to institution’s wide spectrum of activities followed by specialized lectures on the concerned subject were arranged for the students. Visit to state-of–the–art laboratory facilities encouraged student’s interest towards Polar and ocean sciences.
Active contribution of NCPOR scientists and researchers have increased outreach activities making it more convenient for the students and general public to approach scientific community.
Figure 126: Winner of Antarctica Day Flash Presentation
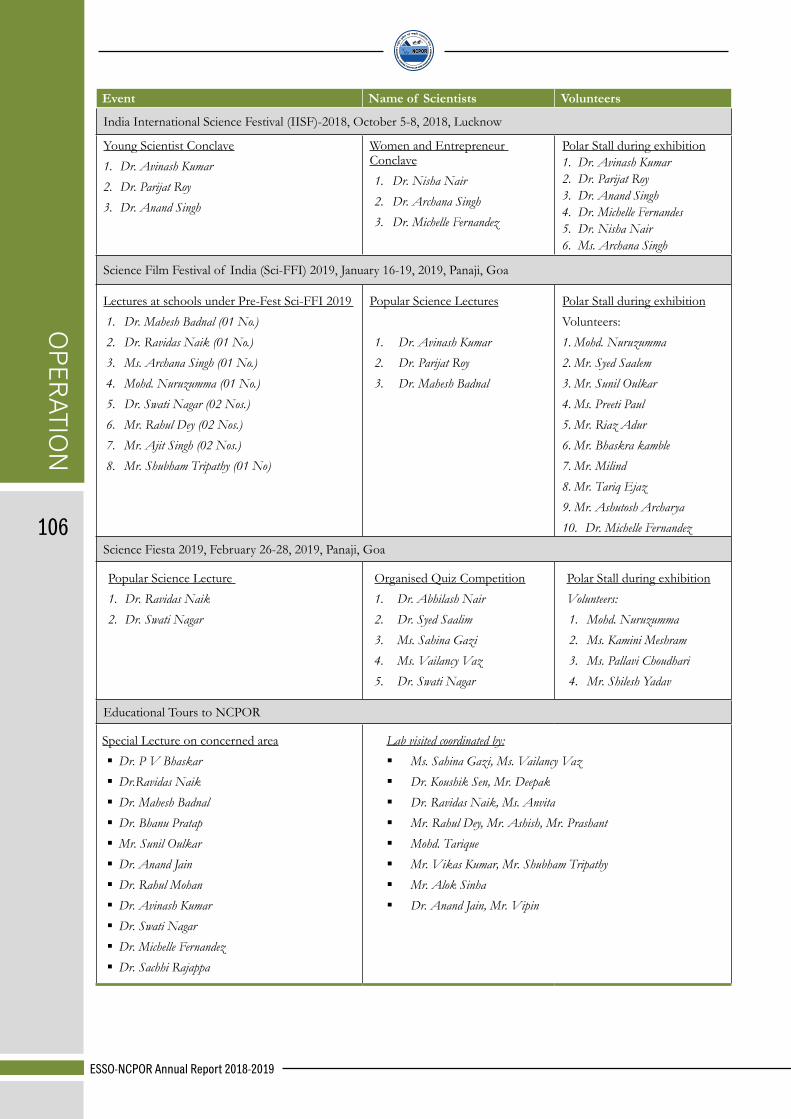
OPER
ATION
ESSO-NCPOR Annual Report 2018-2019
106
Event Name of Scientists Volunteers
India International Science Festival (IISF)-2018, October 5-8, 2018, Lucknow
Young Scientist Conclave1. Dr. Avinash Kumar2. Dr. Parijat Roy 3. Dr. Anand Singh
Women and Entrepreneur Conclave1. Dr. Nisha Nair2. Dr. Archana Singh 3. Dr. Michelle Fernandez
Polar Stall during exhibition1. Dr. Avinash Kumar2. Dr. Parijat Roy3. Dr. Anand Singh4. Dr. Michelle Fernandes5. Dr. Nisha Nair6. Ms. Archana Singh
Science Film Festival of India (Sci-FFI) 2019, January 16-19, 2019, Panaji, Goa
Lectures at schools under Pre-Fest Sci-FFI 2019 1. Dr. Mahesh Badnal (01 No.)2. Dr. Ravidas Naik (01 No.)3. Ms. Archana Singh (01 No.)4. Mohd. Nuruzumma (01 No.)5. Dr. Swati Nagar (02 Nos.)6. Mr. Rahul Dey (02 Nos.)7. Mr. Ajit Singh (02 Nos.)8. Mr. Shubham Tripathy (01 No)
Popular Science Lectures
1. Dr. Avinash Kumar2. Dr. Parijat Roy3. Dr. Mahesh Badnal
Polar Stall during exhibitionVolunteers:1. Mohd. Nuruzumma 2. Mr. Syed Saalem3. Mr. Sunil Oulkar4. Ms. Preeti Paul5. Mr. Riaz Adur6. Mr. Bhaskra kamble7. Mr. Milind8. Mr. Tariq Ejaz9. Mr. Ashutosh Archarya10. Dr. Michelle Fernandez
Science Fiesta 2019, February 26-28, 2019, Panaji, Goa
Popular Science Lecture 1. Dr. Ravidas Naik2. Dr. Swati Nagar
Organised Quiz Competition1. Dr. Abhilash Nair2. Dr. Syed Saalim3. Ms. Sahina Gazi4. Ms. Vailancy Vaz5. Dr. Swati Nagar
Polar Stall during exhibitionVolunteers:1. Mohd. Nuruzumma 2. Ms. Kamini Meshram3. Ms. Pallavi Choudhari4. Mr. Shilesh Yadav
Educational Tours to NCPOR
Special Lecture on concerned areaDr. P V Bhaskar Dr.Ravidas NaikDr. Mahesh BadnalDr. Bhanu PratapMr. Sunil OulkarDr. Anand JainDr. Rahul MohanDr. Avinash KumarDr. Swati NagarDr. Michelle FernandezDr. Sachhi Rajappa
Lab visited coordinated by: Ms. Sahina Gazi, Ms. Vailancy Vaz Dr. Koushik Sen, Mr. Deepak Dr. Ravidas Naik, Ms. Anvita Mr. Rahul Dey, Mr. Ashish, Mr. Prashant Mohd. Tarique Mr. Vikas Kumar, Mr. Shubham Tripathy Mr. Alok Sinha Dr. Anand Jain, Mr. Vipin

OPE
RAT
ION
ESSO-NCPOR Annual Report 2018-2019
107
6.Induction Programme for Dissertation/ internship students at NCPOR
Every year, NCPOR takes in many graduates and post graduate students for their dissertation and internship. To enhance awareness about the India’s presence and scientific endeavours in Polar and oceanic realms, NCPOR organises Induction programme, twice a year for winter and summer dissertation/ internship students. During 2018-2019, 88 students from 31 academic institutions from 15 states joined NCPOR for dissertation/internship (Figure 128) LRCSC in coordination with outreach team conducted
Introductory Programme for Winter Students with the help of NCPOR Outreach Team on 8th February 2019.
7. IODP outreach program:
IODP-India participated in an outreach program at the 2018 Association of Exploration Geophysicists, India meeting held at Indian Institute of Technology, Mumbai during Oct 31-Nov 3, 2018. Young minds from various schools as well as young scientists benefitted from interactions with NCPOR scientists, Dr Sanjay Singh Negi and Mr Rajeev Yadav at the booth during this workshop.
Figure 127: Map showing location of students visited NCPOR as a part of educational tour / dissertation
Figure 128: Student interactions during AEG 2018 at IIT Mumbai

OPER
ATION
ESSO-NCPOR Annual Report 2018-2019
108
8. World Ocean Day, 2018: School students visit onboard NOAA`s Research Vessel Ronald H Brown.
On the occasion of World Ocean Day (08.06.2018), a visit was organised by Vessel Operations and Management division, NCPOR in association with National Oceanic and
Atmospheric Administration (NOAA) for the school students of Goa. Around 100 students from different schools of Goa were participated in the event. During the visits, students were acquainted with the advance research facilities available onboard to understand and explore the ocean. Scientists onboard the vessel arranged informative sessions for the students.
4.12 DEPUTATION ABROADDeputation details of NCPOR officials during 2018-2019
Sr. Name of the Official Designation Period of
DeputationPlace of
Deputation Deputation Purpose
1. Dr. Shramik Patil DST Inspire Faculty
04.05.2018 to
15.09.2018
Roscoff, France SCAR fellowship.
2. Dr. M. Ravichandran Director13.05.2018
to 19.05.2018
Buenos, Argentina
To attend the Antarctic Treaty Consultative Meeting (ATCM)
3. Dr. Prince Prakash Scientsit ‘E’21.05.2018
to 25.05.2018
Nanjing, China
To attend International Summer School on the Polar Polar Climate System.
4. Dr. K.P. Krishnan Scientist ‘E’22.05.2018
to 23.05.2018
Copengagen, Denmark
To participate in Senior Arctic Officials (SAO) meeting.
5. Dr. Anoop Kumar Tiwari Scientist ‘E’
10.06.18 to
19.06.2018
Garmisch, Germany
To attend XXX COMNAP Annual General Meeting.
6. Dr. M. Ravichandran Director15.06.2018
to 26.06.2018
Davos, Switzerland
To participate in the Arctic Science Summit Week 2018.
7. Dr. Shridhar D. Jawak Project Scientist ‘B’
15.06.2018 to
26.06.2018
Davos, Switzerland
To attend POLAR 2018 conference.
8. Mr. Vikram Goel Project Scientist ‘B’
15.06.2018 to
23.06.2018
Davos, Switzerland
To attend POLAR 2018 conference.
9. Dr. Thamban Meloth Scientist ‘F’16.06.2018
to 23.06.2018
Davos, Switzerland
To attend POLAR 2018 conference.
10. Dr. Rahul Mohan Scientist ‘E’16.06.2018
to 23.06.2018
Davos, Switzerland
To attend POLAR 2018 conference.
11. Dr. K.P. Krishnan Scientist ‘E’16.06.2018
to 23.06.2018
Davos, Switzerland
To attend POLAR 2018 conferences.
12. Dr. Alvarinho J. Luis Scientist ‘E’18.06.2018
to 23.06.2018
Davos, Switzerland
To attend POLAR 2018 conference.

OPE
RAT
ION
ESSO-NCPOR Annual Report 2018-2019
109
Sr. Name of the Official Designation Period of
DeputationPlace of
Deputation Deputation Purpose
13. Dr. Manish Tiwari Scientist ‘E’18.06.2018
to 23.06.2018
Davos, Switzerland
To attend POLAR 2018 conference.
14. Dr. Laluraj C.M. Scientist ‘E’18.06.2018
to 23.06.2018
Davos, Switzerland
To attend POLAR 2018 conference.
15. Dr. P.V. Bhaskar Scientist ‘D’ 18.06.2018
to 23.06.2018
Davos, Switzerland
To attend POLAR 2018 conference.
16. Dr. Avinash Kumar Scientist ‘D’18.06.2018
to 23.06.2018
Davos, Switzerland
To attend POLAR 2018 conference.
17. Dr. Divya David T. Scientist ‘C’18.06.2018
to 23.06.2018
Davos, Switzerland
To attend POLAR 2018 conference.
18. Dr. Rupesh Kumar Sinha
Project Scientist ‘B’
18.06.2018 to
23.06.2018
Davos, Switzerland
To attend POLAR 2018 conference.
19. Ms. Gautami Samui Research Fellow18.06.2018
to 23.06.2018
Davos, Switzerland
To attend POLAR 2018 conference.
20. Mr. MohammadNuruzzama Research Fellow
18.06.2018 to
23.06.2018
Davos, Switzerland
To attend POLAR 2018 conference.
21. Dr. Surya PrakashLankalappali
Project Scientist ‘C’
18.06.2018 to
17.07.2018Seattle, USA To University of Washington
under InterRidge Fellowship 2017.
22. Ms. Archana Singh Scientist ‘B’19.06.2018
to 23.06.2018
Davos, Switzerland
To attend POLAR 2018 conference.
23. Dr. DhananjaiKumar Pandey Scientist ‘F’
26.06.2018 to
28.06.2018
Postdam, Germany
To participate in the IODP Science Evaluation Panel (SEP) meeting.
24. Dr. John Kurian P. Scientist ‘E’20.06.2018
to 22.06.2018
Bergen, Norway
To attend the Steering Committee Meeting on InterRidge.
25. Dr. Parijat Roy Scientist ‘D’27.06.2018
to 29.06.2018
Szczecin, Poland
To participate in Workshop on “Development of a Framework for Regional Environmental (REMPs)
26. Dr. Nuncio Murukesh Scientist ‘C’18.07.2018
to 20.07.2018
Shanghai, China
To attend 5 day workshop on Indian Ocean Workshop, Promotion of friendship & collatoration.
27. Ms. Lathika N. Scientist ‘C’23.07.2018
to 26.07.2018
Livingstone, Zambia
To attend the IODP Science Post Cruise meeting - expedition 361.

OPER
ATION
ESSO-NCPOR Annual Report 2018-2019
110
Sr. Name of the Official Designation Period of
DeputationPlace of
Deputation Deputation Purpose
28. Dr. Anand Kumar Singh Scientist ‘C’
26.07.2018 to
27.07.2018
Brasilia, Brazil
To ateend 2nd Meeting of the BRICS Working Goup on Ocean and Polar Sciences.
29. Sh. Mirza Javed Beg Scientist ‘G’27.08.2018
to 29.08.2018
Virginia, USA
To attend Executive Committee (EXCOM) Meeting of COMNAP.
30. Dr. Bhanu Pratap Project Scientist ‘C’
27.08.2018 to
28.09.2018NPI, Norway
To undertake collaborative radar data analysis under the MADICE project.
31. Mr. HarikrishnaGuruvayoorappan Research Fellow
01.09.2018 to
30.06.2019
Tromso, Norway Research visit at NPI.
32. Dr. Manish Tiwari Scientist ‘E’17.09.2018
to 19.09.2018
Tromso, Norway To attend 2nd PACT Meeting.
33. Dr. Waliur Rahaman Scientist ‘D’17.09.2018
to 19.09.2018
Tromso, Norway To attend 2nd PACT Meeting.
34. Ms. Padmasini Behera Research Fellow17.09.2018
to 19.09.2018
Tromso, Norway To attend 2nd PACT Meeting.
35. Dr. Sarat Chandra Tripathy Scientist ‘E’
20.09.2018 to
21.09.2018
Tromso, Norway
To participate in the Ny-Alesund Kongsfjorden Flagship Meeting.
36. Dr. Vinay Kumar Gaddam
Project Scientist ‘B’
17.09.2018 to
18.09.2018
Kathmandu, Nepal
To attend regional conference on Cryosphere, Clacier Melting and Mountain Economy.
37. Dr. Rahul Mohan Scientist ‘E’10.10.2018
to 12.10.2018
Xiamen, China
To attend Asian Forum for Polar Science (AFoPS) Annual General Meeting.
38. Dr. K.P. Krishnan Scientist ‘E’10.10.2018
to 12.10.2018
Xiamen, China
To attend Asian Forum for Polar Science (AFoPS) Annual General Meeting.
39. Dr. John Kurian P. Scientist ‘E’15.10.2018
to 16.10.2018
Warsaw, Poland
To attend the Meeting of contractors of International Seabed Authority.
40. Mr. Ningthoujam Lachit Singh Scientist ‘B’
22.10.2018 to
24.10.2018
Edinburgh, UK
To attend training program at PETEX Limited, Edinburgh, UK
41. Ms. Nisha Nair Scientist ‘B’22.10.2018
to 24.10.2018
Edinburgh, UK
To attend training program at PETEX Limited, Edinburgh, UK
42. Dr. K.P. Krishnan Scientist ‘E’ 25.10.2018 Berlin, Germany
To attend 2nd Arctic Science Ministerial (ASM) Meeting.
43. Dr. Nuncio Murukesh Scientist ‘C’ 25.10.2018 Berlin, Germany
To attend 2nd Arctic Science Ministerial (ASM) Meeting.

OPE
RAT
ION
ESSO-NCPOR Annual Report 2018-2019
111
Sr. Name of the Official Designation Period of
DeputationPlace of
Deputation Deputation Purpose
44. Ms. Archana Singh Scientist ‘B’ 06.11.2018
to 08.11.2018
Reykjavik, Iceland
To attend the Arctic Contaminants Actions Program (ACAP) Working Group Meeting.
45. Dr. Sabu Prabhakaran Scientist ‘D’16.01.2019
to 17.01.2019
Tromso, Norway
To attend the working group meeting on the development of the SOOS regional group.
46. Dr. Anoop Kumar Tiwari Scientist ‘E’
22.10.2018 to
02.11.2018
Hobart, Australia To attend CCAMLR meeting
PUB
LICATIO
NS
ESSO-NCPOR Annual Report 2018-2019
112
PC @ Mr. Rakesh Rao

PUB
LIC
ATIO
NS
ESSO-NCPOR Annual Report 2018-2019
113
5.0 PUBLICATIONS
PC @ Mr. Rakesh Rao
PUB
LICATIO
NS
ESSO-NCPOR Annual Report 2018-2019
114
LIST OF NCPOR PUBLICATIONS FROM 1ST APRIL 2018 TO 31ST MARCH 2019Peer Reviewed Journals
1. Alikunju, A. P., Joy, S., Salam, J. A., Silvester, R., Antony, A. C., Rahiman, K. M. M., Krishnan, K.P. and Hatha, A. A. M. (2018). Functional characterization of a new cold-adapted β-galactosidase from an Arctic Fjord sediment bacteria Enterobacter ludwigii MCC3423. Catalysis Letters, 148(10), 3223–3235.
2. Antony, R., Willoughby, A.S., Grannas, A.M., Catanzano, V., Sleighter, R.L., Thamban, M. and Hatcher, P.G. (2018). Photo-biochemical transformation of dissolved organic matter on the surface of the coastal East Antarctic ice sheet. Biogeochemistry, 141(2), 229–247.
3. Ashok, A., Doriya, K., Rao, J., Qureshi A., Tiwari, A. K. and Kumar, D. S. (2018) Microbes Producing L-Asparaginase free of Glutaminase and Urease isolated from Extreme Locations of Antarctic Soil and Moss. Scientific reports, https://doi.org/10.1038/s41598-018-38094-1
4. Bandekar, M., Ramaiah, N., Jain, A. and Meena, R. M. (2018). Seasonal and depth-wise variations in bacterial and archaeal groups in the Arabian Sea oxygen minimum zone. Deep Sea Research Part-II, 156, 4-18.
5. Bharathi, M.D., Sarma, V. V. S. S., Ramaneswari, K. and Venkataramana, V. (2018). Influence of river discharge on abundance and composition of phytoplankton in the western coastal Bay of Bengal during peak discharge period. Marine Pollution Bulletin, 133, 671-683.
6. Bijesh, C.M., Kurian, J. P., Yatheesh, V., Tyagi, A. and Twinkle, D. (2018). Morphotectonic characteristics, distribution and formation of bathymetric highs off southwest coast of India. Geomorphology, 315, 33-44.
7. Bosta, S. M. and Basavaiah, K. (2019). Removal of Nitrophenols from wastewater by monoclinic CuO/RGO nanocomposite. Nanotechnology for Environmental Engineering, 4: 1. https://doi.org/10.1007/s41204-018-0045-z.
8. Botsa, S. M., Subba rao P. S. and Chug, S., (2019). Visible Light Enhanced Photocatalytic degradation of 2, 4-Dinitrophenol Using Reduced Graphene Oxide Based Zinc Oxide Nanocomposite Via Hydrothermal Process, Journal of Nanotechnology and Materials Science, 6(1), 04-09.
9. Chatterjee, S., Raj, R. P., Bertino, L., Skagseth, O., Ravichandran, M. and Johannessen, O. M. (2018). Role of Greenland Sea gyre circulation on AW temperature variability in the Fram Strait. Geophysical Research Letters, 45(16), 8399-8406.
10. Chaudhuri, D., Sengupta, D., D’Asaro, E., Venkatesan, R. and Ravichandran, M. (2019). Response of the salinity-stratified Bay of Bengal to cyclone Phailin. Journal of Physical Oceanography, https://doi.org/10.1175/JPO-D-18-0051.1
11. Choudhary, S., Nayak, G. N., Tiwari, A. K. and Khare, N. (2018). Sediment composition and its effect on the productivity in Larsemann Hills, East Antarctica. Arabian Journal of Geosciences (AJGS), https://doi.org/10.1007/s12517-018-3755-4
12. Choudhary, S., Nayak, G. N., Tiwari, A. K. and Khare, N. (2018). Source, processes and productivity from distribution of surface sediments, Prydz Bay, East Antarctica. Polar Science, 18, 63-71.
13. D’Costa, P. M. and Naik, R. K. (2018). Advances in sampling strategies and analysis of phytoplankton. In: Meena, S. N. and Naik, M. M. (eds.). Advances in Biological Science Research, Elsevier, chapter 31, 501-516.
14. Dailey, S. K., Clift, P. D., Kulhanek, D. K., Blusztajn, J., Routledge, C. M., Calvès, G., O’Sullivan, P., Jonell, T. N., Pandey, D. K., Andò, S., Coletti, G., Zhou, P., Li, Y., Neubeck, N. E., Bendle, J.
PUB
LIC
ATIO
NS
ESSO-NCPOR Annual Report 2018-2019
115
A.P., Aharonovich, S., Griffith, E. M., Gurumurthy, G. P., Hahn, A., Iwai, M., Khim, B., Kumar, A., Kumar, A. G., Liddy, H. M., Lu, H., Lyle, M. W., Mishra, R., Radhakrishna, T., Saraswat, R., Saxena, R., Scardia, G., Sharma, G. K., Singh, A. D., Steinke, S. Suzuki, K., Tauxe, L., Tiwari, M., Xu, Z., Yu, Z. (2019). Large-scale Mass Wasting on the Miocene Continental Margin of Western India. Geological Society of America Bulletin, https://doi.org/10.1130/B35158.1.
15. Das, M., Singh, R. K., Vats, N., Holbourn, A., Mishra, S., Farooq, S.H. and Pandey, D.K. (2018). Changes in the distribution of Uvigerinidae species over the past 775 kyr: Implications for the paleoceanographic evolution of the Japan Sea. Palaeogeography, Palaeoclimatology, Palaeoecology, 507, 201-213.
16. Diniz, J. E., Nayak, G. N., Noronha-D’Mello, C. A. and Mishra, R. (2018). Reconstruction of palaeo-depositional environment in North-Eastern Arabian Sea. Environmental Earth Sciences, 77: 665, https://doi.org/10.1007/s12665-018-7838-z.
17. Everett, A., Kohler, J., Sundfjord, A., Kovacs, K. M., Torsvik, T., Pramanik, A., Boehme, L. and Lydersen, C. (2018). Subglacial discharge plume behaviour revealed by CTD instrumented ringed seals. Scientific Reports, 8:13467, DOI:10.1038/s41598-018-31875-8.
18. Feba, F., Ashok, K. and Ravichandran, M. (2018). Role of changed Indo-Pacific atmospheric circulation in the recent disconnect between the Indian summer monsoon and ENSO. Climate Dynamics, 52(3–4), 1461–1470.
19. Gaddam, V. K., Kulkarni, A. and Gupta, A. K. (2018). Assessment of the Baspa basin glaciers mass budget using different remote sensing methods and modeling techniques. Geocarto International, https://doi.org/10.1080/10106049.2018.1516247
20. George, J. V., N. Anilkumar, Nuncio, M., Soares, M. A., Naik, R. K. and Tripathy, S. C. (2018). Upper layer diapycnal mixing and nutrient flux in the subtropical frontal region of the Indian sector of the Southern Ocean. Journal of Marine Systems, 187, 197-205.
21. Goel, V., Martín, C., Matsuoka, K. (2018). Ice rise stratigraphy reveals changes in surface mass balance over the last millennia in Dronning Maud Land. Journal of Glaciology, 64(248), 932-942.
22. Gruetzner, J., Espejo, F. J. J., Lathika, N., Uenzelmann-Neben, G., Hall, I. R., Hemming, S. R., LeVay, L. J., the Expedition 361 Scientists. (2019). A new seismic stratigraphy in the Indian-Atlantic Ocean gateway resembles major paleo-oceanographic changes of the last 7 Ma. Geochemistry, Geophysics, Geosystems, 20, 339-358.
23. Jain, A. Krishnan, K. P., Singh, A., Thomas, F. A., Begum, N., Tiwari, M., Bhaskar, P. V., Gopinath, A. (2019) Biochemical composition of particles shape particle-attached bacterial community structure in a high Arctic fjord. Ecological Indicators, 102, 581-592.
24. Jampana, V., Ravichandran, M., Sengupta, D., D’Asaro, E. A., Rahaman, H., Joseph, S., Sreelekha, J. and Chaudhuri, D. (2018). Shear flow instabilities and unstable events over the North Bay of Bengal. Journal of Geophysical Research (Oceans), 123(12), 8958-8969.
25. Jawak, S. D., Panditrao, S. N. and Luis, A. J. (2018). Synergistic object-based multi-calss feature extraction in urban landscape using airborne LiDAR data. Spatial Information Research, 26(5), 483-496.
26. Jawak, S. D., Sengupta, M. and Luis, A. J. (2018). Detection of iceberg calving events in Prydz Bay, East Antarctica during 2013 – 2015 using LISS-IV/IRS-P6 satellite data, Czech Polar Reports 8 (2): 275-285, 2018.
27. Jena, B., Kumar, A., Ravichandran, M. and Kern, S. (2018). Mechanism of sea-ice expansion in the Indian Ocean sector of Antarctica: Insights from satellite observation and model reanalysis. PLOS ONE, doi: 10.1371/journal.pone.0203222
PUB
LICATIO
NS
ESSO-NCPOR Annual Report 2018-2019
116
28. Jena, B., Ravichandran, M. and Turner, J. (2019). Recent reoccurrence of large open-ocean polynya on the Maud Rise seamount. Geophysical Research letters, 46(8), 4320-4329.
29. Johnson, K. S., Riser, S. C. and Ravichandran, M. (2019) Oxygen Variability Controls Denitrification in the Bay of Bengal Oxygen Minimum Zone. Geophysical Research letters, 46(2), 804-811.
30. Kessarkar, P. M., Naqvi, S. W. A., Thamban, M., Fernandes, L. L., Siebert, C., Rao, V. P., Kawahata, H., Ittekkot, V. and Frank, M. (2018). Variations in Denitrification and Ventilation Within the Arabian Sea Oxygen Minimum Zone During the Holocene. Geochemistry, Geophysics, Geosystems, 19(7), 2179–2193.
31. Khim, B-K., Lee, J., Ha, S., Park, J., Pandey, D. K., Clift, P. D., Kulhanek, D. K., Steinke, S., Griffith, E. M., Suzuki, K., Xu, Z., and IODP Expedition 355 Scientists [Mishra, R. and Tiwari, M]. (2019) Variations in δ13C values of sedimentary organic matter since late Miocene time in the Indus Fan (IODP Site 1457) of the eastern Arabian Sea. Geological magazine, https://doi.org/10.1017/S0016756818000870
32. Kumar, N., Ramanathan, AL., Tranter, M., Sharma, P., Pandey , M., Ranjan, P. and Raju, N. J. (2019) Switch in chemical weathering caused by the mass balance variability in a Himalayan glacierized basin: a case of Chhota Shigri Glacier. Hydrological Sciences Journal, 64(2), 179–189.
33. Kumar, V., Tiwari, M. and Rengarajan, R. (2018). Warming in the Arctic Captured by Productivity Variability at an Arctic Fjord over the Past Two Centuries. PLOS ONE, 13(8), e0201456, https://doi.org/10.1371/journal.pone.0201456.
34. Larsen, H. C., Mohn, G., Nirrengarten, M., Sun, Z., Stock, J., Jian, Z., Klaus, A., Alvarez-Zarikian, C. A., Boaga, J., Bowden, S. A., Briais, A., Chen, Y., Cukur, D., Dadd, K., Ding, W., Dorais, M., Ferré, E. C., Ferreira, F., Furusawa, A., Gewecke, A., Hinojosa, J., Höfig, T. W., Hsiung, K. H., Huang, B., Huang, E., Huang, X. L., Jiang, S, Jin, H., Johnson, B. G., Kurzawski, R. M., Lei, C., Li, B., Li, L., Li, Y., Lin, J., Liu, C., Liu, C., Liu, Z., Luna, A. J., Lupi, C., McCarthy, A., Ningthoujam, L., Osono, N., Peate, D. W., Persaud, P., Qiu, N., Robinson, C., Satolli, S., Sauermilch, I., Schindlbeck, J. C., Skinner, S., Straub, S., Su, X., Su, C., Tian, L., van der Zwan, F. M., Wan, S., Wu, H., Xiang, R., Yadav, R., Yi, L., Yu, P. S., Zhang, C. Zhang, J., Zhang, Y.,Zhao, N., Zhong, G. and Zhong, L. (2018). Rapid transition from continental breakup to igneous oceanic crust in the South China Sea. Nature Geoscience, 11, 782–789.
35. Li, Yuanlong, H. Weiqing, Wang, W., Zhang, L. and Ravichandran, M. (2018). The Indian Summer Monsoon Intraseasonal Oscillations in CFSv2 Forecasts: Biases and Importance of Improving Air-Sea Interaction Processes. Journal of Climate, https://doi.org/10.1175/JCLI-D-17-0623.1
36. Liu Ruixuan, Lu HuaYu, Wang Yao, Yu Zhaojie, Zhaokai Xu, Fen Han Rong Hu and IODP Expedition 355 Scientists [Pandey, D. K., Mishra, R. and Tiwari, M] (2018). Grain size analysis of a depositional sequence in Laxmi Basin (IODP Hole U1456A, Arabian Sea) reveals the Indian monsoon shift at the Mid-Pleistocene Climatic Transition. Quaternary Sciences, 38(5), 1120-1129.
37. Mahajan, A. S., Tinel, L., Hulswar, S., Cuevas, C. A., Wang, S., Ghude, S., Naik, R. K., Mishra, R. K., Sabu, P., Sarkar, A., N. Anilkumar and Lopez, A. S. (2019) Observations of iodine oxide in the Indian Ocean Marine Boundary Layer: a transect from the tropics to the high latitudes. Atmospheric Environment: X, https://doi.org/10.1016/j.aeaoa.2019.100016
38. Mahapatro, D., Panigrahy, R. C., Panda, S., Karna, S. K., Mishra, R. K., Mishra, S. S. and Mohanty, S. K. (2018). New distributional record Halieutaea Indica (Lophii forms: Ogcocephalidae) from Chilika Lagoon, India. Indian Journal of Geomarine Sciences, 47 (08), 1594-1600.
39. Mahapatro, D., Panigrahy, R. C., Panda, S., Mishra, R. K., Rout, D. and Karna, S. K. (2018). First record of a flathead lobster from Chilika lagoon, Bay of Bengal. Indian Journal of Geomarine Sciences, 47(09), 1888-1892.

PUB
LIC
ATIO
NS
ESSO-NCPOR Annual Report 2018-2019
117
40. Mahesh, B. S., Nair, A., Warrier, A. K., Avadhani, A., Mohan, R. and Tiwari, M. (2018). Paleolimnological records of regime shifts from marine-to-lacustrine system in a coastal Antarctic lake in response to post-glacial isostatic uplift. Current Science, Special Section: Polar Sciences, 115 (9), 1679-1683.
41. Mahesh, B. S., Warrier, A. K., Mohan, R. and Tiwari, M. (2018). Impact of Antarctic Climate during the Late Quaternary: Records from Zub Lake Sedimentary archives from Schirmacher Hills, East Antarctica. Palaeogeography, Palaeoclimatology, Palaeoecology, 514, 398-406.
42. Mallik, A., Ejaz, T., Shcheka, S. and Garapic, G. (2019). A petrologic study on the effect of mantle overturn: Implications for evolution of the lunar interior. Geochimica et Cosmochimica Acta, 250(1), 238-250.
43. Mathew, S., Natesan, U., Latha, G., Venkatesan, R., Rao, R. R. and Ravichandran, M. (2018). Observed warming of sea surface temperature in response to tropical cyclone Thane in the Bay of Bengal. Current Science, 114(7), 1407-1413.
44. Matul, A., Barash, M. S., Khusid, T. A., Behera, P. and Tiwari, M. (2018). Paleoenvironment Variability during Termination I at the Reykjanes Ridge, North Atlantic. Geosciences, 8(10), 375.
45. Matul, A., Spielhagen, R. F., Kazarina, G., Kruglikova, S., Dmitrenko, O. and Mohan, R. (2018). Warm-water events in the eastern Fram Strait during the last 2,000 years as revealed by different microfossil groups. Polar Research, 37(1), https://doi.org/10.1080/17518369.2018.1540243
46. McKay, R., Exon, N., Müller, D., Gohl, K., Gurnis, M., Shevenell, A., Henrys, S., Inagaki, F., Pandey, D. K., Whiteside, J., Van de Flierdt, T., Naish, T., Heuer, V., Morono, Y., Coffin, M., Godard, M., Wallace, L., Kodaira, S., Bijl, P., Collot, J., Dickens, G., Dugan, B., Dunlea, A. G., Hackney, R., Ikehara, M., Jutzeler, M., McNeill, L., Naik, S., Noble, T., Opdyke, B., Pecher, I., Stott, L., Uenzelmann-Neben, G., Vadakkeykath, Y., and Wortmann, U. G. (2018). Developing community-based scientific priorities and new drilling proposals in the Southern Indian and Southwest Pacific oceans. Scientific Drilling, 24, 61-70.
47. Nagajothi, V., Geetha Priya, M. and Sharma, P. (2019) Snow cover estimation of Western Himalayas using Sentinel -2, High spatial resolution data, Indian Journal of Ecology, 46(1), 88-93.
48. Naik, R. K., D’Costa, P.M., Mishra R. K. and Anilkumar N. (2019). “Implications of the altered Nitrogen cycle for coastal ecosystems: emphasis on primary producers” in book titled “Global implications of the nitrogen cycle” Cambridge Scholars Publishing, Newcastle, UK. (in press)
49. Naveen, Sarkar, S., Nirmal Kumar, T., Ray, D., Bhattacharya, S., Shukla, A.D., Moitra, H., Dagar, A., Chauhan, P., Sen, K. and Das. S. (2019). Mineralogy and spectroscopy (VIS near infrared and micro-Raman) of chromite from Nidar ophiolite complex, SE Ladakh, India: Implications for future planetary exploration. Planetary and Space Science, 165, 1-9.
50. Orme, L. C., Miettinen, A., Divine, D., Husum, K., Pearce, C., Nieuwenhove, N. V., Born, A., Mohan, R. and Seidenkrantz, M-S. (2018). Subpolar North Atlantic sea surface temperature since 6 ka BP: Indications of anomalous ocean-atmosphere interactions at 4-2 ka BP. Quaternary Science Reviews, 194, 128-142.
51. Pandey, D. K., Pandey, A., Clift, P. D., Nair, N., Ramesh, P., Kulhanek, D. K. and Yadav, R. (2018). “Flexural subsidence analysis of Laxmi Basin, Arabian Sea and its tectonic implications” in its current form for publication in the Special Issue “Climate-Tectonic Interactions in the Eastern Arabian Sea”. Geological Magazine, https://doi.org/10.1017/S0016756818000833.
52. Prajith, A., Tyagi, A. and Kurian, P. J. (2018). Changing sediment sources in the Bay of Bengal: evidence of summer monsoon intensification and ice-melt over Himalaya during the Late Quaternary. Palaeogeography, Palaeoclimatology, Palaeoecology, 511, 309-318.

PUB
LICATIO
NS
ESSO-NCPOR Annual Report 2018-2019
118
53. Pramanik, A., W. J. J. van Pelt, J. Kohler, and T.V. Schuler. (2018). Simulating climatic mass balance, seasonal snow development and associated freshwater runoff in the Kongsfjord basin, Svalbard (1980-2016). Journal of Glaciology, 64(248), 943-956.
54. Prerna, S., Chatterjee, A., Mukherjee, A., Ravichandran M. and Shenoi, S. S. C. (2018). Wyrtki Jets: Role of Intraseasonal forcing. Journal of Earth System Science, JESS-D-18-00047, DOI: 10.1007/s12040-018-1042-0
55. Rahaman, H., Venugopal, T., Penny, S. G., Behringer, D. W., Ravichandran, M., Raju, J. V. S., Srinivasu, U. and Sengupta D. (2018) Improved ocean analysis for the Indian Ocean. Journal of Operational Oceanography, 12(1), 16-33.
56. Rahaman, W., Chatterjee, S., Ejaz, T. and Thamban, M. (2019) Increased infuence of ENSO on Antarctic temperature since the Industrial Era. Nature: Scientific Reports, 9:6006.
57. Ramesh, P., Pandey, D. K. and Kotha, M. (2018). Longitudinal Profiling and Elevation-Relief Analysis of the Indus. Arabian Journal of Geosciences, https://doi.org/10.1007/s12517-018-3657-5
58. Ravi K., Mohan, B. S., Sree, G. S., Raju, I. M., Basavaiah, K. and Rao, B. V. (2018). ZnO/RGO nanocomposite via hydrothermal route for photocatalytic degradation of dyes in presence of visible light. International Journal of Chemical Studies, 6(6), 20-26.
59. Rawat, R., Echer, E. and Gonzalez, W. D. (2018). How different are the solar wind-interplanetary conditions and the consequent geomagnetic activity during the ascending and early descending phases of the solar cycles 23 and 24? Journal of Geophysical Research - Space Physics, 123(8), 6621-6638.
60. Samui, G., Antony, R. and Thamban, M. (2018). Chemical characteristics of hydrologically distinct cryoconite holes in coastal Antarctica. Annals of Glaciology, 59(77), 69-76.
61. Schulz, I., Montresor, M., Klaas, C., Assmy, P., Wolzenburg, S., Gauns, M., Sarkar, A., Thiele, S., Wolf-Gladrow, D., Naqvi, W. and Smetacek, V. (2018). Remarkable structural resistance of a nanoflagellate-dominated plankton community to iron fertilization during the Southern Ocean experiment LOHAFEX. Marine Ecology Progress Series, 601, 77-95.
62. Sharma, A., Giri, R. K., Rao, N.V. C., Rahaman, W., Pandit, D. and Sahoo, S. (2019). Arc-related pyroxenites derived from a long-lived subduction system of Neoarchaean age at the SW margin of the Cuddapah basin: Geodynamic implications for the evolution of the Eastern Dharwar Craton, Southern India. The Journal of Geology. (Accepted).
63. Singh N., Rajan S., Choudhary S., Krishnaiah C. and Peter M. (2018). Diisopropylnaphthalene in the surface sediments of an Arctic fjord: environmental significance. Polar Science, 18, 142-146.
64. Singh, A. K., Das, R. M., Saini, S. (2019) Variations of total electron content over high latitude region during the ascending phase of 24th solar cycle. Advances in Space Research, 63 (11) 3558–3567.
65. Singh, A. K., Saini, S. and Das, R. M. (2019). Impact of geomagnetic variation over sub-auroral ionospheric region during high solar activity year 2014. Advances in Space Research, 63, 3189–3199.
66. Sinha, A. K., Bhaskar, P. V., Tripathy, S. C., Sarkar, A. and Sabu, P. (2019) Effects of growth conditions on siderophore producing bacteria and siderophore production from Indian sector of Southern Ocean. Journal of Basic Microbiology, 59(4), 412-424.
67. Sinha, R. K., Krishnan, K.P. and Kerkar, S. (2018). Population dynamics of bacterioplanktonic component associated with the phytoplankton biomass in Kongsfjorden, an Arctic fjord. Current Science, 115(9), 1690-1694.
68. Sinha, R. K., Krishnan, K.P., Thomas, F. A., Binish, M. B., Mohan, M. and Kurian, P. J. (2018). Polyphasic approach revealed complex bacterial community structure and function in deep sea
PUB
LIC
ATIO
NS
ESSO-NCPOR Annual Report 2018-2019
119
sediment of ultra-slow spreading Southwest Indian Ridge. Ecological Indicators, 96(1), 40-51.
69. Subhavana, K. L., Qureshi, A., Chakraborty, P. and Tiwari, A. K. (2018) Mercury and Organochlorines in the Terrestrial Environment of Schirmacher Hills, Antarctica. Bulletin of Environmental Contamination and Toxicology, 102 (1), 13-18.
70. Tripathy, S. C. and Jena, B. (2019) Iron stimulated phytoplankton blooms in the Southern Ocean: a brief review. Remote Sensing in Earth Systems Science, 2(1), 64-77.
71. Turner, J , Phillips, T., Thamban, M., Rahaman, W., Marshall, G. J., Wille, J. D. , Favier, V., Winton, H.,Thomas, E., Wang, Z. , Broeke, M., Hosking, J. S. and Lachlan-Cope. T. (2019). The Dominant Role of Extreme Precipitation Events in Antarctic Snowfall Variability. Geophysical Research Letters, 46(6), 3502-3511.
72. Venkataramana, V., Anilkumar, N., Naik, R. K., Mishra, R. K., Sabu, P. (2019) Temperature and phytoplankton size class biomass drives the zooplankton food web dynamics in the Indian Ocean sector of the Southern Ocean. Polar Biology, 42(4), 823–829.
73. Victor, N. J., Siingh, D., Panneerselvam, C., Elango, P. and Samy, V. S. (2019). Fair-weather potential gradient and its coupling with ionospheric potential from three Antarctic stations: Case studies. Journal of Atmospheric and Solar-Terrestrial Physics (JASTP), 184, 5-17.
74. Vidya, P. J. and Kurian, S. (2018). Impact of 2015–2016 ENSO on the winter bloom and associated phytoplankton community shift in the northeastern Arabian Sea. Journal of Marine Systems, 186, 96–104.
75. Vidyasakar, A., Neelavannan, K., Krishnakumar, S., Prabaharan, G., Sathiyabama Alias Priyanka, T., Magesh, N. S., Godson, P. S. and Srinivasalu, S. (2018). Macrodebris and microplastic distribution in the beaches of Rameswaram Coral Island, Gulf of Mannar, Southeast coast of India: A first report. Marine Pollution Bulletin, 137, 610-616.
76. VishnuRadhan, R., Eldho, T. I. and Divya, D. T. (2019) Can plastics affect near surface layer ocean processes and climate? Marine Pollution Bulletin, 140, 274-280.
77. Weller, R. A., Farrar, J. T., Prend, C., Sengupta, D., Sree Lekha, J., Ravichandran, M. and Venkatesan, R. (2018) Moored observations of the surface meteorology and air-sea fluxes in the northern Bay of Bengal in 2015. Journal of Climate, https://doi.org/10.1175/JCLI-D-18-0413.1
78. Wojtasiewicz, B., Trull, T. W., Bhaskar, T.V.S. U., Gauns, M., Prakash, S., Ravichandran, M., Shenoy, D. M., Slawinski, D. and Hardman-Mountford, N. J. (2018). Autonomous profiling float observations reveal the dynamics of deep biomass distributions in the denitrifying oxygen minimum zone of the Arabian Sea. Journal of Marine Systems, https://doi.org/10.1016/j.jmarsys.2018.07.002
79. Yu, S., Colin, C., Wan, S., Saraswat, R., Song, L., Xu, Z., Clift, P., Lu, H., Lyle, M., Kulhanek, D., Hahn, A., Tiwari, M., Mishra, R., Miska, S. and Kumar, A. (2019). Sea level-controlled sediment transport to the eastern Arabian Sea over the past 600 kyr: Clay minerals and Sr-Nd isotopic evidence from IODP Site U1457. Quaternary Science Reviews, 205, 22-34.
REPORTS:
1. Cottier, F., Skogseth, R., Divya D. T. and Berge, J. (2019); Temperature time-series in Svalbard fjords. A contribution from the “Integrated Marine Observatory Partnership (iMOP)”, SESS report, ISSN 2535-6321, ISBN 978-82-691528-0-7, Pages: 108-119.
2. Mohan, R. and Vui Ling, C. M. W. (2018) Editorial Special Section, Preface. Asian Forum for Polar Sciences. Current Science, 115(9), 1668.
3. Pandey, D. K., Clemens, S. and Edmonds, M. (2018), Investigating the northern Indian Ocean’s puzzling geodynamics, EOS, 99, https://doi.org/10.1029/2018EO111895.

PUB
LICATIO
NS
ESSO-NCPOR Annual Report 2018-2019
120
4. Staby, A., Lødemel, H., Skagseth, Ø., Grøsvik, B.E., Bruck, S.A., Solhaug, J., Søraas, O., Jupiter, D.C., Appoo, J.C., Fernandes, M., Flynn, B.A., Nirbadha, K.G.S., Ratnayake, R.M.D.I., Kumara, M.D.I.C. and Rajapaksha, J.K. (2018). Oceanographic survey in the Indian Ocean, Leg 2.2: Characterizing environmental conditions and distribution of mesopelagic fish between Mauritius and Sri Lanka; 7 – 21 June 2018. Cruise Reports ‘Dr Fridtjof Nansen’, Survey No. 2018407.
Year wise Publication and its impact factor
Pl. Note- Only peer- reviewed publications with impact factor are taken into consideration

AUD
ITED
STA
TEM
ENT
ESSO-NCPOR Annual Report 2018-2019
1216.0 AUDITED STATEMENT OF ACCOUNT FOR THE YEAR ENDING 31ST MARCH 2019
PC @ Dr. Priyanka Dutta
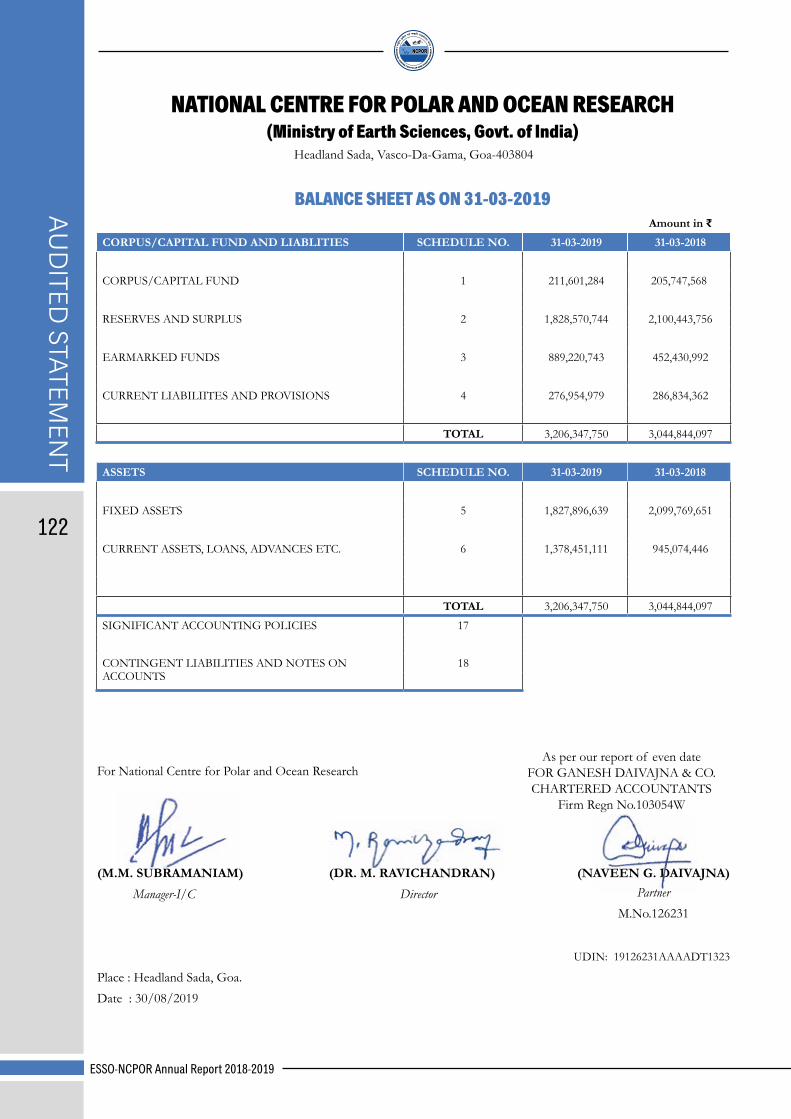
AUD
ITED STATEM
ENT
ESSO-NCPOR Annual Report 2018-2019
122
NATIONAL CENTRE FOR POLAR AND OCEAN RESEARCH(Ministry of Earth Sciences, Govt. of India)
Headland Sada, Vasco-Da-Gama, Goa-403804
BALANCE SHEET AS ON 31-03-2019 Amount in ₹
CORPUS/CAPITAL FUND AND LIABLITIES SCHEDULE NO. 31-03-2019 31-03-2018
CORPUS/CAPITAL FUND 1 211,601,284 205,747,568
RESERVES AND SURPLUS 2 1,828,570,744 2,100,443,756
EARMARKED FUNDS 3 889,220,743 452,430,992
CURRENT LIABILIITES AND PROVISIONS 4 276,954,979 286,834,362
TOTAL 3,206,347,750 3,044,844,097
ASSETS SCHEDULE NO. 31-03-2019 31-03-2018
FIXED ASSETS 5 1,827,896,639 2,099,769,651
CURRENT ASSETS, LOANS, ADVANCES ETC. 6 1,378,451,111 945,074,446
TOTAL 3,206,347,750 3,044,844,097
SIGNIFICANT ACCOUNTING POLICIES 17
CONTINGENT LIABILITIES AND NOTES ON ACCOUNTS
18
As per our report of even date FOR GANESH DAIVAJNA & CO. CHARTERED ACCOUNTANTS
Firm Regn No.103054W
For National Centre for Polar and Ocean Research
(M.M. SUBRAMANIAM) (DR. M. RAVICHANDRAN) (NAVEEN G. DAIVAJNA) Manager-I/C Director Partner
M.No.126231
UDIN: 19126231AAAADT1323
Place : Headland Sada, Goa.
Date : 30/08/2019
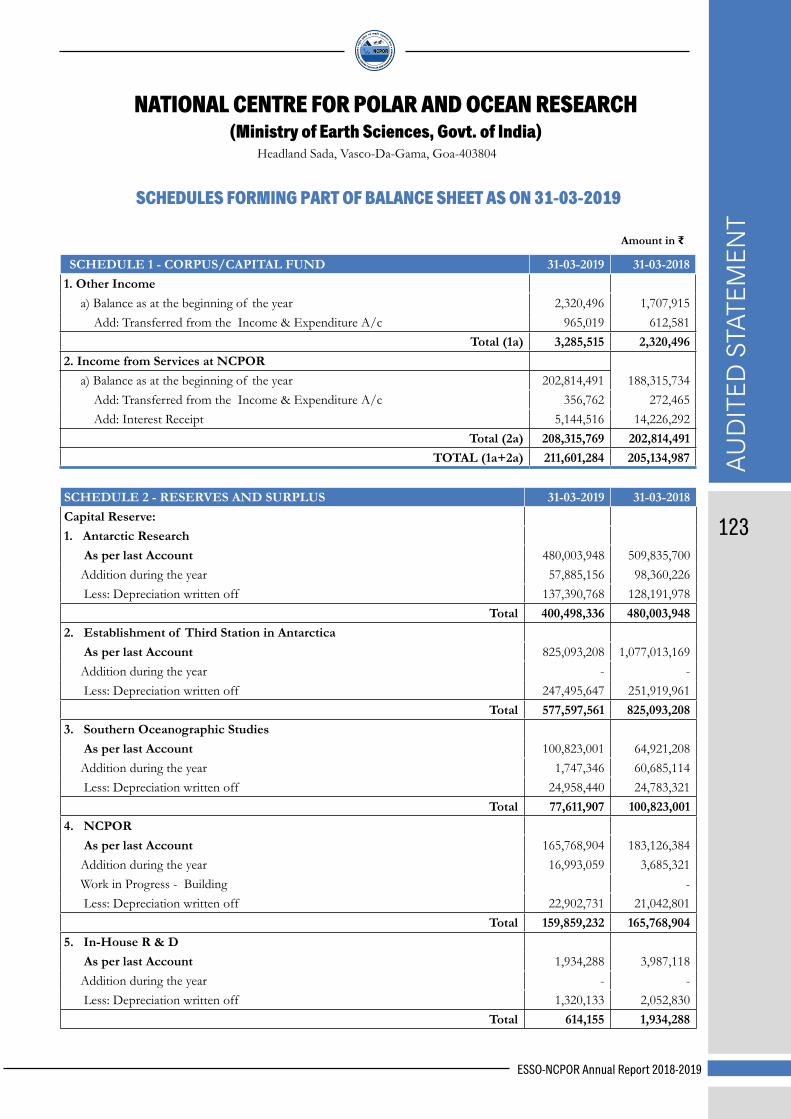
AUD
ITED
STA
TEM
ENT
ESSO-NCPOR Annual Report 2018-2019
123 SCHEDULE 2 - RESERVES AND SURPLUS 31-03-2019 31-03-2018 Capital Reserve: 1. Antarctic Research As per last Account 480,003,948 509,835,700 Addition during the year 57,885,156 98,360,226 Less: Depreciation written off 137,390,768 128,191,978
Total 400,498,336 480,003,948 2. Establishment of Third Station in Antarctica As per last Account 825,093,208 1,077,013,169 Addition during the year - - Less: Depreciation written off 247,495,647 251,919,961
Total 577,597,561 825,093,208 3. Southern Oceanographic Studies As per last Account 100,823,001 64,921,208 Addition during the year 1,747,346 60,685,114 Less: Depreciation written off 24,958,440 24,783,321
Total 77,611,907 100,823,001 4. NCPOR As per last Account 165,768,904 183,126,384 Addition during the year 16,993,059 3,685,321 Work in Progress - Building - Less: Depreciation written off 22,902,731 21,042,801
Total 159,859,232 165,768,904 5. In-House R & D As per last Account 1,934,288 3,987,118 Addition during the year - - Less: Depreciation written off 1,320,133 2,052,830
Total 614,155 1,934,288
NATIONAL CENTRE FOR POLAR AND OCEAN RESEARCH(Ministry of Earth Sciences, Govt. of India)
Headland Sada, Vasco-Da-Gama, Goa-403804
SCHEDULES FORMING PART OF BALANCE SHEET AS ON 31-03-2019
Amount in ₹
SCHEDULE 1 - CORPUS/CAPITAL FUND 31-03-2019 31-03-2018 1. Other Income a) Balance as at the beginning of the year 2,320,496 1,707,915 Add: Transferred from the Income & Expenditure A/c 965,019 612,581
Total (1a) 3,285,515 2,320,496 2. Income from Services at NCPOR a) Balance as at the beginning of the year 202,814,491 188,315,734 Add: Transferred from the Income & Expenditure A/c 356,762 272,465 Add: Interest Receipt 5,144,516 14,226,292
Total (2a) 208,315,769 202,814,491 TOTAL (1a+2a) 211,601,284 205,134,987

AUD
ITED STATEM
ENT
ESSO-NCPOR Annual Report 2018-2019
124
SCHEDULE 2 - RESERVES AND SURPLUS 31-03-2019 31-03-2018 6. Indian Arctic Programme As per last Account 45,302,852 49,175,482 Addition during the year 27,782,141 9,854,980 Less: Depreciation written off 17,883,603 13,727,610
Total 55,201,390 45,302,852 7. CLCS Programme As per last Account 156,664 168,773 Addition during the year 198,300 182,853 Less: Depreciation written off 137,739 194,962
Total 217,225 156,664 8. ORV Sagar Kanya As per last Account 11,158,464 4,705,499 Addition during the year 1,947,112 7,732,454 Less: Depreciation written off 3,296,905 1,279,489
Total 9,808,671 11,158,464 9. Sea Bed Survey of Exclusive Economic Zone As per last Account 2,997,509 3,784,384 Addition during the year 591,000 83,200 Less: Depreciation written off 537,703 870,075
Total 3,050,806 2,997,509 10. Chartering of A. Boris Petrov As per last Account 3 3 Addition during the year - Less: Depreciation written off -
Total 3 3 11. Hydro Thermal Programme As per last Account 81,764,928 85,536,829 Addition during the year 7,198,000 12,342,914 Less: Depreciation written off 18,059,017 16,114,815
Total 70,903,911 81,764,928 12. Geoid Low Programme As per last Account 1,957,266 40,926 Addition during the year 424,800 2,446,580 Less: Depreciation written off 1,063,592 530,240
Total 1,318,474 1,957,266 13. IODP As per last Account 1,350,342 1,452,288 Addition during the year - 178,802 Less: Depreciation written off 280,748 280,748
Total 1,069,594 1,350,342 14. IT & e-Governance As per last Account 3,797 9,467 Addition during the year - - Less: Depreciation written off - 5,670
Total 3,797 3,797 15. Ice Class Research Vessel As per last Account 3,559 5,339 Addition during the year - - Less: Depreciation written off 1,780 1,780
Total 1,779 3,559

AUD
ITED
STA
TEM
ENT
ESSO-NCPOR Annual Report 2018-2019
125
SCHEDULE 2 - RESERVES AND SURPLUS 31-03-2019 31-03-2018 16. Cryosphere & Climate Studies As per last Account 92,438,015 59,806,342 Addition during the year 14,479,053 51,004,386 Work in Progress 40,000,000 18,372,713 Less: Depreciation written off 20,654,135.00 -
Total 126,262,933 92,438,015 17. Geotraces Research Programme As per last Account 2,140,240 3,125,686 Addition during the year - - Less: Depreciation written off 985,446 985,446
Total 1,154,794 2,140,240 18. Koyna - ICDP As per last Account 287,385,402 236,839,659 Addition during the year 89,525,220 450,642 Work in Progress - Building 70,000,000 Less: Depreciation written off 33,724,650 19,904,899
Total 343,185,972 287,385,402 19. ICMAM - Ecosystem Modelling As per last Account 124,725 873,545 Addition during the year - Less: Depreciation written off - 748,820
Total 124,725 124,725 20. Project between NCPOR & INCOIS As per last Account 36,623 96,494 Addition during the year Less: Depreciation written off 59,871
Total 36,623 36,623 21. DST-Fjord Dynamics Studies As per last Account 2 2 Addition during the year - Less: Depreciation written off -
Total 2 2 22. Project between NCPOR & ISRO - GBP As per last Account 2 2 Addition during the year - Less: Depreciation written off -
Total 2 2 23. PMN Programme - Survey & Exploration As per last Account 2 2 Addition during the year - Less: Depreciation written off -
Total 2 2 24. PMN Programme - CTD Procurement As per last Account 2 2 Addition during the year - Less: Depreciation written off -
Total 2 2
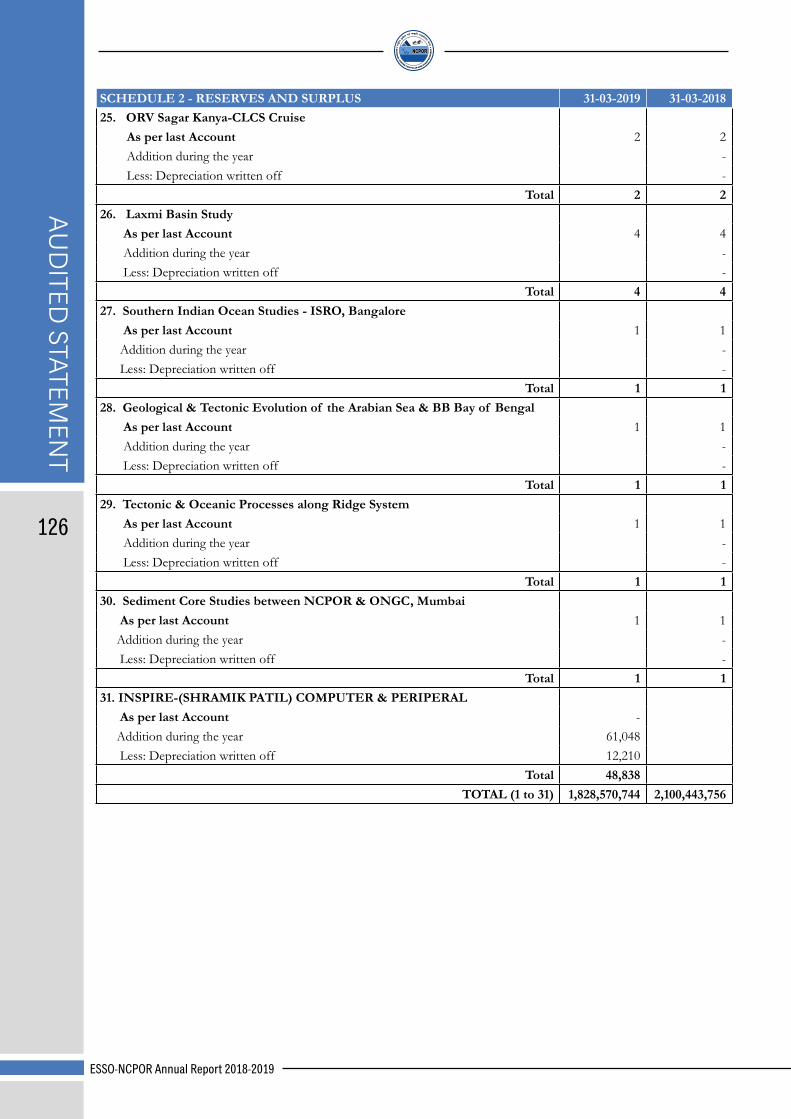
AUD
ITED STATEM
ENT
ESSO-NCPOR Annual Report 2018-2019
126
SCHEDULE 2 - RESERVES AND SURPLUS 31-03-2019 31-03-2018 25. ORV Sagar Kanya-CLCS Cruise As per last Account 2 2 Addition during the year - Less: Depreciation written off -
Total 2 2 26. Laxmi Basin Study As per last Account 4 4 Addition during the year - Less: Depreciation written off -
Total 4 4 27. Southern Indian Ocean Studies - ISRO, Bangalore As per last Account 1 1 Addition during the year - Less: Depreciation written off -
Total 1 1 28. Geological & Tectonic Evolution of the Arabian Sea & BB Bay of Bengal As per last Account 1 1 Addition during the year - Less: Depreciation written off -
Total 1 1 29. Tectonic & Oceanic Processes along Ridge System As per last Account 1 1 Addition during the year - Less: Depreciation written off -
Total 1 1 30. Sediment Core Studies between NCPOR & ONGC, Mumbai As per last Account 1 1 Addition during the year - Less: Depreciation written off -
Total 1 1 31. INSPIRE-(SHRAMIK PATIL) COMPUTER & PERIPERAL As per last Account - Addition during the year 61,048 Less: Depreciation written off 12,210
Total 48,838 TOTAL (1 to 31) 1,828,570,744 2,100,443,756

AUD
ITED
STA
TEM
ENT
ESSO-NCPOR Annual Report 2018-2019
127
Amount in ₹ Sl.No. Particulars 31-03-2019 31-03-2018
1 Antarctic Researcha) Opening Balance (32,310,436) 56,775,819 b) Additions to the funds:- i) Grant-in-aid 1,194,000,000 1,045,200,000 ii) Interest Receipt - 5,815,116
Total (a+b) 1,161,689,565 1,107,790,935 c) Utilization/Expenditure towards objective of funds i) Capital Expenditure - Fixed Assets 57,885,156 98,360,226 ii) Revenue Expenditure 761,680,633 1,041,741,145
Total (c) 819,565,789 1,140,101,371 Net Balance as at year end (a+b-c) 342,123,775 (32,310,436)
2 Southern Oceanographic Studiesa) Opening Balance 23,371,626 112,386,724 b) Additions to the funds:- 5,819,338 i) Grant-in-aid 33,338,343 148,800,000 ii) Interest Receipt - 1,910,556
Total (a+b) 56,709,969 268,916,618 c) Utilisation/Expenditure towards objective of funds i) Capital Expenditure - Fixed Assets 1,747,346 60,685,114 ii) Revenue Expenditure 16,917,459 184,859,878
Total (c) 18,664,805 245,544,992 Net Balance as at year end (a+b-c) 38,045,164 23,371,626
3 NCPORa) Opening Balance (6,029,896) 20,232,456 b) Additions to the funds:- i) Grant-in-aid 250,000,000 143,500,000 ii) Interest Receipt - 81,950
Total (a+b) 243,970,105 163,814,406 c) Utilisation/Expenditure towards objective of funds i) Capital Expenditure - Fixed Assets 16,993,059 3,685,321 ii) Work in Progress - Building - - iii) Revenue Expenditure 195,617,892 166,158,981
Total (c) 212,610,951 169,844,302 Net Balance as at year end (a+b-c) 31,359,154 (6,029,896)
4 Indian Arctic Programmea) Opening Balance 24,760,151 17,418,559 b) Additions to the funds:- - - i) Grant-in-aid 121,000,000 70,000,000 ii) Interest Receipt - 1,140,581
Total (a+b) 145,760,151 88,559,140 c) Utilisation/Expenditure towards objective of funds i) Capital Expenditure - Fixed Assets 27,782,141 9,854,980 ii) Revenue Expenditure 59,831,128 53,944,009
Total (c) 87,613,269 63,798,989 Net Balance as at year end (a+b-c) 58,146,882 24,760,151
5 Ice Class Research Vessela) Opening Balance 47,279,608 33,378,500 i) Grant-in-aid - 13,942,349 ii) Interest receipt of 2018-19 - -
SCHEDULE 3 - EARMARKED FUNDSGrant-in-aid received/receivable and spent during the year from 01/04/2018 to 31/03/2019
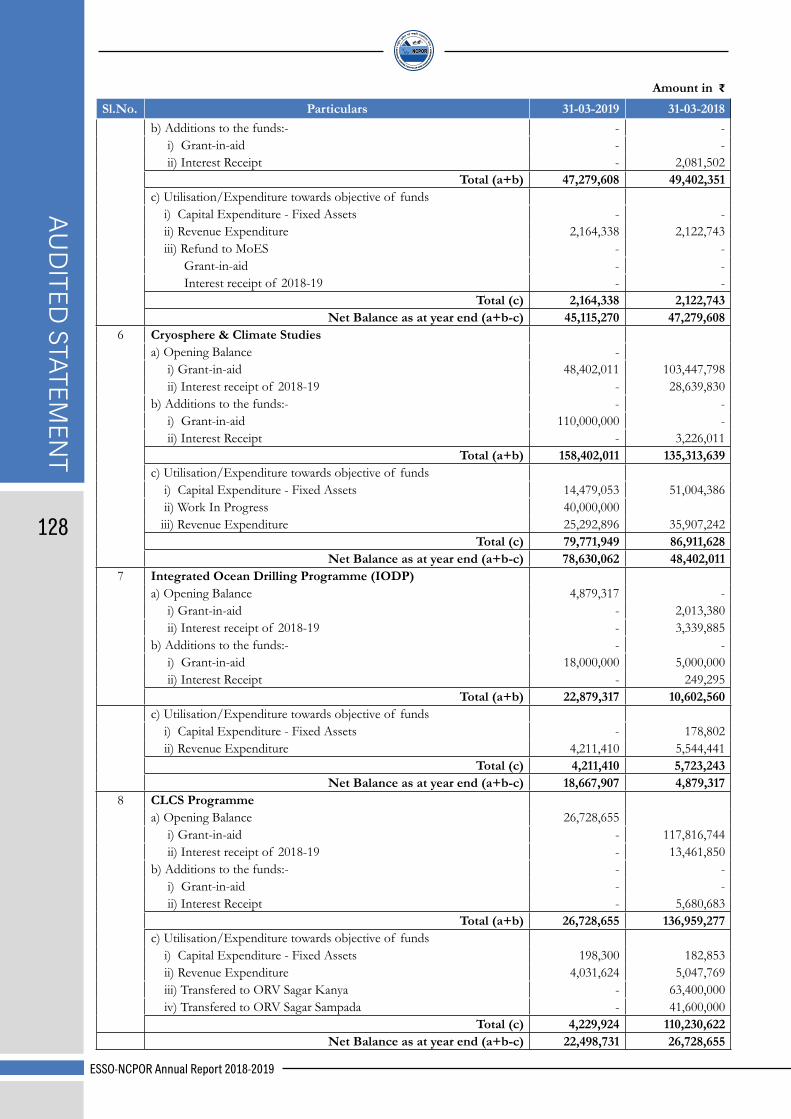
AUD
ITED STATEM
ENT
ESSO-NCPOR Annual Report 2018-2019
128
Amount in ₹ Sl.No. Particulars 31-03-2019 31-03-2018
b) Additions to the funds:- - - i) Grant-in-aid - - ii) Interest Receipt - 2,081,502
Total (a+b) 47,279,608 49,402,351 c) Utilisation/Expenditure towards objective of funds i) Capital Expenditure - Fixed Assets - - ii) Revenue Expenditure 2,164,338 2,122,743 iii) Refund to MoES - - Grant-in-aid - - Interest receipt of 2018-19 - -
Total (c) 2,164,338 2,122,743 Net Balance as at year end (a+b-c) 45,115,270 47,279,608
6 Cryosphere & Climate Studiesa) Opening Balance - i) Grant-in-aid 48,402,011 103,447,798 ii) Interest receipt of 2018-19 - 28,639,830 b) Additions to the funds:- - - i) Grant-in-aid 110,000,000 - ii) Interest Receipt - 3,226,011
Total (a+b) 158,402,011 135,313,639 c) Utilisation/Expenditure towards objective of funds i) Capital Expenditure - Fixed Assets 14,479,053 51,004,386 ii) Work In Progress 40,000,000 iii) Revenue Expenditure 25,292,896 35,907,242
Total (c) 79,771,949 86,911,628 Net Balance as at year end (a+b-c) 78,630,062 48,402,011
7 Integrated Ocean Drilling Programme (IODP)a) Opening Balance 4,879,317 - i) Grant-in-aid - 2,013,380 ii) Interest receipt of 2018-19 - 3,339,885 b) Additions to the funds:- - - i) Grant-in-aid 18,000,000 5,000,000 ii) Interest Receipt - 249,295
Total (a+b) 22,879,317 10,602,560 c) Utilisation/Expenditure towards objective of funds i) Capital Expenditure - Fixed Assets - 178,802 ii) Revenue Expenditure 4,211,410 5,544,441
Total (c) 4,211,410 5,723,243 Net Balance as at year end (a+b-c) 18,667,907 4,879,317
8 CLCS Programmea) Opening Balance 26,728,655 i) Grant-in-aid - 117,816,744 ii) Interest receipt of 2018-19 - 13,461,850 b) Additions to the funds:- - - i) Grant-in-aid - - ii) Interest Receipt - 5,680,683
Total (a+b) 26,728,655 136,959,277 c) Utilisation/Expenditure towards objective of funds i) Capital Expenditure - Fixed Assets 198,300 182,853 ii) Revenue Expenditure 4,031,624 5,047,769 iii) Transfered to ORV Sagar Kanya - 63,400,000 iv) Transfered to ORV Sagar Sampada - 41,600,000
Total (c) 4,229,924 110,230,622 Net Balance as at year end (a+b-c) 22,498,731 26,728,655
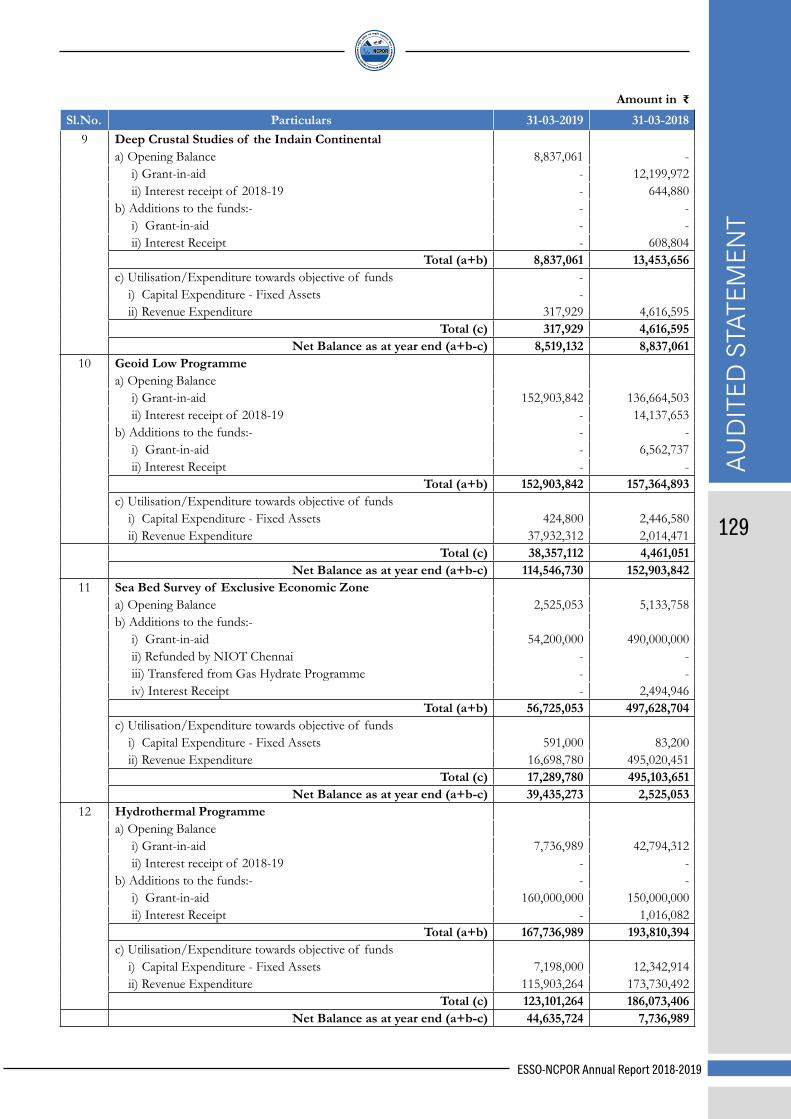
AUD
ITED
STA
TEM
ENT
ESSO-NCPOR Annual Report 2018-2019
129
Amount in ₹ Sl.No. Particulars 31-03-2019 31-03-2018
9 Deep Crustal Studies of the Indain Continentala) Opening Balance 8,837,061 - i) Grant-in-aid - 12,199,972 ii) Interest receipt of 2018-19 - 644,880 b) Additions to the funds:- - - i) Grant-in-aid - - ii) Interest Receipt - 608,804
Total (a+b) 8,837,061 13,453,656 c) Utilisation/Expenditure towards objective of funds - i) Capital Expenditure - Fixed Assets - ii) Revenue Expenditure 317,929 4,616,595
Total (c) 317,929 4,616,595 Net Balance as at year end (a+b-c) 8,519,132 8,837,061
10 Geoid Low Programmea) Opening Balance i) Grant-in-aid 152,903,842 136,664,503 ii) Interest receipt of 2018-19 - 14,137,653 b) Additions to the funds:- - - i) Grant-in-aid - 6,562,737 ii) Interest Receipt - -
Total (a+b) 152,903,842 157,364,893 c) Utilisation/Expenditure towards objective of funds i) Capital Expenditure - Fixed Assets 424,800 2,446,580 ii) Revenue Expenditure 37,932,312 2,014,471
Total (c) 38,357,112 4,461,051 Net Balance as at year end (a+b-c) 114,546,730 152,903,842
11 Sea Bed Survey of Exclusive Economic Zonea) Opening Balance 2,525,053 5,133,758 b) Additions to the funds:- i) Grant-in-aid 54,200,000 490,000,000 ii) Refunded by NIOT Chennai - - iii) Transfered from Gas Hydrate Programme - - iv) Interest Receipt - 2,494,946
Total (a+b) 56,725,053 497,628,704 c) Utilisation/Expenditure towards objective of funds i) Capital Expenditure - Fixed Assets 591,000 83,200 ii) Revenue Expenditure 16,698,780 495,020,451
Total (c) 17,289,780 495,103,651 Net Balance as at year end (a+b-c) 39,435,273 2,525,053
12 Hydrothermal Programmea) Opening Balance i) Grant-in-aid 7,736,989 42,794,312 ii) Interest receipt of 2018-19 - - b) Additions to the funds:- - - i) Grant-in-aid 160,000,000 150,000,000 ii) Interest Receipt - 1,016,082
Total (a+b) 167,736,989 193,810,394 c) Utilisation/Expenditure towards objective of funds i) Capital Expenditure - Fixed Assets 7,198,000 12,342,914 ii) Revenue Expenditure 115,903,264 173,730,492
Total (c) 123,101,264 186,073,406 Net Balance as at year end (a+b-c) 44,635,724 7,736,989

AUD
ITED STATEM
ENT
ESSO-NCPOR Annual Report 2018-2019
130
Amount in ₹ Sl.No. Particulars 31-03-2019 31-03-2018
13 PMN Programmea) Opening Balance - - i) Grant-in-aid 4,150,859 410,256 ii) Interest receipt of 2018-19 - 3,545,298 b) Additions to the funds:- - - i) Grant-in-aid - - ii) Interest Receipt - 195,305
Total (a+b) 4,150,859 4,150,859 c) Utilisation/Expenditure towards objective of funds i) Capital Expenditure - Fixed Assets - - ii) Revenue Expenditure - -
Total (c) - - Net Balance as at year end (a+b-c) 4,150,859 4,150,859
14 EIA - PMN Programmea) Opening Balance i) Grant-in-aid 7,355,850 900,000 ii) Interest receipt of 2018-19 4,689,835 b) Additions to the funds:- i) Grant-in-aid - - ii) Interest Receipt - 1,766,015
Total (a+b) 7,355,850 7,355,850 c) Utilisation/Expenditure towards objective of funds i) Capital Expenditure - Fixed Assets - - ii) Revenue Expenditure - -
Total (c) - - Net Balance as at year end (a+b-c) 7,355,850 7,355,850
15 Gas Hydrate Programmea) Opening Balance i) Grant-in-aid 2,032,541 262,199 ii) Interest receipt of 2018-19 - 1,665,522 b) Additions to the funds:- i) Grant-in-aid - - ii) Interest Receipt - 104,820
Total (a+b) 2,032,541 2,032,541 c) Utilisation/Expenditure towards objective of funds i) Capital Expenditure - Fixed Assets - - ii) Revenue Expenditure - - iii) Transfered to Sea Bed Survey of EEZ - -
Total (c) - - Net Balance as at year end (a+b-c) 2,032,541 2,032,541
16 Ocean Research Vessela) Opening Balance i) Grant-in-aid 8,417,101 5,779,621 ii) Interest receipt of 2018-19 2,241,441 b) Additions to the funds:- i) Grant-in-aid ii) Interest Receipt 396,039
Total (a+b) 8,417,101 8,417,101 c) Utilisation/Expenditure towards objective of funds i) Capital Expenditure - Fixed Assets ii) Revenue Expenditure
Total (c) - - Net Balance as at year end (a+b-c) 8,417,101 8,417,101

AUD
ITED
STA
TEM
ENT
ESSO-NCPOR Annual Report 2018-2019
131
Amount in ₹ Sl.No. Particulars 31-03-2019 31-03-2018
17 ORV Sagar Kanyaa) Opening Balance i) Grant-in-aid 15,625,542 40,695,877 ii) Interest receipt 1,722,528 b) Additions to the funds:- i) Grant-in-aid 361,350,465 159,446,068 ii) Interest Receipt 487,008 ii) Transfered from CLCS Programme 63,400,000
Total (a+b) 376,976,007 265,751,481 c) Utilisation/Expenditure towards objective of funds i) Capital Expenditure - Fixed Assets 1,947,112 7,732,454 ii) Revenue Expenditure 365,098,157 242,393,485
Total (c) 367,045,269 250,125,939 Net Balance as at year end (a+b-c) 9,930,738 15,625,542
18 MoES Fellowship at NPI Norwaya) Opening Balance i) Grant-in-aid 10,568,481 9,736,946 ii) Interest receipt 286,510 b) Additions to the funds:- i) Grant-in-aid - ii) Interest Receipt 545,025
Total (a+b) 10,568,481 10,568,481 c) Utilisation/Expenditure towards objective of funds i) Capital Expenditure - Fixed Assets ii) Revenue Expenditure
Total (c) - - Net Balance as at year end (a+b-c) 10,568,481 10,568,481
19 Koyna - ICDPa) Opening Balance i) Grant-in-aid 92,492,027 158,098,497 ii) Interest receipt of 2018-19b) Additions to the funds:- i) Grant-in-aid - 333,300,000 ii) Interest Receipt 3,623,574
Total (a+b) 92,492,027 495,022,071 c) Utilisation/Expenditure towards objective of funds i) Capital Expenditure - Fixed Assets 89,525,220 450,642 ii) Work in Progress-Building 70,000,000 iii) Revenue Expenditure 2,960,315 332,079,402 iv) Refund to MoES 6,492
Total (c) 92,492,027 402,530,044 Net Balance as at year end (a+b-c) - 92,492,027
20 ORV Sagar Sampadaa) Opening Balance 810,328 i) Grant-in-aid 689,240 ii) Interest receipt of 2018-19 80,151 b) Additions to the funds:- i) Grant-in-aid 109,108,035 109,449,718 ii) Interest Receipt 41,836 ii) Transfered from CLCS Programme 41,600,000
Total (a+b) 109,918,363 151,860,945 c) Utilisation/Expenditure towards objective of funds i) Capital Expenditure - Fixed Assets

AUD
ITED STATEM
ENT
ESSO-NCPOR Annual Report 2018-2019
132
Amount in ₹ Sl.No. Particulars 31-03-2019 31-03-2018
ii) Revenue Expenditure 109,108,035 151,050,617 Total (c) 109,108,035 151,050,617
Net Balance as at year end (a+b-c) 810,328 810,328 21 Pannikkar Professorship to Shri Rasik Ravindra
a) Opening Balance (126,337) (126,337)b) Additions to the funds:- i) Grant-in-aid
Total (a+b) (126,337) (126,337)c) Utilisation/Expenditure towards objective of funds i) Capital Expenditure - Fixed Assets - ii) Revenue Expenditure
Total (c) - - Net Balance as at year end (a+b-c) (126,337) (126,337)
22 CSIR Fellowshipa) Opening Balance 132,676 294,284 b) Additions to the funds:- 112,000 i) Grant-in-aid 105,484
Total (a+b) 244,676 399,768 c) Utilisation/Expenditure towards objective of funds i) Capital Expenditure - Fixed Assets ii) Revenue Expenditure 112,920 267,092 iii) Refunded back to EMR New Delhi 19,080
Total (c) 132,000 267,092 Net Balance as at year end (a+b-c) 112,676 132,676
23 INSPIRE-DSTa) Opening Balance 1,887,942 1,984,256 b) Additions to the funds:- i) Grant-in-aid 1,983,199 1,439,661
Total (a+b) 3,871,141 3,423,917 c) Utilisation/Expenditure towards objective of funds i) Capital Expenditure - Fixed Assets 61,048 ii) Revenue Expenditure 1,719,047 1,535,975
Total (c) 1,780,095 1,535,975 Net Balance as at year end (a+b-c) 2,091,046 1,887,942
24 IGC Meetinga) Opening Balance - b) Additions to the funds:- i) Grant-in-aid 900,000
Total (a+b) - 900,000 c) Utilisation/Expenditure towards objective of funds i) Capital Expenditure - Fixed Assets ii) Revenue Expenditure 900,000
Total (c) - 900,000 Net Balance as at year end (a+b-c) - -
25 BIRAC-Patent-CRS Scheme Expensesa) Opening Balance - b) Additions to the funds:- - i) Grant-in-aid 300,000 450,000
Total (a+b) 300,000 450,000 c) Utilisation/Expenditure towards objective of funds i) Capital Expenditure - Fixed Assets - ii) Revenue Expenditure 300,000 450,000
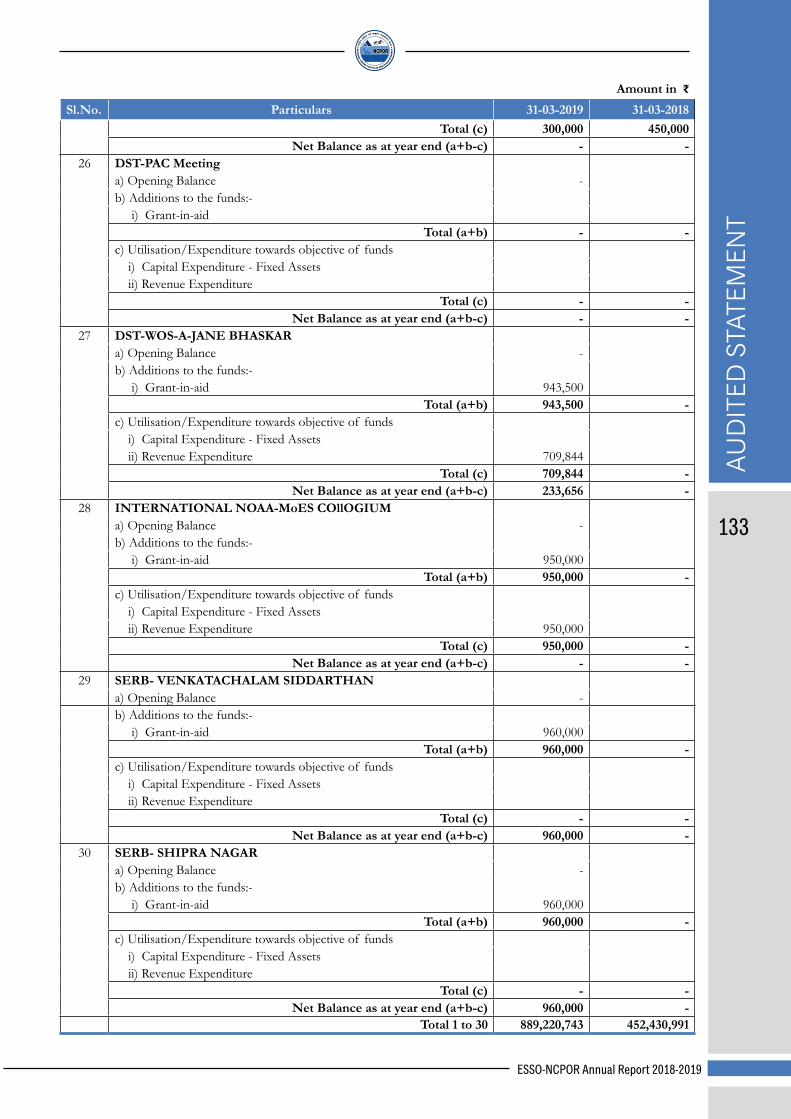
AUD
ITED
STA
TEM
ENT
ESSO-NCPOR Annual Report 2018-2019
133
Amount in ₹ Sl.No. Particulars 31-03-2019 31-03-2018
Total (c) 300,000 450,000 Net Balance as at year end (a+b-c) - -
26 DST-PAC Meetinga) Opening Balance - b) Additions to the funds:- i) Grant-in-aid
Total (a+b) - - c) Utilisation/Expenditure towards objective of funds i) Capital Expenditure - Fixed Assets ii) Revenue Expenditure
Total (c) - - Net Balance as at year end (a+b-c) - -
27 DST-WOS-A-JANE BHASKARa) Opening Balance - b) Additions to the funds:- i) Grant-in-aid 943,500
Total (a+b) 943,500 - c) Utilisation/Expenditure towards objective of funds i) Capital Expenditure - Fixed Assets ii) Revenue Expenditure 709,844
Total (c) 709,844 - Net Balance as at year end (a+b-c) 233,656 -
28 INTERNATIONAL NOAA-MoES COllOGIUM a) Opening Balance - b) Additions to the funds:- i) Grant-in-aid 950,000
Total (a+b) 950,000 - c) Utilisation/Expenditure towards objective of funds i) Capital Expenditure - Fixed Assets ii) Revenue Expenditure 950,000
Total (c) 950,000 - Net Balance as at year end (a+b-c) - -
29 SERB- VENKATACHALAM SIDDARTHANa) Opening Balance - b) Additions to the funds:- i) Grant-in-aid 960,000
Total (a+b) 960,000 - c) Utilisation/Expenditure towards objective of funds i) Capital Expenditure - Fixed Assets ii) Revenue Expenditure
Total (c) - - Net Balance as at year end (a+b-c) 960,000 -
30 SERB- SHIPRA NAGARa) Opening Balance - b) Additions to the funds:- i) Grant-in-aid 960,000
Total (a+b) 960,000 - c) Utilisation/Expenditure towards objective of funds i) Capital Expenditure - Fixed Assets ii) Revenue Expenditure
Total (c) - - Net Balance as at year end (a+b-c) 960,000 -
Total 1 to 30 889,220,743 452,430,991
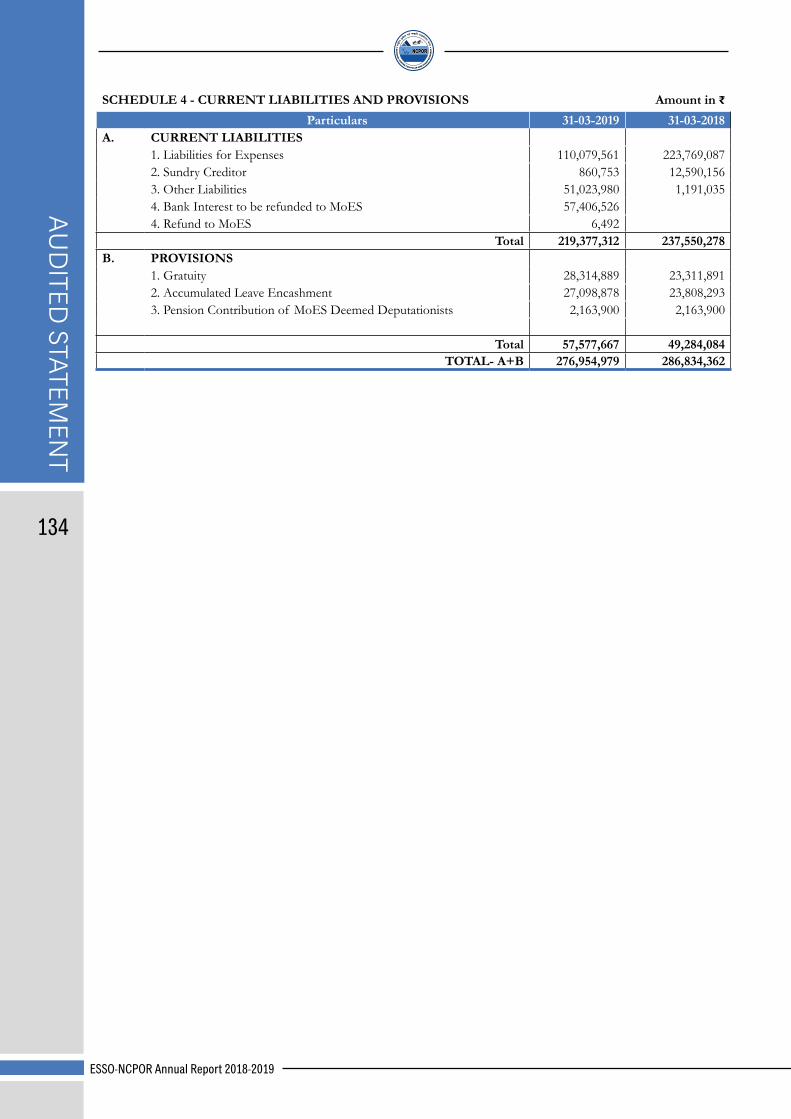
AUD
ITED STATEM
ENT
ESSO-NCPOR Annual Report 2018-2019
134
SCHEDULE 4 - CURRENT LIABILITIES AND PROVISIONS Amount in ₹ Particulars 31-03-2019 31-03-2018
A. CURRENT LIABILITIES1. Liabilities for Expenses 110,079,561 223,769,087 2. Sundry Creditor 860,753 12,590,156 3. Other Liabilities 51,023,980 1,191,035 4. Bank Interest to be refunded to MoES 57,406,526 4. Refund to MoES 6,492
Total 219,377,312 237,550,278 B. PROVISIONS
1. Gratuity 28,314,889 23,311,891 2. Accumulated Leave Encashment 27,098,878 23,808,293 3. Pension Contribution of MoES Deemed Deputationists 2,163,900 2,163,900
Total 57,577,667 49,284,084 TOTAL- A+B 276,954,979 286,834,362
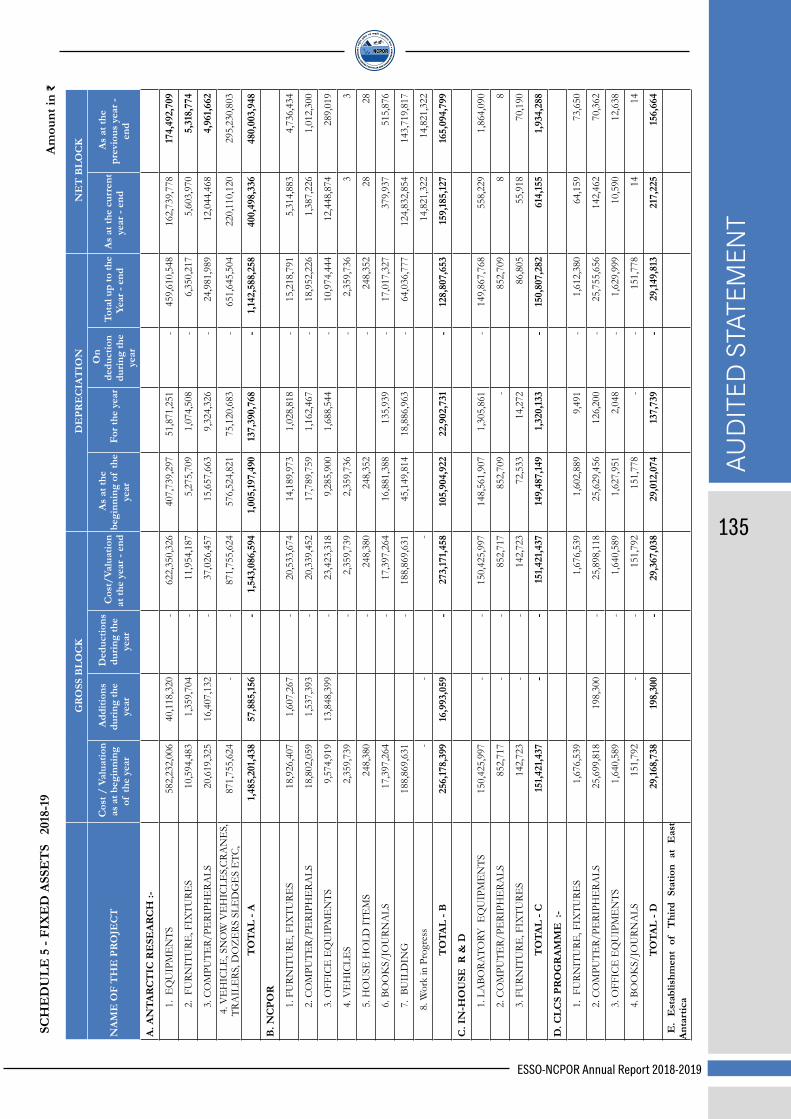
AUD
ITED
STA
TEM
ENT
ESSO-NCPOR Annual Report 2018-2019
135
GR
OSS
BLO
CK
D
EPR
EC
IAT
ION
N
ET
BLO
CK
NA
ME
OF
TH
E P
RO
JEC
T
Cos
t / V
alua
tion
as a
t beg
inni
ng
of th
e ye
ar
Add
ition
s du
ring
the
year
Ded
uctio
ns
durin
g th
e ye
ar
Cos
t/Va
luat
ion
at th
e ye
ar -
end
As
at th
e be
ginn
ing
of th
e ye
ar
Fo
r the
yea
r
On
dedu
ctio
n du
ring
the
year
Tot
al u
p to
the
Year
- en
d A
s at
the
curr
ent
year
- en
d
As
at th
e pr
evio
us y
ear -
en
d
A. A
NTA
RC
TIC
RE
SEA
RC
H :-
1. E
QU
IPM
EN
TS
582
,232
,006
4
0,11
8,32
0 -
622
,350
,326
4
07,7
39,2
97
51,
871,
251
- 4
59,6
10,5
48
162
,739
,778
1
74,4
92,7
09
2. F
URN
ITU
RE, F
IXTU
RES
10,
594,
483
1,3
59,7
04
- 1
1,95
4,18
7 5
,275
,709
1
,074
,508
-
6,3
50,2
17
5,6
03,9
70
5,3
18,7
74
3. C
OM
PUTE
R/PE
RIPH
ERA
LS
20,
619,
325
16,
407,
132
- 3
7,02
6,45
7 1
5,65
7,66
3 9
,324
,326
-
24,
981,
989
12,
044,
468
4,9
61,6
62
4.
VE
HIC
LE, S
NO
W V
EH
ICLE
S,C
RAN
ES,
TR
AIL
ERS
, DO
ZE
RS S
LED
GE
S E
TC,
871
,755
,624
-
- 8
71,7
55,6
24
576
,524
,821
7
5,12
0,68
3 -
651
,645
,504
2
20,1
10,1
20
295
,230
,803
TO
TAL
- A
1,4
85,2
01,4
38
57,
885,
156
- 1
,543
,086
,594
1
,005
,197
,490
13
7,39
0,76
8 -
1,1
42,5
88,2
58
400
,498
,336
4
80,0
03,9
48
B. N
CPO
R
1. F
URN
ITU
RE, F
IXTU
RES
18,
926,
407
1,6
07,2
67
- 2
0,53
3,67
4 1
4,18
9,97
3 1
,028
,818
-
15,
218,
791
5,3
14,8
83
4,7
36,4
34
2. C
OM
PUTE
R/PE
RIPH
ERA
LS
18,
802,
059
1,5
37,3
93
- 2
0,33
9,45
2 1
7,78
9,75
9 1
,162
,467
-
18,
952,
226
1,3
87,2
26
1,0
12,3
00
3. O
FFIC
E E
QU
IPM
EN
TS
9,5
74,9
19
13,
848,
399
- 2
3,42
3,31
8 9
,285
,900
1
,688
,544
-
10,
974,
444
12,
448,
874
289
,019
4. V
EH
ICLE
S 2
,359
,739
-
2,3
59,7
39
2,3
59,7
36
- 2
,359
,736
3
3
5. H
OU
SE H
OLD
ITE
MS
248
,380
-
248
,380
2
48,3
52
- 2
48,3
52
28
28
6. B
OO
KS/
JOU
RNA
LS
17,
397,
264
- 1
7,39
7,26
4 1
6,88
1,38
8 1
35,9
39
- 1
7,01
7,32
7 3
79,9
37
515
,876
7. B
UIL
DIN
G
188
,869
,631
-
188
,869
,631
4
5,14
9,81
4 1
8,88
6,96
3 -
64,
036,
777
124
,832
,854
1
43,7
19,8
17
8
. Wor
k in
Pro
gres
s -
- -
14,
821,
322
14,
821,
322
TO
TAL
- B
256
,178
,399
1
6,99
3,05
9 -
273
,171
,458
1
05,9
04,9
22
22,
902,
731
- 1
28,8
07,6
53
159
,185
,127
1
65,0
94,7
99
C. I
N-H
OU
SE R
& D
1. L
ABO
RATO
RY E
QU
IPM
EN
TS
150
,425
,997
-
- 1
50,4
25,9
97
148
,561
,907
1
,305
,861
-
149
,867
,768
5
58,2
29
1,8
64,0
90
2. C
OM
PUTE
R/PE
RIPH
ERA
LS
852
,717
-
- 8
52,7
17
852
,709
-
852
,709
8
8
3. F
URN
ITU
RE, F
IXTU
RES
142
,723
-
- 1
42,7
23
72,
533
14,
272
86,
805
55,
918
70,
190
TO
TAL
- C
151
,421
,437
-
- 1
51,4
21,4
37
149
,487
,149
1
,320
,133
-
150
,807
,282
6
14,1
55
1,9
34,2
88
D. C
LCS
PRO
GR
AM
ME
:-
1. F
URN
ITU
RE, F
IXTU
RES
1,6
76,5
39
1,6
76,5
39
1,6
02,8
89
9,4
91
- 1
,612
,380
6
4,15
9 7
3,65
0
2. C
OM
PUTE
R/PE
RIPH
ERA
LS
25,
699,
818
198
,300
-
25,
898,
118
25,
629,
456
126
,200
-
25,
755,
656
142
,462
7
0,36
2
3. O
FFIC
E E
QU
IPM
EN
TS
1,6
40,5
89
- 1
,640
,589
1
,627
,951
2
,048
-
1,6
29,9
99
10,
590
12,
638
4. B
OO
KS/
JOU
RNA
LS
151
,792
-
- 1
51,7
92
151
,778
-
- 1
51,7
78
14
14
TO
TAL
- D
29,
168,
738
198
,300
-
29,
367,
038
29,
012,
074
137
,739
-
29,
149,
813
217
,225
1
56,6
64
E.
Est
ablis
hmen
t of
Thi
rd S
tatio
n at
Eas
t A
ntar
tica
SC
HE
DU
LE 5
- FI
XE
D A
SSE
TS
201
8-19
A
mou
nt in
₹

AUD
ITED STATEM
ENT
ESSO-NCPOR Annual Report 2018-2019
136
GR
OSS
BLO
CK
D
EPR
EC
IAT
ION
N
ET
BLO
CK
NA
ME
OF
TH
E P
RO
JEC
T
Cos
t / V
alua
tion
as a
t beg
inni
ng
of th
e ye
ar
Add
ition
s du
ring
the
year
Ded
uctio
ns
durin
g th
e ye
ar
Cos
t/Va
luat
ion
at th
e ye
ar -
end
As
at th
e be
ginn
ing
of th
e ye
ar
Fo
r the
yea
r
On
dedu
ctio
n du
ring
the
year
Tot
al u
p to
the
Year
- en
d A
s at
the
curr
ent
year
- en
d
As
at th
e pr
evio
us y
ear -
en
d
1. E
QU
IPM
EN
T 1
3,03
9,22
8 -
13,
039,
228
12,
838,
549
191
,064
-
13,
029,
613
9,6
15
200
,679
2. S
NO
W V
EH
ICLE
S,C
RAN
E
,TRA
ILE
RS,D
OZ
ERS
SLE
DG
ES
ETC
,
1
22,8
52,9
09
- 1
22,8
52,9
09
122
,102
,070
7
50,8
33
- 1
22,8
52,9
03
6
750
,839
3
. BU
ILD
ING
2
,465
,537
,496
-
2,4
65,5
37,4
96
1,6
41,3
95,8
08
246
,553
,750
1
,887
,949
,558
5
77,5
87,9
38
824
,141
,688
4
. CO
MPU
TER/
PERI
PHE
RALS
1
,443
,079
1
,443
,079
1
,443
,077
1
,443
,077
2
2
TO
TAL
- E
2,6
02,8
72,7
12
- -
2,6
02,8
72,7
12
1,7
77,7
79,5
04
247,
495,
647
- 2
,025
,275
,151
5
77,5
97,5
61
825
,093
,208
F. O
RV
SA
GA
R K
AN
YA :-
1. C
OM
PUTE
R/PE
RIPH
ERA
LS
4,8
26,8
15
- 4
,826
,815
4
,574
,463
1
68,2
21
- 4
,742
,684
8
4,13
1 2
52,3
52
2. E
QU
IPM
EN
TS
26,
391,
237
1,1
81,5
12
27,
572,
749
15,
488,
840
3,0
52,1
24
- 1
8,54
0,96
4 9
,031
,785
1
0,90
2,39
7
3. F
URN
ITU
RE &
FIX
TURE
S 1
5,72
9 7
65,6
00
- 7
81,3
29
12,
014
76,
560
- 8
8,57
4 6
92,7
55
3,7
15
TO
TAL
- F
31,
233,
781
1,9
47,1
12
- 3
3,18
0,89
3 2
0,07
5,31
7 3
,296
,905
-
23,
372,
222
9,8
08,6
71
11,
158,
464
G. S
EA
BE
D S
UR
VE
Y O
F E
EZ
:-
1.
CO
MPU
TER
& P
ERI
PHE
RALS
2
,325
,353
5
91,0
00
- 2
,916
,353
2
,110
,904
1
18,2
00
- 2
,229
,104
6
87,2
49
214
,449
2.
EQ
UIP
ME
NTS
8
3,89
1,05
4 -
83,
891,
054
81,
372,
881
369
,921
-
81,
742,
802
2,1
48,2
52
2,5
18,1
73
3
. FU
RNIT
URE
& F
IXTU
RES
495
,820
-
495
,820
2
30,9
33
49,
582
280
,515
2
15,3
05
264
,887
TO
TAL
- G
86,
712,
227
591
,000
-
87,
303,
227
83,
714,
718
537
,703
-
84,
252,
421
3,0
50,8
06
2,9
97,5
09
H. C
HA
RT
ER
ING
OF
A.B
OR
IS P
ET
RO
V
-PM
N
PR
OG
RA
MM
E &
DE
VE
LOPM
EN
T
1.
EQ
UIP
ME
NT
42,
350
- -
42,
350
42,
349
- -
42,
349
1
1
2.
CO
MPU
TER
& P
ERI
PHE
RALS
1
28,8
68
- 1
28,8
68
128
,866
-
- 1
28,8
66
2
2
TO
TAL
- H
171
,218
-
- 1
71,2
18
171
,215
-
- 1
71,2
15
3
3
I.
SOU
TH
ER
N O
CE
AN
OG
RA
PHIC
ST
UD
IES
1.
CO
MPU
TER
& P
ERI
PHE
RALS
1
,892
,967
6
6,00
0 -
1,9
58,9
67
1,7
10,6
72
139
,175
-
1,8
49,8
47
109
,120
1
82,2
95
2.
EQ
UIP
ME
NTS
1
87,2
89,7
11
1,6
70,3
46
- 1
88,9
60,0
57
86,
834,
391
24,
796,
065
- 1
11,6
30,4
56
77,
329,
601
100
,455
,320
3.
FU
RNIT
URE
& F
IXTU
RES
298
,797
1
1,00
0 3
09,7
97
113
,411
2
3,20
0 1
36,6
11
173
,186
1
85,3
86
TO
TAL
- I
189
,481
,475
1
,747
,346
-
191
,228
,821
8
8,65
8,47
4 2
4,95
8,44
0 -
113
,616
,914
7
7,61
1,90
7 1
00,8
23,0
01
J. O
RV
SA
GA
R K
AN
YA (C
LCS
CR
UIS
E) :
-
1
. EQ
UIP
ME
NTS
2
,876
,005
-
- 2
,876
,005
2
,876
,003
-
- 2
,876
,003
2
2
TO
TAL
- J
2,8
76,0
05
2,8
76,0
05
2,8
76,0
03
- -
2,8
76,0
03
2
2

AUD
ITED
STA
TEM
ENT
ESSO-NCPOR Annual Report 2018-2019
137
GR
OSS
BLO
CK
D
EPR
EC
IAT
ION
N
ET
BLO
CK
NA
ME
OF
TH
E P
RO
JEC
T
Cos
t / V
alua
tion
as a
t beg
inni
ng
of th
e ye
ar
Add
ition
s du
ring
the
year
Ded
uctio
ns
durin
g th
e ye
ar
Cos
t/Va
luat
ion
at th
e ye
ar -
end
As
at th
e be
ginn
ing
of th
e ye
ar
Fo
r the
yea
r
On
dedu
ctio
n du
ring
the
year
Tot
al u
p to
the
Year
- en
d A
s at
the
curr
ent
year
- en
d
As
at th
e pr
evio
us y
ear -
en
d
K. P
MN
PR
OG
RA
MM
E
(
SUR
VE
Y &
EX
PLO
RA
TIO
N.)
1
. EQ
UIP
ME
NTS
1
,514
,720
-
- 1
,514
,720
1
,514
,718
-
- 1
,514
,718
2
2
TO
TAL
- K
1,5
14,7
20
1,5
14,7
20
1,5
14,7
18
- -
1,5
14,7
18
2
2
L. P
MN
PR
OG
RA
MM
E C
TD
PRO
CU
RE
ME
NT
1
. EQ
UIP
ME
NTS
2
,921
,851
-
- 2
,921
,851
2
,921
,849
-
- 2
,921
,849
2
2
TO
TAL
- L
2,9
21,8
51
2,9
21,8
51
2,9
21,8
49
- -
2,9
21,8
49
2
2
M. L
AX
MI
BA
SIN
ST
UD
Y
1.
CO
MPU
TER
& P
ERI
PHE
RALS
1
,596
,708
-
- 1
,596
,708
1
,596
,704
-
- 1
,596
,704
4
4
TO
TAL
- M
1,5
96,7
08
1,5
96,7
08
1,5
96,7
04
- -
1,5
96,7
04
4
4
N.
IT &
E -G
OV
ER
NA
NC
E
1.
CO
MPU
TER
& P
ERI
PHE
RALS
9
,952
,466
-
9,9
52,4
66
9,9
52,4
50
- 9
,952
,450
1
6 1
6
2.
EQ
UIP
ME
NTS
9
9,33
6 -
99,
336
95,
555
- 9
5,55
5 3
,781
3
,781
TO
TAL
- N
10,
051,
802
- -
10,
051,
802
10,
048,
005
- -
10,
048,
005
3,7
97
3,7
97
O.
EX
PED
ITIO
N T
O A
RC
TIC
1.
EQ
UIP
ME
NT
100
,264
,257
2
7,78
2,14
1 -
128
,046
,398
5
6,02
2,93
8 1
7,54
7,30
6 -
73,
570,
244
54,
476,
154
44,
241,
319
2.
CO
MPU
TER
& P
ERI
PHE
RALS
1
,774
,818
-
1,7
74,8
18
1,4
49,8
67
225
,643
-
1,6
75,5
10
99,
308
324
,951
3.
FU
RNIT
URE
& F
IXTU
RE
1,1
06,5
92
- 1
,106
,592
3
70,0
10
110
,654
-
480
,664
6
25,9
28
736
,582
TO
TAL
- O
103
,145
,667
2
7,78
2,14
1 -
130
,927
,808
5
7,84
2,81
5 1
7,88
3,60
3 -
75,
726,
418
55,
201,
390
45,
302,
852
P. T
EC
TO
NIC
& O
CE
AN
IC P
RO
CE
SSE
S A
LON
G R
IDG
E I
ND
IAN
SY
STE
M
1.
EQ
UIP
ME
NTS
6
,857
,676
-
- 6
,857
,676
6
,857
,675
-
- 6
,857
,675
1
1
TO
TAL
- P
6,8
57,6
76
6,8
57,6
76
6,8
57,6
75
- -
6,8
57,6
75
1
1
Q. S
OU
TH
ER
N I
ND
IAN
OC
EA
N S
TU
DIE
S
ISR
O B
AN
GA
LOR
E
1.
CO
MPU
TER
& P
ERI
PHE
RALS
7
5,96
1 -
- 7
5,96
1 7
5,96
0 -
- 7
5,96
0 1
1
TO
TAL
- Q
75,
961
75,
961
75,
960
- -
75,
960
1
1
R. S
ED
IME
NT
CO
RE
ST
UD
IES
BE
TW
EE
N
NC
POR
& O
NG
C, M
UM
BA
I
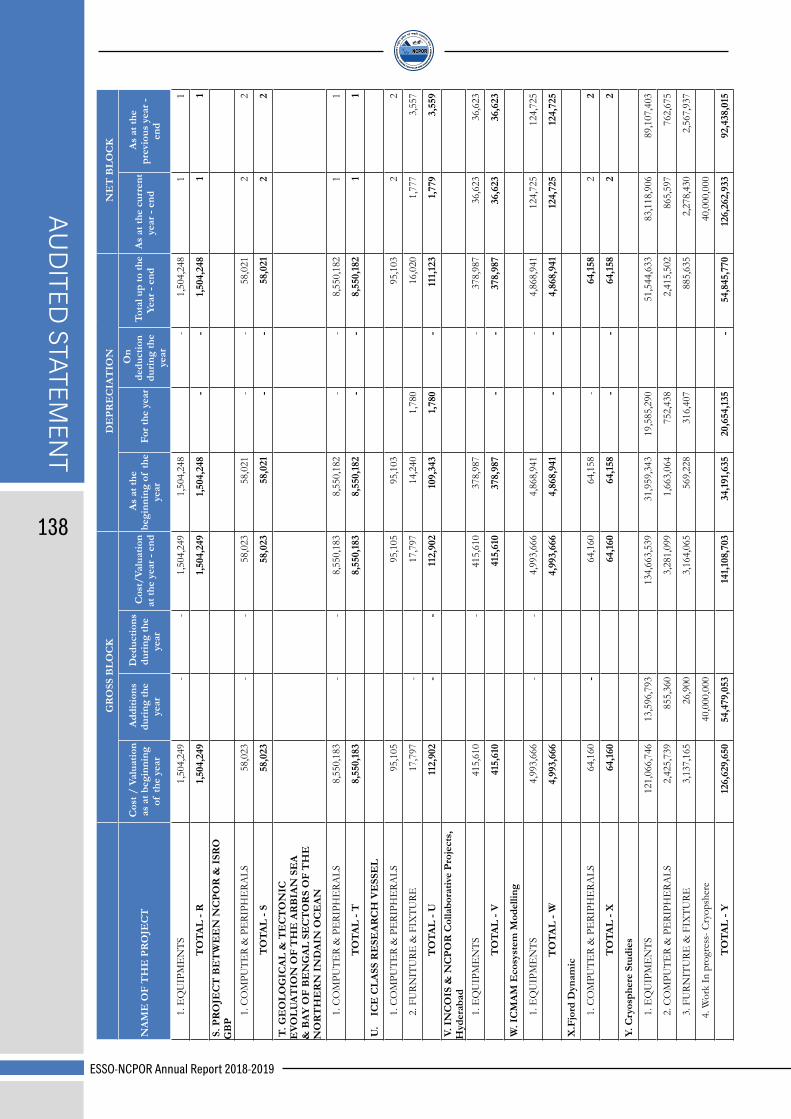
AUD
ITED STATEM
ENT
ESSO-NCPOR Annual Report 2018-2019
138
GR
OSS
BLO
CK
D
EPR
EC
IAT
ION
N
ET
BLO
CK
NA
ME
OF
TH
E P
RO
JEC
T
Cos
t / V
alua
tion
as a
t beg
inni
ng
of th
e ye
ar
Add
ition
s du
ring
the
year
Ded
uctio
ns
durin
g th
e ye
ar
Cos
t/Va
luat
ion
at th
e ye
ar -
end
As
at th
e be
ginn
ing
of th
e ye
ar
Fo
r the
yea
r
On
dedu
ctio
n du
ring
the
year
Tot
al u
p to
the
Year
- en
d A
s at
the
curr
ent
year
- en
d
As
at th
e pr
evio
us y
ear -
en
d
1.
EQ
UIP
ME
NTS
1
,504
,249
-
- 1
,504
,249
1
,504
,248
-
1,5
04,2
48
1
1
TO
TAL
- R
1,5
04,2
49
1,5
04,2
49
1,5
04,2
48
- -
1,5
04,2
48
1
1
S. P
RO
JEC
T B
ET
WE
EN
NC
POR
& I
SRO
G
BP
1.
CO
MPU
TER
& P
ERI
PHE
RALS
5
8,02
3 -
- 5
8,02
3 5
8,02
1 -
- 5
8,02
1 2
2
TO
TAL
- S
58,
023
58,
023
58,
021
- -
58,
021
2
2
T. G
EO
LOG
ICA
L &
TE
CT
ON
IC
EV
OLU
AT
ION
OF
TH
E A
RB
IAN
SE
A
& B
AY
OF
BE
NG
AL
SEC
TO
RS
OF
TH
E
NO
RT
HE
RN
IN
DA
IN O
CE
AN
1.
CO
MPU
TER
& P
ERI
PHE
RALS
8
,550
,183
-
- 8
,550
,183
8
,550
,182
-
- 8
,550
,182
1
1
TO
TAL
- T
8,5
50,1
83
8,5
50,1
83
8,5
50,1
82
- -
8,5
50,1
82
1
1
U.
IC
E C
LASS
RE
SEA
RC
H V
ESS
EL
1.
CO
MPU
TER
& P
ERI
PHE
RALS
9
5,10
5 9
5,10
5 9
5,10
3 9
5,10
3 2
2
2.
FU
RNIT
URE
& F
IXTU
RE
17,
797
- 1
7,79
7 1
4,24
0 1
,780
1
6,02
0 1
,777
3
,557
TO
TAL
- U
112
,902
-
- 1
12,9
02
109
,343
1
,780
-
111
,123
1
,779
3
,559
V
. IN
CO
IS &
NC
POR
Col
labo
rativ
e Pr
ojec
ts,
Hyd
erab
ad
1.
EQ
UIP
ME
NTS
4
15,6
10
- 4
15,6
10
378
,987
-
378
,987
3
6,62
3 3
6,62
3
TO
TAL
- V
415
,610
4
15,6
10
378
,987
-
- 3
78,9
87
36,
623
36,
623
W. I
CM
AM
Eco
syst
em M
odel
ling
1.
EQ
UIP
ME
NTS
4
,993
,666
-
- 4
,993
,666
4
,868
,941
-
4,8
68,9
41
124
,725
1
24,7
25
TO
TAL
- W
4,9
93,6
66
4,9
93,6
66
4,8
68,9
41
- -
4,8
68,9
41
124
,725
1
24,7
25
X.F
jord
Dyn
amic
1.
CO
MPU
TER
& P
ERI
PHE
RALS
6
4,16
0 -
64,
160
64,
158
- 6
4,15
8 2
2
TO
TAL
- X
64,
160
64,
160
64,
158
- -
64,
158
2
2
Y. C
ryos
pher
e St
udie
s
1.
EQ
UIP
ME
NTS
1
21,0
66,7
46
13,
596,
793
134
,663
,539
3
1,95
9,34
3 1
9,58
5,29
0 5
1,54
4,63
3 8
3,11
8,90
6 8
9,10
7,40
3
2.
CO
MPU
TER
& P
ERI
PHE
RALS
2
,425
,739
8
55,3
60
3,2
81,0
99
1,6
63,0
64
752
,438
2
,415
,502
8
65,5
97
762
,675
3.
FU
RNIT
URE
& F
IXTU
RE
3,1
37,1
65
26,
900
3,1
64,0
65
569
,228
3
16,4
07
885
,635
2
,278
,430
2
,567
,937
4. W
ork
In p
rogr
ess-
Cry
opsh
ere
40,
000,
000
40,
000,
000
TO
TAL
- Y
126
,629
,650
5
4,47
9,05
3 1
41,1
08,7
03
34,
191,
635
20,
654,
135
- 5
4,84
5,77
0 1
26,2
62,9
33
92,
438,
015

AUD
ITED
STA
TEM
ENT
ESSO-NCPOR Annual Report 2018-2019
139
GR
OSS
BLO
CK
D
EPR
EC
IAT
ION
N
ET
BLO
CK
NA
ME
OF
TH
E P
RO
JEC
T
Cos
t / V
alua
tion
as a
t beg
inni
ng
of th
e ye
ar
Add
ition
s du
ring
the
year
Ded
uctio
ns
durin
g th
e ye
ar
Cos
t/Va
luat
ion
at th
e ye
ar -
end
As
at th
e be
ginn
ing
of th
e ye
ar
Fo
r the
yea
r
On
dedu
ctio
n du
ring
the
year
Tot
al u
p to
the
Year
- en
d A
s at
the
curr
ent
year
- en
d
As
at th
e pr
evio
us y
ear -
en
d
Z. G
eotr
aces
1.
EQ
UIP
ME
NTS
6
,569
,639
-
6,5
69,6
39
4,4
29,3
99
985
,446
5
,414
,845
1
,154
,794
2
,140
,240
TO
TAL
- Z
6,5
69,6
39
6,5
69,6
39
4,4
29,3
99
985
,446
-
5,4
14,8
45
1,1
54,7
94
2,1
40,2
40
Z1.
Geo
id lo
w
1.
CO
MPU
TER
& P
ERI
PHE
RALS
3
,273
,391
4
24,8
00
3,6
98,1
91
1,3
16,1
25
1,0
63,5
92
2,3
79,7
17
1,3
18,4
74
1,9
57,2
66
TO
TAL
- Z1
3,2
73,3
91
424
,800
3
,698
,191
1
,316
,125
1
,063
,592
-
2,3
79,7
17
1,3
18,4
74
1,9
57,2
66
Z 2
.Hyd
ro T
herm
al P
rogr
amm
e
1.
EQ
UIP
ME
NTS
1
11,1
36,8
01
7,1
98,0
00
118
,334
,801
3
0,52
5,03
8 1
7,69
6,23
5 4
8,22
1,27
3 7
0,11
3,52
8 8
0,61
1,76
3
2.
CO
MPU
TER
& P
ERI
PHE
RALS
1
,203
,185
1
,203
,185
6
21,4
89
290
,846
9
12,3
35
290
,850
5
81,6
96
3.
FU
RNIT
URE
& F
IXTU
RE
719
,357
7
19,3
57
147
,888
7
1,93
6 2
19,8
24
499
,533
5
71,4
69
TO
TAL
- Z2
113
,059
,343
7
,198
,000
1
20,2
57,3
43
31,
294,
415
18,
059,
017
- 4
9,35
3,43
2 7
0,90
3,91
1 8
1,76
4,92
8
Z 3
.Koy
n IC
DP
1
. EQ
UIP
ME
NTS
2
4,08
8,89
0 6
95,2
20
24,
784,
110
7,3
57,7
95
3,7
17,6
19
11,
075,
414
13,
708,
696
16,
731,
095
2
. CO
MPU
TER
& P
ERI
PHE
RALS
2
,839
,266
2
,839
,266
2
,810
,066
2
9,18
8 2
,839
,254
1
2 2
9,20
0
3
. FU
RNIT
URE
& F
IXTU
RE
2,4
01,6
78
2,4
01,6
78
717
,632
2
40,1
67
957
,799
1
,443
,879
1
,684
,046
4
. Bui
ldin
g 2
15,9
23,5
20
162
,906
,480
3
78,8
30,0
00
21,
058,
939
29,
737,
675
50,
796,
614
328
,033
,386
1
94,8
64,5
81
5
.Wor
k in
pro
gres
s -
Build
ing
- 7
4,07
6,48
0
TO
TAL
- Z3
245
,253
,354
1
63,6
01,7
00
- 4
08,8
55,0
54
31,
944,
432
33,
724,
649
- 6
5,66
9,08
1 3
43,1
85,9
73
287
,385
,402
Z 4
.IO
DP
1
. EQ
UIP
ME
NTS
1
,848
,409
1
,848
,409
5
27,7
02
277
,261
8
04,9
63
1,0
43,4
46
1,3
20,7
07
2
. FU
RNIT
URE
& F
IXTU
RE
34,
865
34,
865
5,2
30
3,4
87
8,7
17
26,
149
29,
635
TO
TAL
-Z4
1,8
83,2
74
- -
1,8
83,2
74
532
,932
2
80,7
48
- 8
13,6
80
1,0
69,5
94
1,3
50,3
42
IN
SPIR
E-S
HR
AM
IK P
AT
IL
1. C
OM
PUTE
RS &
PE
RIPH
ERA
LS
- 6
1,04
8 6
1,04
8 -
12,
210
12,
210
48,
838
-
TO
TAL
-Z5
- 6
1,04
8 -
61,
048
- 1
2,21
0 -
12,
210
48,
838
-
TO
TAL
OF
CU
RR
EN
T Y
EA
R
5,4
73,8
49,2
59
332
,908
,715
-
5,7
66,7
57,9
74
3,4
62,9
77,4
10
530
,705
,247
-
3,9
93,6
82,6
57
1,8
27,8
96,6
40
2,0
99,7
69,6
51
TO
TAL
OF
PRE
VIO
US
YE
AR
5
,099
,761
,939
3
74,0
87,3
20
- 5
,473
,849
,259
2
,961
,909
,381
5
01,0
68,0
29
3,4
62,9
77,4
10
2,0
99,7
69,6
51
2,2
84,5
03,3
13

AUD
ITED STATEM
ENT
ESSO-NCPOR Annual Report 2018-2019
140
NATIONAL CENTRE FOR POLAR AND OCEAN RESEARCH(Ministry of Earth Sciences, Govt. of India)
Headland Sada, Vasco-Da-Gama, Goa-403804
INCOME AND EXPENDITURE ACCOUNT FOR THE YEAR ENDED 31-03-2019 Amount in ₹
INCOME SCH.NO. 31-03-2019 31-03-2018 Grants 7 2,252,263,231 3,400,452,817 Income from Services 8 125,666 52,254,177 Interest Earned 9 62,782,138 272,465 Other Income 10 935,010 612,581
TOTAL 2,316,106,045 3,453,592,040 EXPENDITURE
1) Antarctic Research 11 761,680,634 1,041,741,145 2) NCPOR 12 195,617,893 166,158,981 3) Indian Arctic Programme 13 59,831,128 53,944,009 4) CLCS Programme 14 4,031,624 5,047,769 5) Other Projects 15 700,396,706 1,632,492,884 Depreciation (as per schedule 5):- 1. Antarctic Research 137,390,768 128,191,978 2. Establishment of Third Station in Antarctica 247,495,647 251,919,961 3. Southern Oceanographic Studies 24,958,440 24,783,321 4. NCPOR 22,902,731 21,042,801 5. In-House R & D 1,320,133 2,052,830 6. Indian Arctic Programme 17,883,603 13,727,610 7. CLCS Programme 137,739 194,962 8. ORV Sagar Kanya 3,296,905 1,279,489 9. Sea Bed Survey of Exclusive Economic Zone 537,703 870,075 10. Koyna-ICDP 33,724,649 19,904,899 11. Geoid Low Programme 1,063,592 530,240 12. Integrated Ocean Drilling Programme (IODP) 280,748 280,748 13. IT & e-Governance - 5,670 14. Ice Class Research Vessel 1,780 1,780 15. Cryosphere & Climate Studies 20,654,135 18,372,713 16. Geotraces Research Programme 985,446 985,446 17. Hydro Thermal Programme 18,059,017 16,114,815 18. ICMAM-Ecosystem Modelling - 748,820 19. Project between NCPOR & INCOIS - 59,871 20. Chartering of A.Boris Petrov - - 21. Inspire Sharmik 12,210 -
TOTAL 2,252,263,231 3,400,452,817 Balance being excess of Income over Expenditure 63,842,814 53,139,223
1. Balance being surplus carried to Balance Sheet- Schedule 1 Corpus/Capital Fund a. Other Income 935,010 612,581 b. Income from Service at NCPOR 125,666 52,254,177 2. Interest earned-transferred to Balance Sheet 16 62,782,138 272,465
TOTAL 63,842,814 53,139,223
As per our report of even date FOR GANESH DAIVAJNA & CO. CHARTERED ACCOUNTANTS
Firm Regn No.103054W
For National Centre for Polar and Ocean Research
(M.M. SUBRAMANIAM) (DR. M. RAVICHANDRAN) (NAVEEN G. DAIVAJNA) Manager-I/C Director Partner
M.No.126231 Place : Headland Sada, Goa. UDIN: 19126231AAAADT1323Date : 30/08/2019

AUD
ITED
STA
TEM
ENT
ESSO-NCPOR Annual Report 2018-2019
141
SCHEDULE – 6 CURRENT ASSETS LOANS ADVANCES Amount in ₹
31-03-2019 31-03-2018 A CURRENT ASSETS 1 Cash Balances – In Hand :- - 2,807.00
Closing Cash Balance - 2 Bank Balances :-
a) With Scheduled Banks: In Short Term Deposits Account 594,394,478.00 429,549,402.00 In SBI Savings Bank Account No.10153336180 106,277,715.18 462,428,873.00 In SBI Savings Bank Account No.36706713855 57,992,259.34 2,061.00 In SBI Savings Bank Account No.37629472025 124,115,443.92 In SBI Savings Bank Account No.37629471644 38,384,470.92 In SBI Savings Bank Account No.37629466168 331,414,381.22 In SBI Savings Bank Account No.38051184043 8,554.16
TOTAL (A) 1,252,587,302.74 891,983,143.00 B LOANS ADVANCES AND OTHER ASSETS 1 Advances and other amounts recoverable in cash or in kind :-
a) Staff & Others- NCPOR 2,289,608.00 1,190,884.00 b) Antarctic Research Advances 93,139,954.00 46,737,123.00 c) Indian Arctic Programme Advances 479,974.00 261,058.00 d) Cryosphere & Climate Studies Advances 13,135,082.00 - e) Koyna- ICDP Advances - 50,000.00
f) Other Advances 11,702,932.00 65,000.00
Total-1 120,747,550.00 48,304,065.00 2 Others - Deposits
a) Indian Oil Corporation Ltd. 135,000.00 135,000.00 b) VSNL 120,000.00 120,000.00 c) Vasco Gas Services 3,000.00 3,000.00 d) MPT Hospital 408,000.00 408,000.00 e) Airtel 5,000.00 5,000.00 f) Post Office Vasco 1,000.00 1,000.00 g) Goa Gas Service 2,850.00 2,850.00 h) BSNL 27,300.00 27,300.00 i) Electricity Dept. Goa 13,100.00 13,100.00 j) Govind Poy Oxygen Ltd. 207,250.00 207,250.00 k) Gomantak Gas Goa 4,700.00 4,700.00 l) Antrix Corporation Ltd. 3,592,035.00 3,592,035.00
Total-2 4,519,235.00 4,519,235.00 3 Receivables
a) Bank Interest 597,023.00 268,003.00 Total-3 597,023.00 268,003.00
TOTAL (A + B) 1,378,451,110.74 945,074,446.00
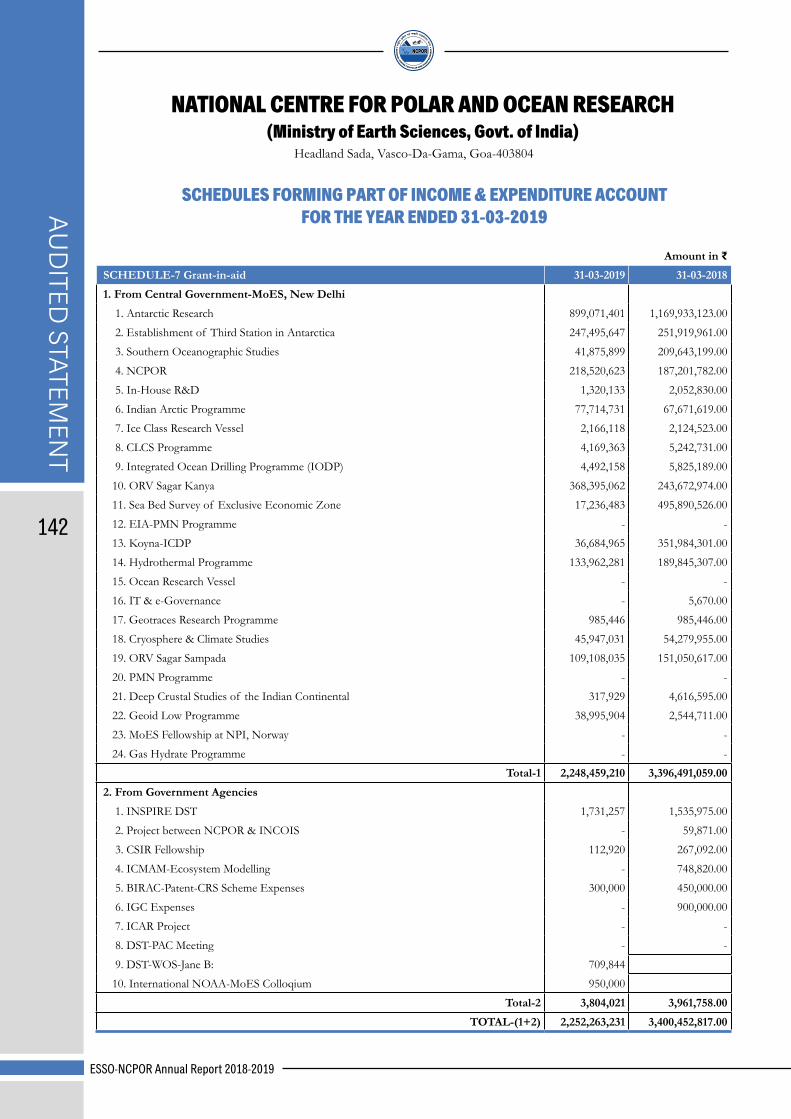
AUD
ITED STATEM
ENT
ESSO-NCPOR Annual Report 2018-2019
142
NATIONAL CENTRE FOR POLAR AND OCEAN RESEARCH(Ministry of Earth Sciences, Govt. of India)
Headland Sada, Vasco-Da-Gama, Goa-403804
SCHEDULES FORMING PART OF INCOME & EXPENDITURE ACCOUNT FOR THE YEAR ENDED 31-03-2019
Amount in ₹ SCHEDULE-7 Grant-in-aid 31-03-2019 31-03-2018
1. From Central Government-MoES, New Delhi
1. Antarctic Research 899,071,401 1,169,933,123.00
2. Establishment of Third Station in Antarctica 247,495,647 251,919,961.00
3. Southern Oceanographic Studies 41,875,899 209,643,199.00
4. NCPOR 218,520,623 187,201,782.00
5. In-House R&D 1,320,133 2,052,830.00
6. Indian Arctic Programme 77,714,731 67,671,619.00
7. Ice Class Research Vessel 2,166,118 2,124,523.00
8. CLCS Programme 4,169,363 5,242,731.00
9. Integrated Ocean Drilling Programme (IODP) 4,492,158 5,825,189.00
10. ORV Sagar Kanya 368,395,062 243,672,974.00
11. Sea Bed Survey of Exclusive Economic Zone 17,236,483 495,890,526.00
12. EIA-PMN Programme - -
13. Koyna-ICDP 36,684,965 351,984,301.00
14. Hydrothermal Programme 133,962,281 189,845,307.00
15. Ocean Research Vessel - -
16. IT & e-Governance - 5,670.00
17. Geotraces Research Programme 985,446 985,446.00
18. Cryosphere & Climate Studies 45,947,031 54,279,955.00
19. ORV Sagar Sampada 109,108,035 151,050,617.00
20. PMN Programme - -
21. Deep Crustal Studies of the Indian Continental 317,929 4,616,595.00
22. Geoid Low Programme 38,995,904 2,544,711.00
23. MoES Fellowship at NPI, Norway - -
24. Gas Hydrate Programme - -
Total-1 2,248,459,210 3,396,491,059.00
2. From Government Agencies
1. INSPIRE DST 1,731,257 1,535,975.00
2. Project between NCPOR & INCOIS - 59,871.00
3. CSIR Fellowship 112,920 267,092.00
4. ICMAM-Ecosystem Modelling - 748,820.00
5. BIRAC-Patent-CRS Scheme Expenses 300,000 450,000.00
6. IGC Expenses - 900,000.00
7. ICAR Project - -
8. DST-PAC Meeting - -
9. DST-WOS-Jane B: 709,844
10. International NOAA-MoES Colloqium 950,000
Total-2 3,804,021 3,961,758.00
TOTAL-(1+2) 2,252,263,231 3,400,452,817.00

AUD
ITED
STA
TEM
ENT
ESSO-NCPOR Annual Report 2018-2019
143
SCHEDULE-8-Income from Services
1. Other Receipts 105,300 257,226.00
2. INSPIRE DST 20,366 15,239.00
Total 125,666 272,465.00
Amount in ₹ SCHEDULE-9 -Interest Earned 31-03-2019 31-03-2018
1. On Short Term Deposits
a) With Scheduled Bank 54,293,903 33,906,394.00
b) Accrued interest 231,096
2. On Savings Account
a) Accrued interest 365,927 18,347,783.00
b) With Scheduled Bank 7,891,212
Total 62,782,138 52,254,177.00
Amount in ₹ SCHEDULE-10-Other Income 31-03-2019 31-03-2018
1. Sale of Tender Forms 2,000 95,607.00
2. Guest House Receipts 385,350 286,300.00
3. Licence Fee from Staff Quarters 181,657 159,956.00
4. Miscellaneous Receipts 75,706 19,718.00
5. Disposal Income 272,938 50,000.00
6. Interest on VA/HBA 17,359 1,000.00
Total 935,010 612,581.00
Amount in ₹ SCHEDULE-11-Antarctic Research 31-03-2019 31-03-2018
1. Charter Hire of Ship & Helicopter
1. Charter Hire of Ship 83,916,179 396,698,610.00
2. Charter Hire of Helicopters 89,791,893 68,438,294.00
Total-1 173,708,072 465,136,904.00
2. Expedition to Antarctica
1. Logistic Personnel & Operational Expenses 14,789,235 70,129,322.00
2. Ration & Medicine 12,224,257 4,948,592.00
3. Kit Clothing & Allowance 13,058,841 8,704,743.00
4. Cargo Movement 41,559,209 72,848,187.00
5. Goa Arrangement 1,108,047 34,335,950.00
6. Team Arrangement 134,022,991 152,256,433.00
7. POL 47,342,252 54,526,365.00
8. Publication & Membership Fees 1,576,246 1,910,658.00
9. Lab Accessories 23,907,150 29,850,298.00
10. Advertisment 1,392,718
11. Arbitration Charges 50,000
12. Bunkering 61,552,092
13. Computer Maintenance 2,124,353
14. Meeting 6,308,429
15. MOB/Demob-Ship 46,166,989
16.Office Expenses 5,581,112
17.Printing & Stationery 1,134,383
Amount in ₹

AUD
ITED STATEM
ENT
ESSO-NCPOR Annual Report 2018-2019
144
SCHEDULE-11-Antarctic Research 31-03-2019 31-03-2018
18. Repairs & Maintenance 1,351,223
19. Telephone 2,203,253
20. Third Station Infrastructure (Rev) 0
21. Third Station Manpowe & Operational Exp 29,961,386
22. Victualling 5,001,624
23. Membership Fees(Comnap,Scar Etc.) 1,408,087
24. Salary 30,107,552
25. Wages 4,066,631
26. Travel Domestic 4,788,565
27. Travel Foreign 10,867,488
28. Antarctic,Arctic,Himalaya & SO,Polar Stations 6,106,515
Total-2 509,760,628 429,510,548.00
3. Research Station in Antarctica (Revenue)
1. Station Infrastructure 63,067,068 59,120,534.00
2. Spares for Vehicle & Machinery 12,684,069 60,734,427.00
3. Communication Charges 578,157 313,146.00
4. Earth Station 36,646 26,925,586.00
5. Lab Infrastructure/Scientific Projects 1,845,994
Total-3 78,211,934 147,093,693.00
TOTAL-(1+2+3) 761,680,634 1,041,741,145.00
Amount in ₹ SCHEDULE-12-NCPOR 31-03-2019 31-03-2018
1. Establishment Expenses (Admn. & Manpower)
1. Salaries 94,347,694 84,089,427.00
2. Other Allowances & Adhoc Bonus 12,663 171,846.00
3. Contribution to CPF, EL Encashment, Pension & Gratuity 7,933,900 21,403,499.00
4. Domestic Travel 2,021,234 1,189,333.00
5. Wages 9,139,423 6,564,000.00
Total-1 113,454,914 113,418,105.00
2. Operation & Maintenance
1. Vehicle Running & Maintenance (POL/Transport) 1,993,758 1,434,541.00
2. Electricity Charges 12,113,239 8,905,635.00
3. Water Charges 1,406,107 1,278,904.00
4. Computer Repairs & Maintenance 3,215,217 2,754,238.00
5. Meetings/Conference/Seminars 3,646,901 3,314,459.00
6. Repairs & Maintenance 14,350,282 16,214,719.00
Total-2 36,725,504 33,902,496.00
3. Office Expenditure & Miscellaneous
1. Postage,Telephone & Fax 721,718 861,650.00
2. Printing, Stationery & Stores 910,559 1,101,119.00
3. Security Charges 10,658,054 6,802,156.00
4. House Keeping 7,307,181 4,062,428.00
5. Advertisement & Publicity 3,645,658 963,518.00
6. Auditors Remunerations 58,410 59,895.00
7. Library 2,194,902 1,997,178.00
8. Office Expenses 3,000,846 2,990,436.00
9.Maintenance of Campus 2,740,154 -

AUD
ITED
STA
TEM
ENT
ESSO-NCPOR Annual Report 2018-2019
145
SCHEDULE-12-NCPOR 31-03-2019 31-03-2018
10. LTC 2,667,312 -
11.Medical Exp Reim 2,657,945 -
12. NPS & CPF Contribution 7,641,777 -
13. Tuition Fees Reimbursement 1,224,781 -
14.Travel Foreign 8,178 -
Total-3 45,437,475 18,838,380.00
TOTAL-(1+2+3) 195,617,893 166,158,981.00
Amount in ₹ SCHEDULE-13-Expedition to Arctic 31-03-2019 31-03-2018
1. Logistic Expenses 41,351,501 25,789,500.00
2. Operational Expenses 8,189,413 6,597,300.00
3. Station Expenses 4,557,926 10,437,626.00
4. Scientific Studies Support 5,732,288 11,119,583.00
Total 59,831,128 53,944,009.00
Amount in Rs.
SCHEDULE-14-CLCS Programme 31-03-2019 31-03-2018
1. Manpower, Operational Expenses & Data Storage 4,031,624 4,953,674.00
2. Miscellaneous Expenses - 94,095.00
Total 4,031,624 5,047,769.00
Amount in ₹ SCHEDULE-15-Other Projects 31-03-2019 31-03-2018
1. Southern Oceanographic Studies 16,917,459 184,859,878.00
2. Cryosphere & Climate Studies 25,292,896 35,907,242.00
3. Ocean Research Vessel - -
4. Ice Class Research Vessel 2,164,338 2,122,743.00
5. Integrated Ocean Drilling Programme (IODP) 4,211,409.64 5,544,441.00
6. Deep Crustal Studies of the Indian Continental 317,929 4,616,595.00
7. Geoid Low Programme 37,932,312 2,014,471.00
8. Hydrothermal Programme 115,903,264 173,730,492.00
9. Sea Bed Survey of Exclusive Economic Zone 16,698,780 495,020,451.00
10. ORV Sagar Kanya 365,098,157 242,393,485.00
11. Koyna-ICDP 2,960,315 332,079,402.00
12. INSPIRE DST 1,719,047 1,535,975.00
13. CSIR Fellowship 112,920 267,092.00
14. ORV Sagar Sampada 109,108,035 151,050,617.00
15. BIRAC-Patent-CRS Scheme Expenses 300,000 450,000.00
16. IGC Expenses - 900,000.00
17. DST-WOS-Jane B: 709,844
18. International NOAA-MoES Colloqium 950,000
Total 700,396,706 1,632,492,884.00

AUD
ITED STATEM
ENT
ESSO-NCPOR Annual Report 2018-2019
146
Amount in ₹ SCHEDULE-16-Interest Earned-trabsferred to Balance Sheet 31-03-2019 31-03-2018
A. Schedule-3-Earmarked Funds
1. Antarctic Research - 5,815,116.00
2. Southern Oceanographic Studies - 1,910,556.00
3. Indian Arctic Programme - 1,140,581.00
4. Ice Class Research Vessel - 2,081,502.00
5. Cryosphere & Climate Studies - 3,226,011.00
6. Integrated Ocean Drilling Programme (IODP) - 249,295.00
7. Ocean Research Vessel - 396,039.00
8. CLCS Programme - 5,680,683.00
9. Geoid Low Programme - 6,562,737.00
10. Deep Crustal Studies of the Indian Continental - 608,804.00
11. Hydro Thermal Programme - 1,016,082.00
12. NCPOR - 81,950.00
13. PMN Programme - 195,305.00
14. EIA PMN Programme - 1,766,015.00
15. ORV Sagar Kanya - 487,008.00
16. Koyna - ICDP - 3,623,574.00
17. MoES Fellowship at NPI, Norway - 545,025.00
18. ORV Sagar Sampada - 41,836.00
19. Gas Hydrate Programme - 104,820.00
20. Sea Bed Survey of Exclusive Economic Zone - 2,494,946.00
B. Schedule-1-Corpus/Capital Fund:-Income from Service at NCPOR 5,144,516 14,226,292.00
TOTAL-(A+B) 5,144,516 52,254,177.00
SCHEDULE 17 - SIGNIFICANT ACCOUNTING POLICIES1. ACCOUNTING CONVENTION:-
The financial statements are prepared on the basis of historical cost convention and on the accrual method of accounting.
2. FIXED ASSETS:-
2.1 Fixed assets are stated at cost of acquisition inclusive of freight, duties and taxes and incidental and direct expenses related to acquisition.
2.2 As per MoES resolution No.DOD/18/4/98 dated 1st September 1998 the ownership of Land & Building of the NCPOR is rest with the Ministry of Earth Sciences, Govt. of India, New Delhi.
3. DEPRECIATION:-
Depreciation is provided on straight line method as per rates prescribed in the Income Tax Act, 1961 and has been written off from the respective Capital Reserve. A nominal Amount of Rs.1.00 is retained under the Capital Reserve for each asset until disposal/ written Off.
4. GOVERNMENT GRANTS:-
4.1 Grant-in-aid utilized for Capital Expenditure is transferred to respective Capital Reserve.
4.2 Grant-in-aid utilized for Revenue Expenditure is transferred to Income and Expenditure Account.
4.3 Grant-in-aid utilized at the end of the year is shown under earmarked fund in the Balance Sheet.

AUD
ITED
STA
TEM
ENT
ESSO-NCPOR Annual Report 2018-2019
147
5. FOREGIN CURRENCY TRANSACTION :-
Transaction denominated in foreign currency are accounted at the exchange rate prevailing at the date of transaction.
6. RETIREMENT BENEFITS:-
6.1 Liability towards gratuity & pension contribution payable on death/ retirement of Employees in provided on actual basis of their service at the NCPOR.
6.2 Provision for accumulated leave encashment benefit to the employees is accrued and Computed on the assumption that the employees are entitled to receive the benefits as at each year end.
SCHEDULE 18 - CONTIGENT LIABILITIES AND NOTES TO THE ACCOUNTS 1. Contingent Liabilities in respect off letter of credit opened by Bank on behalf of NCPOR
Rs. 158,800,000/-
2. Current assets and loans and advances:-
Current assets, loans and advances have a value on realization in the ordinary course of business, equal at least to the aggregate amount shown in the Balance Sheet.
3. Taxation:-
In view of there being no taxable income under Income Tax 1961, no provision for Income Tax has been considered necessary.
4. Foreign Currency Transactions:-
Value of Imports calculated on CIF Basis Rs.I) Capital Goods 62,764,786/-
ii) Spares 18,793,479/-Expenditure in Foreign Currency
i) Ship and Helicopter Charter 410,352,992/-ii) Expenditure Related Expenses 229,262,946/-iii) Other Expenditure 54,874,833/-
5. Corresponding figures for the previous year have been regrouped/rearranged, wherever necessary.
6. Schedule 1 to 18 are annexed to and form an integral part of Balance Sheet as at 31-03-2019 and the Income and Expenditure Account for the year ended on the date.
As per our report of even date FOR GANESH DAIVAJNA & CO. CHARTERED ACCOUNTANTS
Firm Regn No.103054W
For National Centre for Polar and Ocean Research
(M.M. SUBRAMANIAM) (DR. M. RAVICHANDRAN) (NAVEEN G. DAIVAJNA) Manager-I/C Director Partner
M.No.126231 Place : Headland Sada, Goa. UDIN: 19126231AAAADT1323Date : 30/08/2019
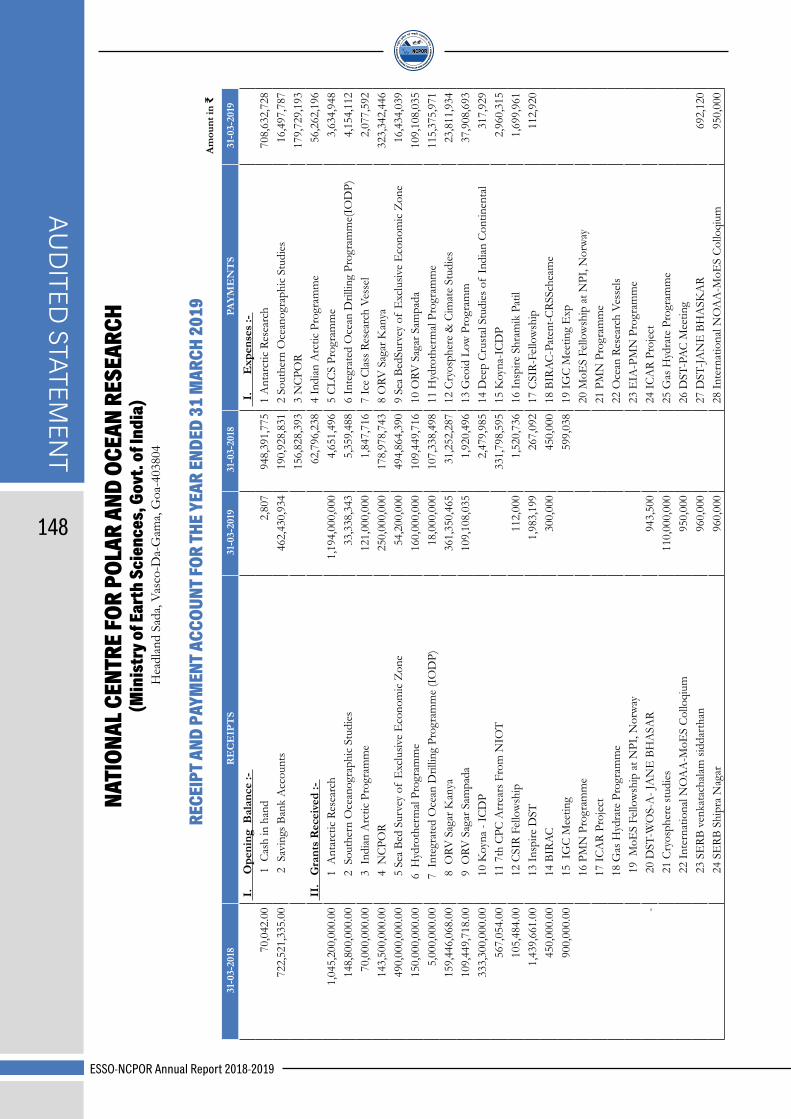
AUD
ITED STATEM
ENT
ESSO-NCPOR Annual Report 2018-2019
148
Am
ount
in ₹
31-
03-2
018
RE
CE
IPT
S 3
1-03
-201
9 3
1-03
-201
8 P
AY
ME
NT
S 3
1-03
-201
9
I.
O
peni
ng B
alan
ce :-
I
.
Exp
ense
s :-
70,
042.
00
1
Cas
h in
han
d 2
,807
9
48,3
91,7
75
1 A
ntar
ctic
Res
earc
h 7
08,6
32,7
28
722
,521
,335
.00
2
Sav
ings
Ban
k A
ccou
nts
462
,430
,934
1
90,9
28,8
31
2 S
outh
ern
Oce
anog
raph
ic S
tudi
es
16,
497,
787
156
,828
,393
3
NC
POR
179
,729
,193
I
I.
Gra
nts
Rec
eive
d :-
62,
796,
238
4 In
dian
Arc
tic P
rogr
amm
e 5
6,26
2,19
6 1
,045
,200
,000
.00
1 A
ntar
ctic
Res
earc
h 1
,194
,000
,000
4
,651
,496
5
CLC
S Pr
ogra
mm
e 3
,634
,948
1
48,8
00,0
00.0
0
2
Sou
ther
n O
cean
ogra
phic
Stu
dies
3
3,33
8,34
3 5
,359
,488
6
Inte
grat
ed O
cean
Dril
ling
Prog
ram
me(
IOD
P)
4,1
54,1
12
70,
000,
000.
00
3 I
ndia
n A
rctic
Pro
gram
me
121
,000
,000
1
,847
,716
7
Ice
Cla
ss R
esea
rch
Vess
el
2,0
77,5
92
143
,500
,000
.00
4 N
CPO
R 2
50,0
00,0
00
178
,978
,743
8
ORV
Sag
ar K
anya
3
23,3
42,4
46
490
,000
,000
.00
5 S
ea B
ed S
urve
y of
Exc
lusiv
e E
cono
mic
Zon
e 5
4,20
0,00
0 4
94,8
64,3
90
9 S
ea B
edSu
rvey
of
Exc
lusiv
e E
cono
mic
Zon
e 1
6,43
4,03
9 1
50,0
00,0
00.0
0
6
Hyd
roth
erm
al P
rogr
amm
e 1
60,0
00,0
00
109
,449
,716
1
0 O
RV S
agar
Sam
pada
1
09,1
08,0
35
5,0
00,0
00.0
0
7
Int
egra
ted
Oce
an D
rillin
g Pr
ogra
mm
e (I
OD
P)
18,
000,
000
107
,338
,498
1
1 H
ydro
ther
mal
Pro
gram
me
115
,375
,971
1
59,4
46,0
68.0
0
8
ORV
Sag
ar K
anya
3
61,3
50,4
65
31,
252,
287
12
Cry
osph
ere
& C
imat
e St
udie
s 2
3,81
1,93
4 1
09,4
49,7
18.0
0
9
ORV
Sag
ar S
ampa
da
109
,108
,035
1
,920
,496
1
3 G
eoid
Low
Pro
gram
m
37,
908,
693
333
,300
,000
.00
10
Koy
na -
ICD
P 2
,479
,985
1
4 D
eep
Cru
stal
Stu
dies
of
Indi
an C
ontin
enta
l 3
17,9
29
567
,054
.00
11
7th
CPC
Arr
ears
Fro
m N
IOT
331
,798
,595
1
5 K
oyna
-IC
DP
2,9
60,3
15
105
,484
.00
12
CSI
R Fe
llow
ship
1
12,0
00
1,5
20,7
36
16
Insp
ire S
hram
ik P
atil
1,6
99,9
61
1,4
39,6
61.0
0
1
3 In
spire
DST
1
,983
,199
2
67,0
92
17
CSI
R-Fe
llow
ship
1
12,9
20
450
,000
.00
14
BIRA
C
300
,000
4
50,0
00
18
BIRA
C-P
aten
t-CRS
Sche
ame
900
,000
.00
15
IGC
Mee
ting
599
,038
1
9 IG
C M
eetin
g E
xp
16
PMN
Pro
gram
me
20
MoE
S Fe
llow
ship
at N
PI, N
orw
ay
17
ICA
R Pr
ojec
t 2
1 PM
N P
rogr
amm
e
1
8 G
as H
ydra
te P
rogr
amm
e 2
2 O
cean
Res
earc
h Ve
ssel
s
19 M
oES
Fello
wsh
ip a
t NPI
, Nor
way
2
3 E
IA-P
MN
Pro
gram
me
-
20 D
ST-W
OS-
A- J
AN
E B
HA
SAR
943
,500
2
4 IC
AR
Proj
ect
21
Cry
osph
ere
stud
ies
110
,000
,000
2
5 G
as H
ydra
te P
rogr
amm
e
22 In
tern
atio
nal N
OA
A-M
oES
Col
loqi
um
950
,000
2
6 D
ST-P
AC
Mee
ting
23
SE
RB v
enka
tach
alam
sidd
arth
an
960
,000
2
7 D
ST-JA
NE
BH
ASK
AR
692
,120
24 S
ERB
Shi
pra
Nag
ar
960
,000
2
8 In
tern
atio
nal N
OA
A-M
oES
Col
loqi
um
950
,000
NATI
ONAL
CEN
TRE F
OR P
OLAR
AND
OCE
AN R
ESEA
RCH
(Min
istr
y of E
arth
Sci
ence
s, G
ovt.
of In
dia)
Hea
dlan
d Sa
da, V
asco
-Da-
Gam
a, G
oa-4
0380
4
REC
EIPT
AND
PAY
MEN
T ACC
OUNT
FOR
THE Y
EAR
ENDE
D 31
MAR
CH 2
019
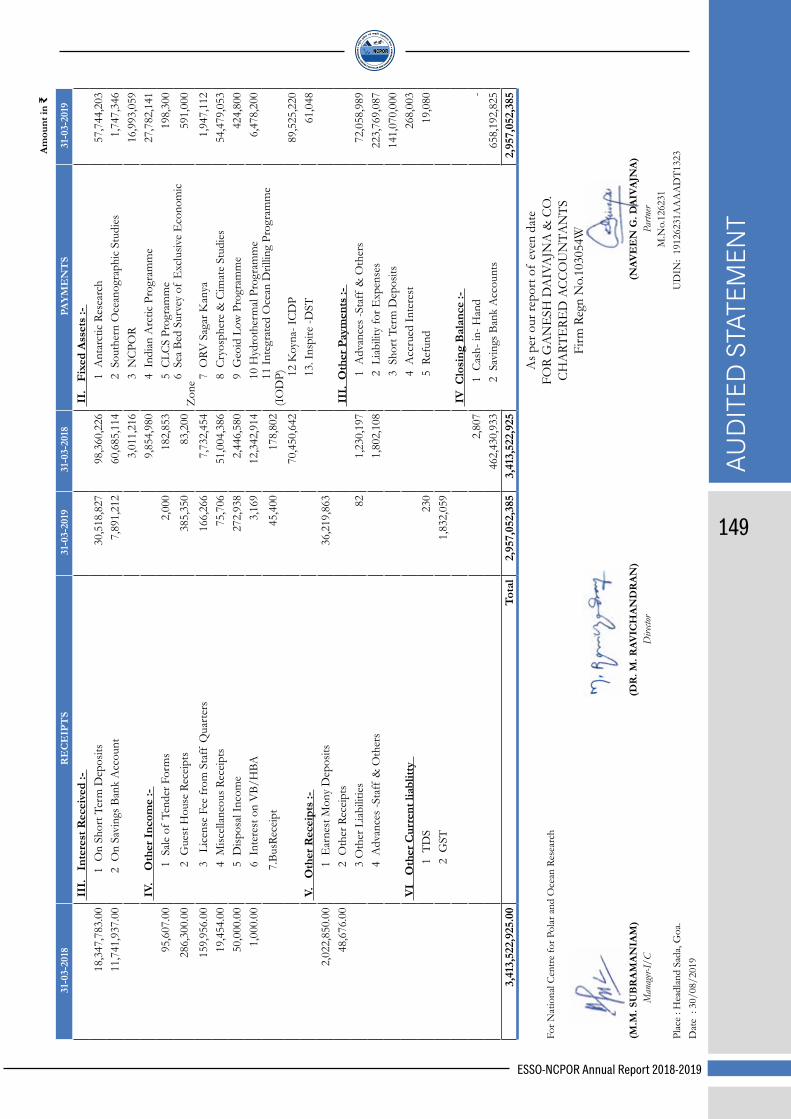
AUD
ITED
STA
TEM
ENT
ESSO-NCPOR Annual Report 2018-2019
149
Am
ount
in ₹
31-
03-2
018
RE
CE
IPT
S 3
1-03
-201
9 3
1-03
-201
8 P
AY
ME
NT
S 3
1-03
-201
9
III
. I
nter
est R
ecei
ved
:- I
I.
Fixe
d A
sset
s :-
18,
347,
783.
00
1
On
Shor
t Ter
m D
epos
its
30,
518,
827
98,
360,
226
1
Ant
arct
ic R
esea
rch
57,
744,
203
11,
741,
937.
00
2
On
Savi
ngs B
ank
Acc
ount
7
,891
,212
6
0,68
5,11
4
2 S
outh
ern
Oce
anog
raph
ic S
tudi
es
1,7
47,3
46
3,0
11,2
16
3
NC
POR
1
6,99
3,05
9 I
V.
Oth
er I
ncom
e :-
9,8
54,9
80
4
Indi
an A
rctic
Pro
gram
me
27,
782,
141
95,
607.
00
1
Sal
e of
Ten
der F
orm
s 2
,000
1
82,8
53
5
CLC
S Pr
ogra
mm
e 1
98,3
00
286
,300
.00
2
Gue
st H
ouse
Rec
eipt
s 3
85,3
50
83,
200
6
Sea
Bed
Sur
vey
of E
xclu
sive
Eco
nom
ic
Zon
e 5
91,0
00
159
,956
.00
3
Li
cens
e Fe
e fr
om S
taff
Qua
rter
s 1
66,2
66
7,7
32,4
54
7
ORV
Sag
ar K
anya
1
,947
,112
1
9,45
4.00
4 M
iscel
lane
ous R
ecei
pts
75,
706
51,
004,
386
8
Cry
osph
ere
& C
imat
e St
udie
s 5
4,47
9,05
3 5
0,00
0.00
5 D
ispos
al In
com
e 2
72,9
38
2,4
46,5
80
9
Geo
id L
ow P
rogr
amm
e 4
24,8
00
1,0
00.0
0
6 I
nter
est o
n V
B/H
BA
3,1
69
12,
342,
914
10
Hyd
roth
erm
al P
rogr
amm
e 6
,478
,200
7
.Bus
Rece
ipt
45,
400
178
,802
11 In
tegr
ated
Oce
an D
rillin
g Pr
ogra
mm
e (I
OD
P)
70,
450,
642
1
2 K
oyna
- IC
DP
89,
525,
220
V.
Oth
er R
ecei
pts
:-
13.
Insp
ire -D
ST
61,
048
2,0
22,8
50.0
0
1 E
arne
st M
ony
Dep
osits
3
6,21
9,86
3 4
8,67
6.00
2 O
ther
Rec
eipt
s I
II.
Oth
er P
aym
ents
:-
3
Oth
er L
iabi
litie
s 8
2 1
,230
,197
1 A
dvan
ces -
Staf
f &
Oth
ers
72,
058,
989
4
Adv
ance
s -St
aff
& O
ther
s 1
,802
,108
2 L
iabi
lity
for E
xpen
ses
223
,769
,087
3 S
hort
Ter
m D
epos
its
141
,070
,000
V
I O
ther
Cur
rent
liab
litty
4 A
ccru
ed In
tere
st
268
,003
1
TD
S 2
30
5
Ref
und
1
9,08
0
2
GST
1
,832
,059
I
V C
losi
ng B
alan
ce :-
2
,807
1
Cas
h- in
- Han
d -
462
,430
,933
2
Sav
ings
Ban
k A
ccou
nts
658
,192
,825
3
,413
,522
,925
.00
Tot
al
2,9
57,0
52,3
85
3,4
13,5
22,9
25
2,9
57,0
52,3
85
As p
er o
ur re
port
of
even
dat
e F
OR
GA
NE
SH D
AIV
AJN
A &
CO
. C
HA
RTE
RED
AC
CO
UN
TAN
TS
Firm
Reg
n N
o.10
3054
W
For N
atio
nal C
entre
for P
olar
and
Oce
an R
esea
rch
(M.M
. SU
BR
AM
AN
IAM
)(D
R. M
. RAV
ICH
AN
DR
AN
) (N
AVE
EN
G. D
AIV
AJN
A)
Man
ager-
I/C
Dire
ctor
Par
tner
M.N
o.12
6231
Pl
ace
: Hea
dlan
d Sa
da, G
oa.
UD
IN:
1912
6231
AA
AA
DT1
323
Dat
e :
30/0
8/20
19
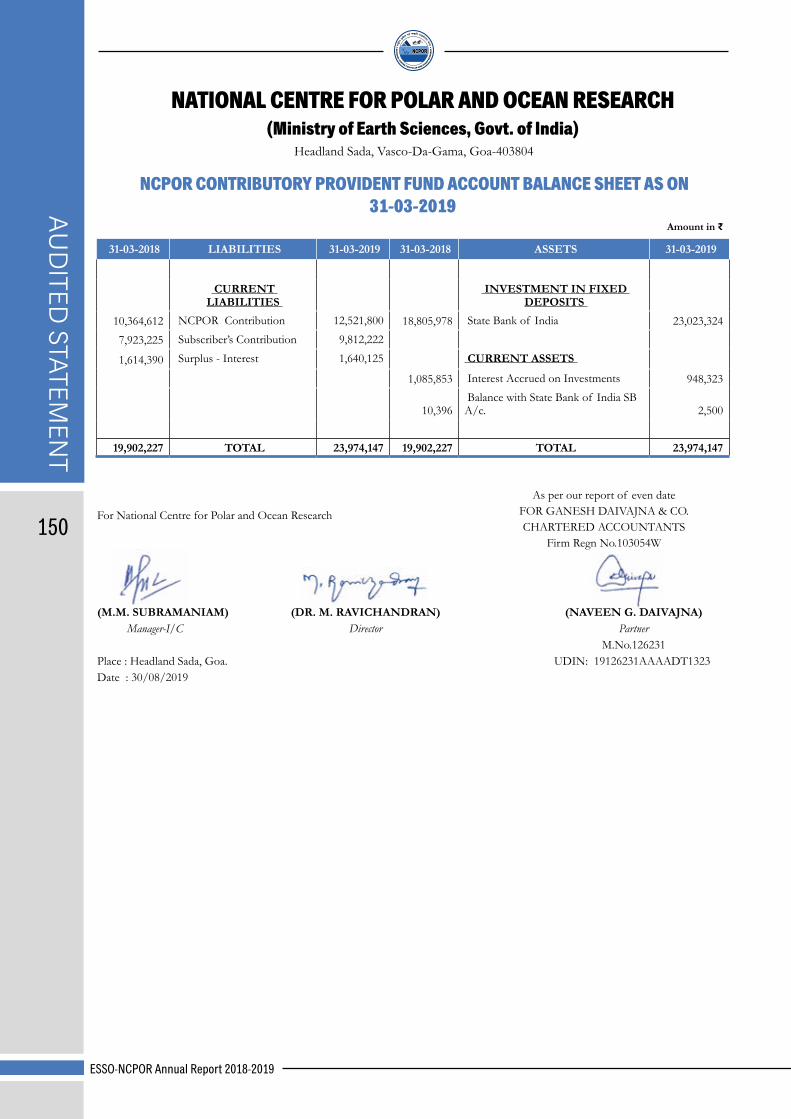
AUD
ITED STATEM
ENT
ESSO-NCPOR Annual Report 2018-2019
150
NCPOR CONTRIBUTORY PROVIDENT FUND ACCOUNT BALANCE SHEET AS ON 31-03-2019
Amount in ₹
31-03-2018 LIABILITIES 31-03-2019 31-03-2018 ASSETS 31-03-2019
CURRENT LIABILITIES
INVESTMENT IN FIXED DEPOSITS
10,364,612 NCPOR Contribution 12,521,800 18,805,978 State Bank of India 23,023,324
7,923,225 Subscriber’s Contribution 9,812,222
1,614,390 Surplus - Interest 1,640,125 CURRENT ASSETS
1,085,853 Interest Accrued on Investments 948,323
10,396 Balance with State Bank of India SB A/c. 2,500
19,902,227 TOTAL 23,974,147 19,902,227 TOTAL 23,974,147
NATIONAL CENTRE FOR POLAR AND OCEAN RESEARCH(Ministry of Earth Sciences, Govt. of India)
Headland Sada, Vasco-Da-Gama, Goa-403804
As per our report of even date FOR GANESH DAIVAJNA & CO. CHARTERED ACCOUNTANTS
Firm Regn No.103054W
For National Centre for Polar and Ocean Research
(M.M. SUBRAMANIAM) (DR. M. RAVICHANDRAN) (NAVEEN G. DAIVAJNA) Manager-I/C Director Partner
M.No.126231 Place : Headland Sada, Goa. UDIN: 19126231AAAADT1323Date : 30/08/2019

AUD
ITED
STA
TEM
ENT
ESSO-NCPOR Annual Report 2018-2019
151
NATIONAL CENTRE FOR POLAR AND OCEAN RESEARCH(Ministry of Earth Sciences, Govt. of India)
Headland Sada, Vasco-Da-Gama, Goa-403804
As per our report of even date FOR GANESH DAIVAJNA & CO. CHARTERED ACCOUNTANTS
Firm Regn No.103054W
For National Centre for Polar and Ocean Research
(M.M. SUBRAMANIAM) (DR. M. RAVICHANDRAN) (NAVEEN G. DAIVAJNA) Manager-I/C Director Partner
M.No.126231 Place : Headland Sada, Goa. UDIN: 19126231AAAADT1323Date : 30/08/2019
NCPOR CONTRIBUTORY PROVIDENT FUND ACCOUNT RECEIPT AND PAYMENT ACCOUNT FOR THE YEAR ENDED 31-03-2019
Amount in ₹
31-03-2018 RECEIPTS 31-03-2019 31-03-2018 PAYMENTS 31-03-2019
Opening Balances Investment in Fixed Deposits 1,000 State Bankof India SB A/c 10,396 11,202,053 State Bank of India 24,652,300
6,951,790 Deposit with State Bank of India 20,434,954 Closing Balance 2,339,897 NCPOR Contribution 1,347,252 10,396 State Bankof India SB A/c 2,500
1,334,114 Subscribers Contribution 1,228,543
Interest on Investment 167,165 Interest 618,300
Current Assets 418,483 Accured Interest on Investment 1,015,355
11,212,449 TOTAL 24,654,800 11,212,449 TOTAL 24,654,800
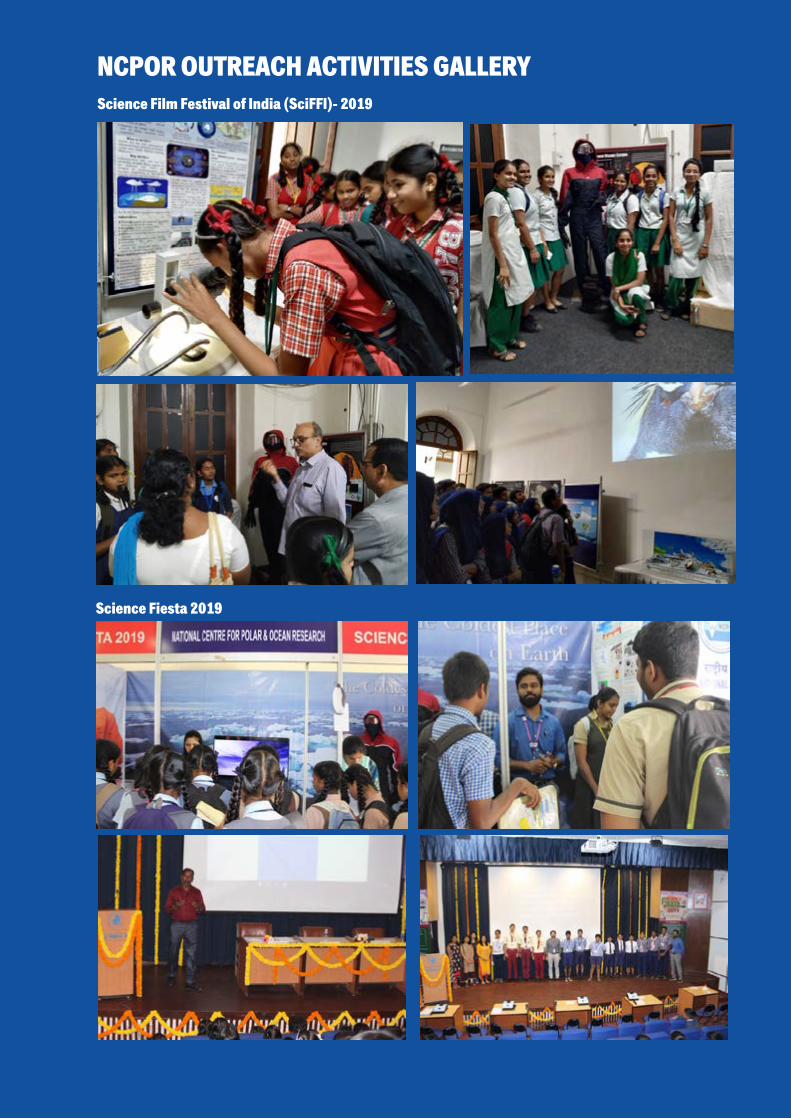
NCPOR OUTREACH ACTIVITIES GALLERYScience Film Festival of India (SciFFI)- 2019
Science Fiesta 2019
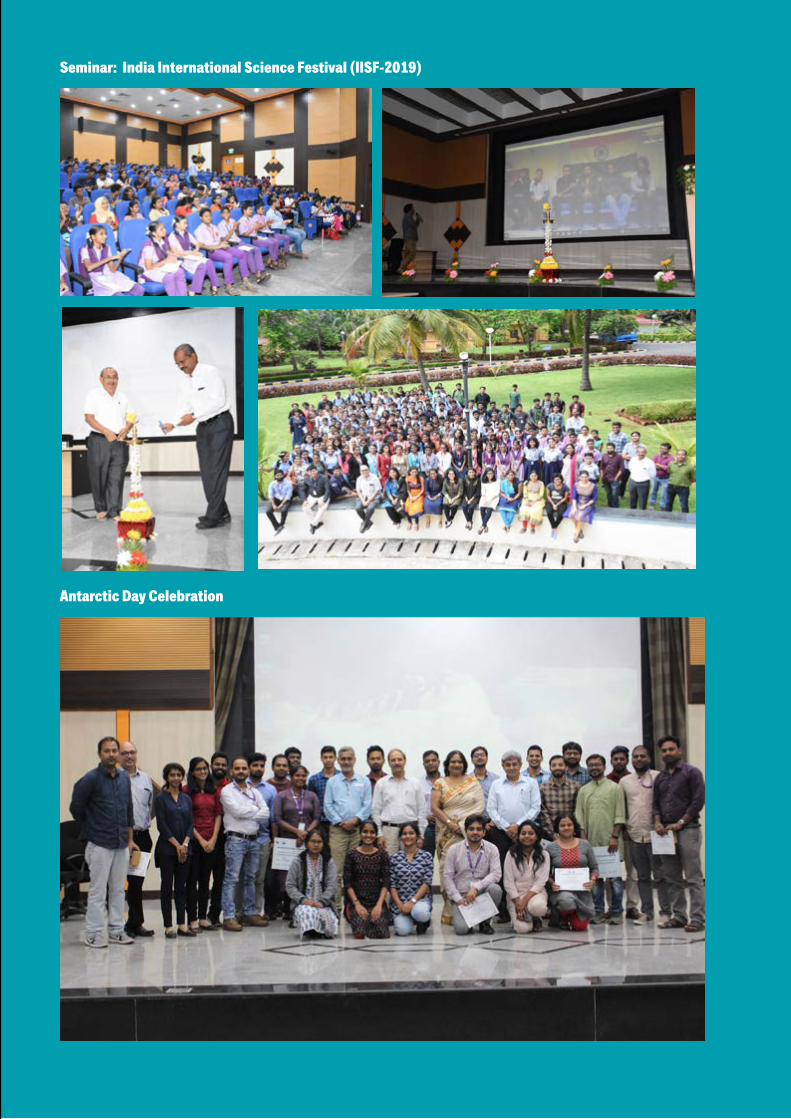
Seminar: India International Science Festival (IISF-2019)
Antarctic Day Celebration

Women’s Day Celebration
Educational Tours to NCPOR
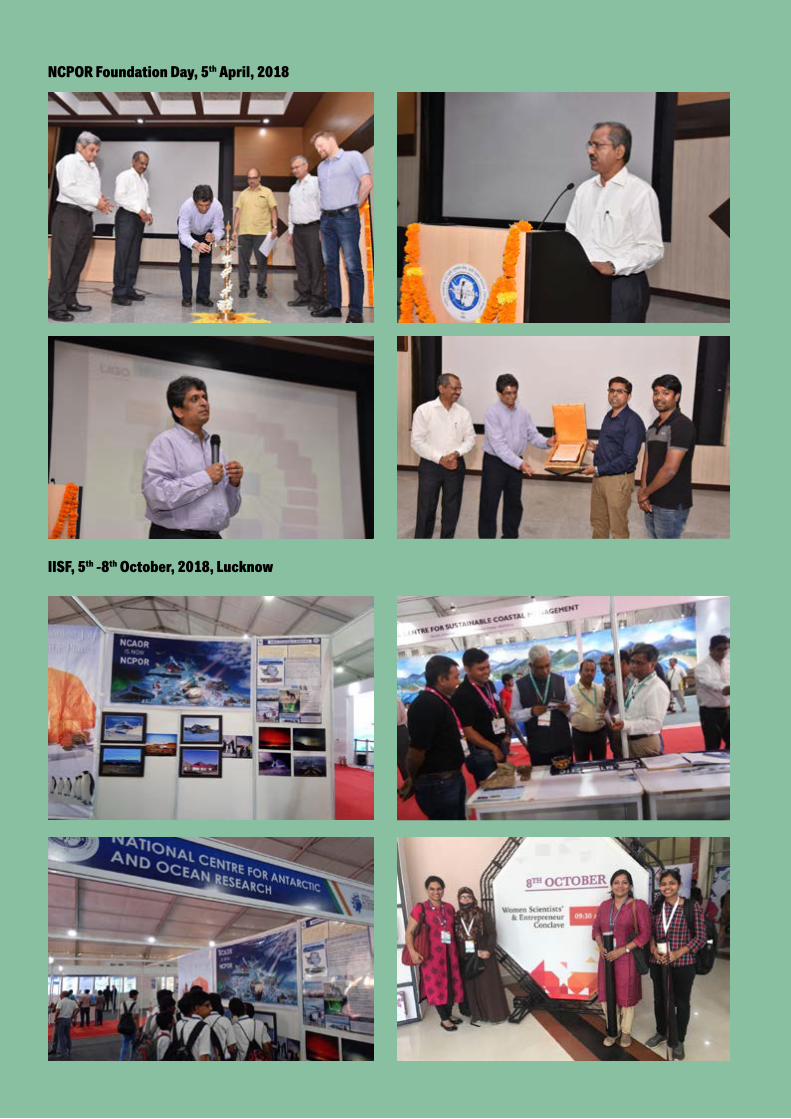
NCPOR Foundation Day, 5th April, 2018
IISF, 5th -8th October, 2018, Lucknow


Sem
apho
re T
echn
olog
ies P
vt. L
td. #
9830
2498
00