plant and soil resistance to water flow in faba bean (vicia faba l. major harz.)
TRANSCRIPT

Plant and Soil210: 219–231, 1999.© 1999Kluwer Academic Publishers. Printed in the Netherlands.
219
Plant and soil resistance to water flow in faba bean (Vicia fabaL. majorHarz.)
Celestino Ruggiero, Stefania De Pascale∗ and Massimo FagnanoDepartment of Agricultural Engineering and Agronomy, University of Naples Federico II, 80055 Portici (Naples),Italy
Received 30 May 1998; accepted in revised form 3 May 1999
Key words:total resistance, transpiration, leaf water potential, root water potential, root density
Abstract
An experiment was conducted to determine soil and plant resistance to water flow in faba bean under field condi-tions during the growing season. During each sampling period transpiration flux and leaf water potential measuredhourly were used with daily measurements of root and soil water potential to calculate total resistance using Ohm’slaw analogy. Plant growth, root density and soil water content distributions with depth were measured. Leaf areaand root length per plant reached their maximum value during flowering and pod setting (0.31 m2 and 2200 m, re-spectively), then decreasing until the end of the growing period. Root distribution decreased with depth ranging, onaverage, between 34.2% (in the 0–0.25 m soil layer) and 18.1% (in the 0.75–1.0 m soil layer). Mean root diameterwas 0.6 mm but most of the roots were less than 0.7 mm in diameter. Changes in plant and soil water potentialsreflected plant growth characteristics and climatic patterns. The overall relationship between the difference in waterpotential between soil and leaf and transpiration was linear, with the slope equal to average plant resistance (0.0165MPa/(cm3 m−1 h−1 10−3). Different regression parameters were obtained for the various measurement days. Thewater potential difference was inversely related to transpiration at high leaf stomatal resistance and at high valuesof VPD. Total resistance decreased with transpiration flux in a linear relationship (r=−0.68). Different slope valueswere obtained for the different measurement days. Estimated soil resistance was much lower than the observedtotal resistance to water flow. The change from vegetative growth to pod filling was accompanied by an increasein plant resistance. The experimental results support previous findings that resistance to water flow through plantsis not constant but is influenced by plant age, growth stage and environmental conditions. A more complex modelthan Ohm’s law analogy may be necessary for describing the dynamic flow system under field conditions.
Introduction
The flow of water through the Soil–Plant–AtmosphereContinuum can be visualised in a simplified modelas a physical catenary flow system (van den Hon-ert, 1948). The pathway of water movement can beexpressed using the following equationT = Q =(9s − 9r)/Rs = (9r − 9l)/Rp = (9s − 9l)/RTwhereT is the transpiration rate,Q is the root wa-ter uptake,9s , 9r , and9l are the water potentialin the soil matrix, at the root surface, and in plantleaves, respectively, andRs andRp are resistances of
∗ FAX No: +39-81 7755129. E-mail: [email protected]
the soil and plant pathway, withRT = Rs + Rp. Onthis basis, the root system has been described in termsof cylindrical geometry with water flowing radially inresponse to pressure gradients from the surroundingsoil, towards an isolated cylindrical root. This modelassumes steady state conditions, under which the flowrate through any segment of root is proportional to thepotential gradient across that segment, and is limitedby the segmental hydraulic resistance by analogy withOhm’s law for the flow of electricity through a resistor(Gardner, 1960, 1964; Feddes, 1981). The resistivecomponents are the resistance to water flow in the soil(Rs) and in the plant (Rp) which are assumed to be

220
constant, while water potential gradients could varywith external conditions.
The resistance that most frequently limits plantwater uptake is still a matter of controversy and con-flicting results have been reported in the literature.Some theoretical and experimental studies suggestthat the conductivity of the unsaturated soil is thedominant factor controlling water flow through thesoil-plant system and conclude that any increase intotal resistance is mainly due to an increase in soilresistance (Gardner and Ehlig, 1962a,b; Cowan, 1965;Hainsworth and Aylmore, 1986; Baker and van Bavel,1986). However, experimental results provide evid-ence that there is higher resistance to liquid water flowin the plant than soil and that root resistance is pre-dominant. The soil hydraulic resistance with normalroot densities would be the limiting resistance only invery dry conditions (Newman, 1974; Taylor and Klep-per, 1975; Reicosky and Ritchie, 1976; Blizzard andBoyer, 1980; Passioura, 1988; Olsson and Rose, 1988;Rasiah and Kohl, 1989; Sarkar and Kar, 1992; Kramerand Boyer, 1995).
At the same time, the results of many experiments,carried out under different soil, plant and atmosphericconditions, show that this simplified model only inpart explains the phenomenon (Bristow et al., 1984;Lafolie et al., 1991; Passioura, 1988; Zur et al.,1982). Moreover, several reports provide evidence thata steady state is the exception rather than the rule incharacterising the soil-plant system and that plant res-istance is not a constant, as assumed by the van denHonert model, but it increases with a decrease in tran-spiration flux (Newman, 1974; Zur et al., 1982; Riegerand Motisi, 1990; Steudle, 1994). In the last few years,though many studies have shown that the cohesion-tension theory holds for plants (Tyree, 1997), it hasbeen pointed out that water flow through the rootis much more complex. A certain role may be per-formed by chemical messages which the roots sendto the stomata to regulate their aperture (Davies andZhang, 1991). However, of still greater importanceis the fact that, given the complex anatomical struc-ture of the root, water flow in the root may followdifferent paths with differing resistance and there issome variability in the conductivity of roots whichis related to the nature of the driving force. At thesame time, resistances do not always act in series, butmay act in parallel, and according to the conditionsthe water flow may be diverted onto different paths orseveral paths. This implies that flow resistance mayvary in relation to root structure, and hence species
and age (Steudle, 1994; Steudle and Peterson, 1998).Furthermore, the discovery of protein channels called‘aquaporins’, whose role is to facilitate the transcel-lular movement of water, especially in old suberizedroots, suggests that the plant’s physiological activ-ity may have another role (Maurel, 1997; Schäffner,1998). For the above reasons, more complex modelshave been proposed, which are currently less manage-able and which require a larger number of parametersto be measured.
It must be pointed out that most of the experi-ments in which resistances were measured have beencarried out with single root and with plants grown inhydroponics, under controlled and constant laboratoryconditions, with measurements taken over short timeintervals. Under laboratory conditions, it is possible toestablish steady-state flow to measure hydraulic res-istance. For steady-state conditions, assuming that thewater uptake (Q) is proportional to the water potentialdifference, the total resistance (RT ) to the flow canbe defined as:RT = (90 − 91)/Q where90 is theaverage water potential at sites of entry into the roots(the average soil water potential) and91 is the averageexit potential in the leaves (the average leaf water po-tential). Using this approach, Lascano and van Bavel(1984) found experimentally that the total resistanceto flow for cotton was independent of the leaf waterpotential and the transpiration rate. Moreover, apply-ing the steady-state approximation on the whole rootsystem, with plants grown in a field environment andassuming that90 was the bulk soil water potential,Jones et al. (1982) and Hirasawa and Ishihara (1991)reported that the hydraulic resistance of plants de-creased with increasing transpiration rate. Rieger andMotisi (1990) tested this hypothesis under steady stateconditions, and also found decreasing resistances athigher transpiration rates.
In wet soil, where the bulk soil water potential ap-proaches zero with respect to the leaf water potential,the water flux equation can be written:Q = −91/RT .In the absence of transpiration (Q=0) we can assumethat:90 = 91. Measurements performed in laborat-ories under steady-state conditions (Lascano and vanBavel, 1984; Passioura and Munns, 1984; Baker andvan Bavel, 1988; Rieger and Motisi, 1990) and in thefield (Cohen et al., 1983; Moreshet et al., 1990), found90 close to−0.5 MPa. Therefore, calculation ofRTby the extrapolated value of9 at zero flow does notpass through the origin and omitting90, especiallyat high values of the leaf water potential, results inoverestimatedRT .

221
Figure 1. The moisture retention curveh (θ ) (above) and the soil hydraulic conductivity curveK (θ ) (below).
To account for these results, the diode electricalanalog is a more appropriate model than the linearbattery-resistor, withψ0 as the threshold potentialand with resistance defined asRT = δψ1/δQ whereδψ1 and δQ are changes in leaf water potential andchanges in transpiration flux respectively (Moreshet etal., 1996).
In most of the above studies the resistance to waterflow is assumed to be a constant within a given speciesduring the growing cycle nevertheless, large ranges ofbehaviour occur within a species during growth. Fromthe agronomic point of view and in order to elaborate
models able to quantify root water uptake and plantwater status, the behaviour of each species during thegrowing cycle is very important. It was thus deemedappropriate to test the equations that are commonlyused to describe water flow in the soil-plant systemunder field conditions. Our objective was to evaluatewater potentials, transpiration rate of a faba bean cropand their relations during plant growth by using theabove-mentioned equations.
222
Materials and methods
Three seeds of faba bean (Vicia fabaL. major Harz.,cv Supersimonia) were sown on 21 December 1995in each of 12 plastic cylinders of 17.7 l in volume(0.15 m in dia.×1.0 m deep) filled with a clay-loamsoil. Pre-sowing dressing was 100 kg ha−1 of P2O5.After germination and establishment one seedling wasallowed to grow in each pot without irrigation duringthe winter season with the exception of two wateringson March 20 and on April 24 (to avoid plants wilting)to reach soil field capacity (3.0 litres in each pot). Anet with 2 mm-mesh covered the bottom of each con-tainer, and the containers were placed in a trench withtheir upper ends at soil level. Soil physical and chem-ical characteristics were: 42% sand; 27% loam; 31%clay; lime traces; 1.57% organic matter; 0.09% totalN; pH 7.1; field capacity and−1.5 MPa water contentsof 0.345 and 0.175 cm3 cm−3. The moisture retentioncurve,h (θ ), and the soil hydraulic conductivity curve,K (θ ), were evaluated on undisturbed soil samples asfunctions of the water content measured usingγ -raysand are reported in Figure 1. The hydraulic conductiv-ity of the unsaturated soil was also described followingthe closed form equation developed by van Genuchten(1980).
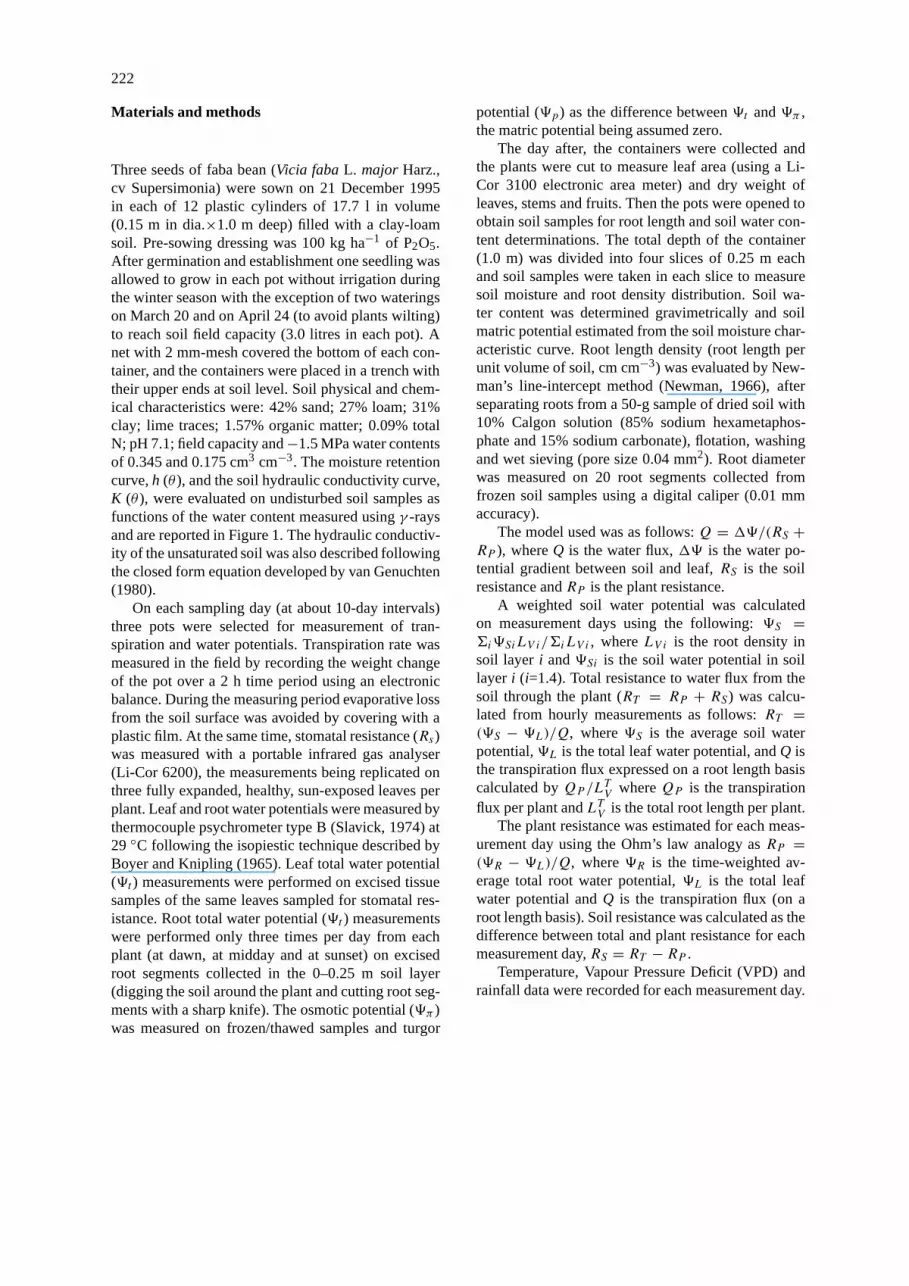
On each sampling day (at about 10-day intervals)three pots were selected for measurement of tran-spiration and water potentials. Transpiration rate wasmeasured in the field by recording the weight changeof the pot over a 2 h time period using an electronicbalance. During the measuring period evaporative lossfrom the soil surface was avoided by covering with aplastic film. At the same time, stomatal resistance (Rs)was measured with a portable infrared gas analyser(Li-Cor 6200), the measurements being replicated onthree fully expanded, healthy, sun-exposed leaves perplant. Leaf and root water potentials were measured bythermocouple psychrometer type B (Slavick, 1974) at29 ◦C following the isopiestic technique described byBoyer and Knipling (1965). Leaf total water potential(9t ) measurements were performed on excised tissuesamples of the same leaves sampled for stomatal res-istance. Root total water potential (9t ) measurementswere performed only three times per day from eachplant (at dawn, at midday and at sunset) on excisedroot segments collected in the 0–0.25 m soil layer(digging the soil around the plant and cutting root seg-ments with a sharp knife). The osmotic potential (9π )was measured on frozen/thawed samples and turgor
potential (9p) as the difference between9t and9π ,the matric potential being assumed zero.
The day after, the containers were collected andthe plants were cut to measure leaf area (using a Li-Cor 3100 electronic area meter) and dry weight ofleaves, stems and fruits. Then the pots were opened toobtain soil samples for root length and soil water con-tent determinations. The total depth of the container(1.0 m) was divided into four slices of 0.25 m eachand soil samples were taken in each slice to measuresoil moisture and root density distribution. Soil wa-ter content was determined gravimetrically and soilmatric potential estimated from the soil moisture char-acteristic curve. Root length density (root length perunit volume of soil, cm cm−3) was evaluated by New-man’s line-intercept method (Newman, 1966), afterseparating roots from a 50-g sample of dried soil with10% Calgon solution (85% sodium hexametaphos-phate and 15% sodium carbonate), flotation, washingand wet sieving (pore size 0.04 mm2). Root diameterwas measured on 20 root segments collected fromfrozen soil samples using a digital caliper (0.01 mmaccuracy).
The model used was as follows:Q = 19/(RS +RP ), whereQ is the water flux,19 is the water po-tential gradient between soil and leaf,RS is the soilresistance andRP is the plant resistance.
A weighted soil water potential was calculatedon measurement days using the following:9S =6i9SiLV i/6iLV i , whereLV i is the root density insoil layer i and9Si is the soil water potential in soillayer i (i=1.4). Total resistance to water flux from thesoil through the plant (RT = RP + RS) was calcu-lated from hourly measurements as follows:RT =(9S − 9L)/Q, where9S is the average soil waterpotential,9L is the total leaf water potential, andQ isthe transpiration flux expressed on a root length basiscalculated byQP /LTV whereQP is the transpirationflux per plant andLTV is the total root length per plant.
The plant resistance was estimated for each meas-urement day using the Ohm’s law analogy asRP =(9R − 9L)/Q, where9R is the time-weighted av-erage total root water potential,9L is the total leafwater potential andQ is the transpiration flux (on aroot length basis). Soil resistance was calculated as thedifference between total and plant resistance for eachmeasurement day,RS = RT − RP .
Temperature, Vapour Pressure Deficit (VPD) andrainfall data were recorded for each measurement day.

223
Table 1. Plant characteristics of faba bean during growth (mean±standard error)
Date Leaf Area [10−2 m2 pt−1] Root length [m pt−1] Root diameter [mm] Root area [10−2 m2 pt−1] Root area/Leaf area
February 21 3.7±0.5 734±84 0.46±0.02 106±9 29.6±4.0
March 8 5.4±0.3 930±110 0.62±0.07 181±22 34.1±5.3
March 13 8.5±1.4 1040±107 0.55±0.02 180±25 21.7±1.5
March 22 9.4±0.8 1507±108 0.62±0.04 392±27 31.6±4.8
April 1 17.8±3.3 1811±90 0.58±0.02 327±7 19.1±3.5
April 11 30.7±1.8 2236±151 0.58±0.02 405±28 13.2±0.5
April 22 22.7±3.5 2154±37 0.61±0.03 413±24 19.4±3.3
May 3 15.4±1.2 1939±231 0.60±0.01 377±50 24.5±2.5
May 15 20.1±3.8 1698±189 0.58±0.02 308±39 16.1±3.3
May 23 16.9±2.9 1591±182 0.65±0.02 333±31 19.9±4.3
Figure 2. Root length density of faba bean vs. time by soil depth.
Results
Plant growth
Leaf area per plant increased from February to April,reaching a maximum of 0.31 m2 during flowering andpod setting, and then decreased until the end of theplant cycle with a mean value of 0.20 m2 (Table 1).Root length per plant followed a time course similarto that of leaf area reaching its maximum at pod set-ting (2200 m per plant) but showed a less pronounceddecrease (Table 1). The root density was relativelyhigh, even for the first sampling and in the deep-est layer (0.75–1.0 m). Maximum root density wasattained four months after sowing (Figure 2). Root
growth continued until the filling of the first pods ofbasal nodes. Root distribution decreased with depthranging between 34.2% (in the 0–0.25 m soil layer)and 18.1% (in the 0.75–1.0 m soil layer) on average.Root diameter increased from the end of February tothe beginning of March in each soil layer and was0.6 mm on average (Table 1). Mean root diametertended to be higher in the top than in the deepest soillayer (0.67 mm vs. 0.55 mm). Calculated root surfaceshowed a gradual increase until April 11, following thesame trend recorded for root length. The ratio betweenroot and leaf area changed during the growing seasondepending on the different growth rates between shootand root: on average it was 23:1 and higher valueswere recorded at the initial stages (Table 1).
Plant and soil water potential
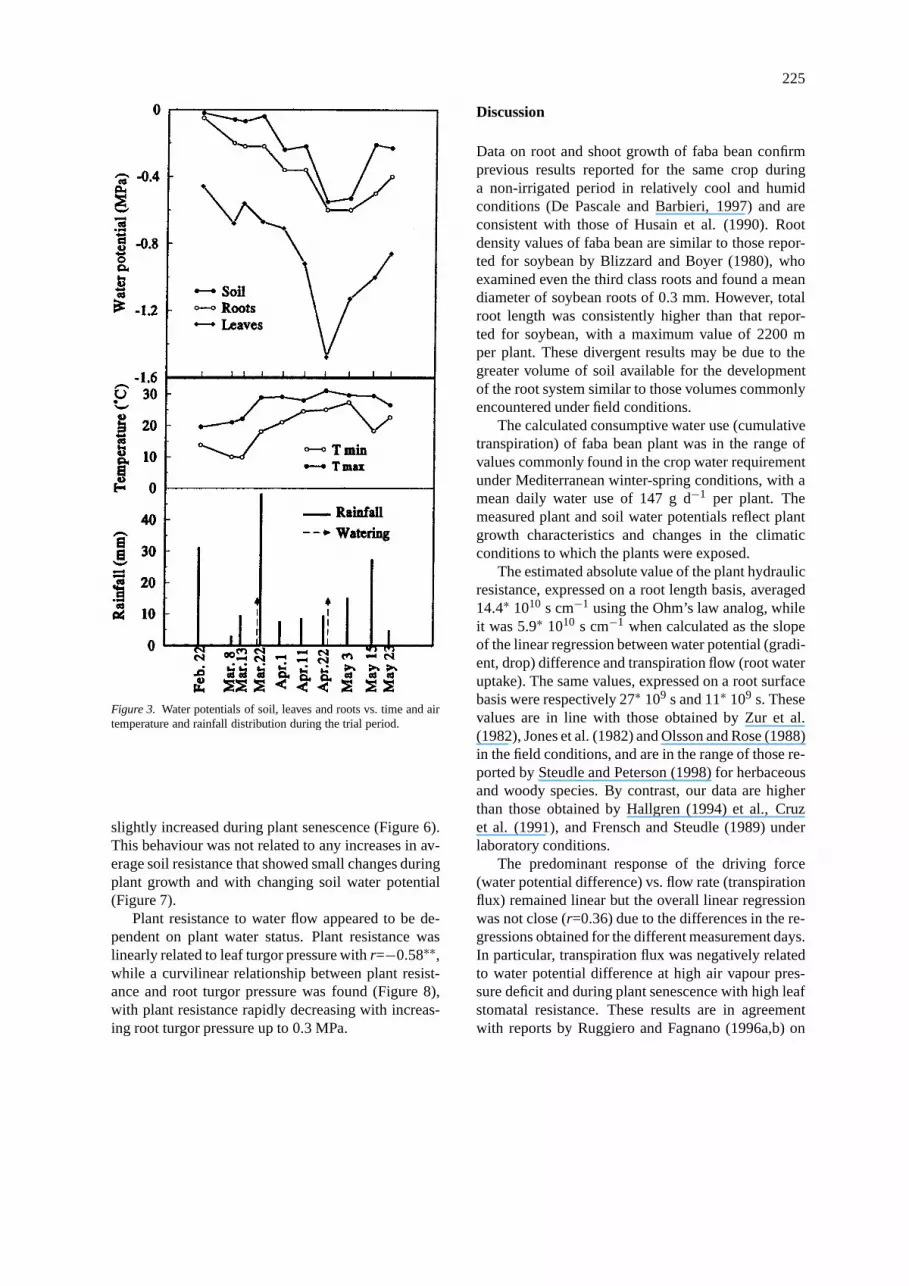
The data relative to the main meteorological para-meters for the measurement days show increasingtemperatures with a peak on April 22 (Figure 3). Onthe same day, very low relative humidity was recor-ded. The rainfall, indicated in the figure as the sumof precipitation in the interval between two samplings,was very low in the month of April, and higher in thefirst half of May.
Soil water potential was almost constant at−0.05MPa during the first four samplings, decreasing to−0.59 MPa at the end of April and increasing to avalue of about−0.2 MPa during May (Figure 3). Meandaily plant water potentials decreased up to the middleof April and increased subsequently. Leaf and root wa-ter potential showed a general tendency to decrease assoil water potential decreased according to air temper-ature and rainfall distribution during the trial period,

224
Table 2. Transpiration rate and water uptake of faba bean during growth (mean±standard error)
Date Transpiration per plant Transpiration per unit leaf area Water uptake per unit root length Water uptake per unit root area
[cm3 d−1] [102 cm3 m−2 d−1] [cm3 m−1 d−1] [cm3 m−2 d−1]
February 21 39.5±3.1 11.0±0.9 0.056±0.005 37±4
March 8 64.0±2.3 12.0±0.3 0.070±0.006 36±4
March 13 160.0±20.7 19.2±1.1 0.154±0.004 88±2
March 22 152.3±11.1 16.3±0.3 0.101±0.004 53±9
April 1 221.7±8.2 12.8±1.3 0.122±0.010 68±5
April 11 208.3±15.6 6.8±0.1 0.093±0.002 52±3
April 22 161.0±1.3 7.4±1.1 0.075±0.020 38±2
May 3 176.0±26.4 11.4±2.4 0.091±0.011 45±8
May 15 173.0±31.1 8.7±0.7 0.102±0.012 56±8
May 23 110.3±19.0 7.1±1.9 0.069±0.002 34±6
and changes in root and leaf water potential could bedescribed as essentially symmetrical (Figure 3).
Diurnal trends of total leaf water potential were es-sentially the same for the different measurement dayswith a minimum recorded between 12:00 and 14:00and a steady increase during the late afternoon hours.
Transpiration rate and root water uptake
The transpiration rate per plant showed a similar trendto the leaf area per plant (Table 2), while the transpir-ation rate per unit leaf area started to decrease whensoil water potential decreased. Root water uptake, bothon the basis of root length and on the basis of rootsurface, increased up to March 13, and subsequently adecreasing trend was recorded (Table 2).
Until the beginning of April, transpiration fluxincreased during the morning hours, reaching its max-imum value around midday, and decreased throughoutthe afternoon with wide changes in successive hourlymeasurements. Subsequently, transpiration fluxes be-came much smaller with slight diurnal fluctuations.
Total and plant resistance
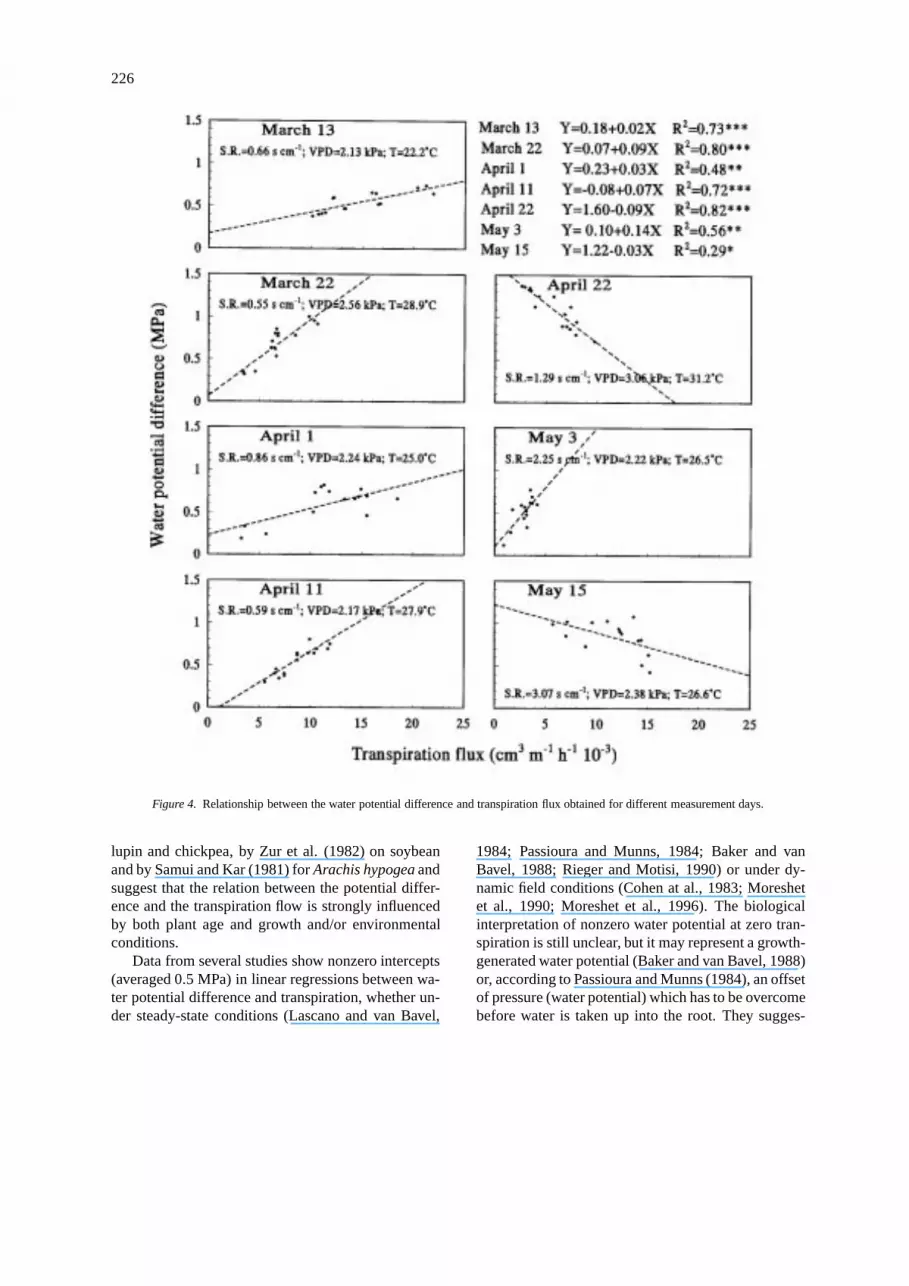
The overall relationship between transpiration flux(x=water lost per unit root length) and the differ-ence in water potential between soil and leaf waslinear with the slope equal to the average plant resist-ance (y=0.493+0.0165x). However, this overall linearmodel, even though significant (r=0.36∗∗), does notaccount for all the variability in the total hydraulic res-istance because of the different relationships betweentranspiration flux and water potential differences ob-tained for the sampling days (Figure 4 and Table 3).
Table 3. Coefficients and standard errors (a=intercept;b=slope) of the regression lines between water potentialdifference and transpiration flux for each measurementday
Date a Std. Err. b Std. Err.
March 13 0.180 0.006 0.025 0.0025
March 22 0.070 0.006 0.090 0.0081
April 1 0.230 0.040 0.031 0.0056
April 11 −0.082 0.009 0.074 0.0086
April 22 1.600 0.120 −0.094 0.0090
May 3 0.100 0.008 0.140 0.0180
May 15 0.220 0.120 −0.003 0.0032
After flowering, with high leaf stomatal resistance(May 15) and at a high value of VPD (April 22) thewater potential gradient was inversely related to tran-spiration. When the stomata close, as at noon duringa hot day, the resistance between the leaves and theatmosphere may become much greater than the resist-ance of the plant and the soil and result in a decreasedrate of transpiration.
Daily data showed a linear response of total res-istance vs. transpiration flux with different slopes forthe measurement days (Figure 5). The absolute val-ues of the regression coefficients increased during thegrowing season until the flowering (April 22). Also theoverall relationship between resistance and transpira-tion flux was linear (y=198−10.7x) with r=−0.68∗∗.
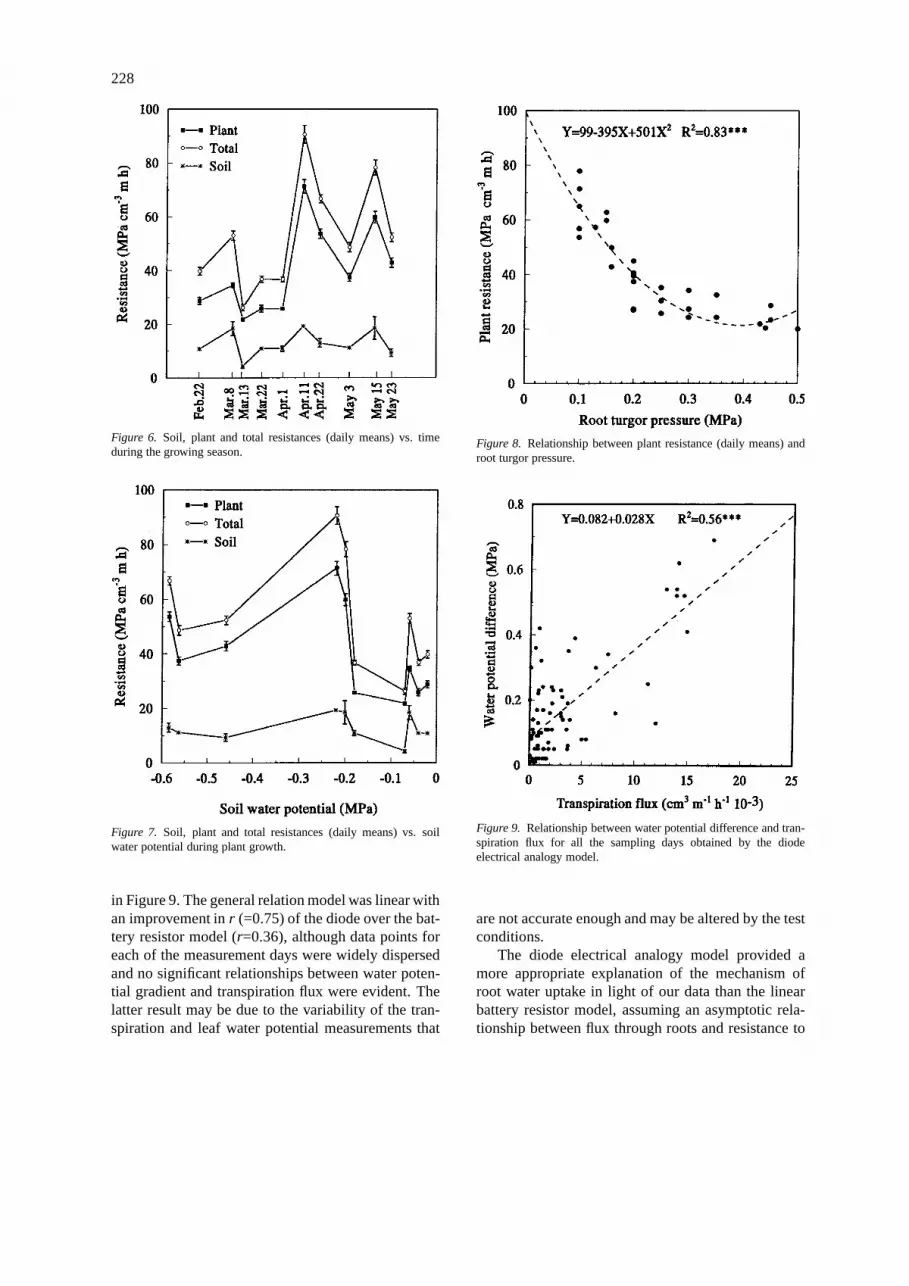
Total and plant resistances were not constant dur-ing the growing season but markedly increased whenthe change from the vegetative to reproductive stageoccurred, decreased at the pod filling phase and
225
Figure 3. Water potentials of soil, leaves and roots vs. time and airtemperature and rainfall distribution during the trial period.
slightly increased during plant senescence (Figure 6).This behaviour was not related to any increases in av-erage soil resistance that showed small changes duringplant growth and with changing soil water potential(Figure 7).
Plant resistance to water flow appeared to be de-pendent on plant water status. Plant resistance waslinearly related to leaf turgor pressure withr=−0.58∗∗,while a curvilinear relationship between plant resist-ance and root turgor pressure was found (Figure 8),with plant resistance rapidly decreasing with increas-ing root turgor pressure up to 0.3 MPa.
Discussion
Data on root and shoot growth of faba bean confirmprevious results reported for the same crop duringa non-irrigated period in relatively cool and humidconditions (De Pascale and Barbieri, 1997) and areconsistent with those of Husain et al. (1990). Rootdensity values of faba bean are similar to those repor-ted for soybean by Blizzard and Boyer (1980), whoexamined even the third class roots and found a meandiameter of soybean roots of 0.3 mm. However, totalroot length was consistently higher than that repor-ted for soybean, with a maximum value of 2200 mper plant. These divergent results may be due to thegreater volume of soil available for the developmentof the root system similar to those volumes commonlyencountered under field conditions.
The calculated consumptive water use (cumulativetranspiration) of faba bean plant was in the range ofvalues commonly found in the crop water requirementunder Mediterranean winter-spring conditions, with amean daily water use of 147 g d−1 per plant. Themeasured plant and soil water potentials reflect plantgrowth characteristics and changes in the climaticconditions to which the plants were exposed.
The estimated absolute value of the plant hydraulicresistance, expressed on a root length basis, averaged14.4∗ 1010 s cm−1 using the Ohm’s law analog, whileit was 5.9∗ 1010 s cm−1 when calculated as the slopeof the linear regression between water potential (gradi-ent, drop) difference and transpiration flow (root wateruptake). The same values, expressed on a root surfacebasis were respectively 27∗ 109 s and 11∗ 109 s. Thesevalues are in line with those obtained by Zur et al.(1982), Jones et al. (1982) and Olsson and Rose (1988)in the field conditions, and are in the range of those re-ported by Steudle and Peterson (1998) for herbaceousand woody species. By contrast, our data are higherthan those obtained by Hallgren (1994) et al., Cruzet al. (1991), and Frensch and Steudle (1989) underlaboratory conditions.
The predominant response of the driving force(water potential difference) vs. flow rate (transpirationflux) remained linear but the overall linear regressionwas not close (r=0.36) due to the differences in the re-gressions obtained for the different measurement days.In particular, transpiration flux was negatively relatedto water potential difference at high air vapour pres-sure deficit and during plant senescence with high leafstomatal resistance. These results are in agreementwith reports by Ruggiero and Fagnano (1996a,b) on
226
Figure 4. Relationship between the water potential difference and transpiration flux obtained for different measurement days.
lupin and chickpea, by Zur et al. (1982) on soybeanand by Samui and Kar (1981) forArachis hypogeaandsuggest that the relation between the potential differ-ence and the transpiration flow is strongly influencedby both plant age and growth and/or environmentalconditions.
Data from several studies show nonzero intercepts(averaged 0.5 MPa) in linear regressions between wa-ter potential difference and transpiration, whether un-der steady-state conditions (Lascano and van Bavel,
1984; Passioura and Munns, 1984; Baker and vanBavel, 1988; Rieger and Motisi, 1990) or under dy-namic field conditions (Cohen at al., 1983; Moreshetet al., 1990; Moreshet et al., 1996). The biologicalinterpretation of nonzero water potential at zero tran-spiration is still unclear, but it may represent a growth-generated water potential (Baker and van Bavel, 1988)or, according to Passioura and Munns (1984), an offsetof pressure (water potential) which has to be overcomebefore water is taken up into the root. They sugges-

227
Figure 5. Relationship between the total resistance and transpiration flux obtained for different measurement.
ted that root resistance consisted of two components:a true hydraulic resistance, given by the slope of therelationship between water potential difference andtranspiration and an offset, representing the minimumpressure gradient to permit water flow whose mag-nitude is given by they-intercept. Data obtained in thisstudy seem to indicate that this threshold is not a con-stant but depends on the growth stage and may changewith environmental conditions as proposed by Riegerand Motisi (1990) or with anatomical modifications(Steudle and Peterson, 1998).
The presence of non-zero intercepts in linear re-gression of water potential gradient vs. transpirationflux suggested a rectification by the diode electricalanalogy:Rp = δ9L/δQ (whereδQ is the variation inwater flux,δ9L is the drop in leaf water potential, andRp is the plant resistance and withψ0 as the thresholdpotential), as a more appropriate explanatory modelthan the linear battery resistorRp = (90 − 9L)/Q(Baker and van Bavel, 1988; Hirasawa and Ishihara,1991; Moreshet et al., 1996). The relationship betweenwater potential difference and transpiration flux for allthe sampling days obtained by the former is presented
228
Figure 6. Soil, plant and total resistances (daily means) vs. timeduring the growing season.
Figure 7. Soil, plant and total resistances (daily means) vs. soilwater potential during plant growth.
in Figure 9. The general relation model was linear withan improvement inr (=0.75) of the diode over the bat-tery resistor model (r=0.36), although data points foreach of the measurement days were widely dispersedand no significant relationships between water poten-tial gradient and transpiration flux were evident. Thelatter result may be due to the variability of the tran-spiration and leaf water potential measurements that
Figure 8. Relationship between plant resistance (daily means) androot turgor pressure.
Figure 9. Relationship between water potential difference and tran-spiration flux for all the sampling days obtained by the diodeelectrical analogy model.
are not accurate enough and may be altered by the testconditions.
The diode electrical analogy model provided amore appropriate explanation of the mechanism ofroot water uptake in light of our data than the linearbattery resistor model, assuming an asymptotic rela-tionship between flux through roots and resistance to

229
Figure 10. Overall relationship between total resistance and tran-spiration flux obtained by the diode model (solid-line) and by thelinear battery resistor model (dashed line).
water flow (Figure 10), although it is still far fromaccounting for all the variability in the phenomenon.
Nonetheless, the rectification (the adjustment) inthe model is rather speculative, since no anatomical orother evidence in support of the concept of a minimumpotential difference required for flow in the roots hasyet emerged (Baker and van Bavel, 1988).
Soil resistance to water flow remained essentiallythe same during the plant cycle averaging 30% ofthe total resistance and was not sensitive to changesin soil water potential above−0.60 MPa. How-ever, the calculated soil resistance may be over-estimated by including part of the plant resistance(Blizzard and Boyer, 1980). Soil resistance to wa-ter flow calculated using the Gardner (1960) equa-tion: RT = ln(1/πr2LZ)/(4πk LZh), wherer=rootradius; LZ=root density; h=soil layer depth; andk=unsaturated hydraulic conductivity, was two ordersof magnitudes smaller than the soil resistance valueobtained when computed asRS = RT − RP usingmean daily values (results not reported here).
The change from vegetative growth to pod fillingwas accompanied by an increase in plant resistance.The increase in plant resistance with age was pre-viously reported by Hailey et al. (1973) forVignasinensis, by Jones et al. (1982) and by Zur et al. (1982)for soybean. The results of this research and other sim-ilar results led to the conclusion that plant resistance isnot constant during the growth cycle. Several explana-
Figure 11. Relationship between root diameter and total resistance.
tions have been proposed, namely that environmentaland plant conditions such as temperature (Huang et al.,1991), water stress (Cruz et al., 1991), oxygen tension(Cephas et al., 1980) and plant age (Hirasawa et al.,1991), may induce root anatomical changes that affectroot system resistivity (Steudle and Peterson, 1998).
Increased hydraulic resistances at the reproductivestage together with reduction of the ratio between rootsurface area and leaf area (Table 2), may also explainthe fact that the sensitivity to drought stress is notuniform throughout crop development, but faba beanis more sensitive to drought stress during floweringand pod formation. In hot, dry weather the inad-equate soil moisture from flowering time onwards(while in flower) is the limiting factor in faba bean podproduction (Grashoff, 1990, 1991).
Plant resistance appeared to be inversely related toroot turgor pressure, while there was a less significantrelation to total root water potential (r=−0.55). Theobserved increase in plant resistance with a decrease inroot turgor pressure may be due to a loosening of root-soil contact. This would alter the hydraulic propertiesin this interfacial region and increase resistance to flow(Hansen, 1974; Herkelrath et al., 1977).
Changes in root diameter with turgor were de-rived from data of the elastic modulus of root cells(Hazaizeh et al., 1992). However, the relation betweencorrected root diameter and total resistance showedthat such a ‘theory’ only explains a limited part(r=−0.58∗∗) of the observed variability in total resist-ance (Figure 11).
230
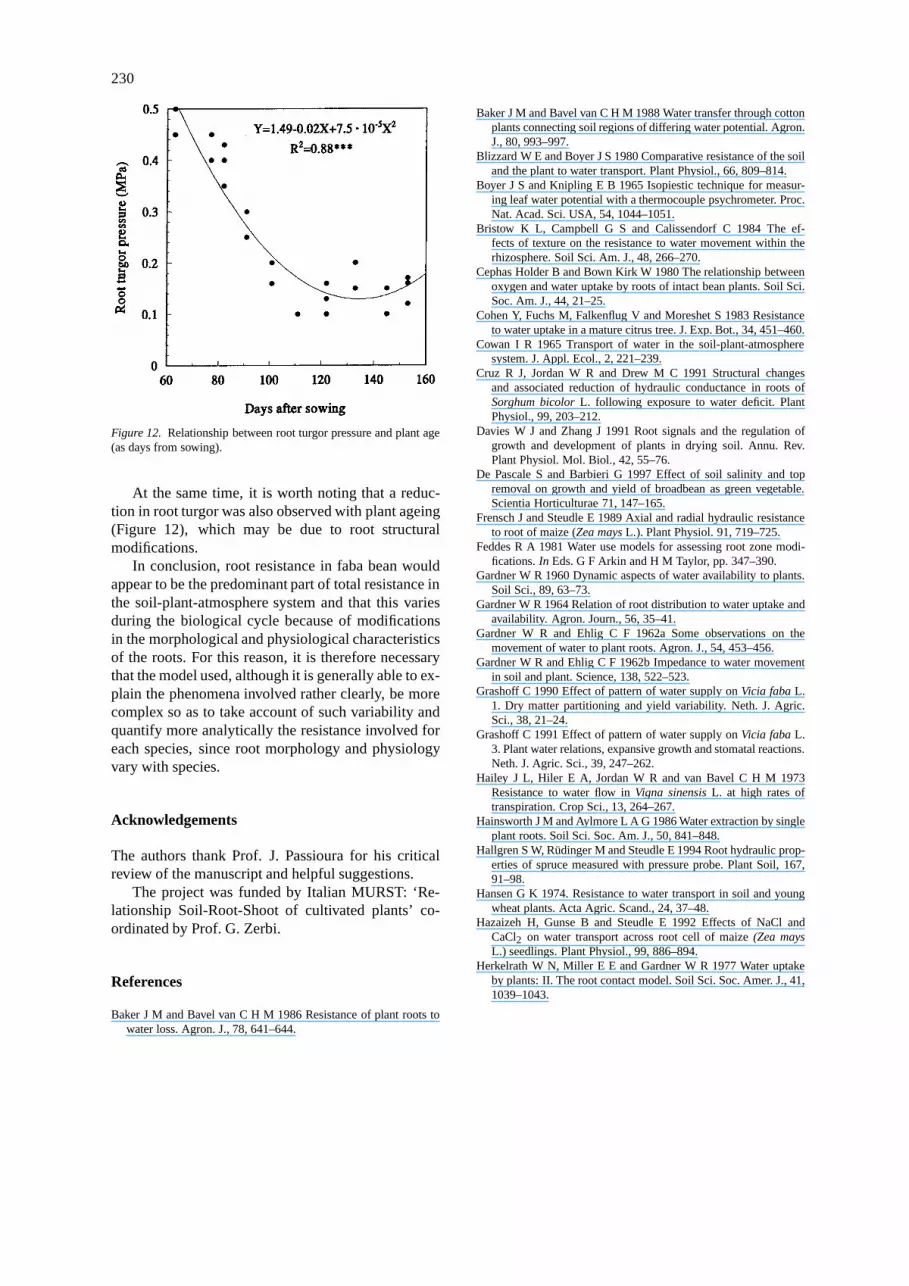
Figure 12. Relationship between root turgor pressure and plant age(as days from sowing).
At the same time, it is worth noting that a reduc-tion in root turgor was also observed with plant ageing(Figure 12), which may be due to root structuralmodifications.
In conclusion, root resistance in faba bean wouldappear to be the predominant part of total resistance inthe soil-plant-atmosphere system and that this variesduring the biological cycle because of modificationsin the morphological and physiological characteristicsof the roots. For this reason, it is therefore necessarythat the model used, although it is generally able to ex-plain the phenomena involved rather clearly, be morecomplex so as to take account of such variability andquantify more analytically the resistance involved foreach species, since root morphology and physiologyvary with species.
Acknowledgements
The authors thank Prof. J. Passioura for his criticalreview of the manuscript and helpful suggestions.
The project was funded by Italian MURST: ‘Re-lationship Soil-Root-Shoot of cultivated plants’ co-ordinated by Prof. G. Zerbi.
References
Baker J M and Bavel van C H M 1986 Resistance of plant roots towater loss. Agron. J., 78, 641–644.
Baker J M and Bavel van C H M 1988 Water transfer through cottonplants connecting soil regions of differing water potential. Agron.J., 80, 993–997.
Blizzard W E and Boyer J S 1980 Comparative resistance of the soiland the plant to water transport. Plant Physiol., 66, 809–814.
Boyer J S and Knipling E B 1965 Isopiestic technique for measur-ing leaf water potential with a thermocouple psychrometer. Proc.Nat. Acad. Sci. USA, 54, 1044–1051.
Bristow K L, Campbell G S and Calissendorf C 1984 The ef-fects of texture on the resistance to water movement within therhizosphere. Soil Sci. Am. J., 48, 266–270.
Cephas Holder B and Bown Kirk W 1980 The relationship betweenoxygen and water uptake by roots of intact bean plants. Soil Sci.Soc. Am. J., 44, 21–25.
Cohen Y, Fuchs M, Falkenflug V and Moreshet S 1983 Resistanceto water uptake in a mature citrus tree. J. Exp. Bot., 34, 451–460.
Cowan I R 1965 Transport of water in the soil-plant-atmospheresystem. J. Appl. Ecol., 2, 221–239.
Cruz R J, Jordan W R and Drew M C 1991 Structural changesand associated reduction of hydraulic conductance in roots ofSorghum bicolorL. following exposure to water deficit. PlantPhysiol., 99, 203–212.
Davies W J and Zhang J 1991 Root signals and the regulation ofgrowth and development of plants in drying soil. Annu. Rev.Plant Physiol. Mol. Biol., 42, 55–76.
De Pascale S and Barbieri G 1997 Effect of soil salinity and topremoval on growth and yield of broadbean as green vegetable.Scientia Horticulturae 71, 147–165.
Frensch J and Steudle E 1989 Axial and radial hydraulic resistanceto root of maize (Zea maysL.). Plant Physiol. 91, 719–725.
Feddes R A 1981 Water use models for assessing root zone modi-fications.In Eds. G F Arkin and H M Taylor, pp. 347–390.
Gardner W R 1960 Dynamic aspects of water availability to plants.Soil Sci., 89, 63–73.
Gardner W R 1964 Relation of root distribution to water uptake andavailability. Agron. Journ., 56, 35–41.
Gardner W R and Ehlig C F 1962a Some observations on themovement of water to plant roots. Agron. J., 54, 453–456.
Gardner W R and Ehlig C F 1962b Impedance to water movementin soil and plant. Science, 138, 522–523.
Grashoff C 1990 Effect of pattern of water supply onVicia fabaL.1. Dry matter partitioning and yield variability. Neth. J. Agric.Sci., 38, 21–24.
Grashoff C 1991 Effect of pattern of water supply onVicia fabaL.3. Plant water relations, expansive growth and stomatal reactions.Neth. J. Agric. Sci., 39, 247–262.
Hailey J L, Hiler E A, Jordan W R and van Bavel C H M 1973Resistance to water flow inVigna sinensisL. at high rates oftranspiration. Crop Sci., 13, 264–267.
Hainsworth J M and Aylmore L A G 1986 Water extraction by singleplant roots. Soil Sci. Soc. Am. J., 50, 841–848.
Hallgren S W, Rüdinger M and Steudle E 1994 Root hydraulic prop-erties of spruce measured with pressure probe. Plant Soil, 167,91–98.
Hansen G K 1974. Resistance to water transport in soil and youngwheat plants. Acta Agric. Scand., 24, 37–48.
Hazaizeh H, Gunse B and Steudle E 1992 Effects of NaCl andCaCl2 on water transport across root cell of maize(Zea maysL.) seedlings. Plant Physiol., 99, 886–894.
Herkelrath W N, Miller E E and Gardner W R 1977 Water uptakeby plants: II. The root contact model. Soil Sci. Soc. Amer. J., 41,1039–1043.

231
Hirasawa T and Ishihara K1991 On the resistance to water transportin crop plants for estimating water uptake ability under intensetranspiration. Jpn. J. Crop Sci., 60, 174–183.
Hirasawa T, Gotou T and Ishihara K 1991 On the resistance to watertransport from the roots to the leaves at different position on astem in rice plants. Jpn. J. Crop Sci., 61, 153–158.
Huang B R, Taylor H M and McMichael B L 1991 Effects of tem-perature on development of metaxylem in primary wheat rootsand its hydraulic consequence. Annal Botany, 67, 163–166.
Husain M M, Reid J B, Othman H and Gallagher J N 1990 Growthand water use of faba beans(Vicia faba L.) in a sub-humidclimate. Field Crop Research, 23, 1–17.
Jones J W, Zur B, Boote K J and Hammond L C 1982 Plant res-istance to water flow in field soybeans: I. Non limiting soilmoisture. Agron. J., 74, 92–98.
Kramer P J and Boyer J S 1995 Water Relations of Plants and Soils.Academic Press, London, 576 pp.
Lafolie F, Bruckler L and Tardieu F 1991 Modelling root water andsoil-root water transport: I. model presentation. J. Soil Sci. Soc.Am., 55, 1203–1212.
Lascano R J and van Bavel C H M 1984 Root water uptake and soilwater distribution: test of an availability concept. Soil Sci. Soc.Am. J., 48, 233–237.
Maurel C 1997 Aquaporins and water permeability of plant mem-branes. Annu. Rev. Plant Physiol. Mol. Biol., 48. 399–429.
Moreshet S, Cohen Y, Green G S and Fuchs M 1990 The partitioningof hydraulic conductances within mature orange trees. J. Exp.Bot., 41, 833–839.
Moreshet S, Fuchs M, Cohen Y and Langensiepen M 1996 Watertransport characteristics of cotton as affected by drip irrigationlayout. Agron. J., 88, 717–722.
Newman E I 1966 A method of estimating the total length of root ina sample. J. Appl. Ecol., 3, 139–145.
Newman E I 1974 Root and soil water relations.In The Plant Rootand its Environment. Ed. E W Carson. pp. 363-440. Universityof Virginia Press, Charlottesville.
Olsson R A and Rose C W 1988 Patterns of water withdrawal be-neath an irrigated peach orchard on a red-brown earth. Irr. Sci.,9, 89–104.
Passioura J B 1988 Water transport in and to the root. Annu. Rev.Plant Physiol. Plant Mol. Biol., 39, 245–265.
Passioura J B and Munns Rana 1984 Hydraulic resistance of plants.II. Effects of rooting medium, and time of day in barley andlupin. Aust. J. Plant Physiol., 11, 341–350.
Rasiah V and Kohl R A 1989. Soybean root uptake in two soils.Agricultural water management, 15, 387–393.
Reicosky D C and Ritchie J T 1976 Relative importance of soilresistance and plant resistance in root water absorption. Soil Sci.Am. J., 40, 293–297.
Rieger M and Motisi M 1990 Estimation of root hydraulic con-ductivity on intact peach and citrus rootstocks. HortScience, 25,1631–1634.
Ruggiero C and Fagnano M 1996a Relazioni tra parte aerea, parteipogea, traspirazione e assorbimento radicale del lupino dolce(Lupinus albusL. cv ‘Multitalia’). Riv. di Agronomia, 1, 58–71.
Ruggiero C and Fagnano M 1996b Relazioni tra parte aerea, parteipogea, traspirazione e assorbimento radicale del cece (CicerarietinumL.). Riv. di Agronomia, 1, 78–88.
Samui R P and Kar S 1981 Soil and plant resistance effects on tran-spirational and leaf water responses by groundnut to soil waterpotential. Austr. J Soil Res., 19, 51–60.
Sarkar S and Kar S 1992 Estimation of water uptake pattern ofgroundnut (Arachis hypogeaL.). Agri. Water Man., 21, 137–143.
Schäffner A R 1998 Aquaporin function, structure, and expression:are there more surprises to surface in water relations? Planta,204, 131–139.
Slavick B 1974 Methods of studying plant water relations. Eco-logical Studies, 9. Acad. Sci. Prague. 449 pp. Springer VerlagHeidelberg New York.
Steudle E 1994 Water transport across roots. Plant Soil, 167, 79–90.Steudle E and Peterson A 1998 How does water get through roots?.
J. Exper. Bot., 49, 775–788.Taylor H M and Keppler B 1975 Water uptake by cotton root system:
an examination of assumption in the single root model. Soil Sci.,120, 57–67.
Tyree M T 1997 The cohesion-tension theory of sap ascent: currentcontroversies. Journal of Exper. Bot., 48, 1753–1765.
van den Honert T H 1948 Water transport in plants as a catenaryprocess. Discussion Faraday Soc., 3, 146–153.
van Genuchten M 1980 A closed form equation for predicting thehydraulic conductivity of unsaturated soil. Soil Sci. Soc. Am. J.,44, 892–897.
Zur B, Jones J W, Boote K J and Hammond L C 1982 Total resist-ance to water flow in field soybeans: II. Limiting soil moisture.Agron. J., 74, 99–105.
Section editor: H Lambers