planning for an uncertain future
TRANSCRIPT

Assessing Risk and Vulnerability for Water Resources in a Changing Climate
Planning for an Uncertain Future
Phil PasterisPrincipal Technologist
Global Water ResourcesCH2M HILL
Portland, Oregon
Armin Munévar, P.E.Senior Technologist
Global Water ResourcesCH2M HILL
San Diego, CA 92101
[email protected] Ext. 7218

Fundamental Issues
Climate change represents a planning problem facing decision-makers at local, national and global levelsDegree and nature of the impacts of climate change are potentially large but uncertainThe fundamental issues:– “Policymakers look to climate change science to answer two
critical questions:– What could we do to prepare for the impacts of climate
change (adaptation);– What steps might be taken to slow it (mitigation)?”
- Richard Alley, Professor, Penn State University

A Brief Recap of Climate Observations
Is Climate Changing?

Global Temperatures, Sea Levels, and Snow Cover
Source: IPCC 4AR (2007)
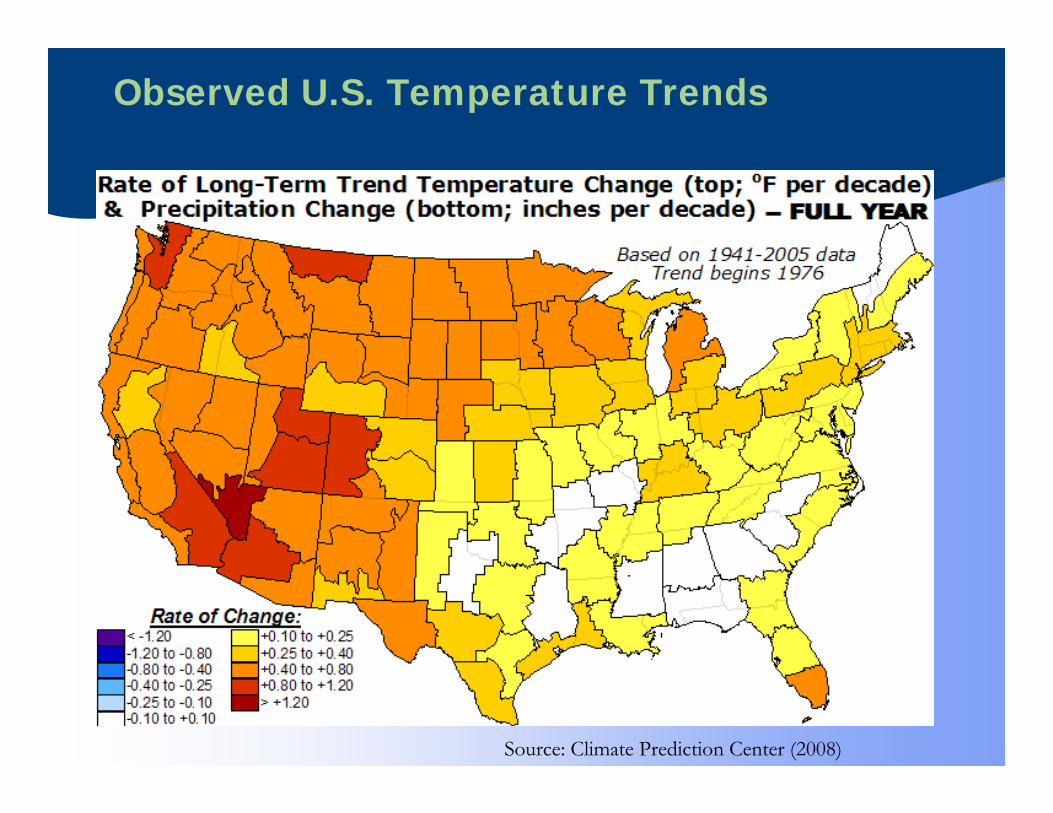
Observed U.S. Temperature Trends
Source: Climate Prediction Center (2008)

Observed Sea Level Rise in California
Source: Roos (2003)

A Brief Recap of Climate Change Projections
Is Climate Changing?

Emission Scenarios Developed by Intergovernmental Panel on Climate Change
Second Lowest Greenhouse Emission
B2 – Intermediate Population growth, local solutions.
Lowest Greenhouse Emissions
B1 – Convergent WorldSame Population as A1, more service and information technology.
Highest Greenhouse Emissions
A2 – HeterogeneousHigh Population GrowthSlow Economic and Technology Change
Second Highest Greenhouse Emissions
A1 – Rapid GrowthA1F1 - Fossil IntensiveA1T - Non-fossilA1B – Balanced
Description“Scenario Family”
A1F1
B2
A2
B1A1T
A1B
Scenarios for GHG emissions from 2000 to 2100 in the absence of additional climate policies.
SRES (Special Report on Emission Scenarios, IPCC 2000)

Multi-Model Projected Temperature Increases
Source: IPCC 4AR (2007)

Source: IPCC 4AR (2007)
Multi-Model ProjectedTemperature & Sea Level Increases

Spatial Temperature Projections (Atmosphere-Ocean GCM)
Source: IPCC 4AR (2007)
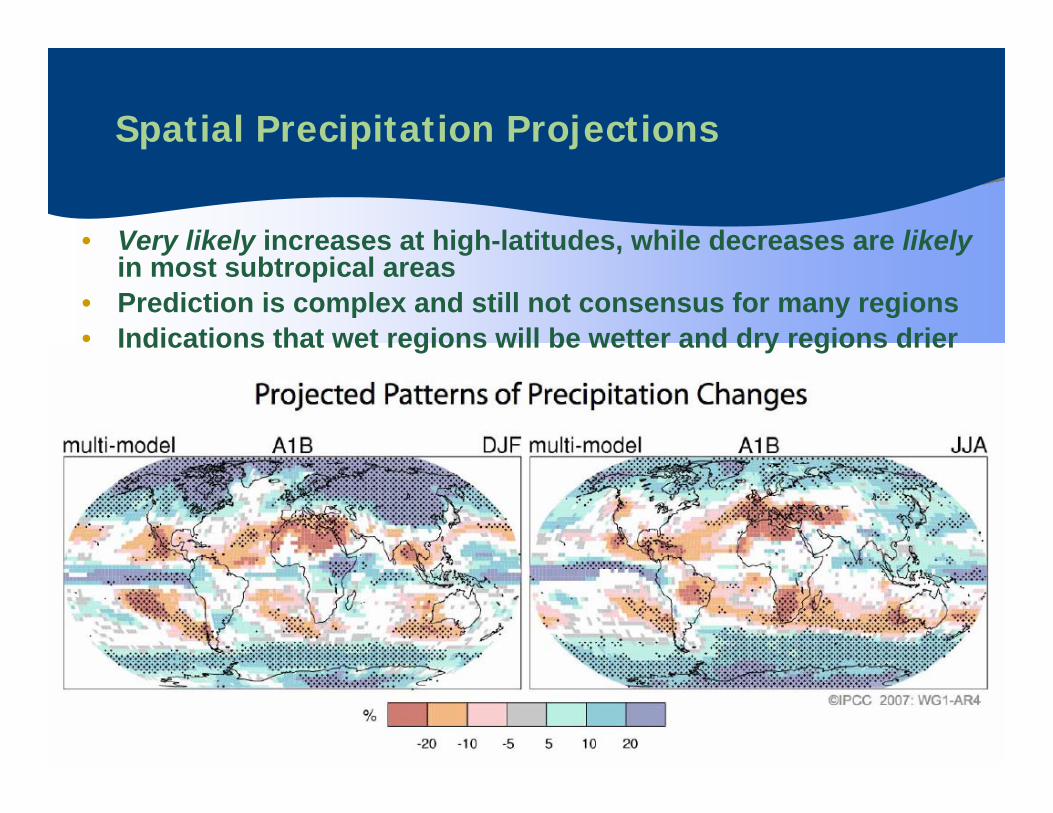
Spatial Precipitation Projections
• Very likely increases at high-latitudes, while decreases are likelyin most subtropical areas
• Prediction is complex and still not consensus for many regions• Indications that wet regions will be wetter and dry regions drier

Some Sectors will be Impacted More than Others
Source: NAS 2006
Water Resources Sector is Leading Area for Adaptation

Climate Variability and Uncertainty

Climate Variability: Past, Present, Future
• Observed climate and hydrology is only a small piece of the puzzle
• Must recognize that insights to hydroclimatic variability come from paleo, observed, and future views of variability
Paleo
Variability Observed
Variability Future
Variability ??
Time
Clim
ate
Var
iabi
lity

Dealing with Time - Climate Sudden Impact?

Dealing With Time - Climate Un-Sudden Impact?
“An American public that is more informed about global warming isn't necessarily one that is more concerned about it.” - Researchers at Texas A&M University http://www.usatoday.com/weather/climate/globalwarming/2008-04-07-climate_N.htm
Muir and Riggs Glaciers, Alaska 1941 - 2004

Paleo Climate Record – Colorado River
Meko et al. (2007) reconstruction of annual streamflow for the Colorado River at Lees Ferry, 762-2005, 20-year running mean in black (annual
values not shown). The yellow bar highlights the severe and sustained mid-1100s drought.

Recent Data – Colorado River
Reservoir storage in Lake Powell and Lake Mead has decreased during the past 8 years. Reservoir storage in Lake Powell is 45
percent of capacity. Storage in Lake Mead is 50 percent of capacity.
Full Pool – 3,700’
~111’From Full
3/6/08

April 1, 2008 WSF – Colorado River
A Closer Look at the West

Is Western Snowpack Changing?
What happened to the “smooth” snowpack accumulation?
Poison Flat

Is Western Snowpack Changing?
Wide variations in peak snowpacks.
Midway Valley
2005 - Record High Peak 70”SWE Old Record 57”
2002 - Record Low Peak 11”SWE

Rapid Intra-Annual Changes? – March 2004
Lack of precipitation
+Warm
temperatures=
Perfect storm for snowpack
reduction
(Pagano, Pasteris, Dettinger, Redmond
EOS 2004)
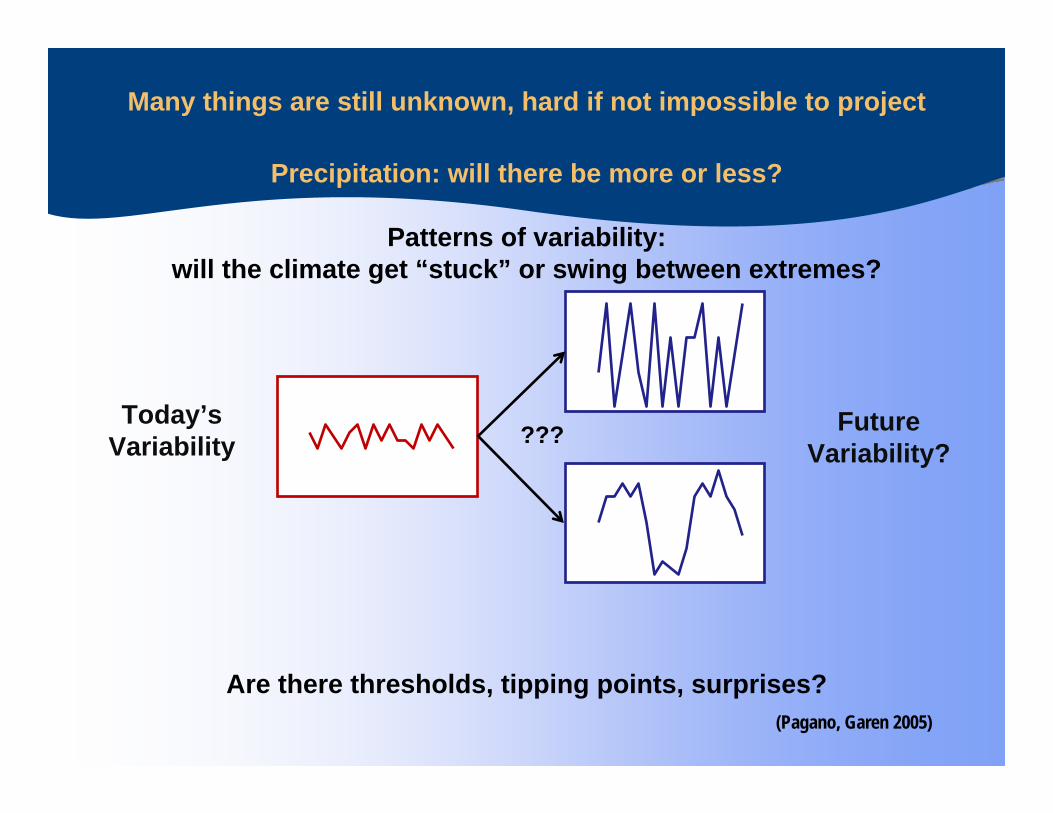
Precipitation: will there be more or less?
Patterns of variability:will the climate get “stuck” or swing between extremes?
Are there thresholds, tipping points, surprises?
Many things are still unknown, hard if not impossible to project
Today’sVariability ??? Future
Variability?
(Pagano, Garen 2005)

A +3ºC change (+5.4ºF…as soon as 2060-2100?) in average temperature
means less snow (red areas meanmore vulnerable)
Pagano, 2008; Maurer et al, 2002
Annual fraction of snow + rain that would fall as rain instead of snow
Most vulnerable
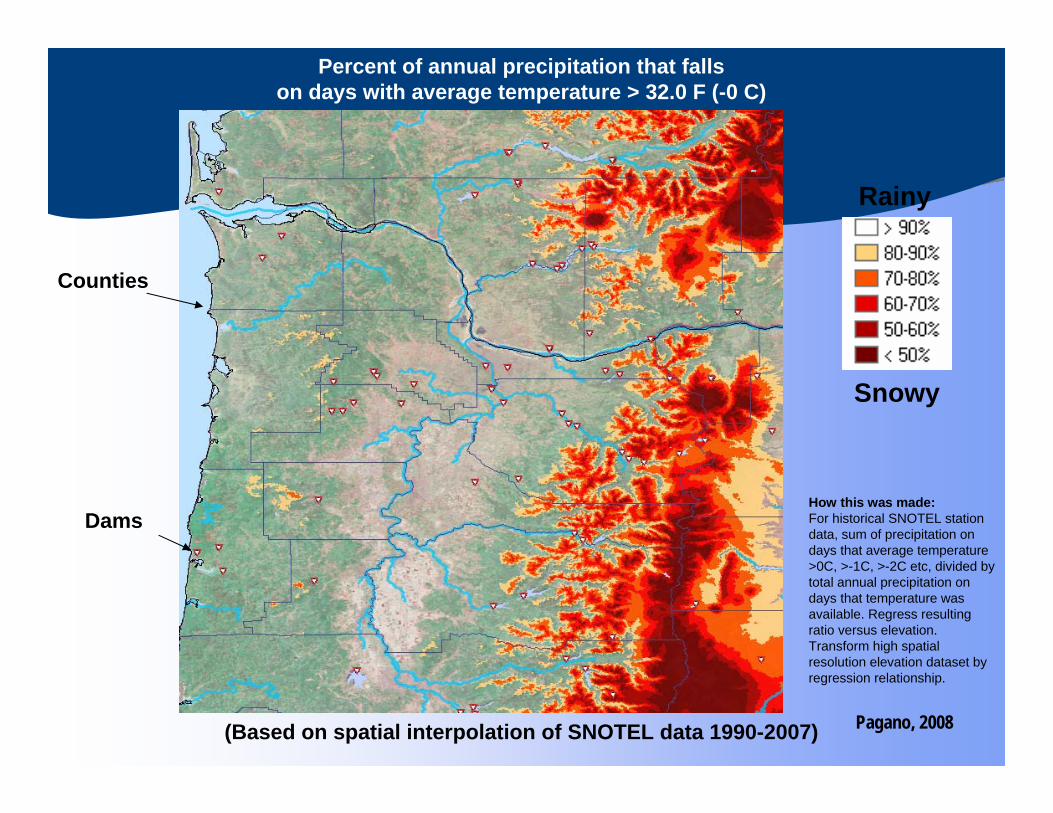
Percent of annual precipitation that falls on days with average temperature > 32.0 F (-0 C)
(Based on spatial interpolation of SNOTEL data 1990-2007)
Snowy
Rainy
Dams
Counties
How this was made:For historical SNOTEL station data, sum of precipitation on days that average temperature >0C, >-1C, >-2C etc, divided by total annual precipitation on days that temperature was available. Regress resulting ratio versus elevation. Transform high spatial resolution elevation dataset by regression relationship.
Pagano, 2008

Percent of annual precipitation that falls on days with average temperature > 30.2 F (-1 C)
(Based on spatial interpolation of SNOTEL data 1990-2007)
The newlandscape
in 2030?
Dams
Counties
Snowy
Rainy
Pagano, 2008

Percent of annual precipitation that falls on days with average temperature > 28.4 F (-2 C)
(Based on spatial interpolation of SNOTEL data 1990-2007)
The newlandscape
in 2065?
Dams
Counties
Snowy
Rainy
Pagano, 2008

Percent of annual precipitation that falls on days with average temperature > 26.6 F (-3 C)
(Based on spatial interpolation of SNOTEL data 1990-2007)
Dams
Counties
The newlandscape
in 2100?
Snowy
Rainy
Pagano, 2008

Percent of annual precipitation that falls on days with average temperature > 32.0 F (-0 C)
(Based on spatial interpolation of SNOTEL data 1990-2007)
Dams
Counties
Snowy
Rainy
Today(1990-2007)
Pagano, 2008

Percent of annual precipitation that fell on days with average temperature > 32 F (0 C)
All snow
All rainBlazed Alder
Mt HoodTest Site
+1 C+1.8 F
+2 C+3.6 F
Future lines:expected change, assuming
warming by certain dates
Blazed Alder (3650’)
Mt Hood Test Site (5400’)
The details: “Future” value at 2030 is 1990-2007 observed % of annual precipitation falling on days with Tavg > -1C, 2050 value is for Tavg > -2C. 1997 is 1990-2007 observed for Tavg > 0C. Lines between are linear interpolations.Pagano, 2008

Bull Run Study: Streamflow impacts from snow changes
From Stickel, WGA/WSWC Water Policy Conf, 2007, based on Palmer et al
Water stored insnow for later…
…now comes aswinter rains
Pagano, 2008
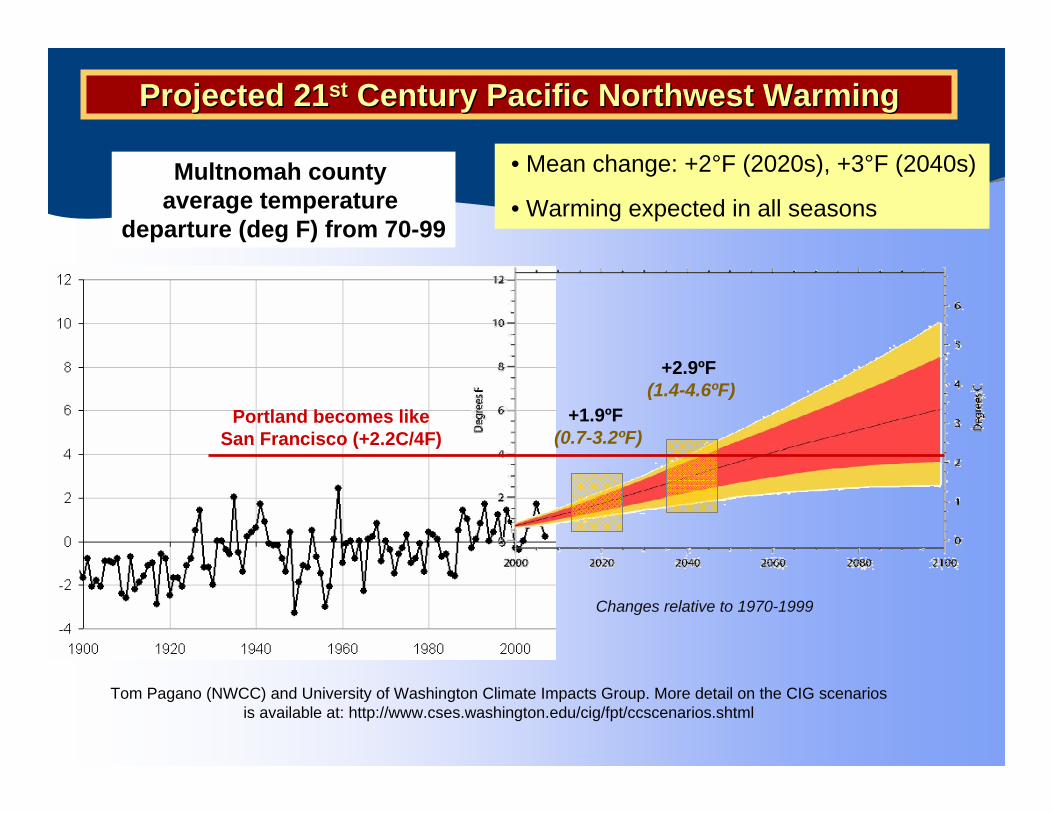
Tom Pagano (NWCC) and University of Washington Climate Impacts Group. More detail on the CIG scenarios is available at: http://www.cses.washington.edu/cig/fpt/ccscenarios.shtml
Projected 21Projected 21stst Century Pacific Northwest WarmingCentury Pacific Northwest Warming
• Mean change: +2°F (2020s), +3°F (2040s)
• Warming expected in all seasons
+1.9ºF (0.7-3.2ºF)
+2.9ºF (1.4-4.6ºF)
Changes relative to 1970-1999
Multnomah county average temperature
departure (deg F) from 70-99
Portland becomes like San Francisco (+2.2C/4F)
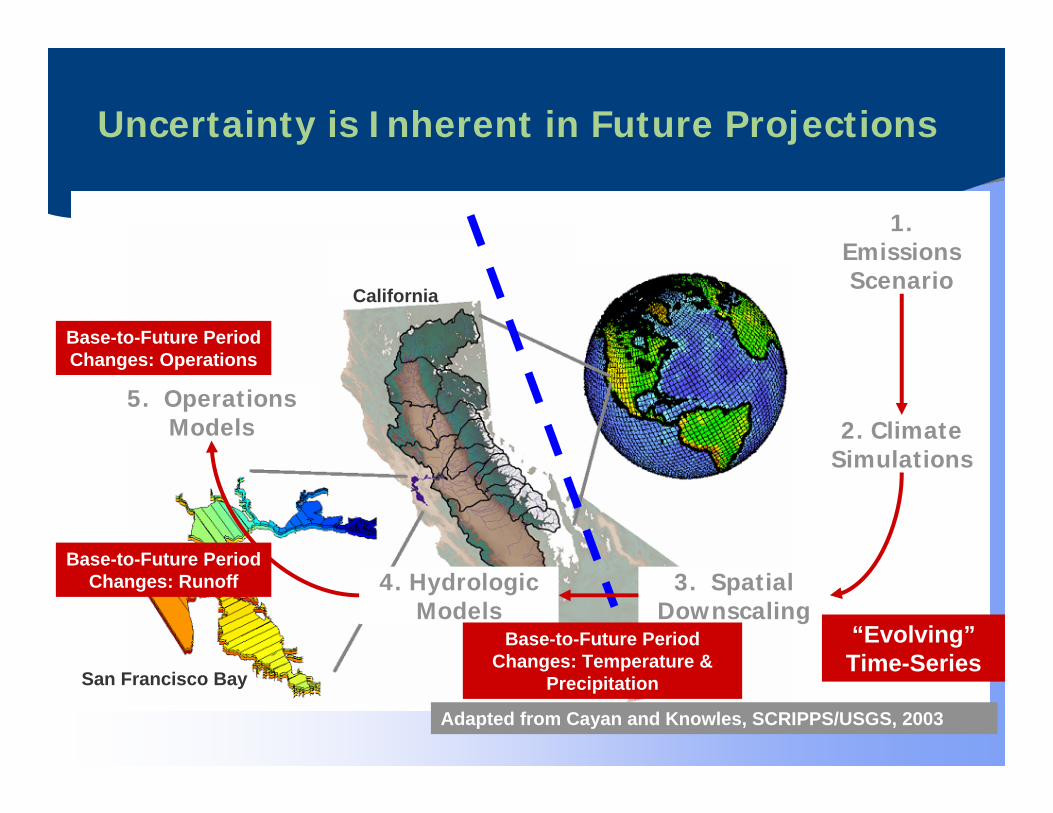
Uncertainty is Inherent in Future Projections
1. Emissions Scenario
Adapted from Cayan and Knowles, SCRIPPS/USGS, 2003
2. Climate Simulations
3. Spatial Downscaling
5. Operations Models
4. Hydrologic Models
“Evolving”Time-Series
California
San Francisco Bay
Base-to-Future Period Changes: Temperature &
Precipitation
Base-to-Future Period Changes: Runoff
Base-to-Future Period Changes: Operations

Integrating GCC With Water Resources

Integrating GCC With Water Resources
• “Implications of Climate Change for Urban Water Utilities”
• Lists of possible impacts, by region
• Basic information about responses
• http://www.amwa.net/cs/climatechange

http://www.nrdc.org/globalWarming/hotwater/contents.asp
• “In Hot Water: Water Management Strategies to Weather the Effects of Global Warming”
• Science of climate• Observed trends• Predicted impacts on water
management• Water and Energy connection• How to design a comprehensive
response
Integrating GCC With Water Resources

http://cses.washington.edu/cig/fpt/guidebook.shtml
• “Preparing for Climate Change: A Guidebook for Local, Regional, and State Governments”
• Establishing “Climate Resilient Communities”
• Focuses on the process to assess climate impacts and risk.
• Designing a response• Workbook-style with
checklists, milestones
Integrating GCC With Water Resources

Establish “Climate Resilient Communities”
• What is a Climate Resilient Community?– One that takes proactive steps to prepare for
(i.e. reduce the vulnerabilities and risks associated with) climate change impacts
– Creates preparedness plans that examine sectors that may be impacted by climate change
– King County, WA (water supply, floods)– Olympia, WA (sea level rise / stormwater)
http://cses.washington.edu/cig/fpt/guidebook.shtml
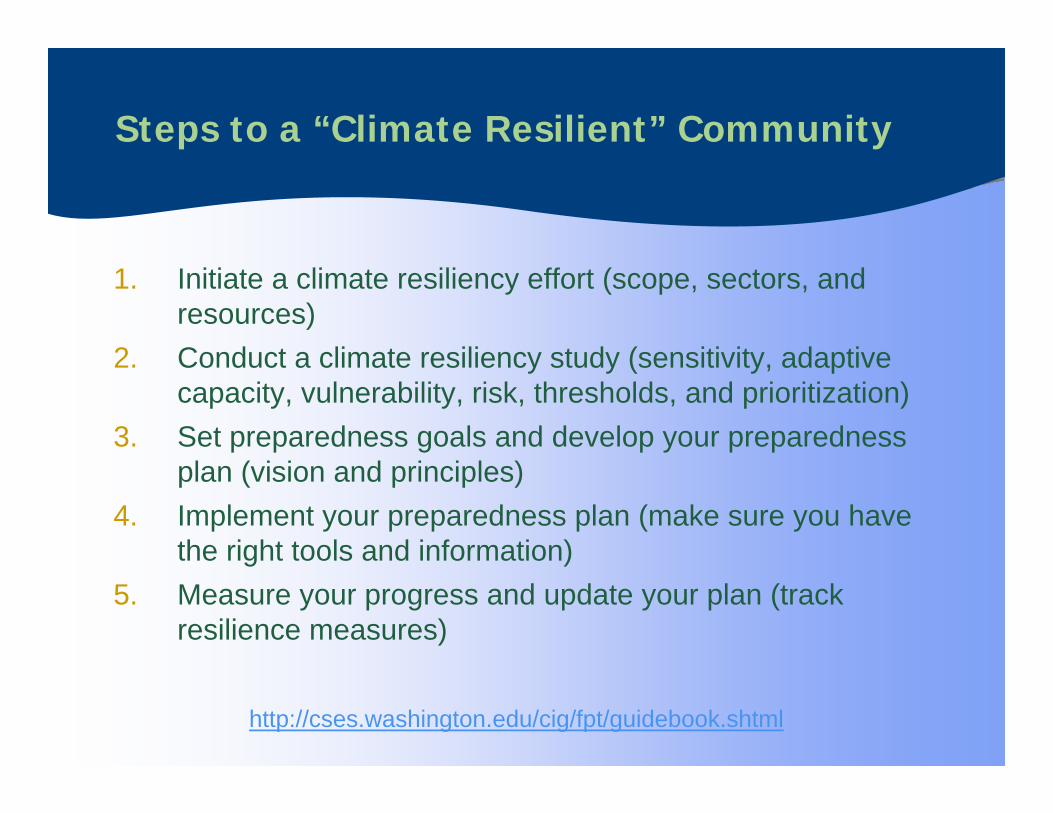
Steps to a “Climate Resilient” Community
1. Initiate a climate resiliency effort (scope, sectors, and resources)
2. Conduct a climate resiliency study (sensitivity, adaptive capacity, vulnerability, risk, thresholds, and prioritization)
3. Set preparedness goals and develop your preparedness plan (vision and principles)
4. Implement your preparedness plan (make sure you have the right tools and information)
5. Measure your progress and update your plan (track resilience measures)
http://cses.washington.edu/cig/fpt/guidebook.shtml
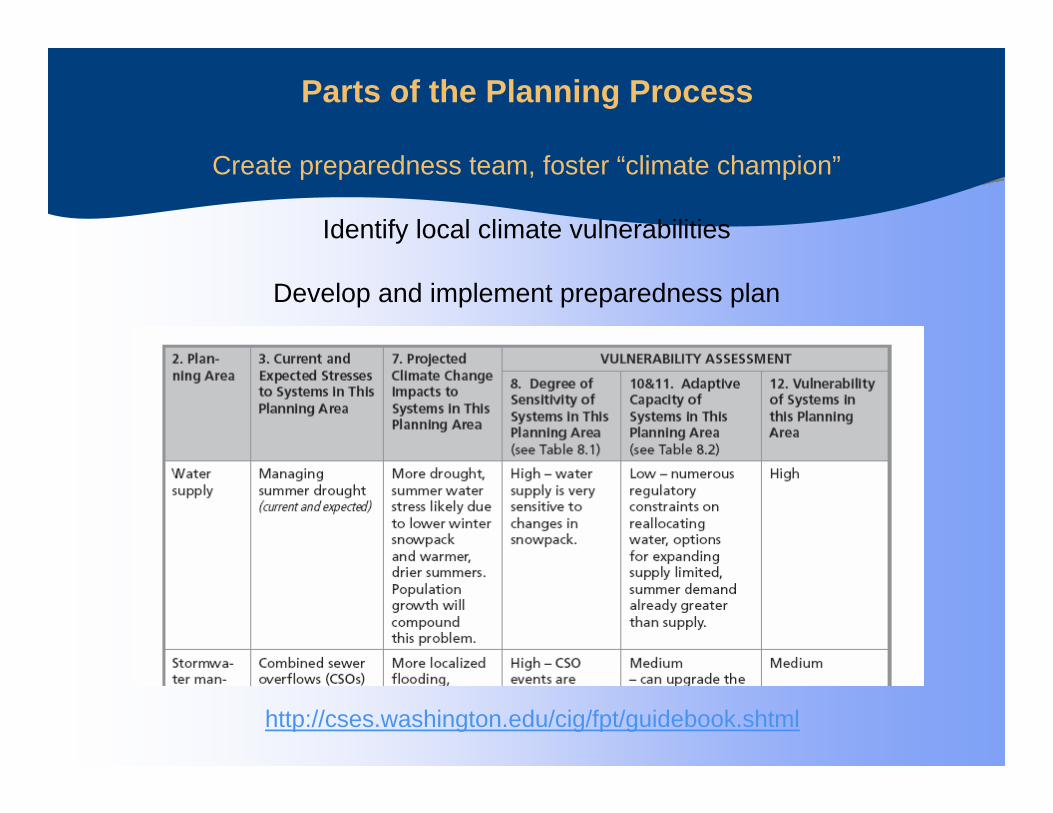
Create preparedness team, foster “climate champion”
Identify local climate vulnerabilities
Develop and implement preparedness plan
Parts of the Planning Process
http://cses.washington.edu/cig/fpt/guidebook.shtml

Global Climate Change IntegrationA Continuous Process With Water Managers
5. Update and Manage Operations
2. Develop Risk Analysis andScenario Planning
3. Develop Adaptive Strategies
4. Assess Effectiveness
1. Establish Climate Access
Integrating Global Climate Change Water Resource
Planning

Some Information Sources to Manage Climate Change Impacts

Applied Climate Information System (ACIS)
http://www.rcc-acis.org/

ACIS Monthly Data
(NOAA Regional Climate Centers)
http://www.rcc-acis.org/

ACIS Daily Data(NOAA Regional Climate Centers)
http://www.rcc-acis.org/

Westwide Snowpack Map
(NRCS, NWCC)
http://www.wcc.nrcs.usda.gov/
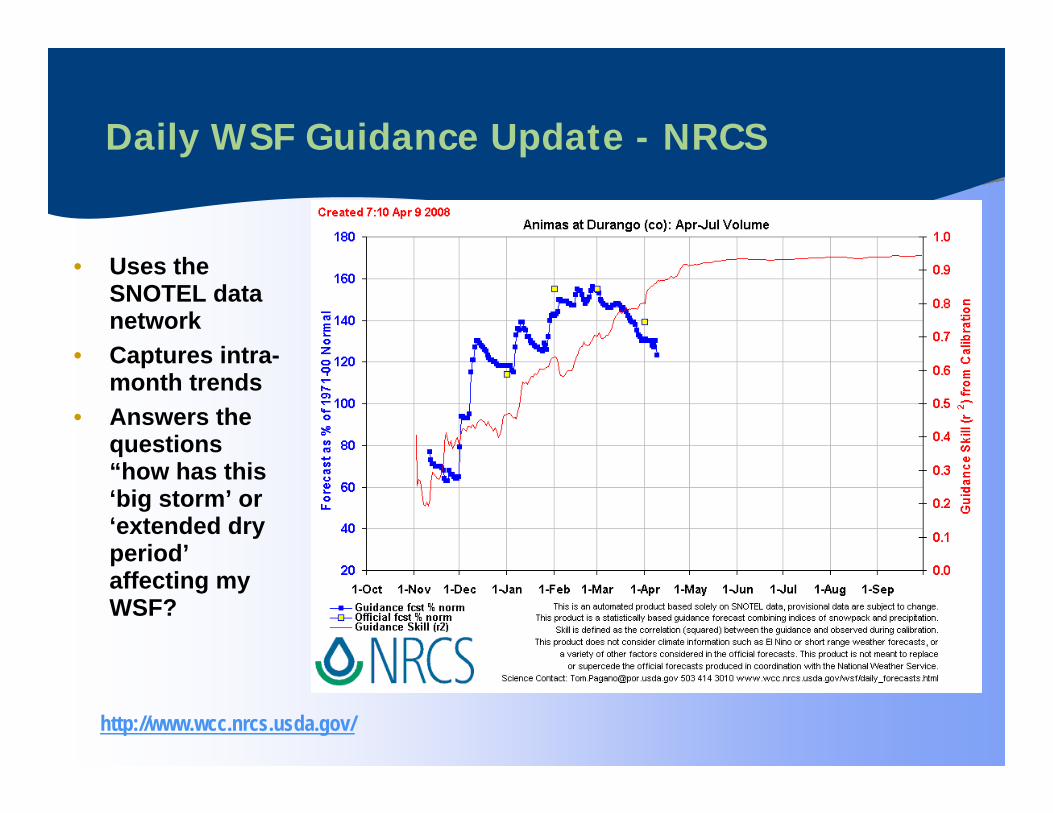
Daily WSF Guidance Update - NRCS
• Uses the SNOTEL data network
• Captures intra-month trends
• Answers the questions “how has this ‘big storm’ or ‘extended dry period’affecting my WSF?
http://www.wcc.nrcs.usda.gov/

Summary
• The data, technology, and expertise are now available to help create “Climate Resilient Communities.”
• A process and framework can be implemented that can provide water managers with realistic steps to
– Assess climate risk and vulnerabilities– Manage resources– Develop resilient climate change preparedness plans.
• A significant amount of work remains, but there has never been an opportunity of this magnitude to meet customer’s needs.

Thank You!